A Preliminary Study of the Causality of Freezing of Gait for Parkinson's Disease Patients: Bayesian...
8
A Preliminary Study of the Causality of Freezing of Gait for Parkinson's Disease Patients: Bayesian Belief Network Approach Ali Saad 1, 5 , Iyad Zaarour 2, 3 , Abbas Zeinedine 3 , Mohammad Ayache 1 , Paul Bejjani 4 , François Guerin 5 , Dimitri Lefebvre 5 1 Biomedical Department, Faculty of Engineering, Islamic University of Lebanon Beirut-Lebanon 2 Laboratoire d'Informatique, de traitement de l'Information et des Systèmes (LITIS- EA 4108) -Université de Rouen Rouen-France 3 Faculty of business and economical sciences, Doctoral school of Science and technology, Lebanese University Beirut-Lebanon 4 Director of Parkinson Center, Notre Dame de secours University Hospital, Beirut , Lebanon Beirut-Lebanon 5 Laboratoire GREAH -Groupe de Recherche en Electrotechnique et Automatique du Havre, Université du Havre Le Havre-France Abstract Parkinson Disease (PD) patients suffer from a disabling phenomenon called Freezing of Gait (FoG), which can be described as if their feet were „frozen‟ or stuck, but that the top half of their body was still able to move. In this paper, we make a graphical probabilistic modeling study, "Bayesian Belief Network (BBN) approach" of a previously collected dataset that represents the measurements of acceleration sensors placed on the ankle, knee and hip of PD patients during their walk. In order to know if this is a traditional BBN model or a causal one, we built a FoG Model and tested its causality behavior, first by forming an Epidemiological Approach, and then, by inferring causal relations based on Additive Noise Models (ANM). Consequently, we built a Bayesian Naive Classifier Model related to FoG. The Bayesian belief Network classifier has the ability to identify the onset of freezing of PD patients, during walking using the extracted features. Promising results appeared when testing the BNC classifier models. Keywords: Parkinson Disease, Freezing of Gait, Bayesian Network, Causality, Data Mining, Epidemiology, Classification 1. Introduction Parkinson's Disease (PD) is a common neuro- degenerative disease. One of PD symptoms is freezing, which may occur during gait, speaking or a repetitive movement like handwriting. Freezing of Gait (FoG) can be defined as “a brief, episodic reduction of forward progression of the feet despite the intention to walk”, and is often described by patients as if their feet are glued to the floor for a short period of time [1]. FoG aspects of PD do not respond well to dopaminergic drugs, as it is one of the symptoms that often result from non- dopaminergic pathology [2]. Recent studies investigated measuring features that may evaluate patterns of the handwriting and speech of PD patients as well as handwriting of school children [3, 4], which can be used to detect writing and voice freezing episodes for PD patients. This study highlights the Freezing of Gait phenomenon of PD patients. Our proposal is a modeling approach that focuses on a specific class of Probabilistic Graphical Model (PGM), the directed 1 one, i.e. Bayesian Belief Network (BBN).The followed methodology mainly includes assessing the framework of the BBN model, we tried to identify if this is a traditional BBN case [5, 6] or a causal one [7, 8].The utility of causal structure encompasses: (1) a natural expert interfaces, and (2) a reliable view to predict the effect of a “change in structure” due to an external intervention [32]. Moreover, by means of the assessed model, a classification tool is built to estimate the FoG episodes of PD patients. This classification model can be inferred to diagnosis or forecasting issues. The first part of this paper discusses the explanation and background of the pre-collected dataset. The second part gives a clear explanation of the modification done on the dataset. The third part explains briefly the formalism of Bayesian Belief Networks. Next, we illustrated a brief state of the art in theories and concepts surrounding the causality, as a background, in order to assess a causal link between 1 The alternative classes of Probabilistic Graphical Model are undirected Markov networks and hybrid graphs [9], those families of classes are more adapted to statistical physics and computer vision [10]. IJCSI International Journal of Computer Science Issues, Vol. 10, Issue 3, No 2, May 2013 ISSN (Print): 1694-0814 | ISSN (Online): 1694-0784 www.IJCSI.org 88 Copyright (c) 2013 International Journal of Computer Science Issues. All Rights Reserved.
-
Upload
independent -
Category
Documents
-
view
0 -
download
0
Transcript of A Preliminary Study of the Causality of Freezing of Gait for Parkinson's Disease Patients: Bayesian...
A Preliminary Study of the Causality of Freezing of
Gait for Parkinson's Disease Patients: Bayesian Belief
Network Approach
Ali Saad1, 5, Iyad Zaarour 2, 3, Abbas Zeinedine3, Mohammad Ayache1, Paul Bejjani4, François Guerin5, Dimitri Lefebvre 5
1 Biomedical Department, Faculty of Engineering, Islamic University of Lebanon
Beirut-Lebanon
2 Laboratoire d'Informatique, de traitement de l'Information et de s Systèmes (LITIS- EA 4108) -Université de Rouen Rouen-France
3Faculty of business and economical sciences, Doctoral school of Science and technology, Lebanese University
Beirut-Lebanon
4Director of Parkinson Center, Notre Dame de secours University Hospital, Beirut , Lebanon Beirut-Lebanon
5Laboratoire GREAH -Groupe de Recherche en Electrotechnique et Automatique du Havre, Université du Havre
Le Havre-France
Abstract Parkinson Disease (PD) patients suffer from a disabling phenomenon called Freezing of Gait (FoG), which can be described as if their feet were „frozen‟ or stuck, but that the top half of their body was still able to move. In this paper, we make a graphical probabilistic modeling study, "Bayesian Belief Network (BBN) approach" of a previously collected dataset that represents the measurements of acceleration sensors placed on the ankle, knee and hip of PD patients during their walk. In order to know if this is a traditional BBN model or a causal one, we built a FoG Model and tested its causality behavior, first by forming an Epidemiological Approach, and then, by inferring causal relations based on Additive Noise Models (ANM). Consequently, we built a Bayesian Naive Classifier Model related to FoG. The Bayesian belief Network classifier has the ability to identify the onset of freezing of PD patients, during walking using the extracted features. Promising results appeared when testing the BNC classifier models. Keywords: Parkinson Disease, Freezing of Gait, Bayesian Network, Causality, Data Mining, Epidemiology, Classification
1. Introduction
Parkinson's Disease (PD) is a common neuro-degenerative disease. One of PD symptoms is freezing, which may occur during gait, speaking or a repetitive movement like handwriting. Freezing of Gait (FoG) can be defined as “a brief, episodic reduction of forward progression of the feet despite the intention to walk”, and is often described by patients as if their feet are glued to the floor for a short period of time [1]. FoG aspects of PD do not respond well to dopaminergic drugs, as it is
one of the symptoms that often result from non-dopaminergic pathology [2]. Recent studies investigated measuring features that may evaluate patterns of the handwriting and speech of PD patients as well as handwriting of school children [3, 4], which can be used to detect writing and voice freezing episodes for PD patients. This study highlights the Freezing of Gait phenomenon of PD patients. Our proposal is a modeling approach that focuses on a specific class of Probabilistic Graphical Model (PGM), the directed1one, i.e. Bayesian Belief Network (BBN).The followed methodology mainly includes assessing the framework of the BBN model, we tried to identify if this is a traditional BBN case [5, 6] or a causal one [7, 8].The utility of causal structure encompasses: (1) a natural expert interfaces, and (2) a reliable view to predict the effect of a “change in structure” due to an external intervention [32]. Moreover, by means of the assessed model, a classification tool is built to estimate the FoG episodes of PD patients. This classification model can be inferred to diagnosis or forecasting issues. The first part of this paper discusses the explanation and background of the pre-collected dataset. The second part gives a clear explanation of the modification done on the dataset. The third part explains briefly the formalism of Bayesian Belief Networks. Next, we illustrated a brief state of the art in theories and concepts surrounding the causality, as a background, in order to assess a causal link between
1The alternative classes of Probabilistic Graphical Model are
undirected Markov networks and hybrid graphs [9], those families of classes are more adapted to statistical physics and computer vision [10].
IJCSI International Journal of Computer Science Issues, Vol. 10, Issue 3, No 2, May 2013
ISSN (Print): 1694-0814 | ISSN (Online): 1694-0784
www.IJCSI.org 88
Copyright (c) 2013 International Journal of Computer Science Issues. All Rights Reserved.
variables of interest before building our BBN model. The machine learning approach is described in the fifth part, whereas the obtained results are described and illustrated in the sixth part of the paper. Finally the last part sums up the general conclusion and some perspectives.
2. Data Preparation
2.1 Native Dataset
In previous studies, Marc Bächlin et al [11] developed a wearable assistant for Parkinson‟s disease patients that detects FoG by analyzing frequency components inherent in the body movements, using measurements from on-body acceleration sensors. They used three acceleration sensors positioned in different body parts (ankle, knee and hip). Each sensor measures three components of acceleration(x: horizontal forward axis, y: the vertical axis and z: the horizontal lateral axis).Their detection algorithm was based on the principle illustrated by Moore et al [12] that introduced a Freeze Index (FI) to evaluate the gait condition of PD patients. The FI is a ratio defined as the power in the freeze band [3-8Hz] divided by the power in the locomotors band [0.5-3Hz]. The FoG detection is performed by defining a freeze threshold, where values higher than this threshold are considered as FoG events. Referring to the data obtained by Marc Bächlin et al [11] from 10 PD patients, we incorporated these values into our probabilistic model in order to predict upcoming FoG episodes. The data is composed of separated files for each patient, although some patients have multiple files for each test done. Each file is composed of a matrix that contains measurement data of the three sensors in x, y and z directions. The last column contains the annotation, weather FoG occurred or not. These annotations was labeled by synchronizing the data by a video that recorded each patient run, which allowed to identify the exact start times, durations and end times of FoG episodes.
2.2 Employed features
Starting from the above described dataset, the Freezing Index for each acceleration measurement is calculated, using a sliding window that calculates the FI of 256 acceleration samples. So we will map the dataset from raw data to normalized data for generalization purposes in future work. The second step was to eliminate the data which is irrelevant to experiments done (Annotation 0), in order to constrain the classification between occurring of FoG (Annotation 1) and or NoFoG (Annotation 2).Then we calculated the magnitude of the three FIs components for each sensor. Accordingly, all the
measurements taken are represented in a low dimensional dataset, that it is ready to be introduced to our proposed machine learning model. The obtained continuous variables have been discretized based on Akaike‟s criterion [13], before it was introduced to the BBN model.
3. BBN Formalism
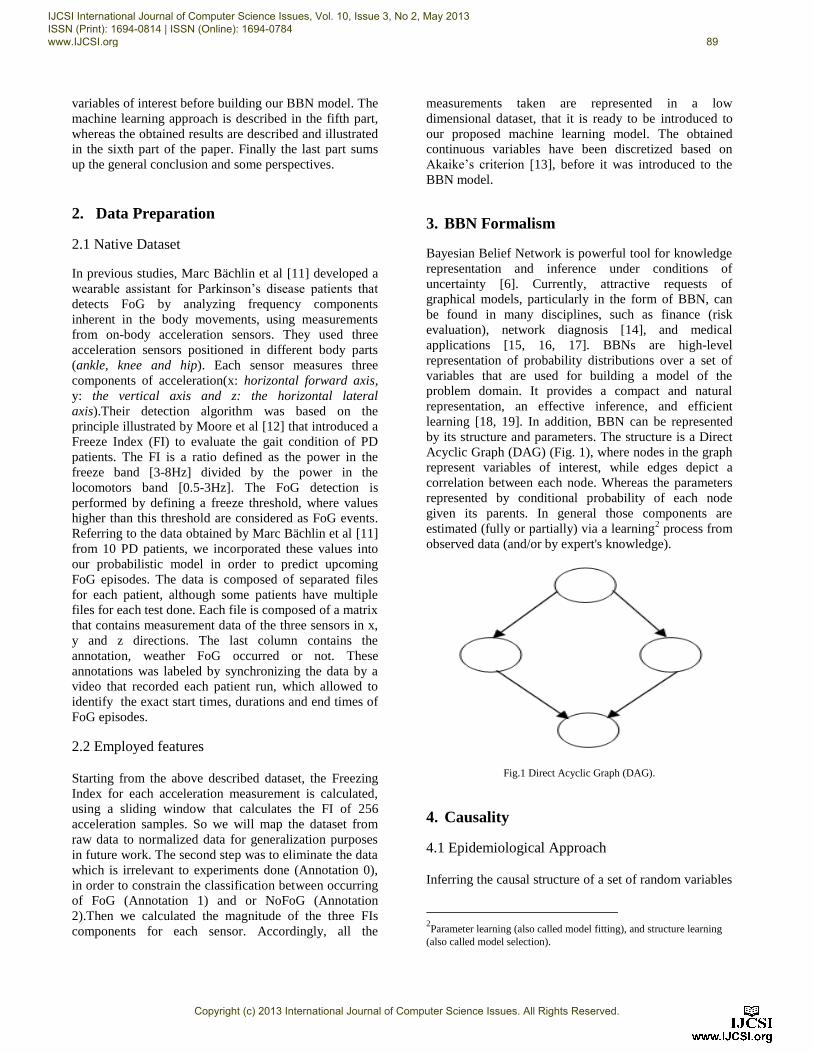
Bayesian Belief Network is powerful tool for knowledge representation and inference under conditions of uncertainty [6]. Currently, attractive requests of graphical models, particularly in the form of BBN, can be found in many disciplines, such as finance (risk evaluation), network diagnosis [14], and medical applications [15, 16, 17]. BBNs are high-level representation of probability distributions over a set of variables that are used for building a model of the problem domain. It provides a compact and natural representation, an effective inference, and efficient learning [18, 19]. In addition, BBN can be represented by its structure and parameters. The structure is a Direct Acyclic Graph (DAG) (Fig. 1), where nodes in the graph represent variables of interest, while edges depict a correlation between each node. Whereas the parameters represented by conditional probability of each node given its parents. In general those components are estimated (fully or partially) via a learning2 process from observed data (and/or by expert's knowledge).
Fig.1 Direct Acyclic Graph (DAG).
4. Causality
4.1 Epidemiological Approach
Inferring the causal structure of a set of random variables
2Parameter learning (also called model fitting), and structure learning
(also called model selection).
IJCSI International Journal of Computer Science Issues, Vol. 10, Issue 3, No 2, May 2013
ISSN (Print): 1694-0814 | ISSN (Online): 1694-0784
www.IJCSI.org 89
Copyright (c) 2013 International Journal of Computer Science Issues. All Rights Reserved.
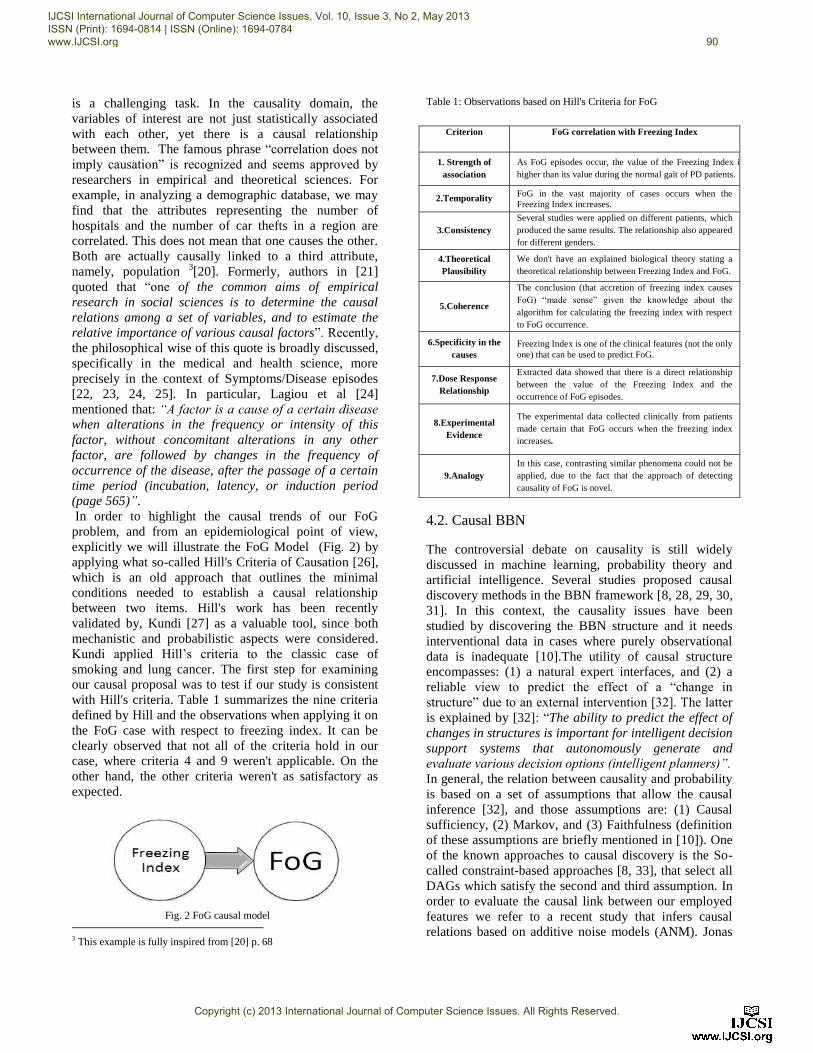
is a challenging task. In the causality domain, the variables of interest are not just statistically associated with each other, yet there is a causal relationship between them. The famous phrase “correlation does not imply causation” is recognized and seems approved by researchers in empirical and theoretical sciences. For example, in analyzing a demographic database, we may find that the attributes representing the number of hospitals and the number of car thefts in a region are correlated. This does not mean that one causes the other. Both are actually causally linked to a third attribute, namely, population 3[20]. Formerly, authors in [21] quoted that “one of the common aims of empirical research in social sciences is to determine the causal relations among a set of variables, and to estimate the relative importance of various causal factors”. Recently, the philosophical wise of this quote is broadly discussed, specifically in the medical and health science, more precisely in the context of Symptoms/Disease episodes [22, 23, 24, 25]. In particular, Lagiou et al [24] mentioned that: “A factor is a cause of a certain disease when alterations in the frequency or intensity of this factor, without concomitant alterations in any other factor, are followed by changes in the frequency of occurrence of the disease, after the passage of a certain time period (incubation, latency, or induction period (page 565)”. In order to highlight the causal trends of our FoG problem, and from an epidemiological point of view, explicitly we will illustrate the FoG Model (Fig. 2) by applying what so-called Hill's Criteria of Causation [26], which is an old approach that outlines the minimal conditions needed to establish a causal relationship between two items. Hill's work has been recently validated by, Kundi [27] as a valuable tool, since both mechanistic and probabilistic aspects were considered. Kundi applied Hill‟s criteria to the classic case of smoking and lung cancer. The first step for examining our causal proposal was to test if our study is consistent with Hill's criteria. Table 1 summarizes the nine criteria defined by Hill and the observations when applying it on the FoG case with respect to freezing index. It can be clearly observed that not all of the criteria hold in our case, where criteria 4 and 9 weren't applicable. On the other hand, the other criteria weren't as satisfactory as expected.
3 This example is fully inspired from [20] p. 68
Table 1: Observations based on Hill's Criteria for FoG
4.2. Causal BBN
The controversial debate on causality is still widely discussed in machine learning, probability theory and artificial intelligence. Several studies proposed causal discovery methods in the BBN framework [8, 28, 29, 30, 31]. In this context, the causality issues have been studied by discovering the BBN structure and it needs interventional data in cases where purely observational data is inadequate [10].The utility of causal structure encompasses: (1) a natural expert interfaces, and (2) a reliable view to predict the effect of a “change in structure” due to an external intervention [32]. The latter is explained by [32]: “The ability to predict the effect of changes in structures is important for intelligent decision support systems that autonomously generate and evaluate various decision options (intelligent planners)”. In general, the relation between causality and probability is based on a set of assumptions that allow the causal inference [32], and those assumptions are: (1) Causal sufficiency, (2) Markov, and (3) Faithfulness (definition of these assumptions are briefly mentioned in [10]). One of the known approaches to causal discovery is the So-called constraint-based approaches [8, 33], that select all DAGs which satisfy the second and third assumption. In order to evaluate the causal link between our employed features we refer to a recent study that infers causal relations based on additive noise models (ANM). Jonas
Criterion FoG correlation with Freezing Index
1. Strength of association
As FoG episodes occur, the value of the Freezing Index in higher than its value during the normal gait of PD patients.
2.Temporality FoG in the vast majority of cases occurs when the Freezing Index increases.
3.Consistency Several studies were applied on different patients, which produced the same results. The relationship also appeared for different genders.
4.Theoretical Plausibility
We don't have an explained biological theory stating a theoretical relationship between Freezing Index and FoG.
5.Coherence
The conclusion (that accretion of freezing index causes FoG) “made sense” given the knowledge about the algorithm for calculating the freezing index with respect to FoG occurrence.
6.Specificity in the causes
Freezing Index is one of the clinical features (not the only one) that can be used to predict FoG.
7.Dose Response Relationship
Extracted data showed that there is a direct relationship between the value of the Freezing Index and the occurrence of FoG episodes.
8.Experimental Evidence
The experimental data collected clinically from patients made certain that FoG occurs when the freezing index increases.
9.Analogy In this case, contrasting similar phenomena could not be applied, due to the fact that the approach of detecting causality of FoG is novel.
Fig. 2 FoG causal model
IJCSI International Journal of Computer Science Issues, Vol. 10, Issue 3, No 2, May 2013
ISSN (Print): 1694-0814 | ISSN (Online): 1694-0784
www.IJCSI.org 90
Copyright (c) 2013 International Journal of Computer Science Issues. All Rights Reserved.
et al [34] published an algorithm that able to distinguish between cause and effect, for a finite sample of discrete variables, and works both on synthetic and real data sets. The principle is that whenever the joint distribution P(X; Y) admits such a model in one direction, e.g. but does not admit the reversed model, one infers the former direction to be causal (i.e. X →Y). Briefly, this algorithm tests whether the data admits an additive noise model by checking all possible functions and test whether they result in independent residuals. Furthermore, ANM's method does not give wrong results, but answers “I do not know the answer", especially the case of binary variable. By applying all two by two vectors from our Dataset, Jonas et al [34] causal inference method resulted that no causal relationships can be applied between any of our variables and between FoG. Next, we will build a specific BBN, by assuming that a simplest structure exist between variables and FoG, and we will study the FoG episode via a traditional way of classification using Bayesian Naïve Classifier (BNC), which is one of the most effective and popular classifiers in data mining techniques [20, 35].
5. Bayesian Naïve Classifier
Data mining is the science of extracting useful information from large data sets. It covers areas of machine learning, pattern recognition, artificial intelligence, and other areas [36]. One of data mining main objectives is prediction, which involves using some variables in data sets in order to predict unknown values of other relevant variables (e.g. classification, regression, and anomaly detection) [37].We already initialized the process of building a BBN model (sections 4.1 and 4.2) by studying the type of relationship between the Freezing Index concept and FoG episode via Hill's rule, and among features themselves via (ANM) model. Those two methodologies didn‟t validate the causality behavior between Freezing Index and FoG. Hence, we assume that BBN structure will depict a simple correlation between variables and FoG, and we will study the FoG episode via the simplest and traditional way of Classification Model where the FoG can be simply inferred to diagnosis or forecasting issues, specifically we tended to use the Bayesian Naïve Classifier (BNC), which is broadly used as a popular classifiers in data mining techniques [20, 35]. It has been successfully applied to the different problem domains of classification task such as intrusion detection, image and pattern recognition, medical diagnosis, loan approval and bioinformatics [38]. BNC assumes the attributes are independent given the classification node, is surprisingly effective [39].
5.1. Classification Rule
Using the notation of [19](chapter 6 page 157); Let C be a class attribute with a finite domain of m classes, that is, let � = { 1 , … , }, and let� = {�1, … , � } be a set of other attributes. For a numeric attribute, � = ℝ. With this notation a case or an object can be described, as usual, by an instantiation (�1 , … , � ) of the attributes{�1, … , � }. For a given instantiation (�1 , … , � )a naive Bayes classifier tries to compute the conditional probability �(� = \�1 = �1 , … , � = � ) for all , and then it predicts the class for which this probability is highest. Naive Bayes classifiers use Bayes’ rule and a set of (naive) conditional independence assumptions, where the conditional probabilities are inverted. That is, naive Bayes classifiers consider: � � = |�1 = �1 , … , � = � =
� �1 = �1 , … , � = � � = . �(� = )�(�1 = �1 , … ,� = � ) (1)
Then we make the crucial (but naive) assumptions that: given the value of the class attribute, any attribute � is independent of any other. The latter postulation simplifies the formula stated above, since with it we can cancel all attributes � appearing in the conditions. Thus we get: � � = |�1 = �1 , … , � = � = �(� = )
0
. �(
=1
� = � � = . (2)
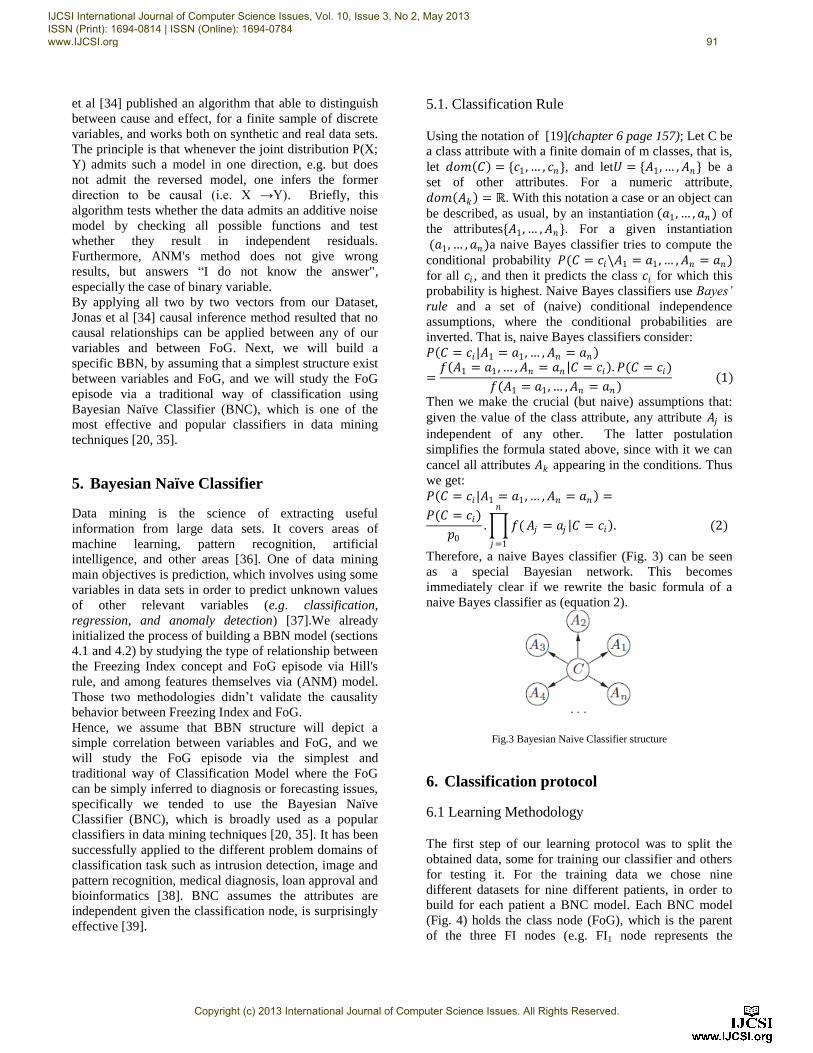
Therefore, a naive Bayes classifier (Fig. 3) can be seen as a special Bayesian network. This becomes immediately clear if we rewrite the basic formula of a naive Bayes classifier as (equation 2).
Fig.3 Bayesian Naive Classifier structure
6. Classification protocol
6.1 Learning Methodology
The first step of our learning protocol was to split the obtained data, some for training our classifier and others for testing it. For the training data we chose nine different datasets for nine different patients, in order to build for each patient a BNC model. Each BNC model (Fig. 4) holds the class node (FoG), which is the parent of the three FI nodes (e.g. FI1 node represents the
IJCSI International Journal of Computer Science Issues, Vol. 10, Issue 3, No 2, May 2013
ISSN (Print): 1694-0814 | ISSN (Online): 1694-0784
www.IJCSI.org 91
Copyright (c) 2013 International Journal of Computer Science Issues. All Rights Reserved.
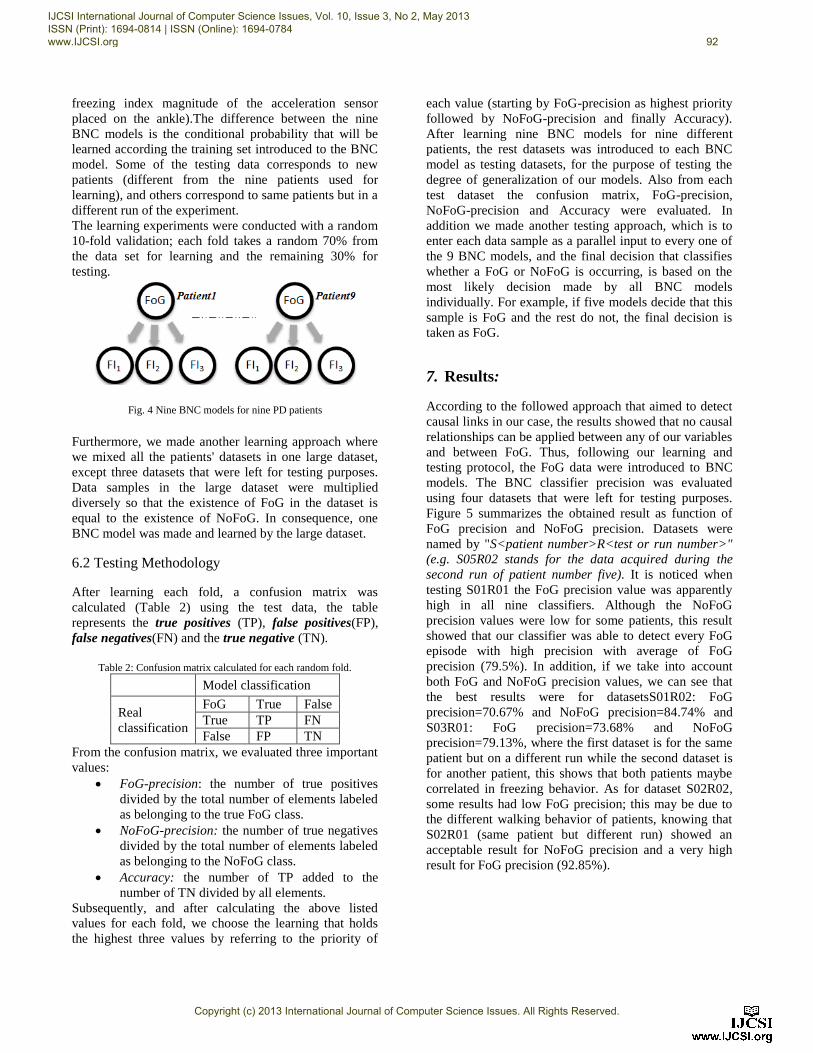
freezing index magnitude of the acceleration sensor placed on the ankle).The difference between the nine BNC models is the conditional probability that will be learned according the training set introduced to the BNC model. Some of the testing data corresponds to new patients (different from the nine patients used for learning), and others correspond to same patients but in a different run of the experiment. The learning experiments were conducted with a random 10-fold validation; each fold takes a random 70% from the data set for learning and the remaining 30% for testing.
Fig. 4 Nine BNC models for nine PD patients
Furthermore, we made another learning approach where we mixed all the patients' datasets in one large dataset, except three datasets that were left for testing purposes. Data samples in the large dataset were multiplied diversely so that the existence of FoG in the dataset is equal to the existence of NoFoG. In consequence, one BNC model was made and learned by the large dataset.
6.2 Testing Methodology
After learning each fold, a confusion matrix was calculated (Table 2) using the test data, the table represents the true positives (TP), false positives(FP), false negatives(FN) and the true negative (TN).
Table 2: Confusion matrix calculated for each random fold.
Model classification
Real classification
FoG True False True TP FN False FP TN
From the confusion matrix, we evaluated three important values: FoG-precision: the number of true positives
divided by the total number of elements labeled as belonging to the true FoG class. NoFoG-precision: the number of true negatives divided by the total number of elements labeled as belonging to the NoFoG class. Accuracy: the number of TP added to the number of TN divided by all elements.
Subsequently, and after calculating the above listed values for each fold, we choose the learning that holds the highest three values by referring to the priority of
each value (starting by FoG-precision as highest priority followed by NoFoG-precision and finally Accuracy). After learning nine BNC models for nine different patients, the rest datasets was introduced to each BNC model as testing datasets, for the purpose of testing the degree of generalization of our models. Also from each test dataset the confusion matrix, FoG-precision, NoFoG-precision and Accuracy were evaluated. In addition we made another testing approach, which is to enter each data sample as a parallel input to every one of the 9 BNC models, and the final decision that classifies whether a FoG or NoFoG is occurring, is based on the most likely decision made by all BNC models individually. For example, if five models decide that this sample is FoG and the rest do not, the final decision is taken as FoG.
7. Results:
According to the followed approach that aimed to detect causal links in our case, the results showed that no causal relationships can be applied between any of our variables and between FoG. Thus, following our learning and testing protocol, the FoG data were introduced to BNC models. The BNC classifier precision was evaluated using four datasets that were left for testing purposes. Figure 5 summarizes the obtained result as function of FoG precision and NoFoG precision. Datasets were named by "S<patient number>R<test or run number>" (e.g. S05R02 stands for the data acquired during the second run of patient number five). It is noticed when testing S01R01 the FoG precision value was apparently high in all nine classifiers. Although the NoFoG precision values were low for some patients, this result showed that our classifier was able to detect every FoG episode with high precision with average of FoG precision (79.5%). In addition, if we take into account both FoG and NoFoG precision values, we can see that the best results were for datasetsS01R02: FoG precision=70.67% and NoFoG precision=84.74% and S03R01: FoG precision=73.68% and NoFoG precision=79.13%, where the first dataset is for the same patient but on a different run while the second dataset is for another patient, this shows that both patients maybe correlated in freezing behavior. As for dataset S02R02, some results had low FoG precision; this may be due to the different walking behavior of patients, knowing that S02R01 (same patient but different run) showed an acceptable result for NoFoG precision and a very high result for FoG precision (92.85%).
IJCSI International Journal of Computer Science Issues, Vol. 10, Issue 3, No 2, May 2013
ISSN (Print): 1694-0814 | ISSN (Online): 1694-0784
www.IJCSI.org 92
Copyright (c) 2013 International Journal of Computer Science Issues. All Rights Reserved.

Fig. 5 FoG precision vs. NoFoG precision results for testing datasets,(a)S01R01,(b)S02R01,(c)S05R02 and(d)S06R01
Results for S05R02 showed that this patient may have a unique freezing behavior among the other learned patients, that's why none of the nine BNC models were able to differentiate this patient's freezing episodes from normal gait with high precision. Finally, for the dataset S06R01, some results had very good FoG precision about 89%. The best results were for S07R02 and S05R01 since they have moderate FoG and NoFoG precision. This may be due to the similarity in FoG behavior between the two patients. The testing results of each dataset can be summarized by calculating the average for Accuracy, FoG precision and NoFoG precision (Table 3). We can see that our system's accuracy is about 66.87 % with FoG precision 59.34% and NoFoG precision 69.24%.
Table 3: First approach averaged system accuracy
Accuracy (%)
FoG precision (%)
NoFoG precision (%) Average
60.10 81.20 59.07 S01R01 80.87 50.31 85.22 S02R02 65.10 39.20 71.42 S05R02 61.40 66.66 61.23 S06R01
66.87 59.34 69.24 System Average As for the second testing approach, which is making the final decision based on the most likely one made by all BNC models individually (Table 4). The results show that the accuracy and NoFoG precision increased and the FoG precision slightly decreased.
Table 4: Second approach averaged system accuracy
Accuracy (%)
FoG precision (%)
NoFoG precision (%) Average
66.16 85.71 65.21 S01R01 88.58 43.65 94.97 S02R02 73.36 33.74 83.03 S05R02 69.13 67.85 69.23 S06R01
74.31 57.74 78.11 System Average
Finally using the large dataset learning approach, the results show improvements of the classifier decision. It can be clearly seen that as the number of records in the learning dataset increase, the classifier maintained close proximity between FoG and NoFoG precision with acceptable accuracy (65 %) as shown in (Fig. 6).
Fig.6 Variation of FoG precision, NoFoG precision and Accuracy percentages as function of increasing the number of records in test
datasets, (a) S01R01, (b) S05R02, (c) S06R01
8. Conclusion
We have described a way for modeling Freezing of Gait phenomena of PD patients, based on BBN formalism. We used a dataset available online extracted from real PD patients while walking and having freezing episodes. The first approach, was studying the causality in the FoG/Freezing Index system, this was done by making an epidemiological study followed by causal inference one. This approach resulted in weak or no answers of causality in FoG/Freezing Index system with respect to the ANM approach. Although, this can be further evaluated in future by calculating more features that may define FoG better, or by applying different causality search model in BBN formalism, this can be combined with an epidemiological study to assess the causation. In
IJCSI International Journal of Computer Science Issues, Vol. 10, Issue 3, No 2, May 2013
ISSN (Print): 1694-0814 | ISSN (Online): 1694-0784
www.IJCSI.org 93
Copyright (c) 2013 International Journal of Computer Science Issues. All Rights Reserved.
this perspective we may construct an influence diagram that fits the expert‟s causal model in the framework of FoG, hence we possibly will generate understandable explanations of the FoG causal structure. In the second approach which was applying Bayesian Naive Classifier (BNC) model to represent the datasets, we built nine different BNC models for different patients, and the remaining datasets were introduced to each BNC model as testing datasets. This approach showed a fluctuating percentage of accuracy, FoG precision and NoFoG precision. Our classifier had the ability to detect FoG up to 99 %( FoG precision) if tested on the nine BNC models locally, and up to 86% if tested globally. Some testing results were not as good as expected, we assume this was because of the different freezing behaviors for different patients, knowing that when testing a specific BNC model related to a specific patient, with a dataset extracted from the same patient the result was significantly improved. Upon creating a large dataset, the final testing procedure showed promising results, where our classifier sustained concurrence between FoG and NoFoG precision with satisfactory accuracy.
References: [1] N. Giladi, D. McMahon, S. Przedborski, E. Flaster, S.
Guillory, V. Kostic, and S. Fahn, “Motor Blocks in Parkinson's Disease”, PubMed, Neurology, Vol. 42, No.3, 1992.
[2] Rajesh Pahwa, and E. Kelly Lyons, Handbook of Parkinson‟s disease, 4th edition, London, 2007.
[3] Ali Saad, Iyad Zaarour, Paul Bejjani, and Mohammad Ayache, “Handwriting and Speech Prototypes of Parkinson Patients: Belief Network Approach”, IJCSI International Journal of Computer Science Issues, Vol. 9, Issue 3, No. 3, May 2012.
[4] I. Zaarour, L. Heutte, PH. Leray, and J. Labiche, “Clustering and Bayesian Network Approaches For Discovering Handwriting Strategies of Primary School Children”, International Journal of Pattern Recognition and Artificial Intelligence, Vol. 18, No. 7, 2004.
[5] Judea Pearl, “Fusion, Propagation, and Structuring in Belief Networks”, Artificial Intelligence, Elsevier, Vol. 29, No. 3, pp.241-288, 1986.
[6] Judea Pearl, Probabilistic Reasoning in Intelligent Systems: Networks of Plausible Inference, Morgan Kaufmann Publishers Inc., San Francisco, A, USA, 1988.
[7] C. Glymour, and G. Cooper, “Computation, Causation, and Discovery”, MIT Press, Cambridge, MA, 1999.
[8] Judea Pearl, “Causality: Models, Reasoning and Inference”, Cambridge University Press, Cambridge, MA, 2000.
[9] Steffen L. Lauritzen, “Graphical Models”, Clarendon Press, Oxford,UK, 1996.
[10] Montassar B. Messaoud, “SemCaDo: An Approach for Serendipitous Causal Discovery and Ontology Evolution”, PhD thesis, Ecole Polytechnique de l‟Université de Nantes, 2012.
[11] Marc Bächlin, Meir Plotnik, Daniel Roggen, InbalMaidan, Jeffrey M. Hausdorff, NirGiladi, and Gerhard Tröster, “Wearable Assistant for Parkinson's Disease Patients with the Freezing of Gait Symptom”, IEEE Transactions on Information Technology in Biomedicine, Vol. 14 No. 2, pp 436-446, 2010.
[12] S. T. Moore, H. G. MacDougall, and W. G. Ondo, “Ambulatory Monitoring of Freezing of Gait in Parkinson‟s Disease,” Journal of Neuroscience Methods, Vol. 167, No. 2, pp. 340-348, 2008.
[13] D. Song, C. E. Henrik, K. Huebner, and D. Kragic, "Multivariate Discretization for Bayesian Network Structure Learning in Robot Grasping", IEEE/RSJ International Conference on Intelligent Robots and Systems, Vol. 11. pp. 20-27, 2011.
[14] R.M. Khanafar, B. Solana, J. Triola, R. Barco, L.Moltsen, Z. Altman, and P. Lazaro, “Automated Diagnosis for UMTS Networks Using a Bayesian Network Approach”, IEEE Trans. on Vehicular Technology, Vol. 57, No. 4, pp. 2451-2461, 2008.
[15] R. Intan, and O. Y. Yuliana, “Fuzzy Bayesian Belief Network for Analyzing Medical Track Record”, Journal of Advances in Intelligent Information and Database Systems, Studies in Computational Intelligence, Vol. 283, pp. 279-290, 2011.
[16] J.P. Sacha, L. Goodenday, and k. J. Cios, “Bayesian Learning for Cardiac SPECT Image Interpretation”, Journal of Artif Intell Medline, Vol. 26, No. 1-2, pp. 109-143,2002
[17] Y. B. Gong, N. L. Zhang, and S. H. Gao, “A Study of Symptom Distribution Regularities of Type II Diabetes Using Latent Structure Models”, Journal of World Science and Technology-Modernization of Traditional Chinese Medicine and Materia, Vol. 4, No. 4, pp. 516-521, 2009.
[18] N. Friedman, "Learning Bayesian networks in the presence of missing values and hidden variables", in D. Fisher (Ed.), Proceedings of the Fourteenth International Conference on Machine Learning, San Francisco, Calif. Morgan Kaufmann, 1997.
[19] C. Borgelt, M. Steinbrecher, and R. Krus, “Graphical Models: Representations for Learning, Reasoning and Data Mining”, United Kingdom: John Wiley & Sons, Ltd, 2009.
[20] Jiawei Han, and MichelineKamber, “Data Mining: Concepts and Techniques”, 2nd Edition, University of Illinois at Urbana-Champaign, Morgan Kaufman Publishers, Elsevier Inc., USA, 2006.
[21] Spirtes Peter, Glymour Clark, and Scheines Richard, “Causality from Probability”, Department of Philosophy, Report Paper 236, 1990.
[22] Federica Russo, and Jon Williamson, “Interpreting Causality in the Health Sciences”, Research Project, International Studies in the Philosophy of Science Vol. 21, No. 2, pp. 157-170, July 2007.
[23] H. Frumkin, “Causation in medicine, Emory University, Rollins School of Public Health, Emory University, Atlanta, Georgia, 2006.
[24] P. Lagiou, H.O Adam., and D. Trichopoulos, “Causality in Cancer Epidemiology”, European Journal of Epidemiology, Vo. 20, pp.565-574, 2005.
IJCSI International Journal of Computer Science Issues, Vol. 10, Issue 3, No 2, May 2013
ISSN (Print): 1694-0814 | ISSN (Online): 1694-0784
www.IJCSI.org 94
Copyright (c) 2013 International Journal of Computer Science Issues. All Rights Reserved.
[25] P. Thagard, Explaining Disease: Correlations, Causes, and Mechanisms” Journal of Minds and Machines, Vol. 8, pp.61-78, 1998.
[26] B. Hill, “The Environment of Disease: Association or Causation?” Proceedings of the Royal Society of Medicine, Vol. 58, pp.295-300, 1965.
[27] M. Kundi, “Causality and the Interpretation of Epidemiological Evidence”, Environmental Health Perspectives, Vol. 114, pp. 969-974, 2006.
[28] R.E. Neapolitan, “Learning Bayesian Networks”, Prentice Hall Series in Artificial Intelligence, 1st Edition, 2003.
[29] J. Zhang, and P. Spirtes, “Detection of Unfaithfulness and Robust Causal Inference”, Journal of Minds and Machines, Vol. 18, No.2, pp.239-271, June 2008.
[30] J. Pellet, and A. Elisseef, “Using Markov Blankets for Causal Structure Learning”, Journal of Machine Learning Research, Vol. 9, pp.1295-1342, 2008.
[31] S. Nagl, M. Williams, and J. Williamson, “Objective Bayesian Nets for Systems Modeling and Prognosis in Breast Cancer”, studies in computational sciences, Vol. 156, pp 131-167, Springer Berlin Heidelberg, 2008.
[32] Marek J. Drudzel, and Herbert A. Simon, “Causality in Bayesian Belief Networks”, In Proceedings of the 9thAnnual Conference on Uncertainty in Artificial Intelligence (UAI),1993.
[33] P. Spirtes, and C. Glymour, and R. Scheines, “Causation, prediction, and search”, Lecture notes in statistics, New York, NY, Springer-Verlag, 1993.
[34] Jonas Peters, Dominik Janzing, and Bernhard Scholkopf, “Identifying Cause and Effect on Discrete Data using Additive Noise Models, Appearing in Proceedings of the 13th International Conference on Artificial Intelligence and Statistics (AISTATS) ,Vol. 9,2010.
[35] R.Duda, and P. Hart, Pattern Classification and scene analysis, John Wiley & Sons, 1973.
[36] Adem Karahoca, “Data Mining Applications in Engineering and Medicine”, 2012.
[37] F. Gorunescu, “Data Mining: Concepts, Models, and Techniques”, India, Springer, 2011.
[38] R. O. Duda et al, Pattern Classification, 2nd Edition, Chichester, U.K, Wiley-Interscience, 2000.
[39] P. Langley, W. Iba, and K. Thompson, “An analysis of Bayesian Classifiers”, In Proceedings of the 10th National Conference on Artificial Intelligence, San Jose, AAAI Press, pp.223-28, 1992.
Ali Saad is a PhD student at the G.R.E.A.H. (Electric and Automatic Engineering Research Group), University Le Havre, France. He received his bachelor degree of engineering in biomedical from the Islamic university in Lebanon (2011). His current research is on reducing the risk of falls in Parkinson disease patients. His interests include biomedical signal processing, patterns recognition and control systems. Iyad Zaarour is an Assistant Professor in Faculty of Economical sciences and Management, his research efforts on Machine Learning, Probabilistic reasoning, and Data Mining, with latest study on causality in the Framework of Bayesian Network Formalism and Epidemiology Discipline, he has an adjacent association with Doctoral School (EDST) of Faculty of science at Lebanese University, and a close collaboration with The Laboratory of Biomedical Department of Islamic University in
Partnership with (GREHA) Laboratory of Le Havre University-France. He is associated with the Laboratory (LITIS- EA 4108) at Rouen University-France where he got his Ph.D in Computer Science since 2004. His applications interest consists of the handwriting, neurology, social Networks, ethics, medicine, motor control and Parkinson Disease. He is one of the directors of the Transcendental Philosophy institute in Lebanon. Abbas Zeinedine is a Masters 2 student at the Lebanese university. He received a bachelor in informatics from the Lebanese university, Faculty of science. His research efforts are on Machine Learning, Probabilistic reasoning, and Data Mining. Mohammad Ayache obtained a bachelor degree of engineering in biomedical from the Islamic University of Lebanon in 2003. He received the DEA in Signals and Images in biology and medicine from the University of Angers, France in 2004. He received the Ph.D degree in medical Image Processing from the University of Tours, France, in 2007. He is the head of the department of biomedical at the faculty of engineering at the Islamic University of Lebanon. His research interests include advanced neural networks software development and advanced signal and image processing techniques. François Guérin (47 years old) works as assistant professor with the Research Group in Electrotechnics and Automatics (G.R.E.A.H) and with the Electrical Engineering Department of the Institute of Technology of the University of Le Havre (France). He teaches digital electronics devices (microcontrollers, FPGA) for embedded systems and advanced automatic control. His research interests include modeling, advanced automatic control and applications to mobile robotics and electrical engineering (renewable energy).
Dimitri Lefebvre is graduated from the Ecole Centrale of Lille (France) in 1992. He received the Ph.D. degree in Automatic Control and Computer Science from University of Sciences and Technologies, Lille in 1994, and the HAB. degree from University of Franche Comté, Belfort, France in 2000. Since 2001 he is Professor at Institute of Technology and Faculty of Sciences, University Le Havre, France. He is with the G.R.E.A.H. (Electric and Automatic Engineering Research Group). His current research interests include continuous time and discrete event systems, learning processes, adaptive control, fault detection and diagnosis and applications to electrical engineering.
IJCSI International Journal of Computer Science Issues, Vol. 10, Issue 3, No 2, May 2013
ISSN (Print): 1694-0814 | ISSN (Online): 1694-0784
www.IJCSI.org 95
Copyright (c) 2013 International Journal of Computer Science Issues. All Rights Reserved.