Functional reorganization of the locomotor network in Parkinson patients with freezing of gait.
10
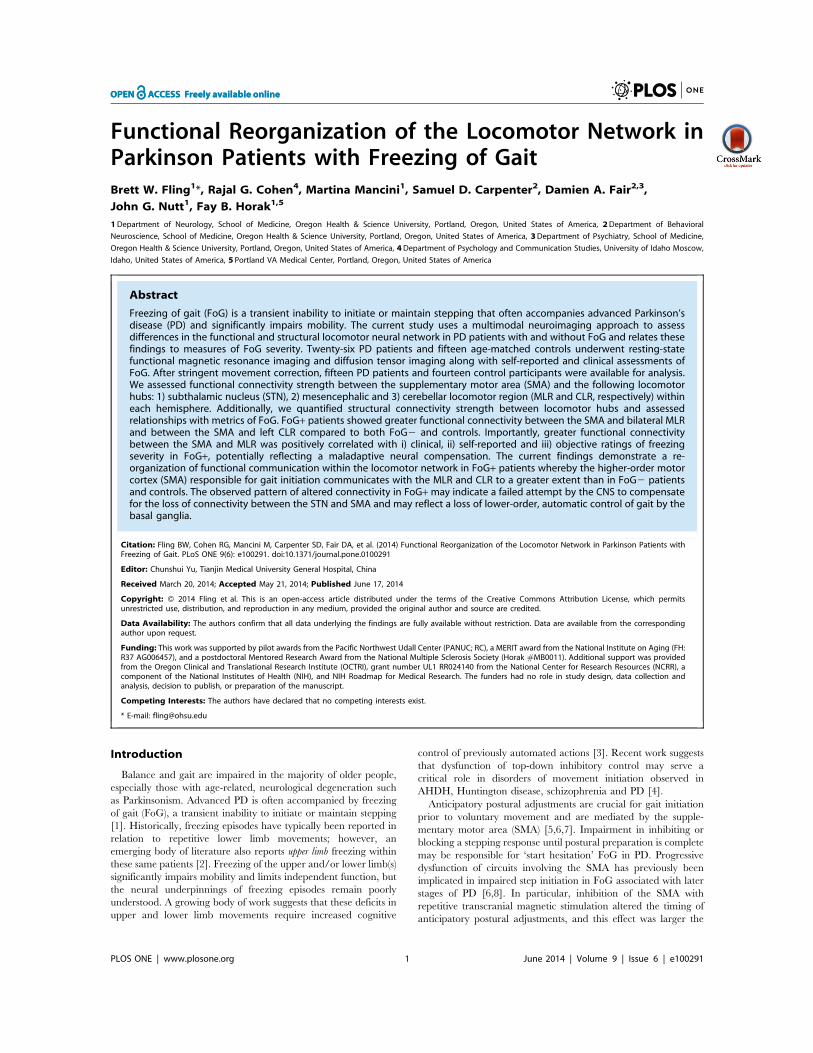
Functional Reorganization of the Locomotor Network in Parkinson Patients with Freezing of Gait Brett W. Fling 1 *, Rajal G. Cohen 4 , Martina Mancini 1 , Samuel D. Carpenter 2 , Damien A. Fair 2,3 , John G. Nutt 1 , Fay B. Horak 1,5 1 Department of Neurology, School of Medicine, Oregon Health & Science University, Portland, Oregon, United States of America, 2 Department of Behavioral Neuroscience, School of Medicine, Oregon Health & Science University, Portland, Oregon, United States of America, 3 Department of Psychiatry, School of Medicine, Oregon Health & Science University, Portland, Oregon, United States of America, 4 Department of Psychology and Communication Studies, University of Idaho Moscow, Idaho, United States of America, 5 Portland VA Medical Center, Portland, Oregon, United States of America Abstract Freezing of gait (FoG) is a transient inability to initiate or maintain stepping that often accompanies advanced Parkinson’s disease (PD) and significantly impairs mobility. The current study uses a multimodal neuroimaging approach to assess differences in the functional and structural locomotor neural network in PD patients with and without FoG and relates these findings to measures of FoG severity. Twenty-six PD patients and fifteen age-matched controls underwent resting-state functional magnetic resonance imaging and diffusion tensor imaging along with self-reported and clinical assessments of FoG. After stringent movement correction, fifteen PD patients and fourteen control participants were available for analysis. We assessed functional connectivity strength between the supplementary motor area (SMA) and the following locomotor hubs: 1) subthalamic nucleus (STN), 2) mesencephalic and 3) cerebellar locomotor region (MLR and CLR, respectively) within each hemisphere. Additionally, we quantified structural connectivity strength between locomotor hubs and assessed relationships with metrics of FoG. FoG+ patients showed greater functional connectivity between the SMA and bilateral MLR and between the SMA and left CLR compared to both FoG2 and controls. Importantly, greater functional connectivity between the SMA and MLR was positively correlated with i) clinical, ii) self-reported and iii) objective ratings of freezing severity in FoG+, potentially reflecting a maladaptive neural compensation. The current findings demonstrate a re- organization of functional communication within the locomotor network in FoG+ patients whereby the higher-order motor cortex (SMA) responsible for gait initiation communicates with the MLR and CLR to a greater extent than in FoG2 patients and controls. The observed pattern of altered connectivity in FoG+ may indicate a failed attempt by the CNS to compensate for the loss of connectivity between the STN and SMA and may reflect a loss of lower-order, automatic control of gait by the basal ganglia. Citation: Fling BW, Cohen RG, Mancini M, Carpenter SD, Fair DA, et al. (2014) Functional Reorganization of the Locomotor Network in Parkinson Patients with Freezing of Gait. PLoS ONE 9(6): e100291. doi:10.1371/journal.pone.0100291 Editor: Chunshui Yu, Tianjin Medical University General Hospital, China Received March 20, 2014; Accepted May 21, 2014; Published June 17, 2014 Copyright: ß 2014 Fling et al. This is an open-access article distributed under the terms of the Creative Commons Attribution License, which permits unrestricted use, distribution, and reproduction in any medium, provided the original author and source are credited. Data Availability: The authors confirm that all data underlying the findings are fully available without restriction. Data are available from the corresponding author upon request. Funding: This work was supported by pilot awards from the Pacific Northwest Udall Center (PANUC; RC), a MERIT award from the National Institute on Aging (FH: R37 AG006457), and a postdoctoral Mentored Research Award from the National Multiple Sclerosis Society (Horak #MB0011). Additional support was provided from the Oregon Clinical and Translational Research Institute (OCTRI), grant number UL1 RR024140 from the National Center for Research Resources (NCRR), a component of the National Institutes of Health (NIH), and NIH Roadmap for Medical Research. The funders had no role in study design, data collection and analysis, decision to publish, or preparation of the manuscript. Competing Interests: The authors have declared that no competing interests exist. * E-mail: [email protected] Introduction Balance and gait are impaired in the majority of older people, especially those with age-related, neurological degeneration such as Parkinsonism. Advanced PD is often accompanied by freezing of gait (FoG), a transient inability to initiate or maintain stepping [1]. Historically, freezing episodes have typically been reported in relation to repetitive lower limb movements; however, an emerging body of literature also reports upper limb freezing within these same patients [2]. Freezing of the upper and/or lower limb(s) significantly impairs mobility and limits independent function, but the neural underpinnings of freezing episodes remain poorly understood. A growing body of work suggests that these deficits in upper and lower limb movements require increased cognitive control of previously automated actions [3]. Recent work suggests that dysfunction of top-down inhibitory control may serve a critical role in disorders of movement initiation observed in AHDH, Huntington disease, schizophrenia and PD [4]. Anticipatory postural adjustments are crucial for gait initiation prior to voluntary movement and are mediated by the supple- mentary motor area (SMA) [5,6,7]. Impairment in inhibiting or blocking a stepping response until postural preparation is complete may be responsible for ‘start hesitation’ FoG in PD. Progressive dysfunction of circuits involving the SMA has previously been implicated in impaired step initiation in FoG associated with later stages of PD [6,8]. In particular, inhibition of the SMA with repetitive transcranial magnetic stimulation altered the timing of anticipatory postural adjustments, and this effect was larger the PLOS ONE | www.plosone.org 1 June 2014 | Volume 9 | Issue 6 | e100291
Transcript of Functional reorganization of the locomotor network in Parkinson patients with freezing of gait.
Functional Reorganization of the Locomotor Network inParkinson Patients with Freezing of GaitBrett W. Fling1*, Rajal G. Cohen4, Martina Mancini1, Samuel D. Carpenter2, Damien A. Fair2,3,
John G. Nutt1, Fay B. Horak1,5
1Department of Neurology, School of Medicine, Oregon Health & Science University, Portland, Oregon, United States of America, 2Department of Behavioral
Neuroscience, School of Medicine, Oregon Health & Science University, Portland, Oregon, United States of America, 3Department of Psychiatry, School of Medicine,
Oregon Health & Science University, Portland, Oregon, United States of America, 4Department of Psychology and Communication Studies, University of Idaho Moscow,
Idaho, United States of America, 5 Portland VA Medical Center, Portland, Oregon, United States of America
Abstract
Freezing of gait (FoG) is a transient inability to initiate or maintain stepping that often accompanies advanced Parkinson’sdisease (PD) and significantly impairs mobility. The current study uses a multimodal neuroimaging approach to assessdifferences in the functional and structural locomotor neural network in PD patients with and without FoG and relates thesefindings to measures of FoG severity. Twenty-six PD patients and fifteen age-matched controls underwent resting-statefunctional magnetic resonance imaging and diffusion tensor imaging along with self-reported and clinical assessments ofFoG. After stringent movement correction, fifteen PD patients and fourteen control participants were available for analysis.We assessed functional connectivity strength between the supplementary motor area (SMA) and the following locomotorhubs: 1) subthalamic nucleus (STN), 2) mesencephalic and 3) cerebellar locomotor region (MLR and CLR, respectively) withineach hemisphere. Additionally, we quantified structural connectivity strength between locomotor hubs and assessedrelationships with metrics of FoG. FoG+ patients showed greater functional connectivity between the SMA and bilateral MLRand between the SMA and left CLR compared to both FoG2 and controls. Importantly, greater functional connectivitybetween the SMA and MLR was positively correlated with i) clinical, ii) self-reported and iii) objective ratings of freezingseverity in FoG+, potentially reflecting a maladaptive neural compensation. The current findings demonstrate a re-organization of functional communication within the locomotor network in FoG+ patients whereby the higher-order motorcortex (SMA) responsible for gait initiation communicates with the MLR and CLR to a greater extent than in FoG2 patientsand controls. The observed pattern of altered connectivity in FoG+may indicate a failed attempt by the CNS to compensatefor the loss of connectivity between the STN and SMA and may reflect a loss of lower-order, automatic control of gait by thebasal ganglia.
Citation: Fling BW, Cohen RG, Mancini M, Carpenter SD, Fair DA, et al. (2014) Functional Reorganization of the Locomotor Network in Parkinson Patients withFreezing of Gait. PLoS ONE 9(6): e100291. doi:10.1371/journal.pone.0100291
Editor: Chunshui Yu, Tianjin Medical University General Hospital, China
Received March 20, 2014; Accepted May 21, 2014; Published June 17, 2014
Copyright: ! 2014 Fling et al. This is an open-access article distributed under the terms of the Creative Commons Attribution License, which permitsunrestricted use, distribution, and reproduction in any medium, provided the original author and source are credited.
Data Availability: The authors confirm that all data underlying the findings are fully available without restriction. Data are available from the correspondingauthor upon request.
Funding: This work was supported by pilot awards from the Pacific Northwest Udall Center (PANUC; RC), a MERIT award from the National Institute on Aging (FH:R37 AG006457), and a postdoctoral Mentored Research Award from the National Multiple Sclerosis Society (Horak #MB0011). Additional support was providedfrom the Oregon Clinical and Translational Research Institute (OCTRI), grant number UL1 RR024140 from the National Center for Research Resources (NCRR), acomponent of the National Institutes of Health (NIH), and NIH Roadmap for Medical Research. The funders had no role in study design, data collection andanalysis, decision to publish, or preparation of the manuscript.
Competing Interests: The authors have declared that no competing interests exist.
* E-mail: [email protected]
Introduction
Balance and gait are impaired in the majority of older people,especially those with age-related, neurological degeneration suchas Parkinsonism. Advanced PD is often accompanied by freezingof gait (FoG), a transient inability to initiate or maintain stepping[1]. Historically, freezing episodes have typically been reported inrelation to repetitive lower limb movements; however, anemerging body of literature also reports upper limb freezing withinthese same patients [2]. Freezing of the upper and/or lower limb(s)significantly impairs mobility and limits independent function, butthe neural underpinnings of freezing episodes remain poorlyunderstood. A growing body of work suggests that these deficits inupper and lower limb movements require increased cognitive
control of previously automated actions [3]. Recent work suggeststhat dysfunction of top-down inhibitory control may serve acritical role in disorders of movement initiation observed inAHDH, Huntington disease, schizophrenia and PD [4].Anticipatory postural adjustments are crucial for gait initiation
prior to voluntary movement and are mediated by the supple-mentary motor area (SMA) [5,6,7]. Impairment in inhibiting orblocking a stepping response until postural preparation is completemay be responsible for ‘start hesitation’ FoG in PD. Progressivedysfunction of circuits involving the SMA has previously beenimplicated in impaired step initiation in FoG associated with laterstages of PD [6,8]. In particular, inhibition of the SMA withrepetitive transcranial magnetic stimulation altered the timing ofanticipatory postural adjustments, and this effect was larger the
PLOS ONE | www.plosone.org 1 June 2014 | Volume 9 | Issue 6 | e100291
more severe the PD [6]. These data indicate FoG may be relatedto dysfunction of linking step initiation with postural weight shifts.In addition to the SMA, multiple subcortical regions are
involved in locomotion, specifically the subthalamic nucleus (STN)and the mesencephalic and cerebellar locomotor regions – (CLRand MLR, respectively) [9]. Interestingly, these are all principalareas that demonstrate metabolic increases with disease progres-sion implicating these key motor and cognitive hubs as markers ofdisease progression in PD [10]. Our recent work demonstratedreduced structural connectivity between the pedunculopontinenucleus (a principal nucleus of the MLR) and the CLR, STN, andSMA, along with multiple regions of the frontal and prefrontalcortex in the right hemispheres of Parkinson’s patients with FoG[11]. Furthermore, Shine and colleagues [12] reported decreasedneural activity within the STN and the MLR in PD patientsduring freezing episodes, the magnitude of which was positivelycorrelated with the severity of clinical FoG. Conversely, Snijderset al. [13] reported increased activity within the MLR of PDpatients who experience FoG during motor imagery of normalwalking, i.e. in-between freezing episodes.Whereas these task-based functional MRI studies provide
isolated regions of neural activity, resting state functionalconnectivity analysis allows for integrative assessments of distrib-uted neural systems. A limited body of work demonstratesfunctional connectivity differences within PD patients whoexperience freezing episodes compared to those who do not[14]; however, functional connectivity within the locomotornetwork has yet to be explored. Taken together, these resultsimplicate compromised structural integrity and potential function-al disconnection between subcortical and cortical regions of thelocomotor network in individuals who experience FoG; however,functional connectivity within the locomotor network has yet to beexplored.In the current study, we use a novel multimodal neuroimaging
approach to assess differences in functional and structuralconnectivity of the locomotor network between PD patients with(FoG+), those without (FoG2) freezing of gait, and age-matchedhealthy controls. We hypothesized that FoG+ patients would havereduced functional and structural connectivity within the locomo-tor network compared to both FoG2 and control participants.Furthermore, we predicted that these declines in structural andfunctional connections would be strongly related to freezingseverity.
Materials and Methods
Standard Protocol Approvals, Registration, and PatientConsentsOregon Heath & Science University Institutional Review Board
approved this study and all participants gave their informed,written consent before beginning the experiment.
SubjectsData were collected from 26 patients with PD and 15 age-
matched controls. Participants were recruited through theParkinson’s Center of Oregon clinic at Oregon Health & ScienceUniversity (OHSU). Individuals were excluded if they could notsafely walk 20 feet without walking aids, or if they had a jointreplacement, musculoskeletal or vestibular disorder, dementia,claustrophobia, severe tremor, or metal in their bodies. Due toviolation of strict movement thresholds during functional imaging(described below) eleven patients with PD and one healthy controlwere excluded from further analysis; thus, data presented are fromfifteen patients with PD (14 male; age 64.766.0 years; duration of
disease 9.166.2 years) and fourteen healthy controls (5 male; age66.967.8 years). Of the fifteen PD patients, eight were classified asFoG+ based on a score of .3 on the new freezing of gaitquestionnaire (NFOGQ) [15]. Seven patients scoring #3 wereclassified as FoG2. All PD patients were tested in the ‘‘OFF’’state, after 12–18 hour overnight withdrawal from anti-parkinso-nian medications to mitigate the pharmacological effects on neuralactivity. Diffusion imaging data of the entire study population haspreviously been reported [11].
Freezing of Gait AssessmentsAll participants provided self-rated assessments of their freezing
severity by filling out the NFOGQ [15]. Recent work has calledinto question the accuracy of such self-rated measurements [16] sowe also used more objective clinical assessments of freezing.Because FoG is notably difficult to provoke in the laboratory orclinic setting, clinicians examined trials in which participantsperformed tight clockwise and counter-clockwise turns, a taskknown to elicit freezing [17]. Participants wore 3 inertial sensors(Opal by APDM, Portland, OR) mounted on the posterior trunkand on each shank while turning in place for 2 minutes under twodifferent conditions: i) single task, turning 360u to their right, thenturning 360u to their left, and repeating this at their owncomfortable pace for 2 minutes, ii) dual task (wearing headphonesproducing a tone in the left or right ear), turning 360u to their leftor right depending on the side in which a tone was produced. Thepower spectral density (PSD) was calculated for each trial from theantero-posterior shank accelerations using a 4 s Hanning windowwith 50% overlap (using the Welch method). The total power wasthen normalized to the area under the PSD for each subject. AFreezing Ratio was calculated as the square of the total power inthe 3–8 Hz band, divided by the square of the total power in the.5–3 Hz band [18,19]. Turning trials were also video recordedand two experienced neurologists who specialize in movementdisorders subsequently reviewed and provided a clinical measureof freezing severity. Scores were based upon on ordinal scale from0–4 where: 0 = absent, 1 = mild, 2 = moderate, 3 = significantinterference with movement, and 4= severe with risk for falls. Theraters were blinded to whether the patients with Parkinson’sdisease were identified as having freezing of gait or not based upontheir self-assessed NFOGQ score; each patient’s average score andthe objective Freezing Ratio in the two turning conditions wereused to compare with functional connectivity.
Image AcquisitionParticipants were scanned on a 3.0 T Siemens Magentom Tim
Trio scanner with a 12-channel head coil at Oregon Health andScience University’s Advanced Imaging Research Center. Onehigh-resolution T1-weighted MPRAGE sequence (orientation= -Sagittal, echo time= 3.58 msec, repetition time= 2300 msec,2566256 matrix, resolution 1.061.061.1 mm. total scantime= 9 min 14 sec) was acquired. One BOLD-weighted func-tional image was acquired with a T2*-weighted EPI (repetitiontime= 2000 msec, echo time= 30 msec, flip angle = 90u, field ofview= 240 mm, 33 slices covering the whole brain, resolu-tion= 3.8 mm3, total scan time= 10 min 6 sec). Steady-statemagnetization was assumed after three volumes (, 6 sec). Subjectswere instructed to remain still and fixate on a standard fixationcross, projected in the center of their visual field. Three sets ofdiffusion-weighted images were collected using a 30-gradientdirection, whole-brain echoplanar imaging sequence(TR=9,100 ms, TE= 88 ms, field of view= 240 mm2, b val-ue = 1,000 s/mm2, isotropic voxel dimensions = 2 mm3) and threeimages in which the b value was equal to zero. A static magnetic
Functional Locomotor Connectivity in PD
PLOS ONE | www.plosone.org 2 June 2014 | Volume 9 | Issue 6 | e100291
field map was also acquired using the same parameters as thediffusion weighted sequence.
Functional Image PreprocessingAll functional images were preprocessed in an identical method
to best alleviate known types of artifacts [20]. These steps included1) removal of central spike caused my MR signal offset, 2)correction of odd versus even slice intensity differences due tointerleaved acquisition without gaps, 3) correction for headmovement within the run, and 4) within-run intensity normaliza-tion to a whole brain mode value of 1000. Atlas transformation ofthe functional data was computed for each individual via the MP-RAGE scan [21]. The functional data was then resampled intoatlas space on an isotropic 3-mm grid, combining movementcorrection and atlas transformation in one interpolation [22]. Allsubsequent operations were performed on the atlas-transformedvolumetric time series.Connectivity preprocessing followed prior methods [23]. These
steps included: 1a) a temporal band-pass filter (0.009 Hz,f ,0.08 Hz), 1b) spatial smoothing (6 mm full width at halfmaximum). All data were computed with and without smoothing;unless otherwise stated, all results reported were drawn from theno smoothing condition, 2) regression of six parameters obtainedby rigid body head motion correction, 3) regression of the wholebrain signal averaged over the whole brain, 4) regression ofventricular signal averaged from ventricular region of interest(ROI), and 5) regression of white matter signal averaged fromwhite matter ROI. Regressions of the first order derivatives fromsteps 3–5 were also included in the correlation preprocessing.These preprocessing steps are thought to best reduce variance thatis unlikely to reflect neuronal activity [24].
Motion CorrectionIn an effort to account for inter-acquisition subject motion that
could potentially be problematic for correlation analysis, anadditional motion correction step was implemented as describedby Power and colleagues [25]. This method, titled framewisedisplacement (FD), calculates a time series of volume-to-volumemotion from the movement measures created by the aforemen-tioned rigid body motion correction. This is calculated for all sixparameters by the equation FDi=|Ddix|+|Ddiy|+|Ddiz|+|Dai|+|Dbi|+|Dci|, where Ddix=d(i21)x – dix, (the same holds true forthe other five parameters [dix diy diz ai bi ci]). Essentially, thisformula sums the absolute values of the volume-to-volume changesin six directions. The rotational measures were first converted tomillimeters by calculating surface displacement on a sphere ofradius 50 mm, which is the approximate distance from thecerebral cortex to the center of the head. This method ‘scrubs’ thedata by removing any volume that exceeds a set threshold (in thiscase 0.5 mm) from the time series. The correlation analysis wasperformed on the remaining concatenated volumes. If greater than50% of the functional volumes (.150 out of 300) exceeded thethreshold, participants were excluded from analysis. Due toexcessive movement, one healthy control participant, four FoG2participants, and seven FoG+ participants were excluded.
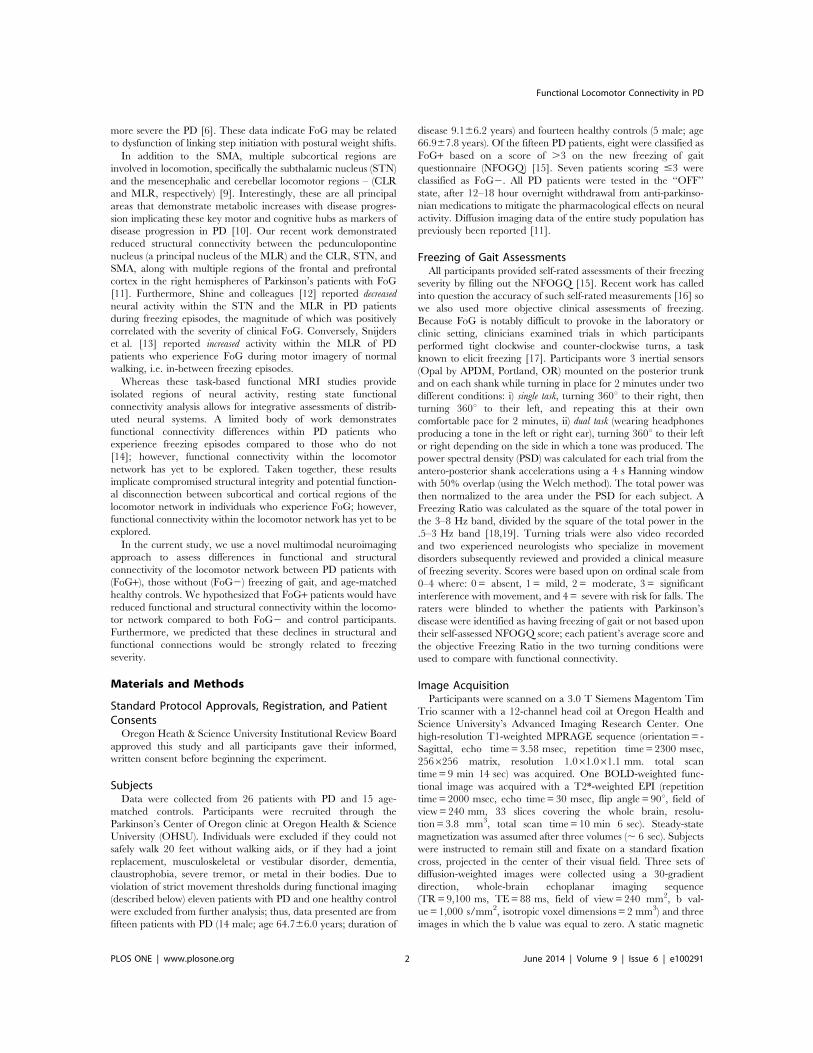
fcMRI Region of Interest SelectionWe selected the SMA, STN, MLR and CLR as locomotor hubs,
all of which have previously been identified as neural regions (bychemical or electrical stimulation within the cat) [26,27,28] knownto initiate and pace gait (Figure 1). All regions of interests (ROIs)were analyzed in Talairach space. For those ROIs that wereinitially identified within MNI space (MLR and CLR), theLancaster transform was used to convert into Talairach space
[29]. A 10-mm sphere was created at the peak coordinates of theSMA on the midline (x=0, y=27, z=55) as identified byactivation likelihood estimates identified in the three-dimensionallocations and boundaries meta-analysis of motor regions by Maykaand colleagues [30]. For all sub-cortical ROIs a 6-mm sphere wascreated bilaterally for the STN, MLR and CLR. The STN liesventral to the thalamus, and lateral and caudal to the hypothal-amus. Peak coordinates for the STN (x=611, y=214, z=23)were chosen from the task-related activation ROI template of thehuman basal ganglia identified by Prodoehl et al. [31]. The MLRlies ventral to the inferior colliculus, in the upper pons; it comprisesthe pedunculopontine and cuneiform nuclei. Peak coordinates forthe MLR (x=66, y=230, z=219) were selected similar to ourrecent work [11], and were informed by local field potentialrecordings [32] and immunohistochemistry [33]. The CLR islocated in the cerebellar midline, slightly dorsal to the fastigialnuclei; peak coordinates (x=67, y=252, z=216) were identifiedbased on recent imaging of the supraspinal locomotor centers inthe brainstem and cerebellum [34].As discussed in the Introduction, the SMA is thought to
contribute to the generation of anticipatory postural adjustments,which act to stabilize supporting body segments prior tomovement. Because dysfunction of the SMA has been implicatedrepeatedly in contributing to altered step initiation, functionalconnectivity strength was restricted to analyses between the SMAand the bilateral sub-cortical locomotor hubs assessed bycorrelation coefficients between each ROI pair (e.g., SMA – leftSTN). The mean time series from the SMA was correlated withthe mean time series from each of the six sub-cortical ROIs usingPearson’s coefficient of correlation (r) for each participant. Weexamined normality of distribution using the Kolmogorov-Smirnov test for all functional connectivity pairs. Assumptionsfor parametric statistics were met, so we compared the strength offunctional connectivity between the SMA and the six sub-corticalROIs for the three groups (controls, FoG2, FoG+) using arepeated-measures ANCOVA. UPDRS score was included as acovariate for all comparisons. Significant main effects weresubjected to post-hoc analyses using a two-tailed Tukey’s HSDtest to correct for multiple comparisons. All statistical analyseswere carried out using SPSS (IBM SPSS Statistics v. 19). A p-value#0.05 was considered significant.
Diffusion Tensor Imaging AnalysisWe used the same methodology as employed in a previous study
[11]. Diffusion data were processed using the tools implemented inFSL (Version 5.0; www.fmrib.ox.ac.uk/fslwww.fmrib.ox.ac.uk/fsl). The three raw data sets were first corrected for eddy currentdistortions and motion artifacts using the correction tool (FDT1.0), then averaged to improve signal-to-noise ratio [35] andsubsequently skull-stripped (using FSL’s brain extraction tool). Theprincipal diffusion direction was estimated for each voxel as aprobability density function, using Bayes’ rules in order to accountfor noise and uncertainty in the measured data. As describedelsewhere [36], the implicit modeling of noise in a probabilisticmodel enables a fiber tracking procedure without externally addedconstraints such as fractional anisotropy threshold or fiber angle.Thus, fiber-tracking in or near cortical areas becomes moresensitive. The use of a 2-fiber model [37] also improves themodeling of crossing fibers. By sending out 25,000 streamlinesamples per seed voxel, we mapped the probabilistic connectivitydistributions for each voxel in each ROI (see below). For eachindividual, the fractional anisotropy images were normalized intoMontreal Neurological Institute (MNI) space by using a linear
Functional Locomotor Connectivity in PD
PLOS ONE | www.plosone.org 3 June 2014 | Volume 9 | Issue 6 | e100291
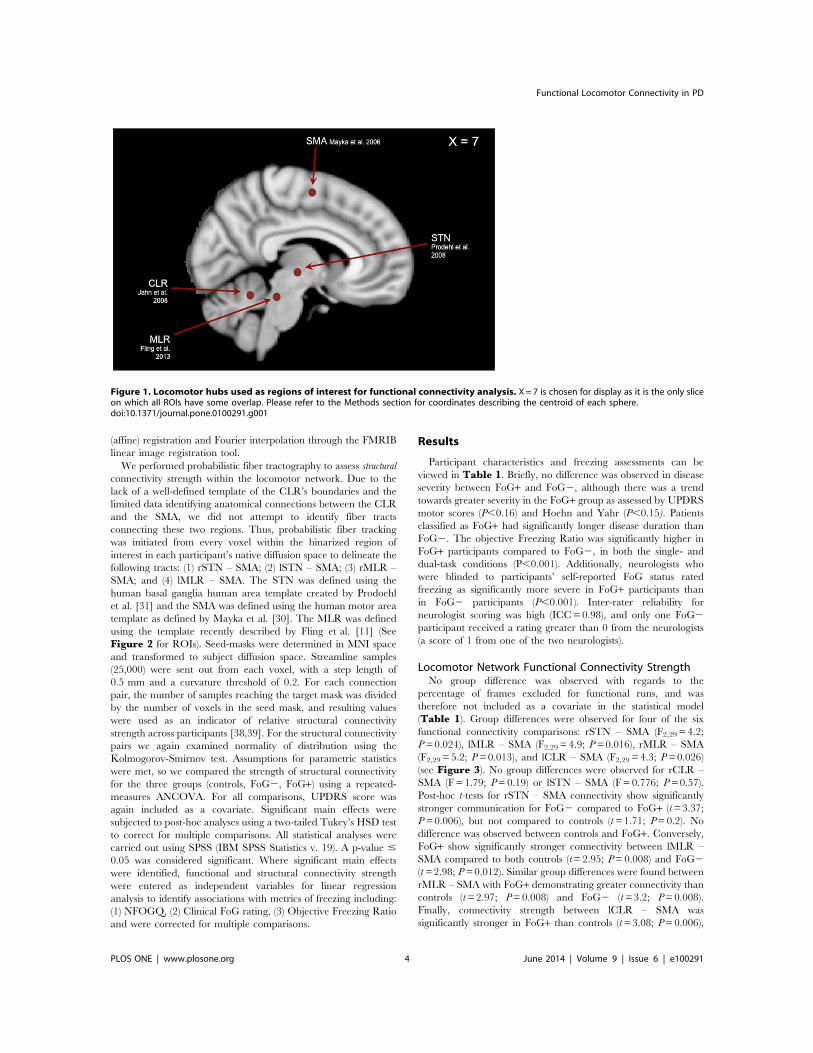
(affine) registration and Fourier interpolation through the FMRIBlinear image registration tool.We performed probabilistic fiber tractography to assess structural
connectivity strength within the locomotor network. Due to thelack of a well-defined template of the CLR’s boundaries and thelimited data identifying anatomical connections between the CLRand the SMA, we did not attempt to identify fiber tractsconnecting these two regions. Thus, probabilistic fiber trackingwas initiated from every voxel within the binarized region ofinterest in each participant’s native diffusion space to delineate thefollowing tracts: (1) rSTN – SMA; (2) lSTN – SMA; (3) rMLR –SMA; and (4) lMLR – SMA. The STN was defined using thehuman basal ganglia human area template created by Prodoehlet al. [31] and the SMA was defined using the human motor areatemplate as defined by Mayka et al. [30]. The MLR was definedusing the template recently described by Fling et al. [11] (SeeFigure 2 for ROIs). Seed-masks were determined in MNI spaceand transformed to subject diffusion space. Streamline samples(25,000) were sent out from each voxel, with a step length of0.5 mm and a curvature threshold of 0.2. For each connectionpair, the number of samples reaching the target mask was dividedby the number of voxels in the seed mask, and resulting valueswere used as an indicator of relative structural connectivitystrength across participants [38,39]. For the structural connectivitypairs we again examined normality of distribution using theKolmogorov-Smirnov test. Assumptions for parametric statisticswere met, so we compared the strength of structural connectivityfor the three groups (controls, FoG2, FoG+) using a repeated-measures ANCOVA. For all comparisons, UPDRS score wasagain included as a covariate. Significant main effects weresubjected to post-hoc analyses using a two-tailed Tukey’s HSD testto correct for multiple comparisons. All statistical analyses werecarried out using SPSS (IBM SPSS Statistics v. 19). A p-value #0.05 was considered significant. Where significant main effectswere identified, functional and structural connectivity strengthwere entered as independent variables for linear regressionanalysis to identify associations with metrics of freezing including:(1) NFOGQ, (2) Clinical FoG rating, (3) Objective Freezing Ratioand were corrected for multiple comparisons.
Results
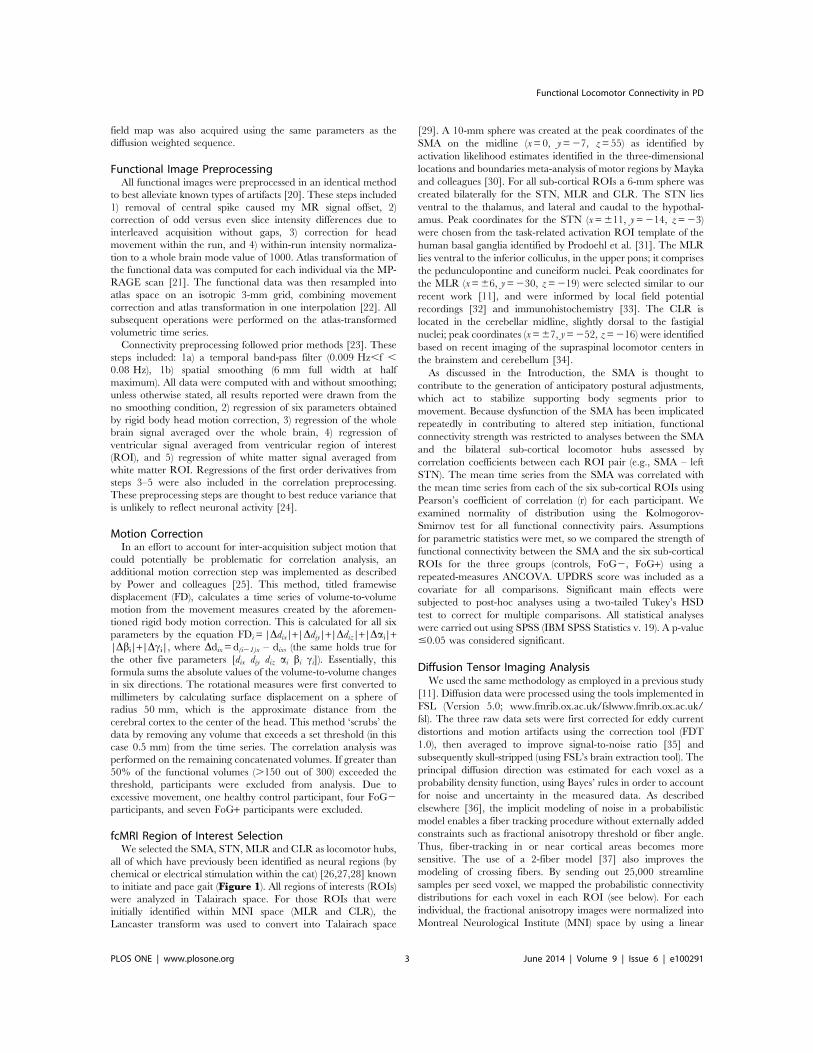
Participant characteristics and freezing assessments can beviewed in Table 1. Briefly, no difference was observed in diseaseseverity between FoG+ and FoG2, although there was a trendtowards greater severity in the FoG+ group as assessed by UPDRSmotor scores (P,0.16) and Hoehn and Yahr (P,0.15). Patientsclassified as FoG+ had significantly longer disease duration thanFoG2. The objective Freezing Ratio was significantly higher inFoG+ participants compared to FoG2, in both the single- anddual-task conditions (P,0.001). Additionally, neurologists whowere blinded to participants’ self-reported FoG status ratedfreezing as significantly more severe in FoG+ participants thanin FoG2 participants (P,0.001). Inter-rater reliability forneurologist scoring was high (ICC=0.98), and only one FoG2participant received a rating greater than 0 from the neurologists(a score of 1 from one of the two neurologists).
Locomotor Network Functional Connectivity StrengthNo group difference was observed with regards to the
percentage of frames excluded for functional runs, and wastherefore not included as a covariate in the statistical model(Table 1). Group differences were observed for four of the sixfunctional connectivity comparisons: rSTN – SMA (F2,29 = 4.2;P= 0.024), lMLR – SMA (F2,29 = 4.9; P= 0.016), rMLR – SMA(F2,29 = 5.2; P= 0.013), and lCLR – SMA (F2,29 = 4.3; P= 0.026)(see Figure 3). No group differences were observed for rCLR –SMA (F= 1.79; P=0.19) or lSTN – SMA (F=0.776; P= 0.57).Post-hoc t-tests for rSTN – SMA connectivity show significantlystronger communication for FoG2 compared to FoG+ (t = 3.37;P= 0.006), but not compared to controls (t = 1.71; P=0.2). Nodifference was observed between controls and FoG+. Conversely,FoG+ show significantly stronger connectivity between lMLR –SMA compared to both controls (t=2.95; P=0.008) and FoG2(t = 2.98; P= 0.012). Similar group differences were found betweenrMLR – SMA with FoG+ demonstrating greater connectivity thancontrols (t = 2.97; P=0.008) and FoG2 (t = 3.2; P=0.008).Finally, connectivity strength between lCLR – SMA wassignificantly stronger in FoG+ than controls (t = 3.08; P=0.006),
Figure 1. Locomotor hubs used as regions of interest for functional connectivity analysis. X=7 is chosen for display as it is the only sliceon which all ROIs have some overlap. Please refer to the Methods section for coordinates describing the centroid of each sphere.doi:10.1371/journal.pone.0100291.g001
Functional Locomotor Connectivity in PD
PLOS ONE | www.plosone.org 4 June 2014 | Volume 9 | Issue 6 | e100291

but not significantly greater for FoG+ than FoG2 (t = 1.97;P= 0.075). For the latter three post-hoc comparisons, nodifferences were observed between controls and FoG2 partici-pants (P.0.7).The overall pattern of these results demonstrated a re-
organization of functional communication within the locomotornetwork in FoG+ patients whereby the SMA communicated withthe MLR and CLR to a greater extent than in control participantsor FoG2 PD patients. We direct the reader to Figure S1 for fullcohort analysis without the additional step of framewise displace-ment motion correction.
Locomotor Network Structural Connectivity StrengthA main effect of group was found for rSTN – SMA structural
connectivity (F = 4.2; P= 0.026), but no difference was observedfor rMLR – SMA structural connectivity strength (F = 2.4;P = 0.10). Nor were group differences in structural connectivitystrength observed within either the lSTN – SMA (F=0.3;P = 0.72) or lMLR – SMA loop (F = 0.94; P= 0.41). Post-hoccomparisons for the rSTN – SMA loop demonstrate greaterconnectivity for control participants in comparison to both FoG2(t=2.12; P=0.02) and FoG+ (t=1.83; P=0.04) groups. Nodifference was observed between the two PD sub-groups (P= 0.8;Figure 4). The overall pattern of these results demonstrate similar
reductions in structural connectivity strength between the rSTN –SMA in both PD sub-groups, despite the notable differenceobserved in functional connectivity of this loop for FoG2 comparedto FoG+.
Relationships between Locomotor Network Connectivityand FreezingSeed pairings demonstrating group differences in functional
connectivity strength were analyzed for relationships with metricsof freezing (see Table 2 for all relationships). Briefly, higherfunctional connectivity between the lMLR-SMA pair (Figure 5), aswell as between the lCLR – SMA pair, was strongly correlatedwith higher clinical ratings of FoG and self-reported NFOGQscores in FoG+. Similarly, the higher functional connectivitybetween the rMLR – SMA pair was strongly related with higherFreezing Ratio during turning under the dual task condition inFoG+ (Figure 5). It is worth noting that disease duration was notrelated to functional connectivity strength for any of the identifiedseed pairings, nor were any significant relationships betweenstructural connectivity strength and measures of freezing found.
Figure 2. Structural connectivity ROIs in the A) sagittal, B) coronal, and C) axial plane. The SMA, as defined by Mayka et al (2006) is shownin blue. The STN, as defined by Prodoehl et al (2008) is shown in yellow. The MLR, as defined by Fling et al. (2013), is shown in purple. All ROIs areoverlaid on the MNI 1 mm template and are displayed in neurologic convention (right = right). Similar ROIs for the SMA and MLR were used in the lefthemisphere (not displayed here).doi:10.1371/journal.pone.0100291.g002
Functional Locomotor Connectivity in PD
PLOS ONE | www.plosone.org 5 June 2014 | Volume 9 | Issue 6 | e100291
Discussion
Bipedal locomotion is a complex process involving coordinatedsupraspinal control between multiple locomotor hubs. Theselocomotor regions and their contributions to gait have recentlybeen reviewed [9,40], and a growing body of literature has begunto explore the clinical implications of dysfunction within theseneural hubs. The current findings demonstrate a reorganization offunctional communication within the locomotor network in FoG+patients whereby the higher order motor cortex (SMA) responsiblefor gait initiation communicates with the MLR and CLR to agreater extent than for FoG2 or controls. Conversely, FoG2 hadsignificantly greater functional connectivity than FoG+ in thehyperdirect pathway between rSTN and SMA. The observedpattern of altered connectivity in FoG+ does not appear to serve auseful compensatory role, but rather may contribute to FoG, asevidenced by the positive association between ratings of FoGseverity and increased functional connectivity in the MLR – SMAand CLR – SMA loops. Our results complement a growing bodyof literature indicating that age- and disease-related deficits inupper and lower limb movements are reflective of an increasedneed for cognitive, or higher-order motor control of previouslyautomated actions [41].
Locomotor Network Functional ConnectivityNeural regions underlying locomotor function have traditionally
shown diminished functional activation in patients with PD. Forexample, previous work in PD patients has reported decreasedactivity of the SMA during gait [42] and diminished pre-movement electroencephalographic potentials over SMA prior tostep initiation [43,44]. Furthermore, Shine and colleagues [12]recently reported decreased fMRI neural activity within the STNand the MLR during freezing episodes, the magnitude of whichwas positively correlated with the severity of clinical freezing ofgait. It is worth noting that a small number of fMRI [13] and PETimaging [45] studies have reported increased activity in the MLRin between FoG episodes providing evidence that neural activityduring walking [42] or with imagined stepping [13] which maydiffer from neural activity during an actual freezing episode. Thatis to say, the increased activity in MLR during imagined normalgait [13] may be compensatory in-between FoG episodes whenthere is normal walking. With increased strain on the system (e.g.turning), this fragile and vulnerable compensation system (withdecreased structural connectivity) fails, leading to FoG episodes[12].Whereas studies of fMRI and PET provide insight into specific
areas of activity during movement, resting state fcMRI allows forthe assessment of integrated, spatially disparate neural networks.The current study allows for a greater understanding of howcommunication between these neural locomotor hubs is crucial forthe appropriate coordination of posture with gait and the ability toadapt to changing environments that elicit freezing – e.g. turning,doorways, or crowded areas. We report that PD patients whoexperience freezing episodes have significantly greater communi-cation between the SMA and the MLR and between the SMA andCLR than either FoG2 or controls. The observed pattern ofaltered functional connectivity in FoG+ may be indicative ofneural reorganization changes that may contribute to FoG ratherthan serving a compensatory role. We speculate that this alteredpattern of connectivity within the locomotor circuitry maycoincide with increased cognitive control of gait [3].
Table
1.Patientcharacteristics.
Age
Disease
Duration
More
Affected
Side(R/L/E)
L-D
opa
(mg/day)
UPDRS
Moto
rH
&Y
NFOGQ
ClinicalFoG
Rating
ObjectiveFreezing
RatioST
DT
Frame
Exclusion(%
)
HC(n=14
)66
.9(7.8)
––
––
––
–0.3(0.2)
0.3(0.2)
19.1
(16.3)
FoG2
(n=7)
63.9
(6.4)
4.4
(2.5)
3/3/1
504.3(315
.9)
29.6
(9.2)
1.9(0.9)
0.4
(1.1)
0.09(0.2)
1.4
(0.9)
1.5
(1.1)
17.7
(19.5)
FoG+(n=8)
65.4
(6.0)
13.2
(5.5)
3/4/1
625.0(365
.5)
36.3
(7.8)
2.6(0.7)
18.1
(5.4)
2.0
(1.7)
4.8
(3.1)
4.6
(3.0)
9.8(12.1)
Significantdifferen
ces(P,0.05
)betweenPDgroups,assessed
byTu
key’sHSD
test,arehighlig
htedin
bold.A
lldatadisplayedaremean(6
stan
darddeviation).HC=healthycontrols.R=right,L=left,E
=eq
ual.S
T=single
task,
DT=
dual
task
condition.
doi:10.13
71/journal.pone.01
0029
1.t001
Functional Locomotor Connectivity in PD
PLOS ONE | www.plosone.org 6 June 2014 | Volume 9 | Issue 6 | e100291

Locomotor Network Structural ConnectivityThe current results provide the first evidence of altered
structural and functional connectivity of the locomotor networkwithin the same cohort of PD patients. Structural connectivitybetween locomotor hubs was analyzed via probabilistic fibertractography. Contrary to our initial hypothesis, both PD sub-groups had reduced structural connectivity along the hyperdirectrSTN – SMA loop, despite the significant group differences infunctional connectivity between these same regions. It is alsoimportant to note that the structural connectivity loss is similar inboth PD groups, even though the FoG2 group had significantly
shorter disease duration. While it appears that structuralconnectivity changes occur quickly between the STN – SMA inPD, the changes in functional connectivity do not appear to belinear. Similar to previous work [46] the current data show thatearly in PD progression (e.g. the FoG2 group) there was anincrease in functional communication from the STN to the SMA,whereas later in PD progression (the FoG+ group) there was asignificant reduction in functional connectivity. Thus, althoughPD patients with and without FoG show similar structural declinealong the hyperdirect loop between the rSTN – SMA, we
Figure 3. Functional connectivity strength between the SMA and the other locomotor hubs. FoG+ patients show greater connectivity tothe MLR and CLR, but reduced connectivity to the STN. **P,0.001, *P,0.05.doi:10.1371/journal.pone.0100291.g003
Figure 4. Structural connectivity between the SMA and right STN, as assessed by diffusion tensor imaging. A) Normalized z-scores forstructural connectivity strength between the rSTN – SMA. HC have significantly greater connectivity than either FoG2 or FoG+. B) Rendered fibertracts (red) from one healthy control demonstrating the structural connectivity within the hyperdirect loop between the SMA and STN (bothdisplayed in green). *P,0.05. HC= healthy controls.doi:10.1371/journal.pone.0100291.g004
Functional Locomotor Connectivity in PD
PLOS ONE | www.plosone.org 7 June 2014 | Volume 9 | Issue 6 | e100291

speculate that FoG2 patients compensate for this loss withsignificantly greater functional communication as we report here.Consistent with right hemisphere involvement in response
inhibition [47], we have recently demonstrated reduced structuralconnectivity of the pedunculopontine nucleus with the cerebellum,thalamus and multiple regions of the frontal cortex solely in theright hemisphere of patients with FoG+ [11]. Additionally, themore left hemisphere-lateralized the pedunculopontine nucleustract volume in FoG+, the poorer the performance on cognitivetasks (Stroop task) requiring the initiation of appropriate actionsand/or the inhibition of inappropriate actions [11]. Takentogether there is mounting evidence speculating that deficits inconflict resolution (cognitive inhibition) is a principal componentof freezing within PD [3].
Cortical Contributions to FoGAbnormal communication between cortical and subcortical
structures in the presence of increased cognitive load has beenproposed as a principal component underlying FoG [48].Progression to more advanced PD (when FoG occurs) is likelyassociated with a progressive involvement of cortical structuressuch as the SMA [8]. Anticipatory postural adjustments that shiftbody weight to the stance leg for gait initiation are primarilymediated by the SMA [6,49,50]. It has been hypothesized that the
SMA receives internal cues from the basal ganglia in order tocoordinate and link together sub-movements (e.g. anticipatorypostural adjustment and step initiation) [51]. As a result of basalganglia dysfunction with PD progression, the SMA may lose itsability to sequence and coordinate postural adjustments andstepping. This is evidenced by studies demonstrating thatanticipatory postural responses are smaller in PD [6] and mayoccur repeatedly without leading to a step [52]. In agreement withprevious imaging work in humans [46] and electrophysiologicalrecordings demonstrating excessive synchronization in basalganglia-cortical circuitries in both humans [53,54,55] and animalPD models [56] we report greater functional connectivity in therSTN – SMA loop in early stage PD patients (i.e. FoG2) than incontrols. While previous work [46] suggests that overactivity of thehyperdirect pathway plays a crucial role in the pathophysiology ofPD [55,56], the current results suggest that the increased activityalong this loop may serve a compensatory role in PD patients whodo not experience FoG, whereas this compensation is lost overtime, or was never present, in FoG+ individuals.
LimitationsThe current study has several limitations. Due to our strict
motion correction procedures for processing of the functionalimaging our sample size was noticeably reduced from the original
Figure 5. Associations between locomotor network functional connectivity and freezing severity. A) Functional connectivity strength ofthe lMLR – SMA loop was positively correlated with clinical rating of FoG severity during the single task turning condition (r = 0.71). B) Functionalconnectivity strength of the rMLR – SMA loop was also positively correlated with objective sensor measurement of FoG severity during dual-taskturning (0.76).doi:10.1371/journal.pone.0100291.g005
Table 2. Relationships between functional connectivity strength and 1) self-reported freezing severity, 2) clinical ratings offreezing severity, 3) Objective Freezing Ratio during single task turning, 4) Objective Freezing ratio during dual task turning, and 5)disease duration in FoG+ patients.
lMLR – SMA rMLR 2 SMA lCLR 2 SMA rSTN – SMA
FoG+ NFOGQ 0.74* 0.45 0.63* 0.19
FoG+ FoG Rating 0.71* 0.29 0.37 0.28
FoG+ Freezing Ratio, single task 0.45 0.20 0.04 0.46
FoG+ Freezing Ratio, dual task 0.22 0.76* 0.44 0.86*
FoG+ Dis. Duration 20.14 0.04 0.19 20.13
Stronger functional connectivity between lMLR – SMA and lCLR – SMA was related to more severe self-perceived or clinically assessed freezing, while stronger functionalconnectivity between rMLR – SMA was related to more severe freezing assessed with the Objective Freezing Ratio during the dual task turning. Values representcorrelation coefficients (r). Dis. Duration = disease duration. *P,0.05 shown in bold, analyses are corrected for multiple comparisons.doi:10.1371/journal.pone.0100291.t002
Functional Locomotor Connectivity in PD
PLOS ONE | www.plosone.org 8 June 2014 | Volume 9 | Issue 6 | e100291
cohort; however, when including all participants the results remainconsistent (Figure S1). Further, for those participants includedwithin the FoG2 and FoG+ groups there is a noticeable differencein disease duration. This is often an issue when attempting tomatch disease characteristics between groups due to the onset offreezing episodes late in disease progression [57]. The increaseddisease duration provides the nervous system with more time tocompensate for the disease-related changes, which may bereflected within our imaging results. Furthermore, early in diseaseprogression, PD symptoms tend to be more asymmetric, possiblyinfluencing the laterality differences seen in our FoG2 group. Thisis tempered by the fact that both PD groups’ most affected sidewas evenly distributed and that the full cohort of data does notdemonstrate laterality (Figure S1). It is also worth noting that thecurrent study did not find significantly reduced structuralconnections between the rMLR – SMA in FoG+ patients as wasfound in recent work [11]. This is likely due to the smaller cohortinvestigated in the current study as a result of the strict motioncorrection processing implemented for the functional imaging.
Conclusions
The current study provides the first evidence of alteredstructural and functional connectivity of the locomotor networkwithin the same cohort of PD patients. These results demonstratecompromised structural integrity and abnormal functional com-munication between subcortical and cortical regions of thelocomotor network in individuals who experience FoG. Increasedfunctional connectivity between the SMA and the MLR and CLRmay be reflective of a maladaptative compensation in FoG+. Theloss of structural connectivity and the subsequent reduction infunctional communication observed within FoG+ between therSTN – SMA potentially represents a loss of the ability to inhibitcompeting motor programs (anticipatory postural adjustments)and to initiate the correct movement (gait). Because of the STN’s
demonstrated association with inhibitory control the currentfindings add to the literature that implicates a role for executivedysfunction within the inhibitory domain leading to motorimpairment in the form of FoG. The observed pattern of reducedstructural and functional connectivity between the rSTN – SMAin a small sample of FoG+ patients, provides a specific target forcognitive neurorehabilitation [58] within these individuals.
Supporting Information
Figure S1 Functional connectivity strength between the SMAand the other locomotor hubs for the full cohort of participants(HC=15; FoG2=12; FoG+=14). FoG+ patients show greaterconnectivity bilaterally to the MLR compared to HC and FoG2.FoG+ patients also demonstrated greater connectivity to the rCLRcompared to FoG2 and bilateral CLR compared to HC. FoG2patients had greater connectivity to the rSTN compared to HCand bilateral STN compared to FoG+. **P,0.001, *P,0.05.(TIFF)
Acknowledgments
We thank the volunteers for participating in this study and the Parkinson’sCenter of Oregon for referring patients. We are grateful to PatriciaCarlson-Kuhta for administrative oversight and Mari Nomura, MichaelFleming, and Krystal Klein for assistance in data collection and analysis.We are also grateful to the Oregon Clinical and Translational ResearchInstitute for providing facilities to conduct our studies. We would like tothank neurologists N. Giladi, M.D., and J. Nutt, M.D. (co-author) for theirassistance in providing clinical ratings of freezing severity.
Author Contributions
Conceived and designed the experiments: RC MM JN FH. Performed theexperiments: RC MM JN FH. Analyzed the data: BF MM RC SC DF.Contributed to the writing of the manuscript: BF RC MM SC DF JN FH.
References
1. Nutt JG, Bloem BR, Giladi N, Hallett M, Horak FB, et al. (2011) Freezing ofgait: moving forward on a mysterious clinical phenomenon. Lancet Neurol 10:734–744.
2. Vercruysse S, Spildooren J, Heremans E, Wenderoth N, Swinnen SP, et al.(2013) The Neural Correlates of Upper Limb Motor Blocks in Parkinson’sDisease and Their Relation to Freezing of Gait. Cereb Cortex.
3. Shine JM, Moustafa AA, Matar E, Frank MJ, Lewis SJ (2013) The role offrontostriatal impairment in freezing of gait in Parkinson’s disease. Front SystNeurosci 7: 61.
4. Boulinguez P, Ballanger B, Granjon L, Benraiss A (2009) The paradoxical effectof warning on reaction time: demonstrating proactive response inhibition withevent-related potentials. Clin Neurophysiol 120: 730–737.
5. Massion J (1992) Movement, posture and equilibrium: interaction andcoordination. Prog Neurobiol 38: 35–56.
6. Jacobs JV, Lou JS, Kraakevik JA, Horak FB (2009) The supplementary motorarea contributes to the timing of the anticipatory postural adjustment during stepinitiation in participants with and without Parkinson’s disease. Neuroscience164: 877–885.
7. Wiesendanger M, Hummelsheim H, Bianchetti M, Chen DF, Hyland B, et al.(1987) Input and output organization of the supplementary motor area. CibaFound Symp 132: 40–62.
8. Braak H, Del Tredici K, Bratzke H, Hamm-Clement J, Sandmann-Keil D, et al.(2002) Staging of the intracerebral inclusion body pathology associated withidiopathic Parkinson’s disease (preclinical and clinical stages). J Neurol 249Suppl 3: III/1–5.
9. Jahn K, Deutschlander A, Stephan T, Kalla R, Hufner K, et al. (2008)Supraspinal locomotor control in quadrupeds and humans. Prog Brain Res 171:353–362.
10. Huang C, Tang C, Feigin A, Lesser M, Ma Y, et al. (2007) Changes in networkactivity with the progression of Parkinson’s disease. Brain 130: 1834–1846.
11. Fling BW, Cohen RG, Mancini M, Nutt JG, Fair DA, et al. (2013) Asymmetricpedunculopontine network connectivity in parkinsonian patients with freezing ofgait. Brain 136: 2405–2418.
12. Shine JM, Matar E, Ward PB, Bolitho SJ, Gilat M, et al. (2013) Exploring thecortical and subcortical functional magnetic resonance imaging changesassociated with freezing in Parkinson’s disease. Brain 136: 1204–1215.
13. Snijders AH, Leunissen I, Bakker M, Overeem S, Helmich RC, et al. (2011)Gait-related cerebral alterations in patients with Parkinson’s disease withfreezing of gait. Brain 134: 59–72.
14. Tessitore A, Amboni M, Esposito F, Russo A, Picillo M, et al. (2012) Resting-state brain connectivity in patients with Parkinson’s disease and freezing of gait.Parkinsonism Relat Disord 18: 781–787.
15. Nieuwboer A, Giladi N (2008) The challenge of evaluating freezing of gait inpatients with Parkinson’s disease. Br J Neurosurg 22 Suppl 1: S16–18.
16. Shine JM, Moore ST, Bolitho SJ, Morris TR, Dilda V, et al. (2012) Assessing theutility of Freezing of Gait Questionnaires in Parkinson’s Disease. ParkinsonismRelat Disord 18: 25–29.
17. Snijders AH, Haaxma CA, Hagen YJ, Munneke M, Bloem BR (2012) Freezer ornon-freezer: clinical assessment of freezing of gait. Parkinsonism Relat Disord18: 149–154.
18. Moore ST, MacDougall HG, Ondo WG (2008) Ambulatory monitoring offreezing of gait in Parkinson’s disease. J Neurosci Methods 167: 340–348.
19. Mancini M, Priest KC, Nutt JG, Horak FB (2012) Quantifying freezing of gait inParkinson’s disease during the instrumented timed up and go test. Conf ProcIEEE Eng Med Biol Soc 2012: 1198–1201.
20. Miezin FM, Maccotta L, Ollinger JM, Petersen SE, Buckner RL (2000)Characterizing the hemodynamic response: effects of presentation rate, samplingprocedure, and the possibility of ordering brain activity based on relative timing.Neuroimage 11: 735–759.
21. Talairach J, Tournoux P (1988) Co-planar stereotaxic atlas of the human brain.New York, N.Y.: Thieme Medical Publisheres, Inc.
22. Lancaster JL, Glass TG, Lankipalli BR, Downs H, Mayber H, et al. (1995) Amodality-independent approach to spatial normalization of tomographic imagesof the human brain. Hum Brain Mapp 3: 209–223.
23. Fair DA, Nigg JT, Iyer S, Bathula D, Mills KL, et al. (2012) Distinct neuralsignatures detected for ADHD subtypes after controlling for micro-movementsin resting state functional connectivity MRI data. Front Syst Neurosci 6: 80.
Functional Locomotor Connectivity in PD
PLOS ONE | www.plosone.org 9 June 2014 | Volume 9 | Issue 6 | e100291

24. Fox MD, Raichle ME (2007) Spontaneous fluctuations in brain activity observedwith functional magnetic resonance imaging. Nat Rev Neurosci 8: 700–711.
25. Power JD, Barnes KA, Snyder AZ, Schlaggar BL, Petersen SE (2012) Spuriousbut systematic correlations in functional connectivity MRI networks arise fromsubject motion. Neuroimage 59: 2142–2154.
26. Shik ML, Orlovsky GN (1976) Neurophysiology of locomotor automatism.Physiol Rev 56: 465–501.
27. Armstrong DM, Edgley SA (1988) Discharges of interpositus and Purkinje cellsof the cat cerebellum during locomotion under different conditions. J Physiol400: 425–445.
28. Mori S, Matsuyama K, Mori F, Nakajima K (2001) Supraspinal sites that inducelocomotion in the vertebrate central nervous system. Adv Neurol 87: 25–40.
29. Lancaster JL, Tordesillas-Gutierrez D, Martinez M, Salinas F, Evans A, et al.(2007) Bias between MNI and Talairach coordinates analyzed using the ICBM-152 brain template. Hum Brain Mapp 28: 1194–1205.
30. Mayka MA, Corcos DM, Leurgans SE, Vaillancourt DE (2006) Three-dimensional locations and boundaries of motor and premotor cortices asdefined by functional brain imaging: a meta-analysis. Neuroimage 31: 1453–1474.
31. Prodoehl J, Yu H, Little DM, Abraham I, Vaillancourt DE (2008) Region ofinterest template for the human basal ganglia: comparing EPI and standardizedspace approaches. Neuroimage 39: 956–965.
32. Thevathasan W, Cole MH, Graepel CL, Hyam JA, Jenkinson N, et al. (2012) Aspatiotemporal analysis of gait freezing and the impact of pedunculopontinenucleus stimulation. Brain 135: 1446–1454.
33. Mesulam MM, Geula C, Bothwell MA, Hersh LB (1989) Human reticularformation: cholinergic neurons of the pedunculopontine and laterodorsaltegmental nuclei and some cytochemical comparisons to forebrain cholinergicneurons. J Comp Neurol 283: 611–633.
34. Jahn K, Deutschlander A, Stephan T, Kalla R, Wiesmann M, et al. (2008)Imaging human supraspinal locomotor centers in brainstem and cerebellum.Neuroimage 39: 786–792.
35. Eickhoff SB, Jbabdi S, Caspers S, Laird AR, Fox PT, et al. (2010) Anatomicaland functional connectivity of cytoarchitectonic areas within the human parietaloperculum. J Neurosci 30: 6409–6421.
36. Behrens TE, Woolrich MW, Jenkinson M, Johansen-Berg H, Nunes RG, et al.(2003) Characterization and propagation of uncertainty in diffusion-weightedMR imaging. Magn Reson Med 50: 1077–1088.
37. Behrens TE, Berg HJ, Jbabdi S, Rushworth MF, Woolrich MW (2007)Probabilistic diffusion tractography with multiple fibre orientations: What canwe gain? Neuroimage 34: 144–155.
38. Coxon JP, Van Impe A, Wenderoth N, Swinnen SP (2012) Aging and inhibitorycontrol of action: cortico-subthalamic connection strength predicts stoppingperformance. J Neurosci 32: 8401–8412.
39. Forstmann BU, Anwander A, Schafer A, Neumann J, Brown S, et al. (2010)Cortico-striatal connections predict control over speed and accuracy inperceptual decision making. Proc Natl Acad Sci U S A 107: 15916–15920.
40. Takakusaki K (2013) Neurophysiology of gait: From the spinal cord to thefrontal lobe. Mov Disord 28: 1483–1491.
41. Seidler RD, Bernard JA, Burutolu TB, Fling BW, Gordon MT, et al. (2010)Motor control and aging: links to age-related brain structural, functional, andbiochemical effects. Neurosci Biobehav Rev 34: 721–733.
42. Hanakawa T, Katsumi Y, Fukuyama H, Honda M, Hayashi T, et al. (1999)Mechanisms underlying gait disturbance in Parkinson’s disease: a single photonemission computed tomography study. Brain 122 (Pt 7): 1271–1282.
43. Vidailhet M, Stocchi F, Rothwell JC, Thompson PD, Day BL, et al. (1993) TheBereitschaftspotential preceding simple foot movement and initiation of gait inParkinson’s disease. Neurology 43: 1784–1788.
44. Smith BA, Jacobs JV, Horak FB (2012) Effects of magnitude and magnitudepredictability of postural perturbations on preparatory cortical activity in olderadults with and without Parkinson’s disease. Exp Brain Res 222: 455–470.
45. Ko JH, Mure H, Tang CC, Ma Y, Dhawan V, et al. (2013) Parkinson’s disease:increased motor network activity in the absence of movement. J Neurosci 33:4540–4549.
46. Baudrexel S, Witte T, Seifried C, von Wegner F, Beissner F, et al. (2011) Restingstate fMRI reveals increased subthalamic nucleus-motor cortex connectivity inParkinson’s disease. Neuroimage 55: 1728–1738.
47. Aron AR (2007) The neural basis of inhibition in cognitive control.Neuroscientist 13: 214–228.
48. Shine JM, Matar E, Ward PB, Frank MJ, Moustafa AA, et al. (2013) Freezing ofgait in Parkinson’s disease is associated with functional decoupling between thecognitive control network and the basal ganglia. Brain 136: 3671–3681.
49. Saitou K, Washimi Y, Koike Y, Takahashi A, Kaneoke Y (1996) Slow negativecortical potential preceding the onset of postural adjustment. ElectroencephalogrClin Neurophysiol 98: 449–455.
50. Viallet F, Massion J, Massarino R, Khalil R (1992) Coordination betweenposture and movement in a bimanual load lifting task: putative role of a medialfrontal region including the supplementary motor area. Exp Brain Res 88: 674–684.
51. Iansek R, Bradshaw JL, Phillips JG, Cunnington R, Morris ME (1995)Interaction of the basal ganglia and supplementary motor area in the elaborationof movement. In: Glencross DJ, Piek JP, editors. Motor control andsensorimotor integration. Amsterdam: Elsevier Science. 37–59.
52. Jacobs JV, Nutt JG, Carlson-Kuhta P, Stephens M, Horak FB (2009) Kneetrembling during freezing of gait represents multiple anticipatory posturaladjustments. Exp Neurol 215: 334–341.
53. Brown P (2003) Oscillatory nature of human basal ganglia activity: relationshipto the pathophysiology of Parkinson’s disease. Mov Disord 18: 357–363.
54. Fogelson N, Williams D, Tijssen M, van Bruggen G, Speelman H, et al. (2006)Different functional loops between cerebral cortex and the subthalmic area inParkinson’s disease. Cereb Cortex 16: 64–75.
55. Lalo E, Thobois S, Sharott A, Polo G, Mertens P, et al. (2008) Patterns ofbidirectional communication between cortex and basal ganglia duringmovement in patients with Parkinson disease. J Neurosci 28: 3008–3016.
56. Dejean C, Gross CE, Bioulac B, Boraud T (2008) Dynamic changes in thecortex-basal ganglia network after dopamine depletion in the rat. J Neurophysiol100: 385–396.
57. Giladi N, Treves TA, Simon ES, Shabtai H, Orlov Y, et al. (2001) Freezing ofgait in patients with advanced Parkinson’s disease. J Neural Transm 108: 53–61.
58. Walton CC, Shine JM, Mowszowski L, Naismith SL, Lewis SJ (2014) Freezing ofgait in Parkinson’s disease: Current treatments and the potential role forcognitive training. Restor Neurol Neurosci.
Functional Locomotor Connectivity in PD
PLOS ONE | www.plosone.org 10 June 2014 | Volume 9 | Issue 6 | e100291