A Novel Logistic Model Based on Clinicopathological Features Predicts Microsatellite Instability in...
11
ORIGINAL ARTICLE A Novel Logistic Model Based on Clinicopathological Features Predicts Microsatellite Instability in Colorectal Carcinomas Anna Colomer, PhD,* Nadina Erill, PhD,* August Vidal, MD,*† Miquel Calvo, PhD,‡ Ruth Roman, PhD,* Montse Verdu ´, PhD,† Carlos Cordon-Cardo, MD, PhD,*†§ and Xavier Puig, MD, PhD*† Abstract: High-frequency microsatellite instability has been reported to be associated with good prognosis in colorectal adenocarcinoma. However, methods to assess microsatellite instability (MIN) are based on genetic assays and are not ideally suited to most histopathology laboratories. The aim of the present study was to develop a model for prediction of MIN status in colorectal cancer based on phenotypic characteristics. Clinicopathological features of a cohort of 204 patients with primary colon cancer were retrospectively reviewed following predetermined criteria. Genetic assessment of MIN status was per- formed on DNA extracted from sections of formalin-fixed, paraffin- embedded specimens by testing a panel of 11 microsatellite markers. Logistic regression analysis generated a mathematical tool capable of identifying colorectal tumors displaying MIN status with a sensitivity of 77.8% and a specificity of 96.8%. Features associated with insta- bility included the proximal location of the lesions, occurrence of solid and/or mucinous differentiation, absence of cribriform struc- tures, presence of peritumoral Crohn-like reaction, expansive growth pattern, high Ki67 proliferative index, and p53-negative phenotype. This approach predicts microsatellite instability in colorectal car- cinoma with an overall assigned accuracy of 95.1% and a negative predictive value of 97.8%. Implementation of this tool to routine histopathological studies could improve the management of patients with colorectal cancer, especially those presenting with stage II and III of the disease. It will also assist in identifying a subset of patients likely to benefit from adjuvant chemotherapy. Key Words: hereditary nonpolyposis colorectal cancer, sporadic colorectal cancer, microsatellite instability, DNA replication errors, logistic model (Diagn Mol Pathol 2005;14:213–223) F amiliar and sporadic colorectal carcinomas arise through a multistep process from the transformation of normal colonic epithelial cells. Two main genetic pathways of tu- morigenesis have been distinguished, known as chromosomal instability (CIN) and microsatellite instability (MIN). 1 CIN is the most common, affecting approximately 85% of sporadic colorectal cancers, and shares genetic alterations characteristic of the familial adenomatous polyposis (FAP). 2 It involves mutations of critical genes, such as APC, K-RAS, and TP53; DNA hypermethylation; and chromosomal aberrations, in- cluding loss of heterozygosity at chromosomes 17p and 18q, leading to aneuploidy. 2–4 MIN tumors share their molecular mechanisms with hereditary nonpolyposis colorectal cancer (HNPCC). They are characterized by alterations of the mis- match repair (MMR) genes 5,6 and secondary mutations af- fecting genes involved in growth signaling (eg, TGFßRII, IGFRII) 7,8 and apoptosis (eg, BAX). 9 Because cells with alterations in MMR genes do not properly repair spontaneous errors occurring during DNA replication, they are prone to accumulate frame-shift mutations and base-pair substitutions at microsatellite sequences. Therefore, colorectal cancers that belong to this mutator phenotype display a characteristic mo- lecular pattern that has been termed ‘‘high-frequency micro- satellite instability’’ or MSI-H. 5,6,10 Clinical evidence let to the conclusion that patients carrying sporadic MIN colorectal cancers behave like those with HNPCC in terms of improved survival 10–12 and display a stage-by-stage better prognosis than those with sporadic CIN tumors. 13–16 Additional studies confirmed the good prognosis of stage II or III colorectal carcinoma patients with MSI-H. 13,14,16–18 Furthermore, it was reported that MSI-H tumors possessed greater chemosensitivity. 17–19 However, it was also found that 5-fluorouracil–based chemotherapy (5-FU) did not signifi- cantly increase overall and disease-free survival in patients with stage II or III MSI-H tumors. 20–22 Due to this different response to adjuvant chemotherapy, defining MIN status could assist in discriminating a subgroup of patients who may benefit from 5-FU regimens. A distinct histologic appearance has been attributed to colorectal cancers arising from the MIN pathway. These lesions are typically right sided, more likely to be poorly dif- ferentiated, and often display mucinous-type or signet-ring cells. 23,24 Additionally, these lesions frequently exhibit pronounced intraepithelial lymphocytic infiltration 25,26 and From *BIOPAT, Grup Assiste `ncia, Barcelona, Spain; †HISTOPAT Labo- ratoris, Barcelona, Spain; ‡Statistics Department of the Universitat de Barcelona, Barcelona, Spain; and §Division of Molecular Pathology, Memorial Sloan-Kettering Cancer Center, New York, NY. Reprints: Carlos Cordon-Cardo, Division of Molecular Pathology, Memorial Sloan-Kettering Cancer Center, 1275 York Avenue, New York, NY 10021 (e-mail: [email protected]). Copyright Ó 2005 by Lippincott Williams & Wilkins Diagn Mol Pathol Volume 14, Number 4, December 2005 213
-
Upload
independent -
Category
Documents
-
view
0 -
download
0
Transcript of A Novel Logistic Model Based on Clinicopathological Features Predicts Microsatellite Instability in...

ORIGINAL ARTICLE
A Novel Logistic Model Based on ClinicopathologicalFeatures Predicts Microsatellite Instability
in Colorectal Carcinomas
Anna Colomer, PhD,* Nadina Erill, PhD,* August Vidal, MD,*† Miquel Calvo, PhD,‡
Ruth Roman, PhD,* Montse Verdu, PhD,† Carlos Cordon-Cardo, MD, PhD,*†§
and Xavier Puig, MD, PhD*†
Abstract: High-frequency microsatellite instability has been reported
to be associated with good prognosis in colorectal adenocarcinoma.
However, methods to assess microsatellite instability (MIN) are based
on genetic assays and are not ideally suited to most histopathology
laboratories. The aim of the present study was to develop a model for
prediction of MIN status in colorectal cancer based on phenotypic
characteristics. Clinicopathological features of a cohort of 204 patients
with primary colon cancer were retrospectively reviewed following
predetermined criteria. Genetic assessment of MIN status was per-
formed on DNA extracted from sections of formalin-fixed, paraffin-
embedded specimens by testing a panel of 11 microsatellite markers.
Logistic regression analysis generated a mathematical tool capable of
identifying colorectal tumors displaying MIN status with a sensitivity
of 77.8% and a specificity of 96.8%. Features associated with insta-
bility included the proximal location of the lesions, occurrence of
solid and/or mucinous differentiation, absence of cribriform struc-
tures, presence of peritumoral Crohn-like reaction, expansive growth
pattern, high Ki67 proliferative index, and p53-negative phenotype.
This approach predicts microsatellite instability in colorectal car-
cinoma with an overall assigned accuracy of 95.1% and a negative
predictive value of 97.8%. Implementation of this tool to routine
histopathological studies could improve the management of patients
with colorectal cancer, especially those presenting with stage II and
III of the disease. It will also assist in identifying a subset of patients
likely to benefit from adjuvant chemotherapy.
Key Words: hereditary nonpolyposis colorectal cancer, sporadic
colorectal cancer, microsatellite instability, DNA replication errors,
logistic model
(Diagn Mol Pathol 2005;14:213–223)
Familiar and sporadic colorectal carcinomas arise througha multistep process from the transformation of normal
colonic epithelial cells. Two main genetic pathways of tu-morigenesis have been distinguished, known as chromosomalinstability (CIN) and microsatellite instability (MIN).1 CIN isthe most common, affecting approximately 85% of sporadiccolorectal cancers, and shares genetic alterations characteristicof the familial adenomatous polyposis (FAP).2 It involvesmutations of critical genes, such as APC, K-RAS, and TP53;DNA hypermethylation; and chromosomal aberrations, in-cluding loss of heterozygosity at chromosomes 17p and 18q,leading to aneuploidy.2–4 MIN tumors share their molecularmechanisms with hereditary nonpolyposis colorectal cancer(HNPCC). They are characterized by alterations of the mis-match repair (MMR) genes5,6 and secondary mutations af-fecting genes involved in growth signaling (eg, TGFßRII,IGFRII)7,8 and apoptosis (eg, BAX).9 Because cells withalterations in MMR genes do not properly repair spontaneouserrors occurring during DNA replication, they are prone toaccumulate frame-shift mutations and base-pair substitutionsat microsatellite sequences. Therefore, colorectal cancers thatbelong to this mutator phenotype display a characteristic mo-lecular pattern that has been termed ‘‘high-frequency micro-satellite instability’’ or MSI-H.5,6,10
Clinical evidence let to the conclusion that patientscarrying sporadic MIN colorectal cancers behave like thosewith HNPCC in terms of improved survival10–12 and displaya stage-by-stage better prognosis than those with sporadic CINtumors.13–16 Additional studies confirmed the good prognosis ofstage II or III colorectal carcinoma patients with MSI-H.13,14,16–18
Furthermore, it was reported that MSI-H tumors possessedgreater chemosensitivity.17–19 However, it was also found that5-fluorouracil–based chemotherapy (5-FU) did not signifi-cantly increase overall and disease-free survival in patientswith stage II or III MSI-H tumors.20–22 Due to this differentresponse to adjuvant chemotherapy, defining MIN status couldassist in discriminating a subgroup of patients who may benefitfrom 5-FU regimens.
A distinct histologic appearance has been attributed tocolorectal cancers arising from the MIN pathway. Theselesions are typically right sided, more likely to be poorly dif-ferentiated, and often display mucinous-type or signet-ringcells.23,24 Additionally, these lesions frequently exhibitpronounced intraepithelial lymphocytic infiltration25,26 and
From *BIOPAT, Grup Assistencia, Barcelona, Spain; †HISTOPAT Labo-ratoris, Barcelona, Spain; ‡Statistics Department of the Universitat deBarcelona, Barcelona, Spain; and §Division of Molecular Pathology,Memorial Sloan-Kettering Cancer Center, New York, NY.
Reprints: Carlos Cordon-Cardo, Division of Molecular Pathology, MemorialSloan-Kettering Cancer Center, 1275 York Avenue, New York, NY 10021(e-mail: [email protected]).
Copyright � 2005 by Lippincott Williams & Wilkins
Diagn Mol Pathol � Volume 14, Number 4, December 2005 213
extensive peritumoral accumulation of lymph cells, similar tothat observed in Crohn’s disease.27,28 Several studies wereconducted in an attempt to predict the MIN status of colorectaltumors by their sole clinical and pathologic features. Jasset al23 reported that tumors exhibiting less than 30% unstablemicrosatellite markers are phenotypically indistinguishablefrom stable lesions. They concluded that pathologic exami-nation allows a sensitive and specific identification of tumorsexhibiting MSI-H by means of a decision tree-based model.
The objective of this study was to provide pathologistswith an inexpensive and versatile device to categorize whichcolorectal tumors should undergo MIN analysis on the basis ofavailable clinical and pathologic data. A model based onstepwise logistic regression is presented by which non–MSI-Htumors could be identified with great accuracy.
MATERIALS AND METHODS
Patient Characteristics and TissuesBetween July 1996 and June 2003, 237 consecutive
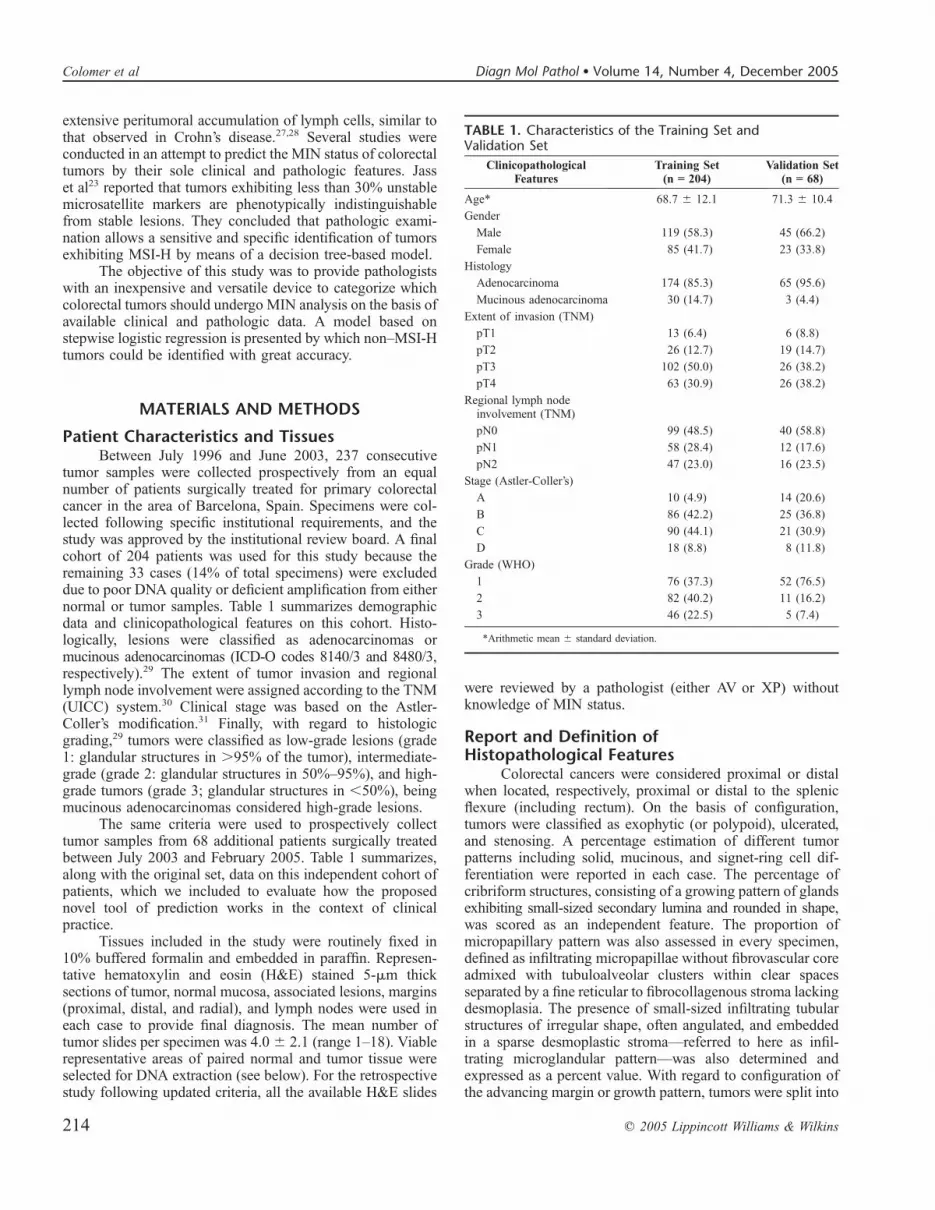
tumor samples were collected prospectively from an equalnumber of patients surgically treated for primary colorectalcancer in the area of Barcelona, Spain. Specimens were col-lected following specific institutional requirements, and thestudy was approved by the institutional review board. A finalcohort of 204 patients was used for this study because theremaining 33 cases (14% of total specimens) were excludeddue to poor DNA quality or deficient amplification from eithernormal or tumor samples. Table 1 summarizes demographicdata and clinicopathological features on this cohort. Histo-logically, lesions were classified as adenocarcinomas ormucinous adenocarcinomas (ICD-O codes 8140/3 and 8480/3,respectively).29 The extent of tumor invasion and regionallymph node involvement were assigned according to the TNM(UICC) system.30 Clinical stage was based on the Astler-Coller’s modification.31 Finally, with regard to histologicgrading,29 tumors were classified as low-grade lesions (grade1: glandular structures in .95% of the tumor), intermediate-grade (grade 2: glandular structures in 50%–95%), and high-grade tumors (grade 3; glandular structures in ,50%), beingmucinous adenocarcinomas considered high-grade lesions.
The same criteria were used to prospectively collecttumor samples from 68 additional patients surgically treatedbetween July 2003 and February 2005. Table 1 summarizes,along with the original set, data on this independent cohort ofpatients, which we included to evaluate how the proposednovel tool of prediction works in the context of clinicalpractice.
Tissues included in the study were routinely fixed in10% buffered formalin and embedded in paraffin. Represen-tative hematoxylin and eosin (H&E) stained 5-mm thicksections of tumor, normal mucosa, associated lesions, margins(proximal, distal, and radial), and lymph nodes were used ineach case to provide final diagnosis. The mean number oftumor slides per specimen was 4.06 2.1 (range 1–18). Viablerepresentative areas of paired normal and tumor tissue wereselected for DNA extraction (see below). For the retrospectivestudy following updated criteria, all the available H&E slides
were reviewed by a pathologist (either AV or XP) withoutknowledge of MIN status.
Report and Definition ofHistopathological Features
Colorectal cancers were considered proximal or distalwhen located, respectively, proximal or distal to the splenicflexure (including rectum). On the basis of configuration,tumors were classified as exophytic (or polypoid), ulcerated,and stenosing. A percentage estimation of different tumorpatterns including solid, mucinous, and signet-ring cell dif-ferentiation were reported in each case. The percentage ofcribriform structures, consisting of a growing pattern of glandsexhibiting small-sized secondary lumina and rounded in shape,was scored as an independent feature. The proportion ofmicropapillary pattern was also assessed in every specimen,defined as infiltrating micropapillae without fibrovascular coreadmixed with tubuloalveolar clusters within clear spacesseparated by a fine reticular to fibrocollagenous stroma lackingdesmoplasia. The presence of small-sized infiltrating tubularstructures of irregular shape, often angulated, and embeddedin a sparse desmoplastic stroma—referred to here as infil-trating microglandular pattern—was also determined andexpressed as a percent value. With regard to configuration ofthe advancing margin or growth pattern, tumors were split into
TABLE 1. Characteristics of the Training Set andValidation Set
ClinicopathologicalFeatures
Training Set(n = 204)
Validation Set(n = 68)
Age* 68.7 6 12.1 71.3 6 10.4
Gender
Male 119 (58.3) 45 (66.2)
Female 85 (41.7) 23 (33.8)
Histology
Adenocarcinoma 174 (85.3) 65 (95.6)
Mucinous adenocarcinoma 30 (14.7) 3 (4.4)
Extent of invasion (TNM)
pT1 13 (6.4) 6 (8.8)
pT2 26 (12.7) 19 (14.7)
pT3 102 (50.0) 26 (38.2)
pT4 63 (30.9) 26 (38.2)
Regional lymph nodeinvolvement (TNM)
pN0 99 (48.5) 40 (58.8)
pN1 58 (28.4) 12 (17.6)
pN2 47 (23.0) 16 (23.5)
Stage (Astler-Coller’s)
A 10 (4.9) 14 (20.6)
B 86 (42.2) 25 (36.8)
C 90 (44.1) 21 (30.9)
D 18 (8.8) 8 (11.8)
Grade (WHO)
1 76 (37.3) 52 (76.5)
2 82 (40.2) 11 (16.2)
3 46 (22.5) 5 (7.4)
*Arithmetic mean 6 standard deviation.
214 q 2005 Lippincott Williams & Wilkins
Colomer et al Diagn Mol Pathol � Volume 14, Number 4, December 2005

infiltrative when an irregular, infiltrating pattern of growth wasdemonstrated, as opposed to expansive when the tumorborder was a smooth-pushing front.32 The presence of tumor-infiltrating lymphocytes (TIL) was characterized by the findingof 4 or more unequivocal intraepithelial lymphocytes ina single high-power field (403 objective) of an H&E-stainedsection, identified and counted in areas displaying the highestcontent of TILs.26 Peritumoral Crohn-like lymphoid responsewas considered positive when at least 3 nodular aggregatesof lymphocytes deep to the advancing margin of the tumorwere found within a single low-power field (43 objective).28
Intramural and extramural thin-walled vessel invasion(TWVI), venous vessel invasion (VVI), and perineural inva-sion (PNI) were also evaluated and recorded. Occurrence ofadenomas, nonadenomatous polyps, and presence of residual(contiguous) adenoma were features additionally reported inall cases.
Immunohistochemical AnalysisImmunohistochemistry was carried out using primary
mouse monoclonal antibodies DO-7 and MIB-1 (both fromDAKO, Glostrup, DK) detecting p53 and Ki67 proteins,respectively. The avidin-biotin immuno-peroxidase methodwas performed on 4-mm thick paraffin sections. Briefly, sec-tions were treated with 0.1 mol/L citrate buffer (pH 6.0) as theantigen retrieval method and independently incubated over-night at 4�C with mAb DO-7 (1:2000 dilution, 200 ng/mL) ormAb MIB-1 (1:600 dilution, 60 ng/mL). Secondary reagentswere biotinylated horse antimouse antibodies (Vector Labo-ratories Inc., Burlingame, CA) used at 1:100 final workingdilution. Avidin-biotin complexes (Vectastain ABC PK 4000ST, Vector Laboratories) were then applied at 1:100 dilution.3,3#-diaminobenzidine was used as the final chromogen andHarris-modified hematoxylin as the nuclear counterstain.
Positive controls for DO-7 staining were colorectaltumors previously known to harbor TP53 mutations displayingpositive nuclear immunoreactivity. Positive controls for MIB-1staining were tumors known to have a high proliferative index(over 20%) as measured by Ki67 nuclear antigen expression.The corresponding negative controls, omitting primary anti-body, were also included. Immunohistochemical evaluationwas conducted double-blind by scoring the estimated per-centage of tumor cells showing nuclear staining. Consistentwith previous reports,33–35 certain intratumoral heterogeneitywas observed in the distribution of both p53- and Ki67-stainedneoplastic cells. In these cases, the score was produced byestimating the percentage of positive cells in microscopicfields displaying the most intense immunoreactive tumorcells. We avoided microscopic fields displaying weak immu-noreactivities, which could represent artefactual loss ofantigenicity.
DNA Extraction and Control AmplificationEleven serial 5-mm thick sections were used for each
case. One of these sections was used for tissue characterizationafter H&E staining. Unstained slides were then aligned bymorphology to the stained slide and corresponding areasmacrodissected. Tumor samples were microscopically exam-ined to confirm the specificity of dissection.
Genomic DNA was obtained from the macrodissectedsections using a proteinase-K extraction method, followed bypurification with phenol/chloroform and ethanol precipitation,as described previously.36 To assess the quality of the genomicDNA extracted, 1 mL of a 200 ng/mL dilution was used astemplate for the amplification of a 268-bp fragment of thehuman b-globin gene,37 using a GeneAmp PCR System 2400thermal cycler (PE Biosystems, Foster City, CA). The ampli-fication profile is summarized in Table 2. Efficiency of PCRreactions was assessed in 2% agarose gels.
TABLE 2. Size of PCR Products, Primer Labeling, and Profiles of Amplification
Locus Product Size (pb) Labeling Amplification Profile
b-globin gene
PC04/GH20 268 None 94�C 5 min; hold/94�C 30 sec; 57�C 30 sec;72�C 30 sec; 35 cycles/72�C 7 min; hold
NCI panel
BAT25 120 6-FAM 94�C 2 min; hold/94�C 10 sec; 55�C 30 sec;72�C 30 sec; 30 cycles/72�C 7 min; holdBAT26 116 TET
D5S346 (APC) 96–122 HEX
D2S123 197–227 6-FAM
D17S250 (Mfd 15CA) 151–169 TET
18q panel
D18S55 134–152 6-FAM 94�C 5 min; hold/94�C 30 sec; 55�C 30 sec;72�C 30 sec; 30 cycles/72�C 30 min; holdD18S58 144–160 TET
D18S61 157–183 HEX
D18S64 188–208 6-FAM
D18S69 194–210 TET
TP53 locus
P53 CA 103–135 6-FAM 94�C 5 min; hold/94�C 30 sec; 60�C 30 sec;72�C 30 sec; 27 cycles/72�C 30 min; hold
q 2005 Lippincott Williams & Wilkins 215
Diagn Mol Pathol � Volume 14, Number 4, December 2005 Predicting MIN Status of Colorectal Cancers

Analysis of Microsatellite InstabilityAll selected tumors were studied to assess their MIN
status using 11 microsatellite markers; 5 of them were chosenfollowing the guides recommended by the American JoinCommission on Cancer, the International Collaborative Groupon HNPCC, and the HNPCC Cancer Study Group in Germany(BAT25, BAT26, D5S346, D2S123 and D17S250).38 The 6additional microsatellites represent a consensus panel origi-nally aimed at elucidating the LOH status of chromosome 18q(D18S55, D18S58, D18S61, D18S64, and D18S69)39 andLOH at the TP53 locus on 17p (P53CA).40
Microsatellite markers from the consensus panel (NCIpanel) were amplified in multiplex reactions using the HNPCCMicrosatellite Instability Test (Roche Molecular Biochemi-cals, Mannheim, Germany) according to the manufacturer.Briefly, 200 ng of genomic DNA from both paired normal andtumor samples were used as template for amplification, mixedalong with 5 mL of 53 multiprimer mix and 5 mL of 53enzyme master mix up to 25 mL. PCR conditions and fluo-rescence dyes for primer labeling are summarized in Table 2.
Amplification of the five 18q microsatellite markers wasalso performed with 200 ng of genomic DNA in 25-mLreaction mixtures containing 200 mmol of each dNTP, 1.5mmol/L Mg2+, and 1.05 U of the Expand High Fidelity PCRSystem (Boehringer Mannheim Corp, Indianapolis, IN). Twoto 7 pmols of the 5 pairs of primers reported elsewhere39 wereused per multiplex reaction. Product sizes and fluorescencedyes used to modify the primers are also summarized in Table 2,along with PCR conditions. To avoid polymerase shuttering,a 5# tail was added at the nonlabeled counterpart of each pairof primers. A final 30-minute extension was performed toavoid incomplete 3# A nucleotide addition.
Amplification of the P53CA dinucleotide repeat40 wasset up as a single reaction using the same amounts of PCR mixcompounds than those for the 18q markers but the polymerasewhich was diminished to 0.7 U. PCR conditions and primerlabeling are also summarized in Table 2.
One microliter of each fluorescent product previouslydiluted 1:10 in distilled water (except those from the consensuspanel of markers) was separately denatured for 2 minutes at90�C in 12.5 mL of deionized formamide to which 0.5 mL ofGeneScan-350 (TAMRA) size marker (PE Applied Biosys-tems, Foster City, CA) had been previously added. Oncedenatured, products were run by capillary electrophoresis onan ABI PRISM 310 Genetic Analyzer (PE AppliedBiosystems). Analysis was performed using the GeneScansoftware (PE Applied Biosystems). Instability was assigned toa microsatellite marker if its fragment pattern displayed eitheradditional peaks or the appearance of separated novel frag-ments when the fluorescence profiles of the normal and tumortissue were compared with each other. In accordance withconsensus definitions of the US National Cancer Institute,tumors were classified as being microsatellite stable (MSS)when none of the tested markers exhibited instability, micro-satellite instability-low (MSI-L) when less than 30% of the lociscreened displayed instability (up to 3 out of 11), and micro-satellite instability-high (MSI-H) when 30% or more of thetested loci resulted unstable.38
Statistical AnalysisTwenty-nine independent variables were subdivided into
either categorical (gender, tumor location, tumor configura-tion, histologic grade, extent of invasion, clinical stage, intra-mural and extramural TWVI, intramural and extramural VVI,intramural and extramural PNI, growth pattern, Crohn-likelymphoid response, TIL, occurrence of adenomas and non-adenomatous polyps, and presence of residual adenoma; n = 18)or numerical (age, tumor size, percentage of solid, mucinousand signet-ring cell differentiations, cribriform growth, micro-papillar and infiltrating microglandular patterns, nodal invol-vement, Ki67 proliferative index, and p53 phenotype; n = 11).Categorical features were investigated for their possibleassociation with MIN status by x2 test or Fisher exact testof contingency tables as appropriate. The relationship betweenMIN status and the numerical variables was approached witha logistic regression-based model that included each of thevariables one at a time. For all 3 tests, probability values(P values) were considered statistically significant when lessthan .05. Data were analyzed using the SPSS software packagev.11.01 (Statistical Package for the Social Sciences Inc,Chicago, IL).
Two alternative multivariate statistical modeling ap-proaches were considered in a primary stage, both aimed toreach the better predictor set for MSI-H. The tree program ofthe R package v.1.7.1 (R Development Core Team)41,42 wasused to build decision trees. This hierarchical structure ofclassification consists of a series of tests carried out in specificorder, each one splitting data samples into subsets (nodes) thatdepend on the possible outcomes of the tests (branches). Thetree sequentially flows from the root node toward the leafnodes, which represent a class of event.
The logistic regression approach was applied to thewhole set of 29 variables, with independence of the resultsobtained from the univariate analysis. Variables were enteredinto a stepwise procedure to assign a regression coefficient foreach factor and to develop a mathematical formula whichserves to estimate the probability of a tumor exhibiting MSI-Haccording to the following equation:
P ¼ 1� 1
1þ eX
� �
where P is the expected probability and
X ¼ b0 þ b1X1 þ b2X2 þ ::: þ bnXn
is the development of the linear component of theformula.27 b0 is the independent term of the regression equa-tion, bi is the regression coefficient for the i-th explanatoryvariable, and xi is the value of the i-th variable for anyindividual tumor. Notice that for dichotomous variables, xiassumes value 1 or 0.
The robustness of both models derived from our cohortof patients was evaluated using a 10-fold cross-validationtechnique,43 which is a halfway compromise between thestandard procedure that uses a training/validation pair of setsand the one leave-out (jackknife) method. The 10-fold cross-validation technique is a resampling procedure based ona randomly partition of the full dataset into 10 disjoint subsets
216 q 2005 Lippincott Williams & Wilkins
Colomer et al Diagn Mol Pathol � Volume 14, Number 4, December 2005

of approximately equal size. The prediction model is trained10 times, each one discarding a different subset, on theremaining 9. Actually, 10 estimations were computed with thisapproach on reasonably different subsets of data, instead of thesingle estimation in the training/validation set, or the numer-ous, but most probably overfitted, estimations in the jackknife.The 10-fold cross-validation technique also allowed compar-ison of node’s position within the trees, something not feasiblewith the training/validation set approach, that was a key pointto choose a best-fitting model in our study (see Results section).
In a subsequent stage, once the modeling approach hadbeen decided, a second independent cohort of patients wasused to test the performance of the novel model to validate it asa clinical tool for MSI-H prediction.
RESULTS
Frequency of Microsatellite InstabilityOf the 237 tumors initially included in the series, 204 were
suitable for microsatellite instability analysis. In 9 cases (3.8%),the study was not performed due to lack of amplification of theb-globine control in either normal or tumor samples. Another24 cases (10.1%) fail to demonstrate amplification in morethan 4 loci, so they were also excluded from the series. Out of204 evaluable colorectal tumors, 18 (8.8%) exhibited MSI-H,33 (16.2%) were MSI-L, and 153 (75.0%) failed to demon-strate instability (MSS). Overall, 186 tumors (91.2%) wereclassified as non–MSI-H (MSI-L plus MSS).
Tumors with MSI-H included cases with instability in allloci tested (n = 2), in 10 loci (n = 3), in 9 loci (n = 5), in 8 loci(n = 5), and in 7 or less loci (n = 3). Sixteen out of 18 tumorswere unstable at both BAT25 and BAT26 (Fig. 1), whereas anadditional case showed no signs of instability in those markers.The most frequently unstable dinucleotide marker of the NCIpanel was D2S123 (n = 17), followed by D17S250 (n = 16)and D5S346 (n = 13) (Fig. 1). Among the 6 spare lociscreened, D18S58 was the most commonly affected byinstability (n = 16), followed by D18S55 (n = 14), D18S64(n = 13), D18S61 (n = 11), and PCA53 (n = 9).
Among the 33 MSI-L tumors, 26 were found to beunstable at just 1 locus, 6 at 2 loci, and a single one exhibitedinstability at 3 loci. Instability involved BAT25 (n = 2), BAT26(n = 2), D5S346 (n = 3), D2S123 (n = 7), and D17S250 (n = 8),and 12 tumors exhibited unstable markers other than those ofthe NCI panel.
Of the 68 tumors suitable for microsatellite instabilityanalysis that were used to evaluate the performance of theeligible model into clinical practice, 64 tumors (94.1%) wereclassified as non–MSI-H.
Correlation of Clinicopathological FeaturesWith MIN Status
Table 3 summarizes clinical data and histopathologicvariables of the patients analyzed. Univariate analysis revealedthat 7 out of the 18 categorical variables studied were sig-nificantly associated with MIN status (Table 3). The factorsmore tightly linked to MSI-H colorectal cancers were proximaltumor location, poor differentiation (grade 3), presence of TIL,and peritumoral Crohn-like reaction (P , 0.001). Other traitsalso related to unstable tumors were expansive tumor growthpattern (P = .003), Astler-Coller’s tumor stage B (P = 0.043),and absence of intramural TWVI (P = 0.045). Regardingnumerical features, 5 out of 11 were found to be related to MINstatus (Table 3). Microsatellite unstable lesions were signif-icantly larger than stable ones (P = 0.022), more solid (P =0.045), and more mucinous (P , 0.001). MSI-H tumors alsoexhibited a higher Ki67 proliferative index (P = 0.002) anda lower p53 positive phenotype (P = 0.016) when comparedwith non–MSI-H colorectal carcinomas.
Decision Tree–Based AnalysesAn initial training approach to reproduce Jass’ model23
with our data provided the following results: for tumorsexhibiting less than 50% of mucinous differentiation (adeno-carcinomas), the algorithm yielded an overall accuracy of86.8%, with a sensitivity of 77.8%, a specificity of 87.3%, anda negative predictive value of 98.3%. For those tumors with50% or more mucinous differentiation (mucinous adenocarci-nomas), accuracy was estimated to be 56.7%, with a sensitivity88.9%, a specificity 42.9%, and a negative predictive value of90.0%. Finally, the global accuracy for all the tumors was82.3%.
Table 4 summarizes the results obtained from the 10-foldcross-validation analyses of the decision tree generated usingour series of tumors, after pruning the redundant nodes. Fivecategorical plus 6 numerical variables were found to beassociated with MIN status at least once after analyzing the10 different partitions. The node’s positions of these variablesin each of the trees are also summarized in Table 4. Thispreliminary approach pointed at Crohn-like reaction andmucinous differentiation as the main factors implicated in the
FIGURE 1. Electropherograms ob-tained from microsatellite instabilitytesting using the five microsatellitemarkers of the NCI panel. Represen-tative appearance of a tumor exhibit-ing MSI-H. For each marker, the topgraph represents normal DNA and thebottom graph represents tumor DNA.(A) BAT25, (B) BAT26, (C) D5S346,(D) D2S123, and (E) D17S250.
q 2005 Lippincott Williams & Wilkins 217
Diagn Mol Pathol � Volume 14, Number 4, December 2005 Predicting MIN Status of Colorectal Cancers

definition of MIN status in the colorectal tumors studied.Nevertheless, the decision tree-based approach was soondiscarded due to its lack of robustness. In Figure 2, trees fromsets 3 and 8 have been plotted to illustrate the inconsistency ofthe variables involved in the algorithms and the swinging ofnode’s position within the trees.
Logistic Regression-Based ModelAfter disposing of the histologic grade (see Discussion),
8 out of the 28 variables tested were found to be related to MINstatus. Representative examples of some of these morphologicand immunohistochemical related features are illustrated inFigures 3 and 4, respectively. Among categorical features,proximal tumor location, expansive growth pattern (Fig. 3A),and peritumoral Crohn-like reaction (Fig. 3B) resulted inassociation with MSI-H tumors. Regarding numerical features,solid differentiation, mucinous differentiation (Fig. 3C), andKi67 proliferative index (Fig. 4A) were found to be directlyproportional to instability. On the contrary, occurrence ofcribriform structures (Fig. 3D) and p53-positive phenotype(Fig. 4B) were both traits inversely proportional to MSI-Hcancers. Regression coefficients (bi) assigned to the 8variables that exhibited relationship to MIN are summarizedin Table 5. The best-fitting model was obtained by substitutionof the bi coefficients for their estimates into formula,2 asfollows:
X ¼ 22:648 2 2:401x1 þ 0:021x2 þ 0:045x3 2 1:884x4
þ 0:050x5 2 0:029x6 2 0:118x7 2 1:600x8
An estimated probability of a tumor being MSI-H higherthan 29%, that is, a value of P . 0.29 in formula, was em-pirically found to be the best cut point to discriminate betweenMSI-H and non–MSI-H cancers. Table 5 shows the probabilitycalculation of a tumor being MSI-H as an example of im-plementation of the logistic regression model into clinicalpractice.
This regression equation was capable of correctlyclassify 194 out of 204 tumors, which represents an accuracyof 95.1%. Six of the 10 misclassified tumors resulted falsepositives and the other 4 corresponded to false negatives.Overall, the model had a sensitivity of 77.8% and a specificityof 96.8%, being the positive and negative predictive values of70.0% and 97.8%, respectively. After the 10-fold cross-validation analysis, the equation was still able to correctlyclassify all but 19 tumors (90.7%), including 8 false-negative(negative predictive value of 95.6%) and 11 false-positive(positive predictive value of 47.6%) lesions.
Finally, when the model was prospectively tested usinga validation cohort of 68 naive tumors (4 MSI-H and 64 non–MSI-H), a sensitivity of 75.0%, a specificity of 93.8%, a positivepredictive value of 42.9%, and a negative predictive value of98.4% were obtained, with an overall accuracy of 92.7%.
DISCUSSIONThe assessment of MIN status in colorectal cancers has
been based on genetic assays, mainly PCR tests. However,DNA extraction, amplification, and subsequent analysis ofPCR products from primary tumors are time-consuming steps,
TABLE 3. Univariate Analysis to Correlate ClinicopathologicalFeatures With MIN Status of Colorectal Adenocarcinomas:Categorical Variables and Numerical Variables
Categorical Variable(n = 204)
MSI-H(n = 18)
Non-MSI-H(n = 186) P Value*
Gender
Male 8 (44.4) 111 (59.7)0.222
Female 10 (55.6) 75 (40.3)
Location
Proximal 14 (77.8) 58 (31.2),0.001
Distal 4 (22.2) 128 (68.8)
Configuration
Exophytic 9 (50.0) 74 (39.8)
0.545Ulcerated 7 (38.9) 73 (39.2)
Stenosing 2 (11.1) 39 (21.0)
Grade (WHO)
1 3 (16.7) 73 (39.2)
,0.0012 2 (11.1) 80 (43.0)
3 13 (72.2) 33 (17.7)
Extent of invasion (TNM)
pT1 0 13 (7.0)
0.482pT2 3 (16.7) 23 (12.4)
pT3 11 (61.1) 91 (48.9)
pT4 4 (22.2) 59 (31.7)
Stage (Astler-Coller’s)
A 0 10 (5.4)
0.043B 13 (72.2) 73 (39.2)
C 5 (27.8) 85 (45.7)
D 0 18 (9.7)
Intramural TWVI
Present 3 (16.7) 77 (41.4)0.045
Absent 15 (83.3) 109 (58.6)
Extramural TWVI
Present 3 (16.7) 66 (35.5)0.124
Absent 15 (83.3) 120 (64.5)
Intramural VVI
Present 2 (11.1) 11 (5.9)0.321
Absent 16 (88.9) 175 (94.1)
Extramural VVI
Present 3 (16.7) 38 (20.4)1.000
Absent 15 (83.3) 148 (79.6)
Intramural PNI
Present 0 7 (3.8)1.000
Absent 18 (100.0) 179 (96.2)
Extramural PNI
Present 0 22 (11.8)0.228
Absent 18 (100.0) 164 (88.2)
Growth pattern
Expansive 12 (66.7) 56 (30.1)0.003
Infiltrative 6 (33.3) 130 (69.9)
Crohn-like lymphoid reactivity
Present 13 (72.2) 37 (19.9),0.001
Absent 5 (27.8) 149 (80.1)
TIL
Present 9 (50.0) 21 (11.3),0.001
Absent 9 (50.0) 165 (88.7)
218 q 2005 Lippincott Williams & Wilkins
Colomer et al Diagn Mol Pathol � Volume 14, Number 4, December 2005

involving complex processes that require specialized equip-ment and trained personnel. Because such molecular techniquesare not implemented in most histopathology laboratories,MIN testing in most colorectal cancers is not performed.
Nevertheless, MSI phenotype remains a predictive marker ofgood prognosis1,2,13,14,19,28,29,44,45 and differential response toadjuvant chemotherapy.20–22 The present study was con-ducted to generate a model for prediction of MIN status incolorectal cancers that could minimize routinely molecularMIN testing.
Jass et al23 had reported that histopathological exami-nation of colorectal cancer could define MSI-H tumors. Theseinvestigators proposed a decision tree–based model that per-formed with reasonable specificity and sensitivity. Neverthe-less, they also underlined that the relative small sample size(n = 120) analyzed and the subjectivity of some of the variablesused could limit the clinical applicability of the algorithm. Yet,when we used such approach in our cohort, we obtainedsimilar results to those previously published. In our series,colorectal adenocarcinomas other than mucinous lesions couldbe correctly classified as non–MSI-H (negative predictivevalue of 98.1%), whereas mucinous adenocarcinomas failed toexhibit a reliable negative predictability (90.0%). It was basedon these findings that we resolved to generate a novel modeladdressing previous limitations. However, despite an improve-ment in sensitivity, specificity, and accuracy, the initial devicedid not display enough robustness, as deduced from the 10-foldcross-validation analysis performed (Table 4, Fig. 2). As analternative, logistic regression was used as an approach toobtain a best-fitting model. The rationale to apply mathemat-ical formulation was to routinely estimate the probability ofa tumor being stable by the time the histopathology report wasbeing assembled.
In the present logistic approach, tumor histology gradewas not included as a variable in the explanatory set. This wasdue, in part, to the functional relationship of this variable withsolid and mucinous patterns because these 2 features are actu-ally part of the WHO grading system of colorectal tumors.29
As it is well known in regression analysis, a high dependencebetween multiple variables, termed collinearity, may produceundesired effects in the stepwise procedure, leading to bias ofcoefficient estimates.
Results obtained through the stepwise analysis did notsubstantially differ from those reported by Jass et al23 usinga decision tree–based model. Four out of the 6 factors involved
TABLE 3. (continued ) Univariate Analysis to CorrelateClinicopathological Features With MIN Status of ColorectalAdenocarcinomas: Categorical Variables and NumericalVariables
Categorical Variable(n = 204)
MSI-H(n = 18)
Non-MSI-H(n = 186) P Value*
Adenomas
Present 5 (27.8) 49 (26.3)1.000
Absent 13 (72.2) 137 (73.7)
Non adenomatous polyps
Present 3 (16.7) 21 (11.3)0.451
Absent 15 (83.3) 165 (88.7)
Residual adenoma
Present 6 (33.3) 53 (28.5)0.786
Absent 12 (66.7) 133 (71.5)
Numerical variable(n = 204)
MSI-H(�x 6 SD)†
Non-MSI-H(�x 6 SD)† P Value*
Age (years) 67.6 6 14.1 67.8 6 11.9 0.940
Tumor size(mm ø maximum) 51.3 6 10.5 30.9 6 20.6 0.022
Solid carcinoma (%) 19.4 6 28.3 10.5 6 16.7 0.045
Mucinous carcinoma (%) 40.8 6 31.4 10.9 6 24.1 ,0.001
Signet-ring cellcarcinoma (%) 0.8 6 2.6 0.5 6 3.7 0.672
Cribriform structures (%) 2.2 6 5.2 6.9 6 15.1 0.193
Micropapillary pattern (%) 1.1 6 3.2 3.6 6 10.7 0.320
Infiltrating microglandularpattern (%) 0.8 6 2.6 4.4 611.8 0.204
Nodal involvement (n) 3.6 6 8.8 2.2 6 3.3 0.170
Ki67 proliferativeindex (%) 70.8 6 13.9 53.9 6 22.1 0.002
p53 overexpression (%) 15.3 6 22.6 35.5 6 34.5 0.016
*P values of x2 test, Fisher test, and logistic regression were considered statisticallysignificant when less than 0.05.
†�x is the arithmetic mean, while SD relates to standard deviation.
TABLE 4. Ten-Fold Cross-Validation Results of Decision Tree Trained on Our Series
Variable Set 1 Set 2 Set 3 Set 4 Set 5 Set 6 Set 7 Set 8 Set 9 Set 10
Tumor location 3
Solid differentiation 3 3 3 5
Mucinous differentiation 4 2 4 1 1 1 1 2 1 (4) 1
Cribriform pattern 4 4 5
Nodal involvement 3 3 3 3 4
Crohn-like lymphoid reactivity 1 1 1
Ki67 proliferative index 3 (4) (5) 2 4 2 2 3 2 2
Residual adenoma 5 5
Tumor size 2 2 2 2 4 1 (5) 3 4 (5)
Adenomas 6
Infiltrating microglandular pattern 3
Note. Each of the columns shows the results of a disjoint subset of randomly selected tumors. The numbers found in each cell correspond to the node’s position (eg, number 1 is theroot node, numbers 2 are the nodes immediately below the root, etc), being the numbers in brackets lower node’s positions of a determinate variable within the same tree.
q 2005 Lippincott Williams & Wilkins 219
Diagn Mol Pathol � Volume 14, Number 4, December 2005 Predicting MIN Status of Colorectal Cancers

in Jass’ algorithm were found to be explanatory variables inour model of best fit, including tumor type (equivalent to ourpercentage of mucinous pattern), histologic grade (correspondingto our percentage of solid tumor), peritumoral Crohn-likereaction, and tumor location. Neither TIL nor clinical stagingwere found to be predictive factors in our model. Accumu-lating evidence indicates that MSI-H tumors are characterizedby pronounced TILs.25,26,46,47 Certainly, univariate analysis ofour dataset revealed that TIL correlates extremely well withMIN status by itself but not when other variables are includedin the model. This is consistent with the fact that TIL is relatedto other tested variables, mainly Crohn-like reactivity andtumor location, becoming insignificant when better predictors
are placed onto the model. In any event, we estimate thisfinding particularly advantageous because TIL is a difficultfeature to assess by simply H&E staining. As a matter of fact,TIL evaluation can be dramatically improved with the use ofimmunohistochemical assays using antibodies to T-lympho-cyte surface markers (eg, CD3+, CD8+).24,26
Four explanatory variables arose from our multivariatelogistic analysis that were not identified in Jass’ model: growthpattern, cribriform pattern, Ki67 proliferative index, and iden-tification of a p53 phenotype. Of these variables, the first2 were included in Jass’ study as potential predictive factors.The expanding growth at the advancing tumor margin hadbeen found to be associated with MSI-H tumors.44,45,48,49
FIGURE 2. Two examples of the algorithms obtained from the 10-fold cross-validation analysis of the decision tree-basedmodel. Datasets 3 and 8 share approximately 80% of cases. The inconsistency of the variables involved in each algorithm, as well as the swingingof node’s position within the trees, evidences the lack of robustness of this approach. A, Tree from set 3. B, Tree from set 8.
FIGURE 3. Representative examplesof morphologic features found to beassociated to MSI-H colorectal can-cers. A, Expansive growth pattern:well-defined smooth margin (H&E,whole mounting). B, Dense diffuseperitumoral lymphoid infiltrate ina Crohn-like pattern (H&E, 2003).C, Mucinous differentiation: acinarstructures and strips of neoplasticcells in a background of extracellularmucin (H&E, 2003). D, Glandularstructures lacking intervening stromagrowing in a cribriform pattern(H&E, 2003).
220 q 2005 Lippincott Williams & Wilkins
Colomer et al Diagn Mol Pathol � Volume 14, Number 4, December 2005

Furthermore, this variable is accepted as an independentfavorable prognosis factor.32 Cribriform growth had not beenconsidered in the context of MIN status. Results from ourlogistic approach revealed the significant association betweenthe presence of cribriform structures and non–MSI-H tumors,as reported previously by Alexander et al.27 This is notsurprising if such cribriform pattern is defined as a glandulargrowth and, in consequence, a sign of differentiation.Conversely, other reports23,48 suggested that the occurrenceof cribriform structures existed within some poorly differen-tiated TIL-rich and well-circumscribed adenocarcinomas, thussuggesting an indirect linkage of this trait with MSI-Hcancers.44,49,50 We assign the disparity of reports to the misuseof the term ‘‘cribriform,’’ mainly when dealing with un-differentiated solid tumors.
Identification of a p53-positive phenotype and Ki67proliferative index, both biomarkers routinely assessed in most
laboratories when studying colorectal cancers, were immuno-phenotypical features included in our logistic approach. Thesefeatures had been previously reported to significantly correlatewith MIN status. Results from the univariate analysisperformed showed that MSI-H cancers had a lower percentageof p53-positive phenotype than non–MSI-H cancers, inaccordance with previously reported studies.24,44,49,51 Re-garding Ki67, we found that MSI-H cancers exhibiteda significantly higher proliferative index than non–MSI-H,consistent with other reports.34,52 This higher proliferativeindex may be due to large proportion of poorly differentiatedcancers within this group of unstable lesions. This findingmatches with the good behavior ascertained to MSI-H tumorsbecause the increased cell growth of such cancers appearscounterbalanced by the high apoptotic index.34
In sum, the logistic model proposed posses a highoverall accuracy in predicting microsatellite instability. The
FIGURE 4. Representative examples ofimmunohistochemical features foundto be associated to MSI-H colorectalcancers. A, High proliferative index ina MSI-H case (MIB-1 immunostaining,2003). B, p53 overexpression inabout 100% of neoplastic cells (rightside) in contrast with negative nucleiin non tumoral crypts (DO-7 immu-nostaining, 2003).
TABLE 5. Explanatory Variables of the Logistic Regression Model
Explanatory Variable i* bi
95% ConfidenceLimits P Value†
Crohn-like lymphoid reactivity‡ 1 22.401 0.019–0.426 0.002
Mucinous differentiation 2 0.021 0.999–1.044 0.065
Solid differentiation 3 0.045 1.009–1.085 0.016
Growth pattern§ 4 21.884 0.032–0.727 0.018
Ki67 proliferative index 5 0.050 1.008–1.097 0.061
p53 overexpression 6 20.029 0.943–1.001 0.021
Cribriform pattern 7 20.118 0.786–1.005 0.061
Tumor locationk 8 21.600 0.040–1.011 0.052
Constant — 22.648 (b0) — —
*i relates to the step at which a particular variable is introduced into the model.†P value at the last step of the backward stepwise analysis (Pin = 0.05 and Pout = 0.10). The forward approach had
equivalent outcome (Pin = 0.10 and Pout = 0.15).‡Crohn-like lymphoid reactivity: (0 = presence; 1 = absence).§Growth pattern: (0 = expansive; 1 = infiltrative).kTumor location: (0 = proximal; 1 = distal).Example: AMSS proximal tumor (x8 = 0) that exhibits Crohn like lymphoid reactivity (x1 = 0) and expansive growth
pattern (x4 = 0), with 15% mucinous differentiation (x2 = 15), no solid differentiation (x3 = 0), 80% occurrence ofcribriform structures (x7 = 80), has 70% Ki67 immunostaining (x5 = 70), and a negative p53 phenotype (x6 = 0). Theprobability of this tumor being MSI-H can be estimate according to the formula:
P ¼ 1� 1
1þ eX
� �;
where the development of X = 22.648 2 (2.401 3 0) + (0.021 3 15) + (0.045 3 0) 2 (1.884 3 0) + (0.050 3 70) 2(0.029 3 0) 2 (0.118 3 80) 2 (1.600 3 0)
The use of the predictive tool gives a P = 0.0003, which is below the optimal cut point of 0.29, thus leading toa prediction of MSS tumor.
q 2005 Lippincott Williams & Wilkins 221
Diagn Mol Pathol � Volume 14, Number 4, December 2005 Predicting MIN Status of Colorectal Cancers

new equation was able to correctly classify all but 10 tumors(95.1%), including 6 false-positive (positive predictive valueof 70.0%) and 4 false-negative (negative predictive value of97.8%) lesions. In this context, we consider that clinicopath-ological features may not be used as a substitute of molecularmethods to assess MIN status. Some authors have reported27,46
that there is not only a considerable interlaboratory variabilitywith regard to tissue processing and DNA testing but alsoa significant interobserver variability in the interpretation ofcertain morphology findings, which may account for thefailure of predictions. Thus, our goal was to restrict MINtesting to lesions with suspected instability. The 6 false-positive cases of this series could skip misclassification. Thecommitted error would be reduced to 4 out of 204 tumors,which represents less than 2% of misclassified cases, by justtesting 9.8% of the series (20 cases). Moreover, this errorwould only rise to 8 out of 204 tumors in the worse case, asdeduced from the 10-fold cross-validation analysis, whichrepresents 3.9% of misclassified cases, by testing 10.3% of theseries (21 cases).
Furthermore, the value of our logistic model is itscapacity of well-predicting new cases. As a matter of fact, themodelwas prospectively tested in 68 cases, rendering a sensitivityof 75.0%, a specificity of 93.8%, a positive predictive value of42.9%, and a negative predictive value of 98.4%. Theapproach combining the logistic model with instability testingof positively predicted cases resulted thus in less than 2% ofmisclassified new cases. The easy of handling the new equa-tion (as shown in the example below Table 5), once imple-mented in a program, makes this approach attractive forroutine practice. We believe that this logistic model can assistin discerning the profile of colorectal cancers, leading to theidentification of patients that are more likely to benefit fromadjuvant therapy, and thus tailoring individual treatments. Thistool, in concert with Amsterdam criteria, may also contributein a cost-benefit approach to the identification and clinicalmanagement of HNPCC patients.
ACKNOWLEDGMENTThe authors thank Eva Torija from BIOPAT for her
secretarial assistance in data collection.
REFERENCES1. Dunican DS, McWilliam P, Tighe O, et al. Expression differences between
the microsatellite instability (MIN) and chromosomal instability (CIN)phenotypes in colorectal cancer revealed by high-density cDNA arrayhybridization. Oncogene. 2002;21:3253–3257.
2. Fearon ER, Vogelstein B. A genetic model for colorectal tumorigenesis.Cell. 1990;61:759–767.
3. Kinzler KW, Vogelstein B. Lessons from hereditary colorectal cancer.Cell. 1996;87:159–170.
4. Lengauer C, Kinzler KW, Vogelstein B. Genetic instabilities in humancancers. Nature. 1998;396:643–649.
5. Ionov Y, Peinado MA, Malkhosyan S, et al. Ubiquitous somatic mutationsin simple repeated sequences reveal a new mechanism for coloniccarcinogenesis. Nature. 1993;363:558–561.
6. Shibata D, Peinado MA, Ionov Y, et al. Genomic instability in repeatedsequences is an early somatic event in colorectal tumor genesis thatpersists after transformation. Nat Genet. 1994;6:273–281.
7. Markowitz S, Wang J, Myeroff L, et al. Inactivation of the type IITGF-beta receptor in colon cancer cells with microsatellite instability.Science. 1995;268:1336–1338.
8. Souza RF, Appel R, Yin J, et al. Microsatellite instability in the insulin-like growth factor II receptor gene in gastrointestinal tumours. Nat Genet.1996;14:255–257.
9. Rampino N, Yamamoto H, Ionov Y, et al. Somatic frameshift mutations inthe BAX gene in colon cancers of the microsatellite mutator phenotype.Science. 1997;275:967–969.
10. Thibodeau SN, Bren G, Schaid D. Microsatellite instability in cancer ofthe proximal colon. Science. 1993;260:816–819.
11. Lothe RA, Peltomaki P, Meling GI, et al. Genomic instability in colorectalcancer: Relationship to clinicopathological variables and family history.Cancer Res. 1993;53:5849–5852.
12. Lukish JR, Muro K, DeNobile J, et al. Prognostic significance of DNAreplication errors in young patients with colorectal cancer. Ann Surg.1998;227:51–56.
13. Gryfe R, Kim H, Hsieh ET, et al. Tumor microsatellite instability andclinical outcome in young patients with colorectal cancer. N Engl J Med.2000;342:69–77.
14. Halling KC, French AJ, McDonnell SK, et al. Microsatellite instabilityand 8p allelic imbalance in stage B2 and C colorectal cancers. J NatlCancer Inst. 1999;91:1295–1303.
15. Samowitz WS, Curtin K, Ma KN, et al. Microsatellite instability insporadic colon cancer is associated with an improved prognosis atthe population level. Cancer Epidemiol Biomarkers Prev. 2001;10:917–923.
16. Watanabe T, Wu TT, Catalano PJ, et al. Molecular predictors of survivalafter adjuvant chemotherapy for colon cancer. N Engl J Med. 2001;344:1196–1206.
17. Hemminki A, Mecklin JP, Jarvinen H, et al. Microsatellite instabilityis a favorable prognostic indicator in patients with colorectal cancerreceiving chemotherapy. Gastroenterology. 2000;119:921–928.
18. Wright CM, Dent OF, Barker M, et al. Prognostic significance of extensivemicrosatellite instability in sporadic clinicopathological stage C colorectalcancer. Br J Surg. 2000;87:1197–1202.
19. Elsaleh H, Joseph D, Grieu F, et al. Association of tumour site and sexwith survival benefit from adjuvant chemotherapy in colorectal cancer.Lancet. 2000;355:1745–1750.
20. Carethers JM, Smith EJ, Behling CA, et al. Use of 5-fluorouracil andsurvival in patients with microsatellite-unstable colorectal cancer.Gastroenterology. 2004;126:394–401.
21. Parc Y, Gueroult S, Mourra N, et al. Prognostic significance of microsatel-lite instability determined by immunohistochemical staining of MSH2 andMLH1 in sporadic T3N0M0 colon cancer. Gut. 2004;53:371–375.
22. Ribic CM, Sargent DJ, Moore MJ, et al. Tumor microsatellite-instabilitystatus as a predictor of benefit from fluorouracil-based adjuvant chemo-therapy for colon cancer. N Engl J Med. 2003;349:247–257.
23. Jass JR, Do KA, Simms LA, et al. Morphology of sporadic colorectalcancer with DNA replication errors. Gut. 1998;42:673–679.
24. Kim H, Jen J, Vogelstein B, et al. Clinical and pathological characteristicsof sporadic colorectal carcinomas with DNA replication errors in micro-satellite sequences. Am J Pathol. 1994;145:148–156.
25. Dolcetti R, Viel A, Doglioni C, et al. High prevalence of activatedintraepithelial cytotoxic T lymphocytes and increased neoplastic cellapoptosis in colorectal carcinomas with microsatellite instability. Am JPathol. 1999;154:1805–1813.
26. Michael-Robinson JM, Biemer-Huttmann A, Purdie DM, et al. Tumourinfiltrating lymphocytes and apoptosis are independent features in colo-rectal cancer stratified according to microsatellite instability status. Gut.2001;48:360–366.
27. Alexander J, Watanabe T, Wu TT, et al. Histopathological identificationof colon cancer with microsatellite instability. Am J Pathol. 2001;158:527–535.
28. Graham DM, Appelman HD. Crohn’s-like lymphoid reaction andcolorectal carcinoma: A potential histologic prognosticator. Mod Pathol.1990;3:332–335.
29. Hamilton SR, Aaltonen LA, eds. World Health Organization Classifica-tion of Tumours. Pathology and Genetics of Tumours of the DigestiveSystem. Lyon; IARC Press; 2000:103–143.
30. Sobin LH, Wittekind Ch, eds. TNM Classification of Malignant Tumours.6th edition. New York: Wiley-Liss; 2002.
222 q 2005 Lippincott Williams & Wilkins
Colomer et al Diagn Mol Pathol � Volume 14, Number 4, December 2005

31. Astler VB, Coller FA. The prognostic significance of direct extension ofcarcinoma of the colon and rectum. Ann Surg. 1954;139:846–852.
32. Compton CC. Colorectal carcinoma: Diagnostic, prognostic, and mole-cular features. Mod Pathol. 2003;16:376–388.
33. Colomer A, Erill N, Verdu M, et al. Lack of p53 nuclear immunostaining isnot indicative of absence of TP53 gene mutations in colorectal adenocarci-nomas. Appl Immunohistochem Mol Morphol. 2003;11:130–137.
34. Michael-Robinson JM, Reid LE, Purdie DM, et al. Proliferation,apoptosis, and survival in high-level microsatellite instability sporadiccolorectal cancer. Clin Cancer Res. 2001;7:2347–2356.
35. Purdie CA, O’Grady J, Piris J, et al. p53 expression in colorectal tumors.Am J Pathol. 1991;138:807–813.
36. Shibata DK, Arnheim N, Martin WJ. Detection of human papilloma virusin paraffin-embedded tissue using the polymerase chain reaction. J ExpMed. 1988;167:225–230.
37. Bauer HM, Ting Y, Greer CE, et al. Genital human papillomavirusinfection in female university students as determined by a PCR-basedmethod. JAMA. 1991;265:472–477.
38. Boland CR, Thibodeau SN, Hamilton SR, et al. A National CancerInstitute Workshop on Microsatellite Instability for cancer detection andfamilial predisposition: Development of international criteria for thedetermination of microsatellite instability in colorectal cancer. CancerRes. 1998;58:5248–5257.
39. Jen J, Kim H, Piantadosi S, et al. Allelic loss of chromosome 18q andprognosis in colorectal cancer. N Engl J Med. 1994;331:213–221.
40. Jones MH, Nakamura Y. Detection of loss of heterozygosity at the humanTP53 locus using a dinucleotide repeat polymorphism. Genes Chromo-somes and Cancer. 1992;5:89–90.
41. Breiman L, Friedman JH, Olshen RA, et al. In: Bickel P, Cleveland W,Dudley R, eds. Classification and Regression Trees. Belmont: WadsworthInternational Group; 1984.
42. Ripley BD. Pattern Recognition and Neural Networks. Cambridge:Cambridge University Press; 1996.
43. Weiss SM, Kulikowski CA. Computer Systems That Learn, Classificationand Prediction Methods From Statistics, Neural Nets, Machine Learningand Expert Systems. San Mateo: Morgan Kaufmann Publishers; 1991.
44. Edmonston TB, Cuesta KH, Burkholder S, et al. Colorectal carcinomaswith high microsatellite instability: Defining a distinct immunologic andmolecular entity with respect to prognostic markers. Hum Pathol. 2000;31:1506–1514.
45. Gafa R, Maestri I, Matteuzzi M, et al. Sporadic colorectal adenocarci-nomas with high-frequency microsatellite instability. Cancer. 2000;89:2025–2037.
46. Shia J, Ellis NA, Paty PB, et al. Value of histopathology in predictingmicrosatellite instability in hereditary nonpolyposis colorectal cancer andsporadic colorectal cancer. Am J Surg Pathol. 2003;27:1407–1417.
47. Smyrk TC, Watson P, Kaul K, et al. Tumor-infiltrating lymphocytes area marker for microsatellite instability in colorectal carcinoma. Cancer.2001;91:2417–2422.
48. Jass JR. Towards a molecular classification of colorectal cancer. Int JColorectal Dis. 1999;14:194–200.
49. Suh JH, Lim SD, Kim JC, et al. Comparison of clinicopathologiccharacteristics and genetic alterations between microsatellite instability-positive and microsatellite instability-negative sporadic colorectalcarcinomas in patients younger than 40 years old. Dis Colon Rectum.2002;45:219–228.
50. Parc YR, Halling KC, Burgart LJ, et al. Microsatellite instability andhMLH1/hMSH2 expression in young endometrial carcinoma patients:Associations with family history and histopathology. Int J Cancer. 2000;86:60–66.
51. Samowitz WS, Holden JA, Curtin K, et al. Inverse relationship betweenmicrosatellite instability and K-ras and p53 gene alterations in coloncancer. Am J Pathol. 2001;158:1517–1524.
52. Takagi S, Kumagai S, Kinouchi Y, et al. High Ki-67 labeling index inhuman colorectal cancer with microsatellite instability. Anticancer Res.2002;22:3241–3244.
q 2005 Lippincott Williams & Wilkins 223
Diagn Mol Pathol � Volume 14, Number 4, December 2005 Predicting MIN Status of Colorectal Cancers