A Novel Autocrine Loop Involving IGF-II and the Insulin Receptor Isoform-A Stimulates Growth of...
10
A Novel Autocrine Loop Involving IGF-II and the Insulin Receptor Isoform-A Stimulates Growth of Thyroid Cancer VERONICA VELLA, GIUSEPPE PANDINI*, LAURA SCIACCA, ROSSANA MINEO†, RICCARDO VIGNERI, VINCENZO PEZZINO, AND ANTONINO BELFIORE Istituto di Medicina Interna e di Malattie Endocrine e del Metabolismo, Cattedra di Endocrinologia, University of Catania, Ospedale Garibaldi (V.V., G.P., L.S., R.M., R.V., V.P.), 95123 Catania, Italy; and Dipartimento di Medicina Sperimentale e Clinica, Cattedra di Endocrinologia, University of Catanzaro, Policlinico Mater Domini (A.B.), 88100 Catanzaro, Italy The insulin receptor (IR) occurs in two isoforms (IR-A and IR-B) resulting from alternative splicing of exon 11 of the gene. The IR-A isoform is predominantly expressed in fetal tissues and malignant cells and binds IGF-II with high affin- ity. We previously observed that IRs are overexpressed in thyroid cancer cells; now we evaluated whether these cells preferentially express IR-A and produce IGF-II, which would activate a growth-promoting autocrine loop. The IR content ranged 6.0 –52.6 ng/100 g cell membrane protein in thyroid cancer primary cultures (n 8) and permanent cell lines (n 6) vs. 1.2–1.7 in normal thyroid cells (n 11 primary cultures; P < 0.0001). IR-A isoform relative abundance ranged from 36 –79% in cancer cells (with the highest values in undiffer- entiated cancers) vs. 27–39% in normal cells. Similar results were obtained in normal vs. cancer thyroid tissue specimens. IGF-II caused IR autophosphorylation with an ED 50 of 1.5– 40.0 nM in cancer cells vs. more than 100 nM in normal cells; IGF-II affinity correlated with the relative abundance of IR-A (r 0.628; P < 0.0001). IGF-II was expressed in all cancer cells, highly expressed in anaplastic cells, and less expressed in normal cells. In conclusion, malignant thyrocytes, especially when poorly differentiated, produce IGF-II and overexpress IR, pre- dominantly as IGF-II-sensitive isoform A . A growth-promot- ing autocrine loop is activated, therefore, and may affect thy- roid cancer biology. (J Clin Endocrinol Metab 87: 245–254, 2002) T HYROID CANCER ORIGINATING from the follicular epithelium is represented by well differentiated tu- mors (papillary or follicular) in over 90% of cases and by undifferentiated tumors in the remaining 10% of cases. Can- cer-related mortality ranges from approximately 10% in dif- ferentiated tumors up to 100% in undifferentiated tumors (1). The mechanisms determining thyroid cancer aggressiveness and/or dedifferentiation are incompletely understood (2, 3). Pituitary TSH is a major growth factor for differentiated thyroid tumors, but not for those poorly differentiated (2). Even in differentiated tumors, however, TSH suppression may not be sufficient to prevent or inhibit local invasion and metastatic spread, indicating that other factors may be im- portant for tumor progression (1). These factors include nu- merous growth factors and their tyrosine kinase receptors that may be abnormally overexpressed or constitutively ac- tivated in thyroid tumors and influence the tumor biological behavior (4 –10). We recently observed that insulin receptors (IRs) are over- expressed in most thyroid tumors as an early step in thyroid carcinogenesis (11). The role of overexpressed IRs was not clear, because insulin is not locally produced in these tumors. One possibility is that IRs may contribute to transmit the mitogenic signals of insulin homolog IGF-I and IGF-II, pro- duced locally in thyroid cancers (12, 13). IGFs are potent mitogenic and antiapoptotic factors that play a major role in a variety of human malignancies (14). Both IGFs are believed to signal through the IGF-I receptor (IGF-I-R), because they have a low affinity for IR (15, 16). However, we recently identified new mechanisms for the interaction of IGFs with IR. One mechanism involves paracrine IGF-I secretion. IR overexpression may amplify the response of thyroid malig- nant cells to locally produced IGF-I by increasing the for- mation of IR/IGF-I-R hybrids (heterodimers formed by one IR - and -subunit complex and one IGF-I-R - and - subunit complex) (17). Hybrid receptors bind IGF-I with high affinity, similar to that of typical IGF-I-Rs (18). Another mechanism involves direct IR interaction with IGF-II. Al- though in most cells IGF-II interacts with IR with relatively low affinity, atypical IRs that bind IGF-II with high affinity have been described in human placenta and IM-9 lympho- blasts (19, 20). In addition, in IGF-I-R-deficient mouse fibro- blasts that overexpress the IR, IGF-II stimulates cell prolif- eration via this receptor, which behaves, therefore, as an IGF-II-R (21). The molecular basis of this phenomenon relies on the fact that IGF-II binds with high affinity and activates only one of the two IR isoforms, isoform A (22). The relative abundance of IR isoforms A and B is tightly regulated in a tissue-specific manner by alternative splicing of the 36-bp exon 11 (Ex 11-) of the IR gene (23). Although the IR-B isoform is predominantly expressed in most adult tissues, the IR-A isoform, which binds IGF-II with high affinity, is pref- erentially expressed in fetal tissues and in certain human malignancies, including breast cancer (22, 24). Abbreviations: HNMPA, Hydroxy-2-naphthalenylmethyl phospho- ric acid triacetoxymethyl ester; IGF-BP, IGF-binding protein; IR, insulin receptor; IGF-I-R, IGF-I receptor; MPR, mannose-6-phosphate receptor; PMSF, phenylmethylsulfonylfluoride. 0013-7227/02/$15.00/0 The Journal of Clinical Endocrinology & Metabolism 87(1):245–254 Printed in U.S.A. Copyright © 2002 by The Endocrine Society 245
-
Upload
independent -
Category
Documents
-
view
6 -
download
0
Transcript of A Novel Autocrine Loop Involving IGF-II and the Insulin Receptor Isoform-A Stimulates Growth of...

A Novel Autocrine Loop Involving IGF-II and the InsulinReceptor Isoform-A Stimulates Growth ofThyroid Cancer
VERONICA VELLA, GIUSEPPE PANDINI*, LAURA SCIACCA, ROSSANA MINEO†,RICCARDO VIGNERI, VINCENZO PEZZINO, AND ANTONINO BELFIORE
Istituto di Medicina Interna e di Malattie Endocrine e del Metabolismo, Cattedra di Endocrinologia, University of Catania,Ospedale Garibaldi (V.V., G.P., L.S., R.M., R.V., V.P.), 95123 Catania, Italy; and Dipartimento di Medicina Sperimentale eClinica, Cattedra di Endocrinologia, University of Catanzaro, Policlinico Mater Domini (A.B.), 88100 Catanzaro, Italy
The insulin receptor (IR) occurs in two isoforms (IR-A andIR-B) resulting from alternative splicing of exon 11 of thegene. The IR-A isoform is predominantly expressed in fetaltissues and malignant cells and binds IGF-II with high affin-ity. We previously observed that IRs are overexpressed inthyroid cancer cells; now we evaluated whether these cellspreferentially express IR-A and produce IGF-II, which wouldactivate a growth-promoting autocrine loop. The IR contentranged 6.0–52.6 ng/100 �g cell membrane protein in thyroidcancer primary cultures (n � 8) and permanent cell lines (n �6) vs. 1.2–1.7 in normal thyroid cells (n � 11 primary cultures;P < 0.0001). IR-A isoform relative abundance ranged from36–79% in cancer cells (with the highest values in undiffer-entiated cancers) vs. 27–39% in normal cells. Similar results
were obtained in normal vs. cancer thyroid tissue specimens.IGF-II caused IR autophosphorylation with an ED50 of 1.5–40.0 nM in cancer cells vs. more than 100 nM in normal cells;IGF-II affinity correlated with the relative abundance of IR-A(r � 0.628; P < 0.0001). IGF-II was expressed in all cancer cells,highly expressed in anaplastic cells, and less expressed innormal cells.
In conclusion, malignant thyrocytes, especially whenpoorly differentiated, produce IGF-II and overexpress IR, pre-dominantly as IGF-II-sensitive isoform A. A growth-promot-ing autocrine loop is activated, therefore, and may affect thy-roid cancer biology. (J Clin Endocrinol Metab 87: 245–254,2002)
THYROID CANCER ORIGINATING from the follicularepithelium is represented by well differentiated tu-
mors (papillary or follicular) in over 90% of cases and byundifferentiated tumors in the remaining 10% of cases. Can-cer-related mortality ranges from approximately 10% in dif-ferentiated tumors up to 100% in undifferentiated tumors (1).The mechanisms determining thyroid cancer aggressivenessand/or dedifferentiation are incompletely understood (2, 3).Pituitary TSH is a major growth factor for differentiatedthyroid tumors, but not for those poorly differentiated (2).Even in differentiated tumors, however, TSH suppressionmay not be sufficient to prevent or inhibit local invasion andmetastatic spread, indicating that other factors may be im-portant for tumor progression (1). These factors include nu-merous growth factors and their tyrosine kinase receptorsthat may be abnormally overexpressed or constitutively ac-tivated in thyroid tumors and influence the tumor biologicalbehavior (4–10).
We recently observed that insulin receptors (IRs) are over-expressed in most thyroid tumors as an early step in thyroidcarcinogenesis (11). The role of overexpressed IRs was notclear, because insulin is not locally produced in these tumors.One possibility is that IRs may contribute to transmit themitogenic signals of insulin homolog IGF-I and IGF-II, pro-duced locally in thyroid cancers (12, 13). IGFs are potent
mitogenic and antiapoptotic factors that play a major role ina variety of human malignancies (14). Both IGFs are believedto signal through the IGF-I receptor (IGF-I-R), because theyhave a low affinity for IR (15, 16). However, we recentlyidentified new mechanisms for the interaction of IGFs withIR. One mechanism involves paracrine IGF-I secretion. IRoverexpression may amplify the response of thyroid malig-nant cells to locally produced IGF-I by increasing the for-mation of IR/IGF-I-R hybrids (heterodimers formed by oneIR �- and �-subunit complex and one IGF-I-R �- and �-subunit complex) (17). Hybrid receptors bind IGF-I with highaffinity, similar to that of typical IGF-I-Rs (18). Anothermechanism involves direct IR interaction with IGF-II. Al-though in most cells IGF-II interacts with IR with relativelylow affinity, atypical IRs that bind IGF-II with high affinityhave been described in human placenta and IM-9 lympho-blasts (19, 20). In addition, in IGF-I-R-deficient mouse fibro-blasts that overexpress the IR, IGF-II stimulates cell prolif-eration via this receptor, which behaves, therefore, as anIGF-II-R (21). The molecular basis of this phenomenon relieson the fact that IGF-II binds with high affinity and activatesonly one of the two IR isoforms, isoform A (22). The relativeabundance of IR isoforms A and B is tightly regulated in atissue-specific manner by alternative splicing of the 36-bpexon 11 (Ex 11-) of the IR gene (23). Although the IR-Bisoform is predominantly expressed in most adult tissues, theIR-A isoform, which binds IGF-II with high affinity, is pref-erentially expressed in fetal tissues and in certain humanmalignancies, including breast cancer (22, 24).
Abbreviations: HNMPA, Hydroxy-2-naphthalenylmethyl phospho-ric acid triacetoxymethyl ester; IGF-BP, IGF-binding protein; IR, insulinreceptor; IGF-I-R, IGF-I receptor; MPR, mannose-6-phosphate receptor;PMSF, phenylmethylsulfonylfluoride.
0013-7227/02/$15.00/0 The Journal of Clinical Endocrinology & Metabolism 87(1):245–254Printed in U.S.A. Copyright © 2002 by The Endocrine Society
245

In the present study we tested the hypothesis that the IR,overexpressed in most thyroid tumors (11, 17), may behaveas an IGF-II-R. We investigated, therefore, the expression ofIR-A in thyroid cancer cells and its relevance in establishing anautocrine loop with IGF-II. We found that 1) malignant thyro-cytes overexpress IR, predominantly as isoform A; 2) autocrineIGF-II production is activated in malignant thyrocytes; 3) IR-Amay be directly activated by IGF-II and mediates its mitogeniceffect; and 4) both IR-A and IGF-II expression in thyroid cancercorrelate with tumor dedifferentiation.
The present data, therefore, identify a novel autocrineloop, involving IGF-II and the IR-A, which may contribute todetermine thyroid cancer progression and aggressiveness,especially in undifferentiated carcinomas.
Materials and MethodsMaterials
The following materials were purchased: FCS, glutamine, and gen-tamicin were obtained from Life Technologies, Inc. (Paisley, UK); RPMI1640 medium, BSA (RIA grade), bacitracin, phenylmethylsulfonylfluo-ride (PMSF), and porcine insulin were obtained from Sigma (St. Louis,MO); protein A-Sepharose was obtained from Pharmacia Biotech (Upp-sala, Sweden); 125I-labeled insulin (SA, 74,000 GBq/mmol) was obtainedfrom Amersham Pharmacia Biotech (Little Chalfont, UK); IGF-I andIGF-II were obtained from Calbiochem (La Jolla, CA); human Del(1–6)IGF-II was obtained from Upstate Biotechnology, Inc. (Lake Placid,NY).
The following antibodies were employed: 1) anti-IR antibodies:MA-20 and MA-51 monoclonal antibodies that recognize IR �-subunit(I. D. Goldfine, San Francisco, CA) (25, 26), CT-1 monoclonal antibodythat recognizes the IR �-subunit (27) and 83-7 monoclonal antibody thatrecognizes the IR �-subunit (K. Siddle, Cambridge UK) (28), and rabbitpolyclonal antibody that recognizes the IR �-subunit (Transduction Lab-oratories, Inc., Lexington, KY); 2) anti-IGF-I-R antibodies: �IR3 mono-clonal antibody that recognizes IGF-I-R �-subunit (29) (OncogeneResearch, Cambridge, MA), and chicken polyclonal antibody that rec-ognizes IGF-I-R �-subunit (Upstate Biotechnology, Inc.). Antiphospho-tyrosine 4G10 and anti-IGF-II (clone S7F2) monoclonal antibodies werepurchased from Upstate Biotechnology, Inc. Monoclonal antibody an-timannose-6-phosphate receptor (anti-MPR) was purchased fromCalbiochem.
Thyroid cell cultures and human tissue specimens
Thyroid primary cell cultures were prepared from both neoplastic(papillary, n � 7; anaplastic, n � 1) and normal thyroid tissue (n � 11)obtained at surgery. Briefly, the tissue was fragmented with a scalpel,suspended in PBS without Ca2� and Mg2�, and digested with a solutionof type V collagenase (1 mg/ml) in a 37 C shaking bath for 90 min. Thecell suspension, containing intact and fragmented thyroid follicles, wascentrifuged (400 � g for 10 min), and the pellet was resuspended inculture medium consisting of RPMI 1640 supplemented with 2 mmglutamine, 5 �g/ml gentamicin, and 3% FCS. Under these conditionsfollicles formed a monolayer after 1–2 d. The medium was routinelychanged every 2 d. To score the degree of nonepithelial cells present inthe cultures, epithelial thyroid cells were identified by indirect immu-nofluorescence staining with anti-Tg and anticytokeratin antibodies aspreviously described (30). Less than 5% cells were cytokeratin negative,indicating that contamination with nonepithelial cells was low.
Permanent thyroid cancer cell lines (TPC-1, B-CPAP, NPA, FRO,WRO, and ARO) (31–33) and thyroid primary cultures were grown inRPMI 1640 supplemented with 2 mm glutamine, 10% FCS, and 5 �g/mlgentamicin. In all cell lines the medium was routinely changed every 2 d.
Thyroid tissue specimens were collected at surgery, immediatelyfrozen, and stored in liquid nitrogen until processing. Twenty-one thy-roid cancer specimens (13 differentiated, 4 less differentiated, and 4anaplastic) and 5 normal thyroid specimens were used.
Thyroid membrane fraction preparation
The crude thyroid membrane fractions were prepared as follows.Briefly, homogenized tissue specimens or confluent cells were harvestedand washed twice with PBS and once with Tris buffer, pH 7.4 (50 mmTris-HCl, 20 mm benzamidine, 200 �g/ml bacitracin, 30 �g/ml apro-tinin, and 10 mm PMSF). They were resuspended in Tris buffer, soni-cated three times for 10 sec each time, and centrifuged at 2500 rpm for10 min at 4 C. Supernatants were removed and saved. The pellets wereresuspended in Tris buffer, sonicated three times for 20 sec each time,and centrifuged as in the previous step. Supernatants were removed andadded to the previous ones. Combined supernatants were centrifugedat 11,000 rpm for 30 min at 4 C. The pellets were resuspended in Trisbuffer using a syringe with a 25-gauge needle. The suspensions werealiquoted in microfuge tubes and centrifuged for 30 min. Supernatantswere removed, and pellets were stored at �80 C.
Cell monolayers, tissues, and membrane fractions were solubilizedwith 50 mm HEPES buffer, pH 7.6, containing 1 mm PMSF, 1 mg/mlbacitracin,150 mm NaCl, 2 mm sodium orthovanadate, and 1% TritonX-100 for 60 min at 4 C. The solubilized material was then centrifugedat 10,000 � g, and the supernatant was frozen at �80 C until assayed.The protein content in the cellular extracts was measured by the bicin-choninic acid method (Pierce Chemical Co., Rockford, IL).
IR and isoform measurements
IR ELISA. IRs were captured by incubating membrane fraction lysatesfrom cells or tissues in Maxisorp immunoplates (Nunc, Roskilde, Den-mark) precoated with 2 �g/ml MA-20, as previously described (24).After washing, the immunocaptured receptors were incubated with thebiotinylated anti-IR CT-1 antibody (0.3 �g/ml in 50 mm HEPES-bufferedsaline, pH 7.6, containing 0.05% Tween 20, 1% BSA, 2 mm sodiumorthovanadate, 1 mg/ml bacitracin, and 1 mm PMSF) and then withperoxidase-conjugated streptavidin. The peroxidase activity was deter-mined colorimetrically by adding 100 �l 3,3�,5,5�-tetramethylbenzidine(0.4 mg/ml in 0.1 m citrate-phosphate buffer, pH 5.0, with 0.4 �l/ml 30%H2O2). The reaction was stopped by the addition of 1 m H3PO4, and theabsorbance was measured at 450 nm.
IR isoform relative abundance was measured by RT-PCR, as previ-ously described (24, 34). Briefly, total cellular RNA was isolated fromeach cell line or specimen using TRIzol RNA isolation reagent (LifeTechnologies, Inc., Gaithersburg, MD). First strand cDNA synthesis wasperformed on 4–8 �g total RNA using Moloney murine leukemia virusreverse transcriptase (Life Technologies, Inc.) and random hexamerprimers (Pharmacia Biotech) in a total volume of 40 �l 75 mm KCl, 50mm Tris-HCl (pH 8.3), 3 mm MgCl2, and 0.5 mm dNTPs.
cDNA synthesis reaction (5-�l volume) was combined in a 50-�l finalreaction volume for PCR amplification containing 0.2 �m oligonucleo-tide primers spanning nucleotides 2229–2250 (5�-AAC-CAG-AGT-GAG-TAT-GAG-GAT-3�) and 2844–2865 (5�-CCG-TTC-CAG-AGC-GAA-GTG-CTT-3�) of the human IR and 1.25 U Taq DNA polymerase(AmpliTaq, Perkin-Elmer Corp.). PCR amplification was carried out for30 cycles of 15 sec at 95 C, 30 sec at 60 C, and 45 sec at 72 C, using a DNAthermal cycler (Perkin-Elmer Corp.). Products of PCR amplificationwere resolved by electrophoresis on 5% polyacrylamide gels. The elec-trophoretic analysis showed the 600- and 636-bp DNA fragments rep-resenting Ex11� and Ex11� IR isoforms, respectively. Gels were silverstained, and band density was quantified by scanning densitometry.
Ligand-binding assay for IR
Membrane fractions were solubilized as described above, and IR wasimmunocaptured by incubating for 22 h in Maxisorp immunoplatesBreak-Apart (Nunc, Roskilde, Denmark), precoated with 2 �g/ml an-ti-IR 83-7. After washing, the immunocaptured receptors were incubatedwith [125I]insulin (10 pm in 50 mm HEPES-buffered saline, pH 7.6,containing 0.05% Tween 20, 1% BSA, 2 mm sodium orthovanadate, 1mg/ml bacitracin, and 1 mm PMSF) in the presence or absence ofincreasing concentrations of various unlabeled ligands (insulin, IGF-I, orIGF-II). After 2 h at room temperature, plates were washed, and theradioactivity in each well was counted in a �-counter.
246 J Clin Endocrinol Metab, January 2002, 87(1):245–254 Vella et al. • Insulin Receptors and IGF-II in Thyroid Cancer

IR autophosphorylation: ELISA
IR autophosphorylation in intact cells. Ligand-activated IR autophosphor-ylation in intact cells was measured as previously described (35). Cellsin monolayer cultures were stimulated with increasing doses (0–100 nm)of insulin, IGF-II, or IGF-I for 5 min at 37 C. Cells were then solubilized,and receptors were captured by incubating cell lysates (containing �2ng receptor) in Maxisorp plates precoated with antireceptor antibodyMA-20. After washing, a biotinylated antiphosphotyrosine antibody(4G10 �PY from Upstate Biotechnology, Inc., Lake Placid, NY; 0.3 �g/mlin 50 mm HEPES-buffered saline, pH 7.6, containing 0.05% Tween 20, 1%BSA, 2 mm sodium orthovanadate, 1 mg/ml bacitracin, and 1 mm PMSF)was added to reveal phosphorylated receptors by the peroxidase-con-jugated streptavidin method. Peroxidase activity was determined colo-rimetrically by adding 100 �l 3,3�,5,5�-tetramethylbenzidine (0.4 mg/mlin 0.1 m citrate-phosphate buffer, pH 5.0, with 0.4 �l/ml of 30% H2O2).The reaction was stopped by the addition of 1 m H3PO4, and the ab-sorbance was measured at 450 nm.
IR phosphorylation in isolated receptors. IR kinase activity was also mea-sured in purified receptors. Membrane fractions were solubilized asdescribed above and IR immunocaptured in Maxisorp plates coatedwith the anti-IR antibody MA-20. The immunopurified receptors werethen stimulated with various concentrations of either insulin or IGFs inthe presence of ATP (10 �m), MgCl2 (10 mm), and MnCl2 (2 mm). Afterwashing, the phosphorylated proteins were incubated with an antiphos-photyrosine-biotin-conjugated antibody, and the reaction was detectedas described above.
IR autophosphorylation: Western blot analysis
Confluent cells were incubated in serum-free medium for 48 h, stim-ulated with 10 nm insulin, IGF-II, or IGF-I for 5 min at 37 C, andsolubilized in RIPA buffer [50 mm Tris (pH 7.4), 1% NP-40, 0.25% sodiumdeoxycolate, 150 mm NaCl, 1 mm EGTA (pH 8.0), 1 mm PMSF, 10 �g/mlaprotinin, 10 �g/ml leupeptin, 10 �g/ml pepstatin, 2 mm Na orthovana-date, and 1 mm NaF]. Cell lysates were immunoprecipitated with eitheranti-IR (MA-20 monoclonal), or anti-IGF-I-R (�-IR3 monoclonal) anti-bodies. Immunoblottings were performed using 4G10 antiphosphoty-rosine antibody. To show the amounts of receptors loaded in each lane,filters were first subjected to stripping in Tris-HCl buffer (62.5 mm, pH6.7) containing 2% SDS and 100 mm �-mercaptoethanol for 30 min at 50C. Next, the half-filter containing IRs was reprobed with an anti-IR�-subunit polyclonal antibody, and the half-filter containing IGF-I-Rswas reprobed with an anti-IGF-I-R �-subunit polyclonal antibody. Allimmunoblots were revealed by an ECL method (Amersham PharmaciaBiotech), autoradiographed, and subjected to densitometric analysis.
Measurement of IGF-I/II production
IGF-I and IGF-II mRNA content in human thyroid cancer cell linesand tissue specimens was evaluated by PCR. Total RNA was preparedfrom cells and tissue specimens using TRIzol RNA isolation reagent (LifeTechnologies, Inc.). First strand cDNA synthesis was performed on 4–8�g total RNA using Moloney murine leukemia virus reverse transcrip-tase (Life Technologies, Inc.) and random hexamer primers (AmershamPharmacia Biotech) in a total volume of 40 �l 75 mm KCl, 50 mm Tris-HCl(pH 8.3), 3 mm MgCl2, and 0.5 mm dNTPs. PCR amplification wasperformed with 5 �l cDNA, adding 1.25 U Taq polymerase (Perkin-Elmer Corp.), 2.5 mm specific primers, 2.5 mm MgCl2, and 0.2 mmdNTPs. The following primer sequences were used: 5�-3�, GAA-GTC-GAT-GCT-GGT-GCT-TC; and 3�-5�, CTT-CCG-ATT-GCT-GGC-CAT-CT. Conditions for PCR were: 94 C for 30 sec, 60 C for 30 sec, and 72 Cfor 30 sec for 30 cycles. PCR products were resolved by electrophoresison 5% polyacrylamide gels and silver stained.
IGF-II protein secreted by cultured thyroid cancer cells in the con-ditioned medium was measured by a commercial immunoradiometricassay that detects only the IGF-II mature form (BIOS, Naples, Italy) andwas expressed as nanograms of IGF-II secreted per h/106 cells.
Cell growth studies
To evaluate to what extent the mitogenic effect of IGF-II on thyroidcancer cells occurred via the IR, the growth of B-CPAP and ARO cells
was measured in the presence or absence of the anti-IR blocking anti-body MA-51 as previously described (36). Briefly, cells (1.5 � 103) wereseeded in 96-well plates. After 24 h the medium was removed andreplaced with medium containing 1% charcoal-stripped FCS. After anadditional 24 h various concentrations of insulin, IGF-II, or IGF-I (0–10nm) were added in fresh medium in the presence of a 5-fold molar excessof MA-51, aIR-3, or both antibodies. Normal mouse IgGs were used incontrol wells. Cell growth was measured after 4 d by measuring the rateof tetrazolium salts reduction to formazan (3-[4,5-dimethylthiazol-2-yl]-2,5-diphenyltetrazolium bromide, Amersham Pharmacia Biotech),which is proportional to the number of living cells (37). At the end of theincubation the absorbance was read at 540 nm.
To investigate the autocrine effect of IGF-II two different methodswere used: 1) B-CPAP or ARO cells were cultured in serum-free me-dium, and their growth rate was measured in the presence of a blockinganti-IGF-II monoclonal antibody at 2 �g/ml concentration or in thepresence of an unrelated monoclonal antibody (control cultures); 2) inserum-starved cells growth was also evaluated at 2, 4, and 6 d in thepresence or absence of 10 nm exogenous IGF-II with or without theaddition to the culture medium of 1 �g/ml hydroxy-2-naphthalenyl-methyl phosphoric acid triacetoxymethyl ester (HNMPA), a specific IRtyrosine kinase inhibitor (38).
MPR Western blot analysis
To measure IGF type II receptor (MPR), membrane proteins extractedfrom thyroid cells were separated by SDS-PAGE (7.5% polyacrylamide)under nonreducing conditions. Immunoblotting was performed usingan anti-MPR antibody. The immunoblot was revealed by an ECL method(Amersham Pharmacia Biotech), autoradiographed, and subjected todensitometric analysis.
Statistical analysis
Differences between means were evaluated using paired t test, Mann-Whitney test, or one-way ANOVA, as indicated in Results. The abilityof IGF-II to activate the IR and the relative abundance of IR-A werecorrelated by linear regression analysis. The statistical program PRISM(GraphPad Software, Inc., San Diego, CA) was used.
ResultsIR overexpression and predominance of IR isoform A inmalignant thyrocytes: relationship with the degree ofcancer differentiation
IRs were measured by ELISA in cell membrane prepara-tions from both thyroid cell primary cultures and a varietyof thyroid malignant cells in permanent culture. Primarycultures were obtained from either normal thyroid (n � 11)or thyroid carcinomas (papillary, n � 7; anaplastic, n � 1).The median IR content was 8.7- to 37.6-fold higher in ma-lignant thyrocytes compared with normal thyrocytes, whichexpressed the IR at 1.2–1.7 ng/100 �g cell membrane protein(Table 1).
The relative abundance of the two IR isoforms was thenevaluated by RT-PCR in both normal and cancer thyroid cellsin primary cultures. Interestingly, isoform A (IR-A) was oftenpredominant in cancer cells, whereas isoform B (IR-B) waspredominant in normal cells. The proportion of IR-A in-creased from 27–39% in normal thyrocytes to 36–65.2% inpapillary cancer cells and 69.8% in anaplastic cancer cells(Table 1 and Fig. 1).
Six permanent thyroid cancer cell lines (papillary, n � 3;follicular, n � 2; anaplastic, n � 1) were also evaluated.Similarly to what observed in primary cultures, in thesecancer cells both the IR content and the IR-A relative abun-dance were clearly increased compared with those in normal
Vella et al. • Insulin Receptors and IGF-II in Thyroid Cancer J Clin Endocrinol Metab, January 2002, 87(1):245–254 247
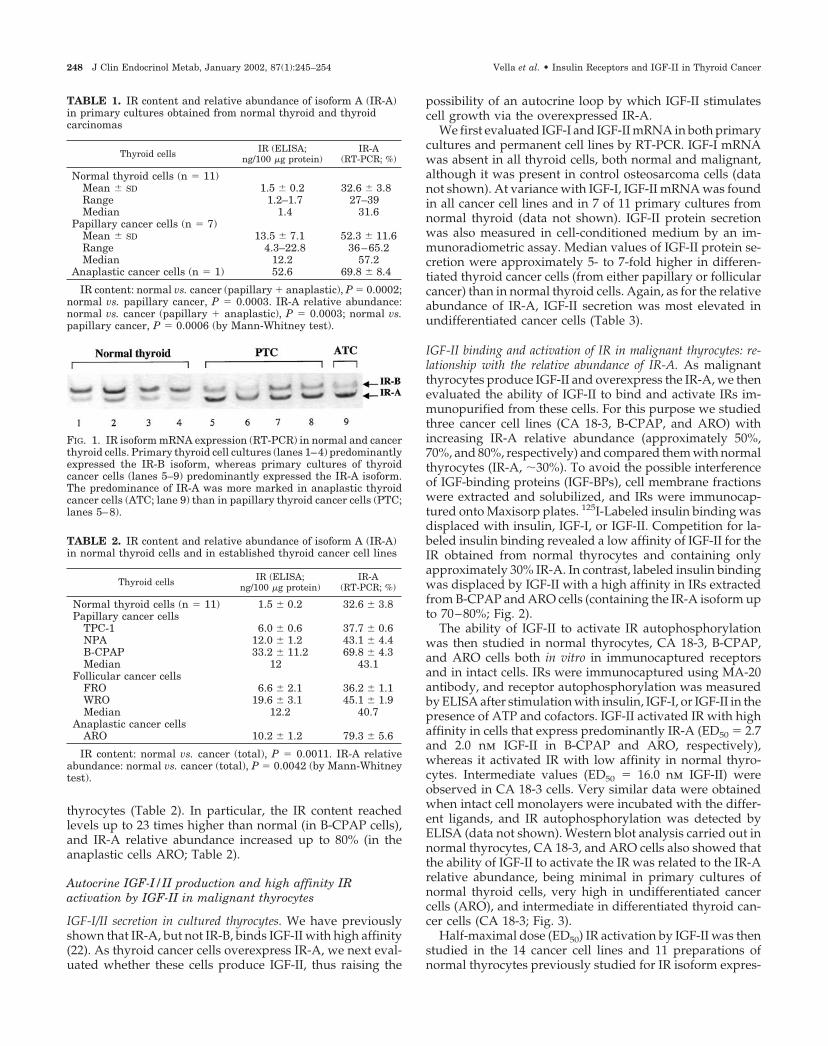
thyrocytes (Table 2). In particular, the IR content reachedlevels up to 23 times higher than normal (in B-CPAP cells),and IR-A relative abundance increased up to 80% (in theanaplastic cells ARO; Table 2).
Autocrine IGF-I/II production and high affinity IRactivation by IGF-II in malignant thyrocytes
IGF-I/II secretion in cultured thyrocytes. We have previouslyshown that IR-A, but not IR-B, binds IGF-II with high affinity(22). As thyroid cancer cells overexpress IR-A, we next eval-uated whether these cells produce IGF-II, thus raising the
possibility of an autocrine loop by which IGF-II stimulatescell growth via the overexpressed IR-A.
We first evaluated IGF-I and IGF-II mRNA in both primarycultures and permanent cell lines by RT-PCR. IGF-I mRNAwas absent in all thyroid cells, both normal and malignant,although it was present in control osteosarcoma cells (datanot shown). At variance with IGF-I, IGF-II mRNA was foundin all cancer cell lines and in 7 of 11 primary cultures fromnormal thyroid (data not shown). IGF-II protein secretionwas also measured in cell-conditioned medium by an im-munoradiometric assay. Median values of IGF-II protein se-cretion were approximately 5- to 7-fold higher in differen-tiated thyroid cancer cells (from either papillary or follicularcancer) than in normal thyroid cells. Again, as for the relativeabundance of IR-A, IGF-II secretion was most elevated inundifferentiated cancer cells (Table 3).
IGF-II binding and activation of IR in malignant thyrocytes: re-lationship with the relative abundance of IR-A. As malignantthyrocytes produce IGF-II and overexpress the IR-A, we thenevaluated the ability of IGF-II to bind and activate IRs im-munopurified from these cells. For this purpose we studiedthree cancer cell lines (CA 18-3, B-CPAP, and ARO) withincreasing IR-A relative abundance (approximately 50%,70%, and 80%, respectively) and compared them with normalthyrocytes (IR-A, �30%). To avoid the possible interferenceof IGF-binding proteins (IGF-BPs), cell membrane fractionswere extracted and solubilized, and IRs were immunocap-tured onto Maxisorp plates. 125I-Labeled insulin binding wasdisplaced with insulin, IGF-I, or IGF-II. Competition for la-beled insulin binding revealed a low affinity of IGF-II for theIR obtained from normal thyrocytes and containing onlyapproximately 30% IR-A. In contrast, labeled insulin bindingwas displaced by IGF-II with a high affinity in IRs extractedfrom B-CPAP and ARO cells (containing the IR-A isoform upto 70–80%; Fig. 2).
The ability of IGF-II to activate IR autophosphorylationwas then studied in normal thyrocytes, CA 18-3, B-CPAP,and ARO cells both in vitro in immunocaptured receptorsand in intact cells. IRs were immunocaptured using MA-20antibody, and receptor autophosphorylation was measuredby ELISA after stimulation with insulin, IGF-I, or IGF-II in thepresence of ATP and cofactors. IGF-II activated IR with highaffinity in cells that express predominantly IR-A (ED50 � 2.7and 2.0 nm IGF-II in B-CPAP and ARO, respectively),whereas it activated IR with low affinity in normal thyro-cytes. Intermediate values (ED50 � 16.0 nm IGF-II) wereobserved in CA 18-3 cells. Very similar data were obtainedwhen intact cell monolayers were incubated with the differ-ent ligands, and IR autophosphorylation was detected byELISA (data not shown). Western blot analysis carried out innormal thyrocytes, CA 18-3, and ARO cells also showed thatthe ability of IGF-II to activate the IR was related to the IR-Arelative abundance, being minimal in primary cultures ofnormal thyroid cells, very high in undifferentiated cancercells (ARO), and intermediate in differentiated thyroid can-cer cells (CA 18-3; Fig. 3).
Half-maximal dose (ED50) IR activation by IGF-II was thenstudied in the 14 cancer cell lines and 11 preparations ofnormal thyrocytes previously studied for IR isoform expres-
TABLE 2. IR content and relative abundance of isoform A (IR-A)in normal thyroid cells and in established thyroid cancer cell lines
Thyroid cells IR (ELISA;ng/100 �g protein)
IR-A(RT-PCR; %)
Normal thyroid cells (n � 11) 1.5 � 0.2 32.6 � 3.8Papillary cancer cells
TPC-1 6.0 � 0.6 37.7 � 0.6NPA 12.0 � 1.2 43.1 � 4.4B-CPAP 33.2 � 11.2 69.8 � 4.3Median 12 43.1
Follicular cancer cellsFRO 6.6 � 2.1 36.2 � 1.1WRO 19.6 � 3.1 45.1 � 1.9Median 12.2 40.7
Anaplastic cancer cellsARO 10.2 � 1.2 79.3 � 5.6
IR content: normal vs. cancer (total), P � 0.0011. IR-A relativeabundance: normal vs. cancer (total), P � 0.0042 (by Mann-Whitneytest).
TABLE 1. IR content and relative abundance of isoform A (IR-A)in primary cultures obtained from normal thyroid and thyroidcarcinomas
Thyroid cells IR (ELISA;ng/100 �g protein)
IR-A(RT-PCR; %)
Normal thyroid cells (n � 11)Mean � SD 1.5 � 0.2 32.6 � 3.8Range 1.2–1.7 27–39Median 1.4 31.6
Papillary cancer cells (n � 7)Mean � SD 13.5 � 7.1 52.3 � 11.6Range 4.3–22.8 36–65.2Median 12.2 57.2
Anaplastic cancer cells (n � 1) 52.6 69.8 � 8.4
IR content: normal vs. cancer (papillary � anaplastic), P � 0.0002;normal vs. papillary cancer, P � 0.0003. IR-A relative abundance:normal vs. cancer (papillary � anaplastic), P � 0.0003; normal vs.papillary cancer, P � 0.0006 (by Mann-Whitney test).
FIG. 1. IR isoform mRNA expression (RT-PCR) in normal and cancerthyroid cells. Primary thyroid cell cultures (lanes 1–4) predominantlyexpressed the IR-B isoform, whereas primary cultures of thyroidcancer cells (lanes 5–9) predominantly expressed the IR-A isoform.The predominance of IR-A was more marked in anaplastic thyroidcancer cells (ATC; lane 9) than in papillary thyroid cancer cells (PTC;lanes 5–8).
248 J Clin Endocrinol Metab, January 2002, 87(1):245–254 Vella et al. • Insulin Receptors and IGF-II in Thyroid Cancer
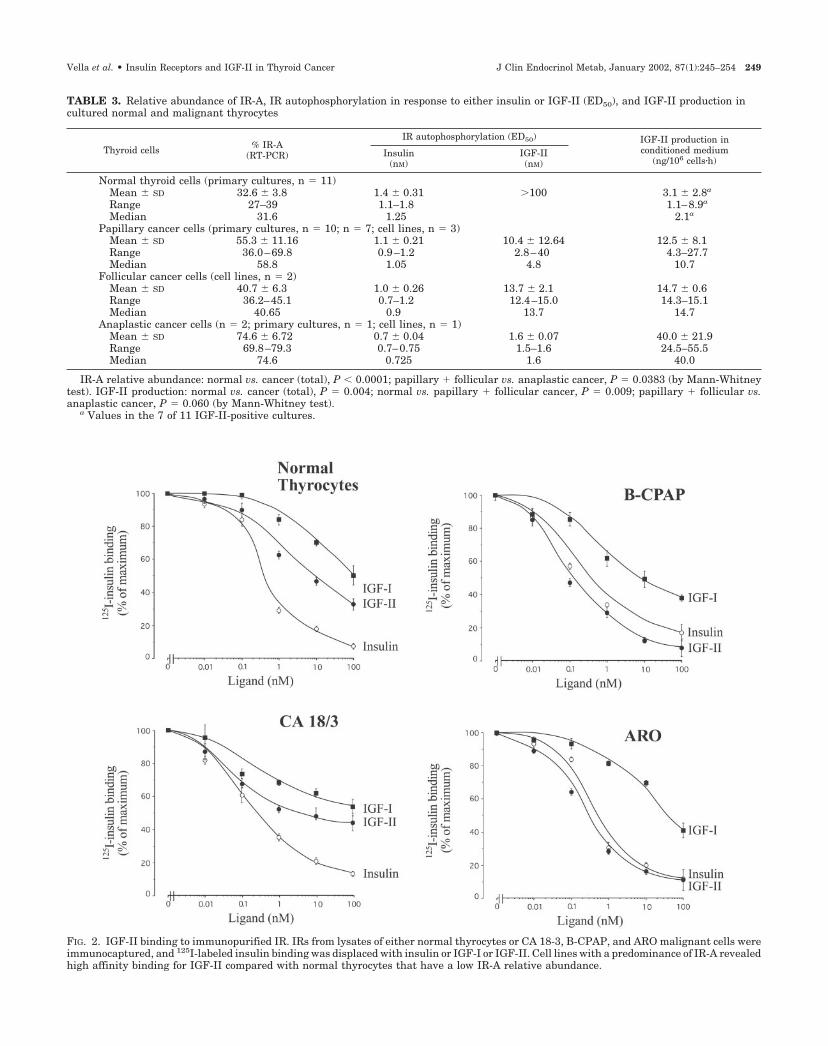
FIG. 2. IGF-II binding to immunopurified IR. IRs from lysates of either normal thyrocytes or CA 18-3, B-CPAP, and ARO malignant cells wereimmunocaptured, and 125I-labeled insulin binding was displaced with insulin or IGF-I or IGF-II. Cell lines with a predominance of IR-A revealedhigh affinity binding for IGF-II compared with normal thyrocytes that have a low IR-A relative abundance.
TABLE 3. Relative abundance of IR-A, IR autophosphorylation in response to either insulin or IGF-II (ED50), and IGF-II production incultured normal and malignant thyrocytes
Thyroid cells % IR-A(RT-PCR)
IR autophosphorylation (ED50) IGF-II production inconditioned medium
(ng/106 cells�h)Insulin
(nM)IGF-II(nM)
Normal thyroid cells (primary cultures, n � 11)Mean � SD 32.6 � 3.8 1.4 � 0.31 �100 3.1 � 2.8a
Range 27–39 1.1–1.8 1.1–8.9a
Median 31.6 1.25 2.1a
Papillary cancer cells (primary cultures, n � 10; n � 7; cell lines, n � 3)Mean � SD 55.3 � 11.16 1.1 � 0.21 10.4 � 12.64 12.5 � 8.1Range 36.0–69.8 0.9–1.2 2.8–40 4.3–27.7Median 58.8 1.05 4.8 10.7
Follicular cancer cells (cell lines, n � 2)Mean � SD 40.7 � 6.3 1.0 � 0.26 13.7 � 2.1 14.7 � 0.6Range 36.2–45.1 0.7–1.2 12.4–15.0 14.3–15.1Median 40.65 0.9 13.7 14.7
Anaplastic cancer cells (n � 2; primary cultures, n � 1; cell lines, n � 1)Mean � SD 74.6 � 6.72 0.7 � 0.04 1.6 � 0.07 40.0 � 21.9Range 69.8–79.3 0.7–0.75 1.5–1.6 24.5–55.5Median 74.6 0.725 1.6 40.0
IR-A relative abundance: normal vs. cancer (total), P 0.0001; papillary � follicular vs. anaplastic cancer, P � 0.0383 (by Mann-Whitneytest). IGF-II production: normal vs. cancer (total), P � 0.004; normal vs. papillary � follicular cancer, P � 0.009; papillary � follicular vs.anaplastic cancer, P � 0.060 (by Mann-Whitney test).
a Values in the 7 of 11 IGF-II-positive cultures.
Vella et al. • Insulin Receptors and IGF-II in Thyroid Cancer J Clin Endocrinol Metab, January 2002, 87(1):245–254 249

sion. Cells cultured in monolayers were exposed to increas-ing doses of insulin, IGF-I, or IGF-II, and IR autophosphor-ylation was detected by ELISA. IR autophosphorylation inresponse to insulin occurred with a similar ED50 in normaland malignant thyrocytes (1.1–1.8 vs. 0.7–1.2 nm, respec-tively; Table 3). In contrast, IR autophosphorylation in re-sponse to IGF-II differed in malignant vs. normal thyrocytes.In normal thyrocytes IGF-II induced IR autophosphorylation
with an affinity that was always less than 1% that of insulin(ED50 � �100 nm), whereas in all thyroid cancer cells IGF-IIactivated IR autophosphorylation with an ED50 much closerto that of insulin. Median ED50 values were 4.8 nm in pap-illary cancer cells, 13.7 nm IGF-II in follicular cancer cells, and1.6 nm in anaplastic cancer cells (Table 3).
In the 25 cell cultures studied (Table 3), the relative affinityof IGF-II for the IR (calculated as the percentage of insulin
FIG. 3. IGF-II-induced IR autophosphorylation in receptors immunopurified by thyroid cells with different IR-A relative abundance. A, In vitroautophosphorylation of immunopurified IR. IRs immunocaptured with antibody MA-20 from lysates of unstimulated cells were stimulated invitro with various concentrations of either insulin or IGFs in the presence of ATP and cofactors. IR activation was measured as described inMaterials and Methods. B, Western blot analysis. Primary cultures of normal thyroid cells, papillary cancer cells, and anaplastic cancer cells,incubated in serum-free medium for 16 h, were stimulated with either insulin or IGF-II (10 nM) and lysed in 1 ml lysis buffer. Samples werethen immunoprecipitated with the anti-IR monoclonal antibody MA-20 and subjected to Western blot analysis using an anti-PY antibody todetect receptor autophosphorylation. In both A and B IGF-II-induced IR autophosphorylation was directly related to the relative abundanceof the IR-A isoform, being minimal in normal thyroid cells (IR-A, 27.0%), high in anaplastic cancer cells (IR-A, 79.1%), and intermediate indifferentiated cancer cells (IR-A, 48.4%).
250 J Clin Endocrinol Metab, January 2002, 87(1):245–254 Vella et al. • Insulin Receptors and IGF-II in Thyroid Cancer

ED50/IGF-II ED50 for stimulation of IR autophosphorylation)was correlated with the relative abundance of IR-A expres-sion (r � 0.628; P � 0.0001; Fig. 4). IGF-I was always less than1% as effective as insulin in stimulating IR autophosphory-lation (data not shown).
Cell growth studies
IGF-II stimulation of thyroid cancer cell growth: role of the IR-A.To evaluate whether IR-A overexpression may have a role inmediating a mitogenic response to IGF-II in thyroid cancercells, we studied B-CPAP (papillary cancer) and ARO cells(undifferentiated cancer), which predominantly expressIR-A (approximately 70% and 80%, respectively). The bio-logical effects of IGF-II in target cells may be regulated bymechanisms that influence IGF-II bioavailability, includingthe expression of IGF-II/MPR, which decreases IGF-II bio-availability, and the presence of IGF-BPs, which may eitherincrease or decrease IGF-II bioavailability. Therefore, we firststudied the expression of IGF-II/MPR in these cell lines.Western blot analysis showed that IGF-II/MPR was unde-tectable in normal thyroid cells and expressed at low levelsin B-CPAP and ARO cell lines (Fig. 5). To evaluate the pos-
sible effect of IGF-BPs, serum-starved cells were exposed for4 d to different doses of IGF-II or del(1–6)IGF-II, a truncatedIGF-II analog that does not bind to IGF-BPs. In B-CPAP andARO cell lines both ligands stimulated 3-[4,5-dimethylthia-zol-2-yl]-2,5-diphenyltetrazolium bromide incorporation ina dose-dependent manner. The maximal growth effect wasobserved at 10 nm for each ligand and ranged from 152–169%in B-CPAP cells and from 174–207% in ARO cells, with nodifference between the two ligands. The very similar growthresponse obtained with both IGF-II and del(1–6)IGF-II sug-gests that IGF-BPs do not have a major role in regulating theIGF-II growth response in this system.
To evaluate the relative contribution of either IR-A orIGF-I-R to IGF-II-induced growth, cells were incubated with10 nm insulin, IGF-II, or IGF-I. Cell growth in response toeach ligand was measured in the presence of MA-51 (IR-blocking antibody), �IR3 (IGF-I-R-blocking antibody), or acombination of these two antibodies. An unrelated mono-clonal antibody was used as control.
In B-CPAP cells, insulin-induced cell growth was effec-tively blocked by MA-51 (P 0.001), but not by �IR-3 (Table4). A combination of the two antibodies was as effective asMA-51 alone. In contrast, IGF-II-induced growth was sig-nificantly inhibited by either MA-51 or �IR-3 to a similarextent (P � 0.025), suggesting that both IR-A and IGF-I-R aresimilarly important in mediating IGF-II effects in B-CPAPcells (Table 4). The two antibodies together were more ef-fective than either antibody alone and almost completelyblocked the growth response to IGF-II. As expected, IGF-I-induced growth was significantly decreased by �IR-3 (P 0.001), but not by MA-51. A combination of the two anti-bodies was as effective as �IR-3 alone (Table 4). Similarresults were obtained in ARO cells (data not shown).
Blockade of the autocrine IGF-II/IR-A loop: effect on cell growth.As both B-CPAP and ARO cells produce substantial amountsof IGF-II (27.7 � 0.4 and 24.5 � 2.6 ng/106 cells�h, respec-tively), but not IGF-I, we evaluated the effect of blockade of
FIG. 4. Correlation between IR autophosphorylation by IGF-II andIR-A relative abundance. In 25 thyroid cell cultures (normal, n � 11;cancer, n � 14) a correlation (linear regression analysis) was observedbetween the IGF-II relative affinity for the IR (calculated as thepercentage of insulin ED50/IGF-II ED50 for stimulation of IR auto-phosphorylation) and the relative abundance of the IR-A isoform asdetermined by RT-PCR.
FIG. 5. IGF-II/MPR content in thyroid cell lines. Western blot anal-ysis of MPR in primary culture of normal thyroid cells (2), papillarycancer cells B-CPAP (3), and anaplastic cancer cells ARO (4). As apositive control, HepG2 cells were used (1). Membrane fractions weresolubilized and subjected to Western blot analysis using an anti-MPRantibody to detect receptor content.
TABLE 4. Effect of receptor blockade on insulin-, IGF-I-, or IGF-II-induced cell growth in B-CPAP cells
Conditions OD(540 nm)
% ofbasal Pa
Basal 0.51 � 0.19 100Insulin 0.98 � 0.04 191.9Insulin � control Ab 0.95 � 0.07 185.9Insulin � MA-51 0.75 � 0.02 147.3 0.001Insulin � �IR3 0.94 � 0.06 184.1 0.204Insulin � MA-51 � �IR3 0.74 � 0.04 144.6 0.007
Basal 0.51 � 0.19 100IGF-II 0.98 � 0.02 190.9IGF-II � control Ab 0.95 � 0.05 185.4IGF-II � MA-51 0.78 � 0.05 152.8 0.005IGF-II � �IR3 0.83 � 0.02 162.5 0.008IGF-II � MA-51 � �IR3 0.67 � 0.03 132.0 0.001
Basal 0.51 � 0.19 100IGF-I 1.03 � 0.04 201.9IGF-I � control Ab 0.99 � 0.06 194.1IGF-I � MA-51 1.01 � 0.05 198.0IGF-I � �IR3 0.71 � 0.02 139.2 0.001
Results are the mean � SEM of three separate experiments.a Statistical significance is calculated vs. growth stimulation in the
presence of control IgG (by paired t test).
Vella et al. • Insulin Receptors and IGF-II in Thyroid Cancer J Clin Endocrinol Metab, January 2002, 87(1):245–254 251

the autocrine IGF-II/IR-A loop on spontaneous cell growth.First, B-CPAP were cultured in serum-free medium in eitherthe presence or absence of an IGF-II-blocking antibody. After5 d in culture cell proliferation was significantly decreased bythe IGF-II-blocking antibody compared with normal mouseIgGs (�26%; P � 0.0016).
Next, we evaluated the effect of HNMPA, a specific IRtyrosine kinase inhibitor. HNMPA (1.0 nm) markedly inhib-ited the growth of serum-starved B-CPAP cells in responseto 10 nm exogenous IGF-II (Fig. 6). Spontaneous cell growthwas also significantly reduced by the presence of 1.0 nmHNMPA (Fig. 6), suggesting that IR tyrosine kinase inhibi-tion blocks cell growth induced by autocrine IGF-II produc-tion. Very similar results were obtained with ARO cells (datanot shown).
IR and IGF-I-R expression and IR-A relative abundance in thyroidtissue specimens obtained at surgery. To investigate the poten-tial in vivo relevance of the IGF-II/IR-A interaction in humanthyroid carcinomas, we measured the IR content and therelative abundance of the two IR isoforms in surgical spec-imens of normal thyroid (n � 6) and cancer thyroid tissues(papillary, n � 14; follicular, n � 4; anaplastic, n � 4).
The total IR content was elevated in cancer specimens ofall histotypes (range, 1.8–26.7 ng/100 �g cell membraneprotein) compared with normal thyroid specimens (range,0.7–2.1 ng/100 �g cell membrane protein; Table 5). MedianIR values were increased approximately 4-fold in differen-tiated cancers and 8- to 10-fold in poorly differentiated andundifferentiated cancers. The IR-A transcript accounted for40.0–50.5% (median, 44.3%) of total IR in normal thyroidtissues, whereas it ranged from 40.5–73% (median, 55.7%) incancer specimens. This difference is highly significant (P �0.006). Poorly differentiated and undifferentiated carcino-mas expressed both higher total IR content and relative abun-dance of IR isoform A compared with well differentiatedpapillary carcinomas (P � 0.005; Table 5).
In four cases of papillary carcinomas, paired specimens ofcancer and normal thyroid tissue from the same patientswere available; the proportion of the IR-A transcript in cancertissues clearly exceeded that in adjacent normal tissues inthree cases, and it was similar in one case (Fig. 7).
To evaluate the relative contributions of IR and IGF-I-R inthe activation of the IGF system in thyroid cancer, we alsomeasured IGF-I-R content in the same thyroid specimens.IGF-I-R was 5.2 � 1.9 ng/100 �g cell membrane protein innormal thyroid specimens and increased to 9.8 � 4.3 inpapillary cancer, but was not increased in poorly differen-tiated and undifferentiated carcinomas (5.2 � 1.6 and 6.6 �4.5 ng/100 �g cell membrane protein, respectively).
Taken together these data indicate that IR-A, but not IGF-I-R, overexpression is the key factor of IGF system activationin both poorly differentiated and undifferentiated thyroidcancers. Even in differentiated cancers the increase in IR-Ais more marked than that in IGF-I-R.
FIG. 6. Thyroid cancer cell growth after interruption of the IGF-II/IR-A autocrine loop. A, By an IGF-II blocking antibody. B-CPAP cellswere seeded in monolayer cultures, and cell proliferation was mea-sured after 5 d of culture, in the presence of either a blocking antibodyto IGF-II or an unrelated monoclonal antibody (control cultures). Cellgrowth was significantly reduced in cultures treated with anti-IGF-IIantibody compared with control cultures (P � 0.0016). Results are themean � SD of three separate experiments. B, By IR tyrosine kinaseinhibitor HNMPA. HNMPA markedly inhibited B-CPAP cell growthin response to 10 nM IGF-II and reduced unstimulated cell growthmost likely due to IR stimulation by autocrine IGF-II production.
TABLE 5. Total IR content and proportion of IR-A in normalthyroid tissue and cancer thyroid tissue specimens
IR (ELISA;ng/100 �g protein)
IR-A(RT-PCR; %)
Normal thyroid (n � 6)Mean � SD 1.3 � 0.5 45.2 � 3.9Range 0.7–2.1 40.0–50.5Median 1.3 44.3
Papillary cancer (n � 14)Mean � SD 5.8 � 3.8 53.5 � 5.7Range 1.8–16.8 40.5–60.5Median 5.7 53
Follicular cancer (n � 4; poorly differentiated)Mean � SD 10.8 � 8.6 56.6 � 7.1Range 5.2–23.7 49.5–65Median 7.2 56
Anaplastic cancer (n � 4)Mean � SD 12.6 � 9.6 69.4 � 4.3Range 6.6–26.7 60.3–73.0Median 9.6 70.5
IR content: normal vs. cancer (total), P � 0.0007 (by Mann-Whitneytest); normal vs. papillary vs. follicular vs. anaplastic cancer, P �0.013 (by one-way ANOVA).
252 J Clin Endocrinol Metab, January 2002, 87(1):245–254 Vella et al. • Insulin Receptors and IGF-II in Thyroid Cancer

Discussion
IGF-I and IGF-II are believed to play an important role incancer progression and malignant cell protection from apo-ptosis (39–41), as they may be locally produced in tumorsand exert their autocrine or paracrine action by binding toand activating the IGF-I-R (15).
We previously observed that IGF-I is overproduced inhuman thyroid cancer in a paracrine fashion and that theIGF-I-R homolog IR plays a role in mediating the IGF-I re-sponse. In fact, IR is overexpressed in most thyroid cancercells (11) and thyroid cancer tissue specimens and amplifiesthe biological effects of IGF-I by forming hybrid IR/IGF-I-Rreceptors that bind IGF-I with high affinity (17). By this mech-anism IR overexpression also causes a marked increase in IGF-I-binding sites in those cancers that do not overexpress IGF-I-Rs.
Here we demonstrate that IR overexpression may alsodirectly increase the thyroid cancer cell response to IGF-II byactivating a newly recognized autocrine loop involving IR-A,which behaves as a high affinity IGF-II-R. Differential splic-ing of IR mRNA is tightly regulated in a tissue-specific man-ner, generating various proportions of IR-A and IR-B iso-forms (23). We recently demonstrated that isoform A, but notisoform B, is a physiological receptor for IGF-II in fetal tissues(22), where IR-A is predominantly expressed, whereas IR-Bis predominantly expressed in adult tissues. These findingsprovide a mechanistic basis to studies suggesting that duringfetal development the growth-promoting effect of IGF-II is par-tially mediated by signaling through the IR (22). We also ob-served that IR-A might be the predominant isoform expressedin major human carcinomas (22, 24). In breast cancer, however,IGF-II is mainly produced in a paracrine manner, and the rel-
ative abundance of IR-A appears not to be related to tumorstage, grading, or ER status (24). Further studies, however, areneeded to assess the clinical relevance of IR-A in breast cancer.
In contrast, in the thyroid model, the relative abundanceof IR-A progressively increases from normal thyrocytes (thatpredominantly express IR isoform B) to differentiated pap-illary thyroid cancer cells, to undifferentiated thyroid cancercells that express a very high (�70%) IR-A proportion. Au-tocrine IGF-II production is also activated in thyroid cancercells and follows the same expression pattern as IR-A, beingespecially elevated in poorly differentiated tumors. In con-trast, primary cultures from normal thyroid produced IGF-IIin only in 7 of 11 cases and only in small amounts. IR acti-vation by IGF-II is directly and significantly related to therelative abundance of IR-A.
Therefore, in thyroid cancer this newly identified auto-crine loop involving IGF-II and IR-A appears particularlyrelevant in poorly differentiated thyroid cancers. The biologicalrelevance of the IGF-II/IR-A loop in thyroid cancer is confirmedby the observation that blockade of either IGF-II or IR, bymultiple approaches, significantly reduces thyroid cancer cellgrowth induced by either exogenous or autocrine IGF-II.
In contrast to IRs, IGF-I-Rs are overexpressed only in welldifferentiated thyroid papillary tumors where paracrineIGF-I secretion is also increased (17), but not in poorly dif-ferentiated or undifferentiated tumors, where paracrineIGF-I secretion is rarely increased (17).
Taken together these studies indicate that IR-A overex-pression is a major determinant for the overactivation of theIGF system in poorly differentiated thyroid cancer, both byactivating the autocrine loop involving IGF-II and by con-tributing to the paracrine loop involving IGF-I, via the for-mation of IR/IGF-I-R hybrids (17). In differentiated thyroidcancer, both the paracrine IGF-I/IGF-I-R loop and, to a lesserextent, the autocrine IGF-II/IR-A loop are activated.
In addition to the specific growth factor (TSH), therefore,a variety of growth factors (IGF-I and IGF-II, hepatocytegrowth factor, epidermal growth factor, and fibroblastgrowth factor) and their tyrosine kinase receptors (4–10) mayplay an important role in thyroid cancer growth and pro-gression. These mechanisms should be taken into account inthyroid tumors that progress despite TSH suppression, astherapeutic strategies that involve the interruption of theseautocrine/paracrine loops may positively influence cancerbiology and patient outcome.
Acknowledgments
We thank Dr. I. D. Goldfine (San Francisco, CA) and Dr. K. Siddle(Cambridge, UK) for kindly providing us with anti-IR and anti-IGF-I-Rantibodies.
Received March 28, 2001. Accepted September 24, 2001.Address all correspondence and requests for reprints to: Prof. Ric-
cardo Vigneri, Cattedra di Endocrinologia, Ospedale Garibaldi, 95123Catania, Italy. E-mail: [email protected].
This work was supported in part by the Associazione Italiana per laRicerca sul Cancro (to A.B. and R.V.) and MURST (Cofin99, to A.B.).
* Recipient of a fellowship from the Giuseppe Alazio Foundation forcancer research.
† Recipient of a Federazione Italiana per la Ricerca sul Cancrofellowship.
FIG. 7. IR-A transcript relative abundance in paired specimens ofnormal and cancer thyroid tissue. IR isoform mRNA expression infour specimens of papillary carcinomas (CA) and in the contralateralnormal thyroid tissues (N). Products of PCR amplification were re-solved by electrophoresis on 5% polyacrylamide gels and silverstained. IR-A relative abundance in paired normal and cancer thyroidtissues was quantified by scanning densitometry. Results are repre-sentative of three separate experiments.
Vella et al. • Insulin Receptors and IGF-II in Thyroid Cancer J Clin Endocrinol Metab, January 2002, 87(1):245–254 253

References
1. Mazzaferri EL 1993 Thyroid carcinoma: papillary and follicular. In: MazzaferriL, Samaan NA, eds. Endocrine tumors. Cambridge: Blackwell; 278–333
2. Farid NR, Shi Y, Zou M 1994 Molecular basis of thyroid cancer. Endocr Rev15:202–232
3. Fagin JA 1994 Molecular pathogenesis of human thyroid neoplasm. ThyroidToday 17:1–7
4. Kanamori A, Abe Y, Yajima Y, Manabe Y, Ito K 1989 Epidermal growth factorreceptors in plasma membranes of normal and desease human thyroid glands.J Clin Endocrinol Metab 68:899–903
5. Haugen DRF, Akslen LA, Varhaug JE, Lillehaug JR 1992 Expression of c-erbB-2 protein in papillary thyroid carcinomas. Br J Cancer 65:832–837
6. Grieco M, Santoro M, Berlingieri MT, Melillo RM, Donghi R, Bongarzone I,Pierotti MA, Della Porta G, Fusco A, Vecchio G 1990 PTC is a novel rear-ranged form of the ret proto-oncogene and is frequently detected in vivo inhuman thyroid papillary carcinomas. Cell 60:557–563
7. Greco A, Pierotti MA, Bongarzone I, Pagliardini S, Lanzi C, Della Porta G1992 TRK-T1 is a novel oncogene formed by the fusion of TPR and TRK genesin human papillary thyroid carcinomas. Oncogene 7: 237–242
8. Belfiore A, Gangemi P, Costantino A, Russo G, Santonocito GM, Ippolito O,Di Renzo MF, Comoglio P, Fiumara A, Vigneri R 1997 Low/absent expres-sion of the Met/HGFR identifies papillary thyroid carcinomas with high riskof distant metastases. J Clin Endocrinol Metab 82:2322–2328
9. Yashiro T, Ohba Y, Murakami H, Obara T, Tsushima T, Fujimoto Y,Shizume K, Ito K 1989 Expression of insulin-like growth factor receptors inprimary human thyroid neoplasm. Acta Endocrinol (Copenh) 121:112–120
10. Eggo MC, Hokins JM, Franklyn JA, Johnson GD, Sanders DS, Sheppard MC1995 Expression of fibroblast growth factor in thyroid cancer. J Clin EndocrinolMetab 80:1006–1011
11. Frittitta L, Sciacca L, Catalfamo R, Ippolito A, Gangemi P, Pezzino V, Fi-letti S, Vigneri R 1999 Functional insulin receptors are overexpressed inthyroid tumors. Cancer 85:492–498
12. Duh QY, Grossman RF 1995 Thyroid growth factors, signal transductionpathways, and oncogenes. Surg Clin North Am 75:421–437
13. Van der Laan BF, Freeman JL, Asa SL 1995 Expression of growth factors andgrowth factor receptors in normal and tumorous human thyroid tissues. Thy-roid 5:67–73
14. Le Roith D, Baserga R, Helman L, Roberts Jr CT 1995 Insulin-like growthfactors and cancer. Ann Intern Med 122:54–59
15. Ullrich, A, Gray, A, Tam, AW, Yang-Feng T, Tsubokawa M, Collins C,Henzel W, Le Bon T, Kathuria S, Chen E 1986 Insulin-like growth factor Ireceptor primary structure: comparison with insulin receptor suggests struc-tural determinants that define functional specificity. EMBO J 5:2503–2512
16. Steele-Perkins G, Turner J, Edman JC, Hari J, Pierce SB, Stover C, Rutter WJ,Roth RA 1988 Expression and characterization of a functional human insulin-like growth factor I receptor. J Biol Chem 263:11486–11492
17. Belfiore A, Pandini G, Vella V, Squatrito S, Vigneri R 1999 Insulin/IGF-I re-ceptors play a major role in IGF-I signaling in thyroid cancer. Biochimie 81:403–407
18. Soos WA, Whittaker J, Lammers R, Ullrich A, Siddle K 1990 Receptors forinsulin and insulin-like growth factor-I can form hybrid dimers. Biochem J270:383–390
19. Jonas HA, Cox AJ, Harrison LC 1989 Delineation of atypical insulin receptorsfrom classical insulin and type I insulin-like growth factors receptors in humanplacenta. Biochem J 257:101–107
20. Jonas HA, Cox AJ 1990 Insulin-like growth factor binding to the atypicalinsulin receptors of a human lymphoid-derived cell line (IM-9). Biochem J266:737–742
21. Morrione A, Valentinis B, Xu S-q, Yumet G, Louvi A, Efstratiadis A,
Baserga R 1997 Insulin-like growth factor II stimulates cell proliferationthrough the insulin receptor. Proc Natl Acad Sci USA 94:3777–3782
22. Frasca F, Pandini G, Scalia P, Sciacca L, Mineo R, Costantino A, Goldfine ID,Belfiore A, Vigneri R 1999 Insulin receptor isoform A, a newly recognizedhigh affinity insulin-like growth factor II receptor in fetal and cancer cells. MolCell Biol 19:3278–3288
23. Moller DE, Yokota A, Caro JF, Flier JS 1989 Tissue-specific expression of twoalternatively spliced insulin receptor mRNAs in man. Mol Endocrinol 3:1263–1269
24. Sciacca L, Costantino A, Pandini G, Mineo R, Frasca F, Scalia P, Sbraccia P,Goldfine ID, Vigneri R, Belfiore A 1999 Insulin receptor activation by IGF-IIin breast cancers: evidence for a new autocrine/paracrine mechanism. Onco-gene 18:2471–2479
25. Roth RA, Cassel DJ, Wong KY, Maddux BA, Goldfine ID 1982 Monoclonalantibodies to the human insulin receptor block insulin binding and inhibitinsulin action. Proc Natl Acad Sci USA 79:7312–7316
26. Forsayeth JR, Montemurro A, Maddux BA, DePirro R, Goldfine ID 1987 Effectof monoclonal antibodies on human insulin receptor autophosphorylation, neg-ative cooperativity, and down-regulation. J Biol Chem 262:4134–4140
27. Ganderton RH, Stanley KK, Field CE, Coghlan MP, Soos MA, Siddle K 1992A monoclonal anti-peptide antibody reacting with the insulin receptor �-subunit. Biochem J 288:195–205
28. Soos MA, Siddle K, Baron MD, Heward JM, Luzio JP, Bellatin J, Lennox ES1986 Monoclonal antibodies reacting with multiple epitopes on the humaninsulin receptor Biochem J 235:199–208
29. Kull FC Jr, Jacobs S, Su YF, Svoboda ME, Van Wyk JJ, Cuatrecasas P 1983Molecolar antibodies to receptors for insulin and somatomedin C. J Biol Chem258:6561–6566
30. Milazzo G, La Rosa GL, Catalfamo R, Vigneri R, Belfiore A 1992 Effect of TSHin human thyroid cells: evidence for both mitogenic and antimitogenic effect.J Cell Biochem 49:231–238
31. Estour B, Van Herle AJ, Juillard GJF, Totanes TL, Sparkes RS, Giuliano AE,Klandorf H 1989 Characterization of a human follicular thyroid carcinoma cellline (UCLA RO 82 W-1). Virchows Arch B Cell Pathol 57:167–174
32. Tanaka J, Ogura T, Sato H, Hatano M 1987 Establishment and biologicalcharacterization of an in vitro human cytomegalovirus latency model. Virology161:62–72
33. Fabien N, Fusco A, Santoro M, Barbier Y, Dubois PM, Paulin C 1994 Descriptionof a human papillary thyroid carcinoma cell line. Cancer 73:2206–2212
34. Ebina Y, Ellis L, Jarnaglin K, Edery M, Graf L, Clauser E, Ou JH, Masiarz F,Kan YW, Goldfine ID 1985 The human insulin receptor cDNA: the structural basisfor hormone-activated transmembrane signalling. Cell 40:747–758
35. Belfiore A, Costantino A, Frasca F, Pandini G, Mineo R, Vigneri P, Maddux B,Goldfine ID, Vigneri R 1996 Overexpression of membrane glycoprotein PC-1 ininsulin-resistant MDA-MB231 human breast cancer cells. Mol Endocrinol 10:1318–1326
36. Giorgino F, Belfiore A, Milazzo G, Costantino A, Maddux B, Whittaker J,Goldfine ID, Vigneri R 1991 Overexpression of insulin receptors in fibroblastand ovary cells induces a ligand-mediated transformed phenotype. Mol En-docrinol 5:452–459
37. Heo DS, Park J-G, Hata K, Day R, Herberman RB, Whiteside TL 1990Evaluation of tetrazolium-based semiautomatic colorimetric assay for mea-surement of human antitumor cytotoxicity. Cancer Res 50:3681–3690
38. Baltensperger K, Lewis RE, Woon CW, Vissavajjhala P, Ross AH, Czech MP1992 Catalysis of serine and tyrosine autophosphorilation by the human in-sulin receptor. Proc Natl Acad Sci USA 89:7885–7889
39. Humbel RE 1990 Insulin-like growth factors I and II. Eur J Biochem 190: 445–46240. Baserga R 1995 The insulin-like growth factor I receptor: a key to tumor
growth? Cancer Res 55:249–25241. Macaulay VM 1992 Insulin-like growth factors and cancer. Br J Cancer 65:
311–320
254 J Clin Endocrinol Metab, January 2002, 87(1):245–254 Vella et al. • Insulin Receptors and IGF-II in Thyroid Cancer