A novel approach to the encapsulation of silica particles - Pure
258
A novel approach to the encapsulation of silica particles : mechanisms and kinetics Citation for published version (APA): Zirkzee, H. F. (1997). A novel approach to the encapsulation of silica particles : mechanisms and kinetics. Technische Universiteit Eindhoven. https://doi.org/10.6100/IR499220 DOI: 10.6100/IR499220 Document status and date: Published: 01/01/1997 Document Version: Publisher’s PDF, also known as Version of Record (includes final page, issue and volume numbers) Please check the document version of this publication: • A submitted manuscript is the version of the article upon submission and before peer-review. There can be important differences between the submitted version and the official published version of record. People interested in the research are advised to contact the author for the final version of the publication, or visit the DOI to the publisher's website. • The final author version and the galley proof are versions of the publication after peer review. • The final published version features the final layout of the paper including the volume, issue and page numbers. Link to publication General rights Copyright and moral rights for the publications made accessible in the public portal are retained by the authors and/or other copyright owners and it is a condition of accessing publications that users recognise and abide by the legal requirements associated with these rights. • Users may download and print one copy of any publication from the public portal for the purpose of private study or research. • You may not further distribute the material or use it for any profit-making activity or commercial gain • You may freely distribute the URL identifying the publication in the public portal. If the publication is distributed under the terms of Article 25fa of the Dutch Copyright Act, indicated by the “Taverne” license above, please follow below link for the End User Agreement: www.tue.nl/taverne Take down policy If you believe that this document breaches copyright please contact us at: [email protected] providing details and we will investigate your claim. Download date: 06. Mar. 2022
-
Upload
khangminh22 -
Category
Documents
-
view
9 -
download
0
Transcript of A novel approach to the encapsulation of silica particles - Pure

A novel approach to the encapsulation of silica particles :mechanisms and kineticsCitation for published version (APA):Zirkzee, H. F. (1997). A novel approach to the encapsulation of silica particles : mechanisms and kinetics.Technische Universiteit Eindhoven. https://doi.org/10.6100/IR499220
DOI:10.6100/IR499220
Document status and date:Published: 01/01/1997
Document Version:Publisher’s PDF, also known as Version of Record (includes final page, issue and volume numbers)
Please check the document version of this publication:
• A submitted manuscript is the version of the article upon submission and before peer-review. There can beimportant differences between the submitted version and the official published version of record. Peopleinterested in the research are advised to contact the author for the final version of the publication, or visit theDOI to the publisher's website.• The final author version and the galley proof are versions of the publication after peer review.• The final published version features the final layout of the paper including the volume, issue and pagenumbers.Link to publication
General rightsCopyright and moral rights for the publications made accessible in the public portal are retained by the authors and/or other copyright ownersand it is a condition of accessing publications that users recognise and abide by the legal requirements associated with these rights.
• Users may download and print one copy of any publication from the public portal for the purpose of private study or research. • You may not further distribute the material or use it for any profit-making activity or commercial gain • You may freely distribute the URL identifying the publication in the public portal.
If the publication is distributed under the terms of Article 25fa of the Dutch Copyright Act, indicated by the “Taverne” license above, pleasefollow below link for the End User Agreement:www.tue.nl/taverne
Take down policyIf you believe that this document breaches copyright please contact us at:[email protected] details and we will investigate your claim.
Download date: 06. Mar. 2022
A Novel Approach to the · Encapsulation of Silica Particles
Mechanisms and Kinetics
H.F. Zirkzee

A Novel Approach to the Encapsulation of Silica Particles
•
Mechanisms and Kinetics
PROEFSCHRIFT
ter verkrijging van de graad van doctor aan de Technische Universiteit Eindhoven, op gezag van de Rector Magnificus, prof.dr. M. Rem,
voor een commisie aangewezen door het College voor Promoties in het openbaar te verdedigen op
maandag 22 september 1997 om 16.00 uur
door
Hendricus Franciscus Zirkzee
geboren te Leiden

Dit proefschrift is goedgekeurd door de promotoren:
prof.dr.ir. AL. German prof.dr. J.B.F.N. Engberts
en de copromotor:
dr. A.M. van Herk •
The author is indebted to IOP Coatings for financial support of the work described in this thesis

'Gren::en ::yn kooien; de werkelijkheid is een tere
vogel die trillend in je hand ::it. Als je hem te lang
vast houdt, sterft hij'
(Deepak Chopra, De wereld van Merlijn)
aan mijn ouders
en Sien

Samenvatting
SAMENVATTING
Dit proefschrift beschrijft de concepten, kinetiek en proces controle van de omhullingsreactie van anorganische silica deeltjes via een emulsie polymerisatie proces. Eerdere studies, betreffende dit onderwerp, gaven aan dat de omhullingsreactie met redelijk succes kan worden uitgevoerd. De vorming van ongewenste vrije polymeerdeeltjes kan echter niet worden voorkomen, wat de efficiëntie van het omhuHingsproces verlaagt. Deze studies toonden ook aan dat de efficiëntie van het omhu11ingsproces sterk afhangt van de gebruikte procesvariabelen. Echter de concepten van de omhullingsreactie op submoleculair niveau zijn relatief nog onderbelicht. Het doel van dit onderzoek is om deze concepten en de daarbij behorende kinetiek te begrijpen als functie van de opgelegde procesvariabelen. Voor deze studie is een gedefinieerde omhullingsreactie nodig. Bijvoorbeeld, de silica deeltjes moeten bij voorkeur rond zijn en een smalle deeltjesgrootteverdeling hebben. Deze silica deeltjes worden gemaakt via een Sol-Gel proces in water-ethanol mengsels. In dit onderzoek zijn twee fYsisiche modificatie procedures gebruikt om de sihca deeltjes hydrofoob te maken: de blokcopolymeer route en de 'dubbelstaartige surfactant' route. Beide routes worden beschreven in dit proefschrift, betreffende de achterliggende concepten, kinetiek en proces controle van de omhullingsreactie. De voornaamste resultaten en conclusies worden hieronder gegeven.
Blokcopolymeer route Het gebruikte blokcopolymeer bestaat uit een polyethyleenoxide deel en een polybutylmethacrylaat deel. Deze surfactant kan micellen vormen in water en in waterethanol mengsels. Uit monomeerverdelings evenwichten is gebleken dat de modificatie van het silica oppervlak essentieel is om het monmeer aan het oppervlak te krijgen. Als het systeem, echter, bestaat uit gemodificeerde silica deeltjes, blockcopolymeer micellen en latex deeltjes, dan zal het grootste gedeelte van het monomeer in de micellen en de latex deeltjes gaan zitten en relatiefminder in de gemodificeerde silica deeltjes. De invloed van ethanol en de deeltjes morfologie op het kinetisch gedrag van omhullingsreacties en polymerisatie reacties is bestudeerd. De aanwezigheid van ethanol verlaagt de ontledingsnelheid van de initiator. Ook heeft het invloed op de snelheid van radical overdrachtsprocessen van en naar latex deeltjes en gemodificeerde silica deeltjes. Als er twee klassen deeltjes met een verschillende morfologie aanwezig zijn, dan heeft dat een duidelijk effect op het kinetisch gedrag van de reactie. Het blijkt dat de radicaal concentratie in de gemodificeerde silica deeltjes lager is dan de radicaalconcentratie in de latex deeltjes van vergelijkbare grootte. Het gevolg is dat de voornaamste plaats van reactie optreedt in de polymeerdeeltjes (als ze gevormd zijn), wat de efficiëntie van het omhullingsprocess verlaa!,>t. De vorming van deze tweede generatie deeltjes moet dus worden voorkomen. De vorming van deze deeltjes zal plaatsvinden als het aangeboden oppervlak van de silica deeltjes niet voldoende is om alle oppervlakteactieve radicalen in te vangen. Het blijkt dat niet kan bij omhullingsreacties die worden uitgevoerd in een batch reactor met een 'industrieel recept'. Echter van dit vormingsmechanisme kan gebruikt gemaakt worden door deze deeltjes op het oppervlak van silica te laten coaguleren.

Samenvatting
'Dubbelstaartige surfactant' route Dioctadecyldimethylammonium bromide (DODAB) is gebruikt als dubbelstaartige surfactant in dit onderzoek. Voordat omhullingsreacties zijn uitgevoerd met deze surfactant, is eerst een haalbaarheidstudie uitgevoerd naar de polymerisatie in aggregaten (vesikels) van DODAB. Tijdens deze studie bleek dat karakterisering van alle stadia van het polymerisatieproces essentieel is. De morfologie van deze vesikels is afuankelijk van de gebruikte bereidingsmethode. De vesikels zijn thermodynamisch metastabiel en bezitten een fase overgangstemperatuur, wat een behoorlijke invloed heeft op monomeer verdelingsevenwicbten en de kinetiek van de polymerisatie reactie. Het blijkt dat wanneer de temperatuur boven deze fase overgangstemperatuur is de boeveelbeid monomeer ,wat kan oplossen in de bilaag, veel hoger is dan wanneer de temperatuur lager is dan de fase overgangstemperatuur. Deze systemen kunnen, qua monomeer verdelingsevenwichten, niet beschreven worden met bulk thermodynamica, maar de microstructuur van de bilaag moet worden meegenomen in de beschouwing. Resultaten tonen ook aan dat tijdens het zwel proces fasenscheiding kan optreden. Dit kan resulteren in een DODAB rijke fase en een solvent rijke fase in de bilaag. Het kinetisch gedrag van een polymerisatiereactie inDODAB vesikels verschilt aanzienlijk van een gewone emulsiepolymerisatie. In vesikels is de polymerisatie diffusie gelimiteerd, wat een aanzienlijke invloed heeft op de fundamentele reactiestappen in het vesikel, maar ook op de overdracht van radicaalactiviteit van en naar het vesikel. Onderzoek betreffende de modificatie van silica met DO DAB toont aan dat DODAB op silica adsorbeert als een bi laag. Monomeerverdelings experimenten tonèn dat deze bilaag hetzelfde gedrag met betrekking tot temperatuur vertoont als de gewone vesikels. De adsorptie isotherm van DODAB op silica is kwalitatief bepaald. Het blijkt dat als teveel DODAB vesikels worden toegevoegd een zogenaamd gemengd systeem ontstaat, met zowel gemodificeerde silica deeltjes als DODAB vesikels. Wanneer een scheidingsstap wordt uitgevoerd na de modificatie procedure, wordt een dispersie met alleen gemodificeerde silica deeltjes verkregen. Dit mengsel kan gepolymeriseerd worden, wat resulteerd in selectief omhulde silica deeltjes met polymeer. Theoretische thermodynamische beschouwingen tonen aan dat fasenscheiding tusen DO DAB surfactant ketens en polystyreen kan optreden. wat de morfologie kan beinvloeden. Echter het systeem wordt kinetisch gecontroleerd en fasenscheiding kan onderdrukt worden door geschikte procescondities te kiezen, zoals een lage reactie temperatuur. De algemene conclusie is dat selectieve omhulling van silica deeltjes mogelijk is met behulp van dubbelstaartige surfactants. Ook is er meer inzicht verkregen in de concepten en kinetiek van polymerisatie en omhullings reacties met deze bilagen. Wel is bet zo dat er vele fundamentele vragen betreffende monomeer verdelingsevenwichten en reactie kinetiek nog niet beantwoord zijn. Dit biedt nog voldoende ruimte voor toekomstig onderzoek op dit gebied.
Summary
SUMMARY
This thesis describes the concepts, kinetics and process control conceming encapsulation reactions ofinorganic silica particles, via an emulsion polymerization process. Previous studies demonstrated that encapsulation of pigment particles can be performed \\1th reasonable success. The formation ofundesired pigment particles, however, could not be prevented, which results in a decrease ofthe efficiency ofthe encapsulation reaction. Additionally it was shown that the encapsulation efficiency is highly dependent upon the applied process conditions, which are not always well defined Therefore, the objective of this investigation is to obtain insight into the mechanisms of the encapsulation process at the molecular level, and its dependenee on the applied process conditions. For this purpose the encapsulation system should be well defined. The inorganic pigment particles used are silica particles, prepared by the Sol-Gel process. These silica particles are spherical and exhibit a narrow partiele size distribution. In this investigation two physical modification procedures have been used, to make the silica particles more hydrophobic: the b1ockcopo1ymer procedure and the twin-tailed surfactant route. Both routes are evaluated in this thesis, according to concepts, kinetics and process control ofthe encapsulation procedure. The basic results and conclusions wiJl be given bere.
Blockcopolymer route The blockcopolymer used is PEO-PBMA, which forms micelles in aqueous solutions as well as in water-ethanol solutions. When phase equilibria is regarded, it has been shown that the modification of the silica particles is essential in order to adsolubilize styrene monomer at the surface of the silica particles. When next to the modified silica particles, micelles and/or latex particles are present, most ofthe styrene will be adsolubilized in the particles and micelles. Polymerization and Encapsulation reactions have been studied with respect to their kinetic behavior. The presence of ethanol in the system has a considerable effect upon the kinetic behavior in the continuous phase as well in the partiele phase. The presence of particles with different morphology has an considerable effect on the kinetic behavior ofthe system as wel I. For modified silica particles the entry rate will be lower and the exit rate will be higher than for latex particles of the same size. For both partiele morpbologies pseudobulk kinetics are appropriate. However, the radical concentration in the modified silica particles is significantly lower then the radical concentration in the latex particles ( when present). This effect, together with monoroer partitioning, illustrates that when secondary nucleation, during encapsulation, occurs the main locus of polymerization '"1ll be in the polymer particles. As a result the efficiency of the encapsulation process decreases. Secondary nucleation in these polymerizations, wiJl occur when the surface area offered by the silica partiele species is not enough to irreversibly adsorb all surface active oligomers. Unfortunately, secondary nucleation can not be prevented in batch reactor systems. Benefit of secondary nucleation can be made, however, by heterocoagulate these particles on the surface of the silica particles.
Summary
Twin-tailed surfactant route Dioctadecyldimethylammonium Bromide (DODAB) is used as twin-tailed surfactant in this investigation. Preliminary to the encapsulation study, the polymerization inDODAB vesicles has been investigated. It appeared that the characterization of the individual stages of the process is of paramount importance. Characterization studies showed that the morphology of the DODAB vesicles is dependent upon the preparation procedure. Vesicles are thermodynamic metastable and exhibit a phase transition temperature, which influences phase equilibria phenomena and polymerization kinetics. Phase equilibria of solvents in DODAB vesicles has been studied as function of temperature. When the temperature is above the phase transition temperature much more solvent can be incorporated in the bilayer than when the temperature is lower than the phase transition temperature. Next, it appeared that bulkthermodynamics do not describe the phase behavior of these systems, but the mi crostmeture of the bilayer should be taken into account Results also indicate that miero-pbase separation can occur, possibly leading to solvent rich parts and DODAB rich parts in the bilayer. The kinetic behavior of polymerizations inDODAB vesicles deviates from a conventional emulsion polymerization. The polymerization starts at a relatively high volume fraction of hydrocarbon DODAB chains. This implies that the basic reactions events are diffusion controlled. Diffusion of species in these bilayers is characterized by lateral and transmembrane diffusion. The coefficient for transmembrane diffusion is many orders lower than for lateral diffusion, as determined by ESR. Therefore, entry and exit events, that are characterized by transmembrane diffusion will be diffusion controlled. Whether polymerization in vesicles exhibit a zero-one or pseudobulk behavior is still uncertain. Studies conceming modification of silica particles with DODAB revealed that DODAB adsorbs on silica as a bilayer. Phase equilibria with solvents withinthese modified silica particles showed the same behavior with respect to temperature, as in the case ofDODAB vesicles. The adsorption isotherm bas been determined qualitatively. When too much DODAB is used, conditions fora mixed system are created, i.e. modified silica particles and DODAB vesicles. When a separation procedure is performed, prior to the encapsulation reaction, selective encapsulated silica particles with polystyrene are obtained. The temperature and the reaction time of the encapsulation reaction seems to be important with respect to the partiele morphology of the encapsulated silica species. Theoretica! thermodynamic considerations suggest that the system DODAB-polystyrene is able to phase separate, which changes the morphology. However, the polymerization is kinetically controlled, and therefore phase separation phenomena can be suppressed by tuning the applied experimental conditions, i.e. low polymerization temperatures. The overall conclusion is that encapsulation of silica particles is possible via the twin-tailed surfactant route. Additionally, a considerable understanding is obtained about the concepts and kinetics of polymerization and encapsulation reactions in genera!, using these bilayers. However, at this stage the conceptsof these polymerization reacrions are described and many fundamental questions conceming phase equilibria and polymerization kinetics are existing. This implies that there is sufficient area for future research, conceming tbis topic.
Table of Contents
TABLE OF CONTENTS
CHAPTER 1 INTRODUCTION l.l General introduetion 1 1.2 Innovation-oriented Research Program (IOP) 2 1.3 Polymer encapsulation of inorganic pigments 3 1.4 Encapsulation procedures used in this investigation 4
1.4.1 Blockcopolymers used as modification agent 4 1.4.2 Bilayer forming surfactauts as modification agent 5
1.5 Aims ofthe investigations 6 1.6 Survey ofthe thesis 8
CHAPTER 2 GENERAL BASICS OF EMULSJON POL YMERIZATION AND SURFACTANT (SELF)-ASSEMBLY
2.1 Introduetion 11 2.2 Emulsion (co )-Polymerization 12
2.2.1 Monomer partitioning 13 2.2.2 Free radical copolymerization kinetics 14 2.2.3 Kinetic events in emulsion polymerization 15
2.2.3.1 The rate of an emulsion polymerization 18 2.2.4 The translation of emulsion polymerization phenomena to
encapsulation systems 19 2.3 Literature survey on Amphiphilic structures 20
2.3.1 Amphilic structure and aggregate morphology 20 2.3.2 Liposomes and vesicles 22 2.3.3 Self-assembly of aggregates 23 2.3.4 Morphology ofDODAB aggregates 24
2.3.4.1 Influence ofpreparation procedure upon the morphology ofDODAB vesicles 24
2.3.5 Assembly oflipid bilayers onto spherical particles 27 2.4 Concluding remarks 28
CHAPTER 3 THE CONCEPT OF NUCLEATION IN HOMOGENEOUS AND HETEROGENEDUS SYSTEMS
3.1 Introduetion 31 3.2 General conceptsin nucleation phenomena 34
3.2.1 Thermodynamicaspects ofnucleation 34 3.3 Kineticaspects ofnucleation 36
3.3.1 The early nucleation stage 36 3.3.2 The subsequent nucleation stage 36 3.3.3 Secondary nucleation 38
3.4 Example 1: polymer particles tbrmed in an emulsion polymerization 38 3.4.1 Historie overview 38 3.4.2 Secondary nucleation in emulsion polymerization 42

ii Table ofContents
3.5 Example 2: Silicon alkoxide particles formed in a Sol-Gel process 45 3.5.1 Historie overview 45 3.5.2 Silica particles formed by the Sol-Gel process 46 3.5.3 Nucleation phenomena in the Sol-Gelprocessof silica 47
3.5.1.1 Secondary nucleation in Sol-Gel process 51 3.6 Example 3:Poly-R-3-hydroxybutyrate particles formed in Alcaligenes
Eutrophus bacteria 52 3.6.1 Biosynthesis ofPoly-R-3-hydroxybutyrate (PHB) particles 52 3.6.2 General frameworkof nucleation phenomena in the formation
of PHB granules 54 3.7 Concluding remarks 56
CHAPTER 4 POL YMERIZA TION REACTlONS AND ENCAPSULATION REACTIONS ON SILICA PARTICLES WITH THE AID OF BLOCKCOPOLYMERSURFACTANTS The influence of process conditions upon the initial situation concerning micellization and phase equilibria
4.1 Introduetion 59 4.2 Experimental section 61
4.2.1 Matenals 61 4.2.2 Preparation of silica particles 62 4.2.3 Solubility of styrene in water-ethanol mixtures 62
4.2.3.1 High performance liquid chromotography 62 4.2.4 Determination blockcopolymer adsorption onto silica using
reflectometry 63 4.2.5 Determination ofthe CMC ofthe blockcopolymer and the size
size of the micelles in water and ethanol-water mixtures 64 4.2.5.1 Bubble tel1Siometry 64 4.2.5.2 Dynamic lightscattering 65
4. 2. 6 Determination of the phase equilibria of styrene 66 4.2.6.1 Phase equilibria of styrene on blockcopolymer modified
silica particles 66 4.2.6.2 Phase equilibria of styrene within the PEO/PBMA
blockcopolymer micelles 66 4.3 Results and discussion 67
4.3.1 Micellization ofPEO/PBMA blockcopolymer 67 4.3.2 Adsorption ofPEO/PBMA blockcopolymer onto silica particles 70 4.3.3 Phase equilibria of styrene 73
4.3.4.1 Influence of partiele morphology upon styrene partitioning 73
4.3.4.2 Influence of ethanol upon monomer partitioning in regular polymerization as well as in encapsulation reactions 79
4.4 Concluding Remarks 83
Table ofContents
CHAPTER 5 POL YMERIZA TION REACTIONS AND ENCAPSULA TION REACTIONS ON SILICA PARTICLES WITH THE AID OF BLOCKCOPOLYMERSURFACTANTS An analysis conceming reaction kinetics and nucleation
5. l Introduetion 85 5.2 Experimental section 87
5.2.1 Matcrials 87 5.2.2 Preparation of silica particles 87 5.2.3 Determining decomposition of persulfate 87 5.2.4 Batch emulsifier free polymerization reactions of styrene 87
5.2.4.1 Measurement of partiele size distributions 89 5.2.5 Batch emulsifier free emulsion polymerization in ethanol-water
mixtures 90 5.2.6 Polymerization of styTene using blockcopolymer emulsifier
in water-ethanol mixtures 90 5.2.7 Batch encapsulation reactions using blockcopolymer surfactant
in water-ethanol mixtures 91 5.2.8 Batch encapsulation of large silica particles 91 5.2.9 Semi-continuous encapsulation reactions using blockcopolymer
surfactant in ethanol-water mixtures 92 5.3 Results and discussion 93
5.3.1 Initiation 93 5.3.2 Continuous phase kinetics 94
5.3.2.1 Entry mechanisms in polymerization and encapsulation systems 95
5.3.2.2 Exit mechanisms in polymerization and encapsulation systems 96
5.3.2.3 The radical balance 98 5.3.3 Nucleation phenomena in emulsion polymerization and
encapsulation reactions 98 5.3.3.1 (secondary) nucleation in emulsifier free polymerization
of styrene 98 5.3.3.2 Nucleation phenomena in emulsifier free polymerization
of styrene in water-ethanol mixtures 99 5.3.3.3 Nucleation phenomena in the polymerization ofstyrene
using blockcopolymer emulsifier in water-ethanol mixtures I 01
5.3.3.4 Nucleation phenomena in the encapsulation ofsilica particles with styrene using blockcopol)'mer emulsifier in water-ethanol mixtures 101
5.3.3.5 Nucleation phenomena in the encapsulation of silica particles with styrene using blockcopolymer emulsifier in water-ethanol mixtures in a semi-continuous process 1 05
5.3.4 Encapsulation oflarge inorganic particles by heterocoagulation 106 5.4 Concluding remarks 108
lil

iv Table of Contents
CHAPTER 6 POL YMERIZA TION IN DIOCT ADECYLDIMETHYLAMMONIUM BROMIDE VESICLES AND 1,2-DIMYRISTOYL-SN-GL YCER0-3-PHOSPHOCHOLINE VESICLES A characterization study
6.1 Introduetion 111 6.2 Experimental section 113
6.2.1 Materials 1 13 6.2.2 Yesiele preparation 114 6.2.3 Bromide counterion titration 114 6.2.4 Steady state fluorescence anisotropy measurements 1 14 6.2.5 (Cryo)-transmission electron microscopy 115 6.2.6 Wide angle X-ray diffraction 115 6.2.7UV-spectroscopy 115 6.2.8 High performance liquid chromatography 116 6.2.9 Gel permeation chromatography 116 6.2.10 Swelling ofDODAB and DMPC vesicles with monomer 116 6.2.11 Polymerization of styrene!EGDM inDODAB and DMPC
vesicles 117 6.3 Results and discussion 1 18
6.3.1 Characterization ofthe DODAB vesicle preparation process 118 6.3.2 Characterization ofthe DMPC vesicle preparation process 123 6.3.3 Swelling ofthe vesicle bilayer with monomer(s) 123 6.3.4 Co-polymerization of styrene!EGDM in the DODAB vesicle
bilayer 127 6.3.4.1 Characterization of composition drift 129 6.3.4.2 Characterization ofmorphology ofpolymerized
DODAB vesicles 132 6.3.5 Co-polymerization ofDMPC vesicles with styrene and EGDM 133
6.3.5. 1 Characterization of composition drift 133 6.3.5.2 Characterization ofmorphology 134
6.4 Concluding remarks 135
CHAPTER 7 MONOMER PARTITIONING IN THE DIOCTADECYLDIMETHYLAMMONIUM BROMIDE VESICLE SYSTEM
7.1 Introduetion 7.2 Experimental section
7.2.1 Materials 7.2.2 Yesiele preparation 7.2.3 Bromide counter-ion titration 7.2.4 High performance liquid chromatography 7.2.5 Cryo-transmission electron microscopy 7.2.6 Swelling ofDODAB vesicles with monomer
137 139 139
140 140 140 140

Table ofContents
7.3 Theoretica! section 7.3.1 Chain configurations and molecular organîzation
7.3.1 1 Effect oftemperature upon the molecular organization 7.3. 1.2 Effect of surface curvature upon the molecular
organization 7.3.2 Solvent partitioning in vesicle containing solutions
7.3.2.1 Mean field (lattice) theories for solute partitioning 7.3.2.2 Theories for solvent partitioning based upon bulk
thermodynamics 7.4 Results and discussion
7.4.1 Model calculations and experimental data 7.4.2 lnterfacial phenomena in solvent partitioning 7.4.3 Effect of polymer-solvent interactions upon solvent partitioning 7.4.4 Effect ofthe microstructure ofDODAB bilayers upon solvent
partitioning 7.4.4.1 Concentration gradient of solvent over the bilayer 7.4.4.2 Effects of size and shape of solvent molecules on
partitioning behavior 7.4.5 Change ofmorpholO!,'Y ofDODAB vesicles after solvent
partitioning 7.5 Concluding remarks
CHAPTER 8 POL YMERIZATION IN DIOCTADECYLDIMETHYLAMMONIUM BROMIDE VESICLES Polymerization kinetîcs
140 140 143
143 144 144
145 147 148 150 153
154 154
157
159 161
8.1 Introduetion 163 8.2 Experimenta1 section 166
8.2.1 Materials 166 8.2.2 Yesiele preparation 166 8.2.3 Bromide counter-ion titration 167 8.2.4 High performance liquid chromatography 167 8.2.5 Swelling of DODAB vesicles with styrene 167 8.2.6 Polymerization of styrene inDODAB vesicles 167 8.2.7 Pulsed laser polymerization inDODAB vesicles with styrene 167 8.2.8 Determining transmembrane diffusion with electron spin
resonance 168 8.3 Results and discussion 172
8.3.1 Diffusion processes of small molecules in vesicle bilayers I 72 8.3.1.1 Lateral ditfusion 173 8.3.1.2 Transmembrane diffusion 173 8.3.1.3 Mechanism of diffusion 174
8.3.2 Detennination of intrinsic rate parameters by PLP in vesicles 176 8.3.2.1 Propagation rate coefficient 176 8.3.2.2 Transfer rate coefficients 179
8.3.3 Kinetic events in polymerization in vesicles 182 8.3.3.1 Phase transfer processes in polymerization in vesicles 182 8.3.3.2 Polymerization inDODAB vesicles, zero-one or
pseudo-bulk? 184 8.4 Concluding Remarks 188
V
vi Table of Contents
CHAPTER 9 ENCAPSULATION OF INORGANIC SILICA PARTICLES USING DODAB BILA YERS
9.1 Introduetion 191 9.2 Experimental section 193
9.2.1 Materials 193 9.2.2 Preparation ofDODAB vesicles 194 9.2.3 Preparation of silica particles 194 9.2.4 Modification of silica particles 194 9.2.5 (Inverse-phase) High cbromatogmphy 194 9.2.6 Steady state fluorescence polarization 195 9 .2. 7 Cryo-Transmission electron microscopy 195 9.2.8 Determination ofthe t;-potential ofthe modified silica particles 195 9 .2. 9 Swelling of the modified silica partiele with styrene 195 9.2.10 Encapsulation experiments 196
9.3 Results and discussion 196 9.3.1 Adsorption behavior ofDODAB on silica particles 196
9. 3 .l.l Characterization of tbe silica surface 197 9.3.1.2 Determination ofthe adsorption isotherm ofDODAB
on the silica particles 198 9.3.1.3 Bilayer adsorption? ) 99
9.3.2 Monoroer partitioning of styrene into modified silica particles 202 9.3.3 Encapsulation ofinorganic silica particles 203
9.3.3.1 Morphology oftbe encapsulated products 203 9.3.3.2 Kinetic evaluation ofthe encapsulation process using
DODAB bilayers 208 9.4 Concluding remarks 211
CHAPTER lOEPILOGUE 213
GLOSSARY OF SYMBOLS 217
APPENDIX A
APPENDIXB
APPENDIXC
SIMULATION OF NUCLEATION PHENOMENA IN THE EMULSIFIER FREE POL YMERIZA TION OF STYRENE 223
THEORETICAL DETERMINA TION OF THE PHASE EQUILffiRIA OF STYRENE AND ETHANOL IN EMULSION SYSTEMS 227
PHASE EQUILffiRIA IN VESICLES 231
ACKNO~EDGEMENTSillANKWOORD 238
CURRICULUM VITAE 239
LIST OF PUBLICATIONS 240

Introduetion 1
1 INTRODUCTION
1.1 General introduetion "There is nothing new under the sun" is a saying which is certainly true for coatings. Evidence of their use for decorative or syrnbolic puqx>ses goes back to prehistorie times. In early times the ancient Egyptians used color coatings on a large scale and in a way that entbralis people to this day. The Egypt ofthe Pharaohs was a highly sophisticated society; this was reflected in a variety of technological skills. Much of the know-how was obtained by using the "alchemy procedure". The word "alchemy" has its origins in pragmatism and empiricism - the straightforward techniques of trial and error on which our predecessors laid the foundation of our own age. Alehemy's more traditional meaning is also relevant for the development of coatings, where the ingredients were all taken directly from what Mother Nature had to offer, such as iron oxide pigments mixed with vegetab ie glue. New developments over time were done consirlering pigments and binder materials. Eventually, the technological revolution of our own age turned alchemy into chemistry and created today's coating based on synthetic binders and pigments. In fact, the modem world would be unthinkable without the proteetion provided by coatings on land, on sea, and in the air. In terms of global volume, the paint industry produces about 24.5 million tons, annually. Today, however, the consequences for a great deal of our industrial heritage are coming in. The coatings industry is faced with great a groundswell of public opinion and the first effects of environmental neglect. Govemments are tightening up environmentallegislation, which prescribes the notification of chemicals, rednetion and limitation of volatile organic compounds, classification ofpackaging labeling, etc. All these legislation's force the coatings industry to become innovative intheir research and development of new materials. These developments are reflected in high solid coatings, water based coatings or powder coatings.

2 Chapter 1
In terrns of energy conservation, developments are made in low-temperature coatings, infrared curing, and two-component finishes. These developments require fundamental scientific research and it seerns that research in coatings has shifted from technological nature to a more scientific nature. This change in direction of coating related research is reflected by the fact that more fun.. damental research is performed in an academie environment The corporation between the paint industry and universities is established in several research programs.
1.2 Innovation-oriented Research Program (I OP) An example of these programs is the Innovation-oriented research program on coatings. Financial support for the IOP is provided by the Dutch Department of Economie affairs. The main objective of the IOP is to act as a comrnunicative bridge between research performed at research institutes such as universities and the industrial research. In industry the research is often focused on business research; support existing production lines and development of new products for which a market already exists. University is more focused on fundamental research using model experimental systems or techniques not comrnonly used in industry. The function ofthe IOP is to act as a bridge between industry and university thus decreasing the gap between the two
approaches of research. A subdivision of the IOP coatings is the Dispersion group, who deals with the dispersion of pigments in the polymer binder material. Recently, water-borne paints have gained much importance in the attempts to reduce the volatile organic compounds. The major components of a paint are the binder, the pigment, and the solvent or dispersion medium. One of the problems introduced by the use of water instead of organic solvents is caused by the difference in surface properties of the pigment 'and the binder material. When the (inorganic) pigment particles are hydrophilic in contrast with to hydropbobic binder rnaterial, agglomeration is likely to take place during the drying and film formation process. These pigment agglomerates reflect light less efficiently, which reduces the biding power and the gloss of the final coating. The agglomerates formed may also introduce hydrophilic zones which can enhance water ditfusion to the underlying substrate surface. As a consequence the mechanical and the protecting properties of the paint are negatively affected. The main objective of the dispersion group is to study the agglomeration process and when the basic mechanisms of agglomeration are known, procedures should be developed in order to
prevent pigment agglomeration. Several PhD students of different universities have different projects, which are focused upon both aspects. Amongst others, the problem of pigment agglomeration may be solved by encapsulating the pigment with a polymer prior to the paint production. In this way it is possible (in principle) to adjust the pigment properties to those ofthe binder material. The distribution of the pigment in the paint film would be more homogeneous, leading to improved durability and weather resistance, and improved mechanical properties.

Introduetion 3
1.3 Polymer encapsulation of inorganic pigments In this thesis the encapsulation of silica pigments wil! be focused on. The opacity properties of
silica are not as superior as those of titanium dioxide. However perfectly spherical silica particles with a narrow partiele size distribution can act as model pigment species for systematic studies
regarding the encapsulation mechanism and its kinetics The methods ofpolymer encapsulation are numerous and excellent reviews are available1
'2
'3
. The
encapsulation procedures can be divided into three main categories.
(1) The first class of polymer encapsulation reactions comprise processes performed in organic solvents. In these procedures the polymer, dissolved in an organic solvent, is adsorbed onto the pigment surface. Close attention should be paid to the polarities ofthe components involved4
'5'6
.
Encapsulation is most likely to take place if the pigment and the polymer are of equal polarity, where the polarity of the solvent should be different from both. Given the number of
disadvantages of encapsulation processes in organic solvents (laborious synthesis, Jow
efficiencies and extensive use of organic solvents), it is desirabie to find other encapsulation
routes, which are more friendly for the environment.
(2) Water bas been used as a reaction andlor dispersion medium instead of an organic solvent, and may be regarcled as the second class of polymer encapsulation. These procedures involve
polymer adsorption from the aqueous phase onto the pigment surface, and emulsion polymerization processes in the presence of inorganic partiel es. Examples of polymer adsorption
is the deposition of polyacrylic acid on titanium dioxide particles by adjustment of the pH, or adsorption ofpolystyrene particles upon titanium dioxide7
, which is usually called encapsulation
by heterocoagulation 17.
Emulsion polymerization in the presence of inorganic particles has been frequently applied as a process of polymer encapsulation of pigment, in the presence or absence of surfactant. Emulsifier
free emulsion polymerization reactions are performed, in the presence of silica, using cationic
surface active monomers8, and nonionic monoroers such as vinyl acetate, methyl methacrylate,
and styrene9.
The general observation is that next to encapsulated product, free polymer partiele formation takes place, which reduces the encapsulation efficiency.
The influence of surfactants on encapsulation reactions has been stuclied as wel! 10. When the
surfactant concentration is above the critical micelle concentration (CMC), significant partiele formation takes place, teading to low encapsulation efficiencies. The best results were obtained
using surfactant concentration below the CMC. However to prevent coagulation attention must be paid to the colloidal stabîlity of the system. In these encapsulation processes via emulsion
polymerization techniques, pigment particles were used without pigment modification, and it may be concluded that the existence of a (hydrophobic) layer around the pigment particles enhances polymerization at the pigment surface. Keeping this in mind, a modification procedure of the pigment particles prior to the encapsulation process may be useful.

4 Chapter 1
Polymer encapsulation in aqueous systems preceded by pigment modification can be regarded as the third class of polymer encapsulation process. Physical pigment modification has been performed using hydroxyl propyl cellulose11
, and amphiphilic polymers12•
The surface modifications mentioned above are physical in nature and the modifying agents may desorb from the surface of the pigment partic les. In order to circumvent the problem of desorption a somewhat different modification process can be used. Caris et al. 13 and Janssen et a1. 14 describe the modification of a titanium dioxide pigment surface with titanate coupling · agents in an aprotic medium ( di-chloro methane). The titanate reacts with the hydroxyl groups at the surface of the pigments and forms a hydrophobic layer around the inorganic surface which is more or less covalently bound Next the hydrophobic particles are dispersed in water using a surfactant and the encapsulation process is performed. Generally a water soluble initiator is used. This approach seems to be the most promising one, since the encapsulation efficiencies are quite high ( 500/o) and it has been shown that this process is flexible in its monitoring and controlling aspectsts. ·
1.4. Encapsulation procedures used in this investigation From previous work on encapsulation it must be concluded that a surface modification of the pigment particles (physical or chernical) may be useful, since this modification makes the particles more hydrophobic initially. Therefore, in this thesis two encapsulation routes are investigated: both using a physical surface modification. However, as described in the previous section, it should be realized that surface modifying agents may desorb from the partiele surface. The rate of desorption may be estimated by the rate of surfactani exchange between micelles and free surfactant present It appears1
8,2° that for low molecular weight surfactants such as sodium dodecylsulfate (SDS), the tirnescale for monoroer excursion in and out of micelles is about 104
sec. Therefore SDS is not vecy suitable for encapsulation purposes. Therefore, surfactant species should be selected, where the rate of surfactant exchange is not that fast, ie. more static systems. In this context blockcopolymers and twin-tailed surfactants are selected for the encapsuJation reactions.
1.4.1 Blockcopolymers as stuface modification agents For the first surface modification of the silica particles blockcopolymers are applied. Blockcopolymers are high molecular weight polymers having two or more distinct regions of different properties16
•19
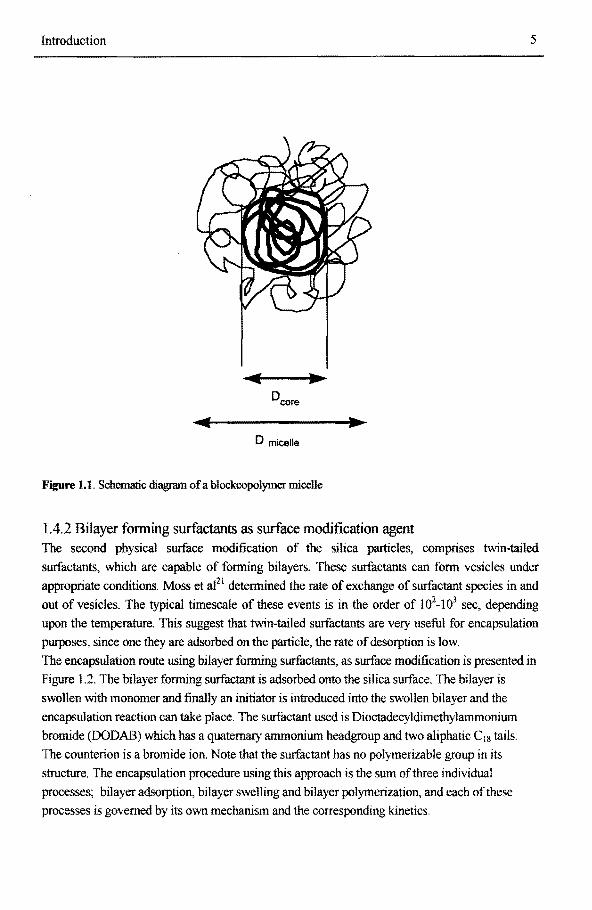
• For instance, an A-B diblock copolymer can be synthesized in such a way that one region of the polymer, the A block say, is hydrophilic and the B block is hydrophobic. When the B block is strongly incompatible with water, the molecules will aggregate to form micelles in which the hydrophobic blocks cluster tagether in within a non-polar hydrocarbon-like core. The hydrophilic blocks extend into the surrounding aqueous solvent forming a "shell" around the interior of the micelle, see Figure l.I. These blockcopolymers wil! be used as physical modification agents which wilt be adsorbed onto the silica particles. After adsorption encapsulation reactions are performed. The results are compared with the results of emulsifier free encapsuJations, where no modification procedure has been applied.
Introduetion 5
0core ... D micelle
Figure 1.1. Schematic diagram of a blockcopolymer micelle
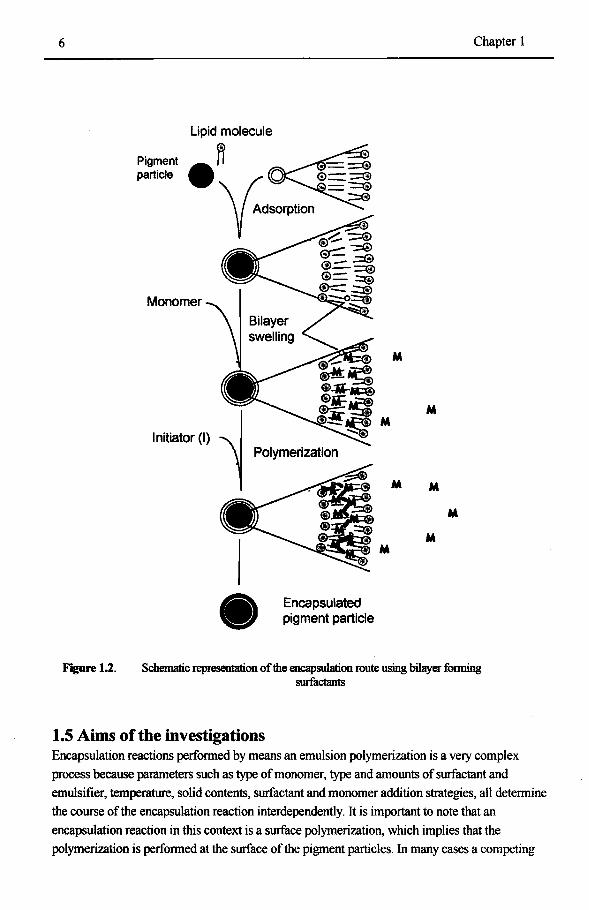
1.4.2 Bilayer fonning surfactants as surface modification agent The second physical surface modification of the silica particles, oomprises twin-tailed surfactants, which are capable of fonning bilayers. These surfactants can fonn vesicles under appropriate conditions. Moss et al21 detennined the mte of exchange of surfactant species in and out of vesicles. The typical timescale of these events is in the order of 102-103 sec, depending upon the tempemture. This suggest that twin-tailed surfactauts are very useful for encapsulation purposes, since one they are adsorbed on the particle, the rate of desorption is low. The encapsulation route using bilayer fonning surfactants, as surface modification is presented in Figure 1.2. The bilayer fonning surfactant is adsorbed onto the silica surface. The bilayer is swollen with monomer and finally an initiator is introduced into the swollen bilayer and the encapsulation reaction can take place. The surfactant used is Dioctadecyldimethylammonium bromide (DODAB) which has a quaternary ammonium headgroup and two aliphatic C18 tails. The counterion is a bromide ion. Note that the surfactant has no polymerizable group in its structure. The encapsulation procedure using this approach is the sum of three individual processes; bilayer adsorption, bilayer swelling and bilayer polymerization, and each of these processes is governed by its own mechanism and the corresponding kinetics.
6
Figure 1.2.
Pigment partiele
Monomer
1-(l)l Polymerization
Encapsulated pigment partiele
M
M
Chapter 1
M
M
M M
M
M
Schematic representation of the encapsulalion route using bilayer fonning surfactants
1.5 Aims of the investigations Encapsulation reactions performed by means an emulsion polymerization is a very complex process because parameters such as type of monomer, type and amounts of surfactant and emulsifier, temperature, solid contents, surfactant and monoroer addition strategies, all determine the course ofthe encapsulation reaction interdependently. It is important to note that an
encapsulation reaction in this context is a surface polymerization, which implies that the polymerization is performed at the surface of the pigment partic les. In many cases a competing

Introduetion 7
process will proceed.leading to the fonnation offree polymer particles (secondary nucleation). For a maximal encapsulation efficiency secondary nucleation should be minimized. However, before this objective can be achieved, basic knowledge about the mechanisms and kinetics of the encapsulation reaction is required. Classica\ roodels used in emulsion polymerization, such as Harkins and Smith and Ewart, are important for basic understanding but are almost useless if applied to these kinds of reactions. Therefore, it becomes necessary to develop general roodels and theories that can be applied to these encapsulation reactions. Only with this knowledge special procedures for encapsulation reaelions can be designed in order to obtain products with the desired properties. This defines the objective of the present investigations: The primary aim ortbis investigation is to obtain a more detailed onderstanding of how the encapsulation mechanisms are related to the cbaracteristics of the monomers, surfactauts and process conditions. The encapsulation process is govemed by a complex matrix of parameters and mechanisrns. The most important and difficult mechanism in the encapsulation reaction is the nucleation stage,
which is responsible for the formation of a second generation of polymer particles. In a conventional emulsion polymerization reaction, nucleation is the less understood stage. It is essential to obtain more basic knowledge about nucleation, in general, in order to control and minimize secondary nucleation. When secondary nucleation in encapsulation reactions cannot be suppressed completely, one should realize that in an encapsulation reaction, always one additional phase is present in the system (pigment particles) compared to a normal emulsion polymerization. The introduetion of an additional phase in the system will affect the monoroer partitioning and the free radical polymerization kinetics. The kinetics of the polymerizing system is determined by the radical balance, i.e. the entry of free radicals into the particles (polymer and/or pigment), the rate ofbimolecular termination, the rate of desorption of free radicals from the particles, and the subsequent events involving these radicals in the aqueous phase. The concentration of radicals, the individual monoroer concentrations in each phase and the kinetics govem the rate of polymerization in each phase. lt is clear that in order to understand the whole process of encapsulation, all of these individual aspects need to be understood. With respect to the route where the bilayer fonning surfactants are used fora physical modification, the same considerations from the above section can be applied. Basic insight in nucleation mechanisms is required in order to force the polymerization to take place in the bilayer exclusively. lt is essential to know how the monoroer partitioning and the polymerization kinetics are influenced using a bilayer fonning surfactant as polymerization medium.

8 Chapter 1
1.6 Survey of the thesis In the previous section it is described that the aim of this investigation is to obtain a more detailed understanding of how the encapsulation mechanisms are related to the characteristics of the monomers, surfactauts and process conditions. However, before doing so, it is essential to design encapsulation systems with well defined conditions. Therefore, perfectly spherical silica particles with a narrow partiele size distribution are prepared, using a Sol-Gel process, which act as model pigment species. When the Sol-Gel process is applied, the consequence is that a considerable amount of ethanol and ammonia is present in the system, prior to the encapsulation reaction. In some studies the ethanol are removed. However, in other investigations the total system is used, in order to evaluate if the presence of ethanol can enhance the polymerization at the surface of the silica particles and suppress secondary nucleation. This thesis can be divided into three major parts. The first part (cbapters 1)., and 3) will introduce the different reaction systems. The second part (cbapters 4, 5} is focused upon the encapsulation route using blockcopolymers. The final section (chapters 6, 7, 8, and 9) describes and characterizes the encapsulation and polymerization reactions, using twin-tailed OODAB surfactant. An outline of chapters 2-10 is given below. Chapter 2 should be considered as a preliminary introduetion and is divided into two sections. The first section is an introduetion to emulsion polymerization. The most important features of emulsion polymerization are briefly considered: monoroer partitioning, free radîcal polymerization kinetics in emulsion polymerization, in order to present the geneml basics. The second section of chapter 2 deals with surfactant assembly processes of twin-tailed surfactant species, divided into surfactant self assembly as well as assembly of surfactant species onto inorganic particles. In this section the peculiar characteristics of twin-tailed surfactants will be introduced, since they are important to consider in polymerization and encapsulation reactions. In Chapter 3 The geneml concepts of nucleation will be discussed for heterogeneous systems. As explained in the preceding section, the understanding of nucleation mechanisms operative in encapsulation reactions very important in order to develop strategies to suppress secondary nucleation. However, before doing so, it is essential to recognize the different mechanisms in the nucleation process in geneml. In this chapter the concept of nucleation in heterogeneaus systems is discussed, teading to the conclusion that there are geneml principles, which are applicable for a number of heterogeneaus systems. Examples of nucleation in heterogeneous systems will given: partiele formation in emulsion polymerization, formation of particles from alkoxymetals (silica and titaniumdioxide particles ), and the formation of granule particles from bacteria species. Chapter 4 deals specifically with nucleation in encapsulation reactions via emulsion polymerization. Results of encapsulation reactions using blockcopolymers as well as emulsifier free encapsulation reactions will be given, which emphasis upon micellization behavior ofthe blockcopolymer and phase equilibria of styrene. Since the preparation of spherical silica particles proceed in ethanol-water mixtures, it is highly likely that ethanol bas an additional influence upon monomee partitioning in the polymerization and encapsulation reactions. Therefore experimental results ofthe influence of ethanol upon these characteristics will be presented, for encapsulation reactions as well as for normal polymerization reactions.

Introduetion 9
In cbapter 5 the results, obtained from polymerization and encapsulation experiments will be discussed upon a more fundamental theoretical basis. The analysis itself will be focused upon the kinetic aspects of the polymerization and encapsulation reactions. (Secondary) nucleation
phenomena will be addressed as welL Chapter 6 presents a characterization study of the polymerization in Dioctadecyldiammonium bromide vesicles is. This twin-tailed OODAB surfactant is used in the final encapsulation process of silica particles. However, as a preliminruy study, polymerization in the vesicle forming species is performed, possibly leading to 'hollow' latex particles. The individual aspects of the polymerization ofDODAB vesicles includes vesicle formation, the incorporation of monoroer in the vesicle structure and finally the polymerization. Each individual aspect is reflected by its own mechanisms and kinetics. Therefore, for visualizing, unraveling and studying these characteristics, proper characterization procedures as well as development reactor setups are essential in order to perform polymerization in OODAB vesicles, and encapsulation reactions successfully. Chapter 7 deals with monoroer partitioning in OODAB vesicles. It wilt be shown by experiments that above the phase transition temperature, much more monoroer is incorporated into the vesicle bilayer than below the phase transition temperature, indicating that the properties of the surfactant molecule significantly affect the mechanism of swelling. An important aspect is that bulk thermodynamics cannot be applied to describe monoroer partitioning in OODAB vesicles, in contrast to swelling of latex partiel es, but that the heterogeneity of the bilayer should be taken into account. Chapter 8 will describe the kinetics of the free radical polymerization in DODAB vesicles. Radical polymerization of unsaturated monoroers in host systems such as vesicles shows similarities with a conventional emulsion polymerization, where traditional micelle forming surfactauts are used. Therefore, the characteristics and kinetics of the polymerization in OODAB vesicles is described from an emulsion polymerization point of view. 1t appears that polymerization in vesicles can be regarcled as a quasi-two dimensional polymerization reaction. Chapter 9 deals with the encapsulation of silica particles using DODAB bilayers, where all the knowledge obtained in chapters 6,7, and 8 is used. In this chapter the determination of the adsorption isotherms, the bilayer swelling, and the encapsulation reactions together with the characterization procedures are described. In Chapter 10, which is the Epilogue, the results and their impact on future developments will be evaluated against the background of the aims described in section 1. 5.

10
References 1. Finch, C.A; in "Encapsulation and controlled release", edited by D.R Karsa
and R.A Stephenson, Royal Society of Chemistl)', Cambridge (1993), 1-12. 2. Karsa, D.R; Stephenson, RA (editors), "Encapsulation and controlled
release", Royal University ofChemistl)', Cambridge, (1993). 3. Ono, T.; Org. Coat., 1986, 8, 279. 4. Nollen, K.; Kaden, V.; Hamann, K, Angew. Makromol. Chem., 1969, 6, 1. 5. Dulog, L.; Schmitz, 0., IJ"' FA11PEC Cèmference Book(1980), Vol I, 145. 6. Laible, R; Hamann, K., Adv Colloid Interface Sci., 1980, 13, 65. 7. Heijman, S.G.J., "Oxide pigmentsin water: the co//oidchemical point of view",
Ph.D. Dissertation, Eindhoven University ofTechnology, (1993). 8. Nagai, K.; Ohishi, Y.; Ishiyama, K.; Kurarnoto, N.,.J. Appl. Polym. Sci., 1989,38,2183.
Chapter 1
9. Hergeth, W.O.; Steinau, U.J.; Bittrich, H.J.; Simon, G.; Schmutzler, K., Polymer, 1989, 30, 254. 10. Hergeth, W.O.; Starre, P.; Schmutzler, K.; Wartewig, S., Polymer, 1988, 29, 1323. 11. Furusawa, K.; Kimura, Y.; Tagawa, T.,.!. Col/oid Interface Sci., 1986, 109, 69. 12. Hoy, KL.; Smith, O.W., Polym. Mater. Sci. & Eng., ACS Fall Meeting 1991, New York,
65 (1991), 78. 13. Caris, C.H.M., Kuijpers, RP.M.; v. Herk, AM.; German, AL, Makromo/ Chem., Makromol.
Symp., 35/36, (1990), 335. 14. Janssen, RQ.F.; v. Herk, AM.; German, AL, 2r FA11PEC Conference Book(1994), vol.l, 140 15. Janssen, RQ.F.; Derks, G.J.W.; v. Herk, AM; German, AL., in ''EncapsulationandControlledRelease",
edited by D.R Karsa and .A Ste phenson,Royal Society ofChemistl)', Cambridge (1993), 633. 16. Hurter, P.N.; Hatton, T.A, Langmuir, 1992, 8, 1291. 17. van Herk, AM., German, AL., "Microencapsulated pigments and fillers", to be published. 18. Meguro, K., Akasu, H., Keno M.,.!. Am. Chem. Soc., 1976, 53, 145. 19. Kawaguchi S., Yekta, A, Duhamel, J., Wmnik, M.A., Ito, K.,.J. PhysChem., 1994,98,7891. 20. Karaboni, S., Esselink K., Hilbers, P.AJ., Smit B.,.!. Phys. Condens Mater., 1994, 6, A 351.
Moss, RA, Bhattacharya S., Chatteijee, S.,.!. Am. Chem. Soc., 1989, 111, 3680.

General Basics ofEmulsion Polyrnerization and Surfactant (Self)-Assembly
2 GENERAL BASICSOF EMULSION
POLYMERIZATION AND SURFACTANT (SELF)ASSEMBLY
2.1 Introduetion
11
In this thesis the attention will he focused on two different encapsulation procedures, where a physical modification is adopted prior to the encapsulation reaction, i.e. the physical modification routes using blockcopolyrners and bilayer forrning surfactants. For both modification routes the aim of the investigation is to understand the mechanism and kinetics of the encapsulation process. In this context, this chapter should he considered as a prelirninary introduction, basically introducing background information and general concepts of emulsion polyrnerization and surfactant (self}assembly. This chapter is divided into two major sections. In the first section emulsion polyrnerization as a heterogeneous system is introduced. The typical characteristics of an emulsion (co )-polyrnerization process, i.e., monoroer partitioning, composition drift and polyrnerization are described from a 'basic point of view'. These general principles wiJlheusedas a reference point for further model development in order to descrihe heterogeneaus systems with a more complex behavior, which are introduced by the silica particles andlor ethanol. The second section is concemed with surfactant self assembly as well as assembly onto inorganic silica particles. The attention is focused upon twin-tailed surfactants, because in the second modification procedure Dioctadecyldimethylarnmoniurn Bromide (DODAB) is used as double tailed surfactant, prior to the encapsulation reaction. A literature survey will be given about arnphiphilic molecules, in general, where important arnphiphile structures and morpbologies are described. Historically, phospholipid arnphiphiles, produced by nature, are the most studied class of arnphiphilic molecules. Nowadays, twin-tailed surfactants are produced synthetically, which exhibit the sarne properties as the natura! phospholipids. Very important properties of these twin-tailed surfactants are introduced such as: a gel to liquid phase transition temperature (Tm), packings parameters, flip
flop dynamics, etc. These characteristics are of pararnount importance in regard of the polyrnerization and encapsulation reactions using these species.

12 Chapter 2
2.2 Emulsion (Co)-Polymerization Conventional (radical) emulsion polymerization involves the dispersion of a monomer, an unsaturated molecule, in a continuous aqueous phase and may be stabilized by an emulsifier, followed by free radical polymerization started usually with a water soluble initiator. This results
in a reaction medium consisring of submicron polymer particles swollen with monoroer and dispersed in the aqueous phase. The final product is called a latex and consists of a colloidal dispersion in water. The Harkins-Smith-Ewart theory describes that the batch process of emulsi
on polymerization can be divided into three intervals. Interval I describes partiele nucleation, where besides monoroer dropiets and water a third phase is formed consisting of monoroer swollen latex partic les. Interval 11 starts when the nucleation stage has ceased; the polymerization process proceeds with the monoroer dropiets present, and the polymer particles as well as the aqueous phase are saturated with monomer. At the end of interval 11 the monoroer dropiets have disappeared and the remaining monoroer in the aqueous phase and in the polymer particles is polymerized in interval m. The initiator is usually watersoluble and dissociates thermally in two radicals (e.g. the commonly used persulfate ). The persulfate radicals react very rapidly with monoroer dissolved in the aqueous phase. The radicals will propagate further to form oligomers. The latter can either ( 1) terminate in the aqueous phase, (2) precipitate to form precursor particles that become stabie latex particles, or (3) enter into existing micelles and/or latex particles. Note that aqueous phase kinetics are very important in the emulsion polymerization process. When emulsion copolymerization is considered, the process involves two monomers. Although this is very obvious, it characterizes the main difficulty of the process: the only thing the monoroers have in common is that they can react with a free radical to give a polymer. All other characteristics, for example water solubility, reactivity, may be different. The major consequence of this variety of characteristics is that emulsion copolymerization in a batch process airoost always shows composition drift. This phenomenon is responsible for the chemica! heterogeneity of the copolymers formed. Composition drift occurs when the monoroers are not consumed at the same rate. As a consequence the composition of the monoroer mixture then changes continuously. The difference between the instantaneous copolymer composition and the monoroer feed composition is caused by two contributions. The first contribution to composition drift is the difference between the monoroer composition in the loci of polymerization (latex particles) and the overal monoroer composition. This is caused by the differences in monoroer partitioning over the phases present. The second contribution to the composition drift is caused by a difference in the reactivities of the monoroers towards the radicals. There are two general situations. ( 1) The monoroer that is more reactive in copolymerization is also less water soluble. The composition drift may be very strong, as the main loci of polymerization are richer in the more reactive monomer. In comparison to bulk polymerization the composition drift becomes stronger by

General Basics ofEmulsion Polymerization and Surfactant (Self}Assembly 13
addition of water. (2) The monoroertbat is more reactive is also more watersoluble. In this case the direction ofthe composition drift depends upon the monoroer/water ratio62
.
As a result of composition drift, a batch reaction may not result in tbe desired polymer latex. A
(semi)-continuous processcan be used to suppress composition drift, because then the monoroer concentrations in all phases can be controlled at any time63
•64
. However, this requires detailed knowledge of monoroer partitioning ( section 2.2.1) and of free radical (co )polymerization kinetics (section 2.2.2).
2.2.1 Monomer Partitioning Phase equilibria govem the concentrations of monomer( s) in all phases, because it is generally assumed tbat thermodynamic equilibrium is approximated in emulsion (co )polymerizations.
Most roodels described in literature are based on the description of tbe thermodynamics of polymer solutions according to the Flory-Huggins lattice theory1
'2'3. When this lattice theory is
applied to emulsion polymerization, the resulting expression for the Gibbs energy of mixing a solvent (monomer(s)) with polymer bas to be combined with an expression for tbe interfacial energy (Kelvin effect). This contribution is significantforsmalt particles, as reported by Morton et al.4 The Morton equation for the saturation swelling of polymer particles by one monomer is given by:
Where AGi,p is the partial molar Gibbs energy or chemica! potential of mixing of the monoroer in the polymer phase, vP is the volume fraction of polymer, Pn is the average degree of polymerization, X.~p is the Flory-Huggins interaction parameter, V m is the molar volume of monomer, y is the interfacial tension between the partiele phase and tbe aqueous phase, and Ro is tbe radius of the swollen particle.
Several investigators5•6•7•8 applied this approach in tbeir work to describe monomer partitioning in
emulsion (co )polymerizations by combining expressions for the molar free energy of each monoroer in every phase with mass balances. However, only in a few cases the theoretica! expressions were validated witb experimental data. Recently a number of papers have been publisbed dealing with major simplifications to the full equations derived by Ugelstad et af Maxwell et al.9
•10 have madesome assumptions teadingtoa
simplification of tbe Vanzo equation5. The results of the assumptions for the one monoroer
system are that partial swelling, especially at higher volume fractions of polymer, can be described by combinatorial entropy of mixing9
•10
.

14 Chapter2
2.2.2 Free radical copolymerization kinetics The model most frequently used to describe sequence distribution and chemical composition of copolymers is the terminal model, also known as the ultimate model. The ultimate model was introduced independently by Alfrey and Goldfinger1 1 and by Mayo and Lewis12
• In this model the basic assumption is that the monomer addition to a radical hearing chain only depends on the
nature of the terminal group of the radical and the monomer. The reactivity ratios of monomers i and j are defined by ri = kpnlkpg and ri = ~i> where kpn, kp_ij are the homopropagation rate coefficients of monoroers i and j respectively, and ~i is the propagation rate coefficient of the propagation reaction of a radical with terminal unit i and monomer j. The instantaneous copolymerization equation relating monomer composition with the copolymer composition is given by Eq. (2.2).
(2.2)
Where fi is the molar fraction of monoroer i in the mixture and Fi the molar ftaction of monomer i in the copolymer. The average propagation rate coefficient (kp) for copolymerization can also be described by the terminal model according to:
(2.3)
In many copolymerization systems the terminal model bas been shown to describe the copolymer composition satisfactory. However, when experimental techniques became available such as pulsed laser polymerization (PLP)13
• 14
, it became clear that the terminal modelsoften fails in descrihing the average propagation rate coefficient properly. Therefore, amongst others, the penultimate model is used by many investigators14
'15
•16
•17 to describe absolute propagation rate
coefficients. Although the terminal model, in most cases, bas been accepted to describe the copolymer composition, the penultimate model is commonly used for the average propagation rate coefficient. Fukuda et al. 18 reported an overview of the various models for the kinetics of free radical copolymerization Pulsed laser polymerization bas been widely accepted as the standard metbod for obtaining (almost model independent) propagation rate coe:fficients for styrene and alkyl methacrylate monomers. Since the molecular weight distribution is used for the calculations, it is essential to have highly accurate procedures for obtaining the molecular weight distributions. Normally gel permeation chromatography (GPC) is used for this purpose. In this respect the IUP AC committee wil! introduce standard procedures concernins pulsed laser polymerization, which is useful but also essential for obtaining proper propagation rate coefficients21
• Accurate propagation rate coefficients are essential since these are the most important fundamental parameters, used in all model calculations concerning emulsion polymerization22
.

General Basics ofEmulsion Polymerization and Surfactant (Self)-Assembly
2.2.3 Kinetics Events in emulsion polymerization A free radical polymerization is a chain reaction polymerization where initiation, propagation,
termination and chain transfer occur simultaneously. Radical processes occur both in homogeneous systems (bulk and solution polymerization) and heterogeneous systems such as
dispersion and emulsion polymerization.
Initiation and propagation
15
The simplest recipe for an emulsion polymerization starts out with water, surfactant, a water
soluble insoluble monoroer and a water soluble initiator. The system is agitated to form an emulsion. Hearing or irradiation results in the production of free radicals by dissociation of the
initiator. In this investigation persulfate is used as water soluble initiator, which decomposes
schematically according to:
(2.4)
where I represents the initiator, R* the initiator radical and k.J. the fust-order rate coefficient for dissociation. The initiator may be water soluble or oil-soluble and two fundamental steps are
possible for the radicals formed by the initiator. First they can be terminated by recombination
with the other primary radical, formed from the sameinitiator molecule (cage effecti4•25
. The other step is the addition of a monoroer unit to produce a monomeric free radical, whicb is called
initial propagation according to:
(2.5)
where M represents the monoroer unit, RM1* is a radical with an initiator end group and one monoroer unit added, and kp1 is the second-order rate coefficient for the addition of the fust monoroer unit to the primary free radical.
The further addition of monoroer units to the growing free radical is called propagation which is schematically represented as:
(2.6)
where R.Mn * and RM'n+1 represent growing polymer ebains with n and n+ 1 monoroer units respectively, kp is the chain length independent second-order rate coefficient for propagation.
Terminanon When two (growing) radicals react to form an alkyl chain without radical activity this is called termination. Due to this process radical activity is lost in free-radical polymerization. It is wellestablished that termination rate coefficients depend upon the length of the radicals involved.
Furthermore, termination is govemed by the ditfusion coefficient of a polymerie radical, consisting of two contributions: center-of-mass ditfusion and 'reaction diffusîon'. The former,

16 Chapter 2
due to the motion of a radical is by far the most important contribution to the total ditfusion coefficient in emulsion systems. The latter is ditfusion of the chain end by propagation. The termination of two growing polymer chains, forming non-living polymer rnaterial, can occur in two distinct ways, i.e. combination and disproportionation. The general termination reaction is given in Eq. 2. 7, where kt is the second-order rate coefficient for termination:
RMo• + RMo * ~ dead polymer (2.7)
Chain transfer Chain transfer is the process by which radical activity is transferred from a growing chain to another species i.e. monomer, polymer, chain transfer agent, solventor surfactant When no chain transfer agents are added, chain transfer to monomer is the most dominant event If chain transfer to monoroer occurs, the resulting monomeric radical can either propagate to beoome a new growing polymer chain. Therefore, chain transfer is not necessarily a radicalloss process. It just
decreases the average kinetic chain length of the polymer. The general termination reaction is given in Eq. 2.8, where ktr is thesecond-order rate coefficient for chain transfer
Mn*+T~Mn+T* (2.8)
Phase Transfer Processes in Emulsion Polymerization Kinetics and mechanisms in emulsion polymerization are govemed by propagation, transfer, and termination (as described above ), and additionally two processes arising from phase transfer reactions called "entry" and "exit" (or synonymously, adsorption and desorption) ofradicals by and from the particles. Phase transfer phenomena are a direct consequence ofthe heterogeneous nature of emulsion polymerization. Propagation, transfer and termination are obviously kinetic events, but phase transfer events are controlled by phase equilibria, kinetics and mass transfer events. Usually water soluble initiators are used in emulsion polymerization, such as persulfate. Therefore, free radicals are produced in the aqueous phase. These primary free radicals first undergo a few propagation steps in the aqueous phase until the oligomeric radical beoomes surface active and will migrate towards the partiele surface. This processis called "entry". Maxwell et al26 supposed entry to be instantaneous when the oligomeric radical becomes surface active. This means that the rate determining stepforentry is the growth ofthe sulfate oligomeric radical to beoome a surface active oligomer, which is govemed by aqueous phase kinetics. Entry is therefore a phase transfer process, by which the radical activity is transferred from the aqueous phase to the partiele phase. It is obvious that entry into polymer particles is a radical gain mechanisrn, which will increase O!Jar when no radicalloss mechanism is operative. Next to termination, "exit" from radical species from latex particles is a radicalloss mechanism and an important phenomenon in emulsion polymerization reactions. Exit is characterized by transfer of free radical activity to mornoroer or chain transfer agent, creating a small radical, which is more or less soluble in the aqueous phase.

General Basies ofEmulsion Polymerization and Surfaetant (Self)-Assembly 17
This radieal may be transferred from the partiele into the aqueous phase8. Nomura et al27
proposed a three-step meehanism for the exit event: ( 1) a monomerie free radical is generated by
transfer; (2) the monomerie radical must diffuse through the interior of the latex partiele to the
partiele surfaee, and undergo desorption, and both these steps must occur before additional
propagation events in the partiele phase ean take plaee; (3) the species must diffuse away from
the partiele into the bulk phase.
Note that a transfer event must take place before exit phenomena can occur and that exit is
strongly dependent upon the partiele radius and glass transition temperature of the polymer, since
ditfusion processes are dominant here28. The fate of desorbed free radicals is rather complex,
because of the concomitant process of re-entry. Desorption results in free radicals being removed
from the particles, but does not necessarily mean a loss of free-radical activity for the entire
system when re-entry events are operative29'30
. Phase transfer processes in emulsion
polymerization are very complex in nature and depend strongly upon temperature, amount of
specifie surface available (particle size), surfactant coverage of the latex particles, type of
monomer, and the possible presence of chain transfer agent. In figure 2. 1 the schematic picture
for the fundamental events operative in an emulsion polymerization process is presented.
Figurel.l
Initiator
( ""' aqueous-phase
/ en try
propagation
aqueous-phase terminstion
re-escape
A schematic representation of the fundamental events in an emulsion polymerization

18 Chapter 2
2.2.3.1 The Rate of Emu/sion Polymerization The kinetics of emulsion polymerization are mainly controlled by the distribution and exchange of the radicals over the various phases. The rate of polymerization (Rp) for any batch free radical polymerization is given by:
Rp=-d[MJ/dt=kp [M] [M*] (2.9)
where [M] is the monomer concentration, and [M*] is the radical concentration in the reaction medium. This equation is usually applied to homogeneous systems such ·as solution and bulk polymerization However, when heterogeneous systems are considered such as emulsion polymerization, compartmentalization must be taken into accounr3
. Compartmentalization means that each latex partiele acts as a bulk reactor. In a homogeneous system, any radical has access to any other radical. However, in emulsion polymerization, the loci of polymerization are the latex particles, and a radical in one partiele will have no direct access to a radical in another particle, without the occurrence of a phase-transfer event. Compartmentalization has a major influence on the kinetics ofthe emulsion polymerization system. The rate ofpolymerization in emulsion is given by:
(2.10)
where Cm is the monomer concentration in the polymer particles, N.: is the number of particles, Door is the time average number ofradicals per partiele and Nav is Avagadro's number. The time evolution ofthe fractional conversion in a batch process, dx/dt is:
(2.11)
where A is the so called conversion factor and 11mo is the initially added number of moles of monomerper unit volume in the recipe. Eq. (2.8) is valid in interval I,II, and ID. In interval ll the propagation rate coefficient (kp) and the monomer concentration in the particles are assumed to be constant In interval m, however, the monomer concentration decreases. Assuming that all monomer is present in the partiele phase and that the volume contraction due to polymerization is negligible, it can be shown that:
(2.12)
where Cmo is the value of Cm at the beginning of interval ID.

General Basics ofEmulsion Polymerization and Surfactant (Self)-Assembly 19
Substituting Eq. (2.11) into Eq. (2.12) leads to:
-dln( 1-x )/dt = kp Cmo Ne noo/ N. nmo = A' Ilmr (2.13)
where A' is the conversion factor for interval III, and x is the monoroer conversion in interval III. Data evaluation using Eq. (2.13) is very useful to gain mechanistic information of the time
evolution of Ilmr·
However, this approach is limited to seeded emulsion polymerization systems: by restricting attention to Interval II and m the complexity of nucleation is avoided. The second restrictive condition necessary to perform this mathematica! treatment, is that the emulsion polymerization system under investigation exhibit zero-one kinetics, in which termination is not mte determinini3
. This may he achieved by using sufficiently smal! seed particles so that whenever a second mdical enters a partiele already containing a radical, termination will occur sufficiently quickly. The partiele sizes in this case should notexc.eed 100 nm.
In principle it is possible to use the time dependenee data of the conversion of monomer into polymer, in seeded emulsion polymerization systems exhibiting zero-one hehavior, for the time evolution of tlmr, which yields mechanistic information about phase transfer processes. However systems with larger partiele sizes than 100 run, will display a pseudo-bulk hehavio~3 . A pseudo-bulk system is one in which the compartmentalized nature of the locus of the
polymerization has no effect on any kinetic property (molar mass, mte and partiele size distribution). A system where 11mr is appreciably larger than 0.5 is pseudo-bulk: there are so many radicals in a partiele that the polymerization wil! be indistinguishable from the equivalent bulk one.
2.2.4 The Translation ofEmulsion Polymerization Phenomena to Encapsulation Reactions
If a conventional emulsion polymerization is compared with an encapsulation reaction performed in emulsion, there is an essential difference that will change the monomer partitioning as well as the kinetics. In encapsulation reactions there is always the presence of an additional phase namely the (silica) pigment particles. When monomer partitioning in encapsulation reactions is considered it is obvious that the incorpomtion of an extm phase in the system (pigment particles) will have a significant effect upon the monomer partitioning processes. The monomer partitioning in encapsulation reactions may he described by the original equations with the addition of an extra term descrihing the surface energy of the pigment particles. This approach will he outlined further in chapter 4. It is further important to note that monomer partitioning in conventional latex systems is described using modified Flory-Huggings equations, which is a bulk thermodynamic approach. In bulk systems with bulk properties the heterogeneity of the system is not taken into account.

20 Chapter2
This approach is validated for the description of swelling of amorphous composite particles i.e. modified silica particles with blockcopolymer, but may fail in descrihing the swelling of semicrystalline structures, such as DODAB vesicles and silica particles covered with OODAB bilayers. General observations in this respect will be reported in chapter 7 and chapter 9. The introduetion of an extra phase may have a pronounced effect on the kinetics as well. The
encapsulation reaction may be regarded as a seeded emulsion polymerization where the modified silica particles may act as the initial seed. When secondary nucleation cannot be prevented, there will be two kinds of particles in the system, different in morphology as well as in size. It might be possible that the secondarily nucleated particles will have a larger degree of swelling than the modified silica partic les. As a consequence the main locus of polymerization will be the polymer particles rather than the surface ofthe silica particles. When a water soluble initiator such as sodium persulfate is used, the oligomeric radicals that have become surface active can undergo entry into the polymer particles as well into the modified silica particles. These competitive entry processes are highly dependent upon the amount of partiele surface present. In the beginning of the reaction there is only surface available ftom the composite silica particles. When secondary nucleation can not be avoided, the surface area of polymer particles is increasing rapidly, causing the "locus of entry'' to change. The radicalloss mechanism of exit may be different as well. When the rate of chain transfer is assumed to be equal for both types of particles, the rate of exit ftom silica modified particles will be larger than ftom polymer particles, since the total volume of polymer will be lower. Finally the termmation mechanisms may differ for both partiele types. lt is obvious that the radical balance is influenced dramatically by the introduetion of an additional phase. The radical concentration in the modified silica particles will be lower than in the polymer particles, due to a lower entry rate and a higher exit rate. It is obvious that whenever possible, secondary nucleation should be completely avoided. When secondary nucleation cannot be sufficiently suppressed, it might be possible to achleve heterocoagulation of the secondarily nucleated particles on the outer surface of the (modified) silica particles (see chapter 4 and chapter 5)
2.3 Literature Survey on Amphiphilic Structures 2.3.1 Amphiphile structure and aggregate morphology Amphiphiles are molecules that contain a hydrophobic as wen as a hydrophilic part31
. Because of this property these molecules form all kinds of aggregates in water. The hydrophilic parts interact with the aqueous phase and the hydrophobic parts tend to minimize the contact with water by assembling together, see Figure 2.2. The possible structure of these aggregates include micelles, single or multilarninar vesicles , microtubes, bilayers and inverted structures. A great variety of molecules have been reported to form such supramolecular structures as those shown in Figure 2.2. The hydrophobic sections of these amphiphilic molecules usually consists of one or two saturated or unsaturated hydrocarbon chains, which may contain polymeri.zable groups, rigid aromatic segments, etc.

General Basics ofEmulsion Polymerization and Surfactant (Selt}Assembly 21
The hydrophilic headgroup may be a neutral group, like a poly(oxyethylene) chain, or may be an
ionic group, such as a phosphate, sulfonate, ammonium, or a carboxylate group32• The driving
force for aggregation of amphiphiles in polar solvents such as water, is the hydrophobic
effece3•34
. On the one hand, aggregation is accompanied by a decrease in entropy which is the
result of a smaller motional freedom of the amphiphilic molecules in the aggregate. On the other hand, the release of water molecules from the highly ordered hydration shells around the
hydrophobic parts of the amphiphiles compensates for this negative entropy effect. As a result the
net change in entropy of the system is positive. In contrast to what is frequently thought, this
favourable entropie effect is probably not the major contribution to the negative free energy of
the aggregation process, but the favorable change in the enthalpy should be taken into account as
well. In dilute solutions those types of aggregates will be formed for which the interfacial free energy is at a minimum. This interfacial free energy is made up of two opposing forces: (i)
repulsive headgroup interactions which include electrostatic repulsion between charged
headgroups and overlap of hydration shells, and (ii) attractive interactions which arise from the
hydrophobic effect. The total interfacial free energy of an aggregate containing N amphiphilic
molecules can be regarcled as the sum of the interfacial free energies is of the separate amphiphilic molecules (J.t0J in the aggregate35
• The amphiphiles wil! form that type ofaggregate
for which (J.t0J is at a minimum. When (~J.0J is equal for different aggregate sizes the entropy factor will favor the formation of smaller aggregates. Israelachvilli et al. 36 have used statistica)
mechanics to derive criteria for the optimal paclcing of amphiphiles in various aggregates.
For this purpose a packing parameter is derived i.e. v/a.l, in which v and 1 are the volume and the length of the hydrophobic chains, respectively, and a is the headgroup area. The criteria are:
spherical micelles will be formed when v/al< 1/3, vesicles and bilayers when 1/2 <v/al< 1, and inverted structures if v/al> 1, as presented in Figure 2.2.
This approach bas reasonable predictive power under conditions of thermodynamic equilibrium.
However the approach has been questioned by some mechanistic studies, where exceptions to the rule have been found47
•48
•49
. The packings parameter does not take into account different types of
interdigitation and tilting of the alkyl ebains in the aggregate.
The magnitude of the packing parameter may be finther affected by factors such as unsaturation in the hydrocarbon chain, pH and temperature which influence the motion of the non-polar ebains and the hydration ofthe headgroup50
.
From these considerations it is obvious that the morphology of the aggregates is still difficult to predict

22
Figure2.2
Micellar structures
'cone shaped' (v/a I}< 0.5
Bilayer Structures
Chapter2
lnverted structures
.R· ·.
. . . . ~·:~·.·.·.·::.·.:.· ... :.
'lnverted-cone shaped (v/al>1}
'Cilindrical shaped' 0.5< v/al <1
Schematic representation of common surfactant aggregate structures inwater
2.3.2 Liposomes and Vesicles In 1967 Bangham et al?7 reported that phospholipids isolated from natural membranes fonn so called lipasomes upon dispersion in water. These aggregates contain a bilayer membrane which encloses an aqueous oompartment Lipasomes are osmotically active which indicates that the bilayer membrane is semi-penneablé8
. Because of their structural resemblance to biomembranes, liposomes are the most frequently used model systems. More practical applications of these systems include their use as matrices for the construction of synthetic blood substitutes39 and their use as micro-capsules for drug delivery40
'41
. Chapman et al. 42 were the first to report that lipasomes fonned from pure phospholipids show a pbase transtion fonn a gel-state to a liquid-crystalline state which occurs at a specific temperature (Tm). When the bilayer membrane is in the gel-state the amphiphilic molecules are regularly packed with their alkyl ebains in an all-trans confonnation, and have a very low mobilitY9
. Above the phase transition the regular pacldng of the molecules is disturbed and the number of gauche defonnations in the alkyl ebains is increased.

General Basics ofEmulsion Polymerization and Surfactant (Self)-Assembly 23
The discovery by Kunitake43 and coworkers in 1977 that a simple synthetic surfactant N,N
didodecyl-N,N- dimethylammonium bromide, can also form !i posomes upon dispersion in water,
has opened a new field of research. These "synthetic liposomes" are commonly called vesicles.
Excellent reviews are available32•44 which describe vesicle formation from all kinds of synthetic
amphiphiles. Vesicles have properties that are similar to those of liposomes. They also entrap
aqueous solutes, are osmotically active and show a gel to liquid-crystalline phase transition of the
bilayer.
2.3.3 Self-Assembly of aggregates Surfactants usually form three dimensional molecular aggregates in water, and the main driving
force is the hydrophobic effect. The size and the morphology of the amphiphile assembly is
govemed by a complex compromise of intermol ecular interncrions leading to a minimum value
of the Gibbs (free) energy. The assembly process has been analyzed in terros of equilibrium
thermodynamics. However, the kinetic aspects in the assembly process should not be omitted
Computer simulations based upon molecular dynamics have shown the dynamic nature of the
assembly. Statistica! thermodynamics prediets that vesicles composed of one type of amphiphile
are in a metastable state45•46. It is clear that smal! perturbations may trigger a transitiontoa more
stabie andlor unstable state. Generally the formation of vesicles requires additional energy to
reach thermodynamic stability. The preparation procedure, such as sonification, ethanol injection
or extrusion, generates the required energy. The size and morphology of the vesicles will be
determined by the preparation method. This applies also to the thermal stability. Often there is a
tendency to crystallization depending on the nature of the surfactant molecules in the bilayer.
Important phenomena in determing vesicle stability are vesicle aggregation and vesicle fusion.
Yesiele fusion, although wellknown as molecular event for decades, is still ill-defined on a
molecular basis50. Vesicles composed of cationic amphiphiles (OODAB) are triggered to fuse by
adding anions such as citrate, EDTA and dipicolic acid anion51 , resulting in a decreased
electrostatic repulsion and dehydration of the bilayer surface. Fusion processes are mainly
operative at temperatures above the liquid crystalline state.
Another phenomenon that affects the assembly is the dynamics of the 'monomeric' surfactant
molecules within the bilayer. It is generally assumed that once vesicles have been formeel, al most
all 'monomeric' surfactant molecules are enclosed in the aggregate structures. The dynamics of
trans-membrane ditfusion or Flip-Flop, between endovesicular and exovesicular loci may be
important. Flip-flop dynamics are investigated for alkylammonium ion vesicles, as a fimction of
alkyl chain lengthand temperature using esterolytic cleavage reactions52.
Flip-flop dynamics are suppressed significantly (time period hours) with increasing alkyl chain
length and when the temperature of the vesicular dispersion decreases below the phase transtion
temperature of the surfactant.
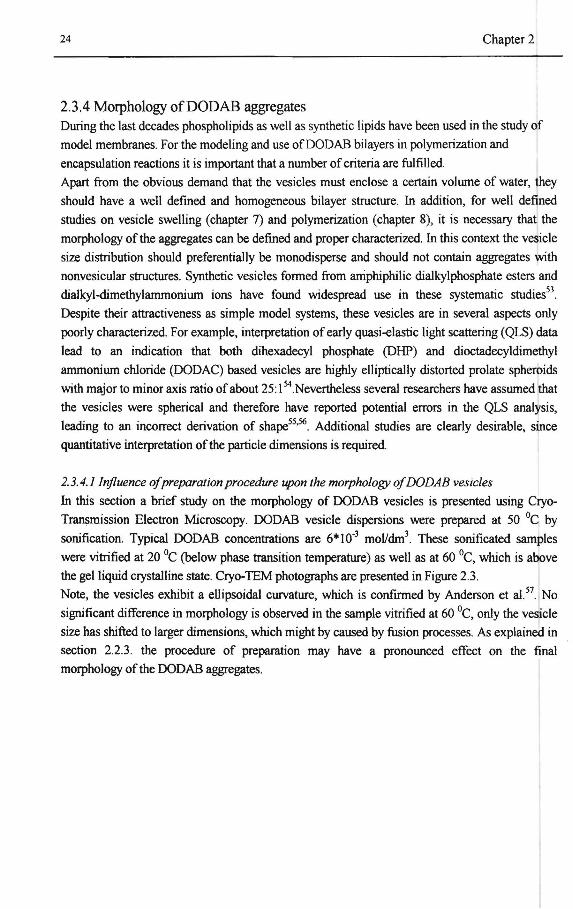
24 ehapter 2
2.3.4 Morphology ofDODAB aggregates During the last decades phospholipids as well as synthetic lipids have been used in the study of
model membranes. For the modeling and use of DO DAB bilayers in polymerization and
encapsulation reaelions it is important that a number of criteria are fulfilled.
Apart from the obvious demand that the vesicles must enclose a certain volume of water, they
should have a well defined and homogeneous bilayer structure. In addition, for well defined
studies on vesicle swelling ( chapter 7) and polymerization ( chapter 8), it is necessary that the
morphology of the aggregates can be defined and proper characterized. In this context the vesicle
size distribution should preferentially be monodisperse and should not contain aggregates with
nonvesicular structures. Synthetic vesicles formed from amphiphilic dialkylphosphate esters and
dialkyl-dimethylarnmonium ions have found widespread use in these systematic studies53.
Despite their attractiveness as simple model systems, these vesicles are in several aspects only
poorly characterized. For example, interpretation of early quasi-dastic light scattering (QLS) data
lead to an indication that both dihexadecyl phosphate (DHP) and dioctadecyldimethyl
ammonium chloride (DODAC) based vesicles are highly elliptically distorted prolate spheroids
with major to minor axis ratio of about 25: 154.Nevertheless several researchers have assumed that
the vesicles were spherical and therefore have reported potential errors in the QLS analysis,
Jeading to an incorrect denvation of shape55,56. Additional studies are clearly desirable, since
quantitative interpretation of the partiele dimensions is required.
2. 3. 4.1 lnjluence of prepara/ion procedure upon the morphology of DO DAB vesicles
In this section a brief study on the morphology of OODAB vesicles is presented using eryo
Transmission Electron Microscopy. OODAB vesicle dispersions were prepared at 50 °e by
sonification. Typical OODAB concentrations are 6*10-3 moVdm3. These sonificated samples
were vitrifled at 20 °e (below phase transition temperature) as wellas at 60 °e, which is above
the gelliquid crystalline state. eryo-TEM photographs are presented in Figure 2.3.
Note, the vesicles exhibita ellipsoidal curvature, which is confmned by Anderson et al.57. No
significant ditTerenee in morphology is observed in the sample vitrifled at 60 °e, only the vesicle
size has shifted to larger dimensions, which might by caused by fusion processes. As explained in
section 2.2.3. the procedure of preparation may have a pronounced effect on the final
morphology ofthe OODAB aggregates.

General Basics ofEmulsion Polymerization and Surfactant (Self)-Assembly
Figure 2.3
(a)
t>- ·)~)} ... \$...,_.. ~1 '>"I;<{J ';-'"-S:;l;J d•l!P~ •"r• •bl 'ot'" •""(-~
(b)
ecyo-TEM photographs of sonificated DO DAB vesicular dispersions (a) vitrified at 20 °e, (b) vitrified at 60 °e
25
Sonification as preparation technique may cause structural damage to the OODAB amphiphilic molecule. Therefore, extrusion procedures have been used. OODAB solutions were extruded at
60 °e using polycarbonate filters with pore sizes of 400, 200, 100 and 50 run. Samples were taken and vitrifled at 25 °e. The photographs are shown in Figure 2.4.

26
Figure2.4
Chapter 2
(c) (d)
Cryo-TEM photographs of DO DAB vesicular dispersions prepared by extrusion (a) pore size 400 mn, (b) pore size 200 mn, ( c) pore size 100 nm, (d) pore size 50 run
Note that in all cases the vesicle size distributions are rather polydisperse, although caution
should be taken when drawing confinnative conclusions, since the vesicles will become
separated according to size during the vitrification process. The change in DODAB vesicle
morphology, however, is clearly visualized. The structures obtained by extrusion through 200 nm
pore size filters are almost spherical. When the pore size is decreased a tendency towards a larger
number ellipsoidal species is observed. It is beyond the scope ofthis thesis to explain in detail the
reasons for this behavior of the morphology. However, it is c\ear that only a slight change in
preparation procedure may lead to a significant change in morphology, and therefore proper
characterization should be perfonned upon these species, before further systematic studies
conceming vesicle swelling, polymerization and encapsulation can proceed.

General Basics ofEmulsion Polymerization and Surfactant (Selt)-Assembly
2.3.5 Assembly oflipid bilayers onto spherical particles When DODAB bilayers are used for the functionalization of silica particles, it is important to recognize the conditions necessary for applying such a moditication successfully. For the preparation of such functionalized surfaces it is required to deposit lipid bilayers on solid surfaces. These so-called substrate supported membranes currently can be prepared by two methods: (1) by monolayer transfer from a Langmuir·Blodget film balance58,and (2) by vesicle fusion59
•60 The latter process is often performed since it is relatively simpte. In this thesis the
vesicle fusion approach will be adopted for the adsorption of DO DAB bilayers onto silica particles. Despite the practical importance of vesicle fusion on solid surfaces, little is known about the mechanisms and kinetics of the formation of a completely supported bilayer61
27
The formation of a supported bilayer involves vesicle adhesion and rupture, foliowed by fusion of the bilayer. A schematic view ofthis processis presented in Figure 2.5
Figure2.5
a) o~
Schematic view of the formation of a supported membrane by random deposition of vesicles from solution which adsorb and spread out at random sites. The deposition technique may involve four steps: (a) approach, (b) adhesion (c) rupture, and ( d) lateral spreading of the bilayel1
The situation is to some extent analogous to the classical spreading of liquid dropiets on dry solid surfaces. The colloidal intemctions between the bilayer and the substrate are of paramount importance. Temperafure may have a significant effect, because the adsorption may proceed above or below the gel to liquid crystalline transition tempemture of the bilayers used. Here it is obvious that proper chamcterization techniques are required to study the adsorption of liquid bilayers onto spherical particles. These techniques must be developed before systematic studies conceming this interesting phenomena can be performed.

28 Chapter 2
2.4 Concluding Remarks In this chapter the general concepts of emulsion (co )-polymerization and surfactant ( self)assembly bas been discussed These concepts will be used as setpoints for further model developments concerning the polymerization and encapsulation reactions. The feeling may be that the title ofthis chapter is somewhat a misomer since it appeared that the "General Basics" are not that basic. In fact all the mechanisms discussed are extremely complex and highly dependent upon the conditions applied. In the case where blockcopolymers will be used in the modification procedure, emulsion polymerization kinetics and monomer partitioning will become important The introduetion of an additional phase( s) will influence monomer partitioning as well as the polymerization kinetics, since secondary nucleation is likely to occur. These formed polymer particles may shift monomer partitioning and the radical concentration, which is unfavorable for the composite silica particles, since the encapsulation efficiency wilt be reduced. If possible, secondary nucleation must be suppressed, or the secondarily formed particles could be used in the encapsulation process through heterocoagulation on the surface of the pigment particles. The modification route using :OODAB bilayer forming surfactant is difficult as well, since surfactant (self}assembly processes are opemtive. The principles of surfactant assembly are, although extensively studied, still not completely understood Therefore, before systematic studies can be perfurmed upon these phenomena, emphasis must be put upon design of proper characterization and polymerization procedures. As wilt be revealed in this thesis, proper experiments, using proper characterization procedures, are essential for model development conceming polymerization and encapsulation phenomena.
General Basics ofEmulsion Polymerization and Surfactant (Self)-Assembly
References
1. Flory;P.J.;.J. ChemPhys., 1942, 10, 51. 2. P.J. Flory "Principles of Polymer Chemistry", Comel University Press,
lthaca, NewYork, (1953). 3. Huggins, M.L., .I. P~s. Chem. 1942,26, 151. 4. Morton, M.; Kaizerman, MW.; Alter, J;.!. Colloid Sci., 1954, 9, 300. 5. Vanzo, E., Marchessault, V; Stannet, J.,.!. Colloid Sci, 1965, 20, 62. 6. Ugelstad, J.; Mork, P.C.; Mfutakamba, H.R.; Soleimany, E.; Nordhuus, 1.;
Schmid, R; Berge, A.; Ellingsen, T.; Aune, 0.; Nustad, K; in "Science and Techno/ogy of Polymer Colloidv", Eds. Poehlein, GW.; Ottewil, RH; Goodwin, J.W., NATO ASI Series 1, (1983).
7. Guillot, J.;Makromol Chem., RapidCommun., 1980, 1, 697. 8. Forcada, J.; Asua, J.M;.!. Appl. Polym. Sci., 1990, 28, 987. 9. Maxwell, I. A.; Kwja, J., van Doremaele, G.H.J., Gerrnan, A.L.; Morrison, B.R; Makromol.
Chem., 1992, 193,2049. 10. Maxwell, IA; Kwja, J.; van Doremeale, G.H.J.; Gerrnan, A.L.,Makromol.Chem., 1992, 193, 2065. 11. Alfrey, T.; Goldfinger, J;.!. Chem. P~s., 1944, 12, 205. 12. Mayo, F.M.; Lewis, J.;.J. Am. Chem. Soc., 1944,66, 1594. 13. Olaj, O.F.; Bitai, 1.; Gleixner, G.; Makromol. Chem. 1985, 186, 2569. 14. Davis, T.P.; O'Driscoll, K.F.;.!. Polym. Sci., Polym. Lett., 1989, 27, 181. 15 Fukuda, T.; Ma, Y-D.; Inagaki, H.,Macromo/ecules, 1985, 18, 17. 16. Davis, T.P; O'Driscoll, K.F.; Piton, M.C.; Winnik, M.A.; Polym.lnt., 1991, 24, 65. 17. Ma, Y-D.; Kim, P.-S,; Kubo, K.; Fukuda, T., Polymer, 1994, 35, 1375. 18. Fukuda, T.; Kubo, K; Ma, Y-D, Prog. Polym. Sci., 1992, 17,875. 19. Fukuda, T.; Ma, Y-D.; Kubo, K; Inagaki, H., lbid, 1991,24,370. 20. Heuts, J.P.A.; Maxwell, I.A.; Gilbert. RG. in preparation 21. Buback, M., Gilbert, RG., Hutehinson, RA., Klumperman, B., Kuchta, F.D., .Manders, B.G.
O'Driscoll, K.F., Russel, G.T, Schweer, I., Macromol Chem. P~s.. 1995, 196, 3267. 22. Zirkzee, HF.; van Kilsdonk, W.F.; van den Eoden, M.C.A.; van Herk, A.M.,
German A.L., Acta Polymerica, 1996, 47, 441. 23. Gilbert, R. G.; "Emulsion Polymerization, "A Mechanistic Approach", Academie
Press, Harcourt Brace & Company, New York, (1995). 24. Franek, J.; Rabinowitsch, E.; Trans Faraday Soc., 1934, 30, 120. 25. Hansen, F.K.; Ugelstad, J.; in "Emulsion Polymerization", Pirma, I., Ed., Academie Press, New
York, (1982). 26. Maxwell, lA.; Morrison, B.R; Napper, D.H.; Gilbert, R.G.,Macromolecu/es, 1991,24, 1629. 27. Nomura, M; Harada, M;.!. Appl. Polym. Sci., 1981, 26, 17. 28. Ugelstad, J.; Hansen, F.K.; Rubber Chem. Techno/., 1976, 49, 536. 29. Casey, B.S.; Morrison, B.R; Gilbert, R.G.; Prog. Polym. Sci., 1993, 18, 1041. 30. Casey, B.S.; Morrison, B.R; Maxwell, I.A.; Gilbert, R.G.; Napper, DH;.!. Polym. Sci. A: Polym. Chem.,
1994, 32, 605. 31. Fendler, J.H.; Membrane Minmetic Chemistry, Wûey, New York, (1982). 32. Ringsdorf, H.; Sehlarb, B.; Venzmer, .!., Angew. Chem, 1979, 18, 325. 33. Evans, D.F.; Nmham, B.W.; J. P~s. Chem., 1986, 90, 226. 34. Tanfurd, C; "The Hydrophobic F;ffeeC, Wûey Interscience, New York, (1973) 35. Israelachvilli, J.N.; Marcelja, S.; Hom, R.G.; Quart. Rev. Biaph., 1980, 13, 121. 36. Israelachvilli, J.N.; Mitchell, D.J.; Nmham, BW.; J. Chem. Soc. Far. Trans., 1976, 2, 72, 1525. 37. Bangham, A.D.; Hom, RW.;.!. Mol. Biol., 1964,8, 660. 38. Bangham, A.D.; de Gier, l; Greville, G.D.; Chem. Phys. Lipids, 1967, 1, 225. 39. Seelig, J.; Seelig, A.; Quart Rev. Biophys., 1980, 13, 19. 40. Devaux, P.F.; Seigneuret, M.; Bioch. Biaph. Acta, 1985, 822, 63. 41. Knowles, P.F.; Marsh, D.; Bioch. J., 1991,274, 625. 42. Philips, M.C.; Williams, R.M.; Chapman, D.; Chem. P~s. Lipids, 1969, 3, 234. 43. Kunitake, T.; Okahata, Y.;.!. Am. Chem. Soc., 1977, 99, 3860. 44. Kunitake, T.;Angew. Chem. Int. Ed. Eng/., 1992,31,709. 45. Leermakers, F.A.M.; Scheutjens, J.M.H.M.;.!. Phys. Chem., 1989, 93, 7417. 46. Lacic, D.D., Biochem. J, 1988, 256, 1.
29

30 Chapter2
47. Nusselder, J.JH.; Engberts, J.B.F.N, Langmuir, 1991, 7, 2934 48. Nusselder, J.J.H.; Engberts, J.B.F.N, J. Org. Chem., 1991 49, 3088. 49. Nagarajan, R; Ruckenstein, E; Langmuir, 1991, 7, 2934. 50. Engberts, J.B.F.N., Hoekstra, D., Biochimicaet BiophysicaAclrl, 1995, 1241,323. 51. Rupert, LAM.; van Breemen; J.F.L., Hoekstra, D.; Engberts, J.B.F.N.
J. Phys Chem., 1988, 92,4416. 52. Moss, RA.; Fujita, F.; Ganguli, S;Langmuir, 1990,6, 1197. 53. Fendler, J.H, "Membrane Mimetic Chemistry", Wiley-Interscience: New York, 1982 54. Hemnann, U.; Fendler, J.H., Chem. Phys. Lett., 1979, 64, 270. 55. Cannona-Ribeiro, A.M.; Yosbida, L.S.; Sesso, A.; Chaimovich, H.
J. Col/oidlnteljace Sci, 1984, 100,433. 56. Tricot, Y.M.; Furlong, D.N.; Sasse, WHF.; Daivis, P., Snook, L.
van Megen, W.J., J. Colloid Intelface &i, 1984, 97, 380. 57. Andersson, M.; Hammerstrom, L.; Edwards, K., J. Phys. Chem., 1995, 99, 14531. 58. Tamm, L.K.; McConnel, H.M.; Biophys J, 1985, 47, 105 59. Bayerl, T.M.; BloomM. Biophys J., 1990, 58, 357. 60 Kalb, E; Frey, S; Tamm, L.K., Biochim. Biophys. Aclrl, 1992, 1103, 307. 61. Radler, J., Strey, H.; Sackmann, E.; Langmuir, 1995, 11, 4539.
The Concept ofNucleation in Homogeneous and Heterogeneous Systems
3 THE CONCEPT OF NUCLEATION IN
HOMOGENEOUS AND HETEROGENEOUS SYSTEMS
3.1 Introduetion
31
When encapsulation of silica particles with styrene proceeds via an emulsion polymerization
process, it is recognized that encapsulation is a surface polymerization where the
polymerization is performed at the surface of the pigment partiel es. A competing reaction
may be operative, depending upon the applied conditions, teading to the formation of free
polymer particles, which will decrease the encapsulation efficiency. Therefore, for maximal
encapsulation efficiency secondary nucleation should be minimized. Adequate process
control in encapsulation reactions can accomplish this requirement. However, before doing
so, basic knowledge about nucleation phenomena at the molecular level is required.
Nucleation of solids species , in general, from liquid systems is important in many diverse
areas ofscience such as metallurgy, physiology and chemistry. In industry, paint formulation,
polymerization and plastic manufacture (crystallization), saline water conversion (via ice),
photographic chemica! manufacture and many other process involve the principles and
mechanisms of partiele nucleation. Therefore, a fundamental onderstanding of the
thermodynamics, kinetics and mechanisms of nucleation is of major importance for control
of partiele structure and morphology.
It is the objective ofthis chapter to recognize general mechanisms operative in partiele
nucleation in any kind of heteropbase polymerization.
These mechanisms may bedescribed using general principles. Before the nucleation process
itself is discussed in more detail, it may be interesting to characterize the products of
nucleation and their behavior.

32 Chapter 3
The major common feature of all these products is that they express a co Hoidal behavior. An
important question in this context is: What are colloids and what is co Hoidal behavior?. In
order to answer this question it is obvious that fundamental theoretica! understanding of
co Hoidal behavior is required. Colloid science is a truly interdisciplinary subject1, which
combines knowledge ofbroad areas ofphysics, chemistry, mathematica! physics, together
with an understanding ofbiological structures and processes.
When the definition of colloids is considered, it should be said that any attempt to postulate a
scheme or definitions and nomendature is likely to be unnecessary restrictive. Rather than
try to develop a formal definition, it is preferabie to describe examples of systems to where
the term 'colloidal' is applied.
Ostwald et ae described colloid systems consisting of a dispersed phase ( or discontinuous
phase) distributed uniformly in a finely devided state in a dispersion medium ( or continuous
phase ). Some familiar examples of colloidal systems are: fogs, mists, and smokes ( dispersion
of fine liquid dropiets or solid particles in a gas- aerosols); milk (a dispersion of fine dropiets
offat in an aqueous phase- emulsions); paints, and slurries (dispersions of fine solid
particles in a liquid medium- sols or colloidal suspensions). Other examples are association
colloids where molecules of surface-active substances are associated together to form small
aggregates (micelles/vesicles) in water. The aggregates formed by certain substances may
adopt an ordered structure and form liquid crystals. Many biologica} systems are colloidal in
nature. For example, blood is a dispersion of corpusdes in serum, and bone is essentially a
dispersion of a calcium phosphate embedded in collagen.
Some of the more important types of colloidal systems outlined above are summarized in
Table 3.1. By many experiences in colloid science and systems, it turns out that colloidal
systems exhibit a specific colloidal character when the dimensions of the dispersed phase is
in the range of 1-1000 nm. The limit below which colloid behavior merges into that of
molecular solutions is usually presumed to be around 1 nm. When the range of dimensions in
colloidal structures is considered, the observation is that the surface-to-volume ratio is high.
Out ofthe above, it appeared that the products ofnucleation processes express a colloidal
behavior, and that as result ofnucleation processes, (additional) heterogeneity is introduced
in the reaction system. Therefore it may be postulated that nucleation is an array of colloid
chemical events, which results in the formation of a new phase, exhibiting co Hoidal
properties. In this respect partiele nucleation, precipitation, phase formation. and phase
separation can be used as synonyms37.
lt is important to note that the communities of nucleation events are governed by
thermodynamics, where the peculiarities of the nucleation events are determined by the
chemistry and the kinetics of the partienlar process.

The Concept ofNucleation in Homogeneous and Heterogeneous Systems 33
Table 3.1. Some typical colloidal systems
Examples Class Disperse Phase Dispersion Medium
Di&~r::HI)Wim&
Fog, mist, tobacco Liquid aerosol or Liquid Gas smoke, sprays aerosol particles lndustrial smokes Solid aerosol Solid Gas Milk, butter, Emulsions Liquid Liquid mayonnaise lnorganic colloids Sols or colloidal Solid Liquid gold, silver iodide, suspensions paints and coatings Organic colloids Solid suspension Solid Liquid Polymer latices, or dispersion toothpaste, muds Foams, Froths Foam Gas Liquid
Macromolecular colloids
Jellies, glue Gels Macromolecules Solvent
Association colloids
Soap I water, solutions (---) MicellesiVesides Solvent
Biocolloids
Musde, cell (--) Protein structures Lethecin
Natural rubber (-) Solid Liquid
PHB in granules (-) Solid Cytoplasma
However, it may be argued that nucleation phenomena can be characterized according to a
general framework, which describes the thermodynamics and kinetic behavior ofthe
nucleation process. First the thermodynamîc aspects ofthe nucleation process will be
discussed, which can bedescribed according to the classica! nucleation theory (CNTt.
Secondly the kinetic characteristics ofthe nucleation process will be described, since usually
the nucleation events take place in 'living dynamic systems', where the relevant parameters
are changing rapidly with time. This general framework of nucleation will be illustrated by
several examples:
* Polymer particles formed in emulsion polymerization
* *
Alkoxymetal particles formed from condensation reactions
Polyhydroxybutyrate granules formed in Alcanologenes Eutrophus bacteria
Note that all these examples are intrinsic different products, but they have one characteristic
in common which is their colloidal behavior where surface chemistry plays an important role.
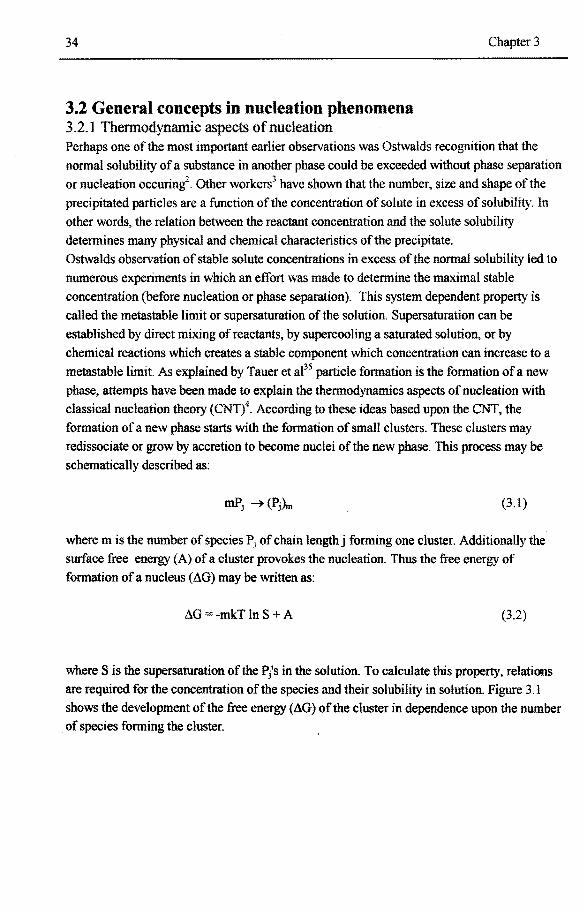
34
3.2 General concepts in nucleation phenomena 3 .2.1 Thennodynamic aspects of nucleation
Chapter3
Perhaps one of the most important earlier observations was Ostwalds recognition that the normal solubility of a substance in another phase could be exceeded without phase separation or nucleation occuring2
. Other workers3 have shown that the number, size and shape ofthe precipitated particles are a function of the concentration of solute in excess of solubility. In other words, the relation between the reactant concentration and the solute solubility determines many physical and chemical characteristics of the precipitate. Ostwalds observation of stabie solute concentrations in excess of the normal solubility led to numerous experiments in which an effort was made to determine the maximal stabie concentration (before nucleation or phase separation). This system dependent property is called the metastable limit or supersaturation of the solution. Supersaturation can be established by direct mixing of reactants, by supercooling a saturated solution, or by chemical reactions wbicb creates a stabie component which concentration can increase to a metastable limit As explained by Tauer et ae5 partiele formation is the formation of a new phase, attempts have been made to explain the thermodynamics aspects of nucleation with classical nucleation theory (CNTt, According tothese ideas based upon the CNT, the formation of a new phase starts with the formation of small clusters. These clusters may redissociate or grow by accretion to become nuclei of the new phase. This process may be schematically described as:
(3.1)
where m is the number of species Pj of chain length j forming one cluster. Additionally the surface free energy (A) of a cluster provokes the nucleation. Thus the free energy of formation of a nucleus (L\G) may be written as:
L\G = ·mkT In S + A (3.2)
where Sis the supersaturation oftbe Pj's in the solution. To calculate this property, relations are required for the concentration ofthe species and their solubility in solution. Figure 3.1 shows the development ofthe free energy(L\G) ofthe cluster in dependenee upon the number of species forming the cluster.

The Concept ofNucleation in Homogeneous and Heterogeneous Systems
Figurel.l
Critica! point
0
-m
" I ••• \ /
• • lndividual particles species
Free energy of nucleus formation dependenee on the number of species fonning a nucleus
35
The curve L\G increases with increasing m and goes through a maximum which corresponds to the critical nucleus with the critica) composition IIlc-
The maximum in the free energy curve can be considered as the activation energy for nucleation. Nuclei formed with a number of molecules less then IIlc will dissolve again but when m is larger then me the nuclei are considered to be stable. It is obvious that the activation energy and the rate of nucleation is strongly dependent upon the experimental conditions36.The general observation is that nucleation phenomena can only occur when a critical degree of supersaturation is exceeded, which is determined in principle by thermodynamic considerations. The supersaturation can be estimated according to4
:
S q,t/ Cj,o (3.3)
where Cj,t is the concentration of the species of a critica) size j and Cj,o is the solubility of species of size j in the continuous phase. From equation 3.3 it is obvious that when the concentration of species of size j increases, supersaturation will be exceeded and the formation of a new phase will proceed. When nucleation proceeds usually Cj,t decreases and subsequently the supersaturation will drop below its critica! value, which will cease the nucleation processas recognized by Tauer et ae7
. This principle of supersaturation in nucleation phenomena may be valid for almost all colloidal systems.

36
3.3 Kinetic aspects of nucleation 3.3.1 The early nucleation stage In the previous section the thermodynamic aspects of nucleation are discussed.
Chapter 3
It appears that nucleation can be described as the formation of a new phase and that the
thermodynamic aspects of nucleation can be modeled according to general principles of the
CNT theory. The intrinsic CNT theory, however, does not take into account the kinetic
aspects of the nucleation process, although this is an essential requirement in order to
describe the dynamics of the nucleation process. In many cases nucleation events take place
in 'living dynamic systems', where a chemical reaction is involved. As a consequence the
relevant parameters will change rapidly as function of time. This may be visualized by the
definition of supersaturation in equation 3.3. The property Cj,o in equation 3.3 may be
regarded as a constant depending upon the hydrophobicity of the continuous phase.
However, the concentration development of Cj,t may or may not occur by reaction. In the
formation process of micelles and vesicles, for example, there is no reaction involved and Ci,t
is dependent upon the amount of surfactant added to the solution. The formation process of
polymer particles in many other heterogeneous processes involves the buildup of species to
the critical size j by the addition of individual monomer units. Since the dynamic process to
reach supersaturation may involve a chemical reaction, kinetic aspects in nucleation
phenomena are becoming important as well. The complex interaction between the
thermodynamic aspects, whoputs forward the boundary conditions ofthe nucleation
processes and the reaction kinetics, which is responsible for the dynamic behavior, may be
regarded as the general framework for descrihing nucleation. The reaction rate for the
addition ofthe building bloks to the critica! size j is dependent upon the concentration ofthe
initiaring species, the concentration, and the chemical structure ofthe building bloks in the
aqueous phase. When supersaturation is reached at the critica! degree of polymerization of j,
these species will become insoluble in the aqueous phase.
Concomitantly these j-mers want to minimize their surface area and will collapse forming a
precursor particle. Here two casescan be distinguished: (1) The j-mer will collapse by itself,
forming a precursor particle, or (2) severalj-mers will agglomerate together forming a
precursor particle, see figure 3 .1. At this stage the first precursor particles are formed,
indicating the first stage of the nucleation process. Several attempts have been made to
modify the CNT theory in order to incorporate the dynamic behavior ofthe first stage ofthe
nucleation process36•38
•39
•40
. It is clear, however, that the relative simple model, based upon
CNT, can only he valid for the early nucleation stage35.
3.3.2 The subsequent nucleation stage The subsequent nucleation stage proceeds after the formation of the first precursor
particles. Precursor particles in this context mean colloidal unstable particles.
The events that are occurring in the subsequent stage of the nucleation process are
schematically presented in Figure 3.2.

The Concept ofNucleation in Homogeneons and Heterogeneons Systems
In the snbseqnent stage of the nucleation process two different events may occur simultaneously: (1) The precursor particles are colloidal unstable and may coagulate with each other until they become stabie particles. (2) A competitive eventin the aqneous phase will proceed. The reaction in the
37
continuous phase generate species which are becoming surface active at a critica! chain length z (z<j). These species will adsorb on the partiele surface of already existing partic les, provided that enough partiele surface ts available.
2) Subsequent stage of nucleation
A'· + M_. M'"A + i---A' + 8 Surface active
___ A...;dso~rpti..;.'o...;n __ _. ~-~••-
! Coagulation of Precursor articles
species
Gompeiltion between adsorption and furrther growth ®piil'lderi upon partiele SUfface availeble
I
I
A'· +M .... M'"Ar M;-A·----t--...... 8 Surface active F urther growth t
species towards nucleation
Figure3.2
Reaction in continuous phase
1) Earty stage of nucleatlon,
Formation Precursor particles
The events that govern partiele nucleation in the early and the subsequent stage of the nucleation process
In the early stage ofthe nucleation process this is not the case. Therefore, the surface active species have no opportunity to adsorb onto existing partiel es. These species will continue to grow in the continuons phase and will form a new precursor particle. Later in the nucleation process, When the total partiele surface increases, the competitive event for adsorption onto existing particles will become more dominant, and the rate of nucleation will cease. This is an important observation which may be valid irrespective of the mechanism of partiele formation: Partiele formation wil! cease when there
is a sufficient number of particles, of sufficient size, to capture all z-mer speciei 1•
It is clear that for theoretica! model development conceming these nucleation phenomena, knowledge of thermodynamicaspects as wellas kineticaspects (coagulation, adsorption) is required.

38 Chapter 3
state assumption can be made in the kinetic evaluation. Since the development of partiele
number and partiele size distribution as a function of time are the most accessible
parameters, which can in principle determined experimentally, proper model development
must focused upon these parameters. The experimental determination of the partiele number
and partiele size distribution as function oftemperature is essential, but often very difficult
due tothespeed ofthe nucleation process.
3. 3. 3 Secondary nucleation Secondary nucleation is the generation of a new erop of particles in a reacting heterogeneous
system. This phenomena usually occurs later in the reaction, after the first partiele formation
event. It is important to avoid the formation of a second erop of particles in encapsulation
reactions, but also in core-shell emulsion polymerization reactions. Predicting the conditions
for partiele formation is necessary in order to determine operating conditions, which do not
result in the formation of new particles. In general, secondary nucleation can be induced by
two reasons which are triggered by events in the system prior to secondary nucleation: ( 1)
The total partiele surface available is not sufficient to capture all the surface active z-mer
species. (2) The properties ofthe surface ofthe particle, i.e. chemical composition, are not
compatible to the species which are undergoing adsorption. Adsorption of these species is
not irreversible and further growth in the continuous phase towards partiele formation can
proceed. It is obvious that the events responsible for triggering secondary nucleation are
highly dependent upon the reaction system under investigation and the applied experimental
conditions. The appearance of secondary nucleation in reactive systems will be discussed
more quantitatively for emulsion polymerization systems, see section 3.4, and the formation
of silica particles via Sol-Gel processes, see section 3. 5.
The combination of the driving force towards nucleation, based upon thermodynamic
considerations, andreaction kinetics (responsible for dynamic behavior)
may be regarded as the general framework of nucleation. This general concept will be
illustrated by three examples, discussed in the next sections.
3.4 Example 1: Polymer Particles formed in an Entnision Polymerization Process
3.4.1 Historie Overview characteristics ofthe fmallatex i.e., partiele size distribution, partiele number and stability
will be fixed. Partiele nucleation is also a complex process that is still not well understood.
Note that the chemistry which is responsible for the peculiarities of the nucleation process is
of a free radical type.

The Concept ofNucleation in Homogeneaus and Heterogeneaus Systems 39
Partiele nueleation in emulsion polymerization is the most important stage, since during this
interval the finallatex i.e., partiele size distribution, partiele number and stability will be
fixed. Partiele nucleation is also a complex process that is still not well understood. Note that
the chemistry which is responsible for the peculiarities ofthe nucleation process is of a free
radical type. In literature three different nucleation models have been proposed, i.e. micellar,
homogeneous and coagulative nucleation. Harkings5 ( 194 7), in his widely used theory,
proposed micelles as the locus of nucleation .. The fundamental assumption in this theory is
that free radicals, generated by decomposition of the initiator in the aqueous phase, are
adsorbed in the monomer swollen micelles. Smith and Ewart6 derived an analytica! solution,
based upon micellar nucleation, predicting the final number of partiel es. Micellar nucleation
seems to describe the nucleation phenomena for hydrophobic monomers (styrene) and
surfactant concentrations above the critical surfactant concentration. However for more water
soluble monomers do notfit this theory, and for thermodynamic reasoos it is unlikely that
primary free radicals, formed in the aqueous phase, will transfer spontaneously into the
(organic) micellar phase, because they are charged7. Priest8
, investigating vinyl acetate
emulsion polymerization, was the first to report on partiele nucleation by homogeneaus
nucleation. According to this mechanism aqueous phase kinetics will play a dominant role in
the partiele formation process. The charged radicals generated in the aqueous phase will react
with dissolved monomer to form soluble oligomeric radicals. These oligomeric radicals will
grow by further addition of monomer units until they exceed their solubility limit
(supersaturation) in the aqueous phase and precipitate. The precipitated oligomeric radicals
will adsorb surfactant molecules (when available) and form precursor particles. Oligomeric
radicals formed later in the nucleation process may form precursor particles or can be
captured by already formed polymer particles, see tigure 3.1.
Hansen, Ugelstadt, Fitch and Tsai9•10 (HUFT) modified the concepts ofthe classical
homogenous nucleation theory for emulsion polymerization. They coneluded that the rate of
nucleation is decreasing when the rate of formation of surface active oligomers is equal to the
adsorption rate of oligomeric radicals by already formed particles. The coagulative
nucleation mechanism is an extension ofthe HUFT-theory, introducing coagulation events
after the formation of the first precursor partieles. These precursor particles are extremely
small in size (lnm) and have a high surface curvature, as explained insection 3.3. This
causes the precursor particles to coagulate, since they exhibit poor co Hoidal stability and also
the monomer concentration in those precursor particles is much lower than in the larger
stabie latex partiel es. Consequently the growth of the particles in volume due to coagulation
processes may befaster then by propagation, although both phenomena occur. Usually
coagulation phenomena in the nucleation stage are modeled using the Smoluchovski equation
for ditfusion controlled coagulation11 More advanced coagulation models also incorporate
the calculation of coagulation coefficients for the different size clusters 12' 13
.

40 Chapter 3
Maxwell et al7 studied seeded emulsion polymerization of styrene and concluded at oligomeric species at a critical chain length for surface activity z, will give instantaneous radical entry into polymer particles. Tauer et ae6 modeled nucleation processes in emulsion polymerization, using the classical nucleation theory (CNT) together with the Flory-Huggins theory of polymer solutions and radical kinetics. From this historie overview it may be concluded that there is a more or less accepted concept for partiele nucleation in emulsion polymerization based upon: ( 1) Ponnation of oligomeric radicals in the aqueous phase, (2) Competition between entry of oligomeric radicals in particles andlor micelles, and growth until the critical chain length for phase fonnation has been reached, and (3) Coagulation processes of colloidal unstable precursor partiel es. This accepted concept of the nucleation phenomena, operative in emulsion polymerization is presented schematically is in Figure 3.2.
Figure3.l Accepted concept of nucleation phenomena operative in emulsion polymerization processes
This accepted concept is able to explain the observed effects qualitatively. However the detennination ofthe correct nucleation mechanism fora given polymerization system is very difficult. The reason is that there is no general nucleation mechanism that can describe all the aspects of the early stage of nucleation as welt as the subsequent stage of nucleation of any given polymerization system. This indicates that the nucleation mechanism is dependent upon tbe emulsion polymerization systern characteristics. These characteristics are type of monomer, type of initiator, temperature, importance of aqueous phase kinetics, water solubility of monomer and initiator, etc.

The Concept ofNucleation in Homogeneons and Heterogeneous Systems 41
Therefore, it is not yet possible to distinguish unambiguously between the existing roodels
using the current experimental data. From an ex perimental point of view it is crucial that no experimental data is available for the time evolution ofthe partiele number and the partiele size distribution, e.g. from the first appearance of particles up to the end of polymerization. It seems that there is an urgent requirement of reliable experimental data, which requires suitable set-ups for experimental investigations during the nucleation step36
• These set-ups should use characterization procedures which are focused on speed, since all event conceming nucleation proceed very rapidly. In order to illustrate this statement, model calculations have been perforrned conceming nucleation in the emulsifier free polymerization of styrene. This model involves aqueous phase kinetics and partiele phase kinetics, including all the relevant mechanisms as entry, exit, aqueous phase terrnination and partiele growth. Fora detailed description ofthe simulation, see appendix A. The concentration development of the individual oligomeric species as function of time is presented in Figure 3.3
Figure 3.3
1E..()Q9
-- r·
so;
Time(s)
Concentranon development of oligomeric species of different chain length as function of time at 50 °C. Simulation results concerning partiele nucleation process in the emulsifier free polymerization of styrene, T* total number of radicals in the aqueous phase, S04-• persulfate radicals, MiS04-• persulfate oligomeric radicals composed of Mi monomerunits I 1,2,3, Ne is the latex partiele concentration, persulfate concentration l 10'3 mol dm-3
, for further details see appendix A

42 Chapter 3
Note, that according to these calculations, the early nucleation stage is extremely fast. Within five secouds all the oligomeric species have reached their equilibrium concentration, and the reactions operative in the aqueous phase may be assumed to be in the pseudo steady state. The development of on-line measurements are essential in order to study such rapid nucleation processes. Kuhn et al43 used on-line conductivity and turbidity, and showed a strong influence of emulsifier concentration on the time evolution of the partiele number in the very early stages of emulsion polymerization.
3.4.2 Secondary nucleation in emulsion polymerization Secondary nucleation in emulsion polymerization bas been the subject of much attention in literature. Hanssen and Ugelstad45
•46 provided means by which the onset of secondary partiele
formation may be calculated. However these descriptions require a large number parameters which are often unknown. From an engineering point a "yes/no" answer is required to the question "Will there be secondary nucleation under given reaction conditions?'' Morrison et al44 developed a semi-quantitative model for emulsion polymerization systems where the arnount of added surfactant is below tbe critica! micelle concentration, and verified it experimentally with seeded emulsion polymerization reactions of styrene. These authors stated that there will be extensive (new) partiele formation ifthe overallentry rateis significantly less then that of creation of new partic les. The partiele formation mechanism is supposed to be homogeneous/coagulative for these emulsion systems. In situ micellization , which is the event that aqueous phase terminated species of sufficient length can micellize and subsequently can be the locus of secondary nucleation, was rejected by Morrison et al45
for their experiments. Their treatment gives good accord with experimentally observed conditions for the onset of secondary nucleation in low-surfactant systems, i.e. increasing the partiele size and seed concentration leads to a decrease in the arnount of new nucleation. Unfortunately the charaeterization of the partiele size distribution bas always been performed upon the endproduels of the reaction. The evolution of the partiele size distribution as function of time and/or conversion may yield valuable information about the onset of secondary nucleation. In order to illustrate this emulsifier free ab initio emulsion polymerizations of styrene have been performed. The recipe and the experimental conditions of a typical polymerization reaction are given in table 3.2. The evolution ofthe partiele size distribution as function of conversion is presented in figure 3.4. During polymerization, samples were taken in order todetermine conversion, by gravimetry, and partiele size distributions by the disk centrifuge pbotosedimentry procedure, see section 5.2.4.1. The samples, which were used for the determination ofthe partiele size distribution, were first injected into a surfactant solution in order to minimize coagulation events after sampling.
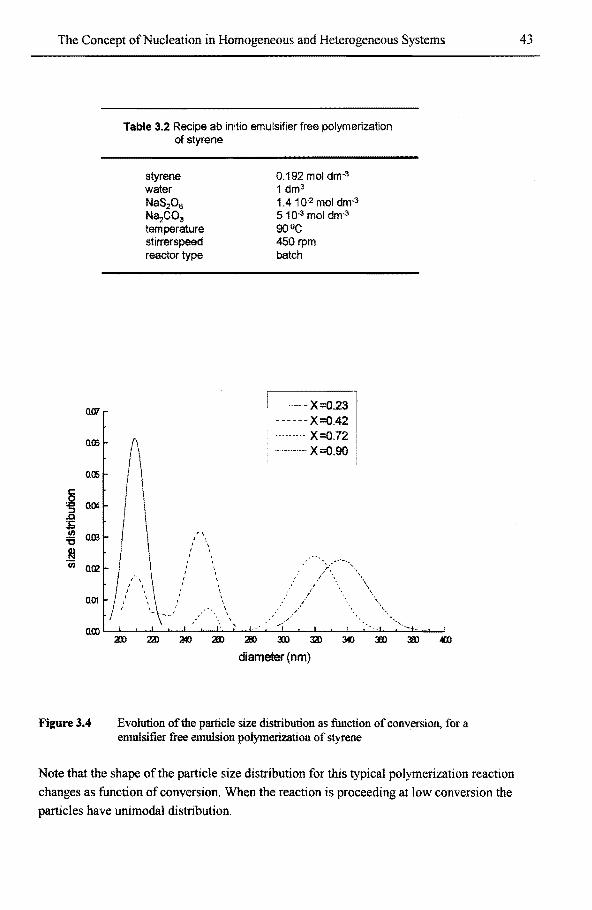
The Concept ofNucleation in Homogeneous and Heterogeneous Systems
o.re
QC6
c: 0 ~ 0.04 ..0 li til om '6 lij ïii Q.Q2
0.01
0.00
Figure3.4
Table 3.2 Recipe ab initia emulsifier free polymerization of styrene
I I I \
styrene water NaS20 8 NS:1C03 temperature stirrerspeed reactor type
\
}'-· I \ I \
I I
aD 22) :a«)
\ \
' ' ' I I I
' \ I
\
<6) '
0.192 mol dm-3 1 dm3
1.4 1 Q-2 mol dm·3 5 1 o-3 mol dm·3
9QOC 450 rpm batch
--X=0.23 ------X=0.42 · ······ X=0.72
--·-··-· X=0.90
:lBl :m :m 3«) :m :m .m diameter (nm)
Evolution of tbe partiele size distri bution as function of conversion, fora emulsifier free emulsion polymerization of styrene
Note that the shape of the partiele size distribution for this typical polymerization reaction
changes as function of conversion. When the reaction is proceeding at low conversion the
particles have unimodal distribution.
43
44 Chapter 3
The onset to secondary nucleation is occurring at a conversion of ca 0.40, teading to a bimodal distribution which is still visible at higher conversions. Fina1ly the shape of the partiele size distribution seems to become unimoetal again, in this partienlar case, when very high conversions (>0.85) are reached. This typical behavior ofthe partiele size distribution as function of time may be explained as follows. Insection 3.2.2.3 it is described that secondary nucleation is occurring when the total partiele surface available is not sufficient to capture all the surface active oligomeric radicals. When the first partiele formation process has proceed, the rate of surface active oligomeric radicals (M2SO/, M3SO/) is approximately constant, see tigure 3.3. For emulsifier free polymerization of styrene, it has been shown by Zirkzee et al47
, that coagulation of precursor particles is included in the first nucleation event, which will decrease the total partiele surface significantly. The total partiele surface available is not sufficient to capture all surface active radicals, which can grow towards partiele formation. In this case coagulation of existing particles can induce secondary nucleation. In emulsifier free systems partiele coagulation phenomena, within nucleation, will stop when enough stahilizing forces are present upon the partiele surface to prevent further coagulation. These stahilizing forces are electrostà.tic forces caused by the negative sulfate endgroups which will give electrostatic repulsion between the latex particles. It is obvious that the initiator concentration and the ionic strength are essential parameters, which will govern the aqueous phase kineties but also the coagulation kinetics. In this typical case, the shape of the
partiele size distribution beoomes unimoetal again at high conversions. This may he due to the fact that the particles grow at relatively the same rate in mass. However in volume rate, smaller particles will grow faster then bigger particles. Therefore, the smalt particles may he growing into the larger particles, which will change the shape ofthe partiele size distribution from bimodal to unimodal. However, for other reaction conditions used for the emulsifier free polymerization of styrene, bimodality in the partiele size distribution occurs and is present through the entire polymerization reaction 47
• The onset of secondary nucleation observed in these polymerizations is varying from 20-40 % conversion, depending upon the reaction conditions47
• From these considerations it may he argued that the analysis ofthe partiele size distribution of the end products is not enough to elucidate between different nucleation mechanisms. In this respect evolution of the partiele size distribution as function of conversion/time should he evaluated since it yields more information concerning nucleation. Finally, the observation is that seconetary nucleation events, in emulsifier free emulsion polymerization reactions, can he triggered by coagulation events operative in the first partiele formation period.
The Concept ofNucleation in Homogeneous and Heterogeneous Systems
3.5 Example 2: Silicon Alkoxide particles formed in a Sol-Gel process
3.5.1 Historie Overview
45
In 1956 Gerhard Kolbe14 observed the formation ofspherical silica particles, when
tetraethylorthosilicate (TEOS) was hydrolyzed in the presence of ammonia. Stober et al15
improved this process to produce monodisperse silica particles. The final partiele size and
partiele size distribution could be controlled reasonable well within the range of0.05-l!lm.
This process, which bas become known as the Sol-Gel process, is a wet chemica! metbod
involving hydrolysis and condensation of metal alkoxides 16. The synthesis of silica partiel es,
using the Sol-Gel technique is based upon the controlled polycondensation reaction of
Si(OH)4 species. These may be formed by hydrolysis of soluble metal silicates. In order to get
a rapid and complete hydrolysis ofTEOS, an acid or a base catalyst may be used. In both
cases the reaction occurs by a nucleophilic attack of the oxygen contained in water to the
silicon atom. Acid catalyzed hydrolysis ofTEOS proceeds by an SN""2 type mechanism. The
teaving alkoxy group is rapidly protonated and a water molecule performs a nucleophilic
attack at the central silicon atom17. The base catalyzed hydrolysis ofTEOS is a two-step
process, with the formation of a pentacoordinale intermediate17. After hydrolysis silicic acid
molecules may condense to form siloxane honds with the release of water according to:
=Si-OH + HO-Si= --+ =Si-0-Si= + H20 (3.4)
The condensation reaction may be acid or based catalyzed. Hydrolysis and condensation
reacrions occur simultaneously. The relative rate ofboth reactions determines the sol
structure. Under acidic conditions the hydrolysis reaction is faster than the condensation
reaction. Therefore, the rate of condensation decreases with increasing number of silioxane
linkages around a silicon atom, which leads to weekly branched polymerie networks. Under
base conditions the condensation reaction is accelerated relative to the hydrolysis reaction.
The rate of condensation increases with increasing number of siloxane linkages, leading to
highly branched networks. Based catalyzed gels give spherical porous particles.
The general polymerization behavior of silica is depicted in Figure 3.3

46
Figure3.l
30nm
pll7·11--nt B
Polymerization behavior of silica using the Sol-Gel technique
Chapter3
It seems that tbe chemistry oftbe Sol-Gelprocessis characterized by an complex interaction ofhydrolysis and
polycondensation processes.
3.5.2 Silica Particles prepared by the Sol-Gel process For systematic: mechanistic: studies of enc:apsulation processes, welt defined inorganic: pigment particles are required. Therefore, Silica particles prepared by the Sol..Qel process were used for mecbanistic studies conceming encapsulation reactions, because these particles are spherical and have relative monodisperse partiele size distributions. Silica particles were prepared by the base catalyzed Sol-Gel process ofTEOS in aqueous ethanol solutions containing ammonia. As explained insection 3.5. l the hydrolysis and condensation reacrions are competitive. These competitive reactions can be monitored using conductivity, which measures the activity and mobility of ionic species in the Sol-Gel process 18
• For base catalyzed reactions, the decrease in conductivity can be attributed to a decrease in ion activity as water is consumed during the hydralysis of TEOS. Due to the low dielectric constant of the ethanol-water solutions, used as precipitation media, ionic activities are less than unity. Consequently, ammonia is present as unprotonated NH3• When the ammonia deprotonates a silicic acid group, the net number of ionized species increases, as result of the hydrolysis reaction, and wilt be reflected in an increase in conductivity.
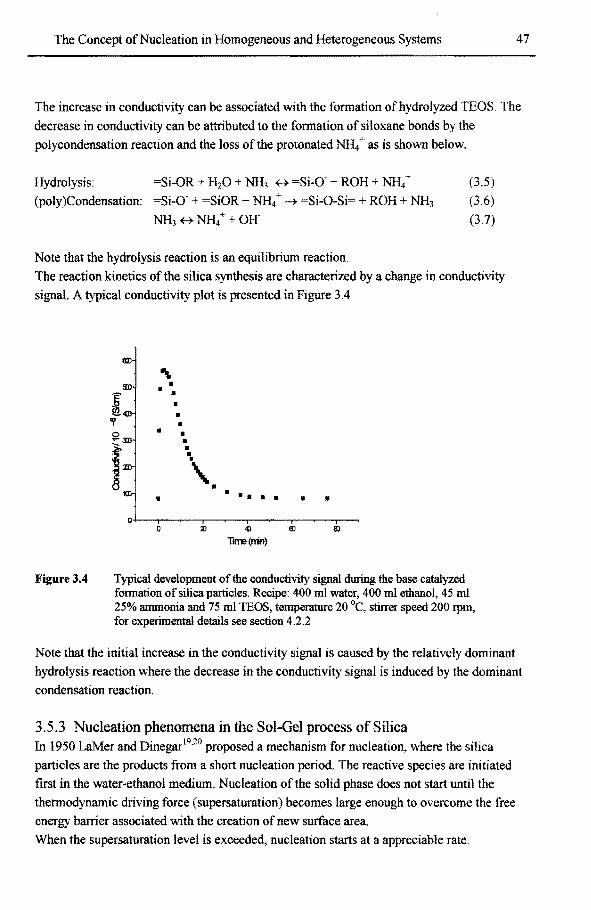
The Concept ofNucleation in Homogeneous and Heterogeneous Systems 47
The increase in conductivity can be associated with the formation ofhydrolyzed TEOS. The deercase in conductivity can be attributed to the formation of sîloxane honds by the polycondensation reaction and the loss ofthe protonated NH4 +as is shown below.
Hydrolysis: =Si-OR + H20 + NH3 B =Si-0- + ROH..;. NH4 + (3.5)
(poly)Condensation: =Si-0- + =SiOR + NH/ ~ =Si-0-Si= + ROH + NH3 (3.6) NH3 ++ NH4+ +OH" (3.7)
Note that the hydrolysis reaction is an equilibrium reaction. The reaction kinetics ofthe silica synthesis are characterized by a change in conductivity signal. A typical conductivity plot is presented in Figure 3.4
Figure3.4
tm
" 9D • • 14D
• • • "i' •
$2 • • •
~m • • • \ • 'liD • •• • • • • •
0 2l 4) 6) 8)
1irre(nin)
Typical development ofthe conductivity signal during the base catalyzed formation of silica particles. Recipe: 400 ml water, 400 ml ethanol, 45 ml 25% ammonia and 75 ml TEOS, temperature 20 °C, stirrer speed 200 rpm, for experimental details see section 4.2.2
Note that the initial increase in the conductivity signal is caused by the relatively dominant hydrolysis reaction where the decrease in the conductivity signal is indoeed by the dominant condensation reaction.
3.5.3 Nucleation phenomena in the Sol-Gel process ofSilica In 1950 LaMer and Dinegar19
•20 proposed a mechanism for nucleation, where the silica
particles are the products from a short nucleation period. The reactive species are initiated first in the water-ethanol medium. Nucleation ofthe solid phase doesnotstart until the thermodynarnic driving force (supersaturation) becomes large enough to overcome the free energy harrier associated with the creation of new surface area. When the supersaturation level is exceeded, nucleation starts at a appreciable rate.
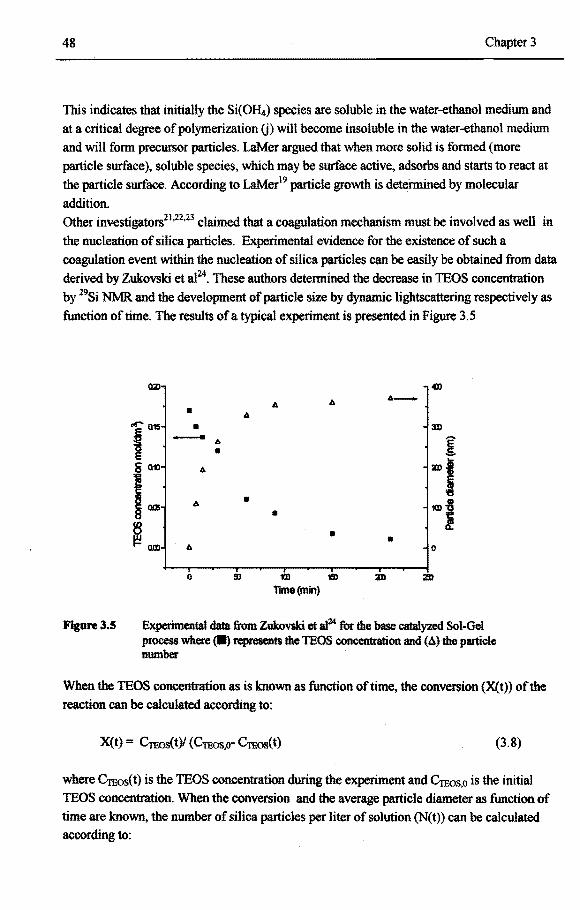
48 Chapter 3
This indicates that initially the Si( OH,.) species are soluble in the water-ethanol medium and at a critical degree ofpolymerization G) will beoome insoluble in the water-ethanol medium and will form precursor particles. La.Mer argued that when moresolidis formed (more partiele surface ), soluble species, which may be surface active, adsorbs and starts to react at the partiele surface. According to La.Mer19 partiele growth is deteimined by molecular addition. Other investigators21.2
2.23 claimed that a coagulation mechanism must be involved as well in
the nucleation of silica partic les. Experimental evidence for the existence of such a coagulation event within the nucleation of silica particles can be easily be obtained from data derived by Zukovski et al24
• These authors determined the decreasein TEOS concentration by 29Si NMR. and the development of partiele size by dynarnic lightscattering respectively as function of time. The results of a typical experiment is presented in Figure 3. 5
Figure3.5
Q2) CD ... _ 4 • 4
(#[""" 015 • m
I - 11. î E • 6 010 11. ZDI 1 'el i (KB
4 • m~ •
~ • • 11. 0
0 m 11) :m 11me(mln)
Experimental data trom Zukovski et af' for the base catalyzed Sol-Gel process where ~ represents the TEOS coneentration and (A) the partiele number
When the TEOS concentration as is known as function of time, the conversion (X(t)) ofthe reaction can be calculated according to:
X(t) = Crnos(t)l (Crnos.o- Crnos(t) (3.8)
where CTEOS(t) is the TEOS concentration during the experiment and CTEOs,o is the initial TEOS concentration. When the conversion and the average partiele diameter as function of time are known, the number of silica particles per liter of solution (N(t)) can be calculated according to:

The Concept ofNucleation in Homogeneous and Heterogeneous Systems 49
N(t) = 6 * CTEOs,o *Mrnos*X(t) I 1t Ps d(t),3 (3.9)
where MTEos is the molecular mass ofTEOS, p, is the density of silica particles and d(t), is
the partiele diameter. The results ofthis data manipulation are depicted in figure 3.6, where
the conductivity was monitored as function of time as well.
Figure3.6
!l
3J •At.
I>.
"Î f :§_:as tJ.
;!!: 6 0 I>. :t::;o
.2i t::.-
515 "' c: Q)
"0 'E10 -· ~
• • • 5 A • •
0
0 5l 100 15:l :m lime(min)
The development of the number of particles <•) as function of time and the subsequent development ofthe conductivity signal (I\)
Note that the partiele number decreases significantly due to coagulation phenomena during
the nucleation of silica particles. Coagulation events are operative until the silica particles are
colloidal stable. Concomitantly the partiele number remains constant and further growth is
accomplished by adsorption of species initiated in the water-ethanol medium who have
become surface active. lt is clear that the formation of silica particles from hydrolysis can be
fitled within the general framework of nucleation. The total nucleation process can be
subdivided in the early nucleation stage, which is the buildup of species in the medium
towards supersaturation and will subsequently become insoluble. The subsequent nucleation
stage involves partiele growth by monomer addition as well as partiele growth by
coagulation events. Note that the total nucleation process is characterized by the increasing
conductivity signal. When the particles grow they will become larger in size, which results in
a decreasing mobility. Therefore, the conductivity decreases. It is obvious that the nucleation
phenomena of silica by the Sol-Gel process are critically dependent upon the experimental
applied conditions. For instanee the amount of ammonia is a very crucial parameter.

50 Chapter3
More ammonia in the recipe causes a higher ionic strength ofthe solution since more NH/ is generated. Therefore, coagulation processes will be more dominant in the subsequent nucleation stage teading to larger particles sizes. The amount of ethanol present in the system also plays an important but a more complex role. Ethanol is used to dissolve the TEOS. On the other hand the presence of ethanol forces the thermodynamic equilibrium ofthe hydralysis reaction is forced to the right side, see eq. 3.5. Finally ethanollowers the dielectric constant ofthe solution, which will have an influence upon the coagulation phenomena. In order to illustrate this several Sol-Gel experiments have been conducted where the volume fraction of ethanol bas been varied, while keeping other parameters constant. The reaction bas been monitored using conductivity and the final silica partiele size bas been determined with SEM. The results are presented in figure 3.7.
Fiaure3.7
a
a a .. -. .~~. .. 0
0 4l 8)
Tlme(min)
The intluence of ethanol upon the Sol-Gel process of silica, the conductivity versus reaction time for different volume fractions of etbanol recipe: ammonia 45 mi, TEOS 50 mi, total volume 0.9 dm3
, T=2S oe, stirrer speed 200 rpm
Note that the maximum in the conductivity signal decreases with increasing amount of ethanol present, which is caused by a decrease in the dielectric constant of the medium. Another issue is that the partiele size appears to go through a maximum with increasing amount of ethanol, which bas also been observed by other investigators 18,2°·21
•
An explanation for this phenomena is difficult since two opposing events are happening bere. On one hand the lower dielectric constant of the medium should favor coagulation phenomena, since the width of the double layer is decreasing.

The Concept ofNucleation in Homogeneaus and Heterogeneaus Systems 51
On the other hand more ethanol causes more formation of SiOI-4 species and therefore more precursor particles can be formed. The interaction between percursor generation and coagulation phenomena is still not solved quantitatively and remains an aspect for future research.
Analogy afSol-Gel process and emulsion polymerization concerning nucleation
The Sol-Gel process is used for the preparation of metal oxide particles which are inorganic in nature. On the other hand emulsion and dispersion wilt yield polymer particles which are organic. However, the mechanisms involved in these reactions are very similar for both systems. NormaHy for free radical ( organic) polymerization in heterogeneaus systems, the Flory-Stockmayer model can be used to determine the molecular weight distribution. For alkoxide polymerization reactions, under basic conditions, the alkoxide species polymerizes as if had 3-4 reactive sites. The Flory-Stockmayer model has been used successfully by Klemperer et al50 to predict the molecular weight distribution in an alkoxide polymerization reaction, which exhibit a polycondeosation behavior. With respect to nucleation, it seems that similar phenomena are happening although the chemistry of these processes is totally different. Still the endproducts ofboth systems.exhibit colloidal properties as has been described above. Therefore, it can be concluded that there is a clear analogue between the emulsion polymerization and the Sol-Gel process concerning nucleation.
3.5.1.1 Secondary nucleation in Sol-Gel processes
Secondary nucleation have been observed experimentally when a semi-continuous Sol-Gel experiments are performed using a silica seed exhibiting a unimodal partiele size distribution with an average of 400 nm. Extra TEOS was added at an addition rate of 1. 7 milmin and the reaction temperature was 25 °C, see section 4.2.2. When the added amount ofTEOS was too large (100 g TEOS upon 50 g Silica seed particles), secondary nucleation phenomena, next to normal partiele growth, were operative as is visualized using SEM, see figure 3.8. The observation is that secondary can occur and is critically dependent upon the applied experimental conditions, which is also the case in an emulsion polymerization process. From these considerations it is obvious that the general framework of nucleation also holds for the formation of base catalyzed silica particles prepared by the Sol-Gel process.

Figure 3.8 Scanning Electron Microscope photograph of a semi-continuous Sol-Gel process of silica particles
Supersaturation is the driving force towards nucleation bere and kinetic aspects are essential bere as well. The Sol-Gel process bas analogies with emulsion polymerization process as described in section 3. 4. It may be stated that the general framework of nucleation is clear. However, a lot has to be done to develop models which can predict the development of partiele number as wellas partiele size as function of time. To do this the complex stability behavior of the silica particles in ethanol-water-ammonia mixtures has to be investigated in more detail. This is an important aspect for further research in this area.
3.6 Example 3: Poly-( R )-3-hydroxybutyrate particles formed in Alealigenes eutrophus baeteria
3.6.1 Biosynthesis ofPoly-( R )-3-hydroxybutyrate (PHB) particles Poly-( R )-3-hydroxybutyrate (Figure 3.9) is a biopolymer which is synthesized by a wide variety of micro-organisms as a carbon reserve, like fat in mammals25
• These polymers are accumulated in intracellular particles called granules. PHB was first described by Lemoigne26
, and has offered many ebaHenges to microbiologists and biochemist who were interested in its metabolism and physiological function. Recently PHB have been under considerable attention due tosome interesting features of these polymers, such astheir biodegradability and biocompatibility.

The Concept ofNucleation in Homogeneaus and Heterogeneous Systems 53
Figure3.9 The schematic representation ofPoly-( R )-3-hydroxybutyrate
The availability of nutrients is a key factor in regulating the PHB metabolism in Alcaligenes eutrophus. Under balanced growth conditions, coenzyme-A (HSCoA) levels are high and the synthesis ofPHB is inhibited, thus acetyl-CoA is merely metabolized in the tricarbox.ylic acid cycle (TCA cycle) as presented in Figure 3.10
In nutrient limitation but carbon excess, however, proteins can no longer be synthesized and the built up ofNAD(P)H inhibits citrate synthase, and consequently acetyl-CoA is no Jonger able to be oxidized at high rate via the TCA cycle and therefore it accumulates. Although the equilibrium constant ofthe reversible condensation reaction of acetyl-CoA does not favor acetoacetyl-CoA formation. Under these conditions, i.e. high concentrations of NAD(P)H and acetyl-CoA and low concentrations of coenzyme-A, the equilibrium is displaced in favor ofPHB biosynthesis. Simultaneously these conditions inhibit the degradation ofPHB and prevent unrestricted recycling ofpolymer.
TCA cycle Glucose 7CH3·CO-SCoA- Fructose
CoA-SH ;:t-ketothiolase i .. lnhibits
CH 3-CO·CH 2-CO-SCoA
lAcetoacetyi-CoA Reductase
(R) CH 3_.CH(OH)-CH 2-CO-SCoA
~ PHB synthase
Figure 3.10 Schematic representation of the metabolîc pathway of the bîosynthesis of PHB in Alcaligenes eutrophus

54 Chapter 3
3.6.2 General Framework ofnucleation phenomena in the formation ofPHB granules
This section will focuss upon the nucleation phenomena in the biosynthesis ofPHB granules which is the last part ofthe metabolic pathway, see Figure 3.10. Since Lemoigne isolated and characterized the PHB homopolymer in 1925, PHB bas been extensively studied by biochemists to elucidate its biosynthetic pathways including polymerization. Ellar et al27
, who reported on the morphology ofthe PHB granules in 1968, drew some equivalents with the conventional emulsion polymerization process. Ballard et af8 have drawn the conciusion that the PHB biosynthesis has some features of emulsion polymerization with the individual granules corresponding to latex particles and the membrane lipid to surfactant. Very recently, Gemgrosset al29 proposed a model for granule formation, which is caused by the formation of micelles formed from polymerase enzyme molecules which are propagating in the cytoplasm. At the same time de Koning and Maxwell30 drew a clear analogy between the emulsion polymerization process and the biosynthesis ofPHB. They proposed a homogenous nucleation mechanism for granule formation. According to this model; the polymerase molecules are initiated in the cytoplasm and grow a PHB tail.
The polymerase molecule, with tail, acts as a surfactant since the polymerase "'head" is hydrophilic and the PHB tail is hydrophobic. When the chain grows in the cytoplasm, it becomes increasingly hydrophobic and at a certain degree of polymerization G) it will collapse to minimize its surface area. The driving force towards nucleation is also supersaturation for this specific system. A precursor granule is formed now, 'which can grow to stabie granules by coagulation andlor polymerization at the surface caused by adsorption of species which have reached chain length sufficient for adsorption (z). The Nucleation phenomena are schematically depicted in Figure 3.11

The Concept ofNucleation in Homogeneous and Heterogeneous Systems 55
l::::::'!i.'f;"_ ifi --..~ E-1:1-Ml
Figure3.11 The nucleation phenomena ofPHB granules in Alealgenes eutrophus
Kurja and Zirkzee31•32
•33 have quantified the mechanisms of granule nucleation and granule
growth in Alcalogenes eutrophus and showed that the course of the molecular mass of the
polymer formed can be explained in terms ofkinetic mechanisms as propagation, and chain
transfer and the affect of granule size upon these mechanisms. A comparison between
experiment and theory for the development of molecular weight as function of time is given
in Figure 3.12
i I • I e
= ö ll
Time (hours)
Figure 3.12 Molar mass ofPHB versus time for different fructose concentrations, (•)
[Fructose]= 20 g/1, (•) [Fructose] 10 g/1, and (.1\) [Fructose]= 5 g/1. Solid
line: model calculation. Data taken from Kawaguchi and Doi34

56 Chapter 3
The model developed can descnl>e the experimental results relative well, especially when it is considered that the model contains only one adjustable parameter, i.e. the propagation mte coefficient, which is fitted to the conversion vs time curve. In this context more sophisticated experiments are required in order to submit the model to a more robust test. Note that the formation ofPHB gmnules in Alcalogenes eutrophus fits with in the geneml fmmework of nucleation phenomena. Here supersatumtion is the driving force towards nucleation where its boundary conditions is govemed by thermodynamic aspects. Also the introduetion of a heterogeneaus character is obvious bere. The dynamic nature of the nucleation process is present bere as well although not that fast as in the emulsion polymerization or Sol-Gel processes.
3. 7 Concluding Remarks This chapter was concemed with nucleation mechanisms in heterogeneaus systems, focusing on the question whether there is a geneml framework for nucleation. The ftrSt important observation is that all intrinsic different products have one characteristic property in common which is their colloidal behavior where surface chemistry is becoming important. The nucleation mechanism must therefore be based upon geneml principles in colloid science. The driving force for nucleation is the supersatumtion which is govemed as the ratio of the concentration of species of a cri ti cal size j and the solubility of these species in the continuous phase. The development of this concentration may or may not occur by chemical reaction. The type of chemical reaction and its kinetics is very important since this is responsible for the dynamic nature of the nucleation process, introducing the peculiarities of the nucleation process. The combination of the driving force towards nucleation and reaction kinetics may be regarded as the geneml framework within nucleation phenomena are active, and can be used to explain phenomena for all colloidal systems, irrespective of the chemistry involved. This concept can explain qualitatively the mechanism of secondary nucleation as well. Nucleation phenomena are always introducing a (more) heterogeneous ebameter in the system. This concept is illustrated by three different examples i.e. polymer particles formed in emulsion polymerization, alkoxymetal particles formed in Sol-Gel processes and PHB gmnules formed in Alcalogenes eutrophus. Although the cbemistry in these examples is totally different the general framework is the same for these examples.

The Concept ofNucleation in Homogeneous and Heterogeneous Systems
References I. Everet, P.H.; in "Basic Principles ojColloid Science", Royal Chemistry of Society, Whitstable
Litho Ltd, 1988. 2. Ostwald, W., Z. Phys. Chem, 1897,22, 284. 3. von Weimarn, P.P., Chem Revs., 1925, 217. 4. Ostwald, W.; Kokkoros, H.; Hoffinann, K., Kolloid Z., 1937, 81, 48. 5. Harkins W.D., J. Am. Chem. Soc., 1947, 69, 1428. 6. Smith W.; Ewart, R.HJ., J. Chem. Phys., 1948, 16, 592 7. Maxwell, LA, Monison, B.R; Napper, D.H.; Gilbert, R.G., Macromolecules, 1991
24, 1629. 8. Priest, W.ll, J. Phys. Chem., 1952, 56, 1077. 9. Hansen, F.K.; Ugelstad, l; J. Polym Sci. Pol. chem. Ed., 1978, 16, 1953. 10. Fitch, R.M.; Tsai, C.H.; Polymer Colloids; Fitch R.M. Ed.; Plenum, 1971, 73
NewYork. 11. von Smoluchovski, M., Phys. Z., 1916, 17, 557. 12. Feeney, P.J.; Napper, D.H.; Gilbert, R.G.;Macromolecules, 1984, 17,2520. 13. Mayer, M.J.J.; Meuldijk, J.; Thoenes, D., accepted by J. of Appl. Pol. Sci, 1995. 14. Kolbe, G., Das komplex Verhalten der Kieselsaure. Dissertion, Friedrich-Schiller
Universitat Jena, 1956 IS. St ober, W., Fink, A; J. Colloid Intelface Sci, 1968, 26, 62. 16. Vansant, E.F.; Van der Voort, P.; Vrancken, K.C.; "Studies in Sulface Science and
Catalysis", Elsevier, Amsterdam, 1995. 17. Osterholz and Pohl 18. Bogush, G.H., Zukoski, C.F.; J. Co/loidlnterjace Sci, 1991, 142, 1, 1. 19. LaMer, V.K., Ind. Eng. Chem, 1952,44, 1270. 20. LaMer, V.K., Dinegar, R.H., J. Am. Chem. Soc., 1950, 72, 4847. 21. Look, J.L, Bogush, G.H., Zukoski, C.F., Faraday Discuss Chem. Soc., 1990, 90, 345. 22. Van Blaaderen, A; Van Geest, l Vrij, A, J. Col/oid Intelface Sci, 1992, 154, 2, 481. 23. Philipse, A.P., ColloidPolym. Sci., 1988,266, 1174. 24. Bogush, G.H.; Zukoski, C.F.; J. Colloid Interface Sci, 1991, 142, l, 17. 25. Anderson, A.I., Dawes, E.A., Microbiol. Rev., 1990, 54, 450. 26. Lemoigne, M., Ann. lnst. Pasleur Paris, 1925, 39, 144. 27. Ellar, D., Lundgren, D.G., Okamura, K., Marchessault, R.H., J. Mol. Biol., 1968, 35, 489. 28. Ballard, D.G.H., Holmes, PA, Senior, P.J., Recent Adv. Mech. Synth. Aspects Pol., 1987
215, 293. 29. Gemgross, T.U., Reilly, P., Stubbe, JH., Sinskey, AJ., Peoples, O.P., J. Bacteriol, 1993,
175, 5289. 30. De Koning, G.J.M., Maxwell, lA, J. Environ. Pol. Degr., 1993, 3, 223. 31. Kmja, J. Zirlczee, H.F., De Koning, G.J.M., Maxwell, lA in "Biodegradable Plastics and
Polymers", eds: Y. Doi and K. Fukuda, Elsevier Amsterdam, (1994), 379. 32. Kmja, J. Zirkzee, H.F., Maxwell lA, "Unconventional Emu/sion Polymerizations", in "Emu/sion
Polymers and Emu/sion Polymerization", M.S. El-Aasser and P. Lovell (Eds.), Wiley, (1995).
33. Kmja, J., Zirkzee, H.F., Maxwell, I.A., Macromol. Theory and Sim., 1995, 4, 839. 34. Kawaguchi, Y, Doi, Y, Macromolecules, 1992, 25, 2324. 35. Tauer, K, Kuhn, I., Kaspar, H., Progr. Colloid Sci, 1996, 101,30. 36. Tauer, K, Kuhn, 1., Macromolecules, 1995, 28, 2236. 37. Tauer, K, Kuhn, I. Partiele nucleation, Recent advances in polymerie dispersions, NATO
Advanced Study lnstitute, Navarra, Spain, 1996. 38. Carra, S. Morbidelli, M. Strotti, G., Role of sulfactants in emulsion polymerization, Physics of
Amphiphiles: Micelles, Vesicles and Microemulsions., SC Corso, Soc., Italiana di Fisica, 1989, 483. 39. Barret, K.E.J. Dispersion Polymerization in Organic Media, John Wiley & Sons, London,
1975.
57

58 Chapter 3
40. Basset, D.R., Hamielec, A.E., Emu/sion Polymers and Emulvion polymerization, ACS Symposium Series NO. 165, Washington, 1981.
41. Gilbert, R.G., Emu/sion Polymerization, aMechanistic Approach, Academie, London, 1995. 42. Kuhn, 1., Tauer, K., Macromolecules, 1995, 28, 8122. 43. Janssen, E.H., Zirkzee, H.F., Maxwell, l.A., Gennan, A.L., J. of Appl. Polym. Sci., 1994, 4, 195. 44. Morrison, B.R., Gilbert, R.G.,Macromol. Symp., 1995. 45. Hanssen, F.K., Ugelst~ J. J. Polym. Sci., Clrem. Ed., 1979, 17, 3047. 46. Hanssen, F.K., Ugelstad, J. J. Polym. Sci., Chem. Ed., 1979, 17, 3033. 47. Zirkzee, H.F., Maxwell, I. A., Paquet, D., Partiele nucleation in emulsifier free emulsion
polymerization of styrene, to be published. 48. Parker, H.Y., Westmoreland, D.G., Chang, H.R.,Macromolecules, 1996,29,5119.

Polymerization and Encapsulation Reactions using Blokcopolymer Surfactants 59
4 POL YMERIZATION REACTIONS AND
ENCAPSULATION REACTIONS ON SILICA PARTICLES WITH THE AID OF BLOCKCOPOL YMER
SURF ACTANTS
The influence of process conditions upon the initial situation conceming micellization and phase equilibria
4.1 Introduetion The principle of encapsulating inorganic species with a layer of polymer through an emulsion
polymerization has been a promising approach for more than a decade now. Although many
attempts, following this approach, have been used in the past, only a few successful
applications can be recorded24. In the final application it is a major importance that the
inorganic particles are dispersedas 'single' particles in the final matrix. This major problem
of dispersability is also shifted towards the encapsulation process itselr Initially the 'bare'
inorganic particles should be well dispersed in the reaction medium and (partial) coagulation
during the polymer encapsulation step should be avoided, which might not always be the
case. Stability of the reaction mixtures is usually maintained by adding conventional
surfactants such as sodium dodecylsulfate (SDS). In chapter 1 it is rationalized that the rate
ofSDS exchange between micelles and single surfactant species is very large. Therefore, it
can be argued that, when desorption of these species from the silica surface is too large,
effective hydrophobic domains around the silica partiele cannot be maintained. The
consequence may be that relatively less styrene monomer is solubilized. However, on the
other hand the dynamic surfactant exchange of SDS may enhance the stability of the pigment
particles during polymerization, since they are able to stabilize a growing partiele surface.

60 Chapter4
In thls investigation the blockcopolymer surfactant used is polyethyleneoxide-polybutyl methacrylate (PEO-PBMA, 3:1, M=4000 g/mol). The polyethyleneoxide ebains will preferentially adsorb onto the silica partiel es, because of the high affinity of the ethylene oxide unit for the silica surface. It may be possible that bilayer formation is occurring atthe silica interface, since the polybutyl methacrylate unit does not favor the aqueous environment. The rate of surfactant desorption, using these blockcopolymers may be lower as compared to SOS, and therefore it may be possible to solubilize more styrene in the bilayer interior. The polybutyl methacrylate units ofthe blockcopolymer are relatively compatible with the styrene monomer units, but relatively incompatible with polystyrene of high molecular weight. Therefore, it may be possible that, during reaction phase separation occurs, and as a consequence the blockcopolymer is not buried inside the polymer. In case of phase separation the stability of the growing surface may be maintained, together with the electrostatic repulsion properties arising from the persulfate endgroups at the partiele surface. The concentration of the blockcopolymer used is an important parameter beeause above the critical micelle concentration, micelles rnay act as loci for the formation of polymer particles by secondary nucleation. Therefore, the CMC of the blockcopolymer in aqueous solutions as well as in water-ethanol solutions should be known. Additionally the total amount of blockcopolymer onto silica particles should be determined in order to optimize surfactant addition. From these considerations it is clear that during the encapsulation reaction a delicate balance has to be maintained between keeping the reaction mixture colloidal stabie and prevention of free polymer particles by secondary nucleation. In a batch process an optimal balance can be adjusted by adjusting the initia! conditions (such as monoroerand surfactant concentration) in a batch process, but this delicate balance must be maintained during the entire course of the polymerization process, which exhibit a highly dynamic character. The dynamic control ofthe surfactant concentration during an encapsulation process might be the best solution for maintaining co Hoidal stability and increasing the encapsulation efficiency. Proper characteri.zation procedures for monitoring the reaction are essential for the success of such a strategy. A very powerfut characterization technique is electrical conductivity, which is mainly determined by the amount of molecular dissolved surfactant and therefore gives information on migration of ionic surfactant species1
•23
•
However, before dynamic control of the encapsulation reaction is possible, it is essential to understand the mechanisms and kinetics of the encapsulation process at the molecular level, which is one of the aims of thls investigation. The silica particles are prepared using the SolGel process, as introduced insection 3.5. Ethanol-water mixtures with a considerable amount of ammonia are used in the preparation of the silica partic les.

Polymerization and Encapsulation Reactions using Blokcopolymer Surfactauts 61
As explained in section 2.4.3, the introduetion of ethanol and ammonia, influences on the
partitioning of styrene over the different phases, the micellization of the blockcopolymer and
the phase transfer events of oligomeric radicals over the different phases. Finally secondary
nucleation of polystyrene particles may be affected by the presence of ethanol. It seems that
the system is very complex. Therefore, it is necessary to study and to determine
experimentally the initia! situation of the system, as a function of the applied conditions. The
initia! situation in this context is defined as the stage before the final encapsulation reaction
and governs the silica modification and the equilibrium of styrene over the different phases.
The following fundamental questions have to be answered:
- what is the CMC ofthe blockcopolymer and how is it affected by the presence of
ethanol?
- how much blockcopolymer will be adsorbed on the silica particles and wbat is the layer
thickness?
-how does ethanol influence the styrene partitioning over the different phases, being the
modified silica particles, the continuous phase and the blockcopolymer micelles
(if present)?
The aim ofthis chapter is to gain more fundamental insight into the initia! situation
The micellization of the blockcopolymer surfactant has been studied using bubble
tensiometry and dynamic light scattering. Light scattering experiments give information
about micellization but also about the size ofthe micelles formed. For the determination of
the layer thickness ofthe blockcopolymer layer adsorbed onto silica particles, dynamic light
scattering is used as well. The amount ofblockcopolymer on the silica particles bas been
estimated using a plane silica surface, where the adsorption ofblockcopolymer can be
monitored using reflectometry. The partitioning of styrene into blockcopolymer micelles and
modified silica particles bas been determined for aqueous solutions. Finally the solubility of
styrene in water-ethanol mixtures has been determined, which gives information about the
influence of ethanol upon the phase equilibria of styrene in these systems.
4.2 Experimental Section 4.2.1 Materials Styrene was distilled at reduced pressure in a nitrogen atmosphere and storedat 4 °C. Water
was purified by a Millipore Milli-Q system, ethanol (Merck, analytical grade ), methanol
(Merck analytical grade ), persulfate (Fluka Chemie), ammonium hydroxide ( NH3 25% in
water), tetraethylorhosilicate (TEOS, 98%, Aldrich), hydrochinone (Merck) and sodium
carbonate (Merck), were used as received. The blokcopolymer, used as modification agent is
polyethylene oxide-polybutyl methacrylate (PEO-PBMA, 3:1, M=4000 glmol, VP BE 1030,
Th. Goldschmidt).

62 Chapter4
4.2.2 Preparation of silica particles Silica particles were prepared using the Sol-Gel processas described in chapter 3. A typical recipe which yields silica particles with an average diameter of 236 nrn, is mixing 400 ml water, 400 ml ethanol, 45 ml ofNH3 solution, and 50g TEOS in a glass batch reactor equipped with a turbine stirrer and with four baffles. The volume ofthe reactor was 1.3 dm3
.
The reaction was started by adding the TEOS to the reaction mixture at 25 °C. The change in conductivity during the reaction was monitored on-line with a PP1042 two point electrode cell in combination with a CDM80 conductivity meter (Radiometer) operatingat 2000Hz. The average partiele size of the silica particles as well as the partiele size distribution were checked using TEM (Jeol FX-2000), or SEM. In particular cases the silica dispersions were submitted to extensive dialysis in order to remove the ethanol and ammonia.
4.2.3 Solubility of styrene in water-ethanol mixtures For measuring the solubility of styrene in water-ethanol mixtures, a separation funnel was used, where water as well as ethanol was inserted. The total volume of this mixture was 30 ml. The volume fraction of ethanol in the mixture is therefore known. Upon this layer an additional amount of styrene was inserted, foliowed by vigorous mixing. The solution was allowed to phase separate, and the styrene concentration in the two phases (ifpresent) could he deterrninedusing HPLC. The solubility experiments were performed at 70 °C. Two experiments are performed
using an additional amount of styrene of 2 ml and 5 ml respectively.
4.2.3.1 High Performance Liquid Chromatography
Running partitioning experiments, the styrene concentration was analyzed by High Performance Liquid Chromatography (HPLC). The chromatographic analysis were performed on an HPLC equipment, equipped with a modellOOA pump (Beckman, Exllerton CA, USA) operaring at an eluent flow of 1.0 mi/min. Measurements ofthe column effluent were done with a Uvidec-1 OOm UV-detector (Japan Spectroscopie Co., Tokyo, Japan) at 215 nm wavelength. Separation of the monoroers was achieved on a Zorbax RX-C18 column (Rockland Technologies Inc., Newport, DE, USA); partiele size 5 J.Ull; specific area 180 m2/g and pore size 8 nm. The eluent consistedof a mixture of water and methanol; 65:35 volume ratio. Calibration curves ofthe monoroers were obtained by HPLC-measurements of different standard solutions in tetrahydrofuran (THF).

Polymerization and Encapsulation Reactions using Blokcopolymer Surfactauts 63
4.2.4 Determination ofblockcopolymer adsorption onto silica by reflectometry In this section the experimental setup will be described foliowed by a brief outline of the
underlying theory. The experimental setup is schematically shown in Figure 4.la and 4.1 b. A
polarized He/Ne laser beam (1) enters the cell through a 45° glass prism (2).
The laser beam reflects on the adsorbing surface, for which a strip cut from an oxidized
silicon wafer is used (3 ). The angle of incidence 91 is equal to the Brewester angle for the
silicon-water interface. The laser beam leaves the cell through a second 45° glass prism ( 4 ).
For the detection, the beam is split into its paralleland perpendicular components (with
respect to the plane of incidence) by means of a polarizing beam splitter cube ( 5). Both
components are detected by photodiodes (6) and the resulting signals are electronically
combined (7) to give the output signal S.
A stagnation flow point flow (Fig 4.1 b) is obtained by pumping solventor polymer solution
(8) into the cell through a cylindrical channel (9) of radius R, drilled in a piece of solid
PMMA which is mounted between the two prisms. The distance between the end of the
cylindrical channel and the adsorbing surface is h. Flow lines are indicated schematically in
the left hand side ofFig 4.1b. The channel is perpendicular to the silicon wafer and the
intersection of its symmetry axis with the surface is called the stagnation point (1 0). This
point is positioned such that it coincides with the reileetion spot ofthe laser beam. With the
help of the two-way valve ( 11) it is possible to switch from solvent to polymer solution and
vice versa. Two automatic burettes (Methrom) were used
The technique of reflectometry makes use of the fact that the adsorption of polymer causes a
change in the reflectivity of the substrate. In this setup the reflected intensities Is and lp for
the perpendicular and parallel polarization components respectively, are continuously
measured and electronically combined to give the output signal S defined as:
(4.1)
Note that S is normalized by the totallight intensity and is therefore not affected by
fluctuations in the laser light intensity. Various authors have shown, using light reileetion
theory, that Sis proportional to the adsorbed amount r (mass/unit area), where the
proportionality constant depends upon the oxide layer thickness dox· Fora single
homogeneous polymer layer with thickness dP and refractive index nP the adsorbed amount r is given bl5
:
r (np·n,J dpf(dnldc)) (4.2)

64 Chapter4
where r1s is the reftactive index of the solvent and dnldc the refractive index iocrement of the polymer-solvent system.
(b)
/
t INJECTION
10
Figure 4.1. (a) Schematic diagram ofthe experimental setup. (b) details ofthe stagnation point region. For explanation ofthe numbers see text, h=l.l mm, R=0.65, and f1J= 70°
4.2.5 Determination ofthe CMC ofthe blockcopolymer, and the size ofthe micelles in water and ethanol-water mixtures
4.2.5.1 Bubble tensiometry
The critica! micelle concentration (CMC) ofthe PEOIPBMA blockcopolymer has been determined by the surface tension of the solution as function of its concentration using the Maximum Pressure BubbleTensiometry method36
. In this investigation a SensaDyne 6000 surface tensiometer was used, where two capillaries with different radii are used, immersed to the same depth in the solution. The surface tension y cao be calculated from the ditTerenee ofthe pressures, required to liberate bubbles from each capillary. Ethanol-water solutions were prepared with a known amount of ethanol. The total volume ofthe solution was 0.1 dm3
. In this mixture blockcopolymer was dissolved at a concentratio u of l 1 o·2 mol dm ·3•

Polymerization and Encapsulation Reactions using Blokcopolymer Surfactants 65
This 'Stocksolution' was added in known volumes to an ethanol-water solution, with the same amount of ethanol, as the stocksolution. This procedure was adopted in order to ensure that the volume fraction of ethanol remained constant during the determination ofthe CMC. After every addition step the surface tension of the total mixture was measured by the bubble tensiometry. The temperature ofthe experiments was 25 °C.
4.2.5.2 Dynamic Light scattering
The presence of micelles in the solution and the size ofthe micelles can be determined using
dynamic light scattering (DLS). Dynamic light scattering uses the fluctuations ofthe scattered light due to Brownian motion. Brownian motion causes time dependent fluctuations
ofthe light scattered by particles in solution. From the correlation of these fluctuations information about the mobility and the ditfusion coefficient of the particles is obtained. The partiele radius can he calculated from the diffusion coefficient according to the StokesEinstein relation. The experimental setup ofthe AL V-light scattering equipment is given in Figure 4.2. By illuminating the particles with a monochromatic light beam of 637 nm from a Omnichrome 150 mW multi line Ar-laser. With a polarizer the phase angle ofthe beam can he defined. The sample is contained in a cylindrical quartz cell enabling a volume of 2 1 o-3
dm3. Measurements were made at different angles (0) between the detector (ALV- 125 laser
light spectrometer) and the direction ofpropagation. The scattered light intensity at a given angle is measured in time by the photomultiplier. The output of the photomultiplier is analyzed by a AL V-5000 auto-digital correlator. Dynamic light scattering experiments were performed upon aqueous solutions ofPEO/PBMA blockcopolymer varyingin concentration from 1 10"5 to 5 10·3 mol dm-3 at 20°C. The second class oflight scattering scattering experiments were performed upon water-ethanol solutions of PEO/PBMA blockcopolymer, where the volume fraction of ethanol was varied. The blockcopolymer concentration was 1.25 10"3 mol dm-3 and the temperature was 20° C.
polarizer sample
Figure 4.2 Experimental setup of the AL V light scattering device

66 Chapter4
4.2.6 Determination ofthe phase equilibria ofstyrene 4.2.6.1 Phase equilibria of styrene upon blockcopolymer modified silica particles
The partitioning of styrene over the different phases in the presence of silica particles bas heen detennined using the experimental set-up presented in Figure 4.3. The swelling vessel bas a glass tube in which a dialysis tube , containing the silica solution, was placed. The average size of the particles in the silica solution was 200 nm, and the solid content was 5%. The vessel was filled with distilled water and a styrene monoroer layer was brought on top ofthe system. The vessel was thermostatted at 70 °C. With this experimental set-up direct contact of the silica solution with an excess of monoroer was prevented. Styrene transport from the monoroer layer to the silica particles occurs via the aqueous phase and the cellulose membrane. At several times samples were taken from the aqueous phase as welt as from the silica solution. The styrene concentration in both phases was determined using HPLC. Unmodified silica particles as well as blockcopolymer modified silica particles are used for the partitioning experiments.
Styrene
glass tube
Silica solutlon
Figure 4.3 Experimental set-up for the determination of styrene upon silica particles
4.2.6.2 Phase equilibria of styrene within PEOIPBMA b/ockcopolymer micelles
The phase equilibria of styrene with the PEOIPBMA blockcopolymer micelles was determined using the same procedure as described in the previous section. The blockcopolymer concentration was 1 10"2 moldm03 and the size ofthe micelles has heen determined using dynamic light scattering, see section 4.2.5.2

Polymerization and Encapsulation Reactions using Blokcopolymer Surfactauts 67
4.3 Results and Discussion The physical phenomena in the conventional polymerization as well as in the encapsulation
reactions are critically dependent upon the applied experimental conditions. In the
encapsulation reactions performed, the initia! amount of ethanol present seems to be the
crucial parameter. Therefore the initia! situation prior to the encapsulation reaction has been
stuclied as function of the applied experimental conditions. These conditions involve the
addition ofblockcopolymer and/or ethanol to the system.
4.3.1 Micellization ofPEO/PBMA blockcopolymer Micellization phenomena are an important area of research in colloid science for a long time.
Initially, most of the work was focused u pon low molecular mass arnphiphiles, such as SDS,
but recently micelles made ofblockcopolymers have also reached considerable attention38.
Micellization oflow molecular mass amphiphiles and blockcopolymer arnphiphiles is a
process in which critica! phenomena are important. It has been observed that most
amphiphiles of low molecular mass exhibit a critica! micelle concentration where single
chains as well as micelle aggregates are found. For blockcopolymer the situation is less
pronounced. However, in general micellization phenomena in blockcopolymer systems occur
at very rnuch lower concentrations than for low molecular mass amphiphiles. Many
techniques can be applied for the determination of CMC, which all have their advantages and
disadvantages. Light scattering experiments as well as bubble tensiometïy have been used to
determine he CMC ofthe PEO/PBMA blockcopolymer. The CMC ofthe blockcopolymer at
20 °C in aqueous solutions (no electrolyte present) is 5 104 mol dm-3, as determined by
bubble tensiometry. The CMC in water-ethanol solutions could not be measured accurately
using this technique because ethanol itselfhas surface active properties and therefore the
surface tension is lowered already by the addition of ethanol. In principle dynamic light
· scattering is capable to determine the onset of micellization as well as the size of the
micelles. In figure 4.4 light scattering experirnents upon blockcopolymer solutions are
presented where the intensity ofthe scattered light and the apparent radius ofthe species are
displayed as function ofthe blockcopolymer concentration.

68
Figure 4.4
Chapter4
30
28
2500
,.....26
! i 24
~22 ~
20
I "' -! I I 0
1a6 1tr 10-3
Blockcopolymer conc. (mol dm-a)
Light scattering upon blockcopolymer samples, visualizing the apparent micelle radius <•) and the scattered intensity (6) as function ofblockcopolymer concentration, temperature 20 °C, scattering angle 90°, error bars represent the standard deviation, no. of experiments 20
Note the decreasein intensity with decreasing blockcopolymer concentration. However, using light scattering aggregates are still visible at blockcopolymer concentration of 2 1 o-s mol dm-3
, which is one order of magnitude lower, then the CMC determined with bubble tensiometry. The samples were measured one hour and two days after preparation respectively. No significant in the size ofthe species was observed and therefore it is assumed that the system is in a thermodynamic equilibrium. It seems that the apparent radius of the micelles present is relatively unaffected by the blockcopolymer concentration, which may suggest that rate ofblockcopolymer surfactant desorption from the micelles is relatively low. Care should betaken in drawing this condusion because the interpretation oflight scattering data can be complicated because of secondary association. According to Winnik et atl8 this mechanism envisions the formation of two types of associated structures. At low blockcopolymer concentrations, large loosely aggregated structures involving the PEO ebains are formed. At higher blockcopolymer concentrations normal micelles can be formed. Secondary association can be observed experimentally by light scattering experiments at different angles as presented in figure 4.5. Figure 4.5 clearly shows that at low angles relatively large aggregates are visible, which suggests that the size distribution of the micelles is broad.

Polymerization and Encapsulation Reactions using Blokcopolymer Surfactants 69
250 !:l
8 10000 200 I ~'~
~ §
0 8000 E 150
.s -s "' 100
* ~ ' ::> 6000 '5
~ ~ ~ 0
50 B 0 "' E !:! c:
l l:l 0 0 0 4000 !! til 0 0 0 Cl D 0 0 0 E .... til 0 0. • 0. <( • • t 2000
-50 • • À • 4 • 4 4 4 4 4 4--.
-100 0 20 40 60 80 100 120
Angle (dag)
Figure4.5 Light scattering upon PEO/PBMA blockcopolymer samples, visualizing the apparent micelle radius and the scattered intensity (.À) as function of angle, at 20 °C, blockcopolymer concentration 2 1 o-5 mol dm-3
In order to study the influence of ethanol on the micellization behavior of the PEO/PBMA
blockcopolymer, light scattering experiments have been performed. The estimated radius of
the aggregates and the intensity ofthe solution has been determined as function ofthe
volume fraction of ethanol. The results are collected in figure 4.6. Note that the radius ofthe
aggregates increases with increasing volume fraction of ethanol. The intensity ofthe
scattered light from the solution, however, shows no clear trend.
It seems that ethanol influences the size and probably the shape of the aggregates.
The general observation conceming the micellization of the blockcopolymer that the
distinction of a clear CMC can not be observed. However, aggregate formation is operative in
aqueous solutions as wel\ as in water-ethanol solutions even at relatively low blockcopolymer
concentrations.

70
Figure4.6
Chapter4
I :lOOl 0
300 2500
I -~~
2000~ -!!. ~
1100
1500! 0 -· .m
.E
f o- 1000
• • 0
0 500 0.0 0.2 0.4 0.6 0.8
F eth (·)
Light scattering upon blockcopolymer samples, visualizing the apparent micelle radius <•> and the scattered light întensity (à) as function ofthe volume fraction of ethanol, temperature 20 °C, blockcopolymer concentration 1.25 10'3mol dm'3, scattering angle 90°, error bars represent the standard deviation, no. of experiments 20
4.3.2 Adsorption ofPEO/PBMA blockcopolymer onto silica particles The adsorption of the PEOIPBMA blockcopolymer onto the silica particles is an important aspect of the modification process. Important parameters which should be known in order to adjust the initial situation are the amount ofblockcopolymer adsorbed onto silica particles (f), and the thickness ofthe adsorbed layer. It is not the purpose to unravel the kinetics and the adsorption mechanism in detail. Qualitatively the global process of polymer adsorption may be divided into three fundamental events ( 1) transport of polymer molecules from the bulk solution to the partiele surface, (2) attachment to the surface and (3) unfolding ofthe polymer chain35
. The adsorption rateis determined by either of these steps and is dependent upon factors as the type, molar mass and concentration of the (blockco )-polymer, the surface coverage, the strength ofthe silica blockcopolymer bond, and the solvent properties35
• With reflectometry it is possible todetermine the adsorbed amount (mass/area) under well-de:fined hydrodynamic conditions, see section 4.2.4. The adsorption of the PEO/PBMA blockcopolymer onto a plane silica surface bas been studied using reflectometry. The results are depicted in :figure 4.7.
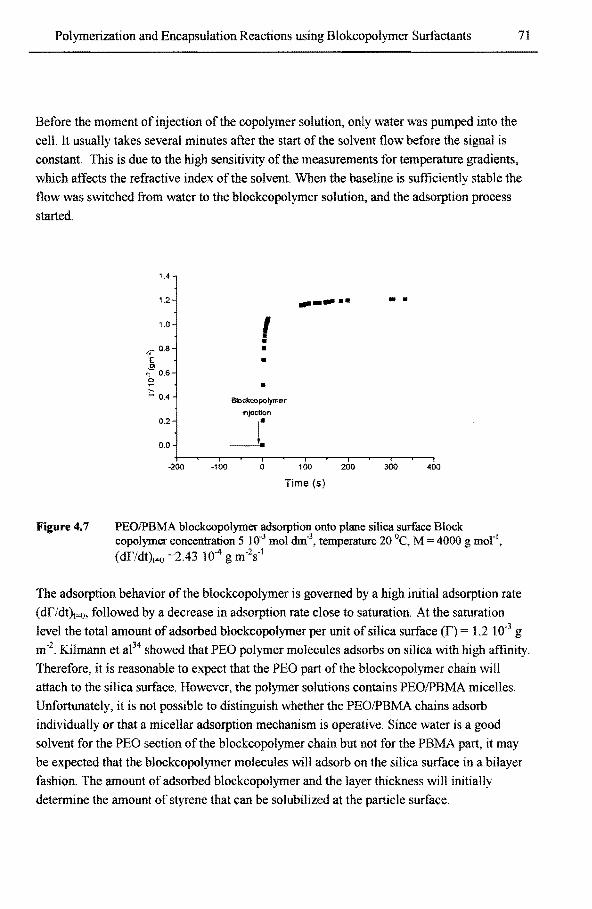
Polymerization and Encapsulation Reactions using Blokcopolymer Surfactauts 71
Before the moment of injection ofthe copolymer solution, only water was pumped into the
cell. It usually takes several minutes after the start of the solvent flow before the signa! is
constant. This is due to the high sensitivity of the measurements for temperature gradients,
which affects the refractive index of the solvent. When the baseline is sufficiently stabie the
flow was switched from water to the blockcopolymer solution, and the adsorption process
started.
Figure4.7
1.4
1.2 ---·· • • 1.0 I • •
"'0.8 • 'E • "' '?- 0.6
~ • i:; 0.4
Blocl<:eopolymer
injeotion 0.2
0.0
-200 -100 Q 100 200 300 400
Time (s)
PEO/PBMA blockcopolymer adsorption onto plane silica surface Block copol.ymer concentration 5 10·3 mol dm-3
, ternperature 20 °C, M = 4000 g mor1,
(drldt)t"il =2.43 104 g m·2s-1
The adsorption behavior of the blockcopolymer is govemed by a high initia! adsorption rate
(drldt)1"il, followed by a decreasein adsorption rate close to saturation. At the saturation
level the total amount of adsorbed blockcopolymer per unit of silica surface (r) 1.2 1 0"3 g
m·2. Kilmannet ae4 showed that PEO polymer molecules adsorbs on silica with high affinity.
Therefore, it is reasonable to expect that the PEO part of the blockcopolymer chain will
attach to the silica surface. However, the polymer solutions contains PEOIPBMA micelles.
Unfortunately, it is not possible to distinguish whether the PEO/PBMA ebains adsorb
individually or that a micellar adsorption mechanism is operative. Since water is a good
solvent for the PEO section of the blockcopolymer chain but not for the PBMA part, it may
be expected that the blockcopolymer molecules wiJl adsorb on the silica surface in a bilayer
fashion. The arnount of adsorbed blockcopolymer and the layer thickness wil! initially
determine the arnount of styrene that can be solubilized at the partiele surface.

72 Chapter4
Therefore the layer thickness ofthe adsorbed blockcopolymer onto silica particles was estimated using dynamic light scattering experiments. An unmodified silica dispersion with an average partiele radius of 118.1 ± 1 nm has been used.
Figure4.8
130
120
Ê 110
..s 111 100
.a ~ 90
~ 80 111 a. ~ 70
60
1!"------------------------------------------· Radius bare silioa particles is 118.1 nm
I I standard deviatlon is 1.2 nm
I
I
o.o 5.0x10.. 1.0x1a·3 1.5x10'3 2.0x10'3 2.5x1tr'
Blockcopolymer concentration (mol dm-3)
Light scattering upon aqueous silica dispersions, visualizing the apparent radius ofthe system <• as a function ofblockcopolymer concentration, temperature 20 °C, scattering angle 90°, solid content silica 1.22 gig, no. of silica particles 9.1 1014 m·3, amount of surface area offered: 158.48 m2
, error bars represent the standerd deviation, no. of experiments 20
This silica dispersion bas been used for light scattering experiments where the angle of detection bas been varied. No significant influence ofthe detection angle upon the partiele size was observed, indicating that the silica dispersion exhibit a narrow partiele size distribution. Different amounts ofblockcopolymer has been added to the silica dispersions. It is important to note that no ethanol was present in this system. The samples were allowed to equilibrate for 24 hours in order to reach thermodynamic equilibrium. Afterwards the samples were submitted to light scattering with a detection angle of 90° at 20 °C. The results are presented in figure 4.8. Note, at relatively high blockcopolymer concentrations, the apparent radius of the species in the solution is far below the radius of the bare silica particles. This effect is due to the presence of micelles in the solution with an average radius of20 nm, see figure 4.4. When the blockcopolymer concentration decreases the contri bution of the micelles to the total scattering si goal decreases as well.

Polymerization and Encapsulation Reactions using Blokcopolymer Surfactants 73
At very low blockcopolymer concentrations, i.e. 3 I o-5 - I 1 o-5 mol dm-3 the apparent radius
goes through a maximum of I23.2 nm. This indicates that the maximum layer thickness is
estimated to be 5 nm, and is present at very low blockcopolymer concentrations, i.e. in order
of 10-5 mol dm-3. Insection 4.2.3 the amount ofadsorbed blockcopolymer, using
reflectometry on a plane silica surface is estimated to be I .2 I o-3 g m2 which corresponds to 3
10-7 mol m-2. When it is assumed that the chemica! properties ofthe plane silica surface and
the surface of the colloidal silica particles do not differ significantly, it is estimated that per
liter of solution 4. 8 I o-5 mol can be adsorbed onto the silica partiel es. This value is in
reasonable agreement with the amount ofblockcopolymer used in the light scattering
experiments. The observation is that, although micelles can still be present in the solution, all
blockcopolymer is adsorbed on the silica particles when the amount ofblockcopolymer is
low. The layer thickness ofPEOIPBMA surfactant species onto silica particles in aqueous
solutions is ca 5 nm. Unfortunately the adsorption behavior of the blockcopolymer surfactant
on silica particles in ethanolic solutions has notbeen investigated. One might expect that due
to the increased solubility ofthe blockcopolymer in the ethanolic medium, the amount of
adsorbed surfactant species may be less, leading to thinner layers. However, this assumption
should be tested experimentally.
4.3.4 Phase equilibria of styrene In the previous section the typical properties of the blockcopolymer were discussed. This
section will emphasize upon the phase equilibria of styrene.
First, the influence of partiele morphology upon phase equilibria will be discussed, where
theoretica! calculations are compared with experimental results. The considerations are
related to aqueous systems where no ethanol is present. Subsequently, the influence of
ethanol upon the phase equilibria of styrene is briefly studied.
4.3.4.1 Jnfluence of partiele morphology upon styrene partitioning
Suppose that the initial situation of an encapsulation system, prior to polymerizations
comprises modified silica particles and blockcopolymer micelles. This will be the case when
the blockcopolymer concentration is too high. When styrene is added, partitioning over the
different phases occurs, i.e. the modified silica particles and the micelles.
Styrene partitioning in blockcopolymer micelles
The micelles (when present) may be considered to have a uniform morphology. However
silica particles, when modified with surfactant, should be considered as core-shell structures
where the silica core will not swell with monomer.

74 Chapter4
The uptake of monomer at the surface of the silica particles is definitely dependent upon the modification process and characterized by the type and amount of surfactant present on the silica surface. During polymerization monomer is converted into polymer and secondary nucleation by micellar nucleation is likely to occur. These freshly formed polymer particles also have a different morphology as the modified silica particles. Therefore, the ditTerenee in partiele morphology should be taken into account in theoretica! calculations conceming the phase equilibria of styrene. The partitioning of styrene in a conventionallatex system is described by the Vanzo equation, see section 2.2.1. This equation may also be used to describe styrene partitioning in blockcopolymer micelles and the surrounding liquid. In this respect two boundary situations rnay be considered. In the first situation is it is assumed that styrene only is only taken up into the hydrophobic PBMA part of the blockcopolymer micelles. Consequently the degree of polymerization Dp is about 8. The second situation is that styrene is taken up by both the PEO and the PBMA part of the blockcopolymer chain. The degree of polymerization increases and is estimated to be about 7 4. In figure 4.9 theoretica! calculations are presented where the volume fraction of styrene is plotted against the apparent radius of the micelle for the two boundary situations.
Figure4.9
0.6
0.5
0.4
0.3
2 .. > 0.2
0.1
0.0
5 10 15 20 25 30
Micelle radius (nm)
The volume fraction of styrene within the micelles as function of the mieeDe radius according to the Vanzo equation, y = 0.025 N/m, x=0.4537
,
Temperature 70 °C, V sty = 1.14 104 m3mor1, (.) Dp=8, (A) Dp=74,
radius micelle 19 nm, no. of micelles 1.4 1017 dm'3
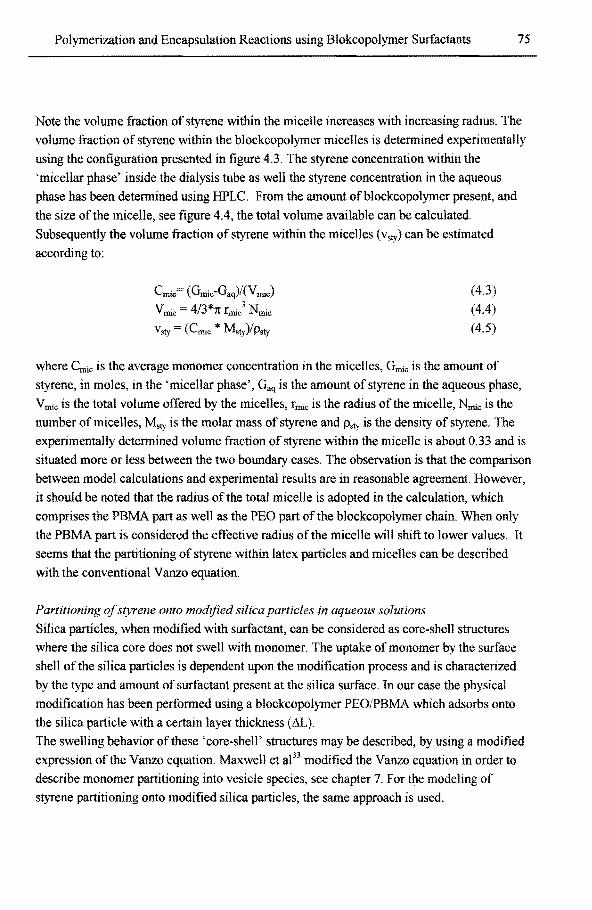
Polymerization and Encapsulation Reactions using Blokcopolymer Surfactauts 75
Note the volume fraction of styrene within the micelle increases \Vith increasing radius. The volume fraction of styrene within the blockcopolymer micelles is determined experimentally using the con:figuration presented in :figure 4.3. The styrene concentration within the 'micellar phase' inside the dialysis tube as well the styrene concentration in the aqueous phase has been determined using HPLC. From the amount ofblockcopolymer present, and
the size ofthe micelle, see :figure 4.4, the total volume available can be calculated. Subsequently the volume fraction of styrene within the micelles (vsty) can be estimated according to:
Cmic= (Gmic"Gaq)/(Vmic) V mie 4/3*1t rmic3 Nmic
V sty ( Cmic * Msty )/ Psty
(4.3) (4.4) (4.5)
where ~" is the average monomer concentration in the micelles, Gmic is the amount of styrene, in mol es, in the 'micellar phase', Gaq is the amount of styrene in the aqueous phase,
V mie is the total volume ofTered by the micelles, rmic is the radius of the micelle, Nmic is the number of micelles, M,1y is the molar mass of styrene and Psty is the density of styrene. The experimentally determined volume fraction of styrene within the micelle is about 0.33 and is situated more or less between the two boundary cases. The observation is that the comparison between model calculations and experimental results are in reasonable agreement. However, it should be noted that the radius ofthe total micelleis adopted in the calculation, which comprises the PBMA part as well as the PEO part of the blockcopolymer chain. When only the PBMA part is considered the effective radius ofthe micelle will shift to lower values. It
seems that the partitioning of styrene within latex particles and micelles can be described with the conventional Vanzo equation.
PartWoning of styrene onto modified silica particles in aqueous solutions
Silica particles, when modi:fied with surfactant, can be considered as core-shell structures where the silica core does not swell with monomer. The uptake of monomer by the surface shell of the silica particles is dependent upon the modi:fication process and is characterized by the type and amount of surfactant present at the silica surface. In our case the physical modi:fication bas been performed using a blockcopolymer PEOIPBMA which adsorbs onto the silica partiele with a certain layer thickness (&).
The swelling behavior of these 'core-shell' structures may be descri bed, by using a modi:fied expression ofthe Vanzo equation. Maxwell et ae3 modi:fied the Vanzo equation in order to describe monomer partitioning into vesicle species, see chapter 7. For the modeling of styrene partitioning onto modi:fied silica partiel es, the same approach is used.

76 Chapter4
The basic assumption is that mixtures of styrene and and the BMA part of the blockcopolymer is described by the Flory-Huggins theory. The BMA part in the blockcopolymer is considered to hebave as a polymer chain oflow molecular weight. The layer, adsorbed onto the silica particles, is able to swell with styrene where the silica core is not. The full equation descrihing the swelling of the modified silica particles with styrene is given by:
(4.6)
where vps is the volume fraction ofPBMA chains in the shell, and Vpsv is the volume fraction ofthe PBMA part ofthe blockcopolymer in the styrene swollen silica particle. Note, this fraction includes the silica core, i.e.
(4.7)
where V is the absolute volume and the subscripts p, si, and s represent the PBMA part of the blockcopolymer, the silica core, and styrene respectively. In this way the basic equations for swelling latex particles and modified silica particles are the sarne. When the modified silica particles are spherical, the volume of the PBMA part is given by:
(4.8)
where Re is the extemal radius which comprises the bare silica particles and the bilayer, i.e. (R.;+ AL), and Rsi is the intemal radius of the 'bare' silica partiel es. The volume of styrene in the modified silica particles is given by:
(4.7)
The volume of the silica V si is simply given by:
V si = 4/3 1t R,i (4.9)
when the modified silica particles are swollen with styrene, the radius increases due to expansion of the modified layer only. Using this approach, the volume fraction of styrene at the modified vesicle surface can be estimated as a function of the layer thickness, provided that values for the interaction parameter and the interfacial tension are known accurately.

Polymerization and Encapsulation Reactions using Blokcopolymer Surfactants 77
The results ofthe model calculations ofthe volume fraction of styrene on the modified silica
particles as function ofthe layer thickness is summarized in Figure 4.10, where the
interfacial tension ofthe blockcopolymer-water interface has been varied. In these
calculations it is assumed that only the PBMA section is capable of solubilize styrene.
Therefore, the degree of polymerization is assumed to be 8. The value taken for the
interaction between styrene and the PBMA part ofthe chain is relatively low, since styrene is
a relatively good solvent for PBMA polymer. All other parameters are supposed to be known
and accurate. It should be realized that this approach is a qualitative one, but useful in order
to understand the mechanisms involved.
0.40
0.35
0.30
0.25
. 0.20 ~
~ > 0.15
0.10
0.05
0.00 0 5 10 15 20
Layer thickness (nm)
Figure 4.10 Volume fraction of styrene at the silica surface as function of the layer thickness for different values for the interfacial tension, Ternperature 70 °C, x= 0.45, Dp=8, radius silica 118.1 nm, Ysty=l.l4 104 m3 mor1
, p,~y=878 kg m·3, M.ty = 104.15 g mor1
Note, the calculations show that the volume fraction of styrene at the silica surface increases
with increasing layer thickness. This suggests which that a modification procedure enhances
the presence of styrene at the surface of the silica partiel es. When the value for the interfacial
tension increases the volume fraction of styrene deercases for a given layer thickness. Again
it is emphasized that Figure 4.10 only suggest a qualitative trend, since the layer thickness is
critically dependent upon the modification procedure. Additionally, exact and accurate
values for the interfacial tension and the interaction parameter as function of the layer
thickness are not known.

78 Chapter4
In general, the layer thickness for blockcopolymer adsorption upon silica particles is in the order of2-10 nm35
• Therefore, layers larger in size than 20 nm seems to be physically unrealistic. However, ftom figure 4.10 it can be derived that fora system of silica particles of 118.1 nm size, modified with a blockcopolymer layer of 2-10 nm, the calculated volume ftaction of styrene is less than 0.35. Experiments have been performed to determine the volume fraction of styrene at the surface ofthe silica particles using the contiguration presented in figure 4.3. First bare silica particles, without blockcopolymer modification, were submitted to the partitioning experiment. No styrene adsorption on the silica surface was observed within experimental error. Next the particles have been modified with blockcopolymer. The blockcopolymer concentration in the solution was 4.7 10"5 mol dm"3, which is c1ose to the maximum value of the adsorbed amount ofblockcopolymer determined with reflectometry, see figure 4. 7. The total amount of silica surface offered is the same as for the adsorption experiments. Therefore, it may be expected that the thickness of the adsorbed layer is 5 nm, as shown previously by light scattering, see figure 4.8. The amounts ofstyrene in the 'silica phase' as well in the aqueous phase are determined with HPLC. The total volume Vsilica ofTered for styrene partitioning can be estimated according to:
(4.10)
where rsilica is the radius of the bare silica partiel es, i.e. 118.1 nm, M.. is the layer thickness and Nsilica is the number of silica particles. The experimentally determined volume fraction of styrene upon the modified silica particles is 0.206, see the data point in figure 4.1 0. The comparison between model calculations and the experiment is reasonable assuming a layer thickness. This result also suggests that it is essendal to perform a modification procedure prior to the encapsulation reaction in order to enhance the amount of styrene at the surface of the silica particles. The intial situation prior to encapsulation is very important and is critically dependent upon the amount ofblockcopolymer added. When the concentration ofblockcopolymer is far above 5 1 o·5 mol dm"3
, micelles will be present. The consequence is that micelles will take up more styrene than the modified silica partiel es. The volume fraction of styrene in micelles is higher, i.e. 0.334 then the volume ftaction of styrene on the modified silica particles, i.e. 0.206. Suppose that during polymerization secondary micellar nucleation occurs. These freshly formed particles wilt grow rapidly and the volume fraction of styrene within the particles can easily exceed 0.6.

Polymerization and Encapsulation Reacrions using Blokcopolymer Surfactauts 79
Therefore, it may be the case, as explained qualitatively insection 2.2.4, that when secondary
nucleation occurs, polymerization mainly takes place in the polymer particles. since the
styrene concentration is higher than the styrene concentration at the modified silica partiel es.
4.3.4.2 lnfluence of ethanol upon monomer partWoning in regular polymerizations as wel/ encapsulation reaelions
In the previous section phase equilibria in aqueous based systems is discussed without the
presence of ethanol in the medium. However, in the polymerization and encapsulation
systems under investigation, ethanol is present, which changes the properties ofthe medium.
In a conventional emulsion polymerization as well as an encapsulation system, the medium
consists of a reactive component, namely styrene, and a non-reactive component which itself
may contain more than one component (e.g. only water or ethanol/water). In this context it is
necessary to understand that the solubility of styrene in the medium is strongly dependent
upon the composition of the medium.
In order to verify this, experiments have been performed where the solubility of styrene in the
medium (continuous phase) is determined as function ofthe composition ofthe medium, i.e.
volume fraction of ethanol in the absence of latex particles.
For experimental details, see section 4.2.3. The results are shown in figure 4.11.
1.2
"'~ 1.0 E g 0.8 0 E :; 0.6 c:: 0 (.) 0.4 <11 c::
~ 0.2
êi.i 0.0
0.0
...
0
• 0.2 ().4 0.6 0.8 1.0
Ethanol volume fraction (-)
Figure 4.11 Tbe soluhihty of styrene in the continuons ethanol-water phase at 70 as a function ofthe ethanol volwne fraction, total volwne ofthe continuons phase (water and ethanol) is 30 m1, (0) volwne styrene added is 2 mi, (Ä) volwne styrene added is 5 mi. Tbe solid lines represent the maxirnwn concentranon of styrene in the continuons phase, asswning no volwne contraction

80 Chapter4
Note, at low volume fractions of ethanol in the continuous phase the solubility of styrene in the medium is low. However, when the composition ofthe medium changes, i.e. the volume fraction of ethanol increases, the solubility of styrene in this continuous phase increases. Styrene is dissolved in completely in the continuous phase at approximately 50 vol% ethanol. Thls behavior is dependent upon the initial amount of styrene added to the system. A striking question is how the styrene partitioning will occur in an ethanol-water continuous phase in the presence of a polymer latex partiele phase. Unfortunately these experiments have not (yet) been performed. However, in literature similar cases with a latex partiele phase present have been studied. Schoonbrood39 investigated the partitioning ofHydroxyethyl methacrylate (HEMA) and methylacrylate (MA} between water, the monomer droplet phase and the latex particles and observed that the concentradon of MA in the water phase below saturation was independent ofthe amount ofHEMA in the water phase which was comparable with the case where no latex particles were present. Popliet al7•
8, studied the partitioning of several
solvents, exhibiting different water solubilities, between the aqueous phase and the latex particles, i.e. polystyrene and a acrylate terpolymer. They concluded that solvents with a low solubility preferably reside in the latex particles. With increasing solubility in the medium, the volume fraction of solvent in the particles decreased. Two different situations can be encountered when latex particles are swollen by a medium miscible monomer/solvent40
• Firstly the medium miscible solvent is a poor solvent for the polymer in the latex particles teading to phase separation and probably a low solvent uptake by these partic les. Secondly, the medium miscible solvent is a good solvent for the polymer in the latex particles. This system under investigation is an example of the latter case depending on the recipe used. By adjusting the amount of ethanol the solubility of styrene in the medium is increased but styrene still remains a good solvent for polystyrene in this case. An additional effect is that the latex partiele will take up ethanol despite the fact that ethanol is a non-solvent for polystyrene7
'8'40
In the case of styrene, whlch can be miscible with the medium, the general equations which describe the partial and saturation swelling in the latex particles do not hold any more since styrene used to swell the latex particles can be miscible with the medium depending on the recipe. The free energy of the medium is becorning more important and should be evaluated for each component present in the medium. This requires an extension of the existing models which are up to now basedon the Vanzo equation. Note that the recipe is very is an important on the item to consider since the absolute concentrations of styrene in the different species will change with increasing volume fraction of ethanol present. When the volume fractîon of ethanol in the recipe is low, the styrene partitioning may bedescribed using the general the Vanzo equation.

Polymerîzation and Encapsulation Reactions using Blokcopolymer Surfactauts 81
However using higher volume fraction of ethanol in the recipe, the polymerization reaction
can be regarcled as a dispersion polymerization, where the system is composed of a single
polymer component (polystyrene) in a medium consisting of three components (water,
ethanol and styrene ). The thermodynamic treatment of the equilibrium distribution of each
component between the continuous phase and the polymer partiele phase is, in principle,
basedon Flory-Huggins theory10•11 It is obvious that the ethanol-water, ethanol-styrene and
styrene-water interactions in the medium makes a strong contobution to the partition
behavior. The extension of existing models, based upon Flory-Huggins theory, to include the
solubility ofmonomer in the continuous phase bas been done in recent years by Guillot 13,
Tseng14, Lu, El-Aasser7 and Bindscheadle2·6. In addition to the partial molar free energy of
styrene, the partial molar free energy of ethanol has been considered for the continuous phase
as well the partiele phase7•9
. In order to calculate and understand pbase equilibria of styrene,
water, ethanol and polystyrene latex particles, a similar approach is adopted. For details of
the calculations see appendix B, where the equations as well as the relevant input parameters
are given. In figure 4.12 the results are presented for the phase equilibria of styrene in ethanol
in polymer particles for an emulsion system where the continuous phase consists of water and
ethanol with a constant amount of styrene and polystyrene. The volume fraction of styrene
and ethanol in the polymer particles is plotted as function of the volume ftaction of ethanol in
the continuous phase. These results suggest that when the volume fraction of ethanol in the
continuous phase is low, the volume fraction of styrene within the particles will be relatively
high and the volume fraction of ethanol within the particles is very low. With increasing
volume ftaction of ethanol in the continuous phase the volume fraction of styrene in the
particles decreases significantly. More styrene will dissolve in the continuous phase resulting
in a lower styrene concentration in the polymer particles.

82 Chapter4
0.6 0.6
• • • • 0.5 • 0.5
0.4 0.4
~ ..... ..:.. 0.3 -· 0.3..:..
"" t 11 > >
0.2 0.2
• • • 0.1 0.1
" a-IJ IJ IJ IJ 0 0
0.0 0 0.0 0.0 0.2 0.4 0.6 0.8
F eth (-)
Figure 4.12 Calculated results concerning phase equilibria of styrene and ethanol in an emulsion system, volume fraction of styrene and ethanol in the particles as function of the volume fraction of ethanol in the continuous phase, Temperature 70 °C, partiele size 100 nm, amount ofpolystyrene 50 g. amount ofstyrene60 g. total volume I dm3
,
for further details see appendix B
The volume fraction of ethanol seerns to remain relatively constant until high volume ftactions of ethanol are adopted in the recipe. Note that figure 4.12 only illustrates a qualitative trend, since the interaction parameters only be estimated to a reasonable extent. Additionally it is assumed that the interaction parameters between styrene-water, styreneethanol.and water-ethanol are independent upon the volume ftaction of styrene, water and ethanol in the continuous phase, which will introduce deviations. However, this predicted behavior has been observed experimentally. Popli et at1·8 determined the volume ftaction of ethanol in polystyrene lattices as a function of the added amount of ethanol. Their experiments indicated that the volume fraction of ethanol can exceed 0.10 at high ethanol amounts. Lu et al7 estimated theoretically and determined experimentally the volume ftaction of styrene and ethanol in polystyrene lattices in water-ethanol solutions. Their results are in qualitative agreement with the results presented in figure 4.12. It is clear that the addition of ethanol has a distinct influence upon the initial situation, conceming the phase equilibria. In general, it may be stated that the addition of ethanol willlower the styrene concentration in the latex particles, (when present), the blockcopolymer micelles and the blockcopolymer modified silica particles, compared to phase equilibria in aqueous based systems, where the continuous phase consists only of water. This decreasein styrene concentration within the particles, of different morphology, will have a significant effect upon reaction kinetics and on nucleation mechanisms.

Polymerization and Encapsulation Reactions using Blokcopolymer Surfactants 83
It may be possible that the locus of polymerization may shift from the partiele phase( s) to the
continuous phase when the volume fraction of ethanol added is too high. A more extensive
discussion conceming these topics \vill be discussed in chapter 5.
4.4 Concluding Remarks In this chapter the blockcopolymer route which leads to the encapsulation of the silica
particles is described, in order to design stmtegies for control of the encapsulation reaction.
However, before dynamic control ofthe encapsulation reaction is possible, it is essential to
understand the mechanism and kinetics of the encapsulation process at the molecular level.
The emphasis in this chapter is focused on the study of the initia! situation, prior to the
polymerization reaction with emphasis focused upon micellization and phase equilibria . The
initia! situation is defined bere as the stage before the final encapsulation reaction and
comprises the silica modification and the partitioning of styrene over the different phases. It
is clear that the initia! situation is influenced by the applied process parameters such as the
addition of ethanol and blockcopolymer. The amount ofblockcopolymer added is of
paramount importance. In aqueous solutions the PEO/PBMA blockcopolymer will form
micelles even at very low blockcopolymer concentrations i.e. 10·5 mol dm-3. These micelles
appear to be rather stabie with respect to dynamic surfactant exchange processes, as shown
with light scattering experiments. In water-ethanol solutions, however, aggregates are formed
which increase in size with increasing amount of ethanol present. The adsorption of
blockcopolymer onto a plane silica surface has been determined with reflectometry as a
function oftime. The adsorption processis fast and the amount ofadsorbed blockcopolymer
is 1.2 10·3 g m-2. The blockcopolymer will probably adsorb as a bilayer since the PEO part of
the chain bas a high affinity for the silica surface and water is not a good solvent for the
PBMA part of the chain. With light scattering experiments the layer thickness of the
adsorbed blockcopolymer onto silica particles has been determined, which is about 5 nm.
The amount ofblockcopolymer required to produce a layer of 5 nm is estimated and is in
good agreement with the value obtained by reflectometry. Theoretica! calculations and
experiments concerning phase equilibria of styrene in latex particles, styrene and modified
silica particles have been performed for aqueous systems. The results indicate that partiele
morphology has an pronounced effect upon the styrene partitioning. It seems phase equilibria
of styrene is in favor of the micelles and the latex partic les ( when present) instead of the
modified silica particles. When ethanol is introduced the phase equilibria of styrene and
ethanol over the different phases should be considered. Theoretica} calculations show that the
addition of ethanol willlower the styrene concentration in the latex particles, (when present),
the blockcopolymer micelles and the blockcopolymer modified silica partiel es, compared to
phase equilibria in aqueous based systems.
Summarizing: Experiments and model calculations, concerning micellization of the
blockcopolymer and phase equilibria of styrene and ethanol, show that the initia! situation is
significantly affected by the applied process conditions in the encapsulation process.
84
References
I. Janssen, R.Q.F., "Polymer Encapm/ation of Titanium Dioxide, e.ffficiency, stability and compatibility", PllD thesis, 1995.
2. Janssen, R.Q.F., Derks, G.J.W., van Herk, AM., German, AL., in "Encapmlation and controlled release", Eds. D.R. Karsa, R.A. Stephenson, Royal Society ofChemistry, Cambridge, (1993), 102.
3. Janssen, R.Q.F., van Herlc, A.M., German, A.L., 22"" FAllPEC Conference Book, (1994), vol1, 104.
4. Sudo~ E.D., "Dispersion Polymerization" in Nato Advanced Study Institute on Recent advances in Polymerie Dispersions, Elizondo, Spain, 1996.
S. Bindschaedler, C., Gurny, R., Doelker, E., Peppas, N.A. J. ofColloidandlnterface Sci, 1985, 108, l, 75.
6. Bindschaedler, C., Gumy, R., Doelker, E., P!!Ppas, N.A. J. ofColloid and Interface Sci, 1985, 108, 1, 83.
7. Popli, R., Luccas, M.H., Tsaur, S.L., Langmuir, 1991, 7,1, 65. 8. Popli, R., Langmuir, 1991, 7, 1, 73. 9. Lu, Y.Y., El-Aasser, M.S., Vanderhot: J.W., J. ofPo/ym Sci, Polym. Physics, 1988,
26, 1187. 10. Morton, M., Kaizerman, S., Altier, M.W., J. Colloid Sci, 1954, 9, 300.
Chapter4
11. Flory, P.J., Principles ofPolymer Chemistry, Comell University Press, Ithaca, N.Y., 1953. 12. Barret, K.E.W., Dispersion Polymerization in Organic Media, John Wiley & Soos, New
York, 1975. 13. Guillot, J., Makromol. Chem., Rapid Commun., 1980, 1, 697. 14. Tseng, C.M., El-Aasser, M.S., Vanderhof( J.W., Org. Coat. Plast. Chem., 1981,45, 317. 15. Maxwell, I.A, Kwja, J., van Dorernaele, G.H.J., Gennan, AL., Makromol. Chem., 1992,
193,2065. 16. Paine, A.J.,Macromo/ecules, 1990,23, 3109. 17. Astafieva, I, Zhong, F., Eisenberg, A., Macromolecules, 1993, 26, 7339. 18. Judeinstein, P., Clement, S., J. Mater. Chem., 1996, 6, 4, 511. 19. Kihira, H., Mateijevic, E., Langmuir, 1991, 8, 2855. 20. Kihira, H., Mateijevic, J. Chem. Soc. Faroday Trans., 1992, 88, 16, 2379. 21. Sarkar S., Adhikari, M.S., Baneljee, M., Konar, R.S., J. of Appl. Polym. Sci., 1988, 35, 109. 22. Homula, A.M., Inoue, M., Robertson, AA, J. of Appl. Polym. Sci., 1975, 19, 3077. 23. Hildebrand, J.H., Scott, R.L., "The solubility of nonelectrolytes ", 3 rd ed., Reinhold New York,
1955. 24. Janssen, R.Q.F., "Polymer Encapsulation ofTrtanium Dioxide", PllD thesis, Technica! University
Eindhoven, 1995. 25. Kawagucbi, S., Yekta, A, Duharnel, J., Winnik, M.A, Ito, K., J. Phys. Chem., 1994,98, 7891. 26. Shouldice, G.T.D., Rudin, A., Paine, A.I., J. of Polym. Sci, Polymer Chemistry, 1996, 34, 3061. 27. Hergeth, W.O., Steinau, U.J., Bittrich, G.S., Schrnutzler, K., Polymer, 1989, 30, 254.
28. Hasegawa, M., Arai, K. Saito, S.J. Polym. Sci, Polymer Chemistry, 1987, 25, 3117. 29. Furusawa, K., Kimura, Y. Tagawa, T., J. ofCo/loid Interface Sci, 1986, 109, 1, 70. 30. Zana, R., Advances in Co/loid and Interface Science, 1995, 57, l. 31. Islam, A.M., Chowdhry, B.Z., Snowden, M.J., Advances in Colloid and Interface Sci., 1995, 62,
109. 32. Furusawa K., Anzai, c., Colloids and Surjaces, 1992, 63, 103. 33. Maxwell, I.A., Kuija, J., Langmuir, 1995, 11, 1987. 34. Kilmann, E., Maier, H., Kaniut., P., Gutling, N., Colloids Surjaces, 1985, 15, 261 35. Dijt, J.C., "Kinetics of Polymer Adsorption, Desarpiion and Exchange", PhD thesis, University of
Wageningen, 1993. 36. Astafieva, 1., Zhong, F., Eisenberg, A, Macromo/ecules, 1993, 26, 7339. 37. Noël, E.F.J., Maxwe~ I.A., German, A.L.,Macromo/ecules, 1993, 26, 2911. 38. Kawaguchi S., Y ekta, A, Duhamel, I., Winnik, M.A., Ito, K., J. Phys Chem., 1994, 98, 7891 39. Schoonbrood, H.A.S., Emulsion Co-and Terpolymerization, PllD-thesis, University of Eindhoven,
1994 40. Kwja, J., Some outstanding problems conceming heterogeneaus polymerization in
aqueous media, PllD-thesis, University ofEindhoven, 1997.

Polymerization and Encapsulation Reaction using Blockcopolymer Surfactauts 85
5 POL YMERIZA TION REACTIONS AND
ENCAPSULATION REACTIONS ON SILICA PARTICLES WITH THE AID OF BLOCKCOPOL YMER
SURFACTANTS
An Analysis concerning reaction kinetics and nucleation
5.1 Introduetion In chapter 4, it was emphasized that the applied process conditions have a significant
influence Based upon the results, described in chapter 4, it seems that the initial situation for
the polymerization processis largely dependent on the amount ofblockcopolymer, the
amount of styrene, and the amount of ethanol added to the system.
In this chapter an attempt will be made to evaluate nucleation and kinetics ofthe
polymerization and encapsulation reactions, with respect to the applied process conditions.
The kinetics of the polymerization and encapsulation reactions are significantly dependent
upon these initia] conditions. The encapsulation process starts with the preparation of silica
particles using the Sol-Gel technique. This technique requires ethanol and its presence
influences the partitioning of styrene over the different phases.
In addition blockcopolymer may or may not be added, but the micellization of surfactant
species is influenced by ethanol. These aspects concerning micellization and phase equilibria
are described in chapter 4.
Ethanol will also have a prononnced effect npon the reaction kinetics in the continuons phase
as well as in the partiele phase. Starting with the continuons phase, the decomposition of
persulfate initiator may be inflnenced by the presence of ethanol.

86 Chapter 5
The persulfate radicals generated will react styrene dissolved in the continuous phase. Since the solubility of styrene in the continuous increases when ethanol present, see section 4.3.4.2, entry processes of surface active oligomeric radicals are likely to be affected. Exit phenomena of radical species, generated by transfer will be influenced by ethanol as well. When the partiele phase kinetics are considered, it is likely that ethanol will influence these kinetics as well. Insection 4.3.4.2 it bas been shown that ethanol will partition between continuous phase and the particles. When this is the case ethanol can be treated as a solvent which may influence fundamental reaction steps in the particles such as propagation, termmation and transfer. Finally the presence of ethanol in the emulsion polymerization and encapsulation reactions will influence nucleation. From these considerations it beoomes clear that the kinetics of these systems are very complex and still not understood. Therefore, the aim of this chapter is to gain more fundamental onderstanding about the kinetics of this type of emulsion polymerization and encapsulation reactions. For this purpose an experimental strategy bas been adopted. First, as a reference system, the emulsifier free ab initio emulsion polymerization of styrene is performed in an completely aqueous environment, i.e. styrene, water and persulfate. In a second class of experiments emulsifier free polymerizations of styrene are performed, but now with different amounts of ethanol present. In this way the influence of ethanol upon the kinetics and nucleation of these emulsifier free polymerization reactions can be evaluated. The third class of experiments are conducted introducing ethanol as well as blockcopolymer surfactant in the polymerizing system. Utilizing this approach the influence ofblockcopolymer and ethanol upon the kinetics is studied, where the morphology ofthe latex particles is sirnilar. Finallyin the last class of experiments encapsulation reactions are performed where all the intrinsic phenomena (introduction, ethanol, blockcopolymer and different partiele morphology) are coming together. In the encapsulation reactions secondary nucleation takes place, resulting in two partiele classes of different morphology. Next to the influence of ethanol and blockcopolymer, the morphology of the partiele bas an additional influence upon the kinetics of the polymerizing system. For batch encapsulation reactions, the formation of polymer particles appeaJiS to be dominant in all cases. To suppress secondary nucleation semi-continuous encapsulation reactions are performed at monomer starved conditions. On the other hand one can make benefit of the formed polymer particles by heterocoagulation them with the surface ofthe inorganic silica particles. Both approaches are evaluated.

Polymerization and Encapsulation Reaction using Blockcopolymer Surfactauts 87
5.2 Experimental Section 5.2.1 Materials Styrene was distilled at reduced pressure under nitrogen and storedat 4 °C. Water was
purified by a Millipore Milli-Q system, Ethanol (Merck, analytical grade ), methanol (Merck
analytica] grade), sodium persulfate (Fluka Chemie), ammonium hydroxide ( NH3 25% in
water), tetraethylorthosilicate (TEOS, 98%, Aldrich), hydrochinone (Merck) and sodium
carbonate (Merck), were used as received. The blockcopolymer, used as modification agent
is polyethylene oxide-polybutyl methacrylate (PEO-PBMA, 3:1, M=4000 glmol).
5.2.2 Preparation of silica particles Silica particles were prepared using the Sol-Gel process, as described insection 4.2.2 and
chapter 3.
5.2.3 Determination decomposition ofpersulfate The decomposition of persulfate in water-ethanol mixtures was monitored using
conductivity. The experiments were performed at a temperature of 70 °C The change in
conductivity during the decomposition ofpersulfate was monitored on-line with a PP1042
two point electrode cell in combination with a CDM 80 conductivity meter (Radiometer) at
2000 Hz. The recipes of the reactions are given in Table 5 .1.
Table 5.1 Recipes used for the determination of the decomposition of persulfate in water-ethanol mixtures
Amount
Component (a) (b) (c) (d)
Ethanol (mi) 0 50 100 150 Water (mi) 200 175 100 50 Persulfa te (g) 0.104 0.104 0.104 0.104
F eth (-) 0 0.25 0.5 0.75
5.2.4 Batch emulsifier free polymerization reactions of styrene The emulsifier free polymerizations were performed in nitrogen atmosphere in a 1.3 dm3
reactor, see tigure 5 .1. Before use, the reactor was purged with nitrogen to remove the
oxygen. Styrene, water, and the persulfate solution were degassed and purged with nitrogen.
First the styrene/water mixture was inserted into the reactor. The stirrer speed used was 450
rpm. When the temperature ofthe reaction mixture was 70 °C, the reaction was initiated

88 ehapter 5
by adding a persulfate solution in degassed water. No inductiontime was observed. Usually every I 0 minutes, two samples were taken. The reaction was shortstopped using hydroquinone. One sample was used for the determination of conversion by means of gravimetry. The secoud sample, used for measuring partiele size distribution, was injected into a solution containing 20 mol dm ·3 sodium dodecyl sulfate in order to prevent possible coagulation after sampling. The polymerization reacrions discussed bere, were performed at two different temperatures, e.g. 70 °e and 90 °e. The persulfate concentrations varied from 1 10"3 mol dm'3 to 5 10·2 mol dm"3
• The total solid content ofthe polymerization reaction was typically 2%. A typical recipe ofthe emulsifier free polymerization is given in Table 5.2.
Table 5.2 Typical recipe used in emulsifier tree polymerizationof styrene
Styrene Water Na2~0e NaC03
stirrerspeed 450 rpm
20g 1000 g 2.38g 1g
batch reactor, Rushton contiguration

Polymerization and Encapsulation Reaction using Blockcopolymer Surfactants 89
Figure 5.1
1. Stainless Steel Reactor 2. Glass Jacket 3. Electric Motor 4. Speed lndicating Controller 5. Twelve-Blade Flat-Blade
Turbine 6. Baj]les 7. Chromel-Alumel
Thermocouple 8. Temptrature Transmitter to
Thermostalie Bath 9. Filling Tube with Funnel
10. Sample Tube 11. Bottom Tube 12. Gas Tube 13. Evacuation Tube 14. Pressure Indicator 15. Safety Valve
Batch reactor contiguration used for the polymerization and encapsulation experiments
5.2.4.1 Measurement of partiele size distributions
Normally Transmission Electron Microscopy is used for deterrnining partiele size
distributions. However, at least 1000 particles have to be counted for obtaining accurate
distributions. Tberefore, tbis metbod is very time consuming for determining partiele size
distributions as timetion of time. Additionally only tbe partiele size distribution of unswollen
particles can be determined. Disk Centrifuge Pbotosendmentometry (DCP) is another metbod
to obtain partiele size distributions. This rapid procedure is used for measuring partiele size
distributions of colloidal systems, e.g. pigments and synthetic lattices of partiele sizes ranging
from 50 nm to 5 f,tffi. DCP is based on the fact that particles with different density and
diameter migrate at a different speed througb a fluid in a force field, as described by Stokes
law the field applied in this technique is a centrifugal force field within a hollow rotating
disk. It bas been found that the partiele size distributions obtained with DCP are in good
agreement with those obtained with TEM35. In this work the line start metbod was used35
,
where 1 ml of ethanol is injected into the spinning disk, which contains distilled water as
spinfluid. The volume ofthe spintluid is 15 mi.

90 Chapter5
The used instrument is a Brookhaven BI DCP partiele sizer, operating at a speed of 8000 rpm. Usually 0.25 ml ofthe latex sample was inserted into the cavity ofthe spinning disk, where the water and methanol was already present.
5.2.5 Batch emulsifier free emulsion polymerization in ethanol-water mixtures
The batch emulsifier free emulsion polymerization reactions in ethanol-water mixtures were performed using the reaction contiguration presented in tigure 5 .1. The procedure concerning degassing ofthe components bas been described in the previous section. Water, ethanol and the ammonia solution were brought into the reactor and subsequently heated until 70 °C. Next styrene was inserted and allowed to equilibrate for approximately 30 minutes. The reaction started with the addition of a solution of sodium persulfate. Conductivity was foliowed as function of time and conversion was determined using gravimetry. The final partiele size distributions obtained are determined using SEM. The recipes of the polymerization reactions are given in Table 5.3.
Table 5.3 Recipe for the emulsifier free polymerization in ethanol-water mixtures
Experiment A B c D
ethanol (mi) 0 800 400 200 water (mi) 1000 200 400 800 Fe111 (-) 0 0.25 0.5 0.75 styrene (g) 30 30 30 30 ammonia (mi) 50 50 50 50 persulfata (g) 2.38 2.38 2.38 2.38
5.2.6 polymerization of styrene using blockcopolymer emulsifier in water-ethanol mixtures
In these polymerization reactions PEO/PBMA blockcopolymer is used. Besides the components and their amounts collected in Table 5 .3, in every experiment 2 gram of the blockcopolymer was used.

Polymerization and Encapsulation Reaction using Blockcopolymer Surfactants 91
5.2.7 Batch encapsulation reactions using blockcopolyrner surfactant in ethanol-water mixtures
A series of encapsulation reactions was performed upon silica partiel es, using the
blockcopolymer PBMAIPEO as surfactant. In these experiments, first the silica particles
were produced, see section 4.2.2. When the Sol-Gel synthesis was completed the reaction
temperature was increased to 70 °C. The stirrer speed used is 450 rpm. For all the
experiments, 2 gram of the blockcopolymer surfactant was dissolved in 50 ml water, and
added into the reactor mixture after silica formation. Next styrene was added and allowed to
equilibrate for approximately 30 minutes. The polymerization was started by adding the
sodium persulfate solution. The reaction was monitored using conductivity. The conversion
was determined by gravimetry. The final morphology ofthe particles was characterized by
TEM. The recipes ofthe encapsulation reactions are collected in Table 5.4.
Table 5.4 Recipe tor the encapsulation reactions of silica particles with styrene in ethanol-water
Experiment Blok A Blok B Blok C Blok D
ethanol (mi) 250 300 400 500 water (mi) 550 500 400 20 Feth (-) 0.31 0.38 0.50 0.71 styrene (g) 50 50 50 50 ammonia (mi) 45 45 50 45 persulfate (g) 0.25 0.26 0.26 0.26 TEOS (g) 50 50 50 50
5.2.8 Batch encapsulation oflarge inorganic silica particles An encapsulation experiment with styrene was performed upon silica particles, with a
partiele size of 50 f.lill. In this typical case no ethanol and no blockcopolymer surfactant was
used. The reaction has been carried out as described insection 5.2.7. The reaction
temperature was 70 °C, and the stirrer speed 450 rpm. After completion ofthe encapsulation
reaction the partiele morphology was characterized using SEM. The recipe of this
encapsulation reaction is given in Table 5.5

92
Table 5.5 Recipe used for the encapsulation of large silica particles
water Si02 styrene Na2CÛ3 Na2SzOs
850ml 80g 50g 1 g 2.38
Chapter 5
5.2.9 Semi-continuous encapsulation reactions using blockcopolymer surfactant in ethanol-water mixtures
A typical recipe for the semi-continuous encapsulation reaction is given in
Table 5.6. Initially a silica dispersion was brought into the reaction, with an average partiele
size of200 nm and asolid content of0.05 gig. An initial amount ofblockcopolymer was
added to the dispersion, and the temperature was raised to 70 °C. Afterwards the persulfate
initiator was inserted, and styrene and a blockcopolymer surfactant solution were added at a
rate of0.05 ml/min. The morphology ofthe species was characterized using TEM. The
reaction was proceeding at a stirrer speed of 450 rpm.
Table 5.6 Typical recipe semi-continuous encapsulation reaction
Material Quantity
Silica dispersion Blockcopolymer (initial) Persulfata Added styrene Added blockcopolymer
675ml 0.1 g 2.43g 77ml 0.4 g

Polymerization and Encapsulation Reaction using B!ockcopolymer Surfactauts 93
5.3 Results and Discussion 5.3.1 Initiation In free radical polymerization reactions, initiation is considered as the first step in the chain
reaction. The rate and efficiency of initiation are known to be extremely important in the
elucidation of the kinetics of polymerization31. In this case the initiation by sodium persulfate
will be briefly discussed. The initiation process of persulfate is very complex and highly
dependent upon the applied experimental conditions. A typical polymerization system
comprises many components beside the initiator and the monomers. There will be solvents,
additives, etc. which may be reactive towards the initiator derived radicals. The reaction
mediummayalso influence the reactivity ofthe primary or other radica\s. The decomposition
of persulfate generate a radical pair, see section 2.2.3. The self-reaction of the persulfate
radicals can be the pathway for the direct conversion of primary radicals into non-radical
species in solution, bulk, suspension and emulsion polymerization. This cage reaction is
dependent upon the reactivity ofthe initiator-derived radicals and the reaction medium31•
The fraction of radicals which escape the solvent cage to form initiating radicals is called the
initiator efficiency. In this investigation the initiation reaction is the decomposition of
persulfate in water-ethanol mixtures.
With increasing amount of ethanol the polarity ofthe reaction medium and the relative
permittivity of the medium will decrease24. In order to study the decomposition of persulfate
in water-ethanol mixtures, conductivity experiments have been performed. The results are
presented in Figure 5.2.
Figure 5.2
1.8
~
E .!::! 1.6
!!1 ~ . 2: ö 1.4 ::1 "'0 c: 0 0
(I) 1.2 > ~ Q) 0::
• • • •
• • •
• • • • •
• F =0 . ..,
• AAAAAAi!.li,AAAf..,=0.25 • .o.A"-
A A Y'l' yY'I''I''I''I' 'I' 'I' 'I' 'I' 'I''I'F ..,=0.50 •t•"' • fo 0000 O!J !J !JOOOO!JO!J !J OD!J oF..,~0.75
1.0 i--..,..:::•-..----r-~.---.----,-.,...--r---r----,,-....-.....-~ 0 5 10 15 20 25 30
Time (min)
The relative conductivity as function of time for the decomposition of
persulfate in water-ethanol mixtures at 70 °C, for different volwne fractions of
ethanol, lNa2S20s]= 2.2 10"3 mol dm-3

94 Chapter 5
In figure 5.2 the relative conductivity is plotted which is defined as cond(t)/condo, where
cond(t) is the conductivity ofthe solution at timetand condo is the conductivity ofthe
solution before the addition ofpersulfate. For all reactions the conductivity is increased by
the production of the primary sulfate radicals. These radicals are charged and have a relative
high mobility, resulting in an increase ofthe conductivity ofthe solution. Unfortunately, no
conclusions can be drawn about the rate coefficient ofthe decomposition reaction using
conductivity. As explained above the introduetion of ethanol willlower the relative
permittivity of the solution and therefore has an additional influence on the conductivity
signal. However, the initia! slopes ofthe conductivity curve are identical for all reactions
except for the reaction where Feth is 0.75.
This may imply that the dissociation of persulfate is not affected too much unless very high
amounts of ethanol are used. Additionally, it should be noted that these experiments were
performed in the absence of styrene, blockcopolymer and further additives, which may
influence initiation interdependently. However, this effect should be considered in the kinetic
analysis.
5.3.2 Continuous phase kinetics The kinetics in the continuous phase in polymerization and encapsulation reactions using
water-ethanol may differ considerably from conventional emulsion polymerization. In section
4.3.4.2 it has been observed that the solubility of styrene in the continuous phase increases
significantly with increasing amount of ethanol. When the amount of ethanol used in the
recipe is relatively low, it is possible to have monomer dropiets present in the system, as in a
conventional emulsion polymerization. However, when the recipe contains a higher amount
of ethanol then it may be possible that all styrene is dissolved in the continuous phase and
therefore this polymerization may be considered as a dispersion polymerization. In this
context the question may be drawn: where is the locus of polymerization in these systems?
In conventional emulsion polymerization, using persulfate, the locus of initiation is in the
aqueous phase, but the main locus of polymerization is in the particles. In a dispersion
polymerization the locus of polymerization occurs both in the continuous phase and in the
particles4'9
'16
. These conclusions were based upon styrene partitioning studies in water
ethanol systems, see section 4.3.2.4. When the amount of ethanol is relatively high, then the
concentration of styrene in the particles is relatively low, indicating that the continuous phase
is becoming important as polymerization locus16'22
. However, these experiments have been
performed with AIBN and other 'oil-soluble' initiators16•22
• In this study persulfate has been
used which definitely generates radicals in the continuous phase. Therefore it may be
assumed that the initiation ofthe polymerization reaction occurs in the water-ethanol
continuous phase.

Polymerization and Encapsulation Reaction using Blockcopolymer Surfactants 95
5.3.2.1 Entry mechanisms in polymerization and encapsulation systems
Insection 2.2.3 entry of oligomeric radicals is introduced for conventional emulsion polymerization. Maxwell et at12 have studied entry mechanisms in the emulsion polymerization of styrene and showed that entry is instantaneous when the oligomeric radical becomes surface active. This means that the rate determining step for entry is the growth of the sulfate oligomeric radical towards surface active oligomer, which is govemed by the aqueous phase kinetics. Entry phenomena can be characterized by a cri ti cal chainlength z, necessary for the oligomeric radical to become surface active. This chainlength is characterized by the solubility of styrene in the aqueous phase according ~ .
z 1 + (-23000/(RT In [Maq]) (5.1)
where [Maq] is the solubility of styrene in the aqueous phase, R is the gas constant and T is the absolute temperature. For emulsion polymerizations with styrene z=2-3. In water-ethanol mixtures, ho wever, the solubility of styrene increases with increasing amount of ethanol, see figure 4 .11. Therefore one might expect, utilizing equation 5 .1, that the critica! chainlength forentry increases from z=2 for aqueous solutions to z=ll for ethanolic solutions. This suggests that the kinetics in the continuons phase are becoming more dominant with increasing amount of ethanol, with respect to initiation processes and entry mechanisms. Unfortunately, a quantitative evaluation ofthe entry mechanism is not possible, since the decomposition rate coefficient of persulfate is not known accurately in water-ethanol mixtures. Additionally, a limitation of the Maxwell entry model is a yes/no matter: either an oligomeric species of a partienlar degree of polymerization always adsorbs to give irreversible entry, or it never wilt. A more sophisticated treatment should take into account the rates of adsorption, desorption and propagation for an oligomer with each degree of polymerization, see appendix A. Until now little attention has been focused upon the nature of the partiele surface in relation toentry phenomena. It is clear that entry rates are dependent upon the total partiele surface offered, but the chemica! composition of the partiele surface (polymer, monomer and surfactant) should betaken into account as well. Suppose a polymerization system comprises styrene latex particles and unmodified silica particles of the same size, where the total surface offered is the same for the two species. When an oligomeric radical has reached a sufficient chainlength for adsorption, it will adsorb onto the particles. In the case of the styrene swollen polystyrene partiel es, where enough styrene is present, the oligomeric species can propagate further and undergo actual entry, before desorption from the partiele surface is occuring. When the same oligomer adsorbs on the surface of an unmodified silica partic Ie, desorption is favored over propagation, because not enough styrene is present at the surface. Therefore the modification of silica surface prior to encapsulation is important in order to adsolubilize st)Tene at the partiele surface.

96 Chapter 5
5.3.2.2 Exit mechanisms in polymerization and encapsulation systems
Exit as introduced in section 2.2.3 is characterized hy transfer of free radical activity to monomer or chain transfer agent, creating a small radical which is more or less soluble in the aqueous phase. This radical may he transferred from the partiele into the aqueous phase8
.
Nomura et ae5 proposed a three step mechanism for exit in emulsion polymerization. The equations, descrihing exit for conventional emulsion polymerizations can he depicted as (assuming no re-entry):
k = ktrCm[ke./(ke. + kp,oCm)) lees= 3 Dw [M).c/ (rp2*Cm
(5.2) (5.3)
where ktr is the rate coefficient for transfer, kes is the rate coefficient for the escape of radical species, generated hy transfer, away from the partiele surface, kp,o is the propagation rate coefficient of the radical species, Cm is the styrene concentration in the partiel es. Dw is the ditfusion coefficient of the radical species in the partiel es, [M.q) is the soluhility of styrene in the aqueous phase and rp is the size of the latex partiel es. Although these equations descrihe exit very well in emulsion systems, for encapsulation reactions equation 5.3 should he
modified in order to take the partiele morphology into account. In encapsulation reacrions the partiele species can he regarded as core-shell particles, where the core is the silica partiele and the shell is the modified monomer swollen layer. The escape rate coefficient can he calculated according to:
(5.4)
where T0 is the outer radius ofthe partiele species and rsilica is the radius ofthe silica core. The layer thickness is assumed to he 5 nm, which is approximately the case for modified silica partieles, see section 4.3.2. The influence ofthe partiele morphology on the exit rate coefficient is visualized qualitatively in tigure 5.3.
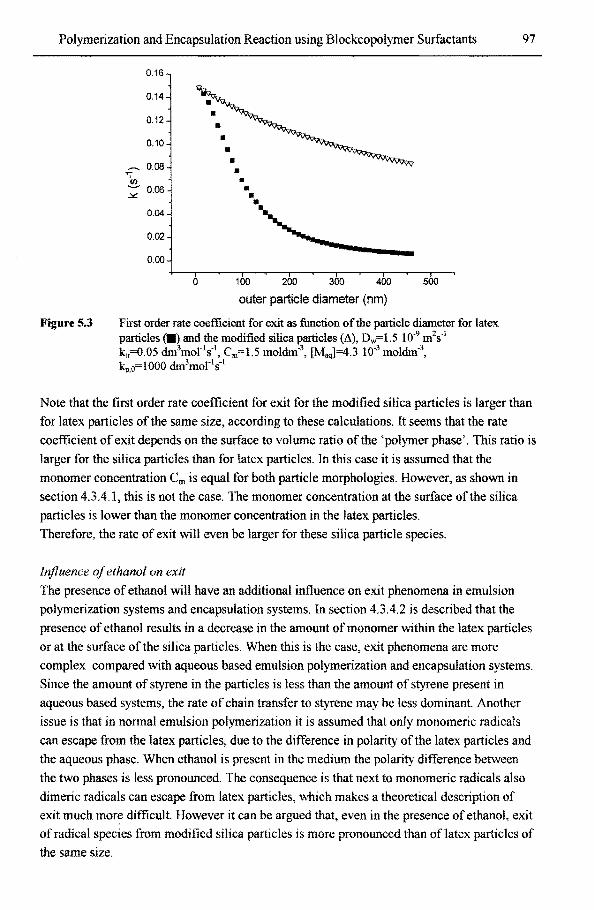
Polymerization and Encapsulation Reaction using Blockcopolymer Surfactauts 97
Figure5.3
0.16
0.14
0.12
0.10
- 0.08 ~(n
:;; 0.06
0.04
0.02
0.00
0
• • • • • •
100 200 300 400
outer partiele diameter {nm)
500
First order rate coefficient for exit as function of the partiele diameter for latex particles (.) and the modified silica particles (~). Dw=L5 10·9 m2s·1
k1,=0.05 dm3mor1s-1, Cm=l.5 moldm-3
, [Maq]=4.3 10·3 moldm-3,
kp,o=lOOO dm3mor1s·1
Note that the first order rate coefficient for exit for the modified silica particles is larger than
for latex particles ofthe same size, according tothese calculations. It seems that the rate
coefficient of exit depends on the surface to volume ratio ofthe 'polymer phase'. This ratio is
larger for the silica particles than for latex partiel es. In this case it is assumed that the
monoroer concentration Cm is equal for both partiele morphologies. However, as shown in
section 4.3.4.1, this is not the case. The monoroer concentration at the surface ofthe silica
particles is lower than the monoroer concentration in the latex particles.
Therefore, the rate of exit will even he larger for these silica partiele species.
Injluence of ethanol on exit
The presence of ethanol will have an additional influence on exit phenomena in emulsion
polymerization systems and encapsulation systems. Insection 4.3.4.2 is described that the
presence of ethanol results in a decrease in the amount of monoroer within the latex particles
or at the surface ofthe silica particles. When this is the case, exit phenomena are more
complex compared with aqueous based emulsion polymerization and encapsulation systems.
Since the amount of styrene in the particles is less than the amount of styrene present in
aqueous based systems, the rate of chain transfer to styrene may he less dominant Another
issue is that in normal emulsion polymerization it is assumed that only monomeric radicals
can escape from the latex partic les, due to the difference in polarity of the latex particles and
the aqueous phase. When ethanol is present in the medium the polarity difference between
the two phases is less pronounced. The consequence is that next to monomeric radicals also
dimeric radicals can escape from latex particles, which makes a theoretica! description of
exit much more difficult. However it can be argued that, even in the presence of ethanol, exit
of radical species from modified silica particles is more pronounced than oflatex particles of
the same size.

98 Chapter 5
5.3.2.3 The radica/ balance
The radical balance is govemed by generation of radicals, the mass transfer of radials over the different phases and the termination of radical species. In literature, to the best of our knowledge, radical balances have been determined in kinetic studies conceming particles with one partiele morphology. In these encapsulation systems, however, two partiele classes witb different partiele morphology can be present, i.e. secondary formed latex particles and modified silica particles. Therefore, the radical balance becomes very complex. However, some qualitative remarks can still be made: In these investigations, silica particles are used with particles sizes above 200 nm. Secondly in all polymerization and encapsulation experiments it is observed that the styrene polymer particles have also partiele sizes above 200 nm. In literature it is generally accepted for many emulsion polymerization systems, that when the partiele size is above 150 nm, the system exhibit pseudo-bulk behavio~2•36•37, see section 2.2.3. 1. Applying this result to the systems under investigation might suggest that these systems also obeys a pseudo bulk behavior, where the average number of radicals per partiele species is larger than 0.5., irrespective of partiele morphology. Another item which can be mentioned is that the average number of radicals in the modified silica particles may be substantially lower tban for latex particles of the same size. This is caused by a lower entry rate and a higher exit rate. Concluding it can be postulated that when during an encapsulation process secondary nucleation takes place, tbe main locus of polymerization will be in the polymer particles, teading to lower encapsulation efficiencies. Therefore, when possible, secondary nucleation should be avoided in encapsulation reactions.
5.3.3 Nucleation phenomena in emulsion polymerization and encapsulation reactions
In chapter 3 the basic frameworkof nucleation bas been discussed. The main condusion is that there is a general framework which describes (at least qualitative) the nucleation phenomena for systems which exhibit colloidal properties. In this section this framework will be specified more with respect to the systems under investigation. The discussion presented below will be illustrated by experimental results.
5.3.3.1 (Secondary) nucleation phenomena in emulsifier free polymerization of styrene
The formation of polymer particles is induced by homogeneaus nucleation where an oligomeric grows until it becomes insoluble in the medium and phase separation occurs. The boundary conditions for this phase separation are govemed by thermodynamic considerations. After the formation of the precursor particles limited partiele coagulation plays a major role in emulsifier free polymerization of styrene. The degree of stability of tbe particles depends on their size, surface charge density, electrolyte valency and concentration and temperature. U pon coagulation of the precursor partic les, rearrangement of the physically or chemically bound surface functional groups will occur and so the partiele surface charge density will increase. At a eertaio size, the surface charge density is high enough to rnaintaio

Polymerization and Encapsulation Reaction using Blockcopolymer Surfactants 99
colloidal stability, and thus further coagulation ceases. In fact this limited coagulation
process ean be visualized by looking at the time evolution of the partiele size distribution38
Secondary nucleation in emulsifier free polymerization bas been observed by looking at the
time evolution ofthe partiele size distribution, see tigure 3.4. This seeondary nueleation has
been observed especially at elevated temperatures (70 °C-90 °C) and high initiator
concentrations (above 10-2 mol dm-3).
When the temperature is high the decomposition of persulfate is relatively fast teading to a
high rate of generation of surface active radicals. On the other hand a high initiator
coneentration will induce a high ionic strength ofthe solution.
The consequenee is that severe coagulation events of precursor particles are included in the
first nucleation process, which will deerease the total partiele surface significantly. The total
partiele surface available is not sufficient to eapture all surface active radicals, which can
grow towards partiele formation. In this case coagulation of existing particles induces
secondary nucleation.
5.3.3.2 nucleation phenomena in emulsifier free polymerization of styrene in water-ethanol mixtures
In the previous section it has been explained that seeondary nucleation in emulsifier free
systems in aqueous solutions is triggered by elevated temperatures and high initiator
concentrations. This seetion will be focused on the question how will the presenee of ethanol
influence nueleation compared to the aqueous based systems.
In order to evaluate nucleation in the presence of ethanol, a second elass of four experiments
of emulsifier free polymerizations of styrene have been performed, see Table 5.4.
In these experiments the recipes are the sarne exeept the volume fraetion of ethanol in the
medium.
Figure 5.4
:3«)
• :m
ê:m s • 13n tll3n '5 ~:!(I • ~ZD
:m • 1!1)
® Q4 Q6 Qa
F<lh
Final partiele size as function of the volume fraction of ethanol in the medium for emulsifier free polymerization of styrene, T= 70 °C, for experimental details see Table 5.4

100 Chapter 5
The final partiele size distribution bas been determined using SEM and the average partiele size is depicted in tigure 5.4 Note that when the volume fraction of ethanol in the medium increases the partiele size increases as welt. In order to explain this effect some items have to be addressed first. When the amount of ethanol used in the recipe is relatively low, it is possible to have styrene monoroer dropiets present in the system, see also figure 4.11. The polymerization reaction then can be considered as an emulsion polymerization. However, when higher amounts of ethanol are used, it may be possible that all styrene will dissolve in the continuous phase and that this polymerization may be considered as an dispersion polymerization. Conventional dispersion polymerization reactions comprises a process by which stabie colloidal polymer particles are formed in a continuous ( organic) medium by a polymerization of a monoroer which is completely miscible with this medium and in which a stabilizer bas been dissolved4
.12
. In these systems no stabilizer is used. but the other characteristics do match this defmition. In dispersion polymerization, the chemical reactions in the continuous phase such as decomposition ofthe initiator species, iilitiation, propagation, termination and transfer are similar with those occurring in emulsion polymerization. Therefore, nucleation phenomena in emulsion polymerization and dispersion polymerization can be regarded as related processes since both polymerization reactions are heterogeneous in nature. The homogeneous nucleation with limited coagulation model is applicable bere. However, when the amount of ethanol is increased it is observed that also the onset of nucleation is retarded, due to the fact that the oligomeric radicals need a higher degree ofpolymerization to become insoluble in their medium. Another issue that is reflected in figure 5.4 is that with increasing amount of ethanol fewer particles are produced exhibiting a larger partiele size. The reason for this may be more severe coagulation events in the nucleation due to the lower relative permittivity of the medium. In water which bas a relatively high permittivity of water (&r=80) the styrene carry an electric charge which arises from ionizable so4- groups. The distribution ofthe Na+ cations and S04- anions in the diffuse layer around the particles is given by a Boltzman equation. From the Boltzman equation it can be derived that the decrease ofthe partiele potential with distance from the partiele surface follows an exponentiallaw with a parameter K acting as controlling factor. In fact K has the dimensions of a reciprocallength and is given by:
(5.5)
where Na is Avagadro's number, I is the ionic strength ofthe medium, eo is the permittivity of free space, &r is the relative permittivity of the medium, kb is the Boltzman constant and T is the absolute temperature. liK is often spoken as the thickness ofthe double layer and gives an useful indication between the partiele surfaces at which the electric fields on adjacent surfaces start to overlap and electrostatic interaction between the particles starts.

Polymerization and Encapsulation Reaction using Blockcopolymer Surfactauts 101
In these systems the relative permittivity will decrease significantly from ër=80 for pure water
to er=24 for pure ethanol. Therefore the length ofthe double layer decreases with increasing
amount of ethanol, allowing particles to approach each other at shorter distances before
electrostatic interaction become dominant, thus increasing the chance for particles to
coagulate. The electrostatic repulsion between two particles is dependent upon the relative
permittivity ofthe medium. The electrostatic repulsion decreases with decreasing
permittivity ofthe medium. Thus at a constant ionic strength, an increase in the amount of
ethanol willlead to more dominant coagulation phenomena of particles in the nucleation step
which lead to particles of a larger partiele size.
5.3.3.3 Nucleation phenomena in the polymerization of styrene using blockcopolymer emulsifier in water-ethanol mixtures
In these polymerization reactions PEO/PBMA blockcopolymer is used, with a concentration
of5 104 moldm-3. The CMC at 20 °C in aqueous solutions is 5 104 moldm-3 as determined
with bubble tensiometry, see section 4.3.1. Therefore, with increasing amount of ethanol the
CMC ofthe blockcopolymer is expected to become higher since more blockcopolymer is
able to dissolve in the medium. This implies that the nucleation process may occur at
surfactant concentrations lower than the CMC and the homogenous nucleation scheme with
limited coagulation can be adopted. It was expected that, compared to the emulsifier free
system, more particles are formed with a smaller partiele size, sirree the surfactant molecules
will adsorb on the partiele surface and may provide colloidal stability. However, this effect
has not been observed. It seems that the rate at which surfactant molecules adsorb relative to
the coagulation rate are important parameters in determining the partiele number. Faster
adsorbing surfactauts (e.g. low molecular weight ionic surfactants) willlead to the formation
of a larger number of particles compared to slower adsorbing surfactants such as the
PEO/PBMA blockcopolymer under investigation4•30
.
5.3.3.4 Nucleation phenomena in the encapsulation of silica particles with styrene using blockcopolymer emulsifier in water-ethanol mixtures
The encapsulation experiments have been performed as described insection 5.2. 7, where first
the formation of the silica particles has been accomplished and afterwards the polymerization
is performed. Four different encapsulation experiments were performed where only the total
amount of ethanol has been varied, and the recipe and operation remained constant. In this
way it is possible to study the nucleation phenomena of silica particles as well as the
(secondary) formation process ofpolymer particles. All the encapsulation reactions are
monitored using conductivity. A typical conductivity plot is presented in tigure 5.5

102
Figure 5.5
0
.~ .
-:r " ~ . . ' ...
t
4l)
11me(min)
•
• • • ••
Chapter 5
The typical development ofthe conductivity signal during the formation of silica particles and the subsequent encapsulation reaction, Blok B. see Table 5.4
Note the conductivity signal during the formation ofthe silica particles exhibita maximum. Afterwards styrene and blockcopolymer are added which results in a slight decrease in the signal due to the addition of a non-conducting pbase. When persulfate is added the conductivity increases strongly, since the decomposition of persulfate introduces ionic 804
ionic radical species. The conductivity during polymerization passes a maximum again, which indicates that polymer particles have been formed and are growing1
•2.3.2
4. The
conductivity behavior of the polymerization reaction is equal for all polymerization andlor encapsulation systems described above In order to study the nucleation phenomena Transmission Electron Microscopy has been performed on the partiele morphology ofthe final product ofthe encapsulation reaction. The TEM photographs are presented in figure 5.6

Polymerization and Encapsulation Reaction using Blockcopolymer Surfactants 103
Figure 5.6
(a)
(c)
, .. • • t • t .. . .
.... . (
. . \
(b)
-~ , ". -.~ .-:- . -~ ,"Jt.J~;. .... ,: ..... • .. ' •
' o • > V'.,. ~/, , •'' •
'. , .
(d)
The morphology ofthe endproduct ofthe encapsulation reactions as visualized by TEM, (a). Blok A, (b) Blok B, ( c) Blok C, (d) Blok D

104 Chapter 5
Note that in all encapsulation experiments performed there are two partiele classes with
different partiele morphology. In the polyrnerization denoted by Blok A, the volume fraction
of ethanol is relatively low (Feth=0.31 ), which resu\ts in the formation of silica particles with
a very small size, i.e. 15 nm, which in principle should yield a high total partiele surface
ofTered for the subsequent encapsulation. However, despite the high partiele surface available
the formation of polyrner particles has taken place, which are ca. 200 nm in size. One might
suggest that the small silica particles are heterocoagulated upon the large polystyrene
partiel es. However, care should be taken in drawing these conclusions because of artifacts
induced by the sample preparation prior to TEM analysis. When the amount of ethanol is
increased slightly (Feth=0.38) it can beseen that the silica particles have a larger size
compared to the previous case. Secondary nucleation of polymer particles has occurred as
wel!. No core-shell morphology can be observed. Note that the silica particles in this case
exhibita porous character. When the amount of ethanol is further increased towards 0. 71 , the
global picture about the partiele morphology does notchange very much. The silica partiele
size has increased further (dark particles on the photographs), and the secondary formed
polymer particles are visible as wel!. The observation is that forthese systems secondary
nucleation of polymer particles cannot be prevented, which may be attributed to several
effects. First the total partiele surface area ofTered and the nature ofthe partiele surface is
critica!. According to Hergeth and coworkers27 a certain minimum surface area offiller
particles is required to prevent secondary nucleation. In order to estimate this surface area an
equation derived by Schmutzler was modified for seeded emulsion polymerization with
spherical particles and a water soluble initiator. Un upper limit was estimated to be 100 nm
for encapsulation of silica by the polymerization of polyvinyl acetate. However, these results
do not confirm the results obtained by Hergeth at al27. lt seems that next to the partiele
surface area ofTered the nature and the chemica\ composition is important as wel!.
The nature of the surface of the silica particles is largely affected by the presence of
surfactant and styrene at the surface. The PEO/PBMA blockcopolymer surfactant is assumed
to adsorb on the silica particles in a bilayer fashion. Lightscattering experiments conceming
adsorption showed that that the adsorbed layer thickness is about 5 nm, for aqueous
solutions, see section 4.3.2. Surfactant adsorption of these blockcopolymers in an ethanolic
environment is not as clear. One might expect that, due to the increased solubility ofthe
blockcopolymer in the medium, less surfactant species will adsorb on the silica particles,
generating a thinner surfactant layer. Less surfactant species at the partiele surface will imply
that less styrene will be adsolubilized at the partiele surface.
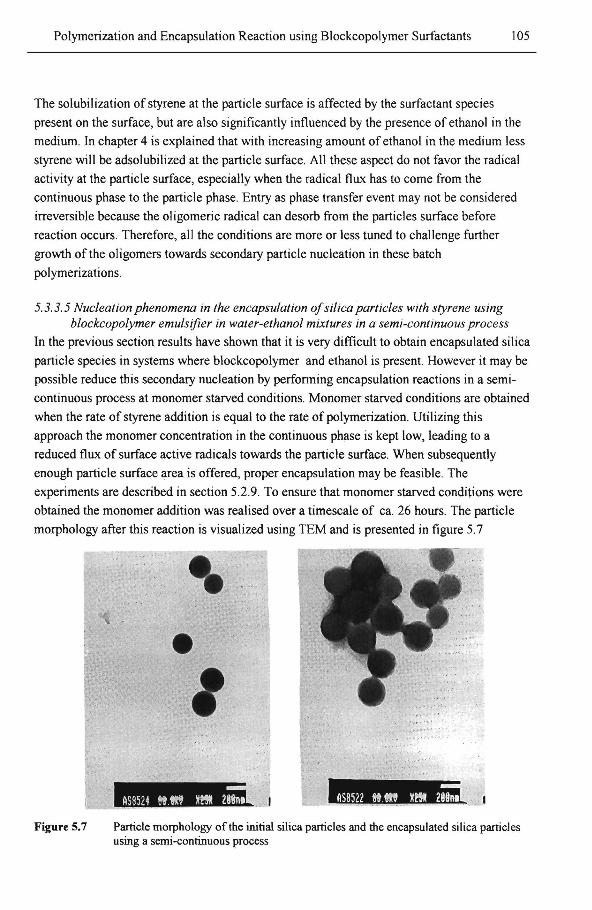
Polymerization and Encapsulation Reaction using Blockcopolymer Surfactants 105
The solubilization of styrene at the partiele surface is affected by the surfactant species
present on the surface, but are also significantly influenced by the presence of ethanol in the
medium. In chapter 4 is explained that with increasing amount of ethanol in the medium less
styrene wil! be adsolubilized at the partiele surface. All these aspect do not favor the radical
activity at the partiele surface, especially when the radical flux has to come from the
continuous phase to the partiele phase. Entry as phase transfer event may not be considered
irreversible because the ol igomeric radical can desorb from the particles surface before
reaction occurs. Therefore, all the condirions are more or less tuned tochallenge further
growth ofthe oligomers towards secondary partiele nucleation in these batch
polymerizations.
5.3.3.5 Nucleation phenomena in the encapsulation of silica particles with styrene using b/ockcopolymer emulsifier in water-ethanol mixtures in a semi-continuous process
In the previous section results have shown that it is very difficult to obtain encapsulated silica
partiele species in systems where blockcopolymer and ethanol is present. However it may be
possible reduce this secondary nucleation by performing encapsulation reactions in a semi
continuous process at monomer starved conditions. Monomer starved conditions are obtained
when the rate of styrene addition is equal to the rate of polymerization. Utilizing this
approach the monomer concentration in the continuous phase is kept low, leading to a
reduced flux of surface active radicals towards the partiele surface. When subsequently
enough partiele surface area is offered, proper encapsulation may be feasible. The
experiments are described insection 5.2.9. To eosure that monoroer starved conditions were
obtained the monomer addition was realised over a timescale of ca. 26 hours. The partiele
morphology after this reaction is visualized using TEM and is presented in figure 5.7
Figure 5.7
e
' Partiele morphology ofthe initial silica particles and the encapsulated silica particles using a SerJJi-continuous process

106 Chapter 5
Note that in this case the silica particles are encapsulated with polystyrene yielding a "core
shell" morphology. It seems that secondary nucleation can be suppressed significantly using
this approach. However, for industrial applications a reaction time of about 30 hours is
generally unacceptable.
5.3.4 Encapsulation oflarge inorganic particles by heterocoagulation In the previous section it has been stated that it is difficult to produce encapsulated silica
particles in batch processes, without the formation of undesired polystyrene particles.
However, instead of trying to prevent secondary nucleation during the encapsulation, one can
make benefit ofthis process by heterocoagulate these formed particles onto the surface ofthe
silica partiel es. Encapsulation of inorganic particles by heterocoagulation is not new, and is
often the main mechanism of encapsulation. Heterocoagulation is an intensive studied
subject by colloid scientists19•20•21 •29 . Furusawa et al29studied the heterocoagulation behavior
ofpolymer lattices with spherical silica and found that the surface charge and the partiele
size and differences between the partiele sizes govem the coagulation process. Kihira et
al 19•20 focused their research upon the kineticaspects ofheterocoagulation ofsurfactant free
lattices, silica and cerium hydroxide using light scattering. Most literature is focused upon
heterocoagulation processes between two particles classes of opposite charge. However small
particles can heterocoagulate with large particles ifthey have the same sign of charge and the
surface potentials are in the right ranges. An example is given by Shouldice et al26 who
performed the heterocoagulation of emulsifier free prepared polybutyl methacrylate particles
untillarge aggregates are obtained. Afterwards these investigators raised the temperature
towards 80 °C with the addition of extra stabilizer. When the temperature was above the glass
transition temperature of polybutylmethacrylate (T8=40 °C), the distinct particles within the
aggregate flowed together to form one distinct partiele with a smooth surface. This approach
may be used for encapsulation purposes as well. Therefore a feasibility study has been
performed to encapsulate large silica particles (50 ).Un) with small polystyrene particles. The
experimental details are given insection 5.2.8. When the encapsulation was completed the
morphology was characterized with SEM.

Polymerization and Encapsulation Reaction using Blockcopolymer Surfactants 107
Figure 5.7 Scanning Electron Microscopy of the partiele morphology oflarge silica particles encapsulated with small polystyrene particles
Care should he taken in interpretation because of artefacts introduced by the drying process
ofthe sample, prior the SEM-analysis. Note that encapsulation by heterocoagulation has
occurred. In principle when the temperature ofthis system is raised above 100 °C, i.e. above
the T 8 of styrene smooth partiele surfaces should be obtained. In these experiments the
polymerizations are perforrned in the presence ofthe silica particles, but this is not absolutely
necessary.

108 Chapter 5
The samepartiele morphology can be obtained by blending this silica dispersion and an
emulsion ofpreviously polymerized particles. However, this relatively simpte encapsulation
technique can find its purpose in industrial applications.
5.4 Concluding Remarks In this investigation polymerization reaelions and encapsulation reactions on silica particles
using blockcopolymer surfactants have been performed. Strictly speaking this section should
swnmarize all aspects described in this thesis concerning encapsulation of silica particles
concerning the blockcopolymer route. [n chapter 3 the aspectsof (secondary) nucleation are
discussed and it is stated that although there is a general framework for nucleation, several
pecuharities of nucleation are highly dependent upon the system and the applied conditions.
In chapter 4 the focus was emphasized on monoroer partitioning and micellization ofthe
blockcopolymer species.
Again experiments and model calculations concerning micellization ofthe blockcopolymer
and phase equilibria of styrene and ethanol show that the initial situation, prior to
polymerization, is affected by the applied process route. In this chapter the emphasis was
focused on the analysis of the kinetics and nucleation in these polymerization systems. Mass
transfer processes are strongly affected by partiele morphology, the presence of ethanol and
the presence of surfactant. Generally, it can be stated, for aqueous systems as well as
ethanolic systems, that entry into polymer latex particles (when present) is higher than into
modified silica particles ofthe same size. On the other hand exit is higher for modified silica
particles than for latex particles. In all polymerization systems sufficiently large partiele sizes
are observed to assume that pseudo-bulk kinetics are appropriate to describe these systems.
However, the average number of radicals in the modified silica particles is lower than the
average radical concentration in the polymer particles. This indicates that the main locus of
polymerization will shift towards the polymer particles (if formed) for all systems.
Nucleation has been studied for these systems. lt appeared that the nucleation behavior can
be characterized by homogeneous nucleation, foliowed by limited coagulation. Ethanol bas
an effect upon the coagulation event within nucleation. More ethanol in the medium induces
larger particles, due to decreasing stahilizing forces between the particles. Results concerning
secondary nucleation showed that this event occurred in all encapsulation reactions in batch
reactors. Provided that enough partiele surface area is ofTered for adsorption of surface active
oligomers, the nature and chemica! composition seems to be important as wel I. Pertorming
encapsulation reactions in semi-continuous reactors provide improvement in order to
suppress secondary nucleation. However, these reactions have to be performed under starved
conditions which gives polymerization times, which are unacceptable for industrial purposes.

Polymerization and Encapsulation Reaction using Blockcopolymer Surfactants I 09
Another option is to use this secondary nucleation event to heterocoagulate these particles on the surface of large inorganic partiel es. Summarizing: More basic understanding is obtained conceming polymerization and encapsulation reactions using blockcopolymer surfactants. Experiments conceming micellization, monomer partitioning andreaction kinetics have been performed, and semi quantitative models, where appropriate, have been adopted. However, these systems are very complex since many parameters determine events interdependently. An attempt is made in this thesis to unravel systematically micellization, monomer partitioning, kinetics and nucleation. Although significant progress has been made, there remains substantially research in order to develop quantitative models conceming these items.
References
I . Janssen, R.Q.F., "Polymer Encapsulalion of Titanium Dioxide, efficiency, stability and compatibility", PhD thesis, 1995.
2. Janssen, R.Q.F., Derks, G.J.W., van Herk, A.M., German, A.L., in "Encapsulation and controlled release", Eds. D.R. Karsa, R.A. Stephenson, Royal Society ofChemistry, Cambridge, (1993), 102.
3. Janssen, R.Q.F., van Herk, A.M., Gennan, A.L., 22"d FATIPEC Conference Book, (1994), vol I, 104.
4. Sudol, E.D., "Dispersion Polymerization" in Nato Advanced Study Institute on Recent advances in Polymerie Dispersions, Elizondo, Spain, 1996.
5. Bindschaedler, C., Gumy, R., Doelker, E., Peppas, N.A., J. ofCol/oid and Interface Sci, 1985, 108, I , 75.
6. Bindschaedler, C., Gumy, R., Doelker, E., Peppas, N.A., J. ofCol/oid and Interface Sci, 1985, 108, I , 83 .
7. Popli, R., Luccas, M.H., Tsaur, S.L., Langmuir, 1991, 7,1 , 65 . 8. Popli, R., Langmuir, 1991, 7, I, 73 . 9. Lu, V. V., EI-Aasser, M.S., Vanderhof, J.W., J. ofPolym Sci, Polym. Physics, 1988,
26, 1187. 10. Morton, M., Kaizennan, S., Altier, M.W.,J. Col/oidSci,l954, 9, 300. 11 . Flory, P.J., Principles ofPolymer Chemistry, Comell University Press, Ithaca, N. V., 1953. 12. Barret, K.E.W., Dispersion Polymerization in Organic Media, John Wiley & Sons, New
Vork, 1975. 13. Guillot, J., Makromol. Chem., Rapid Commun., 1980, I, 697. 14. Tseng, C.M., EI-Aasser, M.S., Vanderhoff, J.W., Org. Coat. Plas/. Chem., 1981,45,317. 15. Maxwell, I.A., Kurja, J. , van Doremaele, G.H.J., German, A.L. , Makromol. Chem., 1992,
193, 2065 . 16. Paine, A.J., Macromolecules, 1990, 23, 3109. 17. Astafieva, 1., Zhong, F., Eisenberg, A., Macromolecules, 1993, 26, 7339. 18. Judeinstein, P., Clement, S., J. Mater. Chem., 1996, 6, 4, 511. 19. Kihira, H. , Mateijevic, E., LAngmuir, 1992, 8, 2855. 20. Kihira, H., Mateijevic, J. Chem. Soc. Faraday Trans., 1992, 88, 16, 2379. 21 . Sarkar S., Adhikari, M.S., BaneJjee, M., Konar, R.S., J. of Appl. Polym. Sci., 1988, 35, 109. 22. Homula, A.M., lnoue, M., Robertson, A. A., J. of Appl. Polym. Sci .. 1975, 19, 3077. 23 . Hildebrand, JH., Scott, R.L. , "The solubility ofnonelectrolytes ", 3 rd ed ., Reinhold New Vork, 1955.

110 Chapter 5
24. Janssen, R.Q.F., "Polymer Encapsulation of Titanium Dioxide", PhD thesis, Technica! University Eindhoven, 1995.
25. Kawaguchi, S., Yekta, A., Duhamel, J., Winnik, M.A., lto, K., J. Phys. Chem .. 1994, 98, 789 1. 26. Shouldice, G.T.D., Rudin, A., Paine, A.J., J. of Po/ym. Sci, Polymer Chemistry, 1996, 34, 306 1. 27. Hergeth, W.O., Steinau, U.J., Bittrich, G.S .. Schmutzler, K., Po/ymer, 1989, 30, 254. 28. Hasegawa, M., Arai, K. Saito, S.J. Po/ym. Sci, Polymer Chemistry, 1987, 25, 3117. 29. Furusawa, K., Kimura, Y Tagawa, T.,J. ofColloidlnterjaceSci, 1986,1 09, I , 70. 30. Zana, R., Advances in Col/oid and Interface Science, 1995, 57, 1. 31. Moad, G.M., solomon, D.H ., The Chemistry ofFree Radical Polymerization, Elsevier Science Ltd,
Oxford, 1995. 32. Maxwell, I. A., Morrison, B .R., Gilbert, R.G., Napper, D.H., Macromo/ecu/es, 1992, 26, 1629 . 33 . Parker, H.Y., Westmoreland, O.G., Chang. H.R., Macromolecu/es, 1996, 29, 5119. 34. Janssen, E.H., Zirkzee, H.F., Maxwell, I.A., Gerrnan, A.L., J. of Appl. Polym. Sci., 1994, 4, 195. 35. Coll, H., Searles, C.G.J., Co/loid Interface Sci ., 1986, 110, 65. 36. Zirkzee. H.F., van den Enden, M.J.W.A., van Kilsdonk, W.T., van Herk, A.M., German, A.L.,
Acta Polymer., 1996., 47, 441. 37. Gilbert, R.G., in Ernulsion Polymerization, A Mechanistic Approach, Academie Press,
London, 1995. 38. Zirkzee, H.F. , Maxwell, LA., Paquet, O.A., German, A.L., to be published

Polymerization inDODAB and DMPC Vesicles: A Characterization study 111
6 POL YMERIZA TION IN DIOCT ADECYL
DIMETHYLAMMONIUM BROMIDE VESICLES AND 1,2-DIMYRISTOYL-SN-GL YCER0-3-PHOS
PHOCHOLINE VESICLES
1. A Characterization Study
6.1 Introduetion
In this chapter, the polymerization in Dioctadecyldimethylammonium Bromide (DODAB)
Vesicles and in Dimyristoyl-sn-glycero-3-phosphocholine (DMPC) vesicles are presented with
emphasis on the characterization of the polymerization process. This investigation can be
regarcled as a preliminary study towards the final goal of encapsulation of silica particles using
the DODAB bilayers. The main question to he answered is "Is polymerization in vesicle
structures pÛssible without vesicle break-up, and how can the process be monitored and
controlled?". Vesicles are aggregates of non-covalently associated molecules. In many types of
assemblies, the amphiphilic molecules are free to move in a two-dimensional environment' . The
polymerization of these assemblies provides an opportunity toprepare novel materials, that are of
interest in biology and material science2. When these polymerized nano-structures are stabie they
may he used as model systems for biologica! membranes, or as species in controlled drug release
systems4. In genera!, polymerization processes can be divided in two ways. First, according to the
polymerization mechanism by which the polymer is being formed, i.e. anionic, cationic, free
radical, or a coordination type of mechanism. Second, according to the physical system for
polymerization, e.g. homogeneaus or heterogeneous.
It is known that a free radical polymerization can be performed in micelles ( emulsion
polymerization) and in inverse micelles (inverse emulsion polymerization).

112 Chapter 6
Concomitantly the question arises if one can polyrnerize in other surfactant structures such as vesicles, i.e. "Polymerization in Vesicles". Before the different aspects of polyrnerization in
vesicles wil\ be discussed, a distinction between "Polymerized Vesicles" and "Polymerization in Vesicles" is necessary. Polymerization in vesicles is defmed here as the polyrnerization of a monomer in the hydrophobic vesicle bilayer, with the restrietion that the monomer is not the original surfactant molecule35. Polyrnerized vesicles, however, are aggregate species where the original surfactant molecules are polymerized. Polyrnerization in vesicles can be regarcled as an
unconventional emulsion polyrnerization35, and the primary goal is to use the vesicle structure to obtain a morphology similar to that of hollow latex particles. These special latex particles find a
wide range of applications: such as encapsulating species, opacifiers, fiJiers in composite materials and in the paper indusuy28. The classical way of producing hollow latex particles is quite digressive29. By using the vesicles bilayer as the initia! site of polyrneriza.tion, hollow latex
particles may be produced in a one step process. Recently, various investigators reported on the polymerization of styrene in the bilayer of OODAB vesicles3•24 However, polymerization in
DMPC vesicles with unsaturated monomers has never been reported In this chapter, a more elaborate and systematic investigation of the polymerization in OODAB
vesicles and DMPC vesicles is reported. The process of polymerization in vesicles has been divided into three separate parts30:
(1) Vesicle Formation Yesiele formation is governed by the self-assembly of the OODAB andlor DMPC molecules in
water. Due to its complexity the vesicle formation process is not yet understood in great detail, since many parameters play a role; like the structure of the amphiphilic molecule, . its concentration, the phase transition temperature, and the dynamic properties of the bilayer. In
addition, it has been discussed insection 2.3.4 that at least for OODAB vesicles the procedure for vesicle preparation is of paramount importance for obtaining the final morphology. Over the years, systematic theoretica! studies ofthe self-assembly ofbilayer forming surfactants have been reported6'7'8.36, including Molecular Dynamic Simulations9•10.
lt is obvious that before vesicles can be used in the polymerization process they have to be
characterized to get insight into their size and size distribution.
(2) Swelling oftbe Vesicle Bilayer with Monomer(s) The swelling of OODAB and DMPC vesicles with monomer(s) is an important aspect of polyrnerization in vesicles, and is governed by monomer partitioning between the aqueous phase and the hydrophobic vesicle bilayer. During the swelling process, the vesicles should remaio stable.
Polymerization inDODAB and DMPC Vesicles: A Characterization study 113
This can be achieved by perfonning the swelling processin a reactor set-up that prevents direct
contact between the vesicles and the monomer. The design of the polymerization reactor should,
among other things, also be focussed on this requirement.
(3) Polymerization ofthe Monomer in the Vesicle Bilayer
The keyword in polymerization in vesicles is 'stability'. The stability of the monoroerswollen
vesicles must be maintained throughout the polymerization process. Of course, a detailed
characterization of the product of a polymerization in vesicles is necessary to evaluate whether
the foliowed strategy has been successful. As already stated earlier, the size and size distribution
of the vesicles used is important in choosing the strategy to polymerize the monoroer swollen
vesicles. The strategy used is based on the experience gathered from studying seeded emulsion
polymerizations and the polymerization of micro-emulsions, i.e. secondary nucleation must be
avoided at all times. More details about the kinetic aspects of polymerization in vesicles will be
discussed in chapter 8.
The following characterization techniques will be discussed as they are used : bromide counter
ion titration, Static Light Scattering, Fluorescence anisotropy measurements, (Cryo)
Transmission Electron Microscopy ((Cryo)-TEM), Wide Angle X-ray Diffraction (WAXD), UV
spectroscopy, High Perfonnance Liquid Chromatography, and Gel Penneation Chromatography.
It is obvious, from the discussion above, that before a successful Polymerization in Vesicles or an
encapsulation with an adsorbed bilayer can be perfonned, one needs to characterize the
intennediates and the products ofthe separate process steps, as weii astodesigna flexible reactor
system to perfonn the (different) processes in. Therefore, the aim ofthe current investigation is to
optimize different characterization techniques in the characterization of vesicles, monoroer
swollen vesicles and polymer containing vesicles.
The thennodynarnics ofthe swelling process ofthe vesicle bilayer below and above its phase
transition temperature as wellas the kinetics ofthe polymerization process will be discussed in
more detail in chapter 7 and chapter 8, respectively. This chapter will only introduce the basic
concepts.
6.2 Experimental Section 6.2.1 Materials Dioctadecyldimethylammonium Bromide (OODAB, Fluka Chemie), Cetyltrimethylamrnonium
Bromide (CTAB, Fluka Chemie), 1,2-Dimyristoyl-sn-glycero-3-phosphocholine (DMPC, Sygena
Ltd), diphenylhexatriene (DPH, Molecular Probes Inc.) were used as recieved. Ethanol, methanol
and propanol (MERCK, analytical grade) were used without further purification. Silver Nitrate
(AgN03, MERCK), and Potassium Bromide (KBr, MERCK) were used as received.
114 Chapter 6
Water was purified by a Millipore Milli-Q system. Styrene and ethyleneglycol dimethacrylate
(EGDM, MERCK) were distilled at reduced pressure under nitrogen and stored at 4 °C. The
initiator used is a,a' -azobis(isobutyronitrile) (AIBN, Fluka Chemie).
6.2.2 Yesiele preparation DODAB vesicle solutions were prepared using two different procedures. The first procedure is to
dissolve the synthetic surfactants in water heated to 60 °C foliowed by sonification in a
thermostatted Branson sonicator (60 W), for various periods of times. Typical OODAB
concentrations were l to 10 mM. The second preparation procedure is used for OODAB as wel!
as DMPC vesicles. Here the vesicular dispersion (6 mM) is extruded through Polycarbonate
filters (pore size 200 nm) at 60 °C and 20 °C, which is above and below the phase transition
temperature ofDMPC, respectively. The procedure was repeated at least six times.
6.2.3 Bromide counter-ion titration The bromide counter-ions of OODAB vesicles in water as well as in an alcoholic environment
were detected using an argentiometric ritration procedure16' 14• The argentiometric precipitation
reaction is given by equation I :
+ Ag+ - > AgBr (6.1)
The counter-ions ofDODAB will react with the silver ion ofthe titrant silver nitrate ([AgN03]
= 1 o·2 mol dm·\ After the reaction of all bromide i ons, the excess of si! ver i ons wil! result in a
strong increase in the potentiometric signa!, indicating the endpoint of the titration. The
potentiometric ritration was performed using a bromide selective electrode (Orion 94-35) in
combination with a calomel reference electrode (Orion 520 A). The titration of I mi of the
vesicle solution was performed under weak acidic conditions (pH = 5-6) to prevent the
precipitation of AgOH, which would disturb the titration. Typical addition rates of the titrant
were 1-10 milmin
6.2.4 Steady State Fluorescence anisotropy measurements Steady state anisotropy measurements were performed on OODAB vesicles with a SLM
fluorometer at an excitation wavelength of 360 nm15•19. Emission intensities were taken above
418 nm. The probe used is DPH. The anisotropy values (P) can be calculated from the emission
intensities using the equation :
p

Polymerization inDODAB and DMPC Vesicles: A Characterization study 115
where 11 and lp represent intensities of fluorescence emission polarized perpendicular and parallel
to the excitation, respectively. The vesicles were DPH-labeled by incubating an ethanolic DPH
salution into the vesicle bilayers. The typical DPH concentration in the vesicle species is 2*10-10
M. Anisotropy experiments have been perfonned upon pure DODAB vesicle solutions as a
function of temperature; DO DAB vesicles swollen with styrene monoroer at 20 °C, and polymer
containing DO DAB vesicles.
6.2.5 (Cryo)-Transmission Electron Microscopy ((cryo)-TEM) For conventional TEM exposures, OODAB and Dtvfl>C vesicle solutions ([DODAB] = [Dtvfl>C]
= 0.1 % w/w) were negatively stained with 0.2 % (w/w) uranylacetate. The stained samples were covered with carbon and transferred to the Microscope (Jeol FX-2000). Sample preparation for
cryo-TEM experiments were perfonned by putting a thin film on a specimen grid (700 mesh
hexagonal, without supporting film). Starting from different temperatures (20-80 °C) thin films
were vitrifled within one second after their fannation by plunging the grid into ethane cooled to
its melting point by liquid nitrogen. The vitrifled specimens are mounted at 77 K in the
cryoholder (GATAN model 626) and transferred to the microscope (Philips CM 12). During
transfer and observation the cryoholder remained cold (below 90 K) and precautions were taken
to prevent contamination ofthe specimen. Specimen were observed at 120 keV and photographs
were made under low dose conditions21 , in order to rninimize structural damage inflicted by the
electron beam.
6.2.6 Wide Angle X-ray Diffraction (W AXD) W AXD was used to estimate the size of a single OODAB molecule. From this observation, the
size of the bilayer thickness can be calculated. The diffraction pattems were recorded on a flat
photography film placed beyond the sample and perpendicular to the beam direction, using a flat plane phone camera. The beam was generated using a Philips generator with a CuKa-source,
operatingat a voltage of 40 kV (l= 0.154 nm). The beam was monochromized by a Ni-filter. The
OODAB samples were incorporated into smal! capillaries and placed before the beam. Typical
exposure times were 5-7 h.
6.2.7 UV-Spectroscopy Th is technique was used for the detennination of the concentration of styrene in the different
phases during the vesicle swelling process. The apparatus used is a UV Hewlett-Packard 8451-A
Diode Array spectrophotometer. The calibration curve was made by using ethanolic styrene
solutions with a fixed amountofOODAB ([DODAB] = 10-6 mol dm-\ The use of ethanol was
essential since it forces the vesicles to break up. OODAB was incorporated into the cabbration
samples for correcting any matrix effects. Pure ethanol was used as a blank, and the wavelength
used for absorption of styrene was 244 nm.

116 Chapter 6
6.2.8 High Performance Liquid Chromatography (HPLC) Running the swelling experiments the monoroers styrene and EGDM were analyzed by High
Perfomance Liquid Chromatography (HPLC). The chromatographic analysis were performed on
an HPLC equipment, equipped with a model 100A pump (Beckrnan, Exllerton CA, USA)
operatingat an eluent flow of 1.0 mi/min. Measurements ofthe column effluent were done with a
Uvidec-100-IJJ UV-dectector (Japan Spectroscopie Co., Tokyo, Japan) at 215 nm wave1ength.
Separation ofthe monoroers was achieved on aZorbax RX-Cl8 column (Rocldand Technologies
lnc., Newport, DE, USA); partiele size 5 J1111; specific area 180 m2/g and pore size 8 nm. The
eluent consisted of a mixture of water and methanol, 65:35 volume ratio. Cabbration curves of
the monoroers were obtained by HPLC-measurements of different standard solutions in
tetrahydrofuran (THF). Prior to the analysis, samples of the monoroer swollen vesicles (0.1 ml)
were diluted with 0.9 mi THF, which destroys the vesicle structure.
6.2.9 Gel Permeation Chromatography (GPC) Molecular weight and molecular weight distribution of the polymer formed were determined by
GPC, equipped with two Shodex linear columns (GPC KF80, 30 cm) and a refractive index
detector (Waters model410). THF was used as the effluent, at a flow rate of 1 mi/min. Universa!
calibration was applied using monodisperse Polystyrene standards.
6.2.10 Swelling ofDODAB and DMPC Vesicles with Monomer(s) The experimenta1 set-up used fortheswelling ofthe vesicle bi1ayer is presented in Figure 6. L
The swelling vessel has a glass tube in which a dialysis tube was placed, containing the vesicle solution. Typically DODAB and DMPC concentrations were 1-6*10-3 mol dm-3. The vessel was
filled with distilled water and finally a styrene monoroer layer was placed on top ofthe system.
The vessel could be thermostatted within the temperature range of20-60 oe With this
experimental set-up, direct contact ofvesicles with an excess ofmonomer was prevented The
monomer will diffuse through the aqueous phase to the vesicle bilayer. Samples could be taken
separately from the aqueous phase as well as from the vesicle solution.

Polymerization inDODAB and DMPC Vesicles: A Characterization study 117
Monomer
glass tube
Vesicle solution
Figure 6.1 Experimentalset-up for OODAB and DMPC vesicle swelling
6.2.11 Polymerization of Styrene/EGDM in DO DAB and DMPC Vesicles
The polymerization ofOODAB vesicles with styrene and EGDM was performed in a slightly different reactor set-up. Initially, the vesicles were swollen with styrene!EDGM totheir
maximum value using the reactor setup presented in Figure 6. 1. After the vesicles were maximally swollen, the vesicle system in the membrane tube was injected into another reactor system that was thermostatted at the same temperature asthereactor used for swelling. In this way it was possible to measure conversion vs time curves. When the reaction is performed in the swelling reactor, conversion vs time curves could not be obtained since during polymerizations additional swelling would take pi ace. Prior to adding the initiator ([ AIBN] = 10-3 mol dm-\ the monomer concentra ti ons in the polymerization system was measured by means of HPLC. During the polymerization reaction, samples were taken and the decreasing monomer concentrations
were detennined, from which the conversion vs time curves could be constructed. After the polymerization reaction, bromide counter ion titration, steady state fluorescence polarization and gel permeation chromatography were performed on the polymerized DODAB vesicles. CryoTEM experiments were performed on polymerized OODAB as wellas DMPC Vesicles.

118 Chapter 6
6.3 Results and Discussion 6.3.1 Characterization ofThe DODAB Yesiele Preparation Process lt is generally accepted in literature that conventional TEM-experiments are used to visualize
vesicle structures. However, tllis metbod is time consuming and strongly suffers from artifacts
introduced by tbe sample preparation. Another metbod used to characterize vesicles is dynamic
light scattering34. This metbod strongly depends on tbe model used for tbe interpretation of the
scattering data. Recently, Pansu et al. 16 determined the total concentration of
dioctadecyldimethylarnmonium chloride (DODAC) by argentiometric titration of tbe chloride
counter-ions with silver ions. In order to obtain a homogeneous solution tbey added butanol to
force vesicle break-up. Since vesicles are closed bilayer structures, in the present investigation it
was decided to titrate tbe vesicle solution. Iftbe vesicle stability was not affected by the addition
of silver nitrate then, in principle, it should be possible to titrate only the bronlide counter-ions
present at tbe outer surface of tbe vesicle. Therefore, a vesicle solution ([DODAB] = 6 * 10"3 mol
dm-3, sonificated for 6 hours) was titrated witb silver nitrate at 20°C, i.e. below the phase
transition temperature of tbe vesicle bilayer. Since the vesicle solution was extensively
sonificated before titration it can be assurned that tbe smallest possible structures were formed.
The consurnption of silver nitrate indicated that notall the bromide counter-ions were accessible
to react with the silver ions. In tllls experiment a bromide recovery of typically 70 % was
obtained. Increasing tbe addition rate of the ti trant did not affect the results. lf the same vesicle
solution was titrated in an ethanolic environment, i.e. when all the vesic\es are destroyed, 100%
ofthe bromide counter-ions were recovered. This result indicated that in this case all the bromide
counter-ions were accessible to titration.
An additional experiment was performed in which the micelle-fornling surfactant CT AB was
used. Since CTAB will form nlicelles (CMC = 7.92 * 104 mol dm"3) 17, all tbe bromide
counterions wi\1 be available for titration. Thus, in water and in ethanol, all bromide ions present
should be titrated. Indeed, titration experiments with CT AB above the critica\ micel Ie
concentration showed tbat in water, and in ethanol, 100% recovery of the bromide i ons was
obtained. A possible explanation for the observed phenomena is that due to the geometry of the
vesicles in water, only a limited arnount of tbe bromide ions, viz. tbose residing at the outside of
the closed bi\ayer structure can react with the silver ions of tbe titrant. From the bromide
recovery, the average diameter of tbe vesicles can be calculated, assurning spherical structures,
according to:
(6.3.)

Polymerization inDODAB and DMPC Vesicles: A Characterization study 119
where Vc is the number of bromide ions at the extemal vesicle surface, V1 is the total number of
bromide ions, d.: is the extemal vesicle diameter, and Ie is the length of a DODAB molecule. The
lengthof a OODAB molecule can be deterrn.ined using WAXD (figure not shown). Using the
Bragg diffraction equation18, the length of a DODAB molecule is estimated to be 26.5 A0.
Utilizing equation 3, the extemal vesicle diameter can be calculated as a function of the fraction
of extemal surface, which is proportional to the bromide recovery. From Eq. 3 it can be
caluclated that when the bromide recovery is 70%, the average vesicle diameter is 25 nm.
The effect of sonification time on the size of the vesicles formed was investigated, using the
bromide counter-ion ritration method After sonification the vesicle solution was cooled to room
temperature prior to titration.
80 50
c 40 Ê .s. - • ~ A A A A A •
>- 70 A ö • A A ..
> A 30 • • c > a A .. • c • 11: c c ..
c • • c c c c 0 E .. 20 .! Ë 60 A .. • • .. • • •
10 .. • > <C
50 0 0 50 100 150 200 250 300
time(min)
Figure6.2 Average diameter of DO DAB vesicles (D), calculated using the argentiometric titrations (.~)as a fimction of time
Figure 6.2 clearly shows that upon increasing the sonification time the average size ofthe
vesicles formed decreases and eventually ( after 150 minutes) reaches a final value of ca. 25 nm,
according to the calculations using Eq. 3. In further experiments all vesicle solutions were
sonificated for at least 300 minutes, thus ensuring that at the start of all experiments, the vesicles
had the sameaverage size. In order to check the validity ofthe results obtained with the titration
procedure, the final sample was vitrifled at 20 °C, and studied at low temperature by means of
Cryo-TEM. The photograph ofthe sonificated DODAB dispersion is presented in Figure 6.3.

120 ehapter 6
Since the vitrification processis extremely rapid, it is possible totrap (almost) all dynamic events
within the time resolution ofvitrification (in the order of 10"3-10-5 sec)' 4 This indicates that the
morphology ofthe DODAB dispersion can be physically fixed by the vitrification process''. It is clearly observed that the OODAB structures are not spherical but have amongst others a rather
ellipsoidal shape.
Figure 6.3 Cryo-TEM photograph of a sonificated DO DAB dispersion vitrifled at 20 °C
Note that the vitrificationtemperature is below the phase transition temperature ofDODAB vesicles (Tm= 37 °C). lt may be possible that a crystallization event is responsible fora change in
structure. Hence, the OODAB structures may be spherical above the phase transition temperature, but when the temperature of the OODAB dispersion is below Tm the structures may change from spherical to ellipsoidal. Sim i lar effects have been observed by various investigators. Hamroerstrom et al.31 reported that after coolingto room temperature, dispersions of dihexadecylphosphate (Dl-IP) sonificated at 80 oe are dominated by highly irregular structures.
Engberts, Hoekstra and co-workers32 have examined vesicles of a number of dialkylphosphates
including DHP by electron microscopy. They reported that all surfactants formed vesicles above Tm but that the surfactants with shorter chains ( decyl or dodecyl) crystallized below that temperature. In order to evaluate this observation for DODAB vesicles, vitrification experiments have been perfonned at 60 °e. Unfortunately, vitritkation of sonificated DODAB dispersions at
60 °e did notchange the morphology toa more spherical contiguration (photo shown in section 2.2.4).

Polymerization inDODAB and DMPe Vesicles: A eharacterization study 121
The question now arises: can the titration technique still be utilized for the calculation of the
average vesicle diameter, since these species are not spherical but ellipsoidal. If the titration
method is still valid the surface area of the ellipsoidal structures should be equal to the surface
area of a spherical structure with an average diameter of ca 25 run. The ellipsoidal structure is defined by its aspect ratio alb, where a is the length ofthe ellipsoidal structure and bis the width.
The aspect ratio can be measured from the photograph. The three dimensional structure is
divided into small cross-sections, and the curvature of the cross-section is assurned to follow an
ellipsoidal function. The surface area (S) ofthis structure then can be calculated as a function of
the aspect ratio, according to:
S = nb/a [ a2 sin·1 (al lal)+ i sin·• (-al lal)] (6.4)
Measuring the average values for a and b from the electron microscope photograph revealed: a = 24.2 nm and b = 6.8 run, and this leads to a surface area for the rugby ball structures of 1620 nm2. The surface area of the rugby-baH structures is then oomparabie to the surface area of
spherical particles with a partiele diameter of 23 nm. This result suggests that the bromide
counterion titrations can be used to calculate the "average diameter" of the OODAB structures, even when these structures are not spherical.
Further geometrical calculations show that for a vesicle diameter of 23 nm, the nurnber of DO DAB molecules in the outer shell is a factor 2. 7 higher than the nurnber of molecules in the
inner shell. Assuming that all the OODAB molecules are incorporated in the aggregates, the calculated nurnber of OODAB molecules per aggregate is 4000. The molecular weight of the
vesicle structures ofthis size is calculated be 2.5*106 g/mol. These qualitative calculations seem
to be confirmed by static lightscattering experiments upon these OODAB structures at 20 °e (Zimm plot not shown). The general observation is that from bromide counter-ion tritrations on
DODAB structures, qualitative conclusions can be drawn about the vesicle size and molecular
weight. However, the counter-ion titrations described sofar were all conducted we\1 below the
phase transition temperature ofthe vesicle bilayer. To investigate the effect ofthe bilayer phase
transition on the ritration method, additional ritration experiments of vesicle solutions were performed as a function of temperature. The results are presented on the right side y-axis in
Figure 6.4. Up to a temperature of 30 °e, the bromide recovery is 70%, indicating that on the
time scale oftitration no silver ions diffuse over the bilayer.

122 Chapter 6
0.35
0.30 100 0 0 0 ...... ... 0 0
~ 0 ~ tl 0.25 ~ 0
~ QJ )>
Q) :::s > 0 0.20 ëi> 0 ... aD !a. 0 ....
0 ~ Q)
80 - ... o---- 0.15 ~ :'Q E ... 0 ... ... 0.10 ..... 0 al
0
0.05
60 20 30 40 50 60
Tempersture (°C)
Figure 6.4 Argentiometric ritration of DO DAB vesicles (.Ä.), in combination with Steady State Fluorescence Anisotropy measurements (0)
'
However, when the temperature exceeded the phase transition temperature ofthe vesicle bilayer,
bromide recovery increased to 100%. This may be due to the ditfusion of silver!bromide ions
over the bilayer. As a consequence of this behavior, the argentiometric titration technique can
only be used as a method to determine the vesicles size at temperatures below the phase
transition temperature of the vesicle bilayer. From the above section it is clear that the phase
transition temperature (Tm) affects many characteristics. Since vesicle bilayers exhibit phase
transitions it is necessary to determine at what temperature these transitions occur. The phase
transition temperature of DO DAB vesicles was also measured using Steady State Fluorescence
Anisotropy experiments . At temperatures below the phase transition temperature, the surfactant
chains are in the liquid crystalline state. The microviscosity of the system is high and therefore
the rotation of the DHP probe is forced to follow a structural motion, i.e. the anisotropy of the
system is then high. When the temperature exceeds the phase transition temperature, the
surfactant chains are in a gel-to-liquid state. The microviscosity of the bi1ayer will then decrease
and therefore the DHP probe will rotate more randornly, which causes a decrease in anisotropy.
The results of these experiments are presented on the left side y-axis of Figure 6.4. Combining
the resu1ts of the Steady-state Fluorescence Anisotropy experiments and counter-ion titrations, it
can be concluded that above the phase transition temperature (37 °C), silver!bromide ions can
diffuse over the bilayer which causes an increase in the bromide recovery. The above described
titration method can be used to determine the average vesicle size.

Polymerization inDODAB and DMPC Vesicles: A Characterization study 123
At the same time, this method can be used to check the stability of the vesicle structures after
swelling and polymerization. In order to perfarm an accurate measurement, the samples have to
be cooled below the phase transition temperature ofthe bilayer. Although the developed method
is based on the ritration of bromide ions, it is not unlikely that other counter-ions also can be
titrated as long as a suitable titrant and detection method are available.
6.3.2 Characterization ofThe DMPC Yesiele Preparation Process DMPC vesicles have been prepared by extrusion of a vesicular dispersion through a
polycarbonate filter at a temperature slightly above the gel to liquid crystalline temperature.
These vesic\es have been characterized using Cryo-TEM, vitrified below the gel to liquid
crystalline temperature. The Cryo-TEM photograph is presented in Figure 6.5. Note that the
DMPC vesicles are spherical. The DMPC vesicles vitrified under the phase transition
temperature exhibit a rippled surface curvature.
Figure 6.5 Cryo-TEM picture of extruded DMPC vesicle structures vinified below the gel to liquid crystalline transition temperature
6.3.3 Swelling ofthe Yesiele Bilayer with Monomer(s) When an organic solvent is added to a vesicle salution the organic solvent wiJl partirion between
the aqueous phase and the hydrophobic vesicle bilayer. This partitioning behavior can be
determined experimentalll5•26'27.23 One of the major conditions that should be satisfied by the
experimental methad used for the determination of the partitioning of the organic solvent
between the different phases is that the vesicles remain stabie during the swelling experiment.
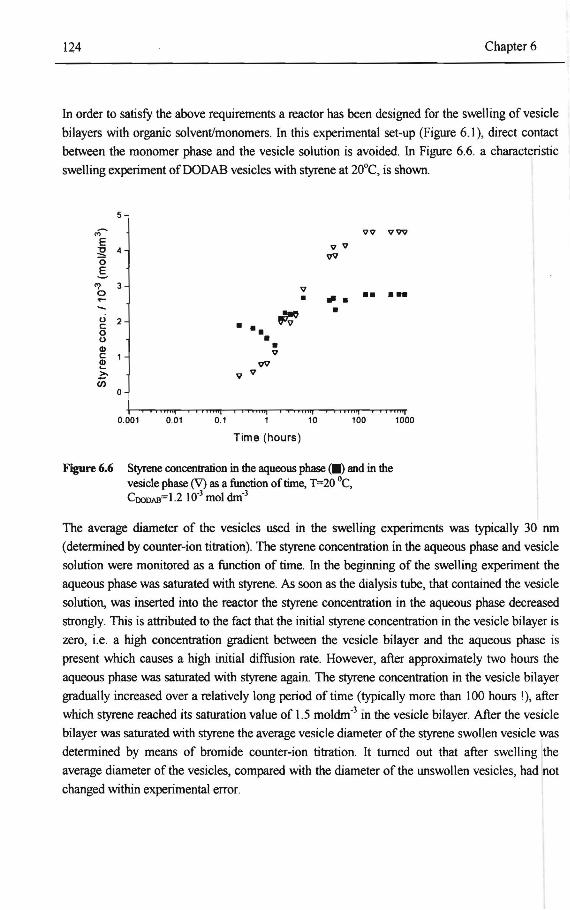
124 Chapter6
In order to satisfy the above requirements a reactor has been designed fortheswelling ofvesicle
bilayers with organic solvent/monomers. In this experimental set-up (Figure 6.1 ), direct contact
between the monomer phase and the vesicle solution is avoided. In Figure 6.6. a characteristic
swelling experiment ofDODAB vesicles with styrene at 20°C, is shown.
5
«>~ VV VVV
E 32 4 0 E
'? 3 0 V
• .". . •
•• • •• g 2 0 (.)
CD 5; 1 .... >. û)
0
0.001 0.01 0.1
• i?: •• • • V
vv V V
Time (hours)
10 100
Figure 6.6 Styreoe concentration in the aqueous phase (11) and in the vesicle phase (V) as a function of time, T=20 °C, CoooAB= 1.2 10"3 mol dm"3
1000
The average diameter of the vesicles used in the swelling ex.periments was typically 30 run
(determined by counter-ion titration). The styrene concentration in the aqueous phase and vesicle solution were monitored as a function of time. In the beginning of the swelling experiment the aqueous phase was saturated with styrene. As soon as the dialysis tube, that contained the vesicle
solution, was inserted into the reactor the styrene concentration in the aqueous phase decreased strongly. This is attributed to the fact that the initia! styrene concentration in the vesicle bilayer is
zero, i.e. a high concentration grad.ient between the vesicle bilayer and the aqueous phase is
present which causes a high initia! ditfusion rate. However, after approximately two hours the aqueous phase was saturated with styrene again. The styrene concentration in the vesicle bilayer gradually increased over a relatively long period of time (typically more than 100 hours !), after which styrene reached its saturation value of 1.5 moldm-3 in the vesicle bilayer. After the vesicle bilayer was saturated with styrene the average vesicle diameter of the styrene swollen vesicle was
determined by means of bromide counter-ion titration. It turned out that after swelling the average diameter of the vesicles, compared with the diameter of the unswollen vesicles, had not changed within experimental error.

Polymerization inDODAB and DMPC Vesicles: A Characterization study 125
Weber et al. 22 showed that steady state anisotropy measurements can be used todetermine the
microviscosity of the bilayer using symmetrie non-polar fluorescence probes. Therefore,
polarized fluorescence measurement were used to visualize the swelling of the vesicle bilayer by
styrene. During a swelling experiment a fluorescence probe (DPH) was incorporated in the
vesicle bilayer. The results ofthis experiment are depicted in Figure 6.7. Note that the anisotropy
of DPH decreased when the concentratien of styrene in the vesicle bilayer increased. The
microviscosity of the vesicle bilayer is reflected by the anisotropy of the DPH probe. Upon
swelling the microviscosity of the vesicle bilayer decreases. Concomitantly, the DPH probe wiJl
rotate more randomly in the vesicle bilayer. The swelling experiments were also performed as a
function of temperature in order to investigate the effect of the phase transition of the vesicle
bilayer on the swelling behavior with styrene. As is clearly demonstrated in Figure 6.8.,
temperature has a pronounced effect on the styrene saturation concentration in the vesicle bilayer.
This is attributed to the fact that below the phase transition temperature the alkane part of the
surfactant is in a semi-crystalline state. A similar effect oftemperature onswelling was observed
by Sirnon et al.23 in the case ofphospholipid vesicles swollen with hexane and benzene. Above
the phase transition temperature the styrene concentration in the vesicle bilayer is approximately
a factor of2 higher than below the phase transition temperature.

126
ç;-E :!:!. ö g > 1-!!!.
2.00
1.50 " " 1;6 " t!/' ll
1.00
0.50
•
" 6
• •
• • • •
0.40
• 0.30
0.20
0 .10
0.00 '----~~ta---.t ____ .J.._ ___ .....L ___ ____J 0.00
0.1 10 100 1000
;..., (hcu111)
' ... ... ~ ö .. ë <
Figure 6. 7 Swelling process of styrene visualized with Steady State Fluorescence Polarization, where the styrene concentrarion in the vesicle bilayer (., and the anisotropy (A) is depicted as finletion of time, T=20 °C
2.8
,.,.. 2.6
E ~ 2.4 0
§. 22
IJ r:: 0 2.0 IJ Q)
~ 1.8
~ Cl) 1.6
20 25 30 35 40 45 50
Tempersture (°C)
Figure 6.8 Styrene concentration in the vesicle bilayer as a function of temperature
Chapter 6

Polymerization inDODAB and DMPe Vesicles: A eharacterization study 127
A more extensive explanation for this phenomenon wil! be given in chapter 7 together with a
thermodynamic treatment of the swelling process11• 12, i.e. evaluation of the concentrations of styrene and other monomers in the different phases. Also the question whether the morphology of
the vesicle will change during the swelling process will be discussed in chapter 7.
In condusion it can be said that the swelling ofvesicle bilayers can be visualized by steady state fluorescence measurements while the vesicle stability after the swelling experiment can be
determined by means of bromide counter-ion titration. Furthermore, temperature has a strong
influence on the swelling behavior ofvesicle bilayers.
6.3.4 Co-polymerization ofStyrene/EGDM in the DODAB Yesiele Bilayer
Different kinds of polymer containing vesicles were prepared by swelling the vesicle bilayer with
monomer or monomer mixtures, such as Styrene-EGDM, Butylacrylate-EGDM and Styrene
Butylacrylate, after which the polymerization was initiated by adding a 10"2 moldm-3 solution of
AIBN. The polymerization temperatures were in the range 20 - 70 °C. A typical copolymerization discussed in this section is with the monomer combination Styrene-EGDM. The
total polymerization time was 24 hours at 70 oe. Samples were taken during reaction for
determining conversion. The reason:for using EDGM as a comonomer is the fact that through
cross-linking the molecular weight of the polymer formed increases, which in principle could
lead to more stabie polymer containing vesicles. After the polymerization process had been performed the polymer containing vesicles were subjected to a comprehensive structure analysis
by means of bromide counter-ion titration, steady state fluorescence polarization, gel permeation chromatography, and conventional as wel! as cryo-TEM First, the average vesicle diameter of
the resulting polymer containing vesicle solution was determined by bromide counter-ion
titration and showed no measurable difference from · the virgin vesicles. Second, steady state fluorescence polarization was performed and these results are shown in Figure 6.9. In the same
plot the anisotropy of DPH in virgin vesicles is depicted. As is clearly shown in this tigure the
presence of polymer in the vesicle bilayer has a pronounced effect on the mobility of DPH. The
anisotropy remains relatively constant up to a temperature of approximately 60 oe after which it
gradually decreases. The typical phase transition temperature of DODAB is significantly suppressed by the presence of styrene/EGDM copolymer in the vesicle bilayer.
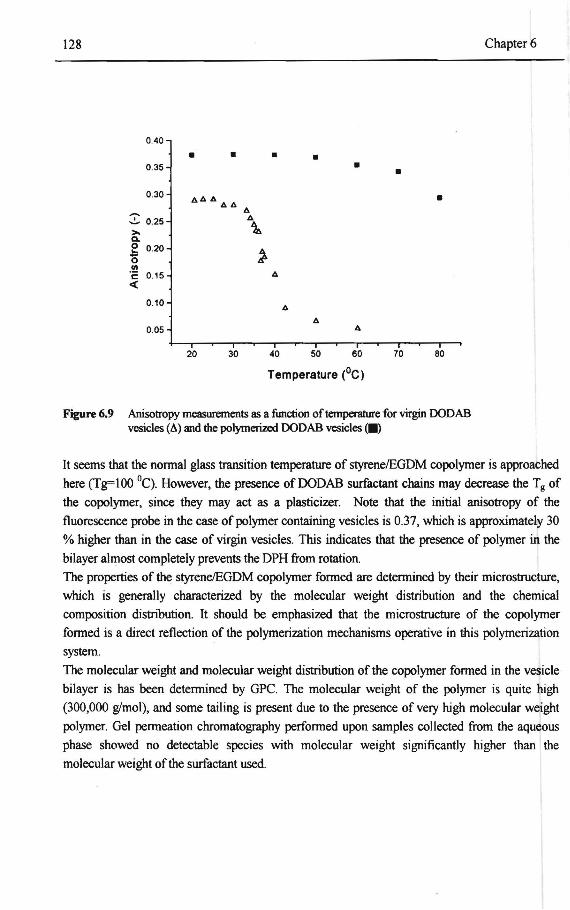
128 Chapter 6
040
• • • • 0.35 • • 0.30
!!.I!. I!. • à à à
2 0.25 à
>- \. Q. 0 0.20 ....
~ ö .!!
0.15 à c: <(
0.10 à
à 0.05 à
20 30 40 50 60 70 80
T emperature (°C)
Figure 6.9 Anisotropy measurements as a timetion oftemperature for virgin OODAB vesicles (A) and the polymerized OODAB vesicles <•)
lt seems that the normal glass transition temperature of styrene!EGDM copolymer is approached
here (Tg=lOO 0C). However, the presence ofDODAB surfactant chains may decrease the T8 of
the copolymer, since they may act as a plast:icizer. Note that the initia! anisotropy of the
fluorescence probe in the case of polymer containing vesicles is 0.37, which is approx.imately 30
% higher than in the case of virgin vesicles. This indicates that the presence of polymer in the
bilayer al most completely prevents the DPH from rotation.
The properties of the styrene/EGDM copolymer fonned are determined by their microstructure,
which is generally characterized by the molecular weight distribution and the chemica!
composition distribution. It should be emphasized that the microstructure of the copolymer
formed is a direct reflection of the polymerization mechanisms operalive in this polymerization
system.
The molecular weight and molecular weight distribution of the copolymer formed in the vesicle
bilayer is has been determined by GPC. The molecular weight of the polymer is quite high
(300,000 glmol), and some tailing is present due to the presence of very high molecular weight
polymer. Gel permeation chromatography performed upon samples colleeled from the aqueous
phase showed no detectable species with molecular weight significantly higher than the
molecular weight ofthe surfactant used.

Polymerization inDODAB and DMPC Vesicles: A Characterization study 129
6.3.4.1 Characterization of composition drift In conventional emulsion copolymerizations, the presence of two mortomers in the systerri
induces almost always composition drift. As explained in chapter 2 composition drift is a result
of the difference between the instantaneous copolymer composition and the overall monomer
consumption: because of this the monoroers are not consumed at the same relative rate, and the composition ofthe monomermixture changes continuously. These differences are caused by the
difference in the reactivities ofthe monoroers towards the radicals and the monomer partitioning over the different phases. Since the copolymerization of styrene/EGDM in DO DAB vesicles can
be regarcled as an unconventional emulsion polymerization, it is not to unlikely that composition drift also occurs in this system. Composition drift can be observed experimentally by analyzing the partial conversion curves vs. the overall conversion. The partial conversions .of styrene and
EGDM are plotted as a function of overall conversion in Figure 6.10.
1.0 .--· ... • 0.8 •
" • I 0.6 • ~ ~ ' ~ " .. 0 .4
"" >< • "
// " 0 .2
" " 0.0
0 .0 0.2 0.4 0 .6 0 .8 1.0
Overall Conversion (-)
Figure6.10 Partial conversion ofStyrene (11) and EGDM (Ä) as function of overall conversion for the polymerization in DO DAB vesicles
initial mole fraction of styrene in the system F sty = 0.60

130 Chapter 6
Note that composition drift is occurring in this polymerization system. Styrene is consumed at a
faster rate than EGDM, causing the chemica\ composition ofthe copolymer to change as function
of conversion. Composition drift has been modeled theoretically in emulsion co- and
terpolymerizations and is compared with experimental data37. A computer model has been developed, initially for co-polymerizations and later for terpolymerization by Van Doremaele37
and Schoonbrood38 respectively. The procedure used is to divide the whole reaction in smal!
conversion steps, during which it is assumed that composition drift is negligible. The calculations
are based on combining the monoroer partitioning equations, mass balances of each monoroer in
the three phases and the recipe. The input parameters include the binary reactivity ratios
according to the terminal model, the solubilities in the aqueous phase, the swellabilities of the
polymer particles byeach monomer, the density ofthe monoroerand the polymer, the number of
seed latex particles and the total amount of the seed latex polymer. An attempt is made to adjust
this model to make it applicable for the simulation of the composition drift of styrene/EGDM in
DODAB vesicles. The solubility of styrene and EGDM, as well as the swellability of styrene and
EGDM in DODAB vesicles have been measured experimentally. The input parameters used in the modeling procedure are presented in Table 6.1
Table 6.1: Input Parameters for the Model Gaa.dation cl Corrposition Drift for StyreneiEGDM Copolyn-erization in DODAB Vesides
Paarnet er Styrene
reac::tivity ratios (-) r5rr-o.3~39l solubility in aquous phase (rml dm-3) 3.8*1()-3 swellability cl DODAB vesides (rml dm-3) 1.35 density cl monomer (g drrr3) 878 density á pdyrrer (g ctrrr3) 1100 null"ber of vesides (drrr3) 101s rmlar mass (gfrml) 104.15
•T=700C • Cocx:w! = 5'"10"3 mol dm-3
EGDM
r Ec:ot.r0.67t39l
15*10"3
0.89 1051 1100 1Q15
198

Polymerization inDODAB and DMPC Vesicles: A Characterization study
1.0
0.8
0.6
><tiJ 0.4
0.2
0.0
0.0 0.2 0.4 0.6 0.8 1.0
Overall Conversion (-)
Figure 6.11 Simulation of composition drift of the styrene/EGDM copolymerization in DODAB vesicles, partial conversion of styrene (11) and EGDM (e) as fimction of overall conversi011, initia! mole fraction öf styrene in the system F "Y = 0.60
131
When the theoretical model calculations ( figure 6.11) are compared with the experimental results (Figure 6.10), it appears that there is a large deviation. Since EGDM is the more reactive monomer compared to styrene, it is expected that the consumption of EGDM should be larger. This is not observed experimentally. Although styrene is the less reactive monomer, the consumption of styrene is larger, leading to the opposite trend. The reason for this ditTerenee may be the model assumption that the monoroer partitioning may be described using bulk thermodynarnic models based upon Flory-Huggins lattice theory. This assumption is applicable for conventional emulsion polymerization systerns. Schoonbrood37 showed this theoretically as well as experimentally for styrene/methylmethacrylate, styrene/methylacrylate and methylrnethacrylate/methylacrylate emulsion systems. For these emulsion systems, the reactivity ratios are the most important parameters and that the swellability ofthe latex particles could be changed within a reasonable range without having a noticeable effect on composition drift. For copolymerization reacrions in DO DAB vesicles, however, this assumption may not be valid, si nee the heterogeneity ofthe bilayer should betaken into account in the partitioning phenomena. Morediscussion about this topic will be presented in chapter 7.

132 Chapter 6
Note, however, that this is an interesting phenomena, and more research is required to evaluate
whether the morphology of the bilayer can have an influence upon the selectivity of the
copolymerization reaction.
6.3.4.2 Characterization of morphology of polymerized DO DAB vesicles
A photograph of a conventional TEM sample ( no staining) as well as a cryo-TEM photograph of
the same JX>lymer containing vesicle sample (vitrified at 20 °C) is presented in Figure 6.12. The
structures visualized with conventional TEM are spherical and have an average diameter of
approximately 30 run, which is in good agreement with the diameter determined by the bromide
counter-ion titration. In the case of the conventional TEM sample agglomerated structures are
observed. In conventional TEM sample preparation is often a souree of artifacts, due to the
drying process of the sample (Figure 6.12a). On the other hand, in cryo-TEM, many of these
artifacts induced by conventional TEM can be avoided, since the rapid cooling rate increases the
probability that the structures remain in their original state. In Figure 6.12b. agglomerated
structures are not observed.
(a) (b)
Figure 6.12 Convent:ional TEM photograph (a) and a Cryo-TEM photograph (b) ofthe species obtained by polymerization in DO DAB vesicles

Polymerization inDODAB and DMPC Vesicles: A Characterization study 133
Note that the polymerized structures observed with Cryo-TEM are also spherical, whereas the
virgin vesicles before polymerization had a ellipsoidal shape. A daunting question to be answered
is whether the change in morphology from ellipsoidal to spherical is induced by vesicle swelling,
vesicle polymerization or both? As explained in section 2.3.3 the DO DAB vesicles formed by the
sonification process are in a thermodynamically metastable state, at a 'pseudo-minimum' ofthe Gibbs free energy. It may be possible that during swelling and/or polymerization, the OODAB
vesicular system may rearrange itself, since then another pseudo-minimum may be reached that
is more favorable. The addition of monoroer and the increase in temperature may be the trigger
for the rearrangement of the system changing the vesicle morphology. The next question is: "Is
the swelling process itself sufficient for the change in morphology, or is the polymerization required as well, and what is the influence oftemperature ?"These questions will be discussed in
more detail in chapters 7 and 8.
6.3.5 Polymerization ofDMPC Vesicles with Styrene and EGDM 6. 3. 5.1 Characterizalion of composition drift
DMPC vesicles are polymerized using the monomer combination Styene-EGDM. The total
polymerization time was 24 hours at 50 °C. Samples were taken during reaction for determining
conversion time curves. The parrial conversion of styrene and EGDM vs. the overall conversion
is given in Figure 6.13. Note that for styrene/EGDM copolymerization in DMPC vesicles
composition drift is observed as well. It seems that styrene is the more reactive monomer which is similar to the copolymerization in the DO DAB system. Note that the same intrinsic difference
between simulation and experimental data is the same. Based upon the reactivity ratios EGDM is
expected to be consumed faster. Also for this system the explanation for the observed phenomena
may conceming monomer partitioning, see chapter 7.
t .O
0 .8
0.6
><fl 0.4
0.2
0.0
/ /
A
• • • • . ~/ b.
o // A . / " o / A .· / .. '/'":A
/l>M"" ,y
0.0 0.2 o.• o.a o.8 LO
Overatl Conversion (-)
Figure 6.13 Partial conversion ofStyrene <•> and EGDM (A) as function of overall conversion for the polymerization of styrene/EGDM in DMPC vesicles, initia! mole fraction ofstyrene in the system FSI) = 0.50, T= 50 °C
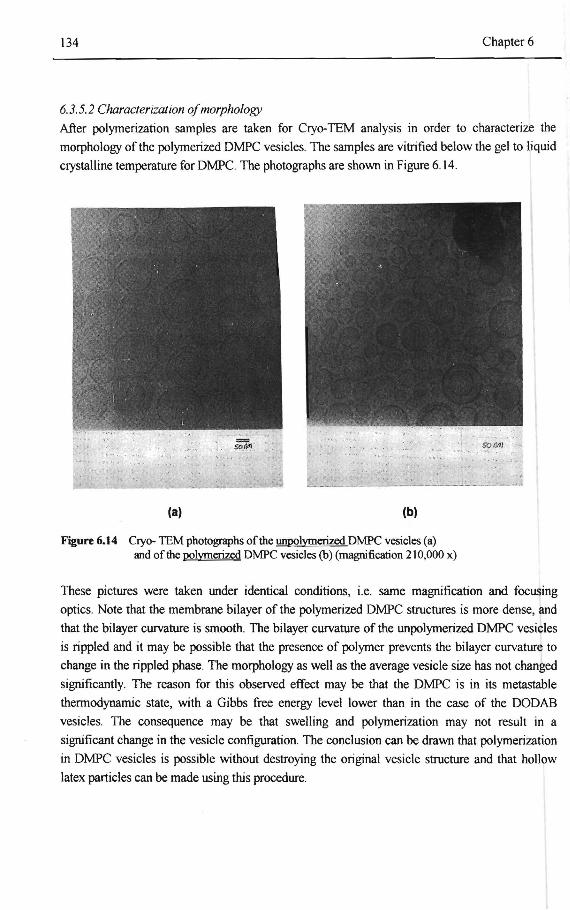
134 Chapter6
6. 3. 5. 2 CharacterizaJ ion of morphology
After polymerization samples are taken for Cryo-TEM analysis in order to characterize the
morphology of thc polymerized DMPC vesicles. The samples are vitrified below the gel to liquid
crystalline temperature for DMPC. The photographs are shown in Figure 6.14.
(a) (b)
Figure 6.14 Ciyo- TEM photographs ofthe unpolymerized DMPC vesicles (a) and ofthe polymerized DWC vesicles (b) (magnification 210,000 x)
These pictures were taken under identical conditions, i.e. same magnification and focusing
opties. Note that the membrane bilayer of the polymerized DMPC structures is more dense, and
that the bilayer curvature is smooth. The bilayer curvature of the unpolymerized DMPC vesicles
is rippled and it may be possible that the presence of polymer prevents the bilayer curvature to
change in the rippled phase. The morphology as wel! as the average vesicle size has not changed
significantly. The reason for this observed effect may be that the DMPC is in its metastable
thermodynamic state, with a Gibbs free energy level lower than in the case of the OODAB
vesicles. The consequence may be that swelling and polymerization may not result in a
significant change in the vesicle configuration. The condusion can he drawn that polymerization
in DMPC vesicles is possible without destroying the original vesicle structure and that hollow
latex particles can he made using this procedure.
Polymerization inDODAB and DMPC Vesicles: A Characterization study 135
6.4 Concluding Remarks In this chapter, it has been shown that a variety of powerfut techniques are necessary for
characterizing and visualizing the individual aspects of DODAB and DMPC vesicle polymerization. The stability of the OODAB vesicle structure can be checked using the argentiometric titration procedure. It is possible to swell DODAB vesicles without destroying the vesicle structure. The swelling processcan be characterized using UV-spectroscopy, HPLC, and
steady state fluorescence polarization measurements. The combined results of these techniques
gives evidence that the vesicle bilayer actually swells with monomer. When polymerization in
vesicles is perfonned, fluorescence polarization, TEM, and gel permeation chromatography show that polymerization actually takes place in the vesicle bilayer without destroying the vesicle
structure. The polymer formed within these bilayers has a high molecular weight. The
copolymerization of styrene/EGDM in the DO DAB as well in DMPC vesicles shows significant
composition drift, although in an unexpected fashion. With respect to the morphology of the
polymerized vesicles, cryo-TEM pictures of the polymerized OODAB vesicles showed spherical species. However, it is not possible todetermine unequivocally whether these structures are really hollow, on the basis of this technique alone, because the partiele dimensions are too smal\. However, based upon the combination of bromide counterion titrations, Fluorescence
Polarization, GPC and cryo-TEM, it becomes reasonable to assume that these particles may
exhibit a hollow character. The polymerization of DMPC vesicles has been perfonned successfully and hollow structures are obtained as shown by cryo-TEM. In summary: we have
successfully modified characterization methods and polymerization procedures in order to achieve vesicle polymerization. We have shown that polymerization in vesicles is possible, and
may be an alternative way of producing hol\ow latex particles. When polymerization in vesicles
is regarcled from an emulsion polymerization point of view, it is obvious that this system is very interesting, but at the same time complex with respect to the polymerization kinetics and
monomer partitioning over the different phases present.
References
I. Lei, J.; O'Brien, D.F., Macromolecu/es, 1994, 27, 6, 1381. 2. Evans. D.F.; Nmham, BW., J Phys. Chem., 1986, 90, 2, 226. 3. Murtagh, J.; Thomas, J.K., Faraday Discuss. Chem. Soc., 1986, 81, 127. 4. O'Brien, D .F.; Ramaswam, R., Encyclopedia ofPolymer Science and Engineering,
2od ed.; John Wuey & Sons New York, 1989; Vol17, pp 108-135. 5. Ringsdort; H; Schlarb, B.; Venzmer, J., J of Angew Chem., Int. Ed Eng/., 1988,
27, 113. 6. Regen, S.L.; In Liposomes.from Biophysics to Therapeutics, Ostro, MJ., Ed;
Marcel Dekker: New York, 1987, 73 . 7. lsraelachvilli, J.N.; Mitchell, DJ.; Ninham, B.W., J ofChem. Soc. Faraday Trans.,
1976,72, 1525. 8. Fendler, JH, Science, 1984, 222, 888.
136
9. Karaboni, S; Langmuir, 1993, 9, 5, 1334. 10. Drouffe, J.M.; Maggs, A.C.; Leibler, S., Science, 1991, 1353. I\. Maxwell IA; Ku~a, J, Langmuir, 1995, 11, 1987. 12. Zirkzee, H.F.; Rietjens, G.H.; Kwja, J; Gennan, A.L., Polymerization in Dioctadecyldimethyl
ammonium Bromide Vesic/es. IJ: Monomer Partitioning, in preparation. \3. Zirkzee, HF.; Rietjens, G.H.; Kwja, J; Gennan, A.L., Polymerization in Dioctadecyldimethyl
ammonium Bromide Vesic/es. lil: Polymerization kinetices, in preparation. 14. Pansu, RB; Baer, B.; Faure, S.; Roncin, J; Arrio, B., J. Phys. Chem., 1990, 94, 796. IS. Loew, L.M., Spectroscopy of Membrane Probes, CRC Press lnc. Boca Rat on,
Florida, Volume I. 16. Pansu, R.B.; Liu, L.; Roncin, J; Arrio, B., NewJ. Chem., 1990, 14, 97,796. 17. Fendler, JH., Membrane Mimetic Chemistry, John WJ.!ey & Sons, New York, 1982. 18. Bouwstra, J.A; Gooris, G.S.; Bras, W; Talsma, H., Chemistry and Physics of
Lipid~,1993, 64, 83. 19. Rupert, L.AM., PhD thesis, University of Groningen, 1988. 20. Yogev, D.; Bruno C.; Guillaume, R.; Fendler, JH., Langmuir, 1991,7, 4, 623. 21. Frederik, P.M.; Stuart, M.C.M.; Bomans, P.H.H.; Busing, W.M.; Burger, K.NJ.;
Verkleij, A.J,Joumal ofMicroscopy, 1991, 161,253. 22. Weber, G; Annu. Rev. Biophys. Biochem, 1972, 1, 553. 23. Simon, S.A;McDaniel, R.V.;Mclntosh, TJ., J. ofPhys. Chem., 1982, 86,1449. 24. Kurja, J; Maxwell, IA; Nolte, R.J.M; German, A.L., Polymer, 1993, 34, 2045 25. Wishnia, A; Pinder, TW., Biochemistry, 1966, 5, 1534. 26. De Young, L.R.; Dill, K.A, Biochemistry, 1988, 27, 5281. 27. De Young, L.R.; Dill, K.A, J. Phys. Chem., 1990, 801. 28. Okubo, M.; Ichikawa, K; Fujimura, K, Col. Pol. Sci., 1991, 2, 69, 1257. 29. Kowalski, A; US patent, Patent No. 4.468.498, Aug 28, 1984. 30. Ku~a, J; Zirkzee, HF.; Gennan, A.L.; Nolte, R.J.M.; Maxwell, I. A,
in "The polymerie Matelials Encyclopedia, Properties and Applications, e<lited by J.C. Salamone, CRC Press, BocaRaton (1995).
31 . Hammarstrom, L; Velikan, I; Karlsson, G.; Edwards, K, Langmuir, 1995, 11, 408. 32. Wagenaar, L; Rupert, LAM.; Engberts, J.B.F.N.; Hoekstra, D.J., J. of Org. Chem.,
1989; 54, 238. 33. Frederik, P.M.; Stuart, M.C.M.; Verkleij, A.J., Biochimica and Biophysica Acta, 1991,
1062, 133. 34. Bachrnan, L; Mayer, E. in "Physics ofWater and lee: Jmplicationsfor Cryoftxation,
Cryotechniques in Biologica/ Electron Microswpj', (eds) Steinbrecht, R.A; Zierold, K.; Springer Verlag Berlin, pag 3-34.
35. Ku~a, J., Zirkzee, HF., German, A.L., Nolte, R.J.M, "Polymerization in Vesicles", Polymerie Matenals Encyclopedia, ed: J.C. Salamone, New York, 1996.
36. Poulain, N., Nakache, E., Pina, A., Levesque, G.,J. Polym. Sci. Polym. Chem.. Ed. 1996, 34, 729.
37. Schoonbrood, H.AS., "Emu/sion co- en Terpolymerization, Motlomer Partitioning, Kinetics and Control of Microstructrure and Mechanica/ Propterties", PhD thesis, University of Eindhoven, 1994.
38. Van Dorernaele, G.H.J., "Model Prediction, Experimental Determination and Control of Emu/sion Copolymer Microstntcture ", PhD thesis, University of Eindhoven, 1990.
Chapter 6
Monomer Partitioning in the DODAB Yesiele System
7 MONOMER PARTITIONING IN THE
DIOCT ADECYLDIMETHYLAMMONIUM BROMIDE VESICLE SYSTEM
7.1 Introduetion
137
The partitioning of solutes into lipid bilayers, in genera), is important for many biologica) as
we11 as chemica! systems. Examples include, drug and metabolite uptake, passive transport
across membranes, and possibly the molecular mechanism of anesthetic drug action. Another
example, is the use of these bilayers to purify waste streams in process industry. In chapter 6,
the free radical polymerization reaction in Dioctadecyldimethylammonium Bromide
(DODAB) vesicles was investigated, where an unsaturated monomer is incorporated into the
bilayer and subsequently polyrnerized2. The emphasis ofthe previous chapter was focused
upon the characterization techniques necessary to perform the polyrnerization reactions and
encapsu\ation reactions in a controlled way. The partitioning in DODAB vesic\es with
unsaturated monomer is an essential aspect of polyrnerization in vesicles as wel! as in
encapsulation reactions where DODAB bilayers are used. The swelling process is govemed
by the monomer partitioning between the aqueous phase and the vesicle bilayers. When an
organic solvent (monomer) is added toa vesicle solution, it w111 partition between the
aqueous phase and the hydrophobic vesicle bilayers. The partitioning of an organic solvent
between the aqueous phase and the micel Ie or the vesicle bilayers can be determined
experimenta11y. Aqueous solutions of aggregate structures of micelles and vesicles are, in
principle supramolecular aggregates dissolved. Therefore, one option to determine the
solvent concentration in the micellar/vesicle phase and in the aqueous phase after the
swelling process, the two phases have to be separated. Usually ultracentrifuge equipment is
suitable for this purpose1. Another option is to develop systems where the aqueous
micellar/vesic\e solution can be considered as a separate phase.

138 Chapter 7
This phase can be treated as though it was inmisicible with the feed phase during the swelling
process. One example is the Wishnia solubility cell3, where solubilities of solvents in water
and micelles/vesicles are detennined from the saturated vapor pressure using Henry's Jaw.
Young and Dill4'5 used this procedure to measure partition coefficients fortheswelling of
phospholipid bilayers with hexane. Sirnon et al.6 measured the organic phase-aqueous phase
partition coefficient ofbenzene into non polar isotropie liquids andphospholipid bilayers
using the Wishnia solubility cell. The other example is the use ofhollow fiber membrane
modules. The membrane is penneable for solvents which are able to transfer from the
extemal solution to the internat ofthe hollow fibers where solubilization takes place by the
micelles/vesicles2•7. The hollow fiber membrane must have sufficiently small pores to
prevent the micelle/vesicle aggregates can pass this harrier. In chapter 6, the partitioning
behavior of styrene has been detennined experimentally for phospholipid vesicles as well as
DODAB vesicles4'5'6' 11 , using a cellulose membrane. From an experimental as well as from a
theoretica! point of view, an analogy can be drawn between the swelling ofvesicles and the
swelling of latex particles by solvents. The reason is that the vesicles as well as the latex
partiel es, can by regarded as hydrophobic species. The saturation swelling of latex particles
by solvents is described by the Morton equation8, and partiaJ swelling of latex particles is
described by a simpte adaptation ofthis equation 13. The basis of these equations is that the
mixing ofpolymer and solvents is described by the Flory-Huggins lattice theory. Bulk
thennodynamic models, based upon the Flory-Huggins theory, which assumes that the
mixing of monoroerand polymer occurs in a single phase, works very well for describing the
swelling of latex partic les. Maxwell et al 13 derived expressions for the swelling of vesicles,
which are modified expressions used for descrihing the swelling of latex partiel es. The
experimental verification ofthis model was perfonned successfully, using experimental data
ofthe partitioning ofbenzene and hexane in large phospholipid vesicles above the phase
transition temperature being about 23 °C. The basic assurnption in this model is that mixing
of solventand the alkane part of the phospholipid surfactant molecules obeys Flory-Huggins
theory. However, many investigators claimed that the swelling behavior ofbilayers and
vesicles, in contrast to latex particles, cannot be explained in tenns of bulk thennodynamics,
even above the gel-to-liquid crystalline transition temperature4•5•11.19•20. There are many
reasoos to believe these statements could be true. The most important one is that vesicles and
bilayers have a semi-crystalline nature, as revealed by Synchotron X-ray diffraction
experiments 12• These experiments indicate that there is a gradient of disorder in lipid
membranes and, therefore, bilayers are considered to have a non-unifoon microstructure
which is not the case for bulk phases. Therefore, for modeling phase equilibria in these
systems statistica! mechanical approaches should be used, which ignore bulk
thennodynamics.

Monoroer Partitioning in the DO DAB Vesicle System 139
It seems that temperature has a major influence on the partitioning of solvents into these
bilayer systems. Insection 6.3.3 it has been reported that temperature has a pronounced effect
on the styrene concentration in the bilayer. Above the phase transition temperature, the
styrene concentration in the vesicle bilayer is approximately a factor two higher than that
below the phase transition temperature. Obviously, a clear distinction has to bemadein
swelling processes below and above the phase transition temperature.
In addition, there is another topic that should be investigated. In section 6.3.4.2 it has been
described that the original DO DAB vesicular dispersion, before swelling and polymerization,
contains species with an ellipsoidal curvature, where the polymerized DODAB vesicle
dispersion contains spherical species. The observed change in morphology can be the result
of swelling and/or polymerization processes. Therefore, it may be possible that the average
vesicle size and morphology ofthe original vesicular dispersion has an effect upon the
monoroer partitioning as well.
In this chapter, partitioning data will be presented conceming DODAB vesicles with styrene,
ethyleneglycol dimethacrylate, diisopropenyl benzene, and butyl acrylate. Partitioning
experiments have been performed with vesicles of different sizes and at temperatures below
as wel! as above the phase transition temperature ofthe vesicles. The experimental results
will be compared with model calculations using the Flory-Huggens bulk thermadynamie
approach as proposed by Maxwell et al 13, in order to evaluate to which extent this modeland
other bulk thermadynamie roodels can be used for the description of the effect of
temperature on the partitioning of solvents in vesicle species.
7.2 Experimental Section 7.2.1 Matenals Dioctadecyldimethylammonium bromide (DODAB, Fluka Chemie), styrene (STY),
ethyleneglycol dimethacrylate (EGDM), butyl acrylate (BA), and diisopropylbenzene
(Merck), silver nitrate (Merck), ethanol (Merck), and diphenylhexatriene (DPH, Molecular
Probes, Inc.) were used as received. Water was purified by a Millipore Milli-Q system.
Before use the monomers styrene, ethyleneglycol dimethacrylate, butyl acrylate and
diisopropylbenzene were distilled at reduced pressure in a nitrogen atmosphere and stored at 4 OC.

140 ehapter 7
7.2.2 Yesiele preparation DODAB vesicle solutions were prepared by dissolving the surfactant in water at a
temperature of 60 °e, foliowed by sonification in a thermostatted Branson sonicator for 6
hours, see section 6.2.2. Typical volumes of DODAB solutions are I 00 mi and the DO DAB
concentration was 6* l o-3 moUdm3.
7.2.3 Bromide counter-ion titration For determining the stability ofthe DODAB vesicles bromide counter-ion titrations of
DODAB vesicles in water as wel1 as in alcoholic environment were performed using an
argentiometric titration procedure, see section 6.2.3.
7.2.4 High Performance Liquid Chromatography (HPLC) The concentration of styrene, ethyleneglycol dimethacrylate, butyl acrylate, and diisopropyl
benzene were determined using HPLe, as described insection 6.2.8
7.2.5 Cryo-Transmission Electron Microscopy eryo-TEM experiments have been perfonned using the procedure explained insection 6.2.6.
7.2.6 Swelling ofDODAB Vesicles with Monoroer The experimentalset-up which was used fortheswelling ofvesicle bilayers is shown m
Figure 6.1. The swelling vessel has a glass tube in which a cellulose dialysis membrane was
placed, containing the vesicle solution. The vessel was filled with distilled water and finally a
monoroer layer was brought on top of the system. The vessel was thennostatted in the
temperature range of20-70 °e. With this set-up direct contact ofthe vesicles with excess
monoroer was prevented. The monoroer wiJl diffuse through the aqueous phase, passing the
membrane to the vesicle bilayer. Samples could be taken from the aqueous phase as welt as
from the vesicle solution separately. Samples were also taken for eryo-TEM analysis and
vitrifled byrapidly cooling down from the same temperature as the temperature used in the
swelling experiments.
7.3 Theoretica( Section 7.3.1 Chain Configurations and Molecular Organization Amphiphilic molecules are an important class of molecules fonned in nature and also being
used in industry. Despite the overwhelming importance of amphiphilic molecules in genera!,
there are considerable gaps in our knowledge at the molecular level about the complex
structures formed by amphiphilic molecules, viz. in monolayers and in bilayers21 .

Monomer Partitioning in the DODAB Yesiele System 141
Better understanding ofthe molecular organization ofthe amphiphilic molecules in the
bilayers may lead to new applications. During the last decade, considerable effort has been
invested in experimental and theoretica! studies based upon first principles. The results of
these studies showed that the molecular organization of amphiphilic molecules in membranes
depends on a balance of intramolecular and intermolecular forces22.
The surfactant chains present within the bilayer may be regarded as dynamic entities.
Configurational and conformational changes ofthe surfactant species are dynamic processes,
occurring at various time scales38. A simplified presentation of the molecular motions of
individual surfactant species within the bilayer is depicted in Figure 7.1.
Figure 7.1
(a)
~ (b);~~
Simplified representation of molecular motionsin bilayer~8 . Individual surfactant speciescan (a) rotate, (b) undergo lateral diffusion, ( c) undergo segmental motion and ( d) flip flop
In genera!, rotational and segmental motions, lateral diffusion, and transverse motion from
one interface ofthe bilayer to the other have been recognized, see also chapter 2. Substantial
information conceming these molecular motions has been obtained from NMR, ESR and
Raman spectroscopie measurements, often expressed in tenns of order parameters. These
order parameters provide information about the molecular organization within the bilayer. A
number of theories, based upon statistica! mechanics, have been developed to describe the
ordering ofthe amphiphilic chains in bilayers in termsof these intra- and interrnolecular
contributions, including lattice and mean-field theories22•23•24 '25. Using lattice models it
appeared that the amphiphilic bilayers are govemed by the molecular order parameter as
function ofthe hydracarbon chain segment, as is shown schematically in Figure 7.2.
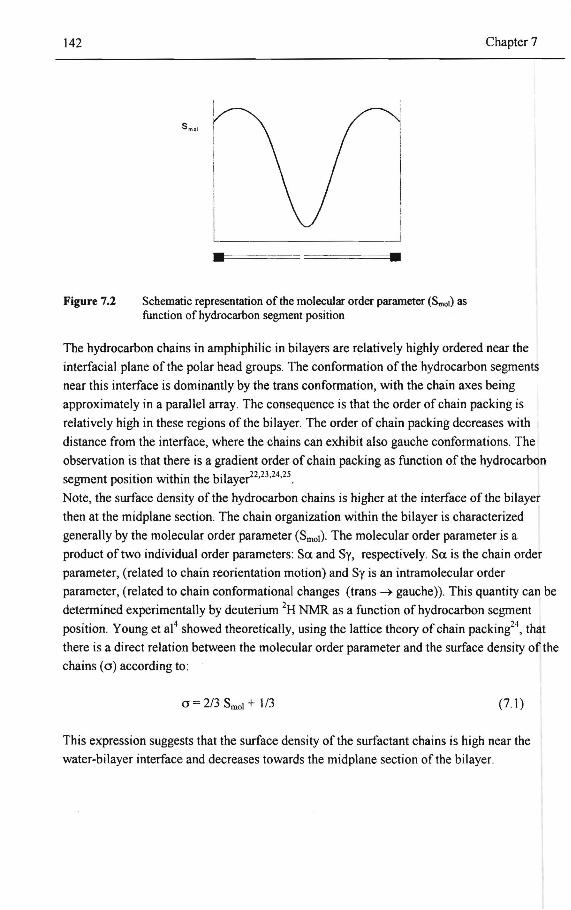
142
Figure 7.2
s mal
I I
I I L
---l
----------------~ ==11
Schematic representation of the molecular order parameter (Smoi) as function ofhydrocarbon segment position
Chapter 7
The hydrocarbon chains in amphiphilic in bilayers are relatively highly ordered near the
interfacial plane ofthe polar head groups. The conformation ofthe hydrocarbon segments
near this interface is dominantly by the trans conforrnation, with the chain axes being
approximately in a parallel array. The consequence is that the order of chain packing is
relatively high in these regionsof the bilayer. The order of chain packing decreases with
di stance from the interface, where the chains can exhibit also gauche conforrnations. The
observation is that there is a gradient order of chain packing as function of the hydrocarbon
segment position within the bilaye~2 •23 •24 •25 . Note, the surface density ofthe hydrocarbon chains is higher at the interface ofthe bilayer
then at the midplane section. The chain organization within the bilayer is characterized
generally by the molecular order parameter (Sm01). The molecular order parameter is a
product oftwo individual order parameters: Sa. and Sy, respectively. Sa. is the chain order
parameter, (related to chain reorientation motion) and Sy is an intramolecular order
parameter, (related to chain conforrnational changes (trans---+ gauche)). This quantity can be
deterrnined experimentally by deuterium 2H NMR as a function ofhydrocarbon segment
position. Young et a14 showed theoretically, using the lattice theory of chain packing24, that
there is a direct relation between the molecular order parameter and the surface density ofthe
chains ( o) according to:
0 = 2/3 Smol + 1/3 (7.1)
Th is expression suggests that the surface density of the surfactant chains is high near the
water-bilayer interface and decreases towards the midplane section ofthe bilayer.

Monoroer Partitioning in the DODAB Yesiele System 143
7.3.1.1 Effect of Temperafure upon the Molecular Organi:::ation
Bilayers undergo distinct structural changes above and below the phase transition
temperature. These changes do notaffect the gross structure of the ag!,YTegates, i.e. they will
remain roughly closed structures. However, it will affect the molecular organization within
the bilayer. These transitions are induced by temperature and may be affected by the uptake
of solvents as well. The low-temperature lipid phase corresponds toa lamellar crystalline
state. With increasing temperature, the steric and Van der Waals intermolecular interactions
that favor crystalline packing are counteracted by the thermal rotational chain excitations38,
At some temperature the bilayer may undergo a subtransition toa lammeilar gel or ordered
bilayer. When the temperature is further increased the molecular organizations ofthe chains
is lost significantly due to the cooperative chain melting. Chain melting occurs in two steps.
In the first step, the hydracarbon chains undergo trans-gauche isomerizations and is
considered as the nucleation step for transition. The nucleated fluid domains will grow until
all hydrocarbon chains in the bilayer are melted, resulting inthefluid bilayer phase. It is
obvious that the chain melting process reduces the molecular organization in the bilayer.
7.3.1.2 Effect of Surface Curvature upon the Molecular Organization
In the previous sections, general considerations concerning the molecular organization are
given for flat bilayers where no curvature is involved. However, in the next sections the
uptake of solvent in DO DAB vesicles is discussed, which definitely have a curvature. Surface
curvature may have influence u pon the molecular organization of the hydrocarbon ebains
within the bilayer. When a curved bilayer is considered as the sum oftwo monolayers,the
inner monolayer and the outer monolayer, the following considerations are relevant. First, in
vesicles due to the geometry, one monolayer has a positive curvature and one has a negative
curvature. Secondly, the surface densities in the two monolayers are not equae7•28·29 since
the number of amphiphilic molecules in the outer monolayer is up to a factor of three larger
than in the inner layer, depending on the size of the vesicle. lt is obvious that the existence of
curvature will affect the uptake of solvent in the vesicle species. The degree of curvature is
important as wel!. When the radius ofthe vesicle species is smal! (higher degree of
curvature ), the greater the exclusion of solvents will be. It has been observed that, when flat
bilayers at a fixed temperature are taken as a reference, the introduetion of a curvature has an
additional effect on the molecular organization ofthe amphiphilic molecules.

144
7.3.2 Solvent Partitioning in vesicle containing solutions 7.3.2.1 Mean Field {Lattice) Theories for Solute Partitioning
Chapter 7
Transfer of a sol u te from one medium to another is of widespread importance. lt may be
characterized by a free energy of transfer and a corresponding partilion coefficient. Since it is
well known that vesicle structures exhibita molecular organization in the bilayer, depending
on temperature and on curvature, many investigators stated that bulk thermodynamics are not
appropiate4•5•6•11•20, especially below the gel to liquid phase transition temperature. These
complex processes are described by models based upon Mean Field Theories, where transfer
of solvent depends on the entropy of mixing, the contiguration ofthe chains, the contact
interactions among solventand chains; and the volumetrie expansion ofthe curved
interphases20.
General\y, the models, based upon mean field lattice theory, are capable of predicting
distributions of solvent as function of hydracarbon chain segment position within the bilayer.
They take into account (1) the perbutation ofthe chain conformations, (2) the entropy of
mixing and (3) the change in solvent environment ofthe solute upon its transfer from the
extemal solvent to the bilayer. Predictions of the distri bution of solvent as a function of
position within the bilayer for different temperatures are presented schematically in Figure
7.3
Figure7.3
Solvent co nee ntration
Temperature
-+.
i
Schematic representation of the distri bution of solvent within the bilayer for different temperatures
Below the phase transition temperature, the carbon-carbon honds are mainly in the trans
conformation. This indicates that the domain volume, where the chain packing is in a highly
ordered fashion, is relatively large, and the solvent will be preferentially located in the
"amorphous" midplane section ofthe bilayer.

Monomer Partitioning in the DODAB Yesiele System 145
With increasing temperature, the volume ofthe amorphous region increases since the
fraction {)f gauche conformations in the chain will increase. As a consequence the solvent concentration within the bilayer will become larger. Although mean field based models are based upon solid physical considerations, they wntain implicit parameters which are hardly known experimentally. An example of such a parameter is the interfacial tension, which characterizes the nature ofthe interface between water and the vesicle bilayer. The assumption that the interfacial tension may bedescribed by the "Laplace equation" is
presently debated. Another disadvantage is that the mean field models are rather complex and an analytica! solution ofthe equations, which describes the phase equilibria, is generally not possible.
7.3.2.2 Theoriesjor Solvent Partitioning based upon Bulk Thermodynamics
In this section, the approach of Maxwell et al 13 is followed. These authors derived expressions for the partitioning of solvents in vesicle species. The experimental verification of this model was performed successfully using experimental data of the partitioning of benzene and hexane in large phosphorlipid vesicles above the phase transition temperature, which is about 23 °C10. The basic assumption in the model is that a mixture of solvent and the alkane part of the DO DAB molecules can bedescribed by the Flory-Huggins theory, for ideal solutions. An ideal solution is formed when the two components to mix yield a free energy change that is completely determined by the entropy gained by each component due to the extra degrees offreerlom created by the solution process. Ideal solubility precludes volume changes on mixing and the enthalpy of mixing,
Mlmix must be zero, i.e. athennal mixinl7. The alkane parts ofthe DODAB molecules are treated as polymer chains. When the swollen vesicle species are in equilibrium with the free solvent phase, the partial molar free energy ofthe solvent is given by:
(7.2)
where AG is the excess partial molar free energy ofthe solvent, AGm the contribution from the energy of mixing of solvent and polymer, and AG. the contri bution from the vesicle-water interfacial energy. The free energy of mixing of a solvent and polymer in tenns of the classica! Flory-Huggins theory is given by31 :
(7.3)

146 Chapter 7
where vP is the volume fraction of alkane chains in the vesicle bilayer, P n the average
degree of polymerization, R the gas constant, T the absolute temperature and x is the Flory
Huggins interaction parameter.
The surface free energy tenn is given by the Gibbs-Thomson equation:
(7.4)
where V m is the partial molar volume of the solvent, y the vesicle-water macroscopie
interfacial tension and Ro the outer radius ofthe vesicle, and vpv is the volume fraction ofthe
alkane part of the DO DAB molecules in the swollen vesicle. Note that the definition of this
fraction includes the volume of water in the interior ofthe vesicle, i.e.:
(7.5)
where V is the absolute volume and the subscripts p, s and w represent the alkane part of the
DODAB, solventand interior water, respectively. The use ofthis fraction (Eq. 7.5) was
rationalized by the wish to keep the fonns of the equations for vesicles and latex particles
identical13. In Eq. 7.5. the molar volume of water molecules in the bilayer is neglected. This
approximation is j ustified by experimental results from Gruen et al 11. who found that, given
the very low solubility of water in bulk n-alkane (about one water molecule for 2*104 CH2-
groups), water penetration into the aggregate core is negligible. The volume ofthe alkane
part of DO DAB depends on the vesicle structure. lf the vesicle structure is assumed to be
spherical., the volume ofthe alkane part is given by:
(7.6)
where Ro is the outer radius and Ri is the inner radius ofthe vesicle structure. The volume of
the solvent in the vesicle is given by:
(7.7)
The volume of interior water of the vesicle V w is simply given by:
(7.8)

Monoroer Partitioning in the DODAB Vesicle System 147
When avesicleis swollen the outer radius increases due to expansion ofthe bilayer
only. Therefore, no change in volume ofthe water interior is assumed, which may justify the
use ofthe Gibbs-Thomson equation. The change in radius due toswelling is then reflected in
the (vpv)113 term. The full equation descrihing the swelling ofDODAB vesicles by solvents is
given by:
Saturation swelling may be defined in this case as the maximum uptake of solvent in the
DO DAB vesicles without the occurrence of a separate solvent phase which may cause vesicle
breakup. In this case, the term at the right hand side of equation 7.9 is zero. When the uptake
of solvent in the vesicles is not at its maximum equilibriumvalue, equation 7.9 should be
consi(iered completely. Since the mixing of the alkane part of DO DAB with solvents is
described by bulk thermodynamics, the just presented model does not describe the swelling
phenomena within vesicles on a microscopie scale, but it only prediets the absolute
concentration of the solvent within the vesicle.
7.4 Results and Discussion Before the mechanistic aspects of monoroer partitioning in DO DAB vesicular systems will be
discussed, it is important to define the term saturation swelling in this context. Saturation
swelling is defined here as the maximum uptake of solvent in the DO DAB vesicles without
the occurrence of a second monoroer phase which may cause vesicle break up. The solvent
concentration in the aqueous phase then is at its maximum value. From an experimental point
of view, saturation swelling is achieved when at saturation
monoroer concentration in the aqueous phase the monoroer concentration in the vesicle phase
doesnotchange with time any more, and that the vesicle structure is still present (as
visualized using bromide counter-ion titrations, see section 6.2.3). The values of parameters
necessary to perform model calculations in this chapter are collected in Table 7.1.

148 Chapter 7
Table 7.1 Parameters utilized in the fitting of Eq. 7.9 to experimental partitioning data
Monomer
Parameter Styrene EGDM Diisopropenyl benzene Butyl acrylate
Density (kg/nil) 878 1051 925 900 Molar mass (g/mol) 104.15 198 158.3 128 Interaction parameter(-) 0.45 0.45 0.45 0.45 lnterfacial lension (N/m) 0.030 0.030 0.070 0.030
• Thickness of vesicle bilayer: 5 nm • Outer vesicle radius 15 nm • Inner vesicle radius 10 nm • P0 = 9
7.4.1 Model Calculations and Experimental data The results ofthe model calculations and the experimentally determined partitioning data as
a function oftemperature are presented in Figure 7.4 for styrene and ethyleneglycol
dimethacrylate, and in Figure 7.5 for diisopropenyl benzene and butyl acrylate.
Figure 7.4
1.00
0.95
O.GO
0 .85
' - ... o.eo >
0.75
0.70
0 .65
20
• •
• •
... ... . ----------------~----- .
30 40 50 60 70
Tempersture (°C)
Partitioning of styrene and ethyleneglycol dimethacrylate in DO DAB vesicles. The volwne fraction of alkane chains as a function of temperature for styrene (•) and ethyleneglycol dimethacrylate (11). The lines are fits ofEq. 7.9 for styrene (fullline) and EGDM (dashed line)
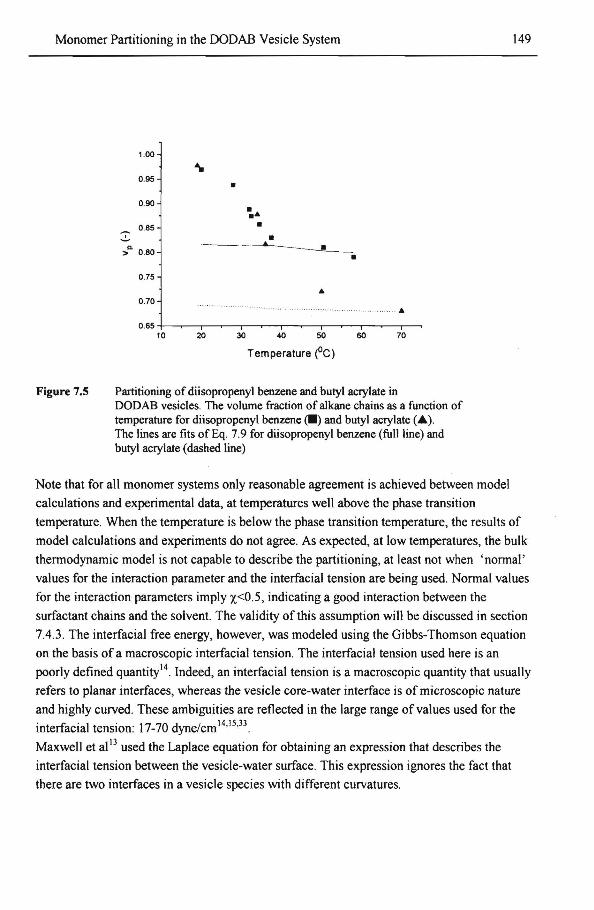
Monomer Partitioning in the DODAB Yesiele System
Figure 7.5
-'
1.00
0 .95
0.90
0 .85
0.75
0 .70
• • ....
• • ·- - - -- _..__ __ ---L_
•
... · · ·· · · ··········· ·· · · ········· ··· · ··· ·· · ·· ··· · ··· .. ... . ...
0.65 +-~-.-~--r-~-r---.-...---~-r-~--r~ 10 20 30 40 50 60 70
Temperature (°C)
Partitioning of diisopropenyl benzene and butyl acrylale in DO DAB vesicles. The volume fraction of alkane chains as a function of temperature for diisopropenyl benzene (11) and butyl acrylate (.Ä). The lines are fits of Eq. 7.9 for düsopropenyl benzene (fullline) and butyl acrylale ( dashed line)
149
Note that for all monomer systems only reasonable agreement is achieved between model
calculations and experimental data, at temperatures wel\ above the phase transition
temperature. When the temperature is below the phase transition temperature, the results of
model ca\culations and experiments do not agree. As expected, at low temperatures, the bulk
thennodynamic rriodel is not capable to describe the partitioning, at least not when 'nonna!'
values for the interaction parameter and the interfacial tensionare being used. Normalvalues
for the interaction parameters imply x<0.5, indicating a good interaction between the
surfactant chains and the solvent. The validity ofthis assurnption will be discussed insection
7.4.3. The interfacial free energy, however, was modeled using the Gibbs-Thomson equation
on the basis of a macroscopie interfacial tension. The interfacial tension used here is an
poorly defined quantity14. Indeed, an interfacial tension is a macroscopie quantity that usually
refers to planar interfaces, whereas the vesicle core-water interface is of microscopie nature
and highly curved. These ambiguities are reflected in the large range ofvalues used for the
interfacial tension: 17-70 dyne/cm14•15•33
Maxwell et al 13 used the Laptace equation for obtaining an expression that describes the
interfacial tension between the vesicle-water surface. This expression ignores the fact that
there are two interfaces in a vesicle species with different curvatures.

150 Chapter 7
The justification for this approach was that only large vesicles were considered ( si ze 400
run), where the Laplace expressionwas valid. However, in this investigation the partitioning
of solvents in smal! vesicles (size ca. 30 run) is considered, where the Laplace expression
may not be valid. This topic wil! be discussed further in section 7.4.2.
7.4.2 Interfacial phenomena in solvent partitioning
In order to obtain a more qualitative understanding of interfacial phenomena in partitioning
processes, the bending of a bilayer in the vesicle formation process is considered. The
bending properties ofbilayers and their influence on the formation and shape ofvesicles have
been discussed in a number of papers32•33. The bending of a bilayer is associated with a free
energy change related to the intrinsic bilayer properties. The free energy offormation of
vesicles from an infinite planar bilayer can be written as the sum ofthe workof bending and
an intravesicular interaction potential: F = Fbend + Fin134. The bending free energy ofthe
bilayer is usually described with the Helfrich expression as34:
y(H,K) = Yo + 2 k., (H-Ho/ + k.,,nK (7.10)
where H= 0.5(c1+c2) is the mean curvature, K= c1c2 is the gaussian curvature, and c 1 and c2
denote the principal curvatures which are taken positive fora convex and negative fora
concave surface, kc and k.,.n are two curvature elasticity moduli, which are determined by
head-head and tail-tail interactions respectively, and Ho is the spontaneous curvature. Fora
spherica/ly shaped surface of radius r : H= 1/r and K= 1/r, and the interfacial tension then
can be written as:
(7.11)
where Ypt is the equilibrium interfacial tension ofthe planar monolayer, k1 = -4k.,Ho and k2 =
2k.,+ k.,.n· Fora spherical vesicle, however, an inner and an outer monolayer are present.
Thus the expressions for the intemal (y1) and extemal (Ye) monolayer interfacial tension are,
respectively:
Yt = Ypt - k/Ri + k2/Ri2
Ye = Ypt- k,fRe + k2~
where Ri is the intemal vesicle radius and Re is the extemal vesicle radius.
(7.12)
(7.13)
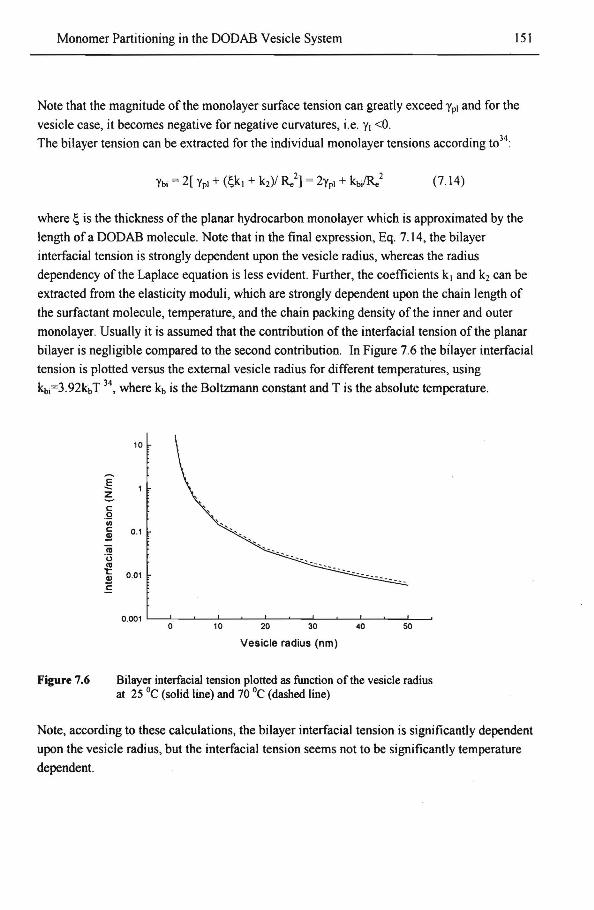
Monomer Partitioning in the DODAB Vesicle System 151
Note that the magnitude ofthe monolayer surface tension can greatly exceed 'Ypt and for the
vesicle case, it becomes negative for negative curvatures, i.e. y1 <0.
The bilayer tension can be extracted for the individual monolayer tensions according to34:
(7.14)
where Ç is the thickness of the p1anar hydrocarbon monolayer which is approximated by the
lengthof a DODAB molecule. Note that in the final expression, Eq. 7.14, the bilayer
interfacial tension is strongly dependent upon the vesicle radius, whereas the radius
dependency ofthe Laptace equation is less evident. Further, the coefficients k1 and k2 can be
extracted from the elasticity moduli, which are strongly dependent upon the chain length of
the surfactant molecule, temperature, and the chain packing density ofthe inner and outer
monolayer. Usually it is assumed that the contribution ofthe interfacial tension ofthe planar
bilayer is negligible compared to the second contribution. In Figure 7.6 the bilayer interfacial
tension is plotted versus the extemal vesicle radius for different temperatures, using
kbi=3.92kbT 34, where kb is the Boltzmann constant and T is the absolute temperature.
.§ ~ c: .Q "' c: .!! (ij 'ö -ê Q)
ë
Figure 7.6
10
' '
0 .1
0 .01
0.001 0 10 20 30 40 50
Vesicle radius (nm)
Bilayer interfacial tension plotted as function of the vesicle radius at 25 °e (solid line) and 70 °e (dashed line)
Note, according to these calculations, the bilayer interfacial tension is significantly dependent
upon the vesicle radius, but the interfacial tension seems not to be significantly temperature
dependent

152 Chapter 7
From Fi!,'llre 7.6 it can beseen that the interfacial tension varies from 0.09 N/m to 0.02 N/m
when the radius of the vesicle increases from 15 nm to 50 nm, which is in the range of
generally accepted values for the interfacial tensions14. Still it is important todetermine these
quantities as a function ofvesicle radius and temperature. In order to illustrate the
importance of the interfacial tension, the results of a ca\culation exercise are presented. In
these calculations the interfacial tension is adjusted in order to fit the experimental data for
the partitioning of styrene inDODAB vesicles (radius 15 nm). It is assurned that the size of
the vesicle does not change, which has been confinned by bromide counterion titrations, see
section 6.2.10. The results are shown in figure 7.7, where the experimental partitioning data
for styrene has been used
0 .85
0.80
0.75
' ~ D.
> 0.70
0.65
Figure 7.7
•
~-\
"''~ .-----.....
20 25 30 35 40 45 50
Temperature (°C)
0 .25
0 .20 .ê z c: 0
0 .15 ·;;; c: .2! äi
0.10 ë:J as 't: .! c:
0 .05
Adjustment ofthe bilayer interfacial tension to the experimental partitioning data ofDODAB vesicles, swollen with styrene,(•) is the volume fraction of alkane chains, determined experimentally as function of ternperature, x=0.45
For temperatures above the phase transition temperature, the interfacial tension required .to
match model calculations and experimental data is about 0.05 N/m, which is realistic value.
However, note that the interfacial tension increases with a factor of four to ca. 0.2 N/m, when
the temperature drops below the phase transition temperature. These high values for the
interfacial tensionseem to he unrealistic because to the best of our knowledge they have
never been confinned by experimental studies. Therefore, it can be concluded that the bulk
thermodynamic model, basedon Flory-Huggins theory, is unable to predict monomer
partitioning in vesicles below the phase transition temperature. Model calculations based
upon bulk thennodynamics can not be applied to describe the monomer partitioning events in
these small vesicle species.

Monoroer Partitioning in the DODAB Yesiele System 153
Improvement can be expected from roodels that take the microstructure ofthe bilayer into
account concerning monoroer partitioning phenomena.
7.4.3 Effect ofpolymer-solvent interactions upon solvent partitioning Insection 7.4.1 it is described the bulk thermadynamie model is not capable to describe the
partitioning, when 'normal' values for the Flory-Huggins interaction parameter are being
used, which assume i deal behavior of the mixing between solvent and polymer.
Thermadynamie evidence, from measurements of solvent activities showed that solutions of
polymers in simpte liquids are far from ideal47. This implies that the free energy expression,
resulting from the athermic considerations does not describe these solutions. Furthermore,
such a free energy expressiondoes notaccount for partial miscibility ofthe solventand the
polymer chains, which may trigger phase separation phenomena. lt may be argued that phase
separation can occur in the partitioning of solvents in the DO DAB vesicles. Th is will be
evaluated in appendix B. It is clear, however, that the Flory-Huggins interaction parameter is
a function oftemperature, composition and the molar mass distribution ofthe polymer,
volume fraction of solvent, and thus has lost its simplistic classification as 'parameter'48.
Unfortunately the dependency ofthe Flory-Huggins interaction parameter upon these
variables is not known for the DODAB-solvent system.
In order to illustrate the importance of the interaction parameter, the results of a second
calculation exercise are presented. In these calculations the Flory-Huggins interaction
parameter is adjusted in order to fit the experimental data for the partitioning of styrene in
DODAB vesicles (radius 15 nm) and an interfacial of0.030 N/m. The results are shown in
figure 7.8. For temperatures above the phase transition temperature, the Flory-Huggins
interaction parameters required to match model calculations and experimental data is about
less than 0.5, indicating good interaction between the DODAB chains and styrene. This may
be attributed to the fact that the DODAB chains, above the phase transition temperature, is in
the melted phase. Baranyi et al46 studied polymer-solute interactions by inverse gas
chromatography. These authors found for the system Polyethylene-benzene, an interaction
parameter of0.36 at temperatures above the melting temperature ofpolyethylene.
This system may be comparable to DODAB-styrene since the aliphatic part ofthe surfactant
chain may beregardedas polyethylene with a degree ofpolymerization of9. However, note
that the interaction parameter increases withafactor of four to ca. 1.1, when the temperature
drops below the phase transition temperature.

154
Figure 7.8
0 .85 .a.
.a. .a. 1.00
0 .80
0.75
0.75
~ .,.. ' ~
>0. 0 .70 0.50 ~
0 .65 0.25
20 25 30 35 40 45 50
Temperature (°C)
Adjustment ofthe Flory-Huggins interaction parameter to the experimental partitioning data of DODAB vesicles, swollen with styrene,(•) is the volume fraction of alkane chains, determined experimentally as function oftemperature, y=0.030 N/m
Chapter 7
7.4.4 Effect ofthe microstructure of DODAB bilayers upon solvent partitioning 7.4.4. I Concentra/ion gradient of solvent over the bilayer
In the previous section it has been shown that model calcu\ations and experimental
partitioning data showed considerable deviations. The volume fraction of solvent in the
bilayer decreases dramatically on cooling below the phase transition temperature, see tigure
7.4 and 7.5. The calculated volume fractions of solvent using bulk partitioning, however,
change only slightly when passing the phase transition temperature. Th is indicates that the
solute partitioning is determined considembly by the microstructure ofthe bilayer. There is
no doubt that thermodynamic mode!S based on mean field lattice theories are more capable
in explaining the experimentally observed effects. However, these models generate a
concentration distri bution of solvent as function of the hydrocarbon segment position within
the bilayer. The experimental determination of the concentroti on distri bution within the
bilayer is very difficult. Very sofisticated experiments using techniques such as small angle
neutron scattering, using deuterated solvents, and X-my diffraction experiments should be
employed35.36 in order to determine the concentration distribution.

Morromer Partitioning in the DODAB Yesiele System 155
The obtained concentrations of styrene, ethyleneglycol dimethacrylate, diisopropenyl
benzene and butyl acrylate, in the DODAB vesicles, are average concentrations and give no
indication ofthe concentration distribution of solvent as function ofthe position within the
bilayer. However, it may be possible to give a qualitative explanation for the observed
effects. This explanation is based upon the molecular order parameter and the surface density
ofthe surfactant chains, using a statistica[ approach37. In Figure 7.2, a schematic
representation of the concentra ti on gradient of solvent as function of the radial position in the
bilayer is presented.
Those profiles appear to be symmetrical (at least for planar bilayers) with the maximum at
the midplane section ofthe bilayer. The concentration profile may statistically beregardedas
a distribution function with an average value ).l ofthe distribution and a standard deviation cr.
In this case ).l is depicted as the average concentration within the bilayer which has been
determined by experiments. The standard deviation, which is the positive square root ofthe
variance, is an indication ofthe width ofthe distribution. The average value and the standard
deviation of a continuous distribution is given by:
00
f.J = J xf(x'f:lx
00
u= J (x- f.J)(x- f.J)f(x)dx
(7.15)
(7.16)
In this case x may represent the coordinate within the bilayer, which is not going to infinity
but is clearly defined. The parameter x is varying from -2.5 nm to +2.5 nm. The length ofthe
OODAB surfactant molecule is 2.56 nm as determined with Wide Angle X-ray Diffraction.
Normally, the standard random variabie Z is introduced according to:
Z = X-).l/ cr (7.17)
where Z is defined in the interval of -1 <Z< l. This modification is necessary to ensure that the
peak maximum is located at x=O and that the area under the distribution function ft x) is equal
for all applied parameters.

156 Chapter 7
The major assumption in this evaluation is that the concentration gradient profile may be
described as a nonna! distribution according to:
f(x) =(I/cr (27t)112 ) exp (-1/2 (Z2)) (7.18)
In these calculations, the average monomer concentration is assurned to be 3 moldm-3, which
has been detennined experimentally fortheswelling ofDODAB vesicles with styrene at
70 °C, see figure 7.4. The standard deviation is considered as the adjustable parameter, so the
width ofthe concentration distribution over the bilayer can be varied. The objective of these
calculations perfonned is to detennine how the absolute value ofthe maximurn concentration
changes as function of the width of the distribution.
The maximum concentration that can be obtained is the bulk concentration of styrene ( 8.4
mol dm -3, calculated from the molecular weight and the density of styrene ), and restricts the
absolute value that can be used for the standard deviations. The results of these calculations
are presented in Figure 7.8.
~8 "C !-0
.§.. 6
c: 0 :;:; IV .._ ë 4 Q) u c: 0 u Q) 2 c: Q) .._ ... ~ u s u: : ........... ,zee: ~ """' w 0~----~--~~--~----r----T----,-----~--~
Figure 7.8
-1 .0 -0 .5 0 .0 0 .5 1.0
z (-)
Concentration distri bution of solvent as function of the standardized variabie Z, (•) cr = 0.05, (0 ) cr = 0.08, (À) cr =0.1 0, (0) cr = 0.25, ( .. ) (J = 0.5
The somewhat surprising result shown in Figure 7.8 is that, when the solvent is forced to
reside only in a small section around the midplane ofthe bilayer, the maximurn concentration
can easily exceed its average concentration and may even approach the

Monoroer Partitioning in the DODAB Yesiele System 157
the bulk concentration of styrene, and in fact an apparent phase separation occurs, see a lso
appendix C. When the solvent is allowed to reside in a wider section ofthe bilayer, the
maximum concentration decreases. Note that this approach is fora planar bilayer which is a
more ideal case. For the vesicle system, the influence of curvature may shift the
concentration maximum more to the outer region ofthe bilayer, inducing asymmetry ofthe
concentration profile20 . The question remains whether this qualitative approach can be
quantified, but the general condusion is that the local concentration can deviate significantly
from the average concentration. Th is indicates that for the determination of local
concentrations it is essential to take the heterogeneity ofthe bilayer into account. The
average monoroer concentration in the bilayer may be estimated using bulk thermodynamic
models. These conclusions are supported by molecular dynamic studies performed by
Bassolino-Klimas et ae9. These authors studied the ditfusion ofbenzene through lipid
bilayers as a function oftemperature. The benzene molecuJes are supposed to diffuse by
'hopping' between empty voids in the bilayer. Benzene molecules seem to prefer different
regions ofthe bilayer at different temperatures. When the temperature is lowered the benzene
molecules are located near the midplane region of the bilayer. When the temperature is
raised, the benzene molecuJes can also reside at locations near the headgroup.
The local solvent concentrations in the bilayer may be important in unraveling the kinetic
mechanisms of the polymerization in vesicles. This will be outlined further in chapter 8. It is
obvious that results of the calculations of the concentration profile only illustrate a possible
explanation for the observed effects. Before any quantitative modeling can be performed in
this area, it is necessary to determine the concentration distribution over the bilayer
experimentally. This seems to be an important objective of future research. Small angle
neutron scattering measurements performed on vesicle species with deuturated monoroer
may be suitable for this purpose.
7. 4. 4. 2 Effects of si ze and shape of solvent molecules on partilioning behavior
In this section, the influence ofthe size and shape of solvent molecules on the partitioning
behavior wilt be discussed. A very interesting aspect of copolymerization inDODAB vesicles
has been described insection 6.3.4. Copolymerization ofstyrene/EGDM inDODAB vesicles
has been performed and composition drift has been observed with styrene as the more
reactive monomer, see tigure 6.10. From theoretica) calcuJations conceming composition
drift, it is expected that EGDM is consumed more rapidly. Insection 6.3.4 it is explained that
the equations used for monoroer partitioning, concerning two solvents, may be applicable to
emulsion polymerization systems, but not to polymerization in vesicles.

158 ehapter 7
Monoroer partitioning oftwo solvents inDODAB vesicles cannot bedescribed using bulk
thermodynamic models, but the microstructure ofthe bilayer should betaken into account.
The microstructure of the bilayer is retlected by the molecular organization within the
bilayer, which is induced by the molecular motions ofthe individual surfactani molecules.
Apparent\y the (empty) voids, which are a part ofthe molecular organization, are triggered by
the molecular motionsas well, see also section 8.3.1. Ifthis is the case, the size and the shape
of the solute molecules are of crucial importance since the latter should fit in the voids
present within the bilayer39•40. With respect to the shape ofthe solvent molecules used, it can
be stated by approximation that styrene has a planar structure as compared to ethyleneglycol
dimethacrylate, butyl acrylate and diisopropenyl benzene. The size ofthe solvent molecules
can be characterized by their molar volumes. In order to investigate the influence ofthe size
ofthe solvent molecule on the partitioning inDODAB vesicles, the volume fraction of
solvent within the vesicles is plotted against the molar volume ofthe solvent molecule in
tigure 7.9
at 20 °e and 50 °e, i.e. below and above the phase transition temperature ofDODAB,
respectively. Note that the general trend is that the volume fraction of solvent within the
DODAB vesicles decreases when the molar volume ofthe molecules, applied in the
partitioning experiments, is increased. Algrem et al1 stuclied the solubilization of a
homologous series of neutral arenes in cetyltrimethylammoniurn bromide micelles. These
authors found comparable results, i.e. the molar fraction of the arene solvent within the
micelles decreased when the molar volume ofthe solvent molecule increased. These results
suggests that in case ofpartitioning oftwo solvents, the solvents are solubilized in separate
sections within the bilayer.
In the case of styrene!EGDM partitioning, it may be possible that styrene is preferentially
present within the midplane section ofthe bilayer, whereas EGDM is situated at the outside
ofthe bilayer, i.e. near the headgroup ofthe surfactant molecules. As a consequence, the
solvents will not be randomly distributed in the bilayer. When the radical polymerization
starts in the midplane section ofthe bilayer, where relatively less EGDM is present, the
consurnption of styrene will be relatively fast. As the reaction proceeds, the locus of
polymerization may shift towards the outer section ofthe bilayer and subsequently EGDM is
consumed. The observation is that a:lthough EGDM is the more reactive monomer, EGDM is
should he present at the locus of reaction.

Monomer Partitioning in the DODAB Yesiele System
Figure7.9
0 .35
0 .30
0 .25
0.20
'i' 0.15 >
0.10
0.05
• t
Styrene
! •
• •
• • • 0 .00 --1----,--~-.----~-,---~-r--~~---,
1.2x1o·• 1.4x1o-• 1.6x1o-• 1.8x1o-• 2.0x1o·•
Molar volume monomars (m3/mol)
Volume fraction ofmonomer inDODAB vesicles as a function of the molar volume ofthe monomers, for 50 °e (e) and 20 °e (.A.), lines are guide to the eye.
159
When this is not the case, due to different solubilization behavior, styrene consumption will
be favored leading to a composition drift, opposite to that expected from bulk considerations.
In order to study and evaluate this effect, future experiments should be focused on
determining the chemica! composition distribution ofthe styrene/EGDM copolymer.
Nevertheless, these obsetved effects illustrate how important the microstructure ofthe bilayer
is, with respect to the partitioning of solvents within these bilayers.
7.4.5 Change ofMorphology ofDODAB Vesicles a:fter Solvent Partitioning In chapter 6, it was shown that the original DODAB vesicular dispersion, before swelling and
polymerization, contains species with an ellipsoidal cutvature, whereas a polymerized
vesicular dispersion contains spherical species. This change in morphology may occur during
swelling and/or polymerization. The change ofmorphology ofDODAB vesicles upon solvent
partitioning is investigated as function oftemperature using eryo-TEM. The swollen
vesicular dispersions were vitrifled at the actual temperature ofthe partitioning experiments.
Two photographs of samples are presented in Figure 7.10. The flrst sample is a partitioning
experiment with styrene performed at 20 °e which is below the phase transition temperature,
and the second sample is a partitioning experiment performed at 70 °e, which is significantly
above the phase transition temperature. Several samples were taken as function of time.
The samples presented in Figure 7.10 were vitrifled after 48 hours.

160
(a) (b)
Figure 7.10 Cryo-TEM photographs ofswollen vesicular DODAB species with styrene, (a) Temperature is 20 °C, (b) Temperature is 70 °C
ehapter 7
Care should be taken when interpreting these photographs because of the risk of artifacts.
However, it appears that the morphology of the swollen DO DAB species
at 20 °e has not changed significantly. The majority ofthe observed structures still have an
ellipsoidal curvature. On the other hand, the morphology ofthe DODAB species, swollen at
70 °e have undergone a significant change in shape. As explained in chapter 2, the DODAB
vesicle species are in a thermodynamically metastable state. In principle the system will
favor a Gibbs free energy as low as possible fora given configuration. The rate process of
reaching that ideal contiguration may be relatively long, so that a given vesicle concentration
may remain stabie over a relatively long period of time. When the DODAB vesicular
dispersion is submitted toa modification such as adding a solvent and/or increasing the
temperature, the system may rearrange itselfto the configuration that is thermodynamically
more stable, i.e. has a lower Gibbs free energy. The combination of adding a solvent and
increasing the temperature above the phase transition temperatur~ seems to have an even
more pronounced effect, perhaps also as results of fusion processes. From these
considerations, it is clear that the change of morphology of DO DAB vesicles should be
considered in the evaluation of partitioning experiments.

Monomer Partitioning in the OODAB Yesiele System 161
7.5 Concluding remarks In this chapter, the monomer partitioning invalving small OODAB vesicles has been
considered as a function oftemperature. The experimental partitioning data were compared
with the results of theoretica! calculations, using a modelbasedon Flory-Huggins bulk
thermodynamics. It appeared that for all monomer systems investigated, only reasonable
agreement is achieved between model calculations and partitioning data at temperatures well
above the phase transition temperature. Below the phase transition temperature, models
based on bulk thermodynamics fail to describe the observed results, since the microstructure
ofthe bilayer should betaken into account., The microstructure ofthe bilayer, which is
govemed by the molecular order of the bilayer, seems to control the concentration gradient of
solvent(s) as function ofthe hydracarbon segment location within the bilayer. The local
monomer concentration within the bilayer may be estimated from conventional partitioning
experiments, and statistica! procedure. From these calculations it appeared that the local
concentration at the midplane section of the bilayer rnay be significantly higher than the
average concentration, as determined from partitioning experiments. These local monomer
concentrations will be important in understanding the basic kinetic mechanisms of
polymerization in vesicles. From the morphology study using Cryo-TEM, it has been
observed that the morphology ofOODAB vesicles may changes from ellipsoidal to more
'spherical' species. In this context, it is important to consider the time dependenee of these
rearrangement processes.
Relerences
L Algrem, M.; Grieser, F.; Thomas, JK, J. Am. Chem. Soc., 1979, 101, 279. 2. Zirkzee, HF.; Rietjens, G.H; Kulja, J.; German, A.L.; Frederiks, P.M.; Stuart, M.CA;
"Polymerization in Dioctadecyldimethylammonium Bromide Vesicles; 1. A Characterization Sttuzy"submitted to Macromolecules, 1995.
3. Wishnia, A:, Pinder, T.W.; Biochemistry, 1966, 5, 1534. 4. De Young, LR.; Dill, KA.; Biochemistry, 1988, 27, 5281. 5. De Young, L.R.; Dill, KA.; J. Phys Chem, 1990, 94, 801. 6. Simon, SA; Me Daniel, R.V.; Me Intosh, T.J.;J. ofPhys. Chem., 1982,86, 1449. 7. Hurter, P.N.; Hatton, TA; Langmuir, 1992,8, 1291.. 8. Morton, m.; Kaizerman, S; Altier, M.W.; J. Colloid Sci., 1954, 9, 300.

162 Chapter 1
11. Gruen, D.W.R; Biophysics J. 1981, 33, 149. 12. Bouwstra, J.A.; Gooris G.S; Bras, W; Talsma, H., Chemistry and Physics of Lipid~, 1993, 64, 83 13. Maxwell, LA., KUija, 1.; Langmuir, 1995, 11, 1987. 14. Zana, R.; Langmuir, 1995, 11, 2314. 15. Nagarajan, R; Ruckenstein, E.; Langmuir, 1991, 7, 2934. 16. Brandrup, J.; Immergut, E.H., Polymer Handbook, 3rd ed., Wiley: New York, 1989. 17. Weast, RC.; Ed. CRC Handhook ofChetnistry and Physics; CRC Press: Bocka
Raton, FL, 1986. 18. Maxwell, I.A., Kurja, J.; van Doremale, G.H.J.; German, A.L.; Makromol. Chem., 1992, 193,
2064. 19. Gruen, D. WR.; J. of Phys. Chem., 1985, 89, 146. 20. Marqusee, JA., Dill, K.A., J. Chem. Phys, 1986, 85, 1, 434. 21. Karaboni, S. Tenside Surf Det., 1993,30, 4. 22. Jansson, M.; Thurmond, RL.; Barry, J.A.; Brown, M.F., J. Phys. Chem.
1992, 96, 9532. 23 Marcelja, S. Biochim. Biophys. Acta, 1974, 367, 165. 24. Dill, K.A.; Flory, P.J., Proc. Nat/. Acad Sci USA, 1980, 77, 3115. 25. Pastor, RW.; Venable, RM.; Karplus, MJ., J. Chem. Phys., 1988, 89, 1112. 26. Seelig, J. Q. Ri!v. Biophys. 1977, 10, 353. 27. Huang, C; Mason, JT., Proc. Nat/. Acad Sci USA, 1978, 75, 308. 28. Zirkzee, H.F.; Rietjens, G.H., Janich M., German, A.L., in preparatien 29. Chrzeszczyk, A.; Wishnia, A.; Springer, C.S., Biochim. Biophys. Acta., 1977,
470, 161. 30. Evans, E.A., Skalak R in "Mechanics and Thermodynamics of
Biomembranes" (Chemica) Rubber, Cleveland, 1980). 31. Flory, P.J. "Princip/es of Polymer Chemistry", Comell University Press, Ithaca
New York, 1953. 32. Ou-Yang, Z., Helfiich, W. Phys Rev. A, 1989, 39, 5280. 33. Safran, S.A., Pincus, P., Andelman, D., Science, 1990, 248, 354. 34. Bergstrom, M., Eriksson, J.C., Lt:mgmuir, 1996, 12,624. 35. S.H. White, G.I. King, J.E. Cain, Nature, 1981, 290, 161. 36. T.J. Me Intosh, S.A. Simon, RC. Me Donald, Biochim. Biophys. Acta,
1980, 597, 445. 37. Kreyszig, E. in" Advanced Engineering Mathematic.s'', John Wiley & Sons, Singapore, 1993 38. Fendler, J.H., Membratie Mimetic Chemistry, John Wiley & Sons, New York, 1982. 39. Bassilino-Klimas, D., Alper, H.E., Stough,J. Am. Chem. Soc., 1995, ll7, 4118. 40. Marrink, S.J., Berendsen, H.J.C., J. Phys. Chem., 1996, 100, 16729. 41. Jeberien, H.E., Klein, J. Makromol. Chem .• 1980, 181, 227. 42. Goosens, H. PhD-thesis, 1996. 43. Blandamer, M.J., Briggs, B., Cullis, P.M., Engberts, J.B.F.N, Norman, Rl, J. Chem. Soc .•
Faraday Trans., 1996, 92, 17,3163. 44. Boots, H.M.J., Kloosterboer, J.G., Serbutoviez, C., Touwslager, F.J., Macromolecules, 1996, 29, 7683. 45. RudolfB.,Macromol. Chem. Phys., 1995, 1%,4057. 46. DiPaola-Baranyi, G., Guillet, J.E., Jeberien, H.E., Klein, J., Macromol. Chem., 1980, 181, 227. 47. Olabisi, 0., Robeson, L.M., and Shaw, M.T .. "Polymer-Polymer Misicibility", Academie Press, New
York, 1979. 48. Kurja, J. PhD-thesis, University ofEîndhoven, 1997. 49. Zirkzee, H.F., unpublished results 50. Amouts, J. Berghmans H., Koningsveld, R., Makrom. Chemie, 1993, 194, 77.

Polymerization inDODAB Vesicles: Polymerization Kinetics
8 POL YMERIZATION IN
DIOCTADECYLDIMETHYLAMMONIUM BROMIDE VESICLES
Polymerization Kinetics
8.1 Introduetion
163
Emulsion and micro-emulsion polymerization are well known examples of polymerization
reactions in heterogeneous media. The association of surfactant molecules plays an important
role in these processes and provides an unique ambiance for polymerization and
encapsulation reactions. Vesicles represent a special type of agglomerates of amphiphiles,
see chapter 2. The free radical polymerization in Dioctadecyldimethylammonium Bromide
(DODAB) vesicles can be subdivided into three distinct processes, i.e. vesicle formation
which determines the number of vesicles, the swelling of the vesicle bilayer with monomer
and finally the polymerization ofthe monomer(s) in the vesicle bilayer. The encapsulation
reaction can be regarded as a similar process, except that the silica particles have to be
modified with a bilayer of twin-tailed DODAB molecules. It is obvious that for both types
of reactions proper characterization procedures for the products are required.
The characterization techniques necessary and the reactor systems have been described
in chapter 6. An importantevent in polymerization inDODAB vesicles is monomer
partitioning, which is significantly affected by the phase transition temperature of the
DODAB vesicles.

164 Chapter 8
much more monomer is incorporated into the DO DAB bilayer than below the phase transition temperature, see figure 7.4 and 7.5. These results indicate that the properties of the surfactant molecules and the mi crostmeture of the bilayer significantly affect solvent partitioning. In this chapter, the attention wil! be focused on the mechanism and kinetics ofthe free radical polymerization in vesicles. Radical polymerization of unsaturated monoroers in host systems such as vesicles have similarities with a conventional radical emulsion polymerization where traditional surfactauts are used, but there are several differences as welL The similarity is that both systems represent polymerization reactions in heterogeneons media, where mass transfer phenomena are operative. Compartmentalization is therefore important for the kinetic analysis of vesicle systems as well as for conventional emulsion polymerization. However, the highly ordered nature ofthe bilayer assembly indicates that the polymerization reaction may differ from conventional emulsion polymerization 1• In a conventional emulsion polymerization the surfactant used are single tailed micelle forming surfactauts such as sodium dodecyl sulfate (SDS). lt is well known that when the surfactant concentration is above the critical micelle concentration there is surfactant partitioning between the molecularly dissolved surfactant and the micelles. The rate of surfactant exchange is rather high. For twin-tailed surfactauts such as DODAB, even above the phase transition temperature, the surfactant partitioning is almost negligible. Almost all DODAB molecules will be incorporated in the vesicle species, and the exchange rate of surfactant molecules will be very low23
, see also section 2.3.3. In fact, this surfactant behavior is one ofthe reasons that polymerization inDODAB vesicles is possible. Three intrinsic differences between emulsion polymerization and polymerization in vesicles will be mentioned bere. - In a conventional free radical emulsion polymerization the latex particles may vary in size from 40-500 nm. Those species are solid polymer containing spheres. Looking at the dimensions of vesicles, it is obvious that the structure can be described as hollow spheres with a size between 20 and 200 nm. Therefore the reaction volume available per vesicle is much lower than in the case of a latex partic Ie. Since mass transfer events are dependent upon partiele dimensions, i.e. partiele volume and specific surface area, some differences may be expected. - The second difference is that conventional free radical polymerization will yield polymer particles which are amorphous in nature. The initia! loci of polymerization i.e. micelles can be regarded as amorphous aggegrates. The consequence is that usually the kinetic events are chemically controlled and that diffusion of the specific species within the system is not the rate determining step. For polymerization in DODAB vesicles, the reaction takes place takes place in an ordered medium.

Polymerization inDODAB Vesicles: Polymerization Kinetics 165
When the temperature is below the phase transition temperature the bilayer may be packed
like a liquid crystalline smectic phase. The characteristic times for propagation and
termination in vesicle polymerization, below the phase transition temperature, may ditfer
considerably from those in emulsion polymerization, because these processes will he
controlled by the rate of ditfusion. Wben the temperature is above the phase transition
temperature the bilayer is in the gel phase, and diffusion limitation may be much less
pronounced.
- The third reasou is related to the second one. It is generally accepted4 that in many types of
assemblies, the molecules within the bilayer are free to move in a quasi two-dimensional
environment. Therefore the chemica! reactivities ofthe components within the bilayer are
dependent upon the constraints imposed by the two-dimensional matrix. The two major
ditfusion processes of molecules, operative in these bilayers, are schematically presented in
Figure 8.1
Lateral ditfusion
4 4 Transmembrane ditfusion
4 ~ •
Figure 8.1 Schematic overview of different ditfusion processes in assembied bilayers
Wben the moleculescan undergo laterat diffusîon, they \vill remain in the membrane bilayer.
Coefficients5 oflateral ditfusion have the order of magnitude of 10·11 m2/s. Transmembrane
diffûsion processes may result in exit of molecules. These ditfusion processes of molecules
are much more restricted by the surfactant molecules. Typical coefficients of transmembrane
ditfusion6 have the order of magnitude of 10-20 m2/s. Therefore, ît may be assumed that the
total diffusion process in the bilayer is dominated by lateral dîffusion and that diffusion
processes are mainly operative in two dimensions. From swelling experiments, using styrene
as described in chapter 7, it can be calculated that there are 1-3 solvents molecules per
surfactant molecule, depending on temperature. This means that during polymerization the
initial polymerization reaction in the transmembrane direction might occur over maximally 6
monoroer molecules, which is almost negligible with respect to the polymerization in the

166 Chapter 8
lateral direction. This implies that the initia! polymerization in vesicles may be tegarded as a quasi two-dimensional polymerization, whereas a conventional emulsion polymerization has to be considered as a three dimensional polymerization. The aim of this chapter is to study the polymerization kinetics and mechanisms of the polymerization in DO DAB vesicles, and compare the relevant mechanism with those in conventional emulsion polymerization. The tnonomer used in these reactions is styrene since the rate coefficients ofthe fundamental steps are reported in literature2
•14
. An excellent tooi to deterrnine basic kinetic parameters is Pulsed Laser Polymerization (PLP). PLP experiments have been successfully performed in heterogeneous systems such as latex systems17 and microemulsions2
'3
. Therefore, the application ofPLP experiments on vesicles also might be possible. In order to get a first insight into the kinetic parameters of polymerization in vesicles, PLP experiments with styrene swollen DO DAB vesicles have been performed above as well as below the phase transition temperature. Since both the propagation rate coefficient kp and the monomer concentradon at the locus of reaction [Mh"' are not known for vesicles, the experiments result in the product ofkp and [M]1oc.
Electron spin resonance is used to study ditfusion processes of small molecules within the vesicle bilayer. Ditfusion is very important in descrihing exit events. Finalty free radkal polymerization in vesicles with styrene is performed as a function of temperature using the initiator system benzoyl peroxide with dimethyl aniline. From the conversion vs time histories it may be possible to estimate the number of growing ebains per vesicle.
8.2 Experimental Section 8.2.1 Materals Dioctadecyldimethylammonium Bromide (OODAB, Fluka Chemie), was used as· received. Ethanol (Merck, analytical grade ), silver nitrate (AgN03, Merck) were used as received. Water was purified by a Millipore Milli-Q system. Styrene was destilled at reduced preassure in a nitrogen atmosphere and storedat 4 "C. The thermal initiator used was benzoylperioxide in combination with dimethylaniline (Fluka Chemie). The photoinitiator used for PLP experiments is 2,2-dimethoxy-1 ,2-diphenyl-ethan-l-one (Irgacur 651 ). For the ESR -experiments 2,2,6,6-tetramethylpiperidinoxy, free radical (TEMPO, 9~/o; Jali:Ssen Chimica, Geel, Belgium), ascorbic acid (CJ1806), Merck, Darm~, Germany) atld tris(hydroxymethyl)aminomethane(Janssen Chimica, Geel, Belgium:) were osed
8.2.2 Yesiele preparation DODAB vesicle solutions were prepared by dissolving the synthetic surfactant in water heated to 60 °C, foliowed by sonification in a thermostatted Branson sonificator (60 W) for six hours. Typîcal DO DAB concentradons are (l-1 0)*10-3 mol dm-3
. :OODAB vesicular dispersions containing the photoinitiator 2,2-dimethoxyacetophenone were made, using the same procedure.

Polymerization in DODAB Vesicles: Polymerization Kinetics 167
8.2.3 Bromide counter-ion titration The bromide counter-ions ofOODAB vesicles in water as well as in an ethanolic
environment were performed using an argentiometric titration procedure as described earlier,
see section 6.2.3.
8.2.4 High Performance Liquid Chromatography (HPLC) During the swelling and the polymerization experiments the styrene concentration was
analyzed by HPLe, see section 6.2.8.
8.2.5 Swelling ofDODAB vesicles with styrene The experimental setup which was used fortheswelling ofvesicle bilayers is described
previously in, see section 6.3.8. The vessel was thermostatted within the temperature range of
20-70 °C. Samples could be taken separately from the aqueous phase as well from the vesicle
phase, and its morromer concentration could be determined using HPLC.
8.2.6 Polymerization ofStyrene inDODAB vesicles The polymerization ofDODAB vesicles with styrene was performed in another reactor setup
than shown in figure 6.1. Kinetic data acquisition during the polymerization reaction in the
"swelling equipment" is not possible because during polymerization, swelling processes wil!
be operative. Therefore, it is impossible to measure proper conversion-time plots. A fier
swelling the reaction mixture is rapidly transferred into another reactor thermostatted at the
same temperature as the reaction mixture. The mixture is allowed to equilibrate (since the
gasphase ofthe system is not saturated with monomer) and the initia! morromer concentration
in the mixture is measured, which is the starting point for the polymerization reaction.
Polymerizations have been performed in the temperature range of20-70 °e The initiator was
a mixed initiator system containing benzoylperoxide, and dimethylaniline. This initiator
system was dissolved in 2 ml of THF and injected in the vesicular dispersion. The initia!
concentration ofboth componentsin the reaction mixture was about 10·3 moldm-3. The
decreasing monomer concentration in the polymerization system was measured by means of
HPLe. After polymerization, bromide counter-ion titrations were performed in order to
determine whether the vesicle structure remained stabie during the polymerization reaction.
8.2.7 Pulsed Laser Polymerization inDODAB vesicles with styrene DO DAB vesicle dispersions { concentration 1-20 * l o·3 moldm-3
), containing the
photoinitiator 2,2-dimethoxyacetophenone {Irgacur 651) , were swollen with styrene at 20 °e,
and 60 °e, see section 8.2.5. The pulsed eximer laser (Lamda Physics 11 OiMe) was operated
at 351 nm (XeF). The pulsed laser polymerization reactions were carried out in quartz tubes.

168 ehapter 8
During the experiments temperature was maintained at (20,0 ± 0.2) 0e or (60.0 ± 0.2 °C).
Pulse repetition rates were between1-10Hz and the pulse energy between 10-75 mJ. Typical polymerization times were between 5 and 30 minutes. Samples were taken fi:om the experiments for determining conversion using HPLe. After laser irradiation the samples were freeze dried. The dried samples were filtered over a 0.45 J.ID1 filter and analyzed by means of gel-permeation chromatography. Five Waters Ultra styragel columns were used at 25 °e. The eluent was dichloromethane at flow rate of l mi/min. eatibrations were performed with polystyrene standards (Polymer Standards Service). A Waters R 401 differential refractometer and a Waters 440 absorbance detector, operatingat 254nm were used for determining the styrene concentration.
8.2.8 Detennining Transmembrane Dirfusion with Electron Spin Resonance
Ditfusion experiments using Electron Spin Resonance were performed at the original vesicles and polymer containing vesicles at 20 °e. TEMPO was added at a typical concentration of 1 *10"3 moldm"3 and was allowed to equilibrate within the bilayer. Afterwards, the ascorbic acid solution (containing 0.15 moldm"3 ofascorbic acid, pH= 5, adjusted with 0.05 mol dm·3 Tris buffer) was added in volumina of30 J.tl. The intensity ofthe ESR signa\ was recorded as function of time on a ESR spectrometer (Bruker ER 200). Quantification was achieved by calculation ofthe height h(t) ofthe middle peak ofthe ESRsignal, and the height ho ofthe corresponding peak at t=O. The ratio ofh(t)lho is equal to the ratio ofTEMPO concentration c(t)/Co at timetand t=O. The schematic representation ofthe ESR procedure is represented in Figure 8.2. The decreasein TEMPO concentration is the result of a diffusionlreaction process where the TEMPO molecules diffuse over the bilayer to the vesicle water interface, where the reaction with ascorbic acid takes place. When the intrinsic reaction kinetics between TEMPO and ascorbic acid are known, the diffusion coefficient can be estimated by solving a mass balance over a volume element of the bilayer with thickness Ar.

Polymerization in OODAB Vesicles: Polymerization Kinetics
P'
p•
P'
Figure8.2
p•
P' Addition of leductor
p• att"
P' Co
\ \
C(WC0 \
i I
' ' ' ' ' ---lo -time
A schematic representation ofESR experiments perfonned at 20 °C upon virgin as wellas polymerized DODAB vesicles, p* are the TEMPO species
169
The assumptions are that the majority of the TEMPO molecules are located in the hydrophobic bilayer of the vesicle species, and the reaction between TEMPO and ascorbic acid proceeds at the vesicle-water interface as shown in Figure 8.3. This means that the penetration of ascorbic acid into the vesicle bilayer must be negligible. The following mass balance on a spherical vesicle bilayer can be derived
(8.1)
where NmMPO,r is the flux of TEMPO molecules through a plane at position r, see eq. 8.2
The flux of TEMPO molecules at the radical position r in the bilayer NTEMPO,r can be
estimated using Ficks first law for diffusion:
Ntempo,r = -Dtempo ( dC~empo:/ dr) (8.2)

170
lntemal volume veside
R,
I
ehapter 8
lnstantaneous reaction at veside water interphase
r +tor
Figure 8.3 Schematic representation ofthe diffusion- reaction phenomena ofTEMPO and ascorbic acid
where DTEMPO is the diffusion coefficient of TEMPO within the DODAB bilayer. Substitution ofEq. 8.1 in Eq. 8.2 provides the following partial differentia] equation:
r (deTEMP{)I'dt) + r R. = r DTEMPQ (d2etempoldi) + 2 DTEMPO (deTEM!'I:Idr) (8.3)
The boundruy conditions, in order to solve equation 8.3 at t=O are: t=O r = R1 deTEMJ'OI'dr = 0 No TEMPO in the internat volume t=O r = R2 eTEMPO= 10·10 moldm-3 Past reaction with ascorbic acid at interface
The first boundruy condition means that the TEMPO molecules should preferential partition in the bilayer. The solubility of TEMPO in water bas been measured experimentally39 and is about 45 I o-3 moldm.3 at 85 °e. Unfortunately the solubility of TEMPO in water at 20 °e is not available. However an additional experiment was performed to obtain information about TEMPO partitioning between a hydrophilic and a hydrophobic phase. In this experiment a separation funnel was used where an aqueous solution of TEMPO was inserted, see figure 8.4 (1 ). The initia! TEMPO concentration was 1 10-3 moldm-3
. From this solution the ESR spectra was obtained, in order to obtain the height ho. Next a hydrophobic styrene phase was placed on top of the hydrophilic phase, foliowed by vigorous mixing of the two phases. These phases were allowed to phase separate again and after 7 days the TEMPO concentration in the aqueous solution was determined again using ESR. It appeared that the partitioning coefficient K = [TEMPO]styi[TEMPO]H2o = 820. The observation from this experiment may be that assumption one is justified.

Polymerization inDODAB Vesicles: Polymerization Kinetics
Figure8.4
( 1)
styrene
TEMPO
~
(2)
styrene +TEM PO
As co rb ie acid sol.
Experimental setup for measuring the partitioning of TEMPO over a hydrophobic and a hydrophilic phase ( 1 ), and the ditfusion of aseorb ie acid into a hydrophobic enviromnent (2)
171
The second boundary condition assumes that diffusion of ascorbic acid into the bilayer, on
the time scale of the experiment, can be neglected in the calculations.
In order to verify this assumption an additional experiment was performed, see figure 8.4.
(2). In the separation funnel a aqueous solution containing 0.15 moldm-3 ascorbic acid was inserted. Next a styrene layer containing TEMPO, with a initial TEMPO concentration of 1
1 o-3 moldm-3, was inserted. From this solution the ESR spectra was obtained, in order to
obtain the height ho. The system was allowed to equilibrate for 7 days. The reaction between
TEMPO and ascorbic acid should occur when aseorb ie acid molecules diffuse into the
'styrene phase', or when TEMPO molecules diffuse into the 'ascorbic phase'. Afterwards
the TEMPO concentration in the styrene phase was determined by ESR. It appeared that after
7 days the TEMPO concentration in the styrene phase had decreased by a factor of two
towards 5 104 moldm-3. The time scale ofthe actual ESR experimentsis about 30 minutes.
Therefore, it may be assumed that on the time scale ofthe experiment, diffusion of ascorbic
acid into the bilayer may be neglected and that the reaction between TEMPO and ascorbic
acid proceeds at the vesicle-water interface.
A further requirement is that the reduction reaction at the interface should be relatively fast
compared to diffusion processes. Therefore, the intrinsic rate coefficient of the reaction
between TEMPO and ascorbic acid, at 20 °C and pH=5, in aqueous environment, has been
determined, see Figure 8.5. Note, in presence of an excessof ascorbic acid the decay of
TEMPO obeys a pseudo first order rate law. Therefore, the reaction between the TEMPO
probe and ascorbic acid can be characterized as a pseudo first order reaction in TEMPO and
the reaction rate (Ra) can be described according to:
Ra kobs [TEMPO] (8.4)

172 Chapter 8
The pseudo first order rate coefficient (koos) bas been determined from tbe slope ofthe decay curve and is estimated to be: k..bs 3.3 I o-3 s·1
. The value obtained for the pseudo first order tate coefficient is in good agreement with the value obtained by Pàhsu et al 10 the intrinsic kinetics between TEMPO artd àscorbic acid. From the described experiments it may be concluded that the assumptions, which lead to the second boundary condition, are justified. In order to solve Eq. 8.3 numerically, a Fortran program has been written that generates the relative TEMPO concentration profile {C(t)/C0) over the bilayer as function of timefora given Drr.MPO· From this profile the average concentration of tEMPO as futletion of time can be calculated and compared with the experimentally obtained values, as determined with ESR.
0.00091
.:;- 0.00034
E 0.00012 "0 :::. 0 0.00005 .§. 0.00002 c: :8 6.1442E-8
_g 22603E-8 c: ~ 8.3153E-7 c: 8 3.059E-7
0 1.1254E-7 ll. :i 4.1399E-8
• • • • • • • • • • • • • • • •• •• • ••• •
~ 1.523E-8 ~.-~~r-~~~--.-~-.~~--~--~
Figure 8.5
0 200 400 600
Time (s)
aoo 1000 1200
The TEMPO concentration as a function of time for the tEMPO- ascorbic acid reduction reaction in an aqueous environment, [TEMP0]=10"3 moldm"3
[Ase]= 0.15 moldm"3, at 20 °C and pH= 5
8.3 Results and Discussion 8.3.1 Diffusion processes of small molecules in vesicle bilayers The transport of smalt molecules through a bilayermembrane is essential for many biologica! processes. Insight into these diffusion processes is important for drug delivery and drug design purposes32
. When polymerization inDODAB vesicles is considered, it will be obvious that the understanding ofthe diffusion processes ofsmall molecules (monomers) is important for a proper kinetic analysis of the polymerization process. As explained in section 8. 1, the total ditfusion processis generally divided into two major diffusion processes, i.e. lateral ditfusion and transmembrane diffusion.

Polymerization in OODAB Vesicles: Polymerization Kinetics 173
8.3.1.1 Lateral dijfusion
Lateral diffusion of small molecules within the plane of the bilayer is an important feature,
which give an indication ofthe fluidity ofthe lipid phase. In the field ofvesicles based upon
phospbolipid ampbiphiles, a lot of work has been done to determine lateral diffusion
coefficients. A widely used metbod todetermine this quantity is the metbod offluorescence
recovery after pbotobteaching (FRAPl8. The FRAP metbod is basedon bleaching a sharply
bounded area on a membrane labelect with a fluorescence probe, with an intensive light
beam. The result of such a treatment is that the fluorescence probe molecules lose their
activity in that area Subsequently, at a much reduced light intensity, the reappeamnce of
fluorescence in this area (by diffusion ofthe fluorescence probe) is monitored as function of
time. Using this information, tbe ditfusion coefficient of the fluorescent species may be
estimated. Lateml ditfusion coefficîents obtained of fluorescent molecules in membranes of
phosphorlipid amphiphiles are in tbe order of magnitude of 10·12 -10-10 m2/s and are
dependent upon the tempemture and the presence of additives ( chloresterol or proteins) in the
membrane. These absolute values are of the same order of magnitude as the diffusion
coefficient of small molecules in latex particles at high volume fmction of polymer. When
the weight fraction of polymer increases from zero to one, the diffusion coefficient decreases
from w·9 to w·12 m2/s, wbich is in the sameorder of magnitude as the lateral diffusion in
vesicles. Unfortunately lateral diffusion coefficients of molecules in DODAB vesicles have
notbeen measured but it is assumed that these values are of the same order of magnitude.
8.3.1.2 Transmembrane dijfusion
Transmembrane ditfusion of small molecules in vesicles is an important pbenomenon since
it determines the mass transfer rate of species between tbe vesicle bilayer and the
surrounding liquid. Usually these ditfusion coefficients are determined by measuring the
membrane permeability forspin labelect molecules by electron spin resonance spectroscopy.
Tbe principle ofthe determination oftransmembrane diffusion coefficients in OODAB
vesicles loaded with the spin-label TEMPO have been described in section 8.2.8. The
calculations performed using eq. 8.3 initially result in a concentration profile of TEMPO over
tbe bilayer at every time step 1\t, for a given diffusion coefficient. Therefore in order to
compare the calculations with the experimental results, an average concentration (C(t)) was
estimated from the concentration distribution. These average concentrations are compared
with the experimental obtained TEMPO concentrations as function of time. The results are
depicted in Figure 8.6. Note, that tbe tmnsmembrane diffusion processof TEMPO over the
DODAB bilayer is extremely slow, i.e. D1EMPO= 5*10.20 m2s-1, when compared to lateml
diffusion events in the bilayer. Marshet al6 found simHar values for the transmembrane
diffusion of TEMPO-spin labels in dimyristoylphospbatidyl choline (DMPC) from
permeability experiments using ESR (D = 2 10"21- 9 *10.21 m2s.1
).

174 Chapter 8
The transmembrane diffusion coefficient is obtained at 20 °C, which is below the phase transition temperature. The DO DAB bilayer is, therefore, in a highly ordered semi-crystalline state which will affect the diffusion of TEMPO. When the temperature is above the phase transition temperature the diffusion of TEMPO may be two orders of magnitude higher6
. The influence ofthe vesicle species curvature may have an additional effect upon the transmembrane diffusion as well.
::!: 0
(.)
; (.)
Figure8.6
5.5x10'2
s.0x1o·• •
4.5x1o·2
4.0x1o·2
3.5x10'2
3.0x1o·2
2.5x10'2
2.0x1o·2
1.5x10"2
0 200 400 6ÓO èoo 1000
Time (s)
Estimation of the ditfusion coefficient of TEMPO over the OODAB bilayer vesicles at 20 ° C and pH = 5, The relative TEMPO concentration ( average va1ue) is plotted as function of elapsed time after mixing. [TEMP0)0 =C0 = 10"3 tnoldtn"3
, [Ase]= 0.15 moldm"3, [OODAB] = 6*10"3
moldtn"3' vesicle size ± 30 nm . Upper Iine DruMPO = 4 * l 0"20 m2!f1
' tniddle line DttMP0 = 5*10"20 l11
2 S1, lower line 0rnMPO= 6*10-20 t112s·l
8.3.1.3 Mechanistn of Dijfusion
The determination of the lateral and transmembrane ditfusion coefficients is usually done by spectroscopie methods. Fluorescence probes or spin probes are used. Although these ditfusion coefficients of these molecules are important kinetic pàrameters, they do not really contribute to the understanding ofthe mechanism of diffusion at the molecular level. The ditfusion coefficients observed experimentally are average values which describes the average transport of the probe molecules. Diffusion, quantified by the diffusion coefficients, characterizes the average movement over a period of time and is a composite measure of allaspects of a molecule's motion32
•40
. When this is the case, it is important to consider the location ofthe probes within the bilayer and whether the distribution of these probes is uniform over the bilayer or not.

Polymerization inDODAB Vesicles: Polymerization Kinetics 175
In chapter 7, phase equilibria are considered leading to the conclusion that there is a
concentration gradient ofmonomer over the bilayer, caused by its microstructure. This may
also be the case for probe molecules in the bilayer. The consequence is that the rate of
diffusion depends on the location of the molecule within the bilayer. Studies performed on
unraveling the molecular mechanism of diffusion are based on computational techniques as
Molecular Dynamics (MD) and Monte Carlo simulations5•32
•40
.
Bassolino-Klimas et al32 stuclied the mechanism ofbenzene diffusion through lipid bilayer
membranes by molecular dynamics as a function of temperature. The small molecules are
supposed to diffuse by "hopping" between empty voids in the bilayer. These authors found
that at different temperatures tbe molecules preferred different regions ofthe bilayer. When
tbe temperature is lowered the benzene molecules seem to be located near tbe midplane
section ofthe bilayer, where there are more voids available. When the temperature is raised
the benzene molecules can also reside in locations near the headgroup. The rate of diffusion
changes with the location ofthe benzene molecules in the bilayer. Generally, when the
benzene molecules move away from the center of the bilayer they diffuse more slowly. When
the mechanism of diffusion is assumed to appear as j umps of solvent molecules between the
voids within the bilayer, it can be argued that these jumps are determined by the number of
voids available in the bilayer and the size ofthe voids. These quantities are controlled not
only by temperature but also by the surfactant density v•lithin the vesicle species. For small
vesicles, the surfactant density may be high and therefore less and smaller voids within the
bilayer are available, causing lower diffusity. When large vesicles are considered, the
surfactant density may be lower, resulting in more and larger voids. Therefore, it might be
the case that at a fixed temperature diffusity of small molecules is less hindered in large
vesicles than in smal! vesicles. Voids can also be triggered by self-motion ofthe surfactant
molecules. When the hydrocarbon chain undergoes torsional isomerization (trans ~ gauche ),
a part of the chain can move aside and can open a path between two voids or enlarges a
smaller void. Temperature is important bere since these changes are largely dependent upon
temperature. It is clear that the molecular mechanism of diffusion of small molecules in
bilayers is very complex and yet not completely understood. Still, this aspect is extremely
important since kinetic events within tbe bilayer, i.e. propagation, termination, and chain
transfer may become diffusion controlled, both propagation as well as the termination rate
coefficient. In conventional emulsion polymerization process are chemically controlled until
high conversion. In this respect it is important to observe that the volume fraction of
monoroer to be polymerized is low in the vesicles, (maximum value 0.32 for styrene at 70°C),
as compared with a conventional emulsion polymerization system (typical 0.6). Therefore, in
polymerization in vesicles the propagation and the termination rate coefficient may become
diffusion controlled at lower conversion, especially when the temperature is below the phase
transition temperature. Termination is a center-of-mass diffusion controlled process in
emulsion polymerization.

176 Chapter 8
Since the center-of-rnass ditTusion in vesicles is strongly reduced (at least in the transmembrane direction at low temperatures), 'reaction diffusion' may contribute to the overall ditfusion coefficient oftbe polymer cbain33
. Phase transfer processes e.g. entry and exit are ditfusion controlled as well. Thus entry and exit may be expected to be strongly hampered by transmembrane ditfusion, especially below the phase transition temperature. This will be discussed in section 8.3.3
8.3.2 Determination of intrinsic rate parameters by PLP in vesicles 8.3.2.1 Propagation rate coe.fficient In the previous section, it is bas been reported that there are two directions of ditfusion in the DODAB bilayer, i.e. lateral and transmembrane ditfusion. It appeared tbat the lateral ditfusion is many orders of magnitude higher (10'10-10.12 m2s"1
) than the transmembrane ditfusion (10.20 m2s·\ The lateral ditfusion of smalt species in vesicles is ofthe sarne order of magnitude as tbe ditfusion of solvents in latex particles. Still it is important to evaluate whether the fundamental steps within the vesicles, i.e. propagation, transfer and termination are ditfusion controlled. Tberefore the determination of tbe basic rate parameters is an essential requirement in order to understand the mecbanism of polymerization in tbis vesicle system. Determination of the propagation rate coefficients is preferably performed by the Pulsed Laser Polymerization technique combined with size exclusion chromatography (SEC). This metbod is very suitable to obtain propagation rate coefficients in homogeneaus systems. The PLP-SEC technique was described originally by Alexandrov et al 11 in 1977 and was further developed by Olaj et al12
. The procedure comprises the generation of radicals by a photo initiator activated by a laser pulse. The growth time of a polymer chain is directly determined by the time between pulses and a PLP experiment gives direct access to the propagation rate coefficient kp. The length ofthe ebains initiated and terminated by smalt laser induced radicals is given by the equation:12
•
(8.5)
where Lo,r is the chain length of the polymer formed in the process of growth in the time between two laser pulses, kp is the propagation rate coefficient, [M] is tbe monomer concentration at the site of reaction, t is the time between two subsequent laser pulses, 1=1,2,3. The higher order peaks (1=2,3 .. ) occur when growing ebains survive one or more subsequent pulses. During the time between two pulses normal bimolecular termination can occur wbich results in so-called background polymer. The fundamental requirement to perform proper PLP experiments is that both the rate of initiation and chain stopping reactions are fast enough to couvert the applied frequency of the laser to the growing time, (i.e. length) oftbe polymer ebains characteristics ofPLP.

Polymerization inDODAB Vesicles: Polymerization Kinetics 177
PLP experiments have been performed in homogenous systems 13'14
, i.e. bulk and solution and · h · · 1 · d I . I 1.:; 16 n 1s m eterogeneous systems, Le. m1cro emu stons an atex parttc es · · · .
Pulsed laser polymerization in dispersions containing small DODAB vesicle species, i.e. 30
nm, bas been performed at 20 °C and 60 °C respectively. Molecular weight distributton of a
typical pulsed laser polymerization experiment conducted on swollen vesicles at 20 °C is
presented in Figure 8.7. Note that this is nota typical molecular weight distribution obtained
by PLP experiments. The molecular weight distribution is rather broad and the typical PLP
induced overtones are missing. Running through the experiments, it appeared that the
molecular weight at the point of inflection is independent of the pul se repetition rate (2-l 0
Hz). The observation may mean that the polymerization in vesicles does not respond to the
conditions applied by PLP and that the basic requirement to perfoon proper PLP is not
fulfilled. Care should be taken, in drawing conclusions bere, because ofthe following
experimental reasons:
- The Irgacur 651 initiator is incorporated in the DO DAB bilayer during the sonification
process by which the vesicles are formed. Due to this procedure the initiator may
decompose teading to a lower initiator concentration within the vesicle species.
Therefore, it may be possible that during each pulse not enough radicals are initiated. When
this is the case, the assumption of instantaneous termination may not be valid any more
-The second reason is related to the monoroer conversion. For determining accurate
propagation rate coefficients by PLP the conversion should be lower than 5%, because then
it can be assumed that [M] remains constant during the experiment
This condition is not fulfilled in the case of the polymerization in vesicles.
Figure8.7
0
3 4 5 6 7
log{M)
Molecular weight distri bution typical of a PLP experiment of styrene in DO DAB vesicles at 20 °C, pulse energy 40 mJ, pul se frequency 2 Hz, pulse time 15 min

178 ehapter 8
The amount ofpolymer in vesicle polymerization forthese low conversionsis too small to determine an accurate MWD. Until now, conversions over 20% are necessary todetermine proper MWD. The consequence is that only information can be obtained from the product kp[M]. ealculated values ofkp[M] range between 1000 s·1 and 2500 ·1
• In chapter 7, the average monomer concentration in the bilayer at 20 °e is detertnined to be ca. 1.5 moldm·3.
The bulk value14 for the propagation rate coefficient for styrene at 20 °e is 68 dm3mor's·1.
eonsequently, the value for the product ofkp[M] in bulk would be 102 s·1• Because
polymerization in vesicles is expected to be slow, compared to bulk one would expect kp[M] to be lower than or equal to this value. eiearly this is not the case. When PLP experiments are performed at 60 °e, above the phase transition temperature, the results are different. When the shape of the molecular weight distri bution is considered, the same observations can be drawn as for the experiments below the phase transition temperature. The MWD is broad and there are no significant overtones present. However, the molecular weight at the inflection point is dependent upon the applied frequency as shown in Figure 8.8
Fiaure 8.8
1.4x10⁶
0.1 0.2 0.~ 0.4 0.5
Oark time (s)
Molecular weight at the point of intleerion as function of the darktime between two laser pulses for PLP of styrene in OODAB vesicles at 60 °C
Note that the data points obey a linear relation. The slope of the curve gives infonnation about kp[M] acoording to:
slope kp[M] Mo (8.6)
Polymerization inDODAB Vesicles: Polymerization Kinetics 179
where Mo is the molecular weight of styrene. From these experiments it follows that kp[M] =
2160 s-1. In chapter 7, styrene partitioning results ofDODAB vesicles have been presented.
The average styrene concentration, at 60 °C, obtained was about 2.7 moldm-3. Using the bulk
value14 of the propagation rate coefficient at 60 °C , i.e. 340 dm3mor1s-1, the product kp[M] is
expected to be equal or smaller than 918 s·1. When it is assumed that the propagation rate
coefficient is correct, one can derive the monomer concentration within the vesicle species
from the experimentally observed product of kp[M]. This will give a styrene concentration
within the vesicle species of ca. 6.3 moldm-3• It may be suggested that in PLP experiments
the polymerization coordinate is preferentially occurring in the midplane section of the
bilayer. As explained in chapter 7, it may be that the styrene concentration at the midplane
section is significantly higher than the average styrene concentration as determined from
partitioning experiments. This explanation may also hold for the PLP experiments performed
at 20 °C. lt indicates that a styrene concentration gradient over the bilayer may significantly
affect the kinetic events ofthis polymerization reaction. Unfortunately it is not possible yet to
obtain experimental results, that confirm the existence of this concentration gradient over the
bilayer. Caution, therefore, should betaken in drawing more confirmative conclusions,
because it is still not clear whether theseexperimentscan be interpreted as proper PLP
experiments. Another explanation for the observed results is that even above the phase
transition temperature, the fundamental requirements for PLP are not met, and that
termînation within the vesîcle species is dîffusion controlled and therefore not instantaneous.
More detailed experiments are required in this context. The newly developed Pulsed Electron
Beam Polymerization18, where the initiating species are electrous may be a powerfut
technique
8.3.2.2 Transfer rate coefficients
Chain transfer to monomer
The traditional procedure to obtain the rate coefficients for transfer (ktr) to monomer,
surfactant, or chain transfer agent involves the use ofthe Mayo equation:
(8.7)
where P nis the number-average degree of polymerization, À is a parameter that is determined
by the mode of termination, k1 is the termination rate coefficient, kp is the propagation rate
coefficient, Rp is the rate of polymerization and Cm is the transfer ( to monomer) constant
(=ktrfkp), ktr is the rate coefficient of transfer. By performing experiments at different initiator
concentrations, a plot of 1/Pn versus R~[M]2 is constructed, from which the transfer to
monomer rate coefficient is determined from the intercept, provided that kp is known.
Theoretica! and experimental evidence indicates that this method suffers from
inconsistencies, since termînation is chain length dependent, which is not incorporated into
the Mayo equation19.
180 ehapter 8
When reliable full molecular weight distributions (MWD's) are becoming available, an alternative for the Mayo technique was found. Olaj and Gilbert20 reported that the value ofktr can be found from the high molecular weight slope ofthe logarithmic number MWD. This procedure considers the mechanisms that contribute to the dead-chain distribution. The final expression for the polymer distribution n(N) is given by:
lim In n(N) =A-( ktr[M] + <kt>[R] I kp[M])N (8.8)
where N is the degree of polymerization, A is a constant related to the total amount of instantaneous polymer produced, and [R] is the radical concentration. It should he noted that this result applies to the instantaneous polymer production, n(N), and will not, in general, apply to the cumulative polymer distribution. An important limit ofEq. 8.8 occurs when <kt>[R] << ktr[M]. This situation may be satisfied for two options: either as result of a very low average terrnination rate coefficient, which should occur when the viscosity ofthe system is high (low volume fraction of solvent), or as result of a very low radical concentration (low entry and exit). In such cases Eq. 8.8 becomes:
lim In n(M) = A • (ktrfkpMo) M (8.9)
Where In n{M) is the cumulative polymer chain distribution, M is the molecular weight ofthe polymer chain and ~ is the molecular weight of styrene. The cumulative polymer distribution may be used because ktr/kp is relatively independent of conversion. This approach is used for determining the transfer to monomer constant Cm for the polymerization in DODAB vesicles with styrene at 60 °e. The naturallogarithm of the number-weight distribution is plotted versus molecular weight. A typical result is shown in Figure 8.9. In most graphs obtained there is a straight line at the high molecular weight si de of the plot. However, before the transfer coefficient can be determined one has to realize that the curvefitting is done rnanually. This means that the discrimination of where the linear part of the curve begins and the curved part ends in the graph is subjective. Furthermore, the weight fraction of polymer ebains with molecular weight over one million is very small compared to the weight fraction of shorter polymer chains. Since the transfer rate coefficient is deterrnined by high molecular weight polymer, the values presented hereafter should be handled with great caution. The slopes of the fitted curves were all in the same order of magnitude, i.e. {-1 ± 0.1) * 10-6. According to equation 8.9, the value ofktrfkp for styrene polymerization in vesicles is calculated to be (-I ± 0.1) * 104
. From Iiterature34, the value
ku/k:p for styrene in homogeneous systems.at 60 °e is 6.7 * 10·5, which is comparable to the results for polymerization in vesicles. However, values for ktr in homogeneous media show large ditierences in various literature sources. It may be concluded that the rate of transfer to monomer is hardly affected by the geometry ofthe vesicle or ditfusion processes inside the vesicle.

Polymerization inDODAB Vesicles: Polymerization Kinetics
Figure8.8
-25
....... ::;! I: -30
.E
-35
M
Detennination of the transfer to monoroer constant for styrene in a DO DAB vesicular system (size ca. 30 nm) at 60 °C, pulse energy 40 mJ, pulse frequency 5 Hz, pulse time 10 min, conversion 0.40
Chain transfer to DODAB surfoctant
181
Chain transfer to surfactant is normally negligible in emulsion polymerization due the low
concentrations of these species with respect to the monomer concentration. In vesicle
systems the surfactantlmonomer ratio is much larger. Therefore, chain transfer to surfactant
may signîficantly influence the polymerization.
Although experiments have been performed in bulk to verifY this phenomena, it is yet
uncertain if transfer to surfactani can compete significantly with transfer to monomer in
polymerization in vesicles. When all the results conceming the determination of the intrinsic
rate parameters are considered, it can be concluded that Pulsed Laser Polymerization does
not yet give explicit answers, but only trends. Thus in order to place the results presented in
perspective, one has to keep in mind the considerable practical problems as described above.
The hypothesis that all the rate phenomena within the bilayer are diffusion controlled can
not be refuted on the grounds of these experimental results. On the other hand, the trends in
the PLP experiments cao be explained, assuming a concentration gradient of monomer in
radial direction over the bilayer. Clearly, more experiments are required in order to draw
more robust conclusions.
182 Chapter 8
8.3.3 Kinetic events in polymerization in vesicles In chapter 2, the basic mechanisms of a conventional radical emulsion polymerization have been described and it was stated that the global rate of emulsion polymerization are mainly controlled by the fundamental reaction steps in the particles and by the distribution and exchange of radîcal species over the various phases. This global pictures holds for polymerization in vesicles as well. Polymerization in vesicles is performed in the absence of monomer dropiets and its kinetic behavior may therefore be comparable with an interval lli in an emulsion polymerization. The rate ofpolymerization in interval III is given by Eq. 8.10.
(8.10)
where kp is the propagation rate coefficient which is assumed to be independent of the weight fraction of polymer, [Ml-,o is the average styrene concentration in the vesicle species, N_ is the number of vesicles, mves is the initia! styrene concentration and floot is the average number of radicals within the vesicle species. The average number of radicals may be determined by plotting -ln(l-x) against time, provided that all the other parameters are known.
8.3. 3.1 Phase transfer processes in polymerization in vesicles Latex particles usually have diameters between 40 and 500 nm. Vesicles on the other hand are hollow particles with sizes varying from 25 to 400 nm. The considerably smaller reaction volume in vesicles itself and the fact that various phase transfer processes are dependent on partiele dimensions may cause some differences in phase transfer processes compared to emulsion polymerization. Mass transfer events of radicals in vesicles can occur at the extemal vesicle surface as wel! at the internat vesicle surface. From a mechanistic point of view, entry and exit at the outer surface of the vesicle are similar to those events in latex particles. Mass transfer phenomena between the vesicle phase and the inner water volume is unique for vesicles. However, it is assumed that free radicals transferred from the internat volume will eventually give re-entry into the bilayer. Therefore, the assumption is made that the inner volume ofthe vesicle structure is a dead space, where neither propagation nor termination occurs. In the following, only entry and exit at the outer surface of the vesicle are considered.
Entry mechanisms in polymerization in vesicles Insection 2.2.3.2, the phase transfer processes ofradical species in emulsion polymerization have been discussed. Por water soluble initiators aqueous phase kinetics are important since the primary radicals will undergo the first propagation steps in the aqueous phase until the oligomeric radical beoomes surface active and will migrate towards the partiele surface28
.

Polymerization inDODAB Vesicles: Polymerization Kinetics 183
In emulsion polymerization, it is generally accepted that the rate detennining step forentry is
the grm.vth rate of an oligomeric radica\ to become a surface active otigomeric radical. Th is
means that ditfusion of species towards and across the partiele surface is fast and not rate
detennining. In vesicle polymerization, however, more oil-soluble initiators are used, such as
AIBN and BPO/DMA When the initiator system BPO/DMA is considered the initiation
reaction is a redox type of reaction24. The decomposition ofBPO is induced by DMA to fonn
an intennediate species, that thermally decomposes in benzoyloxy radicals and an amine
radical cation, which bothare capable of initiating polymerization25. In heterogeneous media
this initiator system comprises a combination of an oil-soluble initiator (BPO) and a water
soluble initiator (OMA). Therefore, the locus of initiation may occur in both phases, i.e. the
aqueous phase as well as the partiele phase. When the assumption holds that aqueous phase
kinetics are still significant for these types of initiator, the following scheme for entry in
vesicles can be proposed:
- Similar to conventional emulsion polymerization the prirnary radicals in the aqueous phase
will propagate until they become surface active .
- These surface active species move through the aqueous phase to the partiele surface
- Next, the species diffuse through the partiele surface towards the midplane ofthe bilayer,
since the polymerization will proceed probably mainly in this part of the bilayer.
When this scheme is adopted, it will be clear that mass transport phenomena play a very
important role. Insection 8.3., 1 it is shown by ESR that transmembrane ditfusion of TEMPO
is very slow. This indicates that for the vesicles the ditfusion of oligomeric species through
the vesicle surface towards the midplane section of the bilayer may be rate detenninîng for
entry in the process, at least at temperatures below the phase transition temperature.
Unfortunately, the transmembrane ditfusion of TEMPO above the phase transition
temperature bas notbeen measured, but it is assumed that the diffusion coefficients of solutes
can increase over orders of magnitude with increasing temperature. For example, Xie35
measured the ditfusion of methyl methacrylate (MMA) into 'dry' polymethyl methacrylate
(PMMA) particles as function oftemperature by inverse gas chromatography, using fused
silica open tubular columns. These authors showed that the ditfusion ofMMA into the
particles is largely dependent upon temperature. Since the glass transition temperature of
PMMA is about 100 °C, they concluded that diffusion coefficients at a temperature below
the glass transition temperature are at least two orders of magnitude Jower than those above
the glass transition temperature. Keeping this in mind it may be expected that diffusion
behaviour in vesicles, above the phase transition temperature is simHar to that in PMMA.
When this is the case, entry may be less, but still ditfusion controlled. Hansen and Ugelstad29
already treated this problem for emulsion polymerization in 1979. The physical factors that
affect the rate of entry are electrostatic repulsion and ditfusion reversibility. Qualitative
expresslons based upon these considerations are able to explain the low entry rate of
oligomers into partiel es. It may be possible that entry in vesicles can be described kinetically
by adopting the procedure described by Hansen and U gel stad.

184 Chapter 8
Exit mechanisms in polymerization in vesicles
Radical exit from vesicles is a mass transfer of monomeric radical species, generated by transfer reactions e.g. to monomer and/or DODAB surfactant, will transfer from the vesicle phase to the surrounding liquid. Generally, the exit rate coefficient depends on the surface-tovolume ratio ofthe polymer phase. This ratio is obviously larger for vesicles than for latex partic les, because of the differences in geometry between the two types of species. Obviously, the effect of geometry is more pronounced at large partiele diameters, but at all radii, exit in vesicles will exceed exit in latex particles, at least if diffusion processes were at the sameorder of magnitude in both systems. However, as discussed insection 8.3.1, this is not the case. The monomer diffusion coefficient may he characterized by the transmembrane diffusion coefficient, since diffusion in that direction governs exit. The effect of the reduced diffusion on exit is enormous. The exit rate in vesicles may he diffusion control1ed, and therefore much lower than in emulsion polymerization. However, absolute values cannot he given, and the determination of these quantities is an important aspect of future research. Kinetics of entry and exit may he investigated by · using the ''slope & intercept method31
" or gamma radiolysis30
•
The general condusion is that phase transfer phenomena are extremely important in the overal1 kinetics of the polymerization in vesicles.
8.3.3.2 Polymerization inDODAB vesic/es, Zero-one or Pseudo-bulk?
In emulsion polymerization, compartmentalization is very important as described in section 2.3.3. When polymerization inDODAB vesicles is considered, compartmentalization will he operative as well, since a radical in one vesicle will have no direct access to a radical in another vesicle, without the occurrence of mass transfer. lf termination is rapid, entry of a radical in a vesicle which containsalready a growing chain,·will result in·instantaneous termination. Then, all vesicles will contain either zero or one radical. This is called a zeroone system. In this case, termination is not rate determining and can therefore he excluded from kinetic considerations. When termination is not rapid, the average numher of radicals may exceed 0.5, i.e. there rnay he more than one growing chain per vesicle, and the termination process must he taken into account. Then the system oheys pseudo-bulk kinetics. In order to evaluate whether polymerization in vesicles obeys zero-one or a pseudo-bulk behavior, the average numher of radicals per vesicle is determined using conversion time histories. However, the assumption that all vesicles are initiated at the sametime is crucial before f11:Jar can he determined from equation 8.10. Since conversion is a function of time, plotting -In ( 1-x) versus time characterizes the time-dependenee of nbar. Note, however, that before polymerization proceeds, the vesicles are swollen with styrene. Monomer partitioning experiments indicate that the maximum volume fraction ofmonomer is 0.3 at 60 °C.

Polymerization inDODAB Vesicles: Polymerization Kinetics 185
This indicates that the polymerization starts already at a relative high volume fraction of
'polymer' and therefore may be regarcled as a high conversion polymerization where mass
transfer limitations will be operative. Since the apparent rate coefficients for propagation,
termination and chain transfer may change during reaction as a result of diffusion limitations,
only low conversion data should be used for determination of 11oor.
Rate of polymerization
Thermal Polymerization experiments with styrene at 20, 30, 40, and 60 °e, initiated by
adding a BPO/DMA solution, and PLP experiments at 20 °C were performed to obtain
conversion data as a function of time. All data points in the conversion time plot of the PLP
result from separate experiments with different reaction times at a frequency of2 Hz.
Initiator concentrations were approximately equal for all experiments
(ca. 1.25 10-3 moldm"3). By means of the argentiometric titration, the extemal diameter of
the vesicles was estimated before polymerization. The temperature dependent values ofkp
were taken from Buback et al 14• The parameters used for the calculation of n00 are collected
in Table 8.1 In figure 8.9 the conversion time histories are presented.
Ta bie 8.1: Input parameters for the calucation of the average number of radicals per veside
T Yesiele diameter [DODAB] mv.. kp !Mlv..o ~ Resetion (OC) (nm) (mol dm·3) (mol dm-3) (dm3mol-1s·1) (mol dm-3) (dm-3) initiator
P2o 20 34 5.5 10.9*10·3 68 1.52 5.4*1017 BPOIOMA
3.2*1017 BPOIOMA p30 30 43 5.7 11.8*10·3 106 1.61 p40 40 29 6.5 17.6*10"3 160 2.24 8.5*1017 BPO/DMA
7.3*1017 BPO/DMA Poo 60 29 5.5 16.8*10•3 339 2.50
PLP 20 32 10 16.3*10·3 68 1.43 1.1*1016 lrgaCUfe
Obviously, the initia! polymerization rates increase with increasing temperature.
The reason for this behavior is not only the increase in kP> but also the change in the
mi crostroeture of the bilayer. When the temperature is below the phase transition
temperature (Tm= 37 °C), the surfactant ebains are in the crystalline state and above this
temperature the surfactant ebains are in the gel state. Therefore, propagation, termination and
exit processes may be less hindered by mass transport limitations at 60 °e, than at
temperatures below the phase transition temperature.

186
1.0
0.8
-• ; 0.6 . 2 f CD 0.4 > c 0 0 0.2
0.0
Figure8.9
Chapter 8
0
tl Cl
• • • • • • •• A Cl • A •• • A
• A
• A Cl
i • A A A • • • ÁA • • •
0 2000 4000 6000 8000 10000
Time (s)
Conversion histories measured at different temperatures for the polymerization ofOODAB vesicles with styrene, using the initiator system benzoylperoxide (BPO) catalyzed with dimethylaniline (OMA), (.) T=20 °C, (A) T= 30 °C, (A) T= 40 °C, m T= 60 °C, (D), PLP experiment, T= 20 °C
Furthermore, the polymerization rate for the PLP experiment at 20 °e is much higher than that for the polymerization at 20 °e with BPO/DMA as initiator. This may be caused by the two following circumstances: -While the oil-soluble lrgacure is dissolved in the bilayer during vesicle formation, the BPO/DMA solution is added to the reaction vessel at the beginning ofthe polymerization. Hence, Irgacure is already present inside the vesicle bilayer when the first laser pulse initiates the reaction and noentry event ofthe initiator is required tostart polymerization. The reaction rate is therefore high. The BPO/DMA initiator complex bas to dissociate, diffuse through the aqueous phasè and enter a vesicle in order to initiate the polymerization. As stated earlier; the entry and exit rates for vesicles may be vecy low, which causes low reaction rates for polymerizations initiated by BPOIDMA. According to this explanation, it can be concluded that the locus ofthe initiation, which is determined by the partition ofthe initiator, bas a pronounced effect on the polymerization rate. A second reason for the higher reaction rates when using Irgacure 651 compared to the BPOIDMA complex is the efficiency ofboth species during polymerization. Moad and Solomon22 report that Irgacure bas a high initiator efficiency and the BPO/DMA complex is known for its low efficiency. High initiator efficiencies imply large average radical concentrations during polymerization and, hence, higher reaction rates.

Polymerization inDODAB Vesicles: Polymerization Kinetics 187
Average number of growing chains per vesic/e
For the detennination of the average number of radicals per vesicle, the input parameters
presented in Table 8.1 and Figure 8.10 were used. When the rate of polymerization is
calculated from the conversion time history for each polymerization, it occurs that the rate of
polymerization decreases continuously with time. From the rate of polymerization the
average number of radicals per vesicle are calculated using equation 8.1 0. The results of this
calculation are presented in Figure 8.10
• 0.1 • ...
tJ. tJ. ...
tJ. • 0 A A A ... A A tJ.
0.01 -• -.... • • • • • • "' ~ c
0.001 [J
tJ.
Cl
0.0001 -f---.---.---.---.---.----.---.---.---.----6 0 2000 4000 6000 8000 10000
Time (s)
Figure 8.10 Average number ofradicals per vesicle, using the initiator system BPO catalyzed with DMA, as function oftemperature, (.) T=20 °e, (.:\) T= 30 °e, (À) T= 40 °e, (Ci) T= 60 °e, ( .. ) PLP experiment T= 20 °e
The average number of radicals per vesicle, calculated using equation 8.1 0, is well below 0.5
and asymptotically approaches zero in all graphs. In emulsion polymerization this indicates
that the system is behaving like a zero-one system. However, this condusion can only be
drawn when it is assumed that the number of polymerizing vesicle species N, ... is constant
Generally in vesicles systems this may not be the case. It is possible that only a few vesicles
may contain growing radicals at the sametime and other vesicles are not initiated at alL
decreasing the average number ofradicals per vesicle considerably. The assumption that all
vesicles are initiated at the same time may not be applicable. In that case, the number of
vesicles (Nves) is notconstant and it is notallowed to use equation 8.10 in this fonn. Due to
insuftkient experimental data at this point, the validity of this assumption cannot be
investigated.
188 ehapter 8
Therefore, the resulting value of hbar is only a rough estintation. Hence, whether the kineti.c behavior ofthe free radical polyrnerization reaction in vesicles is zero-óne or pseudo-bulk system remains uncertain.
8.4 Concluding Remarks In this chapter, the polyrnerization of styrene in dioctadecyldimethylammonium bromide is described with emphasis on the polyrnerization kinetics. An attempt is made to compare the kinetics of this specific systems with the kinetics of a conventional emulsion polyrnerization system. When ditfusion is considered, it is observed that the ditlusion of species in vesicles is operative in mainly two directions. The diffusity of species in the lateral direction of the bilayer is many orders of magnitude higher than the ditfusion of species in the transmembrane direction. Using ESR an estimation of the transmembrane diffusion of TEMPO is made and is approximately 5 * 10·20 m2 s·1 at 20 °e. Todetermine to which extent the kinede events within the vesicles are he ditfusion controlled, pulsed laser polyrnerization is used below and above the phase transition temperature. The results obtained should be considered with care. No distinct overtones in the molecular weight distribution can be found at both applied temperatures, and at 20 °e the point of inflection is independent of the applied frequency. Above the phase transition temperature, the molecular weight at the point of inflection is dependent upon the applied pulse frequency. However, the product of kp[M] is too high. When it is assumed that kp at 60 °e is similar to its bulk value, then the styrene concentration at the locus of polymerization in the bilayer is approximately two times higher than the average styrene concentration determined by conventional partitioning experiments. Rate coefficients for transfer to styrene at 60 °e were derived from PLP, and appeared to be relatively close to normalvalues observedin conventional systems. In order todetermine the average number of radicals per vesicle, the knowledge of an accurate kp value is essential. However, it is still not clear at this point ifthe propagation rate coefficient retains its 'bulk value' for polymerization in vesicles. When this assumption is made the average number of radicals per vesicle can be estimated from conventional as well as from pulsed laser polyrnerization experiments. The average number of radicals per vesicle appears to be far below 0.5. This result suggest two possible explanations; - The average number of radicals per vesicle is that low since the mass transfer mechanisms are very low, that the diffusion govems exit and entry processes - Only a few vesicles may contain growing radicals at the same time. This decreases the average number of radicals per vesicle considerably. In polyrnerization in vesicles it may be concluded that these preliminary results give, a global picture about the kinetics of polymerization in vesicles, but many questions remain to be answered, which should be the objective of future research.

Polymerization inDODAB Vesicles: Polymerization Kinetics
References
L Lei, J. O'Brien, D.F., Macromolecules, 1994, 27, 1381. 2. Blackley, D.C., "Emu/sion Polymerization", Applied Science, London, 1975. 3. Napper, DH, Gilbert, R.G. in "Comprehensive Polymer Science 4", Eds. G.
Allen and J.C. Bevington, Pergamon Press, Oxford, 1989. 4. Sells, T.D., O'Brien, D.F., Macromolecules, 1994, 226. 5. EggL P., Quinn, B., Ringsdorf, H., Sackmann, E., Macromolecules, 1990, 23, 3472. 6. Marsh, R. Watts, A., Knowles, PF., Biochemistry, 1976, 15, 3570. 7. Blume, A, Currem Opinion in Colloid & Interface Science, 1996, 1, 64. 8. Heesemann, J., Zingsheim in "Membrane Spectroscopy", Ed by E.Gre\1, Springer Verlag,
Berlin, 1981.
189
9. Scheren, PAG.M., Russell, G.T., Sangster, D.F., Gilbert, R.G., German, A.L., Macromolecules, 1995, 28,3637.
10. Pausu, R.B., Baer, S., Faure, J., Roncin, J., New J. Chem., 1990, 97, 104. ll. Alexandrov, A.I., Gonkin, V.N., Kitai, M.S., Smimova, J.M., Sokolov, V. V., Sov. J. Quanturn
Electron, 1977, 7, 547. 12. Olaj, O.F., Bitai, J, Hinkelmann, F., Makromol Chem., 1987, 177, 155. 13 Davis, T.P., O'Driscoll, K.F., Piton, M.C., Winnik, MA., Macrornolecules, 1989, 22, 2785. 14. Buback, M., Gilbert, R.G., Hutchinson, RA, Klurnperman, B., Kuchta, F.D., Manders, B.G.,
O'Driscoll, KF., Russel, G.T., Schweer, J., Macromol. Chem. Phys., 1995, 196, 3267 15. Holdkroft, S., Guillet, J.F., J. Polym. Sci. Part A: Polymer Chemistry, 1990, 28, 1823. 16. Manders, B.G., Van Herk, A.M., Gerrnan, A.L., Sarnecki, R, Schweer, J., Makromol. Chem., Rapid
Commun., 1993, 14, 693. 17. Schweer, J., van Herk, A.M, Pijpers, R.J., Manders, B.G., German, A.L., Makromol. Symp., 1995, 92,
31 18. Van Herk, A.M., de Brouwer, J.J., Manders, B.G., pulsed electron beam 19. Christie, DJ., Gilbert, R.G., Macromol. Chem. Phys., 1996, 197, 403. 20. Clay, P.A., Gilbert, R.G., Macromolecules, 1995, 28, 552. 21. Polyrner Handboek, Brandgup, ImmerguL .. 22. Moad G., Solornon, D.H., The Chemistry ofFree Radîcal Polyrnerizatîon,
Elsevier Science Ltd, 1995. 23. Moss, RA, Bhattacharya, S., Chatterjee, S., J. Am. Chem. Soc., 1989, 111, 3680. 24. Walling, C., Free radicals in solution, Wiley: New York, 1957, 592. 25. Pryor, WA, Hendrickson, W.H. Jr., Tetrahedron Lett., 1983, 24, 1459. 26. Nomura, M., Yamada, A, Fujita, S., Sugirnoto, A., lkoma, J., Fujita, J.,
J. Polym. Sci., Polym. Chem., 1991, 23, 987. 27. Asua, J.M., Rodriguez, V.S., Sudol, E.D., EI-Aasser, M.S., !bid, 1993, 31,2103. 28. Maxwell, l.A., Morrison, B.R., Napper, D.H., Gilbert, R.G., Macromolecules, 1991
24, 1629. 29. Hanssen, F.K., Ugelstad, J. ofPolym. Sci.: Polym. Chem. Ed., 1978, 16, 1953. 30. Gilbert, RG., Emu/sion Polymerization; a mechanistic approach, Sydney, 1995. 31. Zirkzee, H.F., van Kilsdonk, PA, van den Enden, M.C.A., van Herk, AM., German, A.L.,
Acta Polymerica, 1996,47, 441. 32. Bassolino-Kiimas, D., Alper, H, E., Stough, J. Am. Chem. Soc., 1995, 117,4118. 33. Clay, P ., Theoretica! and Experimental Studies of Molecular Weight Distributions in Free Radical
Po/ymerization, PhD thesis, University ofSydnedy, Austrilia, 1995. 34. Whang, B.C.Y., Ballard, M.J., Napper, D.H., Gilbert, R.G, Aust. J. Chem., 1991,44, 1133. 35. Xie, L.Q., Polymer, 1993, 34, 21, 4579. 36. ParkerH.Y., Westrnoreland, O.G., Chang, H.R.,Macromolecu/es, 1996,29,5119. 37. Scheren, P.A.G.M., Russel, G.T., Sangster, D.F., Gilbert, R.G., German, A.L, Macromolecules, 1995,
28, 3637. 38. Marrink, S.J., Berendsen, H.J.,J. Phys. Chem., 1996, 100, 16729. 39. Bon, S.A.F., unpublished results

190
Encapsulation oflnorganic Silica Particles using DODAB Bilayers
9 ENCAPSULATION OF INORGANIC SILICA
PARTICLES USING DODAB BILAVERS
9.1 Introduetion
191
Up to now most coatings contain organic solvents. Theemission of these compounds
becomes more and more restricted by environmentallegislation. Therefore, a lot of effort is
being put into the development of water bom coatings. Usually this is done by emulsion
polymerization yielding polymer particles dispersed in water; the product is called a latex. lt
is difficult to obtain a homogeneous dispersion of inorganic pigment particles in the polymer
binding matrix during the film formation process of the coating. This problem may he
overcome by encapsulation of the pigment particles by a polymer layer. In chapter 1 several
approaches have been described to encapsulate inorganic particles. Considerable research has
been performed on the modification ofthe surface groups of silica, alumina, and
titaniumdioxide14'17 in order to make the inorganic compound more compatible with the
polymerie host material (binder). Currently, siloxane, titanate, and zirconate coupling agents
are being used extensively in industry for this purpose18. These chemica! coupling agents can
lead to significant and important improvements in physical properties. However, these agents
can also he expensive, thus significantly increasing the cost of a product.
The formation of ultrathin polymer films in adsorbed surfactant bilayers, called admicelles,
has been investigated since 1980.

192 Chapter9
Wu et al 13•14
•15 investigated this phenomenon in the formation ofpolystyrene from styrene
adsolubilized in anionic sodiumdodecyl sulfate (SDS) admicelles upon alumina and silica. Perfluorinated and cationic surfactánt species have beert used for this purpose15
• The disadvantage of using single tailed surfactauts is the relative fast surfactafit exchange between micelles and single surfactant species. This implies that the rate of desorption of the surfactaut species from the pigment partiele surface will he relatively high18
. When twintailed surfactauts are used the surfactant desorption willless dominant. Another advantage of twin-tailed surfactauts is that they or able to solubilize more monoroer as compared with single tailed surfactauts ofthe same chemica! composition3
. The adsorption oftwin-tailed surfactant upon inorganic particles has been studied extensively20
'3
. However, a complete partiele encapsulation using twin-tailed surfactauts baS, to the best of our kn.owledge, only recently been reported in literature. Esumi et al19 studied the encapsulation of silica particles with polypyrrole using dodecyldimethylammonium chloride, didodecyldimethylammonium bromide and tridodecyldimethylamrnonium chloride prior to encapsulation. These authors performed polymerization reactions at pH=2 and reported uniformly polypyrrole coated silica particles using double or triple-chained surfactant as well as in the absence of surfactaut. In this investigation, the twin-tailed surfactant Dioctacdecyldimethylammonium Bromide (DODAB) is used. The encapsulation of a pigment partiele with DODAB bilayers is a three step process, see figure 2.2. The first step is thè adsorption of the bilayer onto the surface of the particles. Once a homogeneaus bilayet has been formed, it can be swollen with styrene in the second step. The third step is the addition of an initiator to start the polymerization reaction, after the monoroer concentration inside the bilayer bas teached its saturation value. A systematic study has been performed, investigating the polymerization in DODAB vesicles. The polymerization in DODAB vesicles may he regarded as a special encapsulation reaction, where a core of water is being encapsulated with polymer, possibly leading to hollow latex particles. Proper characterization ofthe processis essential as explainèd in chapter 6, where Cryo-TEM and steady state fluorescence polarization have been applied as valuable tools in monitoring the polymerization process. Monoroer partitioning, i.e. the distribution of monoroer over the different phases bas been measured as function of temperature fot
different monomers as described in chapter 7. It appeared that the phase transition temperature ofDODAB and the size ofthe vesicles baS a significant effect on the solubilization of monoroer into the vesicle bilayer. Polymerization in DO DAB vesicles rnay heregardedas an unconventional emulsion polymerization from a kinetic point of view.

Encapsulation of Inorganic Silica Particles using DO DAB Bilayers 193
The system may be regarded as a quasi two dimensional polymerization system where diffusion processes have a dominant effect upon the mechanistic events in the polymerization processes. As explained in chapter 8, temperature seems to be the most important parameter to be considered. When the attention is focused on the encapsulation of inorganic silica partiel es, the first observation is that this reaction may not differ too much from a polymerization in DO DAB vesicles with respect to monoroer partitioning and polymerization kinetics. The core of water is replaced by an inorganic silica core. Therefore, the objective of this chapter is to use the prior knowledge in the encapsulation of inorganic silica particles using DODAB bilayers. Additionally, the modification ofthe silica partiele surface with DO DAB needs to be investigated. In this case the modification is performed by mixing a DODAB vesicular dispersion with a dispersion of silica particles as described in section 2.3.4. The adsorption isotherm should be determined, because when too much DODAB is beinf used, free vesicles may remain in the system causing secondary nucleation. The product then may be a mixture of encapsulated silica particles and 'hollow polymer particles'. To prevent secondary nucleation, the excess of free, non adsorbed DO DAB species can he removed from the solution by centrifugation. Another question to be answered is; wil! the DO DAB surfactant molecules adsorb as a bilayer onto the silica surface? Procedures to evaluate this issue wiJl be discussed in this chapter. Finally the encapsulation reaction wil! be discussed in re lation to the obtained morphology of the particles but also to evaluate to which extent this process is kinetically comparable to the polymerization in vesicles.
9.2 Experimental Section 9.2.1 Materials Dioctadecyldimethylammonium bromide (OODAB, Fluka Chemie) was used as received. Styrene was distilled at reduced preasure under nitrogen and storedat 4°C. Water was purified by a Millipore Milli-Q system. Tetrahydrofuran (THF, Merck, p.a.), methanol (Merck, analytical grade), ethanol (Merck, analytical grade), benzoyl peroxide (BPO, Aldrich), N,N-dimethylaniline (DMA, Aldrich), hydrochloric acid (HCL, Merck), potassium hydroxide (KOH, Merck), p-Toluenesulphonic acid (sodium salt, Aldrich) were used as received. tetraethylorthosilicate (TEOS, 98%, Aldrich) and ammonium hydroxide (NH3, 25% in water, Janssen Chimica) were used for the preparation ofthe silica.

194 Chapter9
9.2.2 Preparation ofDODAB vesicles DODAB vesicle solutions were prepared by dissolving the synthetic surfactant in water heated to 60°C followed by sonification for at least si x hours. Typical DO DAB concentrations were between 6 10"3 mol dm"3 and 20 10"3 mol dm"3
• For estimating the average vesicle size and stability an argentiometric titration ofthe bromide counterions bas been used, see section 6.2.3.
9.2.3 Preparation of silica particles For the preparation of silica particles with an average diameter of 200 nm, 400 ml of water, 400 ml ethanol, 45 mi ofNH3 solution and 50 g ofTEOS were added to the reactor. The stirring device (RW 20 DAM Janke&Kunkel, IKA werke) was adjusted to 200 rpm and the reactor was thermostatted at 20 °C. The resulting silica dispersion was dilllyzed for a week in a dialysis tube to remove the excess ofNH3 and ethanol. The diameter ofthe silica particles was checked with Transmission Electron Microscopy (Jeol FX·2000), The Ç·potential ofthe silica particles as function of pH was measured with a Matec SSPl (Matec Applied Sciences) using 0.1 M HCL solution for the forward ritration and 0.1 M KOH for the backward titration.
9.2.4 Modification of silica particles Different amounts of a 10 10·3 tnol dm"3 DöDAB solution were added toa constant volume of silica dispersion. The samples were shaken for at least S hours at 20 °C. These modified silica particles can he used further irt the encapsulation process. However, further treattnents were also performed by centrifugation of this dispersion for 2 hours at 6000 rptn. The supernatant was separated from the residue by decantation. The siliêa residue was redispersed by addition of water and sonificatîon for at leàSt 2 hours
9.2.5 (Inverse-phase) High Perfonnance Chromatography The DODAB concentration in the supernatant was measured by méans of inverse phase ion~ pair HPLC. The chromatographlc analysis were performed on a HPLC appal!lltus equipped with a Beekman 100 A pump, operatingat an eluent flow of 1.0 m11mîn. The column used was a Zorbax RX-Cl8 column (Rockland TechnCJlögies Inc.,Newport, USA): partiele siteS J.UTI; specific area 180 m2/g and pore site 8 nm. Measurements ofthe column emuent were done with a Vvidee-l 00-lll Uv~detector at 254 nm wavelength. the eluent consisted of a mixture of water and methanol, 75:25 volume ratio, with 5 10"3 mol dm4 p-Toluene sulphonic acid Clllibration curves for DODAB were obtained by injections of eluent solutions of different OODAB concentrations. The injection volume was 5 ~-tl.

Encapsulation of Inorganic Silica Particles using DO DAB Bilayers 195
9.2.6 Steady state fluorescence polarization Steady state anisotropy measurernents were perforrned on water, bare silica particles,
DODAB vesicles, modified silica particles and the initia! adsorption systern with a SLM
fluorometer at an excitation wavelength of 360 nrn at a temperature of 25 °e. Emmision
intensities were taken above 418 nrn. The samples were labelled with a diphenylhexatriene
(DPH) probe by incubating an ethanolic DPH-solution into the bilayers. Typical DHP
concentrations in the bilayer species were 2 10"10 mol dm·3 Irnrnediately after incubation of
the probe, the depolarization was measured from which the value for the anisotropy was
deterrnined, see section 6.2.4.
9 .2. 7 (Cryo )-Transmission Electron Microscopy These techniques were used for the visualization of modified silica particles and
encapsulated silica partic les. The experimental procedure of these techniques has been
described extensively insection 6.2.5.
9.2.8 Determination ofthe Ç-potential ofmodified silica particles By deterrnining of the Ç, -potential of modified silica partic les, after redispersion, the surface
charge can be foliowed as function ofthe arnount ofDODAB added to the initia] silica
solution. The Ç,-potentials were measured by Doppier Electrophoretic Light Scattering
Analysis (DELSA), which combines electrophoresis and laser doppier velocimetry.
Electrophoresis characterizes particles by their movement in an applied electric field.
Doppier velocimetry measures the electrophoretic mobility (EM) ofthe particles by
analyzing the doppier shifts of scattered light. The Ç,-potential is calculated from the
obtained electrophoretic mobility according to:
Ç=(4JtrtEM)/s (9.1)
where 11 is the viscosity ofthe solution and & is the dielectric constant.
9.2.9 Swelling ofmodified silica particles with styrene The swelling ofDODAB modified silica particles with styrene is govemed by monorner
partitioning between the aqueous phase and the bilayer modified silica particles. The
experimentalset-up forswelling experiments has been described insection 6.2. 1 l, a
technique was used that prevented direct contact between the modified silica particles
and the monomer phase. Swelling experiments have been perforrned at 20 °e and 60 °e.
Monorner concentrations have been deterrnined using High Performance Liquid
ehromatography (HPLC) as described insection 6.2.8. All swelling experiments were carried
out until phase equilibrium was reached.

196 Chapter9
9.2.1 0 Encapsulation experiments Encapsulation experiments ofthe modified silica particles were performed in a closed thermostatted reactor set-up at 20 °C and 60 °C. The swollen modified silica solution was transformed from the swelling set-up to the polymerization reactor. The initiator system used was DMAIBPO, dissolved in 10 mi ofTHF. A volume of0.5 ml ofthis solution was added to the reactor. The BPO as well as the DMA concentration at the beginning of the reaction was 1.25 10-3 moldm-3
, based upon total reaction volume. Samples were taken as function of time and conversion analysis was performed using HPLC.
9.3 Results and Discussion 9.3.1 Adsorption behavior ofDODAB on silica particles Adsorption of surfactant at the solid/aqueous solution interface has been extensively studied in order to understand better the interactions between the surfactant and the solid surface1
'2
'3
•
Generally, it has been found that the adsorption of surfactant is affected by the surfactant structure, pH, ionic strength, and temperature. Due to the electrostatic interaction between the positively charged headgroup ofDODAB molecules and the negatively charged surface ofthe silica particles, adsorption ofOODAB onto sîlîca spheres is favoured4
• According to Esumi et atl and Kitiyanan et aiS, cationic surfactauts with more than one hydrocarbon chain show a high affinity for adsorption. They also consider adsorption to be an irreversible process. Carmona-Ribeiro studied the adsorption ofOODAB vesicles onto polystyrene particles4 and Esumi et at3 did the same for dioctadecyldimethylammonium chloride (OODAC) vesicles on silica. Both authors are confident that surfactant delivery occurs via vesicles rather than via single surfactant molecules as presented schematically in Figure 2.8. They based their statements on the short time required for adsorption. Single surfactant molecule delivery requires a OODAB molecule to leave the vesicle structure, diffuse through the aqueous phase and adsorb at the silica surface. Since the time for adsorption is much shorter than expected for the mechanism of single molecule delivery, the mechanism of vesicle adsorption must be operative here3.4. The amount ofDODAB adsorbed on the silica surface wilt increase with increasing free OODAB concentrationin the solution until a saturation value is reachedu6
• This adsorption behavior can bedescribed by a Langmuir adsorption isotherm.

Encapsulation of Inorganic Silica Particles using DO DAB Bilayers 197
9.3.1.1 Characterization ofthe silica sur.fàce
In order todetermine the adsorption isotherm ofDODAB on silica, it is necessary to check
whether the silica surface is negatively charged. The formation of silica particles is actually a
polymerization oftetraethyl orthosilicate (TEOS) in water with-OHand -OR as the resulting
endgroups. The hydroxyl groups will partly dissociate to -0- and H+, depending upon the pH
ofthe solution. The pH dependency ofthe surface charge can be determined by measuring
the Ç-potential ofthe particles during titration with astrong acid and/or strong base. Although
the Ç-potential is nota quantitative measure ofthe surface charge, it gives an indication of
the sign of the surface charge and the point ofzero charge 7. The pH dependency of the Ç
potentlal of silica particles is shown in figure 9.
Figure 9.1
20
0
"' "' > ·20 • §. A
• A iii "' A ~ ..oiO • .!! • 0 Q.
-60 • .!! • CD •• N ••
.SI) •• ••• -100
2 3 4 5 6 8
pH(-)
Ç -potential of silica particles as a function of pH, (A) is the forward ritration using HCL, and <•> is the back ritration using KOH
It is assumed that the silica particles do not agglomerate before or during the titrations. Note,
the surface charge ofthe silica particles is negative when the pH ofthe solution is above 4.
This means that there is a driving force for adsorption ofDODAB surfactant species on the
surface, since the pH ofthe solution during modification is 7.9. The forward and backward
titrations do not result in simîlar curves. This hysteresis effect may be caused by a time
interval between ti trant addition and measurement that is too short to allow full equilibration
of the sample.

198 Chapter9
9.3.1.2 Determination ofthe adsorption isotherm of DODAB on
silica particles
The free DODAB concentration is an essential parameter for the determination of a quantitative adsorption isotherm. According to several authors8
•9
, the free DODAB concentration in the supernatant after centrifugation can be analyzed in several way.s. Huang et al10 and Helboe et al11 performed quantitative determination ofDODAB by reversed-phase HPLC using ultraviolet-absorbing counter ions. p-toluene sulphonic acid is an ultravioletabsorbing ion which forms a complex with DODAB. The complex is not ultravioletabsorbing. When p-toluene sulphonic acid is dissolved in the eluent of a suitable HPLC apparatus, quantitative indirect UV-detection ofDODAB is possible. Unfortunately, this procedure did not give reproducible results for this specific system. Therefore, the evaluation of a quantitative adsorption isotherm was impossible. A qualitative adsorption isotherm could still be obtained by measuring the Ç-potential of the silica particles modified with different amounts of DO DAB, by means of the DELSA technique. In order to obtain a series of differently modified silica partiel es, a bare silica solution and 1 0* 10"3 mol dm"3 vesicle solution were mixed in several volume mtios between 1 and 100. After centrifugation and redispersion in water, the pH ofthe solutions was 7.5 ± 0.5. The measured Ç-potentia1 ofthe particles as a function ofthe initial DODAB concentmtion is depicted in Figure 9.2. The initial DODAB concentmtion is the amount ofDODAB (in moles) added to the silica solution, divided by the amount of dry silica present in the mixture before centrifugation. Note, the inversion of surface charge from negative to positive is clearly visible. The Ç-potential increases with increasing amount ofDODAB and reaches a saturation level. This qualitative adsorption isotherm is valid at pH values of approximately 7.5. At higher or lower pH values the surface charge ofthe bare silica will be different, as can beseen in Figure 9.1. Hence other pH values yields other adsorption isotherms.

Encapsulation oflnorganic Silica Particles using DO DAB Bilayers
Figure 9.2
~j I • I •
• 20
> g 0
:i ë • 'Ë -20 Q. I ,l! <D -40 N
-60
Added amount of DO DAB (mollgsilica)
Qualitative adsorption isothenn ofDODAB on silicaat pH"' 7.5 ± 0_5, diameter silica particles ca 200 nm
199
From tigure 9.2, it can be observed that DODAB surfactant molecules are adsorbed on the silica particles in a bilayer contiguration, since the surface charge has inverted. It is obvious that when the total amount ofDODAB added is larger than the saturation level, conditions are created fora mixed system, wbere vesicles exists next to moditied silica partiel es. This bas been observed with cryo-TEM, see section 9.3.1.3.
9.3./.3 Bilayer adsorption?
In order to get a detinite answer about the contiguration of the DODAB molecules, fluorescence measurements were performed, at 20 °C, on samples prepared during the different stages ofthe moditication process. The initial added amount ofDODAB was 1 *1 o-3
mol/g,ilica, which is the saturation level. The results ofthe fluorescence polarization measurements are presented in Table 9.1
Table 9.1 Results of the Fluorescence Polarization measurements
Sample
Water Bare silica particles T otal adsorption system Vesicles in supernatant Redispersed modified silica particles
Anisotropy (P)
0 0 0.25 0.30 0.21
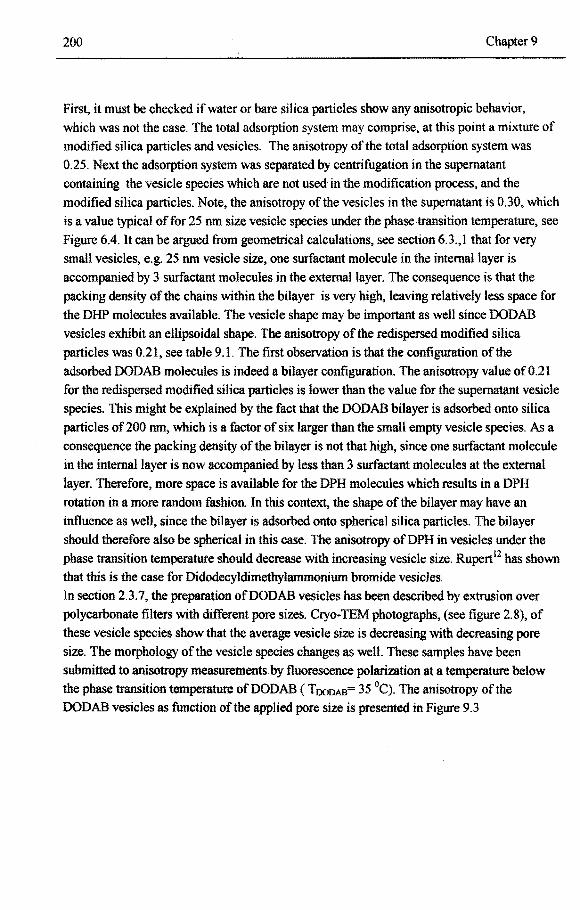
200 Chapter9
First, it must be checked ifwater orbare silica particles show any anisotropic behavior, which was not the case. The total adsorption system may comprise, at this point a mixture of modified silica particles and vesicles. The anisotropy ofthe total adsorption system was 0.25. Next the adsorption system was separated by centrifugation in the supernatant containing the vesicle species which are not used in the modification process, and the modified silica particles. Note, the anisotropy ofthe vesicles in the supernatant is 0.30, which is a value typical of for 25 nm size vesicle species under the phase transition temperature, see Figure 6.4. lt can be argued from geometrical calculations, see section 6.3.,1 that for very small vesicles, e.g. 25 nm vesicle size, one surfactant molecule in the intemallayer is accompanied by 3 surfactant molecules in the external layer. The consequence is that the packing density of the ebains within the bilayer is very high, leaving relatively less space for the DHP molecules available. The vesicle shape may be important as well since OODAB vesicles exhibit an ellipsoidal shape. The anisotropy of the redispersed modified silica particles was 0. 21, see table 9 .1. The first observation is that the contiguration of the adsorbed OODAB molecules is indeed a bilayer configuration. The anisotropy value of0.2l for the redispersed modified silica particles is lower than the value for the supernatant vesicle species. This might be explained by the fact that the OODAB bilayer is adsorbed onto silica particles of200 nm, which is a factor of six larger than the small empty vesicle species. As a consequence the packing density ofthe bilayer is not that high, since one surfactant molecule in the intemallayer is now accompanied by less than 3 surfactant molecules at the external layer. Therefore, more space is available for the DPH molecules which results in a DPH rotation in a more random fashion. In this context, the shape of the bilayer may have an influence as weU, since the bilayer is adsorbed onto spherical silica particles. The bilayer should therefore also be spherical in this case.· The anisotropy ofDPH in vesicles under the pbase transition temperature should decrease with increasing vesicle size. Rupert12 bas shown that this is the case for Didodecyldimethylammonium bromide vesicles. Insection 2.3.7, the preparation ofDODAB vesicles bas been described by extrusion over polycarbonate filters with different pore sizes. Cryo-TEM photographs, (see tigure 2.8), of these vesicle species show that the average vesicle size is decreasing with decreasing pore size. The morphology ofthe vesicle species changes as welt. These samples have been submitted to anisotropy measurements by tluorescence polarization .at a temperature below the phase transition temperature ofDODAB ( ToooAB= 35 °C). The anisotropy ofthe OODAB vesicles as function ofthe applied pore size is presented in Figure 9.3
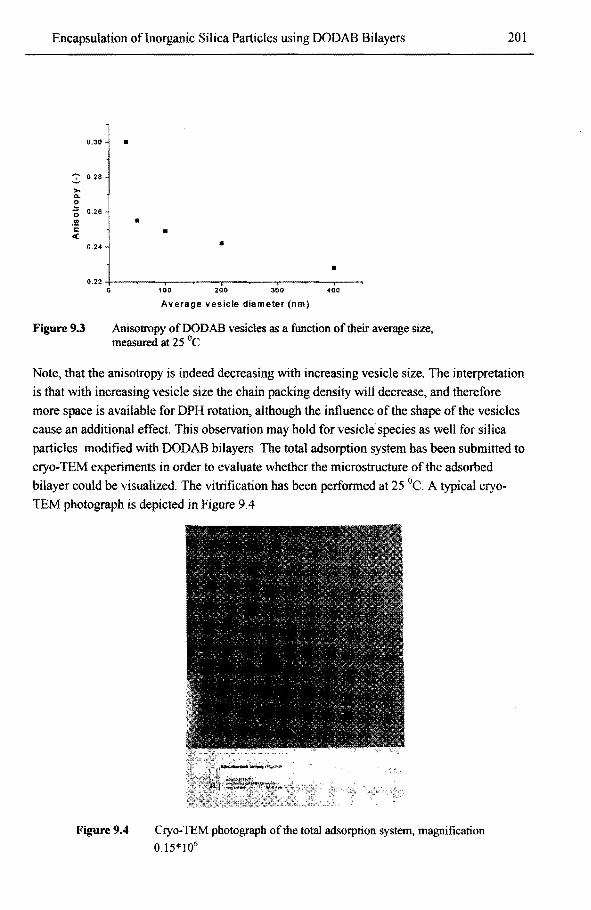
Encapsulation of lnorganic Silica Particles using DO DAB Bilayers
0"30
0"~8 ->-<>. 0
~ 0"26
. !! c: <(
0"24
0.22
Figure9.3
•
• •
• 100 200 300 400
Average vesicle diameter (nm)
Anisotropy ofDODAB vesicles as a function oftheir average size, measured at 25 °C
201
Note, that the anisotropy is indeed decreasing with increasing vesicle size. The interpretation is that with increasing vesicle size the chain packing density will decrease, and therefore more space is available for DPH rotation, although the influence of the shape of the vesicles cause an additional effect. This observation may hold for vesicle species as well for silica particles modified with DO DAB bilayers. The total adsorption system has been submitted to cryo-TEM experimentsin order to evaluate whether the microstructure ofthe adsorbed bilayer could be visualized. The vitrification has been perforrned at 25 °C. A typical cryoTEM photograph is depicted in Figure 9.4
Figure9.4 Cryo-TEM photograph ofthe total adsotption system, magnification 0.15*106

202 ehapter9
Unfortunately, from these experiments it is not possible to get a definitive answer about the morphology ofthe adsorbed bilayer. Note, however, that this is a mixed system comprising modified silica particles as well as ellipsoidal vesicle species. The vesicle species are not observed when the separated redispersed modified silica particles are investigated with cryoTEM. Although it is not the objective to study the mechanisms ofbilayer adsorption onto silica particles in detail, it may be concluded that the general scherne of surfactant adsorption in figure 2.5 seems to be valid.ln the case ofDODAB vesicles, the breakup of these species may occur at the sharp edges ofthe vesicles. Unfortunately, with the experimental techniques available only the initia! situation and the final situation of the adsorption process can be characterized. Therefore, further research in this area should be focused on the development of on-line characterization techniques capable of monitoring the intermediale stages of the modification process.
9.3.2 Monomer partitioning of styrene into bilayer modified silica particles In chapter 7, partitioning ofmonomer(s) into smal! OODAB vesicles has been described. It appeared that temperature ofDODAB bas a significant effect upon the arnount ofmonomer solubilized in the DODAB vesicles. Also the vesicle size, which influences the chain packing density, is considered to be important. It is expected that the same phenomena are also applicable when monomer partitioning of styrene into bilayer modified silica particles is considered. The effect oftemperature on the partitioning bas been investigated by running the partitioning experiments at 20 °e and 60 °e, i.e. below and above the phase transition temperature respectively. The swelling process has bee described insection 6.2.11. One blank experiment has been performed where unmodified silica particles have been submitted to the swelling process. The monomer concentration in the aqueous phase was equal to the monomer concentration in the silica phase, indicating that no monomer adsorption had occurred onto the surface of the silica partic les. This indicates that a surface modification is essential in order to force the monomer towards the surface ofthe silica particles. The modîfied silica particles used showed a maximum in the <;-potential, indicating that the DO DAB adsorption is at saturation. lt is assumed that all free vesicles are being removed by centrifugation. The final styrene concentration in the silica phase was 5.4*10.3 mol dm-3 at 20 0e and 15.9*10-3 mol dm-3 at 60 °e. As explained insection 9.3.2, a quantitative determination ofthe adsorption isotherm was impossible. eonsequently, the amount of DODAB adsorbed on the silica surface is unknown and a quantitative comparison between the styrene saturation concentration in the surface bilayers and that swollen in DODAB vesicles can not be made.

Encapsulation of Inorganic Silica Particles using DODAB Bilayers 203
On the other hand, the saturation concentration of styrene at 60 °e divided by the saturation
concentration of styrene at 20 °e was found to be ca. 2 for DO DAB vesicles, see section
7.3.1. For the bilayer modified silica particles this ratio is ca. 2.8, i.e. ofthe sameorder of
magnitude. This indicates that temperature has a significant effect on the partitioning of
styrene on modified silica particles as well, and that the phenomena determining phase
equilibria may be similar at molecular level for both systems. The (small) dîfference in the
ratio may be caused by ditTerences in partiele diameter. The modified silica particles are
larger (200 nm) than the vesicles (30 nm). The bilayer adsorbed onto the silica may have a
lower surfactant density than the bilayer of 'empty' vesicles, which in the former case allows
more styrene inside the bilayer.
9. 3.3 Encapsulation of inorganic silica particles The encapsulation of inorganic particJes using twin-tailed surfactant in the modification
procedure, is a complex process. This section will be focused on the final stage of the
encapsulation procedure; the polymerization reaction itself
9. 3. 3.1 Morphology of the encapsulation products Insection 9.3.1.3 it has been mentioned that when the total added amount ofDODAB is
larger than the saturation level, conditions are created for a mixed system, where vesicles
exist next to modified silica partiel es. When no separation stage is being performed on the
solution prior to the encapsulation reaction, it is obvious that the polymerization of this
system may result in encapsulated silica particles next to polymerized vesicles as shown by
conventional TEM in Figure 9.5.
Note, the system is a mixed system, i.e. it contains polymerized vesicle species and silica
partic les. The silica partiele are surrounded with lobs of polymer, indicating an encapsulating
layer. It is clear that after adsorption ofDODAB on the silica particles, the excess of
surfactant must be removed in order to avoid polymerized vesicles in the system. When this
condition is futtilled the encapsulation of si! i ca particles with styrene using DO DAB bilayers
can be performed successfully as shown in Figure 9.6.

204
Figure9.5:
Figure 9.6:
.Chapter9
eonventional TEM photograph of encapsulated silica partiele together with polymerized vesicles, T= 60 °e, solid content 0.08 gig, initiator AIBN, eAJBN= 1*10"3 mol dm"3
, magnification 0.2*106
(a) (b)
eonventional TEM photograph of an unmodified silica partiele (a), magnification 0.5 106
, and an encapsulated sitica partiele (b), magnification l l06,
Encapsulation reaction: T = 20 °e, solid content 0.012 gig, initiator BPO/DMA, eBro=CoMA = l * l 0"3 moldm"3

Encapsulation of lnorganic Silica Particles using DO DAB Bilayers 205
Note tbat tbere is an interface visible between tbe silica partiele surface and the polystyrene
surrounding the silica partîcle. In the case of an unmodified silica partiele this interface is not
observed. The thickness of the polystyrene layer is approximately 7 nm, which is al most
equal to the thickness ofthe initia! bilayer ofDODAB. The samples submitted toTEM
showed only encapsulated species and no polymerized vesicles. All in all this leads to the
condusion that selective encapsulation of silica particles is possible via a modification prior
to tbe encapsulation reaction using twin-tailed DO DAB surfactants.
The morphology obtained is a silica core surrounded by a polystyrene shell. It should be
emphasized, however, that these polymerizations were conducted at 20 °e, which is well
below the phase transition temperature ofDODAB. The encapsulation reactions also has
been perforrned at 60 °e, i.e. above the phase transition temperature. Intbat case the
morphology of these encapsulated species is quite different as presented in figure 9.7.
Figure 9.7: Conventional TEM photographs of an encapsulated silica particles magnification 0.5 106
, Encapsulation reaction: T 60 °C, solid content 0.012 gig, initiator BPO/DMA, CBro=CDMA = l * l 0"3 moldm"3

206 ehapter9
It is obvious that the morphology ofthe silica particles after encapsulation has changed, as compared with the morphology obtained at 20 °e. The surface bas a rather rippled curvature. Two effects may explain the ditTerenee in morphology. Generally twin-tailed surfactants show a relatively slow exchange of surfactant species in and out ofaggregate structures. Tbe typical rate ofsurfactant exchange is 102-103 s18
, but the processis highly dependent on temperature and the presence of solventwithin the aggregate. Mosset al18
, measured the exovesicular rate coefficientfor DODAe related aggregates as a function of temperature, and showed that the exovesicalar rate coefficient increases significantly ftom 0.025 s·1at 25 °e to 0.1 s·1 around the phase transition temperature of DODAe (T m=34 °C). Unfortunately, no experimental data is available at higher temperatures, but the trend is clearly visible. As a result of the increased rate of surfactant desorption, the bilayer around the silica partiele may partly lose its ordered structure during polymerization, teading to a rippled surface. The second reason is also related to temperature, but ftom the polymerization reaction point of view. In appendixBit is explained that phase separation phenomena canoccur in solvent swollen DODAB vesicles. This phase separation behavior can affect the microstructure ofthe bilayer. Since temperature is the key parameter, the process may he called thermally induced phase separation (TIPS). Phase separation can also he induced by a polymerization reaction. In this system styrene is converted into polystyrene. It may he possible that when polymerization is proceeding. polystyrene will become immiscible with the DO DAB surfactant ebains and phase separation may occur during some stage of the polymerization. The phase diagram ofthe DODAB-polystyrene system may he constructed, assuming an average molecular weight of polystyrene of 105 g mor1
. Tbe equation which describes the spinodal points for this system is given by:
(9.2)
Where Pn,IJ(IDAB and Pn,PS are the degree ofpolymerization ofDODAB and polystyrene respectively, cjl1 is the volume ftaction ofDODAB, cjl2 is the volume fraction of polystyrene and x is the Flory-Huggins interaction parameter. Tbe calculated binair_phase diagram is given in tigure 9.8

Encapsulation of Inorganic Silica Particles using DO DAB Bilayers 207
Figure9.8
: ,. Q12
x Q14
Q16
•
~~~~ .. ..... •
QD+-~------~~--~----~---.--~-. (10 (14 (\6
OCil'B ~
Q8 1,0 ~
The spinodai curve for DODAB-polystyrene as a function ofthe volume fraction of polystyrene, P n,OODAB=9, P n,PS= 1000
Note that when the Flory-Huggins interaction parameter becomes larger than 0.06 then,
thermodynamically, the system is able to phase separate. Phase separation processes during
an isothermic polymerization reaction can be visualized using a temair phase diagram for
DODAB-styrene-polystyrene as schematically presented in figure 9.9.
Figure9.9
DO DAB
Styrene Qne Phase Region (Homogeneous)
Two Phase Region (Heterogeneous)
Polystyrene
A schematic temair phase diagram ofthe DODAB-styrene-Polystyrene
system, Lines A-A', B-B' and C-C' represent polymerization lines and the horizontal
tie line connecting the co-existing phases

208 Chapter9
Assuming that the composition ofDODAB and styrene results in a homogeneous phase, the initia] composition is located on the DODAB-styrene axis. When polymertzation proceeds a reaction line is followed as indicated by the dasbed lines in tigure 9.9. At low conversion of styrene the binodalline (solid line) is crossed and the system beoomes metastable. However, when the spinodalline is crossed ( dasbed line), the system wilt phase separate. The position of the binodal and spinoclal curves depend on the molar mass of polystyrene and the interaction parameters of styrene-polystyrene, DODAB-styrene and DODAB-polystyrene. Thermodynamically this system may phase separate which will definitely change the morphology of the polymerized bilayer. In this case it may be possible that polystyrene is pusbed out. However, the DODAB system is a metastable system, where the morphology does not only depend upon thermodynamics but, more importantly, upon the rate of phase separation and the rate of polymertzation. In fact the system may be dominantly kinetically controlled Therefore, morphology changes by phase separation mechanisms can only occur under suitable expertmental conditions, i.e. high temperatures fora relatively long pertod of time, see tigure 9. 7. However this is an important issue which should be considered continuously. The change in morphology during and after polymertzation may be prevented by the DO DAB aggregates at temperatures below the phase transition temperature.
9.3.3.2 Kineticevaluation ofthe encapsulation process using DODAB bi/ayers Kinetic studies on free radical polymerization reactions taking place within organized media are vary scarce. Wu et al15 described the polymerization of styrene in an adsorbed SDS surfactant bilayer, onto alumina,. A quasi-emulsion kinetic approach is adopted to descrtbe the polymertzation behavior. Using Smith-Ewart theory, these authors found that the average number ofradicals per alumina partiele is less than unity, which indicates instantaneous termination. Additionally, rnass-transfer of monoroer from the supernatant to the polymerizing loci is important Unfortunately, the comparison ofthe encapsulation system under investigation with the polymerization in SDS micelles is not possible, due to the fast surfactant exchange between micelles and single surfactant molecules. Polymerization in DODAB vesteles is possible, since surfactant partitioning is rather slow, even above the phase transition temperature. The kinetic evaluation of polymerization in DODAB vesicles has been described in chapter 8. When this system is taken as reference, a kinetic comparison can be made between the encapsulation reaction using OODAB bilayers and the polymertzation in DODAB vesicles. This section will focus on the question to which extent this process is kinetically comparable to that of polymertzation in vesicles.

Encapsulation ofJnorganic Silica Particles using DODAB Bilayers 209
For proper kinetic comparison, the temperature ofboth types of reactions must be equal, and
the initiator concentration with respect to the morromer concentration must be the same.
Finally, the total volume available for polymerization should be the same. The experimental
conditions applied during the polymerization (P) and the encapsulation (E) as a function of
temperature are depicted in Table 9.2.
Table 9.2 Experimental conditions for the polymerization and encapsulation reaelions
Temp Diameter Nv.. Ns11 kp mves Initiator Reaction (<'C) (nm) (dm-3) (dm-3) (dm3mol·1s-1) (mol dm-3)
p20 20 34 5.4* 1017 68 10.9*10•3 BPO/DMA BPO/DMA
Pao 60 29 8.5* 1017 339 16.8*10-3 BPO/DMA
E20 20 236 1.42* 1015 68 5.40*10"3 BPO/DMA
Eao 60 236 1.42* 1015 339 15.9*10-3
It should be noted that the intrinsic difference between both systems is v., which is caused by
the difference in diameter. Conversion vs time plots of encapsulation reactions at 20 and 60
°C are presented in Figure 9.10. In the same plot, the conversion vs time data of
polymerization in DODAB vesicles at 20 and 60 °C are depicted. It appears that for both
types of polymerizations the effect of temperature on the rate of polymerization is significant
When the temperature is above the phase transition temperature the rate of polymerization is
higher than when the temperature is below the phase transition temperature. This may be
caused by the increase in the propagation rate coefficient, but also by an increase in the
number of radicals per vesicle. As explained in section 8.3 .I, at higher temperatures diffusion
of species into vesicles may be faster, leading to higher phase transfer events. Assuming that
all 'vesicles' are initiated at the same time, the number of radicals per vesicle is less than
unity, which is similar to the observations made by Wu et al 15.
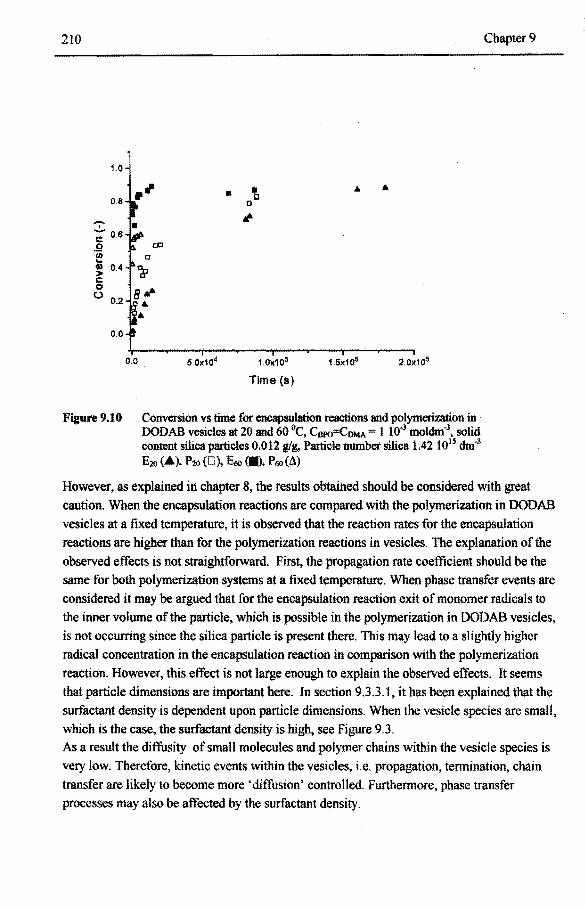
210
1.0
0.8
...... I
'ë' 0.6 .9 ~ ~ 0.4
(.) 0.2
0.0
Figure9.10
•' IÎ Ä Ä • ótl
0.0
11'
OJ
ó
5.0K104 1.0K105 1.5x10⁵ 2.0x10⁵
fime (s)
Conversion vs time for encapsulation reactions and polymerization in DODAB vesicles at 20 and 60 °C, C8ro=CDMA 1 10·3 moldni\ solid content sllica particles O.oi2 gig. Partiele numbet silica 1.42 1015 dtn-3
E20 (.ä.), Pto (D), Eoo (11), Poo (i\)
Chapter9
However, as explained in chapter 8, the results obtained should he considered witb great caution. When the encapsulation reactions are compared with the polymerization inDODAB vesicles at a fixed temperature, it is observed that tbe reaction rates for the encapsulation reactions are higher than for the polymerization reactions in vesicles. The explanation of the observed effects is not straightforward. First, the propagation rate coefficient should be the same for both polymerization systems at a fixed temperature. When phase transfer events are considered it may he argued that for the encapsulation reaction exit of monomer radiéals to the inner volume ofthe particle, which is possible in the polymerizatîon inDODAB vesicles, is not occurring since the silica partiele is present there. This may lead to a sllghtly higher radical concentration in the encapsulation reaction in comparison with the polymerization reaction. However, this effect is not large enough to expláin the observed effects. It seems that partiele dimensions are important bere. Insection 9.3.3.1, it bas been explained that the surfactant density is dependent upon partiele dimensions. When the vesicle species are smalt, which is the case, the surfactant density is high, see Figure 9.3.
As a result the diffusity of smalt molecules and polymer ebains within the vesicle species is very low. Therefore, kinetic events within the vesicles, i.e. propagation, termination, chain transfer are likely to become more 'diffusion' controlled. Furthermore, phase transfer processes mayalso be affected by the surfactant density.

Encapsulation oflnorganic Silica Particles using DODAB Bilayers 2ll
When the surfactant ebains are tightly packed, the entry of oligomeric species may become diffusion controlled which possibly causing that entry to be no Jonger instantaneous. This
wilt lower the entry rate, and consequently the average number of radicals in the vesicle
speet es. For larger species the surfactant density is smallerand therefore there is more space available
for small species to diffuse. The diffusity of such species will be larger teading less diffusion
controlled kinetic events within the silica species. It may also be the case that the phase
transfer events will he faster. This may lead to a higher radical concentration in the silica
species and therefore higher rates ofpolymerization. To confirm this explanation more
experiments are required on encapsulation reactions as well as on normal polymerization
reactions, before the kinetic behavior can be uuraveled quantitatively. The effect of partiele
dimensions on polymerization kinetics should be considered as an important item. Note that
the shape ofthe conversion curves and the temperature dependency are comparable forboth
processes. Thus, sofar there are no reasons to reject the assumption that encapsulation and
polymerization in vesicles are kinetically comparable, except for the effect of partiele dimensions on diffusity and phase transfer events.
9.4 Concluding remarks In this chapter the attention has been focused upon the encapsulation of silica particles using DODAB bilayers. It has been shown that when the pH ofthe solution is above 4, the silica
particles are negatively charged and therefore electrastatic interactions with DODAB are
possible. Unfortunately, a quantitative determination of the adsorption isotherm is not
possible. However, a qualitative adsorption isotherm has been determined by measuring the
è;~potential ofthe redispersed silica particles as function ofthe initially added amount of DO DAB. Charge inversion has been observed, indicating that DODAB surfactant species
adsorb as a bilayer, which is confirmed by fluorescence polarization experiments. Phase
equilibrium experiments have been performed on the modified silica particles as function of temperature. The typical phenomena goveming styrene partitioning are similar as in tbe case of the normal DODAB vesicles. Encapsulation reactions on redispersed modified silica will result in silica particles convered with polystyrene with a core~shell morphology. When the separation step is not included in
the procedure, a mixed polymerization system is observed consisting of encapsulated silica particles and polymerized vesicles.

212 Chapter9
Encapsulation reactions and polymerization in vesicles seem to be kinetically comparable, except for the effect of partiele dimensions. The encapsulation reactions are faster than polymerization in vesicles, due to the larger partiele diameter in the former case. The final conclusion is that the selective encapsulation of silica particles with the aid of DO DAB twintailed surfactants is possible. In all the steps in the encapsulation process characterization of the products as well as kinetic and morphological control bas been accomplished.
Relerences
L Schwuger, MJ. in Amonic Surjactonts; Lucassen-Reynders, E.H. Ed.; Surfactant series; Marcel Dekker: New York, 1981, vol. 1 L
2. Dobias, B. in Coagulation and Floccu/ation; Dobias, B., Ed; Marcel Dekker: New York, 1993, vo17.
3. Esumi, K., Matoba, M., Yamanaka, Y., Longmuir, 1996, 12, 2130. 4. Carmona-Ribeiro, A.M., Midmore, B.R, Longmuir, 1992, 8, SOL 5. Kitiyanan, B., O'Haver, J.H., HarweU, J.H., Osawan, S., Longmuir, 1996, 12, 9. 6. Esumi, K., Sagimura, A., Yamata, T., Meguro, K., Colloicls and Surjaces, 1992, 62, 249. 7. Heiman, S.G.I., Oxidepigmentsin water, The colloitkhemical point of view, Department of
Colloidal Chemistry, TUE, Eindhoven, 1993. 8. McPherson, B.P., Rasmussen, H.T., Surf Sci Ser., 1994, 53 (cationic surfactants), 289. 9. Watersj., Surf Sci. Ser., 1994, 53, (cationic surfactants), 235. 10. Huang, C.B., J. Liq. Chmnatogr., 1987, lO (6), 1103. 11. Helboe, P., J. Chomatogr., 1983, 261, 117. 12. Rupert. L.A.M., Vesiclesfrom simple synthetic amphiphiles as membrane mimetic systems, PhD
thesis, University of Groningen, 1987. 13. Wu, J., Harwell, J.H., O'Rear, E.A., Longmuir, 1987, 3, 531. 14. O'Haver, J.H., Harwell, J.H., O'Rear, E.A., Snodgrass, L.J., Waddell, W.H., Longmuir, 1994,
10, 2588. 15. Wu, J., Harwell, J.H., O'Rear, E.A.,J. Phys. Chem., 1987, 91,623. 16. Kitiyanan, B., O'Haver, J.H., Harwell, 1.H., Osuwan, S., Longmuir. 1996, 12, 2162. 17. Carls, C.H.M., luijpers, RP.M., van Herk, A.M., German, A.L., Makromol. Chem. Makromol.
Symp., 1990, 35/36, 535. 18. Moss, RA., Bhattacharya, S., Chatteljee, S., J. Am. Chem. Soc., 1989, 111, 3680. 19. Esumi, K., Matoba, M., J. Jpn. Soc. Colour. Mater., 1996, 69, 7, 443.
20. Funkhouser, G.P., Arevalo, M.P., Glatzhofer, D.T., O'Rear, E.A., langmuir, 1995, 11, 1443.
Epilogue 213
10 EPILOGDE
This thesis describes the encapsulation of inorganic particles via an emulsion polymerization
process. The major objective ofthis investigation was to obtain insight and understanding of
the mechanisms of the encapsulation process at the molecular level, and its dependenee on
the applied process conditions. For this purpose the encapsulation system should be well
defined. The înorganic particles used are silica partiel es, prepared by the Sol-Gelprocessin
water-ethanol solutions. These silica particles are spherical and exhibita narrow partiele size
distribution. In this investigation two physical modification procedures have been used to
make the silica particles more hydrophobic: the blockcopolymer procedure and the twin
tailed surfactant route. Both routes will be evaluated according to concepts, kinetics and
process control of the encapsulation procedure.
Blockcopolymer route The blockcopolymer used is a PEO-PBMA blockcopolymer which forms micelles in aqueous
solutions. These blockcopolymers were chosen as modification agents since the rate of
surfactant exchange is less dynamic compared to surfactant species oflow molecular weight
suchas SDS ..
The PEO-PBMA blockcopolymer is used to hydrophobize the silica particles. Monoroer
partitioning experiments conceming modified silica particles in aqueous solutions showed
that modification is essential in order to adsolubilize styrene at the surface of the silica
partiel es. Monoroer partitioning experiments also revealed that when there is a mixed system,
i.e. micelles, modified silica particles and latex partiel es, the amount of styrene adsolubilized
is different for each partiele morphology. The presence of ethanol in the system decreases the
styrene concentration in the particles, due to improving interactions of styrene-ethanol and
styrene water in the continuous phase.
The kinetic behavior of the polymerization and the encapsulation reaction has been studied
with respect to the influence of ethanol and the influence of partiele morphology upon the
kinetics. lt appeared that ethanol significantly affects the kinetics in the continuous phase. It
seems that phase transfer processes are affected by ethanol. The degree of polymerization of
oligomers, necessary to become surface active is increasing with increasing amount of
ethanol in the continuous phase.

214 Chapter 10
This results in a lower entry rate compared to aqueous systems. Ethanol will decrease the rate of exit as wel!. The morphology of the particles has a significant effect on the kinetic behavior. The entry rate of oligomeric species wilt be lower for modified silica particles than for latex particles of the same size. The exit rate for modified silica particles will be higher than for latex particles of the same dimensions. For both morphologies, pseudo bulk kinetics may be appropriate. However, the radical concentration in the modified silica particles is significant lower than the radical concentration in the latex particles ( when present). This principle, together with the monomer partitioning, illustrates that when secondary nucleation takes place, the main locus of polymerization wil! be in the polymer particles. As result the efficiency of the encapsulation process will decrease. Nucleation phenomena are very important in encapsulation reactions. Studies with respect to nucleation for different systems suggests that general principles, concerning nucleation are applicable for many heterogeneous systems. Secondary nucleation in polymerization reactions will occur when the surface area offered by
the existing particles species is not enough to irreversibly adsorb all surface active oligomers. Secondary nucleation in encapsulation reactions in batch reactors can generally not be prevented. Secondary nucleation during encapsulation can be prevented in semi--continuous reactors, where monomer starved conditions are applied. However, this results in long polymerization times which are commercially not acceptable. Benefit of secondary nucleation can be made in encapsulation reactions by hetercoagulate these particles onto the surface of the silica particles.
Concluding remarks and future developments The overall conclusion is that encapsulation of silica particles is possible via the blockcopolymer route. The efficiency of the encapsulation reaction is highly dependent on the applied experimental conditions. The question in the final application is: Does the secondary formed polymer particles affect the final properties ofthe product negatively?. When this is not the case, i.e. when the chemical composition ofthe formed polymer is compatible with the matrix, then encapsulations can be performed as described in this thesis. When secondary nucleation has to be avoided at all cost, the amount ofblockcopolymer surfactant and the amount of monomer in the system becomes crucial. The presence of micelles should be avoided, and swelling experiments should be performed in reactor set-ups as presented in tigure 4.3, where only the modified layer around the silica particles and the continuous phase are saturated witb monomer. Afterwards the solution can be polymerized. In this context the polymerization ofthe blockcopolymer micelles can be performed in the sameway.

Epilogue 215
Twin-tailed surfactant route
The second route for the encapsulation of silica particles comprises the use of twin-tailed
surfactants. Preliminaty to the encapsulation study, the polymerization inDODAB vesicles
has been investigated. lt appeared that characterization of the individual stages of the process
is of paramount importance. Characterization studies revealed that the morphology of the
DODAB vesicles is dependent upon the preparation procedure. DODAB vesicle species are
thermodynamically metastable but the system seems to be kinetically controlled with respect
to phase separation phenomena. Finally the phase transition temperature ofthe DODAB
vesicles influences phase equilibrium and polymerization kinetics significantly.
Phase equilibria of solvents in DODAB vesicles has been stuclied as function of temperature.
It appeared that bulk thermodynamic roodels do not describe properly the phase equilibria,
but the microstructure of the bilayer should be taken into account. Results also indicate that
micro-phase separation can occur, possibly teading to solvent rich parts and OODAB rich
parts in the bilayer. Phase equilibria of these solvents into vesicles is affected by the size and
the shape of the solvent molecule as well as the hydrophobicity of the solvent.
The kinetic behavior of polymerization in DO DAB vesicles deviates form a conventional
emulsion polymerization. It appeared that polymerization starts at a relatively low volume
fraction ofmonomer, which is similar toa high conversion polymerization. This implies that
the basic reaction steps are ditfusion controlled. Ditfusion of molecules in the bilayer is
characterized by a lateraland a transmembrane ditfusion coefficient. ESR-experiments
showed that the latter quantity is many orders lower than the lateral ditfusion coefficient. As
a consequence entty and exit mechanisms, which are characterized by transmembrane
diftusion, are ditfusion controlled as well. With respect to copolymerization, it appeared that
the selectivity of the copolymerîzation reaction is determîned by the molecular organization
of the bilayer. Whether polymerization in vesicles exhibit a zero-one or pseudo-bulk behavior
is still uncertain.
Studies concerning encapsulation of silica particles with DO DAB bilayers revealed that these
bilayers adsorb on silica particles. Phase equilibria of solvents within these modified silica
particles showed the same behavior with respect to temperature as in the case ofDODAB
vesicles. The adsorption isotherm is determined quantitatively. When too much DODAB is
added, conditions are created fora mixed system, i.e. modified silica particles and DODAB
vesicles.When a separation procedure is performed, prior to the encapsulation reaction,
selective encapsulated silica particles with polystyrene are obtained. The temperature and
reaction time of the encapsulation reaction seems to be important with respect to the
morphology ofthe encapsulated silica species.

216 Chapter 10
Theoretica! thermodynamic considerations suggest that the system DODAB-Polystyrene is able to phase separate, which may change the morphology. However, the polymerization reaction is kinetically controlled, and therefore phase separation can be suppressed by using the proper experimental conditions, i.e. low polymerization temperatures;
Coneluding remarks and future developments
The overall condusion is that encapsulation of silica particles is possible via the twin-tailed surfactaBt route. Additionally a considerable understanding is obtained about polymerization and encapsulation reactionsin general using these bilayers. However, at this stage the conceptsof these polymerization reactions are described and many fundamental questions conceming phase equilibria and polymerization kinetics are existing. This implies that there is sufficient area for future research. The procedure for vesicle preparation should be optimized. Extrusion processes may be suitable for this purpose, see section 2.3.4. Phase equilibrium phenomena of solvents should be determined as function of vesicle size. The solvents studied bere all have a relatively poor interaction with the alkane part of the DODAB chain. Therefore, for basic understanding, solvents should be selected which have a goodinteraction with the DODAB chain, i.e. hexane. Phase separation phenomena during swelling and polymerization will affect monoroer partitioning and polymerization kinetics and should be studied for vesicles, monomer swollen vesicles and monomer swollen polymerized vesicles. Microcalorimetry may be a technique to study these phenomena experimentally. Since ditfusion dominates the kinetic behavior ofthe polymerization reaction, transmembrane and lateral ditfusion coefficients should be determined for vesicles, monomer swollen vesicles and polymerized vesicles as function of vesicle size. With respect to an application in encapsulation reactions with the aid of these twin-tailed surfactants, it can be concluded it is useful to investigate whether the DODAB species can be added to the silica particles as normal surfactant insteadas vesicle species: Forther emphasis should be focused upon process development and upscaling, in order to transform the concepts, presented in this thesis, into a useful application.

Glossary of Symbols 217
Glossary of Symbols
Symbol Definition Unit
A Conversion factor in interval II A' Conversion factor in interval lll As Surface free energy of a nucleus a Headgroup area of amphiphilic molecule (m2) Cm Monomer concentration in latex particles (moldm-3
)
Cm,o Monomer concentration in latex particles at start interval II (mol dm'3)
Cj.O Solubility of species, size j in continuons phase (mol dm-3)
cj_t Concentration of species, size j in continuons phase (mol dm-3) CTEos Concentration ofTEOS (mol dm'3) Crros Initial TEOS concentration (mol dm'3)
CoooAB DODAB concentration (mol dm'3) Caq Solubility monomer in aqueous phase (mol dm-3
)
CrEMPO TEMPO concentration within DODAB bilayer (mol dm'3)
CM Transfer rate constant: kJkP (-) Cmic Concentration styrene in micellar phase (mol dm'3)
C.q Concentration styrene in aqueous phase (mol dm-3)
dx/dt Time evolution of fractional conversion (s-I) D; Diffusion coefficient ofl-mer in aqueous phase (m2s-l) dVm/dt Volumetrie growth rate polymer partiele (dm3s-l) dp Thickness polymer layer (m) dn/dc Refractive index increment df/dt adsorption rate of polymer onto specific surface area (mol m·2s-1)
Dw Ditfusion coefficient of radical species in polymer particles (m2s-l)
DrEMPO Ditfusion coefficient of TEMPO species in bilayer (m2s-t)
d. Extemal vesicle diameter (m) dp Density polymer (gdm-3) dm Density monomer (g dm'3) F; Molar fraction component I in copolymer (-) fl Molar fraction component I in feed (-) Fw Volume fraction water in continuons phase (-) F, Volume fraction styrene in continuons phase (-) F. Volume fraction ethanol in continuons phase (-) Feth Volume fraction ethanol in recipe (-) Fsty Mole fraction styrene in system (-) F Free energy of formation of vesicles (Jmor1
)
Fhend Free energy for bending vesicles (Jmol'1)
Fint Intra vesicular potenrial AG~p Partial molar free energy of mixing monomer I in polymer (Jmor') AG Free energy of formation of a nucleus (Jmor') AG~d Partial molar free energy of mixing component I in
droplet phase; I = ethanol or styrene (Jmor1)
AG;"pp Partial molar free energy of mixing component I in polymer partiele phase (Jmor1
)
AG;"sp Partial molar free energy of mxing component I in silica partiele phase (Jmor1
)

218 Glossary of Symbols
öG Partial free energy of mixing solvent (Jmor') 6Gm Partial free energy of mixing of solvent and polymer (Jmof1
)
öG, Partial free energy contributing from vesicle-water interface (Jmor')
6Gmix Gibbs free energy of mixing solvent and polymer (Jmof1)
H Mean cUTVature vesicles (m) 6Hmix Entbalpy of mixing solvent and polymer (Jmor1)
6Hm.p Melting enthalpy per monomerunit for DO DAB at Tm (jmol"1)
I Initiator I. Retlected light intensity perpendicular to excitation lp Retlected light intensity parallel j Critical chainlengtb for precipitation (-) kp,t Propagation rate coefficient first monomer addition dm3mor1s'1) kp Propagation rate coefficient (dm3mor1s-1) kp,ii homopropagation rate coefficient component I (dm3mor1s-1) kp,ij Cross propagation rate coefficient (dm3mor1s'1) k.i First order rate coefficient for initiator decomposition (s-') kt, Boltzmann Constant (Jmor1K 1)
k.,r Second order rate coefficient for radical entry (dm3mor1s'1) kt Second order rate coefficient for radical termination (dm3mor1s'1) k First order rate coefficient for radical exit (s'')
k.. Escape rate coefficient of radical from particles (s'') ktr Rate coefficient for radical transfer (dm3mor1s'1) koos First order reaction rate coefficient (s'') K Gaussian cUTVature (m) I Length hydrocarhon ebains (m) 61 Bilayer thickness (m) L.iooat, Length of a OODAB molecule (m) Lo,l Chainlength of polymer formed between two laser pulses M Molarmass (gmor1
)
M!'l Monomer concentration in the aqueous phase (mol dm'3) M• Radical concentration in reaction medium (mol dm'3) m Number of species (-) Mo Molar mass ofmonomer (gmor1) Msty Molar mass styrene (gmor') Mrnos Molecular mass ofTEOS (gmo1'1)
Miso4· Persulfate oligomeric radicals composed of Mi monomer units. I 1,2,3
llles Ratio of molar volumes of ethanol and styrene (-) lllso Ratio of molar volumes of styrene and ethanol (-) m.w Ratio of molar volumes of ethanol and water (-) mw. Ratio of molar volumes of water and ethanol (-) m.w Ratio of molar volumes of styrene and water (-) mws Ratio of molar volumes of water and styrene (-) hl"q,sat Monomer concentration in aqueous phase at saturation (mol dm'3) M~oc Monomer concentration at locus of reaction (mol dm'3) N. Number of latex particles per reaction volume (dm-3)
Nav Avagadro's Number (mon Dbar Average number of radicals per partiele (-) Dm,O The initia! amount of monoiner per reaction volume (mol dm'3) n. Refractive index solvent (-) Dp Refractive index polymer (-) Nmic Number of micelles per reactor volume (dm'") Nsilica Number of silica particles per reactor volume (dm-3)

Glossary of Symbols 219
Nves Number of vesicles per reactor volume (dm-3)
NrEMPO,R Flux of TEMPO molecules through plane at position R (mol m·2s"1) N Degree of polymerization (-) n(N) Instantaneous distribution of polymer ebains with
degree of polymerization N (-) n(M) Cumulative polymer chain distribution (-) Pn Degree of polymerization (-) pi Species with chainlength j (-) p Anisotropy of DPH probe within DO DAB bilayer ( -) R Gas constant (Jmor1K 1)
Ro Radius unswollen particles (m)
~ Reactivity ratio of radicals I and j (-) Radical concentration (mol dm-3)
Rp Rate of polymerization (mol dm"3s-1) RMt* Radical with one monomer unit added RM•
n Radical with n monomer units added RMn+t • Radical with n+ 1 monomer units added Rm Radius swollen latex particles (m) R; Radius oligomer 1-mer species, I= I ,2,2 (m) Rsi Radius silica particles (m) R. External radius modified silica particles (m) fmic Radius micelles (m) ro External radius vesicles (m) f; Internal radius vesicles (m) fp Radius polymer particles (m)
R. Reaction rate of TEMPO and ascorbic acid (mol dm"3s1) s Surface area ellipsoidal species (m2)
s Supersaturation of species in solution (mol dm"3) T Absolute temperature (K) T• Total radical concentration in aqueous phase (mol dm"3)
Tm Gel to liquid crystalline phase transition temperature (C) Tc Critical temperature (OC)
Tm,t Equilibrium melting temperature ofOODAB ebains containing styrene in the bilayer (OC)
Time (s) Vp Volume fraction of polymer within polymer species (-) Vm Molar volume monomer (m3 mor1
)
V; Volume of oligomeric 1-mer species, 1=1,2,3 (dm3)
Vs04 Volume of a persulfate molecule (dm3)
Vsty volume fraction of styrene (-) Vsty Molar volume of styrene (m3mor1) V mie Total rnicelle volume (dm3)
Vps Volume fraction PBMA chains in layer situated onto silica particles (-)
Vpsv Volume fraction ofthe PBMA part ofblockcopolymer swollen with styrene situated on silica particles (-)
Vp Absolute volume PBMA part ofblockcopolymer (dm3)
v. Absolute volume styrene (dm3)
V Absolute volume silica partiele (dm3) V,;t Total volume silica particles (dm3
)
Vms Mol ar volume styrene (m3 mort) V me Molar volume ethanol (m3 mor') Vmw Molar volume water (m3 mort) v. Number of bromide ions at external vesicle surface (-)

220 Glossary of Symbols
vlot Total number of bromide ions (-) Vm Molar volume solvent (m3 mor1
)
Vm volume fraction of solvent within polyrner species (-) Vp volume fraction of alkane ebains in swollen vesiele (-) Vpv volume fraction of alkane ebains in swollen vesicle (-) Vp Absolute volume alkane part ofDODAB (dm3
)
Vw Absolute volume water in interior vesicles (drn3)
v. Absolute volume solvent (drn3)
Vt Molar volume solvent (m3 mor1)
v2 Molar volume DODAB chain segment (m3 mor1)
x Conversion (-) x Coordinate within bilayer (-) z Critical chainlength for radical entry (-) y lnterfacial tension (Nm-I)
Ypt Interfacial tension planar monolayer (N m"1)
•• Volume fraction styrene in polymer phase (-)
.Pe Volume fraction ethanol in polyrner phase (-)
'p Volume fraction of polyrner in polymer phase (-) q,, Angle of ineidence (deg) +I Volume fraction solvent (·)
'2 Volume fraction polymer (·)
.P:z.c Critical volume fraction of polymer (·) À. Parameter determined by mode termination (·) a Standani deviation (·) 0d surface density ofthe ebains Jl Average value of a continuous distribution (·) ç Thickness planar monolayer (m) u Volume hydrocarbon DODAB ebains (m3)
P'Silica Density silica particles (g dm"3)
Pp Density polyrner (g drn"3) r Amount of adsorbed species per unit partiele area (mol m"2
)
Xl,p Flory-Huggins interaction parameter between polyrner and solvent (·)
'les Flory-Huggins interaction parameter between ethanol andstyrene (·)
x.. Flory-Huggins interaction parameter between styrene andethanol (-)
Xws Flory-Huggins interaction parameter between water and styrene (-)
Xsw Flory-Huggins interaction parameterbetween styrene andwater (-)
X we Flory-Huggins interaction parameter between water andethanol (-)
lew Flory-Huggins interaction parameter between ethanol and water (-)
lep Flory-Huggins interaction parameter between ethanol andpolymer (-)
lsp Flory-Huggins interaction parameter between styrene and polyrner (-)
Xe Critical Flory-Huggins interaction parameter (-)

Glossary of Symbols
Acronyms
CMC DO DAB DHP QLS CNT TEOS SOS PEO PBMA DLS TEM DCP DMPC HLPC DHP CTAB BA EGDM DISOP
Critica! Micelle Concentration Dioctadecyldimehylammonium Bromide Dihexadecyl Phosphate Quasi-elastic Lightscattering Classica! Nucleation Theory Tetraethylorthosilicate Sodium dodecylsulfate Polyethyleneoxide Polybutyl methacrylate Dynamic Lightscattering Transmission Electron Microscopy Disk Centrifuge Photosendmentometry 1,2-Dimyristoyl-sn-glycero-3-phosphocholine High Performance Liquid Chromatography Diphenylhexatriene Cetyltrimethylammonium Bromide Butyl acrylate Ethyleneglycol dimethacrylate Diisopropylbenzene
221

222
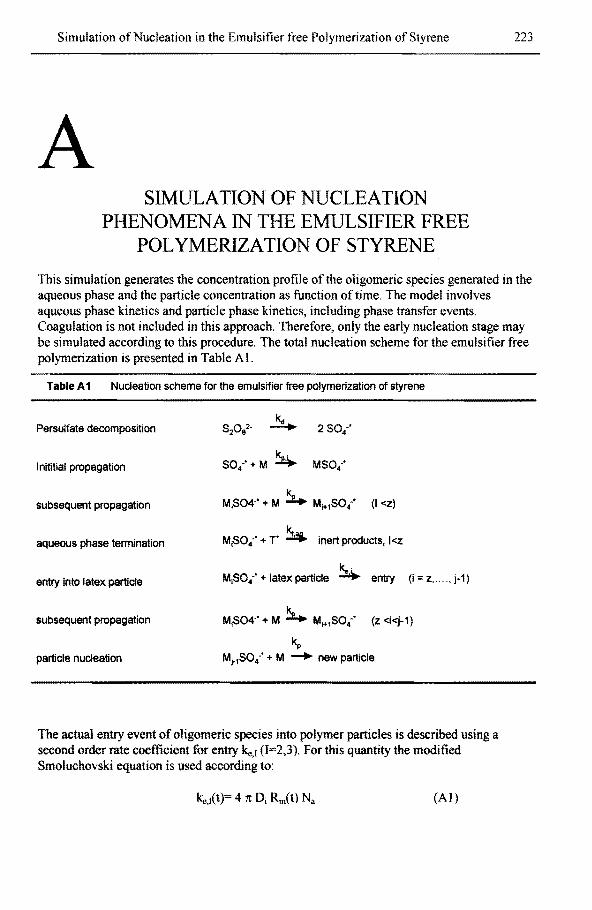
Simulation ofNucleation in the Emulsifier free Polymerization ofStyrene
A SIMlTLATION OF NUCLEATION
PHENOMENA IN THE EMULSIFIER FREE POL YMERIZATION OF STYRENE
223
This simulation generates the concentration profile of the oligomeric species generated in the aqueous phase and the partiele concentration as function of time. The model involves aqueous phase kinetics and partiele phase kinetics, including phase transfer events. Coagulation is not included in this approach. Therefore, only the early nucleation stage may be simulated according to this procedure. The total nucleation scheme for the emulsifier free polymerization is presented in Table AL
Table A 1 Nucleation schema for the emulsifier free polymerization of styrene
Persulfata decomposition
lnititial propagation
subsequent propagation
aqueous phase terminatien M;S04-' + T' ~ inert products, l<z
entry into latex partide k.a·
M;S04-' +latex partide ~ entry (i= z .....• j-1)
subsequent propagation
k" partiele nudeation MJ-1SO/ + M __... new partiele
The actual entry event of oligomeric species into polymer particles is described using a second order rate coefficient for entry ke,1 (1=2,3). For this quantity the modified Smoluchovski equation is used according to:
(AI)

224 Appendix A
where D; is the ditfusion coefficient of an I-meric radical in the aqueous phase, Rm is the swollen volume of a latex particle, and Na is Avagadro' s number. The ditfusion coefficient can be estimated according to the Stokes-Einstein model as:
(A2)
where R; is the radius ofthe I-meric oligomeric species, T is the reaction temperature, kt, is the Boltzmann constant and 11 is the viscosity ofthe reaction medium. The radius of anImeric oligomer may be taken from the Lebas volume expression according to:
R; = [(3(I*V; + V804)/ (4n)] 113 (A3)
where V; is the volume ofthe I-meroligomeric species, taken as I*Vt. where V1 is the volume of a styrene molecule and V 804 is the volume of a persulfate molecule. Note that equations Al, A2, and A3 contain parameters which are nearly constant during nucleation, except the partiele radius. Since within the nucleation event polymer particles will grow partiele growth next to partiele formation should be described. The assumption used bere is that in the nucleation stage the system obeys zero-one kinetics (noor<O.S). When this is the case the volume growth rate (dV"/dt) of a latex partiele may be evaluated from:
where lep is the propagation rate coefficient, Cm is the monomer concentration in the particle, noo is the average number ofradicals perparticle, M., is the molar mass ofstyrene and p" is the density of polystyrene. When expression A4 is integrated over time, the time dependent partiele radius can be calculated according to:
R.m(t) = [( 4V m(t))/(31t)] 113 (AS)
The time-evolution ofthe partiele radius is calculated based upon growth by polymerization only, and no physical coagulation events are incorporated. The corresponding ditferential equations which describes the nucleation scheme are:
1. Decomposition of persulfate d [S20t]/dt = -k.i [S20il
2. Fortnation persulfate radical species d[So4·*]/dt = 2k.J[S20s21- kp,;M;.q[SO/]
(A6)
(A7)
3. Formation first oligomeric radicals d[MSOtJidt = kp;M;.q[SO/]- kpM..q[MSO/] - 2k1[MSO/][T•] (A8)

Simulation ofNucleation in the Emulsifier free Polymerization ofStyrene
4. Formation subsequent oligomeric species d[M2SO/]!dt kpM.q[MSO/]- kpMa,JM2S04.•]- 2kt[M2SO/][T*]
- Cke.2 Nc[M2S04. ])/(Na)
d[M3SO/]Jdt = kpM.q[M2SO/]- kpM.~[M3SO/]- 2k1[M3SO/][T*] - (k.,,3 N.,[M3SÜ4. ])/(N.)
5. Formation precursor particles dN.,/dt = kpMaq[MJSO/]
6. Overall radical balance [T*] = [SO/] + l: [M1SO/], 1=1,2,3
225
(A9)
(AlO)
(All)
(A12)
where Ne is the partiele concentration and [T*] is the total radical concentration present in the aqueous phase. With these set of equations the concentration development of the oligomeric species and the partiele concentration is simulated, using relevant values of the rate parameters as presented in table A2.
Table A2 Values of rate parameters used in the simulations of the nucleation processof emulsifierfree polymerization of styrene
~ (dm3mol·1s·1) 107.14 exp (-29.3/RT)
~.o (dm3mol·1s·1) 1000 k.t (s·1) 110-6
kt (dm3mol-1s·1) 3109
kt. (dm3mol·1s·1) 110·2
11 (PaS) 81()-4
N,. (mol-1) 6.023 1()23 Cm (mol drn--3) 5 vm (dm3) 1.9 10-25
VS04 (dm3) 1.510'25
Mo (gmol-1) 104.15 PP (g dm-'l) 1053 Maq (mol dm-'l) 3.7 10'3

226

Phase Equilibria of Styrene and Ethanol in Emulsion Systems 227
B THEORETICAL DETERMINATION OF
PHASE EQUILIBRIA OF STYRENE AND ETHANOL IN EMULSION SYSTEMS
At equilibrium the partial molar free energy of styrene and ethanol absorbed in the polymer phase is equal totheir partial molar free energy in the continuous phase, i.e.
(AG,/RT)c = (AG,/RT)p (AG.,IR.T)c = (AG.,IR.T)p
(AGwiRT)c = (AGwiRT)p
(B1) (B2) (B3)
where the subscripts s, e, c" w and p represent styrene, ethanol, continuous phase, water, and polymer phase respectively. In this approach it is assumed that (1) the continuous phase contains a negligible amount ofpolymer, (2) the polymer phase contains a negligible amount of water. The partial free energy of styrene and ethanol in the continuous phase can be
described as1·2•3
:
(AG,/RT)c =In F,+ 1-F,-m.wFw-ms.,Fe+[(mswXwsFw+m,.x.,,F.)(Fw +F.)]
-mswXweFwFe (B4)
(AG.,!R.T)c =InF.+ 1-F._mewFw-IDesFs+[(mewXw.,Fw +x.,F,)(Fw +F,)]
-IDewXwsfwFs (B5)
where Fw, F,, Fe is are the volume fraction of water, styrene and ethanol in the continuous phase, rn.. is the ratio of the molar volumes of ethanol and styrene
(i.e. m., =V m./V ms, where V me and V ms are the mol ar volume of ethanol and styrene respectively), Xes is the interaction parameter between ethanol and styrene. See for further explanation of the symbols TableB 1. The partial free energy of styrene and ethanol in the polymer partiele phase can bedescribed as4
•5
:

228
( AG,/R T)p = In 4ts +( 1-mse)ljle +cjlp +Xseclle 2 +Xsp4>/+4>e4lp(XéXsp·Xeplllse)
+2V ms'YI!lp1131RroT
( AGJR T)p = In cl>. +(1-m..)ljl. +!(lp +x .. +/ +xepl!l/+4l.l!lp(Xes +xep-Xspffies) + 2V ms Yi(lp 113/Rro T
AppendixB
(B6)
(B7)
where 4ts, cjl." and !(lp is the volume fraction of styrene, ethanol and polystyrene respectively in the polymer phase, Xep, Xsp are the interaction parameters between ethanol-polystyrene and styrene-polystyrene, y is the interfacial tension between the polystyrene and the continuous phase, r0 is the radius ofthe latex particles and T is the absolute temperature. The explanation of the used symbols and their values used in the calculations are presented in T able B 1. Note, that the equations are analogue for the description of the swelling of latex particles with two monomers4.s. The Flory-Huggins interaction parameter is a function of temperature and the composition ofthe medium, and thus bas lost its classification as parameter. However an estimation of the Flory-Huggins interaction parameter can be obtained by utilizing the Rildebrand Solubility parameter appraoch6
.
In this case the Flory-Huggins interaction parameter can be visualized as
(B8)
where Ösolvent and ~ respresent the Rildebrand solubility parameter for solvent and polymer respectively. V 1 is the molar volume of the solvent. The Flory-Huggins interaction between the components in the medium, i.e. x-, Xwe. Xse, Xes. Xws. Xsw can be calculated using the sameRildebrand approach.
(B9)
In these calculations it is assumed that the interactions parameters ofthe component present in the medium are independent ofthe volume fraction present in the medium. It is possible to solve these equations analytically for a given recipe, provided that the solubility of styrene in the continuous phase as function of the volume fraction of ethanol is known.

Phase Equilibria of Styrene and Ethanol in Emulsion Systems
Table 81 The values used in the Flory-Huggins expressions tor the polymer phase and the continuous phase, and the recipe used
Parameter value Descliption
ms& (-) 1.43 ratio molar volume styrene-ethanol mes (-) 0.70 ratio molar volume ethanol-styrene m_ (-) 6.63 ratio molar volume styrene-water m_ (-) 4.44 ratio molar volume water-styrene mew (-) 0.225 ratio molar volume ethanol-styrene m_ (-) 50 1fr9 ratio molar volume styrene-ethanol ro (m) 8.314 radius polystyrene particles R (Jmoi-1K-1) 343 gasconstant T (K) 1 tempersture M.w (-) 1 interaction parameter ethanol-water X. we (-) 7 interaction para meter water -ethanol X.ws (-) 7 interaction parameter water-styrene
x.- (-) 2 interaction parameter styrene-water X.as (-} 2 interaction parameter ethanol-styrene 'XS& (-) 0.6 interaction parameter styrene-ethanol X.sp (-) 0.3 interaction parameter styrene-polystyrene M,p (-) 0.025 interaction parameter ethanol-polystyrene 'Y (Nm-1) 19 intertacial tension Oslyrene (MPa1f.2) 47.8 Hildebrand solubility parameter styrene owater (MPa1f.2) 26.5 Hildebrand solubility parameter water 0ethanol (MPa1r.z) 1.1410"4 Hildebrand solubility parameter ethanol vms (m3mol-1) 8.0 1()-S molar volume styrene V me (m3mol-1) 1.8 1frS molar volume ethanol Vmw {m3mol-1} molar volume water
recipe: Polystyrene 50 g Styrene 50g Tota/volume 1 drrfS
References
I. Bindschaedler, C., Gurny, R, Doel.ker, E., Peppas, N.A, J. ofCo/loidand Interface Sci, 1985, 108, 1, 75.
2. Bindschaedler, C., Gurny, R., Doelker, E., Peppas, NA. J. ojColloid and Interface Sci, 1985, 108, 1, 83
3. Tseng, C.M, EI.-Aasser, M.S., Vanderhofl', J.W., Org. Coat. Plast. Chem., 1981,45, 317. 4. Maxwell, I.A., Kurja, J., van Doremaele, G.H.J., German, A.L., Makromol. Chem., 1992,
193, 2065. 5. Noë!, E F.J , Maxwell, I.A, Gern1an, A. L., Macromolecu les, 1993, 26, 2911. 6. Hildebrand, J.H., J. Chem. Phys., 1947, 15, 225.
229

230
Phase Equilibria in Vesicles 231
c PHASE EQUILIBRIA IN VESICLES
Introduetion Phase behavior of polymer blends is controlled by two competing factors. The first one is the
entropy of mixing which always supports miscibility. The second one is given by the local
Gibbs free energy ofthe interacting segments, which usually opposes miscibility. The
consequence is that phase separation phenomena may be operative in these polymer
solutions. In the case ofDODAB and styrene it should be noted that OODAB can be
regarcled as a semi-crystalline polymer, see section 6.2.6. The phase separation behavior for
semi-crystalline polymer solutions can bedescribed theoretically using Flory-Huggins theory.
It should be emphasized that this treatment applies for the bulk system OODAB-styrene
which are assumed to be in a thermodynarnic equilibrium. For a solution of polymer in a
solvent the Gibbs free energy of mixing polymer and solvent per mol of segments is given by:
(Cl)
where $1 is the volume fraction of solvent, $2 is the volume fraction of polymer, P n is the
degree of polymerization, and x is the Flory-Huggins interaction parameter. Utilizing this
equation, the effect ofthe Flory-Huggins interaction parameter on the phase behavior for the
DODAB-styrene system can be investigated. In this case 'Î't is the volume fraction of styrene
and cj)2 is the volume fraction ofOODAB. The calculations are depicted in Figure Cl
Phase separation Phenomena When phase separation occurs, the Gibbs free energy change associated with the phase
separation process should be negative. In the case where the change in the Gibbs free energy
is positive, a single homogeneous phase is favored over the whole composition range. The
curves in figure Cl have two different shapes:

232 Appendix C
-at x-values below a certain critical value for the interaction parameter Xe the DODAB ebains and styrene are miscible over the entire composition range. - when x>x., the system can phase separate ( either via the binodal or the spinodal phase separation process) depending on the overall composition. The binodal compositions occur at the local minimlllll, while the spinodal occur at the point of inflection.
400
200
0 ....... "L
0 E -200 :z --i -400 (.!) <I
-600
-800
FigureCl
" •""""• " " " " " " " ••••••• " • " • •• " •• "" • •
• •• • • ••••• • • • • • • • • • • • • • • • 0.0 0.2 0,4 0.6 0.8 1.0
.2 Free energy of mixing DO DAB and styrene as a function of the volume fraction ofDODAB (~) for different values of x. P8=9, and T=343 K. <•> x=O.s, m x=t.3, ~ x=2
It can be noticed that in these curves two minima are present which result from the contribution ofthe enthalpy of mixing, i.e. ÄHmlx:;t:O, to the Gibbs free energy of mixing. This contribution of ÄHmlx to the Gibbs free energy decreases with increasing temperature. Concomitantly the binodal and spinodal points are corning closer together until a critical temperature T., they coincide at the critical composition ~ .•. For polymer solutions where ÄHmlx is positive, Tc correspond to the common maximum of the binodal and spinodal. This critical temperature is referred to as the upper critical solution temperature (UCST) above which polymer and solvent are miscible at all compositions. In the case where AHmix is negative the temperature at which the corresponding minimum of the binodal and the spindal occurs is referred to as the lower critical solution temperature (LCST), below which polymer and solvent are miscible. From equation 7A, the spinodal pointscan be obtained, where the second derivative of equation 7A with repeet to ~ equals zero, see equation C2.

Phase Equilibria in Vesicles 233
(C2)
The critica! composition «j)2,c can he derived from the third derivative of equation Cl with
repeet to Ql2 equals zero, see equation C3. The critica] interaction parameter Xe results from
the combination of equations C 1 and C2
(C3)
(C4)
This procedure bas been adopted for the description of the DODAB-styrene system. The results are presented in tigure C2
0,5
LO •• ..... -·,
• • • • 1.5 • •
x(-) 2.0 • •
2.5 • •
3.0 • • 0.0 0.2 0.4 0.6 0.8 1.0
Styrene ~DODAS (·) DO DAB
Figure C2 The spinodal curve for the DODAB-styrene system as timetion of the volume fraction of styrene 4h>ooAB=<Pz , P n=9
Note, according to these calculations, this system may exhibit an UCST phase separation
behavior. At relatively high volume fraction ofDODAB the Flory-Huggins interaction
parameter should be lower than unity in order to suppress phase separation. These results,
although very interesting are not sufficient due to the following reasons: - First, one should he
able to calculate the phase behavior of the DODAB-styrene system as function of
temperature. This requires the dependenee of the Flory-Huggins interaction parameters as
function oftemperature and the volume fraction of styrene. Secondly this treatment bas been performed to the DODAB-styrene bulk system, The critica! temperature Tc in this system is the melting temperature ofthe DODAB

234 AppendixC
chains49 which is 434 K. This chain melting transition temperature is essentially independent of the quatemary ammonium headgroup.
Translation phase equilibria to vesicles The question is whether this treatment can be applied to the OODAB vesicle system itself, where water is present This phenomena bas been investigated for phospholipid systems where the chain melting phase-transition temperature bas been investigated as a function of the water/lipid molar ratio, using DSC. It appeared that the chain melting transition decreased dramatically with increasing amount of water, towards the phase transition temperature ofthe phospholipid vesicle. This effect is attributed to the polar interface on the chain-melting transition temperature. The headgroup of the lipid is hydrated by the presence of water. increasing the total contribution of the polar region to the free energy change at the phase transition. It bas been found by Evans et al1 that the hydration-induced transition-temperature shift is roughly proportional to the number of bound water molecules. The same effect is observed for OODAB-water systems, where water will hydrate the quaternary ammonium headgroups2
. Therefore it is assumed that the chainmelting temperature ofthe DODAB vesides in aqueous solutions is characterized by its typical phase transition temperature Tm.
Phase behavior of monomer swollen vesicles in solution In the case of semi-crystalline structure of the OODAB molecules the attention is focused upon the phase transition temperature Tm· The depression of Tm due to the presence of solvents is usually described with the following expression:
where Tm and Tm,t are the equilibrium phase transition temperature of the pure OODAB ebains within the vesicle and the equilibrium melting temperature of the OODAB and the solvent. respectively, AHm,p is the melting enthalpy per monomerunit for OODAB at Tm. V 1 and V2
represent the molar volume ofthe solventand the OODAB chain and P nis the degree of polymerization. This expression can be used to determine whether styrene, butyl acrylate, EGDM and diisopropenyl benzene are good solvents for DO DAB chains. In the case of a good solvent T m.t wilt decrease with increasing solvent content. In the case of a poor solvent, the phase diagram is becoming more complex as schematically presented in tigure C3. When a poor solvent is adopted the Tm curve often interferes with a liquid-liquid demixing. The intersection point where the Tm composition curve intersects with the L-Ldemixing is called the Berghmans poinf. When the volume fraction ofDODAB is lower than +t, the homogeneous solution will become metastable upon cooling into the L-L demixing region.
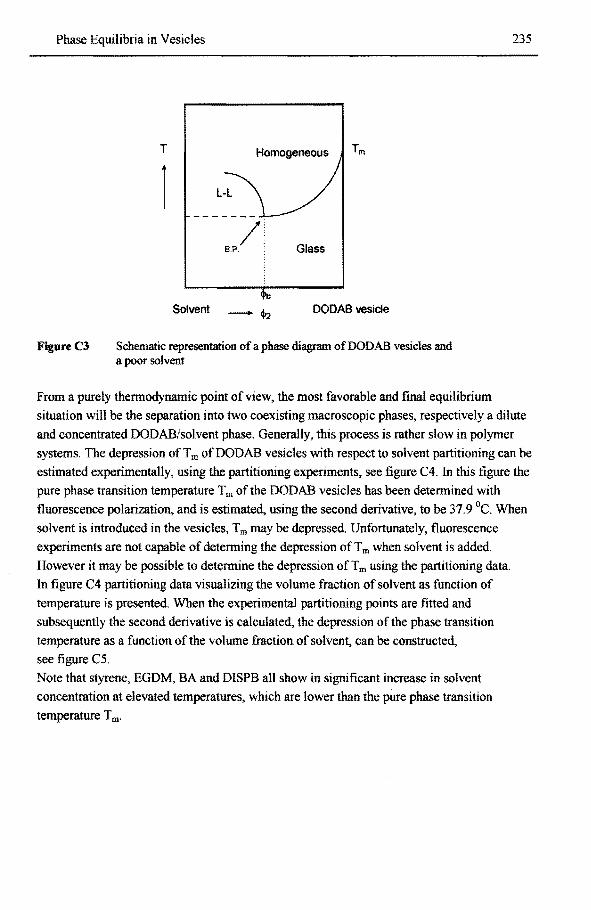
Phase Equilibria in Vesicles
FigureC3
T Homogeneaus
1
Solvent -lll2 DODAB veside
Schematic representation of a phase diagram ofDODAB vesicles and a poor solvent
235
From a purely thennodynamic point of view, the most favorable and final equilibrium situation will be the separation into two coexisting macroscopie phases, respectively a dilute and concentrated DODAB/solvent phase. Generally, this process is rather slow in polymer systems. The depression of Tm ofDODAB vesicles with respect to solvent partitioning can be estimated experimentally, using the partitioning experiments, see figure C4. In this figure the pure phase transition temperature Tm of the DODAB vesicles has been detennined with fluorescence polarization, and is estimated, using the second derivative, to be 37.9 °C. When solvent is introduced in the vesicles, Tm may be depressed. Unfortunately, fluorescence experiments are not capable of detenning the depression of Tm when solvent is added. However it may be possible to detennine the depression of Tm using the partitioning data. In figure C4 partitioning data visualizing the volume fraction of solvent as function of temperature is presented. When the experimental partitioning points are fitted and subsequently the second derivative is calculated, the depression of the phase transition temperature as a function of the volume fraction of solvent, can be constructed, see figure C5.
Note that styrene, EGDM, BA and DISPB all show in significant increase in solvent concentration at elevated temperatures, which are lower than the pure phase transition temperature Tm·

236
FipreC4
FigureCS
0.35
0.30
0.25
0.20
:!'.: 015 <i . >
0.10
0.05
0.00
t Sly!Wne
20
• o--E GOM
...
• •- DISPIJ
30 40 50
Temperaturè {'>C)
60
AppendixC
0.35
0.30
0.25
0.20 ~
g 0.15 ~ ·c:
< 0.10
0.05
Partitioning experiments used in the estimation of the Tm depression
40
31+-~~----~~~~~~~r----r~~ .0.05 0.00 0.05 0.10 0.15 0.20 0.25 0.30
v. (·)
Depression ofT m as function of the volume fraction of solvent ( v .) for different solvents, (11) styrene, (_.) butyl acrylate, ('Y) DISPB, (e)EGDM
Note the depression of Tm is relatively low for all solvents used, whicb implies a tbat the interaction between tbe solvent and the OODAB ebains is not that good. 1t is also observed that the depression of Tm as a function of the volume fraction of solvent exbibit a linear bebavior. When this is the case the Flory interaction parameter can be estimated as function of the volume fraction of solvent, using equation CS. The melting enthalpy per monomer unit (ARm) for OODAB at Tm has been determined by Blandaroer et al4
, using microcalorimetry. The Flory interaction parameter as function ofthe volume fraction of solvent is presented for styrene in figure C6.
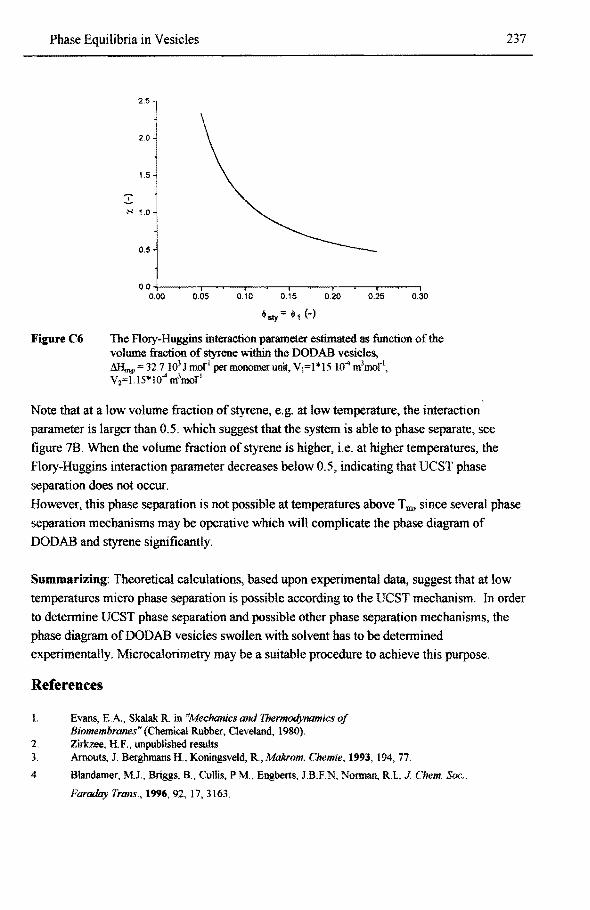
Phase Equilibria in VesicJes
FigureC6
2.5
2.0
1.5
,... 1.0
0.5
0.0 +---..-.-----..--.----..--.--~--.--~--.----.----, 0.00 0.05 0.10 0.15 0.20 0.25 0.30
~sty= ~1 (-)
The Flory-Huggins interaction parameter estimated as function ofthe volume fraction of styrene within the DODAB vesicles, MI.n,p = 32 7 103 J mol"1 permonoroer unit, V1=1*1S 104 m3mor\ V2=1.15*104 m3moT1
Note that at a low volume fraction ofstyrene, e.g. at low temperature, the interaction parameter is larger than 0.5. which suggest that the system is able to phase separate, see figure 7B. When the volume fraction of styrene is higher, i.e. at higher temperatures, the Flory-Huggins interaction parameter decreases below 0.5, indicatîng that UCST phase separation does not occur.
237
However, this phase separation is not possible at temperatures above Tm, since several phase separation mechanisms may be operative which will complicate the phase diagram of DODAB and styrene significantly.
Summarizing: Theoretica! calculations, based upon experimental data, suggest that at low temperatures micro phase separation is possible according to the UCST mechanism. In order to determine UCST phase separation and possible other phase separation mechanisms, the phase diagram ofOODAB vesicles swollen with solvent bas to be determined experimentally. Microcalorimetry may be a suitable procedure to achieve this purpose.
References
1. Evans, E.A., Skalak R. in "Mechanics and Thermodynamics of Biomembranes" (Chemica! Rubber, Cleveland, 1980).
2. Zirkzee, H.F., unpublished results 3. Arnouts, J. Berghmans H., Koningsveld, R,Makrom. Chemie, 1993, 194,77.
4. Blandamer, M.J., Briggs, B., Cullis, PM., Engberts, J.B.F.N, Norman, R.l, J. Chem. Soc.,
Faraday Trans., 1996,92, 17,3163.

238 Acknowledgements/Dankwoord
Acknowledgements/Dankwoord
Het dankwoord is waarschijnlijk het meest gelezen onderdeel van een proefschrift. Eén van de belangrijkste voorwaarden voor een goed dankwoord is dat men niemand vergeet die een bijdrage heeft geleverd aan het proefschrift. Immers onderzoek is geen individuele zaak maar werk voor gebundelde krachten waarbij één plus één vaak meer is dan twee. Als eerste aanzet tot een dankwoord wil ik daarom iedereen bedanken die een bijdrage heeft geleverd aan het tot stand komen van dit boekje.
Enkele mensen wil ik graag persoonlijk bedanken: Ian Maxwell, thanks for the encouragement that drives me to accept this PhD position. Mijn promotor Prof Ton German, voor de geboden academische vrijheid, die dan ook genomen is. Jenci Kwja, voor het fungeren als (wetenschappelijk) klankboord.
De grootste bijdrage aan dit proefschrift is geleverd door het grote aantal studenten en stagiares die voor mij gewerkt hebben: Eric van Rijn, Gerard Rietjes, Pim van Kilsdonk, Myrna Boon, Gaston Bongerts, José Schlief, Ronald Hoenen, Mark de Koek, bedankt voor jullie bijdragen. Anne Spoelstra en Wieb Kingma voor het vele electronenmicroscopie respectivelijk GPC werk. Eric Nies voor de relevante discussies op gebied van thermodynamica. Marcel Visschers en Peter Krotzen voor hun hulp op colloidchemisch vlak. Martijn Wienk, voor de diffusiemetingen van probes in vesicle hilagen m.b.v. ESR. Mateo Mayer, and Don Paquet for the support in mathematica! modeling concerning reaction kinetics and nucleation phenomena. Klaus Tauer, thanks for the inspiring discussions concerning nucleation during my visit at the Max Planck lnstitute.
Cryo-electronen microscopie is zeer belangrijk geweest in de karakterisering van vesicle systemen. Ik wil hierbij Peter Frederiks, Mark Stuart en Paul Bomans van de universiteit Limburg bedanken voor hun bijdrage. Edward Pap en Henri Bijsterbosch (Landbouw Universiteit Wageningen) bedankt voor de fluorescentie respectivelijk lichtverstrooiingsmetingen.
De vakgroep TPK, zonder iedereen bij name te noemen, bedankt voor de goede sfeer deze afgelopen vier jaar. Co-promotor Alex van Herk, Prof Stas Bancken, Jan Meuldijk en 2e promotor Prof Jan Engerts, bedankt voor de kritische correcties betreffende dit manuscript Dank aan mijn (schoon?!)familie, Sien, en speciaal mijn ouders voor de geboden belangstelling.
Als laatste Monique Jakobs, je bijdrage aan onderzoek en ontspanning zou ik niet kunnen schatten. Je bent en blijft daarom van onschatbare waarde.

Curriculum Vitae 239
Curriculum Vitae
Hennie F. Zirkzee was bom in Leiden, the Netherlands, November 20, 1966. After graduation from secondary school (Fioretti College, Lisse) in 1985, his boys dream of becoming a pilot was over. He started his studyin chemica] technology at the Polytechnical school (H.T.S., the Hague). He obtained bis degree in chemica! engineering in 1989 o the project: The separation of
nitrogen and carbondioxide using polymerie membranes. He continued studying chemica] technology and chemistry at the Eindhoven University ofTechnology. In 1992 he obtained his degree in the group of Prof dr. ir. A.L. German on the project: Emulsifier free polymerization of styrene, a nucleation study. In 1993 he started his PhD proj eet in the same group, resulted in this thesis. Additionally he contributed significant efforts to other subjects
and programs. As fromjanuari 1997, he has joined General Electric Plastics in the Technicalleadership Program.
240 List ofpublications
LIST OF PUBLICATIONS
Zirkzee, H.F., van den Enden, M.J.W.A., van Kilsdonk, P.W.T., van Herk, A.M., German, AL., "Seeded Emu/sion Polymerization of Butyl Acrylate, Zero-one or Pseudobulk? ", Acta Polymerica, 1996, 47, 441.
Zirkzee, H.F., Kurja, J. German, AL., "Phase equilibria in Vesicular Systems" in preparation
Janssen, E.H., Zirkzee, H.F., Maxwell, I. A., German AL., "Determination of Partiele Size Distributions with the Disk Centrifuge", J. of Appl. Polym. Sci., 1994, 4, 195.
Kurja, J. Zirkzee, H.F., de Koning, G.J.M., Maxwell, I.A., "A New Kinetic Model for the Accumulation ofPoly-3-hydroxybutyrate inA/caligenes Eutrophus", Biodegradable Plastics and Polymers, Y. Ooi and K. Fukuda (Eds.) Elsevier Amsterdam, p. 379-386, (1994).
Kurja, J., Zirkzee, H.F., de Koning, G.J.M., Maxwell, I.A., "A New Kinetic Model for the Accumulation of Poly-3-hydroxybutyrate in Alcaligenes Eutrophus: I. Granule growth ", Macromol. Theory and Sim., 1995,4,839.
Kurja, J., Zirkzee, H.F., de Koning, van de Brink, M., "A New Kinetic Model for the Accumulation of Poly-3-hydroxybutyrate in Alcaligenes Eutrophus: 2. Granule formation ", submitted 1997.
Kurja, J., Zirkzee, H.F., de Koning, van de Brink, M., "A New Kinetic Modelfor the Accumulation of Poly-3-hydroxybutyrate in Alcaligenes Eutrophus: 3. Model calculation.~ vs Experiment", submitted 1997.
Kurja, J., Zirkzee, H.F., German, AL., Nolte, R.J.M., Maxwell, I.A., "Polymerization in Vesicles, Thermodynamics, Kinetics and Characterization ", "The Polymerie Matenals Encyclopedia: Synthesis, Properties and Applications", J.C. salamone (Ed.), CRC Press, Inc., 1995.
Kurja, J., Zirkzee, H.F., Maxwell, I. A., "Unconventional Emu/sion Polymerizations ", in Emulsion Polymerization and Emulsion Polymers, M.S. El-Aasser and P. Lovel (Eds.), Wiley, 1997.
Aerdts, A. Groenincks, G., Zirkzee, H.F., Geurts, J.M, "Compatibilisation of Po/yamide-6 with Epaxy-Functionalized MBS Core-Shell particles prepared in Emulsion ", Polymer, submitted 1996.
German, AL., van Herk, A.M., van Es, S.J.J.G., Mayer, M.J.J., Zirkzee, H.F., "Novel Developments in Controlled Emu/sion Polymerization ", 21 81 Austratian Polymer Symposium, Royal Australian Chemical Institute, 1996.

List of publications
Gennan, AL., van Herk, A.M., Zirkzee, H.F., Manders, B.M., Klumpennan, B. "Local Monomer concentrations in Heterogeneaus Polymeri;:ation Systems ", MacromoL Symp, 1996, lll, 107.
Feng, J., Pham, H., Macdonald, P.M., Winnik, M.A., Geurts, J.M.,
241
Zirkzee, H.F., "Preparation of Reactive Latices and formation of Latex Films Crosslinkable under ambient Conditions ", Progress in Organic Coatings, submitted 1997.
Zirkzee, H.F., Maxwell, I.A., Gennan, AL, "Emulsifier Free Polymerization ofStyrene, a Nucleation Study", in preparation
Zirkzee, H.F., Rietjens, G.H., Kurja, J., Gennan, AL., Frederiks, P.M., Stuart, M.C.A., "Polymerization in Dioctadecyldimethylammonium Bromide Vesicles, A Characterization Study ", in preparation.

STELLINGEN
behorende bij het proefschrift
A Novel Approach to the Encapsulation of Silica Particles
Mechanisms and Kinetics
van
Hennie Zirkzee
1. Onderzoek naar parameters in polymeersystemen die de grensvlakspanning bepalen tussen water en het aggregaat verdient niet alleen vanwege de complexiteit, maar nog meer vanwege de relevantie in monomeerverdelingsevenwichten, meer aandacht dan het tot nu toe heeft verkregen.
Zana, R., Langmuir, 1995, 11, 2134 Hoofdstuk 7 van dit proefschrift
2. Cryo-electronenmicroscopie is intrinsiek een betere karakteriseringsmetbode voor de bestudering van vesikelsystemen dan "gewone" electronenmicroscopie.
Andersson M., Hammerström L, Edwards, K., J. Phys. Chem .• 1995, 39, 14537 Hoofdstuk 2 en 6 van dit proefschrift
3. De beschikbaarheid van betere technieken om fundamèntele reactiesnelheidsparameters te bepalen, geeft aanleiding tot een nieuwe evaluatie van het kinetisch gedrag van polymeersystemen.
Zirkzee, H.F., van den Enden, M.J.W.A., van Kilsdonk, P.W.T., van Herk, A.M., German, A.L., "Seeded Emulsion Polymerization of Butyl Acrylate, Zero-one or Pseudobulk?", Acta Polymerica, 1996,47,441
4. De reden waarom voorwerpen van isotactisch polypropeen helder verkregen kunnen worden tijdens spuitgietprocessen in aanwezigheid van clarifying agents is nog niet opgehelderd.
Thîerry, A., Straupe, C, Lotz, and Wittmann, J.C., Polymer Comm., 1990, 31, 299

5. Bij de beschrijving van het zwelgedrag van kleine latex deeltjes met één of meerdere monomeren wordt vaak voorbijgegaan aan de invloed van de aanwezige surfactant.
Tauer, K., Kuhn, 1., and Kaspar, H., Prog. Colloid Polym., 19%, 101, 30
6. Elementair onderzoek wordt vooral uitgevoerd door mensen in de leeftijdscategorie van nul tot drie jaar.
7. Het experiment dat alle andere experimenten overbodig maakt wordt meestal pas bedacht als al die andere experimenten reeds zijn uitgevoerd.
8. Het verkrijgen van "zeebenen" kan tegenwoordig op zeer winderige dagen ook aan land beoefend worden op de Brasmusbrug te Rotterdam.
9. Beloningen aan directeuren en commissarissen van bedrijven zouden, ter verhoging van de maatschappelijke aanvaardbaarheid, gekoppeld dienen te worden aan de koers van de bedrijfsaandelen.
10. Psychologie zal nooit als een bèta-wetenschap betiteld kunnen worden. Daarom is het moeilijk, zo niet onmogelijk, het resultaat van psychologische behandelingen wetenschappelijk aan te tonen.
Harold Merckelbach: "De zielkunde verschilt weinig van bèta-wetenschappen" Volkskrant 19 juli 1997
11. Het feit dat beroepsgroepen in de gezondheidszorg ten behoeve van de financiële vergoeding wetenschappelijk moeten bewijzen dat hun behandeling succesvol is, wekt bevreemding. Immers, het wetenschappelijke bewijs dat een mens werkt zoals hij/zij werkt is nog nooit gegeven.
12. De "werkelijkheid" bestaat bij de gratie van waarnemen, en alle waarnemingen zijn subjectief.
22 september 1997