Acidic Ribosomal Proteins from Eukaryotic Cells. Effect on Ribosomal Functions
ARTICLE IN PRESS
0723-2020/$ - se
doi:10.1016/j.sy
�CorrespondE-mail addr
Systematic and Applied Microbiology 29 (2006) 593–605
www.elsevier.de/syapm
A molecular approach to the characterization of the
eukaryotic communities of an extreme acidic environment: Methods for
DNA extraction and denaturing gradient gel electrophoresis analysis
Angeles Aguileraa,�, Felipe Gomeza, Eva Lospitaob, Ricardo Amilsa,b
aCentro de Astrobiologıa (INTA-CSIC), Carretera de Ajalvir Km 4, Torrejon de Ardoz, 28850 Madrid, SpainbCentro de Biologıa Molecular (UAM-CSIC), Universidad Autonoma de Madrid, Cantoblanco 28049 Madrid, Spain
Received 19 December 2005
Abstract
The diversity of the phytobenthonic community present in six acidophilic microbial mats from Rıo Tinto (IberianPyritic Belt, SW Spain) was analysed by optical microscopy and two molecular techniques, denaturing gradient gelelectrophoresis (DGGE) and sequence analysis of 18S rDNA cloned gene fragments. Sixteen DNA isolation protocolsas well as two commercial DNA extraction kits were tested and their efficiency compared. Purified DNA extracts wereamplified by PCR using universal eukaryotic primers and the PCR products analysed by DGGE. Bead-millhomogenization was found to be superior to the other cell lysis methodologies assayed (sonication or freeze-thawingcycles) as it allowed efficiencies of cell disruption of over 95%. The methods combining bead-mill homogenization inthe presence of SDS, treatment with chemical extractants (hexadecylmethylammonium bromide or guanidineisothiocyanate) and phenol extraction resulted in DNA preparations that amplified the same number of bands whenanalysed by DGGE as the two commercial kits assayed. The phylogenetic affiliations of the DGGE bands weredetermined by a BLAST search, and nine different species related to the Chlorophyta, Ciliophora, Kinetoplastida,Ascomycota, Streptophyta and Colcochaetales taxonomical groups were identified. Similar levels of diversity werefound using cloning procedures. Although not all the species observed under the microscope were detected usingmolecular techniques, e.g. euglenas, heliozoan, or amoebae, DGGE fingerprints showed rather well the level ofdiversity present in the samples analysed, with limitations similar to cloning techniques.r 2006 Elsevier GmbH. All rights reserved.
Keywords: Ecology; Extremophiles; Microbial diversity; Acidophilic eukaryotes; Denaturing gradient gel electrophoresis (DGGE);
DNA extraction
Introduction
Although the identification and quantification oforganisms is routinely performed in microbial ecology,
e front matter r 2006 Elsevier GmbH. All rights reserved.
apm.2006.01.006
ing author. Tel.:+34 915206461; fax: +34 915201074.
ess: [email protected] (A. Aguilera).
they still have limitations that only careful comparativeanalysis make evident [3,23]. Small phototrophic andheterotrophic eukaryotes are frequently found in manyecosystems and their identification and classification,usually based on morphological characteristics, isdifficult due their size, similarity and lack of distinctivetaxonomic properties. In the same manner, traditionalcultivation techniques for enrichment and isolation of

ARTICLE IN PRESSA. Aguilera et al. / Systematic and Applied Microbiology 29 (2006) 593–605594
different species yield only a limited fraction of allmicroorganisms present.
In order to identify a larger fraction of speciesin natural samples, several molecular techniqueshave been developed over the last 15 years [18,26,33].PCR-based molecular methods offer a fast andsensitive alternative to conventional cultivationtechniques, because nucleic acids can be extracteddirectly from environmental samples, amplifiedand made amenable to nucleotide sequencecomparative analyses [28,39]. The use of this approachshows us that microbial diversity is much greater thanpreviously thought, and that isolation and culturetechniques are insufficient to carry out these studiesaccurately.
Some techniques in molecular ecology are based ongenetic fingerprinting which provides a pattern of thedifferent species present in the community on the basisof the physical separation of their nucleic acid sequences[30]. In this respect, separation of DNA fragments bydenaturing gradient gel electrophoresis (DGGE), hasbeen used in an increasing number of microbial ecologystudies [20].
Although DGGE has been very successful fordescribing bacterial diversity in a large number ofecosystems [9,19,22,27], only a few studies have usedthis technique to characterize the diversity of eukaryoticorganisms. Most of the analysis of genes coding for 18SrRNA were carried out in fungal communities [34,36]and, only recently have some studies of marinepicoeukaryotes [5], sludge bioreactors [16] and fresh-water lagoons [37] focused on the whole eukaryoticassemblage revealing in all cases an unexpected level ofdiversity.
In the same regard, interest in the study of biodiver-sity in extreme environments has grown over the pastyears for several reasons, mainly biotechnological. Onegroup of extremophiles that is becoming increasinglyimportant, both ecologically and economically, corre-sponds to acidophilic organisms that live in low pHenvironments (pHo3). Rıo Tinto (Iberian Pyritic Belt,Southwestern Spain) corresponds to a 92 km long riverwith a constant acidic pH (mean value 2.3) and highconcentrations of heavy metals [14,15]. In spite of itsphysicochemical characteristics, eukaryotic organismsare the principal contributors to the biomass in thishabitat, showing an unexpected degree of diversity[1,15].
In this study, we examined the suitability of theDGGE technique for the study of the eukaryoticdiversity present in extreme acidic environments. Therelative effectiveness of different DNA extractionprotocols was tested with two environmental samplesfrom Rıo Tinto. Finally, the DGGE results werecompared with those obtained using gene cloning andmicroscopy observations.
Materials and methods
Sampling and microscopic species identification
Six different samples were taken from Rıo Tinto bycarefully scraping biolayers from the upper part ofsediments with sterile razor blades. Samples weretransported to the laboratory in sterile 25ml plastictubes, centrifuged (10min at 8000g), the supernatantwas removed and cells were frozen and stored at �20 1Cuntil DNA extraction.
Identification of algae and heterotrophic protists wascarried out by direct microscopic observation usingdifferent phenotypic features based on previous studiesof the eukaryotic communities in this river [1,15]. AZeiss Axioscope 2 microscope equipped with phase-contrast was used for optical microscopy. Cell countswere performed in triplicate in a Sedwerick–Rafterchamber.
DNA isolation
Sixteen DNA extraction methods differing in cell lysistreatment were compared (Table 1). These methods canbe classified as (i) mechanical lysis, (ii) mechanical lysisfollowed by phenol extraction, (iii) mechanical lysis inthe presence of SDS, followed by chemical treatment,and a final phenol extraction, (iv) mechanical lysis in thepresence of SDS, followed by chemical treatment,enzymatic incubation and phenol extraction and (v)commercial kit extractions. Each sample was dividedinto two 1ml subsamples and DNA was extractedindependently from duplicate sets.
(i)
Mechanical lysis: After washing the samples fivetimes with TE buffer (10mM Tris-HCl, 1mMEDTA, pH 8), three different mechanical treat-ments were used:� Method 1: sonication. Cells resuspended in0.5ml TE buffer were sonicated for 5min usingpulses of 1min on ice in a Mixonic XL sonicatorwith an output frequency of 20 kHz.� Method 2: freeze-thaw cycles. Samples were
frozen for 2min in liquid N2 and immediatelyplaced in a boiling water bath for 1min torapidly thaw the sample. This process wasrepeated 5 times.� Method 3: Bead-mill homogenization. Samples
were homogenized for 40 s at 5500 rpm in a beadbeater cell disruptor (FastPrep Instrument, Bio101, Carlsbad, CA, USA). Samples were placedin 2ml bead beater tubes containing 1.8 g of amixture of ceramic beads (1/400 spheres and agarnet matrix). This bead combination is able todisrupt soil colloids, plant tissues, fungal andother eukaryotic cells as well as bacterial cells.

ARTICLE IN PRESS
Table 1. Cell lysis and DNA extraction methods
Method Cell lysis treatment
Mechanical Chemical Enzymatic
1 Sonication
2 Freezing–thawing
3 Bead beating
4 Sonication Phenolization
5 Freezing–thawing Phenolization
6 Bead beating Phenolization
7 Sonication SDS 1%-CTAB
8 Bead beating SDS 1%-CTAB
9 Sonication SDS 1%-GIT
10 Bead beating SDS 1%-GIT
11 Sonication SDS 1%-CTAB Pronasa/lysozyme
12 Bead beating SDS 1%-CTAB Pronasa/lysozyme
13 Sonication SDS 1%-GIT Pronasa/lysozyme
14 Bead beating SDS 1%-GIT Pronasa/lysozyme
15 Fast DNA for soil
16 Fast DNA
A. Aguilera et al. / Systematic and Applied Microbiology 29 (2006) 593–605 595
After the cell lysis, all samples were centrifugedat 8000g for 10min at room temperature toremove cells debris as well as the beads. Thesupernatants containing DNA were precipitatedby the addition of 1/10 vol of 3M sodium acetate(pH 5.2) and 2.5 vol of ethyl alcohol and storedovernight at �20 1C. Samples were centrifuged at8000g for 10min, supernatants were removedand the pellets containing DNA were dried for10min in a speed vacuum centrifuge andresuspended in 30 ml of ultrapure water.
(ii)
Mechanical lysis-phenol extraction: After each ofthe cell lysis treatments (sonication, freezing/thaw-ing and bead beating) supernatants containingDNA were centrifuged at 12,000 rpm for 10min atroom temperature to remove cells debris as well asthe beads, and transferred into sterile 1.5ml tubes.DNA was extracted with 1 vol of phenol, followedby a second extraction with 1/2 vol phenol–1/2 volchloroform:isoamyl alcohol (24:1). DNA was pre-cipitated in the aqueous phase by addition of 2.5 volof ethyl alcohol overnight at �20 1C. Samples werethen centrifuged at 8000g for 10min, the super-natants were removed and the pellets containingDNA were dried for 10min in a speed vacuumcentrifuge and resuspended in 30 ml of ultrapurewater (methods 4–6).(iii)
Mechanical lysis in the presence of SDS–chemicalextractants–phenol extraction: Methods 7–10 weresimilar to the phenolic extraction methods de-scribed above but including a previous treatmentwith hexadecylmethylammonium bromide (CTAB)or guanidine isothiocyanate (GIT) and 1% SDS.� Methods 7 and 8, CTAB treatment. About100mg wet/weight cells were resuspended in1ml of lysis buffer with 1% SDS. After the lysistreatment (sonication or bead beating), sampleswere incubated with 200 ml of NaCl 5M and150 ml of CTAB for 1 h at 65 1C. Then, cells werefrozen for 2min in liquid N2 and placed in a bathat 65 1C. DNA was extracted with phenol asdescribed previously.� Methods 9 and 10, GIT treatment. These
methods were similar to methods 7 and 8 butincluded treatment with guanidine isothiocya-nate (GIT) 5M, EDTA 0.1M and sarkosylL-laurylsarcosina 0.5%) for 15–30min at 60 1C,followed by incubation with ammonium acetate7.4M for 15min at 60 1C. DNA was extractedwith phenol as described above.
(iv)
Mechanical lysis in the presence of SDS–enzymaticincubation–chemical extractants–phenol extraction:methods 11–14 were similar to methods 7–10 butincluded enzymatic incubations with lysozyme andpronase prior to treatment with CTAB or GI.About 100mg wet/weight cells were used. After celllysis, samples were incubated with 30 ml of lysozyme(300mg/ml) for 1 h at 37 1C with agitation. Then,15 ml of pronase (10mg/ml) and 100 ml of 10% SDSwere added and incubated for 1 h at 371. Treatmentwith either CTAB or GIT was followed by DNAextraction with phenol as described previously.(v)
Commercial kits: The following commercial DNAextraction kits were used according to the manu-facturer’s instructions: Fast DNA kit and FastDNA Spin kit for soil (Bio 101, Carlsbad, CA,
ARTICLE IN PRESSA. Aguilera et al. / Systematic and Applied Microbiology 29 (2006) 593–605596
USA) using the mixture of ceramic and silica beadsprovided in the kit and six pulses of 40 s at a speedof 5.5 on the FastPrep bead beating instrument(Bio 101). The manufacturers did not supplycomplete information on the composition of theingredients of their commercial kits. Technicalinformation indicate that lysis buffers were highstrength chaotrophic guanidium salts and deter-gents, with washing buffers consisting of lowstrength chaotrophic salts, and Tris/alcohol/acidbuffers for DNA elution.
In all the methods, integrity of the total DNA waschecked by agarose gel electrophoresis. Nucleic acidextracts were stored at �70 1C until further analysis.
DNA quantification
After extraction, DNA concentrations were quanti-fied spectrophotometrically by calculating the A260/A230 and A260/A280 ratios for humic acid and proteincontent, respectively. A standard curve of DNAconcentration (10–50 ng of DNA) was constructed usingherring sperm DNA (Sigma Chemical, St. Louis, MO).The DNA yields were estimated on the basis of at leastthree replicate determinations.
PCR for DGGE analysis
Universal eukaryotic primers targeting 18S rDNAwere used for DNA amplification. For DGGE primersEuk20F (50GTA GTC ATA TGC TTG TCT C 30) andEuk516r-GC (50 ACC AGA CTT GCC CTC C 30),which amplify fragments of about 500 bp [5], were used.These primers were checked against a database of about4000 eukaryotic sequences with satisfactory results [5].PCRs were run in a Perking Elmer Cycler in 150 ml tubesusing 100 ml reaction volumes. The reaction mixturecontained 5 ml of template, 0.5 ml of both primers(50 mM), 1 ml of 25mM solution of nucleotides, 1�reaction buffer and 0.5U of Taq DNA polymerase(Promega Co., Madison, USA). The program includedan initial denaturation at 94 1C for 5min, followed by 19touchdown cycles of denaturation at 94 1C for 1min,annealing at 64 1C (with the temperature decreasing0.5 1C each cycle) for 1min and extension at 72 1C for3min. Final extension was done at 721 for 6min.Aliquots of 5 ml of the PCR product were run in 1%agarose gel at 130V for 1 h, stained with ethidiumbromide, and quantified using an appropriate standard(F29 digested with HindIII).
DGGE electrophoresis
DGGE was carried out using a DCode UniversalDetection System instrument and a gradient formermodel 475 according to the manufacturer’s instructions(Bio-Rad). Electrophoresis was performed with 0.75mmthick 6% polyacrylamide gels with a ratio of acrilamideto bisacrilamide of 37.5:1, and a denaturing gradient(urea/formamide) from 20% to 60%. The runningbuffer was TAE (40mM Tris, 40mM acetic acid,1mM EDTA, pH 7.4). Approximately 100 ng of PCRproducts were mixed with the same volume of loadingdye (2% bromophenol blue, 2% xylene cyanol, 100%glicerol) and applied to individual wells. Gels were runat 60 1C for 11 h at 100V, stained with ethidium bromideand visualized under UV illumination.
DNA bands were cut from the gel with a sterile bladeand placed in sterile vials. Twenty microlitres of milliQwater were added. DNA was allowed to diffuse into thewater at 4
%oC overnight. Five millilitres of the eluate
were used as a DNA template in a PCR with the primersdescribed above. The PCR products were directlysequenced with a Big-Dye sequencing kit (AppliedBiosystem) as described by the manufacturer’s instruc-tions. The sequences were aligned to 18S rDNAsequences obtained from the National Center ofBiotechnology Information Database using BLASTsearch.
Clone library construction
18S rDNA genes were amplified from DNA extractedfrom all environmental samples by PCR using twogeneral eukaryotic primers, Euk1a (50 CTG GTT GATCCT GCC AG 30) and EukBr (50 TGA TCC TTC TGCAGG TTC ACC TAC 30) [5]. PCR conditions were asfollows, initial denaturation at 97 1C for 5min, followedby 29 cycles of denaturation at 94 1C for 40 s, annealingat 40 1C for 1min, and extension at 72 1C for 1min. Theamplification products were used to construct a clonelibrary with the TOPO 1 Kit (InvitroGen, Carlsbad,CA, USA). Positive transformants (white colonies) werestreaked for isolation and stored in both stab culturesand dimethyl sulfoxide. Clones were numbered con-tinuously from 1 to 100, digested with the restrictionenzyme XbaI. Clones with different restriction patternswere sequenced as described above.
To calculate the percentage of similarity between thesequences obtained by using DGGE and cloning, adistance matrix was generated by Neighbor-joining withthe correction method of Felsenstein as implemented inARB, taking into account all unambiguous nucleotidesbetween Saccharomyces cerevisiae positions 20–563. Thesequences were aligned with 18S rDNA sequencesobtained from the National Center of Biotechnology
ARTICLE IN PRESSA. Aguilera et al. / Systematic and Applied Microbiology 29 (2006) 593–605 597
Information Database and checked for potentialquimeras with the Bellerophon Chimera Check pro-gram. The sequences were subsequently aligned with 18SrDNA reference sequences in the ARB package (http://www.arb-home.de). The rRNA alignments were cor-rected manually and alignment uncertainties wereomitted. Only unambiguously aligned positions wereused to calculate the similarity coefficients.
Results
Comparison of DNA extraction procedures using
natural samples
When different DNA extraction procedures wereassayed with Rıo Tinto samples, all except procedures1–3 yielded ethidium bromide-stained bands in agarosegels. Bead-beating, sonication and freezing/thawingcycles failed to allow the isolation of any substantialamount of DNA. The size distribution of the DNAfragments (1.3–4.5 kb) obtained by gel electrophoresiswith each of the remaining procedures revealed thatsome limited shearing took place during the extractionsregardless of the physical disruption method employed.
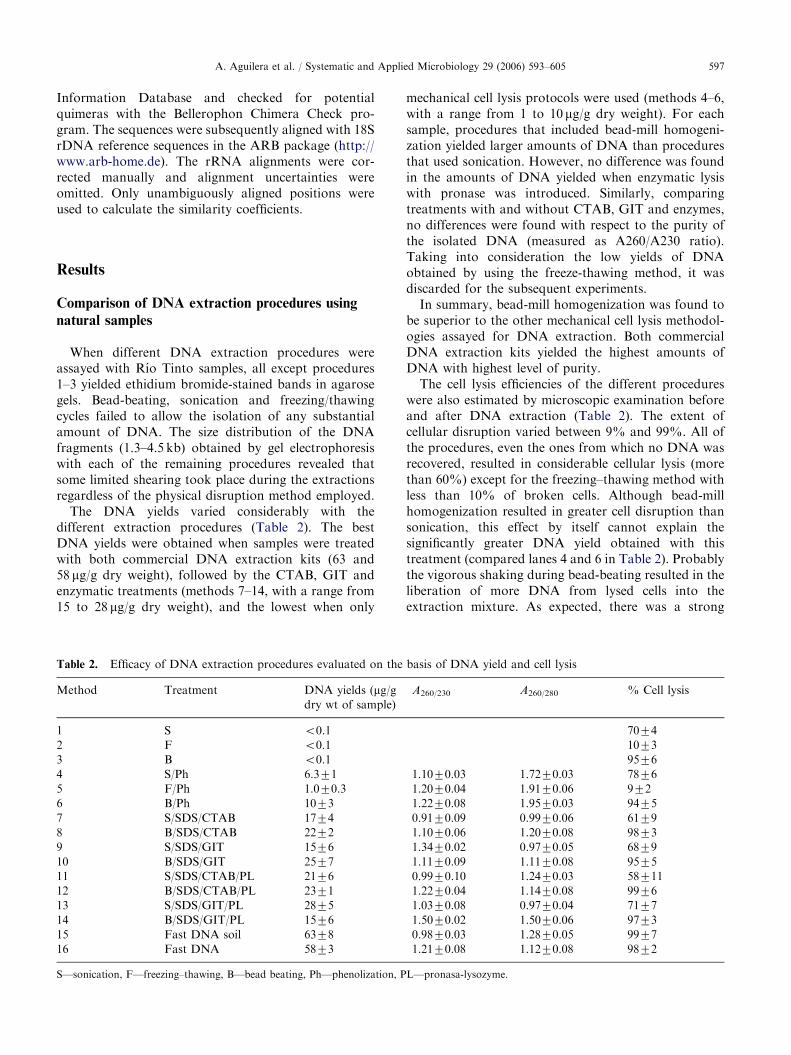
The DNA yields varied considerably with thedifferent extraction procedures (Table 2). The bestDNA yields were obtained when samples were treatedwith both commercial DNA extraction kits (63 and58 mg/g dry weight), followed by the CTAB, GIT andenzymatic treatments (methods 7–14, with a range from15 to 28 mg/g dry weight), and the lowest when only
Table 2. Efficacy of DNA extraction procedures evaluated on the
Method Treatment DNA yields (mg/gdry wt of sample)
1 S o0.1
2 F o0.1
3 B o0.1
4 S/Ph 6.371
5 F/Ph 1.070.3
6 B/Ph 1073
7 S/SDS/CTAB 1774
8 B/SDS/CTAB 2272
9 S/SDS/GIT 1576
10 B/SDS/GIT 2577
11 S/SDS/CTAB/PL 2176
12 B/SDS/CTAB/PL 2371
13 S/SDS/GIT/PL 2875
14 B/SDS/GIT/PL 1576
15 Fast DNA soil 6378
16 Fast DNA 5873
S—sonication, F—freezing–thawing, B—bead beating, Ph—phenolization, P
mechanical cell lysis protocols were used (methods 4–6,with a range from 1 to 10 mg/g dry weight). For eachsample, procedures that included bead-mill homogeni-zation yielded larger amounts of DNA than proceduresthat used sonication. However, no difference was foundin the amounts of DNA yielded when enzymatic lysiswith pronase was introduced. Similarly, comparingtreatments with and without CTAB, GIT and enzymes,no differences were found with respect to the purity ofthe isolated DNA (measured as A260/A230 ratio).Taking into consideration the low yields of DNAobtained by using the freeze-thawing method, it wasdiscarded for the subsequent experiments.
In summary, bead-mill homogenization was found tobe superior to the other mechanical cell lysis methodol-ogies assayed for DNA extraction. Both commercialDNA extraction kits yielded the highest amounts ofDNA with highest level of purity.
The cell lysis efficiencies of the different procedureswere also estimated by microscopic examination beforeand after DNA extraction (Table 2). The extent ofcellular disruption varied between 9% and 99%. All ofthe procedures, even the ones from which no DNA wasrecovered, resulted in considerable cellular lysis (morethan 60%) except for the freezing–thawing method withless than 10% of broken cells. Although bead-millhomogenization resulted in greater cell disruption thansonication, this effect by itself cannot explain thesignificantly greater DNA yield obtained with thistreatment (compared lanes 4 and 6 in Table 2). Probablythe vigorous shaking during bead-beating resulted in theliberation of more DNA from lysed cells into theextraction mixture. As expected, there was a strong
basis of DNA yield and cell lysis
A260/230 A260/280 % Cell lysis
7074
1073
9576
1.1070.03 1.7270.03 7876
1.2070.04 1.9170.06 972
1.2270.08 1.9570.03 9475
0.9170.09 0.9970.06 6179
1.1070.06 1.2070.08 9873
1.3470.02 0.9770.05 6879
1.1170.09 1.1170.08 9575
0.9970.10 1.2470.03 58711
1.2270.04 1.1470.08 9976
1.0370.08 0.9770.04 7177
1.5070.02 1.5070.06 9773
0.9870.03 1.2870.05 9977
1.2170.08 1.1270.08 9872
L—pronasa-lysozyme.
ARTICLE IN PRESSA. Aguilera et al. / Systematic and Applied Microbiology 29 (2006) 593–605598
positive correlation between DNA yields and extent ofcellular lysis (r ¼ 0:85, data not shown) for theprocedures that yielded significant amounts of DNA.
Impact of DNA isolation method on DGGE analysis
The DNAs extracted using the different methodscompared in this work were suitable as PCR templates.We obtained PCR products in all cases except withmechanically disrupted cells (methods 1–3), where noPCR products were achieved. DGGE performance wasfurther tested with DNA obtained from methods 4–16once the optimal conditions for electrophoresis were
4 5 6 8 10 12 14 15 16METHODS
12
31617
1314
15
1112
15
10
5
0RT-40 RT-56 RT-84
(A) (
DG
GE
n° o
f ba
nds
(C)
Method 4 Method 5 Metho
Merhod 12 Merhod 14 Merho
Fig. 1. DGGE gel separation of PCR-amplified 18S rDNA fragm
correspond to the DNA extraction methods. Arrows correspond to
obtained per DNA extraction method assayed.
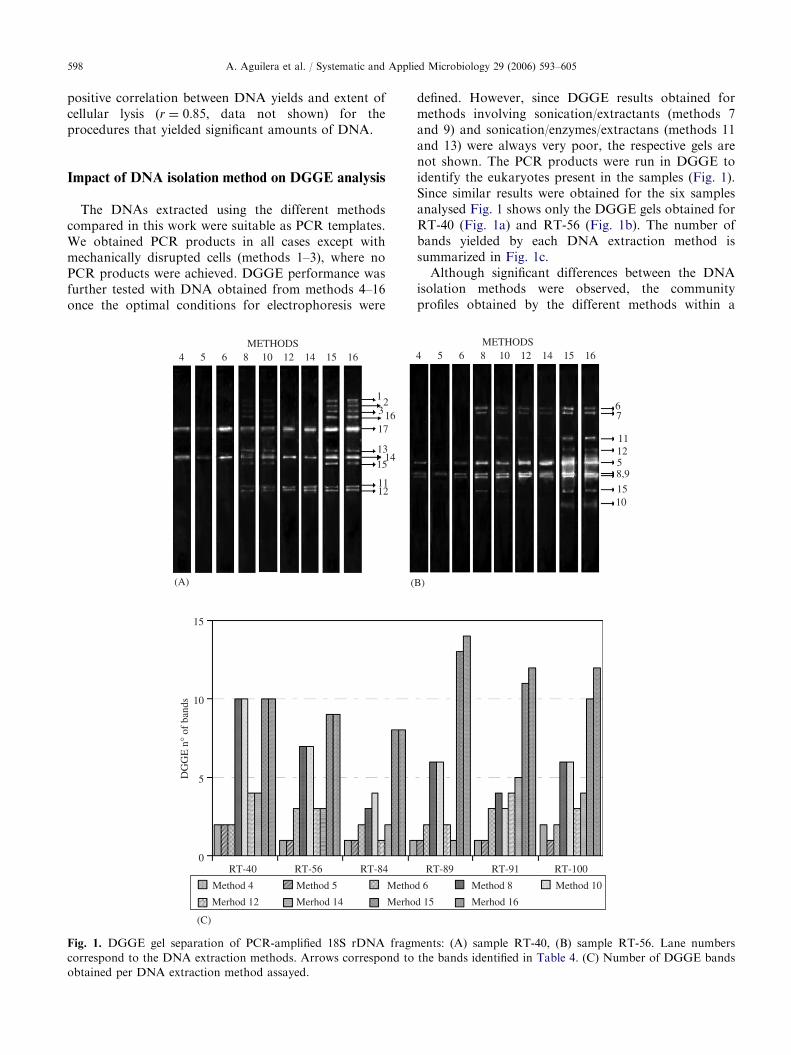
defined. However, since DGGE results obtained formethods involving sonication/extractants (methods 7and 9) and sonication/enzymes/extractans (methods 11and 13) were always very poor, the respective gels arenot shown. The PCR products were run in DGGE toidentify the eukaryotes present in the samples (Fig. 1).Since similar results were obtained for the six samplesanalysed Fig. 1 shows only the DGGE gels obtained forRT-40 (Fig. 1a) and RT-56 (Fig. 1b). The number ofbands yielded by each DNA extraction method issummarized in Fig. 1c.
Although significant differences between the DNAisolation methods were observed, the communityprofiles obtained by the different methods within a
4 5 6 8 10 12 14 15 16METHODS
67
111258,9
1510
RT-89 RT-91 RT-100
B)
d 6 Method 8 Method 10
d 15 Merhod 16
ents: (A) sample RT-40, (B) sample RT-56. Lane numbers
the bands identified in Table 4. (C) Number of DGGE bands
ARTICLE IN PRESSA. Aguilera et al. / Systematic and Applied Microbiology 29 (2006) 593–605 599
given sample, resembled each other (Fig. 1a, b). For allthe samples analysed, extraction methods 4–6 revealedfewer bands than those methods that received additionaltreatments with detergents, chemical extractants andenzymes (Fig. 1c). Although the addition of extractantssuch as GIT or CTAB resulted in a higher number ofbands (methods 8 and 10), the additional use of enzymesresulted in a decrease in the number of bands (methods12 and 14). Commercial kits , methods 15 and 16,yielded the broadest and the most intense band patterns.Three of the six samples (RT-40, RT-56 and RT-84) didnot show differences between the number of bands ofboth methods. However, method 16 yielded a highernumber of bands for the remaining samples than theDNA extraction method 15. For this reason, all themolecular analysis of the samples were carried out usingonly DNA extracted by this methodology.
Identification of eukaryotic populations
Table 3 summarized the species identified by usingoptical microscopy, DGGE and 18S cloning as well astheir relative abundances per sample.
Microscopic analysis
Seventeen species belonging to different genera wereidentified based on their morphological characteristicsand previous studies of the eukaryotic communities inthis river [1,14,15]. One species of diatoms related to thegenera Pinnularia; one species of euglenas, Euglena
mutabilis; five species of green algae, Chlamydomonas
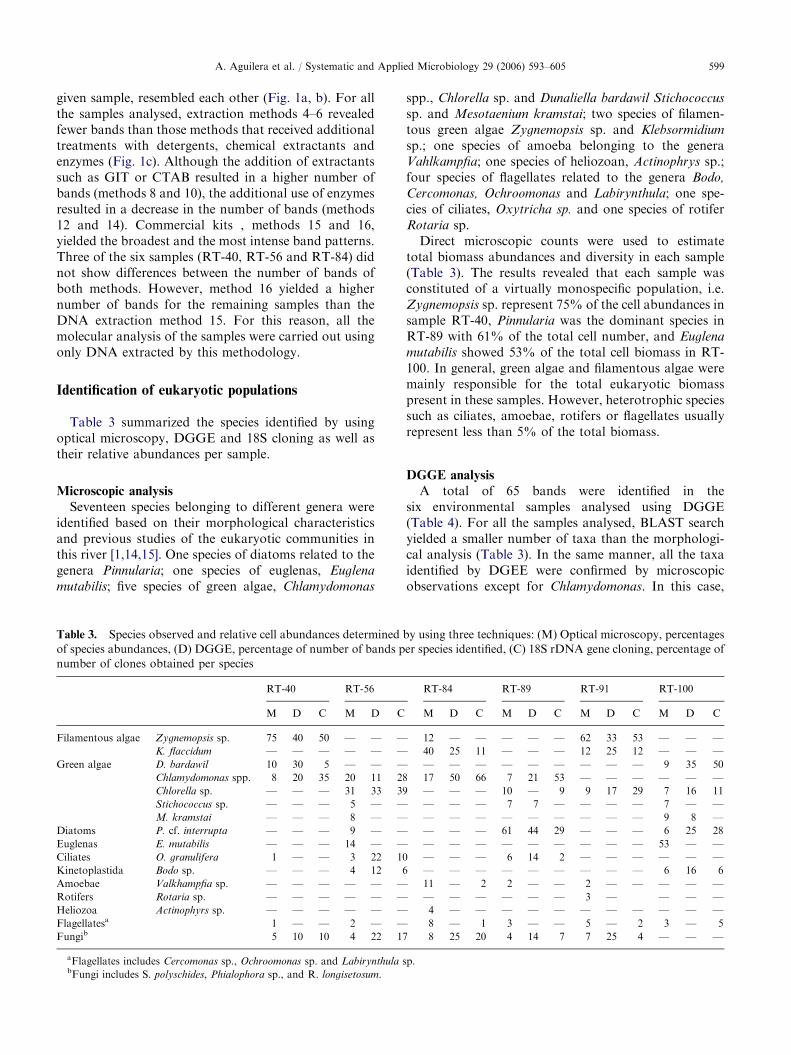
Table 3. Species observed and relative cell abundances determined b
of species abundances, (D) DGGE, percentage of number of bands p
number of clones obtained per species
RT-40 RT-56
M D C M D C
Filamentous algae Zygnemopsis sp. 75 40 50 — — —
K. flaccidum — — — — — —
Green algae D. bardawil 10 30 5 — — —
Chlamydomonas spp. 8 20 35 20 11 28
Chlorella sp. — — — 31 33 39
Stichococcus sp. — — — 5 — —
M. kramstai — — — 8 — —
Diatoms P. cf. interrupta — — — 9 — —
Euglenas E. mutabilis — — — 14 — —
Ciliates O. granulifera 1 — — 3 22 10
Kinetoplastida Bodo sp. — — — 4 12 6
Amoebae Valkhampfia sp. — — — — — —
Rotifers Rotaria sp. — — — — — —
Heliozoa Actinophyrs sp. — — — — — —
Flagellatesa 1 — — 2 — —
Fungib 5 10 10 4 22 17
aFlagellates includes Cercomonas sp., Ochroomonas sp. and Labirynthula sbFungi includes S. polyschides, Phialophora sp., and R. longisetosum.
spp., Chlorella sp. and Dunaliella bardawil Stichococcus
sp. and Mesotaenium kramstai; two species of filamen-tous green algae Zygnemopsis sp. and Klebsormidium
sp.; one species of amoeba belonging to the generaVahlkampfia; one species of heliozoan, Actinophrys sp.;four species of flagellates related to the genera Bodo,
Cercomonas, Ochroomonas and Labirynthula; one spe-cies of ciliates, Oxytricha sp. and one species of rotiferRotaria sp.
Direct microscopic counts were used to estimatetotal biomass abundances and diversity in each sample(Table 3). The results revealed that each sample wasconstituted of a virtually monospecific population, i.e.Zygnemopsis sp. represent 75% of the cell abundances insample RT-40, Pinnularia was the dominant species inRT-89 with 61% of the total cell number, and Euglena
mutabilis showed 53% of the total cell biomass in RT-100. In general, green algae and filamentous algae weremainly responsible for the total eukaryotic biomasspresent in these samples. However, heterotrophic speciessuch as ciliates, amoebae, rotifers or flagellates usuallyrepresent less than 5% of the total biomass.
DGGE analysis
A total of 65 bands were identified in thesix environmental samples analysed using DGGE(Table 4). For all the samples analysed, BLAST searchyielded a smaller number of taxa than the morphologi-cal analysis (Table 3). In the same manner, all the taxaidentified by DGEE were confirmed by microscopicobservations except for Chlamydomonas. In this case,
y using three techniques: (M) Optical microscopy, percentages
er species identified, (C) 18S rDNA gene cloning, percentage of
RT-84 RT-89 RT-91 RT-100
M D C M D C M D C M D C
12 — — — — — 62 33 53 — — —
40 25 11 — — — 12 25 12 — — —
— — — — — — — — — 9 35 50
17 50 66 7 21 53 — — — — — —
— — — 10 — 9 9 17 29 7 16 11
— — — 7 7 — — — — 7 — —
— — — — — — — — — 9 8 —
— — — 61 44 29 — — — 6 25 28
— — — — — — — — — 53 — —
— — — 6 14 2 — — — — — —
— — — — — — — — — 6 16 6
11 — 2 2 — — 2 — — — — —
— — — — — — 3 — — — —
4 — — — — — — — — — — —
8 — 1 3 — — 5 — 2 3 — 5
8 25 20 4 14 7 7 25 4 — — —
p.
ARTICLE IN PRESS
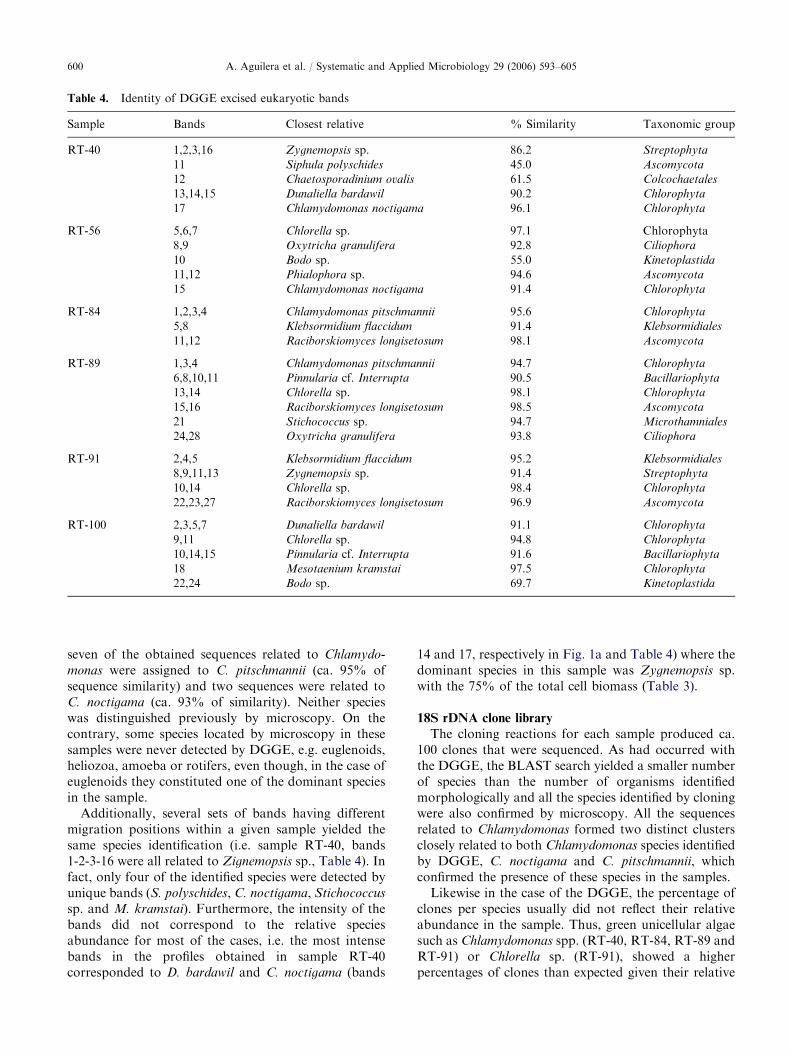
Table 4. Identity of DGGE excised eukaryotic bands
Sample Bands Closest relative % Similarity Taxonomic group
RT-40 1,2,3,16 Zygnemopsis sp. 86.2 Streptophyta
11 Siphula polyschides 45.0 Ascomycota
12 Chaetosporadinium ovalis 61.5 Colcochaetales
13,14,15 Dunaliella bardawil 90.2 Chlorophyta
17 Chlamydomonas noctigama 96.1 Chlorophyta
RT-56 5,6,7 Chlorella sp. 97.1 Chlorophyta
8,9 Oxytricha granulifera 92.8 Ciliophora
10 Bodo sp. 55.0 Kinetoplastida
11,12 Phialophora sp. 94.6 Ascomycota
15 Chlamydomonas noctigama 91.4 Chlorophyta
RT-84 1,2,3,4 Chlamydomonas pitschmannii 95.6 Chlorophyta
5,8 Klebsormidium flaccidum 91.4 Klebsormidiales
11,12 Raciborskiomyces longisetosum 98.1 Ascomycota
RT-89 1,3,4 Chlamydomonas pitschmannii 94.7 Chlorophyta
6,8,10,11 Pinnularia cf. Interrupta 90.5 Bacillariophyta
13,14 Chlorella sp. 98.1 Chlorophyta
15,16 Raciborskiomyces longisetosum 98.5 Ascomycota
21 Stichococcus sp. 94.7 Microthamniales
24,28 Oxytricha granulifera 93.8 Ciliophora
RT-91 2,4,5 Klebsormidium flaccidum 95.2 Klebsormidiales
8,9,11,13 Zygnemopsis sp. 91.4 Streptophyta
10,14 Chlorella sp. 98.4 Chlorophyta
22,23,27 Raciborskiomyces longisetosum 96.9 Ascomycota
RT-100 2,3,5,7 Dunaliella bardawil 91.1 Chlorophyta
9,11 Chlorella sp. 94.8 Chlorophyta
10,14,15 Pinnularia cf. Interrupta 91.6 Bacillariophyta
18 Mesotaenium kramstai 97.5 Chlorophyta
22,24 Bodo sp. 69.7 Kinetoplastida
A. Aguilera et al. / Systematic and Applied Microbiology 29 (2006) 593–605600
seven of the obtained sequences related to Chlamydo-
monas were assigned to C. pitschmannii (ca. 95% ofsequence similarity) and two sequences were related toC. noctigama (ca. 93% of similarity). Neither specieswas distinguished previously by microscopy. On thecontrary, some species located by microscopy in thesesamples were never detected by DGGE, e.g. euglenoids,heliozoa, amoeba or rotifers, even though, in the case ofeuglenoids they constituted one of the dominant speciesin the sample.
Additionally, several sets of bands having differentmigration positions within a given sample yielded thesame species identification (i.e. sample RT-40, bands1-2-3-16 were all related to Zignemopsis sp., Table 4). Infact, only four of the identified species were detected byunique bands (S. polyschides, C. noctigama, Stichococcus
sp. and M. kramstai). Furthermore, the intensity of thebands did not correspond to the relative speciesabundance for most of the cases, i.e. the most intensebands in the profiles obtained in sample RT-40corresponded to D. bardawil and C. noctigama (bands
14 and 17, respectively in Fig. 1a and Table 4) where thedominant species in this sample was Zygnemopsis sp.with the 75% of the total cell biomass (Table 3).
18S rDNA clone library
The cloning reactions for each sample produced ca.100 clones that were sequenced. As had occurred withthe DGGE, the BLAST search yielded a smaller numberof species than the number of organisms identifiedmorphologically and all the species identified by cloningwere also confirmed by microscopy. All the sequencesrelated to Chlamydomonas formed two distinct clustersclosely related to both Chlamydomonas species identifiedby DGGE, C. noctigama and C. pitschmannii, whichconfirmed the presence of these species in the samples.
Likewise in the case of the DGGE, the percentage ofclones per species usually did not reflect their relativeabundance in the sample. Thus, green unicellular algaesuch as Chlamydomonas spp. (RT-40, RT-84, RT-89 andRT-91) or Chlorella sp. (RT-91), showed a higherpercentages of clones than expected given their relative
ARTICLE IN PRESS
Bodo sp.
Pinnularia cf. interrupta
Chlamydomonas spp.
Klebsormidium sp.Zygnemopsis sp.0.9
0.92
0.94
0.96
0.98
1
Dunaliella bardawil
Chlorella sp.
Oxytricha granulifera
Sim
ilari
ty c
oeff
icie
nt
Sim
ilari
ty c
oeff
cien
tSi
mila
rity
coe
ffic
ient
Sim
ilari
ty c
oeff
icie
nt
0.9
0.92
0.94
0.96
0.98
1
0.9
0.92
0.94
0.96
0.98
1
0.9
0.92
0.94
0.96
0.98
1
0.9
0.92
0.94
0.96
0.98
1
0.9
0.92
0.94
0.96
0.98
1
0.9
0.92
0.94
0.96
0.98
1
0.9
0.92
0.94
0.96
0.98
1
(a) (b)
(c) (d)
(e) (f)
(g) (h)
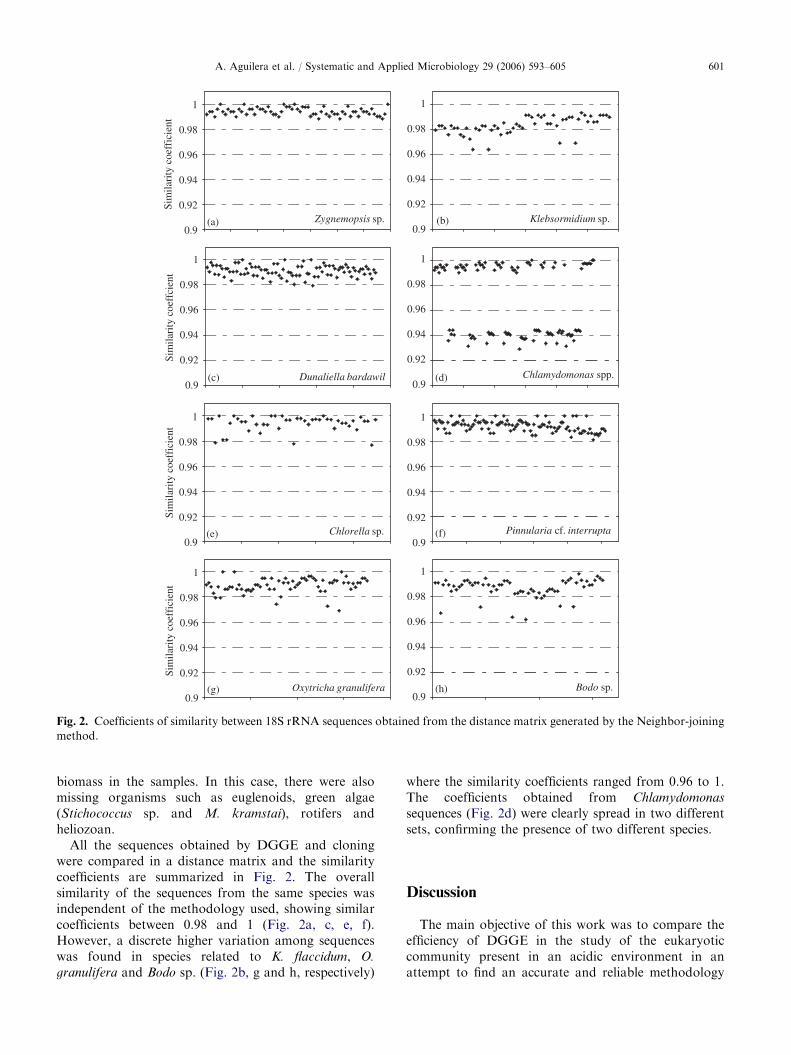
Fig. 2. Coefficients of similarity between 18S rRNA sequences obtained from the distance matrix generated by the Neighbor-joining
method.
A. Aguilera et al. / Systematic and Applied Microbiology 29 (2006) 593–605 601
biomass in the samples. In this case, there were alsomissing organisms such as euglenoids, green algae(Stichococcus sp. and M. kramstai), rotifers andheliozoan.
All the sequences obtained by DGGE and cloningwere compared in a distance matrix and the similaritycoefficients are summarized in Fig. 2. The overallsimilarity of the sequences from the same species wasindependent of the methodology used, showing similarcoefficients between 0.98 and 1 (Fig. 2a, c, e, f).However, a discrete higher variation among sequenceswas found in species related to K. flaccidum, O.
granulifera and Bodo sp. (Fig. 2b, g and h, respectively)
where the similarity coefficients ranged from 0.96 to 1.The coefficients obtained from Chlamydomonas
sequences (Fig. 2d) were clearly spread in two differentsets, confirming the presence of two different species.
Discussion
The main objective of this work was to compare theefficiency of DGGE in the study of the eukaryoticcommunity present in an acidic environment in anattempt to find an accurate and reliable methodology

ARTICLE IN PRESSA. Aguilera et al. / Systematic and Applied Microbiology 29 (2006) 593–605602
that would be easier and less time consuming thanconventional microscopy approaches. We can dividethis work into two parts, (i) the evaluation of differentprotocols for eukaryotic DNA extraction, and (ii) thecomparative analysis of eukaryotic diversity usingdifferent molecular techniques.
DNA extraction methods
The development of efficient and comparative DNAextraction methods is one of the most critical steps forevaluation of the microbial diversity of a given environ-ment using molecular approaches. The study of sedi-ments further complicates DNA extraction due to theneed to separate DNA from substances interfering withits analysis, e.g. heavy metals [40]. Our aim was tooptimize DNA isolation for community analysis insediments from acidophilic environments. Even thoughcommercial methods (15 and 16), Fast DNA extractionkit for soil and Fast DNA extraction kit, yielded DNAof large molecular size with almost no fragmentation,two methods, 8 and 10 (cells disrupted by bead beatingand treatment with CTAB or GIT) gave DNA of similarquality, in terms of intactness and amplificationefficiency, although with one third lower efficiency thanthe commercial kits. The addition of an enzymatictreatment (pronase and lysozyme) did not improve theefficiency of amplification, on the contrary, fewer bandswere obtained when analysed by DGGE. DNA frag-mentation increased when chemical and enzymatictreatments were introduced.
Our findings support the results of previous studies[12,13] where the use of bead beating for an efficient celllysis for the extraction of DNA were recommended. Inthese studies hot detergent treatment and freeze-thawcycles were observed to be rather ineffective in disrupt-ing cells. Our results concur, with percentages of celllysis ca. 98% for the bead beating system and less than10% when cells were treated with freeze-thaw cycles.Although sonication produces a high percentage of celllysis (ca. 70%), DNA fragmentation was greater thanwith beads. In the same manner, higher DNA yieldswere obtained with bead mill homogenization than withthe other two physical treatments (sonication and freeze-thawing cycles).
Although CTAB has been used in previous studies toremove contaminants from DNA [2,8], none of thepurification agents tested (CTAB and GIT) completelyremoved all the contaminants present in the samples.Additional purification steps involving CTAB or GITyielded purification efficiencies equivalent to the rest ofthe extraction protocols.
In our case, DNA recovery was higher whencommercial kits were used, three times more than theDNA yields obtained with the second best methods, 10
and 14, which also include bead beating and GIT (60and 20 mg/g dry wt, respectively). Although technicalinformation supplied with the commercial kits mentionthat lysis buffers contain high-strength guanidium saltsand detergents, without knowledge of the exact compo-nents in each of the commercial kits the reasons for theirapparent advantage can only be speculative.
The use of DGGE with universal primers revealsdominant species [20], however when rare species arestudied more gentle or harsher DNA isolation methodsmay be optimal, depending on cell envelope structure[40]. Krsek and Wellington [12] compared a variety oftreatments in the isolation and purification of DNAfrom soil using DGGE in the analysis of one soil sample.They observed that DNA extracts obtained withdifferent procedures yielded patterns with differencesin intensities and number of bands and recommended acombination of bead-beating with lysozyme and SDSfollowed by a phenol/chloroform purification andisopropanol precipitation. Our results support thesefindings regarding the efficiency of the combined actionof detergent, lysozyme and bead-beating, although inour samples, shearing of DNA was extensive with themethods including detergent and enzyme treatment, andthe number of bands yielded in the DGGE by theseprotocols were lower in number and intensity than thoseobtained with methods that did not include thesetreatments (methods 8, 10 or 14, 15).
Clear conclusions can be drawn from our results.Each isolation and purification method yielded dis-tinctly different DGGE profiles. Methods that includebead-beating as well as chemical extractants andcommercial kits recovered the broadest spectrum ofeukaryotes and were the easiest to perform.
Analysis of the extracted DNA
Although molecular techniques, such as DGGE, havebeen proven particularly useful for an initial investiga-tion to distinguish and identify the dominant commu-nity members, the interpretation of data for eukaryoticdiversity study in natural environments presents un-certainties, and several difficulties may arise in the longprocesses required for natural samples to sequence[6,31]. Some of the problems are intrinsic to PCRamplification kinetics, and, therefore, are shared by allof the approaches that use this step (PCR cloning andPCR fingerprinting techniques). Other difficulties arespecific for the DGGE technique used in this study. Weused independently obtained microscopy-based infor-mation for some of the organisms present in Rıo Tintoto investigate the magnitude of the difficulties.
One of the main problems we found when DGGE isused was the presence, in the same sample, of more thanone band showing different mobility but the same

ARTICLE IN PRESSA. Aguilera et al. / Systematic and Applied Microbiology 29 (2006) 593–605 603
identity (Table 4). This could be due to the formation ofheteroduplex molecules during the amplification processthat might contribute to difficulties in the interpretationof community complexity from DGGE patterns[7,21,32]. DGGE analysis of two PCR products afterinducing heteroduplex formation will result in fourbands, two heteroduplex and two homoduplex mole-cules, leading to an overestimation of the real number ofcommunity constituents [10,29]. However, when weexcised, reamplified, reelectrophoresed and sequencedall of these bands, only two of them (10%) yieldedmultiple bands. The multiple bands (presumably repre-senting homo- and heteroduplexes) were clearly sepa-rated in the gel when we performed a new DGGEanalysis, and, therefore, they cannot be related to thequality of gel separation or the precision of the excision.These results agree with previous studies reported byMurray et al. [17].
An important result of this study was the observationthat some of the species detected by microscopy werenot detected by the molecular analysis. Most of theheterotrophic species such as heliozoan, amoebae orrotifers detected by microscopy, were not molecularlyidentified and, more surprisingly, species as abundant asEuglenas was never detected by DGGE or cloning. Inthe same manner, the band intensity or the number ofclones retrieved per species did not always correlate withthe abundance observed microscopically. Thus, mem-bers of the Chlorophyta such Chlamydomonas, Chlorellas
or Dunaliellas appeared to be relatively easily amplifiedin our study regardless of their abundance in thesamples, producing the most intense bands in theDGGE.
This fact could be due to the practical problemsinherent to both molecular methodologies used: that therelative abundance of any population detected maydeviate from that actually present in a sample.Although, in principle, procedures for extracting DNAmay be selective, the primer designs could compromisePCR amplification. Thus, using primers targetingplastid genes, rather than the primers specific foreukaryotes, may improve the detection of elusive species[29]. Furthermore, the relative large genome andpotentially high rrn copy number of species related toChlorophyatas, such as Chlamydomonas, may partiallyexplain the apparent preferential amplification anddetection of these species in complex environmentalsamples [11,24].
In the same manner, despite DNA extraction andPCR biases, it has been demonstrated that is not alwayspossible to separate DNA fragments which have acertain amount of sequence variation [4,35] and wecannot eliminate the possibility that some of the minorbands might be masked if they exhibited the samemelting behaviour as other populations or that theirconcentrations were less than the detection limit of the
staining solution. More information might be obtainedfrom weak bands by employing a more sensitive geldeveloping protocol such silver staining. Although somework has been carried out in this regard [23], thelimitations of currently available methodologies leadmany authors to conclude that the ecological quantifica-tion of organism abundances based on molecularapproaches have not yet been convincingly reported[25,31,38].
Nevertheless, one of the strongest points of theapplication of DGGE in microbial ecology is thepossibility of performing simultaneous analysis ofmultiple samples as well as the advantage of obtainingbands that can be sequenced and compared. Eukaryoteshave been traditionally identified based on morphologi-cal characteristics using microscopy-related techniques.These methodologies are time-consuming, require ex-pertise in taxonomy and, sometimes, fail to distinguishamong similar species. Although sequences obtainedfrom DGGE are short (ca. 500 pb), the reliability of theDGGE regarding taxonomic identification is high, atleast at the genus level. In this regard, two sequencescorresponding to different species of Chlamydomonas
have been detected in this work using moleculartechniques, species that were not previouslydistinguished microscopically due to their similarmorphology.
In conclusion, we think that the application of DGGEtechniques could be as useful for eukaryotic commu-nities as it is for prokaryotic ones. However, our resultsalso illustrate that any method, even a molecular one,only reflects a portion of the real biodiversity. Only anintegrated approach combining molecular techniques,microscopic observations and new isolation strategieswill guarantee a more realistic picture of the microbialdiversity of any given ecosystem.
Acknowledgements
We gratefully acknowledge Dr. E. Dıez for hisgenerous and continuous technical support. Thisresearch has been supported by Centro de Astrobiologıapost-doctoral fellowships (to A.A. and F.G). This workwas funded by grants BOS 2002-02148 and CGL2005-05470/BOS.
References
[1] L. Amaral, F. Gomez, E. Zettler, B. Keenan, R. Amils,
M. Sogin, Eukaryotic diversity in Spain’s river of fire,
Nature 417 (2002) 137.
[2] F.M. Ausubel, R. Brent, E. Kingston, D.D. Moore,
J.G. Seidmen, J.A. Smith, K. Struhl, In: Current

ARTICLE IN PRESSA. Aguilera et al. / Systematic and Applied Microbiology 29 (2006) 593–605604
Protocols in Molecular Biology, vol. 2, Greene Publishing
Associates & Wiley-Interscience, New York, 1990, p. 231.
[3] T.D. Brock, The study of microorganisms in situ:
progress and problems, Symp. Soc. Gen. Microbiol. 1
(1987) 1–17.
[4] B.B.E. Buchholz-Cleven, B. Rattunde, K.L. Straub,
Screening for genetic diversity of isolates of anaerobic
Fe(II)-oxidizing bacteria using DGGE and whole-cell
hybridisation, Syst. Appl. Microbiol. 20 (1997) 301–309.
[5] B. Dıez, C. Pedros-Alio, T. Marsh, R. Massana,
Application of DGGE to study the diversity of marine
picoeukaryotic assemblages and comparison of DGGE
with other molecular techniques, Appl. Environ. Micro-
biol. 67 (2001) 2942–2951.
[6] V. Farrelly, F.A. Rainey, E. Stackebrandt, Effect of
genome size and rrn gene copy number on PCR
amplification of 16S rRNA genes from a mixture of
bacterial species, Appl. Environ. Microbiol. 61 (1995)
2798–2801.
[7] M.J. Ferris, S.C. Nold, N.P. Revsbech, N.M. Ward,
Population structure and physiological changes within a
hot spring microbial mat community following distur-
bance, Appl. Environ. Microbiol. 63 (1997) 1367–1374.
[8] W.E. Holben, J.K. Jansson, B.K. Chelm, J.M. Tiedje,
DNA probe method for the detection of of specific
microorganisms in the soil bacterial community, Appl.
Environ. Microbiol. 54 (1998) 703–711.
[9] P. Hugenholtz, B.M. Goebel, N.R. Pace, Impact of
culture-independent studies of the emerging phylogenetic
view of bacterial diversity, J. Bacteriol. 180 (1998)
4765–4774.
[10] M.A. Jensen, N. Straus, Effect of PCR conditions on the
formation of heteroduplex and single-stranded DNA
products in the amplification of bacterial ribosomal
DNA spacer regions, PCR Methods Appl. 3 (1996)
186–194.
[11] M. Kapoor, T. Nagai, T. Wakasugi, K. Yoshinaga, M.
Sugiera, Organization of chloroplast ribosomal RNA
genes and in vitro self-splicing activity of the large subunit
rRNA intron from the green alga Chlorella vulgaris C-27,
Curr. Genet. 31 (1997) 503–510.
[12] M. Krsek, E.M.H. Wellington, Comparison of different
methods for the isolation and purification of total
community DNA from soil, J. Microbiol. Methods 39
(1999) 1–16.
[13] C.R. Kuske, K.L. Banton, D.L. Adorada, P.C. Stark,
K.K. Hill, P.J. Jackson, Small-scale DNA sample
preparation method for field PCR detection of microbial
cells and spores in soil, Appl. Environ. Microbiol. 64
(1998) 2463–2472.
[14] A.I. Lopez-Archilla, R. Amils, Microbial community
composition and ecology of an acidic aquatic environemt,
Microbial. Ecol. 41 (1999) 20–35.
[15] A.I. Lopez-Archilla, I. Marın, R. Amils, Microbial
community composition and ecology of an acidic aquatic
environment: Rıo Tinto Spain, Microbial Ecol. 41 (2001)
20–32.
[16] T.L. Marsh, W.T. Liu, L.J. Forney, H. Cheng, Beginning
a molecular analysis of the eukaryal community in
activated sludge, Water. Sci. Technol. 37 (1998) 455–460.
[17] A.E. Murray, J.T. Hollibaugh, C. Orrego, Phylogenetic
compositions of bacterioplankton from two California
estuaries compared by DGGE of 16S rDNA fragments,
Appl. Environ. Microbiol. 62 (1996) 2676–2680.
[18] G. Muyzer, Structure, function and dynamics of micro-
bial communities: the molecular biological approach, In:
G.R. Carvalho (Ed.), Advances in Molecular Ecology,
87–117. NATO Science Series, IOS Press, Amsterdam,
1998, pp. 742–767.
[19] G. Muyzer, Genetic firgenprinting of microbial commu-
nities present status and future perspectives, In: C.R. Bell,
M. Brylinsky, P. Johnson-Green (Eds.), Microbial Bio-
systems: New Frontiers, Proceedings of the Eighth
International Symposium on Microbial Ecology, Atlantic
Canada Society for Microbial Ecology, Halifax, Canada,
1999, pp. 251–255.
[20] G. Muyzer, E.C. De Waal, A.G. Uitterlinden, Profiling of
complex microbial populations by DGGE analysis of
polymerase chain reaction-amplified genes encoding for
16S rRNA, Appl. Environ. Microbiol. 59 (1993) 695–700.
[21] R.M. Myers, V.C. Sheffield, D.R. Cox, Mutation detec-
tion by PCR, GC-clams and DGGE, In: H.A. Elrich
(Ed.), PCR Technology: Principles and Applications for
DNA Amplification, Stockton Press, New York, 1989,
pp. 71–88.
[22] O. Nubel, B. Engelen, A. Felske, J. Snaidr, A. Wieshuber,
R.I. Amann, W. Ludwig, H. Backhaus, Sequence hetero-
geneities of genes encoding 16SrRNAs in Paenibacillus
polymyxa detected by TGGE, J. Bacteriol. 178 (1996)
5636–5643.
[23] U. Nubel, F. Garcıa-Pichel, M. Kuhl, G. Muyzer,
Quantifying microbial diversity: morphotypes, 16S rDNA
genes, and carotenoids from oxygenic phototrops in
microbial mats, Appl. Environ. Microbiol. 65 (1999)
422–430.
[24] O.W. Odom, S.P. Holloway, N.N. Deshpande, J. Lee,
D.L. Herrin, Mobile self-splicing group I introns from the
psbA gene of Chlamydomonas reinhardtii: highly efficient
homing of an exogenous intron containing its own
promoter, Mol. Cell. Biol. 21 (2001) 3472–3481.
[25] A.G. O’Donell, M. Goodfellow, D.L. Hawksworth,
Theoretical and practical aspects of the quantification of
biodiversity among microorganisms, In: D.L. Hawks-
worth (Ed.), Biodiversity, Measurement and Estimation,
Chapman & Hall, London, 1995, pp. 65–73.
[26] G.J. Olsen, D.J. Lane, S.J. Giovannoni, Microbial
ecology and evolution: a ribosomal approach, Annu.
Rev. Microbiol. 40 (1986) 337–365.
[27] L. Ovreas, L. Forney, F.L. Daae, V. Torsvik, Distribution
of bacterioplankton in meromictic lake Saelenvannet, as
determined by DGGE of PCR-amplified gene fragments
coding for 16S rRNA, Appl. Environ. Microbiol. 63
(1997) 3367–3373.
[28] N.R. Pace, D.A. Stahl, D.J. Lane, G.J. Olsen, The
analysis of natural microbial populations by ribosomal
RNA sequences, Adv. Microbiol. Ecol. 9 (1986) 1–55.
[29] M.S. Rappe, M.T. Suzuki, K.L. Vergin, S.J. Giovannoni,
Phylogenetic diversity of ultraplankton plastid small-
subunit rRNA genes recovered in environmental nucleica
acid samples from the Pacific and Atlantic coasts of the
ARTICLE IN PRESSA. Aguilera et al. / Systematic and Applied Microbiology 29 (2006) 593–605 605
United States, Appl. Environ. Microbiol. 64 (1988)
294–303.
[30] D.A. Stahl, W.C. Capman, Application of molecular
genetics to the study of microbial communities, NATO
Sci. Ser. G 35 (1995) 193–206.
[31] C.E.W. Steinberg, W. Geller, Biodiversity and interac-
tions within pelagic nutrient cycling and productivity, In:
E.D. Schulze, H.A. Mooney (Eds.), Biodiversity and
Ecosystem Function, Springer, Berlin, 1993, pp. 497–510.
[32] M.T. Suzuki, S.J. Giovannoni, Bias caused by template
annealing in the amplification of mixtures of 16S rRNA
genes by PCR, Appl. Environ. Microbiol. 62 (1996)
625–630.
[33] V. Torsvik, F.L. Daae, R.A. Sandaa, L. Ovreas, Novel
techniques for analysing microbial diversity in natural
and perturbed environments, J. Biotechnol. 64 (1998)
53–62.
[34] E.J. Vainio, J. Hantula, Direct analysis of wood-inhabit-
ing fungi using DGGE of amplified ribosomal DNA,
Mycol. Res. 104 (2000) 927–936.
[35] T. Vallaeys, E. Topp, G. Muyzer, V. Macheret, G.
Laguerre, G. Soulas, Evaluation of DGGE in the
detection of 16S rDNA sequence variation in rhizobia
and methanotrophs, FEMS Microbiol. Ecol. 24 (1997)
279–285.
[36] J.D. Van Elsas, G.F. Duarte, A. Keijzer-Wolters,
E. Smith, Analysis of the dynamics of fungal communities
in soil via fungal-specific PCR of soil DNA followed by
DGGE, J. Microbiol. Methods 43 (2000) 133–151.
[37] E.J. Van Hannen, G. Zwart, M.P. Van Agterveld, H.J.
Gons, J. Ebert, H.J. Laanbroek, Changes in bacterial and
eukaryotic community structure after mass lysis of
filamentous cyanobacteria associated with viruses, Appl.
Environ. Microbiol. 65 (1999) 795–801.
[38] F. Von Wintzingerode, U.B. Goebel, E. Stackebrandt,
Determination of microbial diversity in environmental
samples:pitfalls of PCR-based rRNA analysis, FEMS
Microbiol. Rev. 21 (1997) 213–229.
[39] D.M. Ward, R. Weller, M.M. Bateson, 16S ribosomal
RNA sequences reveal numerous uncultured microorgan-
isms in a natural community, Nature 345 (1990) 63–65.
[40] I.G. Wilson, Inhibition and facilitation of nucleic acid
amplification, Appl. Environ. Microbiol. 63 (1997)
3741–3751.
Copyright © 2022 FDOKUMEN