A MODEL TO OBTAIN A SERVPERF SCALE EVALUATION ...
24
© 2018 e Author(s). Published by VGTU Press is is an Open Access article distributed under the terms of the Creative Commons Attribution License (http://creativecommons. org/licenses/by/4.0/), which permits unrestricted use, distribution, and reproduction in any medium, provided the original author and source are credited. *Corresponding author. E-mail: [email protected] Technological and Economic Development of Economy ISSN: 2029-4913 / eISSN: 2029-4921 2018 Volume 24 Issue 4: 1606–1629 https://doi.org/10.3846/tede.2018.5080 A MODEL TO OBTAIN A SERVPERF SCALE EVALUATION OF THE CRM CUSTOMER COMPLAINTS: AN APPLICATION TO THE 4G TELECOMMUNICATIONS SECTOR Ramón Alberto CARRASCO 1 , María Francisca BLASCO 1 , Jesús GARCÍA-MADARIAGA 1 , Ana PEDREÑO-SANTOS 1 , Enrique HERRERA-VIEDMA 2* 1 Department of Marketing and Market Research, Complutense University, Campus de Somosaguas, Madrid 28223, Spain 2 Department of Computer Science and Artificial Intelligence, University of Granada, Granada 18071, Spain Received 23 March 2017; accepted 30 September 2017 Abstract. e relationship between customer churn and their complaints is sufficiently contrasted in the telecom sector. erefore, a key part of a company’s strategy is the measurement of this dis- satisfaction. It is important to conduct periodic surveys on complaints in a standard form like the SERVPERF scale because it enables the organization to benchmark. Many of these complaints are stored in the company’s CRM. Our first aim is to define a model to transform CRM customer com- plaints, expressed in natural language, into SERVPERF scales. In the proposed model, we use the 2-tuple model, which allows computing this linguistic data without losing information. Our second purpose is to implement a prototype to apply the model in a 4G Company. As a practical conclu- sion, most complaints in this emerging technology (which still has some deficiencies) are related to technical aspects of the services rather than to staff. Keywords: SERVPERF, customer complaints, sentiment analysis, Fuzzy linguistic model, 2-tuple model, CRM trouble tickets. JEL Classification: D81, M15, M31, L96, O32. Introduction Customer Relationship Management (CRM) is a combination of people, processes and tech- nology with the aim of understanding the company’s customers. It is an integrated approach to manage relationships, putting the focus on customer retention and relationship develop- ment (Jain, Tomar, & Vishwakarma, 2016), and its capability is influenced both by customer- centric management systems and social media technologies (Trainor, Andzulis, Rapp, & Ag- nihotri, 2014). Its functionalities should be perfectly integrated with the Enterprise Resource
-
Upload
khangminh22 -
Category
Documents
-
view
0 -
download
0
Transcript of A MODEL TO OBTAIN A SERVPERF SCALE EVALUATION ...

© 2018 The Author(s). Published by VGTU Press
This is an Open Access article distributed under the terms of the Creative Commons Attribution License (http://creativecommons.org/licenses/by/4.0/), which permits unrestricted use, distribution, and reproduction in any medium, provided the original author and source are credited.
*Corresponding author. E-mail: [email protected]
Technological and Economic Development of EconomyISSN: 2029-4913 / eISSN: 2029-4921
2018 Volume 24 Issue 4: 1606–1629
https://doi.org/10.3846/tede.2018.5080
A MODEL TO OBTAIN A SERVPERF SCALE EVALUATIONOF THE CRM CUSTOMER COMPLAINTS: AN APPLICATION
TO THE 4G TELECOMMUNICATIONS SECTOR
Ramón Alberto CARRASCO1, María Francisca BLASCO1,Jesús GARCÍA-MADARIAGA1, Ana PEDREÑO-SANTOS1,
Enrique HERRERA-VIEDMA2*
1Department of Marketing and Market Research, Complutense University,Campus de Somosaguas, Madrid 28223, Spain
2Department of Computer Science and Artificial Intelligence,University of Granada, Granada 18071, Spain
Received 23 March 2017; accepted 30 September 2017
Abstract. The relationship between customer churn and their complaints is sufficiently contrastedin the telecom sector. Therefore, a key part of a company’s strategy is the measurement of this dis-satisfaction. It is important to conduct periodic surveys on complaints in a standard form like theSERVPERF scale because it enables the organization to benchmark. Many of these complaints arestored in the company’s CRM. Our first aim is to define a model to transform CRM customer com-plaints, expressed in natural language, into SERVPERF scales. In the proposed model, we use the2-tuple model, which allows computing this linguistic data without losing information. Our secondpurpose is to implement a prototype to apply the model in a 4G Company. As a practical conclu-sion, most complaints in this emerging technology (which still has some deficiencies) are related totechnical aspects of the services rather than to staff.
Keywords: SERVPERF, customer complaints, sentiment analysis, Fuzzy linguistic model, 2-tuplemodel, CRM trouble tickets.
JEL Classification: D81, M15, M31, L96, O32.
Introduction
Customer Relationship Management (CRM) is a combination of people, processes and tech-nology with the aim of understanding the company’s customers. It is an integrated approach to manage relationships, putting the focus on customer retention and relationship develop-ment (Jain, Tomar, & Vishwakarma, 2016), and its capability is influenced both by customer-centric management systems and social media technologies (Trainor, Andzulis, Rapp, & Ag-nihotri, 2014). Its functionalities should be perfectly integrated with the Enterprise Resource

Technological and Economic Development of Economy, 2018, 24(4): 1606–1629 1607
Planning (ERP) software (Hadidi, Assaf, & Alkhiami, 2017) for a successful implementation of the CRM. The relationship between customer churn (cancellations caused by switching to another company) and customers’ complaints is sufficiently contrasted (Picón, Castro, & Roldán, 2014; Hadden, Tiwari, Roy, & Ruta, 2006). Many companies consider investments in complaint handling as means to increase customer commitment and to build customer loyalty (Yilmaz, Varnali, & Kasnakoglu, 2016; Tax, Brown, & Chandrashekaran, 1998). Suc-cessful complaint resolution can keep customer relations harmonious, making them even stronger. Through complaints, firms can learn about their own weaknesses as well as custom-ers’ needs (Maurer & Schaich, 2011). Therefore, complaint management is an integral part of today’s business strategies (Gambetta, Zorio-Grima, & García-Benau, 2015).
Obviously, an important part of this strategy is the measurement of such customer sat-isfaction or, in other words, dissatisfaction. Service quality is essential to satisfy customers (F. A. Ferreira, J. J. Ferreira, Fernandes, Meidutė-Kavaliauskienė, & Jalali, 2017; Chang & Tsai, 2016; Naik, Gantasala, & Prabhakar, 2010; Wisniewski, 2001). There are two broadly used research methodologies to assess quality service from the user perception perspective: SERVQUAL and SERVPERF. There is still no consensus, however, about which one is better (Jain & Gupta, 2004). In both cases, they use customer questionnaires to obtain their con-clusions. These questionnaires usually have about twenty-two items classified as five basic indicators: tangibility, reliability, responsiveness, assurance and empathy. Often, an n-point Likert scale is used to respond to the questions (Jain, 2013; Lai, Griffin, & Babin, 2009), where customers express their agreement or disagreement with the corresponding item. The semi-nal SERVQUAL scale was first proposed by Parasuraman, Zeithaml, and Berry (1985). They obtain customers’ responses to their expectations (E) and perceptions (P) and then define service quality as the gap between the customers’ perceptions and the expectations, which is referred to as the P-E gap. The SERVPERF scale was developed by Cronin and Taylor (1994) and only uses customer perceptions (P) as a measure of quality of service.
It is very important for a company to do regular surveys about customer complaints on a standard scale, either SERVQUAL or SERVPERF. The use of standard surveys enables the organization to benchmark both internally and externally, i.e., with other competing com-panies. This is especially interesting in stiff sectors where customers’ churn rate is very high and therefore, retention policies are crucial. Among them is the 4G telecommunications sector, the subject matter of this paper. In this industry, we find examples of the use of both, SERVQUAL (Van der Wal, Pampallis, & Bond, 2002) and SERVPERF (Shen, Tang, & Zhu, 2010), to obtain customer satisfaction information. However, there are very few researches based on these standards that study only customer complaints. One of the main reasons is that customers who complain are frequently reluctant to answer questionnaires.
The support functions included in the CRM system (Piepiorra, 2015; Snyder, Steger, & Landers, 2011) help to collect and sort customer requests, inquiries, disturbances, problems, etc. related to sold goods or services. Sales staff and management can obtain a quick over-view of support activities related to customers. Therefore, the CRM stores these complaints expressed in natural language and from the customer’s point of view. Some authors have pro-posed mechanisms such as ontologies to help understand the semantics of such complaints (Lee, Wang, & Trappey, 2015). Often, these opinions contain disagreements with the service on one or more of the five indicators of which SERVQUAL and SERVPERF are composed.

1608 R. A. Carrasco et al. A model to obtain a SERVPERF scale evaluation of the CRM customer complaints ...
Therefore, it would be desirable to obtain SERVQUAL or SERVPERF surveys based on this unstructured information stored in the CRM, i.e., customer complaints expressed in natural language. This is the main purpose of this work. The first decision is the choice of the standard quality measurement model. We chose SERVPERF because customer complaints usually express their perceptions but rarely their expectations. These perceptions, which are not usually positive, are implicitly included in the customers’ expectations.
This problem is related to the scope of Sentiment Analysis (SA), which is the broad field of study that analyses people’s opinions, sentiments, evaluations, appraisals, attitudes, and emotions towards entities such as products, services, organizations, individuals, issues, events, topics, and their attributes (Nakov et al., 2013). Therefore, the task of SA is to obtain customers’ sentiments by analysing large numbers of documents. In several SA approaches, as a result of this analysis, each document (i.e., the customer’s opinion) is globally categorised into one of two categories: positive and negative, or on a linguistic n-point scale, e.g., very good, good, satisfactory, bad and very bad (Prabowo & Thelwall, 2009). In our case, these SA approaches are not useful to achieve our primary goal because we have to qualify documents more roughly. For example, we have to identify the service features in these complaints that could be assigned to any SERVPERF scales, i.e., a characteristic that would be equivalent to an item of a SERVPERF questionnaire, and the sentiments that qualify these features, using linguistic n-point scales, which would be equivalent to the customer’s response to the corresponding SERVPERF item. Therefore, within the same complaint, we could identify many different sentiments toward different features. Hence, the approach proposed by Hi-roshi, Tetsuya, and Hideo (2004), which is based on the concept of sentiment unit, is more appropriate for our purposes.
These linguistic n-point scales that come from natural language, and therefore, have an important component of uncertainty, were successfully modelled using the fuzzy linguistic approach proposed by Zadeh (1975). Some later models, such as the 2-tuple model (Herrera & Martínez, 2000), have allowed, under certain premises, computing these types of linguistic expressions without losing information and thus obtaining more accurate results in the con-text in which they were applied (Carrasco, Sánchez-Fernández, Muñoz-Leiva, Blasco, & Her-rera-Viedma, 2017; De Maio, Fenza, Loia, & Orciuoli, 2016a; Cid-López, Hornos, Carrasco, & Herrera-Viedma 2015; Li & Liu, 2015; Mi, Shan, Qiang, Stephanie, & Chen, 2014). For this reason, we use the 2-tuple model to represent and compute the sentiment identified.
After defining the model to transform the CRM textual customer complaints to the stand-ard SERVPERF, the second purpose of this paper is to implement a prototype for practical application in the 4G telecom sector.
The rest of the article is structured as follows. Section 1 presents a review of the pre-liminary concepts used to explain the elements involved in the model, such as linguistic variables and 2-tuple representation, the SERVPERF scale, and its adaptations to 4G service perceptions, SA and the sentiment unit concept. Section 2 describes the model to obtain the SERVPERF scale evaluation from customer complaints. Section 3 displays a case study in which the presented model is applied to CRM information of Clearwire, a 4G Service Multinational Company located in Europe. Finally, the last section presents the conclusions and future research avenues.

Technological and Economic Development of Economy, 2018, 24(4): 1606–1629 1609
1. Preliminaries
In this section, we present the elementary foundations needed to understand our new model, the 2-tuple fuzzy linguistic approach, the SERVPERF scale and its adaptations to 4G service perceptions, SA and the sentiment units.
1.1. Fuzzy linguistic modelling: the 2-tuple fuzzy linguistic approach
The fuzzy linguistic approach (Zadeh, 1975) is a tool intended for modelling qualitative information in a problem. It is based on the concept of linguistic variables and has been sat-isfactorily used in many domains (Morente-Molinera, Mezei, Carlsson, & Herrera-Viedma, 2017; Cid-López et al., 2015; Martínez-Cruz, Porcel, Bernabé-Moreno, & Herrera-Viedma, 2015; Cabrerizo, Herrera-Viedma, & Pedrycz, 2013).
We will analyse the approach to fuzzy linguistic modelling used in our system, i.e., the 2-tuple fuzzy linguistic approach (Herrera & Martínez, 2000). This approach is a continuous model of information representation that has been used in many applications. The linguistic computational model based on linguistic 2-tuples carries out processes of “computing with words” without the loss of information that is typical of other classical and ordinal fuzzy linguistic approaches. To define it, we must establish the 2-tuple representation model and the 2-tuple computational model to represent and aggregate the linguistic information, re-spectively.
Let S = {s0,…, sT} be a linguistic term set with odd cardinality, where the mid-term rep-resents an indifference value, and the rest of the terms are symmetric with respect to it. We assume that the semantics of labels is given by means of triangular membership functions and consider all terms distributed on a scale on which a total order is defined, i.e., si ≤ sj ⇔ i < j. In this fuzzy linguistic context, if a symbolic method (Cabrerizo et al., 2013) aggregating linguistic information obtains a value of b ∈ [0, T], and b∉ {0,…, T}, then an approximation function is used to express the result in S.Definition 1 (Herrera & Martínez, 2000): Let b be the result of an aggregation of the indexes of a set of labels assessed in a linguistic term set S, i.e., the result of a symbolic aggregation opera-tion, b ∈ [0, T]. Let i = round (b) and α = b-i be two values, such that i ∈ [0,T] and α ∈[–0.5, 0.5), then α is called a Symbolic Translation.
The 2-tuple fuzzy linguistic approach is developed from the concept of symbolic trans-lation by representing the linguistic information by means of 2-tuples (si, αi), si
∈ S and αi
∈[–0.5, 0.5), where si represents the information linguistic label, and αi is a numerical value expressing the value of the translation from the original result b to the closest index label, i, in the linguistic term set (si ∈ S).
This model defines a set of transformation functions between numerical values and 2-tu-ples.Definition 2 (Herrera & Martínez, 2000): Let S = {s1,…, sT} be a linguistic term set and b ∈ [0, T] a value representing the result of a symbolic aggregation operation, then the 2-tuple that expresses the equivalent information to b is obtained with the following function:
∆: [0, T] → S × [–0.5, 0.5)

1610 R. A. Carrasco et al. A model to obtain a SERVPERF scale evaluation of the CRM customer complaints ...
)
, ( ) , , , –0.5, 0.( ) 5( ) ,
ii
s i round bb s with b i
=∆ = α α = − α∈ (1)
where round () is the usual round operation, si has the closest index label to “b”, and “α” is the value of the symbolic translation.
For all ∆, there exists ∆–1, defined as:
∆–1(si, α) = i + α. (2)
Moreover, it is obvious that the conversion of a linguistic term into a linguistic 2-tuple consists of adding a symbolic translation value of 0, i.e., si ∈ S ð (si, 0).
The computational model is defined by presenting the following operators: – Negation operator: neg((si, α)) = ∆(T – (∆–1(si, α))). (3) – Comparison of 2-tuples (sk, α1) and (sl, α2):
• If k < l, then (sk, α1) is smaller than (sl, α2).• If k = l, then
– If α1 = α2, then (sk, α1) and (sl, α2) represent the same information; – If α1 < α2, then (sk, α1) is smaller than (sl, α2); – If α1 > α2, then (sk, α1) is larger than (sl, α2). – Maximization operator: max((sk, α1), (sl, α2)) = (sk, α1), if (sk, α1) is larger than or equal to (sl, α2).
– Minimization operator: min((sk, α1), (sl, α2)) = (sk, α1), if (sk, α1) is smaller than or equal to (sl, α2).
– Aggregation operators. Information aggregation consists of obtaining a value that summarizes a set of values. Hence, the result of the aggregation of a set of 2-tuples must be a 2-tuple. Many aggregation operators can be found in the literature, which allow combining the information according to different criteria. Using the functions ∆ and ∆–1 that transform numerical values into linguistic 2-tuples and vice versa without loss of information, any of the existing aggregation operators can be easily extended to deal with linguistic 2-tuples. Below, we describe the aggregation operator used in our model.• Arithmetic mean. The arithmetic mean is a classical numerical aggregation operator.
Its equivalent operator for linguistic 2-tuples is defined as:Definition 3 (Carrasco et al., 2017): Let A = {(l1, α1),…, (ln, αn)} be a set of linguistic 2-tuples, the 2-tuple arithmetic mean Āe is computed as:
Āe [(l1, α1),…, (ln, αn)] = ∆(1
1 n
i n=∑ ∆–1(li, αi)) = ∆
1
1 n
i
in =
β ∑ . (4)
1.2. The SERVPERF scale
As aforementioned, the SERVPERF scale was developed by Cronin and Taylor (1994) and uses customer perceptions as a measure of service quality. In this section, we explain the five dimensions proposed for the SERVPERF instrument and their adaptations to 3G service perceptions (Shen et al., 2010) which may be applied for the most part to 4G technologies:
– Tangibles: the appearance of physical facilities or equipment. The major advantage of 4G technology lies in high-speed data transmission. This feature of 4G technology
Technological and Economic Development of Economy, 2018, 24(4): 1606–1629 1611
can be perceived by practical experience through cell phone, wireless network modem and notebook using several services such as video call, online HD movie appreciation, network up/downstream file transmission, etc.
– Reliability: the ability to perform the promised service dependably and accurately, i.e., the reliability of operations. In a 4G context, it is important to build a quality network and supply customers with stable and fast digital transmission rate. 4G technology greatly enriches the service types and enhances the requirement to service level ac-cordingly. Therefore, improving the level of operation and maintenance and doing one’s best to fulfil the promise of the product to the customer is the major expression of reliability. Customers perceive this dimension through aspects such as network signal stability and coverage, ease of configuration of the network or devices, etc.
– Responsiveness: willingness to help customers and provide prompt service, i.e., cus-tomer care attention. A customer hotline timely responding to customers’ inquiries and complaints about 4G businesses is the key to improve service quality. Customers perceive “responsiveness” as the proper resolution of their complaints and requests.
– Assurance: the level of protection of confidential information, the security of the operations and their ability to inspire trust and confidence. Considering that most customers lack information about 4G services, it is very important to build the trust relationship between telecom operators and customers technically and through mar-keting staff. Abundant professional knowledge of marketing staff and the practical op-eration level can make the customer feel the advantage of 4G service. Assurance on 4G technology can be perceived through absence of network outages, dropped calls, etc.
– Empathy: the level of attention (and its usefulness and suitability) to the needs of the uses of the system. Every customer hopes to feel that telecom operators under-stand and think highly of him. 4G technology enriches the service types of telecom operators. It is completely possible to provide customers, especially business custom-ers, with the appropriate product and service for their characteristics by formulating comprehensive communication solutions to meet their personalized requirements. Customers perceive this dimension through the appropriate information provided, satisfactory treatment received by staff, etc.
Thus, we can define a SERVPERF questionnaire, SP, as SP = {SP1,…, SPn}, n = 5, where SP1 = Tangibles, SP2 = Reliability, SP3 = Responsiveness, SP4 = Assurance, and SP5 = Em-pathy. That is, an SP questionnaire consists of 5 sub-questionnaires SPi, i = 1,…, n, one for each SERVPERF dimension. Each SPi has its own question definitions or items, i.e., SPi = {q1
i,…, q#SPii}, where #SPi represents the number of items of SPi. The total number of items
is typically 22 (see Figure 1).Assuming that we have several groups of users, Y = {y1,…, ym}, which have filled in the
form answering the corresponding items on questionnaire SP, we consider that yk(qji), ∀k ∈
{1,…, m}, ∀i ∈ {1,…, n}, ∀j ∈ {1,…, #SPi} is the subjective opinion provided by the user yk on the item qj
i, i.e., the user’s assessment or perception of the feature contained in this item. Often, these assessments are expressed on n-point Likert scales (Jain, 2013; Lai et al., 2009) where customers express their agreement or disagreement with the corresponding item.
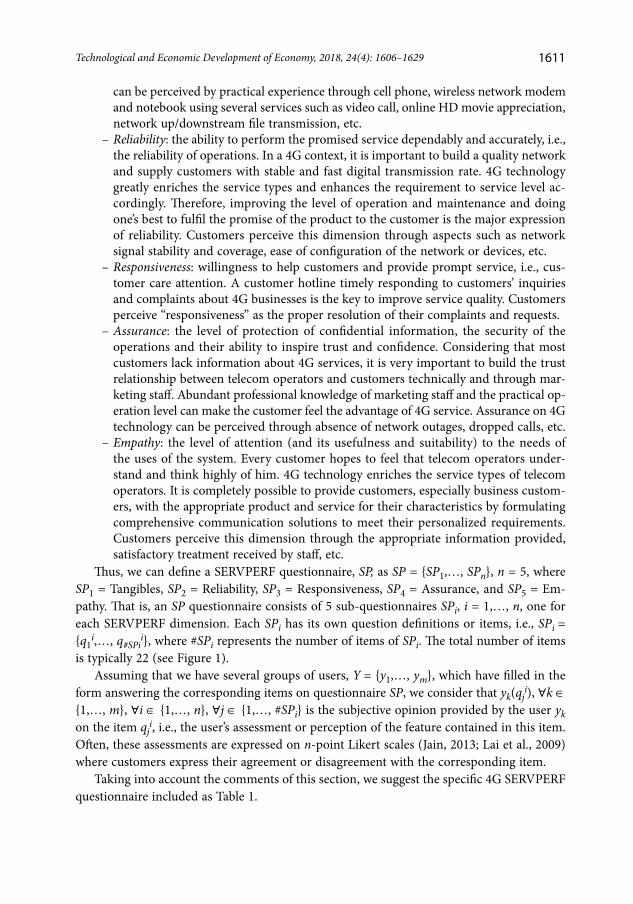
Taking into account the comments of this section, we suggest the specific 4G SERVPERF questionnaire included as Table 1.

1612 R. A. Carrasco et al. A model to obtain a SERVPERF scale evaluation of the CRM customer complaints ...
Table 1. 4G SERVPERF questionnaire
qji Question SERVPERF
ScaleStrongly disagree
Dis-agree
Neither agree nor disagree Agree Strongly
agree
q11 I can download files
correctly Tangibles 1 2 3 4 5
q21 I can upload files correctly Tangibles 1 2 3 4 5
q31 I have a good experience
browsing the Internet Tangibles 1 2 3 4 5
q41 I can watch videos and
listen to music on line Tangibles 1 2 3 4 5
q51 The connection is stable Tangibles 1 2 3 4 5
q61 I have a good speed
experience Tangibles 1 2 3 4 5
q12 I can use the service
where I expected to Reliability 1 2 3 4 5
q22 The service signal is
always on Reliability 1 2 3 4 5
q32 The service configuration
is simple and easy Reliability 1 2 3 4 5
q42
When needed, I have made technical updates easily
Reliability 1 2 3 4 5
q13
Employees give me prompt solutions when I have a problem
Responsiveness 1 2 3 4 5
q23 Employees always respond
to my requests Responsiveness 1 2 3 4 5
q33 Employees take actions
when I make a complaint Responsiveness 1 2 3 4 5
q43
Employees are knowledgeable about the products and issues
Responsiveness 1 2 3 4 5
Figure 1. SERVPERF questionnaire (based on Cronin & Taylor, 1994)
ServiceQuality
SP
SP₁
Tangibles
q₁₁ q₁₂ q₁₃ q₁₄ q₁₅ q₁₆
SP₂ SP₃ SP₄ SP₅
ReliabilityRespon-siveness Assurance Empathy
q₅₁q₂₁ q₅₂q₂₂ q₅₃q₂₃ q₂₄ q₃₁ q₃₂ q₃₃ q₃₄ q₄₁ q₄₂ q₄₃ q₄₄
Technological and Economic Development of Economy, 2018, 24(4): 1606–1629 1613
qji Question SERVPERF
ScaleStrongly disagree
Dis-agree
Neither agree nor disagree Agree Strongly
agree
q14 I use the service with no
breakdowns Assurance 1 2 3 4 5
q24 I make and receive phone
calls correctly Assurance 1 2 3 4 5
q34 Downloads rarely fail Assurance 1 2 3 4 5
q44 Uploads rarely fail Assurance 1 2 3 4 5
q15
Employees give me required information properly
Empathy 1 2 3 4 5
q25
When I have a problem with any services, employees show interest in solving it
Empathy 1 2 3 4 5
q35
Employees are very helpful and their behaviour instils confidence
Empathy 1 2 3 4 5
1.3. Sentiment analysis and sentiment unit
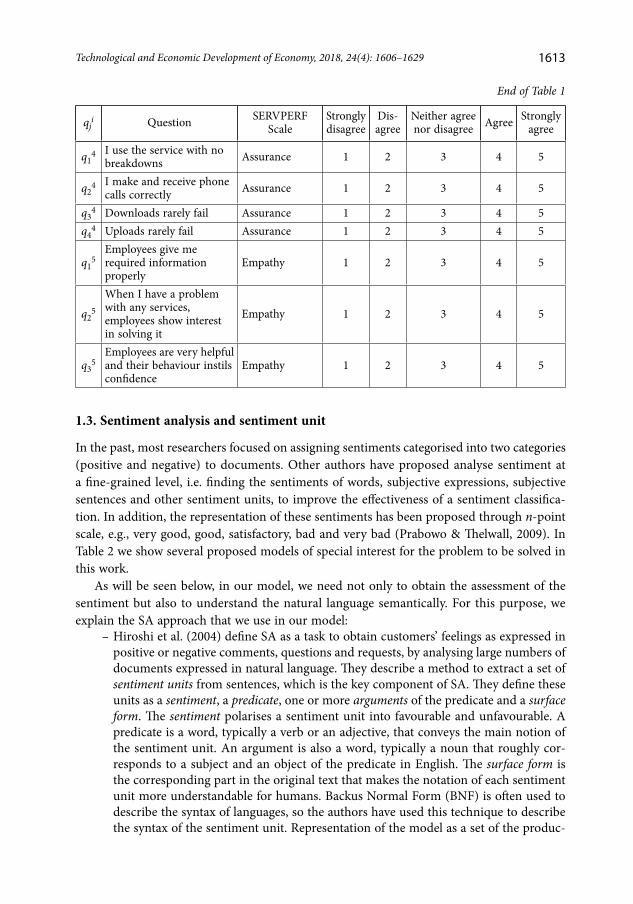
In the past, most researchers focused on assigning sentiments categorised into two categories (positive and negative) to documents. Other authors have proposed analyse sentiment at a fine-grained level, i.e. finding the sentiments of words, subjective expressions, subjective sentences and other sentiment units, to improve the effectiveness of a sentiment classifica-tion. In addition, the representation of these sentiments has been proposed through n-point scale, e.g., very good, good, satisfactory, bad and very bad (Prabowo & Thelwall, 2009). In Table 2 we show several proposed models of special interest for the problem to be solved in this work.
As will be seen below, in our model, we need not only to obtain the assessment of the sentiment but also to understand the natural language semantically. For this purpose, we explain the SA approach that we use in our model:
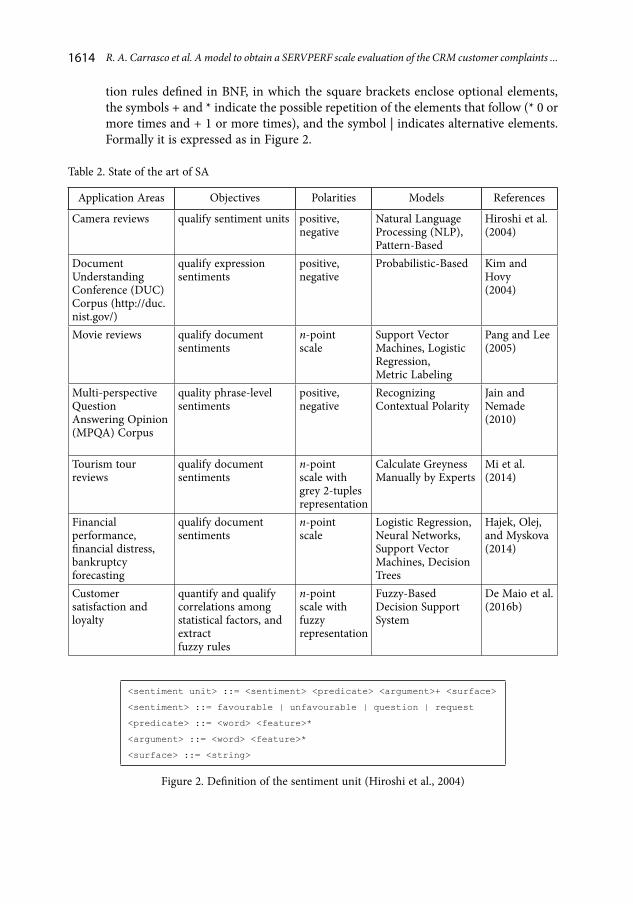
– Hiroshi et al. (2004) define SA as a task to obtain customers’ feelings as expressed in positive or negative comments, questions and requests, by analysing large numbers of documents expressed in natural language. They describe a method to extract a set of sentiment units from sentences, which is the key component of SA. They define these units as a sentiment, a predicate, one or more arguments of the predicate and a surface form. The sentiment polarises a sentiment unit into favourable and unfavourable. A predicate is a word, typically a verb or an adjective, that conveys the main notion of the sentiment unit. An argument is also a word, typically a noun that roughly cor-responds to a subject and an object of the predicate in English. The surface form is the corresponding part in the original text that makes the notation of each sentiment unit more understandable for humans. Backus Normal Form (BNF) is often used to describe the syntax of languages, so the authors have used this technique to describe the syntax of the sentiment unit. Representation of the model as a set of the produc-
End of Table 1
1614 R. A. Carrasco et al. A model to obtain a SERVPERF scale evaluation of the CRM customer complaints ...
tion rules defined in BNF, in which the square brackets enclose optional elements, the symbols + and * indicate the possible repetition of the elements that follow (* 0 or more times and + 1 or more times), and the symbol | indicates alternative elements. Formally it is expressed as in Figure 2.
Table 2. State of the art of SA
Application Areas Objectives Polarities Models References
Camera reviews qualify sentiment units positive, negative
Natural Language Processing (NLP), Pattern-Based
Hiroshi et al.(2004)
Document Understanding Conference (DUC) Corpus (http://duc.nist.gov/)
qualify expressionsentiments
positive, negative
Probabilistic-Based Kim and Hovy(2004)
Movie reviews qualify documentsentiments
n-pointscale
Support Vector Machines, Logistic Regression,Metric Labeling
Pang and Lee(2005)
Multi-perspective Question Answering Opinion (MPQA) Corpus
quality phrase-level sentiments
positive, negative
Recognizing Contextual Polarity
Jain and Nemade (2010)
Tourism tour reviews
qualify documentsentiments
n-pointscale with grey 2-tuples representation
Calculate Greyness Manually by Experts
Mi et al. (2014)
Financial performance, financial distress, bankruptcy forecasting
qualify documentsentiments
n-pointscale
Logistic Regression, Neural Networks,Support Vector Machines, Decision Trees
Hajek, Olej, and Myskova (2014)
Customer satisfaction and loyalty
quantify and qualify correlations among statistical factors, and extractfuzzy rules
n-pointscale with fuzzy representation
Fuzzy-Based Decision Support System
De Maio et al. (2016b)
<sentiment unit> ::= <sentiment> <predicate> <argument>+ <surface>
<sentiment> ::= favourable | unfavourable | question | request
<predicate> ::= <word> <feature>*
<argument> ::= <word> <feature>*
<surface> ::= <string>
Figure 2. Definition of the sentiment unit (Hiroshi et al., 2004)

Technological and Economic Development of Economy, 2018, 24(4): 1606–1629 1615
Example 1 (Hiroshi et al., 2004). We have obtained these sentences from a customer’s review of a digital camera:
It has an excellent lens but the price is too high. I don’t think the quality of the recharger will give problems.
This review contained three sentiment units with the assessments expressed using brack-ets:
– [favourable] excellent (lens) – [unfavourable] high (price) – [favourable] problematic+neg (recharger)
2. A model to obtain a 2-tuple SERVPERF scale evaluation of customer complaints
The 4G SERVPERF questionnaire (Table 1) has been defined in Section 1.2. Now, the basic idea is to obtain the answers to the questionnaire about the complaints that are included in the CRM. Therefore, in our problem, we are dealing with unstructured information as the input of our system, i.e., the customer’s complaints expressed in natural language. However, the output of our system is structured information, i.e., the assessment of each SERVPERF dimension, and it must be referred to an ordinal scale. As seen in Section 1.2, SERVPERF is commonly assessed using a n-Likert scale. Therefore, we will also use a Likert scale for the results of our system.
A Likert scale is a set of items, made up of approximately an equal number of favourable and unfavourable statements concerning the attitude object. People are asked to respond to each statement in terms of their own degree of agreement or disagreement. For example, on a 5-point Likert scale, they would be instructed to select one of the responses: “strongly agree”, “agree”, “neither agree nor disagree”, “disagree”, or “strongly disagree” (see Table 1). Of course, these perceptions are characterized by uncertainty and fuzziness. Some authors consider that the use of conventional (crisp) numbers is not suitable to model these human perceptions and they consider that a better approach would be based on the use of linguistic assessments (Carrasco et al., 2017; Cid-López et al., 2015).
Therefore, we model such a Likert scale through the set T = {s0, …, st}, with the same characteristics of the set S defined in section 1.1, i.e., t is an odd number, the mid-term rep-resents an indifference value, the rest of the terms are symmetric with respect to it, and the semantics of labels is given by means of triangular membership. In the Figure 3 we show an example of definition of a 5-Likert scale.
Once this basic domain T is defined, we can describe the process to obtain the SERVPERF scale value from the customer’s complaints expressed in natural language. In this process, we will use the 2-tuple model (Section 1.1). This model will allow us to compute the results more precisely without losing the linguistic interpretability of the Likert scale used. As shown in Figure 4, our model contains several stages which we explain below.

1616 R. A. Carrasco et al. A model to obtain a SERVPERF scale evaluation of the CRM customer complaints ...
2.1. Obtaining customers who have complained and their textual complaints in the CRM
In the CRM terminology, trouble tickets (Piepiorra, 2015) or cases (Snyder, Steger, & Landers, 2011) are any kind of customer service requests or complaints as they occur after sales. Therefore, at this stage, we need to identify the tickets containing the customer com-plaints. Normally, this is easy because the tickets often contain a field that categorizes its type.
We represent this set of customers as Y = {y1,…, ym}, such that each of them has made at least one complaint. Complaints by these customers are expressed in natural language in the corresponding CRM tickets, considering that yk(x), ∀k ∈ {1,…, m} contains these complaints corresponding to the customer yk in a given period of time.
0.0 0.2 0.4 0.6 0.8 1.0
s₀ s₁ s₂ s₃ s₄
0.0
0.2
0.4
0.6
0.8
1.0
Mem
bers
hift
Gra
de
Figure 3. Example of definition of a 5-Likert scale using a fuzzy linguistic model: s0 = strongly disagree = SD, s1 = disagree = D, s2 = neither agree nor disagree = N,
s3 = agree = A, s4 = strongly agree = SA
Figure 4. Model to obtain a 2-tuple SERVPERF scale evaluation of the customer’s complaints
Obtaining customers who have complained and their textual complaints in the CRM
•
y , y (x) k k
Identifying the different SERVPERF features included in the complaints
Identifying the possible sentiment about the SERVPERF features
Assessing the SERVPERF sentiment units
Obtaining a SERVPERF scale evaluation value of customer complaints
•
•
•
•
xj
z (x ), z (x ) Оk i k iS ґ [–0.5, 0.5)
y ( )Оk
i
sj
i
sj
ixj
i

Technological and Economic Development of Economy, 2018, 24(4): 1606–1629 1617
2.2. Identifying the different SERVPERF features included in the complaints
A SERVPERF feature xji, i ∈ {1,…, n}, n = 5, j ∈ {1,…, #SPi} is a/some word/s symbolizing
the perception by the user of a particular characteristic corresponding to a SERVPERF scale, Pi, which underlies the question xj
i in Table 1.Therefore, this step aims to identify these features of services (on which customers focus
their complaints), that could be included in yk(x).Example 2. As seen in Section 1.2, customers perceive the reliability dimension, i.e., P2, through aspects such as network signal stability and coverage (question q1
2 in Table 1) and ease of configuration of the network or terminals (question q3
2 in Table 1). Therefore, two SERVPERF features for this scale could be:
x12 = Coverage, x3
2 = Configuration.
2.3. Identifying the possible sentiment about the SERVPERF features
A sentiment about a SERVPERF feature is a word or set of words that conveys the main no-tion of the assessment of the feature. In other words, it is the domain in which the sentiment is expressed.
This stage provides the possible sentiments of these SERVPERF features expressed in nat-ural language in the corresponding complaints. For each feature, xj
i, we define the linguistic term set with t possible basic sentiments about such a feature, Tj
i = {s0ji,…, stj
i}, with the same characteristics of set T that are used to express the results of our system.
Finally, we define the domain of a possible sentiment about the feature xji with all the
linguistic terms defined, adding their corresponding negative term, i.e., Sji = {(s0j
i,0),…, (stj
i,0), neg((s0ji,0)),…, neg((stj
i,0))}, using the operator neg() defined in Eq. (3). We have used the 2-tuple model explained in Section 1.1 to define this set. Each element of the set has the value 0 as a symbolic translation but the great advantage of this representation is that no subsequent calculations with these elements will lose information.Example 3. Following Example 2, we could define the characteristics shown below:
– Coverage: s012 = very bad, s11
2 = bad, s212 = average, s31
2 = good, s412 = very good.
– Configuration: s022 = very complicated, s13
2 = complicated, s232 = average, s33
2 = easy, s43
2 = very easy.
2.4. Assessing the SERVPERF sentiment units
Based on the idea of sentiment unit explained in Section 1.3, at this stage we introduce the SERVPERF sentiment units, which relate the SERVPERF features with their sentiment identi-fied in the CRM complaints. In other words, this unit contains the categorized SERVPERF features with their corresponding sentiments. We symbolize them with yk(xj
i) ∈ Sji, ∀k ∈
{1,…, m}, ∀i ∈ {1,…, n}, ∀j ∈ {1,…, #SPi} as the subjective opinion provided by the user yk about the feature xj
i (belonging to the SERVPERF scales Pi) i.e., the user’s assessment or perception of this feature expressed with set Sj
i. This step defines a method to extract each yk(xj
i) from the complaint tickets expressed in natural language, i.e., from yk(x).

1618 R. A. Carrasco et al. A model to obtain a SERVPERF scale evaluation of the CRM customer complaints ...
We proceed to define the representation of our model as a set of the production rules defined in BNF (Figure 5) in order to extract the yk(xj
i) ∈ Sji (sentiment unit assessment)
from the yk(x) (natural language).Thus, a <complaint ticket> consists of one or more <servperf sentiment unit> and a <sur-
face ticket> in natural language (yk(x)). Each of these sentiment units consists of a <servperf features> (xj
i) qualified by a <sentiment> (srji, r ∈ {0,…,t }). In addition, the sentiment could
be qualified by a <negative sentiment>, which becomes a negative sentiment. In this case, the assessment of SERVPERF sentiment unit is yk(xj
i) = neg((srji,0)), using the negation op-
erator defined in Eq. (3). If we have not identified this negative sentiment, the assessment is yk(xj
i) = (srji,0).
<complaint ticket> ::= <servperf sentiment unit>+ <surface ticket>
<servperf sentiment unit> ::= <servperf features> <sentiment>
<sentiment > ::= [<negative sentiment>] <label sentiment>
<servperf features> ::= xji
<label sentiment> ::= s0ji | … | stj
i
<negative sentiment> ::= not
<distance> := <non negative integer>
<surface ticket> ::= yk(x)
Figure 5. BNF definition of a complaint ticket
If we relate the sentiment unit, proposed by Hiroshi et al. (2004) and explained in Sec-tion 1.3, to our SERVPERF sentiment unit, then the SERVPERF features would correspond to the arguments. However, the domain in which the sentiment about the features is expressed is different in our case, because it not only has two values (favourable and unfavourable) but is also modelled with several linguistic terms with fuzzy semantics. Such linguistic labels could be identified in the corresponding predicate. Using the idea of surface form, we have defined the surface ticket as the part of the complaint in the original text yk(x). In Table 3, we present a summary of this comparison.
Table 3. Sentiment unit (Hiroshi et al., 2004) vs. SERVPERF sentiment unit
Sentiment unit SERVPERF sentiment unit
Purpose global sentiment analysis perception of quality according to the SERVPERF scales
Original text to evaluate surface form surface ticket: yk(x)Object to evaluate arguments SERVPERF features: xj
i
Sentiment unit assessment
predicate assessment ∈ {favourable, unfavourable, question, request}
yk(xji) ∈ Sj
i
Example 4. We might find the following complaint in a CRM trouble ticket expressed by the customer y1:
y1(x) = “The client tells us that the modem configuration was not easy, moreover once finished, coverage is very bad.”

Technological and Economic Development of Economy, 2018, 24(4): 1606–1629 1619
This complaint contains two SERVPERF sentiment units: the first one, whose assessment is obtained by applying the negation operator; and the second one with no identified negation operator. These units are shown below:
1. x23 = Configuration, y1(x2
3) = not((easy,0)) = (complicated,0) = (s132,0);
2. x21 = Coverage, y1(x2
1) = (very bad,0) = (s012,0).
2.5. Obtaining a SERVPERF scale evaluation value of customer complaints
Based on the assessment of the SERVPERF sentiment unit obtained in the previous phase, the aim is to obtain the complaint assessment on each SERVPERF scale. This must be achieved in two phases; in the first one, we obtain this assessment for each client, i.e., at the client level; in the second phase, we obtain an overall SERVPERF scale evaluation value of customer complaints.
For our first objective, the 2-tuple arithmetic mean operator Āe defined in Eq. (4) is used to obtain the complaint assessment of each SERVPERF scale Pi for each client yk:
zk(xi) = Āe[yk(xji)], ∀k ∈ {1,…, m}, ∀i ∈ {1,…, n}, n = 5, ∀j ∈ {1,…,#SPi}. (5)
These result are 2-tuple values, i.e., zk(xi) ∈ T × [–0.5, 0.5), computed without loss of information.Example 5. In order to obtain the complaint assessment of the SERVPERF scales P2 for customer y1 (Example 4) we apply Eq. (5):
z1(x2) = Āe[y1(x23), y1(x2
1)] = Āe[(s132, 0), (s01
2, 0)] = (D, –0.5).
This means that the assessment of reliability of client y1 on the SERVPERF scale is strongly disagree minus 0.5.
Again, we use the operator Āe to obtain an overall evaluation of each SERVPERF scale Pi for all customer complaints:
z(xi) = Āe[zk(xi)], ∀k ∈ {1,…, m}, ∀i ∈ {1,…, n}, n = 5. (6)
Once more, these results are 2-tuple values, i.e., z(xi) ∈ T × [–0.5, 0.5), computed without loss of information.
It should be noted that we have available the SERVPERF assessment, zk(xi), for each CRM customer. Thus, we could take this last aggregation step by grouping by any dimension related to the customer, available in the CRM. For example, we could obtain SERVPERF evaluations at several levels: customer segment, age, geographic location, etc.
3. Applying the SERVPERF evaluation of the customer complaints model to A 4G service company
In this section, we present an example of an application of our SERVPERF evaluation of the customer complaints model, explained in the above section, using the CRM information of Clearwire, to a 4G Multinational Service Company located in Europe.
1620 R. A. Carrasco et al. A model to obtain a SERVPERF scale evaluation of the CRM customer complaints ...
First we chose the scale that will express the output results, i.e., the SERVPERF scale eval-uation. In our case, we decided to use a 5-Likert scale, i.e., t = 4. In Figure 1, we presented a definition of this scale.
Next, we will explain the different stages that comprise our model (see Figure 2):
Obtaining customers who have complained and their textual complaints in the CRM
Based on information from the CRM included in the corporate data warehouse, we ob-tain all the trouble tickets that we believe may contain a customer complaint. Thus, we select all the information stored on tickets where the field TROUBLETICKET_TYPE contains any value of the set {Incident, Claim, Deactivation Request}. We discard those tickets that do not contain textual information about the claim made by the customer.
A total of 82511 trouble tickets were selected, corresponding to 60534 clients. We con-sider that yk(x), ∀k ∈ {1,…,m}, m = 60534 contain these complaints, expressed in natural language, corresponding to the customer yk.
Identifying the different SERVPERF features included in the complaints and their possible sentiment
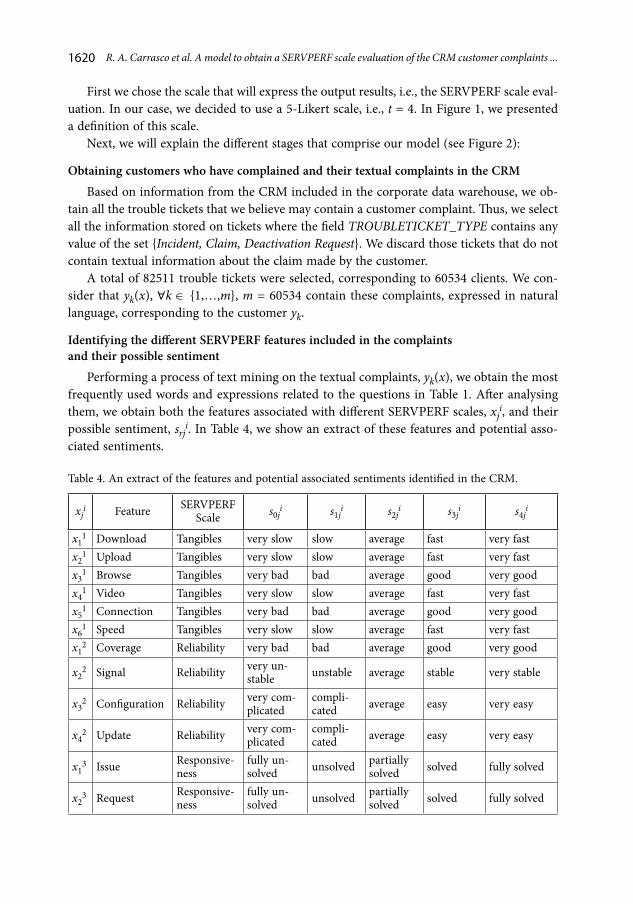
Performing a process of text mining on the textual complaints, yk(x), we obtain the most frequently used words and expressions related to the questions in Table 1. After analysing them, we obtain both the features associated with different SERVPERF scales, xj
i, and their possible sentiment, srj
i. In Table 4, we show an extract of these features and potential asso-ciated sentiments.
Table 4. An extract of the features and potential associated sentiments identified in the CRM.
xji Feature SERVPERF
Scale s0ji s1j
i s2ji s3j
i s4ji
x11 Download Tangibles very slow slow average fast very fast
x21 Upload Tangibles very slow slow average fast very fast
x31 Browse Tangibles very bad bad average good very good
x41 Video Tangibles very slow slow average fast very fast
x51 Connection Tangibles very bad bad average good very good
x61 Speed Tangibles very slow slow average fast very fast
x12 Coverage Reliability very bad bad average good very good
x22 Signal Reliability very un-
stable unstable average stable very stable
x32 Configuration Reliability very com-
plicatedcompli-cated average easy very easy
x42 Update Reliability very com-
plicatedcompli-cated average easy very easy
x13 Issue Responsive-
nessfully un-solved unsolved partially
solved solved fully solved
x23 Request Responsive-
nessfully un-solved unsolved partially
solved solved fully solved

Technological and Economic Development of Economy, 2018, 24(4): 1606–1629 1621
xji Feature SERVPERF
Scale s0ji s1j
i s2ji s3j
i s4ji
x33 Complaint Responsive-
nessfully un-solved unsolved partially
solved solved fully solved
x43 Required in-
formationResponsive-ness
fully un-provided
unpro-vided
partially provided provided fully pro-
vided
x14 Network out-
ages Assurance very fre-quent frequent some-
times rare never
x24 Dropped calls Assurance very fre-
quent frequent some-times rare never
x34 Failed down-
loads Assurance very fre-quent frequent some-
times rare never
x44 Failed uploads Assurance very fre-
quent frequent some-times rare never
x15 Provided in-
formation Empathy fully incor-rect incorrect partially
correct correct fully correct
x25 Treatment Empathy very bad bad normal good very good
x35 Staff Empathy very un-
friendlyunfriend-ly
partially friendly friendly very friendly
Assessing the SERVPERF sentiment units
In order to identify sentiment units and obtain the assessment of the unit, yk(xji), we
must implement the production rules defined in Figure 4. Basically, we have to find within the same semantic unit (sentence or phrase portion yk(x)) some sentiment, srj
i, about any of the associated features, xj
i, both identified in the previous phases. The extraction of these sentiment units is not a trivial task because many syntactic and semantic operations are required. As an approach to this process, we proceed to define the representation of our model as a set of the production rules defined in an extended BNF (Elkhalifa, Adaikkalavan, & Chakravarthy, 2005). Formally, it is expressed as in Figure 6.
End of Table 4
<complaint ticket> ::= <servperf sentiment unit>+ <surface ticket>
<servperf sentiment unit> ::= <servperf features> <proximal op><sentiment>
<sentiment > ::= [<negative sentiment> < proximal op>] <label sentiment>
<servperf features> ::= xji <synonym op>
<label sentiment> ::= s0ji <synonym op> | … | stj
i <synonym op>
<negative sentiment> ::= not <synonym op>
<proximal op> := “NEAR” [“/”<D>]
<D> := <non negative integer>
<synonym op> := “[SYN]”
<surface ticket> ::= yk(x)
Figure 6. The definition of a complaint ticket

1622 R. A. Carrasco et al. A model to obtain a SERVPERF scale evaluation of the CRM customer complaints ...
According to this definition, each of the sentiment units <servperf sentiment unit> con-sists of a <servperf features> close to a <sentiment>. The closeness of the two entities or pat-terns implies that the basic sentiment srj
i, r ∈ {0,…,t}, qualifies the feature (xji). The closeness
is modelled using the NEAR operator (Elkhalifa et al., 2005): a conjunction of two simple or complex patterns, P1= srj
i and P2= xji, denoted by P1 NEAR [/D] P2, occurs when both P1
and P2 occur, regardless of their order of occurrence. D is the maximum distance allowed between patterns P1 and P2, always within the same semantic unit (sentence or phrase por-tion). The default value of D is the whole semantic unit. For example, “speed” NEAR/4 “slow” will be detected whenever both these words co-occur within a distance of 4 words.
Both features of such a sentiment can have multiple forms (synonyms, abbreviations...) so we use the [SYN] operator (Elkhalifa et al., 2005) to identify them. For example, we specify the word “speed”[SYN] is equivalent to “speed”, “velocity”, “celerity”, “fastness”, “quickness”, etc.
The sentiment may have close words that turn into a negative sentiment; in this case, the assessment of the SERVPERF sentiment unit is yk(xj
i) = neg((srji,0)). These negative particles
can also have multiple forms, so we again use “not” [SYN] for this identification. If we have not identified this negative sentiment, the assessment is yk(xj
i) = (srji,0).
Oracle Text (Shea, Faisal, Ford, Lin, & Matsuda, 2008) has been used as a tool to imple-ment such production rules (Figure 6). In particular, we use the Oracle Text contains and near operators (Shea et al., 2008) to implement the NEAR operator to identify the proximity of the two patterns searched (feature and sentiment) and/or the proximity of the words that turn sentiment into negative sentiment. In order to implement the [SYN] operator, we use some specialized thesaurus of terms comprised of: synonyms that include formal and infor-mal terms and abbreviators; higher level terms; and words that have the same root as the specified term, using the stem operator (Shea et al., 2008). Moreover, we improve the [SYN] operator to find more precise results when there are many misspellings in the CRM textual customer complaints: words that sound like the specified terms, identified with the soundex operator (Shea et al., 2008) and words that are spelled the same as the specified terms, rec-ognised with the fuzzy operator (Shea et al., 2008).
Performing the implemented process on the textual complaints, yk(x), using the features and associated sentiments identified in the previous step (Table 4), we obtain the SERVPERF sentiment units and their assessment for each client yk. In Table 5, we present an extract of these results. In order to make clearer the values used for linguistic term conversion to linguistic 2-tuple, in the texts included in Table 5, the features are written in boldface and the sentiment in italics.
Obtaining the SERVPERF scale evaluation of customer complaints
As explained, the Eq. (5) is used to obtain the SERVPERF scale evaluation, zk(xi), for each client, yk, and for each scale, Pi. In Table 6, we show an extract of these results for the customer and assessments of the SERVPERF sentiment units included in Table 5. As can be seen, for the customers identified as 55518 and 568008 (they have more than one assessment of features that belong to the same scale), owing to the 2-tuple model, this aggregation pro-cess is carried out without any loss of information.

Technological and Economic Development of Economy, 2018, 24(4): 1606–1629 1623
Table 5. An extract of the assessments of SERVPERF sentiment units
ykCall Type yk(x) xj yk(xj
i)
562379 Out-bound
Customer wants to cancel because of bad coverage in the house so she can’t browse correctly. I remind her that we offered to install outdoor antenna for better coverage, but she didn’t call back. I offer a discount tariff of 19.90€ for 6 months after installing outdoor antenna and she accepts.
“coverage” [SYN]= Coverage“browse” [SYN]= Browse
(“bad” [SYN] ,0)= (bad,0) = (s11
2,0)
“can’t” [SYN] ((“correctly” [SYN],0))= not((good,0))= (bad,0) = (s13
1,0))
556741 Out-bound
Sales channel requests cancelling the service because customer received incorrect information regarding coverage areas. Customer doesn’t want to cancel, but we inform that it is not possible to provide a good service. We process cancellation without penalty. Customer agrees. We deactivate.
“received information” [SYN]= Provided information
(“incorrect” [SYN], 0) = (incorrect,0) = (s11
5,0))
558797 In-bound
Customer wants deactivation. She complains about the service. We have verified technical data: has saturated BTS. She uses the service for Play Station 3 games online, YouTube. I explain that the contract is 1-3Mb. She feels tricked by the seller because he said it would have more speed, and she told him about their use of online games. She also says slow speed when opening any page in Internet. We offer a Save agent visit.
“seller” [SYN]= Staff
“speed” [SYN]= Speed
(“tricked” [SYN], 0)= (very unfriendly,0) = (s03
5,0))(“slow” [SYN],0) = (slow,0) = (s16
1,0))
557444 In-bound
Customer requests cancelling the service. At first, was only the phone service but now he wants to cancel the Internet access too. I ask why and he says it is not acceptable to wait for 12 days without solution to his claim of being unable to make calls and we didn’t even call him to inform how we were managing the situation. First, I apologize and try to find out whether the issue is solved and he says he doesn’t know because he has disconnected the phone, ready to send it back.
“claim” [SYN]= Issue
“without” [SYN] ((“solution” [SYN], 0))= not((solved,0) = (unsolved,0) = (s11
3,0))
560698 In-bound
Customer requests cancelling the service. I ask the reason why and he says the connection is very bad and with frequent power cuts. We arrange an appointment with Save agent tomorrow to solve the issue. Customer agrees to continue, has no permanence.
“connection” [SYN]= Connection“power cuts” [SYN]= Network outages
(“very bad” [SYN], 0) = (very bad,0)= (s05
1,0))(“frequent” [SYN], 0) = (frequent,0) = (s11
4,0))

1624 R. A. Carrasco et al. A model to obtain a SERVPERF scale evaluation of the CRM customer complaints ...
ykCall Type yk(x) xj yk(xj
i)
559907 In-bound
Ana, the customer’s wife, calls. Coverage light green / yellow. Cable connection. firmware_version_1: ESP_IX380V1.0.0C13. Computer doesn’t have antivirus. She complains about slow navigation. They also have some conversation cuts when using the phone service: in the middle of the conversation or else they can’t contact, either outgoing or incoming calls. We try to make speed test in safe mode, but it is not possible, so we do it in normal mode: 1906 kbps download and 236 kbps.
“navigation” [SYN] = Browse“conversation cuts” [SYN] = Dropped calls
(“slow” [SYN], 0) = (bad,0) = (s13
1,0))
(“some” [SYN], 0) = (sometimes, 0)= (s22
4,0)
555108 In-bound
Customer calls because the service is very slow in download and when browsing. I inform of p2p policy. He is not in front of computer. I inform him to call then.
“Download” [SYN]= Download“browsing” [SYN]= Browse
(“very slow” [SYN], 0)= (very slow,0)= (s01
1,0))(“very slow” [SYN], 0)= (very bad,0)= (s03
1,0))
553355 Out-bound
We proceed to cancel by Save agent request- technical issue. Reason: unstable signal, incidence 545,759 sent from the 22/03 front, client does not want commercial offer.
“signal” [SYN]= Signal
(“unstable” [SYN], 0) = (unstable,0)= (s12
2,0))
555076 In-bound
Customer says the service fails when installing the modem upgrade. Indicates that he has already installed java, and it produces errors. He will reset the modem and call us after he tries again.
“installing” [SYN] = Configura-tion
(“fails” [SYN], 0)= (complicated,0)= (s13
2,0))
568008 In-bound
Customer calls and points out that incidence 540887 is not solved yet. When she has required information, this has been provided partially but she doesn’t know who the solution depends on.
“incidence” [SYN] = Issue
“required information” [SYN] = Required information
“not” [SYN] ((“solved” [SYN]), 0)= not ((solved, 0))= (unsolved,0)= (s11
3,0))(“provided partially” [SYN], 0)= (partially provided,0) = (s24
3,0))
Finally, applying Eq. (6), we obtain the overall SERVPERF evaluation of all CRM com-plaints. We present these results in Table 7, including the percentage of complaints identified for each scale out the total of complaints.
End of Table 5

Technological and Economic Development of Economy, 2018, 24(4): 1606–1629 1625
Table 6. An extract of the SERVPERF scale evaluation of customer complaints
ykzk(x1)
Tangibleszk(x2)
Reliabilityzk(x3)
Responsivenesszk(x4)
Assurancezk(x5)
Empathy
562379 (D, 0) (D, 0)556741 (D, 0)558797 (D, 0) (SD, 0)557444 (D, 0)560698 (SD, 0) (D, 0)559907 (D, 0) (N, 0)555108 (SD, 0)553355 (D, 0)555076 (D, 0)568008 (N, –0.5)
Table 7. Overall SERVPERF scale evaluation of customer complaints and percentage of total complaints.
Tangibles Reliability Responsiveness Assurance Empathy
z(xi) (D, –0.044) (D, –0.039) (SD, +0.067) (D, –0.047) (SD, +0.082)% Total 6.78% 6.51% 1.78% 5.54% 1.83%
If we analyse the claims in which no SERVPERF assessment was identified, we found that most of these claims do not have a customer rating, i.e., they have only annotations on the internal processes of the company. In some cases, customers focus their complaints on services through the trade name. Therefore, the business portfolio of the company should be included in the feature set {xj
i}. In general, most complaints are related to the technical aspects of services: tangibles (6.78%), reliability (6.51%) and assurance (5.54%). Few are re-lated to staff: responsiveness (1.78%) and empathy (1.83%). Precisely these two scales are the worst valued by customers, whereas reliability receives the best assessment. Through a man-ual sampling, we found that almost 5 per cent of the opinions were not correctly classified. We consider this an acceptable value due to the complexity of natural language processing.
Conclusions and future work
A model was presented to transform CRM customer complaints, expressed in natural lan-guage, into SERVPERF scales. Several authors have adapted the SERVPERF to analyse sat-isfaction and dissatisfaction, but none have adopted a model to obtain this standard from unstructured CRM information. The proposed model is supported by:
– The idea of sentiment unit adapted to identify the SERVPERF features and their corre-sponding sentiments. This allows us to treat a complaint not as a unit but as different subunits corresponding to the SERVPERF scales on which the customer complains.
– The concept of fuzzy linguistic variable to represent these sentiments, as such fuzzy models are very appropriate to represent the uncertainty associated with these lin-guistic sentiments.

1626 R. A. Carrasco et al. A model to obtain a SERVPERF scale evaluation of the CRM customer complaints ...
– The 2-tuple model in order to compute (negation and aggregation operators) these sentiments without losing information.
– The proposed model, therefore, provides an accurate standard measure of the com-plaints, enabling better strategic management of these complaints on several funda-mental aspects:
– We use internal information about the complaints contained in the CRM, providing advantages over possible SERVPERF ad-hoc studies based on surveys conducted by the company to obtain customer dissatisfaction information:• Customers who complain frequently are reluctant to answer questionnaires.• We could obtain several precise SERVPERF sub-surveys by grouping by any di-
mension, related to the customer, available in the CRM: customer segment, age, geographic location, etc.
• These surveys could be updated quasi in real time because the original information is collected by the support functions included in the CRM system.
– We could obtain enhanced over conventional Key Performance Indicators (KPIs) from the CRM customer complaints: rates of customer complaints, customer complaint average, number of complaints per month, etc. The following aspects are improved:• These conventional KPIs could be segregated by the different SERVPERF scales.• The calculation of KPIs could be more accurate because it takes into account the
linguistic intensity of the complaint. – We obtain customer level SERVPERF results allowing a better individual complaints management, improving loyalty programs and integrated communication with cus-tomers.
To prove the efficiency of the model and experimentally validate it, a prototype has been implemented and applied to a case study in a particular CRM system of Clearwire, a 4G multinational telecommunication company. The application of the prototype and its results has been described step by step. As a practical conclusion, most complaints are related to the technical aspects of services (tangibles, reliability and assurance) more than to staff (re-sponsiveness and empathy). However, scales related to staff, responsiveness and empathy, are the worst valued by customers, whereas reliability receives a better assessment. As a point of improvement in the prototype, we note the identification of the particular business service portfolio as a feature on which customers could focus their complaints.
Regarding a weak point of our proposal, we could highlight the limitations of the 2-tuple linguistic model itself. This is based on a set of linguistic labels uniformly distributed in the context interval, which is why it does not conform to problems requiring an unbalanced solution space. As future work, we consider the possible scope for incorporating into our model other alternative fuzzy linguistic approaches as multi-granular or unbalanced fuzzy linguistic modelling.
The proposal was specially designed for its implementation in the telecommunications sector. However, we consider the possibility of experimentally applying this model to other economic areas where the process of making SERVPERF scale evaluations of the CRM cus-tomer complaints could be interesting.
Technological and Economic Development of Economy, 2018, 24(4): 1606–1629 1627
Acknowledgements
This paper has been developed with the financing of FEDER funds in the National Project TIN2016-75850-R.
References
Cabrerizo, F. J., Herrera-Viedma, E., & Pedrycz, W. (2013). A method based on PSO and granular com-puting of linguistic information to solve group decision making problems defined in heterogeneous contexts. European Journal of Operational Research, 230(3), 624-633. https://doi.org/10.1016/j.ejor.2013.04.046
Carrasco, R. A., Sánchez-Fernández, J., Muñoz-Leiva, F., Blasco, M. F., & Herrera-Viedma, E. (2017). Evaluation of the hotels e-services quality under the user’s experience. Soft Computing, 4(21), 995-1011. https://doi.org/10.1007/s00500-015-1832-0
Chang, S. C., & Tsai, P. H. (2016). A hybrid financial performance evaluation model for wealth man-agement banks following the global financial crisis. Technological and Economic Development of Economy, 22(1), 21-46. https://doi.org/10.3846/20294913.2014.986771
Cid-López, A., Hornos, M. J., Carrasco, R. A., & Herrera-Viedma, E. (2015). A hybrid model for de-cision-making in the information and communications technology sector. Technological and Eco-nomic Development of Economy, 21(5), 720-737. https://doi.org/10.3846/20294913.2015.1056281
Cronin Jr, J. J., & Taylor, S. A. (1994). SERVPERF versus SERVQUAL: reconciling performance-based and perceptions-minus-expectations measurement of service quality. Journal of Marketing, 58(1), 125-131. https://doi.org/10.2307/1252256
De Maio, C., Fenza, G., Loia, V., & Orciuoli, F. (2016ª). Linguistic fuzzy consensus model for collab-orative development of fuzzy cognitive maps: a case study in software development risks. Fuzzy Optimization and Decision Making, 1-17.
De Maio, C., Tommasetti, A., Troisi, O., Vesci, M., Fenza, G., & Loia, V. (2016b). Contextual fuzzy-based decision support system through opinion analysis: a case study at university of the Salerno. International Journal of Information Technology & Decision Making, 15(05), 923-948. https://doi.org/10.1142/S0219622016500231
Elkhalifa, L., Adaikkalavan, R., & Chakravarthy, S. (2005, March). InfoFilter: a system for expressive pattern specification and detection over text streams. ACM Symposium on Applied Computing. Santa Fe, New Mexico, USA. https://doi.org/10.1145/1066677.1066923
Ferreira, F. A., Ferreira, J. J., Fernandes, C. I., Meidutė-Kavaliauskienė, I., & Jalali, M. S. (2017). En-hancing knowledge and strategic planning of bank customer loyalty using fuzzy cognitive maps. Technological and Economic Development of Economy, 23(6), 1-17. https://doi.org/10.3846/20294913.2016.1213200
Gambetta, N., Zorio-Grima, A., & García-Benau, M. A. (2015). Complaints management and bank risk profile. Journal of Business Research, 68(7), 1599-1601. https://doi.org/10.1016/j.jbusres.2015.02.002
Hadden, J., Tiwari, A., Roy, R., & Ruta, D. (2006, May). Churn prediction using complaints data. Con-ference World Academy of Science, Engineering and Technology, 13, 158-163.
Hadidi, L., Assaf, S., & Alkhiami, A. (2017). A systematic approach for ERP implementation in the construction industry. Journal of Civil Engineering and Management, 23(5), 594-603. https://doi.org/10.3846/13923730.2016.1215348
Hajek, P., Olej, V., & Myskova, R. (2014). Forecasting corporate financial performance using sentiment in annual reports for stakeholders’ decision-making. Technological and Economic Development of Economy, 20(4), 721-738. https://doi.org/10.3846/20294913.2014.979456

1628 R. A. Carrasco et al. A model to obtain a SERVPERF scale evaluation of the CRM customer complaints ...
Herrera, F., & Martínez, L. (2000). A 2-tuple fuzzy linguistic representation model for computing with words. IEEE Transactions on Fuzzy Systems, 8(6), 746-752. https://doi.org/10.1109/91.890332
Hiroshi, K., Tetsuya, N., & Hideo, W. (2004, August). Deeper sentiment analysis using machine transla-tion technology. 20th International Conference on Computational Linguistics. Geneva, Switzerland. https://doi.org/10.3115/1220355.1220426
Jain, P. (2013). Telecommunication service quality assessment: a comparative study of Bharat Sanchar Nigam Limited and Reliance Communications Limited. Asia-Pacific Journal of Management Re-search and Innovation, 9(1), 99-106. https://doi.org/10.1177/2319510X13483517
Jain, P., Tomar, A., & Vishwakarma, N. (2016). Analysis of customer satisfaction in Telecom Sector on implementation of CRM with respect to users. International Journal of Engineering, Management & Medical Research, 2(3), 1-8.
Jain, S. K., & Gupta, G. (2004). Measuring service quality: SERVQUAL vs. SERVPERF scales. Vikalpa, 29(2), 25-37. https://doi.org/10.1177/0256090920040203
Jain, T. I., & Nemade, D. (2010). Recognizing contextual polarity in phrase-level sentiment analysis. International Journal of Computer Applications, 7(5), 5-11. https://doi.org/10.5120/1160-1453
Kim, S. M., & Hovy, E. (2004, August). Determining the sentiment of opinions. 20th International Con-ference on Computational Linguistics. Geneva, Switzerland. https://doi.org/10.3115/1220355.1220555
Lai, F., Griffin, M., & Babin, B. J. (2009). How quality, value, image, and satisfaction create loyalty at a Chinese telecom. Journal of Business Research, 62(10), 980-986. https://doi.org/10.1016/j.jbusres.2008.10.015
Lee, C. H., Wang, Y. H., & Trappey, A. J. (2015). Ontology-based reasoning for the intelligent handling of customer complaints. Computers & Industrial Engineering, 84, 144-155. https://doi.org/10.1016/j.cie.2014.11.019
Li, Y., & Liu, P. (2015). Some Heronian mean operators with 2-tuple linguistic information and their application to multiple attribute group decision making. Technological and Economic Development of Economy, 21(5), 797-814. https://doi.org/10.3846/20294913.2015.1055614
Martínez-Cruz, C., Porcel, C., Bernabé-Moreno, J., & Herrera-Viedma, E. (2015). A model to represent users trust in recommender systems using ontologies and fuzzy linguistic modeling. Information Sciences, 311, 102-118. https://doi.org/10.1016/j.ins.2015.03.013
Maurer, C., & Schaich, S. (2011). Online customer reviews used as complaint management tool. In R. Law, M. Fuchs & F. Ricci (Eds.), Information and communication technologies in tourism. New York, NY: Springer-Wien. https://doi.org/10.1007/978-3-7091-0503-0_40
Mi, C., Shan, X., Qiang, Y., Stephanie, Y., & Chen, Y. (2014). A new method for evaluating tour online review based on grey 2-tuple linguistic. Kybernetes, 43(3/4), 601-613. https://doi.org/10.1108/K-06-2013-0123
Morente-Molinera, J. A., Mezei, J., Carlsson, C., & Herrera-Viedma, E. (2017). Improving supervised learning classification methods using multi-granular linguistic modelling and fuzzy entropy. IEEE Transactions on Fuzzy Systems, 25(5), 1078-1089. https://doi.org/10.1109/TFUZZ.2016.2594275
Naik, C. K., Gantasala, S. B., & Prabhakar, G. V. (2010). Service quality (SERVQUAL) and its effect on customer satisfaction in retailing. European Journal of Social Sciences, 16(2), 231-243.
Nakov, P., Kozareva, Z., Ritter, A., Rosenthal, S., Stoyanov, V., & Wilson, T. (2013, June). Sentiment analysis in Twitter. 7th International Workshop on Semantic Evaluation. Atlanta, Georgia, USA.
Pang, B., & Lee, L. (2004, July). A sentimental education: sentiment analysis using subjectivity sum-marization based on minimum cuts. 42nd Annual Meeting on Association for Computational Lin-guistics. Barcelona, Spain. https://doi.org/10.3115/1218955.1218990
Parasuraman, A., Zeithaml, V. A., & Berry, L. L. (1985). A conceptual model of service quality and its implications for future research. Journal of Marketing, 49, 41-50. https://doi.org/10.2307/1251430
Technological and Economic Development of Economy, 2018, 24(4): 1606–1629 1629
Picón, A., Castro, I., & Roldán, J. L. (2014). The relationship between satisfaction and loyalty: a mediator analysis. Journal of Business Research, 67(5), 746-751. https://doi.org/10.1016/j.jbusres.2013.11.038
Piepiorra, F. (2015). vtiger CRM v6. 2.0-User and Administration Manual. Lulu.Prabowo, R., & Thelwall, M. (2009). Sentiment analysis: a combined approach. Journal of Informetrics,
3(2), 143-157. https://doi.org/10.1016/j.joi.2009.01.003Shea, C., Faisal, M., Ford, R., Lin, W., & Matsuda, Y. (2008). Oracle Text Reference 11g. Release 1: Oracle
Corporation.Shen, J., Tang, S., & Zhu, H. (2010, August). The investigation in service quality management of 3G
business for telecom operators. International Conference on Management and Service Science. Wu-han, China. https://doi.org/10.1109/ICMSS.2010.5577082
Snyder, M., Steger, J., & Landers, B. (2011). Microsoft Dynamics CRM 2011 step by step. Pearson Educa-tion.
Tax, S. S., Brown, S. W., & Chandrashekaran, M. (1998). Customer evaluations of service complaint experiences: Implications for relationship marketing. Journal of Marketing, 62, 60-76. https://doi.org/10.2307/1252161
Trainor, K. J., Andzulis, J. M., Rapp, A., & Agnihotri, R. (2014). Social media technology usage and customer relationship performance: a capabilities-based examination of social CRM. Journal of Business Research, 67(6), 1201-1208. https://doi.org/10.1016/j.jbusres.2013.05.002
Van der Wal, R. W. E., Pampallis, A., & Bond, C. (2002). Service quality in a cellular telecommunica-tions company: a South African experience. Managing Service Quality: An International Journal, 12(5), 323-335. https://doi.org/10.1108/09604520210442119
Wisniewski, M. (2001). Using SERVQUAL to assess customer satisfaction with public sector services. Managing Service Quality: An International Journal, 11(6), 380-388. https://doi.org/10.1108/EUM0000000006279
Yilmaz, C., Varnali, K., & Kasnakoglu, B. T. (2016). How do firms benefit from customer complaints?. Journal of Business Research, 69(2), 944-955. https://doi.org/10.1016/j.jbusres.2015.08.038
Zadeh, L. A. (1975). The concept of a linguistic variable and its applications to approximate reasoning, Pt I. Information Sciences, 8, 199-249. Pt II, Information Sciences, 8, 301-357. Pt III, Information Sciences, 9, 43-80. https://doi.org/10.1016/0020-0255(75)90046-8