
Experimental Characterization of a Novel Small-Scale Natural ...
105
Experimental Characterization of a Novel Small-Scale Natural Circulation Loop Methanol Synthesis Reactor Pratik Basarkar Technische Universiteit Delft
-
Upload
khangminh22 -
Category
Documents
-
view
1 -
download
0
Transcript of Experimental Characterization of a Novel Small-Scale Natural ...

Experimental Characterization of aNovel Small-Scale Natural CirculationLoop Methanol Synthesis Reactor
Pratik Basarkar
Tech
nische
Unive
rsite
itDelft


Experimental Characterization of aNovel Small-Scale NaturalCirculation Loop Methanol
Synthesis Reactor
by
Pratik Basarkar
in partial ful llment of the requirements for the degree of
Master of Sciencein Mechanical Engineering
at the Delft University Of Technology,to be defended publicly on Thursday August 30, 2018 at 02:00 PM.
Student Number: 4616049
Project Duration: January, 2018-August, 2018
Daily Supervisor: ir. Jan van Kranendonk, ZEF B.V., Delft, The Netherlands
Thesis committee: Dr. ir. Wiebren de Jong TU Delft, The Netherlands | ChairDr. ir. Earl Goetheer TU Delft, The NetherlandsDr. ir. Rob Stikkelman TU Delft, The Netherlands
An electronic version of this thesis will be available on August 30, 2020.


Acknowledgements
This thesis is written in my voice, but it is actually a collaborative work between three people-Jan, En-rique and I. Even though it was I who did all the planning and experiments, the constant feedback Iwould get from the other two greatly helped me in doing my work. Special thanks to Wiebren for hisguidance during the project and his valuable feedback for the rst draft of this work. Credit also goes toEarl Goetheer and Wim Brilman, from TNO and UT Twente respectively, who helped shape this thesis toits present state. I am also grateful to Prof. Rob Stikkelman for agreeing to be in my thesis committeeand for reviewing my thesis.
I would like to express my gratitude to Ulrich and Hessel for those laughs whenever I went to the o ceto take a break from experiments. Credit also goes to team ZEF 1 and 2 who built the entire subsystemfrom scratch. In particular, I would like to thank Diego and Rens, who helped me with and providedconstructive criticisms of my design whenever I wanted some honest opinion. Special thanks to Jaapand Michel who helped me whenever I had some problems with my experimental setup.
I would like to speci cally thank Zerui, Daniel and Sotiris who read my rst draft and suggested possibleareas for improvement.
In the end, I would like to thank my friends here at Delft for these two years of fun and speci callyRenika, without whose constant ”support and guidance” I could have nished my thesis in half thetime.
PratikDelft, August 2018
iii


Abstract
The present-day industrialized nations reached high standards of living using cheap fossil fuel energy.The high CO2 emissions as a result of burning these fuels over the years have started outpacing thenatural carbon cycle, resulting in climate changes around the globe. We have reached a point in ourhistory where merely reducing our carbon emissions would not solve the problem, rather carbon has tobe captured from the atmosphere and either stored or converted to fuels. Converting the captured CO2into methanol has been gaining traction in recent years as it is not only an excellent fuel but also servesas the building block to manufacture other important chemicals like dimethyl ether (DME), para n,ole ns, plastics and polymers.
This thesis focusses on the complete experimental characterization of a small-scale, energy e cientmethanol synthesis reactor modelled on the concept developed by Wim Brilman of the University ofTwente, with respect to feed ow rates, methanol production and overall e ciency. The problemof comparative energy ine ciency of the Brilman reactor was solved by carrying out the reactionsin a novel, natural circulation loop (NCL) xed packed bed reactor with internal heat recovery usingCu/ZnO/Al2O3 as the catalyst. A mixture of H2 and CO2 in the molar ratio of 3:1-the optimum ratio formethanol production was fed into the reactor. A sensitivity analysis was carried out with regards tothe sampling time of the liquids at the outlet and the reaction temperature. Maximum methanol pro-ductivity of 6.8 mmole (millimoles) CH3OH/gcat/h was obtained at 228 °C reactor wall temperature and62 °C condenser wall temperature using 5 mm diameter pellets compared to 4.3 mmole CH3OH/gcat/hobtained by Brilman at 210 °C reaction temperature and 85 °C condenser temperature. Also, a highcarbon conversion of 99.2% and methanol selectivity of 99.0% was achieved. The energy demand (inMJ/kgCH3OH) was reduced from 75 in the Brilman reactor to 24 using the current design. From theseresults, it was established that methanol could be synthesized using a small, lab-scale reactor in anenergy e cient manner.
It was further observed that reduced size of the catalyst did not contribute much to methanol yield dueto the high-pressure drop. Finally, a brief analysis of the heat losses in the system led to the conclusionthat an additional 14.6 W of heat would have enabled autothermal operation.
v


Contents
List of Tables ix
List of Figures xiAbbreviations . . . . . . . . . . . . . . . . . . . . . . . . . . . . . . . . . . . . . . . . . . . xvNomenclature . . . . . . . . . . . . . . . . . . . . . . . . . . . . . . . . . . . . . . . . . . .xviiGlossary . . . . . . . . . . . . . . . . . . . . . . . . . . . . . . . . . . . . . . . . . . . . . . . xix
1 Introduction 11.1 Methanol as a sustainable fuel. . . . . . . . . . . . . . . . . . . . . . . . . . . . . . . 21.2 Role of the start-up company Zero Emission Fuels . . . . . . . . . . . . . . . . . . . 31.3 Research Questions . . . . . . . . . . . . . . . . . . . . . . . . . . . . . . . . . . . . . 41.4 Thesis Outline . . . . . . . . . . . . . . . . . . . . . . . . . . . . . . . . . . . . . . . . 4
2 Literature Review 52.1 History of methanol synthesis . . . . . . . . . . . . . . . . . . . . . . . . . . . . . . . 52.2 Low pressure methanol synthesis . . . . . . . . . . . . . . . . . . . . . . . . . . . . . 5
2.2.1 Sources of methanol . . . . . . . . . . . . . . . . . . . . . . . . . . . . . . . . . 52.2.2 Catalysts for methanol synthesis . . . . . . . . . . . . . . . . . . . . . . . . . 72.2.3 Kinetic Modeling . . . . . . . . . . . . . . . . . . . . . . . . . . . . . . . . . . . 92.2.4 Reactor types for methanol production . . . . . . . . . . . . . . . . . . . . . . 122.2.5 Brilman Reactor . . . . . . . . . . . . . . . . . . . . . . . . . . . . . . . . . . . 16
3 Experiments 213.1 Reactor Design and Fabrication . . . . . . . . . . . . . . . . . . . . . . . . . . . . . . 213.2 Experimental System . . . . . . . . . . . . . . . . . . . . . . . . . . . . . . . . . . . . 21
3.2.1 Process and Instrumentation Diagram . . . . . . . . . . . . . . . . . . . . . . 223.2.2 Reactor . . . . . . . . . . . . . . . . . . . . . . . . . . . . . . . . . . . . . . . . . 223.2.3 Gas cylinders . . . . . . . . . . . . . . . . . . . . . . . . . . . . . . . . . . . . . 273.2.4 Electrical circuits and data logging . . . . . . . . . . . . . . . . . . . . . . . . 273.2.5 Instruments used for analysis . . . . . . . . . . . . . . . . . . . . . . . . . . . 28
3.3 Reactor Operating Procedure . . . . . . . . . . . . . . . . . . . . . . . . . . . . . . . . 283.4 Experimental Test Plan . . . . . . . . . . . . . . . . . . . . . . . . . . . . . . . . . . . 31
4 Results and Discussion 334.1 Experiments using N2 as the fluid. . . . . . . . . . . . . . . . . . . . . . . . . . . . . 334.2 Experiments using feed gas. . . . . . . . . . . . . . . . . . . . . . . . . . . . . . . . . 344.3 Fault Tree Analysis. . . . . . . . . . . . . . . . . . . . . . . . . . . . . . . . . . . . . . 34
4.3.1 High fluid temperature in the condenser . . . . . . . . . . . . . . . . . . . . . 354.3.2 No reaction in the catalyst zone . . . . . . . . . . . . . . . . . . . . . . . . . . 354.3.3 No liquid accumulation . . . . . . . . . . . . . . . . . . . . . . . . . . . . . . . 374.3.4 No gas flow in the reactor . . . . . . . . . . . . . . . . . . . . . . . . . . . . . . 37
4.4 Experiments with 5 mm catalyst pellets . . . . . . . . . . . . . . . . . . . . . . . . . 404.4.1 Sampling time optimization. . . . . . . . . . . . . . . . . . . . . . . . . . . . . 414.4.2 Reaction temperature optimization . . . . . . . . . . . . . . . . . . . . . . . . 42
4.5 Experiments with crushed catalyst particles . . . . . . . . . . . . . . . . . . . . . . 474.6 Experiments with 5 mm pellets cut into two halves . . . . . . . . . . . . . . . . . . 484.7 Comparison of experimental results with simulations in COCO and Fluent . . . . 504.8 Heat Exchange Network . . . . . . . . . . . . . . . . . . . . . . . . . . . . . . . . . . . 51
5 Conclusions and Recommendations 555.1 Conclusions . . . . . . . . . . . . . . . . . . . . . . . . . . . . . . . . . . . . . . . . . . 555.2 Recommendations . . . . . . . . . . . . . . . . . . . . . . . . . . . . . . . . . . . . . . 56
vii

viii Contents
Bibliography 59
Appendices 65
A Parameters for estimating equilibrium conversion of methanol 67
B Reactor Dimensions 69B.1 Reaction Zone . . . . . . . . . . . . . . . . . . . . . . . . . . . . . . . . . . . . . . . . . 69B.2 Heat Integration Blocks . . . . . . . . . . . . . . . . . . . . . . . . . . . . . . . . . . . 70B.3 Condenser Block . . . . . . . . . . . . . . . . . . . . . . . . . . . . . . . . . . . . . . . 70
C Industrial methanol production 71
D Internal Fins 73
E Efficiency Calculations 75
F Heat Exchange Network Calculations 77F.1 Heat loss through bolts . . . . . . . . . . . . . . . . . . . . . . . . . . . . . . . . . . . 77F.2 Heat loss through PT 60. . . . . . . . . . . . . . . . . . . . . . . . . . . . . . . . . . . 77F.3 Heat loss through the insulation. . . . . . . . . . . . . . . . . . . . . . . . . . . . . . 78F.4 Heat loss through air gap . . . . . . . . . . . . . . . . . . . . . . . . . . . . . . . . . . 78F.5 Heat transferred to the condenser from COCO simulations. . . . . . . . . . . . . . 80
G Effect of condenser temperature and channel diameter variation on methanolyield 81
H Corrosion in aluminium blocks 83

List of Tables
2.1 History of methanol synthesis [7, 11, 14, 15]. . . . . . . . . . . . . . . . . . . . . . . . . 52.2 Sources of syngas production. A stoicheometric ratio (SN) close to 2 is desired for max-
imum methanol production. [15]. . . . . . . . . . . . . . . . . . . . . . . . . . . . . . . . 62.3 Composition of Cu methanol synthesis catalysts from di erent manufacturers [14]. . . . 72.4 Carbon source of methanol according to literature. As can be observed, there is little
consensus among the authors regarding the source of methanol (table adopted from[15]). . . . . . . . . . . . . . . . . . . . . . . . . . . . . . . . . . . . . . . . . . . . . . . . 9
2.5 Kinetic models for methanol synthesis (adapted from [14, 15]). . . . . . . . . . . . . . . 112.6 Adiabatic reactor technologies for methanol synthesis. . . . . . . . . . . . . . . . . . . . 132.7 Isothermal reactors used for methanol synthesis. . . . . . . . . . . . . . . . . . . . . . . 152.8 Summary of liquid based reactors used for methanol synthesis. . . . . . . . . . . . . . . 162.9 Plants working on CO2 to methanol conversion. . . . . . . . . . . . . . . . . . . . . . . . 192.10 Parameters a ecting the mass ux [93]. . . . . . . . . . . . . . . . . . . . . . . . . . . . 19
3.1 Parameter values used to estimate heat integration for one block. . . . . . . . . . . . . . 303.2 Sample calculation to estimate the mass ow rate. . . . . . . . . . . . . . . . . . . . . . . 31
4.1 Details of the experiments performed with N2 as the uid. Only the rst test without thecatalyst was simulated by Guttierez-Neri [104] in Fluent. . . . . . . . . . . . . . . . . . . 34
4.2 Temperatures at the top and bottom thermocouple of the heat integration blocks at thereaction temperature of 225 °C. Block 1 is closest to the reaction zone and Block 6 tothe condensation zone. . . . . . . . . . . . . . . . . . . . . . . . . . . . . . . . . . . . . . 39
4.3 Molar ow rate of the components at the outlet of the reactor for 5 mm pellets at 228 °Creaction temperature, presented as an example. . . . . . . . . . . . . . . . . . . . . . . . 44
4.4 Estimation of carbon conversion and selectivity for 5 mm pellets at di erent temperatures. 444.5 Results of the experiment with 5 mm catalyst at 228 °C and 10 minutes of sampling time. 464.6 Comparison of the results of the current study with those of Brilman et al [16]. . . . . . 464.7 Results of the experiments performed using 5 mm pellets cut into two halves at 14 min-
utes of sampling time. The methanol production and e ciency are lower compared tothe results obtained using 5 mm pellets. . . . . . . . . . . . . . . . . . . . . . . . . . . . 49
4.8 Simulation parameters for the COCO model for 5 mm pellets at 228 °reaction temperature. 514.9 Comparison of mass ow rate obtained from experiments and simulations. . . . . . . . . 514.10 Heat losses in the system. . . . . . . . . . . . . . . . . . . . . . . . . . . . . . . . . . . . . 524.11 Comparison of heat transferred to the condenser based on experimental and simulation
results. . . . . . . . . . . . . . . . . . . . . . . . . . . . . . . . . . . . . . . . . . . . . . . 52
A.1 Parameters used for conversion of methanol in a single pass reactor. . . . . . . . . . . . 68
B.1 Dimensions of various components of the reaction zone. . . . . . . . . . . . . . . . . . . 69B.2 Dimensions of the various components of the heat integration block. . . . . . . . . . . . 70B.3 Dimensions of the various components of the condenser block. . . . . . . . . . . . . . . 70
C.1 Calculation of methanol production using the results of Chen et al. [21]. . . . . . . . . . 71
E.1 Maximum theoretical e ciency calculation for di erent reaction temperatures using 5mm pellets. . . . . . . . . . . . . . . . . . . . . . . . . . . . . . . . . . . . . . . . . . . . . 76
E.2 Maximum theoretical e ciency calculation for di erent reaction temperatures using 5mm pellets cut into two halves. . . . . . . . . . . . . . . . . . . . . . . . . . . . . . . . . . 76
F.1 Heat loss through bolts. . . . . . . . . . . . . . . . . . . . . . . . . . . . . . . . . . . . . . 77
ix

x List of Tables
F.2 Heat loss through PT 60. . . . . . . . . . . . . . . . . . . . . . . . . . . . . . . . . . . . . 78F.3 Heat loss through the insulation. . . . . . . . . . . . . . . . . . . . . . . . . . . . . . . . . 78F.4 Heat loss through the air gap. . . . . . . . . . . . . . . . . . . . . . . . . . . . . . . . . . 79F.5 Flow rates and temperature values of some of the streams in the COCO model (Figure
4.21). . . . . . . . . . . . . . . . . . . . . . . . . . . . . . . . . . . . . . . . . . . . . . . . 80F.6 Mode of heat transfer in the condenser . . . . . . . . . . . . . . . . . . . . . . . . . . . . 80

List of Figures
1.1 World Total Final Consumption (TFC) by fuel in 2015 in Million Tonnes of Oil Equivalent(Mtoe) [10]. . . . . . . . . . . . . . . . . . . . . . . . . . . . . . . . . . . . . . . . . . . . 1
1.2 Methanol demand and production in millions of metric tons (MMT) per year. Since 2013,there has been a sharp growth in methanol demand and production driven mainly by thedemand in China [12, 13]. . . . . . . . . . . . . . . . . . . . . . . . . . . . . . . . . . . . 2
1.3 Circular carbon loop of methanol [7, 11]. CO2 released into the atmosphere by burningof fuels and also from point sources like industries can be captured and stored by theprocess of carbon capture and storage (CCS). The CO2 can also be reacted with H2 toproduce methanol by the process of carbon capture and recycling (CCR). . . . . . . . . 3
1.4 Schematic of the process by which ZEF plans to produce methanol. The focus of thisthesis is on the experimental characterization of the methanol synthesis reactor. . . . . 3
2.1 Variation of equilibrium conversion to methanol with temperature using syngas as thefeed at 50 bar (Mole fraction H2:CO2:CO:Ar=0.82:0.03:0.04:0.11). . . . . . . . . . . . . 7
2.2 Schematic of the reactions occuring at the catalyst surface. CO2 and H2 adsorb disso-ciatively (on di erent sites) on Cu. CO2 is hydrogenated to bicarbonates, then to Cuformate, formaldehyde, methoxy species and nally to methanol. Hydrogenation of theformate is considered to be the rate determing step of the reaction, as formate speciesis the longest living intermediate [25]. . . . . . . . . . . . . . . . . . . . . . . . . . . . . 8
2.3 Simpli ed ow diagram formethanol synthesis reactors. The feed gas is rst compressedafter which it exchanges heat with the unreacted recycled gas. The gas mixture is thenheated to the reaction temperature and fed to the reactor. The products are then sep-arated using membranes, solvents or in-situ condensation while the unreacted gas isrecycled back [14]. . . . . . . . . . . . . . . . . . . . . . . . . . . . . . . . . . . . . . . . 12
2.4 Examples of adiabatic reactors used for methanol synthesis: (2.4a) Quench reactor and(2.4b) Kellogg, Brown and Root reactor. . . . . . . . . . . . . . . . . . . . . . . . . . . . . 12
2.5 Examples of reactors used for methanol synthesis. . . . . . . . . . . . . . . . . . . . . . . 142.6 Dew point temperature of the gas mixture as a function of the reaction pressure and tem-
perature (H2:CO2=3:1). At a high temperature (523 K), a very high pressure is requiredto condense the gases at the reaction temperature. At lower pressures (50 bar) andtemperatures (473 K), a decrease of temperature is required to initiate condensation. Atthese pressures, a temperature gradient can be achieved in the reactor to drive the ow. 17
2.7 Design of the reactor proposed by [16]. The feed gas enters through the inlet and owsthrough the inner tube before passing through the tube annulus which contains the cata-lyst. The catalyst bed is maintained at the reaction temperature using an oven. Methanoland water mixture are then condensed at the top using a cooling coil. The liquids formedare tapped out at regular intervals. . . . . . . . . . . . . . . . . . . . . . . . . . . . . . . 18
2.8 Internal heat exchange (shown on the left) and external heat exchange design (shownon the right) with arrows showing the syngas ow direction. An internal heat exchangesystem would decrease the average temperature di erence between the heating and thecooling zones, decreasing the mass ux. An external heat exchange system on the otherhand increases the absolute temperature di erence between the two zones, increasingthe mass ux. The latter is used in this thesis. . . . . . . . . . . . . . . . . . . . . . . . . 20
3.1 Process and instrumentation diagram of the methanol synthesis reactor setup. The gascylinders (highlighted in green), the reactor (in red), the data logging circuit (in blue)and the instruments used for analysis (in yellow) can be clearly seen. . . . . . . . . . . . 22
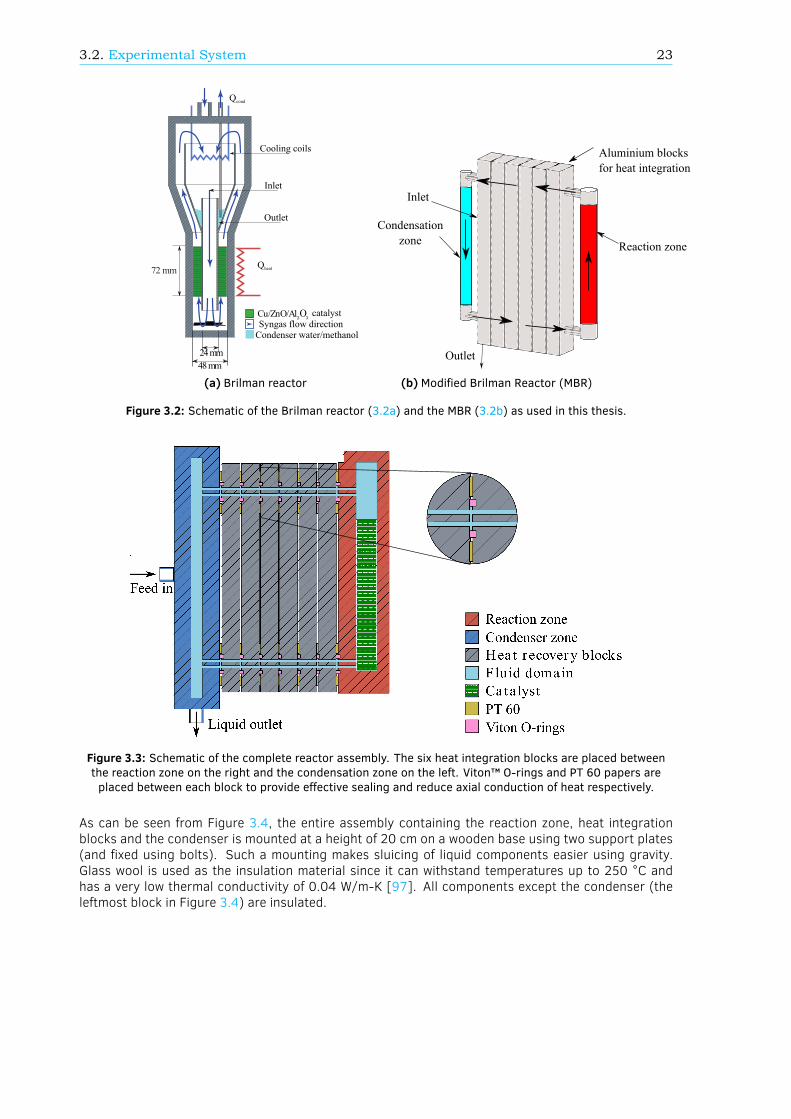
3.2 Schematic of the Brilman reactor (3.2a) and the MBR (3.2b) as used in this thesis. . . . 23
xi

xii List of Figures
3.3 Schematic of the complete reactor assembly. The six heat integration blocks are placedbetween the reaction zone on the right and the condensation zone on the left. Viton™O-rings and PT 60 papers are placed between each block to provide e ective sealing andreduce axial conduction of heat respectively. . . . . . . . . . . . . . . . . . . . . . . . . . 23
3.4 Reactor assembly as used in the experiment. Glass wool is used as the insulation mate-rial. The thermocouple connections can be clearly seen. The feed input is from the leftand the methanol and water mixture is tapped from the bottom using the two open closevalves. . . . . . . . . . . . . . . . . . . . . . . . . . . . . . . . . . . . . . . . . . . . . . . . 24
3.5 Isometric view of the reaction zone (left) and front and sectional view (on the right). Thereaction zone consists of a cylindrical channel where the catalyst in inserted. All thedimensions are in mm. . . . . . . . . . . . . . . . . . . . . . . . . . . . . . . . . . . . . . . 24
3.6 Catalyst pellets as sourced from the manufacturer (The red colour of some of the pelletsis due to prior reduction with H2). . . . . . . . . . . . . . . . . . . . . . . . . . . . . . . . 25
3.7 Schematic of the heat integration block with the isometric view on the left, the front viewin the middle and the sectional view on the right. All the dimensions are in mm. . . . . . 26
3.8 Condenser block. . . . . . . . . . . . . . . . . . . . . . . . . . . . . . . . . . . . . . . . . . 263.9 Schematic of the electrical circuit for the reactor. . . . . . . . . . . . . . . . . . . . . . . 273.10 Electrical circuit for the reactor made using a breadboard and then using a PCB. . . . . 283.11 Reactor start-up procedure. . . . . . . . . . . . . . . . . . . . . . . . . . . . . . . . . . . 283.12 Heat integration block. All dimensions are in mm. . . . . . . . . . . . . . . . . . . . . . . 293.13 Heat integration in each block. . . . . . . . . . . . . . . . . . . . . . . . . . . . . . . . . . 303.14 Schematic of the procedure to calculate the mass ow rate. . . . . . . . . . . . . . . . . 30
4.1 Schematics of the reactor during experiments with N2 as the uid. The reactor withoutcatalyst (Figure 4.1a), with catalyst (Figure 4.1b), with catalyst and internal ns (Figure4.1c) and with the ow completely blocked (Figure 4.1d) can be seen. . . . . . . . . . . 33
4.2 Fluid temperaturemeasurement in the condenser. The di erence between the condensersurface and uid temperature is a maximum of 5.5 °C using 1 bar N2. . . . . . . . . . . . 35
4.3 Causes for no reaction taking place in the catalyst zone with their solutions. . . . . . . . 364.4 Causes for insu cient liquid accumulation in the bottom port of the condenser and their
solutions. . . . . . . . . . . . . . . . . . . . . . . . . . . . . . . . . . . . . . . . . . . . . . 374.5 Causes for no gas ow in the reactor and their solutions. . . . . . . . . . . . . . . . . . . 384.6 Modi cation at the outlet of the catalyst bed to measure the gas composition. Two open
close valves were used to enable gas sampling. . . . . . . . . . . . . . . . . . . . . . . . 384.7 Pressure drop using (4.7a) six heat integration blocks and (4.7b) three heat integration
blocks. Premature condensation in the case of six blocks was the cause of low liquidproduction and thus low pressure drop in time. . . . . . . . . . . . . . . . . . . . . . . . . 39
4.8 Change in ow channel dimensions to solve the problem of ow blockage due to liquidcondensation. . . . . . . . . . . . . . . . . . . . . . . . . . . . . . . . . . . . . . . . . . . 40
4.9 Schematic of the Small Modi ed Brilman Reactor (SMBR) used for the experiments. Thereactor now consists of the reaction zone, three heat integration blocks (with larger owchannels) and a condensation zone. . . . . . . . . . . . . . . . . . . . . . . . . . . . . . . 40
4.10 Procedure followed for calculating the methanol production rate in mmole CH3OH/gcat/h. 414.11 Variation in methanol production with sampling time at 235 °C for 5 mm catalyst pellets. 414.12 Schematic of the reactor showing the inlet and outlet streams. . . . . . . . . . . . . . . . 424.13 Procedure to calculate the moles of gaseous components in the reactor. . . . . . . . . . 434.14 Flowchart for mass balance calculations. . . . . . . . . . . . . . . . . . . . . . . . . . . . 434.15 Variation in methanol production, energy e ciency and overall e ciency with time for 5
mmpellets. Methanol production, overall and energy e ciency of the system are found toincrease with temperature (till 228 °C), and then start to decrease. 228 °C was identi edas the optimum temperature to produce methanol in the SMBR using 5 mm pellets. . . . 45
4.16 Crushed catalyst pellets. . . . . . . . . . . . . . . . . . . . . . . . . . . . . . . . . . . . . 474.17 Variation in CO formation with time for 5 mm and crushed catalyst pellets. Reduction in
catalyst size did not lead to increasedmethanol production as the ow rate was restrictedas a result of high pressure drop caused by the small particle size. . . . . . . . . . . . . 47
4.18 5 mm catalyst pellets cut into two halves along the central axis. . . . . . . . . . . . . . . 48
List of Figures xiii
4.19 Variation in methanol production with sampling time. Maximum production is observedat 14 minutes of sampling compared to 10 minutes using 5 mm pellets, pointing towardsow limitations imposed by a higher pressure drop. . . . . . . . . . . . . . . . . . . . . . 48
4.20 Variation of overall e ciency and methanol production with reaction temperature. . . . 494.21 Simulation model developed in COCO by Guttierez-Neri [104] incorporating the heat
integration achieved by the aluminium blocks. . . . . . . . . . . . . . . . . . . . . . . . . 504.22 Steps to compare experimental and simulation results obtained from COCO. Red font
indicates possible sources of error in the measurement. . . . . . . . . . . . . . . . . . . . 504.23 Heat exchanging network depicting the pathway of heat loss in the reactor. Loss through
the insulation is the highest suggesting that selection of proper insulationmaterial shouldbe a priority for future experimental designs. . . . . . . . . . . . . . . . . . . . . . . . . . 52
4.24 Scenarios for estimating the performance of the reactor in case of no heat losses. Au-tothermal reactor operation is possible if an additional 14.6 W of heat is generated fromthe system. This can be achieved using higher heat integration or by producing moremethanol. . . . . . . . . . . . . . . . . . . . . . . . . . . . . . . . . . . . . . . . . . . . . . 53
A.1 Model developed in COCO for calculating equilibrium conversion to methanol in a singlepass. . . . . . . . . . . . . . . . . . . . . . . . . . . . . . . . . . . . . . . . . . . . . . . . . 67
D.1 Internal ns. . . . . . . . . . . . . . . . . . . . . . . . . . . . . . . . . . . . . . . . . . . . 73
G.1 E ect of changing condenser temperature onmethanol mole fraction. Reducing the tem-perature ensures more liquid is condenser, leading to more methanol production. . . . . 81
H.1 Corrosion in the ow channels of the aluminium block. . . . . . . . . . . . . . . . . . . . 83


List of Abbreviations
BASF Badische Anilin und Soda FabriekCCS Carbon Capture and StorageCCR Carbon Capture and RecyclingCo CobaltCSV Comma Separated ValueCMD Collect-Mix-DistributeDME Dimethyl EtherHHV Higher Heating ValueICI Imperial Chemical IndustriesLOGIC Liquid Out Gas In ConceptLHHW Langmuir-Hinshelwood-Hougen-WatsonLPG Lique ed Petroleum GasMBR Modi ed Brilman ReactorMMT Millions of metric tonsMo MolybdenumMn ManganeseMtoe Million Tonnes of Oil EquivalentNCL Natural Circulation LoopNOx Nitrogen oxidePd PalladiumAu GoldZrO2 Zirconium dioxideSiO2 Silicon dioxideRh RhodiumRu RutheniumRWGS Reverse Water Gas Shift reactionSSD Solid State DriveSMBR Small Modi ed Brilman ReactorSOx Sulfur oxideSN Stoichiometric RatioTCD Thermal Conductivity DetectorTFC Total Final ConsumptionWGS Water Gas Shift reactionZEF Zero Emission Fuels
xv


Nomenclature
Sign Name UnitA Cross sectional area m𝐴1...6 kinetic constants in literature expressions -C Speci c heat J/kg-K𝑓 Fugacity bar𝑓 Partial fugacity of component i barℎ Thiele modulus -k Thermal conductivity W/m-K𝐾 Adsorption equilibrium constant bar𝐾 Chemical equilibrium constant based on partial pressure bar or -L Length mm⋅ Mass ow rate kg/s or kg/hmmole Millimoles mmolen Moles mole𝑝 Partial pressure bar𝑟 Reaction rate per weight of the catalyst mol s kgT Temperature KΔ𝑇 Absolute temperature di erence KΔ < 𝑇 > Average temperature di erence K< 𝑇 > Average temperature Klog 𝐾pCO Equilibrium constant for CO hydrogenation barlog 𝐾pRWGS Equilibrium constant for reverse water gas shift reaction -Δ H Heat of the reaction kJ/moleΔ𝐻 Standard enthalpy of reaction at 298 K kJ/mole
xvii

xviii List of Figures
Subscripts
Index NameAr indicates component ArgonCO indicates component Carbon monooxideCO2 indicates component Carbon dioxideH2 indicates component HydrogenH2O indicates component WaterCH3OH indicates component MethanolCu indicates component CopperZn indicates component ZincZnO indicates component Zinc oxideAl2O3 indicates component AluminaH2S indicates component Hydrogen sulphideCH4 indicates component MethaneCO → CH3OH Conversion of CO to CH3OHCO2 → CH3OH Conversion of CO2 to CH3OHCO2 hydrogenation indicates the CO2 hydrogenation reaction1..6 Denotes heat integration blocks 1 to 6air gap Air gapAl Aluminiumb bottombolts Boltsc Average heat transfer coe cient between the insulation surface and the ambientcond Conductioncondenser Condenserconv Convectionrst Al block, avg Average temperature at the top and bottom of the rst heat integration blockHEX Heat integrationin inputins Insulationlat Latent heatliquid indicates the Liquid stream of the reactorout indicates the sum of the molar ow rates of the Sample and Liquid streamPT 60 PT 60 paperrad Radiationreaction zone, avg Average temperature at the top and bottom of the reaction zonesample indicates the Sample stream of the reactort topsens Sensible heat
Superscripts
Index Name𝑒𝑞 Equilibrium
Greek Symbols
Symbol Name Unit𝜖 Emissivity -𝜂 Internal e ectiveness factor -𝜌 Density kg/m𝜎 Stefan-Boltzmann constant W/m -K

Glossary
Aspen Plus®Chemical process simulator and optimizer by Aspen Technology [1].
COCOCAPE OPEN to CAPE OPEN- a free-of-charge CAPE-OPEN compliant steady-state simulation en-vironment [2].
LPMEOH™Liquid phase technology developed by Air Products for the production of methanol in a slurryreactor.
Viton™A brand of uoroelastomers, commonly used in O-rings.
Feed gasThe 3:1 molar mixture of H2 and CO2 that is fed into the reactor.
MATLABMulti-paradigm numerical computing environment and proprietary programming language devel-oped by MathWorks [3].
ProcessingAn open source programming tool similar to Ardiuno environment. Used for data collection incomma separated value (CSV) format.
xix


1Introduction
The Kyoto Protocol in 1997 was the rst instance where the nations agreed that global warming wasindeed a pressing problem and ”anthropogenic CO2 emissions were a major cause of it” [4]. Whilethis protocol was based on di erential agreements-where a few nations bear the most costs-the ParisAgreement of 2015 put the onus on all countries (which rati ed it) to keep the temperature increaseto 2 °C above pre-industrial levels, and if possible, to limit this to 1.5 °C [5]. As of 2016, 92% of themaximum CO2 needed to restrict the increase to 1.5 °C is already in the atmosphere, which means weonly have until 2020 before we miss the target [6].
Contrary to popular perception, the discovery of shale oil, methane hydrate, shale gas, tight oil andtar sands has meant that the world will not run out of fossil fuels for a long time. Rather, the use ofthese fuels will be constrained by the level of CO2 emissions [7]. One of the ways to reduce emissionsis to capture CO2 from the air and store it underground in large spaces by a technique called CarbonCapture and Storage (CCS). While the technology is being currently used for enhanced oil recoveryapplications and also to store CO2 underground in depleted oil and gas elds [8] such as the Sleipnerfacility in Norway, the safety aspect remains a question mark. Storage of high concentrations of CO2underground can lead to limnic eruptions (where CO2 can erupt from deep water bodies and kill livingbeings), which is what happened at Lake Nyos in Cameroon [9].
Figure 1.1: World Total Final Consumption (TFC) by fuel in 2015 in Million Tonnes of Oil Equivalent (Mtoe) [10].
1

2 1. Introduction
Electricity comprises about 19% of our total energy demand (Figure 1.1). Therefore, even if renewablesources like wind and solar are used for electricity production, 81% of our energy needs still needto be met. Allowing for buses and cars to be run on batteries, heavy-duty, long-range transport, ingeneral, will continue using liquid fuels as batteries are too heavy. One way to produce these fuels is tocapture atmospheric CO2 and react it with H2 created using water electrolysis. Thus, Carbon Captureand Recycling (CCR) emerges as an attractive alternative to CCS, where the captured CO2 is convertedto liquid fuels [7, 11]. One such promising fuel and bulk chemical gaining attention in the internationalmarket is methanol which is evident from its increased demand and production in the recent years asshown in Figure 1.2.
Figure 1.2: Methanol demand and production in millions of metric tons (MMT) per year. Since 2013, there hasbeen a sharp growth in methanol demand and production driven mainly by the demand in China [12, 13].
1.1. Methanol as a sustainable fuelAlthough H2 is the simplest fuel which can be produced using renewable sources (by electrolysis of wa-ter), its storage and transportation issues mean that it is unattractive (based on cost-e ectiveness)to be used as an energy carrier (or storage) medium with the current technological advancement.Methanol o ers an attractive alternative to H2 as it is a liquid at room temperature. Methanol pro-duction from sources like biomass, bio-methane, CO2 etc. o ers a way to achieve a closed carbon loopas shown in Figure 1.3 [7, 11].
Beside being a liquid at room temperature, methanol o ers the following advantages [7, 11, 14, 15]:
1. It is biodegradable.
2. It has a high octane number and therefore, it can be blended with gasoline. It burns cleanly withno soot and low NO or SO emissions [16, 17].
3. It can be used in direct methanol fuel cells to charge portable electronic devices.
4. Dimethyl ether (DME) can be produced using methanol and the former is a good diesel substitute.Methanol and DME can also be used in gas turbine based power plants.
5. Methanol can be used to produce ole ns, polymers and simple plastics [16, 18].
The fuel also has some disadvantages [19]:
1. It is less volatile than gasoline which would make pure methanol based engines di cult to startup in a cold environment.

1.2. Role of the start-up company Zero Emission Fuels 3
Electricity (from renewable sources)
Electrolysis of H2O
H2
Methanol synthesis
CCR
CCS
Atmospheric CO2
CO2
CO2 storage
CO2 capture
Conversion to synthetic fuels and other products
Gasification
Biomass
Methanol
PlantsPhotosynthesis
Combustion CO2 from point sources
Figure 1.3: Circular carbon loop of methanol [7, 11]. CO2 released into the atmosphere by burning of fuels andalso from point sources like industries can be captured and stored by the process of carbon capture and
storage (CCS). The CO2 can also be reacted with H2 to produce methanol by the process of carbon capture andrecycling (CCR).
2. It is highly toxic as about 1-2 ml of methanol per kg of body weight is enough to cause death. Itcan lead to permanent blindness if ingested in small quantities of 10-20 ml.
3. It is corrosive to certainmaterials like aluminium, zinc andmanganese. Therefore, if puremethanolis to be used in an engine, then other suitable materials need to be chosen or corrosion inhibitorsneed to be added.
4. Methanol has a greater re risk than H2 if released into the open atmosphere as the former is aliquid at room temperature. A re caused by methanol is invisible, especially in bright sunlight.However, it can be easily extinguished using water whereas gasoline oats on water and continuesto burn.
1.2. Role of the start-up company Zero Emission Fuels
Figure 1.4: Schematic of the process by which ZEF plans to produce methanol. The focus of this thesis is onthe experimental characterization of the methanol synthesis reactor.

4 1. Introduction
Zero Emission Fuels (ZEF B.V.) is an ambitious start-up working on methanol production using renew-able sources [20]. Their aim is to produce methanol using CO2 and H2O captured from the air, withthe latter being used to make H2 in an electrolyzer. The feed components, namely CO2 and H2 will befed into a reactor which produces a mixture of methanol and water, with a downstream distillation unitbeing used to separate the two products. The entire plant will be tted to the back of a solar panel andwill be powered using solar energy (Figure 1.4).
1.3. Research QuestionsThis thesis focuses on the experimental characterization of a novel, small-scale, NCL methanol synthe-sis reactor and aims to answer the following research questions:
1. What is the maximum methanol productivity and overall system e ciency that can be obtainedexperimentally using the reactor given the process conditions?
(a) How does this productivity compare with that of industrial processes and other experimentalstudies?
(b) What are the most important process parameters needed to obtain the maximum productiv-ity?
(c) What is the e ect of heat integration on the overall e ciency of the system?
2. How do the heat losses and mass ow rate of the system compare with the values obtained fromsimulations?
3. What implications do the results obtained have for future designs of the NCL reactor?
1.4. Thesis OutlineWith the background for the thesis and the research questions established in Chapter 1, an overview ofthe reactor types used for low pressure methanol synthesis is provided in Chapter 2. This is followedby a description of the materials and methods used for the experiments in Chapter 3. The results ofthe experiments and their discussion is done in Chapter 4. Chapter 5 presents a summary of the workdone in this thesis and answers the research questions posed in Chapter 1. Recommendations for fu-ture designs of the reactor and its operation are also provided.

2Literature Review
2.1. History of methanol synthesisMethanol was rst produced in 1661 by wood distillation, with the production volumes being very low(about 20 liters/ton of wood). Because of such limited quantities, methanol as a fuel did not gainmuch traction until Badische Anilin und Soda Fabriek (BASF) patented a process for its production[15]. BASF produced methanol using Zn based catalysts via coal gasi cation at high temperaturesand pressures. This process was limited by the presence of pollutants in the syngas such as H2S,CH4 and other hydrocarbons which caused deactivation of the catalyst. Also, the catalyst producedmethanol with only 2-5 wt% selectivity [14]. Improvements in syngas puri cation (removal of sulfurand chlorine from the gas) and development of a more active Cu catalyst allowed methanol productionat low pressures and temperatures. Reactions at these temperatures meant that the production oflight hydrocarbons was suppressed. Today, Cu based catalysts are the most widely used for methanolsynthesis, with the reactions occurring at low temperatures and pressures, with the process classi edas a high pressure (250-300 bar), medium pressure (100-250 bar) or low pressure (50-100 bar) [15].A brief history of methanol synthesis is tabulated in Table 2.1.
Table 2.1: History of methanol synthesis [7, 11, 14, 15].
Industry Productionmethod
Catalyst Operationconditions
BASF (1923) (0.07896 tonnes/day) Coal gasi cation Zn/Cr2O3 300-400 °C250-300atm
Lonza, Switzerland (1940s) Reaction of elec-trolytic H2 and CO2,the latter obtainedfrom Ca(NO3)2synthesis
ZnO based catalyst -
ICI (1966) (2500 tonnes/day) Methane steamreforming
Cu/ZnO 300 °C100 atm
Lurgi (90000 tonnes/day) [21] Methane steamreforming
Cu/ZnO 230-250 °C40-50 atm
2.2. Low pressure methanol synthesis2.2.1. Sources of methanolAs is evident from Table 2.1, methane steam reforming has replaced coal gasi cation as themost widelyused method for methanol production, mainly because of cleaner syngas output in the former. The syn-gas composition depends on the source of carbon and the process of production (as can be seen from
5

6 2. Literature Review
Table 2.2), with an ideal ratio of 2 desired for maximum methanol production [15].
Stoichiometric Ratio (SN) = moles ofH2 −moles ofCO2
moles ofCO2 +moles ofCO
Table 2.2: Sources of syngas production. A stoicheometric ratio (SN) close to 2 is desired for maximummethanol production. [15].
Source Process SN DrawbacksCoal and biomass Gasi cation Close to 1 Extensive downstream and up-
stream cleaning operationsMethane Steam reforming Close to 3 High stoicheometric ratio;
endothermic process requireshigh heat input
Methane Partial oxidation Close to 2 Exothermic process requiringheat management
Methane Autothermalreforming
Close to 2 Partial oxidation and steamreforming need to be conductedat di erent process conditions
Steam reforming, partial oxidation and autothermal reforming have their own disadvantages (the pro-cesses are not carbon neutral as methane has 28-34 times the global warming potential of CO2 and isa major greenhouse gas [22]). Therefore, in the recent years, attention has turned towards biomassand CO2 as possible candidates for methanol production.
The problem with rst generation biomass (any food crop) being used as the source is that it com-petes with food production for available land and also leads to high handling and transportation costs.Second generation biomass (any non-food crop) on the other hand o ers many advantages. It canbe grown on land unsuitable for crop production. If the biomass is perennial grass, then it helps toimprove the water retention capability of the land as well as prevent soil erosion [23].
While research on making and transportation of fuels from second generation biomass is ongoing, nocommercial plants have been developed so far. Also, little research has been done on native lignocellu-losic crops in Asia and Africa, while the experience with pilot plants has demonstrated that non-nativespecies threaten the local biodiversity. To conclude, while second-generation biomass o ers severaladvantages, there are many loopholes that need to be closed before it can be used on a large scalefor biofuel production, including methanol. [23]. On the other hand, if CO2 is used as the feedstock, ithelps to avoid CO2 sequestration, which is a very expensive process [24]. Also, a potent greenhousegas is directly reduced [16, 18].
Methanol synthesis consists of three main reactions with the product formation favoured at high pres-sures and low temperatures according to Le Chatelier’s principle. Equation 2.1 and Equation 2.2present the CO hydrogenation and CO2 hydrogenation reactions, respectively, while Equation 2.3 de-tails the water gas shift reaction (WGS).
CO+ 2H2 ⇌ CH3OH, Δ𝐻 = −90.8 kJ/mole (2.1)CO2 + 3H2 ⇌ CH3OH+H2O, Δ𝐻 = −49.2 kJ/mole (2.2)
CO+H2O ⇌ CO2 +H2, Δ𝐻 = −41.6 kJ/mole (2.3)
This process has two major drawbacks [16]:
1. Low conversion to methanol per pass because of thermodynamic limitations necessitating recycleof the feed. The variation of equilibrium conversion tomethanol with temperature for a single passreactor is shown in Figure 2.1 and the parameters for calculation (taken from [25]) are presentedin Table A.1.

2.2. Low pressure methanol synthesis 7
Figure 2.1: Variation of equilibrium conversion to methanol with temperature using syngas as the feed at 50bar (Mole fraction H2:CO2:CO:Ar=0.82:0.03:0.04:0.11).
2. High cooling duty due to exothermic nature of the reactions. This necessitates the use of extraequipment to provide cooling and maintain the reaction temperature and increases the operationcost.
2.2.2. Catalysts for methanol synthesisAlthough initial processes producedmethanol by the catalytic hydrogenation of CO, most of the authorsagree that CO2 hydrogenation proceeds faster than CO hydrogenation, even if syngas was used as thestarting feed [15]. Cu and Zn based catalysts are considered to be among the most selective andactive for methanol synthesis from CO2 and H2 [26–29], with their composition in the catalyst varyingaccording to the manufacturer and the manufacturing process (2.3) [14].
Table 2.3: Composition of Cu methanol synthesis catalysts from di erent manufacturers [14].
Manufacturer Cu (wt%) Zn (wt%) Al (wt%) OtherIFP 45-70 15-35 4-20 Zr-2-18
Synetix (formerly ICI) 20-35 15-50 4-20 MgBASF 38.5 48.8 12.9 Rare earth oxide-SShell 74 21 12
Sud Chemie 65 22 31DuPont 50 19 17
United Catalysts 62 21 17Haldor Topsoe >55 21-25 8-10Mitsubishi Gas 63.6 33.4 3Ammonia Casale 30 50 3 Cr (16)
Lonza 40 20 Zr (40)AIST, RITE 45.2 27.1 4.5 Zr (22.6) Si (0.6)
YKK Corporation 76.3 11 12.7
Cu acts as the active phase in these catalysts, with ZnO increasing the sulfur tolerance which gains im-portance especially if the syngas is produced by coal gasi cation. Al2O3 acts as the support on whichCO2 is dispersed, increasing CO2 conversion and selectivity to CH3OH [15, 30, 31].
The catalyst Cu/ZnO/Al2O3 is usually prepared by the co-precipitation method, however uncoventional

8 2. Literature Review
methods of production to improve the Cu/ZnO dispersion have gained interest in recent years [32, 33].Pd, Au, ZnO, ZrO2 and SiO2 are the supports that are proposed for methanol synthesis catalysts [34].ZrO2 provides high stability to the catalyst, particularly in oxidizing and reducing atmosphere, but theactivity is slightly less than ZnO for methanol synthesis [35]. SiO2 based catalysts have the problem oflow selectivity towards methanol. Several surface modi ers (Rh, Ru, Co,Mo,Mn) could also be addedto the catalyst to increase the surface converage of Cu intermediates [36].
The Cu based catalysts are highly suseptible to deactivation via poisoning and thermal sintering [37].While the problem of poisoning has mostly been eliminated by advances in syngas puri cation, catalystsintering remains a problem. A test conducted to check the activity of the catalyst (CuO/ZnO/Al2O3)after exposure to CO/H2 stream found that 60% of the activity was lost after 25 hours of operation at250 °C catalyst bed temperature [38]. Presence of water can also reduce the activity of the catalyst,which is more evident in case of liquid reactors [39].
A schematic of the mechanism for methanol synthesis occuring at the catalyst surface is presented inFigure 2.2.
Figure 2.2: Schematic of the reactions occuring at the catalyst surface. CO2 and H2 adsorb dissociatively (ondi erent sites) on Cu. CO2 is hydrogenated to bicarbonates, then to Cu formate, formaldehyde, methoxy
species and nally to methanol. Hydrogenation of the formate is considered to be the rate determing step ofthe reaction, as formate species is the longest living intermediate [25].
Intra-particle di usion limitations inside the catalyst assume importance in the case of low pressuremethanol synthesis using Cu based catalysts. Numerous studies have been conducted in literature todevelop models in order to evaluate the e ciency of the catalyst. Five principles approaches for thesame are reported [14]:
1. Dusty gas model,
2. Modi ed or extended Stefan-Maxwell equations,
3. Multicomponent pore di usion model combined with convective mass transport,
4. Multicomponent pore di usion model with constant di usion coe cients,
5. Model based on Thiele modulus and rst order kinetics for methanol and water production.

2.2. Low pressure methanol synthesis 9
The Thiele modulus is the ratio of the reaction rate to the di usion rate in porous catalyst pellets withno mass transfer limitations. It is one of the most widely used methods to determine the e ectivenessfactor of catalyst pellets as it can be easily implemented in methanol reactor models and reduces thecomputation time [14].
ℎ = Reaction rateDi usion rate
(2.4)
where,
ℎ is the Thiele modulus,
Reaction rate and di usion rate are expressed in mol/gcat/s.
Thiele modulus is then used to calculate the internal e ectiveness factor (𝜂) of the pellets which is de-ned as [40]:
𝜂 = Actual rate of the reactionRate of the reaction if the entire interior surface was exposed to the external pellet surface conditions
(2.5)where,
Numerator and denominator are expressed in mol/gcat/s.
The internal e ectiveness factor is inversely related to the Thiele modulus by the following relation[40]:
𝜂 = 3ℎ ∗ (ℎ ∗ 𝑐𝑜𝑡(ℎ ) − 1) (2.6)
An internal e ectiveness factor of 75% was reported at 80 bar pressure and 538 K using 4.2 mmcatalyst pellets by Seyfert et al. [41] while Graaf et al. [42] found the e ectiveness factor to decreasewith increasing temperature (factor varying between 32% and 92%). The factor decreases at a highertemperature as the gases have less time to be adsorbed on the catalyst surface, reducing di usion.Reducing the catalyst size reduces the di usion limitations leading to a higher e ectiveness factor. Thetreatment of di usion limitation is outside the scope of this thesis.
2.2.3. Kinetic ModelingEven after almost a century of industrial methanol production, there is still a lot of debate regardingthe actual source of methanol-CO or CO2. An analysis of literature studies has been adopted from [15]to nd the carbon source of methanol and presented in Table 2.4.
Table 2.4: Carbon source of methanol according to literature. As can be observed, there is little consensusamong the authors regarding the source of methanol (table adopted from [15]).
CO CO2 CO + CO2 Referencesx [41, 43, 43–47]
x [21, 25, 48–58]x [42, 59–69]
As there is no clear solution to the debate regarding the carbon source, kinetic models for methanolsynthesis by various authors also di er. Initial models took CO as the source of methanol, with thepresence of CO2 in the feed not taken into account [47, 60]. A rate expression based on the dual-siteLangmuir-Hinshelwood-Hougen-Watson (LHHW) mechanism was proposed by Dybkjaer et al. [58],with H2 and H2O adsorbed on one site and CO and CO2 adsorbed on the other.

10 2. Literature Review
Graaf et al. [42, 70] proposed that methanol is produced by successive CO and CO2 hydrogenationwith the WGS reaction playing a major role. Their model tted well with their experimental data and alsowith other proposed models [41, 43, 58, 60]. They calculated the equilibrium constants for CO hydro-genation and WGS reactions based on partial pressures and based their model on LHHW mechanism,similar to [58]. The equilibrium constants presented by the authors had the following form:
log 𝐾pCO = 5139/T− 12.621 (2.7)log 𝐾pRWGS = −2073/T+ 2.029 (2.8)
where,
𝐾pCO is the equilibrium constant for CO hydrogenation in bar ,
𝐾pRWGS is the equilibrium constant for reverse water gas shift (RWGS) reaction,
T is the absolute temperature in K.
Skrzypek et al. [50] conducted experiments with di erent CO and H2 feeds and found no productionof methanol. They proposed that the role of CO was restricted to CO2 production via the WGS reactionand removal of H2O. A few years after Graaf, Bussche and Froment [25] proposed a mechanistic modelwith CO2 as the source. They used the equilibrium constants and also based their model on the dualsite approach proposed by [42, 58]. According to their model, CO2 and H2 undergo dissociation onthe catalyst surface (on di erent sites) and produce methanol, with the rate determining step beingthe hydrogenation of the formate. The model was developed from literature and experimental studiesconducted by the authors on a bench scale setup. The e ect of temperature, pressure and ratio ofpartial pressures of CO and CO2 on methanol production was investigated. CO2 was found to be thesource of methanol, with CO being produced by the RWGS. The author proposed a ratio of 22 betweenthe reactor diameter and the pellet size for uniform distribution of feed over the reactor section.
The model developed could also predict results outside the experimental window with good agreement.Bussche and Froment validated this model for an adiabatic reactor, Chen et al. [21] validated it for anisothermal reactor while Luyben et al. [71] modeled a methanol synthesis reactor with a distillationcolumn.
A dynamic microkinetic model was proposed by Oversen et al. [72] which was used to reproduce theexperimental results of Graaf et al. [42]. The model could explain the behavior of the system undertransient conditions. Another microkinetic mechanism consisting of 48 elementary steps was proposedby Lim et al. [67] with the rate-determining step for WGS being the hydrogenation of the formate, sim-ilar to [25]. Grabow et al. [68] suggested both CO and CO2 hydrogenation as the source of methanolusing their microkinetic model, with CO2 being responsible for about 67% of the industrial methanolproduction.
Kinetics proposed by [42] and [25] are the most widely used today for modeling methanol synthesisprocesses. Some of the other kinetic models are presented in Table 2.5.

2.2. Low pressure methanol synthesis 11
Table 2.5: Kinetic models for methanol synthesis (adapted from [14, 15]).
Operationparameters(P,T)
Equation rates Reference
40-50 bar,493-533 K
𝑟CO→CH3OH =k(. ⋅ H2
CH3OH .−
.CH3OH.
CO⋅ H2 ⋅ ∗ ) [47]
NA 𝑟CO2→CH3OH =⋅ ⋅ . ⋅[ CO2 ⋅ H2
CH3OH⋅ H2OH2
⋅ ,CO2]
( ⋅ CO2 )[ . ⋅ .H2 ⋅ H2O/( ⋅ H2 ) . ]
𝑟 =⋅ ⋅ . ⋅[ CO2 ⋅ .
H2CO⋅ H2O.
H2⋅ ,WGS
]
( ⋅ CO2 )[ . ⋅ .H2 ⋅ H2O/( ⋅ H2 ) . ]
[58]
15-50 bar,483-518 K
𝑟CO→CH3OH =⋅ CO⋅[ CO⋅ .
H2 CH3OH/( .H2 ⋅ )]
( ⋅ CO CO2 ⋅ CO2 )[ .H2 ( / .
H2 ⋅ H2O)]
𝑟 = ⋅ CO2 ⋅[ CO2 ⋅ H2 H2O⋅ CO/( )]( ⋅ CO ⋅ CO2 )[ .
H2 ( / .H2 ⋅ H2O)]
𝑟CO2→CH3OH =⋅ CO2 ⋅[ CO2 ⋅ .
H2 CH3OH⋅ H2O/( .H2 ⋅ )]
( ⋅ CO CO2 ⋅ CO2 )[ .H2 ( H2O/ .
H2 ⋅ H2O)]
[42]
15-51 bar,453-553 K
𝑟CO2→CH3OH =⋅ ⋅ ⋅ ⋅ H2 ⋅ CO2 ⋅ H2 ⋅[ ( / ∗)⋅ H2O⋅ CH3OH/( CO2 ⋅ H2 )]
( ( H2O/( ⋅ ⋅ H2 ⋅( H2O/ H2 √ H2 ⋅ H2 H2O⋅ H2O))))
𝑟 = ⋅ CO2 ⋅[ ∗ ⋅ H2O⋅ CO/( CO2 ⋅ H2 )]( ( H2O/( ⋅ ⋅ H2 ⋅( H2O/ H2 √ H2 ⋅ H2 H2O⋅ H2O))))
[25]
49 bar, 473-548 K
𝑟CO2→CH3OH =⋅ CO2 ⋅ H2 CH3OH⋅ H2O/[ ⋅ H2 ][ CO2 ⋅ CO2 H2O⋅ H2O]
𝑟 = ⋅ CO2 ⋅ CO H2O⋅ H2O/[ ⋅ H2 ][ CO2 ⋅ CO2 H2O⋅ H2O]
[53]
50-90 bar,503-613 K
𝑟CO→CH3OH =CO→CH3OH
⋅ CO⋅[ CO⋅ .H2 CH3OH/( .
H2 ⋅ CO→CH3OH )]
( CO⋅ CO)( .H2 ⋅
.H2 H2O⋅ H2O
𝑟 = ⋅ CO2 ⋅[ CO2 ⋅ H2 CO⋅ H2O/ ]( CO⋅ CO)( .
H2 ⋅.
H2 H2O⋅ H2O)
𝑟CO2→CH3OH =CO2→CH3OH
⋅ CO2 ⋅[ CO2 ⋅ .H2 CH3OH⋅ H2O/( .
H2 ⋅ CO2→CH3OH )]
( CO⋅ CO)( .H2 ⋅
.H2 H2O⋅ H2O
[69]
52 bar, 513 K 𝑟CO2→CH3OH =⋅ H2 ⋅(
H2O⋅ CH3OH(CH3OH⋅ H2 ⋅ CO2
)
( ⋅ H2O ⋅ H2O/( ⋅ CO2 )[66]

12 2. Literature Review
2.2.4. Reactor types for methanol productionSince the reactions for methanol synthesis are exothermic in general, any reactor chosen must havee ective temperature control to maintain the temperature and maximize the yield per pass. A simpli edow diagram for methanol synthesis is presented in Figure 2.3.
Figure 2.3: Simpli ed ow diagram for methanol synthesis reactors. The feed gas is rst compressed afterwhich it exchanges heat with the unreacted recycled gas. The gas mixture is then heated to the reactiontemperature and fed to the reactor. The products are then separated using membranes, solvents or in-situ
condensation while the unreacted gas is recycled back [14].
The reactors for methanol synthesis fall into two major categories-adiabatic and isothermal, which aresummarized in Table 2.6 and in Table 2.7 respectively with the liquid reactor technologies presented inTable 2.8 [15].
Gas outlet
Quench gas
Feed gas
Lozenges
(a) Quench reactor [15, 73] (b) Kellogg, Brown and Root reactor [15, 74]
Figure 2.4: Examples of adiabatic reactors used for methanol synthesis: (2.4a) Quench reactor and (2.4b)Kellogg, Brown and Root reactor.

2.2. Low pressure methanol synthesis 13
Table 2.6: Adiabatic reactor technologies for methanol synthesis.
Reactor Features Advantages Reference(s)Quench reactor(ICI) (Figure2.4a)
1.Multiple adiabaticbeds in a shell2.Catalyst loaded in onebed3.Reaction temperaturecontrolled using syngasfeed from lozenges
1.Simple and reliable de-sign2.Easy catalyst loading andunloading3.Heat of reaction recov-ered
[15, 73]
Kellogg, Brownand Rootreactor (Figure2.4b)
1.Series of adiabatic,xed bed reactors2.Catalyst placed inannulus of two shells
1.Installation, manufactur-ing cost lower due to lowwall thickness2.Less recycle streamneeded3.Low pressure drop due toradial syngas ow
[15, 74]
AdvancedReactor Con-cept (Casale)(Figure 2.5a)
Adiabatic bed sectionseparated usingdistribution plates
1. E cient and reliabledesign2. 20 % increase in yieldcompared to quench reac-tors
[15]
Collect-Mix-Distribute(CMD)(Used by Hal-dor Topsoe)(productionup to 10000tonnes/d)
1.Series of catalyst bedsseparated by verticalbeams2.Syngas fed at thebottom travels upwardsand mixes with cold feedat the top, and thentravels downwards
1.E ective temperaturecontrol achieved2.Improved carbon conver-sion and catalystlife
[15]
MRF-Z (devel-oped by ToyoEngineeringCorporation)(Figure 2.5b)
1. Multi-stage radialow reactor2.Catalyst loaded in con-centric beds
1. Easy scale up2. Less pressure drop dueto radial ow3. E cient heat recovery
[15]

14 2. Literature Review
(a) Advanced Reactor Concept [15]
Gas inlet
Catalyst
Central pipe
Steam outlet
Gas outlet and catalyst unloading
Boiler water inlet
Inert balls
Cooling tube
(b) MRF-Z reactor [15]
(c) Linde isothermal reactor [15, 75] (d) Isothermal Methanol Converter [15]
Steam outlet
Flexible hose
Feed gas inlet
Gas out
ManwayManway
Manway
Catalyst
Outer tube
Boiling feedwater
inlet
(e) Mitsubishi Reactor (Isothermal) [15, 76] (f) LPMEOH™reactor (Liquid) [15, 77]
Figure 2.5: Examples of reactors used for methanol synthesis.

2.2. Low pressure methanol synthesis 15
Table 2.7: Isothermal reactors used for methanol synthesis.
Reactor Features Advantages Reference(s)Linde reactor(Figure 2.5c)
Consists of helical tubesin catalyst bed which carry thecooling uid
1.Reduced thermalstresses due to helicaltubes2.Longer material life,e cient heat transfer,optimum reaction temper-ature3.Reduced reaction andcatalyst volume due togood heat transfer
[15, 75]
Lurgi reactor 1.Shell and tube design withcatalyst inside the tubes andboiling wateron the outside2.Reaction temperature con-trolled by waterpressure
1.Good temperature con-trol2.High yield and low recycleratio3.Availability of high pres-sure steam which can beused in otherapplications
[15, 78–80]
MitsubhishiGas ChemicalandMitsubhishiHeavy Industry(MGC/MHI)superconverter(Figure 2.5e)
1.Shell and tube design withdouble walled tubes2.Catalyst loaded in tube an-nulus3.Gas ows through the insidetube and enters the catalystbed4.Cooling water on the outsidemaintains the reaction tem-perature
1.High conversion per pass(14% methanol produc-tion)2.Safe operation and highmechanical stability
[15, 76]
IsothermalMethanol Con-verter(IMC) (devel-oped by CasaleSA) (Figure2.5d)
1.Series of plates arranged ra-dially surrounded by thecatalyst2.Cooling uid ows inside theplates to maintain reactiontemperature
1.Good temperature andreaction rate control2.Easy loading and unload-ing of catalysts3.Small pressure drop
[15]
Fluidized bedconvertertechnology(Developed byNEDO)
1.Gas fed into the reactor bot-tom uidizes the catalyst bed2.Catalyst temperature con-trolled using coolingpipes
1.Good temperature andreaction rate control2.Easy loading and unload-ing of catalysts
[15]

16 2. Literature Review
Table 2.8: Summary of liquid based reactors used for methanol synthesis.
Reactor Operation Principle Advantages Reference(s)Slurry liq-uid phasetechnology(LPMEOH™)(developed byAir Products)(Figure 2.5f)
The reactor consists ofcatalyst particles sus-pended in a bed of inertoil, with the gas and liq-uid owing co-currently
1.High conversion per passwith signi cantly less recy-cle2.Heat of reaction recov-ered and reused3.Can be operated as acontinuous or a batch pro-cess4.High production capacityof 3E5 L/d of methanol
[15, 77]
BrookhavenNational Labo-ratory, USA
The reactor producedmethanol via the methylformate pathway
1.Low temperature andpressure of operation2.High conversions ofabout 90% leading tolower recycles
[15]
Pittsburg Uni-versity
Co-current slurry basedprocess using themethylformate pathway
1.Low temperature opera-tion (170-200 °C)2.High conversions andhigh selectivity achieved
[15]
One of the major drawbacks of liquid based reactors compared to the gas based ones is the quick deac-tivation of catalysts. This is due to decomposition of oil used to suspend the catalyst and also becauseof carbon deposition. [81, 82].
Even though some of the reactor designs mentioned in Tables 2.6, 2.7 and 2.8 have the advantage ofreduced feed recycle, their equilibrium yield of methanol is still low (see Figure 2.1). One way of improv-ing this yield is by shifting the equilibrium towards the product side using either membranes, solvents,maintaining a temperature gradient or by in-situ condensation (also called ”separation enhanced equi-librium approach”) [16–18, 83–90]. As mentioned by [16], using membranes or solvents necessitatesthe use of extra equipment and increases the processing cost. Very high pressures are also not suitableto increase the yield as they require the use of special high pressure resistant equipments and add tothe operating costs.
2.2.5. Brilman ReactorBrilman et al. [16] proposed a method for driving the equilibrium to the right in the reactor by in-situcondensation of products. The authors calculated the dew point temperatures of the gases at di erentreaction temperatures by varying the pressure. According to Figure 2.6, if the reaction temperature ishigh (523 K), then a very high pressure (>150 bar) is required to condense the products at the reactiontemperature. If the reaction temperature is kept low (473 K), then a decrease of temperature is neededin the reactor to achieve condensation (dew point temperature of 423 K), if the reactor is operated atlow pressure (50 bar). Therefore, the authors chose 50 bar as the pressure of operation.
At 473 K reaction temperature, the temperature di erence available for driving the ow (reaction tem-perature - dew point temperature) is 50 K, which increases when the reaction temperature is increased(about 80.27 K for 498 K and 112.57 K for 523 K). The authors then postulated that a minimum tem-perature di erence of 70 K is required to drive the ow (50 K di erence for the 473 K case plus anaddition 20 K temperature di erence is desired to ensure e ective heat and mass transfer in accor-dance with practical condensation manuals [91]).

2.2. Low pressure methanol synthesis 17
Figure 2.6: Dew point temperature of the gas mixture as a function of the reaction pressure and temperature(H2:CO2=3:1). At a high temperature (523 K), a very high pressure is required to condense the gases at thereaction temperature. At lower pressures (50 bar) and temperatures (473 K), a decrease of temperature is
required to initiate condensation. At these pressures, a temperature gradient can be achieved in the reactor todrive the ow.
The reactor design of [16] is presented in Figure 2.7. The reaction zone consists of two tubes with thecatalyst placed in the tube annulus. A gas bu er is lled with the feed gas (mixture of CO2 and H2 in thevolume ratio 1:3) upto a pressure of 100 bar and is connected to the reactor inlet. The reactor itself isoperated in a semi-continuous mode, keeping the pressure in the reactor constant at 50 bar. From thebu er vessel, the feed ows through the inside tube into the annulus region containing the catalyst.5 mm catalyst pellets are used, with a catalyst bed volume of 97713 mm . The reaction temperatureis maintained using a temperature controlled heating jacket. After reacting on the catalyst bed, theproducts are condensed at the top of the reactor and collected in a collection vessel. The condensa-tion is achieved by owing tap water through cooling coils. The condensation temperature was variedbetween 358 K and 413 K for the duration of the experiment (which is lower than the dew point of ap-proximately 423 K at a reaction temperature of 483 K and pressure of 50 bar), while the catalyst outlettemperature was set at 483 K. Hence a temperature di erence of atleast 70 K was maintained betweenthe reaction and the condensation zone. To improve circulation, a fan was placed at the bottom of thevessel. This concept was named as Liquid Out Gas In Concept (LOGIC) and it provided a simple wayto achieve high carbon conversion and methanol yield, while negating the external recycle of productsand circumventing thermodynamic equilibrium limitations.
The authors performed two sets of experiments-one varying the condensation temperature and theother varying the fan speed. In the former case, lowering the condensation temperature increased theyield of methanol as more liquid product was condensed per pass leading to higher carbon conver-sion. The methanol productivity was measured in terms of mmole CH3OH/gcat/h and was found to beabout 4.3 mmole CH3OH/gcat/h for a condenser temperature of 363 K compared to about 19.4 mmoleCH3OH/gcat/h for an industrial scale reactor (see Appendix C for the calculation procedure) [21]. Theindustrial yield was higher as the reactor was operated at a higher pressure of 69.7 bar with a higherfeed ow rate and a feed temperature of 225 °C.
When the fan was used, productivity increased at slow fan speeds (around 7.5 mmole CH3OH/gcat/h)as a result of improved circulation, but higher speeds decreased the catalyst bed temperature leading

18 2. Literature Review
to lower productivity.
72 mm
Qcond
Qheat
Cu/ZnO/Al2O3
Syngas flow direction
catalyst
Condenser water/methanol
Cooling coils
Inlet
Outlet
48 mm
24 mm
Figure 2.7: Design of the reactor proposed by [16]. The feed gas enters through the inlet and ows throughthe inner tube before passing through the tube annulus which contains the catalyst. The catalyst bed is
maintained at the reaction temperature using an oven. Methanol and water mixture are then condensed at thetop using a cooling coil. The liquids formed are tapped out at regular intervals.
The authors identi ed the feed of CO2 and H2 as the more e cient route to produce methanol thanusing CO and H2. This was because although the minimum energy required to remove oxygen from CO2and H2O is the almost the same (Eq 2.9 and Eq 2.10, respectively), water electrolysis is much moreadvanced and e cient than the former process [16, 92]. Several methanol plants around the worldare currently working on CO2 to methanol conversion (Table 2.9).
CO2 ⇌ CO+ 1/2O2, Δ𝐻298 K = 283 kJ/mole (2.9)H2O ⇌ H2 + 1/2O2, Δ𝐻298 K = 286 kJ/mole (2.10)
Inspite of the advantage of almost complete carbon conversion to methanol and no external recycle,this reactor was comparatively energy ine cient (The energy input was about three times the higherheating value (HHV) of methanol) [16]. In order to improve this e ciency, Lammerink in his MSc thesisproposed the use of a heat exchange system to transfer heat between the reaction and the conden-sation zone [93]. Since the driving force for ow in this reactor is the temperature di erence (andultimately, the density di erence) between the two zones, Lammerink evaluated some factors whichcould improve the e ciency of the system while increasing the mass ux of the uid at the same time.These parameters are given in Table 2.10.

2.2. Low pressure methanol synthesis 19
Table 2.9: Plants working on CO2 to methanol conversion.
Plant Features Capacity ReferencesLaboratorypilot plant,Japan
High methanol selectivity(about 99.8%)
50 kg/day [7, 11,26]
Carbon Recy-cling Interna-tional,Iceland
CO2 captured from exhaust ofgeothermal/aluminium smelting plantsH2 produced from water electrolysisusing geothermal energy
10 (metric)MT/day
[7,11]
Mitsui Chemi-cals
CO2 obtained as an industrial by-productH2 obtained from photochemical split-ting of water
100 (metric)MT/year
[7, 11,94]
Blue Fuel En-ergy, Canada
CO2 obtained from natural gasH2 produced via electrolysis using hydro-electricity
2.5 millionliters/day
[7, 11,95]
Sun re, Ger-many
CO2 obtained from direct air capture orindustrial emissions; H2 obtained fromelectrolysis using renewable energyCO2 and H2 will be converted todi erent fuels using a fuel cell
Proposed(8000tonnes/year)
[7, 11,96]
Table 2.10: Parameters a ecting the mass ux [93].
Parameter E ect on mass ux ReasonLength Increases and
then stabilizesAdditional frictional losses decreasewith increasing length. The massux will increase till these lossesbecome negligible and then becomeconstant.
Diameter Increases andthen stabilizes
Initial increase is due to reducingwall friction per unit volume.Then this friction becomes negligibleas compared to other losses likeinternal friction because ofdeveloping ow.
Pressure Increases Pressure is directly correlated withdensity.
Absolute tem-peraturedi erence (Δ𝑇)
Increases Increasing absolute temperaturedi erence increases the densitydi erence.
Average tem-peraturedi erence(Δ(< 𝑇 >))
Decreases Δ𝜌 = ( ) − ( ) . The rstterm in the denominator decreasesfaster than the second term with in-creasing Δ(< 𝑇 >) leading to re-duced density di erence.
If the pressure of the system is kept constant, then increasing the absolute temperature di erence be-tween the heating and the cooling zones increases the mass ux (observe Table 2.10). Based on thisresult, Lammerink proposed two heat exchanger designs for improving the mass ux.
Internal heat exchange can be achieved using plate and n or plate and shell heat exchangers. However,having such an arrangement would decrease the di erence in average temperature between the twozones and thus lead to lower mass ux (see Table 2.10), in addition to increasing the frictional lossesdue to increased heat transfer area. External heat exchangers on the other hand can increase the

20 2. Literature Review
mass ux by increasing the absolute temperature di erence between the condenser and reaction zonesthrough simultaneous cooling of the hot uid and heating of the cold uid. According to the authors,an external cooling uid would be required to transfer heat in this case [93].
Cooling
Heating ThHeating
Cooling
Th
Figure 2.8: Internal heat exchange (shown on the left) and external heat exchange design (shown on the right)with arrows showing the syngas ow direction. An internal heat exchange system would decrease the averagetemperature di erence between the heating and the cooling zones, decreasing the mass ux. An external heatexchange system on the other hand increases the absolute temperature di erence between the two zones,
increasing the mass ux. The latter is used in this thesis.

3Experiments
This chapter describes the experimental setup used for the project. Section 3.1 details the MATLABconvection model and the process model in COCO to dimensionalize the reactor. This work was doneas part of the internship project of the author. Section 3.2 describes the various components in theexperimental setup. Section 3.3 discusses the operating procedure of the reactor while Section 3.4presents the test plan of the experiments.
3.1. Reactor Design and FabricationZEF speci ed 135 grams per day as the production capacity of the methanol synthesis reactor. As-suming that one day meant ve hours of operation, the methanol production rate should be close to 27grams per hour. Apart from the methanol production rate, the outside dimensions too were speci edas it needed to t on the back of a solar panel.
A process model of the reactor was then made in COCO (CAPE-OPEN to CAPE-OPEN-an open sourceprocess simulator similar to Aspen Plus™) [2]. The reactor was simulated as a plug ow reactor usingthe kinetics of Bussche and Froment [25]. The dimensions of the catalyst bed were varied until themethanol production rate from the reactor was close to the desired value of 27 g/h. The condenserwall temperature was kept at 40 °C and the reaction wall temperature at 210 °C to have enough drivingforce for the ow.
A convection model was built in MATLAB and the heat needed to be released to maintain the temper-ature di erence of 170 K was calculated. Using the catalyst bed dimensions obtained above, the arearequired for heat transfer was obtained using the MATLAB model. Since the area was quite large com-pared to the outer dimensions available, it was decided to have small ow channels in the blocks toenhance their area. This area was divided into six blocks made of aluminium. Six blocks were chosenas they would be easier to manufacture and to assemble considering the number of seals that wouldbe required to maintain the leak tightness of the system.
Hence, in the end, it was decided to use six blocks to enhance the surface area for heat transfer alongwith the block where the reaction would take place (reaction zone) and the block to condense the prod-ucts (condensation zone).
This design of the reactor and its fabrication was done during the internship project of the author.
3.2. Experimental SystemBefore describing di erent components, a process and instrumentation diagram of the experimentalsystem is rst presented.
21

22 3. Experiments
3.2.1. Process and Instrumentation DiagramThe experimental system consists of the reactor assembly, gas cylinders, electrical and data loggingcircuit and the apparatus used to analyze the gas and liquid components (density measurement ap-paratus and the gas chromatograph). The process and instrumentation diagram for the experiment ispresented in Figure 3.1.
H2:CO2 cylinder
Reactor
To Gas Chromatograph
H2 cylinder
T
P
TOpen close valve
Methanol and water outlet
Check valveNeedle valve
CO, CO2, H2
Reaction zoneCondensation zone
Data logging
To density measurement apparatus
Heat integration
blocks
T
T
T
Figure 3.1: Process and instrumentation diagram of the methanol synthesis reactor setup. The gas cylinders(highlighted in green), the reactor (in red), the data logging circuit (in blue) and the instruments used for
analysis (in yellow) can be clearly seen.
3.2.2. ReactorModified Brilman ReactorAs discussed in Section 2.2.5, Brilman et al [16] demonstrated a reactor concept where the externalrecycle of the feed stream was negated and complete carbon conversion was achieved using in-situcondensation of products (see Figure 2.7). Since the reactor was comparatively low on energy e -ciency, a new reactor design was developed by the author to improve the e ciency of the system byadding heat integration blocks between the reaction and the condensation zones. The presence of heatintegration blocks would enable the hot uid owing to the condenser to cool down by heating the colduid going to the reaction zone. This design, although similar to one proposed by Lammerink [93], wasdeveloped independently. This updated version of the reactor was called the Modi ed Brilman Reactor(MBR). MBR coupled the advantages of the natural circulation loop of the Brilman reactor with a heatintegration system. The schematics of the Brilman reactor and MBR are presented in Figure 3.2.
Reactor AssemblyThe reactor assembly is shown in Figure 3.3, while Figure 3.4 shows the reactor assembly as used inthe experiment.
3.2. Experimental System 23
72 mm
Qcond
Qheat
Cu/ZnO/Al2O3
Syngas flow direction
catalyst
Condenser water/methanol
Cooling coils
Inlet
Outlet
48 mm
24 mm
(a) Brilman reactor
Aluminium blocks for heat integration
Reaction zone
Inlet
Condensation zone
Outlet
(b) Modi ed Brilman Reactor (MBR)
Figure 3.2: Schematic of the Brilman reactor (3.2a) and the MBR (3.2b) as used in this thesis.
Figure 3.3: Schematic of the complete reactor assembly. The six heat integration blocks are placed betweenthe reaction zone on the right and the condensation zone on the left. Viton™ O-rings and PT 60 papers areplaced between each block to provide e ective sealing and reduce axial conduction of heat respectively.
As can be seen from Figure 3.4, the entire assembly containing the reaction zone, heat integrationblocks and the condenser is mounted at a height of 20 cm on a wooden base using two support plates(and xed using bolts). Such a mounting makes sluicing of liquid components easier using gravity.Glass wool is used as the insulation material since it can withstand temperatures up to 250 °C andhas a very low thermal conductivity of 0.04 W/m-K [97]. All components except the condenser (theleftmost block in Figure 3.4) are insulated.

24 3. Experiments
Figure 3.4: Reactor assembly as used in the experiment. Glass wool is used as the insulation material. Thethermocouple connections can be clearly seen. The feed input is from the left and the methanol and water
mixture is tapped from the bottom using the two open close valves.
Reaction zone
Top plate
O-ring
Catalyst inlet
PT 60 paper
Heater block
Cartridge heater
Thermocouple
Flow channels
(a) Isometric view
5
40
162 197 204
Ø18 Ø2
Ø11
18
45
184
(b) Front and sectional view
Figure 3.5: Isometric view of the reaction zone (left) and front and sectional view (on the right). The reactionzone consists of a cylindrical channel where the catalyst in inserted. All the dimensions are in mm.
The reaction zone (Figure 3.5) is a cylindrical channel drilled inside an aluminium block. The channelis drilled from the top and provides an opening to feed the catalyst pellets. The top is sealed using aVitonTM O-ring and covered with a plate of aluminium. VitonTM is used as the material for O-rings as ithas a ”fair” compatibility with methanol [98] and can withstand temperatures up to 230 °C [99]. Twocartridge heaters (80/20 NiCr heated wire, the maximum operating temperature of 400 °C, sourcedfrom TC Direct, Netherlands) are placed inside two small aluminium blocks (heater blocks) which arethen xed on either side of the reaction zone using a clamp to provide uniform heating to the system.K-type thermocouples (sourced from TC Direct; maximum operating temperature 1024 °C; the accu-

3.2. Experimental System 25
racy of± 1.5 °C) are used to measure the temperature of the heaters and at the top and bottom sectionof the reaction zone.
Small ow channels in the block (at the top and bottom) provide an increased surface area for heattransfer to the uid. Two VitonTM O- rings are placed in the groove surrounding these channels to pro-vide e ective sealing. Four pieces of paper (PT 60) are placed near the bolt holes to reduce the axialconduction of heat between the blocks. The dimensions of the various components in the reaction zonesummarized in Table B.1 in the appendix.
The reaction zone is lled with Cu/ZnO/Al2O3 catalyst used in this experiment, up to a height of 14cm (just below the ow channels at the top). This catalyst is the most widely used in the industryfor methanol synthesis because of its high methanol selectivity and low temperature operation (seeSection 2.2.2). The catalyst is sourced from Riogen, USA and is in the form of cylindrical pellets of 5mm diameter and 6 mm height (see Figure 3.6) [100].
Figure 3.6: Catalyst pellets as sourced from the manufacturer (The red colour of some of the pellets is due toprior reduction with H2).
Heat integration blocksThe heat integration blocks (Figure 3.7) like the reaction zone, have ow channels at the top and bot-tom of 2 mm diameter each. The blocks are solid and provide means for achieving heat integration.Aluminium is used as the block material because of its high thermal conductivity, light weight and easeof machining.
Thermocouples placed at the top and bottom of each block provide means for estimating this heattransfer. Like in the reaction zone, VitonTM O-rings are placed around the ow channels for sealingpurposes. The relevant dimensions of the block are summarized in Table B.2 in the appendix.

26 3. Experiments
54
0
16
2
19
7
20
2
Ø6
Ø2
Ø18
Ø11
10
16
O-ring
PT 60
Flow channels
Thermocouples
Figure 3.7: Schematic of the heat integration block with the isometric view on the left, the front view in themiddle and the sectional view on the right. All the dimensions are in mm.
Condensation zone
Top plate
Bottom plate
Port for liquid
sluicing
O-ring
O-ring
Feed inlet
Purge
Pressure gauge
(a) Back view
Ø6
Ø2
10
45
167
202
212
40
10
(b) Front and sectional view
Figure 3.8: Condenser block.
The condenser block (Figure 3.8) has a cylindrical channel drilled through which serves to condensethe methanol and water mixture for collection at the bottom port. One side of the condenser has 2 mmow channels at the top and bottom, while the other side has holes for mounting the pressure sen-sor (ADZ-SML-37.0 with an operating range of -1 to 50 bar and accuracy of ± 1E-2 bar), purge valve(Swagelok; maximum operating pressure 275 bar) and the connections for the inlet feed.
The methanol and water mixture is sampled from the bottom using a combination of two open-closevalves (see Figure 3.1). Like the reaction zone, this block is also sealed at the top and bottom usingVitonTM O-rings and aluminium plates of 10 mm thickness. The relevant dimensions of the condensa-tion zone are summarized in Table B.3 in the appendix.

3.2. Experimental System 27
3.2.3. Gas cylindersTwo gas cylinders (sourced from Linde, Netherlands) are used in this experiment-one of pure H2 andthe other containing the feed gas (24.9 ± 0.1 vol% of CO2 in H2). The pure H2 cylinder is used duringthe activation of the catalyst, while the feed gas is used to carry out the reaction.
3.2.4. Electrical circuits and data logging
230 V
230 V
230 V
5 V
5 V
Solid State
Relay
PCB mounted on
Arduino Mega 2560External
power source MAX 6675
module
Power line
Control line
Pressure
measurement
Figure 3.9: Schematic of the electrical circuit for the reactor.
An electric circuit is constructed in order to capture the values of essential parameters like tempera-ture, pressure and heat input. A total of seventeen K-type thermocouples are used in the setup-twelvein the heat integration blocks (two per block-one at the top and one at the bottom), two in the reactionzone (one each at the top and bottom of the catalyst bed), two to control the heater temperature andone to measure the surface temperature of the condenser block. The position of the sensors in thereactor assembly is shown in Figure 3.9.
A pressure sensor is placed in the condensation zone to have a measure of the reaction pressure. Allthe thermocouples and the pressure sensor are then placed on a printed circuit board (PCB) speci callydesigned for this setup, with the PCB placed over an Arduino Mega 2560 and powered by an externalpower source.
The power to the heaters is regulated with the help of a solid state drive (SSD) relay. A code is devel-oped in the Arduino open source compiler and linked with the Processing tool for data collection. Theoutput of the Processing tool is a comma separated value (CSV) le, which is then analyzed to providethe processed results.
The electrical connections were rst made using a breadboard and later using a PCB (Figure 3.10).PCB was used during the experiments as it eliminated a lot of wiring.

28 3. Experiments
(a) Electrical wiring using a breadboard (b) Printed circuit board
Figure 3.10: Electrical circuit for the reactor made using a breadboard and then using a PCB.
3.2.5. Instruments used for analysisA total of three instruments were used for analysis of the gas and liquid components of the reaction-weight balance (Mettler Toledo; accurate upto 1E-4 grams), a density measurement apparatus (AntonParr DMA 5000 density meter, accurate upto 1E-5 kg/L) and a micro gas chromatograph (Varian CP-4900 Micro-GC3) with a 1 m CP-COX column (carrier gas-N2; column temperature-100 °C; run time-240 s). The column could separate gases like CO, CO2 and H2 but detection of methanol in gaseousstate was not possible using the current setup [101]. A more accurate thermal conductivity detector(TCD) can help analyze the methanol and water composition in the gaseous phase.
3.3. Reactor Operating ProcedureThe reactor start-up procedure is depicted in Figure 3.11.
Figure 3.11: Reactor start-up procedure.
The catalyst was activated in a reducing environment by owing H2 in the reaction zone for a periodof two hours before the start of the reaction. This was done as the system temperatures take a longtime (approximately 90 minutes) to reach steady state on account of the high thermal mass. The ex-periments are performed in a semi-continuous mode with a continuous amount of feed gas enteringthe reactor to maintain the pressure at 50 bar (The pressure in the reactor would reduce due to con-densation of the products). The pressure sensor used in this reactor is calibrated using the pressuregauge on the feed gas cylinder. The temperature drop over the catalyst bed is measured using the twothermocouples placed on the reaction zone while the thermocouple in the condenser block gives anestimate of its surface temperature. All the thermocouples are placed in holes drilled 14 mm into theblocks and therefore, measure the surface temperature and not the ow temperature.

3.3. Reactor Operating Procedure 29
Gas samples taken at regular intervals are analyzed using the gas chromatograph. The liquid samplesobtained are rst weighed using the weight balance and then analyzed in the density measurementapparatus to get its density. This density value is then used as an input for an online calculation tool(the website www.handymath.com) to get the weight fraction of methanol in the liquid [102].
In order to stop the reaction, all the gas mixture inside is purged out and the reactor is lled with H2to store the catalyst in a reducing atmosphere. The results obtained are then analyzed. The heat inputto the reactor from the heaters is calculated based on the amount of time the heater was switched onduring the course of the experiment. Heat integration and mass ow rate of the gases are evaluatedusing the procedure outlined in Section 3.3 and 3.3.
Heat integration CalculationA schematic of a heat integration block is reproduced in Figure 3.12.
T1
T2
L
16
202
30
32
Figure 3.12: Heat integration block. All dimensions are in mm.
The heat integration achieved in one block is calculated using the Fourier Law of heat conduction as-suming that the thermal conductivity of aluminium does not change with temperature. The tempera-tures measured are at the surface of the block and not in the uid.
Q = kAl ∗ AAl ∗ (T − T )L
(3.1)
where,
Q is the heat integration achieved in one block in W,
kAl is the thermal conductivity of aluminium in W/m-K,
AAl is the cross sectional area of the heat integration block in m ,
L is the distance between the two thermocouples in m,
T and T are the temperatures at the top and bottom surface respectively of the aluminium block.
The values used for calculation are given in Table 3.1.

30 3. Experiments
Table 3.1: Parameter values used to estimate heat integration for one block.
Parameter Value UnitL 8.50E-01 mA 4.80E-04 mkAl [103] 237 W/m-KT 185 °CT 175 °CQ 13.4 W
This process is repeated to calculate the heat integration of all the other blocks and the values are thenadded together to give the heat integration for the entire system.
Mass Flow Rate CalculationHeat integration values derived from the previous section (Section 3.3) were used to estimate the massow rate as there was no direct method for its calculation. Schematic of the reactor for mass ow ratecalculations is shown in Figure 3.13.
Figure 3.13: Heat integration in each block.
where,
Q are the heat integration values for each block in W,
QHEX is the total heat integration for the reactor in W.
The process for calculating the mass ow rate is depicted in Figure 3.14 and a sample calculation isperformed in Table 3.2.
Figure 3.14: Schematic of the procedure to calculate the mass ow rate.

3.4. Experimental Test Plan 31
Since the temperatures measured here are at the surfaces of the block, it is assumed that the surfacetemperature pro les are the same as that of the uid temperature. In this way, ΔTb and <Tb> for thetwo cases remains the same.
Table 3.2: Sample calculation to estimate the mass ow rate.
Block Temperatures (°C)Top Bottom Heat
integration(W)
<Tb> (°C) Cp (J/kg-K) ΔTb (°C) m⋅ (kg/s)
183.96 174.85 11.8
123.01 1091 102.21 4.12E-04
158.73 153.73 6.5138.42 131.75 8.7119.25 113.58 7.496.29 91.52 6.276.75 72.65 5.3
QHEX 45.9
3.4. Experimental Test PlanAfter the reactor assembly was complete and the electrical connections done, a test plan to performthe experiments was made.
Experiments with N2 were performed rst to get an estimate of the mass ow rate and the heat inputto the system when using an inert gas. The reaction temperature was chosen as 210 °C (since it gavethe maximum conversion to methanol-observe Figure 1.2 and 42 °C was maintained as the condensertemperature using an external fan). These temperatures were chosen to get a high driving force for thegases.
Four reaction process scenarios were tested-without any catalyst, with the catalyst, with internal nsand nally, with the ow completely blocked in the reactor using aluminium foil. In these four tests, theow was increasingly blocked and the e ect on heat input and the mass ow rate due to this increasedblockage was observed.
Once the tests with N2 were completed, tests with the feed gas were performed at the same tempera-tures as the previous case. However, these tests gave a low methanol yield. This yield was less than theminimum quantity required by the density measurement apparatus to analyze the composition. Hencea fault tree analysis was constructed (explained in detail in Chapter 4) to identify the source of lowmethanol yield and correct it.
Once this problem of low yield was solved, experiments were performed with the feed gas using 5 mmpellets (as sourced from the manufacturer). Three parameters were identi ed as a ecting the methanolproduction, assuming that the reaction pressure is held constant at 50 bar-catalyst particle size, sam-pling time of the liquids from the reactor and the reaction temperature. The procedure presented belowwas followed to identify the in uence of these three parameters on the methanol yield:
• Keep the catalyst size xed,
• Keeping the reaction temperature as constant, optimize the sampling time of the liquid mixture,
• Once the optimum sampling time has been found, keep this time xed and vary the reaction tem-perature to see its e ect on methanol production,
• Change the catalyst size (5 mm pellets cut into two halves along the central axis and crushedpellets) to see the e ect of catalyst diameter change on methanol production and repeat steps 2and 3.

32 3. Experiments
After performing the experiments with di erent catalyst sizes, a COCO model of the process includingthe e ect of heat integration developed by Guttierez-Neri [104] was worked on and the experimentalresults using the 5 mm catalyst were compared with the simulation results.

4Results and Discussion
4.1. Experiments using N2 as the fluidThe reactor schematics while experimenting with N2 as the uid are presented in Figure 4.1.
(a) Flow without catalyst (b) Flow with catalyst
(c) Flow with internal ns
Cata lystFlow blockage
d
Feed in
Liquid outlet
(d) Flow blockage using aluminium foil
Figure 4.1: Schematics of the reactor during experiments with N2 as the uid. The reactor without catalyst(Figure 4.1a), with catalyst (Figure 4.1b), with catalyst and internal ns (Figure 4.1c) and with the ow
completely blocked (Figure 4.1d) can be seen.
Experiments were performed using N2 as the uid to understand the temperature pro le in the reactor
33

34 4. Results and Discussion
when no reaction was taking place. The reaction wall temperature was kept at 208 °C (Average tem-perature of the two thermocouples at the top and bottom of the catalyst bed) as it gave the highestsingle pass conversion to methanol (see Figure 2.1) and the condenser wall temperature was set at 42°C using the fan placed near the condenser block. The condenser temperature was kept low so as tohave a high driving force between the two zones.
Four di erent tests were performed (as mentioned in Section 3.4)- one without any catalyst (to simu-late a condition of no ow blockage-Figure 4.1a), a second with the catalyst (Figure 4.1b), third withthe catalyst and internal ns on the condenser side (Figure 4.1c) and the last with the catalyst and theow completely blocked on the condenser side (Figure 4.1d).
Each successive test introduced more ow blockage in the reactor. Therefore, the mass ow rate ofthe gas inside the reactor should decrease with each successive case. As the heat input and the heatintegration are related to the mass ow rate, these should also go down. This is what is observed in theresults of Table 4.1. The mass ow rate and heat input are the highest for the case without the catalystand the lowest for the completely blocked ow case. The heat integration also follows the same trendexcept in the last case where its value is higher than the internal ns case. This is because even thoughthe ow is completely blocked, the gas can still ow from the top of the reaction zone to the condenserand from the bottom of the condenser to the bottom of the reaction zone, giving the ”impression” ofow and correspondingly a higher heat integration.
The case without catalyst was simulated in Fluent by Guttierez-Neri [104]. The di erence in the massow rates between the experiments and the Fluent model is due to the fact that higher heat integrationwas achieved in the experiments as compared to the latter case because of inaccuracies in the thermo-couples used. The mass ow rates di er since the heat integration is directly related to it (see Section3.3).
Table 4.1: Details of the experiments performed with N2 as the uid. Only the rst test without the catalyst wassimulated by Guttierez-Neri [104] in Fluent.
Test condition Heat input (W) Heat integration (W)m⋅ (kg/s)
Experiments Fluent
Flow without catalyst(Figure 4.1a)
51.8 46.0 4.12E-04 2.09E-04
Flow with catalyst(Figure 4.1b)
46.2 18.8 1.54E-04 -
Flow with internalns (Figure 4.1c)
45.7 13.2 1.04E-04 -
Flow blockage usingaluminium foil (Fig-ure 4.1d)
43.0 16.0 1.26E-04 -
4.2. Experiments using feed gasOnce the experiments with N2 were completed, experiments using the feed gas (refer Section 3.2.3)were done. The reactor, in this case, consisted only of the catalyst with no internal ns or ow block-age on the condenser side (Figure 4.1b). No/low liquid production was achieved using 208 °C reactiontemperature and 42 °C condenser temperature. Therefore, a fault tree analysis was done to nd thesolutions to the problem of low liquid production.
4.3. Fault Tree AnalysisA fault tree analysis was done as no/low liquid production was achieved using the feed gas mixture.Four probable causes were the identi ed-high uid temperature in the condenser, no reaction of the

4.3. Fault Tree Analysis 35
gases, no liquid accumulation at the bottom port and no gas ow. The likely causes for each of theseproblems were identi ed and solutions proposed and acted upon. Each of these problems and theirsolutions is described in the subsequent subsections.
4.3.1. High fluid temperature in the condenserOne of the causes of low liquid yield of the reactor could be insu cient heat transfer in the condenserblock which could cause the uid temperature to be at or above the dew point of the mixture. In orderto nd the true uid temperature, a small K-type thermocouple (1 mm tip diameter; sourced from TCDirect; maximum temperature 1024 °C; accuracy ± 1.5 °C) was inserted into the ow channel in thecondenser by making a groove in the top plate. Nitrogen at a pressure of one bar was circulated insidethe reactor, with the reaction zone temperature maintained at 210 °C. Ideally, this test should havebeen conducted at the reaction pressure (50 bar), but leaks in the top plate meant that the test had toperformed at one bar.
The modi cations to the top plate of the condenser zone, the thermocouple and the result from theexperiment are shown in Figure 4.2.
(a)Modi cations to the top plate for measuring the uid temperature (shown on the left) and the top plate withthe thermocouple (shown on the right)
Figure 4.2: Fluid temperature measurement in the condenser. The di erence between the condenser surfaceand uid temperature is a maximum of 5.5 °C using 1 bar N2.
The maximum temperature di erence between the surface and the uid temperatures was found to be5.5 °C. The maximum condenser surface temperature during this test was 45.75 °C and the uid tem-perature was 51.25 °C, well below the dew point of the mixture (dew point temperature is around 80.16°C for a feed of 3:1 ratio by volume of H2 and CO2 with 210 °C as the reaction temperature and 50 baras the pressure). However, this test was performed at one bar and using N2 as the uid, which doesnot simulate the reaction conditions exactly, since the temperature pro les would be di erent whenanother uid was used (like the feed gas) and if the pressure was higher. Therefore, a test at the re-action conditions would give an exact measure of the correct temperature pro les. For the time being,it was assumed that high uid temperature in the condenser was not the cause of low liquid production.
4.3.2. No reaction in the catalyst zoneAnother reason for no liquid production could be that there is no reaction taking place in the catalystzone. Some of the reasons for this and the solutions are given in the owchart below (Figure 4.3).
• Air inside the reactor: As mentioned in Section 3.3, the reactor was lled with H2 and heated tothe reaction temperature. Once steady state temperature pro les were reached, H2 was purgedout (using the purge valve) and the feed gas mixture was circulated through the reactor. Thereactor was pressurized with this gas after being circulated for around two minutes. The gascomposition at this point was analyzed using the gas chromatograph and was found to contain

36 4. Results and Discussion
Figure 4.3: Causes for no reaction taking place in the catalyst zone with their solutions.
no oxygen, removing air inside the reactor as one of the causes of low liquid production.
• Catalyst deactivated: The catalyst was activated before the start of every experiment at 230 °Creaction zone wall temperature using H2 (Literature proposes using a mixture of 90-95% N2, Heor Ar in H2 for activation [37, 38, 105, 106]. The inert gas is present only as a carrier gas andto dilute the H2 concentrations for safety purposes. Pure H2 was used in this case as ZEF wouldnot have access to N2 when they deploy the system in the eld). Visual inspection of the catalystwas carried out just after reduction, and the colour of the catalyst was found to be reddish, whichindicates the presence of metallic copper, suggesting proper activation.
• Pressure/temperature/gas composition wrong: Wrong operating conditions can also lead tono/limited liquid production. However, the working of the thermocouples was veri ed with thatof the ice-water mixture and boiling water (100 °C at one bar pressure) while the readings ofthe pressure sensor in the reactor were found to be the same as the pressure set using the feedgas cylinder pressure gauge. The pressure sensor in the reactor was calibrated using the gaugein the cylinder (see Section 3.3). The gas composition from the cylinder was also analyzed in agas chromatograph and found to be very close to the composition mentioned in the gas cylinder.Therefore, wrong parameter values was also ruled out as one of the reasons for low liquid pro-duction.
The experiments up to this point were performed at 208-210 °C reaction temperature (tempera-ture of the catalyst bed). At this temperature, the reactionmight be kinetically limited (the catalystbecomes active for reaction around 200 °C). Therefore, it was decided to increase the reactiontemperature and observe whether the methanol production was increased. However, increasingthe reaction temperature also yielded an almost negligible liquid amount.
• Less catalyst surface area for reaction: If the catalyst pellets are large, then there is less outersurface area per unit volume available for the reactions to take place. On the other hand, smallcatalyst size increases the pressure drop across the catalyst bed and therefore, decreases theow. Hence there is a trade-o between the size of the catalyst and the pressure drop. While theexperiments in this project were done with 5 mm catalyst pellets up to this point, it was decidedto also experiment with smaller catalyst sizes and then compare the results of the two. However,lowering the catalyst size did not improve the reaction yield and led to very low methanol produc-tion.

4.3. Fault Tree Analysis 37
4.3.3. No liquid accumulationThe likely causes of this problem and its solutions are presented in the owchart (Figure 4.4).
Figure 4.4: Causes for insu cient liquid accumulation in the bottom port of the condenser and their solutions.
• Droplets not sticking to the wall: One possible reason for low liquid accumulation can be theinability of droplets formed to stick to the walls. However the surface tension in these dropletswould cause them to stick to the walls as the mass ow rate of the gases is too low to carry them(see Table 4.1). The exception here is very ne droplets, which may not stick because of lowsurface tension. However, there was no way to verify these claims during the experiment.
• Less reaction time: Methanol synthesis is a slow reaction, especially at temperatures of around210 °C, at which the reaction was run initially. Hence less reaction time could well be a reasonfor low liquid output (The outlet port was checked for liquid presence till this point after about 3hours of reactor operation). Therefore, it was decided to increase the reaction time to ve and/oreven seven hours to see if there was any methanol formation. However, even after doing this, themethanol production was negligible.
4.3.4. No gas flow in the reactorEven if the catalyst is activated, the gas composition is as expected and the temperature and pressurematch the reaction conditions, the reaction progression can still be hindered by no gas ow inside thereactor. Some of the possible causes for this are mentioned in Figure 4.5.
• Flow blockage by catalyst particles: If the ow is blocked in the catalyst bed, then there wouldbe no reaction and hence no/very little formation of the products. In order to check this hypoth-esis, a ow outlet channel was made on top of the catalyst bed to analyze the gas as shown inFigure 4.6. On analysis, the gas mixture showed the presence of CO, thereby con rming that thereaction was taking place and catalyst particles (5 mm particles were used up to this point) werenot blocking the ow.

38 4. Results and Discussion
Figure 4.5: Causes for no gas ow in the reactor and their solutions.
(a) Modi cation to the top plate
Figure 4.6: Modi cation at the outlet of the catalyst bed to measure the gas composition. Two open closevalves were used to enable gas sampling.
• Installation of a di erential pressure sensor: A di erential pressure sensor can give an estima-tion of the pressure drop across the catalyst bed. However, such a sensor was not used duringthe experiment and hence there was no way to measure the pressure drop experimentally.
• Flow blockage due to premature condensation in the heat integration blocks: The ow can beblocked due to trapping of liquids in the heat exchanger blocks due to premature condensation.Once the channels are clogged with the liquid, the droplets remain in place due to the strongcapillary forces.
An experiment was done using the feed gas by increasing the average catalyst bed temperatureto 225 °C (about 15 °C higher than that used previously) as per one of the solutions mentioned inSection 4.3.2. The temperatures at the top and bottom of the heat integration blocks are shownin Table 4.2.

4.3. Fault Tree Analysis 39
Table 4.2: Temperatures at the top and bottom thermocouple of the heat integration blocks at the reactiontemperature of 225 °C. Block 1 is closest to the reaction zone and Block 6 to the condensation zone.
Thermocouple readings (°C)Top Bottom
Block 1 197.51 192.03Block 2 173.01 170.89Block 3 150.13 146.32Block 4 130.82 118.57Block 5 104.74 102.98Block 6 80.17 80.07
The dew point of the gas mixture at 225 °C (498 K ) is around 127.38 °C (from COCO-using themodel described in Section 4.7). From Table 4.2 it can be seen that the temperatures of block4-6 fall below that dew point. This could result in some liquid getting trapped in the ow channelsand blocking the ow.
In order to prove that liquid was indeed trapped in the ow channels, a batch process was per-formed with six heat integration blocks and then with three heat integration blocks. In this exper-iment, the reactor was fed with the feed gas at 50 bar and the needle valve connected to the feedgas cylinder (see Figure 3.1) was closed. The experiment was continued till the pressure in the re-actor stabilized (the pressure would fall because of reaction and subsequent condensation of theproducts) and the process was repeated again twice. The pressure pro les for this experiment arepresented in Figure 4.7. A higher pressure drop in time in Figure 4.7b indicates less ow blockage.
(a) Six heat integration blocks (b) Three heat integration blocks
Figure 4.7: Pressure drop using (4.7a) six heat integration blocks and (4.7b) three heat integration blocks.Premature condensation in the case of six blocks was the cause of low liquid production and thus low pressure
drop in time.
Following this result, subsequent experiments were performed with three heat integration blocks.Even with three blocks, enough liquid was not produced to be analyzed in the density measure-ment apparatus. This pointed to the fact that some liquid might still be trapped there.
To check this hypothesis, the ow channels were made larger by enlarging the holes from 2mm to6.5 mm as shown in Figure 4.8. This size was chosen because that was the largest diameter thatcould be drilled into the blocks without damaging the grooves for the O-rings. Tests performedusing heat integration blocks with bigger holes yielded a signi cant amount of liquid, pointing tothe fact that it was indeed condensation in the small ow channels that was blocking the ow and

40 4. Results and Discussion
(a) Aluminium blocks with 2 mm channels
Channel diameter
increased
(b) 6.5 mm ow channels
Figure 4.8: Change in ow channel dimensions to solve the problem of ow blockage due to liquidcondensation.
leading to less liquid output.
Once the problem of the too low methanol output was solved, a series of experiments were performedto calculate the reactor productivity, which are detailed in the subsequent sections.
4.4. Experiments with 5 mm catalyst pellets
C u /Zn O /Al2O 3 C a t a lys t
F low d ir ect ion
C on d en s ed Wa t er /M et h a n ol
Figure 4.9: Schematic of the Small Modi ed Brilman Reactor (SMBR) used for the experiments. The reactornow consists of the reaction zone, three heat integration blocks (with larger ow channels) and a condensation
zone.
Based on the results obtained in Section 4.3.4, three heat integration blocks were removed and thechannel dimensions in the remaining three blocks were increased from 2 mm to 6.5 mm. This reactor

4.4. Experiments with 5 mm catalyst pellets 41
was called the Small Modi ed Brilman Reactor (SMBR) and is shown in Figure 4.9. 45 grams of 5 mmcatalyst pellets (as sourced from the manufacturer) were put into the reactor.
4.4.1. Sampling time optimizationOnce the catalyst size was xed, the reactor wall temperature was set at 235 °C and the condenserwall temperature at 62 °C using an external fan. A higher temperature was chosen to achieve fasterkinetics. The sampling time of the liquids (the time after which the liquid mixture of methanol and wateris taken out from the reactor) was then optimized.
Initial tests (mentioned in Section 4.3.3) had yielded negligible amounts of liquid even if the liquid wassampled every three hours. Therefore, in this test, the liquid was rst sampled every 3 hours. Sincea signi cant amount of methanol was produced this time, the sampling time was then reduced to onehour. Even after one hour, almost the same amount of liquid as that obtained at 3 hours was sampled.Therefore, the liquid sampling time was continually lowered to 30 , 15 , 10 and ultimately 5 minutes.The methanol production rate was expressed in mmoleCH3OH/gcat/h (as the same was done by Brilmanet al.[16]) and calculated using the procedure outlined in Figure 4.10.
Figure 4.10: Procedure followed for calculating the methanol production rate in mmole CH3OH/gcat/h.
Figure 4.11: Variation in methanol production with sampling time at 235 °C for 5 mm catalyst pellets.
The variation in methanol production rate with sampling time is shown in Figure 4.11. The methanolproduction at 30 mins of sampling time was 2.2 mmole CH3OH/gcat/h, while at 15 mins was 4.4 mmole

42 4. Results and Discussion
CH3OH/gcat/h, since the liquid was sampled four times for 15 minutes and two times for 30 minutes.This signi ed that the reaction reached equilibrium at or before 15 minutes. Lowering the samplingtime to 10 minutes further increased the production, signifying that equilibrium was attained at or be-fore 10 minutes. Finally, the liquid was sampled every ve minutes. This did not increase the methanolyield by a proportional amount, suggesting that the reaction did not reach equilibrium at 5 minutes.Therefore, 10 minutes was chosen as the optimum sampling time.
The error bars for 5 and 10 mins of sampling time are larger than at the other two times as more num-ber of samples were taken in the former case.
4.4.2. Reaction temperature optimizationOnce the sampling time was optimized, it was kept xed and the reaction temperature was varied. Testswere rst conducted at 235 °C (the temperature at which the sampling time was optimized). The re-actor wall temperature was then lowered in steps to 228 °C, 220 °C and nally to 213 °C. Higher andlower temperatures than 240 °C and 210 °C were not chosen. This is because at higher temperatures,the Viton™ O-rings fail and the reaction is kinetically limited at lower temperatures. The condenser walltemperature was maintained at 62 °C for all the cases.
Mass BalanceA mass balance was conducted prior to analyzing results from the temperature test. This was done toestimate the feed ow rate of the mixture into the reactor. The inlet and outlet streams into the reactoralong with their relevant process parameters were de ned (Figure 4.12).
Figure 4.12: Schematic of the reactor showing the inlet and outlet streams.
1. Feed: This is the feed gas mixture that is fed into the reactor at a pressure of 50 bar. The temper-ature of the feed stream is taken as the average temperature in the reactor (<T>), ie, the averageof the reaction and condensation zone temperatures.
2. Sample: This stream represents the gas sample that is taken at the outlet of the catalyst bed (seeFigure 4.2a). Although the sample is intially at a high temperature (temperature of the catalystbed), it is analyzed when its temperature is around 20 °C. It was not possible to detect CH3OHand H2O in this stream using the current gas analysis setup. However using a more accurate TCDcan solve this problem.
3. Liquid: This stream is the liquid that is sluiced out from the reactor periodically. Methanol and wa-ter are considered as the only liquid outlet components (the catalyst is quite selective to methanol

4.4. Experiments with 5 mm catalyst pellets 43
production and produces other components only in trace amounts [16]) with some CO and CO2dissolved [107, 108]. The liquid components are analyzed in a density measurement apparatuswith CO and CO2 solubility in the liquid mixture calculated using the reactor model developed inCOCO (Section 4.7).
Once the inlet and outlet streams have been de ned, themoles of various components at these locationsare found using the steps outlined in Figure 4.13.
Figure 4.13: Procedure to calculate the moles of gaseous components in the reactor.
The moles found using the above steps are then used to nd the carbon conversion, selectivity and feedow rate of the gas into the reactor using the steps mentioned in Figure 4.14.
Figure 4.14: Flowchart for mass balance calculations.
where,

44 4. Results and Discussion
H2,sample is the molar ow rate of H2 in the Sample stream,
H2,liquid is the molar ow rate of H2 in the Liquid stream,
Cout is the molar ow rate of carbon leaving the system.
The molar ow rates, carbon conversion and selectivity calculated using the procedure outlined in Fig-ure 4.13 and Figure 4.14 are presented in Table 4.3 and Table 4.4.
Table 4.3: Molar ow rate of the components at the outlet of the reactor for 5 mm pellets at 228 °C reactiontemperature, presented as an example.
Molar ow rate (moles/s)Gas Sample Liquid Outlet
(Sample + Liquid)H2 2.74E-06 0 2.74E-06CO2 4.72E-07 9.30E-07 1.40E-06CO 1.38E-07 7.83E-09 1.46E-07
CH3OH 0 8.45E-05 8.45E-05H2O 0 8.84E-05 8.84E-05
Table 4.4: Estimation of carbon conversion and selectivity for 5 mm pellets at di erent temperatures.
ParameterValue
Unit213 °C 220 °C 228 °C 235 °CFeed ow rate 2.72E-04 3.09E-04 3.47E-04 3.42E-04 moles/sH2 feed ow 2.04E-04 2.31E-04 2.60E-04 2.56E-04 moles/sCO2 feed ow 6.80E-05 7.71E-05 8.68E-05 8.55E-05 moles/sCarbon conversion 99.0 99.1 99.2 99.2 %Selectivity 98.7 98.8 99.0 98.9 %
The carbon and oxygen balance was found to be within±1.5% for all the cases. Hydrogen was assumedto be completely balanced (observe Figure 4.14).
The carbon conversion and selectivity increase with temperature to 228 °C, after which they stabilize.This is because, at lower temperatures, the solubility of CO and CO2 in the liquid mixture is higher[107, 108]. So more carbon is lost since it is dissolved in the mixture and therefore, less carbon isavailable for conversion to methanol. At 235 °C, carbon is also being increasingly converted to CO,since its formation is favoured at high temperature, in addition to losing some CO and CO2 in the liquidmixture. Carbon is also lost at all temperatures in the Sample stream since methanol detection wasnot possible using the current gas analysis setup.
Brilman et al. [16] obtained a selectivity higher than 99.5% as their condenser temperature was higher(about 85 °C) compared to 62 °C in this experiment. Operation at this temperature meant that the sol-ubility of CO2 and CO in the methanol and water mixture was less [107, 108].
Efficiency calculationOnce the mass balance calculations are done and the feed ow rates of H2 and CO2 determined, the ef-ciencies are calculated using Equation 4.1, Equation 4.2 and Equation 4.3. The maximum theoreticale ciency of the system [109] is de ned considering methanol production only by CO2 hydrogenation(Equation 2.2).
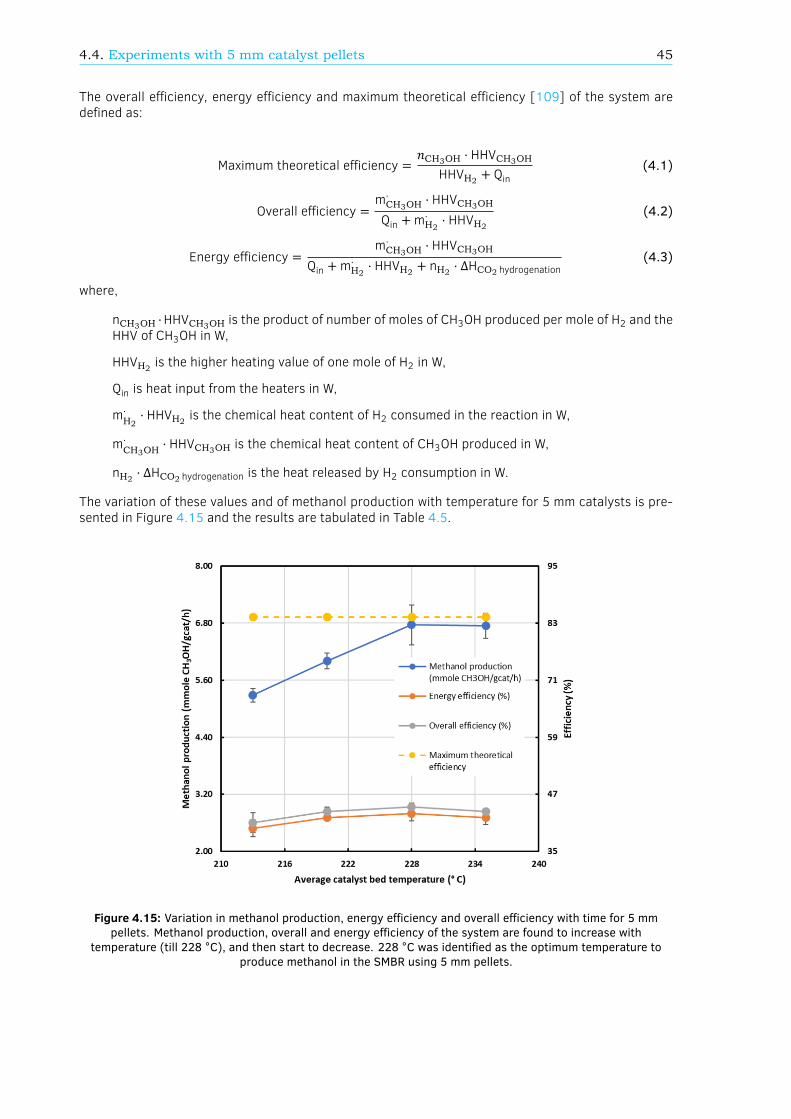
4.4. Experiments with 5 mm catalyst pellets 45
The overall e ciency, energy e ciency and maximum theoretical e ciency [109] of the system arede ned as:
Maximum theoretical e ciency =𝑛CH3OH ⋅ HHVCH3OH
HHVH2 + Qin(4.1)
Overall e ciency =m⋅CH3OH ⋅ HHVCH3OH
Qin +m⋅H2⋅ HHVH2
(4.2)
Energy e ciency =m⋅CH3OH ⋅ HHVCH3OH
Qin +m⋅H2⋅ HHVH2 + nH2 ⋅ ΔHCO2 hydrogenation
(4.3)
where,
nCH3OH ⋅HHVCH3OH is the product of number of moles of CH3OH produced per mole of H2 and theHHV of CH3OH in W,
HHVH2 is the higher heating value of one mole of H2 in W,
Qin is heat input from the heaters in W,
m⋅H2⋅ HHVH2 is the chemical heat content of H2 consumed in the reaction in W,
m⋅CH3OH⋅ HHVCH3OH is the chemical heat content of CH3OH produced in W,
nH2 ⋅ ΔHCO2 hydrogenation is the heat released by H2 consumption in W.
The variation of these values and of methanol production with temperature for 5 mm catalysts is pre-sented in Figure 4.15 and the results are tabulated in Table 4.5.
Figure 4.15: Variation in methanol production, energy e ciency and overall e ciency with time for 5 mmpellets. Methanol production, overall and energy e ciency of the system are found to increase with
temperature (till 228 °C), and then start to decrease. 228 °C was identi ed as the optimum temperature toproduce methanol in the SMBR using 5 mm pellets.

46 4. Results and Discussion
The methanol production increases when the temperature is increased to 228 °C as the reaction is ki-netically favoured. At temperatures above 228 °C, the thermodynamic limitations of the reactions (thereaction is more favoured at lower temperatures) lead to less methanol production as CO formation isfavoured.
A similar trend is observed for energy e ciency and overall e ciency curves. The heat content ofmethanol produced increases faster than the heat input from the heaters and the heat released by hy-drogen consumption till 228 °C, after which the heat content of methanol starts to drop as less amountof the component is produced.
Based on these results, 228 °C was identi ed as the reaction temperature for methanol production us-ing 5 mm pellets and given the current reaction zone dimensions.
The methanol composition in the liquid mixture did not change with temperature and was found to be48.3 ± 1.9 mol% of methanol in water, while the expected theoretical ratio is 50 mol% of methanol inwater. The di erence is probably due to some methanol loss during sampling as it is volatile [16].
Table 4.5: Results of the experiment with 5 mm catalyst at 228 °C and 10 minutes of sampling time.
ParameterValue
Unit213 °C 220 °C 228 °C 235 °Cm⋅CH3OH
7.61E-03 8.64E-03 9.74E-03 9.60E-03 kg/hm⋅H2
1.43E-03 1.62E-03 1.83E-03 1.80E-03 kg/hm⋅CO2
1.05E-02 1.19E-02 1.34E-02 1.32E-02 kg/hnH2 ⋅ ΔHCO2 hydrogenation 3.3 3.7 4.2 4.1 WQin 59.2 60.1 64.8 66.9 WHeat integration 6.7 9.9 11.1 11.4 Wm⋅CH3OH
⋅ HHVCH3OH 47.3 53.8 60.6 59.7 Wm⋅H2
⋅ HHVH2 56.1 63.8 71.9 70.8 WEnergy e ciency 39.9 42.2 43.0 42.1 %Overall e ciency 41.0 43.4 44.3 43.4 %Maximum theoretical e ciency 84.3 84.3 84.3 84.3 %
Since the maximum methanol production was obtained at 228 °C, these results were then compared tothose obtained by Brilman et al. [16] as the catalyst pellet size was similar in both cases (Table 4.6).
Table 4.6: Comparison of the results of the current study with those of Brilman et al [16].
Reactiontemperature(°C)
Condensertemperature(°C)
Methanol pro-duction (mmoleCH3OH/gcat/h)
Reactionheat(W)
Energyinput(MJ/kgCH3OH)
Present study 228 62 6.8 4.2 24Brilman et al 210 85 4.3 8.5 75
In the present study, the reactor was operated at a higher reaction temperature and a lower conden-sation temperature than the Brilman reactor. This leads to higher kinetic rates (due to higher reactiontemperature) and higher methanol condensation (due to lower condenser temperature). However, themass of the catalyst in the Brilman reactor was almost four times higher than in this case ((about 172grams compared to 45 grams). Therefore, in terms of mass, the methanol produced is higher in thecase of Brilman, which results in a higher reaction heat, but a lower methanol productivity because ofhigh catalyst mass. The major drawback of high energy input in the Brilman reactor was overcome inthis study mainly due to the presence of heat integration. This is the reason why the energy demand inthe current reactor is almost a third of the Brilman reactor.

4.5. Experiments with crushed catalyst particles 47
4.5. Experiments with crushed catalyst particles
Figure 4.16: Crushed catalyst pellets.
After experiments with 5 mm pellets, crushed catalyst particles were used to see whether a reduction incatalyst size would increase the methanol production. 228 °C was set as the catalyst bed temperatureand 10 minutes as the sampling time (since these were the optimum values obtained using the 5 mmpellets). The condenser wall temperature was maintained at 62 °C.
Figure 4.17: Variation in CO formation with time for 5 mm and crushed catalyst pellets. Reduction in catalystsize did not lead to increased methanol production as the ow rate was restricted as a result of high pressure
drop caused by the small particle size.
Tests with crushed pellets did not yield any liquid even after an hour of operation. This could be due toow blockage due to high catalyst packing, resulting in no reaction. In order to check this hypothesis,the gas composition was analyzed in the gas chromatograph. Indeed, it was found that the maximumCO concentration using crushed pellets was only 1.27% after an hour of reaction time compared to6.17% for 5 mm pellets (see Figure 4.17). This con rmed the hypothesis that the high pressure drop
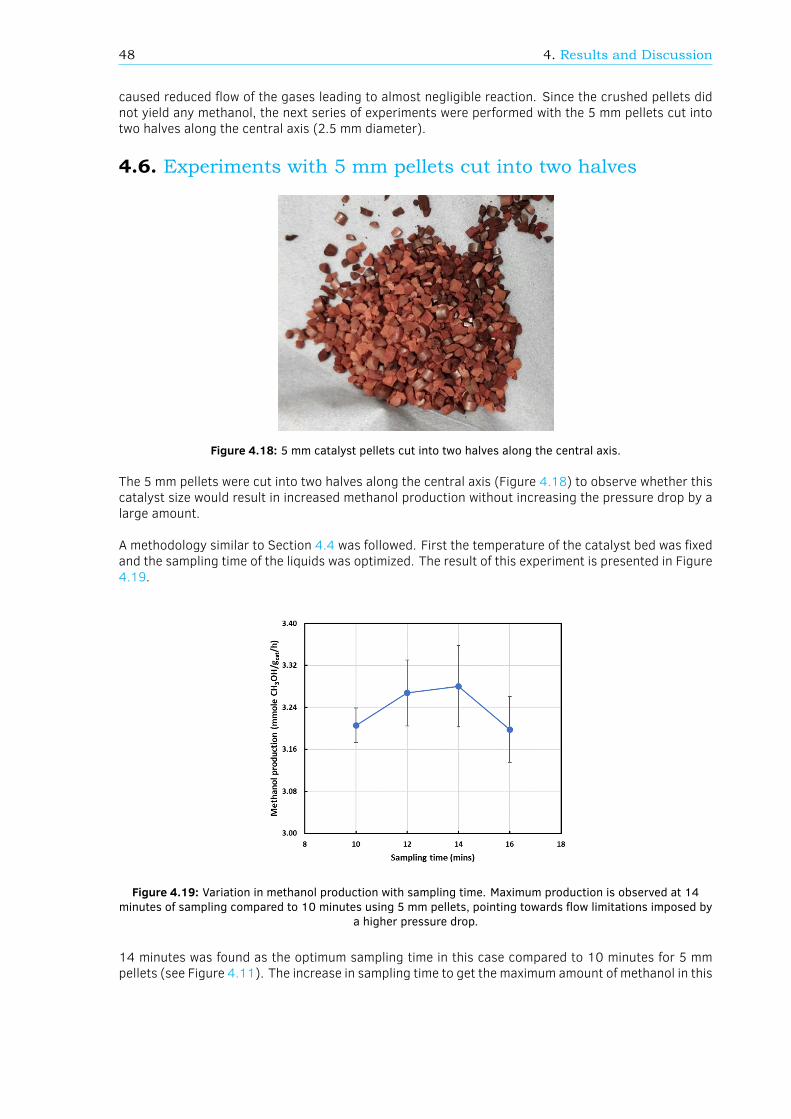
48 4. Results and Discussion
caused reduced ow of the gases leading to almost negligible reaction. Since the crushed pellets didnot yield any methanol, the next series of experiments were performed with the 5 mm pellets cut intotwo halves along the central axis (2.5 mm diameter).
4.6. Experiments with 5 mm pellets cut into two halves
Figure 4.18: 5 mm catalyst pellets cut into two halves along the central axis.
The 5 mm pellets were cut into two halves along the central axis (Figure 4.18) to observe whether thiscatalyst size would result in increased methanol production without increasing the pressure drop by alarge amount.
A methodology similar to Section 4.4 was followed. First the temperature of the catalyst bed was xedand the sampling time of the liquids was optimized. The result of this experiment is presented in Figure4.19.
Figure 4.19: Variation in methanol production with sampling time. Maximum production is observed at 14minutes of sampling compared to 10 minutes using 5 mm pellets, pointing towards ow limitations imposed by
a higher pressure drop.
14 minutes was found as the optimum sampling time in this case compared to 10 minutes for 5 mmpellets (see Figure 4.11). The increase in sampling time to get the maximum amount of methanol in this

4.6. Experiments with 5 mm pellets cut into two halves 49
case can be attributed to reduced ow due to increased pressure drop. This meant that the gas neededmore time to reach the equilibrium composition in the latter case. This is also evident in the maximumproduction of 3.3 mmole CH3OH/gcat/h using these pellets compared to 6.8 mmole CH3OH/gcat/h using5 mm pellets.
Experiments were then performed by keeping the sampling time xed at 14 minutes and varying thetemperature. The results are presented in Figure 4.20. The methanol production as well as the e -ciency values for these pellets do not show a decrease with temperature beyond 230 °C as was thecase when using 5 mm pellets (observe Figure 4.15). This again points towards reduced mass owin the reactor with these pellets, which means that the gas mixture is yet to reach equilibrium withinthe sampling time of 14 minutes. Increasing the temperature increases the mass ow rate (see Table2.10), thereby driving the gas mixture closer towards equilibrium and increasing the methanol produc-tion. The results of these tests are tabulated in Table 4.7.
Figure 4.20: Variation of overall e ciency and methanol production with reaction temperature.
Table 4.7: Results of the experiments performed using 5 mm pellets cut into two halves at 14 minutes ofsampling time. The methanol production and e ciency are lower compared to the results obtained using 5 mm
pellets.
ParameterValue
Unit210 °C 220 °C 230 °C 240 °Cm⋅CH3OH
2.38E-03 3.09E-03 3.90E-03 4.89E-03 kg/hm⋅H2
4.46E-04 5.80E-04 7.31E-04 9.17E-04 kg/hm⋅CO2
3.27E-03 4.25E-03 5.36E-03 6.72E-03 kg/hnH2 ⋅ ΔHCO2 hydrogenation 1.0 1.3 1.7 2.1 WQin 68.8 71.5 78.5 82.8 WHeat integration 8.4 8.5 8.6 8.6 Wm⋅CH3OH
⋅ HHVCH3OH 14.8 19.2 24.3 30.4 Wm⋅H2
⋅ HHVH2 17.6 22.8 28.8 36.1 WEnergy e ciency 17.5 20.9 23.5 25.2 %Overall e ciency 17.7 21.2 23.6 25.6 %Carbon conversion 96.0 96.0 96.9 98.7 %Selectivity 96.6 97.4 98.0 98.5 %

50 4. Results and Discussion
4.7. Comparison of experimental results with simulations in COCOand Fluent
A process model developed by Gutierrez-Neri [104] in COCO was worked on to match the simulationresults with those of the experiments. The model took into account the e ect of heat integration.
Figure 4.21: Simulation model developed in COCO by Guttierez-Neri [104] incorporating the heat integrationachieved by the aluminium blocks.
The model consists of a fresh feed of the feed gas which mixes with the recycle stream. The feed is thencompressed and heated after which it reacts in an isothermal plug ow reactor, which has the kineticsof Bussche and Froment [25]. The inlet and outlet streams of the reactor pass through a heat integra-tion block, after which the feed is cooled in the condenser and ashed to give a liquid and vapor stream.Methanol and water mixture is obtained in the liquid stream while the vapor products are recycled afterpurging. Purging is done to keep the concentration of CO in the reactor low.
Figure 4.22: Steps to compare experimental and simulation results obtained from COCO. Red font indicatespossible sources of error in the measurement.

4.8. Heat Exchange Network 51
In order to compare the experimental results with those of COCO, the steps outlined in Figure 4.22 arefollowed. The methanol yield, as well as the inlet and outlet mole fractions of the components obtainedfrom the experiments, are used in the mass balance calculations to obtain the feed ow rate of thegases in the reactor. This calculation is quite accurate since the methanol yield and mole fractions aremeasured using precise instruments.
During the simulation, the feed ow rate of the gases, the heat integration and the reaction temper-ature obtained from the experiments are xed. These last two values have some sources of error asthey are both calculated using surface temperatures and not using the actual ow temperatures. Thecondenser temperature is varied until the methanol yield obtained from simulations matches that ofthe experiments. The value of the temperature so obtained gives a measure of the uid temperature inthe condenser. The parameters for simulating the reaction in COCO are given in Table 4.8. The exper-imental results using 5 mm pellets at 228 °C reactor wall temperature are compared with COCO sincethey gave the best results.
Table 4.8: Simulation parameters for the COCO model for 5 mm pellets at 228 °reaction temperature.
Parameter Value UnitCatalystDiameter 5 mmDensity 1263 kg/m
Void fraction 0.29Heat integrationHeat integration 11.1 WReaction zone
Reaction temperature 228 °CLength 0.14 mDiameter 0.018 mCondenser
Condenser temperature 62 °C
The mass ow rate value obtained from the experiments di ers slightly from those of the simulations.This is because there was a di erence between the gas composition measured during the experimentsand obtained from the simulation study. This led to a di erence in the speci c heat of the mixture,resulting in di erence in mass ow rates. The result is presented in Table 4.9.
Table 4.9: Comparison of mass ow rate obtained from experiments and simulations.
Parameter Experiments COCO Fluent UnitMass ow rate 4.61E-5 3.27E-5 3.06E-5 kg/s
To make a comparison between the heat transferred to the condenser from the experiments and sim-ulations, a heat exchange network was constructed to account for the system losses.
4.8. Heat Exchange NetworkA heat exchange network (shown in Figure 4.23) was constructed based on the experimental resultsusing 5 mm catalyst pellets at 228 °C reactor wall temperature to account for the losses of the system.
During steady state operation of the reactor, the heat transferred from the heaters should be releasedthorough the condenser. However, losses from the reactor mean that these two values are not thesame. The heat input and losses from the system are summarized in Table 4.10. This value of heatobtained from the experiments was then compared with the results from COCO (Table 4.11). The twovalues have a close agreement with each other. The di erence is due to inaccuracies in temperature

52 4. Results and Discussion
Figure 4.23: Heat exchanging network depicting the pathway of heat loss in the reactor. Loss through theinsulation is the highest suggesting that selection of proper insulation material should be a priority for future
experimental designs.
measurements during the experiments.
Table 4.10: Heat losses in the system.
Parameter Value UnitHeat input 64.8 W
Heat loss through bolts 8.3 WHeat loss through air gap 8.3 WHeat loss through PT 60 1.9 W
Heat loss through insulation 31.7 WHeat transferred to the condenser 14.6 W
Heat integration 11.2 WHeat released by the reaction 4.2 W
Table 4.11: Comparison of heat transferred to the condenser based on experimental and simulation results.
Parameter Experiments COCO UnitHeat transferred to the condenser 14.6 14.1 W
Once this comparison was done, di erent scenarios were postulated for the heat exchange network toestimate whether autothermal operation of the reactor was possible (Figure 4.24).
In the rst case, the values of the heat input and the losses calculated from experimental ndings areshown. In the next case (”Perfect insulation”), the insulation is assumed to be perfect with no heatloss to the surroundings. This leads to a decrease in heat input needed to maintain the reaction tem-perature. In subsequent cases (”Perfect insulation + Air gap insulated” and ”Perfect insulation + Airgap insulated + Insulated bolt spacers”), the losses from the air gap, PT 60 and from the bolts are alsoassumed to be zero. It can be seen that even though the heat released by the reaction and the heatintegration achieved are 4.2 W and 11.2 W, respectively, 14.6 W of heat needs to be applied at theinput externally to maintain the reaction temperature. Therefore, autothermal operation of the reac-tor is possible if an additional 14.6 W (and in total 25.8 W) of heat integration is achieved, given thecurrent rate of methanol production. The calculation procedure for the same is presented in Appendix F.

4.8. Heat Exchange Network 53
Figure 4.24: Scenarios for estimating the performance of the reactor in case of no heat losses. Autothermalreactor operation is possible if an additional 14.6 W of heat is generated from the system. This can be achieved
using higher heat integration or by producing more methanol.

5Conclusions and Recommendations
5.1. ConclusionsThe objective of this thesis was to experimentally characterize a novel small-scale natural circulationloop methanol synthesis reactor with internal heat recovery. To that end, the reactor with six heat inte-gration blocks having 2 mm ow channels developed at the end of the internship project of the authorwas modi ed to include additional sensors to measure the heat integration and pressure. A data log-ging circuit was built to enable easy data collection.
Experiments were rst performed with N2 to get an estimate of the mass ow rate and heat input to thesystem when using an inert gas. The data obtained was compared with the simulation results in Fluentby Gutierrez-Neri [104]. After these tests, experiments with the feed gas were performed which yieldedno/very less liquid output. A fault tree analysis was done to identify possible causes of this low yield.It was ultimately found that premature condensation of the liquid in the channels was the problem andtherefore, three heat integration blocks were removed and the ow channel dimensions increased from2 mm to 6.5 mm. Signi cant methanol yield was obtained after these modi cations.
Experiments were then performed using 5 mm catalyst pellets as they were obtained from the manu-facturer. The sampling time of the liquids was optimized and the methanol production variation withtemperature was studied. Tests were performed using the 5 mm pellets cut into two halves as well ascrushed pellets. They did not yield much liquid since the pressure drop caused by the smaller catalystsizes was high compared to the driving force available to the ow due to natural convection.
Based on the experimental results using 5 mm pellets, a mass balance calculation was done to estimatethe feed ow rate of the gases into the reactor. A process model incorporating heat integration devel-oped by Gutierrez-Neri [104] was then worked on to compare the experimental results with those ofthe simulations in COCO. Finally, a heat exchange network was built to identify the losses in the systemand to determine whether autothermal operation of the reactor was feasible.
Three main research questions were posed at the beginning of this thesis. Having studied the process,the questions can now be answered.
What is the maximum methanol productivity and overall system e ciency that can be obtainedexperimentally using the reactor given the process conditions?
Amaximummethanol productivity of 6.8mmole CH3OH/gcat/h was obtained at 228 °C reactor wall tem-perature using 5 mm catalyst pellets. While this value is more than that obtained by Brilman et al. [16]because of a higher reaction temperature (faster kinetics) and lower condensation temperature (moremethanol condensed) in this study, it is less than the industrial value of 19.4 mmole CH3OH/gcat/hobtained by Chen et al. [21]. This is because Chen simulated the industrial process at higher pressure(66.7 bar) and with higher feed ow rates. The methanol production is also lower compared to what
55

56 5. Conclusions and Recommendations
the reactor was initially designed for (18.8 mmole CH3OH/gcat/h-Section 3.1). This limitation is mainlybecause the liquid sampling was done at xed intervals rather than when the liquid collection tube atthe bottom of the reactor was lled up.
The optimum reactor wall temperature using 5 mm pellets has been found to be 228 °C. The otherimportant parameters to obtain high methanol productivity are the condenser temperature, the heatintegration achieved and the liquid sampling time. Lowering the condenser temperature ensures that allthe methanol and water that is produced is condensed. A lower condenser temperature also increasesthe driving force available to the ow (See Appendix G). Increased heat integration leads to a highermass ow rate which results in more methanol production. Optimum liquid sampling time ensures thatthe liquid is sampled when the liquid collection tube is full and not at speci c time intervals (as done inthis study).
Heat integration has an indirect impact on the overall e ciency of the system. This is because a highvalue of heat integration lowers the heat input required from the heaters to maintain the reaction tem-perature. This in turn increases the overall system e ciency. In the case of experiments using 5 mmpellets at 228 °C, the heat input, heat integration and overall e ciency of the system were 64.8 W, 11.2W and 44.3%, respectively. If there were no heat integration, the overall e ciency would have been41.0% instead of 44.3%.
How do the heat losses and mass ow rate of the system compare with the values obtained fromsimulations?
The simulations of the process done in COCO by the author assume perfect heat transfer (no losses).Therefore, comparison of heat losses obtained from the experiments to those from simulations was notdirectly possible. A heat exchange network was developed which accounted for all the heat losses inthe system. These losses were subtracted from the heat input to give the heat transferred to the con-denser and it was this value that was compared with the simulation results. The experimental and COCOvalues showed a close match (observe Table 4.11). Heat transfer to the condenser obtained from theFluent model developed by Guttierez-Neri [104] accounted only for the sensible heat loss (and not thelatent heat loss) and therefore was not compared with the values obtained from experiments and COCO.
The mass ow rates di ered slightly due to the di erent gas compositions measured during the exper-iments and obtained from the Fluent simulation study. This led to a di erence in speci c heat of themixture and ultimately, di erent mass ow rates.
What implications do the results obtained have for future designs of the NCL reactor?
The heat exchange network developed provided valuable insights regarding future reactor designs. Ifall the losses of the system are assumed to be zero (an ideal case), then an additional 14.6 W of heat isrequired to achieve autothermal reactor operation for the current system. This additional heat can beobtained by increasing the methanol production (which is an exothermic reaction and releases heat)and by improving the heat integration that can be achieved. The next section discusses how this canbe done.
5.2. RecommendationsWhile this study provided valuable insights into the working of a small-scale reactor, there are still manyareas of improvement.
The mass of the reactor used in this study was close to ve kilograms. This resulted in the systemtaking a long time to reach steady state in terms of temperature pro les (close to 90 minutes). Sucha time frame will not be feasible when this system is deployed in the eld. Therefore, the weight ofthe reactor should be reduced. This can be done by reducing the thicknesses of the reaction and con-densation zone blocks (which are currently overdimensioned). Replacing the heat integration blocks

5.2. Recommendations 57
made of aluminium with copper heat pipes would reduce the weight as well as improve the heat transfersigni cantly.
Although aluminium was chosen as the material of construction in this study, it has a ”fair” (not toogood) tolerance to methanol. Over the course of the experiments, the author found that the area nearthe ow channels which came in contact with the liquid methanol was starting to corrode (see AppendixH). Therefore, some other material compatible with methanol must be chosen. Stainless steel lined alu-minium can be an alternative.
An experiment was conducted using N2 as the uid with the ow on the condenser side completelyblocked. The reactor wall and the condenser wall temperature were maintained as 210 °C and 42 °C.The heat input in this case was obtained as 43.0 W (Table 4.1). The heat exchange network predicted50.2 W of heat losses from the system (Section 4.8). However this test was done at a higher tem-peratures (228 °C and 62 °C respectively for the two zones). Since the N2 test gives a heating valuein case of no ow (which ideally translates to heat loss since there is no ow, and hence no energyis transferred to the ow), an experiment conducted with N2 at the operation parameters used in theexperiment should give a heat input close to 50 W. This would help in correlating the experimental andanalytical results better.
Based on the results of the heat exchange network constructed, the losses of the system need to bereduced to achieve autothermal operation. Loss through insulation was identi ed as the major compo-nent. Therefore, choosing an appropriate insulation material becomes paramount. Silica aerogels canbe the material of choice as they have a very low thermal conductivity (about 0.005 W/m-K [110]) andcan withstand very high temperatures.
Loss through the air gaps can be reduced by having some space between the blocks, which is only 1mm in the current design and therefore not feasible to insulate. Placing an insulation material like silicaaerogel between the gap can help reduce the axial heat loss to almost zero.
Eight bolts connect the reactor components together. Since these are made of stainless steel, theyalso conduct heat. Having plastic spacers in the places where these bolts touch the metal componentsof the reactor can help reduce this heat loss. Vespel® can be used as the plastic material because ofits high temperature resistance.
Once all these losses are reduced, autothermal operation of the reactor can be possible if an additional14.6 W of heat is available (based on the results obtained using 5 mm pellets at 228 °C). This heatcan be achieved in two ways-either by increasing the methanol production (which results in more heatreleased by the reaction) or by increasing the heat integration. Increasing the heat integration canbe done by adding more blocks to the reactor. For the current design, an experiment with six heatintegration blocks-three with 2 mm ow channels placed close to the reaction zone followed by threeblocks with 6.5 mm ow channels close to the condensation zone would increase the heat integrationeven more, and thereby the overall e ciency. Improving the heat integration would help to improvemethanol production as the mass ow rate would then be increased.
Reducing the condenser temperature would also help to improve the methanol production. To this end,the COCO process model shown in Figure 4.21 was used to evaluate the e ect of changing this param-eter changes on methanol yield. It was found that reducing the condenser temperature to 35 °C (thecondenser wall temperature in the experiments was 62 °C) can greatly improve the methanol yield (Ap-pendix G). Reduction of the condenser uid temperature can be done using external ns. If internal nsare used, they can limit the ow rate in the reactor by adding resistance to the ow. Also ow blockagecan result due to condensation of the liquid droplets in the ow channels. Increasing the catalyst beddiameter can also lead to more methanol production (because of higher mass of the catalyst). Butthe heat transfer from the walls to the uid in case of large diameters needs to be investigated as thepossibility of hot spot formation is high.
The methanol yield was also limited by the size of the collection zone (the tube at the bottom of the

58 5. Conclusions and Recommendations
condenser block where the liquid used to accumulate before being sluiced). Therefore, future designsneed to have a level sensor whereby the liquid is sampled when the collection tube becomes full andnot at speci ed time intervals (determined by the sampling time measurements in this study). Thiswould help increase the productivity. If the tube having the level sensor is transparent, then the liquidaccumulation can also be observed.
One of the sources of error in the measurements came from the fact that surface temperatures weremeasured and not the uid temperatures. Therefore, to improve the accuracy, uid temperatures needto be measured using precise thermocouples since the ones used in this study were not very accurate.In addition, two thermocouples should be placed at the inlet and outlet of the condenser block to havea measure of the temperature gradient (only one was used in this study).
A di erential pressure gauge placed across the catalyst bed can give an accurate measure of the pres-sure drop developed due to the ow. This can be useful when using smaller catalyst pellets. Smallerpellets increase the outer surface area available for the reaction and also take the ratio of the diameterof the channel to the those of the pellets closer to 22, which was suggested by Bussche and Froment[25] as the optimum to achieve uniform ow. However in this study, using smaller pellets led to lowproduction due to increased pressure drop. A di erential pressure sensor would help to get a measureof this value.
This study was conducted using H2 and CO2 in the molar ratio of 3:1. Tests also need to be conductedwith di erent feed ratios to test the system response under various inlet compositions.

Bibliography
[1] Aspen plus, .
[2] Cape open to cape open simulation environment, .
[3] Matlab, .
[4] Kyoto protocol: United nations framework convention on climate change, .
[5] Paris agreement: United nations framework convention on climate change, .
[6] R. Pidcock, Analysis: What global emissions in 2016 mean for climate change goals, (2016).
[7] A. Goeppert, G. A. Olah, and G. S. Prakash, Toward a sustainable carbon cycle: the methanoleconomy, in Green Chemistry (Elsevier, 2017) pp. 919–962.
[8] Global ccs institute: Projects database, .
[9] Lake nyos: Deadliest lake in the world su ocated over 1,746 people in one night, .
[10] I. Statistics, Key world energy statistics 2017, International Energy Agency (2017).
[11] A. Goeppert, M. Czaun, J.-P. Jones, G. S. Prakash, and G. A. Olah, Recycling of carbon dioxide tomethanol and derived products–closing the loop, Chemical Society Reviews 43, 7995 (2014).
[12] Annual worldwide methanol supply and demand balance, .
[13] Ihsg: Global methanol market review, (2012).
[14] A. Basile and F. Dalena, Methanol: Science and Engineering (Elsevier, 2017).
[15] G. Bozzano and F. Manenti, E cient methanol synthesis: perspectives, technologies and opti-mization strategies, Progress in Energy and Combustion Science 56, 71 (2016).
[16] M. J. Bos and D. W. F. Brilman, A novel condensation reactor for e cient CO2 to methanol con-version for storage of renewable electric energy, Chemical engineering journal 278, 527 (2015).
[17] B. Xu, R. Yang, F. Meng, P. Reubroycharoen, T. Vitidsant, Y. Zhang, Y. Yoneyama, and N. Tsubaki,A new method of low temperature methanol synthesis, Catalysis surveys from Asia 13, 147(2009).
[18] J. Van Bennekom, R. Venderbosch, J. Winkelman, E. Wilbers, D. Assink, K. Lemmens, andH. Heeres, Methanol synthesis beyond chemical equilibrium, Chemical Engineering Science 87,204 (2013).
[19] A. MacCarley, Methanol fuel safety-a practical guide, (2013).
[20] Zero emission fuels, .
[21] L. Chen, Q. Jiang, Z. Song, and D. Posarac, Optimization of methanol yield from a lurgi reactor,Chemical engineering & technology 34, 817 (2011).
[22] United states environmental protection agency: Understanding global warming potentials, .
[23] A. Eisentraut, Sustainable production of second-generation biofuels, (2010).
[24] G. A. Olah, Beyond oil and gas: themethanol economy, Angewandte Chemie International Edition44, 2636 (2005).
59

60 Bibliography
[25] K. V. Bussche and G. Froment, A steady-state kinetic model for methanol synthesis and the watergas shift reaction on a commercial Cu/ZnO/Al2O3 catalyst, Journal of Catalysis 161, 1 (1996).
[26] M. Saito, R&d activities in japan on methanol synthesis from CO2 and H2, Catalysis Surveys fromAsia 2, 175 (1998).
[27] Y. Amenomiya, Infrared study of methanol synthesis from CO2+ H2 on supported copper-zincoxide catalysts, in Proc. of 8th Int. Congress on Catal, Vol. 2 (1984) pp. 557–567.
[28] T. Tagawab, G. Pleizier, and Y. Amenomiya, Methanol synthesis from CO2+ H2 i. characterizationof catalysts by tpd, Applied catalysis 18, 285 (1985).
[29] T. Tagawa and Y. Amenomiya, An infrared spectroscopy system for catalytic reaction at elevatedpressure and temperature, Applied spectroscopy 39, 358 (1985).
[30] H. Arakawa, Recycling technology of emitted CO2.-selective synthesis of methanol from CO2 bycatalytic hydrogenation over Cu–ZnO/SiO2, Shokubai (Catalyst) 33, 103 (1991).
[31] K. Okabe, K. Sayama, N. Matsubayashi, K. Shimomura, and H. Arakawa, Selective hydrogenationof carbon dioxide to methanol on Cu–ZnO/SiO2 catalysts prepared by alkoxide method, Bulletinof the Chemical Society of Japan 65, 2520 (1992).
[32] Y. Zhang, Q. Sun, J. Deng, D.Wu, and S. Chen, A high activity Cu/ZnO/Al2O3 catalyst formethanolsynthesis: Preparation and catalytic properties, Applied Catalysis A: General 158, 105 (1997).
[33] M. Pori, B. Likozar, M. Marinšek, and Z. C. Orel, Preparation of cu/zno-based heterogeneouscatalysts by photochemical deposition, their characterisation and application for methanol syn-thesis from carbon dioxide and hydrogen, Fuel Processing Technology 146, 39 (2016).
[34] X.-M. Liu, G. Lu, Z.-F. Yan, and J. Beltramini, Recent advances in catalysts for methanol synthesisvia hydrogenation of CO and CO2, Industrial & engineering chemistry research 42, 6518 (2003).
[35] G. Bonura, F. Arena, G. Mezzatesta, C. Cannilla, L. Spadaro, and F. Frusteri, Role of the ceriapromoter and carrier on the functionality of cu-based catalysts in the CO2-to-methanol hydro-genation reaction, Catalysis Today 171, 251 (2011).
[36] J. S. Lee, K. I. Moon, S. H. Lee, S. Y. Lee, and Y. G. Kim, Modi ed Cu/ZnO/Al2O3 catalysts formethanol synthesis from CO2/H2 and CO/H2, Catalysis letters 34, 93 (1995).
[37] M. B. Fichtl, D. Schlereth, N. Jacobsen, I. Kasatkin, J. Schumann, M. Behrens, R. Schlögl, andO. Hinrichsen, Kinetics of deactivation on Cu/ZnO/Al2O3 methanol synthesis catalysts, AppliedCatalysis A: General 502, 262 (2015).
[38] J. T. Sun, I. S. Metcalfe, and M. Sahibzada, Deactivation of Cu/ZnO/Al2O3 methanol synthesiscatalyst by sintering, Industrial & engineering chemistry research 38, 3868 (1999).
[39] X. Zhai, J. Shamoto, H. Xie, Y. Tan, Y. Han, and N. Tsubaki, Study on the deactivation phenomenaof cu-based catalyst for methanol synthesis in slurry phase, Fuel 87, 430 (2008).
[40] H. S. Fogler et al., Elements of chemical reaction engineering, (1999).
[41] W. Seyfert and G. Luft, Untersuchungen zur methanol-synthese im mitteldruckbereich, ChemieIngenieur Technik 57, 482 (1985).
[42] G. Graaf, E. Stamhuis, and A. Beenackers, Kinetics of low-pressuremethanol synthesis, ChemicalEngineering Science 43, 3185 (1988).
[43] P. Villa, P. Forzatti, G. Buzzi-Ferraris, G. Garone, and I. Pasquon, Synthesis of alcohols fromcarbon oxides and hydrogen. 1. kinetics of the low-pressure methanol synthesis, Industrial &engineering chemistry process design and development 24, 12 (1985).
[44] O. Schermuly and G. Luft, Methanol-syntheses im treibstrahlreaktor, Ger Chem Eng 1, 222(1977).

Bibliography 61
[45] J. Monnier, G. Apai, and M. Hanrahan, E ect of CO2 on the conversion of H2CO to methanol overcopper-chromia catalysts, J. Catal.;(United States) 88 (1984).
[46] M. Takagawa and M. Ohsugi, Study on reaction rates for methanol synthesis from carbonmonox-ide, carbon dioxide, and hydrogen, Journal of Catalysis 107, 161 (1987).
[47] V. Leonov, M. Karavaev, E. Tsybina, andG. Petrishcheva, Kinetik dermethanol-synthese an einemtieftemperatur-katalysator, Chemischer Informationsdienst 4, no (1973).
[48] A. Y. Rozovskii, G. Lin, L. Liberov, E. Slivinskii, S. Loktev, Y. B. Kagan, and A. Bashkirov, Mecha-nism of methanol synthesis from carbon dioxide and hydrogen iii. determination of the rates ofindividual steps using carbon-14 monooxide, Kinet. Katal 18, 691 (1977).
[49] A. Y. Rozovskii, Y. B. Kagan, G. Lin, E. Slivinskii, S. Loktev, L. Liberov, et al., Mechanism ofmethanol synthesis from carbon monoxide and hydrogen, Kinetika i Kataliz 16, 810 (1975).
[50] J. Skrzypek, M. Lachowska, and H. Moroz, Kinetics of methanol synthesis over commercial cop-per/zinc oxide/alumina catalysts, Chemical engineering science 46, 2809 (1991).
[51] Y. Borodko and G. Somorjai, Catalytic hydrogenation of carbon oxides–a 10-year perspective,Applied Catalysis A: General 186, 355 (1999).
[52] T. Askgaard, J. Norskov, C. Ovesen, and P. Stoltze, A kinetic model of methanol synthesis, Journalof Catalysis 156, 229 (1995).
[53] T. Kubota, I. Hayakawa, H. Mabuse, K. Mori, K. Ushikoshi, T. Watanabe, and M. Saito, Kineticstudy of methanol synthesis from carbon dioxide and hydrogen, Applied organometallic chem-istry 15, 121 (2001).
[54] M. Šetinc and J. Levec, Dynamics of a mixed slurry reactor for the three-phase methanol syn-thesis, Chemical engineering science 56, 6081 (2001).
[55] G. Chinchen, R. Logan, and M. Spencer, Water-gas shift reaction over an iron oxide/chromiumoxide catalyst.: Ii: Stability of activity, Applied Catalysis 12, 89 (1984).
[56] Z. Xu, Z. Qian, and H. Hattori, Mechanistic study of the hydrogenation of carbon dioxide tomethanol over supported rhenium and copper–zinc catalysts, Bulletin of the Chemical Societyof Japan 64, 3432 (1991).
[57] J. S. Lee, K. H. Lee, S. Y. Lee, and Y. G. Kim, A comparative study of methanol synthesis fromCO2/H2 and CO/H2 over a Cu/ZnO/Al2O3 catalyst, Journal of Catalysis 144, 414 (1993).
[58] I. Dybkjaer, Design of ammonia and methanol synthesis reactors, in Chemical Reactor Designand Technology (Springer, 1986) pp. 795–819.
[59] B. Denise, R. Sneeden, and C. Hamon, Hydrocondensation of carbon dioxide: Iv, Journal ofMolecular Catalysis 17, 359 (1982).
[60] K. Klier, V. Chatikavanij, R. Herman, and G. Simmons, Catalytic synthesis of methanol fromCOH2:Iv. the e ects of carbon dioxide, Journal of Catalysis 74, 343 (1982).
[61] R. Bardet, J. Thivolle-Cazat, and Y. Trambouze, Hydrocondensation des oxydes de carbone, à lapression atmosphérique, sur des catalyseurs Cu–ZnO–Al2O3. in uence de l’eau sur la formationdu méthanol, Comptes-rendus des séances de l’Académie des sciences. Série 2, Mécanique-physique, chimie, sciences de l’univers, sciences de la terre 299, 423 (1984).
[62] The role of CO2 in methanol synthesis on [cu-zn, .
[63] G. Chinchen, C. Hay, H. Vandervell, and K. Waugh, The measurement of copper surface areasby reactive frontal chromatography, Journal of Catalysis 103, 79 (1987).
[64] C. J. Schack, M. A. McNeil, and R. G. Rinker, Methanol synthesis from hydrogen, carbon monox-ide, and carbon dioxide over a CuO/ZnO/Al2O3 catalyst: I. steady-state kinetics experiments,Applied catalysis 50, 247 (1989).

62 Bibliography
[65] M. A. McNeil, C. J. Schack, and R. G. Rinker, Methanol synthesis from hydrogen, carbonmonoxideand carbon dioxide over a CuO/ZnO/Al2O3 catalyst: Ii. development of a phenomenological rateexpression, Applied catalysis 50, 265 (1989).
[66] A. Y. Rozovskii and G. I. Lin, Fundamentals of methanol synthesis and decomposition, Topics inCatalysis 22, 137 (2003).
[67] H.-W. Lim, M.-J. Park, S.-H. Kang, H.-J. Chae, J. W. Bae, and K.-W. Jun, Modeling of the kineticsfor methanol synthesis using Cu/ZnO/Al2O3/ZrO2 catalyst: in uence of carbon dioxide duringhydrogenation, Industrial & Engineering Chemistry Research 48, 10448 (2009).
[68] L. Grabow and M. Mavrikakis, Mechanism of methanol synthesis on cu through CO2 and COhydrogenation, Acs Catalysis 1, 365 (2011).
[69] N. Park, M.-J. Park, Y.-J. Lee, K.-S. Ha, and K.-W. Jun, Kinetic modeling of methanol synthesisover commercial catalysts based on three-site adsorption, Fuel Processing Technology 125, 139(2014).
[70] G. Graaf, H. Scholtens, E. Stamhuis, and A. Beenackers, Intra-particle di usion limitations inlow-pressure methanol synthesis, Chemical Engineering Science 45, 773 (1990).
[71] W. L. Luyben, Design and control of amethanol reactor/column process, Industrial & EngineeringChemistry Research 49, 6150 (2010).
[72] C. Ovesen, B. Clausen, J. Schiøtz, P. Stoltze, H. Topsøe, and J. K. Nørskov, Kinetic implicationsof dynamical changes in catalyst morphology during methanol synthesis over Cu/ZnO catalysts,Journal of Catalysis 168, 133 (1997).
[73] A. Pinto and P. Rogerson, Heat transfer-impact of high fuel cost on plant design, Chemical En-gineering Progress 73, 95 (1977).
[74] J. LeBlanc and R. Schneider, Cape horn methanol: reliable performance in a remote location, inProceedings of the 1991 World Methanol Conference, Vancouver, BC, Canada (1991).
[75] L. Engineering, Isothermal reactor, .
[76] I. Takase and K. Niwa, Mitsubishi (mgc/mhi) methanol process, Chemical economy and engi-neering review 17, 24 (1985).
[77] E. Heydorn, B. Diamond, and R. Lilly, Commercial-scale demonstration of the liquid phasemethanol (lpmeoh) process, Prepared for the US DOE, National Energy Technology Laboratory(2003).
[78] P. L. Spath and D. C. Dayton, Preliminary screening-technical and economic assessment of syn-thesis gas to fuels and chemicals with emphasis on the potential for biomass-derived syngas,Tech. Rep. (National Renewable Energy Lab Golden Co, 2003).
[79] E. Supp and R. Quinkler, The lurgi low-pressure methanol process, Handbook of Synfuels Tech-nology. Edited by RA Meyers. New York: McGraw Hill , 2 (1984).
[80] J. Haid and U. Koss, Lurgi’s mega-methanol technology opens the door for a new era in down-stream applications, in Studies in Surface Science and Catalysis, Vol. 136 (Elsevier, 2001) pp.399–404.
[81] S. Lee, Methanol synthesis technology (CRC Press, 1989).
[82] H. H. Kung, Deactivation of methanol synthesis catalysts-a review, Catalysis Today 11, 443(1992).
[83] F. Gallucci, L. Paturzo, and A. Basile, An experimental study of CO2 hydrogenation into methanolinvolving a zeolite membrane reactor, Chemical Engineering and Processing: Process Intensi -cation 43, 1029 (2004).

Bibliography 63
[84] B. Sea and K.-H. Lee, Methanol synthesis from carbon dioxide and hydrogen using a ceramicmemebrane reactor, Reaction Kinetics and Catalysis Letters 80, 33 (2003).
[85] A. Basile, L. Di Paola, F. Hai, and V. Piemonte, Membrane reactors for energy applications andbasic chemical production (Elsevier, 2015).
[86] R. Struis and S. Stucki, Veri cation of the membrane reactor concept for the methanol synthesis,Applied Catalysis A: General 216, 117 (2001).
[87] L. G. van der Ham, H. van den Berg, A. Benneker, G. Simmelink, J. Timmer, and S. van Weerden,Hydrogenation of carbon dioxide for methanol production, CHEMICAL ENGINEERING 29 (2012).
[88] B. Tidona, C. Koppold, A. Bansode, A. Urakawa, and P. R. von Rohr, CO2 hydrogenation tomethanol at pressures up to 950 bar, The Journal of Supercritical Fluids 78, 70 (2013).
[89] B. Haut, V. Halloin, and H. B. Amor, Development and analysis of a multifunctional reactor forequilibrium reactions: benzene hydrogenation and methanol synthesis, Chemical Engineeringand Processing: Process Intensi cation 43, 979 (2004).
[90] D. Perko, A. Pohar, and J. Levec, Hydrogenation of CO2 and CO in a high temperature gradienteld between catalyst surface and opposite inert cool plate, AIChE Journal 60, 613 (2014).
[91] V. H. Atlas, Vdi-verlag gmbh, (1993).
[92] C. Graves, S. D. Ebbesen, M. Mogensen, and K. S. Lackner, Sustainable hydrocarbon fuels byrecycling CO2 and H2O with renewable or nuclear energy, Renewable and Sustainable EnergyReviews 15, 1 (2011).
[93] R. Lammerink, Mathematical characterization and simulation of natural convective ow in a con-densing CO2 to methanol reactor, Master Thesis (2015).
[94] A. M. Shulenberger, F. R. Jonsson, O. Ingolfsson, and K.-C. Tran, Process for producing liquidfuel from carbon dioxide and water, (2012), uS Patent 8,198,338.
[95] Blue fuel energy:low-carbon blue fuel gasoline, (2018).
[96] Sun re-energy everywhere, .
[97] The engineering toolbox: Thermal conductivity of common materials and gases, .
[98] Cp lab safety: Viton chemical compatibility, .
[99] Eriks: Viton® temperature rating, .
[100] Riogen: Data sheet, .
[101] Permanent gases on a cox module using an agilent 490 micro gc, .
[102] Density and concentration calculator for mixtures of methanol and water, .
[103] C. Pears, Y. in Touloukian, R. Powell, C. Ho, and P. Klemens, Thermophysical and electronicproperties information and analysis, TPRC Data Ser. 2, 145 (1971).
[104] Modelling of natural circulation ow reactor for methanol synthesis from renewable sources,(2018).
[105] I.-C. Lo and H.-S. Wu, Methanol formation from carbon dioxide hydrogenation usingcu/zno/al2o3 catalyst, Journal of the Taiwan Institute of Chemical Engineers (2018).
[106] J. Schumann, A. Tarasov, N. Thomas, R. Schlögl, and M. Behrens, Cu, zn-based catalysts formethanol synthesis: On the e ect of calcination conditions and the part of residual carbonates,Applied Catalysis A: General 516, 117 (2016).

64 Bibliography
[107] S. B. Dake and R. V. Chaudhari, Solubility of carbon monoxide in aqueous mixtures of methanol,acetic acid, ethanol and propionic acid, Journal of Chemical and Engineering Data 30, 400(1985).
[108] J. Xia, M. Jödecke, Á. Pérez-Salado Kamps, and G. Maurer, Solubility of CO2 in (CH3OH+ H2O),Journal of Chemical & Engineering Data 49, 1756 (2004).
[109] H. Yin, S. Jiang, Y. Zhang, and H. Ju, Thermodynamic analysis of thermal e ciency of htr-10hydrogen production system, Journal of nuclear science and technology 43, 1188 (2006).
[110] A. S. Dorcheh and M. Abbasi, Silica aerogel; synthesis, properties and characterization, Journalof materials processing technology 199, 10 (2008).
[111] Engineering toolbox: Convective heat transfer, .
[112] The engineering toolbox: Methanol-thermophysical properties at varying temperature, ().
[113] Encyclopaedia britannica: Latent heat, ().

Appendices
65


AParameters for estimating
equilibrium conversion of methanol.A one pass reactor model was developed in the open source software COCO for estimating the equi-librium methanol conversion (Figure A.1). The kinetics developed by Bussche and Froment were used[25]. The relevant parameters used in the simulation are summarized in Table A.1. While the catalystdensity and mass ow rate of the feed are taken from the above mentioned literature, the feed molefractions are chosen to have a SN of 2. All the parameters are kept the same as mentioned in [25],except the length which is increased so that equilibrium is reached in the reactor in a single pass.
Figure A.1: Model developed in COCO for calculating equilibrium conversion to methanol in a single pass.
67

68 A. Parameters for estimating equilibrium conversion of methanol
Table A.1: Parameters used for conversion of methanol in a single pass reactor.
Parameter Value UnitFeed mole fraction
H2 0.82 -CO2 0.03 -CO 0.04 -Ar 0.11 -
Feed parametersTemperature [200-300] °CPressure 50 bar
Mass ow rate 2.80E-05 kg/sReactorDiameter 0.016 mLength 7 mCatalystPorosity 0.5 -Diameter 5.00E-04 mDensity 1775 kg/m

BReactor Dimensions
B.1. Reaction ZoneThe dimensions of various components in the reaction zone are presented in Table B.1.
Table B.1: Dimensions of various components of the reaction zone.
Component Dimensions CommentsAluminium block Cross section: 45 mm * 45 mm
Height: 204 mmThermocouples: 2
Channel dimension Diameter: 18 mmLength: 184 mm
None
Flow channel Diameter: 2 mm Quantity: 20O-ring 1 Outer diameter: 29 mm
Inside diameter: 23 mmThickness: 3 mm
Quantity: 1
O-ring 2 Outer diameter: 17 mmInside diameter: 11 mmThickness: 3 mm
Quantity: 2
Top plate Width: 40 mmLength: 40 mmThickness: 10 mm
None
Heater block Cross section: 30 mm * 30 mmLength: 100 mm
Quantity: 2Thermocouples: 2
Cartridge heaters Power rating: 250 W (each)Diameter: 10 mmLength: 80 mm
Quantity: 2
PT 60 (paper) Width: 10 mmLength: 30 mmThickness: 0.5 mm
Quantity: 4
69

70 B. Reactor Dimensions
B.2. Heat Integration BlocksThe dimensions of the heat integration block are presented in Table B.2.
Table B.2: Dimensions of the various components of the heat integration block.
Component Dimensions CommentsAluminium block Width: 30 mm
Thickness: 16 mmHeight: 202 mm
Thermocouples: 2
Flow channel Diameter: 2 mm Quantity: 20O-ring Outer diameter: 17 mm
Inside diameter: 11 mmThickness: 3 mm
Quantity: 2
PT 60 (paper) Width: 10 mmLength: 30 mmThickness: 0.5 mm
Quantity: 4
B.3. Condenser BlockThe dimensions of various components of the condenser block are presented in Table B.3.
Table B.3: Dimensions of the various components of the condenser block.
Component Dimensions CommentsAluminium block Cross section: 40 mm * 40
mmHeight: 212 mm
Thermocouples: 1To measure the surfacetemperature of the blockPressure gauge: 1To measure the reactorpressurePurge valve: 1For periodically purging thereactor of unwanted gascomponents (like CO)
Cylindrical chan-nel
Diameter: 10 mmLength: 212 mm
None
Flow channel Diameter: 2 mm Quantity: 20O-ring 1 Outer diameter: 29 mm
Inside diameter: 23 mmThickness: 3 mm
Quantity: 2
O-ring 2 Outer diameter: 17 mmInside diameter: 11 mmThickness: 3 mm
Quantity: 2
Top and bottomplate
Width: 40 mmLength: 40 mmThickness: 10 mm
Bottom plate is connectedto two open close valvesfor liquid sampling
PT 60 (paper) Width: 10 mmLength: 30 mmThickness: 0.5 mm
Quantity: 4

CIndustrial methanol production
Chen et al. [21]modelled themethanol production process of a quasi-isothermal Lurgi reactor in AspenPlus™ and compared their simulation data with an industrial scale reactor with good agreement. Theresults of the calculation procedure for estimating the methanol production (in mmole CH3OH/g /h)are shown in Table C.1.
Table C.1: Calculation of methanol production using the results of Chen et al. [21].
Parameter Value Unit
ReactorReactor tube diameter 0.04 m
Reactor length 7 mNumber of tubes 1620 -Tube volume 8.9E-3 mCatalyst
Void fraction 0.285 -Particle fraction 0.715 -
Density 1190 kg/mMass 10.47 kgcat/tube
MethanolMethanol production 10526.4 kg/h
Methanol production per tube 6.5 kg/h/tubeMethanol production 0.621 g/gcat/hMethanol molar mass 32 g/moleMethanol production 19.4 mmole CH3OH/gcat/h
71


DInternal Fins
The internal ns used for an experimental study using N2 as the uid were made of aluminium sheets.A mould with corrugations on its surface was 3D printed along with a roller having ridges on its outersurface.
Ribs were created in an aluminium sheet of one micron thickness using the mould after which the sheetwas folded to form n like structures. The 3D mould is shown in Figure D.1a, while the ns themselvesare presented in Figure D.1.
(a) 3D printed mould used for making the ns (b) Fins placed inside the condenser block
Figure D.1: Internal ns.
73

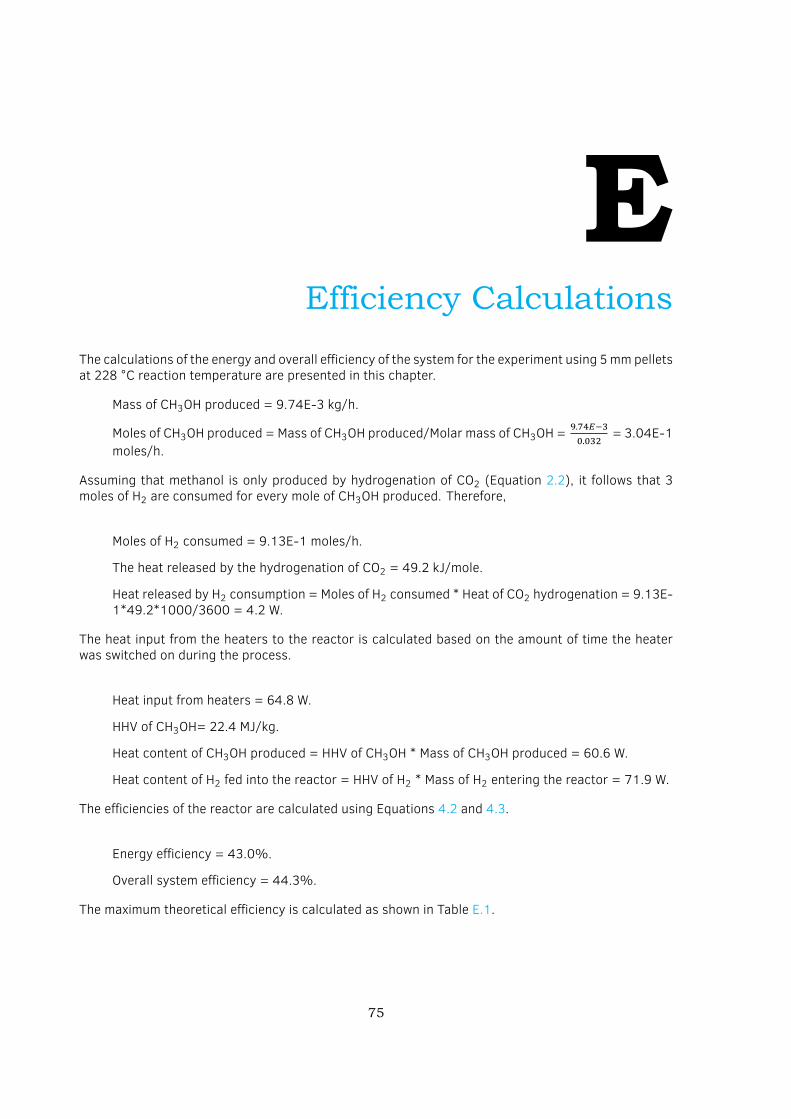
EEfficiency Calculations
The calculations of the energy and overall e ciency of the system for the experiment using 5mmpelletsat 228 °C reaction temperature are presented in this chapter.
Mass of CH3OH produced = 9.74E-3 kg/h.
Moles of CH3OH produced = Mass of CH3OH produced/Molar mass of CH3OH =.. = 3.04E-1
moles/h.
Assuming that methanol is only produced by hydrogenation of CO2 (Equation 2.2), it follows that 3moles of H2 are consumed for every mole of CH3OH produced. Therefore,
Moles of H2 consumed = 9.13E-1 moles/h.
The heat released by the hydrogenation of CO2 = 49.2 kJ/mole.
Heat released by H2 consumption = Moles of H2 consumed * Heat of CO2 hydrogenation = 9.13E-1*49.2*1000/3600 = 4.2 W.
The heat input from the heaters to the reactor is calculated based on the amount of time the heaterwas switched on during the process.
Heat input from heaters = 64.8 W.
HHV of CH3OH= 22.4 MJ/kg.
Heat content of CH3OH produced = HHV of CH3OH * Mass of CH3OH produced = 60.6 W.
Heat content of H2 fed into the reactor = HHV of H2 * Mass of H2 entering the reactor = 71.9 W.
The e ciencies of the reactor are calculated using Equations 4.2 and 4.3.
Energy e ciency = 43.0%.
Overall system e ciency = 44.3%.
The maximum theoretical e ciency is calculated as shown in Table E.1.
75

76 E. Efficiency Calculations
Table E.1: Maximum theoretical e ciency calculation for di erent reaction temperatures using 5 mm pellets.
ParameterValue
Unit213 °C 220 °C 228 °C 235 °CHeat content of CH3OH (HHV basis) 716800 716800 716800 716800 WHeat content of H2 (HHV basis) 850200 850200 850200 850200 WHeat input (from heaters) 59.2 60.1 64.8 66.9 W
Maximum theoretical e ciency 84.3 84.3 84.3 84.3 %
Table E.2: Maximum theoretical e ciency calculation for di erent reaction temperatures using 5 mm pelletscut into two halves.
ParameterValue
Unit210 °C 220 °C 230 °C 240 °CHeat content of CH3OH (HHV basis) 716800 716800 716800 716800 WHeat content of H2 (HHV basis) 850200 850200 850200 850200 WHeat input (from heaters) 68.8 71.5 78.5 82.8 W
Maximum theoretical e ciency 84.3 84.3 84.3 84.3 %

FHeat Exchange Network
Calculations
F.1. Heat loss through boltsThere are eight bolts in the system which hold the components of the reactor in place. These bolts aremade of stainless steel, with one end placed inside the reaction zone and the other at the condenser.The heat loss through the bolts is calculated using Fourier’s law of heat conduction (Table F.1).
𝑄bolts = kbolts ⋅ Abolts ⋅ ΔTboltswhere Qbolts is the heat loss through the bolts in W,
kbolts is the thermal conductivity of the bolt material,
Abolts is the cross sectional area of the bolts,
Δ𝑇bolts is the temperature di erence across the bolts.
Table F.1: Heat loss through bolts.
Parameter Value UnitDiameter 6.00E-03 m
Number of bolts 8 -Abolts 2.26E-04 mkbolts 30 W/m-KΔTbolts 116 KLength 9.45E-02 mQbolts 8.3 W
F.2. Heat loss through PT 60The PT 60 papers are placed between adjacent blocks (The position of these papers can be seen inFigure 3.5 and Figure 3.7). A part of the heat loss from the papers placed at the top and bottom in thegap between the reaction zone and the rst heat integration block will be transferred to the subsequentpapers due to axial heat ow. Therefore, heat loss through the paper is considered to be only the lossthrough the ones placed between the reaction and the rst heat integration block.
Like for bolts, the heat loss in this case is also estimated using Fourier’s Law:
QPT 60 = kPT 60 ⋅ APT 60 ⋅ ΔTPT 60
77

78 F. Heat Exchange Network Calculations
where QPT 60 is the heat loss through the PT 60 paper,
kPT 60 is the thermal conductivity of PT 60 paper,
APT 60 is the cross sectional area of the paper, which is estimated using Autodesk Fusion.
ΔTPT 60 is the temperature di erence across the paper.
Table F.2: Heat loss through PT 60.
Parameter Value UnitSurface area 2.23E-04 m
ΔTtop 45.8 KΔTbottom 41.3 KkPT 60 0.05 W/m-K
QPT 60,top 1.0 WQPT 60,bottom 0.9 WQPT 60 1.9 W
F.3. Heat loss through the insulationThe heat loss through the insulation is primarily due to convection. The temperature of the insulationsurface was measured using an infrared temperature sensor while the ambient temperature was mea-sured using a K-type thermocouple connected to the Arduino. Glass wool is the insulation material(sourced from?) and an insulation thickness of around 5 cm is used for the reactor (except the con-denser which is uninsulated). The heat loss (presented in Table F.3) is calculated as:
Qins = hc ⋅ Ains ⋅ ΔTinswhere Qins is the heat loss through the insulation,
hc is the heat transfer coe cient between the surface of the insulation and the ambient surroundings,
Ains is the cross sectional area of the insulation,
ΔTins is the temperature di erence between the outer surface of the insulation and the ambient.
Table F.3: Heat loss through the insulation.
Parameter Value UnitInsulation dimensions 0.14 * 0.13 * 0.4 m
Insulation surface temperature 28 °CAmbient temperature 22.8 °C
hc,avg 30 [111] W/m KAins 2.01E-1 mQins 31.7 W
F.4. Heat loss through air gapHeat can be lost through convection, conduction and radiation from the gap of 1 mm between adjacentblocks. Heat lost by conduction is calculated using Fourier’s Law:
Qair gap,cond = kair gap ⋅ Aair gap ⋅ ΔTair gap/Lair gapwhere Qair gap, cond is the heat loss through conduction,

F.4. Heat loss through air gap 79
kair gap is the thermal conductivity of the air,
Aair gap is the cross sectional area of the air gap (found from Autodesk Fusion),
Lair gap is the thickness of the air gap,
ΔTair gap is the di erence of the average temperatures of the reaction zone and the rst heat integrationblock. Similar to heat loss through PT 60, the heat loss through the air gap is considered to be only theloss between the reaction and the rst heat integration block.
Heat lost though radiation is found using the Stefan-Boltzman Law:
Qair gap, rad = 𝜖 ⋅ Aair gap ⋅ 𝜎 ⋅ (Treaction zone, avg − T rst Al block, avg)where Qair gap, rad is the heat lost through radiation,
𝜖 is the air gap emissivity,
𝜎 is the Stefan Boltzman constant,
Treaction zone, avg is the average temperature of the top and bottom of the reaction zone,
T rst al block, avg is the average temperature of the top and bottom of the rst heat integration block.
Heat loss through convective heat transfer is estimated using:
Qair gap, conv = hair gap ⋅ Aair gap ⋅ ΔTair gapwhere Qair gap, conv is the heat lost through convection from the air gap,
hair gap is the convective heat transfer coe cient for still air. The heat lost from these three routes isgiven in Table F.4.
Table F.4: Heat loss through the air gap.
Parameter Value UnitConductionLair gap 1E-3 mkair gap 2.4E-2 W/m-KAair gap 5.24E-3 mΔ𝑇air gap 43.6 K
Qair gap, cond 5.5 WConvectionhair gap 20 W/m -K
Qair gap, conv 2.3 WRadiation
𝜖 0.09 -𝜎 5.67E-08 W/m K
Qair gap, rad 0.5 WQair gap 8.3 W
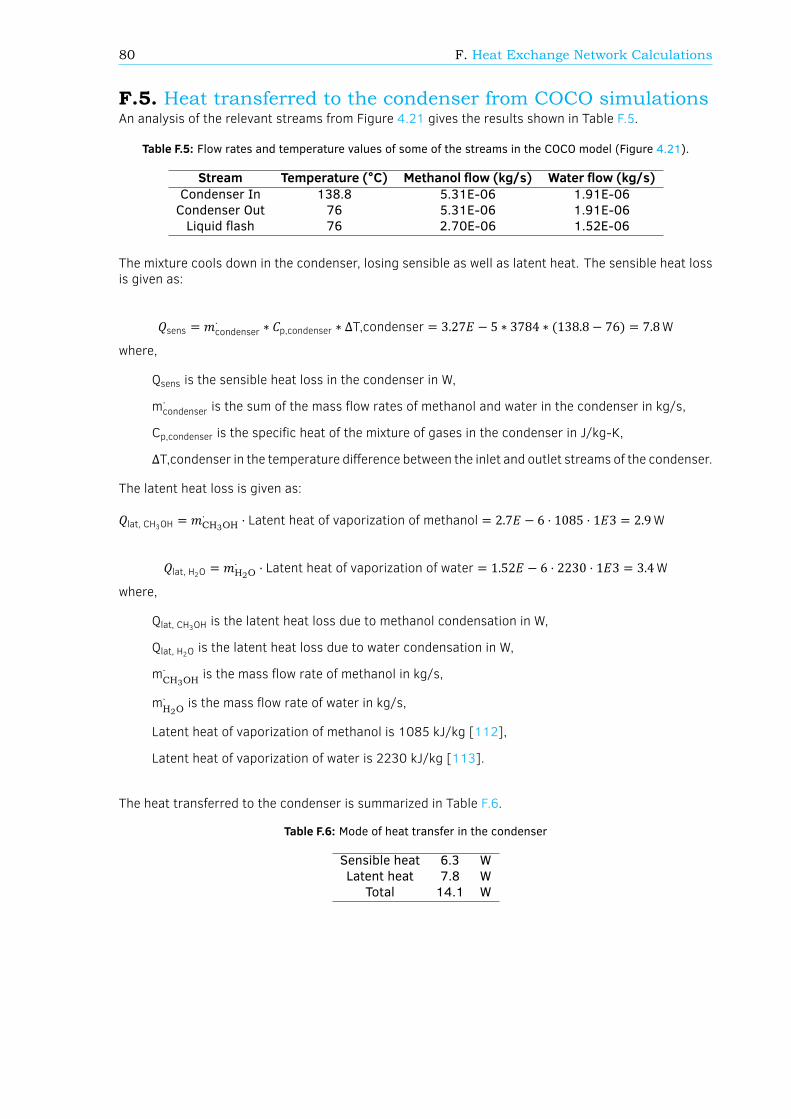
80 F. Heat Exchange Network Calculations
F.5. Heat transferred to the condenser from COCO simulationsAn analysis of the relevant streams from Figure 4.21 gives the results shown in Table F.5.
Table F.5: Flow rates and temperature values of some of the streams in the COCO model (Figure 4.21).
Stream Temperature (°C) Methanol ow (kg/s) Water ow (kg/s)Condenser In 138.8 5.31E-06 1.91E-06Condenser Out 76 5.31E-06 1.91E-06Liquid ash 76 2.70E-06 1.52E-06
The mixture cools down in the condenser, losing sensible as well as latent heat. The sensible heat lossis given as:
𝑄sens = 𝑚⋅condenser ∗ 𝐶p,condenser ∗ ΔT,condenser = 3.27𝐸 − 5 ∗ 3784 ∗ (138.8 − 76) = 7.8Wwhere,
Qsens is the sensible heat loss in the condenser in W,
m⋅condenser is the sum of the mass ow rates of methanol and water in the condenser in kg/s,
Cp,condenser is the speci c heat of the mixture of gases in the condenser in J/kg-K,
ΔT,condenser in the temperature di erence between the inlet and outlet streams of the condenser.
The latent heat loss is given as:
𝑄lat, CH3OH = 𝑚⋅CH3OH ⋅ Latent heat of vaporization of methanol = 2.7𝐸 − 6 ⋅ 1085 ⋅ 1𝐸3 = 2.9W
𝑄lat, H2O = 𝑚⋅H2O ⋅ Latent heat of vaporization of water = 1.52𝐸 − 6 ⋅ 2230 ⋅ 1𝐸3 = 3.4Wwhere,
Qlat, CH3OH is the latent heat loss due to methanol condensation in W,
Qlat, H2O is the latent heat loss due to water condensation in W,
m⋅CH3OHis the mass ow rate of methanol in kg/s,
m⋅H2Ois the mass ow rate of water in kg/s,
Latent heat of vaporization of methanol is 1085 kJ/kg [112],
Latent heat of vaporization of water is 2230 kJ/kg [113].
The heat transferred to the condenser is summarized in Table F.6.
Table F.6: Mode of heat transfer in the condenser
Sensible heat 6.3 WLatent heat 7.8 W
Total 14.1 W

GEffect of condenser temperature and
channel diameter variation onmethanol yield
As mentioned in Section 5.2, reducing the condenser temperature can improve the methanol yield. Thisresult is plotted in Figure G.1.
Figure G.1: E ect of changing condenser temperature on methanol mole fraction. Reducing the temperatureensures more liquid is condenser, leading to more methanol production.
81


HCorrosion in aluminium blocks
Corossion in the ow channels of the blocks due to the presence of methanol is shown in Figure H.1.
Figure H.1: Corrosion in the ow channels of the aluminium block.
83