Psychological factors and entrepreneurial orientation - EconStor
Upload
khangminh22Category
view
3download
0
“Factors influencing entrepreneurial activities of small-scale fish farmers in deriving income
improvement and product sustainability in Central Java, Indonesia”
Tita Elfitasari
Thesis submitted in fulfilment of the
requirements for the degree of Doctor of Philosophy
Faculty of Business and Enterprise Swinburne University of Technology
2010

ii
Abstract
The significant decline of the world fish catch has given aquaculture a promising future.
Many countries, including Indonesia, are developing their aquaculture industry.
Although the fish farming industry in Indonesia is dominated by small scale fish
farmers, it still showed a significant growth in the last decades. Operating a fish farming
business is different to other small business or other manufacturing-based businesses
because it looks after live species that live in an aquatic environment. Therefore, besides
mastering business skills, fish farmers also master technical fish farming skills which
include water quality management, feeding management, fish parasite and disease
handling. Inadequate fish farming skills can lead to business failure and even business
closure. In their attempt to achieve income improvement and ensure product
sustainability, small scale fish farmers carry out dedicated activities. The present
research focused on entrepreneurial activities of small scale fish farmers that included
fish feed production, fish seed production, market extension, fish species extension,
product range extansion and utilisation of other fish parts. In carrying out fish farming
activities, the fish farmers contend with endogenous and exogenous factors as well as
constraints and problems. This research identified the endogenous and exogenous
factors as well as constraints and problems that influence fish farmers’ income
improvement and product sustainability, identified implemented entrepreneurial
activitivies in Central Java, compared entrepreneurial activities between fish farmers
with different demographic background and developed recommendations based of the
findings of this research.
This research collected data through questionnaire distribution to small scale fish
farmers in Central Java. The questionnaire was distributed to two different groups of
fish farmers: groups of fish farmers that had received awards in the last five years and
groups that had not. The data was analysed by using exploratory factor analysis in order
to group the variables into meaningful factors. This assisted in the interpretation of
results and testing of hypotheses. The reliability of the eight scales was tested by using
Cronbach’s Alpha test and Pearson’s correlations. The core analysis of this research
used descriptive analysis, logistic regression analysis and chi-square test of association.

iii
The findings of this research showed that there was a positive correlation between
income improvement and endogenous factors but not with exogenous factors. On the
other hand, product sustainability was found to have positive correlation with both
endogenous and exogenous factors. Results also indicated that both income
improvement and product sustainability correlated positively with constraints and
problems. The analyses showed that there is at least one entrepreneurial activity that
was carried out by small scale fish farmers in Central Java and that there were
significant differences between awardees and non-awardees in Central Java in carrying
out entrepreneurial activities. Significant differences were also found between gender
groups, age groups, marital status, different education level, different fish farmer group
level, and different reasons to become fish farmers.
Based on the findings of this research, recommendations for the aquaculture and
fisheries industry, government, educational institutions and research communities in
Indonesia were developed on aspects that may contribute to the success of small scale
fish farmers in obtaining their income improvement and product sustainability. It is
hoped that the Indonesian federal, provincial and regional governments can include
promotion of entrepreneurial activities in the aquaculture development programs and
future policies. Also with support from the government, it is expected the small scale
fish farmers will proactively implement entrepreneurial activities to increase their
income and to implement sustainable aquaculture to ensure product sustainability in
their business.

iv
Acknowledgements
First of all I would like to thank God Almighty, my words will never be enough to
express my thankfulness for this great life and everything he has given me.
I would like to take this opportunity to extend my greatest gratitude to my Principal
Coordinating Supervisor, Dr Harchand Singh Thandi who guided me most patiently
throughout my candidature until the completion of this thesis. I also wish to give my
greatest appreciation to my associate supervisor Dr Janusz Tanas who believed in my
capability to complete my thesis no matter what my circumstances are.
My deepest appreciation to my statistical advisor Dr Denny Meyer who has been an
angel to me by being very generous and patient in assisting me with my statistical
analysis. Without her great help, it would be impossible to complete this thesis.
To my thesis editor, Barbara Bok, I am very grateful for all your kind assistance in
making my thesis more comprehesable.
I would also like to express my gratitude to Dr Toby Harfield who has helped me in
stressful time applying for ethics approval. She also always remind me on how
important my children are and to do things one step at a time.
I would like to thank my AusAID officer Emilia Tabrizi who is always there when I
needed her assistance and special thanks to AusAID for providing me the opportunity to
study PhD in Australia.
To my parents who have always believed in my capability and encourage me
throughout my study, I will never be who I am now without their prayer and support.
Last but not least, to my husband Albert, and my children Alita, Ayesha and Alden who
have always been on my side the whole time, thank you for supporting and motivating
me all the way, you are all the light of my life.

v
Declaration
This thesis:
• Contains no material which has been accepted for the award to the candidate of
any other degree or diploma, except where due reference is made in the text of
the examinable outcome;
• To the best of the candidate’s knowledge contains no material previously
published or written by another person except where due reference is made in
the text of the examinable outcome;
• Where the work is based on joint research or publications, discloses the relative
contributions of the respective workers or authors; and
• Has met all the requirements of the Ethics Approval from the Swinburne
University of Technology under SUHREC Project 0708/110.
………………………………
Tita Elfitasari
ID 5735262

vi
Contents
Abstract ............................................................................................................................ii
Acknowledgements.........................................................................................................iv
Declaration.......................................................................................................................v
Figures ...........................................................................................................................xiv
Tables ...........................................................................................................................xvii
Chapter 1
Introduction .....................................................................................................................1
1.1 Introduction .............................................................................................................1
1.2 Background to the study..........................................................................................3
1.3 Rationale of the study..............................................................................................5
1.4 Objectives of the study............................................................................................8
1.5 Benefits of the study................................................................................................9
1.6 Scope of the study .................................................................................................11
1.7 Limitations of the study ........................................................................................11
1.8 Structure of the study ............................................................................................12
1.9 Conclusion ............................................................................................................14 Chapter 2
Literature Review..........................................................................................................15
2.1 Introduction ...........................................................................................................15
2.2 Entrepreneurship, the entrepreneur and entrepreneurial activities........................16
2.2.1 Entrepreneurship and the entrepreneur ..........................................................16
2.2.2 Entrepreneurial activities ...............................................................................22
2.3 Identification of small scale fish farmer entrepreneurial activities.......................27
2.3.1 Fish feed production.......................................................................................28
2.3.2 Fish seed production ......................................................................................29
2.3.3 Fish species extension (poly-culture system).................................................30
2.3.4 Product range extension (adding value to product) .......................................31
2.3.5 Utilisation of other fish parts .........................................................................32
2.3.6 Market extension............................................................................................35
2.4 Comparison between fish farmers with different demographic background in entrepreneurial activities implementation ...................................................................36
2.4.1 Comparing awardees and non awardees ........................................................36

vii
2.4.2 Comparing male and female small scale fish farmers ...................................38
2.4.3 Comparing fish farmers of different ages ......................................................40
2.4.4 Comparing fish farmers of different marital status ........................................41
2.4.5 Comparing fish farmers with different educational levels.............................41
2.4.6 Comparing different fish farming groups ......................................................42
2.4.7 Comparing fish farmers with different reasons for become fish farmers ......44
2.5 Extant constraints and problems faced by small scale fish farmers......................45
2.5.1 Lack of start up capital...................................................................................46
2.5.2 Lack of technical abilities ..............................................................................47
2.5.3 Lack of family support ...................................................................................47
2.5.4 Lack of federal and regional government support .........................................47
2.5.5 Lack of training provided by local government.............................................49
2.5.6 Lack of fish farming experience and knowledge ...........................................49
2.5.7 Lack of potential market ................................................................................50
2.5.8 Low selling price............................................................................................50
2.5.9 Low profits .....................................................................................................50
2.5.10 Low quality and quantity of fish seed ..........................................................51
2.5.11 Low quality and quantity of fish feed ..........................................................51
2.5.12 Poor financial management skills ................................................................51
2.5.13 Poor quality control......................................................................................52
2.5.14 Low ability to handle fish disease and parasite problems............................52
2.5.15 Poor water quality ........................................................................................53
2.5.16 Inability to secure sufficient loans ...............................................................53
2.6 Endogenous and exogenous factors affecting small scale fish farmers ................54
2.6.1 Quantum of knowledge..................................................................................55
2.6.2 Mastery of fish farming skills ........................................................................55
2.6.3 Length of experience......................................................................................56
2.6.4 Level of education..........................................................................................56
2.6.5 Entrepreneurial characteristics and personality .............................................57
2.6.6 Reasons for going into business.....................................................................57
2.6.7 Length of personal business experience.........................................................58
2.6.8 Family business experience ...........................................................................58
2.6.9 Density of business network ..........................................................................59

viii
2.6.10 Start-up financial capital (quantum and sources).........................................59
2.6.11 Family support .............................................................................................60
2.6.12 Market demand. ...........................................................................................60
2.6.13 Infrastructure in the area of operation..........................................................61
2.6.14 Government support.....................................................................................61
2.6.15 Other institutional support ...........................................................................64
2.7 Income and income improvement.........................................................................64
2.7.1 Current status of Indonesian small scale fish farmers’ income .....................66
2.7.2 Importance of income improvement for small scale fish farmers in Indonesia
.................................................................................................................................66
2.8 Product sustainability............................................................................................67
2.8.1 Definition and importance of product sustainability......................................67
2.8.2 Aquaculture product sustainability in Indonesia............................................69
2.8.3 Obstructions in sustainable aquaculture practices .........................................70
2.9 Conclusion ............................................................................................................73 Chapter 3
The Aquaculture Industry............................................................................................74
3.1 Introduction ...........................................................................................................74
3.2 The development of the world’s aquaculture industry..........................................74
3.3 The development of the aquaculture industry in Indonesia ..................................79
3.4 The development of the aquaculture industry in Central Java..............................83
3.5 The small scale fish farmer in Central Java ..........................................................87
3.6 Small scale fish farmers and their activities..........................................................89
3.6.1 Definition of the small scale fish farmer........................................................89
3.6.2 Small scale fish farmer activities ...................................................................90
3.7 Conclusion ............................................................................................................97 Chapter 4
Conceptual framework and research methodology ...................................................99
4.1 Introduction ...........................................................................................................99
4.2 Conceptual framework ..........................................................................................99

ix
4.3 Hypothesis development .......................................................................................99
4.4 Research process .................................................................................................106
4.4.1. Development of research interest................................................................109
4.4.2. Information search ......................................................................................109
4.4.3. Development of research design .................................................................109
4.4.4. Development of research methodology ......................................................111
4.4.5. Data collection ............................................................................................111
4.4.6. Data analysis and interpretation ..................................................................112
4.5 Sample/Participants.............................................................................................113
4.5.1 Personal Characteristics ...............................................................................113
4.5.2 Respondents Business Characteristics .........................................................116
4.6 Measurement instrument.....................................................................................119
4.6.1. The questionnaire ........................................................................................119
4.6.2. Steps in the questionnaire development......................................................121
4.6.3. Translation of the questionnaire..................................................................121
4.7 Data collection procedure ...................................................................................122
4.7.1 Preliminary correspondence.........................................................................122
4.7.2 Personal approaches and leads .....................................................................123
4.7.3 Questionnaire distribution method...............................................................123
4.8 Data analysis .......................................................................................................124
4.8.1 Descriptive analysis .....................................................................................124
4.8.2 Exploratory Factor Analysis ........................................................................124
4.8.3 Binary Logistic Regression..........................................................................126
4.8.4 Chi-square test analysis................................................................................126
4.8.5 Cronbach’s alpha test ...................................................................................126
4.9 Interpretation and presentation of results ............................................................127
4.10 Conclusion ........................................................................................................127 Chapter 5
Preliminary Analysis...................................................................................................129
5.1 Introduction .........................................................................................................129

x
5.2 Exploratory factor analysis .................................................................................129
5.2.1 Steps in conducting factor analysis ..............................................................129
5.3 Endogenous and Exogenous Factors...................................................................131
5.3.1 Endogenous and exogenous factors that influence income improvement ...132
5.3.2 Endogenous and exogenous factors that influence product sustainability...136
5.4 Constraints and Problems....................................................................................140
5.4.1 Constraints and problems that influence income improvement...................140
5.4.2 Constraints and problems that resulted in lower product sustainability ......144
5.5 Construction of scales and Cronbach’s Alpha ....................................................148
5.6 Conclusion ..........................................................................................................150 Chapter 6
Data analysis – findings and interpretation..............................................................152
6.1 Introduction .........................................................................................................152
6.2 Statistical analysis ...............................................................................................152
6.2.1 Descriptive analysis .....................................................................................152
6.2.2 Binary logistic regression.............................................................................153
6.2.3 Chi-square test..............................................................................................154
6.3 Endogenous and Exogenous Factors...................................................................155
6.3.1 Influence income improvement ...................................................................155
6.3.2 Influence product sustainability ...................................................................157
6.4 Constraints and Problems....................................................................................162
6.4.1 The effect of problems and constraints on income ......................................162
6.4.2 The effect of problems and constraints on product sustainability ...............163
6.5 Implemented Entrepreneurial activities in Central Java .....................................168
6.6 Comparison between fish farmers with different demographic background in entrepreneurial activities implementation .................................................................170
6.6.1 Comparing awardees and non awardees ......................................................170
6.6.2 Comparing male and female small scale fish farmers .................................171
6.6.3 Comparing fish farmers of different ages ....................................................172
6.6.4 Comparing fish farmers of different marital status ......................................173

xi
6.6.5 Comparing fish farmers with different educational levels...........................174
6.6.6 Comparing different fish farmer groups (FFGs)..........................................176
6.6.7 Comparing fish farmers with different reasons for become fish farmers ....177
6.7 Conclusion ..........................................................................................................181 Chapter 7
Discussion...................................................................................................................1822
7.1 Introduction .......................................................................................................1822
7.2 Demographic characteristics of the respondents.................................................182
7.2.1 Respondents’ Personal Characteristics ........................................................183
7.2.2 Respondents’ Business Characteristics ........................................................185
7.3 Endogenous and exogenous factors that influenced income improvement ........187
7.3.1 Results of Exploratory Factor Analysis (EFA) for endogenous and exogenous
factors that influenced income improvement...............................................187
7.3.2 Results of Binary Logistic Regression Analysis for endogenous and
exogenous factors that influenced income improvement..............................189
7.4 Endogenous and exogenous factors that influenced product sustainability........191
7.4.1 Results of Exploratory Factor Analysis (EFA) of endogenous and exogenous
factors that influenced product sustainability ..............................................191
7.4.2 Results of Binary Logistic Regression Analysis of endogenous and
exogenous factors that influenced product sustainability ............................194
7.5 Constraints and problems that influenced income improvement........................199
7.5.1 Results of Exploratory Factor Analysis (EFA) for constraints and problems
that influenced income improvement...........................................................199
7.5.2 Results of Logistic Regression Analysis for constraints and problems that
influenced income improvement..................................................................200
7.6 Constraints and problems that influenced product sustainability .......................203
7.6.1 Result of Exploratory Factor Analysis (EFA) for constraints and problems
that influenced product sustainability ..........................................................203
7.6.2 Result of Binary Logistic Regression Analysis for constraints and problems
that influenced product sustainability ..........................................................204
7.7 Implemented entrepreneurial activities by small scale fish farmers in Central Java...................................................................................................................................208

xii
7.7.1 Fish feed production.....................................................................................209
7.7.2 Fish seed production ....................................................................................210
7.7.3 Market extension..........................................................................................210
7.7.4 Fish species extension (poly-culture system)...............................................210
7.7.5 Product range extension (adding value to fish product) ..............................211
7.7.6 Utilisation of other fish parts .......................................................................211
7.8 Comparison between fish farmers with different demographic background in entrepreneurial activities implementation .................................................................211
7.8.1 Comparison between awardees and non awardees ......................................212
7.8.2 Comparison between male and female small scale fish farmers..................214
7.8.3 Comparison between age groups .................................................................216
7.8.4 Comparison between marital status .............................................................218
7.8.5 Comparison between different educational levels .......................................220
7.8.6 Comparison between different fish farmer groups ......................................224
7.8.7 Comparison of the different reasons to become fish farmers ......................227
7.9 Discussion ...........................................................................................................230
7.10. Conclusion .......................................................................................................249 Chapter 8
Conclusions and Recommendations ..........................................................................251
8.1 Introduction .........................................................................................................251
8.2 Endogenous and exogenous factors that influenced income improvement and product sustainability ..........................................................................................251
8.3 Constraints and problems that influenced income improvement and product sustainability .......................................................................................................252
8.4 Entrepreneurial activities implemented by small scale fish farmers in Central Java...................................................................................................................................252
8.5. Comparison between different groups of fish farmers in carrying out entrepreneurial activities in Central Java ...........................................................253
8.6. Hypotheses acceptance or rejection ...................................................................253
8.7. Development of recommendations ....................................................................261
8.8. Conclusion .........................................................................................................272

xiii
References ....................................................................................................................276
Appendices ...................................................................................................................289
Appendix 1................................................................................................................289
Appendix 2................................................................................................................300
Appendix 3................................................................................................................310

xiv
Figures
Figure 1.1 Reported aquaculture production in Indonesia (1950-2006) ...........................3
Figure 2.1 Entrepreneurship as a variable phenomenon .................................................17
Figure 2.2 Proposed relationships between environmental factors and levels of
entrepreneurship present in society................................................................18
Figure 2.3 A model of the environmental context of entrepreneurship ..........................24
Figure 2.4 A synchronic view of the constructivist framework for understanding
entrepreneurship performance........................................................................55
Figure 2.5 Sustainability as the intersection of three discipline: ecology, economy, and
sociology .......................................................................................................68
Figure 3.1 Prediction of global seafood species in a century (1950-2050).....................75
Figure 3.2 World fish production (wild catch and farmed), 1950-2003 .........................76
Figure 3.3 Contribution of aquaculture to total world fisheries landing (1970 – 2000) .77
Figure 3.4 Projected total world aquaculture production in 2000...................................78
Figure 3.5 Major aquaculture producing countries within the Asian region excluding
mainland China .............................................................................................80
Figure 3.6 Non-species specific aquaculture production reported in 2000.....................81
Figure 3.7 The contribution of world’s Aquatic Production to their nation in 1996 ......82
Figure 3.8 Maps of Central Java aquaculture region ......................................................86
Figure 4.1 Conceptual Framework................................................................................100
Figure 4.2 Research approach .......................................................................................108
Figure 5.1 Scree Plot for endogenous and exogenous factors that influence income
improvement ................................................................................................134
Figure 5.2 Scree Plot for endogenous / exogenous factor that influence product
sustainability ...............................................................................................138
Figure 5.3 Scree Plot for constraints and problems that influence income improvement
.......................................................................................................................................142
Figure 5.4 Scree Plot for constraints and problems that influence product sustainability
.......................................................................................................................................146
Figure 7.1 Result of data reduction for endogenous and exogenous factors that
influenced income improvement.................................................................188
Figure 7.2 Factors that influenced income improvement..............................................190
xv
Figure 7.3 Result of data reduction for endogenous and exogenous factors that
influenced product sustainability ................................................................192
Figure 7.4 Endogenous and exogenous factors that influenced product sustainability
activities .......................................................................................................195
Figure 7.5 Result of data reduction for constraints and problems that influenced income
improvement ...............................................................................................200
Figure 7.6 Constraints and problems that influenced income improvement ................201
Figure 7.7 Result of data reduction for constraints and problems that influenced product
sustainability ...............................................................................................204
Figure 7.8 Constraints and problems that influenced product sustainability activities.205
Figure 7.9 Percentage of implemented entrepreneurial activities by small scale fish
farmers in Central Java.................................................................................209
Figure 7.10 Comparison between awardees and non awardees in implementing
entrepreneurial activities ............................................................................213
Figure 7.11 Proportional Comparison between awardees and non awardees in
implementing entrepreneurial activities....................................................214
Figure 7.12 Comparison between gender in implementing entrepreneurial activities..215
Figure 7.13 Proportional comparison between gender in implementing entrepreneurial
activities .....................................................................................................216
Figure 7.14 Comparison between age groups in implementing entrepreneurial activities
.......................................................................................................................................217
Figure 7.15 Proportional comparison between age groups in implementing
entrepreneurial activities ...........................................................................218
Figure 7.16 Comparison between marital status groups in implementing entrepreneurial
activities .....................................................................................................219
Figure 7.17 Proportional comparison between marital status groups in implementing
entrepreneurial activities ...........................................................................220
Figure 7.18 Comparison between different education levels in implementing
entrepreneurial activities ...........................................................................221
Figure 7.19 Proportional comparison between different education levels in
implementing entrepreneurial activities....................................................222
Figure 7.20 Comparison between different levels of FFGs in implementing
entrepreneurial activities ...........................................................................225

xvi
Figure 7.21 Proportional comparison between different levels of FFGs in implementing
entrepreneurial activities ............................................................................226
Figure 7.22 Comparison of reasons to become fish farmers in implementing
entrepreneurial activities, based on push and pull factors.........................228
Figure 7.23 Proportional comparison between reasons to become fish farmers in
implementing entrepreneurial activities....................................................229

xvii
Tables
Table 2.1 Small business and entrepreneurial business characteristics ..........................22
Table 2.2 Entrepreneurial characteristics and entrepreneurial activities ........................27
Table 2.3 Indonesian gelatine imports ............................................................................33
Table 2.4 Utilisation of gelatine in world’s food and non-food industry use .................33
Table 2.5 Gelatine user companies .................................................................................34
Table 3.1 The top ten aquaculture producers in the Asian region ..................................81
Table 4.1 Steps in the research process.........................................................................107
Table 4.2 Cross tabulation between awardees and non awardees and age ...................113
Table 4.3 Cross tabulation between awardees/non awardees and gender.....................114
Table 4.4 Cross tabulation between awardees/non awardees and marital status ..........114
Table 4.5 Cross tabulation between awardees/non awardees and their number of
children..........................................................................................................115
Table 4.6 Cross tabulation between awardees/non awardees and highest education ...116
Table 4.7 Cross tabulation between awardees/non awardees and business group........117
Table 4.8 Cross tabulation between awardees/non awardees and income....................118
Table 4.9 Cross tabulation between awardees/non awardees and land size .................118
Table 4.10 Cross tabulation between awardees/non awardees and number of employee
.......................................................................................................................................119
Table 4.11 Sources of questions for the questionnaire .............................................12020
Table 5.1 KMO and Bartlett’s Test results for endogenous and exogenous factors that
influence income improvement.....................................................................132
Table 5.2 Total variance explained for endogenous and exogenous factors that influence
income improvement when two factors are selected ....................................133
Table 5.3 Pattern Matrix(a) for endogenous and exogenous factors that influence income
improvement .................................................................................................135
Table 5.4 KMO and Bartlett’s Test for endogenous and exogenous factors that influence
product sustainability ....................................................................................137
Table 5.5 Total variance explained for endogenous and exogenous factors that influence
product sustainability ....................................................................................138
Table 5.6 Pattern Matrix(a) for endogenous and exogenous factors that influence product
sustainability ................................................................................................139

xviii
Table 5.7 KMO and Bartlett’s Test results for constraints and problems that influence
income improvement.....................................................................................141
Table 5.8 Total variance explained for constraints and problems that influence income
improvement .................................................................................................142
Table 5.9 Pattern Matrix(a) for constraints and problems that influence income
improvement .................................................................................................143
Table 5.10 KMO and Bartlett’s Test for constraints and problems that influenceproduct
sustainability ................................................................................................145
Table 5.11 Total variance explained for constraints and problems that influence product
sustainability ...............................................................................................145
Table 5.12 Pattern Matrix(a) for constraints and problems that influence product
sustainability ...............................................................................................147
Table 5.13 Cronbach’s Alpha test of scales ..................................................................149
Table 5.14 Pearson’s correlation of the scales ..............................................................150
Table 6.1 Frequency table for income...........................................................................156
Table 6.2 Omnibus Tests of Model Coefficients for endogenous and exogenous factors
that influence income improvement..............................................................156
Table 6.3 Variables in the equation for endogenous and exogenous factors that influence
income improvement....................................................................................156
Table 6.4 Frequency of product sustainability activities ..............................................157
Table 6.5 Omnibus Tests of Model Coefficients for endogenous and exogenous factors
influencing product sustainability by checking water quality.......................158
Table 6.6 Variables in the equation for endogenous and exogenous factors influencing
product sustainability through checking water quality .................................158
Table 6.7 Omnibus Tests of Model Coefficients for endogenous and exogenous factors
influencing product sustainability by giving feed at the right quantity and time
.......................................................................................................................................159
Table 6.8 Variables in the equation for endogenous and exogenous factors influencing
product sustainability by giving feed at the right quantity and time.............159
Table 6.9 Omnibus Tests of Model Coefficients for endogenous and exogenous factors
influencing product sustainability by maintaining fish feed quality and
availability....................................................................................................160
Table 6.10 Variables in the equation for endogenous and exogenous factors influencing
product sustainability by maintaining fish feed quality and availability ....160

xix
Table 6.11 Omnibus Tests of Model Coefficients for endogenous and exogenous factors
influencing product sustainability by maintaining fish seed quality and
availability..................................................................................................161
Table 6.12 Variables in the Equation for endogenous and exogenous factors influencing
product sustainability by maintaining fish seed quality and availability ....161
Table 6.13 Significant effect of endogenous and exogenous factors............................162
Table 6.14 Omnibus Tests of Model Coefficients for constraints and problems
influencing income improvement ...............................................................163
Table 6.15 Variables in the Equation for constraints and problems influencing income
improvement ...............................................................................................163
Table 6.16 Omnibus Tests of Model Coefficients for constraints and problems
influencing product sustainability through checking water quality ............164
Table 6.17 Variables in the Equation for constraints and problems influencing product
sustainability through checking water quality.............................................164
Table 6.18 Omnibus Tests of Model Coefficients for constraints and problems
influencing product sustainability through giving feed at the right quantity
and time.......................................................................................................165
Table 6.19 Variables in the Equation for constraints and problems influencing product
sustainability through giving feed at the right quantity and time................165
Table 6.20 Omnibus Tests of Model Coefficients for constraints and problems
influencing product sustainability through managing fish feed quality and
availability..................................................................................................166
Table 6.21 Variables in the Equation for constraints and problems influencing product
sustainability through managing fish feed quality and availability ............166
Table 6.22 Omnibus Tests of Model Coefficients for constraints and problems
influencing product sustainability through managing fish seed quality and
availability...................................................................................................167
Table 6.23 Variables in the Equation for constraints and problems influencing product
sustainability by managing fish seed quality and availability.....................167
Table 6.24 Significant effect of constraints and problems to income and product
sustainability ...............................................................................................167
Table 6.25 Implemented entrepreneurial activities according to percentage................168
Table 6.26 Frequency of implemented entrepreneurial activity ...................................169
Table 6.27 Frequency and percentage of answer option...............................................170

xx
Table 6.28 Frequency between awardees and non-awardees........................................171
Table 6.29 Relationship of awardees/non awardees to entrepreneurial activities ........171
Table 6.30 Frequency between gender..........................................................................172
Table 6.31 Relationship of gender to entrepreneurial activities ...................................172
Table 6.32 Frequency between ages .............................................................................173
Table 6.33 Relationship of age to entrepreneurial activities.........................................173
Table 6.34 Frequency of marital status .........................................................................174
Table 6.35 Relationship of marital status to entrepreneurial activities.........................174
Table 6.36 Frequency between highest education ........................................................175
Table 6.37 Relationship of education level to entrepreneurial activities ......................176
Table 6.38 Frequency of Fish farmer groups ................................................................177
Table 6.39 Relationship of fish farmer groups to entrepreneurial activities.................177
Table 6.40 Frequency in reason to become fish farmers ..............................................178
Table 6.41 Relationship of reasons to become fish farmer to entrepreneurial activities
.......................................................................................................................................179
Table 6.42 Summary of significant effect of implemented entrepreneurial activities
between different groups of fish farmer community...................................180
Table 8.1 Research objective and acceptance/rejection of related hypotheses.............260

1
Chapter 1
Introduction
1.1 Introduction
In a developed country, where most of its people are highly educated, almost every
business has planning, organising, and controlling functions. But, in developing
countries, like Indonesia, where most people have lower levels of education, things are
different: business people may not know about business planning, organising, or
controlling. Undoubtedly though, many business owners in Indonesia are still
successful, including those owners of fish farming businesses. The global aquaculture
industry is experiencing growth, and in Indonesia many resources are available for the
industry to achieve its maximum potential. This raises questions about how these people
achieve success, and the factors that contribute to their success. This research explores
the factors that the small-scale fish farmers in Central Java, Indonesia, regard as
important to achieve success. This research also examines the constraints and problems
that influence fish farmers’ income improvement and product sustainability, as well as
their entrepreneurial activities.
According to Erondu and Anyanwu (2005), fish farming is one of the worlds fastest
growing industries, and fish is becoming the fastest developing food produce in the
world. The importance of aquaculture as a world fish supply has been widely
acknowledged due to the sharp declines in the global fish harvest since the 1980s as a
result of overfishing in many parts of the world. This decline has created many new
problems such as the declining number of species that resulted in food web
simplification (Pauly et al. 2002) which has created a shortage of several fish species
and has decreased fish stock supply around the globe. Furthermore, the human
population has continued to grow each year and this has contributed to the increase in
demand for fish stock (Poor countries will dominate world fish production 2003;
Edwards et al. 1996; Ministry of Marine Affairs and Fisheries 2005).
2
To sufficiently provide for the global fish demand, aquaculture has become an
important option to address the shortage of fish stock. Aquaculture has grown
tremendously over the past few decades (Naylor et al. 2000). Jia et al. (2000, p. 9)
explained that “over the past three decades, aquaculture has developed to become the
fastest growing food production sector in the world; it has expanded, diversified,
intensified and technologically advanced”. This statement clearly gives support to the
view that aquaculture is now becoming the number one source of fish supply in the
world and that it is developing constantly. It shows that the prospects for aquaculture
are bright, especially for developing countries in the Asian region.
In coming years, the increasing population in developing countries will not only
produce and consume fish, but will also trade them to fulfil world fish demand.
According to Poor countries will dominate world fish production (2003) in coming
years the majority of fish supplies from aquaculture industry will come from developing
countries; in the future, 77 per cent of fish consumption and 79 per cent of world fish
production will take place in developing countries. This has emerged as the result of the
large population growth in developing countries, and therefore also the rise in demand
for fish. Asia is responsible for most of the world’s fish supply as it provides 63 per cent
of world fish production with 90 per cent from fish farming (Briones, Dey & Ahmed
2004). Indonesia is among the world’s top ten fish producers and is the third largest in
the aquaculture industry after China and India (Suara Pembaruan 2005). With the
increasing global demand for fish, it is not surprising that the aquaculture industry
around the world is also growing significantly, including in Indonesia where small-scale
fish farmers are the predominant players.
Owning a fish farming business is different to operating other small business or other
manufacturing-based businesses because fish farming businesses look after live animals
that live in an aquatic environment. Therefore, besides mastering the skills of business,
a fish farmer should also master technical fish farming skills, which include water
management and fish disease handling. Without adequate water management and fish
disease handling skills, fish farmers can lose their whole fish harvest. Furthermore, if
the mismanagement or mishandling re-occurs, it can lead to business closure.

3
Financial planning is also an important business skill for fish farmers. Each fish farming
season has a duration of several months, from the time fish seeds are introduced into the
grow-out pond until harvest time. Therefore, fish farmers must carefully calculate their
financial capital for the whole season in advance. And then they must wait till the end of
the season to first sell their produce before they can collect the profit. In spite of the
complexity of this financial planning, many small-scale fish farmers in Indonesia
manage this type of business successfully.
Given the aquaculture potential and the complexities of fish farming as a business, the
researcher considers it worthwhile to explore how fish farmers in a developing country,
like Indonesia, achieve income improvement and product sustainability. As the majority
of the players in the Indonesian fish farming industry come from the lower education
strata, it is also economically justifiable to explore and analyse the small-scale fish
farmers’ opinions and views about the constraints and problems affecting them and their
businesses, and the entrepreneurial activities they conduct.
1.2 Background to the study
The aquaculture activities in Indonesia have grown in the past few decades. According
to FAO (2008), the fish farming activities in Indonesia have increased approximately
8.5 per cent per year. Figure 1.1 shows the aquaculture growth in Indonesia from 1950
to 2006.
Figure 1.1 Reported aquaculture production in Indonesia (1950-2006)
Source: FAO (2008)
http://www.fao.org/fishery/countrysector/naso_indonesia

4
Figure 1.1 shows that significant growth began to form around the 1980s and there is a
big jump in aquaculture production in 2005. The increase in the Indonesian aquaculture
industry is due to developments in technology, the availability of better quality of fish
seeds, and the development of the fish farming area (FAO 2008). In addition, this
increase is also the result of the trawl fishing ban in 1980 and the government’s priority
to develop the Indonesian aquaculture industry.
As a country, Indonesia has many benefits to support the aquaculture industry and it has
great scope to maximise this potential. In fact, according to the report from ADB
(2003), Indonesia uses less than 3 per cent of its total potential aquaculture area. FAO
(2008) also claimed that Indonesia have only used 0.03 per cent of its marine culture
potential, 39.9 per cent of the brackish water, and 11.22 per cent of the freshwater
aquaculture potential. Therefore, Indonesia shows great potential to widely expand its
fish farming industry.
The aquaculture industry in Central Java is also experiencing an increase with huge
potential for more still available. Its fish farming production has increased by 7.49 per
cent per year, in the report year 2002-2004 (Central Java Fisheries and Marine Affairs
Office 2005). Moreover, the potential area for aquaculture in Central Java is 293
thousand hectares with less than 46 thousand hectares currently being exploited. Human
capital also contributes to supporting the aquaculture industry in Indonesia. By 15th
June 2008, the total number of Indonesian population has reached more than 227.5
million people (Indonesian Statistical data 2008). Therefore, there is huge potential for
further aquaculture development in Central Java.
So, despite having the potential aquaculture resources and the human capital to develop
the resources, Indonesia has not yet been able to maximise its fish farming industry.
This may be caused by the internal weaknesses of small-scale fish farmers’ businesses,
or by a lack of external support by the Indonesian government or other institutions. Four
constraints and problems faced by small-scale fish farmers were recognised: (1) lack of
knowledge, skills, and experience, (2) lack of quality fish seed, (3) lack of capital, and
(4) a lack of support from Government agencies (Das 2006; Practical Action n.d.).
Other authors have identified problems such as lack of market opportunity and the low
input supply (De la Cotera 2001), and marketing (Nurdjana 2006). Many fish farmers
5
depend on middlemen to buy and market their produce. Besides marketing their
produce, these middlemen often also act as moneylenders to provide funding or credit to
fish farmers who are unable to secure sufficient capital from the banks or cooperatives.
This gives the moneylenders the ability to set the price they pay for the farmer’s
produce (Nurdjana 2006). This reduces the fish farmers’ ability to sell their produce
freely since they are bound to the moneylender (Kinseng 2005). In some cases
moneylenders may force farmers to sell their produce at a very low price. These
constraints and problems may only be part of the issues that influence the income
improvement and product sustainability of the fish farming business. Small-scale fish
farmers may have to manage other factors that influence their success.
1.3 Rationale of the study
Indonesia is the largest archipelago in the world, possessing more than 17,000 large and
small island (Asianinfo 2000) comprising 81,000 km of coastline (Nurdjana 2006) with
2.5 million fish farmers across the country (ADB 2006). It also has a geophysical
environment conducive to aquaculture, such as a stable tropical temperature all year
through, surrounded by smaller islands that provide shelter, and geographically located
close to potential markets (Nurdjana 2006). With all of these strengths, there is no
question that Indonesian aquaculture industry has great potential for future growth.
The Indonesian government has supported the fisheries industry in many ways. One of
the significant supports was provided through the formation of the Department of
Marine Affairs and Fisheries in 2000 (Department of Marine Affairs and Fisheries
2008) to provide support to the fish farmer groups (FFGs). Fish farmers in Indonesia
usually belong to their village’s locally formed FFG. It is most often the head of the
village who initiates the formation of the FFG which is then officially certified by local
Fisheries Office. The members of the FFG are fish farmers who are located in the same
village, who carry out similar fish farming activities, and have similar needs. Annually,
the regional government organises a regional fish farming competition between FFGs to
encourage their activities by awarding them with prize money and certificates. The
winner of the competition is decided on social, technical, and economic criteria. It is
expected that through the formation of an FFG the livelihoods of the FFG members are
increased (Semarang Marine Affairs and Fisheries Office 2005).

6
Despite having an abundance of natural resources, the available human capital, and
government support, Indonesian aquaculture has yet to reach its maximum production.
The main problem may be in the quality of the human resources. The number of fish
farmers exceeds 2.5 million and small-scale fisheries or backyard aquaculture industries
dominate the industry (Central Java Fisheries and Marine Office 2005). Previous
research have reported that the predominant small-scale fish farming conditions with
lack of access to good quality fish seed and poor farming systems is restraining the
growth of the industry. It also causes environmental degradation and pollution in the
area of operations (ADB 2006). Problems like financial limitations, lack of marketing
strategies, and other constraints are also holding back the fish farmers’ business
expansion. These problems are only part of the possible restrictions faced by Indonesian
fish farmers. They may also have internal constraints that prevent them from achieving
more.
Income improvement and product sustainability are two aspects that are important for
fish farming in Central Java and have been selected as the indicators for this research.
Income improvement is selected as an indicator for this research because income is an
important constraint for every living person. And for the small-scale fish farmer in
Indonesia income is even more important, since their daily income has to support their
daily needs for food, education, health care, and so on. It is therefore very important to
determine if their fish farming businesses are able to deliver income improvement for
the fish farmers.
Product sustainability is selected as an important indicator for this research based on the
results of past studies. Past reports and research have found that, although aquaculture is
considered as a reliable activity in generating fish supply, it has also created new
problems. Science Daily (1998) claimed that aquaculture is the cause of environmental
destruction and is using huge quantity of wild fish for “fish food”. A similar report by
Pauly et al. (2002) has claimed that current aquaculture is unsustainable since it
adversely affects the environment by contributing to pollution and fish disease outbreak.
The Indonesian government is trying to implement sustainable aquaculture by
introducing an “eco-friendly production process” (Sukadi 2006) because many
aquaculture activities have resulted in environmental degradation. For example, one of
the major unsustainable aquaculture problems in Central Java was shrimp production.

7
Elfitasari (2006) explained that shrimp culture in Central Java in the 1970s increased
rapidly due to the high export demand. Unfortunately, sustainable fish farming
management did not accompany the increase in shrimp production. Many mangrove
forests were removed to provide production space for the shrimp culture and this
eventually resulted in the deterioration of the ecosystem.
This research explored the possible factors as well as constraints and problems that the
small-scale fish farmers in Central Java regard as influencing them in achieve income
improvement and product sustainability. Two factors influence fish farmers’ business
outcomes and activities: endogenous and exogenous factors (Bouchiki 1993). This is
explained in greater detail in the literature review chapter. According to Bouchikhi
exogenous factors come from the entrepreneur’s environment (both sociological and
economic factors), and endogenous factors are those related to the personality and
strategy of the entrepreneur.
However, in spite of having limited capitals and income, some fish farmers in Indonesia
are very active and through their fish farming groups have achieved regional and
national awards from the fisheries sector. This research also explores how these fish
farming groups can become so much more successful than other fish farmer groups.
Through a questionnaire distributed to the individual fish farmers, the opinions of fish
farmers will provide a more detailed description of how they value their own
weaknesses and strengths, and what factors they regard as having the most influence on
their business success.
In their attempt to achieve income improvement and product sustainability, fish farmers
carry out entrepreneurial activities. Previous studies of entrepreneurial activities of
small-scale businesses focused on industrial based business, while the few studies of
small-scale fish farming have mainly concentrated on the methodological and
technological aspects of fish farming. Therefore, this research examined entrepreneurial
activities of small-scale fish farmers in Central Java and compared the implementation
methods between the FFGs. The present research will fill the gap in research of small-
scale fish farmers’ activities in their attempt to derive income improvement and product
sustainability in Central Java, Indonesia.

8
The entrepreneurial activities of small-scale fish farmers in Central Java were explored
by asking participants to choose from a list the entrepreneurial activities that they had
implemented. The list of activities included activities such as fish feed production, fish
seed production, market extension, fish species extension, product range extension
(adding value), and utilisation of other fish parts. Also, the ways in which different
groups of fish farmers implemented these activities were surveyed and compared. These
groups included recipients (awardees) and non-recipients (non-awardees) of government
awards, members of different ages, gender, educational levels, marital statuses, level of
FFGs, and their reasons for become fish farmers.
In summary, this research analysed the endogenous and exogenous factors, as well as
constraints and problems faced by fish farmers. In addition, the entrepreneurial
activities implemented by small-scale fish farmers were identified, and compared
between different fish farmers groups. This research provides recommendations
regarding the endogenous and exogenous factors, as well as constraints and problems
that influence income improvement and product sustainability. Recommendations are
also made regarding the entrepreneurial activities that can be implemented in other
provinces to assist small-scale fish farmers to improve their income and product
sustainability.
1.4 Objectives of the study
This research has five objectives:
1. Identify the endogenous and exogenous factors that small-scale fish farmers regard
as influencing their income improvement and product sustainability.
2. Identify the constraints and problems that small-scale fish farmers regard as
influencing their income improvement and product sustainability.
3. Identify and describe various aspects of the entrepreneurial activities of small-scale
fish farmers in Central Java, Indonesia.
4. Compare the entrepreneurial activities implementation of small scale fish farmers
with different demographic background.
5. Develop recommendations for the aquaculture and fisheries industry, government,
educational institutions, and research communities in Indonesia on aspects that may

9
contribute to the success of small-scale fish farmers in obtaining their income
improvement and product sustainability.
1.5 Benefits of the study
This study contributes new knowledge of the entrepreneurial activities of small-scale
fish farmers. Many previous studies have been carried out regarding small-scale fish
farmers. This research is the first to contribute to a more detailed understanding of fish
farmers’ entrepreneurial activities, and the factors that influence them in carrying out
their fish farming activities in order to derive their income improvement and product
sustainability.
This research also contributes information to the aquaculture industry, the small-scale
fish farmer, government/related institutions, and students and researchers who wish to
carry out similar research.
For the aquaculture industry, this research contributes by:
• providing new information regarding small-scale fish farmer entrepreneurial
activities in Central Java, Indonesia,
• providing information on problems and constraints that are faced by small-scale fish
farmers in Central Java, Indonesia,
• providing information regarding the endogenous and exogenous factors that
influence small-scale fish farmer entrepreneurial activities in Central Java,
Indonesia,
• providing recommendations to the industry on how to help and support fish farmers
in deriving their income improvement and product sustainability, through
supporting their entrepreneurial activities, and
• providing information on the different groups of fish farmers in implementing
entrepreneurial activities.
For the small-scale fish farmers, the results of this study are hoped to:
• provide a better understanding of how to derive income improvement and product
sustainability,
10
• provide ideas on how to rapidly expand their business through innovative
entrepreneurial activities,
• help change the way they value themselves, so they will have confidence to achieve
more in their businesses and improve their income, and
• increase their awareness of the importance of sustainable fish farming.
For the government and related institutions, the results of this research are intended to:
• give them information on what is needed to achieve small-scale fish farmer income
improvement and product sustainability,
• encourage them to act more to rapidly implement a sustainable aquaculture in
Indonesia,
• provide them with the information about the kinds of support small-scale fish
farmers report that they need,
• provide ideas on how to increase small-scale fish farmers’ entrepreneurial activities
in order to support them in their income improvement and product sustainability ,
and
• provide ideas of what to prioritise in order to overcome poverty in the small-scale
fish farmer community.
For students and researchers who wish to carry out similar research, this study:
• provides additional information needed for their research,
• provides information and better understanding regarding small-scale fish farmer
entrepreneurial activities in Central Java, Indonesia,
• provides information concerning the problems and constraints faced by the small-
scale fish farmers in Central Java, Indonesia,
• provides information about the endogenous and exogenous factors of the small-scale
fish farmer that either support or obstruct them from carrying out their activities,
and
• provides information on the importance of income improvement and product
sustainability for small-scale fish farmer in Central Java, Indonesia.

11
1.6 Scope of the study
This research explores the fisheries industry in Central Java, Indonesia, focussing on the
small-scale fish farmers. The research investigates the possible aquaculture
entrepreneurial activities that have been carried out by these fish farmers. The
questionnaire used in the research asked farmers about possible entrepreneurial
activities that they have implemented such as fish feed production, fish seed production,
market extension, and so on. This study also gathered demographic data concerning
farmers’ personal and business information. This data was used to compare how groups
of fish farmers with different demographic background carried out their entrepreneurial
activities. Any additional information presented in the discussion section of this
document, which correlated with other provinces in Indonesia, was used as a standard
guide to execute and support the interpretation of data analysis.
This research also tries to reveal major problems and constraints that emerge and
obstruct the small-scale fish farmers from obtaining income improvement and product
sustainability. The individual fish farmers were surveyed for their opinions about the
problems and constraints they regard as having greatest influence on their attempts to
derive their income improvement and product sustainability. The information obtained
are analysed to search for any possible reasons to why fish farmers in Central Java have
remained in a vulnerable situation in spite of assistance from the government and other
domestic and international institutions to support their businesses.
The questionnaires for this research were distributed to two major groups. The first
group (awardees) consisted of the individual fish farmers of Fish Farming Groups that
have received Central Java regional awards within the past five years. The second group
(non-awardees) consisted of individual fish farmers of Fish Farming Groups that have
not received any Central Java regional awards in the past five years. The aim with the
two research groups was to compare and analyse for significantly different views,
strengths, and abilities between members of the two groups.
1.7 Limitations of the study
This study investigates the small-scale fish farmers’ business point of view; therefore,
this research is limited to the business side of fish farming. The scientific and technical
side of fish farming are not be discussed nor analysed. Although some data are derived

12
from technical questions they are only used as guidance during the analysis and
interpretation of data.
1.8 Structure of the study
The study comprise of eight chapters:
Chapter 1. Introduction
This chapter explains the basic development of the conceptual framework of the
thesis. It discusses the key concepts such as the thesis background, rationale,
objectives, benefits, scope, and limitations.
Chapter 2. Literature Review
The literature review chapter reviews existing literature that serve as the
fundamental conceptual framework in this thesis. It explains concepts of the
endogenous and exogenous factors, constraints and problems, and
entrepreneurial activities of small-scale fish farmers.
Chapter 3. The aquaculture industry
This chapter discusses the development of the aquaculture industry. It contains
information on the development of the world’s aquaculture industry. It also
describes the development of this industry in Indonesia and Central Java,
Indonesia.
Chapter 4. Conceptual framework and research methodology
The fourth chapter of this thesis provides an explanation of the formation of the
conceptual framework and methodology of this research. It also provides
information of the research hypothesis, the respondents’ personal and business
characteristics, as well as the data collection and analyses steps.
Chapter 5. Preliminary analysis
This chapter provides the preliminary analysis of the data. It explains the results
of the exploratory factor analysis that collapses numerous variables into a
smaller number of meaningful factors. It creates factors for the endogenous and

13
exogenous variables that influence income improvement and product
sustainability.
This chapter also shows the Cronbach’s alpha reliability test result to examine
the reliability of the scales developed, and the Pearson correlation analysis result
to observe the relationships between scales.
Chapter 6. Data analysis – findings and interpretation
The analysis in this chapter is divided into four sections aligned with the
research objectives. These sections are:
• The effect of endogenous and exogenous factors on income improvement and
product sustainability (associated with objective # 1).
• The effects of constraints and problems on income improvement and product
sustainability (associated with objective # 2).
• Entrepreneurial activities that have been implemented by small-scale fish farmers in
Central Java (associated with research objective # 3)
• Comparison between small scale fish farmers with different demographic
background in implementing entrepreneurial activities (associated with objective #
4)
Description analysis, chi-square test and binary logistic regression analyses are
used to address these research objectives.
Chapter 7. Discussion
This chapter examines the results found in chapter 5 and 6. It discusses the four
parts of the thesis:
• Endogenous and exogenous factors that influence income improvement and product
sustainability.
• Constraints and problems that influence income improvement and product
sustainability.
• Implemented entrepreneurial activities in Central Java.

14
• Compare small scale fish farmers with different demographic background in
implementing entrepreneurial activities.
Chapter 8. Conclusions and recommendations
This final chapter presents the conclusions of the thesis’ objectives. It also
makes recommendations for the aquaculture and fisheries industries and related
institutions.
1.9 Conclusion
The depletion of global fish stocks has turned aquaculture into the fastest growing food
industry in the world. This development is also evident in Indonesia: the Indonesian
industry continues to grow each year. Indonesia’s geographical location and
topographical conditions also supports the aquaculture industry, increasing its potential
even more compared to other countries. The large numbers of human resources also
supports Indonesia’s ability to establish a potential aquaculture industry.
In carrying out their activities, small-scale fish farmers implement entrepreneurial
activities. In this research these activities are identified and include fish seed production,
fish feed production, market extension, product range extension, fish species extension,
and utilisation of other fish parts.
In their attempt to derive income improvement and product sustainability, small-scale
fish farmers may experience obstacles and difficulties. There are many factors that
influence small-scale fish farmers’ income improvement and product sustainability. In
this research these factors are divided into endogenous factors, exogenous factors,
constraints, and problems.
There are five objectives developed in this research: (1) identify endogenous and
exogenous factors, (2) identify the constraints and problems, (3) describe various
aspects of the entrepreneurial activities, (4) Compare the entrepreneurial activities
implementation of small scale fish farmers with different demographic background and
(5) develop recommendations, for aquaculture / fisheries industry and related
institutions.

15
Chapter 2
Literature Review
2.1 Introduction
Farming is a different type of business compared to other small businesses or
manufacturing businesses. This is because the farming business includes taking care of
live animals, which, if managed incorrectly, may result in business closure. Not only
does the farming business need business knowledge, skills and experience, the farming
entrepreneur also needs strong farming knowledge, skills and experience. This is
especially true for fish farming: the fish farmer entrepreneur needs advanced knowledge
and skills. Taking care of fish is much more difficult than farming cattle: fish farming
requires additional skills in water management, knowledge of fish diseases and
parasites, as well as fish rearing skills. The task is made difficult because fish live in a
water environment where, by the time disease is detected, it may already have spread
throughout the whole pond leading to total fish mortality and a complete harvest failure.
This makes water quality management an essential element of the fish farming business.
To make things even more difficult, fish farmers also need to plan their operational
capital months in advanced. Fish farmers need to rear their fish for two or more months
before they can sell their harvest and collect an income. Therefore, the initial
operational capital needs to include the operational cost for the whole fish rearing
season.
In carrying out fish farming activities, small scale fish farmers in Central Java encounter
problems and constraints that hinder their fish farming activities. Each fish farmer
approaches these problems and constraints differently in accordance with endogenous
and exogenous factors that occur within their domain of business activity. As well, these
endogenous and exogenous factors impede each fish farmer’s ability to carry out their
entrepreneurial activities.
The entrepreneurial activities that fish farmers engage in have been identified as, but not
limited to: fish feed production, fish seed production, fish species extension (poly-
culture system), market extension, product range extension (adding value to product),
and utilisation of other fish parts. The entrepreneurial activities implemented by small

16
scale fish farmers in Central Java influence the actions they take in their attempts to
improve their income and ensure their product sustainability.
2.2 Entrepreneurship, the entrepreneur and entrepreneurial activities
This section examines entrepreneurship as a discipline, the entrepreneur as the person
who runs the business, and entrepreneurial activities as the actions carried out by fish
farmers.
2.2.1 Entrepreneurship and the entrepreneur
Entrepreneurship
Entrepreneurship is a complex area of research since it involves many domains
of knowledge. As defined by Shane and Venkataraman “entrepreneurship
involves the study of (a) the source of opportunities, (b) the processes of
discovery, (c) evaluation and taking advantage of the opportunities as well as (d)
the group of individuals who discover, evaluate and exploit these opportunities”
(Shane & Venkataraman cited in Ulhoi 2005, p. 939). Entrepreneurship can also
be defined as a process that appears in any type or size of business venture and
depends on specific personal characteristics (Morris & Lewis 1995). This
definition of entrepreneurship emphasises the effort of the entrepreneur in
turning his or her innovative ideas into a successful business. The definition of
entrepreneurship is often associated with the growth process of a business; the
growth of a business can either be slow or fast depending on the business
entrepreneur. Morris and Lewis (1995) believed that the determination of this
entrepreneurship process depends on two questions: “how much?” and “how
often?”.
Figure 2.1 shows Morris and Lewis’s (1995) determinants of entrepreneurial
activity according to how much and how often entrepreneurship events occur. In
the graph the vertical axis represents the “how much” determinant as measured
by the number of entrepreneurship events that occur. The horizontal axis
represents the “how often” determinant as measured by the degree of
entrepreneurship (whether the events are innovative, risky, or proactive). Morris
and Lewis developed five scenarios from the combination of these two
entrepreneurship determinants: periodic/incremental, periodic/discontinuous,
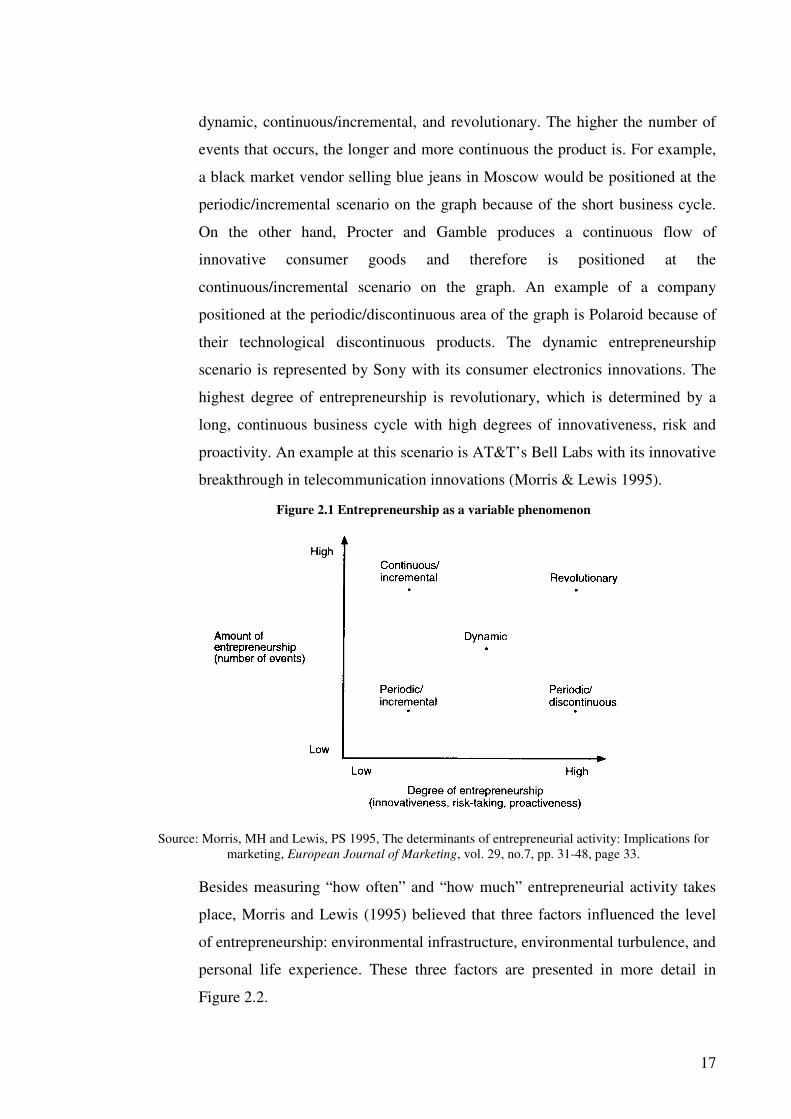
17
dynamic, continuous/incremental, and revolutionary. The higher the number of
events that occurs, the longer and more continuous the product is. For example,
a black market vendor selling blue jeans in Moscow would be positioned at the
periodic/incremental scenario on the graph because of the short business cycle.
On the other hand, Procter and Gamble produces a continuous flow of
innovative consumer goods and therefore is positioned at the
continuous/incremental scenario on the graph. An example of a company
positioned at the periodic/discontinuous area of the graph is Polaroid because of
their technological discontinuous products. The dynamic entrepreneurship
scenario is represented by Sony with its consumer electronics innovations. The
highest degree of entrepreneurship is revolutionary, which is determined by a
long, continuous business cycle with high degrees of innovativeness, risk and
proactivity. An example at this scenario is AT&T’s Bell Labs with its innovative
breakthrough in telecommunication innovations (Morris & Lewis 1995).
Figure 2.1 Entrepreneurship as a variable phenomenon
Source: Morris, MH and Lewis, PS 1995, The determinants of entrepreneurial activity: Implications for
marketing, European Journal of Marketing, vol. 29, no.7, pp. 31-48, page 33.
Besides measuring “how often” and “how much” entrepreneurial activity takes
place, Morris and Lewis (1995) believed that three factors influenced the level
of entrepreneurship: environmental infrastructure, environmental turbulence, and
personal life experience. These three factors are presented in more detail in
Figure 2.2.

18
Figure 2.2 Proposed relationships between environmental factors and levels of entrepreneurship present in society
Source: Morris, MH and Lewis, PS 1995, The determinants of entrepreneurial activity: Implications for
marketing, European Journal of Marketing, vol. 29, no.7, pp. 31-48, page 41.
The environmental infrastructure consists of six structures: economic, political,
legal, financial, logistical and social aspects. Figure 2.2 shows that more free
enterprise, more democracy, more limited liability, more competitiveness, more
well developed logistics, and more individualism will likely lead to increases in
the level of entrepreneurship.
The same can be said for environmental turbulence which includes the
technological, economic, customer, competitor, legal, resource, and social
environment: environmental turbulence also plays a big role in determining the
level of entrepreneurship. The more an environment is unstable, the higher the
level of entrepreneurship that will develop. Similarly the life experiences such as

19
family, education, peer group, and job experience also influence the level of
entrepreneurship. Job dissatisfaction and creative educational experiences will
encourage entrepreneurship to emerge.
However, Morris and Lewis (1995) warned that although the relationships in
Figure 2.2 seem linear, this may not always be the case. For example,
environmental turbulence will determine the level of entrepreneurship. More
turbulence will encourage a higher level of entrepreneurship; nevertheless, too
much turbulence will actually discourage entrepreneurship. In fact it is difficult
to successfully implement new innovations under extreme levels of
environmental turbulence. Likewise, for financial or logistical infrastructure, if
these are underdeveloped then it will discourage entrepreneurship. Even an
overdeveloped financial or logistical infrastructure can also discourage
entrepreneurship.
The entrepreneur
There are distinct differences between the entrepreneur and the small business
owner: although an entrepreneur and a small business owner have many
characteristics in common, an entrepreneur is believed to expand beyond the
small business owner. According to Littunen (2000), successful entrepreneurs
are characterised as: taking risk, innovating, possessing market awareness,
having production knowledge, possessing marketing skills, having business
management skills, being able to cooperate, having a sense of business,
competently recognising and grabbing opportunities, and being proficient at
adjusting efficiently to failures.
Carland et al. (1984) also believed that small business owners differed from
entrepreneurs and that small business ventures differed from entrepreneurial
businesses. Entrepreneurial businesses were identified by Carland et al. (1984)
as having the following characteristics:
• innovating new product,
• innovating new means of manufacturing,
• expanding market distribution,
• expanding supplier resources, and
20
• reorganising the industry.
These entrepreneurial business characteristics can be recognised in the fish
farming businesses of Central Java. The characteristic of innovating new
products can be recognised in the way fish farmers create new products by
selling their harvest in forms other than fresh fish. Fish farmers can sell their
produce as frozen, dried, smoked, or fermented fish (Heruwati 2002). Fish
farmers who are more creative will innovate to a greater extent to produce an
even wider range of products. For example, the members of one FFG in Central
Java turned catfish of lower quality into a variety of processed foods such as
shredded catfish, catfish crackers, catfish balls, and catfish nuggets (Suara
Merdeka 2007c). This group used the different parts of catfish such as the meat,
skin, and fins to make the catfish products. In addition to transforming the
catfish into processed food products, they also provided the consumer with
many choices of flavour such as a sweet, onion, or spicy flavour.
The characteristic of innovating new means of manufacturing would equate to
innovation of the fish farming method. One of the entrepreneurial innovations of
fish farming methods has been the adoption of a poly-culture system. A poly-
culture system is about cultivating more than one species of fish in the same
pond. The idea is to utilise the same space but at the same time not to create
food and space competition between the fish. This method of fish farming
combines fish with different feeding habits (Bocek 2008) to decrease the chance
of food rivalry but at the same time to enhance fish production. An example of a
poly-culture system is the combination of seaweed, shrimp, and milkfish. The
seaweed provides oxygen for the shrimp and milkfish while the pieces of
seaweed that drop to the bottom of the pond, including the algae that grow on
the seaweed, can be used by the shrimp and the milk fish for their feed.
Expanding market distribution is a very common business characteristic of fish
farmers. Fish farming market expansion comes from selling their products to
new fish markets, restaurants, hotels, or at other potential locations. Most often
the small scale fish farmers expand their markets after receiving information
regarding potential markets from their colleagues or other trusted sources. They
21
may not have the courage or ability to search for their own potential markets due
to the lack of capitals to invest in market extension.
The characteristic of expanding supplier resources may include finding
additional sources for their fish feed and fish seed supplies to their existing
suppliers. Fish farmers may need to find suppliers at times when they are
planning to expand their fish species, therefore, they will need suppliers that
produce fish seed of the species which they are planning to culture. Accordingly,
they will need to find new fish feed suppliers that can supply them with fish feed
suitable for their new fish species. Other supplier expansions may include
finding new manure suppliers and suppliers of fish farming related equipment.
The characteristic of reorganising the industry may happen when fish farming
responsibilities are shifted between the employees of the business. Since most
small scale fish farmers do not have large business organisations and therefore
often only employ their own family members in their fish farming business,
reorganisation will be in terms of shifting responsibilities between family
members. For example the wife who was previously in charge of feeding the
fish may be moved to fish processing, while feeding is done by another family
member. Business reorganisation helps to make sure that the most suitable
person is handling the tasks and that the business is managed more effectively
and efficiently.
The entrepreneurial characteristics just mentioned can lead new ventures to
achieve significant growth, which is the key distinguishing feature of
entrepreneurial ventures. Many new businesses will remain stagnant over the
years, but true entrepreneurial ventures will show remarkable growth over time
(Carland et al. 1984). Previous research showed that entrepreneurs tended to
have higher levels of motivation, set higher goals, and used more innovative
strategies.
Small business owners, on the other hand, mainly ran their businesses to fulfil
family needs, were interested in higher income only to support the family, and
tended to be less motivated to expand their businesses. Consequently, the small
business owner’s actions did not focus on company growth (Carland et al. 1984;

22
Stewart et al. 1998). Table 2.1 compares the characteristics of small businesses
and entrepreneurial ventures. It shows that small businesses do not take
innovative actions to develop the business and do not use strategic planning. On
the other hand, entrepreneurial ventures focus on business growth by taking
innovative actions and using strategic planning to increase profit and to establish
a bigger business.
Table 2.1 Small business and entrepreneurial business characteristics
Source Small Business Entrepreneurial Venture
Carland et al. (1984) • Start small and remain small
• Do not take innovative actions
• Do not seek new market
• Focus on income for family needs
• Do not use innovative planning
• Start small and rapidly grow
• Taking innovative actions
• Seeking new market
• Focus on profit and growth
• Use innovative planning
Stewart et al. (1998) • Lower in achievement motivation
• Lower in risk taking
• Low in innovation
• Focus goals for family income
• Do not use strategic planning
• Higher in achievement
• Higher in risk taking
• Higher in innovation
• Focus goals for profit and growth
• Use strategic planning
Source: Adapted from Carland, JW Hoy, F Boulton, WR, and Carland, JA 1984, Differentiating entrepreneurs from small business owners: a conceptualization, Academy of Management Review, vol. 9,
no. 2, pp. 354-359 and Stewart, WH Watson, WE Carland, JC Carland, JW 1998, A proclivity for entrepreneurship: a comparison of entrepreneurs, small business owners, and corporate managers, Journal
of Business Venturing, vol. 14, no. 2, pp. 189-214.
2.2.2 Entrepreneurial activities
What are entrepreneurial activities? The definition varies depending on the
reference consulted and is viewed from many different perspectives. Krause
(2003) defined entrepreneurial activity from a political perspective as the
capability of generate and apply new creative ideas in a political practice.
Uhlaner and Thurik (2007) defined entrepreneurial activity from a time period
perspective referring to people who had just started a business or who had been
managing a business for no more than 42 months. Another definition was given
by Jackson and Rodkey (1994) who defined entrepreneurial activity as all those
efforts made to grow small firms into big businesses. Although many definitions
of entrepreneurial activity have been proposed, entrepreneurial activity is always

23
concerned with the implementation of an idea as an effort to develop a business
to a higher level.
In the context of this research, entrepreneurial activity is viewed from an
aquaculture perspective, and is defined as the implementation of an idea to
improve aquaculture techniques, management, and product quality in order to
develop the aquaculture business so as to achieve income improvement and
product sustainability.
Morris and Lewis (1995) believed that there are three factors that influence the
level of entrepreneurial activity: environmental infrastructure, environmental
turbulence, and personal experience (see Figure 2.3). As shown in Figure 2.3,
the environmental infrastructure, environmental turbulence, and personal
environmental experiences of societal members influence the level of
entrepreneurial intensity in the society. A discussion of the three factors follows
Figure 2.3.

24
Figure 2.3 A model of the environmental context of entrepreneurship
Source: Morris, MH and Lewis, PS 1995, The determinants of entrepreneurial activity: Implications for marketing, European Journal of Marketing, vol. 29, no.7, pp. 31-48, page 36.
Environmental infrastructure
Environmental infrastructure factors consist of logistical, financial, economic,
political, legal, and social structures. Well developed infrastructure supports
entrepreneurial behaviours as it assists entrepreneurs in finding supplies and
markets. For small scale fish farmers who live in rural areas, well developed
infrastructures, such as roads and telecommunications, are crucial and can assist
small scale fish farmers in many ways. Developed road ways may help small
scale fish farmers in locating new suppliers, finding new information on
potential markets, having easy access to government offices, and attending
25
important training sessions, as well as delivering rapid market service and
adapting new methods and technologies (Morris & Lewis 1995).
Entrepreneurial activity is encouraged where the financial and economic systems
are more competitive in terms of source of capital and interest rates (Morris &
Lewis 1995). Entrepreneurial activity is also encouraged in a free competitive
market that provides more options to choose from and compare, and where there
are greater opportunities for starting a business. In a similar way to the financial
and economic systems, a free political system encourages the development of
new entrepreneurial businesses and increases the entrepreneurial intensity. As
Morris and Lewis described: “the political system fosters entrepreneurship when
it is built around freedom of choice, individual rights, democratic rule and a
series of checks and balances among the executive, legislative and judicial
branches of government” (Morris & Lewis 1995, p. 36).
Legal structures refer to the legal protection available to ventures such as permit
structures, contract enforcement, patent protection, and strong restrictions on
monopolistic trade practises. Such legal structures encourage the emergence of
new ventures since their rights are protected by legal systems.
Social structure is associated with network development. Morris and Lewis
explained that “social systems that facilitate the development of networks are
conducive to entrepreneurial activity. Social relationships provide forum for
entrepreneurs to share information, identify opportunities and marshal
resources” (Morris & Lewis 1995, p. 37).
Environmental turbulence
There are three conditions of environmental turbulence that can affect the
intensity of entrepreneurship in the society: dynamic, threatening, and complex.
These three conditions can develop from threats as well as opportunities. Fast
change in technology, the economy, customer needs, competition, and the legal
and social environments forces businesses to make innovative decisions. It has
been found that “the more dynamic, hostile and heterogenous the environment,
the higher the level of innovative, risk-taking and proactive behaviours” (Morris
& Lewis 1995, p. 38).

26
A key concept of environmental turbulence is change. Where there is a high
level of infrastructure change, entrepreneurial activity will also be higher. On the
other hand, in stable conditions where there are no changing environments to
deal with, there is no need to develop innovative and creative reactions.
Personal environmental experiences
The personal experiences that influence entrepreneurial intensity include
personal experiences within the family, educational, and work environment, and
contact with role models. Many researchers have observed a positive effect of
family on the emergence of entrepreneurship (Matthews & Moser 1996; Morris
& Lewis 1995). Entrepreneurs with a family business background are more
prepared for unexpected situations since they have previously been exposed to
the risks of business and they have a better understanding of the consequences
for the business. Entrepreneurs with a family business background are more alert
and ready for a downturn in business. Furthermore, a successful family business
will influence a person’s decision to become an entrepreneur (Scott & Twomey
1988; Wang & Wong 2004). It has been found that continuous business
demonstration encourages children to have their own business in the future
(Brown 1990).
Education has a large effect on business and self employment decisions (Morris
& Lewis 1995; Rees & Shah 1986; Robinson & Sexton 1994) since an education
provides the entrepreneur with the necessary skills to deal with unexpected
business situations. Educated entrepreneurs have a higher sense of confidence
and efficacy which enhance their ability to observe and pursue opportunities
(Robinson & Sexton 1994). Higher educated people also have the ability to seek
out more information about business opportunities.
Work related factors also impact entrepreneurial activity. Many people who are
dissatisfied with their work are forced to go into business (Amit & Muller 1995).
Reasons such as unemployment (being out of a job or struggling to find suitable
work) or dissatisfaction with a workplace will finally push a person to
establishing their own business. Morris and Lewis (1995) observed that the
majority of entrepreneurs (59%) are desperate to start a business before they
even know what product they are going to sell or produce, or what type of

27
service they want to provide. Despite the negative impact of job dissatisfaction,
Brockhaus (1980) found that greater experience of job dissatisfaction increased
the success of an entrepreneur.
2.3 Identification of small scale fish farmer entrepreneurial activities
The entrepreneurial business characteristics identified by Carland et al. (1984) include
five characteristics that differentiated entrepreneurial ventures from small businesses
and were described as innovating new product, innovating new means of
manufacturing, expanding market distribution, expanding supplier resources, and
reorganising the industry. Based on the two characteristics of taking innovative actions
and seeking new markets, this research elaborated six fish farming entrepreneurial
activities as shown in Table 2.2. Five entrepreneurial activities were developed as
innovative actions: fish feed production, fish seed production, fish species extension,
product range extension and utilisation of other fish parts. The sixth entrepreneurial
activity, market extension, was developed from the second entrepreneurial
characteristics identified by Carland namely seeking new market. These fish farming
entrepreneurial activities are discussed next.
Table 2.2 Entrepreneurial characteristics and entrepreneurial activities
Entrepreneurial characteristics
(Carland et al., 1984)
Entrepreneurial activities
in this research
1. Taking innovative action 1. Fish feed production
2. Fish seed production
3. Fish species extension
4. Product range extension
5. Utilisation of other fish part
2. Seeking new market 6. Market extension
Source: Adapted from Carland, JW Hoy, F Boulton, WR and Carland, JA 1984, Differentiating entrepreneurs from small business owners: a conceptualization, Academy of Management Review, vol. 9,
no. 2, pp. 354-359.

28
2.3.1 Fish feed production
The Food and Agriculture Organisation (FAO) of the United Nations carried out
a Regional Expert Consultation on Farm-made Aquafeeds in Thailand to
increase awareness of the importance of self made fish feed by fish farmers
(hereafter called farm-made aquafeeds). This meeting was attended by
representatives from ten Asian countries who defined the term farm-made
aquafeeds as “feeds in pellet or other forms, consisting of one or more artificial
and / or natural feed stuffs, produced for the exclusive use of a particular
farming activity, not for commercial sale or profit” (New, Tacon & Csavas
1994, p. 4).
According to New, Tacon and Csavas (1994) although there is still a high
dependence on commercially made fish feed, most representatives at this
meeting agreed on the potential and importance of the farm-made aquafeeds for
the following reasons:
• Most of the Asian finfish and crustacean aquaculture productions are
depending on this feeds.
• Farm-made aquafeeds can reduce production costs since it is reasonably
cheaper than commercial feed.
• Farm-made aquafeeds are environmentally friendly since it uses wastes from
agro-processing industries.
• Farm-made aquafeeds provide fish feed to small scale fish farmers who are
not covered by commercially made fish feed.
The importance of farm-made aquafeeds was based on the assumption that at
least 1 million tons of farm-made aquafeeds have been annually produced and
used in Asia (New & Csavas 1993). Despite the large amount of farm-made
aquafeeds produced in Asian countries, and despite some freshwater fish farmers
who produce their own fish feed by using local ingredients such as rice bran,
cassava leaves, and soy bean cake, the majority of Indonesian fish farmers still
prefer to use commercial feed (Djunaidah 1992). This is because producing their
own fish feed is time consuming and the required ingredients are difficult to
obtain.

29
Indonesian small scale fish farmers are facing problems in producing farm-made
aquafeed for several reasons but the greatest problem is the lack of good quality
raw material within the farmers’ area of activity. Raw materials needed to
produce farm-made aquafeed are mostly imported and it is difficult to supply
locally. Consequently the prices of the raw materials are too high for small scale
fish farmers (Djunaidah 1992).
2.3.2 Fish seed production
Aquaculture has become the fastest growing food sector in the world and,
according to Siriwardena (2007), Asia ranks as the world’s largest aquaculture
suppliers. In order to achieve optimum aquaculture production a supply of good
quality fish seed is vital to the security of ongoing aquaculture operations. In
developing countries fish seed supply is a major problem due to a lack of
sufficient productive fish hatcheries (Akpaniteaku, Weimin, & Xinhua 2005).
The limited supply of fish seed has meant that fish farmers remain dependent on
natural spawning or fish hatcheries for supplies. This condition has forced some
fish farmers to innovate to produce their own fish seed (Mantau, Rawung, &
Sudarty 2004) simply to survive under the unreliable conditions and to improve
their standard of living (Nandeesha 2007). Therefore, there are concerns that
need to be addressed in the development of fish seed production (Bondad-
Reantaso 2007):
• Seed supplies are unpredictable and insufficient.
• The genetic quality of fish seed is not guaranteed.
• The number of hatcheries for fish seed rearing is insufficient.
• Problems with fish seed distribution.
Indonesian aquaculture has experience significant growth associated with the
growth in global fish demand. In turn, this has led to an increase in demand for
good quality fish seed. To date, freshwater fish seed in Indonesia are mostly
supplied from hatcheries and only small amounts are obtained from the wild
(Budhiman 2007). Although the supply of freshwater fish seedling has
expanded, the progress is slow compared to the developments taking place in

30
marine fish and shrimp seedling technology. Budhiman (2007) suggested that
this difference may be associated with the following circumstances:
• Freshwater fish seed supplies are more likely to fulfill local demand with
only small amounts available for export purposes.
• A decrease in the quality of freshwater fish seed.
• The slow growth characteristic of most freshwater fish.
• Strict export requirements.
• The inability of small scale fish farmers to obtain sufficient loans.
In spite the difficulties in producing freshwater fish seed, fish farmers still prefer
it to marine fish cultivation. This may be because freshwater fish cultivation is
easier to put into effect due, for example, to the relative ease of obtaining fresh
water compared to obtaining seawater or brackish water.
2.3.3 Fish species extension (poly-culture system)
In the main, small scale fish farmers in Indonesia will start their business
cultivating one species of fish and gradually add other fish species. As their
business grows and they see other opportunities, some fish farmers will expand
into a poly-culture system where they cultivate more than one fish specie in the
same pond. For this type of system fish farmers have to have adequate
knowledge of fish feeding habits because a poly-culture system works by
combining fish with different feeding habits (Bocek 2008). A poly-culture
system reduces the possibility of food competition and at the same time
increases fish production.
Many benefits can be derived from poly-culture systems. In addition to the
increase in production, there is less need to add fish feed. For example, in a
poly-culture system of shrimp, seaweed, and milkfish, the pieces of seaweed that
drops at the bottom of the pond and the algae that grow on the seaweed, become
feed for the shrimp and milk fish. The seaweed also produces oxygen for the
shrimp and milk fish.
Many small scale fish farmers have experienced significant increases in profits
by adopting poly-culture systems. A fish farmer in West Java claimed that prior

31
to poly-culture his income was Rp 3 million per month. After implementation of
the poly-culture system, his income increased five times (Kompas 2006).
Similar examples were given by Bisnis Indonesia (2007) to demonstrate that
poly-culture system implementation significantly increased fish farmers’ profits.
2.3.4 Product range extension (adding value to product)
Small-scale fish farmers in Indonesia usually sell their fish harvest as fresh fish,
but some add value to their fish harvest. In Indonesia only 23 - 47 percent of fish
are processed into higher value products while the rest are sold as fresh fish
(Heruwati 2002). Adding value to the product is a common and widely accepted
method to preserve fish harvest quality and reduce fish harvest spoilage
(Venugopal & Shahidi 1995). By the time fish products reached consumers the
quality of many fish products has deteriorated because of the long distribution
time from the producer to the consumer (Heruwati 2002). Not only is it
important to find ways to preserve the fish product such as by adding salt but the
preserved fish also fetches a higher market price since consumers are able to
keep their purchased fish for longer. Fish farmers also sell fish as frozen, dried,
smoked, or fermented fish (Heruwati 2002). The traditional ways to add value
such as via salting, smoking, drying and fermenting still predominate in the
Indonesian market. Modern techniques like freezing and canning are used less
frequently in Indonesia because these techniques require high quality fish as the
raw material inputs which are still difficult for small scale Indonesian fish
farmers to achieve.
Susilowati (2005) explained that with adequate knowledge a fish farmer can
attract more buyers by finding ways to add value to their fish product. This was
exemplified by a successful FFG in the Mangkubumen village of Central Java
that transformed their fish waste into high quality edible fish products. Nearly all
of the village residents were catfish farmers whose livelihoods depend on
cultivating catfish (Suara Merdeka 2007b). Four male residents, led by Darseno,
started to cultivate catfish in 1999 when the price of catfish was on the increase.
Darseno took risks that secured him great profits (Suara Merdeka 2007d). His
rapid success encouraged other village residents to cultivate catfish and in 1999
they formed a FFG called ‘Karya Mina Utama’ with 92 members. Over the next

32
few years the wealth of the village increased dramatically as evidenced by the
number of beautiful new houses and new cars belonging to the FFG members.
In 2007 the President of the Republic of Indonesia visited this famous village
and accorded the village an appreciation ‘Minapolitan’ (translated to English it
means: fish-town) (Suara Merdeka 2007b). The name Minapolitan was chosen
because almost all of its residents cultivated catfish over 21 hactares of land
comprising 1,661 catfish ponds. In this village it is not surprising to see fish
harvest activity on a daily basis; the village can produce a phenomenal 7 - 10
tons of catfish each day.
Not only does the catfish farming benefit the pond owners, but it also benefits
the local people who work as their employees. The catfish pond workers are
paid higher than average local wages. Suara Merdeka (2007b) explained that the
high salaries for pond workers were possible because of the high profits that
pond owners could garner.
The women sub-members of this FFG have also contributed to the value added
catfish products by creatively turning lower quality catfish into processed foods
such as shredded catfish, catfish crackers, catfish balls, and catfish nuggets
(Suara Merdeka 2007c). In addition to creating the range of processed food
products, the women have also provided consumers with a choice of sweet,
onion, or spicy flavours. The catfish crackers are made from a combination of
the meat, skin, and fin parts of fish. These innovations made by the Karya Mina
Utama women sub-members have provided additional income for the FFG
families. The FFG’s successful activities have attracted the attention of many
government officers from other Indonesian provinces to duplicate this in their
own region.
2.3.5 Utilisation of other fish parts
The women sub-members of the FFG Karya Mina Utama in the catfish town
(described in the previous section) is a demonstration of one of the five
innovative actions identified for this research. The women created delicious fish
crackers by utilising fish waste like fish skin, fin, and tail (Suara Merdeka
2007c).

33
Other uses of fish have also been identified through research. According to
Wahyuni and Peranginangin (2007) there has been a major increase in the
number of exports between 1998 and 2000 of fish waste from Indonesia. The
fish waste includes fish bones which are processed into gelatine. Gelatine is a
protein substance made from the collagen derived from skin, bones, and
cartilage. For many decades, Indonesia has imported thousands of tons of
gelatine for domestic requirements (see Table 2.3).
Table 2.3 Indonesian gelatine imports
Year Gelatine import (kg) Value (US $)
1995 1,169,197 5,503,803
1996 2,673,500 7,406,426
1997 2,148,415 8,831,742
1998 1,851,328 6,781,571
1999 2,371,738 9,095,440
2000 2,712,345 9,119,997
2001 3,115,382 8,683,771
2002 1,925,732 6,102,019
2003 1,102,019 9,962,237
Source: Wahyuni, M and Peranginangin, R 2007, Industrial Competition in Fish Processing through the
use of Non-economical Fish Waste into Gelatine, Department of Marine and Fisheries, Jakarta-Indonesia, page 2.
Table 2.4 shows that the world’s demand for gelatine in both the food and non-
food industries is very high.
Table 2.4 Utilisation of gelatine in world’s food and non-food industry use
Food industry Usage (tons) Non-food industry Usage (tons)
Confectionary 68,000 Film product 27,000
Jelly 36,000 Soft capsule 22,600
Meat product 16,000 Capsule shells 20,200
Dairy product 16,000 Pharmacy industry 12,600
Margarine/butter 4,000 Technical industry 6,000
Food supplement 4,000
Total 144,000 Total 88,400
Source: Wahyuni, M and Peranginangin, R 2007, Industrial Competition in Fish Processing through the
use of Non-economical Fish Waste into Gelatine, Department of Marine and Fisheries, Jakarta-Indonesia, page 2.
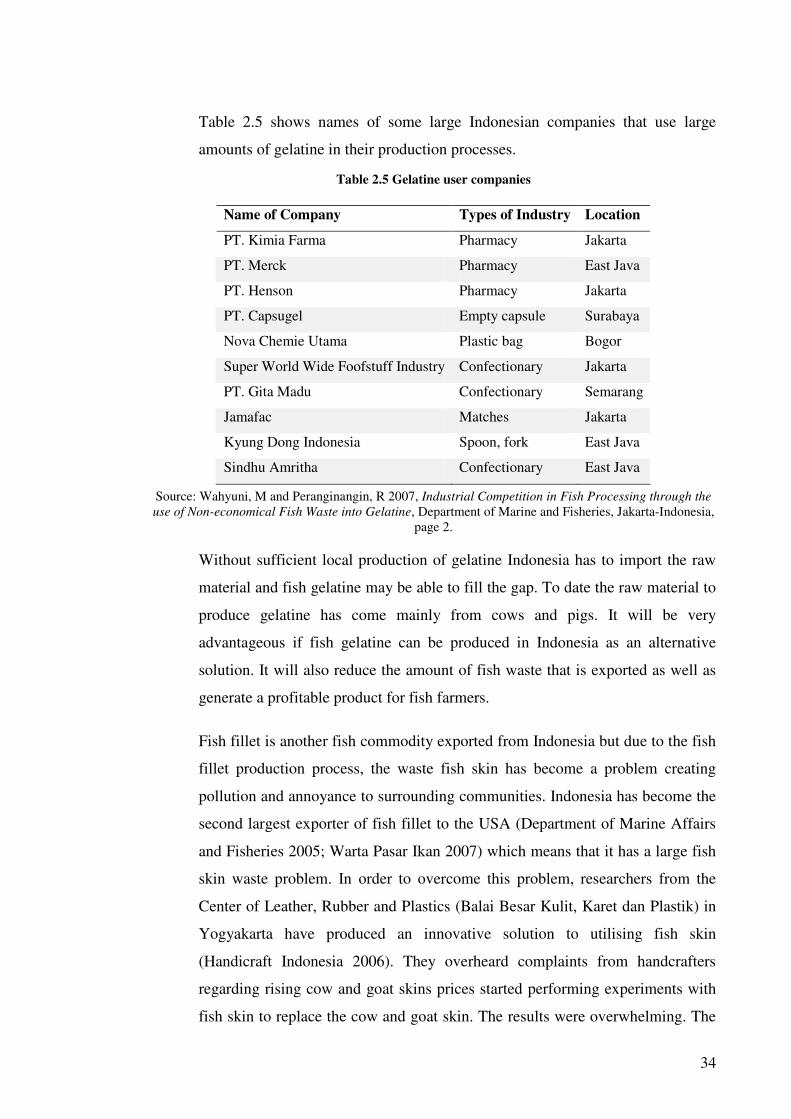
34
Table 2.5 shows names of some large Indonesian companies that use large
amounts of gelatine in their production processes.
Table 2.5 Gelatine user companies
Name of Company Types of Industry Location
PT. Kimia Farma Pharmacy Jakarta
PT. Merck Pharmacy East Java
PT. Henson Pharmacy Jakarta
PT. Capsugel Empty capsule Surabaya
Nova Chemie Utama Plastic bag Bogor
Super World Wide Foofstuff Industry Confectionary Jakarta
PT. Gita Madu Confectionary Semarang
Jamafac Matches Jakarta
Kyung Dong Indonesia Spoon, fork East Java
Sindhu Amritha Confectionary East Java
Source: Wahyuni, M and Peranginangin, R 2007, Industrial Competition in Fish Processing through the
use of Non-economical Fish Waste into Gelatine, Department of Marine and Fisheries, Jakarta-Indonesia, page 2.
Without sufficient local production of gelatine Indonesia has to import the raw
material and fish gelatine may be able to fill the gap. To date the raw material to
produce gelatine has come mainly from cows and pigs. It will be very
advantageous if fish gelatine can be produced in Indonesia as an alternative
solution. It will also reduce the amount of fish waste that is exported as well as
generate a profitable product for fish farmers.
Fish fillet is another fish commodity exported from Indonesia but due to the fish
fillet production process, the waste fish skin has become a problem creating
pollution and annoyance to surrounding communities. Indonesia has become the
second largest exporter of fish fillet to the USA (Department of Marine Affairs
and Fisheries 2005; Warta Pasar Ikan 2007) which means that it has a large fish
skin waste problem. In order to overcome this problem, researchers from the
Center of Leather, Rubber and Plastics (Balai Besar Kulit, Karet dan Plastik) in
Yogyakarta have produced an innovative solution to utilising fish skin
(Handicraft Indonesia 2006). They overheard complaints from handcrafters
regarding rising cow and goat skins prices started performing experiments with
fish skin to replace the cow and goat skin. The results were overwhelming. The
35
fish skin waste was transformed into beautiful products such as shoes, bags,
purses, wallets, belts, and other handmade products.
The fish skin process technology can transform fish waste into a valuable
product with a comparatively high sales price for Indonesian small handcrafters
(Department of Marine Affairs and Fisheries 2005). Processing will add between
30 to 60 per cent to the value of fish skin compared to unprocessed fish skin.
Handicraft Indonesia (2006) stated that the value of processed fish skin (12 - 15
cm in width) are worth Rp 25,000 (approximately AU$ 3.50), whereas finished
fish skin product (e.g., shoes, or bags) can reach Rp 150,000 to Rp 300,000
(approximately AU$ 22.00 to AU$ 43.00). This product shows tremendous
potential to utilise Indonesia’s large amounts of fish skin waste by turning it into
value added products.
2.3.6 Market extension
It has been claimed that market extension is a basic entrepreneurial activity
carried out by businessmen (Morris & Lewis 1995). It is believed that
entrepreneurial activity is applicable at the individual, societal, and
organisational level. Therefore, entrepreneurial activity also applies to small
scale fish farmers. Currently, many Indonesian small scale fish farmers are
dependent on fish gatherers as middlemen to market their harvest (Nurdjana
2006). Some farmers take their product to the local fish market however some
fish farmers with an entrepreneurial mind will try and expand their market
range. As described by Susilowati (2005), fish sellers should know about
marketing strategy to sell their fish. A marketing strategy is concerned with (1)
the market or consumer, (2) attractive communications to buyers, (3) the price of
the product, and (4) managing profits through future planning.
Market extension has strong parallels with networking. It was found that high
density networking may result in wider market extension. With higher numbers
and a wider range of networks, it is believed that a firm is able to expand its
market distribution into a wider geographical range and to greater numbers of
markets (Havnes &Senneseth 2001).

36
2.4 Comparison between fish farmers with different demographic background in
carrying out entrepreneurial activities
This research included comparative analyses using demographic and farming group data
to increase understanding of how fish farmers implemented entrepreneurial activities
and to reveal the most commonly practiced entrepreneurial activities. The research
survey was developed to collect demographic information, amongst other data, with
which to compare the entrepreneurial activities of fish farmers. The demographic
information made it possible to compare fish farmers on the basis of: awardees and non
awardees status, gender, age groups, marital status, educational levels, FFG levels, and
reasons to become fish farmers.
2.4.1 Comparing awardees and non awardees
The first comparison of entrepreneurial activities was between the awardees and
non awardees FFGs. The definition of awardees used in this research is fish
farmers who belonged to FFGs that had won the annual FFG competition
organised by the Indonesian government in the last five years. The non awardees
were defined as fish farmers who belonged to FFGs that had not won awards in
the last five years.
It is important to compare entrepreneurial activities between fish farmers who
had received awards and those who had not because FFGs that have received
awards are evaluated by the government officials according to at least three
classes of criteria relevant to this research. The three classes of criteria or aspects
that FFGs are evaluated on are: social aspects, technical aspects, and economical
aspects (Semarang Marine Affairs and Fisheries Office 2005).
The social aspects of the FFGs that are evaluated consider the ability of the
group members to manage their social activities. This includes managing their
organisational structure, arranging internal FFG meetings, organise fish farmers’
member social activities, planning on capital collection, and other socially
related issues which they enact internally (within the FFG member) and
externally (with other parties).
The technical aspects that are evaluated consider all the fish farming related
technical aspects such as aquaculture skills, raw material knowledge,

37
aquaculture infrastructure, and the members’ ability to develop these. The FFG
members’ technical knowledge and skills include the methods to obtain supplies,
pond engineering, as well as fish feed and fish seed management. The way the
members develop each skill is also evaluated and scored. The more skills they
possess the higher the score they receive.
The economical aspects criteria evaluate business development and management
skills. This includes the ability of FFG member to analyse their business, to
obtain and secure sufficient loans, to organise and manage their capital, and also
how they collaborate with village cooperation units. FFGs that demonstrate
greater skills in managing their finances will receive a higher score in the
competition evaluation.
The competition follows two steps during evaluation. In the first step the
competition evaluator team establishes a questionnaire based on the three
aspects mentioned earlier. When the FFG has answered and returned the
questionnaire, the competition team carries out a field evaluation based on the
answers that the FFG had given in the questionnaire.
The FFG that received the highest score is declared the winner of the FFG
competition. The winner is given a certificate and prize money to use in their
FFG. Despite the Indonesian government’s commitment to this annual
competition, some fish farmers do not see the benefit and regard it as a waste of
their time and money. For example, a winning FFG in Bali had declined the
invitation to visit Jakarta to receive their national award arguing that the cost to
travel to and stay in Jakarta was more than the prize money (Terranet 2001).
This is not surprising considering that most of the fish farmers are small scale
businesses with very limited capital that must carefully plan their financial
affairs. Furthermore, some fish farmers who are located far from the capital city
of Indonesia need the government’s assistance with the expenses incurred for the
sake of the award ceremony.
The three key aspects evaluated in the competition generally cover all
developmental aspects of a farm based business. The winning FFG is deemed to
have the highest capability in those three aspects. However, there are concerns

38
regarding the objectiveness of the evaluation. Although each FFG receives the
same questionnaire, the field evaluation carried out by the government officials
may not be objective. It is impossible for one person or one evaluation team to
evaluate the large numbers of FFGs in a country as large as Indonesia. The field
evaluation is usually performed by many teams which may result in different
judgements between teams. Therefore, the final result may not be valid or
objective.
2.4.2 Comparing male and female small scale fish farmers
The second demographic characteristic that was used for comparing fish
farmers’ entrepreneurial activities was that of gender. The aim of this
comparison was to explore how men and women fish farmers differ in the
entrepreneurial activities they implemented. The most favoured type of
entrepreneurial activities between men and women was also compared.
There have been arguments regarding men and women working as fish farmers.
Some believed that being a fish farmer is a man’s job (Mbozi 1991) because fish
farming involves hard physical labour such as harvesting and pond cleaning.
However, when it comes to implementing entrepreneurial activities, certain
activities may be dominated by women instead of men. This is especially true
for activities that require women’s knowledge and skills. For example product
range extension may involve cooking, adding flavour to products, or creating
new flavours, which are tasks that women are most familiar with.
Gender arguments extend to beliefs that men carry out more entrepreneurial
activities than women (Cowling & Harding 2001; Reynolds et al. 2002). This
may be associated with beliefs that women focus more on family matters rather
than on business development. The role of women as the primary family
nurturers somehow limits the women’s ability to put emphasis on work related
issues. Nevertheless, despite the fact that women implemented fewer
entrepreneurial activities than men, it was found that women were better at
repaying loans than men (Panjaitan-Drioadisuryo & Cloud 1999). Based on this
finding, the Bank of the Republic of Indonesia (BRI) had developed the world’s
largest micro enterprise credit program called ‘Kupedes’ that target small scale
women entrepreneurs as their primary customers.

39
Previous researches have also observed that men and women had different
reasons for choosing to become self-employed (Matthews & Moser 1996;
Robinson & Sexton 1994). While both men and women tried to find balance
between life and work, women chose to be self employed for the flexibility it
offers her to be with her children. Since women have the power to control their
working hours, they have more time to look after their children while earning an
income. On the other hand, men with families chose to become self employed to
achieve stable financial conditions (Robinson & Sexton 1994). Therefore, men
will choose to be self-employed if they know that the business can deliver a
stable income.
Panjaitan-Drioadisuryo and Cloud (1999) described the different ways men and
women spent their income. They observed that women spent most of their
income to provide for their family’s needs such as investing in better education
for their children, better health care, buying more nutritious foods, birth control,
and other family related issues. In other words women focused on developing
their families rather than developing their businesses.
Research carried out by Matthews and Moser (1996) found that men were more
interested in becoming self-employed than women. Self-employed men
primarily had role model entrepreneurs who inspired them to develop an
entrepreneurial interest (Cowling & Harding 2001).
An interesting observation was made by Robinson and Sexton (1994) regarding
the effect of children on men and women entrepreneurs. Children were found to
have a positive effect on men but a negative effect on women entrepreneurs. The
presence of children gave men the stability to be self-employed and tended to
increase their earnings because children inspired men to work harder in order to
fulfil their families’ needs. Conversely, children interrupted most women in their
business development and resulted in decreased income. Women as the primary
carer of children always served her children before the needs of her company,
therefore her working hours were also shorter and her income less.
The timing for starting a business was also different between men and women:
men tended to be older, more experienced, and married when they started their

40
business (Cowling & Harding 2001; Robinson & Sexton 1994). Older men were
more experienced and had wider networks that increased their confidence to
start a business. They were already aware of the possible negative impacts on
their financial situations from being self-employed. On the other hand, women
were found to be married and had young children when they started their
business (Robinson & Sexton 1994).
2.4.3 Comparing fish farmers of different ages
The implementation of entrepreneurial activities of small scale fish farmers in
different age groups was also explored in this research. The aim of comparing
fish farmers in different age groups was to determine whether age differences
influenced the carrying out of entrepreneurial activities. The aim was also to
determine whether age influenced fish farmers’ preferences for implementing
particular types of entrepreneurial activities.
Age group was considered to be an important influence to measure in this
research since fish farming activities involve heavy physical labour and hence
influenced how fish farmers worked. For example, younger fish farmers may
choose to implement activities that require new knowledge such as fish species
extension. In practising fish species extension or poly-culture, fish farmers
require knowledge of fish feeding habit because the system combines a few
species of fish in one pond. These fish need to have different feeding habits to
avoid feeding competition. For example herbivore fish is combined with
plankton feeder fish, so they will feed on different food.
On the other hand, older fish farmers may choose to implement entrepreneurial
activities that they are familiar with and that do not require them to learn new
skills or carry out heavy work. One of the entrepreneurial activities that fit into
these criteria is market extension. It is well known that market extension is one
of the major and most basic entrepreneurial activities, and hence older fish
farmers may choose this type of activity more frequently than other activities.
Research supports the link between age and implementation of entrepreneurial
activity. The average age to start a business was 40 years and increased to reach
peak at 45 years old before it decreased significantly above 45 (Cowling &
41
Taylor 2001; Devine 1994). The research showed that it took time for an interest
in entrepreneurship to emerge (Devine 1994). The older the person, the more
experience they have, the more self-employment opportunities they recognised,
and the more interested they become in self-employment.
2.4.4 Comparing fish farmers of different marital status
The marital status of fish farmers was one of the demographic variables used to
analyse the implementation of entrepreneurial activities. The reason for this
choice of demographic variable was that the presence of a husband or a wife was
thought to influence the way a person made decisions in life: decisions which
includes the carrying out entrepreneurial activities.
The aim was therefore to compare how fish farmers of different marital statuses
implemented entrepreneurial activities. This comparison also aimed to determine
whether or not differences in marital status influenced fish farmers’ preferences
for types of entrepreneurial activities.
Previous researchers have found a positive relation between being married and
the probability of being an entrepreneur (Rees & Shah 1986; Robinson & Sexton
1994). Robinson and Sexton (1994) found that being single or divorced had a
negative impact on self employment. Their findings showed that being married
and having a partner and children, increased a person’s sense of responsibility to
secure financial stability. This increased the person’s interest in becoming self-
employed as a way to reach financial stability.
2.4.5 Comparing fish farmers with different educational levels
The fourth demographic characteristic of fish farmers used to compare
entrepreneurial activities implementation was their levels of education. The
entrepreneurial activities implemented by fish farmers who have completed high
school were compared to those who have not completed high school. The aim of
this comparison was to explore how fish farmers with different education level
differed in terms of implementing entrepreneurial activities. The most favourite
type of entrepreneurial activities implemented by those with different education
levels was also compared.

42
Education is known to have a large effect on business activity since it equips the
entrepreneur with the necessary skills to deal with unexpected business
situations. Education has also been found to have be positive associated with self
employment (Morris & Lewis 1995; Rees & Shah 1986; Robinson & Sexton
1994). People who were educated had a higher sense of confidence and efficacy
which increased their ability to notice and take hold of opportunities (Robinson
& Sexton 1994). Furthermore, people with higher education levels tended to
have an ability to find more information on business opportunities.
It is thought that people with higher levels of education may be more successful
in business, as they received more information, and had more skills and
knowledge including those of entrepreneurial activities. However, other factors
may contribute to the success of small scale fish farmers and success may not
depend exclusively on education. Hence, it cannot be generalised that people
with higher levels of education are necessarily more successful. Although
education contributed to the level of people’s knowledge, it may be that
confidence and efficacy, and other factors such as government support ranging
from the provision of capital equipment and fish farming training, may have
contributed more to their success.
2.4.6 Comparing different fish farming groups
Comparisons of the implementation of entrepreneurial activities between small
scale fish farmers at different levels of FFGs were also conducted in this
research. The aim of comparing fish farmers’ communities at different FFG
levels was to determine whether the level of FFG influenced the carrying out of
entrepreneurial activities. The aim was also to determine whether the level
influenced the FFGs’ preferences for the types of entrepreneurial activities
implemented.
According to the Semarang’s Marine Affairs and Fisheries Office’s (2005) Fish
Farmer Group Formation Guide Book, there are two steps in FFG formation:
the group development and group monitoring steps. In forming a FFG, fish
farmers should have five things in common. They should have the same needs,
same location, same social and economic status, trust in each other, and able to
select one person to become the FFG leader. There are also five characteristics
43
of the FFGs that are monitored by the government: the ability to plan the
business, the ability to honour agreements made with other institutions, the
ability to increase capital, the ability to increase relationships with other FFGs
and with the village unit cooperation, and the ability to implement new
technology and information systems.
According to Semarang Marine Affairs and Fisheries Office (2005), there are
four levels of FFGs: kelas pemula (starter level or level 1), kelas lanjut (level 2),
kelas madya (level 3), and kelas uatama (advanced level or level 4). These levels
are determined by annual evaluations carried out by the local Fisheries and
Marine Affairs office.
Kelas Pemula ( Level 1 – the lowest level or starter level).
This is the lowest level of FFGs. Groups at this level have the lowest ability to
perform according to the evaluation criteria.
Kelas Lanjut (Level 2 – the secondary level).
This is a step higher than Level 1. The FFG members usually have more
advanced ability to carry out the activities of the evaluation criteria than those
from level 1.
Kelas Madya (Level 3 – the mid advance level).
FFG members at this level have much higher levels of abilities than the FFGs at
Levels 1 or 2, which include their ability to perform activities mentioned in the
evaluation criteria.
Kelas Utama (Level 4 – the advanced level)
This is the most advanced level a FFG group can reach. The members have the
highest ability to perform according to all ten evaluation criteria.
There are ten evaluation criteria used to evaluate the levels of FFGs:
a. The ability to search and use information.
b. The ability to plan activities which can increase productivity.

44
c. The ability to work as a team in carrying out the planned activities in a
disciplined way.
d. The ability to provide and develop the FFGs own facilities.
e. The ability to collect the FFGs capital.
f. The ability to properly carry out and honour cooperative agreements with
other parties.
g. The ability to cope with adverse circumstances.
h. The development of the leader and other members and their efforts to
improve their skills.
i. The quality of the relationship between the FFG and the village cooperation
unit.
j. The level of productivity. (Translated from Fish Farmer Group Formation
Guide Book 2005, pp. 8-9)
The ten evaluation criteria used to assess the levels of FFG distinguishes the
FFGs by their creativity, productivity, mutual unity, cooperation, and self
improvement. Based on these evaluation criteria, it is obvious that FFGs at
higher levels would also be a higher performing group. And higher performance
includes the ways that FFGs to increase their business through innovative
entrepreneurial activity.
2.4.7 Comparing fish farmers with different reasons for become fish farmers
The fish farmers’ reasons for choosing their businesses were also included as a
demographic of practical implication used to compare farmers’ implementation
of entrepreneurial activities. This choice was made because the different reasons
(push factors or pull factors) influence the way a person makes decision in life,
including the decision to carry out entrepreneurial activities.
The aim of this comparison was to explore how fish farmers who had different
reasons for becoming fish farmers implemented entrepreneurial activities. The
aim was also to determine whether or not differences in reasons influenced the
farmers’ preferences for types of entrepreneurial activities to implement.
45
There are two types of reasons or motivations that people have for turning to
self-employment. The reasons or motivations can be classified as either push
factors or pull factors. The push and pull factors of entrepreneurs are determined
by the initial motivations prior to starting their own businesses (Amit & Muller
1995). People motivated by pull factors are people who are naturally attracted to
start their own venture because they have many business ideas and are attracted
by the potential results of implementing those ideas (Amit & Muller 1995).
Entrepreneurs motivated by pull factors are naturally attracted to business
simply because they have the financial capacity to do so, or because of other
psychological or sociological reasons such as the attraction of personal
independence (Basu 1998; Watson, Hogarth-Scott & Wilson 1998). Therefore,
these people in self-employment are more willing to try anything in order to
grow their business.
On the other hand, people motivated by push factors are people who are not
happy with their work for reasons not associated with their entrepreneurial
characteristics and are forced to go into business (Amit & Muller 1995). The
reasons may be unemployment (out of a job or inability to find suitable work) or
dissatisfaction at their current workplaces. Any of these reasons pushes a person
into establishing their own business.
Researchers have found that entrepreneurs motivated by push factors are less
likely to succeed (Solymossy 1997) and earn less money (Amit & Muller 1995)
than those motivated by pull factors. Pushed entrepreneurs were forced to leave
their jobs which resulted in unemployment. This meant that the majority of
entrepreneurs (59%) were already desperate to start their business before they
had decided which products to sell or produce or what type of service to deliver
(Morris & Lewis 1995).
2.5 Extant constraints and problems faced by small scale fish farmers
In performing their fish farming practices, small scale fish farmers in Indonesia face
many and harsh obstacles. In this research these obstacles are divided into constraints
and problems. Most research do not distinguish between constraints and problems and
instead use either name for the same circumstances. In this research constraints and
problems are separated to distinguish different situations. Ask Oxford (2008), defined a

46
constraint as “a limitation or restriction or stiffness of manner and inhibition” and a
problem is defined as “an unwelcome or harmful matter needing to be dealt with”.
The above definition shows that constraint is characterised as a person’s limits and is
viewed as an internal restriction. On the other hand, according to the Oxford dictionary
a problem is viewed as an external obstruction that creates difficult conditions for a
person with which to deal. Therefore, in this research constraint is associated with
internal matters and problems to external issues.
Research has identified some constraints and problems faced by fish farmers, as
described next. However, since no distinctions were made between constraints and
problems, the following obstructions are not defined specifically as constraints and
problems. Rather, the classification of specific obstructions as either constraints or
problems was made according to the results of the exploratory factor analysis in Chapter
5.
2.5.1 Lack of start up capital
Lack of start up capital is a common constraint for many small scale farmers
around the world (Awulachew et al. 2008; Das 2006). Most small scale fish
farmers in Central Java came from lower income families with limited funds for
business start-up. The lack of start-up capital often forces small scale fish
farmers into minimising their budgets, with the result that they end up using
only the simplest equipment they can afford. This sometimes then also means
that the outcomes of the fish farming process is also minimised. For example, a
good water circulation system is necessary to obtain the optimum performance
of a fish pond, however, due to the lack of capital, the minimum requirements of
a good water circulation system are not met. The consequences may be that
waste is accumulated in the process which reduces the survival rate of fish. This
will lead to even lower income and lower product sustainability.
The lack of start up capital is also linked to the priorities given to cash
expenditures. Many small scale fish farmers are forced to save their money for
more important family matters such as school fees and health services (FAO
2009). This creates a dilemma for small scale fish farmers in setting their
priorities for financial expenses: they have to decide whether to invest in their

47
business or save for unexpected family circumstances. To complicate matters,
many small scale fish businesses do not keep records of their expenses and
rarely separate between family and business transactions (Honig 1998). This has
made it more difficult to determine whether they have had a return on capital
invested.
2.5.2 Lack of technical abilities
A technical ability to rear fish is one of the most important requirements of fish
farmers. In spite of the potential of a fish faming business, if the fish farmer has
limited technical skills, then the potential for a fish harvest failure is high
(Mkoka 2007). This technical ability may be developed in several ways, such as
from the family (many fish farmers inherit their fish farming business from their
parents or relatives), from neighbours, or from training delivered by government
or other agencies.
2.5.3 Lack of family support
Family, as a person’s closest community contact, has a large influence on a
person’s ability to manage a business (Basu 1998). Research has found a
positive correlation between the importance of family and running a business
(Verheul, Van Stel & Thurik 2006). There are two positive impacts between
self-employed people and their families. A supportive family will encourage
their family members in running the business, including giving them financial
and moral support. Secondly, a person who runs their own business can be
flexible about their working hours and can also work from home. Conversely, a
non-supportive family environment may discourage or even obstruct a person in
running their business. This was a finding by Loscocco et al. (1991) who also
believed that a lack of family support will disadvantage small business owner,
since they do not have emotional support from their family to manage their
business.
2.5.4 Lack of federal and regional government support
Indonesia’s wide geographical position may be contributing to a lack of support
from federal and regional government. Indonesia consists of thousands of large
and small islands that are spread widely across the nation. This creates
48
difficulties at the federal and national governmental levels to control and support
every region. Furthermore, some of the fish farmer communities are located in
isolated and hard to reach areas which make it even more difficult to support
their development. This lack of access to farms in “hard to reach places” may
have been the reason why some fish farmers interviewed by Kristiansen (2002)
complained that the Indonesian government was not providing them with
support for their businesses. Nonetheless, irrespective of the reason, lack of
government support creates problems for the small scale fish farmers (Das
2006).
It is important that government supports small scale business. If a government
can support entrepreneurial behaviours, it can encourage and increase the
development of businesses (Willis, cited in Morris & Lewis 1995). An example
of the Indonesian government’s support is the development of the small farmers
development programs (SFDP) (Panjaitan-Drioadisuryo & Cloud 1999). This is
a financial credit program from the Bank of the Republic of Indonesia (BRI)
supported with training programs. The program of training consists of essential
guidance needed to manage a business. The small scale farmers are taught how
to lead a business, how to start a business, how to find and evaluate the market,
and how to manage the business. The Indonesian government developed this
program with the support from BRI as well as international institutions such as
FAO and IFAD. The targets groups of this program meet the following
conditions: they have the same economic interests, they know each other, they
are able to get along well, and they are able to cooperate and to support each
other. The impact of the Small Farmer Development Program (SFDP) has been
very satisfying. Some of the reported positive affects of the program are:
1. The majority of participants have been able to increase their household
income. Some have even been able to help members of their family to create
new job opportunities.
2. The members are more independent in managing their business. They are
also more open to discuss family issues and to share their decisions with
other family members.
3. Their increased income has helped them to increase the quality and quantity
of their family’s nutritional provisions.

49
4. Inspired their views on their children’s education. The majority of members
now wish for their children to go to college and have a higher education.
(Panjaitan-Drioadisuryo & Cloud 1999)
The results show that a supportive government can have positive and helpful
impacts on the establishment of successful small farming businesses.
2.5.5 Lack of training provided by local government
Aquaculture training is an important element in boosting the technical abilities
of small scale fish farmers. Some fish farmers may be fortunate to have been
taught technical skills by their relatives or neighbours. Fish farmers without
relatives or neighbours willing to teach fish farming technical skills may need to
obtain their skills from the training provided by local government. However, not
every local government has training programs for the small scale fish farmers
due to a lack of financial resources (De La Cotera 2001).
2.5.6 Lack of fish farming experience and knowledge
Most fish farmers in Indonesia are small scale businesses run by farmers with
low levels of education. Some of these fish farmer may have past fish farming
experience obtained from working with their parents or neighbours but most of
them have no institutionally delivered fish farming education. Some may have
gained knowledge from governmental training programs that they then applied
through trial and error. The lack of knowledge, skills, and experience act as
constraints for small scale fish farmers (Das 2006). Not only are these
constraints on how to cultivate fish, or on how much, what, and when to feed,
but also equally important on how to prepare and manage their ponds and how
to combine fish species (Nam & Thuok 1999). Fish farmers with more years’
experience will have accumulated more knowledge and skills on how to
successfully cultivate fish and earn more income. This is backed up by research
that has shown that longer experience will result in higher earnings (Robinson &
Sexton 1994).

50
2.5.7 Lack of potential market
Lack of potential markets may be a problem faced by fish farmers who are
located far from market sites. Fish farmers with long established businesses
usually already have steady customers and steady markets and may not consider
access to markets as a problem.
Anecdotal interviews with Central Java local fish farmers found that they did not
have market problems: they reported that no matter how much they produced,
they can always find markets since they cannot even fulfill local market demand
of fish. This may be the situation with the low production small scale fish
farmers who may not want to expand their businesses. Nevertheless, lack of
potential markets is considered one of the critical factors (Sukadi 2006) for most
entrepreneurial small scale fish farmers as it may limit their ability to expand
their business.
2.5.8 Low selling price
For many small scale fish farmers, low sales prices are closely associated with
their inability to secure sufficient loans. Sales prices become a problem when the
inability to secure loans forces them to find other loans from money lenders
(Kinseng 2005). In Indonesia, a money lender is someone who lends money to
small farmers at times when they cannot borrow elsewhere. The money lenders
charge fish farmers very high interest rates and force the farmers to sell their
produce to them at very low prices (Effendi 2008). Many money lenders operate
during difficult times for the fish farmers such as when their harvests fail or
when they have urgent financial needs.
2.5.9 Low profits
The role of money lenders (as discussed above) also affect how much profit the
small scale fish farmer can receive. Since they are forced to sell their produce at
very low prices, the fish farmers earn very low profits. If this situation is
prolonged, it is likely that the small scale fish farmers may have to go out of
business since they can not maintain the positive cash flow of their business.
Small scale fish farmers who wish to expand their businesses need to increase
their working capital. This investment for expansion will include not only
51
additional operational costs, but may also include investments in new tools and
equipment. This will result in higher production costs, and if it is not
accompanied by an increase in the sales price, will result in lower profit margins
(Zainal 1998).
2.5.10 Low quality and quantity of fish seed
Fish seed shortages are a common problem in Central Java. Most fish farmers
obtain their fish seed from outside their local regions which raises their
operational costs. These seed shortages are due to the limited number of fish
hatcheries that operate in the region (Akpaniteaku, Weimin, & Xinhua 2005). In
addition, Mantau, Rawung, & Sudarty (2004) gave a similar account of the
shortage of fish seed supplies. This limitation does not only refer to the quantity
but also the quality of fish seed. Most of the time fish seed cannot be obtained at
the time of production or hatcheries are too far from the area of operation. This
situation led to higher operation costs for fish farming businesses (FAO 2009).
2.5.11 Low quality and quantity of fish feed
Fish feed and fish nutrition is one of many important factors in the success of a
sustainable aquaculture system (Hasan 2001). The focus of many aquaculture
researchers is to develop good quality fish feed formulas that will result in
perfect fish maturation while maintaining fish quality.
The quality and quantity of fish feed is still a problem for many small scale fish
farmers (Bueno 1999). With limited available cash, they attempt to minimise
their expenditure on the good quality fish feed. Instead of the good formulas,
farmers may use commercial feed with very simple formulas or they will
produce their own fish feed with locally available ingredients (Djunaidah 1992).
2.5.12 Poor financial management skills
The ability to manage cash flow is one of the skills of successful business
management. However, many small scale fish farmers have limited cash flow
management skills. Their small amounts of money have to be divided between
business investments and family support (such as meeting their children’s’
educational and health expenses). Their limited financial management skills
were listed as one of the four major problems faced by small business owners;

52
the other constraints include marketing, accounting and stock control (Theng &
Boon 1996).
2.5.13 Poor quality control
Another weakness for small scale fish farmers is the inability to control the
quality of their produce. In order to keep cash flow going, fish farmers need to
sell their fish harvest as soon as possible. This has meant that fish farmers
tended to ignore fish quality. Aquaculture is different from many other
manufacturing companies. In aquaculture, cash flow cannot be revolved in a
short time. Fish need time to reach maturity and hence it takes a few months
before fish farmers can sell their harvest. Within the few months of fish rearing,
fish farmers continue to require money for their own needs. This may be one of
the dilemmas faced by small scale fish farmers, where working capital needs to
be calculated ahead for several months to keep the business operational.
Poor quality control is one of the challenges for Indonesia in achieving
sustainable aquaculture (Sukadi 2006). According to Sukadi, the other
challenging aspects include fish seed quality, better maturation systems,
marketing, environmental issues, and fish parasite and disease problems.
2.5.14 Low ability to handle fish disease and parasite problems
Fish parasite and disease breakouts are a major problem. Without adequate
knowledge of fish diseases and parasites, many small scale fish farmers are
unable to manage outbreaks in their fish ponds. Most fish farmers will ask for
assistance from the government on how to identify and manage diseases or
parasites.
A low ability in managing fish diseases and parasites results in low fish survival
rates and can even result in total mortality of the fish life in the pond. That is
why fish disease and parasite management is considered a critical factor in
achieving a sustainable aquaculture in Indonesia (Sukadi 2006).

53
2.5.15 Poor water quality
There have been significant developments in the global aquaculture industry that
have attracted many new investors to the aquaculture industry. This
phenomenon has introduced new side effects because the increased aquaculture
production has not been accompanied by environmental sustainability (Elfitasari
2006). This has led to environmental degradation and poor water quality for the
aquaculture industry (ADB 2006).
In aquaculture, poor water quality means poor quality fish habitat and limited
opportunity for fish to grow to the desired quality. Poor water quality also means
that there is a low probability for achieving product sustainability due to the
unsustainable environment.
2.5.16 Inability to secure sufficient loans
The inability to secure sufficient loans is one of the most common problems in
developing countries: applying for a loan requires a well prepared financial plan
but many small scale fish farmers did not develop a well thought out and
organised financial plan (Nam & Thuok 1999). This is because of the
complexity of developing a financial plan for small scale fish farmers; their
financial plans require that the operational cash flows have to be carefully
calculated to accommodate the long fish maturation cycle before profits can be
earned at harvesting time. For this reason many fish farmers in Central Java
prefer to cultivate fish with short time to harvest such as tilapia, carp, and
catfish.
From the money lender’s point of view, lending to small scale businesses is a
high risk activity due to the high operational costs and low repayment rates
(Panjaitan-Drioadisuryo & Cloud 1999). It has been observed that women are
better at repaying loans than men and so the Bank of the Republic of Indonesia
(BRI) launched a program called KUPEDES which targeted small scale
businesses especially those owned by women. The program was very successful
and many small business owners have been able to increase their standard of
living or help other family members create new jobs.

54
2.6 Endogenous and exogenous factors affecting small scale fish farmers
In undertaking their activities, there are several factors that support entrepreneurs in
successfully achieving their goals. There are two types of factors that influence the
entrepreneurial process outcome (Bouchikhi 1993). The first type consists of those
factors that arise from within the individual (endogenous factors) and the second type
consists of those factors that arise externally to the person (exogenous factors). Many
different definitions of endogenous and exogenous factors were found in the research;
definitions depended on how the endogenous and exogenous factors were viewed.
Bouchiki (1993) believed that endogenous factors are those within the entrepreneur,
whereas Ploeg and Long (1994) described endogenous factors as local potential that
include local ecology or local environmental strengths. In order to objectively explain
the endogenous and exogenous factors, this section will identify and discuss all factors
identified without specifying whether they were classified as endogenous or exogenous
factors (see sections 2.6.1 to 2.6.15 below). The groupings of these factors for this
research were determined through exploratory factor analysis reported in Chapter 5.
Figure 2.4 shows that here are two business outcome possibilities namely success and
failure. Bouchiki (1993) believed that two areas influenced the success or failure of
business: the entrepreneur’s personality and behaviour (the endogenous factors), and the
constraining and facilitating environment (the exogenous factors). The exogenous
factors either supported or obstructed the business. Bouchiki identified chance as
another intermediate factor that influenced the success or failure of a business. He
believed that “chance may be present in all stages of an entrepreneurial process. It does
not operate only as an opportunity. Sometimes, chance events may destroy decades of
work” (Bouchiki 1993, p. 566). Just like the endogenous and exogenous factors, chance
can also be supportive as well as destructive.

55
Figure 2.4 A synchronic view of the constructivist framework for understanding entrepreneurship performance
Source: Bouchiki, H 1993, A constructivist framework for understanding entrepreneurship performance, Organization Studies, vol. 14, no. 2, page 560.
2.6.1 Quantum of knowledge
Knowledge is a basic requirement for any business. In starting a new business,
no matter how small, entrepreneurs would generally have at least some product
knowledge. Small-scale fish farmers in Indonesia usually have initial
aquaculture knowledge before they set up their fish farms. This aquaculture
knowledge could have been obtained from family, friends, government, or other
institutions.
2.6.2 Mastery of fish farming skills
Similarly to aquaculture knowledge, fish farming skills can also be developed by
working with family, friends, government, or other institutions. Skills are more
advanced than knowledge as it represents the actual implementation of fish
farming. Having aquaculture skill, means that the farmers have the ability to
implement all fish farming activities including fish feeding, seedling, maturing,

56
harvesting, as well as the ability to deal with problems associated with fish
disease and parasites, water quality, and feed quality.
2.6.3 Length of experience
Aquaculture experience usually comes from the application of skills and
knowledge over a period of time. The greater the person’s experience the higher
their levels of skill and the wider their domains of knowledge. Experience is
defined as the number of years an individual has worked in the fish farming
industry. As observed by Lee and Tsang (2001), half of the important success
factors arise from within the entrepreneur and experience is one of these.
Experience can be grouped according to three classes: entrepreneurial,
managerial, and industrial experience. Industrial experience was found to be
positively associated with business performance. Business growth and
performance was found to depend on experience and relevant experience is
compulsory for entrepreneurs prior to starting their own business (Lee & Tsang
2001).
2.6.4 Level of education
Some fish farmers may have received fish farming education. This can be
through formal or informal education. Formal education includes any type of
attendance based education such as at High Schools, Academies, or Universities,
whereas informal education may include training or taking part in aquaculture
projects.
Since education has become an “essential quality” for entrepreneurs (Lee &
Tsang 2001), it is believed that education will play a big role and will be
positively associated with successful businesses. Furthermore, education is
important because it prepares a person with essential skills to manage a business.
In developing countries improvement of the educational systems has become
one of the top future strategic priorities. As pointed out by Ramphele (2003),
without a strong educational system, developing countries will not be able to
achieve prosperity.
57
2.6.5 Entrepreneurial characteristics and personality
Many opinions have been put forward regarding entrepreneurial characteristics.
Successful entrepreneurs have been identified as having the ability to take risks,
to innovate, to have marketing skills, being able to identify business
opportunities, and being able to correct errors in an effective way (Littunen
2000).
Many other entrepreneurial characteristics have also been proposed, but there is
one basic characteristic that is essential for entrepreneurs: the willingness to take
risks. However, the willingness to take risk should be accompanied by
calculated planning. Someone who takes risks without careful calculation is
known as a foolish person, while someone who plans too much but cannot take
risk is a doubtful person (Susilowati 2005). This calculation ability includes
conducting sufficient planning prior to forming a business.
Lichtkoppler (1993) prescribes four steps that should be taken to establish a
successful aquaculture business. The first step is getting to know how the
aquaculture industry works. As much as possible essential information,
techniques, and methodologies should be gathered through attending workshops,
seminars, and training sessions provided by institutions or government. The
second step is to evaluate the availability of essential capital requirements such
as human, financial, and natural capital, which includes land, water, and fish
capital. The third step is to plan the business. Planning is important as it ensures
the entrepreneur prepares an operational strategy, considers the possible risks
that may arise, and identify strategies to avoid. Planning is also essential for
obtaining financial loans. The last step should be to test the plan on a small scale
to see if the entrepreneur can cope and whether the planned strategy works
before deciding to make the commitment on a larger scale.
2.6.6 Reasons for going into business
A person can choose to have an unemployed, paid-employment, or self-
employment status (Watson, Hogarth-Scott & Wilson 1998), and, at some stage,
a person will change from one status to another. With high unemployment rates,

58
an unemployed person will be forced to choose between being self-employed or
remaining unemployed.
There are many reasons why people decide to become self employed or to
become an entrepreneur. Some reasons can be called push factors, where
someone is forced to be an entrepreneur because of reasons such as being unable
to find a suitable job or being made redundant. Other reasons can be called pull
factors, where a person is naturally attracted to becoming an entrepreneur either
simply because they have the financial resources to do so, or they have other
psychological or sociological reasons such as being attracted to the possibility of
personal independence (Basu 1998; Watson, Hogarth-Scott & Wilson 1998).
2.6.7 Length of personal business experience
Evidence has been found of a positive correlation between the business’
performance and the entrepreneur’s experience (Lee & Tsang 2001). The length
of personal business experience has a large impact on the success or failure of an
entrepreneur’s performance in running their business: the longer an
entrepreneur’s business experience the greater the benefits to the business.
Entrepreneurs who have been in business for longer periods of time would have
gained more technical and managerial knowledge, experience, and skills
compared to those entrepreneurs who have just ventured into business.
Entrepreneurs have also had a chance to develop more business contacts which
were useful in business expansion (Lee & Tsang 2001).
2.6.8 Family business experience
Family background plays a major role in the development of entrepreneurial
behaviour of an individual (Morris 1995). Furthermore, an entrepreneur with a
family business background is more likely to be prepared for the unexpected.
This suggests that if a person has previously been exposed to business, has
experience running a business, and an understanding of business consequences,
they will be more aware and ready should they have experience business
downturns. This suggestion is supported by Brown (1990) findings that students
who were interested in owning a business were most likely to have had parents
or grandparents who had owned businesses. Similar findings by Scott and

59
Twomey (1988) established that self employment was preferred by people
whose parents were full time business owners. Matthew and Moser (1996) also
believed that role models have solid influence on how entrepreneurial a person
will become.
A successful family business will influence a person’s decisions to become an
entrepreneur (Scott & Twomey 1988; Wang & Wong 2004). Research by Brown
(1990) has shown that having an entrepreneurial family background encouraged
the children to start their own businesses in the future. In addition to that,
experienced families also demonstrated the importance of planning before
starting a business. Hiemstra, Van der Kooy, and Frese (2006) established that a
key success factor in business was a well planned strategy. They found that most
business failure in businesses that did not sufficiently prepare plans prior to
formation.
2.6.9 Density of business network
Research emphasised the importance of networking in business. To achieve
success in business, entrepreneur did not only focus on internal issues but also
created external relations by expanding their industrial networks (Lee & Tsang
2001). In Lee and Tsang’s research, network relations included governments,
suppliers, consumers, buyers, neighbours, and institutions, virtually anyone that
could support the small-scale fish farmer’s business expansion. The density of
business networks played a big role in increasing the opportunities for business
expansion. Greater network density meant more personal contacts to help an
entrepreneur to expand their business. Other research has also assumed that
networking may increase small businesses performance and growth (Havnes &
Senneseth 2001).
2.6.10 Start-up financial capital (quantum and sources)
Lack of capital was one of the constraints faced by small scale farmers (Das
2006). There were many cases in Indonesia where small farmers could not freely
sell their produce due to the contracts they had with money lenders (Kinseng
2005). Usually farmers had to sell their produce to the money lender at a low
60
price. This condition is common amongst fish farmers since many poor farmers
are unable to secure sufficient loans from the banks or cooperatives.
2.6.11 Family support
Family support contributes to the success of an individual since the family
includes the people closest to the person. Entrepreneurial success was influenced
by close family and community networks (Basu 1998). Family support also
substantially influenced the continuity of the business (Morrison 2000). A
family did not only contribute financially but also provided moral support:
without a family to support them it was doubtful that an entrepreneur would be
able to achieve success in business.
2.6.12 Market demand
A market is the cornerstone of business success. Without a market to sell their
products, a business will most likely close down. Before starting a business, a
smart entrepreneur will plan everything ahead, including doing research on their
markets. Through market research an entrepreneur will not only know the
market size, but will also evaluate the strengths and weaknesses of their
competitors (Hyde 1997). In addition, adopting a market approach ensures the
entrepreneur has excellent contact with customers.
In relation to the aquaculture industry, Lichtkoppler developed questions that
fish farmers should answer prior to starting their businesses: “(1) Who is
specifically is going to buy my fish? (2) Is there a market for fish that I can
supply? (3)At what price can I sell my fish? (4)What is my market risk? (5) How
do plan to sell what I produce? (6) Why produce something if I cannot sell it?”
(Lichtkoppler 1993, p. 2). It was suggested that these questions had to form part
of the planning strategy prepared and evaluated by every business owner.
However, small scale fish farmers may have limited capital and access to
markets. They might also be unfamiliar with market research and not know how
to market their product (De la Cotera 2001).

61
2.6.13 Infrastructure in the area of operation
Small scale fish farmers require developed infrastructure in their area of
operation. Without developed infrastructure, fish farmers, especially those who
operate in remote rural areas may not have access to markets or suppliers. It is
critical that for their operations, small scale fish farmers can access roads,
transport facilities, and receive electricity supply to operate their businesses
(Islam 2004). Developed infrastructure will assist them in operating their
business with greater ease. If fish farmers do not have access to infrastructure
they may not be able to operate their fish farming businesses; they will have
limited access to markets to sell their produce, limited access to suppliers for
supplies, and without electricity they will not be able to carry out their daily fish
farming activities.
2.6.14 Government support
The government plays an important role in the growth of entrepreneurship since
it holds authority over the rules of business (Morrison 2005). Besides
maintaining the business rules, government also has the power to assist the
community, especially to support the poor. Issues have arisen regarding the lack
of assistance from the government to poor communities. International funding
institutions such as the International Fund Agriculture Development (IFAD) and
the Asian Development Bank (ADB) have given financial support directly to
Indonesian poor fish farmers and fishermen instead of to the Indonesian
government for distribution (Kompas 2002). Kristiansen (2002) reported on his
interview with a local fish farmer. The fish farmer complained that the State
Fish Seed Centre controlled him and that foreign traders were the ones that had
opened his eyes. The fish farmer claimed that he did not trust the government
staff who gave him trouble but no support.
Despite such controversial opinions regarding the lack of support from the
government, there are also reports about the support that the Indonesian
government has given to small scale fish farmers. Detiknet (2005) confirmed
that the Indonesian government had announced the elimination of the 10 per
cent fishery tax to boost exports and to stimulate investment. Their hope was
62
that the policy would increase fisheries’ production in Indonesia and help poor
fish farmers to find more markets.
Since realising the huge potential of aquaculture the Indonesian government has
increased their assistance to the fish farmers in Central Java. The government is
now providing support through various means described next.
Providing soft loans from the bank
The Department of Marine Affairs and Fisheries have made cooperative
arrangements with an Indonesian Bank to give soft loans to fish farmers in
Indonesia (Bernas 2003). This soft loan arrangement was established to support
fish farmers to develop their businesses. It is expected that with loans like these
fish farmers will be able to increase their prosperity.
Providing capital support
The Indonesian government is not only providing seed subsidies but is also
providing capital support to fish farmers through their FFGs. Rokanhilir (2008)
reported that the government had given as much as Rp 194.5 million capital
support for FFGs. The report goes on to explain that the objective of the capital
support was to motivate the FFGs to develop their businesses and indirectly to
increase their productivity. The capital support given to the FFGs, according to
the report, was in the form of a complete fish feed producing machine which
allowed FFGs to produce their own fish feed. Antaranews (2007) reported that
the President of the Republic of Indonesia has given FFGs in Central Java
supporting capital of around Rp 600 million to build irrigation for FFG fish
ponds. Saragih (2000) reported that the government has given capital support to
FFGs to motivate FFGs to develop themselves and become the center of fish
production in the area.
Providing technical and managerial training
The local and regional governments often provide training programs to FFG
members. Training material include not only technical materials, but also
managerial content to support FFG members in running their businesses.
Usually local government offices prepare annual training schedules specifically

63
for fish farmers and the fees for this training come from the APBD/APBN
(Regional Budget and State Budget).
Providing fish disease and parasite management support
FFG members receive assistance from the government during fish disease or
parasite outbreaks. Suara Merdeka (2002) reported that FFGs in Central Java
received around Rp 500 million support from the government in the form of
antibiotic vaccine, vitamins, and clinical laboratory tools for the local fisheries’
officer to monitor the outbreak and from spreading of diseases. The report
further explains that the government has also assisted with fish disease and
parasite outbreak management by building fish clinics in Magelang, Central
Java.
Providing subsidies
The government has shown their concern for small scale fish farmer in
Indonesia by giving them subsidies. In 2007, the Indonesian President gave
about Rp 2.5 million fish seed subsidies to FFGs in Central Java who had shown
significant growth in production and have demonstrated innovative undertakings
(Antaranews 2007). Suara Merdeka (2007a) also reported that the Fisheries and
Marine Affairs Office has given seed subsidies to FFG members in order to
support their fish farming businesses. The fish farmers were reportedly very
happy with the fish seed subsidies since they had experienced difficulty in
obtaining good quality fish seed.
Encouraging the formation of FFGs
The government is encouraging fish farmers to form FFGs in their villages. The
objective is to unite fish farmers who conduct similar practices, who reside in
the same area, and who have similar views and goals (Semarang Marine Affairs
and Fisheries Office 2005). It is expected that raising fish farmers’ awareness
will encourage them to make the first move in forming a FFG in their village.
Further objectives of encouraging FFG formation were to improve the fish
farmer family’s standard of living and to increase the opportunities for self
development available to fish farmers.

64
2.6.15 Other institutional support
In addition to the support from the Indonesian government to fish farmers, other
agencies, such as international organisations and domestic institutions, are also
making available support. Some of the more active agencies who conduct
projects to help fish farmers in Central Java are:
• Asian Development Bank (ADB) mainly provides loans or technical
assistance for aquaculture development in Indonesia (ADB 2008).
• Food and Agriculture Organisation of the United Nation (FAO) actively
carry out campaigns and give support to fish farmers to implement
responsible fisheries through their Fish Code and fish farm partnerships
(FAO 2008). They mainly give technical support and carry out projects in
Central Java.
• Australian Centre for International Agricultural Research (ACIAR) carries
out research projects to overcome aquaculture problems in Indonesia,
specifically in shrimp farming (Martin 2008).
• International universities, such as the University of Sydney in cooperation
with ACIAR, carry out projects in Central Java. They assist small scale
shrimp farmers to produce shrimp of a good quality standard for both export
and domestic markets. (ACIAR 2008).
• Many local universities fund research projects and civil service programs for
fish farmers. This includes developing technical skills.
2.7 Income and income improvement
Income improvement is a crucial consideration in decreasing the level of poverty in
developing countries. Fish farmers in most parts of Indonesia are small scale and have
limited capital to run their businesses. They also have limited avenues through which to
upgrade their businesses. The Indonesian Constitution No. 9/1995 defined small-scale
businesses as having the following characteristics:
• A productive business owned by Indonesian citizens and formed with or without
legal status.
• Is not affiliated with or a branch of a middle or large scale business.
65
• Possesses assets of no more than Rp 200 million, not including land and building,
or, has maximum annual revenue of Rp 1 billion.
According to the Department of Marine Affairs and Fisheries (2005), almost 80 per cent
of fish farmers in Indonesia are people with low levels of education. Susilowati (2005)
explained that generally people with low levels of education did not have inspiration
and aspiration, and therefore that they did not have the motivation to change their lives.
Contrary to this it has also been argued that higher levels of education did not guarantee
success in business, although to some extent it did play a role. For example, higher
education may give a person a chance to expand networks as well as expand their
knowledge, but, at the end of the day, it is up to the person to use their large networks
and knowledge to benefit their business. In some cases, it has also been recognised that
knowledge is not the only key to successful business. There have been other arguments
presented on the extent to which education affects entrepreneurs in creating successful
businesses.
Lee and Tsang (2001) observed that education was vital in establishing successful
entrepreneurs in the increasingly complex global business environment. The
information from the Department of Marine Affairs and Fisheries (2005) showed that
since almost 80 percent of Indonesian fish farmers do not complete their primary school
education it significantly affected the way these fish farmer think and manage their
business. Although much research has been conducted in the fisheries industry, only
people with higher levels of education can understand and gain benefit from such
information. Flor explained that many people can use information, including farmers,
except those with lower income (Flor 2005). In other words such information can only
benefit those that have sufficient intellect, since “poor farmers” are normally assumed to
have lower levels of intellect.
Bolt (2005) established a conceptual framework of the influences on farmers’ income.
This framework links micro, meso and macro factors. Macro factors like producers,
consumers, and the economy (e.g., interest rates and trade policies), and meso factors
(e.g., infrastructure, institutions, and incentives) facilitated as well as constrained
farmers. Macro and meso factors were both out of the farmer’s control and the
influences that they had on the farmer’s income.
66
Based on Bolt’s framework, and together with farmers’ capital, the meso and macro
factors are important factors that effect farmers’ income improvement. Governments,
both federal and local, to a great extent determine the macro and meso factors and are
therefore an essential part in improving farmers’ income through their policies and
support. The Indonesian government still needed to give their full support to lower
income communities with an official declaration in their five-year development plan
(Booth 1993).
2.7.1 Current status of Indonesian small scale fish farmers’ income
The small scale fish farmers’ income improvement is important if they are to
expand their businesses and at the same time enhance their families’ welfare.
Improvement in the small scale fish farmers’ family welfare means that their
families have better access to health and educational services. This will lead to
better life for their descendents in the future. Unfortunately, this has not yet a
reality for many fish farmers in Central Java: many have indicated that fish
farming is a promising source of income but it is only enough to meet their daily
needs. Many may not have enough capital to expand their business. However,
this is a reflection of how individuals manage their financial situations because
some fish farmers with limited income are able to use their profits to meet their
family needs as well as expand their businesses.
2.7.2 Importance of income improvement for small scale fish farmers in Indonesia
The ability of fish farmers to improve their income will also mean an ability to
improve their levels of business since they will have a larger amount of capital
to run their businesses. Growth in income is an important aspect for all
businesses; while larger companies may have growth planned right from the
start, smaller family businesses or micro scale businesses may have not done so
at all.
Many aquaculture projects are aimed at increasing fish farmers’ income in
Indonesia. It is believed that income improvement will bring many benefits to
fish farmers. For example, they will have more capital to expand their
businesses and more income for their own family expenses (such as health and
education).
67
2.8 Product sustainability
Despite the large increase in global aquaculture production, unsustainable aquaculture
has led to a negative view of aquaculture since the practices may have caused
environmental degradation. Science Daily (1998) reported that instead of resolving
problems, the fish farming practices of some species of fish were causing problems.
Salmon and shrimp farming was mentioned as causing fish depletion, environmental
disruption because of excess fish feed and pesticides, and consuming more fish for fish
feed. Examples such as this will damage the image of aquaculture as “the solution of
overfishing” and will cause unsustainable aquaculture in the future. It is crucially
important that fish farmers adopt sustainable aquaculture practices.
2.8.1 Definition and importance of product sustainability
Sustainability has been viewed from many perspectives by past researchers.
Pezzey (1992) defined sustainability as the ability to maintain the needs of
human beings over a long period of time by using various interdisciplinary ideas
to sustain industrial civilisation. Be (1994) quoted the definition of sustainability
from the World Commission on Environment and Development—WCED
(1987)—as the ability to meet the current generation’s needs without disturbing
the needs of future generations. Based on past research product sustainability
can be defined as the ability to continuously provide a product over a long
period of time.
Sustainability as described by Caffey et al. (1998), referred to in Wurts (2000),
and by Phillips et al. (2001), referred to in McClausland et al. (2005), was
categorised according to three types: social, economic, and environment
sustainability. Social sustainability highlights the social aspects, for instance
local concerns about employment and ownership. For example, the rapid rise in
the aquaculture industry in the last decades has resulted in the rise of
employment rates. In fact, according to McCausland et al. (2005), aquaculture
was the only subdivision in the fisheries industry to achieve increases in
working opportunities. The second type focuses on economic aspects such as
market demand and profitability, which are important factors in achieving
revenue growth. The third type, environmental sustainability, focuses on
environmental concerns such as water and soil quality. McCausland et al. (2005)

68
highlighted concerns about the relationship between environmental and social
aspects: environmental degradation may well cause unsustainable aquaculture
which could lead to job losses.
Similar definitions of sustainability were put forward by Caffey, Kazmierczak,
and Avault (2001) who categorised sustainability into economic, biological, and
socio-cultural types. These three types are believed to be the main source of
achieving sustainability and are depicted in figure 2.5. From these three
discipline, Beveridge, Phillips and Macintosh (1997) have stated that the most
important factor that can no longer be ignored is the environmental discipline.
They reasoned that the environmental discipline may well be the key to ensuring
the socio-cultural and economic concerns since without a sustained environment
the sustainability of the other disciplines may be threatened.
Source: Caffey, RH, Kazmierczak, RF & Avault, JW 2001, ‘Developing consensus indicators of
sustainability for South eastern United States aquaculture’, LSU Ag Center, Bulletin No. 879, December 2001, USA
The research carried out by Caffey, Kazmierczak and Avault (2001) examined
sustainability from a business and aquaculture perspective. Sustainable
aquaculture is very important in the future fulfillment of fishery demand (Alder
et al. 1996, Boyd 1999; Hopkins 1996). People have in the past made
improvements in many industrial areas, including fisheries; however, some
efficiency improvements may have included unforeseen side affects that caused
new problems. For example, environmental degradation has emerged as a
consequence of chemical use in farming (Hopkins 1996). High demand for
Sustainability
Ecology
Sociology Economics
Figure 2.5 Sustainability as the intersection of three discipline: ecology, economy, and sociology

69
certain products have also been known to degrade environmental conditions.
During the 1970s when world demand for shrimp was increasing rapidly, many
investors were encouraged to invest in shrimp cultivation. This led to land
clearing for shrimp cultivation through the removal of some mangrove forests.
Unfortunately, this expansion was not environmentally sustainable and resulted
in rapid environmental degradation (Elfitasari 2006). Failure to move swiftly to
overcome these problems will have direct consequences for aquaculture product
sustainability in the future.
Many aspects are involved in achieving aquaculture product sustainability.
Caffey, Kazmierczak, and Avault (2001) named four stakeholders in
aquaculture: producer, researcher, government, and other institutions. In this
research, the focus was on the first group—the producers—the small scale fish
farmers who directly produce and carry out the fish farming activities.
2.8.2 Aquaculture product sustainability in Indonesia
Many steps have been taken to obtain aquaculture sustainability in Indonesia,
however there was still a long way to go before achieving sustainability since
the aquaculture industry was dominated by small scale fish farmers. Therefore,
strong action is needed to empower small scale fish farmers to use sustainable
aquaculture practices (Sukadi 2006).
Some of the steps required as recommended by Sukadi (2006) to empower small
scale fish farmers are:
1. Provide information that empowers small scale fish farmers about the
importance and requirements of aquaculture product quality that meet
regulator and consumer demands.
2. Empower small scale fish farmers to use and produce good quality fish seed
and fish feed.
3. Empower small scale fish farmers to implement sustainable fish farming
techniques and management practices that support environmental
preservation.

70
4. Improve small scale fish farmers’ production and marketing activities.
5. Improve small scale fish farmers’ production and income in a more
responsible, effective and efficient way.
2.8.3 Obstructions in sustainable aquaculture practices
There are many obstructions encountered by the Indonesian government in their
attempt to implement sustainable aquaculture practices. The most frequently
mentioned problems in achieving sustainable aquaculture are as follows.
a. The frequent occurrence of fish diseases and parasites in fish stocks
Disease outbreak in fish farming is known for its enormous impact on fish
products. Since fish stocks share the same environment, when a disease outbreak
occurs, it is already too late to save the other fish, and often the result is total
mortality of the affected fish stocks.
Based on this experience, the shrimp farmers in Lampung, South Sumatra, have
changed their strategy from disease treatment to disease prevention (Sukadi
2006). They took several preventative measures to minimise the possibility of
disease outbreak and the introduction of parasites into their fish stocks. The
preventative measures included maintenance of water quality (including
positioning a filter devise at the inlet pipe), developing bio-security fences, and
obtaining high quality fish feed and fish seed.
b. The frequent use of by catch fish as fish feed
One of the causes of the depletion of a number of wild fish stocks was the high
volumes of by catch products. Although fishing has had a large direct impact on
decreasing the numbers of wild fish, the volumes of by catch have also had a
high impact; the by catch figures are often not reported (Tidwell & Allan 2001).
Furthermore, it has been estimated that in some areas in the Gulf of Mexico, that
the by catch are higher than the main species targeted. It was found that of the
total catch the accidental by catch was almost four times the intended shrimp
catch.
71
In Indonesia, although by catch feed are not always available, it is used by many
marine water fish farmers. There has been continuing fears and reports that this
by catch may be the cause of the decreasing stocks of demersal fish in the
Malaka straits (Sumiono cited in Sukadi 2006).
To minimise the depletion of wild fish stocks as a consequence of by catch
feeding, the usage of commercial feed in the aquaculture industry has been
recommended.
c. The use of chemicals in aquaculture
Chemicals are in common use in aquaculture to enhance the pond soil and water
quality as well as to control phytoplankton bloom and fish disease or parasites in
fish ponds (Boyd & Massaut 1999). The Indonesian government realised the
harm that may be caused by chemicals used in aquaculture and issued a
prohibition on the usage of chemicals. As reported by Sukadi: “Chapter 8
Indonesian Act No. 31/2004: Owner of aquaculture farm, representative of the
owner, and/or responsible person who run aquaculture business is not allowed to
use chemicals, biological agents, explosive materials, equipments and/or
methods and/or constructions which may be harmful and/or threatening the
sustainability of fish resources and/or its environments of fisheries management
area in the republic of Indonesia.” (Sukadi 2006, p. 5) To enforce this act, a
monitoring program is carried out in Indonesia to control the use of chemicals in
fish farming, and also to check for the introduction of possible trace heavy
metals in molluscs or mussel cultures.
Some research has established the use of bio catalyzation in fish farming as
substitute for the use of chemicals in fish farming (Simbolon & Juyana 2007).
This technique uses plankton feeder fish in integrated fish farming with shrimp
cultures called a poly-culture system. The fish feed on the phytoplankton that
grow in the shrimp pond eliminates the need for chemicals to control
phytoplankton blooms. Another positive effect of this method is additional
income from the harvest of the plankton feeder fish itself.

72
d. The lack of infrastructure in remote areas
Lack of infrastructure in remote areas such as roads, electricity, and irrigation
channels are hindering efficiency increases in fish farming (Sukadi 2006). The
lack of infrastructure makes selling products, obtaining supplies, and even
attending training at local fisheries offices difficult. Without well developed
infrastructure in fish farming areas it is difficult to achieve sustainable
aquaculture.
e. The availability of good quality fish seed
Fish seed production controls are necessary to maintain good quality fish seed.
To facilitate fish farmers in obtaining good quality fish seed, Sukadi (2006)
made the following development recommendations:
1. Development of controlled brood stock centers. These centers are developed
to multiply brood stocks and distribute them to hatcheries. The brood stock
center for shrimp is located in Java, Sulawesi, and Sumatra, while Tilapia
brood stock center is located in Java, Sulawesi and Kalimantan. Other
specific brood stock center such as carps, prawns, seaweed etc. are
developed in several area across Indonesia.
2. Development of backyard hatcheries. These hatcheries are usually small
scale and produces milkfish, grouper, shrimp and prawns. Most are located
in coastal areas in Indonesia to support mariculture development.
3. Introduction of new species that can be developed in Indonesia. One of the
new species and now widely cultured, is freshwater lobster Cherax, which
originated from Australia.
4. Development of fish seed certification programs, established in 2004, to
guarantee the quality of seed produced by hatcheries.
f. The availability of good quality fish feed
One of the problems that hinder the availability of good quality fish feed is the
use of imported ingredients. Imported ingredients lead to high production costs
and lower profit margins (Sukadi 2006). To minimise the use of imported
ingredients several solutions have been put forward:
• Encouraging the use of local ingredients rather than imported ones.

73
• Encouraging the use of agricultural waste and products as substitutes for
commercial fish feed.
• Improving feed composition without decreasing its nutritional value.
2.9 Conclusion
Many factors support small scale fish farmers’ entrepreneurial activities in deriving
their income improvement and ensuring their product sustainability. The entrepreneurial
activities that have already been implemented in Central Java according to research
were identified as, but not limited to, fish feed production, fish seed production, fish
species extension, product range extension, utilisation of other fish parts, and market
extension
In carrying out their fish farming activities, small scale fish farmers in Central Java face
problems and constraints that hamper their activities. Sixteen constraints and problems
were identified in this research.
Factors that influence the small scale fish farmers in carrying out these activities can be
divided into two categories: endogenous factors and exogenous factors. Endogenous
factors are controllable since they arise from within the person, whereas exogenous
factors are uncontrollable since they appear in the person’s environment. Eight
endogenous factors have been identified such as fish farming knowledge and skills,
levels of education, experience, and entrepreneurial characteristics. Six exogenous
factors have been identified including business networks, financial capital, family
support, and market.
Income improvement is an important factor for small scale fish farmers. It acts as a tool
for business expansion but also serves as a device to fulfill the needs of their families.
Product sustainability can be achieved through practicing sustainable aquaculture.
Indonesia still faces obstacles in implementing sustainable aquaculture such as fish
diseases and parasites, the use of by-catch as fish feed, the use of chemicals, a lack of
infrastructure, and the unavailability of good quality fish seed and fish feed.

74
Chapter 3
The Aquaculture Industry
3.1 Introduction
The aquaculture industry has been growing over the past decade and the growth in fish
trade has exceeded the production of traditional crops in many developing countries.
One reason for this growth is the declining global fish catch (Hanneson 2002). Another
reason is that over the last 30 years fish consumption has doubled. Sukadi (2006) stated
that aquaculture has been acknowledged as the fastest growing food sector in the world.
These facts confirm that aquaculture is now globally accepted as the fastest growing
sector and that it has great prospects for further growth. Development of aquaculture
will help reduce the huge strain on the global fish catch and will create new job
opportunities (Yusuf, Pahlevi & Tambunan 1995). At the same time aquaculture
generates income and employment, decreases the pressure on the dwindling wild catch,
and supports food security in countries (FAO 2008).
Indonesia has a large population; in Central Java alone the population reached 30
million people in 2003. Around 400,000 people or 1.33 per cent of Central Java’s
population are employed in the aquaculture industry and most of them work as small-
scale fish farmers (Central Java Fisheries and Marine Affairs Office 2005). The
topographical advantages of Central Java also favor the development of its fish farming
industry. The Indonesian government has recognised this potential and has given their
support to the development of this industry. The government support come in many
forms such as the establishment of the Indonesian Marine Affairs and Fisheries
Department in 2000, fish seed subsidies to fish farmer groups, and capital support.
3.2 The development of the world’s aquaculture industry
Fish is a vital source of nutrients to human beings and the downward trend in the wild
fish stock has spurred governments and fishermen into action to respond to the problem.
Unfortunately one of the solutions has been to invest in more sophisticated tools and
technology to locate new fish populations into waters much further and deeper than
previously harvested. The consequences are that fish populations are being found more
easily, wild fish stocks are being caught much faster, and overfishing are occurring
more intensely (Larsen 2005; Tidwell & Allan 2001). Figure 3.1 presents the actual

75
decline in global fish species since 1950 to the present, with predictions to the year
2050.
Figure 3.1 Prediction of global seafood species in a century (1950-2050)
Source: Black (2006) http://news.bbc.co.uk/2/hi/science/nature/6108414.stm
The global seafood species is expected to have collapsed completely in less than half a
century if the current levels of fish exploitation stay the same (Black 2006). The graph
shows that by the year 2050, 100 per cent of fish species will have collapsed. The
introduction of technology such as larger fisheries vessels and more advanced
equipment is detrimental to the size of the wild fish stock. In fact, it is accelerating the
collapse of the wild seafood stock (Black 2006). In response to the severe depletion of
wild fish stock, aquaculture is becoming the favored substitute option and is being
developed rapidly by countries all over the world.
Taken together the wild catch and farmed fish world production is on the increase.
However, a significant increase in farmed fish only began in the 1980’s when it was
realised that the wild catch was suffering a major decline and when, in 1980, the
practice of trawl fishing was banned (FAO 2008). In spite of many efforts to reduce the
size of the wild fish harvest, it is still on the increase. Even with the sharp increases in
farmed fish production, it is still far behind the wild fish catch production. This situation
is presented in Figure 3.2.
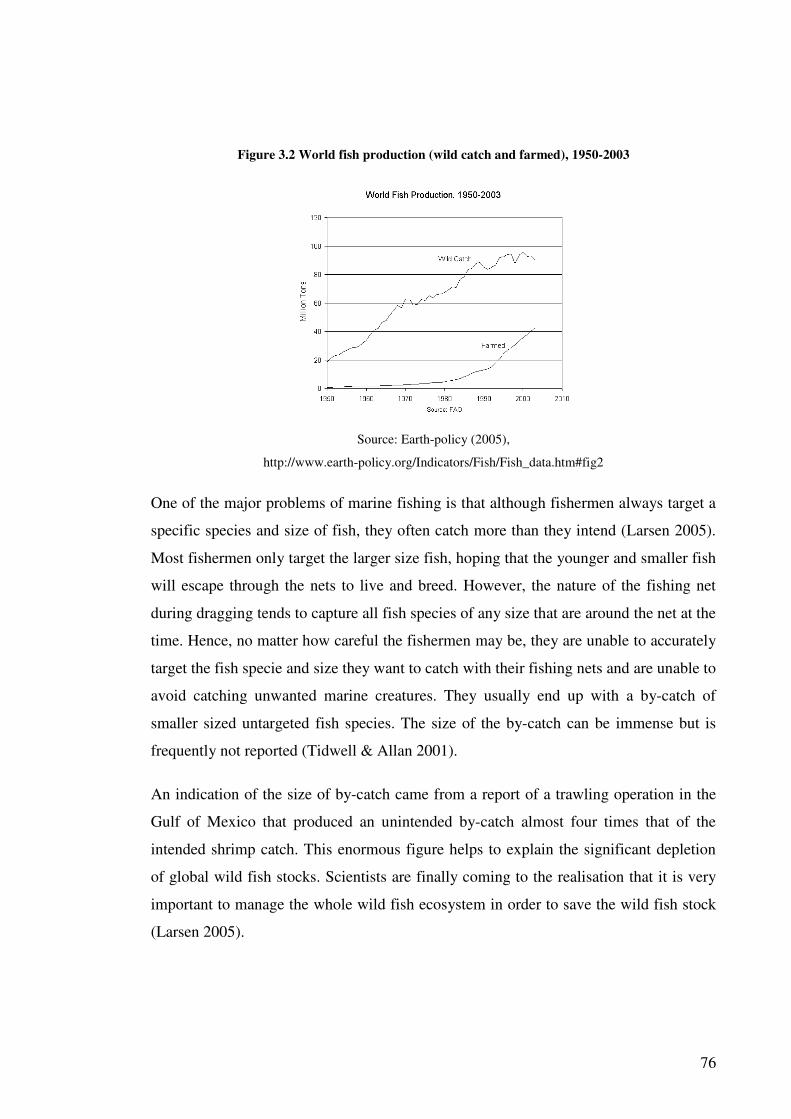
76
Figure 3.2 World fish production (wild catch and farmed), 1950-2003
Source: Earth-policy (2005),
http://www.earth-policy.org/Indicators/Fish/Fish_data.htm#fig2
One of the major problems of marine fishing is that although fishermen always target a
specific species and size of fish, they often catch more than they intend (Larsen 2005).
Most fishermen only target the larger size fish, hoping that the younger and smaller fish
will escape through the nets to live and breed. However, the nature of the fishing net
during dragging tends to capture all fish species of any size that are around the net at the
time. Hence, no matter how careful the fishermen may be, they are unable to accurately
target the fish specie and size they want to catch with their fishing nets and are unable to
avoid catching unwanted marine creatures. They usually end up with a by-catch of
smaller sized untargeted fish species. The size of the by-catch can be immense but is
frequently not reported (Tidwell & Allan 2001).
An indication of the size of by-catch came from a report of a trawling operation in the
Gulf of Mexico that produced an unintended by-catch almost four times that of the
intended shrimp catch. This enormous figure helps to explain the significant depletion
of global wild fish stocks. Scientists are finally coming to the realisation that it is very
important to manage the whole wild fish ecosystem in order to save the wild fish stock
(Larsen 2005).

77
Several solutions have been recommended for adoption to manage the wild fish stock:
• Create marine reserve areas where fishing is banned, completely, to give fish stock
the chance to regain their numbers.
• Set a strict limit on fishing quotas.
• Enforce stricter controls over illegal fishing.
• Restrict the use of fishing equipment that is known to be most damaging to fish
stocks.
• Develop by-catch reducing equipment to stop unwanted fish harvesting (Larsen
2005).
By implementing the above solutions, it is expected that the depletion of wild fish stock
can be slowed down, and perhaps even allow wild fish stock to regain past numbers.
As previously explained, the aquaculture industry has experienced significant growth in
the past few decades in response to the depletion of the wild fish harvest. However,
Figure 3.3 shows that in spite of the significant increase in aquaculture production, it is
remains well below the capture fisheries landings.
Figure 3.3 Contribution of aquaculture to total world fisheries landing (1970 – 2000)
Source: Tacon (2003)
ftp://ftp.fao.org/docrep/fao/005/y4490E/y4490e01.pdf
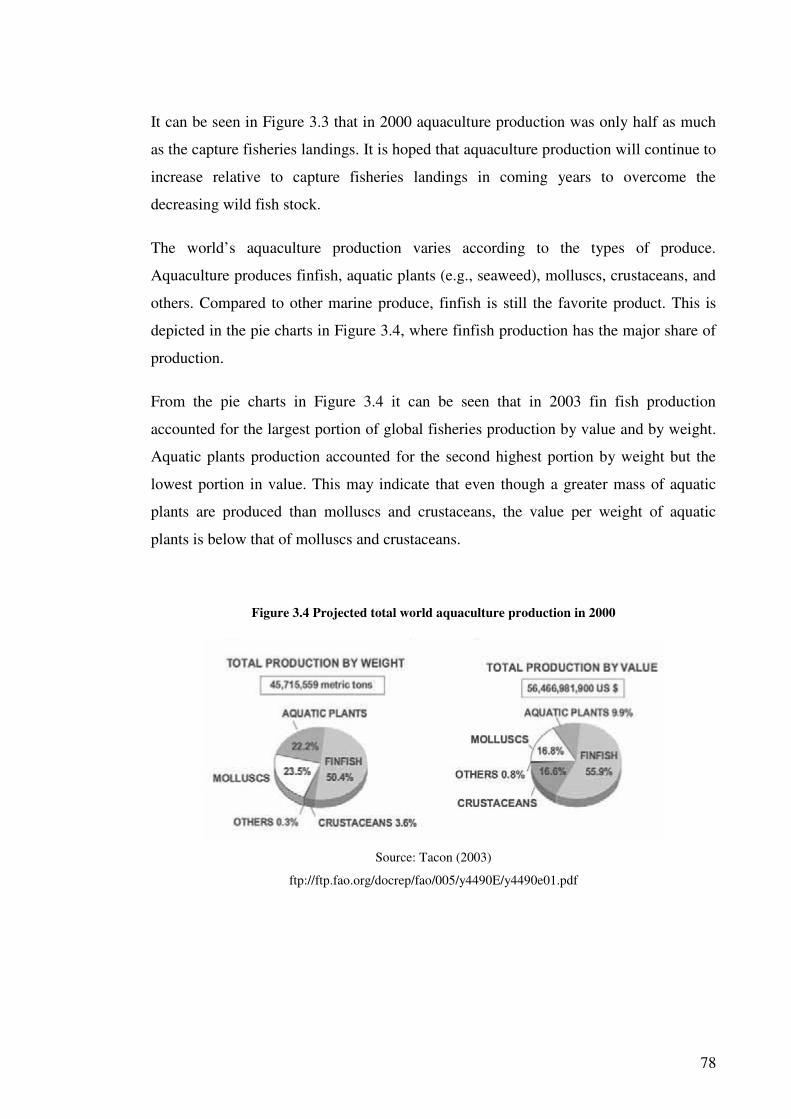
78
It can be seen in Figure 3.3 that in 2000 aquaculture production was only half as much
as the capture fisheries landings. It is hoped that aquaculture production will continue to
increase relative to capture fisheries landings in coming years to overcome the
decreasing wild fish stock.
The world’s aquaculture production varies according to the types of produce.
Aquaculture produces finfish, aquatic plants (e.g., seaweed), molluscs, crustaceans, and
others. Compared to other marine produce, finfish is still the favorite product. This is
depicted in the pie charts in Figure 3.4, where finfish production has the major share of
production.
From the pie charts in Figure 3.4 it can be seen that in 2003 fin fish production
accounted for the largest portion of global fisheries production by value and by weight.
Aquatic plants production accounted for the second highest portion by weight but the
lowest portion in value. This may indicate that even though a greater mass of aquatic
plants are produced than molluscs and crustaceans, the value per weight of aquatic
plants is below that of molluscs and crustaceans.
Figure 3.4 Projected total world aquaculture production in 2000
Source: Tacon (2003)
ftp://ftp.fao.org/docrep/fao/005/y4490E/y4490e01.pdf
79
3.3 The development of the aquaculture industry in Indonesia
Indonesia is one of the countries in the world with the largest archipelago, consisting of
more than 17 thousand islands and 81,000 km of coastline (Dyspriani 2007; FAO 2008).
This makes Indonesia a very attractive location for aquaculture development.
Aquaculture already plays a significant role in the Indonesian economic improvement
with 2.5 million people employed in this industry (ADB 2006). It also provides a source
of protein and generates economic income for rural communities (FAO 2008). Nurdjana
declared that “[a]quaculture is an important component for Indonesian fisheries which
contributes to national food security, income, and employment generation and foreign
exchange earnings” (2006, p. 1). This underscores the importance of aquaculture for
national economic growth and the necessity to urgently develop the industry in
Indonesia.
Indonesia is very fortunate and blessed with geographical and typological conditions
ideally suited to aquaculture. Nurdjana (2006) and Dyspriani (2007) explained that with
a very extensive coastline of 81,000 km, Indonesia has enormous potential to develop
its fish farming industry. Nurdjana (2006) further pointed out that the total potential
area available for brackish water aquaculture development is 1,225,000 hectares and the
total potential area for freshwater aquaculture is 2,230,500 hectares. With the stable
water temperature of the area the fish farming industry is able to operate all year round,
and with the large numbers of small islands surrounding the big island they are
protected from the dangers of destructive waves. The large human population also
provides the aquaculture industry in Indonesia with access to low-cost labour (Nurdjana
2006). For these reasons aquaculture in Indonesia has expanded fast and the favorable
conditions have made it easier for Indonesian fish farmers to carry out their fish farming
activities.
Another reason contributing to the rapid expansion of the industry is simply that many
people are motivated when they observing the success of their families’ or neighbours’
in their fish farming businesses, and they attempt to follow in their footsteps. Without
sufficient capital, however, fish farmers experience many difficulties in successfully
operating their fish farming businesses.

80
China is the largest aquaculture producer in the world. There are six other Asian
countries that contribute to the aquaculture industry: Bangladesh, India, Indonesia,
Korea, Philippines, and Japan, as can be seen in Figure 3.5 (Tacon 2003).
Figure 3.5 Major aquaculture producing countries within the Asian region excluding mainland China
Source: Tacon (2003)
ftp://ftp.fao.org/docrep/fao/005/y4490E/y4490e01.pdf
The top ten aquaculture producers in the Asian region in 2003 are listed in Table 3.1.
According to the list, Indonesia is one of the top five aquaculture producers in the Asian
region contributing 2.4 per cent of Asian aquaculture production.

81
Table 3.1 The top ten aquaculture producers in the Asian region
Country Aquaculture production
(% of total)
Mainland China 77.7
India 5.0
Japan 3.1
Philippines 2.5
Indonesia 2.4
Thailand 1.7
Republic of Korea 1.7
Bangladesh 1.6
Vietnam 1.3
Democratic People’s Republic of Korea
1.1
Source: Tacon (2003)
ftp://ftp.fao.org/docrep/fao/005/y4490E/y4490e01.pdf
According to Figure 3.6 China contributed 81.1 per cent of the global total aquaculture
production in the world in 2000 (for reporting countries). In comparison Indonesia’s
contribution was 3.2 per cent in that year.
Figure 3.6 Non-species specific aquaculture production reported in 2000
Source: Tacon (2003)
ftp://ftp.fao.org/docrep/fao/005/y4490E/y4490e01.pdf
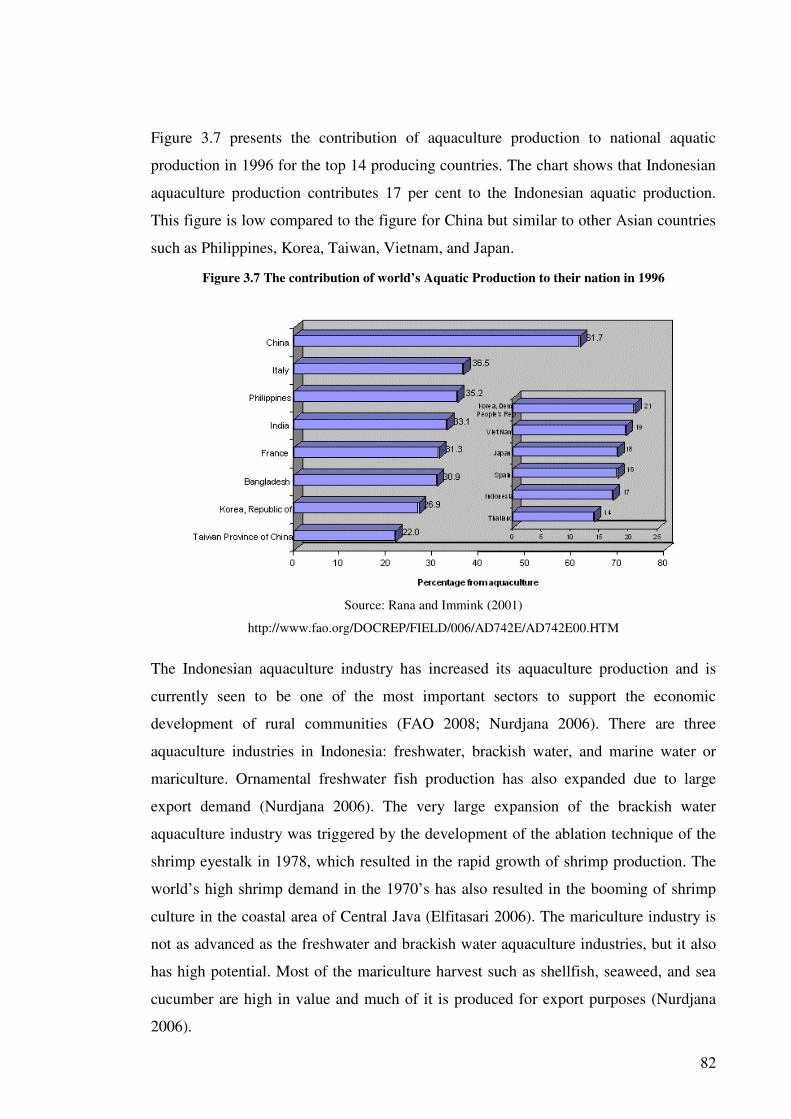
82
Figure 3.7 presents the contribution of aquaculture production to national aquatic
production in 1996 for the top 14 producing countries. The chart shows that Indonesian
aquaculture production contributes 17 per cent to the Indonesian aquatic production.
This figure is low compared to the figure for China but similar to other Asian countries
such as Philippines, Korea, Taiwan, Vietnam, and Japan.
Figure 3.7 The contribution of world’s Aquatic Production to their nation in 1996
Source: Rana and Immink (2001)
http://www.fao.org/DOCREP/FIELD/006/AD742E/AD742E00.HTM
The Indonesian aquaculture industry has increased its aquaculture production and is
currently seen to be one of the most important sectors to support the economic
development of rural communities (FAO 2008; Nurdjana 2006). There are three
aquaculture industries in Indonesia: freshwater, brackish water, and marine water or
mariculture. Ornamental freshwater fish production has also expanded due to large
export demand (Nurdjana 2006). The very large expansion of the brackish water
aquaculture industry was triggered by the development of the ablation technique of the
shrimp eyestalk in 1978, which resulted in the rapid growth of shrimp production. The
world’s high shrimp demand in the 1970’s has also resulted in the booming of shrimp
culture in the coastal area of Central Java (Elfitasari 2006). The mariculture industry is
not as advanced as the freshwater and brackish water aquaculture industries, but it also
has high potential. Most of the mariculture harvest such as shellfish, seaweed, and sea
cucumber are high in value and much of it is produced for export purposes (Nurdjana
2006).

83
3.4 The development of the aquaculture industry in Central Java
The Central Java aquaculture industry has also experienced growth within the last few
decades. Media Indonesia (2008) predicted that the Central Java aquaculture production
for the period 2006-2009 will grow annually by 4.20 per cent.
The Central Java Fisheries and Marine Office defined aquaculture as “activities that
relates to managing and using of resources for culturing and harvesting fish” (2006, p.
ix). Unlike fishing where fish can be caught by anyone, the fish and activities of
aquaculture are owned by a certain person or group of people and are carried out at a
certain location. The Indonesian aquaculture business was defined as “a legally
recognized (by the Indonesian government) economic unit that carry out fish culture /
other water plants / animal culture with aim to sell partly / whole of its production”
(Central Java Fisheries and Marine Office 2005, p. x).
Central Java is a province located on the Java Island of Indonesia between West Java
and East Java. The northern part of Central Java lies along the Java Sea, and the
southern part of Central Java joins the Indian Ocean. This province has a variety of
water resources occurring naturally and man made, such as rivers, streams, and dams.
Central Java also has estuaries and a long coastal line which potentially supports
brackish water aquaculture. The Java Sea and Indian Ocean are rich in natural resources
to develop its sea water culture (Central Java Fisheries and Marine Office 2005).
The Central Java Fisheries and Marine Affairs provincial office is located in the capital
city of Central Java, Semarang. It acts as the technical resource for the Central Java
government in all aspects related to fisheries and marine affairs in the Central Java
region. The head of the Fisheries and Marine Affairs office is responsible for the
provincial office and reports to the Governor through the Regional Secretary
(Government of Central Java 2007b).
The Central Java Government has provided funding to the Fisheries and Marine Affairs
office to develop the Central Java fisheries and marine structure. Their activities
currently consist of three major programs: (1) the development of aquaculture, (2) the
development and empowerment of capture fisheries, and (3) the growth of fisheries
landings. The Indonesian Government is also funding (through national funding) the
Central Java Fisheries and Marine Affairs office to conduct a development program to

84
develop the fisheries resources of Central Java. This program has four objective or
subprograms: (1) development of capture fisheries, (2) development of aquaculture, (3)
technical support to marine and fisheries activities, and (4) development in fisheries
exports, competition, promotion, market sourcing, and import control (Government of
Central Java 2007c).
Central Java Aquaculture
Central Java Fisheries and Marine Office’s vision for Central Java aquaculture is
“to develop aquaculture as a main economic development resource which is
carried out through fisheries businesses with competitiveness and fairness”
(2005, p. 3). This determines that the status of businesses in the fisheries
industry is to be based on principles of competition and fair play. The Central
Java Fisheries and Marine Office defined their vision according to several
missions:
• Develop aquaculture in a responsible and environmentally friendly way
based on science and technology.
• Empower and improve the prosperity of fish farmers.
• Provide food, increase foreign exchange, and raw materials for fish
processing industry.
• Create employment and business opportunities.
• Establish a conducive aquaculture business environment (Central Java
Fisheries and Marine Office 2005, pp. 3-5).
The objectives for aquaculture in Central Java, according to the Central Java
Fisheries and Marine Office, are:
• Increase production and productivity of fish culturist.
• Increase income and prosperity of fish farmer community.
• Increase fish production follow by the increase of fish consumption and
community nutrition.
• Enhance the resource and environmental rehabilitation and protection.
• Increase employment and business opportunity.

85
• Boost national investment and export (Central Java Fisheries and Marine
Office 2005, pp. 3-5).
The Central Java government also has five Seedling and Aquaculture technical
workshops, which assist the small scale fish farmers in developing their
aquaculture system and technology, as well as training them with aquaculture
skills (Government of Central Java 2007d). In Janti, Ngrajek, Ambarawa the
technical workshops are focused on freshwater seedling and aquaculture. In
Sluke the workshops centre brackish water seedling and aquaculture, and on the
Karimunjawa islands the workshops focus on seawater seedling and aqualture.
There are many species cultivated in Central Java depending on the type of
water available: fresh water, brackish water, or sea water. Elfitasari (2006)
explained that in the coastal area of Central Java, many brackish water ponds
can be found and many fish farmer culture milkfish and shrimp along the
coastline of Central Java. Shrimp is one of the most promising products for
production in Central Java. It is being cultivated by many fish farmers located
near the coast who have access to a brackish water supply. Besides brackish
water cultivation, fish farmers in Central Java also carry out freshwater
aquaculture and sea water culture (also known as mariculture). The Central Java
Fisheries and Marine Office organises the areas of development according to
these three types of cultivation and hence there are three aquaculture industries:
(1) seawater culture or mariculture (2) brackish water culture, and (3) freshwater
culture (Central Java Fisheries and Marine Office 2005).
The Central Java Fisheries and Marine Office divides Central Java into three
aquaculture regions: (1) the northern part of Central Java (2) the middle part of
Central Java, and (3) the southern part of Central Java. These divisions
correspond to the type of fish farming carried out in each region. The
aquaculture regional divisions are shown in Figure 3.8.

86
Figure 3.8 Maps of Central Java aquaculture region
a. Map of Northern Central Java aquaculture region
b. Map of Middle Central Java aquaculture region
c. Map of Southern Central Java aquaculture region
Three regions of Central Java aquaculture: (a) Northern (b) Middle (c) Southern
Source: Official website of the Government of Central Java, 2007a, http://www.jawatengah.go.id
The northern and southern parts of Central Java, are located in proximity to
brackish water and sea water and therefore the type of cultivation carried out in
villages from this area consist of mariculture, brackish water cultivation, and
fresh water cultivation. On the other hand, fish farmers in the middle region of

87
Central Java only carry out freshwater cultivation activities, since they are not
close to the coast.
The aquaculture industry in Central Java is showing promise for development.
The huge resources that could support aquaculture have not been fully exploited
yet. According to Central Java Fisheries and Marine Office (2005), only 6.57 per
cent of the land suitable for freshwater cultivation, and 0.73 per cent of the land
is suitable for mariculture has been exploited. In other words there is potential
for the aquaculture industry in Central Java as long as it can be developed and
supported in the best way.
3.5 The small scale fish farmer in Central Java
According to the Central Java Fisheries and Marine Office (2005), the Central Java
aquaculture industry is currently dominated by small scale or home based fish farmers.
Sukadi (2006) also reported similarly that the number of small scale fish farmers in
Indonesia outnumbered large aquaculture companies.
Most of the fish farmers live in small villages. Most fish farmer communities in a
village start out with one fish farmer. The communities then expand to the neighbours
when they see the success and become motivated to achieve the same success. A
specific example of this expansion is given by the Boyolali Animal Husbandry and
Fisheries Office (2007). In their example a fish farmer community in a village in the
Boyolali region started off with one successful fish farmer cultivating about 3,000 fish
in two ponds. This built interest amongst the neighbours and many decided to follow
their neighbour’s success. A similar example is mentioned by Miyata and Manatunge
(2004) from their observation of 400 fish farmers in Indonesia that adopted Floating Net
Aquaculture (FNA). In their example they explained that the reason the fish farmers
adopted FNA is because they observed the success of their neighbours who had already
adopted FNA. Furthermore, an important factor in the early years of FNA adoption was
that many of the fish farmers learned about FNA from their colleagues (Miyata and
Manatunge 2004).
The Indonesian government has fully realised the importance of aquaculture for national
economic growth. Nurdjana, the Director General for Aquaculture, Ministry of Marine
Affairs and Fisheries, the Republic of Indonesia, acknowledged this during the

88
International Workshop on Innovative Technologies for Eco-Friendly Fish Farm
Management and Production of Safe Aquaculture Foods in Bali, December 2006. He
said:
Aquaculture is an important component for Indonesian fisheries which
contributes to National food security, income and employment generation
and foreign exchange earnings. Aquaculture has played its role as an
alternative source of income for coastal fishery communities. It has also
contributed for reducing the pressure on marine natural resources. Recently,
aquaculture development in Indonesia has been accelerated and considered
as an important sector for in supporting rural economic development
(Nurdjana 2006, p. 1).
There are several factors that have contributed to the growing importance of aquaculture
in Indonesia:
1. Securing food supply
Aquaculture is being slated as the solution to the fish supply shortages as the
result of global overfishing. Aquaculture is a growing supply of protein food for
rural fish farming communities. In addition to being a source of protein, fish also
provide vitamins, fatty acids, minerals, and is high in energy (Edwards 2000).
2. A source of income and employment
With fish farming it is expected that land owners can make use of their land to
cultivate fish and to obtain additional income for their family. Furthermore, by
establishing many new fish farms, many new employment opportunities can be
created in the neighbourhood. This is a strategy that the Central Java aquaculture
has adopted in the implementation of its mission, which is to create employment
and business opportunities (Central Java Fisheries and Marine Affairs office
2005). Therefore, aquaculture in Central Java can be directed to increase
employment opportunities for the community and expand business opportunities
in the aquaculture industry.

89
3. Increased foreign exchange earnings
Aquaculture is a means of increasing the Indonesian national exports of fisheries
products and this strategy has been adopted for implementing the Central Java
aquaculture mission, which is to secure food, increase foreign exchange earnings
and increase raw material for the fish processing industry (Central Java Fisheries
and Marine Affairs Office 2005). It is expected that aquaculture developments in
Central Java can enhance the export volumes of both fresh fish produce and
processed fish. Hutabarat (2002) claimed that the development in the fishery
sector can increase the national income of foreign exchange and added that
during the economic crisis, the fishery sector had not been badly affected.
Indeed, it had been beneficial for those with export oriented businesses because
of the Indonesian currency exchange rate against the US dollar.
3.6 Small scale fish farmers and their activities
Small scale fish farming involves many activities. This section will define small scale
fish farmers and identify some of their activities.
3.6.1 Definition of the small scale fish farmer
The small scale fish farmer has the following characteristics: (1) uses a small
piece of land, only up to 1 hectare with low fertility, (2) usually dependent on
rain for water and water storage, and (3) dependent on raw material inputs that
can be collected in the local area (Edwards et al., 1996).
According to the Indonesian Constitution, the characteristics of a small-scale
business are:
• A productive business owned by an Indonesian citizen and formed with or
without legal status.
• Is not affiliated to or a branch of a middle or large scale business.
• Possesses assets of no more than Rp 200 million, not including land and
buildings, or, has maximum annual revenue of Rp 1 billion (Indonesian
Constitution No. 9/1995).
For the purposes of this research, based on the characteristics of a small scale
business, the definition of a small scale fish farmer is: a productive business

90
owned by an Indonesian citizen, having no official legal status, with only up to 1
hectare of land, depended on raw material inputs that are collected from nearby
places, and possessing no more than Rp 200 million in assets.
3.6.2 Small scale fish farmer activities
Semarang’s Marine Affairs and Fisheries Office have publicly announced their
support for the importance of aquaculture development in Indonesia. They
pointed out that the efficiency and productivity of the individual fish farmer
depended on the strength of the fish farmer to develop his or her own
aquaculture business. And in order to strengthen the fish farmer’s and their
family’s position as part of the developing community, the Indonesian
government has recommended that fish farmers establish and merge into Fish
farmer Groups (FFGs) (Marine Affairs and Fisheries Office 2005).
According to the Semarang’s Marine Affairs and Fisheries Office’s Book of Fish
Farmer Group Formation Guide, there are two steps in the FFG formation:
group development and group monitoring. The following text provides an
overview of these steps and draws heavily from the guide.
a. Group development
Fish Farmer Groups are formed when fish farmers recognise a need for unity to
achieve shared objectives. There are five factors that influence the formation of a
Fish Farmer Group:
1. The members of the Fish Farmer (FF) community should have the same
needs. If the FFs do not have the same needs, they might not be able to work
closely together. Moreover, they might even have opposing objectives.
2. The FF community should be located in the same area using similar
resources or carrying out similar aquaculture practices. If FFs are located in
different areas, it will be difficult to carry out their group activities.
3. The members of the FF community should have similar social and economic
backgrounds. Generally, it is difficult to unify when members are of
different social and economic status because people with higher economic

91
status will prefer to socialize with people that have a similar status to them
and vice versa. Therefore, a FFG should be formed by fish farmers with
similar social and economic status so they can match their vision, mission,
and objectives.
4. All member of the FF community should trust one another. Psychologically,
it will be difficult to work together if individual members of the FFG do not
trust each other. As explained by Dirks: “trust seems to influence how
motivation is converted into work group processes and performance” (1999,
p. 1). It follows that trust will have a tremendous impact on how people will
cooperate and this will affect the outcome of their teamwork. Consequently,
trust is one of the crucial components in the formation of a FFG since it will
influence how the FFG members will work together.
5. The FF community should be able to select someone in their community to
become the leader of the group. This requirement is simply to avoid
competition for leadership of the FFG. When competition is involved in a
group it will influence the teamwork and may lead to separation of the group
itself.
It is expected that the formation of the FFG will help the members of the group
and their families to increase the quality of their livelihoods. The expected
outcomes of the FFG formation are:
• Increased ability to meet the primary needs of the fish farmer group and their
family, such as providing for food, clothes, and home security. It is expected
that by merging into a FFG individual fish farmers will have a greater
chance of expanding their business since members share the business capital,
the risk, and the profit.
• Making it easier for FFG members to earn a living.
• Improved education, skills and personal development of the FFG members
and their families.

92
b. Group monitoring
The Semarang Marine Affairs and Fisheries Office, with their objective to
increase and develop the number of FFGs, monitors the Fish Farmer Groups.
There are five areas that are monitored in the development of each FFG:
1. Monitoring the ability of the group to plan their business activities in order
to increase their productivity. This includes aspects of post harvest planning,
business analysis, and optimization of resource usage.
2. Monitoring the ability of the FFG to carry out and honour agreements with
other institutions.
3. Monitoring the ability of the group to increase its capital and the way they
spend their income.
4. Monitoring the relationship between the FFG and the village unit
cooperation (KUD) in order to enhance the relationship.
5. Monitoring the ability of the FFG to implement and use new technology and
information, and monitor the ability of members to cooperate to improve
their levels of productivity.
Existing FFGs are evaluated annually and accredited to a FFG level. The local
Fisheries and Marine Affairs office conducts the evaluation to determine the
accreditation levels. The evaluation criteria are:
a. The ability to search and use information.
b. The ability to plan activities which can increase productivity.
c. The ability to work as a team in carrying out the planned activities in a
disciplined way.
d. The ability to provide and develop the FFGs own facilities.
e. The ability to collect the FFGs capital.
f. The ability to properly carry out and honour cooperative agreements with
other parties.
g. The ability to cope with adverse circumstances.

93
h. The development of the leader and other members and their efforts to
improve their skills.
i. The quality of the relationship between the FFG and the village cooperation
unit.
j. The level of productivity.
(Translated from Fish Farmer Group Formation Guide Book 2005, pp. 8-9)
In general there are four accreditation levels assigned to FFGs (Semarang
Marine Affairs and Fisheries Office 2005). In the following section the group
levels are given in the original Indonesian language, and, because there are no
direct translations for these descriptions into English, are identified as Level 1 to
Level 4.
Kelas Pemula ( Level 1 – the lowest level or starter level).
This is the lowest level and usually the newly formed FFGs are assigned to this
level. They are evaluated as having the lowest capabilities according to the ten
evaluation criteria. The village head signs the certificate for this level.
Kelas Lanjut (Level 2 – the secondary level).
This is a step up from Level 1. The FFG members are usually evaluated as
having a higher level of abilities according to the ten evaluation criteria than the
FFG at Level 1. The Head of District officer, in Indonesia known as Camat,
signs the certificate for this level.
Kelas Madya (Level 3 – the mid advance level).
The FFG at this level has much higher levels of abilities than the FFGs at Levels
1 or 2, as measured according to the ten evaluation criteria. The Head of the
Region officer, in Indonesia known as Walikota or Bupati, signs the certificate
for this level.
Kelas Utama (Level 4 – the advanced level)
This is the highest level of FFG achievement. The members perform at the
highest level according to all ten evaluation criteria. The Governor of the
province where the FFG is located signs the certificate for this level.
94
In order to motivate the FFGs in Central Java to improve their businesses, the
Central Java Fisheries and Marine office conducts an annual FFG competition.
The winning FFG is given a certificate and prize money. The competition
criteria are grouped into three categories:
1. Social criteria. These criteria evaluate the ability of the FFG to self manage,
its organisational structure, the conduct of internal FFG meetings, activities,
capital collection, and other socially related aspects both within the FFG and
externally between the FFG and other parties.
2. Technical criteria. These criteria include technical aspects such as
aquaculture skills, raw materials, aquaculture infrastructure, and technology
development.
3. Economical criteria. These criteria include aspects of business analysis,
business loans, capital, and cooperation with village cooperation unit.
(Semarang Marine Affairs and Fisheries Office 2005)
The competition evaluation team establishes a questionnaire based on the above
criteria which the FFG completes. When the completed questionnaires have
been collated, the competition evaluation team carries out a field evaluation
based on the answers that the FFG provided in the questionnaire.
Many of the fish farmers believe that the FFG not only benefit their livelihoods
but that they receive additional benefits from membership. The benefits fish
farmers have identified are:
Income growth
Kadin-sumbar (2008) explained that the impact of FFG formation can be
directly seen in the increase of the FFG member’s income. As an example, the
income of Erman, a member of a FFG, doubled after he became a member of
FFG. He received fish seedling training and implemented his fish seedling
technique in his business. The increase in his income was a result not only of the
increase in fish production but also of the establishment of processed fish
products (Kabupaten Jombang 2007).
95
Soft loans from the bank
The Department of Marine Affairs and Fisheries has developed cooperation
between an Indonesian bank and fish farmers in Indonesia for the provision of
soft loans (Bernas 2003). These soft loans help to support fish farmers in
developing their business. It is expected that these loans will help to increase the
fish farmers’ level of prosperity.
Fish disease and parasite handling support
Another government service to FFG members is provided during fish disease or
parasite outbreaks. Suara Merdeka (2002) reports that FFGs in Central Java
received support of around Rp 500 million from the government in the form of
antibiotic vaccine, vitamins, and clinical laboratorial tools for the local fisheries
officer to anticipate outbreaks and prevent the spreading of the outbreaks. As an
example the government built a fish clinic in Magelang, Central Java to monitor
fish diseases and parasite outbreaks.
Government subsidies
The government has shown their concern for small scale fish farmer in
Indonesia through the provision of subsidies. In 2007, the Indonesian President
provided Rp 2.5 million’s worth of fish seed to FFG in Central Java. Since then
these FFGs have shown significant growth in their production and have
demonstrated themselves to be creative FFGs (Antaranews 2007). Suara
Merdeka (2007a) described another case of seed subsidies received by FFG
members from the Fisheries and Marine Affairs Office. The fish farmers are
reported to be very happy with the fish seed subsidies as they found it difficult to
obtain good quality fish seed.

96
Capital support from the government
The Indonesian government has shown their concern and full support towards
aquaculture development in Indonesia not only by subsidising seed but also
providing capital support to FFGs. Rokanhilir (2008) reported that the
government provided as much as Rp 194.5 million capital support to FFGs. The
aim of the subsidy was to encourage FFGs to develop and indirectly to increase
their productivity. The capital support was given in the form of a complete fish-
feed producing machine that allows a FFG to produce their own fish feed.
Antaranews (2007) provides another example of capital support to FFGs: the
President of the Republic of Indonesia made available around Rp 600 million to
improve fish pond irrigation systems. Saragih (2000) reported that the
government gave capital support to FFGs to encourage the development of FFGs
in order to become a centre of fish production.
Government supplied training
The local and regional governments often provide training workshops to FFGs.
Training focuses not only on the technical aspects of fish farming, but also on
the managerial aspects of running the business. Usually each local government
office prepares a list of training sessions for the year. The government subsidises
the fees for the training from the APBD or APBN (Regional Budget and State
Budget).
Business expansion support
The FFG business expansion support does not only develop and increase
production of fish farming, but also improves the ability of female farmers to
creatively process fish food produce such as fish ball, fish crackers, and
shredded fish (Kabupaten Jombang 2007). Through process fish produce leads
to expansion which leads to significant increases in FFG revenue. A similar
situation is currently being experienced at Karya Mina Utama, an excellent
example of a FFG in Central Java, that are have rapidly expanded their product

97
range and have turned their village into the largest catfish producer in Central
Java. They produce not only fresh catfish, but also other processed catfish
product managed by the female FFG submembers (Suara merdeka 2007).
3.7 Conclusion
The rapid decline of the world’s fish stock has been a factor in the rise of the global
aquaculture industry. The realisation that aquaculture is the only solution that can offset
the declining global fish stock has been a catalyst in the industry’s growth.
The Indonesian aquaculture industry has also experienced significant development over
the recent past and has become an important sector supporting the economic
development of the rural community. There are national conditions that are
advantageous to the aquaculture industry in Indonesia: the topographical condition of
the Indonesian islands and the high availability of human labour.
The aquaculture industry in Central Java is developing rapidly along with the
Indonesian developments. The development of the Central Java aquaculture industry is
monitored by the Central Java Fisheries and Marine Affairs provincial office which act
as technical support to the Central Java government.
There are three divisions of aquaculture development in Central Java based on the
geographical location of the aquaculture practice: the northern, middle and southern
areas. The northern and southern parts of Central Java practice brackish water and
seawater cultivation. The middle part of Central Java practices freshwater aquaculture
because they are far from seawater resources.
Three factors contribute to making aquaculture an important industry in Indonesia. The
first is that it helps to secure the food supply. The second is that it is a source of income
and employment for the people. And thirdly, it increases foreign exchange earnings.
The Indonesian government is supporting fish farmers’ communities by encouraging
them to form Fish Farmer Groups (FFGs). The government specifies certain conditions
for the formation of a FFG. The conditions include that all those in the community have
the same needs, that they are located in the same area, that they have the same economic
and social status, and that they choose one member as their leader. By bringing fish
farmers together into a FFG derives many benefits to the farmers. For example, their

98
incomes increase, they can receive soft loans from the bank, they receive fish disease
and parasite handling support, they receive subsidies and capital support, and they
receive training and business expansion support from the government. In addition, the
government holds an annual competition between FFGs that serves to encourage self
development of the FFGs. The FFGs in Indonesia are classified into four levels
depending on their ability to perform to ten evaluation criteria.

99
Chapter 4
Conceptual framework and research methodology
4.1 Introduction
This chapter describes the conceptual framework, the research methodology, and the
research design in this study’s overall research process. The seven sections of this
chapter cover the research steps of: hypothesis development (section 4.2), conceptual
framework (section 4.3), research process (section 4.4), sample/participants (section
4.5), measurement instrument (section 4.6), data collection procedure (section 4.7) and
data analysis (section 4.8).
This research had five objectives:
1. Identify the endogenous and exogenous factors that small-scale fish farmers regard
as influencing their income improvement and product sustainability.
2. Identify the constraints and problems that small-scale fish farmers regard as
influencing their income improvement and product sustainability.
3. Identify and describe various aspects of the entrepreneurial activities of small-scale
fish farmers in Central Java, Indonesia.
4. Compare the entrepreneurial activities implementation of small scale fish farmers
with different demographic background.
5. Develop recommendations for the aquaculture and fisheries industry, government,
educational institutions, and research communities in Indonesia on aspects that may
contribute to the success of small-scale fish farmers in obtaining their income
improvement and product sustainability.
4.2 Conceptual framework
Three key domains form the foundations of the research: the aquaculture industry,
constraints and problems faced by small scale fish farmers, and small scale fish farmers’
entrepreneurial activities. These key concepts form a conceptual framework on which
an understanding of the whole research idea was developed. The conceptual framework
is shown in Figure 4.1.

100
Source: Author
ANTECEDENTS VARIABLES UNDER STUDY OUTCOMES
Entrepreneurial activities of
small scale fish farmers
Constraints and problems
faced by small-scale fish farmers
Aquaculture industry Endogenous
Factors
Exogenous Factors
Entrepreneurial Activities
Recommendations for aquaculture
industry and related institutions
for income improvement and
product sustainability
Product Sustainability
Income Improvement
INDEPENDENT Variables
DEPENDENT Variables
Figure 4.1 Conceptual Framework

101
The conceptual framework for this research, as illustrated in Figure 4.1, was centered on
endogenous and exogenous variables that influence entrepreneurial activities of small
scale fish farmers in deriving income improvement and product sustainability.
The conceptual framework was divided into three independent but related domains:
1. Antecedents. This part examined and described previous studies with similar
research topics as the baseline for this research. It contained information found
by previous studies regarding constraints and problems faced by small scale fish
farmers, the development of the aquaculture industry, and entrepreneurial
activities of small scale fish farmers. Previous studies that focused their research
on small scale fish farmer activities in Indonesia as well as other parts of the
world were compiled and discussed. The aquaculture activities in Indonesia have
grown in the past few decades. The increase in the Indonesian aquaculture
industry relate to developments in technology, the availability of better quality
of fish seeds, and the development of the fish farming area (FAO 2008). The
trawl fishing ban in 1980 and also the government’s priority to develop the
Indonesian aquaculture industry, have also contributed to the significant increase
in the Indonesian fish farming business.
The aquaculture industry in Central Java is also experiencing an increase with
huge potential for more still available, especially with its topographical and
human resources support. Nevertheless, despite having the potential aquaculture
resources and the human capital to develop the resources, Indonesia has not yet
been able to maximise its fish farming industry. This may be caused by the
internal weaknesses of small-scale fish farmers’ businesses.
In carrying out fish farming activities, small scale fish farmers in Central Java
face problems and constraints that obstruct their fish farming activities. Each
fish farmer approaches these problems and constraints differently in accordance
with endogenous and exogenous factors that occur within their domain of
business activity. As well, these endogenous and exogenous factors impede each
fish farmer’s ability to carry out their entrepreneurial activities.
102
The entrepreneurial business characteristics identified by Carland et al. (1984)
include five characteristics that differentiated entrepreneurial ventures from
small businesses and were described as innovating new product, innovating new
means of manufacturing, expanding market distribution, expanding supplier
resources, and reorganising the industry. Based on the two characteristics of
taking innovative actions and seeking new markets, this research elaborated six
fish farming entrepreneurial activities. Five entrepreneurial activities were
developed as innovative actions: fish feed production, fish seed production, fish
species extension, product range extension and utilisation of other fish parts. The
sixth entrepreneurial activity, market extension, was developed from the second
entrepreneurial characteristics identified by Carland namely seeking new
market.
2. Variables under study. The variables from previous references discovered in
the antecedents were gathered into three major groups: endogenous and
exogenous factors, constraints and problems, and entrepreneurial activities of
small scale fish farmers. Based on the results of the antecedent studies, these
variables were predicted to influence income improvement and product
sustainability. This part also collected data on the commonly implemented
entrepreneurial activities in Central Java and developed comparisons of different
groups of small scale fish farmers in carrying out these activities.
In undertaking their activities, there are factors that support entrepreneurs in
successfully achieving their goals. The first type consists of those factors that
arise from within the individual (endogenous factors) and the second type
consists of those factors that arise externally to the person (exogenous factors).
The entrepreneurial activities that fish farmers engage in this study have been
identified as: fish seed production, fish species extension (poly-culture system),
market extension, product range extension (adding value to product), and
utilisation of other fish parts. The entrepreneurial activities implemented by
small scale fish farmers in Central Java influence the actions they take in their
attempts to improve their income and ensure their product sustainability.

103
Income improvement and product sustainability are two aspects that are
important for fish farming in Central Java and have been selected as the
indicators for this research. Income improvement is selected as an indicator for
this research because income is an important constraint for every living person.
And for the small-scale fish farmer in Indonesia income is even more important,
since their daily income has to support their daily needs for food, education,
health care, and so on. It is therefore very important to determine if their fish
farming businesses are able to deliver income improvement for the fish farmers.
The comparison between fish farmers with different demographic background in
implementing entrepreneurial activity were were also examined in this research
by comparing different classification of fish farmers communities such as
awardees and non awardees, male and female, different age groups, different
education level, different level of fish farmer group, different marital statuses,
and different reasons for becoming fish farmers. This comparative analyses
using demographic and farming group data were included to increase
understanding of how fish farmers implemented entrepreneurial activities and to
reveal the most commonly practiced entrepreneurial activities in Central Java.
3. Outcomes. The expected outcomes of this research had to establish several
recommendations for the aquaculture industry and related institutions on factors
that influence entrepreneurial activities among small scale fish farmers in
deriving income improvement and product sustainability.
4.3 Hypothesis development
According to Ethridge (2004), a hypothesis is an untested possible outcome. Sixteen
hypotheses were developed from the four research objectives:
Objective # 1.
Identify the endogenous and exogenous factors that small-scale fish farmers
regard as influencing their income improvement and product sustainability.
Four hypotheses were developed from the first objective:
104
Hypothesis # 1
H1: there is a positive correlation between the endogenous factors and the
small scale fish farmers’ income improvement.
Hypothesis # 2
H2: there is a positive correlation between the exogenous factors and the
small scale fish farmers’ income improvement.
Hypothesis # 3
H3: there is a positive correlation between the endogenous factors and the
small scale fish farmers’ product sustainability.
Hypothesis # 4
H4: there is a positive correlation between the exogenous factors and the
small scale fish farmers’ product sustainability.
Objective # 2.
Identify the constraints and problems that small-scale fish farmers regard as
influencing their income improvement and product sustainability.
Four hypotheses were developed from the second objective:
Hypothesis # 5
H5: there is a correlation between constraints and the small scale fish
farmers’ income improvement.
Hypothesis # 6
H6: there is a correlation between problems and the small scale fish farmers’
income improvement.

105
Hypothesis # 7
H7: there is a correlation between constraints and the small scale fish
farmers’ product sustainability.
Hypothesis # 8
H8: there is a correlation between problems and the small scale fish farmers’
product sustainability.
Objective # 3.
Identify and describe various aspects of the entrepreneurial activities of small-
scale fish farmers in Central Java, Indonesia.
One hypothesis was developed from the third objective:
Hypothesis # 9
H9: there is at least one entrepreneurial activity implemented by small scale
fish farmers in Central Java.
Objective # 4.
Compare the entrepreneurial activities implementation of small scale fish
farmers with different demographic background.
Seven hypotheses were developed from the fourth objective:
Hypothesis # 10
H10: there are significant differences between awardees and non awardees in
implementing entrepreneurial activities in Central Java.
Hypothesis # 11
H11: there are significant differences between different gender groups in
implementing entrepreneurial activities in Central Java.

106
Hypothesis # 12
H12: there are significant differences between groups of different ages in
implementing entrepreneurial activities in Central Java.
Hypothesis # 13
H13: there are significant differences between groups of different marital
status in implementing entrepreneurial activities in Central Java.
Hypothesis # 14
H14: there are significant differences between groups with different
educational levels in implementing entrepreneurial activities in Central
Java.
Hypothesis # 15
H15: there are significant differences between groups with different fish
farmer levels in implementing entrepreneurial activities in Central Java.
Hypothesis # 16
H16: there are significant differences between groups with different reasons
for becoming fish farmers in implementing entrepreneurial activities in
Central Java.
4.4 Research process
Leedy (1997) observed that a research design is a research plan. The research process is
a plan of all the steps required to start and complete a journey of research. DeBakey
(cited in Leedy 1997, p. 93) asserted that “thinking through your project clearly and
thoroughly before beginning to write a proposal is crucial”, which means that designing
a research project requires forethought about potential research problems and planning
and carefully thinking about finding the answers to the research questions.
It is beneficial to draw out the research project into a well planned research process,
where the steps required are placed in order and required actions for each step are
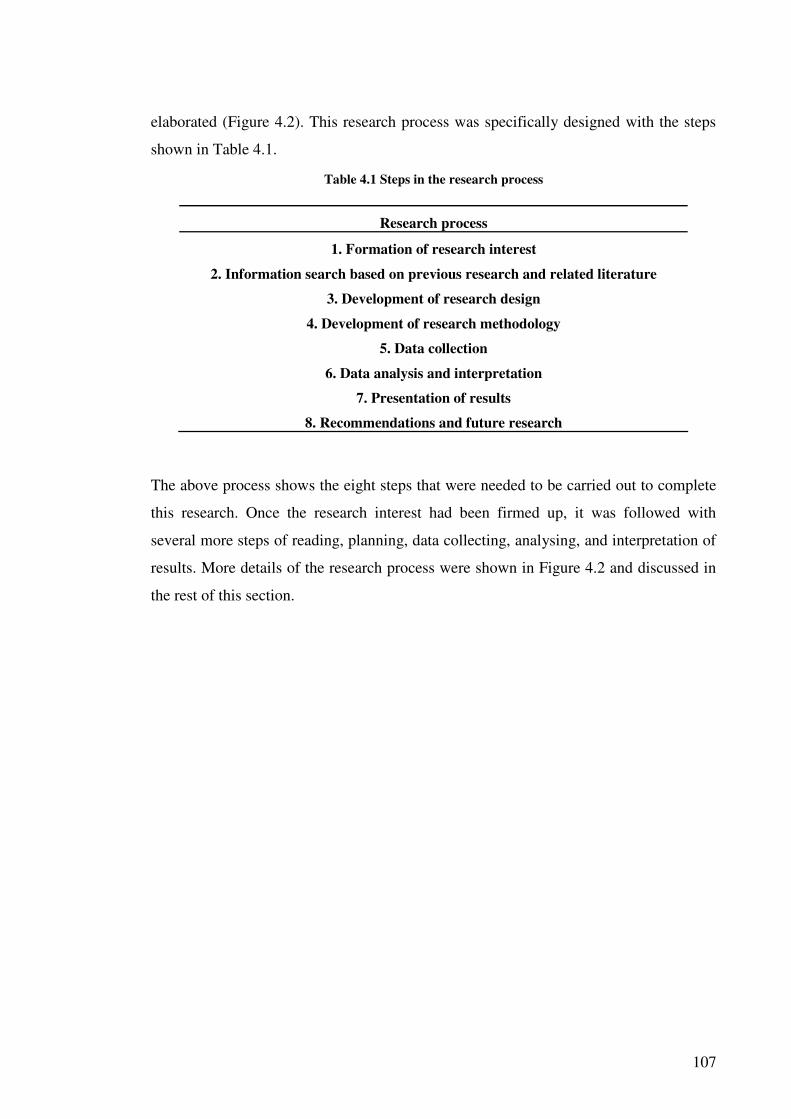
107
elaborated (Figure 4.2). This research process was specifically designed with the steps
shown in Table 4.1.
Table 4.1 Steps in the research process
Research process
1. Formation of research interest
2. Information search based on previous research and related literature
3. Development of research design
4. Development of research methodology
5. Data collection
6. Data analysis and interpretation
7. Presentation of results
8. Recommendations and future research
The above process shows the eight steps that were needed to be carried out to complete
this research. Once the research interest had been firmed up, it was followed with
several more steps of reading, planning, data collecting, analysing, and interpretation of
results. More details of the research process were shown in Figure 4.2 and discussed in
the rest of this section.
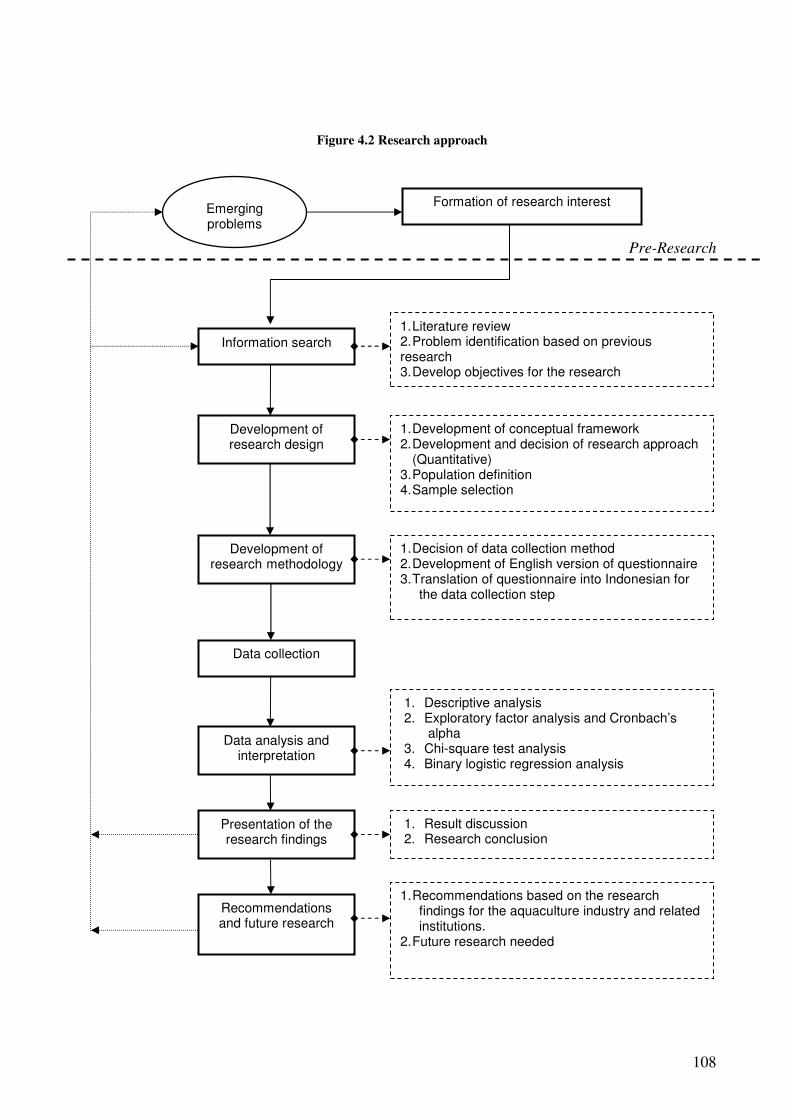
108
Pre-Research
Formation of research interest Emerging problems
Information search
1. Literature review 2. Problem identification based on previous research 3. Develop objectives for the research
Development of research design
1. Development of conceptual framework 2. Development and decision of research approach
(Quantitative) 3. Population definition 4. Sample selection
Development of research methodology
1. Decision of data collection method 2. Development of English version of questionnaire 3. Translation of questionnaire into Indonesian for
the data collection step
Data collection
Data analysis and interpretation
1. Descriptive analysis 2. Exploratory factor analysis and Cronbach’s
alpha 3. Chi-square test analysis 4. Binary logistic regression analysis
Presentation of the research findings
Recommendations and future research
1. Recommendations based on the research findings for the aquaculture industry and related institutions.
2. Future research needed
1. Result discussion 2. Research conclusion
Figure 4.2 Research approach
109
4.4.1. Development of research interest
The interest to conduct research on factors influencing entrepreneurial activities
of small scale fish farmers in deriving income improvement and product
sustainability in Central Java emerged from a lack of previous research which
focused on and studied the entrepreneurial activities of the many fish farmers in
Central Java. Interest grew out of a situation in Central Java where currently
small scale fish farmers dominate the aquaculture industry. These small scale
fish farmers encounter many constraints and problems, yet despite facing many
obstacles, some of the small scale fish farmers are able to increase their income
and win the government annually sponsored competition. It was felt that this
situation warrants research to discover the conditions that have led to the success
of the small scale fish farmers.
In addition, it is of interest that this research was the first to study the
entrepreneurial activities of small scale fish farmers. This was a major
breakthrough since there was no prior research on this topic. This research had
objectives to observe the factors that have greatest effect on fish farmers’
entrepreneurial activities and to develop recommendations to the aquaculture
industry and related institutions based on the research findings.
4.4.2. Information search
The first step of this research accumulated previous research and related
literature to gather together information in support of the three fundamental key
concepts of this research. This information was used during the problem
identification and objective development stages of this research.
4.4.3. Development of research design
The development of the research design step consisted of four actions:
1. Development of conceptual framework
The development of the conceptual framework was considered essential in order
to facilitate the research process. The conceptual framework that was developed
is shown in Figure 4.1.

110
2. Development and decision of research approach (Quantitative)
Creswell defined a quantitative research as “an inquiry into a social or human
problem, based on testing a theory composed of variables, measured with
numbers and analysed with statistical procedures, in order to determined
whether the predictive generalisations of the theory hold true” (cited in Leedy
1997, p. 104). The decision to use a quantitative study for this research was
based on the consideration that the purpose of this study was to test and confirm
a theory or hypotheses, accommodate a large number of samples, and employ a
standardised instrument or questionnaire to gather data.
3. Population definition
The population for this research was the small scale fish farmers in Central Java.
The factors (endogenous, exogenous, problems, and constraints) that were
predicted to influence income improvement and product sustainability were
observed in this population. The sample of the population of small scale fish
farmers in Central Java who were surveyed had to meet the following criteria:
• Had to be located in the Central Java region.
• Had to be registered as members of a Central Java fish farmer groups under
the Central Java Fisheries and Marine Office.
• Had to be classified as small-scale businesses according to the Indonesian
Constitution No. 9/1995 and the Ministry of Finance Rule No.
12/PMK.06/2005. Therefore, according to these classifications the criteria
that the fish farmers had to meet were:
1. Be a productive business owned by an Indonesian citizen and formed
with or without legal status.
2. Not be affiliated to or a branch of a middle or large scale business.
3. Possess assets of no more than Rp 200 million, not including land and
buildings, or, has maximum annual revenue of Rp 1 billion.

111
The small scale fish farmers were divided into two groups in order to compare
responses: those who had received regional awards and those who had not
received awards. The publicly available lists of fish farmer groups and their
addresses were obtained from the local and regional Fisheries and Marine
Offices in Central Java. The lists of fish farmers who had won the regional
awards were also obtained from the Central Java Fisheries and Marine office in
Semarang. To increase the chances that the fish farmers who had received
regional awards were still in operation, the lists of regional award farmers were
restricted to the five years from 2003 to 2007.
4. Sample selection
The list of small scale fish farmers obtained publicly from the Central Java
Fisheries and Marine Office was entered into a computer spreadsheet file. The
names of fish farmers for this study were then randomly selected in proportion
to the percentage of award winners (coded A in the questionnaire) and non
award winners (coded NA in the questionnaire).
4.4.4. Development of research methodology
The research methodology comprised of the following steps:
1. Decide on the data collection method.
2. Develop an English version of the questionnaire (see Appendix 1).
3. Translate the English questionnaire into Indonesian for the data collection
step (see Appendix 2).
The steps above are described in greater detail in section 4.6 of this chapter.
4.4.5. Data collection
Data collection was preformed in Central Java, Indonesia between December
2007 and May 2008. The steps in carrying out the data collection were:
1. Contact the Central Java Fisheries and Marine Affairs Office to obtain a
detailed list of FFGs in Central Java. This list included the name of the FFGs
and their contact details.

112
2. From the Central Java government office obtain a list of FFGs that have
received awards from the Provincial government in the past 5 years.
3. Contact appointed staff from the Central Java Fisheries and Marine Affairs
Office for a supporting letter for the designated Regional Fisheries and
Marine Affairs Office.
4. Randomly choose the FFGs to include in the data collection sample.
5. Make copies of the questionnaire.
6. Make appointments and visit the Regional Fisheries and Marine Affairs
Office with the questionnaire and support letter and place the questionnaires
at the regional Fisheries and Marine Affairs office. Obtain the cooperation of
the staff at these offices to assist data collection by encouraging members of
appointed FFGs to take and complete the questionnaires.
7. Collect the questionnaires at an agreed date.
The steps above are described in greater detail in section 4.7 of this chapter.
4.4.6. Data analysis and interpretation
This research used the SPSS statistical software application for data analysis
using functions such as:
Descriptive analysis. Descriptive analysis was used to describe the
characteristics of the small scale fish farmers’ personal and business
backgrounds and of their implemented entrepreneurial activities.
Binary Logistic Regression. Binary (or binomial) logistic regression was used
for measurements made with dichotomous dependent variables (Garson 2008).
This research used binary logistics regression to carry out the analysis where the
dependant variables used a Likert scale and the independent variables were
categorical (Pallant 2005).
Chi-square statistics. Chi-square statistics are used in this research to compare
different groups of small scale fish farmer communities. For example this

113
research compared the entrepreneurial activities between awardees and non
awardees of different gender, age, and educational background.
The analyses above are described in greater detail in section 4.8 of this chapter.
4.5 Sample/Participants
The data sample consisted of responses collected from two categories of small scale fish
farmers groups: fish farmer groups who had not won the regional fish farming award in
the past five years (labeled the non awardees), and those who had won the regional
award in the past five years (labeled the awardees). The sample selection step is
described in greater detail in section 4.7 of this chapter.
4.5.1 Personal Characteristics
The data collected about the personal characteristics of the respondents were:
age, gender, marital status, number of children, and highest education.
1. Respondents’ Age
There was a significant gap in the number of respondents in the awardees’ age
categories. Only 15 awardees respondents were counted in the age category 20-
39, whereas in the age category 40-59 there were 75 respondents. For the non
awardees respondents, there is a more fair distribution with 155 respondents for
the age category 20-39, and 145 respondents for the age category 40-59.
Moreover, there were only ten responses from non awardees and no responses
from awardees. The response figures for the age categories are shown in Table
4.2.
Table 4.2 Cross tabulation between awardees and non awardees and age
Age
20-39 40-59 60+ Total
Awardees 15 75 0 90
Non Awardees
155 145 10 310
Total 170 220 10 400
Source: Survey on the factors influencing entrepreneurial activities of small scale fish farmer in deriving income improvement and product sustainability in Central Java, Indonesia
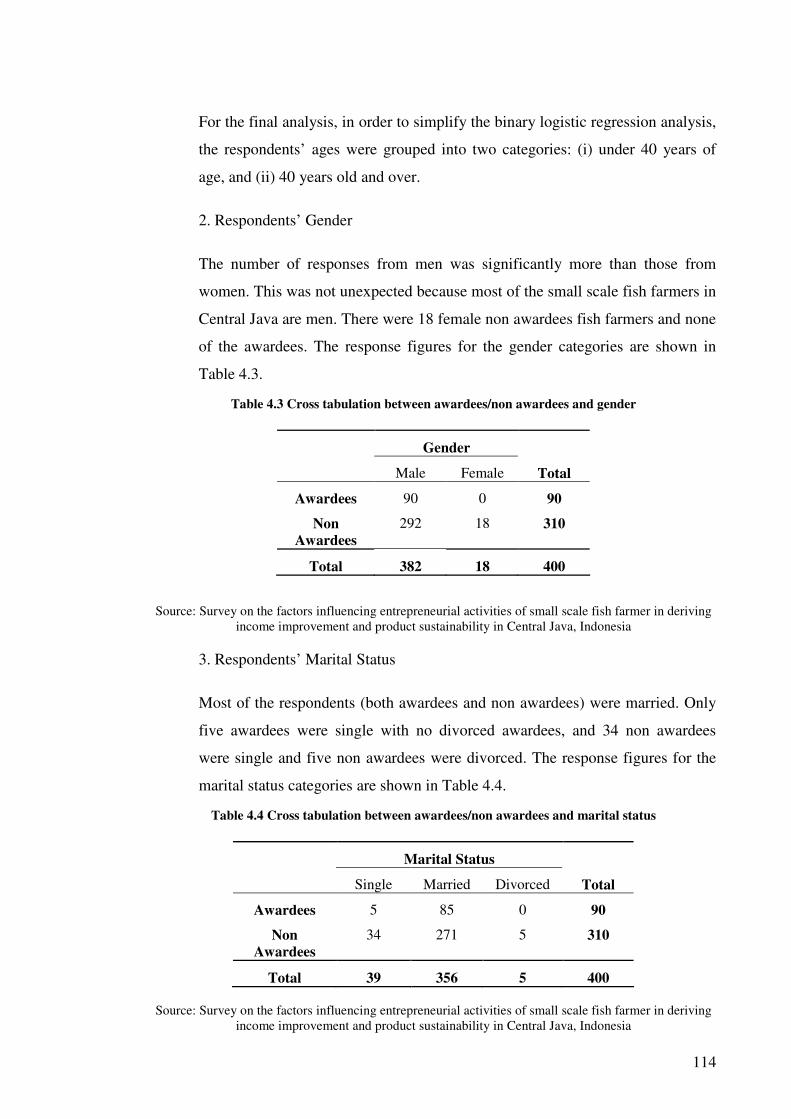
114
For the final analysis, in order to simplify the binary logistic regression analysis,
the respondents’ ages were grouped into two categories: (i) under 40 years of
age, and (ii) 40 years old and over.
2. Respondents’ Gender
The number of responses from men was significantly more than those from
women. This was not unexpected because most of the small scale fish farmers in
Central Java are men. There were 18 female non awardees fish farmers and none
of the awardees. The response figures for the gender categories are shown in
Table 4.3.
Table 4.3 Cross tabulation between awardees/non awardees and gender
Gender
Male Female Total
Awardees 90 0 90
Non Awardees
292 18 310
Total 382 18 400
Source: Survey on the factors influencing entrepreneurial activities of small scale fish farmer in deriving income improvement and product sustainability in Central Java, Indonesia
3. Respondents’ Marital Status
Most of the respondents (both awardees and non awardees) were married. Only
five awardees were single with no divorced awardees, and 34 non awardees
were single and five non awardees were divorced. The response figures for the
marital status categories are shown in Table 4.4.
Table 4.4 Cross tabulation between awardees/non awardees and marital status
Marital Status
Single Married Divorced Total
Awardees 5 85 0 90
Non Awardees
34 271 5 310
Total 39 356 5 400
Source: Survey on the factors influencing entrepreneurial activities of small scale fish farmer in deriving income improvement and product sustainability in Central Java, Indonesia
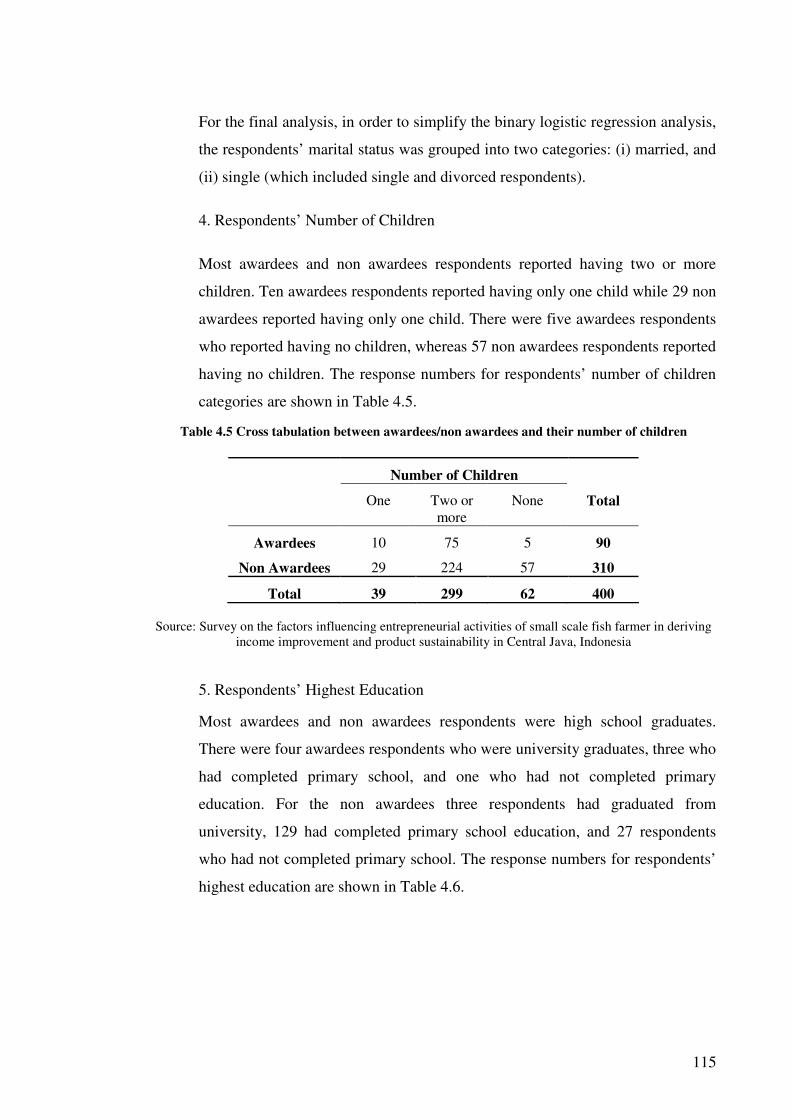
115
For the final analysis, in order to simplify the binary logistic regression analysis,
the respondents’ marital status was grouped into two categories: (i) married, and
(ii) single (which included single and divorced respondents).
4. Respondents’ Number of Children
Most awardees and non awardees respondents reported having two or more
children. Ten awardees respondents reported having only one child while 29 non
awardees reported having only one child. There were five awardees respondents
who reported having no children, whereas 57 non awardees respondents reported
having no children. The response numbers for respondents’ number of children
categories are shown in Table 4.5.
Table 4.5 Cross tabulation between awardees/non awardees and their number of children
Number of Children
One Two or more
None Total
Awardees 10 75 5 90
Non Awardees 29 224 57 310
Total 39 299 62 400
Source: Survey on the factors influencing entrepreneurial activities of small scale fish farmer in deriving income improvement and product sustainability in Central Java, Indonesia
5. Respondents’ Highest Education
Most awardees and non awardees respondents were high school graduates.
There were four awardees respondents who were university graduates, three who
had completed primary school, and one who had not completed primary
education. For the non awardees three respondents had graduated from
university, 129 had completed primary school education, and 27 respondents
who had not completed primary school. The response numbers for respondents’
highest education are shown in Table 4.6.

116
Table 4.6 Cross tabulation between awardees/non awardees and highest education
Highest Education
University graduate
Completed high school
Completed primary school
Did not complete primary school
Total
Awardees 4 82 3 1 90
Non Awardees
3 151 129 27 310
Total 7 233 132 28 400 Source: Survey on the factors influencing entrepreneurial activities of small scale fish farmer in deriving
income improvement and product sustainability in Central Java, Indonesia
For the final binary logistic analysis, the respondents’ education level was
grouped into two categories: (i) did not complete high school (included
respondents who had not complete primary school and those who had completed
primary school), and (ii) completed high school (included respondents who had
completed high school and those who were university graduates).
4.5.2 Respondents Business Characteristics
The business characteristics of the respondents included information about their
fish farming group classes, annual income, land size, and number of employees.
1. Respondents’ Fish Farmer Group (FFG) Class
Most of the awardees respondents came from the fourth level of business class
group and only two awardees came from the starter group, one from the second
level group, and five from the third level group. The non awardees respondents
came mostly from the third level class group (114 respondents), followed by 107
respondents from the starter group, 55 from the second level group, and 28
respondents from the fourth level group. The response numbers for respondents’
fish farmer group class are shown in Table 4.7.
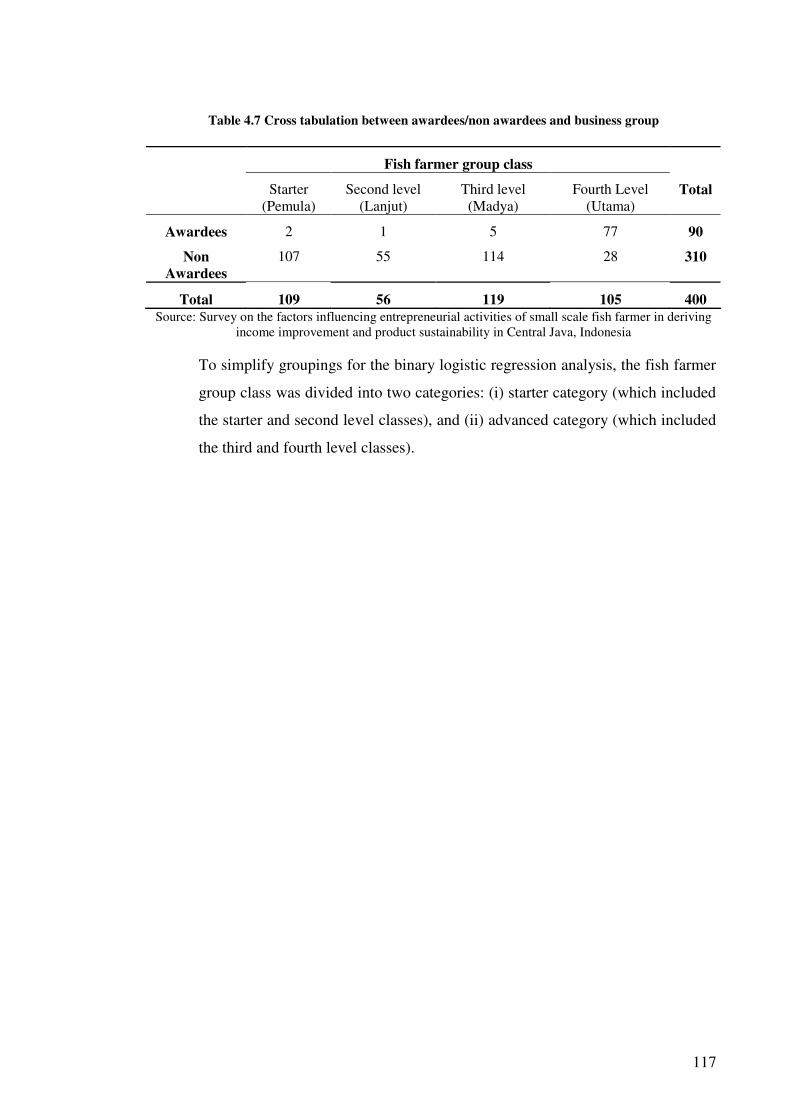
117
Table 4.7 Cross tabulation between awardees/non awardees and business group
Fish farmer group class
Starter (Pemula)
Second level (Lanjut)
Third level (Madya)
Fourth Level (Utama)
Total
Awardees 2 1 5 77 90
Non Awardees
107 55 114 28 310
Total 109 56 119 105 400 Source: Survey on the factors influencing entrepreneurial activities of small scale fish farmer in deriving
income improvement and product sustainability in Central Java, Indonesia
To simplify groupings for the binary logistic regression analysis, the fish farmer
group class was divided into two categories: (i) starter category (which included
the starter and second level classes), and (ii) advanced category (which included
the third and fourth level classes).
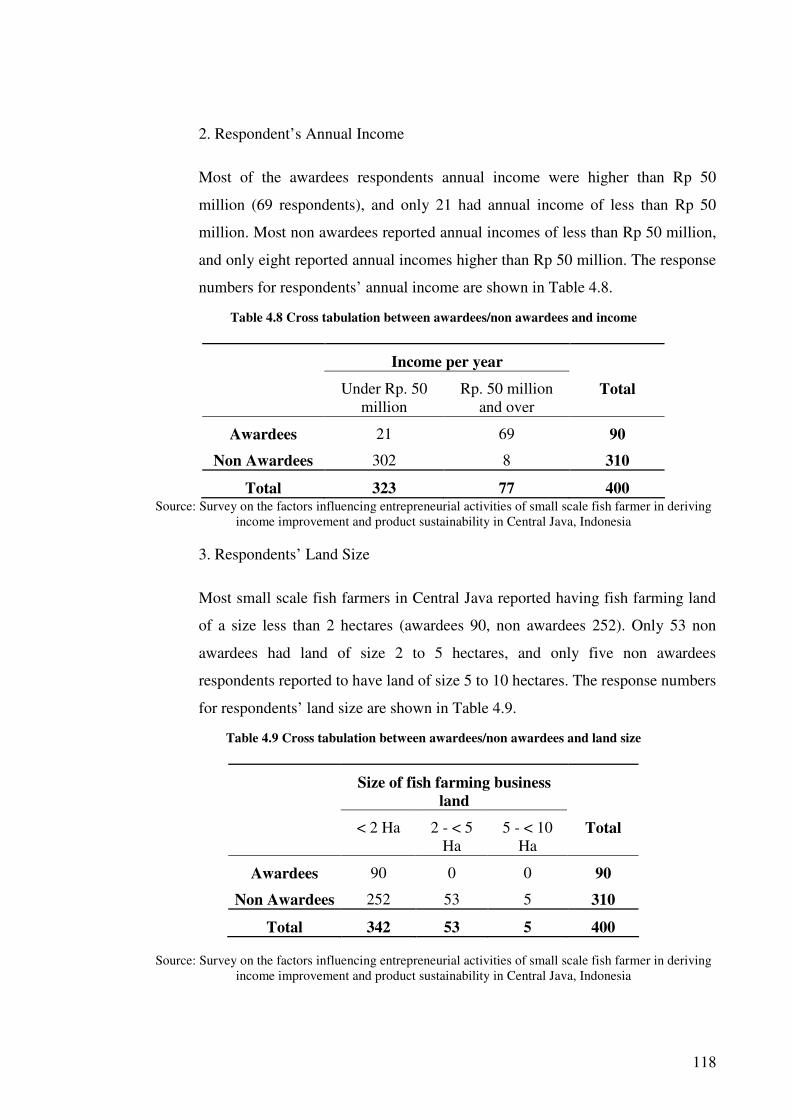
118
2. Respondent’s Annual Income
Most of the awardees respondents annual income were higher than Rp 50
million (69 respondents), and only 21 had annual income of less than Rp 50
million. Most non awardees reported annual incomes of less than Rp 50 million,
and only eight reported annual incomes higher than Rp 50 million. The response
numbers for respondents’ annual income are shown in Table 4.8.
Table 4.8 Cross tabulation between awardees/non awardees and income
Income per year
Under Rp. 50 million
Rp. 50 million and over
Total
Awardees 21 69 90
Non Awardees 302 8 310
Total 323 77 400 Source: Survey on the factors influencing entrepreneurial activities of small scale fish farmer in deriving
income improvement and product sustainability in Central Java, Indonesia
3. Respondents’ Land Size
Most small scale fish farmers in Central Java reported having fish farming land
of a size less than 2 hectares (awardees 90, non awardees 252). Only 53 non
awardees had land of size 2 to 5 hectares, and only five non awardees
respondents reported to have land of size 5 to 10 hectares. The response numbers
for respondents’ land size are shown in Table 4.9.
Table 4.9 Cross tabulation between awardees/non awardees and land size
Size of fish farming business land
< 2 Ha 2 - < 5 Ha
5 - < 10 Ha
Total
Awardees 90 0 0 90
Non Awardees 252 53 5 310
Total 342 53 5 400
Source: Survey on the factors influencing entrepreneurial activities of small scale fish farmer in deriving income improvement and product sustainability in Central Java, Indonesia

119
4. Respondent’s Number of Employee
Most awardees reported having 3-5 employees (72 respondents), and 18
respondents reported employing 0-2 people. Of the non awardees respondents,
280 answered that they only have 0-2 people working for them, 16 respondents
reported having 3-5 employees, nine respondents reported having 6 to 8
workers, and five respondents stated that they have nine or more people working
for them. The response numbers for respondents’ number of employees are
shown in Table 4.10.
Table 4.10 Cross tabulation between awardees/non awardees and number of employee
Number of Employees
0-2 people 3-5 people 6-8 people 9 or more people Total
Awardees 18 72 0 0 90
Non Awardees
280 16 9 5 310
Total 298 88 9 5 400
Source: Survey on the factors influencing entrepreneurial activities of small scale fish farmer in deriving income improvement and product sustainability in Central Java, Indonesia
4.6 Measurement instrument
The steps involved in the development of the data collection instrument included the
construction of a questionnaire in English and then the translation of the English
questionnaire into Indonesian for use during the data collection step.
4.6.1. The questionnaire
The questions used on the questionnaire were developed from different sources.
Some of the questions in the questionnaire were borrowed from previous
research questionnaires. Other questions were borrowed from previous research
questionnaires but modified to suite the surveying of small scale fish farmers.
Some new questions were developed specifically to meet the objectives of this
research. Table 4.11 shows the sources of questions on the questionnaire. The
table also lists the parts of the questionnaire that were adapted or modified from
previous studies or the parts that the researcher developed afresh for this
research.

120
Table 4.11 Sources of questions for the questionnaire
Section A. Background Details
Section Background Details Sources
A1. Personal
A2. Family Business Experience
Ippaso (2002), Susilowati, Winarni, and Sudaryono (2005), Department of
Agriculture, Fisheries, and Forestry Australia (2002),
Blackman (2003)
A3. Business Information Be (1994), Department of Agriculture, Fisheries, and Forestry Australia (2002),
Blackman (2003)
Section B. Current Situation
Section Current Situation Sources
B1. Entrepreneurial Activities Developed by researcher
B2. Problems/constraints
Leta (2002)
B3.1.
B3.2.
Aquaculture knowledge
Aquaculture skills
B3.3. Aquaculture experience
B3.4. Aquaculture education
Be (1994), Susilowati, Winarni, and Sudaryono (2005), Department of
Agriculture, Fisheries, and Forestry Australia (2002),
Blackman (2003)
B3.5. Entrepreneurial personality Morris, Avila, and Teeple (1990), Blackman (2003)
B3.6. Reason Miyata and Manatunge
(2004), Leta (2002)
B3.7. Personal business experience
B3.8. Business network relation
B3.9. Financial capital
B3.10. Family support
Ippaso (2002), Department of Agriculture, Fisheries, and Forestry Australia (2002),
Blackman (2003)
B3.11. Market Susilowati, Winarni, and
Sudaryono (2005)
B3.12. Logistics Developed by researcher
B3.13. Influencing factors Be (1994), Susilowati,
Winarni, and Sudaryono (2005)
B3. 14. Government/other institution support Department of Agriculture,
Fisheries, and Forestry Australia (2002)

121
Section C. Other Aspects of the Business
Section Other aspects of the Business Source
C1. Income improvement Susilowati, Winarni, and
Sudaryono (2005), Blackman (2003)
C2. Product sustainability Be (1994)
4.6.2. Steps in the questionnaire development
The questionnaire was tested with a small number of Indonesian people to obtain
their views about the questionnaire and to estimate the completion time. The
questionnaire was revised from the test feedback for use during the data
collection step to make it easier for the small scale fish farmer to answer and
complete.
1. Paper based methods
A paper based questionnaire was chosen for carrying out this survey because it
was considered more suitable since few small scale fish farmers have access to
the Internet or computers.
2. Interviews
No interviews were carried out for this research.
4.6.3. Translation of the questionnaire
The questionnaire was translated into Indonesian for data collection. The
questionnaire was edited several times to find the most suitable language that
small scale fish farmers would understand.
The Indonesian version of the questionnaire was then tested with Indonesian
colleagues to obtain responses and feed back. Several necessary changes were
then made for even easier understanding. The final version of the questionnaire
is presented in the Appendices.

122
4.7 Data collection procedure
Prior to returning to Indonesia to do the fieldwork, and in accordance with the
Swinburne research policy, an ethics application was submitted for approval. The
application was approved by the Swinburne University Human Ethics Committee
(SUHREC) on 9 November 2007 (see Appendix 3). With this clearance the research
could commence in Central Java, Indonesia; the fieldwork of this research was carried
out from December 2007-May 2008.
The researcher gathered information regarding small scale fish farmers in Central Java
from the Central Java Fisheries and Marine Affairs Provincial Office. In order to obtain
more detailed contact information of the small scale fish farmers in each region and the
Central Java Fisheries and Marine affairs Office have provided an official support letter
for the researcher to give to the Regional Fisheries Office to obtain the necessary data.
4.7.1 Preliminary correspondence
A publicly available list of small scale fish farmer groups with their addresses
were obtained from the Central Java Fisheries and Marine Office. Another
publicly available list was also taken from the Central Java Government Office
which contained names of small scale fish farmer groups that have won the
regional or national awards.
These lists were then combined to develop two lists of small scale fish farmer
groups. The first list contained the details of the farmers who had won the
regional awards in the last five years, from 2003 – 2007, and the second list
contained the details of those farmers who had not won an award in the five
years, from 2003 - 2007.
The lists of names and addresses were then entered manually into a computer
spreadsheet file and 400 names of potential respondents were randomly picked.
The numbers of potential respondents from the two groups were proportionally
divided according to the size of the population in each group. Data obtained
from the Central Java Fisheries and Marine Affairs Office (2005) reported that
the size of the fish farmer community in Central Java was approximately
400,000 fish farmers and that 22 per cent of fish farmers had received awards in

123
the past five years while 78 per cent of fish farmers had not received awards in
the past five years.
4.7.2 Personal approaches and leads
The survey was conducted by using a paper based questionnaire distributed to
the potential participants. Each questionnaire contained a code to differentiate
the two groups. Questionnaires with the code “A” at the top right corner was
distributed to the small scale fish farmers who had won regional awards and
questionnaires with the code “NA” at the top right corner were distributed to the
other group.
The Central Java Marine and Fisheries Office was personally approached to ask
for support for this research. The Central Java Fisheries and Marine Office
endorsed the research with a formal letter that was given to the local fisheries
offices from where the questionnaires were distributed.
4.7.3 Questionnaire distribution method
Questionnaires were distributed to participants by leaving the questionnaires at
the designated local Fisheries and Marine Affairs office. The participants
voluntarily completed the questionnaires and returned them to the Fisheries and
Marine Affairs Office.
Questionnaire distribution to several selected regions in Central Java occurred in
January 2008. In order to avoid confusion between awardees and non awardees,
one category (out of awardees or non awardees) was assigned to a region. For
example only questionnaires for awardees were distributed in regions A, B, and
C, whereas, regions D, E, F, and G received questionnaires for non awardees.
Deadlines were set for the collection of the completed questionnaires.
Questionnaires that were not fully completed were omitted from the collected
data set. At the first deadline date, the required sample size had not yet been
reached and therefore a second distribution of questionnaires was carried out
using the same method, but in different regions.

124
Four hundred completed questionnaires were collected after the second
distribution. The data was then entered into a software application to enable
statistical analysis on the data.
4.8 Data analysis
This research used the SPSS statistical software to carryout statistical analyses on the
collected data. Several analyses and tests were used to examine the data:
4.8.1 Descriptive analysis
Descriptive statistics were used in this research analysis to describe the
characteristics of the sample used in a research. According to Pallant (2005)
there are three reasons to use descriptive analysis: (i) to characterise the sample,
(ii) to address the research questions, and (iii) to look for patterns in the data that
will invalidate statistical tests when answering the research questions. In this
research, the descriptive analysis was used to describe the personal and business
characteristics of the participants, for example their age, educational levels,
marital status, and number of employees. This analysis was also used to test
hypothesis number 9 that examines the implemented entrepreneurial activities of
small scale fish farmers in Central Java.
4.8.2 Exploratory Factor Analysis
Exploratory factor analysis was used to collapse numerous variables into a
smaller number of meaningful variables. It minimised the number of variables
for endogenous factors, exogenous factors, constraint, and problems that
influence income improvement and product sustainability. It is a type of analysis
usually used to construct a small number of scales from a large number of
variables. This assisted manipulation of the data and eased the interpretation of
the results.
There are two kinds of factor analysis: (i) exploratory factor analysis (EFA) to
explore the relationships between variables, and (ii) confirmatory factor analysis
(CFA) to confirm the hypotheses or theories that underlie the variables (Pallant
2005). In this research the EFA approach was used since the reseearch
formulated hypotheses regarding the correlation between variables.

125
There are three steps in carrying out EFA: (i) assessment of the appropriateness
of the data for factor analysis, (ii) factor extraction, and (iii) factor rotation
(Pallant 2005). For data to be suitable for EFA, the sample size should be large
(at least 300 samples) and there should be strong relationships between items
(Tabachnick & Fidell 2007).
The Kaiser-Meyer-Olkin (KMO) measure of sampling adequacy and the
Bartlett’s test of sphericity can be used to assess the appropriateness of the data
for factor analysis. The Kaiser-Meyer-Olkin (KMO) measure of sampling
adequacy should have a minimum value of 0.6 but a value above 0.8 would be
ideal and the Bartlett’s test of sphericity should be significant (p<.05)
(Tabachnick & Fidell 2007).
The reason for using EFA is to find the least number of factors that would make
the interpretation of the results easier but, at the same time, would explain as
much variation in the original data as possible (Pallant 2005). Three
techniques—Kaiser’s criterion, a scree plot test, and parallel analysis—can be
used to assist with the process of identifying the numbers of factors to be
extracted. The Kaiser’s criterion uses the number of eigenvalues above one to
determine the number of factors that should be extracted. The Catell’s scree plot
test involves the investigation of the scree plot curve which plots eigenvalues by
number. It is suggested that all factors with eigenvalues above the sharp curve or
“the elbow” should be retained. The Parallel analysis technique involves a
comparison between “the size of the eigenvalues from the research data with the
size of eigenvalues obtained from randomly generated data sets of the same
size” (Pallant 2005, p. 175). Eigenvalues higher than the eigenvalues generated
from random data provide evidence for the retention of a factor.
With factor rotation, there are two types of rotation: orthogonal (uncorrelated
factors) or oblique (correlated factors) (Pallant 2005). Both techniques can be
used to further decide which result is easiest to interpret. Tabachnick and Fidell
(2007) explain that oblique rotation is more difficult to interpret but allows the
factors to be correlated while the orthogonal approach is easier to interpret but is
based on the assumption that there is no correlation between the factors.
126
4.8.3 Binary Logistic Regression
Binary logistics regression was used to analyse the research data because the
dependent variable was dichotomous and the independent variable was
continuous. This statistical analysis was carried out to test hypotheses number 1
to 4, which explored the correlation between endogenous and exogenous factors
with income improvement and product sustainability. It was also used to
examine hypotheses 5 to 8 which assessed the interaction between constraints
and problems with income improvement and product sustainability. Binary
logistics regression was used, because these hypotheses used the same
dichotomous dependent variable (income) and was categorised into two classes
which was (a) lower than Rp. 50 million and (b) Rp. 50 million or more.
4.8.4 Chi-square test analysis
There are two types of chi-square test: the chi-square goodness of fit and the chi-
square test of independence (Pallant 2005). Pallant explained that the chi-square
for the goodness of fit “explores the proportion of cases that fall into the various
categories of a single variable, and compares these with hypothesised values”
(Pallant 2005, p. 287). On the other hand, the chi-square test of independence is
used to explore relationships between two categorical variables by comparing
the frequency of categories in one variable with the categories in the other
variable. The chi-square test of independence is used in this research to compare
two groups of categorical variables. It was used to answer hypotheses 10 to 16,
which compared relationships between: (a) awardees and non awardees, (b)
male and female, (c) ages, (d) marital status, (e) educational levels, (f) fish
farmer groups, and (g) reason to go into business, according to the types of
implemented entrepreneurial activities.
4.8.5 Cronbach’s alpha test
The Cronbach’s alpha test was used in this research to test the reliability of the
scales that were developed for the binary logistics regression analysis.
According to Pallant (2005) ideally the Cronbach’s alpha coefficient should be
above 0.7 for good reliability of scales.

127
In this research four scales were developed: (i) constraints and problems that
influence income improvement, (ii) constraints and problems that influence
product sustainability, (iii) endogenous and exogenous factors that influence
income improvement, and (iv) endogenous and exogenous factors that influence
product sustainability. These four scales were tested with the Cronbach’s alpha
test to confirm their reliability.
4.9 Interpretation and presentation of results
The results obtained from each of the statistical analyses described in the previous step
were interpreted and presented separately. The statistical analyses are presented in two
chapters: the preliminary analysis chapter and the main data analysis chapter. The
preliminary analysis chapter describes the data reduction by using the exploratory factor
analysis and the main analysis chapter presents the results from the binary logistic
regression analysis, the chi-square test, the descriptive analysis, and the Cronbach’s
alpha test.
4.10 Conclusion
This research administered a paper based questionnaire because it was believed that
most of the expected respondents would not have access to a computer or the Internet. A
questionnaire was developed in English from English academic research literature and
then translated into Indonesian for the data collection step of the research.
The questionnaires were distributed to two groups (fish farmer groups that had won
awards and fish farmer groups that had not won awards) through a stratified random
sampling method. A proportional number of questionnaires were distributed to possible
participants from the two groups. The proportional number was determined according to
the information about fish farmer groups obtained from Central Java Fisheries and
Marine Office, the Department of Marine and Fisheries, and the Governor of Central
Java Office. With the assistance from the regional Fisheries and Marine Office,
questionnaires were left at the office to be voluntarily taken by the small scale fish
farmers and returned back to the regional office after completion. Questionnaires were
collected from the regional Fisheries and Marine Office at an agreed collection date.
The questionnaires were checked for completion and only completed questionnaires
were used. Uncompleted questionnaires were omitted from the collected data.

128
Questionnaires were distributed on two occasions to collect the required number of
responses. Once sufficient responses were collected, the researcher typed the data into a
SPSS dataset for analysis.
The five objectives of this research were broken down into several hypotheses. The
research used several statistical analyses to analyse the data: descriptive analysis,
exploratory factor analysis, binary logistics regression, and chi-square analysis.

129
Chapter 5
Preliminary Analysis
5.1 Introduction
This chapter presents the preliminary analysis of the thesis. It includes information
regarding the data reduction of variables that were used in the research. It also provides
information on the test for the reliability of the eight scales that were used by using
Cronbach’s Alpha test and Pearson’s correlations. The preliminary analysis used
exploratory factor analysis in order to group the variables into meaningful factors. This
assisted in the interpretation of results and testing of hypotheses.
5.2 Exploratory factor analysis
Exploratory factor analysis is a statistical function programmed in SPSS that assists
with data reduction (Pallant 2005). It is usually used by researchers with a large number
of variables to help them discover the small number of variables which account for the
greatest percentage of variation in the original variables. This makes it easier for the
researcher to work with the data and interpret the result.
There are two ways of approaching factor analysis, exploratory factor analysis (EFA)
and confirmatory factor analysis (CFA). Exploratory factor analyses are widely used to
explore the relationship between variables, whereas confirmatory factor analyses are
used to confirm the hypotheses or theories that underlie the variables (Pallant 2005). In
this research, an exploratory factor analysis approach was used because there are no
relevant models available in the literature.
5.2.1 Steps in conducting factor analysis
In order to successfully carry out the factor analysis, several steps have to be
followed. These steps are to firstly assess the appropriateness of the data for
factor analysis, and then do the factor extraction and factor rotation (Pallant
2005). If a simple structure is obtained the factors are checked for face validity
and named. If a simple structure is not obtained, the factor analysis is rerun
using a different extraction method or rerun with items removed until a simple
structure is achieved. The simple structure obtained is defined in more detail
below.

130
5.2.1.1 Assessment for suitability of data
There are two data requirements which must be met in order for a factor analysis
to be suitable. These requirements relate to the sample size and the strength of
the relationship between the variables. It is commonly known that the larger the
sample size, the better and more reliable an analysis will be. According to
Tabachnick and Fidell (2007), the minimum sample size needed to appropriately
use factor analysis is at least 300 cases. In this research 400 observations were
gathered; therefore, the sample size in this research was sufficiently large.
Regarding the strength of the relationship among items, Tabachnick and Fidell
(2007) suggested checking the correlation matrix for the number of coefficients
larger than 0.3. If only a few correlations are found with value greater than 0.3,
they suggest that factor analysis may not be appropriate for the data. In this
research, most of the values in the correlation matrix were larger than 0.3,
therefore, factor analysis was considered to be appropriate for this research.
There are two statistical measures that can be used to assess the appropriateness
of a factor analysis: Bartlett’s test of sphericity and the Kaiser-Meyer-Olkin
(KMO) measure of sampling adequacy. The Bartlett’s test of sphericity should
be significant (p < 0.05) and the Kaiser-Meyer-Olkin (KMO) measure of
sampling adequacy should have a minimum value of 0.6 but ideally a value
above 0.8 to have a good factor analysis (Tabachnick & Fidell 2007). All of the
KMO and Bartlett’s statistics for the research data are presented in section 5.3.
5.2.1.2 Factor extraction
In EFA the goal is to find the least number of factors to make the interpretation
easier but, at the same time, to explain as much variation in the original data as
possible (Pallant 2005). In order to achieve a satisfactory solution, it is
recommended that the researcher explore and experiment with different numbers
of factors until a best decision can be made. Three techniques can be used to
assist with this process: Kaiser’s criterion, a scree plot test and parallel analysis.
a. Kaiser’s criterion
Kaiser’s criterion uses the number of eigenvalues above one to determine the
number of factors that should be extracted.

131
b. Catell’s scree plot test
This technique involves the investigation of the scree plot curve which is a plot
of eigenvalues by number. It is recommended that all factors with eigenvalues
above the “elbow” should be retained.
c. Parallel analysis
The Parallel analysis technique involves a comparison between “the size of the
eigenvalues from the research data with the size of eigenvalues obtained from
randomly generated data sets of the same size” (Pallant 2005, p. 175).
Eigenvalues higher than the eigenvalues generated from random data provide
evidence for the retention of a factor.
5.2.1.3. Factor rotation and interpretation
There are two types of rotation, either orthogonal (uncorrelated factors) or
oblique (correlated factors) (Pallant 2005). Rotation techniques can be used in
addition to the previous factor extraction techniques to decide which solution is
easier to interpret. Tabachnick and Fidell (2007) explained that the orthogonal
approach gives results that are easier to interpret but the technique requires an
assumption of no correlation between the factors. Although the results for an
oblique rotation are more difficult to interpret it does allow for the factors to be
correlated.
5.3 Endogenous and Exogenous Factors
The step to do data reduction for endogenous and exogenous factors was based on the
large numbers of variables used in this research to measure exogenous and endogenous
factors. There were 14 such variables that influence income improvement and another
14 variables that influence product sustainability. The variables were grouped under
income improvement and product sustainability categories because the aim was to study
the respondents’ perceptions about how these variables affect their business’ efforts to
achieve income improvement and product sustainability.

132
5.3.1 Endogenous and exogenous factors that influence income improvement
The data used for the endogenous and exogenous factors that influence income
improvement were obtained from question number 65 in the questionnaire: “To
what extent do you agree that the factors below influence income improvement
for your business?”. The answers were given on a Likert scale, ranging from
“strongly agree” (number 6) to “strongly disagree” (number 1).
An initial EFA was performed for the income improvement variables in order to
reduce the 14 variables to a smaller number of meaningful factors. The KMO
and Bartlett’s test scores for the endogenous and exogenous factors relating to
income improvement are shown in Table 5.1: the test results indicate that the
requirements for factor analysis were met with the KMO value of 0.809 and a
Bartlett p-value less than 0.05.
Table 5.1 KMO and Bartlett’s Test results for endogenous and exogenous factors that influence income improvement
Kaiser-Meyer-Olkin Measure of Sampling Adequacy. .809
Bartlett's Test of Sphericity Approx. Chi-Square 2464.582
df 66
Sig. .000
Source: Survey on the factors influencing entrepreneurial activities of small scale fish farmer in deriving income improvement and product sustainability in Central Java, Indonesia.
Table 5.2 shows that according to Kaiser’s criterion three factors explained
67.5% of the variation in the data. However, an initial three factor solution was
not successful because the third factor had only two items assigned to it.

133
Table 5.2 Total variance explained for endogenous and exogenous factors that influence income
improvement when two factors are selected
Component Initial Eigenvalues Extraction Sums of Squared
Loadings Rotation Sums of
Squared Loadings(a)
Total % of
Variance Cumulative
% Total % of
Variance Cumulative
% Total
1 4.805 40.045 40.045 4.805 40.045 40.045 4.147
2 2.157 17.972 58.017 2.157 17.972 58.017 3.730
3 1.138 9.486 67.502
4 .881 7.345 74.848
5 .724 6.034 80.882
6 .549 4.577 85.459
7 .446 3.720 89.179
8 .358 2.986 92.165
9 .290 2.415 94.580
10 .244 2.032 96.612
11 .215 1.789 98.401
12 .192 1.599 100.000
Extraction Method: Principal Component Analysis. (a) When components are correlated, sums of squared loadings cannot be added to obtain a total variance.
Source: Survey on the factors influencing entrepreneurial activities of small scale fish farmer in deriving income improvement and product sustainability in Central Java, Indonesia.
The Scree Plot in Figure 5.1 shows that there were two eigenvalues before the
elbow that explained 58% of the variation in the data. According to the Catell’s
scree plot test, all factors with eigenvalues above the elbow should be retained,
so for this data it was determined that two factors should be extracted. Theory
suggested that one of these factors related to endogenous influences while the
other related to exogenous influences.

134
Figure 5.1 Scree Plot for endogenous and exogenous factors that influence income improvement
Eig
en
va
lue
5
4
3
2
1
0
Scree Plot
Source: Survey on the factors influencing entrepreneurial activities of small scale fish farmer in deriving income improvement and product sustainability in Central Java, Indonesia.
The result of the two factor data reduction for the endogenous and exogenous
factors that influence income improvement is presented in the Pattern Matrix
(see Table 5.3).

135
Table 5.3 Pattern Matrix(a) for endogenous and exogenous factors that influence income improvement
Component
1 2
"Agree that market influence income improvement" .953 -.200
"Agree that financial capital influence income improvement" .871 -.078
"Agree that logistics influence income improvement" .808 .051
"Agree that gov./other institution support influence income improvement" .800 .025
"Agree that business network influence income improvement" .586 .230
"Agree that family support influence income improvement" .549 .231
"Agree that aquaculture skills influence income improvement" -.146 .917
"Agree that aquaculture knowledge influence income improvement" -.093 .821
"Agree that aquaculture experience influence income improvement" .159 .753
"Agree that personal business experience influence income improvement" .118 .633
"Agree that aquaculture education influence income improvement" .091 .574
"Agree that family business background influence income improvement" -.009 .491
Extraction Method: Principal Component Analysis. Rotation Method: Oblimin with Kaiser Normalization.
(a) Rotation converged in 6 iterations.
Source: Survey on the factors influencing entrepreneurial activities of small scale fish farmer in deriving income improvement and product sustainability in Central Java, Indonesia
In the factor reduction process two variables: “Agree that strong entrepreneurial
characteristics influence income improvement” and “Agree that family support
influence income improvement” were removed from the data. The decision to
take out these two variables led to a simple structure with each variable loading
on only one factor.
In Table 5.3 the component loadings show that the variables were grouped into
exogenous factors and endogenous factors. According to the data reduction
results, six variables were included as exogenous factors which influence
income improvement:
1. Business network
2. Financial capital
3. Market
4. Logistics

136
5. Government./other institution support
6. Family support
There were also six variables that were included as endogenous factors that
influence income improvement:
1. Aquaculture knowledge
2. Aquaculture skills
3. Aquaculture experience
4. Aquaculture education
5. Personal business experience
6. Family business background
5.3.2 Endogenous and exogenous factors that influence product sustainability
The data for factors that influence product sustainability was derived from
question number 66 in the questionnaire: “To what extent do you agree that the
factors below influence product sustainability for your business?”. The answer
were given on a Likert scale ranging from 1 to 6 (“strongly disagree” to
“strongly agree”).
An initial EFA was performed for product sustainability variables to reduce the
14 variables to a smaller number of meaningful factors. Table 5.4 shows the
value of KMO and Bartlett’s test for endogenous and exogenous factors relating
to product sustainability. The results show that the requirements for factor
analysis were met with KMO value of 0.857 and a Bartlett Test Sphericity p-
value below 0.05.

137
Table 5.4 KMO and Bartlett’s Test for endogenous and exogenous factors that influence product sustainability
Kaiser-Meyer-Olkin Measure of Sampling Adequacy. .857
Bartlett's Test of Sphericity Approx. Chi-Square 3425.476
df 66
Sig. .000
Source: Survey on the factors influencing entrepreneurial activities of small scale fish farmer in deriving income improvement and product sustainability in Central Java, Indonesia.
Table 5.5 suggests that the three factors selected by Kaiser’s Criterion explained
73% of the variation in the data. However, the third factor (1.094) was very
close to 1.0, so the Catell’s scree plot (see Figure 5.2) was also examined prior
to deciding how many factors to retain. Two factors explained 64% of the
variation in the data while the first factor explains 53% of the variation in the
data.

138
Table 5.5 Total variance explained for endogenous and exogenous factors that influence product sustainability
Component Initial Eigenvalues Extraction Sums of Squared
Loadings Rotation Sums of
Squared Loadings(a)
Total % of
Variance Cumulative
% Total % of
Variance Cumulative
% Total
1 6.386 53.214 53.214 6.386 53.214 53.214 5.912
2 1.305 10.875 64.089 1.305 10.875 64.089 3.170
3 1.094 9.117 73.206
4 .835 6.961 80.167
5 .584 4.867 85.035
6 .402 3.349 88.383
7 .344 2.866 91.249
8 .319 2.656 93.905
9 .279 2.325 96.230
10 .199 1.657 97.887
11 .151 1.260 99.147
12 .102 .853 100.000
Extraction Method: Principal Component Analysis. (a) When components are correlated, sums of squared loadings cannot be added to obtain a total variance.
Source: Survey on the factors influencing entrepreneurial activities of small scale fish farmer in deriving income improvement and product sustainability in Central Java, Indonesia.
The Scree Plot in Figure 5.2 shows only one eigenvalue above the first elbow.
However, the theory suggested that there should be two factors.
Figure 5.2 Scree Plot for endogenous / exogenous factor that influence product sustainability
Eig
en
va
lue
6
4
2
0
Scree Plot
Source: Survey on the factors influencing entrepreneurial activities of small scale fish farmer in deriving income improvement and product sustainability in Central Java, Indonesia.

139
The result of the data reduction with two factors is presented in the Pattern
Matrix (see Table 5.6).
Table 5.6 Pattern Matrix(a) for endogenous and exogenous factors that influence product sustainability
Component
1 2
"Agree that business reason influence product sustainability" .835 -.175
"Agree that family business background influence product sustainability" .820 -.028
"Agree that strong entrepreneur character influence product sustainability" .773 .089
"Agree that family support influence product sustainability" .753 -.156
"Agree that personal business experience influence product sustainability" .734 -.105
"Agree that aq. education influence product sustainability" .683 .214
"Agree that logistics influence product sustainability" .651 .295
"Agree that aq. knowledge influence product sustainability" .634 .401
"Agree that aq. skills influence product sustainability" .623 .401
"Agree that business network influence product sustainability" -.190 .792
"Agree that financial capital influence product sustainability" .372 .675
"Agree that gov./other institution support influence product sustainability" .400 .624
Extraction Method: Principal Component Analysis. Rotation Method: Oblimin with Kaiser Normalization.
(a) Rotation converged in 9 iterations.
Source: Survey on the factors influencing entrepreneurial activities of small scale fish farmer in deriving income improvement and product sustainability in Central Java, Indonesia.
According to the results of the factor reduction data in Table 5.6, there were two
groups of variables: endogenous and exogenous factors that influence product
sustainability. Nine variables were grouped into the endogenous factor, and three
variables into the exogenous factor. Two variables were removed from the
variable set to ensure a simple structure with each variable loading on only one
factor. The two variables that were removed were:
1. Agree that potential market influence product sustainability
2. Agree that aquaculture experience influence product sustainability
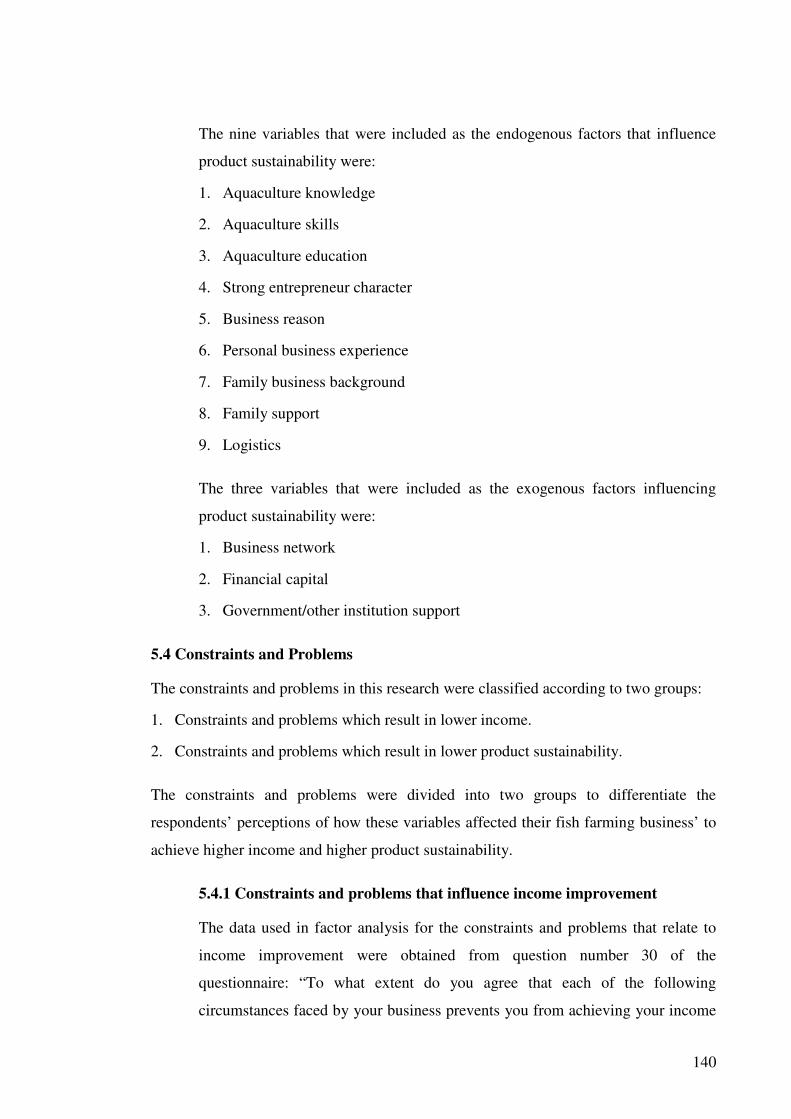
140
The nine variables that were included as the endogenous factors that influence
product sustainability were:
1. Aquaculture knowledge
2. Aquaculture skills
3. Aquaculture education
4. Strong entrepreneur character
5. Business reason
6. Personal business experience
7. Family business background
8. Family support
9. Logistics
The three variables that were included as the exogenous factors influencing
product sustainability were:
1. Business network
2. Financial capital
3. Government/other institution support
5.4 Constraints and Problems
The constraints and problems in this research were classified according to two groups:
1. Constraints and problems which result in lower income.
2. Constraints and problems which result in lower product sustainability.
The constraints and problems were divided into two groups to differentiate the
respondents’ perceptions of how these variables affected their fish farming business’ to
achieve higher income and higher product sustainability.
5.4.1 Constraints and problems that influence income improvement
The data used in factor analysis for the constraints and problems that relate to
income improvement were obtained from question number 30 of the
questionnaire: “To what extent do you agree that each of the following
circumstances faced by your business prevents you from achieving your income

141
improvement?”. The answers were given on a Likert scale ranging from 1 to 6 (1
for “strongly disagree” and 6 for “strongly agree”).
The EFA was performed for the constraints and problems variables related to
income improvement in order to reduce the 16 variables to a smaller number of
meaningful factors. The KMO and Bartlett’s test results for the constraints and
problems relating to income improvement are shown in Table 5.7; they show
that the requirement for factor analysis were met with the KMO value of 0.856
and a Bartlett p-value less than 0.05.
Table 5.7 KMO and Bartlett’s Test results for constraints and problems that influence income
improvement
Kaiser-Meyer-Olkin Measure of Sampling Adequacy. .856
Bartlett's Test of Sphericity Approx. Chi-Square 6089.441
df 78
Sig. .000
Source: Survey on the factors influencing entrepreneurial activities of small scale fish farmer in deriving income improvement and product sustainability in Central Java, Indonesia.
Table 5.8 shows that according to Kaiser’s criterion two factors had to be
extracted, because they explained 79% of the variation in the data.

142
Table 5.8 Total variance explained for constraints and problems that influence income improvement
Component Initial Eigenvalues Extraction Sums of Squared
Loadings Rotation Sums of
Squared Loadings(a)
Total % of
Variance Cumulative
% Total % of
Variance Cumulative
% Total
1 8.639 66.451 66.451 8.639 66.451 66.451 8.052
2 1.652 12.711 79.162 1.652 12.711 79.162 5.210
3 .587 4.517 83.679
4 .449 3.456 87.135
5 .369 2.840 89.975
6 .284 2.188 92.163
7 .262 2.018 94.180
8 .205 1.580 95.761
9 .170 1.308 97.069
10 .152 1.169 98.238
11 .116 .889 99.127
12 .071 .543 99.670
13 .043 .330 100.000
Extraction Method: Principal Component Analysis. (a) When components are correlated, sums of squared loadings cannot be added to obtain a total variance.
Source: Survey on the factors influencing entrepreneurial activities of small scale fish farmer in deriving income improvement and product sustainability in Central Java, Indonesia.
The result of the screeplot (see Figure 5.3) also showed that two factors had to
be retained.
Figure 5.3 Scree Plot for constraints and problems that influence income improvement
Eig
en
valu
e
10
8
6
4
2
0
Scree Plot
Source: Survey on the factors influencing entrepreneurial activities of small scale fish farmer in deriving income improvement and product sustainability in Central Java, Indonesia.

143
The result of the two factor data reduction is shown in the Pattern Matrix (see
Table 5.9). It shows constraints and problems as separate factors that influence
income improvement.
Table 5.9 Pattern Matrix(a) for constraints and problems that influence income improvement
Component
Constraints Problem
"Low quality of fish seed" .975 -.139
"Poor quality control" .970 -.093
"Low quality of fish feed" .927 -.087
"Poor water quality" .901 -.025
"Poor financial management skills" .878 .036
"Cannot secure a sufficient loan" .821 .119
"Lack of Capital " .667 .234
"Lack of profit" .659 .339
"Low selling price" .611 .405
"Lack of family support " -.228 1.023
"Lack of government support" .195 .785
"Lack of fish farming experience" .343 .659
"Lack of training" .367 .653
Extraction Method: Principal Component Analysis. Rotation Method: Oblimin with Kaiser Normalization.
(a) Rotation converged in 6 iterations.
Source: Survey on the factors influencing entrepreneurial activities of small scale fish farmer in deriving income improvement and product sustainability in Central Java, Indonesia.
In this data reduction analysis three variables were removed:
1. Fish diseases and parasites
2. Lack of potential markets
3. Lack of technical abilities
144
According to the EFA results the constraints that influence income improvement
that were retained were:
1. Lack of Capital
2. Low selling price
3. Lack of profit
4. Low quality of fish seed
5. Low quality of fish feed
6. Poor financial management skills
7. Poor quality control
8. Poor water quality
9. Cannot secure a sufficient loan
Problems that influence income improvement were:
1. Lack of family support
2. Lack of government support
3. Lack of training
4. Lack of fish farming experience
5.4.2 Constraints and problems that resulted in lower product sustainability
Similar to the constraints and problems for income improvement, the data used
to perform factor analysis in this section also used Likert scale data with a range
from 1 to 6. The EFA was executed for constraints and problems relating to
product sustainability in order to reduce the 16 variables into a smaller number
of meaningful factors.
The data used was obtained from question number 31 in the questionnaire: “To
what extent do you agree that each of the following circumstances faced by your
business prevents you from achieving your product sustainability?”. The KMO
and Bartlett’s test for constraints and problems that influence product
sustainability in Table 5.10 shows that the requirement to carry out EFA were
met with KMO value of 0.921.

145
Table 5.10 KMO and Bartlett’s Test for constraints and problems that influenceproduct sustainability
Kaiser-Meyer-Olkin Measure of Sampling Adequacy. .921
Bartlett's Test of Sphericity Approx. Chi-Square 8366.005
df 120
Sig. .000
Source: Survey on the factors influencing entrepreneurial activities of small scale fish farmer in deriving income improvement and product sustainability in Central Java, Indonesia.
Table 5.11 shows that according to Kaiser’s criterion two factors had to be
extracted; the two factors explained 78% of the variation in the data.
Table 5.11 Total variance explained for constraints and problems that influence product
sustainability
Component Initial Eigenvalues Extraction Sums of Squared
Loadings Rotation Sums of
Squared Loadings(a)
Total % of
Variance Cumulative
% Total % of
Variance Cumulative
% Total
1 10.771 67.319 67.319 10.771 67.319 67.319 9.747
2 1.775 11.091 78.410 1.775 11.091 78.410 8.546
3 .991 6.192 84.602
4 .433 2.705 87.307
5 .369 2.309 89.616
6 .320 1.999 91.615
7 .254 1.587 93.202
8 .224 1.403 94.605
9 .178 1.110 95.715
10 .158 .988 96.703
11 .121 .758 97.460
12 .106 .663 98.123
13 .096 .603 98.726
14 .079 .495 99.220
15 .076 .474 99.694
16 .049 .306 100.000
Extraction Method: Principal Component Analysis. (a) When components are correlated, sums of squared loadings cannot be added to obtain a total variance.
Source: Survey on the factors influencing entrepreneurial activities of small scale fish farmer in deriving income improvement and product sustainability in Central Java, Indonesia.

146
The scree plot in Figure 5.4 shows that there were three factors which lie above
the second elbow. However, the literature suggested only two factors namely
constraints and problems, so the third eigenvalue certainly had a value less than
one.
Figure 5.4 Scree Plot for constraints and problems that influence product sustainability
Eig
en
valu
e
12
10
8
6
4
2
0
Scree Plot
Source: Survey on the factors influencing entrepreneurial activities of small scale fish farmer in deriving
income improvement and product sustainability in Central Java, Indonesia.
The result of the two factor data reduction for constraints and problems that
influence product sustainability is presented in the Pattern Matrix (see Table
5.12).
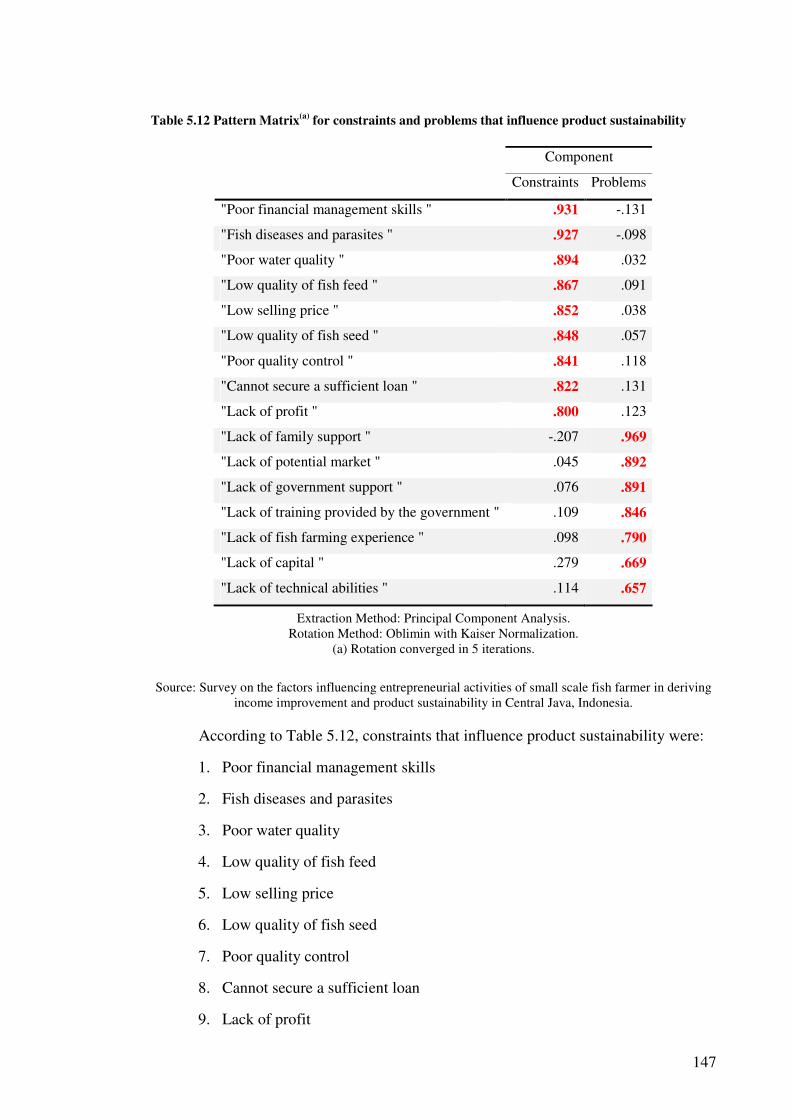
147
Table 5.12 Pattern Matrix(a) for constraints and problems that influence product sustainability
Component
Constraints Problems
"Poor financial management skills " .931 -.131
"Fish diseases and parasites " .927 -.098
"Poor water quality " .894 .032
"Low quality of fish feed " .867 .091
"Low selling price " .852 .038
"Low quality of fish seed " .848 .057
"Poor quality control " .841 .118
"Cannot secure a sufficient loan " .822 .131
"Lack of profit " .800 .123
"Lack of family support " -.207 .969
"Lack of potential market " .045 .892
"Lack of government support " .076 .891
"Lack of training provided by the government " .109 .846
"Lack of fish farming experience " .098 .790
"Lack of capital " .279 .669
"Lack of technical abilities " .114 .657
Extraction Method: Principal Component Analysis. Rotation Method: Oblimin with Kaiser Normalization.
(a) Rotation converged in 5 iterations.
Source: Survey on the factors influencing entrepreneurial activities of small scale fish farmer in deriving income improvement and product sustainability in Central Java, Indonesia.
According to Table 5.12, constraints that influence product sustainability were:
1. Poor financial management skills
2. Fish diseases and parasites
3. Poor water quality
4. Low quality of fish feed
5. Low selling price
6. Low quality of fish seed
7. Poor quality control
8. Cannot secure a sufficient loan
9. Lack of profit

148
Table 5.12 shows that the problems that influence product sustainability were:
1. Lack of family support
2. Lack of potential market
3. Lack of government support
4. Lack of training provided by the government
5. Lack of fish farming experience
6. Lack of capital
7. Lack of technical abilities
5.5 Construction of scales and Cronbach’s Alpha
The Cronbach’s alpha test in this research was used to test the reliability of the four
scales that were developed for this research. The preliminary analysis of EFA resulted
in only one endogenous factor and one exogenous factor for income improvement and
product sustainability. Similarly, there was only one constraints factor and only one
problems factor that influence income improvement and product sustainability.
Summated scales were constructed for each of these factors and the reliability of each
scale was assessed using Cronbach’s Alpha. A value for Cronbach’s Alfa above 0.8
indicates excellent reliability; a value above 0.7 indicates good reliability while a value
above 0.6 indicates adequate reliability, according to Hair et al. (2006). Table 5.13 and
Table 5.14 show the descriptive statistics and correlations for the eight scales defined
above.
Table 5.13 shows that six out of the eight scales developed had excellent reliability
given that their values for Cronbach’s Alpha were above 0.8. The endogenous factors
for income improvement and exogenous factor for product sustainability had good
reliability given their Cronbach’s Alpha values above 0.7.

149
Table 5.13 Cronbach’s Alpha test of scales
Scales for Income Improvement
Cronbach’s
Apha
Mean Std. Deviation
1) Endogenous 0.798 29.41 3.51
2) Exogenous 0.867 29.81 4.45
3) Constraints 0.959 35.79 12.11
4) Problems 0.905 14.27 5.78
Scales for Product Sustainability
5) Endogenous 0.910 42.20 6.41
6) Exogenous 0.754 15.14 2.42
7) Constraints 0.967 33.19 12.57
8) Problems 0.944 26.57 10.08
Source: Survey on the factors influencing entrepreneurial activities of small scale fish farmer in deriving income improvement and product sustainability in Central Java, Indonesia.
Table 5.14 shows Pearson’s correlation: values greater than 0.7 for the correlations
between these scales is an indication of strong positive correlation. The Pearson’s
correlations for the scales show strong positive correlations between: 1) constraints
income improvement and constraints product sustainability, 2) constraints income
improvement and problems product sustainability, 3) problems income improvement
with problems product sustainability. The strong correlations suggested that these scales
were strongly associated with each other, for example if constraints for income
improvement increased, constraints for product sustainability were also expected to
increase, and vice versa.

150
Table 5.14 Pearson’s correlation of the scales
Constrain
ts
II
Pro
blem
s
II
Constrain
ts
PS
Pro
blem
s
PS
Endogen
ous
II
Exogen
ous
II
Endogen
ous
PS
Exogen
ous
PS
Constraints II 1 .622** .871** .744** -.336** -.093 -.136** -.144**
Problems II .622** 1 .505** .761** -.094 -.085 .048 -.021
Constraints PS .871** .505** 1 .714** -.390** -.050 -.104* -.193**
Problems PS .744** .761** .714** 1 -.315** -.065 -.064 -.226**
Endogenous II -.336** -.094 -.390** -.315** 1 .384** .466** .466**
Exogenous II -.093 -.085 -.050 -.065 .384** 1 .639** .625**
Endogenous PS -.136** .048 -.104* -.064 .466** .639** 1 .572**
Exogenous PS -.144** -.021 -.193** -.226** .466** .625** .572** 1
II: Income Improvement, PS: Product Sustainability
Significance level: Strong correlation if value > 0.7, moderate correlation if value > 0.5
Source: Survey on the factors influencing entrepreneurial activities of small scale fish farmer in deriving income improvement and product sustainability in Central Java, Indonesia.
Moderate positive correlations are shown by correlation values greater than 0.5. From
Table 5.14 it can be seen that moderate correlations occured between: 1) exogenous
income improvement with endogenous product sustainability, 2) exogenous income
improvement with exogenous product sustainability, 3) constraints income
improvement with problems income improvement and 4) problems income
improvement with constraints product sustainability. These moderate correlations
suggested that these scales were related to each other. Nevertheless, it was possible that
either strong or moderate correlations may be considered as spurious correlations that
occurred without any causal connections.
5.6 Conclusion
Exploratory factor analysis (EFA) described in this chapter reduced the number of
variables in the endogenous and exogenous factors, constraints and problems, to a
smaller number of meaningful factors.

151
The EFA results showed that there were six endogenous and six exogenous variables
that related to income improvement, and nine endogenous and three exogenous
variables that influenced product sustainability. There were nine constraint and four
problem variables that influenced income improvement, nine constraint and seven
problem variables that influenced product sustainability.
Scales for endogenous and exogenous factors and scales for constraints and problems
were calculated for income improvement and product sustainability. The scales were
reliable with Cronbach’s alpha above 0.8 (for six of the developed scales) and above 0.7
(for two of the scales). In addition strong correlations were found between constraints
income improvement and constraints product sustainability, constraints income
improvement and problems product sustainability, and problems income improvement
and problems product sustainability.

152
Chapter 6
Data analysis – findings and interpretation
6.1 Introduction
The primary analysis of the research is presented in this chapter. It includes the results
of several statistical analyses that include descriptive analyses, logistic regression
analyses, and chi-square tests of association. These results are discussed further in
chapter 7 in relation to the hypotheses developed in Chapter 4 Methodology.
The core analyses in this research used binary logistic regression analysis because the
dependent variable was a dichotomous categorical variable. Multiple regression analysis
was not a suitable technique for this case because multiple regression analysis requires a
continuous dependent variable. Following the core analyses, a chi-square test of
association was used to compare the data of small scale fish farmers with different
demographic background in regard to their entrepreneurial activities.
6.2 Statistical analysis
Three statistical analysis techniques were used for the primary analyses of this research:
descriptive analysis, binary logistic regression analysis, and the chi-square test.
Overviews of the functions of these techniques are described next and the results of the
techniques are presented in the sections after this.
6.2.1 Descriptive analysis
Descriptive analysis was used in this research to describe the characteristics of
the research sample. There are three uses of descriptive analysis according to
Pallant: “to describe the characteristics of your sample in the Method section of
your report; to check your variables for any violation of the assumptions
underlying the statistical techniques that you will use to address your research
questions; and to address specific research questions” (2005, p. 49).
In this research, descriptive analysis was used for the personal and business
characteristics of the research sample, for example for the variables of the
participants such as age, education, marital status, and number of employees.
Descriptive analysis was also used to test Hypothesis #9 for the most commonly

153
implemented entrepreneurial activities of small scale fish farmers in Central
Java.
Frequency tables were used as the descriptive analysis technique in this research;
this method was chosen because all the variables were categorical variables.
Frequency tables were used for the specific characteristics of the respondents
such as the number of participants who were male or female, the number of
participants who were single or married, and the number of participants who had
completed or not completed high school. Frequency tables were also used to
show how frequently small scale fish farmers implemented particular
entrepreneurial activities in Central Java.
6.2.2 Binary logistic regression
Logistic regression analysis is a statistical tool to test models where the
dependent variable is categorical and the independent variable is categorical or
continuous (Pallant 2005). Binary logistic regression was used for the cases of
this research where the dependent variable was dichotomous (when it had only
two category values). Multinomial logistic regression was used when the
dependent variable consisted of more than two categories.
There are three assumptions that have to be considered before deciding to use
logistic regression analysis. The assumptions are: sample size, multicollinearity,
and outliers (Pallant 2005).
Sample size
The sample size assumption concerns the number of cases and the number of
independent variables. A small sample with many independent variables could
be a problem; this situation occurs when there are large numbers of independent
variables but very few cases in each category. When this occurs it is advisable to
collapse or delete the categories with the fewer cases.
Multicollinearity
Multicollinearity occurs when there is a high inter-correlation between the
independent variables. Ideally, there should be a strong relationship between the
independent variable and the dependent variable, but not with the other

154
independent variables. When multicollinearity occurs, the variable set of the
model may need to be reconsidered to remove the highly correlated variables.
Outliers
May be predicated as one category but turned out to classify as other category.
The outliers should be identified by examining residuals.
6.2.3 Chi-square test
There are two types of chi-square tests that can be used with categorical data
(Pallant 2005): the chi-square goodness of fit test and the chi-square test of
independence. Overviews of these two tests are given next.
1. The chi-square goodness of fit test
According to Pallant the chi-square goodness of fit test “explores the proportion
of cases that fall into the various categories of a single variable, and compares
these with hypothesised values” (2005, p. 287). This type of chi-square test was
not used in this research.
2. The chi-square test of independence
The chi-square test of independence is used to test for correlation between two
categorical variables by comparing the frequency of categories in one variable
with the frequency of categories of the other variable. The chi-square test of
independence was used in this research to compare two groups of categorical
variables.
The test was performed to test Hypotheses #10 to #16 for comparisons between
some groups of small scale fish farmer communities according to the types of
entrepreneurial activities they implemented. The groups of small scale fish
farmer communities that were compared were:
1. awardees and non awardees,
2. male and female,
3. ages,
4. marital status,
5. educational level,

155
6. fish farmer groups, and
7. reason to go into business.
6.3 Endogenous and Exogenous Factors
The analysis of the endogenous and exogenous factors was performed to address the
first research objective which was to identify endogenous and exogenous factors that
small scale fish farmers regard as influencing their income improvement and product
sustainability. The objective was developed into two questions in the questionnaire: “to
what extent do you agree that the factors below influence income improvement for your
business?” and “to what extent do you agree that the factors below influence product
sustainability for your business?”. The sample data was analysed separately for each of
the two questions.
The questions were intentionally analysed separately in order to differentiate the
answers of the fish farmers in their response to their income improvement and their
awareness of product sustainability. The analyses for the two questions are presented
next in section 6.3.1 for income improvement and section 6.3.2 for product
sustainability.
6.3.1 Influence income improvement
The analyses of this section are based on the responses obtained for the survey
question: “to what extent do you agree that the factors below influence income
improvement for your business?”.
The dependent variable used for this analysis was income which was divided
into two categories: (i) less than Rp 50 million, and (ii) Rp 50 million and over.
Table 6.1 shows that small scale fish farmers in Central Java mainly earned
incomes less than Rp 50 million (80.0%), while 19.2% earned annual incomes of
Rp 50 million and over.

156
Table 6.1 Frequency table for income
Income Frequency Percentage
Less than Rp 50 million 323 80.8
Rp 50 million and over 77 19.2
Source: Survey on the factors influencing entrepreneurial activities of small scale fish farmer in deriving income improvement and product sustainability in Central Java, Indonesia.
Table 6.2 shows the Omnibus test of model coefficients; a significant result for
this test indicates good model performance. In this case the test result was highly
significant with p-value of 0.005.
Table 6.2 Omnibus Tests of Model Coefficients for endogenous and exogenous factors that
influence income improvement
Chi-square df Sig.
Step 1 Step 10.571 2 .005
Block 10.571 2 .005
Model 10.571 2 .005
Source: Survey on the factors influencing entrepreneurial activities of small scale fish farmer in deriving income improvement and product sustainability in Central Java, Indonesia.
Table 6.3 shows that the endogenous factors made a significant contribution to
income levels (p = 0.019). For the exogenous factors the p-value was 0.316
which indicated that the exogenous factors did not make a significant
contribution to income improvement.
Table 6.3 Variables in the equation for endogenous and exogenous factors that influence income improvement
B S.E. Wald df Sig. Exp(B)
Lower Upper Lower Upper Lower Upper
Step 1(a) Endogenous .122 .052 5.525 1 .019 1.130
Exogenous .042 .042 1.006 1 .316 1.043
Constant -5.718 1.447 15.611 1 .000 .003
(a) Variable(s) entered on step 1: Endogenous, Exogenous.
Source: Survey on the factors influencing entrepreneurial activities of small scale fish farmer in deriving income improvement and product sustainability in Central Java, Indonesia.

157
According to Table 6.3, the odds of earning a higher income (Rp 50 million and
over) increased by 13.0% when the endogenous factors scale for income
improvement was increased by one unit while the exogenous scale was
statistically controlled.
6.3.2 Influence product sustainability
The following binary logistic regression analyses show the results for the effects
of the endogenous and exogenous factors on product sustainability as measured
by the dependent variables for the activities of checking water quality, giving
fish feed at the right quantity and at the right time, maintaining fish feed quality
and availability, and maintaining fish seed quality and quantity. These four
dependent variables were measured using dichotomous categorical variables.
Table 6.4 Frequency of product sustainability activities
Activities for product sustainability Frequency Percentage
Check water quality 210 52.5
Give feed at the right quantity and time 213 53.2
Maintain fish feed quality and availability 156 39
Maintain fish seed quality and availability 110 27.5
Source: Survey on the factors influencing entrepreneurial activities of small scale fish farmer in deriving income improvement and product sustainability in Central Java, Indonesia.
Table 6.4 shows that, of the four activities, giving feed at the right quantity and
time was the most common activity carried out by small scale fish farmers in
Central Java to sustain their produce. The second most common activity of the
fish farmers was checking the water quality, followed by maintaining fish feed
quality and availability, and then maintaining fish seed quality and availability.
a. Check water quality
The Omnibus test for model coefficients resulted in a p-value of 0.067 (see
Table 6.5). This result was not significant because the p-value needed to be less
than 0.05 to be significant (Pallant 2005). This suggested that the endogenous
and exogenous factors associated with product sustainability did not affect the
water checking activity.

158
Table 6.5 Omnibus Tests of Model Coefficients for endogenous and exogenous factors influencing product sustainability by checking water quality
Chi-square df Sig.
Step 5.399 2 .067
Block 5.399 2 .067
Step 1
Model 5.399 2 .067
Source: Survey on the factors influencing entrepreneurial activities of small scale fish farmer in deriving income improvement and product sustainability in Central Java, Indonesia.
Table 6.6 shows that the endogenous factors significantly influenced product
sustainability through the activity of checking water quality. This is shown by
the p-value of 0.024. Conversely, the exogenous factors did not have a
significant relationship with the activity of checking water quality (p = 0.314).
Table 6.6 Variables in the equation for endogenous and exogenous factors influencing product sustainability through checking water quality
B S.E. Wald df Sig. Exp(B)
Lower Upper Lower Upper Lower Upper
Step 1(a) Endogenous .049 .022 5.088 1 .024 1.051
Exogenous -.069 .069 1.014 1 .314 .933
Constant -.949 .775 1.500 1 .221 .387
(a) Variable(s) entered on step 1: AprilEndogenousPS, AprilExogenousPS.
Source: Survey on the factors influencing entrepreneurial activities of small scale fish farmer in deriving income improvement and product sustainability in Central Java, Indonesia.
The odds ratio, Exp(B), shows that the odds of influencing product sustainability
by checking water quality was increased by a factor of 1.051 for a one unit
increase in the endogenous factors scale while the exogenous factors scale was
statistically controlled.
b. Give feed in the right quantity and at the right time
As displayed in Table 6.7, the model using endogenous and exogenous factors
influencing product sustainability to predict the activity of giving feed at the
right quantity and time was not significant (p = 0.225).

159
Table 6.7 Omnibus Tests of Model Coefficients for endogenous and exogenous factors influencing
product sustainability by giving feed at the right quantity and time
Chi-square df Sig.
Step 1 Step 2.980 2 .225
Block 2.980 2 .225
Model 2.980 2 .225
Source: Survey on the factors influencing entrepreneurial activities of small scale fish farmer in deriving income improvement and product sustainability in Central Java, Indonesia.
The result of the analysis shown in Table 6.8 confirmed that the exogenous
factors influencing product sustainability did not impact significantly on the
activity of giving fish feed in the right quantity and at the right time (p = 0.086).
Also, endogenous factors influencing product sustainability did not have a
significant influence (p = 0.339) on giving feed in the right quantity and at the
right time.
Table 6.8 Variables in the equation for endogenous and exogenous factors influencing product
sustainability by giving feed at the right quantity and time
B S.E. Wald df Sig. Exp(B)
Lower Upper Lower Upper Lower Upper
Step 1(a) Endogenous .020 .021 .914 1 .339 1.021
Exogenous -.118 .069 2.942 1 .086 .888
Constant .764 .759 1.014 1 .314 2.147
(a) Variable(s) entered on step 1: AprilEndogenousPS, AprilExogenousPS.
Source: Survey on the factors influencing entrepreneurial activities of small scale fish farmer in deriving income improvement and product sustainability in Central Java, Indonesia.
The odds ratio in Table 6.8 shows that the odds of influencing product
sustainability by giving feed in the right quantity and at the right time was
increased by a factor of 1.021 for a one unit increase in the endogenous factors
scale while the exogenous factors scale was statistically controlled.
c. Fish feed quality and availability
Table 6.9 shows the results of the Omnibus test of model coefficients and it was
found that the model relating endogenous and exogenous factors influencing

160
product sustainability to the activity of maintaining fish feed quality and
availability was significant with p-value of 0.000.
Table 6.9 Omnibus Tests of Model Coefficients for endogenous and exogenous factors influencing product sustainability by maintaining fish feed quality and availability
Chi-square df Sig.
Step 1 Step 15.379 2 .000
Block 15.379 2 .000
Model 15.379 2 .000
Source: Survey on the factors influencing entrepreneurial activities of small scale fish farmer in deriving income improvement and product sustainability in Central Java, Indonesia.
Table 6.10 shows that the endogenous factors contributed to the product
sustainability through maintaining fish feed quality and availability. This was
shown by the significant result for the endogenous factors (p = 0.04). On the
other hand, the exogenous factors did not show a significant result with a p-
value of 0.578 which indicated that exogenous factors did not contribute
significantly to the fish farmers’ product sustainability through their activity of
maintaining fish feed quality and availability.
Table 6.10 Variables in the equation for endogenous and exogenous factors influencing product sustainability by maintaining fish feed quality and availability
B S.E. Wald df Sig. Exp(B)
Lower Upper Lower Upper Lower Upper
Step 1(a) Endogenous .072 .025 8.130 1 .004 1.075
Exogenous .041 .073 .309 1 .578 1.041
Constant -3.678 .957 14.783 1 .000 .025
(a) Variable(s) entered on step 1: AprilEndogenousPS, AprilExogenousPS.
Source: Survey on the factors influencing entrepreneurial activities of small scale fish farmer in deriving income improvement and product sustainability in Central Java, Indonesia
Table 6.10 shows that the odds of influencing product sustainability by
maintaining fish feed quality and availability was increased by a factor of 1.075
for a one unit increase in the endogenous factor scale while the exogenous
factors scale was statistically controlled.

161
d. Fish seed quality and availability
Table 6.11 shows the Omnibus test of model coefficients for endogenous and
exogenous factors influencing product sustainability through maintaining fish
seed quality and availability. It presents a significant result of .000 which
indicated that this model performs well.
Table 6.11 Omnibus Tests of Model Coefficients for endogenous and exogenous factors influencing product sustainability by maintaining fish seed quality and availability
Chi-square df Sig.
Step 1 Step 30.968 2 .000
Block 30.968 2 .000
Model 30.968 2 .000
Source: Survey on the factors influencing entrepreneurial activities of small scale fish farmer in deriving income improvement and product sustainability in Central Java, Indonesia.
Table 6.12 shows that both endogenous and exogenous factors significantly
contributed to product sustainability through maintaining fish seed quality and
availability. This was shown by the significant result for both the endogenous
and exogenous factors (both with p-value of 0.000).
Table 6.12 Variables in the Equation for endogenous and exogenous factors influencing product sustainability by maintaining fish seed quality and availability
B S.E. Wald df Sig. Exp(B)
Lower Upper Lower Upper Lower Upper
Step 1(a) Endogenous .122 .029 17.865 1 .000 1.129
Exogenous -.422 .085 24.789 1 .000 .656
Constant -.666 .906 .541 1 .462 .514
(a) Variable(s) entered on step 1: Endogenous, Exogenous
Source: Survey on the factors influencing entrepreneurial activities of small scale fish farmer in deriving income improvement and product sustainability in Central Java, Indonesia.
The odds of influencing product sustainability by maintaining fish seed quality
and availability increased by a factor of 1.129 for a one unit increase in the
endogenous factor scale while the exogenous scale was statistically controlled.
However, the odds of influencing product sustainability by maintaining fish seed
quality and availability is decreased by 34% when the exogenous factors scale
was increased by one and the endogenous factors scale was statistically
controlled.

162
Table 6.13 Significant effect of endogenous and exogenous factors
Influencing Endogenous factors
(p-value)
Exogenous factors
(p-value)
Income 0.019* 0.316
Check water quality 0.024* 0.314
Give feed at the right quantity and time 0.086 0.339
Maintain fish feed quality and availability 0.004* 0.578
Maintain fish seed quality and availability 0.000* 0.000*
Source: Survey on the factors influencing entrepreneurial activities of small scale fish farmer in deriving income improvement and product sustainability in Central Java, Indonesia.
Table 6.13 summarises the significant effect of endogenous and exogenous
factors. It shows that the endogenous factors significantly affected the income,
but the exogenous factors did not. Three of the product sustainability activities:
check water quality, maintain fish feed quality and availability, and maintain fish
seed quality and availability, were significantly affected by the endogenous
factors, while exogenous factors only affected product sustainability through one
activity: maintain fish seed quality and availability.
6.4 Constraints and Problems
The following logistic regression analyses present the tests for determining whether
constraints and problems experienced by small scale fish farmers affected the income
and product sustainability.
6.4.1 The effect of problems and constraints on income
Income is split into higher and lower categories: (i) below Rp 50 million, and (ii)
Rp 50 million and above. For this analysis the chapter 5 scales for constraints
and problems affecting income improvement were used as the independent
variable.
Table 6.14 shows the Omnibus test of the model coefficients for constraints and
problems faced by small scale fish farmers in their attempts to improve their
income. The highly significant result of 0.005 demonstrates that the model
performed well.

163
Table 6.14 Omnibus Tests of Model Coefficients for constraints and problems influencing income improvement
Chi-square df Sig.
Step 104.434 2 .000
Block 104.434 2 .000
Step 1
Model 104.434 2 .000
Source: Survey on the factors influencing entrepreneurial activities of small scale fish farmer in deriving income improvement and product sustainability in Central Java, Indonesia.
Table 6.15 shows that both constraints and problems influenced income. This is
indicated by the significant result for both constraints and problems with p-value
of 0.000.
Table 6.15 Variables in the Equation for constraints and problems influencing income improvement
B S.E. Wald df Sig. Exp(B)
Constraints .194 .027 53.155 1 .000 1.214
Problems -.397 .048 67.361 1 .000 .672
Step 1
Constant -3.831 .769 24.828 1 .000 .022
Source: Survey on the factors influencing entrepreneurial activities of small scale fish farmer in deriving income improvement and product sustainability in Central Java, Indonesia.
The odds ratio shows that the odds of a higher income are decreased by a factor
of 0.672 for a one unit increase in the problems scale while the constraints scale
was statistically controlled. However, a one unit increase in the constraints scale
was associated with a 21.4% increase in the odds of a higher income while the
problems scale was statistically controlled.
6.4.2 The effect of problems and constraints on product sustainability
a. Checking water quality
The Omnibus test of model coefficients for constraints and problems influencing
income improvement is shown in Table 6.16. The result was significant with p-
value of .000. This suggests that constraints and problems associated with
product sustainability affect water quality checking.

164
Table 6.16 Omnibus Tests of Model Coefficients for constraints and problems influencing product sustainability through checking water quality
Chi-square df Sig.
Step 18.282 2 .000
Block 18.282 2 .000
Step 1
Model 18.282 2 .000
Source: Survey on the factors influencing entrepreneurial activities of small scale fish farmer in deriving income improvement and product sustainability in Central Java, Indonesia
Table 6.17 shows that constraints contributed to the product sustainability
through water quality checking. This is shown by the p-value of 0.006.
Conversely, problems did not have a significant relationship with water quality
(p = 0.822).
Table 6.17 Variables in the Equation for constraints and problems influencing product sustainability through checking water quality
B S.E. Wald df Sig. Exp(B)
Constraints -.037 .013 7.443 1 .006 .964
Problems -.004 .017 .050 1 .822 .996
Step 1
Constant 1.298 .317 16.776 1 .000 3.660
Source: Survey on the factors influencing entrepreneurial activities of small scale fish farmer in deriving income improvement and product sustainability in Central Java, Indonesia.
The odds ratio shows that the odds for influencing product sustainability by
checking water quality were decreased by a factor of 0.996 for a one unit
increase in the problems scale while the constraints scale was statistically
controlled.
b. Give feed at the right quantity and at the right time
Table 6.18 shows the Omnibus test of the model coefficients for using
constraints and problems influencing product sustainability to predict giving
feed at the right quantity was significant (p = 0.000).

165
Table 6.18 Omnibus Tests of Model Coefficients for constraints and problems influencing product sustainability through giving feed at the right quantity and time
Chi-square df Sig.
Step 49.875 2 .000
Block 49.875 2 .000
Step 1
Model 49.875 2 .000
Source: Survey on the factors influencing entrepreneurial activities of small scale fish farmer in deriving income improvement and product sustainability in Central Java, Indonesia.
Table 6.19 confirms that the problems influencing product sustainability
impacted significantly on giving feed at the right quantity and time (p=0.000).
On the other hand, constraints influencing product sustainability did not have
significant influence (p = 0.979) on giving feed at the right quantity and time.
Table 6.19 Variables in the Equation for constraints and problems influencing product sustainability through giving feed at the right quantity and time
B S.E. Wald df Sig. Exp(B)
Constraints .000 .014 .001 1 .979 1.000
Problems .084 .018 21.372 1 .000 1.088
Step 1
Constant -1.783 .335 28.372 1 .000 .168
Source: Survey on the factors influencing entrepreneurial activities of small scale fish farmer in deriving income improvement and product sustainability in Central Java, Indonesia.
The odds ratio shows that the odds of influencing product sustainability by
giving feed at the right quantity and time was increased by a factor of 1.088 for a
one unit increase in the problem scale while the constraints scale was
statistically controlled.
c. Fish feed quality and availability
Table 6.20 shows the Omnibus test of model coefficients where a significant
result indicates a useful model. In this case the model relating constraints and
problems influencing product sustainability to maintaining fish feed quality and
availability was significant with a p value of 0.002.
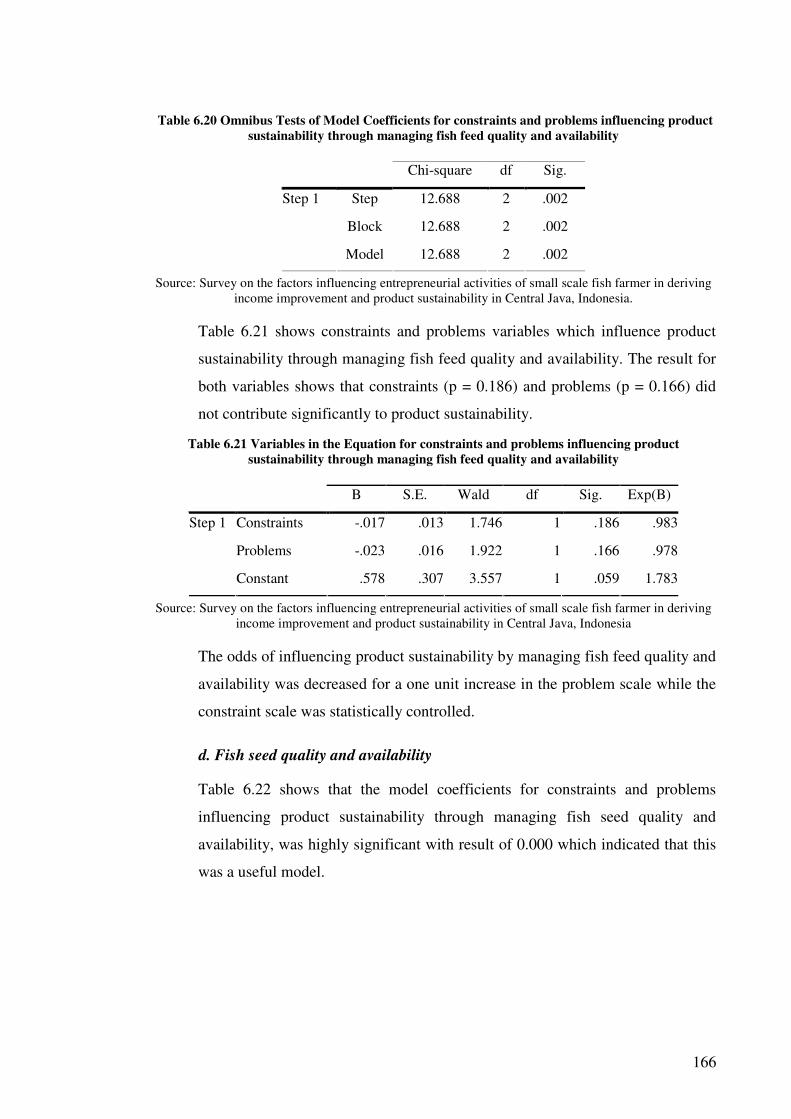
166
Table 6.20 Omnibus Tests of Model Coefficients for constraints and problems influencing product sustainability through managing fish feed quality and availability
Chi-square df Sig.
Step 12.688 2 .002
Block 12.688 2 .002
Step 1
Model 12.688 2 .002
Source: Survey on the factors influencing entrepreneurial activities of small scale fish farmer in deriving income improvement and product sustainability in Central Java, Indonesia.
Table 6.21 shows constraints and problems variables which influence product
sustainability through managing fish feed quality and availability. The result for
both variables shows that constraints (p = 0.186) and problems (p = 0.166) did
not contribute significantly to product sustainability.
Table 6.21 Variables in the Equation for constraints and problems influencing product sustainability through managing fish feed quality and availability
B S.E. Wald df Sig. Exp(B)
Constraints -.017 .013 1.746 1 .186 .983
Problems -.023 .016 1.922 1 .166 .978
Step 1
Constant .578 .307 3.557 1 .059 1.783
Source: Survey on the factors influencing entrepreneurial activities of small scale fish farmer in deriving income improvement and product sustainability in Central Java, Indonesia
The odds of influencing product sustainability by managing fish feed quality and
availability was decreased for a one unit increase in the problem scale while the
constraint scale was statistically controlled.
d. Fish seed quality and availability
Table 6.22 shows that the model coefficients for constraints and problems
influencing product sustainability through managing fish seed quality and
availability, was highly significant with result of 0.000 which indicated that this
was a useful model.

167
Table 6.22 Omnibus Tests of Model Coefficients for constraints and problems influencing product sustainability through managing fish seed quality and availability
Chi-square df Sig.
Step 42.668 2 .000
Block 42.668 2 .000
Step 1
Model 42.668 2 .000
Source: Survey on the factors influencing entrepreneurial activities of small scale fish farmer in deriving income improvement and product sustainability in Central Java, Indonesia.
Table 6.23 presents a significant result that problems influenced product
sustainability (0.000) by managing fish seed quality and availability.
Conversely, constraints that influenced product sustainability significantly
influenced managing fish seed quality and quantity (p = 0.957).
Table 6.23 Variables in the Equation for constraints and problems influencing product sustainability by managing fish seed quality and availability
B S.E. Wald df Sig. Exp(B)
Constraints .001 .014 .003 1 .957 1.001
Problem .091 .019 23.709 1 .000 1.095
Step 1
Constant -3.227 .454 50.584 1 .000 .040
Source: Survey on the factors influencing entrepreneurial activities of small scale fish farmer in deriving income improvement and product sustainability in Central Java, Indonesia.
The odds of influencing product sustainability by managing fish seed quality and
availability were increased by a factor of 1.095 for a one unit increase in the
problem scale while the constraints scale was statistically controlled.
Table 6.24 Significant effect of constraints and problems to income and product sustainability
Influencing Constraints
(p-value)
Problems
(p-value)
Income 0.000* 0.000*
Check water quality 0.006* 0.822
Give feed at the right quantity and time 0.979 0.000*
Maintain fish feed quality and availability 0.186 0.166
Maintain fish seed quality and availability 0.957 0.000*
Source: Survey on the factors influencing entrepreneurial activities of small scale fish farmer in deriving income improvement and product sustainability in Central Java, Indonesia.
Table 6.24 summarises the significant effects of constraints and problems on
income and product sustainability. It shows that both constraints and problems

168
significantly affected income. Constraints showed a significant relation to
product sustainability by checking water quality, but no relationships to other
product sustainability activities. Problems showed significant effect on two of
the product sustainability activities: give feed at the right quantity and time, and
maintain fish seed quality and availability.
6.5 Implemented Entrepreneurial activities in Central Java
This section describes the entrepreneurial activities that have been implemented by
small scale fish farmers in Central Java. These activities include fish feed production,
fish seed production, market extension, fish species extension, product range extension,
and utilisation of other fish parts.
Table 6.25 Implemented entrepreneurial activities according to percentage
Number Types of entrepreneurial activities Percentage (%)
1 Market extension 48.5
2 Fish species extension 27.3
3 Product range extension 18
4 Others 13.8
5 None of the above 7.8
6 Fish seed production 5.8
7 Utilisation of other fish parts 3
8 Fish feed production 1
Source: Survey on the factors influencing entrepreneurial activities of small scale fish farmer in deriving income improvement and product sustainability in Central Java, Indonesia.
As shown in Table 6.25 the most commonly implemented entrepreneurial activities by
small scale fish farmers in Central Java were market extension (48.5%) and fish species
extension (27.3%), followed by product range extension (18%). The least favourite
entrepreneurial activities were fish seed production (5.8%), utilisation of other fish parts
(3%), and fish feed production (1%).
Table 6.26 shows that there were only 4 respondents of the 400 (1%) that implemented
the entrepreneurial activity of fish feed production in Central Java. It shows that this
entrepreneurial activity was not practised by small scale fish farmers in Central Java.
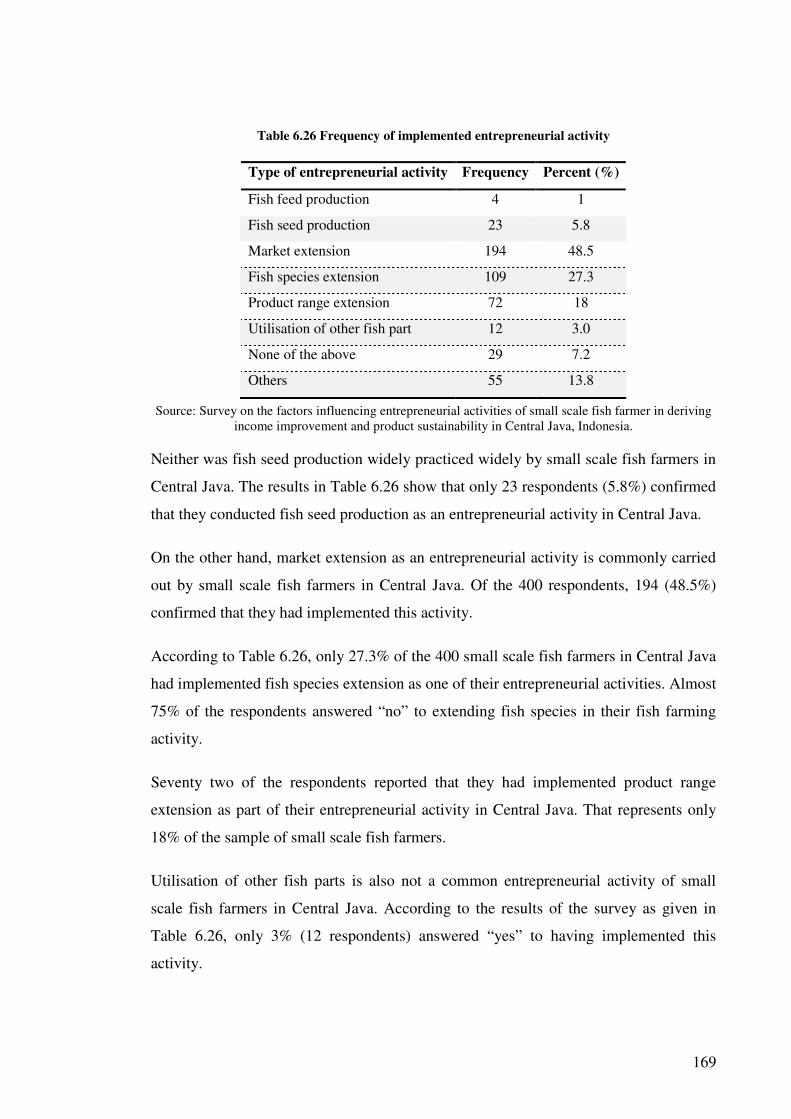
169
Table 6.26 Frequency of implemented entrepreneurial activity
Type of entrepreneurial activity Frequency Percent (%)
Fish feed production 4 1
Fish seed production 23 5.8
Market extension 194 48.5
Fish species extension 109 27.3
Product range extension 72 18
Utilisation of other fish part 12 3.0
None of the above 29 7.2
Others 55 13.8
Source: Survey on the factors influencing entrepreneurial activities of small scale fish farmer in deriving income improvement and product sustainability in Central Java, Indonesia.
Neither was fish seed production widely practiced widely by small scale fish farmers in
Central Java. The results in Table 6.26 show that only 23 respondents (5.8%) confirmed
that they conducted fish seed production as an entrepreneurial activity in Central Java.
On the other hand, market extension as an entrepreneurial activity is commonly carried
out by small scale fish farmers in Central Java. Of the 400 respondents, 194 (48.5%)
confirmed that they had implemented this activity.
According to Table 6.26, only 27.3% of the 400 small scale fish farmers in Central Java
had implemented fish species extension as one of their entrepreneurial activities. Almost
75% of the respondents answered “no” to extending fish species in their fish farming
activity.
Seventy two of the respondents reported that they had implemented product range
extension as part of their entrepreneurial activity in Central Java. That represents only
18% of the sample of small scale fish farmers.
Utilisation of other fish parts is also not a common entrepreneurial activity of small
scale fish farmers in Central Java. According to the results of the survey as given in
Table 6.26, only 3% (12 respondents) answered “yes” to having implemented this
activity.

170
Table 6.27 shows that of all six entrepreneurial activities, 83.2% of the respondents
have implemented at least one activity. The rest of the respondents (5.8%) answered
“none of the above” which suggested that they either had not implemented any
entrepreneurial activities or had implemented other activities.
Table 6.27 also shows that some small scale fish farmers had implemented
entrepreneurial activities that have not been identified in this study. This represented
nearly 11% of the sample who had implemented “other” entrepreneurial activities.
Table 6.27 Frequency and percentage of answer option
Answer option Frequency Percentage
Implement entrepreneurial activity 414 83.2
“None of the above” 29 5.8
“Others” 55 11
Source: Survey on the factors influencing entrepreneurial activities of small scale fish farmer in deriving income improvement and product sustainability in Central Java, Indonesia.
6.6 Comparison between fish farmers with different demographic background in entrepreneurial activities implementation
The comparison between fish farmers with different demographic background in
implementing entrepreneurial activity were examined by comparing different
demographic classification of fish farmers such as awardees and non awardees, male
and female, different age groups, different education level, different level of fish farmer
group, different marital statuses, and different reasons for becoming fish farmers.
6.6.1 Comparing awardees and non awardees
The first demographic characteristic to be compared was the awardees and non
awardees category. The awardees were fish farmers who belonged to fish farmer
groups (FFGs) that have received government awards in the last five years,
whereas the non awardees were fish farmers who belonged to FFGs that had not
received government awards in the last five years.
Table 6.28 shows a frequency table of awardees and non-awardees respondents.
It shows that 90 respondents who had participated in this research were
awardees and 310 were non-awardees.
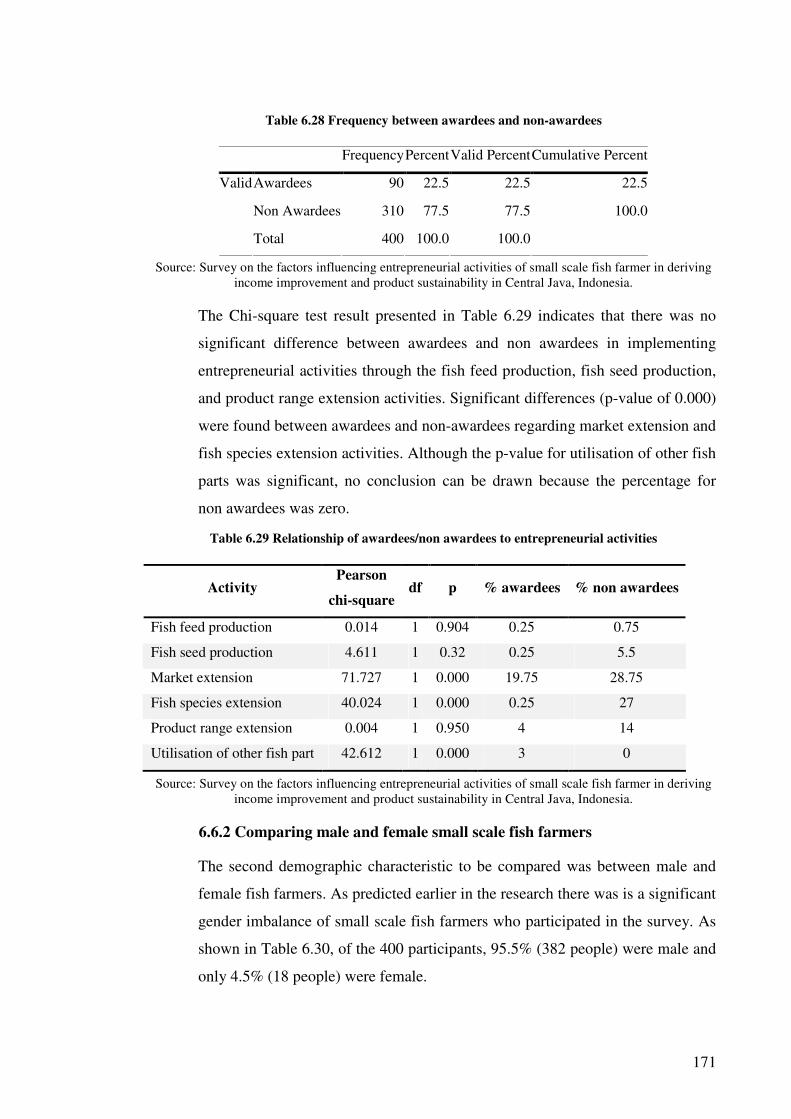
171
Table 6.28 Frequency between awardees and non-awardees
Frequency Percent Valid Percent Cumulative Percent
Awardees 90 22.5 22.5 22.5
Non Awardees 310 77.5 77.5 100.0
Valid
Total 400 100.0 100.0
Source: Survey on the factors influencing entrepreneurial activities of small scale fish farmer in deriving income improvement and product sustainability in Central Java, Indonesia.
The Chi-square test result presented in Table 6.29 indicates that there was no
significant difference between awardees and non awardees in implementing
entrepreneurial activities through the fish feed production, fish seed production,
and product range extension activities. Significant differences (p-value of 0.000)
were found between awardees and non-awardees regarding market extension and
fish species extension activities. Although the p-value for utilisation of other fish
parts was significant, no conclusion can be drawn because the percentage for
non awardees was zero.
Table 6.29 Relationship of awardees/non awardees to entrepreneurial activities
Activity Pearson
chi-square df p % awardees % non awardees
Fish feed production 0.014 1 0.904 0.25 0.75
Fish seed production 4.611 1 0.32 0.25 5.5
Market extension 71.727 1 0.000 19.75 28.75
Fish species extension 40.024 1 0.000 0.25 27
Product range extension 0.004 1 0.950 4 14
Utilisation of other fish part 42.612 1 0.000 3 0
Source: Survey on the factors influencing entrepreneurial activities of small scale fish farmer in deriving income improvement and product sustainability in Central Java, Indonesia.
6.6.2 Comparing male and female small scale fish farmers
The second demographic characteristic to be compared was between male and
female fish farmers. As predicted earlier in the research there was is a significant
gender imbalance of small scale fish farmers who participated in the survey. As
shown in Table 6.30, of the 400 participants, 95.5% (382 people) were male and
only 4.5% (18 people) were female.
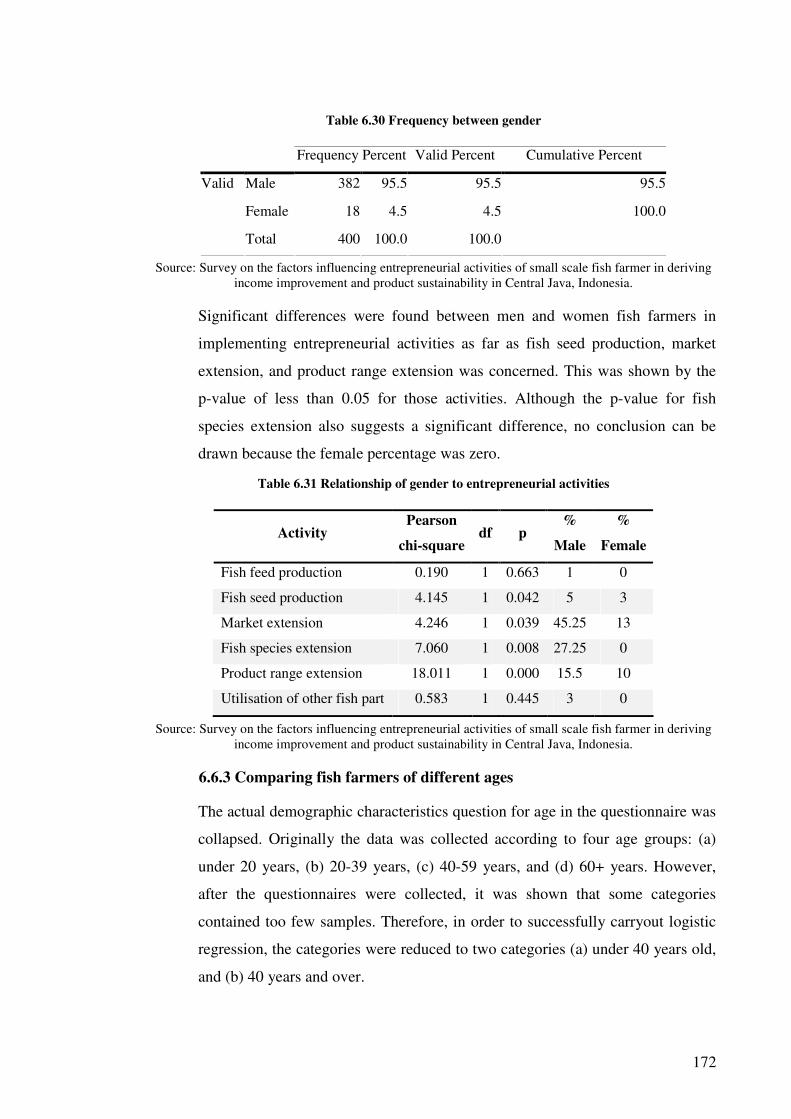
172
Table 6.30 Frequency between gender
Frequency Percent Valid Percent Cumulative Percent
Male 382 95.5 95.5 95.5
Female 18 4.5 4.5 100.0
Valid
Total 400 100.0 100.0
Source: Survey on the factors influencing entrepreneurial activities of small scale fish farmer in deriving income improvement and product sustainability in Central Java, Indonesia.
Significant differences were found between men and women fish farmers in
implementing entrepreneurial activities as far as fish seed production, market
extension, and product range extension was concerned. This was shown by the
p-value of less than 0.05 for those activities. Although the p-value for fish
species extension also suggests a significant difference, no conclusion can be
drawn because the female percentage was zero.
Table 6.31 Relationship of gender to entrepreneurial activities
Activity Pearson
chi-square df p
%
Male
%
Female
Fish feed production 0.190 1 0.663 1 0
Fish seed production 4.145 1 0.042 5 3
Market extension 4.246 1 0.039 45.25 13
Fish species extension 7.060 1 0.008 27.25 0
Product range extension 18.011 1 0.000 15.5 10
Utilisation of other fish part 0.583 1 0.445 3 0
Source: Survey on the factors influencing entrepreneurial activities of small scale fish farmer in deriving income improvement and product sustainability in Central Java, Indonesia.
6.6.3 Comparing fish farmers of different ages
The actual demographic characteristics question for age in the questionnaire was
collapsed. Originally the data was collected according to four age groups: (a)
under 20 years, (b) 20-39 years, (c) 40-59 years, and (d) 60+ years. However,
after the questionnaires were collected, it was shown that some categories
contained too few samples. Therefore, in order to successfully carryout logistic
regression, the categories were reduced to two categories (a) under 40 years old,
and (b) 40 years and over.

173
The frequency results in Table 6.32 show an evenly balanced number of small
scale fish farmers under 40 and over 40 years old who participate in the survey.
There were 170 participants (42.5%) who were under 40 years and 230
participants (57.5%) aged over 40 years.
Table 6.32 Frequency between ages
Frequency Percent Valid Percent Cumulative Percent
Under 40 170 42.5 42.5 42.5
40 or more 230 57.5 57.5 100.0
Valid
Total 400 100.0 100.0
Source: Survey on the factors influencing entrepreneurial activities of small scale fish farmer in deriving income improvement and product sustainability in Central Java, Indonesia.
The p-values in Table 6.33 show that significant differences in implementing
entrepreneurial activities were found between different fish farmers of different
ages in terms of the fish species extension, and product range extension
entrepreneurial activities.
Table 6.33 Relationship of age to entrepreneurial activities
Activity Pearson
chi-square df p
%
Under 40
%
40 or more
Fish feed production 5.466 1 0.019 1 0
Fish seed production 1.963 1 0.161 3.25 2.5
Market extension 0.811 1 0.368 19 29
Fish species extension 17.997 1 0.000 16.25 11
Product range extension 10.657 1 0.001 10.75 7.25
Utilisation of other fish part 0.425 1 0.514 1 2
Source: Survey on the factors influencing entrepreneurial activities of small scale fish farmer in deriving income improvement and product sustainability in Central Java, Indonesia.
6.6.4 Comparing fish farmers of different marital status
The actual demographic characteristics question for marital status in the
questionnaire was collapsed into two categories. Originally there were three
marital status options: (a) single, (b) married, and (c) divorced. However, after
the questionnaires were collected, it showed that the “single” and “divorced”
categories had too small sample sizes. Therefore, in order to successfully

174
carryout logistic regression, these two categories (single and divorced) were
collapsed into one category: single.
The marital status of small scale fish farmers in Central Java who participated in
the survey was predominantly married fish farmers. The results shown in Table
6.34 illustrate the marital condition of participants. Three hundred and fifty six
participants (89%) were married, and only 44 (11%) were single.
Table 6.34 Frequency of marital status
Frequency Percent Valid Percent Cumulative Percent
Valid Single 44 11.0 11.0 11.0
Married 356 89.0 89.0 100.0
Total 400 100.0 100.0
Source: Survey on the factors influencing entrepreneurial activities of small scale fish farmer in deriving income improvement and product sustainability in Central Java, Indonesia.
The only ssignificant difference in implementing entrepreneurial activities
between fish farmers of different marital status were observed in the fish species
extension activity with a p-value of 0.012.
Table 6.35 Relationship of marital status to entrepreneurial activities
Activity Pearson
chi-square df p
%
Single
%
Married
Fish feed production 0.499 1 0.480 0 1
Fish seed production 3.016 1 0.082 0 5.75
Market extension 0.045 1 0.833 5.5 43
Fish species extension 6.294 1 0.012 1.25 26
Product range extension 0.749 1 0.387 2.5 15.5
Utilisation of other fish part 1.529 1 0.216 0 3
Source: Survey on the factors influencing entrepreneurial activities of small scale fish farmer in deriving income improvement and product sustainability in Central Java, Indonesia.
6.6.5 Comparing fish farmers with different educational levels
The original demographic characteristics question for highest education level
achieved in the questionnaire provided five selection options: (a) University
Graduate, (b) Completed High School, (c) Completed Primary School, (d) Did
not complete primary school, and (e) Never went to school. However, after the
questionnaires were collected and analysed, it was shown that some categories

175
had too small sample sizes to successfully carryout logistic regression. Therefore
the categories were reduced into two categories (a) completed high school, and
(b) did not complete high school.
Table 6.36 shows the frequency results of highest education, comparing the
small scale fish farmers who have completed high school and those who had not
completed high school. Two hundred and forty participants (60%) had
completed high school while 160 participants (40%) had not completed high
school.
Table 6.36 Frequency between highest education
Frequency Percent
Valid
Percent
Cumulative
Percent
Completed high school 240 60.0 60.0 60.0
Did not completed high
school 160 40.0 40.0 100.0
Valid
Total 400 100.0 100.0
Source: Survey on the factors influencing entrepreneurial activities of small scale fish farmer in deriving income improvement and product sustainability in Central Java, Indonesia.
From Table 6.37 it can be observed that the different education level of fish
farmers have an influence on the implementation of entrepreneurial activities.
Such influence was found in almost every activity: fish seed production, market
extension, fish species extension, and product range extension. Fish feed
production and utilisation of other fish parts also showed a significant p-value,
however, since there were no participants in either of these categories for those
two activities, the significant effect is not valid.

176
Table 6.37 Relationship of education level to entrepreneurial activities
Activity Pearson
chi-square df p
%
Completed
%
Not completed
Fish feed production 6.061 1 0.014 1 0
Fish seed production 26.764 1 0.000 5.25 0.5
Market extension 8.890 1 0.003 15.75 32.75
Fish species extension 8.079 1 0.004 14 13.25
Product range extension 6.778 1 0.009 4.75 13.25
Utilisation of other fish part 8.247 1 0.004 0 3
Source: Survey on the factors influencing entrepreneurial activities of small scale fish farmer in deriving income improvement and product sustainability in Central Java, Indonesia.
6.6.6 Comparing different fish farmer groups (FFGs)
The original demographic characteristics question for different fish farming
groups in the questionnaire was also reduced. Previously there were four levels
of fish farming group options to select: (a) starter, (b) secondary, (c) tertiary, and
(d) advanced. However, after the questionnaires were collected, and the
descriptive analysis was carried out to observe the frequencies, it was found that
these categories had very small sample sizes. Therefore, in order to successfully
carryout logistic regression, the categories were reduced to two categories:
starter and advanced.
Table 6.38 shows the frequency statistics of fish farmer groups divided into the
two groups: starter and advance. The result show that of the 400 respondents,
42.4% came from starter fish farmer groups while 57.6% came from advanced
fish farmer groups.
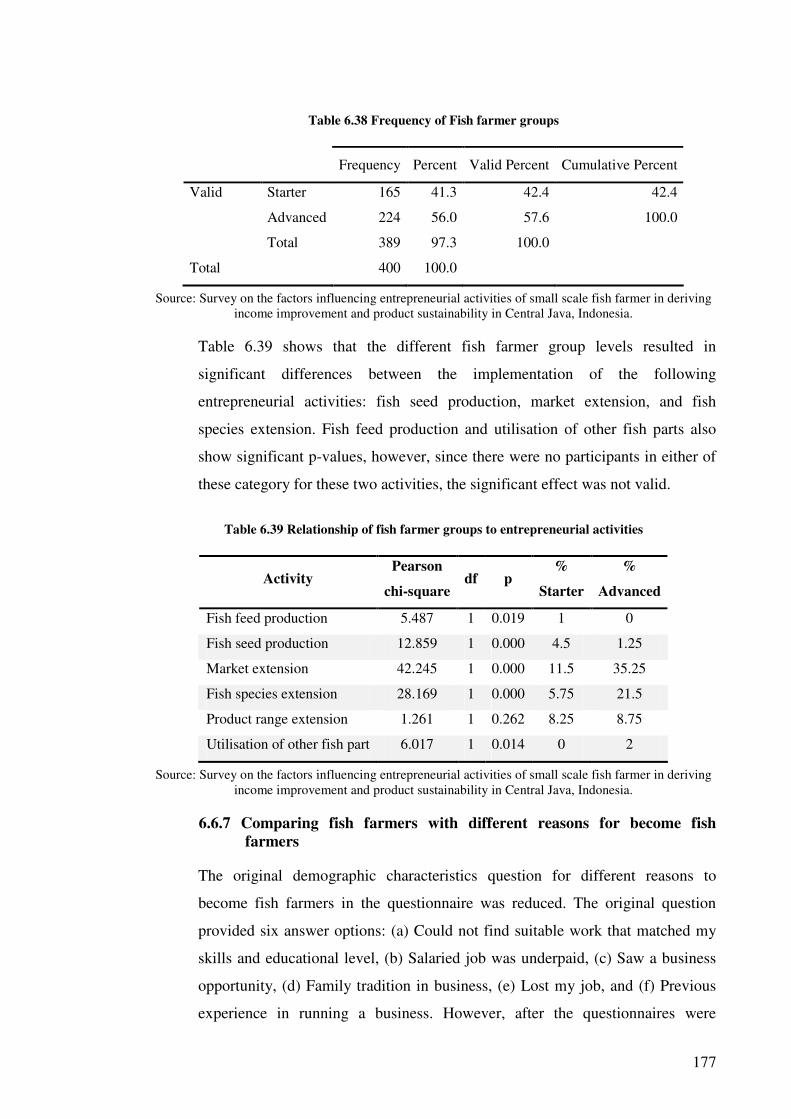
177
Table 6.38 Frequency of Fish farmer groups
Frequency Percent Valid Percent Cumulative Percent
Valid Starter 165 41.3 42.4 42.4
Advanced 224 56.0 57.6 100.0
Total 389 97.3 100.0
Total 400 100.0
Source: Survey on the factors influencing entrepreneurial activities of small scale fish farmer in deriving income improvement and product sustainability in Central Java, Indonesia.
Table 6.39 shows that the different fish farmer group levels resulted in
significant differences between the implementation of the following
entrepreneurial activities: fish seed production, market extension, and fish
species extension. Fish feed production and utilisation of other fish parts also
show significant p-values, however, since there were no participants in either of
these category for these two activities, the significant effect was not valid.
Table 6.39 Relationship of fish farmer groups to entrepreneurial activities
Activity Pearson
chi-square df p
%
Starter
%
Advanced
Fish feed production 5.487 1 0.019 1 0
Fish seed production 12.859 1 0.000 4.5 1.25
Market extension 42.245 1 0.000 11.5 35.25
Fish species extension 28.169 1 0.000 5.75 21.5
Product range extension 1.261 1 0.262 8.25 8.75
Utilisation of other fish part 6.017 1 0.014 0 2
Source: Survey on the factors influencing entrepreneurial activities of small scale fish farmer in deriving income improvement and product sustainability in Central Java, Indonesia.
6.6.7 Comparing fish farmers with different reasons for become fish farmers
The original demographic characteristics question for different reasons to
become fish farmers in the questionnaire was reduced. The original question
provided six answer options: (a) Could not find suitable work that matched my
skills and educational level, (b) Salaried job was underpaid, (c) Saw a business
opportunity, (d) Family tradition in business, (e) Lost my job, and (f) Previous
experience in running a business. However, after the questionnaires were

178
collected, and the descriptive frequency analysis was carried out, it was evident
that some categories had very small sample sizes. Therefore, in order to
successfully carryout logistic regression, the categories were reduced to two
categories: (a) push factor, and (b) pull factor. Three of the original categories
were collapse into the push factor: (a) Could not find suitable work that matched
my skills and educational level, (b) Salaried job was underpaid, and (e) Lost my
job. Three categories were also collapsed into the pull factor: (c) Saw a business
opportunity, (d) Family tradition in business, and (f) Previous experience in
running a business.
The reasons for becoming fish farmers were divided into push factor and pull
factor. Table 6.40 shows that 211 respondents (52.8%) selected push factors as
their reason for becoming fish farmers, and 189 respondents (47.3%) selected
pull factors as their reasons.
Table 6.40 Frequency in reason to become fish farmers
Frequency Percent Valid Percent Cumulative Percent
Push factor 211 52.8 52.8 52.8
Pull factor 189 47.3 47.3 100.0
Valid
Total 400 100.0 100.0
Source: Survey on the factors influencing entrepreneurial activities of small scale fish farmer in deriving income improvement and product sustainability in Central Java, Indonesia.
The result of the chi-square test in Table 6.41 shows that the different reasons
(pull factor or push factor) to become fish farmer had significant effect for the
implementation of the following entrepreneurial activities: market extension and
fish species extension. Fish feed production and utilisation of other fish parts
also show significant p-values (0.034 and 0.001 respectively); however, since
there were no participants in either of these categories for these two activities,
the significant effects were not valid.

179
Table 6.41 Relationship of reasons to become fish farmer to entrepreneurial activities
Activity Pearson
chi-square df p
%
Push factor
%
Pull factor
Fish feed production 4.511 1 0.034 0 1
Fish seed production 3.161 1 0.075 0 5.75
Market extension 5.160 1 0.023 5.5 43
Fish species extension 41.104 1 0.000 0.5 26.75
Product range extension 1.098 1 0.295 5.5 12.5
Utilisation of other fish part 11.081 1 0.001 3 0
Source: Survey on the factors influencing entrepreneurial activities of small scale fish farmer in deriving income improvement and product sustainability in Central Java, Indonesia.
Table 6.42 summarises the significant results of the different fish farmers groups
that effected the implementation of entrepreneurial activities. The most
significant effect was found for the different education levels with four
entrepreneurial activities. This suggested that fish farmers who had completed
high school and those who had not completed high school differed significantly
in their implementation of entrepreneurial activities.

180
Table 6.42 Summary of significant effect of implemented entrepreneurial activities between different groups of fish farmer community
Activity Between
awardees
and non
awardees
Between
gender
Between
ages
Between
marital
statuses
Between
education
level
Between
level of
FFGs
Between
different
reasons
Fish feed
production
Fish seed
production
** ** **
Market
extension
** ** ** ** **
Fish
species
extension
** ** ** ** ** **
Product
range
extension
** ** **
Utilisation
of other
fish part
** Significant effect
Source: Survey on the factors influencing entrepreneurial activities of small scale fish farmer in deriving income improvement and product sustainability in Central Java, Indonesia.
The groups with the second most significant effect for entrepreneurial activities
was between different level of FFGs (starter and advanced) and for different fish
farmer gender. This suggested that differences in FFG level and gender also
significantly affected the way fish farmers implemented entrepreneurial
activities.
The other groups of fish farmers community (awardees/non awardees, different
age groups, different marital status, and different reasons) have a slight
significant affects for implementation of entrepreneurial activities since they
only resulted in one or two entrepreneurial activities that showed significant
differences.

181
6.7 Conclusion
The primary analysis of the research comprised of binary logistic regression, descriptive
analysis, and chi-square test. The binary logistic regression analysis included factors
that influenced income improvement and product sustainability. The results showed that
factors which correlated positively with income improvement were endogenous factors,
constraints, and problems. Factors that correlated positively with product sustainability
were endogenous factors, exogenous factors, constraints, and problems.
The descriptive analysis concluded that the highest frequencies of entrepreneurial
activities carried out by small scale fish farmers in Central Java were market extension,
followed by fish species extension, and product range extension (adding value to fish
product).
The Chi-square test results showed that all compared fish farmers of different
demographic background were significantly different in carrying out entrepreneurial
activities. However, fish farmers with different education level have the highest number
of significant effect in entrepreneurial activities implementation, followed by fish
farmers of different FFG level, and fish farmers of different gender. The other groups of
fish farmers (awardees/non awardees, different age groups, different marital status, and
different reasons) showed a slight significant affects with only one or two
entrepreneurial activities that showed significant differences.

182
Chapter 7
Discussion
7.1 Introduction
This research focused on factors that influenced small scale fish farmers’ activities in
their attempt to derive income improvement and ensure their product sustainability. As
described in the methodology chapter, a questionnaire was developed for this research
and was distributed to small scale fish farmers at designated regions in Central Java.
The completed questionnaires were collected at an agreed date.
Four hundred completed questionnaires were collected from two rounds of distribution.
Only fully completed questionnaires were retained. Chapters 5 and 6 presented the
analyses of the data obtained from the questionnaires and this chapter discusses the
results of the analyses. The discussion is divided into the following sections:
1. Demographic characteristics of the respondents.
2. Endogenous and exogenous factors that influenced income improvement.
3. Endogenous and exogenous factors that influenced product sustainability.
4. Constraints and problems that influenced income improvement.
5. Constraints and problems that influenced product sustainability.
6. Implemented entrepreneurial activities by small scale fish farmers in Central
Java.
7. Compare the entrepreneurial activities implementation of small scale fish
farmers with different demographic background.
7.2 Demographic characteristics of the respondents
The discussion of demographic characteristics of the research respondents is divided
into two sections: the personal characteristics and the business characteristics.
183
7.2.1 Respondents’ Personal Characteristics
The following discussion about the personal characteristics of the respondents
comprises the aspects: age range, gender, marital status, number of children and
highest education.
Age Range
According to Table 4.2 the research sample contained more awardee than non
awardee respondents. Most of the respondents were in the 40-59 years age
range. This finding is supported by previous research that found that the average
age for starting self-employment was around 40 years old and older (Cowling &
Taylor 2001; Matthews & Moser 1996; Robinson & Sexton 1994). The reason
given for why most people start self employment at an older age was that at an
older age people were believed to have enough experience and more confidence
to step into a riskier situation. Devine (1994) also mentioned that it took time for
entrepreneurial interest to develop. As people get older, they will be more
experienced, have more knowledge, greater networks, and more confidence
about taking on a business opportunity. The more they understood about self
employment, the more interested they were in becoming self employed.
Gender
Table 4.3 showed that respondents for this research were predominantly men.
There were only 18 women in contrast to 292 men who responded to the
questionnaires. This finding was as previously predicted: that the majority of
small scale fish farmers in Central Java were men. This result is aligned with
previous research that found that fish farming was considered as a man’s job
since it involved physical work (Mbozi 1991). In a fish farming business, heavy
physical work may include harvesting, pond cleaning and manuring. This
condition as stated by Mbozi was also applicable in Central Java as shown by
the number of men in fish farming businesses. This finding was also in
accordance with the finding by Matthews and Moser (1996) and Cowling and
Harding (2001) who observed that men were more likely to have higher
entrepreneurial skills and be more interested in owning their own businesses
than women.

184
Marital Status
Table 4.4 showed that the majority of the respondents were married (356
respondents) while only 44 respondents were single (either divorced or never
married). This result was supported by previous research. According to Cowling
and Harding (2001) and Robinson and Sexton (1994), marital status was
associated with higher probability of being self-employment. Moreover,
Robinson and Sexton (1994) found that being single, divorced or widowed was
associated with a lower probability of being self employment. It was supposed
that being married and having children meant having more responsibility for
balancing work and family life. Furthermore, people with family decided to
become self employed for different reasons: men tended to be self employed to
be financially more stable, whereas women chose to become self employed to
obtain working hour flexibility allowing them to be with their children more
often (Robinson & Sexton 1994).
Number of Children
According to Table 4.5, the majority of the respondents had two or more
children (299 respondents) while 101 respondents either had one or no children.
Children have a large impact on entrepreneurs (Robinson & Sexton 1994).
Nevertheless, the affects are different for men and women. Children were found
to have a positive effect for men, but a negative effect for women. Male
entrepreneurs with children tended to have more financially stable conditions
and were able to increase their earnings, while children disrupted women’s
careers and tended to decrease their income (Robinson & Sexton 1994).
Highest Education
More than half of the respondents were high school graduates (see Table 4.6).
Only seven respondents were university graduates while the other respondents
(160) had not completed high school. In Indonesia, where there is no free
education, people struggle to send their children to school. And, even when
children attend public schools, parents still have to pay for uniforms, school
fees, books, stationary, and other school related expenses. This is why school
related fees are one of the top priorities on low income parents’ expenditure list
after health and food.

185
Every parent aspires to help their children achieve the highest education
possible. In spite of their aspirations, many small scale fish farmers can only
support their children to a high school education. College or university costs are
considered very high and only the people with higher incomes can afford to pay
for tertiary education for their children. This could explain the low number of
university qualified respondents of this research. Approximately forty per cent
of the respondents did not complete high school. This result can also be
explained with the above discussion about the high cost of education in
Indonesia, including for public school.
7.2.2 Respondents’ Business Characteristics
The following discussion about the business characteristics of the respondents
comprises the aspects: their fish farming group classes, income, land size and
number of employees.
Respondent’s Fish Farmer Group (FFG) level
According to Table 6.38, most of the respondents in this research were members
of FFGs of advanced level (57.6%). There were four levels of FFGs in Central
Java: starter (level one), secondary (level two), tertiary (level three) and
advanced (level four). All four levels were provided as selection options on the
questionnaire but the frequency analysis revealed that some categories had very
low sample counts. Therefore, in order to carry out the logistic regression
analysis, the four categories of FFGs were collapsed into two: starter level and
advanced level. The starter level included the level one and level two FFGs,
while the advanced level consisted of the level three and four FFGs.
The FFG levels were assessed according to their members’ abilities to conform
to ten evaluation criteria developed by the Fisheries and Marine Affairs Office.
The ten evaluation criteria were used to assess the FFGs’ creativity,
productivity, mutual unity, cooperation and self improvement. Government
officials used these evaluation criteria to annually evaluate FFGs and to upgrade
or downgrade the FFGs’ levels depending on the results.
Since the majority of respondents in this research belonged to an advanced FFG
it meant that most respondents were members of either a level three or a level

186
four FFG. According to the evaluation criteria an advanced FFG should have a
higher ability to manage and develop their business than a starter FFG. This
ability to manage and develop their business may include the ability to carry out
entrepreneurial activities since the evaluation criteria include the following
performance criteria: (a) the ability to search and use information and (b) the
ability to plan activities which can increase their productivity. This indicated that
being entrepreneurial is part of the evaluation where the majority of fish farmers
were evaluated as being able to search and use any information obtained to
increase their productivity.
Respondent’s annual income
According to Table 6.1, over 80 per cent of the respondents had an annual
income below Rp 50 million, and only 19.2% had an annual income over Rp 50
million. Having an income of Rp 50 million per year (approximately Rp 4
million per month) was approximately equivalent to earning A$ 520.00 per
month. From this the household expenses, school fees, health related expenses
and other family related expenses had to be paid. In addition, the operational
costs of the fish farming business also needed to be paid. This made it difficult
for fish farmer to decide how to allocate their income between their home and
business expenses. The situation was made more difficult when members of the
family were sick or children needed new school uniforms or books. Fish farmers
had to carefully balance their priorities so that home and business expenses
could be met.
It was previously predicted that the majority of the respondents would have an
annual income under Rp 50 million which accorded with the findings of this
research. This prediction was based on the fact that most fish farmers in central
Java are small scale and only utilised their back yards for their fish ponds. In this
way they were able to maximise the use of their land and so earn an income.
Respondent’s Land size
Table 4.9 showed that the majority of respondents reported having land size of
less than two hectares. Only 53 respondents reported having land size of 2-5
hectares, and only five respondents reported having between 5-10 hectares of

187
land. Most of small scale fish farmers utilised their backyards as their fish
farming business area. In spite of having small land area, many fish farmers
were still able to achieve income improvement. A well known example in
Central Java is the fish farmers from the “catfish village”. Approximately 105
fish farmers in this village only cultivate catfish using 20 hectares of pond to
produce between seven and ten tons of catfish per day (Boyolali Animal
Husbandry and Fisheries Office 2007). These fish farmers belonged to the
“Karya Mina Utama” FFG and became the first fish farming group winner in
their region and in Central Java. Karya Mina Utama is an excellent example of a
FFG in Central Java that had rapidly expanded their products and turned their
village into the largest catfish producer in Central Java. Their ability to achieve
income improvement was demonstrably visible in their increasing ability to
afford new cars and homes improvements (Suara Merdeka 2007c).
Respondent’s Number of Employees
The majority of respondents reported having only up to two employees. Most of
the fish farmers in Indonesia employed family members to assist them in
managing the fish ponds. Not many small scale fish farmers employed paid
workers because it entailed paying salaries which they cannot afford.
7.3 Endogenous and exogenous factors that influenced income improvement
The literature review chapter used the research from Bouchiki (1993) to explain that
there were endogenous and exogenous factors that influenced business outcomes.
Fourteen endogenous and exogenous factors were identified, however, after performing
an Exploratory Factor Analys (EFA) some of these factors were removed in order to
obtain a simpler structure of the endogenous and exogenous factors.
7.3.1 Results of Exploratory Factor Analysis (EFA) for endogenous and exogenous factors that influenced income improvement
The EFA for factors that influenced income improvement classified the factors
into two groups: endogenous and exogenous factors. This was aligned with
research literature that suggested that two groups of factors influenced business
outcomes (Bouchiki 1993). Figure 7.1 shows the result of the factor analysis for
endogenous and exogenous factors that influenced income improvement.

188
Source: Survey on the factors influencing entrepreneurial activities of small scale fish farmer in deriving income improvement and product sustainability in Central Java, Indonesia
According to the literature review (see Chapter 2), there were 14 endogenous
and exogenous factors that influenced income improvement. After conducting
the EFA (see Chapter 5) the factors were classified into six endogenous factors
and six exogenous factors. The six endogenous factors that influenced income
improvement were: aquaculture knowledge, aquaculture skills, length of
aquaculture experiences, aquaculture education, personal business experience
and family business background. The factor analysis also identify six exogenous
factors: density of business network, start up financial capital, market demand,
infrastructure in the area of operation, government or other institution support,
and family support. The factor analysis suggested that the factors entrepreneurial
characteristics or personality and reason for going into business could be
excluded as factors.
Question 65 of the questionnaire provided the data for the endogenous and
exogenous factors that influence income improvement. The question was: “To
what extent do you agree the following factors influence income improvement
for your business?”. Answers were provided on a Likert scale coded from 1
(Strongly disagree) to 6 (Strongly agree). The purpose of this question was to
Exploratory Factor
Analysis
Endogenous factors that influence income improvement
1. Quantum of knowledge 2. Mastery of fish farming skills 3. Length of experience 4. Level of education 5. Personal business experience 6. Family business experience
Exogenous factors that influence income improvement
1. Density of business network 2. Start up financial capital 3. Market demand 4. Infrastructure in the area of
operation 5. Gov./other institution support 6. Family support
Endogenous and exogenous factors 1. Quantum of knowledge 2. Mastery of fish farming skills 3. Length of experience 4. Level of education 5. Entrepreneurial characteristics /
personality 6. Reasons for going into business 7. Personal business experience 8. Family business experience 9. Density of business network 10. Start up financial capital 11. Family support 12. Market demand 13. Infrastructure in the area of
operation 14. Government/other institution
support
Figure 7.1 Result of data reduction for endogenous and exogenous factors that influenced income improvement
189
find out how small scale fish farmers saw the endogenous and exogenous factors
affecting their business in their attempt to improve income.
It has been explained previously that Bouchiki (1993) classified factors that
influenced entrepreneurial process outcomes into two types: endogenous and
exogenous factors. Endogenous factors arise from within the individual and
exogenous factors are external to the person. On the other hand, Morris and
Lewis (1995) believed that three dimensions influenced the level of
entrepreneurship: environmental infrastructure, environmental turbulence and
personal life experience. It has been assumed that the environmental
infrastructure mentioned by Morris and Lewis is similar to the exogenous factors
of this research. Exogenous factors therefore consist of economic, political,
legal, financial, logistical and social structures. Hence personal life experience is
assumed to be the same as endogenous factors and consisting of family,
educational, peer group and work experiences.
These different perceptions of viewing a variable imply that an endogenous
factor can also be viewed as exogenous factor and vice versa. Start up financial
capital was classified as exogenous even though it was previously predicted to
be an endogenous factor. Based on the definition of endogenous and exogenous
factors by Bouchiki (1993), financial capital was a part of individual strength
(endogenous factor). However, based on Morris and Lewis (1995), financial
capital was classified into environmental infrastructure (exogenous factor). The
EFA classified financial capital as an exogenous factor, suggesting that it could
be viewed as a resource needing to be obtained from several external sources,
for example banks, cooperatives, neighbours or families. While financial capital
could be viewed as an endogenous as well as exogenous factor, for factors that
influenced income improvement in this research, financial capital was viewed as
an exogenous factor.
7.3.2 Results of Binary Logistic Regression Analysis for endogenous and exogenous factors that influenced income improvement
The results from the binary logistic regression analysis showed that only
endogenous factors had an influence on income improvement while exogenous
factors had no positive correlation with income improvement. The negative
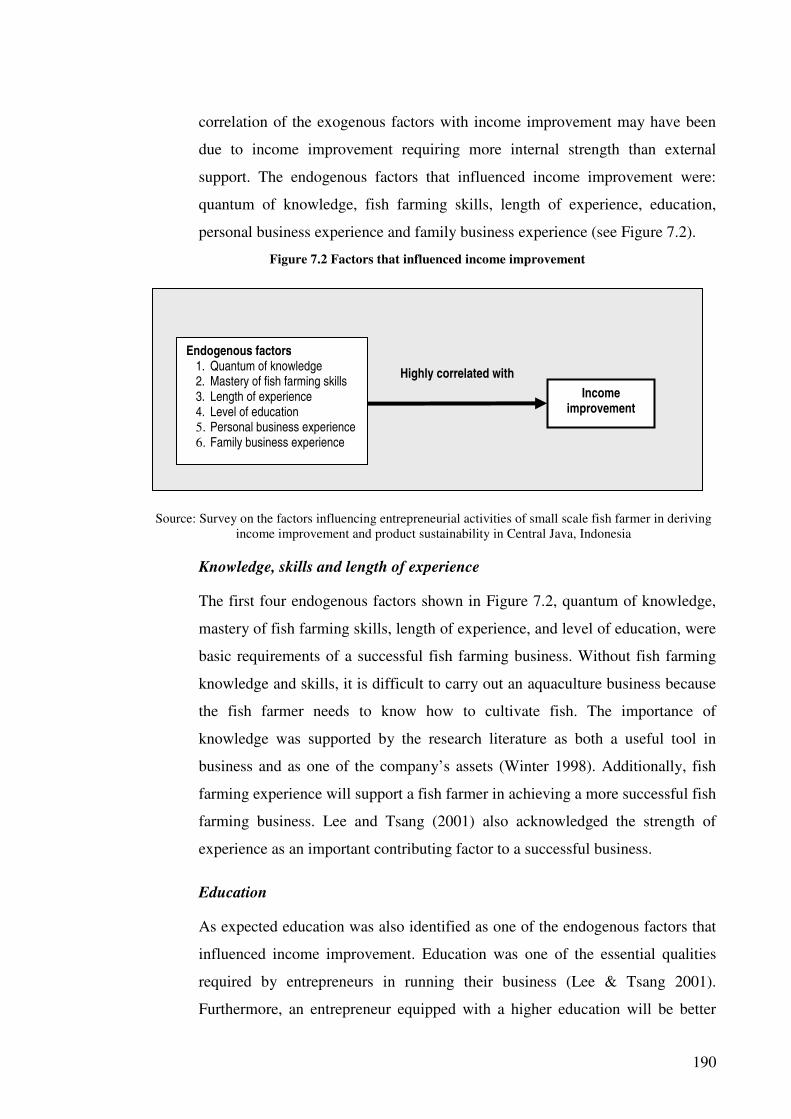
190
correlation of the exogenous factors with income improvement may have been
due to income improvement requiring more internal strength than external
support. The endogenous factors that influenced income improvement were:
quantum of knowledge, fish farming skills, length of experience, education,
personal business experience and family business experience (see Figure 7.2).
Source: Survey on the factors influencing entrepreneurial activities of small scale fish farmer in deriving income improvement and product sustainability in Central Java, Indonesia
Knowledge, skills and length of experience
The first four endogenous factors shown in Figure 7.2, quantum of knowledge,
mastery of fish farming skills, length of experience, and level of education, were
basic requirements of a successful fish farming business. Without fish farming
knowledge and skills, it is difficult to carry out an aquaculture business because
the fish farmer needs to know how to cultivate fish. The importance of
knowledge was supported by the research literature as both a useful tool in
business and as one of the company’s assets (Winter 1998). Additionally, fish
farming experience will support a fish farmer in achieving a more successful fish
farming business. Lee and Tsang (2001) also acknowledged the strength of
experience as an important contributing factor to a successful business.
Education
As expected education was also identified as one of the endogenous factors that
influenced income improvement. Education was one of the essential qualities
required by entrepreneurs in running their business (Lee & Tsang 2001).
Furthermore, an entrepreneur equipped with a higher education will be better
Endogenous factors 1. Quantum of knowledge 2. Mastery of fish farming skills 3. Length of experience 4. Level of education 5. Personal business experience 6. Family business experience
Highly correlated with
Income improvement
Figure 7.2 Factors that influenced income improvement

191
prepared to face unexpected obstacles since they have more skills to face and
resolve problems. Therefore, fish farmers with higher educational levels will be
more aware of the risks they face and the problems that may arise, including
financial situations and seeking ways to improve their income.
Personal business experience
The length of personal business experience may also assist fish farmers in
managing their business. Lee and Tsang (2001) suggested that business
experience prior to starting an own business is better than no experience since
business experience prepared a person for unexpected downturns in business and
being able to handle downturns more professionally.
Family business experience
Family business background plays a large role in determining the success of an
entrepreneur. It has been observed that entrepreneurs with family business
experience were more prepared to face unexpected circumstances that occurred
within their business (Morrisson 2000).
7.4 Endogenous and exogenous factors that influenced product sustainability
As was previously explained, fourteen endogenous and exogenous factors that
influenced business outcomes have been identified from the literature review. As
described in section 7.3, the exploratory factor analysis categorised these factors into
two groups: endogenous and exogenous factors. This finding agreed with the literature
which found that there were two groups of factors that influenced business outcomes
(Bouchiki 1993). The results of the exploratory factor analysis were then further
analysed using binary logistic regression analysis to establish the factor groups that had
positive correlation with the product sustainability activities.
7.4.1 Results of Exploratory Factor Analysis (EFA) of endogenous and exogenous factors that influenced product sustainability
The exploratory factor analysis classified the fourteen identified endogenous and
exogenous factors into two groups. It was established that nine endogenous
factors and three exogenous factors influenced product sustainability.

192
The endogenous factors that influenced product sustainability were: knowledge,
skills, education, entrepreneurial characteristics, reason for going into business,
personal business experience, family business experience, family support and
infrastructure in the area of operation. The exogenous factors that influenced
product sustainability were: density of business network, financial capital and
government or other institution support. Figure 7.3 presents the result of the
factor analyses for endogenous and exogenous factors that influenced product
sustainability.
The Exploratory Factor Analysis for endogenous and exogenous factors that
influenced product sustainability therefore excluded length of experience and
market demand from the factors. However, two factors that were previously
predicted to be exogenous factors were classified as endogenous factors: family
support and infrastructure in the area of operation.
Source: Survey on the factors influencing entrepreneurial activities of small scale fish farmer in deriving income improvement and product sustainability in Central Java, Indonesia
Endogenous factors that influenced product sustainability
1. Quantum of knowledge 2. Mastery of fish farming skills 3. Level of education 4. Entrepreneurial characteristics /
personality 5. Reasons for going into business 6. Personal business experience 7. Family business experience 8. Family support 9. Infrastructure in the area of
operation
Exogenous factors that influenced product sustainability 1. Density of business network 2. Start up financial capital 3. Gov./other institution support
Exploratory Factor
Analysis
Endogenous and exogenous factors 1. Quantum of knowledge 2. Mastery of fish farming skills 3. Length of experience 4. Level of education 5. Entrepreneurial characteristics /
personality 6. Reasons for going into business 7. Personal business experience 8. Family business experience 9. Density of business network 10. Start up financial capital 11. Family support 12. Market demand 13. Infrastructure in the area of operation 14. Government/other institution support
Figure 7.3 Result of data reduction for endogenous and exogenous factors that influenced product sustainability
193
The family support factor was predicted to be exogenous, since it was seen as
coming from outside the individual. However, the exploratory factor analysis
suggested otherwise since the definitions of endogenous and exogenous were
dependent on one’s viewpoint. Bouchiki (1993) defined endogenous factors as
factors arising from within the individual and exogenous factors were factors
arising externally to the person. Morris and Lewis (1995) on the other hand
found that three dimensions influenced the level of entrepreneurship:
environmental infrastructure, environmental turbulence and personal life
experience. In this research it was taken that the meaning of environmental
infrastructure by Morris and Lewis was similar to the exogenous factors as
meant by Bouchiki, while personal life experience was similar to endogenous
factors. According to Morris and Lewis (1995), family experience was included
in the personal life experience or endogenous factor category. Their view was
that endogenous factors were not only limited to the individual’s possessions
(knowledge, skills, experience, etc.) but also to how the individual was raised
and the closest people who significantly influenced their way of thinking and
their behaviour (in this case, family business experience).
The infrastructure in area of operation factor was also classified as one of the
endogenous factors that influenced product sustainability even though it was
previously predicted to be an exogenous factor. The explanation for this is
similar to the description of family support above. The exact definitions of
endogenous and exogenous factors were unclear and depend on how the
endogenous and exogenous factors were viewed. Bouchiki (1993) defined the
endogenous and exogenous factors from the perspective that endogenous is
strength from within the person and exogenous is support from outside the
person. Porta and Ona (2006) on the other hand, took a wider perspective on
endogenous and exogenous, defining endogenous as the strength possessed by a
business as a whole (internal assets) and exogenous as support from structures
external to the business. Hence, according to Porta and Ona’s (2006),
endogenous may include all internal assets, not just the individual, but also
family support, family background, including infrastructure that supports the
business. Conversely, exogenous factors may include every other aspect that

194
does not have direct relation to the internal strength of the business, for example
the government, international institutions, networking, and financial institutions.
The startup financial capital factor was also grouped into the exogenous factors
that influenced product sustainability even though it was predicted to be an
endogenous factor. The EFA classified financial capital as an exogenous factor
possibly because in the majority of cases financial capital was obtained from
external sources such as cooperatives, neighbours, families, friends, banks or
money lenders. This classification aligns with Morris and Lewis’ (1995)
definition that financial structure was classified into environmental infrastructure
(exogenous factors).
Question 66 of the questionnaire provided the data for the endogenous and
exogenous factors that influenced product sustainability. The question was: “To
what extent do you agree the following factors influence product sustainability
for your business?”. Answers were provided on a Likert scale coded from 1
(Strongly disagree) to 6 (Strongly agree). The purpose of this question was to
find out how small scale fish farmers saw the endogenous and exogenous factors
affecting their business in the attempt to sustain their product.
7.4.2 Results of Binary Logistic Regression Analysis of endogenous and exogenous factors that influenced product sustainability
The results of the binary logistic regression analysis showed that nine
endogenous factors and three exogenous factors influenced product
sustainability activities. Unlike the results obtained for factors influencing
income improvement, both the endogenous and exogenous factors were found to
have positive correlations with product sustainability activities. Endogenous
factors were found to significantly affect three of the product sustainability
activities: checking water quality, maintaining fish feed quality and availability
and maintaining fish seed quality and availability. The exogenous factors were
observed to only significantly affect one product sustainability activity:
maintaining fish seed quality and availability. Conversely, no significant
correlation was found for both of the endogenous and exogenous factors to the
activity of giving feed at the right quantity and time.

195
The results from the binary logistic regression for the endogenous and
exogenous factors that influenced product sustainability are shown in Figure 7.4.
The endogenous factors that influenced three of the product sustainability
activities were: quantum of knowledge, fish farming skills, education,
entrepreneurial characteristics, reason for being a fish farmer, personal business
experience, family business experience, family support and infrastructure. The
exogenous factors that affected the one product sustainability activity namely
maintain fish seed quality and availability were: density of business network,
financial capital and support from government/other institution.
Source: Survey on the factors influencing entrepreneurial activities of small scale fish farmer in deriving income improvement and product sustainability in Central Java, Indonesia
Quantum of knowledge and skills
The quantum of knowledge was one of the critical factors that influenced
product sustainability. Indonesian fish farmers were yet to become aware of the
importance of sustainable aquaculture. This was one of the challenges faced by
the Indonesian fisheries industry. The implementation of sustainable aquaculture
was not as easy as anticipated because of the large numbers of small scale fish
farmers in Indonesia (Sukadi 2006). Most small scale fish farmers had low
levels of education and hence they had limited knowledge of the importance of
Endogenous factors 1. Quantum of knowledge 2. Mastery of fish farming skills 3. Level of education 4. Entrepreneurial
characteristics / personality 5. Reasons for going into
business 6. Personal business
experience 7. Family business experience 8. Family support 9. Infrastructure in the area of
operation
Check water quality
Exogenous factors 1. Density of business
network 2. Start up financial
capital 3. Gov./other institution
support
Give feed at the right quantity
and time
Maintain fish seed quality
and availability
Maintain fish feed quality
and availability
Figure 7.4 Endogenous and exogenous factors that influenced product sustainability activities

196
applying sustainable aquaculture to their fish farming activities. They also had
limited skills in applying sustainable aquaculture. Many of their current fish
farming activities may not include sustainable fish farming techniques such as
checking water quality on daily basis and maintaining fish feed and fish seed
quality and availability.
Level of education
The level of education also significantly affected product sustainability.
Education was one of the essential qualities in running a business since it
equiped an entrepreneur with the necessary skills and knowledge to face
negative circumstances in their business (Lee & Tsang 2001). This included
having knowledge of the importance of sustainable aquaculture and having
relevant skills in performing sustainable aquaculture practices.
Entrepreneurial characteristics
One of the characteristics that differentiated an entrepreneur from a small
business owner was that entrepreneurs focused on company growth (Carland et
al. 1984). For an entrepreneur to focus on company growth required undertaking
any actions needed to increase the development of the business. One of the
actions to secure their product was implementing sustainable aquaculture.
Reasons for going into business
The reasons given for going into business factor were also found to be related to
product sustainability. There were two reasons for why someone decided to
become an entrepreneur: either because he had no other opportunities and was
forced to be a fish farmer (push factor), or because he was naturally attracted to
the fish farming business (pull factor) (Basu 1998; Watson, Hogarth-Scott &
Wilson 1998). Someone basing their decision on a pull factor was more likely to
experiment with new techniques in order to increase their business performance
than a person who was forced to become a fish farmer. New techniques tried
may include implementing sustainable aquaculture techniques in their fish
farming business.

197
Business experience
Previous business experience (personal and family business experience) was
also found to have significant affect for product sustainability. In the literature
review chapter it was found that business experience had a positive impact for
an existing business. This finding also applied to the implementation of
sustainable aquaculture. Fish farmers with previous fish farming business
experience that used sustainable aquaculture practises were more likely to
implement such practises themself.
Family support
Family members often assisted small scale fish farmers in their businesses. This
included helping them to run the fish ponds, giving feed, and changing water.
For this reason family support was very crucial for running their businesses.
Family support has a strong relation with product sustainability because family
members are the closest people able to help the fish farmers manage their fish
farms and if family members apply sustainable aquaculture practices in their
daily tasks then product sustainability can be achieved.
Infrastructure
A developed infrastructure in the area of operation was critically needed in order
to obtain product sustainability. Without developed infrastructure, it was
difficult for fish farmers to obtain supplies (Islam 2004) or even information on
sustainable aquaculture from the government officers or other related
institutions. Without developed infrastructure, it was also difficult for the
government officers to provide sustainable fish farming training to fish farmers
who were located in inaccessible rural areas.
Density of business network
Business networks were important because it helped to increase business
performance and growth (Havnes & Sanneseth 2001). The greater the density of
the network the more personal contacts the fish farmers had. More contacts also
meant that fish farmers had access to more information about sustainable
aquaculture issues and how to implement them in their fish farming businesses.

198
Start up financial capital
Financial capital was one of the critical constraints faced by small scale fish
farmers (Das 2006). This also applied to small scale fish farmers in their attempt
to achieve product sustainability. In implementing sustainable aquaculture, small
scale fish farmers may need additional funds to obtain tools for sustainable
aquaculture practises. For example they may need water quality measuring
equipment to control the temperature, pH and salinity of the water. Therefore,
financial capital was a factor that strongly influenced small scale fish farmers in
achieving product sustainability.
Government/other institution support
Government played a big role in the success of small scale fish farmers in
implementing sustainable aquaculture. The government acts as a regulator by
developing policies on sustainable aquaculture. The government also monitors
small scale fish farmers’ attempts at implementing sustainable aquaculture. The
Fisheries Act No. 31 (2004) listed environmental sustainability as one of the
objectives of the Indonesian Fisheries Management (Sukadi 2006).
The exogenous factors were shown to have a significant affect on only one
product sustainability activity. This result may be explained by the condition of
limited fish seed stock (Mantau, Rawung & Sudarty 2004) and the fact that not
many fish farmers produced their own fish seed. This explanation was supported
by the results of this research that found that producing own fish feed was not a
common activity among small scale fish farmers in Central Java (see figure 7.1).
Fish farmers ordered their fish seed from hatcheries (Budhiman 2007), some of
which were subsidised by the government (Suara Merdeka 2007a). This result
may conversely be explained by pointing out that other activities such as
checking water quality required the presence of endogenous factors such as
knowledge, skills and experience to be aware of its importance.
The maintaining fish feed quality and availability activity was not affected by
exogenous factors possibly because fish feed were widely available. Therefore,
although fish farmers did not produce their own fish feed, they could still easily
obtain fish feed.
199
The result that endogenous and exogenous factors were influencing three
product sustainability activities: checking water quality, maintaining fish feed
quality and availability and maintaining fish seed quality and availability was
supported by the research of Sukadi (2006). In his paper, Sukadi explained that
few sustainable practices and management techniques were implemented to
preserve the aquaculture environment. The practises included water
management, providing good quality fish seed and fish feed management.
7.5 Constraints and problems that influenced income improvement
Several internal and external obstacles were identified as influencing income
improvement. This research identified 16 internal and external obstacles however the
EFA results indicated that some obstacle variables could be removed to produce a
simpler structure with fewer but more meaningful variables.
In the literature there was not a clear differentiation between what was meant by the
terms constraints and problems. Many authors have used both terms for describing the
same situation. In this research, the terms constraints and problems were specifically
differentiated and were used for describing different situations. According to Askoxford
(2008), a constraint is “a limitation or restriction or stiffness of manner and inhibition”
and a problems is “an unwelcome or harmful matter needing to be dealt with”.
The above definition associates the term constraint with a limitation of a person and
therefore was viewed as an internal restriction. On the other hand, the term problem was
viewed as an external obstruction. Therefore, in this research constraint was approached
as an internal matter and problem as an external issue.
7.5.1 Results of Exploratory Factor Analysis (EFA) for constraints and problems that influenced income improvement
According to the literature review there were sixteen obstructions faced by small
scale fish farmers. Based on the outcomes of the EFA, these common
obstructions were classified into two groups: constraints and problems. The
obstructions were classified into nine constraints and four problems that
influenced income improvement (see Figure 7.5).
According to the EFA results as shown in Figure 7.5, the constraints that
influenced income improvement were: lack of capital, low selling price, low

200
profit, low quality and quantity of fish seed, low quality and quantity of fish
feed, poor financial management skills, poor quality control, poor water quality
and inability to secure a sufficient loan. Figure 7.5 shows that according to the
EFA results the problems that influenced income improvement were: lack of
family support, lack of federal and regional government support, lack of training
and lack of fish farming experience and knowledge. According to the EFA
results the obstacles that were removed because they had less impact on income
improvement were: lack of technical abilities, lack of family support, lack of
potential market and low ability to handle fish disease and parasite as obstacles
that influenced income improvement.
Source: Survey on the factors influencing entrepreneurial activities of small scale fish farmer in deriving income improvement and product sustainability in Central Java, Indonesia
7.5.2 Results of Logistic Regression Analysis for constraints and problems that influenced income improvement
The results from the EFA suggested that there were nine constraints and four
problems that played a role in influencing income improvement. Unlike the
Constraints and problems
1. Lack of startup capital 2. Lack of technical abilities 3. Lack of family support 4. Lack of federal and regional
government support 5. Lack of training 6. Lack of fish farming experience
and knowledge 7. Lack of potential market 8. Low selling price 9. Low profit 10. Low quality and quantity of fish
of fish seed 11. Low quality and quantity of fish
feed 12. Poor financial management
skills 13. Poor quality control 14. Low ability to handle fish
disease and parasite problems 15. Poor water quality 16. Inability to secure a sufficient
loan
Constraints that influence income improvement
1. Lack of startup capital 2. Low selling price 3. Low profit 4. Low quality and quantity of fish
seed 5. Low quality and quantity of fish
feed 6. Poor financial management
skills 7. Poor quality control 8. Poor water quality 9. Inability to secure a sufficient
loan
Problems that influence income improvement
1. Lack of family support 2. Lack of federal and regional
government support 3. Lack of training 4. Lack of fish farming experience
and knowledge
Exploratory Factor
Analysis
Figure 7.5 Result of data reduction for constraints and problems that influenced income improvement

201
research findings where only endogenous factors were correlated with income
improvement (see Section 7.3), the results of the binary logistic regression
suggested that positive correlations existed for both constraints and problems
that influenced income improvement.
Figure 7.6 shows the constraints and problems that influenced the income
improvement of small scale fish farmers. There were nine constraints and four
problems classified by the exploratory factor analysis that influenced income
improvement.
Source: Survey on the factors influencing entrepreneurial activities of small scale fish farmer in deriving income improvement and product sustainability in Central Java, Indonesia
Financial constraints
Financial constraints consisted of all the weaknesses of fish farmers that affected
their income. The two main financial constraints identified by fish farmers in
Central Java were: lack of capital and inability to secure sufficient loans. These
were the most common problems found in small business in developing
countries. There were many factors associated with these financial problems.
Sinar harapan (2007) proposed unavoidable natural disaster as one such factor.
They reported that some fish farmers’ milkfish brackish water pond cultures
were swept away during strong high tides. This left the fish farmers more
vulnerable since they could not continue their production and had to rebuild their
fish cultures from scratch. This situation gives rise to financial problems because
they no longer have an income having lost their fish harvest and hence they no
Constraints 1. Lack of Capital 2. Low selling price 3. Lack of profit 4. Low quality fish
seed 5. Low quality fish feed 6. Poor financial
management skills 7. Poor quality control 8. Poor water quality 9. Cannot secure a
Problems 1. Lack of family support 2. Lack of government
support 3. Lack of training 4. Lack of fish farming
experience and knowledge
Income improvement
Figure 7.6 Constraints and problems that influenced income improvement

202
longer had capital to buy new fish seed. Financial problems also emerged when
fish farmers needed instant cash for their production or daily needs (Kompas
2003). Most fishermen in this situation were willing to sell their products to
middlemen at lower than market prices, rather than selling to large restaurants or
hotels for higher prices but having to wait weeks before receiving full payment.
Lack of capital, poor financial management skills and the inability to secure
sufficient loans, were all constraints that played a big role in influencing the
small scale fish farmers’ income. This is because without adequate sources of
money to run the business and without an ability to manage it fish farmers were
limiting their income. Obtaining low sales prices and hence having reduced
profits also affected their income. Some of the low sales price and lack of profits
were situations caused by money lenders who forced fish farmers to sell their
harvest at very low prices (Effendi 2008).
Technical constraints
An inability to provide good quality harvests as a result of low quality fish seed,
low quality fish feed, poor quality control and poor water quality may also have
influenced income. This was because low quality fish seed and fish feed together
with poor quality control will result in a low quality fish that fetches low sales
prices. Further more, poor quality control can result in the total mortality of fish
and a total harvest failure.
Lack of training, family and government support
Problems such as a lack of support from family and government have strong
influences on income improvement. Family members were the closest people to
the fish farmers and therefore had a large impact on the fish farming activities,
including the income. Family needs also influenced the fish farmers’ decisions
about allocating the income to providing family needs and business
development. Government supports have considerable impact through
establishment of policies and providing trainings for small scale fish farmers.
Experience and knowledge
Experience was an important factor in determining the success of a business
(Lee & Tsang 2001). Fish farmers with more fish farming experience may be
203
able to achieve higher incomes since they may be able to predict what can
happen in a fish farming business and, having learnt from experience, are better
able to counter obstructions.
7.6 Constraints and problems that influenced product sustainability
Several variables were identified as influencing product sustainability. This research
identified 16 common obstructions from the literature. The obstructions were divided
into internal obstructions (constraint) and external obstructions (problems). The EFA
grouped the 16 common obstructions into two categories and showed that some
variables could be removed to produce a simpler structure with fewer but more
meaningful variables.
7.6.1 Result of Exploratory Factor Analysis (EFA) for constraints and problems that influenced product sustainability
The literature review identified 16 obstructions faced by small scale fish
farmers. Based on the outcomes of the EFA, the obstructions that influenced
product sustainability were classified into two groups: constraints and problems.
The obstructions were classified into nine constraints and seven problems as
shown in Figure 7.7.
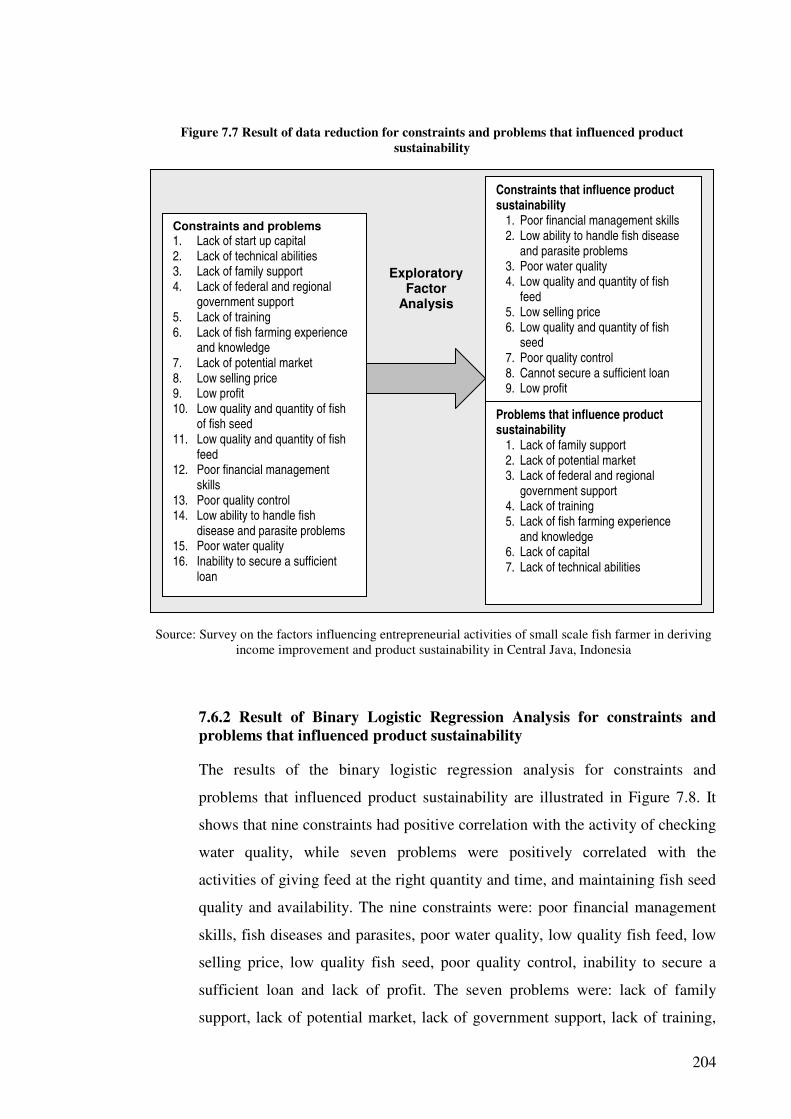
204
Source: Survey on the factors influencing entrepreneurial activities of small scale fish farmer in deriving income improvement and product sustainability in Central Java, Indonesia
7.6.2 Result of Binary Logistic Regression Analysis for constraints and problems that influenced product sustainability
The results of the binary logistic regression analysis for constraints and
problems that influenced product sustainability are illustrated in Figure 7.8. It
shows that nine constraints had positive correlation with the activity of checking
water quality, while seven problems were positively correlated with the
activities of giving feed at the right quantity and time, and maintaining fish seed
quality and availability. The nine constraints were: poor financial management
skills, fish diseases and parasites, poor water quality, low quality fish feed, low
selling price, low quality fish seed, poor quality control, inability to secure a
sufficient loan and lack of profit. The seven problems were: lack of family
support, lack of potential market, lack of government support, lack of training,
Constraints and problems
1. Lack of start up capital 2. Lack of technical abilities 3. Lack of family support 4. Lack of federal and regional
government support 5. Lack of training 6. Lack of fish farming experience
and knowledge 7. Lack of potential market 8. Low selling price 9. Low profit 10. Low quality and quantity of fish
of fish seed 11. Low quality and quantity of fish
feed 12. Poor financial management
skills 13. Poor quality control 14. Low ability to handle fish
disease and parasite problems 15. Poor water quality 16. Inability to secure a sufficient
loan
Constraints that influence product sustainability
1. Poor financial management skills 2. Low ability to handle fish disease
and parasite problems 3. Poor water quality 4. Low quality and quantity of fish
feed 5. Low selling price 6. Low quality and quantity of fish
seed 7. Poor quality control 8. Cannot secure a sufficient loan 9. Low profit
Problems that influence product sustainability
1. Lack of family support 2. Lack of potential market 3. Lack of federal and regional
government support 4. Lack of training 5. Lack of fish farming experience
and knowledge 6. Lack of capital 7. Lack of technical abilities
ExploratoryFactor
Analysis
Figure 7.7 Result of data reduction for constraints and problems that influenced product sustainability

205
lack of fish farming experience and knowledge, lack of capital and lack of
technical abilities.
Source: Survey on the factors influencing entrepreneurial activities of small scale fish farmer in deriving income improvement and product sustainability in Central Java, Indonesia
Technical constraints
Five technical constraints directly impacted product sustainability through the
activity of checking water quality: low ability to handle fish disease and
parasites, poor water quality, low quality and quantity of fish feed, low quality
and quantity of fish seed, and poor quality control. The combination of low
quality fish feed, low quality fish seed, a low ability to handle fish disease and
parasite, and low water quality were signs of a lack of sustainable aquaculture
practises. The poor quality control constraint, which also includes environmental
quality control, also indicated the absence of sustainable fish farming practices.
Managerial constraints
Four managerial constraints influenced product sustainability through the
activity of checking water quality: poor financial management skills, low selling
price, inability to secure sufficient loans and lack of profit. These managerial
constraints had no direct impact on product sustainability. Nevertheless, they
Constraints 1. Poor financial
management skills 2. Fish diseases and
parasites 3. Poor water quality 4. Low quality fish feed 5. Low selling price 6. Low quality fish seed 7. Poor quality control 8. Cannot secure a
sufficient loan 9. Lack of profit
Problems 1. Lack of family support 2. Lack of potential market 3. Lack of government
support 4. Lack of training provided
by the government 5. Lack of fish farming
experience 6. Lack of capital 7. Lack of technical abilities
Check water quality
Give feed at the right quantity
and time
Maintain fish feed quality
and availability
Maintain fish seed quality
and availability
Figure 7.8 Constraints and problems that influenced product sustainability activities

206
had significant indirect impact on product sustainability. Without access to
sufficient loans and without adequate financial management skills already makes
it difficult for small scale fish farmers to manage their fish farming businesses,
let alone implementing sustainable aquaculture practises. Obtaining low sales
prices and lacking profits exasperate the business situation and make it even
harder to implement sustainable fish farming.
Lack of family support
Family members were the closest people to fish farmers in their ability to
influence how the fish farmers conduct their business (Basu 1998). Without a
supportive family, fish farmers may be discouraged in developing their
businesses. This includes their ability to develop and implement sustainable
aquaculture in order to achieve product sustainability.
In addition, many small scale fish farmers received direct assistance from family
members in running their businesses. Many family members help out in
managing the fish ponds, which includes managing fish feed and fish seeds, and
hence their direct assistance influenced product sustainability.
Lack of potential market
The lack of potential market had a significant influence on achieving product
sustainability. It was identified as one of the critical factors in achieving
sustainable aquaculture (Sukadi 2006). Without fish markets, fish farmers were
unable to sell their products. Fish products have limited shelf life and the longer
it takes to sell the products, the greater the deterioration and decomposition of
the fish which influenced the quality of the environment.
Lack of government support and lack of training provided by the government
Governments have the power to develop policies to support small scale fish
farmers. As it pertains to the implementation of sustainable aquaculture practices
by small scale fish farmers, the Indonesian government developed the
Indonesian Fisheries Act No. 31 (2004) which required that environmental
sustainability practices be included in all fish farming practices (Sukadi 2006).
Small scale fish farmers were also dependent on the government to provide them
with training on sustainable aquaculture and other subsidies.

207
Lack of fish farming experience and knowledge
Small scale fish farmers cannot implement sustainable aquaculture if they do not
have sufficient experience and knowledge of the practices. Prior fish farming
experience and knowledge was important in equipping fish farmers with
technical and managerial skills needed in conducting sustainable aquaculture,
practices such as how to prepare and manage their pond as well as how to
combine fish in poly-culture system (Nam & Thuok 1999).
Lack of capital
Financial capital was an ongoing problem faced by small scale fish farmers
(Awulachew et al. 2008; Das 2006). A lack of adequate funds makes it difficult
for small scale fish farmers to run their business. This includes their ability to
implement sustainable aquaculture as a means to achieving product
sustainability.
Lack of technical abilities
Lack of technical skills was a rising problem as some of these fish farmers did
not receive adequate fish farming education. Some fish farmers started their fish
farming business simply because they had witnessed their neighbours or
relatives achieve success in fish farming. They tried to copy what they see but
they did not have the required knowledge to undertake this type of business.
Boyolali Animal Husbandry and Fisheries Office (2007) cited the example of
the catfish Village in Boyolali region that started off with one successful fish
farmer managing his pond that inspired his neighbours to follow suit by
fortuitously being willing to share his fish farming secrets. Unfortunately this
situation is rare and competition often exceeded the willingness to share and
help each other. A similar observation was made by Miyata and Manatunge
(2004) about the adoption of floating net aquaculture (FNA) amongst fish
farmers. They detected that decisions to adopt FNA by fish farmers were
attributed to other fish farmers’ success.
A lack of technical abilities includeds a lack of technical skills to implement
sustainable aquaculture. Limited technical abilities in implementing sustainable
aquaculture may result in failure to obtain product sustainability and even total

208
fish harvest failure (Mkoka 2007). This technical inability is incorporated in fish
feed and fish seed management.
7.7 Implemented entrepreneurial activities by small scale fish farmers in Central Java
This section is based on question number 17 of the questionnaire: “Which of the
following activities have you implemented in your business?”. There were eight
answers that could be selected from; six of the selection items were entrepreneurial
activities that were identified from the literature review. These activities were:
producing own fish feed, producing own fish seed, extending market distribution,
extending the varieties of fish species, adding value to product and finding other use of
fish part. Respondents also had the option to answer “others” to specific other activities
that were not listed. Respondents could also select the option “none of the above”,
which was taken as an indication that the respondent had not implemented any
entrepreneurial activities.
Participants were asked to answer all activities that apply to their fish farming business
and the data was analysed descriptively. Results showed that some of these
entrepreneurial activities had been implemented by many small scale fish farmers in
Central Java while others had not. This section will discuss in detail the result of the
implemented entrepreneurial activities by small scale fish farmers in Central Java.
Figure 7.9 illustrates the frequency of implemented entrepreneurial activities by small
scale fish farmers in Central Java. It shows that the most frequently implemented
entrepreneurial activity was extending market distribution, followed by extending the
varieties of fish species and adding value to product. Conversely, the least frequently
implemented entrepreneurial activities were producing own fish feed, finding other use
of fish parts and producing own fish seed. Figure 7.9 also shows that some respondents
chose “none of the above” and “others” which indicated that some small scale fish
farmers in Central Java have either implemented other activities or have not
implemented entrepreneurial activities at all.

209
Figure 7.9 Percentage of implemented entrepreneurial activities by small scale fish farmers in
Central Java
0
5
10
15
20
25
30
35
40
45
50P
erc
en
tag
e
Pro
ducin
g o
wn fis
h feed
Pro
ducin
g o
wn fis
h s
eed
Exte
ndin
g m
ark
et dis
trib
utio
n
Exte
ndin
g the v
arietie
s o
f fis
h s
pecie
s
Addin
g v
alu
e to p
roduct
Fin
din
g o
ther
use o
f fis
h p
art
s
None o
f th
e a
bove
Oth
ers
Types of Entrepreneurial Activities
Implemented entrepreneurial activities
Source: Survey on the factors influencing entrepreneurial activities of small scale fish farmer in deriving income improvement and product sustainability in Central Java, Indonesia
7.7.1 Fish feed production
Figure 7.9 shows the entrepreneurial activities implemented by small scale fish
farmers in Central Java. It shows that producing own fish feed was the least
implemented activity. The descriptive analysis in Table 6.26 shows that only one
percent or four out of 400 respondents had implemented this activity in their fish
farming businesses in Central Java. This may be due to the complexity of
producing fish feed and the scarcity of the needed ingredients. This finding was
supported by Djunaidah (1992) who believed that most Indonesian fish farmers
prefered to use commercial fish feed rather than produce their own fish feed.
Besides finding it difficult to locate the ingredients, small scale fish farmers also
regarded this activity as time consuming.
210
7.7.2 Fish seed production
According to Table 6.26, producing own fish seed was found to be the sixth
most frequently implemented entrepreneurial activity in Central Java: 5.75% of
respondent (or 23 of the 400 respondents) had implemented this activity. The
reason why only small numbers of fish farmers in Central Java implemented this
activity was because most small scale fish farmers in Indonesia still obtained
fish seed from the wild or bought it from hatcheries (Mantau, Rawung, &
Sudarty 2004).
7.7.3 Market extension
Extending market distribution was found to be the most frequently implemented
entrepreneurial activity. According to Table 6.26 the activity of extending
market distribution was reported by the largest percentage of respondent
(48.5%). This may be because market size was one of the fundamental obstacles
in business. This was supported by Morris and Lewis (1995) who believed
market extension to be one of the primary entrepreneurial activities for carrying
on business. Moreover, through market extension an entrepreneur can also
increase the size of networks, thus allowing the business to expand its market
distribution into a wider geographical range and a greater number of markets
(Havnes & Senneseth 2001).
7.7.4 Fish species extension (poly-culture system)
Extending the varieties of fish species was Central Java’s fish farmers’ second
most frequently implemented entrepreneurial activity (27.3%). Many fish
farmers extended the variety of their fish species because they can increase their
income significantly by adopting poly-culture systems. This was supported by
Kompas (2006) that reported that a fish farmer in West Java increased his
income five times by adopting the poly-culture system.
Although poly-culture systems were associated with an increase in income, it
required knowledge of fish feeding habit. This is because in a poly-culture
system the fish species are combined according to their different feeding habits
(Bocek 2008). For example carnivore fish is combined with herbivore fish, or
plankton feeder is combined with demersal fish etc. The central idea of this
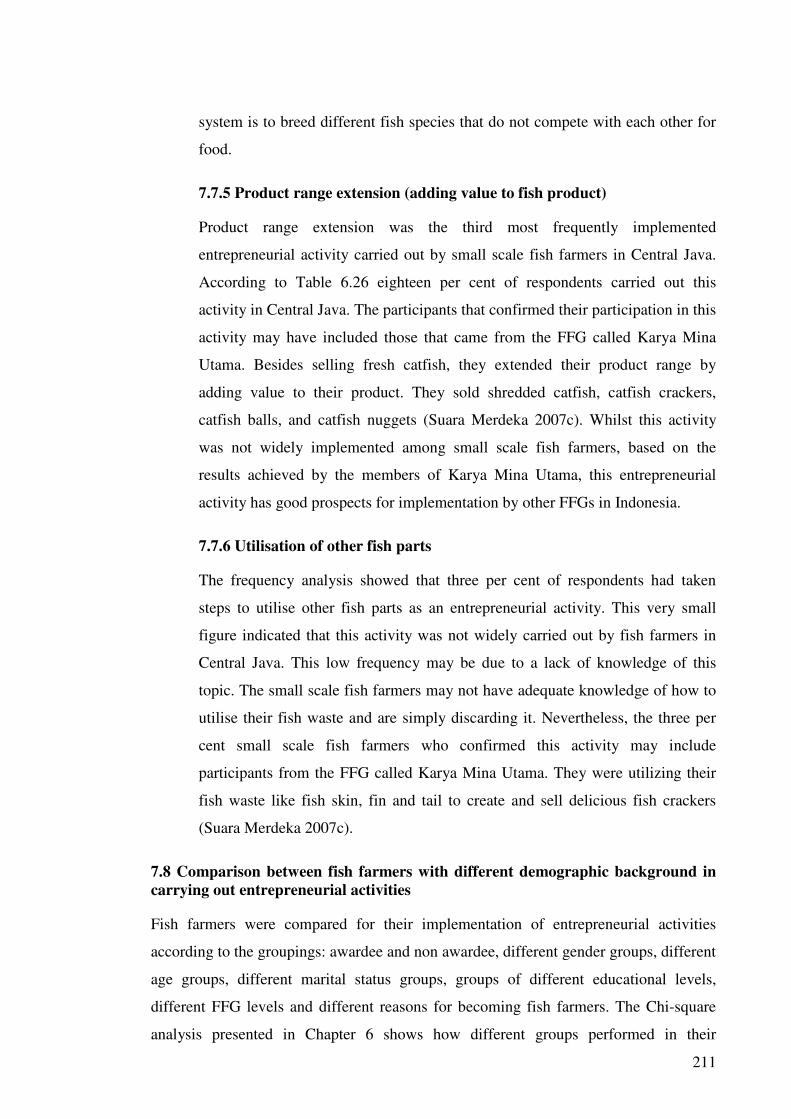
211
system is to breed different fish species that do not compete with each other for
food.
7.7.5 Product range extension (adding value to fish product)
Product range extension was the third most frequently implemented
entrepreneurial activity carried out by small scale fish farmers in Central Java.
According to Table 6.26 eighteen per cent of respondents carried out this
activity in Central Java. The participants that confirmed their participation in this
activity may have included those that came from the FFG called Karya Mina
Utama. Besides selling fresh catfish, they extended their product range by
adding value to their product. They sold shredded catfish, catfish crackers,
catfish balls, and catfish nuggets (Suara Merdeka 2007c). Whilst this activity
was not widely implemented among small scale fish farmers, based on the
results achieved by the members of Karya Mina Utama, this entrepreneurial
activity has good prospects for implementation by other FFGs in Indonesia.
7.7.6 Utilisation of other fish parts
The frequency analysis showed that three per cent of respondents had taken
steps to utilise other fish parts as an entrepreneurial activity. This very small
figure indicated that this activity was not widely carried out by fish farmers in
Central Java. This low frequency may be due to a lack of knowledge of this
topic. The small scale fish farmers may not have adequate knowledge of how to
utilise their fish waste and are simply discarding it. Nevertheless, the three per
cent small scale fish farmers who confirmed this activity may include
participants from the FFG called Karya Mina Utama. They were utilizing their
fish waste like fish skin, fin and tail to create and sell delicious fish crackers
(Suara Merdeka 2007c).
7.8 Comparison between fish farmers with different demographic background in carrying out entrepreneurial activities
Fish farmers were compared for their implementation of entrepreneurial activities
according to the groupings: awardee and non awardee, different gender groups, different
age groups, different marital status groups, groups of different educational levels,
different FFG levels and different reasons for becoming fish farmers. The Chi-square
analysis presented in Chapter 6 shows how different groups performed in their

212
implementation of entrepreneurial activities. This section discusses the significant
differences between the groups in how they carried out entrepreneurial activities.
7.8.1 Comparison between awardees and non awardees
Four hundred small scale fish farmers from Central Java participated in this
research survey. The “Non-awardees” participants dominated the sample
population. Non-awardees participants were fish farmers who belonged to a fish
farmer groups (FFGs) that had not received any awards from the government in
the last five years. The “Awardees” participants are fish farmers who belonged
to a FFG that had won the government award in the last five years. In the sample
310 participants (77.5%) were non awardees and 90 participants (22.5%) were
award receivers.
The significant differences between awardees and non awardees in
implementing entrepreneurial activities are shown in Table 6.29. According to
the chi-square test result, significant differences between the groups were found
for the following entrepreneurial activities: market extension, fish species
extension and utilisation of other fish part. No significant differences were found
for producing own fish feed, producing own fish seed and adding value to
product.
The bar chart in Figure 7.10 shows the results of comparisons between awardees
and non awardees in implementing entrepreneurial activities. It shows that non
awardees implemented more entrepreneurial activities than awardees. The initial
prediction was that awardees would implement more entrepreneurial activities
that non-awardees.

213
Figure 7.10 Comparison between awardees and non awardees in implementing entrepreneurial
activities
0
20
40
60
80
100
120
Fis
h fe
ed
pro
du
ctio
n
Fis
h s
ee
d
pro
du
ctio
n
Ma
rke
t
exte
nsio
n
Fis
h s
pe
cie
s
exte
nsio
n
Pro
du
ct ra
ng
e
exte
nsio
n
Utilisa
tio
n o
f
oth
er
fish
pa
rt
Awardees
Non awardees
Source: Survey on the factors influencing entrepreneurial activities of small scale fish farmer in deriving income improvement and product sustainability in Central Java, Indonesia
However, based on a proportional comparison, where the proportion of non
awardees (77.5%) is to awardees (22.5%), a different result is obtained. Figure
7.11 shows the results of comparing the entrepreneurial activities proportionally.
Figure 7.11 shows that a greater proportion of non awardees implemented
entrepreneurial activities than awardees. The proportion of awardees only
exceeds non awardees in implementing market extension. This is contrary to
expectations that awardees would have higher abilities than non awardees and
would therefore implement more entrepreneurial activities than non awardees.
The only explanation for this contradictory finding is the quality of the award
winners. The selection of FFG winners may be impossible to justify given that
field evaluations may be performed by different people. As a result the
assessment of award winners may not be objective and result in invalid
evaluations.

214
Figure 7.11 Proportional Comparison between awardees and non awardees in implementing entrepreneurial activities
0
10
20
30
40
50
60
70
80
Fis
h fe
ed
pro
du
ctio
n
Fis
h s
ee
d
pro
du
ctio
n
Ma
rke
t e
xte
nsio
n
Fis
h s
pe
cie
s
exte
nsio
n
Pro
du
ct ra
ng
e
exte
nsio
n
Utilisa
tio
n o
f
oth
er
fish
pa
rt
Awardees
Non awardees
Source: Survey on the factors influencing entrepreneurial activities of small scale fish farmer in deriving income improvement and product sustainability in Central Java, Indonesia
7.8.2 Comparison between male and female small scale fish farmers
According to the frequency analysis shown in Table 6.30, there were only 18
female (4.5%) participants and 382 male participants (95.5%). This may be due
to the view that fish farming activities require physical hard work which is more
likely to be carried out by men.
The result of the chi-square test in Chapter 6 suggests that there were four
entrepreneurial activities that showed significant differences given the gender of
the fish farmer: fish seed production, market extension, fish species extension
and product range extension. The chi-square test also suggested that no
significant differences existed between the two groups in carrying out fish feed
production and utilisation of other fish part.
Figure 7.12 shows that male fish farmers implemented the whole range of
entrepreneurial activities while female fish farmers only implemented three of
the entrepreneurial activities (fish seed production, market extension and product
range extension). This finding may have been due to the significant difference in

215
the proportion of male (95.5%) and female (4.5%) survey respondents. The bar
chart in Figure 7.13 presents the proportional comparison between men and
women in their implementation of entrepreneurial activities.
Figure 7.12 Comparison between gender in implementing entrepreneurial activities
0
20
40
60
80
100
120
140
160
180
200F
ish
fe
ed
pro
du
ctio
n
Fis
h s
ee
d
pro
du
ctio
n
Ma
rke
t
exte
nsio
n
Fis
h s
pe
cie
s
exte
nsio
n
Pro
du
ct ra
ng
e
exte
nsio
n
Utilisa
tio
n o
f
oth
er
fish
pa
rt
Male
Female
Source: Survey on the factors influencing entrepreneurial activities of small scale fish farmer in deriving income improvement and product sustainability in Central Java, Indonesia
Figure 7.13 shows that women implemented only three entrepreneurial
activities: fish seed production, market extension and product range extension.
What is interesting is that women implemented fewer entrepreneurial activities,
but when they did, they did so in greater proportions than men. A greater
proportion of women than men implemented the following activities: fish seed
production, market extension and product range extension. The outcome of this
research, where men implemented a greater range of entrepreneurial activities, is
supported by previous research that found that men tended to be more
entrepreneurial than women (Cowling & Harding 2001; Reynolds et al. 2002).
This may be associated with the reality that women are more focused on family
matters than business development because the role of women as the primary
family caretaker restricts their ability to give priority to work related issues.
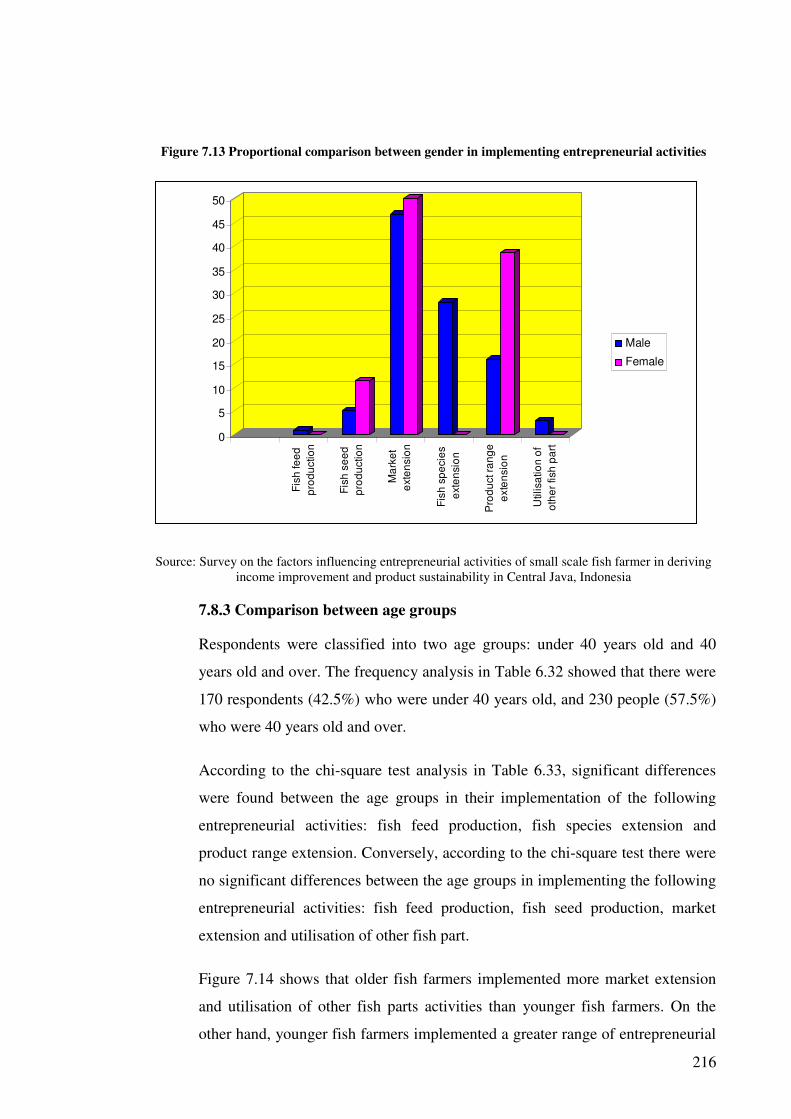
216
Figure 7.13 Proportional comparison between gender in implementing entrepreneurial activities
0
5
10
15
20
25
30
35
40
45
50
Fis
h fe
ed
pro
du
ctio
n
Fis
h s
ee
d
pro
du
ctio
n
Ma
rke
t
exte
nsio
n
Fis
h s
pe
cie
s
exte
nsio
n
Pro
du
ct ra
ng
e
exte
nsio
n
Utilisa
tio
n o
f
oth
er
fish
pa
rt
Male
Female
Source: Survey on the factors influencing entrepreneurial activities of small scale fish farmer in deriving income improvement and product sustainability in Central Java, Indonesia
7.8.3 Comparison between age groups
Respondents were classified into two age groups: under 40 years old and 40
years old and over. The frequency analysis in Table 6.32 showed that there were
170 respondents (42.5%) who were under 40 years old, and 230 people (57.5%)
who were 40 years old and over.
According to the chi-square test analysis in Table 6.33, significant differences
were found between the age groups in their implementation of the following
entrepreneurial activities: fish feed production, fish species extension and
product range extension. Conversely, according to the chi-square test there were
no significant differences between the age groups in implementing the following
entrepreneurial activities: fish feed production, fish seed production, market
extension and utilisation of other fish part.
Figure 7.14 shows that older fish farmers implemented more market extension
and utilisation of other fish parts activities than younger fish farmers. On the
other hand, younger fish farmers implemented a greater range of entrepreneurial

217
activities than older fish farmers. This may be due to younger fish farmers being
more willing to experiment with new activities than older people. The finding
that a greater number of the older fish farmers had implemented the activities of
market extension and utilisation of other fish parts may be due to older fish
farmers’ longer experience in implementing these activities.
Figure 7.14 Comparison between age groups in implementing entrepreneurial activities
0
20
40
60
80
100
120
Fis
h f
eed
pro
duction
Fis
h s
eed
pro
duction
Mark
et
exte
nsio
n
Fis
h s
pecie
s
exte
nsio
n
Pro
duct
range
exte
nsio
n
Utilis
ation o
f
oth
er
fish p
art
Under 40 yrs
40 yrs and over
Source: Survey on the factors influencing entrepreneurial activities of small scale fish farmer in deriving income improvement and product sustainability in Central Java, Indonesia
Figure 7.15 presents a proportional comparison between age groups in
implementing entrepreneurial activities. It shows that the proportion of older fish
farmers exceeded younger fish farmers only in the activity of market extension.
This is possibly because older fish farmers were only familiar with market
extension as a form of business expansion. They were perhaps not as familiar
with the other means of entrepreneurial activities that younger fish farmers may
be more familiar with given their greater use of the latest information
technologies.

218
Figure 7.15 Proportional comparison between age groups in implementing entrepreneurial activities
0
10
20
30
40
50
60
Fis
h fe
ed
pro
du
ctio
n
Fis
h s
ee
d
pro
du
ctio
n
Ma
rke
t
exte
nsio
n
Fis
h s
pe
cie
s
exte
nsio
n
Pro
du
ct ra
ng
e
exte
nsio
n
Utilisa
tio
n o
f
oth
er
fish
pa
rt
Under 40 yrs
40 yrs and over
Source: Survey on the factors influencing entrepreneurial activities of small scale fish farmer in deriving income improvement and product sustainability in Central Java, Indonesia
7.8.4 Comparison between marital status
Respondents were classified into two marital status groups: single and married
respondents. “Single” respondents included not only people who have not
married, but also those who were divorced. The frequency analysis in Table 6.34
shows the survey sample was dominated by married fish farmers: only 44
respondents (11%) were single and 356 respondents (89%) were married.
Significant differences were found between the marital status groups in their
implementation of only one of the entrepreneurial activities namely fish species
extension. No significant differences between single and married fish farmers
were found in their implementation of the other activities: fish feed production,
fish seed production, market extension, fish species extension, product range
extension and utilisation of other fish part.
Figure 7.16 shows a frequency graph of the activities of the marital groups of
this research sample. It shows that the married fish farmers of this sample
implemented all the entrepreneurial activities compared to only three activities
implemented by the single fish farmers. This condition may be due to family
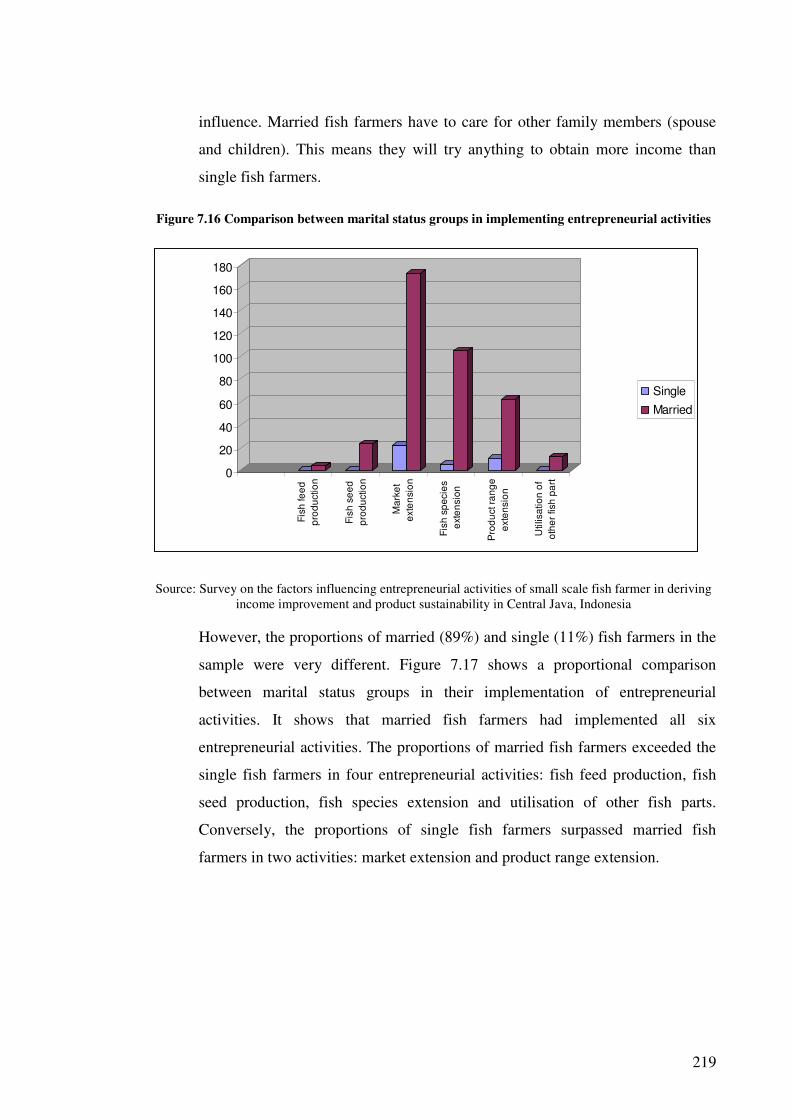
219
influence. Married fish farmers have to care for other family members (spouse
and children). This means they will try anything to obtain more income than
single fish farmers.
Figure 7.16 Comparison between marital status groups in implementing entrepreneurial activities
0
20
40
60
80
100
120
140
160
180
Fis
h fe
ed
pro
du
ctio
n
Fis
h s
ee
d
pro
du
ctio
n
Ma
rke
t
exte
nsio
n
Fis
h s
pe
cie
s
exte
nsio
n
Pro
du
ct ra
ng
e
exte
nsio
n
Utilisa
tio
n o
f
oth
er
fish
pa
rt
Single
Married
Source: Survey on the factors influencing entrepreneurial activities of small scale fish farmer in deriving income improvement and product sustainability in Central Java, Indonesia
However, the proportions of married (89%) and single (11%) fish farmers in the
sample were very different. Figure 7.17 shows a proportional comparison
between marital status groups in their implementation of entrepreneurial
activities. It shows that married fish farmers had implemented all six
entrepreneurial activities. The proportions of married fish farmers exceeded the
single fish farmers in four entrepreneurial activities: fish feed production, fish
seed production, fish species extension and utilisation of other fish parts.
Conversely, the proportions of single fish farmers surpassed married fish
farmers in two activities: market extension and product range extension.

220
Figure 7.17 Proportional comparison between marital status groups in implementing
entrepreneurial activities
0
10
20
30
40
50
60
Fis
h f
eed
pro
duction
Fis
h s
eed
pro
duction
Mark
et
exte
nsio
n
Fis
h s
pecie
s
exte
nsio
n
Pro
duct
range
exte
nsio
n
Utilis
ation o
f
oth
er
fish p
art
Single
Married
Source: Survey on the factors influencing entrepreneurial activities of small scale fish farmer in deriving
income improvement and product sustainability in Central Java, Indonesia
7.8.5 Comparison between different educational levels
Respondents were classified into groups of different education levels: completed
high school and did not complete high school. The results of the frequency
analysis in Table 6.36 show that 240 respondents (60%) had completed high
school, while 160 respondents (40%) had not complete high school.
Significant differences were found between the levels of education for five of
entrepreneurial activities: fish seed production, market extension, fish species
extension, product range extension and utilisation of other fish part. The only
entrepreneurial activity that did not show a significant difference between
education levels was fish feed production. The differences found between
groups with different education levels had the greatest influence on
entrepreneurial activities implemented by small scale fish farmers in Central
Java. This may be due to the possibility that higher levels of education
contribute to higher knowledge.
The bar chart in Figure 7.18 shows the comparison between fish farmers in
implementing entrepreneurial activities who had completed high school and

221
those who had not completed high school. Of the two groups, fish farmers who
had not completed high school were more numerous in implementing the
following activities: fish feed production, fish seed production and fish species
extension. Conversely, those who did complete high school were more
numerous in implementing the following entrepreneurial activities: market
extension, product range extension and utilisation of other fish parts. The
greatest difference between the groups was in their implementation of the
market extension activity. The number of fish farmers that had completed high
school was nearly double the number of fish farmers that had not completed
high school. The reason for this significant difference may be that fish farmers
with a higher education may also have higher knowledge, including market
knowledge. People with higher education were also more prepared with the
essential and necessary skills to manage a business (Lee & Tsang 2001).
Figure 7.18 Comparison between different education levels in implementing entrepreneurial activities
0
20
40
60
80
100
120
140
Fis
h fe
ed
pro
du
ctio
n
Fis
h s
ee
d
pro
du
ctio
n
Ma
rke
t
exte
nsio
n
Fis
h s
pe
cie
s
exte
nsio
n
Pro
du
ct ra
ng
e
exte
nsio
n
Utilisa
tio
n o
f
oth
er
fish
pa
rt
Not completed high school
Completed high school
Source: Survey on the factors influencing entrepreneurial activities of small scale fish farmer in deriving income improvement and product sustainability in Central Java, Indonesia
Figure 7.19 shows a proportional comparison of the two groups. The proportion
of fish farmers who had completed high school exceeded the proportion of fish
farmers who had not completed high school in their implementation of the
following entrepreneurial activities: market extension, product range extension
and utilisation of other fish parts. Surprisingly, the proportion of fish farmers

222
who had not completed high school exceeded the proportion of fish farmers who
had completed high school in implementing the following entrepreneurial
activities: fish feed production, fish seed production and fish species extension.
Therefore, it cannot be generalised from Figure 7.19 that differences in
educational levels played a role in the implementation of entrepreneurial
activities. Such a discussion will need to go far beyond the information provided
in Figure 7.19 because many other factors are involved in how small scale fish
farmers with lower educational levels are able to implement entrepreneurial
activities. For example, possible explanations can be that in the area where this
research survey was carried out the government had provided training to fish
farmers and encouraged them to produce their own fish feed and fish seed. Fish
species extension may also have been carried out successfully over the years and
have made poly culture systems one of the commonly implemented fish farming
methods in the area.
Figure 7.19 Proportional comparison between different education levels in implementing entrepreneurial activities
Source: Survey on the factors influencing entrepreneurial activities of small scale fish farmer in deriving income improvement and product sustainability in Central Java, Indonesia
Fish farmers who had completed high school were shown to implement the more
complicated entrepreneurial activities: market extension, product range
extension and utilisation of other fish parts. Market extension required that fish
0
10
20
30
40
50
60
Fis
h f
eed
pro
duction
Fis
h s
ee
d
pro
duction
Mark
et
exte
nsio
n
Fis
h s
pe
cie
s
exte
nsio
n
Pro
duct
range
exte
nsio
n
Utilis
atio
n o
f oth
er
fish p
art
Not completed high school Completed high school
223
farmers have wider networks, broader knowledge of potential markets and have
a greater “risk taking” attitude to sell their product to a wider area. Product range
extension also required fish farmers to innovate and create new products to a
greater extent than other fish farmers. Likewise, the utilisation of other fish parts
also required fish farmers to be innovative.
A very good example of fish farmers with a greater “risk taking” attitude is the
fish farmer group in the Mangkubumen village in Central Java where almost all
residents were catfish farmers whose livelihoods depended on cultivating catfish
(Suara Merdeka 2007b). Four male residents, led by farmer Darseno, started to
cultivate catfish in 1999 when the price of catfish was rising. Darseno was an
optimist and grew 5000 catfish and made a healthy profit (Suara Merdeka
2007d). Their success led other resident into the cultivation of catfish and in less
than one year they formed the “Karya Mina Utama” FFG with 92 members.
Over a few years this village’s prosperity rose rapidly as evidenced by the new
and beautiful houses and new cars owned by the FFG members. The benefits of
this activity were not only confined to the pond owners, but also extended to the
people around who were employed by the farmers. The catfish pond workers
were paid very well because, as Suara Merdeka (2007b) explained, the pond
owner obtained high profits.
A very good example of fish farmers who implemented more complicated
entrepreneurial activities is the woman sub-members of the “Karya Mina
Utama” FFG. These women turned lower quality catfish into delicious processed
food such as shredded catfish, catfish crackers, catfish balls, and catfish nuggets
(Suara Merdeka 2007c). They also provided the consumer with many choices of
flavor for example the shredded catfish was supplied with an original sweet
flavour, onion flavour or spicy flavour. Additionally, the catfish crackers were
made from different parts of the fish body: fish meat crackers, fish skin crackers
and fish fin crackers. These innovations produced additional income for the FFG
members and their families. Their success has also attracted the attention of
many government officers from other province in Indonesia who came to study
their activities with the view to implement what they learn in their own regions.

224
7.8.6 Comparison between different fish farmer groups
The FFGs of small scale fish farmers in Central Java, were classified into two
groups: starter and advanced. According to the frequency analysis result in Table
6.38, there were 165 respondents belonging to a starter FFGs and 224
respondents from an advanced FFGs.
Differences were found between the FFG levels for four entrepreneurial
activities: fish seed production, market extension, fish species extension and
utilisation of other fish parts. The entrepreneurial activities that did not show any
significant differences between FFG levels were fish feed production and
product range extension.
Figure 7.20 supports the expected outcome that fish farmers who belonged to
advanced FFGs were more likely to implement entrepreneurial activities than
fish farmers who were members of starter level FFGs. Figure 7.20 shows that
more fish farmers belonging to advanced FFGs compared to starter FFGs
implemented the following activities: market extension, fish species extension,
product range extension and utilisation of other fish parts. This finding matched
what was expected since fish farmers from higher level FFGs were awarded
their FFG levels from the local Fisheries and Marine Affairs office that carried
out annual evaluations to allocate levels to FFG. Ten evaluation criteria are used
to distinguish FFG levels (Semarang’s Marine Affairs and Fisheries Office’s
Book of Fish Farmer Group Formation Guide 2005). Therefore, FFGs at higher
levels can be assumed to have higher levels of abilities including the ability to
carry out entrepreneurial activity as part of the evaluation criterion “plan
activities which can increase their productivity”.

225
Figure 7.20 Comparison between different levels of FFGs in implementing entrepreneurial activities
0
20
40
60
80
100
120
140
160
Fis
h fe
ed
pro
du
ctio
n
Fis
h s
ee
d
pro
du
ctio
n
Ma
rke
t
exte
nsio
n
Fis
h s
pe
cie
s
exte
nsio
n
Pro
du
ct ra
ng
e
exte
nsio
n
Utilisa
tio
n o
f
oth
er
fish
pa
rt
Starter
Advanced
Source: Survey on the factors influencing entrepreneurial activities of small scale fish farmer in deriving income improvement and product sustainability in Central Java, Indonesia
Nevertheless, although Figure 7.20 shows that fish farmers from advanced FFGs
were more likely to implement entrepreneurial activities, the number of
respondents from advanced FFGs was more than those from starter FFGs.
Figure 7.21 presents a proportional comparison between fish farmers from
different level of FFGs in implementing entrepreneurial activities.
Figure 7.21 shows that the proportion of fish farmers from advanced FFGs
exceeded the proportion of fish farmers from starter FFGs in the entrepreneurial
activities of market extension, fish species extension and utilisation of other fish
parts. On the other hand, the proportion of fish farmers from starter FFGs
exceeded the proportion of fish farmers from advanced FFGs in the
entrepreneurial activities of fish feed production, fish seed production and
product range extension. This latter finding was very similar to the finding about
fish farmers that did not complete high school (see section 7.8.5) that
implemented in greater proportion the following entrepreneurial activities: fish
feed production and fish seed production. This may be due to government
training provided to fish farmers that focused mainly on these two production
methods. Therefore, it is likely that many fish farmers have implemented these
activities.
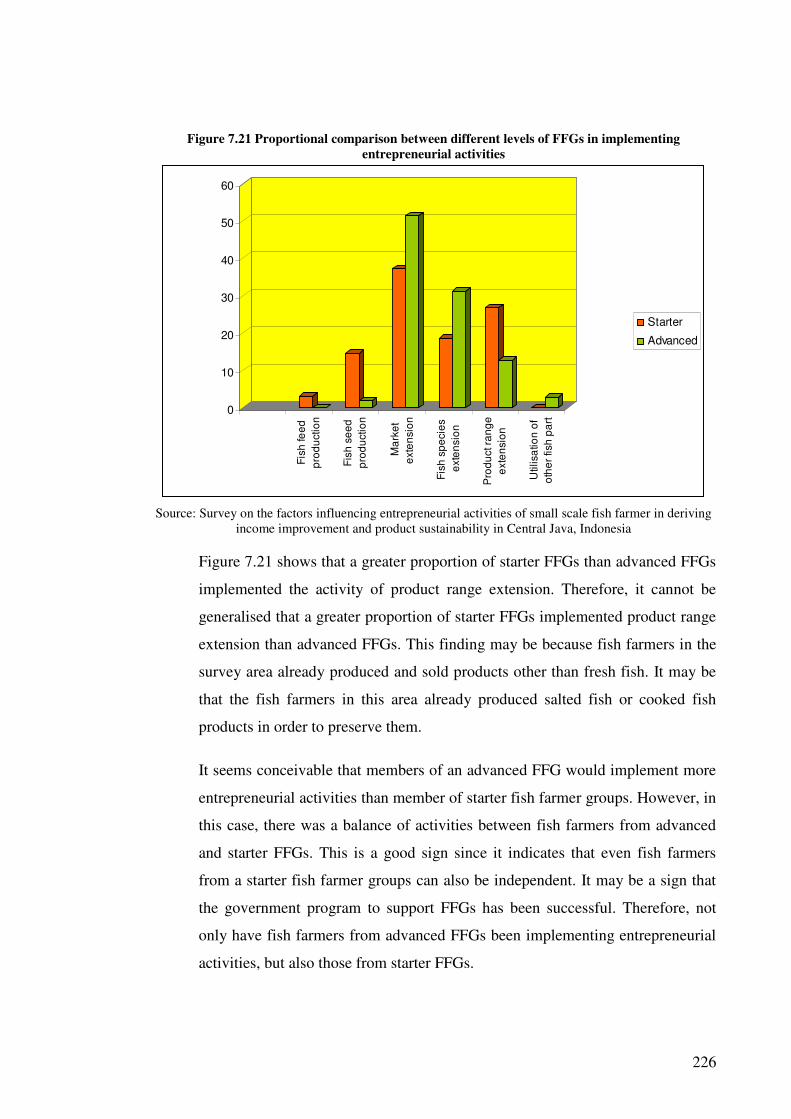
226
Figure 7.21 Proportional comparison between different levels of FFGs in implementing
entrepreneurial activities
0
10
20
30
40
50
60
Fis
h fe
ed
pro
du
ctio
n
Fis
h s
ee
d
pro
du
ctio
n
Ma
rke
t
exte
nsio
n
Fis
h s
pe
cie
s
exte
nsio
n
Pro
du
ct ra
ng
e
exte
nsio
n
Utilisa
tio
n o
f
oth
er
fish
pa
rt
Starter
Advanced
Source: Survey on the factors influencing entrepreneurial activities of small scale fish farmer in deriving
income improvement and product sustainability in Central Java, Indonesia
Figure 7.21 shows that a greater proportion of starter FFGs than advanced FFGs
implemented the activity of product range extension. Therefore, it cannot be
generalised that a greater proportion of starter FFGs implemented product range
extension than advanced FFGs. This finding may be because fish farmers in the
survey area already produced and sold products other than fresh fish. It may be
that the fish farmers in this area already produced salted fish or cooked fish
products in order to preserve them.
It seems conceivable that members of an advanced FFG would implement more
entrepreneurial activities than member of starter fish farmer groups. However, in
this case, there was a balance of activities between fish farmers from advanced
and starter FFGs. This is a good sign since it indicates that even fish farmers
from a starter fish farmer groups can also be independent. It may be a sign that
the government program to support FFGs has been successful. Therefore, not
only have fish farmers from advanced FFGs been implementing entrepreneurial
activities, but also those from starter FFGs.
227
7.8.7 Comparison of the different reasons to become fish farmers
Reasons to become fish farmers were divided into two groups: push factors and
pull factors. Push factors were all the reasons that forced fish farmers into
becoming what they are today such as losing a job or not having any other
choice. Pull factors were all the reasons given when respondents willingly
became or choose to become fish farmers such as finding opportunities or being
motivated by other people’s success.
Table 6.40 presents frequency results that show that 189 (47.3%) respondents
became fish farmers because of pull factors, and 211 (52.8%) because of the
push factors. Therefore, more respondents were forced to become fish farmers
than respondents who willingly chose to become fish farmers.
Differences were found between the fish farmers with different reasons for
becoming fish farmers in their implementation of entrepreneurial activities. The
chi-square test results in Table 6.41 shows that there were significant differences
in implementing the following entrepreneurial activities according to the
different starting reasons: market extension, fish species extension and
utilisation of other fish parts. On the other hand, no significant differences were
found between fish farmers with different reasons for becoming fish farmers in
their carrying implementation of the following entrepreneurial activities: fish
feed production, fish seed production and product range extension.
Figure 7.22 shows that the number of fish farmers who responded to pull factors
reasons to becoming fish farmers, implemented a greater range of
entrepreneurial activities than those who had responded to push factor reasons.
This was an expected outcome since fish farmers who responded to pull factor
reasons on becoming fish farmers were likely to be more willing to try out and
implement new activities than those who responded to push factor reasons.

228
Figure 7.22 Comparison of reasons to become fish farmers in implementing entrepreneurial
activities, based on push and pull factors
0
20
40
60
80
100
120
140
160
180
Fis
h fe
ed
pro
du
ctio
n
Fis
h s
ee
d
pro
du
ctio
n
Ma
rke
t
exte
nsio
n
Fis
h s
pe
cie
s
exte
nsio
n
Pro
du
ct ra
ng
e
exte
nsio
n
Utilisa
tio
n o
f
oth
er
fish
pa
rt
Push factor
Pull factor
Source: Survey on the factors influencing entrepreneurial activities of small scale fish farmer in deriving
income improvement and product sustainability in Central Java, Indonesia
People reporting push factor reasons were forced to become fish farmers
because of various reasons such as an inability to find a suitable job or being
pulled out from employment. These people were not as interested in applying
new activities as fish farmers reporting pull factor reasons. This was because
fish farmers with pull factor reasons were naturally attracted to become fish
farmers. This was supported by Basu (1998) and Watson, Hogarth-Scott and
Wilson (1998) who believed that entrepreneurs with pull factor reasons were
naturally attracted to business simply because they have the capital to do so, or
have other psychological or sociological reasons such as the attraction of
personal independence.
Figure 7.23 illustrates the proportional comparisons between participants with
pull and push factor reasons in implementing entrepreneurial activities. It shows
that participants with pull factor reasons compared to push factors implemented
more of the following entrepreneurial activities: fish feed production, fish seed
production, market extension and fish species extension. This finding matched
the prediction that fish farmers with pull factor reasons will implement more
entrepreneurial activities. The result was confirmed by research reporting that
entrepreneurs with pull motivations were more likely to earn more money than
entrepreneurs with push factor motivations (Amit & Muller 1995).

229
Figure 7.23 Proportional comparison between reasons to become fish farmers in implementing entrepreneurial activities
0
5
10
15
20
25
30
35
40
45
50
Fis
h f
eed
pro
duction
Fis
h s
eed
pro
duction
Mark
et
exte
nsio
n
Fis
h s
pecie
s
exte
nsio
n
Pro
duct
range
exte
nsio
n
Utilis
ation o
f
oth
er
fish p
art
Push factor
Pull factor
Source: Survey on the factors influencing entrepreneurial activities of small scale fish farmer in deriving income improvement and product sustainability in Central Java, Indonesia
Figure 7.23 also shows that the proportions of participants with push factor
reasons exceeded the proportion of participants with pull factor reasons in their
implementation of the following entrepreneurial activities: product range
extension and utilisation of other fish parts. This may correspond to one of the
examples given by Morris and Lewis (1995) in research. They observed that
entrepreneurs pushed as a result of job dissatisfaction were more likely to be
successful. The greater the entrepreneurs’ dissatisfaction, the more likely they
were to succeed. Relating Morris and Lewis’s results to the findings of this
research, it may be that fish farmers with push factor reasons may implement
more entrepreneurial activities than those with pull factors.
230
7.9 Discussion
Entrepreneurial activities have been the topic of much research especially in the areas of
small business and other manufacturing based businesses, but no research has focused
on the entrepreneurial activities of small scale fish farmers. Small scale fish farmers are
unique in how they run their businesses. Small scale fish farmers need to give extra
attention to managing their financial cash flows because of the nature of their business.
The small scale fish farmer has to manage living animals that require several months of
fish rearing before they can be harvested, sold and the profits collected. Moreover, since
fish farmers deal with living animals, extra care is needed to ensure the living
requirements of the fish are met. Without extra care there exists the possibility of total
collapse of the fish farmer’s fish stock which could result in total economic failure of
the small scale fish farmers’ business.
Due to the complex nature of the fish farming business, several factors contribute to the
support needed by fish farmers to achieve income improvement. Furthermore,
additional factors contribute to the ability of fish farmers to ensure the sustainability of
their fish farming business. This research explored these factors and also identified the
most common internal and external obstructions faced by small scale fish farmers in
Central Java. The entrepreneurial activities of small scale fish farmers were identified in
the literature review chapter (Chapter 2) and an inquiry was designed and conducted
into the actual implementation of small scale fish farming in Central Java. Finally, this
research compared the different groups of fish farmer communities in implementing
their entrepreneurial activities in their fish farming businesses.
The analyses results of this research classified the factors that affected income
improvement and product sustainability into two groups: endogenous and exogenous
factors. This classification of results is aligned with research literature that identified
two groups of factors that influence business outcome (Bouchiki 1993). The results of
the binary logistic regression analyses confirmed that income improvement was only
affected by the endogenous factors, whereas product sustainability was affected by both
endogenous and exogenous factors. The reason why income improvement was only
influenced by endogenous factors is possibly because more internal strength is needed
to achieve income improvement than external support. Conversely, product
sustainability involves the wider communities and hence internal strength is not enough

231
to achieve sustainable aquaculture. Without continuous support from business networks,
federal and regional government and other institutions, it is difficult for a fish farmer to
achieve sustainable aquaculture.
The results of analyses of this research classified the most common obstructions faced
by small scale fish farmers into two groups: constraints and problems. Results of the
binary logistic regression analyses confirmed that both constraints and problems
influenced income improvement and product sustainability. These positive correlations
of both constraints and problems with income improvement and product sustainability
confirmed that any obstructions (either internal or external) will affect small scale fish
farmers’ abilities in achieving income improvement and product sustainability.
This research identified six entrepreneurial activities carried out by small scale fish
farmers: fish seed production, fish feed production, market extension, fish species
extension, product range extension and utilisation of other fish parts. Results of the
descriptive analysis showed that the most common entrepreneurial activities
implemented by small scale fish farmers in Central Java were: market extension, fish
species extension and product range extension.
This research also compared the entrepreneurial activities carried out by different
groups of small scale fish farmer communities in Central Java. The comparison was
carried out between different fish farmer groups in carrying out their entrepreneurial
activities, such as fish farmer groups with different educational levels, age and fish
farmer group levels. Results of the Chi-square tests for the differences between fish
farmers groups showed that different educational levels had the most significant impact
for fish farmers in carrying their out entrepreneurial activities
The following section discusses the hypotheses developed for this research and how the
findings contributed to accepting or rejecting the hypotheses.
232
Hypothesis # 1
There is a positive correlation between the endogenous factors and the
small scale fish farmers’ income improvement: accepted
The aim of the first hypothesis of this research was to test for a positive
correlation between income improvement and the endogenous factors. The result
from the binary logistic regression confirmed that income improvement had a
positive relationship with endogenous factors. Therefore, hypothesis number one
was accepted.
The positive correlation of endogenous factors with income improvement may
be interpreted as indicating that internal strength is required to increase income.
The endogenous factors that were found to influence income improvement are:
1. aquaculture knowledge,
2. aquaculture skills,
3. aquaculture experience,
4. aquaculture education,
5. personal business experience, and
6. family business background.
The combined result of the exploratory factor analysis and binary logistic
regression analysis showed that these five internal characteristics were the most
important endogenous factors in determining the ability of small scale fish
farmers in deriving income improvement. Therefore, the first hypothesis was
accepted.
Hypothesis # 2
There is a positive correlation between the exogenous factors and the small
scale fish farmers’ income improvement: rejected
The aim of hypothesis number two was to test for a positive relationship
between income improvement and the exogenous factors. The result from the
binary logistic regression showed there was no positive correlation between
income improvement and the exogenous factors. As explained for hypothesis

233
number one, the ability to increase income requires more internal strength
characteristics than external support.
The exogenous factors that were previously thought to influence income
improvement are:
1. business network,
2. financial capital,
3. market,
4. logistics,
5. government/other institution support, and
6. family support.
The above exogenous factors did not show a direct relationship with income
improvement as evidenced by the result of a negative effect reported by the
binary logistic regression. Business network, government support and family
support, can only assist fish farmers with achieving income improvement but
cannot directly improve the fish farmers’ income. Other exogenous factors such
as capital, market and logistics also showed no direct relation to income
improvement. Therefore, the second hypothesis was rejected.
Hypothesis # 3
There is a positive correlation between the endogenous factors and the
small scale fish farmers’ product sustainability: accepted
The aim of hypothesis number three was to test for a positive correlation
between product sustainability and the endogenous factors. The result from the
binary logistic regression confirmed there was a positive relation between
product sustainability and the endogenous factors. The endogenous factors that
influenced product sustainability are:
1. aquaculture knowledge,
2. aquaculture skills,
3. aquaculture education,
4. strong entrepreneur character,
5. reason for going into business,
6. personal business experience,

234
7. family business background,
8. family support, and
9. logistics.
All nine of the identified endogenous factors of this research were found to be
important factors needed by small scale fish farmers in order to achieve product
sustainability. Knowledge, skills, education, character, reason and business
experience were all interpersonal characteristics needed to implement
sustainable fish farming. Family related factors (family business background and
family support) were also important factors that can support fish farmers in
implementing a sustainable aquaculture. Logistics too is considered important to
the achievement of product sustainability since services such as roads make it
easier for fish farmers to obtain information and training regarding sustainable
aquaculture. Logistics also make it possible for government officials to visit fish
farming locations to monitor sustainable aquaculture practices. Therefore, the
third hypothesis was accepted.
Hypothesis # 4
There is a positive correlation between the exogenous factors and the small
scale fish farmers’ product sustainability: accepted
The aim of the fourth hypothesis for this research was to test for a positive
correlation between the small scale fish farmers’ product sustainability and the
exogenous factors. The analyses result confirmed there was a positive
correlation between product sustainability and the exogenous factors. The
exogenous factors that influenced product sustainability were:
1. business network,
2. financial capital, and
3. government/other institution support.
These three exogenous factors had the greatest influence on product
sustainability. The government played the greatest role in assisting small scale
fish farmers in their attempt to achieve product sustainability. The Indonesian
government is aware on the importance of carrying out sustainable aquaculture
to secure the long term viability of fish farming businesses (Sukadi 2006).

235
Business networks also had an influence on product sustainability, since through
networking fish farmers shared information regarding product sustainability and
ways to implement sustainable aquaculture in their businesses. Networks may
assist the transfer of information regarding the consequences of unsustainable
aquaculture.
Access to financial capital also influenced product sustainability since
implementing sustainable aquaculture resulted in extra expenses for equipment
such as thermometers, pH meters, and salinometers. Therefore, the fourth
hypothesis was accepted.
Hypothesis # 5
There is a correlation between constraints and the small scale fish farmers’
income improvement: accepted
The aim of hypothesis number five was to test for a correlation between
constraints and fish farmers’ income improvement. The result of the binary
logistic regression analysis confirmed there was a correlation between
constraints and income improvement. According to the results of the exploratory
factor analysis the constraints that influenced income improvement were:
1. lack of capital,
2. low selling price,
3. lack of profit,
4. low quality fish seed,
5. low quality fish feed,
6. poor financial management skills,
7. poor quality control,
8. poor water quality, and
9. cannot secure a sufficient loan.
The constraints that directly influence income is lack of capital, low selling
price, lack of profit and poor financial management skills. The other constraints,
such as low quality fish feed, low quality fish seed, poor quality control and
poor water quality influenced income improvement through having and effect on
the quality of the fish harvest. Low quality fish will fetch low selling prices. An

236
inability to secure sufficient loans also influenced income since insufficient
funds to operate the fish farming business will result in financial problems.
Therefore, the fifth hypothesis was accepted.
Hypothesis # 6
There is a correlation between problems and the small scale fish farmers’
income improvement: accepted
The aim of hypothesis number six was to test for a correlation between problems
and the small scale fish farmers’ income improvement. The result of the binary
logistic regression analysis confirmed there was a correlation between income
improvement and problems. According to the exploratory factor analysis results
the problems that influenced income improvement were:
1. lack of family support,
2. lack of government support,
3. lack of training, and
4. lack of fish farming experience.
These problems had the greatest influence in obstructing fish farmers from
achieving income improvement. Without reasonable support from family
members, it is difficult for fish farmers to develop their business. This was a
result also supported by Lascocco et al. who believed that “a lack of family
support may place small business owners at a disadvantage” (Loscocco et al.
1991, p. 67). Fish farmers with supportive families benefited from their family’s
emotional support.
The government played a big role in the income improvement of small scale fish
farmers. The Indonesian government upheld the important contribution that
aquaculture made to the national economy. Nurdjana, the Director General for
Aquaculture, Ministry of Marine Affairs and Fisheries, the Republic of
Indonesia acknowledged this during the International Workshop on Innovative
Technologies for Eco-Friendly Fish Farm Management and Production of Safe
Aquaculture Foods in Bali, December 2006:
Aquaculture is an important component for Indonesian fisheries
which contributes to National food security, income and

237
employment generation and foreign exchange earnings.
Aquaculture has played its role as an alternative source of income
for coastal fishery communities. It ha also contributed for reducing
the pressure on marine natural resources. Recently, aquaculture
development in Indonesia has been accelerated and considered as
an important sector for in supporting rural economic development.
(Nurdjana 2006, p. 1)
The Indonesian government has supported the aquaculture industry with actions
such as:
1. Providing soft loans through the bank
The Indonesian government has developed cooperative measures with an
Indonesian bank to provide soft loans to fish farmers in Indonesia to develop
their business (Bernas 2003).
2. Providing capital support from the government
The Indonesian government has providing capital support to fish farmers
through their FFGs to benefit aquaculture development in Indonesia. As
much as Rp 194.5 million has been provided to motivate the self
development of FFGs and as a result indirectly increase their productivity
(Rokanhilir 2008). Antaranews (2007) also reported that the President of the
Republic of Indonesia has given FFGs in Central Java Rp 600 million in
supporting capital to install and improve irrigation systems in FFG fish
ponds.

238
3. Providing technical and managerial training
The Indonesian government, through the Department of Marine Affairs and
Fisheries, often delivered free training programs to FFG members. Training
programs were provided nationally, regionally and locally depending on the
specific training course. The training courses may cover technical content
such as fish farming methodologies, fish feed production or fish seed
production. It may also cover managerial training such as leadership and
financial management to enable FFGs in running their businesses. The fees
for this training were provided from the APBD/APBN (Regional Budget /
State Budget).
4. Providing fish disease and parasite handling support
The Indonesian government has also provided fish disease or parasite
outbreak services. Suara Merdeka (2002) reported that fish farmer groups in
Central Java received around Rp 500 million in support from the government
in the form of antibiotic vaccine, vitamins, and clinical laboratory tools to
assist the local fisheries officer to predict outbreaks and prevent outbreaks
from spreading. This fish disease and parasite handling centres were usually
located at local Fisheries and Marine Affairs Offices.
5. Providing subsidies
The Indonesian government has also provided small scale fish farmers in
Indonesia with subsidies. The Indonesian president has given up to 2.5
million fish seed to fish farmer groups in Central Java (Antaranews 2007).
The fish seed subsidies have been very valuable to fish farmers because fish
farmers have had difficulties in obtaining good quality fish seed. These
subsidies were another demonstration of the Indonesian government’s
support to fish farmers. Therefore, the sixth hypothesis was accepted.
239
Hypothesis # 7
There is a correlation between constraints and the small scale fish farmers’
product sustainability: accepted
The aim of hypothesis number seven was to test for a correlation between
constraints and the small scale fish farmers’ product sustainability. The result of
the binary logistic regression analysis confirmed there was a correlation between
product sustainability and constraints. According to the exploratory factor
analysis result the constraints that influenced product sustainability were:
1. poor financial management skills,
2. fish diseases and parasites,
3. poor water quality,
4. low quality fish feed,
5. low selling price,
6. low quality fish seed,
7. poor quality control,
8. cannot secure a sufficient loan, and
9. lack of profit.
The above constraints were divided into two major categories: financially related
and technically related constraints. The financially related constraints included:
poor financial management skills, low selling price, cannot secure a sufficient
loan and lack of profit. These financially related constraints influenced product
sustainability. The technically related constraints included: fish diseases and
parasites, poor water quality, low quality fish feed, low quality fish seed and
poor quality control. Therefore, the seventh hypothesis was accepted.
240
Hypothesis # 8
There is a correlation between problems and the small scale fish farmers’
product sustainability: accepted
The aim of the eighth hypothesis of this research was to test for a correlation
between problems and the small scale fish farmers’ product sustainability. The
result of the binary logistic regression analysis confirmed there was a correlation
between product sustainability and problems. According to the exploratory
factor analysis result the problems that influenced product sustainability were:
1. lack of family support,
2. lack of potential market,
3. lack of government support,
4. lack of training provided by the government,
5. lack of fish farming experience,
6. lack of capital, and
7. lack of technical abilities.
These seven problems listed above were believed to be the most influencing
problems faced by small scale fish farmers in Central Java in ensuring their
product sustainability.
Family support undoubtedly affected product sustainability since family
members were the closest persons supporting the fish farmers in their
businesses. The government support that focused on providing continuous
information and monitoring on sustainable aquaculture practices also played a
big role in affecting product sustainability. The government support included
government provided training, in particular training in sustainable aquaculture.
Other problems also affected product sustainability although not as directly as
the three problems discussed above. Therefore, the eighth hypothesis was
accepted.

241
Hypothesis # 9
There is at least one entrepreneurial activity implemented by small scale
fish farmers in Central Java: accepted
The aim of hypothesis number nine was to test if there was at least one
entrepreneurial activity that was implemented by small scale fish farmers in
Central Java. The result of the descriptive analysis through the frequency
analyses confirmed that there was at least one entrepreneurial activity that was
implemented by small scale fish farmers in Central Java. Therefore, hypothesis
number nine was accepted.
Hypothesis # 10
There are significant differences between awardees and non awardees in
implementing entrepreneurial activities in Central Java: accepted
The aim of the tenth hypothesis was to test for a significant difference between
awardees and non awardees in implementing entrepreneurial activities in Central
Java. The result from the chi-square test confirmed a significant difference
between awardees and non awardees small scale fish farmers in implementing
entrepreneurial activities. The test found that awardees and non awardees
showed significant differences in their implementation of two activities: market
extension and fish species extension. The fact that there was at least one activity
that showed a significant difference suggested that awardees and non awardees
did have significant differences in implementing entrepreneurial activities.
Therefore, hypothesis number ten was accepted.
This research predicted that there was a significant difference between small
scale fish farmers who had won the regional competition and received an award
from the government in the last five years and small scale fish farmers that had
not won the competition and received an award in the last five years. The results
of the chi-square analysis confirmed this prediction. It would seem obvious to
assume that members of fish farmer groups that had received a government
award would have a higher ability in implementing entrepreneurial activities
than those who had not received the award since the abilities of FFGs

242
participating in the competition were evaluated according to three aspects:
social, technical and economic aspects.
According to the social aspects evaluation, the FFGs were evaluated to identify
their abilities to manage their social activities such as managing their
organisational structure and activities as well as planning on how to gather their
working capital and other social issues related internally (within the fish farmer
group member) and externally (with other parties). The technical aspects
evaluation included all fish farming related technical aspects such as the FFG’s
ability to implement and develop fish farming skills. The competition evaluated
the FFG members’ technical fish farming knowledge and skills which included
the methods to obtain supplies, pond engineering as well as fish feed and fish
seed management. The way in which the FFG made innovations to each skill
was also evaluated and scored. Fish farmers with higher skills received higher
scores. The economic aspects evaluation of FFGs included business
development and management evaluations which included the ability of FFG
member to analyse their business. These also included the way in which they
obtained and secured sufficient loans, organised and managed their capital, and
also how they collaborated with village cooperative units. FFGs with members
with higher abilities for managing their finances received higher scores in the
competition evaluation.
The annual competition consisted of a two stage process of evaluation: (1) FFGs
answered a standard questionnaire and (2) field evaluations were conducted.
Since the three aspects mentioned above are included in the evaluation, it would
seem logical that the winning fish farmer group must have the highest capability
for those three aspects. However, there are some concerns regarding the
objectiveness of the evaluation. It would be impossible for one person or one
evaluation team to evaluate all fish farmer groups in Central Java not to mention
the whole country. The field evaluations have to be performed by many teams
assigned by each regional government. This may result in different judgements
being made between evaluation teams. Although standard guidelines were
available for the field evaluations, individual judgements between evaluators
differed and hence the results of the evaluation may not be objective.

243
Despite the differences in the objectiveness of the competition evaluation, the
result of the Chi-square analysis confirmed that there was a positive correlation
between awardees and non awardees in implementing entrepreneurial activities.
However, the positive correlation was not as expected. The research had
predicted that awardees should implement more entrepreneurial activities than
non-awardees. However, according to the results shown in Figures 7.10 and 7.11
non awardees implemented more entrepreneurial activities than awardees. As
was explained this finding may be due to invalid and non-objective qualities of
the competition evaluation.
The possibility of an invalid evaluation outcome of the competition has been
observed in actuality by the researcher. During data collection, one of the FFGs
listed as an awardee showed ambiguous signs. This FFG was listed as one of the
awardees of the 2007 competition, however, when the researcher inspected the
detailed data of this FFG, it was found that production had dramatically decline
over the years and that the number of members had also decreased. During a
personal interview with past members of that particular FFG, they claimed that
they had fish disease problems over the years which resulted in regular collapses
in fish stocks. This resulted in the decline of production and some members had
given up fish farming and changed to other activities. When the fish farmer was
questioned about the competition and about how they had won despite their
current condition, they claimed that the government officials had used their data
from prior years when they were still at the height of their success and still had
many members in their FFG.
This personal observation showed that the quality of the competition evaluations
may not been valid. This invalidity may also occur at the regional level of the
Department of Marine Affairs and Fisheries office from where the field
examinations are carried out. Monitoring of government officials to ensure field
evaluation validity may not be easy since many government officials are
involved and another strategy may be needed to avoid invalidity during FFG
competitions.

244
Hypothesis # 11
There are significant differences between different gender groups in
implementing entrepreneurial activities in Central Java: accepted
The aim of the eleventh hypothesis was to test for a significant difference
between genders in implementing fish farming entrepreneurial activities in
Central Java. The result from the chi-square test confirmed a significant
difference between genders in implementing the following three entrepreneurial
activities: fish seed production, market extension and product range extension.
This result confirmed that different genders of fish farmers showed a significant
difference in implementing entrepreneurial activities. Therefore, hypothesis
number eleven was accepted.
The significant difference between men and women fish farmers was obvious
just by looking at the large imbalance in the number of men and women fish
farmers that participated in this research. According to Table 6.30, 95.5% of the
participants were men and only 4.5% were women. This research had predicted
that there were more male fish farmers than female fish farmers. This is also
aligned with traditional beliefs that fish farming is a man’s job (Mbozi 1991).
This is because fish farming involves many heavy physical works such as
harvesting and pond cleaning. Furthermore, it was also found that men carried
out more entrepreneurial activities than women (Cowling and Harding 2001;
Reynolds et al 2002). This statement also supported the finding of this research
that significant differences were found between men and women in carrying out
entrepreneurial activities and that men implemented more entrepreneurial
activities than women (see Figures 7.12 and 7.13). This may be related to the
observation that women concentrate more on their family issues rather than their
business. The role of women as the primary family caretaker may limit the
women’s ability to focus on work related issues.

245
Hypothesis # 12
There are significant differences between groups of different ages in
implementing entrepreneurial activities in Central Java: accepted
The aim of the twelfth hypothesis of this research was to test for significant
differences between small scale fish farmers from different age groups in
implementing entrepreneurial activities in Central Java. The result from the chi-
square test confirmed that small scale fish farmers from different age groups
showed significant differences in implementing the following entrepreneurial
activities: fish species extension and product range extension. Since two
entrepreneurial activities identified in this research showed significant
differences between different age groups, hypothesis number twelve was
accepted.
Figures 7.14 and 7.15 show that younger fish farmers implemented more
entrepreneurial activities that older fish farmers. This finding contradicts
previous research that believed that older people were more interested in
becoming entrepreneurs (Cowling and Taylor 2001; Matthews & Moser 1996;
Robinson and Sexton 1994), which also implied that older people would be
more entrepreneurial. However, these previous research studied non-farm based
entrepreneurs and moreover, were carried out in developed countries. In
developing countries like Indonesia, especially in villages where low income
earners dominate society, young people are already trained to work hard in order
to help their parents to earn money and provide for their daily needs. Going to
school is often not an option because of the expensive. Therefore fish farmers
already have a heavy responsibility from a young age, while older fish farmers
expect their children to work hard and replace them. This may be an explanation
for why the result in this research that showed that young fish farmers
implemented more entrepreneurial activities than older fish farmers.

246
Hypothesis # 13
There are significant differences between groups of different marital status
in implementing entrepreneurial activities in Central Java: accepted
The aim of the thirteenth hypothesis of this research was to test for a significant
difference between small scale fish farmers with different marital status in
implementing entrepreneurial activities in Central Java. The result from the chi-
square test confirmed that small scale fish farmers with different marital status
showed significant difference in the entrepreneurial activity of fish species
extension. Since a significant difference was found in one of the entrepreneurial
activities identified in this research showed significant differences between
groups of different marital status, hypothesis number thirteen was accepted.
Figure 7.16 and Figure 7.17 show the comparison of small scale fish farmers
with different marital statuses in implementing entrepreneurial activities. The
figures both show that married fish farmers implement more entrepreneurial
activities than single. This finding is supported by previous references who
claimed that being married positively influence the probability of being
entrepreneurial (Cowling & Harding 2001; Robinson & Sexton 1994). It is
confirmed that by being married, fish farmers have bigger responsibility to
provide needs for their partner and children. Therefore, married fish farmers are
willing to implement any new techniques that can increase their income.
Hypothesis # 14
There are significant differences between groups with different educational
levels in implementing entrepreneurial activities in Central Java: accepted
The aim of the fourteenth hypothesis was to test for significant differences
between small scale fish farmers with different educational levels in
implementing entrepreneurial activities in Central Java. The result from the chi-
square test confirmed that small scale fish farmers with different educational
levels showed significant differences in implementing the following
entrepreneurial activities: fish seed production, market extension, fish species
extension and product range extension. Since significant differences were found

247
in four of the entrepreneurial activities identified in this research, hypothesis
number fourteen was accepted.
Figures 7.18 and 7.19 present the frequency and proportional comparisons of
small scale fish farmers with different education levels in implementing
entrepreneurial activities. The results showed that although there were four
entrepreneurial activities that showed significant differences between groups
with different education levels, there were only two activities that were
dominated by fish farmers who had complete high school: market extension and
product range extension. The other two activities, fish seed production and fish
species extension, were dominated by fish farmers who had not completed high
school.
These findings contradict this research’s prediction that fish farmers who have
completed high school should implement more entrepreneurial activities than
fish farmers who had not completed high school. The explanation for this
disparity may be found by focusing on the type of entrepreneurial activities that
were carried out. Fish farmers who had completed high school implemented the
entrepreneurial activities that were more complex and required higher levels of
innovativeness, knowledge and wider networks. Market extension required
market knowledge as well as wider networks in order to successfully expand
their market. Product range extension also required a higher level of creativeness
to create new products that were accepted in the market.
On the other hand, fish farmers who had not completed high school
implemented the activities of fish seed production and fish species extension.
Although these two activities were considered as entrepreneurial, the activities
did not require the fish farmer to have wider networks, knowledge or creativity.
Training for these activities was usually provided by the government for free.
The fish farmers did not have to make much extra effort in attending these
training courses.

248
Hypothesis # 15
There are significant differences between groups with different fish farmer
levels in implementing entrepreneurial activities in Central Java: accepted
The aim of the fifteenth hypothesis of this research was to test for significant
differences between small scale fish farmers from different levels of fish farmer
groups in implementing entrepreneurial activities in Central Java. The result
from the chi-square test confirmed that small scale fish farmers from different
levels of fish farmer groups showed significant differences in implementing the
following entrepreneurial activities: fish seed production, market extension and
fish species extension. Since significant differences were found in three of the
entrepreneurial activities identified in this research, hypothesis number fifteen is
accepted.
Figure 7.21 shows the proportional comparison between small scale fish farmers
from different levels of fish farming groups in implementing entrepreneurial
activities. The figure shows that fish farmers from advanced fish farmer groups
implemented more market extension and fish species extension activities than
farmers from starter fish farmer groups. Conversely, fish farmers from starter
fish farmer groups implemented more fish seed production activities than
advanced fish farmer groups.
The explanation for these results may be similar to the explanation provided for
the differences between fish farmers with different education level at Hypothesis
#14. Fish farmers from an advanced fish farmer groups implemented
entrepreneurial activities that were more complicated and required greater effort.
Market extension activities required that fish farmers have wider networks and
market knowledge, while fish species extension activities additionally required
fish farmers have adequate knowledge of fish feeding habits. On the other hand,
fish seed production activities only required the fish farmers had attend fish seed
production training courses and had implemented them according to the
instructions.
249
Hypothesis # 16
There are significant differences between groups with different reasons for
becoming fish farmers in implementing entrepreneurial activities in Central
Java: accepted
The aim of the last hypothesis of this research was to test for significant
differences between small scale fish farmers with different reasons for becoming
fish farmers in implementing entrepreneurial activities in Central Java. The
result from the chi-square test confirmed that small scale fish farmers with
different reasons for becoming fish farmers showed significant differences in
implementing the following entrepreneurial activities: market extension and fish
species extension. Since there were two entrepreneurial activities identified in
this research that showed significant differences between fish farmers with
different reasons for becoming fish farmers, the last hypothesis is accepted.
The finding relevant to this last research hypothesis is shown in Figure 7.23. The
figure shows a proportional comparison between fish farmers with different
reasons for becoming fish farmers in implementing entrepreneurial activities.
Small scale fish farmers reporting pull factors dominated both of the significant
entrepreneurial activities. This finding was aligned with previous research that
found that entrepreneurs reporting pull factors as their reasons were more likely
to succeed and earn more money than entrepreneurs reporting push factors
(Amit & Muller 1995). This is not surprising as fish farmers reporting pull
factors were naturally attracted to business since no one had forced him or her
into becoming a fish farmer. The people became fish farmers because they
wanted to, or have been inspired by the success of others and have become
interested in achieving the same success.
7.10. Conclusion
In carrying out their activities, small scale fish farmers have to face constraints and
problems that obstruct their fish farming businesses. In dealing with these obstructions,
fish farmers experience endogenous and exogenous factors that influence their actions
in their attempt to achieve income improvement and product sustainability. This
research explored the constraints and problems as well as the endogenous and
250
exogenous factors that fish farmers regard as influencing their activities in achieving
income improvement and product sustainability.
The results of the exploratory factor analyses and logistic regression analyses showed
that:
• Six endogenous factors influenced income improvement, while none of the
identified exogenous factors influenced income improvement.
• Nine endogenous factors and three exogenous factors influenced product
sustainability.
• Nine constraints and four problems influenced income improvement.
• Nine constraints and seven problems influenced product sustainability.
The descriptive analyses conducted for the implemented entrepreneurial activities in
Central Java illustrated that the most frequently implemented entrepreneurial activities
were: market extension, fish species extension and product range extension.
The comparisons between different groups of fish farmers in carrying out
entrepreneurial activities were analysed with Chi-square tests. The results showed that
significant differences in carrying out entrepreneurial activities were found in all of the
compared small scale fish farmer communities, namely between awardee and non
awardees, between different gender groups, between different age groups, between
different marital status groups, between groups with different educational levels,
between groups with different levels of fish farmer groups and between groups with
different reasons for become fish farmers.
In terms of the research hypotheses, of all sixteen hypotheses developed in this research,
only the second hypothesis was rejected. This rejection was the statistical analyses
showed no positive correlation between the small scale fish farmers’ income
improvement and the exogenous factors.

251
Chapter 8
Conclusions and Recommendations
8.1 Introduction
This research explored factors that influenced entrepreneurial activities of small scale
fish farmers in Central Java, in their attempt to improve their income and sustain their
production. Results and discussion of the findings have led to some recommendations
for the fisheries industry and related institutions, as presented below.
As the final chapter of the research, this chapter encapsulates the research from the
basic concept through to the final discussion based on the results of the analyses. This
chapter is divided into two sections: conclusions drawn from the analyses (section 8.2 to
section 8.6) and the development of recommendations including recommendations for
further research (section 8.7).
8.2 Endogenous and exogenous factors that influenced income improvement and product sustainability
The results of the exploratory factor analyses and logistic regression analyses confirmed
that income improvement was positively correlated with six endogenous factors but
showed no correlation with exogenous factors.
The analyses also found that three product sustainability activities: check water quality,
maintain fish feed quality and availability, and maintain fish seed quality and
availability were positively correlated with nine endogenous factors. Also, the analyses
found one product sustainability activity: maintain fish seed quality and availability to
be positively correlated with three exogenous factors. The positive correlation found for
both endogenous and exogenous factors in relation to product sustainability indicated
that in achieving product sustainability, endogenous strength and exogenous support
were important. Endogenous strength was not enough by itself to achieve product
sustainability. Exogenous support such as support from the government also played an
important role in determining the success of product sustainability.

252
8.3 Constraints and problems that influenced income improvement and product sustainability
The results of the analyses indicated a positive correlation between income
improvement and nine constraints. The analyses also found a positive correlation
between income improvement and four problems. Constraints consist of all the internal
weaknesses of fish farmers that affected their income. On the other hand, problems
arose as the result of uncontrollable negative support from people or institutions
surrounding the fish farmers. In this research, both constraints and problems were found
to influence income improvement.
Results of the exploratory factor analyses and logistic regression analyses showed that
one product sustainability activity: check water quality, was influenced by nine
constraints. Also, two product sustainability activities: give feed at the right quantity
and time, and maintain fish seed quality and availability were found to be influenced by
seven problems.
8.4 Entrepreneurial activities implemented by small scale fish farmers in Central Java
The implemented entrepreneurial activities refer to activities that were most commonly
carried out by small scale fish farmers in Central Java. Survey participants of this
research were asked to select from a list the entrepreneurial activities that they applied
in their fish farming businesses. The list of activities contained eight options: fish feed
production, fish seed production, market extension, fish species extension, product
range extension, utilisation of other fish parts, others and none of the above.
The analyses results indicated that the activity of market extension was most frequently
implemented by small scale fish farmers in Central Java. The next two most frequently
implemented options, in ascending frequency order, was: fish species extension, and
product range extension (adding value to fish product).
The least frequently implemented entrepreneurial activities by small scale fish farmers
were found to be fish feed production, fish seed production and utilisation of other fish
parts.
Participants who selected the ‘others’ option were assumed to have indicated that they
were carrying out activities that were not identified in this research and therefore not on

253
the list. Participants who chose the ‘none of the above’ option were taken to have
indicated that they had not implemented any entrepreneurial activities.
8.5. Comparison between fish farmers with different demographic background in carrying out entrepreneurial activities
The comparative analyses between fish farmers with different demographic background
aimed to determine how different groups of fish farmers implemented entrepreneurial
activities. The comparisons were made between: awardees and non awardees groups,
different gender groups, different age groups, groups of different marital status, groups
with different educational level, groups with different fish farmer group levels and
groups with different reasons for becoming fish farmers.
The results found that of all the groups compared, those that varied significantly in
implementing entrepreneurial activities were: fish farmers with different educational
level, groups with different fish farmer group level, groups with different reasons for
becoming fish farmers, and the awardees and non awardees groups. The comparisons
between groups based on different gender, different ages and different marital statuses
did not show significant variation in carrying out entrepreneurial activities.
8.6. Hypotheses acceptance or rejection
Objective # 1: Identify the endogenous and exogenous factors that small-scale fish
farmers regard as influencing their income improvement and product
sustainability
Hypothesis # 1: accepted
There is a positive correlation between the endogenous factors and the
small scale fish farmers’ income improvement
The results of the binary logistic regression analyses confirmed that there was a
positive correlation between the small scale fish farmers’ income improvement
and the endogenous factors. Therefore, the first hypothesis of this research was
accepted.

254
Hypothesis # 2: rejected
There is a positive correlation between the exogenous factors and the small
scale fish farmers’ income improvement
The results of the binary logistic regression analyses found no positive
correlation between the small scale fish farmers’ income improvement and the
exogenous factors. Therefore, the second hypothesis of this research was
rejected.
Hypothesis # 3: accepted
There is a positive correlation between the endogenous factors and the
small scale fish farmers’ product sustainability
The results of the binary logistic regression analyses confirmed that there was a
positive correlation between the small scale fish farmers’ product sustainability
and the endogenous factors. Therefore, hypothesis number three of this research
was accepted.
Hypothesis # 4: accepted
There is a positive correlation between the exogenous factors and the small
scale fish farmers’ product sustainability
The results of the binary logistic regression analyses verified that there was a
positive correlation between the small scale fish farmers’ product sustainability
and the exogenous factors. Therefore, hypothesis number four of this research
was accepted.

255
Objective # 2: Identify the constraints and problems that small-scale fish farmers
regard as influencing their income improvement and product sustainability
Hypothesis # 5: accepted
There is a correlation between the small scale fish farmers’ income
improvement and constraints
The results of the binary logistic regression analyses verified that there was a
correlation between the small scale fish farmers’ product sustainability and the
exogenous factor. Therefore, hypothesis number four of this research was
accepted.
Hypothesis # 6: accepted
There is a correlation between the small scale fish farmers’ income
improvement and problems
The results of the binary logistic regression analyses verified that there was a
correlation between the small scale fish farmers’ product sustainability and the
exogenous factors. Therefore, hypothesis number four of this research was
accepted.
Hypothesis # 7: accepted
There is a correlation between the small scale fish farmers’ product
sustainability and constraints
The results of the binary logistic regression analyses verified that there was a
correlation between the small scale fish farmers’ product sustainability and the
exogenous factors. Therefore, hypothesis number four of this research was
accepted.

256
Hypothesis # 8: accepted
There is a correlation between the small scale fish farmers’ product
sustainability and problems
The results of the binary logistic regression analyses verified that there was a
correlation between the small scale fish farmers’ product sustainability and the
exogenous factors. Therefore, hypothesis number four of this research was
accepted.
Objective # 3: Identify and describe various aspects of the entrepreneurial
activities of small-scale fish farmers in Central Java, Indonesia
Hypothesis # 9: accepted
There is at least one entrepreneurial activities implemented by small scale
fish farmers in Central Java
The results of the descriptive analyses confirmed that at least one entrepreneurial
activity was implemented by small scale fish farmers in Central Java is.
Therefore, hypothesis number nine was accepted.
Objective# 4: Compare between different groups of fish farmers in carrying out
entrepreneurial activities
Hypothesis # 10: accepted
There are significant differences between awardees and non awardees in
implementing entrepreneurial activities in Central Java
The results of the chi-square test confirmed that awardees and non awardees
small scale fish farmers displayed significant differences in implementing
entrepreneurial activities. These significant differences were found in the
following entrepreneurial activities: market extension and fish species extension.
Therefore, hypothesis number ten was accepted.
257
Hypothesis # 11: accepted
There are significant differences between different gender groups in
implementing entrepreneurial activities in Central Java
The results of the chi-square test confirmed that different gender groups showed
significant differences in implementing entrepreneurial activities. Therefore,
hypothesis number eleven was accepted.
There were three entrepreneurial activities that were found to be significantly
different when carried out by small scale fish farmers of different gender. These
entrepreneurial activities were: fish seed production, market extension and
product range extension.
Hypothesis # 12: accepted
There are significant differences between different groups of different ages
in implementing entrepreneurial activities in Central Java
The results of the chi-square test verified that groups of small scale fish farmers
of different ages showed significant differences in implementing entrepreneurial
activities. Therefore, hypothesis number twelve was accepted.
There were two entrepreneurial activities that were found to be significantly
different when carried out by small scale fish farmers with different ages. These
activities were: fish species extension and product range extension.
Hypothesis # 13: accepted
There are significant differences between groups of different marital
statuses in implementing entrepreneurial activities in Central Java
The results of the chi-square test suggested that groups of small scale fish
farmers with different marital statuses showed significant differences in
implementing entrepreneurial activities. Therefore, hypothesis number thirteen
was accepted.
There was only one entrepreneurial activity that showed significant differences.
This activity was fish species extension.

258
Hypothesis # 14: accepted
There are significant differences between different education levels in
implementing entrepreneurial activities in Central Java
The results of the chi-square test confirmed that groups of small scale fish
farmers with different educational levels show significant differences in
implementing entrepreneurial activities. Therefore, hypothesis number fourteen
was accepted.
There were four entrepreneurial activities that were found to be significantly
different when carried out by groups of small scale fish farmers with different
educational levels. These entrepreneurial activities were: fish seed production,
market extension, fish species extension and product range extension.
Hypothesis # 15: accepted
There are significant differences between different groups with different
fish farmer levels in implementing entrepreneurial activities in Central
Java
The results of the chi-square test suggested that small scale fish farmers from
groups with different levels of fish farmer group levels showed significant
differences in implementing entrepreneurial activities. Therefore, hypothesis
number fifteen was accepted.
There were three entrepreneurial activities that were found to be significantly
different when carried out by small scale fish farmers who belonged to different
levels of fish farmer groups. These entrepreneurial activities were: fish seed
production, market extension and fish species extension.

259
Hypothesis # 16: accepted
There are significant differences between groups with different reasons for
becoming fish farmers in implementing entrepreneurial activities in Central
Java
The results of the chi-square test suggested that small scale fish farmers with
different reasons for becoming fish farmers showed significant differences in
implementing entrepreneurial activities. Therefore, the last hypothesis was
accepted.
There were only two entrepreneurial activities that were found to be
significantly different when carried out by small scale fish farmers with different
reasons for becoming fish farmers. These entrepreneurial activities were: market
extension and fish species extension.
Table 8.1 summarises the research objectives as well as the acceptance or rejection of
the research hypotheses.
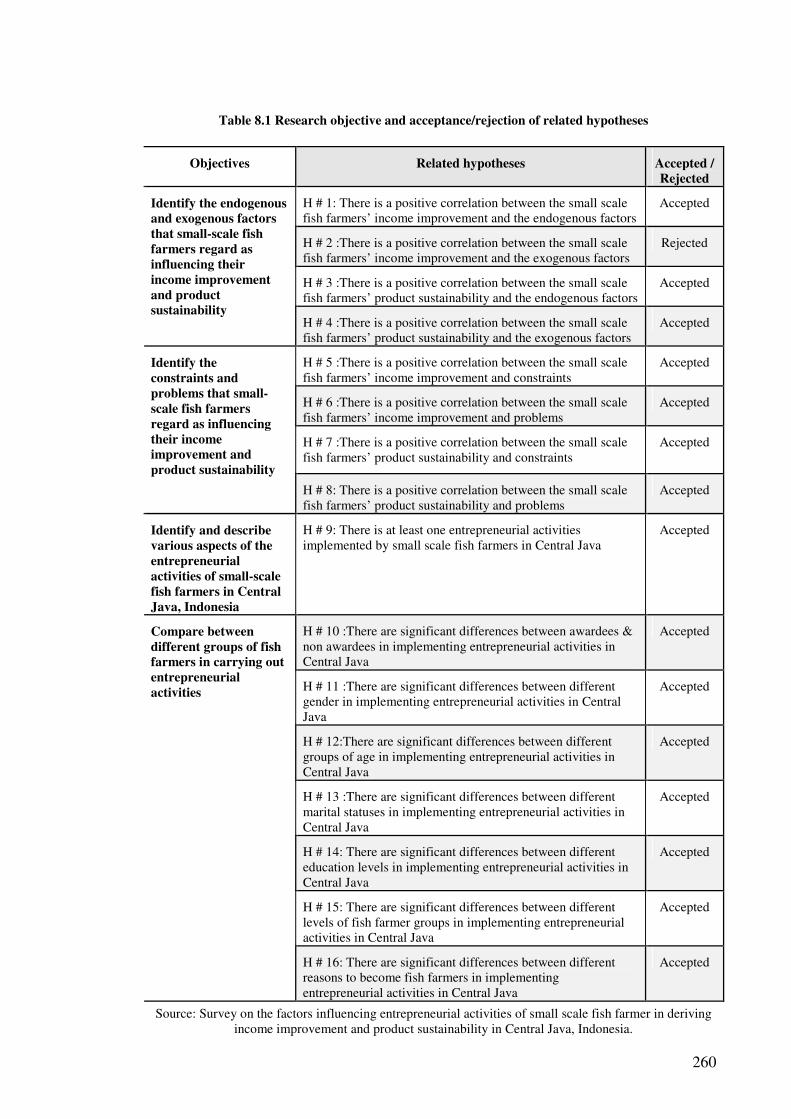
260
Table 8.1 Research objective and acceptance/rejection of related hypotheses
Objectives Related hypotheses Accepted / Rejected
H # 1: There is a positive correlation between the small scale fish farmers’ income improvement and the endogenous factors
Accepted
H # 2 :There is a positive correlation between the small scale fish farmers’ income improvement and the exogenous factors
Rejected
H # 3 :There is a positive correlation between the small scale fish farmers’ product sustainability and the endogenous factors
Accepted
Identify the endogenous and exogenous factors that small-scale fish farmers regard as influencing their income improvement and product sustainability
H # 4 :There is a positive correlation between the small scale fish farmers’ product sustainability and the exogenous factors
Accepted
H # 5 :There is a positive correlation between the small scale fish farmers’ income improvement and constraints
Accepted
H # 6 :There is a positive correlation between the small scale fish farmers’ income improvement and problems
Accepted
H # 7 :There is a positive correlation between the small scale fish farmers’ product sustainability and constraints
Accepted
Identify the constraints and problems that small-scale fish farmers regard as influencing their income improvement and product sustainability
H # 8: There is a positive correlation between the small scale fish farmers’ product sustainability and problems
Accepted
Identify and describe various aspects of the entrepreneurial activities of small-scale fish farmers in Central Java, Indonesia
H # 9: There is at least one entrepreneurial activities implemented by small scale fish farmers in Central Java
Accepted
H # 10 :There are significant differences between awardees & non awardees in implementing entrepreneurial activities in Central Java
Accepted
H # 11 :There are significant differences between different gender in implementing entrepreneurial activities in Central Java
Accepted
H # 12:There are significant differences between different groups of age in implementing entrepreneurial activities in Central Java
Accepted
H # 13 :There are significant differences between different marital statuses in implementing entrepreneurial activities in Central Java
Accepted
H # 14: There are significant differences between different education levels in implementing entrepreneurial activities in Central Java
Accepted
H # 15: There are significant differences between different levels of fish farmer groups in implementing entrepreneurial activities in Central Java
Accepted
Compare between different groups of fish farmers in carrying out entrepreneurial activities
H # 16: There are significant differences between different reasons to become fish farmers in implementing entrepreneurial activities in Central Java
Accepted
Source: Survey on the factors influencing entrepreneurial activities of small scale fish farmer in deriving income improvement and product sustainability in Central Java, Indonesia.

261
8.7. Development of recommendations
This study hoped to establish new understanding of the entrepreneurial activities of
small scale fish farmers. Many research projects have been carried regarding small scale
fish farmers, however, this research was the first that contributed to a more detailed
understanding of fish farmers’ entrepreneurial activities and the factors that influenced
them in carrying out their fish farming activities in order to derive their income
improvement and product sustainability.
The recommendations of this study derived from the research findings will provide
information to the aquaculture industry, the federal government and related institutions,
the provincial governments, the regional governments, students and researchers who
wish to carry out similar research.
Recommendations for small scale fish farmers
(1) For small scale fish farmers that have not yet implemented entrepreneurial
activity, the recommendation is to proactively implement entrepreneurial
activities to support them in achieving income improvement and product
sustainability.
Figure 7.9 showed that of the six entrepreneurial activities identified in this
research, there were three activities that were most frequently implemented by
the respondents in Central Java. These activities were: market extension,
followed by fish species extension and then product range extension. The figure
also showed that the entrepreneurial activities least frequently implemented were
fish feed production, utilisation of other fish parts and fish seed production.
Figure 7.9 also showed that there were fish farmers that had responded with the
option “none of the above” to the question about which of the listed
entrepreneurial activities they have implemented. This indicated that some of the
respondents had not implemented any entrepreneurial activity. It is advised that
these small scale fish farmers that have not implement any entrepreneurial
activities seek information from the government or from other small scale fish
farmers that have been successful in implementing of entrepreneurial activities
to improve their income and sustain their production.
262
This recommendation may be easier to achieve if there support is provided by
the federal, provincial and regional governments to encourage small scale fish
farmers to carry out entrepreneurial activities. Currently, the Diponegoro
University, the Wonososbo regional government and the Department of Marine
Affairs and Fisheries, as well as the Department of Youth and Sports are
developing a fish cultivation development program which includes four of the
entrepreneurial activities identified in this research (Undip, 2010). Their fish
cultivation development program includes fish seed production, product range
extension, utilization of other fish parts and market extension. This program is
expected to encourage young fish farmers in the Wonosobo region to increase
their income through cultivating of nila and patin species by undertaking those
four activities. Therefore, not only they will have the ability to cultivate fish but
will also add value to their harvest.
(2) For small scale fish farmers that have implemented entrepreneurial activities,
the recommendation is to continue to carry out these activities and implement
additional ones. As showed in Figure 7.9 that there was a significant gap
between the numbers of respondents who had implemented market extension,
fish species extension and product range extension, and respondents who had
implemented fish feed production, utilization of other fish parts and fish seed
production. Based on this finding, the recommendation for small scale fish
farmers is to try and implement the other entrepreneurial activities (such as
produce their own fish feed, produce their own fish seed and utilize other parts
of fish) in their fish farming activities.
To encourage other fish farmers, small scale fish farmers who have successfully
implemented entrepreneurial activities are advised to share their success stories
with other fish farmers and to encourage those other small scale fish farmers to
do the same thing. The most recent and well known example of fish farmers who
are sharing their success stories in Central Java is the fish farmers from the
catfish village. The approximately 105 fish farmers in this village cultivate only
catfish in 20 hectares of pond and produce 7-10 tons of catfish per day (Boyolali
Animal Husbandry and Fisheries Office 2007). These fish farmers belong to the
FFG called “Karya Mina Utama” and was the first winning fish farming group
in the region and in Central Java. Karya Mina Utama is an excellent example of

263
a FFG in Central Java that have expanded their product range rapidly and turned
their village into the largest catfish producer in Central Java. Their products are
not limited to fresh catfish, but also include processed catfish product such as
fish ball, fish crackers, fish skin crackers, fish nuggets, and shredded catfish that
are managed by the female FFG members (Suara merdeka 2007c).
(3) It is recommended that small scale fish farmers attend every training and
skill enhancement opportunity provided by government and other institutions in
order to support their business development. Any kind of technical or
managerial training or skill enhancement is very important for increasing the
knowledge and skills of small scale fish farmers. The findings of this research
have confirmed the importance of fish farming skills in achieving income
improvement and product sustainability. Figure 7.2 showed that mastery of fish
farming skills were included as one of the endogenous factors that influenced the
success of fish farmers in achieving income improvement. Figure 7.4 also
showed that mastery of fish farming skills is an important endogenous factor that
influenced product sustainability. Based on these findings, it is advised that
small scale fish farmers attempt to attend these training opportunities under any
circumstances, that is, they are advised to attend training no matter what their
circumstances, whether they are located far from the training centre or
experience any other condition that might make it difficult for them attend.
(4) It is recommended that small scale fish farmers proactively implement
sustainable fish farming activities to achieve product sustainability. Many small
scale fish farmers are unaware of the importance of implementing sustainable
aquaculture to sustain their production. It is vital for small scale fish farmers to
understand just how important this is for their own business. Figure 7.4 showed
that there were nine endogenous factors that were important for fish farmers to
achieve product sustainability. Knowledge, skills and experience in sustainable
fish farming can be more successful if the government provides full support. As
explained previously that Sukadi (2006) mentioned several factors that
Indonesia is facing such as fish disease, fish farming systems and environmental
management in order to achieve sustainable aquaculture, therefore, it is
important that the government also fully support small scale fish farmers in
sustainable aquaculture implementation.

264
Recommendations for the federal government
It is recommended that the federal government establish new policies and
develop new programs to support fish farmers such as:
(1) Include the promotion of entrepreneurial activities into future aquaculture
development policy and encourage the implementation of entrepreneurial
activities by small scale fish farmers through the provision of development
programs.
Most policies established by the Indonesian federal government are focused on
the outcomes of aquaculture and the quality the fish that the farmer produces.
For example, the Regulation and Decision from the Marine and Fisheries
Minister of the Republic of Indonesia mainly focuses on aquaculture production
guidelines, the monitoring of the use of chemicals, biological and contaminants
in aquaculture, good methods of fish cultivation, quality surveillance, and more.
Most of these policy objectives concentrate on the consumer and are focus to a
lesser extent on the importance of the fish farmers. One of the few of policies
targeting fish farmers is the Decision from the Marine and Fisheries Minister
No. KEP. 18/MEN/2004: The general gudelines for the implementation of
economic empowerment programmes for coastal communities (Decision of the
Minister of Marine and Fisheries No. KEP. 18/MEN/2004). This aim of this
guideline is to increase the welfare of the coastal communities through economic
development activities, increase the quality of human resources, and optimise
the use of fisheries and marine resources in Indonesia. The implementation of
this guideline focuses on providing soft loans to coastal communities for
expanding their businesses. The recommendation of this research is for the
federal government to include the promotion of entrepreneurial activities as a
program to enable the fisheries community to improve their own welfare. Suara
Merdeka (2007d) and Kompas (2006) reported that fish farmers improved their
income through implementing entrepreneurial activities and therefore it is
important to include these activities in the federal government’s future policies
and programs.
265
(2) Encourage small scale fish farmers to proactively implement sustainable
aquaculture practice.
The implementation of sustainable aquaculture has been developed as the vision
and mission for aquaculture development in Indonesia. The vision was to “shape
Indonesian aquaculture as a competitive and sustainable mainstay of economic
growth”, and the third mission was to “develop an aquaculture sector which is
responsible and environmentally friendly (Nurdjana 2006, p. 16). The results of
this research strongly support the government’s mission and vision for
sustainable aquaculture development. The findings have shown that product
sustainability was positively correlated with the endogenous and exogenous
factors as well as with the problems and constraints. Therefore, future programs
to encourage sustainable aquaculture implementation can be developed and
based on the findings of this research.
Recommendations for the provincial governments
It is recommended that the provincial governments:
(1) Establish aquaculture development program which focus on fish farmers’
income improvement through entrepreneurial activities.
The findings of this research showed that some of the fish farmers in Central
Java have not yet implement entrepreneurial activities. This is shown in Figure
7.9 where some of the respondents selected the “none of the above” option,
which indicated that they had not implemented any entrepreneurial activities.
The importance of entrepreneurial activities is also supported by research that
found that these activities can support small scale fish farmers in achieving
income improvement. For example Kompas (2006) reported that a fish farmer in
West Java had successfully increased his income five times after he
implemented fish species extension systems (poly-culture system). Another
example of successful entrepreneurial activity implementation was reported by
Suara Merdeka (2007d) that a fish farmer group in Central Java had applied
product range extension and utilization of other fish parts (Suara Merdeka
2007c) which brought them large profits that could be seen in the increased
number of new houses and cars within the village.

266
According to the Central Java Fisheries and Marine Affairs Office (2007), the
focus of aquaculture development in Central Java is on the development of
aquaculture commodities according to the regions. For example, development of
Vennamae shrimp is focused in four regions: Brebes, Tegal, Pekalongan and
Kendal, while catfish or seaweed development is focused in other regions. The
Provincial governments have not yet focused on the development of
entrepreneurial activities that will not only increase the fisheries production but
that can also add value to the product. Just like the federal government, the
aquaculture development in Central Java is still focused on the development of
production and the quality of the harvest and has not yet focused on the
development of the fish farmers.
Based on the findings of this research it is important for provincial governments
to establish aquaculture development program which focus on income
improvement of the fish farmers through the implementation of entrepreneurial
activities.
(2) Establish a small scale fish farmers’ Entrepreneurial Activities Department
(EAD) at the Provincial Fisheries and Marine Affairs office.
This recommendation is provided because the Indonesian government has not
yet included a developmental program which focuses on the income
improvement of the fish farmers. Findings of this research have suggested that
although governments or other institution have no direct correlation with income
improvement (Figure 7.2), governments can help fish farmer to increase their
knowledge, skills and experience (which were important endogenous factors that
influenced income improvement) by providing them with training and other
developmental programs. Research by, for example, Kompas (2006), Suara
Merdeka (2007d) and Suara Merdeka (2007c) reported on the importance of
entrepreneurial activities in increasing fish farmers’ income. Therefore, it is
recommended that entrepreneurial activities be included into the Indonesian
Aquaculture Development Program. In order to support the implementation of
entrepreneurial activities and practices, a separate department which focuses on
entrepreneurial activities should be established at the Provincial Fisheries and
Marine affairs office. This department can arrange training sessions, as well as

267
monitor the progress of implementation of entrepreneurial activities of small
scale fish farmers.
(3) In order to stimulate the implementation of entrepreneurial activities, it is
recommended that the provincial governments establish an annual
entrepreneurial activities’ competition for small scale fish farmers.
Currently, the provincial government has organised an annual fish farmer’s
group (FFG) competition. The current competition evaluates FFGs according to
three evaluation criteria:
a. Social criteria. These criteria evaluate the ability of the FFG to self manage,
its organisational structure, the conduct of internal FFG meetings, activities,
capital collection, and other socially related aspects both within the FFG and
externally between the FFG and other parties.
b. Technical criteria. These criteria include technical aspects such as
aquaculture skills, raw materials, aquaculture infrastructure, and technology
development.
c. Economical criteria. These criteria include aspects of business analysis,
business loans, capital, and cooperation with village cooperation unit.
(Semarang Marine Affairs and Fisheries Office 2005)
It is recommended that entrepreneurial activities are included in this competition
either as part of the evaluation criteria or as a stand alone entrepreneurial
activities competition. For example, the competition could evaluate fish farmer
groups according to their ability to significantly increase their income by
developing new aquaculture techniques or by inventing new value added
products. The winner of the entrepreneurial activity competition should receive
not only prize money, but also recognition and guarantees by the government for
markets for their new products or patent protection for their new aquaculture
techniques. The hope is that this may encourage more small scale fish farmers to
implement entrepreneurial activities in their fish farming business.
268
Recommendations for the regional governments
For regional governments and related institutions, the recommendations are to:
(1) Establish an Entrepreneurial Activities Centre (EAC) at the regional
Fisheries and Marine affairs office to conduct continuous training and
monitoring of small scale fish farmers.
To be aligned with Entrepreneurial Activities Department (EAD) in the Fisheries
and Marine Affairs office at the provincial level, it also recommended that a
similar department at the regional level is established. The Entrepreneurial
Activities Centre (EAC) at the regional Fisheries and Marine Affairs Office are
to:
a. Provide information of entrepreneurial activities that can be implemented by
small scale fish farmers.
b. Provide entrepreneurial activities training for small scale fish farmers in the
region.
c. Carry out continuous monitoring of fish farmers that implement
entrepreneurial activity.
d. Become the direct technical support for small scale fish farmers in the case
of any problems that arise or to support fish farmers with advice.
(2) Provide training and continuous monitoring of sustainable aquaculture in
order to achieve product sustainability.
Indonesia is still facing challenges in implementing sustainable aquaculture
(Sukadi 2006) and therefore it is crucial for the government to provide training
and continuous monitoring in the establishment of sustainable aquaculture. In
order to achieve sustainable aquaculture the recommendation is for the Regional
Fisheries and Marine Affairs Office to:
a. Provide information on the importance of sustainable aquaculture
implementation to fish farmers.

269
b. Provide training on the implementation of sustainable aquaculture in fish
farmers’ businesses.
c. Carry out continuous monitoring of fish farmers that carry out sustainable
aquaculture.
d. Provide technical support for fish farmers that need assistance in
implementing sustainable aquaculture.
(3) Provide soft loans as well as financial management skills training and
continuous financial monitoring for the period of the loan.
Lack of capital and inability to secure sufficient loans (Awulachew et al. 2008;
Das 2006; Nam & Thuok 1999) are recurrent problems faced by many small
scale fish farmers. In order to support fish farmers, it is important for the
government to assist them through the provision of soft loans that are tied to
financial management skills training and continuous monitoring for the period of
the loan. It is hoped that in this way fish farmers will be able to manage their
finances and receive financial advice before they make wrong decisions. It is
expected that by following this program, small scale fish farmers will be able to
eventually become financially independent and not need financial support again
from the government or from other related institutions.
(4) Establish fish seed and fish feed production centers to assist small scale fish
farmers with fish seed and fish feed production training as well as providing the
seed and feed to them for purchase.
This recommendation is provided in support of the federal government’s policy
to encourage fish feed and fish seed production. By providing fish feed and fish
seed production centers, small scale fish farmers will be able to secure their fish
feed and fish seed stock. They can also be trained to produce their own fish feed
and fish seed and also maintain the quality and quantity of their fish feed and
fish seed.

270
(5) Provide training and information about potential markets.
In order to open up other market opportunities, it is recommended that the
government provide training to small scale fish farmers on how to develop new
customers as well as to provide them with information on potential markets. It is
expected that this can assist fish farmers in broadening their market potential and
widening their networks. For example, Undip (2010) reported on a program that
is being developed to empower young small scale fish farmers and to find
potential markets for small scale fish farmers in the Wonosobo region. This
development program is supported by the Wonosobo Regional government as
well as the Department of Marine Affairs and Fisheries and also the Department
of Youth and Sport.
(6) Provide training and continuous monitoring on poly-culture systems.
Poly-culture systems have been shown to increase small scale fish farmers’
income (Kompas 2006). Therefore, it is important for the government to provide
training on poly-culture systems. Continuous monitoring on poly-culture
systems is also important to make sure the small scale fish farmers are using
correct techniques.
(7) Provide training on product range extension.
The activity of product range extension (adding value to product) has been
implemented by several FFGs in Central Java and it has been shown to increase
their income (Suara Merdeka 2007d). Success stories on product range extension
should be distributed to encourage other fish farmers to adopt similar activities.
Government involvement is critically needed in the form of training on product
range extension for fish farmers who have not implemented this activity.
(8) Provide training on the utilisation of other fish parts.
Utilisation of other fish parts is a very infrequently implemented activity since
many fish farmers may have no idea on what to do with their fish waste.
However, a FFG in Central Java have utilised their fish waste by turning it into
food such as fish skin crackers and fish fin crackers (Suara Merdeka 2007c). The
fish farmers were able to raise a good amount of money by utilising other fish

271
parts. It is crucial that the government assist small scale fish farmers by
providing training on the utilisation of other fish parts. Through this small scale
fish farmers will be able to recognise opportunities for utilising other parts of
fish and improve their income.
(9) Assist small scale farmers in all aspects for carrying out their fish farming
activities.
Many unexpected circumstances may befall fish farmers while carrying out their
activities. Hence, it is important that the government provide constant assistance
to small scale fish farmers in all aspects of fish farming activities.
Recommendations for further research
This study is limited to the factors that influence a small number of
entrepreneurial activities implemented by small scale fish farmers in Central
Java, in their attempt to improve their income and sustain their product. There
are only six entrepreneurial activities identified in this research. Furthermore,
each of the identified activities in this study has not been researched individually
in detail. Therefore, for students and researchers who wish to conduct similar
research to this study is recommended to:
(1) Develop further research on entrepreneurial activities of small scale fish
farmers.
It is recommended that other students or researchers carry out further research
on the entrepreneurial activities of small scale fish farmers. It is important that
this community group is not ignored but is supported. By carrying out further
research on entrepreneurial activities, this group can enhance their standard of
living and increase the potential of the world’s aquaculture.
(2) Conduct comparative research on entrepreneurial activities of fish farmers in
developing and developed countries.
There may be differences between entrepreneurial activities carried out by fish
farmers in developed and in developing countries. By comparing the activities in
different countries, the success of fish farmers in developed country may be

272
identified for implementation by fish farmers in developing countries, or vice
versa.
(3) Conduct more detailed research on each of the entrepreneurial activities
identified in this research.
This research only made a cursory examination of six entrepreneurial activities.
It is recommended that further research of a more detailed construction is carried
out for each of the entrepreneurial activities identified in this research.
(4) Identify additional entrepreneurial activities for small scale fish farmers’.
The entrepreneurial activities identified in this research have not exhausted all
possibilities for entrepreneurial activities of small scale fish farmers. There may
be activities carried out by fish farmers that were not been identified in this
research. It is advisable that further research be carried out to identify other
possible entrepreneurial activities.
8.8. Conclusion
The objectives of this research have been achieved by testing the sixteen hypotheses.
After the statistical analyses were carried out, the results showed that of all sixteen
hypotheses, only one hypothesis was rejected while the other fifteen were accepted.
The first objective for this research was to identify endogenous and exogenous factors
that small-scale fish farmers regarded as influencing their income improvement and
product sustainability. There were four hypotheses developed from this objective and
one of them was rejected. The statistical analyses suggested that there was a positive
correlation between the endogenous factors and income improvement, but there was not
a positive correlation between the exogenous factors and income improvement. On the
other hand the analyses showed that both endogenous and exogenous factors influenced
product sustainability.
The second objective was to identify the constraints and problems that small-scale fish
farmers regarded as influencing their income improvement and product sustainability.
There were also four hypotheses developed from this objective and all of them were

273
accepted. The tests indicated that both product sustainability and income improvement
were correlated with constraints and problems.
The third objective for this research was to identify and describe various aspects of the
entrepreneurial activities of small-scale fish farmers in Central Java, Indonesia. One
hypothesis was developed from this objective and the hypothesis was accepted based on
the results of the descriptive analyses. The analyses showed that there was at least one
entrepreneurial activity that was being carried out by small scale fish farmers in Central
Java.
The fourth objective was to compare different groups of fish farmers in implementing
entrepreneurial activities. Seven hypotheses were developed from the fourth objective
and all of them were accepted. The statistical analyses indicated that there was a
significant difference between awardees and non-awardees in Central Java in carrying
out entrepreneurial activities. Significant difference were also found between groups of
different gender, different age groups, groups of different marital statuses, groups with
different educational levels, groups with different fish farmer group levels, and groups
with different reasons for becoming fish farmers.
The last objective for this research was to develop recommendations for the aquaculture
and fisheries industry, government, educational institutions and research communities in
Indonesia on aspects that may contribute to the success of small scale fish farmers in
obtaining their income improvement and product sustainability. Based on the fifth
objective, the following recommendations were developed:
For small scale fish farmers:
1. For small scale fish farmers that have not yet implemented entrepreneurial activity,
the recommendation is to proactively implement entrepreneurial activities to support
them in achieving income improvement and product sustainability.
2. For small scale fish farmers that have implemented entrepreneurial activities, the
recommendation is to continue to carry out these activities and implement additional
ones.
274
3. It is recommended that small scale fish farmers attend every training and skill
enhancement opportunity provided by government and other institutions in order to
support their business development.
4. It is recommended that small scale fish farmers proactively implement sustainable
fish farming activities to achieve product sustainability.
For the federal government:
It is recommended that the federal government establish new policies and develop new
programs to support fish farmers such as:
1. Include the promotion of entrepreneurial activities into future aquaculture
development policy and encourage the implementation of entrepreneurial activities
by small scale fish farmers through the provision of development programs.
2. Encourage small scale fish farmers to proactively implement sustainable aquaculture
practice.
It is recommended that the provincial governments:
1. Establish aquaculture development program which focus on fish farmers’ income
improvement through entrepreneurial activities.
2. Establish a small scale fish farmers’ Entrepreneurial Activities Department (EAD) at
the Provincial Fisheries and Marine Affairs office.
3. In order to stimulate the implementation of entrepreneurial activities, it is
recommended that the provincial governments establish an annual entrepreneurial
activities’ competition for small scale fish farmers.
For regional governments and related institutions, the recommendations are to:
1. Establish an Entrepreneurial Activities Centre (EAC) at the regional Fisheries and
Marine affairs office to conduct continuous training and monitoring of small scale
fish farmers.
2. Provide training and continuous monitoring of sustainable aquaculture in order to
achieve product sustainability.
3. Provide soft loans as well as financial management skills training and continuous
financial monitoring for the period of the loan.

275
4. Establish fish seed and fish feed production centers to assist small scale fish farmers
with fish seed and fish feed production training as well as providing the seed and
feed to them for purchase.
5. Provide training and information about potential markets.
6. Provide training and continuous monitoring on poly-culture systems.
7. Provide training on product range extension.
8. Provide training on the utilisation of other fish parts.
9. Assist small scale farmers in all aspects for carrying out their fish farming activities.
For students and researchers who wish to conduct similar research the recommendations
are to:
1. Develop further research on entrepreneurial activities of small scale fish farmers.
2. Conduct comparative research on entrepreneurial activities of fish farmers in
developing and developed countries.
3. Conduct more detailed research on each of the entrepreneurial activities identified in
this research.
4. Identify additional entrepreneurial activities for small scale fish farmers’.

276
References
ACIAR 2008, ‘Improving productivity and profitability of smallholder shrimp aquaculture and related agribusiness in Indonesia’, viewed on 3rd September 2008, http://www.aciar.gov.au/project/FIS/2005/169 ADB 2003, ‘Technical assistance to the Republic of Indonesia for preparing the sustainable aquaculture development for food security and poverty reduction project’, Asian Development Bank. ADB, 2006, ‘Expanding aquaculture production for Indonesia’s poor fish farmer’, viewed on 18th June 2008, http://www.adb.org/Media/Articles/2006/11167-indonesian-aquaculture-development-projects/ ADB 2008, ‘Projects in Indonesia’, viewed on 2nd September 2008 , http://www.adb.org/projects/summaries.asp?browse=1&type=&query=development&fld=1&srt=-1&ctry=INO&offset=150 Akpaniteaku, RC, Weimin, M & Xinhua, Y 2005, ‘Evaluation of the contribution of fisheries and aquaculture to food security in developing countries’, NAGA, WorldFish
Center Newsletter, vol. 28, no. 1 & 2, Jan-Jun, pp. 28-32. Alder, PR, Takeda, F, Glenn, DM & Summerfelt, ST 1996, ‘Utilizing by products to enhance aquaculture sustainability’, World Aquaculture, vol. 27, no. 2, pp. 24-26. Amit, R & Muller, E 1995, ‘“Push” and “Pull” entrepreneurship’, Journal of Small
Business and Entrepreneurship, vol. 12, no. 4, pp. 64-80. Antaranews 2007, ‘Presiden Yudhoyono memulai kunjungan ke Jateng (President Yudhoyono started his Central Java visit)’, viewed on 5th March 2008, http://www.antara.co.id/print/?i=1171945075 Asianinfo 2000, ‘Asianinfo, your complete resource on Asia: Indonesia’s geography’, viewed on 16th June 2008, http://www.asianinfo.org/asianinfo/indonesia/pro-geography.htm Askoxford 2008, viewed on 9th September 2008, http://www.askoxford.com/?view=uk Awulachew, SB, Merrey, D, van Koppen, B, Kamara, A, de Vries, PF & Boelee, E 2008, ‘Roles, constraints and opportunities of small-scale irrigation and water harvesting in Ethiopian agricultural development’, viewed on 3rd March 2008, http://www.ilri.org/data/livelihood/Proceedings/papers/10SeleshiNew.htm#TopOfPage Basu, A 1998, ‘An exploration of entrepreneurial activity among Asian small businesses in Britain’, Small Business Economics, no. 10, pp. 313-326. Bernas 2003, ‘Petani ikan terima kredit lunak (Fish farmers receive soft loans)’ , viewed on 5th March 2008, http://www.indomedia.com/bernas/032002/11/UTAMA/11jat2.htm

277
Beveridge, MCM, Phillips, MJ & Macintosh, DJ 1997, ‘Aquaculture and the environment: the supply of and demand for environmental goods and services by Asian aquaculture and the implications for sustainability’, Aquaculture Research, no. 28, pp. 797-807. Be, TT 1994, Sustainability of rice-shrimp farming system in a brackish water area in
the Mekong delta of Vietnam, Thesis for Master of Science in Systems Agriculture, School of Agriculture and Rural Development, Faculty of Agriculture and Horticulture, University of Western Sydney, Australia. Bisnis Indonesia 2007, ‘PT. Ohama Nusantara andalkan rumput laut polikultur (PT. Ohama Nusantara are depending on polyculture seaweed)’, Bisnis Indonesia online newspaper, 20th May 2007, viewed on 28th October 2008, http://web.bisnis.com/cetak.php?cid=1&id=6073&url=http%3A%2F%2Fweb.bisnis.com%2Fedisi-cetak Black, R 2006, ‘Only 50 years left for sea fish’, BBC online news, 2nd November 2006, viewed on 15th September 2008, http://news.bbc.co.uk/2/hi/science/nature/6108414.stm Blackman, AJ 2003, Entrepreneurs:Interrelationships between their characteristics,
values, expectations, management practices and SME performance (thesis), School of Business, Department of Management, Griffith University, Australia. Bocek, A (ed) 2008, ‘Water harvesting and aquaculture for rural development, International Center for Aquaculture and Aquatic Environments’, Auburn University, USA, viewed on 28th October 2008, http://www.ag.auburn.edu/fish/international/polycul.htm Bolt R, 2005, ‘Improving the relevance and feasibility of agriculture and rural development operations: How economic analyses can help’, ERD Technical Note
Series, no. 12, September, Economic and Research Department, Asian Development Bank, Philippines. Bondad-Reantaso, MG (ed) 2007, ‘Assessment of freshwater fish seed resources for sustainable aquaculture’, FAO Fisheries Technical Paper, no. 501, viewed on 3rd December 2008, http://www.fao.org/docrep/010/a1495e/a1459e00.HTM Booth, A 1993, ‘Counting the poor in Indonesia’, Bulletin of Indonesian Economic
Studies, vol. 29, no. 1, pp. 53-83. Bouchikhi, H 1993, ‘A constructivist framework for understanding entrepreneurship performance’, Organization Studies, vol. 14, no. 4, pp. 549-570. Boyd, CE 1999, ‘Aquaculture sustainability and environmental issue’, World Aquaculture, vol. 30, no. 2, pp. 10-13. Boyd, CE & Massaut, L 1999, ‘Risk associated with the use of chemicals in pond aquaculture’, Aquacultural Engineering, vol. 20, pp. 113-132.

278
Boyolali animal husbandry and fisheries office 2007, Selayang pandang “Kampung
Lele” (A preview of the “Catfish Village”), Boyolali animal husbandry and fisheries office, Central Java, Indonesia. Briones, M, Dey, DD & Ahmed, M 2004, ‘The future for fish in the food and livelihoods of the poor in Asia’, NAGA WorldFish Center Quarterly, vol. 27, no. 3&4 Jul-Dec 2004, pp. 48-50. Brockhaus, RH 1980, ‘Risk taking propensity of entrepreneurs’. Academy of
Management Journal, vol. 23, no. 3, pp. 509-520. Brown, R 1990, Encouraging Enterprise: Britain`s Graduate Enterprise Program, Journal of Small Business Management, vo. 28, no. 4, pp. 71-77. Budhiman, A 2007, Freshwater fish seed resources in Indonesia, FAO Fisheries
Technical Paper, no. 501, pp. 329-341. Bueno, P 1999, ‘The small fish farmers of Asia: Will they have to lift themselves by their own bootstraps?’ , Paper presented at the meeting of the FAO/APFIC Ad Hoc working group of expert on rural aquaculture, 20-22 October 1999, Bangkok, Thailand, viewed on 11th February 2009, http://www.fao.org/docrep/005/x4545e/X4545e32.htm Caffey, RH, Kazmierczak, RF & Avault, JW 2001, ‘Developing consensus indicators of sustainability for South eastern United States aquaculture’, LSU Ag Center Bulletin, no. 879, December 2001, USA. Carland, JW, Hoy, F, Boulton, WR & Carland, JA 1984, ‘Differentiating entrepreneurs from small business owners: a conceptualization’, Academy of management Review, vol. 9, no. 2, pp. 354-359. Central Java Fisheries and Marine Affairs Office 2005, Profil Potensi Perikanan
Budidaya Jawa Tengah 2005 (Central Java Potential Aquaculture Profile 2005), Central Java Fisheries and Marine Office in Cooperation with the Fisheries and Marine Development and Research Institute, Central Java-Indonesia. Cowling, M & Harding, R 2001, ‘The present and the future: Gender differences in the nature and scale of entrepreneurial activity and potential activity in the UK’, IES
Working paper:WP6, Institute of Employment Studies, UK. Cowling, M & Taylor, M 2001, ‘Entrepreneurial Women and Men: Two Different Species?’ , Small Business Economics, no.16, pp. 167–175. Das, SK 2006, ‘Small-scale rural aquaculture in Assam, India-a case study’, NAGA
WorldFish Center Quarterly, vol. 29, no. 1&2, Jan-Jun, pp. 42-47. De la Cotera, J 2001, ‘ALBANIA-QABI a tool to support private farmers association in Southern Albania’, The World Bank Group.

279
Department of Agriculture, fisheries and forestry Australia 2002, ‘Farm help post program assessment questionnaire’, Department of Agriculture, fisheries and forestry Australia. Department of Marine Affairs and Fisheries 2005, ‘The Added Value of Fish Skin Waste’, Department of Marine and Fisheries, Jakarta-Indonesia. Department of Marine Affairs and Fisheries 2008, ‘Sejarah terbentuknya departemen kelautan dan perikanan (The history on the formation of the Department of Marine Affairs and Fisheries)’ , viewed on 5th August 2008, http://www.dkp.go.id/index.php/ind/newsmenus/2/sejarah-dkp# Detiknet 2005, PPN 10% perikanan segera dihapus (10% Fishery tax will be eliminated), Detiknet, 21st November 2005, Jakarta-Indonesia. Devine, TJ 1994, ‘Characteristics of self-employed women in the United States’, Monthly Labor Review, vol. 117, pp.20-34. Dirks, KT 1999, ‘The Effects of Interpersonal Trust on Work Group Performance’, Journal of Applied Psychology, no. 84, pp. 445-455. Djunaidah, IS 1992, ‘Aquafeed and feeding strategies in Indonesia’, FAO Report, viewed on 15th October 2008, http://www.fao.org/docrep/003/V4430E/V4430E06.htm Dyspriani, P 2007, Governance and the study of shrimp revatilization program in
Indonesia, Master Thesis in International Fisheries Management, Department of Social and Marketing Studies, Norwegian College of Fishery Science, University of Tromso, Norway. Earth-policy, 2005, Figure 2: World fish catch and aquaculture production 1950-2003, viewed on 15th September 2008, http://www.earth-policy.org/Indicators/Fish/Fish_data.htm#fig2 Edwards, P, Demaine, H, Innes-Taylor, N & Turongmang, D 1996, ‘Sustainable aquaculture for small scale farmers: need for a balanced model’, Outlook on
Agriculture, vol. 25, no. 1, pp. 19-26. Edwards, P 2000, ‘Aquaculture, poverty impacts and livelihoods’, Overseas
Development Institute: Natural Resource Perpectives, no. 56, June. Effendi, E 2008, ‘Penyaluran KUR (Kredit usaha rakyat) belum sentuh kemiskinan (The passing-on of business community credit loan has not yet touch the poor)’, Waspada online, viewed on 26th February 2009, http://www.waspada.co.id/index2.php?option=com_content&do_pdf=1&id=30937 Elfitasari, T 2006, ‘Recent existing condition on shrimp culture at Jepara Coast Central Java’, Saintek Perikanan: Indonesian Journal of Fisheries Science and Technology, vol. 2, no. 1, pp. 94-101.
280
Erondu, ES & Anyanwu, PE 2005, ‘Potential hazards and risks associaied with the aquaculture industry’, African Journal of Biotechnology, vol. 4, no. 13, pp. 1622-1627. Ethridge, D 2004, Research methodology in applied economics (second edition), Blackwell publishing, USA. FAO 2008, ‘National aquaculture sector overview: Indonesia’, FAO Official website, viewed on 12th September 2008, http://www.fao.org/fishery/countrysector/naso_indonesia FAO 2009, ‘Aquaculture and farming systems development’, FAO corporate document repository, viewed on 3rd March 2009, http://www.fao.org/docrep/003/X7156E/x7156e03.htm Flor, AG 2005, Poor farmers income improvement through innovation project:
Information management needs assessment of Indonesian agricultural research,
development and extension with emphasis on poor farmers` empowerment. Ministry of Agriculture, Indonesian Agency for Agricultural Research and Development, Jakarta. Garson, GD 2008, ‘Logistics regression’, North Carolina State University, viewed on 13th November 2008, http://faculty.chass.ncsu.edu/garson/PA765/logistic.htm Government of Central Java 2007a, ‘Peta perikanan budidaya Jawa Tengah: Bagian Utara, Peta perikanan budidaya Jawa Tengah: Bagian Selatan dan Peta perikanan budidaya Jawa Tengah: Bagian Tengah (Central Java aquaculture map: North, Central Java aquaculture map: South, Central Java aquaculture map: Middle)’ viewed on 21st August 2007, http://www.jawatengah.go.id/instansi.php?DIR=diskanlut&DATA=adds/PETA%20budidaya%20bag%20utara , http://www.jawatengah.go.id/instansi.php?DIR=diskanlut&DATA=adds/peta%20budidaya%20bag%20selatan , http://www.jawatengah.go.id/instansi.php?DIR=diskanlut&DATA=adds/peta%20budidaya%20bag%20tengah Government of Central Java 2007b, ‘Dinas Perikanan dan Kelautan: Kedudukan (The Fisheries and Marine Affairs Office: Position)’, viewed on 6th September 2007, http://www.jawatengah.go.id/instansi.php?DIR=diskanlut&DATA=kedudukan Government of Central Java 2007c, ‘Dinas Perikanan dan Kelautan: Program (The Fisheries and Marine Affairs Office: Program)’, viewed on 6th September 2007 http://www.jawatengah.go.id/instansi.php?DIR=diskanlut&DATA=program Government of Central Java 2007d, ‘Dinas Perikanan dan Kelautan: UPTD (The Fisheries and Marine Affairs Office: UPTD)’, viewed on 6th September 2007, http://www.jawatengah.go.id/instansi.php?DIR=diskanlut&DATA=adds/uptd
Hair, JF, Black, B, Babin, B, Anderson, RE & Tatham, RL 2006, Multivariate Data
Analysis (6th edn.), Upper Saddle River, N.J.: Pearson Education Inc.

281
Handycraft Indonesia 2006, ‘Kulit kakap, dari limbah jadi indah (Snapper’s skin, from waste into beautiful)’, Majalah Handicraft Indonesia, viewed on 22nd October 2008, http://www.majalah-handicraft.jogja.com/?UncgL0Z1WjNWRi9Jb1VkUmghOIHk%3D= Hannesson, R 2002, ‘Aquaculture and fisheries’, Marine Policy, no. 27, pp. 169-178. Hasan, MR 2001, ‘Nutrition and feeding for sustainable aquaculture development in the third millenium’, FAO corporate document repository, viewed on 4th March 2009, http://www.fao.org/docrep/003/AB412E/ab412e10.htm Havnes, PA & Senneseth, K 2001, ‘A panel study of firm growth among SMEs in network’, Small Business Economics, vol. 16, no. 4. Heruwati, ES 2002, ‘Traditional fish processing: prospects and opportunities for development’, Jurnal Litbang Pertanian, vol. 21, no. 3, pp. 92-99. Hiemstra, AMF, Van der Kooy, KG & Frese M, 2006, ‘Entrepreneurship in the street food sector of Vietnam – assessment of psychological success and failure factors’, Journal of Small Business Management, vol. 44, no. 3, pp. 474-481. Honig, B 1998, ‘What determines success? Examining the human, financial, and social capital of Jamaican microentrepreneurs’, Journal of Business Venturing, vol. 13, pp. 371-394. Hopkins, JS 1996, ‘Aquaculture sustainability: Avoiding the pitfalls of the Green Revolution’, World Aquaculture , vol. 27, no. 2, pp. 13-15. Hutabarat, J 2002, ‘The role of fishery in helping accelerate the Indonesian economic growth’, Business Forum: Central Java Business Information, vol. 6, no. 11, pp.14-15. Hyde, K 1997, A Handbook for farmers and investors: Success factors for developing
new rural industries, RIRDC Publication, Australia Indonesian Statistical Data 2008, ‘Demographic Parameter of 2007 Population Projection 2000-2025, Per 16th June 2008 Population’ , viewed on 16th June 2008, http://www.datastatistik-Indonesia.com/proyeksi/index.php?option=com_pdd&Itemid=943 Ippaso, RA 2002, The strategic intent of entrepreneurs within entrepreneurially led
companies and the preconditions for their success or failure (thesis), Swinburne University, Australia. Islam, R 2004, ‘Pro-poor growth: lingkage and policies, Trade unions and poverty reduction strategies’, International Labour Organisation, viewed on 18th December 2008, http://www-ilo-mirror.cornell.edu/public/english/dialogue/actrav/publ/134/11.pdf Jackson, JE & Rodkey, GR 1994, ‘The attitudinal climate for entrepreneurial activity’, The Public Opinion Quarterly, vol. 58, no. 3, pp. 358-380.

282
Jia, J, Wijkstrom, U, Subasinghe, R & Barg, U, 2000, ‘Aquaculture development beyond 2000: global prospect keynote address II’, FAO Corporate Document
Repository, Fisheries Department, FAO, Rome, Italy. Kabupaten Jombang 2007, ‘Kembali Bupati Jombang menerima penghargaan nasional (Again, Bupati Jombang recieved a national award)’ , viewed on 4th March 2008, http://www.jombangkab.go.id/e-gov/layanan/berita.asp?menu=detail_berita&no=1743 Kadin Sumbar 2008, ‘Sekilas Tirta Mina Saiyo di Rimbo Binuang: kelompok petani ikan meningkatkan perekonomian (A glimpse of Tirta Mina Saiyo at Rimbo Binuang, fish farmer group improving their economy)’ , viewed on 5th February 2008, http://www.kadin-sumbar.or.id/mod.php?=publisher&op=printarticle&artid=600 Kinseng, RA 2005, ‘Kemerdekaan versus kemiskinan (Poverty versus independence)’, Sinar Harapan newspaper, 7th September 2005, Jakarta-Indonesia. Kompas 2002, ‘Proyek P4K memiliki kepatutan mengentaskan kemiskinan (The P4K project holds the ability to fight poverty)’, Kompas newspaper, 28th May 2002, Jakarta-Indonesia. Kompas 2003, ‘Menabur benih udang galah, menuai untung rupiah (Scatter the prawn seed obtain the rupiah profit)’, Kompas newspaper, 11th June 2003. Kompas 2006, ‘Pola polikultur kian diminati: udang, rumput laut, dan bandeng dibudidayakan dalam satu tambak (Many are more interested in polyculture: shrimp, seaweed, and milkfish are cultured in the same brackish water pond)’, Kompas online newspaper , 24th March 2006 viewed on 28th October 2008, http://www2.kompas.com/kompas-cetak/0603/24/ekonomi/2536571.htm Krause, A 2003, ‘The European union’s Africa policy: The commission as policy entrepreneur in the CFSP’, European Foreign Affairs Review, no. 8, pp. 221-237. Kristiansen, S 2002, ‘Competition, innovation, and knowledge in Javanese rural business’, Singapore Journal of Tropical Geography, vol. 23, no. 1, pp. 52-69. Larsen, J 2005, ‘Wild fish catch hits limit-Oceanic decline offset by increased fish farming’, Earth Policy Institute, viewed on 15th September 2008, http://www.earth-policy.org/Indicators/Fish/2005.htm Long, A & Ploeg, D (eds) 1994, ‘Endogenous development: practices and perspective’, in Born from within: Practice and perspectives of endogenous rural development, The Hague, The Netherlands. Loscocco, KA, Robinson, J, Hall, RH & Allen, JK 1991, ‘Gender and small business success: an inquiry into women’s disadvantage’, Social Forces, vol. 70, no.1, pp. 65-85. Leedy, PD, 1997, Practical Research: Planning and design, Prentice-Hall, USA

283
Lee, DY & Tsang, EWK 2001, ‘The effects of entrepreneurial personality, background and network activities on venture growth’, Jounal of Management Studies, vol. 38, no. 4, pp. 583-602. Leta, RL 2002, Role of agricultural extension workers in horticultural agribusiness in
Nusa Tenggara Timur Province, Indonesia (thesis), Muresk Institute of Agriculture, Curtin University of Technology, Australia. Lichtkoppler, FR 1993, ‘Factors to consider in establishing a successful aquaculture business in the North Central region’, Technical Bulletin Series, no. 106, USA. Littunen, H 2000, ‘Entrepreneurship and the characteristics of the entrepreneurial personality’, International Journal of Entrepreneurial Behaviour & Research, vol. 6, no. 6, pp. 295. Mantau, Z, Rawung, JBM & Sudarty, 2004, ‘The Effective and Efficient way to Carp Seedling’. Jurnal Litbang Pertanian, vol. 23, no. 2. pp. 68-73. Martin, G 2008, ‘ACIAR fisheries projects in Indonesia: review and impact assessment’, viewed on 3rd September 2008, http://www.aciar.gov.au/system/files/node/9705/IAS55+Part+1.pdf Matthew, CH & Moser, SB 1996, ‘A longitudinal investigation of the impact of family background and gender on interest in small firm ownership’, Journal of Small Business
Management, vol. 34, no. 2, pp. 29-43. Mbozi, E 1991, ‘The Integration of Gender Issues in Fish Fanning in Chibote Area, Luapula Province, Zambia’, Proceeding of the Workshop on Enhanced Women's Participation in Fisheries Development, 4-7 December 1990, Victoria Falls, Zimbabwe. Media Indonesia 2008, ‘Hasil budidaya perikanan Jawa Tengah diproyeksikan 105.245,14 ton (Central Java aquaculture production is predicted to reach 105,245.14 tons)’, newspaper 25th March 2008. Miyata, S & Manatunge, J 2004, ‘Knowledge Sharing and Other Decision Factors Influencing Adoption of Aquaculture in Indonesia’, International Journal of Water
Resources Development, vol. 20, no. 4, pp. 523-536. McCauseland, WD, Mente, E, Pierce, GJ, Theodossiou, I 2005, ‘A simulation of sustainability of coastal communities: aquaculture, fishing, environment and labour markets’, Ecological Modelling, no. 193, pp. 271-294. Ministry of Marine Affairs and Fisheries 2006, The Department of Marine and
Fisheries` Support in Overcoming Poverty. The Department of Marine and Fisheries, Indonesia. Mkoka, C 2007, ‘Fish farming helps rural poor in Malawi, Science and Development network’, viewed on 11th February 2009, http://www.scidev.net/en/news/fish-farming-helps-rural-poor-in-malawi.html
284
Morris, MH, Avila, R & Teeple, E 1990, ‘Sales management as an entrepreneurial activity’, Journal of Personal Selling and Sales Management, vol. x, pp. 1-15. Morrison, A 2000, ‘Entrepreneurship: what triggers it?’, International Journal of
Entrepreneurial Behaviour, vol. 6, no. 2, pp. 59-71. Morris, MH 1995, ‘The determinant of entrepreneurial activity: Implications for marketing’, European Journal of Marketing, vol. 29, no. 7, pp. 31-48. Morris, MH & Lewis, PS 1995, ‘The determinant of entrepreneurial activity: implications for marketing’, European Journal of Marketing, vol. 28, no. 7, pp. 31- 48. Nam, S & Thuok, N 1999, ‘Aquaculture Sector Review (1984-1999) and Aquaculture Development Plan (2000-2020)’. Consultancy report for World Bank/APIP. Department of Fisheries, Phnom Penh, Cambodia. Nandeesha, MC 2007, ‘Asian experience on farmer’s innovation in freshwater fish seed production and nursing and the role of women’, FAO Fisheries Technical Paper, no. 501, pp. 581-602. Naylor, RL, Goldburg, RJ, Primavera, JH, Kautsky, N, Beveridge, MCM, Clay, J, Folkes, C, Lubchenco, J, Mooney, H & Troell M, 2000, ‘Effect of Aquaculture on World Fish Supply’, Nature, vol. 405, pp. 1017-1024. New, MB, Tacon, AGJ & Csavas, I (eds) 1994, ‘Farm-made aquafeeds: Report of the FAO/AADCP regional expert consultation on farm-made aquafeeds’, FAO Fisheries
Technical Paper, no. 343, viewed on 15th October 2008, http://www.fao.org/docrep/003/V4430E/V4430E00.HTM New, MB & Csavas, I 1993, ‘A summary of information on aquafeed production in eleven Asian countries’, FAO, viewed on 15th October 2008, http://www.fao.org/docrep/003/V4430E09.htm Nurdjana, ML 2006, ‘Indonesian aquaculture development’, RCA International Workshop on Innovative Technologies for Eco-Friendly Fish Farm Management and Production Safe Aquaculture Foods, Bali, Dec. 4-8 2006. Pallant, J 2005, SPSS survival manual: a step by step guide to data analysis using SPSS 2
nd edition, Allen & Unwin, Australia.
Panjaitan-Drioadisuryo, RDM & Cloud, K 1999, ‘Gender, self-employment and microcredit programs: An Indonesian case study’, The Quarterly Review of Economics
and Finance, no. 39, pp. 769–779. Pauly, D, Christensen, S, Pitcher, TJ, Sumaila, UR, Walters, CJ, Watson, R & Zeller, D 2002, ‘Towards sustainability in world fisheries’, Nature, vol. 418, 8 August 2002, pp. 689-695. Pezzey, J 1992, ‘Sustainability: An interdisciplinary guide’, Environmental Values, vol. 1, no. 4, pp. 321-362.

285
‘Poor countries will dominate world fish production’, 2003, Appropriate Technology, Hemel Hempstead: Dec 2003, vol. 30, no. 4. Porta, D & Ona, M 2006, ‘Focus on competitiveness: the Spanish furniture industry as a case study’, Paper presented on 46th Congress of the European Regional Science Association, 30 August – 3 September 2006, Volos, Greece. Practical Action n.d, ‘Small scale fish farming in Bangladesh’, Practical Action, The Schumacher Center for Technology & Development, UK. Ramphele, M 2003, ‘The role of higher education in reducing poverty and promoting prosperity’, Speech delivered to the Conference: Policies and Models for International Co-operation in Higher Education, October 6th, Bergen, Norway. Rana, K & Immink, A 2001, ‘Trends in global aquaculture production: 1984-1996’, viewed on 15th September 2008, http://www.uwsp.edu/biology/faculty/chartleb/Biol386/Trends%20in%20Global%20Aquaculture%20Production.pdf Rees, H & Shah, A 1986, ‘An empirical analysis of self-employment in the UK’, Journal of Applied Econometrics, vol. 1, No. 1, pp. 95-108. Reynolds, PD, Bygrave, WD, Autio, E, Cox, LW & Hay, M 2002, ‘Global Entrepreneurship Monitor’, 2002 Executive Report, Babson College, London Business School and Kauffman Foundation. Robinson, PB & Sexton, EA 1994. ‘The effect of education and experience on self-employment success’, Journal of Business Venturing , no. 9, pp. 141–156. Rokanhilir, 2008, ‘Pokdakan menerima Rp. 194,5 juta (Fish farmer groups recieved Rp. 194,5 million)’ , viewed on 4th March 2008, http://www.rokanhilir.go.id/berita.php?go=beritalengkap&id=2938 Scott, MG & Twomey, DF 1988, ‘The Long-Term Supply of entrepreneurs: students` career aspirations in relation to entrepreneurship’, Journal of Small Business
Management, vol. 26, no. 4, pp. 5-13. Saragih, R 2000, ‘Jambi is developing an agricultural production center, viewed on 5th March 2008’, http://www.pu.go.id/humas/April/sp0904001.htm Science Daily 1998, ‘Aquaculture: Not and easy answer to overfishing’, viewed on 10th June 2008, http://www.sciencedaily.com/releases/1998/10/981031180758.htm Semarang Marine Affairs and Fisheries Office 2005, Pedoman pembentukan kelompok
(Fish farmer group formation guide book), City of Semarang Marine Affairs and Fisheries Office-Semarang.

286
Simbolon, MK & Juyana, TW 2007, ‘Penggunaan bio katalisator pada budidaya udang galah (The use of bio catalyzations in shrimp farming)’, Jurnal Budidaya Air Tawar, vol. 4, no. 1, pp. 19-26. Sinar Harapan 2007, ‘The long agony of brackish water pond fish farmers’, Sinar harapan news paper, 5th December 2007. Siriwardena, SN 2007, ‘Role of freshwater fish seed supply in rural aquaculture’, FAO
Fisheries Technical Paper, no. 501, pp. 563-579. Solymossy, E 1997, ‘Push/pull motivation: does it matter in venture performance?’, Frontiers of Entrepreneurship Research 1997 Edition, viewed on 6th October 2009, Case Western Reserve University, http://www.babson.edu/entrep/fer/papers97/solomo/soly1.htm Stewart, WH, Watson, WE, Carland, JC & Carland, JW 1998, ‘A proclivity for entrepreneurship: a comparison of entrepreneurs, small business owners, and corporate managers’, Journal of Business Venturing, vol. 14, no. 2, pp. 189-214. Suara Merdeka 2002, ‘Petani ikan emas dan kio dibantu: ratusan ton terserang herpes (Goldfish and Koi fish farmers are supported: hundreds of tons are infected with herpes)’, viewed on 5th March 2008, http://www.suaramerdeka.com/harian/0212/27/eko1.htm Suara Merdeka 2006, ‘Penghasilan petani ikan Kedungombo menurun (Fish farmer’s income at Kedungombo is decreasing)’, Newspaper 28th August 2006, Semarang, Indonesia. Suara Merdeka 2007a, ‘Budidaya ikan terkendala bibit (Aquaculture are facing fish seed problem)’ , viewed on 5th March 2008, http://www.suaramerdeka.com/harian/0712/22/pan02.htm Suara Merdeka 2007b, ‘Minapolitan berjuluk Kampung Lele (Fishpolitan called Catfish Village)’, Newspaper, 4th March 2007, Semarang, Indonesia. Suara Merdeka 2007c, ‘Abon dan keripik lele, nendang banget.. (Shredded Catfish and Catfish crackers, delicious...)’, Newspaper, 4th March 2007, Semarang, Indonesia. Suara Merdeka, 2007d, ‘Pancaran kemakmuran (The glow of prosperity)’, Newspaper, 4th March 2007, Semarang, Indonesia. Suara Pembaruan Daily, 2005, ‘Sumber daya tangkap perikanan menurun (The decrease of fish catch resources)’, Newspaper, 15th September 2005, Surabaya, Indonesia. Sukadi, MF 2006, ‘Sustainable aquaculture in Indonesia’, RCA International Workshop on Innovative Technologies for Eco-Friendly Fish Farm Management and Production Safe Aquaculture Foods, Bali, Dec. 4-8 2006.
287
Susilowati, I 2005, Report on Coastal Community development model (micro, small,
middle, and cooperation business) to support food security in Pekalongan, Central
Java, Diponegoro University, Indonesia. Susilowati, I, Winarni, T & Sudaryono, A 2005, ‘Penelitian tentang Pengembangan Model Pemberdayaan Masyarakat Pesisir (Usaha Mikro, Kecil, Menengah Dan Koperasi- Umkmk) Dalam Mendukung Ketahanan Pangan Di Kabupaten/Kota Pekalongan, Jawa Tengah (Research on “The Model of Empowerment for Coastal Community (Micro and Small Business) to Support the Food Security in Pekalongan Regency / Municipality-Central Java Province”)’, Indonesian Science Reseach Institute, Indonesia. Tabachnick, BG & Fidell, LS 2007, Using multivariate statistics (5
th edition),
Pearson/Allyn and Bacon, Boston, USA. Tacon, AJ 2003, ‘Aquaculture production trends analysis’, viewed on 15th September 2008, ftp://ftp.fao.org/docrep/fao/005/y4490E/y4490e01.pdf Terranet 2001, ‘Kelompok tani ikan Tabanan tolak ikut lomba tingkat nasional (A fish farmer group in Tabanan refuse to participate in the National competition)’ , viewed on 2nd October 2009, http://www.mail-archive.com/[email protected]/msg02137.html Theng, LG & Boon, JLW 1996, ‘An exploratory study of factors affecting the failure of local small and medium enterprises’, Asia Pacific Journal of Management, vol. 13, no. 2, pp. 47-61. Tidwell, JH & Allan, GL 2001, ‘Fish as food: aquaculture’s contribution’, EMBO
Reports vol. 2, no. 11, pp. 958-963. Undip, 2010, ‘Project on youth development program: Youth empowerment on Nila and Patin fish production development at Wadaslintang dam - Wonosobo, Coastal management doctoral program’, Undip, Semarang, Indonesia. Uhlaner, L & Thurik, R 2007, ‘Postmaterialism influencing total entrepreneurial activity across nations’, Journal of Evolutionary Economics, no. 17, pp. 161-185. Ulhoi, JP 2005, ‘The social dimensions of entrepreneurship’, Technovation, no. 25, pp. 939-946. Venugopal, V & Shahidi, F 1995, ‘Value-added products from underutilized fish species’, Critical reviews in food science and nutrition, vol. 35, no. 5, pp 431-453. Verheul, I, Van Stel, A & Thurik, R 2006, ‘Explaining female and male entrepreneurship’, Entrepreneurship and Regional Development, no. 18, March , pp.151-183. Wahyuni, M & Peranginangin, R 2007, ‘Industrial Competition in Fish Processing through the use of Non-economical Fish Waste into Gelatine’, Department of Marine and Fisheries, Jakarta-Indonesia.
288
Wang, CK & Wong, P 2004, ‘Entrepreneurial interest of university students in Singapore’, Technovation, no. 24, pp. 163-172. Warta Pasar Ikan 2007, ‘Kulit ikan limbah bernilai tambah (Added value of fish skin waste)’ , viewed on 22nd October 2008, http://www.pusatagroindustri.com/2007/12/04/kulit-ikan-limbah-bernilai-tambah/ Watson, K, Hogarth-scott, S & Wilson, N 1998, ‘Small business start-ups: success factors and support implications’, International Journal of Entrepreneurial Behaviour
& Research, vol. 4, no. 3, pp. 217-238. Winter, SG 1998, ‘Knowledge and competence as strategic assets’, in The Strategic
Management of Intellectual Capital (Klein, DA ed.), Butterworth-Heinemann, USA. Wurts, WA 2000, ‘Sustainable aquaculture in the twenty-first century’, Reviews in
Fisheries Science, vol. 8, no. 2, pp. 141-150. Yusuf, DH, Pahlevi, RS & Tambunan, P 1995, ‘Annex II Country reports: Annex II-6: Indonesia’, FAO Corporate Document Repository, Viewed on 18th June 2008, http://www.fao.org/docrep/field/003/AC279E/AC279E13.htm Zainal, S 1998, ‘Implementation of extension for net-cage aquaculture in Indonesian reservoirs: pitfalls and prospects’, FAO Corporate Document Repository, viewed on 11th February 2009, http://www.fao.org/docrep/005/W8514E/W8514E16.htm

289
Appendices
Appendix 1
CONFIDENTIAL QUESTIONNAIRE
For each item, please circle the number that relates to your response or fill in your answer(s) as required. In some cases, multiple selections may be appropriate. No individual participant will be identifiable, as your responses are confidential. Section A. BACKGROUND DETAILS A1. PERSONAL
1) Are you: 1. Male 2. Female
2) Your age in years: 1. Under 20 2. 20-39 3. 40-59 4. 60 +
3) Your marital status: 1. Single 2. Married 3. Divorced
4) How many children do you have: 1. One 2. Two or more 3. None
5) What is your highest educational level 1. University Graduate 4. Did not completed primary school 2. Completed High School 5. Never went to school 3. Completed Primary School
A2. FAMILY BUSINESS EXPERIENCE 6) Your father’s present or past profession
1. Fish Farmer 2. Government employee 3. Private company employee 4. Other than fish farmer, but self employed, please specify………………… 5. Not working 6. Others, please specify..............................................
7) Your mother’s present or past profession 1. Fish Farmer 2. Government employee 3. Private company employee 4. Other than fish farmer, but self employed, please specify………………… 5. Not working 6. Others, please specify..............................................
8) What links your parents to your current fish farming profession (you may circle more than one):
1. They have their own fish farming business. 2. They started the business that I am currently running. 3. None of the above 4. Others, please specify..............................................
9) Who has always been your role model in business (you may circle more than one answer):
1. Father 5. Neighbours 2. Mother 6. Family friend 3. Sibling 7. None 4. Relative 8. Others (please specify)…………
A3. BUSINESS INFORMATION 10) What is your fish farming business class group?
1. Starter (Pemula) 2. Secondary (Lanjut) 3. Tertiary (Madya) 4. Advanced (Utama)

290
11) How much do you earn per year? 1. Under Rp. 50 million 2. Rp. 50 million – < Rp.100 million 3. Rp. 100 million – < Rp. 500 million 4. Rp. 500 million or more
12) What is the size of your land for your fish farming business? 1. < 2 Ha 2. 2 - <5 Ha 3. 5 - <10 Ha 4. 10 Ha or more
13) How many employees do you currently have? 1. Up to 2 people 2. 3-5 people 3. 6-8 people 4. 9 people or more
14) What type is your fish culture? (you may circle more than one answer) 1. Sea water 2. Brackish water 3. Fresh water
15) What is your method of culture? (you may circle more than one answer) 1. Brackish water pond 2. Floating net cage 3. Paddy field 4. Freshwater pond 5. Others (please specify)…………………
16) What stage of fish culture do you produce? 1. Seedling 4. Grow-out 2. Seedling and grow-out 5. Others, (please specify)................... 3. Ornamental Fish
Section B. CURRENT SITUATION B1. ENTREPRENEURIAL ACTIVITIES
17) Which of the following aquaculture activities have you implemented in your business (you may circle more than one answer):
1. Producing your own fish feed 2. Producing your own fish seed 3. Extending market distribution 4. Extending the variety of fish species 5. Extending the product range (adding value) 6. Find other use of product 7. None of the above 8. Others (please specify)……………………………..
18) How long have you produced your own fish feed? 1. Since I started my business. 2. A few years ago 3. Just recently 4. I do not produce my own fish feed.
19) Why do you produce your own fish feed 1. I can control the quality. 2. It is more economical for me. 3. To ensure fish feed availability 4. To increase my revenue by selling some of my fish feed product 5. Other reason (please specify)…………………… 6. I do not produce my own fish feed

291
20) How long have you produced your own fish seed? 1. Since I started my business. 2. A few years ago 3. Just recently 4. I do not produce my own fish seed.
21) Why do you produce your own fish seed 1. I can control the quality. 2. It is more economical for me. 3. To ensure fish feed availability 4. To increase my revenue by selling some of my fish seed product 5. Other reason (please specify)…………………… 6. I do not produce my own fish seed.
22) To whom do you usually sell your fish harvest? (you may circle more than one option): 1. my neighbours 5. large companies 2. my family 6. international market 3. local fish market 7. local fish gatherers 4. fish gatherers elsewhere 8. others, please specify……………………
23) In addition to your present customers, who else do you plan to sell your fish harvest in the future? (you may circle more than one answer):
1. my neighbours 6. large companies 2. my family 7. international market 3. local fish market 8. no one else 4. local fish gatherers 9. others, please specify……………………… 5. fish gatherers elsewhere
24) In what form do you sell your fish harvest (you may circle more than one answer): 1. Fresh fish 2. Salted fish 3. Roasted fish 4. Frozen fish 5. Cooked food 6. Others (please specify)………………………………………………………………
25) With how many species of fish did you start this business? 1. < 3 species 2. 4-6 species 3. 7 or more species
26) How many species do you have now? 1. < 3 species 2. 4-6 species 3. 7 or more species
27) Why did you decided to increase the variety of your fish species? 1. Want to sell more variety of fish. 2. Want to get more profit. 3. To fulfil market demand 4. I did not increase the variety of my fish species. 5. Others (please specify)…………………………….
28) Why did you decide NOT to increase the variety of your fish species? 1. I didn’t have the capital to do so. 2. I didn’t know the method of culturing other fish species. 3. I didn’t have enough land to extend the fish variety. 4. I didn’t want to extend, I am happy with what I have now. 5. I have increased the variety of my fish species. 6. Others (please specify)…………………………………
29) Which part of the fish do you sell? (you may circle more than one answer) 1. Whole fish 4. Gut 2. Fish fillet 5. Blood 3. Skin 6. Carcass / bones

292
B2. PROBLEMS/CONSTRAINTS
30) To what extent do you agree that each of the following circumstances faced by your business prevents you from achieving your income improvement ?
Circumstances that occur Strongly Agree Strongly Disagree
a. Lack of capital b. Lack of technical abilities c. Lack of family support d. Lack of government support e. Lack of training provided by government/
other institution f. Lack of fish farming experience and
knowledge g. Lack of potential markets h. Low selling price i. Lack of profit j. Low quality of fish seed k. Low quality of fish feed l. Poor financial management skills m. Poor quality control n. Fish diseases and parasites o. Poor water quality o. Cannot secure a sufficient loan
6 5 4 3 2 1 6 5 4 3 2 1 6 5 4 3 2 1 6 5 4 3 2 1 6 5 4 3 2 1 6 5 4 3 2 1 6 5 4 3 2 1 6 5 4 3 2 1 6 5 4 3 2 1 6 5 4 3 2 1 6 5 4 3 2 1 6 5 4 3 2 1 6 5 4 3 2 1 6 5 4 3 2 1 6 5 4 3 2 1 6 5 4 3 2 1
31) To what extent do you agree that each of the following circumstances faced by your
business prevents you from achieving your product sustainability ? Numbers are interpreted as: (6) Strongly agree (5) Agree (4) Somewhat Agree (3) Somewhat disagree (2) Disagree (1) Strongly disagree
Circumstances that occur Strongly Agree Strongly Disagree
a. Lack of capital b. Lack of technical abilities c. Lack of family support d. Lack of government support e. Lack of training provided by government/
other institution f. Lack of fish farming experience and
knowledge g. Lack of potential markets h. Low selling price i. Lack of profit j. Low quality of fish seed k. Low quality of fish feed l. Poor financial management skills m. Poor quality control n. Fish diseases and parasites o. Poor water quality p. Cannot secure a sufficient loan
6 5 4 3 2 1 6 5 4 3 2 1 6 5 4 3 2 1 6 5 4 3 2 1 6 5 4 3 2 1 6 5 4 3 2 1 6 5 4 3 2 1 6 5 4 3 2 1 6 5 4 3 2 1 6 5 4 3 2 1 6 5 4 3 2 1 6 5 4 3 2 1 6 5 4 3 2 1 6 5 4 3 2 1 6 5 4 3 2 1 6 5 4 3 2 1
Numbers are interpreted as: (6) Strongly agree (5) Agree (4) Somewhat agree (3) Somewhat disagree (2) Disagree (1) Strongly disagree

293
B3. ENDOGENOUS AND EXOGENOUS FACTORS B3.1. AQUACULTURE KNOWLEDGE
32) How did you gain knowledge about fish farming? (you may circle more than one answer)
1. From my parents 2. From my other family members (please specify)……………….. 3. From my neighbours 4. From governmental training 5. Others (please specify)……………………………..
B3.2. AQUACULTURE SKILLS 33) In which of the following fish farming activities are you most experienced (you may
circle more than one answer) 1. Fish seedling 2. Fish grow-out 3. Fish feed production 4. Fish disease and parasite handling
B3.3. AQUACULTURE EXPERIENCE
34) How long have you carried out fish farming activities, both in your own business and elsewhere?
1. Less than a year 2. 1-5 years 3. 5-15 years 4. more than 15 years
B3.4. AQUACULTURE EDUCATION 35) Which of the following aquaculture education have you been through? (you may circle
more than one answer): 1. Aquaculture education in tertiary level 2. Aquaculture education high school level 3. Government aquaculture training. 4. Aquaculture training provided by education institutions. 5. Aquaculture training provided by private companies. 6. Aquaculture training provided by International organisations.
36) In which of these forms of training have you participated? (you may circle more than one answer)
1. Fish culture training. Provided by………………………………. 2. Entrepreneurship training. Provided by……………………………… 3. Management training. Provided by………………………………… 4. Fish seedling training. Provided by……………………………….. 5. Fish feed production training. Provided by………………………… 6. Others (please specify)……………………..Provided by…………………………
B3.5. BUSINESS KNOWLEDGE 37) Are you familiar and carry out production planning for your business?
1. Yes 2. No 3. Sometimes 4. I don’t know 38) Are you familiar and carry out financial planning for your business?
1. Yes 2. No 3. Sometimes 4. I don’t know 39) Are you familiar and carry out marketing/selling plan for your business?
1. Yes 2. No 3. Sometimes 4. I don’t know 40) Do you have job description for your employees?
1. Yes 2. No 3. Sometimes 4. I don’t know 41) Do you perform quality control in your business?
1. Yes 2. No 3. Sometimes 4. I don’t know B3.6.PERSONAL BUSINESS EXPERIENCE
42) What other business experience did you have prior to becoming a fish farmer? 1. Retail 2. Production (please specify) ……………….. 3. Service business 4. Other (Please specify)………………… 5. None, this is my only business experience

294
43) Prior to becoming a fish farmer, how long did you work in business? 1. Not at all 2. Less than 5 years 3. 6-10 years 4. More than 10 years
B3.7. ENTREPRENEURIAL CHARACTERISTICS
44) To what extent do you agree that each of these characteristics for business people like you is vital for your success in the aquaculture business?
Characteristics Strongly Agree Strongly Disagree
a. Intelligence b. Action-oriented c. Organisational skills d. Self-discipline e. Experience f. Leadership skills g. Risk taking h. Analytical skills i. Persistence j. Independence k. Self confidence l. Business network m. Strong moral values n. Luck
6 5 4 3 2 1 6 5 4 3 2 1 6 5 4 3 2 1 6 5 4 3 2 1 6 5 4 3 2 1 6 5 4 3 2 1 6 5 4 3 2 1 6 5 4 3 2 1 6 5 4 3 2 1 6 5 4 3 2 1 6 5 4 3 2 1 6 5 4 3 2 1 6 5 4 3 2 1 6 5 4 3 2 1
45) If you had Rp. 20 million, what would you do with it?
1. Invest to rapidly expand my business. 2. Deposit it in the bank 3. Spend it 4. Other (please specify)…………..
B3.8. REASON
46) Which of the following factors influenced your decision to go into business on your own? 1. Could not find suitable work that matched my skills and educational level. 2. Salaried job was underpaid. 3. Saw a business opportunity. 4. Family tradition in business. 5. Lost my job 6. Previous experience in running a business
47) How did you become interested in fish farming? 1. My parents are fish farmers. 2. My extended family are fish farmers. 3. My neighbours are fish farmers. 4. Others, please specify……………………
48) What motivated you to become a fish farmer? 1. I had previous experience in this business. 2. My parents invited me to join in their business. 3. I saw others succeeding through fish farming. 4. I wanted to be wealthy. 5. I didn’t want to work for other people. 6. I had no job and no other option. 7. None of the above (please specify)…………………………..
Numbers are interpreted as: (6) Strongly agree (5) Agree (4) Somewhat agree (3) Somewhat disagree (2) Disagree (1) Strongly disagree

295
49) How satisfied are you with your fish farming activities? 1. I am very satisfied with and enjoy my fish farming activities. 2. I am satisfied with but do not enjoy my fish farming activities. 3. I am not satisfied with but I enjoy my fish farming activities. 4. I am not satisfied with nor enjoy my fish farming activities.
50) If you had other options, what would you like to do? 1. I do not need another option, I like being a fish farmer. 2. I’d like to work for private companies. 3. I’d like to work as a civil servant. 4. I’d like to own another kind of business (please specify) ……………………. 5. None of the above (please specify)………………………
B3.9. BUSINESS NETWORK RELATION
51) With which of these do you deal in your business? (you may circle more than one answer):
1. Suppliers 2. Buyers 3. Consumers 4. Government institutions 5. Neighbours 6. Lending bodies (eg. Banks and cooperatives) 7. Others (please specify)……………………
B3.10. FINANCIAL CAPITAL
52) With how much initial capital did you start this business? 1. Less than Rp. 10 million 2. Rp. 10 million – less than Rp. 20 million 3. Rp. 20 million – less than Rp. 30 million 4. More than Rp. 30 million 5. I do not know, I inherited the business from my parents. 6. I do not remember
53) How was the money raised for the capital? (you may circle more than one answer) 1. Own savings 2. Loan from family / relative(s) 3. Loan from neighbours 4. Loan from bank/cooperative 5. Others (please specify)………………………. 6. I do not know, I inherited the business from my parents
B3.11. FAMILY SUPPORT 54) At anytime in the past, who gave you financial support in your business? (you may
circle more than one answer) 1. Spouse 4. Extended family member 2. Children 5. No one 3. Parents 6. Other (please specify)……………
55) At anytime in the past, who gave you non-financial support (giving ideas, suggestions, moral support) in running your business? (you may circle more than one answer)
1. Spouse 4. Extended family member 2. Children 5. No one 3. Parents 6. Other (please specify)……………
56) Now, who gives you financial support in your business? (you may circle more than one answer)
1. Spouse 4. Extended family member 2. Children 5. No one 3. Parents 6. Other (please specify)……………
57) Now, who gives you non-financial support (eg. giving ideas, suggestions, moral
support) in running your business? (you may circle more than one answer) 1. Spouse 4. Extended family member 2. Children 5. No one 3. Parents 6. Other (please specify)……………

296
58) Who is NOT supporting you financially at all in this business? (you may circle more than one answer)
1. Spouse 4. Extended family member 2. Children 5. No one 3. Parents 6. Other (please specify)……………
59) Who is NOT giving you non-financial support in this business? (you may circle more than one answer)
1. Spouse 4. Extended family member 2. Children 5. No one 3. Parents 6. Other (please specify)……………
60) Which of your family members is helping to manage your business? (you may circle more than one answer)
1. Spouse 4. Extended family member 2. Children 5. No one 3. Parents 6. Other (please specify)……………
B3.12. MARKET 61) From whom do you get the potential market information? (you may circle more than one
answer): 1. Federal government 6. Media 2. Local government 7. Family / friends 3. Educational institution 8. Business colleagues 4. International organisation 5. Others, please specify……………………….
62) How do you offer your product to new market? (you may circle more than one answer): 1. Door to door 2. I send out marketing material through mail. 3. I send out marketing material through e-mail. 4. Through my website 5. I have steady customers only. 6. Mouth to mouth advertisement 7. I don’t know 8. Others (please specify)…………………….
B3.13. TRANSPORTATION INFRASTRUCTURE 63) What type of transportation do you use for your business? (you may circle more than
one answer) 1. My own vehicle 2. I borrow my friend’s/relative’s vehicle. 3. I rent a vehicle. 4. Public transport 5. Others (please specify)……………
64) How far is the nearest public transport from your business location? 1. 0 – 1 km 2. 1 km - < 5 km 3. more than 5 km

297
B3.14. INFLUENCING FACTORS 65) To what extent do you agree that the factors below influence income improvement for
your business?
Characteristics Strongly Agree Strongly Disagree
1. Aquaculture knowledge 2. Aquaculture skills 3. Aquaculture experience 4. Aquaculture education 5. A strong character in the
entrepreneur / business owner 6. Reason 7. Personal business experience 8. Family business background 9. Business network 10. Financial capital 11. Family support 12. Market 13. Logistics 14. Support from government and
other institutions
6 5 4 3 2 1 6 5 4 3 2 1 6 5 4 3 2 1 6 5 4 3 2 1 6 5 4 3 2 1 6 5 4 3 2 1 6 5 4 3 2 1 6 5 4 3 2 1 6 5 4 3 2 1 6 5 4 3 2 1 6 5 4 3 2 1 6 5 4 3 2 1 6 5 4 3 2 1 6 5 4 3 2 1
66) To what extent do you agree that the factors below influence product sustainability for
your business?
Characteristics Strongly Agree Strongly Disagree
1. Aquaculture knowledge 2. Aquaculture skills 3. Aquaculture experience 4. Aquaculture education 5. A strong character in the
entrepreneur / business owner 6. Reason 7. Personal business experience 8. Family business background 9. Business network 10. Financial capital 11. Family support 12. Market 13. Logistics 14. Support from government and other
institutions
6 5 4 3 2 1 6 5 4 3 2 1 6 5 4 3 2 1 6 5 4 3 2 1 6 5 4 3 2 1 6 5 4 3 2 1 6 5 4 3 2 1 6 5 4 3 2 1 6 5 4 3 2 1 6 5 4 3 2 1 6 5 4 3 2 1 6 5 4 3 2 1 6 5 4 3 2 1 6 5 4 3 2 1
B3.15. GOVERNMENT/OTHER INSTITUTIONS SUPPORT
67) Which of these institutions are most helpful in supporting your business? (you may circle more than one answer)
1. Federal government 4. International organisation 2. Local government 5. Private company 3. Educational Institution 6. Others (please specify)………
Numbers are interpreted as: (6) Strongly agree (5) Agree (4) Somewhat agree (3) Somewhat disagree (2) Disagree (1) Strongly disagree
Numbers are interpreted as: (6) Strongly agree (5) Agree (4) Somewhat agree (3) Somewhat disagree (2) Disagree (1) Strongly disagree

298
68) Which of the following support has the government / other institution provided you to help your fish farming business? (you may circle more than one answer)
1. soft loans in appointed banks / cooperatives 2. technical aquaculture training 3. technical assistance 4. marketing assistance 5. information on potential market 6. fish seed subsidies 7. fish feed subsidies 8. other subsidies (please specify)…………………………..
C. OTHER ASPECTS OF THE BUSINESS C1. INCOME IMPROVEMENT
69) How do you define your current financial status compared to 5 years ago? 1. It is much better 2. It is the same 3. It is worse
70) How do you think your financial condition will be in 3 years time with running this business?
a. It will be much better. 2. It will be the same. 3. It will be worse. 71) How do you think your business affects your family?
1. It supplements my family’s overall income. 2. It diminishes my family’s overall income. 3. It significantly increases my family income.
72) How do you plan to increase your business income in the future? (you may circle more than one answer):
1. Producing my own fish feed. 2. Producing my own fish seed. 3. Extending market distribution. 4. Extending the variety of fish species. 5. Extending the product range (adding value). 6. Finding other uses of product. 7. Others (please specify)……………………………..
C2. PRODUCT SUSTAINABILITY
73) How concerned are you that your fish farming activities might adversely affect the SOIL quality of the fish habitat?
1. I am very concerned 3. I am not concerned 2. I am rather concerned 4. I don’t know
74) How concerned are you that your fish farming activities might adversely affect the WATER quality of the fish habitat?
1. I am very concerned. 3. I am not concerned. 2. I am rather concerned. 4. I don’t know.
75) How do you ensure the ENVIRONMENTAL quality of your fish farm? (you may circle more than one answers):
1. I clean my fish culture environment on regular basis. 2. I prohibit littering around my fish culture pond. 3. I am not concerned about environmental quality. 4. I don’t know 5. Others (please specify)……………………………….
76) How do you ensure the WATER quality of your fish farm? (you may circle more than one answer):
1. I check and control the water quality on daily basis. 2. I lime the pond prior to every fish stocking. 3. I store water in a quality controlled water tank. 4. I am not concerned about water quality. 5. This question does not apply to my practice 6. Others (please specify)…………………………………………….
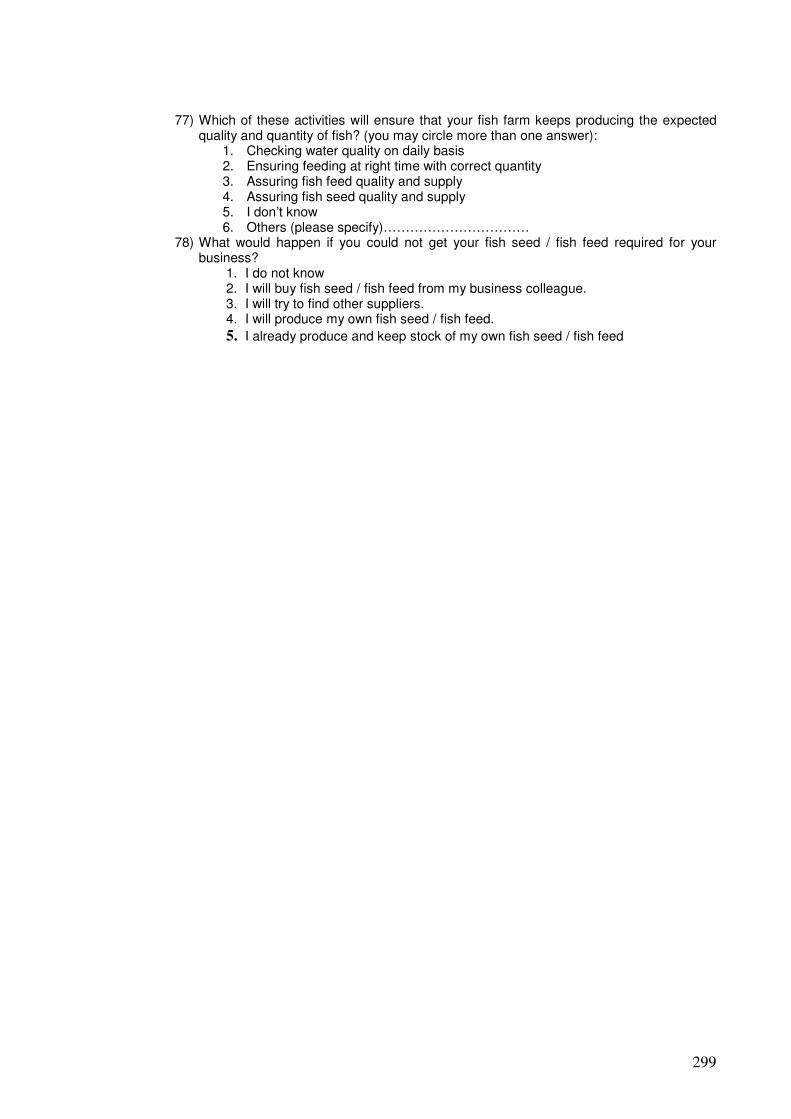
299
77) Which of these activities will ensure that your fish farm keeps producing the expected quality and quantity of fish? (you may circle more than one answer):
1. Checking water quality on daily basis 2. Ensuring feeding at right time with correct quantity 3. Assuring fish feed quality and supply 4. Assuring fish seed quality and supply 5. I don’t know 6. Others (please specify)……………………………
78) What would happen if you could not get your fish seed / fish feed required for your business?
1. I do not know 2. I will buy fish seed / fish feed from my business colleague. 3. I will try to find other suppliers. 4. I will produce my own fish seed / fish feed.
5. I already produce and keep stock of my own fish seed / fish feed
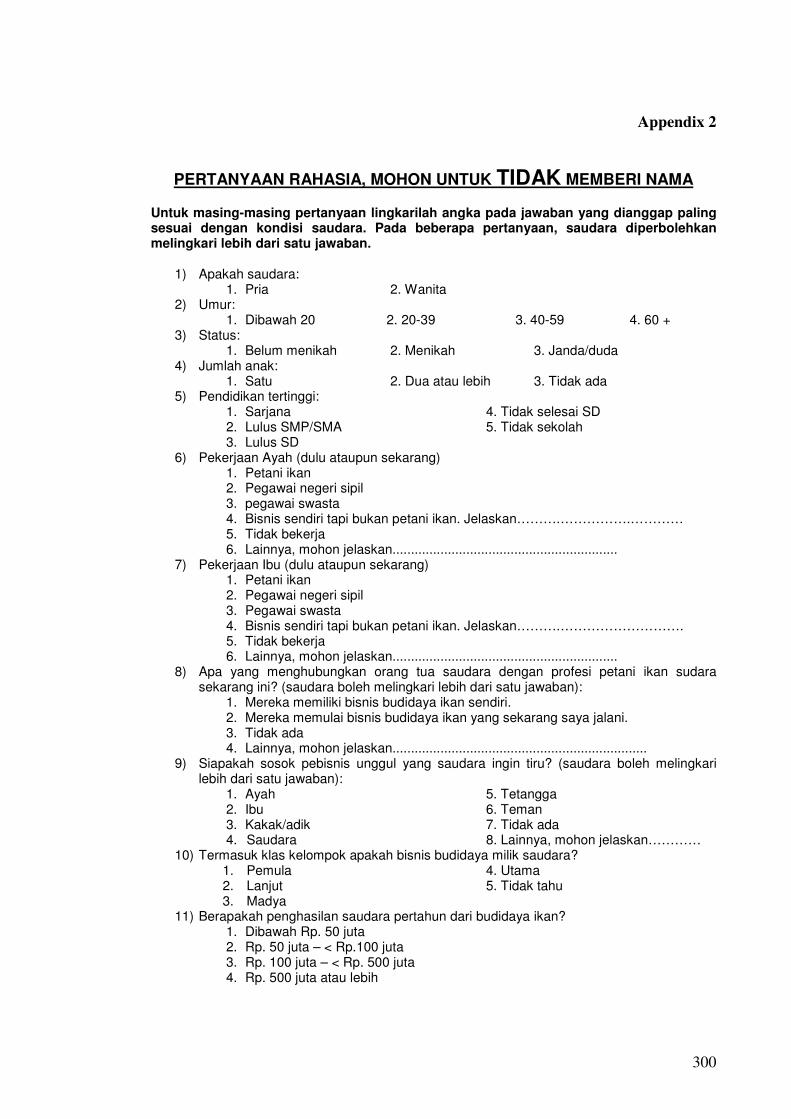
300
Appendix 2
PERTANYAAN RAHASIA, MOHON UNTUK TIDAK MEMBERI NAMA
Untuk masing-masing pertanyaan lingkarilah angka pada jawaban yang dianggap paling sesuai dengan kondisi saudara. Pada beberapa pertanyaan, saudara diperbolehkan melingkari lebih dari satu jawaban.
1) Apakah saudara: 1. Pria 2. Wanita
2) Umur: 1. Dibawah 20 2. 20-39 3. 40-59 4. 60 +
3) Status: 1. Belum menikah 2. Menikah 3. Janda/duda
4) Jumlah anak: 1. Satu 2. Dua atau lebih 3. Tidak ada
5) Pendidikan tertinggi: 1. Sarjana 4. Tidak selesai SD 2. Lulus SMP/SMA 5. Tidak sekolah 3. Lulus SD
6) Pekerjaan Ayah (dulu ataupun sekarang) 1. Petani ikan 2. Pegawai negeri sipil 3. pegawai swasta 4. Bisnis sendiri tapi bukan petani ikan. Jelaskan……….…………….………… 5. Tidak bekerja 6. Lainnya, mohon jelaskan.............................................................
7) Pekerjaan Ibu (dulu ataupun sekarang) 1. Petani ikan 2. Pegawai negeri sipil 3. Pegawai swasta 4. Bisnis sendiri tapi bukan petani ikan. Jelaskan……….………………………. 5. Tidak bekerja 6. Lainnya, mohon jelaskan.............................................................
8) Apa yang menghubungkan orang tua saudara dengan profesi petani ikan sudara sekarang ini? (saudara boleh melingkari lebih dari satu jawaban):
1. Mereka memiliki bisnis budidaya ikan sendiri. 2. Mereka memulai bisnis budidaya ikan yang sekarang saya jalani. 3. Tidak ada 4. Lainnya, mohon jelaskan.....................................................................
9) Siapakah sosok pebisnis unggul yang saudara ingin tiru? (saudara boleh melingkari lebih dari satu jawaban):
1. Ayah 5. Tetangga 2. Ibu 6. Teman 3. Kakak/adik 7. Tidak ada 4. Saudara 8. Lainnya, mohon jelaskan…………
10) Termasuk klas kelompok apakah bisnis budidaya milik saudara? 1. Pemula 4. Utama 2. Lanjut 5. Tidak tahu 3. Madya
11) Berapakah penghasilan saudara pertahun dari budidaya ikan? 1. Dibawah Rp. 50 juta 2. Rp. 50 juta – < Rp.100 juta 3. Rp. 100 juta – < Rp. 500 juta 4. Rp. 500 juta atau lebih

301
12) Berapa ukuran tanah milik saudara yang digunakan untuk budidaya ikan? 1. < 2 Ha 2. 2 - <5 Ha 3. 5 - <10 Ha 4. 10 Ha atau lebih
13) Berapa orang pegawai yang saudara miliki saat ini? 1. Sampai dengan 2 orang 2. 3-5 orang 3. 6-8 orang 4. 9 orang atau lebih
14) Apakah jenis budidaya ikan saudara? (saudara boleh melingkari lebih dari satu jawaban)
1. Air laut 2. Air payau 3. Air Tawar
15) Apakah metode budidaya ikan saudara? (saudara boleh melingkari lebih dari satu jawaban)
1. Tambak 2. Karamba 3. Sawah 4. Kolam 5. Lainnya, mohon jelaskan…………………………………………………………
16) Budidaya jenis apakah yang anda produksi?
1. Pembenihan 4. Pembesaran 2. Pembenihan dan pembesaran 5. Budidaya rumput laut 3. Ikan hias 6.Lainnya
(sebutkan)........................................ 17) Kegiatan apa saja yang telah saudara jalankan pada usaha budidaya ikan saudara?
(saudara boleh melingkari lebih dari satu jawaban) 1. Memproduksi pakan ikan sendiri 2. Memproduksi benih ikan sendiri 3. Memperluas jaringan pemasaran 4. Menambah species ikan yang dibudidayakan 5. Menjual ikan dalam bentuk lain (ikan asap, ikan asin, lauk dsb.) 6. Menjual bagian lain ikan selain daging (tulang, kulit, dsb.) 7. Bukan salah satu diatas 8. Lainnya, sebutkan…………………………………………………………………..
18) Semenjak kapan saudara meproduksi pakan ikan sendiri? 1. Sejak saya memluai bisnis. 2. Beberapa tahun yang lalu 3. Baru saja 4. Saya tidak meproduksi pakan ikan sendiri .
19) Mengapa saudara meproduksi pakan ikan sendiri? (saudara boleh melingkari lebih dari satu jawaban)
1. Agar saya dapat mengontrol kualitas pakannya. 2. Untuk menurunkan biaya produksi. 3. Untuk menjaga ketersediaan pakan ikan 4. Untuk meningkatkan pendapatan dengan menjual sebagian produksi pakan
ikan kepada orang lain 5. Alasan lain, jelaskan…………………………………………………………………. 6. Saya tidak memproduksi pakan ikan sendiri
20) Semenjak kapan saudara memproduksi benih ikan sendiri? 1. Sejak saya memulai bisnis. 2. Beberapa tahu yang lalu 3. Baru saja 4. Saya tidak memproduksi benih ikan sendiri.
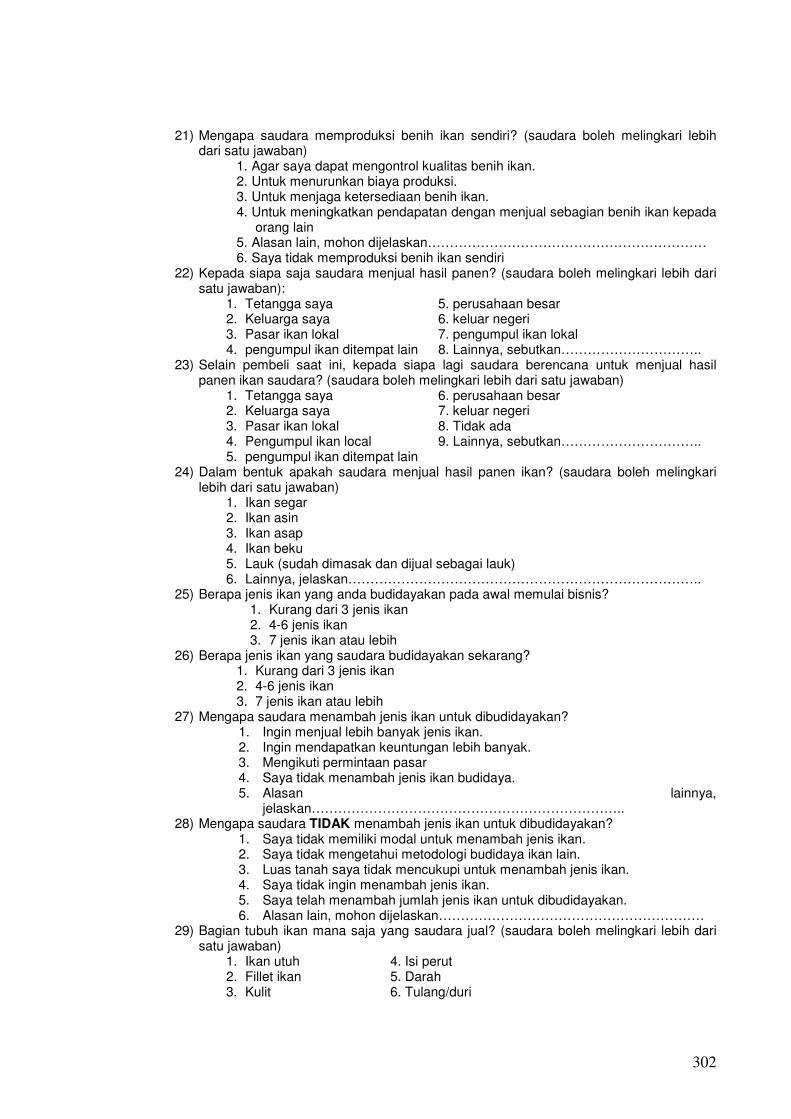
302
21) Mengapa saudara memproduksi benih ikan sendiri? (saudara boleh melingkari lebih
dari satu jawaban) 1. Agar saya dapat mengontrol kualitas benih ikan. 2. Untuk menurunkan biaya produksi. 3. Untuk menjaga ketersediaan benih ikan. 4. Untuk meningkatkan pendapatan dengan menjual sebagian benih ikan kepada
orang lain 5. Alasan lain, mohon dijelaskan……………………………………………………… 6. Saya tidak memproduksi benih ikan sendiri
22) Kepada siapa saja saudara menjual hasil panen? (saudara boleh melingkari lebih dari satu jawaban):
1. Tetangga saya 5. perusahaan besar 2. Keluarga saya 6. keluar negeri 3. Pasar ikan lokal 7. pengumpul ikan lokal 4. pengumpul ikan ditempat lain 8. Lainnya, sebutkan…………………………..
23) Selain pembeli saat ini, kepada siapa lagi saudara berencana untuk menjual hasil panen ikan saudara? (saudara boleh melingkari lebih dari satu jawaban)
1. Tetangga saya 6. perusahaan besar 2. Keluarga saya 7. keluar negeri 3. Pasar ikan lokal 8. Tidak ada 4. Pengumpul ikan local 9. Lainnya, sebutkan………………………….. 5. pengumpul ikan ditempat lain
24) Dalam bentuk apakah saudara menjual hasil panen ikan? (saudara boleh melingkari lebih dari satu jawaban)
1. Ikan segar 2. Ikan asin 3. Ikan asap 4. Ikan beku 5. Lauk (sudah dimasak dan dijual sebagai lauk) 6. Lainnya, jelaskan……………………………………………………………………..
25) Berapa jenis ikan yang anda budidayakan pada awal memulai bisnis? 1. Kurang dari 3 jenis ikan 2. 4-6 jenis ikan 3. 7 jenis ikan atau lebih
26) Berapa jenis ikan yang saudara budidayakan sekarang? 1. Kurang dari 3 jenis ikan 2. 4-6 jenis ikan 3. 7 jenis ikan atau lebih
27) Mengapa saudara menambah jenis ikan untuk dibudidayakan? 1. Ingin menjual lebih banyak jenis ikan. 2. Ingin mendapatkan keuntungan lebih banyak. 3. Mengikuti permintaan pasar 4. Saya tidak menambah jenis ikan budidaya. 5. Alasan lainnya,
jelaskan…………………………………………………………….. 28) Mengapa saudara TIDAK menambah jenis ikan untuk dibudidayakan?
1. Saya tidak memiliki modal untuk menambah jenis ikan. 2. Saya tidak mengetahui metodologi budidaya ikan lain. 3. Luas tanah saya tidak mencukupi untuk menambah jenis ikan. 4. Saya tidak ingin menambah jenis ikan. 5. Saya telah menambah jumlah jenis ikan untuk dibudidayakan. 6. Alasan lain, mohon dijelaskan……………………………………………………
29) Bagian tubuh ikan mana saja yang saudara jual? (saudara boleh melingkari lebih dari satu jawaban)
1. Ikan utuh 4. Isi perut 2. Fillet ikan 5. Darah 3. Kulit 6. Tulang/duri
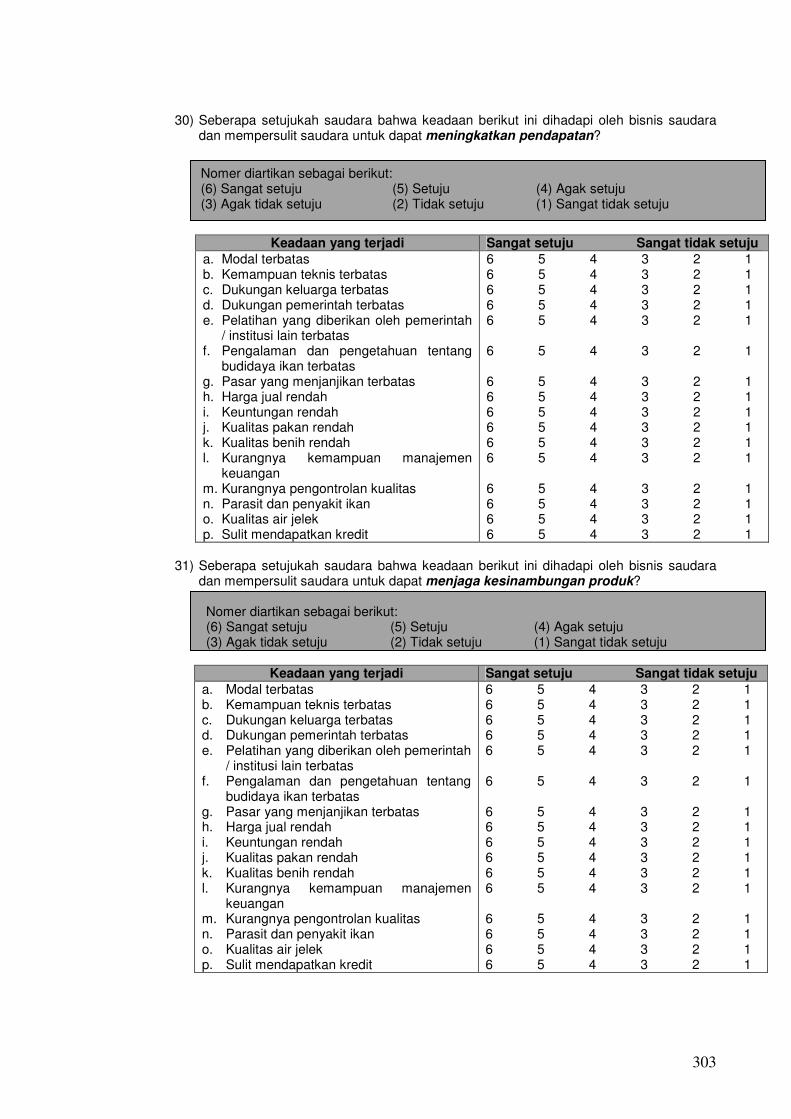
303
30) Seberapa setujukah saudara bahwa keadaan berikut ini dihadapi oleh bisnis saudara dan mempersulit saudara untuk dapat meningkatkan pendapatan?
Keadaan yang terjadi Sangat setuju Sangat tidak setuju
a. Modal terbatas b. Kemampuan teknis terbatas c. Dukungan keluarga terbatas d. Dukungan pemerintah terbatas e. Pelatihan yang diberikan oleh pemerintah
/ institusi lain terbatas f. Pengalaman dan pengetahuan tentang
budidaya ikan terbatas g. Pasar yang menjanjikan terbatas h. Harga jual rendah i. Keuntungan rendah j. Kualitas pakan rendah k. Kualitas benih rendah l. Kurangnya kemampuan manajemen
keuangan m. Kurangnya pengontrolan kualitas n. Parasit dan penyakit ikan o. Kualitas air jelek p. Sulit mendapatkan kredit
6 5 4 3 2 1 6 5 4 3 2 1 6 5 4 3 2 1 6 5 4 3 2 1 6 5 4 3 2 1 6 5 4 3 2 1 6 5 4 3 2 1 6 5 4 3 2 1 6 5 4 3 2 1 6 5 4 3 2 1 6 5 4 3 2 1 6 5 4 3 2 1 6 5 4 3 2 1 6 5 4 3 2 1 6 5 4 3 2 1 6 5 4 3 2 1
31) Seberapa setujukah saudara bahwa keadaan berikut ini dihadapi oleh bisnis saudara
dan mempersulit saudara untuk dapat menjaga kesinambungan produk?
Nomer diartikan sebagai berikut: (6) Sangat setuju (5) Setuju (4) Agak setuju (3) Agak tidak setuju (2) Tidak setuju (1) Sangat tidak setuju
Keadaan yang terjadi Sangat setuju Sangat tidak setuju
a. Modal terbatas b. Kemampuan teknis terbatas c. Dukungan keluarga terbatas d. Dukungan pemerintah terbatas e. Pelatihan yang diberikan oleh pemerintah
/ institusi lain terbatas f. Pengalaman dan pengetahuan tentang
budidaya ikan terbatas g. Pasar yang menjanjikan terbatas h. Harga jual rendah i. Keuntungan rendah j. Kualitas pakan rendah k. Kualitas benih rendah l. Kurangnya kemampuan manajemen
keuangan m. Kurangnya pengontrolan kualitas n. Parasit dan penyakit ikan o. Kualitas air jelek p. Sulit mendapatkan kredit
6 5 4 3 2 1 6 5 4 3 2 1 6 5 4 3 2 1 6 5 4 3 2 1 6 5 4 3 2 1 6 5 4 3 2 1 6 5 4 3 2 1 6 5 4 3 2 1 6 5 4 3 2 1 6 5 4 3 2 1 6 5 4 3 2 1 6 5 4 3 2 1 6 5 4 3 2 1 6 5 4 3 2 1 6 5 4 3 2 1 6 5 4 3 2 1
Nomer diartikan sebagai berikut: (6) Sangat setuju (5) Setuju (4) Agak setuju (3) Agak tidak setuju (2) Tidak setuju (1) Sangat tidak setuju
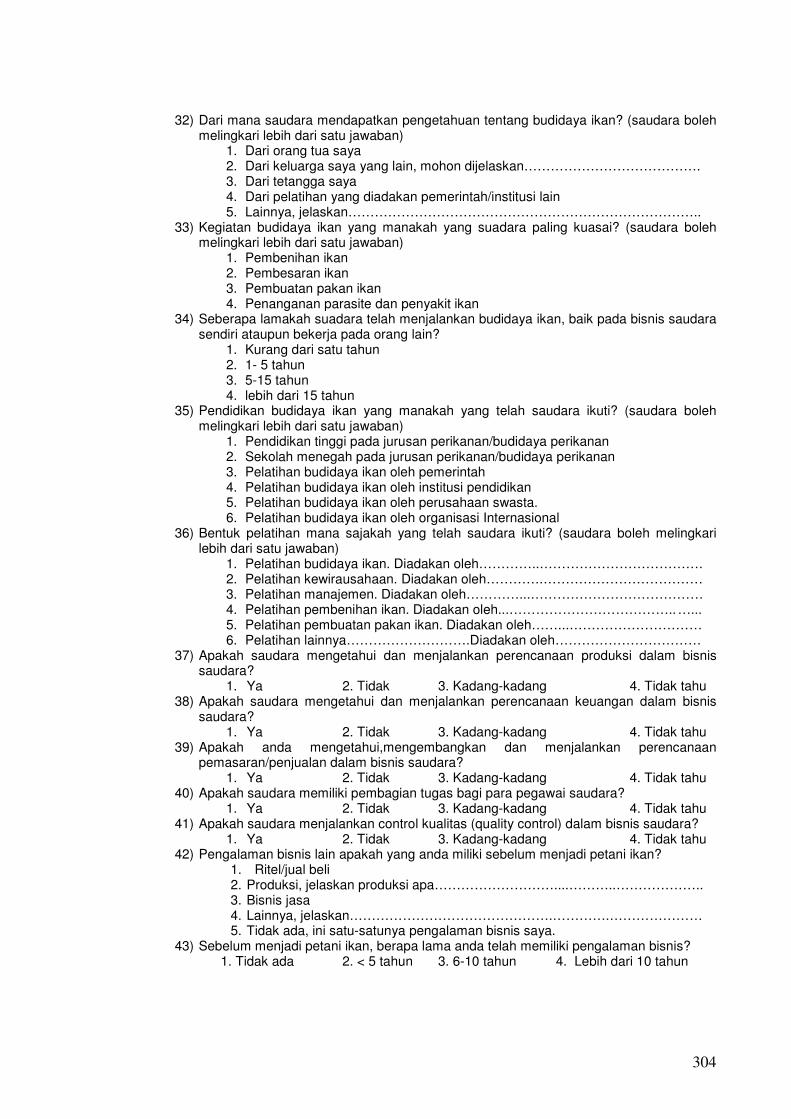
304
32) Dari mana saudara mendapatkan pengetahuan tentang budidaya ikan? (saudara boleh melingkari lebih dari satu jawaban)
1. Dari orang tua saya 2. Dari keluarga saya yang lain, mohon dijelaskan…………………………………. 3. Dari tetangga saya 4. Dari pelatihan yang diadakan pemerintah/institusi lain 5. Lainnya, jelaskan……………………………………………………………………..
33) Kegiatan budidaya ikan yang manakah yang suadara paling kuasai? (saudara boleh melingkari lebih dari satu jawaban)
1. Pembenihan ikan 2. Pembesaran ikan 3. Pembuatan pakan ikan 4. Penanganan parasite dan penyakit ikan
34) Seberapa lamakah suadara telah menjalankan budidaya ikan, baik pada bisnis saudara sendiri ataupun bekerja pada orang lain?
1. Kurang dari satu tahun 2. 1- 5 tahun 3. 5-15 tahun 4. lebih dari 15 tahun
35) Pendidikan budidaya ikan yang manakah yang telah saudara ikuti? (saudara boleh melingkari lebih dari satu jawaban)
1. Pendidikan tinggi pada jurusan perikanan/budidaya perikanan 2. Sekolah menegah pada jurusan perikanan/budidaya perikanan 3. Pelatihan budidaya ikan oleh pemerintah 4. Pelatihan budidaya ikan oleh institusi pendidikan 5. Pelatihan budidaya ikan oleh perusahaan swasta. 6. Pelatihan budidaya ikan oleh organisasi Internasional
36) Bentuk pelatihan mana sajakah yang telah saudara ikuti? (saudara boleh melingkari lebih dari satu jawaban)
1. Pelatihan budidaya ikan. Diadakan oleh…………..………………………………. 2. Pelatihan kewirausahaan. Diadakan oleh………….……………………………… 3. Pelatihan manajemen. Diadakan oleh…………...………………………………… 4. Pelatihan pembenihan ikan. Diadakan oleh...……………………………….. …... 5. Pelatihan pembuatan pakan ikan. Diadakan oleh……...………………………… 6. Pelatihan lainnya……………………….Diadakan oleh……………………………
37) Apakah saudara mengetahui dan menjalankan perencanaan produksi dalam bisnis saudara?
1. Ya 2. Tidak 3. Kadang-kadang 4. Tidak tahu 38) Apakah saudara mengetahui dan menjalankan perencanaan keuangan dalam bisnis
saudara? 1. Ya 2. Tidak 3. Kadang-kadang 4. Tidak tahu
39) Apakah anda mengetahui,mengembangkan dan menjalankan perencanaan pemasaran/penjualan dalam bisnis saudara?
1. Ya 2. Tidak 3. Kadang-kadang 4. Tidak tahu 40) Apakah saudara memiliki pembagian tugas bagi para pegawai saudara?
1. Ya 2. Tidak 3. Kadang-kadang 4. Tidak tahu 41) Apakah saudara menjalankan control kualitas (quality control) dalam bisnis saudara?
1. Ya 2. Tidak 3. Kadang-kadang 4. Tidak tahu 42) Pengalaman bisnis lain apakah yang anda miliki sebelum menjadi petani ikan?
1. Ritel/jual beli 2. Produksi, jelaskan produksi apa………………………....………..……………….. 3. Bisnis jasa 4. Lainnya, jelaskan……………………………………….………….………………… 5. Tidak ada, ini satu-satunya pengalaman bisnis saya.
43) Sebelum menjadi petani ikan, berapa lama anda telah memiliki pengalaman bisnis? 1. Tidak ada 2. < 5 tahun 3. 6-10 tahun 4. Lebih dari 10 tahun
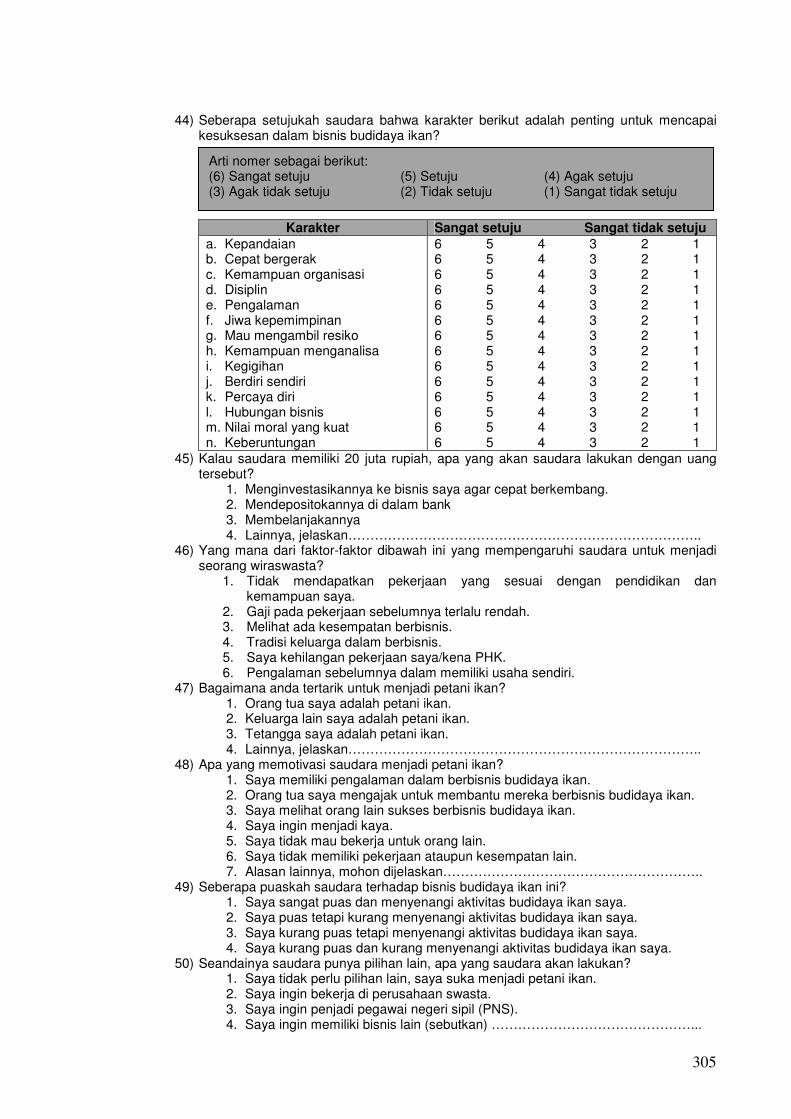
305
44) Seberapa setujukah saudara bahwa karakter berikut adalah penting untuk mencapai kesuksesan dalam bisnis budidaya ikan?
Karakter Sangat setuju Sangat tidak setuju
a. Kepandaian b. Cepat bergerak c. Kemampuan organisasi d. Disiplin e. Pengalaman f. Jiwa kepemimpinan g. Mau mengambil resiko h. Kemampuan menganalisa i. Kegigihan j. Berdiri sendiri k. Percaya diri l. Hubungan bisnis m. Nilai moral yang kuat n. Keberuntungan
6 5 4 3 2 1 6 5 4 3 2 1 6 5 4 3 2 1 6 5 4 3 2 1 6 5 4 3 2 1 6 5 4 3 2 1 6 5 4 3 2 1 6 5 4 3 2 1 6 5 4 3 2 1 6 5 4 3 2 1 6 5 4 3 2 1 6 5 4 3 2 1 6 5 4 3 2 1 6 5 4 3 2 1
45) Kalau saudara memiliki 20 juta rupiah, apa yang akan saudara lakukan dengan uang tersebut?
1. Menginvestasikannya ke bisnis saya agar cepat berkembang. 2. Mendepositokannya di dalam bank 3. Membelanjakannya 4. Lainnya, jelaskan……………………………………………………………………..
46) Yang mana dari faktor-faktor dibawah ini yang mempengaruhi saudara untuk menjadi seorang wiraswasta?
1. Tidak mendapatkan pekerjaan yang sesuai dengan pendidikan dan kemampuan saya.
2. Gaji pada pekerjaan sebelumnya terlalu rendah. 3. Melihat ada kesempatan berbisnis. 4. Tradisi keluarga dalam berbisnis. 5. Saya kehilangan pekerjaan saya/kena PHK. 6. Pengalaman sebelumnya dalam memiliki usaha sendiri.
47) Bagaimana anda tertarik untuk menjadi petani ikan? 1. Orang tua saya adalah petani ikan. 2. Keluarga lain saya adalah petani ikan. 3. Tetangga saya adalah petani ikan. 4. Lainnya, jelaskan……………………………………………………………………..
48) Apa yang memotivasi saudara menjadi petani ikan? 1. Saya memiliki pengalaman dalam berbisnis budidaya ikan. 2. Orang tua saya mengajak untuk membantu mereka berbisnis budidaya ikan. 3. Saya melihat orang lain sukses berbisnis budidaya ikan. 4. Saya ingin menjadi kaya. 5. Saya tidak mau bekerja untuk orang lain. 6. Saya tidak memiliki pekerjaan ataupun kesempatan lain. 7. Alasan lainnya, mohon dijelaskan…………………………………………………..
49) Seberapa puaskah saudara terhadap bisnis budidaya ikan ini? 1. Saya sangat puas dan menyenangi aktivitas budidaya ikan saya. 2. Saya puas tetapi kurang menyenangi aktivitas budidaya ikan saya. 3. Saya kurang puas tetapi menyenangi aktivitas budidaya ikan saya. 4. Saya kurang puas dan kurang menyenangi aktivitas budidaya ikan saya.
50) Seandainya saudara punya pilihan lain, apa yang saudara akan lakukan? 1. Saya tidak perlu pilihan lain, saya suka menjadi petani ikan. 2. Saya ingin bekerja di perusahaan swasta. 3. Saya ingin penjadi pegawai negeri sipil (PNS). 4. Saya ingin memiliki bisnis lain (sebutkan) ………………………………………...
Arti nomer sebagai berikut: (6) Sangat setuju (5) Setuju (4) Agak setuju (3) Agak tidak setuju (2) Tidak setuju (1) Sangat tidak setuju

306
5. Tidak ada diatas, jelaskan…………………………………………………………... 51) Dengan siapa sajakah anda berhubungan dalam bisnis ini? (saudara boleh melingkari
lebih dari satu jawaban): 1. Supplier 2. Pembeli 3. Konsumen 4. Kantor / staff pemerintah 5. Tetangga 6. Bank / koperasi 7. Lainnya, mohon dijelaskan……………………………………. ……………………
52) Berapakah modal awal bisnis ini? 1. Kurang dari 10 juta rupiah. 2. Rp. 10 juta – kurang dari Rp. 20 juta 3. Rp. 20 juta – kurang dari Rp. 30 juta 4. Lebih dari Rp. 30 million 5. Saya tidak tahu, saya mewarisi bisnis ini dari orang tua saya. 6. Saya tidak ingat
53) Bagaimana saudara mengumpulkan uang untuk modal awal? (saudara boleh melingkari lebih dari satu jawaban)
1. Tabungan sendiri 2. Pinjam dari keluarga 3. Pinjam dari tetangga 4. Pinjam dari bank/koprasi 5. Lainnya, mohon dijelaskan………………………………….………………………. 6. Saya tidak tahu, saya mewarisi bisnis ini dari orang tua saya.
54) Di masa lalu, siapakah yang memberikan dukungan finansial (keuangan) untuk bisnis saudara? (saudara boleh melingkari lebih dari satu jawaban)
1. Suami/istri 4. Keluarga besar 2. Anak 5. Tidak ada 3. Orang tua 6. Lainnya, sebutkan…………………………..
55) Di masa lalu, siapakah yang memberikan dukungan non-finansial (dukungan moral) untuk bisnis saudara? (saudara boleh melingkari lebih dari satu jawaban)
1. Suami/istri 4. Keluarga besar 2. Anak 5. Tidak ada 3. Orang tua 6. Lainnya, sebutkan……………………….….
56) Saat ini, siapakah yang memberikan dukungan finansial (keuangan) untuk bisnis saudara? (saudara boleh melingkari lebih dari satu jawaban)
1. Suami/istri 4. Keluarga besar 2. Anak 5. Tidak ada 3. Orang tua 6. Lainnya, sebutkan…………………………
57) Saat ini, siapakah yang memberikan dukungan non-finansial (dukungan moral) untuk bisnis saudara? (saudara boleh melingkari lebih dari satu jawaban)
1. Suami/istri 4. Keluarga besar 2. Anak 5. Tidak ada 3. Orang tua 6. Lainnya, sebutkan…………………………..
58) Siapakah yang sama sekali TIDAK mendukung saudara secara FINANSIAL (KEUANGAN) dalam bisnis ini? (saudara boleh melingkari lebih dari satu jawaban)
1. Suami/istri 4. Keluarga besar 2. Anak 5. Tidak ada 3. Orang tua 6. Lainnya, sebutkan…………………………..
59) Siapakah yang sama sekali TIDAK mendukung saudara secara NON-FINANSIAL (MORAL) dalam bisnis ini? (saudara boleh melingkari lebih dari satu jawaban)
1. Suami/istri 4. Keluarga besar 2. Anak 5. Tidak ada 3. Orang tua 6. Lainnya, sebutkan…………………………..
60) Siapa saja dalam keluarga yang membantu menjalankan bisnis saudara? (saudara boleh melingkari lebih dari satu jawaban)
1. Suami/istri 4. Keluarga besar 2. Anak 5. Tidak ada 3. Orang tua 6. Lainnya, sebutkan…………………………..

307
61) Dari manakah saudara mendapatkan informasi tentang pasar yang berpotensi? (saudara boleh melingkari lebih dari satu jawaban):
1. Pemerintah pusat 6. Media masa (koran, radio, TV, dll) 2. Pemerintah daerah 7. Keluarga/teman 3. Institusi pendidikan 8. Teman bisnis 4. Organisasi Internasional 5. Lainnya, sebutkan…………………………………………………………………….
62) Bagaimana saudara menawarkan hasi panen saudara kepada konsumen baru? (saudara boleh melingkari lebih dari satu jawaban):
1. Menawarkan dari rumah ke rumah 2. Saya mengirimkan penawaran lewat pos 3. Saya mengirimkan penawaran lewat e-mail. 4. Melalui website saya 5. Saya memiliki konsumen tetap saja. 6. Pemasaran dari mulut ke mulut (gethok tular) 7. Saya tidak tahu 8. Lainnya, sebutkan……………………………………………...…………………….
63) Jenis transportasi apakah yang saudara gunakan untuk berbisnis? (saudara boleh melingkari lebih dari satu jawaban)
1. Kendaraan pribadi 2. Saya pinjam kendaraan teman/keluarga. 3. Saya menyewa kendaraan. 4. Transportasi umum 5. Lainnya, sebutkan……………………………………………………………………
64) Seberapa jauhkan tempat transportasi umum terdekat dengan lokasi budidaya saudara?
1. 0 – 1 km 2. 1 km - < 5 km 3. lebih dari 5 km
65) Seberapa setujukah saudara bahwa faktor-faktor dibawah ini mempengaruhi usaha untuk meningkatkan pendapatan bisnis saudara?
Faktor-faktor Sangat setuju Sangat tidak setuju
1. Pengetahuan budidaya ikan 2. Ketrampilan budidaya ikan 3. Pengalaman budidaya ikan 4. Pendidikan budidaya ikan 5. Karakter kuat sebagai seorang
wirausahawan/pemilik bisnis 6. Alasan menjadi wiraswasta 7. Pengalaman pribadi dalam
berbisnis 8. Latar belakang bisnis keluarga 9. Hubungan bisnis 10. Modal keuangan 11. Dukungan keluarga 12. Pasar 13. Transportasi 14. Dukungan pemerintah dan
institusi lainnya
6 5 4 3 2 1 6 5 4 3 2 1 6 5 4 3 2 1 6 5 4 3 2 1 6 5 4 3 2 1 6 5 4 3 2 1 6 5 4 3 2 1 6 5 4 3 2 1 6 5 4 3 2 1 6 5 4 3 2 1 6 5 4 3 2 1 6 5 4 3 2 1 6 5 4 3 2 1 6 5 4 3 2 1
Nomer diartikan sebagai berikut: (6) Sangat setuju (5) Setuju (4) Agak setuju (3) Agak tidak setuju (2) Tidak setuju (1) Sangat tidak setuju

308
66) Seberapa setujukah saudara bahwa faktor-faktor dibawah ini mempengaruhi usaha
untuk menjaga kesinambungan produk bisnis saudara?
Faktor-faktor Sangat setuju Sangat tidak setuju
1. Pengetahuan budidaya ikan 2. Ketrampilan budidaya ikan 3. Pengalaman budidaya ikan 4. Pendidikan budidaya ikan 5. Karakter kuat sebagai seorang
wirausahawan/pemilik bisnis 6. Alasan menjadi wiraswasta 7. Pengalaman pribadi dalam berbisnis 8. Latar belakang bisnis keluarga 9. Hubungan bisnis 10. Modal keuangan 11. Dukungan keluarga 12. Pasar 13. Transportasi 14. Dukungan pemerinath dan institusi
lainnya
6 5 4 3 2 1 6 5 4 3 2 1 6 5 4 3 2 1 6 5 4 3 2 1 6 5 4 3 2 1 6 5 4 3 2 1 6 5 4 3 2 1 6 5 4 3 2 1 6 5 4 3 2 1 6 5 4 3 2 1 6 5 4 3 2 1 6 5 4 3 2 1 6 5 4 3 2 1 6 5 4 3 2 1
67) Institusi yang manakah yang paling membantu dalam mendukung bisnis saudara? (saudara boleh melingkari lebih dari satu jawaban)
1. Pemerinath pusat 4. Organisasi Internasional 2. Pemerinath daerah 5. Perusahaan swasta 3. Institusi pendidikan 6. Lainnya, sebutkan…………………
68) Bentuk dukungan apa sajakah yang telah diberikan oleh pemerintah/ institusi lainnya kepada usaha budidaya ikan saudara? (saudara boleh melingkari lebih dari satu jawaban)
1. kredit lunak dari bank/koperasi yang ditunjuk 2. Pelatihan teknis budidaya perikanan 3. Bantuan teknis 4. Bantuan pemasaran 5. Pemberian informasi tentang adanya pasar yang berpotensi 6. Subsidi benih ikan 7. Subsidi pakan ikan 8. Lainnya, sebutkan…………………………………………………………………….
69) Bagaimana saudara menggambarkan kondisi keuangan saudara bila dibandingkan 5 tahun yang lalu?
1. Lebih baik 2. Sama saja 3. Lebih jelek 70) Bagaimana kira-kira kondisi keuangan saudara 3 tahun kedepan dengan adanya bisnis
budidaya ikan ini? 1. Lebih baik 2. Sama saja 3. Lebih jelek
71) Bagaimanakah bisnis ini mempengaruhi keluarga saudara? 1. Menambah penghasilan total keuarga saya 2. Mengurangi penghasilan total keluarga saya 3. Menaikkan pendapatan keluarga saya secara tajam
72) Bagaimanakah rencana saudara untuk menaikkan pendapatan bisnis saudara dimasa mendatang? (saudara boleh melingkari lebih dari satu jawaban):
1. Memproduksi pakan ikan sendiri. 2. Memproduksi benih ikan sendiri. 3. Memperluas jaringan pemasaran. 4. Memperbanyak jenis ikan yang dibudidayakan. 5. Memperbanyak jenis produk yang dijual (ikan asap, ikan asin, dll). 6. Menjual bagian lain ikan (kulit, tulang dll). 7. Lainnya, sebutkan……………………………………………………………………
Nomer diartikan sebagai berikut: (6) Sangat setuju (5) Setuju (4) Agak setuju (3) Agak tidak setuju (2) Tidak setuju (1) Sangat tidak setuju

309
73) Seberapa khawatir kah saudara bahwa budidaya ikan saudara akan mempengaruhi kualitas TANAH tempat budidaya ikan saudara?
1. Saya sangat khawatir 3. Saya tidak khawatir 2. Saya agak khawatir 4. Saya tidak tahu
74) Seberapa khawatir kah saudara bahwa budidaya ikan saudara akan mempengaruhi kualitas AIR budidaya ikan saudara?
1. Saya sangat khawatir. 3. Saya tidak khawatir. 2. Saya agak khawatir. 4. Saya tidak tahu.
75) Bagaimanakah saudara menjaga kualitas LINGKUNGAN tempat budidaya ikan saudara? (saudara boleh melingkari labih dari satu jawaban):
1. Saya membersihkan lingkungan budidaya ikan saya secara rutin setiap hari. 2. Saya melarang pembuangan sampah dekat kolam budidaya ikan saya. 3. Saya tidak khawatir tentang kualitas lingkungan. 4. Saya tidak tahu 5. Lainnya, sebutkan……………………………………………………………………
76) Bagaimanakah saudara menjaga kualitas AIR budidaya ikan saudara? (saudara boleh
melingkari labih dari satu jawaban): 1. Saya mengecek dan mengontrol kualitas air secara rutin setiap hari. 2. Saya memupuk kolam setiap akan memulai budidaya. 3. Saya menyimpan air dalam tanki yang terkontrol kualitasnya. 4. Saya tidak khawatir tentang kualitas air. 5. Pertanyaan ini tidak sesuai dengan kegiatan budidaya saya. 6. Lainnya, sebutkan……………………………………………………………………
77) Kegiatan yang manakah yang akan menjaga bahwa budidaya saudara akan menghasilkan kualitas dan kuantitas produk yang diharapkan? (saudara boleh melingkari lebih dari satu jawaban):
1. Mengecek kualitas air secara rutin setiap hari 2. Memberikan pakan pada waktu dan jumlah yang tepat 3. Menjaga kualitas dan ketersediaan pakan ikan 4. Menjaga kualitas dan ketersediaan benih ikan 5. Saya tidak tahu 6. Lainnya, sebutkan……………………………………………………………………
78) Apa yang akan saudara lakukan apabila tidak dapat memperoleh pakan/benih ikan yang diperlukan?
1. Saya tidak tahu 2. Saya akan membeli pakan/benih dari teman bisnis saya. 3. Saya akan mencoba mencari supplier. 4. Saya akan memproduksi pakan/benih sendiri. 5. Saya menyimpan stok pakan/benih ikan sendiri. 6. Pertanyaan ini tidak sesuai dengan kegiatan budidaya saya

310
Appendix 3
From: Anne Cain To: Thandi, Harch CC: Wilkins, Keith Date: 19/11/2007 5:41 PM Subject: SUHREC Project 0708/110 Ethics Clearance Dear Harch SUHREC Project 0708/110 Factors influencing aquaculture entrepreneurial activity of small-scale fish farmers in deriving income improvements and ensuring product sustainability in CentralJava, lndonesia Dr Harchand Thandi FBE Ms Tita Elfitasari Proposed Duration: From 15/11/2007To 15/07/2008 Ethical review of the above project was carried out on behalf of Swinburne's Human Research Ethics Committee (SUHREC) by a SUHREC SubCommittee (SHESC3) on Friday 9 November,2007. I am pleased to advise that Ethics Clearance has been given for the project as submitted in line with standard conditions here outlined : - All human research activity undertaken under Swinburne auspices must conform to Swinburne and external regulatory standards, including the current National Statement on Ethical Conduct in Research lnvolving Humans and with respect to secure data use, retention and disposal. - The named Swinburne Chief lnvestigator/Supervisor remains responsible for any personnel appointed to or associated with the project being made aware of ethics clearance conditions, including research and consent procedures or instruments approved. Any change in chief investigator/supervisor requires timely notification and SUHREC endorsement. - The above project has been approved as submitted for ethical review by or on behalf of SUHREC. Amendments to approved procedures or instruments ordinarily require prior ethical appraisal/ clearance. SUHREC must be notified immediately or as soon as possible thereafter of (a) any serious or unexpected adverse effects on participants and any redress measures; (b) proposed changes in protocols; and (c) unforeseen events which might affect continued ethical acceptability of the project. - At a minimum, an annual report on the progress of the project is required as well as at the conclusion (or abandonment) of the project. - A duly authorised external or internal audit of the project can be undertaken at any time. Please contact me if you have any queries or concerns about on-going ethics clearance. The SUHREC project number should be cited in communication. Anne Cain Acting Secretary, SHESC3 Ms Anne Cain Acting Research Administrator Faculty of Business and Enterprise Swinburne University of Technology H95 PO Box 218 Hawthorn Vic 3122 Australia Telephone +61 3 9214 8605 Fax +61 3 9214 8381 email: [email protected]
Copyright © 2022 FDOKUMEN