The Context of Small-Scale Integrated Agriculture-Aquaculture ...
331
The Context of Small-Scale Integrated Agriculture-Aquaculture Systems in Mrica: A Case Study of Malawi ~. ....- ,;1(::' II ~~! i~ I"~ rJ \t International Center for Living Aquatic Resources Management iP Deutsche Gesellschaft fUr Technische Zusammenarbeit (GTZ), GmbH ---
-
Upload
khangminh22 -
Category
Documents
-
view
1 -
download
0
Transcript of The Context of Small-Scale Integrated Agriculture-Aquaculture ...
The Context of Small-Scale Integrated
Agriculture-Aquaculture Systemsin Mrica:
A Case Study of Malawi
~.
....-,;1(::'II~~! i~ I"~ rJ \t
International Center for LivingAquatic Resources Management
iPDeutsche Gesellschaft fUr TechnischeZusammenarbeit (GTZ), GmbH
---
The Context of Small-Scale Integrated Agriculture-Aquaculture Systems in Africa: A Case Study of Mala6i
~ T I O N A L CENTER FOR LMNG AQUATIC RESOURCES MANAGEMENT MANILA, PHILIPPINES
The ontext of Small-Scale Integrated &culture-~acuture Systems in Africa: A Case Study of Malaai
DEUTSCHE GESELLSCHAFT F- TECHNISCHE ZUSAMMENARBEIT (GTZ), GmbH ESCHBORN, FEDERAL REPUBLIC OF GERMANY

The context of small-scale integrated agriculture-aquaculture systems in Africa: a case study of Mala%
Published by the International Center for Living Aquatic Resources Management, MC P.O. Box 1501, Makati, Metro Manila, Philippines and Deutsche Gesellschaft fiir Technische Zusammenarbeit (GTZ) GmbH, Postfach 5180, D-6236 Eschborn 1 bei Fra.nkfurt/Main, Federal Republic of Germany
Printed in Manila, Philippines.
ICLARM and GTZ. 1991. The context of small-scale integrated agriculture-aquaculture systems in Africa: a case study of Malaii. ICLARM Stud. Rev. 18,302 p.
ISSN 0115-4389 ISBN 971-1022-65-6
Cover: Zomba District, Southern Region, MalaGi: dry season maintenance activities; clearing and reshaping the pond. Photo by K. Ruddle.
ICLARM Contribution No. 576

CONTENTS
. . . . . . . . . . . . . . . . . . . . . . . . . . . . . . . . . . . . . . . . . . ACKNOWLEDGEMENTS
ABSTRACT . . . . . . . . . . . . . . . . . . . . . . . . . . . . . . . . . . . . . . . . . . . . . . . . . .
ASPECTS OF SMALL-SCAL$ INTEGRATED AGRICULTURE-AQUACULTURE . . . . . . . . . . . . . . . . . . . . . . . . . . . . . . . . . . . . . . . SYSTEMSINMALAWI
INTRODUCTION
Aquaculture in Context . . . . . . . . . . . . . . . . . . . . . . . . . . . . . . . . . . . . . . The Context of National Development Levels . . . . . . . . . . . . . . . . . . . . . . . . . The Context of Alternative Sources of Protein . . . . . . . . . . . . . . . . . . . . . . . . The Physical and Biological Environmental Context . . . . . . . . . . . . . . . . . . . . . The Socioeconomic Environmental Context . . . . . . . . . . . . . . . . . . . . . . . . . . The Context of Integrated Systems . . . . . . . . . . . . . . . . . . . . . . . . . . . . . .
About This Study . . . . . . . . . . . . . . . . . . . . . . . . . . . . . . . . . . . . . . . . . .
CHAPTER 1: PLANNING FOR THE DEVELOPMENT OF AQUACULTURE IN AFRICA
Introduction . . . . . . . . . . . . . . . . . . . . . . . . . . . . . . . . . . . . . . . . . . . . . The Resource Systems Concept and Framework . . . . . . . . . . . . . . . . . . . . . . The Logistics of Aquaculture Development . . . . . . . . . . . . . . . . . . . . . . . . . .
Political Economy or Resource Allocation Strategies . . . . . . . . . . . . . . . . . . . National Development Goals and Priorities . . . . . . . . . . . . . . . . . . . The Development and Status of Aquaculture . . . . . . . . . . . . . . . . . . .
. . . . . . . Technical and Manpower Development and Financial Assistance National Infrastructure . . . . . . . . . . . . . . . . . . . . . . . . . . . . . . . Protective Legislation . . . . . . . . . . . . . . . . . . . . . . . . . . . . . . . .
. . . . . . . . . . . . . . . . . . . Relationships with Other Economic Sectors Biological and Physical Factors . . . . . . . . . . . . . . . . . . . . . . . . . . . . . . .
Environmental . . . . . . . . . . . . . . . . . . . . . . . . . . . . . . . . . . . . Climate . . . . . . . . . . . . . . . . . . . . . . . . . . . . . . . . . . .
Temperatures . . . . . . . . . . . . . . . . . . . . . . . . . . . . . . . . . . . . . . . . . . Rainfall. sunshine and evaporation
Humidity and wind . . . . . . . . . . . . . . . . . . . . . . . . . . . . . . . . . . . . . . . . . . . . . . . . . Hydrology and limnology
Water resources . . . . . . . . . . . . . . . . . . . . . . . . . . Water quality . . . . . . . . . . . . . . . . . . . . . . . . . . .
. . . . . . . . . . . . . . . . . . . . . . . . . . . . . . . Geomorphology . . . . . . . . . . . . . . . . . . . . . . . . . . . . . . . . . . . . . Soils
. . . . . . . . . . . . . . . . . . . . . . . . . . . . . . . . . . Vegetation Fish Biology . . . . . . . . . . . . . . . . . . . . . . . . . . . . . . . . . . . . .
. . . . . . . . . . . . . . . . . . . . . . . . . Resources for aquaculture . . . . . . . . . . . . . . . . . . . . . . . . . . . . . . . . Other aspects
xxi
xxii

Environment Condition . . . . . . . . . . . . . . . . . . . . . . . . . . . . . . . Public health hazards . . . . . . . . . . . . . . . . . . . . . . . . . . . Natural hazards . . . . . . . . . . . . . . . . . . . . . . . . . . . . . .
. . . . . . . . . . . . . . . . . . . . . . . . . . . . . . . . . . . . Sociocultural Factors Farm Household Level . . . . . . . . . . . . . . . . . . . . . . . . . . . . . . .
. . . . . . . . . . . . . . . . . . . . . . . . . . . . . . . . . . Community Level . . . . . . . . . . . . . Land Tenure. Access to Resources and Property Rights
Fish Consumption Rates and Consumer Preferences . . . . . . . . . . . . . . Local Marketing Structures . . . . . . . . . . . . . . . . . . . . . . . . . . . .
Actual Resource System . . . . . . . . . . . . . . . . . . . . . . . . . . . . . . . . . . . Agriculture . . . . . . . . . . . . . . . . . . . . . . . . . . . . . . . . . . . . . .
. . . . . . . . . . . . . . . . . . . . . . . . . . . . . . . . . . . . . . Processing Distribution . . . . . . . . . . . . . . . . . . . . . . . . . . . . . . . . . . . . . Consumption . . . . . . . . . . . . . . . . . . . . . . . . . . . . . . . . . . . . .
Supplementary Inputs . . . . . . . . . . . . . . . . . . . . . . . . . . . . . . . . . . . . Socioeconomic . . . . . . . . . . . . . . . . . . . . . . . . . . . . . . . . . . . .
Labor Supply . . . . . . . . . . . . . . . . . . . . . . . . . . . . . . . . Technology . . . . . . . . . . . . . . . . . . . . . . . . . . . . . . . . .
. . . . . . . . . . . . . . . . . . . . . . . . . . . . . . . . . . . Capital Extension Support . . . . . . . . . . . . . . . . . . . . . . . . . . . . .
Biological and Physical . . . . . . . . . . . . . . . . . . . . . . . . . . . . . . . Selection Processes . . . . . . . . . . . . . . . . . . . . . . . . . . . . . . . . . . . . . .
Species . . . . . . . . . . . . . . . . . . . . . . . . . . . . . . . . . . . . . . . . Biological criteria . . . . . . . . . . . . . . . . . . . . . . . . . . . . . . Biotechnological criteria . . . . . . . . . . . . . . . . . . . . . . . . . .
. . . . . . . . . . . . . . . . . . . . . . . . . . . . Bioeconomic criteria Pathological criteria . . . . . . . . . . . . . . . . . . . . . . . . . . . . Marketing criteria . . . . . . . . . . . . . . . . . . . . . . . . . . . . .
Site . . . . . . . . . . . . . . . . . . . . . . . . . . . . . . . . . . . . . . . . . . Physical and biological criteria . . . . . . . . . . . . . . . . . . . . . .
Thermal viability . . . . . . . . . . . . . . . . . . . . . . . . . Slope . . . . . . . . . . . . . . . . . . . . . . . . . . . . . . . . Soils . . . . . . . . . . . . . . . . . . . . . . . . . . . . . . . .
. . . . . . . . . . . . . . . . . . . . . . Hydrological conditions Natural hazards . . . . . . . . . . . . . . . . . . . . . . . . . .
Demographic criteria . . . . . . . . . . . . . . . . . . . . . . . . . . . Basal stibsistence criteria . . . . . . . . . . . . . . . . . . . . . . . . .
SystemType . . . . . . . . . . . . . . . . . . . . . . . . . . . . . . . . . . . . .
CHAPTER 2: THE STATUS OF AQUACULTURE AND FISH PRODUCTION SYSTEMS IN AFRICA
. . . . . . . . . . . . . . . . . . . . . . . . . . . . . . . . . . . . . . . . . . . . . Introdaiction 39 . . . . . . . . . . . . . . . . . . The Traditional Background of Aquaculture in Africa 39
. . . . . . . . . . . . . . . . . . . . . . . . . . . Colonial and Early Postcolonial Times 40 . . . . . . . . . . . . . . . . . . . . Aquaculture and Fish Production Systems in Africa 40
. . . . . . . . . . . . . . . . . . . . . . . . . Traditional African Systems of Aquaculture 43 . . . . . . . . . . . . . . . . . . . . . . . . . . . The Damming of Natural Depressions 46
. . . . . . . . . . . . . . . . . . . . . . . . . . . . . . . . . . . . . . . . Drain-in Ponds 46 . . . . . . . . . . . . . . . . . . . . . . . . . . . . . . . . . . . . . . . . Howash 46
Whedos . . . . . . . . . . . . . . . . . . . . . . . . . . . . . . . . . . . . . . . . 49 . . . . . . . . . . . . . . . . . . . . . . . . . . . . . . . . . . Fish Aggregation Devices 52

Refuge Traps or Brush Parks . . . . . . . . . . . . . . . . . . . . . . . . . . . TheAcadja . . . . . . . . . . . . . . . . . . . . . . . . . . . . . . . . . . . . . .
Barachois . . . . . . . . . . . . . . . . . . . . . . . . . . . . . . . . . . . . . . . . . . . Shellfish Stocking . . . . . . . . . . . . . . . . . . . . . . . . . . . . . . . . . . . . . .
Modern Aquaculture Systems in Africa . . . . . . . . . . . . . . . . . . . . . . . . . . . . Extensive Systems . . . . . . . . . . . . . . . . . . . . . . . . . . . . . . . . . . . . . .
Dam Stocking . . . . . . . . . . . . . . . . . . . . . . . . . . . . . . . . . . . . Rice-Fish Systems . . . . . . . . . . . . . . . . . . . . . . . . . . . . . . . . . . Extensive Pond Systems . . . . . . . . . . . . . . . . . . . . . . . . . . . . . .
Semi-Intensive Systems . . . . . . . . . . . . . . . . . . . . . . . . . . . . . . . . . . . Pond Culture . . . . . . . . . . . . . . . . . . . . . . . . . . . . . . . . . . . . ,
Intensive Systems . . . . . . . . . . . . . . . . . . . . . . . . . . . . . . . . . . . . . . Intensive Pond Culture . . . . . . . . . . . . . . . . . . . . . . . . . . . . . . . Cage and Pen Culture . . . . . . . . . . . . . . . . . . . . . . . . . . . . . . . Tanks and Raceway Culture . . . . . . . . . . . . . . . . . . . . . . . . . . . .
The Present Status of Aquuaculture in Africa . . . . . . . . . . . . . . . . . . . . . . . . The Present Status of Aquaculture in the SADCC Subregion . . . . . . . . . . . . . .
.
Angola . . . . . . . . . . . . . . . . . . . . . . . . . . . . . . . . . . . . . . . . . . . . . Botswana . . . . . . . . . . . . . . . . . . . . . . . . . . . . . . . . . . . . . . . . . . . Lesotho . . . . . . . . . . . . . . . . . . . . . . . . . . . . . . . . . . . . . . . . . . . . Malaibi . . . . . . . . . . . . . . . . . . . . . . . . . . . . . . . . . . . . . . . . . . . .
. . . . . . . . . . . . . . . . . . . . . . . . . . . . . . . . . . . . . . . . . Mozambique Swaziland . . . . . . . . . . . . . . . . . . . . . . . . . . . . . . . . . . . . . . . . . . . Tanzania . . . . . . . . . . . . . . . . . . . . . . . . . . . . . . . . . . . . . . . . . . . Zambia . . . . . . . . . . . . . . . . . . . . . . . . . . . . . . . . . . . . . . . . . . . . Zimbabwe . . . . . . . . . . . . . . . . . . . . . . . . . . . . . . . . . . . . . . . . . . .
CHAPTER 3: MALAWI, THE NATIONAL SE'ITING
Introduction . . . . . . . . . . . . . . . . . . . . . . . . . . . . . . . . . . . . . . . . . . . . . The Demographic Condition . . . . . . . . . . . . . . . . . . . . . . . . . . . . . . . . . . .
The Geographical Distribution of Population . . . . . . . . . . . . . . . . . . . . . . . The Biophysical Environment . . . . . . . . . . . . . . . . . . . . . . . . . . . . . . . . . .
Physiographic Zonation . . . . . . . . . . . . . . . . . . . . . . . . . . . . . . . . . . . Climate and Climatic Zones . . . . . . . . . . . . . . . . . . . . . . . . . . . . . . . . .
Precipitation . . . . . . . . . . . . . . . . . . . . . . . . . . . . . . . . . . . . . Air Temperatures . . . . . . . . . . . . . . . . . . . . . . . . . . . . . . . . . . Evapotranspiration . . . . . . . . . . . . . . . . . . . . . . . . . . . . . . . . .
. . . . . . . . . . . . . . . . . . . . . Sunshine. Relative Humidity and Winds Climatic Zonation of MalaGi . . . . . . . . . . . . . . . . . . . . . . . . . . . .
Hydrography and Drainage Patterns . . . . . . . . . . . . . . . . . . . . . . . . . . . Soils . . . . . . . . . . . . . . . . . . . . . . . . . . . . . . . . . . . . . . . . . . . . . . . .
The National Economic Profile . . . . . . . . . . . . . . . . . . . . . . . . . . . . . . . . . National Development Policies and Strategies . . . . . . . . . . . . . . . . . . . . . . .
Economic Performance Since Independence . . . . . . . . . . . . . . . . . . . . . . . . . . . . . . . . . . . . . . . . . . . . . . . . . . . . . . . . . Wages. Incomes and Prices
Background to the Development of Agriculture in Mala% . . . . . . . . . . . . . . . . Agricultural Development Policy and Strategies . . . . . . . . . . . . . . . . . . . . . .
Farmers' Clubs and Agricultural Credit . . . . . . . . . . . . . . . . . . . . . . . . . . The Agricultural Situation . . . . . . . . . . . . . . . . . . . . . . . . . . . . . . . . . . . .
. . . . . . . . . . . . . . . . . . . . . . . . . . . . . . . . . . . . . . . Crop Production . . . . . . . . . . . . . . . . . . . . . . . . . . . . . . . . . . . . . . The Estate Sector
. . . . . . . . . . . . . . . . . . . . . . . . . . . . . . . . . . . . . . . . . . . Livestock . . . . . . . . . . . . . . . . . . . . . . . . . . . . . . . . . . . . . . . . . . . Irrigation
vii

Agricultural Marketing . . . . . . . . . . . . . . . . . . . . . . . . . . . . . . . . . . . 123 Constraints on Agricultural Production . . . . . . . . . . . . . . . . . . . . . . . . . . 124
. . . . . . . . . . . . . . . . . . . . . . . . . . . . . . . The Food and Nutrition Situation 130 . . . . . . . . . . . . . . . . . . . . . . . . . . . . . . . . . . . . . . . . . . . . . . Conclusion 131
Introduction . . . . . . . . . . . . . . . . . . . . . . . . . . . . . . . . . . . . . . . . . . . . . . . . . . . . . . . . . . . . . . . . . . . . . . . . . . The Fisheries Areas and Productivity
LakeMalaCNi . . . . . . . . . . . . . . . . . . . . . . . . . . . . . . . . . . . . . . . . . . . . . . . . . . . . . . . . . . . . . . . . . . . . . . . . . . . . . . . . . Lake Malombe
. . . . . . . . . . . . . . . . . . . . . . . . . . . . . . . . . . . . . . . . . Lake Chilwa
. . . . . . . . . . . . . . . . . . . . . . . . . . . . . . . . . . . . . . . . . . Lake Chiuta Lower Shire Valley and Associated Wetlands . . . . . . . . . . . . . . . . . . . . . . .
. . . . . . . . . . . . . . . . . . . . . . . . . . . . . . . . The Elephant Marsh . . . . . . . . . . . . . . . . . . . . . . . . . . . . . . . . . The Ndinde Marsh
. . . . . . . . . . . . . . . . . . . . . . . . . . . . . . . The Chikawa Lagoons . . . . . . . . . . . . . . . . . . . . . . . . . . . . . . . . . The Bangula Marsh
The Lower Shire River . . . . . . . . . . . . . . . . . . . . . . . . . . . . . . . Fish Production in the Lower Shire Valley . . . . . . . . . . . . . . . . . . . . . . . .
. . . . . . . . . . . . . . . . . . . . . . . . . . . . . . . . . . . . . . . . . The Fish Resource LakeMalaG . . . . . . . . . . . . . . . . . . . . . . . . . . . . . . . . . . . . . . . . .
Pelagic Fish Resources of ~ a k e Mala% . . . . . . . . . . . . . . . . . . . . . . . . . . . . Offshore Pelagic Resources . . . . . . . . . . . . . . . . . . . . . . . . . . . . . . . . . Inshore Pelagic Resources . . . . . . . . . . . . . . . . . . . . . . . . . . . . . . . . . .
. . . . . . . . . . . . . . . . . . . . . . . . . . . . . . . Inshore Demersal Fish Resources . . . . . . . . . . . . . . . . . . . . . . . . . . . . . . . . . Traditional Small-Scale Fishing
Technologies Used . . . . . . . . . . . . . . . . . . . . . . . . . . . . . . . . . . . . . . . . . . Nets . . . . . . . . . . . . . . . . . . . . . . . . . . . . . . . . . . . . . . . . . . . . . .
Gill Nets (ndangala. machera) . . . . . . . . . . . . . . . . . . . . . . . . . . . Open Water Seines (chilimila) . . . . . . . . . . . . . . . . . . . . . . . . . . . Beach Seines (kambuzi. khota) . . . . . . . . . . . . . . . . . . . . . . . . . . .
. . . . . . . . . . . . . . . . . . . . . . . . . . . . . . . . . Scoop Nets (pyasa) . . . . . . . . . . . . . . . . . . . . . . . . . . . . . . . . Casting Nets (chavi)
Traps . . . . . . . . . . . . . . . . . . . . . . . . . . . . . . . . . . . . . . . . . . . . . . . . . . . . . . . . . . . . . . . . . . . . . . . . . . . . . . . . . . Fence Traps
Basket Traps (mono) . . . . . . . . . . . . . . . . . . . . . . . . . . . . . . . . . . . . . . . . . . . . . . . . . . . . . . . . . . . . . . . . . . . Vegetation Trap
Hooks . . . . . . . . . . . . . . . . . . . . . . . . . . . . . . . . . . . . . . . . . . . . . Long Lines . . . . . . . . . . . . . . . . . . . . . . . . . . . . . . . . . . . . . .
. . . . . . . . . . . . . . . . . . . . . . . . . . . . . . . . . . . . . Single Lines . . . . . . . . . . . . . . . . . . . . . . . . . . . . . . . . . . . . Pole-and-Line
. . . . . . . . . . . . . . . . . . . . . . . . . . . . . . . . . Simple Manual Techniques Plunge Baskets . . . . . . . . . . . . . . . . . . . . . . . . . . . . . . . . . . .
. . . . . . . . . . . . . . . . . . . . . . . . . . . Spearing and Bow-and-Arrow . . . . . . . . . . . . . . . . . . . . . . . . . . . . . . . . . . Stupefacients and Poisons . . . . . . . . . . . . . . . . . . . . . . . . . . . . . . . . . . Small-Scale Fishing Craft
. . . . . . . . . . . . . . . . . . . . . . . . . . Social Aspects of the Small-Scale Fisheries . . . . . . . . . . . . . . . . . . . . . . . . . . . . . . . . . . . . Part-Time Fishermen
. . . . . . . . . . . . . . . . . . . . . . . . . . . . . . . . . . . . . . Fisheries Laborers . . . . . . . . . . . . . . . . . . . . . . . . . . . . . . . . . . . . Incomes and Earnings
. . . . . . . . . . . . . . . . . . . . . . . . . . . . . . . . . . . . . . . . Industrial Fisheries
Fisheries Development Policy and Strategies . . . . . . . . . . . . . . . . . . . . . . . . 162
CHAPTER 5: THE UTILIZATION OF CAPTURE FISHERY PRODUCTS
Introduction . . . . . . . . . . . . . . . . . . . . . . . . . . . . . . . . . . . . . . . . . . . . . Marketing Infrastructure . . . . . . . . . . . . . . . . . . . . . . . . . . . . . . . . . . . . . Distribution and Marketing Networks . . . . . . . . . . . . . . . . . . . . . . . . . . . . . The Fish Traders and Marketing Relationships . . . . . . . . . . . . . . . . . . . . . . . The Geographical Distribution of Markets for Fishery Products . . . . . . . . . . . .
Distribution from Lake Mala% Fisheries . . . . . . . . . . . . . . . . . . . . . . . . . Distribution from Lake Malombe and the Upper Shire River . . . . . . . . . . . . . . Distribution from Lake Chilwa Fisheries . . . . . . . . . . . . . . . . . . . . . . . . . Distribution from the Lower Shire Fisheries . . . . . . . . . . . . . . . . . . . . . . .
Pricestructures . . . . . . . . . . . . . . . . . . . . . . . . . . . . . . . . . . . . . . . . . . Fish Consumption Patterns . . . . . . . . . . . . . . . . . . . . . . . . . . . . . . . . . . . Consumer Preferences . . . . . . . . . . . . . . . . . . . . . . . . . . . . . . . . . . . . . . Fish Processing and Handling . . . . . . . . . . . . . . . . . . . . . . . . . . . . . . . . . . Conclusion . . . . . . . . . . . . . . . . . . . . . . . . . . . . . . . . . . . . . . . . . . . . . .
CHAPTER 6: AN OVERVIEW OF AQUACULTURE I N MALAG1
Introduction . . . . . . . . . . . . . . . . . . . . . . . . . . . . . . . . . . . . . . . . . . . . . 189 Aquaculture Production in ~ a l a 6 i . . . . . . . . . . . . . . . . . . . . . . . . . . . . . . . 189 The Aquaculture Policy of the Government of ~ a l a 6 i . . . . . . . . . . . . . . . . . . . 189 The ist tor^ of Aquaculture in Mala% . . . . . . . . . . . . . . . . . . . . . . . . . . . . . 193
Trout Stocking . . . . . . . . . . . . . . . . . . . . . . . . . . . . . . . . . . . . . . . . 193 Fish Stocking in Dams . . . . . . . . . . . . . . . . . . . . . . . . . . . . . . . . . . . . 194 Aquaculture on Estates . . . . . . . . . . . . . . . . . . . . . . . . . . . . . . . . . . . 194 Early Experiments with Aquaculture and Extension . . . . . . . . . . . . . . . . . . . 194
The Current Status of Aquaculture in Malaibi . . . . . . . . . . . . . . . . . . . . . . . . 198 . . . . . . . . . . . . . . . . . . . . . . . . . . . . Water Storage Dams and Reservoirs 198
The Private Sector: Estates . . . . . . . . . . . . . . . . . . . . . . . . . . . . . . . . . 201 . . . . . . . . . . . . . . . . . . . The Sugar Company of Mala% (SUCOMA) 201
The Dwangwa Sugar Estate . . . . . . . . . . . . . . . . . . . . . . . . . . . . 202 The Kavusi Tea Estate . . . . . . . . . . . . . . . . . . . . . . . . . . . . . . . 203 The Satemwa Tea Estate . . . . . . . . . . . . . . . . . . . . . . . . . . . . . . 203
The Public Sector . . . . . . . . . . . . . . . . . . . . . . . . . . . . . . . . . . . . . . . 203
CHAPTER 7: AQUACULTURE RESEARCH. TRAINING. EXTENSION AND DEVELOPMENT PROJECTS
Introduction . . . . . . . . . . . . . . . . . . . . . . . . . . . . . . . . . . . . . . . . . . . . . Research Facilities and Work Conducted . . . . . . . . . . . . . . . . . . . . . . . . . . .
The Domasi Experimental Fish Farm (DEFF) . . . . . . . . . . . . . . . . . . . . . . . . . . . . . Research on Water Quality and Supplementary Inputs to Ponds
. . . . . . . . . . . . . . . . . . . . . . . . . . Research on Indigenous Species . . . . . . . . . . . . . . . . . . . . . . . . . . . . . Research on Exotic Species
. . . . . . . . . . . . . . . . . . . . . . . The Research Strategy at the DEFF . . . . . . . . . . . . . . . . . . . . . . . . . . The Kasinthula Pilot Fish Farm (KPFF) . . . . . . . . . . . . . . . . . . . . . . . . . Research Conducted a t the KPFF

. . . . . . . . . . . . . . . . . . . . . . . Research at the Bunda College of Agriculture . . . . . . . . . . . . . . . . . . . . . . . . . . . . . . . . . . . . . . . Aquaculture Training
Training Available a t Present . . . . . . . . . . . . . . . . . . . . . . . . . . . . . . . . Proposals for Manpower Development . . . . . . . . . . . . . . . . . . . . . . . . . . .
Aquaculture Extension . . . . . . . . . . . . . . . . . . . . . . . . . . . . . . . . . . . . . . Aquaculture Development Projects in Mala64 . . . . . . . . . . . . . . . . . . . . . . . .
. . . . . . . . . . . . . . . . . . . . . . . . Area Development Projects for Aquaculture The Central and Northern Regions Fish Farming Development. Extension.
Training and Research Project . . . . . . . . . . . . . . . . . . . . . . . . . . . . . The Project on Fish Farming in the MulanjeIPhalombe Districts
The Malawi-German Fisheries and Aquaculture Development . . . . . . . . . . . . . . . . . . . . . . . . . . . . . Project (MAGFAD)
. . . . . . . . . . . . . . . . . . . . . Research Projects for Aquaculture Development The ICLARMIGTZ-FD-UM Project. Research for the Development of Tropical
Aquaculture Technology Appropriate for Implementation . . . . . . . . . . . . . . . . . . . . . . . . . . . . . . . in Rural Africa
The Polyculture Project of the IDRC . . . . . . . . . . . . . . . . . . . . . . . . . . . . . . . . . . . . . . . . . . . . . . . . . . . . . . . . . . . . . . . . . . . . . Conclusion
CHAPTER 8: SMALL-SCALE FARMING SYSTEMS AND AQUACULTURE
. . . . . . . . . . . . . . . . . . . . . . . . . . . . . . . . . . . . . . . . . . . . . Introduction 233 . . . . . . . . . . . . . . . The Geographical Distribution of Small-Scale Aquaculture 234
. . . . . . . . . . . . . . . . . . . . . . . . . . . . . . . . . . . . . The Southern Region 234 . . . . . . . . . . . . . . . . . . . . . . . . . . . . . . . . . . . . . The Central Region 235 . . . . . . . . . . . . . . . . . . . . . . . . . . . . . . . . . . . . . The Northern Region 236
. . . . . . . . . . . . . . . . . . . . . . . . Small-Scale Aquaculture in Southern Mala% 236 . . . . . . . . . . . . . . . . . . . . . . . . . . . . . . . . . . . . . The Mulanje District 236 . . . . . . . . . . . . . . . . . . . . . . . . . . . . . . . . . . . . . The Mwanza District 238
. . . . . . . . . . . . . . . . . . . . . . . . . . . Demographic Characteristics 238 . . . . . . . . . . . . . . . . . . . . . . . . . . . . . Agricultural Landholdings 239
. . . . . . . . . . . . Agricultural Systems and Patterns of Garden Cropping 239 . . . . . . . . . . . . . . . . . . . The Cultivation Calendar for Garden Crops 239
. . . . . . . . . . . . . . . . . . . . . . . . . . . . . . . . . Garden Crop Yields 241 . . . . . . . . . . . . . . . . . . . . . . . . . . . . . . . . . . . . . . . Livestock 242
. . . . . . . . . . . . . . . . . . . . . . . . . . . . . . . . Household Economies 242 . . . . . . . . . . . . . . . . . . . . . . . . . . . . . . . . . . . . . Aquaculture 243
. . . . . . . . . Case Studies of Small-scale Fish Farmers in Mwanza District 244 . . . . . . . . . . . . . . . . . . . . . . . . . . . Farm 1. Jonan Village 244 . . . . . . . . . . . . . . . . . . . . . . . . . . . Farm 2. Jonan Village 244
. . . . . . . . . . . . . . . . . . . . . . . . Farm 3. Kumphika Village 244 . . . . . . . . . . . . . . . . . . . . . . . . . . . Farm 4. Ntaja Village 245 . . . . . . . . . . . . . . . . . . . . . . . . . . Farm 5. Leketa Village 245
. . . . . . . . . . . . . . . . . . . . . . . . . . . . . . . . . . . . . . The Zomba District 245 . . . . . . . . . . . . . . . . . . . . . . . . . . . Demographic Characteristics 245
. . . . . . . . . . . . . . . . . . Characteristics of Agricultural Landholdings 246 . . . . . . . . . . . . Agricultural Systems and Patterns of Garden Cropping 246
. . . . . . . . . . . . . . . . . . . . . . . . . . . . . . . . . . . . . Aquaculture 246 . . . . . . . . . Case Studies of Small-Scale Fish Farmers in Zomba District 246
. . . . . . . . . . . . . . . . . . . . . . . . . . Farm 1. Minama Village 246 . . . . . . . . . . . . . . . . . . . . . . . . . Farm 2. Chinawa Village 248 . . . . . . . . . . . . . . . . . . . . . . . . . . Farm 3. Mbatata Village 249
Summary of the Characteristics of Fish Farmers and Fish Farming in the Mwanza and Zomba Districts . . . . . . . . . . . . . . . . . . . . . . . . . . . . . . . . . . . . 251 The Location of Fishponds . . . . . . . . . . . . . . . . . . . . . . . . . . . . . . . . . . 251 Pond Type and Size . . . . . . . . . . . . . . . . . . . . . . . . . . . . . . . . . . . . . 251 Pond Management . . . . . . . . . . . . . . . . . . . . . . . . . . . . . . . . . . . . . . 252 Harvesting . . . . . . . . . . . . . . . . . . . . . . . . . . . . . . . . . . . . . . . . . . 252 Age . . . . . . . . . . . . . . . . . . . . . . . . . . . . . . . . . . . . . . . . . . . . . . . 252 Constraints on the Expansion of Fish Farming . . . . . . . . . . . . . . . . . . . . . . 253
CHAPTER 9: COMMUNITY. LAND TENURE AND HOUSEHOLD DECISIONMAKING. WITH REFERENCE TO INTEGRATED AQUACULTURE
Introduction . . . . . . . . . . . . . . . . . . . . . . . . . . . . . . . . . . . . . . . . . . . . . Rural Settlement Patterns and Social Organization in Mala% . . . . . . . . . . . . . Sociocultural Organization . . . . . . . . . . . . . . . . . . . . . . . . . . . . . . . . . . . . Community Level Norms as Constraints on Decisionmaking . . . . . . . . . . . . . . .
The Sharing of Resources . . . . . . . . . . . . . . . . . . . . . . . . . . . . . . . . . . Levelling Mechanisms . . . . . . . . . . . . . . . . . . . . . . . . . . . . . . . . . . . . Magico-Religious Factors . . . . . . . . . . . . . . . . . . . . . . . . . . . . . . . . . . .
Land Tenure and Use Rights . . . . . . . . . . . . . . . . . . . . . . . . . . . . . . . . . . . Matrilinity and the Resource Rights of Males . . . . . . . . . . . . . . . . . . . . . . . Dambo Areas: An Example of Common Property Resources . . . . . . . . . . . . . . .
Household Decisionmaking . . . . . . . . . . . . . . . . . . . . . . . . . . . . . . . . . . . The Importance of Sociocultural Factors . . . . . . . . . . . . . . . . . . . . . . . . . . . Innovation and Rural Communities . . . . . . . . . . . . . . . . . . . . . . . . . . . . . .
The Importance of Appropriate Institutions . . . . . . . . . . . . . . . . . . . . . . . .
CHAPTER 10: LABOR. TIME ALLOCATION AND THE ECONOMIC ROLE OF WOMEN
Introduction . . . . . . . . . . . . . . . . . . . . . . . . . . . . . . . . . . . . . . . . . . . . . Labor and the Traditional Household in Southern Mala64 . . . . . . . . . . . . . . . . Labor Demand and Supply by Principal Crop Type . . . . . . . . . . . . . . . . . . . .
Maize . . . . . . . . . . . . . . . . . . . . . . . . . . . . . . . . . . . . . . . . . . . . . Rice . . . . . . . . . . . . . . . . . . . . . . . . . . . . . . . . . . . . . . . . . . . . . . Manioc . . . . . . . . . . . . . . . . . . . . . . . . . . . . . . . . . . . . . . . . . . . . . Sweet Potatoes . . . . . . . . . . . . . . . . . . . . . . . . . . . . . . . . . . . . . . . . Peanuts . . . . . . . . . . . . . . . . . . . . . . . . . . . . . . . . . . . . . . . . . . . . Cotton . . . . . . . . . . . . . . . . . . . . . . . . . . . . . . . . . . . . . . . . . . . . . Tobacco . . . . . . . . . . . . . . . . . . . . . . . . . . . . . . . . . . . . . . . . . . . .
The Sexual Division of Labor in Small-Scale Farming . . . . . . . . . . . . . . . . . . . Masambanjati . . . . . . . . . . . . . . . . . . . . . . . . . . . . . . . . . . . . . . . . Namwera . . . . . . . . . . . . . . . . . . . . . . . . . . . . . . . . . . . . . . . . . . . Nkhotakota . . . . . . . . . . . . . . . . . . . . . . . . . . . . . . . . . . . . . . . . . .
The ole of women in ~ a l a G i a n ~griculture . . . . . . . . . . . . . . . . . . . . . . .
REFERENCES . . . . . . . . . . . . . . . . . . . . . . . . . . . . . . . . . . . . . . . . . . . . . . . . 291
LISTOFACRONYMS . . . . . . . . . . . . . . . . . . . . . . . . . . . . . . . . . . . . . . . . . . . . 300

GLOSSARY . . . . . . . . . . . . . . . . . . . . . . . . . . . . . . . . . . . . . . . . . . . . . . . . . . 301
RATE OF EXCHANGE OF MALAWIAN KWACHA PER UNIT OF US$ . . . . . . . . . . . . . . 302
LIST OF FIGURES
Fig . 1.1. Africa: elevation above sea level. political divisions and location of MalaGi . . . . . . . . . . . . 2 Fig . 1.1. A resource systems model to assess the viability of
. . . . . . . . . . . . . . . . . . . . . . . . . . . . . . . . . aquaculture and integrated farming 11 Fig . 1.2. Limiting isotherms and potential aquaculture zonation for
. . . . . . . . . . . . . . . . . . . . . . . . . . . . . . . . . . . . . . . central and southern Africa 19 Fig . 1.3. Rates of potentially available fish per capita in
. . . . . . . . . . . . . . . . . . . . . . . . . . . . . . . . . . . the SADCC countries, 1968-1985 29 Fig . 2.1. An Egyptian bas relief from the tomb of Thebaine (before 2000 B.C.)
. . . . . . . . . . . . . . . . . . . . . . . . . . . . . . . . depicting fishing in a pond for tilapia 39 Fig . 2.2. Yields of fish from howash in the Lake Manzalla Area, Egypt . . . . . . . . . . . . . . . . . . 48 Fig . 2.3. Aerial perspective of drain-in ponds in the Oueme Valley, Benin . . . . . . . . . . . . . . . . 50 Fig . 2.4. Productivity in relation to size of whedos in Benin . . . . . . . . . . . . . . . . . . . . . . . . . 51 Fig . 2.5. Construction of a typical whedo in the Oueme Valley of Benin . . . . . . . . . . . . . . . . . . 51 Fig . 2.6. Types of acadja used in Benin . . . . . . . . . . . . . . . . . . . . . . . . . . . . . . . . . . . . 53 Fig . 2.7. Brushparks used in the B e n d Valley of Nigeria . . . . . . . . . . . . . . . . . . . . . . . . . . 53 Fig . 2.8. Variations in the yield of acadjas in Benin . . . . . . . . . . . . . . . . . . . . . . . . . . . . . 54 Fig . 2.9. Method of fishing an acadja in BBnin . . . . . . . . . . . . . . . . . . . . . . . . . . . . . . . . 55 Fig . 2.10. Method of fishing a vovomora in Madagascar . . . . . . . . . . . . . . . . . . . . . . . . . . . 56 Fig . 2.11. Capital investment for various extensive aquaculture systems in Benin . . . . . . . . . . . . 56 Fig . 3.1. Administrative divisions and principal towns of Mala% . . . . . . . . . . . . . . . . . . . . . 68 Fig . 3.2. Population growth and projections for Mala%, 1901 -2015 . . . . . . . . . . . . . . . . . . . . 69 Fig . 3.3. Estimated population of Mala% by age group and sex for 1980 and 2000 . . . . . . . . . . . . 69 Fig . 3.4. Population density of Malaki by traditional authority areas in 1977, and
estimated population by age group and sex for the three regions and . . . . . . . . . . . . . . principal urban centers, 1966 and 1977 . . . . . . . . . . . . .
'2' ' ' 70
. . . . . . . . . . . . . . . . Fig . 3.5. Population density in Mala% by district, 1987 (persons per km ) 71 . . . . . . . . . . . . Fig . 3.6. Population density in ~ a l a G i by district, 1977 (percentage distribution) 74 . . . . . . . . . . . . Fig . 3.7. Population density in Mala% by district, 1987 (percentage distribution) 75
. . . . . . . . . . . . . . . . . . . . . . . . . . . . . Fig . 3.8. Distribution of population in Mala%, 1977 76 Fig . 3.9. Distribution of the principal ethnic groups in Mala% . . . . . . . . . . . . . . . . . . . . . . . 77 Fig . 3.10. The principal physiographic zones of Malafvi . . . . . . . . . . . . . . . . . . . . . . . . . . . 78 Fig . 3.11. Physiographic cross-section of (A) Lake ~ a l a i i and (B) across MalaCNi
from Chikwawa to the Mozambique border . . . . . . . . . . . . . . . . . . . . . . . . . . . . . 79 . . . . . . . . . Fig . 3.12. Coefficient of variability in the onset and end of the rainy season in Malaiki 81
. . . . . . . . . . . . . . . Fig . 3.13. Climatic zonation o f ~ a l a G i , based on the Thornthwaite method 82 Fig . 3.14. Geographical distribution of mean annual rainfall in Mala% and monthly
. . . . . . . . . . . . . . . . . . . . . . . distribution a t representative meteorological stations 84 . . . . . . . . . . . . . . . Fig . 3.15. Geographical distribution of the probability of rainfall in Mala% 85
Fig . 3.16. Isotherms of mean annual maximum and minimum temperatures in Mala% and . . . . . . . . . . . . . . . . . . . . . monthly means for representative meteorological stations 86
Fig . 3.17. The general relationship between elevation above sea level and . . . . . . . . . . . . . . . . . . . . . . . . . . . . . . mean annual air temperatures in Mala% 87
Fig . 3.18. The relationship between mean maximum, mean minimum and average monthly fishpond water and air temperature a t (A) Domasi Experimental Fish Farm and
. . . . . . . . . . . . . . . . (B) Kasinthula Pilot Fish Farm in the southern district of Mala% 87
Fig . 3.19. Zonation of Mala% for integrated agriculture.aquaculture, based on temperature. drought index and elevation above sea level . . . . . . . . . . . . . . . . . . . . . 88
Fig . 3.20. Zonation of mean annual pan evaporation in Malaii . . . . . . . . . . . . . . . . . . . . . . 89 Fig . 3.21. The geographical distribution of average sunshine, relative humidity.
and winds in Mala% and monthly distribution a t representative meteorological stations . . . . . . . . . . . . . . . . . . . . . . . . . . . . . . . . . . . . . . . . . 90
Fig . 3.22. Water resource area (WRA) boundaries and distribution of dams in Mala% . . . . . . . . . 92 Fig . 3.23. Geographical distribution of mean annual surface runoff in Mala% and
monthly distribution of runoff rates a t (a) Lilongwe, (b) North Rumphi and (c)Lufira . . . . . . . . . . . . . . . . . . . . . . . . . . . . . . . . . . . . . . . . . . . . . . . . . 94
Fig . 3.24. Mean monthly rainfall and discharge rates of the Domasi River. Southern Region, Mala% . . . . . . . . . . . . . . . . . . . . . . . . . . . . . . . . . . . . . . . 95
Fig . 3.25. Oscillations in the water level of Lake Mala%. 1900-1986 . . . . . . . . . . . . . . . . . . . 96 Fig . 3.26. Longitudinal profile of the Shire River, Mala%, from Lake Mala% to
the Mozambique border . . . . . . . . . . . . . . . . . . . . . . . . . . . . . . . . . . . . . . . . 96 Fig . 3.27. Oscillations in the water level of Lake Chilwa, Mala%. 1951-1971 . . . . . . . . . . . . . . . 96 Fig . 3.28. Zonation of the principal soil types in MalaGi . . . . . . . . . . . . . . . . . . . . . . . . . . 97 Fig . 3.29a. Comparison of development expenditure, 1964-1975, of the
Ministry of Agriculture and Natural Resources, Malaii . . . . . . . . . . . . . . . . . . . . . 102 Fig . 3.29b. Comparison of appropriations-in-aid. 1964-1975, of the
Ministry of Agriculture and Natural Resources, ~ a l a & i . . . . . . . . . . . . . . . . . . . . . 102 Fig . 3 . 2 9 ~ . Comparison of revenue expenditure, 1964-1975, Ministry of Agriculture and
Natural Resources. Mala% . . . . . . . . . . . . . . . . . . . . . . . . . . . . . . . . . . . . . 102 Fig . 3.30. Location of rural growth center projects in Mala% . . . . . . . . . . . . . . . . . . . . . . . 104 Fig . 3.31. Location of rural development project (RDP) and agricultural development
divisions (ADD) in Mala% . . . . . . . . . . . . . . . . . . . . . . . . . . . . . . . . . . . . . . 105 Fig . 3.32. Statutory minimum daily wage rates, 1974-1985,
for selected localities in Mala% . . . . . . . . . . . . . . . . . . . . . . . . . . . . . . . . . . . 107 Fig . 3.33. Composite retail price index of selected goods and
services in ~ a l a k i , 1980-1 988 . . . . . . . . . . . . . . . . . . . . . . . . . . . . . . . . . . . . 107 Fig . 3.34. Average prices of selected items of basic foodstuffs
for 1975-1985 in Blantyre and Lilongwe, Mala% . . . . . . . . . . . . . . . . . . . . . . . . . 110 Fig . 3.35. Distribution of present-day and hypothetical natural vegetation and
hypothetical estimates of earlier conditions in Eastern Central Africa . . . . . . . . . . . . . 110 Fig . 3.36. Distribution of the tsetse fly (Glossina spp.) in Eastern Central Africa . . . . . . . . . . . . 111 Fig . 3.37. Early distribution patterns of selected staple crops in Central.
Eastern and Southern Africa . . . . . . . . . . . . . . . . . . . . . . . . . . . . . . . . . . . . 112 Fig . 3.38. The geographical distribution of the principal commercial crops
. . . . . . . . . cultivated under the colonial agricultural economy of Nyasaland. 1890-1964 113 Fig . 3.39. The geographical distribution of cultivation density in Malahi . . . . . . . . . . . . . . . . 116 Fig . 3.40. Distribution of small-scale farms in ~ a l a k i . by number,
area and economy, 1980-1981 . . . . . . . . . . . . . . . . . . . . . . . . . . . . . . . . . . . . 117 . Fig 3.41. Geographical distribution of small-scale farm crops in Mala% . . . . . . . . . . . . . . . . 118
Fig . 3.42. Geographical distribution of cattle by number and type and livestock production in Malaki, 1975-1 981 . . . . . . . . . . . . . . . . . . . . . . . . . . . . . 119
. . . . . . . . . . . . . . . Fig 3.43. The cultivable and cultivated area by region in MalaGi, 1980-1981 120
. Fig 3.44. ~ocation of irrigation schemes in ~ a l a f n i . . . . . . . . . . . . . . . . . . . . . . . . . . . . 125 Fig . 3.45. Boundaries of water resource areas (WRA) and number of dams
by area in Mala% . . . . . . . . . . . . . . . . . . . . . . . . . . . . . . . . . . . . . . . . . . . 126 Fig . 3.46. Location of principal ADMARC facilities . . . . . . . . . . . . . . . . . . . . . . . . . . . . . 127 Fig . 3.47. Fertilizer sales by ADMARC to small-scale farmers.
and total imports of fertilizers by ~a la ib i , 1960-1987 . . . . . . . . . . . . . . . . . . . . . . . 128

Fig . 3.48. The geographical distribution of infant mortality rates . . . . . . . . . . . . . . . . . . . . . . . . . . . . . . . . . . . . . . by district in Mala%, 1960 132
Fig . 4.1. Capture fishery production of the principal waterbodies of Mala%. 1962-1986 . . . . . . . . . . . . . . . . . . . . . . . . . . . . . . . . . . . . . . . . . 138
Fig . 4.2. The fisheries management zones of Mala% and delimitation of . . . . . . . . . . . . . . . . . . . . . . . . . the grounds for industrial fishing in Lake MalaGi 141
. . . . . . . . . . . . . . . . . . . . . . . . . . . . . . . . . . . Fig . 4.3. Depth ~rofiles of Lake Mala% 142 . . . . . . . . . . . . . . . . . . . . . . . . . . . . . . Fig 4.4. ~ i s h catch of Mala% by area and species 147
Fig . 4.5. Comparative catch composition by principal species of the Northern, . . . . . . . . . . . . . . . . . Central and Southern Regions of Lake Mala%, 1982 and 1983 147
Fig . 4.6. Operation of the psyailo encircling fish fence, a traditional fishing gear from Mala% . . . . . . . . . . . . . . . . . . . . . . . . . . . . . . . 154
. . . . . . . . . . . . . . . . . . . . . . . . . Fig . 4.7. Fish traps from the Lower Shire Valley, Mala% 155 Fig . 4.8. Rates of increase in the prices of fishing craft built at Salima Boatyard,
1982-1985, compared with the increase in mean fish prices . . . . . . . . . . . . . . . . . . . 158 Fig . 5.1. The principal highways of Mala% . . . . . . . . . . . . . . . . . . . . . . . . . . . . . . . . . 170
. . . . . . . . . . . . . . . . . . . . . . . . Fig . 5.2. Structure of the fish marketing system in Mala% 171 Fig . 5.3. Principal fishing areas and transport routes of fish to the
main markets of Malak, 1981 . . . . . . . . . . . . . . . . . . . . . . . . . . . . . . . . . . . . 172 . . . . . . . . . . . . . . . . Fig . 5.4. Sources of fish supply to markets in Mala% by region of origin 172
Fig . 5.5. Fish production and beach prices for capture fisheries in Malawi, 1960-1986 . . . . . . . . . 179 Fig . 5.6. Seasonal fluctuation in the retail prices of fresh and
dried Oreochromis spp . and Tilapia spp . in Lilongwe, Blantyre, Mzuzu and Zomba markets, MalaGi, 1985-1986 . . . . . . . . . . . . . . . . . . . . 181
Fig . 5.7. The size-price relationship of pond-raised Oreochromis shiranus spp . sold at the Satemwa Tea Estate, Mala%, 1981-1985 . . . . . . . . . . . . . . . . . . . . . . . 182
Fig . 5.8. Population growth, fish consumption and projected fish requirements for Mala% to the year 2000 . . . . . . . . . . . . . . . . . . . . . . . . . . . . . . . . . . . . . . . 184
Fig . 5.9. The "fish market months" as perceived by fish traders in Mala% . . . . . . . . . . . . . . . 184 Fig . 6.1. Tentative zonation for the development of aquaculture in MalaGi . . . . . . . . . . . . . . . 191 Fig . 6.2. The location of former, existing and proposed fish farming stations, and
of ongoing fish farming development projects in Mala% . . . . . . . . . . . . . . . . . . . . . 192 Fig . 6.3. Growth of 0 . s . chilwae and T . rendalli at various stocking rates
in ponds at the DEFF, Mala%, 1960 . . . . . . . . . . . . . . . . . . . . . . . . . . . . . . . . 198 Fig . 6.4. Distribution by age of a sample of dams in Mala% . . . . . . . . . . . . . . . . . . . . . . . . 199 Fig . 6.5. Distribution by size of a sample of dams in MalaGi . . . . . . . . . . . . . . . . . . . . . . . 199 Fig . 6.6. Relationship between dam size and catchment area in Malawi . . . . . . . . . . . . . . . . . 200 Fig . 6.7. Distribution of a sample of dams in Mala% by area of dam catchment . . . . . . . . . . . . 200 Fig . 6.8. Approximate range of construction costs of
earthwall dams in Mala% at 1987-1988 prices . . . . . . . . . . . . . . . . . . . . . . . . . . 200 Fig . 6.9. Total annual fish production, yield by species and
mean monthly farm gate prices of all species for the period 1971-1985 from the dam at Bunda College of Agriculture, Mala% . . . . . . . . . . . . . . . . . . . . . . 200
Fig . 6.10. Fish production and rate of return per hectare (MWha) for 1979-1985 for the Satemwa Tea Estate, Mala% . . . . . . . . . . . . . . . . . . . . . . . . 203
Fig . 7.1. Layout of the Domasi Experimental Fish Farm (DEFF), Domasi, Mala% . . . . . . . . . . . 206 Fig . 7.2. Frequency of mean monthly waterflow of the Domasi River near the Domasi
Experimental Fish Farm (DEFF), Malafni . . . . . . . . . . . . . . . . . . . . . . . . . . . . . 207 Fig . 7.3. A generalized distribution of tilapias in the major waterbodies and
watercourses of Mala% . . . . . . . . . . . . . . . . . . . . . . . . . . . . . . . . . . . . . . . 208 Fig . 7.4. Seasonal weight gain of tilapia under experimental culture at
Kasinthula Pilot Fish Farm (KPFF), MalaGi, 1977 . . . . . . . . . . . . . . . . . . . . . . . . 208 . . . . . . . Fig . 7.5. Ecology of the five tilapia species inhabiting the Southern End of Lake ~a1ab; i 209
xiv

Fig. 7.6. Plan of the Kasinthula Pilot Fish Farm (KPFF), Chikwawa, Mala% (now largely inactive) . . . . . . . . . . . . . . . . . . . . . . . . . . . . . . . . . . . . 215
Fig. 7.7. Estimated growth rates of individual 0. mossambicus and T. rendalli from sexed and unsexed stocks receiving different feed rations in unfertilized ponds at the Kasinthula Pilot Fish Farm (KPFF), Mala%, in 1975 . . . . . . . . . . . . . . . . . . . . . . . . . . . . . . . . . . . . . . . . . . . . 216
Fig. 7.8. Average growth rates of the common carp and silver carp compared with that of 0. mossambicus during a 140-day growing period at the Kasinthula Pilot Fish Farm (KPFF), Mala%, in 1975 . . . . . . . . . . . . . . . . . . . . . . 216
Fig. 7.9. Estimated growth rates of individual 0. mossambicus from an all-male monosex and both sexes during trials in fertilized ponds receiving different feed rations and withlwithout the predator Serranochromis robustus at the Kasinthula Pilot Fish Farm (KPFF), Mala%, in 1975 . . . . . . . . . . . . . . . . . . . 216
Fig. 7.10. Suggested layout of the ICLARWTZ-FD-UM Collaborative Fish Farming Project 20 x 200 m2 research ponds at Bunda College of Agriculture, Malaki . . . . . . . . . . . . . . . . . . . . . . . . . . . . . . . 217
Fig. 7.11. Growth rates of Cyprinus carpw in ponds, and maximum and minimum air temperatures at Bunda College of Agriculture, Mala%, 1976-1977 . . . . . . . . . . . . . . . . . . . . . . . . . . . . . . . . . . . . . . . . . . 218
Fig. 7.12. Proposed organization of the Regional Fisheries Training Program for the SADCC Subregion . . . . . . . . . . . . . . . . . . . . . . . . . . . . . . . . . . . . . . 221
Fig. 7.13. Proposed organization of the SADCC Subregional Fisheries Documentation and Information System . . . . . . . . . . . . . . . . . . . . . . . . . . . . . . . . . . . . . . . 222
Fig. 7.14. Partial distribution of small-scale farms with fishponds in Zomba District, Mala%, 1988 . . . . . . . . . . . . . . . . . . . . . . . . . . . . . . . . . . . . 226
Fig. 8.1. Size distribution of fishponds in Mwanza and Zomba Districts, Mala%, 1988 . . . . . . . . 235 Fig. 8.2. Size distribution of small-scale farms in Mwanza District, ~ a l a % , 1978 . . . . . . . . . . . 239 Fig. 8.3. Size distribution of small-scale farms in Zomba District, Mala%, 1986 . . . . . . . . . . . . 246 Fig. 8.4. Prices for pond fish received by small-scale farmers in Mala%, 1979-1986 . . . . . . . . . . 248 Fig. 9.1. Aggregate time allocation by principal activity of all members of
sampled agricultural households in the Lake Chilwa area, ~ a l a G i , 1970-1972 . . . . . . . . 263 Fig. 9.2. Percentage distribution of common property resource utilization of
dambos in the Lilongwe Plain, Mala%, 1970 . . . . . . . . . . . . . . . . . . . . . . . . . . . 268 Fig. 10.1. Holding size and agricultural labor supply and demand in the
Phalombe District, MalaGi . . . . . . . . . . . . . . . . . . . . . . . . . . . . . . . . . . . . . . 274 Fig. 10.2. Return to labor by farm size in the Mulanje-Phalombe area, MalaGi . . . . . . . . . . . . . 276 Fig. 10.3. Total household incomes and percentage of income derived from agriculture
by farm size in the Mulanje-Phalombe area, Mala% . . . . . . . . . . . . . . . . . . . . . . 276 Fig. 10.4. Annual mean number of agricultural working hours per day by worker
category in the Liwonde Agricultural Development Division, Mala% . . . . . . . . . . . . . . 279 Fig. 10.5. Annual mean number of nonagricultural working hours per day by worker
category in the Liwonde Agricultural Development Division, Mala% . . . . . . . . . . . . . . 279 Fig. 10.6. Total annual labor inputs to some principal crops in the
Liwonde Agricultural Development Division, Mala% . . . . . . . . . . . . . . . . . . . . . . . 280 Fig. 10.7. Monthly labor inputs to maize cultivation by task on light soils
in the Liwonde Agricultural Development Division, Mala% . . . . . . . . . . . . . . . . . . . 280 Fig. 10.8. Monthly labor inputs to maize cultivation by task on heavy soils in the
Liwonde Agricultural Development Division, ~ a l a 6 i . . . . . . . . . . . . . . . . . . . . . . . 280 Fig. 10.9. Monthly labor inputs to rice cultivation by task in the
Liwonde Agricultural Development Division, ~ a l a 6 i . . . . . . . . . . . . . . . . . . . . . . . 281 Fig. 10.10. Monthly labor inputs to manioc cultivation by task in the
Liwonde Agricultural Development Division, ~ a l a & i . . . . . . . . . . . . . . . . . . . . . . . 283
Fig. 10.11. Monthly labor inputs to sweet potato cultivation by task in the Liwonde Agricultural Development Division, Mala% . . . . . . . . . . . . . . . . . . . . . . . 285
Fig. 10.12. Monthly labor inputs to peanut cultivation by task in the Liwonde Agricultural Development Division, Mala% . . . . . . . . . . . . . . . . . . . . . . . 285
Fig. 10.13. Monthly labor inputs to cotton cultivation by task in the Liwonde Agricultural Development Division, MalaCNi . . . . . . . . . . . . . . . . . . . . . . . 286
Fig. 10.14. Monthly labor inputs to tobacco cultivation by task in the Liwonde Agricultural Development Division, Mala% . . . . . . . . . . . . . . . . . . . . . . . 286
Fig. 10.15. Labor division for tobacco cultivation by sex and task in the Liwonde Agricultural Development Division, MalaG . . . . . . . . . . . . . . . . . . . . . . . 286
Fig. 10.16. Labor division for cotton cultivation by sex and task in the Liwonde Agricultural Development Division, MalaCNi . . . . . . . . . . . . . . . . . . . . . . . 287
Fig. 10.1 7. Labor division for sweet potato cultivation by sex and task in the . . . . . . . . . . . . . . . . . . . . . . . Liwonde Agricultural Development Division, Mala% 287
Fig. 10.1 8. Labor division for peanut cultivation by sex and task in the . . . . . . . . . . . . . . . . . . . . . . . Liwonde Agricultural Development Division, alas 287
Fig. 10.19. Labor division for maize cultivation on heavy soils by sex and task in the Liwonde Agricultural Development Division, Malatvi . . . . . . . . . . . . . . . . . . . . . . . 287
Fig. 10.20. Labor division for manioc cultivation by sex and task in the . . . . . . . . . . . . . . . . . . . . . . . Liwonde Agricultural Development Division, MalaiKi 287
Fig. 10.21. Labor division for maize cultivation on light soils by sex and task in the . . . . . . . . . . . . . . . . . . . . . . . Liwonde Agricultural Development Division, ~ a l a s 287
Fig. 10.22. Labor division for rice cultivation by sex and task in the . . . . . . . . . . . . . . . . . . . . . . . Liwonde Agricultural Development Division, ~ a l a & i 288
LIST OF TABLES
Table 1.1. Freshwater aquaculture systems and their possible environmental impact and potential producer benefits based largely on experience in tropical Asia . . . . . . . . . . . . . . 5
Table 1.1. Checklist of the elements of the resource systems model (Fig. 1.1) to . . . . . . . . . . . . . . . . . . . . assess the viability of aquaculture and integrated farming 12
Table 1.2. Potential aquaculture zonation of the SADCC countries, based on elevation above sea level and mean water temperatures, potential fish species and
. . . . . . . . . . . . . . . . . . . . . . . . . . . . . . . . . . . . . . type of aquaculture system 20 Table 1.3. Wild vegetation of potential value for public health measures in
. . . . . . . . . . . . . . . . . . . . . . . . . . . . . . . . . . . . . . . . . . fishponds in Mala% 26 Table 1.4. Total fish landings, international trade in fish products and
potential consumption in the SADCC countries, 1986 . . . . . . . . . . . . . . . . . . . . . . . 28 Table 1.5. Calorie intake and animal protein intake for the SADCC countries, 1983-1985 . . . . . . . 29 Table 1.6. Potential fish requirements and potential fish production in
. . . . . . . . . . . . . . . . . . . . . . . . . . . . . . . . . . . . . . . . . . the SADCC countries 30 Table 2.1. The beginning of pond aquaculture in Africa, and estimates of the number of
ponds, pond area for 1965,1975-1980 and 1980-1985, and potential for . . . . . . . . . . . . . . . . . . . . . . . . . . . . . . . . . . . . . . . aquaculture development 41
Table 2.2. Initiation of pond aquaculture in the SADCC Subregion and . . . . . . . . . . . . . . . . . . . . . . . . . . . . . . . . . . . . . . its development until 1989 43
Table 2.3. Summary of the characteristics, inputs and expected yields of traditional extensive African aquaylture systems . . . . . . . . . . . . . . . . . . . . . . . . . 44
Table 2.4. Summary of the characteristics of modern extensive, semi-intensive and intensive aquaculture systems used in Africa . . . . . . . . . . . . . . . . . . . . . . . . . . . . 45
xvi
Table 2.5. Location. size. costs. production. harvesting and species cultivated of a sample . . . . . . . . . . . of present-day howash in the Lake Manzalla area of the Nile Valley of Egypt 47
Table 2.6. The status of African aquaculture systems . . . . . . . . . . . . . . . . . . . . . . . . . . . . 57 . . . . . . . . . . . . . . . . . . . . . . . . Table 2.7. Aquaculture production in Africa by species. 1986 62
Table 2.8. Indigenous and exotic fish species cultured or considered as potential candidates for aquaculture in the SADCC Subregion . . . . . . . . . . . . . . . . . . 63
. . . . . . . . . . . . . . . . . . . Table 3.1. Summary of vital demographic indicators in Malawi. 1987 69 Table 3.2. Land area. population density. agricultural type. and natural physical
constraints by district in Mala%. 1983 . . . . . . . . . . . . . . . . . . . . . . . . . . . . . . . . 72 Table 3.3. Land area. population distribution. agricultural type and natural physical
constraints by district in MalaGi. 1983 (percentage distribution) . . . . . . . . . . . . . . . . . 73 Table 3.4. Principal climatic divisions of MalaGi . . . . . . . . . . . . . . . . . . . . . . . . . . . . . . . 80
. . . . . . . . . . . . . . . Table 3.5. Climatic conditions a t selected meteorological stations in Mala% 91 Table 3.6. Mean annual rainfall. runoff. number and density of dams. and
elevation above sea level of watersheds in MalaG . . . . . . . . . . . . . . . . . . . . . . . . . 93 Table 3.7. Gross domestic product of Malahi. 1984-1988. by sector of
origin at 1978 constant factor cost. and projections for 1989-1992 . . . . . . . . . . . . . . . . 99 . . . . . . Table 3.8. Number of paid employees by industrial group and sector in Mala%. 1977-1985 100
Table 3.9. Principal export commodities of MalaCKi. 1985-1988 . . . . . . . . . . . . . . . . . . . . . . 101 Table 3.1 0 . Balance of payments in Mala%. 1984-1988 . . . . . . . . . . . . . . . . . . . . . . . . . . 101
. . . . . . . . . . . . . . . Table 3.1 1 . Selected economic and social indicators for Mala%. 1965-1985 106 Table 3.12. Annual average earnings of paid employees in ~ a l a % i . by sector and
industrial classification. 1977-1 985 . . . . . . . . . . . . . . . . . . . . . . . . . . . . . . . . . 107 Table 3.1 3 . Statutory minimum daily wage rates in the principal urban centers of
Malaki in January 1974-April1989 . . . . . . . . . . . . . . . . . . . . . . . . . . . . . . . . 108 . . . . . . . . . . . . . . . Table 3.14. Annual household cash surplus in MalaCKi by ADD. 1980-1981 108
Table 3.1 5 . Composite retail price index in Blantyre and Lilongwe cities. Mala%. 1980-1988 . . . . . . . . . . . . . . . . . . . . . . . . . . . . . . . . . . . . . . . . . . 108
Table 3.16. Average prices of selected basic foodstuffs in Blantyre and Lilongwe. Mala%. 1975-1985 . . . . . . . . . . . . . . . . . . . . . . . . . . . . . . . . . . . . 109
Table 3.1 7 . Number of holdings. area cultivated. female-headed households and cultivation of improved maize on small-scale farms in Mala%. by size class. 1980-1981 . . . . . . . . . . . . . . . . . . . . . . . . . . . . . . . . . . . . . . . 117
Table 3.18. Number of agricultural estates. area under main crop and average area planted. by main crop in Malaivi . . . . . . . . . . . . . . . . . . . . . . . . . . . 117
Table 3.19. Summary of production. international trade and ADMARC purchases of principal agricultural commodities in Mala%. 1984-1986 . . . . . . . . . . . . . . . . . . . . 120
Table 3.20. Total land area. cultivable area. area cultivated and area devoted to maize-growing. by region in MalaGi. 1980-1981 . . . . . . . . . . . . . . . . . . . . . . . . . . 121
Table 3.21. Area under maize and interplanted crops. and maize yields on customary lands in Mala%. by agricultural development division. 1980-1981 . . . . . . . . . . . . . . . . . . . . . . . . . . . . . . . . . . . . . . . . . . 121
Table 3.22. Number and type of livestock in Mala%. by region. 1975-1985 . . . . . . . . . . . . . . . 123 Table 3.23. Irrigation development and cultivation of irrigated land in ~ a l a & i .
197311974-198311984 . . . . . . . . . . . . . . . . . . . . . . . . . . . . . . . . . . . . . . . . . 124 Table 3.24. Volume and value of ADMARC crop purchases in ~ a l a % . 1985-1 987 . . . . . . . . . . . 124 Table 3.25. Sales of fertilizer to small-scale farmers in Mala%. 197411975-1987 . . . . . . . . . . . . 128 Table 3.26. Indicators of agricultural productivity in ~a la&i . . . . . . . . . . . . . . . . . . . . . . . 129 Table 3.27. Vital indicators of nutrition in Mala% . . . . . . . . . . . . . . . . . . . . . . . . . . . . . 131 Table 3.28. Potential availability of animal protein per capita of human population.
by region in ~ a l a % . 1979-1980 . . . . . . . . . . . . . . . . . . . . . . . . . . . . . . . . . . . 133 Table 3.29. Nutritional value of selected Malasan subsistence foods . . . . . . . . . . . . . . . . . . 134
xvii

Table 4.1. Basic limnological and fisheries characteristics of the principal capture fisheries areas of Mala% . . . . . . . . . . . . . . . . . . . . . . . . . . . . . . . . . . 137
Table 4.2. Estimated capture fisheries production of Mala% by area. 1962-1 986 . . . . . . . . . . . . 139 Table 4.3. Summary of total fish production. fish prices and fish consumption
in Mala%. 1947-1986 . . . . . . . . . . . . . . . . . . . . . . . . . . . . . . . . . . . . . . . . . 140 Table 4.4. Estimated capture fisheries production by area in the Lower Shire Valley
of Mala%. 1972 . . . . . . . . . . . . . . . . . . . . . . . . . . . . . . . . . . . . . . . . . . . . 141 . . . . . . . . . . . . . . . . . . . . . Table 4.5. Main species of food fish captured in ~ a l a & i . by area 146
. . . . . . . . Table 4.6. Number of fishing units by zone on Lakes ~ a l a % and Malombe. 1974-1987 149 . . . . . . . . . . . . Table 4.7. Plant materials traditionally used to fabricate fishing gear in MalaGi 150
. . . . . . . . . . . . . . . . . . Table 4.8. Traditional fisheries effort in Mala% by fishery zone. 1986 152 . . . . . . . . . . . . . . . Table 4.9. Plants used to produce fish stupefacients and poisons in Mala% 157
Table 4.10. Annual costs and returns by gear type to small-scale fisheries on Lake Chilwa. Mala%. 1983 . . . . . . . . . . . . . . . . . . . . . . . . . . . . . . . . . . . . . 160
Table 4.11. Annual production costs and returns on a two-man gill netting operation in the Northern Region. Lake Mala%. 1982 . . . . . . . . . . . . . . . . . . . . . . . . . . . . 160
Table 4.12. Operational budget for a two-man gill netting operation in Southern Lake Mala%. 1982 . . . . . . . . . . . . . . . . . . . . . . . . . . . . . . . . . . . . 161
Table 4.13. Annual production costs and returns on a 9-man chilimila operation. Northern Region. Lake Mala%. 1982 . . . . . . . . . . . . . . . . . . . . . . . . . . . . . . . . 161
. . . . . . . . . . . . . . . . . . . Table 4.14. Commercial fisheries production by operator. 1983-1986 162 Table 4.15. Comparative analysis of the average monthly economics of
pair trawler operations for chisawasawa in Lake Mala%. 1986. using old (22-hp) engines and new (30-hp) engines . . . . . . . . . . . . . . . . . . . . . . . . 163
Table 4.16. Annual operational budget for a 15-man seine net operation in Lake Chilwa. Mala%. 1986 . . . . . . . . . . . . . . . . . . . . . . . . . . . . . . . . . . . . . 164
. . . . . . . . . Table 4.17. Profit and loss account of MALDECO Fisheries Ltd.. MalaGi. 1981-1986 164 Table 4.18. Summary of the principal events in the development of capture
fisheries in Mala%. 1946-1 974 . . . . . . . . . . . . . . . . . . . . . . . . . . . . . . . . . . . 165 Table 4.19. Chronology of the development of FD physical infrastructure . . . . . . . . . . . . . . . . 166 Table 4.20. Externally funded FD capture fishery projects. 1966-present . . . . . . . . . . . . . . . . 167 Table 4.21. Increase in recurrent budget expenditures for the FD compared with
other branches of the Ministry of Agriculture and Natural Resources . . . . . . . . . . . . . . 168 Table 5.1. Summary of the costs and earnings by trader type in the marketing of
fresh. dried and smoked fish in Mala%. 1986 . . . . . . . . . . . . . . . . . . . . . . . . . . . 175 Table 5.2. Landed weight and catch composition of fish from the Northern.
Central and Southern Regions of Lake Mala%. 1982 and 1983 . . . . . . . . . . . . . . . . . 177 Table 5.3. Comparative prices for fish and meat in Mala%. 1983 . . . . . . . . . . . . . . . . . . . . . 180 Table 5.4. Retail market prices of selected fish species in Mala%. 1980 . . . . . . . . . . . . . . . . . 181 Table 5.5. Trends in wholesale prices of fresh. dried and frozen fish in
Mala%. 1980-1987 . . . . . . . . . . . . . . . . . . . . . . . . . . . . . . . . . . . . . . . . . . 182 Table 5.6. MalaGan consumer preferences for preserved fish. in 1978 . . . . . . . . . . . . . . . . . 183 Table 5.7. Malakian fish traders' preferred species of preserved fish . . . . . . . . . . . . . . . . . . 186 Table 6.1. Summary of the status of aquaculture in ponds and reservoirs
in Mala%. 1988 . . . . . . . . . . . . . . . . . . . . . . . . . . . . . . . . . . . . . . . . . . . . 190 Table 6.2. Tentative zonation for aquaculture in Mala% . . . . . . . . . . . . . . . . . . . . . . . . . 191 Table 6.3. Results of aquaculture trials with tilapia using madea. compost and
lime as inputs in 4.00 0-m2 ponds at Tipwiri. Northern ~ala&i. 1955-1957 . . . . . . . . . . 196 Table 6.4. The development of fishponds in the Northern Region of Mala%. 1958 . . . . . . . . . . . 196 Table 6.5. Results of an integrated crop-fish farming experiment at Tipwiri.
Northern Mala%. conducted in 1958. in 0.4-ha ponds . . . . . . . . . . . . . . . . . . . . . . 196 Table 6.6. Polyculture fishpond trials including a predatory species . . . . . . . . . . . . . . . . . . . 199
xviii
Table 6.7. Economic summary of construction costs and 1982-1983 operations of the SUCOMA Estate 12.2.ha Fish Farm, Mala% . . . . . . . . . . . . . . . . . . . . . . . . . 202
Table 7.1. Growth rates and allied attributes of tilapia from open waters of Lakes Chilwa and Malaki . . . . . . . . . . . . . . . . . . . . . . . . . . . . . . . . . . . . . . 209
Table 7.2. The results of madea, lime and superphosphate fertilization trials on the yield rate of 0 . s . chilwae in 350-m2 ponds a t the Domasi Experimental Fish Farm, MalaGvi. 1970 . . . . . . . . . . . . . . . . . . . . . . . . . . 210
Table 7.3. Summary of the results of stoclking and feeding trials with 0 . s . chilwae a t Satemwa. Chingale and the DEFF. MalaGi . . . . . . . . . . . . . . . . . . . 211
Table 7.4. Yields of Cyprinus carpio. Oreochrornis shiranus chilwae and Clarias gariepinus under polyculture a t the DEFF. Mala% . . . . . . . . . . . . . . . . . . . 212
Table 7.5. Trial yields of 0 . shiranus chilwae. T . rendalli and C . carpio under polyculture a t the DEFF. Malaki . . . . . . . . . . . . . . . . . . . . . . . . . . . . . . . . . . 213
Table 7.6. Trial yields of 0 . mossarnbicus under monoculture and with C . carpio a t the DEFF. Mala* . . . . . . . . . . . . . . . . . . . . . . . . . . . . . . . . . . . 213
Table 7.7. The impact of applications of chicken manure on the polyculture yields . . . . . . . . . . . of 0 . s . chilwae and C . carpio fed with madea a t the DEFF. Malawi. 1982 213
Table 7.8. Existing and proposed staffing of the Fisheries Department (FD) of the Government of Mala% . . . . . . . . . . . . . . . . . . . . . . . . . . . . . . . . . . . . . . 220
Table 7.9. Sources of fingerlings stocked by fish farmers in the Kunenekude area . . . . . . . . . . . . . . . . . . . . . . . . . . of Mwanza District and Zomba District. ~ a l a k i 224
Table 7.1 0 . Frequency of visits by FD extension staff to fish farmers in the . . . . . . . . . . . . . Kunenekude area of Mwanza District and in Zomba District. Mala% 225
Table 7.1 1 . Summary of the principal characteristics of the main aquaculture . . . . . . . . . . . . . . . . . . . . . . . . . . . . . . . . . . . development projects in ~ a l a % i 228
Table 7.12. Planned development of fish farming stations by the Northern and Central Regions Fish Farming Development. Extension. Training and Research Project. Mala% . . . . . . . . . . . . . . . . . . . . . . . . . . . . . . . . . . . . . . 229
Table 7.13. Studies conducted by the ICLARMIGTZ-FD-UM "Research for the Development of Tropical Aquaculture Technology Appropriate for Implementation in Rural Africa" project . . . . . . . . . . . . . . . . . . . . . . . . . . . . . . 231
Table 8.1. The status of cultured indigenous and exotic fish species in Mala% . . . . . . . . . . . . . 234 Table 8.2. The status of small-scale fish farms in Mulanje District. Mala%. 1986 . . . . . . . . . . . 235 Table 8.3. Summary of the characteristics of a case study of the fishponds of seven
. . . . . . . . . . . small-scale farms in the southern part of Mulanje District. Mala%. 1986 237 . . . . . . . . . . Table 8.4. Area under principal cropping patterns in Mwanza North. ~ a l a 6 i . 1977 240
Table 8.5. Crop cultivation calendar by small-scale farmers for one annual cycle in Mwanza District. Mala* . . . . . . . . . . . . . . . . . . . . . . . . . . . . . . . . . . . . . . . 240
. . . . . . . . . . . . . . . . . . . Table 8.6. Yields of principal crops in Mwanza North. ~ a l a G i . 1977 241 Table 8.7. Ranges in yield of principal crops in Mwanza North. ~ a l a % i . 1977 . . . . . . . . . . . . . 241
. . . . . . . Table 8.8. Rates of economic return on crop cultivation in Mwanza North. ~ a l a % . 1977 242 Table 8.9. Average household subsistence product. farm cash income and off-farm income
by source in Mwanza North. Mala&. 1977 . . . . . . . . . . . . . . . . . . . . . . . . . . . . . 242 Table 8.10. Average annual household expenditure in Mwanza North. MalaGi. 1977 . . . . . . . . . 243 Table 8.11. Fourteen-month summary of monthly activities in Mwanza District.
Mala%. by two aquaculture extension officers. March 1986 to May 1987 . . . . . . . . . . . . 243 Table 8.12. Economic profiles of case studies of small-scale aquaculture operations
in the Zomba and Mulanje Districts. ~ a l a % . 1983 . . . . . . . . . . . . . . . . . . . . . . . . 247 Table 8.1 3 . Stocking and harvesting of Oreochromis shiranus shiranus and
Cyprinlls carpio in a 0.1-ha pond on Farm 1. Minama Village. Zomba District. Mala%. 1984-1985 . . . . . . . . . . . . . . . . . . . . . . . . . . . . . . . . . 247
xix

Table 8.14. Stocking and harvesting of Oreochromis shiranus shiranus. Tilapia rendalli and Cyprinus carpio for Farm 3. Mbatata Village.
. . . . . . . . . . . . . . . . . . . . . . . . . . . . . . . . . Zomba District. Mala%. 1979-1986 250 . . . . . . . . . . Table 8.15. Sources of water for fishponds in Mwanza and Zomba Districts. ~ a l a % i 251
Table 8.1 6 . Factors limiting the development of small-scale fish farming in . . . . . . . . . . . . . . . . . . . . . . . . . . . . . . . Mwanza and Zomba Districts. Mala% 253
Table 9.1. Source of permission to use land for aquaculture in Mwanza and . . . . . . . . . . . . . . . . . . . . . . . . . . . . . . . . . . . . . . . Zomba Districts. Mala% 265
Table 9.2. Percentage distribution of landholdings in Mwanza North. Malawi. by acquisition of use rights. relationship to previous owner and successor . . . . . . . . . . . 265
Table 9.3. Percentage distribution of common property uses of selected dambos in . . . . . . . . . . . . . . . . . . . . . . . . . . . . . . . . . . the Lilongwe Plain. Mala%. 1970 268
. . . . . . . . . . . Table 10.1. Return to labor by farm size in the Mulanje-Phalombe area of ~ a l a & i 275 . . . . . . . . . . . . . . . Table 10.2. Labor inputs to pure stand maize cropping systems in MalaGi 281
. . . . . . . . . . . . . . . . . . . Table 10.3. Labor inputs to maize intercropping systems in Mala% 282 . . . . . . . . . . Table 10.4. Labor inputs to other principal subsistence cropping systems in ~ a l a % i 284

ACKNOWLEDGEMENTS
This study was undertaken by Dr. Kenneth Ruddle in collaboration with Mr. John Balarin and Dr. Roger S.V. Pullin as part of the joint project "Research for the Development of Tropical Aquaculture Appropriate for Implementation in Rural Africa". The project is conducted cooperatively by the International Center for Living Aquatic Resources Management (ICLARM), the Mala% Fisheries Department (FD) the University of Mala% (UM), and the Deutsche Gesellschaft fiir Technische Zusammenarbeit (GTZ), GmbH, and supported financially by the latter. The project was developed under the terms of a Memorandum of Understanding signed on 7 October 1986 between the Government of Mala% and ICLARM.
We wish to express our deep appreciation of the many persons who guided us to the sources of secondary data on Malaf i. We owe a particular debt to Mr. Boniface Mkoko, Chief Fisheries Oficer, Department of Fisheries, for both facilitating this study and for his comments on earlier drafts of the manuscript, and to Mr. Orton Msiska, Senior Fisheries Research Officer, Domasi Experimental Fish Farm, for his general advice on the research and comments on the manuscript.
We are grateful also to: Mr. Sam Mapila, Principal Fisheries Officer, Mr. Gray Nongwa, Assistant Chief Fisheries
Officer and Mr. Dennis Tweddle, Fisheries Research Officer, Monkey Bay Fisheries Research Station, all of the Mala% Fisheries Department;
Dr. Owen Kalinga, Head, Department of History, Professor J.A.K Kandawire, Head, Department of Sociology, Ms. Chrissie Nampeya, Library Assistant, and Dr. Reg Noble, Lecturer, Department of Biology, all of Chancellor College, University of MalaGi;
Mr. Jeremy S. Likongwe, Senior Technician, Department of Animal Science, Dr. Davis H. Ng'ong'gola, Lecturer, Department of Rural Development and Mrs. Margaret Ngwira, Librarian, all of the Bunda College of Agriculture, University of MalaGi;
Mr. Godfrey A. Banda, Research Assistant and Dr. L.A.H. Msukwa, Director, both of the Centre for Social Research, University of MalaGi;
Ms. Ruth B. Ayoade, Department of Nutrition, and Mr. B. Mkomba, Acting Director, Agro- Economic Survey, both of the Ministry of Agriculture;
Dr. Gerd Addicks, Project Co-manager, Mr. Martin Banda, Land Husbandry Officer, and Mr. L. Kachicopa, Survey and Evaluation Officer, all of the Liwonde Agricultural Development Division (LWADD); and
Dr. G. Otte, Team Leader, and Dr. John G. M. Wilson, Fisheries Extension Adviser, both of the ~a la&i-German Fisheries and Aquaculture Development Project (MAGFAD).
xxi

The Context of Small-Scale Integrated Agriculture-Aquaculture Systems in Africa: A Case Study of Mala%
ABSTRACT
This study, supplemented by field surveys, summarizes available literature on aquaculture and the context of aquaculture in Mala%. It is intended to provide a national case study of one African context in which small-scale aquaculture has developed and in which integrated systems of agriculture-aquaculture might be promoted. The study is divided into two parts. The first, Chapters 1 and 2, deals with Africa as a whole, and the second, the remaining chapters, deals specifically with MalaGi.
Chapter 1 summarizes the whole book. Based on a resource systems concept, it gives an overview of the factors involved in African aquaculture for nonspecialist policymakers and development planners, and helps in the organization of feasibility studies and research prerequisites to p l a ~ i n g for aquaculture development. Chapter 2 points out, by studies on the main traditional systems in some areas of North and West Africa, that aquaculture is actually an ancient tradition in Africa. Modern aquaculture systems introduced to the continent in the past fifty years and which have now been locally adapted are examined. A survey of the status of aquaculture in Africa emphasizes the Southern African Development Coordinating Conference (SADCC) Subregion. Chapter 3 gives the environmental, demographic, sociocultural and economic status of MalaCi, and enumerates the national policies and strategies for agriculture and fisheries. It also gives the government's agricultural and nutritional situations relative to aquaculture. Since 20% of Mala% is covered with freshwater, and up to 70% of the country's total animal protein consumption comes from capture fisheries, Chapters 4 and 5 examine this subsector. These detail the fisheries resources, areas, technologies and the socioeconomic aspects, treating aquacdture as a complementary activity to capture fisheries. Chapter 6 includes the history and current status of fish farming in MalaGi and the national aquaculture development policy. Chapter 7 is a n examination of the research, training, extension and development projects in Mala%. Chapter 8 focuses on small-scale aquaculture, particularly in the Southern Region. The constraints to aquaculture development in MalaGi, based on socioeconomic and micmeconomic factors, are described in Chapters 9 and 10.
xxii

Aspects of Small-Scale Integrated Agriculture-Aquaculture Systems in Mala%
4 1. In Zomba District, Southern Region, Mala%, ponds are commonly sited along the break-of-slope contour, as around the foot of Zomba Plateau, where perennial springs provide a relatively reliable water supply. 2. In the Dedza Hills, Central Region, Mala%, as elsewhere, narrow seasonal wetlands (dambo) along stream courses provide sites for both dry season crops (dimba gardens) and ponds. 3. In the Mwanza District, Southern Region, Mala%, ponds are sited along the narrow valleys of small streams, where water is likely to be available in the prolonged dry season. 4. Some ponds are poorly sited in rocky areas, in the land-scarce Zomba District. 5. An almost dry pond in late October, in Zomba District, illustrates the difficulties in securing a year-round water supply.
(All photos by K. Ruddle) xxiii

9 6. Water is usually supplied via simple, shallow channels, thereby compounding seasonal water shortages by evaporation and seepage losses and through obstruction by upstream users. 7. For various reasons, and particularly disenchantment with results or inability to obtain fingerlings or sufficient water, some ponds are severely neglected. 8. Pond maintenance tasks undertaken manually prior to the onset of the rainy season consist mainly of hoeing-out accumulated sediments and weeds, levelling of the bottom, and repair of banks and associated water supply channels. 9. Some of the more progressive fish farmers, especially in Zomba District, fertilize their ponds with compost. 10. Occasionally, fish farmers experiment with alternative fish feeds. Here, in Zomba District, a termite mound has been used.
xxiv

11. Small branches are used by some farmers as obstacles to deter illicit harvesting of ponds distant from their dwelling. 12. Occasionally, as in Mwanza District, the Fisheries Department is able to make a seine net available for pond harvesting. 13. and 14. The bulk of harvesting is done by groping for fish seeking refuge in the pond bottom during the dry season. 15. In an attempt to regulate fish sales immediately following a harvest, some farmers have recently constructed kiosks adjacent to their ponds.

16. Pond harvesting is an important socid event in a fish farming community. 17. The motives for adopting an innovation, such as fish farming, include the prestige of pond ownership, as illustrated by this farm gate sign in Zomba District. 18. Such is the demand for fresh fish that crowds quickly gather at harvest sites, as at this trapping site on the Shire River, a t Liwonde. 19. Localized wetlands are heavily fished with traditional gear, such as these traps and fences on the plains adjacent to Lake Mala*.

INTRODUCTION
This book is about freshwater aquaculture in Africa, based principally on a case study of the context in which aquaculture is developing in MalaGi (Fig. 1.1). Following the FA0 (1988), aquaculture is defined as being the farming of aquatic organisms throughout their rearing period under individual or corporate ownership of the stock being reared. Thus production is enhanced by human intervention, such as stocking, feeding, fertilization, protection, and other activities, in either natural ecological systems or by the artificial creation of agroecosystems. Such an activity governed by sole property rights ownership of the stock being reared, either by individuals or small corporate groups like families, villages, or some other discrete, definable entity, constitutes aquaculture, whereas open access or common property regimes do not; they fall under the rubric of fishing, not aquaculture.
Systems of aquaculture may be classified in various ways. That of most practical value for the comparative assessment of the feasibility of aquaculture development, its sustainability, and impact on the natural and socioeconomic environment is based on the intensity of inputs to systems (Pullin 1989). In these terms, three categories of system can be defined: extensive, which have no feed or fertilizer inputs; semi- intensive, with some feed and/or fertilizer inputs; and intensive, that depend mostly on external feed and/or fertilizer inputs.
This volume is concerned largely with extensive systems, and, to a lesser degree, with semi-intensive systems, and mostly with small- scale pond aquaculture. Further, it is concerned with the transformation of extensive into semi- intensive systems, via the integration of aquaculture with existing farming systems, whereby residues from other on-farm activities are utilized as pond feeds andfor fertilizers. Intensive systems and other technologies are examined briefly.
The principal objectives of aquaculture development in Africa, as elsewhere, are to enhance the production of fish as human food and
to improve the livelihood of farm families, by upgrading household nutritional status and/or cash or in-kind income. These are the main topics addressed in this book, although there are a number of other but less important objectives applicable in Africa to fish production through aquaculture.
Aquaculture in Context
There is an urgent need to increase both the productivity and profitability of agriculture, and especially of small-scale farming, in developing countries, and in Africa south of the Sahara in particular. Chronic food deficits of production relative to consumption of some 25 t million in that region (FA0 19861, have resulted largely from a rapid rate of population growth that exceeds the capacity of the small-scale farmer to meet increased food demands. In general, agricultural productivity per capita of consumer has declined south of the Sahara (IBRD 1981), and small-scale agriculture in that part of Africa is described as 'stagnant', characterized by low average yields and low levels of modern inputs (FA0 1981). It has been widely argued that more productive agricultural technologies are required, together with pricing and marketing policies, to encourage farmer investment. In this way, i t is believed, food supplies will be increased and higher levels of productivity achieved using new technologies with lower real food prices, thereby leading to food security since poorer people could then afford to purchase food (e.g., Christensen and Witucki 1982; Demery and Addison 1987; Lipton 1987).
Given the precarious nutritional circumstances under which most Africans exist, coupled with the incidence of hunger and the occurrence of outright famine, there is a natural tendency to react with incautious optimism to any promising means of raising dramatically food production levels. This is particularly the case
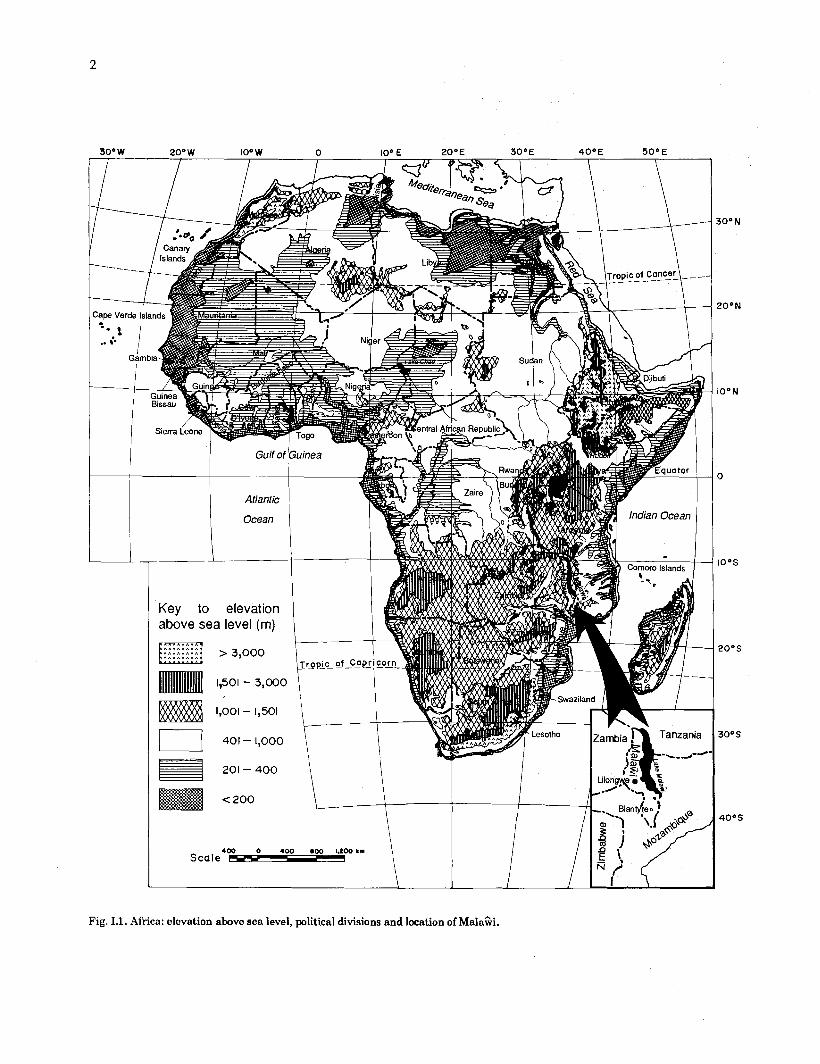
Fig. 1.1. Africa: elevation above sea level, political divisions and location of Mala%.

with a technology like aquaculture, which is new and not uncommonly strange to many organizations involved in third world development. On the one hand, aquaculture is often promoted vigorously as a panacea by specialists with vested interests, but on the other, most members of such assistance organizations, versed mainly in agricultural development, are ill- equipped to assess either the merits of aquatic food production, the difficulty of sustaining aquaculture where there has been no continuous tradition of it, or the potential negative impact on environments and societies of inappropriate aquaculture development.
Aquaculture is no panacea for hunger or nutritional or economic deprivation. It is not a replacement technology; at best, it is a complementary or supplementary technology for producing food. As such, and like any other development, a balanced perspective is essential in considering its development.
Above all, aquaculture must be seen in context. In particular, but not exclusively, it must be assessed in the context of (1) national development policy and goals and existing levels of national development and the constraints that these impose on sustainability; (2) its socioeconomic and other relationships to alternative sources of both animal and vegetable protein; (3) the physical and biological environments into which its introduction is proposed; (4) the socioeconomic environment into which its introduction is proposed; and (5) its capacity for integration with existing or potential resource use practices, especially farming systems.
The Context of National Development Levels
The overriding constraint to be addressed by development policy in Africa, regardless of economic sector, is alleviation of the all-pervasive poverty. Most households lack the money to buy their preferred types or the nutritionally beneficial quantities of food to supplement their subsistence product, not to mention other essential goods and services. Solving this problem depends on comprehensive development, and particularly on increased incomes and purchasing power. This low to nonexistent purchasing power, combined with the all-pervasive tradition of bartering for necessities, is a strong disincentive
to private sector aquaculture development, for example, thus various methods must be examined to encourage the development of fish culture a t the village and household level.
The long-term objectives of alleviating malnutrition and poverty do not depend just on increasing the production of a balanced mix of foodstuffs, as is commonly considered, as much as on increasing their distribution for either direct food use or of the distribution of the benefits of the commodities, when they are not used for direct local consumption. To ensure national food security, improved and inexpensive distribution and marketing of all staple foodstuffs must form an integral part of development strategies from the very start of policy design, lest increased supplies from greater production benefit further the already relatively well-off. For example, throughout the SADCC Subregion transportation costs are perhaps the principal constraint on supplying inexpensive fish to consumers; as in Zambia, they can sometimes be three or four times the value of the fish transported (Subramaniam 1986).
Improved distribution and marketing do not always accompany increases in the supply of a commodity. Appropriate systerris must be planned and implemented to establish good linkages reaching from producer to consumer, especially when intended consumers are the nutritionally deprived. Distribution requires infrastructure for handling, processing, storing, transporting, and selling of commodities, together with a parallel managerial and monitoring structure.
As the history of past failures in Africa demonstrates, the development of sustainable aquaculture requires sound policy, well-conceived planning, and proper implementation via biotechnical and socioeconomic research that works in tandem with a dedicated extension service. These are indispensible for ensuring successful and sustained development. 111- conceived projects coupled with contradictory objectives have been highlighted as a major source of prior failures in aquaculture development projects (FA0 1975). For example, in one appraisal of the status of aquaculture in Africa it was observed that "most failures of aquaculture development programs in Africa so far can be explained by the lack of qualified technicians and of an adequate infrastructure, as well as by the absence of government policy specifically aimed a t this form of development" (Coche 1983). The lack of a well-organized aquaculture extension service - that indispensible link between researcher,

administrator and producer - was therefore considered to be a consequence of the general scarcity of trained specialist personnel, and was a factor contributing to low levels of development, particularly of the small-scale rural sector.
The Context ofAlternative Sources of Protein
As an integral part of national development planning, it is also imperative to assess the potential role of aquaculture to satisfy nutritional requirements in terms of other sources of animal protein, as well as those of vegetable protein, lest effort and funds be squandered unnecessarily. Animal protein from sources other than fish may often be culturally preferred, as in Botswana, for example, where beef is the desired form; or marine fish might be preferred to that from freshwater. However, where the consumer preference is for fresh fish, aquaculture has a role t o play, provided that the products of capture fisheries are neither cheaper nor more readily available. Consumer preference must therefore be ascertained. In terms of fish production alone, the economics and other benefits of aquaculture development must be compared with those of the marine and freshwater capture fisheries sectors.
The Physical and Biological Environmental Context
Africa is a continent of predominantly high elevation above sea level. Further, i t is mainly an arid, semi-arid, or drought-prone continent. Together, these factors exert fundamental and severe constraints on the development of aquaculture. Since rates of fish growth correlate positively with temperature, much of the continent is suboptimal for fish growth and limits the species that can be cultured. Obviously, where a reliable water supply is not available for at least most of the year, aquaculture is infeasible. Paradoxically, therefore, many areas best suited to aquaculture development are naturally fish- rich and are already exploited by freshwater capture fisheries, as, for example, the Lower Shire Valley of Mala%. This is not to say that aquaculture development in such areas would be pointless, rather it highlights the need for a parallel development of distribution and marketing systems for fish products.
Further, and like any system of production, aquaculture is not free of impacts on the biological and physical environment. Freshwater pond aquaculture, for example, may disrupt hydrological systems by altering river flow rates and water tables, or facilitate the spread of waterborne diseases (Table 1.1).
The success of aquaculture depends on the local availablity of species suitable for culture. These will vary according to both the biological and physical parameters of the environment, as well as on such sociocultural parameters as consumer preference. Indigenous species are preferable, but higher-yielding exotic breeds are commonly introduced. Exotics have the drawback that feral populations formed by escapes may threaten indigenous genetic resources, disrupt natural habitats or inadvertently introduce pathogens, predators and pests (Pullin 1989).
The Socioeconomic Environmental Context
The principal universal socioeconomic contexts against which the introduction of aquaculture must be seen are those of the labor demand of and supply to existing agricultural systems, and the economies of households and other rural, small social groups. Other social and cultural factors are also of locally varied importance.
The physical and biological constraint introduced by aridity and proneness to drought, whether year-round or seasonal, has major agroeconomic repercussions, in that over much of Africa south of the Sahara small-scale agriculture is usually a risk-filled undertaking for the general welfare of households and rural communities. The all-pervasive risk is that whereas the rate of return to household labor invested in farming is invariably low (whether measured in terms of subsistence product or cash income), the opportunity cost of labor is high, and, if the rains fail, can be devastatingly so, when the incidence of hunger or even outright starvation becomes the unit of measure.
Throughout much of Africa south of the Sahara the low productivity of a,gricultural labor correlates closely with both the seasonal distribution of rainfall and its reliability (Woodhouse 1989). Given the marked seasonality of rainfall in that region, the bulk of agricultural labor inputs are cdncentrated within a typically

Table 1.1. Freshwater aquaculture systems and their possible environmental impad and potential producer benefits based largely on experience in tropical Asia.
System type - ~~~~~
Species used and principal characteristics
pp - -
Possible environmental impacts
Potential pmducer benefits
(A) Extensive(a) No inputs to systems other than Few, in general Income and employment generation; fingerlings stocked, labor and directly improved nutrition; enhanced capital (mainly a s opportunity costs). prestige and other social benefits.
1. Ponds Carps, catfish and tilapias. Simple Possible local disruption of hydro- Ditto. physical structure (pond and water logical system and retardation of inlet) and basic management (pond sediment transport. Conflicts over reshaping and clearing.) water resource rights
2. Reservoir stocking Carps, catfish and tilapias. Infrequent None foreseen. stocking and harvesting is limit of management usually practised.
Ditto.(Also enhancement of capture fisheries)
3. Pen and cage culture Carps, catfish and tilapias. Use made of Areal conflicts with traditional c a p Ditto. eutrophic waters andlor rich benthos. ture fisheries, leading to social Stocking, equipment maintenance and disruption and management difficulties. hamesting are limit of usual Deforestation and related ecological management practices. problems owing to infrastructure demand.
(B) Semi-intensive Additional inputs include some Same a s A1 . Ditto. feed and fertilizer.
1. Ponds Carps, catfish and tilapias. Physical Ditto. infrastructure may be better than above, and usual management may be more tre- quent and carefully performed to ensure supplemental inputs made.
Ditto.
2. Integrated agriculture Carps, catfish and tilapias. Integrated Ditto. (Also accumulation of toxic sub- Ditto. (Also synergistic interactions be- aquaculture farming of combinations of rice-fish; stances from livestock feeds in pond sedi- tweedamong integrated components; low-
IivestocWpoultry-fish; vegetablesfish. ments and fish; accumulation of agricul- cost sourcing of inputs by recycling on-farm tural chemical residues in fish. Competi- residues.) tion for inputs from other on-farm uses.)
3. Sewagefish culture Carps, catfish and tilapias. Fish culture in sewageladen environ- ments: waste treatment ponds, cages in wastewater channels; latrine effluents and septage used as pond inputs.
Ditto. (Also possible health r i a 6 to farm workers, and fish processors and consumers, consumer resistance.)
Ditto. (Also reduces waste disposal and health hazard problems by converting wastes to resources.)
4. Pen and cage culture Carps, catfish and tilapias. Use made of eutrophic waters andlor rich benthos. Stock- ing, equipment maintenance and harvesting are limit of usual management practices.
(C) Intensive Systems rely mainly on extemally- sourced feeds and fertilizers.
Same a s A3. Same as A.
Possible local disruption of hydr* Ditto. !ogical system and retardation of sediment transport. Possible height. ened health risks from waterborne diseases. Conflicts over water resource rights.
1. Ponds Carps, catfish and tilapias. Same as A1 and B1. (Also Physical infrastructure may efluentddrainage high in be better than above, and usual BOD and suspended solids.) management may be more frequent and carefully performed to maxi- mize r e t ~ m on investment.
Same a s A and B. (Also foreign exchange.)
2. Pen and cage culture Carps, catfish and tilapias. Use Same a s A3. (Also accumulation of Same a s A. (Except only slight employment made of eutrophic waters andlor rich anoxic sediments below cages from generation. Also foreign exchange.) benthos. Stocking, equipment mainte- fecal matter and other wastes.) nance and harvesting are limit of usual management practices.
3. Others (a) Carps, catfish, tilapias and Same a s C1. (Also many Same a s C2. specialized "upmarket" species. location-specific prob- Heavy investment in "modem" lems.) physical infrastructure and management techniques.
- - --
Source: adapted from Pulhn (1989). Note (a) Raceways, s~los, tanks, etc.

short 4 monthslyear growing season. Thus agricultural labor productivity is limited by the amount of indispensible tasks that can be performed during that limited time period. Risk is introduced by the physical ability of available labor to undertake the tasks - the incidence of illness and infirmity, age and gender, among other factors - and by both the capacity to hire labor and the availability of additional labor.
Risk-spreading techniques are customarily built into traditional farming systems as a hedge against such uncertainties. These include, fcr example, complex polyculture on individual farm plots, sequential planting of staple subsistence crops, and the spatial distribution of activities among several holdings with differing edaphic and microclimatic characteristics. (Regardless of whether this latter characteristic is based on a sophisticated ethnoecological knowledge base [i.e., conscious selection] or emanates from social organization [e.g., kinship structure or inheritence patterns], in agroecological terms it is functionally the same.) Reciprocal labor, kinship obligations and communal mutual aid groups have traditionally served to smooth labor constraints.
Diversification of sources of household income has also been a traditional risk-spreading device. Thus, for example, small-scale farmers are not uncommonly either part-time or seasonal fishermen; and beer-brewing is a frequent source of side-income for women. Opportunities to earn complementary, supplementary or totally alternative sources of income have been enhanced by urbanization and by the industrialization and commercialization of economies. Seasonal, long- term or permanent migration, particularly by younger, able-bodied males, for work in cities, mines or on commercial agricultural estates, is now commonplace throughout sub-Saharan Africa. The relative stability of such nonagricultural sources of income adds greatly to the opportunity cost of small-scale farming, and, ironically, exacerbates risk by destabilizing the age and gender balance of rural labor supply. This is offset, however, where incomes earned in those other sectors are used to finance small-scale farming or to mitigate the risks inherent in adopting innovation (Laan 1984).
A thorough understanding of the sociocultural environmental context into which the introduction of small-scale aquaculture is proposed, and the tailoring of systems to fit that context, are absolutely essential prerequisites to any development project, since congruence or not with often complex sociocultural variables
guarantees either the success or failure of the introduction of any innovation, all other variables being equal. I t is taken here a s axiomatic - whereas all too often it seems not to be the case - that aquaculture must be adapted to society and not vice versa, since surely the converse is a prescription for failure.
The Context of Integrated Systems
Whereas most small-scale aquaculture in Africa is of the extensive type, efforts should be made to promote its transformation to semi- intensive systems, and all projects to introduce aquaculture should promote semi-intensive systems from the outset. Given the general inability of small-scale farmers in Africa to purchase pond inputs to sustain even low level semi-intensive systems, all such efforts must focus on the promotion of integrated systems of agriculture-aquaculture, i.e., the integration of an aquaculture component with existing components of farms, principally crop cultivation and animal husbandry, via the flow of energy and materials. In this way inputs derived from those components "drive" the pond, some of the outputs of which, in turn, enhance the performance of agriculture and animal husbandry. This integration should be based as much as possible on the utilization of materials produced on farm, supplemented by those obtained from open access or common property resource areas.
Most ecologically sound traditional agricultural systems developed in the humid tropics have been based on a multispecies focus, and so mimic the surrounding (or formerly surrounding) biological environment into which they were projected. Most widespread among such systems are the various types of shifting cultivation, and among the most complex of purely agricultural variants of such mimetic systems are house garden-plantations. In wetland environments, and better exemplified by those in Asia than by African wetlands, more sophisticated and more highly mimetic of the natural system are integrated ricefield fisheries and the complex, and less commonplace, integrated aquaculture- agriculture farming systems.
The principal ecological attributes of integrated mimetic systems may be hypothesized as (Ruddle 1989):

(a) a polycultural mimicry of a natural state, with a variety of intercropped species represented by a small number of individuals, thereby replicating tropical habitats in terms of a biological diversity index;
(b) the maintenance of the natural ecological system into which the agroecosystem is projected, thereby retaining systemic congruity between the cultural system and the ecological system;
(c) the maintenance of the gross pattern of the natural community while changing selected items of its content;
(d) the recycling and minimizing of losses of energy and materials via the utilization of wastes and products of decay as raw materials;
(e) natural decay and recycling of energy and materials in natural systems is accelerated by human activities, and both largely occur in the biotic community;
(Othe structural congruence of the multilayered natural system and the cultural system allows fuller exploitation of trophic levels and heightened environmental protection;
(g) the multilayered structure reduces the requirement for energy subsidies and labor inputs; and
(h) integration permits a fuller utilization of heat, light, moisture and nutrients by species with different habits and nutritional requirements than is possible in unintegrated systems.
The fundamental concept underlying any integrated farming system is that many outputs (sometimes called "wastes" or "byproducts") of subsystems become basic inputs for other subsystems, rather than just additive components of the overall farm economy. A synergism is thereby created such that the total productivity of the system exceeds the sum of the individual subsystems. This results in higher yields for all commodities produced and a wider range of products than could otherwise be obtained per unit area. In addition to producing subsistence and commercial commodities, among other benefits the farm family is assured a regular and balanced diet and a high degree of self-reliance in a range of foodstuffs and raw materials, and thus risks inherent in more specialized farming are spread (Edwards et al. 1988). Under such systems the economic results from any one component are not viewed as important; instead, maximizing the
returns from the whole is the objective (Ruddle and Zhong 1988).
Another fundamental advantage of integrated systems of aquaculture-agriculture, for example, is that pond fertilizers, fish feeds and crop fertilizers are produced locally, within the system, and a t either a low monetary cost or a t an opportunity cost (Ruddle and Zhong 1988), whereas in the absence of integration they would have to be imported from outside the system, usually a t considerable expense in terms of capital, time and labor. In semi-intensive fish farming, for example, under systems not integrated with either crop production or animal husbandry, supplementary feed usually accounts for some 50% of the total farm operating budget (Schroeder 1980), and pond fertilizers and other inputs for the field crops comprise a large item of the budget of a non-integrated farm. Hence, in integrated systems in China, for example, profits from the fish component alone are increased by as much as 30-40% (FAO/UNDP 1979). Moreover, the uncertainties of supply commonly associated with the use of commercially produced compounded feeds and inorganic fertilizers in developing countries are almost eliminated.
As noted above, a principal physical constraint on aquaculture development in Africa, as well as a prime cause of low labor productivity and high risk in small-scale agriculture, is the pronounced seasonality and unreliability of rainfall. Thus, except where perennial groundwater sources and springs occur, aquaculture must rely on only seasonally available surface water, the volume of which is subject to large intra- and inter-annual variation. As a consequence, particularly in the African context, the control of water must comprise a fundamental element in the design of aquaculture systems. For the small-scale systems addressed in this study that implies informal irrigation systems, that are locally controlled and managed by communities of small-scale farmers (Woodhouse 1989). (In contrast, "formal" irrigation systems are based on high-capitalized, large-scale engineering works, and centrally managed.)
Aquaculture can play a vital role in informal irrigation, since fishponds can also serve as minireservoirs, or water collection points, where water is aggregated for fish culture, crop irrigation and livestock watering. An additional function of the pond, particularly in semi- intensive and intensive systems, is as a sump, where nutrient-rich sediments gradually

accumulate. This pond mud is dug out periodically, and supplied to the surrounding crop areas as a substitute, supplement or complement for other fertilizers or mulches. Fishponds are, then, multifunctional devices that perform several important roles in well-integrated systems of agriculture-aquaculture beyond merely providing a location and medium for fish culture. Not the least important of these is as a focal point in small-scale, localized, informal irrigation systems.
About This Study
This study constitutes the first research component of the I C W G T Z - F D - U M Project, "Research for the Development of Tropical Aquaculture Technology Appropriate for Implementation in Rural Africa" (see Chapter 7 for details). Its principal objective is, supplemented by brief field surveys, to summarize available primary and secondary literature on aquaculture and the context of aquaculture in Mala%. I t is intended to provide a national case study of one African context in which small-scale aquaculture has developed so far, and in which integrated systems of agriculture-aquaculture might be promoted. Another main objective, and one which for practical reasons proceeded concurrentIy with the preparation of this study, was to pinpoint areas that required special in- depth study in order to provide basic data for the design of later phases of the project.
Chapter 1, "Planning for the Development of Aquaculture in Africa", is designed to serve as a comprehensive, detailed "Executive Summary" for the remainder of the book. Based on a resource systems concept, i t was written specifically for policymakers and general development planners who are not specialists in aquaculture, so that they might rapidly be able to grasp the basic interlocking factors involved, and thus begin the organization of comprehensive feasibility studies and basic research prerequisite to sound planning for aquaculture development.
The sequence of steps outlined in Chapter 1 for the evaluation of the suitability of an area for aquaculture is not unique to aquaculture. However, its application to its development in Africa is perhaps more rigid than for other agroecosystems in that aquaculture is still a novel concept there. In addition, exceptionally careful evaluation and planning of any development is critical in the African context, because of both a scant and highly localized tradition of incipient
aquaculture in widely scattered parts of the continent, and owing to the less than successful history of attempts to develop it there. Further, although this may change, when the low price of fish is considered, the energy inputs into aquaculture often outweigh the benefits derived. The objectives of any aquaculture project must therefore be clearly defined a t the outset, and only realistic goals set. In the short term, resources available in Africa for the development of aquaculture should be consolidated, and most research and development activities should focus on just a few species, preferably tilapias, indigenous carps, and African catfish. Regional pools of manpower should be established to gradually form a continent-wide network of aquaculture development centers.
Whereas aquaculture is widely assumed to be a new concept for Africa, on the contrary, as we demonstrate in Chapter 2, via an examination of the main traditional systems, in some areas of North and West Africa aquaculture is an old- established, if not ancient tradition. Further, in some localities in West Africa, simple forms of integrated agriculture-aquaculture appear to have been traditional. Some of these traditiona systems merit thorough evaluation, since, with judicious modification, they might be made more productive.
Modern systems of aquaculture, which have been introduced to the continent over the past half-century and which have now become locally adapted, are also examined. A brief survey is given of the status of aquaculture in Africa, with particular emphasis on the Southern African Development Coordinating Conference (SADCC) Subregion.
The remainder of this study deals just with MalaGi. To provide a comprehensive perspective of the context within which aquaculture is developing in MalaGi, in Chapter 3 summaries of the biological and physical environment, demographic condition, sociocultural organization, national economy, national development policies and strategies for agriculture and fisheries, the agricultural situation, and the nutritional situation relevant to aquaculture development are provided.
In Chapters 4 and 5 we examine the capture fisheries subsector. Since 20% of the surface area of Malaii is covered with freshwater, it is hardly surprising that capture fisheries are the source of up to 70% of the total animal protein consumed in the country. Given the importance of the capture fishery subsector in Mala%, it would be foolhardy

to consider the development of aquaculture in any terms other than as a complement or supplement to capture fisheries, in order to cover the quantitative, geographical or product preference deficits of the latter. In Chapter 4 the fisheries resources, areas, productivity, technologies, fish processing, and the socioeconomic aspects of fisheries are examined. This examination is continued in Chapter 5 with a detailed consideration of the distribution, marketing, supply and demand for fisheries products, as well as consumer preferences for them.
Aquaculture per se is the topic of the next three chapters. In Chapter 6 the national aquaculture development policy is examined, and the history and current status of fish farming in ~ a l a g i described. This is continued in Chapter 7 with an examination of research, training, extension and development projects for
aquaculture in MalaiGi. Small-scale pond aquaculture is examined in Chapter 8, with emphasis on the Southern Region of Mala%.
A principal complex of constraints on any type of rural development, including that of aquaculture, is imposed in traditional societies by sociocultural and microeconomic factors. These factors are examined in Chapters 9 and 10. The major such factors of concern are the farm household decisionmaking process, labor and time allocation by farm families, the critically important role of women in the rural economy of Mala%, land tenure and use rights to renewable natural resources, the diffusion of innovation, as well as intracommunity factors such as the sharing of resources, magico-religious factors, and levelling mechanisms potentially imposed on innovators and entrepreneurs, who may be perceived of as contravening norms.
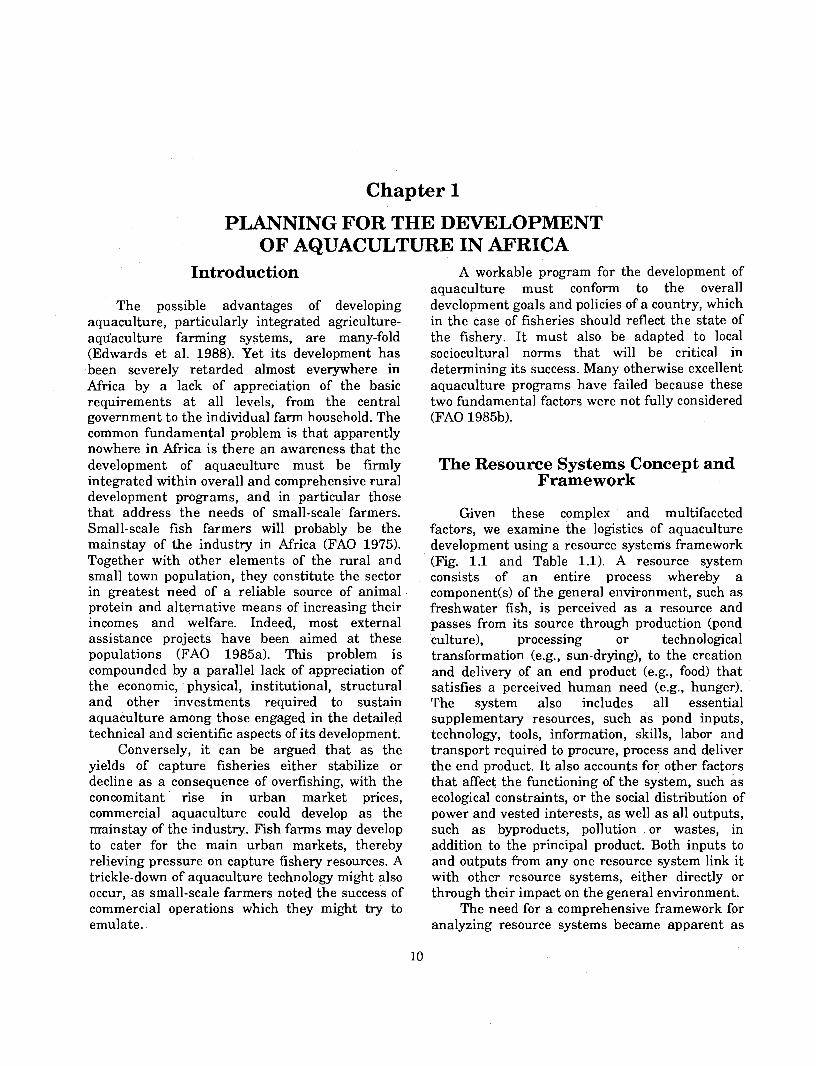
Chapter 1
PLANNING FOR THE DEVELOPMENT OF AQUACULTURE IN AFRICA
Introduction
The possible advantages of developing aquaculture, particularly integrated agriculture- aqdaculture farming systems, are many-fold (Edwards et al. 1988). Yet its development has been severely retarded almost everywhere in Africa by a lack of appreciation of the basic requirements a t all levels, from the central government to the individual farm household. The common fundamental problem is that apparently nowhere in Africa is there an awareness that the development of aquaculture must be firmly integrated within overall and comprehensive rural development programs, and in particular those that address the needs of small-scale farmers. Small-scale fish farmers will probably be the mainstay of the industry in Africa (FA0 1975). Together with other elements of the rural and small town population, they constitute the sector in greatest need of a reliable source of animal protein and alternative means of increasing their incomes and welfare. Indeed, most external assistance projects have been aimed a t these populations (FA0 1985a). This problem is compounded by a parallel lack of appreciation of the economic, physical, institutional, structural and other investments required to sustain aquaculture among those engaged in the detailed technical and scientific aspects of its development.
Conversely, it can be argued that as the yields of capture fisheries either stabilize or decline as a consequence of overfishing, with the concomitant rise in urban market prices, commercial aquaculture could develop as the mainstay of the industry. Fish farms may develop to cater for the main urban markets, thereby relieving pressure on capture fishery resources. A trickle-down of aquaculture technology might also occur, as small-scale farmers noted the success of commercial operations which they might try to emulate.
A workable program for the development of aquaculture must conform to the overall development goals and policies of a country, which in the case of fisheries should reflect the state of the fishery. It must also be adapted to local sociocultural norms that will be critical in determining its success. Many otherwise excellent aquaculture programs have failed because these two fundamental factors were not fully considered (FA0 198513).
The Resource Systems Concept and Framework
Given these complex and multifaceted factors, we examine the logistics of aquaculture development using a resource systems framework (Fig. 1.1 and Table 1.1). A resource system consists of an entire process whereby a component(s) of the general environment, such as freshwater fish, is perceived as a resource and passes from its source through production (pond culture), processing or technological transformation (e.g., sun-drying), to the creation and delivery of an end product (e.g., food) that satisfies a perceived human need (e.g., hunger). The system also includes all essential supplementary resources, such as pond inputs, technology, tools, information, skills, labor and transport required to procure, process and deliver the end product. It also accounts for other factors that affect the functioning of the system, such as ecological constraints, or the social distribution of power and vested interests, as well as all outputs, such as byproducts, pollution or wastes, in addition to the principal product. Both inputs to and outputs from any one resource system link it with other resource systems, either directly or through their impact on the general environment.
The need for a comprehensive framework for analyzing resource systems became apparent as

Biological and
physical factors
Environment - Climate - Hydrology and
limnology - Geomorphology - Soils - Vegetation - Zoological
Fish biology - Ichthyology - Pathology - Species availability
Environmental 4 condition - Public health
hazards - Natural
hazards
Political economy (Resource allocation strategies)
- National development goals and priorities - Development and status of aquaculture - Technical and manpower development
and financial assistance - National infrastructure - Protective legislation - Relationships with other economic sectors
Pollutants and
other environmental
detriments
Supplementary inputs:
Biological and physical
- Fish feeds - Pond fertilizers - Fryflingerlings
Absorb outputs
of fish culture
system - Fertile mud - Nutrient-rich
water
Potential new resource systems (e.g., Integrated
farming)
Social organization
Nutrition Dietary levels Food preferences
ml Context factors
r l System elements
Fig. 1 .l. A resource systems model to assess the *ability of aquaculture and integrated farming.
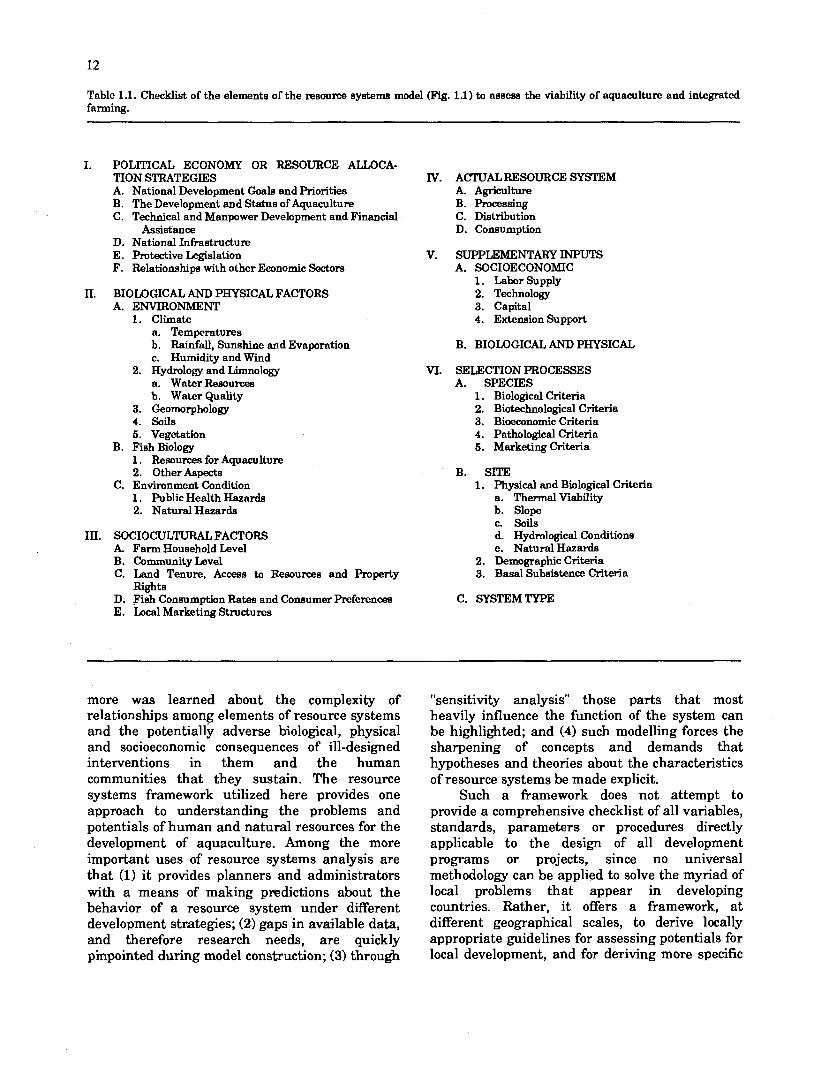
Table 1.1. Checklist of the elements of the resource systems model (Fig. 1.1) to assess the viability of aquaculture and integrated farming.
I. POLITICAL ECONOMY OR RESOURCE ALLOCA- TION STRATEGIES A. National Development Goals and Priorities B. The Development and Status of Aquaculture C. Technical and Manpower Development and Financial
Assistance D. National Infrastructure E. Protective Legislation F. Relationships with other Economic Sectors
11. BIOLOGICAL AND PHYSICAL FACTORS A. ENVIRONMENT
1. Climate a. Temperatures b. Rainfall, Sunshine and Evaporation c. Humidity and Wind
2. Hydrology and Limnology a. WaterResources b. Water Quality
3. Geomorphology 4. Soils 5. Vegetation
B. Fish Biology 1. Resources for Aquaculture 2. Other Aspects
C. Environment Condition 1. Public Health Hazards 2. Natural Hazards
111. SOCIOCULTURAL FACTORS A. Farm Bousehold Level B. Community Level C. Land Tenure, Access to Reeources and Property
Rights D. Fish Consumption Rates and Consumer Preferences E. Local Marketing Structures
IV. ACTUAL RESOURCE SYSTEM A. Agriculture B. Processing C. Distribution D. Consumption
V. SUPPLEMENTARY INPUTS A. SOCIOECONOMIC
1. Labor Supply 2. Technology 3. Capital 4. Extension Support
B. BIOLOGICAL AND PHYSICAL
VI. SELECTION PROCESSES A. SPECIES
1. Biological Criteria 2. Biotechnological Criteria 3. Bioeconomic Criteria 4. Pathological Criteria 5. Marketing Criteria
B. SlTE 1. Physical and Biological Criteria
a. Thermal Viability b. Slope c. Soils d. Hydrological Conditions e. Natural Hazards
2. Demographic Criteria 3. Basal Subsistence Criteria
C. SYSTEM TYPE
more was learned about the complexity of relationships among elements of resource systems and the potentiall-;. adverse biological, physical and socioeconomic consequences of ill-designed interventions in them and the human communities that they sustain. The resource systems framework utilized here provides one approach to understanding the problems and potentials of human and natural resources for the development of aquaculture. Among the more important uses of resource systems analysis are that (1) i t provides planners and administrators with a means of making predictions about the behavior of a resource system under different development strategies; (2) gaps in available data, and therefore research needs, are quickly pinpointed during model construction; (3) through
"sensitivity analysis" those parts that most heavily influence the function of the system can be highlighted; and (4) such modelling forces the sharpening of concepts and demands that hypotheses and theories about the characteristics of resource systems be made explicit.
Such a framework does not attempt to provide a comprehensive checklist of all variables, standards, parameters or procedures directly applicable to the design of all development programs or projects, since no universal methodology can be applied to solve the myriad of local problems that appear in developing countries. Rather, i t offers a framework, at different geographical scales, to derive locally appropriate guidelines for assessing potentials for local development, and for deriving more specific
and detailed techniques of analysis adapted to local circumstances.
A number of issues that may be either random or poorly predictable complicate the analysis of resource systems, and development planning in general. Principal among them are the political process, multilevel linkages and the nature of household and small-group decisionmaking. None, however, is either antithetical to the systems paradigm or destroys its utility. Some aspects of these issues are predictable, although not necessarily normative, and are amenable to inclusion in the evaluation of resource systems and the planning process. Use of the resource systems framework therefore assumes some degree of systems rationality, from which various group or individual decisions may deviate. In this respect it is neither better nor worse than any other model.
A resource systems approach does not necessarily always imply the use of sophisticated techniques. On the contrary, many models should be simple verbal or graphic ones. In most instances, sophisticated mathematical approaches either are not needed a t all or can be introduced only for computer simulations that might be required to analyze alternative scenarios for the development and management of resource systems, or to analyze the various consequences of the modification of systems. This is important because many if not most developing nations lack the trained manpower, the database, the logistical support to generate data, and the hardware to implement a predictive, mathematical analysis of problems and evaluate a variety of possible solutions.
The transfer of the variables or properties of a resource system into a simplified, generalized form of abstract image or model provides one means of understanding a small segment of reality. Simple models, which may be either "word models" (descriptions), "tabular models" (tables, statistics or balances), or "graphic models" (graphs and maps), although not the panacea for poor data, can be constructed from a relatively scanty database, which is often the only type generally available in developing countries. Once the broad outlines of resource systems have been modelled from existing data, and insights into the components, processes and relationships affecting the system derived thereby, detailed empirical research can then be specified to expand available databases. Even rough or preliminary models can be extremely useful guides to the allocation of
further effort in a manpower- and finance-scarce situation.
In the early stages of the analysis of a resource system, a simple graphic model might consist of a simple "box-and-arrow" diagram, such as Fig. 1 .I. In this way the analyst makes explicit the components and processes of the resource system, and, within the limits of available data, ensures that the main opes are accounted for. Functions in the resource system can then be depicted graphically, prior to developing or applying more sophisticated analytical techniques.
In the following section the resource systems framework is applied to summarize the essential factors to be considered in planning any aquaculture development project. Although it can be used to analyze existing systems of aquaculture, i t will be applied here to the examination of basically rural, agricultural areas where consideration is being given to the introduction of aquaculture into existing forms of production, particularly for the creation of integrated systems of agriculture-aquaculture.
The Logistics of Aquaculture Development
The graphic model depicted in Fig. 1.1 is a conventional flowchart in which external or "driving" variables, internal or "system state" variables and "rate" variables or processes are shown. Constants would also be given when it is applied to analysis.
The external or driving variables, "political economy or resource allocation strategies", "biological and physical factors", "sociocultural factors", "selection processes", and "other existing resource systems", are outside the particular resource system being modelled, and comprise the "general environment" in which a particular resource system functions. However, all have an effect on the performance of that system. Each can be regarded as an independent variable.
Principal system state or variables internal to the resource system are indicated by boxes labelled "agricultural or fish culture system", "farm products", "processing", "distribution", and "consumption", within the "Actual Resource System". These are, in effect, subsets of larger structures, and are dependent variables which change through time depending on the rates of the external variables.

Rate variables or processes, which account for the flows from one state variable to another (i.e., the interrelationships among variables), are indicated by arrows between boxes. By convention, the originating state variable is a t the tail of the arrow and affects the recipient variable, a t the head of the arrow.
The item "flowing" in the process between the variables can represent a variety of things: matter, energy, products, or cash. When the model is used to analyze a field situation, the "flows" of rate processes will be described by constants in mathematical equations.
It should be reiterated that this model is only a guide to the topics on which basic data must be assembled. It is not intended that it be replicated, although i t can be used to guide the presentation of final summaries. Much of the data assembled using this framework will be presented in conventional "report form", as word, tabular, or simple graphic models.
Based on Fig. 1.1 the logistics of aquaculture development are examined under the following rubrics: (1) Political Economy or Resource Allocation Strategies, (2) Biological and Physical Factors, (3) Sociocultural Factors, (4) Actual Resource System, ( 5 ) Supplementary Inputs (a) Socioeconomic and (b) Biological and Physical, and (6) Selection Processes. However, since many of the variables are linked directly by rate variables, their examination will, in some cases, inevitably overlap.
Political Economy or Resource Allocation Strategies
NATIONAL DEVELOPMENT GOALS AND PRIORITIES
As a preliminary exercise to further data collection and analysis, the development goals and priorities of a nation should be carefully scrutinized to assess whether aquaculture can play a role in the national development process. This should be done even where the promotion of aquaculture has been stated explicitly in national development plans, because, in some instances, aquaculture may just have become a fashionable term to which lip service is paid only to satisfy the policies of external donors or internationaI assistance agencies. In some nations or regions there may be no justification other than this, and
efforts and funds might be better directed elsewhere.
The overall condition of the national economy is the principal factor determining the nature of aquaculture development, if any. Financial support for aquaculture from government funds is unlikely in poor nations, and local offices of foreign assistance agencies generally assign low priority to aquaculture in such countries. This will continue to be the case either unless or until it expands. In general, government funds allocated to aquaculture comprise only a miniscule portion of the total budget of a fisheries department.
Since it is not always possible to culture fish close to prime markets, economic analyses should be made to compare the benefits of enhanced growth under optimal environmental conditions with crop value and transport costs to distant markets. Analysis should also be made of supporting commercial export ventures aimed solely at generating foreign exchange.
THE DEVELOPMENT AND STATUS OF AQUACULTURE
The past and present status of aquaculture development in a nation should be an indicator of the fate of previous attempts to develop the practice. Analysis of the causes of failure as well as of the factors that contributed to the success of projects should be examined thoroughly, to elucidate strategies to be adopted, and to predict their likely outcomes.
It is foolhardy to consider rehabilitation of former aquaculture projects in a nation with a history of failure in aquaculture, without first analyzing in depth the reasons for past failures. As a first step, an inventory of public and private sector projects should be made, and statistical and other information on the history of each project compiled from all available sources, including official correspondence files and national archives. Successful projects should be highlighted. A correlation of achievements and results with inputs, system type, species, ecological zonation and other critical parameters should pinpoint locations and areas for future focus.
Two main sample groups of small-scale farmers operating fishponds should be selected. One should be based on extension service records to assess those farms that have received official guidance. The other group should be comprised of spontaneous adopters who have not been guided directly by the extension service. This is important since the data thereby derived can

guide development of an extension service, and, in a manpower- and funds-scarce situation, guide the planning of the various levels of extension service that should be provided in areas where new developments are initiated. It will also enable the planning of ex post facto extension inputs to facilitate the upgrading of ponds constructed by, and the management techniques of, spontaneous adopters.
In this component, survey research is required to: (a) establish the economic and nutritional benefits to farm families that have accrued (or not) as a result of taking-up fish culture. If possible, this should be reconstructed to show the progressive improvement in the family condition; and (b) produce a stratified ranking of households by degree of success in aquaculture. From that ranking a subsample is then drawn a t each level, from "highly successful" to "failure". These subsamples are then examined by in-depth (not survey) field research to diagnose:
the biological and physical parameters of the farm and pond site; the parameters of the aquaculture system used; the level of integration among farm components in terms of energy, materials, labor and cash flow rates; the economic yield of each component of the farm unit; the labor situation and time allocation pattern of the total farm unit (demand, supply, absorption capacity, supplementary hiring); the household economy (income, expenses, and savings budget) for each component of the on- and off-farm activities; the land holding size and distribution of agricultural components within i t (mapped); the usufruct or other rights to land and complementary resource rights (e.g., to common land); the level of inputs by the extension service; the educational levels of the farm household; the rates of participation in traditional and nontraditional social activities (particularly in those geared to modernization); the decisionmaking process with respect to farm activities, particularly cash- and time-allocation and the
acceptance of innovation, and especially the role of women in on-farm decisionmaking; the personality characteristics of the principal farm decisionmakers, with special reference to (1) risk-taking; and (2) the ability to conceptualize and evaluate complex linkages among the different operations on the farm; the main socioeconomic characteristics of the farmer's community, including the power structure and the farm family's role and level within it, and the principal decisionmaker's perception of hisher degree of "deviation" from community norms, together with levels of peer group pressure, the sharing of resources and agricultural products, envy, and the like.
extremely important aspect of this component of the overall research is a thorough analysis of the process by which the aquaculture innovation diffused throughout an area. Again, this is important in guiding the types and spatial location of inputs by the extension service in areas where aquaculture is to be promoted, because only relatively few farmers, with optimal conditions, will be directly targetted for the deliberate and guided promotion of aquaculture. Most future fish farmers in Africa must, of necessity, be derived from spontaneous adopters who were not initially targetted for development inputs. These will present a special case, since, because they were not targetted, either by definition their circumstances were judged suboptimal for aquaculture or by location they were outside the radius of the targetted group.
Using all available records, all ponds should be recorded on maps by date of construction. Large samples should then be drawn for interviewing to ascertain the processes involved in information flow with respect to the initial concept of aquaculture, and the management of ponds once established. In particular, information is required on informal teacher-learner relationships, kinship relationships among adopters, and the complementary roles of formal and informal education in the diffusion of the concept and practice of aquaculture. Again, information on community power structure and the personality characteristics of adopters is vital.
Among the major constraints to the more rapid development of small-scale aquaculture in Africa is seed fish supply. In MalaCi, for example,

attempts have been made to overcome this by institution of the "fingerling debt" system, whereby farmers are supplied with free seed for their start-up crop from the DEFF. In return they incur the obligation to provide free seed to another farmer when he begins operations (O.V. Msiska, pers. comm.). The success of any such system requires further study to evaluate its implications for developments elsewhere.
A few fish farmers in Mala% have set up as specialized fingerling suppliers. This would seem to be the more promising avenue for the long- term, reliable supply of monosex fingerlings. Such specialists should be sought out and their operations studied in-depth. Demonstrations should be conducted at aquaculture research stations with the long-term objective of establishing a large number of specialized, commercially-oriented fingerling suppliers, who could emerge as a large-scale aquaculture industry developed.
This is particularly important since, in addition t o guaranteeing a regular supply of seed, this will obviate the need for the construction of breeding and rearing ponds on land-scarce small- scale farm units, and also overcome the problem of having to teach all fish farmers to hand sex tilapias for monosex male culture. For the long- term future, other methods of producing monosex male tilapia should be implemented.
The monitoring and guiding of developments in small-scale aquaculture essentially require the establishment of a series of periodically revised, comparative baselines in areas targetted for the development of small-scale aquaculture to monitor the aquaculture development process and thereby assess its progress. It should also aim to recommend ad hoe research to overcome specific problems as they arise, as well as modifications in the direction of specific aspects of the guided development process.
All adopters should be logged and periodically checked. The research noted in (a) - (n), immediately above, should be replicated in this component.
TECHNICAL AND MANPOWER DEVELOP- MENT AND FINANCIAL ASSISTANCE
When considering the introduction of aquaculture to villagers with no prior experience, the initial target population must be selected with care. Regardless of possible general enthusiasm,
the first target should be either persons with a fisheries background, or livestock farmers. With suitable training, such people are more likely than others to appreciate that fish culture is just a variant of animal husbandry. The technology to be introduced would, initially, be simple subsistence pond culture that could be gradually enhanced to a semi-intensive level. The benefits, problems and risks of fish culture should be explained simply and honestly, and expectations of potential adopters not raised to unrealistic levels. Commercial ventures should be based on more intensive technologies.
The adequacy of in-country training facilities and materials, for both farmers and extension service personnel, must be evaluated and upgraded. This is an initial and key step in any development program. Suitable social and remunerative benefits must be provided to attract high caliber persons to seek careers in the extension service or research centers.
Small-scale fish farmers initially are critically dependent on extension services for seed supply and information, and on sources of either public or private credit. Fundamental to the success of any plan to develop aquaculture is the field assignment of properly trained, highly motivated, and dedicated extension personnel. Usually overlooked, but basic to the performance of their duties, is that these personnel be mobile, either provided with a bicycle or, preferably, a motorized vehicle to enable them to visit frequently all fish farmers in their area of responsibility. Such personnel must be backed-up by aquaculture institutions that provide technical back-stopping, seed, demonstrations, and diagnostic services. At the outset overseas training and technical support services may be required to ensure the success of more intensive operations.
In its early stages, small-scale aquaculture requires financial support. Despite management difficulties and the dismal experience of a great many credit programs, consideration should be given to making capital assistance to enterprising fish farmers a line item in the development budgets of each fisheries department.
In general, viable large-scale commercial operations would be privately financed. However, since it is in the national interest to increase fish production, a variety of financial incentives should be provided to attract foreign capital. These might include joint venture concessions on the import of equipment and supplies, soft loans, reduced taxes, and the repatriation of profits.

NATIONAL INFRASTRUCTURE Similar safeguards should also be extended to the small-scale operator, particularly to reduce one
The state of overall national physical and element of risk that retards wider and faster institutional development can influence the dissemination of the practice. efficiency of aquaculture operations, and is Other categories of legislation, such as that especially relevant to large-scale, commercial governing the international transfer of fish stocks enterprises. The supply of electricity, for example, and their products, as well as any national laws can facilitate pumping, but if electricity is not such as those controlling species introductions available on site then installation and into the Lake ~ a l a % catchment, must also be maintenance costs and the price of fuel can be so taken into consideration and respected. high as to preclude pumping, thereby reducing the potential number of farm site options. Similarly, roads must be constructed to remote sites, either to facilitate extension services or the supply of RELATIONSHIPS WITH OTHER inputs and marketing. The degree of industrial ECONOMIC SECTORS development is also important, since this determines the level of services available and the Since in Africa aquaculture will be developed potential availability of agroindustrial byproducts primarily to satisfy long-term protein as farm inputs. (The importance of appropriate requirements, lest scarce development funds be institutional development is discussed separately needlessly squandered, any consideration of [see below].) aquaculture development should be preceded by a
Village subsistence operations are also thorough analysis of the existing national food affected by these factors, although t o a lesser budget and nutritional levels (by geographical extent. However, they will be severely retarded by location, ethnic grouping [if any], and infrastructural deficiencies that constrain the socioeconomic food preferences, extension service and research centers. and the scope of conventional cropping and
livestock production to satisfy existing and projected needs (for food, energy, protein, etc.). Then existing and projected demands for animal protein should be analyzed, and an examination
PROTECTIVE LEGISLATION made of the scope for farmed fish compared with captured fish and livestock production in
In most of Africa, aquaculture remains a satisfying them. In this way a priority can then be novel f o m of food production. As a consequence it assigned to the development of aquaculture is mostly unprotected by formal legislation; and within a framework of integrated national customary law does not apply to the practice, with development planning. If i t is determined the probable exception of such old-established and quantitatively, by region and culture group, from extensive systems as the acadja or the howash such an analysis of demographic and nutritional (see Chapter 2). On the contrary, legislation conditions, together with patterns of consumer governing water abstraction, river pollution, preference, that both a market exists for the public health, fish handling, and water or coastal products of aquaculture and that aquaculture and lakeshore rights all hinder the development indeed does have an important role to play in of aquaculture, especially by small-scale farmers. national development, then a detailed analysis of Thus there is a need to formalize the processes for the biological, physical, and socioeconomic leasing suitable sites, obtaining exploitation and environments of the country must be undertaken, marketing licenses, securing water rights, and to prepare a "Land Capability Map for obtaining legal protection of aquaculture Aquaculture" as a prerequisite to more detailed enterprises against theft and the like. Legislation research. is also required to protect the water rights of fish At this stage, the national capture fishery farmers against upstream pollution of water sector, if any, must be re-examined in detail in sources by agricultural and industrial effluents, order to estimate its potential maximum as well as to ensure the protection of critical sustainable yield (MSY). The current status of the watersheds. fishery, fishery development plans, and the scope
Commercial fish farmers can usually for realizing the potential MSY should indicate purchase insurance against accidental loss. the capacity for expansion of the capture fishery
and of its likely contribution to the satisfaction of the nutritional budget. The difference between the capacity of the potential MSY and the actual and potential nutritional budget will then indicate the current and potential scope for aquaculture. The next step is to examine the physical and biological characteristics of the environment to determine what, if any, will be the constraints on realizing that potential. The usual pattern, however, is that population growth forces overfishing such that MSYs are not sustained and the capture fishery resources are either damaged or lost.
In the countries of the SADCC Subregion, for example, marine fisheries are nonexistent, except for Angola, Mozambique and Tanzania. Elsewhere in the Subregion most development efforts must focus on natural and man-made freshwaters. The small-scale capture fisheries of rivers and associated wetlands should be the main focus of devqopment, since these have the highest immediate potential for contributing to national fish supply. Further, the traditional seasons and methods of exploitation, processing and distribution .of the ,products would be more familiar to local fishing communities. This would reduce some costs of development compared with having t o establish both capture fisheries and aquaculture in other locations. In addition to their important asset of often being located geographically close to remote, impoverished populations, traditional riverine and wetland capture fisheries invariably produce familiar species acceptable both for local consumption and those in demand by distant urban or even overseas markets. In such areas, fisheries development projects would also enhance the capacity of households to provision themselves either through direct subsistence or from revenue generated from sales.
Among these small-scale freshwater fi~heries, major development attention should be devoted to those that yield the small, sundried, inexpensive, sardine-like fish that are ubiquitously consumed throughout the region. Of little importance to up-market consuming sectors, and therefore of relatively little interest to major market intermediaries, these products constitute perhaps the principal, although not always the preferred, source of animal protein for the bulk of the rural and urban poor throughout Africa, and for which there is an apparently large unfulfilled demand, as in the SADCC Subregion (Kent 1987). However, caution should be exercised where overproduction forces fishermen to sell their catches for conversion to animal feed.
Biological and Physical Factors
ENVIRONMENT
Climate
The fundamental biophysical factor at the macroscale that determines the viability of an area for aquaculture is climate, since net rainfall and potential run-off over the hydrological catchment of an area, allowing for abstraction and other such intervening variables, are the principal determinants of water supply to ponds, and water temperatures determine the species that can be cultured efficiently in a particular location (see Chapter 3).
Temperatures. Since fish are cold-blooded animals, their performance is directly related to water temperatures, and conventionally growth in fish has been regarded as being directly proportional to the number of degree days within an optimal temperature range (see Chapter 3). Tilapias, the preferred species for culture in Africa, perform best in warm waters, since their growth and reproduction are inhibited a t temperatures less than 22°C. The optimal temperature range for tilapia culture is 22-32°C.
Temperatures outside these ranges can adversely affect productivity within the tolerance range of the species. Conversely, fish have a "Q10" of about 2.5, thus for every 10°C of temperature rise within optimum limits growth increases by a factor of 2.5. Ideally, therefore, fish farms should be located near the upper limits of the optimum temperatures.
In Mala%, the principal factor determining the temperature of a location is elevation above sea level (Figs. 3.17 and 3.18). Mean water temperatures are generally 2-5°C below the mean annual air temperature, and suitable zonation can be predicted from isotherms (Fig. 1.2; Table 1.2). However, air temperatures decrease by 0.4-0.8OC for every 100-m increase in elevation above sea level, and water temperature is co&espondingly lower. Thus the relationship between fish yields and elevation above sea level can be predicted. For example, tilapia in ponds at sea level could potentially yield a t a rate of 5-6 a d y e a r . This rate would decrease by 0.25-0.3 tkdyear for every 100-m increase in elevation up to 1,500 m above sea level, which is beyond the natural range of tilapia. From this it can be deduced thqt in Mala% the culture of tilapia is possible up to

-.-.- National boundary 1 - Winter isotherm p{ Warm lowland
Fig. 1.2. Limiting isotherms and potential aquaculture zonation for central and southern Africa. (Source: Balarin 1987a)

N 0
Table 1.2. Potential aquaculture zonation of the SADCC countries, based on elevation above sea level, mean water temperatures, potential fish species and type of aquaculture system.
Zone Approximate Mean water Species and system type Percentage distribution by country (d) elevat~on temperature Coldwater Temperate Warmwater
above sea level Min Max (e.g. Trout) (ex. Carp) (e.g. Tilapia) Angola Botswana Lesotho hfala% Mozambique Swaziland Tanzania Zambia Zimbabwe %Total (m) (a) ('C) ('C) G.P.(b) System G.P.(b) System(c) G.P(b) System SADCC
months) (c) (months) (months) (c)
A: Cold highlands >2,000 - c15 + 12 1-4 6-9 1-4 3.4 0.7 0.1 0.05 0.9 0.05 0.2 03.6) (0) (75.5) (4.8) (0.3) (0) (4.6) (0.3) (2.2) 5.4
B: Temperate midlands 1,000-2,000 15 20 6-9 5 9-1 0 1-4 4-6 1-3 10.1 6.4 0.2 0.3 1.5 0.2 3.3 6.5 2.4 (39.9) (54.9) (24.2) (9.7) (9.5) (53.2) 06.7) (42.4) (29.2) 30.9
C: Mild midlands 500-2,000 20 25 10-12 1-5 6 9 1-4 11.6 5.3 1.3 6.5 0.2 11.4 8.3 3.8 (45.7) (45.1) (0) (46.8) (41.4) (46.3) (58.4) (64.2) (46.5) 48.4 -
D: Warm lowlands c500 >% - +12 1-5 +12 16 0.2 1.1 7.7 4.0 0.5 1 .8 (0.8) (0) (0) (38.7) (48.8) (0) (20.3) (3.1) (22.1) 15.3
Souree: Balarin 0987s) Notes: (a) Elevation above sea level refers mainly to areas mthin the Tropic of Capricorn; (b) G.P. - Growth period in months refem to season of optimum temperature; (c) Systems choiced refers to type and degree of intensification, per Table 2.4 (U3- dams; [21 - rice fish; [31- ponds; [41- pens; E l - caps; E l - tanks); and (d) Zonation is approximate, according to mean winter isotherm, and is subject to availability of water. Values refer to percentage distribution for SADCC Subregion as a whole Percentage by individual country is given in parentheses.

elevations of 1,500 m above sea level, but that optimum growth, and thus greatest returns on investment, will occur a t elevations of less than 500 m.
Since for assessing the viability of small-scale aquaculture in macroterms, minimum pond water temperatures can be regarded as approximately the same as mean minimum air temperatures, the pattern of the winter isotherms is a good broad guide to defining those zones where aquaculture can be conducted at different levels of optimality and for different species. The outer limits for efficient tilapia culture follow the trend of the 20°C winter isotherm (Fig. 1.2), compensated for elevation above sea level.
Based on air temperature patterns, only that small part of MalaGi with elevations below 500 m above sea level is suited to the production of tilapia a t optimal levels. This area is mainly in the Rift Valley plains (Fig. 6.1). Production in all other areas between 500 and 1,500 m will be suboptimal, since fish growth will not occur year- round. The common carp is tolerant of a much wider temperature range, and thus could be cultured over much more of the country, but, owing to protective legislation, not on the Lake Mala% catchment.
Rainfall, sunshine and evaporation. Except in localities where water is obtained from remote sources (e.g., groundwater, large lakes or rivers), total rainfall in a catchment basin often determines the water supply available to a fish farm. Farms located in regions characterized by perennial rainfall, long dry seasons, or arid conditions require a permanent water source. On the other hand, those in areas with precipitation distributed fairly evenly during all seasons could be based on rainfed ponds. Since runoff rates, and ultimately fishpond volume, are related to catchment area, it has been calculated that in a region in Ethiopia with an average annual precipitation of 1,400-1,800 rnrn, a catchment area of 20 ha is required to fill a 1-ha rainfed pond to a water depth of 1 m, and a catchment of up to 100 ha to fulfill annual water requirements (Gamachu 1977). It is unlikely therefore that small-scale rainfed aquaculture would be viable outside the limits of zones suitable for dryland cropping (see Chapter 3).
The intensity of rainfall also has an impact on intensive pond operations, since persistent rainfall reduces the workday and decreases the chances of feeding pelleted feed, which must be kept in dry storage. Pond productivity is also affected, since persistent cloud cover reduces rates
of photosynthesis, which lowers primary productivity and could lead to deoxygenation in densely stocked ponds (see Chapter 3).
Evaporation represents a loss of water from the system, and in warm, low elevation sites could cause a substantial reduction in pond water levels. If evaporation rates range from 1,500 to 2,400 mdyear in a 1-ha pond, a constant inflow of 1.7-2.7 m3hourha would be required just to maintain constant water levels. (LMA 1983a suggests an even higher rate of 3.6 m3hour). Although rainfall reduces this requirement it does not constitute a constant replacement, and in the dry season net losses will occur.
Humidity and wind. Both humidity and wind influence evaporation rates in ponds. More important, however, is that where artificial feeds are used in hot and humid environments, there is a strong likelihood of fungal molds developing and producing aflatoxins like Aspergillosis flavin. Such climatic conditions also cause rancidity of fats in stored feed. Even under good storage conditions in the tropics, feeds generally have an optimum shelf life of less than 30 days, and are prone to weevil infestation.
Whereas winds are important in aerating ponds because wave action enhances oxygenation diffusion, it is not entirely beneficial to align pond axes parallel to prevailing wind directions. Wave action can also erode banks, but, more seriously, under storm conditions it can induce mixing of the bottom layers in stratified ponds and thus cause deoxygenation of the entire pond, especially during the seasonal "overturn".
Hydrology and limnology
The availability of water is the ultimate limiting factor on both pond site selection and the choice of aquaculture system to be implemented in any location. Fishponds require a reliable source of water of a quality suitable for fish culture and sufficient in amount to offset natural losses from evaporation and percolation. (In more highly integrated systems the supply must also be enough to compensate for "fertile water" drawn off for irrigation of adjacent crops [see below], or for livestock or domestic use.) Suitable sources are either perennial streams or springs.
Intensive tank culture requires constant flow rates of some 8-10 mVhour1t (or 70,000-90,000 mWyear (Balarin and Haller 1982); and ponds demand between 52,500 and 68,000 m3Iyearha (or 68,000 m3IWyear) (LMA 1983a) and 30,000 and 40,000 m31Wyear (Pruginin and Arad 1977).

Water resources. In the African context, the only scope for using lake or marine waters for aquaculture is either via floating cages or pens, or possibly by the abstraction of water to sustain either onshore units or drain-in ponds. Pens, enclosures, or acadja systems are suited to shallow water bodies, whereas cages would vary in design according to exposure of the site. All such systems would depend on water currents for determining oxygen supply and stocking rates.
Man-made dams, rivers or streams are potentially suited to gravity diversion systems of water supply to land-based aquaculture units. By eliminating pumping costs, such an option becomes economically feasible for both small-scale farmers and commercial operators. However, a slope of a t least 0.1% is required for gravity channel flow. Ponds can be excavated below watertables, but this creates additional management problems.
Unless either shallow or integrated with irrigation systems, wells and boreholes are not recommended for aquaculture, since pumping costs can be prohibitive unless linked with a recycling system. Where pumping is required it is essential to minimize the total head, since low pressure high volume irrigation systems operate most eficiently below a 5-10 m total head. Animal powered abstraction is also limited to a shallow lift and to where natural flooding can be exploited, as in the howash system of Egypt, described in Chapter 2 (Balarin 1985a).
Water quality. In addition to temperature mentioned above, evaluation of other aspects of water quality are important to an assessment of aquaculture potential. In general, oxygen levels are a pond management consideration, rather than a factor to be evaluated in planning, unless abstraction from ground water or from below a thermocline is envisaged, in which case aeration might be required. Similarly, apart from seasonal variation in coastal sites, salinity level is a more important factor in species selection, which is decided by species biological tolerance range rather than planning.
More important in the African context, where fish farms obtain water mostly from natural watercourses, is the seasonal fluctuation in turbidity rates. Turbidity commonly increases during the flood season, when that from suspended solids can severely restrict light penetration, thus reducing primary productivity and, therefore, fish growth. I t also causes siltation problems in ponds. Further, in intensive systems turbid waters can cause gill damage and, when
the stock cannot be seen, inhibit proper feeding and management. This problem is closely connected with deforestation and burning on surrounding watersheds.
Among other parameters, pond waters should be slightly alkaline (pH 743, and acidity could be controlled with applications of lime or certain ashes (D. Jones, pers. comm.). Other nutrients, although important, can be controlled by manuring or fertilizing, and, apart from questions of toxicity, are of little importance in site selection. Metals, such as ferric hydroxides, are rare, but their occurrence should be considered, especially near mineral deposits where there is a potential for soluble fish poisons. Similarly, when ponds are sustained by waters that receive domestic, mining and industrial effluents, a survey of upstream effluent sources and types should be conducted prior to making decisions about the location of aquaculture units.
Geomorphology
The influence of elevation above sea level on the location of aquaculture enterprises has been discussed above. Here the geomorphological function of slope and pond siting is examined. Microtopographical features are fundamental determinants of the suitability of a site for small- scale aquaculture, since local gradients define both the design of the pond and the system employed to supply water to it. Ponds should be sited where the degree of slope is such that excavation can be done economically and with a minimum of earth movement.
Where large, estate-type ponds of some 1-5 ha are to be constructed, slopes should not exceed 1-2%. However, on small-scale farms where most ponds will be of some 100-500 m2, and dug with family labor largely a t an opportunity cost, sites with slopes of up to 5% can be utilized. Whereas a tract of land with a gradient of 1-2% is considered ideal for constructing a fish pond, most ponds belonging to small-scale farm households in MalaGi are already, or are likely to be, constructed in pocket valleysin gently rolling hill terrain, such as in the Mwanza District. There, slopes of up to 10% can be utilized when the pond is constructed with its long axis aligned along the contour, since the amount of soil to be removed to build the lower bank is not prohibitive in labor terms in small ponds of 0.05-0.5 ha (LMA 1983a). Since all small-scale ponds in Mala% must rely on gravity feed of water via a channel, a gradient of 0.1% or more is required to ensure an adequate

flow into the fishpond along a narrow, shallow channel dug from the source. (Gradient is another factor militating against the use of dambos for siting fish ponds, since the slope is too gentle to ensure an effective water supply to the pond [LMA 1983a1, unless seepage supplies are adequate.) Ponds could be dug into the watertable, but this might increase the dambo evaporation rate, thereby causing excessive rates of drying that might affect other uses of resources in the area.
Ideally, pond sites should be such that dikes would need to be constructed on the downward slope only, with minimum excavation to create the "up-slope" banks. Flat ground is also important, unless only small ponds are envisaged, since either the removal of hillocks, or constructing ponds around them, would be costly. When termite mounds must be removed from a site, tunnels must be carefully sealed to prevent water loss via seepage.
Soils
Fishponds require a substrate with a clay fraction that can create an impermeable layer as well as maintaining structural integrity on the 1 :2 slope characteristic of pond dikes. Further, the depth a t which a clay horizon is located within a soil profile is a major criterion for locating fishponds. It should not be located more than 50 cm from the soil surface, since the labor demand and costs (whether opportunity or actual) involved in removing a greater volume of soil to expose a deeper clay horizon could hardly be justified to small-scale farmers using only manual technologies, given the rate of return to be anticipated from a small pond. Alternatively, where clay layers are shallow pond dikes and bottoms can be lined and the clay puddled to create an impervious seal.
Soil texture is also important, since it determines infiltration rates, and thus the rate of water loss from the system. Seepage losses of 5-10 mrnlday are regarded as acceptable, and in a 1-ha pond would require a daily "topping-up" rate of 2.1-4.2 m3/hour, thus placing further demands on the source of water.
The type of clay-forming mineral present is also a fundamental edaphic determinant for the location of fishponds. Clay soils with a t least a 20% kaolinite clay mineral fraction can be formed into stable and relatively permanent pond banks. These are common in ferralitic soils. Illite, which is a more active clay mineral than is kaolinite,
commonly occurs in ferriginous or leached reddish soils. Stable fishpond banks can be constructed in some such soils. At the opposite extreme, soils unsuited to aquaculture usage are highly weathered ferralitic soils and hydromorphic soils, the latter including principally vertisols with poor drainage and gleys. Among the widespread clay mineral components in Mala% is montmorillonite, which occurs in hydromorphic soils, among others. This structurally weak mineral is a major component of dambo sediments. Pond banks constructed from it are unstable and may collapse easily when wetted and crack deeply when dry (LMA 1983a). Pond maintenance would thus consume a considerable amount of extra labor, which might not be merited by either the fish yields obtained or the risk of loss involved by the use of such sites. (Further, ponds located in dambo areas are likely to wash out by flooding during the wet season, and sociological constraints on their usage might present additional problems for pond construction in them [see Chapters 3 and 91.)
Vegetation
Consideration of the type and quality of wild vegetation, both in sites where fishponds are envisaged and on surrounding watersheds, is an important factor in the location of fish farms. Construction of ponds in wetlands needs special consideration, since levels of organic deposits are high in such areas, with implications for water and soil quality. Decomposition of organic residues could lower oxygen levels and the excavation of ponds in wetlands is expensive, as such soils are often difficult to work and compact. Additional expense would accrue from the need to control the abundant predatory natural fauna of wetlands, including principally frogs, crocodiles, monitor lizards, birds, otters, crabs, and carnivorous fish, which cause serious losses to stocked fish and may damage pond walls.
Similarly, areas of dense forest and brush are also expensive to clear. In addition, the micro- climatic role of riparian forest must be considered. It may lower water temperatures and thus create local niches for particular fish species. The natural nutrient-supply role of different vegetation types must also be examined.
The quality of vegetation on adjacent watersheds is a major consideration in the location of fishponds. Forested watersheds are both a guarantor of perennial stream flow and a stabilizer of soils. Unless aquaculture

development can be coordinated with reafforestation programs, areas in which watershed forests have been severely depleted to supply fuel wood and lumber should be avoided, as should areas downslope of farming based on shifting cultivation, since rates of sedimentation and turbidity in ponds are likely to be high in the wet season, and the stability of water supply low, especially in the dry season. In a catchment area of 100 ha, the rate of erosion and therefore of potential deposition of sediment in a rainfed could be 1,000-1,250 t/year, or 10-12% of pond volume, unless either prevented or trapped (assuming erosion rates of 10 t/ha/year in sandy soils and 12.5 t/halyear in clays [LMA 1983al).
FISH BIOLOGY
Resources for aquaculture
Part of any inventory of the national infrastructure for fish farming should include cultivable fish resources. This should include species in use, other potentially useful indigenous species, exotics introduced previously, and candidate exotic species. Based on these data, combined with those on environmental suitability, supplemented by data gleaned from the literature, it is then possible to develop an ecological rationale for the development of aquaculture.
Other aspects (These are discussed below under "Selection Processes (Species)".)
ENVIRONMENT CONDITION
Public health hazards
Although the farming of fish yields nutritional and economic benefits, it also has the potential to increase hazards to human health. Such hazards result primarily from waterborne diseases and fish parasites. The principal water- borne diseases of concern to the development of aquaculture in Africa are bilharzia or schistosomiasis, malaria and guinea worm. Bilharzia is perhaps the most prevalent debilitating disease, with an incidence of 70-90%. Improperly managed fishponds create ideal conditions for the snail intermediate hosts of this helminth parasite.
The relationship between water development activities and the increased incidence of schistosomiasis has been conclusively
demonstrated in several countries. In Egypt, for example, the replacement of traditional irrigation techniques by perennial methods led to a vastly increased incidence of bilharzia from both Schistosoma mansoni and S. haematobium. In some areas, the worm burden rose from 2-75% within years of the introduction of perennial irrigation (Biswas 1978).
Surveys conducted 40 years ago reported that Mala% "must rank as one of the worst countries in the world" for bilharzia infection (Ransford 1948). The situation remains little changed, and the disease is spreading to new parts of the country (Weill and Kvale 1985). Surveys conducted by the Bilharzia Control Unit of the Ministry of Health showed prevalency rates ranging from 0 to loo%, with an average of 66% (Chiota and Msonthi 1986).
Schistosomiasis is notoriously costly to society, both in terms of the expensiveness of control by standard public health methods, and by its indirect impact on society through the loss in work efficiency owing to physical impairment of large sectors of the population. In Malawi the direct cost of treatment is about MK 0.75hnfected individuayyear (Teesdale and Chitsulo 1983). Other costs are involved in such preventative measures as are taken in agricultural engineering, improved water supplies, sanitation, health education, and the like. Given this large economic drain, the development of alternative methods which must be effective, cheap and simple biological techniques, is urgently required as an integral part of small-scale aquaculture technology, combined with good pond management practices. Standing water, like that in a fishpond, and particularly when located near a dwelling, always involved risks to human health. Good pond management, which involves the regular cleaning of, where feasible, drainable ponds is a key practice that would reduce health risks significantly. In addition, areas near the pond and water sources for the pond must also be managed in a sanitary manner.
Removal of plants that provide food and sanctuary to snails, as well as health education and the use of low cost latrines, are possible solutions to the bilharzia problem. Two other possible forms of inexpensive biological control are the use of molluscivorous fish to control the snail hosts of bilharzia, or the application of plant biocides to infected waterbodies. Research on the use of molluscivorous fish is still relatively new (Chiota and McKaye 1986), and, in particular, the important problems of species selection,

particularly for feeding behavior and coexistence in ponds with the principal food species stocked, remain to be solved. Two important additional advantages of stocking such species is the increased production of animal protein, and the control of mosquito eggs and larvae, and thus a reduction in the malaria hazard, by using species that also consume these foods. However, the polyculture of molluscivores, such as Haplochromis pacodon (Pruginin 1976) together with the main fish species stocked, does add considerably to the complexity of aquaculture, and so would not be desirable in the early stages of the introduction of small-scale fish culture.
The other low-cost approach to bilharzia control is through the use of naturally-occurring biocides, particularly those derived from plants. In Mala%, for example, there are several such biocides that could be integrated easily into the aquaculture system (Table 1.3). Six such plants (the Flacourtiaceae, Flacourtia indica; the Guttiferae, Psorospermum febrifugum; the Papilionoideae, Tephrosia vogelii and Neorautanenia mitis; the Mimosoidae, Elephantorrhiza goetzei, and the Rubiaceae, Xeromphis obovata) were tested in ~ a l a % by Chiotha and Msonthi (1986) on the snail Bulinus (Physopsis) globosus, obtained either from Lake Chilwa or Domasi. The last three were found to be toxic to 100% of the test snails a t concentrations of 1,000 mgA, and the first three were effective at 100 mgll. Further dosage testing is required since at 1,000 ppm, in addition to killing all the snails N. mitis, in one hour it also killed 100% of the Oreochromis shiranus chilwae, one of the principal fish cultured in Mala% (Chiotha and Msonthi 1986).
Elsewhere in Africa, research is most advanced on the rag-weed, Ambrosia maritima (El-Sawy 1979), and the soapberry plant, Phytolacca dodecandra (Steele 1987). In laboratory experiments the former has been found extremely toxic to the host snails; Ambrosia a t 1 ppt is lethal. The plant is potent for two days, and kills the snail as well as both the eggs and larvae of the fluke. Application is simple, the mature plant being either cut or bent into the water, where it becomes effective immediately. In Egypt the plant matures a t the peak breeding time of the snail, and has no deleterious side effects for fish (El-Sawy 1979).
A better understanding is required of the environmental tolerances and other biological requirements of Ambrosia maritima and Phytolacca dodecandra, as well as to search for
and test local alternatives elsewhere in Africa. Once the efficacy and simplicity of such a method has been explained to fish farmers, it should not be difficult to induce them to plant it around their ponds and watercourses.
Aquaculture development planners are confronted with a stark dilemma: viz. if the development of aquaculture is later perceived to increase morbidity rates of bilharzia and other debilitating diseases, the innovation will have to be critically evaluated with respect to nutritional benefits versus health implications. I t is thus incumbent on planners to concurrently promote aquaculture and satisfy public health requirements. Since conventional methods are not acceptable, owing to expense and toxicity hazards, research on natural biocides and polyculture is indispensable.
Malaria also may be problematical. In ponds this will likely be controlled since, in general, most cultured fish will consume mosquito larvae. Guinea worm can be contracted by drinking water from ponds containing the intermediate crustacean host, Cyclops sp. Similarly, other waterborne bacterial or parasitic infections of man can be contracted by drinking or contact with pond water. Filtration or boiling of water are effective prevention measures.
Fish parasites, such as Heterophyiids, are pathogenic to man, and can infect fish in ponds if the snail vector is present. Control is the same as for bilharzia. In addition, fish must be cooked thoroughly before eating.
Natural hazards
Analysis of the climatic history of a nation, region, or site, from the perspective of aquaculture needs, is also of major importance, both in assessing prevailing conditions and to estimate the likelihood of such extreme conditions as those caused by drought, flood, or cyclone.
Based on the data sets assembled and analyzed under "Environment" (p. 18), the frequency of occurrence of cyclones, extreme temperatures, drought, flood-induced turbidity and siltation of ponds, and other locally significant hazards should be assessed. Flash flooding and inundation a t abrupt break-of-slope points, as when bankfull rainy season streams debouch from massifs on to adjacent plains, are also problematical, and indicate locations best avoided for aquaculture and other developments. Such sites should be carefully mapped, and noted for avoidance. This is especially true of fairly

Table 1.3. Wild vegetation of potential value for public health measures in fishponds in Malawi.
Family Scientilic name English common Vernacular names Habit Usage Part name (Ethnic Gmupl) used
Orchidaceae Edophia sp. n.a. t i m k i?) Orchid Alleviate malaria Root
Dutchman's pipe Climbing shrub Antimalarial Root
Traditional map Fruit Molllucicide
- -
Leguminosae EkphantorrhLo gorlni (Harms) na. (Mimosoidae)
chitctq (Ch) Tree chunduna (Ch) chikvdvlimaCn cliolimo Cn
Fish stupefacient Tuber Mollumcide at lo0 ppm
Leguminome Nmmutanmio miiis (A. Rich) n.a denn~ (?) C m F W Revent Newcade Tuber Bnpilionoideae) m'memcnnmb~1~ (Tu) dimbin# shnrb D i m (chickens)
Mollwicide at at lWppm
Tephmiu W i i (Hook.) Fish bean ombw (Ch) n.a MoUusddde at h a * thu (Ch) 1 PPt mktcrp (Tu)
Mollwicide Pods
Polygalacme Ssiridclecr Iongdunculata CTremn.) Tree molet b d (Ch) Shrub or tree Malaria Root
Heartburn Root High blood Bark prassure Molluacicide at 1 PPt
Flmurtio indun @urn.) Governo~'s plum ntWlrdra (Ch) Shrub Astringent Root mafyoholo (Ch) Ant~b~ot~c Bark hdm (Ch) Intestinal ulcer8 nBw (Ch) Cure pneumonia
ntudp (Ch) Mollusnnde at ndumnsa Ua) 1 PPt ntum (La) tumbu3w (Su) &wr (Nk) aowomn (Yl mtawa 0
Verbenaceae CIercdendrum unrez~tum (Schme.) Glorybower Izkodr6) Ch) Rambling Anti-b~harzia k t mkdakda 0 shrub
Rubiaceae Xemmphir obwata (Hochst.) ma. chipmbvr (Ch) n.a. Oral treatment of Root msondohu (Ch) bilharzia. Bark
Molluacidde at loo P P ~
Balanitaceae Bolanites nurughamii (Spraqus) Torchwmd Njuyu (Ch) Tree Anti-bilharzia Fruit rUpzrnbulu 0
Sources: compiled from Binns and Lagah (1572); Williamson a975); Chiota and Msonthi (1986). Notaa: (1) Identifications of the ethnic w u p s a m Ch - ChiehewdNyarua: La - Lambya; Nk - Nkhonde: Su - Sukwa; To - Tonm: Tu - TumbukalHenga: Y - Yao.
confined valley sites. In general, such extreme weather conditions would probably occur once or twice in 10 years, and where farmers are likely to be unavoidably exposed to such conditions the addition of an aquaculture component in their operations would have to be taken into special account.
SociocuZturaZ Factors
An immediate prerequisite to an analysis of sociocultural factors is an analysis of the demographic census materials for the local area, to provide comprehensive data on population structure and dynamics (see Chapter 3). Standard demographic techniques should be used to prepare these data, which should be updated by a field survey, if necessary.
Since sociocultural factors are discussed in detail in Chapters 9 and 10 using the example of Mala% and others, and are examined under "Supplementary Inputs" in this chapter, only a summary of the topic headings applicable to analysis of resource systems throughout Africa is given here. Data should be assembled for all these topics a t both the individual farm household and community levels. Standard anthropological field techniques of prolonged observation and participation in the daily life of a community should be utilized to derive these data.
FARM HOUSEHOLD LEVEL
Intensive research should be conducted on individual farm households to discern labor and time allocation by all members to both economically and socially productive activities, attitudes toward and factors governing economic and social decisionmaking and risk-taking, the personality characteristics of decisionmakers, and attitudes toward and response to innovation.
COMMUNITY LEVEL
At the community level, investigation should focus principally on identifying community organization and traditional institutions, economic and social strata, the distribution of power and prestige, social roles, systems and requirements for sharing of resources, gift-giving and reciprocity, belief systems and magico- religious constraints, community behavioral norms, intracultural diversity and heterogeneity,
tradition and change, social levelling mechanisms, and the handling of social deviants.
LAND TENURE, ACCESS TO RESOURCES AND PROPERTY RIGHTS
Extremely important is the generation of a comprehensive data set on land tenure, property and natural resource rights and the systems of descent and inheritance, since security of usufruct rights to customary land is a major constraint to the introduction of innovation. A survey must be made of each household to determine how closely it conforms to community norms in these terms, and to determine whether it is governed according to matrilineal or patrilineal descent-inheritance rules, or whether these traditional forms have broken down.
FISH CONSUMPTION RATES AND CONSUMER PREFERENCES
It is important to examine the development potential of the crop, livestock, and capture fishery sectors a t the local level, within the context of government policy, to elucidate the potential of fish protein to achieve locally balanced nutritional budgets. A household survey must be conducted by region in each country to ascertain rates of fish consumption per capita and consumer fish preference. This should be conducted by fish species, type of fishery product, rural-urban residence, and economic, educational, social, ethnic, sex, and age stratification. At the same time, rates of consumption and preference should be compared with those for other forms of animal protein, including insects and rodents, both of which are widely consumed throughout Africa.
Undoubtedly, communities which have been fish eaters by tradition, but which are furthest removed from existing fishery resources will potentially demonstrate both the greatest demand and highest market prices, especially for fresh fish. Clearly such areas would benefit from increased fish supply, and the higher prices to be obtained might prove attractive to commercial operations. Regardless of geographical location, an average normal adult daily protein requirement (DPR) is taken as 35-43 g/capita/day, or 12.8-15.7 kg/capita/year (Latham 1979). Thus if population growth rates are known i t is possible to predict future local and regional protein requirements, and thus likely national demand levels.

This area of investigation involves complex, interrelated problems, as can be demonstrated for the countries of the SADCC Subregion. There, fish provides an average of 7% of the daily protein requirements, with average national consumption rates of 8.8-12.9 kglcapitdyear (Table 1.4). These rates are higher than those for Africa as a whole, and suggest the relatively more important dietary role of fish in the Subregion than the average for the continent ( ~ a l a k r j 1987b). Moreover, in the Subregion, an average of 25% of the'population's animal protein intake is derived from fish. However, since the 1970s, fish production has been declining, fish prices have increased sharply, and for a variety of reasons, so has the purchasing power of many of the citizens of the Subregion. Per capita fish consumption rates have therefore declined drastically in some countries, such as in Zambia (Fig. 1.3).
Rates of consumption and the dietary role of fish vary both among and within the countries of the region. They are greatest in Angola, with consumption rates of 17.6-31.9 kglcapitdyear, providing 16.2% of animal protein requirements. At the other extreme are Botswana and Lesotho. In Botswana, the average fish consumption is about 2.5 kglcapitdyear: most of the population are beef-eaters by tradition.
Rates of fish consumption also vary greatly within countries, in large part according to the ease of access to landing and production sites, and purchasing power. In Tanzania, for example, although fish accounts for an average of 30% of the total animal protein supply, it accounts for
only some 2% of the total protein consumption for most of the country. However, near the main production regions of the Lake Victoria fisheries, as a t Kagera and Mtwara, i t accounts for 11 and 158, respectively (Tanzania-UNICEF 1985). Transportation difficulties cause distribution to be grossly uneven. This correlates with consumption rates, which range from a high of 50 kglcapitdyear near the lakes to a low of 1 kgkapitdyear in areas remote from sources of fish supply. The average is 12.5 kglcapitdyear. The rate in Zanzibar is an estimated 40 kglcapitdyear (Kent 1987).
Further, there is the added problem that fish is more available in urban markets catering to wealthier citizens. These are usually served by relatively good transportation links; better than in the impoverished and isolated rural areas. Fishermen and dealers naturally seek to maximize rates of return. Thus, ironically, in marine fishing villages near Dar es Salaam, many families cannot afford to eat fish, since they cannot compete with city prices (Swantz 1986). Rather, they prefer to sell their fish and then purchase cheaper "affordable" protein.
The interlocking variables that affect rates of fish consumption are well illustrated by the case of Zambia. There, average national fish consumption rates have halved in the last 13 years, from approximately 16 kglcapitdyear (1972) to about 8 kglcapitdyear (1985) (Fig. 1.3) (Government of Zambia 1986). This drastic reduction is particularly serious, because fish is the source of more than half the total national
Table 1.4. Total fish landings, international trade in fish products and potential consumption in the SADCC countries, 1986. - - - -
Country Fish production (t x l$ ) - Potential fish consumption Fisb landing6 International fish trade Total fish Population
Marine Inland Aquaculture Total Imports Exports available (x lo6) k$cap/year
Angola 529.0 6.0 0.007 637.0 302.0 233.0-1 28.6 7.3 31.9-17.6
Botswana 1.4 0.0 1.4 2.0-1.6 3.0-1.4 0.9 3.4-1.5 -
Lesotho 0.002 0.03-0.01 4 0.032-0.01 6 0.95 0.99-0.02 1.4 0.01-0.7
Malawi 55-51 01-0.09 55.1-5l.09 5.80 1.2 67.7-56.6 6.1 11.1-9.3
Mozambique 37.0 5.5 0.0 425 30.0-15 1 D.0-4.0 68.0-31.5 11.6 5.9-2.7
Swaziland 0.1 0.05 0.15 1.2 1.53-0.04 0.5 2.7-0.07
Tanzania 36.0 215190 1 .SO2 252.8-226.2 21.6 - 5.00 0.1 274.3-231.0 18.5 14.8-12.5
Zambia 70.0-30.0 6.0-0.3 76.6-30.3 5.00 62.038.8 6.0 10.3-6.5
Zimbabwe 20.8-1 4.2 0.80.5 21.61 4.7 10.0 - 1 .70 0.04 23.0-15.0 7.6 3.0-2.0 -
Total SADCC 6020 369.6-298.2 8.79-1.1 6 980.59-901 36 76.2-36.2 313.2-307.34 733.5-503.0 56.96 12.9-8.8
Total Africa 140 2,976-3,761 484.50 7.84.1
%SADCC 6.3-16.5 32.95-23.97 12.4
Source: Balarin (1987b).

Year
Fig. 1.3. Rates of potentially available fish per capita in the SADCC countries, 1968-1985 (kg/capita/year). (Source: Balarin 1987a)
animal protein intake. However, there is considerable variation in the rates, which are thought to exceed 30 kglcapitalyear near the production sites, and to be about 12 kglcapitdyear in the towns of the Copperbelt and in Lusaka. In rural areas remote from the main sources of fish supply, consumption is about 4 kglcapitalyear.
The decline in consumption rates in major urban areas in particular is attributable in Zambia to three principal factors. First is the remote location of the nation's main capture fisheries relative to the principal urban markets,
and the poor transportation and communication linkages between them. Moreover, the rate of population growth in the urban centers of Copperbelt Province* and in Lusaka was 52% during the period 1980-84, whereas fish supply during the same four years increased by only 3.5%. The result has been a 17% decline in the per capita consumption of fish among the urban population, from about 14.5 kglcapitalyear (1980) to 12 kg/capita/year (1984). A further major factor is the drastic curtailment of fish imports to conserve foreign exchange (Government of Zambia 1986).
Projecting the future Subregional fish protein and production needs to be done within the context of all sources of animal and vegetable protein (Table 1.5). With a projected Subregional total population of 116 million people by the year 2,000 (SADCC 1984), a total annual fish catch of 1.13 million t will be required simply to maintain present levels of consumption (Table 1.6). If, by the turn of the century, an optimum DPR of 5% were to be derived from fish i . . , 10 kghapitafyear), a catch of 1.16 million t/year would be required (Table 1.6).
Considerable variation exists in the estimated MSY of fisheries for the SADCC Region, ranging from 1.3 to 2.1 million tfyear (SADCC 1984). Based on the more optimistic estimates of MSY, for the region as a whole a surplus of supply over demand is possible. To sustain present consumption rates or even attaining optimum dietary intake levels, would require the development of the infrastructure needed to support increased catch rates. Given that one-third of the regional catch is currently taken by foreign fleets, this would represent the need for substantial investment in this sector.
Table 1.5. Calorie intake and animal protein intake for the SADCC countries. 1983-1985.
Country Per capita Calorie intaka Protein intahe food Total Percentage (%) Total % Origina % Fi8h
index (Irdcapita) Staples Requirement (B!capita/day) Meat Fi8h of total
Angola 81 ZJ 36 66 Bl(a)-83 44.q~)-99.9 271 1 L2 37.4
~otswana 81 2.091 55 W a W 67.4 34.2 0.9 8.7-2.6
Lesotho 86 2,428 79 107-106 2.7 17.8 0.01 0.06
Malawi 96 2,279-2.066 74 96-94 67.6-63.1 8.7 5.4 55.2-38.3
Mozambique 73 2J70-1,796 77 74(a)-70 40.4W29.5 13.5 5.4 28.6
Swaziland n.a 2,646 59 110 66.3 33.6 9.1 21.3
Tanzania 91 2J59-2.m 72 8689(a) 47.642.5 22.4 10.691 31.7
Zambia 92 Z,Om-2.%5 79 98-93@) 69.4(c)-0.6 16.2 6.1 28.2
Zimbabwe (e) 86 2,118-1,793 66 73.Xcj64.3 16.7 2.2 11.6
Source: Balarin (1 987a)

Table 1.6. Potential fish requirements and potential fish production in the SADCC countries.
County Population Fish requirement by Fishery potential(2) Potential cf re uirement Potential Growth by A.D.2000 A.D. 2000 ( ~ y e a r x 1 0 ~ ~ 1 ) (t r 103) k10$ aquaculture (%ear) (x 10% Present Optimum Marine Inland Total At present At optimum production
level level level level by A.D.2000 (t x 103)(3)
Angola 2.8 13.0 41 5 130 655 11510 768-665 +353-250 +638-535 0
Botswana 2.6-3.1 1.41.7 3 14 24-1 5 24-1 5 +21-12 +lo-1 0.001-0
Lesotho 2.1-2.9 2.0 0.06 20 0.29 0.29 +0.23 (19.7) 19.7-0
Malawi 2.63.4 10.0-12.0 100 120 150-80 150-80 +50 (20) +30 (40) 40-0
Mozambique 2.7-4.2 20.624.0 58 240 85 55-1 5 140-1 00 +82-42 U40-100) 140-0 (0.5)
Swaziland 2.6-3.1 0 . ~ 1 . 0 0.07 8 0.2 0.2 +0.13 (7.8) 7.8-0
Tanzania 3.33.5 36.0 450 360 100-40 700-340 600-300 +250 (11 0) +340 (20) 11 0-0
Zambia 3.0-3.6 10.211.0 71.5 110 270-70 270-70 +198.5(1.5) +I60 (40) 40-0
Zimbabwe 2.9-4.4 13.0-16.0 31.5 160 28-22 28-22 (9.5-3.5) (1 38-1 32) 138-3.5
Total 2.9-3.3 107.5116.2 1.129.1 1J62 840-780 1,240.5-512.5 2,080.5-1,292.5 +951.4-163.4 +918.5-130.5 495.5-3.5
Source: Balarin (l987a) Notes: (1) Fish requirement by A.D. 2000 is calculated both as that required to sustain present levels of consumption as we11 a s that needed to achieve an optimum above 10 kgfcaplyear; (2) Values in parentheses are negative; and (3) To meet fish requirement.

However, should the lower estimated MSY prove more accurate, present consumption levels could not be sustained in Mala%, Tanzania, Zambia, and Zimbabwe. Worse, if national policy is to promote fish consumption to attain optimum levels of dietary intake, only Angola and Botswana would be able to satisfy the higher levels of demand from capture fisheries (Table 1.4). All things considered, a deficit of almost 0.5 million Wyear could be estimated for the SADCC Region (Balarin 198713).
If not satisfied by imports, which would be undesirable given the economic condition of the region, this protein deficit would have to be compensated for by other, more managed production systems, such as agriculture that includes aquaculture. Further, since in most countries of Africa the demand is for fresh fish rather than processed forms, and satisfaction of this demand is generally unfulfilled, even short distances away from landing points, owing to extreme deficiences in the distribution and marketing systems, the potential role of aquaculture assumes an even greater importance.
LOCAL MARKETING STRUCTURES
One annual cycle of the fish marketing structure and market prices should be conducted in all regions of a country, based on surveys conducted in local markets. Price profiles according to distance from source are particularly important. It is especially important to understand the influence of weather and seasons on supplies and prices, by region. Comparative analyses should be conducted in each area of supplies and prices for all other main sources of animal and plant protein.
Actual Resource System
Several caveats and cautionary notes are in order a t this point. Given the subsistence or near subsistence level at which most small-scale farm households exist in Africa, an overriding prerequisite of any program to develop small-scale aquaculture within existing agricultural operations on household holdings is that diversion of scant on-farm land, labor and capital resources to the aquaculture component should not undermine the viability of the entire farm unit.
Most ponds will be constructed on already agriculturally productive land, rather than in marginal locations, either those which are
marginally productive agriculturally or those that are not at present incorporated within the farm unit by cultivation, grazing or some other form of resource use. Withdrawal of land from the existing farming dystem must not reduce the overall household well-being, as measured either by the subsistence product or by the cash income, or both.
Similarly, construction and routine operation and management of the aquaculture component must not be so demanding of labor inputs that either additional hired labor is required or that the opportunity cost is so high that the household is deprived of the opportunity to earn cash or kind income by off-farm labor during the slack season of the agricultural cycle. Finally, since in relative terms, cash flow and agricultural surpluses on most farms are scant to nonexistent, investment in fish farming that requires an actual cash outlay should be kept to the minimum practicable, and preferably to zero. Wherever possible, construction materials should be either procured on-farm or in village commonland, at only an opportunity cost.
In the same way, labor should be supplied by the household, or, if socially feasible, on a reciprocal basis with other members of the community. Reciprocal labor, or some similar form of labor organization based on traditional practices, would have the great advantage of accelerating pond construction times, thereby bringing ponds into production faster. Properly organized, this would greatly speed up dissemination of aquaculture.
A second fundamental premise of small-scale integrated farming systems designed for application in Africa is that they must be based in most cases entirely, and in others as nearly as possible, on household self-sufficiency in the procurement of the two basic pond inputs, fish feed and pond fertilizer. In some instances in ~ a l a % , for example, but relatively rarely it appears, some pond inputs and particularly the maize bran used as fish feed, can be obtained by barter against salt. However, salt itself must either be purchased or obtained by bartering against another product derived from the farm. On the other hand, chicken manure, the most commonly used pond fertilizer in Mala%, must in almost every instance be produced entirely on the farm, since additional supplies can almost never be obtained from other farms, either by barter or by purchase, owing to either competition from other uses or simply owing to unavailability under traditional free-range practices.

An added complication is that both of these inputs have alternative important on-farm uses. Maize bran is used as a chicken feed, either alone or compounded, on farms where poultry are kept. Where not used in this manner it is an important item of barter for salt, an essential component of the diet. Further, in some seasons maize bran is consumed by members of the farm household if staple food stocks are exhausted.
Chickens are generally allowed to range freely, thus their droppings are scattered over the farm, and not necessarily in locations where they provide the greatest benefit to crops. Where coops are constructed, chicken manure is customarily used as a fertilizer for crop plants. (Because the use of other animal manures is still comparatively rare, and that of human excrements taboo, chicken manure is the only one discussed in detail here.)
A potential and as yet little-examined, inexpensive pond input are elements of the wild vegetation that commonly occur on-farm as weeds, or on unused land. Some of these could be used either as green fodder for herbivorous fish, or could be applied to the pond either green or dried, to decompose and contribute to food webs. Although practised, aquatic composing is little understood and requires further study, especially of those plants that have no present or potential more important alternative uses.
Since, other things being equal, in the simplest type of integrated system envisaged for Mala% the level of pond fish productivity is constrained by the rates of application of these two inputs, important decisions will have to be made by the farm household with respect to trades-off in their allocation. However, with fuller integration the levels of these trades-off can be reduced.
AGRICULTURE
It is assumed here that the resource systems framework is being applied to the analysis of an existing agricultural system in which aquaculture is not practised but where a feasibility study for small-scale aquaculture is being conducted. The first step in this analysis is to map the farm holding by land use and crop type. Data are then obtained for each crop (and livestock type, if applicable) on the annual calendar of agricultural activities for all tasks performed (labor data are obtained at the same time), as well a s crop requirements and cultivation practices, planting
rates and yields. Rates of crop loss or failure should also be obtained.
PROCESSING
Data must be assembled on the techniques used to process and store harvested crops. Rates of postharvest losses should also be obtained. (Data for the "labor" component of these activities will also be collected here.)
DISTRIBUTION
Data are required on two aspects of distribution. First are those on the distribution of the subsistence product among household members, as well a s gif't-giving and exchange patterns, if any. Quantitative data are required by month on the amounts of each crop type consumed by individual household members. (This information links with the nutrition data to be assembled for "Sociocultural" factors.) Secondly, quantitative data, by month, per crop type and by price or value must be obtained for that portion of the harvest that is sold or bartered. Methods of delivery to sale or barter points must also be established and quantified.
CONSUMPTION (This topic is dealt with under "Sociocultural Factors".)
Supplementary Inputs
SOCIOECONOMIC
Labor supply
Labor in many parts of rural Africa has generally been assumed to be in oversupply. But as has been here demonstrated for Mala% (see Chapter 10) this cannot be assumed for all small- scale farm households, since there are a great many variations in agroecosystems, seasonal labor demand, sexual role, household economy and sociocultural imperatives on time allocation. Although small-scale aquaculture as now generally practised in Africa has a minimal labor demand, progression toward fuller integration of farm components will cause a parallel increase in labor demand.
Thus the complete time allocation budget and its subset labor allocation to on-farm and off-farm
economic activities must be analyzed for sampled target households. Potentially, only those households in which total household-supplied labor is in surplus should be deliberately targetted for the introduction of aquaculture, unless diversion of farm labor from normal tasks can be shown to contribute more to general household well-being.
Technology
The current level of, and rates of investment of time and capital in, agricultural technology should be assessed, as should the suitability of the tools for use in fish farming. Most small-scale farmers in Africa use simple and inexpensive hand tools, principally a multipurpose hoe for most agricultural tasks, together with bush knives, possibly an axe, and a variety of baskets and storage containers. Wheelbarrows, plows, carts, and draft animals are rare throughout most of rural Africa.
Capital
Although capital requirements for small-scale fish farming as now practised in Africa are minimal, progression to more fully integrated farming will place increasing demands on capital. Capital requirements are for:
Pond construction and annual maintenance. These costs are, in most instances, purely for labor, although sometimes they might be incurred for such things as drainage and inlet systems. In households with a labor surplus all requirements (at the simple, initial stages of aquaculture) could be met by household members. There is, however, an opportunity cost. Although this must be established, it will be of only academic interest in the absence of alternative on-farm or off-farm income generating activities. But the capital costs of labor (including opportunity costs) will gradually expand proportionate to the level of farm integration.
Fish farmers' club dues. This is a small fixed cash cost. It may include the rental of a net for harvesting or of a wheel-barrow during pond construction, or payment for initial seed stock.
Taxes. In large part these will be theoretical only. However, in some cases water abstraction might be taxed, and there are likely to be local obligations to make in-kind payments to village headmen or other figures of authority, both community members and outsiders.
Pond stocking. So far ponds have initially been stocked with fingerlings supplied free-of- charge from aquaculture stations. Increasingly, in Mala%, for example, fish farmers incur a "fingerling debt" which they are obliged to repay once they are established by supplying fingerlings to another new farmer. If specialized fingerling suppliers emerge, which seems sensible, then individual farmers will not need to construct a breeding-rearing pond. This would seem best where landholding size is a major constraint. Under monosex male tilapia culture (the seemingly most logical system for small-scale farmers) fingerlings will have to be either purchased, or obtained by barter or by the performance of reciprocal services (e.g., labor).
Pond inputs (supplementary feed, fertilizers). Ideally, each farm should be self-supporting in the supply of pond inputs. If not, additional supplies must be obtained by either purchase or barter or reciprocal service. Level of farm-produced inputs must be ascertained (see above). This should include elements of the natural flora or fauna, some of which may be useful as fish feed or other inputs.
Harvesting (net). This will probably be subsumed under "Capital" above, a t least in the early stages of development. However, traditional systems of trapping or the use of fish stupifacients should be encouraged, as well as intermittent cropping using hook-and-line, or, possibly, total draining. The method used will depend on a farmer's knowledge and experience.
Tools (wheelbarrow, mud-sprayer, aerator). This is a future cost that should be anticipated as emerging gradually. Certainly it will become important in large-scale operations or in the event that systems become tightly integrated.
The economy of each household targetted thus far must be examined to provide detailed information on all sources and rates of income, expenditure and savings. In addition, this will provide a baseline against which to assess longitudinally levels of economic improvement or not in household economies as a consequence of the introduction of integrated systems, as well as a means of assessing the economic performance a t the household level of different types of integrated system.
Such labor supply and household economic analyses permit an economic assessment by household type of the level of small-scale aquaculture that could feasibly be introduced.

Extension support
The shortage of fisheries extension personnel is a major handicap to the development of aquaculture in Africa. A further major handicap is that most such personnel have virtually no awareness of the concept of integrated farming systems, apart from a minimal knowledge of the use of a few agricultural residues as pond inputs. Thus it is important that the locally most suitable methods be devised to create an awareness of integrated farming systems, and that extension personnel be trained to enable them to promote effectively the development of such systems. This will necessitate the development of materials and courses specifically on integrated agriculture- aquaculture to train personnel.
The effectiveness of prior attempts by extension personnel in fostering the adoption of small-scale aquaculture must be analyzed, and from this, appropriate curricula aimed a t different levels of personnel should be developed. A parallel and equally important need is to develop curricula, courses and materials for use by extension agents in training farmers. It is particularly critical to examine the special extension needs of those female farmers who are likely to adopt fish cultivation.
Given the acute shortage of extension personnel throughout Africa, the feasibility of training the sons (to work with male farmers) and daughters (to work with female farmers) of already successful fish farmers to work as extension aides, should be examined. In particular, the relative economic merit of having persons assigned to their home communities against the psychological and other pressures that they would encounter by being assigned to their home as opposed to other communities (particularly when the crossing of ethnic lines is involved) requires investigation.
BIOLOGICAL AND PHYSICAL
During the process of planning for the development of fish farming, the type, productivity and zonation of cropping and livestock systems and agroindustries must be examined, to determine the types, amounts, and uses of residues or byproducts the surplus of which could be used in aquaculture to fertilize ponds and feed fish. At the village level these will usually be household kitchen wastes, crop and animal residues, elements of the wild vegetation. Residues from cottage-level agroindustries are
also available. In rural Africa these include maize, millet, or rice bran, cassava peels, residues from beer-making, which all have value as supplementary feeds or fertilizers in aquaculture.
More intensive aquaculture operations, or those located near to an industrial source of inputs can utilize oil seed expeller cakes, wheat middlings or brans, brewery wastes, slaughter house wastes, bagasse, and the like. These byproducts could be used either directly as supplementary feeds, or consolidated as pellets (in which case they would compete with the more commonly used industrial livestock feeds).
Animal husbandry yields manures that, although traditionally applied to crops, can be used as pond fertilizers. (However, over most of Africa livestock are raised under free range conditions, thus its manure is dispersed.) Integrated fish and livestock production is probably one of the most efficient forms of aquaculture production.
Selection Processes
SPECIES
Some 25 fish species are actively cultured in Africa, of which 10 species of tilapia are the dominant species in village fishponds. Five principal criteria require examination in selecting species for local cultivation.
Biological criteria
To maximize growth rates, and thus economic returns, the optimum environmental requirements of a species must be matched with prevailing environmental conditions and the potential aquaculture zonation of a country. Where no local species are suitable, candidates for introduction should be examined.
Large parts of Africa are situated a t elevations above sea level where temperatures are suboptimum for tilapia growth. For this reason the more cold-tolerant common carp (Cyprinus carpio) has been introduced widely. Generally, however, Oreochromis niloticus or closely related species or hybrids are recognized as the most favorable species.
Biotechnological criteria
Historically, tilapia have been cultured widely throughout Africa. As a result, the

technology for their farming is widely known and well documented. In contrast, despite on-going local research, the locally available technology for most other African species has still not developed to the level where they can be farmed reliably. 'In that case, technology transfer, with all its attendant difficulties, would be required for their cultivation. However, there are isolated examples of economically viable commercial trout and prawn farms. Despite the high cost of their transferred technology, these ventures have succeeded by supplying up-market produce of limited availability.
Bioeconomic criteria
In this context, the growth rate, food conversion ability and genetic capacity of a species must be considered to secure both the economic viability of any project and the dedication to fish farming of small-scale farmers, who need to reap maximum benefit for minimum input. These factors assume increased importance in marginal zones, where fish are generally low priced and therefore the species cultured must be selected for maximum biological efficiency to yield the greatest benefits.
The growth rate must be rapid enough to quickly achieve a locally perceived marketable size (i.e., 6-9 months for a fish of 250-300 g). The species cultured should also be able to convert effectively low grade protein into high quality flesh a t the lowest feed conversion ratio (FCR). Further, the species must be able to reproduce readily in captivity while preserving the genetic characteristics (i.e., color, shape, taste, texture, etc.) suitable for the market.
Pathological criteria
Hardy, resilient species such as tilapias should be considered for culture, especially under small-scale farm conditions, where diagnostic and treatment facilities are minimal at best and usually nonexistent. Large-scale operations must either select sites to guard against persistent localized disease or invest either in costly prophylactics or water treatment facilities. Predation should be controlled by screening pond inlets and by wire fences and overhead screening.
Marketing criteria
Up-market products, such as prawn and trout, fetch premium prices. However, since the
local demand for them in Africa is limited and the competition fierce, only a few enterprises would be economically viable. There is potential for such products to be aimed at export, but there may be fierce competition, Ghich would upset economic prospects.
On the other hand, low priced, traditional food fish species are in high local demand. Thus, other things being equal, species for culture should be selected according to local consumer preference. Similarly, if an exotic or nontraditional species is selected for cultivation, based on local environmental and biological conditions, its market acceptability must be tested before its culture is promoted.
SITE
Geographic research that involves the use of familiar cartographic techniques to produce detailed maps of the areas in which aquaculture is feasible, ranked by their degree of suitability, should be used to select locations and sites for the development of aquaculture. This should be conceived of as a cartographic "filtering" excercise. Since the use of sophisticated computer mapping techniques may not be appropriate, either in terms of hardware costs, the time required to train cartographers, or in the level of detail of the output required for field planning, the production of simple overlay maps on acetate sheets is recommended, with the final map on which all factors are correlated being printed and distributed.
This excercise can be undertaken by a small team of quantitatively oriented physical geographers, at least one of whom should be specialized in climatology and another in cartography. The minimum requirements would be a good honors degree for the team members. A junior faculty member should lead and supervise the work. An alternative would be to contract the task to the Survey Branch of the Government.
Physical and biological criteria
Thermal viability. Since temperature declines with increasing elevation above sea level are conventionally accepted as being a major limitation on the viability of aquaculture, a "Map of Thermal Viability" by fish species (starting with those most commonly cultured) is a basic require- ment. To compensate for the lack of accurate meteorological data, such maps can be made by using standard detailed topographical sheets to

plot isotherms derived from the Van der Velden index of air temperatures, calibrated for the physical attributes of water bodies (see Chapter 3). In other words, critical temperatures for a species are converted to an elevation above sea level using a calibrated index of temperature decline by elevation, and the appropriate contour line representing that elevation is mapped from standard topographic sheets. Additional isotherms to represent imputed lines of absolute maxima and absolute minima, by anticipated frequency of occurrence, should also be interpolated. To avoid the need for updating for each new candidate species identified from trials, a range of index isotherms should be plotted.
Slope. This second principal physical limiting factor for pond aquaculture is degree of slope (since no major excavation operations are recommended for small-scale farmers, and since the degree of slope has much to do with environmental hazards). Using standard topographic maps for the areas defined as thermally viable, the degree of slope is then measured. This should be mapped by simple categories, such as "optimal", "good", "acceptable" and "useless".
Soils. The areas defined as acceptable in steps 1 and 2 are then examined for soil type. Since maps of soil types are conventionally prepared for agricultural land capability purposes, they are of little direct relevance for aquaculture planning, and must be supplemented by geological maps. In combination, together with the soil suitability for aquaculture types noted in LMA (1983a) these maps should be used to map areas of soils suitable for pond construction. Such maps should be prepared a t the largest scale practicable.
Hydrological conditions. Zones found suitable according to the three preceding criteria must then be examined for hydrological conditions. Potential water sources for aquaculture should be classified by origin (e.g., perennial stream from runoff; perennial streams from aquifers; perennial stream from wetlands; others), the seasonal variation in their flow rates, the duration of the dry season cessation of flow (if any), and the chemical parameters of the water.
Natural hazards. Since seasonal overabundance of water can be deleterious to fish farming through flash flooding and pond washout, an assessment of watershed quality upstream of otherwise viable sites is essential to prevent ill- advised investment. The quality (plant community composition and degree of canopy
cover) of vegetation on slopes, wet season rainfall runoff and infiltration rates, the degree of slope, nature of the substrate, and wet season rainfall rates and nature of the rainfall should be measured, correlatd, converted to a flood hazard index, which is then mapped.
The information derived from these five steps should then be correlated on a single map to yield "A Land Capability Map for Aquaculture". Where feasible, cartographic and quantitative data bases for microcomputers should also be constructed to permit quick retrieval for local area planning.
Demographic criteria
Site selection for the active promotion of aquaculture will also depend on socioeconomic factors, and especially on demography. This, however, will depend on national resource allocation policies. Area locations based on the "Land Capability Map for Aquaculture" must be correlated with the geographical distribution of rural population, since there is little point in actively promoting, at the outset and with scarce resources, the development of fish culture in areas with less than a critical threshold of inhabitants to absorb extension services. Experience demonstrates, however, that spontaneous adoption of innovation will occur. But spontaneous adopters of aquaculture should not receive a high priority for extension support, unless their numbers become very large in any particular area.
It is particularly important to define the geographical distribution of children < 1-5 years of age (unless the mean figures are accepted for all areas), since these would constitute a particular target of the drive to drastically reduce rates of infant mortality induced by malnutrition.
Basal subsistence criteria
Since in a subsistence society basal household subsistence must essentially be guaranteed from the farm unit (regardless of complementary economic activities that add to total household income, but which might not ensure a constant and consistent income, owing to uncontrollable and unpredictable factors), i t is not acceptable to disrupt the basal farm subsistence product by deliberately introducing an innovation, such as small-scale aquaculture, that entails substantial risk by virtue of being unproven locally. This requirement will have a major impact on site selection. In each locality judged suitable

for the introduction of aquaculture according to the criteria already discussed, a minimum farm size to ensure basal household subsistence must be defined. This will vary among areas according to principal livestock, crops and crop combinations cultivated, but should be broadly consistent within areas. There is also a likelihood of variation in cropping patterns within areas, according to total farm size.
Assuming no income from off-farm sources, the process of establishing basal subsistence land area requirements is to use standard national nutritional constants to establish physical requirements by food type, age group, sex and bodily condition (for pregnant and lactating women), and factor these by household size and composition to yield total subsistence crop demand of household by crop type. The average yield per unit area under each crop is then measured, and the total holding size required to supply household basal subsistence calculated.
Minimum cropping areas required to sustain basal subsistence per household must then be compared with the actual total land area to which each household has usufruct rights. The residual will then yield a list of those households with a total holding size surplus to basal subsistence needs in which fish farming can be actively promoted, assuming that land tenure rights and access to a reliable supply of water are assured. A rule of thumb so far seems to be a total holding size of 1 ha (cf. Beveridge and Stewart 1986). However, this needs verification in terms of differing ecological and socioeconomic factors.
Based on the areas found to be physically and biologically suitable for the development of fish farming, and on policy criteria, areas are ranked by threshold population and nutritional vulnerability. Areas that satisfy all physical, biological and demographic criteria should then be thoroughly surveyed at the household level to pinpoint sites for aquaculture development. Finally, site selection depends heavily on the sociocultural factors, both discussed above and in the following section.
SYSTEM TYPE
The range of systems available is summarized in Table 1.1 and Chapter 2. Since small-scale farmers are the prime target group of plans for aquaculture development, the system which forms the principal focus of this study is extensive aquaculture.
In this type of system, small man-made units, principally ponds, which depend on natural or minimally enhanced fertility, are used to produce fish. Production is limited by the rates a t which natural processes satisfy the fish stock's food and/or oxygen requirements. Yields can reach 5 tfhalyear (Balarin 1987a). Also examined are the processes whereby such elementary systems can be transformed sequentially and additively by the use of on-farm pond inputs to become progressively more intensive types of farming systems, in which pond and cropland are tightly integrated by the recycling of materials and energy.
Certainly, small-scale ponds integrated within small farm operations will not alone solve Africa's demand for fresh fish. For the most part, extensive and semi-intensive systems of aquaculture will be limited mainly to fulfilling household and local community needs, until the infrastructure is in place to make large-scale marketing feasible. A major, if not the main, constraint on the progressive intensification and enhanced productivity of small-scale fishponds will be the cost and manpower limitations of providing essential support services, the principal among which is extension and seed supply.
If the large-scale provision of relatively inexpensive fresh fish to urban markets is an objective, major attention must also be given to developing or enhancing extensive fish production systems, such as the acadja, as well as to large- scale intensive systems. However, unless located near major markets, infrastructural limitations in both types will remain a major constraint.
Among other fish production systems, the traditional acadja systems of West Africa should be evaluated for upgrading and utilization in other shallow water bodies of the continent, such as Lake Chilwa and the lower Shire floodplain, in Mala%, lagoon areas in the Okavango Basin, and other such areas. Other extensive technologies can be applied to natural water bodies and man- made reservoirs, such as the simple stocking with pond-raised fingerlings.
The sequence of steps outlined in this chrpter for the evaluation of the suitability of an area for aquaculture are not unique to fish culture, as similar factors must be considered for any system of food production. However, their application to the development of aquaculture in Africa is perhaps more rigid than for other agroecosystems in that the practice is still a novel concept there. In addition, exceptionally careful evaluation and planning of any development is critical in the

Afi-ican context, bqcause of both a scant and highly localized tradition of incipient aquaculture in widely scattered parts of the continent, and owing to the less than successful history of attempts to develop fish culture there. Further, although this may change, when the low price of fish is considered, the energy inputs into aquaculture often outweigh the benefits derived. The objectives of any aquaculture project must therefore be clearly defined at the outset, and only realistic goals set.
The strategies for the development of squaculture now implemented in Africa require,
at present production rates, that vast tracts of land be converted to fish farms. This is both physically and economically infeasible. Although in the long run intensification of production is necessary, the technological inputs required preclude this in the short term. In the interim resources should be consolidated; most research and development activities should be limited to a few species, preferably tilapias, carps, and African catfish, and regional pools of manpower established to gradually form a continent-wide network of aquaculture development centers.
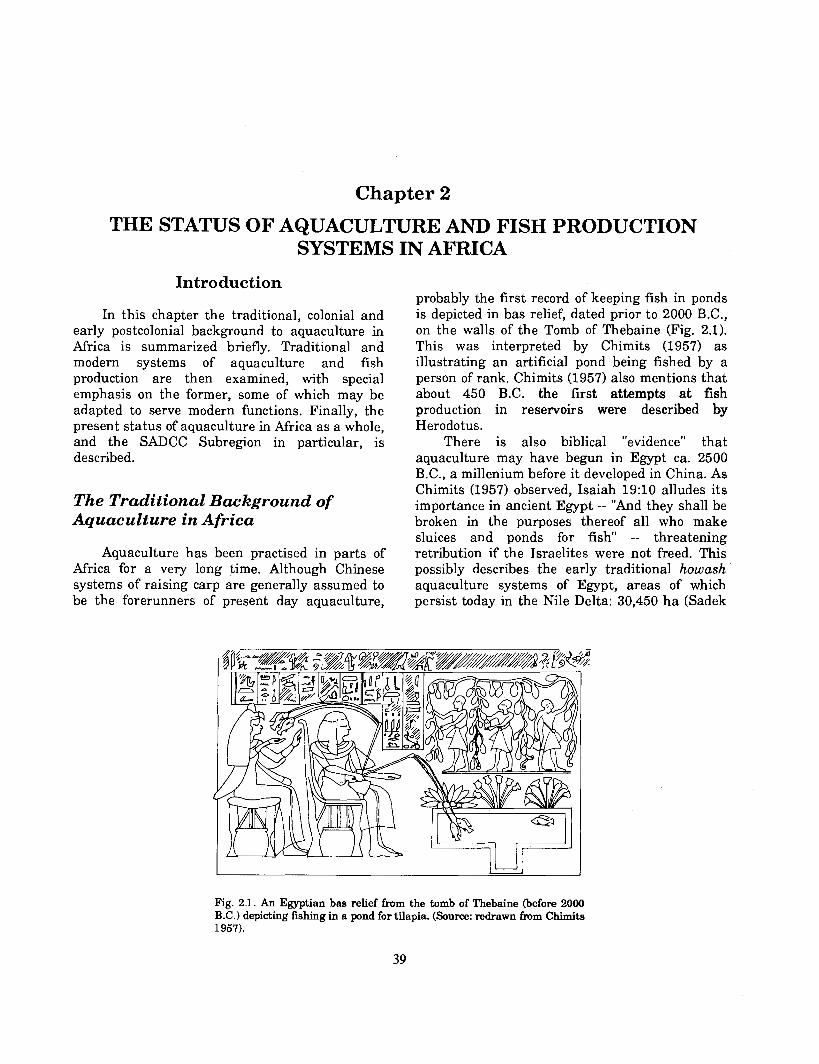
Chapter 2
THE STATUS OF AQUACULTURE AND FISH PRODUCTION SYSTEMS IN AFRICA
Introduction
In this chapter the traditional, colonial and early postcolonial background to aquaculture in Africa is summarized briefly. Traditional and modern systems of aquaculture and fish production are then examined, with special emphasis on the former, some of which may be adapted to serve modern functions. Finally, the present status of aquaculture in Africa as a whole, and the SADCC Subregion in particular, is described.
The Traditional Background of Aquaculture in Africa
Aquaculture has been practised in parts of Africa for a very long time. Although Chinese systems of raising carp are generally assumed to be the forerunners of present day aquaculture,
probably the first record of keeping fish in ponds is depicted in bas relief, dated prior to 2000 B.C., on the walls of the Tomb of Thebaine (Fig. 2.1). This was interpreted by Chimits (1957) as illustrating an artificial pond being fished by a person of rank. Chimits (1957) also mentions that about 450 B.C. the first attempts a t fish production in reservoirs were described by Herodotus.
There is also biblical "evidence" that aquaculture may have begun in Egypt ca. 2500 B.C., a millenium before it developed in China. As Chimits (1957) observed, Isaiah 19:lO alludes its importance in ancient Egypt -- "And they shall be broken in the purposes thereof all who make sluices and ponds for fish" -- threatening retribution if the Israelites were not freed. This possibly describes the early traditional howash aquaculture systems of Egypt, areas of which persist today in the Nile Delta: 30,450 ha (Sadek
Fig. 2.1. An Egyptian bas relief from the tomb of Thebaine (before 2000 B.C.) depiding fishing in a pond for tilapia. (Source: redrawn fmm Chimits 1957).
39
1984) or 48,845 ha (Coche 1982). The survival of the system on such a scale suggests a long- standing practice.
Other traditional African forms of aquaculture are the acadjas or "brushparks" of Benin (Welcomme 1971), Ghana and Madagascar (Coche 1982), the whedos or "fish holes" of Benin, Ghana and Cameroon (Welcomme 19761, the barachois of Mauritius (Coche 1982), and clam stocking on the Lower Volta of Ghana (Balarin 1988a). There is no documentary evidence of the early development history of these systems, but the existence of some has been known over the past two centuries.
Compared with other parts of Africa, there appears to have been less tradition of aquaculture in the SADCC Subregion. There are, however, some traditional fishing practices which can, with slight modification, be adapted to function as aquaculture systems. Among these are the reed fences (psyailo) in the Lower Shire Valley of Malawi (see Chapter 4) that could be adapted for pen culture (D. Tweddle, pers. comm.), and the widely used reed and dike traps, such as the nteta of the Okavango Delta of Botswana, which resemble the traditional howash system of Egypt.
Colonial and Early Postcolonial Times
Toward the end of the colonial period, the colonial powers attempted to introduce more recent forms of aquaculture to Africa. For reasons of familiarity and preference, the early European settlers favored exotic fish like trout, carp and black bass, and large numbers of these and other species were stocked throughout the continent from 1904 to 1960, mainly for angling. It soon became apparent, however, that local species were more appropriate for inland fisheries production for food from reservoir stocking, and later through pond systems.
Perhaps the first scientific approach to aquaculture in Africa was the early attempts to culture tilapia in Kenya in 1924, and in the former Belgian Congo in 1937 (Chimits 1957). But it was only after World War I1 that aquaculture was introduced widely to rural communities, through experimental and demonstration farms linked with active extension services. By 1960 more than 300,000 fishponds, most of which were devoted to tilapia, were operational in 20 countries (Anon. 1984) (Table 2.1).
Fish culture was introduced to the SADCC Subregion in the early years of this century, primarily for stocking waters for angling by colonialist expatriates. Pond culture for food production, using indigenous species, began in the 1950s (Table 2.1). There followed a period of widespread introduction of fish farming in an attempt to raise protein consumption levels among rural populations (Balarin 1985a). Disillusionment set in as a consequence of failure, and as a result many such rural development projects collapsed. Of those early ponds, only about 10% are thought to still to be in operation in Tanzania, 37-44% in Mala%, and 74% in Lesotho (Table 2.2).
Unfortunately, the new farmers' interest declined rapidly, and many ponds were abandoned, except where government support was provided. In most cases farmers became discouraged because resources invested in aquaculture were not justified by the poor yields and mimimal rates of economic return obtained. Major problems seem to have been the stunting of the favored species of tilapia in mixed sex culture, other biological problems in the breeding of suitable alternative species such as clariid catfish, African carp and other indigenous species, as well as a lack of understanding of suitable pond inputs.
Despite the food crisis, aquaculture has not been given high priority in the SADCC Subregion (SADCC 1984). Although its development potential has been recognized, and recent technological developments have sparked a renewed interest such that some derelict small- scale ponds have been renovated, and a few large- scale, industrial projects have emerged in Lesotho, Mala%, Zambia and Zimbabwe, recollection of the poor success of the earlier experiences has generally discouraged more widespread development. The potential of aquaculture now needs rapid reappraisal throughout the Subregion, because every possible avenue must be thoroughly explored to overcome the food crisis.
Aquaculture and Fish Production Systems in Africa
In historical terms, two distinct categories of aquaculture system can be distinguished in Africa, the traditional and modern systems. Systems which are believed to have originated in Africa, although sometimes with counterparts elsewhere in the world, and which are unique to

Table 2.1. The beginning of pond aquaculture in Africa, and estimates of the number of ponds, pond area and production for 1965, 1975-1980 and 1980- 1985, and potential for aquaculture development (a).
1965 (b) 1975-80 (c,d,e,O
Ponds Ponds Date first No % Func- Area Production No. % Func- Area Production
Country started tioning (ha) (tlyear) tioning (ha) Wear)
Algeria Angola BBnin Botswana Burkina Faso Burundi Cameroon Cape Verde Cent. Afr. Rep. Chad Comoros Congo Cate d'Ivoira Djibouti Egypt Equatorial Guinea Ethiopia Gabon Gambia Ghana Guinea Guinea Bissau Kenya Lesotho Liberia Libya Madagascar Mala* Mali Mauritius Mauritania Morocco Mozambique Namibia Niger Nigeria Reunion Rwanda S o Tome-Principe Seychelles SBnBgal Sierra Leone Somalia Sudan Swaziland Tanzania-Zanzibar Togo Tunisia Uganda Western Sahara Zarre Zambia Zimbabwe
2500 B.C. (1934)
? ? ? ? 50
352 9,000
20,000
12,200 340
0 1,500
30
12330 ?
FEW
85,000 1 ,000
20
? 250
0
? 448
8,000 51 4
11,000
122,070 1,230
?
FEW
27,000
95

Table 2.1. Continued
1980-85 Potential for development
Ponds No % Func- Area Product~on Ratmg (e) Area h t m g Dev
t~oning (ha) (Vyear) (do3) (e) x = 9 0 ( D year (g) Country
Algeria Angola Benin Botswana Burkina Faso Burundi Cameroon Cape Verde Cent. Afr. Rep Chad Comoros Congo Ctite d'Ivoire Djibouti
113-115
32-50 352
6,000-1 2,000
900-25,000
2,120-1 2,200 340
11,300
1 0
1 2 1,135-1,140
12,200-32,140
90-300
85,000 370-440
20
250
300 FEW
448-3.000
162
37 250
11,000
0 ?
E&P~ Equatorial Guinea Ethio~ia Gabon Gambia Ghana Guinea Guinea Bissau Kenya Lesotho Liberia Libya Madagascar Mala* Mali Mauritius Mauritania Morocco Mozambique Namibia Niger Nigeria Reunion Rwanda SEo Tome-Principe Seychelles Unbgal Sierra Leone Somalia Sudan Swaziland Tanzania-Zanzibar Togo Tunisia Uganda Western Sahara Zarre Zambia Zimbabwe
Sources: (a) Balarin (1985a); (b) Meschkat (1967); (c) Coche (1983); (d) Balarin and Hatton (1979); (e) Bell and Canterbury (1976); (D Anon. (1984); (g) Balarin (1984a, 1985b, 1986).

Table 2.2. Initiation of pond aquaculture in the SADCC Subregion and its development until 1989.
Starting year until 1965 1976-1980 Year Pond 46 func- Area Production Pond % func- Area Production
Country started no. tioning (ha) Wear) no. tioning (ha) (Vyear)
Angola (a) 1953 n.a. n.a. n.a. n.a. n.8. n.a. n.a. n.a.
Botswana (b,c) n.a. 0 0 0 0 0 0
Lesotho (a,b) 1964 7 n.a. n.a. n.a. 73 n.a. 6-16 14-27 - -- - - - -- -
MalaBi 1930 1,000 n.a. n.a. n.a. 700 70 200 16-92
Mozambique 1952 250 n.a. 10.5 n.a. n.a. n.a. n.a. n.a.
Swaziland (d,e) 1972 0 n.a. n.a n.a. n.a. n.a. 20 n.a.
Tanzania (a,b) 1949 8,000 n.a. n.a. n.a. 10,000 10 1,000 500-1,500
Zambia (b) 1943 1,230 n.a. 100.0 88.5 1,340-1,708 72 459 29-700
Zimbabwe (b,D 1950 7 n.a. n.a. n.a. 5,000 n.a. 12,500 400-800
1980-1 985 1985-1 989 Pond % func- Area Production Pond % func- Area Production no. tioning (ha) (Vyear) no. tioning (ha) (tfyear)
Angola (a) n.a. n.a. n.a. n.a. n.a. n.a. n.a. 2
Botswana (b,c) 0 0 0 0 0 0
Lesotho (a,b) 20-1506) 74 23-30 8-30 132 23-75 30 26-29
Malaii 370-500 37-44 72 96-104 1,000 90 100 88
Mozambique n.a. n.a. n.a. n.a. n.a. n.a. n.a 4
Swaziland (d,e) 250 n.a. 8-16 50 800 n.a. 8-16 16-32
Tanzania (a,b) 600-3,000 10 200 70-100 2,000-5,00O(i) n.a. n.a. 47 - - -
Zambia 6 ) 3,160 n.a. 349-460 29-750 2,000(i) n.a. n.a. 695
Zimbabwe (b,f) 600-800 n.a. n.a. 800 2,OOo(i) n.a. n.a. 1,752
Sources: (a) Balarin (1985a); 6 ) ECAJFAO (1985); (c) Chondoma (1988a); (d) FA0 (1984d); (e) Chondoma (1988b); (f) Balarin (1984a); (g) Kent
the countries in which they are operated, are regarded here as traditional (Table 2.3). These are all extensive systems of fish production which fall outside the new definition of aquaculture adopted by FA0 (FA0 1988). Each has unique site requirements, which limit the areas in which they can be applied. Nevertheless, this does not preclude a t least their trial application in suitable localities elsewhere. Modern aquaculture systems introduced to Africa during the last 50 years, and which have now become adapted to local conditions include, principally, rice-fish culture, ponds, dam-stocking, cages, pens and tanks (Table 2.4).
Traditional African Sys terns of Aquaculture
It seems plausible that various simple methods to improve fish pro$uction from natural waterbodies arose independently in different regions, particularly in floodplains along the lower courses of rivers characterized by seasonal cycles of flooding and drought. During the wet season, fish thrive in the food-rich and sheltered habitats of inundated floodplains (Welcomme 1983). Large numbers become trapped as the floods recede, and those unable to return to permanent channels seek refuge in depressions, particularly those with
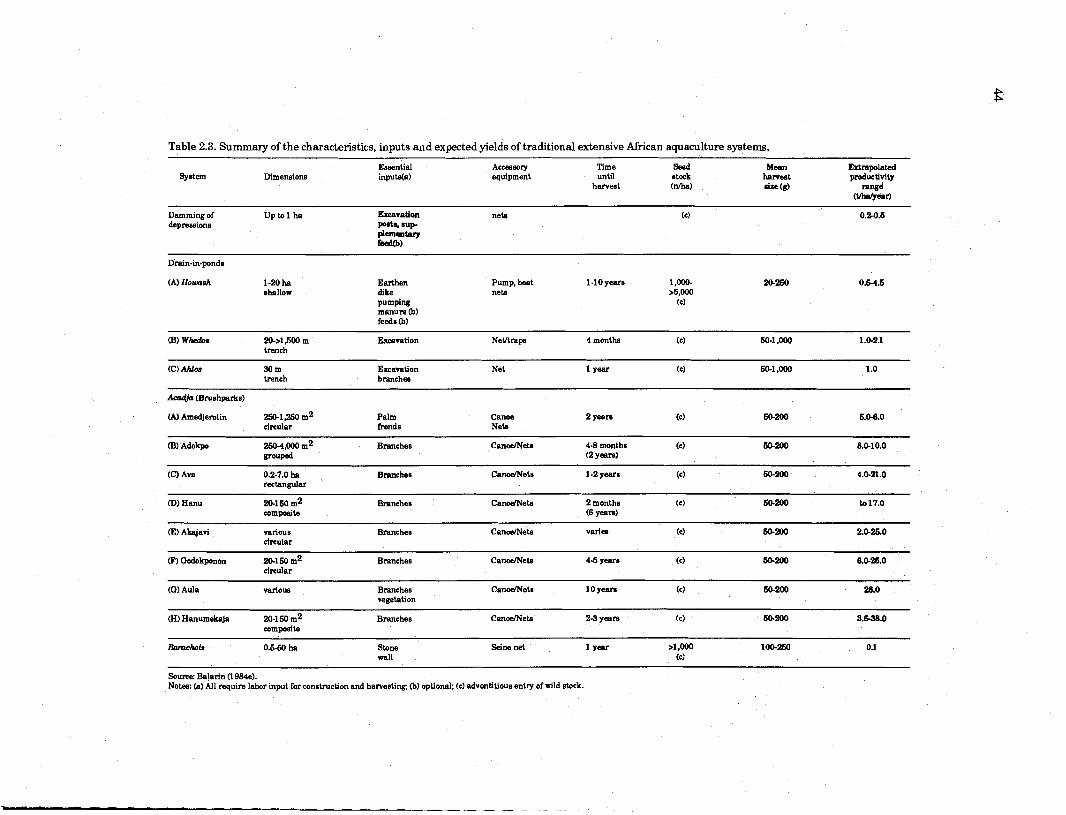
Table 2.3. Summary of the characteristics, inputs and expected yields of traditional extensive African aquaculture systems.
System Essential
Dimensions inputda) Accessory Time Seed equipment until stock
harvest (nh)
Mean Extrapolated harvest pmdwtivity size (rr) range
Damming of Up to l ha Excavation nets (c) 0.24.5 depressions PO&% s u p
flementary fAQ)
Drain-in-ponds
(A) Hourash 1-20 ha Earthen Pump, boat 1-10 years 1,m 20-250 0.5-4.5 shallow dike nets >5,0oO
pumping (c) manure (b) feeds (b)
@) Whedos 20->l,500 m Excavation NeVtrap 4 months ( 4 50-1 ,000 1 .0-2.1 trench
(C) Ahlm 30 m Excavation Net 1 year (c) 50-1,000 1 .O trench branches
-a ( B ~ s h p r k s )
(A) Amedjemtin 250-1,250 m2 Palm Canoe 2 yean (c) 50-200 6.0-6.0 circular fronds Nets
(B) Adokpo 2M)-4,000 m2 Branches C a n d e t s 4-8 months (c) 50-200 8.0-10.0 srouped (2 years)
(C) Ava 0.2-7.0 ha Branches C a n d e t s 1-2 years (c) 50-200 4.0-21 .O rectangular
(D) Hanu 20-1~) m2 Branches Canoflets 2 months (c) 50-200 to17.0 composite (6 yeam)
(El Akajavi various Branches C a n d e t s varies (c) 50-200 2.0-26.0 circular
(F) Godokponon 20-1 M) m2 Branches C a n d e t s 4-5 years ( d 50-200 6.0-26.0 circular
(G) Ada various Branches C a n d e t s 10 years (c) 50-200 28.0 vegetation
(H) Hanumekaja 20-150 m2 Branches C a n d e t s 2-3 years (c) 50-200 3.6-38.0 composite
Bamchois 0.5-50 ha Stone Seine net 1 year >l,OOO 100-250 0.1 wall (c)
Source: Balarin (l984e). Notes: (a) All require labor input for construction and harvesting; (b) optional; (c) adventitious entry of wild stock.
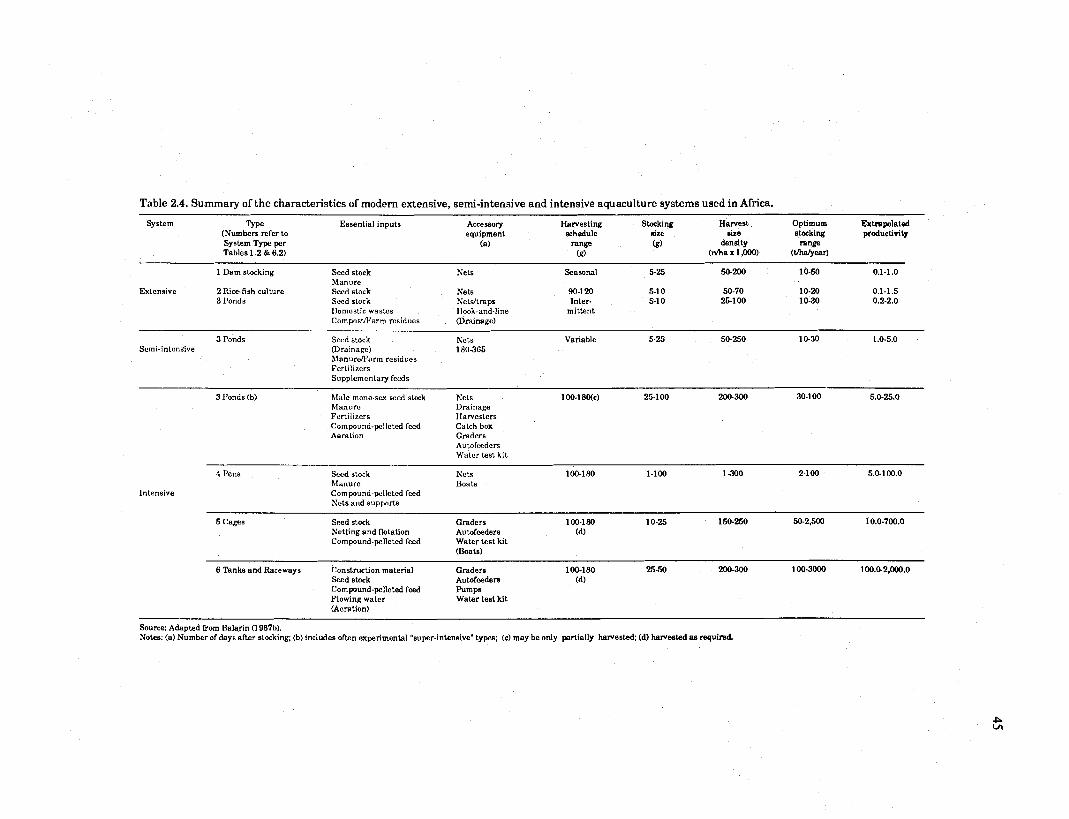
Table 2.4. Summary of the characteristics of modern extensive, semi-intensive and intensive aquaculture systems used in Africa.
System Type Essential inputs (Numbers refer to System Type per Tables 1.2 & 6.2)
Accessory equipment
(a)
Harvesting Stocking Harvest Optimum Extrapolated schedule size 6ize stocking productivity
range (g) density range (9) ( n h a x 1 POO) ( W e a r )
1 Dam stocking Seed stock Nets Seasonal 5-25 50-200 10-50 0.1-1 .O Manure
Extensive 2 Rice-fish culture Seed stock Nets 90-1 20 5-10 50-70 10-20 0.1 -1.5 3 Ponds Sccd stock h'etsltraps Inter- 5-1 0 25-1 00 10-30 0.2-2.0
I)omest~c wastes Hook-and-line mittent CompostA7arrn residues (Drainage)
3 Ponds Srcd stock Ncts Vanahle 5-25 50-250 10-30 1 .O-5.0 Scmi-mtensive (Drainage) 180-365
hlanure/l'arm rcs~ducs Fert~lrzers Supplcrncntary feeds
3 Ponds (b) h2de mono-sex seed stock Nets 100-1SNc) 25-1 00 200-300 30-1 00 5.0-25.0 Manure Dramage Fer t~ l~zers Ilarvesters Compund-pclleted feed Catch box Aerat~on Graders
Autofeeders Water test kit
4 Pcns
Intensive
Sccd stock Nets Manure Boats Compund-pcllctcd feed Nets and supports
5 Cages Seed stock Graders 100-180 10-25 150-250 50-2,500 10.0-700.0 Netting and flotation Autofeeders (dl Compound-pelleted feed Water Lest kit
(Boats)
6 Tanks and Raceways Construction material Graders 100-180 25-50 200-300 100-3000 100.0-2,000.0 Seed stock Autofeeders (d) Compound-pelleted feed Pumps Flowing water Water test kit (Aeration)
Source: Adapted from Balarin (1987b). Notes: (a) Number of days after stocking; (b) includes often experimental "super-intensive" types; (c) may be only partially harvested; (dl harvested a s required

perennial water. Such depressions are foci of dry season floodplain fisheries.
Such fisheries have been enhanced by human intervention. This can be envisaged as an initial stage in the evolution of aquaculture. The simplest form of enhancement is the damming of natural floodplain depressions; somewhat more complex is the excavation of drain-in ponds; yet more highly developed is the creation of refuge traps; from which it is but a small conceptual step to the creation of brushparks. Such systems may be regarded as bein,g steps toward fish husbandry or extensive aquaculture (Welcomme 1983,1985).
The Damming of Natural Depressions
It is but a simple modification of naturally occurring floodplain habitats to block completely the small seasonal streambeds, channels, or associated flooded depressions, and thus to confine fish for later capture during the dry season, as flood waters recede and when fish from other sources become scarce. This is an initial step toward extensive aquaculture. Experiments with simple dams made from wooden posts, earth, and clay-filled sacks in the Niger River (FAOiUNDP 1969) and in the S6nCgal River (Reizer 19741, demonstrate both the increased areas of the dammed depressions, and improved production. Unmanaged depressions yielded a t a rate of about 0.185 thdyear , whereas when managed semi- intensively by both supplementary stocking with fry and supplementary feeding with such agricultural residues as rice husks, harvesting rates increased to as much as 0.5 thdyear (Reizer 1974).
Drain-in Ponds
Three types of drain-in pond are known from Africa: the howash of the Nile Delta, the whedos and ahlos of West and Central Africa (i.e., BBnin, Cameroon, Central African Republic, and Togo).
This system is found in the Nile Delta, where a flat topography facilitates the establishment of shallow ponds bounded by earthen dikes. It may have developed gradually from traditional
agriculture, whereby fields were deliberately flooded to both leach salts and trap nutrient-rich sediments. Howash systems are generally 2-6 ha in area, and have an irregular shape and depth, as determined by local topography. No precise data exist on the number and type of howash, except for some recent studies in the Lake Manzalla area (Table 2.5) (Mclaren et al. 1980).
The fundamental principle is straightforward, but there are numerous variations. Generally, a simple dike encloses a low-lying area, which is filled by permitting the drain-in of waters during May-August, when increased discharge from the Nile floods causes watertables to rise. Pumping is also sometimes used to fill the pond. Fish, such as mullet, tilapia, Clarias gariepinus, Lutes niloticus and eels enter adventitiously. Sluices on the drains are then closed, and the entrapped fish are thus harvested NovemberJanuary. Some ponds may also be stocked from the wild. Occasional use is made of manures or supplementary feeds (FAOMrBCP 1980). Howash systems are harvested by complete drainage when Nile water discharge rates are reduced during November-January. The ponds are then left to dry until the next flood season, and some may be plowed.
Estimates of yields from howash systems range from 0.25 tfhalyear (FAOtWBCP 1980), through 1.48 tfhdyear when fertilized with chicken manure (Ardill 1982), to 3.4 fialyear when supplementary feed is provided (FAOiWBCP 1980). Yields average 1.2 tfhdyear, of which 75% are small fish often used as animal feed (Tang 1977).
There are variations to this practice, and in the Lake Manzalla area, for example, howash are regarded basically as fish harvesting devices (Mclaren et al. 1980). In that area they may be operated as many as 20 times a year in areas of high standing crops, and yield up to 4.75 f i d y e a r of tilapia (Fig. 2.2a). That yields are determined by the frequency of harvesting is evident from Fig. 2.2b, with each harvest yielding 0.19-0.48 f idyea r . However, yields are higher than the area standing crop and are significantly greater than yields from conventional fishery catches (Fig. 2.2~).
An additional three types of howash are described (Tang 1977):
(i) Coastal. In excess of 4,850 ha of this type of howash is found along the seaward slopes between the Mediterranean Sea and coastal lakes. Coastal howash are brackish, filled by tidal action, and have a salinity of 10-25 ppt;

Table 2.5. Location, size, costs, production, harvesting and species cultivated of a sample of present-day howash in the Lake Manzalla area of the Nile Valley of Egypt.
Location Con- Dimensions Equipment Manpower CostsW Fish species Yield Harvest stmction Area Depth required demand&) Construc- Main- Other Amount Value (~ /Y~QT)
date (ha) (m) tion time tenance (c) (t'ha/Year) (a)
Bahr El Bashtir
~1 Timsah El Zarka
L e m n
N.W. Bahr El Bashtir
S.W. El Genki
N. Matariya El Ralein
1-13
0.9 1-1.5 boaffpump
1 .o P U P
1 .o P U P
1-1.5 boaffpump
n.a. ma. P U P
ma.
ma. 15
n.a.
120 160-175
150
na. n.8.
Tilapia Clarias spp. n.a. Tilapia M@ ~PP. 0. aureus 0. niloticus Tilapia C l a r k spp. Tilapia M@ SPP Tilapia na.
1.57 386 3
4.75 1,100 10 0.51 150 2
0.61.43 na. 4-6
3.33 1 pso 3
n.a. 106 1
0.81 8-1 6 1.20 10
Source: Adapted from Maclaren et al. a980). Notesfa) US1 - LE 2.51 (May 1989); (b) pt - parttime, mm - man-month, md - manday; (c) unspecified in m w e .

howa ash ~roduction for different zones I
f Estimated mean howash yield by zone
/ x Estimated mean standing crop by zone
o Estimated mean fishery yield by zone
Lake Manzalla subarea zones
I b. Howash production with respect to harvest rate zones I Zone
No. of harvestdyear
Total yield of al l harvest by zone
Mean yield per harvest by zone
/ c . Howash production relative to standing crop by zone 1 Zone
Ol0 increase in howash yield vs
5 00 fishery yield by zone
o Ol0 increase in howash yield vs. standing crop by zone
x % increase in fishery yield vs. standing crop by zone
0 O X X - 50 x
1
0 1 .o 2.0 Standing crop (t/ha
Fig. 2.2. Yields of fish from howcrsh in the Lake Manzalla area, Egypt. (Source: after

(ii) Lakeshore. These are distributed around lakes Manzalla, Edku and Burullous. Of low salinity, a t 0-5 ppt, these howash are constructed on the lakeward slope and filled by irrigation discharge (Ardill1982);
(iii) Lakewater. This type of howash is smaller than the other two, and is built within the lakes, to a depth of 2 m. I t has a salinity of 0-10 ppt, with water derived from the lake. There are some 44,000 ha of this type (Balarin 1986).
The use of howash in Egypt is controversial, since it is claimed that they consume potential irrigation water and interfere with fisheries, by depriving fish of natural spawning grounds. Lakewater howash also depend partly on the inshore migrations of certain species of juvenile fish, thereby further reducing recruitment in the lake, as well as encroaching on the traditional fishing grounds of local fishermen. As a consequence, legislation has placed restrictions on further howash development, especially of the lakewater type (Balarin 1986).
To develop a howash that would avoid these adverse effects and criticisms, a prototype of a deliberately stocked howash was developed a t the Reswa fish farm (Ardill 1982). It was earlier estimated that over 68 million fingerlings would be required to convert all existing howash to such deliberately-stocked systems (Tang 1977), which would then be capable of yielding a t a rate of 1.8 tlhalyear (Eisawy and El Bolock 1976). However, since most howash operators lack titles to their sites, Ferlin (1980) considered that they would be reluctant to invest in such improvements. On the other hand, however, some 40% were in the process of converting to such stocking practices during the early 1980s (Sadek 1984).
A system that is intermediate between howash and aquaculture ponds is found in irrigable areas of the Nile Delta, where more than 925 ha of shallow, leveed ponds occur; for example, around Hagar and Abassa (FAOIWBCP 1980). These have been described as embanked depressions, in marshes and low-lying irrigated lands, filled by seepage water and stocked with fish.
A similar system is employed at Kodzi, Tegbi, Atorkor, Aflao, and Adina, on the Keta Lagoon of Ghana, where it is known as hatsis ("dam fishery") (Balarin 1988a). The hatsis are described as earthen dams located along the shores of coastal lagoons in zones normally dry for part of the year (Weigel 1985). These dams fill with either rain or flood water. Fish that enter during the wet season are entrapped as waters recede with the onset of the dry season.
Other variants to this technique have also been described for parts of Africa. In floodplain areas villagers commonly build either reed fences or mud dike systems, or a combination of both, to either isolate or retain a body of water. Fish so entrapped may be caught either in basket traps set in the fence or dike, or when the barrier is breached to drain the ponds formed once the floodwaters begin to recede. Variants of such systems have been observed by the authors in the floodplains of Botswana, Kenya, MalaGi, and Zimbabwe.
The howash or floodplain variants of it are therefore traditional fish production systems in use in parts of Africa, Despite the various and complex problems involved in Egypt, howash should be examined more closely, since Africa has enormous tracts of low-lying floodplain land where the concept may not be too unlike existing fishing techniques, and which could, given adequate seasonal water supplies and with minor modifications yield more profitable returns than existing systems.
WHEDOS
Whedos are a major feature of the traditional socioeconomic system of the inhabitants of the Oukme Valley of Bknin, where about 30 km2, or some 3% of the floodplain area, is occupied by these drain-in ponds (Fig. 2.3) (Welcomme 1983). This system, also known as "fish holes", is characteristic of riverine and deltaic floodplains of Benin (Welcomme 1976), Cameroon (Balarin 1985c), and Togo (Balarin 1984c), where it represents a technological advance on the simple isolation of drainage channels from floodplain depressions. In such localities, whedos are constructed by canalizing natural channels, straightening and deepening them to about 1.5 m below the dry season watertable, and sometimes constructing recessed "side arms". The resultant trenches which range from 20 to 1,500 m in length and are up to 4 m wide, are filled during the flood season, and retain water through most of the dry months. Fish enter naturally during the wet season floods and are trapped as the waters recede. The return migration to permanent river channels is prevented by seasonal water recession, and the thus concentrated, entrapped fish are removed by either netting or the use of mobile reed barriers before the onset of the next flood season. The ahlos system of BCnin is a hybrid of the whedos and acadja (see below) systems (Welcomme 1970). In the ahlos system the artificially deepened trenches, some 30 m
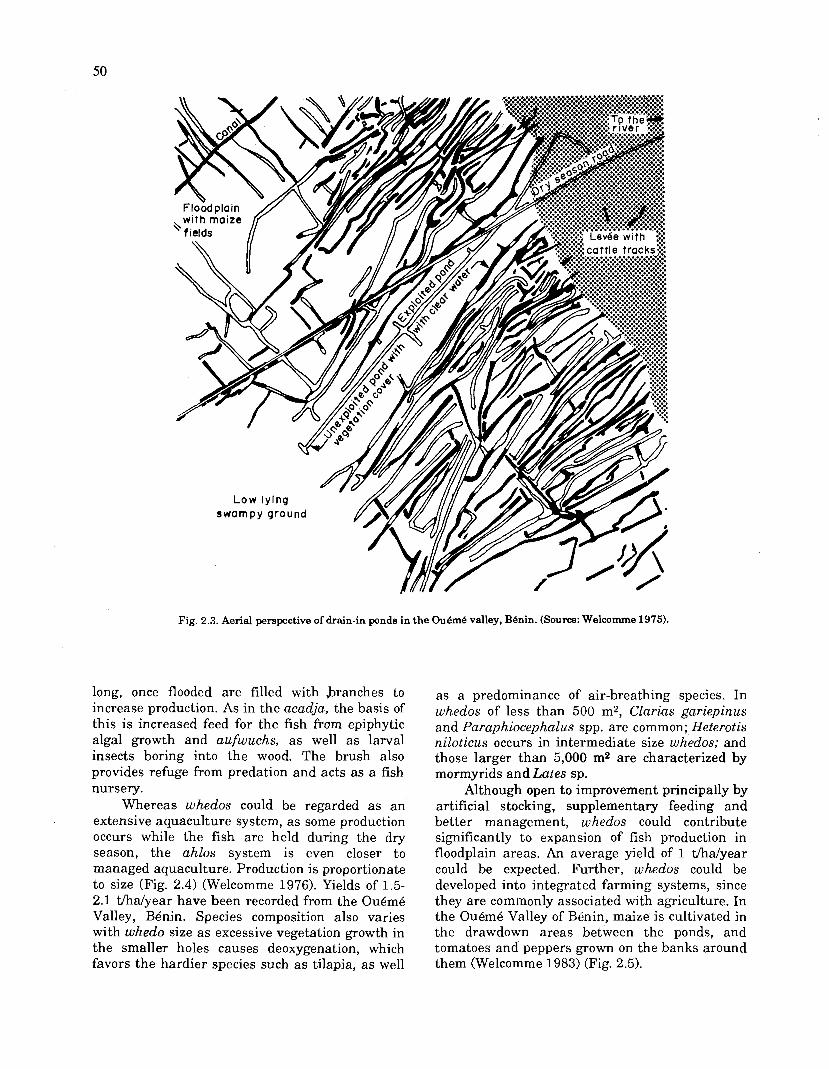
Fig. 2.3. Aerial perspective of drain-in ponds in the OuBmB valley, BBnin. (Source: Welcomme 1975).
long, once flooded are filled with branches to increase production. As in the acadja, the basis of this is increased feed for the fish from epiphytic algal growth and aufwuchs, as well as larval insects boring into the wood. The brush also provides refuge from predation and acts as a fish nursery.
Whereas whedos could be regarded as an extensive aquaculture system, as some production occurs while the fish are held during the dry season, the ahlos system is even closer t o managed aquaculture. Production is proportionate to size (Fig. 2.4) (Welcomme 1976). Yields of 1.5- 2.1 t/ha/year have been recorded from the Ou6m6 Valley, Bknin. Species composition also varies with whedo size as excessive vegetation growth in the smaller holes causes deoxygenation, which favors the hardier species such as tilapia, as well
as a predominance of air-breathing species. In whedos of less than 500 m2, Clarias gariepinus and Paraphiocephalus spp. are common; Heterotis niloticus occurs in intermediate size whedos; and those larger than 5,000 m2 are characterized by mormyrids and Lutes sp.
Although open to improvement principally by artificial stocking, supplementary feeding and better management, whedos could contribute significantly to expansion of fish production in floodplain areas. An average yield of 1 tfhdyear could be expected. Further, whedos could be developed into integrated farming systems, since they are commonly associated with agriculture. In the Ouemk Valley of Benin, maize is cultivated in the drawdown areas between the ponds, and tomatoes and peppers grown on the banks around them (Welcomme 1983) (Fig. 2.5).
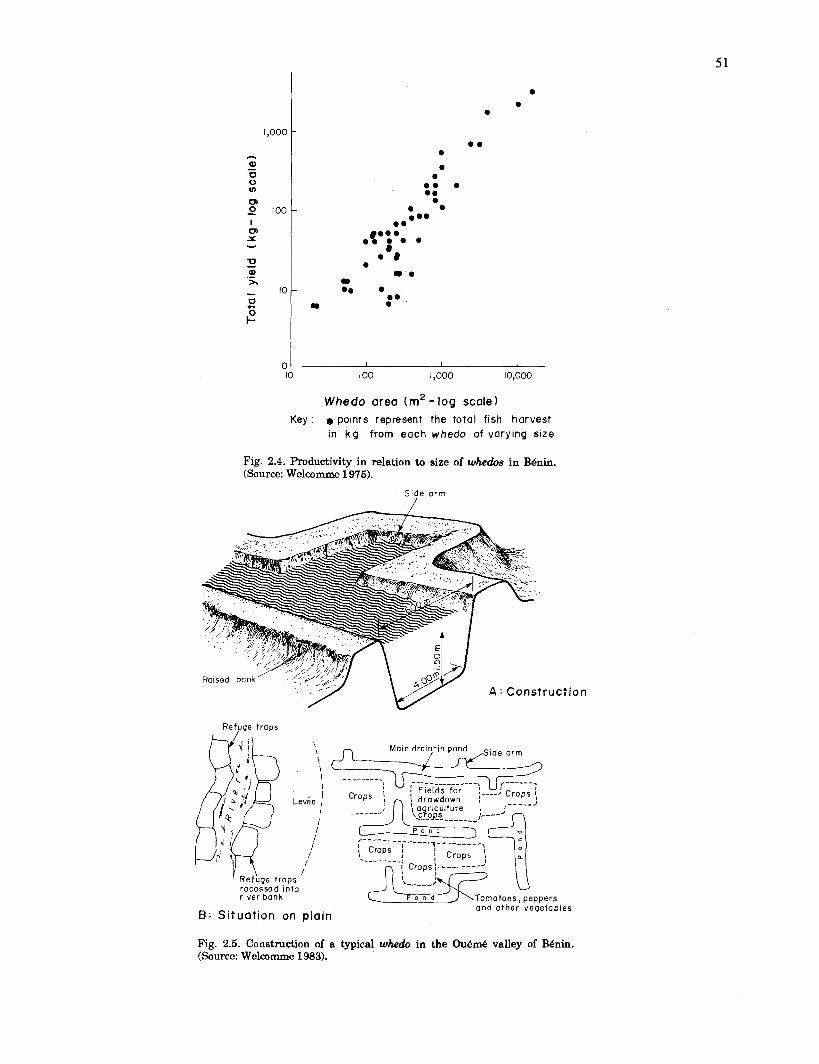
Whedo area (m2 - log scale)
0) - 0 0 V)
0 0 too - - I 0, Y - 2 0) .- - lo 0 C 0
Key: a points represent the total fish harvest in k g from each whedo of varying size
e . .. . . . e . . . . .
8.. . .. . . . e e 8 .
- .. . . .
Fig. 2.4. Productivity in relation to size of whedos in BBnin. (Source: Welcomme 1975).
Side arm /
Refuge traps
\
I 1
and other vegetables B: Situation on plain
Fig. 2.5. Construction of a typical whedo in the OuBmB valley of BBnin. (Source: Welcomme 1983).
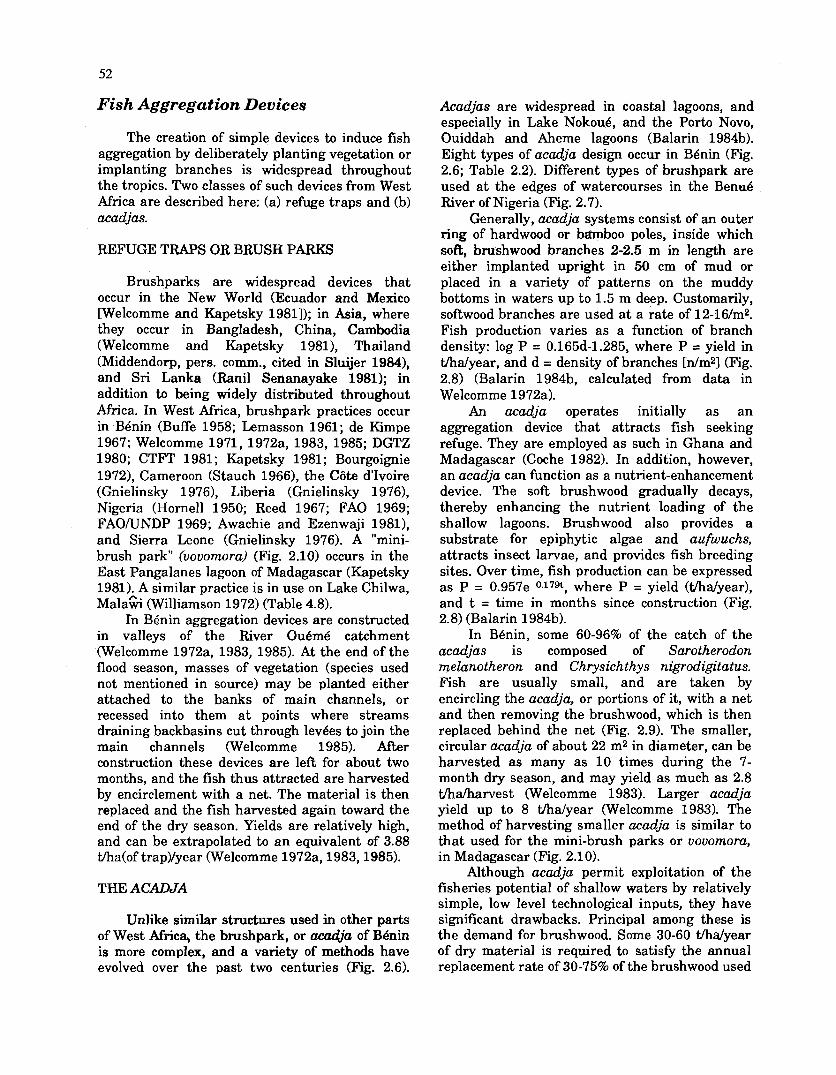
Fish Aggregation Devices
The creation of simple devices to induce fish aggregation by deliberately planting vegetation or implanting branches is widespread throughout the tropics. Two classes of such devices from West Africa are described here: (a) refuge traps and (b) acadjas.
REFUGE TRAPS OR BRUSH PARKS
Brushparks are widespread devices that occur in the New World (Ecuador and Mexico [Welcomme and Kapetsky 19811); in Asia, where they occur in Bangladesh, China, Cambodia (Welcomme and Kapetsky 1981), Thailand (Middendorp, pers. comm., cited in Sluijer 1984), and Sri Lanka (Rani1 Senanayake 1981); in addition to being widely distributed throughout Africa. In West Africa, brushpark practices occur in BBnin (Buffe 1958; Lemasson 1961; de Kimpe 1967; Welcomme 1971, 1972a, 1983, 1985; DGTZ 1980; CTFT 1981; Kapetsky 1981; Bourgoignie 19721, Cameroon (Stauch 19661, the CGte d'Ivoire (Gnielinsky l976), Liberia (Gnielinsky 1976), Nigeria (Hornell 1950; Reed 1967; FA0 1969; FAOJUNDP 1969; Awachie and Ezenwaji 1981), and Sierra Leone (Gnielinsky 1976). A "mini- brush park" (vovomora) (Fig. 2.10) occurs in the East Pangalanes lagoon of Madagascar (Kapetsky 1981). A similar practice is in use on Lake Chilwa, ~ a l a % (Williamson 1972) (Table 4.8).
In BBenin aggregation devices are constructed in valleys of the River OuBmB catchment (Welcomme 1972a, 1983, 1985). At the end of the flood season, masses of vegetation (species used not mentioned in source) may be planted either attached to the banks of main channels, or recessed into them a t points where streams draining backbasins cut through levees to join the main channels (Welcomme 1985). After construction these devices are left for about two months, and the fish thus attracted are harvested by encirclement with a net. The material is then replaced and the fish harvested again toward the end of the dry season. Yields are relatively high, and can be extrapolated to an equivalent of 3.88 t/ha(of trap)/year (Welcomme 1972a, 1983,1985).
THE ACADJA
Unlike similar structures used in other parts of West Africa, the brushpark, or acadja of Benin is more complex, and a variety of methods have evolved over the past two centuries (Fig. 2.6).
Acadjas are widespread in coastal lagoons, and especially in Lake Nokoue, and the Porto Novo, Ouiddah and Aheme lagoons (Balarin 1984b). Eight types of acadja design occur in BBnin (Fig. 2.6; Table 2.2). Different types of brushpark are used a t the edges of watercourses in the B e n d River of Nigeria (Fig. 2.7).
Generally, acadja systems consist of an outer ring of hardwood or bitmboo poles, inside which soft, brushwood branches 2-2.5 m in length are either implanted upright in 50 cm of mud or placed in a variety of patterns on the muddy bottoms in waters up to 1.5 m deep. Customarily, softwood branches are used a t a rate of 12-16/m2. Fish production varies as a function of branch density: log P = 0.165d-1.285, where P = yield in t/halyear, and d = density of branches [dm21 (Fig. 2.8) (Balarin 1984b, calculated from data in Welcomme 1 97Za).
An acadja operates initially as an aggregation device that attracts fish seeking refuge. They are employed as such in Ghana and Madagascar (Coche 1982). In addition, however, an acadja can function as a nutrient-enhancement device. The soft brushwood gradually decays, thereby enhancing the nutrient loading of the shallow lagoons. Brushwood also provides a substrate for epiphytic algae and aufwuchs, attracts insect larvae, and provides fish breeding sites. Over time, fish production can be expressed as P = 0.957e 0.179t, where P = yield (fialyear), and t = time in months since construction (Fig. 2.8) (Balarin l984b).
In BQnin, some 60-96% of the catch of the acadjas is composed of Sarotherodon melanotheron and Chrysichthys nigrodigitatus. Fish are usually small, and are taken by encircling the acadja, or portions of it, with a net and then removing the brushwood, which is then replaced behind the net (Fig. 2.9). The smaller, circular acadja of about 22 m2 in diameter, can be harvested as many as 10 times during the 7- month dry season, and may yield as much as 2.8 t/ha/harvest Welcomme 1983). Larger acadja yield up to 8 a d y e a r (Welcomme 1983). The method of harvesting smaller acadja is similar to that used for the mini-brush parks or vovomora, in Madagascar (Fig. 2.10).
Although accdja permit exploitation of the fisheries potential of shallow waters by relatively simple, low level technological inputs, they have significant drawbacks. Principal among these is the demand for brushwood. Some 30-60 t/ha/year of dry material is required to satisfy the annual replacement rate of 30-75% of the brushwood used
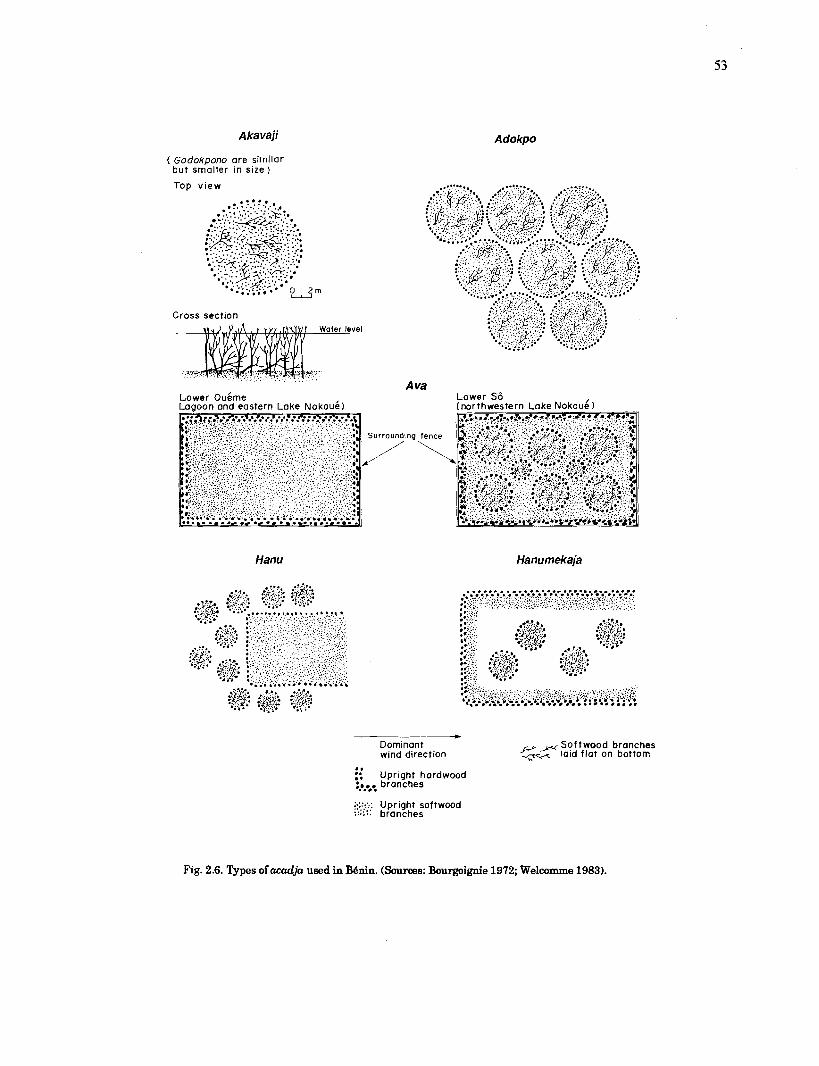
Aka vaji Adokpo
( Godokpono are similar but smaller in size )
Top view
Cross section vel
. . . . . . . . . . . . A v a
Dominant wind direction
Hanumekaja
-Softwood branches ,- laid flat on bottom . . :: Upright hordwood ::...% branches
.... ::.;:.:: Upright softwood .. #.. ...... branches
Fig. 2.6. Types of acadja used in BBnin. (Sources: Bourgoignie 1972; Welmmme 1983).
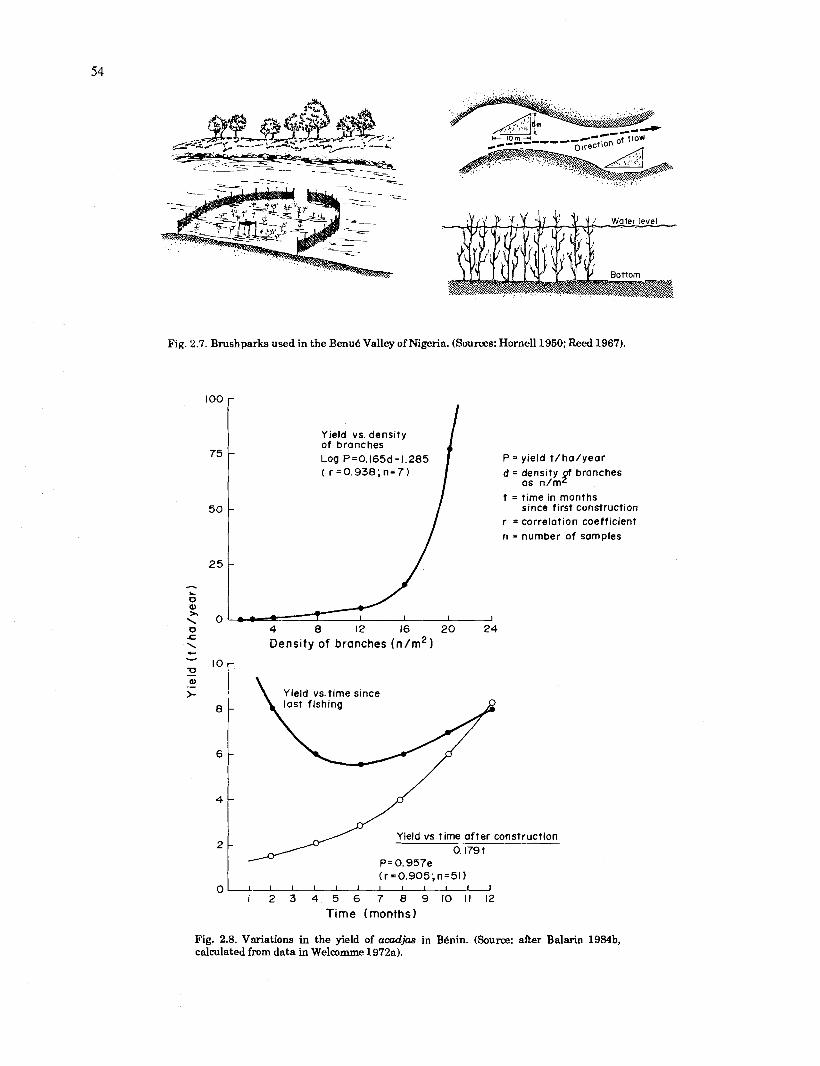
Fig. 2.7. Brushparks used in the Benu6 Valley o f Nigeria. (Sources: Hornell 1950; Reed 1967).
100
Yield vs. density of branches Log P=0.165d-1.285 ( r = O . 9 3 8 ; n = 7 ) I P = yield t /ha/year
d = density f branches as n/m B
t = time in months since first construction 5 0
2 5
- L O w 2, \
r = correlation coefficient -
-
0 - - I I
n = number of samples
o 4 8 12 16 2 0 2 4 c \ Density of branches (n /m2)
Yield vs. time since
Yield vs. time af ter construction 0.179 t
P= O.957e (r=0.905;n=51)
0 I I I I I I I I I ~ ' ~ I 2 3 4 5 6 7 8 9 1 0 1 1 1 2
Time (months)
Fig. 2.8. Variations in the yield of acadjas in B6nin. (Source: after Balarin 1984b, calculated fmm data in Welcomme 1972a).
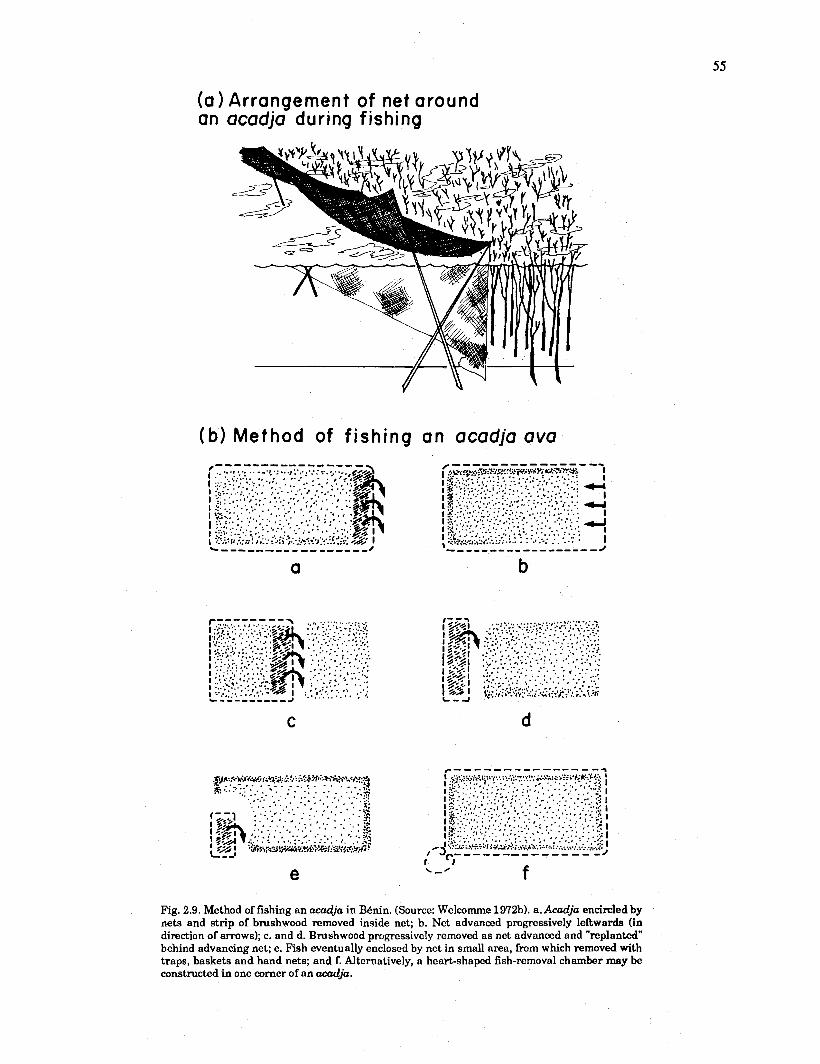
( a ) Arrangement of net around an acadja during fishing
(b) Method of f ishing a n acodjo ava
Fig. 2.9. Method of fishing a n acauja in BBnin. (Source: Welcomrne 1972b). a.Acadja encircled by nets and strip of brushwood removed inside net; b. Net advanced progressively leftwards (in direction of arrows); c. and d. Brushwood progressively removed as net advanced and "replanted" behind advancing net; e. Fish eventually enclosed by net in small area, from which removed with traps, baskets and hand nets; and f. Alternatively, a heart-shaped fish-removal chamber may be constructed i n one corner of a n acauja.

net
Fig. 2.10. Method of fishing a vovomora in Madagascar. (Source: Kapetsky 1981).
for an acadja. This demand, in the absence of a supporting forestry development component, has contributed to deforestation in coastal Bknin, and consequently resulted in dramatically increased rates of investment (Fig. 2.11). In turn, paradoxically, deforestation has led to siltation in the lagoons supporting the acadja. The traditional acadja systems have declined as a consequence, and new enclosure techniques such as cage pens, and substrates such as old car tires (Ardill 1982), are now being examined. Further drawbacks are the competition between the operators of the acadja system and capture fishermen for certain species, poaching, and impediments to navigation (Ruddle, unpub. notes).
Barachois
This system is found mainly in Mauritius, where the fringing barrier reef encloses a relatively sheltered and shallow lagoon. Inlets are converted to barachois by blocking them with stone walls fitted with screen gates to permit water exchange. Fingerlings of mullet (Mugilidae), Siganus sp., and other fish caught by chance in the lagoon, are then stocked in the barachois a t variable rates, but generally at about 1,000ka. Oyster (Crassostrea cucullata) farming may also be practised. Stocking and harvesting are done annually. Although rates of both are low, the yields are double the natural productivity of the lagoon (Coche 1982).
The barachois system is capital intensive but has low depreciation once built. Labor costs are also low. However, yields are poor because fertilization and supplementary feeding are precluded by water exchange. Predation and poaching are also problematical. Legislation has prevented the further expansion of the system.
Similar techniques are to be found in Egypt, Ghana, Madagascar, and Tunisia (Table 2.6). There is probable scope for expansion of such practices along suitable coastlines.
Shellfish Stocking
A traditional form of freshwater shellfish aquaculture was practised in the Lower Volta River of Ghana, where women collect spat of the freshwater clam Egeria radiata for stocking a t a rate of 1,500 individualslm2 in demarcated plots up-river (Pautzke and Crowther 1968, cited in Balarin 1988a). A harvest of over 4,000 t/year was estimated at one time from this system along a 50-km stretch of river below Akuse. Current production figures are unavailable.
Welcornrne(l97l) acodja Tang ( 1976) acadja Tang ( 1976) net.enclosure of Gha P. Morrisen (pers.comrn.) acadja i Net enclosures De Kirnpe (1977)
-upper value IS range for pond construction
-lower value for net enclosure of 100-10,000rn2
P Mornsen (pers.comrn.) I net enckure of 500 m2 1
Ghabl and Soede (1980) ,'Acadja
1 1
Time (years)
Fig. 2.11. Capital investment for various extensive aquaculture systems in BBnin. (Sources: Welcomme 1971; Tang 1976; de Kimpe 1977; Ghabi and Soede 1980; Morrisen, pers. comm.).

Table 2.6. The status of African aquaculture systems. --
Status of aquaculture1 Support senrice Water Culture system3 source2
Country Scale Research Extension Traditional Modem Rxe-
Small Large Drai-in Acadja Barachois Dam fish Pond Pen Cage Tank
Algeria Angola Benin Botswana Burkina Faso B w n d i Camemn Cape Verde Comoros CentAfr. Rap. Chad Congo Cote d'Ivoire Egypt Equatorial Guinea Ethiopia Gabon Gambia Ghana Guinea Guinea Bissau Gnya Lesotho Liberia Libya Madagascar Mala% Mali Mauritius Mauritania Morocco Mozambique Namibia Niger Nigeria Reunion Rwanda s o Tomb-Prineipe Seychelles Sbn6gal Sierra Leone Somalia Sudan Swaziland Tanzania-Zanzibar Togo Tunisia Uganda Western Sahara Zaire Zambia Zimbabwe
M F (D
M B F F F F
B F
F F F
M B F M B F
F F
(M) B F ( W B F
F
M B F F
F F
M B F F F
M B F F
B F M B F
F M B F
M F
M M F M F
M F F
M B F B F
M B F F
F F F
S SEW
S S S E C E C E C s s S(C) C @) S (E) S S S E s s
s s s S C S ESC S C E WEl
Sources: Key: l~evelopment status 2 ~ a t e r source 3~u l tu r e system
0 - Nil M - Marine (Refers mainlv to tilada) P = Poor F - Fair G = Gmd 0 =Planned ? = Unknown
B =Brackish $ - ~ubsis te&e~xtekive F-Fresh C = Commercial-Intensive
E = ExperimentaVFilot Scale
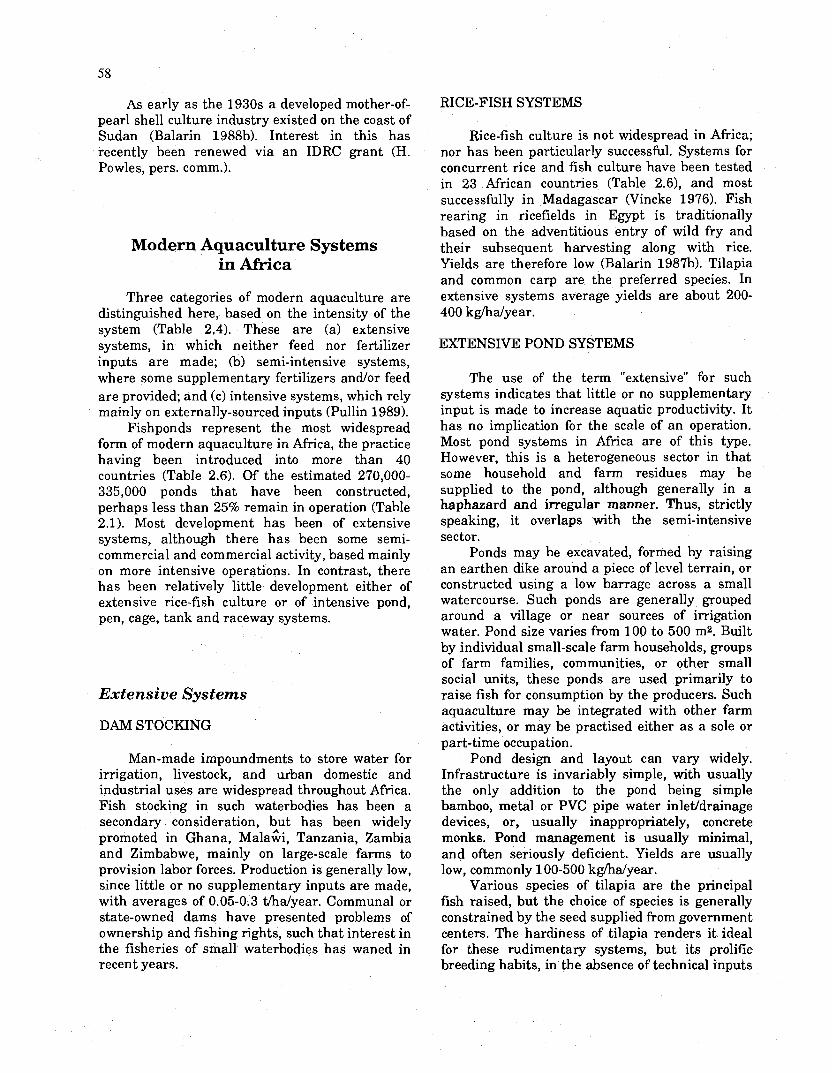
AS early as the 1930s a developed mother-of- pearl shell culture industry existed on the coast of Sudan (Balarin 1988b). Interest in this has recently been renewed via an IDRC grant (H. Powles, pers. comm.).
Modern Aquaculture Sys terns in Africa
Three categories of modern aquaculture are distinguished here, based on the intensity of the system (Table 2.4). These are (a) extensive systems, in which neither feed nor fertilizer inputs are made; (b) semi-intensive systems, where some supplementary fertilizers andlor feed are provided; and (c) intensive systems, which rely mainly on externally-sourced inputs (Pullin 1989).
Fishponds represent the most widespread form of modern aquaculture in Africa, the practice having been introduced into more than 40 countries (Table 2.6). Of the estimated 270,000- 335,000 ponds that have been constructed, perhaps less than 25% remain in operation (Table 2.1). Most development has been of extensive systems, although there has been some semi- commercial and commercial activity, based mainly on more intensive operations. In contrast, there has been relatively little development either of extensive rice-fish culture or of intensive pond, pen, cage, tank and raceway systems.
Extensive Systems
DAM STOCKING
Man-made impoundments to store water for irrigation, livestock, and urban domestic and industrial uses are widespread throughout Africa. Fish stocking in such waterbodies has been a secondary consideration, but has been widely promoted in Ghana, ~ a l a G i , Tanzania, Zambia and Zimbabwe, mainly on large-scale farms to provision labor forces. Production is generally low, since little or no supplementary inputs are made, with averages of 0.05-0.3 tkdyear. Communal or state-owned dams have presented problems of ownership and fishing rights, such that interest in the fisheries of small waterbodies has waned in recent years.
RICE-FISH SYSTEMS
Rice-fish culture is not widespread in Africa; nor has been particularly successful. Systems for concurrent rice and fish culture have been tested in 23 African countries (Table 2.6), and most successfully in Madagascar (Vincke 1976). Fish rearing in ricefields in Egypt is traditionally based on the adventitious entry of wild fry and their subsequent harvesting along with rice. Yields are therefore low (Balarin 1987b). Tilapia and common carp are the preferred species. In extensive systems average yields are about 200- 400 kglhdyear.
EXTENSIVE POND SYSTEMS
The use of the term "extensive" for such systems indicates that little or no supplementary input is made to increase aquatic productivity. It has no implication for the scale of an operation. Most pond systems in Africa are of this type. However, this is a heterogeneous sector in that some household and farm residues may be supplied to the pond, although generally in a haphazard and irregular manner. Thus, strictly speaking, it overlaps with the semi-intensive sector.
Ponds may be excavated, formed by raising an earthen dike around a piece of level terrain, or constructed using a low barrage across a small watercourse. Such ponds are generally grouped around a village or near sources of irrigation water. Pond size varies from 100 to 500 m2. Built by individual small-scale farm households, groups of farm families, communities, or other small social units, these ponds are used primarily to raise fish for consumption by the producers. Such aquaculture may be integrated with other farm activities, or may be practised either a s a sole or part-time occupation.
Pond design and layout can vary widely. Infrastructure is invariably simple, with usually the only addition to the pond being simple bamboo, metal or PVC pipe water inlet/drainage devices, or, usually inappropriately, concrete monks. Pond management is usually minimal, and often seriously deficient. Yields are usually low, commonly 100-500 kg/ha/year.
Various species of tilapia are the principal fish raised, but the choice of species is generally constrained by the seed supplied from government centers. The hardiness of tilapia renders it ideal for these rudimentary systems, but its prolific breeding habits, in the absence of technical inputs

to control reproduction, result in stunting and a harvest of mainly small fish. This has discouraged farmers and may be a prime cause for the decline in the number of functioning ponds. Where temperatures are cool and suboptimal for tilapia growth, common carp are now being introduced. Other species include Clarias gariepinus and Heterotis nilotieus. Tests are also being conducted on Labeo spp., Lutes niloticus, Micropterus salmoides and Hemichromis spp.
Government and institutional support, often required to supply seed and technical information to this sector, is constrained by shortages of funds, trained manpower, infrastructure for research, and extension services. Despite the urgent need to increase animal protein supply for rural populations, it is difficult to justify by economic criteria alone the high cost for effective government and institutional support to small- scale, extensive pond operations.
Extensive pond aquaculture has been recorded for 37 of the countries shown in Table 2.6 (although the data may also include semi- intensive systems, since there was no precise definition in the sources used.) However, 7 countries account for 85.6% of the recorded ponds: Cameroon, Central African Republic, Congo, Egypt, Kenya, Madagascar and Zaire. Among these, Zaire accounts for 38% of the ponds. However, no data are available for Nigeria, which has been variously estimated to produce as little as 125 Vyear (Bell and Canterbury 1976) or as much as 75,000 tlyear from aquaculture (FA0 1980a).
Semi-Intensive Systems
POND CULTURE
Semi-intensive pond systems seek to maximize the use of in situ food production by using inorganic fertilizers, organic composts, or manures; the latter often being obtained by integrating the pond operation with animal husbandry. Natural foods may be either supplemented by green fodder or by artificial feeds, either formulated as fish feeds or residues from agroindustry. In general, yields of about 1.0 t/hdyear are obtained, but could reach 5 t/hdyear with both appropriate feeding and fertilization, and with controlled breeding to eliminate overpopulation and consequent stunting.
Semi-intensive pond culture is widespread in Africa, for example, in the Central African
Republic, Kenya, Mala%, Nigeria, Zambia and Zimbabwe. Operations are usually small scale, since traditional livestock-raising and crops receive priority and compete for the same feedstuffs and fertilizers as could be used as pond inputs. Where made, inputs consist usually of household wastes or composted plant materials. Manuring is not common. There is the further difficulty in much of Africa that, unlike much of Asia, the use of livestock excreta as a pond fertilizer is taboo. Moreover, the use of human excreta, as in Chinese systems, is culturally repugnant. Nevertheless, large, integrated agriculture-aquaculture projects are underway in the Central African Republic, CBte d'Ivoire, Kenya, Madagascar, Nigeria and Zambia (Table 2.6).
Intensive Systems
Intensive aquaculture systems develop through either private sector investment or government corporate activity. They involve high capital outlay, centralized management and a degree of vertical integration, with the dominantly commercial objective of maximizing a return on the investment. Development often involves detailed feasibility studies to identify the most suitable system(s), sites and species. Intensive aquaculture is generally, but not always, conducted on a large, industrial scale, and is usually dependent on inputs sourced off-farm.
There was an early history of the commercial production of "up-market" table species, such as trout, in Africa for food or angling. However, such production was limited in scale and restricted to a few countries. Industrial aquaculture is only a recent development in Africa, possibly because in many countries prices of the most common food fish have until recently been low among sources of animal protein, and hence commercial aquaculture projects were not viable. In some areas this has been compounded by consumer preferences.
At present there are only some 15-20 viable public or private commercial aquaculture enterprises in operation in Africa, a similar number in operation but which have not yet demonstrated their commercial viability, and another 10 projects in planning (FA0 1985b). Among the largest of the planned projects are those for three farms of 1,000 ha in Egypt, 350 ha in Lesotho and 200 ha in Madagascar.

A total of 23 countries record intensive, large- scale aquaculture activities (Table 2.6). Few among these are profitable. Among those profitable include, notably, the tilapia (Oreochrornis spp., Sarotherodon spp. and Tilapia spp.) farms in C6te d'Ivoire, Egypt, Kenya, ~ a l a % , Nigeria, Zambia and Zimbabwe; the trout farms in Kenya and Zimbabwe; the Macrobrachiurn rosenbergii enterprises in Mauritius and Zimbabwe; and the oyster farms in SCnBgal.
INTENSIVE POND CULTURE
Inputs to intensive pond culture systems include formulated feeds, aeration, waste removal, and dense stocking of fish. Farm infrastructure and equipment are expensive and costly. These highly capitalized systems require a ready market for their produce. Although some developments have occurred in Kenya, Madagascar, Morocco and Tanzania for trout production, and in Mauritius and Zimbabwe for Macrobrachiurn rosenbergii, and in Egypt, Kenya, Zambia and Zimbabwe for tilapia, intensive pond systems are of little or no significance for the development of aquaculture in rural Africa.
CAGE AND PEN CULTURE
Deep parts of lagoons, lakes, reservoirs, or watercourses can support cage culture, and shallow areas can be utilized for fish raising in pens. Cage culture has been tested in Egypt, Kenya, Nigeria, Tanzania and Zimbabwe (Table 2.6), and tilapia are now raised commercially in cages in CBte dfIvoire (Balarin and Haller 1982). There has been only limited development of pen aquaculture in Africa. It has been tested in BBnin, Burkina Faso, CBte d'Ivoire, and Togo, but the only major development so far has occurred in BBnin, as an alternative to the traditional acadja system. Yields appear to be in the range of 25-220 thdyear (P. Morrissens, pers.comm.).
ThiVKS AND RACEWAY CULTURE
Concrete or metal tanks have been used for farming trout in Zimbabwe, and for turtle-raising in RBunion. In Kenya, tanks and raceways have been used since 1975 for the intensive culture of tilapia (Balarin and Haller 1982). Similar examples can be found in Egypt, Zambia and Zimbabwe. The technique is now being
considered for application in the Congo and Nigeria.
Tank culture demands an abundance of flowing water, and pumping is often necessary. In a few exceptional cases, such as in Zambia, aeration has been preferred to a flow-through system. The improved oxygenation permits high stocking rates, up to 50 kg/m3. The system is designed to maximize cleaning. A well-balanced, compounded feed is required. Under eficient management, yields equivalent to 2,000 thalyear have been achieved, i.e., more animal protein per unit area than any other known form of animal husbandry. Such systems are not without problems, however. Feed costs amount to 50-60% of operational costs, and poor quality feeds have resulted in nutritional disorders. Feed supply may also be seasonally constrained. Tank and raceway systems can be adapted for integration with other farm operations; the farm in Kenya, for example, incorporates crocodiles, hydroponic vegetable cultivation and irrigated rice in a water reuse system.
The Present Status of Aquaculture in Africa
Recent statistics on aquaculture in Africa are both incomplete and contradictory so that no accurate assessment of its present status in the continent is possible (Coche 1983). Total production in 1981 was estimated a t less than 10,000 t (1981), i.e., less than 0.1% of the then estimated total world aquaculture production of 8.7 million tonnes.
Statistics remain confused owing to the diverse nature of African aquaculture and the absence of any organized continent-wide survey of aquaculture. Whereas FA0 (1975) suggested an excess of 30,000 t/year from just 9 African states, and FA0 (1980a) estimated an African aquaculture production of 107,400 t/year, or 1.8% of total world production based on statistics for 1975, the 1986 production was an estimated 61,000 t, or 0.74% of the estimated world total (FA0 1989) (Table 2.6).
Given this situation, we have provided a composite assessment of the situation in Table 2.1, based on the examination of data from 54 countries and islands. Available historical data are also summarized in Table .2.1. Data are generally scant, and none are available for Cape Verde, the Comoros, Equatorial Guinea, Guinea

Bissau, Namibia, Sao Tom6-Principe and Western Sahara. The gaps and shortcomings highlight the urgent need for establishing a system of enumeration, without which planning for aquaculture development in Africa will be severely constrained.
Most modern aquacultures in Africa are based on extensive freshwater pond systems. The data for 1985 suggest that more than 300,000 ponds, covering between 23,000 and 79,000 ha, may have been established, and that total production of those functioning may be potentially on the order of 43,000-53,000 t/year. This approximates to the FA0 estimates (Table 2.6). In contrast, semi-intensive and intensive pond systems, particularly the latter, are relatively recent innovations of still minor importance. Although there is a long history in parts of the continent using brackishwater drain-in acadjas and barachois (Coche 1982), and fuller use is now beginning to be made of brackishwaters (Table 2.6), modern systems of brackishwater and coastal marine aquaculture are also recent introductions of still minor importance. In marine waters this stems largely from both a limited understanding of the biology of indigenous marine species suitable for cultivation, and to the priority given to developing marine capture fisheries.
The principal species cultured in African aquaculture are shown by quantity and production in Table 2.7, and those either cultured or considered as potential candidates for aquaculture in the SADCC Subregion are listed in Table 2.8. Various tilapia species are the main fish cultured, with a total of about 37,500 t recorded (61.5% of the total). Egypt is by far the largest producer of tilapias, with an estimated production of 30,000 t. An estimated 10,200 t of common carp are produced in Africa, with 98% of the production being accounted for by Egypt. The other main fish cultured are various mullets (Mugilidae) and African catfish (Clarias spp.). African aquaculture production is dominated by Egypt, which accounts for an estimated 80% of total production; Nigeria produces about 9%, Zimbabwe 2.8%, C6te d'Ivoire about 1.3%, and Kenya 1.1%. Production in all other countries is extremely low (FA0 1989).
The Present Status of Aquaculture in the SADCC Subregion
Aquaculture developments in the SADCC Subregion have been mostly of small-scale ponds
for household subsistence purposes. Some 18,000 such ponds are now thought to exist (Table 2.1). Dams are widely stocked throughout the region, rice-fish cultivation has been practised in Mozambique, Tanzania, Zambia, and Zimbabwe. Cage culture is a more recent development, with trials having been conducted in Tanzania and Zimbabwe. Commercial pilot farms using tank culture systems have been developed in Tanzania, Zambia and Zimbabwe (Table 2.6).
Estimates of total aquaculture production from published records for the SADCC Subregion Region range from 1,254 to 8,790 Wyear (Table 2.2), with the lower value being more plausible, and approximating the FA0 estimate of 2,615 Wyear (Table 2.6). The level of development is thus low, and aquaculture contributes a t present less than 1% of the total fish supply of the Subregion.
More than 60 species of fish have been tested as candidates for aquaculture (Table 2.8). The most popular are the tilapias, of which 28 species either have been tested or are in use. Micropterus salmoides, Salmo gairdneri and Cyprinus carpio are the species that have been most widely introduced throughout the region, and they have been farmed in almost all the SADCC countries except Angola and Botswana. Clarias gariepinus has also been stocked.
The status of aquaculture in each SADCC country is summarized in the following section.
Angola
No recent details are available on the development status of aquaculture in Angola, although the FA0 (1989) estimates a total production of 2 Wyear. Sibelka (1979) described experimental ponds established in 1953 a t Sacaala. But these were abandoned in 1975 and are now in need of rehabilitation. The diamond mining company, Mining and Technical Services Ltd., had plans to establish a tilapia pond and cage farm with a yield capacity of 500 Wyear (Balarin 1987b), but there are no published details on the current status of that project.
Botswana
There is no aquaculture in Botswana, except perhaps for the fishing of water storage dams. Poor climatic conditions and an absence of trained manpower have precluded its development (J. Rogers, pers. comm.). Further, what demand


Table 7.8. Irk: p r ~ u r , imd exotic fish species cultured or consi~ered a s potential candidates for aquaculture in the S D C C Subregion. - - A - - - - - - --
Genus -nd b * - idu k i p l a Botswana - -" - Lesotho
Malaik Mozamb~que Swaziland Tanzan~a -- - - Zamb~a Z~mbabwe
Alestes E r n her M E
W*itw2eicj. C ~ ~ & ~ T C . : * ~ E Z J B
ii7lf~~t??lls. spp. m 1~rw:amLrzs c1arGi F S a l m ~ gaisdnwi f
e
8. ttrutto s f
Scluelinui fo:i'na:b 8
j"ilapk heuYrlotii 6
S. rnelanotheron Sermnochromis spp. Siganus spp. F S F 6
Sfolothrissa tanganicae Tilapia rendalli S e F
8
T. sparrmnnii s F F F F
T. zillii e Tinm tinca s f 8
Source: Balarin 0 987a). Notes: (Upper case ;. indigenous; Lower ease - erotic); B - Bilharzia control; E - Experimental; F - Popular farm fish; M - Mosquito control; P - Forage fish; S - River or Dam stocking or Sport fishing.

there is for fish is satisfied by capture fisheries. However, 12 water storage dams have been regularly stocked and fished (Allsop 1970).
Were aquaculture to be developed, the most suitable area would be the floodplains of the lower Okavango Basin, which have the potential to support drain-in ponds, the rudiments for which exist in traditionally used local fishing techniques 'Gilmore 1978). Ricefield fisheries could also be feasible in some parts of the Basin.
Lesotho
Lesotho has no natural fishery, and fish is of minor traditional importance in the diet. Production has concentrated on fish farming, as well as on dams and sport fisheries (FA0 1984a1, and has been reviewed recently by Chondoma (1988a). An aquaculture project was to be included in the Thaba Bosiu Rural Development Scheme (Cremer 1983), and the U.S. Peace Corps began an aquaculture program in 1983 (Osborn 1983). In 1963, the Fisheries Department was assisted by British aid (ODA) (Meschkat 1967), and has since been developing a 28-pond, 2.6-ha carp hatchery at Maseru.
At present there are an estimated 132 ponds covering 30 ha in Lesotho, but only an estimated 30-100 ponds are in production. Most of these are managed by. 30 associations, and about 10 are operated by individuals. In addition, it is estimated that 32 ponds were made idle, for lack of water, owing to the severe drought in 1985. Carp- and duck-rearing is popular. Chicken manure is also used as a fertilizer in most pdnds, and a feed consisting of 20-25% protein pellets is often used. Yields are 0.7-1.0 thafyear, with an FCR of 2.5-4.7 (Chondoma 1985). The total production averages about 20 tlyear, but was severely retarded by the drought of 1983-84, and declined to a low of 8.8 t. Current FA0 (1989) estimates suggest a recovery, with a total production of 23t.
I t was planned to establish at Tshakolo a 350-ha pilot industrial pond farm,z capable of producing 550 tlyear, and operated by the Government, IBRD, and ODA (Coche 1983). An integrated duck-fish project was to be established by the FA0 as part of this pilot project.
There are 200 ha of reservoirs in Lesotho that could be stocked with fish. Trout is established in the eastern part of the country and the feasibility of establishing d trout farm was examined in 1980 by the ODA (D. Robertson, pers. comm.).
(Since this book basically concerns MalaGi, discussion is deferred until Chapters 6-8. Current FA0 [I9891 estimates give 88 t/year as the total aquaculture production of the country.)
Mozambique
It is not known exactly when aquaculture began in Mozambique. Meschkat (1967) puts the beginning in 1956, whereas Carrilho (1985) gives 1952. In the 1950s, a number of large fish farms and about 250 small-scale units were established, covering a total area of 10.5 ha. Despite numerous early publications, nothing has been published to indicate the present status of these units. 0. mossambicus was the main species cultured. Stocking in ricefields was also practised.
Brackishwater aquaculture was first attempted in 1972, near Maputo, and is now being reactivated with bilateral aid under the Mozambique-Nordic Agricultural Programme (MONAP). In addition, an FA0 project, administered by the Institute of Fishery Development, is being implemented to culture tilapia, crab and shrimp in a 14-ha site in Maputo Bay. Three old fish culture stations exist, a t Umbeluzi, Chizizira and Lionde. In addition, one has been constructed recently in Naissa Province and another in Gaza Province (Carrilho 1985). FA0 (1989) estimates the current aquaculture production of Mozambique to be 41 tfyear.
Swaziland
The establishment of 1,500 smallholder ponds was proposed under the Third Development Plan, 1978-1985. In 1978, the U.S. Peace Corps was involved in the development of fishponds and the training of farmers (Jensen 1983). There are about 160 small-scale family fishponds documented in Swaziland, although up to 800 have been estimated but not yet documented (Chondoma 198813). These are mostly operated by women, since many men have migrated for work either to the cities or to the Republic of South Africa (SADCC 1984). Ponds are small, averaging 100-200 m2 and yield 2 thalyear. There is an estimated possible 8-16 ha of productive ponds in Swaziland, with an estimated total production of 16-32 t. However, accurate data are not available,
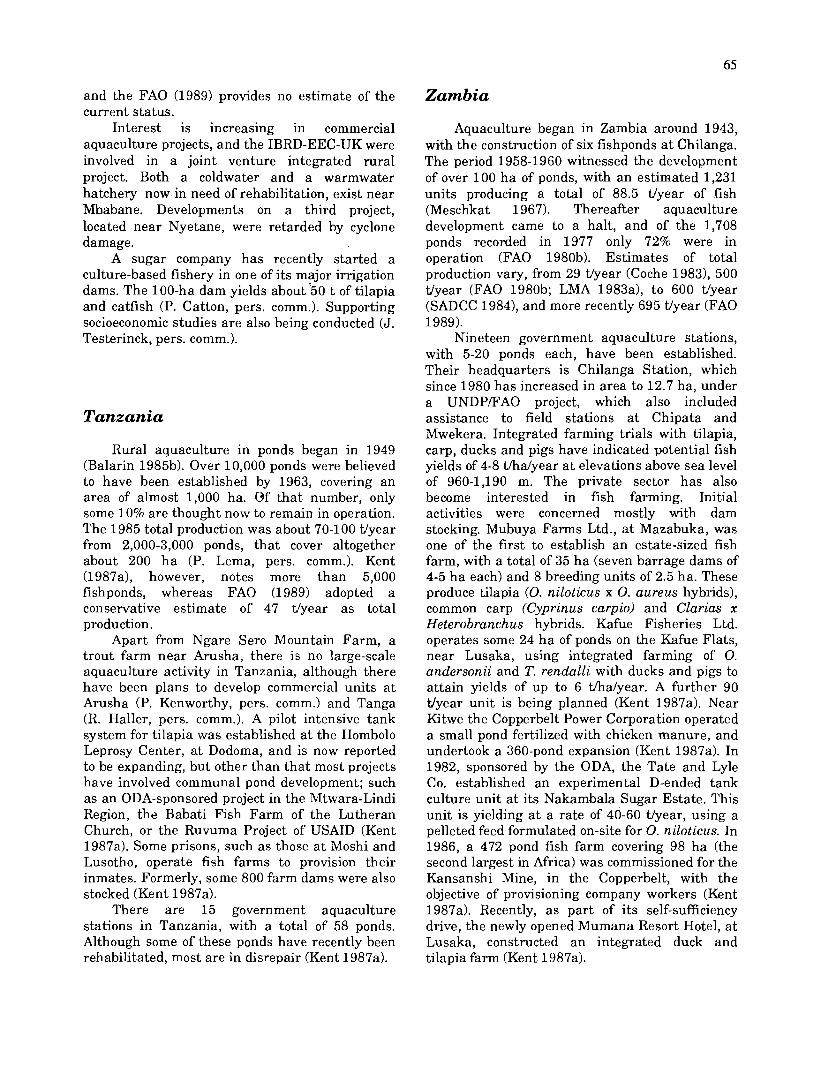
and the FA0 (1989) provides no estimate of the current status.
Interest is increasing in commercial aquaculture projects, and the IBRD-EEC-UK were involved in a joint venture integrated rural project. Both a coldwater and a warmwater hatchery now in need of rehabilitation, exist near Mbabane. Developments on a third project, located near Nyetane, were retarded by cyclone damage.
A sugar company has recently started a culture-based fishery in one of its major irrigation dams. The 100-ha dam yields about750 t of tilapia and catfish (P. Catton, pers. comm.). Supporting socioeconomic studies are also being conducted (J. Testerinck, pers. comm.).
Tanzania
Rural aquaculture in ponds began in 1949 (Balarin 198513). Over 10,000 ponds were believed to have been established by 1963, covering an area of almost 1,000 ha. Of that number, only some 10% are thought now to remain in operation. The 1985 total production was about 70-100 idyear from 2,000-3,000 ponds, that cover altogether about 200 ha (P. Lema, pers. comm.). Kent (1987a), however, notes more than 5,000 fishponds, whereas FA0 (1989) adopted a conservative estimate of 47 ffyear as total production.
Apart from Ngare Sero Mountain Farm, a trout farm near Arusha, there is no large-scale aquaculture activity in Tanzania, although there have been plans to develop commercial units a t Arusha (P. Kenworthy, pers. comm.) and Tanga (R. Haller, pers. comm.). A pilot intensive tank system for tilapia was established at the Hombolo Leprosy Center, a t Dodoma, and is now reported to be expanding, but other than that most projects have involved communal pond development; such as an ODA-sponsored project in the Mtwara-Lindi Region, the Babati Fish Farm of the Lutheran Church, or the Ruvuma Project of USAID (Kent 1987a). Some prisons, such as those a t Moshi and Lusotho, operate fish farms to provision their inmates. Formerly, some 800 farm dams were also stocked (Kent 1987a).
There are 15 government aquaculture stations in Tanzania, with a total of 58 ponds. Although some of these ponds have recently been rehabilitated, most are in disrepair (Kent 1987a).
Zambia
Aquaculture began in Zambia around 1943, with the construction of six fishponds a t Chilanga. The period 1958-1960 witnessed the development of over 100 ha of ponds, with an estimated 1,231 units producing a total of 88.5 idyear of fish (Meschkat 1967). Thereafter aquaculture development came to a halt, and of the 1,708 ponds recorded in 1977 only 72% were in operation (FA0 1980b). Estimates of total production vary, from 29 idyear (Coche 19831, 500 tlyear (FA0 1980b; LMA 1983a1, to 600 tlyear (SADCC 1984), and more recently 695 Wyear (FA0 1989).
Nineteen government aquaculture stations, with 5-20 ponds each, have been established. Their headquarters is Chilanga Station, which since 1980 has increased in area to 12.7 ha, under a UNDPIFAO project, which also included assistance to field stations at Chipata and Mwekera. Integrated farming trials with tilapia, carp, ducks and pigs have indicated potential fish yields of 4-8 thalyear a t elevations above sea level of 960-1,190 m. The private sector has also become interested in fish farming. Initial activities were concerned mostly with dam stocking. Mubuya Farms Ltd., a t Mazabuka, was one of the first to establish an estate-sized fish farm, with a total of 35 ha (seven barrage dams of 4-5 ha each) and 8 breeding units of 2.5 ha. These produce tilapia (0. niloticus x 0. aureus hybrids), common carp (Cyprinus carpio) and Clarias x Heterobranchus hybrids. Kafue Fisheries Ltd. operates some 24 ha of ponds on the Kafue Flats, near Lusaka, using integrated farming of 0. andersonii and T. rendalli with ducks and pigs to attain yields of up to 6 Vhdyear. A further 90 Wyear unit is being planned (Kent 1987a). Near Kitwe the Copperbelt Power Corporation operated a small pond fertilized with chicken manure, and undertook a 360-pond expansion (Kent 1987a). In 1982, sponsored by the ODA, the Tate and Lyle Co. established an experimental D-ended tank culture unit a t its Nakambala Sugar Estate. This unit is yielding a t a rate of 40-60 tlyear, using a pelleted feed formulated on-site for 0. niloticus. In 1986, a 472 pond fish farm covering 98 ha (the second largest in Africa) was commissioned for the Kansanshi Mine, in the Copperbelt, with the objective of provisioning company workers (Kent 1987a). Recently, as part of its self-sufficiency drive, the newly opened Mumana Resort Hotel, a t Lusaka, constructed an integrated duck and tilapia farm (Kent 1987a).

Aid organizations are also actively promoting small-scale aquaculture in Zambia. A major project on fish culture development is being executed by the FAO, originally with funds from the UNDP and subsequently from the Netherlands Government, to develop systems of integrated aquaculture, and then to train farmers in the operation and to begin extension work. The project is being conducted a t the government fish farms a t Chilanga, near Lusaka, Mwekera, Copperbelt Province, and Chipata, Eastern Province (B. Haight, pers. comm.).
An "Aquaculture for Local Community Development Programme" (ALCOM), implemented by the FA0 and funded during its preparatory phase by the Swedish International Development Agency (SIDA), is also based in Lusaka and a t Chipata. This program is focusing initially on southern Africa, with the objective of integrating fish farming into rural development.to raise the living standards of the rural poor.
Private voluntary organizations are also actively promoting the development of aquaculture in Zambia. One example is the International Catholic Migration Commission, which, formerly supported by the UNHCR and now funded by USAID, is undertaking a large project, Icara 11, of over 500 ponds built under a food-for-work scheme, in the Mwinilunga District, Northwestern Province, with the aim of reducing malnutrition both among the local population as well as refugees from Angola and ZaYre (Kent 1987a).
Zimbabwe
Fish farming was initiated in Zimbabwe in 1950. Total production in the 1980s has been estimated a t over 800 Wyear, most of which was derived from dam stocking (Balarin 1984a). Recently, over 2,000 small-scale rural fishponds have been developed (J. Shoniwa, pers. comm.), with plans to develop more (Gurure 1985). The commercial sector is also active. The FA0 (1989) estimates total production a t 1,752 Wyear.
There exist some 12,000 small dams in Zimbabwe, most of which are owned privately by large agricultural estates. In some communal dams, however, fisheries are operated as communal projects. Agritex (the Department of Agriculture, Technical, and Extension Services of the Ministry of Lands, Agriculture, and Rural Settlement) provides an extension service to support the development of aquaculture in small
waterbodies, for which i t recently produced an extension manual (Dodd 1987). Owing to the relatively poorer nutritional situation in communal lands, particular attention is paid to them. In some communal lands the demand for fresh fish is so great that in 1985 some enterprising owners of small-scale fishponds charge a Z$ 1.00 entry fee for individuals fishing with a pole-and-line, plus Z$ 3.00kg for the fish caught (Agritex 1986) (US$ 1.00 = Z$ 1.9, in May 1989).
Five government aquaculture stations provide farmers with seed for dam and pond stocking, as well as extension services. Some, however, have lapsed into inactivity during the period 1983-1986, owing to the prolonged drought. There were plans to develop a 50-ha pilot demonstration center for aquaculture on the Lowveld, with financial assistance from either France or Japan, but an agreed project has yet to emerge (S. Chimbuya, pers. comm.).
Since achieving independence in 1980, Zimbabwe has demonstrated the greatest interest among the SADCC countries in large-scale industrial aquaculture. Farms capable of a total output of 2,000-2,500 Wyear are either in operation or still under construction. Among these developments are the Macrobrachiurn rosenbergii farm established a t Kariba in 1981 by King Prawn Ltd, and capable of producing 20 tlyear; three trout farms, Inyanga Trout Research Centre, Willards Foods Trout Farm, and another one, each of which were intended to produce 30-50 Wyear, but which have been recently uprated at 100 Wyear. The Willards Foods Company established in 1984 a 12-ha tilapia farm, Freshnet Ltd., a t Mt. Hampden which was planned to yield 400-500 Wyear. Subsequently it was relocated to Kariba. Numerous smaller projects have begun operations on the Lowveld, mainly around Harare and Kariba. With the introduction of 0. niloticus in the early 1980s, a large number of commercial hatcheries and farms are being developed. For example, a t Darwendale, V and M Fisheries produce 0. niloticus x 0. aureus hybrids; Tiger Bay Fisheries, Lake McIlwaine; Kariba Bream, Kariba; Rothmans of Pall Mall Ltd., Ruwa; and L. Edwards and Co., Glendale, among others. Four local companies now offer consultancy services in this sector. However, the recent establishment of most such operations precludes their evaluation. Evaluation is further inhibited since most developments represent huge investments and investors are naturally wary of both sharing information and furnishing statistics.
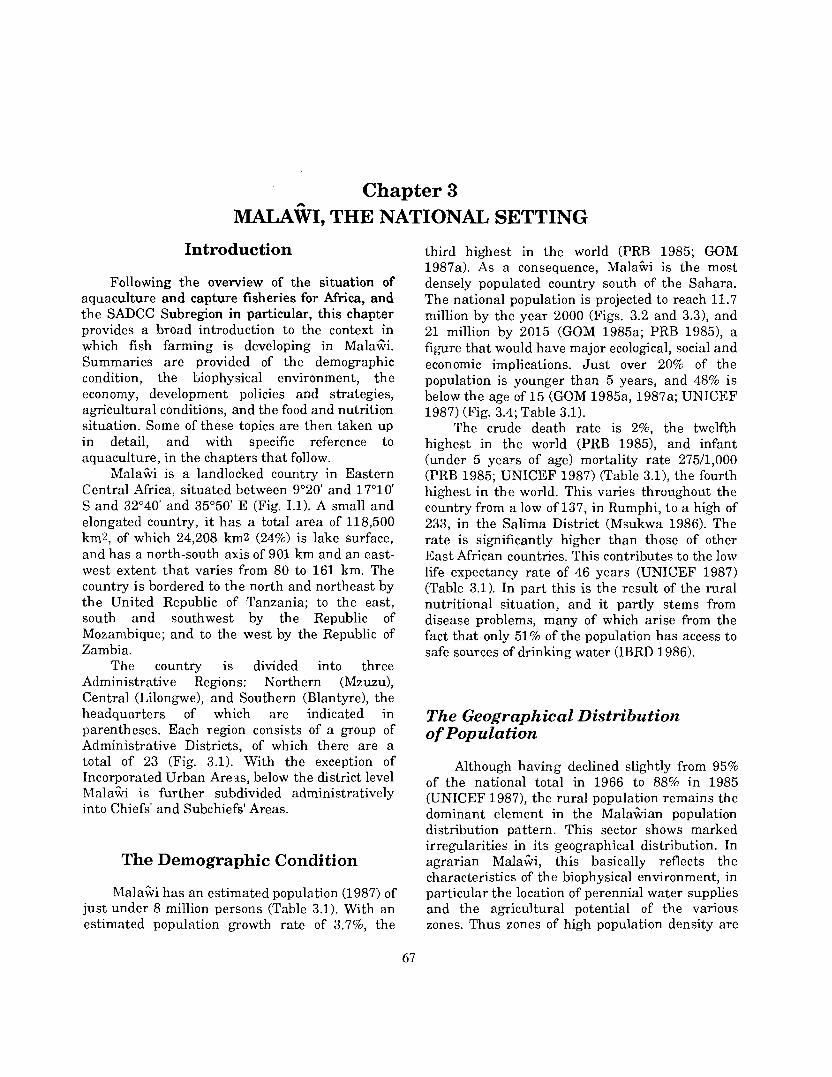
Chapter 3 M A L A ~ I , THE NATIONAL SETTING
Introduction
Following the overview of the situation of aquaculture and capture fisheries for Africa, and the SADCC Subregion in particular, this chapter provides a broad introduction to the context in which fish farming is developing in Mala%. Summaries are provided of the demographic condition, the biophysical environment, the economy, development policies and strategies, agricultural conditions, and the food and nutrition situation. Some of these topics are then taken up in detail, and with specific reference to aquaculture, in the chapters that follow.
Mala% is a landlocked country in Eastern Central Africa, situated between 9'20' and 17O10' S and 32'40' and 35O50' E (Fig. 1.1). A small and elongated country, i t has a total area of 118,500 km2, of which 24,208 kmz (24%) is lake surface, and has a north-south axis of 901 km and an east- west extent that varies from 80 to 161 km. The country is bordered to the north and northeast by the United Republic of Tanzania; to the east, south and southwest by the Republic of Mozambique; and to the west by the Republic of Zambia.
The country is divided into three Administrative Regions: Northern (Mzuzu), Central (Lilongwe), and Southern (Blantyre), the headquarters of which are indicated in parentheses. Each region consists of a group of Administrative Districts, of which there are a total of 23 (Fig. 3.1). With the exception of Incorporated Urban Areas, below the district level Mala% is further subdivided administratively into Chiefs' and Subchiefs' Areas.
The Demographic Condition
Mala% has an estimated population (1987) of just under 8 million persons (Table 3.1). With an estimated population growth rate of 3.7%, the
third highest in the world (PRB 1985; GOM 1987a). As a consequence, Malahi is the most densely populated country south of the Sahara. The national population is projected to reach 11.7 million by the year 2000 (Figs. 3.2 and 3.3), and 21 million by 2015 (GOM 1985a; PRB 1985), a figure that would have major ecological, social and economic implications. Just over 20% of the population is younger than 5 years, and 48% is below the age of 15 (GOM 1985a, 1987a; UNICEF 1987) (Fig. 3.4; Table 3.1).
The crude death rate is 2%, the twelfth highest in the world (PRB 1985), and infant (under 5 years of age) mortality rate 27511,000 (PRB 1985; UNICEF 1987) (Table 3.1), the fourth highest in the world. This varies throughout the country from a low of 137, in Rumphi, to a high of 233, in the Salima District (Msukwa 1986). The rate is significantly higher than those of other East African countries. This contributes to the low life expectancy rate of 46 years (UNICEF 1987) (Table 3.1). In part this is the result of the rural nutritional situation, and it partly stems from disease problems, many of which arise from the fact that only 51% of the population has access to safe sources of drinking water (IBRD 1986).
The Geographical Distribution of Population
Although having declined slightly from 95% of the national total in 1966 to 88% in 1985 (UNICEF 1987), the rural population remains the dominant element in the MalaGian population distribution pattern. This sector shows marked irre ylarit ies in its geographical distribution. In agrarian MalaGi, this basically reflects the characteristics of the biophysical environment, in particular the location of perennial water supplies and the agricultural potential of the various zones. Thus zones of high population density are

Regional boundary - International boundary --- District boundaries ..........-.
20 0 20 40 60 80km
1 I I I I
3 3 O 3 4 O 35O 36 O
Fig. 3.1. Administrative divisions and principal towns of Mala&. (Source: Agnew and Stubbs 1972)

Table 3.1. Summary of vital demographic indicators in Mala%, 1987.
Total estimated population Annual population growth rate (%) Crude birth rate Crude death rate Life expectancy Total fertility rate Rate of urbanization (%) Average annual urban population growth rate Population under 15 years (%) Population under 1 year of age (%) Under 5 mortality rate Under 1 mortality rate
7.858 million 3.7 53/1,000 21n ,000 46 years 7.0 12 7.3 48 18.4 275n ,000 175n ,000
Source: GOM (1987); UNICEF (1987)
Fig. 3.3. Estimated population of Mala& by age group and sex for 1980
C 0 .- + 0 - 2 a
4
0
and 2000. (Source: GOM 1984a) Population (thousands)
0
0
- //O
0 - O d O c o ~ O
/O
Fig. 3.2. Population growth and projections for Malabji, I I I l l I I I I I I I I
1901 '11 '21 '26 '31 ' I 45
1901-201 5. (Source: GOM 1984a, 1985a) b6 '77'80'85'90 '95 2000 2015
Yeor Aae
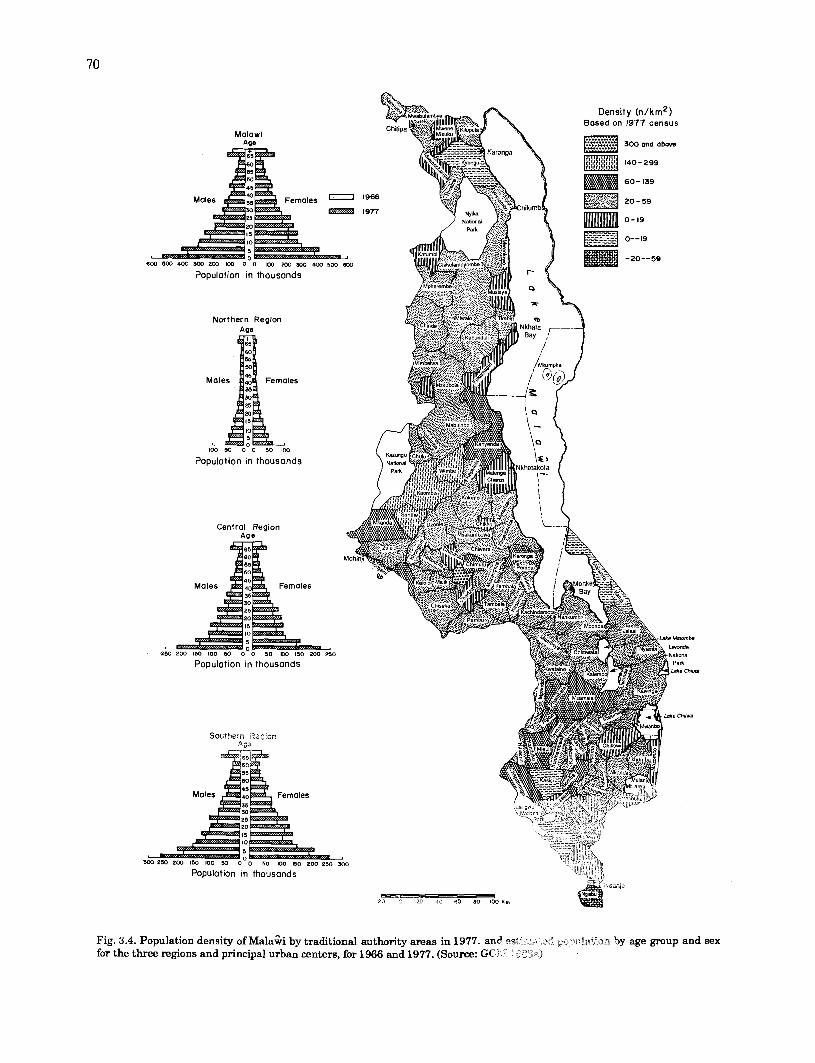
6 0 0 5 W 4 W J O o Z W 100 0 0 a0 2 0 0 ~ 4 C 0 5 0 0 ~
Po~ulation in thousands
Northern Region Age
Males Females
Po~ulation in thousands
Population in thousands
So~Therr , i s c or- 4 3
HX) 250 200 150 100 50 0 0 50 K)O 150 200 250
Populat~on In thousands
Fig. 3.4. Population density of ~ a l a 6 i by traditional authority areas in 1977. by age group and sex
for the three regions and principal urban centers, for 1966 and 1977. (Source:

often juxtaposed against those with scant inhabitants, because of unfavorable environmental characteristics.
The gross pattern of population distribution is summarized in Tables 3.2 and 3.3 and Figs. 3.5- 3.7. From this it can be seen that approximately 11% of the total population lives in the Northern Region, a t an overall density of 32 personslkm2; about 39% inhabits the Central Region a t an average density of 74 personslkm2; and 49% occupies the Southern Region a t an average pf 102 personslkm2 (GOM 1 9 8 7 ~ ) . These gross figures do not, however, reflect the considerable variations in population sizes and densities among the districts within the three regions, as is evident from Figs. 3.4 and 3.8. Variations in densities in terms of persons per unit of cultivable area are much greater.
The majority of the population inhabits plateaux areas, up to elevations of about 1,600 m above sea level (Fig. 3.8 and cf physiographic zonation map, Fig. 3.10). Apart from areas of reduced gradient owing to step faulting, as in the Dedza area, escarpment zones are generally very steeply sloped and are only sparsely populated, since soils are thin and easily eroded (Pike and Rimmington 1965). Further, owing largely to a
history of deforestation, perennial water sources are uncommon, and streams generally cease flowing early in the dry season (French 1986).
Population densities on the higher plateaux surfaces vary considerably, mainly as a consequence of variations in topographic and edaphic conditions. Thus the relatively inaccessible and inhospitable Nyika and Vipya plateaux of the Northern Region are virtually uninhabited, and large areas around these massifs support only sparse populations, principally owing to steep slopes and resultant infertile stony or sandy soils (Tables 3.2 and 3.3). In the Northern Region, rural population densities are high only in pockets along the lakeshore, and along the perennial streams of the upper course of the South Rukuru River (Fig. 3.8) (Pike and Rimmington 1965).
In contrast, the higher elevations in the Central Region are more densely populated, owing to the occurrence of fertile red soils and the frequent incidence of perched watertables beneath dambo land. Pockets of high population density are common in both the Lilongwe, Dedza, Dowa and Ntcheu districts (Pike and Rimmington 1965) (Fig. 3.8; Tables 3.2 and 3.3).
Fig. 3.5. Population density in MalaGi by district, 1987 (persons per km2). (Source: GOM 1987a)

Table 3.2. Land area, population density, agricultural type and natural physical constraints, by district in Mala&, 1983.
Region & Total Estimated Population Area by agricultural type ern2) Area by natural Vacant Popula- Vacant district land total density phy rim1 land tion land
area population (caplung Small- Subsistence farming constraints em2) b 2 ) increase in em2) mid4983 Estates holdings Scattered Nucleated Wetlands Slopes by year year
(1,000s) gardens gardens (> 12%) 2000 2000 (1,000s) b 2 )
Northern 26,930 750 27 1,249.1 9.25 740.4 877.7 889.0 11,886.9 4,881.14 861 2685 Region
Chitipa 3,504 83 24 22.7 3.84 71 .l 62.1 131.0 2,810.0 157.22 64 -1 2 Karonga 2,956 124 42 3.2 0 52.4 150.0 29.0 ZJ03.0 502.59 168 64 Nkhata Bay 4,088 122 30 97.8 1.05 105.5 162.9 153.5 1,891.2 345.1 9 104 67 Rumphi 5,952 72 12 301 .O 3.94 70.0 95.6 0 1,562.7 159.23 86 -70 Mzimba 10,430 349 33 824.4 0.42 441.4 407.1 575.5 3,520.0 3.7l6.91 439 2,646
- - -
Central 35,592 2,628 74 3,522.1 271.6 3,042.1 3,734.9 3J79.0 6,0541 8822.68 2,587 2.1 93 Region
Kasungu 7,878 239 30 1,609.4 265.0 400.0 404.6 786.0 119.5 1,928.45 484 637 Nkhotakota 4,259 115 27 328.9 6.63 66.7 138.5 263.55 142 -116 170.0 1,452.9 Ntchid 1,655 107 65 64.6 0 295.8 114.0 21 .O 765.4 278.96 87 48 Dowa 3,041 303 100 171.5 0 619.5 425.4 nS.0 736.4 762.97 269 73 Salima 2,196 162 74 235.2 0 157.5 143.2 l n . 0 83.4 1,026.30 206 480 Lilongne 6,159 864 140 n4.1 0 804.5 1,090.2 597.0 646 -375 769.2 1347.75
Mchinji 3,356 194 58 662.7 0 331.9 366.2 825.0 158.6 777.70 321 -80 Dedza 3,624 366 101 152.5 0 275.1 631.4 381 .O 1,157.8 739.95 106 459 Ntcheu 3,424 278 81 832 0 91.1 521.4 0 811.0 1,697.05 237 1,066
Southern 31,752 3 m 102 1,538.8 23.04 1826.9 3,306.7 2,122.5 5,724.8 10,977.62 2,469 6587 Region
ManW% 6,272 354 Machinga 5,964 400 Zomh 2680 41 3 Chiradzulu 767 206 Blantyre 2,012 479 Mwanza 2,295 84 T ~ Y O ~ O 1,715 377 Mulanje 3,450 560 Chikawa 4,755 227 Nsanje 1,942 127
Source: Compiled from GOM (1984) and GOM (l986).

Table 3.3. Land area, population distribution, agricultural type and natural physical constraints by district in MalaGi, 1983 (percentage distribution).
Region & Total Estimated Population % of area by agricultural type % of area with % Popula- % district land total distribu- natural physical Vacant tion Vacant
area population tion (5) 9mall- Subsintence farming constraints land increase landin (km2) mid4 983 Estates holdings Scattered Nucleated Wetlands Slopes by year year
(1,000s) gardens gardena (* 12%) 2000 2000 (1 .ooOs) oun2)
~ a l a i k 100.0 6,605 100 6.69 0.32 5.95 8.40 6.56 26.10 26.17 5,917 12.04
Northern 28.57 75~1 11.3 4.63 0.03 274 326 3.20 44.1 4 18.12 861 9.60 Region
Chitip 3.72 83 1.2 0.64 0.11 2.02 1.77 3.73 80.19 4.49 64 0.00 a m n g ~ 3.14 124 1.9 1 .08 0.00 1 .n 5.07 0.98 7l.14 17.00 168 1.83 Nkhata Bay 4.33 122 1.8 239 0.03 2.58 3.98 2.75 46.26 8.44 104 1.63 Rumphi 6.31 72 I .1 5.05 0.06 1.17 1 .60 0.00 26.25 2.67 86 0.00 Mzimba 11.06 949 55 7.90 0.00 4.23 3.90 6.52 33.75 35.64 439 24.41
Central 37.75 2,628 39.8 9.90 0.76 8.54 10.49 8.93 17.01 24.78 2,587 6.16 Region
Kasungu 8.35 239 3.6 20.42 3.36 5.07 5.1 3 9.97 1.52 24.48 464 8.09 Nkhotakota 4.52 115 1.7 7.72 0.16 1.56 3.25 3.99 34.11 6.18 142 0.00 Ntehisi 1.76 107 1.6 3.90 0.00 17.87 6.88 1 .n 46.24 16.86 87 2.90 Doan 3.23 303 4.6 5.64 0.00 20.37 13.99 7.50 24.22 26.08 259 2.40 Salima 2.32 162 25 l0.n 0.00 7.17 6.52 7.79 3.80 46.73 205 21.86 Lilongwe 6.53 864 13.0 3.47 0.00 13.06 17.70 9.690 12.48 Zl.88 646 0.00 Mehiqii 3.56 194 2.9 19.75 0.00 9.89 10.91 24.58 4.70 23.17 321 0.00 Dedza 3.84 366 5.5 4.20 0.00 7.59 14.66 10.51 31.94 20.41 106 12.67 Ntcheu 3.63 278 4.2 2.43 0.00 2.66 15.23 0.00 23.69 49.56 237 31.1 3
Southern 33.68 3227 48.9 4.84 0.07 5.75 10.41 6.68 18.02 34.57 2,469 20.74 Region
-- - ---
Mangochi 6.65 354 Maehinga 6.32 400 Zomba 2.74 41 3 Chiradeulu 0.81 206 Blantyre 2.13 479 Mwanza 2.43 84 Thyolo 1.81 377 Mulade 3.66 560 Chikawa 5.04 227 Nsanje 2.06 in
Sotirce: Compiled from GOM (1984) and GOM (1986).
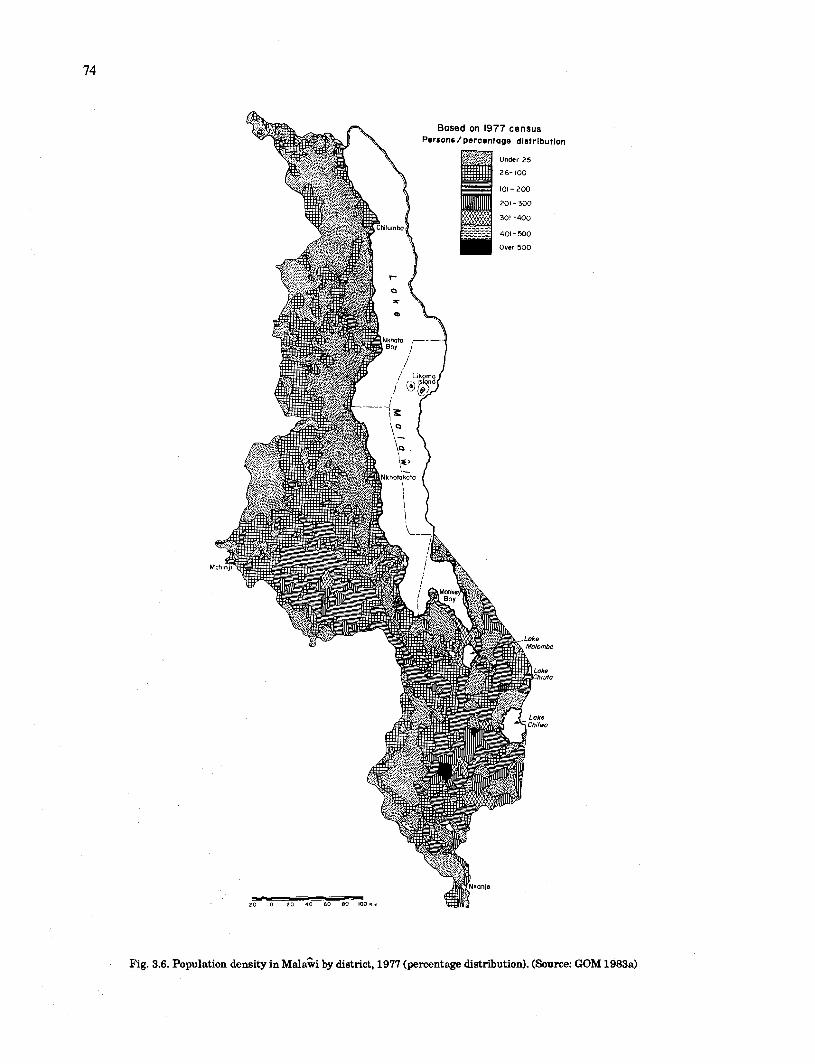
Fig. 3.6. Population density in ~ a l a % by district, 1977 (percentage distribution). (Source: GOM 1983a)
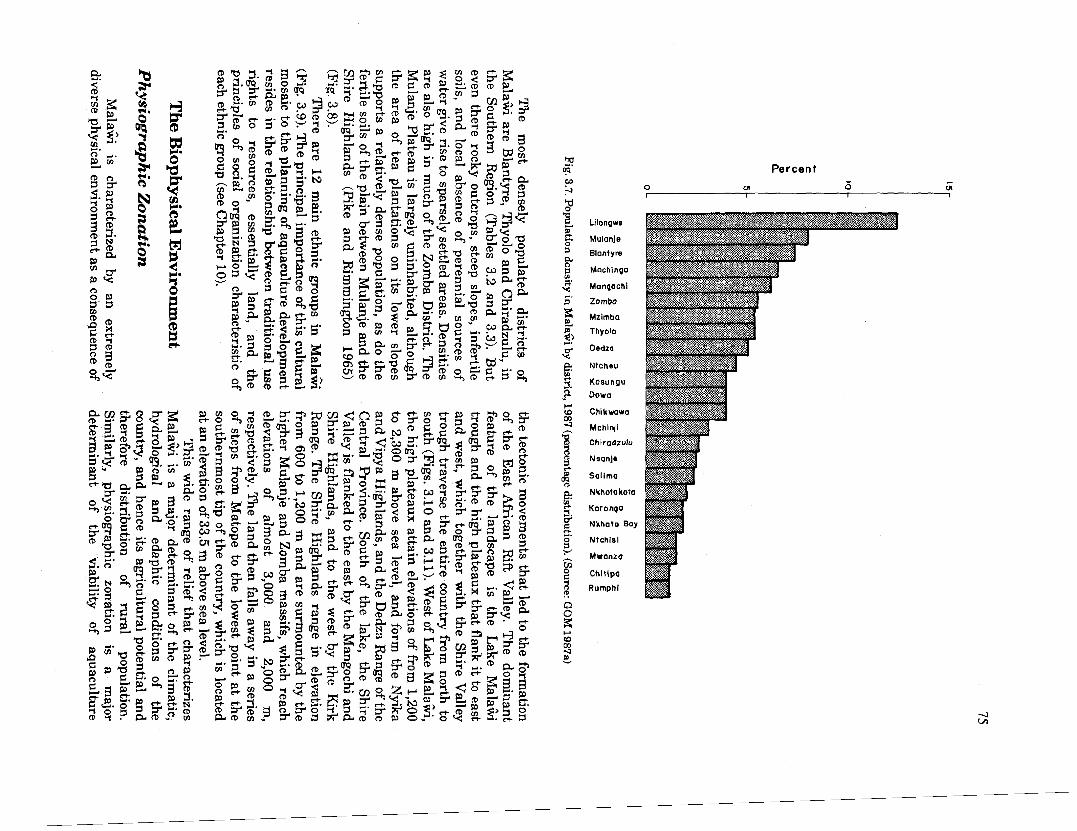
w i Lilongwe
Mulanjs
Blantyre 4 U Mochinga
Mangochi
Mzimba
Thyola $? e Dedza
Ntcheu
W 3. Kasungu
"a Dowa P
Chikwowa m Mchinji
Chiradzulu 1 Nsonje C solimo
Nkhotakota
Karongo
Nkhato Ba)
Ntchisi
Mwonzo
Chitipa
Rumphi
Percent 0 I
UI -
I 0 -
I UI

Fig. 3.8. Distribution of population in Mala*, 1977. (Source: GOM 198%)

K e y :
Nkhonde
Tonga
Ngoni
Chewa
Yao
Nyanja
----- ----- ----- ----- ----- ----- Lomwe ----- ----- E l " " " " " " " V " V V Y Y V V Y sena " " V Y Y V " "
Fig. 3.9. Distxibution of the principal ethnic c u p s in Mala%. (Sou-: Bi- and Logah 1972)
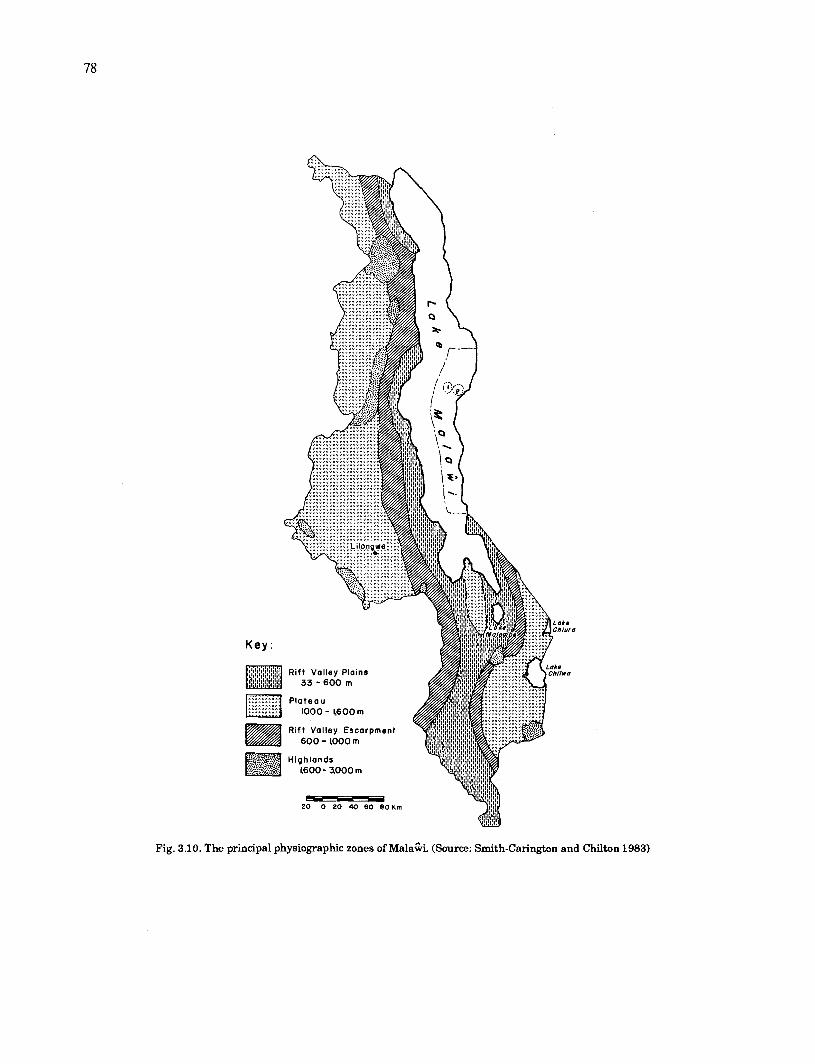
K e y :
Fig. 3.10. The principal physiographic zones of Mala%. (Source: Smith-Carington and Chilton 1983)

A. Section across Lake ~ala4i;ri
Ngondo Hill rn
8. Section across Malaki -~hikwawd to Mozambique border
Sapitwo, higcest point rn in Malawi _ _ _ _ _ _ _ _ - _ --- 3,000
------- -- 2,200
1,600
1,000 600
300
0
Vertical exaggeration 10 times
developments and of the natural distributi indigenous fish species.
For simplification, Mala% may be di into four main physiographic zones (Figs. 3.10 3.11): (1) highlands, (2) plateaux, (3) the Valley Escarpment, and (4) the Rift Valley (Pike and Rimmington 1965; Smith-Car and Chilton 1983).
(1) The Highlands. Extensive highland the most prominent of which are the Mula Zomba and Dedza mountains, together with Vipya and Nyika plateaux, which
Vegetation Mountain grasslands, scrub and Woodlands of the hlgh plains or
Woodlands of escarpments borderlng
Lowland Savanna
F Faults
Fig. 3.11. Physiographic cross-section of (A) Lake Mala% (Source: Hutcheson 1971)
elevations of 2,000-3,000 m above sea level, rise from the plateaux. These mainly granitic and syenitic formations are steep-sided and often deeply dissected resistant remnants of the post- Gondwana erosion surface. The plateaux surfaces are also interrupted abruptly by isolated blocks (inselbergen) of remnantal and resistant bedrock.
(2) The Plateaux. These ancient erosion surfaces are located a t elevations of 900-1,300 m above sea level, and cover extensive tracts of the Central and Northern regions. As a consequence of the tectonic movements that formed the East
rain forests d lower tnountaln slopes
Lower Shire Valley and Lake Shore Plain
and (B) across Mala% from Chikwawa to the Mozambique border.
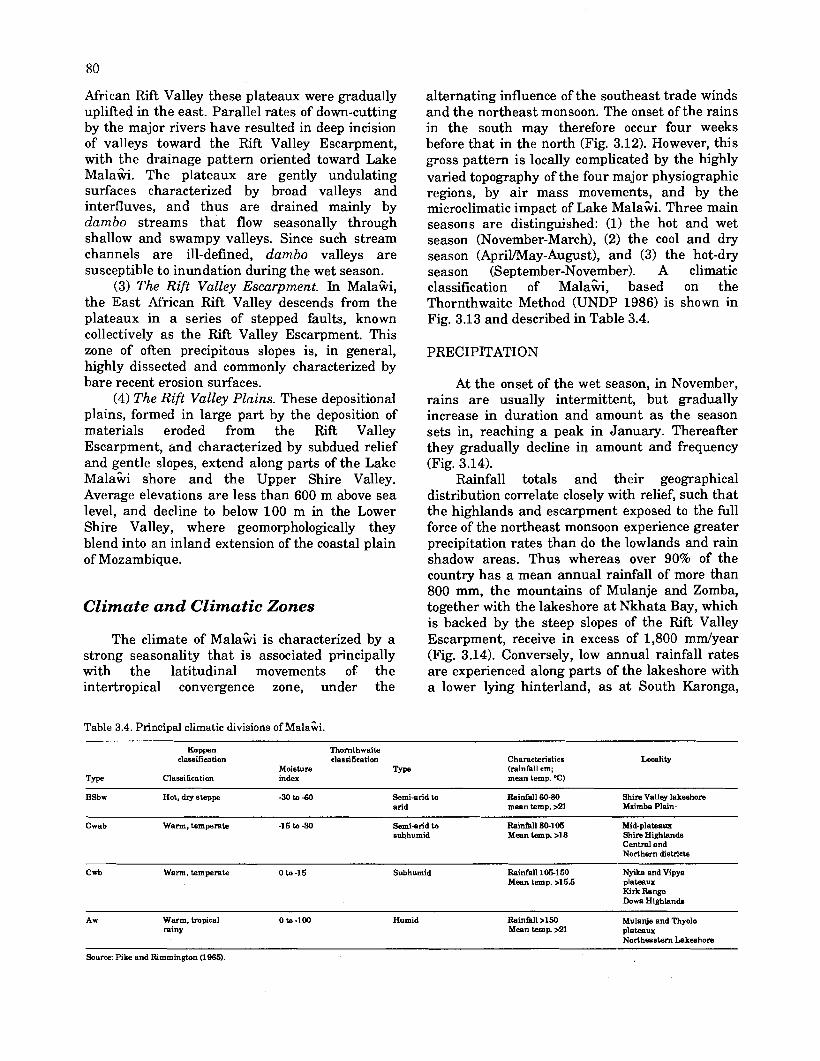
African Rift Valley these plateaux were gradually uplifted in the east. Parallel rates of down-cutting by the major rivers have resulted in deep incision of valleys toward the Rift Valley Escarpment, with the drainage pattern oriented toward Lake Mala%. The plateaux are gently undulating surfaces characterized by broad valleys and interfluves, and thus are drained mainly by dambo streams that flow seasonally through shallow and swampy valleys. Since such stream channels are ill-defined, dambo valleys are susceptible to inundation during the wet season.
(3) The Rift Valley Escarpment. In MalaGi, the East African Rift Valley descends from the plateaux in a series of stepped faults, known collectively as the Rift Valley Escarpment. This zone of often precipitous slopes is, in general, highly dissected and commonly characterized by bare recent erosion surfaces.
(4) The Rift Valley Plains. These depositional plains, formed in large part by the deposition of materials eroded from the Rift Valley Escarpment, and characterized by subdued relief and gentle slopes, extend along parts of the Lake Mala& shore and the Upper Shire Valley. Average elevations are less than 600 m above sea level, and decline to below 100 m in the Lower Shire Valley, where geomorphologically they blend into an inland extension of the coastal plain of Mozambique.
Climate and Climatic Zones
The climate of Malaki is characterized by a strong seasonality that is associated principally with the latitudinal movements of the int<ertropical convergence zone, under the
Table 3.4. Principal climatic divisions of ~ a l a % i .
alternating influence of the southeast trade winds and the northeast monsoon. The onset of the rains in the south may therefore occur four weeks before that in the north (Fig. 3.12). However, this gross pattern is locally complicated by the highly varied topography of the four major physiographic regions, by air mass movements, and by the microclimatic impact of Lake Mala%. Three main seasons are distinguished: (1) the hot and wet season (November-March), (2) the cool and dry season (ApriVMay-August), and (3) the hot-dry season (September-November). A climatic classification of ~ a l a % i , based on the Thornthwaite Method (UNDP 1986) is shown in Fig. 3.13 and described in Table 3.4.
PRECIPITATION
At the onset of the wet season, in November, rains are usually intermittent, but gradually increase in duration and amount as the season sets in, reaching a peak in January. Thereafter they gradually decline in amount and frequency (Fig. 3.14).
Rainfall totals and their geographical distribution correlate closely with relief, such that the highlands and escarpment exposed to the full force of the northeast monsoon experience greater precipitation rates than do the lowlands and rain shadow areas. Thus whereas over 90% of the country has a mean annual rainfall of more than 800 mm, the mountains of Mulanje and Zomba, together with the lakeshore a t Nkhata Bay, which is backed by the steep slopes of the Rift Valley Escarpment, receive in excess of 1,800 mmlyear (Fig. 3.14). Conversely, low annual rainfall rates are experienced along parts of the lakeshore with a lower lying hinterland, as a t South Karonga,
Ko~pen Thornthwaite classification classification
Moisture ' m e Classification index
Characteristics Locality (rainfall cm; mean temp. "C)
BSbw Hot, dry steppe -30 to -60 Semi-arid to Rainfall 60-80 Shire Valley lakeshore arid mean temp. >2l Mzimba Plain.
Cwab Warm, temperate -15 to -30 Semi-arid to Rainfall 80-1 05 Mid-plateaux subhumid Mean temp >18 Shire Highlands
Central and Northern districts
Cwb Warm, temperate 0 to -15 Subhumid Rainfall 1051 50 Nyika and Vipya Mean temp. >15.5 plateaux
Kirk Range Dowa Highland.
Aw Warm, tropical 0 to -100 Humid Rainfall >l50 Mulanje and Thyolo rainy Mean temp. >21 plateaux
Northeastern Lakeshore
Source: Pike and Rimmington U965).
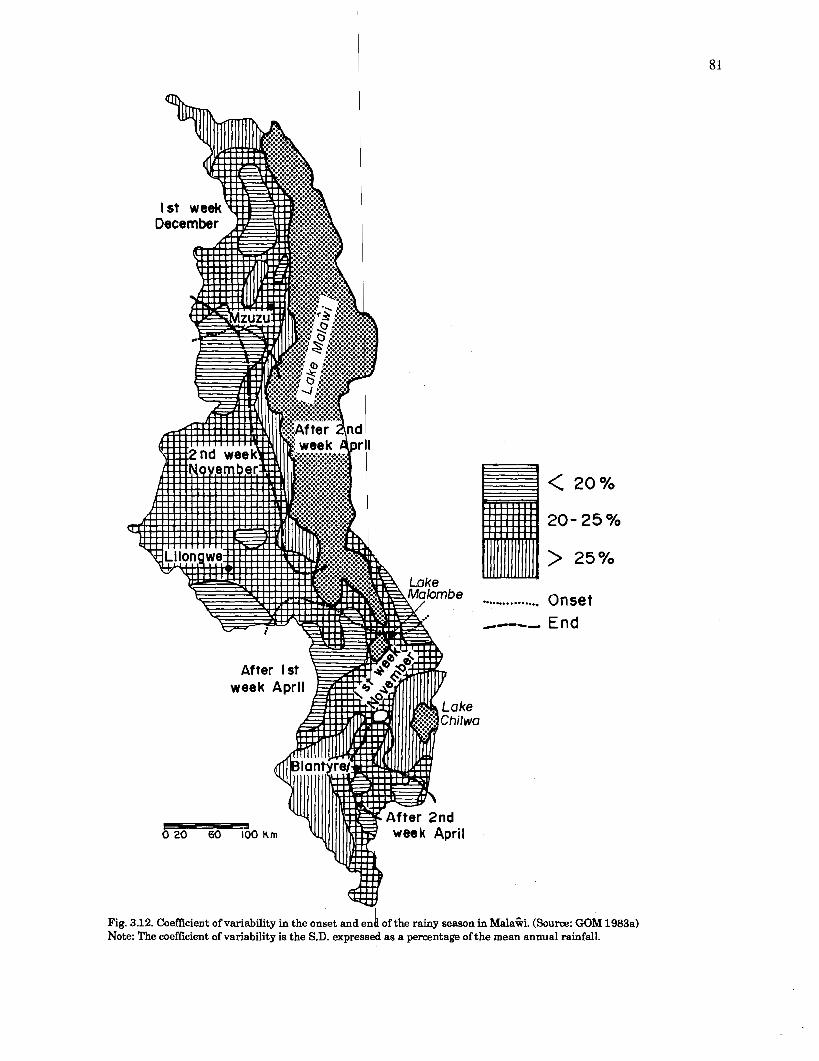
. ............... Onset ,--, End
Fig. 3.12. Coeffkient of variability in the onset and en of the rainy season in Malaivi. (Source: GOM 1983a) d Note: The coefficient of variability is the S.D. expressep as a percentage of the mean annual rainfall.

Fig. 3.13. Climatic. zonation of Mala&, based on the Thornthwaite method. (Sourre: UNDP 1986)

Salima, and Mangochi, in the Shire Valley lowlands, and in more restricted rain shadow areas, such as the Rukuru Valley (Fig. 3.14). Rainfall probability is shown in Fig. 3.15.
MalaGi has been classified into a number of such zones with particular reference to silviculture. This classification can also be applied to integrated agriculture-aquaculture systems (Fig. 3.19).
AIR TEMPERATURES EVAPOTRANSPIRATION
In general terms the cold season occurs during the period June through August, and thermal maxima are registered in November (Fig. 3.16). Thereafter air temperatures decline with the onset of the rainy season. Given the geographical location and small size of Mala%, and, conversely, its relatively high average elevation above sea level, air temperatures in the country are influenced more by relief than by latitude. However, in the cool season cold air masses striking inland from the Mozambique Channel have a greater influence on temperature than does relief. Further, the deep and expansive water mass of Lake Mala% exerts a moderating influence on low-lying lakeshore areas, which in the cool season tend to be warmer than do similarly low-lying locations further away (Fig. 3.16).
The range of mean monthly temperatures is 10-16°C in the Nyika Highlands, 16-26°C on the plateaux of the Central Region, 20-29°C on the lakeshore, and 21-30°C in the Lower Shire Valley. Extreme maxima of 40°C have been recorded in the Lower Shire Valley, in October and November, and are about 30°C in the high plateaux, during the same months. Absolute minima fall to near freezing in the highlands, in June and July, to 4- 6°C on the plateaux, and remain above 10°C along the lakeshore (Van der Velden 1980; Smith- Carington and Chilton 1983).
The relationship of air temperature to elevation above sea level is of major significance to planning for aquaculture in Mala%, and indeed over much of the SADCC Subregion and Africa as a whole, since suboptimal temperatures constrain growth and reproduction rates, according to species (LMA 1983a; Balarin 1987~). Temperatures generally decline between 0.4 and 0.8"C for every 100 m increase in elevation. Tlie relationship between elevation above sea level and temperature is depicted in Fig. 3.17, based on calculations for 52 meteorological stations in MalaGi (Van der Velden 1980). Fig. 3.18 shows the corresponding correlation between air and water temperature a t two fish culture research stations in the Southern Region. In general, natural resource zones are classified by elevation above sea level, temperature and precipitation.
An inverse relationship exists between evapotranspiration and elevation above sea level, with lower rates occurring a t higher elevations. Average annual pan evaporation is in the range of 1,500-2,000 mm in plateaux areas and 2,000-2,200 mm along the lakeshore and down the Shire Valley (Smith-Carington and Chilton 1983) (Fig. 3.20). Average moisture losses by evaporation along the lakeshore and in the uplands have been estimated a t 5.4 mrn/day, peaking in the dry season, when 8-15% of the loss occurs (LMA 1983a). In aquaculture this would represent a loss of 20,000 mVhalyear, or, conversely, would require a daily topping-up of 55 m3/halday, or 0.55%.
SUNSHINE, RELATIVE HUMIDITY AND WINDS
In general, Mala% experiences long hours of sunshine year-round, with the highest values being recorded during the September-October dry period, when cloud cover is least, and the lowest in the December-January wet season, when cloud cover is greatest. Values are also generally lower over mountain ranges and high plateaux, where the lower temperatures of these higher elevations are reflected in a greater relative humidity, and hence cloudiness (Fig. 3.21).
The lowest relative humidity rates correspond to highest sunshine values, and occur in September and October, the two hottest months, and just prior to the onset of the rainy season. Conversely, the highest occur in December-February, the rainy season (Fig. 3.21). Diurnal variations range from about 90% at dawn, when temperatures are lowest, to 40-60% (depending on the season) in mid-afternoon, when temperatures are highest.
Southeasterly winds prevail from March to September, and veer progressively northwards as the hot season intensifies. Prevailing wind patterns are locally distorted by major relief features. In particular, the Lake Mala% Basin and Rift Valley Escarpment reinforce the prevailing southeasterly flow (Fig. 3.21).
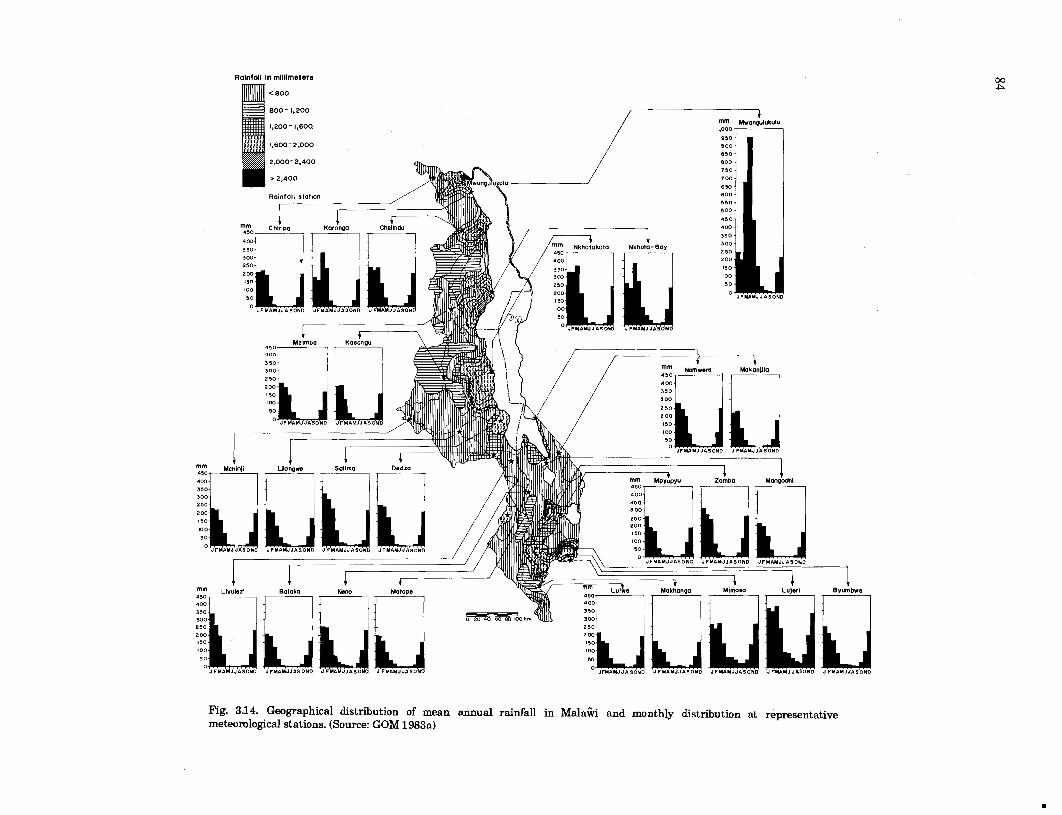
Ralnfall in millimeters
hJ J MAMJJASOND
Fig. 3.14. Geographical distribution of mean annual rainfall in Mala% and monthly distribution at representative meteorological stations. (Source: GOM 1983a)

Fig. 3.15. Geographical distribution of the probability of rainfall in ~ a l a i i . (Source: GOM 1983a)

Mean monthly maximum and minimum temperatures
Chitipa Karonaa Chelinda
Nkhotakota Mzuzu
Salima Lilonawe
Mean annuor minimum temperature (OC) maximum
temperature (OC) Chichiri N'aabu Manaochi
Fig. 3.16. Isotherms of mean annual maximum and minimum temperatures in MalaGIi and monthly means for representative meteorological stations. (Source: GOM 1983a)
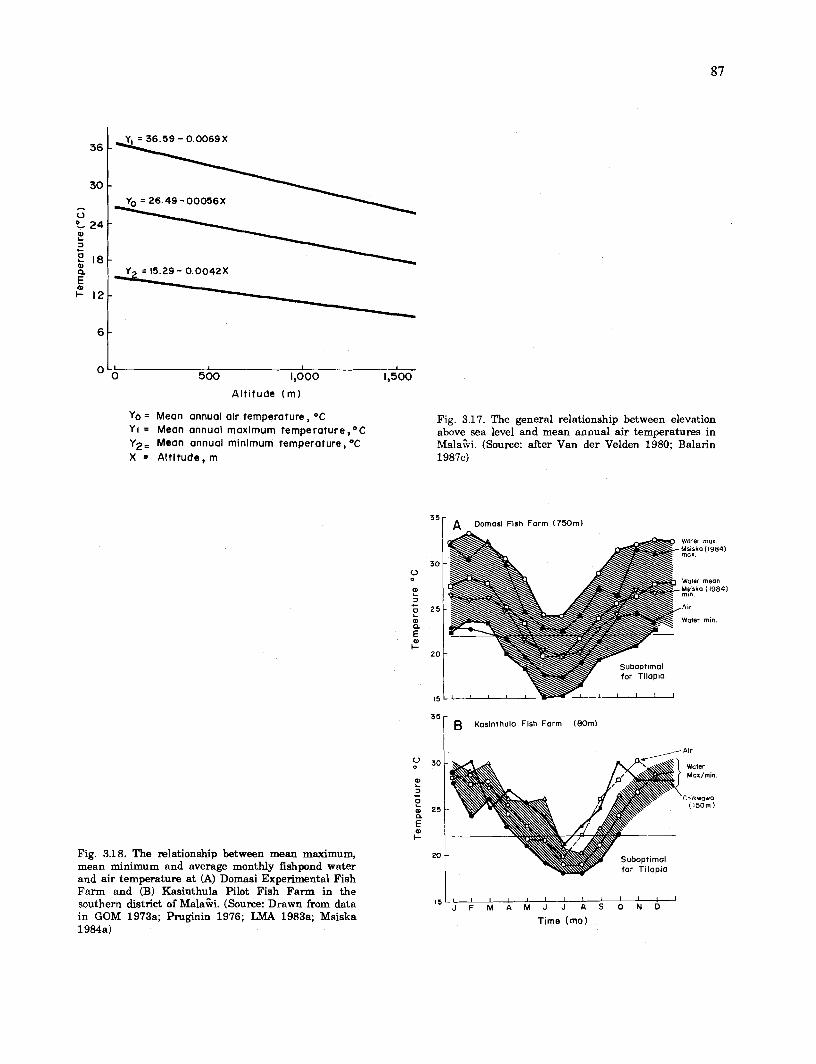
1
1 I
5 0 0 I
1,000 1,500
Altitude ( m )
Yo = Mean annual air temperature, OC YI = Mean annual maximum temperature,OC
Mean annual minimum temperature, OC X = Altitude, m
Fig. 3.18. The relationship between mean maximum, mean minimum and average monthly fishpond water and air temperature at (A) Domasi Experimental Fish Farm and (B) Kasinthula Pilot Fish Farm in the southern district of Mala&. (Source: Drawn from data in GOM 1973a; Pruginin 1976; LMA 1983a; Msiska 1984a)
Fig. 3.17. The general relationship between elevation above sea level and mean annual air temperatures in Malaii. (Source: after Van der Velden 1980; Balarin 1987~)
A Dornasi Fish Farm (750m) . . Water ma% Mslska (1984) max
Water mean M$lska ( 1984) m m
A r
Water mln
B Kasinthula Fish Farm (80m)
Aw
Water Maxlrnm
Chlkwawa ( 1 5 0 m )
1 1 1 1 1 1 1 1 1 1 1 1 1
J F M A M J J A S O N D
Time (mo)


Chiuta
Chilwa
Fig. 3.20.
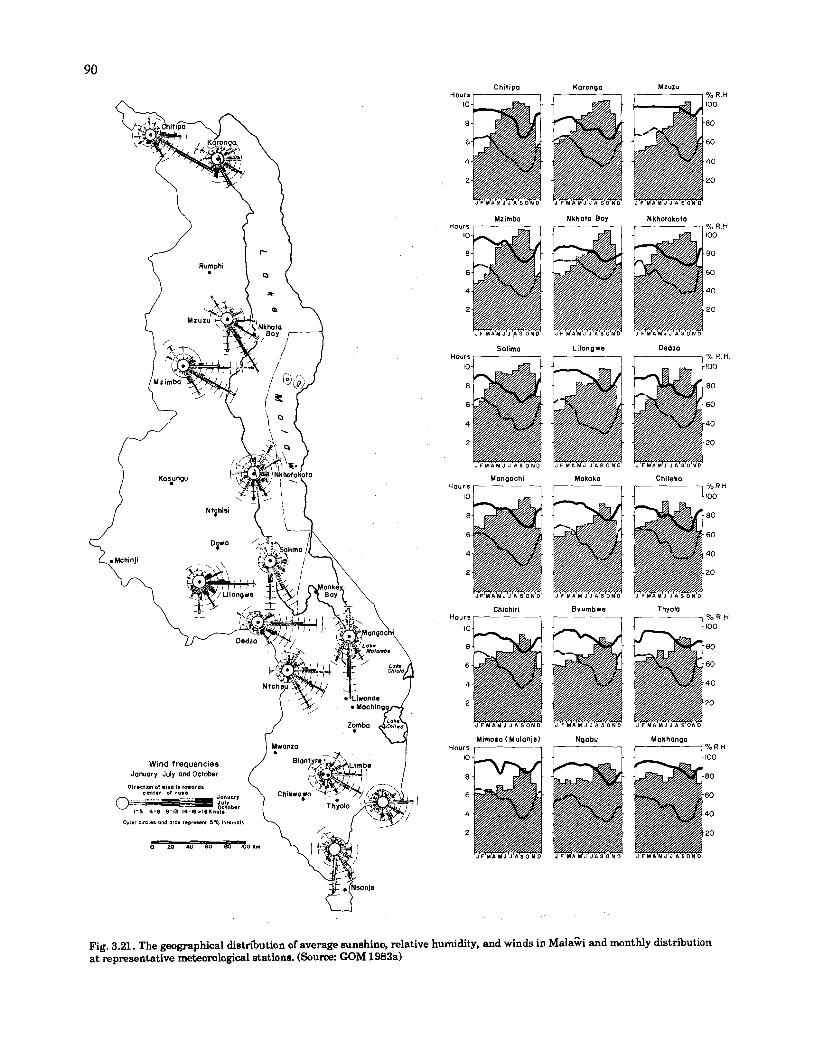
Wmd f r e q u e n c ~ e s January July and October
Olfectlon 01 mnd IS loword. 0.nt.r 01 ro.. , - _--- -_ 0-a 1-3 4-8 9-13 14-1e-1eKnots ~ o " c ~ a w
I
Outer EI ICI~S and arcs represew 5 % Intervals
0-0 km
Fig. 3.21. The geographical distribution of average sunshine, relative at representative meteorological stations. (Souree: GOM 1983a)
Hours 10
8
6
4
2
Mzimba Nkhata Bay Nkhotakota Hours % R H
10 100
8 80
6 60
4 40
2 20
Salima Lilongwe Dedza Hours- r-1 y l o h R H ..
Mangochi Makaka Chileka
Chichiri Bvumbwe Thyolo H o u r s 7 1
Mimosa (Mulanje) Ngabu Makhanga Hours r-1 y ~ % ~ . ~
humidity, and winds in ~ a l a % i and monthly distribution

Based on those characteristics described above, four broad climatic zones are recognizable in M a l a s (Fig. 3.13 and Table 3.4). These are: (1) a hot, dry steppe climate found in the upper and lower Shire Valley, the southwestern lakeshore, and in the Mzimba Plain; (2) a semi-arid warm temperate climate that occurs in the plateaux areas with medium elevations, the Shire Highlands, and in the Northern and Central regions; (3) a subhumid warm temperate climate in the Nyika, Vipya Massifs, in the Kirk Range, and a t Dowa; and (4) a humid tropical climate of Mulanje, Thyolo and the northwestern lakeshore. Further details of climatic conditions for selected meteorological stations are provided in Table 3.5.
Hydrography and Drainage Patterns
The hydrography of ~ a l a G i is dominated by the basin of Lake Malasi. Seventeen separate hydrographic basins or water resource areas (WRA) have been distinguished (Fig. 3.22 and Table 3.6) (Smith-Carington and Chilton 1983; UNDP 1986).
The surface drainage pattern is characterized by a striking seasonal variation in river flow rates (Figs. 3.23 and 3.24) (Smith-Carington and Chilton 1983; UNDP 1986), which are determined principally by the seasonality of rainfall (Fig 3.14). River flow thus becomes progressively lower during the April-November dry season. All but the largest rivers that rise in the highlands may cease flowing entirely a t the height of the hot dry season. In contrast, a t the height of the rainy season stream beds, often choked by sediments
deposited with declining flow rates of the preceding dry period, are commonly incapable of channeling water loads and inundate large surrounding areas, particularly on the gentle slopes of the Rift Valley Plains and in parts of the Shire Valley. This acute seasonality of streamflow has been exacerbated by deforestation and increased agricultural activities in the catchment. Indeed, in many localities the complete drying-up during the dry season of streams and springs may well have been caused by it (French 1986).
Runoff rates vary from as much as 44.1% in the North Rumphi river basin to a low of 10% for that of the Bua River (Table 3.6). This would affect catchment size for filling dams or rainfed ponds, as described in Chapter 1. Catchment areas required to fill and sustain a l-ha pond are given in Table 3.6. Of importance to both aquaculture and the distribution of fish species is that nearly 52% of all river basins in Mala% are located a t elevations in excess of 1,000 m above sea level (Table 3.6), and that only 13.5% lie below 500 m. This demonstrates that Mala* is mainly a country of high elevations (UNDP 1986), and is therefore likely to be better suited to the culture of more cold-tolerant fish species. I t also implies that tilapia will most likely not perform well during the cold season, and that these months of water temperature below 20°C could be discounted from the production cycle.
Perennial watercourses are relatively few in Mala%. For the most part they are associated with such massifs as the Zomba and Mulanje mountains, or the Vipya and Nyika plateaux, as a result of the greater mean annual rainfall -
experienced in those areas, together with the occurrence of deep aquifers. The principal watercourse of the country, the Shire River, is
Table 3.5. Climatic conditions at selected meteorological stations in ~ a l a & .
Town Elevation Temperature Annual Annual above range rainfall evaporation
sea level ("C) (mm) (mm) (m)
Kasinthula Nhkata Bay Dwangwa Karonga Mulanje Limbe Zomba Lilongwe Blantyre Nchenachena Mzuzu Chitipa Mzimba Mwera Hill Dedza Chilinda
Source: Balann (1 987c).

Key: Density of dams,
( k m2/ dam 1
Water resource areas Shire (excluding Ruo) Lake Chilwa Southwest lakeshore Linthipe Bua Dwangwa South Ruku~lNorth Rumphi North Rukuru SongweILufira Southeast lakeshore Lake Chiuta Likoma Island Chisumulo Island Ruo Nkhotakota lakeshore Nkhata Bav lakeshore Karonga lakeshore -
0 2 0 4 0 60 80 I00 Km
'catchment
Fig. 3.22. Water resource area (WRA) boundaries and distribution of dams in Mala%. (Source: UNDP 1986)

Table 3.6. Mean annual rainfall, runoff , number and d e n s i t y o f dams, and e l e v a t i o n a b o v e sea level of watersheds in Mala%.
WRA(a) River basin Catchment Rainfall Runoff Number Density Area (km2) ofvarious elevations of catchment above sea level Minimum catchment area m 2 ) (mm) (mm) (m3/s) 8 ofdams ofdams (m) area (ha) required
(km2/dam) per ha of rainfed pond
<I00 100-200 200-500 500-1,000 1,000-1,500 1,500-2.000 2,000-2,500 >2,500 Filling Season
1 Shire (b) 18.945 902 137 82 15.2 62 305.6 1,970 1,920 5,457 8,058 1,390 150 7.3 29.2
2 Lake Chilwa 4,981 1,053 21 3 34 20.2 31 160.7 4,571 295 115 4.7 18.8
3 Southwest Lakeshore 4,958 851 169 27 19.9 8 61 9.7 740 3,393 625 200 5.9 23.6
4 Linthipe 8,641 964 la 41 15.7 33 261.8 68 1,032 7,284 256 1 6.6 26.5
5 Bua 10,654 1,032 103 35 10.0 38 280.4 48 506 10,080 20 9.7 38.8
6 Dwangwa 7,768 902 109 27 12.1 50 155.4 230 1,310 6,108 120 9.2 36.7
South Rukum 11,993 873 115 44 13.2 8.7 34.8 7 274 46.4 13 187 10,160 1,624 720 1
North Rumphi 712 1,530 674 15 44.1 1.5 5.9
North Rukum 2,091 970 252 17 26.0 2 1,045.5 20 554 924 329 264 4.0 16.0
9 Lufira 1,790 1,391 244 14 17.5 4.1 16.4 3 1,226.7 162 71 3 2,068 722 15
Songwe(c) 1,890 1,601 327 20 20.4 3.1 12.2
10 Southeast Lakeshore (c) 1,540 887 201 10 22.7 1 1,540.0 31 4 1,040 181 5 5.0 20.0
11 Lake Chiuta 2,462 1,135 247 19 21.8 2 1,231 .O 2,089 369 4 1.0 16.0
12 Likoma Island 18.7 1,121 280 0 18.7 3.6 14.3
13 Chisumulo Island 3.3 1,121 280 0 3.3 3.6 14.3
14 Ruo (c) 3,494 1,373 538 60 39.2 21 5 16.2 130 2,751 399 140 67 7 1.9 7.4
1 5 Nkhotakota Lakeshore 4,949 1,399 260 41 18.6 9 549.9 1.1 03 2,998 818 30 3.8 15.4
16 Nkhata Bay Lakeshore 5,458 1,438 461 80 32.1 21 259.9 290 2,295 2,063 81 0 2.2 8.7
17 Kamnga Lakeshore 1,928 1,028 361 22 35.1 0 233 1.1 00 295 200 100 2.8 11.1
Total (dl (Mean) 94,276 (1,037) (196) 588 (18.9) 749 025.9) 1,970 1,920 8,808 32,619 43,059 4,725 1,657 8 5.1 20.4
Percentage 2.1 2.0 9.4 34.6 45.7 5.0 1.2
Source: Adapted from UNDP (1986). Note%: (a) WRA - Water Resources Area; 03) excluding the Ruo catchment; (c) Parts ofthe catchment are outside IdalaGi; (d) lakes areas are excluded; (e) Calculated as described in Ch.1: CX = (PWR) (S+E+D), where C = Catchment area in ha required for x ha of pond, p =
Pond Depth (m) of x ha of pond, R - Runoff (m), S + Seepage loss (mlyear), E = Evaportation loss (&year), D = Drainage loss (mlyear).

a. Lilongwe River runoff
c 5 0 1
b. Lilongwe 8 North Rumphl
40 1
I0 0
0 J F M A M J J A S O N 0
- Lllongwe ----- North Rumphi
c. Lilongwe 8 Lufira runoff
- Lilongwe ---- Luf ira
Surface runoff ( mm)
Fig. 3.23. Geographical distribution of mean annual surface runoff in ~ a l a 6 i and monthly distribution of runoff rates at (a) Lilongwe, (b) North Rumphi and (c) Lufira. (Source: GOM 1983a)
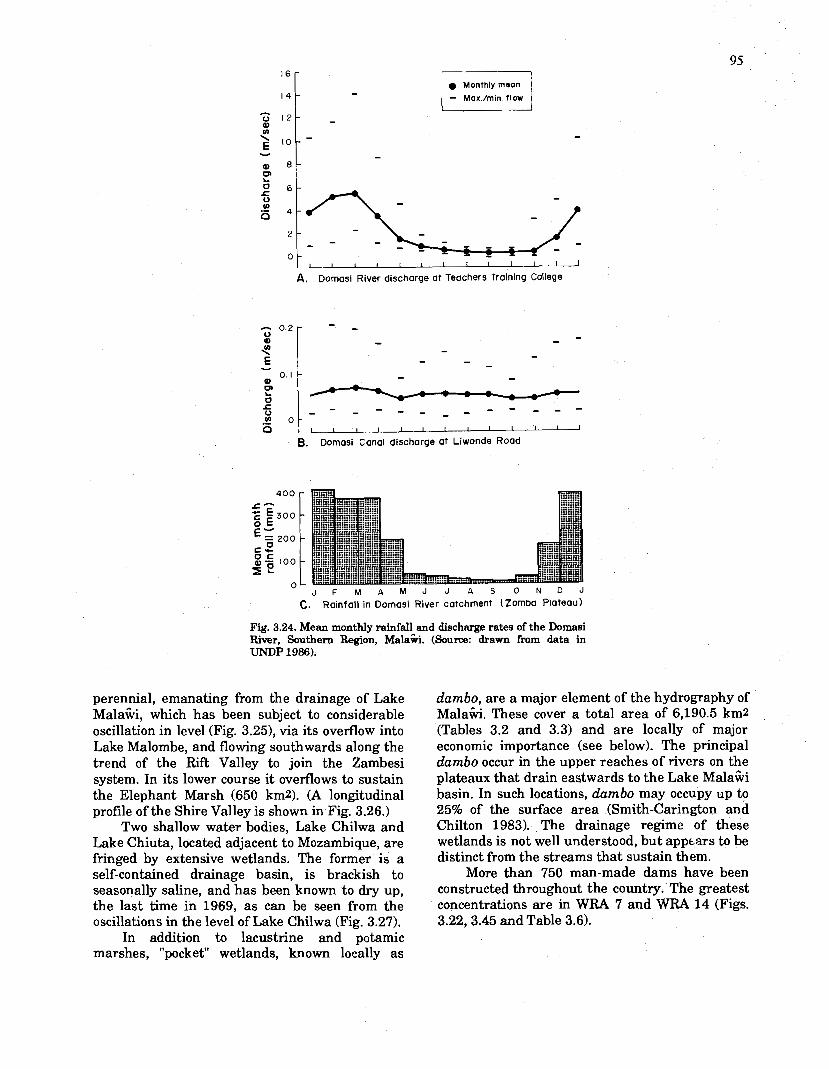
I I I I I I I ~ I I I I I J
A. Domasi River discharge at Teachers Training College
i - - a o \ - - - - - - - - - - - .- 0 1 1 1 1 1 1 1 1 1 1 1
B. Dornasi Canal discharge at Liwonde Road
" J F M A M J J A S O N D J
C. Rainfall in Dornasi River catchment (Zomba Plateau)
Fig. 3.24. Mean monthly rainfall and discharge rates of the Domasi River, Southern Region, Malaii. (Source: drawn fram data in UNDP 1986).
Monthly mean - Max./min flow
-
perennial, emanating from the drainage of Lake Mala%, which has been subject to considerable oscillation in level (Fig. 3.25), via its overflow into Lake Malombe, and flowing southwards along the trend of the Rift Valley to join the Zambesi system. In its lower course it overflows to sustain the Elephant Marsh (650 km2). (A longitudinal profile of the Shire Valley is shown in Fig. 3.26.)
Two shallow water bodies, Lake Chilwa and Lake Chiuta, located adjacent to Mozambique, are fringed by extensive wetlands. The former is a self-contained drainage basin, is brackish to seasonally saline, and has been known to dry up, the last time in 1969, as can be seen from the oscillations in the level of Lake Chilwa (Fig. 3.27).
In addition to lacustrine and potamic marshes, "pocket" wetlands, known locally as
dambo, are a major element of the hydrography of Mala%. These cover a total area of 6,190.5 km2 (Tables 3.2 and 3.3) and are locally of major economic importance (see below). The principal dambo occur in the upper reaches of rivers on the plateaux that drain eastwards to the Lake Mala% basin. In such locations, dambo may occupy up to 25% of the surface area (Smith-Carington and Chilton 1983). The drainage regime of these wetlands is not well understood, but apptars to be distinct from the streams that sustain them.
More than 750 man-made dams have been constructed throughout the country. The greatest concentrations are in WRA 7 and WRA 14 (Figs. 3.22,3.45 and Table 3.6).

46SL, , I i I I I I
1900 1910 1920 19JO 1340 1950 1960 1970 1980
Year
Fig. 3.25. Oscillations in the water level of Lake Mala%, 1900-1986. (Source: UNDP 1986)
Distance (km)
A Mangochl E Matope I Mpatamanga Gorge M Nchalo B Mwera F Kholombidza Falls J Hamilton Falls N Chlromo C Llwonde G Nkuia Falls K Kapochira Falls 0 Nsanje D Mpimbe H Tedzanl Falls L Chlkwawa P Border
Fig. 3.26. Longitudinal profile of the Shire River, MalaGi, from Lake Mala% to the Mozambique border. (Source: Hutcheson 1971
Soils
1951 1955 1959 1963 1967 1971
Year
Fig. 3.27. Oscillations in the water level of Lake Chilwa, Mala%, 1951 -1 971. (Source: Morgan 1971)
Most descriptions and analyses of ~ a l a s a n soils types have been related to land capability studies for agriculture (Kingston et al. 1978). Thus they require some supplementary information to make them more directly relevant to planning aquaculture development. The principal soil types of MalaGi may be grouped into four classes: latosols, calcimorphic soils, hydromorphic soils, and lithosols (Fig. 3.28).
The red-yellow latosols include the ferruginous soils of the Lilongwe Plain and the Southern Region, which are among the best agricultural soils in the country; the weathered ferrallitic ("plateau" or "sandveld") soils, some with a high lateritic content, which are of low natural fertility and easily exhausted, and that cover large parts of the plains along the western border country; and leached ferrallitic soils and ferrisols in areas of high rainfall, such as around Nkhata Bay (GOM 1983a).

I 0-go 1,K.
Fig. 3.28. Zonation of the principal soil types in Mala&.
Soils
Ferrugmous soils
Weathered ferrailltlc SOIIS
Weathered ferrallittc solis With laterlte common
Leached fermllitlc soils and ferrisols
Hum~c ferrall~trc so~ls
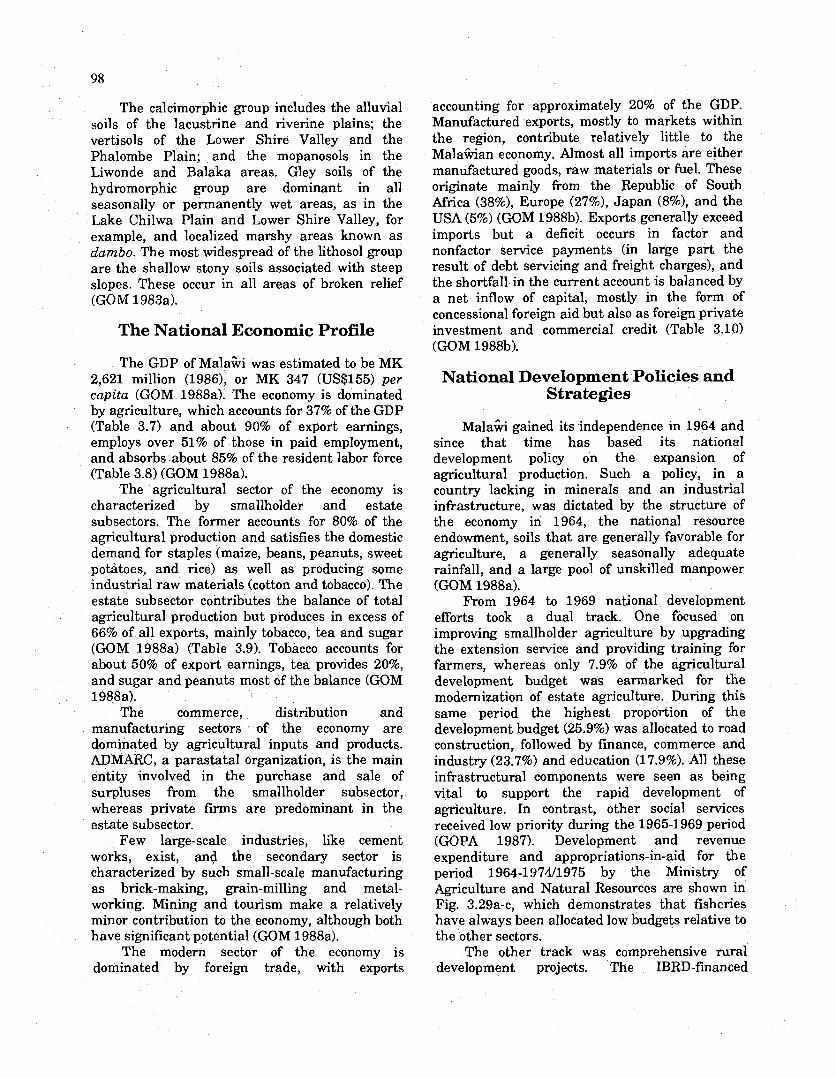
The calcimorphic group includes the alluvial soils of the lacustrine and riverine plains; the vertisols of the Lower Shire Valley and the Phalombe Plain; and the mopanosols in the Liwonde and Balaka areas. Gley soils of the hydromorphic group are dominant in all seasonally or permanently wet areas, as in the Lake Chilwa Plain and Lower Shire Valley, for example, and localized marshy areas known as dambo. The most widespread of the lithosol group are the shallow stony soils associated with steep slopes. These occur in all areas of broken relief (GOM 1983a).
The National Economic Profile
The GDP of Mala& was estimated to be MK 2,621 million (19861, or MK 347 (US$155) per capita (GOM 1988a). The economy is dominated by agriculture, which accounts for 37% of the GDP (Table 3.7) and about 90% of export earnings, employs over 51% of those in paid employment, and absorbs about 85% of the resident labor force (Table 3.8) (GOM 1988a).
The agricultural sector of the economy is characterized by smallholder and estate subsectors. The former accounts for 80% of the agricultural production and satisfies the domestic demand for staples (maize, beans, peanuts, sweet potatoes, and rice) as well as producing some industrial raw materials (cotton and tobacco). The estate subsector contributes the balance of total agricultural production but produces in excess of 66% of all exports, mainly tobacco, tea and sugar (GOM 1988a) (Table 3.9). Tobacco accounts for about 50% of export earnings, tea provides 20%, and sugar and peanuts most of the balance (GOM 1988a).
The commerce, distribution and manufacturing sectors of the economy are dominated by agricultural inputs and products. ADMARC, a parastatal organization, is the main entity involved in the purchase and sale of surpluses from the smallholder subsector, whereas private firms are predominant in the estate subsector.
Few large-scale industries, like cement works, exist, and the secondary sector is characterized by such small-scale manufacturing as brick-making, grain-milling and metal- working. Mining and tourism make a relatively minor contribution to the economy, although both have significant potential (GOM 1988a).
The modern sector of the economy is dominated by foreign trade, with exports
accounting for approximately 20% of the GDP. Manufactured exports, mostly to markets within the region, contribute relatively little to the Malasan economy. Almost all imports are either manufactured goods, raw materials or fuel. These originate mainly from the Republic of South Africa (38%), Europe (27%), Japan (8%), and the USA (5%) (GOM 1988b). Exports generally exceed imports but a deficit occurs in factor and nonfactor service payments (in large part the result of debt servicing and freight charges), and the shortfall in the current account is balanced by a net inflow of capital, mostly in the form of concessional foreign aid but also as foreign private investment and commercial credit (Table 3.10) (GOM 1988b).
National Development Policies and Strategies
~ a l a 6 i gained its independence in 1964 and since that time has based its national development policy on the expansion of agricultural production. Such a policy, in a country lacking in minerals and an industrial infrastructure, was dictated by the structure of the economy in 1964, the national resource endowment, soils that are generally favorable for agriculture, a generally seasonally adequate rainfall, and a large pool of unskilled manpower (GOM 1988a).
From 1964 to 1969 national development efforts took a dual track. One focused on improving smallholder agriculture by upgrading the extension service and providing training for farmers, whereas only 7.9% of the agricultural development budget was earmarked for the modernization of estate agriculture. During this same period the highest proportion of the development budget (25.9%) was allocated to road construction, followed by finance, commerce and industry (23.7%) and education (1 7.9%). All these infrastructural components were seen as being vital to support the rapid development of agriculture. In contrast, other social services received low priority during the 1965-1969 period (GOPA 1987). Development and revenue expenditure and appropriations-in-aid for the period 1964-1974/1975 by the Ministry of Agriculture and Natural Resources are shown in Fig. 3.29a-c, which demonstrates that fisheries have always been allocated low budgets relative to the other sectors.
The other track was comprehensive rural development projects. The IBRD-financed

Table 3.7. Gross domestic product of ~ a l a G i , 1984-1988, by sector or origin at 1978 constant factor cost, and projections for 1989-1992 (MK million). - -- -
Projected Average Rate 1988-1992 Growth
(40) Rate (%) 1984 1985 1986 1987 1988 1989 1990 1991 1992 1986-92
Agriculture Small-scale Largescale
Manuhcturing Electricity and water Construction Distribution Transport and communications Finnncial and mfessional services Ownership of dwellinp Private locia1 end community services Government services Unallomted financial charges GDP at tactor cmt
Sources: GOM (1977); W M (1 988); W P A (1987) Note: For foreign exchange rates, seep. 302.

Table 3.8. Number of paid employees by industrial group and sector in Mala&, 1977-1985. 8
Industry Sector Year
1977 1978 1979 1 980 1981 1982 1983 1984 1985
- -
154.7 168.9 182.3 181.1 157.2 179.2 197.2 177.7
Agnculture, forestry & fishing 189.3
Private 132.8 147.9 160.8 159.1 135.4 158.1 177.3 156.2 1655
Government a .9 21 .O 21.5 22.0 21.1 n .I 24.9 22.5 23.8
0.6 0.6 0.6 0.6 0.6 0.6 0.5 0.3
Mining & quarrying 0.3
Private 0.6 0.6 0.6 0.6 0.6 0.6 0.5 0.3 0.3
Manufacturing 33.5 36.8 37.1 39.7 35.4 31.4 4
Private 32.2 34.8 35.9 382 33.9 29.9 45.8 47.8 57.4
Government 1.3 1 .O 1.2 1.5 1.5 1.5 1 .8 1.4 2.5
2.8 2.9 3.5 4.0 4.1 4.3 5.4 4.9
Electricity & water 4.5
Private 2.3 2.4 3.0 3.4 3.5 3.6 3.5 3.5 8.7
C~vernment 0.5 0.5 0.5 0.6 0.6 0.7 1.9 1.4 0.8
-.
23.3 31.6 33.4 327 24.7 24.7 23.4 25.9
Building & construction 23.1
Private 18.6 27.5 29.7 27.7 20.9 20.9 19.7 20.8 17.9
-"." .... --.." -..
Wholesale & retail trade & hotels & restaurants 25.2 27.5 28.3 26.3 23.6 Zl.8 24.8 31.7 38.6
Private 24.8 27.1 27.9 25.9 23.2 21.1 24.1 31 .O 37.9
Cavernment 0.4 0.4 0.4 0.4 0.4 0.1 1.9 0.7 0.7
Transport, storage & communications
Private 12.9 14.0 14.2 13.3 127 12.4
Government 3.7 3.8 4.2. 3.9 4.3 4.3 4.4 4.6 4.5
Finance, insurance & business services 6.6 6.8 8.4 12.1 10.6 10.0 11.2 11.5
Private 6.0 6.2 7.8 11.5 9.9 9.3 10.5 10.8 11.9
Government 0.6 0.8 0.6 0.6 0.7 0.7 0.7 0.7 0.8
Community, social & personal services 45.5 47.4 48.1 53.6 54.6 55.3 55.3 57.6 67.0
uriv.tp 9 A 10.8 10.6 11.0 12.2 11.8 13.9 15.0 14.7
- - . . . . . .
308.8 339.3 360.0 367.3 327.6 344.1 387.5 380.8 4UY.3
Total
Private 204.2 271.3 290.4 290.9 251.5 267.7 307.6 301.7 328.6
Government 68.6 68.0 69.6 76.4 76.1 76.4 80.0 79.1 80.7
Source: GOM (1988).

Table 3.9. Principal export commodities of Mala%, 1985-1988 (MK million).
Commodity Year 1985 1986 1987 1988
Agricultural c r o p Tobacco Tea Sugar Peanuts Rice Cotton Pulses Coffee Maize
Total Other crops & manufacturing
Total domestic exports Re-exports
Total
S o u m GOM (1 988b) Note: For foreign exchange rates, wie p. 302.
Table 3.10. Balance of payments in Mala%, 1984-1988 (MK million).
Item Year
1984 1985 1986 1987 1988
(A) Current account Merchandise trade
Exports of goods, f.0.b. Imports of goods, t0.h. Trade balance
Services & unrequited transfers Nonfactor services Receipts Payments Balance
Factor services Receipts Payments Balance
Private transfers Receipts Payments Balance
Current account balance
03) Capital account
Long-term capital government transfers Receipts Payments Balance
Government drawings Receipts Payments Balance
Public enterprises Receipts Payments Balance
Private enterprises Receipts Payments Balance
Balance on long-term capital Short-term capital Financing item Errors and omissions
Balance before debt Debt relief Overall balance after debt relief Change in the net foreign assets
of the banking system
Source: GOM (1988b) Note: For foreign exchange rates, seep. 302.
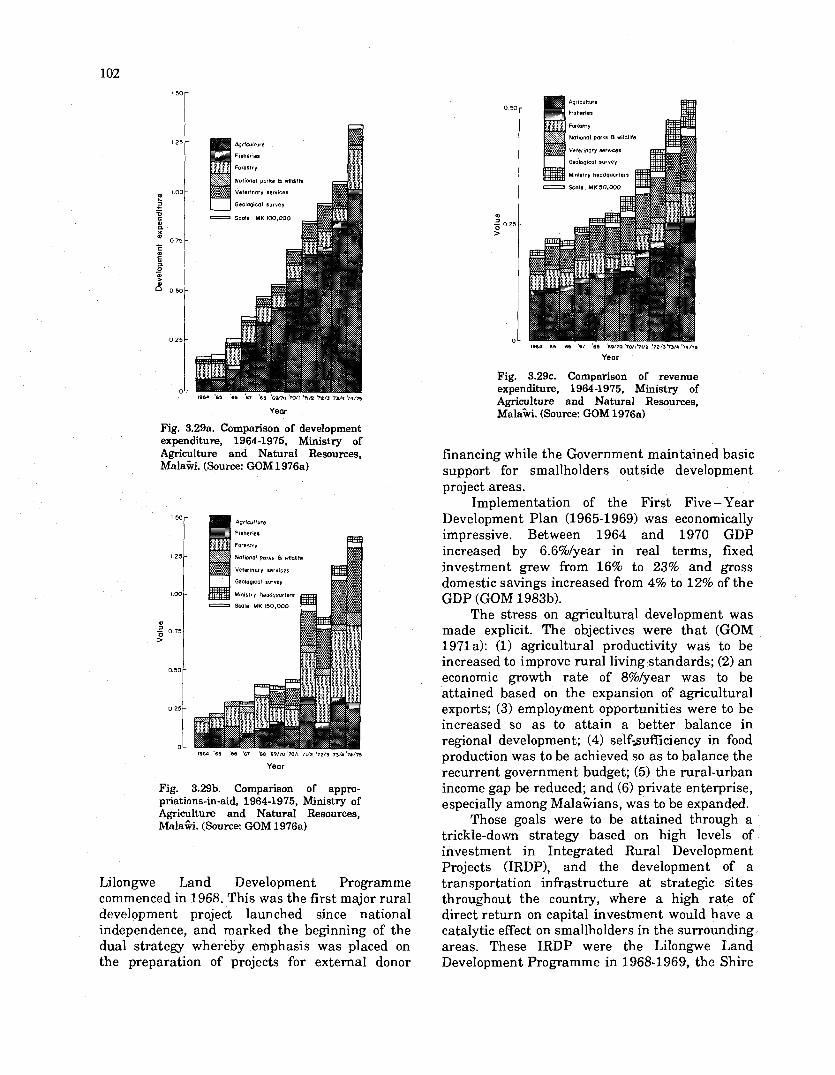
Fig. 3.29a. Comparison of development expenditure, 1964-1975, Ministry of Agriculture and Natural Resources, Malaiki. (Source: GOM 1976a)
Natmol pmks a w ~ f e
Veterlnory rervtcer
Ministry heodquorters
Scale MK 150 ,000
Year
Fig. 3.29Ei. Comparison of appro- priations-in-aid, 1964-1975, Ministry of Agriculture and Natural Resources, Mala%. (Source: GOM 1976a)
Lilongwe Land Development Programme commenced in 1968. This was the first major rural development project launched since national independence, and marked the beginning of the dual strategy whereby emphasis was placed on the preparation of projects for external donor
Notional parks 8 wildlife
Veterrnary services
Geological survey
Year
Fig. 3.29~. Comparison of revenue expenditure, 1964-1975, Ministry of Agriculture and Natural Resources, Mala%. (Source: GOM 1976a)
financing while the Government maintained basic support for smallholders outside development project areas.
Implementation of the First Five - Year Development Plan (1965-1969) was economically impressive. Between 1964 and 1970 GDP increased by 6.6%/year in real terms, fixed investment grew from 16% to 23% and gross domestic savings increased from 4% to 12% of the GDP (GOM 198313).
The stress on agricultural development was made explicit. The objectives were that (GOM 1971a): (1) agricultural productivity was to be increased to improve rural living standards; (2) an economic growth rate of 8%/year was to be attained based on the expansion of agricultural exports; (3) employment opportunities were to be increased so as to attain a better balance in regional development; (4) self-sufficiency in food production was to be achieved so as to balance the recurrent government budget; (5) the rural-urban income gap be reduced; and (6) private enterprise, especially among MalaGians, was to be expanded.
Those goals were to be attained through a trickle-down strategy based on high levels of investment in Integrated Rural Development Projects (IRDP), and the development of a transportation infrastructure a t strategic sites throughout the country, where a high rate of direct return on capital investment would have a catalytic effect on smallholders in the surrounding areas. These IRDP were the Lilongwe Land Development Programme in 1968-1 969, the Shire

Valley Development Project (1969-1970), the Karonga-Chitipa Development Project (1972- 19731, and the Lakeshore Development Project (1968-1969), and others that followed later (Fig. 3.30).
Despite the consistent stress on agricultural development and the large investment in rural development projects, there was little increase in the productivity of smallholder agriculture during in the 1970s. Increases arose more from the expansion in the area cultivated rather than from improved yields (GOM 1985a). Between 1973 and 1979 the growth rate of smallholder agriculture was 4.5%, compared with 9.6% for the estate sector. During the period 1979-1983 smallholder output grew by -2.7%, compared with a growth of 7.0% for the estate sector. Smallholder agriculture recovered to record growth rates of 5.6% (1983) and 7.2% (1984), whereas estate agriculture performed badly, recording rates of 6.6% and -0.6% in the same years, respectively (GOM 1985a).
In 1978 the National Rural Development Programme (NRDP) was devised to shift the emphasis from major capital intensive projects concentrated in areas of high development potential to a rolling program in support of area development which would, over a period of years, modernize the agricultural economy of the whole country. This program was implemented in 1978, with the following objectives: (1) to increase smallholder production to produce cash crops for export and to feed the growing urban population; (2) to provide the inputs and services needed to enable smallholders to increase production per unit area; (3) to conserve natural resources by encouraging good cultivation practices and soil conservation and by conserving key watersheds, especially in areas with fishery potential; and (4) to maintain forests by afforestation in reserves on customary and estate land.
To implement this strategy Mala6 was divided into 8 Agricultural Development Divisions (ADDS), within which agricultural development projects are implemented via 40 Development Areas (DAs) or Rural Development Project Areas (RDPs) (Fig. 3.31), and 180 Extension Planning Areas (EPAs). The latter are mostly ecologically uniform areas with identifiable topographical boundaries, and inhabited by an average of 5,000 small-scale farm families (GOM 198313). Implementation of the NRDP is still based on the project approach.
Economic Performance Since Independence
Selected economic and social indicators since independence are provided in Table 3.11. In terms of economic performance the analysis of the MalaGian economy in the 24 years since independence can be divided into four periods, as follows (GOM 1988a).
The period 1964-1969 was characterized by relatively sluggish growth, in some years of which declines in agricultural yields and related sectors were registered. This was followed from 1970 to 1978 by a general and rapid growth (GOM 1988a).
During the period 1979-1981 the economy stagnated, with a per capita growth rate of -0.8%, and a decline in per capita incomes (GOM 1988a). Agriculture, particularly the smallholder sector, performed badly, with output decreasing a t a rate of -2.7%. This negative result stemmed from a variety of factors, including disruption of international overland transport by unstable conditions in Mozambique, the fall of international commodity prices, and severe and prolonged drought (GOM 1988a). Structural weaknesses were also to blame. These included the limited coverage of past agricultural development projects, inadequate prices to stimulate smallholder development, and a lack of diversification in the estate sector, which was heavily concentrated on tobacco, tea and sugar, among other crops (GOM 1983b).
Implementation of structural adjustment policies has led to steady economic recovery from 1983 to the present, although a modest decline was experienced in 1987 (GOM 1988a). Overall, agriculture grew by 5.9% (1982), 4.3% (1983), and 6.3% (1984) (IBRD 1986). Following price increases the recovery in the smallholder subsector was impressive, with growth rates of 2.5% (1982), 5.6% (1983) and a record 7.2% (1984). In comparison, in 1984 estate agriculture experienced no growth (IBRD 1986).
Since independence, M a l a s s development strategies and policies have been based on growth rather than equity. Agriculture has been used as a means of attaining that growth. As a consequence, in growth economic terms the attainment of the policy objectives has been good, and Mala% is one of the few African countries that not only has been able to produce enough staple food but also an exportable surplus.

Karonga - Chitipa ,'-A
. Y' A - o Chikwin
MbachandojO B (
Mzimba W q f ;i? / (& Nkhata Bay
1- Likorna
-'
/-- i "I Ntchisi
Kasungu A I
Rural growth centers ~sango'nom
project Zarnba West. i Ma
Mchinji
Planning regions for national program -
20 o 20 40 60 80 km
Pilot center sites completed or under
\A construction j r " Mwanza &a@ Pilot centers planned O
I Chim* .L Plnn ..,*a , ?-L-
Fig. 3.30. Locat .ion of rural growth center prajecta in Mala%. (Source: C

Henga Kaaitu R.D.P.
North/West Mzimbo small holder tobacco
West Mzimba land utilization project Nkhata Boy lakeshore R.D.P
Mzimbo South R.DR
Salima A D D
Liwonde A D D
National rural development Ntcheu R.D.P. project and agriculural
development areas
Original major project areas
areas Shire Highlands R.D.P
Ronching areas
Smallholder flue-cured tobacco projects
Agricultural development division boundary
M.Y P. training base *.
P 20 0 20 40 60 80 k m
Fig. 3.31. Location of rural development pmject (RDP) and agricultural development divisions (ADD) in Mala%. (Source: GOM 1983a)

Table 3.11. Selected economic and social indicators for ~ a l a G i , 1965-1985.
Indicator Year 1965 1970 1975 1980 1985
Population (million) GDP at current market prices (MK million) GDP deflator 0970 - 100) GDP at constant 1970 prices
Average annual GDP gmwth rates Agricultural production: GDP at factor cost (46) Exports (MK million) Imports (MK million) Terms of trade 0970 = 100) Fish landings (thousand t) Electricity sales (MK million) Maintained mral boreholes (Na) Bitumen roads (km) Road vehicles (thousand) Rail treight (thousand t) Total wage employment (thousand)
Private (thousand) Government (thousand)
Foreign remittanme (MK million) Manufacturing output 0970 = 100) Primary school enrollment (thousand) Secondaly school enrollment (thousand) University enrollment Hospital beds (No.) Government recurrent revenue (MK million)
Recurrent expenditure (MK million) Development expenditure (MK million)
Inflation (Blantyre) low income index
Source: GOM (1988). Note: For foreign exchange rates, sea p. 302.
Wages, Incomes and Prices
Annual average wages earned by paid employees, by sector and industrial classification, are shown in Table 3.12. Those in the agriculture, forestry and fisheries sector, although having risen by 114% since 1977, and now standing a t MK 317 (19851, are still only 42% of the national average of MK 755 for all sectors (GOM 1988a). Recent substantial increases in the statutory minimum daily wage rates by location for the period 1974-1989 are shown in Fig. 3.32 and Table 3.13.
Since the bulk of the population is involved in smallholder agriculture it is not employed in full- time wage labor. Annual average rural household cash income in 1980-1981 was MK 137, or MK 30.4lper capita (based on an average household size of 4.5 persons) (GOM 1984~). More than 34% of that income was generated by crop sales, including 23.4% from the sale of subsistence foodstuffs (GOM 1982a). (For other potential sources of income for rural households, see Chapter 9.) After spending money on essential goods and services, the average rural household has a cash surplus of only MK 20; ranging from MK 0.57 in Karonga ADD to over MK 50 in Kasungu ADD (GOM 1984~) (Table 3.14).
The composite retail price index for the period 1980-1988 for selected goods and services is shown in Fig. 3.33 and Table 3.15. Average prices
of selected basic foodstuffs for the period 1975- 1985 in Blantyre and Lilongwe are given in Fig. 3.34 and Table 3.16. These indicate the trend in the increase in the cost of living, and in particular a marked recent upsurge in inflation, of 26.7%, in 1987 (GOM 1988c), which stemmed from a currency depreciation in February 1987 (see p. 302), increased government borrowing to finance the public sector deficit, and a general increase in import prices.
Background to the Development of Agriculture in Mala%
During the Pleistocene Era, rainfall in eastern Central Africa averaged some 50-150% more than at present, and evidence suggests that during the Gamblian Pluvial Era (40,000-12,000 B.P.) air temperatures in the region averaged some 5°C less than now, and that montane plant communities flourished a t correspondingly lower elevations (Pachai 1972). Hypothetical reconstruction of former patterns of natural vegetation in eastern Central Africa (Fig. 3.35) suggests that the area now occupied by Mala% may have been more heavily forested than adjacent areas, despite environmental extremes, and thus would have been capable of supporting relatively more intense human settlement.

Table 3.12. Annual average earnings of paid employees in ~ a l a & i , by sector and industrial classification, 1977-1985 (MK).
Agriculture, forestry & fishing Mining and quarrying Manufacturing Electricity and water Building and construction Wholesale & retail trade & hotels & restaurants Transport, storage & communications Finance, insurance & business Community, social & personal service
- - ---- Sector and classification Year
1977 1978 1979 1980 1981 1982 1983 1984 1985
174 191 226 297 266 286 31 7 373 351 381 407 462 848 566 605 729 816 1J90 955 869 845 728 968 762 1,024 1,101 1,191 1,194 467 582 555 566 559 624 673 827 942 1,023 1.1 42 1,254 1.1 35 2,757 892 962 1.01 2 1,208 942 1 ,Om 1,121
1,730 1,733 2,263 2,227 2,521 2,727 2,694 746 81 3 861 926 995 1,135 1.82
All industries Private sector Public sector
Source: GOM (1 988a). Note: For foreign exchange rates, seep. 302.
1 @ Blantyre / Lilongwe I 8 Other areas
1 A Zomba M z v r u 1
' 1975 I I I I 1980 1985 1990
Y e a r
Fig. 3.32. Satutory minimum daily wage rates, 1974-1985, for selected localities in Mala%. (Source: GOM 1987b, 1989. See also Table 3.13)
Proportionate
Key: Foodstuff* Transpartat~on
A Houstng 0 Clothing
Fig. 3.33. Composi goods and services m M 1988~)
rice index of selected i, 1980-1988. (Source:

Table 3.13. Statutory minimum daily wage rates in the principal urban centers of Mala%, in January 1974-April1989 (MK). Urban center Year
1974 1975 1976 1977 1978 1979 1980 1981 1982 1983 1984 1985 1989
Blantyre Lilongwe Zomba Mzuzu Others
Source: GOM (1987b. 1989). Notes: Zomba nnd Meuzu towns becpme municipalities in 1980. In September 1885, Mzuzu became a city, and its rates were aligned with those of other cities. See also Fig. 3.32. For foreign exchange rates, seep. 302.
Table 3.15. Composite retail price index in Blantyre and Lilongwe cities, MalaGi, 1980-1988.
Table 3.14. Annual household cash surplus in Malaki by ADD, 1980-1981 (MK).
Household Area (ADD) cash (MU)
All Malawi K w n g a Mzuzu Kasungu Salima Lilongwe Liwonde Blantyre Ngabu
Source: W M (1 9842). Note: For foreign exchange rates, see p. 302.
Period All Foodstuffs Beverages Clothing Housing Household Transpor- Miwel- items & & operations tation laneous
tobacco footwear
Overall 100.0 32.9 6.4 10.7 13.3 9.6 17.6 9.5 weight
1980 1981 1982 1983 1984 1985 1986 1987
1985 Jan A P ~ Jul Oct
1986 Jan Apr Jul Oct
1987 Jan A P ~ Jul Oct
1986 Jan A P ~
Source: GOM (l988). Table N o k See also Fig. 3.35.

Table 3.16. Average prices of selected basic foodstuffs in Blantyre and Lilongwe, Mala&, 1975-1985 (MK O.Ol/kg).
Maize Maize Rice Manioc Tilapia Tilapia Mixed Green Tomatoes Salt City Year P i n Uour roots (£re&) (dried) beans cabbage (coarse)
Blantyre 1975 1976 1977 1978 1979 1980 1981 1982 1983 1984 1985
1975 1976 1977 1978 1979 1980 1981 1982 1983 1984 1985
Lilongwe
Source: W M (1987~). Note: The items selected are those uaually purchased each month. Yearly averages a re simple arithmetic averages of the monthly price quotation, and are based on 6 to 12 monthly quotations. See also Fig. 3.36. For foreign exchange rates, see p. 302.

K e y :
Jr Tilapia (dried)
A Tilapia (fresh)
8 Maize f lour
Green cabbage
/ Blantyre prices
,.Lilongwe prices ,
Fig. 3.34. Average prices of selected items of bas? foodstuffs for 1975-1985 in Blantyre and Lilongwe, Malawi. (Source: GOM 1 9 8 7 ~ )
I H v ~ o t h e t i c d vegetation ot
Year
Tropical woodland and forest
Moist semi- evergreen woodland
Montane forest ond grassland
Forest savannah mosaic lsssl Brochystegio julbernodia Acacia open woodland Es3 Open woodland wi th mopane and baobob
Mixed Acacia wooded steppe
Thickets scrubs and grassland
Swamps and floodplain grassland
Coastal mangrove swamp
Fig. 3.35. Distribution of present-day and hypothetical natural vegetation and hypothetical estimates of earlier conditions in Eastern Central Africa. (Source: Pachai 1972)
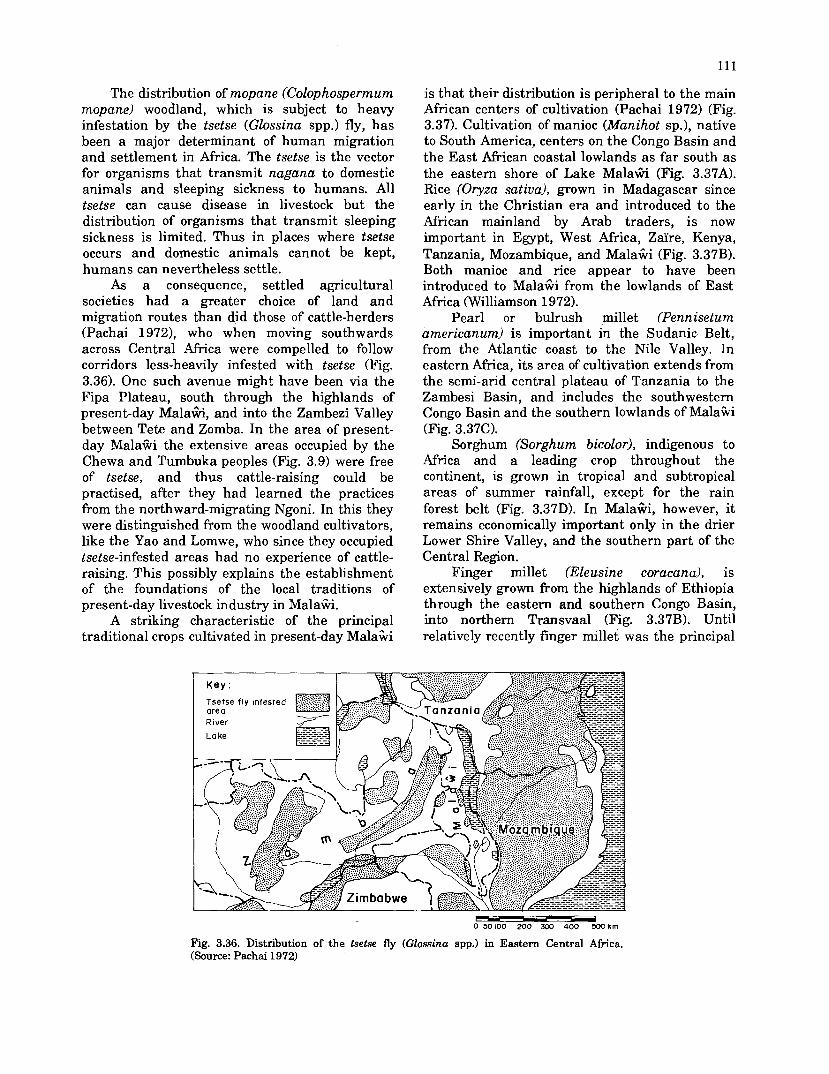
The distribution of mopane (Colophospermum mopane) woodland, which is subject to heavy infestation by the tsetse (Glossina spp.) fly, has been a major determinant of human migration and settlement in Africa. The tsetse is the vector for organisms that transmit nagana to domestic animals and sleeping sickness to humans. All tsetse can cause disease in livestock but the distribution of organisms that transmit sleeping sickness is limited. Thus in places where tsetse occurs and domestic animals cannot be kept, humans can nevertheless settle.
As a consequence, settled agricultural societies had a greater choice of land and migration routes than did those of cattle-herders (Pachai 19721, who when moving southwards across Central Africa were compelled to follow corridors less-heavily infested with tsetse (Fig. 3.36). One such avenue might have been via the Fipa Plateau, south through the highlands of present-day Mala*, and into the Zambezi Valley between Tete and Zomba. In the area of present- day MalaGi the extensive areas occupied by the Chewa and Tumbuka peoples (Fig. 3.9) were free of tsetse, and thus cattle-raising could be practised, after they had learned the practices from the northward-migrating Ngoni. In this they were distinguished from the woodland cultivators, like the Yao and Lomwe, who since they occupied tsetse-infested areas had no experience of cattle- raising. This possibly explains the establishment of the foundations of the local traditions of present-day livestock industry in Mala%.
A striking characteristic of the principal traditional crops cultivated in present-day Mala%
is that their distribution is peripheral to the main African centers of cultivation (Pachai 1972) (Fig. 3.37). Cultivation of manioc (Manihot sp.), native to South America, centers on the Congo Basin and the East African coastal lowlands a s far south as the eastern shore of Lake Mala64 (Fig. 3.37A). Rice (Oryza sativa), grown in Madagascar since early in the Christian era and introduced to the African mainland by Arab traders, is now important in Egypt, West Africa, Zai're, Kenya, Tanzania, Mozambique, and MalaCi (Fig. 3.37B). Both manioc and rice appear to have been introduced to MalaGi from the lowlands of East Africa (Williamson 1972).
Pearl or bulrush millet (Pennisetum americanum) is important in the Sudanic Belt, from the Atlantic coast to the Nile Valley. In eastern Africa, its area of cultivation extends from the semi-arid central plateau of Tanzania to the Zambesi Basin, and includes the southwestern Congo Basin and the southern lowlands of MalaGi (Fig. 3.370.
Sorghum (Sorghum bicolor), indigenous to Africa and a leading crop throughout the continent, is grown in tropical and subtropical areas of summer rainfall, except for the rain forest belt (Fig. 3.37D). In MalaGi, however, it remains economically important only in the drier Lower Shire Valley, and the southern part of the Central Region.
Finger millet (Eleusine coracana), is extensively grown from the highlands of Ethiopia through the eastern and southern Congo Basin, into northern Transvaal (Fig. 3.37B). Until relatively recently finger millet was the principal
Fig. 3.36. Distribution of the tsetse fly (Glossina: spp.) in Eastern Central Africa. (Source: Pachai 1972)

Manioc 1
Pearl millet 1
lmpartant areas
Finger millet and rice 1
Sorghum I
Fig. 3.37. Early distribution patterns of selected staple crops in Central, Eastern and Southern Africa. (Source: Pachai 1972)
crop of the plateau areas of Mala%, where it was valued for its drought-resistant qualities and used mainly for brewing traditional beer (Williamson 1972).
Although maize (Zea mays) was recorded under cultivation in present-day Malaki as early as 200 years ago (Lacerda, cited in Williamson 1972), bulrush millet, finger millet and sorghum were the principal staple grain crops until some 70-80 years ago, since which time they have gradually been displaced by maize. Pachai (1972) shows that until well into the 20th century maize was not the grain staple in most of East and Central Africa, where it is now of major importance, with the possible exception of Zambia. The rapidity of the dietary change to maize in Malaiki can be ascribed to cultural contacts with Arab slavers, Ngoni overlords, European settlers, and the early development of migratory labor to Southern Africa. It might also have resulted from pressures on the land caused by the rapid increase in and concentration of
population that arose from an intensification of agriculture and the use of higher yielding crops.
Other crops important in Malaiian agriculture have also been introduced. Peanuts (Arachis hypogaea), an exotic from Brazil, reached Mala% from Zaire, being brought there by Yao traders; tea (Thea spp.) was introduced in the late 19th century, at which time wheat was also introduced as a winter crop in hilly areas. Bananas and plantains (Musa spp.), the commonest cultivated fruits in Mala%, were recorded as early as 1875; and mango (Mangifera indica), the second most common cultivated fruit, appear to have been introduced by Arabs and Europeans (Williamson 1972). Soybean (Glycine spp.) is a more recent introduction. The first introduction occurred in the 1920~1, in the Southern Region. It was reintroduced in the 1970s, with financial assistance from Taiwan.
The staples of MalaGian agriculture have all been received from either other regions of Africa or overseas, which indicates the nation's former role as a cultural crossroads. Pachai (1972) concludes that the diversity of cultigens in Mala% is illustrative of the advantages conferred by the nation's diverse biophysical environments.
Agricultural Development Policy and Strategies
The commercial and subsistence economy of Mala% has always been based on agriculture. The basic orientation of present-day commercial agriculture was established during the colonial period (Fig. 3.38). In the early colonial era, the cultivation of coffee and cotton was emphasized, and when coffee became economically unviable early in the 20th century its position was assumed first by tobacco and then tea. A more recent trend appears to be a return to coffee cultivation (pers. obs.) In the 1920s cotton cultivation also declined, and tobacco and tea became the main commercial crops (GOM 1983a). Commercial rice cultivation by African farmers began in the 1920s and 1930s.
During the colonial period, the government's contributions to agricultural development were small and confined largely to plantation crops of interest to European settlers. African farmers were largely ignored. With the end of World War I1 it was realized that the economic future of the country lay with the development of the African small-scale farmers, largely to increase their purchasing power to absorb the products of small- scale industrial development (Nankumba 1981).
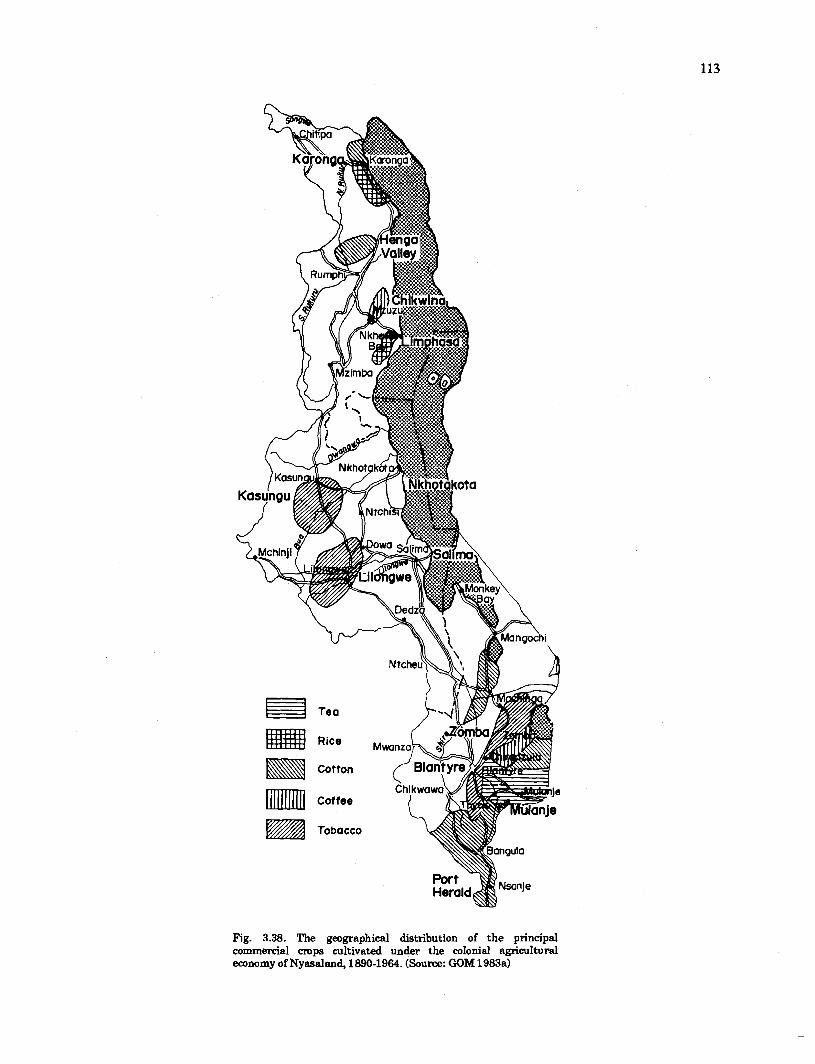
# Tea
Rice
cot,
cottee
Tobacco
Fig. 3.38. The geographical distribution of the principal commercial m p s cultivated under the colonial agricultural economy of Nyasaland, 1890-1964. (Source: GOM 1983a)

The revised government policy was based on four principal policy objectives: (1) to conserve the soil; (2) to encourage the production of more and better food; (3) to develop the agricultural cash economy; and (4) to blend the techniques used to attain those objectives into a sound farming system.
Early land preparation was the main thrust of the colonial government's policy against famine risk. This was based on the understanding that the earliest possible planting of all crops was the surest safeguard against unfavorable weather and resultant food shortages. A soil conservation campaign was also started to replace traditional cropping on flat and circular mounds by a contour ridge system, and later by contour bunds or banks in areas more susceptible bo erosion. Since these measures were arduous for cultivators using simple hand tools, opposition to the soil conservation campaign became a powerful focus for nationalistic sympathies (Kettlewell 1965).
An agricultural extension policy was adopted. This was a simple approach based on limited objectives in one aspect of cultivation and directed a t the mare responsive farmers in more cooperative communities (Kettlewell 1965). Three characteristic features arose from this policy: (I) the annual publication, from 1955, of the Crop Production Programme, and the establishment of the Public Relations Unit, in 1958, to produce extension materials; (2) The Master Farmer Scheme designed to encourage the best farmers to become prosperous (yeoman) farmers on consolidated holdings (Kettlewell 1965; Pike and Rimmington 1965); and (3) the Village Land Improvement Schemes (Village Reorganization Schemes) to reorganize land holdings to give each family a single consolidated plot equal in area to its former scattered plots and fragments. The latter was seen as vital to the economic and social development of the Protectorate, since fragmented land impeded effective farm layout and management.
Agricultural education was designed to establish the research institutes and train African staff, as well a s to train community leaders and introduce agricultural subjects into rural primary schools. Young Farmers' Clubs were encouraged in secondary schools. Agricultural research under local conditions was recognized as essential, and the facilities for this were established in different ecological zones throughout the country. Most of these same objectives have remained since 1964 (Kettlewell 1965).
The present government strategy for agriculture is to encourage both estate and
smallholder production to maintain food self- sufficiency while expanding exports and improving rural incomes. This strategy is based on the NRDP program, an ambitious country-wide scheme started in 1978 and which now focuses on smallholders by providing a wide range of services and inputs to improve the efficiency of extension, marketing and credit. By 1984, 80% of smallholders were embraced by NRDP. The program concentrates on enhancing the productivity of already cultivated areas rather than on developing new land. The growth of village-run farmer clubs has facilitated delivery of extension and training as well as limited credit.
The general extension policy of the Ministry of Agriculture emphasizes the use of groups to increase coverage, and the Block Extension System has been in use since 1981. This stresses the training of extension workers combined with their regular visits a t fortnightly intervals to groups of farmers.
These Field Assistant's divisions are divided into 5-8 subsections of 30-100 farm families, known as "Extension Blocks", and which comprise the basic unit of extension activities. All farmers, including any voluntarily formed clubs in each block, are invited through block leadership to attend meetings and demonstrations a t a predetermined date and time. The Extension Aids Branch of the Ministry of Agriculture supports this through the production of mass media (radio programs, charts, magazines, films and puppet shows). There are now some 1,700 Field Assistants in agriculture, a ratio of one per 800 farmers (GOM 1988a).
Farmers' Clubs and Agricultural Credit
The policy applied to the formation of Farmers' Clubs is that they must be a free association of from 10 to 100 suitable individuals within a village or area, formed with the objective of promoting communally-based developmental activities. Membership is not coerced. There are now 8,100 of these clubs (GOM 1988a).
Credit is extended to only clubs that have paid off prior credit, and those members who have paid off their credit cannot form splinter groups for the purpose of obtaining further credit. Further, in order to obtain credit, the club must satisfy itself that it consists of members who are hardworking, follow extension advice, are

trustworthy, and who have clean credit repayment records. In each village or area, the farmers decide which c rd i t package they want, and either the Village Headman or Club Committee must approve the applicants. The Committee or Headman is then responsible for recovering loans extended to individual members. Clubs that fail to repay in full their seasonal credit are penalized with a surcharge on the balance outstanding by 30 September, the end of the agriculturaYcredit year (GOM 1982b).
Credit is being provided a t present to 16% of farm households (or 212,000 units), with plans to increase the numbers to 25-30% of the households (425,000-560,000 units) (GOM 1988a). MalaGian farmers are provided with 3 types of credit: seasonal, medium-term, and nonseasonal.
Seasonal credit is mainly channeled through farmers' clubs/groups for inputs such as fertilizers or pesticides. Repayment periods are 6-12 months. The distribution of credit and recovery of the loan from individuals is the responsibility of the club/group. Repayment of the entire loan is required by 30 September each year. Continued credit facilities are available only to clubs/group that have repaid their previous loans in full.
Medium-term credit is issued to individuals or clubs for items like work oxen or farm implements. Repayment is over 3-7 years, with an interest rate of 20% per year per loan. Usage rates are not yet available. Loans are secured with the property acquired or other farm property.
Nonseasonal credit is mostly provided to individuals. In general its intent is specialized, such as for the development of stall-feeding, dairy animals or poultry.
Whereas small-scale agriculture grew at about 3%/year in the 1970s, estate output expanded by 17%/year (1 968-1 984), and provided 80% of foreign earnings (1984). However, tobacco production is static and increases have come from the greater area brought into cultivation. The government's structurd adjustment program includes measures to encourage crop diversification and financial and technical management improvement.
The Agricultural Situation
Agriculture is MalaCiri's leading economic sector. Emphasis is placed on increasing the production of high value export crops as well as on the intensification of yields of those for domestic consumption. A zonation by cultivation density is
provided in Fig. 3.39. ("Cultivation Density" expresses the interrelationships among biophysical and sociocultural factors, especially demographic patterns, the natural resource endowment and the geographical distribution of physical infrastructure.) Existing land utilization and the physical constraints on agriculture (Tables 3.2 and 3.3) indicate that projected population growth by the year 2000 will severely stress land in such districts as Blantyre, Zomba, Lilongwe, Thyolo, Nkhotakhota, Rumphi and Chitipa.
The agricultural sector in ~ a l a % i is divisible into two subsectors: smallholder and estate. The characteristics of small-scale farmers are given in Fig. 3.40 and Table 3.17, those of agricultural estates in Table 3.18 and the combined output and trade of both subsectors for the period 1984- 1986 in Table 3.19. The distributions of crops and livestock are shown in Figs. 3.41 and 3.42, respectively.
About 56%, or about 5.3 million ha of the total land area of Mala%, is regarded as suitable for cultivation, whereas approximately 2.09 million ha, or 39% of the area, were cropped in 1981. Of the area under cultivation, 768,000 ha, or 58% of the cropped area of MalaGi, is planted to maize (Fig. 3.43 and Table 3.20) (GOM 1982). The percentage of the land considered suitable for cultivation that is now cultivated varies from a low of 12%, in the Northern Region, to a high of 30%, in the Central Region (Table 3.21) (GOM 1987a). The "Customary Land area in each ADD, under maize cropping systems is shown in Table 3.21.
Crop Production
Crop production figures are given in Table 3.19 and yields by sector in Table 3.26. Maize is the predominant crop cultivated by the small- scale farm sector, and most such farmers cultivate maize for household subsistence on some 65-75% of their total land holdings. Nearly 80% of the maize is grown in pure stand but there is an increasing tendency to intercrop with peanuts, legumes, manioc, and pumpkins (Table 3.21).
Manioc is the second most important foodcrop after maize, with an estimated 200,000 t/year being produced from 73,000 ha (i.e., at an average yield of 2.74 (GOM 1988a) (Table 3.19). Sorghum and millet combined are planted on some 35,000 ha (GOM 1982a), mainly in the Northern Region, along the shores of Lake

Class Hectares
~ 5 % 4,273,000
Total 9 , 4 3 5 , 6 7 1
Fig. 3.39. The geographical distribution of cultivation density in Mala%. (Source: GOM 1983a)

Subsistence Satisfy level dependant subsistence on off-forming and modest cash I I Involved in cash cropping I
income potentiol
" 0 I 2 3
Holding size (ha)
O/o total area
% by number of holdings by economic cotegory : GOM ( 1 9 8 4 C )
O/' by number of holdings 0 - 5 ha groups
Fig. 3.40. Distribution of small-scale farms in Mala% by number, area and economy, 1980-1981. (Source: GOM .1976a, 1984c, 1987c, 1988a, 1988b, 1988~)
Table 3.17. Number of holdings, area cultivated, female-headed households and cultivation of improved maize on small- scale farms in MalaGi, by size class, 1980-81.
Characteristic Numberlaverage Percentage distribution by size class (ha) < 0.5 0.5-1 .O 1 .O-1.5 1.5-2.0 2.03.0 > 3.0
Number of holdings Cultivated area (ha) Female-headed households Improved maize
-
1,300,000 23.0 32.0 20.0 10.9 9.8 4.2 1,488,000 6.2 20.9 21.3 16.3 20.5 14.8 28.0 (a) 42.0 34.0 24.0 18.0 10.0 8.0 10.0 (a) 2.0 2.0 6.0 8.0 15.0 25.0
Source: GOM (1988a). Note: (a) - average.
Table 3.18. Number of agricultural estates, area under main crop and average area planted by main crop in Malaki.
No. of Area Average Main crop estates planted area
(ha) planted (ha)
- -- - - -
Tea 28 16,800 600 Sugar 2 15,200 7,600 Fluecured tobacco 488 16,200 33 Burley tobacco 3,036 31,500 10 Coffee 68 3,200 55
Subtotal 3,612 82,900 23
Others (a) 500 n.8. n.a.
Total 4,100 n.8. n.a.
Total area under lease- and freehold
Source: GOM (1988s) Notes: (a) Estimated figure; (b) including crops other than the main one, together with woodlots, fallow and unused land. All figures include estates awaiting processing of lease applications.

Fig. 3.41. Geographical distribution of small-scale farm crops in Mala%. (Source: GOM 1983a)
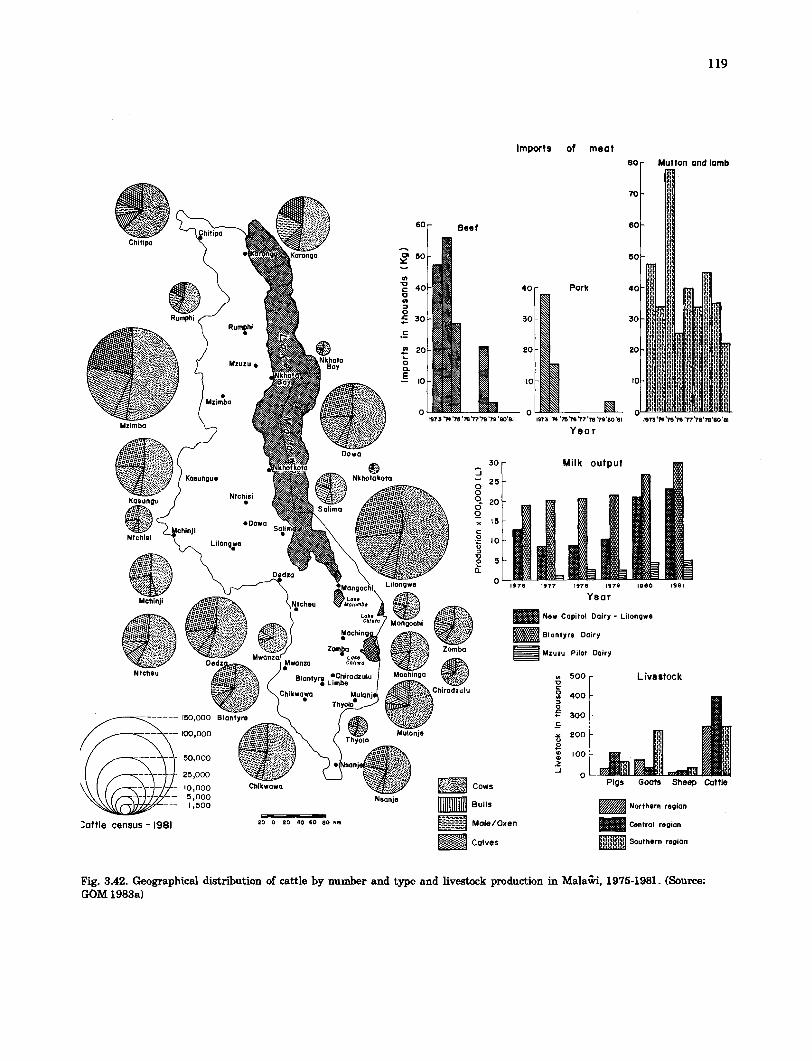

Table 3.19. Summary of production, international trade and ADMARC purchases of principal agricultural commodities in Mala%, 1984-1986 (t x 103).
Commodity group Production International trade 1985 ADMARC & commodity 1984-85 Imports Exports purchases
1985-86
Grains Maize 1,473.0 46.0 271.6 Rice (Paddy) 34.3 0.6 10.7 SorghumIMillet 32.6 0.5 Wheat 3.8 27.1 0.5 Malt barley 2.6
Root crops Manioc 209.3 Irish potatoes 81 .O
Pulses 28.1 11.4 17.0 Oil seed and beans 3.2 2.6 0.7 Peanuts(a) 63.2 19.2 18.1 Edible treenuts 1.5 1.5 0.1 Fruits & vegetables 387.0 Sugar(b) 150.6 142.6 Tea (c) 40 0 39.6 Coffee 3.5 3.5
I (Burley) 30 4 30.4 Tobacco) (Flue-cured) 22 3 22.3
1 (Smallholder) 17 5 17.5 Cotton 33 4(d) 3.6(3 32 7 Rubber 0.4 0.3 Guar beans 3 6 1.2 Tung nut 1 .O 0.4 Cerhfied seeds 4 8 0.3 6.3(0 Animal products
Meat 26 2 Milk 96.7 17.8 Eggs 2 3 Hides and skins 6.4 0.6 Tallow 6.8
Fertilizers 112.2 64.9(0
Source: GOM (1988a). Notes: (a) "Oil Types" comprised 2.800 t of the total production, and 600 t of those purchased by ADMARC; (b) Refined; (c) Made; (d) Seed; (e) Lint; (0 ADMARC sales to smallholders.
A. Northern Region B Central Reg~on
C. Southern Region D, All ~ a l a i i
K e y : M = '% Under maize C = Total cultivated area CA- % Cultivable area including M t C UC= % Uncultlvable area
Fig. 3.43. The cultivable and cultivated area by region in MalaGi, 1980-1 981.
Mala%, and in the lower Shire Valley (GOM 1988a).
Other principal food crops cultivated by this sector are legumes, which are mostly intercropped with maize, manioc, sorghum and millet. An estimated 0.85 million ha are planted to legumes (GOM 1982a). Both dwarf and climbing beans (Phaseolus spp.) are usually interplanted with maize, whereas cowpeas Ninga sinensis) and pigeon peas (Cajanus cajan) are cultivated in pure stands, and mostly in the Southern Region. Estimated total current annual production is 40,000 t ( O M 1988a). The semiarid area of the lower Shire Valley produces about 2,000 Vyear of guar beans (Cyanopsis psoralioides), used for commercial brewing (GOM 1988a).
An estimated 0.4 million ha is planted to peanuts (GOM 1984~) which yielded some 10,000 t/year (i.e., 250 kglha) in the early 1980s (GOM 1988a). The national production of peanuts is entirely in the hands of the small-scale farm sector (GOM 1984~). Yields are low, a t an average of 0.4-0.5 thatyear (shelled weight), and vary

Table 3.20. Total land area, cultivable area, area cultivated and area devoted to maize-growing, by region in MalaGi, 1980-1981 (1,000 ha).
Region Total Cultivable Cultivated Under area area area maize
--
Area %(a) Area Area 8(b) 76
%(c) Northern 2,687 1,236 46 148 12 51 Central 3,552 2,249 63 687 30 409 60 Southern 3J69 1,822 57 506 28 283 56 National total 9,408 5,307 56 1,332 25 768 58
Source: GOM (1984~) ' Notes: (a) Of total area; (b) of cultivable area; (c) of cultivated area.
Tablc 3.21. Arca undcr maim and intcrplantcd crops, and maize yields on customary lands in Malaiki, by agricultural development division, 1980-1981 (1,000 h a and kgha).
Agricultural Total arca Pure stand maize Maize with interplanted crops dcvclopmcnt cultivatcd
division Hybrid Composite Local(a) Peanuts Pulses Manioc Others Arca Yield Arca Yicld Area Yield Arca Yield Area Yield Area Yield Area Yield
Karonga Mzuzu Kasungu Salima Lilongwe Liwondc Blantyrc Ngabu National total
Source: GOM (1980-81). Notes: (a) = "Othcrs". Sce also Fig. 3.46.

considerably by pattern of intercropping and locality.
Other relatively minor crops are planted over much smaller areas, and include mainly 9,000 ha under rice, 4,000 ha in sweet potatoes (GOM 1988a). The main areas for the production of both irrigated and rainfed rice are the shores of Lake ~ a l a % , Karonga, the Lake Chilwa Plain, and the lower Shire Valley. Yields are low (GOM 1988a). Sweet potato (Ipomoea batatas) and Irish potatoes (Solanurn tuberosum) are grown mainly in upland areas. The production of both together is some 60,000-100,000 t/year (GOM 1988a) (Table 3.19).
The main cash crops cultivated by small-scale farmers are seed cotton, tobacco and tea.
Tobacco, MalaGi's principal export commodity since 1908 (GOM 1983a), is cultivated by some 65,000 small-scale farmers (and some 4,000 estates). In 1987 tobacco was planted over a total of about 96,500 ha and yielded about 75,000 t of cured leaf (GOM 1988a). As a quality control measure and to ensure stability of the market, the production of fire-, air- and sun-cured tobacco, as well as oriental tobacco, is controlled. In general, small-scale farmers are permitted to grow neither flue-cured nor burley varieties of tobacco (i.e., those which are flue-cured in barns), which are restricted to estate cultivation, whereas sun- and air-cured tobaccos are limited entirely to the smallholder subsector (GOM 1988a).
Although since 1983 estates are no longer prohibited from growing cotton (GOM 1988a), it remains largely a smallholder crop. Cotton is grown by some 60,000 small farmers, who plant a total area of about 37,000 ha. Production has fluctuated widely from 13,000 to 35,000 tlyear, largely in response to its price sensitivity (GOM 1988a). National average yields are difficult to calculate, owing to wide interannual variations in the area planted, but are generally low, at about 0.5 t h a (GOM 1983a).
Under the control of the Smallholder Tea Authority, approximately 4,800 small-scale farmers grow tea over some 15,600 ha. The balance of 2,400 ha is accounted for by 26 estates.
The Estate Sector
Land under estate agriculture in Mala% covers about 0.605 million ha, divided among more than 4,100 operations (Table 3.18). This sector is the nation's principal foreign exchange earner, mainly through its export of tobacco,
sugar and tea, and to a lesser extent of tung oil (Aleurites fordii), coffee, and macademia nuts (Macadamia ternifolia). Estates contribute some 20% of total national agricultural production while providing about 80% agricultural exports (GOM 1988a). The main crops are flue-cured burley tobacco, tea and sugar.
Of the area under estate agriculture, 47,700 ha, on a total of 3,524 estates, are planted to tobacco; 16,800 ha, on 28 estates, are planted to tea; and 15,200 ha, on two estates, are under sugarcane; and 3,200 ha, on 58 estates, are in coffee (GOM 1988a) (Table 3.18). Of the total 82,900 ha on estates planted to these crops, 57.5% is devoted to tobacco cultivation.
Livestock
The general livestock statistics for Malawi are summarized in Table 3.22. Approximately 15% of the national area, or 1.5 million ha, is classified as either nonarabls grazing land or unused land (GOM 1987a). This area, together with land in fallow plus some of the cultivated area, is used for cattle grazing and the raising of other livestock. Most livestock raised are of traditional breeds and varieties.
In Malaibi, livestock are generally raised by small-scale farmers, who provide for their own subsistence, produce eggs and meat for the rural population, as well as feeder cattle for commercial livestock operations. Only some 11% of rural families own cattle. The commercial livestock sector, however, which includes many small-scale farmers, is that which mostly satisfies urban demand (Manda et al. 1985).
Cattle raising is conducted mainly in the Northern and Central regions, and to a lesser extent in the Shire Valley (Fig. 3.42 and Table 3.22). Most of the estimated 1 million (1985) national herd consists of traditional breeds raised by small-scale farmers, using traditional methods (GOM 1988a). In addition to the traditional use of cattle as a source of wealth and prestige, the national herd is oriented to supplying the domestic market with beef and dairy products. The national dairy herd, based in part on a Mala% Zebu-Friesian crossbreed, has shown a progressive increase over the past three decades and has an average growth rate of 4.87% (Manda et al. 1985). Off-take rates are 9-10% for both the small-scale farmer and the estate sectors (Table 3.26) of which only about 25% passes through formal markets. Calving rates are reportedly 40-

Table 3.22. Number and type of livestock in Mala%, by region, 1975-1985.
Year Cattle Goats Pigs Sheep Donkeys
Total Northern Central Southern Region Region Region
Source: GOM (198713).
60% for both estate and traditional herds (Manda et al. 1985).
Most goats are traditional breeds kept by small-scale farmers, and goat meat is preferred to that of sheep. They are not milked. The growth rate of the national herd, which totals an estimated 799,000 (1985) animals (GOM 1987a), is estimated at 1.52%lyear, with a kidding rate of 120%, and an off-take rate ofsome 40%. Average slaughter weights are 11 kg (Manda et al. 1985).
Sheep are also traditional breeds mostly raised by the small-scale farm sector, although several estates maintain small flocks. The total national population (1985) is estimated to be almost 185,000 animals (GOM 1987c), reproduction rates are estimated to range from 80 to 120%, and the off-take rate is an estimated 50% (Manda et al. 1985).
In many villages, traditional types of pig act as scavengers around homesteads, whereas commercial operations raise exotic breeds. Production and profit margins are generally low, owing principally to periodic outbreaks of African swine fever. The total national pig population is estimated at 322,400 (1985) (GOM 1987a) and is increasing at 1.75%/year (Manda et al. 1985).
The bulk of poultry production is from traditional breeds of "village" chicken kept by small-scale farmers, although there has been some attempt to crossbreed them with Black Austalops. Flocks average 6-8 birds per household, which are usually permitted to range freely to scavenge around the farm. Few farmers pen their poultry. Despite attempts over the years to enhance the productivity of the small-scale poultry raising, little progress is apparent to date. There is some commercial production of chickens
on estates. The total number of chickens in Mala% is estimated at 10-14 million (GOM 1988a), which is increasing a t almost 2%/year, and from which there is a 10% annual off-take. Minor poultry occasionally raised on Malasan small farms includes the Muscovy duck (Cairina moschata), geese (Anatidae), pigeons and doves (Columbidae). They contribute little to the national production of animal products (Manda et al. 1985) (Table 3.28).
Irrigation
Only 4,171 ha (1983-1984) of agricultural land in Malawi has been developed for irrigation of crops other than sugar (GOM 1987a). Of that only 2,377 ha (57%) is actually cropped, and of the area cropped 2,274 ha (96%) is planted to rice (Table 3.23). Irrigated land exists on both government irrigation schemes for rice cultivation and on agricultural estates, particularly those for sugar. The latter comprise about 15,000-20,000 ha. The irrigated rice schemes exist along the shores of Lake Mala%, in the Lake Chilwa Plain, and in the lower Shire Valley (Fig. 3.44).
Agricultural Marketing
ADMARC, the Agricultural Development and Marketing Corporation, is a statutory body that was established to purchase the food and nonfood crops produced by the small-scale farm sector, to sell food crops as well as to sell and deliver to the small-scale farmer required agricultural inputs, and occasionally farm implements. This
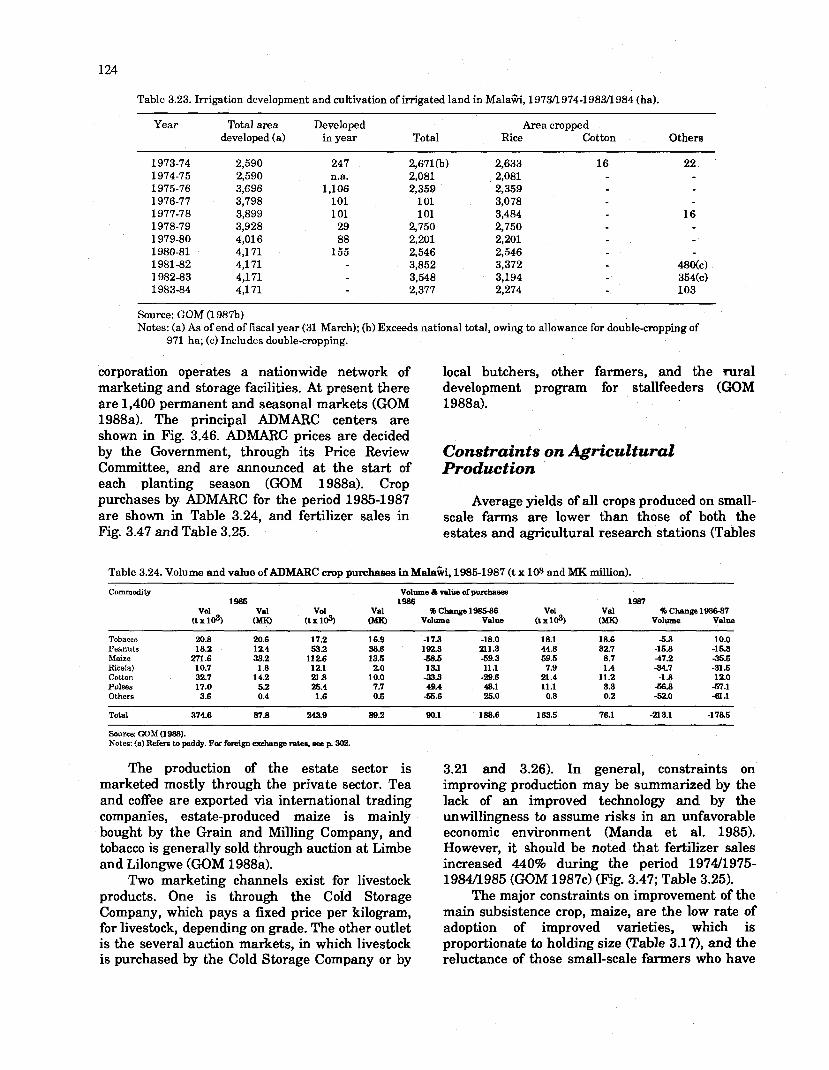
Table 3.23. Irrigation development and cultivation of irrigated land in MaIaGi, 1973/1974-1983/1984 (ha).
Year Total area Developed Area cropped developed (a) in year Total Rice Cotton Others
1973-74 2,590 247 2,67l(b) 2,633 16 22 1974-75 2,590 n.a. 2,081 2,081 1975-76 3,696 1,106 2,359 2,359 1976-77 3,798 101 101 3,078 1977-78 3,899 101 101 3,484 16 1978-79 3,928 29 2,750 2,750 1979-80 4,016 88 2,201 2,201 1980-81 4,171 155 2,546 2,546 1981-82 4,171 3,852 3,372 480(c) 1982-83 4,171 3,548 3,194 354k) 1983-84 4,171 2,377 2,274 103
Source: GOM (1987b) Notes: (a) As of end of fiscal year (31 March); (b) Exceeds national total, owing to allowance for double-cropping of
971 ha; (c) Includes double-cropping.
corporation operates a nationwide network of marketing and storage facilities. At present there are 1,400 permanent and seasonal markets (GOM 1988a). The principal ADMARC centers are shown in Fig. 3.46. ADMARC prices are decided by the Government, through its Price Review Committee, and are announced a t the start of each planting season (GOM 1988a). Crop purchases by ADMARC for the period 1985-1987 are shown in Table 3.24, and fertilizer sales in Fig. 3.47 and Table 3.25.
local butchers, other farmers, and the rural development program for stallfeeders (GOM 1988a).
Constraints on Agricultural Production
Average yields of all crops produced on small- scale farms are lower than those of both the estates and agricultural research stations (Tables
Table 3.24. Volume and value of ADMARC crop purchases in Mala%, 1985-1987 (t x 103 and MK million).
Commodity Volume &value of purchases 1985 1986 1987
Vol Val Val Val % Change 148586 Vol Val % Change 1986-87 (tx103) (MK) (tx103) 0 Volume Value (trio3) (MK) Volume Value
Tobacco 20.8 20.6 17.2 16.9 -17.3 -18.0 18.1 18.6 -5.3 10.0 Peanuts 18.2 12.4 53.2 38.6 192.3 211.3 44.8 32.7 -15.8 -15.3 Maize m.6 33.2 1126 13.5 68.5 59.3 59.5 8.7 -47.2 -35.5 Riee(a) 10.7 1.8 12.1 2.0 181 11.1 7.9 1.4 -34.7 -31.5 Cotton 32.7 14.2 218 10.0 -33.3 -29.6 21.4 11.2 -1.8 12.0 Pulses 17.0 5.2 25.4 7.7 49.4 48.1 11.1 3.3 -56.3 -57.1 Others 3.6 0.4 1.6 0.5 66.6 26.0 0.8 0.2 -520 -61.1
Total 374.6 87.8 !243.9 89.2 90.1 188.6 163.5 76.1 -213.1 -178.5
Source: GOM (1988). Notes: (a) Refers to paddy. For foreign exchange rates, see p. 902.
The production of the estate sector is marketed mostly through the private sector. Tea and coffee are exported via international trading companies, estate-produced maize is mainly bought by the Grain and Milling Company, and tobacco is generally sold through auction at Limbe and Lilongwe (GOM 1988a).
Two marketing channels exist for livestock products. One is through the Cold Storage Company, which pays a fixed price per kilogram, for livestock, depending on grade. The other outlet is the several auction markets, in which livestock is purchased by the Cold Storage Company or by
3.21 and 3.26). In general, constraints on improving production may be summarized by the lack of an improved technology and by the unwillingness to assume risks in an unfavorable economic environment (Manda et al. 1985). However, it should be noted that fertilizer sales increased 440% during the period 197411975- 198411985 (GOM 1987~) (Fig. 3.47; Table 3.25).
The major constraints on improvement of the main subsistence crop, maize, are the low rate of adoption of improved varieties, which is proportionate to holding size (Table 3.1 7), and the reluctance of those small-scale farmers who have

J Mzuzu x
P
i 8
3
Namitete r
I
I Livilidzi a
j (Cotton, groundnutsJ /
Settlement and irrigation i. -c schemes r-(
Dornas Mphetam(R~ce /' kKhandal(Rd,e\
Dry - land settlement schemes i Njala JRce ~ a k a n ~ a l a . ( ~ i $ e )
Irrigated settlement schemes / 0 Mlomba ! Upper
4 Bl~nfyre o ark b r n b a n i fired . (Rice)
Proposed dry - land setTlement '( roundn nuts)^ tobacco? schemes
,--I ,)
Kasinthula. Nkhate / Proposed irrigated settlement
0 ( Rice) . Masenjere
schemes \ ~uona. ice)
Fig. 3.44. Location of irrigation schemes in Mala%. (Source: GOM 1983a) L J

WRA 1
Fig. 3.45. Boundaries of water resource areas (WRA) and number of dams by area in Mala&. (Source: UNDP 1986)

.Agricultural development and
marketing .corporation centers
Produce depot Main market 0
Divisional headquarters Divisional headquarters with produce depot
Agro-industrial complex A Regional headquarters with produce depot
\\ Chomoma Bua Estate
0 Malomo
Agricultural development projects
Ekwendeni seed maize form Vipya Tung estates 0
Chitale Estate Mzenga Macadamia project o Kasikidzi Estate (tobacco) 0 Livilidzi Estate Estate
Kasungu seed maize farm 0 Homboli Estate (tobacco) 0 Motin ADMARC Canning Company 0 Toleza farm (tobacco, tobacco seed, maize, sorghum and livestock )
Kweneng horticultural and pig project Estates
Ruo Estote
Fig. 3.46. Location of principal ADMARC facilities. (Source: GOM 1983a)

either accumulated capital or obtained credit to risk investing in inorganic fertilizers. Yields of the Blue Bonnet variety of rice, produced by irrigation and mostly for export, are limited mostly by its slow growth a t low temperatures, as well as by disease and the limited availability of the different varieties. Yields of the upland, rainfed Faya variety of rice, which is grown mostly for domestic consumption, are constrained by the same problems. Yields of the small amount of wheat grown are also low owing principally to a lack of varieties adapted to the wet season, and the lack of supplemental irrigation to sustain growth during the dry season (Mania et al. 1985; GOM 1988a).
The yields of many commercial crops grown by small-scale farmers are also low, in large part owing to the pricing policy and the risks associated with capital investment in required
Year
Fig. 3.47. Fertilizer sales by ADMARC to small-scale farmers (shaded), and total imports of fertilizers (unshaded) by Mala%, 1960-1987. (Source: GOM 1976% 1987b, 1988a, 1988b)
Table 3.25. Sales of fertiliier to small-scale farmers in Mala%, 197411975-1987 (t).
Year Sales
Source: GOM (1987c, 1988~)
inputs. Thus cotton cultivation is constrained by the high price of insecticides, a common unavailability of necessary inputs, and low farmer prices for the product (GOM 1988a). Similarly, small-scale farmers are generally unwilling to adopt the full package of inputs required for successful tobacco cultivation, owing to uncertainty about potential returns on their investment. The yields of peanuts are also low, partly owing to disease infestation and also owing to late planting, as a consequence of most farmers deciding to give priority to the planting of the subsistence maize crop and, where cultivated, to tobacco (Manda & al. 1985).
The size of landholdings is a massive constraint on the small-scale farm subsector, especially in the Southern Region. For policymaking and planning purposes three categories of small-scale farm are recognized (GOM 1988a) (Fig. 3.40):
(1) the 35% of small-scale farms of less than 0.7 ha that cannot, with present technology, yield a household subsistence base, and that even with improved technology will depend on supplementary off-farm income for survival. For this category government policy aims to improve productivity by the use of low-cost but effective inputs, and by the introduction of small-stock keeping;
(2) the 40% of small-scale farmers, whose holdings of 0.7-1.5 ha can satisfy their household subsistence base as well as producing a modest cash income from crop sales. For this category, policy seeks to increase the yields of staple food crops and thereby release land for cash cropping; and
(3) the 25% who operate holdings larger than 1.5 ha and who are commonly already involved in

Table 3.26. Indicators of agricultural productivity in Mala%. Item Average range
Traditional Estate Research sector sector station
Food crops (a) Maize 325 - 5,200 6,000 3,500 - 9,000 Pulses 160- 330 4,000 Sorghum 250 - 2,200 3,500 Millet 260- 1.100 Rice 1,100 - 2,950 2,300 - 4,000
Cash crops (a) Peanuts 260 - 1,200 1,500 - 3,000 Cottan 325 - 1,000 2,000 Tobacco 03) 1,800 2,600 Tea 2,659 3,000
Cattle (c) Off-take 10 10 10 Mortality 12 15(d) 4 Calving Rate 40-60 40-60 70
--
Source: Manda et al. (1985) Notes: (a) Rates are given in kghalyear; 03) The rates are for flue-cured tobacco, and those for burley tobacco are 2,000 and 3,000, respectively; (c) Rates are percentages; (d) For animals 0-1 year, the rate for animals 1-year+ is 5%.
commercial agriculture. For this category policy calls for the intensification and diversification of cash cropping via improved extension services, the use of draft oxen, better access to credit, and improved marketing services. There is leeway in this latter group for risk-taking, hence the adoption of an innovation like integrated agriculture-aquaculture may be more feasible among them than other groups.
In the Southern Region, nearly 55% of households (1981) had less than 1 ha, and in the Blantyre and Liwonde ADDS this figure reaches 74% and 69%, respectively (Msukwa 1986). This situation is being increasingly exacerbated by population growth. Farmers with holdings of less than 0.5 ha (23.5% nationwide, 38.4% in Blantyre and 29% in Liwonde) can produce only 37% of their basic food requirements, assuming that all land is devoted to crops, and farmers with 0.5-0.99 ha can produce 75% of their requirements (Msukwa 1985a). In Liwonde ADD, only farmers with 1 ha or more (33%) can produce both enough food for subsistence plus a saleable surplus. Farmers with less than 0.5 ha cannot switch to higher value crops in response to price stimuli, since all their land is planted to subsistence crops. Although the ADD realized a food surplus of 8% in 1981-1982, 50% of the small-scale farm households had a negative food balance (LWADD 1983).
Since the government strategy is growth oriented, all smallholder efforts have been concentrated on the commodities that ADMARC purchases. In all government policy documents, emphasis is placed on tobacco, cotton, peanuts and rice for export, and on maize as the main subsistence crop. Until recently, emphasis on
other crops was less than for maize, which has now appeared in areas more suitable for such other crops as sorghum, millet and cassava (Msukwa 1986). This bias is also reflected in the research programs of the Ministry of Agriculture (Msukwa 1986).
Further, there are hardly any credit packages other than for maize and rice. Extension and credit have been biased towards the better off farmers, with bigger holdings and growing hybrid maize and other cash crops (Msukwa 1986). Only farmers judged creditworthy by the extension staff are allowed credit. Such a farmer must have a holding of 1 ha, be cultivating crops or be engaged in activities that qualify for credit, and must have repaid all previous loans (GOM 1982). This discriminates against the small-scale farmer and those who have been unable to repay previous loans. A large component of credit is for fertilizers which are now so expensive (since subsidies were reduced under IMF pressure) that for farmers with less than 1.5 ha the credit package is too risky (Msukwa 1986).
Households headed by women have until recently been left out of development efforts (Msukwa 1986). Of concern is that female farmers generally have very small landholdings (Table 3.18), and therefore limited scope for improving household nutritional conditions. This is exacerbated by the social role of women, which limits the likelihood of them finding off-farm sources of income.
Livestock production, principally cattle, is inhibited by the locally serious problem of overgrazing on communal lands, insufficient forage in the dry season, and a lack of incentives, as a result of tenurial and usufruct factors, to

adopt pasture improvement measures and management techniques (Manda et al. 1985), as well as by the tradition of keeping cattle as a source of wealth and as a symbol of prestige. Commercial pig and poultry operations are hampered by cost-price conditions and the quality and supply of compounded feeds (Manda et al. 1985; GOM 1988a). The livestock sector is further constrained by inadequate veterinary and marketing services, and by the low capacity of the Cold Storage Company, the main wholesale purchaser (GOM 1988a). Small ruminants, goats and sheep, generally range free and compete with cattle for pasture. As a consequence their level of development has remained low and small ruminants contribute little to meat production (3.9% in 1980) (Table 3.28).
Despite the multiple difficulties under which the small-scale farm subsector operates in ~ a l a % it is of fundamental importance to the MalaGian economy, since in aggregate it meets the country's subsistence demand by growing 80% of agricultural production with a wide range of crops. Further, through its cultivation of tobacco and cotton i t supplies much of the raw material demand of Malawi's domestic industries as well as exports. On the other hand, estate agriculture, which covers 5% of the arable land, and which is mostly privately managed, is the major foreign exchange earner.
The Food and Nutrition Situation
Theoretically the daily per capita calorie and protein supply in Mala3i exceeds 100% of requirements (for 1982-1984) (Table 3.27) (Balarin 1987~; Kent 1987). However, such phenomena as high infant and child mortality rates, stunting (i.e., low height for age) and wasting (i.e., low weight for age) indicate problems of malnutrition and widespread morbidity among children and women.
There is a high infant mortality rate (UNICEF 1987). A national average of 55% of rural children under five show symptoms of stunting (GOM 19844; and there is a high incidence of chronic wasting (Table 3.27), with 43% of children below 80% the weight of a reference population, of whom 6% are extremely malnourished, with a weight only 60% that of a reference population (Msukwa 1985a).
Although children less than five years of age comprise only 20% of the total population, they account for 57% of all deaths. In 1983,
malnutrition was the third leading cause of death among children 0-4 years of age, comprising 11.2% of 6,028 reported hospital deaths (GOM 1988a), and the seventh leading cause among children older than four years, at 3.2% of 3,534 reported hospital deaths (GOM 1988a). It was also the ninth leading cause of out-patient visits to hospital of children over five years of age, accounting for 2.2.% (or 34,090 visits) of 7.5 million recorded annual out-patient visits (GOM 1988a).
Malnutrition, arduous physical labor and repeated pregnancies contribute to high morbidity and high rates of maternal mortality in Mala% (GOPA 1987). These rates, thought to be among the highest in Afi-ica, are 27/1,000 deliveries in the Northern Region, 18/1,000 in the Central Region and l O / l O O O in the Southern Region (GOPA 1987).
Avitaminosis and nutritional deficiency in 1983 accounted for 1,053 of all hospital patient deaths. They were the third leading cause of death (10% of the total of 10,404 reported deaths from disease), after pneumonia (11.1%) and measles (11%) (GOM 1987~). Rates vary by region. In the Southern Region avitaminosis and nutritional deficiencies are the leading cause of hospital patient deaths, accounting for almost 14% of all deaths, and in the Central Region, where they are the second main cause of death, they contribute 10.1%. In the Northern Region, in contrast, avitaminosis and nutritional deficiency are only the seventh cause of death, where they account for 4% of in-patient deaths (GOM 1987~).
The geographical distribution of infant mortality rates, by district, is shown in Fig. 3.48. Noteworthy are the relatively higher rates in the Central Region. This corresponds with the nutritional disorders described above as a cause of death, and could be attributed to the fad that this region consumes 60% less animal protein than the other two regions. This could highlight the particular vulnerability of both the Central and Southern regions, which could benefit from the protein either by developments in animal husbandry or aquaculture, or both.
In Mala%, protein comprises about 12% of total energy intake, a satisfactory level if energy requirements are met. Approximately 15% of the dietary protein is of animal origin, of which fish comprises 60-70% (see Chapter 5), and 56% is provided by maize. Maize also provides 74% of recorded energy intakes. Fat, mostly from peanuts, comprises 10% of dietary intake. Foods of animal origin provide about 3% of the dietary
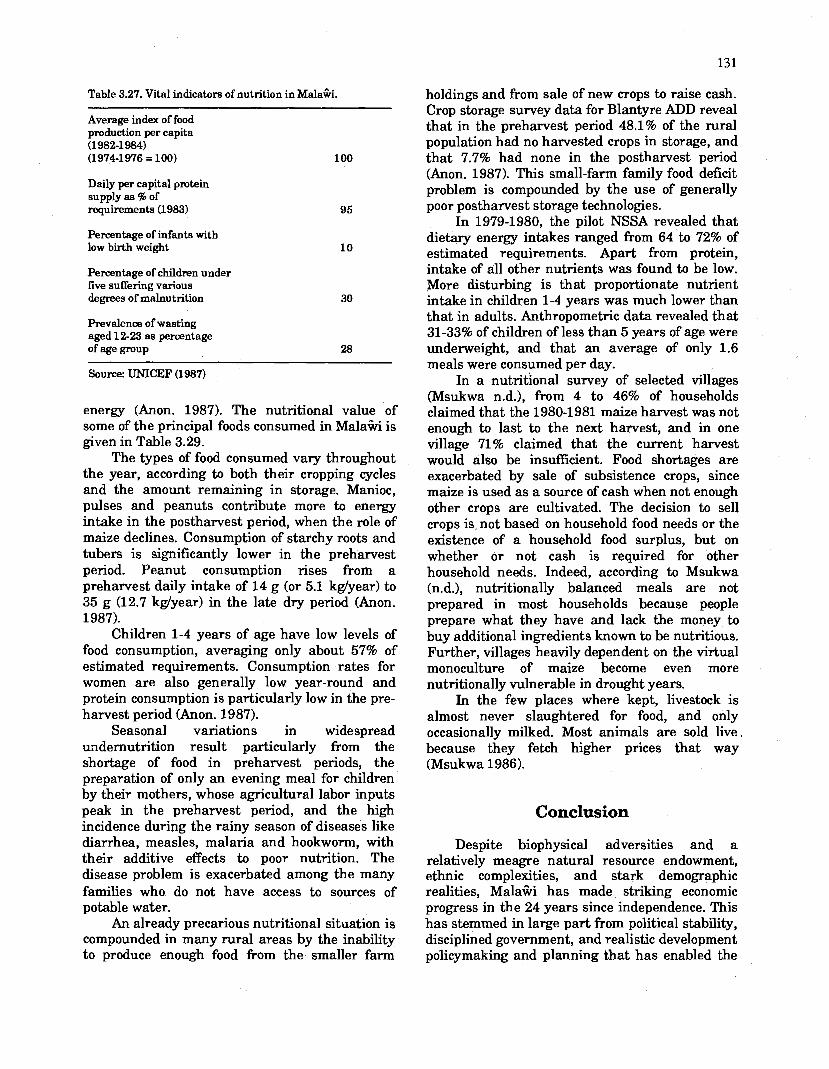
Table 3.27. Vital indicators of nutrition in Mala%.
Average index of food production per capita (1 982-1 984) (1 974-1 976 = 100)
Daily per capital protein supply as % of requirements (1983)
Percentage of infants with low birth weight
Percentage of children under five suffering various degrees of malnutrition
Prevalence of wasting aged 12-23 as percentage of age group
Source: UNICEF (1987)
energy (Anon. 1987). The nutritional value of some of the principal foods consumed in Malaki is given in Table 3.29.
The types of food consumed vary throughout the year, according to both their cropping cycles and the amount remaining in storage. Manioc, pulses and peanuts contribute more to energy intake in the postharvest period, when the role of maize declines. Consumption of starchy roots and tubers is significantly lower in the preharvest period. Peanut consumption rises from a preharvest daily intake of 14 g (or 5.1 kg/year) to 35 g (12.7 kg/year) in the late dry period (Anon. 1987).
Children 1-4 years of age have low levels of food consumption, averaging only about 57% of estimated requirements. Consumption rates for women are also generally low year-round and protein consumption is particularly low in the pre- harvest period (Anon. 1987).
Seasonal variations in widespread undernutrition result particularly from the shortage of food in preharvest periods, the preparation of only an evening meal for children by their mothers, whose agricultural labor inputs peak in the preharvest period, and the high incidence during the rainy season of diseases like diarrhea, measles, malaria and hookworm, with their additive effects to poor nutrition. The disease problem is exacerbated among the many families who do not have access to sources of potable water.
An already precarious nutritional situation is compounded in many rural areas by the inability to produce enough food from the smaller farm
holdings and from sale of new crops to raise cash. Crop storage survey data for Blantyre ADD reveal that in the preharvest period 48.1% of the rural population had no harvested crops in storage, and that 7.7% had none in the postharvest period (Anon. 1987). This small-farm family food deficit problem is compounded by the use of generally poor postharvest storage technologies.
In 1979-1980, the pilot NSSA revealed that dietary energy intakes ranged from 64 to 72% of estimated requirements. Apart from protein, intake of all other nutrients was found to be low. More disturbing is that proportionate nutrient intake in children 1-4 years was much lower than that in adults. Anthropometric data revealed that 31-33% of children of less than 5 years of age were underweight, and that an average of only 1.6 meals were consumed per day.
In a nutriGona1 survey of selected villages (Msukwa n,d.), from 4 to 46% of households claimed that the 1980-1981 maize harvest was not enough to last to the next harvest, and in one village 71% claimed that the current harvest would also be insufficient. Food shortages are exacerbated by sale of subsistence crops, since maize is used as a source of cash when not enough other crops are cultivated. The decision to sell crops is, not based on household food needs or the existence of a household food surplus, but on whether or not cash is required for other household needs. Indeed, according to Msukwa (n.d.), nutritionally balanced meals are not prepared in most households because people prepare what they have and lack the money to buy additional ingredients known to be nutritious. Further, villages heavily dependent on the virtual monoculture of maize become even more nutritionally vulnerable in drought years.
In the few places where kept, livestock is almost never slaughtered for food, and only occasionally milked. Most animals are sold live. because they fetch higher prices that way (Msukwa 1986).
Conclusion
Despite biophysical adversities and a relatively meagre natural resource endowment, ethnic complexities, and stark demographic realities, MalaGi has made striking economic progress in the 24 years since independence. This has stemmed in large part from political stability, disciplined government, and realistic development policymaking and planning that has enabled the
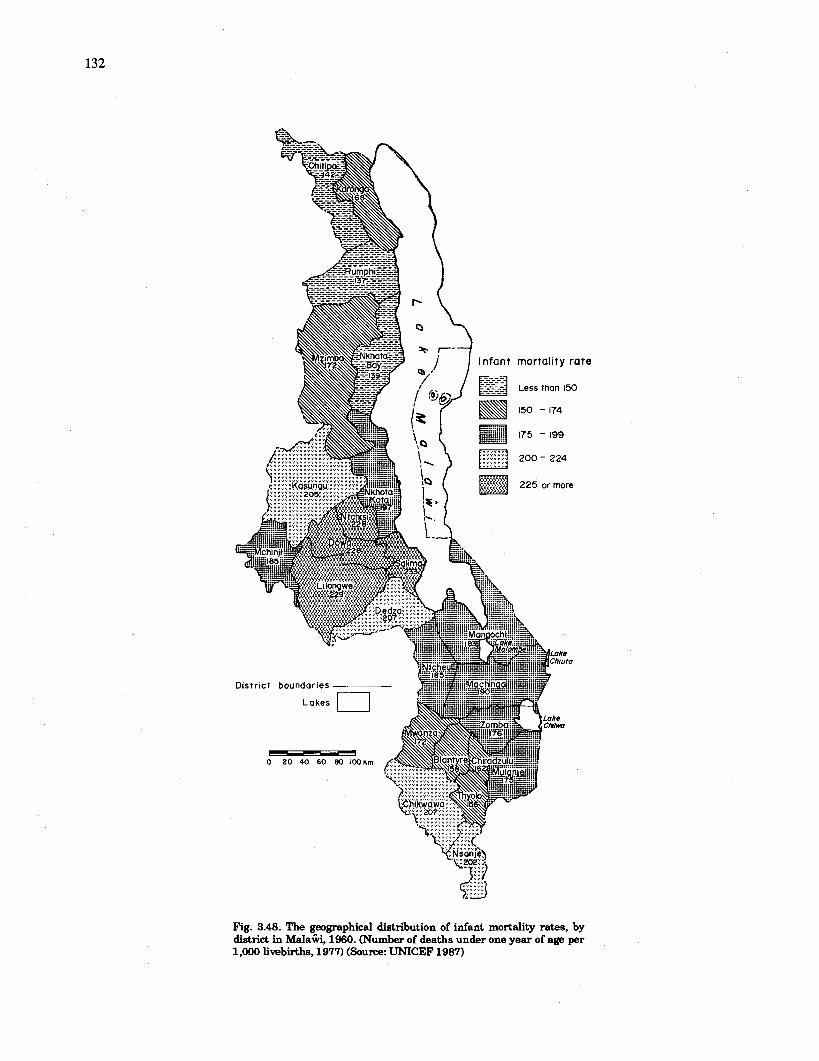
Fig. 3.48. The geographical distribution of infant mortality rates, by district in Malaii, 1960. (Number of deaths under one year of age per 1,000 livebirths, 1977) (Source: UNICEF 1987)

Table 3.28. Potential availability of animal protein per capita of human population, by region in Mala%, 1979-1980.
Region Population Fish Sources of estimated meat production (tlyear), 1980-81(c) Available animal protein % 1980 landings contributed
(1,000sXa) (t/yearXb) Cattle Sheep Goats Pigs Poultry Ducks Total Total Wcaput by (Vyear) Total fish
Fish Animal
Northern 700.5 3,675.0 7,200.0 15.6 9.7 105.8 127.8 1 .8 7,460.7 11,135.7 15.9 33.0
% 11.5 6.1 33.7 15.1 10.3 10.7 15.2 2.7 30.8 13.3 5.2 10.7
Central 2,403.6 9,117.0 11,200.0 39.5 498.3 549.6 341.4 22.7 12,651.5 21,768.5 9.1 41.9
% 39.4 15.2 52.5 38.6 52.7 55.8 40.7 34.6 52.3 26.9 3.8 5.3
Southern 2,993.7 47,021 .O 2,940.0 47.7 350.2 329.2 370.1 41 .O 4,078.0 51,099.0 17.1 92.0
% 49.1 78.7 13.8 46.5 37.0 33.4 44.1 62.6 16.9 60.8 15.7 1.4
Total 6,097.8 59,813.0 21,340.0 102.8 858.2 948.4 839.3 65.5 24,190.2 84,003.2 13.8 71.2 % 100.0 100.0 100.0 100.0 10?.0 100.0 100.0 100.0 100.0 100-0 9.8 4 .O
% contribution meat 88.2 0.4 3.5 4.1 3.5 0.3 100.0
all sources 71.2 25.4 0.1 1 .O 1.2 1 .O 0.1 28.8 100.0 , -
Sources: (a) GOM (1987); (b) GOM (1983); (c) Meat production (P in t) has been calculated from the livestock herd estimate (n) in GOM (1984a), and multiplied by an assumed omake rate (r = %) of an average beast weight (w = kg) according to GOM (1986a), i.e., P = (n.t)W/l,OOO.

Table 3.29. Nutritional value of selected ~ a l a G i a n subsistence foods.
Food item Vernacular E.P. Water Nutrients in lOOg edible portion name % %
Cal Prot Fat CHO Ca Fe Vit A Thiam Ribf Niac Vit C (Chichewa) 13 B 8 mg mg I.U. mg mg * mg
Cereals
Maize (whole) Maize (flour: 96% extract) Maize (flour: 75% extract) Maize (flour: 60% extract) Bulrush millet flour Finger millet (whole) Finger millet (flour) Rice (lightly milled) Rice (highly milled) Sorghum (whole) Sorghum (flour)
Starchy roots
Manioc (fresh root) Manioc (flour) Banana (cooking) Sweet potato Yam (fresh)
Chmanga n Z 4 $ ~ Ufa woyera (a) Ufa woyera (b) Mchewere Mawere n.a. Mpunso n.a. Mapira Ufa wa rnapira
Chinangwa Kondowole Nthochi Mbatata Chilazi (mpama)
h ~ r c e : Williamson (1975). Notes: * Yellow maize contains 150 I.U. Vit Moog; ** quantity too small to be of dietary significance; (a) = milled, (b) = pounded.

progressive development of the physical, institutional, and social infrastructures prerequisite for sustained development. That not all macroeconomic goals have been achieved can, in large part, be attributed to uncontrollable external political and economic factors, and, in some years, to adverse climatic factors.
Nevertheless there is no escaping the evidence that sectors of the rural population have participated but little in national economic progress, that among particular groups in some localities and at certain times of the year the
nutritional situation is severe, and that the ratio between population growth and the actual and potential resources of the country are a source of concern. Given these considerations attention is now turned to fisheries and aquaculture, and the potential role that they could play in both contributing to nutritional improvement and raising household incomes. A detailed consideration of aquaculture is preceded by a two- chapter examination of capture fisheries, since the development of aquaculture should be seen as a complement to these, as well as to agriculture.

Chapter 4
Introduction
With 20% of its surface area covered by water, it is of little surprise that the capture fisheries of MalaGi provide up to 70% of the animal protein consumed. For example, average annual fish consumption in 1980 was 9.8 kglcapitdyear (or 26.8 glcapitdday) (Vincke 1981) (Table 3.29). In contrast, all meat products comprise just under 30% of the total animal protein consumed, a t an annual average consumption rate of 4.0 kglcapitdyear (or 10.9 glcapitafday) (Table 3.29). Thus in 1980, total animal protein from all sources amounted to 13.8 kglcapitdyear, or 37.8 glcapitdday, which is about 56% of total protein intake, estimated at 67.6 glcapitalday. Fish thGrefore comprises nearly 40% of total protein intake. This emphasizes its importance to human nutrition in Mala%. Capture fisheries also provide a major source of rural employment and contribute an estimated 4% to the GDP (FA0 1983).
The principal freshwater body of the country, Lake MalaGi, accounts for some 40% of total annual fisheries production, and Lake Chilwa, which is per unit area more productive, can contribute 20-30%. Other major fisheries are based on Lake Malombe, Lake Chiuta and the Shire River system (Table 4.1).
The capture fisheries of MalaGi are divisible into small-scale traditional, large-scale industrial, and ornamental sectors. The latter, although important to the national economy as a source of foreign exchange, is not relevant here. The traditional sector is the most important, producing between 80 and 90% of the total annual catch, and is conducted mostly from dugout canoes and plank boats that work inshore for only short periods of time. The principal techniques used by traditional fishermen are gill netting, seining, long-lining, the chilimila net (an open
water seine net unique to Lake Malaii), together with a variety of traps, scoop nets and other devices in shallower waters. The industrial sector is characterized by capital intensive and mechanized operations, in specifically demarcated sections of southern Lake MalaGi. In combination with Chapter 5, this chapter sets the scene for the later examination of aquaculture with a discussion of the major features of the capture fisheries of Malafii.
The Fisheries Areas and Productivity
Estimated fish production by area for the period 1962-1986 is shown in Fig. 4.1 and Table 4.2, and aggregated and combined with international trading and consumption data in Table 4.3. The total capture fishery production for Mala% has ranged from a low of 1,100 t (1950) to a high of 84,000 t (1972). Estimates of the total potential maximum sustainable yield (MSY) for Malawi range from a low of 16,000 tlyear (Kerr 1966) to 150,000 Uyear (SADCC 1984). From the recorded maximum and minimum range of catch sizes since the fishery stabilized in 1970, it is possible to project that a more realistic MSY may be in the range of 41,000-84,000 Uyear (Table 4.2), and the same data suggest a relatively stable catch of from 55,000 to 75,000 Vyear. Welcomme (1979) estimated a conservative average annual MSY of 80,000 t, whereas T. Jones (pers. comm.) believes that the potential may be as much as 150,000 Uyear.
For administrative purposes the country is divided into 10 principal fishing areas (Fig. 4.2): Lake MalaGi (with six divisions), Lake Malombe and the Upper Shire River, Lake Chiuta, Lake Chilwa, and the Lower Shire River, with its associated wetlands (GOPA 1987).

Table 4.1. Basic limnological and fisheries characteristics of the principal capture fisheries areas of Mala%.
Area characteristics
Lake Malaii Lake Chilwa Lake Malombe Lake Chiuta Shire Rivers Total floodplain capture
fishery
Basic limnological features
Elevation above sea level (m)
Length x width (km)
Area (1,000's km2)
Depth (m) Max. Mean
Volume (million m3)
Number of fish species
Principal economic uses
Fishery potential (kglhalyear)
Fishery potential (1,000 tlyear)
1970-86 production range (1,000 tlyear) (b & j)
No. of fishing craft
No. of fishermen (1,000)
Geographically varied (1)
471
575 x 85 (a)
23.0-30.5 (b)
730(a)-758(b) 426 (a)
Fishery Transportation Irrigation
Shallow saline
6 54
35 x 27 (a)
0.75 - 2.59
n.a. 2 (a)
n.a.
28
Fishery
110
20 (0
2-26
2,000 (b)
0.7 (g)-l(d)
Shallow
4 70
29 x 17 (b)
0.39
6 (b) 4 (b)
n.a.
90
Fishery
n.a.
2 (g)
2-12.7
360 (g)-422(k)
0.3 (b)-O.g(g)
Shallow saline
620
n.a.
0.113
n.a. 5 (b)
n.a.
40
Fishery
Typical seasonal floodplain
0.5-1 .O(C)
n.a.
Fishery Pasture
100-165(e)
4-1 7 (c)
3.9-6.9
1,450 (b)
2.1 (b)
520 (d)
0.5-10
n.a.
Fishery Domestic use
n.a.
15 (h)
4-17
1,570 (g)
2.2(g)-4 (d)
Sources: (a) GOM (1983); (b) GOPA (1987); (c) FA0 (1983); (d) Welcomme (1975); (e) Hastings (1973); (f) GOM (1978); (g) Chaika (1982); (h) Welcornme (1979); (i) SADCC (1984); (i) GOM (1984); (k) Welcornme (197213). Table Note: (1) Northern Region: deep water, cliffed s h o ~ s ; Likoma-Chizumulu Isles: shallow waters; Nhkotakota-Domira Bay: Deepwater and sandy shore; Southwest Arm: Shallow Bay; Southeast Arm: Shallow Bay.

Karnuzu barrage closed
C I New data system Change in dafa recordilg I
t Lake Chilwa dries up
t Chilwa and Lake Chiuta
Year Fig. 4.1. Capture fishery production of the principal waterbodies of ~ a l a G i , 1962-1986 (1,000 tlyear). (Source: drawn from data in GOPA 1987. See also Table 4.2.).
One of the critical factors affecting the capture fishery is the extent of fluctuations in water levels in the country's principal water bodies, owing to climatic variations. The level of Lake Mala%, for example, fluctuates between 1 and 1.5 mlyear, and in 1982 reached the highest ever recorded (Fig. 3.25). On the other hand, Lake Chilwa dries out completely on occasion, as it did in 1968 (Fig. 3.27).
Lake ~a la ib i
With an area of 30,800 km2 (Table 4.4), Lake Malaii, the southernmost of the great lakes of the East African Rift Valley, is the ninth largest lake in the world. With an average depth of 426 m (and a maximum of 758 m) (Fig. 4.3), it is the fourth deepest in the world (Welcomme 197213). Although mostly characterized by clear waters of low basic biological productivity, seasonal upwelling induced by the prevailing southeasterlies during the period June-September gives rise to rich fishing grounds in the shallower waters a t the southern end of the lake. Lake Mala% is drained southwards, via the Upper Shire River, into Lake Malombe. But this accounts for only about 20% of the outflow. Most of the annual fluctuation of 1- 1.5 m results from evaporation losses (R. Noble,
pers. comm.). Records indicate that the water level of Lake MalaGi receded between 1900 and 1925, was about 5 m below present levels (Fig. 3.25), and that there was no recorded outflow during that period (GOPA 1987). Geological evidence suggests that the lake level has fluctuated by some 125 m during the last millenium.
As demonstrated in Fig. 4.1, the fish yield from Lake MalaGi generally provides some 40- 50% of the national total production. Its share has reached 80% (1962), but this depends largely on fluctuations in the productivity of Lake Chilwa (Table 4.3). However, i t should be noted that the data collection system was changed in 1976 (D. Tweddle, pers. comm.), thus comparisons between those for years before and after that date should be made with caution.
Lake Mala% is divided into six fishery management zones, but for convenience three principal fisheries sections can be recognized: the Northern and Central, the Southwestern Arm, and the Southeastern Arm (Fig. 4.2). The Northern and Central section, which includes waters north of Nkhotakota, plus the Likoma and Chisumulu Islands, is characterized by deep waters and a low basic fisheries productivity. The estimated potential exploitable fish stocks of this area are 4,000 t/year (21% of the total). The

Table 4.2. Estimated capture fisheries pmdudion of Mala% by area, 1962-1986 (1,000 t).
Lake MalaCi Lake Malombe Lake Chilwa Lake Chiuta Lower and Middle Shire Total
Traditional Commercial Total % Total % Total % Total %
Source: Compiled and calculated from various unpublished reports of the Fisheries Department and GOPA (1987) Note: See also Fig. 4.1.

Table 4.3. Summary of total fish production, fish prices and consumption in ~ a l a G i , 1947-1986.
Year Price International (b) Total (MKO.Olkg) fish trade available
Consumption
fish Artisanal Commercial TotaKb) (1,000t) (1,000t) (1,000 t) Population (c) Fish consumption
Imports Exports (millions) (kg/capita/yearXd)
3.42
4.04
4.51
5.25 5.45 5.55 5.75 5.95 6.16 6.21 6.27 6.40
7.0 (a)
8.63
Sources: (a) GOM (1988); (b) GOM (1972,1984); (c) UNFPA (1983); (d) Nongwa (1985); (e) Chaika (1982); (D LMA (1983a); (g) GOM (1984); (h) GOM (1988); (i) GOPA (1987); (j) FA0 (1983). See also Fig. 5.5. Table Note: For foreign exchange rates, see p. 302.

ZOne 1 - Upper Shire and Lake Malombe 2 - southeast ~ r m , Lake Malawi 3 - Southwest Arm 4 - Salima to Domira Bay 5 - Nkhotakota 6 - Nkhata Bay 7 - Karonga 8 - Lake Chluta 9 - Lake Chilwa 10 - Lower Shire
Fig. 4.2. The fisheries management zones of Mala% and delimitation of the grounds for industrial fishing in Lake Mala%. (Source: FD records and Turner 1976).
Table 4.4. Estimated capture fisheries production by area in the Lower Shire Valley of MalaGi, 1972.
Area Total estimated Total annual production (t) area (ha)
Yield kglhalyear
Elephant Marsh North Marsh
Southeast Marsh West Marsh
Bangula Marsh Chikwawa Lagoons Ndinde Marsh
Total 6,874.4 41,740 165
Source: Calculated from data in Hastings (1973).
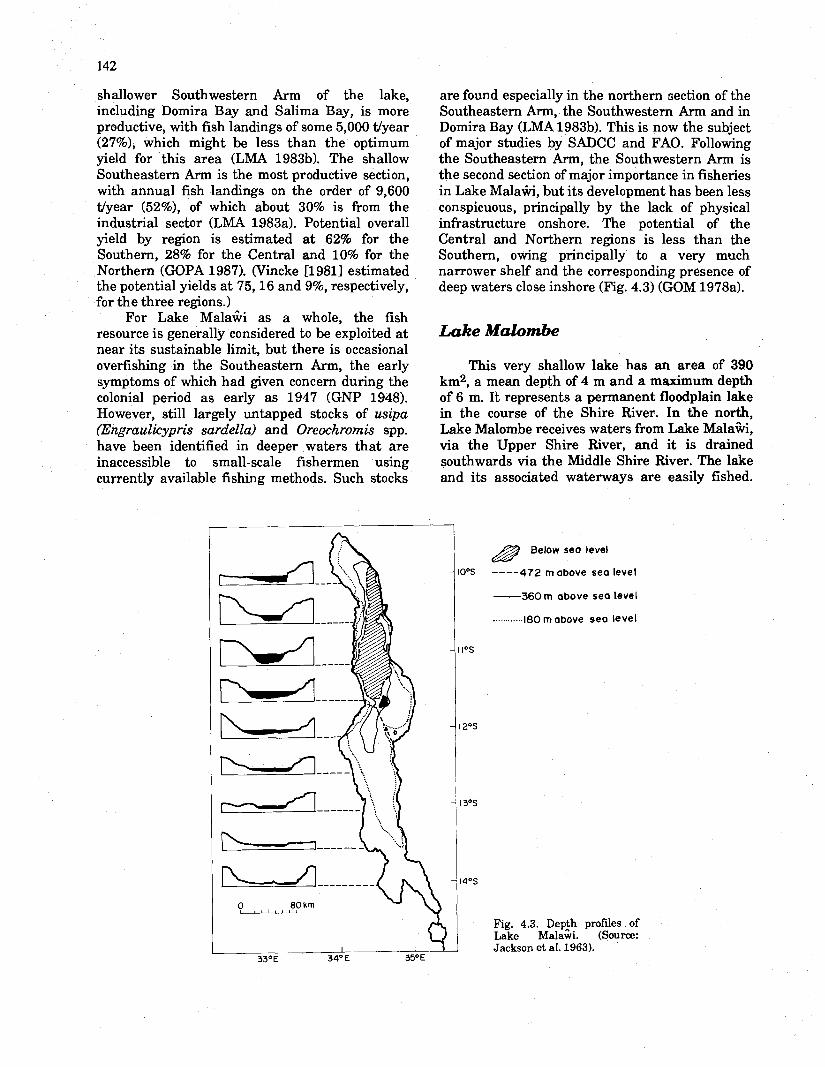
shallower Southwestern Arm of the lake, including Domira Bay and Salima Bay, is more productive, with fish landings of some 5,000 tlyear (27%), which might be less than the optimum yield for this area (LMA 1983b). The shallow Southeastern Arm is the most productive section, with annual fish landings on the order of 9,600 tlyear (52%), of which about 30% is from the industrial sector (LMA 1983a). Potential overall yield by region is estimated a t 62% for the Southern, 28% for the Central and 10% for the Northern (GOPA 1987). Wincke C19811 estimated the potential yields a t 75,16 and 9%, respectively, for the three regions.)
For Lake Mala% as a whole, the fish resource is generally considered to be exploited at near its sustainable limit, but there is occasional overfishing in the Southeastern Arm, the early symptoms of which had given concern during the colonial period as early as 1947 (GNP 1948). However, still largely untapped stocks of usipa (Engraulicypris sardella) and Oreochromis spp. have been identified in deeper waters that are inaccessible to small-scale fishermen using currently available fishing methods. Such stocks
are found especially in the northern section of the Southeastern Arm, the Southwestern Arm and in Domira Bay (LMA 198333). This is now the subject of major studies by SADCC and FAO. Following the Southeastern Arm, the Southwestern Arm is the second section of major importance in fisheries in Lake Mala*, but its development has been less conspicuous, principally by the lack of physical infrastructure onshore. The potential of the Central and Northern regions is less than the Southern, owing principally to a very much narrower shelf and the corresponding presence of deep waters close inshore (Fig. 4.3) (GOM 1978a).
Lake Malombe
This very shallow lake has an area of 390 km2, a mean depth of 4 m and a maximum depth of 6 m. It represents a permanent floodplain lake in the course of the Shire River. In the north, Lake Malombe receives waters from Lake MalaGi, via the Upper Shire River, and it is drained southwards via the Middle Shire River. The lake and its associated waterways are easily fished.
&@ Below sea level
00s ---- 472 m above sea level
- 3 6 0 m above sea Level
. . . . . . . . . . . . 180 m above sea level
Fig. 4.3. Depih profiles of Lake Malawi. (Source: Jackson et al. 1963).

Estimated total annual yields have ranged from 1,100 t (1964) to 12,700 t (19861, or 16.4% of'total national fisheries production in the latter year (Table 4.2). The contribution of the fisheries of Lake Malombe to national production has ranged from 43.3% (1968) to 4.2% (1972).
Lake Chilwa
Lake Chilwa is the twelfth largest African lake south of the equator. Since this lake is liable to periodic drying, its estimated area varies, depending on rainfall and evaporation. Lake Chilwa has effectively dried out more than 6 times during the last century, the last time in 1968 (Fig. 3.27). At maximum it has an estimated area of 2,500 km2, but generally i t has a mean area of 750 km2 of open water and 390 km2 of associated wetlands (GOPA 1987). Lake Chilwa is extremely shallow, with a mean depth of 2 m and an annual fluctuation in water depth of 1.3 m (Fig. 3.27). Kirk (1970) quotes Dixey (1926) who maintained that at one period of its evolution during the Pleistocene Lake Mala64 was 400 feet (122 m) above its present level (i.e., at the approximate present height of Lake Chilwa). This suggests that it drained through Lake Chilwa into the Shire River. However, modern geological evidence does not support this theory (B. Owen, pers. comm.).
In terms of fisheries, Lake Chilwa is the most productive waterbody in MalaGi, yielding up to an estimated 26,000 Vyear, as in 1979, when it flooded to maximum. Catches are of course negligible when the lake dries out. But normal water depths can return during a single wet season (Fig. 3.27), and catches recover to normal levels 3-4 years thereafter. Despite its productivity, Lake Chilwa fisheries must be regarded as an essentially unreliable source of fish supply for southern Malax. The contribution of Lake Chilwa to national fisheries production has ranged from 3.8% (1973) to 57.6% (1965) (Table 4.2).
Lake Chiuta
Lake Chiuta is located along the south- Bastern boundary with Mozambique, and only 50 km2 of its total area of 113 km2 is in MalaCKi. It is also shallow, with a mean depth of 5 m. Since it is less liable to drying than Lake Chilwa, its fisheries productivity is more stable. Estimated total annual catches have ranged from a low of
700 t (1986) to a high of 2,000 t (1984), or from 0.9% to 3% of the total national fisheries production, respectively (Table 4.2).
Lower Shire Valley and Associated Wetlands
This area lies in the extreme south of ~ a l a % , and extends southwards from the Kapachira Falls to the border with Mozambique (Fig. 3.26). Together, the perennial waters of the Lower Shire River and its associated lagoons, permanently inundated swamps and seasonally flooded wetlands cover a maximum area of 695 km? The main wetlands are composed of the Elephant Marsh and Ndinde Marsh. Hitherto dependent on both local rains and wet season outflow from Lake Malaki, via Lake Malombe, and normally inundated by December and relatively dry during the period August- November, the hydrological regime of these wetlands has been modified since 1972 by the Kamazu Barrage at Liwonde, which now controls flow on the Shire River. It appears to have had an impact on fish yields from these marshes, as after its closure in May 1972, there was a record fish production of some 10,000 t in the lower Shire in that year (Hastings 1973) (Fig. 4.1). However, it is also possible that the high production could also be attributed to the high water levels at that time (Fig. 3.25).
The fishery of the Lower Shire Valley is divisible into five main areas. In terms of relative estimated production these are: the Elephant Marsh (518 krna), the Ndinde Marsh (155 kma), the Chikawa lagoons (4 krna), the Bangula Marsh (18 kma), and the Lower Shire River (208 km in length) (Ratcliffe 1972).
THE ELEPHANT MARSH
This, the largest, most important and ecologically most complex division of the fishery, comprises swift-flowing permanent river channels, lagoons, seasonally inundated floodplains, and areas of dense reed beds. It is sustained by the waters of the Shire River. The 140 km2 area that comprises the southeast fishery zone of this fishery has the highest estimated annual production, an estimated 20% of the total (Ratcliffe 1972), owing to its large lagoon complex that permits year-round gill- and cast-netting operations, its proximity to all-weather road and rail communications, and thus to the greater

fishing effort exerted relative to other localities. It is also one of the most productive areas, yielding up to 216 kg/hdyear (Table 4.4).
THE NDINDE MARSH
This is the southernmost fishery in Mala%, and also sustained by the Shire River. Several lagoons are located within this wetland, the largest being at Ndamera, in the southwestern extremity.
THE CHIKAWA LAGOONS
There are five lagoons in this area: Kanjedza, Gumbwa, Makhuthu, Chitimbe and Nyazuluko. The first is the largest and most productive. These lagoons vary in depth and extent according to the flood regime of the Shire River, and their fishery is based on the exploitation of the seasonal stocks which use them as spawning and forage sites (Ratcliffe 1972).
THE BANGULA MARSH
The waters of this wetland are replenished during the wet season from both the Shire River and local seasonal watercourses. Like the Chikawa lagoons, the fishery of this area is based on the exploitation of seasonal spawning stocks, but yields, at 377 kglhdyear (Table 4.41, are the highest in the region.
THE LOWER SHIRE RIVER
The waterflow regime of this river, and thus variations in the ecological characteristics of its fishing sites, is regulated by the barrage at Liwonde. Exploitation is limited to small numbers of small-scale gears (e.g., casting nets, pole-and- line, traps, and the like) positioned in tranquil sites, since the swift current and volume of waterflow in the main stream precludes the use of large-scale, commercial gear.
Fish Production in the Lower Shire Valley
The swamp fishery of the Lower Shire Valley is estimated to yield an estimated 2,000-8,000 tfyear of fish, or equivalent to 100 kg/ha (Hastings 1973). Annual yields are'reported to have ranged from 3,900 t (1980) to 17,300 (1972), or from 5.9% to 20.5%, respectively, of the total annual
production (Table 4.2). (Estimated production by subdivision of the fishery is shown in Table 4.4).
Available data suggest that current levels of production for the entire catchment area are significantly below its estimated sustainable yield of some 12,000 tfyear (Hastings 1973). Other genera, such as Labeo spp., Mormyrops deliciosus, and Synodontis spp. could be better exploited, and the CZarias gariepinus catch enhanced. At present some 94% of the fisheries production is derived from Oreochromis spp. and Clarias gariepinus, with the balance from miscellaneous species. In contrast, experimental catches yielded a species composition of 60% Oreochromis spp. and Clarias gariepinus, and 40% "others" (Hastings 1973).
Particularly noteworthy is the high yield rate of Bangula Lagoon, at 377 kg/ha (Table 4.4), which is akin to, if not higher than, that of fishponds in Mala% (see Chapter 6). This lagoon is more like a semimanaged pond than a natural waterbody, since it was formed by a railway embankment impounding waters against a natural slope (Hastings 1973). Hastings (1973) attributed the fertility of Bangula Lagoon partly to the mineral and detrital input of the more than 3,000 cattle that drink there daily. Assuming that 0.5 kg/animal/day of excrement are deposited in or around the lagoon, the inputs would be some 550 tfyear, or 528 kg/ha of lagoodyear.
As a consequence, Hastings (1973) suggested that the Bangula Lagoon could be managed effectively as an extensive fishpond, by installing sluices to control fish stocking during the flooding of the river, as well as to prevent the entrance of predators. He also suggested a survey to locate similar terrain for conversion to small lagoons, by linking them to the Shire River with small, artificial channels, and where cattle owners could be encouraged to water their livestock on a regular basis.
The rapids between Kapachira Falls and Kholombidzo Falls (Fig. 3.26) act as a natural barrier isolating the Lake Mala% fauna from that of the Zambezi system. This has far-reaching implications in the control of species transfers for aqbaculture between these watersheds, as protective legislation precludes any fish introductions in the Lake Mala% catchment.
The Fish Resource
Despite Lake Mala% having been one of the cradles of ichthyological research in Africa, and the impressive amount of basic scientific work conducted and data accumulated on it, there are
still many knowledge gaps about the fisheries of the region. The study on other waterbodies in the country has not advanced to such a degree (Tweddle and Mkoko 1986). Thus the discussion in this section is based mostly on the fish resources of Lake Mala%.
Lake Mala&
In Lake MalaGvi important biophysical characteristics unique to the country have both influenced the evolution of its fish fauna as well as the development of its fisheries and the techniques used to exploit them. The most important among these are its long, deep, and narrow basin (Fig. 4.3); an unusual water clarity that permits visual detection of fish at depths of 10 m; anoxic waters below 200 m, which are largely devoid of fish life; a marked seasonality of weather and lake surface conditions; and large stocks of mostly small-sized fish.
Adaptation to those factors, and particularly to the habitats and seasonal variations in fish behavior, led not only to the development of some unusual fishing methods, but also to the social organization of itinerant fishermen, particularly those who catch utaka (Haplochromis spp.). The principal species of food fish captured are shown in Table 4.5, but the catch composition varies by region and fishery (Figs. 4.4 and 4.5). Generally, tilapia (chambo) are predominant in landings in the south, whereas utaka are more important in the north.
Pelagic Fish Resources of Lake Mala*
In Lake Mala%, the pelagic fish resource is comprised of species inhabiting the water column either ttbove the lake bottom or in waters less than 200 m deep (i.e., the upper limit of anoxic waters).
Offshore Pelagic Resources
Owing to present low technological levels as well as to marketing constraints, offshore pelagic stocks are relatively little exploited by the small- scale fishermen, except when the fish migrate seasonally into inshore waters. The problems of capturing offshore pelagics are largely insurmountable to the traditional fishermen operating from canoes and small boats. Among
the most important problems are the intrinsic difficulty of capturing pelagics compared with demersal species, since for the former gear must function both vertically and laterally; that the fish are commonly dispersed throughout a large water space in which the bottom may be too deep for anchoring the gear and in which effort may be disproportionately large compared with returns; and the dangers inherent in operating small craR in deep waters subject to sudden and violent changes of weather.
Inshore Pelagic Resources
The most important elements in the fisheries of Lake Mala% are those for usipa (Engrauli- cypris sardella) and utaka (Haplochromis spp.), which regularly provide the economic basis for a great number of fishing households. The familiar and regular migrations of these species are the cause of a parallel migration of fishermen, especially in the southern parts of the lake (Kapeleta 1980; Kandawire 1988).
Usipa is the only species whose entire life cycle is independent of the shore. Much remains to be learned about its biology. An artisanal usipa fishery has been well established in the south of the lake for several years. More efficient methods could be introduced to catch more usipa inshore, but this could lead to competition with the traditional fishery, as the level of investment required may be beyond the economic capacity of all but a few entrepreneurs.
Although they occur inshore, where they sometimes adopt a demersal habit, utaka are classified as a pelagic resource. This is an assemblage of species, but catches are dominated by only a few, particularly H. virginialis, known locally as either kaduna (kadose) or nyakaulu, and the breeding adults of H. quadrimaculatus, known locally as mbarule. Catches of the latter are therefore seasonal, occurring in Nkhata Bay, of the Central Region, during the period May-July (LMA 198313).
This resource is believed ta be possibly in danger of overexploitation (LMA 1983b). Utaka from a wide area concentrate in dense shoals over well known submerged rocky formations (virundu) where currents aggregate the plankton on which the fish feed, and where large catches can be taken. During other current regimes the fish are widely dispersed, and so not vulnerable to capture. Thus when all such sites are being worked the utaka may be under risk of overfishing.

Table 4.5. Main species of food fish captured in Mala%, by area.
Vernacular name Scientific name English common name
Lake Malaki
chambo, mkambo chisawasawa ehigonti, samamw utaka kambuzi binga saguga mzomba dimba mbaba kaduna, kadose (1) mbarule (2) kampango usipa sungwa ncheni, sango m P s a sanjika nchila batamba mlamba sapuwa nkoma kabwili ehimwana pumba nkolokolo kadyakola ngumbo
Lake Malombe
chambo utaka mlamba kampango nchila, ningwi
Lake Chilwa
makumba mlamba matemba
Lake Chiuta
kampango phi la
Lower Shim
mcheni nchenka nghenka matemba njole tsimbu mlamba chikanu n k h o ~ k ~ n o &nde mphende nkakafcdya
Oreochromis squamipinnis Bream Lethrinops spp. Mormyrus longimstris Elephant-snoutfish Haplochromis spp. Happy H. similis H. kiwinge H. speciosus H. lethrotaen H. nototae H. kirkii H. virginalis H. quadrimaculatus Bagrus meridwnnlis Engraulicypris sardella Serranochromis robustus Rhamphochromis spp. Opsaridium mierolepis Opsaridium sp. Labeo mesops Barbus rhodesii C l a r b gariepinus Bathyclarias nyasenii Bathyclarias loweae ~a th~c lar ias longibarbis Bathyclarias faueolatus Synodontis nyassae Barbus eurystomus Barbus phnstonii
Oreoehromis spp. Haplochromis spp. Clariasgariepinus Bagrus meridwnalis Labeo mesops
0. shimnus chilwae Clarias gariepinus Barbus paludinosus
Bagrus meridwnalis Labeo mesops
Hydrocynus vittatus Distichcdus mossambicus D. shenga Barbus spp. Labeo altivelis L. congoro ClariaP gariepinus C. ngnamensis SyMdontis spp. Eutropius depressimtris Oreoehromis spp. Haplochromis spp.
Bagrid catfish Whitebait
Tigerfish Lake salmon Lake trout African carp Minnow Clarid catfish (3)
Squeaker
Tilapia
Catfish (3) Bagrid catfish African carp
Tilapia Clarid catfish (3) WMOW
Bagrid catfish African carp
Tigerfish
Minnow African carp, River salmon African carp Catfish (3) Catfish Squeaker Butter barbel Tilapia
Source: FA0 (1966); GOM (various); LMA (1983b); Ratcliffe (1972). Notes: (1) Males breeding known as nyakaulu.
(2) Juveniles known as mbaba. (3) Also known as barbel.
Inshore Demersal Fish Resources
These resources are exploited with long- and hand-lines, gill nets, beach seines, and fishing traps in suitable areas along the entire shoreline. The principal fish taken are Oreochromis squamipinnis (chambo), Haplochromis similis ( h a m b u z i ) , Bagrus meridionalis ( k a m p a n g o ) ,
Clarias gariepinus (mlamba), Bathyclarias nyasensis, Lethrinops spp. (chisawasawa), Labeo
mesops (nchila) and Opsaridium microlepis ( m p a s a ) and Opsaridium microcephalus (sanjika) (Table 4.5).
Since 1968, when the technique was intro- duced, most Lethrinops spp. have been caught mainly by pair trawlers operating in the south of the Lake MalaGi. Small quantities (e.g., 231 t [19811) are caught in the Northern Region, off Karonga and Nkhata Bay (LMA 1983b).

Key to pie graphs - - - - - - - - - - - - - 20,000 ronnes
1 5,000
1 0,000
Key to species
Oreochrom/s mossombicus
Borbus poiudinows
I = Haplochromis)simi/is
Hoplochrom~sl spp.
Lerhrinops spp. Chsawosawa --
Bogrus mer/d!mlis spp
Clorios goriepinus
Fig. 4.4. Fish catch of Malak by area and species. (Source: GOM 1983a).
Charnbo (Oreochromis and mlapia spp.)
Utaka (Haplochromis spp.)
Usipa (Engraulicypris sardella)
Chisawasawa (Lefhrinops spp.)
Kampango (Bagrus meridionalis)
Mlarnba ( ~ ~ a r i a s gariepinus)
0 Others
Salirna
Fig. 4.5. Comparative catch composition by principal species of the Northern, Central and Southern Regions of Lake ~ a l a % i , 1982 and 1983. (Source: GOPA 1987).

Labeo spp. are an economically important species that have been subject to heavy pressure during the breeding season, as they ascend the rivers in their breeding migrations. Formerly most important in the southern part of the lake, they are no longer a significant catch (LMA 1983b).
The cyprinids, Opsaridium spp., are of high economic value. They are vulnerable to capture during their upstream spawning migration, and sustain important yet localized river fisheries in estuaries and lower reaches of the rivers that debouch into the lake.
Traditional Small-Scale Fishing
Estimates of the numbers of fishermen and vessels involved in the traditional sector vary considerably. Chaika (1982) estimated some 11,000 fishermen, operating 5,889 small craft, some 533 of which were motorized. FA0 (1983) put the number of either full- or part-time fishermen at 15,000-20,000, using 9,000 mainly dugout craft, of which 750 were motorized; and Stoneman and Meecham (1972) suggested that 60,000 fishermen operated 5,000 canoes. Table 4.6 lists fishing craft by region, and shows the increase in their number since 1974. An estimated 11,000 canoes operate on Lake MalaGi, and a further 700 on Lake Malombe and the Upper Shire River. An estimated 16,500 canoes operate nationwide.
Technologies Used
There is considerable variation throughout Mala% in the fishing methods traditionally employed, as there has been in the rate and type of technological modernization accepted by fishing communities. Without exception, however, all techniques traditionally employed have been closely adapted to the local details of fishing grounds as well as to the behavioral patterns of the species present. Traditional materials are still widely used to make fishing gear (Table 4.7), and methods currently in use have been reviewed by Tweddle (1 978).
The principal traditional methods, which vary in relative importance according to fishery, are: (1) NETS
(a) Gill nets
(b) Open water seines (c) Shore seines (d) Scoop nets (e) Casting nets
(2) TRAPS (a) Fence traps (b) Basket traps
(3) HOOKS (a) Long lines (Is) Single hooks (c) Pole-and-line
(4) SIMPLE MANUAL TECHNIQUES (a) Plunge baskets (b) Spears (c) Bow-and-arrow
(5) FISH STUPEFACIENTS
Nets
GILL NETS (NDANGALA, MACHERA)
Gill nets, of which there are 15,713 units in Mala% (Table 4.81, constitute the most widely used gear type. Of these, 9,616 units or 61% of the total, are used in Lake MalaGi, of which 3,612 units or just over 37% of the total, are operated in the Northern Region, 3,308 (34%) in the Central District, and the balance of 2,696 (about 28%) employed in the Southeastern Arm (Table 4.8).
In Lake Mala%, the use of gill nets appears to be seasonal, and limited mainly to periods when the lake is too rough for seining or the use of other gear types. Gill nets can be used then since they can be set below the level of wave action, and require only a short time for setting and hauling. In general, they are set during the calm of evening and hauled on the following morning, before the wind rises. Occasionally, a grass flare is carried back and forth across the net, as a lure. Since gill nets are liable to be torn by crocodiles and turtles feeding on the gilled fish, this gear was not widely used during the early development of the fishery (Bertram et al. 1962). However, with the subsequent reduction of the crocodile population in Lake MalaGi its use is now more widespread.
In Lake Mala% waters of the Northern Region, gill nets account for 41% of the total catch. Catch rates during the period 1979-1982 averaged 3.9 kg/neWset (with one setting per night of a 100 m net). However, during the same period they ranged from a high average of 5-8 kg/net/set, a t Chinteche and in the Likoma and Chizumulu Islands, to a low of 1-2 kg/net/set, in the Karonga District (LMA 1983b). The average catch by unit

Table 4.6. Number of fishing units by zone on Lakes Mala% and Malombe, 1974-1987 (number of boats).
Year Vessel Upper Shire Southeastern Southwestern Salima to Nkhota Bay Nkhata Bay Karonga Total type & Arm Arm Domira Bay Lake MalaGi Lake Mala% Lake ~ a l a 6 i Lake Malaki
Lake Malombe Lake Mala% Lake MalaGi Lake Mala% by unit all units
Canoes
Boats
All
All
All
All
All
Canoes
Boats
All
All
All
Canoes
Boats
All
Canoes
Boats
Canoes
Boats
Source: FD, various; GOPA (1987). Notes: Canoes refer to dugouts; Boats refer to planked boats; na = data not available. (a) Data collected by aerial survey.

Table 4.7. Plant materials traditionally used to fabricate fishing gear in Mala%.
Family Scientific name English common
name
Vernacular Habit Usage Part names used
Gramineae Phragmites mauritianus (Kunth.) Reed grass bango (Ch) matete (Ch, To)
Urticaceae
Vossia cuspidata (Griff.)
Pouzolzia hypoleuca (Wedd.)
Menispermaceae Tinospora caffrara (Miers.)
Polygalaceae Seciridaca longedunculata (Fresen.)
Anacardiaceae Anacardium occidentale (L.)
Lannea discolor (Sand.)
Convolvulacea Zpomoea pes caprae (L.)
Hippo grass (n)duvi (Ch) nsanje (Ch) (m)sali (Tu)
n.a.
Tree violet
mulusa (Ch) mulaza (Ch) t(h)ingo (Ch) luchopwa (Tu) lichopwa (Y) lukayo (Nk) wazi (To)
lulisi (?)
bwazi (Ch)
Aquatic macrophyte
Aquatic macrophyte
Shrubby
perennial
Shrubby climber
Shrub or chosi CY) tree chiguluka (Ch) njefu (To) nakabwazi (Ch) muluka (Tu) mu-uruak (Nk,Su)
Cashew Nut mbibu (Ch) Tree msololikoko CY) nkoloso (Nk)
Livelong chiumbu (Y) Tree sidyatungu (Ch)
msaula (Y) Straggling malandalala (Nk) perennial
Fish traps stem Fish fences
Fish aggreg- sward ation device
Nets bark
fibers
Ropes
Nets
stem
bark fibers
Net seed preservative oil
Poles timber Floats
Net ropes stems Fish attractant leaves on nets
fknme: Compiled from Williamson (1975); Binns and Logah (1972). Table Note: (1) Identifications of the ethnic groups are: Ch = Chichewmanja ; Nk = Nkhonde; Su = Sukwa; To = Tonga; Tu = Tumbukdenga ; Y = Yao.
effort for the whole of Lake Mala% was estimated at 5.5 kglnetket (GOM 1978a).
Apart from traps, gill nets are the predominant fishing gear used in both lakes Chilwa and Chiuta, where 3,345 units were employed in 1986 (Table 4.8). In these waters they are used principally to catch 0 . shiranus chilwae and, to a lesser extent, Barbus paludinosus and Clarias gariepinus (Furse et al. 1979).
Set gill nets (known locally as machera) are the most important gear used in all parts of the Lower Shire fisheries area, and especially in the lagoons and wetlands (Ratcliffe 1972; Willoughby and Tweddle 1975). Drive-in gill-netting is also practised in the hot, postrainy season, when tilapia, in particular, are sluggish and are not readily gilled by the set net method (Ratcliffe 1972).
In 1975, the average length per gill net operated by a Lower Shire fisherman was 285 m, with a range of 250-325 m. The preferred mesh size was 7.6 cm, although 6.3 cm was widely employed. Those preferences were judged sound since juveniles of Clarias gariepinus would not be susceptible to capture. An average of 60% of the fishermen in the Lower Shire wetland fishery used gill nets, which accounted for 49% of the catch. The average annual catch rates with gill nets is 12.2 kgtman-day, ranging from a high of 17.7 kglman-day in August to a low of 7.9 in June. Clarias gariepinus accounted for 65% of the gill- netters' catch, and 24% comprised Oreochromis spp. (Willoughby and Tweddle 1975).
OPEN WATER SEINES (CHILIMILA)
A total of 1,335 of these modified purse seine nets is operated a t present in MalaGi, of which 1,253, or almost 94%, are operated in Lake Mala%, and the remainder in the deeper parts of Lakes Chilwa and Chiuta (Table 4.8). In Lake Mala&, 35% is used in the Southeastern Arm, 36% in the Northern Region, in waters off Karonga and Nkhata Bay, and the balance, 28%, in the Central District, off Nkhotakota and Salima. Some 18% of the total traditional catch is caught by the chilimila net (GOM 1978a).
The open water seine is well-suited to the capture of shoaling fish under the particular conditions of Lake Malaki. There it is worked in relatively deep waters around submerged rock formations, from two canoes. I t is targetted specifically a t utaka (Haplochromis spp.). and also, but to a lesser extent, a t Haplochromis spp., Engraulicypris spp., and other small shoaling fish.
A rocky prominence that rises from the lake floor and attracts fishable shoals of utaka is known locally as chirundu (pl. virundu). The chilamila net was developed in the Northern and Central Regions specifically to work such habitats (LMA 1983b).
Utaka shoal above a chirundu and orient themselves toward the current, which concentrates their planktonic food around the rocks. The regime of these currents fluctuates, both annually and diurnally. Hence a thorough knowledge of both current patterns and bottom topography is essential to successful use of the open water seine. Other species of utaka can be taken over smooth, shallow bottoms, mostly in the south of the lake, where the chilimila can be used for this purpose, but in those habitats functions as a diver-operated lift net (LMA 1983b).
In the Northern Region waters of Lake Mala%, average catch rates for the chilimila net are 10.5 kglset. These range from a high of 16-20 kglset, in the Likoma and Chizumulu Islands, to a low of 5.0 kglset, in Karonga District (LMA 1983b). (However, these data should be used with caution since no information was provided on either net area or length.)
BEACH SEINES (KAMBUZI, K%IOTA)
Although described in the 1950s as the commonest fishing method, particularly in the southern end of Lake MalaGi (Bertram et al. 1962), beach seines have everywhere declined in importance relative to other gear types. As of 1986, in Lake Mala% as a whole, 432 beach seines were in operation, or 39% of the national total of 1,084 (Table 4.8). Of those, 36% are operated in the Southeastern Arm and 25% in the Nkhotakota District. The other main areas for beach seine operation are Lake Malombe and the Upper Shire River, which together account for 43.8% of the total.
Two types of beach seine have been described for Lake ~ a l a $ i , based on mesh size and overall length. The larger nets, with a center mesh size of about 5 cm, a wing mesh of 10-12 cm, and a center size that varies from 135 x 4.8 to 420 x 6 m, were used mostly in shallow water off long sandy beaches, principally to take Oreochromis spp., Labeo spp. and Clarias gariepinus (Bertram et al. 1962).
The smaller nets have a center mesh of some 2 cm, a wing mesh of approximately 5 cm, and a center size of 45 x 1.8 m. A larger version with a small mesh size may be 100 x 3-4 m. These

Table 4.8. Traditional fisheries effort in Mala% by fishery zone, 1986. - -
Fishery zone Number of fishing craft Number of fishermen Number of fishing gear by type
With Without Canoe Total Disused Full- Part- Total No. of Gill Casting Seines Chili- Long- Traps engine engine time time fishery net net mira lines
laborers
Lake Mala% 413 852 Southeastern Arm 231 652 Karonga District 2 1 Nkhata Bay District 12 8 Nkhotahota District 92 74 Salima District 76 117 Lakes Chilwa & Chiuta 15 118 Lake Malombe 1 633 Upper Shire - 157 Lower Shire - 109
Total 429 1,869
Source: GOPA (1 987).

smaller nets are usually set further offshore than are the larger ones, and can be used off smaller, more sharply shelving, and more obstructed beaches than are their larger counterparts, although long stretches of sandy beach are regarded as best. They are targetted a t smaller fish, principally Haplochromis spp. and Engraulicypris sardella (usipa) (Bertram et al. 1962). Often such nets are operated at night, using hurricane lamps to attract shoals of usipa to the surface (Tweddle 1978).
An even smaller beach seine (cheche) was mentioned by Bertram et al. (1962) as being used in Lake Mala%. It is not mentioned in the more recent literature. With an even mesh size of about 5 cm and an overall length of 36-45 m these small seines were generally used a t night, close to a beach, to take mostly Opsaridium microcephalus.
Mosquito netting is used in Lake Mala% as an improvised seine net to take small shoals of usipa. Wooden pieces are attached to each end of a length of mosquito netting, and when a shoal is spotted two men jump off a canoe with it. They swim around the shoal to envelop it. This method generally results in only small catches (LMA 198313). Mosquito netting is also sometimes used a t the wing ends of a standard beach seine to prevent a shoal from escaping.
A similar technique using two small jute sacks is operated by boys in the dam a t Bunda College of Agriculture to catch Barbus sp. Two pairs of boys, each pair with a sack, wade in the shallows and approach each other from opposite directions to trap the fish between them.
The 147 seine nets in operation on Lakes Chilwa and Chiuta, or 13.5% of t.he national total (Table 4.8), are restricted to a relatively few suitable shore areas. They catch mainly Barbus paludinosus, Haplochromis spp. and miscellaneous small juveniles. In terms of yield, seines are the most efficient gear operated in these lakes, producing 33 kghaul (dimensions not given) (GOM 1977). They are, however, much less species-selective than other gear types.
Seine nets are uncommon in the fisheries of the Lower Shire, with only 30, or somewhat less than 3% of the national total, in operation in 1986 (Table 4.8). Those are used mainly in the lagoons, especially in the Bangula Lagoon (Willoughby and Tweddle 1975), as well as in specially cleared areas in the marshes during the low water season (Ratcliffe 1972). Seine nets are relocated to the southern parts of the Lower Shire River and to the eastern Elephant Marsh during the dry season, when decreasing water depth in the
lagoons makes their use impractical there (Willoughby and Tweddle 1975).
SCOOP NETS (PYMA)
This is a minor gear type, for which current data on numbers in use are not available. Three types are in use: those operated from a canoe, nets worked from platforms, and those used by wading fishermen.
On Lakes Malafvi and Chilwa, scoop nets are composed of a conical net bag mounted on two bamboo poles which cross near the distal end, and operated by one man from the prow of a canoe. In the Northern Region waters of Lake Malaii, scoop nets have for long been used to capture usipa (Engraulicypris sardella) a t night during darker phases of the moon, and particularly in August and September, using torch lures from a canoe to aggregate shoals and gradually induce them to move inshore, where they are harvested with scoop nets (LMA 1983b). The technique is known as chiwu (Tweddle 1978).
In Lake Malaivi, also, large canoe-propelled scoop nets are operated a t night in the deeper waters of the Chia and Malombe lagoons, mainly to catch 0. s. shiranus (Bertram et al. 1962). On Lake Chilwa these nets mainly catch Barbus paludinosus, Haplochromis spp., and small juveniles of other species (Furse et al. 1979).
Scoop- or dip-netting platforms have been erected along the Lower Shire River, between Chikwawa and Nsanje, and are usually operated a t night, or during the day in the wet season, when waters are turbid. These are targetted in particular on Oreochromis spp., Gnathanemus macrolepidotus and Macrusenius discorhynchus (Ratcliffe 1972).
Smaller, manual scoop nets are used in shallow waters by wading fishermen. In the rivers in Nhkotakota District, for example, they are used to catch Barbus spp., and near shallow bars a t the mouth of the Rukuru River to catch mpasa (Opsaridium microlepis) during its up-river spawning migration (Bertram et al. 1962). In Lake Chilwa scooping baskets, made from the reed Phragmites mauritianus, are used by wading fishermen CMzumara 1967). Wading and scooping is regarded as a dangerous technique, owing to the risk of crocodile attacks (Furse et al. 1979).
CASTING NETS (CHAV.
Almost all the 460 casting nets recorded have been operated in the Lower Shire fishery (Table

4.8), to which they were probably introduced from Mozambique (Ratcliffe 1972). They are used year- round in open water areas within the wetlands, although the largest catches tend to be made during the dry season, when water levels are low. Average catches are 9 kglday, although those up to 22-27 kg/day are not uncommon (Ratcliffe 1972). The survey conducted by Willoughby and Tweddle (1975) demonstrated an average yield rate of 14.8 kglday, with a range of from 7.9 kglday in February to 19.2 kglday in September. The main species caught by this method are Oreochromis spp. and Haplochromis spp. (Ratcliffe 1972; Willoughby and Tweddle 1975). Some casting nets are also employed in the southern parts of Lake Mala%.
Traps
FENCE TRAPS
After gill nets, fishing traps (Figs. 4.6 and 4.7) are the second most numerous gear type used in MalaGi, with a total of 15,050 units employed (Table 4.8). Unfortunately, available data do not
Poles stuck in mud to mark out psyailo area
distinguish between fence and basket traps. Of these, 13,073, or 87% are employed in lakes Chilwa and Chiuta, and 1,773 (almost 12%) in the Lower Shire, where the extensive marsh habitats are best suited to fish trapping. The balance, 204 units, are scattered throughout the various sectors of Lake Mala%, mostly in the Central region, in dambo lands. Reed fences constructed to exploit dambo fish are referred to as beyu; in the Tonga language.
In the Lower Shire encircling fish fences (psyailo) are used in waters about 1 m deep. They can yield up to 0.5 tketting (area not stated) (Ratcliffe 1972). The fences are constructed from locally available poles, palm leaves, and reeds, by their owners, who are assisted in this fishing technique by 6-8 laborers. The mode of operation is shown in Fig. 4.6.
In Lake Malawi reed fence traps across small lagoons, inlets and smaller rivers trap fish during their spawning migrations. They may remain fixed in place year-round. Small basket traps are inserted a t intervals within them (Bertram et al. 1962). Tweddle (1978) describes a variant of this technique from Bangula Lagoon and Ndinde Marsh, in the Lower Shire, in which beds of
Following morning
Afternoon Fence sections joined together and tied in positlon to poles
Psyailo left open for fish to enter
moved inwards
ven into enclosure ey are scooped with
net into canoe
Fig. 4.6. Operation of thepsyailo encircling fish fence, a traditional fishing gear from ~ a l a h . (Source: aRer Ratcliffe 1972).
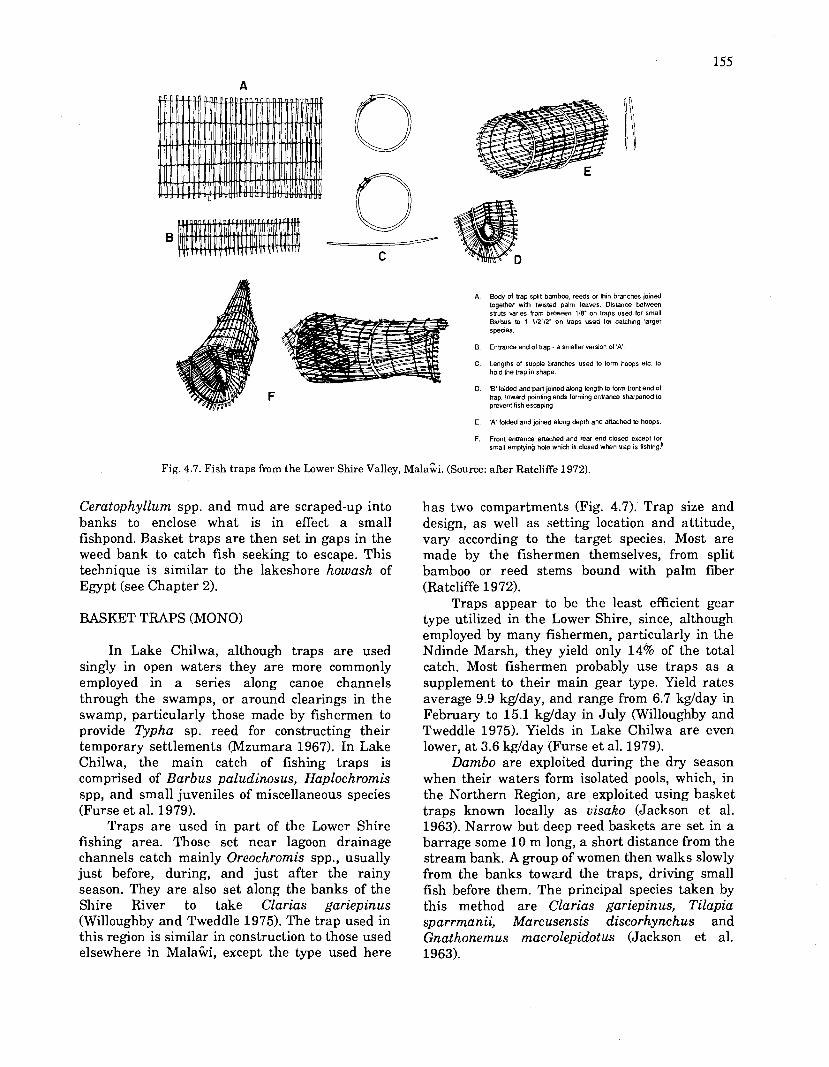
Body of trap split bamboo, reeds or thin branches joined together wlth twisted palm leaves. Distance between struts varies from between 1W' on traps used for small Barbus to 1 112"12' on traps used fw catching larger specles.
Entrance end of trap - a smaller version of 'A'.
Lengths of supple branches used to form hoops etc to hold the trap in shape.
'W folded andpart joined along length to form front end of trap. Inward painting ends forming entrance sharpned to prevent fish escaping.
E. 'A' folded and jolned along depth and attached to hoops.
F. Front entrance attached and rear end closed except for small emptyin@ hole which is closed when uap is fishing!
Fig. 4.7. Fish traps fmm the Lower Shire Valley, ~ a l a % i . (Source: after Ratcliffe 1972).
Ceratophyllum spp. and mud are scraped-up into banks to enclose what is in effect a small fishpond. Basket traps are then set in gaps in the weed bank to catch fish seeking to escape. This technique is similar to the lakeshore howash of Egypt (see Chapter 2).
In Lake Chilwa, although traps are used singly in open waters they are more commonly employed in a series along canoe channels through the swamps, or around clearings in the swamp, particularly those made by fishermen to provide Typha sp. reed for constructing their temporary settlements (Mzumara 1967). In Lake Chilwa, the main catch of fishing traps is comprised of Barbus paludinosus, Haplochromis spp, and small juveniles of miscellaneous species (Furse et al. 1979).
Traps are used in part of the Lower Shire fishing area. Those set near lagoon drainage channels catch mainly Oreochromis spp., usually just before, during, and just after the rainy season. They are also set along the banks of the Shire River to take Clarias gariepinus (Willoughby and Tweddle 1975). The trap used in this region is similar in construction to those used elsewhere in MalaCNi, except the type used here
has two compartments (Fig. 4.7). Trap size and design, as well as setting location and attitude, vary according to the target species. Most are made by the fishermen themselves, from split bamboo or reed stems bound with palm fiber (Ratcliffe 1972).
Traps appear to be the least efficient gear type utilized in the Lower Shire, since, although employed by many fishermen, particularly in the Ndinde Marsh, they yield only 14% of the total catch. Most fishermen probably use traps as a supplement to their main gear type. Yield rates average 9.9 kglday, and range from 6.7 kglday in February to 15.1 kg/day in July (Willoughby and Tweddle 1975). Yields in Lake Chilwa are even lower, a t 3.6 kg/day (Furse et al. 1979).
Dambo are exploited during the dry season when their waters form isolated pools, which, in the Northern Region, are exploited using basket traps known locally as visako (Jackson et al. 1963). Narrow but deep reed baskets are set in a barrage some 10 m long, a short distance from the stream bank. A group of women then walks slowly from the banks towzrd the traps, driving small fish before them. The principal species taken by this method are Clarias gariepinus, Tilapia sparrmanii, Marcusensis discorhynchus and Gnathonemus macrolepidotus (Jackson et al. 1963).

VEGETATION TRAP Simple Manual Techniques
Williamson (1972) described the cutting of grass islands from the shores of Lake Chilwa and their towing and anchoring offshore for use as a fish aggregation device (Table 4.8). No further detail of the catch is provided.
Hooks
LONG LINES
Of the 1,838 long line gears recorded for ~ a l a s , about half are operated in Lake MalaGi and Lake Malombe, 26% in Lakes Chilwa and Chiuta, and 22% in the Lower Shire (Table 4.8). In Lake Mala% long lines are used mainly from rocky areas, or, where rocks are lacking, from beaches that shelve rapidly into deep waters. The principal catch of those set at night is Bagrus meridionalis and Clarias gariepinus (Bertram et al. 1962).
Also used in Lake Chilwa and in the Lower Shire (Table 4.8) they mainly catch Clari&s gariepinus. In the Lower Shire Valley it was demonstrated that this gear has an average yield rate of 11.0 kg/day, with a range of 6.5 kglday in November to 18.1 kglday in September (Willoughby and Tweddle 1975).
In the Northern Region waters of Lake Mala%, yield rates from long-lining average 7 kg/100 hookdset. There they range from a high of 18.5 kg/100 hookslset in the Likoma Islands to a low of 2.48 kg100 hookslset off Nkhata Bay South (LMA 1983b).
SINGLE LINES
Single fixed hooks are used along the banks of the Shire River, and in the denser parts of the marshes (Ratcliffe 1972). This is a minor technique widely used throughout MalaGi, and largely for household subsistence. This gear is also used, mostly by small boys in dambo fisheries (Jackson et al. 1963).
POLE-AND-LINE
In the Lower Shire Valley, pole-and-line fishing is employed particularly along the banks of watercourses (Ratcliffe 1972). This method is also used in fishponds.
PLUNGE BASKETS
In the Lower Shire Valley plunge baskets are used for household subsistence fishing during the rainy season, in residual water holes left by flash flooding, and during the dry season, to take fish isolated by the progressive dessication of the area (Ratcliffe 1972). Plunge baskets are generally conical, open top traps made from closely-spaced reeds. They are plunged into shallow water either at random or over an observed fish or disturbance. Trapped fish are removed through the hole at the top (Tweddle 1978).
SPEARING AND BOW-AND-ARROW
In the Lower Shire Valley, subsistence fishing also makes use of spears and arrows, mainly to take catfish, both when waters are shallow during the dry season as well as during their wet season spawning migrations to the reed beds (Ratcliffe 1972).
Stupefacients and Poisons
A wide range of naturally occurring plants have traditionally been used to either stupify or poison fish (Table 4.9).
Small-Scale Fishing Craft
A total of 9,941 small-scale fishing craft were recorded by the Frame Survey of Traditional Fisheries as being in operation throughout Mala% in 1986 (Table 4.8). Of these 7,643 (77%) are dugout canoes, and 2,298 are other types, mostly planked vessels. Of the latter, 429, or just over 18% (and 4.3% of all traditional fishing vessels in Mala%), are equipped with engines.
Of the dugouts, 58% are operated on Lake Mala%, as are 68% of the other types of craft. Of the motorized craft, 96% are used on Lake Mala*, and of the total 55% fish in the Southeastern Arm of the lake. No motorized vessels are used in the Shire River fisheries.
Until recently, the fishing craft used on Lake Mala* were all dugout canoes, some 3.6-10.5 m in length and with a beam of 0.4-1.2 m, although shapes and sizes now vary considerably (LMA

Table 4.9. Plants used to produce fish stupefacients and poisons in ~ a l a k .
Family Scientific name English Vernacular Habit Part Common names used
Name (Ethnic Group)(l)
Araceae
Leguminosae (Caesalpinioideae)
Leguminosae (Mimosoideae)
Leguminosae (Papilionoideae)
Euphorbiaceae
Thyrnelaeaceae
Combretaceae
Guttiferae
Balanitaceae
Culcasia scandens (Wild.)
Swartzia madagascariensis (Dew.)
Burkea africana (Hook)
Acacia albida (Del.)
Elephantorrhiza goetzei (Harms)
Mundulea sericea (Willd)
Neomutanenia mitis (A. Rich.)
Tephrosia aequilata (Bak.)
T. vogetii (Hook)
Euphorbia tirucalli (L.)
Gnidia kraussiana (Meisn)
Combreturn fragrans (Hoffm.)
Psorospermum febriFLgum
Balanites maughamii (Spraque)
n.a.
Snake bean
Wild syringa Rhodesian Ash
White I Camel thorn Applering acacia n.a.
Corkbush Silverbush
n.a.
n.a.
Fish bean
Milkbush
Yellowheads
n.a.
n.a.
Torchwood
mbol(r)o (Su)
chinyenye (Y) kampangom (Ch) mulundi(u) (To,Tu) cha(i)ronde (Nk) rnkalati (Ch) kalinguti (To) kawi(d)zu (Tu) kabi(d)zu (Tu) muyoka (Nk) nsangu (Tu,Y) msangumsangu (Tu,Y) chitonya (Tu, Y)
chiteta (Ch) chandima (Ch) chikundulima (Y) chamlima (Y) lusunga (Ch, Y) chiguluka (I?) nand010 (Ng) &ma (?) m'memenambuzu (Tu)
ombwe (Ch) katupe (Ch) ntutu (Ch) kapweso (Y) mtutu 01) mthuthu (Ch) mtetezga (Tu)
nkhadze (Ch) (mjngachi 0 katupe (Ch) kazinda (Ch) kadale 01) kasewe (Nk) mdima (Ch)
njuyu (Ch) mpambulu (Y)
Perrenial climber Treehush
Tree Gum
Tree
Tree Seeds
Perennial herb
Creeping1 climbing shrub Shrub
Shrub
Succulent shrub Treel shrub Shrub1 tree Shrub
Tree
Stem Sap Pods
Bark
Pods Seeds
Roots
Whole plant
Root
n.a.
Leaves Branches Pods Latex Branches Bark
n.a.
Roots Bark Fruit
Source: Compiled from Binns and Logah (1972); Williamson (1975). Notes: (1) Identifications of the ethnic groups are: Ch = ChichewdNyanja; Ng = Ngoni; Nk = Nkhonde; Su = Sukwa; To = Tonga; Tu = TumbukaJHenga; Y = Yao. C,
V1 4

1983b) owing to a scarcity of preferred timber (French 1986), a problem that was already noted in the late 1950s (Bertram et al. 1962). Formerly, canoes were shaped from the trunks of such large local trees as mbawa (Khaya nyassica), chonya (Adina microcephala) and mtondo (Cordyla africana) (Bertram et al. 1972; Furse et al. 1979)). But owing to a worsening timber shortage, canoe- builders have now no option but to use inferior timber, most commonly from acacia or blue gum trees, which have a useful life of less than two years. Such canoes are therefore cheap, a t about MK 60 (LMA 1983b). As a further consequence of the lack of preferred construction materials, old canoes are saved for the repair of still serviceable ones, and canoes are patched with an odd assortment of materials. Planked boats, both those built in the fishing villages and vessels constructed in the Salima Boatyard, are gradually becoming more common (LMA 1983b). Price trends, however, are alarming. The increasing scarcity of suitable timber has increased the price of plank boats a t a rate disproportionately greater than the increase in fish prices (Fig. 4.8). This situation has resulted in an intense study of designs for plank boats for Lake Chilwa (J.G.M. Wilson, pers. comm.).
Canoes are poled in the shallows and paddled in deeper waters. Sails are used occasionally (Bertram et al. 1962), as in the Makanjila area, where the shoreline is nearly parallel to the prevailing wind (LMA 198333).
0 1 I I I I 10 1982 1983 1984 1985 1986
Year
Fig. 4.8. Rates of increase in the prices of fishing craft built at Salima boatyard, 1982-1985, compared with the increase in mean fish prices (MK). (Source: drawn from data in GOPA 1987). For foreign exchange rates, see p. 302.
In the late 1970s dugout canoes accounted for 88.7% of the 1,072 fishing vessels operating on Lake Chilwa, 7.8% were Western-style plank boats constructed by the Fisheries Department, and the balance was comprised of 37 strengthened bark fishing platforms, that were operated in the northern marshes (GOM 1977).
The only form of fishing vessel used in the Lower Shire is the dugout canoe. At 3-4 m in length, those used in the Lower Shire fishery are smaller than. those operated on both Lakes Mala% and Chilwa, and unlike elsewhere in the country, are usually operated by a single fisherman (Ratcliffe 1972).
Social Aspects of the Small-Scale Fisheries
In addition to their direct subsistence importance, the small-scale fisheries of MalaGi provide the principal livelihood for a large number ofrural households throughout the country. Some 30,000 individuals are estimated to be directly employed in the small-scale sector, either as self- employed fishermen or as wage- or share-earning laborers (Table 4.8). This, however, maybe a gross underestimate, since on Lakes Mala% and Malombe 70% more fishing crafts were revealed by an aerial survey of August 1986, identified in a recent aerial survey (D. Tweddle, pers. comm.). Further, a large number of people are estimated to be employed in fish processing and distribution (see Chapter 5).
Apart from the industrial fisheries, the operating areas of which are closely specified, entry into fishing is open to all, since in MalaGi access to beaches and the right to fish is considered as common property. Thus the relatively young, the landless or the poorer farmer can either make a subsistence living from fishing, or, on a part-time basis, a farmer can supplement the income of his household, using minimal gear and operating in inshore waters.
Some such people, on the gradual acquisition of fishing skills and with the accumulation of capital, may eventually become full-time fishermen. The typical gear progression, a surrogate for estimating skill acquisition, of a successful fisherman, is from fish trap to beach seine to gill net, and for the relatively few, the chilimila net. Operators of the latter are the elite among MalaGian fishermen (LMA 1983b).

Part-Time Fishermen
Of the total of 8,420 fishermen, 70% worked full-time. Most part-time fishermen also farm their own holdings. For Mala% as a whole, only 29.6% of the fishermen are classified as part- timers. This ranges from a low of 12% of those working on Lake Malombe to a high of 95% in the Upper Shire River fishery (Table 4.8).
Of the total fi'shermen, 56% work on Lake Mala&, where, for the entire lake, 28.5% are part-timers. There the percentage of part-time operators ranges from a low of 17.7% in the fish- rich Southeastern Arm to a high of 46.9% in the waters of Karonga District,in the Northern Region (Table 4.8). In contrast, most of those working in the fisheries of the Lower Shire Valley are specialized, with only 19% being part-timers.
Just over 40% of the fishermen operating on Lakes Chilwa and Chiuta are part-timers. In this region many of the part-time fishermen also rear cattle, principally as an insurance against the recession of Lake Chilwa, and thus a collapse of the fishery (Agnew and Chipeta 1979). Also, since most live permanently in distant agricultural villages, fishermen usually construct temporary fishing camps, either in the reed beds or on artificial islands (zimbowera).
Among some ethnic groups, such as the Tonga, fishing is a part-time activity in the sense of being an occupation undertaken during a particular phase of an individual's life. Among those of Nkhata Bay, traditional fishing is regarded as a developmental stage in a man's life, and one that had to be accomplished before being accepted into adulthood (Chirwa 1983).
Fisheries Laborers
About 21,000 fisheries laborers are employed in the traditional sector. Of these, 70% work on Lake Malafvi. The ratio of self-employed fishermen to laborers varies inter alia according to the dominant gear type employed, degree of commercialization and productivity of the fishing areas (Table 4.8). I t is highest in the Upper Shire, Lake Malombe, and Southeastern Arm of Lake Malawi, with ratios of 1:7.7, 1:5.2, and 1:5.1, respectively, and lowest in the Lower Shire, Karonga District, and Lakes Chilwa-Chiuta, a t 1 :2.5,l:l.5, and 1:1.6, respectively (GOPA 1987).
Small-scale fishing in Malaki was traditionally a communal undertaking that involved the whole kin group in the construction
and maintenance of the craft and gear, in the fishing operations and in the processing and distribution of the catch. Equipment belonged to the group, and the fishery and the disposition of the catch was under the custodianship of the head of the lineage, subclan or the like. Under traditional organization distribution of the catch was based on social relationships of kinship and authority structure. A share payment (chiyambako) for casual labor was traditionally of minor importance (Chirwa 1983).
Wage earning from fishing began with the penetration of the general cash economy, and specifically in the 1940s and 1950s, as a consequence of the increasing involvement of the colonial government in African affairs, and the entry into the fishing sector of returning migrant laborers, with modest capital for investment (GNP [various]; Chirwa 1983; McCracken 1987).
Labor migration, which deprived communities of their physically ablest males, also had an indirect impact on change in fisheries technology, by causing a shift from heavier to lighter nets, such as the gill net, which could be handled by fewer persons. It also led to the change of fishing from a communal to an individual undertaking, and one in which wage labor developed (Chirwa 1983; McCracken 1987).
Traditional communal fishing has now mostly given way to the fishing "company" (lokolo). The fishing craft and gear belong to a generally nonfishing owner, who makes the decisions about the fishing and supervises the distribution and marketing of the landed catch. The fishing is done by employed laborers (alovi), with a son or nephew of the boat-gear owner supervising the operation on the water.
All laborers, whether kin or not, are treated equally in terms of payment, which may be in the form of wages, shares for household subsistence, or shares for sale. In the Monkey Bay area chirimila net laborers from one boat all share 50% of the catch, while the owner takes the other half (Kapeleta 1980). On Lake Chilwa fishing companies (in that area known as khota) are formed around a beach seine operation (Phipps 1973).
Incomes and Earnings
On Lake Chilwa, the annual income of a full- time trap fisherman was an estimated,MK 392, or three times that of a farm family in Liwonde ADD (Landes and Otte 1983) (Table 4-10), and

equivalent to the wage of an urban worker (see Chapter 3). The estimated annual income for a canoe and two gill net operation on Lake Mala% is MK 18.2lman-month (Table 4.11), approximately the wage of an unskilled agricultural laborer. However, since the net and canoe owner would probably take a larger proportion, the laborer would probably receive some MK Glmonth, together with a share of the catch, for household consumption (LMA 1983b). An operational budget for gill netting in southern Lake Malaki is shown in Table 4.12, and indicates a revenue of MK 180lman-month. The owner's annual profit on a chilimila operation is MK 1,293, or MK 144lman-month of time invested (Table 4.13). Costs and returns for gill nets, beach seines, long lines and traps operated by full-time and part-time fishermen on Lake Chilwa are given in Table 4.1 0.
Industrial Fisheries
The semicommercial pair-trawler industry was established in the southern part of Lake MalaGvi in 1968 (GOM 1978a). Twelve trawlers and four ringnetters now operate on Lake Malaii (Chaika 1982). Ten of the trawlers are operated by a total of seven private companies, and the remainder of the vessels by the MALDECO Ltd. parastatal organization (Table 4.14). Only some 120-140 fishermen are involved in this sector (GOPA 1987). The operating budget for pair trawl operations is shown in Table 4.15, and for seining operations on Lake Chilwa in Table 4.16. They show returns of MK 60-660fman-month and MK 243lman-month, respectively.
The industrial sector produced about 7,244 t in 1986 (Table 4.141, some 35-40% of the total annual catch of Lake Mala%. To prevent
Table 4.10. Annual costs and returns by gear type to small-scale fisheries on Lake Chilwa, Malah, 1983 W).
Gear Full time fishermen Part time fishermen
Costs Gross income Net income Costs Gross income Net income
Beach seine 3,143 8,986 5,839 Gill net 93 532 439 37 349 31 2 Long-line 31 586 555 26 186 160 Trap 74 466 392 43 171 1 28 - - - -
Source: After Landes and Otte (1983). For foreign exchange rates, see p. 302.
Table 4.11. Annual production costs and returns on a two-man gill netting operation in the Northern Region, Lake Malaii, 1982.
Canoe MK 60 Gear (2 nets) MK 100
Total costs MI( 160
Average regional catch Number of canoes in region Average catch per canoe Average catch value (at MK 0.26/kg) Net returns Annual return on investment Monthly net return Net return per man month
Assumed is an average catch rate of 4.4 kg/net/set and two men fishing for 250 daydyear, or 50% above the average rate. Realistic average rates of return are probably half.
Source: LMA (1983b). For foreign exchange rates, see p. 302.

Table 4.12. Operational budget for a two-man gill netting operation in Southern Lake Mala%, 1982 (MK).
Investment costs Boat "Seagull" engine Nets (a)
Monthly operating costs Crew (b) Fuel (c) Oil (d)
Cost per tonne fish landed ( W t )
Monthly rate of return (e) Total Return per man-month Annual return on investment
Subtotal 4,000.00
Subtotal 275.00
Source: GOPA (1 987). Notes: (a) 10 nets at 100 yards each; (b) 2 persons at MK 20lmonth each; (c) 5 llday at MK 1.6611 for 20 dayslmonth; (d) 0.5 llday at MK 6.9011 for 20 daylmonth; (e) assume average catch of 30 kglday, mainly of chambo and kampango, at MK 0.60kg. For foreign exchange rates, see p. 302.
Table 4.13. Annual production costs and returns on a 9-man chilimila operation, Northern Region, Lake Mala%, 1982 (MK).
Annual Total Budget Investment
Capital Boat (MK 900 over 4 years) Engine (MK 650 over 2 years) Net (MK 600 over 2 years) Canoe (MK 60 over 2 years)
Subtotal
Recurrent costs Wages for 8 laboredl 60 days 1 mate Fuel Maintenance Fishing license fee Boat registration fee Food for crew
Subtotal
Total Cost pert of fish landed
Revenue 1,600 hauls over 160 days at
10.5 kglhaul= 16.8 t at 0.26 MWkg =
Less total costs
Owner's profit
Return per man-month Return on investment
Source: LMA (1983b). For foreign exchange rates, see p. 302.

Table 4.14. Commercial fisheries production by operator, 1983-1986 (t).
(1 Private sector
Chimanda ChirumbdAnkhoma Fatch Katenga KaundalChifira MalindiIChikwenga Matumba Maulana Mposa Mwakimbwala Mwenda Mzembe Ngalawesa YeWhilemba
Subtotal
(2) Government
FD MALDECO Ltd.
Subtotal Total
SourceiGOPA (1987). Notes: Includes 534 t (1985) and 586 t (1986) by single trawl operations. Balance is by pair trawling.
ovefishing, entry is controlled by licensing, and each fishing unit is assigned carefully defined operating grounds (Fig. 4.2).
The principal catches are of Haplochromis spp., tilapias, and Engraulicypris. Those taken by lMALDECO Ltd. are transported to its ice plant at Mangochi. The fish are either sold to traders for processing or retail fresh, or are frozen for later sale, and, more recently, for export. A financial accounting for MALDECO Ltd. for the period 1981-1986 is shown in Table 4.17. It shows an annual operating cost of MK 272-428/t/year, and is comparable with other fishing operations (Tables 4.12, 4.13, 4.15 and 4.16). The privately- owned trawlers generally sell to traders through official markets.
Fisheries Development Policy and Strategies
All fisheries activities in Mala% are regulated by the Fisheries Department (FD), which was first formed in 1947, as a part of the Game, Fish and Tsetse Control Department, under the Director of Agriculture, was transferred in 1971 to the Ministry of Agriculture, and again, in 1972, to the Ministry of Agriculture and Natural Resources (Table 4.18). The gradual development of the infrastructure of the FD is shown in Table 4.19.
The implementation of fisheries policy is through the FD, of the Ministry of Forestry and Natural Resources, empowered by the Fisheries Act (1973). Departmental policy is, in turn, implemented through its Training, Marketing, Extension, and Research divisions. The FD has a staff of over 500 ( W M 1988a) half of whom are Fisheries Assistants involved in statistical work, extension activities, and enforcement of regulations, and who operate 31 Fisheries stations and two Fish Farming stations.
The fishery policy of the Government of Mala% aims to "maximize the safe sustainable yield of ... fish stocks that can economically be exploited from the national waters; improve the efficiency of exploitation, processing and marketing; promote investment in viable rural aquaculture units; and exploit all opportunities to expand existing, and develop new aquatic resources. Particular care will be taken to protect endemic fish fauna, not only because these are scientific and educational assets, but also because they represent a particularly vulnerable major economic resource (GOM 1988a)."
The specific measures to be taken to implement that policy are ( W M 1988a):
(1) The monitoring and controlling of fishing to regulate production within the safe sustainable yields for each fishery, and using the law to safeguard the resource from other threats;

Table 4.1 5. Comparative analysis of the average monthly economics of pair trawler for chisawasawa in Lake Mala%, 1986, using old (22-hp) and new (30-hp) engines (MK).
Old engines New engines
(A) Expenses (1) Direct
Fuel Oil
1,859 (a) 688 (c)
Subtotal 2,547 5,160
Maintenance Engines Nets Boats
Subtotal 1,270 420
Crew Laborers (g) skipper (h) Senior skipper (i)
Subtotal 270 270
Total direct expenses Total direct expense&
(2) Indirect expenses Depreciation
Boats (i) Engines (k) Nets(m)
Fees License Insurance Mooring Landing
Subtotal Total indirect expenses Total expenses
(B) Total income (r) 5,040 11,760 (C) Net profit 609 5,281 (D) CosVt 260 166 (E) Rate of profit 13.7% 81 5 % (F) Return per man-month 76 660
Source: GOPA (1 987). Notes: (a) 65 Yday at MK 1.43/1, (b) 100 ]/day at MK 1.43A; (c) 5 Yday at MK 6.884 (d) 6 ]/day at MK"6.88A; (e) direct result of engine age; (0 for boats 1-5 years old 2,000 MKJyear, and for those 6-10 year old 3,000 w e a r ; (g) 4-days rotation-6 laborers at MK 25lmonth; (h) 2 at MK 35lmonth; (i) 1 at MK 5OImonth; 6) made of local timber, and in 1977 cost MK 3,000 each (depreciated at 40 MKlmonth); (k) in 1977 cost MK 3,500 each (depreciated at 60 Wmonth ; (1) in 1987 cost MK 16,000 each (depreciated at 60 MWmonth); (m) in 1977 cost MK 1,000 depreciated at 9 MWmonth), and in 1987 cost MK 5,000 (depreciated at 45 m o n t h [%year depreciation used but actual value is 3.7 year]); (n) estimated (actual fee depends on engine power); (0) MK l0/month/boat; (p) at MK 0.04hox; (q) self- management; (r) based on old engines fish up to 20 daylmonth catch 4-45 boxedday or 204 tlyear at MK 6.00/box, whereas new engines operate at 28 dayslmonth, catch 65-75 boxedday or 468 tlyear. For foreign exchange rates, see p. 302.

Table 4.16. Annual operational budget for a 15-man seine net operation in Lake Chilwa, Mala&, 1986 (MK).
(A) Expenses Laborers' wages (a) Replacement of nets (b) Net license fee (c) Food for laborers Mats (for drying of fish) Fuelwood (for smoking fish) Fish consumed by household (d)
Cost pert of fish landed
(B) Income Sale of fresh and dried fish (D
(C) Profit Annual Month Return per man-month
Subtotal
Source: GOPA (1 987). Notes:
(a) 15 men paid an average MK lrblmonth for 12 months (work 7 daylweek, 52 weewyear). (b) 300 ma t MK loll00 m; (c) Rate is MK 10/l00 m; (d) i.e., opportunity cost of sales foregone; (e) i.e., MK 90.2ft (0 Based on an average monthly catch of 4 t, which gives an estimated gross income of MK
4,00O/month. (g) i.e., MK 909.79It. No allowance made for depreciation of the two boats operated, valued at
MK 4OO/each, nor maintcnacc cxpcnscs made in data source. For foreign exchange rates, see p. 302.
Table 4.17. Pmfit and loss account of MALDECO Fisheries Ltd., ~ a l a k i , 1981-1986 (MK).
Costs Turnover Gross profit (loss) Taxes Net profit Pmfit as % of costs Dividend Retained profit Total catch (tlyear) Operation cost (MWt)
Source: GOPA (1 987). For foreign exchange rates, see p. 302.
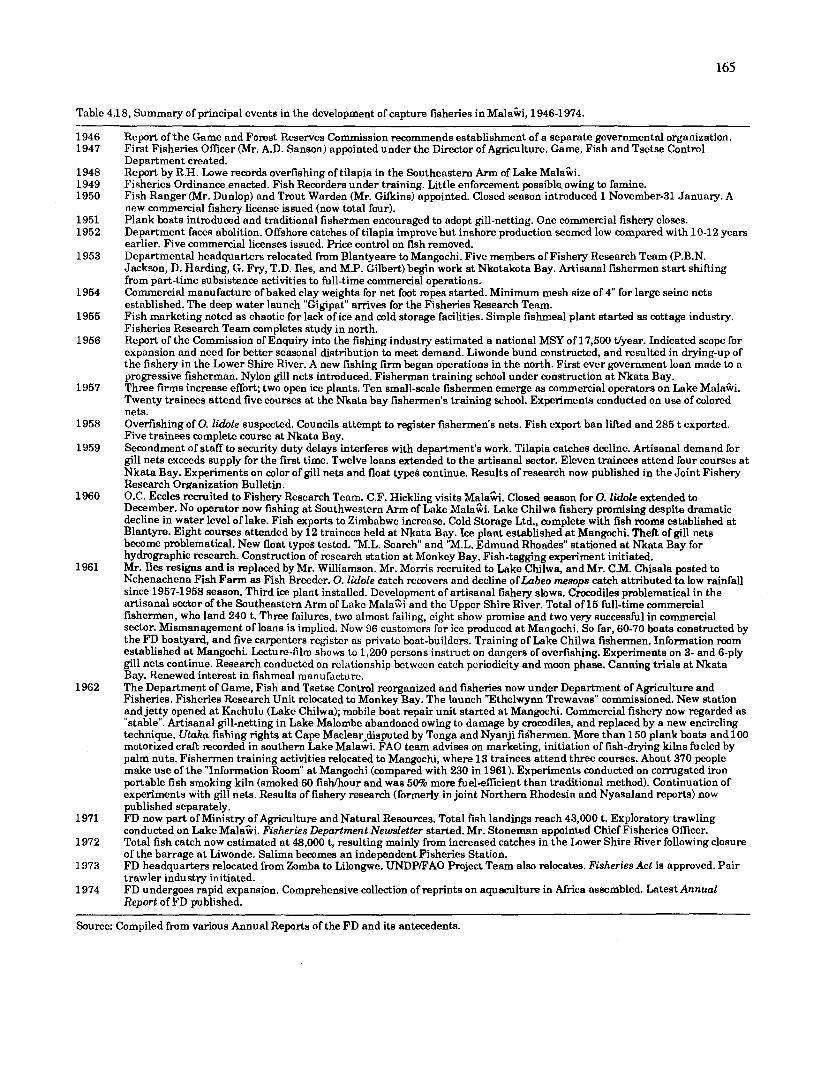
Table 4.18, Summary of principal events in the development of capture fisheries in Mala%, 1946-1974.
Report of the Game and Forest Reserves Commission recommends establishment of a separate governmental organization. First Fisheries Officer (Mr. A.D. Sanson) appointed under the Director of Agriculture. Game, Fish and Tsetse Control Department created. Re~or t bv R.H. Lowe records overfishine of t i la~ia in the Southeastern Arm of Lake Mala%.
L " " Fisheries Ordinance enacted. Fish Recorders under training. Little enforcement possible owing to famine. Fish Ranger (Mr. Dunlop) and Trout Warden (Mr. Gifirins) appointed. Closed season introduced 1 November-31 January. A new commercial fishery license issued (now total four). Plank boats introduced and traditional fishermen encouraged to adopt gill-netting. One commercial fishery closes. Department faces abolition. Offshore catches of tilapia improve but inshore production seemed low compared with 10-12 years earlier. Five commercial licenses issued. Price control on fish removed. Departmental headquarters relocated from Blantyeare to Mangochi. Five members of Fishery Research Team (P.B.N. Jackson, D. Harding, G. Fry, T.D. Iles, and M.P. Gilbert) begin work at Nkotakota Bay. Artisanal fishermen start shifting from part-time subsistence activities to full-time commercial operations. Commercial manufacture of baked clay weights for net foot ropes started. Minimum mesh size of 4" for large seine nets established. The deep water launch "Gigipat" arrives for the Fisheries Research Team. Fish marketing noted as chaotic for lack of ice and cold storage facilities. Simple fishmeal plant started as cottage industry. Fisheries Research Team completes study in north. Report of the Commission of Enquiry into the fishing industry estimated a national MSY of 17,500 Vyear. Indicated scope for expansion and need for better seasonal distribution to meet demand. Liwonde bund constructed, and resulted in drying-up of the fishery in the Lower Shire River. A new fishing firm began operations in the north. First ever government loan made to a progressive fisherman. Nylon gill nets introduced. Fisherman training school under construction at Nkata Bay. Three f m s increase effort; two open ice plants. Ten small-scale fishermen emerge as commercial operators on Lake Malaki. Twenty trainees attend five courses at the Nkata bay fishermen's training school. Experiments conducted on use of colored nets. Overfishing of 0. liable suspected. Councils attempt to register fishermen's nets. Fish export ban lifted and 285 t exported. Five trainees complete course at Nkata Bay. Secondment of staff to security duty delays interferes with department's work. Tilapia catches decline. Artisanal demand for gill nets exceeds supply for the first time. Twelve loans extended to the artisanal d o r . Eleven trainees attend four courses at Nkata Bay. Experiments on color of gill nets and float types continue. Results of research now published in the Joint Fishery Research Organization Bulletin. O.C. Eccles recruited to Fishery Rcscarch Tcam. C.F. Hickling visits &lala&. Closed season for 0. lidole extended to December. No operator now fishing at Southwcstcrn Arm of Lakc Mala%. Lake Chilwa fishery promising despite dramatic decline in water level of lake. Fish exports to Zimbabwe increase. Cold Storage Ltd., complete with fish rooms established at Blantyre. Eight courses attended by 12 trainccs held at Nkata Bay. Ice plant established at Mangochi. Theft of gill nets become problematical. New float types testcd. "M.L. Scorch and "M.L. Edmund Rhoades" stationed at Nkata Bay for hydrographic research. Construction of rcscareh station at Monkcy Bay. Fish-tagging experiment initiated. Mr. Iles resigns and is mplaced by Mr. Williamson. Mr. Morris rccruitcd to Lake Chilwa, and Mr. CM. Chisala posted to Nchenachena Fish Farm as Fish Breeder. 0. lidole catch recovcrs and decline of Labeo mesops catch attributed talow rainfall since 1957-1958 season. Third ice plant installcd. Dcvclopmcnt of artisanal fishery slows. Crocodiles problematical in the artisanal sector of the Southeastern Arm of Lakc MalaGi and the Upper Shire River. Total of 15 full-time commercial fishermen, who land 240 t. Thrce failures, two almost failing, cight show promise and two very successful in commercial sector. Mismanagement of loans is implicd. Now 96 customers for ice produced at Mangochi. So far, 60-70 boats constructed by the FD boatyard, and five carpcntcrs register as private boat-builders. Training of Lake Chilwa fishermen. Information room established at Mangochi. Lecture-film shows to 1,200 pcrsons instruct on dangers of overfishing. Experiments on 3- and 6-ply gill nets continue. Research conducted on relationship bctwccn catch pcriodicity and moon phase. Canning trials at Nkata Bay. Renewed interest in fishmcal manufacture. The Department of Game, Fish and Tsetse Control reorganized and fmheries now under Department of Agriculture and Fisheries. Fisheries Research Unit relocated to Monkey Bay. The launch "Ethelwynn Trewavas" commissioned. New station and jetty opened at Kachulu (Lake Chilwa); mobile boat repair unit started at Mangochi. Commercial fishery now regarded as "stable". Artisanal gill-netting in Lake Malombe abandoned owing to damage by crocodiles, and replaced by a new encircling technique. Utaka fishing rights at Cape Maclear$sputed by Tonga and Nyanji fidhermen. More than 150 plank boats and 100 motorized craft recorded in southern Lake Malawi. FA0 team advises on marketing, initiation of fish-drying kilns fueled by palm nuts. Fishermen training activities relocated to Mangochi, where 13 trainees attend three courses. About 370 people make use of the "Information Room" at Mangochi (compared with 230 in 1961). Experiments conducted on corrugated iron portable fish smoking kiln (smoked 60 fishhour and was 5m more fuelefficient than traditional method). Continuation of experiments with gill nets. Results of fishery research (formerly in joint Northern Rhodesia and Nyasaland reports) now published separately. FD now part of Ministry of Agriculture and Natural Resources. Total fish landiigs reach 43,000 t. Exploratory trawling conducted on Lake Mala%. Fisheries Department Newsletter started. Mr. Stoneman appointed Chief Fisheries Officer. Total fish catch now estimated at 48,000 t, resulting mainly from increased catches in the Lower Shire River following closure of the barrage at Liwonde. Salima becomes an independent Fisheries Station. FD headquarters relocated from Zomba to Lilongwe. UNDP/FAO Project Team also relocates. Fisheries Act is approved. Pair trawler industry initiated. FD undergoes rapid expansion. Comprehensive collection of reprints on aquaculture in Africa assembled. Latest Annual Report of FD published.
Source: Compiled from various Annual Reports of the FD and its antecedents.
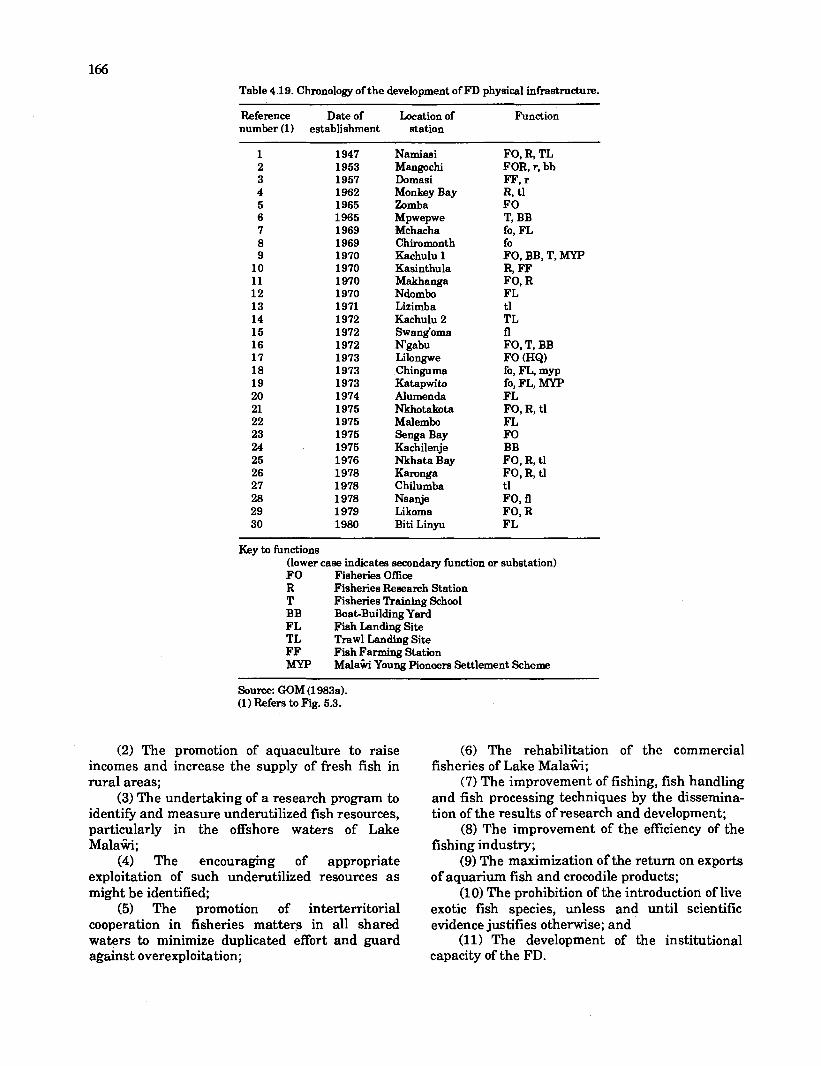
Table 4.19. Chronology of the development of FD physical infrastructure.
Reference Date of Location of Function number (1) establishment station
Namiasi Mangochi Domasi Monkey Bay Zomba Mpwepwe Mchacha Chiromonth Kachulu 1 Kasinthula Makhanga Ndombo Lizimba Kachulu 2 Swang'oma N'gabu Lilongwe Chinguma Katapwito Alumenda Nkhotakota Malembo Senga Bay Kachilenje Nkhata Bay Kamnga Chilumba Nsanje Likoma Biti Linyu
FO, R, TL FOR, r, bb FF, r R, tl FO T, BB fo, FL fo FO, BB, T, MYP R, FF FO, R FL t l TL f l FO, T, BB FO (HQ) fo, FL, myp fo, FL, MYP FL FO, R, tl FL FO BB FO, R, t l FO, R, t l t l FO, f l FO, R FL
Key to functions (lower case indicates secondary function or substation) FO Fisheries Office R Fisheries Reseaxh Station T Fisheries Training School BB Boat-Building Yard FL Fish Landing Site TL Trawl Landing Site FF Fish Farming Station MYP Malak Young Pioneers Settlement Scheme
Source: GOM (1 983a). (1) Refers to Fig. 5.3.
(2) The promotion of aquaculture to raise incomes and increase the supply of fresh fish in rural areas;
(3) The undertaking of a research program to identify and measure underutilized fish resources, particularly in the offshore waters of Lake MalaGvi;
(4) The encouraging of appropriate exploitation of such underutilized resources as might be identified;
(5) The promotion of interterritorial cooperation in fisheries matters in all shared waters to minimize duplicated effort and guard aghinst overexploitation;
(6) The rehabilitation of the commercial fisheries of Lake MalaGi;
(7) The improvement of fishing, fish handling and fish processing techniques by the dissemina- tion of the results of research and development;
(8) The improvement of the efficiency of the fishing industry;
(9) The maximization of the return on exports of aquarium fish and crocodile products;
(10) The prohibition of the introduction of live exotic fish species, unless and until scientific evidence justifies otherwise; and
(11) The development of the institutional capacity of the FD.
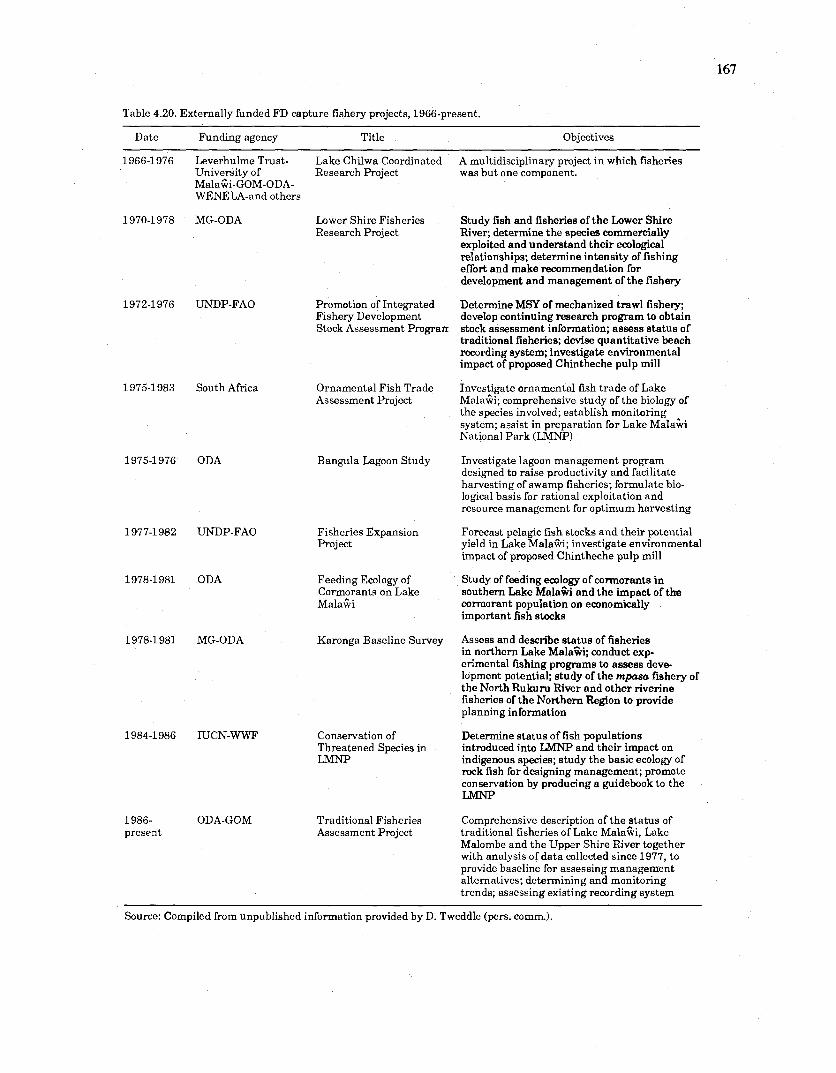
Table 4.20. Externally funded FD capture fishery projects, 1966-present.
Date Funding agency Title Objectives
1966-1976 Leverhulme Trust- Lake Chilwa Coordinated A multidisciplinary project i n which fisheries University of Research Project was but one component. Mala%-GOM-ODA- WENELA-and others
1970-1 978 MG-ODA
1975-1983 South Africa
1975-1976 ODA
1977-1982 TJNDP-FA0
1978-1981 ODA
1978-1 981 MG-ODA
1986- present
ODA-GOM
Lower Shire Fisheries Research Project
Promotion of Integrated Fishery Development Stock Assessment Pmgran
Ornamental Fish Trade Assessment Project
Bangula Lagoon Study
Fisheries Expansion Project
Feeding Ecology of Cormorants on Lake MalaCi
Karonga Baseline Survey
Conservation of Threatened Species in LMNP
Traditional Fisheries Assessment Project
Study fish and fisheries of the Lower Shire River; determine the species commercially exploited and understand their ecological relationships; determine intensity of fishing effort and make recommendation for dcvelopment and managcment of the fishery
Determine MSY of mechanized trawl fishery; develop continuing research program to obtain stock assessment information; assess status of traditional fisheries; devise quantitative beach recording system; investigate environmental impact of proposed Chinthcche pulp mill
Investigate ornamental fish trade of Lake Mala&; comprehensive study of the biology of the species involved; establish monitoring system; assist in preparation for Lake MalaGi National Park (LMNP)
Investigate lagoon management program designed to raise productivity and facilitate harvesting of swamp fisheries; formulate bio- logical basis for rational exploitation and resource management for optimum harvesting
Forecast pelagic fish stocks and their potential yield in Lake MalaBi; investigate environmental impact of proposed Chintheche pulp mill
Study of feeding ecology of cormorants i n southern Lake Mala% and the impact of the cormorant population on economically important fish stocks
Asscss and describe status of fisheries in northcrn Lake MalaGi; conduct exp- crimcntal fishing programs to assess deve- lopmcnt potcntial; study of the mpasa fishery of the North Rukuru River and other riverine fishcrics of the Northern Region to provide planning information
Determine status of fish populations introduced into LMNP and their impact on indigenous species; study the basic ecology of rock fish for designing management; promote conservation by producing a guidebook to the LMNP
Comprehensive description of the status of traditional fisheries of Lake MalaCi, Lake Malombe and the Upper Shire River together with analysis of data collected since 1977, to provide baseline for assessing management alternatives; determining and monitoring trends; assessing existing recording system
Source: Compiled from unpublished information provided by D. Tweddle (pers. comm.).

Table 4.21. Increase in recurrent budget expenditures for the FD compared with other branches of the Ministry of Agriculture and Natural Resources (MK '000s).
Agency Fiscal year Current Constant
(Revised) prices (1981-82) prices
1980181 1981182 1982183 1983184 198-4185 1985186 1986187 1987188
Ministry of Agriculture Subtotal 9,881 11,260 14,372 19,989 20,909 24,519 21 8
Ministry of Forestry and Natural Resources Forestry Department 1,437 1,623 2 , n l 3,069 3,743 3,400 22 9
Fisheries Department 486 552 64 2 71 2 770 840 12 1
Subtotal Total (gross)
Source: GOPA (1 987). For foreign exchange rates, see p. 302.
Externally funded capture fisheries research projects in pursuit of those aims are shown in Table 4.20. The internal FD research program includes studies on commercial fisheries, taxonomic research, studies on usipa and mpasa, a collation of all available information on Lake Chiuta, and studies on riverine fisheries and anadromous fishes (D. Tweddle, pers. comm.).
Despite the major contribution of fisheries to the national food supply, budgetary allocations for the fisheries sector for FY 1987-1988 are 0.33% of the total national budget, and only 4.1% of that of the Ministry of Agriculture and Natural Resources (GOM 198813). The FD was allocated 0.26% of the expenditure on the national development account in FY 1987-1988, a rate that has ranged previously from a low of 0.08% (N 1985-1986) to 0.25% (FYs 1982-1983 and 1986- 1987) (GOM 1988b). Budgetary allocations to the FD have increased a t a relatively lower rate than those for other departments (Table 4.21) (GOPA 1987).
The operating efficiency of the FD, particularly in development and extension work has been hampered by the allocation of almost 50% of operational funds for administrative purposes (GOPA 1987), whereas technical programs receive only a minor share. Excluding salaries, the FY 1987-1 988 intra-FD allocation of funds was: research (9%), aquaculture (12%), training (I%), and development and extension
(23%), compared with 47% allocated to administration (30% a t headquarters and 17% in the field) (GOPA 1987).
Given that situation, development policies and strategies are predicated heavily on international assistance, in terms of financial aid, advisors, research staff, materials and educational assistance. Such projects for capture fisheries, which are either on-going, soon to be implemented, or in a late stage of preparation include (the source of financing is indicated in parentheses): "The Development of Fisheries Economic Centers" (ADB), "A Commercial Fisheries Study" (ADB), "The Northern Region Fisheries Development Project" (EDF) "Central Lakeshore Fisheries Expansion Project" (EDF), "Improvement of Management of the Resources of the Lower Shire Valley (EDF), "The MalaGi- German Fisheries and Aquaculture Development Project" (GTZ), "Demersal Fisheries Reassessment Project" (ODA), "Management of Chambo Fisheries in the Southeast Arm of Lake Malaki, Lake Malombe and the Upper Shire River" (UNDPIFAO), "SADCC Pelagic Fisheries Resources of Lake Malaii/Niassan (ODA), and SADCC Regional Fisheries Development Project" (USAID). In addition there is a proposed "National Fisheries Training Project" (UNDPIFAO) (Dunn and Smith 1987; GOM 1988a).

Chapter 5
THE UTILIZATION OF CAPTURE FISHERY PRODUCTS
Introduction
As a complement to Chapter 4, this chapter examines the socioeconomic aspects of the marketing, distribution and consumption of the products of ~ a l a k i ' s capture fisheries. Although such an examination is fundamentally constrained by the inadequacy and outdatedness of much of the available data, it is evident that there is an apparent imbalance in the supply, distribution, marketing, prices, and consumption patterns of fresh fish and fish products within Mala%. This exists despite a large nationwide demand for fish, and particularly for fresh fish, despite an efficient and vertically integrated traditional distribution and marketing structure, and in spite of great efforts by the government to develop, within the overall context of national development, a modern physical infrastructure, including that in support of fisheries.
As a result, fresh fish is prized and generally in high demand away from fishing centers and principal urban markets, factors which have contributed to its high price relative to average incomes. Despite a commonly acknowledged all- pervasive demand, fresh fish has never been readily available to most potential consumers. In MalaGi the bulk of fish that is consumed fresh is that landed by traditional fishermen and which is consumed immediately in the fishing communities and those located close by.
Large-scale and widespread distribution of fresh fish to the hinterland from the artisanal fisheries catch is hampered by a shortage of all- weather rural feeder roads (Fig. 5.1), by a scarcity of suitable motor vehicles to transport it, and by a general absence of facilities such as ice, chillrooms or insulated boxes to hold it a t points in the distribution system (GOPA 1987). Small quantities of somewhat less than fresh fish do reach areas away from the lakeshore or rivers,
being transported there either by bicycle or on foot. However, handling, quality and hygiene standards are often low as a consequence. Most fresh fish that reach urban markets are from the FD ice plants, such as those a t Salima and Mangochi, or from industrial operations, like MALDECO .
All fish not consumed fresh are processed, most commonly by sun-drying, by members of fishermen's households, specialist families in areas where larger and older-established fisheries exist, or by fish traders. It is then distributed nationwide by a still largely traditional, yet nevertheless relatively efficient and market- sensitive, vertically integrated network (Fig. 5.2) (GOPA 1987).
Marketing Infrastructure
The basic physical infrastructure and services required both to stimulate the supply of fresh fish from capture fisheries, as well as to satisfy consumer demand, are not uniform. Infrastructure has been relatively well developed throughout much of the Southern Region, as well as in the southern part of the Central Region. For much of the rest of the country, and particularly in the Northern Region as well as around lakes Chilwa and Chiuta in the Southern Region, smaller fishing villages commonly lack all- weather roads and public transport to link them with hinterland markets (Figs. 5.3 and 5.4). However, on Lake Chilwa fish are brought by boat to Kachulu, the terminus of an all-weather road.
Around the central and southern parts of Lake Mala% as well as along the Upper Shire River and Lake Malombe the physical infrastructure in support of capture fisheries is well developed (Figs. 5.1 and 5.3). In large part this situation has resulted from the strong
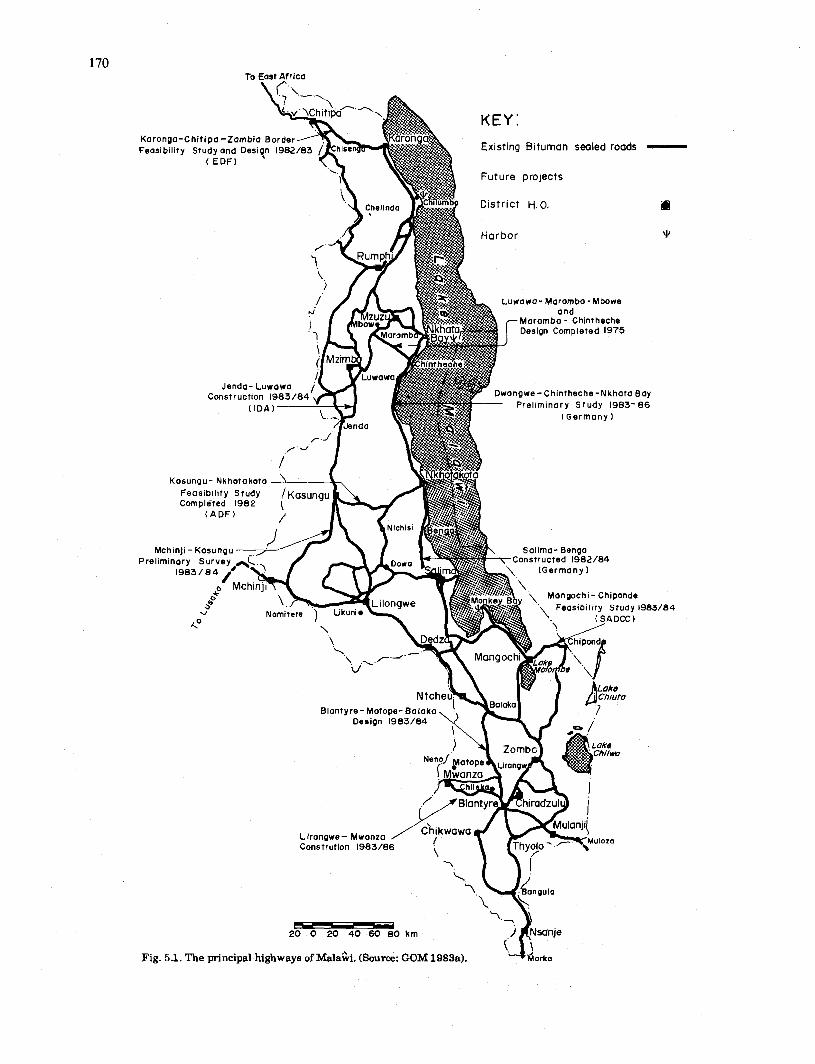
TO East Africa
- .
k Existing Biturnan sealed roads
Future projects
9 District H.O.
Maramba - Chintheche Design Completed 1975
Construction
Kosungu- Nkhotakoto
Mchinji - Kasungu Salima- Benga Constructed 1982/84
a
Blantyre- Matope- Balaka Design 1983 /84
L irongwe- Mwonza Constrution 1983/8
Harbor
Luwawa- Moramba - Mbowe
Dwongwe- Chintheche-Nkhata Bay Preliminary Study 1 9 8 3 - 8 6
(Germany
\ (Germany)
'\ Mangochi- Chiponde '' ~eos ib i l i t y Study 1983/84 B \. (SADCC)
-.
Fig. 5.1. The principal highways of ~ a l a & i . (Source: GOM 1983a).

Fishery source
Fresh fish
Fresh fish retailer
Fresh fish retailer
Smoked fish
Full- and part-time beach processors
Interregional smoked fish
trader
Smoked fish retailer I I
Dried fish
Full- and part-time beach processors
Regional dried fish retailers
Interregional dried fish
trader
t Dried fish retailer
I
Consumer 1
Fig. 5.2. Structure of the fish marketing system in ~ a l a k . (Source: Adapted fmm GOPA 1987).

Fig. 5.3. Principal fishing areas and transport mutes of fish to the main markets in Mala%, 1981. (Source: GOM 1983a).
Mort fish from tho Lower Shirr 'Y ! CJ
Fig. 6.4. Sources of fish supply to markets in Mala% by region of origin. (Source: Williams 1969).
governmental effort to extend the all-weather road network, combined with tne construction of rural feeder roads, to more remote fishing villages (Fig. 5.1). In turn this has stimulated an improved and better integrated system for handling, processing, distributing and marketing fish from this region. This process is clearly demonstrated in Mangochi District, where four important centers exist for the capture fishery sector, at Namiasi, Mangochi, Katapwito and Monkey Bay (Table 4.19). Four more centralized fish landing sites have been proposed for Mangochi District, at Chimwala, Chikulo, Mbwadzulu and Chimphaba. Each will consist of a small office complex, a fish and net store and a small retail market, together

with drying racks, smoking kilns and a sanitary water supply (GOM 1983a).
Elsewhere the FD has developed 13 landing beaches in the Central Lake area, each having access roads and smoking kilns, plus extension personnel. The objective of these centers is to centralize the activities of fishermen, fish processors and fish traders, both to achieve a measure of integration in the industry as well as to provide a locus for community development.
Governmental Fisheries Stations have also been established in the past elsewhere in the country, as at Karonga, Nkhotakota, Nkhata Bay, Salima, and Namiasi, with the objective of enhancing the fish marketing infrastructure (Table 4.19). However, small ice plants are at present operating only at Salima and Namiasi.
An important, if geographically limited, storage and distribution infrastructure is provided by two parastatal companies, MALDECO and Cold Storage Ltd. MALDECO, based at Mangochi, supports its own commercial fishery operation with blast freezers, cold storage and an ice plant (which also retails ice to local traders). Since this company lacks its own distribution network it collaborates with Cold Storage Ltd., based in Blantyre, and more recently with ADMARC. Although essentially a livestock slaughtering and processing operation, on a commission basis Cold Storage Ltd. provides through its two depots, one in Blantyre and the other in Lilongwe, an outlet for MALDECO iced, frozen and smoked fish products, which are sold principally to hotels, restaurants and fish traders (GOPA 1987), as well as a limited quantity for export to Zimbabwe.
That limited distribution network has. recently been supplemented by a small private cold storage depot in Mzuzu, in the Northern Region. Iced or frozen fish from the MALDECO plant at Mangochi are transported to Mzuzu and redistributed from this depot, on a contract basis. Supplies are uncertain, however, and depend on the availability of a large enough surplus a t the MALDECO plant to justify the cost of dedicated road transportation.
The national physical infrastructure for fish marketing consists of four main municipal wholesale markets together with public retail markets in all principal urban centers. The latter are supplemented by supermarket chains (GOPA 1987).
One wholesale market is located in each of Limbe, Lilongwe, Mangoehi, and Luchenza towns. Only those a t Limbe and Lilongwe have facilities for storing fresh fish, the other two being devoted
t o the redistribution of dried products. However, the bulk of the fish sold in all retail markets is dried, although some fresh fish may be delivered year-round. Fish are delivered to these markets by private traders, using either public transport or rented pick-up trucks.
The principal public retail markets are operated a t Lilongwe, Blantyre and Limbe, Zomba, Kasungu, and Mzuzu. Fresh fish is regularly available in the first three, but only on occasion in Kasungu and Mzuzu.
In recent years several supermarket chains have developed in MalaGi. The most widespread, Peoples Trading Centre, has 35 stores, and the second largest, Kandodo, has 8 shops. Both retail fishery products, although the former normally deals only in fresh or frozen fish (GOPA 1987).
Distribution and Marketing Networks
The fish distribution and marketing network is densely concentrated in parts of the Central and Southern regions, and within them it is best developed in and around the principal urban areas (Fig. 5.3). This reflects a variety of factors, among which the most important are the location in these areas of the main sources of fish supply, the distribution of the consuming population and its relatively high purchasing power, the relative level of development of physical infrastructure, and transport costs. On the other hand, supplies to many of the remote rural areas are infrequent, owing largely to low purchasing power. The public sector plays a vital role in Malaibian fisheries, and not the least in the transport of the products in bulk for marketing. The public lake steamer and railway service provides the most economical means of bulk transportation of dried and smoked fish to and from the northern parts of the country, as well as the only means for moving it from the Likoma Islands (Fig. 5.3). The longer distance distribution of smaller consignments of dried fish, to a wide number of marketing or redistribution points, is most economically done by the public bus service.
For short- and intermediate-distance marketing, and especially for fresh or iced fish, private vehicles provide the degree of flexibility most suited to responding fast to fluctuations in supply and demand. In the Southern Region, particularly in the flat hinterland of Lake Chilwa, as well as in Zomba District, a large amount of both fresh and processed fish is distributed by

bicycle. Conveyance by bicycle of 75-150 kg baskets of fish may be up to 50 km or reputedly as much as 150 km where motorized transport and suitable all-weather roads are lacking (Gilberg 1966; Agnew 1973). It should be appreciated that the importance of long range bicycle haulage has declined considerably over many parts of the country since these studies were conducted. However, the bicycie-mounted fish trader was, and still is to some extent, an indispensible element in the Lake Chilwa Basin, where access to some fishing settlements can be impassable to heavier vehicles during the wet season. In the southern part of the area more than 80% of the fishermen sell their catch to such traders, whereas only 8% sell to those operating trucks (Chilivumbo 1972; Phipps 1973). Many traders who distribute by bicycle purchase and smoke or dry fish daily, until a load of about 50 kg has been accumulated, before setting off on their established rounds (Agnew and Chipeta 1979).
Williams (1969) demonstrated that in the fish marketing hinterland of the Lake Chilwa Basin bicycle-mounted fish traders held 90% of the market share in the Mulanje and Chiradzulu districts, where distance and poor access worked against fish supplies from both Lake ~ a l a & i and the Lower Shire (Fig. 5.4). On the other hand fish from Lake Chilwa was in competition with that from those two areas wherever all-weather roads (Fig. 5.1) or the railway impinged on the bicycle traders' area. A survey of 120 fish traders in Lilongwe in 1976 showed that 110 (88.7%) transported their merchandise by public bus, 18 (14.5%) travelled by bicycle and 14 (11.3%) either obtained rides on or rented motor vehicles (GOM 1978b).
Despite the vital role of the public sector, nationwide the bulk of the fish supply depends on the private sector. One characteristic of the distribution system is that the dried fish trade is mostly in the hands of a large number of small- scale traders. Fish sell readily immediately upon landing, primarily to specialized fish traders, and also for subsistence use to residents of fishing communities and nearby villages. Sales precedence is given to regular traders, who, a t the time of Gilberg's study (1966) sometimes required, as they might still do, more than a month to amass and process a marketable quantity of fish, particularly during the rainy season. The final product is then packed in woven split bamboo baskets or jute sacks and transported to market.
The Fish Traders and Marketing Relationships
Since for most people involved it is highly seasonal andlor only temporary, it is virtually impossible to estimate accurately the amount of employment generated by fish processing and trading. Estimates of the total number of people involved both part-time and full-time range from 20,000 to 200,000 (Hartmann 1987). Regardless of the magnitude of the employment generated, clearly these activities are of critical importance to a large number of economically poor rural households in many parts of the country, as either the sole source of income or of a vitally important complementary source. Further, of fundamental importance for the poor household is that entry into the trade is relatively easy, in terms of the low levels of capital and investment required. Nevertheless, for some participants the earnings generated by fish marketing activities can be very high by Malainian standards (Table 5.1). From the national perspective, small-scale fish traders provide a relatively efficient and low cost essential service, and one that could not, without an impossibly large investment, be replicated by the public sector.
There are basically two categories of fish trader, based on operating scale: large- and small- scale. Large-scale fish traders are full-time operators who deal in tonnes of fish and who employ laborers for processing. They may own a boat to collect fish from various outlying fishing settlements, and they distribute the product by truck.
Various categories of small-scale fish trader may be distinguished, but their common characteristics are that they all deal in small lots, do their own processing and selling, and distribute the product by bus, bicycle or on foot. Four categories can be recognized, based on both their operating frequency and on their economic motivation for fish trading (Gilberg 1966; Williams 1969). The most specialized are part- time traders who visit the markets throughout the year, but for only 4-5 days or once or twice a month. When not a t market they are occupied with the acquisition and processing of fish for market.
Many small-scale operators are either farmers or laborers on agricultural estates who engage in fish trading during the agricultural slack season. Others are "fringe traders" (Agnew

TableA5.1. Summary of the costs and earnings by trader type in the marketing of fresh, dried and smoked fish in Malawi, 1986 (MK).
Product Fresh fish trader Dried fish trader Smoked fish trader
Scientific name Vernacular name Marketing route Beach price
Volume purchased (a) Purchase value Input costs:
Hired labor Own labor Container Ice Fuelwood Transport Provisions Market fee Total costs Sales price
Total sales value Income Gross margin
Net margin Fisherman's share of consumer price Perioddmonth (b) Incomdmonth
Tilapia and Oreochromis Tilapia and Oreochromis Chambo Chambo Namiasi-Mwanza Makanjila-Mwanza 19.50 (box) 3.00 (doz.)
5.00 (1 day) 12.00 (6 days) 6.00 (basket) 8.68 (4 blocks) not required 50.00 9.00 (9 days) 1 .00 (2 days) 91.68 40.00 (box)
(boxes) 300.00
6.00 (3 days) 10.00 (5 days) 4.00 (basket) not required not required 22.00 7.50 (5 days) 0.50 (1 day) 50.00 5.99
Bagrus meridionalis Kampango Makanjila-Mchinji 3.00 (doz.)
100 (doz.) 70 (doz.) 210.00
14.00 46.00 (25 days) 4.00 (basket) not required 5.00 40.00 34.50 (23 days) 3.50 (7 days) 146.50 18.00 (doz.)
not available 1,173.00
Source: GOPA (1987). Notes: For foreign exchange rates, see p. 302; (a) Per trade period; (b) Number of trade periods per month.
and Chipeta 1979), who, after becoming unemployed or while seeking employment, invest one or more times in a load of processed fish, which they peddle in various parts of the country. Other small-scale fish traders are fishermen from isolated communities who, usually because they cannot locate a fish trader where they operate, take their own catches to market. This is not uncommon among the isolated fishing communities of the northern wetlands of the Lake Chilwa Basin (Agnew and Chipeta 1979). However, apart from some female members in some ethnic groups, notably the Tonga (Kapeleta 1980), most Malaibian fishers are specialized, and rarely become involved in either fish processing or fish trading (Agnew and Chipeta 1979).
In lieu of a more comprehensive and sophisticated study, the 1978 survey of 124 traders in 20 markets in the Lilongwe hinterland is illustrative (GOM 197813). Of the small-scale fish traders surveyed, 80 (64.5%) had no occupation other than fish trading. Among the remainder, 24 (19.3%) were farmers and 2 (1.6%) were fishermen. Most had recently entered. the
busmess: 68 (54.8%), having done so within the year prior to the survey, and 106 (85.4%) having begun fish trading within the previous four years.
Fish trading as an activity engaged in during the agricultural slack season is apparently commonplace. Thus fishermen find it relatively easy to dispose of their catch to the larger number of traders during the dry season. During the wet season, when agricultural activity is in full-swing and when fish catches are good, the farmer-part- time fish trader has returned to his farm, so the fish are less easily disposed of. However, a t this time the regular trader has a greater opportunity to purchase larger quantities than in the dry season (Gilberg 1966).
Important from the perspective of fisheries development planning is that small-scale fish trading provides a low-capital and subsistence level of employment for young, unemployed males either while they are searching for work or saving to continue their education. Most traders are itinerant, travelling in search of rural markets and spending considerable time a t the fish landing points to acquire their stock. Opportunity

costs are low, since there are few viable alternative ways of earning cash for the relatively unskilled (Gilberg 1966). Since the small profit margins made barely justify such a degree of mobility, an important research topic is to examine the bonds between fish traders, as well as their social status.
Fish trading is one of the principal off-farm income-generating activities engaged in by women, from both fishing and other communities. This, however, differs among ethnic groups. Whereas Tonga women, in particular, are highly involved in both fish trading, "respectable" Yao women, although involved to a degree in processing, are prevented by Muslim proscriptions from participating in trading away from the household. Female participation also varies according to ecological conditions. For example, in parts of the Lake Chilwa basin, fishermen work from temporary fishing camps on artificial islands, leaving their families on-shore. There women have no role in any aspect of the industry (Agnew and Chipeta 1979; Landes and Otte 1983).
Among the matrilineally organized Tonga, for example, in both the Northern and Southern regions of Mala%, the wives and sisters of fishermen are highly involved in fish processing and trading. By Tonga tradition the catch of a married fisherman belongs to his wife, and that of a single man to his mother andlor sisters. The women collect their fish at the landing points, and then process, store, and finally market them. So socially important is this women's role among the Tonga that skills in fish processing and marketing are essential credentials for marriage (Chirwa 1983). This may partly account for the relatively permanent migration of Tonga women to the Southern Region, as around Monkey Bay, where, compared to the Northern Region, there are better opportunities for trading, and so single women can relatively easily establish their credentials as competent fish traders (GOPA 1987).
There are four separate stages in the marketing distribution of processed fish (Agnew and Chipeta 1979) (Fig. 5.2). Several or all stages may be handled by a single individual. The first is the processing of fish purchased at the landing point, followed by transport of the product to a larger market in a main urban center. There the consignment is sold either to other wholesalers, who break it into smaller lots for sale to small- scale retail traders, or in smaller lots directly by the processor-wholesaler to a number of small- scale retailers. Finally, these retailers then
distribute the fish throughout their entire selling area, including the remotest village.
This traditional pattern for distributing processed fish products appears to be an eficiently organized, vertically integrated system. Its various wholesale and retail functions seem reasonably sensitive to market forces, thereby ensuring supplies to areas of dense population, and rapidly adjusting to a varying supply situation, as when Lake Chilwa dried up, for example (Williams 1969). Further, the efficiency and importance of the system in terms of employment generation and the provision of complementary incomes for poor rural families are of vital national importance.
The Geographical Distribution of Markets for Fishery Products
A nationwide quantitative survey of the fish trade flows by landing point of origin and market was conducted in 1981 (Fig. 5.3). The largest and wealthiest markets and richest fisheries coincide geographically, in the Southern Region and the southern districts of the Central Region. The major trade flows are thus from the landing beaches toward the markets in the same region.
As shown in Fig. 5.4, in 1968, 90% of the fish available in the markets of all districts of the Northern Region was supplied from Lake Mala%, as it was in those of all districts of the Central Region, except Dedza, Lilongwe and Ncheu, which, owing to the easy, all-weather access provided by Highway M1 (Fig. 5.1), receive 20% of their supply from Lake Chilwa. About 90% of the supply of the Mangochi District was derived from southern Lake MalaGvi, Lake Malombe and the Upper Shire River. An estimated half of that to Kasupe and Mwanza districts was from Lake Malawi and the balance from Lake Chilwa and local fisheries. Southwards the supply was mostly from Lake Chilwa, except in the southernmost districts of Chikwawa and Nsanje, where 90% of the fish marketed was derived from the Lower Shire River and its associated wetlands. The pattern has probably changed little during the last two decades from that shown in Fig. 5.3.
Distribution from Lake ~ a l a & i Fisheries
Commercial operations are important in the Northern Region, based at Karonga (Fig. 5.3). In

this Region the catch is dominated by utaka (Haplochromis spp.), with kampango (Bagrus meridionalis), mlamba (Clarias gariepinus), usipa (Engraulicypris sardella), chambo (Oreochromis spp.), and a mixture of other species being roughly coequal to each other in quantity, but together far less than the utaka catch (Fig. 4.5; Table 5.2) (GOM 1983a).
landed at Makanjila, on the eastern shore of the lake, is sent by baat t o Lilongwe, via Salima, and southwards by road (Fig. 5.3).
The catches from the Southeastern and Southwestern Arms, the richest fishing grounds in Lake Malaki, are dominated by chambo (Oreochromis spp.), followed by utaka (Haplochromis spp.), and, in the Southwestern
Table 5.2. Landed weight and catch composition of fish from the Northern, Central and Southern Regions of Lake MalaSi, 1982 and 1983 (t). - -
Local name Scientific name Location Karonga Salima Southeastern Arm
(Northern Region) (Central Region) (Southern Region) 1982 1983 1982 1983 1982 1983
Chambo
Utaka Usipa Chisawasawa Kampango Mamba Others Total
Tilapia spp. Oreochromis spp. Haplochromis spp. Engraulicypris sardella Lethrinops spp. Bagrus meridionalis Clarias gariepinus
Source: GOPA (1987).
Fish caught in Northern Region waters in the vicinity of Karonga is marketed mostly in Karonga town and its hinterland. Those taken in the vicinity of the landing point at Chilumba are sent by land northwards to the Karonga area and to the hinterland around Rumphi, as well as by boat or ship southwards to Nkhata Bay. The catch from the Nkhata Bay area, as well as fish received there from other grounds, besides being consumed locally, is marketed inland at Mzuzu and Mzimba, and in their surrounding localities. The catch of the Likoma Islands is also shipped by lake steamer to Nkhata Bay (Fig. 5.3), for marketing in the inland urban centers and their respective hinterlands, as well as to the Central Region and to Mozambique (Renson 1969; GQM 1983a).
The percentage contribution of the various species to the aggregate catch from Central Region waters is similar to that of the Northern Region, except that kampango and chambo are more important, and usipa is not recorded (Fig. 4.5; Table 5.2) (GOM 1983a). Fish from the Nkhotakota area, together with that from the Likoma Islands transhipped through this landing point, is dispatched to Lilongwe, Kasungu, Ntchisi, and Dowa, as well as to Chipoka, on the Southwestern Arm. Some fish from Chipoka goes to Nkhotakota, but mostly to the Southern Region as well as to Salima and Lilongwe. The catch
Arm, usipa (Engraulicypris sardella) (Fig. 4.5; Table 5.2). Fish from these two areas goes predominantly to the Southern Region, as well as to Lilongwe and the Dedza areas (GOM 1983). There is a considerable transhipment of dried and smoked fish, destined for the Central and Southern regions, by lake steamer via Chipoka, and, to a lesser extent, Monkey Bay (Fig. 5.3) (Renson 1969).
For Lake Mala% as a whole, 20% of the catch is distributed as fresh fish, 30% is smoked or roasted and 50% is dried (GOPA 1987).
Distribution from Lake Malombe and the Upper Shire River
The bulk of the catch from this area is composed of chambo (Oreochromis spp.), with smaller amounts of kambuzi (Cyrtocara spp.), and mlamba (Clarias gariepinus) (Fig. 4.5). Most of the fish from the Lake Malombe-Upper Shire fishery is aggregated at Mangochi, and then sent by road to the major markets of the Southern and Central regions (Fig. 5.3). A small quantity enters the eastern hinterland of Mangochi District, via Namwera, and from there some continue into Mozambique (Fig. 5.3) (GOM 1983a).
Distribution from Lake Chilwa Fisheries
The bulk of the catch from this fishery goes to the Southern Region, and to a lesser extent to the Lilongwe, Dedza and Ntcheu areas of the Central District (Fig. 5.3). The largest commercial center in Mala%, Blantyre and Limbe, together with Zomba, the former capital, lie within the immediate marketing region of the Lake Chilwa fisheries. The hinterland of this lake contains some 38% of the total national population (GOPA 1987). The proximity of these fisheries to one of the generally economically better-off urban sectors of MalaXs population, as well as to the large and sustained market provided by the laborers on the tea estates at Thyolo and Mulanje, provides the basis for an above average livelihood to local fishermen, fish processors and fish traders (Agnew and Chipeta 1979).
There are three main fish landing points around Lake Chilwa: Kachulu, on the central western shore; Swang'oma, in the south; and Mposa, in the northwest. In 1966, only Kachulu, the main fishery center of Lake Chilwa, which produced an estimated 78.5% of the main commercial catch (Gilberg 1966), was connected by an all-weather road directly to Zomba (Fig. 5.3), and thence to the Blantyre and Limbe area, and thus had ready access to its hinterland. This road was constantly used by the trucks of the larger fish traders, as well as by the small-scale operators. Swang'oma and Mposa produced an estimated 15.5 and 6.0%, respectively, of the three species that comprise the main commercial catch from Lake Chilwa (Gilberg 1966).
The catch composition at Kachulu, which also serves as an aggregation center for sun-dried and smoke-cured fish from other local landing points, is makumba, Oreochromis shiranus chilwae (40% of the total), matemba, Barbus paludinosus (42% of the total) and mlamba, Clarias gariepinus (18% of the total) (Fig. 4.5) (Gilberg 1966). Swang'omais the outlet for the fisheries of southeastern Lake Chilwa. Isolated from the open water of the lake by swamps, it is connected to its hinterland by only a relatively poor road network (Fig. 5.1). The relative importance, based on landings, of the three main. commercial fish species is: matemba (Barbus paludinosus) 50%, and makumba (0. shiranus chilwae) and mlamba (Clarias gariepinus) 25% each (Gilberg 1966). Mposa serves as the fish landing for the northern sector of Lake Chilwa. Since it is cut off from the lake by extensive marshes, in 1966 processed products
were landed there once a week from the fishing settlements located on mud islands in the open water. At that time there was virtually no trade in fresh fish at this landing point. The three principal preserved fish products marketed through Mposa are mlamba (C. gariepinus; 55% of the total), matemba (B. paludinensis; 35% of the total), and makumba (0.8. chilwae; 10% of the total) (Gilberg 1966).
Fish distribution patterns change occasionally to compensate for the drying of Lake Chilwa. In mid-1967, for example, when the catch from Lake Chilwa declined in the early stages of the 1968 drying, increased fish supplies from Lake Malombe, the Upper Shire River, and the southern portion of Lake MalaCNi were sent to the markets of the Southern Region (Renson 1969; Agnew and Chipeta 1979).
Fresh fish comprises only 10% of the fish thus distributed from the Lake Chilwa fisheries. The bulk is processed, with 40% being smoked and 50% dried (GOPA 1987).
Distribution from the Lower Shire Fisheries
The yield from this region is dominated by mlamba (Clarias gariepinus), chambo (Oreochromis spp.), and chikano (Oreochromis mossambicus) (Fig. 4.5). The bulk of the catch that is not consumed within the region is distributed to markets in Blantyre, Thyolo and Mulanje districts. A lesser amount was sent by rail to Salima, and from there to the Lilongwe area (Renson 1969).
Price Stmctures
There are virtually no data on the fish marketing situation prior to independence in 1964. Those which do exist for that period are fragmentary and generally contradictory. Information is largely anecdotal. Practically nothing was known of fish prices, apart from some information on chambo (Tilapia spp. and Oreochromis spp.) sold by commercial operations. Marketing data on the artisanal sector of that period are derisory and of no practical value, being given in local currency per fish(es) with no indications of size, weight, quality and the like. They are thus valueless for any comparative purpose.
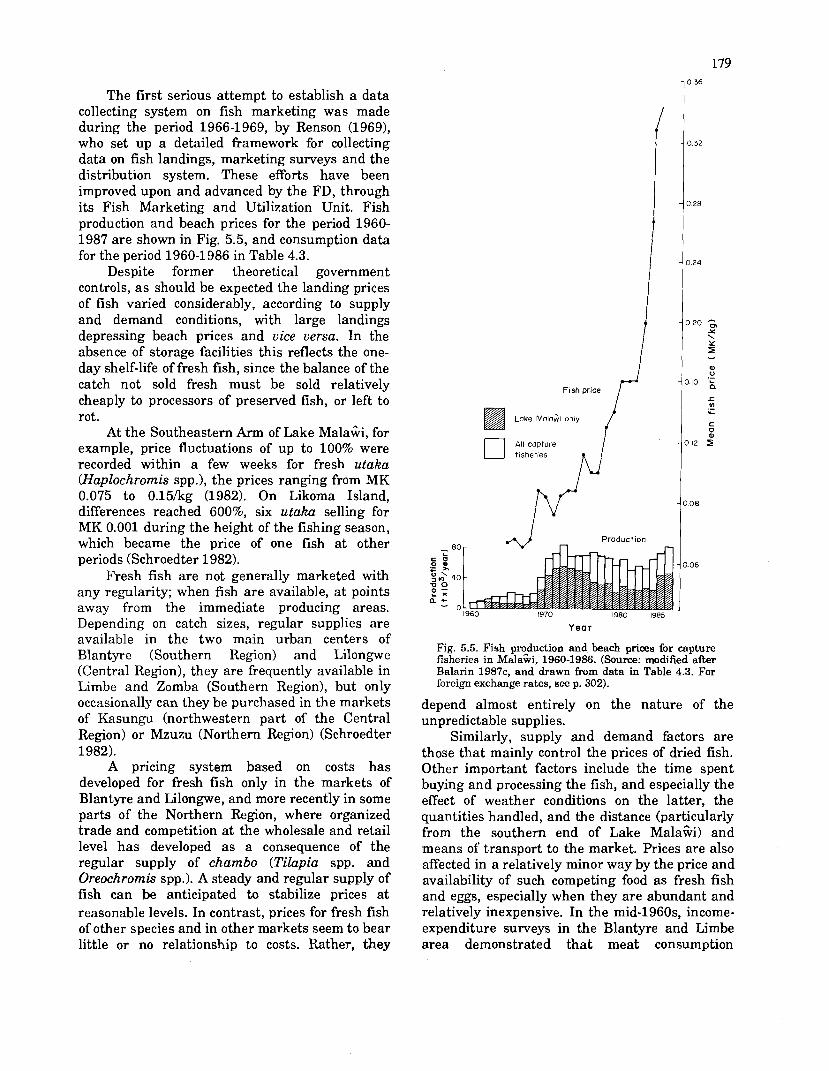
The first serious attempt to establish a data collecting system on fish marketing was made during the period 1966-1969, by Renson (1969), who set up a detailed framework for collecting data on fish landings, marketing surveys and the distribution system. These efforts have been improved upon and advanced by the FD, through its Fish Marketing and Utilization Unit. Fish production and beach prices for the period 1960- 1987 are shown in Fig. 5.5, and consumption data for the period 1960-1986 in Table 4.3.
Despite former theoretical government controls, as should be expected the landing prices of fish varied considerably, according to supply and demand conditions, with large landings depressing beach prices and vice versa. In the absence of storage facilities this reflects the one- day shelf-life of fresh fish, since the balance of the catch not sold fresh must be sold relatively cheaply to processors of preserved fish, or left to rot.
At the Southeastern Arm of Lake Mala%, for example, price fluctuations of up to 100% were recorded within a few weeks for fresh utaka (Haplochromis spp.), the prices ranging from MK 0.075 to 0.15/kg (1982). On Likoma Island, differences reached 600%, six utaka selling for MK 0.001 during the height of the fishing season, which became the price of one fish at other periods (Schroedter 1982).
Fresh fish are not generally marketed with any regularity; when fish are available, a t points away from the immediate producing areas. Depending on catch sizes, regular supplies are available in the two main urban centers of Blantyre (Southern Region) and Lilongwe (Central Region), they are frequently available in Limbe and Zomba (Southern Region), but only occasionally can they be purchased in the markets of Kasungu (northwestern part of the Central Region) or Mzuzu (Northern Region) (Schroedter 1982).
A pricing system based on costs has developed for fresh fish only in the markets of Blantyre and Lilongwe, and more recently in some parts of the Northern Region, where organized trade and competition a t the wholesale and retail level has developed as a consequence of the regular supply of chambo (Tilapia spp. and Oreochromis spp.). A steady and regular supply of fish can be anticipated to stabilize prices a t reasonable levels. In contrast, prices for fresh fish of other species and in other markets seem to bear little or no relationship to costs. Rather, they
Flsh price r' Lake ~ a l a i i oniy i
Production - 80- c 0
:$40-
2 G a t o -
1960 1970 1980 1985
Year
Fig. 5.5. Fish production and beach prices for capture fisheries in ~ a l a k , 1960-1986. (Source: modified after Balarin 1987c, and drawn from data in Table 4.3. For foreign exchange rates, see p. 302).
depend almost entirely on the nature of the unpredictable supplies.
Similarly, supply and demand factors are those that mainly control the prices of dried fish. Other important factors include the time spent buying and processing the fish, and especially the effect of weather conditions on the latter, the quantities handled, and the distance (particularly from the southern end of Lake Mala%) and means of transport to the market. Prices are also affected in a relatively minor way by the price and availability of such competing food as fresh fish and eggs, especially when they are abundant and relatively inexpensive. In the mid-1960s, income- expenditure surveys in the Blantyre and Limbe area demonstrated that meat consumption

increased with increasing income levels, whereas which prices in the Mzuzu area were five times the percentage of total animal protein higher than in the south of the country. Greater consumption composed of fish was higher a t the differentials were demonstrated in 1980 lower income levels (Renson 1969). A comparison (Arrundale 1980). The principal cause is that most of fish, beef and chicken prices for 1983 is given in of the fish retailed in the Northern Region are Table 5.3. caught in the southern end of Lake MalaGi.
Table 5.3. Comparative prices for fish and meat in ~ a l a h , 1983 (MWkg).
Local name Scientific name Beach price Wholesale price Retail price (Price range) Fresh Dried Fresh Dried
Chambo
Utaka Usipa Chisawasawa Kampango Mlamba Beef
Chicken
TiZapia spp. Oreochromis spp. 0.36 - 0.56 Haplochromis spp. 0.19 - 0.35 Engraulicypris sardella 0.19 Lethrinops spp. 0.29- 0.63 Bagrus meridionalis 0.20 - 0.38 Clarias gariepinus 0.21 - 0.48
Source: GOPA (1 987). Notes: For foreign exchange rates, see p. 302. Figures in parentheses are 1987 prices in Lilongwe markets.
Prices of fish vary considerably by season as well as throughout the country (Fig. 5.6; Tables 5.4 and 5.5). In interior markets, they are affected by the seasonal competition from other sources of animal protein. Locations along the lake shores, as well as the two largest urban centers, Blantyre and Lilongwe, exhibit lower wholesale prices"than elsewhere, particularly the hinterland markets of the Northern Region. Schroedter (1982) commented that "amazing" price ranges were "... found in the same market for the same product ... showing clearly that the selling by piece or volume makes comparing prices difficult for the consumer and for the trader [alike]". Price relationships also depend on the purchasing power of the consumer (Gilberg 19661, as well as on the size of the fish (Fig. 5.7).
Further, despite Gilberg's (1966) assertion that at that time price fluctuations among markets appeared to bear little or no relationship to geographical distance from the source of the product, that was clearly not the case a decade later. In the Mzuzu area of the Northern Region, prices were considered extremely high in 1977, when the average retail prices of fresh fish, when it was available, were 1.5 times that in the Blantyre and Limbe area of the Southern Region (Jones and Clucas 1977) (Table 5.4). For some species the differential is even greater, as for usipa (Engraulicypris sardella), for example, for
Since fish are never sold by weight, but, for example, by the piece, basket or pile, it is virtually impossible to enforce government controls, other than by arbitrary interventions of the authorities in each local market place. In 1980, controlled landed prices ranged from MK 0.09/kg (for utaka and catfish) to MK 0.26/kg (for so-called grade 1 fish [usipa, Engraulicypris sardella, mnjika, Opsaridium spp., ncheni, Rhamphochromis spp. and chambo, Oreochromis spp.] (Arrundale 1980).
In 1977 the estimated total market price mark-up of dried usipa (Engraulicypris sardella), compared with the landing beach price, was 172% (Jones and Clucas 1977). Through marketing excercises in the Northern Region Arrundale (1980) demonstrated the feasibility of gross profits of 123.5% and net profits of 118.6%, at Mzuzu Public Market, and of 125.6% and 187.1%, respectively, at Rumphi Public Market.
Mean fish prices in urban markets have continued to show an upward trend. Notwithstanding a production increase of about 17% from 1985 to 1986, during that period public retail prices rose 20% for fresh chambo, 13% for dried chambo, and 2% for dried utaka (GOPA 1987). This trend seems to have resulted from continued strong urban market demand, and increased road transport costs, particularly that of fuel. The influence of the latter factor emerges from a comparison of regional market price,
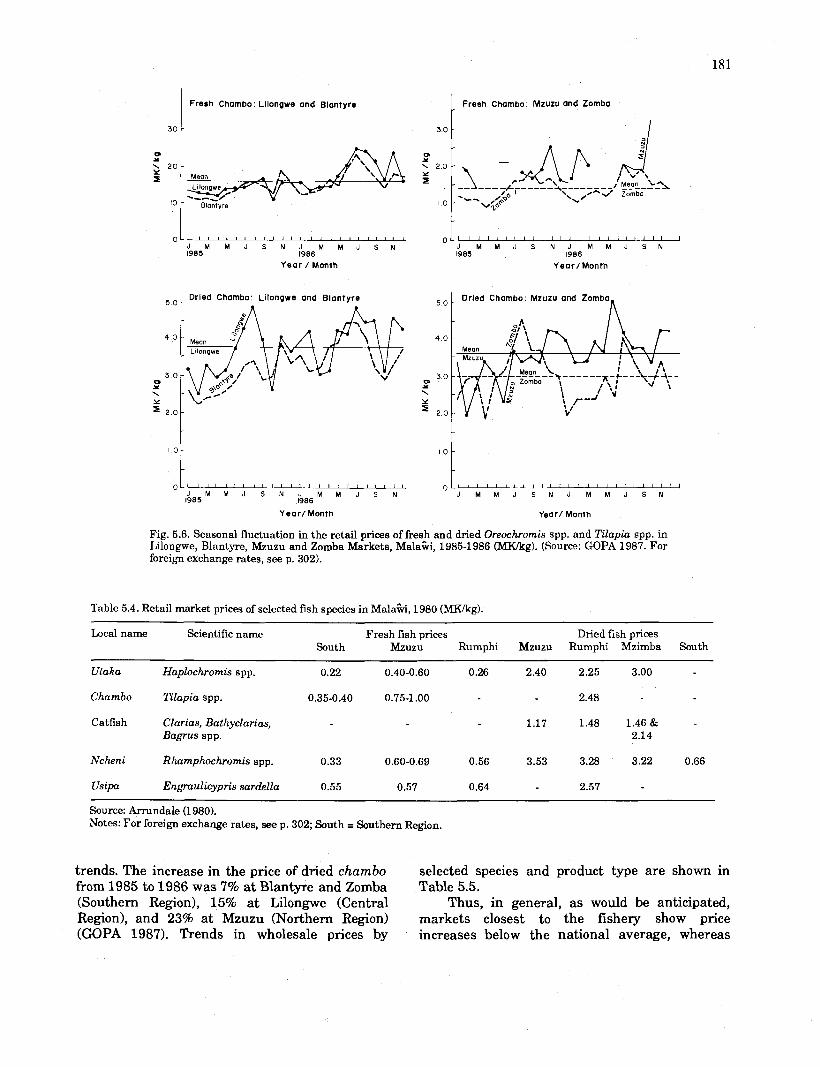
Fresh Chambo: Lllongwe ond Blantyre Fresh Chambo: Mzuzu and Zomba
Year / Month
Dried Chambo: Mzuzu and Zomba
A
0 J M M J S N J M M J S N 1985 1986
Year/Month
I I I I I A I I I 1 I I I I I I I I I 1 1 1 1
J M M J S N J M M J S N
Year/ Month
Fig. 5.6. Seasonal fluctuation in the retail prices of fresh and dried Oreochromis spp. and Tilapia spp. in Lilongwe, Blantyre, Mzuzu and Zomba Markets, MalaGi, 1985-1986 (MX/kg). (Source: GOPA 1987. For foreign exchange rates, see p. 302).
Table 5.4. Retail market prices of selected fish species in Mala%, 1980 (MK/kg) .
Local name Scientific name Fresh fish prices Dried fish prices South Mzuzu Rumphi Mzuzu Rumphi Mzimba South
Utaka Haplochromis spp. 0.22 0.40-0.60 0.26 2.40 2.25 3.00
Chambo Tilapia spp. 0.35-0.40 0.75-1 .OO 2.48
Catfish Clarias, Bathyclarias, 1.17 1.48 1.46 & Bagrus spp. 2.14
Ncheni Rhamphochromis spp. 0.33 0.60-0.69 0.56 3.53 3.28 3.22 0.66
Usipa Engraulicypn's sardella 0.55 0.57 0.64 2.57
Source: Anvndale (1980). Notes: For foreign exchange rates, see p. 302; South = Southern Region.
trends. The increase in the price of dried chambo selected species and product type are shown in from 1985 to 1986 was 7% at Blantyre and Zomba Table 5.5. (Southern Region), 15% at Lilongwe (Central Thus, in general, as would be anticipated, Region), and 23% at Mzuzu (Northern Region) markets closest to the fishery show price (GOPA 1987). Trends in wholesale prices by increases below the national average, whereas
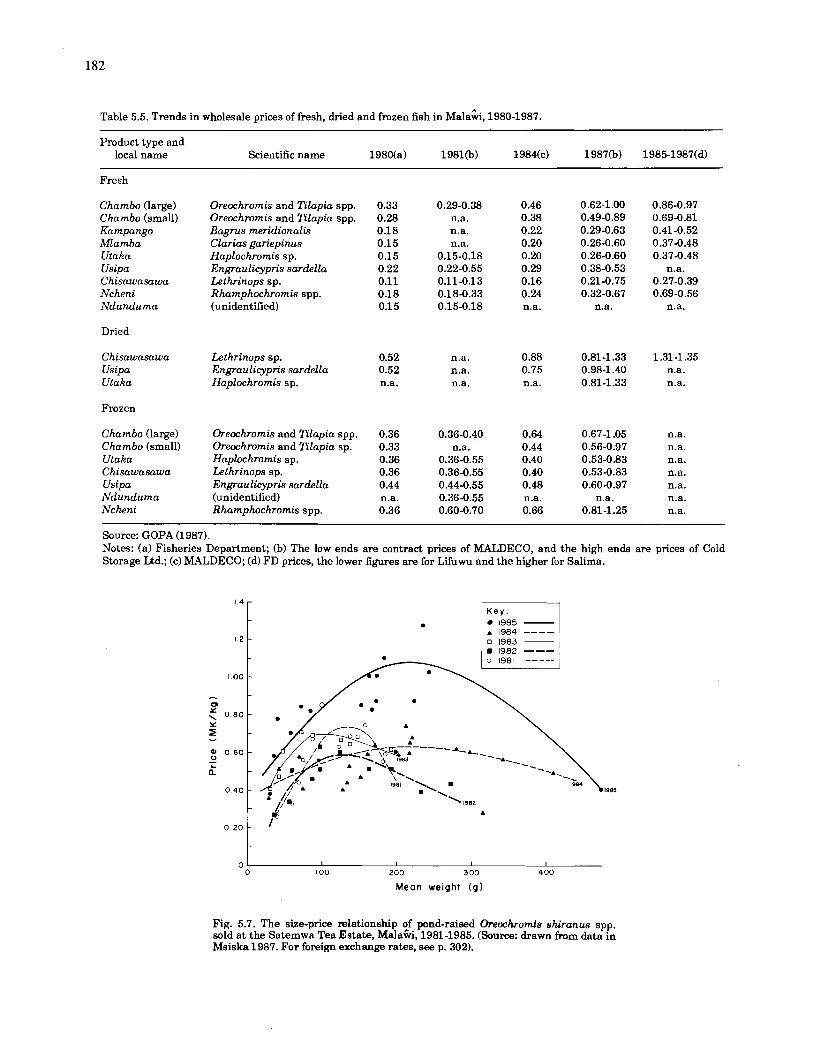
Table 5.5. Trends in wholesale prices of fresh, dried and frozen fish in ~ a l a & , 1980-1987.
Product type and local name Scientific name 198Na) 1981(b) 1984(c) 1987(b) 1985-1987(d)
Fresh
Chambo (large) Chambo (small) Kampango Mlamba Utaka Usipa Chisawasawa Ncheni Ndunduma
Dried
Chisawasawa Usipa Utaka
Frozen
Chambo (large) Chambo (small) Utaka Chisawasawa Usipa Ndunduma Ncheni
Oreochromis and Tilapia spp. Oreochromis and Tilapia spp. Bagrus meridionalis Clarias gariepinus Haplochromis sp. Engraulicypris sardella Lethrinops sp. Rhamphochromis spp. (unidentified)
Lethrinops sp. Engraulicypris sardella Haplochromis sp.
Oreochromis and Tilapia spp. Oreochromis and Tilapia sp. Haplochromis sp. Lethrinops sp. Engraulicypris sardella (unidentified) Rhamphochromis spp.
Source: GOPA (1987). Notes: (a) Fisheries Department; (b) The low ends are contract prices of MALDECO, and the high ends are prices of Cold Storage Ltd.; (c) MALDECO; (d) FD prices, the lower figures are for Lifuwu and the higher for Salima.
K e y : 1985 -
A 1984 ---- 0 1983 -
1982 ---
I I I I
0 I00 200 300 400
Mean weight (g )
Fig. 5.7. The size-price relationship of pond-raised Oreochromis shiranus spp. sold at the Satemwa Tea Estate, Mala%, 1981-1985. (Source: drawn from data in Msiska 1987. For foreign exchange rates, see p. 302).
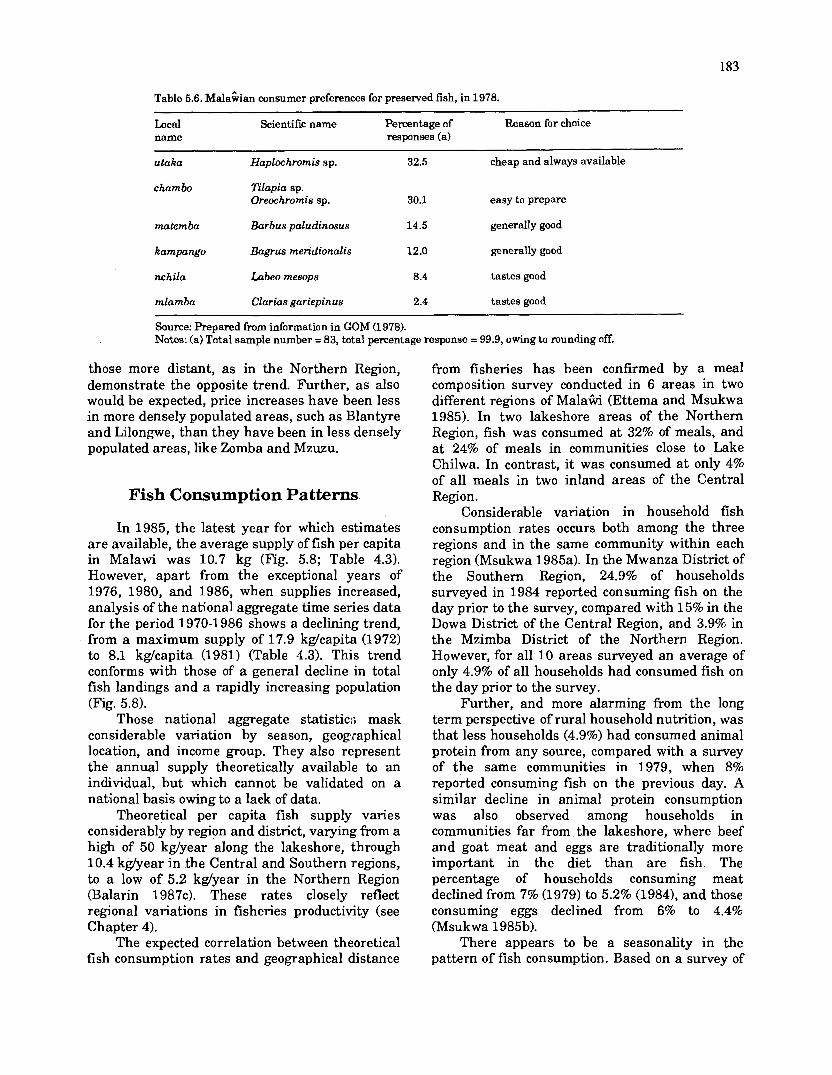
Table 5.6. Mala%ian consumer preferences for preserved fish, in 1978.
Local Scientific name Percentage of Reason for choice name responses (a)
utaka Haplochromis sp. 32.5 cheap and always available
chambo Tilapia sp. Oreochromis sp. 30.1 easy to prepare
matemba Barbus paludinosus 14.5 generally good
kampango Bagrus meridionalis 12.0 generally good
nchila Labeo mesops 8.4 tastes good
mlamba Clarias gariepinus 2.4 tastes good
Source: Prepared from information in GOM (1978). Notes: (a) Total sample number = 83, total percentage response = 99.9, owing to rounding off.
those more distant, as in the Northern Region, demonstrate the opposite trend. Further, as also would be expected, price increases have been less in more densely populated areas, such as Blantyre and Lilongwe, than they have been in less densely populated areas, like Zomba and Mzuzu.
Fish Consumption Patterns
In 1985, the latest year for which estimates are available, the average supply of fish per capita in Malawi was 10.7 kg (Fig. 5.8; Table 4.3). However, apart from the exceptional years of 1976, 1980, and 1986, when supplies increased, analysis of the national aggregate time series data for the period 1970-1986 shows a declining trend, from a maximum supply of 17.9 kghapita (1972) to 8.1 kgkapita (1981) (Table 4.3). This trend conforms with those of a general decline in total fish landings and a rapidly increasing population (Fig. 5.8).
Those national aggregate statistic:; mask considerable variation by season, geographical location, and income group. They also represent the annual supply theoretically available to an individual, but which cannot be validated on a national basis owing to a lack of data.
Theoretical per capita fish supply varies considerably by region and district, varying from a high of 50 kg/year along the lakeshore, through 10.4 kg/year in the Central and Southern regions, to a low of 5.2 kg/year in the Northern Region (Balarin 1987~). These rates closely reflect regional variations in fisheries productivity (see Chapter 4).
The expected correlation between theoretical fish consumption rates and geographical distance
from fisheries has been confirmed by a meal composition survey conducted in 6 areas in two different regions of Malaiki (Ettema and Msukwa 1985). In two lakeshore areas of the Northern Region, fish was consumed a t 32% of meals, and a t 24% of meals in communities close to Lake Chilwa. In contrast, it was consumed a t only 4% of all meals in two inland areas of the Central Region.
Considerable variation in household fish consumption rates occurs both among the three regions and in the same community within each region (Msukwa 1985a). In the Mwanza District of the Southern Region, 24.9% of households surveyed in 1984 reported consuming fish on the day prior to the survey, compared with 15% in the Dowa District of the Central Region, and 3.9% in the Mzimba District of the Northern Region. However, for all 10 areas surveyed an average of only 4.9% of all households had consumed fish on the day prior to the survey.
Further, and more alarming from the long term perspective of rural household nutrition, was that less households (4.9%) had consumed animal protein from any source, compared with a survey of the same communities in 1979, when 8% reported consuming fish on the previous day. A similar decline in animal protein consumption was also observed among households in communities far from the lakeshore, where beef and goat meat and eggs are traditionally more important in the diet than are fish. The percentage of households consuming meat declined from 7% (1979) to 5.2% (1984), and those consuming eggs declined from 6% to 4.4% (Msukwa 1985b).
There appears to be a seasonality in the pattern of fish consumption. Based on a survey of

Fish consumption - Fish consumption levels (kglcapitalyear) (Table 4.3) -.-- Population growth estimates in millions (Fig. 3.2)
Fish production by artisanal sector (wear x 103) Table 4.3
0 Flsh production by commercial sector (Vyear r 103) Table 4 3 Potential fish requirement 1s projected from populatmn numbers 20
----- at a consumpton rate 10-6 kgcap~ta/year assummg flsh consumption
15
Fish production I 0 -
5 -
n
Y e a r Potential fish requirement
( t / year/ 1,000
Fig. 5.8. Population growth, fish consumption and projected fish requirements for ~ a l a Q i to the year 2000. (Source: drawn from data in Table 4.2).
124 small-scale traders in preserved fish conducted in 20 markets in the rural hinterland of Lilongwe City (GOM 1978b), the period from May to October is considered the "market months" (Fig. 5.9). On the demand side this is an expression of the postharvest dry season months (see Chapter 31, when farm families have relatively more disposable cash after selling their recently harvested crops. On the supply side this period represents the slack months in the agricultural cycle (see Chapter lo), when farmers are able to seek supplementary sources of income, and thus may engage in fish trading. During the dry season, also, access along otherwise impassable routes makes it easier for traders to reach both isolated rural markets and sources of supply.
Fig. 5.8 illustrates population trends and the projected amount of fish needed annually to sustain 1986 levels of consumption. Indications are that beyond 1994 i t is unlikely that the capture fisheries could sustain the requirement for fish, and that consumption rates would probably decline. Emphasis would then be placed on the production of other sources of protein.
There is a marked imbalance between the Northern and Southern regions of MalaGi in patterns of fish supply and consumption (Table 3.28). Arrundale (1980) calculated that for the
Month
Fig. 5.9. The "fish market months" ae perceived by fish traders in Malaii. (Source: adapted from data of a survey in GOPA 1987).
Mzuzu, in the Northern Region, annual consumption per capita was only 32% of the national average. Most of the 2,500 t/year fish landed in the Mzuzu area is either consumed fresh in the immediate area of the fishing village or landing point, or is dried or smoked for distribution to inland markets. In the Northern Region fresh fish is never iced at any stage of the catching and distribution system.
The assumptions in Arrundale's calculations were an estimated catch in the area of 2,519 t/year (728 small-scale vessels each landing 12.6 tJday for 220 days/year) supplying 90,990 "farm families" (with an average of 6 members) gives 4.6

kglcapitdyear, compared with a national average in 1976 of 14.4 kglcapitalyear. The national average per capita fish consumption was calculated as 3.9 kg of fresh fish plus an equivalent fresh fish weight of 10.5 kg of dried fish (FFHC 1973). The spurious nature of these purely statistical averages should not be overlooked: i.e., in fishing villages consumption may be of the order of 100 kglcapitdyear, whereas in remote and isolated inland settlements i t may be zero.
Nevertheless, there exists a very strong if largely unsatisfied demand for fresh fish in the Northern Region. Arrundale (1 980) demonstrated that the retailing of fresh fish there is highly profitable, even when the additional costs of icing and modern, hygienic handling facilities were included.
Of a fresh fish vending experiment a t Mzuzu Public Market, Arrundale (1980) commented that "the fish was sold quickly - all the utaka [Haplochromis spp.1 (2.5 kg) in 5 min; the Chambo [Tilapia spp.] (4.5 kg) in 15 min, and the total (64.5 kg) in 105 min. It was estimated that 75% of the fish was sold within the first 45 min." The vendor selected for this excercise made a "remarkable" gross profit of 123%, and it was estimated that this could have been 184% had the presence of the Market Superintendent not inhibited natural market forces! A similar result was reported for an experiment conducted a t Rumphi Public Market, where fresh fish had never before been offered for sale (Arrundale 1980).
However, to satisfy this apparently large demand for fresh fish by attempting to increase the yield of the capture fisheries in the more northerly parts of Lake Mala% would appear to be infeasible. Owing principally to the inherently low biological productivity of that area of the lake, it would appear impossible to produce from local small-scale capture fisheries the additional 550 tfyear, or 10 t/week, that would be required to raise the fish consumption of the population (an estimated 550,000 persons) of the Northern Region by 1 kglcaput (Schroedter 1982).
That being the opinion, Schroedter conducted experiments to demonstrate the feasibility of supplying the Northern Region with fresh fish from the capture fisheries of more southerly parts of the country. The study demonstrated that the most efficient method of transporting iced fresh fish from south to north was by small truck and using an independent and experienced fish trader. The strong demand for fresh fish in the Northern
Region was also demonstrated again, since "... fish were sold out fast, the demand always surpassing the amount which could be delivered." However, the existence of definite preferences among consumers for different species of fresh fish should not be overlooked.
Regardless of these demonstrations of market demand, technological improvements that add even slightly to the purchase price of fresh fish might not be practicable, given the present marginal economic conditions under which the majority of MalaiKians exist. Most consumers simply lack the purchasing power to be selective about fish quality, or to exercise freely their consumption preferences. Thus the viability of programs for technological improvement of fishery products must await increases in the purchasing power of both rural and urban consumers.
Consumer Preferences
Apart from scattered and general statements, all of which are unsatisfactory for any practical purposes, little information is available on consumer preferences for fish. In part this derives from the enormous price variations a t any one time within and among markets, together with the fluctuations that occur throughout the year (Fig. 5.6). I t is also partially the result of the large number of as yet unexplored social, economic, physical and biological variables involved. Thus market prices and sales volumes are an extremely unreliable guide to consumer preferences. Particularly troublesome in this respect is the lack of standardization in the unit of sale.
Typical of the level of information available is the general fourfold classification of consumer preference by Gilberg (1966), presented without demonstration of an empirical basis: the most preferred being fresh fish of any species except Clarias gariepinus; secondly, sun-dried species "sold by the plate"; thirdly grill-cured and sun- dried Clarias gariepinus; and lastly grill-cured and sun-dried "tilapia and Labeo spp. etc". Gilberg (1966) further observed that Malaiians prefer to purchase fish complete with head and tail.
However, not all species of fresh fish are accepted equally. For example, experiments on the marketability in Lilongwe of iced chisawasawa (Lethrinops sp.) showed that whereas on some occasions an entire truckload would be sold out within 90 minutes on others a substantial amount would remain unsold (Rogers 1976). This was attributed to the fact that

Lethrinops sp. is one of the least preferred fish and customers will opt for others, if available. Further, especially in times of glut, prices of iced fish could be undercut by traders using little or no ice. It was further noted that cash to buy fish is also scarce in the week or so before "pay day" (Rogers 1976).
Dried and salted fish are not popular (Gilberg 1966; Arrundale 1980), and nor do MalaGians like to buy eviscerated fish (Renson 1969). In the Northern Region, for example, dried fish is not the preferred form for consumption, and is purchased largely because it is virtually the only fish product always available in the Mzuzu market, and is supposedly a relatively cheap source of animal protein (Arrundale 1980).
In reality, dried and smoked fish products are extremely expensive, since they lose up to an estimated 30% of their weight between processing and consumption, plus losses resulting from insect infestation, breakage and comminution. The animal protein losses to MalaGiri from this source must be enormous. Arrundale (1980) calculated a loss of 600 t/year on the 2,000 t/year (= 30%) preserved in the Mzuzu area alone, with a cash loss of MK 66,000Iyr. Further, it has been demonstrated that the fish from Lake Mala% respond well to icing andlor freezing (Disney 1974; Pinegar and Clucas 1976; Matholtho and Rogers 1977), and that fish preserved thus have a high retail marketability, despite the higher wholesale costs incumed (Arrundale 1980).
Fragmentary information is provided on consumer preferences for preserved fish from a simple survey of 20 markets situated beyond 16 km (sic) of Lilongwe City (Table 5.6) (GOM 1978b). De facto consumer preference, as opposed
to latent preference, is also partly determined by what the fish trader chooses to sell (Table 5.7). Naturally, his decision is also partly influenced by consumer preference as expressed by market behavior, as we1 as the seasonal availability of fish species. Thus it is instructive to examine the marketing selection of fish traders, derived from data obtained in the same survey.
It should be noted that many traders carry the species available a t their sourcing point, and that these are not necessarily their preferred species for marketing. Although crude, the data reveal that the most popular species among the traders is utaka (Haplochromis spp.) (69.3%) and usipa (9.7%). Some reasons advanced for this concern its small size, that it is easy to process in good weather, and that a wholesale batch is easily divisible into small lots and so can be sold in small quantities and a t the low prices that the market can bear. Further, compared with other small-sized species, the customer can easily prepare ufaka for consumption by roasting it on an open hearth, i t has a relatively good shelf-life and is easily packed and transported. Consumer fish preferences were ranked as utaka (32.5%), chambo (30.1%), matamba (14.5%), kampango (12%), and nchila (8.4%) (GOM 1978b).
Subtle local differences in fish flavor may be a strong influence of consumer preferences. For example, owing to its higher salinity, Lake Chilwa yields fish that are locally regarded as being tastier than those from elsewhere. As a consequence, during the recessions of the lake, when fish yields were greatly reduced, many of the local inhabitants preferred to dig for rats and gerbils (Gerbillus spp.) in preference to purchasing - assuming that they had the ability to
Table 5.7. MalaGtian fish traders' preferred species of preserved fish. - -
Local name Scientific name I st choice 2nd choice
(%I (%)
utaka usipa matemba chambo
kampango mlamba others no response no preference
Haplochromis sp. Engraulicypris sardella Barbus paludinosus Tilapia sp. Oreochromis sp. Bagrus sp. Clarias sp.
Source: prepared from data in GOM (197813). Notes: Total sample size = 124; (The original data contain a third choice. However, since it cannot be interpreted owing to an elementary clerical error during the survey, it is not included here.) Percentage response totals 984, owing to rounding off .
do so - fish that was perceived to be inferior from Lakes Mala% and Malombe (Agnew and Chipeta 1979).
Familiarity with and the physical appearance of fish of a particular species may play a major role in preference and consumption patterns, but this assertion needs thorough examination in the protein-short, Malasan context. For example, less familiar pelagic species from deeper waters of northern Lake MalaGi are not targetted, mainly because of technological limitations, but also because, being unknown to potential consumers, it is thought that there would be no market for them. Similarly, a species of the genus Bathyclarias is shunned by consumers for its dissuasive skin patterning (LMA 198333).
Fish size is also an important factor in consumer preference (Fig. 5.7). Records of tilapia sales from 1981 to 1985 from the ponds a t the Satemwa Tea Estate, for example, indicate that in addition to a gradual price increase through time prices also vary by fish size. In 1985, although fish of all sizes were saleable, the best prices were obtained for tilapia in the 200-250 g size range (Fig. 5.8).
Fish Processing and Handling
The bulk of the yield of the capture fisheries is preserved. About 10% of the catch from Lake Mala% and 20% of that from Lake Chilwa is marketed fresh; an estimated 40% of that from Lake ~ a l a 6 i and 30% from Lake Chilwa is either smoked or roasted; and 50% from both lakes is sun-dried (GOPA 1987).
The basic methods of fish processing practised a t the fish landing points are sun- drying, roasting combined with sun-drying and smoking. Salt is virtually never used in curing fish, owing to its extremely high price in Malaki (LMA 1983a).
Sun-drying is used with lower quality fish, such as utaka caught by the chilimila fishermen, or chisawasawa taken by trawlers. Several methods are employed: lying larger fish individually on permanent racks constructed from timber supporting reeds or split bamboo; spreading small fish on rocks, directly on the soil, or on mats; and threading and hanging fish on split palm fronds.
Roasting or otherwise cooking fish prior to sun-drying is popular in some areas, and particularly in the Northern Region. Usipa are commonly blanched in hot water prior to drying to
remove the bitter taste, and in some parts of the Northern Region utaka is placed on grass mats, which are fired to cook and smoke the surface layer of the fish (LMA 1983a).
Three main methods of smoking are practised: using a metal grill placed over a pit fire; placing the fish on bamboo spits, in the unit of sale, and then grilling them; and spreading the larger fish on a bamboo frame for partial cooking and slow drying beside the fire. Bagrid and clarid catfish are generally sold well-smoked.
The processing method differs slightly by species (Gilberg 1966). Preserved fish are considered ready for market when the residual weight of the larger and split fish reaches 45-50% of the original, and that of the smaller species 25- 35% (Gilberg 1966).
The duration of the preservation process is based in large part on the distance from the landing point to the market, together with the estimated time required for selling the product. Best prices are expected where the residual weight is 55-60% of the original. Fish are processed to this degree when the market is only a few hours distant, and when the fish can be expected to sell on the same day as delivered to the market. Delays, such as those encountered by traders waiting to accumulate a saleable lot of fish, necessitate longer periods of sun-drying. This reduces the perceived quality of the product in a market where a meatier and juicier product has more customer appeal, since the residual weight is reduced to 45-25% of the original, depending on this initial size of the fish (Gilberg 1966).
Over most of the country those traditional methods of fish preservation are not inhibited by climatic conditions during the May-September dry season, although they are hampered during the rainy season. In the year-round more humid areas a t lower elevations in the south of the country, as around Lake Chilwa, for example, immediate preservation is a necessity to prevent spoilage.
However, traditional methods have been supplemented with the locally developed use of the rapidly degradable insecticide, Actellic (Pirimiphos Methyl), which reduces postharvest losses to insects, particularly during the wet season. Having succeeded first with such small species as utaka (Haplochromis spp.) and chisawasawa (Lethrinops spp.), the use of Actellic has now been extended to the preservation of larger fish like tilapia and catfish. The active ingredient is applied a t levels less than 0.15% when applied by spray and 0.068% when done by dipping. The monitoring of pesticide residues in

fish treated with Actellic is being conducted by the Mala% Bureau of Standards (GOM 1988).
Conclusion
In pursuit of its policy to improve the efficiency of all aspects of national capture fisheries, to improve the production and supply of existing fisheries products, as well as to develop new ones, in order to satisfy local demand, the Government of Mala%, through its Department of Fisheries, has embarked in recent years on an impressive program of assessment, applied research and development, assistance to the various fisheries subsectors and monitoring of performance. Yet much remains to be done.
Improved fish handling practices are being introduced, and the storage, distribution and marketing infrastructure progressively upgraded and disseminated more fully throughout the nation, so that facilities in lagging areas, especially in the Northern Region, the northern part of the Central Region, and the more isolated parts of the Southern Region, will be gradually raised to the level of those in the better endowed parts of the Southern Region. In this respect infrastructural developments in Mangochi District might serve as a model. To this end integrated fisheries development planning of both capture and culture fisheries is imperative. It is to the implications of this for the development of aquaculture in Mala% that we now turn.

Chapter 6
AN OVERVIEW OF AQUACULTURE IN MALAWI
Introduction
In this and the following two chapters we examine the current state of aquaculture in Mala&. In this chapter the general situation of aquaculture in the country is surveyed briefly and its status on agricultural estates and in the public sector examined. Small-scale aquaculture is dealt with separately in Chapter 8. A brief history of the development of aquaculture in Mala% is presented here. This includes early experiments and extension activities until the end of the colonial era. Post-independence experimentation and development activities are examined in Chapter 7. Unfortunately, this historical survey remains incomplete since many tantalizing questions remain to be answered. Research being conducted under the ICLARM/GTZ-FD-UM Project is locating detailed information in old correspondence files in the National Archives, as well as the memoirs of fish farmers and officials who were involved from the colonial era.
Aquaculture Production in Mala64
Considerable variation exists in the reported total aquaculture production of Mala%. Estimated total annual production ranges from a low of 70 t (SADCC 1984), through 93.6 t from 319 smallholder ponds and 26 ha of estate ponds (LMA 1983a), 96-104 t from 72 ha (370-500 ponds) (Balarin 1987c), to 1,000 t (GOM 1988). However, the total annual aquaculture production of Malawi is probably about 300 t, if the estimated 105-192 tlyear from 700-800 small dams (reservoirs) that cover some 1,000 ha is included (Table 6.1) (Balarin 1987~).
The bulk (85%) of aquaculture production is from the Southern Region, which is also the region with the greatest development potential.
Meecham (1976) estimated, perhaps optimistically, that in excess of 20,000 ha in the Lower Shire Valley alone may be suitable for aquaculture development. In the Northern and Central regions, by contrast, a much smaller area, capable of producing 700 Uyear, has been recommended for development (LMA 1983a). Pruginin (1971), however, suggested a more extensive area as being suitable for aquaculture (Fig. 6.1), but provided no estimates of the area potentially available for development. A tentative zonation of fish farming in ~ a l a % i is shown in Table 6.2. A more precise assessment of regional potentials has still to be made for the country.
The Aquaculture Policy of the Government of ~ a l a & i
The national aquaculture development strategy is embedded within the Fisheries Policy Statement of the FD, which accords high priority to the development of aquaculture, as a complement to capture fisheries, as part of a long- term plan for food security and improved nutritional status of the population (GOM n.d.a). Article 4 of the departmental Fisheries Policy Statement demonstrates that the overall objective of the aquaculture development strategy is "to encourage, where appropriate, fish culture as a means of supplementing supplies of fish from natural waters". Thus aquaculture in MalaGi is officially viewed as having a complementary role to the capture fisheries subsector, under conditions where, as was demonstrated in Chapter 4, an already relatively low average per capita consumption of fish'is declining.
The Policy Statement explicitly recognizes that:
The productivity of smaller water impoundments and ponds could provide a valuable animal protein source, if well

Table 6.1. Summary of the status of aquaculture in ponds and reservoirs in MalaGi, 1988.
PONDS (a,b,c,d) Reservoirs
Location (Date constructed)
Elevation Number Area Production Number Area (ha) Annual above (ha) Individual Total production
sea (t) level Individual Total Average Annual (m) ( W e a r ) (t)
A: Smallholder fish farms
Southern Region total 554 - 684 16.10 19.7 - 26.3 28 (0 1.0(0 28.3 (0 3.2 (0
Central Region total 223 9.80 9.80 57 - 153 (0 10.0 (0 57.0 (0 3.1 (0
Ntcheu D e b Dowa-Ntchisi
ma. 65 (d) 0.06 3.50 1 .O 3.60 31 n.a. n.a. na . n.a. 109 (d) 0.03 3.30 0.8-1.5 330 69 n.a. n.a n.a.
1200 49 (d) 0.10 3.00 1 .O 3.00 50 n.a. n.a. na.
Northern Region total 11 1.10 0.60 34 - 278 (0 1.5(0 64.5 (0 6.7 (D
Mzuu 1,000-1,!m 5 0.10 050 0.50 0.30 268 nu. n.a. na. Nchenaehena ma. R14-40) (g) 0.10 0.50 0.50 0.30 n.a ha. n.a. n.a. Misub 0963) 1,300 1 0.10 0.10 0.50 na. a a . n.a n.a. n.a. Chisenga ma. abandoned 10 n.a. n.a. na.
Smallholder total 789 27.00 30.1 - 36.7 119 - 459 149.8 10.0 - 50.0
B. Estate fish farms (h)
1. SUCOMA Sugar Estate 0960) 100 28 0.10 - 1.00 17.2 3.1 - 3.6 (0 44 ~50-85) 2. Satema Tea Estate 1 , m 6 n.a. 3.0 - 3.5 0.8 - 2.5 7.50 3. Dwangaa Sugar Estate na. 9 0 8 sewage) 0.10 - 0.20 1.2 (3.2) 1.2- 4.0 5.00 18 50 (60) 4. Kavasi Tea Estate n.a. 4 n.a. 1 .O 0.6 0.50 1 10 5
Othen na. n.8. ma. n.a. 10.00
Estate Total 47 2 . 4 - 22.9 67.00 19 60 5
C: Government Stations (h)
5. Domasi (1959) 750 96 0.20 - 1.00 5.0 n.a. 1.4 - (2.0) 6. Kasinthula 0970) 80 25 0.06 - 4.00 23.6 (0 2.0 0.80 - 9.00 (0 7. Bunda Coll. Agr. 0963) lJ00 28 0.08 - 0.80 1.46 - 2.00 0.7 - 5.4 4.7 1 12.0 8. Nchenachena 0962) 1.250 6 n.a na. n.a. na. 9. Mzuzu 0988) 1 f l o 5 n.a. 0.61 na. ma. 10. Zomba 1,700 1 (0 n.a. n.a n.8. 2.00 - (4.0)
Domasi Irrigation n.a. 1 0.6 0.50 ma. n.a. Midisuku na. 2 (0 na . ha. n.a. na. D-ngwa Irrigation na. 1 0.5 0.5 n.a. n.a. Kunenekude nu. 3 n.a. n.a. n.a n.a. Mzimba n.a 2 (0 n.a. n.a. n.a. m a Phalombe n.a. 4 n.a. na. ma. nu. Chisenga n.a. 2 (0 n.a. na. ma. na. Chinseu n.a. 4 n.a. ma. n.a. n.a.
Government total 180 30.1 - 30.6 1 12.0 - 6.90 - 15.10
Grand total 368 - 493 n . 4 - 72.4 98.00 - 106.20 (700 - 800) 1 - 2 (420 - 660) 105 - 192
Sources: (a) Beveridge and Stewart (1986); (b) G.A. Bands (1987); (c)R. Noble (pers. comm.); (d) J.S. Likongwe (pers. comm.); (el Mmska (1984); (D Vincke 0981); (g) T. Jones (pen. armm.) and (h) Numbers 1-10 refer to Fig. 6.1.

managed, especially in regions removed from fish landings and where there are inadequate fish supplies. Little attempt has so far been paid to encourage wise management (supplement fish stockings, feeding, water quality control, etc.) or of the smaller bodies to carry out periodic harvests. An increasing need for economic easy to grow and yet [sic] protein rich food for human consumption means that more attention will have to be paid to this sector .... The estimated short fall, if consumption per capita is the criterion, is in the order of several hundred tonnes. While efforts to meet this deficit continue through increased exploitation of the natural resources, better processing to reduce waste and raise shelf-life of fish, and better distribution modes, fish farming has the potential to raise productivity. If wisely managed both small scale (subsistence) and large scale (commercial) operators could operate viably at the going fish prices ...
A. B. C. D. refer to zones (GOM n.d.a). as perTable 6.2: The focus of this strategy is the small-scale
A = Rift Valley B = Escarpment fish farmer. The feasibility of implementing the c = Plateau development of aquaculture at this level was
demonstrated to the satisfaction of the FD in the 1970s, and, based principally on the perceived
Stations as per success of an OXFAM Project (T. Jones [19781, see Table 6.1 Shaded area indicates below), the FD formulated its "Fish Farming potential fish farming Development Strategy." (T. Jones, pers. comm.) areas after Pruginin (1971 The strategy was to be implemented through
the establishment of 6-7 central aquaculture
Fig. 6.3. Gmwth of 0. shiranus chilwae and Tilapia rendalli at stations located throughout Mala% (Fig. 6.2). various stocking rates in ponde at DEFF, MalaOi, 1960. These stations are intended to provide (Source: drawn from data in GNP 1962). administrative and extension services, undertake
research and adapt fish farming techniques to local needs. The central stations are to support
Table 6.2. Tentative zonation for aquaculture in Mala%.
Region Approximate Air Potential fish species and system type (a) (See Figs. 3.1 0 elevation temperature Coldwater Temperate water Warm water
and 6.1) above sea level Min Max (e.g., trout) (e.g., carp) (e.g., tilapia) (m) "C "C G.P.(b) System (c) G.P. (b) System (c) G.P. (b) System (c)
A: Rift valley 30 - 600 21 30 i 2 1 -6 12 1-6 plains
B: Rift valley 600 - 1,000 20 29 escarpment
12 1-6 9-10 1-5 (summa)
C: Plateaux 1,600 - 2,000 16 26 3-6 4,5 10-1 2 1-6 3-6 1 A 3 (winter) (marginal)
D: Highlands >2,000 1 0 1 6 12 L3,6 3-6 134
Source: Balarin (1987a). Notes: (a) Subject to availability of water; (b) GP = Growth Period, potential duration of favorable season for performance, in months; (c) Systems type and degree of intensification (cf. Table 2.4) (1) dams, (2) ricefish, (3) ponds, (4) pens, (5) cages, (6) tanks.
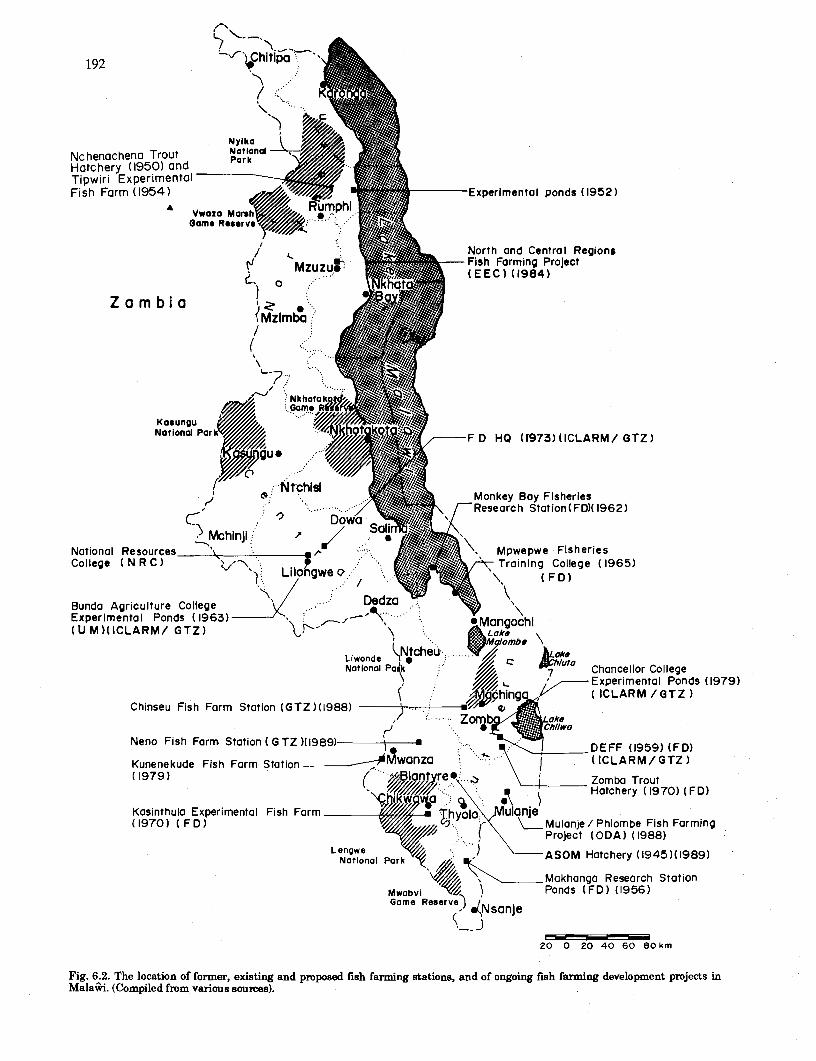
Z a m b i a
Nchenachena Trout Hatchery ( 1950) and Tipwiri Experimental F ish Farm (1954) Experimental ponds ( 1952)
North and Central Regions Fish Farming Project ( E E C ) (1984)
F D HQ (I9731 (ICLARM / GTZ
Monkey Bay Fisheries Research Station(FD)( 1962)
National Resources pwepwe Fisheries College ( N R C
Bunda Agriculture College Experimental Ponds ( 1963) ( U M)( ICLARM/ G T Z )
Chancellor College Experimental Ponds (19 ( ICLARM / G T Z
Chinseu Fish Farm Station (GTZI(1988
Neno Fish Farm Station ( G T Z )(I9891 DEFF (1959) (FD)
Kunenekude Fish Farm Station ( ICLARM / GTZ
(1979) Zomba Trout Hatchery ( 1970) ( FD)
Kasinthula Experimental Fish Farm (1970) ( F D ) Mulanje / Phlornbe Fish Farming
Project (ODA) ( 1988)
ASOM Hatchery (1945)(1989)
Makhanga Research Station Ponds (FD) (1956)
- 20 0 20 40 60 80 km
Fig. 6.2. The location of former, existing and ~roposed fish farming stations, and of ongoing fish farming development projects in Mala&. (Compiled from various sources).

regional networks of substations, such as that a t Kunenekude, in the Mwanza District of the Southern Region, that will function as bases for the demonstration of aquaculture techniques and supply local fish farmers with seed and extension services.
The main emphasis is given to the prior development of the central stations, to provide scientific and technical support. For cost effectiveness these substations are to be developed within the Rural Development Project (RDP) system, as a t Ntcheu, Dowa, Mzuzu and Chitipa. The approximate cost in 1987 of developing each substation within the RDP frawework is estimated a t approximately MK 100,000, whereas those developed independently would cost an estimated MK 200,000-250,000 (GOPA 1987).
Primary focus of the strategy is on the Northern and Central regions, which in the development of aquaculture and the supply of animal protein from aquatic sources are lagging in comparison with the overall situation in the Southern Region. The core around which this network is being developed is the Central and Northern Regions Fish Farming Development Project (see below) (Fig. 6.2 and Tables 7.11 and 7.12).
The History of Aquaculture in MalaGi
This section presents a survey of the development of aquaculture in Mala% during the colonial era. Aquaculture in dams and on agricultural estates since independence, in 1964, is dealt with later in this chapter, and research and development activities conducted since the end of the colonial era are examined in Chapter 8.
The history of aquaculture in MalaGi may be said to have begun with the introduction of rainbow trout (Salmo gairdnerii), in 1906 (Meecham 1976). Trout were reintroduced in the 1920s (Meecham 1976), and thereafter on several occasions (see below), and trout ponds were constructed on the Zomba Plateau (Fig. 6.2) in the 1920s (FA0 1966). In addition, the Angling Society of Malatti (ASOM), known previously as the Nyasaland Angling Society (NAS), also managed a black bass (Micropterus salmoides) hatchery near Blantyre, and was also responsible for introductions from the Republic of South Africa during the 1940s (unpub. NAS Minutes, 1942-04-18).
Although those early introductions were merely for the stocking of streams to provide sport and entertainment for colonial expatriates, demand led over the years to local hatchery development. Eventually the trout hatchery established a t Nchenachena, in the Northern Region, in 1952 (Fig. 6.2), diversified into the culture of local fish species, most notably tilapias, and to extension support for local farmers. Thus, from the small trout hatchery a t Nchenachena, established to satisfy the whim of a small expatriate elite, aquaculture gradually began to diffuse in scattered pockets of Mala%, mostly a t the small-holder level (see Chapter 8).
Trout Stocking
Stream improvement with boulder weirs (GNP 1951) and artificial stocking of upland trout streams for sport fisheries appear to have begun in the 1940s in streams on the Zomba and Mulanje plateaux, in the Southern Region. Attempts were made to investigate breeding seasonality, and elementary physical data (water temperature) were collected in the Northern Region, as a preliminary to stocking (GNP 1950). Much of this effort was by volunteers, presumably either the trout fishing licencees themselves or the members of the Zomba Trout Fishing Association (unpub. NAS Minutes).
The development of the trout fishery was advanced by the appointment, in 1951, of a Trout Warden (GNP 1952). He surveyed streams in the Northern Region, particularly those in the Nyika and Vipya plateaux, to select those for stocking and to locate a site for a small trout hatchery.
A recurrent problem was that all work came to an abrupt halt during extended periods of staff leave (e.g., in 1953 [GNP 19541). Leaves and personnel shortages, together with the scarcity of funds, and the shortcomings in equipment, infrastructure, and housing have always plagued the FD and, a t times, severely hampered its work. This is amply demonstrated by comments in almost all annual reports.
By mid-1951, a small hatchery had been constructed a t Nchenachena, just east of the Nyika Plateau, in Rumphi District, and stocked with 3,000 Shasta rainbow trout eyed ova from the River Research Station (Kenya) and 10,000 from Jonkershoek (Republic of South Africa). By 1952, with the completion of the Nchenachena hatchery (Fig. 6.2), and its continual supply with Kenyan ova, large fingerlings were stocked in

natural waters and reservoirs in the Northern Region (GNP 1953). In 1954 the first attempt was made at Nchenachena to hatch trout eggs from local fish (GNP 1955). Ova imported from South Africa were hatched in situ in the headwaters of the Wamkurumadzi River, of the Kirk Range, in 1956 (GNP 1957). Stream improvements on Zomba Plateau included vegetation clearance and the further construction of boulder weirs (GNP 1952). Trout farming continues to play a minor role in ~ a l a s i a n aquaculture, catering largely to the hotel and restaurant trade, and to tourism, notably in the Zomba, Mulanje and Nyika plateaux.
Fish Stocking in Dams
Dam stocking began in the 1940s, with the creation of the Nyasaland Angling Society, mainly using black bass (Micropterus salmoides) introduced for sport fishing from Zimbabwe to dams around Blantyre (unpub. NAS Minutes, 1940-02-28). A hatchery was established and black bass fry were distributed as far as the Central Region (unpub. NAS Minutes, 1952-1 1 - 06). In addition, an unidentified species of carp appears to have been stocked in Makungwa Dam (unpub. NAS Minutes, 1942-04-08), as well as an unidentified species of blue gill (unpub. NAS Minutes, 1944-10- 03).
Later, in 1952, the Luwawa and Chamakala dams, in Mzimba District of the Northern Region, and the Kasungu District of the Central Region, respectively, were stocked by the owners with tilapia (species not identified), haplochromids (species not identified) and the predatory (t) sungwa (Serranochromis robustus) obtained from the Kasamba Lagoon of Lake Mala%, in the Nkhotakota District of the Central Region. The stocking rates used for the Luwawa Dam were 173 tilapia, 20 haplochromids, and 26 sungwa. For the Chamakala Dam they were 34 tilapia, 2 haplochromids, and 19 sungwa. Three species of tilapia were used, one of which was herbivorous. The others were selected to assist with mosquito control. The small haplochromids were "partly insectivorous and partly carnivorous" and the predatory Serranochromis robustus was selected to "help the achievement of a natural balance and provide a certain amount of sport" (GNP 1953).
Test fishing conducted in 1953 in Luwawa Dam demonstrated that the T. sparrmanii had become established, but no trace was found of the other two tilapia species introduced at the same
time, nor were any Serranochromis robustus found (GNP 1954). (However, intense fishing was impossible owing to the remains of tree stumps and ant hills in the dam.) A few years later, in 1958, a small stock of the Serranochromis, which had by that time become established in the Luwawa Dam, was transported to Nchenachena to be used in dams to control overstocking of herbivorous species, as well as for sports fishing (GNP 1959).
Although no precise evidence has been found, consideration appears to have been given to the feasibility of aquaculture in Mala%, at least by the early 1950s, since this dam stocking exercise was heralded as "a useful forerunner to fish farming, in the upland areas of the North, ..." (GNP 1953). Further, it was envisaged that these dams would provide the fish to stock ponds that could be established in the vicinity and elsewhere (GNP 1953).
Approximately 100 T. rendalli fry from the Tipwiri Valley fish farm research station were used to stock the Khongo Dam, in Lilongwe District, in 1958 (GNP 1959). Wild fry of the same species were taken from the Shire River, at Fort Johnson, and used to stock the Burn Dam, at Limbe, in 1959. However, no information has been found reporting any results of these activities.
Aquaculture on Estates
In 1958 the FD cooperated with the Imperial Tobacco Company to stock ponds on its Lujeri Estate with T. rendalli fry obtained from the Shire River at Fort Johnson (GNP 1959). By 1970, the FD had established a research station a t Kasinthula, a t which to conduct large-scale aquaculture trials (see below, Chapter 7).
Early Experiments with Aquaculture and Extension
The trout hatchery at Nchenachena, in the Northern Region, was the site of the earliest recorded experimental attempts at pond farmipg of indigenous fish in Mala%. In 1952, the Trout Warden began work there on a 0.2-ha pond, for the experimental culture of tilapia. A "seepage" pond was also constructed for tilapia culture, in 1952, in a swamp in the vicinity of the fisheries station on the shore of Lake MalaGi, and close to Nchenachena. But, owing to assumed predation by birds, none of the fish stocked in March 1952 were netted three months later.

In the early 1950s, the development of pond aquaculture was concentrated in the south of the country. The FD made an agreement with Booker Brothers sugar company, which was conducting experiments on irrigated sugar cane cultivation in the Lower Shire area, to conduct pond aquaculture experiments on its land, in order to provision estate laborers, and to provide basic biological data to the FD. Although this collaboration failed to materialize when the sugar cane project was abandoned in December 1952, in collaboration with the Agriculture Department, a similar experimental operation was planned in conjunction with the irrigation work at Makhanga Research Station Experimental Farm, Chiromo, also in the Lower Shire Valley (GNP 1953).An experimental pond was excavated in 1954 (GNP 1955), but no further results were reported.
In 1953, after one or two attempts, 0.s. shiranus from Lake Mala% were introduced into the tilapia ponds at the Nchenachena trout hatchery (GNP 1954). The 161 fish successfully introduced had multiplied by December 1954 into 1,473 specimens in excess of 8 cm long, and an estimated 6,000 of 7 cm or less (GNP 1955). During 1954, fertilizer experiments were conducted in the tilapia pond ,at Nchenachena. Results were invalidated, however, by the irregularity of the pond and by its poor water retention capacity. Thus more suitable ponds were constructed on more favorable terrain in the neighboring Tipwiri valley. The original tilapia ponds at Nchenachena we?e drained and cleared in November 1955, at which time 28,240 fish were recorded, with a total estimated weight of 1,306 kg (from the original stock of 161, weighing, in total, 12.6 kg). This represents a yield rate of 2.7 tfhdyear. However, none of the fish exceeded 0.23 kg in weight (GNP 1956).
In 1955, three 0.4-ha and three 0.04-ha ponds were completed in the Tipwiri Valley. The three larger ponds were each stocked with 6,000 tilapia fry consisting of a mixture of 0.s.shiranus and T. rendalli (GNP 1956), at a ratio of 4:l, respectively, (GNP 1957). (Presumably at a rate of 15,000ha although this is not stated in the source). The three smaller ponds were stocked with the same mixture at a variety of rates (GNP 1956). Under those conditions the herbivorous T. rendalli performed better, since it utilized the range of maize bran (madeya) and composted vegetable waste (constituent materials not specified in the source) added to the pond (GNP 1957). Yields of 2,760 kg/hdyear were obtained by feeding maize waste at 9 kg/ha/day, 1,416 kglhdyear with 16
kgflndday of compost, and 355 kglhdyear with no feeding in the control (Table 6.3).
From the outset it was clearly intended to use the farm in the Tipwiri Valley as a demonstration and training operation: "The object of this miniature farm is to serve as a training ground and demonstration for would-be fish- farmers. It is hoped to begin training courses towards the close of 1956 when efforts of the various treatments and varying stocking rates have become observable" (GNP 1956). The first course was run in October 1956 with a class of six persons (GNP 1957). By 1958 six courses a year were being given, attended by a total of 42 persons, of whom 11 were professional teachers (from whom a spin-off effect could therefore be anticipated) (GNP 1959). Practical demonstrations were also introduced in the course (GNP 1958).
It was evident from the start that the Tipwiri Valley farm was having a positive demonstration effect, since, by the end of 1956, farmers in the vicinity had completed five fish farms and had four more under construction. In addition, a further 20 were awaiting survey and layout instructions on new sites (GNP 1957). Most ponds were small and constructed mainly to satisfy household subsistence needs, although some farmers derived a small cash income from fish sales (GNP 1959).
The development of aquaculture in the Northern Region to the end of 1958 is summarized in Table 6.4. During 1958, 25 persons began aquaculture. However, at the same time another 16 lost interest, one as a result of a land dispute and another through the failure of water supply. Others simply failed to persist (for reasons that were not recorded). In 1958, the total yield of 52 fish farms, which totalled 6.02 ha, in the Northern Region was an estimated 900 kg (GNP 1959). Each farm harvested an average of 17 kglyear of fish, and together the ponds were yielding at an average rate of 150 kghdyear. Yields could have been higher had more farmers harvested during the year (GNP 1959).
As a further incentive to begin aquaculture, farmers were loaned wheelbarrows and other pond construction equipment by the station. The station also purchased a tradesman's bicycle to distribute seed fish. Some 3,000 T. rendalli fingerlings were distributed to farmers in the Northern Region in 1958. It was thought that this latter would also have a demonstration effect and might lead some farmers to specialize as fish breeders (GNP 1959).

Table 6.3. Results of aquaculture trials with tilapia using rnadea, compost and lime as inputs in 4,000 m2 ponds, at Tipwiri, Northern MalaGi, 1955-57.
Treatment Pond A Pond B Pond C
Lime = 1,321 kg Lime = 2,359 kg Untreated Madea = 9 kghalday Compost = 16 kghalday
No. and wt.(kg) of fish stocked(a)
Mean wt (g)
Stocking date 1955-11 1955-11 1955-10
Harvest date 1957-01 1957-01 1957-03
Growing period (months) 14 14 17
No. and wt. (kg) of fish over 3 cm 0s. shiranus (no.)
(wt., kg) (mean wt., g)
T. rendalli (no.) (wt., kg) (mean wt., g)
FCR 1.02 3.57
Yield (kghalyear) 2,760 1,416 355
Source: GNP (1958). Notes: (a) Stocking composition was: 50% of 3-8 cm, 30% of 10-12 cm, 20% of 13 cm, total was made up of 80% 0.s . shiranus and 20% T. rendalli.
Table 6.4. The development of fishponds in the Northern Region of ~ a l a G i , 1958.
General Stocked ponds Under construction Average Sue location No. Area No. Area pondsize range
ha ha ha ha - - -- - -
Nchenachena 17 1.06 8 2.98 0.16 0.05-0.80 Livingstonia 17 2.37 1 0.35 0.1 5 0.05-0.60 Chikwina 10 0.96 5 0.96 0.1 3 0.05-0.30 Muhuju 5 1.21 2 0.70 0.27 0.10-0.80 Njakwa 3 0.40 1 0.40 0.20 0.05-0.40
Totals 52 6.00 17 5.39 0.16 0.05-0.80
Source: GNP (1959).
Table 6.5. Results of an integrated crop-fish farming experiment at Tipwiri, Northern MalaG-i conducted in 1958, in 0.4-ha ponds.
Crop Number of fish Average Average Number of fish Total wt Yield (a) >15 cm TL (b) TL (b) wt (g) e 7 cm TL (b) (ks) (kgiha) (c)
Beans 1,199 18.3 167.9 2,990 184.6 461.5 Millet 1,428 18.6 172.2 3,003 230.9 577.2 Fallow 1,072 16.6 136.8 1,497 135.2 337.9
Source: GNP (1 959). Notes: (a) Crops listed were cultivated on pond bottom before filling pond with water and without removing residues; (b) Total length (cm); (c) No time period for the experiment given in source.

In 1958, an integrated farming experiment, which was probably not replicated, was conducted at Tipwiri on the joint cultivation of crops and fish. One pond was planted with beans (species not recorded), another with millet and a third left fallow. When the crops were "reasonably developed the ponds were filled and stocked at uniform rates with T. rendalli. The fish stocking rate was 1,500 at 12 cm and 25 a t 16 cm (i.e., a t a rate of 3,800ha). Supplementary feeding was done with cuttings of parspalum grass (species not recorded) from the banks of the pond. Fish grown with the millet yielded 70% better than the control and 25% better than with the beans (Table 6.5). Experiments were also initiated on the comparative yields of 0.s. shiranus and T. rendalli under polyculture and monoculture (GNP 1959). No results were reported, however.
Aquaculture development in Mala% was reoriented from the Northern Region to the Southern Region in 1959, when work essentially stopped a t the Nchenachena station and a beginning was made a t Domasi. The role of Nchenachena as a focal point essentially ended in February 1959, when rising political tensions and the onset of violence in the Northern Region necessitated the evacuation of the Fish Ranger from that isolated outpost. He was reassigned to Domasi, and began the construction of a new station, which was designed to become the main experimental and demonstration unit for aquaculture in the country (GNP 1960).
The Nchenachena station was reopened in April 1961, having been on a "care and maintenance basis" for slightly over two years. Operation of the station was reorganized, during a general stock-taking exercise. Ponds were half- drained, and the fish netted and sorted by size; larger fish were placed in a central pond to form a marketing stock and smaller specimens returned to selected ponds where they would form either a reserve for stocking private ponds in the vicinity, or would be raised for marketing by the station. It was planned to follow that pattern thereafter (GNP 1962).
During the two-year interregnum in the station's activities interest in aquaculture in the Nchenachena area appeared to have dissipated. In contrast, in the Chikwina area of Nkhata Bay District ponds had been properly maintained.
Harvesting of private ponds was a problem. These ponds were mostly small and therefore did not justify the purchase of a seine net. Some harvesting was conducted with hook-and-line. To stimulate local interest in either individual or
group net ownership, a spare net was obtained for the Nchenachena station and was loaned, as a temporary measure, to farmers in the vicinity (GNP 1962). This harvesting problem was increasingly perceived of as a major constraint on the adoption of aquaculture by local farmers. Thus trials with traditional traps baited with maize paste were conducted. The results suggested that for sniall-scale operations this would be much more practical than draining and seining. Although it was reported that there seemed to have been an increasing adoption of this harvesting method after the trials, no supporting data were provided (GNP 1963).
During 1962, the reopening of the Nchenachena Station revived interest in aquaculture in the Northern Region. By the end of 1962,141 ponds were operating in the region and three more were being built. (This figure is considerably less than the 1,000 ponds reported for the Northern Region (T. Jones, pers. comm.). That year the station supplied some 760 fingerlings for stocking local ponds and sold 152 kg of fish produced in its ponds to local people for "demonstrations and propaganda" of the effectiveness of aquaculture (GNP 1963).
With the decision to switch activities to the Southern Region, the Domasi Experimental Fish Farm (DEFF) became the lead center in Mala% for aquaculture research and extension. I t has retained that position to the present, strengthened by the location there of such research projects as those of the IDRC and ICLARWGTZ-FD-UM (see Chapter 7). More recently, limited research was conducted a t the now largely inactive Kasinthula Pilot Fish Farm (KPFF), also in the Southern Region (see Chapter 7), as well as a t the Bunda College of Agriculture, in the Central Region. Only the early research activities are summarized here. More recent work is discussed in Chapter 7.
By the end of 1959 three ponds of 0.1 ha had been constructed and filled a t DEFF (GNP 1960). The first stocking occurred in May 1960, with 19 T. rendalli and 42 0s. shiranus, obtained from the Imperial Tobacco Company dam, a t Limbe. A further 182 were added in late July 1960. This stock was originally obtained from the Shire River, a t Fort Johnson (GNP 1961).
Already, in 1960, the DEFF had begun its seed supply role, by dispatching 1,252 T. rendalli fry to four farmers in the Southern Region (GNP 1961). A further 20 ponds, covering a total area of 2.12 ha, were constructed in 1960. Three more ponds were completed in 1961, and another, of 0.8

ha, almost completed. In that year, 1,600 fingerlings were distributed to four dams in the Southern Region.
Stocking trials began at DEFF in 1961. These concerned the potential of the predatory Serranochrornis robustus (synomym S. thumbergii [cf GNP 19631) in polyculture with two herbivorous tilapia (T. rendalli and 0.s. shiranus) to control stunting among the latter, which occurred when it was raised in the absence of a piscivore (Table 6.6); optimum stocking rates of T. rendalli and 0.s. shiranus under both polyculture and monoculture (Fig. 6.3); trials on T. rendalli in ricefield fisheries; and the potential of Clarias gariepinus as a pond fish (GNP 1962).
0. S. 0 8 T.R. 100
Stocking rate (%I
Fig. 6.3. Growth of 0. shiranus chilwae and Rlapia rendalli at various stocking rates in ponds at DEFF, Mala%, 1960. (Source: drawn from data in GNP 1962).
The trials on polyculture including a predator showed a perceptible depression in fry production and growth of forage fish (Table 6.6), although further repetitions were merited. The trials on the stocking rates for the tilapias were considered inconclusive (Table 6.6) and appeared to require testing over a longer period with more repetitions. However, the mean of the growth rate in length (mmlmonth) of the two replicates suggests that increased stocking of T. rendalli with 0.s. shiranus may have a regressive effect on the growth of the latter (Fig. 6.3).
There appears to have been only limited demonstration effects from the DEFF during its first years of experiments. There was no reported widespread adoption of aquaculture by small-scale farmers in the Southern Region, although one or two persons had started to make attempts. The Teacher Training Center at Domasi became
highly interested (GNP 1963). (Unfortunately, it is not known whether that interest was followed up, as no reports were published by the FD for the period 1964-1971 ).
The Current Status of Aquaculture in Mala%
Aquaculture in MalaGi has developed in both the private and public sectors. Two subcategories of the former exist: large-scale, intensive aquaculture on agricultural estates, and extensive and semi-intensive aquaculture on small-scale farms. Most aquaculture in MalaGi is conducted in ponds. Small-scale pond aquaculture is discussed separately in Chapter 8.
Water Storage Dams and Reservoirs
There are an estimated 750 water storage dams and reservoirs of various sizes in MalaGiri that are or could be used also for aquaculture (Table 6.1). The estimated total area of dams and reservoirs in Mala% ranges from 420 ha to 960 ha, which yield an estimated total fish production of 105-192 tlyear, or 0.2-0.45 t/ha/year. The exact number of such water bodies, and data on the average size, condition and degree of dry season drawdown was the subject of a recent study by UNDP (1986). It was estimated by LMA (1983a) that their average size is 1-2 ha, that about 80% are in active use, and that the drawdown reduces their area by an average of 50%. Most dams were constructed between 1955 and 1965 (Fig. 6.4). Many have a capacity of less than 50,000 m3 (Fig. 6.5), with catchments of 1-2 km2 (Figs. 6.6 and 6.7). They also show a large discrepancy in the cqst of construction, depending on the methods used (Fig. 6.8). There has been a recent upsurge in dam development, which is being monitored by the FA0 (M. Vincke, pers. comm.). Both the Dwangwa Sugar Estate and the Kavasi Tea Estate raise fish in reservoirs. Together these two estates have a reservoir area of 60 ha, which yields an estimated 65 tlyear, or 1.08 t/ha/year. The Bunda College of Agriculture dam has an area of 7-12 ha (varying with the drawdown). Fifteen-year (1971-1985) fish yield data indicate a production of 200-736 kg/ha/year, mainly of 0.s. chilwae (Fig. 6.9). This is probably representative of a well-managed reservoir fishery in Mala%.

Table 6.6. Polyculture fishpond trials including a predatory species.
Pond Pond Pond Pond 1 2 3 4
Stocking data
Serranochromis robustus Number Average length (cm)
0. s. shiranus Number Average length (cm)
T. rendalli Number Average length (cm)
Harvesting data
Serranochromis robustus Number Average length (cm)
0. s. shiranus Number Average length (cm)
T. rendalli Number Average length (cm)
Weight of fry and small fish (kg)
Length increment in forage fish (%)
Source: GNP (1 962).
Date of construction
Fig. 6.4. Distribution by age of a sample of dams in Mala%. (Source: UNDP 1986. Drawn from data supplied by the Water Department, Ministry of Works and Supplies, Government of MalaGi).
Dam capacity (m3 x lo3)
Fi . 6.5. Distribution by size of a sample of dams in Mala% 5 (m x lo3). (Source: UNDP 1986. Drawn from data supplied by the Department of Water, Ministry of Works and Supplies, Government of MalaGij.
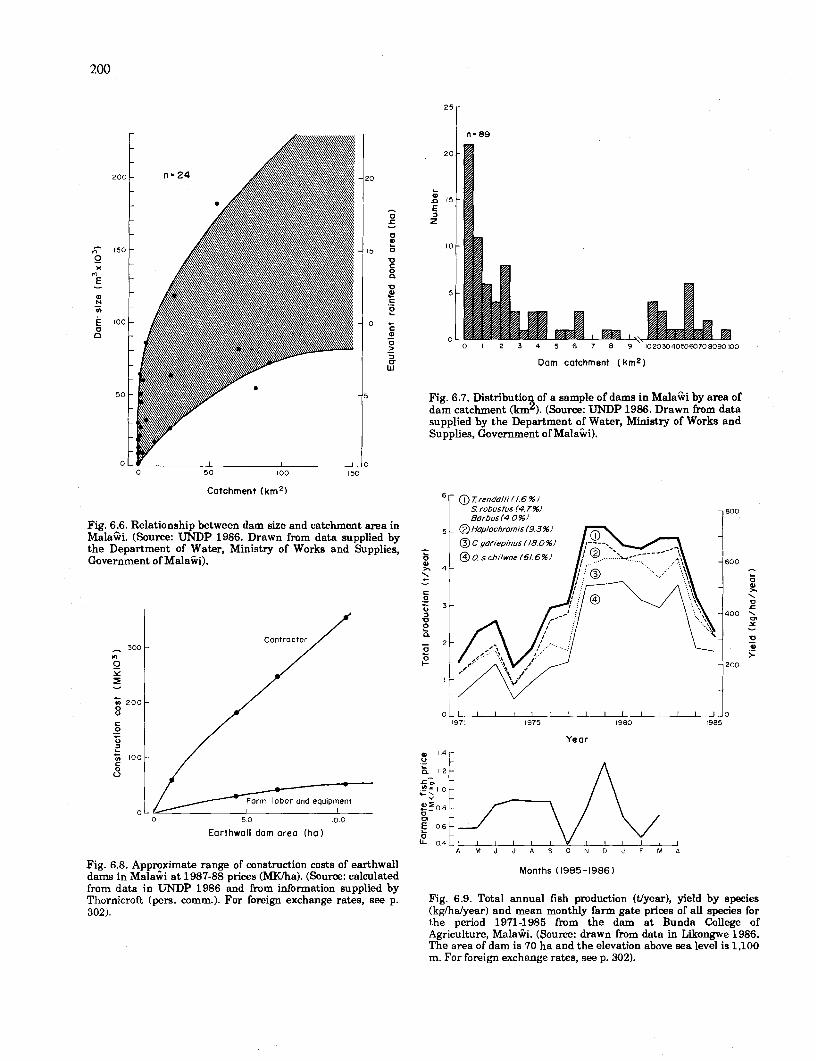
0 50 100 150
Cotchment ( k m 2 )
Fig. 6.6. Relationship between dam size and catchment area in MalaCi. (Source: UNDP 1986. Drawn from data supplied by the Department of Water, Ministry of Works and Supplies, Government of MalaCi).
Contractor ///-I
Earthwall dam area (ha)
Fig. 6.8. Approximate range of construction costs of earthwall dams in Mala% at 1987-88 prices ( m a ) . (Source: calculated from data in UNDP 1986 and from information supplied by Thornicroft (pers. comm.). For foreign exchange rates, see p. 302).
Dom cotchrnent ( k m 2 )
Fig. 6.7. Distributio 1 of a sample of dams in Mala% by area of dam catchment (km ). (Source: UNDP 1986. Drawn from data supplied by the Department of Water, Ministry of Works and Supplies, Government of Mala%).
Months ( 1985-1986)
Fig. 6.9. Total annual fish production (tlyear), yield by species (kghalyear) and mean monthly farm gate prices of all species for the period 1971-1985 from the dam at Bunda College of Agriculture, MalaCi. (Source: drawn from data in Likongwe 1986. The area of dam is 70 ha and the elevation above sea level is 1,100 m. For foreign exchange rates, see p. 302).

The artificial stocking of water storage dams was conducted in all three regions of Mala% from the early 1950s. Whereas many such impoundments are stocked with fish, mostly with 0. shiranus chilwae and T. rendalli in the Southern Region, dams are rarely harvested, and there has been little attempt to manage them commercially. Fishing trials in the Southern Region by the FD demonstrated that yields of 1.2 t/ha/year could be obtained from impoundments without supplementary feeding (Mathotho 1975). Other harvest data are given in Table 6.6.
The Private Sector: Estates
The development of large-scale, intensive aquaculture on estates specialized in commercial crop cultivation began in the colonial period, mainly to provision labor forces. The same requirement has continued until the present. Indeed, it has been asserted that the aquaculture component of estate activities assists in the recruitment of labor, since the fish produced is sold to workers a t subsidized prices lower than those in the market (Cross 1985). This is exemplified by the Satemwa Tea Estate. Despite some 30 years of aquaculture on estates, important developments have occurred only recently. The estate sector now has almost 23 ha devoted to aquaculture, from which 47 ponds produce some 67 tfyear (Table 6.1).
THE SUGAR COMPANY OF M A L A ~ I (SUCOMA)
The largest commercial aquaculture operation in Mala% is run by this company on its estate near Nchalo, in the Chikwawa District of the Southern Region. The fish farm covers 17.2 ha, consists of 28 ponds ranging in size from 0.1 to 1.0 ha, and has an estimated production capacity of 85 tfyear from 16 ha of production ponds (i.e., 5.3 t/ha/year).
Tilapia (0. mossambicus) of 13-20 g are stocked a t a rate of 20,000, ha and harvested twice, to give a yield of approximately 5.3 t/ha/year (1982). The total production in the 1982- 1983 season was 32 t from 6 ponds. But these initial high rates were not replicated in the second season (1983-1984) of operation, when they declined to an estimated 3.5-4.0 tha . (The reasons for this decline are unknown.) (LMA 1983a).
Initially, rice bran was fed with a 2.7:l food conversion ratio, and a t a cost of MK 21 61t of fish.
Later, owing to a rapid increase in the price of rice bran (from MK 36lt [I9811 to MK 80lt [1983]), a feed compounded from 30% estate produced bagasse and filter press cake, 15% purchased rice bran, and 50% molasses (estate produced), with 1% purchased urea, 1% superphosphate and 3% lime, was used effectively, yielding 4 t/ha/year of fish. Subsequently this has evolved into a semi- integrated agriculture-aquaculture operation.
The polyculture of T. rendalli with 0. mossambicus was attempted in two ponds, in 1982. However, the former were virtually all lost to presumed predation by pelicans. The polyculture of tilapia and Clarias gariepinus has also been attempted, and is regarded as promising owing to the faster growth of the catfish compared with the tilapia. Breeding presented problems, however, and injections of pituitary extract were used to overcome them. In 1986, this estate also attempted carp culture, using C. carpw fry obtained from the KPFF, but this operation has not expanded owing to limited fry supplies (C. Cummings, pers. comm.).
In addition to making direct use of the residues of the associated sugar enterprise, the location of this fish farm a t a low elevation of only 100 m above sea level, and thus with a year-round warm climate (cf . KPFF data, Fig 3.18), provides ideal conditions for tilapia culture. But limitations are the need to provide pumped water and occasionally heavy predation by pelicans, since the estate is located close to the Elephant Marsh, along the lower Shire River. At one stage, the latter necessitated expenditure for monofilament lines run over the ponds to entangle the birds. In the final analysis, based on the substitution costs of estate-produced fish with those purchased a t market prices, the profitability of the full 17-ha operation seemed marginal.
Although the SUCOMA aquaculture enterprise is impressive, application of its results to other estate fish farm undertakings should be made with extreme caution. Above all, the high yields must be attributed in large part to the low elevation of the site and the continuously warm temperatures that this ensures. Such conditions could not be replicated over most of the country, which is situated a t much higher elevations above sea level. Further, i t is important to note that the initial high yields were not replicated. Finally, the operation benefitted economically by piggy- backing on the sugar estate's pre-existing physical infrastructure of roads and irrigation, as well as its ability to borrow heavy, mechanized earth- moving equipment from the estate. (Construction

Table 6.7. Economic summary of construction costs and 1982-1983 operations of the SUCOMA Estate 12.2-ha Fish Farm, Mala% (MK).
Capital cost Pond construction
Earth-mover (450 hours) Light equipment (98 hours) Labor
Buildings, pumps, etc.
Annual costs and benefits Capital cost (7.2-ha operations 1982-1983)a
Pond Other items
Subtotal 21,610 7,740
Total 29,350
Total Depreciated over 10 years (MWyear)
Operating costs Feed Labor Management Transport, etc. Bird deterrent twince
Total operating costs and depreciation
Revenues Sale price Retail price
Profit Sale price (MK) %/cost Retail price %/cost
Total
Source: LMA (1983a). Notes: For foreign exchange rates, see p. 302. (a) The following were the operating parameters during the 1982-1983 season: 6 ponds were harvested, with 2 harvestdyear; stocking rate was 20,000 (dha); average stocking wt. was 13-20 g; average harvest wt. was 150-225 g; food conversion ratio for rice bran was 2.7:l; 80 t of rice bran was fed, the cost of which was MK 80/t; a labor force of 21 persons was used at an a ~ u a l cost of MK 250lday; a total of 32 t of fish was sold; the average yield was 5.3 tJhdyear; sale price of fish was MK 680lt; reputed market price in the Lower Shire Valley was MK 800/t.
of a 1-ha fishpond entails the excavation of 2,000 m3 of material. This would have cost MK 1,771, or MK 0.88Im3 (1980 prices) or MK 3,50O,_or MK 1.75Im3 (1983 prices) CLMA 1983a1, or MK 14,00O/ha, at MK 7Im3, at 1987 prices [P. Malfense, pers. comm.1 cf Fig. 6.8.)
THE DWANGWA SUGAR ESTATE
On this estate, located in the Nkhotakota District of the Central region, six villages of estate workers and their families have a combined
population of some 13,000 inhabitants. A semi- integrated agriculture-aquaculture operation has been developed based on the sewage of this population to fertilize some hatchery fishponds and pulped sugar refinery effluent to feed the fish in dams.
The sewage and water from each village passes along canals. The solids separate out and the liquid pass into six complexes of three ponds each, in which 0. shiranus and T. rendalli are cultivated. Precise data on yields are not available, but an extrapolated harvest rate of 4

tfha is projected from a 3.2-ha sewage pond unit. Owing to health reasons (and presumably cultural ones, too) fish from these ponds are not consumed on the estate (LMA 1983a1, but are being used as food for an expanding crocodile farming project on the estate (P. Strover, pers. comm.).
However, the estate does obtain edible fish from 18 night storage irrigation reservoirs, with a combined total area of some 50 ha, which are harvested in rotation. An anticipated yield of 1.2 tfhafyear is envisaged from the approximately 50 ha of reservoir (LMA 1983a), or 4.6 kglcapitalyear for the worker and dependent population. More recently this estate has initiated a commercial venture based on Macrobrachiurn rosenberghii imported from Mauritius (Balarin 1987c), and is actively involved in crocodile farming. An interesting development is that frogs (Xenopus spp.) caught when seining ponds or irrigation canals provide an excellent food for juvenile crocodiles (P. Strover, pers. comm.).
THE KAWSI TEA ESTATE
On this estate, also located in the Nkhotakota District of the Central Region, a 10- ha dam has been stocked with tilapia (0. squamipinnis [O.V.Msiska, pers.comm.l), obtained from Blantyre. Some integration with the estate's minor agricultural operations is done through the supplementary feeding of fish with waste from the estate kitchen, which prepares meals for 800 estate workers, plus the field and processing residues from a 100 ha planting of maize that the estate maintains for the workers' home use (LMA 1983a).
A similar operation is being initiated on the adjacent Kawalazi Estate, where ponds were in use in the 1960s. There four ponds with a total area of one ha are being renovated (LMA 1983a).
THE SATEMWA TEA ESTATE
On this estate, located a t an elevation of 1,000 m above sea level, in the Thyolo District of the Southern Region, six large barrage ponds have been constructed in a valley. Reported yields of 1- 4 tfhdyear from the 3-3.5 ha total pond area are considered in error owing to underestimation of the pond size (LMA 1983a). A low level of integration is practised, since ducks and geese are kept around the pond, and thus provide an inexpensive source of manure. The supplementary fish feed is maize bran (madea) purchased from outside sources.
One of the principal motives for fish production on this estate appears to have been to attract labor by offering a comparatively better diet, since there is strong competition in this area among the many tea estates to secure workers (LMA 1983a). However, the operation is now also functioning commercially by selling fish off the estate. At the prices shown in Fig. 5.7 during the period 1979-1984, fish yields a t Satemwa ranged from 0.8 to 2.1 tfhdyear, and generated MK 440- 710ka (Fig 6.10).
W Revenue
H Production 1 l,OOO - -
Year
Fig. 6.10. Fish production (kglhdyear) and rate of return per ha ( m a ) for the period 1979-1985 for the Satemwa Tea Estate, MalaOi. (Source: drawn fmm data in Nongwa 1985).
The Public Sector
There are 12 government aquaculture stations and substations and one operated by the Bunda College of Agriculture, of the University of Mala% (LMA 1983a). Together these facilities have more than 180 fishponds (Table 6.1). The FD is nowadays responsible for all public sector fish farming in MalaGi, with the exception of two older units that are still operated by Agricultural Development Divisions (ADDS), under the Ministry of Agriculture, and that a t the Bunda College of Agriculture. (Facilities, and research and extension activities are examined in Chapter 7.)
The two facilities managed by the Ministry of Agriculture, through the local ADDS, are a t Nchenachena and Mzuzu. Both are located in cool climates in the Northern Region, and both are largely inactive. The former is considered to hold little promise for further development, other than, perhaps, as a research and support base, but that at Mzuzu has considerable potential for cool water fish culture development, and is being rehabilitated through the Central and Northern

Regions Aquaculture Development Project (see Chapter 7) (LMA 1983a), with 20 new 200-m2 ponds nearing completion.
In addition to the DEFF and the KPFF (see Chapter 7), the FD operates the Zomba Trout Farm and several minor facilities. The Zomba Trout Farm is situated on the Zomba Plateau, in the Southern Region, at 1,700 m above sea level. The farm has five large raceways and one earth pond, and depends on runoff for its water supply. A recent project, initiated with Japanese assistance (JCV), was designed to produce juvenile trout for release into streams for recreational angling. Surplus stock were grown to table size in the raceways and then sold to hotels,
restaurant and to the high class retail trade. Plans call for the farm to produce 4 t/year of 250 g fish. Some 22,000 fingerlings were produced in 1983 (Cayron 1983), but survival and growth rates are low, owing to genetically poor quality stocks, which have not been replaced in recent years, poor feedstuffs and nutritional diseases (Balarin 1987~). Minor stations operated by the FD, but for which information is lacking, are mentioned by Vincke (1981) at Mzimba, Chisenga and Msuka. A relatively new station is located at Kunenekude, in Mwanza District of the Southern Region and near Phalombe, in the Mulanje District (see Chapter 7).

Chapter 7
AQUACULTURE RESEARCH, TRAINING, EXTENSION AND DEVELOPMENT PROJECTS
Introduction
Compared with many African considerable volume of research conducted on aquaculture in ~ a l a & . From their sporadic beginnings in the colonial era, largely a t the Nchenachena-Tipwiri hatchery, together with surveys for stocking upland streams with trout, research has gradually become both broader and deeper. However, much basic work remains to be done and the history of previous work remains to be properly synthesized.
Reflecting the awareness of government and international agencies of the potential role of aquaculture in helping to satisfy the demand for animal protein, as well as in rural development in general, together with the extreme scarcity of indigenous manpower trained to effect the tasks involved, there has been a recent surge of interest by international donor and assistance agencies in sponsoring the development of aquaculture in MalaGi. A comparatively large number of major projects has been either approved or already launched in the fisheries sector, and several surveys for major potential projects have been undertaken recently. These projects include research, infrastructural development, extension and manpower training both for aquaculture specifically and for the fisheries sector in general. Some are purely national projects whereas others are SADCC-wide in scope.
This chapter reviews the aquaculture research facilities available in Mala%, the history of recent research and that being undertaken or planned. It also examines manpower training for aquaculture, including the role of the formal education system and extension services, and the principal research and development projects either approved or now being implemented.
Research Facilities and Work Conducted
countries, a has been
The aquaculture research that has taken place in MalaGi so far has mostly been conducted a t the DEFF, where present research focuses mostly on the evaluation of a range of species suitable for small-scale intensive pond culture, and the types of culture system most suitable for small-scale integrated aquaculture. To a much lesser extent research has been conducted at the KPFF and a t Bunda College of Agriculture, in the Central Region.
Field surveys on the status of aquaculture and its development potential have been undertaken in connection with the formulation of aquaculture development projects (LMA 1983a; Beveridge and Stewart 1986; GOPA 1987). Both survey research and experiments are being undertaken by the ICLAWGTZ-FD-UM project "Research for the Development of Tropical Aquaculture Appropriate for Implementation in Rural Africa".
Limited experimentation on pond management has also been undertaken by private estates. It is noteworthy also that almost all the research conducted so far has taken the form of trials applied to the development of pond aquaculture among small-scale farmers, and thus has been closely linked with, and dependent on, extension efforts, and, further, that the bulk of it has emphasized an integrated farming approach, although of a rudimentary kind, based on the exclusive use of fish feed and pond fertilizers available from other on-farm activities.

The Domasi Experimental Fish Farm (DEFF)
This station is located in the Southern Region some 16 km north of Zomba, to the east of the Zomba Plateau, a t an elevation of 750 m above sea level (Fig. 6.2). Established in 1959, i t is operated by the Fisheries Department. Its present principal functions are research, staff training, extension, and seed supply.
Pond facilities were gradually expanded from three ponds of about 0.1 ha each, in 1959 (GNP 1960), to a present total of 6.0 ha. Originally divided into 27 ponds that ranged in size from 0.02 to 1.0 ha, and 5 x 100 m2 concrete-lined
ponds, this has been modified over the years to 23 units. In 1987, 12 x 500 m2 ponds were constructed with the support of the IDRC, and the ICLARMIGTZ-FD-UM Project has built 73 x 200 m2 ponds and 36 x 5 m3 plus 78 x 500 1 tank research facilities (Fig. 7.1).
The remaining physical infrastructure of the station comprises three laboratories with 8 offices and a library, a covered wet laboratory area with concrete tank (8 x 2.5 m3), an intensive chicken house, staff housing, and a covered parking area. The covered wet laboratory formerly included a unit to rear Macrobrachiurn rosenbergii to the postlarval stage in artificial seawater. However, some of the equipment is in need of repair and
A o F D and ICLARM offices,laborator~es and library complex B 0 36 x 5 m2 Experimental tank
C o 78 x 0 5 m2 Experimental tanks D o F D Staf f houses
Ponds 200 to 5,000 m2
Fig. 7.1. Layout of the Domasi Experimental Fish Farm (DEFF), Domasi, MalaGi. (Source: DF, unpubl. data. Base is Department of Survey Map W 5709,1984).

supplementing (LMA 1983a). Water supply is perennial via a small channel from the Domasi River. The partial rehabilitation required for this (LMA 1983a) was effected with funds from the IDRC and the ICLARM/GTZ-FD-UM project.
The DEFF has a 9,088 m3Jday abstraction from the Domasi River, and is situated in a localized zone of heavy rainfall, with peak flows in March and lows of between 0.091 and 0.283 m%ec (8,000-24,500 ms/day in October) (Figs. 3.24 and 7.2). Evaporation rates are between 1,300 and 1,850 mmlyear, peaking in October (UNDP 1986). Since it requires an average daily flow of 30 m3 to top up evaporation losses, the DEFF has a water supply sufficient to ensure that all ponds and tanks are fi l l year-round. However, temperatures show a win& low during May- September (Fig. 3.18), which may constrain research, since potential growth and reproduction of warmwater fish may be affected (Fig. 6.1).
Month
Fig. 7.2. Frequency of mean monthly waterflow of the Domasi- River near the Domasi Experimental Fish Farm (DEFF), ~ a l a % i ( ~ m ~ l s ) . (Source: UNDP 1986).
Recent research conducted a t the DEFF has included, principally, a study of water quality parameters relative to the application of poultry manure to tilapia ponds (Msiska 1981a, 1981b), the experimental rearing of Clarias gariepinus (Msiska 1981 c) and 0. mossambicus (Msiska
1981b), research on tilapia rearing, research on common carp (Cyprinus carpio) culture (Msiska 1984a), the culture of Macrobrachium rosenbergii (Msiska 1984a), research on rnpasa (Opsaridiurn microlepis) and nchila (Labeo mesops) culture (Msiska 1984b), and trials with Barbus johnstonii (Balarin 19874. Currently underway are polyculture trials using 0 . s . shiranus, T. rendalli, L. mesops, Clarias gariepinus and Cyprinus carpio; pond feeding and fertilizing using madea and grass; the value of cooking fire ash as a liming agent; and mass fry rearing trials.
RESEARCH ON WATER QUALITY AND SUPPLEMENTARY INPUTS TO PONDS
Research into pond inputs, supplemental fish feeds and pond fertilizers, has been conducted for many years a t the DEFF. (Similar work has been conducted to a lesser extent KPFF [see below].)
The Senior Fisheries Research Officer a t DEFF conducted a series of experiments on pond inputs in fulfillment of the requirements of an M.Sc. program a t Chancellor College of the University of Mala% (Msiska 1981a), principally to understand the concentration of selected nutrients in poultry manure and the rate of nutrient release into pond water when chicken manure is applied as a fertilizer. Poultry manure was applied a t rates of 235,470 and 940 kg/ha/week to 10.5 m3 tanks stocked with 0 . s . chilwae. From the results, a manure loading rate of 470 kg/ha/week gave the best performance, with an extrapolated fish yield of 1,185 kgthdyear. Levels of dissolved oxygen were reduced a t the highest rate of manure loading, such that extrapolated fish yields declined to 984 kghdyear (Msiska 1984a). Although safe maximum and optimum levels of manure loading remain to be properly determined (LMA 1983a), Msiska (1981a) was able to show that a t this level of application an appropriate stocking density is between 4,500 and 9,000 fishha, which is on the low side.
An experiment with inorganic fertilizers confirmed that phosphorus was the principal nutrient limiting algal growth in 0.05-ha experimental ponds. The same experiment revealed that lime applications may improve the utilization of nutrients from manures applied to ponds (Msiska 1983a). Lime and ammonium sulfate fertilizer also showed the highest profit index (Msiska 1981a).

RESEARCH ON INDIGENOUS SPECIES
A range of indigenous species that can be utilized for a variety of farming practices and under differing ecological and environmental conditions is being undertaken at the DEFF. This approach is because of the possible adverse ecological consequences of the introduction of exotic species, particularly on the ecosystems of Lake MalaGi. Thus the policy of the Government of Mala% is that introductions can be considered only after exhaustive and systematic research on the aquaculture potential of indigenous species has been completed, and then only if they will not have serious adverse ecological effects (Msiska 1987). So far, this line of research has focused mainly on tilapias, but catfish (Clarias gariepinus), which has been demonstrated to be successful in semi-intensive polyculture, and other local species, such as the carps Opsaridium microlepis, Labeo mesops and Barbus johnstonii (GOM n.d.b), are also being, or will be, examined.
In addition to 0. mossambicus and T. rendalli, research on tilapias has included work on 0. shiranus chilwae, from Lake Chilwa, 0. placidus (from the Lower Shire Valley), and 0. shiranus shiranus, 0. squamipinnis, 0. lidole and 0. sakus (Fig. 7.3) from Lake Mala% (Beveridge and Stewart 1986). Although incomplete, available results demonstrate that 0. shiranus shiranus may be better adapted to pond culture at sites located a t higher elevations than is 0. shiranus chilwae, and that 0. placidus may be better suited to the lower elevations of the Lower Shire Valley than is 0. mossambicus (Beveridge and Stewart 1986). Work at the KPFF suggests, however, that 0. mossambicus may be more tolerant of lower temperatures than 0. shiranus, whereas T. rendalli shows a linear response to rising temperature (Pruginin 1976) (Fig. 7.4). Here, 0. mossambicus grew better than T. rendalli, which grew better than 0. shiranus. Further, the phytophagous T. re~dal l i has been demonstrated as a useful complement in polyculture with 0. shiranus shiranus or 0. placidus (Beveridge and Stewart 1986). On the other hand, the three other species from Lake Mala% (0. lidole, 0. sakus and 0. squamipinnis) are probably better adapted to stocking in dams, since they naturally feed and spawn in waters deeper than those available in ponds (Fig. 7.5). Under natural conditions these three Lake MalaGi tilapias exhibit better growth rates than 0.s. shiranus (Table 7.1), and therefore may hold a greater potential as candidates for aquaculture.
Pig. 7.3. A generalized distribution of tilapias in the major waterbodies and watercourses of Mala%. (Source: Msiska 1988b).
( May-Sept ( Jan -Apr (Oct-Dec)
0 ~ 4 2'0 I' I 25 30
Mean tcmperoture (OC
Fig. 7.4. Seasonal weight gain of tilapia under experimental culture at Kasinthula Pilot Fish Farm (KPFF), MalaCHi, 1977. (Source: drawn from data in Pruginin 1976)
In addition, their apparent inability to breed in shallow waters (O.V. Msiska, pers. comm.) could be advantageous, but not without concomitant problems of controlled breeding for seed production.

T rendolli Feeding shoals
Length of breeding fishes ( crn)
Main breeding season
+0. squomipinn~s ------ +--2.2!Lcc%L-- -I
1 1 1 1 1 1 l l i A S O N D J F ' M A
M o n t h
Fig. 7.5. Ecology of the five tilapia species inhabiting the Southern End of Lake Mala%. (Source: modified from Fryer and Iles 1972).
Table 7.1. Growth rates and allied attributes of tilapia from open waters of Lakes Chilwa and MalaGi. Source: modified from Fryer and Iles (1972).
Species
0. shimnus shimnu
0. shimnus ehilwoe
0. quamipinnis
0. saku
0. lidole
Lake Mala% Opercular 90 170 240 265
Lake M a l a c Oprmlar 120 220 275 300 305 I LakeMala6i Opermlar 6+p 130 230 285 310 325 3
rings
The low cost feeds available as crop residue or byproducts on traditional MalaGan farms have been tried as pond inputs, and stocking rates have been varied, but the results are inconclusive (LMA 1983a1, since trials were not designed as well-replicated, statistically analyzable experiments. Based on these trials, the DEFF recommends that small-scale farmers stock 0. shiranus at a rate of 10,000ha in semi-intensive culture. It is a phytoplanktivore and its food can be produced using manures. However, cattle dung has been found to be relatively ineffective for this purpose (LMA 1983a). Feeding trials have shown
Length at maturity (mm) Remarks
-
Ring formation related ta well marked breeding seasons
that both 0. mossambicus and T. rendalli feed on larger food particles, the former accepting, in particular, madea, which is seasonally available on farms in MalaGi, and the residues of leafy vegetables (LMA 1983a).
The original motive for introducing 0. shiranus chilwae into ponds at the DEFF (as well as to dams elsewhere), in the late 1960s was not aquaculture per se, rather to conserve stocks from Lake Chilwa (its endemic habitat, which was drying up) for later restocking upon the resumption of more favorable conditions in the lake. As water levels returned to the lake, in early

1969 some 300,000 0.s. chilwae fingerlings were transferred from the DEFF ponds and other dams to the Kachulu area of Lake Chilwa (Furse et.al. 1979).
During that period, feeding and pond fertilization trials demonstrated that 0.s. chilwae could yield 1,585 kghdyear, using madea at 7.3%ldaylfinal weight of the fish, plus 6 kglhdday of lime and 1.8 kghdday of the inorganic fertilizer SP04 (Morgan 1971). Yields increased to 1,940 kg/hdyear feeding madea at 6%ldaylfinal weight, or 40 kg/ha/day, and using no other inputs. This represented a six-fold increase over the control (Morgan 1971). The results from this again unreplicated trial are given in Table 7.2.
Since that time 0.s. chilwae has become one of the dominant species cultured in ~ a l a i h . However, under mixed-sex culture, precocious breeding behavior results in severe stunting. Thus trials have been conducted comparing mixed-sex and monosex male culture. The latter has proven to be the superior (Msiska 1981d).
Since much of MalaGi is located at moderate to high elevations above sea level (see Chapter 3;
Fig. 3.10), a large part of the country has been regarded as unsuitable for warmwater species aquaculture (Fig. 6.1), apart from the culture of such exotics as trout (Table 3.4). Research is needed t o evaluate species that pedorm well a t these elevations. This topic has recently been examined by Msiska (1987) with respect to 0.s. chilwae. LMA (1983a) and Balarin (19874 present an inverse relationship between temperatures a t elevations above sea level of 100-1,300 m and their consequent constraint on aquaculture production (Fig. 3.17).
Msiska (1 987) conducted experiments in 1979-1980 on 0.s. chilwae in ponds located in three areas with different elevations above 'sea level. One site was at Chingale (450 m), another at the DEFF (750 m), and a third at Satemwa (1,000 m). Stocking, feeding and pond fertilization parameters were the same at all sites. All ponds were stocked with 0.s. chilwae at a rate of 10,000- 12,00O/ha with manually sexed males, 15-30 g in weight. Madea was supplied once daily for 6 daylweek a t a rate of 4% of the estimated body weight, and adjusted after monthly sample
Table 7.2. The results of madea, lime and superphosphate fertilization trials on the yield rates of Oreochromis shiranus chilwae in 350-m2 ponds at the Domasi Experimental Fish Farm (DEFF), ~ a l a G i , 1970.
Stocking Control (a) Maize Full bran (b) inputs
(c)
Number Mean total length Mean weight (g)
Water quality range PH
minimum maximum
Alkalinity (mg/l) minimum maximum
Temperature (C) mimimum maximum
PO4 ( m d ) minimum maximum
Harvest (180 days) Adults: Nymber (% survival)
Average weight (g) Production (kglhafyear)
Fry and Fingerlings Number Average weight (glind)
Total Fish Production (kflafyear) % fry and fingerlings
400 (d) 8.16 7.5
7.1
8.3
0.4 0.6
23 37
0 0.1 8
303(75.7) 40.8
740
9,000 2.3
1,940 61
400 (d) 8.18 8.5
7.2
8.8
0.7 1 .o
23 37
0 1.06
250(62.5) 47.6
71 5
8,000 1.9
1,585 55
Source: Adapted fmm Morgan (1971). Notes: (a) No supplementary inputs; (b) At 6% body wtfday; (c) Madea at 7.3% body wtfday, plus lime at 6 kglhalday and S P 0 4 at 1.8 kglhalday; (d) 12,500 ind/ha.

weighings. Ponds were fertilized every two weeks with 0.4 t of dry chicken manure.
Were pond water temperature the principal parameter controlling fish growth it could be anticipated from relative elevation above sea level that fish productivity would have been greatest a t the potentially warmest site, Chingale, and least at the coolest location, Satemwa. However, yields were greatest a t Satemwa (at 2,578 kghalyear), but not significantly different from the results of Chingale (Table 7.3). A period of reduced weight gain was observed a t Chingale (July-August) and a t Satemwa (July-September), at which time fish growth is considered to be uneconomical.
It was concluded from this study that the differences in concentrations of the selected nutrients measured suggested that water quality or the husbandry thereof may have exerted a stronger influence on fish yields than did temperature within the range of elevations examined (Msiska 1988a). Further, the history of the successful adaptation of 0. shiranus chilwae f*om its natural habitat in Lake Chilwa (620 m
above sea level) to various higher elevations suggests that upland fish cultivation could be successful in ~ a l a % if species selection is done with consideration of both water quality and temperature.
RESEARCH ON EXOTIC SPECIES
Prior to 1942 an exotic carp of unknown origin and variety was noted in Malawi by the Nyasaland Angling Society (unpub. NAS Minutes, 1942-04-18). However, for the purposes of aquaculture, the common carp was introduced to Mala%, from Israel, in 1976. It is being studied a t the DEFF and a t KPFF. Carp culture field trials have been started recently in the ponds of several small-scale farmers in the Zomba-Domasi area. However, culture of the common carp throughout the country has not been approved for fear of its accidental introduction into Lake Mala% and potential impact on the biota and complex ecosystems of the lake. Common carp are more cold tolerant than tilapias and could therefore
Table 7.3. Summary of the results of stocking and feeding trials with Oreochrornis shimnus chilwae at Satemwa, Chingale and the DEFF, MalaGi.
Site Stocking Average Average Yield Food Daily Culture Production rate stocking final (kgha) conversion growth period (kghdyear) (ha) weight weight ratio rate (days)
(P) (d ( d
Satemwa (1,000 m)
Average (+- 2 SE-X)
Chingale (450 m)
Average (+- 2 SE-X)
Domasi (750 m)
Average (+- 2 SE-x)
Source: Msiska (1987). Note: Subscripts (a) and (b) delineate significant difference at P > 0.05.

grow well during the cool season, especially at high elevations (cf Fig. 7.10, below).
Yields of common carp under semi-intensive culture, in both manured and manured and fed ponds, have been much higher than those of tilapia, and growth rates of some tilapias were higher when cultured with common carp than when raised in monoculture, and food conversion efficiency 2oubled (Msiska 1981d) (Table 7.4). In a polyculture experiment on common carp with T. rendalli, 0.s. chilwae and 0. mossambicus the latter was found to have a 40.5% higher growth rate than when cultivated under monoculture (Msiska 1984a). On the other hand, a similar study conducted on 0. shiranus chilwae gave inconclusive results (Table 7.5) (Msiska 1984a). When raised under polyculture in manured ponds, rates of grow+ in both common carp and 0.s. chilwae were found to be 40.5% greater than in untreated ponds (Tables 7.6 and 7.7) (Msiska 1984a). One potential advantage of this form of
polyculture is that the rate of reproduction in 0.s. chilwae was reduced by almost 60% during the 120-day growing period (Msiska 1984a).
The introduction of grass carp (Ctenopharyngodon idella) and silver carp (Hypophthalmichthys molitrix) was recommended by Pruginin (197513). Common carp rearing has also been undertaken at Bunda College of Agriculture, KPFF and at the Domasi rice cultivation site of the Chinese Agricultural Mission (LMA 1983a).
THE RESEARCH STRATEGY AT THE DEFF
As the lead center for aquaculture research in Malawi, the DEFF has adopted a research strategy to keep government-sponsored research at the forefront of the emerging aquaculture sector in MalaGti, with particular emphasis on small-scale integrated farms. With this in mind, experimental pond facilities at the station have
Table 7.4. Yields o f Cyprinus carpio, Oreochromis shiranus chilwae and Clarias gariepinus under polyculture at the DEFF, Mala%.
Number of fish Manuring Growing Fish growth rate ha Pond rate period Per Per Per
( k g h d m o ) (days) fish pond ha Species (g ) ( kg) (kg)
Cyprinus carpio
Cyprinus carpio
Cyprinus carpio
Cyprinus carpio and
0.s. chilwae
Cyprinus carpio and
0s. chilwae
Cyprinus carpio and
0.s. chilwae
Cyprinus carpio and
0,s . chilwae and
Clarias gariepinus
Cyprinus carpio and
0s. chilwae and
Clarias gariepinus
Source: Msiska (1981d). Notes: (a ) = nursery; (b) = 40 kg of ammonium sulfate; and (c) = manure o f 13 ducks and 40 kg o f ammonium sulfate.

Table 7.5. Trial yields of Oreochromis shiranus chilwae, Tilapia rendalli and Cyprinus carpio undcr polyculture at the DEFF, MalaCi(a).
Species Number Stocked Harvested Weight Survival Food Weight of weight weight gain rate conversion gain
fish (kg;lha) (kgha) (kg;lha) (%I per 'fish (idday)
C. carpi0 1,000 62.8 508.6 445.8 50.4 2.70 T. rendalli 3,000 24.0 87.4 63.4 61.5 1.6 0.19 0 s . chilwae 8,000 144.0 553.0 409.0 86.5 0.31 Small fish 450.0 450.0
Total 12,000 230.8 1,599.0 1,368.2 66.1 (b) 1.6 1.06 (b) -
Source: Msiska (1984a). Note: (a) No information provided in source on when trials were c o n d u d , or on such parameters as size and number of ponds used, duration of the trials, number of replicates, or feeding and manuring, if any; b = average.
Table 7.6. Trial yields of Oreochromis mossambicus undcr monoculLure and with Cyprinus carpio at the DEFF, Mala%(a).
Species Number Stocked Harvested Weight Survival Food Weight of weight weight gain rate conversion gain
fish (kgha) (kg;lha) (kgha) (%I per fish (idday)
Cyprinus carpio 2,000 38.2 393.0 354.8 33.2 1.47 and 1 .25
0. mossambicus 10,000 221.6 910.0 688.2 63.2 1.38
Total 12,000 259.8 1,303.0 1,043.0 48.2(b) 1.25
0. mossambicus (c) 10,000 269.6 752.4 489.8 43.6 2.70 0.41
Source: Msiska (1984a). Notes: (a) Duration of experiment = 278 days; pond size = 10,000 m2; total feed supplied = 2,009 kg; and total manure supplied = 1,300 kg; number of replicates = 1 (unpub. records DEFF and O.V. Msiska, pers. comm.; (b) average; (c) control.
Table 7.7. The impact of applications of chicken manure on the polycultural yields of Oreochromis shiranus chilwae and Cyprinus carpio fed with maolea at the DEFF, MalaGi, 1982(a).
- - - -
Species Pond Number Stacked Average Number Harvested Average Weight Survival Chicken Madea size offish weight weight offish weight weight gain rate manure (kg) (ha) stocked (kg) (g) harvested (kg) (g) (kg) (5%) (W
0,s. chilwae and
Cyprinus carpw
0,s. chilwae and
Cyprinus carpw
0,s. chilwae and
Cyprinus carpw
0,s. c h i l w ~ and
Cyprinus carpi0
0,s. chilwae and
Cyprinus carpw
0,s. chilwae and
Cyprinus carpw
0,s. chilwae
Source: Unpub. records of the DEFF and O.V. Msiska, pera comm. Note: (a) Number of replicates - 1; Stocking date - 5 Jan. 1982 Harvesting date - 6 Apr. 1982; Gmwing period = 130 day..

been recently expanded to provide uniform ponds for replicable experimental treatments (GOM n.d.b; Balarin 1987d). The research focus is on the development of polyculture systems in ponds and small impoundments appropriate for small-scale farming households with limited land, capital and labor resources. The main topics under investigation are species compositions in polyculture, food organisms in ponds, nutrient limitation, the effect of liming, fish parasite infestation and control, pond construction, and hatchery management. Research on pond construction seeks to determine the cheapest and most eficient manner of construction for both subsistence and commercial farmers.
This overall strategy is being enhanced by the collaborative biotechnical, socioeconomic, documentation and information project of ICLAWGTZ, which is based at the DEFF. Operating concurrently with the above program, therefore, is a collaborative research project being undertaken by ICLARhUGTZ-FD-UM. This project built its first set of 36 ponds in about 60 working days using 80 laborers (i.e., 133 man- days per 200-m2 pond, together with associated water supply, drainage and bund-grassing). The main biological trial underway is examining the monoculture and duoculture of T. rendalli and 0. shiranus, using grass, madea, and combinations of these as pond inputs. In addition, M.Sc. student projects are examining green grass as a fish feed, madea as a fish feed, cooking fire ash as a liming agent in composted ponds, and mass fry rearing of 0s. shiranus. Socioeconomic studies also form an integral component of this project (Table 7.13).
The Kasinthula Pilot Fish Farm (KPFF)
This pilot demonstration unit is designated here as the KPFF, although it was at one time known as the Kasinthula Irrigation Demonstration Farm and Fish Farming Training Centre (Pruginin and Arad 1977). It is located in the Southern Region, 5 km south of Chikwawa, in the Lower Shire Valley, a t an elevation of 80 m above sea level. Construction began in 1970, following the recommendations of Pruginin (1969), as an essential prerequisite to test the viability of large-scale aquaculture. It was constructed adjacent to an irrigation project. Information on progress is summarized in Pruginin (1975a, 1975b,1976), Pruginin and Arad (1977), and GOM (1972a, 1973a, 1974).
Initially, 13 ponds were constructed, with a total area of 22 ha. Some were large, in excess of 4 ha. In 1976, three 0.1-ha ponds and nine 0.05-ha units were constructed for breeding and nursery purposes, to supply the growout ponds. The total pond area available to the station thus became 22.75 ha. Growout ponds are large, ranging in area from 1 to 4 ha (Fig. 7.6).
The KPFF was thus designed as a "typical" large estate-type aquaculture operation. Although intended primarily as a demonstration and production farm, it was also partly planned as a research operation for the development of management procedures for large-scale aquaculture. It is operated by the FD, with temporary inputs of labor from the Ministry of Agriculture. The farm is now essentially inactive, but rehabiliation is being considered.
Operation of the KPFF has been hampered by two major constraints, water supply and predation (LMA 1983a). The original plans called for water supplied by a canal from the Kapichira Falls, located on the Shire River 20 km north of Chikwawa. But the canal was never constructed, and water must be pumped into the farm from an adjacent low-level canal. Since gravity supplies are not available much of the pond area of the farm is not usable. A supply of a t least 40,000 m3/ha/year is deemed essential to compensate for seepage and evaporation losses from the ponds (Balarin 1987~).
Predation by frogs (Xenopus mullereae) and birds has been problematical. To prevent the former from consuming fry, a special fence was built around the 12 small breeding and nursery ponds. This resulted in an increase in fish production of 125% over the unfenced units (Pruginin and Arad 1977). This fence is now ineffective owing to soil collapse around the foundations (LMA 1983). Predation by birds (including African fish eagles [Haliaeetus vociferl, pelicans [Pelecanus onocrotalusl, cormorants [Phalacrocorax spp.], herons [Ardea spp.1, kingfishers [Alcedinidael, hammerkops [Scopus umbretta], and egrets [Egretta spp.1) has been heavy. Indeed, the 60-70% mortality rate of common carp during the period May-August, when they swim near the surface and pond water depths are reduced owing to water shortages, has been attributed largely to predation by birds (LMA 1983a).
Yields for 1982-83 for 11 ha (including breeding ponds) were 0.79 thalyear of 0. mossambicus and Cyprinus carpio, together with some Clarias gariepinus and T. rendalli. In the past, ~ ie lds have been higher (LMA 1983a).

Fig. 7.6. Plan of the Kasinthula Pilot Fish Farm (KFTF), Chikwawa, Mala% (now largely inactive). (Source: huginin and h a d 1977).
RESEARCH CONDUCTED AT THE KPFF
Although having been designed primarily as a demonstration and production operation, some research has been conducted a t the KPFF. This research has included aquaria experiments on mollusc-eating fish, feeding, predation, and tests on indigenous species, as well as exotics such as common carp. Research was also conducted by the station in the late 1970s on fish cultivation in ricefields, using the fields of small-scale farmers. This was abandoned as uneconomic at the smallholder level (LMA 1983a).
In 1971-1973, trials were conducted on the growth rates of tilapias under different feeding and fertilization regimes. Unfertilized ponds without supplemental feeding showed average yield rates using 18-g fingerlings of 0.s . chilwae of 353 kg/ha/year (with a range of 70-858 kghdyear) over an average of 333 growing days (range 220- 403 days). T. rendalli had an average yield of 79 kg/ha/yr (range 42-95 kghdyear) over an average 31 7-day growing period (range 287-347 days) (GOM 1973a, 1974; Pruginin 1976).
With svpplemental feeding of madea, at an average rate of 4,087 kgfidyear (range 1,970- 4,875 kg/hdyear), and fertilized a t an average rate of 200 kghdyear (range 200-300 kghdyear), average yields of 2,138 kghdyear (range 1,881- 2,343 kghdyear) were obtained from the polyculture of 0. mossambicus and T. rendalli, cultured in a ratio of 4:1, respectively (Pruginin 1976). (Under similar conditions, yields a t Bunda College of Agriculture averaged 2,067 kg/ha/year, with a range of 1,080-2,668 kgha [GOM 19741. Monosex trials 0. mossambicus, using lO%/day body weight of madea yielded 1,350-3,lOO kglhdyear, and 1,600 kghdyear of T. resdalli [Figs. 7.7-7.91 [Pruginin and Arad 19771.)
A project was mooted, but not implemented, to rehabilitate the KPFF, in order to devise and demonstrate for local adoption systems of integrated livestock-fish farming for application in areas where conventional fish farming is infeasible, to train Malatirim Fisheries Department staff together with those from other SADCC Member States, and to ensure a supply of seed to local fish farmers (GOM 1987d).

Fig. 7.8. Average growth rates of the common carp and silver carp compared with that of Oreochromis mossambicus during a 140-day growing period at the Kasinthula Pilot Fish Farm (KPFF), Mala%, in 1975. (Source: Pruginin and Arad 1977).
8 0
The farm was to be reorganized into three units: a breeding and nursery unit, a fingerling unit, and a production unit. A permanent demonstration only of semi-intensive tilapia farming using as fish feed an (unspecified) meal compounded on the farm was to be operated. Trials were to be conducted on extensive aquaculture using inorganic fertilizers, integrated duck-fish, chicken-fish and pig-fish farming, and aquaculture with organic fertilizers, using locally available crop residues and other plant materials (M. Marachel, pers. comm.).
for aquaculture in ~ a l a % , and therefore should receive the highest priority for aquaculture development. Although the importance of fostering large-scale, capital-intensive aquaculture in supplying urban centers and stimulating local entrepreneurship should not be underrated, the KPFF has, since its inception, had little success in catering for this sector. Indeed, given the number of severe problems that have beset this station since the very beginning, Beveridge and Stewart (1986) recommended that it should be either closed or privatized. Nevertheless, given the potential scope of small- scale aquaculture in the Southern Region, there is a need to encourage farmers. Perhaps this could be done by using a portion of the KPFF as a seed and extension substation.
0 110- 0 ccu-- - j0-
// 0/- I 0 0
. ..-'
- ,.0' - ' / C1, 70- - 9 0
/' . /'. - ../. . /
i so- 1 / 80 - C1, .- w n
5 0 - ~ 1 , 7 0 -
0
.- > .- .s 3 0 C 0 $ 4 0 - g 2 0 - ---
-.-A-.- T. rendal l i -- .-- 50% cotton seed oil cake 3 0
l o - 0. mossomb~cus . T.rendall; } 100% maize germ 2 0
0 I I I I I I I I
0 10 2 0 3 0 4 0 5 0 6 0 7 0 10
o ,025- a. -a - .. /// .....,.... 0 .
,// ,: .......... .--; - ,0, 0 /. . .q.. .... P. *4-- <' ...... 0
10 20 3 0 4 0 5 0 6 0 7 0 8 0 Growth period (days) Growth period (days)
Fig. 7.7. Estimated grpwth rates of individual Oreochromis Key: mossambicus and Tilapia rendalli from sexed and unsexed stocks -. +.- Maize germ males only receiving different feed rations in unfertilized ponds at the - A- Maize- cotton cake males only Kasinthula Pilot Fish Farm (KPFF), Malai'wi, in 1975.(Source: ---..A No feeding on males only Pruginin and Arad 1977). -+- Maize germ, mixed sex, with Serronochromis
........ 0 ........ Maize germ,mixed sex, without predator Note: - Mirror carp ---- ( a 1 Males only both sexes stocking rate 10,000 ha
1200 - Silver carp ( b ) The term "maize germ" may refer to modeo - Silver carp Oreochromis( monosex 1 ............ Oreochromis I mixed sex 1
1000 - n
m Fig. 7.9. Estimated growth rates of individual u
8 0 0 - Oreochromis mossambicus from an all-male monosex and E both sexes during trials in fertilized ponds receiving m .- different feed rations and withlwithout the predator
Serranochromis robustus at the Kasinthula Pilot Fish Farm (KPFF), Mala%, in 1975. (Source: Pruginim and Arad 1977).
Many parts of the Southern Region, and 0 2 0 4 0 6 0 8 0 100 120 140 160 particularly the Lower Shire Valley, are clearly
G r o w t h period (days) the most biologically and ecologically suited areas
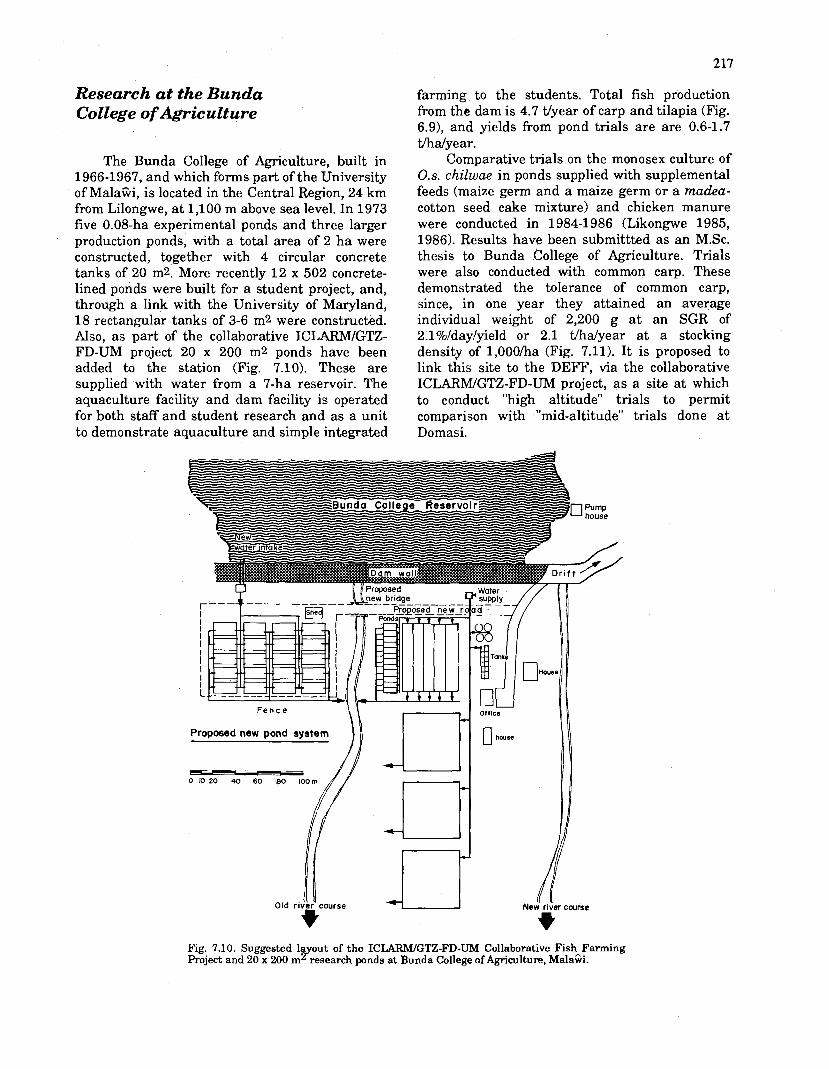
Research at the Bunda College of Agriculture
The Bunda College of Agriculture, built in 1966-1967, and which forms part of the University of MalaGi, is located in the Central Region, 24 km from Lilongwe, a t 1,100 m above sea level. In 1973 five 0.08-ha experimental ponds and three larger production ponds, with a total area of 2 ha were constructed, together with 4 circular concrete tanks of 20 m2. More recently 12 x 502 concrete- lined ponds were built for a student project, and, through a link with the University of Maryland, 18 rectangular tanks of 3-6 m2 were constructed. Also, as part of the collaborative ICLARMIGTZ- FD-UM project 20 x 200 m2 ponds have been added to the station (Fig. 7.10). These are supplied with water from a 7-ha reservoir. The aquaculture facility and dam facility is operated for both staff and student research and as a unit to demonstrate aquaculture and simple integrated
farming to the students. Total fish production from the dam is 4.7 t/year of carp and tilapia (Fig. 6.9), and yields from pond trials are are 0.6-1.7 tfhdyear.
Comparative trials on the monosex culture of 0s. chilwae in ponds supplied with supplemental feeds (maize germ and a maize germ or a madea- cotton seed cake mixture) and chicken manure were conducted in 1984-1986 (Likongwe 1985, 1986). Results have been submittted as an M.Sc. thesis to Bunda College of Agriculture. Trials were also conducted with common carp. These demonstrated the tolerance of common carp, since, in one year they attained an average individual weight of 2,200 g a t an SGR of 2.l%/day/yield or 2.1 t/ha/year a t a stocking density of 1,000ha (Fig. 7.11). It is proposed to link this site to the DEFF, via the collaborative ICLARMIGTZ-FD-UM project, as a site a t which to conduct "high altitude" trials to permit comparison with "mid-altitude" trials done at Domasi.
F e n c e
Proposed new pond system
New river course v Fig. 7.10. Suggested la out of the ICLARMIGTZ-FD-UM Collaborative Fish Farming 2Y Project and 20 x 200 m research ponds at Bunda College of Agriculture, MalaCi.

n 1,000 h d y e a r Y Z I t / h a / y e o r g 5 8 8 g / d o y
SGR 21% / d o y
u A M J
1976 1 9 7 7
Month
Fig. 7.11. Growth rates of Cyprinus carpio in ponds, and maximum and minimum air temperatures at Bunda College of Agriculture, Mala%, 1976-1977. (Source: drawn from growth data in Likongwe 1977 and air temperature data in Likongwe 1986).
Aquaculture Training
Pruginin (1971) commented that to develop any aquaculture in Mala% would require the establishment of a comprehensive training program, since there was an almost complete lack of trained fish farmers in the country. The only formal training in aquaculture in MalaGiri has been a t the FD's Fisheries Training Center, at Mpwepwe, and a t Bunda College of Agriculture. There has also been other ad hoe training, but of a minor nature, such as in conjunction with the KPFF, to project staff, members of the Mala% Young Pioneers, who were assigned to other parts of the country, and to Technical OEcers of the FD (Pruginin and h a d 1977).
This deficiency has been a major constraint on the development of aquaculture. A further problem is that the pool of trained manpower is limited: trained personnel are frequently relocated and promoted out of field operations. This presents obvious problems to continuity and retards development, as a t the KPFF (Pruginin and Arad 1977). Depending on individual personality characteristics and socioeconomic
circumstances, training can have a negative impact on attitudes and the types of jobs that a person is willing to perform, i.e., necessary tasks perceived to be beneath a person's dignity will be neglected. Thus Pruginin and Arad (1977) were prompted to observe that "it must be realized that fish culture is primarily field work, rather than laboratory or office, and that it can only be done with the right attitude towards the task".
Training Available at Present
At the Mpwepwe Fisheries Training Center, 100 lessons on fish farming, or nearly 9% of the total curriculum, were provided in the one-year course for Technical Officers (FTC 1974). The topics covered include breeding, handling, feeding, water quality, harvesting, maintenance and machinery. Practical courses are offered in association with the Fisheries Center a t Kachulu, the Fisheries Station in the Lower Shire Valley, and the DEFF. In the 1983-1984 academic year only four Mpwepwe trainees did their practical exercises a t Domasi (Msiska 1984a). In practice, only few students a t Mpwepwe elect the aquaculture option (T. Jones, pers. comm.). Trainees who complete the Mpwepwe training course successfully must then spend two or three years of on-the-job training a t the Domasi Station before becoming a Fisheries Assistant.
A total of 380 students are currently enrolled at Bunda College of Agriculture in either a five- year degree program or a three-year diploma course. Some 90 diploma students are enrolled in the three-year livestock production course, and fisheries is included in the biology section of this. The education provided in fisheries includes 16 hours on aquaculture, which entails a practical component (J.S.L. Likongwe, pers. comm.).
To date only one domestic M.Sc. degree has been awarded in an aquaculture related study (in the Department of Biology a t Chancellor College). Another is under examination a t Bunda College of Agriculture, and a t the same college a diploma- level aquaculture course was also begun in FY 1988-1989 (J.S.L. Likongwe pers. comm.). Links with plans by FA0 (Dunn and Smith 1987) and SADCC (RDA 1987) have been proposed, but as yet without follow-up developments. Other formal training in aquaculture has, to date, been on an ad hoc basis.
However, plans have now been finalized and studies initiated in fisheries and aquaculture under the regular M.Sc. program in the
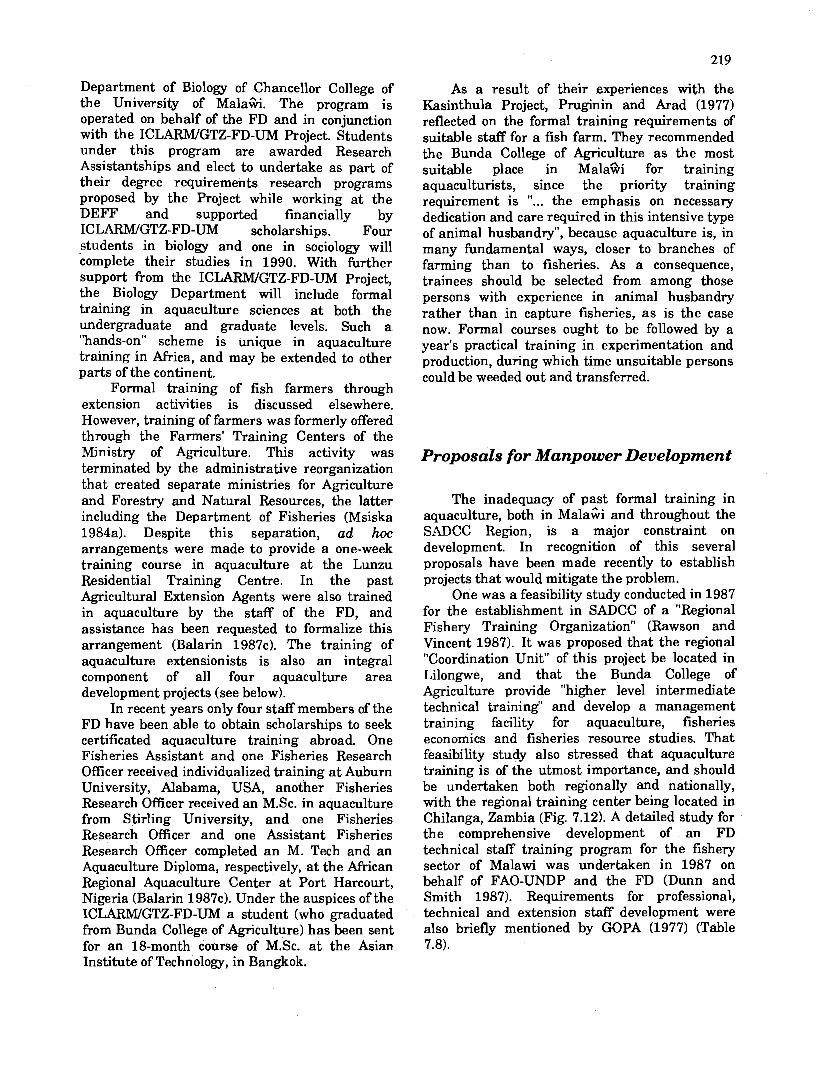
Department of Biology of Chancellor College of the University of Mala%. The program is operated on behalf of the FD and in conjunction with the ICLARM/GTZ-FD-UM Project. Students under this program are awarded Research Assistantships and elect to undertake as part of their degree requirements research programs proposed by the Project while working at the DEFF and supported financially by ICLARMIGTZ-FD-UM scholarships. Four students in biology and one in sociology will complete their studies in 1990. With further support from the ICLARMIGTZ-FD-UM Project, the Biology Department will include formal training in aquaculture sciences at both the undergraduate and graduate levels. Such a "hands-on" scheme is unique in aquaculture training in Africa, and may be extended to other parts of the continent.
Formal training of fish farmers through extension activities is discussed elsewhere. However, training of farmers was formerly offered through the Farmers' Training Centers of the Ministry of Agriculture. This activity was terminated by the administrative reorganization that created separate ministries for Agriculture and Forestry and Natural Resources, the latter including the Department of Fisheries (Msiska 1984a). Despite this separation, ad hoe arrangements were made to provide a one-week training course in aquaculture at the Lunzu Residential Training Centre. In the past Agricultural Extension Agents were also trained in aquaculture by the staff of the FD, and assistance has been requested to formalize this arrangement (Balarin 1987~). The training of aquaculture extensionists is also an integral component of all four aquaculture area development projects (see below).
In recent years only four staff members of the FD have been able to obtain scholarships to seek certificated aquaculture training abroad. One Fisheries Assistant and one Fisheries Research Officer received individualized training at Auburn University, Alabama, USA, another Fisheries Research Officer received an M.Sc. in aquaculture from Stirling University, and one Fisheries Research Officer and one Assistant Fisheries Research Officer completed an M. Tech and an Aquaculture Diploma, respectively, at the African Regional Aquaculture Center at Port Harcourt, Nigeria (Balarin 1987~). Under the auspices of the ICLARM/GTZ-FD-UM a student (who graduated from Bunda College of Agriculture) has been sent for an 18-month course of M.Sc. at the Asian Institute of Technology, in Bangkok.
As a result of their experiences with the Kasinthula Project, Pruginin and Arad (1977) reflected on the formal training requirements of suitable staff for a fish farm. They recommended the Bunda College of Agriculture as the most suitable place in Mala% for training aquaculturists, since the priority training requirement is "... the emphasis on necessary dedication and care required in this intensive type of animal husbandry", because aquaculture is, in many fundamental ways, closer to branches of farming than to fisheries. As a consequence, trainees should be selected from among those persons with experience in animal husbandry rather than in capture fisheries, as is the case now. Formal courses ought to be followed by a year's practical training in experimentation and production, during which time unsuitable persons could be weeded out and transferred.
Proposals for Manpower Development
The inadequacy of past formal training in aquaculture, both in MalaGi and throughout the SADCC Region, is a major constraint on development. In recognition of this several proposals have been made recently to establish projects that would mitigate the problem.
One was a feasibility study conducted in 1987 for the establishment in SADCC of a "Regional Fishery Training Organization" (Rawson and Vincent 1987). It was proposed that the regional "Coordination Unit" of this project be located in Lilongwe, and that the Bunda College of Agriculture provide "higher level intermediate technical training" and develop a management training facility for aquaculture, fisheries economics and fisheries resource studies. That feasibility study also stressed that aquaculture training is of the utmost importance, and should be undertaken both regionally and nationally, with the regional training center being located in Chilanga, Zambia (Fig. 7.12). A detailed study for the comprehensive development of an FD technical staff training program for the fishery sector of Malawi was undertaken in 1987 on behalf of FAO-UNDP and the FD (Dunn and Smith 1987). Requirements for professional, technical and extension staff development were also briefly mentioned by GOPA (1977) (Table 7.8).

Table 7.8. Existing and proposed staffing of the fisheries department (DF) of the government of MaIaGi.
Branch Existing staff Proposed staff Increase (a)
Headquarters Management Branch CFO DCFO ACFO PFO S F 0 FO
Subtotal
Planning, Monitoring and Evaluation Branch Economic advisor Senior fisheries economist Fisheries economist
Subtotal
Marketing and Utilization Branch Senior marketing officer Marketing officer Processing advisor
Subtotal
Fisheries Research Branch PFRO SFRO FRO Research advisor
Subtotal
Aquaculture Branch PFRO (A) SFRO (A) FRO (A) TO (A) TO (dl
Subtotal
Fishing Industry Branch SF10 Fishery inspector Boatyard manager Marine engineer Master fisherman
Subtotal
Training Branch SFTO FTO
Total staff
Source: Modified from GOPA (1987). Notes: (a) Figures in parentheses indicate essential initial requirements; (b) vacant; (c) 2 vacant; (d) Hydro- technician. List of Acronyms: CFO = Chief Fisheries Officer; DCFO = Deputy CFO; ACFO = Assistant CFO; PFO = Principal FO; FO = Fisheries Officer; FRO = Fisheries Research Officer; A = Aquaculture; TO = Technical Officer; SF10 = Senior Fisheries Industry Officer; SFTO = Senior Fisheries Training Officer.
Overseas Institutions Fellowships Seminars 1
Trams Fish Farmers, Technical Assistants
I Coordinating Unit
Fellowships Coordinates All training activities
Receives & disseminates Information
Trains Fresh Water
Research Groups
Tanzania Mbegani
Train Instructors
Receives requests Identifies courses
and clears with institutions.
MalaGi
Develops Management
Courses
Technical Assistant
Fig. 7.12. Proposed organization of the Regional Fisheries Training Program for the SADCC Subregion.
Manpower development, like research and extension, requires information. The lack of relevant and easily accessible information reinforces the other constraints to fisheries and aquaculture development in Mala% and throughout SADCC. RDA (1987) recommended that an SADCC "Regional Fisheries Documentation and Information System" be established, comprising a regional documentation and information center and nine national subcenters or "focal points" (Fig. 7.13). It was suggested that MalaGi, Zambia or Zimbabwe would be suitable locations for the regional center, owing to their relatively more advanced international communications infrastructure. As an interim solution the ICLAWGTZ-FD-UM Project has established a library and computerized information module a t DEFF, that is linked with ICLARM's Selective Fisheries Information Service, in Manila.
Aquaculture Extension
Aquaculture extension services are provided by the FD, from DEFF and from the substation a t Kunenekude, in the Mwanza District, by the Agricultural Development Divisions (ADDS), and increasingly through local farmers' clubs, the latter in collaboration with Extension Agents of the Ministry of Agriculture. They are also
provided through such development projects as MAGFAD, a t Chingale and Neno, in the Southern Region, and the EEC Project, at Mzuzu, in the Northern Region. Since extension activities are of crucial importance to both the initial development and long-term sustainability of small-scale aquaculture, they are of major 'importance in the major aquaculture development projects now in progress in ~ a l a G i (see below).
At present, the Fish Farming Branch of the FD employs 1 3 Fishery Assistants who work in research and extension. They work from 12 stations in conjunction with Agricultural Extension Assistants (LMA 1983a). The first of a number of Fisheries Extension Stations, to be established a t the Rural Development Centres (RDCs) for demonstrations, was established at Kunenekude, in the Mwanza District, in 1979, under UNICEF project auspices. It has been managed by volunteers from the US Peace Corps (USPC) and FD staff. Each of theserunits was to comprise five ponds, an office, store and staff stations housing, plus basic equipment.
At the DEFF, the Extension Officer and his Assistants are charged with providing extension services to fish farmers. They seek to develop and sustain small-scale aquaculture by providing seed to stock local ponds, offering demonstrations of good culture practices and pond design, providing field instruction and technical advice to participating fish farmers on pond location, design and management, and loan to farmers of essential but expensive equipment like a seine net for harvesting. Records are kept of each fish farmer registered with the FD.
Although the extensionists from the DEFF have been nominally responsible for ensuring aquaculture extension throughout Mala$, their main efforts have been concentrated so far in the Southern Region; in the vicinity of the DEFF, in the Chinseu and Chingale areas, around Kunenekude, Mwanza District, and, for past financial reasons, in the Mulanje, Ntcheu and Dedza districts. An average of only one month per year is spent in the Central and Northern regions (Vincke 1981).
A successful aspect of the extension outreach of the DEFF has been the holding of field days, or demonstrations. These have taken two forms: (1) day-long courses for farmers held a t the station itself; and (2) visits to the ponds of established, private, small-scale fish farmers. These demonstrations provide foci for explaining in a practical way the benefits of integrating small ponds into farming systems.
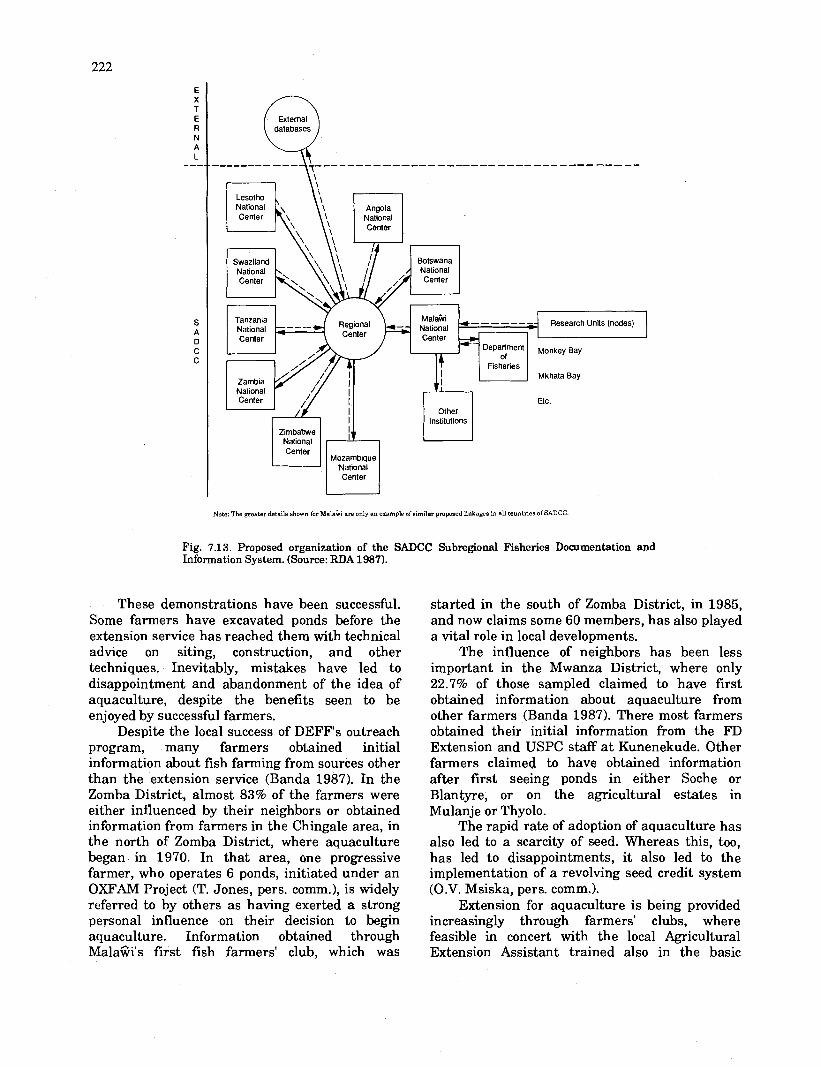
External databases n
Botswana
Research Units (nodes)
I Center I
We: The greater details shown far Mala% are only an example of similar pmposed linkages in all countries of SADCC.
Fig. 7.13. h ~ o s e d orrranization of the SADCC Subregional Fisheries Documentation and 1nTormation &stem. (source: RDA 1987).
These demonstrations have been successful. Some farmers have excavated ponds before the extension service has reached them with technical advice on siting, construction, and other techniques. Inevitably, mistakes have led to disappointment and abandonment of the idea of aquaculture, despite the benefits seen to be enjoyed by successful farmers.
Despite the local success of DEFF's outreach program, many farmers obtained initial information about fish farming from sources other than the extension service (Banda 1987). In the Zomba District, almost 83% of the farmers were either influenced by their neighbors or obtained information from farmers in the Chingale area, in the north of Zomba District, where aquaculture began in 1970. In that area, one progressive farmer, who operates 6 ponds, initiated under an OXFAM Project (T. Jones, pers. comm.), is widely referred to by others as having exerted a strong personal influence on their decision to begin aquaculture. Information obtained through MalaGi's first fish farmers' club, which was
started in the south of Zomba District, in 1985, and now claims some 60 members, has also played a vital role in local developments.
The influence of neighbors has been less important in the Mwanza District, where only 22.7% of those sampled claimed to have first obtained information about aquaculture from other farmers (Banda 1987). There most farmers obtained their initial information from the FD Extension and USPC staff a t Kunenekude. Other farmers claimed to have obtained information after first seeing ponds in either Soche or Blantyre, or on the agricultural estates in Mulanje or Thyolo.
The rapid rate of adoption of aquaculture has also led to a scarcity of seed. Whereas this, too, has led to disappointments, it also led to the implementation of a revolving seed credit system (O.V. Msiska, pers. comm.).
Extension for aquaculture is being provided increasingly through farmers' clubs, where feasible in concert with the local Agricultural Extension Assistant trained also in the basic
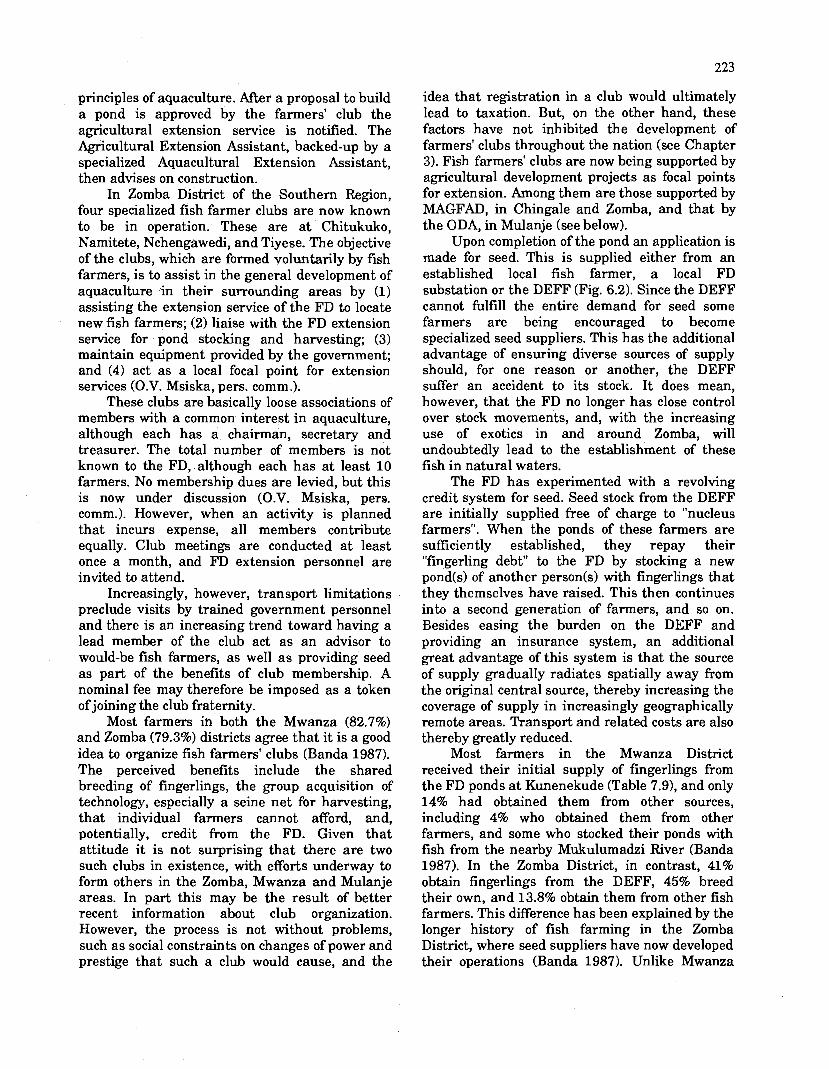
principles of aquaculture. After a proposal to build a pond is approved by the farmers' club the agricultural extension service is notified. The Agricultural Extension Assistant, backed-up by a specialized Aquacultural Extension Assistant, then advises on construction.
In Zomba District of the Southern Region, four specialized fish farmer clubs are now known to be in operation. These are a t Chitukuko, Namitete, Nchengawedi, and Tiyese. The objective of the clubs, which are formed voluntarily by fish farmers, is to assist in the general development of aquaculture in their surrounding areas by (1) assisting the extension service of the FD to locate new fish farmers; (2) liaise with the FD extension service for pond stocking and harvesting; (3) maintain equipment provided by the government; and (4) act as a local focal point for extension services (O.V. Msiska, pers. comm.).
These clubs are basically loose associations of members with a common interest in aquaculture, although each has a chairman, secretary and treasurer. The total number of members is not known to the FD, although each has at least 10 farmers. No membership dues are levied, but this is now under discussion (O.V. Msiska, pers. comm.). However, when an activity is planned that incurs expense, all members contribute equally. Club meetings are conducted at least once a month, and FD extension personnel are invited to attend.
Increasingly, however, transport limitations preclude visits by trained government personnel and there is an increasing trend toward having a lead member of the club act as an advisor to would-be fish farmers, as well as providing seed as part of the benefits of club membership. A nominal fee may therefore be imposed as a token of joining the club fraternity.
Most farmers it1 both the Mwanza (82.7%) and Zomba (79.3%) districts agree that it is a good idea to organize fish farmers' clubs (Banda 1987). The perceived benefits include the shared breeding of fingerlings, the group acquisition of technology, especially a seine net for harvesting, that individual farmers cannot afford, and, potentially, credit from the FD. Given that attitude it is not surprising that there are two such clubs in existence, with efforts underway to form others in the Zomba, Mwanza and Mulanje areas. In part this may be the result of better recent information about club organization. However, the process is not without problems, such as social constraints on changes of power and prestige that such a club would cause, and the
idea that registration in a club would ultimately lead to taxation. But, on the other hand, these factors have not inhibited the development of farmers' clubs throughout the nation (see Chapter 3). Fish farmers' clubs are now being supported by agricultural development projects as focal points for extension. Among them are those supported by MAGFAD, in Chingale and Zomba, and that by the ODA, in Mulanje (see below).
Upon completion of the pond an application is made for seed. This is supplied either from an established local fish farmer, a local FD substation or the DEFF (Fig. 6.2). Since the DEFF cannot fulfill the entire demand for seed some farmers are being encouraged to become specialized seed suppliers. This has the additional advantage of ensuring diverse sources of supply should, for one reason or another, the DEFF suffer an accident to its stock. It does mean, however, that the FD no longer has close control over stock movements, and, with the increasing use of exotics in and around Zomba, will undoubtedly lead to the establishment of these fish in natural waters.
The FD has experimented with a revolving credit system for seed. Seed stock from the DEFF are initially supplied free of charge to "nucleus farmers". When the ponds of these farmers are sufficiently established, they repay their "fingerling debt" to the FD by stocking a new pond(s) of another person(s) with fingerlings that they themselves have raised. This then continues into a second generation of farmers, and so on. Besides easing the burden on the DEFF and providing an insurance system, an additional great advantage of this system is that the source of supply gradually radiates spatially away from the original central source, thereby increasing the coverage of supply in increasingly geographically remote areas. Transport and related costs are also thereby greatly reduced.
Most farmers in the Mwanza District received their initial supply of fingerlings from the FD ponds at Kunenekude (Table 7.9), and only 14% had obtained them from other sources, including 4% who obtained them from other farmers, and some who stocked their ponds with fish from the nearby Mukulumadzi River (Banda 1987). In the Zomba District, in contrast, 41% obtain fingerlings from the DEFF, 45% breed their own, and 13.8% obtain them from other fish farmers. This difference has been explained by the longer history of fish farming in the Zomba District, where seed suppliers have now developed their operations (Banda 1987). Unlike Mwanza
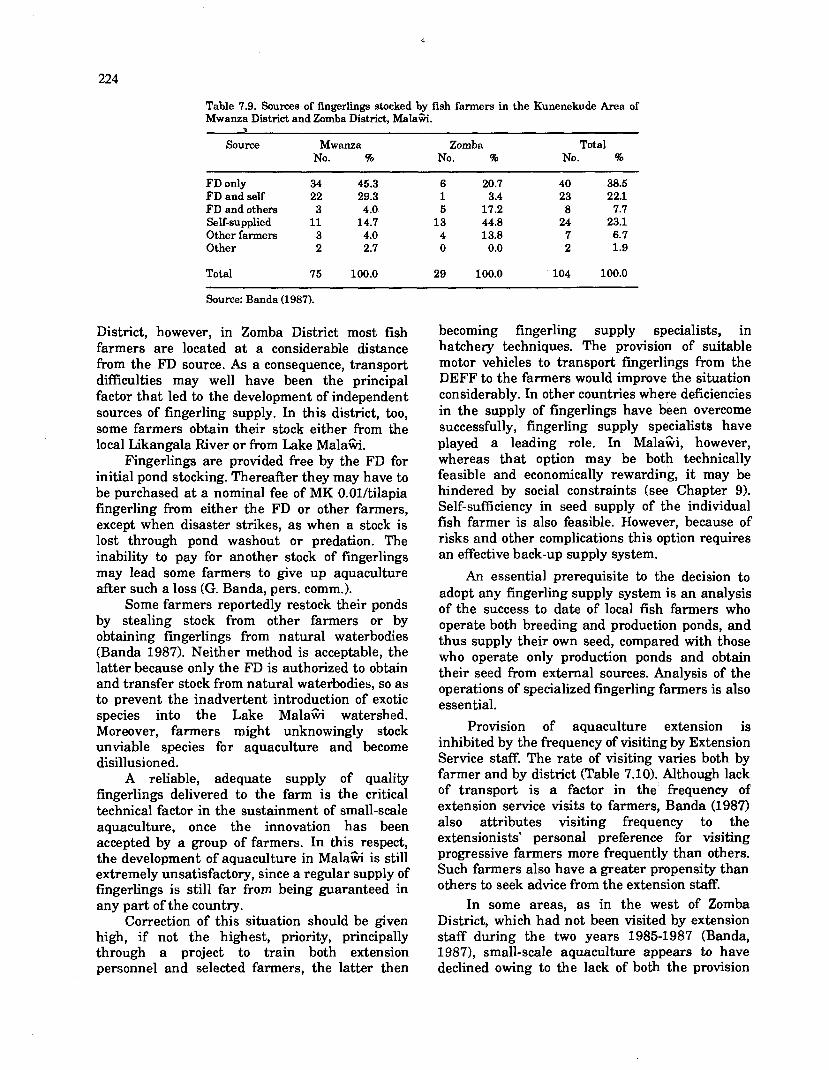
Table 7.9. Sources of fingerlings stocked by fish farmers in the Kunenekude Area of Mwanza District and Zomba District, Malaa.
Source Mwanza Zomba Total No. % No. % No. %
FD only 34 45.3 6 20.7 40 38.5 FD and self 22 29.3 1 3.4 23 22.1 FD and others 3 4.0- 5 17.2 8 7.7 Self-supplied 11 14.7 13 44.8 24 23.1 Other farmen 3 4.0 4 13.8 7 6.7 Other 2 2.7 0 0.0 2 1.9
Total 75 100.0 29 100.0 104 100.0
Source: Banda (1987).
District, however, in Zomba District most fish farmers are located at a considerable distance from the FD source. As a consequence, transport difficulties may well have been the principal factor that led to the development of independent sources of fingerling supply. In this district, too, some farmers obtain their stock either from the local Likangala River or from Lake Mala%.
Fingerlings are provided free by the FD for initial pond stocking. Thereafter they may have to be purchased at a nominal fee of MK O.Ol/tilapia fingerling from either the FD or other farmers, except when disaster strikes, as when a stock is lost through pond washout or predation. The inability to pay for another stock of fingerlings may lead some farmers to give up aquaculture after such a loss (G. Banda, pers. comm.).
Some farmers reportedly restock their ponds by stealing stock from other farmers or by obtaining fingerlings from natural waterbodies (Banda 1987). Neither method is acceptable, the latter because only the FD is authorized to obtain and transfer stock from natural waterbodies, so as to prevent the inadvertent introduction of exotic species into the Lake MalaG watershed. Moreover, farmers might unknowingly stock unviable species for aquaculture and become disillusioned.
A reliable, adequate supply of quality fingerlings delivered to the farm is the critical technical factor in the sustainment of small-scale aquaculture, once the innovation has been accepted by a group of farmers. In this respect, the development of aquaculture in Mala% is still extremely unsatisfactory, since a regular supply of fingerlings is still far from being guaranteed in any part of the country.
Correction of this situation should be given high, if not the highest, priority, principally through a project to train both extension personnel and selected farmers, the latter then
becoming fingerling supply specialists, in hatchery techniques. The provision of suitable motor vehicles to transport fingerlings from the DEFF to the farmers would improve the situation considerably. In other countries where deficiencies in the supply of fingerlings have been overcome successfully, fingerling supply specialists have played a leading role. In MalaGi, however, whereas that option may be both technically feasible and economically rewarding, it may be hindered by social constraints (see Chapter 9). Self-sufficiency in seed supply of the individual fish farmer is also feasible. However, because of risks and other complications this option requires an effective back-up supply system.
An essential prerequisite to the decision to adopt any fingerling supply system is an analysis of the success to date of local fish farmers who operate both breeding and production ponds, and thus supply their own seed, compared with those who operate only production ponds and obtain their seed from external sources. Analysis of the operations of specialized fingerling farmers is also essential.
Provision of aquaculture extension is inhibited by the frequency of visiting by Extension Service staff. The rate of visiting varies both by farmer and by district (Table 7.10). Although lack of transport is a factor in the frequency of extension service visits to farmers, Banda (1987) also attributes visiting frequency to the extensionists' personal preference for visiting progressive farmers more frequently than others. Such farmers also have a greater propensity than others t o seek advice from the extension staff.
In some areas, as in the west of Zomba District, which had not been visited by extension staff during the two years 1985-1987 (Banda, 1987), small-scale aquaculture appears to have declined owing to the lack of both the provision

Table 7.10. Frequency of visits by FD extension st& to fish farmers in the Kunenekude Area of Mwanza District and in Zomba District, MalaGi.
Frequency Mwanza Zomba Total No. of No. of No. of
farmers % farmers % farmers %
1-2 /month 45 60.0 3 10.3 48 46.1 3-5 /month 4 5.3 4 13.8 8 7.7 1-2 /month 6 8.0 2 6.9 8 7.7 2-4 /year 12 16.0 15 51.7 27 26.0 1-2 /year 2 2.7 1 3.5 3 2.9 never 6 8.0 4 13.8 10 9.6
Total 75 100.0 29 100.0 104 100.0
Source: Banda (1987).
and seeking of extension advice. Frequent visiting by the small DEFF staff is logistically difficult, particularly with limited vehicles and operating funds. In Zomba District fish farmers may commonly be located 15-20 km apart (Fig. 7.14), except in the southern part, where the relatively large number of farmers within a small area can be attributed to the fish farmer's club. In the Mwanza District, in contrast, several fish farmers are easier to visit during a short period, despite the rough topography, since they are located only some 2-5 km apart. Despite the severe limitation, 90% of the fish farmers sampled by Banda in Mwanza and Zomba districts claimed to have been visited at least once annually by extension staff.
Although incomplete records prevent full assessment, the success of the extension efforts of the DEFF may be gauged roughly by the rate of establishment of new ponds. Thirty such ponds were established in the Zomba area between 1983 and 1986, and there are now an estimated 100 farmers operating some 200 ponds, of which 51% were built in the last five years (R. Noble, unpub. field notes and pers. comm.). In the Kunenekude area of Mwanza District the number increased from 20 to 400 during the same period (O.V. Msiska, pers. comm.). The most recent figures, for 1987, suggest as many as 600 ponds (Banda 1987).
These figures do not include ponds established outside the recognized official system, and which are not registered with the FD. As a consequence, they are not eligible for extension assistance. Although most fish farmers are registered with the FD, those who are not expressed an unwillingness to have the government interfere in their decisionmaking (10.3% of the total in Zomba) (Banda 1987). In particular, it was claimed that if free fingerlings were accepted from the FD then farmers could not
harvest fish freely, as they desired, and neither could they afford to adhere to the feeding regime required by the FD for recordkeeping purposes: the FD's effort to establish a statistical database on local aquaculture. Thus they prefer to obtain seed stock from other farmers, and be free to develop their own management techniques and set their own harvesting schedule (Banda 1987). This has important implications for the interactions between extensions and local people.
However, unregistered farmers, who are not visited by the FD staff, make use of extension advice indirectly by obtaining information from their friends who are registered and are therefore visited. Thus lack of registration has little effect on the diffusion of knowledge.
The development of aquaculture is clearly hampered by two basic deficiencies in the extension service. One is the acute shortage of adequately trained personnel, particularly Fisheries Assistants, to interact with the fish farmers or potential farmers (Vincke 1981). There is an urgent need to train a t least 50 such persons (T. Jones, pers. comm.). The second is to enhance the physical mobility of these personnel. Most conduct their work a t present by walking around the large area for which they are responsible, since even departmental bicycles are lacking, and personal bicycles are beyond the financial capacity of most people. In Kenya, Coche and Balarin (1982) showed that extension officers making their rounds either on foot, bicycle or public or official transport could visit only 7 fishponds per month, whereas more mobile officers on motorcycles were able to visit over 33 during the same period. The situation in MalaGi is similar (Table 8.1 1).
The extension service urgently requires supporting by both a more adequate provision of documentation and information as well as by

Smallholding with pond ----5: A. Boundary --. District Bound.ary
U H i l I \$ f M a i n rood ---_ -,--Minor rood
3/;.\86
-River 0v.f -%,'--.
'.?. 1 b ~ . / .J
Note: Ponds at 610 to 1,220m above sea level
Fig. 7.14. Partial distribution of small-scale farms with fishponds in the Zomba District, Mala%, 1988. (Source: R. Noble, pers. comm.).

research on the sociological aspects of extension. In particular, the results of the biological research conducted a t the DEFF and elsewhere should be documented and assessed more comprehensively. Further, given the speed with which small-scale farmers in MalaOi are adopting aquaculture (Chapter 8), there is an urgent need to distill this research and to present the beneficial results in a comprehensive handbook for use by extension personnel, as well as in a both highly practical and popular format for direct use by the small- scale fish farmers themselves. Limited attempts have been made a t this, such as the pamphlet by Mathotho (1975), addressed to extension personnel, that by the Malaf i-German Fisheries and Aquaculture Development Project (MAGFAD), addressed to fish farmers, as well a s a manual in ChicheGa, by Nyirenda and Ziyite (in press).
Some schools in MalaGi provide either formal or informal training in small-scale aquaculture. The ideas thus implanted, and particularly if supported by practical experience as part of the school curriculum and later reinforced by the example of demonstration and field days by the extension service, and, initially, by peers who successfully adopt the practice, would seem to be a major way of recruiting young farmers into small-scale intensive aquaculture. Thus an enthusiastic headmaster a t a school in Dowa was able temporarily to reinforce the practice in that area (LMA 1983a), as was another a t the Government School in Domasi (Jones 1978).
At the St. Stanislaus Preparatory Seminary, in Thondwe, located on the main highway between Blantyre and Zomba, in the Southern Region, the priest in charge had learned informally about aquaculture while himself a student. The single fishpond, about 500Im2 in area and stocked with 0.s. chilwae, T. rendalli, and C. carpio, was constructed amid ricefields principally to provide a pleasant "natural" site for meetings, open days and a location for the general entertainment functions of the seminarians and visitors. In this way i t also acted as a demonstration unit and provided fish for the school canteen. The 60-70 seminarians are all taught the theory and practice of fish farming during their first year a t the institution. The course, based on class notes made by the priest, comprises four 30-minute lessons per week, for 42 weeks. The bulk of the course is devoted to the practical aspects of pond construction and routine management tasks (i.e., feeding and manuring). This course is complemented by others on general agriculture.
Aquaculture Development Projects in Mala%
There are three main internationally supported projects for the area development of aquaculture currently underway in Mala%. These are the "Central and Northern Regions Fish Farming Development, Extension, Training, and Research Project", the project on "Fish farming in the MulanjePhalombe District", and the "Mala%- German Fisheries and Aquaculture Development Project" (MAGFAD) (Table 7.11). The three projects have the expressed objective of reducing the nation's deficit in the supply of animal protein, and thus all are targetted primarily on the small-scale farm household, the most nutritionally deprived sector. All include a major emphasis on extension and training, as well as an infrastructural development component. These projects are scheduled to operate for five years, from 1987 to 1991. The other principal project now in operation is the "Research for the Development of Tropical Aquaculture Technology Appropriate for Implementation in Rural Africa", undertaken by ICLAWGTZ in collaboration with the FD and UM.
Other projects are either smaller in scope, or still either in the feasibility study or proposal stage. A project now ongoing, begun in 1987 and scheduled to run until 1990, is the IDRC- supported infrastructural development a t the DEFF and research there on "Polyculture of Indigenous Species". Feasibility studies have been undertaken on behalf of the FA0 for the development of aquaculture in small water bodies. A complementary proposal for a pilot project to develop fish farming in dams in the Central Region [GOPA 19871, has been discussed above (see Chapter 6.)
Area Development Projects for Aquaculture
THE CENTRAL AND NORTHERN REGIONS FISH FARMING DEVELOP- MENT, EXTENSION, TRAINING AND RESEARCHPROJECT
The design of this major project, supported financially by the EDF of the EEC, was based upon the proposal made by LMA (1983a). The project is divided into four main components: an Extension Unit, a Production Facility, a Training Unit, and a Research Unit. Some or all of these

Table 7.11. Summary of the principal characteristics of the main aquaculture development projects in MalaGi. -- -
Project title, supporb ing agency, total fin- ancial cost (% local contribution, period) Goals Outputs Objectives
To implement development of aquaculture in the Northern -, and Central Regions of Malam via extension, training and research activities b a d on aquaculture stations a t Domasi, Mzueu. Nkhata Bay, Wovwe and Dowa-Ntchisi.
-- -
- improve fish supply via fish culture
- provide inexpensive animal pmtein - imomve w a l nutrition
- from fish culture operations established by the project
Central and Northern Regions fish farming development, extension, train in^ and research
increase the national produc- tion of culture fisheries by 696.6 t, with a total revenue of K 431.690 - encouragement ofadoption of aquaculture
- training of Fisheries Depcb ment ~ersannel to sustain
(ea'peeially of children) - imomve income of mal l
- integrate fish culture with other on-farm agri- cultural activities - intmduce eommemial fish
fish ckture development on completion ofproject
farms to estates to impmve nutrition of laborers
- enhance fish production - rewareh to establish species and eystems best adapted to high elevation sites
Fish farming in the MulanjePhalombe District. ODA (United Kingdom) MK0.784 million (2l.9) 1987-91 (6 years)
To mitigate the large de6cit in animal umtein consumution
- demonstrate the viability of small-scale fish farm-
- centralized aquaculture sub- station in the District
in the ~ i s i r i c t by stimulahg and u~madinrr small-scale fish
ing - supply seed fish to farms - train existing and p m s
pective fish brrmers
- stimulation of local fish farmina
farming thro& demonstration, wed production, extension and training programs and via integrated farming.
- trainedFisheries Deprment personnel to continue lccal
- kine pond productivity and reduce costs through
work after project is completed
integrated farming - construction of local
aauaculture station - trhining of Filheriea Deprtment personnel
The ~ala%-German fisheries and aqua- culture development project, pilot phase DGTZ (Federal Republic
- augmentation of lccal staff of Fisheries Department
To promote the development of artisanal fisheries and aquaculture in the Southern Region, to provide an assured supply of fresh fish in the Southern Region
- preliminary study of feed and fertilizer availability and economic viability of fish cultivation in different parts of the Region
- survev of aquacultural
trained in aqu&ulture exten- sion
- mme small-scale farmers trained in techniques of simple aquaculture
- augmentation of fish supply, with farmed output at 300 kg/ W e a r - improved fingerling supply to local fish farmers from spe- cialized fingerling farmers
of Germany) MK 7,396,555 (6.615) 1986-93 (7 years)
poteniial ofthe Region - development of trainina
matenals and trainingof extension assistant trainers
- implementation of small- scale pilot development projects
Research for the Dev- Through collaborative biolog- elopment of Tropical ical and socioeconomic research Aquaculture Technology to investigate past failures Appropriate for Imple- in aquaculture in Africa and mentation in Rural to develop and demonstrate Africa (ICLARMIG'IZ) more appropriate system for MK 3,400,000 Africa with Mala% as the lead 1985-1991 research center, in cmperation
with the FD and UM
better understanding of the socioeconomic factors
- development of aquaculture research faalities of Mala% as a l a d center for small- impinging on small-scale
agriculture and the role of aquaculture as an integral subsystem of the farm
male wnd research - publiihed research results - establishment of an inform-
ation service for aquaculture - training of research person-
el through higher degree studies
biological research orien- ted to the socioeconomic nature of the farm
- wide dissemination of the results through training and information service
Development of National To improve existing training Fisheries Training Pro- facilities at Mpwepwe and gram Bunda College of Agriculture UNDP-FA0 to offer better aquaculture MK 4,000,OM) (approx.) training to meet national 1988-1 991 staffing needs (includes cap (not yet implemented) ture fisheries component)
Development of Small Survey of all small water bod- Water Bodies in the ies in Northern and Central Northern and Central Regions and implementation of Regions a management program for them UNDP-FA0 MK 500,000 (approx) 1988-1 989 (not yet implemented)
Fisheries Sector Review Provision of assistance to the World Bank FD via an advisor to cmrdi-
nate all development projects (No further details and recommend to the World available) Bank area for future assis-
tance
Polyculture research IDRC (No details yet available) (No details yet available) (No details yet available) MK 500,000
Source: Compiled by authors from DGTZ Cl986), GOM (1986d). W M Cl987a) and GOM (1987b).
- To meet WF staffing needs Training of FD staff at all levels
Improved levels of Ash - Increased fish production consumption in communities living near such water bodies
Coordination of develop - Prioritize allocation of ment investment development funds
components will operate from fish farming stations either developed from scratch or upgraded by the project (Table 7.12).
The priority role of the Extension Unit is to work in conjunction with the Agricultural Extension Assistants to help small-scale farmers. Their principal task is to make recommendations to farmers about appropriate siting of ponds, pond design and management, arrange the seed supply, and provide solutions to operational problems. Simple manual equipment, such as wheel-barrows used in pond construction and nets for harvesting, will be loaned, and assistance provided to obtain credit. Under the general supervision of the Extension Unit, the Production Facility manages the ponds of the fish farms both to ensure the seed supply and to run demonstrations for farmers.
The main function of the Training Unit is to ensure a supply of Technical Assistants to the Extension Unit, I t will also provide refresher courses to project staff members and will coordinate the training of farmers.
Three main functions are to be performed by the Research Unit. The first is to undertake trials to increase pond yields by developing improved methods of fish culture, particularly those involving the use of species not hitherto cultured, as well as to enhance pond yields in the cooler waters at higher elevations. Second is the identification of and experimentation with the residues of other on-farm agricultural operations for use as fish feeds and pond fertilizers. Third is working with the Extension Unit to identify other parts of the country in which fish culture is
feasible, then to develop viable systems for such areas, and to monitor their adoption by small- scale fish farmers.
During its first three years, the project will be implemented by expatriate and local counterpart staff. At the end of this period, an internal evaluation will be made and a decision taken as to whether or not financial support should be sought for the construction of an additional two stations during the final two years of the project. Should this expansion not occur, the development phase of the project will be terminated and local personnel alone will then concentrate on serving the fish farming community. After five years, the anticipated additional fish supplied as a result of the project is estimated a t almost 700 t (GOM 1987e).
THE PROJECT ON FISH FARMING IN THE MULANJEIPHALOMBE DISTRICTS
With a few minor variations, the principal conceptual characteristics and methods of implementation and operation of this project reflect those of that just described, but scaled down to fit the requirements of a single District where some small-scale farmers have adopted aquaculture as a result of the extension and demonstration activities of the DEFF. The objective of this project is, in close cooperation with the Blantyre ADD, to establish a centralized aquaculture station in this district to support local farmers with extension, as well as to train FD
Table 7.12. Planned development of fish farming stations by the Northern and Central Regions Fish Farming Development, Extension, Training and Research Project, Malafvi.
Station Functions Comments
Domasi (1 (2)
Nkhata Bay
Wovwe (1 (2)
Dowa-Ntchisi
National fish farm training center Research
Project headquarters Mainly research, training and extension
Extension, seed supply and demonstration
Extension and seed supply Pilot work on commercial fish farming
Extension, demonstration and seed supply
Fisheries and other government staff to be trained, together with private farmers
To be established in first year of project
To be established in first year of project
To be established in fourth year of project
To be developed specifically for the Central Region and for aquaculture at relatively high elevations
Source: Compiled from GOM (1987a) and LMA (1983a).

staff. Research will focus on adaptive techniques suitable for local ecological and socioeconomic conditions, and particularly on the culture of tilapias and common carp. An important secondary function of this project is to support fish farming on private estates, of which there are many in the MulanjeIPhalombe District, in order to improve laborers' diets (Beveridge and Stewart 1986).
THE MALA%GERMAN FISHERIES AND AQUACULTURE DEVELOPMENT PROJECT (MAGFAD)
The aquaculture component of this project aims at developing, testing and introducing viable models of aquaculture into the Southern Region by establishing, together with the extension service of the FD, extension centers in selected locations. It also seeks to identify and use the self- help potential of target groups for aquaculture in the areas in which the extension centers are located, to facilitate the adoption of aquaculture by small-scale farmers and eventually to secure an assured supply of fresh fish to the general population of the extension areas. It is intended to produce 300 kglhalyear of farmed fish by completion of the externally funded phase of the project. Further, one or two advanced fish farmers in each extension area will be assisted to become specialized producers and suppliers of fingerlings for sale to other local farmers. Management guidelines for fish production from estate reservoirs will also be developed and tested for the benefit of estate laborers and inhabitants of nearby settlements (DGTZ 1986).
In the preliminary phase of this project, surveys were conducted on the availability of fish feeds and pond fertilizers, together with an economic viability study of fish farming, in various parts of the Southern Region. This preliminary work was intended to elucidate problems and constraints in small-scale aquaculture and to define suitable systems and species for culture in the Southern Region, and so to define research needs and propose pilot trials for the project. Extension activities, training courses and pilot projects have now been implemented based on those preliminary surveys.
During the second phase of this pilot project, four extension workers, either from the Fisheries Training Center at Mpwepwe, or from the DEFF, will be given theoretical and on-the-job training at the DEFF. Assisted by project personnel, these four persons will then be responsible for training
up to 50 Technical Assistants from the Ministry of Agriculture in the basics of aquaculture. In turn, these Technical Assistants will instruct fish farmers in the techniques of pond construction and fish culture, under the supervision of FD extension workers (DGTZ 1986). The final objective of this pilot project, completed a t a recent planning workshop, is design of a long- term project for the development of aquaculture in the Southern Region (DGTZ 1986).
Research Projects For Aquaculture Development
THE ICLARWGTZ-FD-UM PROJECT, RESEARCH FOR THE DEVELOPMENT OF TROPICAL AQUACULTURE TECHNOLOGY APPROPRIATE FOR IMPLEMENTATION IN RURAL AFRICA
In concept and design this project is distinct from, yet complementary to, the three aquaculture development projects on-going in ~ a l a % . Emphasis is placed on socioeconomic studies of aquaculture in Mala% (Table 7.13), of which this study is one contribution. This study will serve as a pilot investigation for later replication in other African nations. A better sociocultural understanding of the target group, and particularly of the small-scale farmer, is seen as an essential prerequisite to the formulation of other aspects of the project. Similarly, another fundamental prerequisite is the analysis of the past experience of aquaculture development efforts in Mala%, and elsewhere in Africa, lest unnecessary and wasteful repetition occur. A unique thrust of this project is the evaluation of the usefulness of Southeast Asian aquaculture technologies for application to rural African settings. Another principal aspect of the project is research on integrated aquaculture in MalaGi, based on the results of the sociocultural, ecological and biological studies, on-station (at the DEFF), on-farm trials of integrated farming are being conducted, based mainly on the use of locally available on-farm resources (Table 7.13).
The project is conducting research using staff and M.Sc. and other students from the University of Mala%, thereby providing a much needed training input. Staff from the FD and Ministry of Agriculture are also involved in some of the studies. This approach ensures that the expertise developed remains in-country, and that through
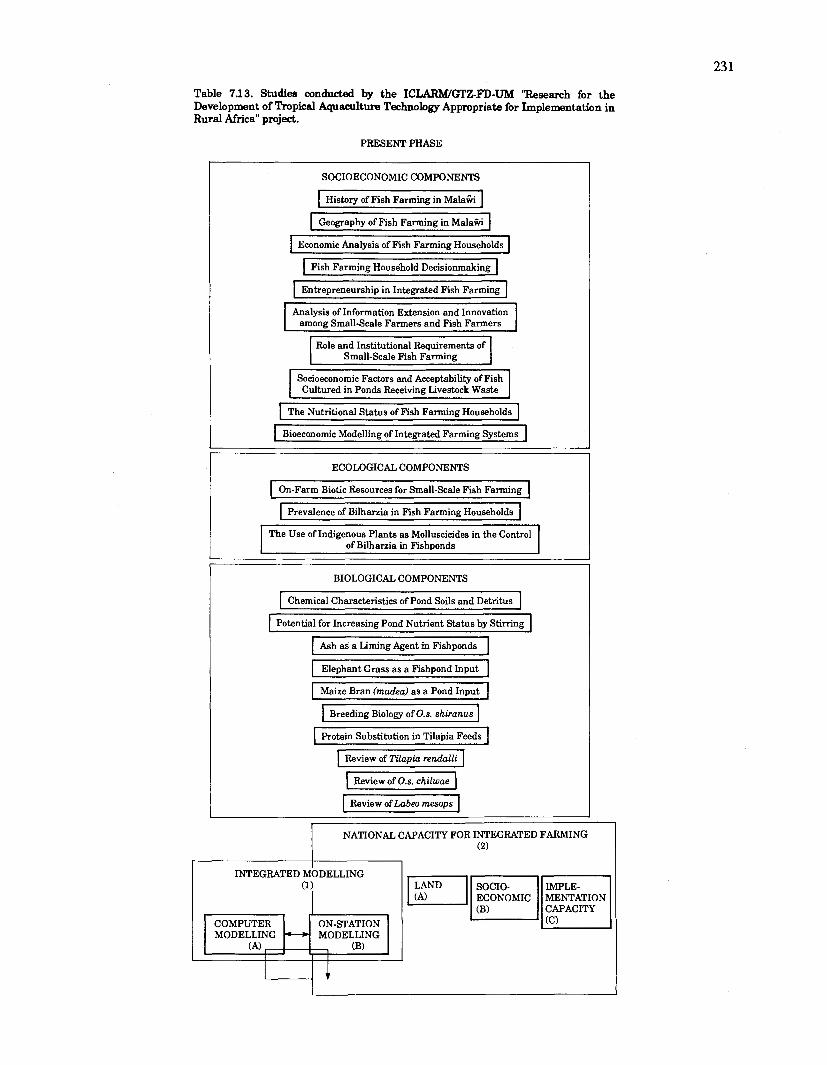
Table 7.13. Studies conducted by the ICLARM/GTZ-FD-UM "Research for the Development of Tropical Aquaculture Technology Appropriate for Implementat ion in Rural Africa" project.
PRESENT PHASE
SOCIOECONOMIC COMPONENTS
I Histow of Fish Farmine in Mala% 1 I Geoaaphv of Fish Farming in Mala* 1
I Economic Analysis of Fish Farming Households 1 -- 1 Fish Farming ~ o u s e g l d Decisionmaking 1
Entrepreneurship in Integrated Fish Farming
I Analvsis of Information Extension and Innovation I I a m k g Small-Scale Farmers and Fish Farmers ( Role and Institutional Requirements of
Small-Scale Fish Farming
Socioeconomic Factors and Acceptability of Fish 1 Cultured in Ponds Receiving Livestock Waste I I The Nutritional Status of Fish Farming Households
I I Bioeconomic Modelling of Integrated Farming Systems ]
I ECOLOGICAL COMPONENTS
I On-Farm Biotic Resources for Small-Scale Fish Farming 1
I 1 Prevalence of Bilhania in Fish Farming Households
I The Use of Indigenous Plants as Molluscicides in the Control of Bilharzia in Fishponds I
I BIOLOGICAL COMPONENTS
Chemical Characteristics of Pond Soils and Detritus 4
I Potential for Increasine Pond Nutrient Status bv Stirrine I I - -
I Ash as a Liming Agent in Fishponds I I - - 1
I E l e ~ h a n t Grass a s a Fishpond Input 1 I Maize Bran (madea) as a Pond Input
Breeding Biology of 0.s. shiranus
1 Protein Substitution in Tilapia Feeds
I Review of Tilaoia rendalli I -
1 Review of 0.s. chilwae 1 1 Review of Labeo mesops I
J
NATIONAL CAPACITY FOR INTEGRATED FARMING (2)
I
I COMPUTER ON-STATION I / MODELLING MODELLING
CAPACITY

UM staff informal training, such as occurs when lecturers use students as research assistants or when they incorporate their research findings into their lectures, will lead to a wider dissemination of this knowledge than could otherwise be expected. In addition, a computerized aquaculture reference library has been established at the DEFF to serve as an information service for African aquaculture scientists. This is linked with the Network of Tropical Aquaculture Scientists (NTAS) and Aquabyte, coordinated and published, respectively, a t ICLARM headquarters, in Manila.
THE POLYCULTURE PROJECT OF THE IDRC
The objective of this project, based at the DEFF, is to develop a system of polyculture for ponds and small impoundments, and that can be adopted easily by smallholder farmers. The most appropriate system will be selected after screening candidate species, understanding their food habits, determining limiting nutrients in fishponds, and identifying and controlling fish parasites. An economic analysis of fishpond construction methods will be made. Further objectives of the project are to upgrade the research capability of the DEFF, txain a core staff in applied aquaculture research, and prepare training and teaching materials for extension workers and fish farmers, respectively (GOM n.d.b; O.V. Msiska, pers. comm.).
Conclusion
Clearly, in the absence of good coordination, such a large number of undertakings couTd easily
overload Malas's absorption capacity for aquaculture inputs. In particular, the major constraint is the scarcity of trained, local manpower, since there are still only three adequately trained and experienced Senior Fisheries Oficers for aquaculture.
However, as is stated in the national strategy for the development of fisheries, the framework for aquaculture development in Mala% is to be constructed around the Central and Northern Regions Fish Farming Development, Extension, Training and Research Project. All other projects will be coordinated with this major effort, which is targetted on two entire regions of the country.
As noted above with respect to extension, it is important to recall that a considerable volume of basic data has already been accumulated on the problems and constraints inhibiting the fuller development of small-scale aquaculture in Southern Mala%. Much is also known about feed and manure supply; basic systems are now being modelled, and basic trials conducted on suitable species for pond stocking. However, the existing data require organization and analysis, and various pond trials bear careful replication. Unless the geographical areas and scientific topics to be examined in all these projects are judiciously selected, if already available data are not closely scrutinized, and if close coordination is not fostered and maintained among all on-going projects, needless repetition and the squandering of the all too scarce MalaGan counterpart manpower and resources are likely unintended outcomes. Above all, the sociocultural constraints being studied under the ICLARMIGTZ-FD-UM project need fuller elucidation and appreciation in the implementation of the area development projects.

Chapter 8
SMALL-SCALE FARMING SYSTEMS AND AQUACULTURE
Introduction
The remaining category of the private sector of MalaGian aquaculture, not discussed in Chapter 6, is small in scale and is undertaken by pockets of small-scale farmers, located in various parts of the country,. but mostly concentrated in the Southern Region. All such aquaculture is done in ponds under extensive and semi-intensive systems. At one time more than 1,000 smallholder ponds were believed to have been in operation in the Northern Region (T. Jones, pers. comm.), but this may have been an overestimate. There is no up-to-date information on the current situation in that region, as there has been a recent major upsurge there of interest in aquaculture. However, surveys suggest that 700-1,000 ponds may exist.
Ponds range in size from 0.01 to 0.6 ha, and yields from 0.5 to 2.5 thdyear . Most estimates, however, are between 1.0 and 1.5 tkalyear. Estimates of total aquaculture production in Mala% have ranged from 22.1 tfyear, in 1983 (LMA 1983a) to 29.7 t/year, in 1987. Overall estimates have ranged from 98 to 106 tfyear (Balarin 1987~) (Table 6.1). Although records on pond inputs are far from satisfactory, data available on semi-intensive operations indicate food conversion ratios of about 3:1, from fish fed with madeya in manured ponds (LMA 1983a).
Indigenous species of tilapia, such as T. rendalli, 0 s . shiranus, and 0s. chilwae, often known collectively as chambo, are those mainly cultured (Table 8.1). Introduced species (Table 8.1), mostly common carp (Cyprinus carpio), are cultivated by small-scale farmers on a more limited scale in Zomba District. Other species not uncommonly reared include Barbus spp. and Clarias gariepinus, which are sometimes accidentally introduced into the pond via the water supply or occasionally deliberately stocked
by farmers either from preference as a food fish or because of a scarcity of fingerlings of other more favorable species (Banda 1987).
A reliable source of water is one of the main determinants of the location of fishponds. Thus, the principal locational characteristic of the areas in which most small-scale fishponds have developed in ~ a l a & i is siting either in or adjacent to large upland catchments from which reliable rainfall sustains small perennial streams that can be used to supply ponds by gravity. Seepage points or springs are also sometimes utilized.
Most small-scale fishponds in ~ a l a G i are essentially family farm, subsistence operations. Those operated semi-intensively absorb as pond inputs only a part of the total amount of byproducts (mostly chicken manure and mudeyu together with other crop residues and kitchen wastes which may be used in compost piles often located in the ponds) produced on the farm, and which may have important alternative uses. They depend mainly on family labor for their operation, and generally yield fish for household consumption, with occasional amounts for either sale or gifi-giving.
In all cases, only simple technology and manual labor are used for pond construction and all other related activities. Where the FD's extension service is either not available or has not been consulted, pond siting and construction techniques are not uncommonly poor. Although some small-scale operations select male tilapia manually for monosex culture, most ponds are stocked with both males and females, often resulting in overpopulation and stunting. Feeding and pond fertilization are usually erratic, where practised at all. However, in better managed operations, and particularly where the extension service has had the greatest impact, production is generally better (LMA 1983a; Beveridge and Stewart 1986; O.V. Msiska, pers. comm.).
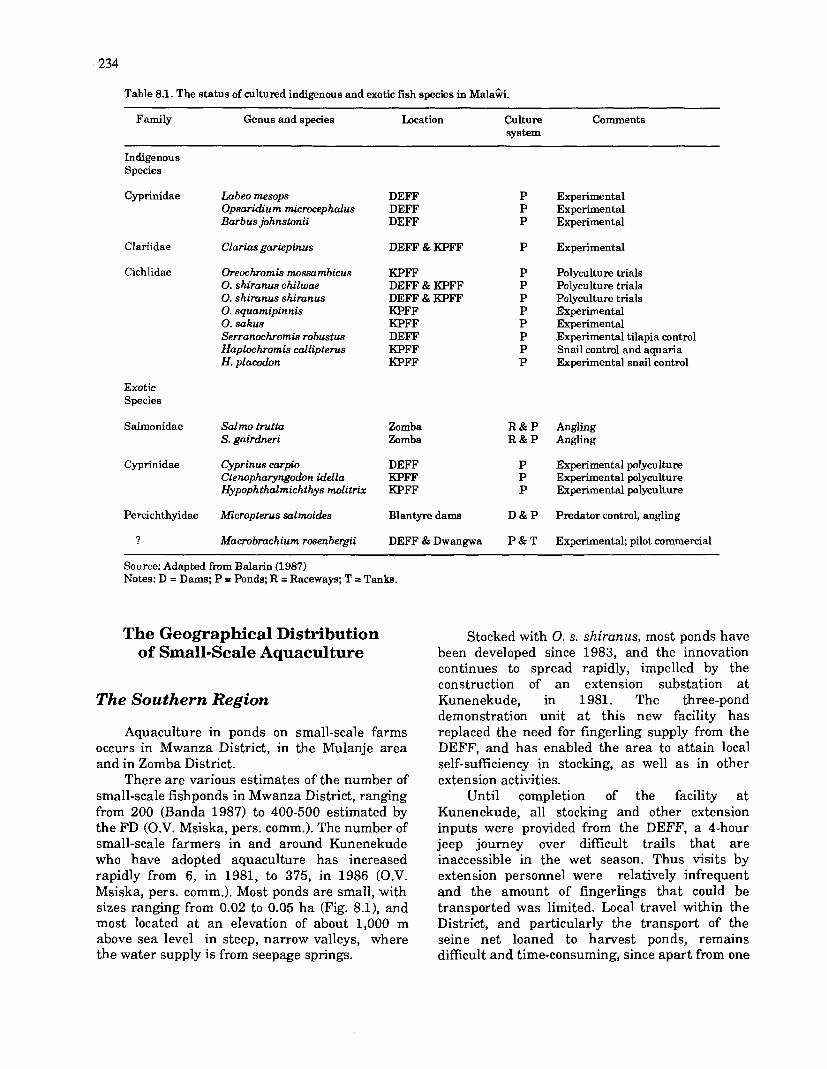
Table 8.1. The status of cultured indigenous and exotic fish species in Mala%.
Family Genus and species Location Culture Comments system
Indigenous Species
Cyprinidae
Clariidae
Cichlidae
Exotic Species
Salmonidae
Cyprinidae
Percichthyidae
?
Labeo mesops Opsaridium microcephalus Barbus johnstonii
Clarias gariepinus
Oreochromis mossambicus 0. shiranus chilwae 0. shimnus shiranus 0. squamipinnis 0. sakus Serranochromis robustus Haplochromis callipterus H. placodon
Salmo truth S. gairdneri
Cyprinus carpio Ctenopharyngodon idella Hypophthalmichthys molitrix
Micropterus salmoides
Macrobrachium rosenbergii
DEFF DEFF DEFF
DEFF & KPFF
KPFF DEFF & KPFF DEFF & KPFF KPFF KPFF DEFF KPFF KPFF
Zomba R & P Zomba R & P
DEFF P KPFF P KPFF P
Blantyre dams D & P
DEFF & Dwangwa P & T
Experimental Experimental Experimental
Experimental
Polyculture trials Polyculture trials Polyculture trials Experiment a1 Experimental Experimental tilapia contml Snail control and aquaria Experimental snail contml
Angling Angling
Experimental polyculture Experimental polyculture Experimental polyculture
Predator control, angling
Experimental; pilot comnlercial
Source: Adapted from Balarin (1 987) Notes: D = Dams; P = Ponds; R =Raceways; T = Tanks.
The Geographical Distribution of Small-Scale Aquaculture
The Southern Region
Aquaculture in ponds on small-scale farms occurs in Mwanza District, in the Mulanje area and in Zomba District.
There are various estimates of the number of small-scale fishponds in Mwanza District, ranging from 200 (Banda 1987) to 400-500 estimated by the FD (O.V. Msiska, pers. comm.). The number of small-scale farmers in and around Kunenekude who have adopted aquaculture has increased rapidly from 6, in 1981, to 375, in 1986 (O.V. Msiska, pers. comm.). Most ponds are small, with sizes ranging from 0.02 to 0.05 ha (Fig. 8.1), and most located a t an elevation of about 1,000 m above sea level in steep, narrow valleys, where the water supply is from seepage springs.
Stocked with 0. s. shiranus, most ponds have been developed since 1983, and the innovation continues to spread rapidly, impelled by the construction of an extension substation a t Kunenekude, in 1981. The three-pond demonstration unit a t this new facility has replaced the need for fingerling supply from the DEFF, and has enabled the area to attain local self-sufficiency in stocking, as well as in other extension activities.
Until completion of the facility a t Kunenekude, all stocking and other extension inputs were provided from the DEFF, a 4-hour jeep journey over difficult trails that are inaccessible in the wet season. Thus visits by extension personnel were relatively infrequent and the amount of fingerlings that could be transported was limited. Local travel within the District, and particularly the transport of the seine net loaned to harvest ponds, remains difficult and time-consuming, since apart from one

Mwanza district
F l
Zomba /Chingale
n-82 i= 488m"
Pond area (rn2)
Fig. 8.1. Size distribution of fishponds in Mwanza and Zomba Districts, Mala&& 1988. (Sources: Drawn from unpub. field data.) Notes: For Mwanza District n = 26 and x = 199 m2; for Zomba District n = 82 and x = 488 m2.
motorbike the extension staff lacks even bicycles (O.V. Msiska, pers. comm.).
Fishponds developed in the Mulanje area as early as 1974, and one farmer claims that he began aquaculture in the 1920s (0. Kalinga, pers. comm.). Some 84 are located around Mulanje Mountain, a t an average elevation of 600 m above sea level (Beveridge and Stewart 1986) (Tables 6.1 and 8.2). In general, these are larger in area than those in the Mwanza District, and have a perennial water supply from streams running off the Mulanje Massif. In general, the ponds are well constructed and well managed. Those that are poorly designed were apparently constructed without the prior invalvement of the extension service. Small-scale farmers with ponds in this area are now becoming independent in seed supply, as a result both of local production and from the newly constructed FD station. The monosex rearing of male tilapia by hand sexing is practised by some farmers, and yields may attain 1.5 t/ha/year in manured ponds where madea is supplied. The conversion ratio of madea in these ponds ranges from 5:l to 10:l (Beveridge and Stewart 1986).
Over 100 small-scale farmers with fishponds are located around the Zomba Plateau (Banda
1987), a t elevations of 700-900 m above sea level. R. Noble (pers. comm.) suggests that over 200 ponds are in existence, although those which are nonfunctioning have not been distinguished (Fig. 7.14). Water supplies are from perennial streams from this upland region. Farmers in this district generally operate ponds larger than those in other areas in the Southern Region, some being as large as 0.4 ha, although they average 300-400 m2 (Fig. 5.1). Pond construction and management in this area are generally of a high standard, and have benefitted from the close proximity to the DEFF and the MAGFAD project,. Local seed supply has become established, with one farmer maintaining six fry ponds to supply other farmers, in addition to his own 0.4-ha production pond. In the main, hand-sexed male or mixed-sex tilapia are raised in ponds fed with madea and composted crop residues and kitchen wastes. Yields are around 1.5 tkalyear, and under exceptionally good management have attained 2.5 fialyear (LMA 1983a; DEFF, unpub. data).
The Central Region
Over 100 small ponds are reported to have been excavated in undulating terrain a t Njonja, 32 km west of Dedza, and about 65 in the Ntcheu District (LMA 1983a). The six 0.03-ha ponds at Njonja have been sunk into the ground and receive their water supply from a perched water table. Fingerlings (species not identified in source)
Table 8.2. The status-of small-scale fwh farms in Mulaqje District, Malawi, 1986. - --
Ecological Location Number Number planning of of area(l) farmers ponds
wno MJn2 ~ ~ n 2 MJ/13 MJn3 w 3 w n 4 MJLl.4 MJn5 MJn6
?(2)
Total
Chambe Thembe Zipangani Misanjo Chiyama Milonde Mathambi Nan& Mimosa Namasalima
?
Source: Bweridge and Stewart (1986). Notes: (1) EPA M J / l O is in Mulaqje West, the remainder are in Mulaqje South. (2) Neither the EPA nor the location are given in the source.
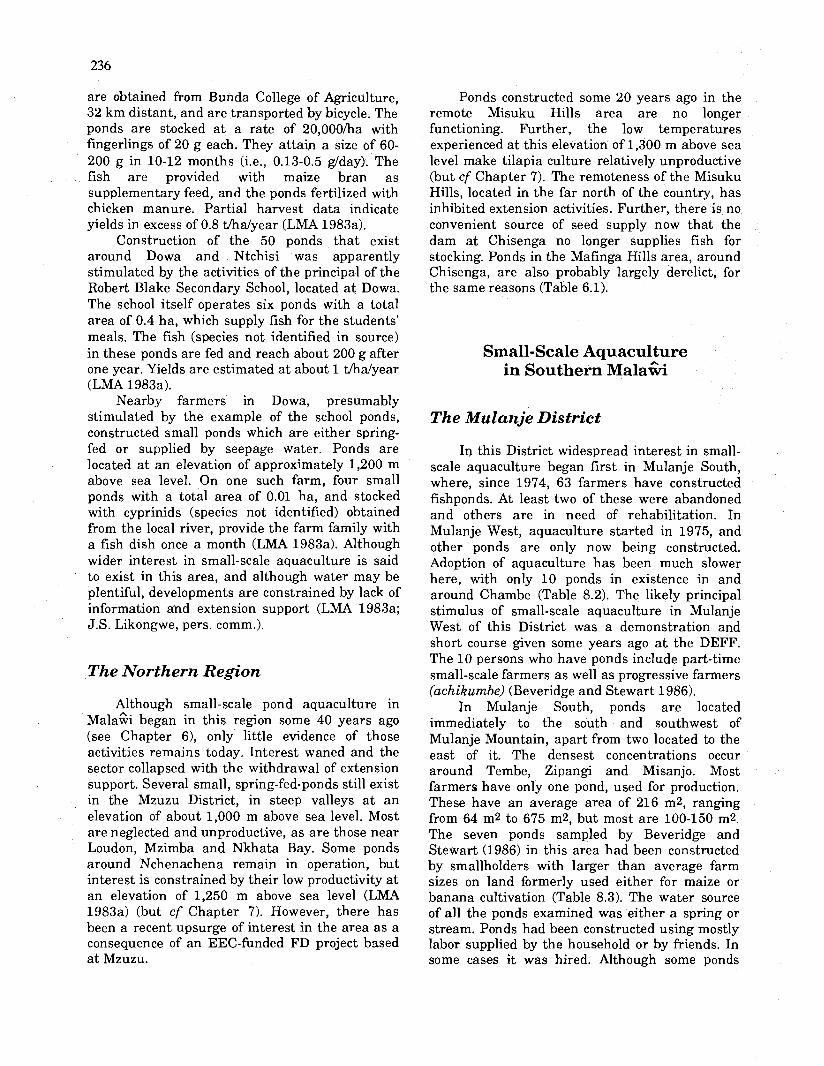
are obtained from Bunda College of Agriculture, 32 km distant, and are transported by bicycle. The ponds are stocked a t a rate of 20,000ha with fingerlings of 20 g each. They attain a size of 60- 200 g in 10-12 months (i.e., 0.13-0.5 glday). The fish are provided with maize bran as supplementary feed, and the ponds fertilized with chicken manure. Partial harvest data indicate yields in excess of 0.8 t hdyea r (LMA 1983a).
Construction of the 50 ponds that exist around Dowa and Ntchisi was apparently stimulated by the activities of the principal of the Robert Blake Secondary School, located a t Dowa. The school itself operates six ponds with a total area of 0.4 ha, which supply fish for the students' meals. The fish (species not identified in source) in these ponds are fed and reach about 200 g after one year. Yields are estimated at about 1 W'ha/year (LMA 1983a).
Nearby farmers in Dowa, presumably stimulated by the example of the school ponds, constructed small ponds which are either spring- fed or supplied by seepage water. Ponds are located at an elevation of approximately 1,200 m above sea level. On one such farm, four small ponds with a total area of 0.01 ha, and stocked with cyprinids (species not identified) obtained from the local river, provide the farm family with a fish dish once a month (LMA 1983a). Although wider interest in small-scale aquaculture is said to exist in this area, and although water may be plentiful, developments are constrained by lack of information and extension support (LMA 1983a; J.S. Likongwe, pers. comm.).
The Northern Region
Although small-scale pond aquaculture in ~ a l a % i began in this region some 40 years ago (see Chapter 6), only little evidence of those activities remains today. Interest waned and the sector collapsed with the withdrawal of extension support. Several small, spring-fed-ponds still exist in the Mzuzu District, in steep valleys a t an elevation of about 1,000 m above sea level. Most are neglected and unproductive, as are those near Loudon, Mzimba and Nkhata Bay. Some ponds around Nchenachena remain in operation, but interest is constrained by their low productivity a t an elevation of 1,250 m above sea level (LMA 1983a) (but cf Chapter 7). However, there has been a recent upsurge of interest in the area as a consequence of an EEC-funded FD project based at Mzuzu.
Ponds constructed some 20 years ago in the remote Misuku Hills area are no longer functioning. Further, the low temperatures experienced at this elevation of 1,300 m above sea level make tilapia culture relatively unproductive (but cf Chapter 7). The remoteness of the Misuku Hills, located in the far north of the country, has inhibited extension activities. Further, there is no convenient source of seed supply now that the dam at Chisenga no longer supplies fish for stocking. Ponds in the Mafinga Hills area, around Chisenga, are also probably largely derelict, for the same reasons (Table 6.1).
Small-Scale Aquaculture in Southern ~ a l a %
The Mulanje District
IQ this District widespread interest in small- scale aquaculture began first in Mulanje South, where, since 1974, 63 farmers have constructed fishponds. At least two of these were abandoned and others are in need of rehabilitation. In Mulanje West, aquaculture started in 1975, and other ponds are only now being constructed. Adoption of aquaculture has been much slower here, with only 10 ponds in existence in and around Chambe (Table 8.2). The likely principal stimulus of small-scale aquaculture in Mulanje West of this District was a demonstration and short course given some years ago a t the DEFF. The 10 persons who have ponds include part-time small-scale farmers as well as progressive farmers (achikumbe) (Beveridge and Stewart 1986).
In Mulanje South, ponds are located immediately to the south and southwest of Mulanje Mountain, apart from two located to the east of it. The densest concentrations occur around Tembe, Zipangi and Misanjo. Most farmers have only one pond, used for production. These have an average area of 216 m2, ranging from 64 m2 to 675 m2, but most are 100-150 m2. The seven ponds sampled by Beveridge and Stewart (1986) in this area had been constructed by smallholders with larger than average farm sizes on land formerly used either for maize or banana cultivation (Table 8.3). The water source of all the ponds examined was either a spring or stream. Ponds had been constructed using mostly labor supplied by the household or by friends. In some cases it was hired. Although some ponds

237
Table 8.3. Summary of the characteristics of a case study of the fishponds of seven small-scale farms in the southern part of Mulanje Distri&, Mala%, 1986.
Total Iacation farm (village) size
(ha) -
Robeni 3.0
Tambala 2.5
Ngolowera 3.5
Chalama 2.0
Golden 1.5
Golden ?
Golden ?
Ponds No Size
(m2)
2 170 1000
Pond construction
costs (b)
O.C. + 0.01 MWm2
O.C. +hired labor
O.C. + 0.42 MWm2
O.C. + hired labor
O.C. + 0.86 MWm2
information not available
Pond inputs Chicken Cattle Madea Waste Tabldb: ianu.re(c) manure(c) (b) Fruit(b) Scraps
Yes Yes Yes no no (76) (5) (0 + P)
Yes no yes yes no ( 0 + P) (0)
Income fmm
pond (a) MWm21year)
0.17
0.14
0.18
0.07
0.125 0.23
0.05
0.08
Source: Beveridge and Stewart (1986). Notes: (a) For &reign exchange rates, see p. 302; (b) OC = Opportunity cost, 0 = Sourced on-farm, P = Purchased off-farm (generally by bartering against salt); (c) Numbers in parentheses refer to total head of livestock.
were constructed based on information received from the DEFF, most had been designed with advice from friends or neighbors.
In the early days of aquaculture in this District, ponds were stocked with 0.s. shiranus obtained from the DEFF. But now there is an ODA-FD-funded station in this area, most farmers use this source, others fulfill their needs from their own breeding ponds. Ponds are stocked a t a rate of 1-1.3 individualdm2. Only one farmer practises hand-sexed monosex male tilapia culture (Beveridge and Stewart 1986).
Although rates of pond inputs vary greatly among farms, all fish farmers in Mulanje South provide supplemental fish feed, principally madea produced from their own maize crop. Sometimes it is supplemented with madea obtained by bartering against salt. Additional feeding is with kitchen and crop residues, the latter including waste or spoiled advocado pears (Persea sp.), overripe papayas (Carica papaya), and the leaves of cocoyam, cabbage and other greens. All ponds are fertilized with chicken manure produced on the farm, but a t rates which vary greatly among farms. Extra supplies are not sought off-farm. Only one farmer uses other manures in his pond, the others reserving them for the crop components of the farm (Beveridge and Stewart 1986).
Ponds are usually harvested twice a year, using a seine net borrowed either from one of the fish farmers or from the DEFF. No yield estimates are available, since harvests are not weighed. Part of the harvest is used for family subsistence and that not required by the producing household is either sold or bartered a t the pond side, immediately after harvesting. The local sale of the fish produced is easy and demand is enough to absorb a greatly increased production. Sales are made readily, since word of an impending harvest passes around quickly. However, this demand is seasonal, slackening off among the rural population in the cash-short months before the crop harvests are made (Beveridge and Stewart 1986) (Fig. 5.9).
Major problems encountered in the fish farms of this area include poor growth rates and stunting, insufficiency of water in the dry season, seepage from ponds, and predation, especially by otters. Prior to the construction of the new FD station a further constraint was deficiencies in the extension service, since visits from officers had become infrequent, owing to both personnel shortages and the remoteness of the area from Domasi (Beveridge and Stewart 1986; O.V. Msiska, pers. comm.). These districts are 150 km from the DEFF, thus travel was both time-

consuming and prohibitively expensive. Further, as aquaculture develops elsewhere in the country, demands on the extension service increase, reducing the amount of attention that can be devoted to any single area. Again, the urgency of the trained manpower deficit of aquaculture extension officers is demonstrated as being a major constraint on fulfilling the future potential of the industry in ~ a l a k . Despite these constraints there is widespread interest in Mulanje West with respect to the adoption of aquaculture (Beveridge and Stewart 1986), and this was the justification for the ODA assistance to this area.
The Mwanza District
The 2,295 km2 Mwanza District is located in western Mala%, in the Southern Region (Fig. 3.1). Much of the District is moderately rugged upland, with elevations above sea level ranging from 333 m to 1,421 m. It has a moderate to high amplitude of relief, and is best suited to reafforestation for use as forest reserves (GOM 1978~). Compared with Mala% as a whole, as well as with the Southern Region, the Mwanza District is much less intensively utilized for agriculture. It also has a much greater percentage (48%) of its land "vacant", since only 170 km2 is cultivated (55.4 km2 under agricultural estates and 114.6 km2 by subsistence farmers)~(Tables 3.2 and 3.3). Population pressure is also much less. (All data in this section are derived from GOM 1978c. Although used with the present tense and more than a decade old, they are the latest available, and so should be considered as indicators only.)
The District is drained by the Shire River system, by the Mwanza River and Wankurumadzi rivers. The former is perennial in its upper reaches but dry for 75% of the year in the lower course. The latter is perennial (GOM 197th).
The climate has two well defined seasons: the rainy season (November-March) with a mean average precipitation of 750-1,375 mm, when about 80-90% of the total rainfall is received, and the dry July-October season (Fig. 3.14). The latter is broken by occasional, localized orographic precipitation, which may cause flash floods and wash-out ponds (particularly owing to the disruptions of deforestation). Data on mean annual air temperature, which fluctuate between 18 and 24°C (Fig. 3.161, and evaporation data (Fig. 3.20) are available in UNDP (1 986).
The drainage pattern has been severely disrupted by cultivation on overly steep slopes, as well as by deforestation to supply both timber for curing tobacco on estates and fuelwood for rural households. The result has been accelerated erosion and deposition of sediments in water- courses (GOM 1978c), and, more importantly from the perspective of aquaculture, the loss of the water-retention and controlled release capacity of the forested areas. Thus streams dry up in the dry season and uncontrolled runoff in the wet season results in floods and destruction of fish ponds (Banda 1987). This has long-term implications for the viability of aquaculture, since the rate of deforestation in Mwanza District is increasing, as it is throughout ~ a l a % i .
If widespread small-scale aquaculture is to succeed in this District, a major reafforestation effort is required to regulate water flow rates and ensure a perennial supply. This effort must be underaken concomitant with the development of ponds, lest small-scale fish farmers experience severe disappointments and loss of investment, and so give up aquaculture. Thus the paramount role of integrated rural development must be stressed. Fish farming cannot be seen in isolation from other development inputs.
Of particular interest is that the Mwanza District has one of the largest concentrations of fishponds in MalaGi, and yet, as Tables 3.2 and 3.3 indicate, it lacks wetlands. This is but one indication of how macroanalysis can mislead, and suggests that those areas with the greatest extent of wetlands (e.g., Mchinji) may have an enormous yet untapped potential for aquaculture development.
DEMOGRAPHIC CHARACTERISTICS
The total population of Mwanza District was an estimated 121,267 persons in 1987 (GOM 1986a) (Tables 3.2 and 3.3). The growth rate for the District is 4.79% a year, compared with 3.75%/year for ~ a l a % i as a whole.
The overall population density of Mwanza District was an estimated 53km2 in 1987 (GOM 1987b), compared with 37/km2, in mid-1983 (GOM 1986a) and 33km2 in 1977 (GOM 1978~). The population density of Mwanza South was 31/km2 and that of Mwanza North 19km2, in 1977. These figures are, however, grossly misleading. Based on the mid-1983 total population estimate, a more accurate figure for the population density for the settled areas of Mwanza District is an astounding 459 personskmz, with the southern portion

having a proportionately greater density than the northern. (This figure was reached by deducting the areas under physical infrastructure, National Parks and Forest Reserves, those with slopes in excess of 12%, and vacant land [Tables 3.2 and 3.31 from the total area of the district, before calculating population density. This assumes that such areas are either not inhabited or have only an insignificant number of inhabitants.)
The population is relatively youthful, with 62.07% in Mwanza North being less than 25 years of age, and 32.81% being younger than 10 years. The sex ratio in Mwanza North is 0.70, compared with 0.95 for the District as a whole (GOM 1978~). This can be ascribed largely to the outmigration of male labor, especially to the estates in the Thyolo, Mulanje and Blantyre districts of the Southern Region, or to the Central Region (GOM 1978~). It thus results in a large number of farm households either permanently or seasonally headed by females, the implications of which for agriculture and aquaculture are discussed later.
AGRICULTURAL LANDHOLDINGS
The average landholding size in Mwanza North is 1.24 ha, with a range of 0.12-3.62. Almost 85% of the holdings are less than 2 ha in area (Fig. 8.2). Each holding contains several fragmented gardens, which, in turn, are composed of one or more contiguous plots. In this area there are an average of 2.77 gardens per 1.24 ha holding, the average size of each being 0.45 ha. The average number of plots per holding is 5.07 and per garden 1.62. The average size of each plot is 0.24 ha. Mean distances of the various plots from the house ranges from 100 m to 1.67 km (GOM 1978~).
Mean- 124 ha
-50%-t35%4--15%- I
Form size ( h a )
Fig. 8.2. Size distribution of small-scale farms in Mwanza District, Mala%, 1978. (Source: Drawn from data in GOM 1 9 7 8 ~ )
AGRICULTURAL SYSTEMS AND PATTERNS OF GARDEN CROPPING
The bulk of the cultivated area in the Mwanza district is devoted to field crops. Most households also own a range of fruit trees, particularly bananas and tangerines, which provide mostly for household consumption with a small surplus for sale. The principal fruits trees are orange (owned by 41% of the households, with an average of 3 trees per household), tangerines (62 and 25, respectively), guava (51 and 2, respectively), pear (52 and 2, respectively), lemon (35 and 2, respectively), papaya (53 and 2, respectively) and banana (86 and 19, respectively).
Pure stand cultivation of crops is relatively rare among small-scale farmers, since scattered crops of cucurbits, pulses, sweet potatoes and the like are commonly interplanted among the main crop. Close to 60% of the cultivated area is devoted to fixed combinations of crops. Maize is the dominant crop grown in pure stands (Table 8.4), followed, in descending order, by sweet potatoes, pulses, millet, and peanuts. Maize with pulses is the dominant form of intercropping, being planted on 52% of the cultivated area. Maize grown in both pure stands or in combination with another crop occupies almost 92% of the cultivated area, reflecting its importance in household subsistence. Pulses are planted over some 54% of the area cultivated.
THE CULTIVATION CALENDAR FOR GARDEN CROPS
Land preparation for maize cultivation begins in June, with general clearance, followed by soil ridging, which occurs during the period July-October. Most planting is done in October and November, although it sometimes continues into December (Table 8.5). Local varieties are planted first, followed by hybrids. The maize crop is generally weeded twice during the period November-February, and occasionally three times. Harvesting begins in March and is mostly completed by mid-May.
Three crops of beans are cultivated per year. The first crop sown is rainfed, and intercropped on the planting ridges either between the maize plants, or together in the same holes. Dwarf varieties are used in the latter case and climbers in the former. The same cultivation practices as are applied to the maize are used for this crop. The rainfed bean crop is harvested in February-

Table 8.4. Area under principal cropping patterns in Mwanza North, Mala%, 1977(a).
Pattern Area Percentage of (ha) total area
Maize Maize + pulses Maize + peanuts Maize + millet Maize + pulses + millet Maize + peanuts + millet Maize + pigeon peas Maize + pigeon peas + millet Maize + pulses + pigen peas Maize + peanuts + pigeon peas Maize + manioc Peanuts Peanuts + pigeon peas Millet Sweet potatoes Sweet potatoes + green grams Pulses Cotton Other (not specified)
Total
Source: GOM (197%); Ndengu and Kawonga (1986a). Note: (a) Based on a sample of 150 households.
Table 8.5. Crop cultivation calendar of small-scale farmers for one annual cycle in Mwanza District, Mala%.
Crop Months Sept. Od. Nov. Dec. Jan. Feb. Mar. Apr. May June July Aug.
Maize L LP LPWF LPWF WF W H H H H BL BL Cotton L L LP P W S W S S S H H H U B L Beans(a) L LP LPW LPW W HW H Beans(b) LP LP H H Beans(c) H H L LP Manioc H H HLP LP LPW Peanuts LP L P W W W H H Cowpeas LP LPW LPW W H H Sweet potatoes LP LP LP H H H
Source: After Ndengu and Kawonga (1986a). Notes: (a) intercropped; (b) relayed; (c) dimba (fallow season); B = burning plant residues; F = fertilizing; H = harvesting; L = land preparation; P = planting; S = spraying; U = uprooting plants; W = weeding.
March. The second annual crop is grown in pure stands. Land preparation is performed in March- April. In relay cropping of beans after maize, the maize leaves are sometimes stripped from the plant, to reduce shading of the beans, and placed in the furrow between the planting ridges to mulch. Two rows of beans are then sown along the planting ridge. Occasionally beans are planted in a separate plot. The final crop is the dimba crop, planted in July-August and harvested in October- November. This crop may either be interplanted with maize or grown as a pure stand (GOM 1978~).
Peanuts are both intercropped with maize and grown in pure stands. When grown alone the plot is ridged in November-December, and planted soon afterwards. The crop is weeded by hand in late December and again in late January. Peanuts grown in pure stands are harvested during March-April. The nuts are stripped from the plant in the field, and dried a t the house site.
The cultivation tasks and sequence of operations for growing cowpeas, pigeon peas and intercropped beans is the same as for maize, since, apart from the dimba crop and the winter crop of beans, these legumes are invariably

intercropped with maize. Only the harvesting months vary. Legumes are generally harvested prior to the maize crop, although pigeon peas are left in the field and harvested after the maize (GOM 1978~).
GARDEN CROP MELDS
Crop yields are shown in Table 8.6 and the range of yields in Table 8.7. Maize is the principal subsistence crop. At 1,114.94 kg/ha, mean yields of maize grown in pure stands in Mwanza North are almost the same as the national average of 1,112 kgha. The relatively little which is maize grown alone with applications of fertilizer has mean yields of 1,652.5 kglha, whereas maize grown without fertilizer yields a t a mean rate of 1,055.73 kg/ha (GOM 1978~). Fertilizer
(ammonium sulfate) is applied a t a rate of 128.75 kgha. Almost 50% of the plots have yields of less than 1 t/ha and less than 1% have yields in excess of 3 &a.
At 1,304.04 kgha, mean maize yields are higher when intercropped with pulses than when grown in pure stands. This probably results from the nitrogen fixing capacity of the pulses. (On the other hand, the yield of pulses is lower when intercropped with maize.) However, when intercropped with other crops the mean maize yields decline to 780.5 kgha with peanuts and 583 kgha with millet, for example (GOM 1978~).
The mean yield for peanuts grown in pure stands is 225 kglha. This is far lower than the national average of 488 kgka. When combined with maize the mean yield declines to only 96.7 kg/ha.
Table 8.6. Yields of principal m p s in Mwanza North, MalaGi, 1977(a).
Main crop yield Interplanting yield C ~ P type % Households Mean Standard error Mean Standard error
cultivating (b) (kg/ha/crop) of the mean (kghafcrop) of the mean
Maize 69 1,114.94 62.41 Peanuts 15 225.00 41.1 2 Millet 12 532.94 125.24 Pulses (1st crop) 24 185.60 72.86 Sweet potatoes 63 2,754.96 279.56 Maize + pulses 76 1,304.04 90.78 87.56 11.56 Maize + peanuts 23 780.52 112.35 96.75 20.81 Maize + millet 15 582;'94 143.55 418.28 108.18 Pulses (c) 18 233.97 60.42
Source: Compiled from data in GOM (1978~). Notes: (a) Based on a sample of 150 households; 03) Refers to percentage of total sample size; (c) = successive cropping.
Table 8.7. Ranges in yield,of principal crops in Mwanza North, Mala%, 1977 (a). - - - - - - - -
Crop type Percentage of plots by yield rate (kgha) Failure 1-499 500-999 1,000-1,499 1,500-1,999 <2,000
Maize 3 12 33 28 15 9 Peanuts 11 83 < 6 > Pulses 36 44 17 < 3 > Pulses 03) 33 56 7 < 4 > Millet 0 61 35 < 4 > Sweet potatoes 5 2 17 10 14 52 Maize 5 10 31 26 20 8 + pulses 44 55 0.5 0.5 <PO-> Maize 18 24 28 24 6 0 + peanuts 31 69 < 0 > Maize 29 25 29 < 17 > + millet 0 74 26 < 0 >
Source: Compiled from data in GOM (1978) Notes: (a) Based on a sample of 150 households; (b) Intercropped.
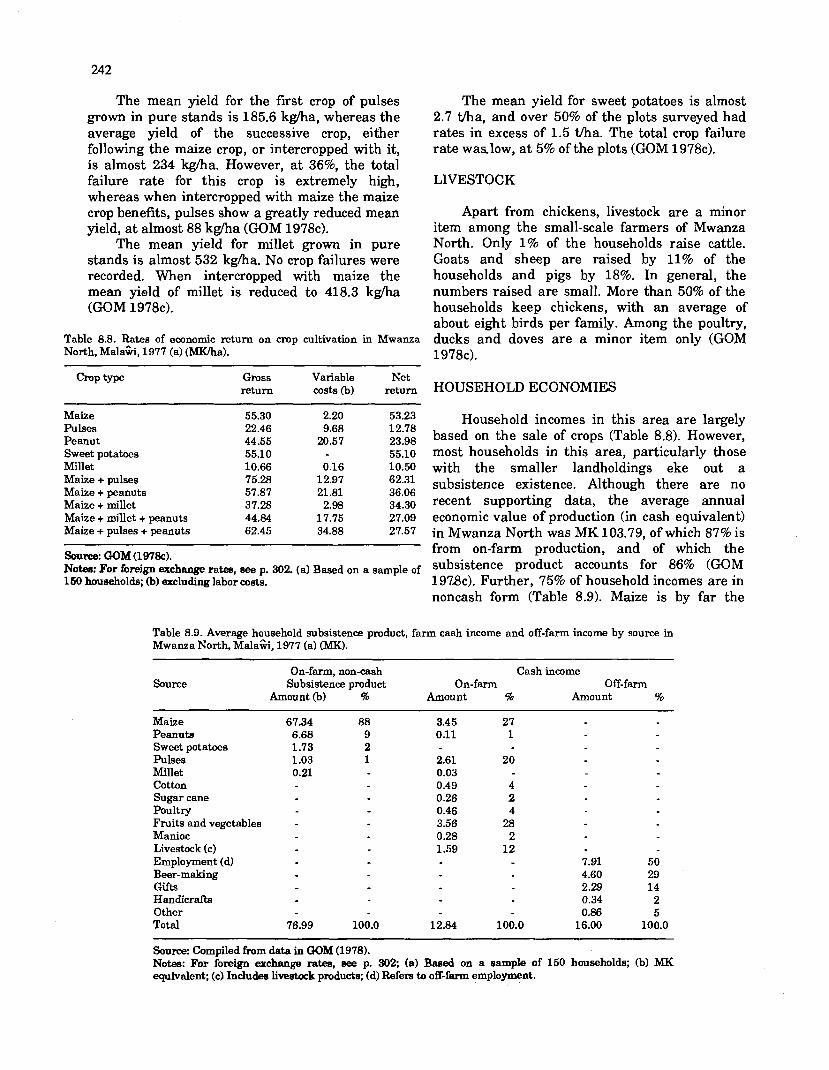
The mean yield for the first crop of pulses grown in pure stands is 185.6 kgha, whereas the average yield of the successive crop, either following the maize crop, or intercropped with it, is almost 234 kgha. However, at 36%, the total failure rate for this crop is extremely high, whereas when intercropped with maize the maize crop benefits, pulses show a greatly reduced mean yield, at almost 88 kgha (GOM 1978~).
The mean yield for millet grown in pure stands is almost 532 kgha. No crop failures were recorded. When intercropped with maize the mean yield of millet is reduced to 418.3 kgha (GOM 19784.
Table 8.8. Rates of economic return on crop cultivation in Mwanza North, Mala%, 1977 (a) (MKha).
The mean yield for sweet potatoes is almost 2.7 tfha, and over 50% of the plots surveyed had rates in excess of 1.5 tfha. The total crop failure rate waslow, at 5% of the plots (GOM 1978~).
LIVESTOCK
Apart from chickens, livestock are a minor item among the small-scale farmers of Mwanza North. Only 1% of the households raise cattle. Goats and sheep are raised by 11% of the households and pigs by 18%. In general, the numbers raised are small. More than 50% of the households keep chickens, with an average of about eight birds per family. Among the poultry, ducks and doves are a minor item only (GOM 1978~).
Gross Variable Net return costs (b) return HOUSEHOLD ECONOMIES
Maize Pulses Peanut Sweet potatoes Millet Maize + pulses Maize + peanuts Maize + millet Maize + millet + peanuts Maize + pulses + peanuts
-- - - --
Source: O M (1 9'7%). Notes: For foreign exchange rates, see p. 302. (a) Based on a sample of 150 households; 03) excluding labor costs.
Household incomes in this area are largely based on the sale of crops (Table 8.8). However, most households in this area, particularly those with the smaller landholdings eke out a subsistence existence. Although there are no recent supporting data, the average annual economic value of production (in cash equivalent) in Mwanza North was MK 103.79, of which 87% is from on-farm production, and of which the subsistence product accounts for 86% (GOM 197Sc). Further, 75% of household incomes are in noncash form (Table 8.9). Maize is by far the
Table 8.9. Average household subsistence product, farm cash income and off-farm income by source in Mwanza North, Mala%, 1977 (a) (MK). -
On-farm, non-cash Cash income Source Subsistence product On-farm Off-farm
Amount (b) % Amount % Amount %
Maize 67.34 88 3.45 27 Peanuts 6.68 9 0.11 1 Sweet potatoes 1.73 2 Pulses 1.03 1 2.61 20 Millet 0.21 0.03 Cotton 0.49 4 Sugar cane 0.26 2 Poultry 0.46 4 Fruits and vegetables - 3.56 28 Manioc 0.28 2 Livestock (c) 1.59 12 Employment (d) 7.91 50 Beer-making 4.60 29 Gifts 2.29 14 Handicrafts 0.34 2 Other 0.86 5 Total 76.99 100.0 12.84 100.0 16.00 100.0
Source: Compiled from data in O M (1978). Notes: For foreign exchange rates, see p. 302; (a) Baaed on a sample of 150 households; (b) MK equivalent; (c) Includes livestock products; (d) Refers to off-farm employment.

dominant component of the subsistence economy, making a contribution of 88%.
Small amounts of cash are raised by the sale of farm produce. In descending order of importance the principal products sold are fruits and vegetables, maize, pulses, and livestock and their products (Table 8.9). Cash is raised also by other off-farm activities, the most important being labor and the sale of home-made beer. The other principal source of income is from gifts, which includes bride price. Average household expenditures are shown in Table 8.10. Although in 1977 household expenditures were valued a t MK 7.64, or 7.4% of the value of total income, nearly 53% was expended to hire labor and only 24% on the purchase of fertilizers. Thus it is evident that although small-scale farmers are prepared to
Table 8.10. Average a ~ u a l household expenditure in Mwanza North, ~ a l a G i , 1977 (a) (MK).
Item Amount %
Current farm expenditures
Hired labor Fertilizer Seed Transport and marketing Insecticide Subtotal
Farm capital cash disbursement
Implements and repair Livestock Other Subtotal
Current cash transfer payments
Gifts
Total
Source: GOM (1978~). Notes: For foreign exchange rates, see p. 302; (a) Based on a sample of 150 households.
invest in fertilizers, labor is a critical limiting factor to raising crop production on small-scale farms.
AQUACULTURE
Despite the operational difficulties of the extension service in this District, of the then estimated 450 fish farmers in the District, 385 were visited by the extension service, in 1986 (DEFF, unpub. records) (Table 8.11). Since the most distant farm with a fishpond is located a t Neno, some 64 km from the Kunenekude substation, another substation located a t Neno is being developed by the MAGFAD Project (O.V. Msiska, pers. comm.).
Information on various farmers was obtained during a reconnaisance visit in May 1987. Although of little value other than to provide a broad overview of the situation in the District, the information does verify the incomplete official records in showing the great influence of the extension service on the adoption of small-scale fish farming, despite the service being both understaffed and under heavy demand pressure from newly adopting farmers. A project to compile a database on tilapia productivity for the District was being launched by a USPC volunteer, just prior to completion of his term, in 1987 (T.J. Lovullo, pers. comm.).
During the period of activities from March 1986 to May 1987, the two extensionists, using a motorcycle, were able to make 12 extension visits per month, during which they visited 64 farmers and oversaw an average of 83 ponds per month (Table 8.11). An average of 12 ponds were stocked and 17 harvested during these visits, when about 820 tilapia fry were also distributed. Fish production averaged 88.4 kglmonth. In summary, an extension worker could effectively visit 30 farmers each month, and so contribute to the production of 500 kglyear of fish.
Table 8.11. Fourteen-month summary of monthly activities in Mwanza District, ~ a l a k by two aquaculture extension ofXcers, March 1986 to May 1987. Date Number Farmers Ponds Ponds Ponds Amount New& Species stocked
of visited visited stocked harvested harvested renovated (no individuals) trips (kg) ponds 0,s. shimnus T. renddli
04-86 10 53 60 4 12 90.8 0 + 0 240 126 06-86 11 33 50 22 5 20.0 3 + 1 495 690 08-86 18 64 93 7 41 180.3 2 + 1 91 0 336 11-86 11 123 154 16 13 96.6 2 + 4 730 262 02-87 28 46 63 10 14 43.5 1 550 05-87 12 84 103 17 20 145.2 no 360 MO mean 11.7 63.7 82.9 12.3 17.1 88.4 2.7 446 374
Source: Compiled from DEFF records.

CASE STUDIES OF SMALL-SCALE FISH FARMERS IN MWANZA DISTRICT
Farm 1, Jonan Village
The farmer in this unit has one pond of 100 ma, with a water depth of 0.60 m. It is constructed on borrowed land. Water is from a perennial stream. This pond has been progressively enlarged since first being excavated in 1983-1984, but was destroyed by flooding during the 1985 rainy season. It was constructed again in 1986 and stocked for the first time in January 1987 (thus production rates were not available at the time of the survey), with 50 0.s. shiranus and 50 T. rendalli, obtained from the Kunenekude extension substation. Owing to a shortage of seed, the stocking rate was only 1 fishlm2.
Supplementary feeding rates for madea and various green leaves, especially those of taro (Colocasia sp.), cassava (Manihot sp.) and sweet potato (Ipomoea batatas), are decided empirically by the farmer, the amount of feed required being "just common sense" ("Farmer No. I", pers. comm.). Grass leaves are not used. The pond is fertilized with goat manure, one "20 liter canful" reportedly being given every two weeks. The idea of composting has not yet been introduced to farmers in this region (O.V. Msiska, pers. comm.).
Farm 2, Jonan Village
Farmer No. 2 helped "Farmer No. 1" to construct his pond. While so doing he decided to build a pond on his own farm, mostly for subsistence purposes. Thus in 1986 he built a 112- m2 pond, and stocked it with 0.s. shiranus and T. rendalli. (The stocking rate has been forgotten.) No yield rates were available a t the time of the visit, since the first harvest had yet to be made.
Supplementary fish food inputs, produced on the farm, comprise madea applied a t a rate of one basinfullday (approx. 0.5 kg), and cassava and Colocasia sp. leaves. The pond is fertilized with chicken manure and produced on the farm a t a rate of one large basinful every two weeks.
As is common in this region with a matriarchal kinship system, the farm is owned by a female relative, in this case the farmer's mother. The "garden" land, of approximately 1.2 ha in all, is divided among household members.
Farm 3, Kumphika Village
The man in this farm unit decided to construct ponds after having his interest aroused by those at the Kunenekude substation. Three ponds have been constructed, with a total area of 286 m2. The largest, 120 m2 and 1 m deep, was built in 1983, and the second, 96 m2, and third, 70 m2, in 1983-1984. All are stocked with 0.s. shiranus, T. rendalli and garli (an unidentified cyprinid), which, prior to the construction of ponds, were caught for family subsistence by handlining in local streams, and are sometimes still caught and stocked in the ponds also. (Stocking rates were not recalled.) Harvest rates have not been recorded, but in 1985 the farm derived an income of MK 12 and MK 15 in 1986 from the sale of pond fish not required for household subsistence.
Fish are provided with a supplementary feed of Colocasia sp. and cassava leaves and maize bran. The farmer reported that the latter is fed a t a rate of four 20-1 canslmonth. Although most fish feed is produced on the farm, some madea is purchased from other farmers in the neighborhood. Manure is not utilized as a pond fertilizer on this farm, because the farmer is a member of the Seventh Day Adventist Church, which has been teaching that manure is filthy. This is causing a significant problem for extension personnel (O.V. Msiska, pers. comm.; Banda 1987). (It should be noted that whereas livestock manure is fairly widely applied to fishponds throughout MalaGi, in common with much of Africa there is a strong taboo in ~ a l a 6 i on the use of human excreta [D. Nghgda , pers. comm.1).
The bulk of the heavy farm labor is provided by the farmer and his sons (one of the latter dug the ponds). Hired labor is used occasionally and paid in kind with tangerines or maize, and is used during the period September-November, when the heavy work of hoeing, planting and weeding fields is performed. Appr~ximately 30 man-days of hired labor are required on this farm, which has 2.02 ha under "garden" crops. This heavy labor is paid in maize. On this farm 10 basketsful (amount not calculated) are saved from the previous harvest to purchase this labor. Payment is a t a rate of one basket of maize for three days of labor.
Approximate average annual cash income figures reveaI that on this farm the garden produces, in addition to food for household subsistence, MK 110 from maize, MK 42 from beans, and MK 10 from sugar cane, for an
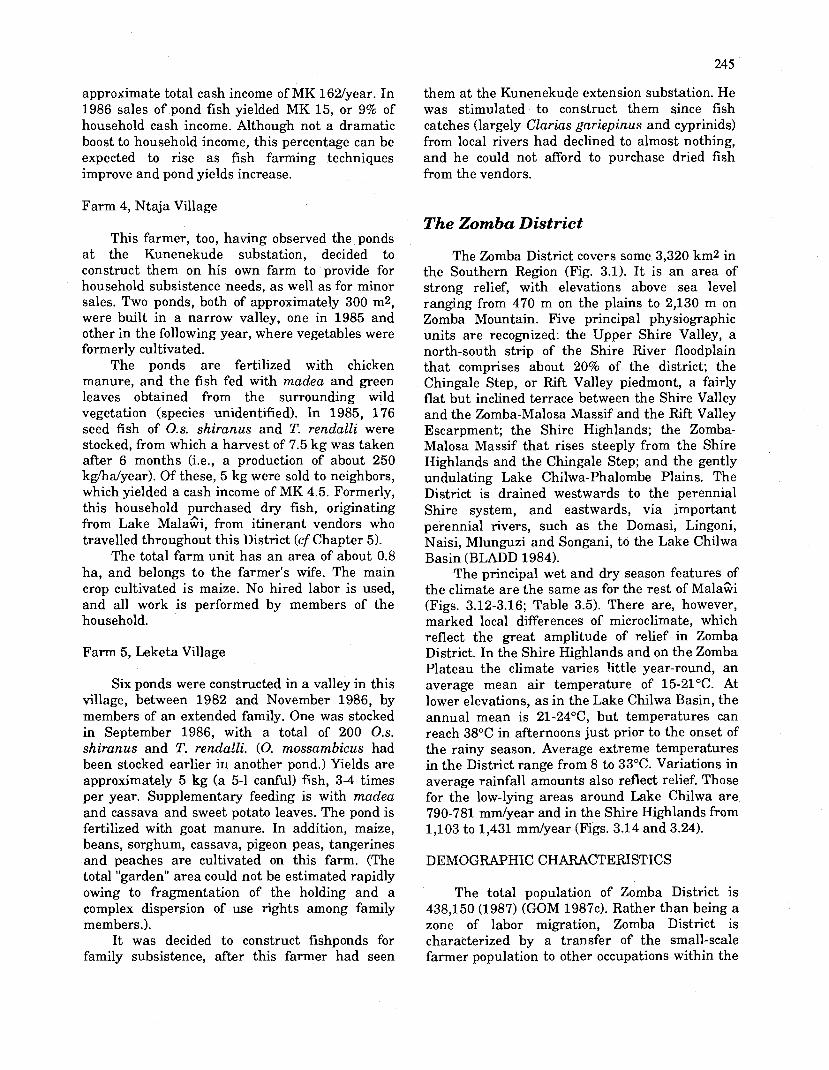
approximate total cash income of MK 162lyear. In 1986 sales of pond fish yielded MK 15, or 9% of household cash income. Although not a dramatic boost to household income, this percentage can be expected to rise as fish farming techniques improve and pond yields increase.
them a t the Kunenekude extension substation. He was stimulated to construct them since fish catches (largely Clarias gariepinus and cyprinids) from local rivers had declined to almost nothing, and he could not afford to purchase dried fish from the vendors.
Farm 4, Ntaja Village The Zomba District
This farmer, too, having observed the ponds at the Kunenekude substation, decided to construct them on his own farm to provide for household subsistence needs, as well as for minor sales. Two ponds, both of approximately 300 m2, were built in a narrow valley, one in 1985 and other in the following year, where vegetables were formerly cultivated.
The ponds are fertilized with chicken manure, and the fish fed with madea and green leaves obtained from the surrounding wild vegetation (species unidentified). In 1985, 176 seed fish of 0.s. shiranus and T. rendalli were stocked, from which a harvest of 7.5 kg was taken after 6 months (i.e., a production of about 250 kghalyear). Of these, 5 kg were sold to neighbors, which yielded a cash income of MK 4.5. Formerly, this household purchased dry fish, originating from Lake ~ a l a & , from itinerant vendors who travelled throughout this District (cf Chapter 5).
The total farm unit has an area of about 0.8 ha, and belongs to the farmer's wife. The main crop cultivated is maize. No hired labor is used, and all work is performed by members of the household.
Farm 5, Leketa Village
Six ponds were constructed in a valley in this village, between 1982 and November 1986, by members of an extended family. One was stocked in September 1986, with a total of 200 0.s. shiranus and T. rendalli. (0. mossambicus had been stocked earlier in another pond.) Yields are approximately 5 kg (a 5-1 canful) fish, 3-4 times per year. Supplementary feeding is with madea and cassava and sweet potato leaves. The pond is fertilized with goat manure. In addition, maize, beans, sorghum, cassava, pigeon peas, tangerines and peaches are cultivated on this farm. (The total "garden" area could not be estimated rapidly owing to fragmentation of the holding and a complex dispersion of use rights among family members.).
It was decided to construct fishponds for family subsistence, after this farmer had seen
The Zomba District covers some 3,320 km2 in the Southern Region (Fig. 3.1). I t is an area of strong relief, with elevations above sea level ranging from 470 m on the plains to 2,130 m on Zomba Mountain. Five principal physiographic units are recognized: the Upper Shire Valley, a north-south strip of the Shire River floodplain that comprises about 20% of the district; the Chingale Step, or Rift Valley piedmont, a fairly flat but inclined terrace between the Shire Valley and the Zomba-Malosa Massif and the Rift Valley Escarpment; the Shire Highlands; the Zomba- Malosa Massif that rises steeply from the Shire Highlands and the Chingale Step; and the gently undulating Lake Chilwa-Phalombe Plains. The District is drained westwards to the perennial Shire system, and eastwards, via important perennial rivers, such as the Domasi, Lingoni, Naisi, Mlunguzi and Songani, to the Lake Chilwa Basin (BLADD 1984).
The principal wet and dry season features of the climate are the same as for the rest of Mala% (Figs. 3.12-3.16; Table 3.5). There are, however, marked local differences of microclimate, which reflect the great amplitude of relief in Zomba District. In the Shire Highlands and on the Zomba Plateau the climate varies little year-round, an average mean air temperature of 15-21°C. At lower elevations, as in the Lake Chilwa Basin, the annual mean is 21-24"C, but temperatures can reach 38°C in afternoons just prior to the onset of the rainy season. Average extreme temperatures in the District range from 8 to 33°C. Variations in average rainfall amounts also reflect relief. Those for the low-lying areas around Lake Chilwa are 790-781 mm/year and in the Shire Highlands from 1,103 to 1,431 mmlyear (Figs. 3.14 and 3.24).
DEMOGRAPHIC CHARACTERISTICS
The total population of Zomba District is 438,150 (1987) (GOM 1987~). Rather than being a zone of labor migration, Zomba District is characterized by a transfer of the small-scale farmer population to other occupations within the
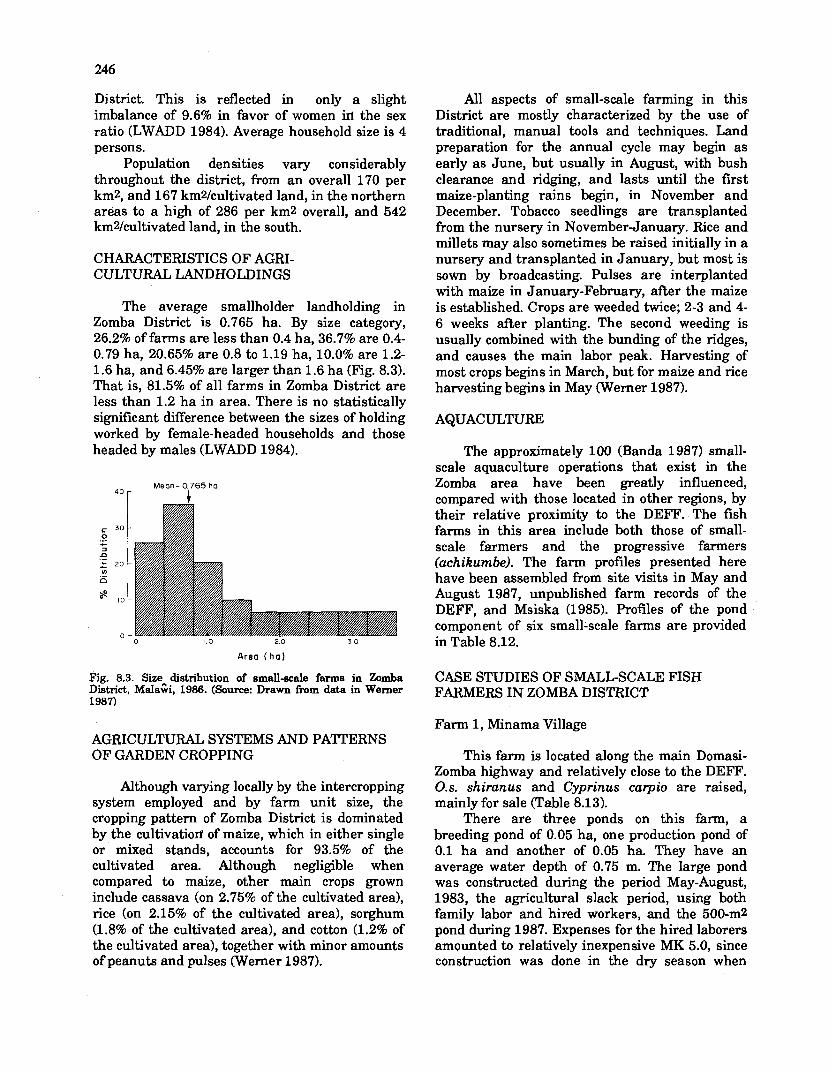
District. This is reflected in only a slight imbalance of 9.6% in favor of women iri the sex ratio (LWADD 1984). Average household size is 4 persons.
Population densities vary considerably throughout the district, from an overall 170 per km2, and 167 km2/cultivated land, in the northern areas to a high of 286 per km2 overall, and 542 kmYcultivated land, in the south.
CHARACTERISTICS OF AGRI- CULTURAL LANDHOLDINGS
The average smallholder landholding in Zomba District is 0.765 ha. By size category, 26.2% of farms are less than 0.4 ha, 36.7% are 0.4- 0.79 ha, 20.65% are 0.8 to1.19ha, 10.0% are 1.2- 1.6 ha, and 6.45% are larger than 1.6 ha (Fig. 8.3). That is, 81.5% of all farms in Zomba District are less than 1.2 ha in area. There is no statistically significant difference between the sizes of holding worked by female-headed households and those headed by males (LWADD 1984).
Mean - 0 765 ha 40 r
Area ( h a )
Fig. 8.3. Size distribution of small-scale farms in Zomba District, Mala%, 1986. (Source: Drawn from data in Werner 1987)
AGRICULTURAL SYSTEMS AND PATTERNS OF GARDEN CROPPING
Although varying locally by the intercropping system employed and by farm unit size, the cropping pattern of Zomba District is dominated by the cultivatiofi of maize, which in either single or mixed stands, accounts for 93.5% of the cultivated area. Although negligible when compared to maize, other main crops grown include cassava (on 2.75% of the cultivated area), rice (on 2.15% of the cultivated area), sorghum (1.8% of the cultivated area), and cotton (1.2% of the cultivated area), together with minor amounts of peanuts and pulses (Werner 1987).
All aspects of small-scale farming in this District are mostly characterized by the use of traditional, manual tools and techniques. Land preparation for the annual cycle may begin as early as June, but usually in August, with bush clearance and ridging, and lasts until the first maize-planting rains begin, in November and December. Tobacco seedlings are transplanted from the nursery in November-January. Rice and millets may also sometimes be raised initially in a nursery and transplanted in January, but most is sown by broadcasting. Pulses are interplanted with maize in January-February, after the maize is established. Crops are weeded twice; 2-3 and 4- 6 weeks after planting. The second weeding is usually combined with the bunding of the ridges, and causes the main labor peak. Harvesting of most crops begins in March, but for maize and rice harvesting begins in May (Werner 1987).
AQUACULTURE
The approximately 100 (Banda 1987) small- scale aquaculture operations that exist in the Zomba area have been greatly influenced, compared with those located in other regions, by their relative proximity to the DEFF. The fish farms in this area include both those of small- scale farmers and the progressive farmers (achikumbe). The farm profiles presented here have been assembled from site visits in May and August 1987, unpublished farm records of the DEFF, and Msiska (1985). Profiles of the pond component of six small-scale farms are provided in Table 8.12.
CASE STUDIES OF SMALL-SCALE FISH FARMERS IN ZOMBA DISTRICT
Farm 1, Minama Village
This farm is located along the main Domasi- Zomba highway and relatively close to the DEFF. 0.s . shiranus and Cyprinus carpio are raised, mainly for sale (Table 8.1 3).
There are three ponds on this farm, a breeding pond of 0.05 ha, one production pond of 0.1 ha and another of 0.05 ha. They have an average water depth of 0.75 m. The large pond was constructed during the period May-August, 1983, the agricultural slack period, using both family labor and hired workers, and the 500-m2 pond during 1987. Expenses for the hired laborers amounted to relatively inexpensive MK 5.0, since construction was done in the dry season when

Table 8.12. Economic profiles of case studies of small-scale aquaculture operations in the Zomba and Mulanje Districts, ~ a l a % , 1983.
Farm Location no.
1 Chingale, Zomba
2 Chingale, Zomba
3 Malesa, Zomba
4 Mbatata, Zomba
5 Mulanje
6 Mulanje
Costs
Pond Pond Operating Seed Feeds/ Total size constr. labor fertilizer (MK) (ha) (MK) W) W)
0.07 101 O.C. O.C. 101 + O.C.
0.07 40 O.C. O.C. 5 45 + O.C.
0.1 5 O.C. n.a. 3 8 + O.C. + O.C.
0.1 52 O.C. O.C. 6 58 + O.C.
0.11 30 O.C. O.C. 7 37 + O.C.
0.06 10 O.C. 0.12. 12 22 + O.C.
Productivity
Total Income yield Production Actual Extrap. (kg) (tma) (MK) (MKIha)
47 0.671 41.69 595.6
74 0.743 44.79 639.9
114 0.610 143.87 1438.7
160.1 1.601 112.00 1120.0
106 0.842 61.49 559.0
35 0.500 30.00 500.0 + O.C.
Source: Prepared from data in Msiska (1985). Notes: For foreign exchange rates, see p. 302; O.C. = opportunity costs; *.a. =not available.
Table 8.13. Stocking and harvesting of Oreochmmis shirrnus shimnus and Cyprinus carpio in a 0.10-ha pond on Farm 1, Minama Village, Zomba District, Mala%, 1984-1985.
p p p p p p -
Stocking Harvesting
Date Species Quantity Total weight Source Date Growing Quantity Grcaa wt Net a t Y~eld Value (indiv.) (kg, period (indiv.) (hg) (kg) (kglha/year) (MK)
(days)
2 7 ~ ~ 1 1 9 8 3 0.a shimnun 2,000 47.00 9Ju11984 347 1,995 15!2.00 105.00 1,104 143.81 17 Atg1984 1 21.74 Own? lOJul198b 338 1,323 176.n 148.17 1,600 103.61 20 Aug 1985 1,730 41.72 30 Jun 1986 374 758 43.07 1.35 . . . " 13 188.00 20 9ep 19% n 7 0.19 . - 11 Nov 1985 C. w p w 96 0.96 DEW 30 Jun1986 229 86 34.40 33.44 533 41.25
Source: Compiled &om DEFF records. Note: For foreign exchange rates, see p. 302.
little other farm work is being done and a large, seasonally surplus, farm labor pool is bidding competitively for what few alternative employment opportunities are available (cf Chapter 10). The number of man-days of pond construction labor was not recorded, thereby making economic valuation impossible. Pond water is supplied by gravity via a channel dug from a perennial stream that rises in the Zomba Plateau.
In addition to fish, muscovy (musk) ducks (Cairina moschata) have been raised on the pond since the farmer began aquaculture. Because this animal is still relatively unfamiliar to the Malakian consumer, eggs are hatched on the farm rather than sold, and ducks raised. Duck meat is marketed a t MK 2.5lkg. Production rates for both
products, if recorded, were not disclosed by the farmer. Rice and bananas are also cultivated on this farm.
Since this farm is located along a main highway and in an economically prosperous and growing region, the bulk of the fish harvest is sold at the farm gate. This farmer tends to secure higher prices for his fish (at MK 0.86kg [19831) by withholding them from the market until the June cool season, when both the products of capture fisheries are scarce in the market and small-scale farmers have disposable income after selling a portion of their harvest (cf Chapter 5). The gradual annual increase in prices received by small-scale fish farmers is shown in Fig. 8.4.
Operating labor is supplied a t an opportunity cost from the household. The production pond is
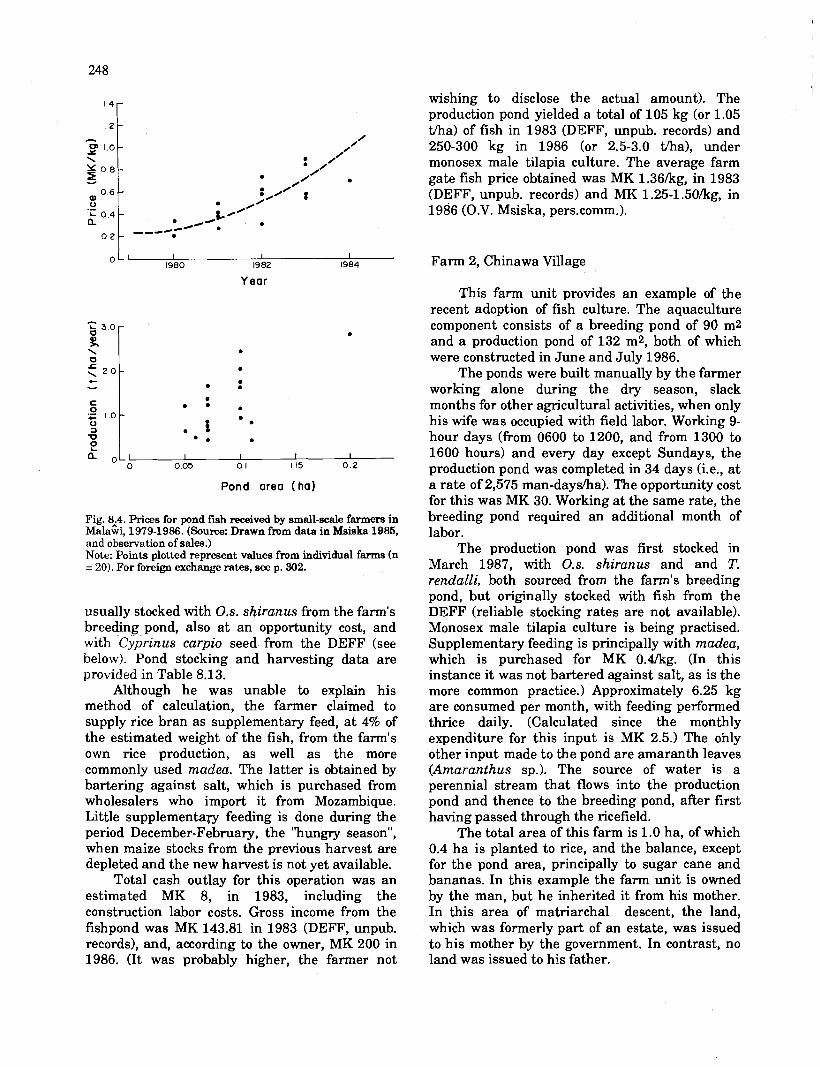
0 L I I I I
1980 1982 1984
Year
Pond area ( h a )
Fig. 8.4. Prices for pond fish received by small-scale farmers in ~ a l a k , 1979-1986. (Source: Drawn from data in Msiska 1985, and observation of sales.) Note: Points plotted represent values from individual farms (n = 20). For foreign exchange rates, seep. 302.
usually stocked with 0s. shiranus from the farm's breeding pond, also at an opportunity cost, and with Cyprinus carpio seed from the DEFF (see below). Pond stocking and harvesting data are provided in Table 8.13.
Although he was unable to explain his method of calculation, the farmer claimed to supply rice bran as supplementary feed, at 4% of the estimated weight of the fish, from the farm's own rice production, as well as the more commonly used madea. The latter is obtained by bartering against salt, which is purchased from wholesalers who import it from Mozambique. Little supplementaw feeding is done during the period December-February, the "hungry season", when maize stocks from the previous harvest are depleted and the new harvest is not yet available.
Total cash outlay for this operation was an estimated MK 8, in 1983, including the construction labor costs. Gross income from the fishpond was MK 143.81 in 1983 (DEFF, unpub. records), and, according to the owner, MK 200 in 1986. (It was probably higher, the farmer not
wishing to disclose the actual amount). The production pond yielded a total of 105 kg (or 1.05 tha) of fish in 1983 (DEFF, unpub. records) and 250-300 kg in 1986 (or 2.5-3.0 tha), under monosex male tilapia culture. The average farm gate fish price obtained was MK 1.36lkg, in 1983 (DEFF, unpub. records) and MK 1 .%-I .5O/kg, in 1986 (O.V. Msiska, pers.comm.).
Farm 2, Chinawa Village
This farm unit provides an example of the recent adoption of fish culture. The aquaculture component consists of a breeding pond of 90 m2 and a production pond of 132 m2, both of which were constructed in June and July 1986.
The ponds were built manually by the farmer working alone during the dry season, slack months for other agricultural activities, when only his wife was occupied with field labor. Working 9- hour days (from 0600 to 1200, and from 1300 to 1600 hours) and every day except Sundays, the production pond was completed in 34 days (i.e., at a rate of 2,575 man-daysha). The opportunity cost for this was MK 30. Working at the same rate, the breeding pond required an additional month of labor.
The production pond was first stocked in March 1987, with 0.s. shiranus and and T. rendalli, both sourced from the farm's breeding pond, but originally stocked with fish from the DEFF (reliable stocking rates are not available). Monosex male tilapia culture is being practised. Supplementary feeding is principally with madea, which is purchased for MK 0.4kg. (In this instance it was not bartered against salt, as is the more common practice.) Approximately 6.25 kg are consumed per month, with feeding performed thrice daily. (Calculated since the monthly expenditure for this input is MK 2.5.) The only other input made t o the pond are amaranth leaves (Amaranthus sp.). The source of water is a perennial stream that flows into the production pond and thence t o the breeding pond, after first having passed through the ricefield.
The total area of this farm is 1.0 ha, of which 0.4 ha is planted to rice, and the balance, except for the pond area, principally to sugar cane and bananas. In this example the farm unit is owned by the man, but he inherited it from his mother. In this area of matriarchal descent, the land, which was formerly part of an estate, was issued to his mother by the government. In contrast, no land was issued to his father.

This farmer first witnessed aquaculture when he participated in a "field day" at the DEFF. He decided to start aquaculture after visiting the farm operated by the chairman of the local fish farmers' club, earlier in 1986.
Farm 3, Mbatata, Zomba
Although being important in raising household nutritional levels among subsistence farmers, the productivity of small-scale pond aquaculture will have its greatest impact on the provision of fresh fish supply to the general populace via the efforts of the larger-scale farmers. This group has the capital from other components of farm activities to cover such variable costs as supplementary feeds, manure and the like, in the start-up phases, before the pond becomes economically self-sustaining.
In particular this is the "progressive farmer" group, known locally as achikumbe. Such persons have been certified for their more intensive farming activities, which successfully integrate the various farm activities, particularly cropping and animal husbandry. The achikumbe operate farm units of above average size, at least of 2 ha, achieve high yields per unit area, maintain livestock, are active participants in farmers' clubs, and attend seminars and courses to learn about new or improved technologies and techniques. Through participation in the cash economy such farmers generate the capital for farm investments and for hiring labor. They are thus able to secure loans.
This farm is typical of such an achikumbe operation. By MalaGan standards this is fairly large, with 4 ha of crop land and a total of 0.75 ha in four fishponds. The principal crops cultivated on this farm are sugarcane (Saccharum offkinarum), maize (Zea mays), sorghum (Sorghum sp.), taro (Colocasia sp.), cocoyam, okra (Hibiscus esculentus), tomatoes (Lycopersicon sp.), pigeon peas (Cajanus cajan), Chinese cabbage (Brassica sp.), sweet potatoes (Ipomoea batatas), yams (Discoren sp.), and rice (Oryza sativa), together with various fruits, including mainly lemons, avocados (Persea sp.), mangoes (Mangifera indica) and bananas (Musa spp.). Chickens are raised. Formerly, cattle were raised, but this was abandoned when aquaculture was adopted, since there was not enough labor to undertake both operations. Further, and also characteristic of the "progressive farmer", the owner of this farm is literate and thus has been
able to draw up a farm plan and to maintain regular farm records. He is also the chairman of the local fish farmers' club. All farm labor is provided by the household, which totals 17 members, including the five married children of the farmer, their spouses and children.
This farmer decided to go into aquaculture after observing the OXFAM Project. Together with his wife, he constructed his ponds between March and June 1979, i.e., at the beginning of the agricultural slack season. The ponds were completed in 122 days (i.e., approximately 325 man-dayha), and at an opportunity cost of MK 52 (i.e., MK 89/ha). The couple also constructed a 0.05-ha breeding pond in less than 20 days (i.e., at 800 man-daysha).
The bulk of pond inputs are generated by other operations on the farm. As usual, the principal supplementary feed is madea. This is mostly produced on the farm but occasional amounts are obtained locally by bartking against vegetables produced on the farm. (Salt is the usual commodity bartered.) Other feed inputs are principally kitchen waste and field residues, plus leafy greens, particularly taro (Colocasia spp.) leaves. Manure is produced by the chickens on the farm and supplements purchased from neighbors at MK 0.0125kg (Msiska, 1985). Chicken manure is applied at a rate of 0.4 t/ha/week (Msiska 1985). A compost made from dry grass, green grass and manure is added to the pond 2-3 times yearly. Water is obtained from a perennial stream.
The ponds are stocked with 0.s. shiranus and T. rendalli, raised in hand-sexed monosex male polyculture (TabIe 8.14). Cyprinus carpio has been cultured since 1985. Initial stocking was with seed from the DEFF, but, since 1980, stock are largely bred on the farm. Some exchange of seed is practised among members of the fish farmers' club, this farmer having occasionally obtained some from other local farms (DEFF, unpub. pond records). Predation problems are occasionally encountered, largely from the greyback heron and sometimes probably by otters, although the latter are not definitely known around here.
Ponds are harvested once a year with a seine net borrowed from the DEFF. Small fish are used for family subsistence, but the large ones, the majority, are sold. After harvesting the ponds are drained and then maintained by digging out accumulated sediment and reshaping the banks and clearing weeds.
Pond stocking and harvest records for this farm for 1979-1986 are given in Table 8.14.
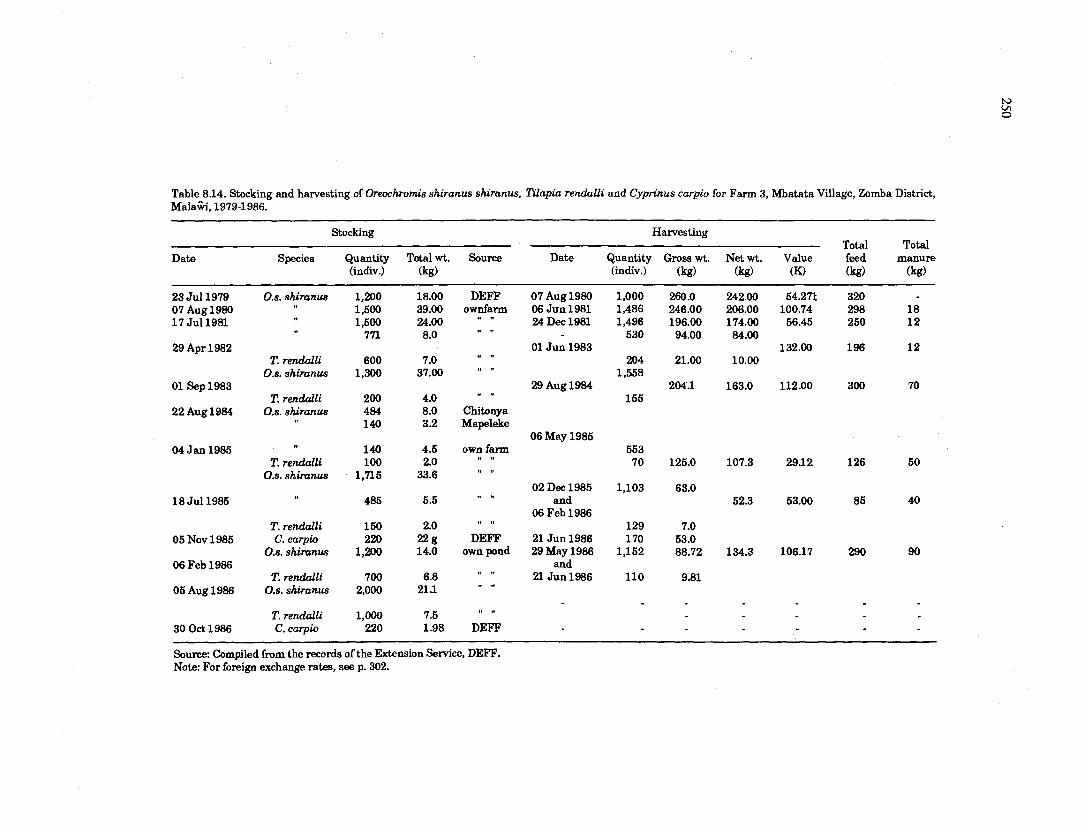
Table 8.14. Stocking and harvesting of Oreochromis shiranus shiranus, Rlapia rendalli and Cyprinus carpio for Farm 3, Mbatata Village, Zomba District, Mala%, 1979-1986.
Stocking Harvesting Total Total
Date Species Quantity Total wt. Source Date Quantity Gross wt. Net wt. Value feed manure (indiv.) (43) (indiv.) (kg) (43) (K) (kg) (kg)
23 Jul1979 07 Aug 1980 17 Jul1981
29 Apr 1982
01 Sep 1983
22 Aug 1984
04 Jan 1985
18 Jul1985
05 Nov 1985
06 Feb 1986
05 Aug 1986
30 Oct 1986
0.s. shimnus
T. rendalli 0.5. shimnus
T. rendalli 0.8. shiranus
T. rendalli 0 s . shimnus
T. rendalli C. carpio
0.s. shimnus
T. rendalli 0 .s . shiranus
T. rendalli C. carpw
DEFF ownfarm
11 11
It I,
0 17
I, 11
" "
Chitonya Mapeleke
own farm 11 I,
11 t1
I, ,I
9 , 8 ,
DEFF own pond
,, ,, It 11
11 It
DEFF
07 Aug 1980 06 Jun 1981 24 Dec 1981
01 Jun 1983
29 Aug 1984
06 May 1985
02 Dec 1985 and
06 Feb 1986
21 Jun 1986 29 May 1986
and 2l Jun 1986
Source: Compiled fmm the records of the Extension Service, DEFF. Note: For foreign exchange rates, see p. 302.

Summary of the Characteristics of Fish Farmers and Fish Farming in the Mwanza and Zomba Districts
On behalf of the ICLARM-GTZ-FD-UM Project, a preliminary socioeconomic survey of small-scale aquaculture in the Mwanza and Zomba Districts was conducted in June 1987. A total of 104 farmers were studied, 75 in Mwanza District and 29 in Zomba District, or 72.1 and 27.9%, respectively, of the fish farmers known to the DEFF in each district (Banda 1987).
The Location ofFishponds
The location of gardens and fishponds with respect to the residence is governed by complex traditional principles of usufruct to land, the location of suitable sites, particularly with reference to water supplies, and, possibly, public health considerations. Frequently, gardens may be located a t a considerable distance from a farmer's residence, a factor which may influence the decision to invest in aquaculture, owing to security problems, and which also affects both the degree of management and the potential level of integration that could be developed with other farming activities. Most fish farmers' (53%) work gardens located between 0.1 and 1 km from their residence; only 20% have them within 100 m; and 20% work gardens located more than 1 km from their homes (Banda 1987).
The source of water to supply fishponds is summarized in Table 8.15. Availability of a reliable water supply appears to have been the principal factor deciding pond location in both the Mwanza and Zomba districts. Sixty-three percent of the fishponds sampled have been dug in dimba gardens, sited in watercourses, or have replaced them as the exclusive type of land use in such locations, The balance is located in either wet dambos areas, or in other locations with a
Table 8.15. Sources of water for fishponds in Mwanza and Zomba Districts, MalaGi.
Source Mwanza Zomba Total No. % No. % No. %
Stream 25 31.2 14 43.8 39 34.8 Spring 20 25.0 7 21.9 27 24.1 Water table 34 42.5 10 31.2 44 39.3 Others 1 1.2 1 1.1 2 1.8
Source: Banda (1987).
favorable water supply that are independent of both dimba and munda gardens. No ponds had been constructed in munda gardens (Banda 1987).
In addition to their relatively reliable water supply, ponds located in dimba sites simplify pond management and permit an initial level of integration of aquaculture and agricultural activities. Cocoyam, the leaves of which are fed to the fish, is planted in the moist soils of the dimba garden. Dimba sites also yield the weed mwamunaaligone (Galinsoga parviflora), which has been found empirically by local farmers to be a useful fish feed. Fishponds also act as small reservoirs from which farmers water their vegetables and other dimba crops during the dry season.
In the Mwanza District, most ponds not associated with dimba gardens are located in dambo areas. In those sites, no agricultural activity is integrated with the pond.
In the Chingale area of northern Zomba District, ponds are located neither in dimba gardens nor dambo areas, since in the gently sloping terrain of that area water is led to the ponds from natural watercourses via gravity flow. In one such case the farmer has accomplished this using a 1-km long artificial channel. However, since that channel passes through the gardens of other farmers they divert water, or even block the flow to irrigate their vegetable gardens, thus depriving the fish farmer of an adequate supply. Piping the water would be prohibitively expensive. It is also discouraged by the government. Construction of such channels is not possible in the hilly Mwanza District.
Pond Type and Size
Whereas all fish farmers have individual production ponds, only 30.8% have breeding ponds (58.6% in Zomba District, and 20% in Mwanza District), and only two farmers, both in Zomba District, operate nursery ponds. Operation of breeding ponds is limited to earlier adopters and to more advanced farmers who manage their production ponds better than do the other fish farmers.
The range of pond sizes is shown in Fig. 8.1. Ponds in Mwanza District tend to be smaller than those in Zomba, with 51% being less than 100 m2, owing largely to the restrictions imposed by the topogr~phy of narrow, incised valleys, and in part to the recent introduction of aquaculture to the area. In contrast, 55% of the ponds in Zomba

District are larger than 200 m2, compared with only 21% in Mwanza District. When aquaculture began in Zomba District, however, many ponds were initially small. They have been expanded several times as the worth of aquaculture became apparent.
Pond size is also determined by water supply. In the Mwanza District, in particular, most streams dry up during the August-November dry season, and so cannot sustain large ponds. Thus smaller ponds that can be sustained are favored. Pond size is also constrained by the availability of biologically and physically suitable land in which to build ponds, plus the number of persons wishing to operate ponds in such areas.
Owing to topographic limitations, many ponds in Mwanza District are formed as a barrage or excavation in or across stream-courses, and so are prone to wash out in the wet season.
Pond Management
No farmer studied had a clear idea of either the current size of his pond stock or the original stocking rate (Banda 1987). This has important implications for pond management. Although a majority of the farmers understand the benefits of hand-sexed monosex male tilapia rearing, only 20% could practise it, the others Iacking skills, enough ponds and sufficient fingerlings.
Pond maintenance consists of draining the pond and removing the accumulated sediment, commonly just using the hands or, a t best, a hoe or shovel. The mud removed is thrown onto the banks in an unsystematic fashion. Although most fish farmers are aware of the need for periodic pond maintenance, only 29% in Mwanza and 48% in Zomba claim to have done it (Banda 1987). The principal reason cited for the lack of regular maintenance was the need to remove fish to another holding facility while draining and maintaining the production pond. This is impossible for most farmers, who have only one pond.
Harvesting
Pond harvesting is done irregularly, sometimes twice a year. In some years ponds are not harvested. This is attributed largely to a lack of a seine net, that which is used being borrowed from the FD. Netting is used by 82.7% of the farmers. Other harvesting techniques used include hook-and-line, trapping and draining.
Although the best practice from the standpoint of public health, only 4 farmers drain their ponds for harvesting. The technique is not popular owing to the labor involved, as well as to risks perceived for the fish. Providing enough water to refill the pond might also be locally perceived as problematical, since this would present difficulties, particularly in the dry season. Seventy-five percent of the farmers claim to return the smaller fish to the ponds after harvesting, for further growout. Harvesting rates are not known, since the fish are not weighed and farmers claim to have forgotten approximate sizes.
News of harvesting spreads rapidly in the local community, either by word of mouth or by handwritten notices at the "farm gate" and in local markets. The price per unit varies not only by the size and quality of the fish but also by the ability of the purchaser to pay. Prices received by fish farmers since 1980 show a steady rise (Fig. 8.4). Those who can afford higher prices are charged more. Prices also depend on the social relationship between the seller and the buyer. Some fish is usually given free to relatives and other members of the village. It is believed that if the community is kept happy by sharing in the fish the ancestral spirits will be appeased and will bless the benevolent fish farmer with good luck (Banda 1987).
In the Mwanza District, 53% of the fish farmers in this district are less than 45 years of age, 21% are less than 25 years old, and 21% are more than 55 years of age. The youngest was 13 years old. In contrast, those in Zomba District are relatively much older, with only 20% being younger than 45 years, and 48% being 60 years old (Banda 1987).
This demographic pattern among fish farmers has important operational implications. In Mwanza, the youngest operators depend on other family members to provide labor support. Also, their ponds are the least well managed in the area, since they lack maize gardens to supply madea as supplementary fish feed and have no alternative source of supply. On the other hand, many ponds in Zomba worked by old men whose physical strength is waning will probably soon be abandoned for lack of a successor to continue operations. Most such elderly fish farmers have independent adult offspring who now live permanently elsewhere.

Cultural factors also impinge on demographic characteristics and physical abilities. Whereas most males between 16 and 35 years of age are those physically most able to undertake agricultural labor, it is this group, which comprises 48% of the fishpond owners in Mwanza and 17.2% in Zomba, that is most affected by the matrilineal system of social organization. Males in this age range may be involved in marriages the stability of which remains unproven, and who, therefore, may be residentially insecure. Thus they might be loathe to invest in fish pond labor in their wives' villages (Banda 1987). Similarly, ponds constructed in a man's home village prior to his marriage and relocation of residence are commonly abandoned, since there is either nobody to manage them or they are abandoned while relatives squabble over their control (Banda 1987).
this is a factor of age and economic security, thus making an innovation less hazardous, or whether it is related to the stability of marriage.) Such people also tend to have more productive gardens, if only a t the subsistence level, than younger persons, thus assuring them of a stable supply, a t a higher rate, of pond inputs or potential inputs.
Constraints on the Expansion of Fish Farming
Although most farmers in both Mwanza and Zomba Districts took up aquaculture in the hope of both improving nutrition directly and of increasing their household income, and 84% of fish farmers in Mwanza and 96% of those in Zomba claim that they would like to expand their
Table 8.16. Factors limiting the development of small-scale fish farming in Mwanza and Zomba Districts, MalaOi.
Factor Mw anza Zomba Total No. % No. % No. %
Land availability 21 25.9 8 25.5 29 25.2 Extension of technology 10 12.3 8 25.5 18 15.7 Water supply 3 3.7 4 11.8 7 16.0 Lack of suitable species 3 3.7 1 2.9 4 3.5 Fingerling availability 40 49.3 1 2.9 41 3.5 Others 50 3 38.2 53 None 4 4.9 0 4 3.5
Source: modified from data in Banda (1987).
Males in the 36-55 years age group are the most promising farmers in which to invest inputs for the development of small-scale aquaculture. They are still physically strong, yet, being older and longer resident in a particular community, tend to have proven and stable marriages, and thus assured access to resource rights. Nevertheless even pond owners in this age group have not always dug ponds where they have rights through marriage. Banda's (1987) study showed that 60% of the pond operators had developed ponds in communities where they had lived for more than 21 years, and 82% where they had lived for more than 10 years. (However, further research is needed to determine whether
aquaculture activities, most are constrained by a lack of suitable land and by technological factors (Table 8.16). The use of only simple manual techniques, involving hoes, buckets and baskets seriously delays pond excavation and consumes labor that may be economically more productive when employed elsewhere. Credit for the purchase of wheelbarrows and shovels was seen as one way of improving pond construction technology and thus facilitating expansion. Other farmers were loathe to expand owing to a scarcity of supplementary feed with which to support a larger pond area, and because of increasing age and the physical inability to undertake more work.
Chapter 9
COMMUNITY, LAND TENURE AND HOUSEHOLD DECISIONMAKING WITH REFERENCE TO AQUACULTURE
Introduction
The activities of households are especially important since in nonindustrialized societies, the household sector produces a large proportion of the "nonmonetized" goods and services for its own use. Whereas in some countries the household sector may produce some 40% of the accounted and unaccounted national income, its share is even greater in producing those goods and services required to satisfy basic human needs (Burki 1980). Despite its importance in rural development, scientific knowledge on rural economies and small group and household economic behavior the world over is grossly inadequate for the formulation of effective development programs.
A major problem in the analysis of traditional rural economies is the difficulty of separating the various household functions, since in the peasant household production, consumption, saving and investment are not independent activities and are generally governed by simultaneous family decisions. Thus although the large body of survey statistical data is available on small farm management and production costs, for example, is useful for piecemeal studies, it has little value for the study of systems of resource use a t the microlevel, since it artificially discriminates among the various household functions.
Another serious complication in analysis arises from the self-contained, subsistence nature of most rural communities in Africa. Typically, locally available renewable natural resources are used to satisfy household and community demands, and, apart from commodities sent to provision urban centers, the major product flows do not enter, or enter only minimally, into the market place (Burki 1980).
The productive activities of most rural African households consist of several complementary economic activities that as a whole provide a balance of subsistence goods. Commonly, small-scale fishing, animal husbandry, hunting and collecting of forest products are the economic complements of cultivation. In integrated systems of agriculture- aquaculture, some of these components are tightly fitted within a single system. Artificial if often unintentional discrimination is also introduced into those economic studies of traditional farming that focus only on the cropping component as the principal activity. Other economic activities, which together might account for more capital, labor or time inputs, are overlooked or downplayed. Clearly, such a fragmented view of traditional household economic activities is grossly misleading.
Nevertheless, in every society, decisions about how resources are used and transformed to satisfy perceived needs are ultimately made by a large number of households, small g ~ u p s and individuals. Economic theory, on which many psychological and marketing models of human behavior are based, is often deficient or irrelevant in understanding the resource use behavior of rural households in non-Western societies (Ruddle 1984). It is especially inappropriate in expIaining how small-scale resource users perceive, use and transform the natural resources on which their livelihoods directly depend. Much more must be learned about their attitude toward risk and uncertainty, about the dynamics of household behavior and about the values and perceptions toward resource use (Ruddle 1984).
Economic theory is predicated on highly specific assumptions about decisionmakers and the conditions under which they operate.

Complete information regarding all prices and returns, among other things, is assumed, as is the ability to compare precisely all inputs and outputs, the capacity to perform all the calculations necessary to determine an optimum decision, to optimize an objective such as income maximization, and to have the capability of operationalizing the decision once it has been reached. Few small-scale farmers come close to this ideal pattern of behavior. The problems of using economic theory are particularly acute in nonmarket economies, where no criterion, like prices or monetary values, exists. Further, one of the all-pervasive aspects of decisionmaking is that many events, such as weather conditions during an agricultural cycle, cannot be predicted with complete accuracy. As a consequence, more recent models have been developed that account for the uncertainty inherent in prediction. But many models still assume that some objective in resource use is optimized, although it is not necessarily income maximization.
The term "risk assumes that decisionmakers can, based on traditional teaching and past experience, estimate the probability of occurrence of some future value or event, such as the chance of flood destroying fishponds, or of the economic failure of some accepted innovation such as aquaculture, but that the estimate is subject to varying degrees of error. The analysis of decisionmaking, however, is complicated by the personality characteristics of the farmer or members of the farm household, as well as the influence of kin and neighbors. An enterprising farmer might be willing to gamble for the highest "expected value" and take a chance on the occurrence of flooding, drought or some other such disaster. On the other hand, a conservative farmer would wish to minimize losses in case of the worst possible conditions.
Perhaps of greater importance is where such decisions as what and how much of a given crop to plant affect household food security. If a farmer makes a bad decision by choosing to gamble on an innovation, such as aquaculture, he is also threatening the welfare of his household. In households where the only available assets available for investment is a limited supply of family labor, farmers may derive security in staying with proven traditional methods and the known associated risks, rather than opting to adopt an innovation.
Most small-scale farmers plant a combination of crops, or may opt to include a fishpond within their operation, to spread risk. But, as in tropical
agroecosystems, combinations of crops, livestock and fish also ensure the exploitation of a range of available ecological niches on a farm, as well as providing a balanced household food supply, thereby also enhancing household food security. Thus distinguishing a single motive with respect to farming systems and the decision to diversify operations by adding new elements is a complex problem.
Most small-scale farmers in developing countries have no way of estimating certain risks involved in their enterprise, and are forced to make decisions under conditions of uncertainty. Under such circumstances, decisionmakers may estimate or impute risk probabilities in accordance with their individual psychological characteristics, rather than on empirical evidence.
Farm household decisionmaking ranges from very deliberate problem-solving to automatic, subconscious behavior, based in large part on traditional teaching and community norms. In the developing world, most tends toward the latter type (Simon 1957). This clearly is in complete conflict with the assumptions on which economic theory is based. I t appears that automatic, subconscious rather than deliberate problem- solving is a response to most individual's inability or unwillingness to process large amounts of data, and the desire to simplify that process by avoiding an overload of demanding mental effort (Hull 1964). Conventional assumptions of optimization must therefore be modified to suit the rural African context. Moreover, most decisionmakers prefer to follow the precedents of established patterns, rather than to process data themselves. This may go far toward explaining "tradition", "conservatism", and "habit" in resource use, and may help to explain the considerable uniformity in decisionmaking among small-scale farmers (Simon 1957).
In defense of traditional models, i t should be noted whereas massive decisions are rarely made by small-scale farmers, they do make small, incremental decisions that in aggregate might lead to large-scale changes. Thus they gradually adjust existing patterns so that an optimum pattern might evolve over a longer time period.
Another major problem with respect to family decisionmaking is the availability of information. The completeness of an individual's "decision environment" is a function of both the traditional and formal level of education achieved, the communication system and his motivation and willingness to make an effort to obtain information. Further, all aspects of
decisionmaking are closely tied to local culture, technological levels and peer group pressure. The assumption that a person optimizes some objective or even seeks to maximize expected utility is dubious. Rather than analyzing all possibilities, individuals probably settle for the first satisfactory decision encountered. This is greatly influenced by an individual's level of aspiration. Moreover, individuals, rather than seeking to reach only one objective probably make decisions with multiple objectives in mind and on several fronts simultaneously.
Further, farm household decisions are not static, as is usually assumed. Rather, later decisions depend on those that preceded them. This is related to changes in aspiration levels through time (Ruddle 1984).
Finally, i t is imperative that the difference between community and individual decisions be understood. Community decisions appear to be more deliberate, explicit and often better publicized. Generally, too, they are of greater importance in establishing and maintaining patterns of resource use within communities and regions.
Several other important behavioral factors must be considered. Spatial variations in the decision environment must be considered because production functions vary spatially in accordance with ecological differences and levels of economic development, in addition to depending on such factors as motivation, and are strongly influenced by community behavior and geographical access to information. The ways in which innovations diffuse in given areas, information systems and communications networks, and the individual's perception of his environment and its resources and the constraints and opportunities that it presents, are also critical in planning for the introduction of aquaculture.
Rural Settlement Patterns and Social Organization
in Mala%
At both the regional and local level of the individual rural settlement the constraints of topography, soil type and water supply exert a major influence on the rural settlement pattern of Mala% (Pike and Rimmington 1965). However, the details of patterns of rural settlement, and particularly their dynamics, are influenced more heavily by historical circumstance and sociocultural factors.
The standard works on the ethnography of Malawi, and especially of southern MalaGvi, are now about four decades old. However, since they remain the most recent comprehensive studies available the following description unavoidably draws heavily on them. Although those studies are in urgent need of revision and supplementing, and despite the erosion of traditional values since the 1950s, much of the material contained in them accurately describes present conditions. For example, members of most Mala%ian rural societies are still bound by traditional kinship obligations, which can be ignored a t one's peril (G.A. Banda, pers. comm.).
The fundamental sociological element in African rural society is the extended family. This is ecologically expressed in the landscape as a village or hamlet. The social core of Cewa and Yao villages is the dominant or founding matrilineage or its descendents, of which the village headman is a member. Village unity and stability depends largely on the personality of the headman and his ability to manage potentially divisive conflict among the villagers, and hence village fissioning (Mitchell 1956).
Traditional MalaGvian villages were small, and ranged in size from the dwellings of five to thirty nuclear families. Among the Yao, the village is the most important element of the social structure (Mitchell 1956), and ranges in size from 4 to 500 huts, and averages 11-15 huts. Among the Cewa villages range in size from 40-200 huts (Marwick 1952).
Cewa and Yao villages are usually compact physically, and consist socially of a combination of members of the headman's matrilineage, spouses of married matrilineage members, male members of their mother's matrilineage, and, occasionally, children of those male members (Marwick 1952). The physical distance between huts within a village mirrors the social distance of their occupants, such that a mother and daughter tend to occupy adjacent huts (Lawry 1981).
The composition of MalaGvian villages is inherently unstable, as fissioning occurs with population increase, and part of the village hives off to relocate nearby and cultivate other lands (Pike and Rimmington 1965). Among the Cewa and Yao peoples of southern Malaki fissioning is also frequently caused by social conflict within a village. Inherent in a matrilineal form of social organization is competition between a mother's brother and a sister's son, as well as between uterine brothers, for control over their nbumba, or sorority group. In Cewa and Yac society,

increasing tensions among these men are manifested in the increasing incidence of arguments and related accusations, primarily of sorcery. If not resolved, fissioning of the village may occur, with the division along kinship lines. This is a cyclical pattern, such that villages are constantly changing (Mitchell 1956). Although an inherent feature of the two societies, attempts are made to mitigate its occurrence through demonstration of village unity a t such ceremonies as sadaka feasts, held to reemphasize the solidarity of a matrilineal kin group when threatened ritually by death (Mitchell 1956).
The support of a man's mbumba in village politics is particularly important when village fissioning occurs, since he can found a new settlement only ifhe has its support. Its following him demonstrates his influence in the village (Mitchell 1956). Thus competition between uterine brothers for the allegiance of the sorority group can of itself lead to village fissioning. This fissioning along sorority group lines emphasizes group solidarity as well as the opposition of adjacent generations (Mitchell 1956).
Among the largely Yao-Cewa population of the Malemia area of Zomba District, Mitchell (1951a) distinguished four types of villages, in terms of social organization: simple hamlet, thorp, compound village, and complex village.
In the simple hamlet, all hut owners belong to the same matrilineage. A new settlement may be inhabited only by the women of a matrilineage, their young children, and their husbands. The hamlet expands gradually as the daughters of a male member of the matrilineage marry, bring in their husbands, and have children, thus forming new matrilineages. The typical Yao village was designed as a thorp, composed of a dominant matrilineage and one or more related matrilineages, which are usually linked to the dominant one by a marital tie through the village headman. A compound village develops when two or more unrelated groups, composed as in a thorp, reside together, but where the dwellings are separated spatially according to matrilineage relationships. A complex village differs from the compound type only in that there is a greater spatial separation between the locations of the huts of the different matrilineages.
No geographical study has been made of a representative sample of villages throughout Mala%, and most of the scant information available is for the plateau area of the Central Region. Much of the rural settlement pattern in that area is attributable to the history of tribal
movement and intertribal conflict. This was modified later by alienation of land by Europeans and the establishment of forest reserves, as well as more gradually by the development of communications, and, with population increase, the tendency of larger settlements to fission (Rimmington and Pike 1965).
Historically, in the Lilongwe area, villages were preferably located near but elevated somewhat above a dambo water source, with adjacent interfluves used for agriculture. Defensible sites on rocky outcrops were also favored. The most common location for villages was on high ground near a dambo or a river margin. In much of the northern and western parts of the Lilongwe Plain villages extend around the upper extremities of dambos, many are sited on interfluves that project into dambos, and others on land situated between a dambo and an adjacent stream course (Rimmington and Pike 1965). In addition to being located close to perennial water supplies, either from the dambo itself or from a shallow well that taps the associated perched watertable, such settlements have access to wet season grazing on dambo pastures as well as to cultivable land on the adjacent interfluves.
Historically, settlements were also sometimes relocated when water supplies ceased in years with particularly severe droughts. This, however, has been mitigated in recent decades by the well- and bore-hole drilling program of the government, and settlement sites have become more permanent as a result (Pike and Rimmington 1965).
Sociocultural Organization
Since early in this century, all ethnic groups in Mala% have been integrated into the government via the "Traditional Authority System". As a consequence, there are no longer paramount chiefs, and ethnic loyalty is directed toward the central government via the immediate channels of the village headman and area chief (Lawry 1981 ).
The sociocultural aspects of rural MalaGian society have been most fully described for the Cewa and Yao peoples, the two dominant ethnic groups of the Southern Region (Fig. 3.9). The Cewa is the largest single ethnic group in Mala%. In comparison, other groups have been little studied, and the literature on them is sparse.
Ethnic affiliations in southern Mala% are
complex, and tribal distinctions have become blurred and fluid. The present ill-defined social structural and cultural boundaries in the region are a reflection of the long history of multiethnic communities. Regardless of continued linguistic differences and some differences in cultural practices, Cewa and Yao societies share many cultural traits.
The social organization of both groups is matrilineal as it is for most rural MalaGans apart from Ngoni, Tumbuka and Nkonde ethnic groups (i.e., mostly in the Northern Region) (Fig. 3.9). As a result, inheritance of social rank, and usufruct and other property rights, which is generally governed by uterine ranking, is through the female line. Residence rules are also uxorilocal, requiring a man to live in his wife's house, from which he operates the farm to which his wife holds the usufruct right. (Males can attain a measure of security to land by virtue of polygyny.) However, this situation is now gradually breaking down, and the female grip on usufruct rights weakening (Lawry 1981 ). Further, there is strong unity of the sibling group, and in particular of the brother-sister link. Both the Cewa and Yao peoples characteristically inhabit small villages that are based on kinship ties which focus on a village headman, to whom villagers are related either matrilineally or patrilineally.
Whereas resources are controlled through the female line, villages are governed according to principles of male leadership. This leads to several inherent paradoxes and tensions within the social system of both the Cewa and the Yao. Among the most important of these are the competition between a husband and his spouse's brother for control of both his wife and children; the ambivalent position of a man in his wife's village; the conflict between the principle of uxorilocality and that of male governance; the structural opposition between proximate generations as a result of emphasis on the unity of the sibling group; the division of a mother's loyalties between her sibling group and her children; and the political competition among uterine brothers for their sisters' loyalty. In general, despite such social releases as accusations of sorcery and, formerly, pawnship (Douglas 19641, i t is these inherent conflicts among principles of social organization, and the social tensions which they cause, that leads to village fissioning. Both Cewa and Yao societies are characterized by a hierarchical social organization, which ranges from tribal chief
through an individual family member. This is reflected in the spatial organization of the territories with which each social unit is associated.
The first level in tribal society is comprised of the chiefs. In both traditional and contemporary southern Malaikian rural society, a chief has three main categories of duty toward his followers: land allocation, judicial matters, and ritual and religious responsibilities. Chiefdoms are comprised of groups of virtually autonomous villages, the head of one which is recognized as being of superior rank by other village heads and is therefore the chief. All village headmen are linked by an integrated power system, and sometimes by blood relationships (Mitchell 1956).
A chief is the trustee of the land under his jurisdiction, for which he is responsible to the tribal ancestors (Pachai 1978). He allocates the land to members of the tribe, through the village headmen, for their own use. Land thus obtained may never be sold, mortgaged or pledged by the occupant.
Individual members of a tribe obtain land rights through membership in a mbumba (Mitchell 1950). Once obtained, an individual cannot lose land rights unless that person becomes registered in a different tax district, when a village headman can request that they leave the village and relinquish their lands (Lawry 1981).
Most disputes to land boundaries are resolved by the village headman in whose village they occur. The few that are not are settled in the Chiefs Court (Mitchell 1951b).
Besides disputes over land, the chiefs arbitrate in any matter that cannot be settled by the village headmen, or when the welfare of the entire chiefdom is threatened. Presiding over traditional courts remains a major role of the chiefs (Lawry 1981).
A chief is also the ritual representative of his people, whose role it is to appease ancestral spirits in times of natural calamity, such as drought (Lawry 1981). This role of the chief has been greatly altered over the last century, however, concomitant with the increased influence of Islam on the Yao and Christianity on the Cewa (Lawry 1981). In return for their performance of these various duties, chiefs received tribute (Tew 1950; Mitchell 1956).
The second level in tribal society is that of the village headman, who, in accordance with the principle of matrilineality, inherits his position through his female line. The choice of a new

headman is greatly influenced by his ability to maintain the unity of the village, as well as by his experience and wisdom. The women of his matrilineage, as well as his predecessor's children, have considerable influence on the selection of a village headman. A new headman inherits his predecessor's name, wives, hut, and property, as well as his kinship and political position. In this way the state of "perpetual relations" in a village, that date from the time of its formation, are maintained (Mitchell 1956).
The various social roles of the tribal chief are mirrored by the village headman at the village level of tribal society. A prospective headman of a new village seeks land for it from the chief in whose territory he wishes to settle. Assuming that vacant land is available, such requests are rarely refused, since a larger number of inhabitants implies an increase in a chiefs status. Land thus acquired is then divided among the various mbumbas, for distribution to individual households. Throughout Mala%, individuals have usufruct rights to, but not ownership of, customary land. Initially these rights are generally assigned by a village headman, and thereafter acquired within the family unit.
The right to grant land to outsiders wishing to settle in a village is retained by a village headman and his councillors (O'Dowd 1978). Outsiders are granted land by a headman from the reserves that he holds in trust for the villagers. In circumstances where all land has been exhausted - an increasingly common occurrence in heavily settled southern Mala% - a headman seeks land from among those villagers who might be willing to spare some. If that fails he seeks it from among his peer group of village headmen of equal rank (Lawry 1981). In former times, a headman could demand that a newcomer render labor service in return for land received (Pachai 1978).
Once allocated to a mbumba, land cannot be arbitrarily revoked by either a chief or a village headman. Land cultivated by a household is treated as if owned by that household, in that no other person may cultivate part of it or even pick fruit from it without first having obtained the permission of the head of the household to which it has been allocated. The land may be inherited. Although a chief or headman can request that some unused land be allocated to newcomers or donated for a public works project he has no powers of compulsion should the rights-holding lineage refuse. Only by invoking the Customary Land (Development) Act (1967), by which land is
reclassified from customary to public, can the government claim land for projects deemed to be in the public interest (Kishindo 1985).
The status of a village headman is demonstrated in his ability to settle disputes, either within his own village or in the traditional court. Dispute settlement is considered a major duty, and particularly those concerning land boundaries. Accusations of sorcery and breach of taboo are also important sources of dispute (Lawry 1981). Village headmen are also responsible for representing the interests of their villagers in dealings with other groups (Mitchell 1956; Pachai 1978), and for holding the ritually important initiation ceremonies for attaining adulthood (Lawry 1981).
The third social level in Cewa and Yao society is that of the warden of a sorority group (asyene mbumba) (Mitchell 1950). The mbumba, which binds brothers and sisters in a mutually supportative relationship, has been regarded as the fundamental social unit of both Cewa and Yao society (Mitchell 1951a, 1956). In return for their sisters' social and especially political support, brothers are responsible for the welfare of both their sisters and their sisters' children. All brothers and sisters have this special relationship, but, unless proven incapable, the eldest brother has primary responsibilty, and is known as the "warden of the sorority group". The mbumba warden must also stand marriage sureties for his sisters, and cover them for health and financial problems.
In many respects the social roles of mbumba wardens mirror at a lower social level those of chiefs and village headmen. The wardens allocate lands granted by a village headman to members of their mbumba, which is then passed on through the female line. In former times, the wardens could also redistribute land among mbumba members, but with increasing land scarcity this authority has weakened (Kydd 1979). Wardens settle disputes among mbumba members and are responsible for the behavior of their sisters and their sisters' children, to the extent that a warden may be required to pay any court fines incurred by them (Mitchell 1951a). A mbumba warden is responsible for paying the medical and school fees of his sisters and their children, and for ensuring that they have resources to obtain the minor necessities of daily life (Lawry 1981).
In former times, wardens held considerable power over their mbumba groups, even to the extent of having the authority to sell their sisters or sisters' children into slavery (Mitchell 1951a).

But much of this power has been eroded. Nevertheless, a warden still has the right to order his mbumba t o do anything that he requires, can discipline them physically, and, if sick, can request them to perform his cultivation labor or household chores (Lawry 1981).
Although in both Cewa and Yao societies the household is the principal economic unit (Vaughan 1981), the mbumba acts as an insurance group if the product of a component household falls below the subsistence threshold, through such misfortune as ill health or divorce. Households with a maize or flour deficit are given food by those with a surplus (O'Dowd 1978). However, there is little direct labor assistance among member households of a mbumba (Lawry 1981 1.
The lowest social unit in Cewa and Yao society is the individual household. This is the everyday production-consumption unit. Household members pool their labor for agricultural and other economically and socially productive tasks, and they consume together from one grain store (nkokhwe), which, by tradition, each household maintains separately (Kydd 1979). In a matrilineal society with uxorilocal residence, the woman of the household is the stable partner, since it is she who inherits the household land and retains the rights t o any children if a marriage dissolves.
In household subsistence economic terms, the woman is responsible primarily for domestic chores and the man for building and maintaining structures. Farm labor and child-rearing are shared tasks (Lawry 1981). Where both partners are present, the male is considered to be the "head of the household" (Rangeley 1962).
As would be anticipated from changing political, economic, and social conditions, as well as from the personality traits of individuals, in few if any societies do everyday social relationships and patterns of behavior correspond exactly to the nominal ideals of social structure. The introduction of Islam and Christianity, colonialism, foreign educational systems, and both domestic and migration for wage labor have been among the principaj factors that have caused major changes in MalaGian social organization.
There is, for example, a fundamental contradiction between the matrilineal and matriarchical mode of social organization and Islamic Law. However, MalaSan Moslems have apparently ignored this, with no dislocation of social behavior, even with conversion to Islam after marriage (Rangeley 1962; Lawry 1981).
Both Islam and Christianity have had a wide social impact through their educational missions, since literacy and numeracy open a wide range of alternative employment opportunities. Colonialism and its associated reorientation of the economy led to new opportunities for labor on European agricultural estates, and thus to wage migration, and migration abroad. Such was the extent of this foreign wage labor employment, that in 1956 almost one-third of the Malakians in wage labor were employed outside the country (Lawry 1981 1.
Migration has been one of the vital influences on social, cultural, economic, and political change in Malawi during this century (Broeder 1973). One of its major impacts on rural society has been often severe agricultural labor shortages for families of women and children, who alone cannot undertake all the necessary tasks (Evans 1981; Lawry 1981). Whereas some observers contend that matrilineal societies are less well able than patrilineal societies to cope with the outmigration of males (e.g., Pachai 1978), others maintain the opposite (e.g., Marwick 1952), since remittances permit the hiring of agricultural labor, and the mbumba group provides both protection and assistance. Clearly, however, where labor migrants take their wives and children with them for extended periods, the matrilineal systems become weakened, since the authority of the wives' brothers is gradually usurped, particularly as husbands gain financial independence of their wives' land (Lawry 1981).
Community Level Norms As Constraints on Decisionmaking
Patterns of resource use within a community usually reflect the decisions of large numbers of individuals, households and small groups. Thus an understanding of the structure and function's of systems of resource use at aggregate regional and national levels can be realistic only if decisionmaking processes at the community level have also been analyzed, since in many non- Western societies individual needs are generally satisfied through the small group relationships of household, kin group, small community or other such similar social unit.
Nevertheless, it is important to realize that not all individuals in a traditional African community think or behave alike. Among the strongest variations in behavior, and thus a major cause of intracultural diversity, are those

stemming from the use of and access to renewable resources, perceptions of biological and physical environments, and in risk-taking and decisionmaking in a wide range of social and economic activities (Johnson 1972; Rutz 1977).
Most observations on intracultural diversity and heterogeneity within communities have been recorded as "deviations" from norms or cultural patterns that were presumed to be standardized. As such they were usually dismissed or ignored when "social structure" or "typical" culture patterns were described. Most social science descriptions of non Western societies are based on the erroneous idea of a homogeneous culture, which is viewed as a set of standards or rules. Throughout the world many peasant communities, for example, have characteristically been depicted as conservative, fatalistic, suspicious of outsiders, resistant to change and imbued with the "image of limited good. This is still the predominant tendency (Pelto and Pelto 1975), and one in urgent need of revision, as much adaptive research, and particularly that dealing with the processes of innovation diffusion, has amply demonstrated.
In any analysis of a culture group aimed at determining the probability of successful adoption of integrated systems of agriculture-aquaculture, an intensive, microlevel examination of the nature of diversity within the group is essential. Further, this microbehavior must be carefully related to the larger regional and national processes of social change, the relationship between micro- and macrolevel interactions will demonstrate whether in a given culture group and in a given context individuals, households or larger organized group are the principal units in decisionmaking with respect to resource use (Ruddle 1984).
The Sharing of Resources
In many cases economic models are of little value in the analysis of traditional rural economies, since individual households rarely function without reference to others in a community. !t'ypically, a high degree of interaction exists among households, and economics is constrained by tradition, kinship and the community-wide needs for security and survival. In the long run, household welfare depends on that of other households, and on such relationships as mutual assistance, welfare and patronage.
Many traditional subsistence communities are bound by close interpersonal relationships via institutions for sharing, which demonstrate that all people in a community are linked together in one way or another, and that everybody has access rights to a common property resource, such as to dambo lands in MalaiKi (Russell 1971). Commonly, subsistence activities are not viewed as a business undertaking but rather operations on which depends the welfare of all members of a community. Widespread are sets of related concepts which stress that more fundamental than increasing profits, spreading risks and gaining assistance is the individual's right to survive; that nobody should go hungry and that everybody should share in the results of an economic activity, however meagre they might be. This is demonstrated in both the Cewa and Yao societies of southern Mala% by the right of deficit households within a rnburnba to receive food and other assistance from surplus households within the same social group (Mitchell 1956).
One of the negative consequences of the moral requirement to share resources is that some farmers might elect not to improve their economic level by adopting improved cultivation techniques such as incorporating a fishpond into their holding. The commonly stated rationale for this is that there is little point in working harder - and possibly thereby also incurring social sanctions - if one will be pressured to give away a large portion of the fruits of the extra labor to relatives or other members of the community (Mitchell 1951a; Lawry 1981). (However, in the Dedza area of the Central Region, small-scale farmers have adopted aquaculture precisely to accrue prestige J.S. Likongwe, pers. comm.].) (This has also been reported from the western Cameroon, where the accrual of prestige and social benefits by having fish to offer as gifts to visitors was also an incentive to culture fish ENji 19861.)
A man who ignores or neglects his duties toward his kin will be criticized and finally deserted by them, thereby depriving himself of both social and economic security, during infirmity, illness and old age, and he cannot be assured of a proper burial (Mitchell 1951b). In traditional communities in parts of southern Malaki, a person who ignores his kinship obligations to such an extent that he is deserted by his relatives is considered to be the target of sorcery by them. Further, he himself was likely to be suspected of being a sorcerer. This suspicion arises from the belief that sorcerers kill their relatives to repay debts of human flesh incurred
at ghoulish feasts. Thus a man without relatives is likely to be one who has "finished his relatives" (Mitchell 1951a). Thus, in some contexts, a man who ignores his kinship obligations by locating permanently far away from them in order to become economically successful by avoiding the levelling mechanism of sharing is doubly damned: his deserted relatives suspect him, as even more so does the community in which he resides. Nevertheless, there are ways around this, especially with the gradual change in traditional behavior. For example, being a migrant worker is acceptable, since kinship bonds are maintained and obligations fulfilled via remittances sent to the family.
Levelling Mechanisms
In many traditional societies worldwide levelling mechanisms can be considered fundamental in controlling the individual and in functioning to maintain community social order. An individual is prevented by a variety of social pressures, obligations, proscriptions and punishments from advancing himself economically beyond his defined social role. On the contrary, people are commonly enmeshed by sets of reciprocal rewards for conduct appropriate to their social status.
As a consequence, in many traditional African societies, an individual who decides to devote his time to economically productive activities, as opposed to socially productive activities, is commonly regarded as a deviant who must bear heavy social costs, for ignoring the social system of male "clubs" and secret societies in a community. He may, as a consequence, be the butt of jokes and gossip, and worse, the victim of vandalism, and violence, even murder. Persons who engage excessively in economically productive activities do so at the cost of social relationships. In many cases, therefore, innovators may be viewed as social deviants (Grove et al. 1980). As a consequence, modem, economically successful African businessmen maintain their social obligations by making remittances to their families and by bringing gifts whenever visiting them.
Thus in any feasibility analysis of integrated farming in Africa, it is important to understand local cultural concepts pertaining to productive activities and the use of time. Many African societies are characterized by a strict sexual and age class division of labor. It should be understood
that obligatory socializing and related activities make inviolable demands on time, and in this respect must be accounted for just as must be the labor input to ensure a basal level of household subsistence. In traditional African societies the time demands of these activities plus those conventionally understood as productive labor may leave little surplus for investment in newly introduced activities, such as aquaculture (Fig. 9.1).
For example, the social drinking of beer or palm wine in West Africa among males, together with the socially binding rituals involved, is regarded as a vitally important activity (Grove et al. 1980). As such it cannot be regarded as an economically irrational use of potential labor time. It provides occasions for the exchange of economic and social information, social control within the community, via gossip and joking, conflict management and resolution, and, for the repayment in beer or wine of services rendered, obligations incurred or just plain reciprocity. Males who do not participate in these social activities and who opt to engage in economically productive activities, for example, are commonly regarded as deviants who are ridiculed, socially ostracized, victimized or even killed, depending on the perceived degree of their deviance (Grove et al. 1980).
Such "obscure" sociocultural factors are commonly either ignored or belittled by people making development feasibility surveys. Thus rarely, if ever, are they accounted for in socioeconomic studies of labor supply. Yet they are of critical importance, since they both clearly diminish the pool of labor and constrain "deviant" economic activities. It is imperative that they be analyzed.
A closely intertwined complex of levelling mechanisms all-pervasive in traditional society reflects the emotions of envy, jealousy and suspicion. This is directed particularly against persons of the same social stratum who are perceived of as having acquired, for either individual or family benefit, and regardless of the means by which it was obtained, a disproportionate share of the limited resources available within the territory of a given community.
Levelling mechanisms may be utilized when activities such as the accumulation of wealth by a particular individual or family within a community are perceived of by traditional leaders as a threat to either their power or status, or both, and to the unity of the community. In Mala%,

Rest and recreation (42.92%)
Social obligations (3.55%)
Unpaid off-farm work (3.21%)
Attending school (2.52%) Beer- and/or handicraft-making (1.35%)
Working own farm (19.52%)
Domestic activities (16.21%)
Paid off-farm work (4.22%)
Illness and tending the sick (5.48%)
Fig. 9.1. Aggregate time allocation by principal activity of all members of sampled agkultural households, in the Lake Chilwa area, Malahi, 1970-1972. (Source: calculated from data in GOM 1972b). Note: (a) A sample of 39 households, with total population that fluctuated from 154-170 members during the survey period was studied from 1 September 1970 to August 1972.
individual advancement is often perceived by sorority wardens as a threat to the unity of the mbumba (Mitchell 1956), and is restrained by accusations of sorcery (Lawry 1981), the frequency of which commonly lead to the fissioning of villages. For this reason successful farmers will occasionally have difficulty in obtaining hired labor (Lawry 1981).
Fear of witchcraft from jealous relatives, aimed a t keeping economically successful men at a common economic level, has been described for southern Mala% (Mitchell 1951b). In a nationwide survey, 56% of the sample agreed that successful farmers would be bewitched by jealous fellow villagers, whereas 31% disagreed. Such social levelling mechanisms were strongest in Ngabu, the poorest part of Mala%, where 68% of the sample agreed, a result that supports the contention that social levelling mechanisms are strongest where there is little to share (Humphrey 1971). That this remains an important levelling mechanism is being demonstrated by preliminary studies undertaken for the ICLARM/GTZ-FD-UM project in the Zomba District of the Southern Region, which show that belief in witchcraft is so strong that small-scale farmers, including fish farmers, dare not produce beyond a certain level for fear of being bewitched by their peers (G.A. Banda, pers. comm.).
Although all-pervasive, envy, jealousy and suspicion are difficult if not impossible to measure other than by sophisticated and time-consuming psychological tests. Thus most observations on these phenomena are inevitably anecdotal, although this does not diminish their usefulness to planners who need to account for them when promoting an innovation, such as the development of integrated farming.
Thus it was observed long ago in Malak, with respect to capture fisheries development (GNP 1952), that:
... the way of the progressive African is not being made easy by his neighbours and it is apparent that envy and suspicion are a considerable obstacle to progress in this field, as in so many others. ... Many] educated and progressive men have ... invested in new fishing equipment and have worked hard to build up a real business, but have found their efforts defeated by the attitude of their fellows. They have either found it impossible to get any labour a t all ... or ... it has been at exorbitant rates .... even some Chiefs have encouraged this hostile attitude ... toward the progressive African element. [Similarly four fishermen who tried to develop the almost untouched utaha fishery using the chilimila net a t Cape Maclearl were welcomed a t first but when they started to land large

quantities of utaka became unpopular ... solely because of their success.
Little appears to have changed over the past four decades (G.A. Banda, pers. comm.).
In the Zomba, Domasi and Mwanza areas envy and jealousy among female siblings of the wives of small-scale fish farmers are common causes of family discord and often reasons for divorce (O.V. Msiska, pers. comm.). Thus a man had to take care not to become too successful lest his wife's sisters accuse their husbands of laziness as a consequence of their relative lack of economic success. This, in turn, would lead to recriminations among the male family members, destroy the unity of the mbumba, and lead eventually to the fissioning of the village. Banda (1987) noted that jealous members of communities in Mwanza District deliberately damage the fishponds of youngsters, of whom they have no fear. The ponds of successful farmers are also damaged or robbed (G.A. Banda, pers. comm.).
Magico-Religious Factors
Local constraints embedded in traditional magico-religious systems may be the most widespread community-wide sociocultural factor impeding the development of aquaculture in Africa (Grove et al. 1980). Such phenomena are not generalizable since they occur as a plethora of local details.
In West Africa, for example, there are taboos and religious beliefs that prohibit the consumption of particular species, and especially to persons in particular physical conditions or stages of their life cycle. Some species are either locally sacred or regarded as powerful medicine. The consumption of catfish, for example, is widely prohibited by taboo (Grove et al. 1980), although the reasons for this were not explained.
Similarly commonplace throughout Africa is the animistic belief that ancestral and guardian spirits of a household or community reside in a wide variety of natural or man-made landscape features. For this reason the development of fish farming may be either retarded or precluded entirely in a particular locality by a rehsal to modify the environment, such as to excavate fishponds or even to modify those constructed by ancestors (Grove et al. 1980). In Mala% such beliefs have retarded the development of small- scale aquaculture in parts of the Lilongwe District (D.H. Ng6ng61a, pers. comm.). Thus prior to the establishment of any program to develop
integrated farming the precise nature of such constraints, if any, must be established for each ethnic group envisaged as a potential target for the introduction of integrated systems.
Land Tenure and Use Rights
Innovations such as aquaculture may be most easily introduced, other things being equal, into ethnic groups and communities where land and improvements to it are vested in the individual. The degree to which an individual will be permitted use of land owned by the extended kin group or the community will vary according to tradition and particularly to conditions within ethnic groups brought about by recent or on-going socioeconomic change.
According to the Malaiiri Land Act (1965) three categories of land are recognized: private, public and customary. Private land is that held, owned or occupied under either freehold or lease- hold title, or by a certificate of claim. Public land includes all that occupied, used or acquired by the Government of Mala%, including agricultural estates purchased for resettlement, forestry reserves and lapsed leasehold land. Customary land is defined as that held, occupied or used according to customary tribal law (Kishindo 1985).
Almost 80% of the agricultural land in Mala% is customary, of which the Head of State is chief trustee and custodian, but which is administered by local chiefs and village headmen according to local custom. Although such local customary laws governing land use and resource rights vary somewhat among the various ethnic groups of Mala*, the major principles are common and so amenable to generalization.
As is common throughout much of Eastern Central Africa, individuals do not own customary land, rather they have usufructury rights of cultiiration, pasturage and the like. The land is not communal, however, the rights of individuals coexisting with those of the social group to which they belong (Pachai 1974). Among the Cewa, the largest single ethnic group in Mala%, for example, an area occupied bg a matrilineage is recognized as being owned by that lineage, as a corporate group. The lineage has the general usufruct right to that area whereas the individual families which compose that lineage have the recognized usufruct (Chilivumbo 1969).
In the predominantly Muslim Northern Region, as among the Ngoni and Nkhonde peoples, for example, kinship and descent systems

are mostly patrilineal, and rights to land are transmitted through the male line. In contrast, most ethnic groups in the Southern and Central Regions of Mala% are organized socially into a matrilineal system of kinship and descent. Thus land and resource rights are inherited through the female line, and decisions are made by a woman's brothers; i.e., a man seeking permission to build a fishpond would usually have to petition his mother's brother(s) (Table 9.1). (To avoid the confusion of Western classificatory terms, they are not here called "uncles".) Traditionally, residence rules have been uxorilocal (i.e., on marriage a man takes up residence in his wife's household), although this custom may be weakening (GOM 1978~). Thus, as in the Mwanza North area of Southern Mala%, for example (Table 9.2), permission to use 41% of plots was granted via females, the use rights to 30% had previously been vested in females, and the successor to the use rights of 61% of t.he plots would be a female.
Matrilinity and the Resource Rights of Males
In the Cewa and Yao societies of southern Mala%, a male is in an anomalous position with respect to resource rights, since although the head of his household, as a consequence of matrilineality and uxorilocality he obtains access to land through the female line and resides in his wife's village, respectively. He works her land. Further, although heading his own household, a man must generally submit to the authority of his wife's brothers - and especially her mbumba warden - with respect to his wife, his children and her land. As a consequence, not uncommonly, husbands experience insecurity of tenure, since divorce rates are reportedly high among the Cewa and Yao (Mitchell 1950; Marwick 1952).
On divorce, or upon the death of his wife, a man returns to his mother's village, and his former wife retains all the usufruct rights to the
Table2.1. Source of permission to use land for aquaculture in Mwanza and Zomba Districts, Malawi.
Source Mwanza Zomba Total No. % No. % No. %
Male relative by birth (a) 25 31.7 19 65.5 44 40.7 Female relative by birth (b) 29 36.7 2 6.9 31 28.7 Male relative by marriage (c) 11 13.9 0 0.0 11 10.2 Female relative by marriage (d) 3 3.8 1 3.4 4 3.7 Village headman 11 13.9 4 13.8 15 13.9 None because leased land 0 0.0 2 6.9 2 1.9 None because freehold land 0 0 .O 1 3.4 1 0.9
Total 79 100.0 29 99.9* 108 100.0
Source: Banda (1987). Notes: * Rounding-off error; (a) Eithcr the mother's or father's brother and their male kin; (b) Either motheis or father's sister and thcir female kin; (c) Eithcr wife's brother or uncle and their male kin; (dl Either wife's mother or mother's sister and thcir female kin.
Table 9.2. Percentage distribution of landholdings in Mwanza North, Mala%, by acquisition of use rights, relationship to pnevious owner and successor.
--
Use rights acquired from
Female relative by birth Male relative by birth Female relative by marriage Male relative by marriage Village headman Loaned Other
Total
-
Relationship of previous rights holder
Female relative by birth Male relative by birth Female relative by marriage Male relative by marriage An unrelated villager Cleared from vacant land Other
Successor
Daughter Son Niece Nephew Sister Brother Division Other
-- -- -
Source: GOM (197%).

lands that they cultivated jointly. Technically, under those circumstances a man may claim half the joint standing or harvested crop, as can his matrilineal kin, should he die. In practice, however, the claims are not invoked since it is regarded as commendable to leave the food for the children (Mitchell 1950).
It has been widely claimed that this insecurity of male tenure under matrilineal systems of social organization is a common disincentive to make long-term investment and improvement in a land unit the usufruct right of which belongs to a wife (Lamport-Stokes 1970), such as the improvement of soil fertility (GOM 1 9 7 8 ~ ) ~ the growing of perennial tree crops (Mitchell 19501, or the construction of a relatively permanent structure such as a fishpond (G.A. Banda, pers. comm.). Yet it may not influence the amount of land given over to short-term cash cropping as opposed to subsistence cultivation (Mitchell 1950; Lawry 1981). The impact of this condition depends greatly, however, on the personality characteristics of the individual male. Whereas some men prefer to invest in movable property which they can take with them on divorce (Mitchell 19501, and others claim they would work harder if cultivating their own land rather than that of their wife (Lawry 1981), yet others express no difference between working their wife's land compared with their own (Lawry 1981 ).
The stereotypical notion that marriages within matrilineal systems are inherently unstable and thus inhibit long-term investment, and therefore agricultural development, is being increasingly challenged. For example, the failure to undertake soil conservation measures in areas of severe soil erosion may reflect more labor scarcity and the inability to hire labor than disincentives inherent in uxorilocal residence (Kishindo 1985); uxorilocality did not seem to impede either the adoption of technological innovations or cash cropping in the Salima ADD (Kishindo 1983). Rather, in matrilineal systems the constant need to provide daughters with land results in excessive fragmentation of holdings, which eventually become economically unviable. This becomes an incentive to give up uxorilocal residence (Kishindo 1983), since a husband has no authority in his wife's village and cannot prevent this fragmentation process. In his own village, however, he will have a greater say in affairs.
Kishindo (1985) concludes that matrilinity is not an inherent barrier to agricultural development, since existing conditions of
customary law do provide long-term security for male cultivators, because social recognition of the validity of a claim is more important than the nominal social structure. Rather, insecurity is a temporary phenomenon of the settling-in period in a wife's village, or when temporary land is being cultivated. In a matrilineal situation a man's usufruct rights by marriage are protected by the leaders of his wife's matrilineage.
Among the Yao the tradition of cross-cousin marriage, preferably with the daughter of one's father's sister, has functioned to mitigate this paradox inherent in the social structure. This type of marriage, which was frequently contracted, enables a male to live uxorilocally and to work his wife's land, as demanded by tradition, yet at the same time to remain close to his own family land and other property (Lawry 1981).
It is also important to note that the female is also in an anomalous situation. She holds the usufruct t o tribal land, and regardless of what happens to the marriage it will remain with her and will be inherited by her female offspring. Wives are thus the marriage partners with an interest in long-term investment in and improvement of the property, yet it is the husband, who does not share this interest and regardless of whether or not he is physically present, who is the principal decisionmaker with respect to farming.
Land scarcity coupled with the disincentives inherent in the traditional social structure are an increasing cause of divergence from cultural norms. These days, lack of land makes it impossible for some parents to satisfy the social ideal of giving cultivable land from their own holding to their newly married daughters, or, as a last resort, to seek it for them from the village headman. (In a matrilineal society the amount of land given to a newly married daughter depends on the size of her parents' holding as well as on the number of other female dependents to whom land will have to be given [Lawry 19811.)
As a consequence, some new couples obtain land from the man's parents, and live virilocally. This has had repercussions for the social system, in that although theoretically the woman's male relatives still have authority to refuse the man the right to cultivate as he wishes on "their" land, this right is rarely exercised (Lawry 1981). A man is therefore freer to do as he wishes on land thus inherited. There has, however, been a tradition among the Cewa whereby after a period of uxorilocal residence a husband may negotiate "wife removal" (chitengwa) with his in-laws to

return with his wife and children to his own village (Kishindo 1985). This is becoming socially more acceptable as the authority of mbumba wardens over their sorority group and its offspring declines (Kydd 1979). Men living uxorilocally frequently seek to establish their own farms, and particularly those for cash crops. This they can do by borrowing land in which to cultivate two or three cash crops, by seeking a permanent plot in their own matrilineal village, or, more rarely, seeking a permanent plot in another area entirely (Mitchell 1950).
Land may be borrowed from a person who has cultivation rights but who may not be able to personally cultivate the land. He may either give the cultivation rights to another person (Mitchell 1950), or, more likely, will loan them. Since land may be reallocated to another person if it is judged to be abandoned, a person who is obliged to leave his farm temporarily may ensure against losing it through reallocation by lending the cultivation rights to somebody else in the interim. This is usually done with the concurrence of the village headman, if the land was originally obtained from him, or from lineage leaders, if it is lineage land (Kishindo 1985). Cultivation of temporarily borrowed land is another source of insecurity for the cultivator, since, not knowing when he might be asked to return the land, long- term investment makes little sense (Kishindo 1985).
Population pressure combined with the increased economic value of cash crops has also had social repercussions. In Namwera, for example, the resultant increase in land values has severely reduced the authority of mbumba wardens to redistribute lands among their membership (Lawry 1981).
Constraints inherent in the traditional matriarchal social organization are also an incentive to develop a holding in unoccupied land, where it remains available. Where unclaimed and uncleared land exists, households can seek permission from the village headman to develop their own gardens. In the Mwanza District, where there is 1,110 km2 of unclaimed and uncleared land (see Tables 3.2 and 3.3), some 40% of the agricultural plots in the area surveyed in Mwanza North had no previous user, having been cleared in vacant land (Table 9.2). Nevertheless, although easily acquired (GOM 1978~1, such land may be of inferior quality (which is one reason why it is vacant).
The amount of land available, as well as its quality, is related to local social structure. In
longer settled areas of the Lilongwe District, for example, members of higher status mbumbas, as well as older established households (factors which are related) cultivate areas with better soils. (The status of a mbumba is conferred by its relationship to the headman's matriclan.) More recently arrived and lower status households work inferior land (O'Dowd 1978).
Length of residence in an area is obviously an important factor in obtaining access to land of superior quality. In one sampled area of Lilongwe District, for example, 75% of "progressive" farmers had been working their present farms for more than 10 years, whereas 70% of those classified as "nonsuccessful" had been operating their holdings for less (Kapeya 1978). In addition to their ability to obtain more and better quality land, longer-term occupants of an area have the best opportunities to obtain both dimba and dambo lands to supplement their household economy (Kapeya 1978).
As a consequence of that highly complex interaction of personal usufruct rights to land, either those obtained through village membership or those acquired individually, the pattern of cultivation rights in any one area of Mala%, and particularly in the Central and Southern regions, is extremely complicated. It is virtually impossible to resolve into a checklist of simple principles, particularly since its inherent complexity is now being additionally ramified by the changes consequent upon population growth and resultant pressures on land and land fragmentation, and as a result of increasing divergences from nominally prescribed cultural forms.
Dambo Areas: An Example of Common Property Resources
In addition to the edaphic limitations discussed in Chapter 3, the possible alienation by individuals or families of dambo areas for the construction of ponds may be commonly restricted by virtue of their traditional utilization as common property resources areas by one or more adjacent or nearby clans or villages. Although they are largely uncultivated, dambos have a variety of traditional economic usages (Fig. 9.2; Table 9.3).
The most widespread use of dambos is as a source of domestic water (which is decreasing proportionate to the increase in boreholes and wells), and second is as a source of thatching grass. Other important communal uses of dambo

Cattle grozing
C 0 .- C 0 N .- - obacco nurseries .- C 3
Domestic water
Percentage Fig. 9.2. Percentage distribution of common property_resource utilization of dambos in the Lilongwe Plain, Malawi, 1970. (Source: Russell 1971). A sample was taken of 608 interviewees living adjacent to the dambos at Mlale, Kakoma, Ulondwe, Mtsukanthanga, Chikungu, Nsaru, Kadakatali, Namanyanga and Dyankhuno.
Table 9.3. Percentage distribution of common pmpeFy uses of selected dambos in the Lilongwe Plain, Malawi, 1970 (a).
- -
Use Sampled users % all users Village headmen
(b) % (no.)
Cattle grazing 29 61 (23) Goat grazing 61 86 (31) Dimba garden 56 61 (23) Tobacco nursery 61 79 (30) Domestic water 89 89 (34) Thatching grass 67 66 (25) Pottery clay 30 63 (24)
Source: Russell (1971). Notes: (a) A sample of 608 interviewees living adjacent to the dambos at Mlale, Kakoma, Ulondwe, Mtsukanthanga, Chikungu, Nsaru, Kadakatali, Namanyanga and Dyankhuno was taken; (b) % of all respondents.
resources are as grazing for goats and cattle, temporary usufruct rights for dimba gardens and for making nurseries for tobacco seedlings, and as a source of clay for pot- and brick-making. Minor uses include being sources of grasses used for stall-feeding cattle, mulching tobacco and firing pots, of reeds for making mats and baskets, of vines for making lashings, and as a location for hunting rodents and for fishing (Russell 1971; Jackson et al. 1963). Dambos are occasionally used as a location for extracting sand.
Use rights to dambos and their resources are both extremely complex and variable among different areas. Rights commonly vary between neighboring villages and among clans within
villages. As might be anticipated, the degree of complexity is generally related to the size of villages and the number and size of the adjacent human settlements.
Traditionally the dambo has been a common property grazing area open to all who live around it. In the Northern Region this situation still prevails. However, where population pressures are greater, as in the Lilongwe area, boundaries have emerged within dambos to delimit areas in which certain groups of individuals have specific rights. Such rights are usually limited to those for dimba cultivation and are rarely exclusive (Russell, 1971).
No intervillage boundaries are recognized for livestock grazing, except that they are not permitted to enter cultivated areas within a dambo. Similarly, the collection of thatching materials and the digging of clay are not restricted by boundaries between or among villages.
Virtually universal rights to dambo resources exist within villages. Intravillage rights to dambo areas are divided among clans and commonly reflect an extension of customary clan rights to munda garden areas.
However, certain activities are subject to control, and villagers wishing to make a dimba, for example, must traditionally obtain the permission of the clan leader and village headman (if different persons). However, once temporary usufruct t o a dimba garden has been established that farmer may dispose of the secondary rights to all or part of it as he alone sees fit. When there is a scarcity of any particular resource, such as thatching grass, particular areas are usually reserved exclusively for it and cannot become alienated by individuals. However, in many instances, traditional authority over resources rights has broken down, and remains only nominal (i.e., traditional leaders claim authority but do not or cannot exercise it).
Household Decisionmaking
Apart from a few unpublished reports of localized field studies, there are scant empirical data on economic decisionmaking in Malasan rural households. Those available are mostly for the Lilongwe ADD, of the Central Region. As yet there are no data on decisionmaking in aquaculture households (although fieldwork is now being conducted on this topic in Zomba

District, as part of the ICLARIWGTZ-DOF-UM project).
The survey data reveal that most household decisions are made after consultation between both conjugal partners, and that, despite a matrilineal social organization, in no case did the wife's brother(s1 have any say in the decisions (Mthinda 1980; Phiri 1981). Further, it was shown that even in households headed either temporarily or permanently by a woman that her brothers had little or no influence on her decisionmaking.
Conjugal partners have distinct spheres of responsibility in decisionmaking, yet even within those domains there is consultation between the two persons before decisions are made. Thus most decisions regarding food preparation and domestic chores are made by the wife, whereas those pertaining to cash-cropping, the hiring of labor, the acceptance of innovation and most financial matters are the responsibility of the husband (Mthinda 1980; Phiri 1981). In the area surveyed by Mthinda (1980) women are more involved in small-scale trading than are the men. Nevertheless, decisions regarding this activity were still made jointly by both husband and wife. Despite the dominance of one conjugal partner in a specific decisionmaking realm, the overall pattern is one of shared decisionmaking (Mthinda 1980; Phiri 1981).
Marital status has an impact on the degree of consultation between husband and wife before decisions are reached. In the Lilongwe area, wives of polygynists have little influence on their husband's farming decisions, whereas in the Kawinga areas of the Liwonde ADD, wives farm almost independently, with just occasional help from their husbands (Lawry 1981). As would be expected, a wife's influence on her husband in decisionmaking increases with the lengthening years of their marriage (Phiri 1981). There is also a correlation between the educational level attained by the husband and the degree to which he consults with his wife before making a decision; the higher the level the more consultation is done (Phiri 1981).
In households where only one adult is present, generally the woman, since husbands are commonly absent owing either to labor migration or divorce, all economic decisions are made by that person alone. This parallels the situation in a household occupied by a conjugal couple: they do not turn to friends or relatives for help in decisionmaking vis-a-vis agriculture or other economic activities. A couple may choose to
discuss options with friends, relatives or extension workers - especially during social occasions - but the final decision rests with either one or both of them (Lawry 1981).
For the large number of very small-scale farmers in MalaCNi whose holdings yield a bare household subsistence the perceived risks inherent in alternative courses of action are of fundamental importance. Those with no fall-back margin tend to be reticent about taking the risks inherent in an innovative technique such as aquaculture, or in pursuing a labor-intensive course of action that reduces their time available to engage in such economically complementary activities as hired labor.
It has been argued that ~ a l a G i a n subsistence farmers are concerned to produce only enough to ensure their household subsistence base, since they value "leisure" more than a cash income obtained from sale of agricultural surpluses (O'Dowd 1978). However, surveys demonstrate the Western economic rationality of certain ~ a l a & i a n small-scale farmers who live above a subsistence base. Dean (1966) demonstrated with respect to tobacco that the MalaGian smallholder is a rational allocator of resources and is influenced by price and other, similar considerations; Minford and Ohs (1970) concluded that there is a significant positive response by farmers to higher producer prices and a negative response to higher consumer prices; Brown (n.d.), in a nationwide survey, found that planting decisions depend more on yield risk than on price or income factors, that increased income promoted increased labor input, that higher prices and incomes led to increased consumption, higher output and greater use of improved technology; and Gordon (1971) calculated the supply response function and a production function for each major crap, and found that a 1% price increase evoked a 2.3% increase in acreage. Mills (1975) demonstrated that ADMARC price increases were followed by an immediate response by 30% of the farmers surveyed, and by an even greater delayed response in the following planting season, when farmers were responding to last year's price incentives. Fieldwork in Zomba District is demonstrating that subsistence households generally base their farming decisions more on social considerations than on economic factors (G.A. Banda, pers. comm.). However, on the other hand, small-scale farmers in transition from household subsistence to an incipient commercial orientation, or those with a holding large enough

to produce a saleable surplus, base their decisionmaking more on economic than social factors.
The Importance of Sociocultural Factors
Sociocultural factors are an important complex of variables that guarantee either the success or failure of development projects. Despite the vast amount of documented evidence supporting this assertion, however, expensive projects continue to operate below designed standards or collapse entirely with dismal regularity because of the failure, inability or outright unwillingness to give sociocultural factors due consideration in program planning and implementation. Sociocultural variables must be analyzed rigorously if basic impediments to rural development in general, and to new technologies such as aquaculture in particular, are to be mitigated and hopefully eliminated altogether.
Although much has been written about the techniques of increasing food production in developing countries, little is known about the best combinations of biological, ecological, technical, social, economic and administrative functions for promoting integrated rural development for nations or within their various regions. Further, in most cases the ultimate beneficiaries of development policies have never been precisely identified, and their behavior patterns and institutional practices are, a t best, poorly understood. This makes it difficult if not impossible to design effective national and regional policy and programs, or to determine the best mix of inputs required in a given location to ensure the success of an aquaculture development project.
The promotion or rural development is also made more complex since a combination of inputs is required. No single service, technology or institution is ever likely to have much impact. This is further complicated since all inputs generate a range of outcomes or impacts, some of which, inevitably, are unintended, unanticipated or undesirable.
Further, there is no universally applicable strategy or package of inputs that will promote development. Because physical, biological, sociocultural and economic environments are so diverse among and within countries, the needs, constraints and capacities for problem-solving for rural development also vary enormously. The
components of a development strategy must therefore be closely tailored to local circumstances; appropriate technologies and services must be combined with appropriate institutions to sustain rural development under widely differing conditions.
Socioeconomic factors should be considered a t the household and community levels, as well as from the perspective of the successful introduction of innovation. But principal emphasis should be placed on the household level, where the critical decisions will be made regarding the adoption or not of integrated farming systems. The main factors to be examined are decisionmaking with respect to the adoption of innovation, labor and time allocation, the economic role of females, and aspects of land tenure, since these are principal factors at the household level in Africa that contain either actual or potential constraints for the development of aquaculture.
Since in traditional rural societies the economic behavior of individual households is often circumscribed by deeply embedded and powerful community-wide forces, this topic must also be examined thoroughly. Of fundamental importance is the question of access rights to common property resources, as well as the local power structure and the all-pervasive pressures to share the fruits of labor and to conform to community norms, which are animated by deeply- seated envy and jealousy.
Further, it is important to note that everywhere behavioral norms are also constantly, if often imperceptibly changing. Thus culturally ideal, or "traditional", social structures and patterns of behavior have been subjected to usually gradual but nonetheless considerable modification throughout rural Africa.
Innovation and Rural Communities
Voluminous research on the acceptance of innovation in rural societies demonstrates five basic and generic attributes that characterize any new technology and affect the way in which a target population perceives it (Rogers and Shoemaker 1971). These perceptions wiIl largely determine the way in which communities respond to the proposed changes that the technology heralds.
These attributes are: (1) Simplicity: Although culturally relative,
simplicity is a key attribute. A technology and its related institutions will be unsuitable if they are

either so complex or indivisible as to require intensive or prolonged training, and if few individuals are available in a community to operate or manage them.
(2) Compatibility: A technology must be compatible with existing agroecosystems, socioeconomic systems, behavior patterns, social roles, and the like;
(3) Offer Advantages: Only technologies that offer a better way of doing things or yield a better result than customary practices will be adopted. Clearly, advantage is also a culturally relative value and one that cannot be measured just monetarily or in terms of efficiency. Further, it has serious implications for established power and prestige structures within a community;
(4) "Testability": Introduced technologies must be "testable" by a representative sample of a community and not by just a relatively affluent or powerful few. Nor should they be such as to exacerbate existing socioeconomic stratification, thereby exacerbating problems of envy and jealousy. They must be accessible to all potential adopters; and
(5) Visibility: New technologies most likely to be adopted are those where quantitative and other results can be quickly appraised by casual observation.
Thus effective programs to introduce and sustain small-scale aquaculture technology and the institutions required to support it consist of several fundamental and interrelated components and processes:
(1) A suitable technology and supporting institutions must be available to attain defined development goals;
(2) Target populations must be identified to receive that technology;
(3) The technology must be communicated to the target populations;
(4) The technology and institutions must be appropriate for the biological, physical, economic and sociocultural environment of the target population, and the latter must recognize this;
(5) A trial period will then follow after which the technology and institutions are either rejected outright, accepted without reservation, accepted with changes, or revised and tried again;
(6) Acceptance of an innovation is then followed by its dissemination, often by informal means from prior innovators to relatives and friends, throughout the target population and over a wide geographical area; and
(7) The final stage occurs when the new technology and its institutions is no longer an
innovation by virtue of being locally regarded as an integral part of the agroecological and sociocultural systems.
The Importance of Appropriate Institutions
Most evaluations of integrated rural development programs assume either the prior existence of, or the ability to quickly create, an institutional structure appropriate to local needs and capable of distributing the resources for decentralized investment and production to far- flung and diverse rural regions (Rondinelli and Ruddle 1977). But most coul~tries still lack both the structure and the ability to create it (Ruttan 1975). This is particularly true for a new idea, such as aquaculture. Most reports on the status of aquaculture development in Africa stress the overwhelming institutional deficiences that preclude rapid growth of the sector. Further, although the concept of appropriate technology for rural development is now long familiar, relatively little attention has ever been paid to its organizational dimensions, and particularly to the characteristics of institutions appropriate for delivering social, commercial and governmental services and technologies to rural areas (Rondinelli and Ruddle 1977).
A combination of a t least four basic institutional deficiencies commonly occurs in impoverished rural regions:
(1) Most organizations that provide technical inputs or services, for example, are either absent or exist in only their traditional forms or surrogates, and the latter are usually inadequate for promoting rural development directly;
(2) Such institutions are rarely linked into a hierarchy of supporting institutions so as to provide a reliable flow of inputs, and their resultant unreliablity makes adoption of their services and techniques by small-scale farmers unnecessarily risky;
(3) Owing to a combination of scarce finances, ineffective linkages, lack of skilled manpower, weak political support, unwillingness to serve the poor, among other things, existing institutions generally have a low administrative capacity to deal with the complex problems and procedures of rural development; and
(4) Newly introduced governmental institutions are commonly incompatible with the traditions, behavior and cultural patterns of local

"target" societies. As such, they may be a further source of alienation and increased impover- ishment.
Like appropriate technology, appropriate institutions to serve aquaculture and other sectors of the economy should be adaptable to the wide and complex variety of problems and conditions found throughout rural Africa. The development and transfer of supporting institutions, like aquaculture technology transfer and development, must blend adaptation, innovation and creativity with an intimate knowledge of local capabilities and constraints.
Thus ultimately all the services and technologies for rural development must be related, thereby forming a mutually reinforcing set of elements for building the productive capacity of a region. Inherent within these services and technologies is a hierarchy of functions that ranges from traditional ta modern, and from simple to complex, each of which is essential for development in rural areas at different stages of progress. Corresponding to this hierarchy of functions is a hierarchy of spatial locations to and from which services and technologies must be delivered to promote social transformation and create an integrated national economy (Rondinelli and Ruddle 1977). It remains to be seen if the elaborate development plans for small-scale pond aquaculture in Africa will eventually also be supported by these broader aspects of development.
It is obvious, then, that a wide range of factors, from community sociocultural constraints, at the general level, through everyday, detailed
household subsistence dictates, have a major impact on the decisions reached by farmers. Not all factors are of equal influence under every circumstance, their importance varying according to the resource base of different households, as well as to such relatively intangible factors as degree of modernization in a community, and the corresponding relative weakness of customary norms of behavior.
Accepting the assumption of rational decisionmaking among Malakian small-scale farmers, major considerations will be farm size, household labor supply and capital, together with the size of the consuming household unit and other essential economic demands, such as medical and educational services. These are fundamental factors that govern the decision to start fish farming or not.
Nevertheless, it would be foolhardy to underrate the continuing importance of customary kinship demands and obligations together with peer group pressures that act to constrain extreme divergence from the nominal customary behavior of a social group, if not outright conformance with them, as well as the roles of traditional institutions. These too represent another set of equally important constraints or potentials that must be carefully evaluated and incorporated in all plans for the development of aquaculture. There is no escaping the conclusion that successful implementation of development plans and the long-term sustainment of an innovation depends largely on their congruence with social organization and behavior patterns.

Chapter 10
LABOR, TIME ALLOCATION AND THE ECONOMIC ROLE OF WOMEN
Introduction
The analysis of labor demand and supply is of fundamental importance in planning for the introduction of aquaculture into small-scale farm operations, since any recommendation to change or adopt practices inevitably causes a change in farm labor requirements and distribution, as well as having an impact on the capacity and need to undertake nonfarm and off-farm economic activities. I t will also have an impact on the allocation of time to social and other noneconomic activities, and, in turn, these will condition any deliberation on whether or not to change or adopt practices. Thus a comprehensive understanding of labor demand and supply, by task, season and gender is an essential prerequisite to the planning of all farming activities.
Labor is generally not regarded as a constraint limiting agricultural productivity in Malaiki (see, for example, Beveridge and Stewart 1986). Indeed, overall there is a national agricultural labor surplus, particularly in the slack season and especially on the smaller landholdings. In the M~lanje~Phalombe area, for example, labor demand is proportionate to farm size, and the absorption capacity of farming there varies from 10-20%, for the smallest farms, to 60- 80% for larger holdings (Fig. 10.1). However, in that same area returns to labor, a t 0.85-1.07 MWman-dayiha, are not proportionate to farm size (Fig. 10.2; Table 10.1), although total income does increase with farm size, from MK 70 to 700/year, the income from agriculture may be proportionately smaller, by 40-90% (Fig 10.3).
There are, however, seasonal labor constraints, particularly as manifested in the need to hire labor on the larger farms. The sexual
division of labor is also another possible constraint on the adoption of aquaculture. Studies of labor comprise a subset of the larger question of time allocation in general. Aquaculture feasibility studies that blandly claim that labor is not a constraint, indeed that labor is in excess supply that needs absorbing, base their assertions on the assessment of the residual after deducting only the amount of time per agricultural cycle required to produce a basal subsistence for a household, together with a small saleable surplus. In general, the perspective taken by various labor time studies is the desire to maximize the rate of return on labor investment. Invariably overlooked is the social value and cultural valuation of time (see Chapter 9).
Relative to most other countries an awesome amount of information has been compiled on labor inputs for various agricultural systems in Malahi. The principal sources are the various district reports compiled in the 1970s by the Agro- Economic Survey of the former Ministry of Agriculture and Natural Resources, as well as those conducted more recently by various ADDS. However, the usefulness of those data is greatly constrained by their having been based almost entirely on estimates, which severely limits their utility for analyzing crop requirements, as well as by their internal inconsistency and the lack of comparability among districts.
The best single study of agricultural labor demand and supply in the Southern Region was conducted by Werner (1987), the quantitative data from which is used as the basis of this section. In the Southern Region, and probably elsewhere, Werner's analysis demonstrates that all previous studies of agricultural labor have seriously underestimated labor demand. In particular,

Unused lobor (%)
Available labor
Required labor
Mean- 1.37 ha r 4
(i) Labor use/ holding
(ii) Holding size:
Mean- 0.73 ha 4
Farm size (ha 1
Fig. 10.1. Holding size and agricultural labor supply and demand in the Phalombe District, Malawi. (Source: calculated from data in BLADD 1985a, 1985b).

Table 10.1. Return to labor (MK/man-daysha) by farm size in the Mulanje-Phalombe area of MalaCi.
Value of agricultural activity, labor input and return to labor Farm size Phalombe Mulanje West Mulanje South
(1) (1) (1) MKha (2) (3) MWha (2) (3) MKha (2) (3)
Range Mean Agric. Man-daysha MWman-daydha Agric. Man-daysha MWman-daysha Agric. Man-daysha MWman-daysha
- -- - - -- --
Source: Calculated from data in Bladd (1985a, 1985b); drawn in Fig. 10.2. Notea: For foreign exchange rates, see p. 302. (1) Total farm revenue (MKma) % from agricultural sourcedmean farm size (ha) = value of agricultural activity (MWla). (2) Farm labor man-daydmean farm size (ha) = labor for agricultural activity (man-dayslha). (3) (1)/(2) = returns of labor agricultural activity (MWman- daydha).

Farm area (ha)
1 8 - 0 s \ ZI
I S -
C 'z \ 1 4 - Y P
g 1 2 - 0 - 0 + E 1 0 - 3 + d
08 -
A. Mulanje West 0. Mulanje South
M Mulanje West
Phalombe
W Mulanje South
Fig. 10.2. Return to labor by farm size in the Mulanje- Phalombe area, MalaGi. (Source: calculated from data in BLADD 1985a, 1985b). (See Table 10.1).
1 1 I I I I I I 0 05 10 15 2 0 2 5 3 0 3 5 40
Farm size (ha)
c. Phalombe
Farm size (ha
""I 70 -
8 - 60
E - 5 0 8
C .-
Fig. 10.3. Total household incomes and percentage of income derived from agriculture by farm size in the Mulanje- Phalombe area, Mala%. (Source: calculated from data in Bladd 1985a, 198513).
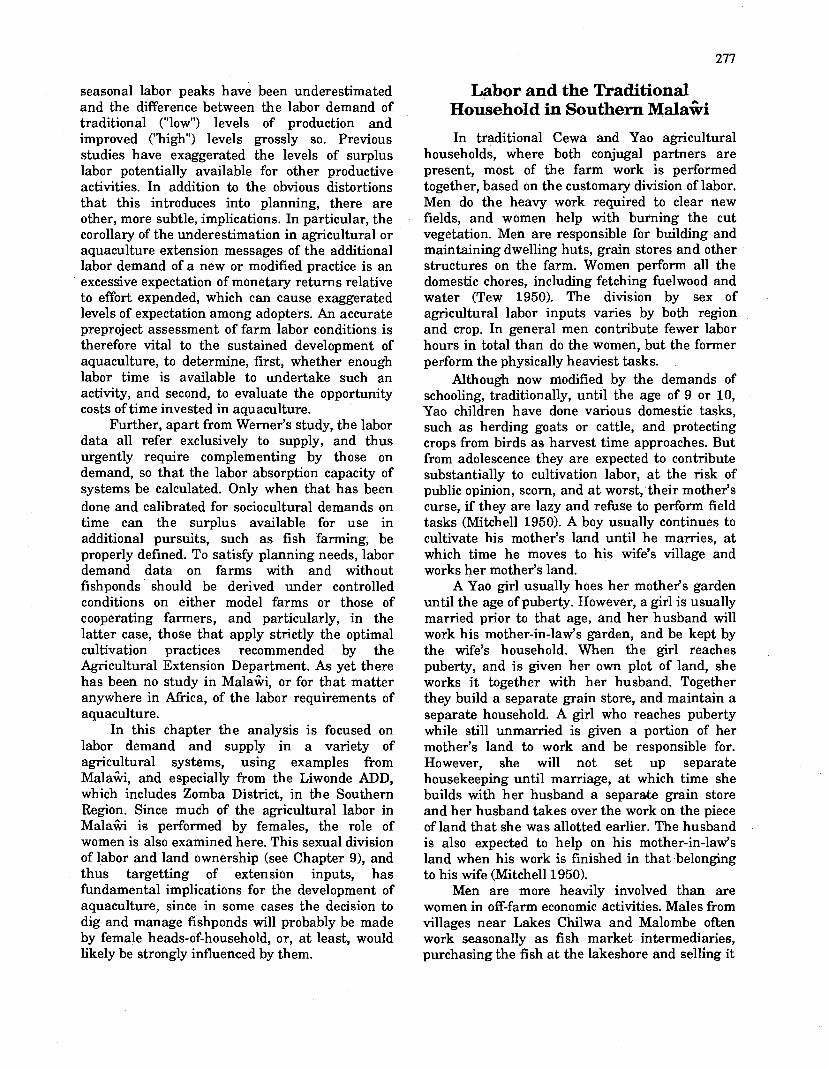
seasonal labor peaks have been underestimated and the difference between the labor demand of traditional ("low") levels of production and improved ("high) levels grossly so. Previous studies have exaggerated the levels of surplus labor potentially available for other productive activities. In addition to the obvious distortions that this introduces into planning, there are other, more subtle, implications. In particular, the corollary of the underestimation in agricultural or aquaculture extension messages of the additional labor demand of a new or modified practice is an excessive expectation of monetary returns relative to effort expended, which can cause exaggerated levels of expectation among adopters. An accurate preproject assessment of farm labor conditions is therefore vital to the sustained development of aquaculture, to determine, first, whether enough labor time is available to undertake such an activity, and second, to evaluate the opportunity costs of time invested in aquaculture.
Further, apart from Werner's study, the labor data all refer exclusively t o supply, and thus urgently require complementing by those on demand, so that the labor absorption capacity of systems be calculated. Only when that has been done and calibrated for sociocultural demands on time can the surplus available for use in additional pursuits, such as fish farming, be properly defined. To satisfy planning needs, labor demand data on farms with and without fishponds should be derived under controlled conditions on either model farms or those of cooperating farmers, and particularly, in the latter case, those that apply strictly the optimal cultivation practices recommended by the Agricultural Extension Department. As yet there has been no study in Mala&, or for that matter anywhere in Africa, of the labor requirements of aquaculture.
In this chapter the analysis is focused on labor demand and supply in a variety of agricultural systems, using examples from Mala%, and especially from the Liwonde ADD, which includes Zomba District, in the Southern Region. Since much of the agricultural labor in MalaGi is performed by females, the role of women is also examined here. This sexual division of labor and land ownership (see Chapter 91, and thus targetting of extension inputs, has fundamental implications for the development of aquaculture, since in some cases the decision to dig and manage fishponds will probably be made by female heads-of-household, or, at least, would likely be strongly influenced by them.
Labor and the Traditional Household in Southern ~ a l a % i
In traditional Cewa and Yao agricultural households, where both conjugal partners are present, most of the farm work is performed together, based on the customary division of labor. Men do the heavy work required to clear new fields, and women help with burning the cut vegetation. Men are responsible for building and maintaining dwelling huts, grain stores and other structures on the farm. Women perform all the domestic chores, including fetching fuelwood and water (Tew 1950). The division by sex of agricultural labor inputs varies by both region and crop. In general men contribute fewer labor hours in total than do the women, but the former perform the physically heaviest tasks.
Although now modified by the demands of schooling, traditionally, until the age of 9 or 10, Yao children have done various domestic tasks, such as herding goats or cattle, and protecting crops from birds as harvest time approaches. But from adolescence they are expected to contribute substantially to cultivation labor, a t the risk of public opinion, scorn, and a t worst, their mother's curse, if they are lazy and refuse to perform field tasks (Mitchell 1950). A boy usually continues to cultivate his mother's land until he marries, at which time he moves to his wife's village and works her mother's land.
A Yao girl usually hoes her mother's garden until the age of puberty. However, a girl is usually married prior to that age, and her husband will work his mother-in-law's garden, and be kept by the wife's household. When the girl reaches puberty, and is given her own plot of land, she works it together with her husband. Together they build a separate grain store, and maintain a separate household. A girl who reaches puberty while still unmarried is given a portion of her mother's land to work and be responsible for. However, she will not set up separate housekeeping until marriage, at which time she builds with her husband a separate grain store and her husband takes over the work on the piece of land that she was allotted earlier. The husband is also expected to help on his mother-in-law's land when his work is finished in that belonging to his wife (Mitchell 1950).
Men are more heavily involved than are women in off-farm economic activities. Males from villages near Lakes Chilwa and Malombe often work seasonally as fish market intermediaries, purchasing the fish at the lakeshore and selling it
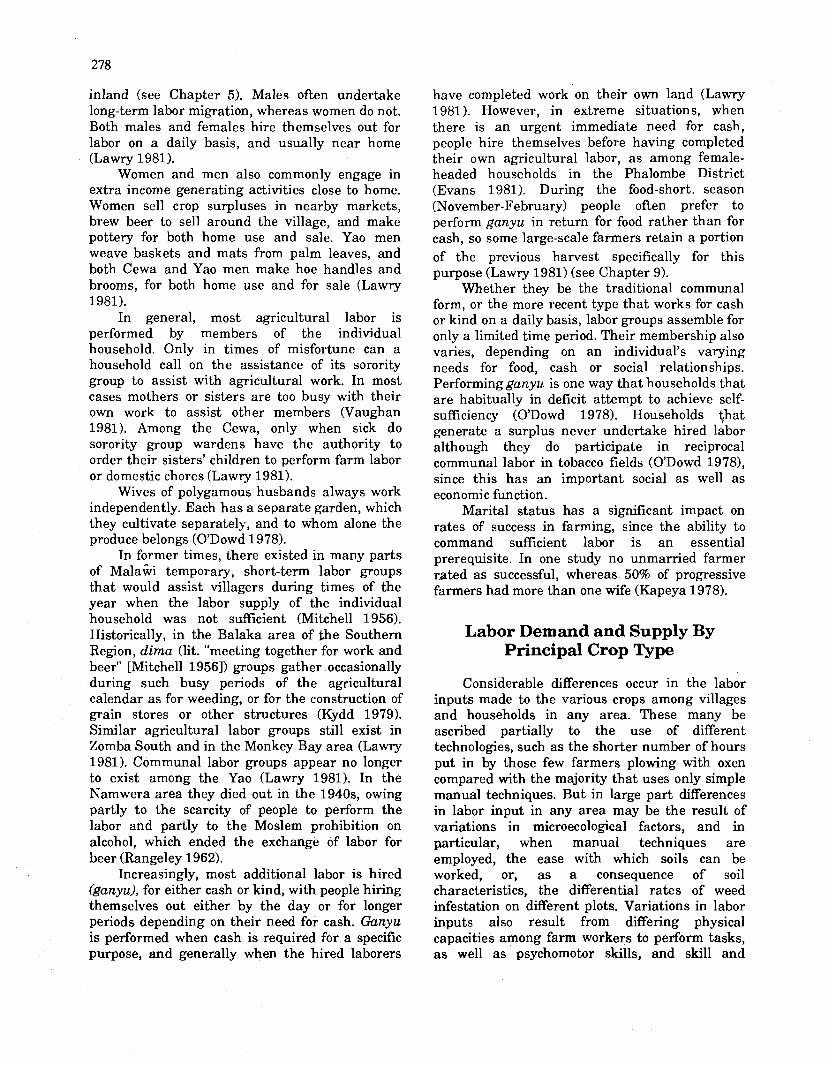
inland (see Chapter 5). Males often undertake long-term labor migration, whereas women do not. Both males and females hire themselves out for labor on a daily basis, and usually near home (Lawry 1981).
Women and men also commonly engage in extra income generating activities close to home. Women sell crop surpluses in nearby markets, brew beer to sell around the village, and make pottery for both home use and sale. Yao men weave baskets and mats from palm leaves, and both Cewa and Yao men make hoe handles and brooms, for both home use and for sale (Lawry 1981).
In general, most agricultural labor is performed by members of the individual household. Only in times of misfortune can a household call on the assistance of its sorority group to assist with agricultural work. In most cases mothers or sisters are too busy with their own work to assist other members (Vaughan 1981). Among the Cewa, only when sick do sorority group wardens have the authority to order their sisters' children to perform farm labor or domestic chores (Lawry 1981).
Wives of polygamous husbands always work independently. Each has a separate garden, which they cultivate separately, and to whom alone the produce belongs (O'Dowd 1978).
In former times, there existed in many parts of Mala% temporary, short-term labor groups that would assist villagers during times of the year when the labor supply of the individual household was not sufficient (Mitchell 1956). Historically, in the Balaka area of the Southern Region, dima (lit. "meeting together for work and beer" [Mitchell 19561) groups gather occasionally during such busy periods of the agricultural calendar as for weeding, or for the construction of grain stores or other structures (Kydd 1979). Similar agricultural labor groups still exist in Zomba South and in the Monkey Bay area (Lawry 1981). Communal labor groups appear no longer to exist among the Yao (Lawry 1981). In the Namwera area they died out in the 1940s, owing partly to the scarcity of people to perform the labor and partly to the Moslem prohibition on alcohol, which ended the exchange of labor for beer (Rangeley 1962).
Increasingly, most additional labor is hired (ganyu), for either cash or kind, with people hiring themselves out either by the day or for longer periods depending on their need for cash. Ganyu is performed when cash is required for a specific purpose, and generally when the hired laborers
have completed work on their own land (Lawry 1981). However, in extreme situations, when there is an urgent immediate need for cash, people hire themselves before having completed their own agricultural labor, as among female- headed households in the Phalombe District (Evans 1981). During the food-short. season (November-February) people often prefer to perform ganyu in return for food rather than for cash, so some large-scale farmers retain a portion of the previous harvest specifically for this purpose (Lawry 1981) (see Chapter 9).
Whether they be the traditional communal form, or the more recent type that works for cash or kind on a daily basis, labor groups assemble for only a limited time period. Their membership also varies, depending on an individual's varying needs for food, cash or social relationships. Performingganyu is one way that households that are habitually in deficit attempt to achieve self- sufficiency (O'Dowd 1978). Households that generate a surplus never undertake hired labor although they do participate in reciprocal communal labor in tobacco fields (O'Dowd 1978), since this has an important social as well as economic function.
Marital status has a significant impact on rates of success in farming, since the ability to command sufficient labor is an essential prerequisite. In one study no unmarried farmer rated as successful, whereas 50% of progressive farmers had more than one wife (Kapeya 1978).
Labor Demand and Supply By Principal Crop Type
Considerable differences occur in the labor inputs made to the various crops among villages and households in any area. These many be ascribed partially to the use of different technologies, such as the shorter number of hours put in by those few farmers plowing with oxen compared with the majority that uses only simple manual techniques. But in large part differences in labor input in any area may be the result of variations in microecological factors, and in particular, when manual techniques are employed, the ease with which soils can be worked, or, as a consequence of soil characteristics, the differential rates of weed infestation on different plots. Variations in labor inputs also result from differing physical capacities among farm workers to perform tasks, as well as psychomotor skills, and skill and

knowledge in general. Finally, the allocation of time by individuals and families among tasks, social obligations and the like reflects the individual personality characteristics of the decisionmakeds).
Such factors also influence the duration of the working day, which, after Werner (1987), is defined here as 4 working hours, and with 25 such days per month. This, however, is simply a convenience for modelling, since, in practice, there is no "standard working day (Figs. 10.4 and 10.5). The number of hours worked per day depends on the fluctuating seasonal demands of the individual crops and the stage of the annual cycle. Little field work is done on any farm during the period June-August, whereas during the peak agricultural season, from October to December or January, 6-8 hourdday of labor are not uncommon (Werner 1987).
Sep Oct Nov Dec Jan Feb Mar Apr May Jun Jul Aug
I Z -
f l o -
! 8 -
s \ u, 6 - 3
2 4 -
C 0 2 - I
0
Month
Male family head Other females over 15
Female head/ wwes Children under 14
Other males over 15
-
Fig. 10.4. Annual mean number of agricultural working hours per day by worker category in the Liwonde Agricultural Development Division, Mala%. (Source: drawn from data in GOM 197215).
Sep Oct Nov Dec Jan Feb Mar Apr May Jun Jul Aug
Month Male family head Other females aver 15
Female heod/wives T I Children under 14
Other males over 15
Fig. 10.5. Annual mean number of nonagricultural working hours per day by worker category in the Liwonde Agricultural Development Division, MalaCHi. (Source: drawn from data in GOM 1972b).
The times when labor is done during a working day also vary considerably by season and task. Tasks such as land preparation, ridging, hoeing and weeding, which involve heavy labor, are normally performed during the cool early morning hours, from 0500-0600 until 0900-1000. During peak periods they may also be performed during the 2 cooler hours before sunset. Lighter tasks are done during the hotter hours Werner 1987).
In the Liwonde ADD of the Southern Region dominant soil type is considered as the principal specific factor that determines labor requirements (Werner 1987). Two types of soil predominate in the ADD, the light, sandy, ferrallitic-ferruginous soils, typified by those of the Chikweo EPA, and the relatively heavy sandy-clay loams and sandy clays of the Mbonechera EPA, both of which are located in the Kawinga RDP. These soils represent the two extremes of the range of soils in Liwonde ADD, and data derived from cropping systems on them can be generalized throughout the ADD. Ten villages within each EPA were selected to sample one annual cycle of labor inputs per principal crop type (Werner 1987). The seasonal labor inputs for some of the main crops in the area are shown in Fig. 10.6.
Maize
In both the Chikweo and Mbonechera EPAs, maize is the overwhelmingly dominant crop cultivated, with 80-90% of the cultivated land devoted to it. Maize cultivation thus dominates the agricultural labor pattern, particularly in tk2 peak period at the beginning of the annual agricultural cycle.
The seasonal labor requirements by task for maize cultivation are shown separately for the light soils of the Chikweo area (Fig. 10.7) and the heavy soils of the Mkonchera area in (Fig. 10.8). The labor demands of the maize grown in the latter area (1,290 man-hours/ha/year) are higher than of that in the former (1,070 man- hours/ha/year), since in the heavy soils operations that involve soil-moving are more arduous and time-consuming, weed growth is more intense, and thus demands a greater labor input for clearing and weeding operations, and the higher yield of the heavier soils requires a greater input for harvesting.
For a variety of reasons, the various husbandry techniques for maize cultivation may be combined in slightly different ways andlor

S ~ P Oc t Nov Dec Jan
peanut (c f Fig 10.12)
r i ce ( c f . Flg.10.91 cotton ( c f . Fig. 0 .13)
tobacco I c f Fig 10 141
Fe b Mar APr M Y Jun Ju l
Month Fig. 10.6. Total labor inputs to some principal crops in the Liwonde Agricultural Development Division, Mala%. (Source: drawn from data in Werner 1987).
Sep Ocr Nov Dec Jan Feb Mar Apr May Jun J u l Aug
Month
Clearlng Burylng and rldglng ~ l a n i m g
Bankmq Horvest~ng and storing ( Ferttl\ztng
Weedlng
Fig. 10.7. Monthly labor inputs to maize cultivation by task on light soils in the Liwonde Agricultural Development Division, Mala%. (Source: drawn from data in Werner 1987).
f 250- e E 2 0 0 - \ 0 f 1 5 0 -
r! 2 l o o - z I
5 0 -
0 - Sep Oct Nov Dec Jan Feb Mar Apr May Jun Jui Auq
Month Clear~ng Burying and rldgmg ~ l o n i m q
Bonking Horvesflng and storing 0 FFert~hzmg
Fig. 10.8. Monthly labor inputs to maize cultivation by task on heavy soils in the Liwonde Agricultural Development Division, Malaii. (Source: drawn from data in Werner 1987).
performed in a different sequence. This has an impact on labor demand. For simplicity, the two principal cultivation systems have been distinguished as "Model 1" and "Model 2". Both are operated on each of the two main soils types. Model 1, the less intensive and less labor- demanding system, comprises the operations of clearinflurning, ridging, planting/weeding, and harvesting maize in a pure stand; whereas in Model 2, the more intensive system, and with the higher labor-demand, the operations are burying of plant residues, ridging, planting, weeding, banking, and harvesting maize interplanted with other crops. Garden preparation for maize cultivation may begin as early as June with clearance and either burying of plant residues or ridging, according to the system practiced. But the bulk of these activities is done in September and October, and may continue until the start of the rains, in November, when maize and the intercrops are planted. Weeding and banking, the latter to reform ridges damaged by the rains, are the dominant activities during the height of the rainy season, in January and February. Harvesting begins in March, peaks in April and is completed in May.
Total labor inputs to maize cultivation on light soils are 590 man-hours/ha/year (Model 1) and 1,070 (Model 21, and on the heavy soils are 800 man-hourshidyear and 1,290 man- hourshidyear, respectively. Elsewhere in Mala%, estimated mean labor inputs for maize cultivated in pure stands range from a low of 100 man- hourshatyear in Ngabu to 1,114 man-

hourskdyear in Masambanjati (Table 10.2). Homfever, there is considerable variation within and among villages in any area. In the Lake Chilwa area, for example, mean labor input to maize plots ranges from a high of 1,069 hourdha among 8 cultivators in Khuzumba village, to 529 hourska among 10 farmers in Ntolwa village. Among the 35 households sampled in four villages growing maize mean labor inputs ranged from a high of 1,618 hoursha t o a low of 185 hourdha (GOM 1972~).
transplanting, weeding, harvesting and threshing. (No data were obtained for transplanting.) Little rice cultivation is done before the onset of the rainy season, with only relatively minimal amounts of field clearance and hoeing being done during the period August through December (Fig. 10.9). The bulk of clearance and hoeing are done with the rains, in January and February. Labor inputs peak in February, when slightly in excess of 600 man- hourshdmonth are input for field clearance,
Table 10.2. Labor inputs to pure stand maize cmpping systems in ~ a l a 6 i (man-hour&a/year).
Location Total Garden Planting Weeding Fertilizing Harvesting preparation
Man-hours % Man-hours % Man-hours % Man-hours % Man-hours %
Masambanjati 1,114 793 71 86 7.7 88 7.9 10 9 137 12.2 Nkhotakota 707 197 28 94 13 138 19 1 277 39 Karonga North 395 68 17 68 17 180 46 0 79 20 Henga Valley 650 190 29 61 9 259 39 (a) 140 21 Ngabu 400 71 18 54 13 78 19 197 49 Mzimba South 256 97 38 75 29 10 4 74 28 Lake Chilwa 418 47 11 281 67 9 2 81 19
Source: Calculated from data in GOM (1971b, 1972a, 1972b, 1973b, 1976b, 1979).
Complications are introduced into the calculation of labor demand by systems of intercropping, and few attempts have been made to estimate labor inputs to them. Estimates of the labor demand of maize intercropped with millet range from a low of 328 man-hourdhdyear in Kasupe West (GOM 1976a) to a high of 1,319 man-hourslhdyear in Masambanjati (GOM 1971b) (Table 10.3). The highest labor demand by an intercropped system for which data are available is for maize and legumes cultivated in Liwonde ADD, at 1,450 man-hourskdyear (Werner 1987).
Rice
The seasonal distribution of labor inputs for rice in the Liwonde ADD (Fig. 10.9) demonstrate that, compared with maize, rice is a highly labor intensive crop, since the total labor demand of more than 2,240 man-hourdhdyear is about double that for the most intensively cultivated maize. However, the cycle of rice cultivation in this region is basically complementary to that of maize, in that the two labor peaks for the former coincide with slack periods in the latter.
The principal tasks in rice cultivation as practised in this area are, in order of performance, field clearance, soil preparation by hoeing,
Sep Oct Nov Dec Jan Feb Mar Apr May Jun J u l Aug
Month
Fig. 10.9. Monthly labor inputs to rice cultivation by task in the Liwonde Agricultural Development Division, Mala%. (Source: drawn from data in Werner 1987).
hoeing, transplanting and weeding. Hoeing and transplanting continue into March, but the main task from then until harvesting is weeding. Harvesting and threshing are done in the dry months of June and July.
In the Lake Chilwa area, estimated mean total labor input for rice cultivation ranges from a high of 1,645 man-hourdhdyear among 8 farmers in Khuzumba village to a low of 507 man- hourdhdyear among 7 growers in Ntolowa village. Similarly, large variation exists among households in the Lake Chilwa area cultivating rice. Among three groups of 10 households, the

Table 10.3. Labor inputs to maize intercropping systems in Mala% (man-hourshdyear). - - - -- - - -
Inter-plant Location Total Garden Planting Weeding Fertilizing Harvesting preparation
Man-hours % Man-hours % Man-hours % Man-hours % Man-hours %
Masambanjati Millet Ngabu
Kasupe West
Masambanjati Legumes
Liwonde
Manioc Masambaqjati
Masambanjati Peanuts
Liwonde
Source: Calculated from data in GOM (1971b, 1976% 1976b); Werner (1987). Notes: (a) Includes "banking" (470 man-hourslhalyear); (b) Of which maize harvesting requires 100 man-hourdhdyear; (c) Includes "banking" (150 man- hourdhalyear).

highest mean labor input was 4,875 man- hourhdyear, the median 2,038 man- hourshdyear and the lowest 694 man- hourshalyear (GOM 197213)
Manioc
The seasonal distribution of labor inputs to manioc cultivation are shown in Fig. 10.10. Tasks for this crop start in January, with field preparation, which consists of either burying plant residues remaining in the field and then making ridges, or burning the residues and ridging, and some planting. Labor inputs peak in February and March, when the bulk of the field preparation is done, together with planting and weeding. Some minor preparation and planting of late fields - done to extend the length of the harvest season - continues into April. A final weeding is done in manioc gardens close to the end of the rainy season, so that they remain relatively weed-free through the ensuing dry period. No data are available for harvesting, since this is a not a concentrated activity, but is done as frequently required for meals o r marketing.
s E 200 - E \ 0 150- s \
C , o o -
c C
50 -
0 - Sep Oct Nov Dec Jan Feb Mar Apr May Jun Jul Aug
Month
Burylng Rldglng Weedlng
Fig. 10.10. Monthly labor inputs to manioc cultivation by task in the Liwonde Agricultural Development Division, Mala%. (Source: drawn from data in Werner 1987).
In the Southern Region, manioc is generally regarded as an insurance crop planted against the risk of maize failure, and the area planted depends on the individual farmer's expectation of his maize yields. In this respect the crop is well- suited, since its peak demands for physically demanding tasks performed by males occur during the relatively slack period of the maize cycle, or during the maize harvest, which is performed mainly by women and children.
Labor inputs shown in Fig. 10.10 for manioc cultivation are based on a sample of 7 farmers
growing manioc in pure stands, since this crop is mostly interplanted. This complicates analysis of the allocation of labor time per crop.
Mean labor requirements for manioc cultivation in the Liwonde ADD are 550 man- hourskalyear when burying of residues and ridging are combined into a single operation, and a t 690 man-hourskalyear when these two operations are performed separately (Werner 1987). (Harvesting is omitted from these totals.).
Elsewhere in Mala%, labor inputs to manioc cultivation range from an estimated low of 469 man-hourdhalyear in Nkhotakota (GOM 1972d) to a high of 968 man-hourshdyear in Karonga South (GOM 1976~) (Table 10.4). In the Lake Chilwa area the mean estimated input is 793 man-hourdhalyear, with household inputs ranging from 824 to 80 man-hourslhdyear (GOM 1972b).
Sweet Potatoes
At 620-760 man-hourslhdyear (depending on the cultivation system used) the total labor demand of sweet potatoes in LWADD is similar to that of manioc, as is the seasonal distribution of labor, the tasks performed and the household subsistence function of this crop (Fig. 10.11). In Kasupe West, labor demand for sweet potato cultivation is estimated a t 748 man-hourdhdyear (GOM 1972b).
Peanuts
In the Liwonde ADD, peanuts are cultivated mainly on the light soils of the Chikweo EPA. They are the only rainfed crop in the area that is not cultivated on ridges. Since the ridges for maize cultivation are too widely spaced to yield a good crop of peanuts, a common practice is to level them and grow peanuts on the resultant flat surface.
Two principal systems are used for peanut cultivation. In the main plant, residues are first cleared and burned, and then the soil is levelled and tilled, all of which require a labor input of 1,000 man-hours/halyear. Peanuts are then planted, weeded and harvested. Less commonly the operations are, in order of performance, the burying of plant residues, ridging, planting, weeding, and harvesting, which demands 1,300 man-hours/halyear. The first system is slightly less demanding of labor for soil preparation, but
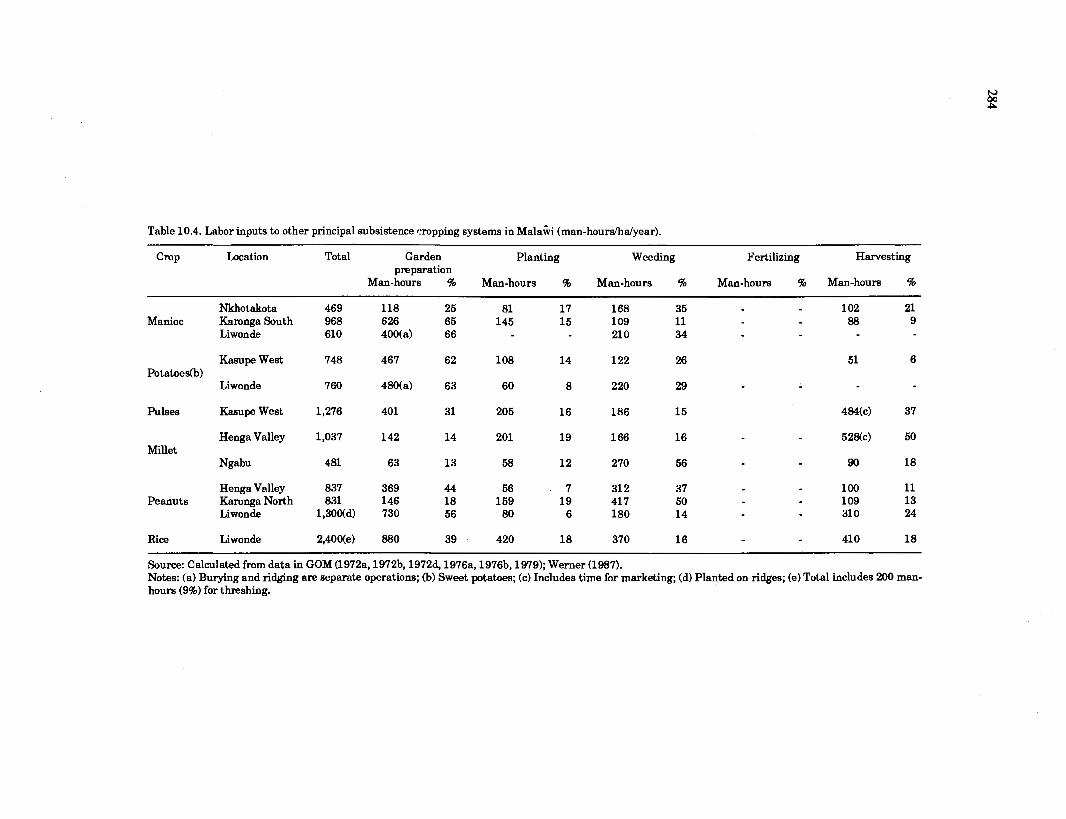
Table 10.4. Labor inputs to other principal subsistence wopping systems in Mala& (man-hours/ha/year).
Crop Location Total Garden Planting Weeding Fertilizing Harvesting preparation
Man-hours % Man-hours % Man-hours % Man-hours % Man-hours %
Nkhotakota 469 118 25 81 17 168 35 102 21 Manioc Kamnga South 968 626 65 145 15 109 11 88 9
Liwonde 610 400(a) 66 21 0 34
Kasupe West 748 467 62 108 14 122 26 51 6 Potatoes(b)
Liwonde 760 480(a) 63 60 8 220 29
Pulses Kasupe West 1,276 401 31 205 16 186 15 4&4(4 37
Henga Valley 1,037 142 14 201 19 166 16 528W 50 Millet
Ngabu 481 63 13 58 12 270 56 90 18
Henga Valley 837 369 44 56 7 31 2 37 100 11 Peanuts Karonga North 831 146 18 1 59 19 417 50 109 13
Liwonde 1,300(d) 730 56 80 6 180 14 31 0 24
Rice Liwonde 2,400(e) 880 39 420 18 370 16 41 0 18
Source: Calculated from data in GOM (1972a, 1972b, 19724 1976a, 1976b, 1979); Werner (1987). Notes: (a) Burying and ridging are separate operations; (b) Sweet potatoes; (c) Includes time for marketing; (d) Planted on ridges; (e) Total includes 200 man- hours (9%) for threshing.

are lower, at 831 man-hours/hdyear, in Fig. 10.12. Monthly labor inputs to peanut cultivation by task in the Karonga North ( W M 1976~1, and 837 man- Liwonde Agricultural Development Division, Mala%. (Source: hours/ha/year, in the Henga Valley (GOM 1979). drawn from data in Werner 1987).
250
$ 200-
E \ 0 150- s \ E 3 100-
s I C
q 50
o
Tobacco
- and uprooting of the plant residues. Banking is sometimes done to improve poorly made ridges.
The seasonal distribution by task of labor inputs to cotton is given in Fig. 10.13. Relative to other crops, inputs to cotton remain relatively high for 75% of the cultivation cycle. Field preparation, which consists of clearance and
- ridging, is done prior to the onset of the rainy
- season, from September to November. Late
Cotton
Among the areas surveyed by Werner (1987) cotton is grown exclusively in the Mbonechera EPA, and particularly on the especially heavy soils of the Shire Valley-Lakeshore area. Labor requirements for cotton are comparable to those for maize grown on heavy soils. The cultivation tasks done, in order of performance, are field clearance, ridging, planting, weeding (done twice), spraying with insecticides (done an average of 8 times), harvesting (an average of three pickings),
preparation continues into December. If supplementary banking is required to repair
Weeding damage from soil erosion during the height of the rainy season, labor inputs peak in February. If
Fig. 10.11. Monthly labor inputs to sweet potato cultivation by task not, there are two main labor peaks. The first in the Liwonde Agricultural Development Division, Mala%. occurs in November through January, when (Source: drawn from data in Werner 1987). gardens are cleared, ridged, planted, and weeded.
The second occurs from March through April, since yields are higher it has a higher labor when the second weeding is done and the cotton is demand for harvesting. The seasonal distribution harvested. Uprooting of the previous season's crop of labor inputs for the second system is shown in residues is done from June to August, just prior to Fig. 10.12. the start of field preparation for the new crop.
The seasonal distribution of labor input is Labor demand is 1,188 man-hourdhalyear if basically the same as for maize (Figs. 10.7 and banking is not required, and 1,538 man- 10.8). Land clearance, levelling and tilling are hourshdyear if it is. done from September until November, and
In the area of the Liwonde ADD surveyed by Werner (1987) tobacco is grown exclusively on the light soils of Chikweo EPA. Unlike other crops, the cultivation of tobacco involves a considerable expenditure of labor for noncultivation tasks, which account for almost half the labor demand. There are two such groups of tasks, those concerning the seedbed, and postharvest tasks. The former comprises the collection of fencing material, fencing, cultivation, burning, sowing, mulching, weeding, watering, and other minor
levelling and tilling continue into January. 400
Peanuts are planted with the rains, in November, r and some planting continues into January. 300-
Weeding, which starts in December, is the main 2 task performed during January and February, the > peak rainy season. Harvesting begins with the $ end of the rains, peaks in April and continues into L l o o
June. g
-
-
-
Total labor requirements in the Chikweo o L EPA for peanuts planted on the flat are 1,390 man-hours/hdyear, and for those grown on ridges 1,300 man-hourslhdyear (Werner 1987). Estimated requirements from elsewhere in

0 L Sep Oct Nov Dec Jan Feb Mar Apr May Jun Jul Aug
Month
Clearing Ridglng Plantmg Weedmg
Banklng Sproymg Horvestlng 0 Uprooting
Fig. 10.13. Monthly labor inputs to cotton cultivation by task in the Liwonde Agricultural Development Division, Mala%. (Source: drawn from data in Werner 1987).
tasks, and the latter includes mainly collecting firewood, maintenance of the curing barn, tying, and curing. The garden operations performed in tobacco cultivation are clearing or burying, ridging, trahsplanting, weeding, fertilizing (twice), banking, and harvesting (done three times).
The total labor demand for tobacco cultivation is 2,030 man-hourslhalyear, of which 960 man-hours are required by non-garden operations (160 man-hours for the seedbed and 800 man-hours for postharvest tasks). The seasonal distribution of labor inputs is shown in Fig. 10.14. Seedbed operations are done mostly in September and October, so that seedlings are ready for transplanting with the onset of the rainy season, in November. Field preparations, which consist of clearing, burying and ridging, begin in July and are completed by November. Some late ridging and transplanting is done in December,
Month
Clearlng and bury~ng R ~ d g ~ n g Piantmg F e r t ~ l ~ z ~ n g
Weedtng Bank~ng Harvesttng 0 Seedbed
Fig. 10.14. Monthly labor inputs to tobacco cultivati~n~by task in the Liwonde Agricultural Development Division, Malawi. (Source: drawn from data in Werner 1987).
but the main task then is weeding. Harvesting begins in January, peaks in February, and ends in March. Postharvest tasks, preparation for which was done in October, begin together with harvesting, and last through April.
The Sexual Division of Labor in Small-Scale Farming
Labor division by sex in MalaGian small- scale agriculture indicates that certain tasks and some crops are basically the domain of either males or females. Operations for such cash crops as tobacco (Fig. 10.15) and cotton (Fig. 10.16) are dominated by men. Heavy tasks, like field preparation and ridging, as well as tasks for household subsistence are performed mainly by men for such crops as sweet potato (Fig. 10.17) and peanut (Fig. 10.18), whereas those for maize in heavy soils (Fig. 10.19) and manioc (Fig. 10.20) are shared, and those for such crops as maize in light soils (Fig. 10.21) and rice (Fig. 10.22) are performed mainly by women in the Liwonde ADD.
Comparable data on subsistence farming systems in three areas, Masambanjati, in Thyolo District of the Southern Region, Namwera Township in Mangochi District, also in the Southern Region, and three villages in the Nkhotakota District of the Northern Region demonstrate that the sex distribution of labor patterns dominant in Liwonde ADD are generalizable nationwide.
U Male
)--. Female
Average Clearmg Fertiltzlng Harvesting Pianrlng Rldglng Weeding for all and and ond and tasks burnmg spraying tilling banking
Task
Fig. 10.15. Labor division for tobacco cultivation by sex and task in the Liwonde Agricultural Development Division, Mala%. (Source: drawn from data in Werner 1987).

A M Male
H Female
I I I I I I Average Cleormg Fert~l lz ing Harvest~ng Plantlng Rldgmg Weedlng for all and and and and rosks burntng spraylng t i l lmg bankmg
Task
Fig. 10.16. Labor division for cotton cultivation by sex and task in the Liwonde Agricultural Development Division, MalaGi. (Source: drawn from data in Werner 1987).
- Male
H Female
r 80
loo r - Male
I H Female
Average Clearlng Fert l l lz lng Harvest~ng Plantlng Rldglng Weeding for al l and and and and tasks burntng spraylng t i l n g banklng
Task
Fig. 10.19. Labor division for maize cultivation on heavy soils by sex and task in the Liwonde Agricultural Development Division, Malak . (Source: drawn from data in Werner 1987).
Fig. 10.17. Labor division for sweet potato cultivation by sex and task in the Liwonde Agricultural Development Division, MalaGi. (Source: drawn from data in Werner 1987).
W Male
H Female
I- Average Clearing Fertll izlng Harvestlng Plantlng Rldgmg Weedlng for al l and and and and tasks burnmg spraying t ~ l l ~ n g banklng
Task
Fig. 10.18. Labor division for peanut cultivation by sex and task in the Liwonde Agricultural Development Division, MalaGi. (Source: drawn from data in Werner 1987).
Average Clear~ng Fertil lzlng Horvesflng Plantlng Rldglng Weed~ng for all and and and and tasks burn~ng spraying t l i l tng banklng
Tosk
H Female
OL I I d I I I Average Ciearlng F e r t i l l r ~ n g Harvestlng Plantlng Rldgtng Weedlng for al i and and and and tasks burnjng spraylng t l l l lng banklng
Task
Fig. 10.20. Labor division for manioc cultivation by sex and task in the Liwonde Agricultural Development Division, Malak . (Source: drawn from data in Werner 1987).
H Female O 0 r -
O L I I I I I I I Average Clearing Fert l l tung Harvestlng Planting Ridglng Weedtng for all and an3 and and tasks burn~ng spraylng t ~ l l l n g bankmg
Task
Fig. 10.21. Labor division for maize cultivation on light soils by sex and task in the Liwonde Agricultural Development Division, Mala%. (Source: drawn from data in Werner 1987).
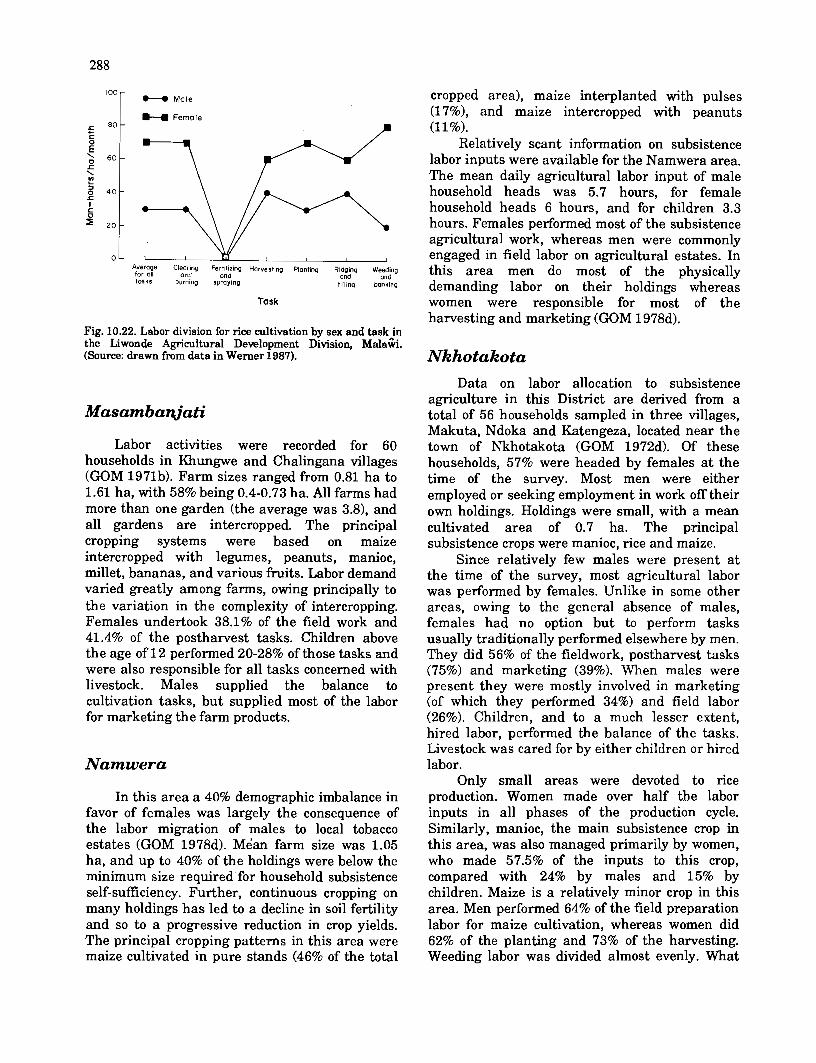
H Fernole
Average Clearing Fertilizing Harvesting Planting Ridging Weeding for all and and and tasks burning spraying
and till~ng bonking
Task
Fig. 10.22. Labor division for rice cultivation by sex and task in the Liwonde Agricultural Development Division, Mala%. (Source: drawn from data in Werner 1987).
Masambaqjati
Labor activities were recorded for 60 households in Khungwe and Chalingana villages (GOM 1971b). Farm sizes ranged from 0.81 ha to 1.61 ha, with 58% being 0.4-0.73 ha. All farms had more than one garden (the average was 3.8), and all gardens are intercropped. The principal cropping systems were based on maize intercropped with legumes, peanuts, manioc, millet, bananas, and various fruits. Labor demand varied greatly among farms, owing principally to the variation in the complexity of intercropping. Females undertook 38.1% of the field work and 41.4% of the postharvest tasks. Children above the age of 12 performed 20-28% of those tasks and were also responsible for all tasks concerned with livestock. Males supplied the balance to cultivation tasks, but supplied most of the labor for marketing the farm products.
Namwera
In this area a 40% demographic imbalance in favor of females was largely the consequence of the labor migration of males to local tobacco estates (GOM 1978d). Me'an farm size was 1.05 ha, and up to 40% of the holdings were below the minimum size required for household subsistence self-sufficiency. Further, continuous cropping on many holdings has led to a decline in soil fertility and so to a progressive reduction in crop yields. The principal cropping patterns in this area were maize cultivated in pure stands (46% of the total
cropped area), maize interplanted with pulses (17%), and maize intercropped with peanuts (11%).
Relatively scant information on subsistence labor inputs were available for the Namwera area. The mean daily agricultural labor input of male household heads was 5.7 hours, for female household heads 6 hours, and for children 3.3 hours. Females performed most of the subsistence agricultural work, whereas men were commonly engaged in field labor on agricultural estates. In this area men do most of the physically demanding labor on their holdings whereas women were responsible for most of the harvesting and marketing (GOM 19788.
Nkhotakota Data on labor allocation to subsistence
agriculture in this District are derived from a total of 56 households sampled in three villages, Makuta, Ndoka and Katengeza, located near the town of Nkhotakota (GOM 1972d). Of these households, 57% were headed by females a t the time of the survey. Most men were either employed or seeking employment in work off their own holdings. Holdings were small, with a mean cultivated area of 0.7 ha. The principal subsistence crops were manioc, rice and maize.
Since relatively few males were present a t the time of the survey, most agricultural labor was performed by females. Unlike in some other areas, owing to the general absence of males, females had no option but to perform tasks usually traditionally performed elsewhere by men. They did 56% of the fieldwork, postharvest tasks (75%) and marketing (39%). When males were present they were mostly involved in marketing (of which they performed 34%) and field labor (26%). Children, and to a much lesser extent, hired labor, performed the balance of the tasks. Livestock was cared for by either children or hired labor.
Only small areas were devoted to rice production. Women made over half the labor inputs in all phases of the production cycle. Similarly, manioc, the main subsistence crop in this area, was also managed primarily by women, who made 57.5% of the inputs to this crop, compared with 24% by males and 15% by children. Maize is a relatively minor crop in this area. Men performed 64% of the field preparation labor for maize cultivation, whereas women did 62% of the planting and 73% of the harvesting. Weeding labor was divided almost evenly. What

little fertilizer was used on maize was applied by the males only.
In a comparison of the sexual division of time allocation and agricultural labor in Karonga, Mzimba, Thyolo, Lake Chilwa, and Ngabu it was found that, in general, women over the age of 15 years spend 20% of their time in agricultural work and 23% performing domestic activities. In all areas they devote more hours to economicaily productive activities than do males (Clark 1975).
However, that situation varies greatly among farming systems in MalaGi, of which there is a large variety. Thus there is no substitute for the specific analysis of the labor situation fora each type of farming system within an area targetted for small-scale aquaculture development, to determine who does what work, so that extension inputs can be appropriately targetted, such as pond construction information for men and routine management guidance directed toward women.
The Role of Women in ~alaibian Agriculture
In most parts of Mala% the sex ratio of the working population is imbalanced in favor of women. Further, in more recent years in many parts of rural MalaGi the female role in agriculture has become increasingly important as more women become full-time farmers whereas men have become part-timers. This has arisen as men have sought wage labor as migrant workers on agricultural estates and in other forms of employment both in MalaGi and abroad. Further, for one reason or another, many rural females are unmarried or widows, and thus may be the sole decisionmakers and principal operators on landholdings that they inherit under the matrilineal system. Many MalaGian males have traditionally been only part-time cultivators on land that belongs to the household of which they are the head (Chipande et al. 1986).
The 1977 population census showed that 57% of subsistence farmers in Mala% were female. However, almost 70% of the full-time subsistence farmers are women (Chipande et al. 1986). Most of these women are married, but are the female heads of their own households, owing to the absence of their spouses. The role of women in MalaGan agriculture is increasing (Kydd and Christiansen 1981).
In excess of one quarter (29%) of rural ~ a l a % a n households, including those of
unmarried women and widows as well as those where spouses are present less frequently than once a month, are headed by women (GOM 198413. In 40% of the National Sample Survey of Agriculture (GOM 1984~) survey areas more than 30% of the households are headed by women. Whereas for MalaGi as a whole, 28.8% of the sampled households were headed by females, 36.5% of those in the Liwonde ADD and 34.2% of those in Blantyre ADD were headed by women, as were 36.9% and 30.9% in Zomba and Mwanza districts, respectively (GOM 1984~).
There are considerable fluctuations in the division by sex of family headship. In two samples of households headed by women in 1980-1981, 12 and 16% became headed by males in the following year. The opposite changes also occurred, with 16% of households headed by women in 1981-1982 having been male-headed the previous year. Of those men, 79% had left the village for outside employment, thus leaving their wife as household head, whereas others, who were polygynously married, left to live with another wife (Spring et al. n.d.). Some of those men left permanently. A similar survey of the Lilongwe Rural Development Project revealed that the rate of households headed by females increased from 11 to 28% in the decade 1968-196911978-1979 (Kydd 1982).
But despite the vast female contribution to MalaCNian agricultural productivity, few aspects of agricultural extension programs are addressed to them. No female-oriented extension programs exist for subsistence aquaculture. This should be urgently remedied, since female-headed households are among likely adopters of small- scale aquaculture, and will in many cases make the decisions about levels of integration among components of farm activities, besides doing much of the labor involved.
A Women's Programme was started in 1981 within the NRDP (Chikagwa 1987). Hitherto women's programs run under the Farm Home Economics Section focused on nutrition, and there was a division between agricultural programs provided for males and the courses available to rural women. Few women participated in these farming courses since they thought that they were intended only for men. From 1981, courses were begun to ensure that female farmers were also trained in recommended agricultural practices and other income-generating activities (Chikagwa 1987).
There are many constraints on implementing such a female-oriented extension program. Although women extension agents are probably

better able to understand women farmers' problems better than men, there are only 250 female Farm Home Assistants compared with 2,000 male Field Assistants. Further, they are given a wide geographical area of responsibility without means of transport. Since few can afford their own bicycles, coverage is small. The attendance of women a t training programs is low compared with men, and few are aware of training opportunities. Time schedules of meetings and the monotony of the messages also result in low female participation (Chikagwa 1987). Programs are still strongly rooted in home economics materials and approaches. However, any planning, such as for aquaculture extension, that aims to target programs specifically on women is made extremely difficult by both the fluctuations in the percentage of households headed by women and fluctuations by the sex of the household head.
Although female farmers are eligible for credit, their participation has generally been low. Women can obtain credit by joining farmers' clubs and obtaining it in their own right or through their husbands, by forming their own clubs and obtaining it through them, or by forming a club and obtaining credit for a communal plot.
In many cases women have formed separate clubs since they see their farming activities as different from those of the men. Religious restrictions in some cases contribute to the formation of a separate club.
The major problems affecting women's clubs are (Chikagwa 1987):
(1) Inadequate information and skills. Because grouplclub formation is new to women
they lack the skills and knowledge of procedures and thus are ineligible for credit;
(2) Women farmers seem to be comparatively unable t o anticipate or control risks inherent in their farm operation, and are, relative to males, more scared of defaulting on loans. Further, sickness or death in the family absorbs much of a female's time and therefore affects her ability to supply farm labor. As a consequence, compared with her male counterparts she has to allow for this extra set of unpredictable risks;
(3) Many farm holdings run by women are very small, and so require minipackages of inputs. Since such very small-scale farmers have no spare cash to buy inputs they invariably continue to use traditional practices;
(4) Female-headed households experience significant labor shortages, and are forced to rely on child labor. Critical shortages at cropping seasons result in low productivity and hence low cash returns;
(5) Cultural and social barriers limit womens' participation in credit programs, and religious prohibitions prevent them from joining mixed-sex clubs in some areas. Women are often shy about their participation in mixed club meetings; and
(6) Male extension workers are often reluctant to assist women, since they not uncommonly regard females as just farmers' wives and not as farmers. Thus men rather than women are encouraged to obtain credit. As a consequence, households headed by females are often bypassed because of these attitudes prevalent among extension sewice personnel (GOM 1983~).
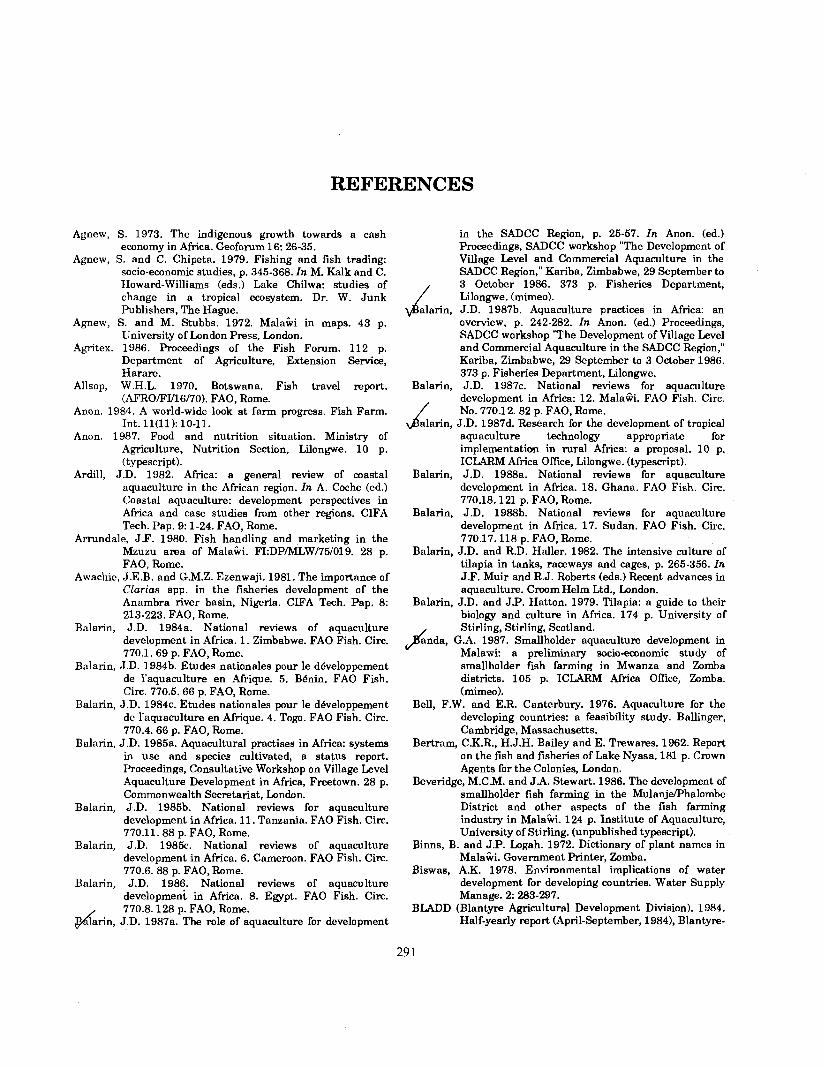
Agnew, S. 1973. The indigenous growth towards a cash economy in Africa. Geoforum 16: 26-35.
Agnew, S. and C. Chipeta. 1979. Fishing and fish trading: socio-economic studies, p. 345-368. In M. Kalk and C. Howard-Williams (eds.) Lake Chilwa: studies of change in a tropical ecosystem. Dr. W. Junk Publishers, The Hague.
Agnew, S. and M. Stubbs. 1972. Mala% in maps. 43 p. University of London Press, London.
Agritex. 1986. Proceedings of the Fish Forum. 112 p. Department of Agriculture, Extension Service, Harare.
Allsop, W.H.L. 1970. Botswana. Fish travel report. (AFRO/FI/16/70). FAO, Rome.
Anon. 1984. A world-wide look at farm progress. Fish Farm. Int. ll(11): 10-11.
Anon. 1987. Food and nutrition situation. Ministry of Agriculture, Nutrition Section, Lilongwe. 1 0 p. (typescript).
Ardill, J.D. 1982. Africa: a general review of coastal aquaculture in the African region. In A. Coche (ed.) Coastal aquaculture: development perspectives in Africa and case studies from other regions. CIFA Tech. Pap. 9: 1-24. FAO, Rome.
Arrundale, J.F. 1980. Fish handling and marketing in the Mzuzu area of Mala%. FI:DP/MLW/75/019. 28 p. FAO, Rome.
Awachie, J.E.B. and G.M.Z. Ezenwaji. 1981. The importance of Clarias spp. in the fisheries development of the Anambra river basin, Nigeria. CIFA Tech. Pap. 8: 213-223. FAO, Rome.
Balarin, J.D. 1984a. National reviews of aquaculture development in Africa. 1. Zimbabwe. FA0 Fish. Circ. 770.1.69 p. FAO, Rome.
Balarin, J.D. 198413. Etudes nationales pour le d6veloppement de l'aquaculture en Afrique. 5. BBnin. FA0 Fish. Circ. 770.5.66 p. FAO, Rome.
Balarin, J.D. 1984c. Etudes nationales pour le developpement de l'aquaculture en Afrique. 4. Togo. FA0 Fish. Circ. 770.4. 66 p. FAO, Rome.
Balarin, J.D. 1985a. Aquacultural practises in Africa: systems in use and species cultivated, a status report. Proceedings, Consultative Workshop on Village Level Aquaculture Development in Africa, Freetown. 28 p. Commonwealth Secretariat, London.
Balarin, J.D. 1985b. National reviews for aquaculture development in Africa. 11. Tanzania. FA0 Fish. Circ. 770.11.88 p. FAO, Rome.
Balarin, J.D. 1985c. National reviews of aquaculture development in Africa. 6. Cameroon. FA0 Fish. Circ. 770.6. 88 p. FAO, Rome.
Balarin, J.D. 1986. National reviews of aquaculture development in Africa. 8. Egypt. FA0 Fish. Circ. 770.8.128 p. FAO, Rome.
d a r i n , J.D. 1987a. The role of aquaculture for development
in the SADCC Region, p. 25-57. In Anon. (ed.) Proceedings, SADCC workshop "The Development of Village Level and Commercial Aquaculture in the SADCC Region," Kariba, Zimbabwe, 29 September to 3 October 1986. 373 p. Fisheries Department, Lilongwe. (mirneo).
alarin, J.D. 1987b. Aquaculture practices in Africa: an d' overview, p. 242-282. In Anon. (ed.) Proceedings, SADCC workshop 'The Development of Village Level and Commercial Aquaculture in the SADCC Region," Kariba, Zimbabwe, 29 September to 3 October 1986. 373 p. Fisheries Department, Lilongwe.
Balarin, J.D. 1987c. National reviews for aquaculture development in Africa: 12. Mala%. FA0 Fish. Circ. No. 770.12.82 p. FAO, Rome.
alarin, J.D. 1987d. Research for the development of tropical J aquaculture technology appropriate for implementation in rural Africa: a proposal. 1 0 p. ICLARM Africa Office, Lilongwe. (typescript).
Balarin, J.D. 1988a. National reviews for aquaculture development in Africa. 18. Ghana. FA0 Fish. Circ. 770.18.121 p. FAO, Rome.
Balarin, J.D. 198813. National reviews for aquaculture development in Africa. 17. Sudan. FA0 Fish. Circ. 770.17.118 p. FAO, Rome.
Balarin, J.D. and R.D. Haller. 1982. The intensive culture of tilapia i n tanks, raceways and cages, p. 265-356. In J.F. Muir and R.J. Roberts (eds.) Recent advances in aquaculture. C m m Helm Ltd., London.
Balarin, J.D. and J.P. Hatton. 1979. Tilapia: a guide to their biology and culture in Africa. 174 p. University of Stirling, Stirling, Scotland.
A n d a , G.A. 1987. Smallholder aquaculture development in Malawi: a preliminary socio-economic study of smallholder fish farming in Mwanza and Zomba districts. 105 p. ICLARM Africa Office, Zomba. (mimeo).
Bell, F.W. and E.R. Canterbury. 1976. Aquaculture for the developing countries: a feasibility study. Ballinger, Cambridge, Massachusetts.
Bertram, C.K.R., H.J.H. Bailey and E. Trewares. 1962. Report on the fish and fisheries of Lake Nyasa. 181 p. Crown Agents for the Colonies, London.
Beveridge, M.C.M. and J.A. Stewart. 1986. The development of smallholder fish farming in the MulanjejPhalombe District and other aspects of the fish farming industry in Malati. 124 p. Institute of Aquaculture, University of Stirling. (unpublished typescript).
Binns, B. and J.P. Logah. 1972. Dictionary of plant names in MalaGi. Government Printer, Zornba.
Biswas, A.K. 1978. Environmental implications of water development for developing countries. Water Supply Manage. 2: 283-297.
BLADD (Blantyre Agricultural Development Division). 1984. Half-yearly report (April-September, 1984), Blantyre-
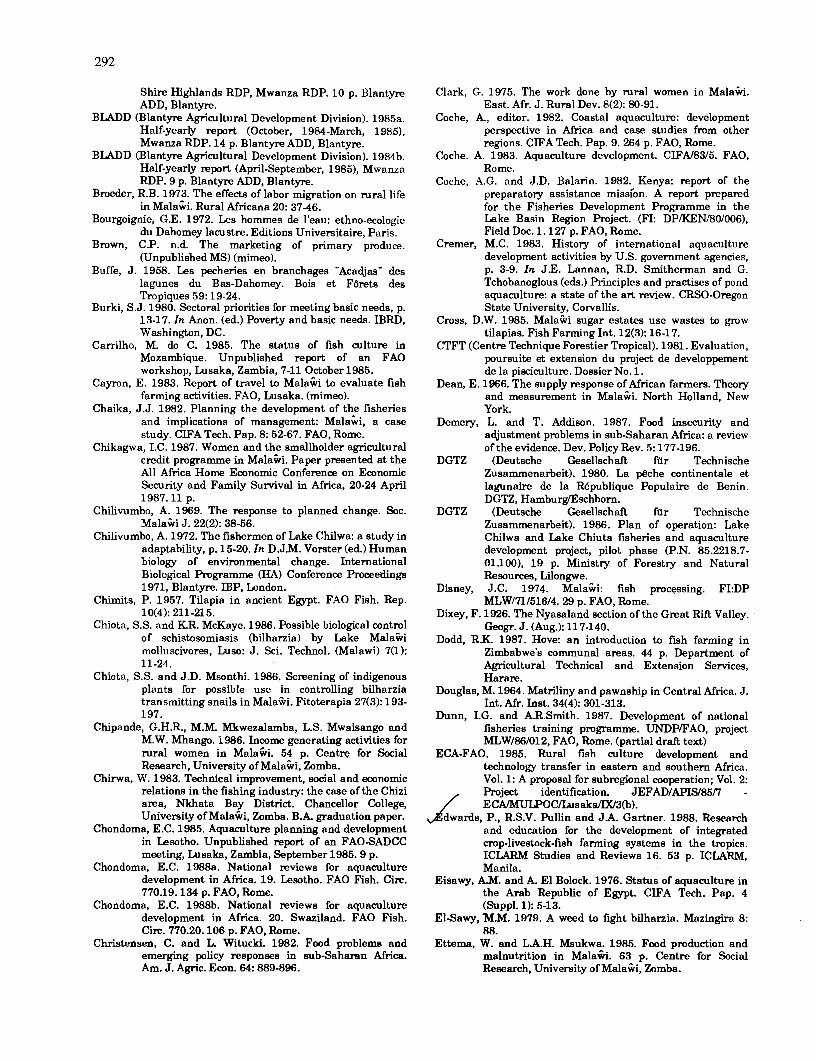
Shire Highlands RDP, Mwanza RDP. 1 0 p. Blantyre ADD, Blantyre.
BLADD (Blantyre Agricultural Development Division). 1985a. Half-yearly report (October, 1984-March, 19851, Mwanza RDP. 14 p. Blantyre ADD, Blantyre.
BLADD (Blantyre Agricultural Development Division). 1984b. Half-yearly report (April-September, 1985), Mwanza RDP. 9 p. Blantyre ADD, Blantyre.
Broeder, R.B. 1973. The effects of labor migration on rural life in Malabi. Rural Africana 20: 37-46.
Bourgoignie, G.E. 1972. Les hommes de l'eau: ethno-ecologie du Dahomey lacustre. Editions Universitaire, Paris.
Brown, C.P. n.d. The marketing of primary produce. (Unpublished MS) (mimeo).
Buffe, J. 1958. Les pecheries en branchages "Acadjas" des lagunes du Bas-Dahomey. Bois et F8rets des Tropiques 59: 19-24.
Burki, S.J. 1980. Sectoral priorities for meeting basic needs, p. 13-17. In Anon. (ed.) Poverty and basic needs. IBRD, Washington, DC.
Carrilho, M. do C. 1985. The status of fish culture in Mozambique. Unpublished report of an FA0 workshop, Lusaka, Zambia, 7-11 October 1985.
Cayron, E. 1983. Report of travel to Mala% to evaluate fish farming activities. FAO, Lusaka. (mimeo).
Chaika, J.J. 1982. Planning the development of the fisheries and implications of management: Malaki, a case study. CIFA Tech. Pap. 8: 52-67. FAO, Rome.
Chikagwa, I.C. 1987. Women and the smallholder agricultural credit programme in Malai i . Paper presented a t the All Africa Home Economic Conference on Economic Security and Family Survival in Africa, 20-24 April 1987.11 p.
Chilivumbo, A. 1969. The response to planned change. Soc. Mala i i J. 22(2): 38-56.
Chilivumbo, A. 1972. The fishemen of Lake Chilwa: a study in adaptability, p. 15-20. In D.J.M. Vorster (ed.) Human biology of environmental change. International Biological Programme (HA) Conference Proceedings 1971, Blantyre. IBP, London.
Chimits, P. 1957. Tilapia in ancient Egypt. FA0 Fish. Rep. lO(4): 211-21 5.
Chiota, S.S. and K.R. McKaye. 1986. Possible biological control of schistosomiasis (bilharzia) by Lake Mala i i molluscivores, Luso: J. Sci. Technol. (Malawi) 7(1): 11-24.
Chiota, S.S. and J.D. Msonthi. 1986. Screening of indigenous plants for possible use in controlling bilharzia transmitting snails in Mala%. Fitoterapia 27(3): 193- 197.
Chipande, G.H.R., M.M. Mkwezalamba, L.S. Mwaisango and M.W. Mhango. 1986. Income generating activities for rural women in Malaii. 54 p. Centre for Social Research, University of M a l a k , Zomba.
Chirwa, W. 1983. Technical improvement, social and economic relations in the fishing industry: the case of the Chizi area, Nkhata Bay District. Chancellor College, University of Malaibi, Zomba. B.A. graduation paper.
Chondoma, E.C. 1985. Aquaculture planning and development in Lesotho. Unpublished report of an FAO-SADCC meeting, Lusaka, Zambia, September 1985.9 p.
Chondoma, E.C. 1988a. National reviews for aquaculture development in Africa. 19. Lesotho. FA0 Fish. Circ. 770.19.134 p. FAO, Rome.
Chondoma, E.C. 1988b. National reviews for aquaculture development in Africa. 20. Swaziland. FA0 Fish. Circ. 770.20.106 p. FAO, Rome.
Christensen, C. and L. Witucki. 1982. Food problems and emerging policy responses in sub-Saharan Africa. Am. J. Agric. Econ. 64: 889-896.
Clark, G. 1975. The work done by ~ r a l women in Malaii. East. Afr. J. Rural Dev. 8(2): 80-91.
Coche, A., editor. 1982. Coastal aquaculture: development perspective in Africa and case studies from other regions. CIFA Tech. Pap. 9.264 p. FAO, Rome.
Coche. A. 1983. Aquaculture development. CIFA.8315. FAO, Rome.
Coche, A.G. and J.D. Balarin. 1982. Kenya: report of the preparatory assistance mission. A report prepared for the Fisheries Development Programme in the Lake Basin Region Project. (FI: DP/KEN/80/006), Field Doc. 1.127 p. FAO, Rome.
Cremer, M.C. 1983. History of international aquaculture development activities by U.S. government agencies, p. 3-9. In J.E. Lannan, R.D. Smitherman and G. Tchobanoglous (eds.) Principles and practises of pond aquaculture: a state of the art review. CRSO-Oregon State University, Cowallis.
Cross, D.W. 1985. Mala i i sugar estates use wastes to grow tilapias. Fish Farming Int. 12(3): 16-17.
CTFT (Centre Technique Forestier Tropical). 1981. Evaluation, poursuite et extension du project de developpement de la pisciculture. Dossier No. 1.
Dean, E. 1966. The supply response of African farmers. Theory and measurement in Mala%. North Holland, New York.
Demery, L. and T. Addison. 1987. Food insecurity and adjustment problems in sub-Saharan Africa: a review of the evidence. Dev. Policy Rev. 5: 177-196.
DGTZ (Deutsche Gesellschaft fur Technische Zusammenarbeit). 1980. La p&che continentale et lagunaire de la RBpublique Populaire de Benin. DGTZ, Hamburg/Eschborn.
DGTZ (Deutsche Gesellschaft fur Technische Zusammenarbeit). 1986. Plan of operation: Lake Chilwa and Lake Chiuta fisheries and aquaculture development project, pilot phase (P.N. 85.2218.7- 01.100), 19 p. Ministry of Forestry and Natural Resources, Lilongwe.
Disney, J.C. 1974. Malabi: fish processing. F1:DP MLW/7l/516/4.29 p. FAO, Rome.
Dixey, F. 1926. The Nyasaland section of the Great Rift Valley. Geogr. J. (Aug.): 117-140.
Dodd, R.K. 1987. Hove: a n introduction to fish farming in Zimbabwe's communal areas. 44 p. Department of Agricultural Technical and Extension Services, Harare.
Douglas, M. 1964. Matriliny and pawnship in Central Africa. J. Int. Afr. Inst. 34(4): 301-313.
Dunn, I.G. and A.R.Smith. 1987. Development of national fisheries training programme. UNDP/FAO, project MLW/86/012, FAO, Rome. (partial draft text)
ECA-FAO. 1985. Rural fish culture development and technology transfer in eastern and southern Africa. Vol. 1: A proposal for subregional cooperation; Vol. 2: Project identification. JEFAD/APIS/85/7 - ECIVMULPOCnUsakdWS(b).
dwards, P., R.S.V. Pullin and J.A. Gartner. 1988. Research and education for the development of integrated crop-livestock-fish farming systems in the tropics. ICLARM Studies and Reviews 16. 53 p. ICLARM, Manila.
Eisawy, A.M. and A. El Bolock. 1976. Status of aquaculture in the Arab Republic of Egypt. CIFA Tech. Pap. 4 (Suppl. 1): 5-13.
El-Sawy, U.M. 1979. A weed to fight bilharzia. Mazingira 8: 88.
Ettema, W. and L.A.H. Msukwa. 1985. Food production and malnutrition in Mala%. 6 3 p. Centre for Social Research, University of MalaGi, Zomba.

Evans, J. 1981. Report on rural women in Phalombe Rural Development Project: agricultural extension to meet their needs. 14 p. Blantyre Agricultural Development Division, Blantyre.
FAO. 1966. A program for fisheries development: report to the Government of Malaki, no. TA 2239. 49 p. FAO, Rome.
FAO. 1969. Fisheries survey in the western and mid-western regions Nigeria: final report. FAO/$F:74/NIR6. FAO, Rome.
FAO. 1975 Aquaculture planning in Africa. 1 2 p. FAO, Rome. FAO. 1980a. Current state of development of aquaculture in
Africa. CIFA, 4th session, Blantyre, Malaki, 8-12 December 1980. (CIFAl8017). FAO, Rome.
FAO. 1980b. Aquaculture development in Zambia. FAO/ADCP/MW80/6. FAO, Rome.
FAO. 1981. Agriculture: toward 2000. FAO, Rome. FAO. 1983. Malak : fisheries country profile.
FID/CP/MLW/Rev. 2 .5 p. FAO, Rome. FAO. 1984a. Lesotho: fishery country profile. (FIDICPILES). 5
p. FAO, Rome. FAO. 1984b. A framework for the formulation and
implementation of a national fishery policy for Tanzania. FAO-Norway Cooperative Programme, Rome.
FAO. 1984c. Swaziland: fishery country profile. (FIDICPISWA). 3 p. FAO, Rome.
FAO. 1985a. Aquaculture and rural development. Advisory Committee of Experts on Marine Resources Research, 11th Session, 21-24 May 1985. ACMRR:IY85 Inf.18.15 p. FAO, Rome.
FAO. 198513. Progress in the development of aquaculture in Africa. Committee for Inland Fisheries of Africa, 6th Session, October 1985. CIFAl85ll2.18 p. FAO, Rome.
FAO. 1986. African agriculture: the next 25 years. FAO, Rome. FAO. 1988. Definition of aquaculture. IPFCIWPAlWP 2, 7th
Session of the IPFC Working Party of Experts on Aquaculture, 1-6 August 1988, Bangkok. 3 p.
FAO. 1989. Aquaculture Production (1 984-1986). FIDI/C815 Statistical tables. Fish. Circ. 815.106 p. FAO, Rome.
FAO/UNDP. 1969. Report to the Government of Nigeria on fishing technology relating to river and swamp fisheries of northern Nigeria. FAOKJNDP(TA) (2711). FAO, Rome.
FAO/UNDP. 1979. Aquaculture development in China. ADCP/REP/79/10.65 p. FAO, Rome.
FAOtWBCP. 1980. Report of the Egypt fish farm development project. FAOlWorld Bank Cooperative Programme, FAO, Rome.
Ferlin, P.L. 1980. Fisheries and aquaculture development in Egypt. 30 p. FAO, ADCPO/MEDRAP, Rome.
FFHC (Freedom from Hunger Campaign). 1973. Report of the FFHC Nutrition Team, Food and Nutrition Programme for Malak , July 1973January 1974. 82 p. FFHC, Rome.
French, D. 1986. Confronting an unsolvable problem: deforestation in Mala%. World Dev. 14(4): 531-540.
Fryer, G. and T.D. new. 1972. The cichlid fishes of the Great Lakes of Africa: their biology and evolution. Oliver and Boyd, Edinburgh.
FTC (Fisheries Training Center). 1974. Prospectus, FTC. Mpwepwe, Mala&.
Furse, M.T., P.R. Morgan and M. Kalk. 1979. The fisheries of Lake Chilwa, p. 211-229. In M. Kalk and C.Howard- Williams (eds.) Lake Chilwa: studies of change in a tropical ecosystem. Junk, The Hague.
Gamachu, D. 1977. Aspects of climate and water budget in Ethiopia. Addis Ababa University Press, Addis Ababa.
Ghabi, I.S. and K.D. Soede. 1980. La p&che dans la lagune de Porto-Novo. Maitrise de Ghgraphie, Universit6 Nationale de BQnin, Cotonou.
Gilberg, Y.C. 1966. Report to the Government of MalaGi on fish handling, preservation and distribution. MR150141.52 p. FAO, Rome.
Gilmore, K.S. 1978. The river and floodplain ecology of the Okavango Delta, Botswana. CIFA Tech. Pap. 5: 165- 167. FAO, Rome.
GnieIinsky, S.V. 1976. Der traditionelle fischfang in Westafrika. Afrika-Studien 93. Info-Institut fiir Wirtschaftsforschung, Munich.
GNP (Government of the Nyasaland Protectorate). 1948. Annual report of the Department of Game, Fish and Tsetse Control for the year ended 31st December, 1948.11 p. Government Printer, Zomba.
GNP (Government of the Nyasaland Protectorate). 1950. Annual report of Department of Game, Fish and Tsetse Control for the year ended 31st Decetnber, 1949. Government Printer, Zomba.
GNP (Government of the Nyasaland Protectorate). 1951. Annual report of Department of Game, Fish and Tsetse Control for the year ended 31st December, 1950. Government Printer, Zomba.
GNP (Government of the Nyasaland Protectorate). 1952. Annual report of Department of Game, Fish and Tsetse Control for the year ended 31st December, 1951. Government Printer, Zomba.
GNP (Government of the Nyasaland Protectorate). 1953. Annual report of Department of Game, Fish and Tsetse Control for the year ended 31st December, 1952. Government Printer, Zomba.
GNP (Government of the Nyasaland Protectorate). 1954. Annual report of Department of Game, Fish and Tsetse Control for the year ended 31st December, 1953. Government Printer, Zomba.
GNP (Government of the Nyasaland Protectorate). 1955. Annual report of Department of Game, Fish and Tsetse Control for the year 1954. Government Printer, Zomba.
GNP (Government of the Nyasaland Protectorate). 1956. Annual report of Department of Game, Fish and Tsetse Control for the year 1955. Government Printer, Zornba.
GNP (Government of the Nyasaland Protectorate). 1957. Annual report of Department of Game, Fish and Tsetse Control for the year 1956. Government Printer, Zomba.
GNP (Government of the Nyasaland Protectorate). 1958. Annual report of Department of Game, Fish and Tsetse Control for the year 1957. Government Printer, Zomba.
GNP (Government of the Nyasaland Protectorate). 1959. Annual report of Department of Game, Fish and Tsetse Control for the year 1958. Government Printer, Zomba.
GNP (Government of the Nyasaland Protectorate).l960. Annual report of Department of Game, Fish and Tsetse Control for the year 1959. Government Printer, Zomba.
GNP (Government of the Nyasaland h t e d o r a t e ) . 1961. Annual report of Department of Game, Fish and Tsetse Control for the year 1960. Government Printer, Zomba.
GNP (Government of the Nyasaland Protectorate). 1962. Annual report of Department of Game, Fish and Tsetse Control for the year 1961. Ministry of Natural Resources and h c a l Government, Zomba.
GNP (Government of the Nyasaland Protectorate). 1963.

Annual report of Department of Game, Fish and Tsetse Control for the year 1962. Ministry of Natural Resources and Surveys, Zomba.
GOM (Government of Malaki). 1964. Development Plan 1965- 1969.20 p. Government Printer, Zomba.
GOM (Government of MalaGi). 1971a. Statement of development policies 1971-1980. 140 p. Government Printer, Zomba.
GOM (Government of MalaCi). 1971b. A sample farm management survey of agricultural households near Masambaqjati in Thyolo District, Mala%. Agro- Economic Survey Report No. 5. 27 p. Ministry of Agriculture and Forestry, Zomba.
GOM (Government of Malaibi). 1972a. Annual report of the Fisheries Department. 39 p. Ministry of Agriculture and Natural Resources, Fisheries Department, Zomba.
GOM (Government of Mala%). 1972b. A farm management survey among rice and maize growers at the northern end of Lake Chilwa in Kasupe District, Malaii. Report No. 9. 63 p. Agro-Economic Survey, Planning Unit, Ministry of Agriculture and Natural Resources, Zomba.
GOM (Government of Malaii). 1972c. A sample farm management survey of cottom growers near Ngabu in Chikwawa District, MalaGi. Agro-Economic Survey Report No. 7. 32 p. Ministry of Agriculture and Natural Resources, Zomba.
GOM (Government of Malaki). 1972d. A sample farm management survey of agricultural households near Nkhota-hota, Malaki. Agro-Economic Survey Report No. 6. 26 p. Ministry of Agriculture and Forestry, Zomba.
GOM (Government of Malah). 1973a. Annual report 1972.120 p. Ministry of Agriculture and Natural Resources, Department of Fishzries, Zomba.
GOM (Government of Malawi). 1973b. A farm management survey among Oriental tobacco, maize and groundnut growers in the southern part of the Mzimba District, MalaCi. Agro-Economic Survey Report No. 11. 87 p. Ministry of Agriculture and Forestry, Zomba.
GOM (Government of Malawi). 1974. Annual report 1973.86 p. Ministry of Agriculture and Natural Resources, De~artment of Fisheries. Zomba.
GOM (GoveAment of Mala%). 1976a. Highlights 1975. 40 p. Extension Aids Branch. De~artment of Extension and Training, Ministry .of &culture and Natural Resources, Lilongwe.
GOM (Government of Malaii). 197613. A farm economic survey of agricultural households in Kasupe West. Agro- Economic Survey Report No. 33. 67 p. Ministry of Agriculture and Natural Resources, Zomba.
GOM (Government of MalaiKi). 1976~. A farm economic survey of agricultural households on the Karonga North Lakeshora Plain, Malaki. Agro-Economic Survey Report No. 18. 64 p. Ministry of Agriculture and Forestry, Zomba.
GOM (Government of Mala%). 1977. Statistics of Lakes Chilwa and Chiuta. Ministry of Agriculture and Natural Resources, Department of Fisheries, Lilongwe.
GOM (Government of Malak). 1978a. Central lake fisheries development project. 23 p. Ministry of Agriculture and Natural Resources, Department of Fisheries, Lilongwe.
GOM (Government of Mala%). 1978b. Report on fish distribution survey in Lilongwe District, MayJune 1976. 152 p. Marketing and Statistics Section, Department of Fisheries, Lilongwe.
GOM (Government of Mala%). 1978c. A farm management
GOM
GOM
GOM
survey of smallholders in the Southern and ~ o r t h e r n parts of Mwanza District, Mala*. Report No. 30. 61 p. Agro-Economic Survey, Planning Division, Ministry of Agriculture and Natural Resources, Lilongwe.
(Government of Mala%). 1978d. A sample farm management survey of agricultural households in Namwera, Mangochi District, Mala%. Agro- Economic Survey Report No. 31. 61 p. Ministry of Agriculture and Forestry, Zomba.
(Government of Mala%). 1979. A farm management survey of smallholders in Henga Valley, Rumphi District, Mala%. Agro-Economic Survey Report No. 34. 103 p. Ministry of Agriculture and Natural Resources, Zomba.
(Government of Malaii). 1981. Monthly statistical bulletin. September, 27 p. National Statistical Office, Zomba.
GOM
GOM
GOM
GOM
GOM (Government of MalaGij. 1982. National credit manual. 31 p. Ministry of Agriculture, Department of Agricultural Development, Extension Aids Branch, Lilongwe.
GOM (Government of Malaki). 1983a. The national atlas of Mala%. Department of Surveys, Lilongwe.
GOM (Government of Mala%). 1983b. Untitled position paper of the Government of MalaGi. Paper prepared for the International Conference of Partners in Economic Development: Past Perfotnance and Prospects for 1983-1987. Ministry o!Finance, Lilongwe.
(Government of Malawi). 1983~. Reaching female farmers through male extension workers, Circular No. 2183.7 p. Ministry of Agriculture, Extension Aids Branch, Lilongwe.
(Gokernment of ~ a l a h ) . 1984a. Malaki population census 1977. 199 p. (vol. 1) and 171 p. (vol. 2). Government Printer,_Zomba.
(Government of Malawi). J984b. National physical development plan, Malawi: general land use and natural physical constraints: Section 5. UNCHSKJNDP Project MLWf79L02. Town and Country P l a ~ i n g Department, Office of the President and Cabinet, Lilongwe.
(Government of Mala%). 1984~. National statistic sample of agriculture. 28 p. (vol. I), 28 p. (vol. 2) and 41 D. (vol. 3). Government Printer. Zomba.
GOM (GoveAment of MalaGi). 1985a. ~conomic report. 102 p. Government Printer, Zomba.
GOM (Government of MalaGi). 1986a. Government gazette, Suppl. No. 81, August, 29 p. Government Printer, Zomba.
GOM (Government of Mala%). 198613. The national health plan. 91 p. Ministry of Health, Lilongwe.
GOM (Government of Malak). 1986~. MalaGi statistical yearbook, 1984. 188 p. National Statistical Ofice, Government Printer, Zomba.
GOM (Government of Malahi). 1986d. MulaqjePhalombe fish farming development project. 83 p. Department of Fisheries, Ministry of Forestry and Natural Resources, Lilongwe. (mimed.
GOM (Government of Mala%). 1987a. Monthly statistical bulletin, January. 27 p. National Statistical Office, Zomba.
GOM (Government of Mala%). 198713. Monthly statistical bulletin, October. 27 p. National Statistical Office, Zomba.
GOM (Government of Mala%). 1987c. P l a ~ i n g division papers. Ministry of Agriculture, Lilongwe.
GOM (Government of MalaGi). 1987d. MalaGi statistical

yearbook, 1985. 189 p. National Statistical Office, Zomba.
GOM (Government of Malaii). 1987e. FrancelSADCC: pilot integrated fishlpig farming development and research project a t Kasinthula (Malaii). 1 5 p. Department of Fisheries, Ministry of Forestry and Natural Resources. (mimeo).
GOM (Government of Mala%). 1988a. Statement of development policies, 1987-1996. 198 p. Office of the President and Cabinet, Department of Economic Planning, Lilongwe.
GOM (Government of Mala%). 1988b. Economic report, 1988. 107 p. Office of the President and Cabinet, Department of Economic Planning, Lilongwe.
GOM (Government of Malaki). 1988c. Monthly statistical bulletin: June 1988. 46 p. National Statistical Office, Zomba.
GOM (Government of Malaii). 1989. Government Gazette, 1 9 April 1989.
GOM (Government of Malaii). n.d.a. Fish farming development strategy. 3 p. Department of Fisheries, Ministry of Forestry and Natural Resources, Lilongwe.
GOM (Government of MalaGi). n.d.b. Polycultural research in experimental fish ponds. Proposal submitted to the IDRC (Canda). 27 p. Department of Fisheries, Lilongwe. (typescript).
GOPA Consultants. 1987. Mala i i fisheries development study. GOPA, Bad Homberg, Federal Republic of Germany.
Gordon, J.G. 1971. A model for estimating future agricultural acreage and production in Mala%. Agrarian Development Studies Report No. 4. Wye College, University of London, London.
Government of Zambia. 1986. Fisheries sub-sedor study. Planning Division, Ministry of Agriculture and Water Development, Lusaka.
Grandstaff, T.B., K. Ruddle, J.N. Hawkins, T.C. Foin and W.G. Davis. 1980. Implementing the resource systems approach to transformational development. Resour. Manage. Optim. 1: 145-160.
Grove, J.H., D.R. Street and P.D. Starr. 1980. Review of aquaculture development activities in Central and West Africa. Research and Development Series No. 28. Auburn University International Center for Aquaculture, Auburn, Alabama.
Gurure, R. 1985. Aquaculture in rural development planning in Zimbabwe. Proceedings, Commonwealth Secretariat Consultancy Workshop on Village Level Aquaculture in Africa. 1 8 p. Commonwealth Secretariat, London.
Hartmann, W. 1987; Socio-economic sectoral paper. In Anon. (ed.) Malawi fisheries development strategy study. GOPA Consultants, Bad Homberg, Federal Republic of Germany. (mimeo).
Hastings, R.E. 1973. Fisheries Research Unit Lower Shire: report 1970-1973. 121 p. Department of Fisheries, Ministry of Agriculture and Natural Resources, Lilongwe. (mimeo).
Hornell, J. 1950. Fishing in many waters. Cambridge University Press, Cambridge.
Hull, C.L. 1964. The behavior system. John Wiley, New York. Humphrey, D.H. 1971. Preliminary report of the smallholder
innovation research project. Chancellor College, University of Malaii, Zomba. (mimeo.).
Hutcheson, A.M. 1971. Atlas for Malaii. Collins-Longman, Blantyre.
IBRD (International Bank for Reconstruction and Development). 1981. Accelerated development in sub- Saharan Africa. 198 p. IBRD, Washington, DC.
IBRD (International Bank for Reconstruction and Development). 1986. M a l a i i and the World Bank. Information and Public Affairs Department, World Bank, Washington, DC.
IMF (International Monetary Fund). 1971. International financial statistics. Vol. 24. IMF, Washington DC.
IMF (International Monetary Fund). 1973. International financial statistics. Vol. 27. IMF, Washington DC.
Jackson, P.B.N., T.D. Iles, D. Harding and G. Fryer. 1963. Report on the survey of northern Lake Nyasa by the Joint Fisheries Research Organization. 171 p. Government Printer, Zomba.
Jensen, G.L. 1983. History of the United States Peace Corps involvement in freshwater aquaculture, p. 11-18. In J.E. Cannan, R.D. Smitherman and G. Tchobanoglous (eds.) Principles and practises of pond aquaculture: a state of the a r t review. CRSP-Oregon State University, Corvallis.
Jones, N.R. and I.J. Clucas. 1977. Malaki fish marketing. Reports of the Tropical Products Institute (R725). 170 p. Tropical Products Institute, London.
Jones, T. 1978. OXFAM extension fish farming project final report. Department of Fisheries, Ministry of Agriculture, Lilongwe. (mimeo).
Johnson, A.W. 1972. Individuality and experimentation in traditional agriculture. Human Ecology 1: 149-159.
Kandawire, J.A.K. 1988. Commercial fishing and food production among lakeshore dwellers in Malaii. Technical Report submitted to the IDRC, Nairobi. 54 p. Zomba, Chancellor College, University of Malaii. (mimw).
Kapeleta, L. 1980. The coming of the Tonga and the commercialization of fishing in the Monkey Bay area - a case study. 11 p. Chancellor College, University of Malawi, Zomba. B.A. graduation paper.
Kapetsb, J.M. 1981. Some considerations for the management of coastal lagoon and estuarine fisheries. Fish. Tech. Pap. 218. FAO, Rome.
Kapeya, E. 1978. A study of the personal characteristics of progressive farmers in units 23 and 24 of the Lilongwe Land Development Programme. 20 p. Bunda College of Agriculture, University of MalaCi, Lilongwe. BSc. research report.
Kent, G. 1987. The contribution of fisheries to alleviating malnutrition in southern Africa. Unpublished consultancy report to the FA0 Action Programme on the Promotion of the Role of Fisheries in Alleviating Malnutrition. 35 p. University of Hawaii, Honolulu.
Kerr, A.A. 1966. The fisheries of East Africa and their development prospects, a preliminary survey. FA0 Fisheries Circ. 103 p. FAO, Rome.
Kettlewell, R.W. 1965. Agricultural change in Nyasaland, 1945-1960. F w d Research (Stanford University) Institute Studies 3: 251.285 p.
Kimpe, P. de. 1977. Les facteurs de production piscicoles des lagunes de Yest Dahomey et leur evolution recente. Bois et Fo&ts des Tropiques 111: 53-62.
Kingston, J.C., A.J.B. Mitchell and E.M. Ntokotha. 1978. Soil surveys 1971-72.190 p. Government Printer, Zomba.
Kirk, R.G. 1970. A study of Tilapia (Sarotherodon) shirana chilwae in Lake Chilwa, Ma1afh.i. 110 p. University of London, London, Ph.D. dissertation.
Kishindo, P.A.K. 1983. Agricultural development a t the grassroots: a study of smallholders in Mala&. 168 p. University of Hull, Hull. Ph.D. dissertation.
Kishindo, P.A.K. 1985. Customary land and agricultural development in Mala%. East. Anthrop. 38(4): 305- 313.

Kydd, J. 1979. Namwera: an investigation into the economic structure of a smallholder community in Mala&. Department of Economics, Occasional Paper No. 3. Chancellor College, University of ~ a l a & , Zomba.
Kydd, J . 1982. Measuring peasant differentiation for policy purposes: a report on a cluster analysis classification of the population of the Lilongwe Land Development Programme. ~ a l a 9 i . Government Printer. Zomba.
Kydd, J. and R.E. Christiansen. 1981. Trends in the distribution of income in ~ a l a G i since independence. Centre for Social Research, University of ~ a l a G i , Zomba.
Laan, van der E. 1984. Factors contributing to the rapid development of small-scale irrigation schemes along / the Senegal river. Agric. Adm. 17: 203-2l3.
Lamport-Stokes, H.J. 1970. Land tenure in ~ a l a k i . Soc. ~ a l a & J. 23(2): 59-87.
Landes, A. and G. Otte. 1983. Entwicklung der fischerei und der teichwirtshaft im gebeit der seen Chilwa und Chiuta, ~ a l a 6 i . Deutsche Gesellschaft fiir Technische Zusammenarbeit, HamburgIEschborn.
Lawry, J.M. 1981. Group formation and dynamics and household decision making in Liwonde Agricultural Development Division. 111 p. LWADD, Liwonde, ~ a l a $ i . (Unpublished MS)
Lemasson, J. 1961. Chmnique piscicole. Bois et For& des Tropiques 76:6267.
Likongwe, J.S.L. 1977. Survival and growth of m i m r carp (Cyprinus carpio) at Bunda College farm in 1976/77. Bunda College of Agriculture Res. Bull. 8:55-62.
Likongwe, J.S.L. 1985. Annual fisheries report, 1st April 1984 31st March 1985 (BC/LP/706/85). 7 p. Livestock Production Department Fisheries Unit, Bunda College of Agriculture, Lilongwe.
Likongwe, J.S.L. 1986. Annual report, 1985186 (BC/LP/383/86). 7 p. Livestock Production Department Fisheries Unit, Bunda College of Agriculture, Lilongwe.
Lipton, M. 1987. Limits of price policy for agriculture: which way for the World Bank? Dev. Policy Rev. 5: 197-215.
LMA (Landell Mills Associates Ltd). 1983a. Central and Northern Regions fish farming, development, extension, training and research projed: final project preparation report. 124 p. Landell Mills Associates, Bath, UK.
LMA (Landell Mills Associates Ltd). 1983b. Northern Region fisheries development project: final project preparation report. 123 p. Landell Mills Associates, Bath, UK.
LWADD (Liwonde ADD). 1983. Field development service, Vol. 5: Agronomic proposal for agroforestry extension and research activities. 35 p. LWADD, Liwonde, ~ a l a k .
LWADD (Liwonde ADD). 1984. Zomba rural development project, vol. 1. Baseline. LWADD, Liwonde, ~ a l a & .
Manda, D.R.B., B.H. Dzowela and W.H. Johnson. 1985. Agricultural research resource assessment in the SADCC countries. Vol. 2, country report: ~ a l a $ i . USAID, Washington, DC.
Marwick, M.G. 1952. The kinship basis of Cewa social structure. S. Afr. J. Sci. 48(8): 258262.
Mathotho, M.J. 1975. A simple guide to rearing fish in small dams in ~ a l a k . Fisheries Bulletin No. 5. 9 p. Department of Extension and Training, Ministry of Agriculture and Natural Resources, Lilongwe.
Mathotho, A.J. and J.F.Rogers. 1977. Fisheries development in ~ a l a k : cornmenial trawling, p. 433-437. In Anon. (ed.) Proceedings of the Conference on the Handling, Processing and Marketing of Tropical Fish, 5-9 July 1976. Tropical Products Institute, London.
McCracken, J. 1987. Fishing and the colonial economy: a case study of ~aladSi. Paper presented a t the colloquium 'The Exploitation of Animals in Africa". 23-24 March 1987. University of Aberdeen, Aberdeen.
McClaren, J.F. 1980. Lake Manzalla study - aquaculture site selection report. UNDPIMinistry of Development and New Communities, Cairo.
Meecham, K. 1976. Aquaculture in ~ a l a k . CIFA Tech. Pap. 4. (Suppl. I):&-72. FAO, Rome.
Meschkat, A. 1967. The status of warmwater fish culture in Africa. Fish. Rep. 44(2): 88-122. FAO, Rome.
Mills, J.C. 1975. Price responses of Malawi smallholder farmers: fast, slow or none? Department of Economics, Occasional Paper No. 2. Chancellor College, University of Mala&, Zomba.
Minford, P. and P. Ohs. 1970. Supply response of ~ a l a & i labor. (Unpublished report) (mimeo).
Mitchell, J.C. 1950. Preliminary notes on land tenure and agriculture among the Machinga Yao. J. Rhodes- Livingstone Inst. 10: 1-14.
Mitchell, J.C. 1951a. An outline of the social structure of Malemia area. Nyasaland J. 4(2): 15-47.
Mitchell, J.C. 1951b. The Yao of Southern Nyasaland, p. 292- 352. In A. Colman and M. Gluckman (eds.j Seven tribes of British Central Africa. London.
Mitchell, J.C. 1956. The Yao Village. Manchester University Press. Manchester.
Morgan, P.R. 1971. The culture of Tilapiu shirana chilwae in fish ponds. Soc. ~ a l a 6 i J. 24(2): 7479.
Msiska, O.V. 1981 a. A study of the use of poultry manure in the fish production of experimenlal fonds. 85 p. Chancellor College, University of Malawi, Zomba. 85 p. MSc. thesis.
Msiska, O.V. 1981b. Quality and nutrient release of poultry manure immersed in water. J. Limnol. Soc. South Mr. 7(2): 59-62.
Msiska, O.V. 1981c. Rearing of the African catfish Clarias lnzera (C. and V.) using live and dry food stuffs. Bamidgeh 33(4): 122-127.
Msiska, O.V. 1981d. Aspects of fish culture development in Mala& and its potential economic impact on a rural economy. Seminar on River Basin Management and Development, CIFA Tech. Pap. 8: 297-302. FAO, Rome.
Msiska, O.V. 1984a. Annual report. 1981-83 of the Domasi fisheries station, experimental fish farm and prawn hatchery. Domasi Fish Farming Station, Domasi. (mimeo).
Msiska. O.V. 1984b. Research on Mpasa (Opsaridium microlepis) and Nchila ( h b e o mesops). 10 p. Domasi Fish Station Progress Report 1983-1984. Domasi Fish Farming Station, Domasi.
Msiska, O.V. 1985. Fish farming for rural development in ~ a l a & i . Paper presented at the FPRD consultative workshop on village Level Aquaculture Development in Africa, 14-20 February 1985. Freetown, Sierra Leone. 16 p.
+ka, O.V. 1988a. Preliminary studies on the performance of Oreochromis shiranus chilwae in ponds with respect to water quality and temperature, p. 63-68. In R.S.V. Pullin, T. Bhukaswan, K. Tonguthai and J.L. Maclean (eds.) The Second International Symposium on Tilapia in Aquaculture. ICLARM Conference Proceedings 15, 623 p. Department of Fisheries, Bangkok and ICLARM, Manila.
siska, O.V. 1988b. Tilapias present in ~ a l a k , p. 32-34. In R.S.V. Pullin (ed.) Tilapia genetic resources for aquaculture. ICLARM Conference Proceedings 16, 108 p. ICLARM, Manila.

Msukwa, L.A.H. n.d.. Nutrition education in ~ a l a h . 45 p. Centre for Social Research, University of Mala&, Zomba.
Msukwa, L.A.H. 1985a. Agriculture and nutrition, p. 511-526. In Anon. (ed.) MalaGi: an alternative pattern of development. Centre for African Studies, University of Edinburgh, Edinburgh.
Msukwa, L.A.H. 1985. Integrated Basic Services Project: an evaluation report. 103 p. Centre for Social Research, University of Mala&, Zomba.
Msukwa, L.A.H. 1986. OXFAM Mala& country review: a review of MalaGi's development policies and strategies, 1964-1986. 61 p. Centre for Social Research, University of ~ a l a 6 3 , Zomba.
Mthinda, C. 1980. Decision making in smallholder farms within the Lilongwe Land Development Programme Area. Lilongwe, Bunda College of Agriculture, University of Mala%, Lilongwe. 15 p. BSc. research paper.
Mzumara, A.J.P. 1967. The Lake Chilwa fisheries. Soc. Malab 5.20: 58-68.
Nankumba, J.S. 1981. Evolution of agricultural policy in Mala& and the National Rural Development Programme (NRDP): a historical review (1891-1980). 52 p. University College of Wales, Aberystwyth.
Ndengu, J.D. and W.T. Kawonga. 1986. Farming system overview Mwanza Rural Development Project: Results of an informal (exploratory) survey. 12 p. Adaptive Research Section, Blantyre ADD, Blantyre. (MS)
Nji, A. 1986. Social, cultural and economic determinants of the adoption of fish pond culture in Menoua, Mezam and Momo divisions of Cameroon. Dschang University Center, Dschang, Cameroon.
Nongwa, G.M. 1985. A review of the status and development of aquaculture in Mala&. Paper presented at the FA0 Workshop on Aquaculture Planning in SADCC Countries, 7-11 October 1985. Lusaka, Zambia.
Nyrenda, Z.R. and Ziyite, L.A.N.K. Aquaculture extension manual. 28 p. MAGFAD, Zomba. (In press).
O'Dowd, E.T. 1978. Studies in the farm economy of traditional smallholders in ~ a l a % i . 32 p. Bunda College of Agriculture, University of ~ a l a & . Lilongwe.
Osborn, T. 1983. Inland fisheries in Lesotho. Paper presented at the Peace Corps Africa Seminar. Gabon, 26 November-3 December 1983.
Pachai, B., editor. 1972. The early history of ~ a l a 6 i . Longman Group Ltd., London.
Pachai, B. 1974. Issues of Thangata in the history of Nyasaland. J. Soc. Sci. 3: 20-34.
Pachai, B. 1978. Land and politics in MalaGi, 1875-1975. Limestone Press. Kingston, Ontario.
Pelto, P.J. and G.H. Pelto. 1975. Intra-cultural diversity: some theoretical issues. Am. Ethnol. 4: 156-174.
Phipps, P. 1973. The "big" fishermen of Lake Chilwa. A preliminary study in entrepreneurism in rural ~ a l a % , p. 39-48. In M.E. Page (ed.) Land and labor in rural Mala&. Rural Africana 21.
Phiri, C.D. 1981. Decision making in smallholder farms within the Lilongwe Land Development Programme Area. Bunda College of Agriculture, University of ~ a l a & i , Lilongwe. 24 p. B.Sc. research paper.
Pike, J.G. and G.T. Rimmington (1965), ~ a l a a i : a geographical study. Oxford University Press, London.
Pinegar, J.A. and Id. Clucas. 1976. Fish processing in Mala&. Reports of the Tropical Products Institute (R353). 49 p. Tropical Products Institute, London.
PRB (Population Reference Bureau). 1985. World population data sheet. 1 p. Population Reference Bureau,
Washington, DC. Pruginin, Y. 1969. Fish farming i n Mala&.
FIDP/MLW/7l/516nO. FAO, Rome. Pruginin, Y. 1971. The development of fish farming in ~ a l a h .
FI: SF/MLW 7 (Working Paper no. 1). 17 p. FAO, Rome.
P ~ g i n i n , Y. 1975a. Fish farming in ~a1ab;i. Third Interim Report. 12 p. FAO, Rome.
Pmginin, Y. 1975b. Fish farming in Mala&. FI3JP/MLW/7l/516/5,4 p. FAO, Rome.
Pmginin, Y. 1976. Fish farming in Mala&. FIDPiMLW/71/516/8.12 p. FAO, Rome.
Pruginin, Y. and A. Arad. 1977. Fish farming in ~ a l a h , FIDP/MLW/7l/516nO. 22 p. FAO, Rome.
llin. R.S.V. 1989. Third-world aquaculture and the environment. NAGA, The ICLARM Quarterly 12(1): 10-13.
Rangeley, W.H.J. 1962. The Amachinga Yao. Nyasaland J. 15(2): 40-70.
a d Senanayake. F. 1981. The athu kotu (brush park) fishery 7' of Sri Lanka. ICLARM Newsletter 4: 20-21. Ransford, O.N. 1948. Schistosomiasis in the KotwKota District
of Nyasaland. Trans. R. Soc. Trop. Med. Hygiene 41(5): 617-628.
Ratcliffe, C. 1972. The fishery of the Lower Shire River area, ~ a l a & 1972. Fish. Bull. No. 3. 79 p. Department of Fisheries, Ministry of Agriculture, Zomba.
Rawson, G.C. and MJ. Vincent. 1987. Feasibility study for the establishment of a regional fisheries training organization on behalf of participating countries in the Southern Africa Development Coordination Conference. Resources Development Associates International Inc., PlacerviUe, California. (dr& report).
RDA International Inc. 1987. Regional Fisheries Documentation Centre feasibility study. 274 p. Resources Development Agency International Inc., Placerville, California. (draR report).
Reed, W. 1967. Fish and fisheries of Northern Nigeria. Ministry of Agriculture of Northern Nigeria, Zaria.
Reizer, C. 1971. Definition d'une politique d'amenagement des resources halieutiques d'un ecosysteme aquatique complex par l'etude dc son environment abiotique, biotique et anthropique. Le fleuve Senegal moyen et inferieur. Fondation Universitaire Luxembourgeoise, Luxembourg. 525 p. Docteur en Sciences de l'Environment, dissertation.
Renson, H.L.F. 1969. Fish marketing in Mala&. 52 p. Ministry of Agriculture, Zomba.
Rogers, J. 1976. Fish processing in MalaGi - fresh fish distribution, utilization of snails, insect infestation. FIMLW/71/516/9.18 p. FAO. Rome.
Rogers, EM. and F. Shoemaker. 1971. Communication of innovations. Free Press, New York.
Rondinelli, D.A. and K. Ruddle. 1977. Appropriate institutions for rural development: organizing services and technology in developing countries. Philipp. J . Public Adm. 210): 35-52.
Ruddle, K. 1984. Normative models and human behavior: some theoretical issues in household resource use. Bull. Natl. Mus. Ethnol. 5(3): 801-822.
Ruddle, K. 1989. Some adaptive strategies and natural resource uses in tropical wetlands. In B.C. Patten (ed.) Wetlands and shallow continental water bodies. SPB Academic Publishing, The Hague. (In press).
Ruddle, K. and T.B. Grandstaff. 1978. The international potential of traditional resource systems in marginal areas. Technol. Forecast. Soc. Change 11: 119-131.

Ruddle, K. and D.A. Rondinelli. 1983. Transforming natural resources for human development: a resource systems framework for development policy. United Nations University, Tokyo.
Ruddle, K. and G. Zhong. 1988. Integrated agriculture- aquaculture in South China: the dike-pond system of the Zhujiang Delta. Cambridge University Press, Cambridge.
Russell, T.P.J. 197l. Dambo utilization survey. Chancellor College, University of Mala&, Zomba. (typescript).
Ruttan, V. 1975. Integrated rural development programs: a sceptical perspective. Int. Dev. Rev. 18(4): 9-16.
Rutz, H.J. 1977. Individual decisions and function systems: economic rationality and environmental adaptation. Am. Ethnol. 4: 156-174.
SADCC (Southern African Development Coordination Conference). 1984. Agriculture toward 2000. 200 p. FAO, Rome.
Sadek, S. 1984. Developpement de Paquaculture en Egypte. Institute Nationale Polytechnique de Toulouse, Toulouse. 184 p. Ph.D. dissertation.
oeder, G.L. 1980. Fish farming in manure-loaded ponds, p. J' 73-86. In R.S.V. Pullin and Z.H. Shehadeh (eds.) Integrated agriculture-aquaculture. ICLARM Conference Proceedings 4,258 p.
Schroedter, W. 1982. Fish marketing in northern Mala&. WP7157.39 p. FAO, Rome.
Sibelka, G. 1979. Possibilities of fish farming in the freshwaters of Angola. 5 p. Internal Fisheries Report. Ministry of Agriculture, Luanda.
Simon, H.A. 1957. Rational choice and the structure of the environment. Psychol. Rev. 63: 129-138.
Sluijer, J. 1984. Brush park fisheries: een inheemse vorm van visserij. 35 p. Landbouhogeschool, University of Wageningen, Wageningen. Graduation paper.
Smith-Carington, A.K. and P.J. Chilton. 1983. Groundwater resources of Mala&. Department of Lands, Valuation and Water, Lilongwe and ODA, Institute of Geological Science, London.
Spring, A., C. Smith and F. Kayuni. n.d. Women farmers in Malawi, their contribution to agriculture and participation in development projects. 80 p. Chitedze Agricultural Research Station, Lilongwe. (MS).
Stauch, A. 1966. Le bassin Camerounais de la Benoue et sa p6che. Memoires ORSTOM 15. ORSTOM, Paris.
Steele, I. 1987. A new way to prevent bilhania. AfricAsia 42: 70-72.
Stoneman, J. and KB. Meecham. 1972. Country paper on Mala& FIE:FET/72/CP.21,6 p. FAO, Rome.
Subrammiam, S.P. 1986. Recent trends in fish utilization and marketing in Zambia, p. 424-436. In Anon. (ed.) Fish processing in Africa: proceedings of the FA0 Expert Consultation on Fish Technology in Africa, Lusaka, Zambia, 21-25 January 1985. FAO, Rome.
Swantz, M-L. 1986. The role of women in Tanzanian fishing societies: a study of the socio-economic context and the situation of women in three coastal fishing villages in Tanzania. NORAD, Oslo.
Tang, Y.A. 1976. Report of travel to Senegal, Nigeria and the Republic of Benin (28 April-18 May, 1975). FIRDTRAM (1201, FAO, Rome.
Tang, Y.A. 1977. Report of the aquaculture mission in Egypt, 20th Oct. to 28th Nov. 1976.48 p. FAO, Rome.
Tanzania-UNICEF. 1985. Analysis of the situation of children and women, vol. 1. Government of the United Republic of Tanzania and the United Nations Children's Fund (UNICEF). Dar es Salaam.
Teesdale, C.H. and L.A. Chitsulo. 1983. Wstosomiasis in Malawi - a review. Mala& Epidemiological Quarterly
4: 10-36. Tew, M. 1950. People of the Lake Nyasa Region. Ethnographic
Survey of Africa, East Central Africa, Part 1. London.
Turner, J. 1976. Pmmotion of integrated fishery development: Mala&, an analysis of the various fisheries of Lake Mala&. FI:DP/MLW/71/516.78 p. FAO, Rome.
Tweddle, D. 1978. Traditional fishing in Mala&. Venture 3(3): 31-34.
Tweddle, D. and B. Mkoko. 1986. A limnological bibliography of Mala&. CIFA Occas. Pap. No. 13. 75 p. FAO, Rome.
UNDP (United Nations Development Programme). 1986. National water resources master plan, report and appendices (UNDP Projects MLW-75-015lMLW-84- 003). UNDP, New York.
UNICEF (United Nations Children's Fund). 1987. Fads and figures 1987. UNICEF, New York.
UNFPA (United Nations Fund for Population Activities). 1983. Mala& - Report of mission on needs assessment for population assistance. UNFPA Report No. 64. 5 p. UNFPA, New York.
Van der Velden, J. 1980. A summary and review of monthly temperature data in Mala&. (WRD-No. T.P.4). 70 p. Ministry of Agriculture and Natural Pmources, Lilongwe.
Vaughan, M.A. 1981. Social and economic change in Southern Mala&: a study of rural communities in the Shire Highlands and the Upper Shire Valley from the mid- 19th century to 1915. University of London, London. Ph.D. dissertation.
Vincke, M.M.J. 1976. La rizipisciculture et les 6levages associ6s en Afrique. CIFA Tech. Pap. 4(Suppl. 1): 659-787. FAO, Rome.
Vincke, M.M.J. 1981. Aquaculture development in ~ a l a h . ADCP/MR/81. FAO, Rome.
Weigel, J.Y. 1985. Traditional management of some lagoons of the Gulf of Guinea (Ivory Coast, Ghana, Togo, and Benin). FA0 Fish. Circ. 790.29 p. FAO, Rome.
Weill, C. and M. Kvale. 1985. Current research on geographic aspects of schistosomiasis. Geogr. Rev. 75(2): 186- 216.
Welcomme, R.L. 1970. Les moyens de p&che dans les eaux continentales du Dahomey. Etudes Dahomeenes (ns) 17: 5-35, Institute de Recherche Applique6 du Dahomey.
Welcomme, R.L. 1971. A description of certain indigenous fishing methods from southern Dahomey. Afr. J. Tmp. Hydrobiol. Fish. 1: 129-140.
Welcomme, R.L. 1972a. An evaluation of the acadja method of fishing as practised in the coastal lagoons of Dahomey (West Africa). J. Fish Biol. 4: 36-55.
Welcomme, R.L. 1972b. The inland waters of Africa. CIFA Tech. Pap. 1.117 p. FAO, Rome.
Welcomme, R.L. 1975. The fisheries ecology of African floodplains. CIFA Tech. Pap. 3.51 p. FAO, Rome.
Welcomme, R.L. 1979. The inland f~her ies of Africa. CIFA Occas. Pap. 7. FAO, Rome.
Welcomme, R.L. 1983. River basins. Fish. Tech. Pap. 202. 60 p. FAO, Rome.
Welcomme, R.L. 1985. River fisheries. Fish. Tech. Pap. 262. 330 p. FAO, Rome.
lmmme, R.L. and J.K. Kapetsky. 1981. Acadjas: the brush / park fisheries of Benin, West Africa. ICLARM Newsletter 4(4): 3-4.
Werner, J. 1987. Crop field operation survey: labour requirement and distribution for smallholder crops. 46 p. LWADD, Liwonde.
WiUiams, R.D. 1969. Fish trading in ~ a ~ a & , p. 83-104. In

Stewart, G. (ed.) Economic development and report, Jan.-Dec. 1975. 51 p. Department of structural change. Edinburgh University Press, Fisheries, Ministry of Agriculture and Natural Edinburgh. Resources, Lilongwe. (mimeo).
Williamson, J. 1972. Useful plants of ~ a l a k . University of Woodhouse, P. 1989. From green revolution to food security in ~ a l a 6 i Press, Zornba. sub-Saharan Africa: issues in research and
Willoughby, N.G. and D. Tweddle. 1975. Fisheries research technology development. Food Policy (Feb. 1989): 7- unit, Makhanga, Lower Shire: annual research 12.
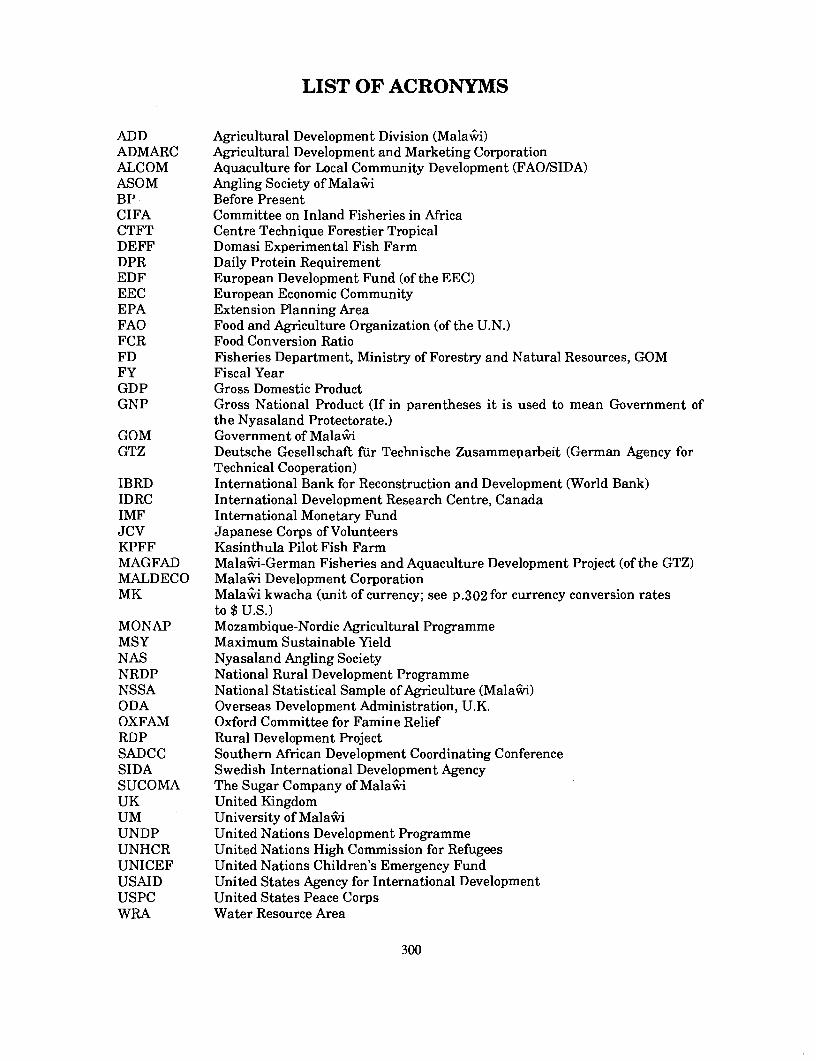
LIST OF ACRONYMS
ADD ADMARC ALCOM ASOM BP CIFA CTFT DEFF DPR EDF EEC EPA FA0 FCR FD FY GDP GNP
GOM GTZ
IBRD IDRC IMF JCV KPFF MAGFAD MALDECO MK
MONAP MSY NAS NRDP NSSA ODA OXFAM RDP SADCC SIDA SUCOMA UK UM UNDP UNHCR UNICEF USAID USPC WRA
Agricultural Development Division (Mala%) Agricultural Development and Marketing Corporation Aquaculture for Local Community Development (FAOISIDA) Angling Society of Mala% Before Present Committee on Inland Fisheries in Africa Centre Technique Forestier Tropical Domasi Experimental Fish Farm Daily Protein Requirement European Development Fund (of the EEC) European Economic Community Extension Planning Area Food and Agriculture Organization (of the U.N.) Food Conversion Ratio Fisheries Department, Ministry of Forestry and Natural Resources, GOM Fiscal Year Gross Domestic Product Gross National Product (If in parentheses i t is used to mean Government of the Nyasaland Protectorate.) Government of Mala% Deutsche Gesellschaft fiir Technische Zusammeparbeit (German Agency for Technical Cooperation) International Bank for Reconstruction and Development (World Bank) International Development Research Centre, Canada International Monetary Fund Japanese Corps of Volunteers Kasinthula Pilot Fish Farm Mala%-German Fisheries and Aquaculture Development Project (of the GTZ) Mala* Development Corporation Mala% kwacha (unit of currency; see p.302 for currency conversion rates to $ U.S.) Mozambique-Nordic Agricultural Programme Maximum Sustainable Yield Nyasaland Angling Society National Rural Development Programme National Statistical Sample of Agriculture (Mala*) Overseas Development Administration, U.K. Oxford Committee for Famine Relief Rural Development Project Southern African Development Coordinating Conference Swedish International Development Agency The Sugar Company of Mala% United Kingdom University of MalaGi United Nations Development Programme United Nations High Commission for Refugees United Nations Children's Emergency Fund United States Agency for International Development United States Peace Corps Water Resource Area
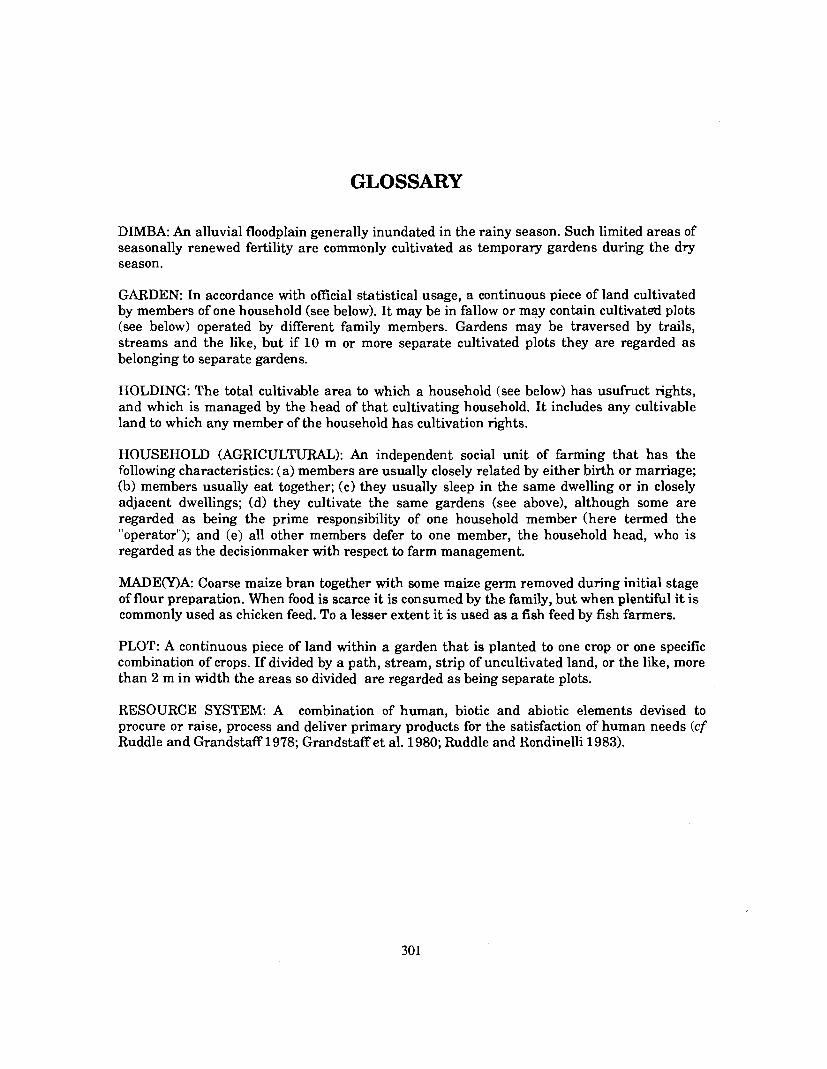
GLOSSARY
DIMBA: An alluvial floodplain generally inundated in the rainy season. Such limited areas of seasonally renewed fertility are commonly cultivated as temporary gardens during the dry season.
GARDEN: In accordance with official statistical usage, a continuous piece of land cultivated by members of one household (see below). I t may be in fallow or may contain cultivated plots (see below) operated by different family members. Gardens may be traversed by trails, streams and the like, but if 10 m or more separate cultivated plots they are regarded as belonging to separate gardens.
HOLDING: The total cultivable area to which a household (see below) has usufruct rights, and which is managed by the head of that cultivating household. I t includes any cultivable land to which any member of the household has cultivation rights.
HOUSEHOLD (AGRICULTURAL): An independent social unit of farming that has the following characteristics: (a) members are usually closely related by either birth or marriage; (b) members usually eat together; (c) they usually sleep in the same dwelling or in closely adjacent dwellings; (dl they cultivate the same gardens (see above), although some are regarded as being the prime responsibility of one household member (here termed the "operator"); and (e) all other members defer to one member, the household head, who is regarded as the decisionmaker with respect to farm management.
MADE(Y)A: Coarse maize bran together with some maize germ removed during initial stage of flour preparation. When food is scarce it is consumed by the family, but when plentiful it is commonly used as chicken feed. To a lesser extent it is used as a fish feed by fish farmers.
PLOT: A continuous piece of land within a garden that is planted to one crop or one specific combination of crops. If divided by a path, stream, strip of uncultivated land, or the like, more than 2 m in width the areas so divided are regarded as being separate plots.
RESOURCE SYSTEM: A combination of human, biotic and abiotic elements devised to procure or raise, process and deliver primary products for the satisfaction of human needs (cf Ruddle and Grandstaff 1978; Grandstaff e t al. 1980; Ruddle and Rondinelli 1983).

RATE OF EXCHANGE OF MALAWIAN KWACHA PER UNIT OF US$
Year June December Year June December
I
Source: GOM (1981, 1987a, 198%); IMF (1971). Note: The exchange rates listed are averages of the buying and selling rates applied by the Reserve Bank of Mala% at the end of June and December each year. Until November 1973, the MK was pegged to the British Sterling. From then to 8 June 1975, it was based on a weighted average of Sterling and the US dollar. From 9 June 1975, it was pegged to the Special Drawing Right (SDR) of the International Monetary Fund (IMF). From 1964 to 1972, the MalaGian currency was known as the "MalaGi pound, and since 1972 it has been the Mala6i kwacha.


- ~
TITLES OF RELATED INTEREST
Integrated agriculture-aquaculture farming systems. RS.V. Pullin and Z.H.Shehadeh, Editors. 1980. Reprinted 1984,1986. ICLARM Conf. Proc. 4, 258 p. Out of print-available at cost in photocopied form.
Detritus and microbial ecology in aquaculture. D.W. Moriarty and RS.V. Pullin,Editors. 1987. ICLARM Conf. Proc. 14,420 p. US$12.50 surface, $24.50 airmail (paperback);$16 surface, $28.50 airmail (cloth).
Aquaculture research and development in rural Africa. B.A. Costa-Pierce, C.Lightfoot, K Ruddle and RS.V. Pullin, Editors. 1991. ICLARM Conf. Proc. 27, 52 p. US$3.50surface, $5.00 airmail.
Food potential of aquatic macrophytes. P. Edwards. 1980. Reprinted 1984, 1987.ICLARM Stud. Rev. 5,51. p. US$4 surface, $7.50 airmail.
Research and education for the development of integrated crop-livestock-fishfarming systems in the tropics. P. Edwards, RS.V. Pullin and J.A. Gartner. 1988.ICLARM Stud. Rev. 16, 53 p. US$3.50 surface, $6 airmail.
The ICLARM-CLSU integrated animal-fish farming project: final report. KD.Hopkins and E.M. Cruz. 1982. ICLARMTech. Rep. 5, 96 p. US$7.75 surface, $14.85 airmail.
HOW TO ORDER
Enquirers from the USA should order directly from our exclusivedistributor, the International Specialized Book Services, 5602 N.E.Hassalo Street, Portland, Oregon 97213-3640, to whom payment should bedirected using the airmail price., Interested persons in Canada andCentral and South America may also find ISBS a convenient source.
Enquirers in Europe may order from Ernst S. Toeche-Mittler GmbH,Versandbuchhandlung, Hindenburgstrasse 33, D-6100 Darmstadt,Federal Republic of Germany, using the airmail price.
Enquirers elsewhere should address orders and payment (payable toICLARM) in US$ by international money order, bank draft or UNESCOcoupons to: The Editor, ICLARM, MC P.O. Box 1501, Makati, MetroManila, Philippines. We accept US$ checks only if from a US-based bankdue to high clearance fees of other banks.
..I:l1.o