Journal of Agriculture and Aquaculture - eScientific Publishers
14
Abstract The study was conducted at Jimma University College of agriculture and veterinary medicine to show how to formulate 35%CP from low-cost locally available ingredients of poultry droppings, maize bran, barley bran and wheat bran, option for small-scale farmers for the best growth performance and to increase yield production of Nile tilapia (Oreochromis niloticus) in pond culture. Nutrient content analyses of experimental ingredients were done and calculated by following AOAC (1990). The processes of quantifying the amount of each feed ingredients to be put together were calculated using Pearson two Square methods and algebraic equations. The homogeniza- tion processes of ingredients were done as described in NAERLS, (2002) as processing, handling and storage. Mean equal size and number of cultured juveniles with equivalent volume of ponds water were stocked at a ratio of 2 fish/m2and feeds were given at a rate recom- mended by ICA (1991) on proximate length-weight and appropriate feeding rates relationships for about 150 days in triplications. All growth performance parameters were computed and variations in the mean fish size were tested using one-way ANOVA and the result indicates on weight gain, daily growth rate, specific growth rate, survival rate, Fulton condition factor, food conversion ratio, food con- version efficiency and net production values were best with the 35%CP as compared with other. Therefore, this research mainly focus on how farmers formulate at home best fish feed, process, handle, store and feed fish from four low cost-locally available ingredients for the best production of Nile tilapia, feeding frequency and cost effectiveness by showing simple, brief and easy homemade procedures/ steps and also using such ingredients are comparable with fish productivity, its environmental benefits and best option for small-scale farmers. The economic assessment recommended that large-scale earthen pond production of Nile tilapia can be economically feasible and environmental benefits. Volume 1 • Issue 2 • 2019 Copyright © All rights are reserved by Firew Admasu Hailu. Journal of Agriculture and Aquaculture Research Article Firew Admasu Hailu 1 *, Abebe Getahun 2 and Mulugeta Wakjira 3 1 Department of Biology, College of Natural Sciences, Dilla University, Dilla, Ethiopia, P. O. Box 419. 2 Department of Zoological Sciences, College of Natural Sciences, Addis Ababa University, Addis Ababa, Ethiopia, P. O. Box 1176. 3 Department of Biology, College of Natural Sciences, Jimma University, Jimma, Ethiopia, P. O. Box 378. Received: October 23, 2019; Published: November 04, 2019 *Corresponding Author: Firew Admasu Hailu, Department of Biology, College of Natural Sciences, Dilla University, Dilla, Ethiopia, P. O. Box 419. The Process of Tilapia Feed Formulation and Implementation in pond aquaculture: Low Cost and Locally Available Ingredients option for small-scale farmers. Citation: Firew Admasu Hailu, Abebe Getahun and Mulugeta Wakjira. (2019). The Process of Tilapia Feed Formulation and Implementa- tion in pond aquaculture: Low Cost and Locally Available Ingredients option for small-scale farmers. Journal of Agriculture and Aquacul- ture 1(2). Key words/phrases: Local ingredients; Least cost; Feed formulation; Growth performance; Pond aquaculture.
-
Upload
khangminh22 -
Category
Documents
-
view
0 -
download
0
Transcript of Journal of Agriculture and Aquaculture - eScientific Publishers
AbstractThe study was conducted at Jimma University College of agriculture and veterinary medicine to show how to formulate 35%CP from low-cost locally available ingredients of poultry droppings, maize bran, barley bran and wheat bran, option for small-scale farmers for the best growth performance and to increase yield production of Nile tilapia (Oreochromis niloticus) in pond culture. Nutrient content analyses of experimental ingredients were done and calculated by following AOAC (1990). The processes of quantifying the amount of each feed ingredients to be put together were calculated using Pearson two Square methods and algebraic equations. The homogeniza-tion processes of ingredients were done as described in NAERLS, (2002) as processing, handling and storage. Mean equal size and number of cultured juveniles with equivalent volume of ponds water were stocked at a ratio of 2 fish/m2and feeds were given at a rate recom-mended by ICA (1991) on proximate length-weight and appropriate feeding rates relationships for about 150 days in triplications. All growth performance parameters were computed and variations in the mean fish size were tested using one-way ANOVA and the result indicates on weight gain, daily growth rate, specific growth rate, survival rate, Fulton condition factor, food conversion ratio, food con-version efficiency and net production values were best with the 35%CP as compared with other. Therefore, this research mainly focus on how farmers formulate at home best fish feed, process, handle, store and feed fish from four low cost-locally available ingredients for the best production of Nile tilapia, feeding frequency and cost effectiveness by showing simple, brief and easy homemade procedures/steps and also using such ingredients are comparable with fish productivity, its environmental benefits and best option for small-scale farmers. The economic assessment recommended that large-scale earthen pond production of Nile tilapia can be economically feasible and environmental benefits.
Volume 1 • Issue 2 • 2019
Copyright © All rights are reserved by Firew Admasu Hailu.
Journal of Agriculture and Aquaculture
Research Article
Firew Admasu Hailu1*, Abebe Getahun2 and Mulugeta Wakjira3
1Department of Biology, College of Natural Sciences, Dilla University, Dilla, Ethiopia, P. O. Box 419.2Department of Zoological Sciences, College of Natural Sciences, Addis Ababa University, Addis Ababa, Ethiopia, P. O. Box 1176.3Department of Biology, College of Natural Sciences, Jimma University, Jimma, Ethiopia, P. O. Box 378.
Received: October 23, 2019; Published: November 04, 2019
*Corresponding Author: Firew Admasu Hailu, Department of Biology, College of Natural Sciences, Dilla University, Dilla, Ethiopia, P. O. Box 419.
The Process of Tilapia Feed Formulation and Implementation in pond aquaculture: Low Cost and Locally Available
Ingredients option for small-scale farmers.
Citation: Firew Admasu Hailu, Abebe Getahun and Mulugeta Wakjira. (2019). The Process of Tilapia Feed Formulation and Implementa-tion in pond aquaculture: Low Cost and Locally Available Ingredients option for small-scale farmers. Journal of Agriculture and Aquacul-ture 1(2).
Key words/phrases: Local ingredients; Least cost; Feed formulation; Growth performance; Pond aquaculture.

Journal of Agriculture and Aquaculture Page 2 of 14
Fisheries and aquaculture involve the production of high qual-ity fish protein (Bozoglu et al., 2006; Obaroh and Achionye-Nzeh, 2011). Fisheries are based on the extraction of living resources from water bodies (Akca et al., 2006; Bostock et al., 2010). Aqua-culture refers to the practice of farming of aquatic organisms, in-cluding fish, crustaceans, mollusks and aquatic plants in various systems in inland water bodies or coastal areas (FAO, 2005). Both disciplines provide most of the world’s aquatic edible resources (FAO, 2010). The Nile tilapia (Oreochromis niloticus) is a widely cultured species because it grows and reproduces in a wide range of environmental conditions and tolerates stress induced by han-dling (Tsadik and Bart, 2007). Nile tilapias are omnivores feeding habits can feed on a wide range of both natural and artificial foods (Kariman et al., 2000). Nile tilapia has considerable potential for aquaculture in many tropical and subtropical regions in the world. Importance of Culturing Nile tilapia in ponds including easy breed-ing, fast grows, can tolerate adverse environmental conditions, has good taste, and market price (FAO, 2011), high tolerance to low water quality, efficient food conversion, resistance to disease and good consumer acceptance make tilapia a suitable fish for culture (El-Saidy and Gaber, 2005; Peña-Mendoza et al., 2005). Thus why, Nile tilapia is selected for this experiment. Feed is one of the major inputs in aquaculture production and fish feed Technology is one of the least development sectors of aquaculture particularly in Africa and other developing countries of the World (Gabriel et al., 2007).
Introduction
In world aquaculture, Asia has retained dominant position in pro-ducing 88.8 percent of global aquaculture production by quantity and 78.7% by value in 2008. China alone accounted for 62.3 per-cent of world aquaculture production by quantity and 51.4% by value in the same year. The average annual growth in production in Europe and North America since 2000 has also slowed substantial-ly to 1.7 and 1.2%, respectively. It is anticipated that, while world aquaculture production will continue to grow, the rate of increase in most of the regions will slow down in the forthcoming decade (FAO, 2010). Aquaculture is the most rapidly expanding sector of agri-business today and has shown continuous growth for the last 20 years, contributing an important input with regards to global fisheries production (Ayinla, 2005). The aquaculture industry is the fastest growing food production industry in the world and approxi-mately 50% of all fish consumed by humans is from aquaculture (Thorarinsdottir et. al., 2011). The modern concept of aquaculture
was introduced from Europe into African countries during the co-lonial periods (FAO, 2004a). The aquaculture in 2006 with total fish production in Kenya (159,000 t), Uganda (399,000 t), Rwanda (9,000 t), Tanzania 359,000 and Burundi (14,000 t) (FAO, 2009). In Egypt by the mid-1980s, the annual production from aquaculture had increased dramatically from a mere 17,000 tones to 45,000 tones which indicates that aquaculture production alone exceeds the total national fish production of any of the East African coun-tries (FAO, 2009). Aquaculture in Ethiopia remains more potential than actual practice, despite the fact that the country’s physical and socio-economic conditions support its development (Abdiladi, 2010). In Jimma, the growth performance of O. niloticus reared in ponds loaded with varying levels of poultry manure resulted in the total production increased with increasing poultry manure, thus, integrated fish-poultry farming seems to be economically viable and environmentally friendly (Kebede Alemu, 2003). Ethiopia is a land-locked country and depends on its inland water bodies with a surface area estimated at 7334 km2 of major lakes and reservoirs, and 275 km2 of small water bodies, with 7185 km length of rivers within the country for fish supply for its population (FAO, 2001). Agriculture has important share in gross domestic product in Ethi-opia (Demese Chanyalew et al., 2010) and aquaculture is essential agricultural activity but not started yet in the country.
Feed is one of the most important factors influencing performance of cultured fish and is influenced by factors such as behaviour of fish, stocking density, quality of feed, daily ration size, feeding fre-quency and water temperature. Feeding frequency mainly depends on species cultured, age, size, feed quality and environmental fac-tors (Aduku, 1992; Storebakken, 2002; El-Sayed, 2006; De Silva et al., 2012). Fish obtain the energy they need by eating protein, lipid and carbohydrate are known as macronutrients and small amounts of minerals and vitamins are essential called micronutri-ents (Carmen and Geoff, 2007). Hence, two or more ingredients should be mixed into homemade, laboratory and commercial feed formulations. Supplementary feeds in fish culture may consist of by-products such as wheat bran, copra meal, wheat flour, oilseed cakes (for instance, rapeseed, peanuts and soybean), green fod-der, maize bran, chicken waste, and/or kitchen waste (Suloma and Ogata, 2006). Wide ranges of ingredients are used in preparation of aquafeeds include aquatic and terrestrial plants and animals, plant or grain processing products and by-products (Oiled Cakes and Meals, Beans, Grains and Brans) and animal-processing by-prod-ucts (Meat and Bone Meal, Bone Meal, Blood Meal, Feather Meal,
Citation: Firew Admasu Hailu, Abebe Getahun and Mulugeta Wakjira. (2019). The Process of Tilapia Feed Formulation and Implementa-tion in pond aquaculture: Low Cost and Locally Available Ingredients option for small-scale farmers. Journal of Agriculture and Aquacul-ture 1(2).
Journal of Agriculture and Aquaculture
Citation: Firew Admasu Hailu, Abebe Getahun and Mulugeta Wakjira. (2019). The Process of Tilapia Feed Formulation and Implementa-tion in pond aquaculture: Low Cost and Locally Available Ingredients option for small-scale farmers. Journal of Agriculture and Aquacul-ture 1(2).
Page 3 of 14
Materials and Methods
This experiment was carried out at Jimma University, in earthen ponds, located 350 km southwest of Addis Ababa at an altitude of 1700 m above sea level. The mean daily temperature and annual rainfall of the study area is 20.71°C and 123.01 mm, respectively (Jimma Meteorological Station). The study required three earthen ponds for replication and equal area of 15m2 (5m x 3m) and av-erage depth of 75 cm with sloped walls. The surrounding area of the ponds and the direction of water sources were cleaned and water canals were reconstructed from the main water source of Aweitu River. The pond pipes of 10 cm diameters were fit to each pond to be used as water inlet and outlet. Moreover, wires of 2 mm
etc.) (Ali and Hoq, 2010). Among the potential alternatives are non-conventional ingredients with little or no use as human food such as blood meal, brewery wastes, and poultry and fish by-products (Coyle et al., 2004; Subhadra et al., 2006; Ogunji et al., 2008). In Ethiopia, agriculture has important share in gross domestic prod-uct and agricultural by-products can be a source of feed and fertil-izer for small-scale farming and increases the natural production of the ponds (Demese Chanyalew et al., 2010). For the commercial fish farming, such by-products can reduce feed costs by replacing some formulated feeds. But, how to process such by products at home-made, laboratory and commercial feed for small scale farming is not started yet in Ethiopia. Therefore, such kind of problems initiate the researchers to undertake this research.
Feed formulation is the process of quantifying the proportion of feed ingredients to be put together, to form a single uniform mix-ture or pellet that will provide all the nutritional requirements of the target fish. Good nutrition in production systems is essential to economically produce a healthy, high product and the first consid-eration for formulation of feed is the quality of the feed ingredients (Bhosale et al, 2010). Optimum use of supplementary feed is impor-tant to obtain rapid fish growth but it is one of the problems faced in fish farming (El-Sayed, 2006). The feed preparation, processing, storage and handling systems that are working in improving small scale feed manufacturing through the development and promotion of simple on feed farm processing (grinding/mashing/drying, etc.), maintain feed quality through the development and promotion of simple feed storage systems to protect feed products from deleteri-ous environmental parameters (sunlight, humidity, rain, etc.) (FAO, 2010). Omnivorous fishes such as tilapia and catfish usually attain optimal growth on diets of 25% to 45% depending on size of the fish (Diyaware et al., 2009; Maina et al., 2011). ICA (1991) proxi-mate length-weight and appropriate feeding rates relationships for Nile tilapia fed by hand at a rate of daily ration of 5% (Zenebe Ta-desseet al., 2012). One of the most commonly used and useful stan-dard analyses of fisheries data is length weight relationship (Mora-to et al., 2001; Mendes et al., 2004). Length-weight regressions have been used frequently to estimate weight from length because direct weight measurements can be time-consuming in the field (Sinovcic et al., 2004).
According to Suloma and Ogata (2006) the content of protein in food must be 30%-40%, the food ration must contain lipids in sig-nificant amount but lower than 20% for tilapias. According to FAO and Department of Science and Technology manual, a good fish food
for high fish farming should contain all required nutrients, high protein 32 to 48% which is standard protein value. Many research-es on protein requirements results indicate that 35% CP is best for growth performance of fishes. But, there are no researches done to show each process or steps briefly involved how to formulate 35%CP of fish feed from low cost and locally available ingredients for small scale farmers. Ethiopia has a great potential for aquacul-ture development with many kinds of agricultural by-products, such as wheat bran, maize bran, chicken waste and/or kitchen waste and oil seeds being locally available. In addition, poultry production has already been bound to the problem of waste dis-posal in urban Ethiopia. However, there is lack of knowledge, ex-perience and research on how to process various by-products for artificial feed formulation, feeding level, feeding frequency, feeding time, regular maintenance and monitoring in different fish culture systems. These reasons motivated the researcher to undertake the present research. Supplemental Fish feed is one of the major in-puts in aquaculture production. Market fish feed is in high rate, So Supplemental feed formulated from low-cost and locally available ingredients to homemade option for small-scale farmers for tilapia feed using four ingredients such as poultry droppings, maize bran, barley bran and wheat bran for the best growth performance and yield of Nile tilapia (Oreochromis niloticus) in pond aquaculture to increase fish meat production having protein value of 35%CP. Therefore, based on the above gaps, this research is focus on how farmers formulate and process fish feed that contain 35%CP from low cost and locally available ingredients for the best production of Nile tilapia (Oreochromis niloticus), feeding frequency, growth performance and cost effectiveness by showing easy homemade procedures/steps that can be best option for small-scale farmers.
Description of study area
Journal of Agriculture and Aquaculture
Citation: Firew Admasu Hailu, Abebe Getahun and Mulugeta Wakjira. (2019). The Process of Tilapia Feed Formulation and Implementa-tion in pond aquaculture: Low Cost and Locally Available Ingredients option for small-scale farmers. Journal of Agriculture and Aquacul-ture 1(2).
Page 4 of 14
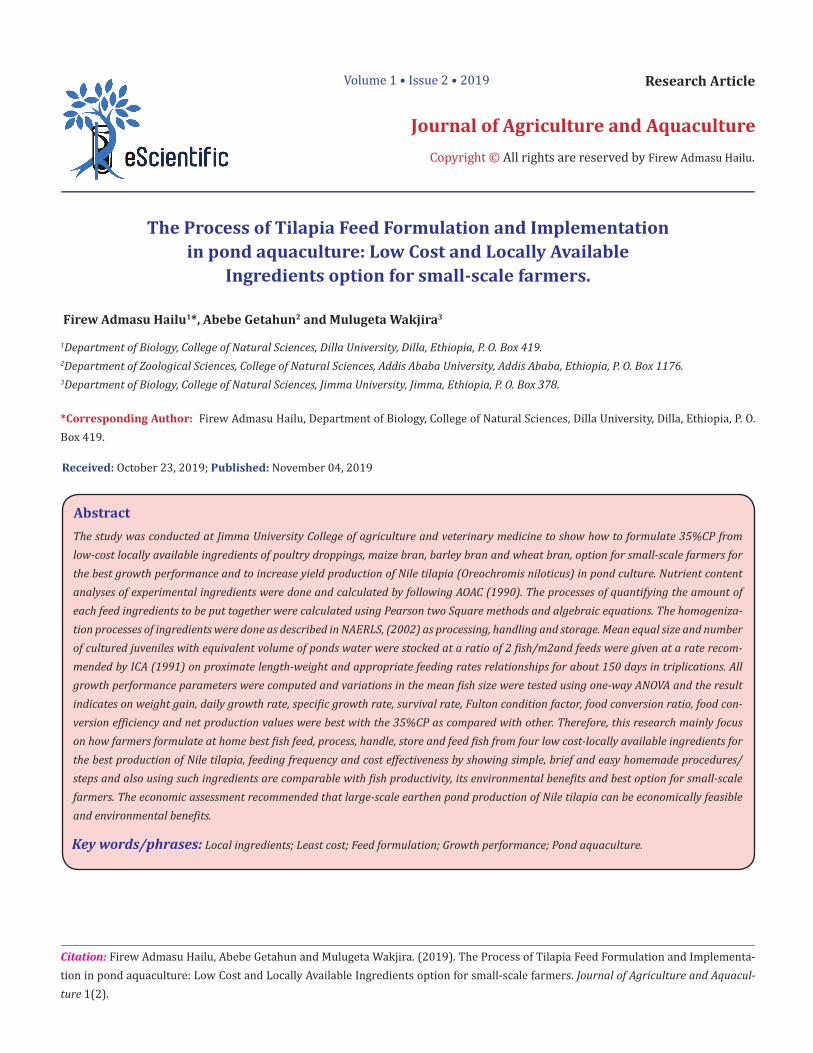
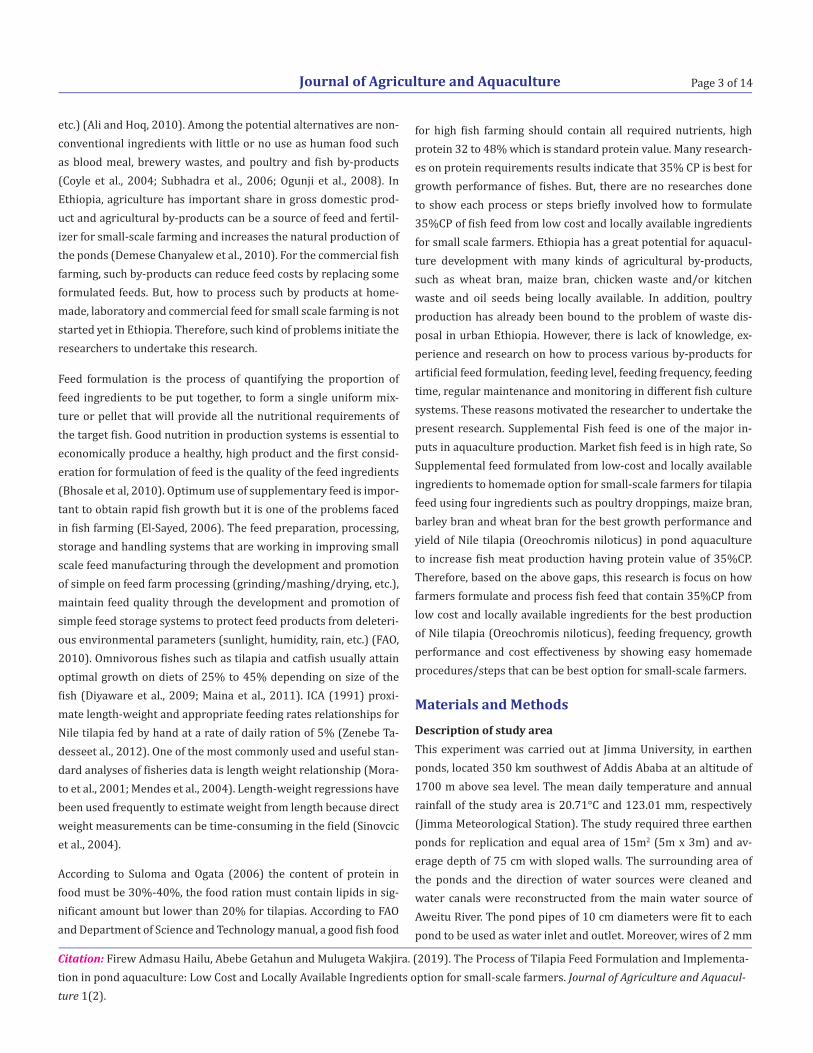
mesh size were fixed to the tip of water inlets and outlets pipes to protect the escape of experimental fish from ponds and also the entry of predatory fish. All ponds were filled with sufficient water from Aweitu River by adjusting constant entry and exit of water to compensate water loss by seepage, evaporation and to control water quality parameters in optimum range for experimental juve-nile fish of Nile tilapia throughout the study period. The study area was fenced with wire mesh and barbed wires to keep out predators and other animals as indicated in figure 1. The 90 live experimental juveniles were obtained from Gilgel Gibe Reservoir, collected with seine nets with the help of local fishermen, handled with gloves to protect their mucus on the fish’s body, transported with water filled plastic jars, acclimatized and stocked into 3 ponds by mea-suring initial length and weight with measuring board and triple beam balance (Ohaus portable balance), respectively with stocking density of 2 fish/m2 has been selected based on the finding by Ke-bede Alemu (2003), that the maximum yield was recorded at this stocking density, for the same fish in the same study area.
Figure 1: The fenced study area with wire mesh and barbed wires.
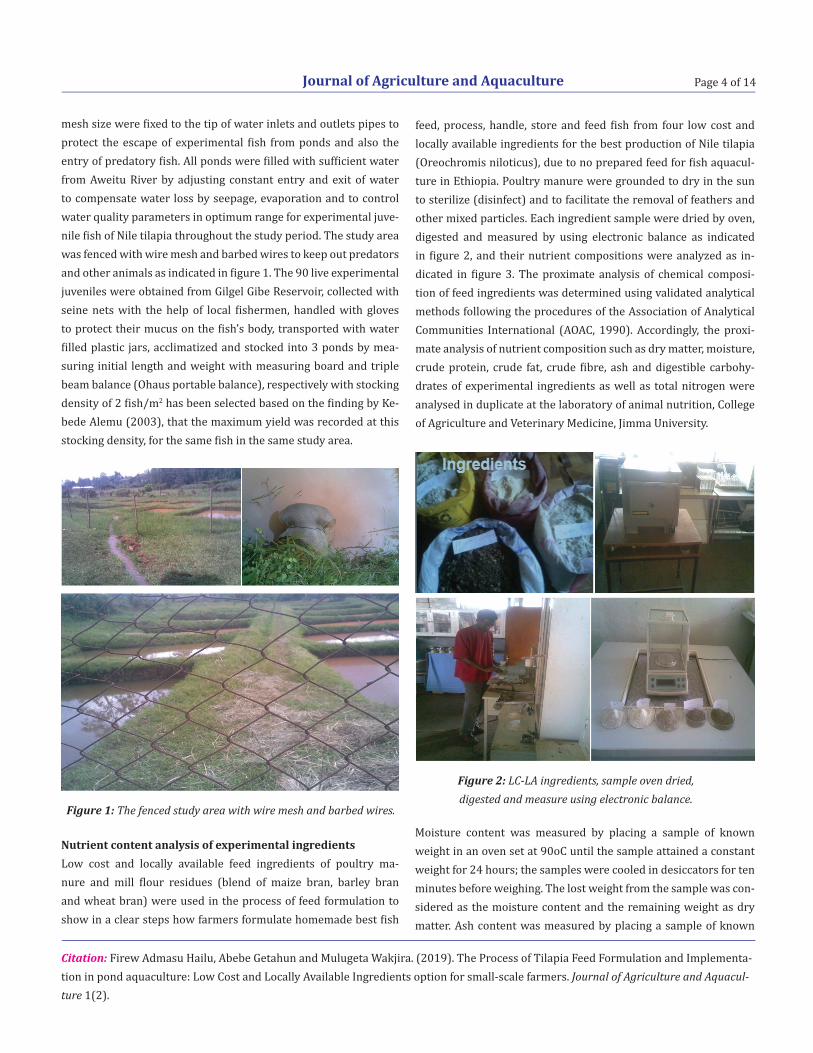
Nutrient content analysis of experimental ingredientsLow cost and locally available feed ingredients of poultry ma-nure and mill flour residues (blend of maize bran, barley bran and wheat bran) were used in the process of feed formulation to show in a clear steps how farmers formulate homemade best fish
feed, process, handle, store and feed fish from four low cost and locally available ingredients for the best production of Nile tilapia (Oreochromis niloticus), due to no prepared feed for fish aquacul-ture in Ethiopia. Poultry manure were grounded to dry in the sun to sterilize (disinfect) and to facilitate the removal of feathers and other mixed particles. Each ingredient sample were dried by oven, digested and measured by using electronic balance as indicated in figure 2, and their nutrient compositions were analyzed as in-dicated in figure 3. The proximate analysis of chemical composi-tion of feed ingredients was determined using validated analytical methods following the procedures of the Association of Analytical Communities International (AOAC, 1990). Accordingly, the proxi-mate analysis of nutrient composition such as dry matter, moisture, crude protein, crude fat, crude fibre, ash and digestible carbohy-drates of experimental ingredients as well as total nitrogen were analysed in duplicate at the laboratory of animal nutrition, College of Agriculture and Veterinary Medicine, Jimma University.
Figure 2: LC-LA ingredients, sample oven dried, digested and measure using electronic balance.
Moisture content was measured by placing a sample of known weight in an oven set at 90oC until the sample attained a constant weight for 24 hours; the samples were cooled in desiccators for ten minutes before weighing. The lost weight from the sample was con-sidered as the moisture content and the remaining weight as dry matter. Ash content was measured by placing a sample of known

Journal of Agriculture and Aquaculture
Citation: Firew Admasu Hailu, Abebe Getahun and Mulugeta Wakjira. (2019). The Process of Tilapia Feed Formulation and Implementa-tion in pond aquaculture: Low Cost and Locally Available Ingredients option for small-scale farmers. Journal of Agriculture and Aquacul-ture 1(2).
Page 5 of 14
weight in a furnace of 550°C for 4 hours, after which the samples were cooled in a desiccators and weighed and the remaining weight was considered the ash. Crude protein was estimated by measur-ing the total nitrogen content of the ingredient using the Kjeldahl method and calculating the crude protein level by multiplying the nitrogen content with specific conversion factors to give crude pro-tein. Crude fat was determined by subjecting the samples to a con-tinuous extraction with petroleum ether method using soxhlet ap-paratus as described by AOAC (1990). Crude fibre was determined as that fraction remaining after digestion with standard solutions of sulphuric acid and sodium hydroxide under carefully controlled conditions. Estimate of carbohydrate (NITROGEN-FREE EXTRACT (NFE) was made by calculating the difference as 100 - % crude pro-tein - % crude fat - % crude fibre - % ash - % moisture. Specific con-version factors for the conversion of nitrogen values to crude pro-tein of ingredients are PM=5.53, WB=6.31, MB=6.25 and BB=5.83 (Mariotti, et al., 2008; FAO, 2009). The levels of major chemical proximate composition of nutrient content of experimental ingre-dients used in the formulated feed are presented in table 1.
Experimental Ingredients
Nutrient composition of experimental ingredients (%)% DM %Moisture %CP %CF %C Fibre %Ash %C %P
Barley bran 85.72 14.28 10.73 2.35 9.9 3.52 59.22 0.35Maize bran 93.66 6.34 8.74 4.0 5.8 1.16 73.77 0.31Wheat bran 85.35 14.65 13.69 2.2 2.4 1.24 65.82 0.37
Poultry Manure 70.73 29.27 26.39 2.55 25.1 16.22 0.47 0.57
Figure 3: Moisture content, total nitrogen using Kjeldahl method, crude fat extraction, crude fibre as described by AOAC (1990).
DM=dry matter, CP=crude protein, CF=crude fat, C=carbohydrate
Table 1: The proximate nutrient composition of experimental ingredients.
The poultry manure has the highest crude protein content followed by wheat bran and barley bran, whereas maize bran had the least crude protein content. Maize bran has the highest carbohydrate content, whereas poultry manure had the least carbohydrate con-tent.
Procedure of Feed FormulationFormulated feed provide all required nutrients in the proper pro-portions necessary for rapid weight gain, high feed efficiency, and a desirable composition of gain (high protein gain and low fat gain) to the culture fish. Thus, the method of combining selected ground feed ingredients in varying proportions has to comply with
predetermined nutrient requirements. In the present study the nutritional proportions obtained from experimental ingredients were determined by using Pearson square 2 method and algebraic equations, the most commonly used methods for balancing crude protein levels. No single feed ingredient can supply all the nutri-ents and energy that fish requires for best growth. Therefore, four ingredients such as poultry manure and mill flour residues (blend of maize bran, barley bran and wheat bran) were used in the pro-cess of feed formulation. According to Suloma and Ogata (2006) the content of protein in food must be 30%-40%, the food ration must contain lipids in significant amount but lower than 20% for tilapias. Accordingly, the present study was focused on the process

Journal of Agriculture and Aquaculture
Citation: Firew Admasu Hailu, Abebe Getahun and Mulugeta Wakjira. (2019). The Process of Tilapia Feed Formulation and Implementa-tion in pond aquaculture: Low Cost and Locally Available Ingredients option for small-scale farmers. Journal of Agriculture and Aquacul-ture 1(2).
Page 6 of 14
of formulated feed based on the optimum range of percentage of crude protein for the best growths of tilapias, 35% CP were for-mulated as the procedure indicated bellow. So, the experimental supplementary protein and energy source feed for juvenile fish were 35% of crude protein consist from the above four ingredients. Red Pepper and salt were added for vitamin premix and to increase their appetite.
The proportion of feedstuffs were calculated and mixed using Pear-son square 2 method and algebraic equations to achieve a desired dietary crude protein level as well as energy level. The following square method shows how 35% CP of experimental feed were formulated (NAERLS, 2002). The Experimental balanced supple-mentary diets containing 35% crude protein prepared from Poul-try droppings (26.39% CP), Wheat bran (13.69%CP), Barley bran (10.73%CP) and Maize bran (8.74%CP) were balanced using both the square method and algebraic equations.
Square is constructed; the desired protein level (35%CP) of 1. the feed is inserted in its centre. Ingredients grouped into protein supplements (poultry drop-2. pings and wheat bran) and energy sources (barley bran and maize bran). The ingredients are separated into two groups and the protein levels of each group calculated according to the proportion specified and calculated an average for the crude protein (CP) contents of each group of ingredients. Four ingredients were mixed using the Pearson square to pre-3. pared 35% mixture that consists of a protein supplement of 50 percent of poultry droppings (26.39%CP) and 50 percent of wheat bran (13.69%CP), and a grain mixture of 50 per-cent of barley bran (10.73%CP) and 50 percent of maize bran (8.74%CP) for Energy Sources.The averages obtained from protein and energy sources placed 4. at the left corners of the square.
Protein supplements:•
Energy Sources:•
(Poultry manure + wheat bran) =40.08% CP 25.26%
(Maize bran + barley) = 9.74%CP 5.08%
Difference: 30.34% Sum: 30.34%
35% is the desired Crude protein level
5. The difference in crude protein content between the proteins supplements (40.08% CP) and energy sources (9.74% CP) are calculated and recorded near the lower left corner of the square (30.34%).
6. The desired protein level (35%) of the feed from the com-bined protein content of the protein supplements (40.08%CP) and energy sources (9.74% CP) were subtracted and the dif-ference is placed in the opposite diagonal corners are 5.08% and 25.26% respectively.
7. The differences (5.08% and 25.26%) are added and recorded their sum near the lower right corner of the square on the left and on the right side (30.34%).
8. Divided the left side sum into each difference obtained in step 6 and multiplies by 100 to calculate the percentage of protein supplement and energy source needed for the feed respectively. The protein and energy sources, along with their calculated protein contents are placed on each corner at the left-hand side of the square. After diagonal subtrac-tion, the calculation proceeds shown as follows. The per-centage of supplementary 35% crude protein calculated as, 25.26/30.34x100=83.26%CP. One half of the protein supple-ments (41.63%CP) provided from poultry droppings and one half of the protein supplements (41.63%CP) provided from wheat bran. The percentage of energy source calculated as, 5.08/30.34x100=16.74%CP. One half of the energy sources (8.37%CP) provided from maize bran and one-half (8.37%CP) provided from barley bran based on NAERLS, (2002). The pro-portion, mean total quantity and contributions of ingredients used feed formulation were presented in Table 2.
Ingredients Used in feed formulation
Percentage, quantity and contributions of ingredients in supplemental feed
formulation (35%CP) P in (%) Q in (kg) C in (%CP)
Poultry Manure 62.77 9.58 21.97Wheat bran 32.57 4.97 11.40Maize bran 2.57 0.39 0.90Barley bran 2.09 0.32 0.73
Total (%, kg & %CP) 100.00 15.26kg 35.00 %CP
Percentage (P in %), Total quantity (Q in kg) and contributions of ingredients (%CP)
Table 2: The proportion, quantity and contributions of ingredients used in feed formulation.
Journal of Agriculture and Aquaculture
Citation: Firew Admasu Hailu, Abebe Getahun and Mulugeta Wakjira. (2019). The Process of Tilapia Feed Formulation and Implementa-tion in pond aquaculture: Low Cost and Locally Available Ingredients option for small-scale farmers. Journal of Agriculture and Aquacul-ture 1(2).
Page 7 of 14
According to ICA, (1991) Proximate length-weight and appropri-ate feeding rate relationships for Nile tilapia, weight of fish 1gm to 50gm, 51 to100gm and 110 to185gram of fish need to feed 5%, 4% and 3% of their body weight respectively. Initial mean length-weights of experimental fish were 11.25cm and 22.50gm respec-tively. Therefore, Based on ICA, (1991) initial feed for Nile tilapia, fed by hand at a rate of quantity of daily ration of 5% body weight of juveniles twice daily in the morning at (8.00-9.00am) and evening before sun set at (5.00-6.00pm) can be calculated as follows.
The overall mixture of ingredients needed in formulated feed con-taining 35%CP from the combination of poultry droppings, wheat bran, barley bran and maize bran to 90 juvenile fishes were calcu-lated as, 1.13gm/day/fishx90JFx150 experimental days = 15.26 kg of feed ingredients were used to each ponds were used throughout 150 days. Thus, 15.26kg feed containing 35% crude proteins from the combination of four ingredients of poultry manure= 9.58kg, wheat bran= 4.97kg, maize bran= 0.39kg and barely= 0.32kg pro-portions were mixed. For statistical reasons, each of the dietary group was duplicated. The initial quantity of total feed ingredi-ents for two weeks was calculated as 1.13gm/dayx90JFx15days = 1.53kg. The quantities of daily ration of feed weights were adjusted at every two weeks according to the last total fish biomass weighed and counted to accommodate for weight changes (ICA, 1991).
Feed Processing and Feeding
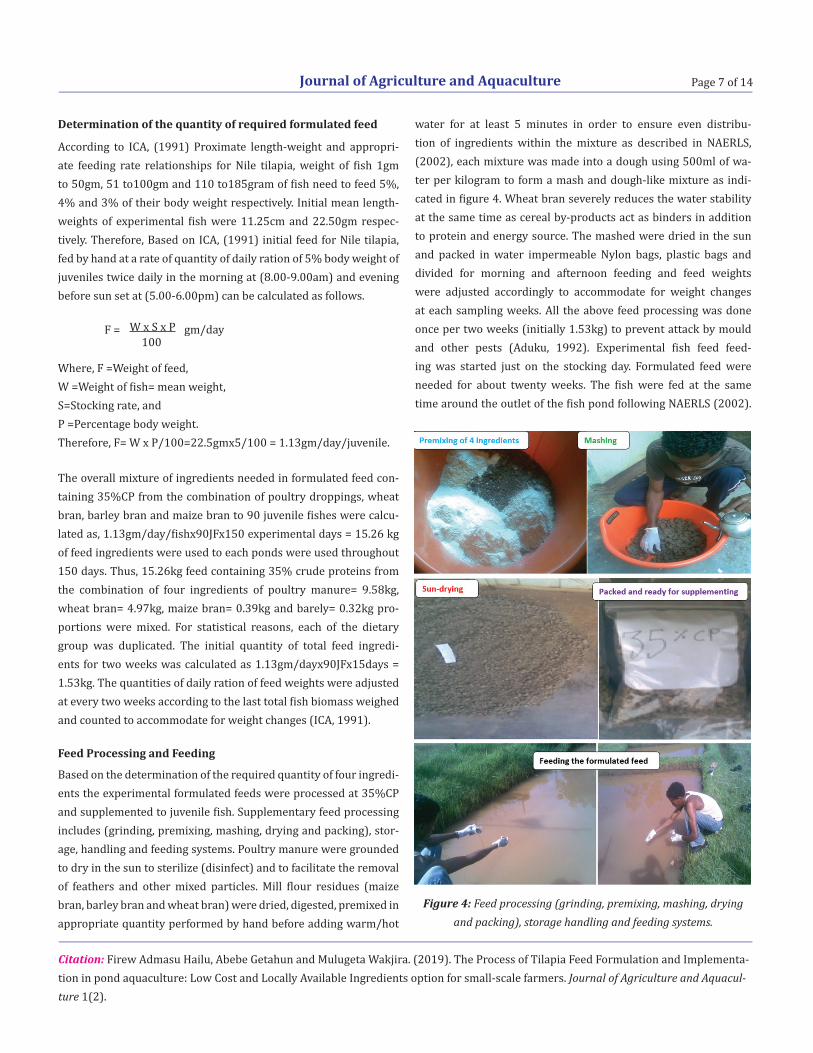
Based on the determination of the required quantity of four ingredi-ents the experimental formulated feeds were processed at 35%CP and supplemented to juvenile fish. Supplementary feed processing includes (grinding, premixing, mashing, drying and packing), stor-age, handling and feeding systems. Poultry manure were grounded to dry in the sun to sterilize (disinfect) and to facilitate the removal of feathers and other mixed particles. Mill flour residues (maize bran, barley bran and wheat bran) were dried, digested, premixed in appropriate quantity performed by hand before adding warm/hot
Determination of the quantity of required formulated feed
F = W x S x P 100
gm/day
Where, F =Weight of feed, W =Weight of fish= mean weight, S=Stocking rate, and P =Percentage body weight.Therefore, F= W x P/100=22.5gmx5/100 = 1.13gm/day/juvenile.
water for at least 5 minutes in order to ensure even distribu-tion of ingredients within the mixture as described in NAERLS, (2002), each mixture was made into a dough using 500ml of wa-ter per kilogram to form a mash and dough-like mixture as indi-cated in figure 4. Wheat bran severely reduces the water stability at the same time as cereal by-products act as binders in addition to protein and energy source. The mashed were dried in the sun and packed in water impermeable Nylon bags, plastic bags and divided for morning and afternoon feeding and feed weights were adjusted accordingly to accommodate for weight changes at each sampling weeks. All the above feed processing was done once per two weeks (initially 1.53kg) to prevent attack by mould and other pests (Aduku, 1992). Experimental fish feed feed-ing was started just on the stocking day. Formulated feed were needed for about twenty weeks. The fish were fed at the same time around the outlet of the fish pond following NAERLS (2002).
Figure 4: Feed processing (grinding, premixing, mashing, drying and packing), storage handling and feeding systems.
Journal of Agriculture and Aquaculture
Citation: Firew Admasu Hailu, Abebe Getahun and Mulugeta Wakjira. (2019). The Process of Tilapia Feed Formulation and Implementa-tion in pond aquaculture: Low Cost and Locally Available Ingredients option for small-scale farmers. Journal of Agriculture and Aquacul-ture 1(2).
Page 8 of 14
Data CollectionMeasuring Fish Growth performance
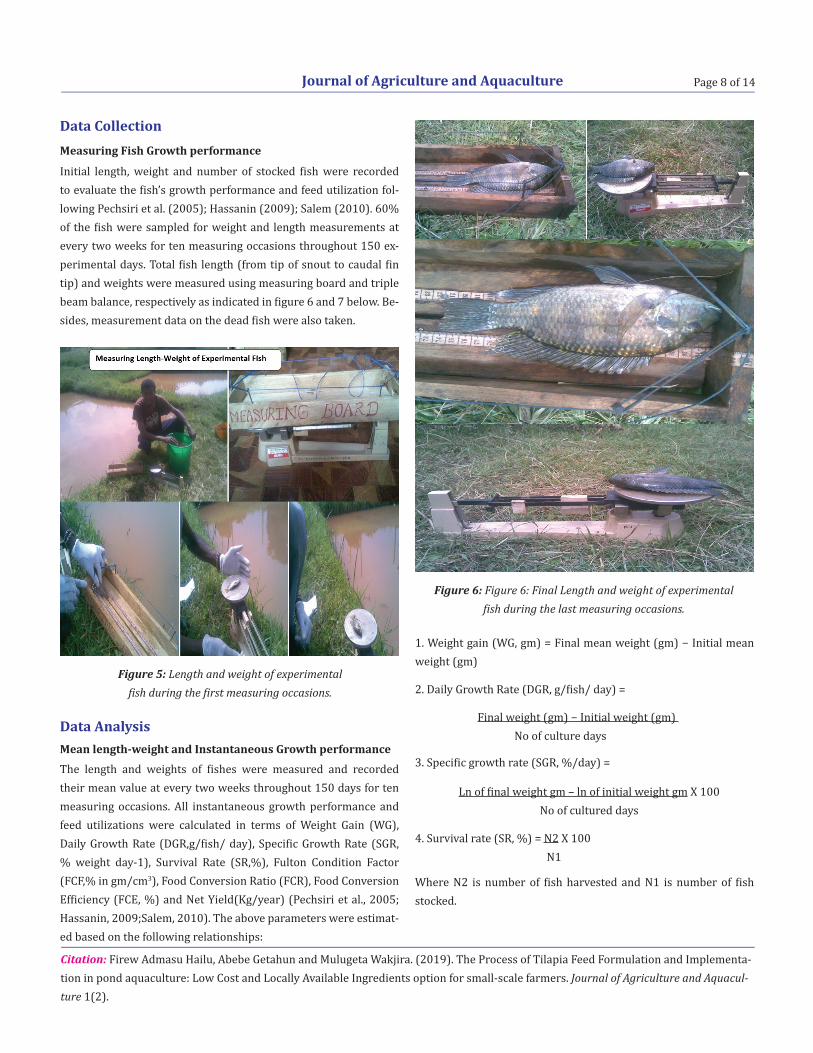
Initial length, weight and number of stocked fish were recorded to evaluate the fish’s growth performance and feed utilization fol-lowing Pechsiri et al. (2005); Hassanin (2009); Salem (2010). 60% of the fish were sampled for weight and length measurements at every two weeks for ten measuring occasions throughout 150 ex-perimental days. Total fish length (from tip of snout to caudal fin tip) and weights were measured using measuring board and triple beam balance, respectively as indicated in figure 6 and 7 below. Be-sides, measurement data on the dead fish were also taken.
Figure 5: Length and weight of experimental fish during the first measuring occasions.
Figure 6: Figure 6: Final Length and weight of experimental fish during the last measuring occasions.
Data AnalysisMean length-weight and Instantaneous Growth performanceThe length and weights of fishes were measured and recorded their mean value at every two weeks throughout 150 days for ten measuring occasions. All instantaneous growth performance and feed utilizations were calculated in terms of Weight Gain (WG), Daily Growth Rate (DGR,g/fish/ day), Specific Growth Rate (SGR, % weight day-1), Survival Rate (SR,%), Fulton Condition Factor (FCF,% in gm/cm3), Food Conversion Ratio (FCR), Food Conversion Efficiency (FCE, %) and Net Yield(Kg/year) (Pechsiri et al., 2005; Hassanin, 2009;Salem, 2010). The above parameters were estimat-ed based on the following relationships:
1. Weight gain (WG, gm) = Final mean weight (gm) − Initial mean weight (gm)
2. Daily Growth Rate (DGR, g/fish/ day) =
3. Specific growth rate (SGR, %/day) =
Where N2 is number of fish harvested and N1 is number of fish stocked.
4. Survival rate (SR, %) = N2 X 100 N1
Final weight (gm) − Initial weight (gm) No of culture days
Ln of final weight gm – ln of initial weight gm X 100 No of cultured days

Journal of Agriculture and Aquaculture
Citation: Firew Admasu Hailu, Abebe Getahun and Mulugeta Wakjira. (2019). The Process of Tilapia Feed Formulation and Implementa-tion in pond aquaculture: Low Cost and Locally Available Ingredients option for small-scale farmers. Journal of Agriculture and Aquacul-ture 1(2).
Page 9 of 14
Mean length-weight and Total Net yield: The mean length and weight of experimental fish from initial stacking to final harvest-ing season result are presented in Table 3. The results showed that growth performances (both length and weight) of the fish were sig-nificantly affected by 35%CP of formulated feed.
5. Feed Conversion Ratio (FCR) =
6. Feed Conversion Efficiency (FCE, %) =
8. Net Yield (Kg/year) =
7. FCF (% in gm/cm3) = 𝑇𝑊/𝑇𝐿3 x 100;
Where TW is total weight (gm) and TL = total length (cm3)
The well being of fishes were studied by calculating the Fulton Con-dition Factor (FCF)
Total weight of dry feed (kg) Total weight gain by fish (kg)
Gain in wet weight in fish (gm) x 100Total weight of f𝑒𝑒d (gm)
Biomass gained (kg) X 365 daysCultured days
Results and DiscussionResult
Formulated feed
Numberoffish Mean Length and Weight Total weight
gain (kg/treatment)
Total Net yield (kg/
year)Stock/treat.
Harvest/treat.
Mean Initial Mean FinalLength
(cm)Weight
(gm)Length
(cm)Weight
(gm)35%CP 90 90 11.25 22.50 21.5 125 9.225 22.45
Table 3: Final mean lengths and mean weights, total weight gain and yield of Nile tilapia during experimental period as indicated in figure 6 and 7 above.
The result of this study indicates that all fishes of O. niloticus sup-plied with 35%CP formulated feed had better performance in terms of best growth, survival and net yield production (22.45kg/year/pond).
The mean value result of instantaneous growth performance such as mean daily growth rate (DGR) in gm/day, specific growth rate (SGR) in %/day, feed conversion ratios (FCR), feed conversion
Instantaneous Growth performance
efficiency (FCE, %) and Fulton’s Condition Factor (FCF, %) in gm/cm3 are presented in Table 4.
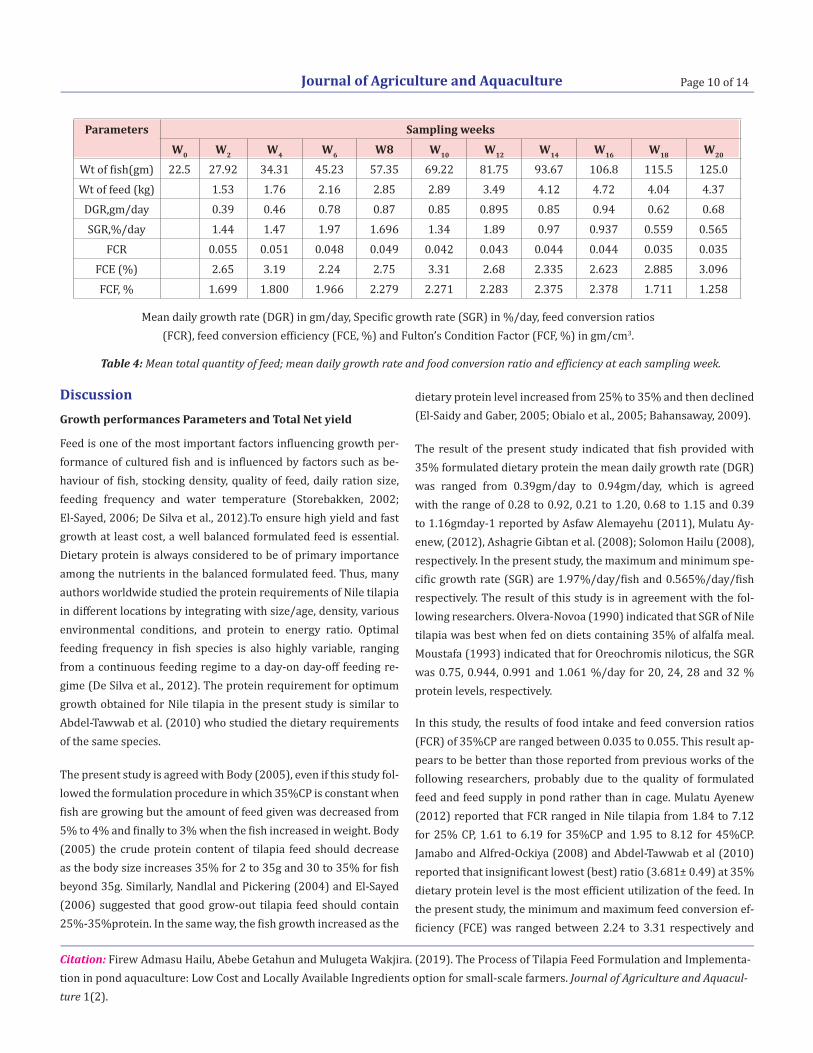
The result of instantaneous growth performance of mean daily growth rate (DGR) in gm/day, Specific growth rate (SGR) in %/day, feed conversion ratios (FCR), feed conversion efficiency (FCE, %) and Fulton’s Condition Factor (FCF, %) in gm/cm3 indicates that 35%CP formulated feed is best in all parameters. The mean daily growth rate (DGR) was calculated between each successive sampling period of the study time and the maximum mean DGR (0.94gm/day) and minimum mean (0.39gm/day) were observed among each sampling period of fish feeding 35%CP formulated feed. The maximum and minimum specific growth rate (SGR) are 1.97%/day/fish and 0.565%/day/fish respectively. The Results of food intake and feed conversion ratios (FCR) of 35%CP are ranged between 0.035 to 0.055 for each sampling week until the end of the experimental period. The minimum and maximum feed conversion efficiency (FCE) was ranged between 2.24 to 3.31 respectively of 35%CP treatments of experimental fish. The mean Fulton Condi-tion Factor (FCF) for each sampling weeks ranged from 1.258 to 2.378. The best FCF in all sampling weeks especially after the 10th sampling week and its maximum FCF (2.378) were recorded dur-ing the 16th sampling week. The Fulton condition factor shows that 35% formulated feed increases with increased culturing dates until the fish become an adult enough as presented in Table 4. The initial length-weight and the final net yield of O. niloticus after 20 weeks
of experiment is given in Table 3. The total net annual production recorded for 35%CP supplemented fish was (22.45kg/year). There was no mortality observed during the study time, so percentage of survival rates was 100. All the above result were completely var-ied with 30%CP and 40%CP and also less in terms of productivity. Thus why 35%CP is selected as best option for small scale farmers with simple procedure to formulate the feed.
Journal of Agriculture and Aquaculture
Citation: Firew Admasu Hailu, Abebe Getahun and Mulugeta Wakjira. (2019). The Process of Tilapia Feed Formulation and Implementa-tion in pond aquaculture: Low Cost and Locally Available Ingredients option for small-scale farmers. Journal of Agriculture and Aquacul-ture 1(2).
Page 10 of 14
Parameters Sampling weeksW0 W2 W4 W6 W8 W10 W12 W14 W16 W18 W20
Wt of fish(gm) 22.5 27.92 34.31 45.23 57.35 69.22 81.75 93.67 106.8 115.5 125.0Wt of feed (kg) 1.53 1.76 2.16 2.85 2.89 3.49 4.12 4.72 4.04 4.37
DGR,gm/day 0.39 0.46 0.78 0.87 0.85 0.895 0.85 0.94 0.62 0.68SGR,%/day 1.44 1.47 1.97 1.696 1.34 1.89 0.97 0.937 0.559 0.565
FCR 0.055 0.051 0.048 0.049 0.042 0.043 0.044 0.044 0.035 0.035FCE (%) 2.65 3.19 2.24 2.75 3.31 2.68 2.335 2.623 2.885 3.096FCF, % 1.699 1.800 1.966 2.279 2.271 2.283 2.375 2.378 1.711 1.258
Mean daily growth rate (DGR) in gm/day, Specific growth rate (SGR) in %/day, feed conversion ratios (FCR), feed conversion efficiency (FCE, %) and Fulton’s Condition Factor (FCF, %) in gm/cm3.
Table 4: Mean total quantity of feed; mean daily growth rate and food conversion ratio and efficiency at each sampling week.
DiscussionGrowth performances Parameters and Total Net yield
Feed is one of the most important factors influencing growth per-formance of cultured fish and is influenced by factors such as be-haviour of fish, stocking density, quality of feed, daily ration size, feeding frequency and water temperature (Storebakken, 2002; El-Sayed, 2006; De Silva et al., 2012).To ensure high yield and fast growth at least cost, a well balanced formulated feed is essential. Dietary protein is always considered to be of primary importance among the nutrients in the balanced formulated feed. Thus, many authors worldwide studied the protein requirements of Nile tilapia in different locations by integrating with size/age, density, various environmental conditions, and protein to energy ratio. Optimal feeding frequency in fish species is also highly variable, ranging from a continuous feeding regime to a day-on day-off feeding re-gime (De Silva et al., 2012). The protein requirement for optimum growth obtained for Nile tilapia in the present study is similar to Abdel-Tawwab et al. (2010) who studied the dietary requirements of the same species.
The present study is agreed with Body (2005), even if this study fol-lowed the formulation procedure in which 35%CP is constant when fish are growing but the amount of feed given was decreased from 5% to 4% and finally to 3% when the fish increased in weight. Body (2005) the crude protein content of tilapia feed should decrease as the body size increases 35% for 2 to 35g and 30 to 35% for fish beyond 35g. Similarly, Nandlal and Pickering (2004) and El-Sayed (2006) suggested that good grow-out tilapia feed should contain 25%-35%protein. In the same way, the fish growth increased as the
dietary protein level increased from 25% to 35% and then declined (El-Saidy and Gaber, 2005; Obialo et al., 2005; Bahansaway, 2009).
The result of the present study indicated that fish provided with 35% formulated dietary protein the mean daily growth rate (DGR) was ranged from 0.39gm/day to 0.94gm/day, which is agreed with the range of 0.28 to 0.92, 0.21 to 1.20, 0.68 to 1.15 and 0.39 to 1.16gmday-1 reported by Asfaw Alemayehu (2011), Mulatu Ay-enew, (2012), Ashagrie Gibtan et al. (2008); Solomon Hailu (2008), respectively. In the present study, the maximum and minimum spe-cific growth rate (SGR) are 1.97%/day/fish and 0.565%/day/fish respectively. The result of this study is in agreement with the fol-lowing researchers. Olvera-Novoa (1990) indicated that SGR of Nile tilapia was best when fed on diets containing 35% of alfalfa meal. Moustafa (1993) indicated that for Oreochromis niloticus, the SGR was 0.75, 0.944, 0.991 and 1.061 %/day for 20, 24, 28 and 32 % protein levels, respectively.
In this study, the results of food intake and feed conversion ratios (FCR) of 35%CP are ranged between 0.035 to 0.055. This result ap-pears to be better than those reported from previous works of the following researchers, probably due to the quality of formulated feed and feed supply in pond rather than in cage. Mulatu Ayenew (2012) reported that FCR ranged in Nile tilapia from 1.84 to 7.12 for 25% CP, 1.61 to 6.19 for 35%CP and 1.95 to 8.12 for 45%CP. Jamabo and Alfred-Ockiya (2008) and Abdel-Tawwab et al (2010) reported that insignificant lowest (best) ratio (3.681± 0.49) at 35% dietary protein level is the most efficient utilization of the feed. In the present study, the minimum and maximum feed conversion ef-ficiency (FCE) was ranged between 2.24 to 3.31 respectively and

Journal of Agriculture and Aquaculture
Citation: Firew Admasu Hailu, Abebe Getahun and Mulugeta Wakjira. (2019). The Process of Tilapia Feed Formulation and Implementa-tion in pond aquaculture: Low Cost and Locally Available Ingredients option for small-scale farmers. Journal of Agriculture and Aquacul-ture 1(2).
Page 10 of 14
Economic Analysis
A total 31.93kg ingredients were used during this experimental pe-riod by mixing 20.04kg of poultry manure, 10.40kg of wheat bran, 0.82kg of maize bran and 0.67kg of barley bran based on their proportion of formulation. The no price at all for poultry manure rather for transportation 5birr, but the prices of wheat bran, maize bran and barley bran were 0.75 Ethiopian Birr (ETB)/kg for each ingredient and 8.92birr for the above three bran. [An average cur-rent exchange rate for 1Ethiopian Birr (ETB) ≈ 0.0357USD]. There-fore, only 13.92ETB was paid to buy the whole ingredients used. Thus, with the free collection of juveniles from wild, 150 ETB for the water canal maintenance, and 100 ETB for the others material cost, ICA was estimated as 263.92ETB throughout experiment period. The current price of fish meat is 85 Birr/kg, the total PV and NPV were estimated as 1908.25ETB and 1644.33ETB, respectively. Thus, large-scale production of Nile tilapia based on the outcome of the present finding, it can be economically feasible as it can produce 1662.96kg of fish ha-1 worth of total value of 141351.6ETB.
The results of the present study are sufficient to generate enough data on feed formulation from locally available ingredients in pond aquaculture for Nile tilapia. But most studies in Ethiopia were around Nile tilapia in cage culture and no more attention on the formulation of feed. Therefore, this study recommended and de-tailed studies are required on other aspects like feed preparation using both animal and plant protein source, cost and availability of feed, and other commercially available fish species, as well as tilapia in concrete tanks and ponds. Applying the outcome of this finding for large scale fish production can be feasible. In addition, based on Firew Admasu, et al., (2018), Integrated fish-vegetable farming is recommended to farmers due to fish pond wastewater had no cost at all and can be used to minimize waste effect when applied as an organic fertilizer in vegetable farming as more envi-ronmentally friendly and economically beneficial.
mean Fulton Condition Factor (FCF) for each sampling weeks ranged from 1.258 to 2.378 of fish feed 35%CP formulated fed re-sult in agreement with Tewodros Abate (2012) reported a better result of FCF that was obtained at 35% dietary protein level (1.77-2.92 gcm-3) and Mulatu Ayenew, (2012) was also observed at 35% dietary protein level (1.77-2.92 gcm-3). In this study there was no mortality observed, therefore, healthy Nile tilapia can be obtained at this formulated dietary crude protein level with efficient utiliza-tion of protein.
The results of the study demonstrated the growth performance of Oreochromis niloticus under 35%CP of formulated feed from low cost and locally available ingredients of wheat bran, maize bran and barley bran is generally cheap and poultry manure is read-ily available every rural in Ethiopia as waste and useless product. Therefore, it can be concluded that a formulated feed containing 35% dietary crude protein appears to be optimum for maximum growth performance and net yield of Nile tilapia in pond aquacul-ture system and farmers and any researchers can simply formulate the required feed using this procedure.
In this study, the total weight gain (9.225kg/treatment) and the total net annual production recorded for 35%CP supplemented fish was (22.45kg/year). The result of this study were better than the figures reported by Mulatu Ayenew (2012) of the total weight gain (7.10 kg cage-1) and total annual net yield (17.28 kg area-1 year-1) were found at 35% dietary protein. The difference may be ascribed, bio-mass gain is directly influenced by good quality of formulated feed with optimum dietary protein. In other words, it means that good quality feed (consisting of all essential amino acids, vitamins and minerals) and optimum protein level bring highest biomass gain. In this study, locally available ingredients used for this formulation were not used for human being food rather dropping them every-where in their surrounding that affect environment, so it seems to be economically feasible and environmental friendly. Applying the outcome of this finding for large scale fish production can be fea-sible in producing about 1662.96kg of fish/hectare.
Conclusion and Recommendation
References
Conclusion
Recommendation
Abdel-Tawwab, M., Ahmad, M., Yassir A., Khattab, Y.A. and 1. Shalaby, A. (2010). Effect of dietary protein level, initial body weight, and their interaction on the growth, feed utilization, and physiological alterations of Nile tilapia [Oreochromis ni-loticus (L., 1758)]. J.Aqua., 298: 267-274.Abdilahi Dill. (2010).The effect of stocking density and supple-2. mentary feeding on growth performance and yield of Nile tila-pia [Oreochromis niloticus (L, 1758)] in cage culture in Wonji Reservoir, Ethiopia. M.Sc. Thesis, School of Graduate Studies, AAU. Addis Ababa. Aduku, A. (1992). Practical Livestock Feeds Production in the 3. tropics. Asekorne and Co. Publishcrs, Zaria.

Journal of Agriculture and Aquaculture
Citation: Firew Admasu Hailu, Abebe Getahun and Mulugeta Wakjira. (2019). The Process of Tilapia Feed Formulation and Implementa-tion in pond aquaculture: Low Cost and Locally Available Ingredients option for small-scale farmers. Journal of Agriculture and Aquacul-ture 1(2).
Page 12 of 14
4. Akca, H., Kayim,M.and Sayili, M. (2006). SWOT analysis of fish-ery sector in Turkey. J. Applied Sci.,6: 1863-1867.
5. Ali, M. and Hoq, M. (2010). Improved Fish Feed Management in Aquaculture. Extension Manual No. 38. Bangladesh Fisher-ies Research Institute, Mymensingh.
6. AOAC (Association of Official Analytical Chemists).(1990). Of-ficial Method of Analysis, 15th Edition. Association of Official Analytical Chemists, Arlington, Virginia.
7. Asfaw Alemayehu. (2011). Effect of Feed Quality on Growth Performance and Water Quality in Cage Culture System for Production of Nile Tilapia [Oreochromis niloticus, (L., 1758)] in Lake Hora-Arsedi, M. Sc.Thesis. School of Graduate Studies, AAU. Addis Ababa.
8. Ashagrie Gibtan, Abebe Getahun and Seyoum Mengistou. (2008). Effect of stocking density on the growth performance and yield of Nile tilapia [Oreochromis niloticus (L., 1758)] in a cage culture system in Lake Kuriftu, Ethiopia. Aqua. Res., 39: 1450- 1460.
9. Ayinla, O. (2005). Final Technical Report on Study and Analy-sis of Feed and nutrients (including fertilizer) for sustainable agriculture in Nigeria for food and Agriculture Organization.
10. Bahnasawy, M. (2009). Effect of dietary protein levels on growth performance and body composition of monosex Nile Tilapia [Oreochromis niloticus (L., 1758)] reared in fertilized tanks. Pak. J. Nutr. 8: 674-678.
11. Bhosale,S., Bhilave, M. and Nadaf, S. (2010). Formulation of Fish Feed using Ingredients from Plant Sources. Res. J. of Agric. Sci., 1(3): 284-287.
12. Body, C. (2005). Farm Level Issues in Aquaculture Certifica-tion. WWF-US. Alablama.
13. Bostock, J., Mcandrew, B., Richards, R., Jauncey, K. and Telfer, T. (2010). Aquaculture: Global status and trends. Phil. Trans. R. Soc. B., 365: 2897-2912.
14. Bozoglu, M., Ceyhan, V., Cinemre, H., Demiryurek,K.and Kilic, O. (2006). Evaluation of different trout farming systems and some policy issues in the Black Sea region, Turkey. J. Applied Sci.,6: 2882-2888.
15. Carmen, G. and Geoff, A. (2007). Preparing Farm-made Fish Feed. Australian centre for international agricultural research. P, 1-21.
16. De Silva, S., Giovanni, T. and Francis, D. (2012). Nutrition. In: Aquaculture: Farming aquatic animals and plants, pp. 164-188, (Lucas, J. S., and Southgate, P. C., eds.). Wiley- Blackwell, UK.
17. Demese Chanyalew, Berhanu Adenew and Mellor, J. (2010). Ethiopia’s Agriculture Sector Policy and Investment Frame-work: Ten Year Road Map (2010-2020). Ministry of Agricul-ture and Rural Development (MoARD).
18. Diyaware, M., Modu, B. and Yakubu, U. (2009). Effect of differ-ent dietary protein levels on growth performance and feed utilization of hybrid catfish (Heterobranchusbidorsalis x Clar-ias anguillaris) fry in north-east Nigeria. Afr. J. Biotechnol. 8: 3954- 3957.
19. EI-Sayed, A. (2006). Tilapia Culture. CABI Publishing, London. p 277.
20. El-Saidy, D. and Gaber, M. (2005). Effect of dietary protein lev-els and feeding rates on growth performance, production traits and body composition of Nile tilapia [Oreochromis niloticus (L., 1758)] cultured in concrete tanks. Aqua. Res.,36: 163-171.
21. FAO. (2001). Fishery and Aquaculture Country Profiles. Rome, Italy.
22. FAO. (2004a). Aquaculture extension in sub-Saharan Africa, FAO fisheries circular, No. 1002. Fisheries Department, Inland Water Resources and Aquaculture Service 2004, FAO, Rome, pp. 55.
23. FAO. (2005).The State of World Fisheries and Aquaculture Pro-duction Statistics 1996 - 2002. FAO Fisheries Circular Rome, FAO. Published in March 2005.
24. FAO. (2009). Statistical Yearbook 2007-2008: capture fisheries and aquaculture production 2006.
25. FAO. (2010). The state of world fisheries and aquaculture. Fisheries and Aquaculture Department, Food and Agriculture Organization of the United Nations, Rome, http://www.fao.org/docrep/013/i1820e/i1820e00.htm.
26. FAO. (2011).Fisheries and Aquaculture Department. National Aquaculture Sector Overview Uganda. Food and Agriculture Organization of the United Nations, Rome, Italy.
27. Firew Admasu, Mulugeta Wakjira and Abebe Getahun (2018). Fishpond Wastewater Versus Chemical Fertilizer On Tomato Productivity In Jimma, Oromia Region, Ethiopia. World Journal of Environmental Biosciences. Volume7, Issue 4: 82-89.
28. Gabriel, U., Akinrotimi, O., Bekibele, D., Onunkwo, D. and An-yanwu, P. (2007). Locally produced Fish Feed: potential for aquaculture development in sub Saharan Africa. African J. of Agri. Res.,2: 287-295.
29. Hassanin Abdel-All Abdel-Halim. (2009). Studies on intensive culture of Nile tilapia (Oreochromis niloticus) in tanks. Faculty of Agriculture, Cairo Al-Azhar University 1430 A.H. pp 1-137.
Journal of Agriculture and Aquaculture
Citation: Firew Admasu Hailu, Abebe Getahun and Mulugeta Wakjira. (2019). The Process of Tilapia Feed Formulation and Implementa-tion in pond aquaculture: Low Cost and Locally Available Ingredients option for small-scale farmers. Journal of Agriculture and Aquacul-ture 1(2).
Page 13 of 14
30. ICA, (1991). International Centre for Aquaculture and Aquatic Environments. Feeding your Fish. Water Harvesting Manuals. GTZ. Auburn University.
31. Jamabo, N.and Alfred-Ockiya, J. (2008). Effects of dietary pro-tein levels on the growth performance of Heterobranchus bi-dorsalis (Geoffroy- Saint-Hilaire, 1809) fingerlings from the Niger Delta. Afr. J. Biotechnol. 7: 2483-2485.
32. Kariman, A., Shalloof, S. and Khalifa, N. (2000). Stomach Con-tents and Feeding Habits of Oreochromis niloticus From Abu-Zabal Lakes, Egypt.W. J. Appl. Sci. 6 (1): 01-05.
33. Kebede Alemu. (2003).The growth performance of Oreo-chromis niloticus l. reared in fresh water ponds loaded with varying levels of poultry manure.SINET: Ethiop. J. Sci., 26(1):17–23.
34. Maina, J., Beames, R., Higgs, D., Mbugua, P., Iwama, G. and Kisia, S. (2011).The feeding value and protein quality in high-fibre and fibre-reduced sunflower cakes and Kenya’s “omena” fish-meal for tilapia (Oreochromis niloticus). Livestock Res., for Ru-ral Development,19 (11).
35. Mariotti, F., Tome, D. and Mirand, P. (2008). Converting nitro-gen into protein beyond 6.25 and Jones’factors. Critical Re-views in Food Science and Nutrition, 48: 177–184.
36. Mendes, B., Fonseca, P. and Campos, A. (2004). Weightlength relationships for 46 fish species of the Portuguese west coast. J. of Applied Icht., 20: 355-361.
37. Morato, T., Afonso, P., Loirinho, P., Barreiros, J., Sanstos, R. and Nash, R. (2001). Length-weight relationships for 21 costal fish species of the Azores, North-eastern Atlantic. Fisheries Re-search, 50: 297-302.
38. Moustafa, S. (1993). Studies on factors affecting productive performance of Tilapia niloticaraised in cages. PhD. Thesis, Animal Production Department Faculty of Agriculture, Univer-sity.Egypt.p231-235.
39. Mulatu Ayenew. (2012). Effect of dietary protein level on growth performance and yield of Nile tilapia (Oreochromis niloticus, l. 1758) in cage culture in Lake Hora-Arsedi, Addis Ababa University, School of Graduate Studies, Ethiopia. Pp1-60.
40. NAERLS (National Agricultural Extension and Research Liai-son Services). (2002). Feed formulation and feeding practices in fish culture. Ahmadu Bello University, Fisheries Series No. 7.
41. Nandlal, S. and Pickering, T. (2004). Tilapia fish farming in Pacific Island countries, Tilapia Grow-out in ponds. Pacific Community and Marine Studies Program, the University of the South Pacific. pp. 1-58.
42. Obaroh, I. and Achionye-Nzeh, G. (2011). Effects of crude ex-tract of Azadirachta indica leaves at controlling profile breed-ing in [Oreochromis niloticus (L., 1758)]. Asia J. Agric.Res., 5:277-282.
43. Obialo, M., Obioma, A. and Linus, U. (2005). Influence of dietary protein level content on gross efficiency food conversion and net protein utilization of African catfish (Clarias gariepinus, Burchell) fry. Animal Research International 2: 212-218.
44. Ogunji, J., Toor, R., Schulz, C. and Kloas, W. (2008). Growth Performance, Nutrient Utilization of Nile Tilapia Oreochromis niloticus Fed Housefly Maggot Meal (Magmeal) Diets. Turkish Journal of Fisheries and Aquatic Sci.,8: 141-147.
45. Olvera-Novoa, M., Campos, G., Sabido, G. and Martinez, C.(1990). The use of alfalfa leaf protein concentrates as a protein source in diets foe tilapia (Oreochromis mossambicus).Aqua.,90: 291-302.
46. Pechsiri, J. and Yakupitiyage, A. (2005). A comparative study of growth and feed utilization efficiency of sex reversed dip-loid and triploid Nile tilapia [Oreochromis niloticus (L., 1758)]. Aqua. Res., 36:45-51.
47. Peña-Mendoza, B., Gómez-Márquez, J., Ugarte, I. and Nogu-era, D. (2005). Reproductive biology of Oreochromis niloticus (Perciformes: Cichlidae) at Emiliano Zapata. Int. J. Trop. Biol. 53(3-4): 515-522.
48. Salem, M. (2010). Evaluation of (Bio-Nutra 200) as a commer-cial probiotic product in Nile tilapia (O. niloticus) diets. J. Ara-bian Aqua. Soci. 5: No 1.
49. Sinovcic, G., Franicevic, M., Zorica, B. and Ciles-Kec, V. (2004). Length-weight and length-length relationships for 10 pe-lagic fish species from the Adriatic Sea (Crotia). J. of Applied Ichthyology,20: 156-158.
50. Solomon Hailu. (2008). Effects of feed quantity on growth per-formance in cage culture system for production of Nile tilapia [Oreochromis niloticus (L., 1758)] in Lake Babogaya, Ethiopia. MSc thesis. Department of Biology, AAU. Addis Ababa.
51. Storebakken, T. (2002). Atlantic Salmon, Salmo salar. In: Nu-tritional requirements and feeding of finfish for aquaculture, pp.99-102, (Websteer, C. D. and Lim, C. E., eds.). CABI Publish-ing, UK.
Journal of Agriculture and Aquaculture
Citation: Firew Admasu Hailu, Abebe Getahun and Mulugeta Wakjira. (2019). The Process of Tilapia Feed Formulation and Implementa-tion in pond aquaculture: Low Cost and Locally Available Ingredients option for small-scale farmers. Journal of Agriculture and Aquacul-ture 1(2).
Page 14 of 14
52. Subhadra, B., Lochmann, R., Rawles, S. and Chen, R. (2006). Ef-fect of fish meal replacement with poultry by product meal on the growth, tissue composition and hematological parameters of largemouth bass (Micropterus salmoides) fed diets contain-ing different lipids. Aqua. 260: 221-231.
53. Suloma, A. and Ogata, H. (2006). Review of Future of Rice-Fish Culture, Desert Aquaculture and Feed Development in Afri-ca: The Case of Egypt as the Leading Country in Africa. JARQ 40:351-360.
54. Tewodros Abate. (2012). Effect of Feeding Frequency on Growth Performance and Survival of Nile Tilapia [Oreochromis niloticus (L., 1758)] in a Cage Culture System in Lake Hora-Arsedi, Ethiopia. Addis Ababa University, School of Graduate Studies, Addis Ababa, Ethiopia, pp1-64.
55. Thorarinsdottir, R., Jokumsen, A., Björnsson, B. and Torrissen, O. (2011). Local raw materials for production of fish feed for aquaculture, Nordic Innovation Centre – Project no. 10102.
56. Tsadik, G. and Bart, A. (2007). Effects of feeding, stocking den-sity and water-flow rate on fecundity, spawning frequency and egg quality of Nile tilapia, [Oreochromis niloticus (L., 1758)]. Aqua.272: 380-388.
57. Zenebe Tadesse, Abeba Wolde Gebriel, Mulugeta Jovani, Fekadu Tefera and Fasil Degefu. (2012). Effect of supplementary feed-ing of agro-industrial byproducts on the growth performance of Nile tilapia[Oreochromis niloticus (L., 1758)] in concrete ponds. Ethiop. J. Biol. Sci. 11(1): 29-41.
BenefitsofPublishingwithEScientificPublishers: Swift Peer Review Freely accessible online immediately upon publication Global archiving of articles Authors Retain Copyrights Visibility through different online platforms
Submit your Paper at:
https://escientificpublishers.com/submission