Mercalli Scale vs. Richter Scale
14
Using MMI scale to estimate population exposed to earthquake shaking |1 Using Modified Mercalli Intensity (MMI) scale to estimate population exposed to Earthquake shaking Magnitude is popularly used as a shorthand measure of earthquake size and severity. Usually, though, when people assess “how bad” a quake was, they consider not only the size of the earthquake and how hard the ground shook, but also its effects on people and the built environment. Magnitude alone is not a reliable indicator of such impacts. The impact of an earthquake depends on how many people are exposed to it. Also important is how well protected these people are from the quake. Have most of the buildings where they live and work been built to resist earthquake damage, or are many of them relatively vulnerable to ground shaking? The Modified Mercalli Intensity (MMI) Scale The MMI scale is a seismic scale used for measuring the intensity of an earthquake. It measures the effects of an earthquake, and is distinct from the moment magnitude usually reported for an earthquake (sometimes misreported as the Richter magnitude), which is a measure of the energy released. The intensity scale consists of a series of certain key responses such as people awakening, movement of furniture, damage to chimneys, and finally - total destruction. Although numerous intensity scales have been developed over the last several hundred years to evaluate the effects of earthquakes, the one currently used in the United States is the MMI Scale. It was developed in 1931 by the American seismologists Harry Wood and Frank Neumann. This scale, composed of increasing levels of intensity that range from imperceptible shaking to catastrophic destruction, is designated by Roman numerals. It does not have a mathematical basis; instead it is an arbitrary ranking based on observed effects. The MMI value assigned to a specific site after an earthquake has a more meaningful measure of severity to the non-scientist than the magnitude because intensity refers to the effects actually experienced at that place. The lower numbers of the intensity scale generally deal with the manner in which the earthquake is felt by people. The higher numbers of the scale are based on observed structural damage. Structural engineers usually contribute information for assigning intensity values of VIII or above. The following is an abbreviated description of the levels of Modified Mercalli intensity. Intensi ty Shaking Description/Damage Coordinated Assessment Support Section (CASS), UNOCHA, Geneva, Switzerland More Info @ Needs Assessment on HR.Info | email: [email protected] / [email protected]
-
Upload
khangminh22 -
Category
Documents
-
view
1 -
download
0
Transcript of Mercalli Scale vs. Richter Scale

Using MMI scale to estimate population exposed to earthquake shaking |1
Using Modified Mercalli Intensity (MMI) scale to estimate population exposed to Earthquake shaking
Magnitude is popularly used as a shorthand measure of earthquake size and severity.Usually, though, when people assess “how bad” a quake was, they consider not only thesize of the earthquake and how hard the ground shook, but also its effects on peopleand the built environment. Magnitude alone is not a reliable indicator of such impacts.
The impact of an earthquake depends on how many people are exposed to it. Alsoimportant is how well protected these people are from the quake. Have most of thebuildings where they live and work been built to resist earthquake damage, or are manyof them relatively vulnerable to ground shaking?
The Modified Mercalli Intensity (MMI) ScaleThe MMI scale is a seismic scale used for measuring the intensity of an earthquake. Itmeasures the effects of an earthquake, and is distinct from the moment magnitudeusually reported for an earthquake (sometimes misreported as the Richter magnitude),which is a measure of the energy released.
The intensity scale consists of a series of certain key responses such as peopleawakening, movement of furniture, damage to chimneys, and finally - total destruction.Although numerous intensity scales have been developed over the last several hundredyears to evaluate the effects of earthquakes, the one currently used in the UnitedStates is the MMI Scale. It was developed in 1931 by the American seismologists HarryWood and Frank Neumann. This scale, composed of increasing levels of intensity thatrange from imperceptible shaking to catastrophic destruction, is designated by Romannumerals. It does not have a mathematical basis; instead it is an arbitrary rankingbased on observed effects.
The MMI value assigned to a specific site after an earthquake has a more meaningfulmeasure of severity to the non-scientist than the magnitude because intensity refers tothe effects actually experienced at that place.
The lower numbers of the intensity scale generally deal with the manner in which theearthquake is felt by people. The higher numbers of the scale are based on observedstructural damage. Structural engineers usually contribute information for assigningintensity values of VIII or above.
The following is an abbreviated description of the levels of Modified Mercalliintensity.
Intensity Shaking Description/Damage
Coordinated Assessment Support Section (CASS), UNOCHA, Geneva, SwitzerlandMore Info @ Needs Assessment on HR.Info | email: [email protected] / [email protected]
Using MMI scale to estimate population exposed to earthquake shaking |2
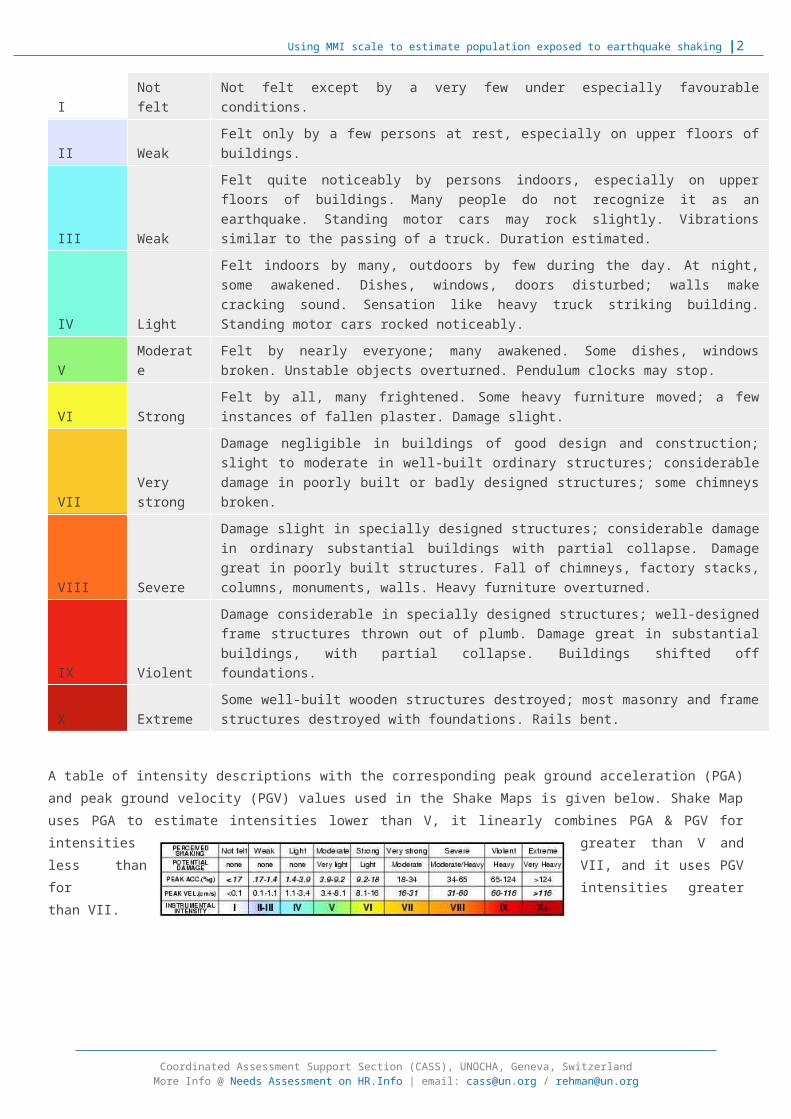
INotfelt
Not felt except by a very few under especially favourableconditions.
II WeakFelt only by a few persons at rest, especially on upper floors ofbuildings.
III Weak
Felt quite noticeably by persons indoors, especially on upperfloors of buildings. Many people do not recognize it as anearthquake. Standing motor cars may rock slightly. Vibrationssimilar to the passing of a truck. Duration estimated.
IV Light
Felt indoors by many, outdoors by few during the day. At night,some awakened. Dishes, windows, doors disturbed; walls makecracking sound. Sensation like heavy truck striking building.Standing motor cars rocked noticeably.
VModerate
Felt by nearly everyone; many awakened. Some dishes, windowsbroken. Unstable objects overturned. Pendulum clocks may stop.
VI StrongFelt by all, many frightened. Some heavy furniture moved; a fewinstances of fallen plaster. Damage slight.
VIIVerystrong
Damage negligible in buildings of good design and construction;slight to moderate in well-built ordinary structures; considerabledamage in poorly built or badly designed structures; some chimneysbroken.
VIII Severe
Damage slight in specially designed structures; considerable damagein ordinary substantial buildings with partial collapse. Damagegreat in poorly built structures. Fall of chimneys, factory stacks,columns, monuments, walls. Heavy furniture overturned.
IX Violent
Damage considerable in specially designed structures; well-designedframe structures thrown out of plumb. Damage great in substantialbuildings, with partial collapse. Buildings shifted offfoundations.
X ExtremeSome well-built wooden structures destroyed; most masonry and framestructures destroyed with foundations. Rails bent.
A table of intensity descriptions with the corresponding peak ground acceleration (PGA)and peak ground velocity (PGV) values used in the Shake Maps is given below. Shake Mapuses PGA to estimate intensities lower than V, it linearly combines PGA & PGV forintensities greater than V andless than VII, and it uses PGVfor intensities greaterthan VII.
Coordinated Assessment Support Section (CASS), UNOCHA, Geneva, SwitzerlandMore Info @ Needs Assessment on HR.Info | email: [email protected] / [email protected]
Using MMI scale to estimate population exposed to earthquake shaking |3
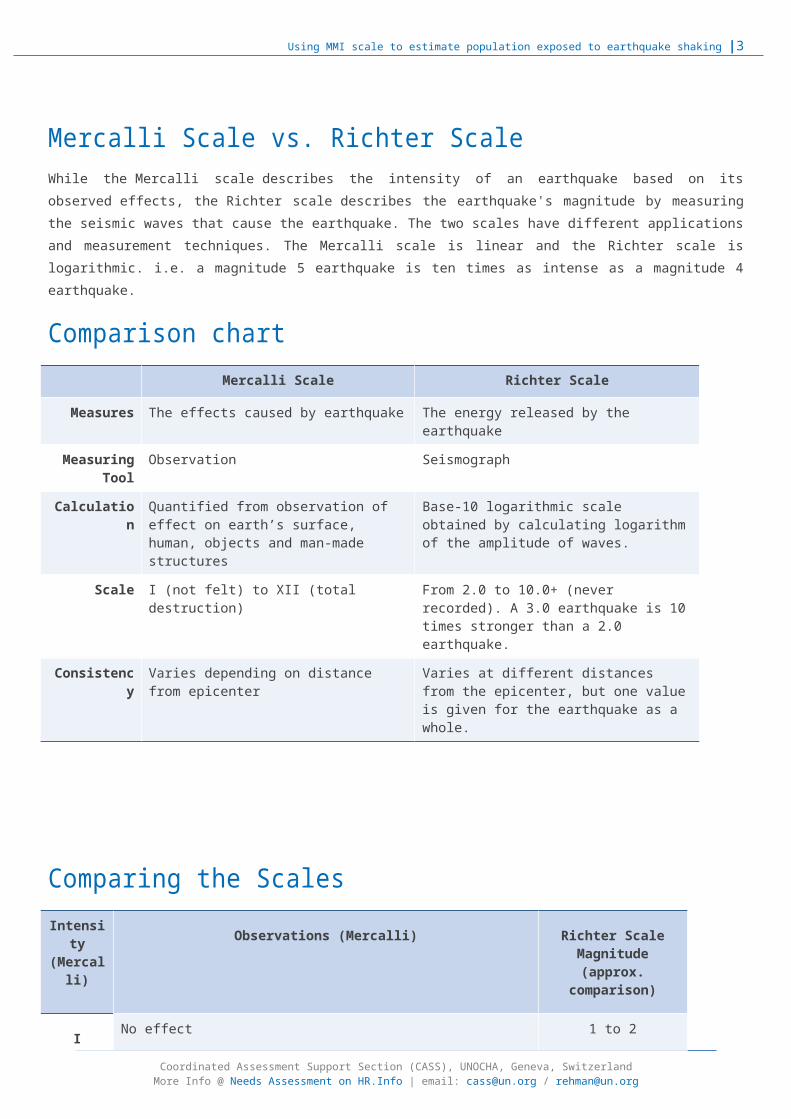
Mercalli Scale vs. Richter ScaleWhile the Mercalli scale describes the intensity of an earthquake based on itsobserved effects, the Richter scale describes the earthquake's magnitude by measuringthe seismic waves that cause the earthquake. The two scales have different applicationsand measurement techniques. The Mercalli scale is linear and the Richter scale islogarithmic. i.e. a magnitude 5 earthquake is ten times as intense as a magnitude 4earthquake.
Comparison chartMercalli Scale Richter Scale
Measures The effects caused by earthquake The energy released by the earthquake
MeasuringTool
Observation Seismograph
Calculation
Quantified from observation of effect on earth’s surface, human, objects and man-made structures
Base-10 logarithmic scale obtained by calculating logarithmof the amplitude of waves.
Scale I (not felt) to XII (total destruction)
From 2.0 to 10.0+ (never recorded). A 3.0 earthquake is 10times stronger than a 2.0 earthquake.
Consistency
Varies depending on distance from epicenter
Varies at different distances from the epicenter, but one valueis given for the earthquake as a whole.
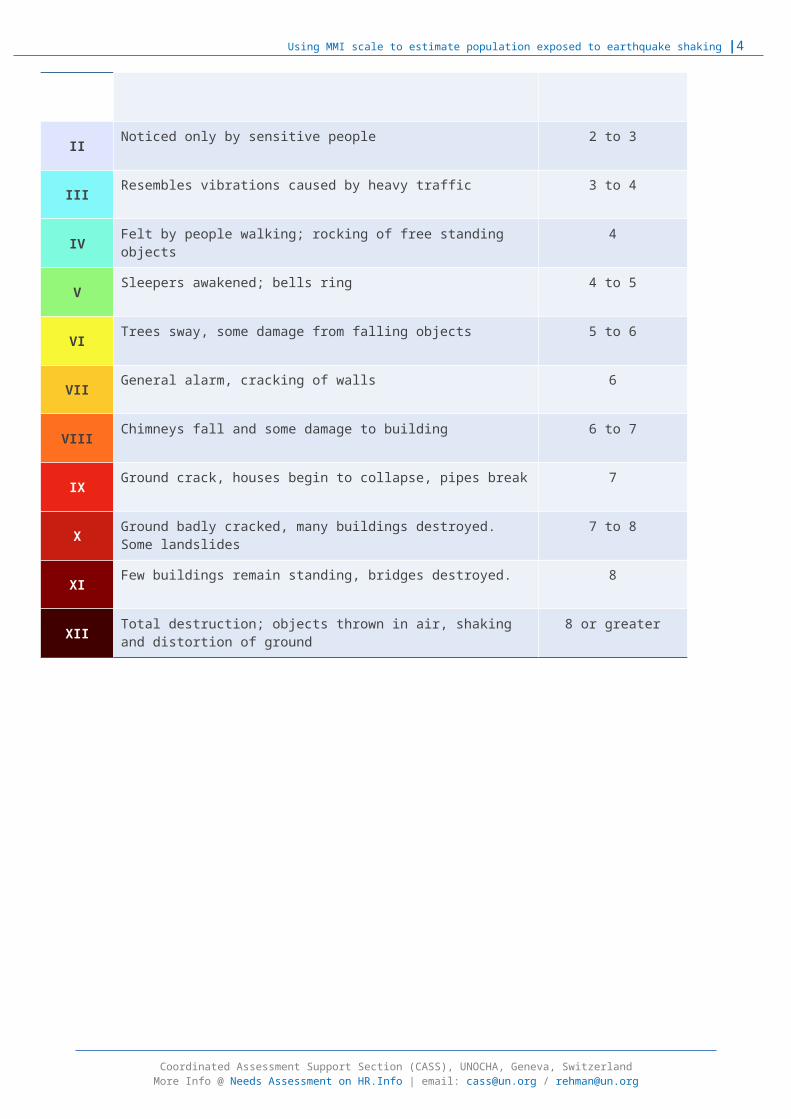
Comparing the ScalesIntensi
ty(Mercalli)
Observations (Mercalli) Richter ScaleMagnitude(approx.
comparison)
I No effect 1 to 2
Coordinated Assessment Support Section (CASS), UNOCHA, Geneva, SwitzerlandMore Info @ Needs Assessment on HR.Info | email: [email protected] / [email protected]
Using MMI scale to estimate population exposed to earthquake shaking |4
II Noticed only by sensitive people 2 to 3
III Resembles vibrations caused by heavy traffic 3 to 4
IV Felt by people walking; rocking of free standing objects
4
V Sleepers awakened; bells ring 4 to 5
VI Trees sway, some damage from falling objects 5 to 6
VII General alarm, cracking of walls 6
VIII Chimneys fall and some damage to building 6 to 7
IX Ground crack, houses begin to collapse, pipes break 7
X Ground badly cracked, many buildings destroyed. Some landslides
7 to 8
XI Few buildings remain standing, bridges destroyed. 8
XII Total destruction; objects thrown in air, shaking and distortion of ground
8 or greater
Coordinated Assessment Support Section (CASS), UNOCHA, Geneva, SwitzerlandMore Info @ Needs Assessment on HR.Info | email: [email protected] / [email protected]
Using MMI scale to estimate population exposed to earthquake shaking |5
The Medvedev–Sponheuer–Karnik (MSK) scaleAlso known as the MSK or MSK-64, is a macroseismic intensity scale used to evaluate theseverity of ground shaking on the basis of observed effects in an area of theearthquake occurrence.
The scale was first proposed by Sergei Medvedev (USSR), Wilhelm Sponheuer (EastGermany), and Vít Kárník (Czechoslovakia) in 1964. It was based on the experiencesbeing available in the early 1960s from the application of the Modified Mercalliintensity scale and the 1953 version of the Medvedev scale, known also as the GEOFIANscale.
With minor modifications in the mid-1970s and early 1980s, the MSK scale became widelyused in Europe and the USSR. In early 1990s, the European Seismological Commission(ESC) used many of the principles formulated in the MSK in the development of theEuropean Macroseismic Scale, which is now a de facto standard for evaluation of seismicintensity in European countries. MSK-64 is still being used in India, Israel, Russia,and throughout the Commonwealth of Independent States.
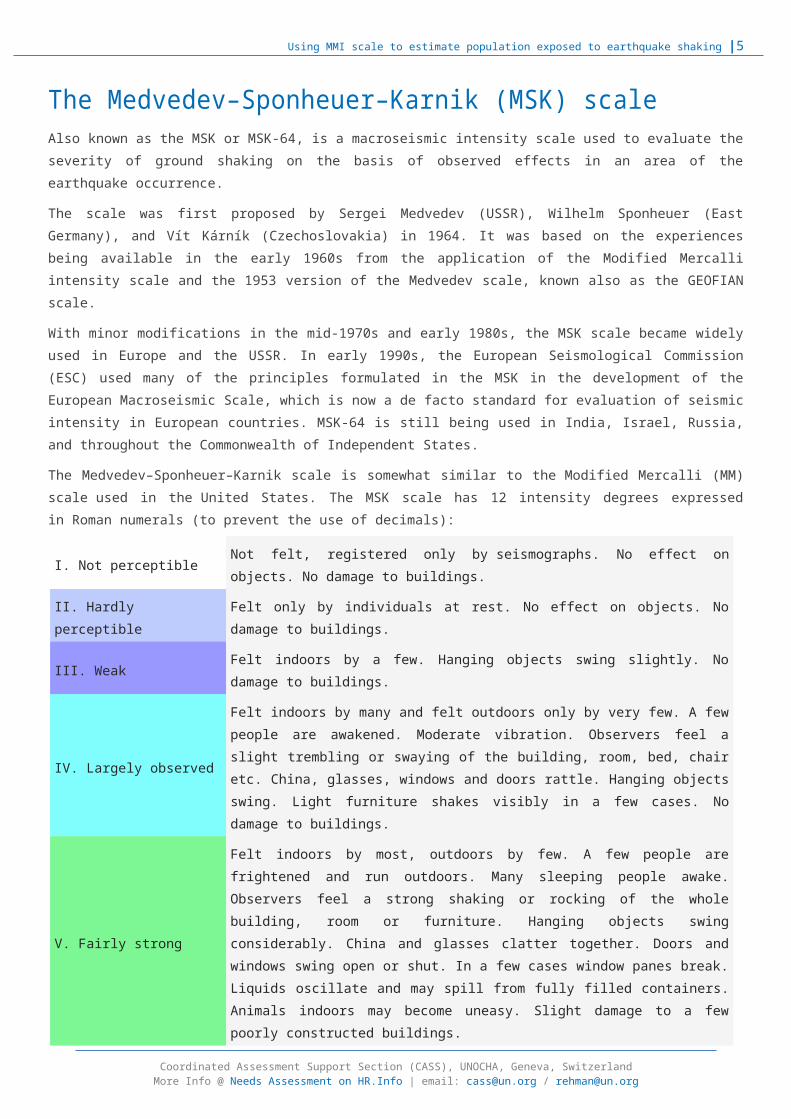
The Medvedev–Sponheuer–Karnik scale is somewhat similar to the Modified Mercalli (MM)scale used in the United States. The MSK scale has 12 intensity degrees expressedin Roman numerals (to prevent the use of decimals):
I. Not perceptibleNot felt, registered only by seismographs. No effect onobjects. No damage to buildings.
II. Hardly perceptible
Felt only by individuals at rest. No effect on objects. Nodamage to buildings.
III. WeakFelt indoors by a few. Hanging objects swing slightly. Nodamage to buildings.
IV. Largely observed
Felt indoors by many and felt outdoors only by very few. A fewpeople are awakened. Moderate vibration. Observers feel aslight trembling or swaying of the building, room, bed, chairetc. China, glasses, windows and doors rattle. Hanging objectsswing. Light furniture shakes visibly in a few cases. Nodamage to buildings.
V. Fairly strong
Felt indoors by most, outdoors by few. A few people arefrightened and run outdoors. Many sleeping people awake.Observers feel a strong shaking or rocking of the wholebuilding, room or furniture. Hanging objects swingconsiderably. China and glasses clatter together. Doors andwindows swing open or shut. In a few cases window panes break.Liquids oscillate and may spill from fully filled containers.Animals indoors may become uneasy. Slight damage to a fewpoorly constructed buildings.
Coordinated Assessment Support Section (CASS), UNOCHA, Geneva, SwitzerlandMore Info @ Needs Assessment on HR.Info | email: [email protected] / [email protected]
Using MMI scale to estimate population exposed to earthquake shaking |6
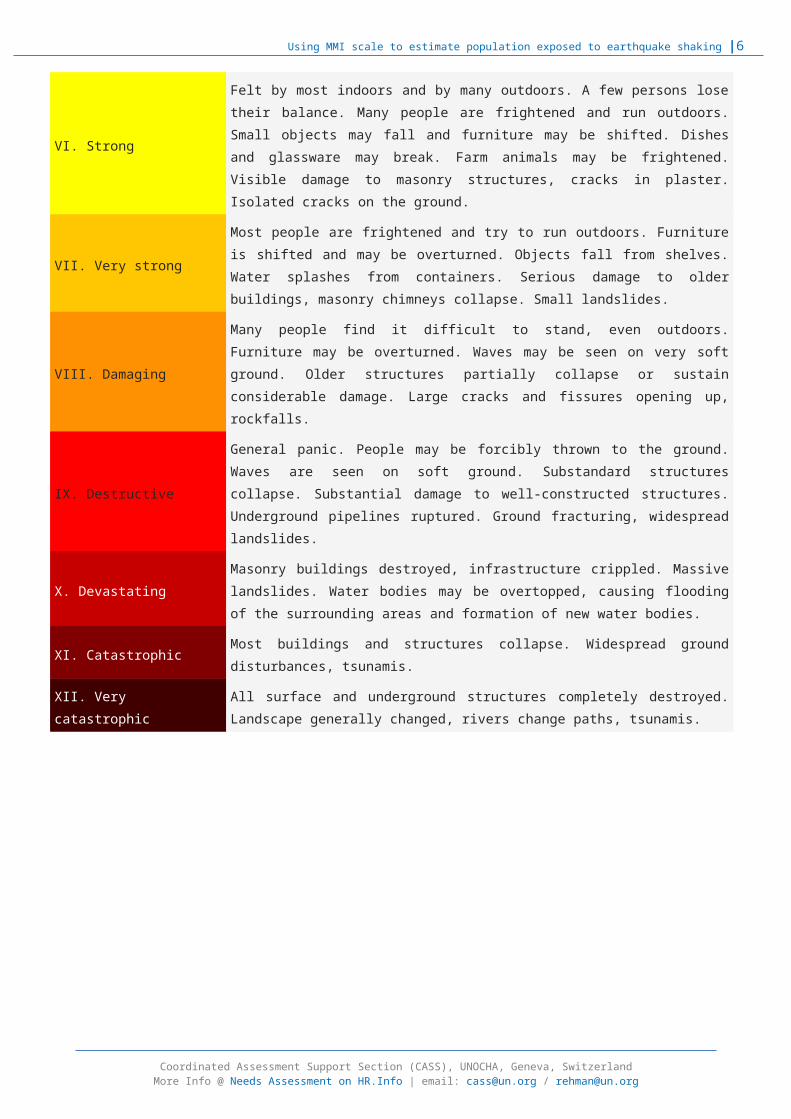
VI. Strong
Felt by most indoors and by many outdoors. A few persons losetheir balance. Many people are frightened and run outdoors.Small objects may fall and furniture may be shifted. Dishesand glassware may break. Farm animals may be frightened.Visible damage to masonry structures, cracks in plaster.Isolated cracks on the ground.
VII. Very strong
Most people are frightened and try to run outdoors. Furnitureis shifted and may be overturned. Objects fall from shelves.Water splashes from containers. Serious damage to olderbuildings, masonry chimneys collapse. Small landslides.
VIII. Damaging
Many people find it difficult to stand, even outdoors.Furniture may be overturned. Waves may be seen on very softground. Older structures partially collapse or sustainconsiderable damage. Large cracks and fissures opening up,rockfalls.
IX. Destructive
General panic. People may be forcibly thrown to the ground.Waves are seen on soft ground. Substandard structurescollapse. Substantial damage to well-constructed structures.Underground pipelines ruptured. Ground fracturing, widespreadlandslides.
X. DevastatingMasonry buildings destroyed, infrastructure crippled. Massivelandslides. Water bodies may be overtopped, causing floodingof the surrounding areas and formation of new water bodies.
XI. CatastrophicMost buildings and structures collapse. Widespread grounddisturbances, tsunamis.
XII. Very catastrophic
All surface and underground structures completely destroyed.Landscape generally changed, rivers change paths, tsunamis.
Coordinated Assessment Support Section (CASS), UNOCHA, Geneva, SwitzerlandMore Info @ Needs Assessment on HR.Info | email: [email protected] / [email protected]
Using MMI scale to estimate population exposed to earthquake shaking |7
Process to estimate population exposure using MMI scale
a) In the event of a majorearthquake, go to theUnited States GeologicalSurvey’s (USGS) website,where website you candownload the shake mapshape files for use inestimating populationexposure using MMI scale.The URL of the websiteis:HTTP://EARTHQUAKE.USGS.GOV/ .Go to the end of thewebpage and enter“Tajikistan 2015” in tesearch box available atthe bottom left corner.On the results page clickon “M 7.2 - 104km W ofMurghob, Tajikistan” link.
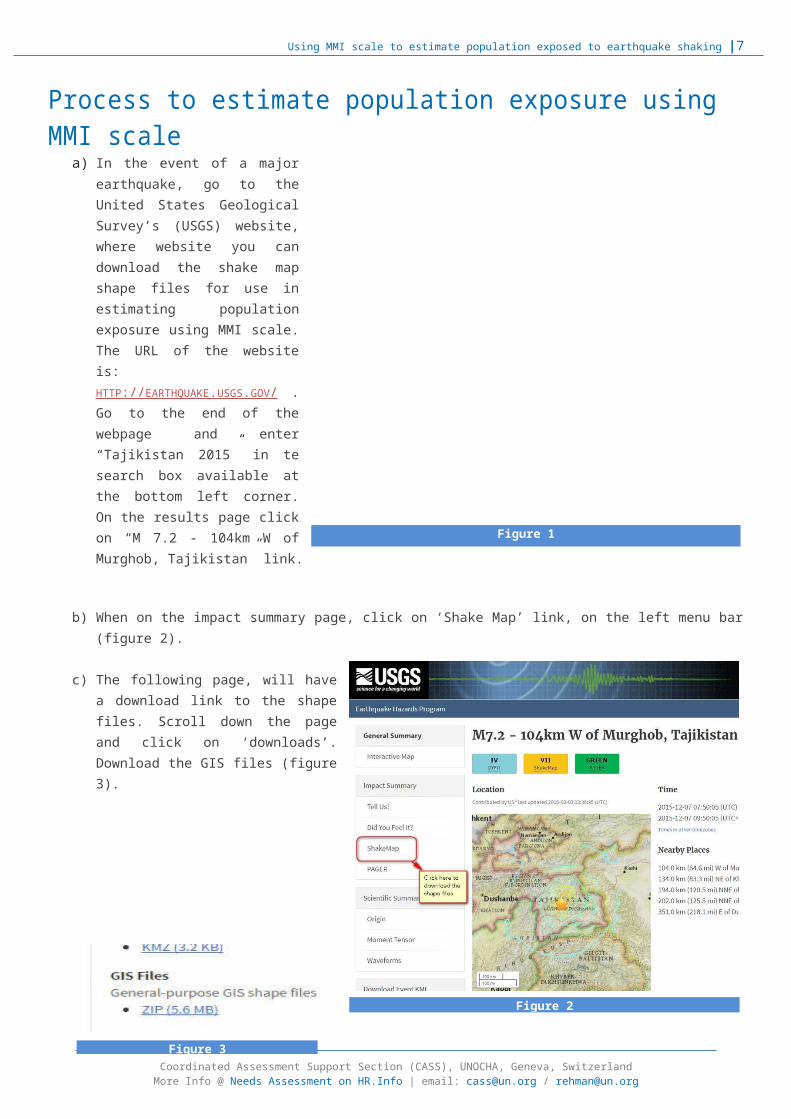
b) When on the impact summary page, click on ‘Shake Map’ link, on the left menu bar(figure 2).
c) The following page, will havea download link to the shapefiles. Scroll down the pageand click on ‘downloads’.Download the GIS files (figure3).
Coordinated Assessment Support Section (CASS), UNOCHA, Geneva, SwitzerlandMore Info @ Needs Assessment on HR.Info | email: [email protected] / [email protected]
Figure 1
Figure 2
Figure 3

Using MMI scale to estimate population exposed to earthquake shaking |8
d) Open ArcMap and add the admin boundaries (Admin level 1 & 2) and MMI shape fileon the data frame1.
e) Open the attribute table of MMI layer, add a new text type field and name it‘MMI’ (see figure 4 on the next page).
f) Using the values of PARAMVALUE field in the MMI layer attribute table, assigncorresponding values of MMI to the newly created ‘MMI’ field.
g) Using the guide available through the link below (under bullet ‘h’), we can addclasses of MMI based on the PARAMVALUE field. For example to add MMIclassification II-III (Weak) we will add a SELECT statement with a condition forthe PARAMVALUE field set to greater than 1.9999 and less than or equal to 3.999.
1 Admin boundaries can be downloaded from the HDX (https://data.humdata.org/) Coordinated Assessment Support Section (CASS), UNOCHA, Geneva, SwitzerlandMore Info @ Needs Assessment on HR.Info | email: [email protected] / [email protected]
Figure 4
Using MMI scale to estimate population exposed to earthquake shaking |9
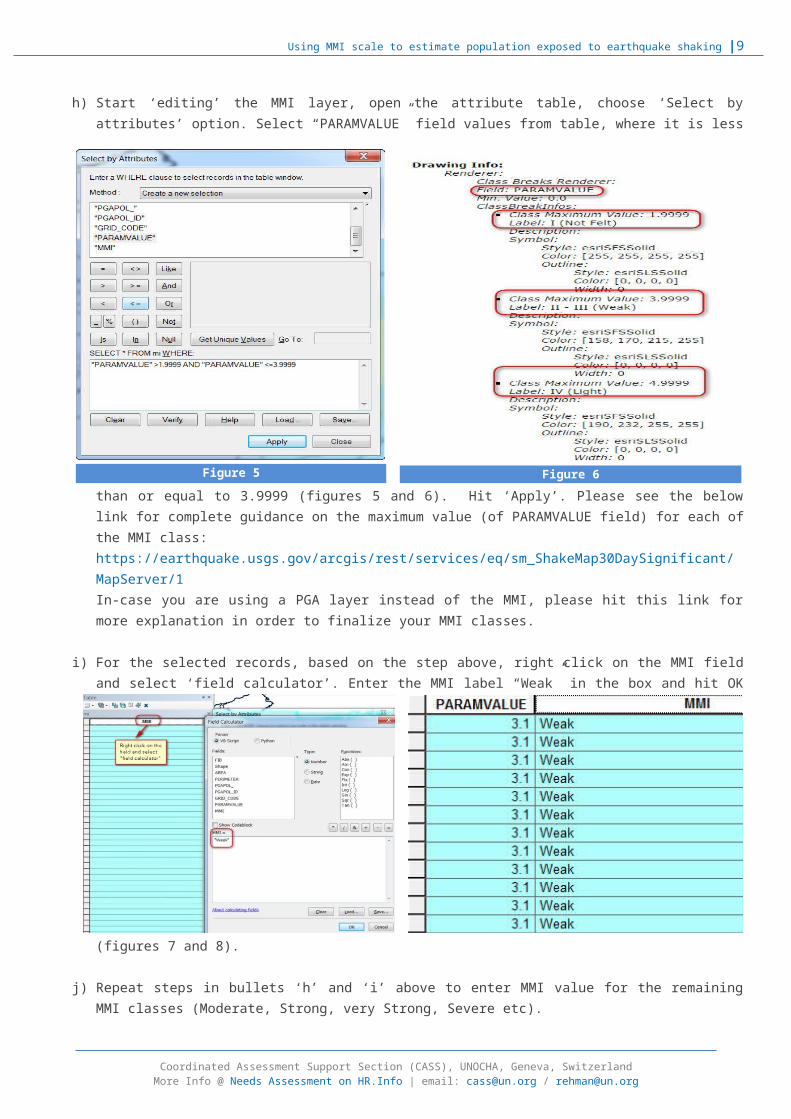
h) Start ‘editing’ the MMI layer, open the attribute table, choose ‘Select byattributes’ option. Select “PARAMVALUE” field values from table, where it is less
than or equal to 3.9999 (figures 5 and 6). Hit ‘Apply’. Please see the belowlink for complete guidance on the maximum value (of PARAMVALUE field) for each ofthe MMI class: https://earthquake.usgs.gov/arcgis/rest/services/eq/sm_ShakeMap30DaySignificant/MapServer/1 In-case you are using a PGA layer instead of the MMI, please hit this link formore explanation in order to finalize your MMI classes.
i) For the selected records, based on the step above, right click on the MMI fieldand select ‘field calculator’. Enter the MMI label “Weak” in the box and hit OK
(figures 7 and 8).
j) Repeat steps in bullets ‘h’ and ‘i’ above to enter MMI value for the remainingMMI classes (Moderate, Strong, very Strong, Severe etc).
Coordinated Assessment Support Section (CASS), UNOCHA, Geneva, SwitzerlandMore Info @ Needs Assessment on HR.Info | email: [email protected] / [email protected]
Figure 5 Figure 6
Using MMI scale to estimate population exposed to earthquake shaking |10
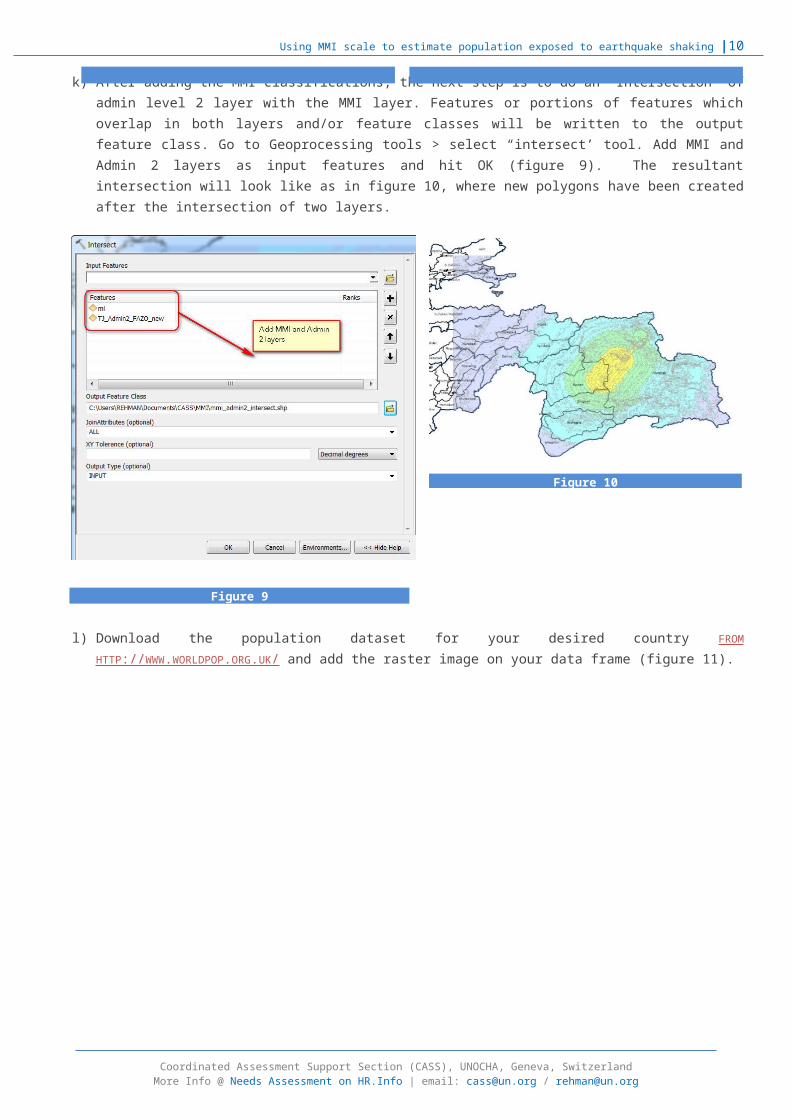
k) After adding the MMI classifications, the next step is to do an ‘Intersection’ ofadmin level 2 layer with the MMI layer. Features or portions of features whichoverlap in both layers and/or feature classes will be written to the outputfeature class. Go to Geoprocessing tools > select “intersect’ tool. Add MMI andAdmin 2 layers as input features and hit OK (figure 9). The resultantintersection will look like as in figure 10, where new polygons have been createdafter the intersection of two layers.
l) Download the population dataset for your desired country FROM HTTP://WWW.WORLDPOP.ORG.UK/ and add the raster image on your data frame (figure 11).
Coordinated Assessment Support Section (CASS), UNOCHA, Geneva, SwitzerlandMore Info @ Needs Assessment on HR.Info | email: [email protected] / [email protected]
Figure 9
Figure 10
Using MMI scale to estimate population exposed to earthquake shaking |11
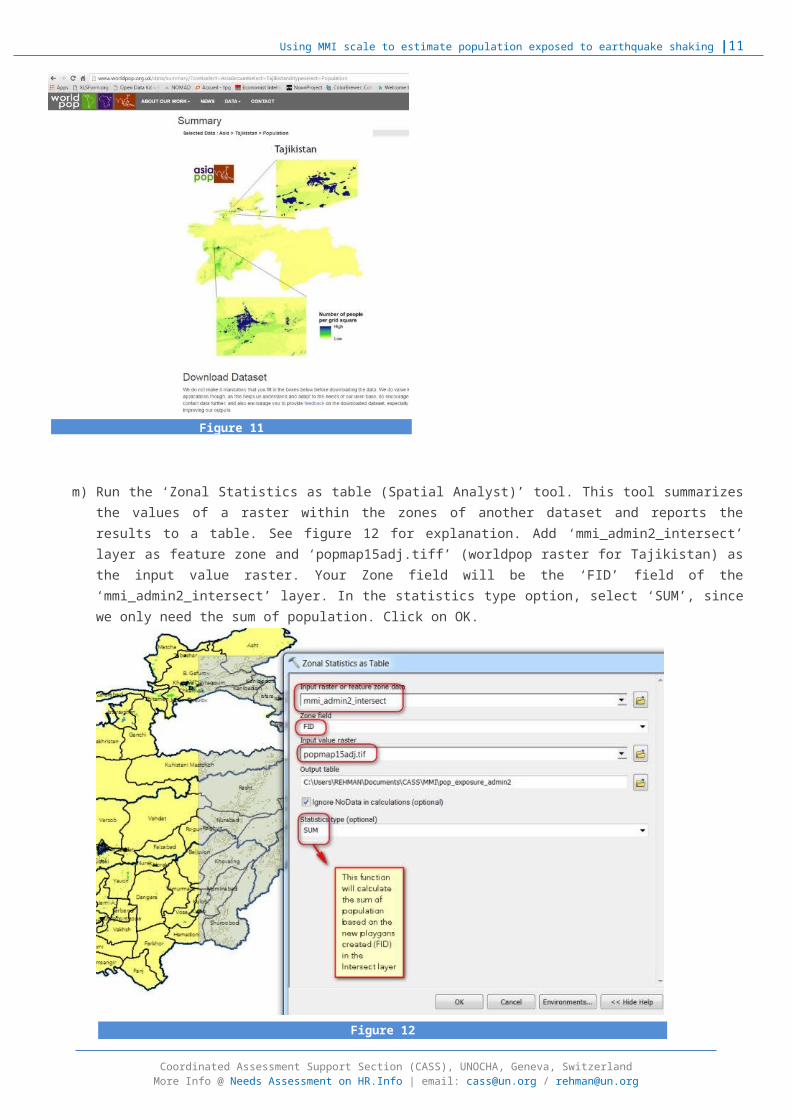
m) Run the ‘Zonal Statistics as table (Spatial Analyst)’ tool. This tool summarizesthe values of a raster within the zones of another dataset and reports theresults to a table. See figure 12 for explanation. Add ‘mmi_admin2_intersect’layer as feature zone and ‘popmap15adj.tiff’ (worldpop raster for Tajikistan) asthe input value raster. Your Zone field will be the ‘FID’ field of the‘mmi_admin2_intersect’ layer. In the statistics type option, select ‘SUM’, sincewe only need the sum of population. Click on OK.
Coordinated Assessment Support Section (CASS), UNOCHA, Geneva, SwitzerlandMore Info @ Needs Assessment on HR.Info | email: [email protected] / [email protected]
Figure 11
Figure 12
Using MMI scale to estimate population exposed to earthquake shaking |12
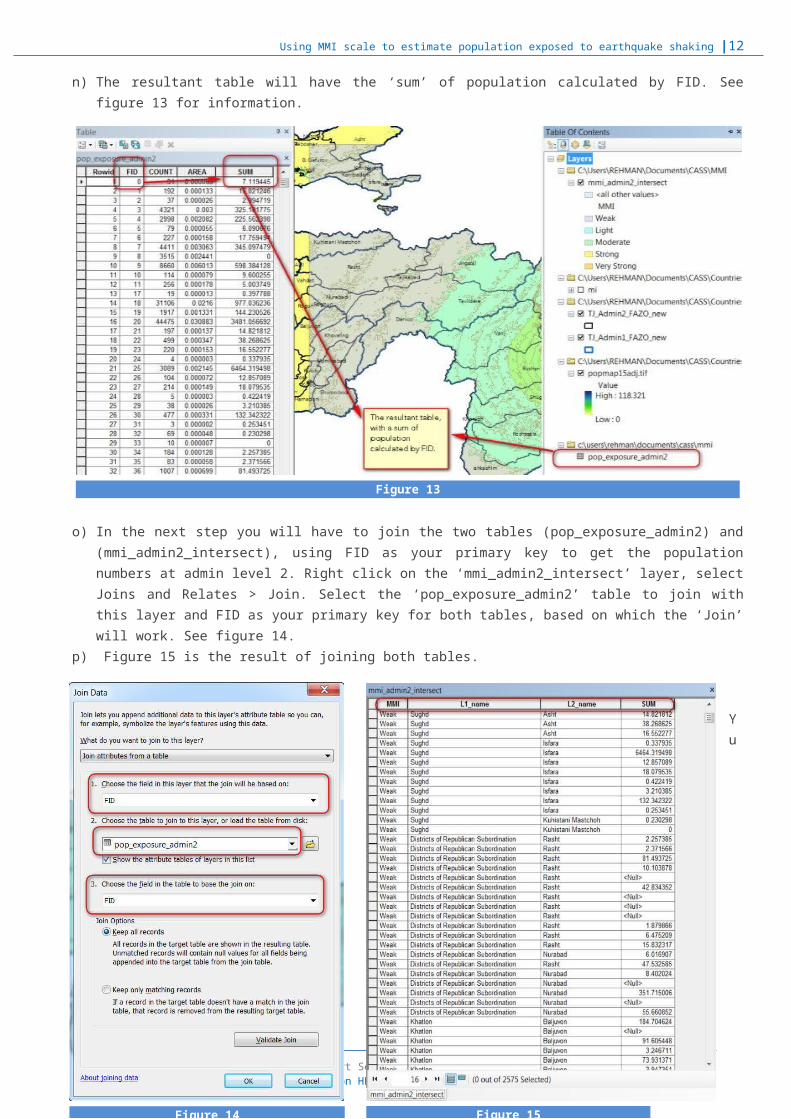
n) The resultant table will have the ‘sum’ of population calculated by FID. Seefigure 13 for information.
o) In the next step you will have to join the two tables (pop_exposure_admin2) and(mmi_admin2_intersect), using FID as your primary key to get the populationnumbers at admin level 2. Right click on the ‘mmi_admin2_intersect’ layer, selectJoins and Relates > Join. Select the ‘pop_exposure_admin2’ table to join withthis layer and FID as your primary key for both tables, based on which the ‘Join’will work. See figure 14.
p) Figure 15 is the result of joining both tables.
q) Yo u
Coordinated Assessment Support Section (CASS), UNOCHA, Geneva, SwitzerlandMore Info @ Needs Assessment on HR.Info | email: [email protected] / [email protected]
Figure 13
Figure 14 Figure 15
Using MMI scale to estimate population exposed to earthquake shaking |13
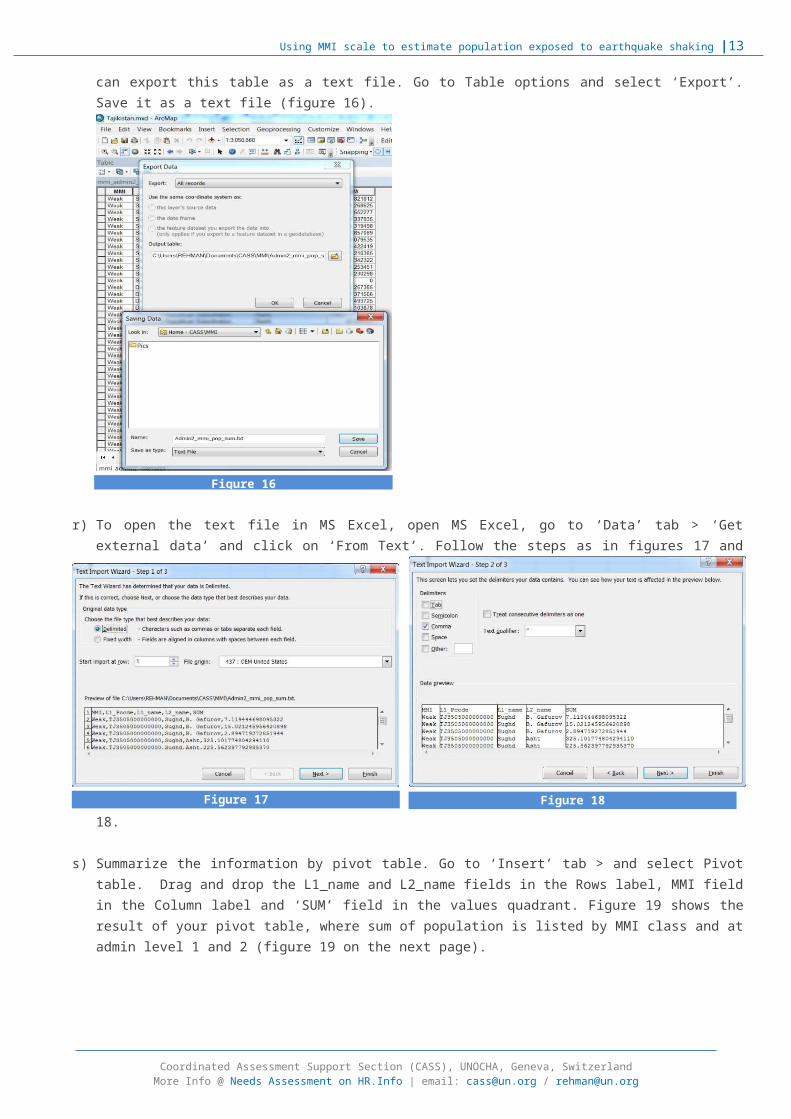
can export this table as a text file. Go to Table options and select ‘Export’.Save it as a text file (figure 16).
r) To open the text file in MS Excel, open MS Excel, go to ‘Data’ tab > ‘Getexternal data’ and click on ‘From Text’. Follow the steps as in figures 17 and
18.
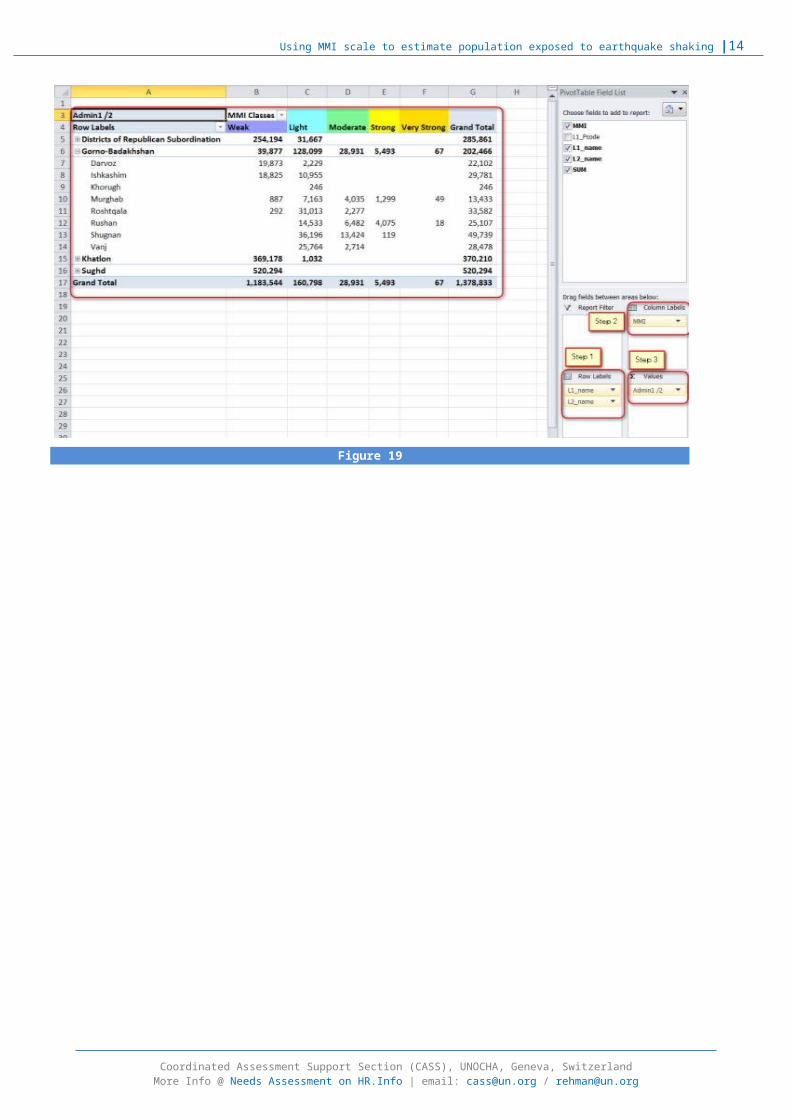
s) Summarize the information by pivot table. Go to ‘Insert’ tab > and select Pivottable. Drag and drop the L1_name and L2_name fields in the Rows label, MMI fieldin the Column label and ‘SUM’ field in the values quadrant. Figure 19 shows theresult of your pivot table, where sum of population is listed by MMI class and atadmin level 1 and 2 (figure 19 on the next page).
Coordinated Assessment Support Section (CASS), UNOCHA, Geneva, SwitzerlandMore Info @ Needs Assessment on HR.Info | email: [email protected] / [email protected]
Figure 17 Figure 18
Figure 16
Using MMI scale to estimate population exposed to earthquake shaking |14
Coordinated Assessment Support Section (CASS), UNOCHA, Geneva, SwitzerlandMore Info @ Needs Assessment on HR.Info | email: [email protected] / [email protected]
Figure 19