Youth Well-Being in Brazil: An Index for Cross-Regional Comparisons
A Regional-Scale Ocean Health Index for BrazilCristiane T. Elfes1*, Catherine Longo2, Benjamin S. Halpern2,3,4, Darren Hardy2,5, Courtney Scarborough2,
Benjamin D. Best2, Tiago Pinheiro6, Guilherme F. Dutra7
1 Department of Ecology, Evolution and Marine Biology, University of California Santa Barbara, Santa Barbara, California, United States of America, 2 National Center for
Ecological Analysis and Synthesis, Santa Barbara, California, United States of America, 3 Bren School of Environmental Science and Management, University of California
Santa Barbara, Santa Barbara, California, United States of America, 4 Imperial College London, Silwood Park Campus, Berkshire, London, United Kingdom, 5 Digital Library
Systems, Stanford University, Stanford, California, United States of America, 6 Atlantic Forest Program, Conservation International Brazil, Belo Horizonte, Minas Gerais,
Brazil, 7 Marine Program, Conservation International Brazil, Rio de Janeiro, Rio de Janeiro, Brazil
Abstract
Brazil has one of the largest and fastest growing economies and one of the largest coastlines in the world, making humanuse and enjoyment of coastal and marine resources of fundamental importance to the country. Integrated assessments ofocean health are needed to understand the condition of a range of benefits that humans derive from marine systems and toevaluate where attention should be focused to improve the health of these systems. Here we describe the first suchassessment for Brazil at both national and state levels. We applied the Ocean Health Index framework, which evaluates tenpublic goals for healthy oceans. Despite refinements of input data and model formulations, the national score of 60 (out of100) was highly congruent with the previous global assessment for Brazil of 62. Variability in scores among coastal stateswas most striking for goals related to mariculture, protected areas, tourism, and clean waters. Extractive goals, includingFood Provision, received low scores relative to habitat-related goals, such as Biodiversity. This study demonstrates theapplicability of the Ocean Health Index at a regional scale, and its usefulness in highlighting existing data and knowledgegaps and identifying key policy and management recommendations. To improve Brazil’s ocean health, this study suggeststhat future actions should focus on: enhancing fisheries management, expanding marine protected areas, and monitoringcoastal habitats.
Citation: Elfes CT, Longo C, Halpern BS, Hardy D, Scarborough C, et al. (2014) A Regional-Scale Ocean Health Index for Brazil. PLoS ONE 9(4): e92589. doi:10.1371/journal.pone.0092589
Editor: Athanassios C. Tsikliras, Aristotle University of Thessaloniki, Greece
Received July 23, 2013; Accepted February 24, 2014; Published April 2, 2014
Copyright: � 2014 Elfes et al. This is an open-access article distributed under the terms of the Creative Commons Attribution License, which permits unrestricteduse, distribution, and reproduction in any medium, provided the original author and source are credited.
Funding: Beau and Heather Wrigley provided the founding grant for the original Ocean Health Index work and the Pacific Life Foundation is the FoundingPresenting Sponsor. Additional financial and in-kind support was provided by the Thomas W. Haas Fund of the New Hampshire Charitable Foundation, the OakFoundation, Akiko Shiraki Dynner Fund for Ocean Exploration and Conservation, Darden Restaurants Inc. Foundation, Conservation International, New EnglandAquarium, National Geographic, and the National Center for Ecological Analysis and Synthesis, which supported the Ecosystem Health Working Group as part ofthe Science of Ecosystem-Based Management project funded by the David and Lucile Packard Foundation. The funders had no role in study design, datacollection and analysis, decision to publish, or preparation of the manuscript.
Competing Interests: The authors have declared that no competing interests exist.
* E-mail: [email protected]
Introduction
Brazil’s coastline spans more than 7,000 km with a vast diversity
of ecosystems, including extensive mangrove areas in the Amazon
basin, coral reefs in the Northeast, and lagoons, estuaries and
saltmarshes in the south. These systems play a fundamental role in
the economy and identity of the country. As Brazil’s economy
continues to grow – for 2012 it was listed as the seventh largest
economy in the world [1] – interest in using and benefiting from
coastal and marine systems is also growing. Often the various
activities tied to these benefits, such as fisheries, coastal develop-
ment and tourism, come into conflict, and resource managers and
policy makers are faced with decisions about how and where to
allow and regulate each of them, with the ultimate goal of
maintaining and ideally improving the overall health of the ocean
and the communities that use it.
Given this context, there is a great need in Brazil for tools to
assess and monitor the overall health of coastal ecosystems, as well
as the status of components of the system. A framework was
recently developed to do just that, and was applied to every coastal
country in the world [2]. This index to assess the health and
benefits of the ocean (Ocean Health Index) evaluates the condition
of coupled human-ocean systems by tracking the current status
and likely future state of ten publicly held goals, ranging from food
provision to jobs, tourism, and coastal protection (Table 1).
The Index is based on the understanding that humans are part
of ecosystems and that the health of natural and human systems
are tightly coupled [3,4]. From this coupled human-natural
systems perspective, a healthy ocean is defined as one that
provides a range of benefits to people now and in the future [2]. As
such, the Index measures the amount of benefits relative to a
sustainable optimum. The Index is not intended to be a measure of
how pristine an area of ocean or coastline is.
The novelty of the Index is that it provides an integrated
framework in which to quantitatively assess and compare the
condition of these benefits, thus providing a portfolio perspective
useful for informing management decisions. The Index can also be
used to track progress in achieving specific management goals,
because it establishes a target or reference point to which current
status and likely future condition are compared ([2,5], Table S1 in
Text S1).
Here we present a case study, applying the Ocean Health Index
framework to Brazil at the national and sub-national levels. The
PLOS ONE | www.plosone.org 1 April 2014 | Volume 9 | Issue 4 | e92589

global analysis [2] precluded use of higher resolution datasets that
are available for individual countries, data that can provide a more
accurate assessment of a country’s ocean health as well as sub-
national assessments. As such, the global analysis is too coarse to
guide specific interventions at national and regional levels,
particularly for a country as large and heterogeneous as Brazil.
Applying the Ocean Health Index to Brazil provides an
important opportunity to test the scalability and flexibility of the
Index to be adapted to country-specific concerns by including
higher resolution information, place-specific targets and regional
proxies for calculating goals. The case study also highlights a
number of challenges related to data quality and quantity for
assessing the range of benefits evaluated under the Index
framework. Here, we show how the Index can be adapted to the
Brazilian context, and discuss the main patterns and policy
implications emerging from our analysis. Our intent is that the
lessons learned from this case study can be used to guide future
assessments and management strategies in Brazil, and help to
inform other current and future regional applications of the Ocean
Health Index.
Methods
Details on calculation of the Index are provided in Halpern et al.
[2]. Here we give a brief summary, and elaborate on goal-specific
methods and data layers used in this case study in Text S1.
The Index is comprised of ten widely-held public goals: Food
Provision, Artisanal Opportunities, Natural Products, Carbon
Storage, Coastal Protection, Coastal Livelihoods and Economies,
Tourism and Recreation, Sense of Place, Clean Waters and
Biodiversity (Table 1). As the Index is focused on the sustainable
provision of benefits, we do not include activities such as oil and
gas exploration. The location of oil and gas deposits and
productivity of such reserves are not indications of a healthy, or
sustainably managed ocean. It is worth noting, however, that oil is
incorporated as a pollutant in the pressure calculations (see below)
and the status of the Clean Waters goal.
For each goal, a score is calculated from four dimensions –
current status, recent trend, existing pressures and expected
resilience in the near-term based on current management actions.
The Index value (I) is determined as a linear weighted sum of the
scores for each of the public goal indices (I1, I2,…, I10) and the
appropriate weights for each of the goals (a1, a2,…a10), such that:
I~a1I1za2I2z:::a10I10 ð1Þ
The weights determine the relative importance of each goal in
the overall Index score and ideally reflect people’s values within
the region. Here we used equal weighting, as an in-depth interview
process with stakeholders from all Brazilian coastal states was
outside the scope of this case study (for an example, see [6]).
Each goal score, Ii, is calculated as the average of its present
status xi, and an estimate of its likely near-term future status xxi,F ,
such that:
Ii~xizxxi,F
2ð2Þ
The present status of goal i, xi, is its present status value, (Xi),
relative to a reference point, Xi, R uniquely chosen for each goal
and scaled 0 to 100.
xi~Xi
Xi,Rð3Þ
The reference point, Xi, R, is determined a number of ways
depending on the purpose (management objective) and data
constraints of each goal. The main ways of establishing a reference
point are: through a known functional relationship (e.g. a target
value of extracting the maximum sustainable yield of a given fish
stock), a time series approach (e.g. historical habitat extent), a
Table 1. Ten public goals and sub-goals showing benefit measured under each.
Goal Subgoal Benefit measured
Food Provision (FP) Fisheries (FIS) Seafood sustainably harvested for human consumption from wild, or cultured stocks
Mariculture (MAR)
Artisanal fishing opportunity (AO) Opportunity to engage in artisanal fishing as a social, cultural and livelihood activity
Natural products (NP) Amount of sustainably harvested natural products (other than for food provision)
Carbon storage (CS) Conservation of coastal habitats affording carbon storage and sequestration
Coastal protection (CP) Conservation of coastal habitats affording protection from inundation and erosion
Tourism and recreation (TR) Opportunity to enjoy coastal areas for recreation for locals and tourists
Coastal livelihoods andeconomies (LE)
Livelihoods (LIV) Employment (livelihoods) and revenues (economies) from marine-related sectors
Economies (ECO)
Sense of place (SP) Iconic species (ICO) Sense of place and cultural connectedness to the ocean afforded by lasting special placesand iconic species
Lasting special places (LSP)
Clean waters (CW) Clean waters that are free from pollution, debris and safe to swim in
Biodiversity (BD) Habitats (HAB) Conservation of biodiversity of species and habitats for their existence value
Species (SPP)
doi:10.1371/journal.pone.0092589.t001
Brazil Ocean Health Index
PLOS ONE | www.plosone.org 2 April 2014 | Volume 9 | Issue 4 | e92589

spatial comparison (e.g. the country with highest wages in marine-
related sectors), or through a known or established target value
(e.g. no species at risk of extinction, or 30% of marine waters
designated in protected areas). A more detailed discussion of the
considerations and process for selecting reference points is found
in Samhouri et al. [5], and in Text S1 for Halpern et al. [2]. Our
case study also used a spatio-temporal comparison, in which the
present status of a goal for all Brazilian coastal states was
compared to the best performing state over the analysis period.
For example, the Tourism and Recreation goal uses as its
reference value the highest score achieved across all states and all
years of data available (i.e. Rio de Janeiro in 2011). A full
description of the goal-specific reference points is provided in the
Supporting Information and listed in Table S1 in Text S1.
The likely near-term future status of a goal, xxi,F , is given as:
xxi,F ~(1zd){1½1zbTiz(1{b)(ri{pi)�xi ð4Þ
where ri is Resilience, pi is Pressures, and Ti is the Trend. A
discount rate (d) was included in the equation, but was
approximated to 0, because the likely future state is an assessment
in the very near future [2]. Beta (b) represents the relative
importance of the Trend versus the Resilience and Pressure terms
in determining the likely trajectory of the goal status into the
future. We assume b= 0.67 based on the idea that the direct
measure of Trend is a better indicator of the near future than the
indirect measures of Pressure and Resilience, and therefore carries
twice the weight [2].
Trend is calculated as the change in Status (slope) over the
previous five years. The annual rate of change was multiplied by
five to give an estimation of the Status in the near-term future [2].
To calculate Pressures for each goal (px) we evaluate both
ecological (pE) and social pressures (pS). Ecological pressures are
comprised of five broad categories: fishing pressure, habitat
destruction, climate change, water pollution and species introduc-
tions. The contribution of individual pressures to the overall
ecological pressure score is based on a weighting scheme having
pressures ranked as ‘high’ (weight = 3), ‘medium’ (weight = 2), and
‘low’ (weight = 1) impacts on the goal, sub-goal, or component (see
Table S7 in Text S1). Ecological pressures (pE) are calculated as
the weighted-average of the Pressure categories relevant to each
goal. Rankings were determined by literature review [2], modified
slightly through expert judgment on Brazilian systems. Social
pressures were based on a metric developed by The Economist
Intelligence Unit (UIE; see Text S1), which ranks management
effectiveness in Brazilian states. The UIE index is comprised of
eight categories: Political Environment, Economic Environment,
Tributary and Regulatory Environment, Policies for International
Investment, Human Resources, Infrastructure, Innovation, and
Sustainability determined at the state level. We used the aggregate
score of all components of the UIE index for each coastal state.
The Pressure for each goal (px) is therefore calculated as:
Px~c � (PE)z(1{c) � (PS) ð5Þ
where c is the relative weight for ecological vs. social pressures and
is set equal to 0.5. Total Pressure scores range between 0 and 100
with 100 being the highest threat.
To calculate Resilience (Table S8 in Text S1) for each goal (rx)
we assess three types of measures: ecological integrity (YE), goal
specific regulations aimed at addressing ecological pressures (G),
and social integrity (YS). When all three aspects are relevant to a
goal, Resilience is calculated as:
rx~c � YEzG
2
� �z(1{c) � YS ð6Þ
where the three measures are scaled 0–100, and gamma is
assumed to be 0.5 (such that ecological and social Resilience
components are equivalent). Ecological integrity (YE) is measured
as the relative condition of assessed marine species (see Text S1),
regulations (G) are laws and institutional measures that support
that goal and is calculated as the weighted average of those
measures, and social integrity measures (YS) is simply the UIE
Index.
The Index was calculated for each Brazilian coastal state
(Figure 1) and for the entire country as an area-weighted average
of coastal state scores. The scale of goal or sub-goal calculations
was dependent on data resolution. Based on available input data
and goal formulation, the spatial scale and geographic domain of
analysis differed between goals (Table 2). When possible, we took
advantage of state-level statistics such as tourism data, population
census counts, and habitat data with direct relevance to the state’s
terrestrial coastline and coastal waters (0–12 nmi offshore).
National level data included variables such as national level
statistics, and data pertaining to the entire Brazilian EEZ (0–
200 nmi). When only national data were available, the values for
the goal’s status and trends across states were identical and any
variation in final score (Table 3) was due to the influence of
pressure and resilience, which differed between states.
To see how the Ocean Health Index compares with another
across-sector index, we compared current versus likely future
status scores for each state with an independent metric used in
Brazil to track development status (FIRJAN Development Index
score, IFDM). IFDM is an index of human development,
measured in three areas: jobs and income, education, and health,
providing a useful comparison to our evaluation of ocean health.
Results
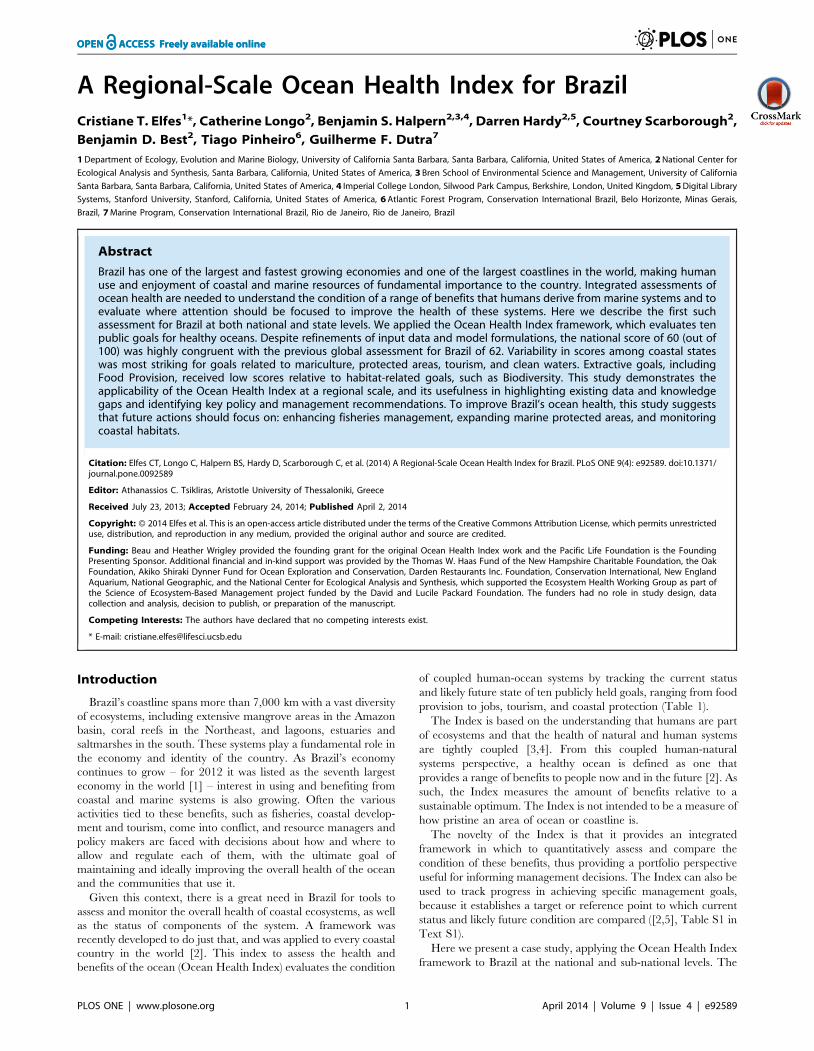
The overall Index score for Brazil was 60 out of 100, with state-
level scores ranging from 47 to 71 (Table 3). Highest scoring goals
were those relating to habitat condition, including Coastal
Protection (score: 92) and Carbon Storage (89). The Biodiversity
score for Brazil was 85, averaged across Habitats (95) and Species
(74) sub-goals.
Mariculture (6) scored lowest in the Index at the national level.
Other extractive goals or sub-goals, such as Natural Products (29)
and Fisheries (42) were also low. Iconic species (47), scored lower
than the Species sub-goal, indicating that a high proportion of
culturally and aesthetically valued species are threatened (Table 3).
Goals and sub-goals for which state-level data were used showed
high variability among regions (Table 3, Figure 2). The most
variable scores among states were for Tourism and Recreation,
which ranged from a low of 1 in Para to 100 in Rio de Janeiro.
Similarly, Lasting Special Places ranged from 10 (Piauı) to 98
(Amapa), and the Mariculture sub-goal ranged from 0 (Maranhao,
Para, Rio de Janeiro and Rio Grande do Sul) to 66 (Santa
Catarina). Clean Waters scored highest in Amapa (90) and Sao
Paulo (95), and lowest in Piauı (31) and Sergipe (47).
Scores for the Artisanal Opportunity goal (62) and Livelihoods
(56) and Economies (48) sub-goals were low, but were evaluated at
the country-level, likely masking important regional differences.
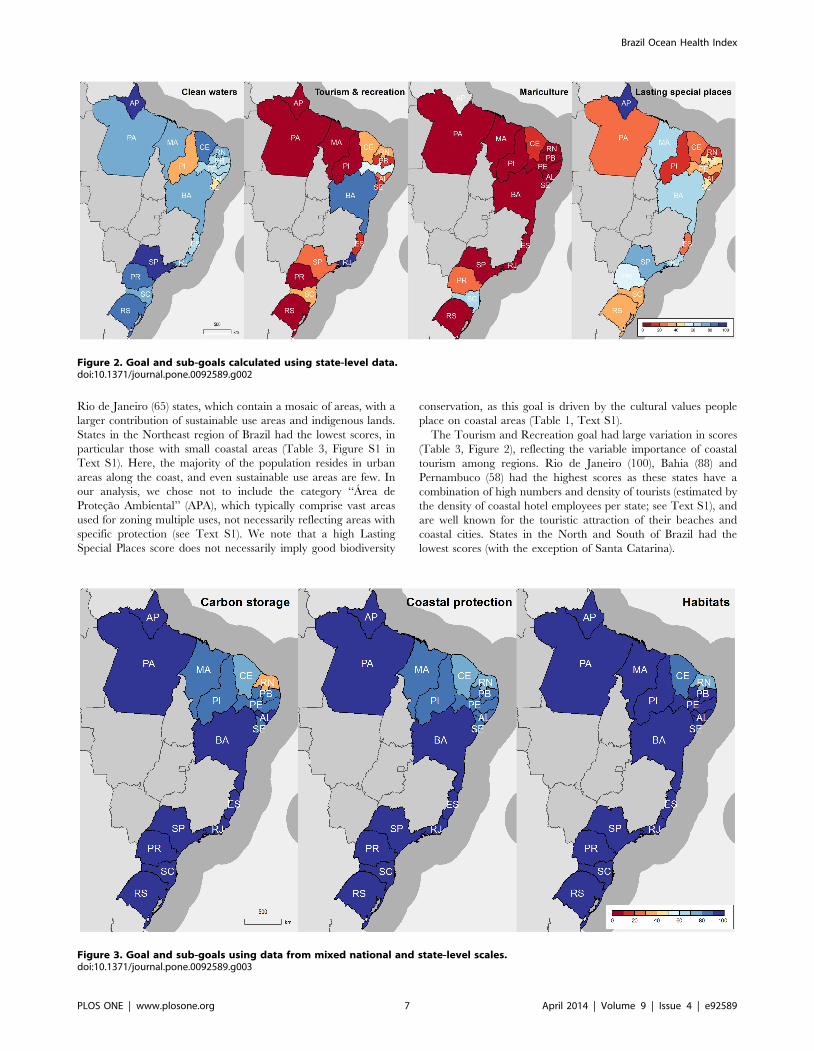
Similarly, Carbon Storage (89), Coastal Protection (92) and the
Brazil Ocean Health Index
PLOS ONE | www.plosone.org 3 April 2014 | Volume 9 | Issue 4 | e92589

Figure 1. Brazil study region showing coastal states, colored by final OHI score and listed in legend by ranked score. The followingislands were considered within the jurisdiction of states specified in parenthesis: 1. Sao Pedro & Sao Paulo Archipelago (PE), 2. Rocas Atoll (RN), 3.Fernando de Noronha (PE), 4. Abrolhos Archipelago (BA), 5. Trindade & Martim Vaz (ES).doi:10.1371/journal.pone.0092589.g001
Brazil Ocean Health Index
PLOS ONE | www.plosone.org 4 April 2014 | Volume 9 | Issue 4 | e92589

Habitats sub-goal of Biodiversity (95) showed high scores, with
little variation among regions (Figure 3). Habitat data varied
greatly in quality and quantity. Effects of these data constraints on
the patterns we observed are discussed below.
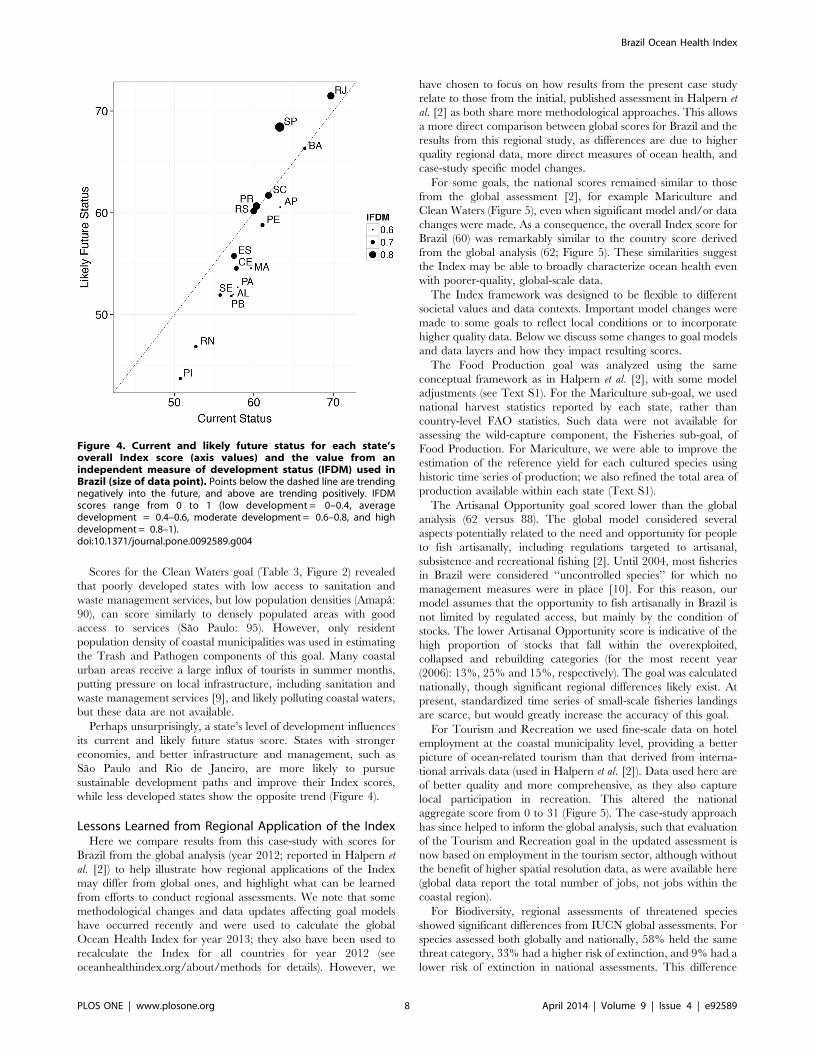
Comparisons of current and likely future status scores for each
state’s combined Index score revealed that the level of develop-
ment of a state (assessed using the independent measure of
development status, IFDM) was influential in determining the
state’s likely future score (Figure 4). The most developed states,
Sao Paulo and Rio de Janeiro, are likely to improve their scores
into the future. Parana, Rio Grande do Sul, Santa Catarina and
Bahia would likely maintain similar scores, while the remaining
states are expected to have lower future scores.
Discussion
This study is the first integrated assessment of the health of
Brazil’s ocean, based on the Ocean Health Index framework [2],
and incorporating regional datasets. In the following sections we
discuss sub-national patterns, lessons learned from this case study
analysis, and key policy implications for Brazil.
Spatial patternsDifferences in Food Provision scores between coastal states were
driven by the Mariculture sub-goal (Table 3), as the Fisheries sub-
goal was evaluated only at the national level. Despite the
importance of wild-capture fisheries to coastal communities in
Brazil, fisheries monitoring data is historically deficient, and it was
not possible to determine state-specific landings. Mariculture
scores were generally low due to low production (i.e. opportunity
lost relative to potential production from mariculture) or
production of unsustainable species. For example, whiteleg shrimp
(Litopenaeus vannamei) was the most commonly cultivated species,
with high production levels in the Northeast region, in particular
Ceara and Rio Grande do Norte. However, these states did not
achieve high Mariculture scores (Figure 2) due to the low
sustainability of production for this species. Indeed, environmental
and social problems associated with shrimp farming in Brazil are
numerous, including severe mangrove loss, coastal erosion,
pollution, land-use conflicts and loss of traditional livelihoods
[7,8]. Highest scores were achieved by Santa Catarina (score: 66)
and Parana (27), the two states with highest landings of bivalves
relative to coastline length.
Habitat-based goals, including Carbon Storage, Coastal Pro-
tection and the Habitat sub-goal of Biodiversity, scored high across
most states, with the exception of Rio Grande do Norte (Table 3,
Figure 3) which has seen high rates of mangrove loss due to rapid
expansion of shrimp farms (see Text S1). The high and relatively
homogenous habitat-related scores are likely related to two
reasons. The first is that for marine habitats such as coral reefs
and seagrasses, there were challenges in obtaining data at the
state-level, and historic reference points were not available within
Brazil, such that Caribbean or South Atlantic averages were used.
Such averages likely masked important localized declines, the
result being remarkably similar scores between states (Figure 3).
The second reason is related to Federal Law providing protection
to mangrove and saltmarsh habitats. This situation may soon
drastically change, as a recent revision of the Brazilian Forest
Code legislation opens the possibility of using the salt flat portions
of mangroves (locally known as ‘‘apicuns’’) for mariculture, up to
10% in the Amazon Biome and 35% in the remaining coastal
regions of the country (Brazilian Federal Law 12,651 of 2012).
The Lasting Special Places sub-goal was assessed using a
national database of protected areas (including fully-protected and
sustainable use designations at federal, state and municipal levels)
and Indigenous lands. The remote state of Amapa achieved a
score of 98, almost reaching the target value of 30% protection of
the coastal zone (Table 3, Figure S1 in Text S1). Amapa contains
the largest continuous extent of protected areas within the country
in what is called the Biodiversity Corridor of Amapa. In the coastal
zone, large areas have been set aside as fully protected and contain
representative ecosystems of the Amazonian region, including the
greatest extent of preserved mangroves in the Americas. Relatively
high scores were also achieved by Sao Paulo (75), Bahia (69) and
Table 2. Spatial resolution and geographic domain of goal calculations based on available input data and goal formulation.
Spatial resolution Goal or sub-goal Geographic Domain
Terrestrial coastlineCoastal waters (0–12 nmi)*
Federal waters (0–200 nmi)
Coastal State Clean Waters x x
Tourism and Recreation x
Mariculture (FP) x x
Lasting Special Places (SP) x x
Mixed State and National Carbon Storage x x
Coastal Protection x x
Habitats (BD) x x
National Fisheries (FP) x
Artisanal Opportunities x
Natural Products x
Livelihoods (LE) x x
Economies (LE) x x
Iconic Species (SP) x
Species (BD) x
Where sub-goals are shown, the respective goal is indicated in brackets (for acronyms see Table 1).doi:10.1371/journal.pone.0092589.t002
Brazil Ocean Health Index
PLOS ONE | www.plosone.org 5 April 2014 | Volume 9 | Issue 4 | e92589
Ta
ble
3.
Ove
rall
Ind
ex,
go
alan
dsu
b-g
oal
sco
res
for
Bra
zil
(co
un
try)
and
eac
hB
razi
lian
coas
tal
stat
e.
Re
gio
nF
PA
ON
PC
SC
PL
ET
RS
PC
WB
D
Ind
ex
FIS
MA
RL
IVE
CO
ICO
LS
PH
AB
SP
P
Bra
zil
60
42
36
66
22
98
99
25
65
24
83
14
74
84
87
79
58
57
4
Ala
go
as(A
L)5
54
03
31
59
28
90
89
55
51
46
22
46
33
20
60
94
82
70
Am
apa
(AP
)6
24
24
26
22
89
39
45
45
04
63
47
73
98
90
96
85
74
Bah
ia(B
A)
66
41
34
16
12
99
39
35
65
24
88
84
75
86
97
19
78
57
3
Ce
ara
(CA
)5
64
13
61
26
02
97
57
65
55
14
73
44
73
52
48
59
08
17
3
Esp
ırit
oSa
nto
(ES)
57
42
35
36
12
99
59
45
65
24
81
54
73
82
86
29
78
57
4
Mar
anh
ao(M
A)
57
40
34
06
02
88
78
85
55
04
69
46
53
60
79
93
82
72
Par
a(P
A)
55
41
34
06
02
89
29
35
55
04
61
46
37
29
74
96
84
72
Par
aıb
a(P
B)
55
40
33
15
92
88
78
95
55
14
61
14
64
44
36
29
38
27
1
Pe
rnam
bu
co(P
E)6
04
13
42
60
29
85
88
56
52
48
58
47
41
35
70
94
83
73
Pia
uı
(PI)
47
40
33
15
92
78
18
25
45
04
52
45
27
10
31
91
80
69
Par
ana
(PR
)6
04
24
02
76
32
99
59
65
65
34
93
48
53
59
85
99
87
76
Rio
De
Jan
eir
o(R
J)7
14
43
60
65
30
99
99
57
54
50
10
05
05
76
57
79
98
87
8
Rio
Gra
nd
eD
oN
ort
e(R
N)
50
40
34
55
92
83
37
45
55
04
63
34
63
21
77
97
77
47
1
Rio
Gra
nd
eD
oSu
l(R
S)6
04
33
60
63
30
10
01
00
57
53
49
54
94
23
58
41
00
88
77
San
taC
atar
ina
(SC
)6
24
24
66
66
22
99
39
45
65
24
93
74
83
93
17
79
98
77
5
Serg
ipe
(SE)
54
40
34
26
02
88
99
05
55
14
71
14
64
54
54
79
58
37
1
Sao
Pau
lo(S
P)
66
45
37
16
63
09
79
75
85
45
12
95
16
37
59
59
98
98
0
Emp
tyce
llsar
eg
oal
sn
ot
rele
van
tto
that
reg
ion
.Go
als
(tw
o-l
ett
er
cod
es)
and
sub
-go
als
(th
ree
-le
tte
rco
de
s)ar
ere
po
rte
dse
par
ate
ly;L
E,SP
and
BD
go
als
are
the
ave
rag
eo
fsu
b-g
oal
sco
res;
FPsc
ore
sar
eth
ew
eig
hte
dav
era
ge
of
sub
-go
alsc
ore
s.A
cro
nym
sar
eth
esa
me
asin
Tab
le1
.d
oi:1
0.1
37
1/j
ou
rnal
.po
ne
.00
92
58
9.t
00
3
Brazil Ocean Health Index
PLOS ONE | www.plosone.org 6 April 2014 | Volume 9 | Issue 4 | e92589
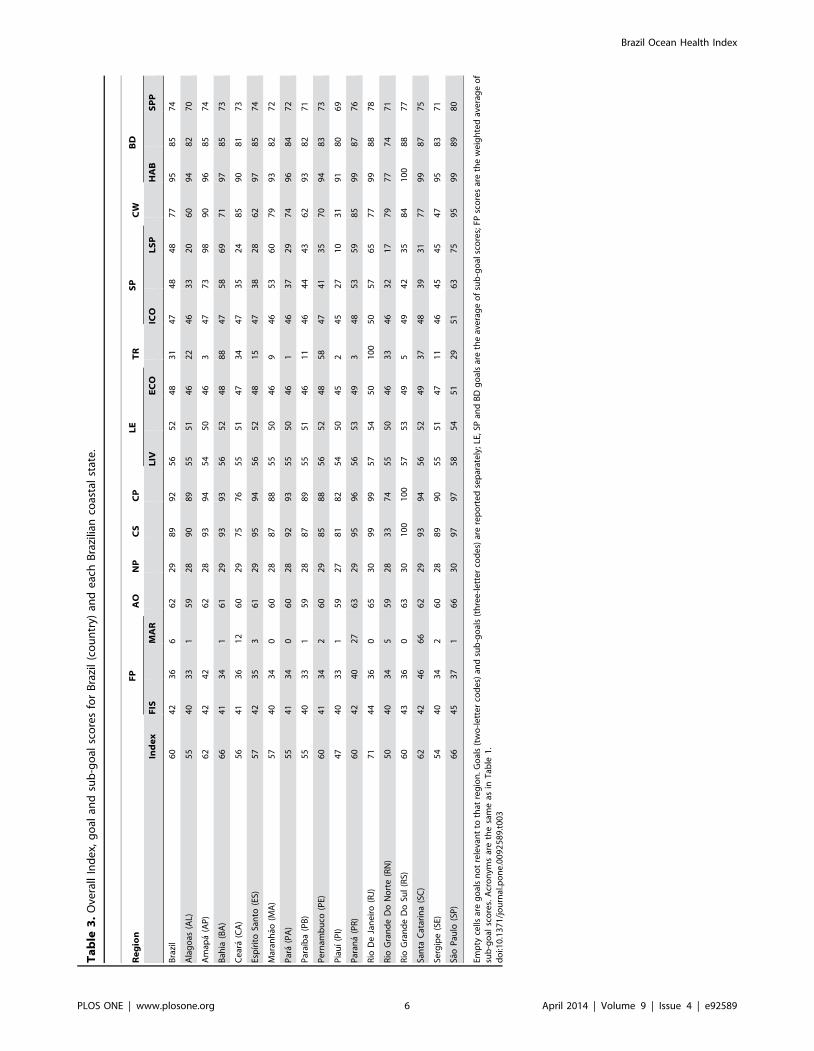
Rio de Janeiro (65) states, which contain a mosaic of areas, with a
larger contribution of sustainable use areas and indigenous lands.
States in the Northeast region of Brazil had the lowest scores, in
particular those with small coastal areas (Table 3, Figure S1 in
Text S1). Here, the majority of the population resides in urban
areas along the coast, and even sustainable use areas are few. In
our analysis, we chose not to include the category ‘‘Area de
Protecao Ambiental’’ (APA), which typically comprise vast areas
used for zoning multiple uses, not necessarily reflecting areas with
specific protection (see Text S1). We note that a high Lasting
Special Places score does not necessarily imply good biodiversity
conservation, as this goal is driven by the cultural values people
place on coastal areas (Table 1, Text S1).
The Tourism and Recreation goal had large variation in scores
(Table 3, Figure 2), reflecting the variable importance of coastal
tourism among regions. Rio de Janeiro (100), Bahia (88) and
Pernambuco (58) had the highest scores as these states have a
combination of high numbers and density of tourists (estimated by
the density of coastal hotel employees per state; see Text S1), and
are well known for the touristic attraction of their beaches and
coastal cities. States in the North and South of Brazil had the
lowest scores (with the exception of Santa Catarina).
Figure 2. Goal and sub-goals calculated using state-level data.doi:10.1371/journal.pone.0092589.g002
Figure 3. Goal and sub-goals using data from mixed national and state-level scales.doi:10.1371/journal.pone.0092589.g003
Brazil Ocean Health Index
PLOS ONE | www.plosone.org 7 April 2014 | Volume 9 | Issue 4 | e92589
Scores for the Clean Waters goal (Table 3, Figure 2) revealed
that poorly developed states with low access to sanitation and
waste management services, but low population densities (Amapa:
90), can score similarly to densely populated areas with good
access to services (Sao Paulo: 95). However, only resident
population density of coastal municipalities was used in estimating
the Trash and Pathogen components of this goal. Many coastal
urban areas receive a large influx of tourists in summer months,
putting pressure on local infrastructure, including sanitation and
waste management services [9], and likely polluting coastal waters,
but these data are not available.
Perhaps unsurprisingly, a state’s level of development influences
its current and likely future status score. States with stronger
economies, and better infrastructure and management, such as
Sao Paulo and Rio de Janeiro, are more likely to pursue
sustainable development paths and improve their Index scores,
while less developed states show the opposite trend (Figure 4).
Lessons Learned from Regional Application of the IndexHere we compare results from this case-study with scores for
Brazil from the global analysis (year 2012; reported in Halpern et
al. [2]) to help illustrate how regional applications of the Index
may differ from global ones, and highlight what can be learned
from efforts to conduct regional assessments. We note that some
methodological changes and data updates affecting goal models
have occurred recently and were used to calculate the global
Ocean Health Index for year 2013; they also have been used to
recalculate the Index for all countries for year 2012 (see
oceanhealthindex.org/about/methods for details). However, we
have chosen to focus on how results from the present case study
relate to those from the initial, published assessment in Halpern et
al. [2] as both share more methodological approaches. This allows
a more direct comparison between global scores for Brazil and the
results from this regional study, as differences are due to higher
quality regional data, more direct measures of ocean health, and
case-study specific model changes.
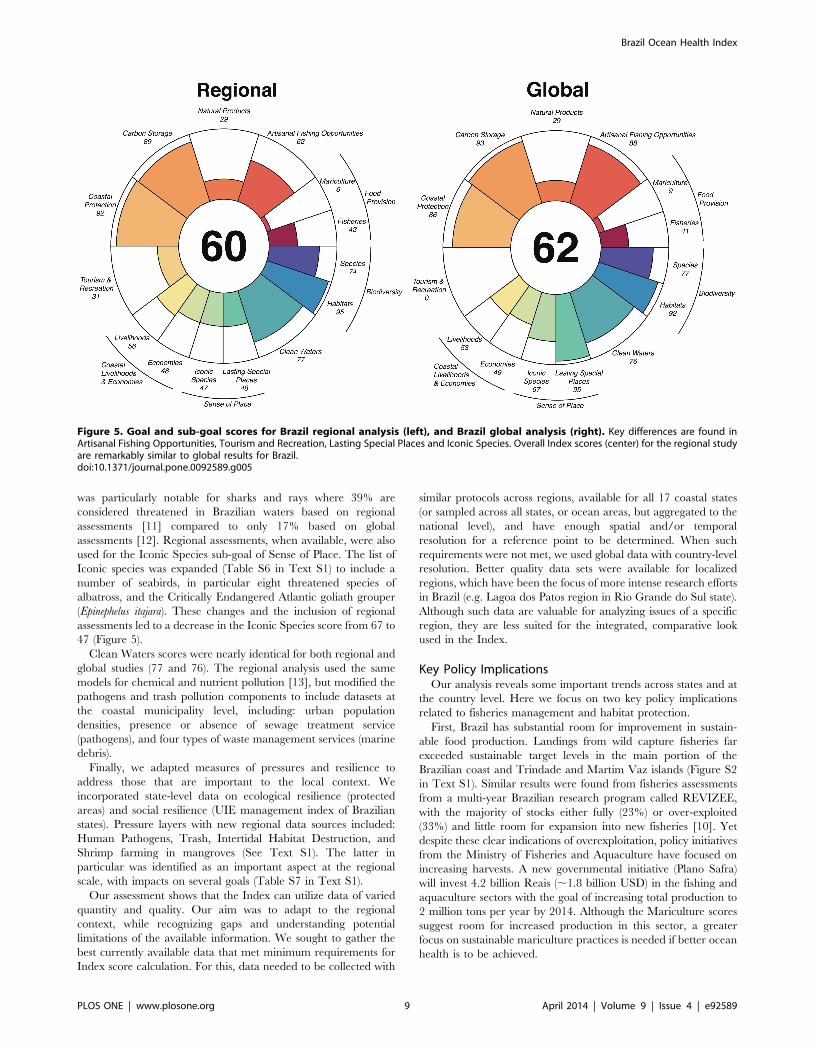
For some goals, the national scores remained similar to those
from the global assessment [2], for example Mariculture and
Clean Waters (Figure 5), even when significant model and/or data
changes were made. As a consequence, the overall Index score for
Brazil (60) was remarkably similar to the country score derived
from the global analysis (62; Figure 5). These similarities suggest
the Index may be able to broadly characterize ocean health even
with poorer-quality, global-scale data.
The Index framework was designed to be flexible to different
societal values and data contexts. Important model changes were
made to some goals to reflect local conditions or to incorporate
higher quality data. Below we discuss some changes to goal models
and data layers and how they impact resulting scores.
The Food Production goal was analyzed using the same
conceptual framework as in Halpern et al. [2], with some model
adjustments (see Text S1). For the Mariculture sub-goal, we used
national harvest statistics reported by each state, rather than
country-level FAO statistics. Such data were not available for
assessing the wild-capture component, the Fisheries sub-goal, of
Food Production. For Mariculture, we were able to improve the
estimation of the reference yield for each cultured species using
historic time series of production; we also refined the total area of
production available within each state (Text S1).
The Artisanal Opportunity goal scored lower than the global
analysis (62 versus 88). The global model considered several
aspects potentially related to the need and opportunity for people
to fish artisanally, including regulations targeted to artisanal,
subsistence and recreational fishing [2]. Until 2004, most fisheries
in Brazil were considered ‘‘uncontrolled species’’ for which no
management measures were in place [10]. For this reason, our
model assumes that the opportunity to fish artisanally in Brazil is
not limited by regulated access, but mainly by the condition of
stocks. The lower Artisanal Opportunity score is indicative of the
high proportion of stocks that fall within the overexploited,
collapsed and rebuilding categories (for the most recent year
(2006): 13%, 25% and 15%, respectively). The goal was calculated
nationally, though significant regional differences likely exist. At
present, standardized time series of small-scale fisheries landings
are scarce, but would greatly increase the accuracy of this goal.
For Tourism and Recreation we used fine-scale data on hotel
employment at the coastal municipality level, providing a better
picture of ocean-related tourism than that derived from interna-
tional arrivals data (used in Halpern et al. [2]). Data used here are
of better quality and more comprehensive, as they also capture
local participation in recreation. This altered the national
aggregate score from 0 to 31 (Figure 5). The case-study approach
has since helped to inform the global analysis, such that evaluation
of the Tourism and Recreation goal in the updated assessment is
now based on employment in the tourism sector, although without
the benefit of higher spatial resolution data, as were available here
(global data report the total number of jobs, not jobs within the
coastal region).
For Biodiversity, regional assessments of threatened species
showed significant differences from IUCN global assessments. For
species assessed both globally and nationally, 58% held the same
threat category, 33% had a higher risk of extinction, and 9% had a
lower risk of extinction in national assessments. This difference
Figure 4. Current and likely future status for each state’soverall Index score (axis values) and the value from anindependent measure of development status (IFDM) used inBrazil (size of data point). Points below the dashed line are trendingnegatively into the future, and above are trending positively. IFDMscores range from 0 to 1 (low development = 0–0.4, averagedevelopment = 0.4–0.6, moderate development = 0.6–0.8, and highdevelopment = 0.8–1).doi:10.1371/journal.pone.0092589.g004
Brazil Ocean Health Index
PLOS ONE | www.plosone.org 8 April 2014 | Volume 9 | Issue 4 | e92589
was particularly notable for sharks and rays where 39% are
considered threatened in Brazilian waters based on regional
assessments [11] compared to only 17% based on global
assessments [12]. Regional assessments, when available, were also
used for the Iconic Species sub-goal of Sense of Place. The list of
Iconic species was expanded (Table S6 in Text S1) to include a
number of seabirds, in particular eight threatened species of
albatross, and the Critically Endangered Atlantic goliath grouper
(Epinephelus itajara). These changes and the inclusion of regional
assessments led to a decrease in the Iconic Species score from 67 to
47 (Figure 5).
Clean Waters scores were nearly identical for both regional and
global studies (77 and 76). The regional analysis used the same
models for chemical and nutrient pollution [13], but modified the
pathogens and trash pollution components to include datasets at
the coastal municipality level, including: urban population
densities, presence or absence of sewage treatment service
(pathogens), and four types of waste management services (marine
debris).
Finally, we adapted measures of pressures and resilience to
address those that are important to the local context. We
incorporated state-level data on ecological resilience (protected
areas) and social resilience (UIE management index of Brazilian
states). Pressure layers with new regional data sources included:
Human Pathogens, Trash, Intertidal Habitat Destruction, and
Shrimp farming in mangroves (See Text S1). The latter in
particular was identified as an important aspect at the regional
scale, with impacts on several goals (Table S7 in Text S1).
Our assessment shows that the Index can utilize data of varied
quantity and quality. Our aim was to adapt to the regional
context, while recognizing gaps and understanding potential
limitations of the available information. We sought to gather the
best currently available data that met minimum requirements for
Index score calculation. For this, data needed to be collected with
similar protocols across regions, available for all 17 coastal states
(or sampled across all states, or ocean areas, but aggregated to the
national level), and have enough spatial and/or temporal
resolution for a reference point to be determined. When such
requirements were not met, we used global data with country-level
resolution. Better quality data sets were available for localized
regions, which have been the focus of more intense research efforts
in Brazil (e.g. Lagoa dos Patos region in Rio Grande do Sul state).
Although such data are valuable for analyzing issues of a specific
region, they are less suited for the integrated, comparative look
used in the Index.
Key Policy ImplicationsOur analysis reveals some important trends across states and at
the country level. Here we focus on two key policy implications
related to fisheries management and habitat protection.
First, Brazil has substantial room for improvement in sustain-
able food production. Landings from wild capture fisheries far
exceeded sustainable target levels in the main portion of the
Brazilian coast and Trindade and Martim Vaz islands (Figure S2
in Text S1). Similar results were found from fisheries assessments
from a multi-year Brazilian research program called REVIZEE,
with the majority of stocks either fully (23%) or over-exploited
(33%) and little room for expansion into new fisheries [10]. Yet
despite these clear indications of overexploitation, policy initiatives
from the Ministry of Fisheries and Aquaculture have focused on
increasing harvests. A new governmental initiative (Plano Safra)
will invest 4.2 billion Reais (,1.8 billion USD) in the fishing and
aquaculture sectors with the goal of increasing total production to
2 million tons per year by 2014. Although the Mariculture scores
suggest room for increased production in this sector, a greater
focus on sustainable mariculture practices is needed if better ocean
health is to be achieved.
Figure 5. Goal and sub-goal scores for Brazil regional analysis (left), and Brazil global analysis (right). Key differences are found inArtisanal Fishing Opportunities, Tourism and Recreation, Lasting Special Places and Iconic Species. Overall Index scores (center) for the regional studyare remarkably similar to global results for Brazil.doi:10.1371/journal.pone.0092589.g005
Brazil Ocean Health Index
PLOS ONE | www.plosone.org 9 April 2014 | Volume 9 | Issue 4 | e92589
Fisheries management in Brazil has been characterized by
decades of open access to most fisheries and consequently to high
fishing exploitation levels impacting both sustainability and
profitability of its fisheries [10]. Brazilian policies for foreign fleets
operating in the outer continental shelf and continental slope lack
even minimal monitoring and enforcement, contributing to the
decline of landings of many demersal stocks [14]. Substantial
changes in current management of fisheries are needed, including
implementation of a comprehensive and permanent monitoring
system to evaluate stock status, and establishment of catch limits
and other measures to protect and allow the rebuilding of marine
resources, where needed.
The second set of policy implications relate to habitat-based
goals. In our analysis, only 12% of the coastal zone (defined as
1 km inland and 3 nmi offshore) was in protected areas. These
areas only cover 0.35% of the Brazilian EEZ (as noted above,
APAs were excluded). This falls well below the target of 10%
marine area to be protected by 2020 under the Convention of
Biological Diversity [15]. A network of marine protected areas
(MPAs) is important for protecting key habitats such as coral reefs
[16], as well as other habitats not included in our analysis [17,18].
For example, the largest contiguous rhodolith bed in the world has
recently been mapped off eastern Brazil, and is estimated to
account for 5% of the world’s total carbonate banks, playing a
significant role in carbon storage [19], but remains totally
unprotected.
With an immense coastline and diverse coastal habitats, Brazil
still lacks systematic mapping and monitoring data for its marine
habitats. Although initiatives for broad-scale mapping and
monitoring of marine and coastal habitats are emerging in Brazil
(e.g. SISBiota: www.sisbiota.ufsc.br, and Rebentos: http://
rebentos.org/), data from these projects were not yet available at
the time of this study. For our analysis, we found that seagrass beds
monitored with similar protocols currently exist for only 3 sites and
coral reef data from repeated surveys were available for only 11
sites. Continuous, rather than sporadic or one-time monitoring of
key sites for coastal and marine habitats is a priority. In the future
it will be important to include habitats not yet incorporated in this
study, such as seamounts, mesophotic and deep corals, and algae
banks. More comprehensive and systematic mapping of marine
habitats provides benchmarks that are useful to understand the
effects of new developing activities and enables to detect in a
timely manner the effects of potentially competing interests, such
as oil development and offshore leasing occurring in Brazil, so as to
regulate these activities based on management priorities.
While data are available for some economic sectors (e.g.
tourism, mariculture, waste disposal, and protected areas), the
country lacks monitoring plans for many of the types of
information required to understand human uses of the marine
environment, thus posing a practical challenge for long-term
management of the health of marine ecosystems. Notwithstanding,
we found that the Index can be a useful metric, using currently
available information for illuminating ecological and social
patterns related to ocean health. We also showed how it is a
scalable, flexible approach that can be applied at different
management units, and this flexibility will allow incorporating
newer and more relevant data as these become available.
The results presented here represent a first attempt to assess
ocean health in a comprehensive manner for Brazil. As such, this
study offers an important baseline against which future change can
be measured. It also highlights where better information is needed,
and can help to guide policy and management actions at national
and sub-national scales.
Supporting Information
Text S1 Supporting Information.
(DOCX)
Acknowledgments
We are grateful to the Brazilian Ministry of the Environment, and the
Chico Mendes Institute for Biodiversity Conservation for help with
obtaining regional data. We would like to thank Monica Brick Peres,
Estevao Carino Fernandes de Souza, Ugo Eichler Vercillo and Steve
Katona for their valuable input. A number of additional scientists
contributed advice on regional datasets. We would also like to thank two
anonymous referees for their useful feedback.
Author Contributions
Conceived and designed the experiments: CTE CL BSH CS TP GD.
Performed the experiments: CTE CL TP. Analyzed the data: CTE DH
BDB BSH CS. Contributed reagents/materials/analysis tools: CTE BSH
DH BDB GD TP. Wrote the paper: CTE CL BSH GD.
References
1. IMF (2013) Report for selected countries and subjects. World Economic Outlook
Database, International Monetary Fund. Available at: http://www.imf.org/
external/pubs/ft/weo/2012/02/weodata/index.aspx Accessed 3 July 2013.
2. Halpern BS, Longo C, Hardy D, McLeod KL, Samhouri JF, et al. (2012) An
index to assess the health and benefits of the global ocean. Nature 488: 615–622.
3. Rapport DJ, Bohm G, Buckingham D, Cairns J Jr., Costanza R, et al. (1999)
Ecosystem health: the concept, the ISEH, and the important tasks ahead.
Ecosystem Health 5:82–90.
4. Millennium Ecosystem Assessment (2005) Ecosystems and Human Well-Being:
Synthesis Report. Island Press, Washington, DC.
5. Samhouri JF, Lester SE, Selig ER, Halpern BS, Fogarty MJ, et al. (2012) Sea
sick? Setting targets to assess ocean health and ecosystem services. Ecosphere 3:
art41.
6. Halpern BS, Longo C, McLeod KL, Cooke R, Frischhoff B, et al. (2013) Elicited
preferences for components of ocean health in the California Current. Marine
Policy 42:68–73.
7. Tobey J, Clay J, Vergne P (1998) Maintaining a balance: the economic,
environmental and social impacts of shrimp farming in Latin America. Coastal
Resources Center, University of Rhode Island, Narragansett, RI, USA.
8. Guimaraes AS (2005) Carcinicultura marinha brasileira: sustentabilidade,
reflexoes historicas e situacao atual. Monograph, Department of Oceanography,
Federal University of Pernambuco.
9. Polette M, Raucci GD (2003) Methodological proposal for carrying capacity
analysis in sandy beaches: a case study at the central beach of Balneario
Camboriu (Santa Catarina, Brazil). Journal of Coastal Research SI 35: 94–106.
10. MMA (2006) Relatorio Executivo Programa REVIZEE: Avaliacao do potencial
sustentavel de recursos vivos na Zona Economica Exclusiva. Ministerio do Meio
Ambiente (MMA), Brasılia.
11. Peres MB, Barreto R, Lessa R, Vooren C, Charvet P, et al. (2012) Heavy fishing
puts Brazilian sharks and rays in great trouble. Abstract. 6th World Fisheries
Congress, 7–11 May 2012, Edinburgh, Scotland. p.21.
12. Polidoro BA, Livingstone SR, Carpenter KE, Hutchinson B, Mast RB, et al.
(2008) Status of the world’s marine species. In: Vie JC, Hilton-Taylor C, Stuart
SN, editors. The 2008 Review of the IUCN Red List of Threatened Species.
IUCN, Gland, Switzerland.
13. Halpern BS, Walbridge S, Selkoe KA, Kappel CV, Micheli F, et al. (2008) A
global map of human impact on marine ecosystems. Science 319: 948–952.
14. Perez JAA, Pezzuto PR, Lucato SHB, Vale WG (2003) Frota de arrasto de Santa
Catarina. In: Cergole MC, Rossi-Wongtscowski CLDB, editors. Dinamica das
frotas pesqueiras – Analise das principais pescarias comerciais do Sudeste-Sul do
Brasil. Avaliacao do potencial sustentavel de recursos vivos na Zona Economica
Exclusiva, Programa REVIZEE, Score Sul. Evoluir, Sao Paulo, pp. 117–183.
15. CBD (2010) Strategic plan for biodiversity 2011–2020, including Aichi
biodiversity targets. Available from: http://www.cbd.int/sp/targets. Accessed
5 November 2012.
16. Selig ER, Bruno JF (2010) A Global Analysis of the Effectiveness of Marine
Protected Areas in Preventing Coral Loss. PLoS ONE 5: e9278. DOI:10.1371/
journal.pone.0009278
Brazil Ocean Health Index
PLOS ONE | www.plosone.org 10 April 2014 | Volume 9 | Issue 4 | e92589

17. Koslow JA, Gowlett-Holmes K, Lowry JK, O’Hara T, Poore GCB, et al. (2001)
Seamount benthic macrofauna off southern Tasmania: community structure andimpacts of trawling. Marine Ecology Progress Series 213:111–125.
18. Marone E, Dutra GF, Prates APL, Soares MLG, Goncalves MA (2012) Biomas
Costeiro e Marinho. In: Scarano FR. Biomas Brasileiros: retratos de um paısplural. Rio de Janeiro: Casa da Palavra e Conservacao Internacional.
19. Amado-Filho GM, Moura RL, Bastos AC, Salgado LT, Sumida PY, et al. (2012)
Rhodolith beds are a major CaCO3 bio-factories in the tropical south west
Atlantic. PLoSONE 7: e35171.
Brazil Ocean Health Index
PLOS ONE | www.plosone.org 11 April 2014 | Volume 9 | Issue 4 | e92589
Copyright © 2022 FDOKUMEN