Atmosphere-ocean dynamics in the Western Indian Ocean recorded in corals
25
doi: 10.1098/rsta.2004.1482 , 121-142 363 2005 Phil. Trans. R. Soc. A C. Dullo and G. R. Davies - J. Zinke, M. Pfeiffer, O. Timm, W. recorded in corals ocean dynamics in the Western Indian Ocean - Atmosphere Email alerting service here right-hand corner of the article or click Receive free email alerts when new articles cite this article - sign up in the box at the top http://rsta.royalsocietypublishing.org/subscriptions go to: Phil. Trans. R. Soc. A To subscribe to This journal is © 2005 The Royal Society on May 18, 2011 rsta.royalsocietypublishing.org Downloaded from
Transcript of Atmosphere-ocean dynamics in the Western Indian Ocean recorded in corals

doi: 10.1098/rsta.2004.1482, 121-142363 2005 Phil. Trans. R. Soc. A
C. Dullo and G. R. Davies−J. Zinke, M. Pfeiffer, O. Timm, W.
recorded in corals
ocean dynamics in the Western Indian Ocean−Atmosphere
Email alerting service hereright-hand corner of the article or click Receive free email alerts when new articles cite this article - sign up in the box at the top
http://rsta.royalsocietypublishing.org/subscriptions go to: Phil. Trans. R. Soc. ATo subscribe to
This journal is © 2005 The Royal Society
on May 18, 2011rsta.royalsocietypublishing.orgDownloaded from
Phil. Trans. R. Soc. A (2005) 363, 121–142doi:10.1098/rsta.2004.1482
Published online 12 November 2004
Atmosphere–ocean dynamics in the WesternIndian Ocean recorded in corals
By J. Zinke1, M. Pfeiffer
2, O. Timm
2,
W.-C. Dullo2
and G. R. Davies1
1Vrije Universiteit Amsterdam, De Boelelaan 1085,1081 HV Amsterdam, The Netherlands ([email protected])
2Leibniz Institut fur Meereswissenschaften, IFM-GEOMAR,Department of Ocean Circulation and Climate, Wischhofstrasse 1-3,
24148 Kiel, Germany ([email protected])
We present a set of Porites coral oxygen isotope records from the tropical and sub-tropical Western Indian Ocean covering the past 120–336 years. All records werethoroughly validated for proxy response to regional climate factors and their rela-tion to large-scale climate modes. The records show markedly different imprintsof regional climate factors. At the same time, all coral records show clear telecon-nections between the Western Indian Ocean and the El Nino–Southern Oscillation(ENSO). The multi-proxy site analysis enables the detection of the covariance struc-ture between individual records and climate modes such as ENSO. This methodunravels shifts in ENSO teleconnectivity of the Western and Central Indian Oceanon multi-decadal time-scales (after 1976). The Seychelles record shows a stationarycorrelation with ENSO, Chagos corals show evidence for non-stationary δ18O/ENSOrelationships and the Southwestern Indian Ocean corals show a strong relationshipwith ENSO when the forcing is strong (1880–1920, 1970 to present).
Our results indicate that the coral δ18O, in combination with other proxies, canbe used to monitor temporal and spatial variations in the sea-surface temperatureand the fresh water balance within the Indian Ocean on interannual to interdecadaltime-scales.
Keywords: oxygen isotopes; Sr/Ca ratios;El Nino–Southern Oscillation (ENSO); monsoon
1. Introduction
Geochemical parameters in skeletons of massive corals have been used to infer pastchanges in climate on interannual to multidecadal time-scales, e.g. sea-surface tem-perature (SST), sea-surface salinity (SSS), upwelling, river run-off and oceanic advec-tion (Cole et al . 1993, 2000; Druffel & Griffin 1993; Dunbar et al . 1994; McCullochet al . 1994; Charles et al . 1997, 2003; Gagan et al . 1998; Quinn et al . 1998; Kuh-nert et al . 2000; Le Bec et al . 2000; Linsley et al . 2000; Juillet-Leclerc & Schmidt
One contribution of 24 to a Discussion Meeting ‘Atmosphere–ocean–ecology dynamics in the WesternIndian Ocean’.
121c© 2004 The Royal Society
on May 18, 2011rsta.royalsocietypublishing.orgDownloaded from
122 J. Zinke, M. Pfeiffer, O. Timm, W.-C. Dullo and G. R. Davies
latit
ude
30º E 60º E 90º E 120º Elongitude
latit
ude
30º S
0
30º N
30º S
0
30º N
(a)
b)
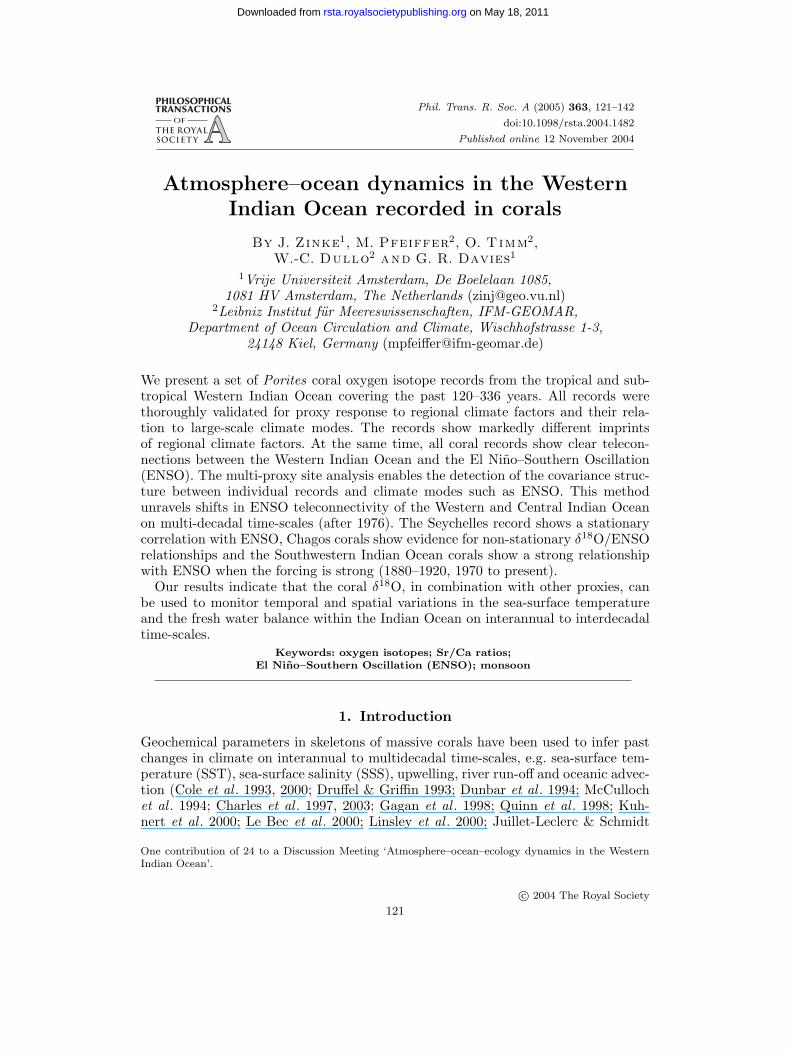
Figure 1. Map of coral core locations superimposed on (a) annual SST range averaged between1981 and 2003 (from Reynolds et al . 2002) and (b) precipitation climatology (mm per month) forJanuary averaged between 1979 and 2003. January is on average the wettest month for all loca-tions (http://iridl.ldeo.columbia.edu/). The coral sites are indicated as follows: SE, Seychelles;CH, Chagos; RE, Reunion; MA, Mayotte; IF, Ifaty.
2001; Hendy et al . 2002; Marshall & McCulloch 2002; Quinn & Sampson 2002). Theoxygen isotope composition is the most widely used tool in coral palaeoclimatol-ogy. In regions with a constant hydrological balance, δ18O provides SST variations,and in regions with variations in the evaporation–precipitation (EP) balance and/oroceanic advection, it provides variations in the isotopic composition of sea water(δ18Osea water). Sr/Ca ratios have been shown to be the most robust thermome-ter in corals unaffected by sea-water variations (Alibert & McCulloch 1997; Gagan
Phil. Trans. R. Soc. A (2005)
on May 18, 2011rsta.royalsocietypublishing.orgDownloaded from

Atmosphere–ocean dynamics in corals 123
et al . 1998; Marshall & McCulloch 2002; Quinn & Sampson 2002). Consequently,coupled measurements of coral Sr/Ca ratios and δ18O therefore allow reconstruc-tion of past changes in δ18O of sea water by subtracting the thermal component ofδ18O based on the Sr/Ca-SST estimates (Correge et al . 2000; Hendy et al . 2002;Ren et al . 2002). The effect of salinity can be resolved from the residual δ18O sig-nal [∆δ18O = ∂δ18O/∂T ∗[T18O − TSr/Ca]] by using the relationship between salinityand δ18Osea water inferred from observations and modelling studies (Schmidt 1999;Delaygue et al . 2001).
The importance of corals as a palaeoproxy is that their potentially long lifetime(100–400 years) and fast growth rate (1–2 cm yr−1) provides high-resolution geo-chemical records for several centuries that allow study of natural climate variabilityunder different boundary conditions, such as during the so-called Little Ice Age(1400–1850). In particular, fossil corals can provide insight into seasonality changesduring the Holocene (last 10 kyr) or the Last Interglacial (125–131 kyr) (Gagan etal . 1998; Hughen et al . 1999; Correge et al . 2000; Tudhope et al . 2001). Such infor-mation is key to understanding the processes that controlled past climate variationsand hence predicting future climate change.
Recent coral records in the Indian Ocean show great potential for resolving theEl Nino–Southern Oscillation (ENSO) and monsoon interaction as expressed in SSTvariations (Charles et al . 1997, 2003; Cole et al . 2000; Cobb et al . 2001; Zinke etal . 2004a, b) and precipitation anomalies (Pfeiffer et al . 2004a). In addition, oceanicvariability (Tudhope et al . 1996; Kuhnert et al . 1999, 2000) and internal IndianOcean phenomena, such as the tropical dipole mode, are manifested in several coralrecords (Marshall & McCulloch 2001; Abram et al . 2003). Instrumental records ofclimate variability from the Western Indian Ocean are generally scarce and shortand thus do not fully delimit the extent to which ENSO or internal Indian Oceanphenomena modulate interannual and interdecadal SST variability. In contrast, high-resolution coral records dating back several centuries provide an excellent tool forthe reconstruction of past surface ocean variability.
Here, we present a set of coral records from Porites sp. from the Western IndianOcean covering the past 120–336 years. We show the results of oxygen isotope andtrace element studies and their link to regional and global climatic patterns. The fol-lowing questions will be addressed using coral δ18O records from the Western IndianOcean. Are the coral δ18O records representative for regional climate variability,i.e. SST and/or precipitation? Does the EP balance changes through time, and if so,on what time-scales? Does coral δ18O record variations in the South Equatorial Cur-rent (SEC) and Indonesian Throughflow? Is the zonal tropical Indian Ocean–ENSOteleconnection stable through time?
2. Regional setting of the coral sites
The climate of the Indian Ocean north of 10◦ S is dominated by the Asian mon-soon system, which is characterized by a seasonal reversal of surface winds and adistinct seasonality in precipitation (Webster et al . 1998). The monsoon circulationis driven by the pressure gradients resulting from differential heating of land andocean, modified by the rotation of the Earth. During boreal winter (NE monsoon),northeasterlies originating from the area of high surface pressure over the cold SouthAsian continent sweep over the Northern Indian Ocean. These airstreams meet the
Phil. Trans. R. Soc. A (2005)
on May 18, 2011rsta.royalsocietypublishing.orgDownloaded from

124 J. Zinke, M. Pfeiffer, O. Timm, W.-C. Dullo and G. R. Davies
Southern Hemisphere southeast trade winds in the Intertropical Convergence Zone(ITCZ). This zone is broadly embedded in a zone of high SSTs, and also featuresmarked convergence and abundant precipitation. Very pronounced changes in tem-perature and airflow fields take place in April and May, marking the changeoverto summer monsoon circulations. The circulation of the boreal summer monsoonis characterized by the highest surface temperatures over the South Asian continentand the adjacent sea areas. Maximum wind speeds occur in the Arabian Sea, the Bayof Bengal and in the core of the Southern Hemisphere trades. Evaporation is highin the regions of maximum wind intensity, and consequently the bulk of the mois-ture precipitated over southern Asia during the summer monsoon originates fromthe Southern Hemisphere (Hastenrath & Greischar 1993).
The strongest interannual signal in the Indian Ocean climate is the ENSO (Juryet al . 2002; Allan et al . 2003; Krishnamurthy & Kirtman 2003). The ENSO telecon-nection pattern is modulated by interdecadal changes. Webster et al . (1998) distin-guished three different regimes in ENSO-monsoon variability:
(i) before 1920, the two weather phenomena showed high variance and were tightlycoupled;
(ii) from 1920 to 1960, there was little variability and correlations were zero; and
(iii) after 1960, there was high variance and higher correlations.
Kumar et al . (1999) reported that the historical relationship between the Asianmonsoon and ENSO has broken down in recent decades, with reduced monsoonvariability even when ENSO is strong.
The coral records assembled here were collected from tropical to subtropical regionswithin the Western Indian Ocean that are influenced by natural modes of oscillationin the Indian Ocean (monsoon) and also show strong interannual variability associ-ated with the ENSO phenomenon (figure 1). The tropical sites include Seychelles,the Chagos Archipelago and Mayotte (Comoro Archipelago), and the subtropicalsites include La Reunion and Ifaty (off Southwestern Madagascar).
The Chagos Archipelago lies in the central tropical Indian Ocean within a regionwith the highest total annual rainfall in the entire Indian Ocean (5◦ S, 73◦ E, fig-ure 1b). Precipitation maxima at Chagos usually occur during the NE monsoon(December–February), when the Chagos is under the influence of the ITCZ. Theisotopic composition of rainfall has been measured at Diego Garcia, an atoll in thesouth of the Chagos Archipelago. Measurements show that rainfall is depleted inδ18O during the NE monsoon (International Atomic Energy Agency 1994). ChagosSSTs are relatively stable throughout the year, varying by less than 2 ◦C annually(Reynolds & Smith 1994). During warm ENSO events, precipitation significantlyincreases while SST typically increases by 0.5–1 ◦C (Reynolds & Smith 1994). TheChagos coral records were examined to see if coral δ18O reflects rainfall variability,i.e. ITCZ variability and to establish the robustness of the ENSO winter monsoonrainfall teleconnection.
The climate of the granitic Seychelles (Mahe; 5◦ S, 55◦ E) is dominated by theseasonal reversal of the monsoon. During the boreal summer, the southwest monsoonseason, Mahe experiences southwesterly trade winds. It is the cool and dry season ofthe year and evaporation is high. The trades are stronger on the eastern coast of the
Phil. Trans. R. Soc. A (2005)
on May 18, 2011rsta.royalsocietypublishing.orgDownloaded from

Atmosphere–ocean dynamics in corals 125
island. This is due to the high relief of Mahe island (900 m) that produces an effectiveclimatic barrier for lower tropospheric winds. During the boreal winter, the island isinfluenced by the ITCZ and most of the total annual rainfall falls during that season.Local climatic differences during this season are less pronounced. SSTs in Seychellesvary seasonally by ca. 3–4 ◦C (figure 1a). The Seychelles lie within a region whereENSO-induced SST anomalies exceed 0.5 ◦C (figure 2). The Mahe coral records wereexamined to determine whether they are a good proxy of SST variability on seasonalto decadal time-scales and whether they represent a good palaeo-monsoon proxy. Wealso determine whether the ENSO teleconnection has been stable through time.
Mayotte (13◦ S, 45◦ E) is situated within the Northern Mozambique Channel, andthe climate is dominated by the seasonal reversal of the monsoon (figure 1). TheNE monsoon season is very warm and humid, and evaporation is high. During theboreal summer, the southwesterly trades are less powerful due to the orographic effectof Madagascar. Mayotte also lies within a region of tropical cyclone activity. SSTsvary seasonally by 3–4 ◦C (figure 1a). ENSO-induced SST anomalies exceed 0.5 ◦C(figure 2). This study assesses whether or not changes in the EP balance influencecoral δ18O, and, if so, on what time-scales. The stability of the ENSO teleconnectionat this site is compared with that of the Seychelles.
La Reunion (21◦ S, 55◦ E) is situated within the southern subtropical Indian Oceanand the climate is dominated by the year-round southeasterly trade winds. Evapora-tion exceeds precipitation in the annual mean. SST has an annual average variationof ca. 4 ◦C (figure 1a). Reunion lies within the path of the South Equatorial Cur-rent (SEC), which is the most powerful and persistent current in the Indian Oceanand carries the bulk of the waters from the Indonesian Throughflow (Gordon et al .1997). Recent observations show substantial variability in the transport of Indone-sian Throughflow waters during ENSO episodes (Meyers 1996; Godfrey 1996). Inaddition, historical salinity measurements show a strengthening of the SEC in the1950–1975 interval compared with the present (Conkright et al . 2001). This paperexamines the coral records to establish whether the EP balance or salinity in theSouthwestern Indian Ocean change over time, and the relationship between coralδ18O and ENSO. A fundamental question is the degree to which the coral δ18Orecord indicates variations in the strength of the SEC and Indonesian Throughflow.
Ifaty reef (23◦ S, 43◦ E) lies off the southwestern coast of Madagascar in the pathof the southward flow through the Mozambique Channel (figure 1). This flow ispart of the warm surface flow of the global ocean circulation (DiMarco et al . 2002;de Ruijter et al . 2002, 2004; Schouten et al . 2002, 2003). The climate is dominatedyear round by the southeasterly trades and evaporation exceeds precipitation in theannual mean. Precipitation only reaches significant amounts during December–March(figure 1b), and is associated with the SE–NW orientated cloud bands stretching fromthe Western Indian Ocean towards South Africa (Todd & Washington 1999). SSTvaries seasonally by 6 ◦C (figure 1a; Reynolds & Smith 1994). ENSO is known toinfluence the EP balance over the Southwestern Indian Ocean and southern Africa(Tyson 1986; Reason & Mulenga 1999; Reason & Rouault 2002; Richard et al . 2000).This paper uses the coral record to determine whether the EP balance has changedthrough time and if so, whether it has been influenced by ENSO. Research questionsfocus on the stability of the ENSO teleconnection through time and the degree towhich regional processes contribute to changes in the EP balance.
Phil. Trans. R. Soc. A (2005)
on May 18, 2011rsta.royalsocietypublishing.orgDownloaded from

126 J. Zinke, M. Pfeiffer, O. Timm, W.-C. Dullo and G. R. Davies
Sr/Ca ratio
8.6
9.0
9.4
Sr/C
a
δ18O Ifat
y-4
May
otte
, And
3
1880
1900
1940
1980
Réu
nion
, Le
Can
yon
1
year
year
Cha
gos,
GIM
8.8
9.0
9.3
9.6
1650
1750
1850
1950
1950Sr
/Ca
Sr/Ca ratio40º
E60
º E
80º
E10
0º E
120º
E
-0.5
0
0
00.5
0.5
1
1
1
1
12
230
º N
20º
N
10º
N
10º
S
20º
S
0º
−5.0
−5.5
−4.0
−4.5
−5.2
−5.4
−4.8
−5.0
−3.5
1920
1960
1995
δ18O
δ18O−5
.0
−4.0
−4.5
δ18O
−5.0
−4.0
−4.5
−4.5
δ18O
−5.1
−3.5
−4.3
δ18Oδ18O
The
Sey
chel
les,
NE
P
1840
1860
1880
1900
1920
1940
1960
1980
2000
year
1860
1880
1900
1920
1940
1960
1980
2000
1700
1800
1900
2000
year
1840
1860
1900
1980
year
1880
1920
1940
1960
1995
0.5
1.5
0.5
2.5
0.5
1.5
0.5 0.
5
1.5
Figure 2. Map of coral core locations superimposed on the February 1998 SST anomaly field(from Reynolds et al . 2002) illustrating their sensitivity to SST anomalies during the strongENSO of 1998 (http://iridl.ldeo.columbia.edu/). The sources for the coral data are as follows:Chagos, Reunion and Seychelles (Pfeiffer 2002; Pfeiffer et al . 2004a–c), Mayotte and Ifaty (Zinkeet al . 2004a, b).
Phil. Trans. R. Soc. A (2005)
on May 18, 2011rsta.royalsocietypublishing.orgDownloaded from

Atmosphere–ocean dynamics in corals 127
Table 1. Location, coral genus, living depth, core length, mean growth rate, time-intervalanalysed and sampling resolution for all Western Indian Ocean corals studied for this article
(A, living depths (m); B, core length (m); C, mean growth rate (mm yr−1).)
time-interval samplinglocation coral species A B C analysed resolution
Chagos, GOI-5 Porites lobata 1.8 1.30 14±1 1962–1996 bimonthlyChagos, GIM Porites solida 3 2.35 14±1 1876–1996 bimonthlySeychelles, NEP Porites solida 9 2.03 11±1.5 1840–1994 bimonthlyMayotte, And3 Porites solida 2 2.38 14±2 1865–1995 bimonthlyReunion, Le Canyon 1 Porites sp. 12 1.95 9.5±1.5 1832–1995 bimonthlyMadagascar, Ifaty-4 Porites lobata 1.8 4.06 10±1.5 1659–1920 bimonthly
1920–1995 monthly
3. Materials and methods
(a) Sample collection and preparation
The coral cores were drilled in the years 1994–1998 from massive colonies of the genusPorites sp. (Porites lobata, Porites lutea, Porites solida), using a commercially avail-able pneumatic drill (table 1). Cores of a length varying between 2 and 4 m with adiameter of 36 mm were drilled vertically along the growth axis. Cores were dupli-cated to ensure reproducibility. All cores were sectioned to a thickness of 5 mm andslabs were rinsed several times with demineralized water and dried with compressedair. To ensure complete removal of any moisture within the coral skeleton, individualsamples were put into an oven for 24 h at 40 ◦C. The slabs were X-rayed to determineannual density banding and hence develop an initial chronology.
(b) Sampling
A high-resolution profile was drilled using a computer-controlled drilling device,along the growth axis as determined from X-radiograph-positive prints. Subsampleswere drilled at a distance of 1 and 2 mm using a 0.5 mm dental drill at 1000 RPM.The drilling depth was 3 mm. The growth rate of the corals sampled averaged9–16 mm yr−1 (table 1). Thus the 1 or 2 mm sample spacing provides approximatelymonthly or bimonthly resolution, respectively.
(c) Chronology
In order to compare the geochemical records recovered from coral samples withinstrumental data, the record must be converted from the depth domain to the timedomain. The density couplets in corals were used to establish an initial chronol-ogy. This preliminary age model was refined using the pronounced seasonal cyclein δ18O and Sr/Ca to develop a chronology for the entire coral core. The seasonalmaxima (minima) of δ18O and Sr/Ca values were assigned to the coldest/driest(warmest/wettest) month at a given site based on long-term climatological data. Atall the stations sampled, the exact timing of the coldest and warmest month variesby about 1–2 months between the years. This methodology thus creates a time-scaleerror of about 1–2 months in any given year. Based on the seasonal maxima and
Phil. Trans. R. Soc. A (2005)
on May 18, 2011rsta.royalsocietypublishing.orgDownloaded from

128 J. Zinke, M. Pfeiffer, O. Timm, W.-C. Dullo and G. R. Davies
minima the δ18O and Sr/Ca time-series were interpolated linearly into 6 and 12equidistant points for any given year using the Analyseries software (Paillard et al .1996) to produce a monthly and a bimonthly time-series. Hence we generate time-series of coral δ18O and Sr/Ca for different seasons of the year (January/February(JF), March/April (MA), May/June (MJ), July/August (JA), September/October(SO), November/December (ND)) over the entire record.
(d) Analysis
For δ18O analysis the samples were reacted with 100% H3PO4 at 75 ◦C in anautomated carbonate reaction device (Kiel Device) connected to a Finnigan MAT252 mass spectrometer. Average precision based on duplicate sample analysis andon multiple analysis of NBS 19 is ±0.07 %% for δ18O.
Sr/Ca ratios were measured at the same resolution as δ18O samples with an induc-tively coupled plasma atomic emission spectrometer (ICP-AES), which simultane-ously collected the respective elemental emission signals. Measurements were carriedout at the Institute fur Chemie und Biologie des Meeres at the University of Olden-burg following the technique reported by Schrag (1999). Instrumental precision wastypically better than ±0.15% relative standard deviation (RSD) for Ca and ±0.08%RSD for Sr (2σ). For the Sr/Ca ratios the error was better than ±0.2% RSD (2σ).The reproducibility of the Sr/Ca ratios of replicate measurements performed on dif-ferent days was ±0.3% RSD or 0.005 mmol mol−1 (2σ).
(e) Advanced statistics
The application of univariate and multivariate statistical techniques aims to iden-tify regional and/or large-scale climate variability in coral proxy data. Because sev-eral studies have found a major shift in the interaction between climate variabilityin the Indian Ocean sector and ENSO (Trenberth 1990; Kumar et al . 1999; Kinteret al . 2002), the stationarity of the relationship between Indian Ocean coral proxiesand ENSO is a crucial aspect in the interpretation of the proxy data. Therefore,statistical parameters (e.g. correlation coefficients or empirical orthogonal functions(EOFs)) are estimated from overlapping temporal sample domains. They allow a firstguess of the temporal stability of the statistical parameters. Note that the choice ofthe sample size should be large enough to establish appropriate estimates of thestatistical parameters. On the other hand, the temporal sample interval limits theaccuracy of detecting instationarities.
EOF analysis was applied to the coral dataset. A 31-year data window was usedto produce a running EOF analysis. The EOF analysis decomposes the covariancematrix of the corals into its eigenmodes, i.e. into the dominant patterns of spatio-temporal variability. Thus, the EOF provides insight into the large-scale climaticvariability recorded in Indian Ocean corals. Since this work was focused on ENSOvariability, the Palmyra coral record from the central Pacific Ocean, which is anexcellent proxy for ENSO (Cobb et al . 2001), was included in the multi-proxy dataset.By inspecting the temporal stability of the leading EOF mode, it was possible toimprove the climatic interpretation of the region by the study of a network of coralproxy data.
Phil. Trans. R. Soc. A (2005)
on May 18, 2011rsta.royalsocietypublishing.orgDownloaded from

Atmosphere–ocean dynamics in corals 129
27 28 31−5.0−5.0−4.5230(W m−2) (mm d−1) ( PDB)
1980
1982
1984
1986
1988
1990
1992
1994
250 5 6 7 8 9 −4.5
year
OLR precipitation core GIM core COI-5 SST
240 29 30
18Oδ %o ( PDB)18Oδ %o (ºC)
Figure 3. Mean December–March OLR, precipitation (Xie & Arkin 1996), coral δ18O of coreGIM and COI-5, SST from NCEP/NCAR (Reynolds & Smith 1994). Data from Pfeiffer et al .(2004a).
4. Results and discussion
(a) Coral records
Western Indian Ocean coral δ18O records in general display a century-scale trend overthe twentieth century (figure 2). This trend of decreasing δ18O with time cannot besolely interpreted as reflecting SST changes, since changes in the EP balance andoceanic advection also influence the δ18O of sea water. The seasonal amplitudes ofeach record are distinct and follow the local SST and EP patterns (Pfeiffer 2002;Pfeiffer et al . 2004a–c; Zinke et al . 2004a, b).
In the following section we will determine the relation of each of the coral δ18O (andSr/Ca, when available) time-series to local and regional climate variability. Hencewe will resolve the interannual to interdecadal variability in the proxy records.
(b) Chagos
We have analysed the oxygen isotope composition of two cores from Peros Banhosatoll with bimonthly resolution (Pfeiffer 2002; Pfeiffer et al . 2004a). Core COI-5 is34 years and core GIM is 124 years long. Over the period of overlap, the correlationcoefficient between the annual mean δ18O series of the two corals is 0.64 (p < 0.001).The corals precisely record the depletion in δ18O sea water during the NE monsoonseason by showing negative δ18O anomalies (figure 3). There is a high correlationbetween mean December–March coral δ18O, precipitation and outgoing long-wave
Phil. Trans. R. Soc. A (2005)
on May 18, 2011rsta.royalsocietypublishing.orgDownloaded from

130 J. Zinke, M. Pfeiffer, O. Timm, W.-C. Dullo and G. R. Davies
Table 2. Correlation matrix between mean December–March OLR, precipitation (Xie & Arkin1996), GIM coral δ18O, COI-5 coral δ18O, and NCEP-SST (Reynolds & Smith 1994)
OLR precipitation GIM COI-5 SST
OLR 1precipitation −0.89 1GIM 0.79 −0.78 1COI-5 0.58 −0.65 0.75 1SST −0.41 0.44 −0.66 −0.82 1
radiation (OLR), but also between δ18O and SST (table 2). The δ18O and SSTseries in figure 3 are scaled according to the coral δ18O/temperature relationship(0.2 %% /1 ◦C) (Juillet-Leclerc & Schmidt 2001). Based on this relationship, the max-imum SST contribution to mean summer coral δ18O is only 29% (GIM) and 50%(COI-5). The SST record does not show as marked variations in the amplitude of theannual cycle as the coral δ18O and rainfall records. Thus, coral δ18O at this site canbe used as a proxy of the temporal variability of precipitation patterns associatedwith the ITCZ through amplitude modulations of the annual cycle.
(c) Seychelles
A monthly resolved 150-year coral δ18O record from Beau Vallon Bay (westerncoast of Mahe) was published by Charles et al . (1997) (4.3◦ S, 55◦ E). The seasonaland interannual coral δ18O shows a high correlation to local and 1◦ × 1◦ griddedSST (Reynolds & Smith 1994) between 1982 and 1995 (Charles et al . 1997). Thus, ithas been suggested that this record provides a tool for tropical SST reconstruction(Charles et al . 1997). Moreover, interannual variability was shown to be significantlycoherent with Nino-3 SST, which captures the ENSO-related SST anomalies in thetropical Pacific. The Western Indian Ocean SST–ENSO relationship was shown tohave been constant over the last 100 years (Charles et al . 1997).
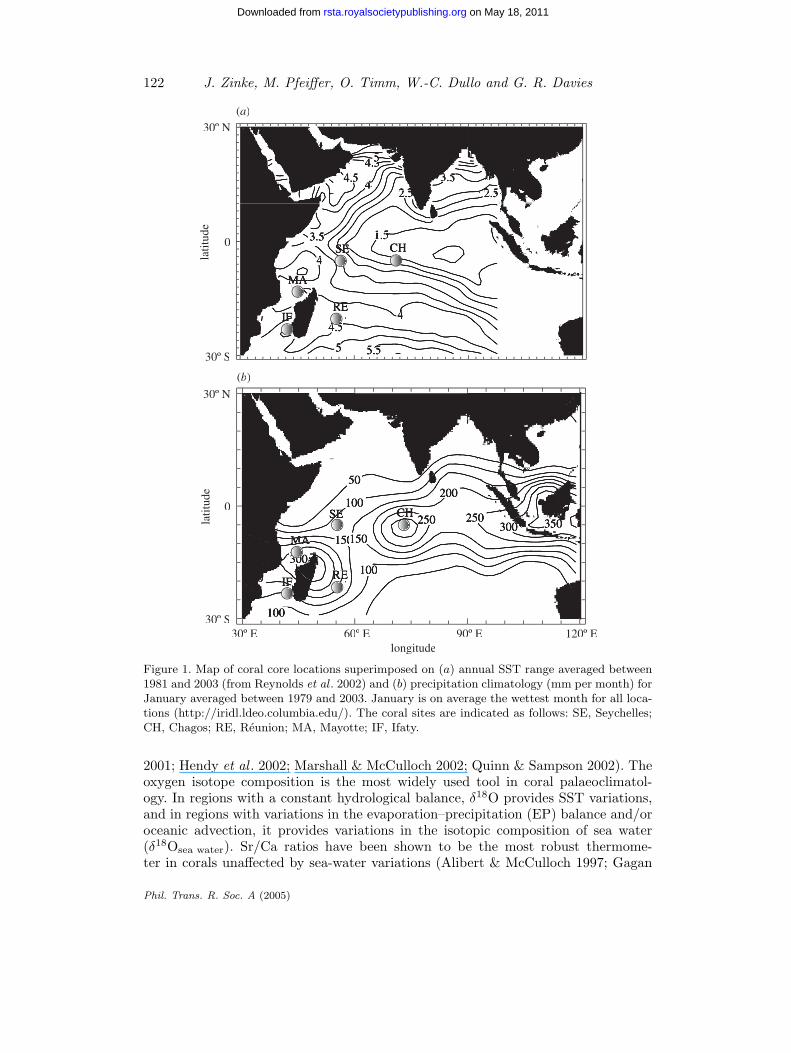
A new Porites colony (NEP) was drilled on the eastern side of Mahe in 1995,which is more exposed to the southeast trades (4.3◦ S, 55◦ E). Over the period from1946 to 1995, the NEP record shows a persistent linear correlation with Arabian SeaSST (r = −0.63, p < 0.001; figure 4a) (Pfeiffer 2002; Pfeiffer et al . 2004b). SpatialCorrelation analysis (Pfeiffer et al . 2004b) reveals a strong relationship with ArabianSea SST in the SW monsoon season, when the Arabian Sea cools due to wind-drivenevaporation and coastal upwelling (Rao & Sivakumar 2000; Vinayachandran 2004).
In contrast, the coral record published by Charles et al . (1997) does show a weakrelationship with Arabian Sea SST in the 1946–1995 period (r = −0.43, p < 0.04;figure 4b). In fact, the coral record diverges from local grid-SST (ERSST (Smith& Reynolds 2003); for 1946–1995, r = −0.29, p < 0.04) prior to the 1980s. Thesediscrepancies may result from local climatic effects specific to the coral site, or biolog-ical factors that affect the incorporation of the stable isotopes into the coral skeleton(see, for example, McConnaughey 1989). The reliability of the Seychelles corals asmonitors of regional and remote climatic processes clearly needs further investigationand a thorough analysis of both coral records.
Phil. Trans. R. Soc. A (2005)
on May 18, 2011rsta.royalsocietypublishing.orgDownloaded from
Atmosphere–ocean dynamics in corals 131
−3
−2
−1
0
1
2
31940 1950 1960 1970 1980 1990 2000
tem
pera
ture
(n
orm
aliz
ed to
uni
t va
rian
ce)
−3
−2
−1
0
1
2
3
tem
pera
ture
(n
orm
aliz
ed to
uni
t va
rian
ce)
cora
l
(no
rmal
ized
to
uni
t var
ianc
e)
−3
−2
−1
0
1
2
3
−3
−2
−1
0
1
2
3
18O
δco
ral
(
norm
aliz
ed
to u
nit v
aria
nce)
18O
δ
(a)
(b)
Figure 4. Relationship of coral δ18O and Arabian Sea temperatures. Arabian Sea temperaturesare averaged over 5◦ S to 20◦ N, and 50◦ E to 70◦ E (http://climexp.knmi.nl). The data aretaken from the HadCRUT2 dataset, which combines land temperature anomalies with marineSST anomalies on a 5◦ × 5◦ grid-box basis (Parker et al . 1995). The Arabian Sea temperatureseries (dashed line) is plotted against (a) the new coral record taken from the east coast of Mahe(Pfeiffer et al . 2004b); (b) the coral from the west coast of Mahe, published by Charles et al .(1997). All indexes are normalized, and their correlations are shown in the panel. (a) r = −0.63,p < 0.001; (b) r = −0.43, p < 0.04.
(d) Mayotte
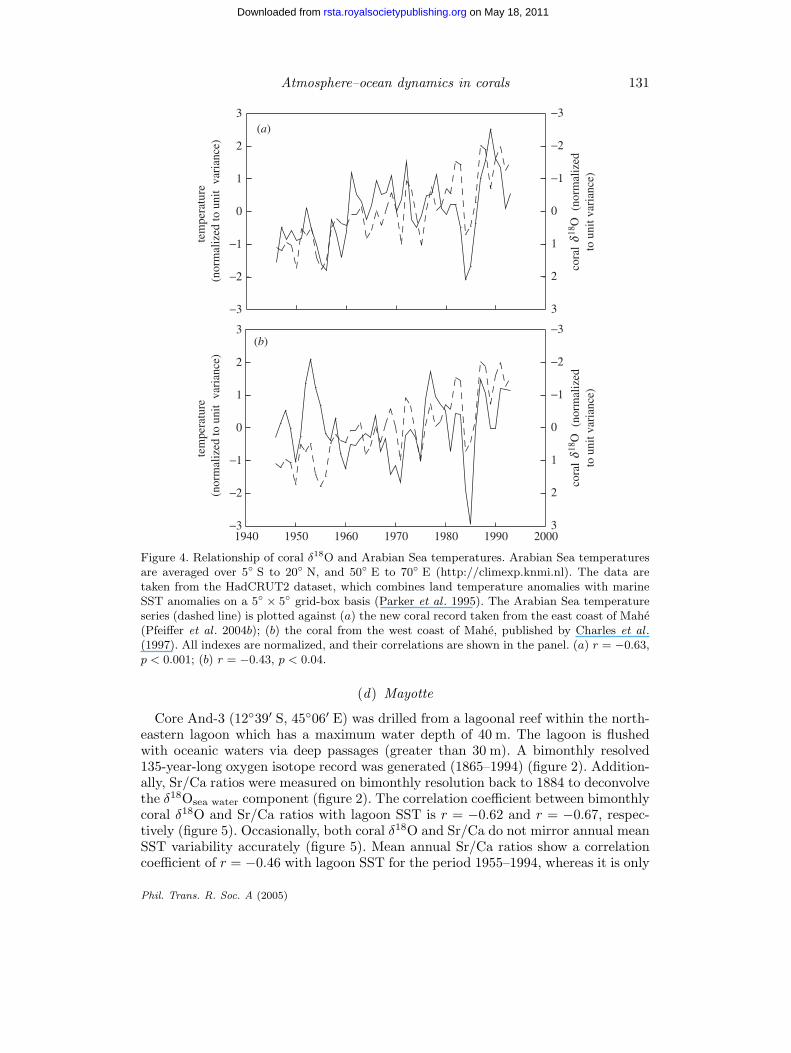
Core And-3 (12◦39′ S, 45◦06′ E) was drilled from a lagoonal reef within the north-eastern lagoon which has a maximum water depth of 40 m. The lagoon is flushedwith oceanic waters via deep passages (greater than 30 m). A bimonthly resolved135-year-long oxygen isotope record was generated (1865–1994) (figure 2). Addition-ally, Sr/Ca ratios were measured on bimonthly resolution back to 1884 to deconvolvethe δ18Osea water component (figure 2). The correlation coefficient between bimonthlycoral δ18O and Sr/Ca ratios with lagoon SST is r = −0.62 and r = −0.67, respec-tively (figure 5). Occasionally, both coral δ18O and Sr/Ca do not mirror annual meanSST variability accurately (figure 5). Mean annual Sr/Ca ratios show a correlationcoefficient of r = −0.46 with lagoon SST for the period 1955–1994, whereas it is only
Phil. Trans. R. Soc. A (2005)
on May 18, 2011rsta.royalsocietypublishing.orgDownloaded from
132 J. Zinke, M. Pfeiffer, O. Timm, W.-C. Dullo and G. R. Davies
−5.5
−5.0
−4.5cora
l
Sr/C
a ra
tio (
mm
ol m
ol−1
)
SST
24
26
28
30
8.6
8.8
9.0
1950 1960 1970 1980 1990 2000
Sr/Ca
year
lagoon SST
18O
δ(%
)o coral 18Oδ
Figure 5. Bimonthly coral δ18O time-series for core And-3 from Mayotte (thin solid line) (top).Sr/Ca ratios for core And-3 (greyish line) (middle). Monthly lagoon SST derived by regressionof measured lagoon SST between 1999 and 2002 with observed air temperature (thick solidline) at Dzaoudzi weather station (Mayotte) for the same time-interval (r2 = 0.85 (Nicet 2003))(bottom). Annual mean values are superimposed on bimonthly values for each time-series. Thecorrelation coefficient (top, r = −0.62; middle, r = −0.67) of each proxy time-series with lagoonSST is indicated for bimonthly resolution.
r = −0.31 for δ18O. This might be due to slight environmental differences betweenlagoon and open ocean waters. By taking into account the SST values from Sr/Caand SST observations, however, we reconstructed past δ18Osea water variability usingthe method of Ren et al . (2002) for the period of best data coverage (1951–1994) (notshown). First results indicate that similar variations in the δ18Osea water on decadaltime-scales can be deduced by using either Sr/Ca-(SST) or lagoon SST (Zinke etal . 2004a). Thus, variations in the EP balance and salinity variations influence coralδ18O. During the 1982/83 warm ENSO event, coral δ18O indicates positive anomaliescoincident with exceptionally high lagoon SST, most probably due to higher evap-oration rates. Additionally, river run-off into the northern Mozambique Channel inresponse to rainfall variability during the NE monsoon season (December–March)may contribute to the coral δ18O signal. Calibration of coral proxy signals withsea-water samples from the Mayotte lagoon was initiated in 2003 in order to thor-oughly interpret environmental factors retrieved from corals. Once these data aregenerated, the Mayotte corals can potentially provide insights into the spatial andtemporal variability of surface waters in the northern Mozambique Channel.
(e) Reunion
We have developed a 163-year bimonthly coral oxygen isotope record (Le Canyon-1;21◦ S, 55◦ E (Pfeiffer 2004c)). On a seasonal scale, coral δ18O reflects SST variations.
Phil. Trans. R. Soc. A (2005)
on May 18, 2011rsta.royalsocietypublishing.orgDownloaded from

Atmosphere–ocean dynamics in corals 133
1870 1880 1890 1900 1910 1920 1930 1940 1950 1960 1970 1980 1990
0
−0.2
0.2
−1.0
0
1.0
GISST SST
coral (a)
(b)
time (yr)
18Oδ
ºC
(
P
DB
)18
Οδ
‰
Figure 6. (a) Annual mean coral δ18O (dashed line) and 11-point moving average (solid line)(Pfeiffer 2002; Pfeiffer et al . 2004c). (b) Annual mean SST from the GISST 2.3 dataset (dashedline) (Parker et al . 1995) and 11-point moving average (solid line). Coral δ18O and SST areshown as anomalies relative to the mean for the period 1871–1995. The long-term trends havebeen removed.
Multidecadal variations in coral δ18O are coherent with regional SST, but the sense ofthis relationship is of opposite sign to that expected from the coral δ18O–temperaturerelationship (Pfeiffer et al . 2004c) (figure 6). This indicates multidecadal variationsin surface salinity. The cause of the salinity variations may be linked to the wind-driven southern Indian Ocean gyre (Allan et al . 1995). Stronger surface winds leadto increased evaporation (and hence colder SST), but also to a strengthening of theSEC, which will advect low-salinity waters towards Reunion.
Interannual variability in the 6–7-year frequency band is the strongest signal inthe coral record (Pfeiffer 2004c). The signal is coherent with the Southern Oscillationindex (Allan et al . 1991), but not with the regional SST record. We suggest that thesignal also results from variations in δ18O sea water through changes in the strengthof the SEC and/or the Indonesian Throughflow during ENSO (Meyers 1996; Godfrey1996).
(f ) Ifaty
A 336-year coral oxygen isotope record is reported from off Southwestern Madagas-car (23◦ S, 43◦ E) with monthly (1920–1995) and bimonthly resolution (1659–1920)
Phil. Trans. R. Soc. A (2005)
on May 18, 2011rsta.royalsocietypublishing.orgDownloaded from

134 J. Zinke, M. Pfeiffer, O. Timm, W.-C. Dullo and G. R. Davies
−0.5
0
0.5
−100
0
100
200
1975 1980 1985 1990 1995
NCEP precipitation anomaly
year
(a)
(b)
%o
SST contribution
SW contribution
18Oδ
18Oδ
SST
con
trib
utio
n18
Oδ
(
) −0.5
0
0.5
−0.5
0
0.5
%o
SW r
econ
st.
18O
δ(
)
SW reconst.18Oδ
%o
SST
con
trib
utio
n18
Oδ
(
)N
CE
P pr
ecip
itatio
n an
omal
yFigure 7. Demonstration of how the δ18O sea-water component from coral δ18O in the Ifatycoral was deconvolved following the method of Ren et al . (2002). This method separatesSST and sea-water contributions in coral δ18O by calculating the instantaneous changes inδ18O and instrumental SST (or Sr/Ca). Thus, freshening or saltification of surface watersrelated to SST and atmospheric changes can be deduced. (a) Monthly variations in coralδ18OSST contribution versus coral δ18Osea-water contribution using SST from GISST 2.3 dataset(Rayner et al . 1996). (b) Reconstructed δ18O sea water variations using SST data from theGISST 2.3 dataset versus NCEP/NCAR precipitation anomaly (http://www.cdc.noaa.gov/cdc/data.ncep.reanalysis.derived.html). El Nino years are indicated by shaded vertical bars (http://www.cpc.noaa.gov:80/products/analysis monitoring/ensostuff/ensoyears.html). Note the gen-eral association of positive δ18Osea water anomalies with deficient precipitation and also theiroccurrence during strong ENSO years (Zinke et al . 2004b).
(Zinke et al . 2004a, b) (figure 2). The coral oxygen isotope record primarily reflectsSST variability on a seasonal scale (Zinke et al . 2004b). Sea-water oxygen isotopecomposition, calculated by subtracting the Sr/Ca derived temperature component,
Phil. Trans. R. Soc. A (2005)
on May 18, 2011rsta.royalsocietypublishing.orgDownloaded from

Atmosphere–ocean dynamics in corals 135
contributes significantly to interannual variations in the coral isotope record (fig-ure 7). During the mature phase of strong ENSO warm events (i.e. December 1982to February 1983) regional evaporation off Southwestern Madagascar increases, whichis shown by positive coral δ18O anomalies (figure 7) (Zinke et al . 2004b). The Ifatycoral record is coherent with the Nino-3 index in the 2–4-year frequency band (Zinkeet al . 2004a, b). Thus, our coral record is a tool for reconstructing the influence ofENSO induced large-scale atmospheric circulation anomalies on the EP balance inSouthwestern Indian Ocean subtropical latitudes through the last 336 years (Zinkeet al . 2004c).
(g) Multi-proxy analysis
The combination of several coral records spanning an ocean basin can be used forlarge-scale climate reconstructions (Evans et al . 1999). Therefore, one can focus onthe variance that is common to all records in a certain frequency band, i.e. ENSOfrequency. We performed running correlations and running EOFs to highlight thetemporal correlation between each individual coral record and ENSO indices (fig-ure 8). We used the Nino-3 index and the Palmyra coral δ18O time-series as robustENSO indices (Cobb et al . 2001). Thus, if we combine the Palmyra record with theNino-3 index (Kaplan et al . 1998), the running EOF analysis should produce a stableEOF pattern. Adding potential ENSO signals measured in Indian Ocean corals, theEOF assigns a proper weight for each coral record. Figure 8 shows the results ofthe running EOF analysis. The first EOF is plotted against time (the coefficients ofthe first EOF are assigned to the centre year of the data window). The coefficientsof Nino-3 and Palmyra coral are constantly high and have the opposite sign to thatexpected (SST higher, δ18O lower) (figure 8a, b). The Seychelles coral record (Charleset al . 1997) has a constant coefficient of large magnitude (figure 8a, b). The coeffi-cients of Chagos, Mayotte, Ifaty and La Reunion corals change their magnitude overthe years (figure 8a, b). The Chagos coral joins the ENSO signal in the covariancestructure only in the end of the twentieth century (figure 8a, b). We suggest that thismay be the result from the amplification of the ENSO cycle, in conjunction with theobserved eastward shift of the ENSO impacts from the Indian to the east Asian–Australian sector after 1970 (Kumar et al . 1999). This so-called 1970s shift weakensthe Indian monsoon rainfall connection (Kumar et al . 1999), but it enhances the linkbetween rainfall in the central Indian Ocean sector (i.e. austral summer) and ENSO(Pfeiffer et al . 2004a).
The variability in the La Reunion and Mayotte coral δ18O in the early to mid twen-tieth century is related to the ENSO signal, but not in the late twentieth century(figure 8a, b). The correlation between Nino-3 SST and Ifaty shows a high correla-tion during phases when the ENSO forcing was strong, 1880–1920 and 1960–1995(Webster et al . 1998; Zinke et al . 2004b). This is in good agreement with Richard etal . (2000), who showed that a strong teleconnection between Southwestern IndianOcean SST (rainfall) and ENSO appears after 1970. Richard et al . (2000) concludedthat the modified east–west circulation is partly forced by a warmer Southern IndianOcean after 1970.
Interestingly, very similar results are obtained when the Nino-3 index is notincluded in the EOF analysis (figure 8b). Thus, the running EOF analysis mightbe able to detect non-stationary ENSO-proxy relationships in pre-industrial eraswhen the only source of climate information comes from proxy data.
Phil. Trans. R. Soc. A (2005)
on May 18, 2011rsta.royalsocietypublishing.orgDownloaded from

136 J. Zinke, M. Pfeiffer, O. Timm, W.-C. Dullo and G. R. Davies
year1890 1905 1920 1935 1950 1965 1980
CH
SE
LR
MA
IF
PA
N3
(a)
(b)
CH
SE
LR
MA
IF
PA
1.0
0.5
0
−0.5
−1.0
1.0
0.5
0
−0.5
−1.0
Figure 8. Running EOF analysis using a 31-year data window: (a) first EOF of the six-coral δ18Otime-series and the Nino-3 index; (b) first EOF when Nino-3 index is removed from the dataset.Note that the EOF analysis is applied to time-series of DJFM seasonal means over the years1887–1991. Legend entries refers to corals from Chagos (CH) (Pfeiffer et al . 2004a), Seychelles(SE) (Charles et al . 1997), La Reunion (LR) (Pfeiffer et al . 2004c), Mayotte (MA), Ifaty (IF)(Zinke et al . 2004a, b), Palmyra (PA) (Cobb et al . 2001); N3 refers to the Nino-3 index (Kaplanet al . 1998).
The power of this analysis is further demonstrated by an example (figure 9).The multi-proxy data were altered in the following way. The Chagos coral wasreplaced by an artificial proxy. This artificial proxy was generated by summationof the normalized Nino-3 index x(t) and normalized white noise e(t). To simulatethe non-stationary linear relationship a time-dependent linear regression coefficient
Phil. Trans. R. Soc. A (2005)
on May 18, 2011rsta.royalsocietypublishing.orgDownloaded from

Atmosphere–ocean dynamics in corals 137
1875 1925 1975
inde
x (u
nitle
ss)
0.4
0
−0.4
a(t)
−4
−2
0
2
4
year1890 1905 1920 1935 1950 1965 1980
1.0
0.5
0
−0.5
−1.0
SE
LR
MA
IF
PA
SIM
(a)
(b)
Figure 9. (a) Time-series of the simulated proxy time-series (thick grey line), the Nino-3 index(thin black line), and the linear regression coefficient between them (dashed line). (b) Therunning EOF analysis (using a 31-year window) as in figure 8b. Note that the artificial proxy(denoted as SIM) replaced the Chagos coral in the multivariate dataset.
a(t) determined the signal-to-noise ratio. Thus, the artificial proxy was generated bythe following equation:
y(t) = a(t)x(t) +√
1 − a(t)2e(t),
wherea(t) = 0.4 tanh[w(t − 1940)],
with w = 10 years, where t denotes the year (1887–1991).
Phil. Trans. R. Soc. A (2005)
on May 18, 2011rsta.royalsocietypublishing.orgDownloaded from

138 J. Zinke, M. Pfeiffer, O. Timm, W.-C. Dullo and G. R. Davies
In figure 9 the generated artificial proxy is shown together with the Nino-3 index.The shape of the regression coefficient a(t) is also shown. Even though the correlationbetween this proxy and the Nino-3 index was rather low in this example, the runningEOF analysis was able to identify the shift in the relationship. Another importantresult is the robustness of the EOF. Only small differences in the weight factors ofthe unchanged coral proxies were caused by the replacement of one proxy.
Even without appropriate statistical hypothesis tests, this technique provides apowerful tool for the multivariate proxy analysis. Of course, more work will be neededto identify the true power of this method.
5. Conclusions
This paper presents a network of coral oxygen isotope and/or Sr/Ca records coveringthe last 120–336 years spanning the western tropical to subtropical Indian Ocean. Allrecords record regional climate variability. Chagos coral δ18O records rainfall vari-ability on interannual to interdecadal time-scales, the Seychelles coral δ18O recordsinterannual and decadal SST variations related to ENSO and the monsoon, Mayotteand Ifaty record changes in the hydrologic balance and Reunion records multidecadalvariations in salinity propagated via changes in the strength of the South EquatorialCurrent.
The coral records show varying sensitivities to ENSO variability. The empiricalorthogonal function analysis (EOF) using moving data windows is presented as amethod to detect the ENSO-proxy relationship for each coral record. The Seychellescoral record shows a stationary relationship to ENSO; all other records show non-stationary ENSO-proxy relationships and/or higher sensitivity to ENSO inducedlarge-scale circulation anomalies when the forcing is strong. Our results indicatethat the coral δ18O in combination with other proxies can be used to reconstructtemporal and spatial variations in the sea-surface temperature and the fresh waterbalance within the Indian Ocean on interannual to interdecadal time-scales. Suchdatasets will prove invaluable in attempts to successfully model past and predictfuture climate change.We thank the TESTREEF-group (contract no. EV5V-CT 94-0447) for the drilling of the coralcores between 1994 and 1996 (CEREGE Aix-en-Provence, France; Universite de Provence, Mar-seille, France; University of Glasgow, UK; Instituto per la Geologia Marina Bologna, Italy). H.Erlenkeuser (Leibniz Laboratory, University of Kiel) and M. Joachimski (University of Erlangen)kindly carried out the oxygen isotope analysis. We thank B. Schnetger (University of Oldenburg)for giving measurement capacity at the ICP-AES. This research was supported by the GermanScience Foundation (grant Du 129, 13-2 and 13-3) and by the German government throughthe KIHZ Initiative (grant BMBF 01LG9909). Comments by two anonymous reviewers helpedimprove the clarity of the manuscript. Work supported in part by the European Community’sHuman Potential Programme under contract HPRN-CT-2002-00221 (STOPFEN).
References
Abram, N. J., Gagan, M. K., McCulloch, M. T., Chappell, J. & Hantoro, W. S. 2003 Coralreef death during the 1997 Indian Ocean Dipole linked to Indonesian wildfires. Science 301,952–955.
Alibert, C. & McCulloch, M. T. 1997 Strontium/calcium ratios in modern Porites corals fromthe Great Barrier Reef as a proxy for sea surface temperature: calibration of the thermometerand monitoring of ENSO. Paleoceanography 12(3), 345–363.
Phil. Trans. R. Soc. A (2005)
on May 18, 2011rsta.royalsocietypublishing.orgDownloaded from

Atmosphere–ocean dynamics in corals 139
Allan, R. J., Nicholls, N., Jones, P. D. & Butterworth, I. J. 1991 A further extension of theTahiti-Darwin SOI, early SOI results and Darwin pressure. J. Clim. 4, 743–749.
Allan, R. J., Lindesay, J. A. & Reason, C. J. C. 1995 Multidecadal variability in the climatesystem over the Indian Ocean region during the austral summer. J. Clim. 8, 1853–1873.
Allan, R. J., Reason, C. J. C., Lindesay, J. A. & Ansell, T. J. 2003 Protracted ENSO episodesand their impacts in the Indian Ocean region. Deep-Sea Res. II 50, 2331–2347.
Charles, C. D., Hunter, D. E. & Fairbanks, R. G. 1997 Interaction between the ENSO and theAsian monsoon in a coral record of tropical climate. Science 277, 925–928.
Charles, C. D., Cobb, K., Moore, M. D. & Fairbanks, R. G. 2003 Monsoon-tropical oceaninteraction in a network of coral records spanning the 20th century. Mar. Geol. 201, 207–222.
Cobb, K. M., Charles, C. D. & Hunter, D. E. 2001 A central tropical Pacific coral demonstratesPacific, Indian, and Atlantic decadal climate connections. Geophys. Res. Lett. 28(11), 2209–2212.
Cole, J. E., Fairbanks, R. G. & Shen, G. T. 1993 Recent variability in the Southern Oscillation:isotopic results from a Tawara Atoll record. Science 260, 1790–1793.
Cole, J. E., Dunbar, R. B., McClanahan, T. R. & Muthiga, N. A. 2000 Tropical Pacific forcingof decadal SST variability in the Western Indian Ocean over the past two centuries. Science287, 617–619.
Conkright, M. E., Locarnini, R. A., Garcia, H. E., O’Brien, T. D., Boyer, T. P., Stephens, C. &Antonov, J. I. 2001 World Ocean Atlas 2001: objective analysis, data statistics, and figures.National Oceanographic Data Center Internal Report, vol. 17.
Correge, T., Delcroix, T., Recy, J., Beck, W., Cabioch, G. & Cornec, F. L. 2000 Evidencefor stronger El Nino–Southern Oscillation (ENSO) events in a mid-Holocene massive coral.Paleoceanography 15(4), 465–470.
Delaygue, G., Bard, E., Rollion, C., Jouzel, J., Stievenard, M., Duplessy, J.-C. & Ganssen, G.2001 Oxygen isotope/salinity relationships in the northern Indian Ocean. J. Geophys. Res.C106(3), 4565–4574.
De Ruijter, W. P. M., Ridderinkhof, H., Lutjeharms, J. R. E., Schouten, M. W. & Veth, C. 2002Observations of the flow in the Mozambique Channel. Geophys. Res. Lett. 29(10), 140–142.
De Ruijter, W. P. M., van Aken, H. M., Beier, E. J., Lutjeharms, J. R. E., Matano, R. P. &Schouten, M. W. 2004 Eddies and dipoles around South Madagascar: formation, pathwaysand large-scale impact. Deep-Sea Res. I 51, 383–400.
DiMarco, S. F., Chapman Jr, P., W. D. N., Hacker, P., Donohue, K., Luther, M., Johnson, G. C.& Toole, J. 2002 Volume transport and property distributions of the Mozambique Channel.Deep-Sea Res. II 49, 1481–1511.
Druffel, E. R. M. & Griffin, S. 1993 Large variations of surface ocean radiocarbon: evidence ofcirculation changes in the southwestern Pacific. J. Geophys. Res. C98(11), 20 249–20 259.
Dunbar, R. B., Wellington, G. M., Colgan, M. W. & Glynn, P. W. 1994 Eastern Pacific seasurface temperatures since 1600 A.D.: the δ18O record of climate variability in Galapagoscorals. Paleoceanography 9(2), 291–315.
Evans, M. N., Fairbanks, R. G. & Rubenstone, J. L. 1999 The thermal oceanographic signal of ElNino reconstructed from a Kiritimati Island coral. J. Geophys. Res. C104(6), 13 409–13 421.
Gagan, M. K., Ayliffe, L. K., Hopley, D., Cali, J. A., Mortimer, G. E., Chappell, J., McCulloch,M. T. & Head, M. J. 1998 Temperature and surface-ocean water balance of the mid-Holocenetropical western Pacific. Science 279, 1014–1018.
Godfrey, J. S. 1996 The effect of the Indonesian Throughflow on ocean circulation and heatexchange with the atmosphere: a review. J. Geophys. Res. C101(5), 12 217–12 237.
Gordon, A. L., Ma, S., Olson, D. B., Hacker, P., Field, A., Talley, L. D., Wilson, D. & Baringer,M. 1997 Advection and diffusion of Indonesian Throughflow water within the Indian OceanSouth Equatorial Current. Geophys. Res. Lett. 24(21), 2573–2576.
Phil. Trans. R. Soc. A (2005)
on May 18, 2011rsta.royalsocietypublishing.orgDownloaded from

140 J. Zinke, M. Pfeiffer, O. Timm, W.-C. Dullo and G. R. Davies
Hastenrath, S. & Greischar, L. 1993 The monsoonal heat budget of the hydrosphere–atmospheresystem in the Indian Ocean sector. J. Geophys. Res. C98(4), 6869–6881.
Hendy, E. J., Gagan, M. K., Alibert, C. A., McCulloch, M. T., Lough, J. M. & Isdale, P. J. 2002Abrupt decrease in tropical Pacific sea surface salinity at end of Little Ice Age. Science 295,1511–1514.
Hughen, K. A., Schrag, D. P., Jacobsen, S. B. & Hantoro, W. 1999 El Nino during the lastinterglacial period recorded by a fossil coral from Indonesia. Geophys. Res. Lett. 26(20),3129–3132.
International Atomic Energy Agency 1994 Environmental Isotope Data no. 10: World survey ofisotope concentration in precipitation (1988–1991). Vienna: IAEA.
Juillet-Leclerc, A. & Schmidt, G. 2001 A calibration of the oxygen isotope paleothermometer ofcoral aragonite from Porites. Geophys. Res. Lett. 28(21), 4135–4138.
Jury, M. R., Enfield, D. B. & Melice, J.-L. 2002 Tropical monsoons around Africa: stability of ElNino–Southern Oscillation associations and links with continental climate. J. Geophys. Res.C107(10), 3151.
Kaplan, A., Cane, M., Kushnir, Y., Clement, A., Blumenthal, M. & Rajagopalan, B. 1998Analysis of global sea surface temperature 1856–1991. J. Geophys. Res. 103, 18 567–18 589.
Kinter, J. L., Miyakoda, K. & Yang, S. 2002 Recent change in the connection from AsianMonsoon to ENSO. J. Clim. 15, 1203–1215.
Krishnamurthy, V. & Kirtman, B. P. 2003 Variability of the Indian Ocean: relation to monsoonand ENSO. Q. J. R. Meteorol. Soc. 129, 1623–1646.
Kuhnert, H., Patzold, J., Hatcher, B., Wyrwoll, K.-H., Eisenhauer, A., Collins, L. B., Zhu, Z. R.& Wefer, G. 1999 A 200-year coral stable oxygen isotope record from a high-latitude reef offWestern Australia. Coral Reefs 18, 1–12.
Kuhnert, H., Patzold, J., Wyrwoll, K.-H. & Wefer, G. 2000 Monitoring climate variability overthe past 116 years in coral oxygen isotopes from Ningaloo Reef, Western Australia. Int. J.Earth Sci. 88, 725–732.
Kumar, K. K., Rajagopalan, B. & Cane, M. A. 1999 On the weakening relationship between theIndian monsoon and ENSO. Science 284, 2156–2159.
Le Bec, N., Juillet-Leclerc, A., Correge, T., Blamart, D. & Delcroix, T. 2000 A coral δ18Orecord of ENSO driven sea surface salinity variability in Fiji (south-western tropical Pacific).Geophys. Res. Lett. 27(23), 3897–3900.
Linsley, B. K., Wellington, G. M. & Schrag, D. P. 2000 Decadal sea surface temperature vari-ability in the subtropical South Pacific from 1726 to 1997 A.D. Science 290, 1145–1148.
McConnaughey, T. 1989 13C and 18O isotopic disequilibrium in biological carbonates. I. Pat-terns. Geochim. Cosmochim. Acta 53, 151–162.
McCulloch, M. T., Gagan, M. K., Mortimer, G. E., Chivas, A. R. & Isdale, P. J. 1994 A high-resolution Sr/Ca and δ18O coral record from the Great Barrier Reef, Australia, and the1982–1983 El Nino. Geochim. Cosmochim. Acta 58(12), 2747–2754.
Marshall, J. F. & McCulloch, M. T. 2001 Evidence of El Nino and the Indian Ocean Dipole fromSr/Ca derived SSTs for modern corals at Christmas Island, Eastern Indian Ocean. Geophys.Res. Lett. 28(18), 3453–3456.
Marshall, J. F. & McCulloch, M. T. 2002 An assessment of the Sr/Ca ratio in shallow waterhermatypic corals as a proxy for sea surface temperature. Geochim. Cosmochim. Acta 66(18),3263–3280.
Meyers, G. 1996 Variations of Indonesian Throughflow and the El Nino–Southern Oscillation.J. Geophys. Res. C101(5), 12 255–12 263.
Nicet, J.-B. 2003 Mayotte lagoon temperature (1999–2002) and bleaching coral event. ReportCollectivite departementale de Mayotte, Direction de l’Agriculture et de la Foret, Service dePeches et de l’Environnement Marin.
Phil. Trans. R. Soc. A (2005)
on May 18, 2011rsta.royalsocietypublishing.orgDownloaded from

Atmosphere–ocean dynamics in corals 141
Paillard, D., Labeyrie, L. & Yiou, P. 1996 Macintosh program performs time-series analysis. Eos77, 379.
Parker, D. E., Folland, C. K. & Jackson, M. 1995 Marine surface temperature: observed varia-tions and data requirements. Clim. Change 31, 559–600.
Pfeiffer, M. 2002 Spatial and temporal variations in the hydrological balance recorded inPorites corals from the Western and Central Indian Ocean. PhD thesis, Christian-Albrechts-Universitat zu Kiel.
Pfeiffer, M., Dullo, W.-C. & Eisenhauer, A. 2004a Variability of the Intertropical ConvergenceZone recorded in coral isotopic records from the central Indian Ocean (Chagos Archipelago).Quat. Res. 61, 245–255.
Pfeiffer, M., Dullo, W.-Chr. & Timm, O. 2004b Arabian Sea sea surface temperatures (SST)recorded by a Seychelles coral. Conference Poster, Discussion Meeting on Atmosphere–ocean–ecology dynamics in the Western Indian Ocean, The Royal Society, London, UK.
Pfeiffer, M., Timm, O., Dullo, W.-Chr. & Podlech, S. 2004c Oceanic forcing of interan-nual and multidecadal climate variability in the southern Indian Ocean: evidence from a160 year coral isotopic record (La Reunion, 55◦ E, 21◦ S). Paleoceanography 19, PA4006.(doi:10.1029/2003PA000964.)
Quinn, T. M. & Sampson, D. E. 2002 A multiproxy approach to reconstructing sea surfaceconditions using coral skeleton geochemistry. Paleoceanography 17(4), 1062.
Quinn, T. M., Crowley, T. J., Taylor, F. W., Henin, C., Joannot, P. & Join, Y. 1998 A mul-ticentury isotopic record from a New Caledonia coral: interannual and decadal sea surfacetemperature variability in the southwest Pacific since 1657 A.D. Paleoceanography 13(4),412–426.
Rao, R. P. & Sivakumar, R. 2000 Seasonal variability of near-surface thermal structure and heatbudget of the mixed layer of the tropical Indian Ocean from a new global ocean temperatureclimatology. J. Geophys. Res. C105(1), 995–1015.
Rayner, N. A., Horton, E. B., Parker, D. E., Folland, C. K. & Hackett, R. B. 1996 Version 2.2of the global sea-ice and sea surface temperature dataset. Climate Research Technical Note,Hadley Centre for Climate Prediction and Research, vol. 74, pp. 1–21.
Reason, C. J. C. & Mulenga, H. 1999 Relationships between South African rainfall and SSTanomalies in the southwest Indian Ocean. Int. J. Climatol. 19, 1651–1673.
Reason, C. J. C. & Rouault, M. 2002 ENSO-like decadal variability and South African rainfall.Geophys. Res. Lett. 29, 10.1029.
Ren, L., Linsley, B. K., Wellington, G. M., Schrag, D. P. & Hoegh-Guldberg, O. 2002 Decon-volving the δ18O seawater component from subseasonal coral δ18O and Sr/Ca at Rarotongain the southwestern subtropical Pacific for the period 1726 to 1997. Geochim. Cosmochim.Acta 67(9), 1609–1621.
Reynolds, R. W. & Smith, T. M. 1994 Improved global sea surface temperature analysis. J.Clim. 7, 929–948.
Reynolds, R. W., Rayner, N. A., Smith, T. M., Stokes, D. C. & Wang, W. Q. 2002 An improvedin situ and satellite SST analysis for climate. J. Clim. 15, 1609–1625.
Richard, Y., Trzaska, S., Roucou, P. & Rouault, M. 2000 Modification of the southern Africanrainfall variability/ENSO relationship since the late 1960’s. Clim. Dyn. 16, 883–895.
Schmidt, G. A. 1999 Oxygen-18 variations in a global ocean model. Geophys. Res. Lett. 25(8),1201–1204.
Schouten, M. W., de Ruijter, W. P. M., van Leeuwen, P. J. & Dijkstra, H. A. 2002 An oceanicteleconnection between the equatorial and southern Indian Ocean. Geophys. Res. Lett. 29(16),59–62.
Schouten, M. W., de Ruijter, W. P. M., van Leeuwen, P.-J. & Ridderinkhof, H. 2003 Eddies andvariability in the Mozambique Channel. Deep-Sea Res. II 50, 1987–2003.
Phil. Trans. R. Soc. A (2005)
on May 18, 2011rsta.royalsocietypublishing.orgDownloaded from

142 J. Zinke, M. Pfeiffer, O. Timm, W.-C. Dullo and G. R. Davies
Schrag, D. 1999 Rapid analysis of high-precision Sr/Ca ratios in corals and other marine car-bonates. Paleoceanography 14(2), 97–102.
Smith, T. M. & Reynolds, R. W. 2003 Extended reconstruction of global sea surface temperaturesbased on COADS data (1854–1997). J. Clim. 16, 1495–1510.
Todd, M. & Washington, R. 1999 Circulation anomalies associated with tropical-temperatetroughs in southern Africa and the south west Indian Ocean. Clim. Dyn. 15, 937–951.
Trenberth, K. E. 1990 Recent observed interdecadal climate changes in the Northern Hemisphere.Bull. Am. Meteorol. Soc. 71(7), 988–993.
Tudhope, A. W., Lea, D. W., Shimmield, G. B., Chilcott, C. P. & Head, S. 1996 Monsoonclimate and Arabian Sea coastal upwelling recorded in massive corals from Southern Oman.Paleobios 11, 347–361.
Tudhope, A. W., Chilcott, C. P., McCulloch, M. T., Cook, E. R., Chappell, J., Ellam, R. M.,Lea, D. W., Lough, J. M. & Shimmield, G. B. 2001 Variability in the El Nino–SouthernOscillation through a glacial–interglacial cycle. Science 291, 1511–1517.
Tyson, P. D. 1986 Climate change and variability in Southern Africa. Oxford University Press.Vinayachandran, P. N. 2004 Summer cooling of the Arabian Sea during contrasting monsoons.
Geophys. Res. Lett. 31, L13306.Webster, P. J., Magana, V. O., Palmer, T. N., Shukla, J., Tomas, R. A., Yanai, M. & Yasunari,
T. 1998 Monsoons: processes, predictability, and the prospects for prediction. J. Geophys.Res. C103(7), 14 451–14 510.
Xie, P. & Arkin, P. 1996 Analysis of global monthly precipitation using gauge observations,satellite estimates, and numerical model predictions. J. Clim. 9, 840–885.
Zinke, J. and the KIHZ Consortium 2004a Evidence for the climate during the Late MaunderMinimum from proxy data and model simulations available within KIHZ. In The climate inhistorical times—towards a synthesis of Holocene proxy data and climate models (ed. H. vonStorch, E. Raschke & G. Floeser), pp. 397–414. Springer.
Zinke, J., Dullo, W.-C., Heiss, G. A. & Eisenhauer, A. 2004b ENSO and Indian Ocean subtropicaldipole variability is recorded in a coral record off southwest Madagascar for the period 1659–1995. Earth Planet. Sci. Lett. 228, 177–197.
Phil. Trans. R. Soc. A (2005)
on May 18, 2011rsta.royalsocietypublishing.orgDownloaded from

NOTICE OF CORRECTIONFigure 2 is now presented in its correct form.
A detailed erratum will appear at the end of the volume.
17 January 2005
on May 18, 2011rsta.royalsocietypublishing.orgDownloaded from

on May 18, 2011rsta.royalsocietypublishing.orgDownloaded from