Live Versus Recorded: Exploring Television Sales Presentations
98
University of South Florida Scholar Commons Graduate eses and Dissertations Graduate School January 2012 Live Versus Recorded: Exploring Television Sales Presentations Christopher Craig Novak University of South Florida, [email protected] Follow this and additional works at: hp://scholarcommons.usf.edu/etd Part of the American Studies Commons , and the Mass Communication Commons is esis is brought to you for free and open access by the Graduate School at Scholar Commons. It has been accepted for inclusion in Graduate eses and Dissertations by an authorized administrator of Scholar Commons. For more information, please contact [email protected]. Scholar Commons Citation Novak, Christopher Craig, "Live Versus Recorded: Exploring Television Sales Presentations" (2012). Graduate eses and Dissertations. hp://scholarcommons.usf.edu/etd/4186
-
Upload
khangminh22 -
Category
Documents
-
view
0 -
download
0
Transcript of Live Versus Recorded: Exploring Television Sales Presentations

University of South FloridaScholar Commons
Graduate Theses and Dissertations Graduate School
January 2012
Live Versus Recorded: Exploring Television SalesPresentationsChristopher Craig NovakUniversity of South Florida, [email protected]
Follow this and additional works at: http://scholarcommons.usf.edu/etd
Part of the American Studies Commons, and the Mass Communication Commons
This Thesis is brought to you for free and open access by the Graduate School at Scholar Commons. It has been accepted for inclusion in GraduateTheses and Dissertations by an authorized administrator of Scholar Commons. For more information, please contact [email protected].
Scholar Commons CitationNovak, Christopher Craig, "Live Versus Recorded: Exploring Television Sales Presentations" (2012). Graduate Theses andDissertations.http://scholarcommons.usf.edu/etd/4186
Live Versus Recorded: Exploring Television Sales Presentations
by
Christopher C. Novak
A thesis submitted in partial fulfillment
of the requirements for the degree of
Master of Arts
Department of Mass Communications
College of Arts and Sciences
University of South Florida
Major Professor: Scott Liu, Ph.D.
Kenneth Killebrew, Ph.D.
Kelly Page Werder, Ph.D.
Date of Approval:
June 28, 2012
Keywords: Credibility, Authenticity, Home, Shopping, Broadcasting
Copyright © 2012, Christopher C. Novak

Dedication
For Mary and Jim, you are missed beyond words.

Acknowledgments
I would like to give a special thanks to the following people without whom this
thesis would not be possible: Dr. Michael Mitrook, Dr. Roxanne Watson, Tiffany
Schweikart, Lauren Klinger, Kristen Arnold-Ruyle, Harold Vincent, Dr. Ambar Basu, Dr.
Abraham Khan, Dr. Emily Ryalls, and Dr. Christopher McRae. Next, I would like to
give an extra special thanks to Dr. Kelly Page Werder for all the encouragement, Dr.
Kenneth Killebrew for his time and patience during all our time working together, and
Dr. Scott Liu for planting the seed and helping it grow. Lastly, the biggest thanks of all
to Vicky Perry, Steve and Pat Novak, my daughter Bethany, and my wife Melinda.

i
Table of Contents
List of Tables iii
List of Figures v
Abstract vi
Chapter 1: Introduction 1
Chapter 2: Literature Review 4
A History of Live 4
The Live Context 6
Live Home Shopping Variations 6
Credibility 11
Authenticity 13
Involvement 18
Urgency 21
Informativeness 23
Entertaining Value 25
Sense of Real Time 26
Spontaneity 28
Interactivity 29
Research Questions 29
Chapter 3: Methodology 33
Participants 33
Design 35
Stimulus Materials 35
Procedure 36
Dependent Measures 37
Chapter 4: Results 40
Manipulation Checks 40
RQ 1-9: Differences in the Nine Factors 41
RQ 10-12: Differences in Attitudes and Purchase Intentions 43
RQ 13-14: The Nine Factors, Attitudes and Purchase Intentions 44
Chapter 5: Discussion and Limitations 55
Discussion 55
Limitations 64
ii
Chapter 6: Conclusion 67
References 71
Appendices 74
Appendix A: IRB Approval Letter 75
Appendix B: Questionnaire 77
Appendix C: Instructions to Test Participants 81
Appendix D: Slides/Description of Key Points of Presentation 82

iii
List of Tables
Table 1 Distribution of Participants’ Gender 34
Table 2 Distribution of Participants’ Ethnicity 34
Table 3 Distribution of Participants Age 34
Table 4 Cronbach’s Alpha of the Nine Factors 38
Table 5 Cronbach’s Alphas of Attitude Measures 39
Table 6 Manipulation Checks 41
Table 7 Descriptive Statistics: Live vs. Recorded 42
Table 8 T-test Results: Live vs. Recorded 43
Table 9 Descriptive Statistics of Attitudes & Purchase Intentions 44
Table 10 T-tests of Attitudes and Purchase Intentions 44
Table 11 Regression Results from Live & Recorded Conditions
Criterion: Attitude toward Presentation 45
Table 12 Regression Results from Live & Recorded Conditions
Criterion: Attitude toward Product 46
Table 13 Regression Results from Live & Recorded Conditions
Criterion: Purchase Intentions 47
Table 14 Regression Results from Live Condition
Criterion: Attitude Toward Presentation 48
Table 15 Regression Results from Live Condition
Criterion: Attitude Toward Product 49
Table 16 Regression Results from Live Condition
Criterion: Purchase Intentions 50

iv
Table 17 Regression Results from Recorded Condition
Criterion: Attitude Toward Presentation 51
Table 18 Regression Results from Recorded Condition
Criterion: Attitude Toward Product 52
Table 19 Regression Results from Recorded Condition
Criterion: Purchase Intentions 53
Table 20 Summary of Regression Results 54

v
List of Figures
Figure C1 Introduction 82
Figure C2 Comparisons 82
Figure C3 Stacks and Counters 83
Figure C4 Carrots and Freshness 83
Figure C5 Breaking Carrots 84
Figure C6 Three Weeks Old 84
Figure C7 Lettuce and Sound Demonstrations 85
Figure C8 Reusable and Lasting Quality 85
Figure C9 Pepper Freshness 86
Figure C10 Refrigerator Demonstration 86
Figure C11 Countdown Clock 87
Figure C12 Taking A Phone Call 87
Figure C13 More Appearances 88

vi
Abstract
This is an exploratory study that poses the questions and discussion regarding live
and recorded sales presentations via television. With its rich history, it appears that live
television has more types of appeal that will get the shopper buying products. However,
the recorded and edited presentation played back on television has had its share to grab
the shopper’s attention. Research questions are presented to determine which
broadcasting method is stronger by examining factors related to home shopping such as
credibility, authenticity, involvement, urgency, informativeness, entertaining value, sense
of real time, spontaneity and interactivity. Additional questions will look at the overall
presentation, the product itself, and what the potential future of home shopping may be
based upon this study. The main findings show there is a significant difference in all
factors between live and recorded; however, some factors are stronger than others
between live and recorded. These factors could indicate where home shopping may want
to concentrate its efforts to remain a viable entity in electronic retail.

1
Chapter One: Introduction
Is the magic of live television losing its ground in mass communication today?
Shows such as Saturday Night Live, Dancing with the Stars, and American Idol would
indicate live broadcasts are strong. Live broadcasting networks like CNN, HSN, and
QVC indicate that there is still room for live television in the 21st century. Home
shopping channels in particular and their live stream equivalents on the Internet have
made a huge impression and apparently are doing well financially. This could give them
an advantage over their retail store, infomercial, and advertising competitors. Just how
effective are live home shopping broadcasts? Could the answer be that people are not
going to the store to buy various items from retail outlets because of rising fuel prices?
Do home shopping products stand a better chance of being sold using such an outlet as a
live home shopping channel? What factors are important to the strengths of live versus
the recorded sell? Out of those factors, what could be important to the presentation of a
product? Also, which factors are important to the product itself?
Live broadcasting, as a whole, is a chaotic world behind the scenes. The viewer
hardly, if at all, sees the work it takes to produce a live show. The realm of home
shopping television falls under this blanket of chaos. The work to produce the shows
requires the host studying and practicing the products. It also requires the guest
presenters making sure they will cover every angle of the product to insure it sells, and
the producers looking over the hourly quota and reading over presentation materials for
the product. There are the live show crews examining the sets, the lights, the
2
microphones, the cameras, the graphics, and the video support for each product to make
sure the show is executed properly when the time comes. Once all these elements are
combined, the execution of the live shopping program takes place. The tension in the
control room and studio is high because there is one chance to get the product
demonstration right. The standard live presentation contains a small introduction of the
product by a show host. Then a possible expert (or guest) representing the product comes
in with the host to give the demonstration. This is the point where factors like credibility,
authenticity, involvement, urgency, and informativeness of what is shown become
important. If the demonstration of the product goes as planned, the likelihood of high
sales of the product will take place. There can also be live phone calls of testimonials
that could boost product sales and potentially enhance the above factors further, as well
as entertainment values, sense of real-time, spontaneity, and interactivity. Sales could go
as high as six figures made in one hour with the success of the overall presentation during
prime time hours. However, if the demonstration fails to live up to the claims of the
product, or if there is evidence the product being shown is not working to its full
potential, then it could be a financial disaster for both the product and the network
presenting the item.
The infomercial, on the other hand, has been a mainstay on local and network
television for years. It has the some of the same characteristics from a home shopping
perspective. There is the standard introduction of the product followed by
demonstrations of the product by an expert, and re-emphasis of what makes the product
so special by discussing or in some cases pushing key selling points. However, there are
general differences between the infomercials and the live presentation to consider as well.

3
For instance, there are hardly any show hosts to introduce the product. There is no one to
call in to give live testimonials. The only testimonials may come from the studio
audience (if the producers even allow one to participate), or from a pre-recorded
interview of a customer that has used the product. Most importantly, the entire
presentation is not live. The presentation is shot and recorded in multiple takes. The raw
footage is then edited into a viewable linear package to be aired by various stations across
the country locally.
This author has worked as a broadcaster at a live home shopping channel for over
fourteen years. The positions over the years entailed various work in the control room,
studios, and managerial areas regarding broadcasting operations. The tasks involved
have always been in some capacity as the executor of the presentation without ever
understanding how it works from in front of the camera. Therefore, there is considerable
curiosity as to what makes the live presentation strong enough to get hundreds, if not
thousands, of people to buy within a certain time frame.
This thesis will provide a literature review that features a history of live
programming and the definition of what live broadcast is by today’s standards. The
review places emphasis on nine different factors that make live presentations effective.
Next, there will be an empirical study that examines the nine factors that give strength to
live presentations as opposed to recorded presentations of the same product, followed by
a discussion of the findings and the limitations of the study. This thesis concludes by
discussing the implications of the study for future research and home shopping via
television.

4
Chapter Two: Literature Review
A History of Live
History has shown positives in the realm of live television. History expressed this
for outsiders so there is a boost of credibility regarding how shows are produced. This
has been done since the 1940s with programs showing backstage in the radio medium
(LaFollette, 2002). More educational shows were shown on television with Serving with
Science and The Nature of Things as examples, with the latter being a live broadcast
lending truth to the behavior of how things work on a scientific level or as LaFollette
(2002) phrases it as “realistic re-creation.” There are further points made in regards to
scientific shows broadcasted live such as Museum of Science and Industry and Meet Me
at the Zoo were broadcasted live. These shows had regular hosts and guests from various
science industries explaining the content and display items that would be of interest to the
audience. Other shows would have guests of stature, such as Admiral Chester Nimitz and
astronomer Harlow Shapley, to give the show more of an more authentic tone. As
television went into the 50’s, the live format started to disappear in favor of more filmed
footage or material where it would be difficult to shoot live and therefore had to be
recorded (LaFollette, 2002). However, when the recorded format arrived, the format
gave what was being shown on television “explanations, gestures, expressions, and
exclamations about a successful experiment were all part of the script. Television thrived
on rehearsal and preparation-all for the sake of re-creating spontaneity” (LaFollette,
2002, p. 46). Nevertheless, the concern now arises that fact and fiction are now making a

5
hybrid type of television where people are comfortable with the information received.
Instead of broadcasts rich in information, they are now rich in entertainment competing
for the audience attention. Recorded television took over and dominated live television
for the simple reason that it was easier to make. By doing so, recorded television created
a void in credibility and authenticity for these programs.
As the viewing audience moved into contemporary times, concern was expressed
over the apparent, degrading importance of live broadcasting. Bourdon (2000) argues in
spite of general audience channels broadcasting worldwide, there is more call of
narrowcasting or appealing to special niche audiences. It is claimed that themed channels
can emphasize live broadcasting along the general audience channels if the programmers
wished (Bourdon, 2000). If live is disappearing, then why are there still shows called
Saturday Night Live, Primetime Live, and Live with Dan Shilon Interviewing? The
continued presence of live shows is because that the liveness of television connects us to
people and places in real time and helps us as a society discover things that would never
be thought of. In other words, there is a sense of authenticity and truth in live television
regardless of its secondary feel in nature. The Barcelona Olympics is cited as an example
where stylistic recorded material can blend in well with the liveness of sporting events.
Live television can be applicable not only to sports, but variety shows, music shows,
amateur presentations on the Internet, etc. With all the options that are found with live
television, it is important that people believe what they are seeing. Excitement is stronger
with live because of the combination of improvisation and rehearsed work involved. The
believability of live broadcast is also enhanced by the presence of unplanned events or
even accidents (Bourdon, 2000) The unpredictable nature of live makes it difficult for
6
people to doubt what they see. By contrast, as Bourdon (2000) points out, the seamless
continuity of recorded broadcast leaves some room for doubt in the viewer’s mind.
The Live Context
Elana Levine has done work in regards to television “liveness.” Live television’s
growth was in the 1950s at a time when it overtook film and theater as the popular
medium. Owning a television was certainly a privilege. The limitations of time and
space were broken by live television. In today’s world, television is struggling to
survive, and the key to its survival is in live television productions (Levine, 2008). There
are further arguments in regards to how credibility is sought by live show producers to
fulfilling audience needs. The potential for anything to happen is central to the appeal of
live. The potential “train wreck” that is waiting to happen in the live environment is
another part of the appeal. The “train wreck” can be defined as when a disaster in a
figurative sense has the potential to happen based upon what is being broadcast. An
interesting conclusion given by Levine (2008) shows that with the rise of the recorded
program, live programming has become less important on television. Live television is
more important than ever with the advent of new media such as the Internet and the
concepts of live streaming. Furthermore, live has a rapid, if not urgent, production time
so any attempts at creativity are taken out of the equation. Removing the creativity
aspect and letting the production flow can enhance credibility and authenticity (Levine,
2008).
Live Home Shopping Variations
There has been discussion regarding how home shopping is now a media
phenomenon. At one time (and this speaks from personal experience working these

7
shows) hosts on the network were doing anything to sell from working with a circus to
running around the studio behaving wild. “Brand names, celebrity guests, live remote
broadcasts, and studio audiences are all part of today’s television shopping” (Gudelunas,
2006, p. 230). The show hosts for these networks became the equivalent to soap opera
stars in that they were not well known outside of the network, just like a star of a soap
opera was not well known outside the show they worked on. Also soap operas and the
home shopping audiences comprise of mainly stay at home women. Gudelunas (2006)
then discusses the media system dependency in this article. Media system dependency is
defined as an ecological theory that attempts to explore and explain role of media in
society by examining dependency relations. This means that there is a possibility that the
home shopping viewer (or at least a certain percentage of them) become so dependent on
the show host they are viewing. The dependency generated enables the viewer to buy
anything the show host presents because Gudelunas (2006) believes that the show host is
talking directly to the viewer almost as if it was their best friend speaking to them. Phone
calls and testimonials can make an impact in this area as well because the interaction
between viewer and show host is now greater.
The next theory that is presented by Gudelunas (2006) is parasocial interaction.
The concept was created back in the 1950s as an illusion that certain media create
between the viewer and what is on the media of being face-to-face action. This type of
interaction is important for loyal viewership and loyal buyers of the products. There are
examinations of the home shopping viewer presented. There are skeptical viewers that
are categorized as younger and not really sure if the item is a good, but they will find the
presentations funny (Gudelunas, 2006). Odds are these viewers will not really bother

8
buying in the end. If they do any type of buying, it would most likely be in the e-
commerce community. Then there are the practical viewers with an average age of 55.
They will watch the presentation and make sound judgments as to buy the item or not.
This is dependent on the strength of the presentation as a whole. So in essence, getting
the presentation right (since these channels are live) is very important if you want to get
these viewers buying. Finally, there are the compulsive buyers and, according to
Gudelunas (2006), they are age 59 or older. These individuals look to these channels for
companionship. They have the money to buy and the time to spend watching these
channels. These customers are more susceptible to having the show hosts be that “best
friend” through the world of buying.
Singh, Balasubramanian, and Chakraborty (2000) examined the standard
advertisement against the infomercial against the direct experience regarding a product.
The primary research involved asked which of the three was the most effective compared
to the others. Characteristics of the infomercial are presented in such a way it is pointed
out how the infomercial is mainly a combination of the advertisement and the direct
experience of a product (Singh et al., 2000). The definitions of the three are immediately
examined. An advertisement is a thirty-second presentation of a product where there is
hardly a demonstration and considerable acting involved in attempts to make the product
memorable to the buyer and in turn buy the product (Singh et al., 2000). Sometimes the
use of giving away free samples to test will make the ad more effective. The direct
experience definition involves a live demonstration in front of people to show how the
product works and what it can do with emphasis on the positive traits of the product. At
the same time, there is involvement getting members of the audience in the demonstration

9
to show effectiveness of the product. The main idea is to try the goods but not to give the
goods away. The infomercial definition is an advertisement from fifteen to thirty minutes
in length that airs on a television station. This type of advertisement explains what the
product is, what it can do, and proceeds to give demonstrations of the product sometimes
recorded with a studio audience (Singh et al., 2000).
Comparisons of the three were made by looking at the overall message of the
presentation and the cognition, affect, and connotation of the product. Between the
definitions and the message examinations, it was concluded that the direct experience is
the most powerful in terms of learning mainly due to the direct contact of the product and
how to use it. Also customers actively seek information to assess the product and by
doing so create a stronger learning experience (Singh et al., 2000). The vicarious
learning model is introduced mentioning that it “attempts to change behavior by having
an individual observe the actions of others (i.e. models) and the consequences of those
behaviors” (Singh et al., 2000, p. 61). This model is important because infomercials
promote vicariously for two reasons that are the length of the message and the
demonstrations involved. Infomercials also have the luxury of re-emphasizing key points
of the product because of its length. This method promotes stronger recall. The direct
experience is stronger than infomercials and more effective than advertisements. With
the combination of elements of the direct experience and the infomercial, it then becomes
understandable why home shopping related channels are successful.
Class ideology is involved in selling to the customer on certain channels (Cook,
2000). The channels looked at were QVC (a.k.a. Quality-Value-Convenience), HSN
(a.k.a. The Home Shopping Network), and Q2 (a sister channel affiliated with QVC).

10
On all three channels, the programming as a whole is to engage and promote
consumerism. The home shopping shows consistently reflect social class of the audience.
Social class is “that awareness acknowledges economic limitations (when necessary) and
simultaneously fosters what be called class anxiety or, more specifically, working-class
anxiety” (Cook, 2000, p. 374). The presentations from the channels researched showed
that looking rich is portrayed as desirable. The programs are designated for women as
the primary consumers. The HSN, QVC, and Q2 networks were examined further in
terms of the items they sell. Both channels sold more affordable items much quicker than
Q2, which primarily was selling higher end items. Cook (2000) notes that the wealthy
buy cheap items for fun while the poor buy expensive items to fit in to the rich side of
society. A more important point by Cook (2000) is that while HSN and QVC broadcast
live, the Q2 channel showed programming that were presentations of products that were
edited for re-broadcast. This type of programming and the higher prices of the items on
Q2 lead to its demise in 1998. While Q2 was on the air, financial limitations of
customers or what was considered the “in” item of the day were not considered
important. This final observation by Cook (2000) shows that viewers of HSN and QVC
when informed that the product was displayed as upscale at the time caused the product
sales to increase. The study did not address the potential of credibility as a factor for
sales and the end of the Q2 channel. However, there is emphasis that the live
demonstrations are still a key since HSN and QVC are still on the air.
What are the factors that could possibly make live television strong on home
shopping related channels? Could pre-recorded material be just as strong in these factors
in spite of what has been cited above? A considerable amount of time has passed

11
between this literature and today and therefore calls for variables between live and pre-
recorded material to be examined. We will examine nine of the variables that may help
explain the differences between live and recorded sales presentations based on existing
research.
Credibility
When it comes to live presentations, credibility is a huge factor. Why would
anyone buy a product if the product has no honesty within the presentation? No truth in
the presentation would hurt it, the product’s sales, and the future of the product.
Audience perceptions and how they are related to the degrees of credibility within a live
presentation environment are looked at (Lee, Park, Lee, & Cameron, 2009). The
presentations were specific to news stories and public relations releases. “Previous
literature concludes that when people perceive the source or medium carrying the
message to be highly credible, they will tend to rely on and use the information more
often than people who evaluate it to be less credible” (Lee et al., 2009, p. 310). This
research illuminates the difference between public relations and news material with
sources attaining stronger credibility. The visual aspects of the material remain
memorable in the consumers mind depending on the source according to another
argument. Across both sources, when the overall production value is perceived to be
high, then the credibility of the complete presentation is thought to be high (Lee et al.,
2009). The greater amount of work and precision to detail that is given to the release;
there will be a higher degree of acceptance by the population. Presentations have
stronger amounts of credibility when placed on television than in the various forms of
print media (Lee et al., 2009). Lastly, if the stories can be verified, the credibility will

12
increase further. This article mainly looked at news presentations and credibility in
multiple media environments.
Media outlets are showing more concern for audience perceptions of media
credibility (Oyedeji, 2007). An investigation was done regarding how brand credibility
affects the attitudes of consumers towards specific brands. Credibility is the main factor
that can cause attitude changes, insure success and keep companies as competitive as
possible. It was demonstrated that credibility is stronger on television than in
newspapers. If people are to take a brand seriously, they can get that perceived
credibility from the television medium.
Several research questions were posed ranging from asking what the audience
perceptions were for credibility on certain channels to perceptions of quality, loyalty,
knowledge, and awareness related to credibility (Oyedeji, 2007). The findings were
some channels such as CNN were stronger in credibility than Fox News. There were
significant credibility concerns in regards to the four sub-categories listed above. The
more subjects had these cognitive sub-categories; the strength of source credibility could
be determined. Credibility should be a concern for television because younger
generations are getting their information increasingly from the Internet. In order to get
these generations to watch television, the level of believability needs to be stronger
(Oyedeji, 2007). Media managers should find ways to increase audience perceptions of
credibility of their respective media networks.
Credibility in the information age is important for the successful live show sale.
Live news credibility can be applied here as to the success of the story. Perceived
credibility, according to Kiousis (2001), is mainly a function to source and channel
13
characteristics. There can be many lines that can influence credibility of channels. Who
is delivering the information? Who does the seller represent? What is the medium in
which the information is relayed? The limitations of exposure to the medium are a link to
the lack of credibility a station carries. The traditional print exposure has more
credibility than a television broadcast (Kiousis, 2001). However, credibility in news is
correlated across print, on-line, and broadcasting. One finding in this study is on-line
news is perceived as more credible than television news. A potential reason behind this
is how on-line sources changed public opinion of media credibility as a whole thus
reducing trust in television and increasing trust in newspapers. Watching television is
considered a group experience while gathering information from a source is an individual
experience hence the lack of bias among group members that would sway an opinion
(Kiousis, 2001). In the end, text-based channels hold credibility for everyone since there
is more trust in the written word .
Authenticity
With authenticity though, one must be ever so careful of potential misleads,
omissions, or incorrect statements that could not only harm the authenticity factor but
lead to severe litigation on the sellers part. If the product does not appear or perform
what it is supposed to do, then what is the point of even selling the item? ‘Bait and
Switch’ tactics are not unheard of, but if these tactics are discovered, this could also
present problems for the product. There are products that exist that could lead to
potential injury of the consumer unless there is a disclaimer of the product given during
the sell (Morgan & Stoltman, 1997). If there is no disclaimer, it leads the consumer to
believe that the seller may have known that something unfortunate could happen.

14
Demonstrations can lead a consumer to believe that a product can be used one way when
it was meant for something else. To enhance authenticity, advertisers and sellers will
need to find ways to reduce the number of injuries to a customer because of their
products. It has been suggested that the courts look at the products to see if the
consumers have the knowledge of how the product works (Morgan & Stoltman, 1997).
The courts do not want to be skeptical of every consumer that brings a claim, but it seems
to be happening more often. Legislatures may need to act if there is a potential issue with
a product by creating new laws that are for the protection of the consumer and the
product’s parent company to prevent further litigation. A conclusion found here is that
advertising in another language can be misleading to the consumer (Morgan & Stoltman,
1997). Laws at the federal level are needed to try and curb this. Miscommunication can
be prevented with advertisers scrutinizing over the ads and selling methods to make sure
there are no misunderstandings with the presentations.
Simple word usage is important to the product demonstration being aired. These
words if used in the incorrect context can be damaging to authenticity even if they are
just small words. A term such as ‘puffery’ comes to mind in situations such as this.
Puffery is defined as “…the difference between precise, testable, factual claim and a
vague, untestable, evaluative claim” (Simonson & Holbrook, 1993, p. 217). Puffery
dilutes fact from opinion because the statements regarding products are difficult to close
to impossible to classify. Puffery is also used as protection to avoid accountability of a
claim regarding a product or service. Another definition of puffery addressed is the
advertising and representations which praises the product aired with subjective opinions.
Issues could arise regarding the preciseness and reliability of the claims made regarding

15
the product. It now becomes a problem when liability is involved. Since there is no clear
protection, now everything is looked at on a case-by-case basis. There are problems
defining puffery and also identifying it. Truth is determined by the expertise of the seller.
Lastly, there are attempts to figure out which family member is being identified as
the buyer. Who would be more susceptible to buy? To further prove there is no negative
puffery, it is asked to what degree the buyer has to access the product to test it before
buying (Simonson & Holbrook, 1993). If there is authenticity, then there is lesser
liability on the seller. Simonson and Holbrook’s (1993) study showed there are
contrasting differences in court judgments regarding puffery. However those judgments
fall under permissible puffery, in other words puffery that leans more towards truthful
advertising. There are underlying factors to be discovered that leads someone to buy a
product outside of puffery statements. The final determination in the study is the strength
of puffery, and if it is considered such by certain audience members. (Simonson &
Holbrook, 1993).
Journalists are assigned to many live from the field reports especially when
politics are involved. Live reporting is regarded as very appealing to journalists
(Snoeijer, de Vreese, & Semetko, 2002). The dimension of authenticity in this area of
broadcasting is important because of the ‘seeing is believing’ mentality. Importance of
the story and involvement between the viewers to the story in question weigh just as
strong as authenticity (Snoeijer et al., 2002). Live related broadcasts could possibly be
recalled than a field report that is sent into the studio. Live cross talk could be evaluated
more positively than field reporting in political arenas. The effects of live recall were
significant in the experiments. This was due to the immediacy of the story that is being

16
presented (Snoeijer et al., 2002). The reports were also thought of more positively than
field reports; however there was no support for positive live cross talk for political issues.
This could be due to the lack of importance, objectivity, and understandability of the
issues at hand. There were conclusions stated that if the live broadcast is of a breaking
news nature then it will be looked at as authentic. However, if there is the feeling of
rehearsed cross talk in a live environment, then viewers will think differently.
Advertising can teeter between the truths and misleads in accessibility of
information and the product itself. Advertising is argued to be one of the most
controversial forms of business communications. The argument continues by showing
how deceptive it can be and the negative psychological effects it can cause to people
involved (Feary, 1992). These same thoughts could possibly apply to vendors. Feary
(1992) argues that John Stuart Mill was one of the people responsible for discrediting
advertising. When it comes to advertising, this type of speech does not conform to Mill’s
principles regarding freedom of expression. Another issue Feary (1992) has with Mill is
how he supports any special restrictions and regulations on products that are necessary
thus leading to a ban on ads completely. Feary (1992) then argues how the Virginia State
Board of Pharmacy case ruling which protected ads because of the necessary information
needed for the consumer to make an appropriate purchase, created a free flow of
information for ads. Another example used involved Talsky v. Department of
Registration and Education, which emphasized truth in health advertising because of the
critical importance of health information on consumers. Central Hudson Gas and
Electric Corp. v. Public Service Commission is another case where information is
important to strengthen the message given by the company. There are arguments on a

17
philosophical level where advertising should be taken seriously. These ideas are how
accessibility in advertising gives us the ability to make autonomous decisions (Feary,
1992). The industry will thrive as long as advertising is true and does not mislead in any
way and has no misinformation that is made accessible. To complicate matters, states are
making commercial speech rulings on their level, instead of the federal level, creates
multiple unclear definitions of what should be in fact protected. It is then suggested that
if advertising regulation (and thus accessibility) is kept at the federal level, then there can
be considerable adherence by companies to abide by their regulations (Feary, 1992).
Until changes as above can be made then there is no true legitimacy in product’s
information. This could hinder choices to make decisions on buying products.
Do consumers recognize something that is misleading or incorrect advertising? A
study in web related advertising attempted to answer this question. With the rise of the
Internet, it gave organizations a chance to get consumers observing “simulated direct
experiences” with a product (Mitra, Raymond, & Hopkins, 2008). When claims are
made, the information on those claims is readily available on the Internet. The downside
of this type of rapid growth makes skeptical consumers worried they are being exposed to
misleading advertisement (Mitra et al., 2008). There are concerns which could rise with
the Internet for advertising. The environment could make the consumer feel he/she is at
the demonstration and the experience of telepresence. Telepresence is the sense of being
in a remote environment that can give the consumer the direct experience (Mitra et al.,
2008). Results of the study showed that computer-mediated direct product learning could
lead to stronger beliefs and positive attitudes regarding the product. Media richness as
well can lead to how consumers perceive truth from fiction in ads found on-line.

18
Whether or not a consumer will believe what they see depends on how truthful the ad was
and the level of involvement of the consumer on the Internet.
Involvement
How do the host and guest involve themselves with the product? Do
presentations have elements of intimacy? Have the host and guest engaged the viewer in
such a way that purchasing the product is inevitable? Personal relevance of the product
between the show host and the viewer could be important. Hogan (2006) starts off with
simplicity by explaining the definitions of the words “covert”, “persuade”, and
“persuasion.” The main idea is to “bypass the critical factor of the human mind without
the process being known to the receiver of the message” (Hogan, 2006, p. 3). There is
the necessity to discuss ethics of this type of practice early on. The first idea addressed is
having the subject think of a different memory than the one that is in their head about the
topic being discussed. Another idea mentioned is to immediately agree with subject’s
point of view. It relieves any potential tension that may come.
The next issue discussed is how people will immediately use the answer “no”
(Hogan, 2006). This word can be argued to be a natural defense mechanism. The first
steps to have the subject say “yes” is to get them to remember a positive related
experience tied to the concern the seller may have. One can guide the subject by
explaining what the future can look like if he/she says “yes.” Using this technique
requires deeper thoughts and explanations as to how things will work out. Finally, the
seller needs to get the subject to act out the positive behavior to get the positive response.
Hogan (2006) at this point feels the seller has the subject they want to persuade
where they want them. It is time to use specific tactics to seal the deal. The first tactic

19
discussed is to rapidly build a rapport with the target (Hogan, 2006). The seller must try
to keep the conversation as positive as possible. Try to keep things friendly so the
rapport will remain on a consistent level. The next step is to use interesting content to
create and build such rapport. This works by discovering what the interests of the
target’s are and molding the seller’s own ideas around the target’s to feel comfortable.
This will give the target’s ideas of thinking that they are like the seller in these ways and
the trust process will grow stronger (Hogan, 2006). Then the seller must proceed to use
processes to build rapport. The processes which need to be used are doing the same
activities as the target’s to enhance the seller’s similarities. One can discuss
commonalities of work, business, and families to make the other feel better.
Synchronization of the target is the next area to proceed to. “First, you must begin where
the other person is; he must feel that you are just like him. He must identify with you on
some level for you to have any power to persuade” (Hogan, 2006, p.49). The next step is
to synchronize each of their voices. The seller’s vocal pace is the same as the target’s. It
is important to mirror the pace of the target and remain on that level throughout. This
also applies to breathing, posture and movement, and vocal tone/pitch. The next step is
where the seller moves to reciprocity. This is where the seller does something for the
target and the target will do something for the seller. Then the seller can share what kind
of person they are with the target.
Hogan (2006) then proceeds to discuss twenty keys to succeed using covert
persuasion in a story. Get the listeners attention as quickly as possible. Get to the point
of intentions early so time is not wasted. Sort out in what the target should think or feel
when the story is told. Make sure the purpose is as clear and concise as possible to your

20
target. Make sure any revelations will touch your target in an emotional way. Share
information in a simple manner and be humble while doing this (Hogan, 2006). Make
visualizations as vivid as possible and avoid what the future could bring in the
presentation. One needs to make sure that all information that is given during the
presentation is verifiable. The last thing anyone needs is to hear claims that cannot be
backed up. The next task is to find ways to have others that have benefited from the
experience relay it to the target. Testimonials such as these can enhance results that
would work for the seller (Hogan, 2006). It is important that the seller can inspire the
target to make actions that will benefit all. All of these keys can establish positive
involvement from the target.
In other areas of researching involvement, there have been studies that address
marketing, and the hows and whys of the shopping experience through various media.
Graves (2010) simply begins by stating if something is plausible to us, then we will
automatically treat it as genuine. The things we wish to buy are all based on beliefs and
perceptions. Arguments are made how marketing researchers are wrong in many respects
regarding people. “The fact that people react similarly to consistently executed
questioning process doesn’t tell us anything other than that the cause-and-effect
relationship of such research is consistent” (Graves, 2010, p. 3). Focus groups and
discussions do not work much because there is always someone leading the conversation
and others in the group will just agree with him/her. There must be more concern in
regards to the here and now and not what people may do or even possibly consider
(Graves, 2010).

21
There is information for us about the unconscious reasons of why we buy things
but we have no explanation for it (Graves, 2010). The Pepsi Challenge is example of
how the unconscious can work to a groups benefit. The challenge was a blind taste test
between Coke and Pepsi. People like Pepsi better than Coke in the test; however this was
done in one taste sitting. If it was done in several sittings, the odds are, one would know
what the drink is and pick that instead. New Coke was developed because of this
challenge. The product backfired because no one took into account what the unconscious
mind was thinking. Basically if one does something enough times, it becomes so
ingrained in their head that when one does it, one does not even think about the fact that
they are doing it. In an experiment, people were provided with data on washing
machines that they can purchase (Graves, 2010). With this data, the subjects could make
an informed decision on which brand of washing machine to buy. The subjects proceeded
to buy a washing machine from a product brand that they have used before and are
familiar with. This was done regardless of what kind of information was given about it,
even if it was good or bad (Graves, 2010). The subjects bought the item because of their
familiarity and trust in the brand. Once someone is used to doing something or buying a
particular brand, it is hard to break that person of that habit on the unconscious level.
Urgency
How important is it for the viewer to have that item right now? How much of a
priority is there to buy that item off of television at that moment? Live broadcasts
streamed through the Internet are just as important. The streaming of live presentations
“make it appear as if representations are unmediated because images and texts seem to be
presented on the screen at the same time as the viewer is watching” (White, 2006, p.

22
342). Direct addresses on-line is aware of the personal interests of the user and at the
same time attempting to tailor make the presentation to the viewer’s buying habits,
behaviors, wants, and needs (White, 2006). There are considerations that the Internet is
currently one giant advertisement that attempts to seduce the viewer to doing what it
wants. Webcam sites are the chief reasons why people are attracted to the Internet and
why people ignore what is going on around them. These sites have the greatest appeal of
the desires of the viewer, which can lead them to where they would like to go. When not
used properly though, the Internet could possibly find too much of the user. Narratives
attempt to reach the user may be obscured by the sites themselves which raises the
question of how trusting can these live streaming camera sites be.
Perceptions in realism, accessibility, and urgency can be another critical factor as
well. Television in general can affect a person’s judgment. Heavier viewers in television
are apt to make quicker judgments (Busselle, 2001). There are arguments presented
showing that there are three reasons for exemplar urgency. The first reason is greater
frequency. More recent views of a channel will cause people to do things. Second,
information comes from examples whether true or not. Third, examples are presented
will affect subsequent judgments in those examples. The possible reason why some
events are memorable while some are not is because when the aftermath of the event is
shown, it makes the presentation less involved and memorable to the point where people
will forget passively (Busselle, 2001). When a decision such as buying a product is
made, people evaluate how they came to this important decision. This move is found to
be very counter-productive and can cause serious doubts in the purchase. In order for
something to be urgent, its presentation must be quick so it can be remembered. Items

23
that measure perceived realism must be looked at to insure the right decisions are always
made in a social context (Busselle, 2001). There must be a fine line between social
conceptions and perceived reality. What we decide based on this type of realism will
certainly affect the outcome of our real life decisions.
Informativeness
Is the presentation rich in information about the product and how it works?
Informativeness could be another factor in the equation of home shopping presentations
and products. Arguments suggest one way exposure to the media may help the judgment
of enhancing informativeness (Busselle & Shrum, 2003). This can help the information
given aid in rendering a final judgment in picking the appropriate product. If
informativeness is manipulated, beware of unintended positive or negative effects. There
are cultivation effects occurring through the television giving the idea of informativness.
It is stated that the more television viewing is involved with the product, the greater the
possibility the product will be bought (Busselle & Shrum, 2003). Judgments from
viewers and shoppers will be arrived at more quickly through this medium.
Informativeness can be attributed to three factors, which are vividness, realism and
distinctiveness (Busselle & Shrum, 2003). Vivid demonstrations are more likely to
attract attention. Distinctive demonstrations can show how the product is unique
compared to products that may be similar to a certain degree. Realistic demonstrations
exemplify the truth in the product leads to the selling of the product. Media exposure can
increase accessibility of what is being shown. The ease of retrieving the item in question
can be with the increased impression of informativeness. If there is experience in
informativeness lacking in consumers, it has a profound effect of how strong the interest

24
of the product will result negatively (Busselle & Shrum, 2003). If informativeness of
what is being shown is not re-enforced constantly, it can increase the lack of memory
regarding it, which will have a significant negative effect on product consumption again.
There have been discussions with regard to how images make a powerful
impression on others. Pratkanis and Aronson (2001) immediately use an example of a
prosecution gone wrong. The prosecutor blames advertising for why things did not work.
Another image that was used to create impact was a rape shown on a television show.
The intent was to show how horrifying the experience is and what to do if this may
happen. A frightening example given is when in 1982, someone was poisoning bottles of
Tylenol. Because of the images shown, they inspired copycats who were poisoning in the
same method. Images can make a considerable impact on others, positive or negative
(Pratkanis & Aronson, 2001). There are outlines that discuss how Americans are
exposed to a huge amount of advertising and various other images on a daily basis. This
can influence Americans to take action, both good and bad. These actions can take place
not only at home but also at work where managers hold meetings and use visuals to
impact employees in a certain way. The society we live in has accepted being persuaded.
Other societies do not give people the kind of options that ours give. With the rise of
mediums such as newspapers, radio, and television and now the Internet we have become
the ultimate example of a persuasive society (Pratkanis & Aronson, 2001).
There are four strategies of influence with regard to informativeness. The first is
to take charge of the situation one is involved in and make the message one presents in a
comfortable environment (Pratkanis & Aronson, 2001). Then one must establish source
credibility by way of creating favorable images in the minds of the target audience

25
(Pratkanis & Aronson, 2001). The next step is to focus the message in a way that keeps
the attention of the target audience. Lastly, arouse the emotions of target audience and
get them to respond to the course of action one wishes to pursue through those emotions.
The examples of these actions are Abraham Lincoln and the Gettysburg Address, the
labeling that comes from Rush Limbaugh and the case of Paul Ingram’s alleged crimes
against his daughters. By using the above tactics, Lincoln was able to boost the morale of
his country, Limbaugh is able to raise anger against certain people in the government, and
Paul Ingram’s conviction was upheld (Pratkanis & Aronson, 2001).
The arguments used in communication to induce thoughts in others that in some
cases may be true (Lincoln’s Gettysburg Address) or in other cases may seem outlandish
(Limbaugh and Ingram), regardless of what is being said, people will remember and
process it in such a way in which no matter what the facts are, what is said must be true
(Pratkanis & Aronson, 2001). In order to insure that one does not fall into these types of
traps it is suggested that, “the goal becomes to prove yourself superior and right no matter
what. We become dependent on those who will support our masquerade.” (Pratkanis &
Aronson, 2001, p. 66).
Entertaining Value
Are these presentations enjoyable to watch while at the same time trying to help
one make an informed decision about purchasing the item? As to continuing further with
overall perceptions of the home shopping media, it is important to stress the way
advertisements are perceived as important with regards to their effectiveness. Well-liked
ads are more effective in the grand scheme (Aaker & Bruzzone, 1981). It is possible
where well-liked product demonstrations can be just as effective on the sale of the

26
product. Various inquires made by Aaker and Bruzzone (1981) were made about the
overall appeal of the commercial. Can the friendliness and affinity of personalities
related to the commercial create support for or against associations to viewer reactions?
Are there perceptions of the personalities and their friendly personalities in the
presentations which could be considered intrusive or just wrong to the viewer?
There were four factors found which may be responsible in creating positive
reactions of viewers when commercial presentations are given. The first factor is the
“dislike” factor which measured if the viewer’s felt comfortable with the presentation or
did it make them feel uneasy about they saw (Aaker & Bruzzone, 1981). There is the
“entertaining” factor which is measured by how amusing the overall presentation was to
the viewing audience. The “warmth” factor shows how friendly the commercial could be
to family, children, and friends. The final factor is of “personal relevance” defined as
presenting useful information to the viewer. Collectively, these factors could be
important with regard to the positive perceptions of the overall presentation and the
product itself (Aaker & Bruzzone, 1981).
Sense of Real Time
Is what we are seeing giving us the idea that this presentation is in fact happening
right now? Does this sense of “as it is happening” mentality make a difference in terms
of buying the item? The news industry visually got its first exposure by way of the
newsreel and became popular worldwide as the best delivery system for the news during
the 1940s (Althaus, 2010). The reason for this popularity was because this type of news
was shot while actual events were happening. This was the historical equivalent of
satellite news. It was considered stronger because of the larger and more diverse

27
audiences that existed at the time. Could these newsreels be the pre-cursor to live
television? The newsreel has now become a forgotten medium instead of it being the
main contribution for the types of news that we as a society are used to (Althaus, 2010).
Granted that this footage was edited before it reached the theaters, it still showed the
events as they were taking place. This made live events more important to the medium
but also to the distributors who produced it and the theater owners that were financially
dependent on it (Althaus, 2010).
Live television, with its real time aspects, can put particular pressure on the
government. The “CNN effect” is taken into account for consideration for real time
coverage of news events to the point where foreign policy is concerned (Gilboa, 2003).
The “CNN effect” is when the news events that are covered in real-time will affect the
policies of other entities including the United States Government. There are positive and
negative effects that may come of this. The negative effects are when the events are
shown on television; it forces the government to make a swift decision that results from
what is being seen by the viewers for the sake of national interest. The positive effects
are when the footage is shown in real time it causes “direct communication with foreign
leaders” (Gilboa, 2003, p. 98). “Breaking News” is seen by policy makers as
intensification for an immediate response to what is taking place. Gilboa (2003) feels this
type of coverage applies this pressure on purpose to see if they can change policy to their
benefit. If the policy is changed that hinders the press, then they become overly critical
of what has been decided. It becomes a Catch-22 for the policy makers as soon as the
real time footage comes to air. With the advent of twenty-four hour news stations, it
makes policy making decisions even more complex. Lastly, Gilboa (2003) suggests there

28
should be contingency plans in case something is aired so government officials will be
ready for potential responses. Communication experts should play a role with policy
makers regarding the messages being given with the footage to insure there is no decrease
in diplomacy with any other foreign entities involved.
Spontaneity
Things suddenly happen during a live presentation, good or bad, can have
implications in terms of purchasing a product. When it comes to broadcasters, “Liveness
in the sense that they express a desire to please audiences by engaging them in a
spontaneous, informal, unscripted ‘here and now’” (Lundell, 2009, p. 271). There are
expressions of how ‘liveness’ can be impartial, objective, balanced, and versatile when
scripts for live shows are done correctly. Lundell (2009) further defines ‘liveness’ as
events that connect us as they happen. ‘Liveness’ is connected to authenticity and truth.
In order to keep interviews as genuine as possible, scripted live is preferred. There is
always a chance though that someone will go off the script to create the spontaneity that
is desired by the audience. Authenticity is stronger in the live environment with the use
of a live studio audience and their participation within the program (Lundell, 2009). With
a live studio audience there is a certain amount of risk where audience members will ask
questions that may seem awkward to the interview subject. In order to minimize that
risk, the producers will have questions prepared. This can make one doubt what he or she
watches on television even if the material is live. These doubts could deteriorate the
spontaneity, credibility, and authenticity of the overall show. There is now more control
of live on the air performances than ever before with a show being rigorously scripted.

29
Interactivity
Conversations and interactions between the show host and guest with a phone
caller could help people make up their minds about buying the product. If there is a
testimonial involved in the conversation, there is a good chance that sales of the item in
question could be elevated further. One study looked at the interactivity of live reality
television broadcasts in which the viewer votes on contestants with real time taken into
account. Kjus (2009) looks at how well regulated these shows are and if the production
values are consistent. Events that are live and immediate are protected from time-shifting
technologies which may cause harm to the advertising revenues of archived television
genres. The music, fashion, tourism, and business fields depend on the strength of
credibility these live shows have. There is evidence these shows and their voting
mechanisms have been tampered with which will need to be addressed. The live events
could create connections between the audience and the advertiser. These connections
could create giant marketing strategies that can be financially beneficial (Kjus, 2009).
The live event can only last for a short time. With the right marketing and freedom from
scandal, these live dimensions increase the value of the production and keep the voting
mechanisms completely legal. Live keeps these commercial industries regulated (Kjus,
2009).
Research Questions
In light of the literature review and the numerous factors that can be investigated,
the nine specific factors above are potential keys to the success and failures of live
presenting and recorded presenting of products to be sold via the television. One can go

30
on further to inquire which way to present a product on television is stronger. With this
in mind, this study can begin by asking:
RQ1: Does live TV product sales presentation generate stronger
perceived credibility than recorded sales presentation?
RQ2: Does live TV product sales presentation generate stronger
perceived authenticity than recorded sales presentation?
Credibility and authenticity are predicted to be considerably stronger and the
recorded equivalent of the presentation. For live to be the stronger variable, the
presentation in this study must be honest at all time. The demonstrations in the
presentation for this study should always work. Authenticity should reflect there is no
types of ‘puffery’. The presentation should feature claims that are genuine to the point
where it would convince someone to buy the item. Furthermore, in order to insure that
there will be discoveries found to strengthen the differences between live and recorded,
the following questions were also posed:
RQ3: Does live TV product sales presentation generate stronger viewer
involvement than recorded sales presentation?
RQ4: Does live TV product sales presentation generate a stronger sense
of urgency to purchase the product than recorded sales
presentation?
RQ5: Does live TV product sales presentation generate stronger
perceived informativeness than recorded sales presentation?
RQ6: Does live TV product sales presentation generate stronger
entertaining value than recorded sales presentation?
RQ7: Does live TV product sales presentation generate a stronger sense
of “real time” than recorded sales presentation?
With involvement, there needs to be an examination that looks at how engaging
and intimate the presentation and product was overall. Urgency will be broken down as

31
to how quickly the buyers should item. How much of a rush is there to purchase item
before it is too late. Research question five will be determined by the amount of facts
given by the show host and/or guest. Was there enough information given to the point
that an informed decision could be made by the viewer? Entertainment will encompass
the fun aspects of the presentation overall. Since the product is airing either live or
recorded, do the sense of “real time” issues affect the judgment of the viewer/shopper to
make the purchase? Will the viewer want to buy the product at the end of the
presentation?
RQ8: Does live TV product sales presentation generate a stronger feeling
of spontaneity than recorded sales presentation?
RQ9: Does live TV product sells presentation generate a stronger feeling of
interactivity than recorded sales presentation?
The last factors to be examined to show differences between live and recorded are
spontaneity and interactivity. Does the presentation have a natural or unscripted feel to it
that there is no time to be creative and therefore make one realize that this presentation
has a realistic feel to the point of buying the product? Also does the presentation have
enough interactivity between the host/guest and the buyer that it would strengthen the
presentation to where it would convince others to buy the product?
Ultimately the nine factors examined in this study are expected to mediate
viewers’ attitude toward the sales presentation and the product, which in turn mediate
viewers’ intentions to purchase or use the product. The following research questions
pertaining to attitudes, purchase intentions and their relationships with the nine factors
were thus raised.
RQ10. Does live TV product sales presentation generate a more positive attitude
toward the presentation than recorded sales presentation?

32
RQ11. Does live TV product sales presentation generate a more positive attitude
toward the product than recorded sales presentation?
RQ12. Does live TV product sales presentation generate stronger purchase
intentions than recorded sales presentation?
RQ13: To what extent can the nine factors be used to determine viewers’
attitudes toward live and recorded sales presentations and the product?
RQ14: To what extent can the nine factors be used to determine viewers’
intentions to purchase the product after exposure to live and recorded sales
presentations?

33
Chapter Three: Methodology
Participants
There were a total of 231 participants in this study. All were undergraduate
students that were participating in summer courses from either the Mass Communications
or Communications curriculum at the University of South Florida. The participants in
this group fell into the 18-23 age bracket with the mean at age 21. The majority of the
subjects were female (155=female, 76=male). The reason that undergraduate students
were chosen for this study is that this age group will be the future of the home shopping
industry. This age group will eventually determine what products will succeed and fail
for future home shopping ventures on any channel as they get older. This group will also
potentially determine the success of the actual home shopping related channel and give us
insight as to where the future of home shopping will potentially lead. The courses that
were chosen for recruitment were based upon class size, availability of the class to the
researcher, and also to insure there would be little to no repeat participants since some of
the subjects would be taking multiple courses during the semester. Eleven course
instructors willingly gave consent for the study to take place during class time. The study
was given either at the very beginning or almost end of class depending on the instructors
needs for the class for the day the study was to take place for no more than fifteen
minutes per class. In order to insure randomization as to which class got to see the live
presentation or the recorded presentation, a lot was drawn from a hat with one paper
showing live and the other showing recorded. Whichever one was picked, that was the

34
one that was used. However, at the point where there was clearly more of one group
picked than another, then the opposite variable lot would be chosen to balance the study
participants out so there would be an equal amount between live and recorded when the
data collection was completed.
Table 1
Distribution of Participants’ Gender
Frequency Percent Valid Percent Cumulative
Percent
Valid
Male 76 32.9 32.9 32.9
Female 155 67.1 67.1 100.0
Total 231 100.0 100.0
Table 2
Distribution of Participants’ Ethnicity
Frequency Percent Valid Percent Cumulative
Percent
Valid
Caucasian 142 61.5 61.5 61.5
African American 31 13.4 13.4 74.9
Latin American 30 13.0 13.0 87.9
Asian American 11 4.8 4.8 92.6
Middle Eastern 1 .4 .4 93.1
Other 16 6.9 6.9 100.0
Total 231 100.0 100.0
Table 3
Distribution of Participants Age
N Minimum Maximum Mean Std. Deviation
Age 231 18 23 21.02 1.268
Valid N (listwise) 231

35
Design
[post-test only with presentation format (live vs. recorded) as the between-subject factor.
In order to find differences between live and recorded presentation, the study was
done in an experimental format. This design manipulates the live and recorded variables.
The manipulation is to convince each respective group that the presentation viewed was
in fact live, or a presentation taking place at this moment, or recorded or a presentation
that was shot in one or more takes and various elements edited and replayed as a package
for later viewing. After the viewing, the study participants then voluntarily answered a
questionnaire that involved factors such as credibility, authenticity, urgency, etc. The
participants were asked to answer the questions truthfully based upon what they saw and
were told by the examiner. One hundred and nineteen participants viewed the live
presentation while 113 viewed the recorded presentation.
Stimulus Materials
The only material that was the stimulus was the actual home shopping
presentation that was viewed by everyone in the experiment. The presentation was
recorded off HSN (a.k.a. The Home Shopping Network) during the 5:00 p.m. hour on
Friday May 11th
, 2012. The product being sold during the presentation was called the
“Green Boxes”. The item is described as a way to keep your vegetable items for a much
longer time than what could be used with ordinary plastic containers one would use for
the refrigerator. There are various important points in the presentation which feature one
or more factors that have been noted by the researcher (but not revealed to the test
participants) that can be found in Appendix D. The presentation included what one
would get if they purchased it. There were differences shown between the foods used

36
with the plastic containers or Green Box containers for three weeks. There were
demonstrations of how to use the Green Boxes in the refrigerator. There was a phone call
from a new buyer who was familiar with the guest and previous items the guest had sold
on the network. The presentation also featured on graphics shows that were coming up
later in the day, shows that were coming up in the following weeks, how many of the
product were sold up to that point, and how much time was left to buy this item.
Procedure
The experimental sessions took place in classrooms where the eleven courses
were taking place during the semester. Either at the beginning or towards the end of class
for no more than fifteen minutes, the examiner would welcome everyone and then read
off instructions (see Appendix C) stating what the study is, what they are about to view,
whether it is live or recorded, expectations while watching the presentation, and
expectations of what to do when the presentation is finished. The script read took
approximately two minutes. For the live group, while the script was being read, the
image of HSN.com and the mouse arrow pointing at the “live-stream” was shown as
another way to convince the students that what they were about to see was live. The
recorded subjects did not see anything on the screen prior to the presentation. This group
just had to listen to what was read off the script. Once the script was completely read,
then the examiner would go to the computer, turn off the HSN.com “live-stream” image,
and then turn on the “Green Boxes” presentation. The actual presentation took six and
half minutes to play. When the presentation was finished, then the test subjects were
given the choice to participate and if so to fill out the consent form that was on a separate
page in front of the questionnaire. Once the subjects consented, then they had to fill out a

37
five page questionnaire that contained thirty-six questions. Out of the thirty-six
questions, twenty seven dealt with the nine factors discussed in the literature review (each
factor was measured at three interrelated questions per factor, hence twenty-seven
questions). Subjects had to rank from one to five or Strongly Disagree to Strongly Agree
respectively with three being neutral. There were three questions with the questionnaire
(Questions 10, 20, and 30) that involved a manipulation check to make sure all
participants believed whether or not the presentation they viewed was live or recorded.
These questions were measured the same as the first twenty-seven. Three questions
measured the attitudes of what was viewed for the overall presentation, the product itself,
and if the subjects would buy the product. The last three questions asked of a subject’s
sex, age, and ethnicity. When the questionnaire was complete, the examiner took the
finished questionnaires and the coded them to prepare for analysis of the results.
Dependent Measures
In order to measure the nine factors, there were three questions for each factor
that was measured on a 5-point Likert Scale. Internal consistency is found on table 4.
Items pertaining to each of the nine factors were averaged to create a composite measure
of that factor.

38
Table 4
Cronbach’s Alpha of the Nine Factors
Factor Items Cronbach's
Alpha
Credibility The presentation was trustworthy.
The presentation was believable.
The presentation was truthful.
0.807
Authenticity The presentation was authentic. The presentation’s information was
precise. The presentation was making
claims that were genuine.
0.725
Involvement The presentation was intimate. The presentation was engaging. The presentation was personally relevant. 0.688
Urgency The presentation gave a sense of urgency to purchase the item. The presentation was convincing me to buy the item right now. The presentation was prompting me to take action to buy the item. 0.744
Informativeness The presentation contained sufficient product information. The presentation was giving an informative demonstration. The presentation was instructive. 0.707
Entertainment This presentation was pleasurable to watch. The presentation was interesting to watch. The presentation was entertaining overall. 0.878
Sense of real-
time
The presentation made me feel the need to purchase the product immediately. I felt like buying the product while watching the presentation. The presentation made me want to act before time runs out. 0.861
Spontaneity The presentation was natural. The presentation appeared to be unscripted. The presentation was spontaneous. 0.690
Interactivity The presentation enabled two-way conversation between the host/guest and the buyer. The presentation had responsive conversation between host/guest and the buyer. There were interactions between host/guest and the buyer. 0.790
Note: All items were measured using a 5-point the Likert Scale (1: Strongly Disagree, 5: Strongly Agree). Items pertaining to each of the nine factors were averaged to create a composite measure of that factor.

39
On the questionnaire, items were inquired to test participants about their attitude
towards the presentation and their attitude towards the actual product on a 7-point
semantic scale. Internal consistency is found on table 5. As with the factors, the items
for the attitudes were averaged to make the composite measure.
Table 5
Cronbach’s Alphas of Attitude Measures
Factor Items Cronbach's
Alpha
Attitude toward
Presentation
Overall, your assessment of the sales PRESENTATION is: Good/Bad, Like/Dislike, Positive/Negative, Favorable/Unfavorable
.928
Attitude toward
Product
Overall, your assessment of the PRODUCT in the presentation is: Good/Bad, Like/Dislike, Positive/Negative, Favorable/Unfavorable
.957
Note: All items were measured on a 7-point semantic differential scale. Items pertaining to each attitudes were averaged to create a composite measure.

40
Chapter 4: Results
Manipulation Check
For each experimental condition (live vs. recorded), three questions were included
in the questionnaire to determine if the experiment successfully manipulated the
independent variable of interest. Specifically, participants in the live condition were
asked to judge if (1) the presentation was similar to other live presentations, (2) the
presentation was a typical live sales presentation on television, (3) it was clear to them
that the presentation was a live broadcast on a 5-point Likert scale. Likewise, participants
in the recorded condition were asked to judge on a Likert scale if (1) the presentation was
similar to other pre-recorded presentations seen on television, (2) the presentation was a
typical pre-recorded sales presentations on television, (3) it was clear to them that the
presentation was a prerecorded broadcast. Results (see Table 6) indicate that the
manipulation was successful. The vast majority of participants in the live condition
strongly agreed, agreed or felt neutral that (1) the sales presentation was similar to other
live presentations (97.5%), (2) it was a typical live presentation (96.7%), and (3) it was
clear to them the presentation was live (85.7%). Similarly, the vast majority of
participants in the recorded condition strongly agreed, agreed or felt neutral that (1) the
presentation was similar to other pre-recorded sales presentations (93.8%), (2) it was a
typical pre-recorded presentation (96.4%), and (3) it was clear to them the presentation
was pre-recorded (92.9%).

41
Table 6
Manipulation Checks
RQ1-9: Differences in the Nine Factors
The mean scores of the nine factors are presented in Table 7. A series of
t-tests were performed to answer RQ 1 to 9 regarding the differences in the nine factors
between live and recorded conditions. Results (Table 8) indicate that the differences in all
nine factors reached statistical significance. Specifically, compared to the recorded
presentation, the live presentation generated stronger perceived credibility (t=6.47, df=229,
p<.001), stronger perceived authenticity (t=6.94, df=229, p<.001), stronger viewer
involvement (t=8.65, df=229, p<.001), stronger sense of urgency to buy (t=6.76, df=229,
p<.001), stronger perceived informativeness (t=7.74, df=229, p<.001), stronger entertaining
value (t=6.19, df=229, p<.001), stronger sense of real-time (t=3.96, df=229, p<.001), stronger
feeling of spontaneity (t=10.8, df=229, p<.001) and stronger feeling of interactivity t=4.27,
df=229, p<.001).
Percent (n) strongly agree,
agree or neutral
Live Condition (n=119)
The presentation was similar to other live presentations.
The presentation was a typical live sales presentation on TV.
It was clear to me that the presentation was a live broadcast.
Recorded Condition (n=112)
The presentation was similar to other pre-recorded presentations on TV.
The presentation was a typical pre-recorded sales presentation on TV.
It was clear to me that the presentation was a prerecorded broadcast.
97.5% (116)
96.7% (115)
85.7% (102)
93.8% (105)
96.4% (108)
92.9% (104)

42
Table 7
Descriptive Statistics: Live vs. Recorded
Live Or Recorded N Mean Std. Deviation Std. Error Mean
Credibility Live 119 3.3361 .72550 .06651
Recorded 112 2.7500 .64608 .06105
Authenticity Live 119 3.4146 .65234 .05980
Recorded 112 2.8274 .63116 .05964
Involvement Live 119 3.4818 .75875 .06955
Recorded 112 2.6667 .66667 .06299
Urgency Live 119 3.5098 .91937 .08428
Recorded 112 2.7262 .83494 .07889
Informativeness Live 119 3.6863 .69202 .06344
Recorded 112 3.0060 .63904 .06038
Entertainment Live 119 3.3810 .93809 .08599
Recorded 112 2.6726 .78904 .07456
Time Live 119 2.6975 .99527 .09124
Recorded 112 2.2083 .86891 .08210
Spontaneity Live 119 3.2521 .71567 .06560
Recorded 112 2.2917 .62019 .05860
Interactivity Live 119 3.5798 .83639 .07667
Recorded 112 3.1131 .82206 .07768

43
Table 8
T-test Results: Live vs. Recorded
t-test for Equality of Means
T Df Sig. (2-
tailed)
Mean
Difference
Credibility 6.47 229 .000 .58613
Authenticity 6.94 229 .000 .58718
Involvement 8.65 229 .000 .81513
Urgency 6.76 229 .000 .78361
Informativeness 7.74 229 .000 .68032
Entertainment 6.19 229 .000 .70833
Time 3.96 229 .000 .48915
Spontaneity 10.8 229 .000 .96043
Interactivity 4.27 229 .000 .46674
RQ10-12: Differences in Attitudes and Purchase Intentions
Table 9 presents the mean values of attitude toward the presentation, attitude
toward the product, and purchase intentions. T-tests showed that participants in the live
condition had more positive attitude toward the presentation (t=2.061, df=229, p<.05)
than those in the recorded condition. However, there was no significant difference in
attitude toward the product (t=1.362, df=229, p=.175) and purchase intentions (t=.263,
df=229, p=.792) between live and recorded conditions.

44
Table 9
Descriptive Statistics of Attitudes & Purchase Intentions
Live Or Recorded N Mean Std. Deviation Std. Error Mean
Attitude toward
Presentation
Live 119 4.5042 1.24447 .11408
Recorded 112 4.1518 1.35415 .12796
Attitude toward
product
Live 119 4.7626 1.33040 .12196
Recorded 112 4.5223 1.35007 .12757
Purchase Intention Live 119 2.40 1.011 .093
Recorded 112 2.37 1.139 .108
RQ13-14: The Nine Factors, Attitudes and Purchase Intentions
Multiple regression analyses were conducted to better delineate the relative
importance of the nine factors in mediating attitudes and purchase intentions. Table 11
shows the results of regressing the nine factors (the predictor variables) on attitude
toward the presentation (the criterion variable) across live and recorded conditions. Of
the nine factors, four reached statistical significance: Entertainment value (β=.400,
t=6.221, p<.001), sense of real time (β=.375, t=3.496, p<.001), perceived credibility
(β=.272, t=3.496, p<.01), perceived urgency (β=-.168, t=-2.52, p<.02). The R² for the
model was .571 (Adjusted R² = .554), indicating that approximately 57% of the variance
Table 10
T-tests of Attitudes and Purchase Intentions
t-test for Equality of Means
T Df Sig. (2-
tailed)
Mean Difference
Attitude toward
Presentation
2.061 229 .040 .35242
Attitude toward
Product
1.362 229 .175 .24028
Purchase
Intention .263 229 .792 .03701
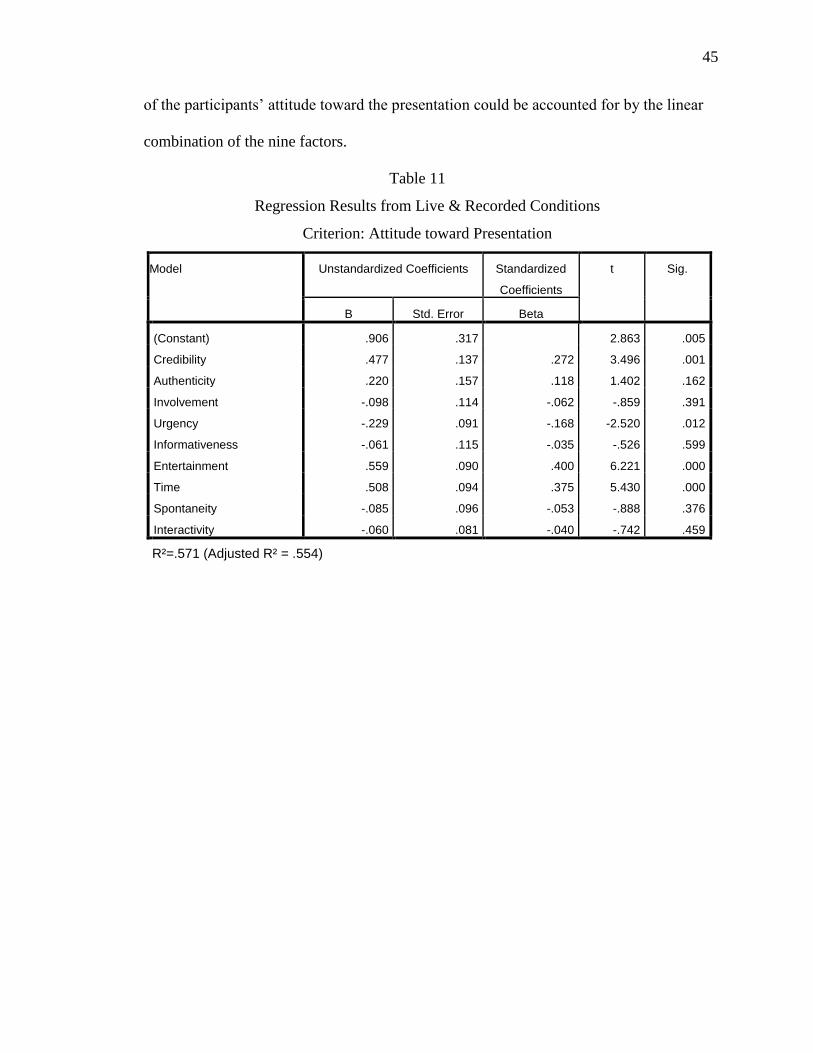
45
of the participants’ attitude toward the presentation could be accounted for by the linear
combination of the nine factors.
Table 11
Regression Results from Live & Recorded Conditions
Criterion: Attitude toward Presentation
Model Unstandardized Coefficients Standardized
Coefficients
t Sig.
B Std. Error Beta
(Constant) .906 .317 2.863 .005
Credibility .477 .137 .272 3.496 .001
Authenticity .220 .157 .118 1.402 .162
Involvement -.098 .114 -.062 -.859 .391
Urgency -.229 .091 -.168 -2.520 .012
Informativeness -.061 .115 -.035 -.526 .599
Entertainment .559 .090 .400 6.221 .000
Time .508 .094 .375 5.430 .000
Spontaneity -.085 .096 -.053 -.888 .376
Interactivity -.060 .081 -.040 -.742 .459
R²=.571 (Adjusted R² = .554)
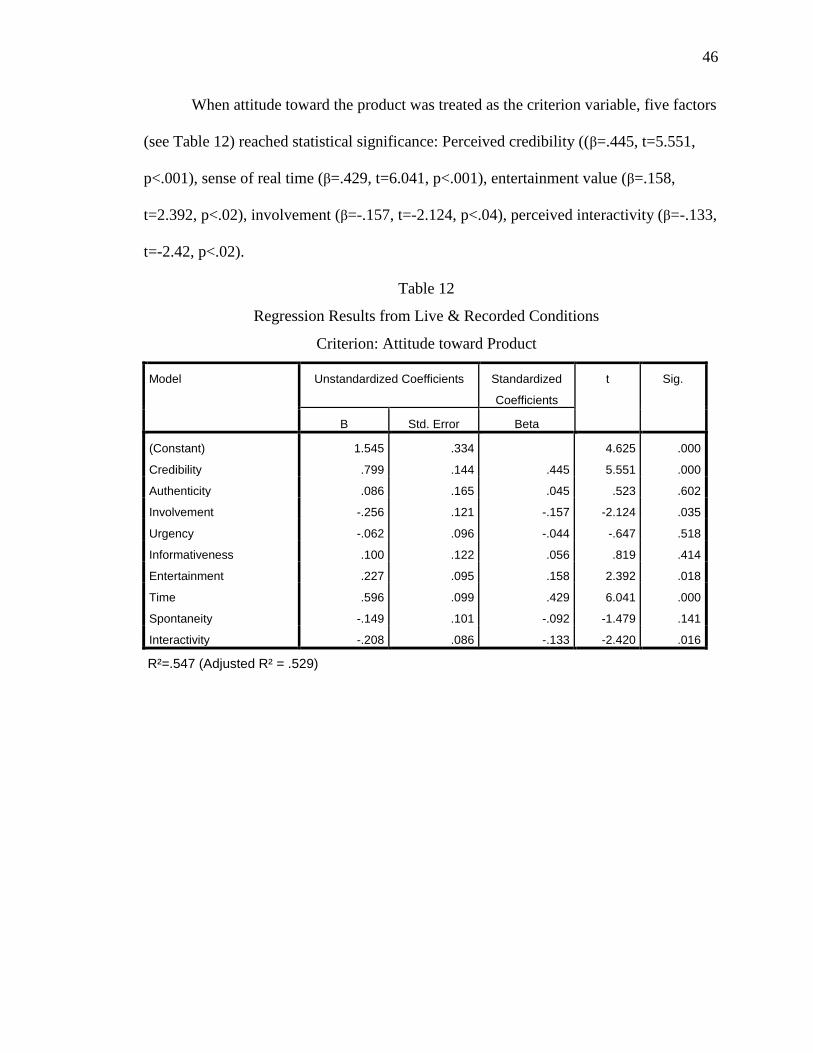
46
When attitude toward the product was treated as the criterion variable, five factors
(see Table 12) reached statistical significance: Perceived credibility ((β=.445, t=5.551,
p<.001), sense of real time (β=.429, t=6.041, p<.001), entertainment value (β=.158,
t=2.392, p<.02), involvement (β=-.157, t=-2.124, p<.04), perceived interactivity (β=-.133,
t=-2.42, p<.02).
Table 12
Regression Results from Live & Recorded Conditions
Criterion: Attitude toward Product
Model Unstandardized Coefficients Standardized
Coefficients
t Sig.
B Std. Error Beta
(Constant) 1.545 .334 4.625 .000
Credibility .799 .144 .445 5.551 .000
Authenticity .086 .165 .045 .523 .602
Involvement -.256 .121 -.157 -2.124 .035
Urgency -.062 .096 -.044 -.647 .518
Informativeness .100 .122 .056 .819 .414
Entertainment .227 .095 .158 2.392 .018
Time .596 .099 .429 6.041 .000
Spontaneity -.149 .101 -.092 -1.479 .141
Interactivity -.208 .086 -.133 -2.420 .016
R²=.547 (Adjusted R² = .529)

47
Table 13 shows regression results using purchase intentions as the criterion
variable. The only two factors that reached statistical significance were sense of time
(β=.716, t=10.348, p<.001) and perceived spontaneity (β=-.146, t=-2.42, p<.02).
Table 13
Regression Results from Live & Recorded Conditions
Criterion: Purchase Intentions
Model Unstandardized
Coefficients
Standardized
Coefficients
t Sig.
B Std. Error Beta
(Constant) .285 .260 1.094 .275
Credibility .207 .112 .144 1.842 .067
Authenticity .039 .129 .026 .304 .761
Involvement -.105 .094 -.080 -1.113 .267
Urgency -.093 .075 -.083 -1.246 .214
Informativeness .121 .095 .084 1.273 .204
Entertainment .101 .074 .089 1.373 .171
Time .796 .077 .716 10.348 .000
Spontaneity -.190 .079 -.146 -2.420 .016
Interactivity -.054 .067 -.043 -.805 .422
R²=.568 (Adjusted R² = .551)

48
Regression analyses were also performed within each individual experimental
condition using the nine factors as predictors and attitudes and purchase intentions as
criterion variables. Within the live condition, four factors reached statistical significance
in predicting attitude toward the presentation: Credibility (β=.332, t=3.175, p<.003),
urgency (β=.-160, t=-2.020, p<.047), entertainment value (β=.386, t=4.733, p<.001),
sense of time (β=.260, t=3.004, p<.004).
Table 14
Regression Results from Live Condition
Criterion: Attitude Toward Presentation
Model Unstandardized Coefficients Standardized
Coefficients
t Sig.
B Std. Error Beta
(Constant) -.147 .524 -.280 .780
Credibility .569 .179 .332 3.175 .002
Authenticity .175 .218 .092 .802 .424
Involvement .058 .155 .035 .372 .710
Urgency -.217 .107 -.160 -2.020 .046
Informativeness .061 .151 .034 .402 .688
Entertainment .512 .108 .386 4.733 .000
Time .325 .108 .260 3.004 .003
Spontaneity -.038 .126 -.022 -.302 .763
Interactivity .002 .106 .001 .021 .984
R²=.614 (Adjusted R² = .583)

49
Within the live condition, four factors reached statistical significance in
predicting attitude toward the product: Credibility (β=.427, t=3.977, p<.001),
informativeness (β=.174, t=2.020, p<.050), sense of time (β=.411, t=4.625, p<.001),
interactivity (β=.171, t=-2.345, p<.025).
Table 15
Regression Results from Live Condition
Criterion: Attitude Toward Product
Model Unstandardized Coefficients Standardized
Coefficients
t Sig.
B Std. Error Beta
(Constant) .827 .575 1.437 .154
Credibility .783 .197 .427 3.977 .000
Authenticity .127 .240 .062 .532 .596
Involvement -.303 .170 -.173 -1.784 .077
Urgency -.024 .118 -.016 -.202 .840
Informativeness .334 .166 .174 2.020 .046
Entertainment .180 .119 .127 1.518 .132
Time .549 .119 .411 4.625 .000
Spontaneity -.098 .139 -.053 -.706 .482
Interactivity -.273 .116 -.171 -2.345 .021
R²=.593 (Adjusted R² = .520)

50
The only factor that reached significance in predicting purchase intentions in the
live condition was sense of time (β=.604, t=6.756, p<.001).
Table 16
Regression Results from Live Condition
Criterion: Purchase Intentions
Model Unstandardized Coefficients Standardized
Coefficients
t Sig.
B Std. Error Beta
(Constant) -.503 .440 -1.143 .255
Credibility .294 .150 .211 1.952 .053
Authenticity -.025 .183 -.016 -.139 .890
Involvement -.095 .130 -.071 -.728 .468
Urgency -.021 .090 -.019 -.233 .816
Informativeness .224 .127 .153 1.768 .080
Entertainment .105 .091 .097 1.154 .251
Time .613 .091 .604 6.756 .000
Spontaneity -.075 .106 -.053 -.711 .479
Interactivity -.048 .089 -.040 -.542 .589
R²=.569 (Adjusted R² = .551)

51
Within the recorded condition, three factors reached statistical significance in
predicting attitude toward the presentation: Credibility (β=.250, t=2.426, p<.02),
entertainment value (β=.413, t=4.594, p<.001), sense of time (β=...421, t=3.725, p<.001).
Table 17
Regression Results from Recorded Condition
Criterion: Attitude Toward Presentation
Model Unstandardized Coefficients Standardized
Coefficients
t Sig.
B Std. Error Beta
(Constant) .670 .524 1.279 .204
Credibility .525 .216 .250 2.426 .017
Authenticity .163 .226 .076 .722 .472
Involvement -.231 .183 -.114 -1.266 .208
Urgency -.166 .163 -.102 -1.018 .311
Informativeness -.236 .185 -.111 -1.272 .206
Entertainment .709 .154 .413 4.594 .000
Time .656 .176 .421 3.725 .000
Spontaneity .227 .164 .104 1.390 .168
Interactivity -.164 .124 -.100 -1.327 .188
R²=.596 (Adjusted R² = .560)

52
Three factors reached statistical significance in predicting attitude toward the
product in the recorded condition: Credibility (β=.429, t=4.052, p<.001), entertainment
value (β=.255, t=2.763, p<.008), sense of time (β=.354, t=3.050, p<.004).
Table 18
Regression Results from Recorded Condition
Criterion: Attitude Toward Product
Model Unstandardized Coefficients Standardized
Coefficients
t Sig.
B Std. Error Beta
(Constant) .868 .536 1.619 .109
Credibility .897 .221 .429 4.052 .000
Authenticity -.028 .232 -.013 -.120 .905
Involvement -.194 .187 -.096 -1.040 .301
Urgency -.003 .167 -.002 -.019 .985
Informativeness -.095 .190 -.045 -.501 .618
Entertainment .437 .158 .255 2.763 .007
Time .550 .180 .354 3.050 .003
Spontaneity .165 .168 .076 .982 .328
Interactivity -.219 .127 -.134 -1.732 .086
R²=.574 (Adjusted R² = .536)
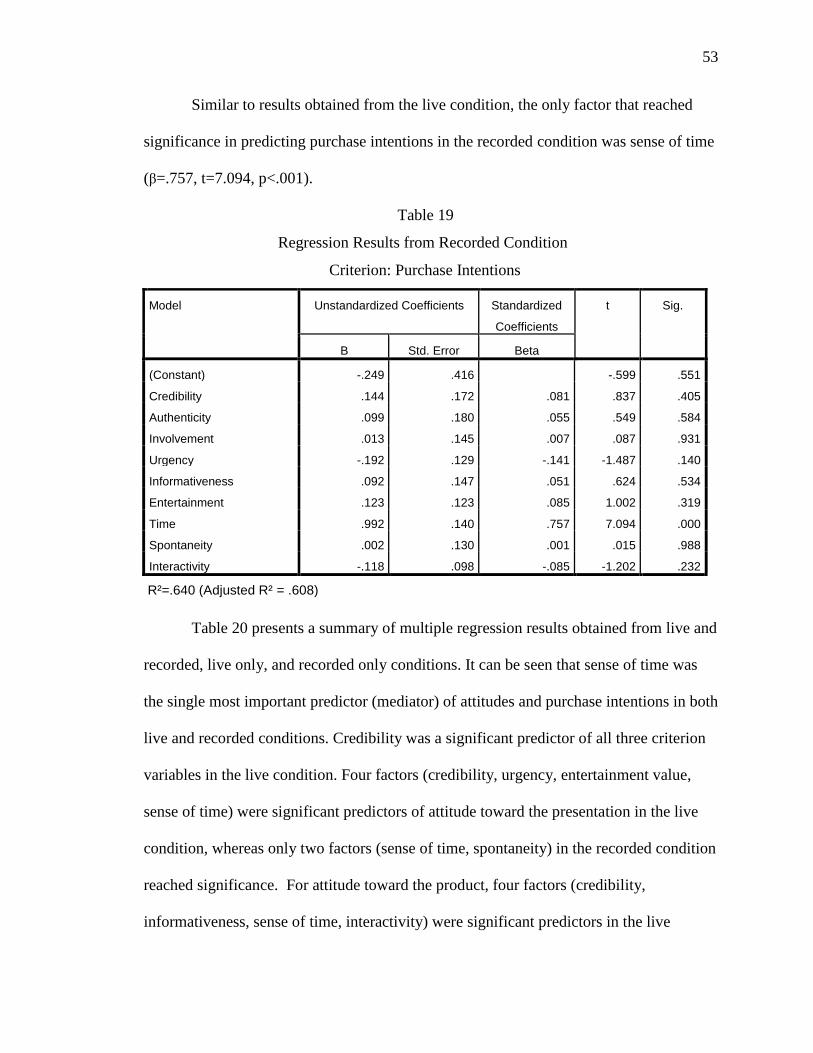
53
Similar to results obtained from the live condition, the only factor that reached
significance in predicting purchase intentions in the recorded condition was sense of time
(β=.757, t=7.094, p<.001).
Table 19
Regression Results from Recorded Condition
Criterion: Purchase Intentions
Model Unstandardized Coefficients Standardized
Coefficients
t Sig.
B Std. Error Beta
(Constant) -.249 .416 -.599 .551
Credibility .144 .172 .081 .837 .405
Authenticity .099 .180 .055 .549 .584
Involvement .013 .145 .007 .087 .931
Urgency -.192 .129 -.141 -1.487 .140
Informativeness .092 .147 .051 .624 .534
Entertainment .123 .123 .085 1.002 .319
Time .992 .140 .757 7.094 .000
Spontaneity .002 .130 .001 .015 .988
Interactivity -.118 .098 -.085 -1.202 .232
R²=.640 (Adjusted R² = .608)
Table 20 presents a summary of multiple regression results obtained from live and
recorded, live only, and recorded only conditions. It can be seen that sense of time was
the single most important predictor (mediator) of attitudes and purchase intentions in both
live and recorded conditions. Credibility was a significant predictor of all three criterion
variables in the live condition. Four factors (credibility, urgency, entertainment value,
sense of time) were significant predictors of attitude toward the presentation in the live
condition, whereas only two factors (sense of time, spontaneity) in the recorded condition
reached significance. For attitude toward the product, four factors (credibility,
informativeness, sense of time, interactivity) were significant predictors in the live

54
condition. Three of the same factors (credibility, informativeness, sense of time) were
significant predictors in the recorded condition. For purchase intentions, credibility and
sense of time were significant predictors in the live condition. In the recorded condition,
the only significant predictor was sense of time.
Table 20
Summary of Regression Results
Attitude toward
Presentation
Attitude toward
Product
Purchase Intention
Overall Live Recorded Overall Live Recorded Overall Live Recorded
Credibility X X X X X X
Authenticity
Involvement X
Urgency X X
Informativeness X
Entertainment X X X X
Time X X X X X X X X X
Spontaneity X X
Interactivity X X
Note: X denotes significant predictor. Overall: live and recorded conditions combined; Live: Live condition only; Recorded: Recorded condition only.

55
Chapter 5: Discussion and Limitations
Discussion
What has the edge on home shopping success? Are live presentations dominant
on television? Could recorded and edited presentations be strong? When it comes to
home shopping, there is a huge difference between live and recorded material to the point
that live is far more important and a greater positive outlet to use than the recorded
counterpart. The majority of the test subjects showed favor for live over recorded
materials. Which factors could possibly make live television strong on home shopping
related channels? As indicated, it appears credibility and senses of time are the
significant factors that give strength to these channels. The results show clearly there are
some factors that are much more important than others. Could pre-recorded material be
just as strong in these factors in spite of what has been cited above? In some areas these
factors do help pre-recorded material but not to a dramatic extent. Is the magic of live
television losing its ground in mass communication today? As far as home shopping is
concerned, no. These questions were posed early in this thesis. Through this study, there
is some confidence that these questions were answered to a certain degree.
There is a significant difference between live and recorded for the credibility
factor. T-tests of items for this factor show .000. The test participants essentially felt
credibility was everything to an extent. If the seller did not have the trust of the buyer,
then the whole presentation would be pointless. There were portions of the presentation
worth noting that would have made this an honest sell. For example, the presentation
56
was detailed in terms of how much you get, the comparisons of brands, and how fresh the
food remains. This confirms a point mentioned by Lee et al. (2009) where the more there
is precision and attention to detail, then the greater chance one has to hold the populations
attention. Another important point is in regards to what Kiousis (2001) stated before
about who is delivering the message. In this case, it was a show host and a guest.
Kiousis (2001) points out how important the delivery is in order to insure that credibility
remains strong and in this study’s instance, it did just that.
Regression analysis show credibility is the second most important factor
investigated here. It did not have an impact on attitude towards presentation-
recorded, or purchase intention overall and recorded. This should tell
programmers as long as an item is live, it must be believable at all times or else
the sell will suffer. Recorded programmers should take note because if there is no
credibility to their products, then this could be the main reason why they may not
be generating as much revenue as they would like.
T-tests for authenticity show there is a significant difference between the
live and recorded (.000 for all items tied to this factor). With the presentation
used in the study, the guest was very knowledgeable regarding how long certain
foods last, approvals by various agencies, and also suggested other clever uses for
the product. Simonson and Holbrook (1993) mentioned the more factual
information you present in your presentation, the better the presentation will be
and the likelihood of buying the product will be higher. However, it was not like
that as far as regression. This could be due to the lack of appeal, even though
truthful, to the test subjects.

57
Snoeijer et al. (2002) discussed the more there is live cross talk between
host and guest, the greater amount of authenticity will come from the
presentation. There was a great amount of cross talk between the show host and
guest in the presentation for the study which may be another reason for the
significant difference. There were hardly any cuts in this presentation to lead one
to think that the cross talk was fixed in any way. Most of the presentation was on
one camera and it caught the host and guest in non-stop cross talk till the phone
call came.
Regression tests for authenticity were a surprise. This factor had no
significant impact across the board. This could be due to people not caring if the
product if can what it claims to do. People may also have no concern if this
product is a real product or a cheap imitation. Taking into account the amount of
litigation which currently exists tied to false product claims, one would think this
factor would be of greater importance regardless of either variable.
Does live have a greater perceived involvement of the buyer than the recorded
and edited presentation? According to t-tests run on items related to this factor, yes it
does. T-tests reflect there was a significant difference between the live and recorded
(.000 for all items). One possible reason was the host and seller finding ways for the
viewer to be involved by telling them what could happen to their vegetables if they do not
use the product. This was a dominant theme brought up by Hogan (2006). By showing
what could possibly happen, one slowly gets the viewer to change their mind about the
product.

58
Another way according to Hogan (2006) to keep involvement going is to keep
friendly rapport going between the host and the guest. In the instance of the presentation
shown to both groups, both host and guest were on a first name basis and friendly to each
other. Both of them were chatting during the sell and attempted to discuss life during the
sell to the point where one could assume there was no sell. Hogan’s (2006) point was to
keep everything on a positive level as much as possible. In this case, keep the sell
positive talking and showing how fresh the food would be if one bought this product.
Involvement was only important in attitude towards product in both categories
when regression tests were complete. As long as people could see the host and guest
demonstrating what the product could do and the product’s success rate with the fresh
food that was seen, it could be why the test participants felt that was enough for just this
category. It is possible there was lack of interest with involvement by the test subjects
because the demonstrations of the working product and just showing the product itself
would have been good enough for a brief advertisement instead of six and a half minutes
of time where they could be doing something else.
Research question four inquired about urgency and if there was a difference
between the variables. According to the T-tests, yes there was. For all items related to
this factor it was .000. Busselle (2001) states in order for something to be urgent, it has
to be remembered quickly. The presentation for this study was about six and a half
minutes. In that time, a considerable amount of ground was covered in terms of what
you are getting and what the product does. Another issue pointed out by Busselle (2001)
is heavier viewers for the television medium are likely to make faster decisions. In the
presentations case, there is counter showing how many items have been sold so far. This

59
could give those watching television more than others a push to make the decision to buy
the item. This can be another cause for the difference between the variables because the
potential heavier viewers felt the need to take action now opposed to others.
Urgency was another factor thought to be of importance mainly due to claims
where it was shown on screen how many units were left and/or how much time was there
left in the presentation. This could lead someone to think that once time was up, one
could not get the item at another time for the price shown. Urgency was only important
for attitude towards presentation for both categories and live. With recorded, it appears
there is no rush to buy the product because there is a good chance the same product will
air again next week. The feeling of urgency is possibly only sensed in a live environment
because there is only so much time for the presentation and then the show must move on
to another product to sell. The importance of the “hurry before it’s too late” can give off
that impression on a live channel. For the most part, it is true that once the product is
gone or if time is up, one will have to wait a long time for the product or even a variation
of it to come back.
Informativeness is another factor with a significant difference between live and
recorded. T-tests show a difference of .000 for all items for this factor. There was plenty
of vividness (via all the food on display), realism (via the factual information given by
the host and guest), and distinctiveness given (via the demonstrations of freshness) per
Busselle and Shrum (2003). These three sub-factors could have been the reason behind
the significant differences. Another point to be made is repeating the information in the
presentation, which was done verbally and visually. This was an important concern by
Busselle and Shrum (2003) because if there was a lack of emphasis for the information

60
given, then the odds are the presentation would have lost value and the product would
certainly not be bought.
Informativeness was only important for attitude towards the product in a live
environment. This could be due to people, when watching a live network, would need all
the information necessary to make the final decision to buy the item. Information may
not be needed in recorded environments because the product, most likely in these
instances, is found in stores. One would think that information would be important
during the actual presentation. Perhaps with presentations, the actual demonstration of the
product alone would make a stronger impact. For the information to become important in
the presentation, it would be necessary to perhaps combine information with
demonstration.
Research question six asked are the live TV product sells perceived as more
entertaining than the recorded and edited presentation? T-tests showed there was a
significant difference between the two (.000 for all items). It could be due to when one
sees the live presentation; there are actual attempts to make it entertaining. However,
with recorded material, it is just talking about and demonstrating the product. This can
go back to the point made by Aaker and Bruzzone (1981) that well-liked ads are more
effective. It was apparent based upon the data that this is presentation was entertaining.
The “warmth” and “entertaining” sub-factors discussed by Aaker and Bruzzone could be
said came into play since the numbers reflected a huge difference.
Entertainment is an important factor for the attitudes of the presentation in all
categories but recorded, attitude towards product for all categories, but live, and is not
important in purchase intent in all categories. For the presentation, in order to have

61
people continue to watch, there will most likely need to be some effort on the part of the
show host to keep the presentation entertaining. With recorded presentations, since there
appears to be more rehearsing done, there seems to be an ease of blending entertainment
into the presentation that it would not feel important. The entertainment value factor
could be more of a detractor towards purchase intent. It could be due to people wanting
to know certain pieces of information that would help them make a somewhat informed
decision. People may not care for jokes or things that may have anything to do with the
product. People do not want their time wasted so therefore any type of entertainment for
purchase intent is a waste.
Does live TV product sells generate a greater feeling of perceived sense of “real
time” of the seller and the product than the recorded and edited presentation was research
question seven. There is a significant difference between the two to reflect the answer is
yes (.000 for all items). To go back to “The CNN Effect” discussed by Gilboa (2003),
where there are positive and negative effects when something is given to us in real time.
In the case of home shopping, the positive effects are we are getting everything we need
to know about the product at that time for us to make an informed decision about buying
the product. Provided that everything was truthful, there will be a product coming that
will help us. However, the negative here would be buyer’s remorse for taking action on
buying the item too soon. The numbers do not reflect concerns about buyer’s remorse
and real time concerns. Live apparently has a dramatic effect for real time concerns on a
positive level.
Sense of real time was the most important factor according to the regression tests.
For attitude towards the presentation, there was a feel with limited time, action on the

62
buyer’s part needed to be done soon because people could feel that is the only real time
they could buy the item. This time frame the presentation gave was a real life window of
opportunity for the shopper to take advantage of. For the product itself, this can tie into
the urgency factor because there are only so many units that could be sold before they are
gone. Since the product is available now, there is no guarantee that the product would be
available in the next hour, or the hour after that. When people see the product on
television, it would be just like seeing something at a display window in a department
store. If the store has it, especially if it is on sale, then it is best to buy it now before the
display disappears or if the price goes up in price. This could possibly drive people to
buy a product if these time factors do not work in their favor.
Spontaneity was addressed with research question seven. This research question
asked if live TV product sells generate a greater feeling of perceived spontaneity between
the host and guest presenter than the recorded and edited presentation. The answer was
yes based on the data presented from T-tests showing a significant difference between the
two variables (.000 for all questions). Going back to points expressed by Lundell (2009),
it was expressed how what is seen can be impartial, objective, balanced, and versatile
when scripts for live shows are done correctly. Spontaneity helps take away any
potential chance of things being scripted and therefore not real to the viewer. Lundell
(2009) mentions how these events can bring us together as they happen and in this
instance bring the viewer to buy the item.
Spontaneity in regression shows it was only important in attitude towards
presentation for recorded and purchase intent for both variables overall. With live there
is always a chance of natural or unscripted situations taking place during the presentation

63
and with the product itself. With recorded, with so much potential rehearsing, this
lessens any potential errors but also lessons anything last minute which could take place.
Spontaneity is needed to make the presentation have a natural feel and give a sense of a
positive accident (where there is an accident while shooting the presentation, but the
results of the accident works in favor of the presentation). With this unscripted type of
action, the presentation demonstrates (although not in the right way) that the product can
work. This could make an impact on purchase intent which makes this factor important
to both variables
Research question nine inquired if live TV product sells generate a greater feeling
of perceived interactivity between the host/guest and the buyer than the recorded and
edited presentation? As with all the other factors, the results from T-tests show a
significant difference and therefore, yes there is a greater feeling (.000 for all items).
According to Kjus, (2009) the interactivity between the audience and advertiser is so
strong that marketing strategies that are beneficial are made. It could be assumed that
marketing strategies of previous appearances of the product and interactivity made the
presentation get stronger and stronger with each subsequent appearance. This leads to
strong numbers for live interactivity. Also Kjus (2009) points out how this type of
interactivity gives value to the presentation and keeps the sell free from problems. With
this in mind, with interactivity involved with live, if the caller says positive things about
the product, there is a good chance the product is actually that good. Product testimonials
from actual customers have proven to work well to get new customers to buy the product
in question.

64
However, regression shows that this is not an important factor for the attitude
towards the presentation. This could be due to some skepticism among the test subjects.
For all they know, the caller could have made the call on the presentation from inside the
building. Plus, there is also a chance the caller may be so overexcited during the
presentation that it could be hindered because the viewer may think the caller is acting
and hurting the presentation. Interactivity is important with the actual product for live
and both overall. This makes sense because when people call in, they are talking about
how great the product is. Testimonials about the actual product would help to a certain
degree from both famous and non-famous people. Interactivity’s importance could
perhaps be enhanced by creating a chat line that can be placed live on television for
people to see comments on the product. This also could help show that the customer’s
voice is important and sway programmer’s future decisions on the product.
Limitations
There were some limitations to this study. There was considerable difficulty
trying to recruit test subjects through classes. There were ten other instructors that were
asked if they could spare the fifteen minutes of class time needed to perform the study
and was told “no”. Had the other instructors stated “yes”, there would have been
probably more than 400 subjects in the study instead of what was presented here.
Another limitation was the time frame to collect the data. It took two weeks to
collect all the data from the classes where the instructors said “yes”. The data was also
collected during the summer semester of school and therefore, the semester is
considerably shorter than the standard fall and spring semesters found at major
universities. If the data collection was done in the fall or spring semester, then the

65
collection time would have been probably two weeks to a month, which would have been
more than adequate to collect the information.
Since the study was set to a shorter time frame than normal, there was no time to
perform a pre-test of the questionnaire on subjects. This would have been ideal to sort
out which questions were good and what may have been necessary to discard. However,
once the questionnaire was fully developed, and the time of the semester was examined,
it was discovered that the pre-test stage would have to be skipped if the time line for the
study was to have been met.
Also, there was also a chance that duplication of data may have been involved due
to certain students taking multiple courses during the summer and those subjects would
have possibly taken the study twice. However, steps were taken to insure this would not
happen, by the researchers asking if the subjects are taking courses where the study
already took place. If the potential test subjects said “yes”, they were automatically
excluded from the study. Also, if any subjects did not say “yes”, but the researcher
recognized them from previous classes where the study took place, then the researcher
excused them.
There was only one product used for this study and this product was not targeted
to students. This product used for the presentation cannot be generalized. This product is
mainly used for people that are more kitchen savvy and wanting to stretch their food
dollar by using this particular product. If the product was geared more for students such
as computers, monitors, study equipment, etc., then there would be a good chance the
results towards the actual product and liklihood of buying the product would have been
higher. Another problem in terms of product would be pricing. There are clearly

66
products that are affordably priced for students but the problem is once more they are not
generalized for everyone to buy. These items are priced to a niche group. There were
other products that could have been used for this study, but with the live environment,
programming can change, prices can change, products can be changed out at the last
minute and there were limited amount of hours for the researcher to work with.

67
Chapter 6: Conclusion
The purpose for this study was to investigate the strengths in live home shopping
and discover if recorded presentations still have a place in regular television
programming. For the home shopping channels around the world, based upon the
numbers here, it is important to make sure credibility is investigated before the product
airs. Unless the product is in fact selling out with no possible return of it, urgency should
be kept at a minimum for live. Authenticity appears to be a minor factor, but must be
bolstered in order to avoid further litigation from outside parties including dissatisfied
customers. Entertainment is important provided it does not distract from the presentation
itself. If there is more interactivity between the seller and buyer, there will certainly be a
positive impact on the sell. More phone calls, e-mails, and other interactive devices are
needed for this to be accomplished. As long as it is reemphasized the presentation is live,
there should be no “real time concerns”, but based on viewing presentations in the course
of this study, this statement is rarely heard. There needs to be more if the consumer is to
realize that they can have this product right now as the host speaks.
Since there was a time lapse between the literature and today, it was necessary to
see if these factors are important now as they were then and also see if factors that were
not important then are important now. To varying degrees, they all are, but the regression
analysis show they may not be in the future and for home shopping on television to
remain as they are now, it would be best to research and find ways to think ahead. By
using college students, which would be the future home shoppers of America possibly,

68
this was one way to start by looking at your future niche audiences. If researchers had
access to what would be sold or possibly sold soon, various tests can be conducted to find
out if these products would be utilized in the future and if so, how often would the
potential customers think so?
In spite of the differences between live and recorded for the main factors
investigated, home shopping still has a long way to go to have a level of success that this
electronic retail entity may desire. The attitude towards the presentation was strong for
live but the actual product and the potential to buy the item has issues. Maybe it has to
do with the product itself? If home shopping is the only outlet for certain products, this
will certainly raise some skepticism as to why people may not be interested in the
product. If the product was available in other outlets, for home shopping to compete,
there must be a good deal that will get the viewers to buy.
Another potential reason for the disinterest in the product may be how similar the
product in the presentation is to products that are sold in regular stores. One may ask
themselves “why should I buy from this channel if other stores are selling products that
are close to the description of what is seen on TV?” Also, another concern is if the
product out in stores has not done what has been claimed, that may play against the
product that is airing on television. These types of issues may need to be researched and
addressed by the merchandisers and mentioned if these concerns are true to pull away
from the disappointing similar products.
As for the differences between live and recorded, it is clear that live is a dominant
way to sell on television. A considerable amount of money is made by using this type of
outlet. If millions are to be made, this raises the question of why channels still use

69
infomercials to sell products outside of making some quick revenue for themselves. With
live being stronger than recorded, would it not make sense for channels to do their
presentations live as well? If channels follow a similar template as home shopping
related networks, would they not bring in similar revenue? With the numbers being what
they are for recorded presentations, would this not be a signal for regular channels to
question using them? Most local channels have the facilities to do live presentations of
their own. Granted it would require additional spending for a crew and other unforeseen
expenses, but one hour could generate anywhere from $30,000 to $300,000 depending on
the product that is being sold.
Future research can determine if live presentations on regular channels are viable
solutions. Other research can be looked at would be what other factors are key to the
success or failure of electronic retail including selling methods for the Internet since this
is another major outlet to sell products. One could find ways to interview the leaders of
the home shopping industry and compare their answers to the answers of actual home
shoppers to see if what the industry is doing is really in the best interests of the
consumers. More research can certainly be done on the individual factors that have been
investigated here. There has to be more sub-categories of each factor that can be
scrutinized. The studies proposed can be exponential in nature. Credibility can produce
some sub-areas, while entertainment can produce considerably more sub-areas that need
to be looked at separately. One last piece of research should be inquiring with those
between the age of twenty to thirty and ask what products should be shown on home
shopping so the future customer base can be maintained for years if not decades to come.

70
Home shopping has been with us since the 1970s. Clearly the numbers indicate
that things have steadily improved. It could be due to better products, better
presentations, or better leadership in the ranks. These networks need to maintain the
strength of credibility while at the same time paying closer attention to authenticity,
involvement, and interactivity. This could be done by showing disclaimers regarding
legal statements of the product or more pushes to have callers call or type positive
reviews of the product. For now, home shopping remains strong, but this entity needs to
tread carefully if they expect to maintain profits instead of relying on the cash cow.

71
References
Althaus, Scott L. (2010). The forgotten role of the global newsreel industry in the
long transition from text to television. The International Journal of
Press/Politics, 15(2), 193-218.
Aaker, David A, & Bruzzone, Donald E. (1981). Viewer perceptions of prime-
time television advertising. Journal of Advertising Research, 21(5), 15-25.
Bourdon, Jerome. (2000). Live television is still alive: On television as an
unfulfilled promise. Media, Culture & Society, 22, 531-556.
Busselle, Rick W. (2001). Television exposure, perceived realism, and exemplar
accessibility in the social judgment process. Media Psychology, 10, 43-67.
Busselle, Rick W., & Shrum, L.J. (2003). Media exposure and exemplar
Accessibility. Media Psychology, 5, 255-282.
Central Hudson Gas and Electric Corp. v. Public Service Commission, 447 U.S. 557,
(1980).
Cook, Judi P. (2000). Consumer culture and television home shopping
programming: An examination of the sales discourse. Mass Communication &
Society, 3(4), 373-391.
Feary, Vaughana M. (1992). Taking the right of freedom of commercial
communication seriously. Journal of Business Ethics, 11 (1), 47-59.
Gilboa, Eytan. (2003). Television news and U.S. foreign policy: Constraints of
real-time coverage. Press/Politics, 8(4), 97-113.
Graves, Philip. (2010). Consumer.ology: The Market Research Myth, the Truth about
Consumers and the Psychology of Shopping, Brealey-Nicholas Publishing.
Gudelunas, David. (2006). Shopping with friends: Audience perspectives on
television shopping. Popular Communication, 4(4), 229-252.
Hogan, Kevin. (2006). Covert Persuasion: Psychological Tactics and Tricks to Win the
Game, Wiley, John & Sons, Inc.

72
Kiousis, Spiro. (2001). Public trust or mistrust? Perceptions of media credibility
in the information age. Mass Communication & Society, 4(4), 381-403.
Kjus, Yngvar. (2009). Everyone needs idols: Reality television and
transformations in media structure, production, and output. European
Journal of Communication, 24(3), 287-304.
LaFollette, Marcel C. (2002). A survey of science content in U.S. television
broadcasting, 1940s through 1950s: The exploratory years. Science
Communication, 24(1), 34-71.
Lee, Hyunmin., Park, Sun-A., Lee, Young Ah., & Cameron, Glen T. (2010).
Assessment of motion media on believability and credibility: An
exploratory study. Public Relations Review, 36, 310-312.
Levine, Elana. (2008). Distinguishing television: The changing meanings of
television liveness. Media, Culture & Society, 30(3), 393-409.
Lundell, Ana K. (2009). The design and scripting of ‘unscripted’ talk:
liveness versus control in a TV broadcast interview. Media, Culture &
Society, 30(2), 271-288.
Mitra, Anu., Raymond, Mary Anne., & Hopkins, Christopher D. (2008). Can
consumers recognize misleading advertising content in a media rich online
environment? Psychology & Marketing, 25 (7), 655-674.
Morgan, Fred W., & Stoltman, Jeffrey J. (1997). Advertising and product
liability litigation. Journal of Advertising, 26 (2), 63-75.
Oyedeji, Tayo A. (2007). The relation between the customer-based brand equity
of media outlets and their media channel credibility: An exploratory
study. International Journal on Media Management, 9(3), 116-125.
Pratkanis, Anthony., & Aronson, Elliott. (2001). Age of Propaganda: The Everyday
Use and Abuse of Persuasion, Holt, Henry, and Company, Inc.
Simonson, Alexander., & Holbrook, Morris B. (1993). Permissible puffery versus
actionable warranty in advertising and sales talk: An empirical
investigation. Journal of Public Policy & Marketing, 12 (2), 216-233.
Singh, Mandeep., Balasubramanian, Siva K., & Chakraborty, Goutam. (2000). A
comparative analysis of three communication formats: advertising,
infomercial, and direct experience. Journal of Advertising, 29(4), 59-75.

73
Snoejier, Roland., de Vreese, Claes H., & Semetko, Holli A. (2002). Research note:
The effects of live television reporting on recall and appreciation of political
news. European Journal of Communication, 17(1), 85-101.
Talsky v. Department of Registration and Education III. Dec. 550, 68 III 2d 579, 370
N.E. 2d 173, (1977).
White, Michele. (2006). Television and internet differences by design.
Convergence: The International Journal of Research into New Media
Techonologies, 12(3), 341-355.

74
Appendices

75
Appendix A: IRB Approval Letter
June 5, 2012
Christopher Novak, B.S.
Mass Communication
11122 Lakeside Vista Drive
Riverview, FL 33569
RE: Exempt Certification for IRB#: Pro00007796
Title: Live Versus Recorded. What is more effective for television shopping.
Dear Mr. Novak:
On 6/4/2012 the Institutional Review Board (IRB) determined that your research meets USF
requirements and Federal Exemption criteria as outlined in the federal regulations at
45CFR46.101(b):
(2) Research involving the use of educational tests (cognitive, diagnostic, aptitude,
achievement), survey procedures, interview procedures or observation of public behavior,
unless:
(i) information obtained is recorded in such a manner that human subjects can be identified,
directly or through identifiers linked to the subjects; and (ii) any disclosure of the human
subjects' responses outside the research could reasonably place the subjects at risk of criminal
or civil liability or be damaging to the subjects' financial standing, employability, or
reputation.
As the principal investigator for this study, it is your responsibility to ensure that this research
is conducted as outlined in your application and consistent with the ethical principles outlined
in the Belmont Report and with USF IRB policies and procedures. Please note that changes
to this protocol may disqualify it from exempt status. Please note that you are responsible for
notifying the IRB prior to implementing any changes to the currently approved protocol.
The Institutional Review Board will maintain your exemption application for a period of five
years from the date of this letter or for three years after a Final Progress Report is received,
whichever is longer. If you wish to continue this protocol beyond five years, you will need to
submit a new application. When your study is completed, either prior to, or at the end of the
five-year period, you must submit a Final Report to close this study.
We appreciate your dedication to the ethical conduct of human subject research at the
University of South Florida and your continued commitment to human research protections.
If you have any questions regarding this matter, please call 813-974-5638.

76
Appendix A: (Continued)
Sincerely,
John A. Schinka, Ph.D., Chairperson
USF Institutional Review Board

77
Appendix B: Questionnaire
Questionnaire:
1. The presentation was trustworthy. (honest, reliable)
1 2 3 4 5 STRONGLY DISAGREE DISAGREE NEUTRAL AGREE STRONGLY AGREE
2. The presentation was authentic.
1 2 3 4 5 STRONGLY DISAGREE DISAGREE NEUTRAL AGREE STRONGLY AGREE
3. The presentation was intimate.
1 2 3 4 5 STRONGLY DISAGREE DISAGREE NEUTRAL AGREE STRONGLY AGREE
4. The presentation gave a sense of urgency to purchase the item.
1 2 3 4 5 STRONGLY DISAGREE DISAGREE NEUTRAL AGREE STRONGLY AGREE
5. The presentation contained sufficient product information.
1 2 3 4 5 STRONGLY DISAGREE DISAGREE NEUTRAL AGREE STRONGLY AGREE
6. This presentation was pleasurable to watch.
1 2 3 4 5 STRONGLY DISAGREE DISAGREE NEUTRAL AGREE STRONGLY AGREE
7. The presentation made me feel the need to purchase the product immediately.
1 2 3 4 5 STRONGLY DISAGREE DISAGREE NEUTRAL AGREE STRONGLY AGREE
8. The presentation was natural.
1 2 3 4 5 STRONGLY DISAGREE DISAGREE NEUTRAL AGREE STRONGLY AGREE
9. The presentation enabled two-way conversation between the host/guest and the
buyer.
1 2 3 4 5 STRONGLY DISAGREE DISAGREE NEUTRAL AGREE STRONGLY AGREE
10. The presentation was similar to other live presentations I've seen on television.
1 2 3 4 5 STRONGLY DISAGREE DISAGREE NEUTRAL AGREE STRONGLY AGREE
11. The presentation was believable.
1 2 3 4 5 STRONGLY DISAGREE DISAGREE NEUTRAL AGREE STRONGLY AGREE

78
Appendix B (Continued)
12. The presentation’s information was precise.
1 2 3 4 5 STRONGLY DISAGREE DISAGREE NEUTRAL AGREE STRONGLY AGREE
13. The presentation was engaging.
1 2 3 4 5 STRONGLY DISAGREE DISAGREE NEUTRAL AGREE STRONGLY AGREE
14. The presentation was convincing me to buy the item right now.
1 2 3 4 5 STRONGLY DISAGREE DISAGREE NEUTRAL AGREE STRONGLY AGREE
15. The presentation was giving an informative demonstration.
1 2 3 4 5 STRONGLY DISAGREE DISAGREE NEUTRAL AGREE STRONGLY AGREE
16. The presentation was interesting to watch.
1 2 3 4 5 STRONGLY DISAGREE DISAGREE NEUTRAL AGREE STRONGLY AGREE
17. I felt like buying the product while watching the presentation.
1 2 3 4 5 STRONGLY DISAGREE DISAGREE NEUTRAL AGREE STRONGLY AGREE
18. The presentation appeared to be unscripted.
1 2 3 4 5 STRONGLY DISAGREE DISAGREE NEUTRAL AGREE STRONGLY AGREE
19. The presentation had responsive conversation between host/guest and the buyer.
1 2 3 4 5 STRONGLY DISAGREE DISAGREE NEUTRAL AGREE STRONGLY AGREE
20. The presentation was a typical live sales presentation on television.
1 2 3 4 5 STRONGLY DISAGREE DISAGREE NEUTRAL AGREE STRONGLY AGREE
21. The presentation was truthful.
1 2 3 4 5 STRONGLY DISAGREE DISAGREE NEUTRAL AGREE STRONGLY AGREE
22. The presentation was making claims were genuine.
1 2 3 4 5 STRONGLY DISAGREE DISAGREE NEUTRAL AGREE STRONGLY AGREE
23. The presentation was personally relevant.
1 2 3 4 5 STRONGLY DISAGREE DISAGREE NEUTRAL AGREE STRONGLY AGREE

79
Appendix B (Continued)
24. The presentation was prompting me to take action to buy the item.
1 2 3 4 5 STRONGLY DISAGREE DISAGREE NEUTRAL AGREE STRONGLY AGREE
25. The presentation was instructive.
1 2 3 4 5 STRONGLY DISAGREE DISAGREE NEUTRAL AGREE STRONGLY AGREE
26. The presentation was entertaining overall.
1 2 3 4 5 STRONGLY DISAGREE DISAGREE NEUTRAL AGREE STRONGLY AGREE
27. The presentation made me want to act before time runs out.
1 2 3 4 5 STRONGLY DISAGREE DISAGREE NEUTRAL AGREE STRONGLY AGREE
28. The presentation was spontaneous.
1 2 3 4 5 STRONGLY DISAGREE DISAGREE NEUTRAL AGREE STRONGLY AGREE
29. There were interactions between host/guest and the buyer.
1 2 3 4 5 STRONGLY DISAGREE DISAGREE NEUTRAL AGREE STRONGLY AGREE
30. It was clear to me that the presentation was a live broadcast.
1 2 3 4 5 STRONGLY DISAGREE DISAGREE NEUTRAL AGREE STRONGLY AGREE
31. Overall, your assessment of the sales PRESENTATION is:
Good 7 6 5 4 3 2 1 Bad
Like 7 6 5 4 3 2 1 Dislike
Positive 7 6 5 4 3 2 1 Negative
Favorable 7 6 5 4 3 2 1 Unfavorable
32. Overall, your assessment of the PRODUCT in the presentation is:
Good 7 6 5 4 3 2 1 Bad
Like 7 6 5 4 3 2 1 Dislike
Positive 7 6 5 4 3 2 1 Negative
Favorable 7 6 5 4 3 2 1 Unfavorable

80
Appendix B (Continued)
33. How likely would you purchase the product in the presentation?
5 4 3 2 1
Very likely Likely Somewhat likely Unlikely Very unlikely
34. What is your gender?
MALE FEMALE
35. What is your age? ________________
36. What is your ethnic origin (CIRCLE ONE)
Caucasion American Indian Other
African-American Asian
Latin Middle Eastern
The following questions replaced questions 10, 20, and 30 respectively for the “recorded”
sessions.
10. The presentation was similar to other pre-recorded presentations seen on television.
1 2 3 4 5 STRONGLY DISAGREE DISAGREE NEUTRAL AGREE STRONGLY AGREE
20. The presentation was a typical pre-recorded sales presentation on television.
1 2 3 4 5 STRONGLY DISAGREE DISAGREE NEUTRAL AGREE STRONGLY AGREE
30. It was clear to me that the presentation was a pre-recorded broadcast.
1 2 3 4 5 STRONGLY DISAGREE DISAGREE NEUTRAL AGREE STRONGLY AGREE
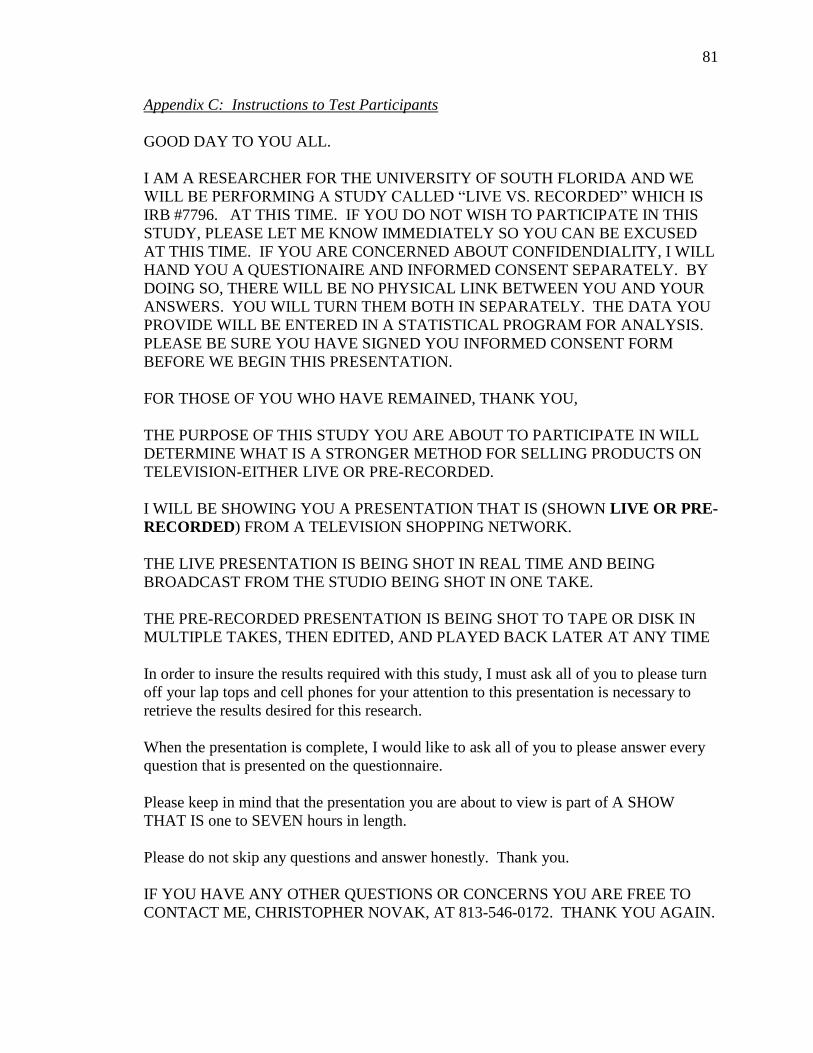
81
Appendix C: Instructions to Test Participants
GOOD DAY TO YOU ALL.
I AM A RESEARCHER FOR THE UNIVERSITY OF SOUTH FLORIDA AND WE
WILL BE PERFORMING A STUDY CALLED “LIVE VS. RECORDED” WHICH IS
IRB #7796. AT THIS TIME. IF YOU DO NOT WISH TO PARTICIPATE IN THIS
STUDY, PLEASE LET ME KNOW IMMEDIATELY SO YOU CAN BE EXCUSED
AT THIS TIME. IF YOU ARE CONCERNED ABOUT CONFIDENDIALITY, I WILL
HAND YOU A QUESTIONAIRE AND INFORMED CONSENT SEPARATELY. BY
DOING SO, THERE WILL BE NO PHYSICAL LINK BETWEEN YOU AND YOUR
ANSWERS. YOU WILL TURN THEM BOTH IN SEPARATELY. THE DATA YOU
PROVIDE WILL BE ENTERED IN A STATISTICAL PROGRAM FOR ANALYSIS.
PLEASE BE SURE YOU HAVE SIGNED YOU INFORMED CONSENT FORM
BEFORE WE BEGIN THIS PRESENTATION.
FOR THOSE OF YOU WHO HAVE REMAINED, THANK YOU,
THE PURPOSE OF THIS STUDY YOU ARE ABOUT TO PARTICIPATE IN WILL
DETERMINE WHAT IS A STRONGER METHOD FOR SELLING PRODUCTS ON
TELEVISION-EITHER LIVE OR PRE-RECORDED.
I WILL BE SHOWING YOU A PRESENTATION THAT IS (SHOWN LIVE OR PRE-
RECORDED) FROM A TELEVISION SHOPPING NETWORK.
THE LIVE PRESENTATION IS BEING SHOT IN REAL TIME AND BEING
BROADCAST FROM THE STUDIO BEING SHOT IN ONE TAKE.
THE PRE-RECORDED PRESENTATION IS BEING SHOT TO TAPE OR DISK IN
MULTIPLE TAKES, THEN EDITED, AND PLAYED BACK LATER AT ANY TIME
In order to insure the results required with this study, I must ask all of you to please turn
off your lap tops and cell phones for your attention to this presentation is necessary to
retrieve the results desired for this research.
When the presentation is complete, I would like to ask all of you to please answer every
question that is presented on the questionnaire.
Please keep in mind that the presentation you are about to view is part of A SHOW
THAT IS one to SEVEN hours in length.
Please do not skip any questions and answer honestly. Thank you.
IF YOU HAVE ANY OTHER QUESTIONS OR CONCERNS YOU ARE FREE TO
CONTACT ME, CHRISTOPHER NOVAK, AT 813-546-0172. THANK YOU AGAIN.

82
Appendix D: Slides/Description of Key Points of Presentation
Figure C1. Introduction. The start of the presentation mentions the number of boxes
and explanation that you cannot wear out their effectiveness.
Figure C2. Comparisons. There are explanations that these items are proudly made in
the USA and BPA free. Comparison if one uses the product and what happens to the
food if one does not.

83
Appendix D (Continued)
Figure C3. Stacks and counters. The show host is explaining she has all 56 pieces in her
hands and goes on to explain how the set looks like with the tops on and further
emphasize how stackable they are. An item counter is added soon after.
Figure C4. Carrots and freshness. The guest says that “this is funny if it wasn’t my
money”. The guest goes on to emphasize what can happen to carrots if they are not
placed in the Green Boxes to maintain freshness for long periods of time.

84
Appendix D (Continued)
Figure C5. Breaking carrots. The guest is breaking the carrots that were stored in the
Green Boxes to demonstrate how they still remain fresh all this time. The sound of the
carrots breaking can be heard here.
Figure C6. Three weeks old. The guest is showing the inside color of the carrot. The
guest explains that these carrots are three weeks old and still fresh after all this time.

85
Appendix D (Continued)
Figure C7. Lettuce and sound demonstrations. Lettuce that was stored in the Green
Boxes was broken. The sounds to demonstrate freshness were overheard once more.
Figure C8. Reusable and lasting quality. At this point the host explains how the
containers in her hands are reusable again and again. The host then implies that regular
containers do not have the lasting quality that the Green Boxes do.

86
Appendix D (Continued)
Figure C9. Pepper freshness. The guest is demonstrating the freshness of peppers by
pushing her finger hard into the pepper in her hand. The host inquires about how
expensive peppers are.
Figure C10. Refrigerator demonstration. The guest then shows how one can easily fit
all the containers into the refrigerator. The guest further explains how they are
translucent so one can see what is in the containers without opening them.

87
Appendix D (Continued)
Figure C11. Countdown clock. The host now points out that there is a countdown clock
on the bottom of the screen indicating how much time one has to buy the product before
she moves to the next item to sell in the show.
Figure C12. Taking a phone call. At this point in the presentation, there is a phone
caller who has just bought the product and wants to say hello to the guest.

88
Appendix D (Continued)
Figure C13. More appearances. The phone caller asks if the guest will be presenting
any other items on the network and states that she misses the guest and hopes the guest
will make more appearances on the network.
The was the ending point of the presentation the test subjects viewed.