Development of a Scale to Diagnose Instructional Strategies
21
CONTEMPORARY EDUCATIONAL TECHNOLOGY, 2012, 3(2), 141-161 141 Development of a Scale to Diagnose Instructional Strategies Bahadir Eristi & Celal Akdeniz Anadolu University, Turkey Abstract The present study aimed at developing a scale for diagnosing instructional strategies to be used to determine the instructional strategies applied in the instructional process. In the process of the scale development, first the related literature was reviewed. Following this, field experts were asked for their views, and the instructional activities to be carried out in the instructional process were identified. Afterwards, considering the similar and different features of the instructional activities, they were grouped by associating them with instructional strategies. The draft scale, which made up of a total of 291 items in the beginning, was exposed to a four-phase application process prior to the actual application. At the end of this process, it was transformed into a 70-item scale applied to 614 home teachers and field teachers. For the content validity of the scale, field experts were asked for their views. Data collected were analyzed with the methods of principle components analysis and exploratory factor analysis. As a result of the exploratory factor analysis conducted to determine the construct validity of the scale, the factor load of each item in the scale was found over .30. In order to determine the factors involving the items in the scale, the orthogonal rotation was applied with the Varimax technique to the data collected. The scale included two sub-scales. The rate of the factors in the sub-scale of meeting the total variance was 43% for the sub-scale of focus strategies and 62% for the sub-scale of process strategies. The value obtained by testing the internal consistency for the whole scale was found as α=.964. With respect to the item-whole scale correlational consistency, the items in the scale ranged between.406 and .816. The findings obtained in the process of developing this five-point Likert-type scale demonstrated that the scale could be used successfully in determining the nature of instructional strategies applied in the instructional process. KeyWords: Instructional strategies; Instructional methods; Instructional tactics; Instructional approaches; Scale development Introduction Instruction is a product of teaching and learning. Instruction can be defined as the whole process applied for learning to occur and for the development of the target behavior that learners are expected to have. According to Simsek (2009), instruction requires not only systematic guidance for learning but also purposeful organization of experiences in order to help students achieve the desired change in their performances. Instruction is also known as an action taken by teachers to create a stimulating learning environment for the purpose of providing guidance along with the necessary instructional tools and carrying out activities that will facilitate learning and help develop behavior appropriate for the gains students are supposed to have (Clark & Starr, 1986; Moore, 2000). Instruction is also defined as procedures and activities planned for teaching (Canady & Retting, 1996).
-
Upload
suleyman-demirel -
Category
Documents
-
view
3 -
download
0
Transcript of Development of a Scale to Diagnose Instructional Strategies

CONTEMPORARY EDUCATIONAL TECHNOLOGY, 2012, 3(2), 141-161
141
Development of a Scale to Diagnose Instructional Strategies
Bahadir Eristi & Celal Akdeniz Anadolu University, Turkey
Abstract
The present study aimed at developing a scale for diagnosing instructional strategies to be used to determine the instructional strategies applied in the instructional process. In the process of the scale development, first the related literature was reviewed. Following this, field experts were asked for their views, and the instructional activities to be carried out in the instructional process were identified. Afterwards, considering the similar and different features of the instructional activities, they were grouped by associating them with instructional strategies. The draft scale, which made up of a total of 291 items in the beginning, was exposed to a four-phase application process prior to the actual application. At the end of this process, it was transformed into a 70-item scale applied to 614 home teachers and field teachers. For the content validity of the scale, field experts were asked for their views. Data collected were analyzed with the methods of principle components analysis and exploratory factor analysis. As a result of the exploratory factor analysis conducted to determine the construct validity of the scale, the factor load of each item in the scale was found over .30. In order to determine the factors involving the items in the scale, the orthogonal rotation was applied with the Varimax technique to the data collected. The scale included two sub-scales. The rate of the factors in the sub-scale of meeting the total variance was 43% for the sub-scale of focus strategies and 62% for the sub-scale of process strategies. The value obtained by testing the internal consistency for the whole scale was found as α=.964. With respect to the item-whole scale correlational consistency, the items in the scale ranged between.406 and .816. The findings obtained in the process of developing this five-point Likert-type scale demonstrated that the scale could be used successfully in determining the nature of instructional strategies applied in the instructional process.
KeyWords: Instructional strategies; Instructional methods; Instructional tactics; Instructional approaches; Scale development
Introduction Instruction is a product of teaching and learning. Instruction can be defined as the whole process applied for learning to occur and for the development of the target behavior that learners are expected to have. According to Simsek (2009), instruction requires not only systematic guidance for learning but also purposeful organization of experiences in order to help students achieve the desired change in their performances. Instruction is also known as an action taken by teachers to create a stimulating learning environment for the purpose of providing guidance along with the necessary instructional tools and carrying out activities that will facilitate learning and help develop behavior appropriate for the gains students are supposed to have (Clark & Starr, 1986; Moore, 2000). Instruction is also defined as procedures and activities planned for teaching (Canady & Retting, 1996).
CONTEMPORARY EDUCATIONAL TECHNOLOGY, 2012, 3(2), 141-161
142
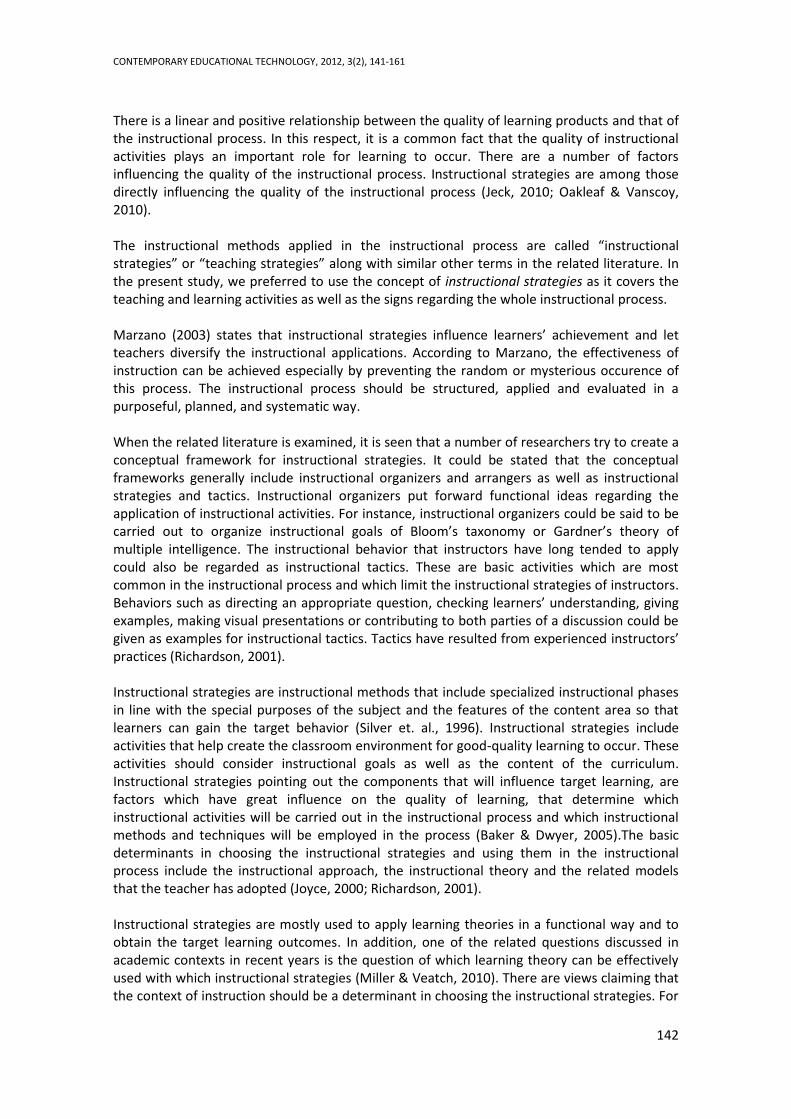
There is a linear and positive relationship between the quality of learning products and that of the instructional process. In this respect, it is a common fact that the quality of instructional activities plays an important role for learning to occur. There are a number of factors influencing the quality of the instructional process. Instructional strategies are among those directly influencing the quality of the instructional process (Jeck, 2010; Oakleaf & Vanscoy, 2010). The instructional methods applied in the instructional process are called “instructional strategies” or “teaching strategies” along with similar other terms in the related literature. In the present study, we preferred to use the concept of instructional strategies as it covers the teaching and learning activities as well as the signs regarding the whole instructional process. Marzano (2003) states that instructional strategies influence learners’ achievement and let teachers diversify the instructional applications. According to Marzano, the effectiveness of instruction can be achieved especially by preventing the random or mysterious occurence of this process. The instructional process should be structured, applied and evaluated in a purposeful, planned, and systematic way. When the related literature is examined, it is seen that a number of researchers try to create a conceptual framework for instructional strategies. It could be stated that the conceptual frameworks generally include instructional organizers and arrangers as well as instructional strategies and tactics. Instructional organizers put forward functional ideas regarding the application of instructional activities. For instance, instructional organizers could be said to be carried out to organize instructional goals of Bloom’s taxonomy or Gardner’s theory of multiple intelligence. The instructional behavior that instructors have long tended to apply could also be regarded as instructional tactics. These are basic activities which are most common in the instructional process and which limit the instructional strategies of instructors. Behaviors such as directing an appropriate question, checking learners’ understanding, giving examples, making visual presentations or contributing to both parties of a discussion could be given as examples for instructional tactics. Tactics have resulted from experienced instructors’ practices (Richardson, 2001). Instructional strategies are instructional methods that include specialized instructional phases in line with the special purposes of the subject and the features of the content area so that learners can gain the target behavior (Silver et. al., 1996). Instructional strategies include activities that help create the classroom environment for good-quality learning to occur. These activities should consider instructional goals as well as the content of the curriculum. Instructional strategies pointing out the components that will influence target learning, are factors which have great influence on the quality of learning, that determine which instructional activities will be carried out in the instructional process and which instructional methods and techniques will be employed in the process (Baker & Dwyer, 2005).The basic determinants in choosing the instructional strategies and using them in the instructional process include the instructional approach, the instructional theory and the related models that the teacher has adopted (Joyce, 2000; Richardson, 2001). Instructional strategies are mostly used to apply learning theories in a functional way and to obtain the target learning outcomes. In addition, one of the related questions discussed in academic contexts in recent years is the question of which learning theory can be effectively used with which instructional strategies (Miller & Veatch, 2010). There are views claiming that the context of instruction should be a determinant in choosing the instructional strategies. For

CONTEMPORARY EDUCATIONAL TECHNOLOGY, 2012, 3(2), 141-161
143
example, Shulman (1987) asserts that different instructional strategies should be applied for different subject fields and contents. In short, the instructional strategies to be applied in the instructional process should be chosen and applied according to the content in addition to other elements of instruction. For instance, the instructional strategies that a math teacher uses to help students understand the Pythagoras theorem will differ from the instructional strategies that a teacher of Turkish language uses while teaching the structural features of Turkish. Similarly, when students’ background knowledge and their development areas are taken into consideration, it could be stated that first-grade teachers at an elementary school will sometimes have to apply instructional strategies, methods, techniques, approaches, and tactics different from those to be applied by second-grade teachers. Modern understandings regarding instructional strategies acknowledge that instructional goals are complex and sophisticated and that instructors are supposed to have a variety of approaches in order to the educational needs of students from different socio-cultural environments and to help them achieve effective learning. In this respect, it could be stated that today, instructors should prefer among various instructional strategies in order to help learners gain effective learning experiences in cognitive, affective and kinetic fields (Williams, 2011). Some of the discussions regarding instructional strategies involve several headings under which instructional strategies can be classified. When the classifications put forward are examined, it could be stated that several variables played a role in doing these classifications. These variables include who is the focus of instructional activities; what methods and techqniques are used in the process; whether the process is followed with an inferential, deductive or inductive understanding; and which constructs are taken into consideration in the preparation, presentation, and restructuring of the information (Marzano, 2003; Shulman, 1987). In addition, instructional strategies are also classified in some studies according to how the process functions; in some studies according to how information is produced and how this information is acquired by learners; and in some other studies, they are classified based on the instructional models that act as a source for strategies. Some of the classifications of instructional strategies in related literature are as follows:
A. Teacher-centered, student-centered, process-based instructional strategies. B. Traditional, constructive instructional strategies C. Strategies for cooperative instruction, instruction via discoveries, instruction via
presentation, instruction via research and investigation D. Strategies for experimental, indirect instruction, direct, interactive, independent
study/individual instruction E. Organization, presentation, and management strategies F. Brain-based instructional strategies G. Strategies for instruction excluding instructional design, student-oriented instruction,
teacher-oriented instruction According to Saskatchewan Education Department (1985; 1991), instructional strategies refer to special independent fields developed on the basis of instructional models. These fields are called five different instructional strategies. They are direct instruction, indirect instruction, interactive instruction, independent study, and experimental/expriencial instruction. There is a hierarchical relationship of Instructional models and instructional strategies with instructional methods and techniques. According to this relationship, the methods and techniques to be applied in the instructional process are determined mostly by instructional strategies. The
CONTEMPORARY EDUCATIONAL TECHNOLOGY, 2012, 3(2), 141-161
144
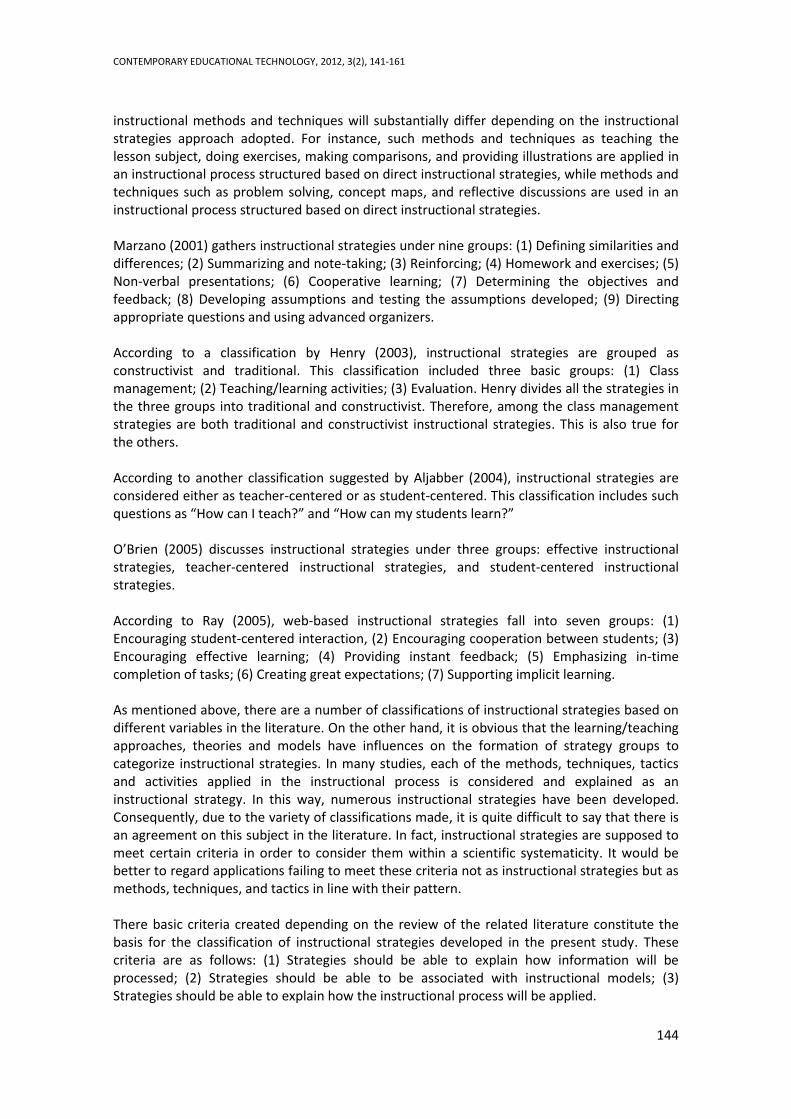
instructional methods and techniques will substantially differ depending on the instructional strategies approach adopted. For instance, such methods and techniques as teaching the lesson subject, doing exercises, making comparisons, and providing illustrations are applied in an instructional process structured based on direct instructional strategies, while methods and techniques such as problem solving, concept maps, and reflective discussions are used in an instructional process structured based on direct instructional strategies. Marzano (2001) gathers instructional strategies under nine groups: (1) Defining similarities and differences; (2) Summarizing and note-taking; (3) Reinforcing; (4) Homework and exercises; (5) Non-verbal presentations; (6) Cooperative learning; (7) Determining the objectives and feedback; (8) Developing assumptions and testing the assumptions developed; (9) Directing appropriate questions and using advanced organizers. According to a classification by Henry (2003), instructional strategies are grouped as constructivist and traditional. This classification included three basic groups: (1) Class management; (2) Teaching/learning activities; (3) Evaluation. Henry divides all the strategies in the three groups into traditional and constructivist. Therefore, among the class management strategies are both traditional and constructivist instructional strategies. This is also true for the others. According to another classification suggested by Aljabber (2004), instructional strategies are considered either as teacher-centered or as student-centered. This classification includes such questions as “How can I teach?” and “How can my students learn?” O’Brien (2005) discusses instructional strategies under three groups: effective instructional strategies, teacher-centered instructional strategies, and student-centered instructional strategies. According to Ray (2005), web-based instructional strategies fall into seven groups: (1) Encouraging student-centered interaction, (2) Encouraging cooperation between students; (3) Encouraging effective learning; (4) Providing instant feedback; (5) Emphasizing in-time completion of tasks; (6) Creating great expectations; (7) Supporting implicit learning. As mentioned above, there are a number of classifications of instructional strategies based on different variables in the literature. On the other hand, it is obvious that the learning/teaching approaches, theories and models have influences on the formation of strategy groups to categorize instructional strategies. In many studies, each of the methods, techniques, tactics and activities applied in the instructional process is considered and explained as an instructional strategy. In this way, numerous instructional strategies have been developed. Consequently, due to the variety of classifications made, it is quite difficult to say that there is an agreement on this subject in the literature. In fact, instructional strategies are supposed to meet certain criteria in order to consider them within a scientific systematicity. It would be better to regard applications failing to meet these criteria not as instructional strategies but as methods, techniques, and tactics in line with their pattern. There basic criteria created depending on the review of the related literature constitute the basis for the classification of instructional strategies developed in the present study. These criteria are as follows: (1) Strategies should be able to explain how information will be processed; (2) Strategies should be able to be associated with instructional models; (3) Strategies should be able to explain how the instructional process will be applied.
CONTEMPORARY EDUCATIONAL TECHNOLOGY, 2012, 3(2), 141-161
145
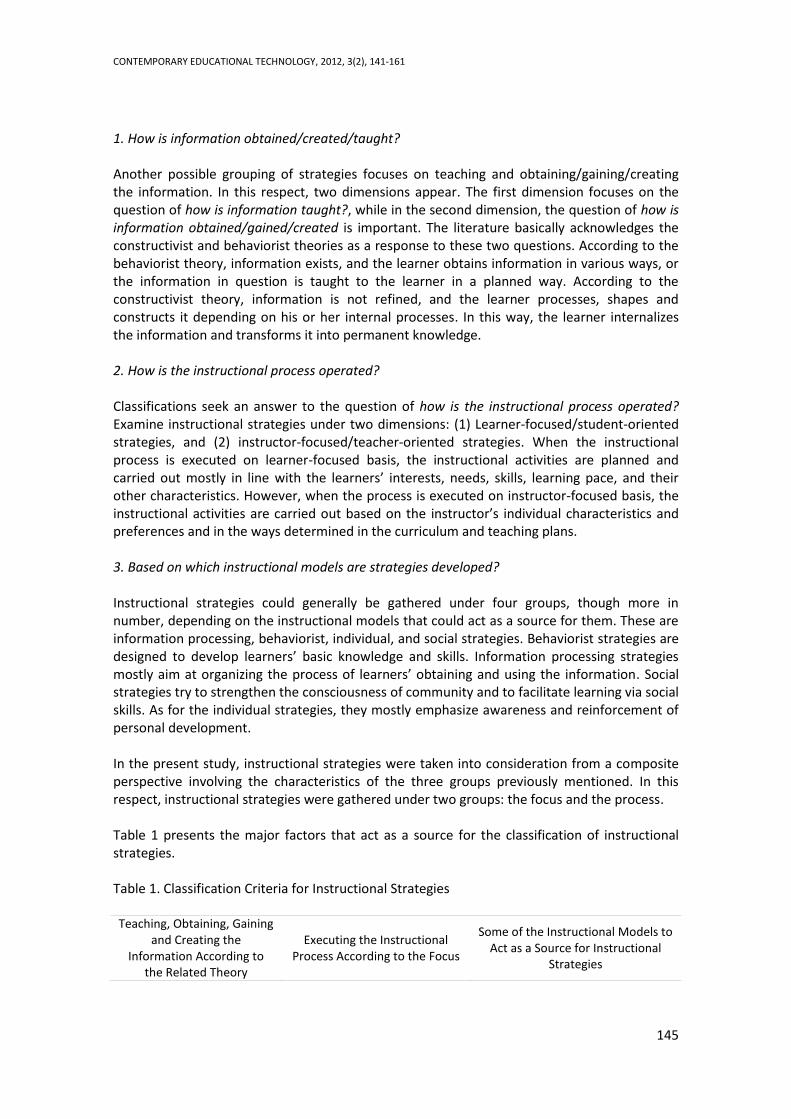
1. How is information obtained/created/taught? Another possible grouping of strategies focuses on teaching and obtaining/gaining/creating the information. In this respect, two dimensions appear. The first dimension focuses on the question of how is information taught?, while in the second dimension, the question of how is information obtained/gained/created is important. The literature basically acknowledges the constructivist and behaviorist theories as a response to these two questions. According to the behaviorist theory, information exists, and the learner obtains information in various ways, or the information in question is taught to the learner in a planned way. According to the constructivist theory, information is not refined, and the learner processes, shapes and constructs it depending on his or her internal processes. In this way, the learner internalizes the information and transforms it into permanent knowledge. 2. How is the instructional process operated? Classifications seek an answer to the question of how is the instructional process operated? Examine instructional strategies under two dimensions: (1) Learner-focused/student-oriented strategies, and (2) instructor-focused/teacher-oriented strategies. When the instructional process is executed on learner-focused basis, the instructional activities are planned and carried out mostly in line with the learners’ interests, needs, skills, learning pace, and their other characteristics. However, when the process is executed on instructor-focused basis, the instructional activities are carried out based on the instructor’s individual characteristics and preferences and in the ways determined in the curriculum and teaching plans. 3. Based on which instructional models are strategies developed? Instructional strategies could generally be gathered under four groups, though more in number, depending on the instructional models that could act as a source for them. These are information processing, behaviorist, individual, and social strategies. Behaviorist strategies are designed to develop learners’ basic knowledge and skills. Information processing strategies mostly aim at organizing the process of learners’ obtaining and using the information. Social strategies try to strengthen the consciousness of community and to facilitate learning via social skills. As for the individual strategies, they mostly emphasize awareness and reinforcement of personal development. In the present study, instructional strategies were taken into consideration from a composite perspective involving the characteristics of the three groups previously mentioned. In this respect, instructional strategies were gathered under two groups: the focus and the process. Table 1 presents the major factors that act as a source for the classification of instructional strategies. Table 1. Classification Criteria for Instructional Strategies
Teaching, Obtaining, Gaining
and Creating the Information According to
the Related Theory
Executing the Instructional Process According to the Focus
Some of the Instructional Models to Act as a Source for Instructional
Strategies

CONTEMPORARY EDUCATIONAL TECHNOLOGY, 2012, 3(2), 141-161
146
A. Constructivist
Learning/Teaching Theories
B. Behaviorist
Learning/Teaching Theories
A. Learner-Focused / Student-
Oriented Instruction
B. Instructor-Focused / Instructor-
Oriented Instruction
Behaviorist Model Information Processing Model Individual Learning /Teaching
Model Social Learning / Teaching Models
Jung’s Learning Styles Model Bloom’s Mastery Learning Model
Learning States Model Humanist Model
Kolb’s Experimental Learning Model Activity Model
Androgogia + others
Purpose of the Study
The present study aimed at testing the scientific validity and reliability of the Scale for Determining Instructional Strategies which was constructed based on the classification of instructional strategies developed by researchers depending on the related literature. In this respect, the following research questions were directed: 1. Is the Scale for Determining Instructional Strategies a sound measurement tool that has a
high enough level of validity to be used for determining the nature of strategies applied in instructional processes?
2. Is the Scale for Determining Instructional Strategies a good measurement tool that has a high level of reliability to be used for determining the the nature of strategies applied in instructional processes?
Method The development process of the Scale for Determining Instructional Strategies consisted of seven phases: (1) Reviewing the related literature; (2) Forming the tentative classification of instructional strategies; (3) Creating the items pool; (4) Developing the data collection tool; (5) Applying the data collection tool to the sample group; (6) Conducting the validity and reliability tests; and (7) Finalizing the scale. The procedure followed in line with the processes mentioned above is as follows: Development of the First Draft of the Scale In the first phase, by reviewing the related literature, the relationship between instruction and instructional concepts was analyzed; instructional strategies and their roles in the instructional process were examined; and the tentative classifications made for instructional strategies were revised. In the phase of forming the classification of instructional strategies, not only the interviews held with field experts but also the classifications made for instructional strategies in related literature were examined; the classifications were analyzed with respect to their quality; and

CONTEMPORARY EDUCATIONAL TECHNOLOGY, 2012, 3(2), 141-161
147
the similarities and differences between these classifications were revealed. As a result, a new classification was formed in the present study by taking the similar and different aspects of instructional strategies into consideration. The classification of instructional strategies formed divided strategies into two basic groups: Focus and Process strategies. Instructional strategies concern what an instructor sometimes does, how he or she achieves it and for what purpose he or she does so. In this respect, in constructing the instructional process, how and for what purpose an instructor carries out the activities reveals to whom he or she bases the instructional process on or based on whom he or she executes the instructional process; in other words, who really constitutes the focus of the instructional process. The strategies revealing based on whom the instruction was made are called focus strategies. Focus strategies gather instructional strategies under two groups: instructor-focused and learner-focused. Instructor-focused instructional strategies refer to application and execution of basically teacher-oriented instructional activities during the instructional process. The learner-focused instructional strategies show that the instructional process has a learner-oriented structure and that instruction is designed in line with the learner’s needs, interests, desires, and skills. The responses given to the question of “what and how did I teach?” in order to determine which of the components of the process and to what extent the instructor includes in the activities he or she carries out in the instructional process will point out the process strategies and the components of these strategies. In the grouping, the strategies revealing “how” the instruction is executed are called process strategies. Process strategies include eight basic instructional skills which the instructor applies and which can be classified as the knowledge and skills regarding teaching profession. These are Problem Solving-Sample Event, Discussion-Brainstorming, Modeling/Role Playing/Simulation, Making Pupils Think/Interrogate/Interpret, Presentation, Question-Answer, Making Write-Take Notes-Summarize and Research-Project. The classification of instructional strategies formed in the present study, the instructional activities pointed out by the components of this classification and the interviews held with field experts helped determine the dimensions/components within the scope of the strategies considered to be included in the scale. In line with the field experts’ views and the sub-dimensions determined, an item-pool of 291 items, each of which could be made associated with an instructional activity, was formed. While creating the draft items, with the thought that instructional strategies reveal themselves via instructional activities, the activities carried out in the instructional process was referred to as the scale items. The development of the data collection instrument included the development process of six sequential scale drafts. First, by ordering the items in the item pool one under another, the response choices for each of the items were rated as 1, 2, 3, 4 and 5 (Likert-type). In order to define the levels of use of instructional strategies, 1 was labeled as never, 2 as rarely, 3 as sometimes, 4 as often and 5 was labeled as very often. These were all inserted in the scale to provide facilities for the respondents. In the data analysis process, the scores assigned to each item in the scale were compared. Five-item Likert scale was assigned to each statement in the scale. In this way, the first draft of the Scale for Determining Instructional Strategies was formed. The first draft of the scale included all the 291 items found in the item pool. The draft scale was applied to 43 teachers for their views. In line with the data obtained from the teachers, the non-functional and overlapping items were excluded from the draft, and the number of
CONTEMPORARY EDUCATIONAL TECHNOLOGY, 2012, 3(2), 141-161
148
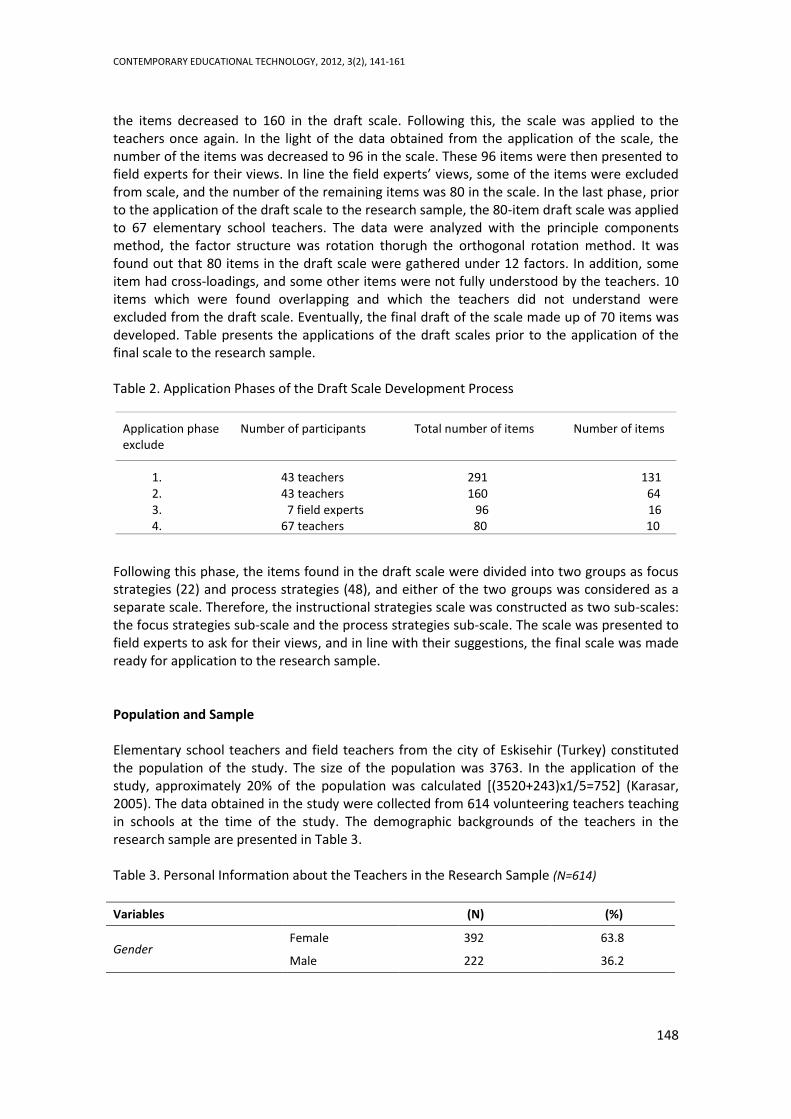
the items decreased to 160 in the draft scale. Following this, the scale was applied to the teachers once again. In the light of the data obtained from the application of the scale, the number of the items was decreased to 96 in the scale. These 96 items were then presented to field experts for their views. In line the field experts’ views, some of the items were excluded from scale, and the number of the remaining items was 80 in the scale. In the last phase, prior to the application of the draft scale to the research sample, the 80-item draft scale was applied to 67 elementary school teachers. The data were analyzed with the principle components method, the factor structure was rotation thorugh the orthogonal rotation method. It was found out that 80 items in the draft scale were gathered under 12 factors. In addition, some item had cross-loadings, and some other items were not fully understood by the teachers. 10 items which were found overlapping and which the teachers did not understand were excluded from the draft scale. Eventually, the final draft of the scale made up of 70 items was developed. Table presents the applications of the draft scales prior to the application of the final scale to the research sample. Table 2. Application Phases of the Draft Scale Development Process
Application phase Number of participants Total number of items Number of items exclude
1. 43 teachers 291 131 2. 43 teachers 160 64 3. 7 field experts 96 16 4. 67 teachers 80 10
Following this phase, the items found in the draft scale were divided into two groups as focus strategies (22) and process strategies (48), and either of the two groups was considered as a separate scale. Therefore, the instructional strategies scale was constructed as two sub-scales: the focus strategies sub-scale and the process strategies sub-scale. The scale was presented to field experts to ask for their views, and in line with their suggestions, the final scale was made ready for application to the research sample. Population and Sample Elementary school teachers and field teachers from the city of Eskisehir (Turkey) constituted the population of the study. The size of the population was 3763. In the application of the study, approximately 20% of the population was calculated [(3520+243)x1/5=752] (Karasar, 2005). The data obtained in the study were collected from 614 volunteering teachers teaching in schools at the time of the study. The demographic backgrounds of the teachers in the research sample are presented in Table 3. Table 3. Personal Information about the Teachers in the Research Sample (N=614)
Variables (N) (%)
Gender Female 392 63.8
Male 222 36.2

CONTEMPORARY EDUCATIONAL TECHNOLOGY, 2012, 3(2), 141-161
149
Field of Teaching
Elementary School Teaching
349 55.8
Turkish Language 48 7.8
Mathematics 32 5.2
Science 44 7.2
Social Sciences 26 4.2
Foreign Language 55 9.0
Religion and Ethics 26 4.2
Technology and Design
28 4.6
Computer 6 1.0
Professional Experience
0–5 Years 56 9.1
6–10 Years 127 20.7
11–15 Years 194 31.6
16–20 Years 105 17.1
21 years + 132 21.5
Data Collection The scale was applied to the sample between the 22nd and 30th June, 2011. The number of the teachers participating in the application process was 614 in total, 506 of whom were teaching at public schools and 108 of whom were teaching at private schools at the time of the study. Table 4 presents the number of participating teachers and their school types. Table 4. Distribution of the Number of Schools and Teachers Constituting the Sample and the Population of the Study
Population Sample
Number
of Schools Number of Teachers
Number of Application
Schools
Number of Participating
Teachers Public Elementary School 125 3520 37 506
Private Elementary School 7 243 4 108
Total 132 3763 41 614
Reliability Studies In order to determine the reliability of the scale, the internal consistency for the scale was tested. For this purpose, the Cronbach’s Alpha coefficient, which is commonly used for Likert-type scales, was calculated. As a result of the internal consistency testing conducted to determine the reliability, the Cronbach’s Alpha reliability coefficient was found as (α=.964).

CONTEMPORARY EDUCATIONAL TECHNOLOGY, 2012, 3(2), 141-161
150
Validity Studies In order to determine the validity of the scale, the content and construct validity tests were carried out. The views of the field experts were considered sufficient for the content validity. Thus, no other testing for this purpose was done. As for the construct validity, exploratory factor analysis was carried out. The exploratory factor analysis is a type of analysis designed to reveal the relationship between unknown latent variables and the observed variables (Akbulut, 2010; Cokluk, Sekercioglu, & Buyukozturk, 2010). For the construct validity tests, the whole scale was analyzed as two separate scales (focus and process). As a result of the analysis, six items of the focus strategies scale had cross-loadings, and they were excluded from the scale. Thus, the first scale with 22 items prior to the analysis eventually had 14 items. The number of the items of the process strategies scale did not change as a result of the analyses and included 48 items. It was observed that by strengthening the item-factor relationships via Varimax rotation, the items in the focus strategies scale were gathered under two factors. Items in the process strategies scale were gathered under 8 factors. As a result of the analyses, the instructional strategies scale was made up of the focus and process scales and included 10 factors with a total of 62 items. The dimensions of the instructional strategies scale and the distributions of the items regarding these dimensions are demonstrated in Table 5. Table 5. Distributions of the Items in the Scale for Determining Instructional Strategies
Instructional Strategies Scale Number of
Items Focus Strategies Scale 14
Factor 1. Instructor-focused instruction 1,2,3,4,5 5 Factor 2. Learner-focused instruction 6,7,8,9,10,11,12,13,14 9
Process Strategies Scale 48 Factor 1. Problem Solving-Sample Event 15,16,17,18,19,20,21 7 Factor 2. Discussion-Brainstorming 22,23,24,25,26 5 Factor 3. Modeling/Simulation/Role Playing 27,28,29,30,31 5
Factor 4. Making Think/Interrogate/Interpret 32,33,34,35,36,37 6 Factor 5. Presentation 38,39,40,41,42,43 6 Factor 6. Question-Answer 44,45,46,47,48,49 6 Factor 7. Making Write-Take Notes-Summarize 50,51,52,53,54 5 Factor 8. Research-Project 55,56,57,58,59,60,61,62 8
Total Number of Items 62
Findings and Interpretation 1. Findings Regarding the Reliability of the Scale The first research question directed in the present study was related to the reliability of the Scale for Determining Instructional Strategies. As a result of the internal consistency test conducted to determine the reliability of the scale, the Cronbach’s alpha reliability coefficient was calculated as (α=.964). When the total number of the items in the scale (62 items) was taken into consideration, the value calculated revealed that the scale was reliable enough to be used as a measurement tool.
CONTEMPORARY EDUCATIONAL TECHNOLOGY, 2012, 3(2), 141-161
151
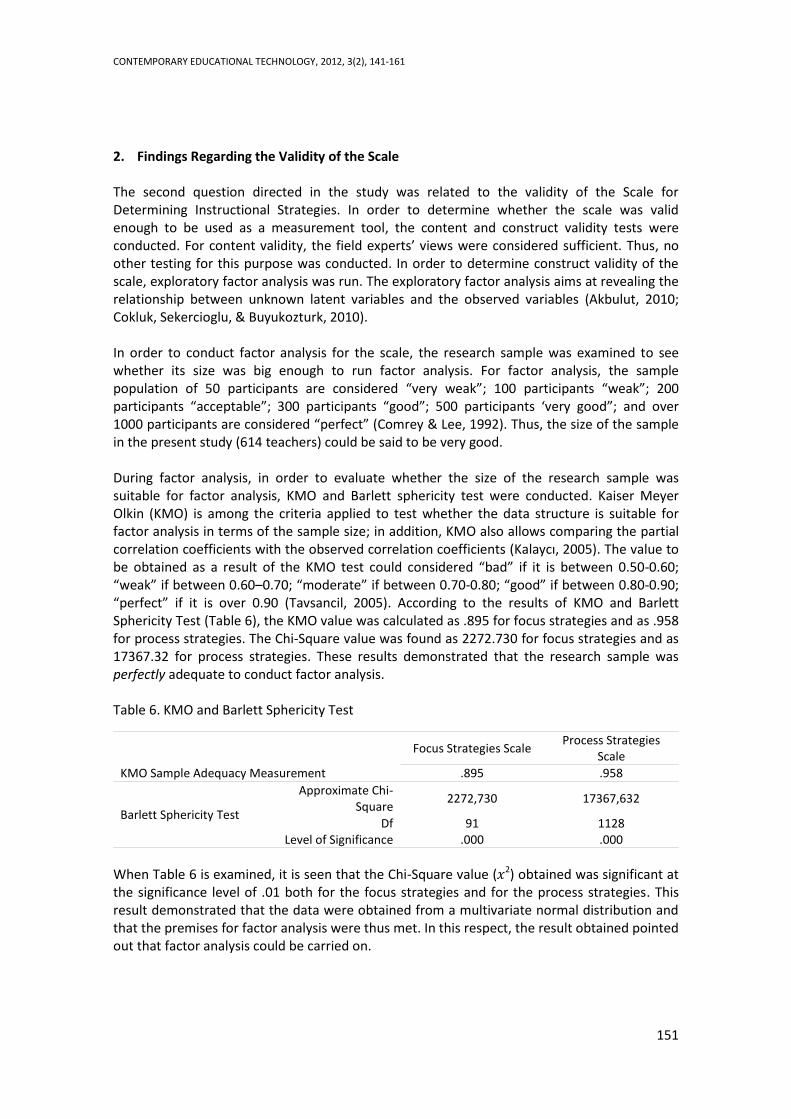
2. Findings Regarding the Validity of the Scale The second question directed in the study was related to the validity of the Scale for Determining Instructional Strategies. In order to determine whether the scale was valid enough to be used as a measurement tool, the content and construct validity tests were conducted. For content validity, the field experts’ views were considered sufficient. Thus, no other testing for this purpose was conducted. In order to determine construct validity of the scale, exploratory factor analysis was run. The exploratory factor analysis aims at revealing the relationship between unknown latent variables and the observed variables (Akbulut, 2010; Cokluk, Sekercioglu, & Buyukozturk, 2010). In order to conduct factor analysis for the scale, the research sample was examined to see whether its size was big enough to run factor analysis. For factor analysis, the sample population of 50 participants are considered “very weak”; 100 participants “weak”; 200 participants “acceptable”; 300 participants “good”; 500 participants ‘very good”; and over 1000 participants are considered “perfect” (Comrey & Lee, 1992). Thus, the size of the sample in the present study (614 teachers) could be said to be very good. During factor analysis, in order to evaluate whether the size of the research sample was suitable for factor analysis, KMO and Barlett sphericity test were conducted. Kaiser Meyer Olkin (KMO) is among the criteria applied to test whether the data structure is suitable for factor analysis in terms of the sample size; in addition, KMO also allows comparing the partial correlation coefficients with the observed correlation coefficients (Kalaycı, 2005). The value to be obtained as a result of the KMO test could considered “bad” if it is between 0.50-0.60; “weak” if between 0.60–0.70; “moderate” if between 0.70-0.80; “good” if between 0.80-0.90; “perfect” if it is over 0.90 (Tavsancil, 2005). According to the results of KMO and Barlett Sphericity Test (Table 6), the KMO value was calculated as .895 for focus strategies and as .958 for process strategies. The Chi-Square value was found as 2272.730 for focus strategies and as 17367.32 for process strategies. These results demonstrated that the research sample was perfectly adequate to conduct factor analysis. Table 6. KMO and Barlett Sphericity Test
Focus Strategies Scale Process Strategies
Scale
KMO Sample Adequacy Measurement .895 .958
Barlett Sphericity Test
Approximate Chi-Square
2272,730 17367,632
Df 91 1128 Level of Significance .000 .000
When Table 6 is examined, it is seen that the Chi-Square value ( 2) obtained was significant at the significance level of .01 both for the focus strategies and for the process strategies. This result demonstrated that the data were obtained from a multivariate normal distribution and that the premises for factor analysis were thus met. In this respect, the result obtained pointed out that factor analysis could be carried on.
CONTEMPORARY EDUCATIONAL TECHNOLOGY, 2012, 3(2), 141-161
152
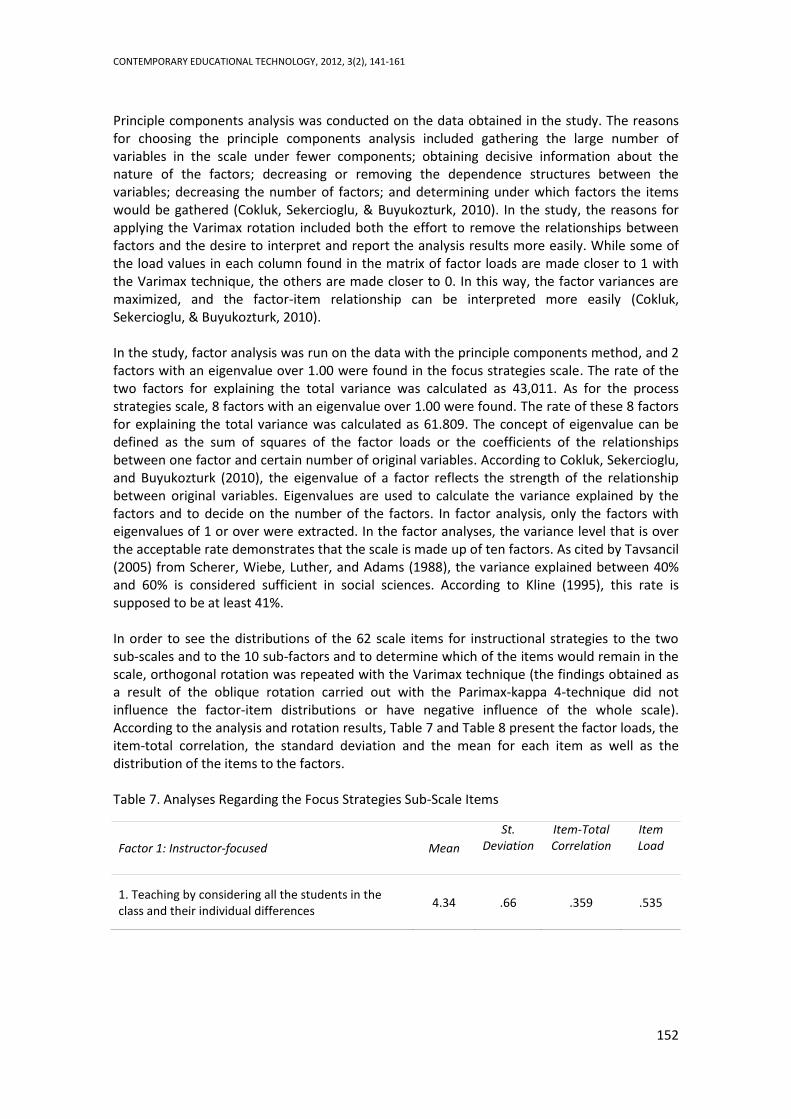
Principle components analysis was conducted on the data obtained in the study. The reasons for choosing the principle components analysis included gathering the large number of variables in the scale under fewer components; obtaining decisive information about the nature of the factors; decreasing or removing the dependence structures between the variables; decreasing the number of factors; and determining under which factors the items would be gathered (Cokluk, Sekercioglu, & Buyukozturk, 2010). In the study, the reasons for applying the Varimax rotation included both the effort to remove the relationships between factors and the desire to interpret and report the analysis results more easily. While some of the load values in each column found in the matrix of factor loads are made closer to 1 with the Varimax technique, the others are made closer to 0. In this way, the factor variances are maximized, and the factor-item relationship can be interpreted more easily (Cokluk, Sekercioglu, & Buyukozturk, 2010). In the study, factor analysis was run on the data with the principle components method, and 2 factors with an eigenvalue over 1.00 were found in the focus strategies scale. The rate of the two factors for explaining the total variance was calculated as 43,011. As for the process strategies scale, 8 factors with an eigenvalue over 1.00 were found. The rate of these 8 factors for explaining the total variance was calculated as 61.809. The concept of eigenvalue can be defined as the sum of squares of the factor loads or the coefficients of the relationships between one factor and certain number of original variables. According to Cokluk, Sekercioglu, and Buyukozturk (2010), the eigenvalue of a factor reflects the strength of the relationship between original variables. Eigenvalues are used to calculate the variance explained by the factors and to decide on the number of the factors. In factor analysis, only the factors with eigenvalues of 1 or over were extracted. In the factor analyses, the variance level that is over the acceptable rate demonstrates that the scale is made up of ten factors. As cited by Tavsancil (2005) from Scherer, Wiebe, Luther, and Adams (1988), the variance explained between 40% and 60% is considered sufficient in social sciences. According to Kline (1995), this rate is supposed to be at least 41%. In order to see the distributions of the 62 scale items for instructional strategies to the two sub-scales and to the 10 sub-factors and to determine which of the items would remain in the scale, orthogonal rotation was repeated with the Varimax technique (the findings obtained as a result of the oblique rotation carried out with the Parimax-kappa 4-technique did not influence the factor-item distributions or have negative influence of the whole scale). According to the analysis and rotation results, Table 7 and Table 8 present the factor loads, the item-total correlation, the standard deviation and the mean for each item as well as the distribution of the items to the factors. Table 7. Analyses Regarding the Focus Strategies Sub-Scale Items
Factor 1: Instructor-focused Mean
St. Deviation
Item-Total Correlation
Item Load
1. Teaching by considering all the students in the class and their individual differences
4.34 .66 .359 .535

CONTEMPORARY EDUCATIONAL TECHNOLOGY, 2012, 3(2), 141-161
153
2. Assigning the same duties and responsibilities to the students in class regarding the content of instruction
3.44 .92 .695 .816
3. Correcting the deficiencies and mistakes in students’ products
4.15 .72 .536 .707
4. Having students take notes regarding the subject during the lesson
3.96 .92 .346 .502
5. Having the whole class acquire all the gains envisaged in the curriculum
4.17 .65 .466 .587
Factor 2: Learner-focused Mean St.
Deviation Item-Total Correlation
Item Load
6. Benefiting from metaphors in the instructional process
3.86 .75 .437 .416
7. Choosing real-life examples related to the learning context by taking the students’ characteristics into consideration
4.37 .69 .547 .616
8. Explaining instructional goals of the course to the students
4.12 .71 .494 .580
9. In the instructional process, preferring to use cooperation and discussion skills effectively rather than teaching simply
3.89 .76 .427 .603
10. In the instructional process, establishing a relationship between the students’ background knowledge and what they have just learnt
4.22 .69 .557 .549
11. Helping students determine the contents of subjects for independent student studies
3.65 .88 .566 .741
12. Encouraging students to direct more questions and to state their views
4.32 .70 .497 .505
13. Having students discuss the problem solving strategies they apply in the learning process
3.92 .77 .647 .749
14. Having students make their learning preferences on the basis of their interests in the subject being taught
3.89 .72 .566 .686
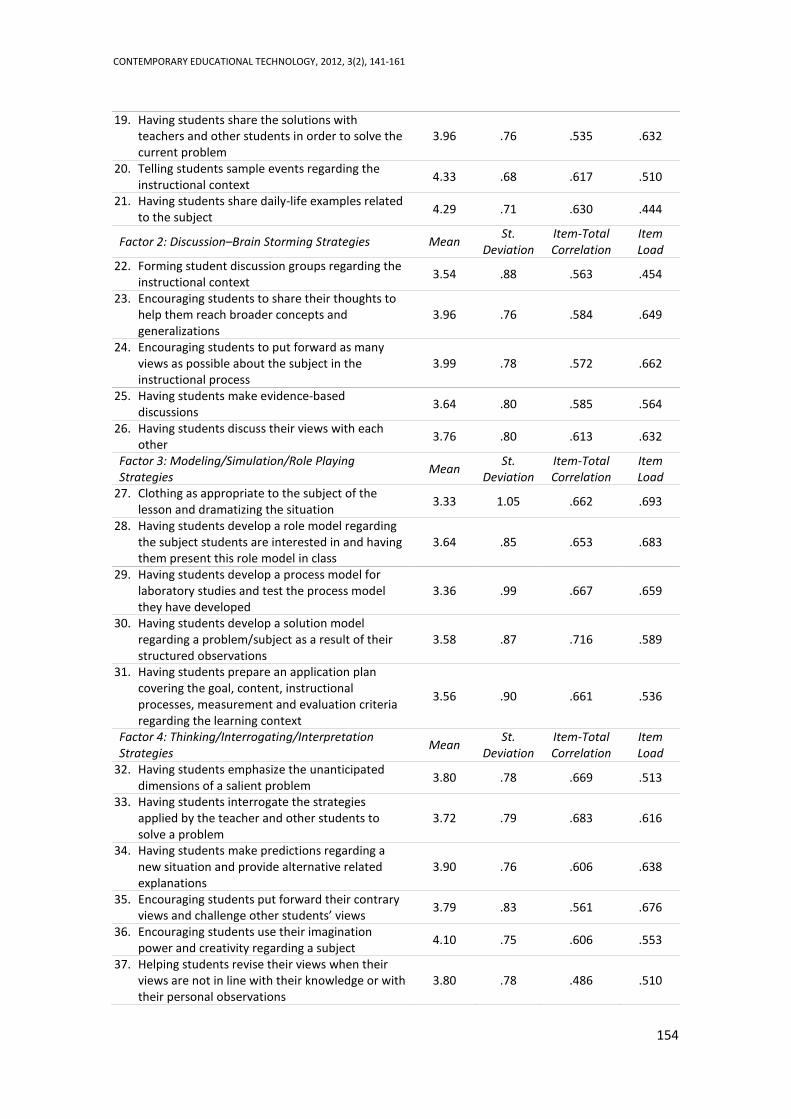
Table 8. Analyses Regarding the Process Strategies Sub-Scale Items
Factor 1: Problem Solving-Sample Event Strategies Mean St.
Deviation Item-Total Correlation
Item Load
15. Regarding a specified problem, having students discover the basic causes of that problem 4.09 .64 .498 .555
16. Having students obtain information from various sources regarding a problem they believe it exists
3.90 .74 .587 .687
17. Having students provide suggestions for solutions to a certain problem in the light of the information they have obtained
3.94 .71 .655 .699
18. Having students develop hypotheses regarding the solution to a specified problem, find evidence supporting the hypotheses and test these hypotheses
3.74 .78 .608 .655
CONTEMPORARY EDUCATIONAL TECHNOLOGY, 2012, 3(2), 141-161
154
19. Having students share the solutions with teachers and other students in order to solve the current problem
3.96 .76 .535 .632
20. Telling students sample events regarding the instructional context
4.33 .68 .617 .510
21. Having students share daily-life examples related to the subject
4.29 .71 .630 .444
Factor 2: Discussion–Brain Storming Strategies Mean St.
Deviation Item-Total Correlation
Item Load
22. Forming student discussion groups regarding the instructional context
3.54 .88 .563 .454
23. Encouraging students to share their thoughts to help them reach broader concepts and generalizations
3.96 .76 .584 .649
24. Encouraging students to put forward as many views as possible about the subject in the instructional process
3.99 .78 .572 .662
25. Having students make evidence-based discussions
3.64 .80 .585 .564
26. Having students discuss their views with each other
3.76 .80 .613 .632
Factor 3: Modeling/Simulation/Role Playing Strategies
Mean St.
Deviation Item-Total Correlation
Item Load
27. Clothing as appropriate to the subject of the lesson and dramatizing the situation
3.33 1.05 .662 .693
28. Having students develop a role model regarding the subject students are interested in and having them present this role model in class
3.64 .85 .653 .683
29. Having students develop a process model for laboratory studies and test the process model they have developed
3.36 .99 .667 .659
30. Having students develop a solution model regarding a problem/subject as a result of their structured observations
3.58 .87 .716 .589
31. Having students prepare an application plan covering the goal, content, instructional processes, measurement and evaluation criteria regarding the learning context
3.56 .90 .661 .536
Factor 4: Thinking/Interrogating/Interpretation Strategies
Mean St.
Deviation Item-Total Correlation
Item Load
32. Having students emphasize the unanticipated dimensions of a salient problem
3.80 .78 .669 .513
33. Having students interrogate the strategies applied by the teacher and other students to solve a problem
3.72 .79 .683 .616
34. Having students make predictions regarding a new situation and provide alternative related explanations
3.90 .76 .606 .638
35. Encouraging students put forward their contrary views and challenge other students’ views
3.79 .83 .561 .676
36. Encouraging students use their imagination power and creativity regarding a subject
4.10 .75 .606 .553
37. Helping students revise their views when their views are not in line with their knowledge or with their personal observations
3.80 .78 .486 .510

CONTEMPORARY EDUCATIONAL TECHNOLOGY, 2012, 3(2), 141-161
155
Factor 5: Presentation Strategies Mean St.
Deviation Item-Total Correlation
Item-Load
38. Teaching a subject in an audio/visual way to students by using various instructional materials
4.05 .74 .524 .630
39. Having students present their subject-related studies to the teacher and other students
3.91 .81 .521 .588
40. Supporting students’ story-development and story-telling studies
3.94 .88 .671 .528
41. Having students read the subject-related sources from a critical perspective and share the results they have obtained with other students
3.82 .82 .633 .542
42. Having students provide additional information about the subject and elaborate the information they present
3.74 .78 .611 .505
43. Teaching the subject to students non-verbally by using appropriate instructional materials
3.49 .91 .466 .461
Factor 6: Question-Answer Strategies Mean St.
Deviation Item-Total Correlation
Item Load
44. Encouraging students to direct appropriate questions to each other
4.02 .74 .484 .406
45. Randomly choosing the students to ask questions during the lesson
4.10 .91 .498 .665
46. Having students wait for a while before they direct consecutive questions
3.97 .78 .516 .687
47. Asking open-ended/unfinished questions to students
4.05 .77 .597 .703
48. Having students prepare questions about a subject that interests students and provide answers to these questions
4.00 .79 .581 .676
49. Having students ask the subject-related questions they have prepared to each other and provide answers to these questions
3.94 .80 .553 .580
Factor 7: Strategies of Having Write/Take notes/Summarize
Mean St.
Deviation Item-Total Correlation
Item Load
50. Having students write down an original essay regarding how to solve a problem
3.49 1.02 .670 .701
51. Having students write down an article/essay about a subject they have determined and evaluate this product according to the writing criteria
3.28 1.09 .740 .789
52. Having students form an original process map that shows the teaching phases of a subject
3.30 1.05 .733 .753
53. Having students form graphical organizers related to the subject (mind, knowledge and concept maps)
3.50 .99 .606 .654
54. Having students take notes regarding the important points of the subject being taught and create remindful signs
3.92 .89 .526 .422
Factor 8: Research/Project Strategies Mean St.
Deviation Item-Total Correlation
Item Load
55. Having students prepare a project draft regarding a subject that interests students
3.81 .83 .603 .663
56. Having students apply and test the project draft they have prepared
3.71 .85 .679 .653
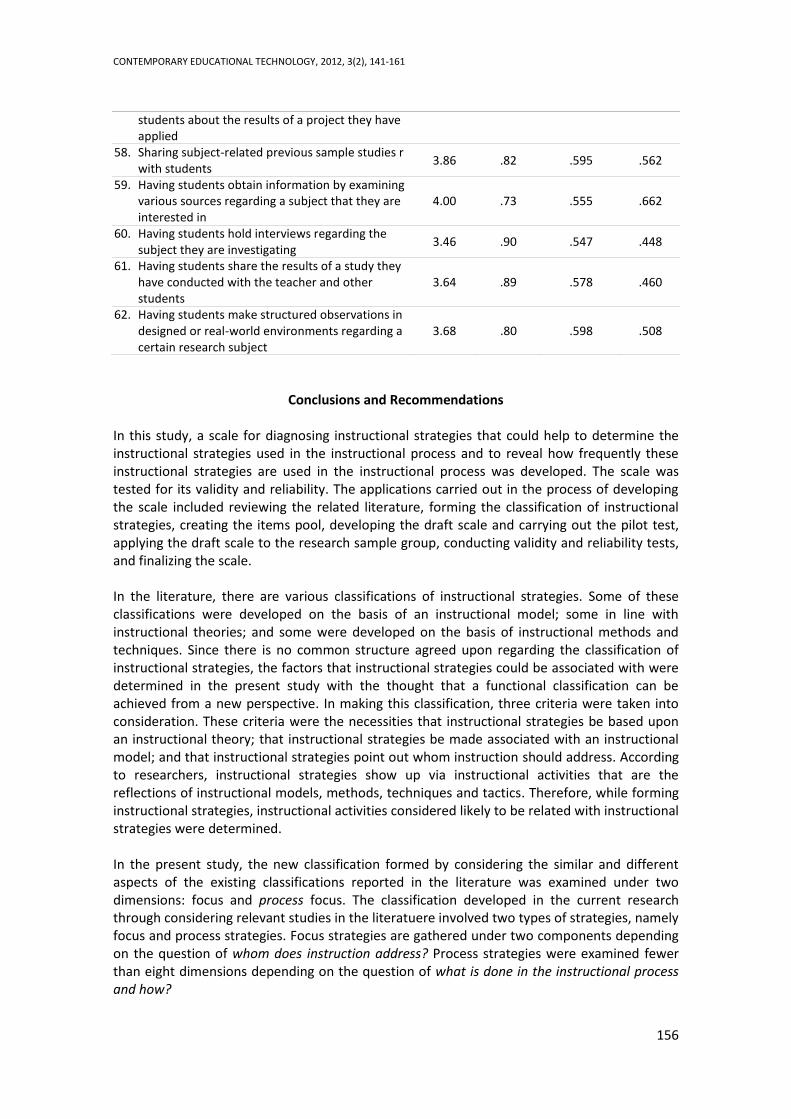
57. Having students inform the teacher and other 3.88 .80 .631 .507
CONTEMPORARY EDUCATIONAL TECHNOLOGY, 2012, 3(2), 141-161
156
students about the results of a project they have applied
58. Sharing subject-related previous sample studies r with students
3.86 .82 .595 .562
59. Having students obtain information by examining various sources regarding a subject that they are interested in
4.00 .73 .555 .662
60. Having students hold interviews regarding the subject they are investigating
3.46 .90 .547 .448
61. Having students share the results of a study they have conducted with the teacher and other students
3.64 .89 .578 .460
62. Having students make structured observations in designed or real-world environments regarding a certain research subject
3.68 .80 .598 .508
Conclusions and Recommendations In this study, a scale for diagnosing instructional strategies that could help to determine the instructional strategies used in the instructional process and to reveal how frequently these instructional strategies are used in the instructional process was developed. The scale was tested for its validity and reliability. The applications carried out in the process of developing the scale included reviewing the related literature, forming the classification of instructional strategies, creating the items pool, developing the draft scale and carrying out the pilot test, applying the draft scale to the research sample group, conducting validity and reliability tests, and finalizing the scale. In the literature, there are various classifications of instructional strategies. Some of these classifications were developed on the basis of an instructional model; some in line with instructional theories; and some were developed on the basis of instructional methods and techniques. Since there is no common structure agreed upon regarding the classification of instructional strategies, the factors that instructional strategies could be associated with were determined in the present study with the thought that a functional classification can be achieved from a new perspective. In making this classification, three criteria were taken into consideration. These criteria were the necessities that instructional strategies be based upon an instructional theory; that instructional strategies be made associated with an instructional model; and that instructional strategies point out whom instruction should address. According to researchers, instructional strategies show up via instructional activities that are the reflections of instructional models, methods, techniques and tactics. Therefore, while forming instructional strategies, instructional activities considered likely to be related with instructional strategies were determined. In the present study, the new classification formed by considering the similar and different aspects of the existing classifications reported in the literature was examined under two dimensions: focus and process focus. The classification developed in the current research through considering relevant studies in the literatuere involved two types of strategies, namely focus and process strategies. Focus strategies are gathered under two components depending on the question of whom does instruction address? Process strategies were examined fewer than eight dimensions depending on the question of what is done in the instructional process and how?

CONTEMPORARY EDUCATIONAL TECHNOLOGY, 2012, 3(2), 141-161
157
The five-point Likert-type draft scale structured in line with this classification was applied to a research sample of 614 participants. Following this, the scale was tested for its validity and reliability. The internal consistency coefficient calculated to determine the reliability of the scale was found α=.964. Considering the number of the items in the scale, this value could be regarded as considerably high. Therefore, it could be stated that the items in the scale were highly consistent with one another and were not overlapping each other. In order to determine the content validity of the scale, the interviews held with field experts and their views were taken as a basis. Depending on the field experts’ views, it could be stated that the scale developed was appropriate for measurement goals. The factor analysis conducted to test the construct validity of the scale helped determine how many dimensions the scale included and what components constituted these dimensions. In order to determine the number of the factors in the scale, the principle components method was applied. In this way, the overlapping items and those with item load values lower than .30 were excluded from the scale. Following this procedure, for the purpose of determining with which factor each item in the scale was associated, the orthogonal rotation analysis was conducted on the data with the Varimax technique. As a result of the analyses, the scale was found to include two sub-scales. These sub-scales were called the focus strategies scale and the process strategies scale. It was also revealed that focus strategies included two factors and that the process strategies included eight factors. Thus, the whole scale had a 10-factor structure. The focus strategies consisted of 14 items, and the process strategies included 48 items. Thus, it was found out that the whole scale was made up of 62 items in total. When the items in the scale were examined, it was seen that the items gathering under the same factor had common features. The items gathered under the first factor included activities in which the instructor was more effective. The items under the second factor were related to learner-oriented/learner-focused instructional activities. The items under the third factor included both activities that helped find solutions to a problem and activities that allowed explaining a situation with the help of sample events. The items gathering under the fourth factor consisted of activities which allowed doing evidence-based discussions and applying the brainstorming technique as well as those which allowed learners to interrogate each other’s views. The items related to activities of role playing, simulation and modeling were gathered under the fifth factor. The items referring to high-level thinking skills were gathered under the sixth factor. The seventh factor included items regarding the activities for the presentation of information by using of various instructional materials. Under the eighth factor were the items including activities related to both directing questions that required preparation and providing appropriate answers. The ninth factor consisted of items regarding activities of taking notes, summarizing and writing. Activities related to research and project works were gathered under the tenth factor. Based on the distribution of the activity items to the factors in that way, it was considered appropriate to name the first factor as instructor-focused instructional strategies, the second as learner-focused instructional strategies, the third as problem solving-sample event, the fourth as discussion-brainstorming, the fifth as modeling/simulation/role taking, the sixth as thinking/interrogating/interpreting, the seventh as presentation, the eighth as question-answer, the ninth as writing-note taking-summarizing and the tenth as research-project. When the item loads of the items in the scale were examined as a result of the analyses conducted, it was seen that a majority of the items had good and very good qualities. The
CONTEMPORARY EDUCATIONAL TECHNOLOGY, 2012, 3(2), 141-161
158
factor loads of the items in the scale ranged between .816 (highest) and .406 (lowest). According to Tabachnick & Fidell (2001), as a basic rule, the load value of each variable is to be considered as .32 or over. Comrey and Lee (1992) report that loadings of .71 or over will explain almost 50% of the variance and could be considered as “perfect”; loadings of .63 or over (40% of the variance) as “very good”; loadings of .55 or over (30% of the variance) as “good”; loadings of .45 or over (20% of the variance) as “average”; and loadings of .32 or over (10% of the variance) could be considered as “weak” (Cokluk, Sekercioglu & Buyukozturk, 2010). This scale was found to include 6 perfect items with loadings of .71 or over; 23 very good items with loadings of .63 or over; 12 good items with loadings of .55 or over; 17 average items with loadings of .44 or over; and 4 items with loadings of .32 or over. Thus, a majority of the items in the scale (41 items) could be said to be “good” and “very good”. This could be considered as an indicator of the fact that the 62 items could be included in the scale. The classification formed in the present study divided instructional strategies into two groups. Focus strategies were developed based on whom instructional strategies addressed (who is found in the center of the instructional process), and process strategies were developed on the basis of how the instruction was conducted. Researchers report that instructional activities take either the learner or the instructor into the center and are carried out accordingly. Therefore, the focus of instruction is on the instructor or on the learner. The way of instruction depends on the activities carried out in the instructional process. Thus, the activities carried out in the instructional process were gathered in eight groups, and the classification of process strategies was formed. When the related literature is examined, it is seen that there are various measurement tools developed to determine the instructional strategies. These tools include “Scale for determining brain-based instructional strategies”, “Scale for motivating instructional design strategies”, “Scale for student/teacher-centered teaching strategies”, “Scale for web-based instructional strategies” and other similar scales (Babadogan, 1996; Bazan, 2007; Henry, 2003; Huang 2006; Marzano, 2001; O’Brien, 2005; Saskatchewan Education Department, 1991). It is considered necessary to compare these scales with the instructional strategies scale developed in the present study with respect to the results and features of the scale. For this purpose, the measurement scales developed by Henry (2003) and Bazan (2007) were compared with the instructional strategies scale developed in the present study. Some of the relevant results are presented below. The scale developed by Henry (2003) to determine the constructivist instructional strategies used by teachers included two major dimensions: traditional instructional strategies and constructivist instructional strategies. The scale considers instructional strategies in three phases such as class management, instructional process, and evaluation. The instructional process sub-dimension of the scale included a total of 50 items, 25 of which were traditional and the rest of which constructivist. The internal consistency coefficients for the traditional instructional strategies group were calculated as α=.65 for teacher authority, as α=.73 for teacher control and as α=.63 for teacher presentation; and the internal consistency coefficients for the constructivist instructional strategies group were calculated as α=.77 for student participation and as α=.74 for student control. As a result of the exploratory factor analysis conducted for construct validity, it was found that in the instructional process sub-dimension, the items were gathered under 5 factors. This result is consistent with the anticipations of the study. Thus, the overlapping items (12 items) and those with item loads lower than .40 (9 items) were excluded from the final scale.

CONTEMPORARY EDUCATIONAL TECHNOLOGY, 2012, 3(2), 141-161
159
The scale developed by Bazan (2007) to determine the instructional strategies used by music teachers (the initial form of the scale was developed by Gumm, 1992) was made up of three dimensions: student-oriented instruction, teacher-oriented instruction, and strategies excluding instructional design. The scale was formed by developing items from a total of 237 statements regarding instructional skills. Following several pre-tests, the number of the items was decreased to 134. Following this, the number of the items was decreased to 80 as a result of the validity tests. The internal consistency coefficient calculated for the whole scale was found α=.80. The construct validity tests revealed that the factor load values for the 8 sub-dimensions under the 3 dimensions of the scale ranged between .296 and .768. As a result of the exploratory factor analysis, the finalized scale was made up of 57 items. The scale for determining instructional strategies developed in the present study covered instructional strategies under two main dimensions including ten sub-dimensions. The scale was made up of 62 items. Initially, before the application of the 291-item draft scale to the research sample, 4 different sequential preliminary applications were carried out. The internal consistency coefficient calculated for the whole 70-item scale applied to the research sample group was found α=.96. The exploratory factor analysis conducted for the construct validity revealed that the item load values ranged between .406 and .816. As a result of the analyses, the overlapping items and those with item load values lower than .40 (8 items) were excluded from the scale, and the finalized scale included 62 items. The values obtained via the internal consistency and construct validity tests demonstrated that the scale was a valid and reliable tool to be used for determining instructional strategies. The present study tried to determine under how many dimensions instructional strategies are gathered and which components instructional strategies are made of. For similar studies, various suggestions could be offered: the relationship of instructional strategies with learning strategies could be emphasized; studies could be conducted to identify the relationships between teachers’’ personal traits and the instructional strategies they use; and studies could be carried out to associate the instructional strategies used by teachers with their personal traits. In this way, such studies could reveal important clues to act as a guide in in-service trainings for teachers. The basic thought considered important in scale development studies is that it is necessary to test the internal reliability of the scale, interrater reliability, the content validity, and construct validity. It is also necessary to maintain objectivity during the development process of the scale and to follow standard processes. The scale developed in the present study is expected to help researchers in their studies for increasing the quality of the instructional process.
References
Akbulut, Y. (2010). Sosyal bilimlerde SPSS uygulamalari [SPSS applications in social sciences]. İstanbul: İdeal.
Aljabber, J.M. (2004). Attitudes of Saudi Arabian secondary preservice teachers toward teaching practices in science: The adequacy of preaparation to use teaching strategies in classrooms. (Unpublished doctoral dissertation). Bloomington, IN: Indiana University Graduate School of Education.
CONTEMPORARY EDUCATIONAL TECHNOLOGY, 2012, 3(2), 141-161
160
Babadogan, C. (1996). Modern ogretim stratejilerinin ogretim–ogrenim sureclerine yansimasi. [Reflection of modern teaching strategies, teaching-learning processes]. (Unpublished doctoral dissertation). Ankara: Ankara Universitesi Sosyal Bilimler Enstitusu.
Baker, R. M. & Dwyer, F. (2005). Effects of instructional strategies and individual differences: a meta-analytic assessment. International Journal of Instructional Media, 32(1), 69-84.
Bazan, D. E. (2007). Teaching and learning strategies used by student-directed teachers of middle school band (Unpublished doctoral dissertation). Cleveland, OH: Case Western Reserve University.
Canady, R. L. & Retting, M. D. (1996). Teaching in the block: Strategies for engaging active learners. Princeton, NJ: Eye on Education.
Clarck, L. H. & Starr, I. (1968). Secondary school teaching method (3nd edition). New York: Collier-McMillan Lt.
Comrey, A. L. & Lee, H. B. (1992). A first course in factor analysis. Hillsdale, NJ: Erlbaum.
Cokluk, O., Sekercioglu, G. & Buyukozturk, S. (2010). Sosyal bilimler icin cok degiskenli istatistik: SPSS ve lisrel uygulamalari. [Multivariate statistics for social sciences: SPSS and Lisrel applications]. Ankara: Pegem Akademi.
Henry, B. B. (2003). Frequency of use of constructivist teaching strategies: Effect on academic performance, student social behavior and relationship to class size (Unpublished doctoral dissertation). Orlando, FL: University of Central Florida.
Huang, H. Y. (2006). Brain-based teaching strategies used to teach English as a foreign language (EFL) in Taiwan high schools, colleges, and universities (Unpublished doctoral dissertation). Louisville, KY: Spalding University.
Jeck, D. C. (2010). The relationship between levels of teacher efficacy and variability in instructional strategies (Unpublished doctoral dissertation). Alexandria, VA: University of Virginia.
Joyce, B. & Marsha, W. (2000). Models of teaching (6th edition). Boston: Allyn and Bacon.
Kalayci, S. (2005). Faktor Analizi. SPSS uygulamali cok degiskenli istatistik teknikleri. [Factor analysis: Applied multivariate statistical techniques in SPSS]. Ankara: Asil.
Karasar, N. (2005). Bilimsel arastırma yontemi. [Scientific method of research]. Ankara: Nobel.
Kline, P. (1995). An easy guide to factor analysis. London: Routledge.
Kline, R. B. (2005). Principles and practice of structural equation modeling (2nd edition). New York: Guilford.
Marzano, R. J. (2003). What works in schools: Translating research into action. Alexandria, VA: ASCD
Marzano, R. J., Pickering, D. J. & Pollock, E. J. (2001). Classroom instruction that works. Alexandria, VA: ASCD.
Miller, M. & Veatch, N. (2010). Teaching literacy in context: choosing and using instructional strategies. The Reading Teacher, 64(3), 154-165.
Moore, K.D. (2000). Classroom teaching skills (5th edition). New York: McGraw Hill.
CONTEMPORARY EDUCATIONAL TECHNOLOGY, 2012, 3(2), 141-161
161
O'Brien, M. (2005). Block Scheduling: A study of teaching strategies found in one public high school in south central Pennsylvania (Unpublished doctoral dissertation). Pennsylvania: Immaculata University.
Oakleaf, M. & Vanscoy, A. (2010). Instructional strategies for digital reference: methods to facilitate student learning. Reference & User Services Quarterly, 49(4), 380-390.
Ray, J. B. (2005). Examination of web-based teaching strategies at the University of North Texas. Texas: University of North Texas.
Richardson, V.E. (2001). Handbook of research on teaching (4th edition). New York: Macmillan.
Saskatchewan Education Department. (1985). Toward the year 2000: Future directions in curriculum and instruction. Regina, SK: Saskatchewan Education Department.
Saskatchewan Education Department. (1991). Instructional approaches: A framework for professional practice. Regina, SK: Saskatchewan Education Department.
Shulman, L. (1987). Knowledge and teaching: Foundations of the new reform. Harvard Educational Review, 57(1), 1-22.
Silver, H. F., Hanson, J. R., Strong, R. W. & Schwartz, P. B. (1996). Teaching styles and strategies (3rd edition). Woodbridge, NJ: Thoughtful Education Press.
Simsek, A. (2011). Ogretim Tasarımı. [Instructional design]. Ankara: Nobel.
Tabachnick, B.G. & Fidell, L.S. (2001). Using multivariate statistics (4th edition). Boston, MA: Allyn & Bacon.
Tavsancil, E. (2005). Tutumlarin olculmesi ve SPSS ile veri analizi. [Measurement of attitudes and data analysis with SPSS]. Ankara: Nobel.
Williams, A. (2011). Teachers' implementation of instructional strategies: frequencies, views on importance, inhibiting factors and relationship to student achievement (Unpublished doctoral dissertation). Arizona: Northcentral University
Correspondence: Bahadir Eristi, Assistant Professor, Department of Educational Sciences, Faculty of Education, Anadolu University, Yunus Emre Campus, Eskisehir, Turkey.