A Meta-Analysis of the Existing Knowledge of Immunoreactivity against Hepatitis C Virus (HCV
12
A Meta-Analysis of the Existing Knowledge of Immunoreactivity against Hepatitis C Virus (HCV) Yohan Kim 1 , Kerrie Vaughan 1 *, Jason Greenbaum 1 , Bjoern Peters 1 , Mansun Law 2 , Alessandro Sette 1 1 The Immune Epitope Database (IEDB), La Jolla Institute for Allergy and Immunology, La Jolla, California, United States of America, 2 Department of Immunology and Microbial Science, The Scripps Research Institute, La Jolla, California, United States of America Abstract Approximately 3% of the world population is infected by HCV, which represents a major global health challenge. Almost 400 different scientific reports present immunological data related to T cell and antibody epitopes derived from HCV literature. Analysis of all HCV-related epitope hosted in the Immune Epitope Database (IEDB), a repository of freely accessible immune epitope data, revealed more than 1500 and 1900 distinct T cell and antibody epitopes, respectively. The inventory of all data revealed specific trends in terms of the host and the HCV genotypes from which sequences were derived. Upon further analysis we found that this large number of epitopes reflects overlapping structures, and homologous sequences derived from different HCV isolates. To access and visualize this information we developed a novel strategy that assembles large sets of epitope data, maps them onto reference genomes and displays the frequency of positive responses. Compilation of the HCV immune reactivity from hundreds of different studies, revealed a complex and thorough picture of HCV immune epitope data to date. The results pinpoint areas of more intense reactivity or research activities at the level of antibody, CD4 and CD8 responses for each of the individual HCV proteins. In general, the areas targeted by the different effector immune functions were distinct and antibody reactivity was positively correlated with hydrophilicity, while T cell reactivity correlated with hydrophobicity. At the sequence level, epitopes frequently recognized by both T cell and B cell correlated with low variability, and our analysis thus highlighted areas of potential interest for practical applications. The human reactivity was further analyzed to pinpoint differential patterns of reactivity associated with acute versus chronic infection, to reveal the apparent impact of glycosylation on T cell, but not antibody responses, and to highlight a paucity of studies involved antibody epitopes associated with virus neutralization. Citation: Kim Y, Vaughan K, Greenbaum J, Peters B, Law M, et al. (2012) A Meta-Analysis of the Existing Knowledge of Immunoreactivity against Hepatitis C Virus (HCV). PLoS ONE 7(5): e38028. doi:10.1371/journal.pone.0038028 Editor: Eui-Cheol Shin, KAIST, Graduate School of Medical Science & Engineering, Republic of Korea Received March 7, 2012; Accepted April 29, 2012; Published May 31, 2012 Copyright: ß 2012 Kim et al. This is an open-access article distributed under the terms of the Creative Commons Attribution License, which permits unrestricted use, distribution, and reproduction in any medium, provided the original author and source are credited. Funding: The La Jolla Institute of Allergy and Immunology is supported by the National Institutes of Health National Institute of Allergy and Infectious Diseases, contract number HHSN26620040006C, under the Immune Epitope Database and Analysis Program. The funders had no role in study design, data collection and analysis, decision to publish, or preparation of the manuscript. Competing Interests: The authors have declared that no competing interests exist. * E-mail: [email protected] Introduction With an estimated 130 to 170 million infections reported worldwide (,3% of the world population), hepatitis C virus (HCV) represents a major global health challenge [1]. Accordingly, HCV immune reactivity has been the focus of intense investigation, to guide the efforts aimed at the development of an HCV vaccine, to probe HCV associated immunopathology, and as a tool to evaluate different vaccine candidates. As a result, a large amount of immunological data currently exists in the HCV literature, and a significant portion of this includes studies defining T cell and antibody epitopes. The Immune Epitope Database and Analysis Resource (IEDB) provides the scientific community with a repository of freely accessible immune epitope data (www.immuneepitope.org). It contains data curated from published literature, and data submitted by NIAID’s high-throughput epitope discovery projects, relating to antibody and T cell data for human, non-human primate, and rodent hosts, as well as a number of other animal species, and encompasses epitopes associated with all infectious diseases, autoimmunity, transplantation and allergy. Thus, the IEDB provides a unique resource to inventory and analyze immunological data for a given pathogen or disease. To date, we have performed a number of such meta-analyses of different human infectious agents, including influenza A, M. tuberculosis, Anthrax and Botulinum toxins, Plasmodium parasites and flaviviruses [2–6]. These analyses provide an overview of the current state of immunological data for a respective disease and highlight specific trends and identify areas in need of further experimentation. Furthermore, these meta-analyses are also meant to increase awareness of the information contained in the IEDB and solicit feedback to further improve the IEDB’s usefulness. In approaching a meta-analysis of HCV-related epitope data we were challenged by the large amount of data available. Since over 3,000 different epitopes, corresponding to largely overlapping or closely related homologous structures have been described, we developed a novel approach whereby immunoreactivity is assessed by mapping epitopes onto reference genomes and calculating aggregate frequency of positive responses. The compilation and visualization of the HCV immune reactivity from nearly 400 different studies, painted an unprece- dented and exhaustive picture of the efforts of the scientific community. The results provide a wealth of information inven- toried for the scientific community, and revealed general features PLoS ONE | www.plosone.org 1 May 2012 | Volume 7 | Issue 5 | e38028
-
Upload
independent -
Category
Documents
-
view
1 -
download
0
Transcript of A Meta-Analysis of the Existing Knowledge of Immunoreactivity against Hepatitis C Virus (HCV
A Meta-Analysis of the Existing Knowledge ofImmunoreactivity against Hepatitis C Virus (HCV)Yohan Kim1, Kerrie Vaughan1*, Jason Greenbaum1, Bjoern Peters1, Mansun Law2, Alessandro Sette1
1 The Immune Epitope Database (IEDB), La Jolla Institute for Allergy and Immunology, La Jolla, California, United States of America, 2 Department of Immunology and
Microbial Science, The Scripps Research Institute, La Jolla, California, United States of America
Abstract
Approximately 3% of the world population is infected by HCV, which represents a major global health challenge. Almost400 different scientific reports present immunological data related to T cell and antibody epitopes derived from HCVliterature. Analysis of all HCV-related epitope hosted in the Immune Epitope Database (IEDB), a repository of freelyaccessible immune epitope data, revealed more than 1500 and 1900 distinct T cell and antibody epitopes, respectively. Theinventory of all data revealed specific trends in terms of the host and the HCV genotypes from which sequences werederived. Upon further analysis we found that this large number of epitopes reflects overlapping structures, and homologoussequences derived from different HCV isolates. To access and visualize this information we developed a novel strategy thatassembles large sets of epitope data, maps them onto reference genomes and displays the frequency of positive responses.Compilation of the HCV immune reactivity from hundreds of different studies, revealed a complex and thorough picture ofHCV immune epitope data to date. The results pinpoint areas of more intense reactivity or research activities at the level ofantibody, CD4 and CD8 responses for each of the individual HCV proteins. In general, the areas targeted by the differenteffector immune functions were distinct and antibody reactivity was positively correlated with hydrophilicity, while T cellreactivity correlated with hydrophobicity. At the sequence level, epitopes frequently recognized by both T cell and B cellcorrelated with low variability, and our analysis thus highlighted areas of potential interest for practical applications. Thehuman reactivity was further analyzed to pinpoint differential patterns of reactivity associated with acute versus chronicinfection, to reveal the apparent impact of glycosylation on T cell, but not antibody responses, and to highlight a paucity ofstudies involved antibody epitopes associated with virus neutralization.
Citation: Kim Y, Vaughan K, Greenbaum J, Peters B, Law M, et al. (2012) A Meta-Analysis of the Existing Knowledge of Immunoreactivity against Hepatitis C Virus(HCV). PLoS ONE 7(5): e38028. doi:10.1371/journal.pone.0038028
Editor: Eui-Cheol Shin, KAIST, Graduate School of Medical Science & Engineering, Republic of Korea
Received March 7, 2012; Accepted April 29, 2012; Published May 31, 2012
Copyright: � 2012 Kim et al. This is an open-access article distributed under the terms of the Creative Commons Attribution License, which permits unrestricteduse, distribution, and reproduction in any medium, provided the original author and source are credited.
Funding: The La Jolla Institute of Allergy and Immunology is supported by the National Institutes of Health National Institute of Allergy and Infectious Diseases,contract number HHSN26620040006C, under the Immune Epitope Database and Analysis Program. The funders had no role in study design, data collection andanalysis, decision to publish, or preparation of the manuscript.
Competing Interests: The authors have declared that no competing interests exist.
* E-mail: [email protected]
Introduction
With an estimated 130 to 170 million infections reported
worldwide (,3% of the world population), hepatitis C virus (HCV)
represents a major global health challenge [1]. Accordingly, HCV
immune reactivity has been the focus of intense investigation, to
guide the efforts aimed at the development of an HCV vaccine, to
probe HCV associated immunopathology, and as a tool to
evaluate different vaccine candidates. As a result, a large amount
of immunological data currently exists in the HCV literature, and
a significant portion of this includes studies defining T cell and
antibody epitopes.
The Immune Epitope Database and Analysis Resource (IEDB)
provides the scientific community with a repository of freely
accessible immune epitope data (www.immuneepitope.org). It
contains data curated from published literature, and data
submitted by NIAID’s high-throughput epitope discovery projects,
relating to antibody and T cell data for human, non-human
primate, and rodent hosts, as well as a number of other animal
species, and encompasses epitopes associated with all infectious
diseases, autoimmunity, transplantation and allergy. Thus, the
IEDB provides a unique resource to inventory and analyze
immunological data for a given pathogen or disease. To date, we
have performed a number of such meta-analyses of different
human infectious agents, including influenza A, M. tuberculosis,
Anthrax and Botulinum toxins, Plasmodium parasites and
flaviviruses [2–6]. These analyses provide an overview of the
current state of immunological data for a respective disease and
highlight specific trends and identify areas in need of further
experimentation. Furthermore, these meta-analyses are also meant
to increase awareness of the information contained in the IEDB
and solicit feedback to further improve the IEDB’s usefulness.
In approaching a meta-analysis of HCV-related epitope data we
were challenged by the large amount of data available. Since over
3,000 different epitopes, corresponding to largely overlapping or
closely related homologous structures have been described, we
developed a novel approach whereby immunoreactivity is assessed
by mapping epitopes onto reference genomes and calculating
aggregate frequency of positive responses.
The compilation and visualization of the HCV immune
reactivity from nearly 400 different studies, painted an unprece-
dented and exhaustive picture of the efforts of the scientific
community. The results provide a wealth of information inven-
toried for the scientific community, and revealed general features
PLoS ONE | www.plosone.org 1 May 2012 | Volume 7 | Issue 5 | e38028
of HCV immune responses. At the same time the analysis
identified specific knowledge gaps that represent areas for further
study.
Methods
Targeted Data and QueryThe complete epitope dataset was retrieved in January 2012 by
performing queries from the IEDB homepage search interface
(http://iedb.org) by specifying ‘‘HCV’’ as source organism and
selecting the ‘‘T cell response’’ and ‘‘B cell response’’ choices
offered in the IEDB webpage as Immune recognition context.
MHC binding and MHC ligand elution data was excluded. This
query will retrieve all available data in the IEDB for antibody and
T cell epitopes associated with hepatitis C virus (all genotypes,
subtypes and isolates) in human and nonhuman (animal models)
hosts. The IEDB data are derived from the peer-reviewed
literature indexed in PubMed. To be included in the IEDB,
epitopes have to be mapped experimentally to a region of 50
residues or smaller. The IEDB captures epitopes and related data
as defined in the literature and thus includes minimal/optimal
epitopes (8–15 residues), larger less well-defined regions (16–50
residues), and key epitope residues identified as being involved in
binding (1–2 residues). The IEDB curation process takes into
account the fact that some residues may be important for protein
folding instead of binding, and only studies providing controls
addressing this issue are curated in the database. Negative
structures (defined as structures for which only negative data has
been reported) are also captured in the IEDB and have been
included in this analysis. Additional detailed curation criteria can
be found in [7]. Additional queries were performed to select
subsets of HCV data using the ‘‘T cell search’’ and ‘‘B cell search’’
functions from the IEDB website, and specifying additional criteria
to those mentioned above, such as response phenotype, host
organism, HCV genotype or assay type. Results from each query
were exported as Excel files and further analyzed in that format to
generate particular tables and figures.
Computational MethodsEach HCV immune epitope was mapped to a position in the
polyprotein sequence of HCV H77, using a multiple sequence
alignment (MSA) of HCV sequences. The use of a MSA permitted
mapping epitopes that varied considerably from the HCV H77
strain. The MSA consisted of 10 HCV polyproteins; covering
genotypes from 1 to 7 and 3 additional polyproteins from subtypes
1b and 2b to account for large sequence variability within
genotypes 1 and 2 (Table 1). To assign a position to a peptide
epitope, all peptides were mapped to each polyprotein and the best
matching position was kept. Mapping was considered successful if
a match with at least 50% sequence similarity was found. Second,
all peptide matched positions were re-numbered with respect to
the H77 polyprotein based on the MSA. A match was excluded if
it was mapped to a gapped region in the reference sequence. Using
this approach, 98.7% of HCV peptides were mapped onto the
H77 sequence. For T cell peptides, 18 of the total 3,378 peptides
were excluded. For antibody, 63 of the total 3,075 were excluded.
When manually examining the reasons for peptide exclusion, we
found that several were mapped to the core frame shift protein (F
protein), represented consensus sequences for which no natural
source can be identified, or from strains of naturally-infected
subjects for which no sequence has been published to date.
Therefore, we did not attempt to add additional strains to the
MSA to further increase the mapping success rate.
Correlation of response frequency with hydrophilicityand entropy
To measure sequence variability, entropy as a function of
position in the polyprotein was calculated. Higher entropy
indicates greater sequence variability. For the entropy calculation,
a web tool provided by the HCV database at Los Alamos National
Laboratory was used: http://hcv.lanl.gov/content/sequence/
ENTROPY/entropy_one.html. The tool takes an MSA as input,
and the MSA ‘Web alignment 2008’ provided by the HCV
database was used: http://hcv.lanl.gov/content/sequence/
NEWALIGN/align.html. The MSA consists of 471 representative
HCV polyproteins from strains belonging to genotypes 1 to 6.
Hydrophilicity values were calculated, utilizing a tool housed on
the IEDB webpage that utilizes the amino acid scale by Parker et
al. [8] to plot average local hydrophilicity as a function of position.
For this calculation a window size of 15 residues was used.
Results
An inventory of HCV immune epitope data in the IEDBThe IEDB contains data related to all epitopes from infectious
diseases, allergy, autoimmunity and transplantation. As such it also
contains HCV related data, as part of the general database. A
search of the IEDB for HCV epitopes returned a total of 419 peer-
reviewed references, 266 of which were related to T cell data and
174 of which were related to antibody data (Table 2). These
references described a total of 6,202 unique molecular structures
tested for immune reactivity, including structures only associated
with negative data. Of the 3,444 structures associated with positive
assays (from here after referred to as epitopes), 1,573 were
identified in the context of T cell reactivity and 1,973 in the
context of antibody reactivity.
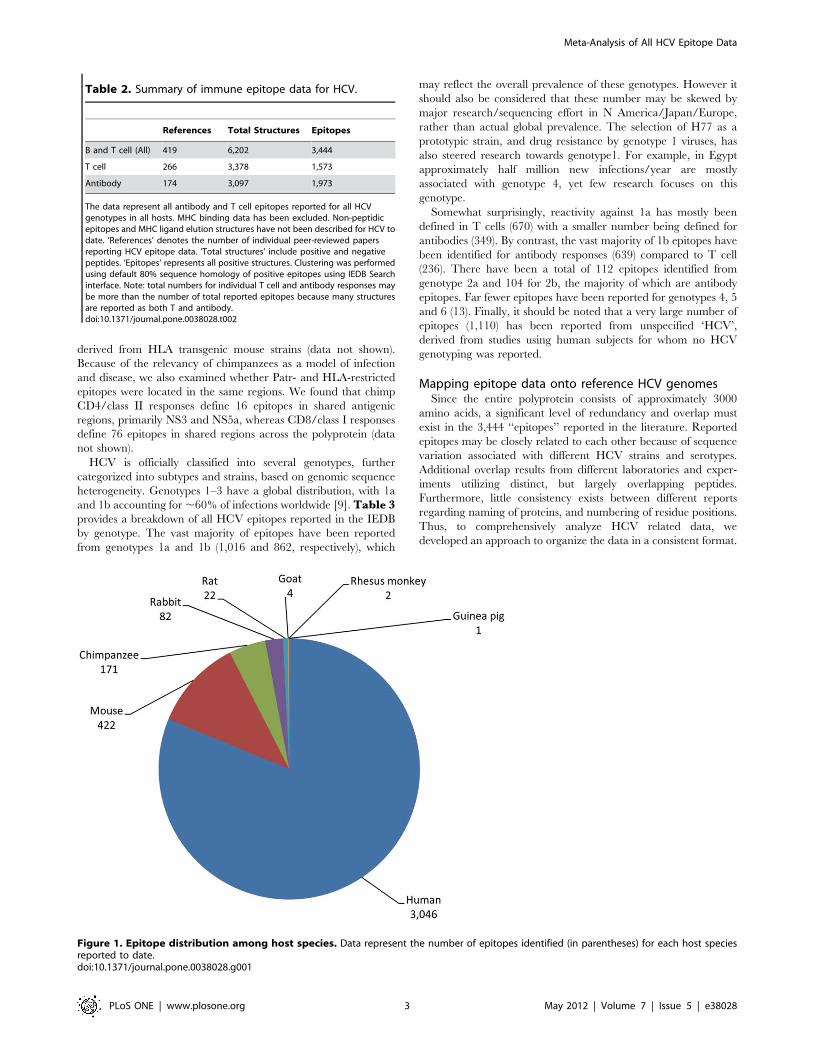
HCV-derived epitopes have been identified in numerous
species, including humans, chimpanzees, rhesus macaques, goats,
guinea pigs, rabbits, rats and mice. Figure 1 represents a
breakdown of the current data with respect to the total number of
epitopes per species. As expected, the vast majority of epitopes has
been defined in human infection (3,046), and mice (422), while
chimpanzees, a genetically relevant and immunologically parallel
host represent only ,5% of the data (171). The large number of
murine epitopes was surprising in light of the fact that mouse is not
a natural host for HCV. However this can be rationalized since
mice are popular for raising mAbs and testing antigen immuno-
genicity. Of the more than 400 epitopes defined in mice, 75 were
Table 1. A list of HCV strains used for mapping peptides topolyproteins.
Genotype Isolate/strain/serogroup NCBI GI
1a H77 22129793
1b China 48237634
1b JT 221615
2a JFH-1 13122262
2b HC-J8 221609
3a Type V-D 633202
4a ED43 2252490
5a EUH1480 2462304
6a 6a33 57791994
7 QC69 124302095
doi:10.1371/journal.pone.0038028.t001
Meta-Analysis of All HCV Epitope Data
PLoS ONE | www.plosone.org 2 May 2012 | Volume 7 | Issue 5 | e38028
derived from HLA transgenic mouse strains (data not shown).
Because of the relevancy of chimpanzees as a model of infection
and disease, we also examined whether Patr- and HLA-restricted
epitopes were located in the same regions. We found that chimp
CD4/class II responses define 16 epitopes in shared antigenic
regions, primarily NS3 and NS5a, whereas CD8/class I responses
define 76 epitopes in shared regions across the polyprotein (data
not shown).
HCV is officially classified into several genotypes, further
categorized into subtypes and strains, based on genomic sequence
heterogeneity. Genotypes 1–3 have a global distribution, with 1a
and 1b accounting for ,60% of infections worldwide [9]. Table 3provides a breakdown of all HCV epitopes reported in the IEDB
by genotype. The vast majority of epitopes have been reported
from genotypes 1a and 1b (1,016 and 862, respectively), which
may reflect the overall prevalence of these genotypes. However it
should also be considered that these number may be skewed by
major research/sequencing effort in N America/Japan/Europe,
rather than actual global prevalence. The selection of H77 as a
prototypic strain, and drug resistance by genotype 1 viruses, has
also steered research towards genotype1. For example, in Egypt
approximately half million new infections/year are mostly
associated with genotype 4, yet few research focuses on this
genotype.
Somewhat surprisingly, reactivity against 1a has mostly been
defined in T cells (670) with a smaller number being defined for
antibodies (349). By contrast, the vast majority of 1b epitopes have
been identified for antibody responses (639) compared to T cell
(236). There have been a total of 112 epitopes identified from
genotype 2a and 104 for 2b, the majority of which are antibody
epitopes. Far fewer epitopes have been reported for genotypes 4, 5
and 6 (13). Finally, it should be noted that a very large number of
epitopes (1,110) has been reported from unspecified ‘HCV’,
derived from studies using human subjects for whom no HCV
genotyping was reported.
Mapping epitope data onto reference HCV genomesSince the entire polyprotein consists of approximately 3000
amino acids, a significant level of redundancy and overlap must
exist in the 3,444 ‘‘epitopes’’ reported in the literature. Reported
epitopes may be closely related to each other because of sequence
variation associated with different HCV strains and serotypes.
Additional overlap results from different laboratories and exper-
iments utilizing distinct, but largely overlapping peptides.
Furthermore, little consistency exists between different reports
regarding naming of proteins, and numbering of residue positions.
Thus, to comprehensively analyze HCV related data, we
developed an approach to organize the data in a consistent format.
Table 2. Summary of immune epitope data for HCV.
References Total Structures Epitopes
B and T cell (All) 419 6,202 3,444
T cell 266 3,378 1,573
Antibody 174 3,097 1,973
The data represent all antibody and T cell epitopes reported for all HCVgenotypes in all hosts. MHC binding data has been excluded. Non-peptidicepitopes and MHC ligand elution structures have not been described for HCV todate. ‘References’ denotes the number of individual peer-reviewed papersreporting HCV epitope data. ‘Total structures’ include positive and negativepeptides. ‘Epitopes’ represents all positive structures. Clustering was performedusing default 80% sequence homology of positive epitopes using IEDB Searchinterface. Note: total numbers for individual T cell and antibody responses maybe more than the number of total reported epitopes because many structuresare reported as both T and antibody.doi:10.1371/journal.pone.0038028.t002
Figure 1. Epitope distribution among host species. Data represent the number of epitopes identified (in parentheses) for each host speciesreported to date.doi:10.1371/journal.pone.0038028.g001
Meta-Analysis of All HCV Epitope Data
PLoS ONE | www.plosone.org 3 May 2012 | Volume 7 | Issue 5 | e38028
For this purpose, all unique molecular structures tested for
immune reactivity and all epitopes were mapped to 10 reference
HCV polyproteins and the best match identified (see methods). A
unique molecular structure is defined by having been tested in at
least one experimental assay in the original report. Using a
multiple sequence alignment of the 10 polyproteins to the
reference strain H77, a starting and ending position for each
epitope in H77 was assigned. This simple operation allowed
organizing and visualizing .98% of different unique molecular
structures tested and reported in the literature.
The results of this process are illustrated in Table 4, where all
structures containing or overlapping with the well-known HLA
class II restricted epitope region NS3 (1248–1261) [10] are shown.
For each structure, the IEDB epitope ID number, the sequence
and the starting and ending positions are tabulated, along with
number of positive assays and the number of total reported assays
is shown. To date, more than 30 different structures have been
reported for this region. As also shown in Table 4, each was tested
in a different number of individuals and associated with different
reported frequencies of positive responses.
Combined Response Frequency scores allowvisualization of epitope data
To identify the most well-studied and frequently recognized
epitopes we derived a ‘‘response frequency score’’, reflecting the
overall frequency of recognition of epitope structures containing a
given residue. A simple approach to measure response frequency
would be to identify the number of individuals positive for a given
epitope. However, this is not desirable. For example, recognition
of a given peptide in 5 out of 100 individuals is quite different from
recognition of a given structure in 5 out of 5 subjects, even though
the absolute number of donors recognizing the two structures is
the same. Conversely, to simply compile frequencies of recognition
is also not desirable. This is because an epitope recognized in 1 out
1 donors tested would be assigned a higher frequency than another
recognized in 99 out of 100 donors tested, even though the latter
data is much more likely to indicate wide recognition in a broad
population.
Table 3. HCV epitope distribution by genotype
Total Positive T cell CD4/Class II CD8/Class I Antibody
HCV genotype unspecified 1,110 570 291 238 623
Genotype 1
subtype unspecified 20 18 0 15 2
1a 1,016 670 267 257 349
1b 862 236 83 140 639
Genotype 2
subtype unspecified 41 1 0 1 40
2a 112 25 1 24 88
2b 104 2 0 2 102
Genotype 3 (all subtypes) 166 40 5 32 128
Genotype4/5/6 (all subtypes) 13 11 2 9 2
The total number of epitopes reported for each genotype is presented. These data are then broken down by response phenotype: all T cell, CD4/class II, CD8/Class I andantibody. All reported genotypes are shown here; not all HCV genotypes have been studied. In some cases, genotypes were reported in the literature as simply‘genotype 1’ or ‘genotype 2’ with no further specification provided. In other cases, no specific genotype was given and the authors simply referred to the epitope’ssource as HCV; it is these records that are presented with the qualifier ‘unspecified.’ For genotypes 3, 4, 5 and 6, data were bulked together (all subtypes), due to thesmall number of epitopes reported for each. The assignment of epitope genotype is made based on the assayed immunogen or antigen when these are indicated in thereference.doi:10.1371/journal.pone.0038028.t003
Table 4. Response frequency data for immunodominantCD4+ T cell epitope NS3 (1248–1261)
Epitope Sequence Position Responders Tested RFscore
AYAAQGYKVLVLNPS 1243–1257 1 10 0.060.10
AYAAQGYKVLVLNPSVAA 1243–1260 12 22 0.39±0.16
YAAKGYKVLVLNPSVAAT 1244–1261 0 1 0.060.00
YAAQGYKVLVLNPSVAAT 1244–1261 0 2 0.060.00
AAQGYKVLVLNPSVA 1245–1259 0 1 0.060.00
AQGYKVLVLNPSVAA 1246–1260 1 1 0.061.00
QGYKVLVLNPSVAAT 1247–1261 1 10 0.060.10
QGYKVLVLNPSVAATLGFGA 1247–1266 1 1 0.061.00
GYKVLVLNPSVAAT 1248–1261 38 54 0.59±0.11
GYKVLVLNPSVAATL 1248–1262 2 2 0.29±0.71
GYKVLVLNPSVAATLGFGAY 1248–1267 1 1 0.061.00
YKVLVLNPSVAATLG 1249–1263 0 1 0.060.00
KVLVLNPSVAATLGF 1250–1264 12 12 0.71±0.29
VLVLNPSVAATLGFG 1251–1265 1 10 0.060.10
VLVLNPSVAATLGFGAYM 1251–1268 2 3 0.2±0.47
VLVLNPSVAATLGFGAYMSK 1251–1270 0 46 0.060.00
VLNPSVAATLGFGAY 1253–1267 0 1 0.060.00
NPSVAATLGFGAYMS 1255–1269 0 10 0.060.00
SVAATLGFGAYMSKA 1257–1271 0 1 0.060.00
VAATLGFGAYMSKAHGID 1258–1275 0 1 0.060.00
VAATLGFGAYMSKAHGVD 1258–1275 2 2 0.29±0.71
AATLGFGAYMSKAHG 1259–1273 0 10 0.060.00
TLGFGAYMSKAHGID 1261–1275 0 1 0.060.00
A larger region was chosen in order to allow for visualization of reactivityupstream and downstream of the known epitope.doi:10.1371/journal.pone.0038028.t004
Meta-Analysis of All HCV Epitope Data
PLoS ONE | www.plosone.org 4 May 2012 | Volume 7 | Issue 5 | e38028
To address these issues we developed a response frequency score
(RFscore) that estimates recognition frequency, conservatively
weighted to factor-in statistical significance. For a given epitope,
the un-weighted response frequency is calculated on the basis of
the number of individuals tested and the number of individuals in
which this test was positive. Recognition of a given epitope in
100% of the cases it was tested will given a frequency of 1.0, and
complete lack of recognition would correspond to a frequency of
0.0. The RFscore is then calculated as (number responded –
number responded0.5)/number tested. The square root is a
correction factor, approximating one standard deviation for the
number of responding donors. This gives a higher score to
epitopes studied with larger sample sizes. For reference, an epitope
positive in 10/10 donors will yield an RFscore of (10–100.5)/
10 = 0.9, and an epitope positive in 100/100 donors tested will
have an RFscore of 0.98. Importantly, this formula can also be
applied to structures that were negative in all assays and donors
tested.
The tabular representation presented in Table 4, organizes the
data in a consistent and more comparable format, but is still
cumbersome, and does not allow for the integration of all
information related to a given epitope/region. To meet this goal,
we noted that the formula and process described above could be
applied not only to individual epitopes, but also to individual
residues. In this case, all epitope structures containing a given
residue are collected, the total numbers of responding donors
summed, and a combined response RFscore is calculated. The
above method plots data accumulated for the recognition of linear
peptides only and therefore is not readily applicable to discontin-
uous antibody epitopes.
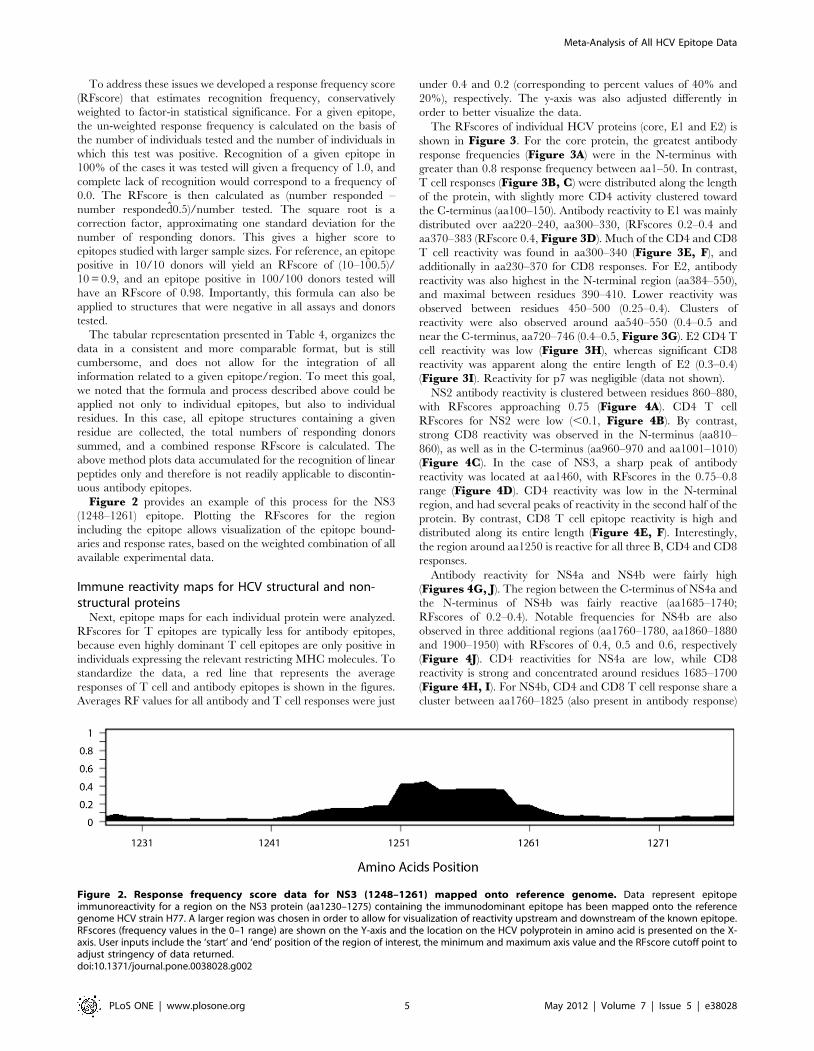
Figure 2 provides an example of this process for the NS3
(1248–1261) epitope. Plotting the RFscores for the region
including the epitope allows visualization of the epitope bound-
aries and response rates, based on the weighted combination of all
available experimental data.
Immune reactivity maps for HCV structural and non-structural proteins
Next, epitope maps for each individual protein were analyzed.
RFscores for T epitopes are typically less for antibody epitopes,
because even highly dominant T cell epitopes are only positive in
individuals expressing the relevant restricting MHC molecules. To
standardize the data, a red line that represents the average
responses of T cell and antibody epitopes is shown in the figures.
Averages RF values for all antibody and T cell responses were just
under 0.4 and 0.2 (corresponding to percent values of 40% and
20%), respectively. The y-axis was also adjusted differently in
order to better visualize the data.
The RFscores of individual HCV proteins (core, E1 and E2) is
shown in Figure 3. For the core protein, the greatest antibody
response frequencies (Figure 3A) were in the N-terminus with
greater than 0.8 response frequency between aa1–50. In contrast,
T cell responses (Figure 3B, C) were distributed along the length
of the protein, with slightly more CD4 activity clustered toward
the C-terminus (aa100–150). Antibody reactivity to E1 was mainly
distributed over aa220–240, aa300–330, (RFscores 0.2–0.4 and
aa370–383 (RFscore 0.4, Figure 3D). Much of the CD4 and CD8
T cell reactivity was found in aa300–340 (Figure 3E, F), and
additionally in aa230–370 for CD8 responses. For E2, antibody
reactivity was also highest in the N-terminal region (aa384–550),
and maximal between residues 390–410. Lower reactivity was
observed between residues 450–500 (0.25–0.4). Clusters of
reactivity were also observed around aa540–550 (0.4–0.5 and
near the C-terminus, aa720–746 (0.4–0.5, Figure 3G). E2 CD4 T
cell reactivity was low (Figure 3H), whereas significant CD8
reactivity was apparent along the entire length of E2 (0.3–0.4)
(Figure 3I). Reactivity for p7 was negligible (data not shown).
NS2 antibody reactivity is clustered between residues 860–880,
with RFscores approaching 0.75 (Figure 4A). CD4 T cell
RFscores for NS2 were low (,0.1, Figure 4B). By contrast,
strong CD8 reactivity was observed in the N-terminus (aa810–
860), as well as in the C-terminus (aa960–970 and aa1001–1010)
(Figure 4C). In the case of NS3, a sharp peak of antibody
reactivity was located at aa1460, with RFscores in the 0.75–0.8
range (Figure 4D). CD4 reactivity was low in the N-terminal
region, and had several peaks of reactivity in the second half of the
protein. By contrast, CD8 T cell epitope reactivity is high and
distributed along its entire length (Figure 4E, F). Interestingly,
the region around aa1250 is reactive for all three B, CD4 and CD8
responses.
Antibody reactivity for NS4a and NS4b were fairly high
(Figures 4G, J). The region between the C-terminus of NS4a and
the N-terminus of NS4b was fairly reactive (aa1685–1740;
RFscores of 0.2–0.4). Notable frequencies for NS4b are also
observed in three additional regions (aa1760–1780, aa1860–1880
and 1900–1950) with RFscores of 0.4, 0.5 and 0.6, respectively
(Figure 4J). CD4 reactivities for NS4a are low, while CD8
reactivity is strong and concentrated around residues 1685–1700
(Figure 4H, I). For NS4b, CD4 and CD8 T cell response share a
cluster between aa1760–1825 (also present in antibody response)
Figure 2. Response frequency score data for NS3 (1248–1261) mapped onto reference genome. Data represent epitopeimmunoreactivity for a region on the NS3 protein (aa1230–1275) containing the immunodominant epitope has been mapped onto the referencegenome HCV strain H77. A larger region was chosen in order to allow for visualization of reactivity upstream and downstream of the known epitope.RFscores (frequency values in the 0–1 range) are shown on the Y-axis and the location on the HCV polyprotein in amino acid is presented on the X-axis. User inputs include the ‘start’ and ‘end’ position of the region of interest, the minimum and maximum axis value and the RFscore cutoff point toadjust stringency of data returned.doi:10.1371/journal.pone.0038028.g002
Meta-Analysis of All HCV Epitope Data
PLoS ONE | www.plosone.org 5 May 2012 | Volume 7 | Issue 5 | e38028
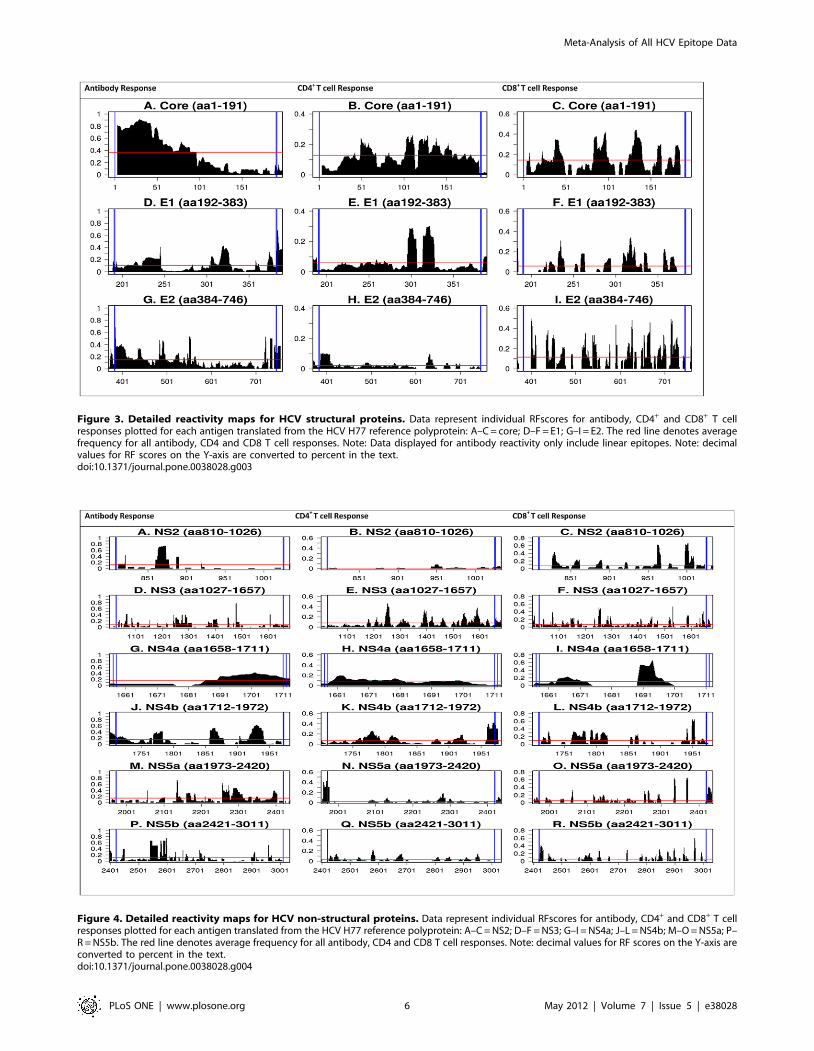
Figure 3. Detailed reactivity maps for HCV structural proteins. Data represent individual RFscores for antibody, CD4+ and CD8+ T cellresponses plotted for each antigen translated from the HCV H77 reference polyprotein: A–C = core; D–F = E1; G–I = E2. The red line denotes averagefrequency for all antibody, CD4 and CD8 T cell responses. Note: Data displayed for antibody reactivity only include linear epitopes. Note: decimalvalues for RF scores on the Y-axis are converted to percent in the text.doi:10.1371/journal.pone.0038028.g003
Figure 4. Detailed reactivity maps for HCV non-structural proteins. Data represent individual RFscores for antibody, CD4+ and CD8+ T cellresponses plotted for each antigen translated from the HCV H77 reference polyprotein: A–C = NS2; D–F = NS3; G–I = NS4a; J–L = NS4b; M–O = NS5a; P–R = NS5b. The red line denotes average frequency for all antibody, CD4 and CD8 T cell responses. Note: decimal values for RF scores on the Y-axis areconverted to percent in the text.doi:10.1371/journal.pone.0038028.g004
Meta-Analysis of All HCV Epitope Data
PLoS ONE | www.plosone.org 6 May 2012 | Volume 7 | Issue 5 | e38028
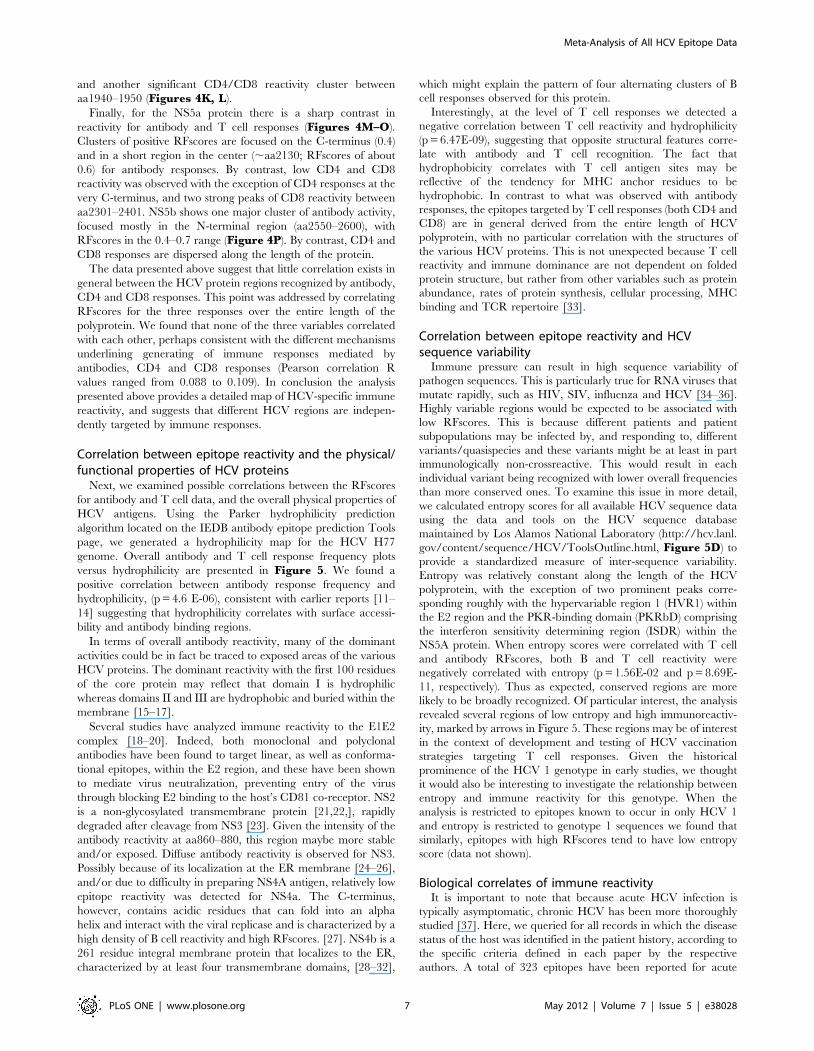
and another significant CD4/CD8 reactivity cluster between
aa1940–1950 (Figures 4K, L).
Finally, for the NS5a protein there is a sharp contrast in
reactivity for antibody and T cell responses (Figures 4M–O).
Clusters of positive RFscores are focused on the C-terminus (0.4)
and in a short region in the center (,aa2130; RFscores of about
0.6) for antibody responses. By contrast, low CD4 and CD8
reactivity was observed with the exception of CD4 responses at the
very C-terminus, and two strong peaks of CD8 reactivity between
aa2301–2401. NS5b shows one major cluster of antibody activity,
focused mostly in the N-terminal region (aa2550–2600), with
RFscores in the 0.4–0.7 range (Figure 4P). By contrast, CD4 and
CD8 responses are dispersed along the length of the protein.
The data presented above suggest that little correlation exists in
general between the HCV protein regions recognized by antibody,
CD4 and CD8 responses. This point was addressed by correlating
RFscores for the three responses over the entire length of the
polyprotein. We found that none of the three variables correlated
with each other, perhaps consistent with the different mechanisms
underlining generating of immune responses mediated by
antibodies, CD4 and CD8 responses (Pearson correlation R
values ranged from 0.088 to 0.109). In conclusion the analysis
presented above provides a detailed map of HCV-specific immune
reactivity, and suggests that different HCV regions are indepen-
dently targeted by immune responses.
Correlation between epitope reactivity and the physical/functional properties of HCV proteins
Next, we examined possible correlations between the RFscores
for antibody and T cell data, and the overall physical properties of
HCV antigens. Using the Parker hydrophilicity prediction
algorithm located on the IEDB antibody epitope prediction Tools
page, we generated a hydrophilicity map for the HCV H77
genome. Overall antibody and T cell response frequency plots
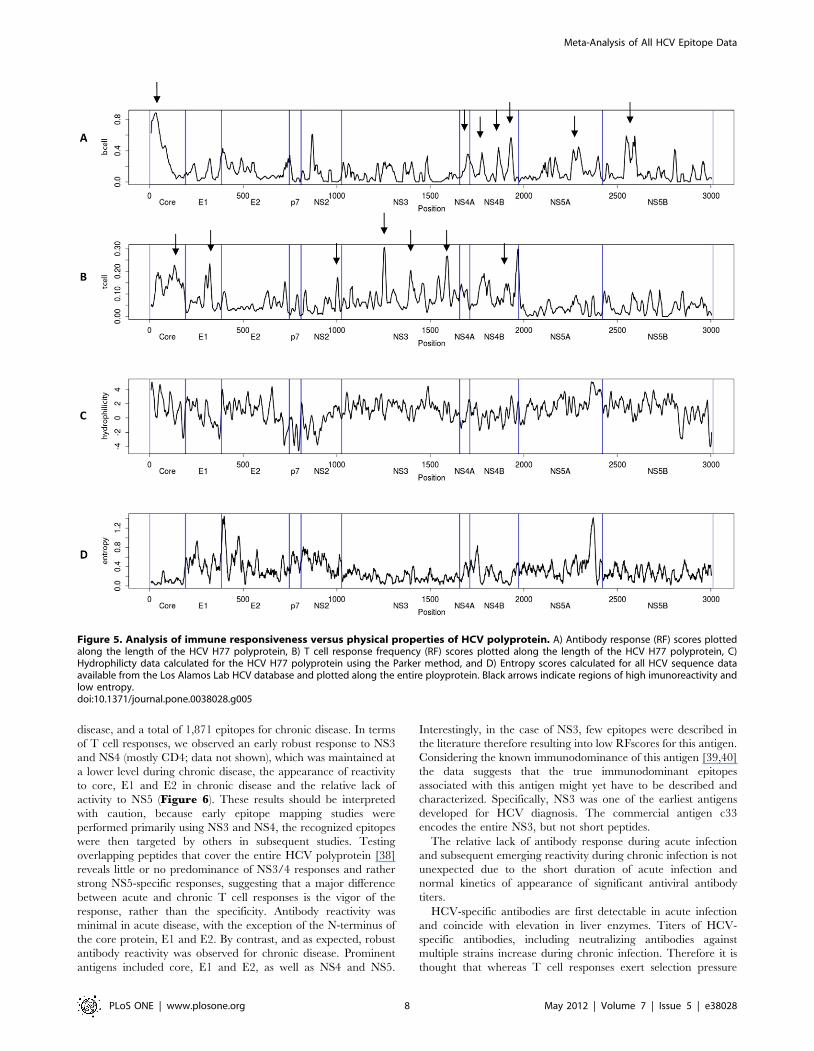
versus hydrophilicity are presented in Figure 5. We found a
positive correlation between antibody response frequency and
hydrophilicity, (p = 4.6 E-06), consistent with earlier reports [11–
14] suggesting that hydrophilicity correlates with surface accessi-
bility and antibody binding regions.
In terms of overall antibody reactivity, many of the dominant
activities could be in fact be traced to exposed areas of the various
HCV proteins. The dominant reactivity with the first 100 residues
of the core protein may reflect that domain I is hydrophilic
whereas domains II and III are hydrophobic and buried within the
membrane [15–17].
Several studies have analyzed immune reactivity to the E1E2
complex [18–20]. Indeed, both monoclonal and polyclonal
antibodies have been found to target linear, as well as conforma-
tional epitopes, within the E2 region, and these have been shown
to mediate virus neutralization, preventing entry of the virus
through blocking E2 binding to the host’s CD81 co-receptor. NS2
is a non-glycosylated transmembrane protein [21,22,], rapidly
degraded after cleavage from NS3 [23]. Given the intensity of the
antibody reactivity at aa860–880, this region maybe more stable
and/or exposed. Diffuse antibody reactivity is observed for NS3.
Possibly because of its localization at the ER membrane [24–26],
and/or due to difficulty in preparing NS4A antigen, relatively low
epitope reactivity was detected for NS4a. The C-terminus,
however, contains acidic residues that can fold into an alpha
helix and interact with the viral replicase and is characterized by a
high density of B cell reactivity and high RFscores. [27]. NS4b is a
261 residue integral membrane protein that localizes to the ER,
characterized by at least four transmembrane domains, [28–32],
which might explain the pattern of four alternating clusters of B
cell responses observed for this protein.
Interestingly, at the level of T cell responses we detected a
negative correlation between T cell reactivity and hydrophilicity
(p = 6.47E-09), suggesting that opposite structural features corre-
late with antibody and T cell recognition. The fact that
hydrophobicity correlates with T cell antigen sites may be
reflective of the tendency for MHC anchor residues to be
hydrophobic. In contrast to what was observed with antibody
responses, the epitopes targeted by T cell responses (both CD4 and
CD8) are in general derived from the entire length of HCV
polyprotein, with no particular correlation with the structures of
the various HCV proteins. This is not unexpected because T cell
reactivity and immune dominance are not dependent on folded
protein structure, but rather from other variables such as protein
abundance, rates of protein synthesis, cellular processing, MHC
binding and TCR repertoire [33].
Correlation between epitope reactivity and HCVsequence variability
Immune pressure can result in high sequence variability of
pathogen sequences. This is particularly true for RNA viruses that
mutate rapidly, such as HIV, SIV, influenza and HCV [34–36].
Highly variable regions would be expected to be associated with
low RFscores. This is because different patients and patient
subpopulations may be infected by, and responding to, different
variants/quasispecies and these variants might be at least in part
immunologically non-crossreactive. This would result in each
individual variant being recognized with lower overall frequencies
than more conserved ones. To examine this issue in more detail,
we calculated entropy scores for all available HCV sequence data
using the data and tools on the HCV sequence database
maintained by Los Alamos National Laboratory (http://hcv.lanl.
gov/content/sequence/HCV/ToolsOutline.html, Figure 5D) to
provide a standardized measure of inter-sequence variability.
Entropy was relatively constant along the length of the HCV
polyprotein, with the exception of two prominent peaks corre-
sponding roughly with the hypervariable region 1 (HVR1) within
the E2 region and the PKR-binding domain (PKRbD) comprising
the interferon sensitivity determining region (ISDR) within the
NS5A protein. When entropy scores were correlated with T cell
and antibody RFscores, both B and T cell reactivity were
negatively correlated with entropy (p = 1.56E-02 and p = 8.69E-
11, respectively). Thus as expected, conserved regions are more
likely to be broadly recognized. Of particular interest, the analysis
revealed several regions of low entropy and high immunoreactiv-
ity, marked by arrows in Figure 5. These regions may be of interest
in the context of development and testing of HCV vaccination
strategies targeting T cell responses. Given the historical
prominence of the HCV 1 genotype in early studies, we thought
it would also be interesting to investigate the relationship between
entropy and immune reactivity for this genotype. When the
analysis is restricted to epitopes known to occur in only HCV 1
and entropy is restricted to genotype 1 sequences we found that
similarly, epitopes with high RFscores tend to have low entropy
score (data not shown).
Biological correlates of immune reactivityIt is important to note that because acute HCV infection is
typically asymptomatic, chronic HCV has been more thoroughly
studied [37]. Here, we queried for all records in which the disease
status of the host was identified in the patient history, according to
the specific criteria defined in each paper by the respective
authors. A total of 323 epitopes have been reported for acute
Meta-Analysis of All HCV Epitope Data
PLoS ONE | www.plosone.org 7 May 2012 | Volume 7 | Issue 5 | e38028
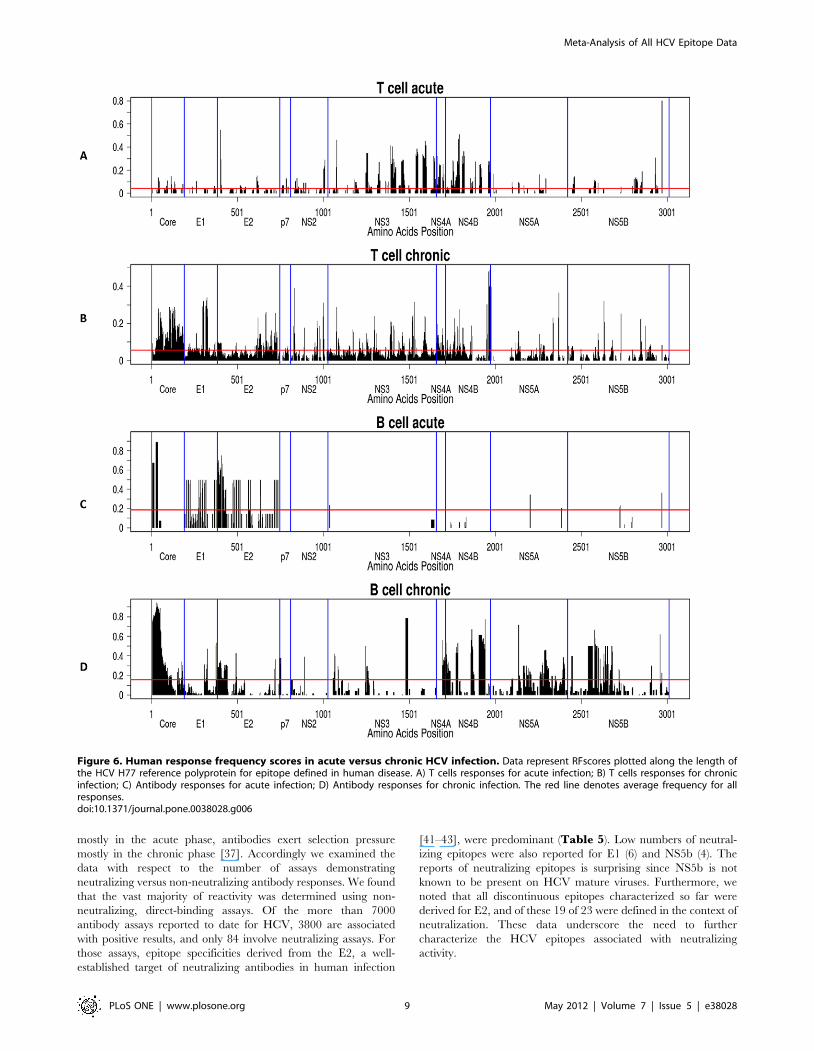
disease, and a total of 1,871 epitopes for chronic disease. In terms
of T cell responses, we observed an early robust response to NS3
and NS4 (mostly CD4; data not shown), which was maintained at
a lower level during chronic disease, the appearance of reactivity
to core, E1 and E2 in chronic disease and the relative lack of
activity to NS5 (Figure 6). These results should be interpreted
with caution, because early epitope mapping studies were
performed primarily using NS3 and NS4, the recognized epitopes
were then targeted by others in subsequent studies. Testing
overlapping peptides that cover the entire HCV polyprotein [38]
reveals little or no predominance of NS3/4 responses and rather
strong NS5-specific responses, suggesting that a major difference
between acute and chronic T cell responses is the vigor of the
response, rather than the specificity. Antibody reactivity was
minimal in acute disease, with the exception of the N-terminus of
the core protein, E1 and E2. By contrast, and as expected, robust
antibody reactivity was observed for chronic disease. Prominent
antigens included core, E1 and E2, as well as NS4 and NS5.
Interestingly, in the case of NS3, few epitopes were described in
the literature therefore resulting into low RFscores for this antigen.
Considering the known immunodominance of this antigen [39,40]
the data suggests that the true immunodominant epitopes
associated with this antigen might yet have to be described and
characterized. Specifically, NS3 was one of the earliest antigens
developed for HCV diagnosis. The commercial antigen c33
encodes the entire NS3, but not short peptides.
The relative lack of antibody response during acute infection
and subsequent emerging reactivity during chronic infection is not
unexpected due to the short duration of acute infection and
normal kinetics of appearance of significant antiviral antibody
titers.
HCV-specific antibodies are first detectable in acute infection
and coincide with elevation in liver enzymes. Titers of HCV-
specific antibodies, including neutralizing antibodies against
multiple strains increase during chronic infection. Therefore it is
thought that whereas T cell responses exert selection pressure
Figure 5. Analysis of immune responsiveness versus physical properties of HCV polyprotein. A) Antibody response (RF) scores plottedalong the length of the HCV H77 polyprotein, B) T cell response frequency (RF) scores plotted along the length of the HCV H77 polyprotein, C)Hydrophilicty data calculated for the HCV H77 polyprotein using the Parker method, and D) Entropy scores calculated for all HCV sequence dataavailable from the Los Alamos Lab HCV database and plotted along the entire ployprotein. Black arrows indicate regions of high imunoreactivity andlow entropy.doi:10.1371/journal.pone.0038028.g005
Meta-Analysis of All HCV Epitope Data
PLoS ONE | www.plosone.org 8 May 2012 | Volume 7 | Issue 5 | e38028
mostly in the acute phase, antibodies exert selection pressure
mostly in the chronic phase [37]. Accordingly we examined the
data with respect to the number of assays demonstrating
neutralizing versus non-neutralizing antibody responses. We found
that the vast majority of reactivity was determined using non-
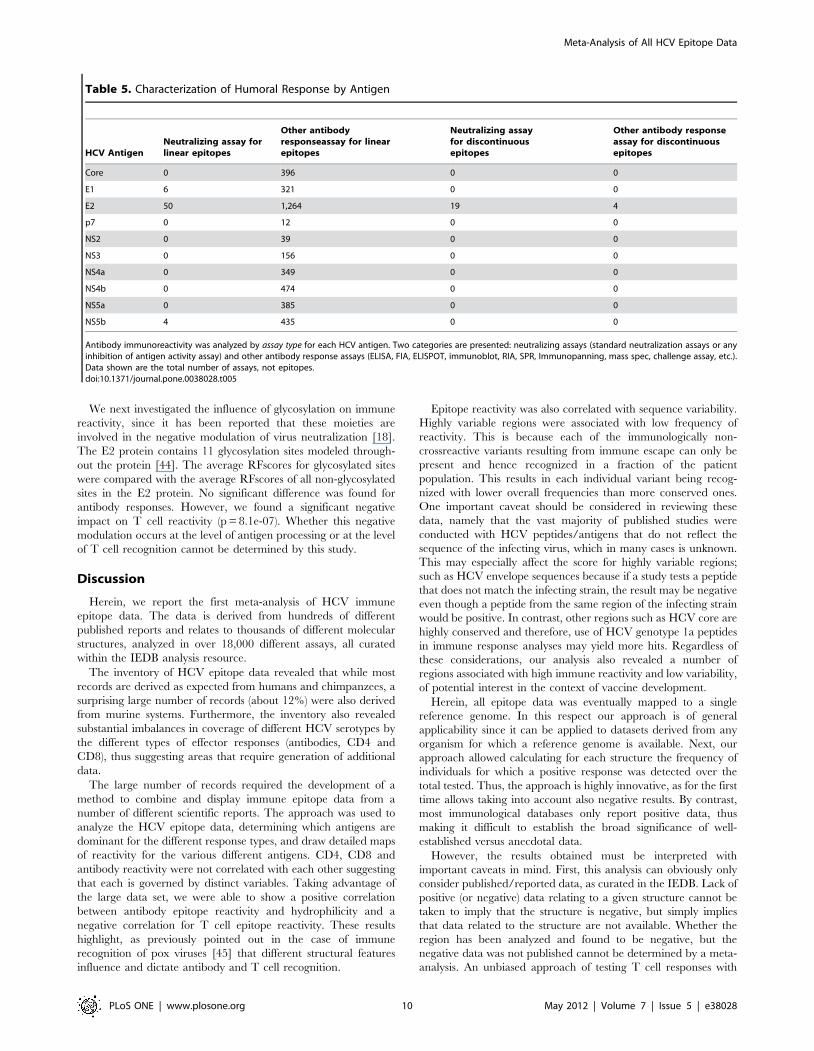
neutralizing, direct-binding assays. Of the more than 7000
antibody assays reported to date for HCV, 3800 are associated
with positive results, and only 84 involve neutralizing assays. For
those assays, epitope specificities derived from the E2, a well-
established target of neutralizing antibodies in human infection
[41–43], were predominant (Table 5). Low numbers of neutral-
izing epitopes were also reported for E1 (6) and NS5b (4). The
reports of neutralizing epitopes is surprising since NS5b is not
known to be present on HCV mature viruses. Furthermore, we
noted that all discontinuous epitopes characterized so far were
derived for E2, and of these 19 of 23 were defined in the context of
neutralization. These data underscore the need to further
characterize the HCV epitopes associated with neutralizing
activity.
Figure 6. Human response frequency scores in acute versus chronic HCV infection. Data represent RFscores plotted along the length ofthe HCV H77 reference polyprotein for epitope defined in human disease. A) T cells responses for acute infection; B) T cells responses for chronicinfection; C) Antibody responses for acute infection; D) Antibody responses for chronic infection. The red line denotes average frequency for allresponses.doi:10.1371/journal.pone.0038028.g006
Meta-Analysis of All HCV Epitope Data
PLoS ONE | www.plosone.org 9 May 2012 | Volume 7 | Issue 5 | e38028
We next investigated the influence of glycosylation on immune
reactivity, since it has been reported that these moieties are
involved in the negative modulation of virus neutralization [18].
The E2 protein contains 11 glycosylation sites modeled through-
out the protein [44]. The average RFscores for glycosylated sites
were compared with the average RFscores of all non-glycosylated
sites in the E2 protein. No significant difference was found for
antibody responses. However, we found a significant negative
impact on T cell reactivity (p = 8.1e-07). Whether this negative
modulation occurs at the level of antigen processing or at the level
of T cell recognition cannot be determined by this study.
Discussion
Herein, we report the first meta-analysis of HCV immune
epitope data. The data is derived from hundreds of different
published reports and relates to thousands of different molecular
structures, analyzed in over 18,000 different assays, all curated
within the IEDB analysis resource.
The inventory of HCV epitope data revealed that while most
records are derived as expected from humans and chimpanzees, a
surprising large number of records (about 12%) were also derived
from murine systems. Furthermore, the inventory also revealed
substantial imbalances in coverage of different HCV serotypes by
the different types of effector responses (antibodies, CD4 and
CD8), thus suggesting areas that require generation of additional
data.
The large number of records required the development of a
method to combine and display immune epitope data from a
number of different scientific reports. The approach was used to
analyze the HCV epitope data, determining which antigens are
dominant for the different response types, and draw detailed maps
of reactivity for the various different antigens. CD4, CD8 and
antibody reactivity were not correlated with each other suggesting
that each is governed by distinct variables. Taking advantage of
the large data set, we were able to show a positive correlation
between antibody epitope reactivity and hydrophilicity and a
negative correlation for T cell epitope reactivity. These results
highlight, as previously pointed out in the case of immune
recognition of pox viruses [45] that different structural features
influence and dictate antibody and T cell recognition.
Epitope reactivity was also correlated with sequence variability.
Highly variable regions were associated with low frequency of
reactivity. This is because each of the immunologically non-
crossreactive variants resulting from immune escape can only be
present and hence recognized in a fraction of the patient
population. This results in each individual variant being recog-
nized with lower overall frequencies than more conserved ones.
One important caveat should be considered in reviewing these
data, namely that the vast majority of published studies were
conducted with HCV peptides/antigens that do not reflect the
sequence of the infecting virus, which in many cases is unknown.
This may especially affect the score for highly variable regions;
such as HCV envelope sequences because if a study tests a peptide
that does not match the infecting strain, the result may be negative
even though a peptide from the same region of the infecting strain
would be positive. In contrast, other regions such as HCV core are
highly conserved and therefore, use of HCV genotype 1a peptides
in immune response analyses may yield more hits. Regardless of
these considerations, our analysis also revealed a number of
regions associated with high immune reactivity and low variability,
of potential interest in the context of vaccine development.
Herein, all epitope data was eventually mapped to a single
reference genome. In this respect our approach is of general
applicability since it can be applied to datasets derived from any
organism for which a reference genome is available. Next, our
approach allowed calculating for each structure the frequency of
individuals for which a positive response was detected over the
total tested. Thus, the approach is highly innovative, as for the first
time allows taking into account also negative results. By contrast,
most immunological databases only report positive data, thus
making it difficult to establish the broad significance of well-
established versus anecdotal data.
However, the results obtained must be interpreted with
important caveats in mind. First, this analysis can obviously only
consider published/reported data, as curated in the IEDB. Lack of
positive (or negative) data relating to a given structure cannot be
taken to imply that the structure is negative, but simply implies
that data related to the structure are not available. Whether the
region has been analyzed and found to be negative, but the
negative data was not published cannot be determined by a meta-
analysis. An unbiased approach of testing T cell responses with
Table 5. Characterization of Humoral Response by Antigen
HCV AntigenNeutralizing assay forlinear epitopes
Other antibodyresponseassay for linearepitopes
Neutralizing assayfor discontinuousepitopes
Other antibody responseassay for discontinuousepitopes
Core 0 396 0 0
E1 6 321 0 0
E2 50 1,264 19 4
p7 0 12 0 0
NS2 0 39 0 0
NS3 0 156 0 0
NS4a 0 349 0 0
NS4b 0 474 0 0
NS5a 0 385 0 0
NS5b 4 435 0 0
Antibody immunoreactivity was analyzed by assay type for each HCV antigen. Two categories are presented: neutralizing assays (standard neutralization assays or anyinhibition of antigen activity assay) and other antibody response assays (ELISA, FIA, ELISPOT, immunoblot, RIA, SPR, Immunopanning, mass spec, challenge assay, etc.).Data shown are the total number of assays, not epitopes.doi:10.1371/journal.pone.0038028.t005
Meta-Analysis of All HCV Epitope Data
PLoS ONE | www.plosone.org 10 May 2012 | Volume 7 | Issue 5 | e38028
overlapping peptides that cover the entire HCV polyprotein was
widely used only after the first decade or so of HCV immunology
research. During the first 10–15 years of study, many investigators
used single peptides that had been selected because they contained
specific HLA-binding motif, had a high HLA binding affinity and
were then shown to be recognized by T cells. For example, most
early studies used predicted HLA-A2 peptides in in-vitro
stimulation assays, whereas now many studies are performed
directly ex vivo, using peptide libraries targeting overlapping, as
well as previously described epitopes. After the first epitopes were
identified, many studies were conducted with those epitopes, and
as a consequence, certain regions were more frequently studied
than others. Second, in the current approach negative data is
plotted as ‘‘zero’’ regardless whether the zero value is derived from
a single observation or negative results have been established in a
large number of observations. Thus, the method is best suited to
highlight which positive data are most reliable. There are also
significant qualitative differences among studies with regard to
how positive responses were defined and/or confirmed. We are
currently exploring different visualization methods, to address this
important issue. Third, the RF method like any other method
plotting discrete variables along a sequence is not suited to
visualize discontinuous epitopes. Here as well, we are currently
exploring different visualization methods, to address this important
issue.
It is also important and relevant to address the issue of the
reagents. Historically, most reagents are based on HCV genotype
1, however the genotype of the infecting virus in human subjects is
often heterogonous and/or the subject may have been infected
with more than one strain. As a result, the cumulative data will
miss many responses because of the impossibility of using
autologous sequence reagents. Moreover, it is possible that the
data will reflect responses that are actually not associated with the
currently infecting genotype.
Our analysis allowed investigation of issues related to the
biological relevance of immune responses. First, comparison of
data derived from acute and chronic infection revealed fine
differences in specificity of T cell and antibody responses, though
due to the complex nature of this disease, the data must be
interpreted with the understanding that there are very different
definitions in the immunological literature regarding what
constitutes acute infection. In some instances, studies include
subjects up to 2 years post-infection for analysis, despite the fact
that after 6 months the outcome has been firmly established in
most cases and immune responses change dramatically in the first
year. Different methodologies may also play a role, in that older
studies tended to focus on testing subjects with persistent chronic
infection, whereas, chronic infection. Large scale studies including
subjects with acute infection have only been performed recently
using the newer ex-vivo methods. Second, the analysis revealed
that, unexpectedly, glycosylation seem to interfere with T cell
recognition, but not antibody responses. Third, the data revealed a
need for far more detailed definition of epitopes recognized by
neutralizing antibodies.
The methodology described herein provides the ability to
combine the data from the literature in a format which is
comprehensive, yet intuitive. Ultimately, it is our goal to
implement this method as a general tool on the IEDB website,
to provide the larger scientific community with the functionality to
easily analyze immune epitope data.
Acknowledgments
We gratefully acknowledge the helpful contribution of Alison Deckhut,
Andrea Cox, Barbara Rehermann, Howard Grey, and Steven Foung in
reviewing this manuscript.
Author Contributions
Conceived and designed the experiments: AS BP YK KV. Performed the
experiments: YK KV. Analyzed the data: AS BP YK KV. Contributed
reagents/materials/analysis tools: BP YK KV JG. Wrote the paper: AS BP
YK KV ML.
References
1. WHO website. Available: http//:www.who.int/mediacentre/factsheets/fs164/
en/. Accessed 2012 February, 15.
2. Vaughan K, Greenbaum J, Blythe M, Peters B, Sette A (2010) Meta-analysis of
all immune epitope data in the Flavivirus genus: inventory of current immune
epitope data status in the context of virus immunity and immunopathology.
Viral Immunol 23: 259–84.
3. Vaughan K, Blythe M, Greenbaum J, Zhang Q, Peters B, et al. (2009) Meta-
analysis of immune epitope data for all Plasmodia: overview and applications for
malarial immunobiology and vaccine-related issues. Parasite Immunol 31:
78–97.
4. Zarebski LM, Vaughan K, Sidney J, Peters B, Grey H, et al. (2008) Analysis of
epitope information related to Bacillus anthracis and Clostridium botulinum.
Expert Rev Vaccines 7: 55–74.
5. Blythe MJ, Zhang Q, Vaughan K, de Castro R Jr., Salimi N, et al. (2007) An
analysis of the epitope knowledge related to Mycobacteria. Immunome Res 3:
10.
6. Bui HH, Peters B, Assarsson E, Mbawuike I, Sette A (2007) Ab and T cell
epitopes of influenza A virus, knowledge and opportunities. Proc Natl Acad
Sci U S A 104: 246–251.
7. Vita R, Peters B, Sette A (2008) The curation guidelines of the immune epitope
database and analysis resource. Cytometry 73: 1066–1070.
8. Parker JM, Guo D, Hodges RS (1986) New hydrophilicity scale derived from
high-performance liquid chromatography peptide retention data: correlation of
predicted surface residues with antigenicity and X-ray-derived accessible sites.
Biochem 25: 5425–5432.
9. Simmonds P, Bukh J, Combet C, Deleage G, Enomoto N, et al. (2005)
Consensus proposals for a unified system of nomenclature of hepatitis C virus
genotypes Hepatol 42: 962–973.
10. Diepolder HM, Gerlach JT, Zachoval R, Hoffmann RM, Jung MC, et al. (1997)
Immunodominant CD4+ T-cell epitope within nonstructural protein 3 in acute
hepatitis C virus infection. J Virol 71: 6011–6019.
11. Hopp TP, Woods KR (1981) Prediction of protein antigenic determinants from
amino acid sequences. Proc Natl Acad Sci USA 78: 3824–3828.
12. Westof E, Altschuh D, Moras D, Bloomer AC, Mondragon A, et al. (1984)
Correlation between segmental mobility and the location of antigenic
determinants in proteins. Nature 311: 123–126.
13. Tainer JA, Getzoff ED, Alexander H, Houghton RA, Olsen AJ, et al. (1984) The
reactivity of anti-peptide antibodies is a function of the atomic mobility of sites in
a protein. Nature 312: 127–134.
14. Tainer JA, Getzoff ED, Paterson Y, Olsen AJ, Lerner RA (1985) The atomic
mobility component of protein antigenicity. Annu Rev Immunol 3: 501–535.
15. Santolini E, Migliaccio G, La Monica N (1994) Biosynthesis and biochemical
properties of the hepatitis C virus core protein. J Virol 68: 3631–3641.
16. Grakoui A, Wychowski C, Lin C, Feinstone SM, Rice CM (1993) Expression
and identification of hepatitis C virus polyprotein cleavage products. J Virol 67:
1385–1395.
17. Harada S, Watanabe Y, Suzuki T, Katayama T, Takebe Y, et al. (1991)
Expression of processed core protein of hepatitis C virus in mammalian cells.
J Virol 65: 3015–3021.
18. Wang Y, Keck Z-Y, Foung SKH (2011) Neutralizing antibody response to
hepatitis C virus. Viruses 3: 2127–2145.
19. Edwards VC, Tarr AW, Urbanowicz RA, Ball JK (2012) The role of
neutralizing antibodies in hepatitis C virus infection. J Gen Virol 93: 1–19.
20. Angus AG, Patel AH (2011) Immunotherapeutic potential of neutralizing
antibodies targeting conserved regions of the HCV envelope glycoprotein E2.
Future Microbiol 6(3): 279–94.
21. Santolini E, Pacini L, Fipaldini C, Migliaccio G, Monica N (1995) The NS2
protein of hepatitis C virus is a transmembrane polypeptide. J Virol 69:
7461–7471.
22. Yamaga AK, Ou JH (2002) Membrane topology of the hepatitis C virus NS2
protein. J Biol Chem 277: 33228–33234.
23. Franck N, Le Seyec J, Guguen-Guillouzo C, Erdtmann L (2005) Hepatitis C
virus NS2 protein is phosphorylated by the protein kinase CK2 and targeted for
degradation to the proteasome. J Virol 79: 2700–2708.
Meta-Analysis of All HCV Epitope Data
PLoS ONE | www.plosone.org 11 May 2012 | Volume 7 | Issue 5 | e38028
24. Bartenschlager R, Lohmann V, Wilkinson T, Koch JO (1995) Complex
formation between the NS3 serine-type protease of the hepatitis C virus andNS4A and its importance for polyprotein maturation. J Virol 69: 7519–7528.
25. Lin C, Thomson JA, Rice CM (1995) A central region in the hepatitis C virus
NS4A protein allows formation of an active NS3–NS4A serine protease complexin vivo and in vitro. J Virol 69, 4373–4380.
26. Tanji Y, Hijikata M, Satoh S, Kaneko T, Shimotohno K (1995) Hepatitis Cvirus-encoded nonstructural protein NS4A has versatile functions in viral protein
processing. J Virol 69, 1575–1581.
27. Lindenbach BD, Pragai BM, Montserret R, Beran RKF, Pyle AM, et al. (2007)The C terminus of hepatitis C virus NS4A encodes an electrostatic switch that
regulates NS5A hyperphosphorylation and viral replication. J Virol 81:8905–8918.
28. Gretton SN, Taylor AI, Mc Lauchlan J (2005) Mobility of the hepatitis C virusNS4B protein on the endoplasmic reticulum membrane and membrane-
associated foci. J Gen Virol 86: 1415–1421.
29. Elazar M, Liu P, Rice CM, Glenn JS (2004) An N-terminal amphipathic helix inhepatitis C virus (HCV) NS4B mediates membrane association, correct
localization of replication complex proteins, and HCV RNA replication.J Virol 78: 11393–11400.
30. Lundin M, Monne M, Widell A, Von Heijne G, Persson MA (2003) Topology of
the membrane-associated hepatitis C virus protein NS4B. J Virol 77:5428–5438.
31. Egger D, Wolk B, Gosert R, Bianchi L, Blum HE, et al. (2002) Expression ofhepatitis C virus proteins induces distinct membrane alterations including a
candidate viral replication complex. J Virol 76: 5974–5984.32. Hugle T, Fehrmann F, Bieck E, Kohara M, Krausslich HG, et al. (2001) The
hepatitis C virus nonstructural protein 4B is an integral endoplasmic reticulum
membrane protein. Virol 284: 70–81.33. Yewdell JW, Mansour Haeryfar SM (2005) Understanding presentation of viral
antigens to CD8+ T cells in vivo: the key to rational vaccine design. Ann Rev ofImmunol 23: 651–682.
34. Berkhoff EGM, Geelhoed-Mieras MM, Fouchier RAM, Osterhaus ADME,
Rimmelzwaan GF (2007) Assessment of the extent of variation in influenza Avirus cytotoxic T-lymphocyte epitopes by using virus-specific CD8+ T-cell
clones. J Gen Virol 88: 530–535.
35. Bansal A, Gough E, Sabbaj S, Ritter D, Yusim K, et al. (2005) CD8 T-cell
responses in early HIV-1 infection are skewed towards high entropy peptides.
AIDS 19: 241–50.
36. Chang KM, Rehermann B, McHutchison JG, Pasquinelli C, Southwood S, et
al. (1997) Immunological significance of cytotoxic T lymphocyte epitope variants
in patients chronically infected by the hepatitis C virus. J Clin Invest 100: 2376.
37. Rehermann B (2009) Hepatitis C virus versus innate and adaptive immune
responses: a tale of coevolution and coexistence. J Clin Invest 119: 1745–1754.
38. Rahman F, Heller T, Sobao Y, Mizukoshi E, Nascimbeni M, et al. (2004) Effects
of antiviral therapy on the cellular immune response in acute hepatitis C.
Hepatol 40: 87–97.
39. Vallari DS, Jett BW, Alter HJ, Mimms LT, Holzman R, et al. (1992) Serological
markers of posttransfusion hepatitis C viral infection. J Clin Microbiol 30(3):
552–556.
40. Beld M, Penning M, van Putten M, Lukashov V, van den Hoek A, et al. (1999)
Quantitative antibody responses to structural (Core) and nonstructural (NS3,
NS4, and NS5) hepatitis C virus proteins among seroconverting injecting drug
users: impact of epitope variation and relationship to detection of HCV RNA in
blood. Hepatology 29(4): 1288–1298.
41. Troesch M, Meunier I, Lapierre P, Lapointe N, Alvarez F, et al. (2006) Study of
a novel hypervariable region in hepatitis C virus (HCV) E2 envelope
glycoprotein. Virology 352: 357–367.
42. Weiner AJ, Brauer MJ, Rosenblatt J, Richman KH, Tung J, et al. (1991)
Variable and hypervariable domains are found in the regions of HCV
corresponding to the flavivirus envelope and NS1 proteins and the pestivirus
envelope glycoproteins. Virol 180: 842–848.
43. Hijikata M, Kato N, Ootsuyama Y, Nakagawa M, Ohkoshi S, et al. (1991)
Hypervariable regions in the putative glycoprotein of hepatitis C virus. Biochem
Biophys Res Commun 175: 220–228.
44. Goffard A, Callens N, Bartosch B, Wychowski C, Cosset FL, et al. (2005) Role of
N-Linked glycans in the functions of hepatitis C virus envelope glycoproteins.
J Virol 79: 8400–8409.
45. Moutaftsi M, Tscharke DC, Vaughan K, Koelle DM, Stern L, et al. (2010)
Uncovering the interplay between CD8, CD4 and antibody responses to
complex pathogens. Future Microbiol 5: 221–239.
Meta-Analysis of All HCV Epitope Data
PLoS ONE | www.plosone.org 12 May 2012 | Volume 7 | Issue 5 | e38028