A Linear Combination of Pharmacophore Hypotheses ... - PLOS
13
A Linear Combination of Pharmacophore Hypotheses as a New Tool in Search of New Active Compounds – An Application for 5-HT 1A Receptor Ligands Dawid Warszycki 1 , Stefan Mordalski 1 , Kurt Kristiansen 2 , Rafał Kafel 1 , Ingebrigt Sylte 2 , Zdzisław Chilmonczyk 3 , Andrzej J. Bojarski *,1 1 Medicinal Chemistry Department, Institute of Pharmacology, Polish Academy of Sciences, Kraków, Poland, 2 Medicinal Pharmacology and Toxicology, Department of Medicinal Biology, Faculty of Health Sciences, UiT The Arctic University of Norway, Tromsø, Norway, 3 Department of Cell Biology, National Medicines Institute, Warsaw, Poland Abstract This study explores a new approach to pharmacophore screening involving the use of an optimized linear combination of models instead of a single hypothesis. The implementation and evaluation of the developed methodology are performed for a complete known chemical space of 5-HT 1A R ligands (3616 active compounds with K i < 100 nM) acquired from the ChEMBL database. Clusters generated from three different methods were the basis for the individual pharmacophore hypotheses, which were assembled into optimal combinations to maximize the different coefficients, namely, MCC, accuracy and recall, to measure the screening performance. Various factors that influence filtering efficiency, including clustering methods, the composition of test sets (random, the most diverse and cluster population-dependent) and hit mode (the compound must fit at least one or two models from a final combination) were investigated. This method outmatched both single hypothesis and random linear combination approaches. Citation: Warszycki D, Mordalski S, Kristiansen K, Kafel R, Sylte I, et al. (2013) A Linear Combination of Pharmacophore Hypotheses as a New Tool in Search of New Active Compounds – An Application for 5-HT 1A Receptor Ligands. PLoS ONE 8(12): e84510. doi:10.1371/journal.pone.0084510 Editor: Andrea Cavalli, University of Bologna & Italian Institute of Technology, Italy Received August 21, 2013; Accepted November 22, 2013; Published December 18, 2013 Copyright: © 2013 Warszycki et al. This is an open-access article distributed under the terms of the Creative Commons Attribution License, which permits unrestricted use, distribution, and reproduction in any medium, provided the original author and source are credited. Funding: This study was supported by the project UDA-POIG.01.03.01-12-063/09-00 Prokog, which is co-financed by the European Union from the European Fund of Regional Development (EFRD) and by Norway Grants within the Polish-Norwegian Research Programme, grant no. Pol-Nor/ 198887/73/2013. The funders had no role in study design, data collection and analysis, decision to publish, or preparation of the manuscript. Competing interests: The authors have declared that no competing interests exist. * E-mail: [email protected] Introduction A pharmacophore model (also called a pharmacophore hypothesis) is one of the most important concepts in medicinal chemistry. It is defined as the spatial orientation of different features of a molecule (thus, pharmacophore modeling is a ligand-based method) required for the activity towards a biomolecular target [1–3]. Such a model can be used to describe a large number of structurally diverse compounds with only a handful of general features. Pharmacophore filtering is widely used in virtual screening campaigns [4–10] and in other drug development processes [11,12] This filter may be applied as a standalone [7,8] or as one of the subsequent steps in a screening cascade [9,10]. The attempts at pharmacophore modeling the known ligands of 5-HT 1A R [13–27], a well-recognized therapeutic target [28,29] also intensively studied in our laboratory [30–33], have focused solely on visualizations and explanations in SAR studies [13–27]. Only very recently published pharmacophores of 5-HT 1A R ligands were intended for use in virtual screening (VS), however only for the off-target activity of α1-adrenoceptor antagonists [34]. It is nearly impossible to define a universal model that covers the entire chemical space of the ligands of a particular target. The use of multiple models at once led to search parameter improvements, yet the arbitrariness of model selection makes it strongly dependent on the researcher’s knowledge and experience. To address the downsides of pharmacophore screening, we developed a novel approach involving the use of a carefully selected collection of pharmacophore models instead of a single hypothesis. The primary goal of the research was to develop and to evaluate a screening protocol that utilized a linear combination of pharmacophore models, i.e. a collection of individual hypotheses covering as much as possible the chemical space defined by ligands of a particular target. From the single hypotheses, created from ligand clusters, a group of models with the best combined performance (chosen using a homemade script) was selected PLOS ONE | www.plosone.org 1 December 2013 | Volume 8 | Issue 12 | e84510
-
Upload
khangminh22 -
Category
Documents
-
view
0 -
download
0
Transcript of A Linear Combination of Pharmacophore Hypotheses ... - PLOS
A Linear Combination of Pharmacophore Hypotheses asa New Tool in Search of New Active Compounds – AnApplication for 5-HT1A Receptor LigandsDawid Warszycki1, Stefan Mordalski1, Kurt Kristiansen2, Rafał Kafel1, Ingebrigt Sylte2, ZdzisławChilmonczyk3, Andrzej J. Bojarski*,1
1 Medicinal Chemistry Department, Institute of Pharmacology, Polish Academy of Sciences, Kraków, Poland, 2 Medicinal Pharmacology and Toxicology,Department of Medicinal Biology, Faculty of Health Sciences, UiT The Arctic University of Norway, Tromsø, Norway, 3 Department of Cell Biology, NationalMedicines Institute, Warsaw, Poland
Abstract
This study explores a new approach to pharmacophore screening involving the use of an optimized linearcombination of models instead of a single hypothesis. The implementation and evaluation of the developedmethodology are performed for a complete known chemical space of 5-HT1AR ligands (3616 active compounds withKi < 100 nM) acquired from the ChEMBL database. Clusters generated from three different methods were the basisfor the individual pharmacophore hypotheses, which were assembled into optimal combinations to maximize thedifferent coefficients, namely, MCC, accuracy and recall, to measure the screening performance. Various factors thatinfluence filtering efficiency, including clustering methods, the composition of test sets (random, the most diverse andcluster population-dependent) and hit mode (the compound must fit at least one or two models from a finalcombination) were investigated. This method outmatched both single hypothesis and random linear combinationapproaches.
Citation: Warszycki D, Mordalski S, Kristiansen K, Kafel R, Sylte I, et al. (2013) A Linear Combination of Pharmacophore Hypotheses as a New Tool inSearch of New Active Compounds – An Application for 5-HT1A Receptor Ligands. PLoS ONE 8(12): e84510. doi:10.1371/journal.pone.0084510
Editor: Andrea Cavalli, University of Bologna & Italian Institute of Technology, Italy
Received August 21, 2013; Accepted November 22, 2013; Published December 18, 2013
Copyright: © 2013 Warszycki et al. This is an open-access article distributed under the terms of the Creative Commons Attribution License, which permitsunrestricted use, distribution, and reproduction in any medium, provided the original author and source are credited.
Funding: This study was supported by the project UDA-POIG.01.03.01-12-063/09-00 Prokog, which is co-financed by the European Union from theEuropean Fund of Regional Development (EFRD) and by Norway Grants within the Polish-Norwegian Research Programme, grant no. Pol-Nor/198887/73/2013. The funders had no role in study design, data collection and analysis, decision to publish, or preparation of the manuscript.
Competing interests: The authors have declared that no competing interests exist.
* E-mail: [email protected]
Introduction
A pharmacophore model (also called a pharmacophorehypothesis) is one of the most important concepts in medicinalchemistry. It is defined as the spatial orientation of differentfeatures of a molecule (thus, pharmacophore modeling is aligand-based method) required for the activity towards abiomolecular target [1–3]. Such a model can be used todescribe a large number of structurally diverse compounds withonly a handful of general features. Pharmacophore filtering iswidely used in virtual screening campaigns [4–10] and in otherdrug development processes [11,12] This filter may be appliedas a standalone [7,8] or as one of the subsequent steps in ascreening cascade [9,10].
The attempts at pharmacophore modeling the known ligandsof 5-HT1AR [13–27], a well-recognized therapeutic target[28,29] also intensively studied in our laboratory [30–33], havefocused solely on visualizations and explanations in SARstudies [13–27]. Only very recently published pharmacophores
of 5-HT1AR ligands were intended for use in virtual screening(VS), however only for the off-target activity of α1-adrenoceptorantagonists [34].
It is nearly impossible to define a universal model that coversthe entire chemical space of the ligands of a particular target.The use of multiple models at once led to search parameterimprovements, yet the arbitrariness of model selection makes itstrongly dependent on the researcher’s knowledge andexperience. To address the downsides of pharmacophorescreening, we developed a novel approach involving the use ofa carefully selected collection of pharmacophore modelsinstead of a single hypothesis. The primary goal of theresearch was to develop and to evaluate a screening protocolthat utilized a linear combination of pharmacophore models, i.e.a collection of individual hypotheses covering as much aspossible the chemical space defined by ligands of a particulartarget. From the single hypotheses, created from ligandclusters, a group of models with the best combinedperformance (chosen using a homemade script) was selected
PLOS ONE | www.plosone.org 1 December 2013 | Volume 8 | Issue 12 | e84510
and evaluated on various test sets. In addition, the proposedbest combinations were compared with a single hypothesis andwith randomly composed groups of pharmacophore models ofequal length.
Materials and Methods
GeneralFigure 1 shows a protocol applied for the development of the
optimal linear combination of the pharmacophore models.Compounds with proven activity toward 5-HT1AR were acquiredfrom the ChEMBL database version 5 [35], clustered, andstructures representative of each cluster were used for theconstruction of a pharmacophore hypothesis. Each modelunderwent evaluation via test sets composed of activecompounds, true decoys and ligands retrieved from theDrugBank [36] that were assumed inactive. The best linearcombinations of pharmacophore models were then composedand validated with new compounds (both active and inactives)retrieved from the ChEMBL database v10 [37].
Data setsThe source of the active compounds was the ChEMBL
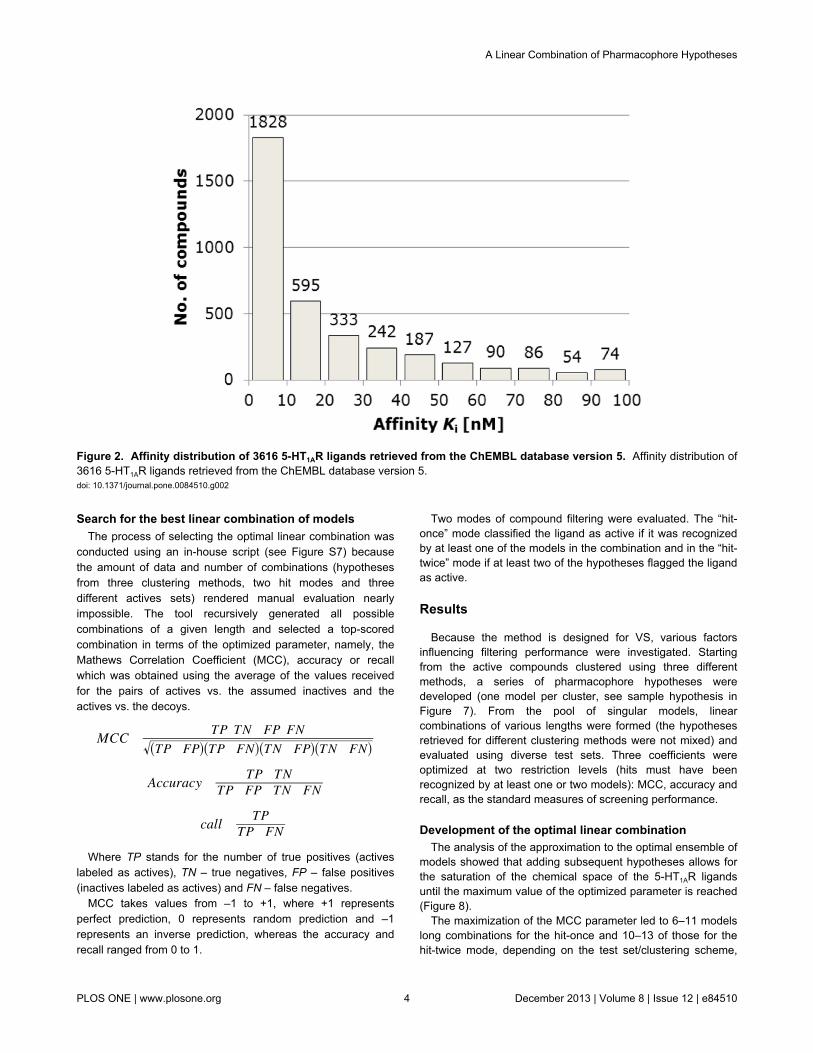
database version 5 (August 2010), containing 5-HT1AR ligandsretrieved from approximately 520 published papers. Due to alarge diversity of activity measures, only the compounds withdefined Ki (IC50 – assumed as 2×Ki, pKi or pIC50 were convertedto Ki) as assayed on human cloned receptors or on rat clonedor native receptors, were taken into account. In the case ofmultiple data for one ligand, the Ki and human receptors weregiven preference; a median value was used in the case ofmany biological results. The ligands were defined as activewhen their binding constant was lower than or equal to 100 nM;the threshold of inactivity was set at 1000 nM. The resultingsets consisted of 3616 active (more than half with Ki valueslower than 10 nM – see Figure 2 for details) and 438 inactive(decoy) compounds (Figure 1).
ClusteringThree methods of clustering were applied: 3D
pharmacophore fingerprint-based (P3D), MOLPRINT 2Dfingerprint [38]-based (M2D) and the manual – classicalmethod (grouping the compounds by a common core). TheP3D and M2D approaches were performed using theHierarchical Clustering feature in Canvas [39].
For the P3D method, 31 clusters were created using theKelly criterion [40]. After merging the singleton and doubletonsubsets into a special class, 28 clusters containing 8–497compounds were obtained.
The same approach, applied to MOLPRINT 2D fingerprints,left one cluster considerably larger than the rest, and itsrecurrent splitting (applied four times) resulted in a total of 36collections consisting of 6 to 744 compounds each.
The manual clustering generally followed the classification of5-HT1AR ligands described in the literature (9 basic classes)[41–43]. However, more subgroups were then created, e.g. forarylpiperazines [44] (Figure 3). In the case of the alkylamines
(714 compounds), indole derivatives were first extracted and,with the exception of the tetrahydropyridoindoles, were divideddepending on the distance between two crucial pharmacophorefeatures: an aromatic system and a basic nitrogen atom. Theentire procedure developed 28 clusters, each containing 17 to605 compounds (Figure 3).
Pharmacophore model developmentCluster representatives, in number proportional to the
cluster’s size (Figure 1), were selected using the diversity-based selection tool in Canvas (similarity metric – Soergeldistance; compounds selection algorithm – sphere exclusion;sphere size – 0.5; initialization – random with random seed).The selected representatives were further used as a basis forthe development of a pharmacophore model using Phase [45]under default settings (conformers generated during search, 10conformers per rotatable bond; not more than 100 conformersper structure; relative energy window between conformations –10 kcal/mol; RMSD tolerance for match – 2 Å). The besthypothesis for each ligand class must have mapped at leasthalf of the input compounds. Among these hypotheses, the onewith the maximum number of features, the highest matchingrate and the best selectivity score was selected for furtherresearch. For some of the clusters, none of the hypotheses metall the requirements (13 for P3D, 5 for M2D and 4 for manualgrouping).
Test setsAll obtained models were first tested on three pairs of 400-
compound sets that were composed of an equal number ofactive and inactive compounds (Figure 1). Of the 5-HT1A
ligands not used in the development of the models, the sets ofactive ligands were selected (i) randomly (marked in green inFigures 1, 4-6 and Figures S1–S6), (ii) to be the most diverse(blue), or (iii) in a way reflecting the abundance of differentscaffolds according to manual clustering (red). Out of the 438compounds from the ChEMBL database with Ki (5-HT1A) >1000 nM, the 200 most diverse compounds (diversity-basedselection tool in Canvas) constituted the set of decoys for theabove-mentioned ligand groups (Figure 1). Similarly, the activeligands were complemented with compounds with assumedinactivity from the DrugBank database (low potential for bindingto 5-HT1A receptor was confirmed by SEA search tool [46]). Themost diverse molecules with polarizable nitrogen and no dataregarding activity toward the 5-HT1A receptor were selected. Allstatistical parameters were calculated as an average of thevalues obtained for the pair of sets that was composed of thesame actives (Figure 1).
A validation set was created out of the novel 5-HT1AR ligandsthat appeared in the ChEMBL database version 10 (May 2011).The inactive compounds from this set were a challenge for themethod because they were very similar to active compounds.Similarity search using MOLPRINT 2D fingerprint andTanimoto metric revealed that 24.8% of inactives compoundshad similarity coefficient with actives of 0.9 or higher.
A Linear Combination of Pharmacophore Hypotheses
PLOS ONE | www.plosone.org 2 December 2013 | Volume 8 | Issue 12 | e84510
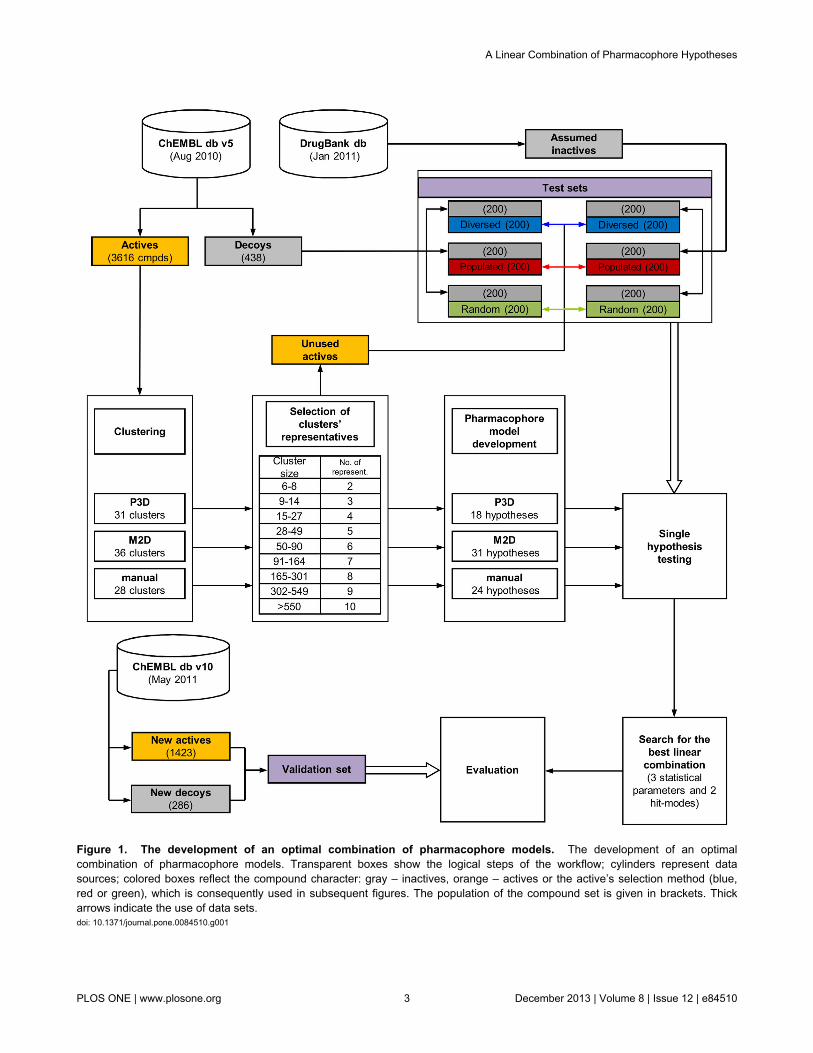
Figure 1. The development of an optimal combination of pharmacophore models. The development of an optimalcombination of pharmacophore models. Transparent boxes show the logical steps of the workflow; cylinders represent datasources; colored boxes reflect the compound character: gray – inactives, orange – actives or the active’s selection method (blue,red or green), which is consequently used in subsequent figures. The population of the compound set is given in brackets. Thickarrows indicate the use of data sets.doi: 10.1371/journal.pone.0084510.g001
A Linear Combination of Pharmacophore Hypotheses
PLOS ONE | www.plosone.org 3 December 2013 | Volume 8 | Issue 12 | e84510
Search for the best linear combination of modelsThe process of selecting the optimal linear combination was
conducted using an in-house script (see Figure S7) becausethe amount of data and number of combinations (hypothesesfrom three clustering methods, two hit modes and threedifferent actives sets) rendered manual evaluation nearlyimpossible. The tool recursively generated all possiblecombinations of a given length and selected a top-scoredcombination in terms of the optimized parameter, namely, theMathews Correlation Coefficient (MCC), accuracy or recallwhich was obtained using the average of the values receivedfor the pairs of actives vs. the assumed inactives and theactives vs. the decoys.
MCC= TP ⋅TN−FP ⋅FNTP+FP TP+FN TN+FP TN+FN
Accuracy= TP+TNTP+FP+TN+FN
Recall= TPTP+FN
Where TP stands for the number of true positives (activeslabeled as actives), TN – true negatives, FP – false positives(inactives labeled as actives) and FN – false negatives.
MCC takes values from –1 to +1, where +1 representsperfect prediction, 0 represents random prediction and –1represents an inverse prediction, whereas the accuracy andrecall ranged from 0 to 1.
Two modes of compound filtering were evaluated. The “hit-once” mode classified the ligand as active if it was recognizedby at least one of the models in the combination and in the “hit-twice” mode if at least two of the hypotheses flagged the ligandas active.
Results
Because the method is designed for VS, various factorsinfluencing filtering performance were investigated. Startingfrom the active compounds clustered using three differentmethods, a series of pharmacophore hypotheses weredeveloped (one model per cluster, see sample hypothesis inFigure 7). From the pool of singular models, linearcombinations of various lengths were formed (the hypothesesretrieved for different clustering methods were not mixed) andevaluated using diverse test sets. Three coefficients wereoptimized at two restriction levels (hits must have beenrecognized by at least one or two models): MCC, accuracy andrecall, as the standard measures of screening performance.
Development of the optimal linear combinationThe analysis of the approximation to the optimal ensemble of
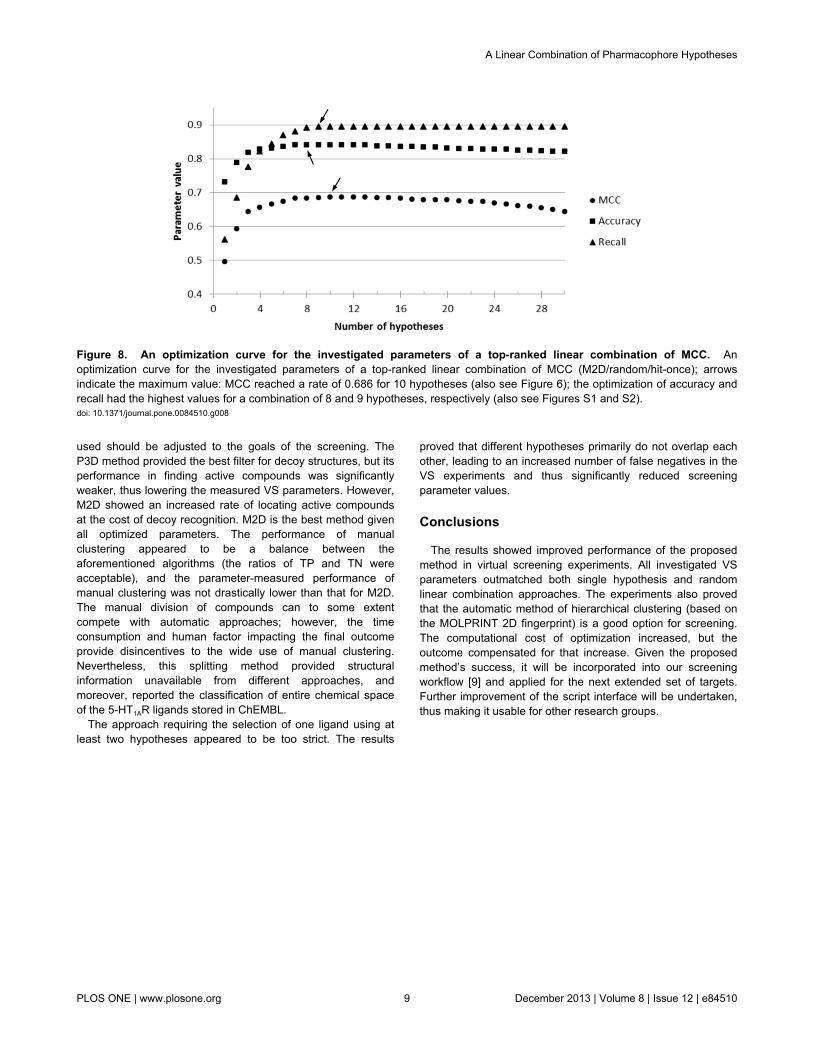
models showed that adding subsequent hypotheses allows forthe saturation of the chemical space of the 5-HT1AR ligandsuntil the maximum value of the optimized parameter is reached(Figure 8).
The maximization of the MCC parameter led to 6–11 modelslong combinations for the hit-once and 10–13 of those for thehit-twice mode, depending on the test set/clustering scheme,
Figure 2. Affinity distribution of 3616 5-HT1AR ligands retrieved from the ChEMBL database version 5. Affinity distribution of3616 5-HT1AR ligands retrieved from the ChEMBL database version 5.doi: 10.1371/journal.pone.0084510.g002
A Linear Combination of Pharmacophore Hypotheses
PLOS ONE | www.plosone.org 4 December 2013 | Volume 8 | Issue 12 | e84510

Figure 3. A dendrogram obtained using the manual clustering procedure. A dendrogram obtained using the manualclustering procedure. The number of compounds comprising each cluster is given in brackets. The last column presents a featurecomposition of the pharmacophore model created for a given cluster. The feature abbreviations used are: hydrogen bond acceptor –A, hydrogen bond donor – D, hydrophobic group – H, positively charged group – P, aromatic ring – R.doi: 10.1371/journal.pone.0084510.g003
A Linear Combination of Pharmacophore Hypotheses
PLOS ONE | www.plosone.org 5 December 2013 | Volume 8 | Issue 12 | e84510
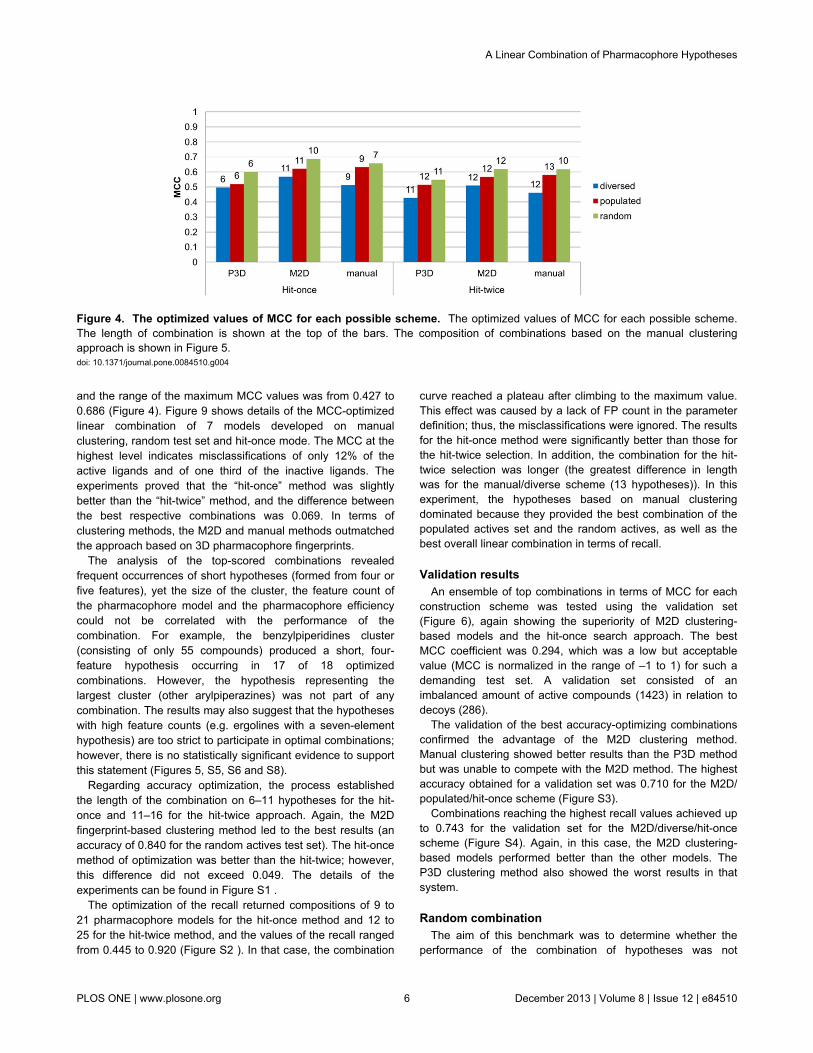
and the range of the maximum MCC values was from 0.427 to0.686 (Figure 4). Figure 9 shows details of the MCC-optimizedlinear combination of 7 models developed on manualclustering, random test set and hit-once mode. The MCC at thehighest level indicates misclassifications of only 12% of theactive ligands and of one third of the inactive ligands. Theexperiments proved that the “hit-once” method was slightlybetter than the “hit-twice” method, and the difference betweenthe best respective combinations was 0.069. In terms ofclustering methods, the M2D and manual methods outmatchedthe approach based on 3D pharmacophore fingerprints.
The analysis of the top-scored combinations revealedfrequent occurrences of short hypotheses (formed from four orfive features), yet the size of the cluster, the feature count ofthe pharmacophore model and the pharmacophore efficiencycould not be correlated with the performance of thecombination. For example, the benzylpiperidines cluster(consisting of only 55 compounds) produced a short, four-feature hypothesis occurring in 17 of 18 optimizedcombinations. However, the hypothesis representing thelargest cluster (other arylpiperazines) was not part of anycombination. The results may also suggest that the hypotheseswith high feature counts (e.g. ergolines with a seven-elementhypothesis) are too strict to participate in optimal combinations;however, there is no statistically significant evidence to supportthis statement (Figures 5, S5, S6 and S8).
Regarding accuracy optimization, the process establishedthe length of the combination on 6–11 hypotheses for the hit-once and 11–16 for the hit-twice approach. Again, the M2Dfingerprint-based clustering method led to the best results (anaccuracy of 0.840 for the random actives test set). The hit-oncemethod of optimization was better than the hit-twice; however,this difference did not exceed 0.049. The details of theexperiments can be found in Figure S1 .
The optimization of the recall returned compositions of 9 to21 pharmacophore models for the hit-once method and 12 to25 for the hit-twice method, and the values of the recall rangedfrom 0.445 to 0.920 (Figure S2 ). In that case, the combination
curve reached a plateau after climbing to the maximum value.This effect was caused by a lack of FP count in the parameterdefinition; thus, the misclassifications were ignored. The resultsfor the hit-once method were significantly better than those forthe hit-twice selection. In addition, the combination for the hit-twice selection was longer (the greatest difference in lengthwas for the manual/diverse scheme (13 hypotheses)). In thisexperiment, the hypotheses based on manual clusteringdominated because they provided the best combination of thepopulated actives set and the random actives, as well as thebest overall linear combination in terms of recall.
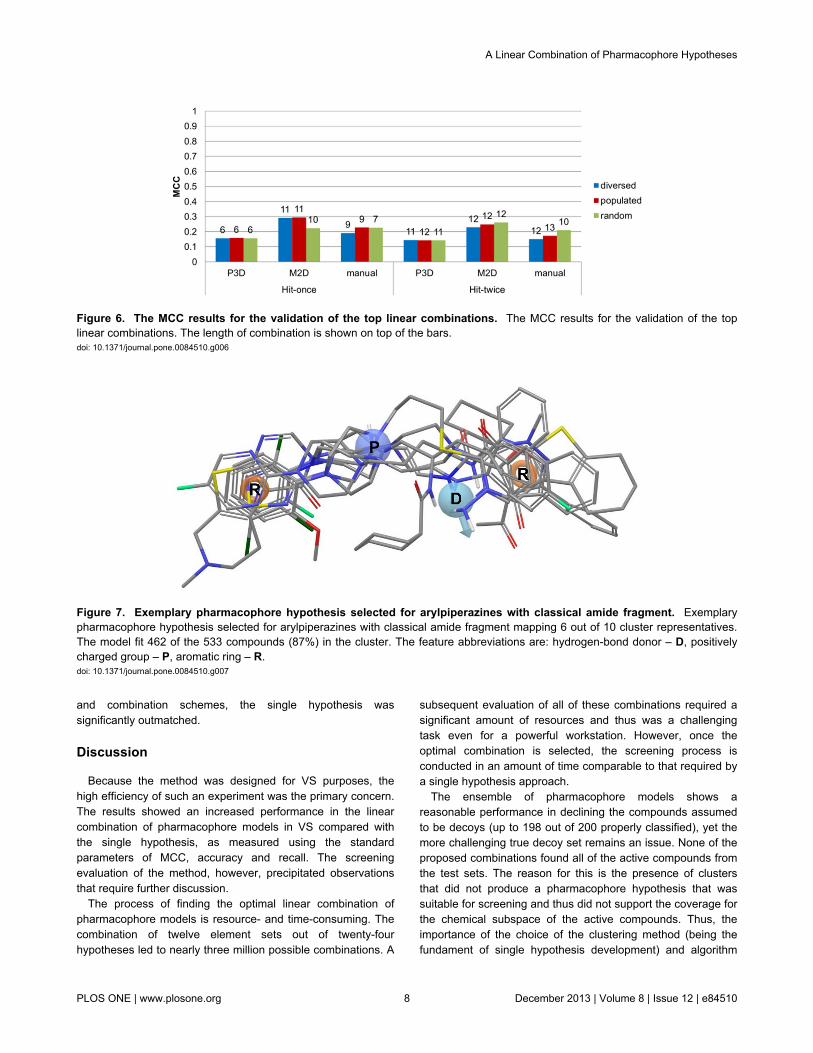
Validation resultsAn ensemble of top combinations in terms of MCC for each
construction scheme was tested using the validation set(Figure 6), again showing the superiority of M2D clustering-based models and the hit-once search approach. The bestMCC coefficient was 0.294, which was a low but acceptablevalue (MCC is normalized in the range of –1 to 1) for such ademanding test set. A validation set consisted of animbalanced amount of active compounds (1423) in relation todecoys (286).
The validation of the best accuracy-optimizing combinationsconfirmed the advantage of the M2D clustering method.Manual clustering showed better results than the P3D methodbut was unable to compete with the M2D method. The highestaccuracy obtained for a validation set was 0.710 for the M2D/populated/hit-once scheme (Figure S3).
Combinations reaching the highest recall values achieved upto 0.743 for the validation set for the M2D/diverse/hit-oncescheme (Figure S4). Again, in this case, the M2D clustering-based models performed better than the other models. TheP3D clustering method also showed the worst results in thatsystem.
Random combinationThe aim of this benchmark was to determine whether the
performance of the combination of hypotheses was not
Figure 4. The optimized values of MCC for each possible scheme. The optimized values of MCC for each possible scheme.The length of combination is shown at the top of the bars. The composition of combinations based on the manual clusteringapproach is shown in Figure 5.doi: 10.1371/journal.pone.0084510.g004
A Linear Combination of Pharmacophore Hypotheses
PLOS ONE | www.plosone.org 6 December 2013 | Volume 8 | Issue 12 | e84510

influenced by size alone. For the three schemes that generatedthe best combinations for the respective statistic parameter(M2D/random/hit-once for MCC and accuracy and M2D/populated/hit-once for recall), ten random collections ofhypotheses containing the same number of elements as theoptimized hypotheses (10 for MCC and recall and 8 foraccuracy) were prepared, and the respective statistics werecalculated and averaged. The results (Table 1) clearly showedthe superiority of the optimized combination over the randomhypotheses ensemble, especially in the case of MCC.
Single hypothesis benchmarkThe benchmark against the single pharmacophore
hypothesis was essential in comparing its performance with theproposed approach. To cover the full chemical space of the 5-HT1AR ligands, a representative from each cluster was selected(either a centroid or a random pick) to develop a single(universal) hypothesis that was then tested on the validationsets.
The results (Table 2) showed that the single hypothesisperformed similarly to the P3D-based combination ofhypotheses in terms of MCC. However, for all other parameters
Figure 5. A composition of each top-ranked linear combination obtained using the manual clustering procedure. Acomposition of each top-ranked linear combination obtained using the manual clustering procedure. Each filled square denotespresence of a hypothesis developed on a particular cluster in the optimal combination for appropriate conditions. Colors code thetype of the test set: blue – diverse, red – populated, and green – random. The last row contains the total number of hypothesesforming a respective top-ranked combination. The values of the optimized statistical parameters for manual clustering are shown inFigure 4, and those for accuracy and recall are shown in Figures S1 and S2, respectively. The exemplary linear combination(manual/random/hit-once; 7 hypotheses long) is shown in Figure 9.doi: 10.1371/journal.pone.0084510.g005
A Linear Combination of Pharmacophore Hypotheses
PLOS ONE | www.plosone.org 7 December 2013 | Volume 8 | Issue 12 | e84510
and combination schemes, the single hypothesis wassignificantly outmatched.
Discussion
Because the method was designed for VS purposes, thehigh efficiency of such an experiment was the primary concern.The results showed an increased performance in the linearcombination of pharmacophore models in VS compared withthe single hypothesis, as measured using the standardparameters of MCC, accuracy and recall. The screeningevaluation of the method, however, precipitated observationsthat require further discussion.
The process of finding the optimal linear combination ofpharmacophore models is resource- and time-consuming. Thecombination of twelve element sets out of twenty-fourhypotheses led to nearly three million possible combinations. A
subsequent evaluation of all of these combinations required asignificant amount of resources and thus was a challengingtask even for a powerful workstation. However, once theoptimal combination is selected, the screening process isconducted in an amount of time comparable to that required bya single hypothesis approach.
The ensemble of pharmacophore models shows areasonable performance in declining the compounds assumedto be decoys (up to 198 out of 200 properly classified), yet themore challenging true decoy set remains an issue. None of theproposed combinations found all of the active compounds fromthe test sets. The reason for this is the presence of clustersthat did not produce a pharmacophore hypothesis that wassuitable for screening and thus did not support the coverage forthe chemical subspace of the active compounds. Thus, theimportance of the choice of the clustering method (being thefundament of single hypothesis development) and algorithm
Figure 6. The MCC results for the validation of the top linear combinations. The MCC results for the validation of the toplinear combinations. The length of combination is shown on top of the bars.doi: 10.1371/journal.pone.0084510.g006
Figure 7. Exemplary pharmacophore hypothesis selected for arylpiperazines with classical amide fragment. Exemplarypharmacophore hypothesis selected for arylpiperazines with classical amide fragment mapping 6 out of 10 cluster representatives.The model fit 462 of the 533 compounds (87%) in the cluster. The feature abbreviations are: hydrogen-bond donor – D, positivelycharged group – P, aromatic ring – R.doi: 10.1371/journal.pone.0084510.g007
A Linear Combination of Pharmacophore Hypotheses
PLOS ONE | www.plosone.org 8 December 2013 | Volume 8 | Issue 12 | e84510
used should be adjusted to the goals of the screening. TheP3D method provided the best filter for decoy structures, but itsperformance in finding active compounds was significantlyweaker, thus lowering the measured VS parameters. However,M2D showed an increased rate of locating active compoundsat the cost of decoy recognition. M2D is the best method givenall optimized parameters. The performance of manualclustering appeared to be a balance between theaforementioned algorithms (the ratios of TP and TN wereacceptable), and the parameter-measured performance ofmanual clustering was not drastically lower than that for M2D.The manual division of compounds can to some extentcompete with automatic approaches; however, the timeconsumption and human factor impacting the final outcomeprovide disincentives to the wide use of manual clustering.Nevertheless, this splitting method provided structuralinformation unavailable from different approaches, andmoreover, reported the classification of entire chemical spaceof the 5-HT1AR ligands stored in ChEMBL.
The approach requiring the selection of one ligand using atleast two hypotheses appeared to be too strict. The results
proved that different hypotheses primarily do not overlap eachother, leading to an increased number of false negatives in theVS experiments and thus significantly reduced screeningparameter values.
Conclusions
The results showed improved performance of the proposedmethod in virtual screening experiments. All investigated VSparameters outmatched both single hypothesis and randomlinear combination approaches. The experiments also provedthat the automatic method of hierarchical clustering (based onthe MOLPRINT 2D fingerprint) is a good option for screening.The computational cost of optimization increased, but theoutcome compensated for that increase. Given the proposedmethod’s success, it will be incorporated into our screeningworkflow [9] and applied for the next extended set of targets.Further improvement of the script interface will be undertaken,thus making it usable for other research groups.
Figure 8. An optimization curve for the investigated parameters of a top-ranked linear combination of MCC. Anoptimization curve for the investigated parameters of a top-ranked linear combination of MCC (M2D/random/hit-once); arrowsindicate the maximum value: MCC reached a rate of 0.686 for 10 hypotheses (also see Figure 6); the optimization of accuracy andrecall had the highest values for a combination of 8 and 9 hypotheses, respectively (also see Figures S1 and S2).doi: 10.1371/journal.pone.0084510.g008
A Linear Combination of Pharmacophore Hypotheses
PLOS ONE | www.plosone.org 9 December 2013 | Volume 8 | Issue 12 | e84510

Figure 9. The best linear combination of pharmacophore models obtained for manual clustering and MCCoptimization. The best linear combination of pharmacophore models obtained for manual clustering and MCC optimization(manual/random/hit-once; see also Figures 4 and 6). For each hypothesis the best fitting compound is presented, along with amatrix of distances (in angstroms) between features and a name of cluster it was developed on. The feature abbreviations used are:hydrogen bond acceptor – A, hydrogen bond donor – D, hydrophobic group – H, positively charged group – P, aromatic ring – R.doi: 10.1371/journal.pone.0084510.g009
A Linear Combination of Pharmacophore Hypotheses
PLOS ONE | www.plosone.org 10 December 2013 | Volume 8 | Issue 12 | e84510

Table 1. A comparison between the optimized parameter values and those obtained for randomly selected combinationsconsisting of the same number of single hypotheses as optimized combinations.
Parameter Optimized Random SD Gaina
MCC 0.686 0.504 0.086 36.10%Accuracy 0.840 0.726 0.044 15.66%Recall 0.920 0.773 0.047 19.02%a Percent increase of the value of the optimized statistical parameters compared with random combinationsThe random values from ten different random linear combinations are averaged.doi: 10.1371/journal.pone.0084510.t001
Table 2. A comparison between a single hypothesis and a linear combination of pharmacophore models.
Clustering approach Selection method Hypothesis composition Actives Decoys MCC Accuracy Recall
TP FN TN FP universal optimized universal optimized universal optimizedP3D centroid APRR 459 964 250 36 0.162 0.158 0.415 0.474 0.323 0.424 random AAPR 456 967 241 45 0.134 0.158 0.408 0.474 0.32 0.424M2D centroid AHPR 639 784 227 59 0.184 0.294 0.507 0.71 0.449 0.743 random APRR 442 981 248 38 0.148 0.294 0.404 0.71 0.311 0.743manual centroid APRR 399 1024 251 35 0.136 0.227 0.38 0.548 0.28 0.665 random APRR 390 1033 252 34 0.134 0.227 0.376 0.548 0.274 0.665
doi: 10.1371/journal.pone.0084510.t002
A Linear Combination of Pharmacophore Hypotheses
PLOS ONE | www.plosone.org 11 December 2013 | Volume 8 | Issue 12 | e84510
Supporting Information
Figure S1. The optimized values of accuracy for eachpossible scheme. Length of combination is shown on top ofthe bars.(TIF)
Figure S2. The optimized values of recall for eachpossible scheme. Length of combination is shown on top ofthe bars.(TIF)
Figure S3. The accuracy results of the validation of toplinear combinations. Length of combination is shown on topof the bars.(TIF)
Figure S4. The recall results of the validation of top linearcombinations. Length of combination is shown on top of thebars.(TIF)
Figure S5. A composition of each top ranked linearcombination, obtained for P3D clustering procedure. Thelength row contains the total number of hypotheses forming arespective top ranked combination. Values of optimizedstatistical parameters for manual clustering are shown in 4 andfor accuracy and recall in Figures S1 and S2, respectively.(TIF)
Figure S6. A composition of each top ranked linearcombination, obtained for M2D clustering procedure. The
length row contains the total number of hypotheses forming arespective top ranked combination. Values of optimizedstatistical parameters for manual clustering are shown in Figure4 and for accuracy and recall in Figures S1 and S2,respectively.(TIF)
Figure S7. Pseudocode of in-house script (about 300lines) used for the search for the best linear combination.(PDF)
Figure S8. Venn diagrams containing numbers ofelements common for the same optimizing schema(clustering approach/actives test set/hit mode) for differentscreening parameters. Number in overlapping area indicateselements present in two or more linear combinations. Numberof hypotheses not used in any of the top-ranked combinationsis beyond the circles. Numbers in circles sum up to the size ofthe given top combination (Figures 5, S5 and S6).(TIF)
Author Contributions
Conceived and designed the experiments: DW AJB. Performedthe experiments: DW KK AJB. Analyzed the data: DW SM AJB.Contributed reagents/materials/analysis tools: SM RK. Wrotethe manuscript: DW SM ZC IS AJB.
References
1. Güner OF (2002) History and evolution of the pharmacophore conceptin computer-aided drug design. Curr Top Med Chem 2: 1321–1332.doi:10.2174/1568026023392940. PubMed: 12470283.
2. Van Drie JH (2003) Pharmacophore discovery--lessons learned. CurrPharm Des 9: 1649–1664. doi:10.2174/1381612033454568. PubMed:12871063.
3. IUPAC Glossary of Terms used in Medicinal Chemistry. Available:http:// www.chem.qmul.ac.uk/iupac/medchem. (Accessed March 27,2012)
4. Ren J-X, Li L-L, Zheng R-L, Xie H-Z, Cao Z-X et al. (2011) Discovery ofnovel Pim-1 kinase inhibitors by a hierarchical multistage virtualscreening approach based on SVM model, pharmacophore, andmolecular docking. J Chem Inf Model 51: 1364–1375. doi:10.1021/ci100464b. PubMed: 21618971.
5. Brunskole Svegelj M, Turk S, Brus B, Lanisnik Rizner T, Stojan J et al.(2011) Novel inhibitors of trihydroxynaphthalene reductase withantifungal activity identified by ligand-based and structure-based virtualscreening. J Chem Inf Model 51: 1716–1724. doi:10.1021/ci2001499.PubMed: 21667970.
6. Svensson F, Karlén A, Sköld C (2012) Virtual screening data fusionusing both structure- and ligand-based methods. J Chem Inf Model 52:225–232. doi:10.1021/ci2004835. PubMed: 22148635.
7. Chiu T-L, Amin E a (2012) Development of a Comprehensive,Validated Pharmacophore Hypothesis for Anthrax Toxin Lethal Factor(LF) Inhibitors Using Genetic Algorithms, Pareto Scoring, and StructuralBiology. J Chem Inf Model 52: 1886-1897. doi:10.1021/ci300121p.PubMed: 22697455.
8. Manepalli S, Geffert LM, Surratt CK, Madura JD (2011) Discovery ofnovel selective serotonin reuptake inhibitors through development of a
protein-based pharmacophore. J Chem Inf Model 51: 2417–2426. doi:10.1021/ci200280m. PubMed: 21834587.
9. Kurczab R, Nowak M, Chilmonczyk Z, Sylte I, Bojarski AJ (2010) Thedevelopment and validation of a novel virtual screening cascadeprotocol to identify potential serotonin 5-HT(7)R antagonists. BioorgMed Chem Lett 20: 2465–2468
10. Zajdel P, Kurczab R, Grychowska K, Satała G, Pawłowski M et al.(2012) The multiobjective based design, synthesis and evaluation ofthe arylsulfonamide/amide derivatives of aryloxyethyl- and arylthioethyl-piperidines and pyrrolidines as a novel class of potent 5-HT(7) receptorantagonists. Eur J Med Chem 56: 348–360. doi:10.1016/j.ejmech.2012.07.043. PubMed: 22926225.
11. Durdagi S, Duff HJ, Noskov SY (2011) Combined receptor and ligand-based approach to the universal pharmacophore model developmentfor studies of drug blockade to the hERG1 pore domain. J Chem InfModel 51: 463–474. doi:10.1021/ci100409y. PubMed: 21241063.
12. Sanders MPa, Verhoeven S, de Graaf C, Roumen L, Vroling B et al.(2011) Snooker: a structure-based pharmacophore generation toolapplied to class A GPCRs. J Chem Inf Model 51: 2277–2292. doi:10.1021/ci200088d. PubMed: 21866955.
13. Hibert MF, Gittos MW, Middlemiss DN, Mir a K, Fozard JR (1988)Graphics computer-aided receptor mapping as a predictive tool for drugdesign: development of potent, selective, and stereospecific ligands forthe 5-HT1A receptor. J Med Chem 31: 1087–1093
14. Mellin C, Vallgårda J, Nelson DL, Björk L, Yu H et al. (1991) A 3-Dmodel for 5-HT1A-receptor agonists based on stereoselective methyl-substituted and conformationally restricted analogues of 8-hydroxy-2-(dipropylamino)tetralin. J Med Chem 34: 497–510. doi:10.1021/jm00106a004. PubMed: 1995871.
A Linear Combination of Pharmacophore Hypotheses
PLOS ONE | www.plosone.org 12 December 2013 | Volume 8 | Issue 12 | e84510

15. Agarwal A, Pearson PP, Taylor EW, Li HB, Dahlgren T et al. (1993)Three-dimensional quantitative structure-activity relationships of 5-HTreceptor binding data for tetrahydropyridinylindole derivatives: acomparison of the Hansch and CoMFA methods. J Med Chem 36:4006–4014. doi:10.1021/jm00077a003. PubMed: 8258822.
16. Orús L, Pérez-Silanes S, Oficialdegui A-M, Martínez-Esparza J, DelCastillo J-C et al. (2002) Synthesis and molecular modeling of new 1-aryl-3-[4-arylpiperazin-1-yl]-1-propane derivatives with high affinity atthe serotonin transporter and at 5-HT(1A) receptors. J Med Chem 45:4128–4139. doi:10.1021/jm0111200. PubMed: 12213056.
17. Sleight AJ, Peroutka SJ (1991) Identification of 5-hydroxytryptamine1Areceptor agents using a composite pharmacophore analysis andchemical database screening. N-S arch pharmacol 343: 109–116
18. Chidester CG, Lin CH, Lahti RA, Haadsma-Svensson SR, Smith MW(1993) Comparison of 5-HT1A and dopamine D2 pharmacophores. X-ray structures and affinities of conformationally constrained ligands. JMed Chem 36: 1301–1315. doi:10.1021/jm00062a001. PubMed:8496900.
19. Mokrosz MJ, Duszynska B, Bojarski AJ, Mokrosz JL (1995) Structure-activity relationship studies of CNS agents--XVII. Spiro[piperidine-4’, 1-(1,2,3,4-tetrahydro-beta-carboline)] as a probe defining the extendedtopographic model of 5-HT1A receptors. Bioorgan Med Chem 3: 533–538.
20. Langlois M, Brémont B, Rousselle D, Gaudy F (1993) Structuralanalysis by the comparative molecular field analysis method of theaffinity of beta-adrenoreceptor blocking agents for 5-HT1A and 5-HT1Breceptors. Eur J Pharmacol 244: 77–87. doi:10.1016/0922-4106(93)90061-D. PubMed: 8093601.
21. Van Steen BJ, van Wijngaarden I, Tulp MT, Soudijn W (1994)Structure-affinity relationship studies on 5-HT1A receptor ligands. 2.Heterobicyclic phenylpiperazines with N4-aralkyl substituents. J MedChem 37: 2761–2773. doi:10.1021/jm00043a015. PubMed: 8064803.
22. Bojarski AJ (2006) Pharmacophore models for metabotropic 5-HTreceptor ligands. Curr Top Med Chem 6: 2005–2026. doi:10.2174/156802606778522186. PubMed: 17017971.
23. Franchini S, Prandi A, Sorbi C, Tait A, Baraldi A et al. (2010) Discoveryof a new series of 5-HT1A receptor agonists. Bioorg Med Chem Lett20: 2017–2020. doi:10.1016/j.bmcl.2010.01.030. PubMed: 20185311.
24. Lepailleur A, Bureau R, Paillet-Loilier M, Fabis F, Saettel N et al. (2005)Molecular modeling studies focused on 5-HT7 versus 5-HT1Aselectivity. Discovery of novel phenylpyrrole derivatives with highaffinity for 5-HT7 receptors. J Chem Inf Model 45: 1075–1081. doi:10.1021/ci050045p. PubMed: 16045303.
25. Chilmonczyk Z, Szelejewska-Wozniakowska A, Cybulski J, Cybulski M,Koziol AE et al. (1997) Conformational flexibility of serotonin1Areceptor ligands from crystallographic data. Updated model of thereceptor pharmacophore. Arch Pharm 330: 146–160. doi:10.1002/ardp.19973300507.
26. Weber KC, Salum LB, Honório KM, Andricopulo AD, da Silva ABF(2010) Pharmacophore-based 3D QSAR studies on a series of highaffinity 5-HT1A receptor ligands. Eur J Med Chem 45: 1508–1514. doi:10.1016/j.ejmech.2009.12.059. PubMed: 20133028.
27. Sanders MP a, Barbosa AJM, Zarzycka B, Nicolaes G a F, Klomp JPG,et al. (2012) Comparative analysis of pharmacophore screening tools. JChem Inf Model 52: 1607–1620
28. Hoyer D, Hannon JP, Martin GR (2002) Molecular, pharmacologicaland functional diversity of 5-HT receptors. Pharmacol Biochem Behav
71: 533–554. doi:10.1016/S0091-3057(01)00746-8. PubMed:11888546.
29. Lanfumey L, Hamon M (2004) 5-HT 1 Receptors. Current Drug Targets- CNS Neurol Disord: 1–10.
30. Paluchowska MH, Mokrosz MJ, Bojarski A, Wesołowska A, Borycz J etal. (1999) On the bioactive conformation of NAN-190 (1) and MP3022(2), 5-HT(1A) receptor antagonists. J Med Chem 42: 4952–4960. doi:10.1021/jm991045h. PubMed: 10585205.
31. Bojarski AJ, Paluchowska MH, Duszyńska B, Kłodzińska A,Tatarczyńska E et al. (2005) 1-Aryl-4-(4-succinimidobutyl)piperazinesand their conformationally constrained analogues: synthesis, binding toserotonin (5-HT1A, 5-HT2A, 5-HT7), alpha1-adrenergic, anddopaminergic D2 receptors, and in vivo 5-HT1A functionalcharacteristics. Bioorg Med Chem 13: 2293–2303. doi:10.1016/j.bmc.2004.12.041. PubMed: 15727878.
32. Paluchowska MH, Bojarski AJ, Charakchieva-Minol S, Wesołowska A(2002) Active conformation of some arylpiperazine postsynaptic 5-HT(1A) receptor antagonists. Eur J Med Chem 37: 273–283. doi:10.1016/S0223-5234(01)01312-5. PubMed: 11960662.
33. Nowak M, Kołaczkowski M, Pawłowski M, Bojarski AJ (2006) Homologymodeling of the serotonin 5-HT1A receptor using automated docking ofbioactive compounds with defined geometry. J Med Chem 49: 205–214. doi:10.1021/jm050826h. PubMed: 16392805.
34. Ngo T, Nicholas TJ, Chen J, Finch AM, Griffith R (2013) 5-HT1Areceptor pharmacophores to screen for off-target activity of α1-adrenoceptor antagonists. J Comput Aided Mol Des 27: 305–319. doi:10.1007/s10822-013-9647-5. PubMed: 23625023.
35. ChEMBL_05, ChEMBL-EBI. http://www.ebi.ac.uk/chembldb/ index.php(accessed August 30 , 2010)
36. Wishart DS, Knox C, Guo AC, Cheng D, Shrivastava S et al. (2008)DrugBank: a knowledgebase for drugs, drug actions and drug targets.Nucleic Acids Res 36: D901–D906. PubMed: 18048412.
37. ChEMBL_10, ChEMBL-EBI. http://www.ebi.ac.uk/chembldb/ index.php(accessed May 28, 2011) .
38. Sastry M, Lowrie JF, Dixon SL, Sherman W (2010) Large-scalesystematic analysis of 2D fingerprint methods and parameters toimprove virtual screening enrichments. J Chem Inf Model 50: 771–784.doi:10.1021/ci100062n. PubMed: 20450209.
39. Canvas, version 1.4, Schrӧdinger, LLC, New York, NY, 201140. Kelly J (1956) A new interpretation of information rate. IEEE T INFORM
Theory 2: 185–189. doi:10.1109/TIT.1956.1056803.41. Caliendo G, Santagada V, Perissutti E, Fiorino F (2005) Derivatives as
5HT1A receptor ligands. Past and Present - Curr Med Chem 12: 1721–1753.
42. Olivier B, Soudijn W, van Wijngaarden I (1999) The 5-HT1A receptorand its ligands: structure and function. Prog Drug Res 52: 103–165.PubMed: 10396127.
43. Oh SJ, Ha HJ, Chi DY, Lee HK (2001) Serotonin receptor andtransporter ligands - current status. Curr Med Chem 8: 999–1034. doi:10.2174/0929867013372599. PubMed: 11472239.
44. López-Rodríguez ML, Ayala D, Benhamú B, Morcillo MJ, Viso a (2002)Arylpiperazine derivatives acting at 5-HT(1A) receptors. Curr MedChem 9: 443–469. doi:10.2174/0929867023371030. PubMed:11945120.
45. Phase, version 3.3, Schrӧdinger, LLC, New York, NY, 201146. Keiser MJ, Roth BL, Armbruster BN, Ernsberger P, Irwin JJ, Shoichet
BK (2007) Relating protein pharmacology by ligand chemistry. NatBiotechnol 25: 197-206. doi:10.1038/nbt1284. PubMed: 17287757.
A Linear Combination of Pharmacophore Hypotheses
PLOS ONE | www.plosone.org 13 December 2013 | Volume 8 | Issue 12 | e84510