A light and electron microscopic study of the development of ...
451
Retrospective eses and Dissertations 1983 A light and electron microscopic study of the development of antheridia in Onoclea sensibilis L Jane Louise Kotenko Iowa State University Follow this and additional works at: hp://lib.dr.iastate.edu/rtd Part of the Botany Commons is Dissertation is brought to you for free and open access by Digital Repository @ Iowa State University. It has been accepted for inclusion in Retrospective eses and Dissertations by an authorized administrator of Digital Repository @ Iowa State University. For more information, please contact [email protected]. Recommended Citation Kotenko, Jane Louise, "A light and electron microscopic study of the development of antheridia in Onoclea sensibilis L " (1983). Retrospective eses and Dissertations. Paper 8494.
-
Upload
khangminh22 -
Category
Documents
-
view
0 -
download
0
Transcript of A light and electron microscopic study of the development of ...
Retrospective Theses and Dissertations
1983
A light and electron microscopic study of thedevelopment of antheridia in Onoclea sensibilis LJane Louise KotenkoIowa State University
Follow this and additional works at: http://lib.dr.iastate.edu/rtd
Part of the Botany Commons
This Dissertation is brought to you for free and open access by Digital Repository @ Iowa State University. It has been accepted for inclusion inRetrospective Theses and Dissertations by an authorized administrator of Digital Repository @ Iowa State University. For more information, pleasecontact [email protected].
Recommended CitationKotenko, Jane Louise, "A light and electron microscopic study of the development of antheridia in Onoclea sensibilis L " (1983).Retrospective Theses and Dissertations. Paper 8494.
INFORMATION TO USERS
This reproduction was made from a copy of a document sent to us for microfilming. While the most advanced technology has been used to photograph and reproduce this document, the quality of the reproduction is heavily dependent upon the quality of the material submitted.
The following explanation of techniques is provided to help clarify markings or notations which may appear on this reproduction.
1. The sign or "target" for pages apparently lacking from the document photographed is "Missing Page(s)". If it was possible to obtain the missing page(s) or section, they are spliced into the film along with adjacent pages. This may have necessitated cutting through an image and duplicating adjacent pages to assure complete continuity.
2. When an image on the film is obliterated with a round black mark, it is an indication of either blurred copy because of movement during exposure, duplicate copy, or copyrighted materials that should not have been filmed. For blurred pages, a good image of the page can be found in the adjacent frame. If copyrighted materials were deleted, a target note will appear listing the pages in the adjacent frame.
3. When a map, drawing or chart, etc., is part of the material being photographed, a definite method of "sectioning" the material has been followed. It is customary to begin filming at the upper left hand comer of a large sheet and to continue from left to right in equal sections with small overlaps. If necessary, sectioning is continued again-beginning below the first row and continuing on until complete.
4. For illustrations that cannot be satisfactorily reproduced by xerographic means, photographic prints can be purchased at additional cost and inserted into your xerographic copy. These prints are available upon request from the Dissertations Customer Services Department.
5. Some pages in any document may have indistinct print. In all cases the best available copy has been filmed.
Uni
International 300 N. Zeeb Road Ann Arbor, Ml 48106

8407093
Kotenko, Jane Louise
A LIGHT AND ELECTRON MICROSCOPIC STUDY OF THE DEVELOPMENT OF ANTHERIDIA IN ONOCLEA SENSIBILIS L (VOLUMES I AND II)
Iowa State University PH.D. 1983
University Microfilms
I ntGrnâtiOnâl 300 N. Zeeb Road, Ann Arbor, Ml 48106


PLEASE NOTE:
In all cases this material heis been filmed in the best possible way from the available copy. Problems encountered with this document have been identified here with a check mark V .
1. Glossy photographs or pages
2. Colored illustrations, paper or print
3. Photographs with dark background
4. Illustrations are poor copy
5. Pages with black marks, not original copy
6. Print shows through as there is text on both sides of page
7. Indistinct, broken or small print on several pages \X
8. Print exceeds margin requirements
9. Tightly bound copy with print lost in spine
10. Computer printout pages with indistinct print
11. Page(s) lacking when material received, and not available from school or author.
12. Page(s) seem to be missing in numbering only as text follows.
13. Two pages numbered . Text follows.
14. Curling and wrinkled pages
15. Other
University Microfilms
International

A light and electron microscopic study of the
development of antheridia in Onoclea sensibilis L.
by
Jane Louise Kotenko
Volume 1 of 2
 Dissertation Submitted to the
Graduate Faculty in Partial Fulfillment of the
Requirements for the Degree of
DOCTOR OF PHILOSOPHY
Major: Botany
Approved :
In Charge of Major Work
For the Major Depaj^roient
For the Gradi fee College
Iowa State University Ames, Iowa
1983
Signature was redacted for privacy.
Signature was redacted for privacy.
Signature was redacted for privacy.
ii
TABLE OF CONTENTS
Page
PREFACE iv
INTRODUCTION 1
LITERATURE REVIEW 5
Taxonomic Classification 5
Gametophyte Morphology 5
Cellular Anatomy of Fern Gametophytes 10
Antheridiogens and Antheridium Formation 15
Location of Antheridium Initials 18
Antheridium Morphology 21
Spermatogenesis 32
MATERIALS AND METHODS 35
Culture Conditions 35
Light Microscopy (LM) 40
Transmission Electron Microscopy (TEM) 47
Scanning Electron Microscopy (SEM) 47
RESULTS 49
Preliminary Experiments 49
Gametophyte Growth Data 55
Antheridium Developmental Data 72
Vegetative Cell Development and Structure 113
Cellular Changes during the Division Phase of Antheridium Initiation and Development 121
Cellular Changes during the Differentiation of Spermatids into Spermatozoids 161
DISCUSSION AND CONCLUSIONS 171
ill
Growth of Gametophytes 171
Induction and Location of Initials In Relation to Gameto-phyte Physiology 174
Formation of Initials from Asymmetric Cell Divisions 182
Comparative Antheridium Morphology 191
Spermatogenesis 209
BIBLIOGRAPHY 226
ACKNOWLEDGMENTS 241
APPENDIX A: KEY TO LABELING 242
APPENDIX B: FIGURES 244
APPENDIX C: CULTURE MEDIUM PREPARATION 419
APPENDIX D: GAMETOPHYTE CLEARING TECHNIQUE AND METHODS OF DATA COLLECTION 421
Clearing Technique and Slide Preparation 421
Gametophyte Collection 421
Data Collection and Analysis 421
APPENDIX E: FORMULAE AND SCHEDULES 425
APPENDIX F: MEAN VALUES AND CONFIDENCE INTERVALS 431
iv
PREFACE
This dissertation is dedicated to the memory of Gregory Bateson,
anthropologist/psychologist/cyberneticist, son of William Bateson,
geneticist. Bateson spent his whole life searching for the "pattern
which connects" all living creatures with each other.
My interests, either directly or indirectly, have involved studying
the continuum or cycling of life. A fundamental question concerns how
an organism can recreate itself by producing two very specialized cells,
the sperm and the egg.
This present study was conducted to investigate part of a fern life
cycle; in particular, the formation of male gametangia and the eventual
formation of sperms. I have experienced similar feelings to those ex
pressed by Lewis Thomas (1974), Chancellor of Sloan-Kettering Cancer
Institute, as he wrote about human embryology. "For the real amaze
ment, if you want to be amazed, is the process. You start out as a
single cell derived from the coupling of a sperm and an egg, this
divides into two, then four, then eight, and so on, and at a certain
stage there emerges a single cell which will have as all its progeny,
the human brain. The mere existence of that cell should be one of
the great astonishments of the earth. People ought to be walking
around all day, all through their waking hours, calling to each other
in endless wonderment, talking of nothing except that cell."
To be realistic, my amazement of living systems is often tempered
with everyday frustrations and pressures, spawning self-doubts about
the importance of science. Lewis Thomas (1974) has been able to place
V
into perspective for me the phenomena of science and scientists. "The
most mysterious aspect of... science is the way it is done. Not the
routine, not just the fitting together of things that no one had guessed
at fitting, not the making of connections; these are merely the workaday
details, the methods of operating. They are interesting, but not as
fascinating as the central mystery, which Is that we do it at all, and
that we do it under such compulsion.... It sometimes looks like a
lonely activity, but it is as much the opposite of lonely as human
behavior can be. There is nothing so social, so communal, so inter
dependent.... It is instinctive behavior in my view, and I do not under
stand how it works.... While it is going on, it looks and feels like
aggression: get at it, uncover it, bring it out, grab it, it's mine I
It is like a primitive running hunt, but there is nothing at the end
to be injured. More probably the end is a sigh. But then, if the air
is right and the science is going well, the sigh is immediately inter
rupted, there is a yawping new question, and the wild, tumbling activity
begins once more, out of control all over again."
I believe that being a scientist is Instinctual, for I have ex
perienced total dissolution of frustrations during the discovery of a
new developmental stage. When I wonder whether my work is significant
or not, I think of the answer given by Gandhi. "Whatever you do will
be insignificant, but it is very Important that you do it."
1
INTRODUCTION
This study was designed to investigate, using light and electron micros
copy, the morphological and anatomical changes which occur during the ini
tiation and subsequent development of sperm-producing structures known as
antheridia. All sexually reproducing homosporous plants form antheridia
during the gametophytic stage of their life cycle, but antheridium morphol
ogy and mode of development vary greatly among different taxonomic groups.
Onoclea sensibilis L.. an advanced, leptosporangiate fern was
selected as the experimental organism in this study due to the simplicity
of its antheridia, composed of only three sterile, jacket cells sur
rounding the spermatogenous tissue. Each antheridium arises from an
asymmetric cell division in one of the vegetative cells of a morpho
logically simple gametophyte plant. The fast-growing gametophytes are
less than 1 mm in length and width at sexual maturity and are composed
of only one layer of chlorenchymatous vegetative cells.
Onoclea sensibilis L. gametophytes respond strongly to an antheridium-
inducing substance known as Antheridiogen Pt (A^^). The A^^ is produced
by Pteridium aquilinum (L.) Kuhn gametophytes and has the ability Lo
induce antheridia in Onoclea gametophytes within a few days, whereas,
Onoclea gametophytes grown in standard culture conditions do not form
antheridia in the time period covered by experiments in this study.
The simple morphology of Onoclea gametophytes readily allows for
measurements of vegetative cell sizes, shapes, and numbers and for
observations on the location of new antheridium initials and the number
of cells within maturing antheridia. Using these characteristics as
2
parameters, the effects of axenic culture conditions and treatment
times and concentrations on the induction period of antheridium formation
and the number and location of antheridia can be monitored.
The simplicity, controllability, and predictability of gametophyte
vegetative and reproductive growth forms provide an excellent system in
which to study cellular differentiation and antheridium development.
Gametophytes can be selectively harvested and processed for examination
of various stages in antheridium development using light and electron
microscopic techniques.
Although fern gametophytes are morphologically simple, the stability
of their morphology under specified conditions and their ability to form
differentiated organs and cell types, such as rhizoids and trichomes,
attest to an internal physiological complexity. Representatives of all
five hormone groups found in higher plants are also present in fern
gametophytes and the ultrastructure of gametophyte vegetative cells is
comparable to chlorenchyma in higher plants. Thus, fern gametophytes,
as experimental organisms, have the advantage of providing a simple
system in which to study complex developmental pathways, comparable in
many ways to higher plants.
No previous studies have investigated the ultrastructural changes
which accompany the initiation of antheridia in ferns and only three
previous reports have mentioned changes which occurred at the light
microscope level. Nevertheless, a generalized description of thé process
of fern antheridium initiation arose in the early literature and has
been accepted unquestioningly in the recent literature.
Alternatively, there is much controversy in the literature in
3
volving developmental aspects of the first four cell divisions in the
initials with respect to the orientation of the spindle apparatus, the
orientation of the subsequent cell wall, and the manner in which the
phragmoplast and cell wall proceed to form. Three different theories
have been proposed to explain the development of the sterile jacket
cells during the first four cell divisions.
Due to the availability of older stages in antheridium development,
this study is expanded to include observations of events during
spermatogenesis. Ultrastructural changes will be observed both in
spermatogenous cells during the division phase and in spermatids developing
into spermatozoids during the differentiation phase. Spermatogenic
events in three other homosporous fern species have been investigated
in detail, but some key developmental events have not yet been described.
In essence, this study is concerned with all aspects of fern
spermatogenesis, which in reality, begins with the formation of the
antheridium initial. Specifically, this study serves six main pur
poses: 1) to add comparative information on the effects of sterilization
and time and concentration of application on gametophyte growth and
antheridium formation; 2) to add correlative information on antheridium
location sites with respect to internal gradients of fern gametophytes ;
3) to provide clarifying information on antheridium morphology and de
velopment in advanced, leptosporangiate ferns; 4) to provide comparative
information on developmental pathways which involve asymmetric cell
divisions and differentiation; 5) to provide new and comparative in
formation on fern spermatogenesis; and 6) to provide a structural

4
foundation for future studies Investigating physiological and physical
factors involved in antherldlum initiation.
5
LITERATURE REVIEW
Taxonomic Classification
The onocleoid ferns, composed of three genera, Onoclea. Onocleopsis.
and Matteuccia. have been variously classified over the years. The most
recent study on the systematics of the group was done by Lloyd (1971)
who placed the group in the family Aspidiaceae as a subfamily,
Onocleoideae. Lloyd used the phylogenetic scheme proposed by Wagner
(1969). In the most recent scheme by Wagner (1974a), the Aspidiaceae
has been combined into the subfamily Dryopteridoideae within the family
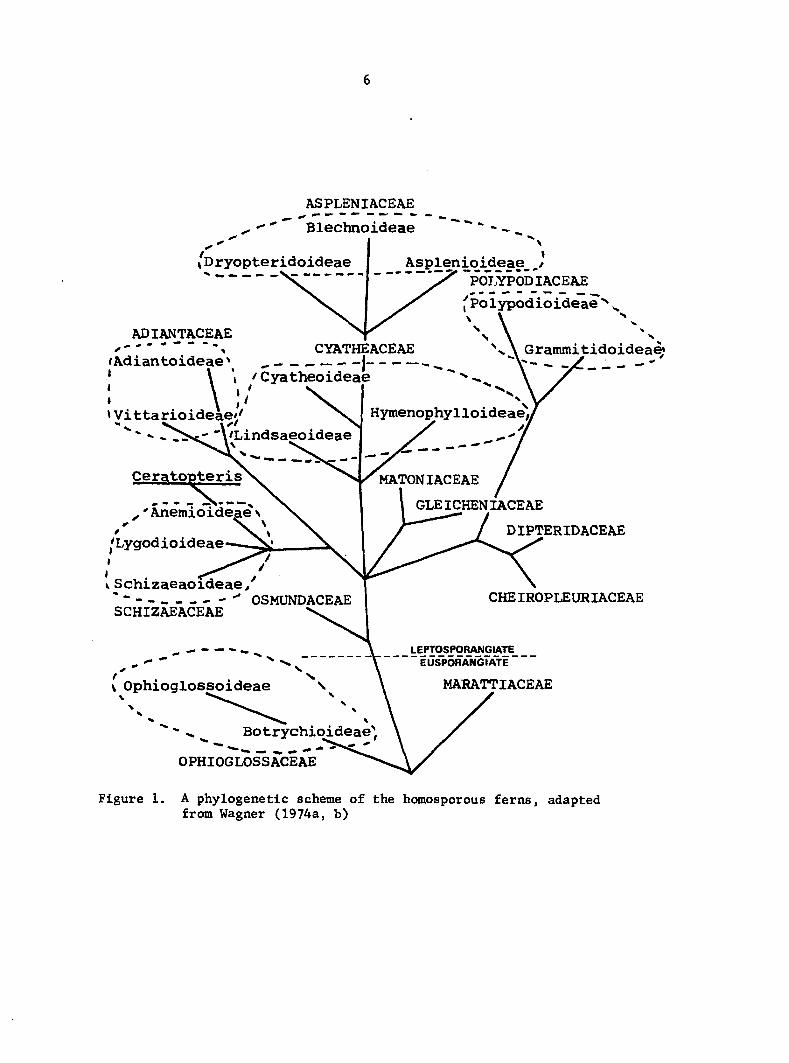
Aspleniaceae. For the comparative purposes of this study, the scheme
proposed by Wagner (1974a, b) will be used and is diagrammatically shown in
Figure 1. Onoclea sensibilis is thus classified as a member of the most
advanced family of ferns.
Gametophyte Morphology
The most recent, comprehensive treatise on comparative morphology
of fern gametophytes was compiled by Nayar and Kaur (1971). They recog
nized eight different patterns of gametophyte (commonly known as a
prothallus) development with five ultimate shapes, including tuberous,
filamentous, cordate, strap-like, and ribbon-like. The most common
shape is the cordate- or heart-shape, which is exemplified by the
Aspleniaceae and which occurs in many other families.
Development of a prothallus begins with the germination of a
haploid spore. The chlorophyllous spores of Onoclea germinate rapidly
in moist environments, as do all chlorophyllous spores, in about 1-3
6
ASPLENIACEAE
Blechnoideae
»Dryopteridoideae Asplenioideae , POT.YPODIACEAE
^Polypodioideae'
ADIANTACEAE ... CYATHEACEAE
'Adiantoideae ^ j . ' * ' Cyatheoideae
\
Grammitidoidea©
J « » Vittarioideàe.
i Xf Hymenophy1loidea^
y 'Anemioide, •
/
j'Lygodioideae
pre: MATONIACEAE
LEPTOSPORANGIATE ÊUSPOR/TNCrATÊ
DIPTERIDACEAE
V S Chi zaeaoideae, OSMUNDACEAE
SCHIZAEACEAE
V Ophioglossoideae \ V ^ >
%
CHEIROPLEURIACEAE
MARATTIACEAE
^ Botrychiqideae^,
OPHIOGLOSSACEAE
Figure 1. A phylogenetic scheme of the homosporous ferns, adapted from Wagner (1974a, b)
7
days (Dyer, 1979; Lloyd, 1971). According to Nayar and Kaur (1971),
prothallial development in Onoclea is of the Aspidium-type. The spore
cell divides transversely four times to produce a filament of four
prothallial cells and a basal rhizoid. The apical cell then divides
obliquely to begin the formation of a two-dimensional plate of
prothallial cells. Eventually, when there are about 20 cells in the
plate, one of the marginal, anterior cells functions as an apical
initial which forms a "notched" meristem composed of a U-shaped, marginal
row of cells. Due to cell division and elongation in this region, a
cordate prothallus forms. This description is consistent with the
description given by Lloyd (1971). However, according to Miller and
Miller (1964), Onoclea spores germinated and typically formed a filament
of two cells. These two cells immediately divided longitudinally to
form a two-dimensional thallus of four cells. The upper two cells
continued to divide to form a plate of prothallial cells. They did
not follow later development, but it is presumably similar to the above
description.
A cordate prothallus has four basic regions, consisting of the notch
meristem, two wing regions, a median midrib or central region, and a
basal region (Nayar and Kaur, 1971). The basal cells generally form
rhizoids, which are long, thin, clear cells implicated in anchorage and
absorption (Cran, 1979; Nayar and Kaur, 1971). The cells in the central
and wing regions normally do not divide unless they are induced to form
gametangia or trichomes (Grotty, 1967; Lloyd, 1971). In mature
gametophytes of Onoclea. antheridia are formed both in the central
region and on the inner two-thirds of the wings (Lloyd, 1971). Marginal
8
cells of the wings of Onoclea commonly form trichomes, small, unicellular,
papillate cells, and eventually cells in the central region will form
these trichomes which often secrete waxy substances (Lloyd, 1971;
Nayar and Kaur, 1971). The sole function of the notch meristem regions
is to produce new vegetative cells (Grotty, 1967).
In cordate gametophytes, the cells of the meristem are small and
isodlame trie, the cells in the central and wing regions undergo the
greatest elongation, while the cells at the base are quite large and
often isodiametric (Naf et al., 1975; Reuter, 1953). Cordate gametophytes
do maintain a plasticity of shape and growth that can be released under
variable culture conditions involving light, temperature, pH, nutrients,
chemicals and hormones, and biotic factors such as spore density (Dyer,
1979; Miller, 1968). For example, gametophytes grown in red light
will often grow indefinitely as filaments, whereupon transfer to blue
light causes them to grow two-dimensionally (Miller, 1968).
There is seme evidence that fungal contamination affects gametophyte
development, either enhancing growth or, in some cases, inhibiting
growth (Dyer, 1979). In order to keep experimental gametophytes free
of other organisms, the spores are often treated with chemical
sterilants, the most commonly used sterllant being sodium hypochlorite
(Miller, 1968). Although this sterllant is widely used, there are few
reports on the effects it has on gametophyte growth or reproductive
structures.
Steeves, Sussex, and Partanen (1955) found that the plasticity of
gametophytes increased in sterilized cultures, with many of the
gametophytes forming filamentous proliferations or coral-like aggrega
9
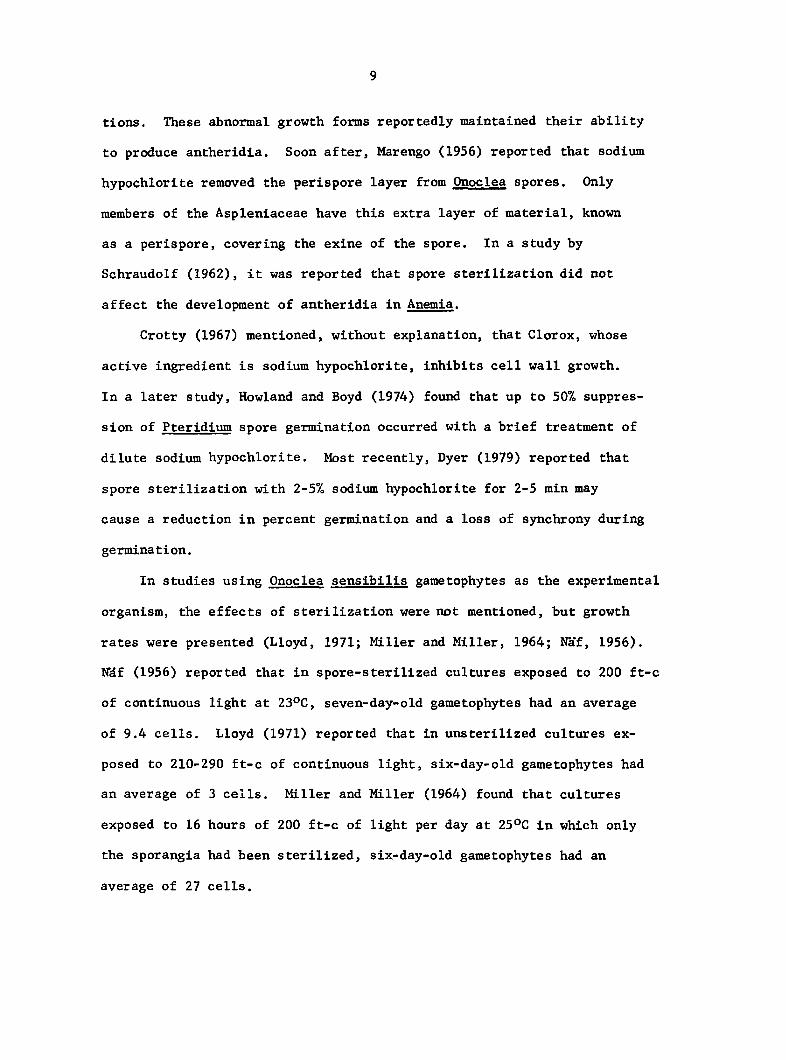
tions. These abnormal growth forms reportedly maintained their ability
to produce antheridia. Soon after, Marengo (1956) reported that sodium
hypochlorite removed the perispore layer from Onoclea spores. Only
members of the Aspleniaceae have this extra layer of material, known
as a perispore, covering the exine of the spore. In a study by
Schraudolf (1962), it was reported that spore sterilization did not
affect the development of antheridia in Anemia.
Grotty (1967) mentioned, without explanation, that Clorox, whose
active ingredient is sodium hypochlorite, inhibits cell wall growth.
In a later study, Rowland and Boyd (1974) found that up to 50% suppres
sion of Pteridium spore germination occurred with a brief treatment of
dilute sodium hypochlorite. Most recently. Dyer (1979) reported that
spore sterilization with 2-5% sodium hypochlorite for 2-5 min may
cause a reduction in percent germination and a loss of synchrony during
germination.
In studies using Onoclea sensibilis gametophytes as the experimental
organism, the effects of sterilization were not mentioned, but growth
rates were presented (Lloyd, 1971; Miller and Miller, 1964; Naf, 1956).
Naf (1956) reported that in spore-sterilized cultures exposed to 200 ft-c
of continuous light at 23°C, seven-day-old gametophytes had an average
of 9.4 cells. Lloyd (1971) reported that in unsterilized cultures ex
posed to 210-290 ft-c of continuous light, six-day-old gametophytes had
an average of 3 cells. Miller and Miller (1964) found that cultures
exposed to 16 hours of 200 ft-c of light per day at 25°C in which only
the sporangia had been sterilized, six-day-old gametophytes had an
average of 27 cells.
10
It is evident from these studies that gametophyte growth is af
fected by different culture conditions, but due to the number of
variables among the studies, including the growth media used, it is not
clear how sterilization affected growth.
Cellular Anatomy of Fern Gametophytes
The ultrastructure of Onoclea gametophytes has not been previously
studied, except for some aspects of sporogenesis (Bassel et al., 1981;
Marengo, 1977, 1979; Marengo and Badalamente, 1978). Ultrastructural
studies on other species of fern gametophytes have been limited to the
early filamentous stage (Cran, 1979). But, with complementary studies
at the light microscope (LM) level, many features of gametophyte cell
anatomy have become clear.
The small, meristematic cells are densely cytoplasmic, staining
strongly with pyronin Y, a stain specific for RNA (Crotty, 1967). As
the cells derived from the meristem begin to expand and become part of
the other regions in the gametophyte, the cytoplasm becomes increasingly
vacuolated (Cran, 1979; Crotty, 1967). These highly vacuolate cells,
with their thin layer of peripheral cytoplasm, do not stain very much
with pyronin Y (Crotty, 1967).
All of the cells of a gametophyte, excluding the rhizoids, contain
numerous chloroplasts. An increasing gradient of chloroplast size was
reported for 7-celled filaments of Dryopteris pseudo-mas growing in blue
light. The average dimensions of the organelles in the apical cells were
6 p,m long X 4 pm wide compared to 10 m x 6 tm in the basal cells. This
11
gradient was also noted in Pteris vittata (Ootaki and Furuya, 1969).
No gradient of chloroplast size was observed in filaments grown
in red light (Bergfeld, 1970). The chloroplasts in the apical cells
grown in red light were on average larger than the chloroplasts in apical
cells grown in blue light (Bergfeld, 1970; Stetler and DeMaggio, 1972).
Proplastids have not been observed in vegetative cells of gametophytes,
although they do occur in spores of some species and in gamete cells
(Cran, 1979). Inmost studies, chloroplasts are described as having
moderate to extensive grana stacks with interconnecting membranes and
large starch grains (Cran, 1979; Stetler and DeMaggio, 1972). Wada and
O'Brien (1975) described two morphological types of chloroplasts in
the tip cells of the filaments of Adiantum capillus-veneris. One type
was cigar-shaped and appeared to be "anchored" by one end close to the
cell membrane. The other type was smaller and more rounded and apparently
pleomorphic. Both types had starch grains.
Smith and Smith (1969) also reported two different types of chloro
plasts in Todea barbara (Osmundaceae). One type had well-developed
grana and intervening membranes with little starch accumulation. The
other type consisted of amyloplasts, containing abundant starch deposits
and stacks of membranes that were unconnected. Even with little starch
present, the latter type had few internal membranes. Both types ap
parently occurred together in the cells of the gametophytes. Amyloplasts
have also been reported to occur in Blechnum (Aspleniaceae) gametophytes
(Beisvag, 1970).
Reversibility of chloroplast size has been reported by Ootaki and
Furuya (1969) who found that larger chloroplasts in white light revert
12
to smaller sizes within 48 hr after interstitial cells were stimulated
to divide by physically isolating them.
All of the prothallial cells in gametophytes contain the usual
components found in cells of higher plants, including ribosomes,
mitochondria, Golgi bodies, rough endoplasmic reticulum, vacuoles, oil
droplets, and microbodies (Cran, 1979). Faivre-Baron (1977) found
abundant microbodies in early cells of Gvmnogranme (Adiantaceae) fila
ments, but very few in older cells. In 4-5-celled protonema of
Drvopteris pseudo-mas. microbodies were found in all of the cells, but
were most common in the apical cells (Cran, 1979). Dense, amorphous
inclusions have been observed in microbodies of fern gametophytes, but
no crystalline structures (Cran, 1979).
Microtubules are present, and according to Cran (1979), they are
more frequent at the anterior end of protenemal cells, around the
nuclear envelope, or running parallel in a band interior to the
plasmalemma of cells about ready to divide. The only report of a
band of microtubules prior to divisions comes from Wada et al. (1980),
who reported the occurrence of cortical, circumferentially aligned
microtubules (CCAM) during pre-prophase in tip cells of Adiantum capillus-
veneris filaments grown in red light. The CCAM disappeared during
metaphase. As described, CCAM appear to be synonymous with the pre-
prophase bands of microtubules (PPBM) described from higher plants
(Busby and Gunning, 1980; Gunning et al., 1978; Palevitz and Hepier,
1974; Pickett-Heaps and Northeote, 1966). The PPBM occurred along
the region of the cell wall where the new cell wall fused.
The CCAM in the tip cells of A. capillus-veneris occur 10-15 M-m
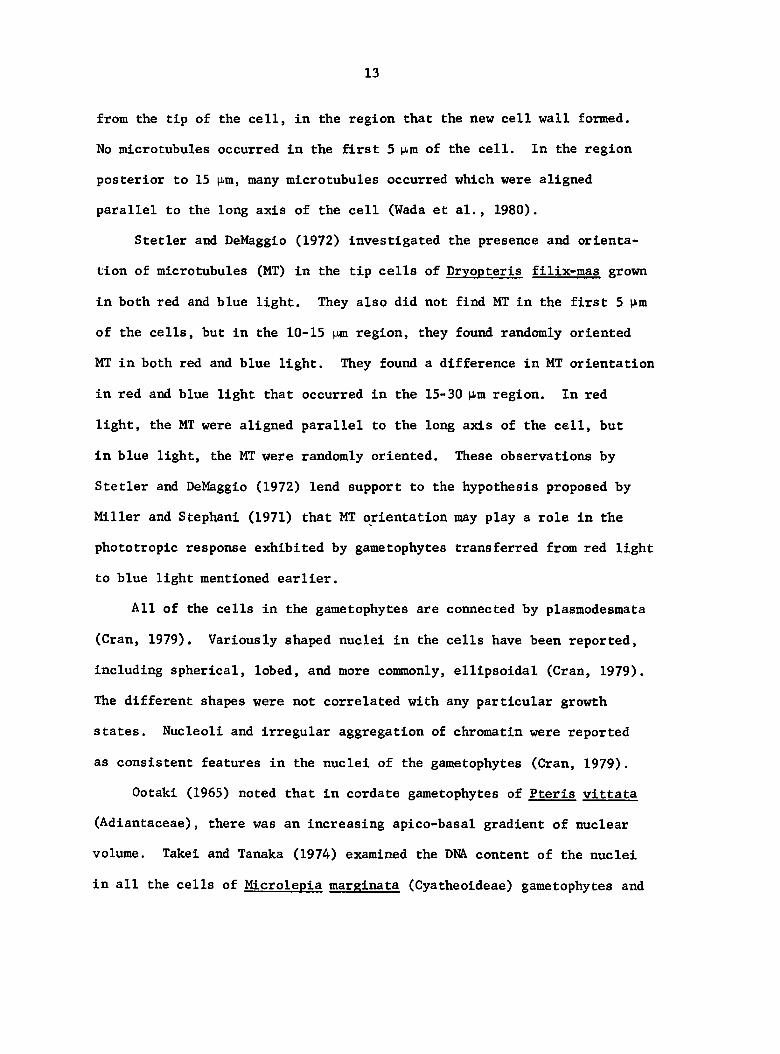
13
from the tip of the cell, in the region that the new cell wall formed.
No microtubules occurred in the first 5 m of the cell. In the region
posterior to 15 many microtubules occurred which were aligned
parallel to the long axis of the cell (Wada et al., 1980).
Stetler and DeMaggio (1972) investigated the presence and orienta
tion of microtubules (MT) in the tip cells of Dryopteris filix-mas grown
in both red and blue light. They also did not find MT in the first 5 Jim
of the cells, but in the 10-15 p,m region, they found randomly oriented
NT in both red and blue light. They found a difference in MT orientation
in red and blue light that occurred in the 15-30 p-m region. In red
light, the MT were aligned parallel to the long axis of the cell, but
in blue light, the MT were randomly oriented. These observations by
Stetler and DeMaggio (1972) lend support to the hypothesis proposed by
Miller and Stephani (1971) that MT orientation may play a role in the
phototropic response exhibited by gametophytes transferred from red light
to blue light mentioned earlier.
All of the cells in the gametophytes are connected by plasmodesmata
(Cran, 1979). Variously shaped nuclei in the cells have been reported,
including spherical, lobed, and more commonly, ellipsoidal (Cran, 1979).
The different shapes were not correlated with any particular growth
states. Nucleoli and irregular aggregation of chromatin were reported
as consistent features in the nuclei of the gametophytes (Cran, 1979).
Ootaki (1965) noted that in cordate gametophytes of Pteris vittata
(Adiantaceae), there was an increasing apico-basal gradient of nuclear
volume, Takei and Tanaka (1974) examined the DNA, content of the nuclei
in all the cells of Microlepia mareinata (Cyatheoideae) gametophytes and
14
found that they all contained IC complement of DNÀ, Alternatively,
Partanen (1965) found that endopolyploidy occurred in cells of Osmunda
gametophytes.
In a histological study of Pterls vitatta gametophytes. Grotty
(1967) found that in divisions of prothallial cells which form two
similar daughter cells, the nucleus became suspended in the center of the
vacuolate cell by cytoplasmic strands. In dividing nuclei, the organelles
tended to aggregate around the nucleus, after which they became dis
persed in the peripheral cytoplasm of the daughter cells (Gran, 1979),
In the regions where cell divisions occur, the nondividing cells had a
thick layer of material surrounding the nucleus and also a layer ad
hering to the cell walls; both layers stained for carbohydrates and
proteins (Grotty, 1967). The material occurred only along the walls in
expanding cells and not in the mature cells, suggesting that it was re
lated to cell wall growth.
There is indication that some cells of gametophytes form an extra
cellular cuticular layer. In Onoclea. Lloyd (1971) found that marginal
cells, along with cells in the wings, secreted a fatty substance that
stained with Sudan IV. Lloyd (1971) also noted a waxy deposit on the
surface of antheridium that stained with Sudan IV. Supporting evidence
of cuticular material comes from a study by Wada and Staehelin (1981)
who, using freeze-fracture electron microscopy, found a multi-
layered, lipid-like coat covering the first filamental cell of
Adiantum capillus-veneris. They also discovered rosettes of 8-9 nm-
wide particles on the P-face of the plasma membrane coinciding with
the region of maximal cell-wall growth and expansion.
15
The ultrastructure of vegetative cells that have been, induced to
form antheridia has not been investigated. Changes that have been
observed at the LM level in induced vegetative cells will be reviewed
in the later section on Antheridium Morphology.
Antheridiogens and Antheridium Formation
According to Naf (1979), most strains of Onoclea fail to form
antheridia spontaneously at any stage in development in cultures grown
in continuous light. But Klekowski and Lloyd (1968) found that a small
percentage of gametophytes formed antheridia after 45 days in culture
under continuous light. Voeller and Weinberg (1969) claimed that
gametophytes of Onoclea not grown under continuous light will soon
form antheridia, but they did not specify how soon. Nâf et al. (1974)
found that gametophytes grown in the light for 7 days and then trans
ferred to near-darkness formed antheridia in about 2-3 wk.
Over 30 years ago, a discovery was made of a substance that could
induce antheridia in Onoclea gametophytes within days of spore germina
tion. D5pp (1950) discovered that medium harvested from maturing cul
tures of Pteridium aquilinum hastened the onset of antheridium formation
in young prothalli of the same species by several days and in the
prothalli of Drvopteris filix-mas by several weeks. The active
substance in the extract was named Antheridiogen Pt (A^^). Naf (1956)
discovered that Onoclea gametophytes responded strongly to A^^ at a
dilution of 1:30,000 of the crude extract. Pringle (1961) isolated A^^
from the crude extract and found that it was active at a concentration
16
of 1 part per 10 billion or 10 ^ mg/ml with Onoclea.
Since the discovery of by Dopp (1950), antheridiogens have been
discovered from ten other species of ferns, including Onoclea and at the
present time, 28 different species of ferns in advanced families have
shown the ability to respond to A^^ (NSf, 1979). Although Onoclea
produces its own antheridiogen, A^^^ the gametophytes respond very
weakly to it, producing only a few antheridia 17 days after treatment
(NSf, 1979). But Naf (1969) found that if A^^ was boiled at pH 2.0,
the activity dramatically increased.
Only the antheridiogen from Anemia phvllitidis has been chemically
characterized, revealing a molecular formula of ^ig^22'^6 Gt al.,
1972) that has the configuration of a derived gibberellin (GA) (Nakanishi
et al., 1971). Not surprisingly, GA was shown to possess the ability to
induce antheridia in some species of gametophytes (Emigh and Farrar,
1977; Schraudolf, 1962, 1966a; Voeller, 1964a). GA was found to be ef
fective at concentrations between 5 x 10 and 5 x 10 ^ g/ml. Although
GA did not hasten the onset of antheridia in Onoclea gametophytes,
Schraudolf (1966b) found that treatment with GA increased the per
centage of antheridium-bearing gametophytes.
The time that A^^ was applied to maturing gametophytes of Onoclea
was found to influence the length of the induction period. When A^^
was applied at 1/10 or 1/50 full strength on the day of sowing,
antheridia did not form until 7 days later when there were about 11
vegetative cells per gametophyte (Naf, 1958). When the same concentra
tions of A^^ were applied six and nine days after sowing, antheridia
formed 2-1/2 to 3 days later (NSf, 1959).
17
A similar correlation between time of treatment and length of in
duction periods was observed for Anemia (Naf, 1959). Schraudolf (1966a)
concluded that the induction of antheridia was possible only after a
certain state of development of the prothalli had been reached. Naf
et al. (1975) hypothesized that a physiological state antagonistic to
antheridium formation became operative if the cultures were treated on
the day of sowing.
Eventually Onoclea gametophytes became totally insensitive to A^^
(Nâf, 1958). NMf (1958) claimed that the gametophytes lost sensitivity
to Ap^ within a period of 2 days, shortly after they attained a notch
meristem, which was about 14 days after sowing. Voeller and Weinberg
(1969) also found a decrease in sensitivity to A^^ in Onoclea gametophytes,
but the decrease occurred over a period of a few weeks.
Dopp (1959) and Naf (1961) have provided indirect evidence that a
substance inhibitory to antheridium formation is produced in the notch
meristem. Dopp (1959) obtained an extract from macerated tissue of
Pteridium gametophytes that inhibited the action of A^^^ Naf (1961)
found that insensitive gametophytes of Onoclea regained the ability to
form antheridia if the notch meristems were excised. The inhibitory
substance has not been isolated. Auxins and abscisic acid have been
implicated as inhibitors to antheridium formation (Dopp, 1962; Hickok,
1983). Further information on the physiology of antheridiogens can be
found in reviews by Miller (1968), Naf et al. (1975), Naf (1979), and
Voeller (1964b).
Along with inducing antheridia, A^^ and GA were found to inhibit
vegetative cell divisions (Naf, 1956; Schraudolf, 1966a). Although
18
Inhibition of vegetative growth by nonspecific effects such as low light
Intensities and lack of nutrients has been correlated with antheridium
formation (D5pp, 1927; Prantl, 1881, Sossountzov and Dolaporto, 1949),
Dopp (1950) and Naf (1956) provided evidence which showed that
was a specific organ-Inducing substance. Dopp (1950) found a concentra
tion of A^^ that induced antheridia without reducing the number of
vegetative cells compared to the control gametophytes. NSf (1956)
found that the total number of cells in A^^-treated gametophytes was
always higher than in untreated gametophytes. Naf (1956) concluded that
the energy normally channeled into vegetative growth was somehow diverted
into antheridium growth.
Location of Antheridlum Initials
Information is completely lacking on the location of antheridia in
young prothalli of Onoclea. However, complementary Information does
exist on other cordate, antheridlate gametophytes. In Anemia.
Schraudolf (1966a) found that the first antheridia were always formed
on lateral, marginal cells. Hofmelster (1862) generalized that in many
young prothalli, antheridia were formed on marginal cells and Atkinson
(1894) and Nayar (1965) found a relationship between crowded conditions
and marginal antheridia.
Naf (1959) found that when older gametophytes of Anemia were
treated with A^^^ only nonmarglnal cells behind the marginal, lateral
meristem formed antheridia. Lygodium gametophytes, which have apical
merlstems, first formed antheridia in the basal region, and then ex
19
clusively in the apical, central region (N5f, 1960). In both Anemia
and Lygodium. there was a tempero-spatial loss of cellular ability to
form antheridia,
Momose (1958a) summarized information on the antheridial areas in
mature, cordate prothalli of ferns from 20 previous years of his work on
gametophyte development. He claimed that there were three basic types
of antheridium location patterns, including axial, laminal, and marginal.
In the axial type, the antheridia are formed on the central cells
between the notch meristem and the basal cells. This distribution sup
posedly occurred in advanced families of ferns. The laminal type pat
tern was characterized by antheridia forming on the surface of the
wings and was common in the primitive families of ferns. The marginal
type prothalli produce antheridia on the margins of the wings.
Ceratopteris was the only example given in this category.
Factors involved in controlling the location of antheridia are not
known. The interaction of hormones may be involved. Abscisic acid
(Cheng and Schraudolf, 1974), auxin in the form of lAA (Hotta, 1959),
ethylene (Miller et al., 1970), GA^ (Schraudolf, 1966c), and ribosylated
zeatin (Schraudolf and Fischer, 1979), along with antheridiogens, all
have been isolated from fern gametophytes. Very little is known about
their sites of synthesis or their modes of translocation. Only lAA has
been shown to move both acropetally and basipetally (Albaum, 1938;
Faivre-Baron, 1981; Reynolds, 1979). There is some evidence which shows
that antheridiogens are probably produced in the notch meristem. For
a review of the effects of hormones on gametophyte development, see
Rowland and Edwards (1979), Miller (1968), and Smith (1979).
20
It has been well-documented that polar gradients do exist in
gametophytes with respect to cell age and position. Obvious gradients
related to age occur in terms of cell divisions, elongation, orientations,
and differentiation (Igura, 1955; Miller, 1968; Reuter, 1953). Other
apico-basal gradients related to age include cell permeability, osmotic
potential of the cells, cell sensitivity to UV radiation, nuclear volume,
the ability of the cells to regenerate new prothalli, and the ability
of cells to respond to auxin (Miller, 1968; Miller and Miller, 1964;
Smith, 1979).
Gradients related to cell position also have been shown to exist
through the use of various stains (Reuter, 1953). When Drvopteris
gametophytes were stained with toluidine blue at pH 6.0, only the cells
in the meristem region stained. At pH 7.0, both the meristem cells and
the marginal region of the wings stained. At pH 8.0, all the regions
excluding the central region, stained. This pattern of staining with
toluidine blue is similar to the pattern involving the loss of ability
of cells to form antheridia.
From numerous observations of many species of fern gametophytes,
it is apparent that only a fraction of the cells in a responding region
actually form antheridia (Dopp, 1962; Momose, 1958b; Nâf et al., 1975;
Stokey, 1951). There are no developmental studies on fern gametophytes
which contribute to an understanding of this differential cell response
within similar regions. A possibility exists that some of the cells
may act as "target cells." In a somewhat similar system involving moss
protonemal gametophytes, target cells have been identified which ac
cumulate cytokinins, in contrast to adjacent cells (Brandes and
21
Kende, 1968). Only the cells that accumulated cytokinin proceeded to
form buds.
According to Nâf et al. (1975), antheridia in Onoclea have a pre
ferred cellular location, which was at the anterior end of elongate,
vegetative cells. Antheridia produced by the large, isodiametric, basal
cells did not have a preferred cellular site of formation. Nayar and
Kaur (1971) claimed that leptosporangiate-type of antheridia develop
toward the middle of the peripheral wall of the mother cell. The only
other reference to cellular location of antheridia was reported by
Naf et al. (1975) who claimed that Dennstaedtia antheridia have no
preferred cellular site of formation.
Antheridium Morphology
The life cycle of seedless plants did not receive much attention
until the mid-nineteenth century, by which time most aspects of the
life cycle of angiosperms were understood (Harvey-Gibson, 1919). In
1842, Bischoff was the first to notice wart-like structures on fern
gametophytes, structures which would eventually be identified as
antheridia by NSgeli in 1844 (Hofmeister, 1862). Although Nageli thought
that the antheridium was the male reproductive structure, he did not
understand its role in reproduction. He was unaware of fern archegonia
and further, his description of antheridium morphology could even apply
to archegonium morphology. He stated that antheridia consisted of two
to five tiers of cells, each with four cortical cells lying in a circle
around a space filled with opaque granules, known as a canal (Hofmeister,
22
1862). By 1862, Hofmeister had determined the true nature of antheridia
and presented his own description of their morphology (Harvey-Gibson,
1919; Hofmeister, 1862).
Although it is well-known today that antheridia in advanced ferns
have three, sterile jacket cells, the earliest workers claimed that the
antheridium had numerous cells and probably developed similar to the
multicellular moss antheridia (Hofmeister, 1862; Strasburger, 1868).
Atkinson (1894), Campbell (1886), and Kny (1895) provided the earliest
descriptions of antheridia with three jacket cells. Their descriptions
and some aspects of the description given by Strasburger (1868) col
lectively have come to be known as the classical theory of antheridium
development in advanced ferns (Verma and Khullar, 1966). The classical
theory, which appeared in early textbooks by Bower (1923), Eames (1936),
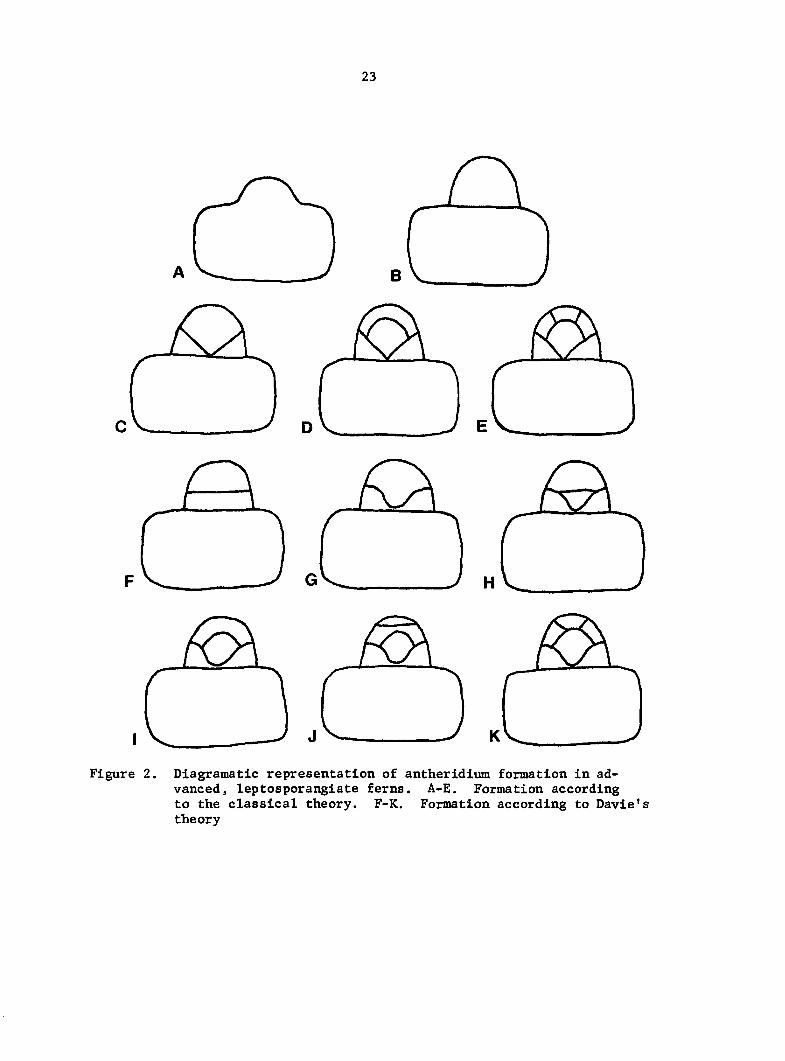
and Smith (1938) claimed that an antheridium arises as a papillate
projection which is then cut off from an epidermal cell by a periclinal
division (Figure 2A, B). The initial then enlarges and divides with
the formation of a funnel-shaped wall, which in most cases reaches the
basal wall of the initial cell (Figure 2C), In some species, the first
wall in the initial may be less concave or even flat (transverse).
If the wall is formed transversely, it remains so throughout the develop
ment of the antheridium. The 2-celled antheridium then consists of a
cup-shaped or barrel-shaped basal cell and an upper cell.
The next division occurs in the upper cell resulting in the formation
of a hemispherical wall parallel to the outer wall of the upper cell
(Figure 2D). The 3-celled antheridium consists of a basal cell, an
upper jacket cell, and a central spermatogenous cell.
23
Dlagramatlc representation of antheridlum formation in advanced, leptosporangiate ferns. A-E. Formation according to the classical theory. F-K. Formation according to Davie's theory
24
The upper jacket cell then is divided by a funnel-shaped wall forming
a cap cell and a doughnut-shaped ring cell (Figure 2E). This completes
the formation of the jacket cells of an antheridium. The spermatogenous
cells then continue to divide and eventually the cells differentiate
into spermatozoids.
An explanation for how the uniquely shaped walls are deposited was
not given in most cases. Kny (1869) purportedly claimed that the funnel-
shaped wall which forms the cap cell, forms simultaneously in all
regions (Davie, 1951).
Davie (1951), unable to comprehend how such walls could form, re
investigated the problem of antheridium development using Pitvroeramma
calomelanos (Adiantaceae). The workers who proposed the classical
theory had used Pteris serrulata (Adiantaceae), Onoclea sensibilis.
Matteuccia struthiopteris. and Drvopteris filix-mas (Aspleniaceae).
According to Davie (1951), the antheridium begins development
as postulated in the classical theory, as a hemispherical protuberance
cut off from the underlying prothallial cell (Figure 2A, B), but the
similarity ceases there. Davie claimed that the first cell wall in the
initial invariably forms transversely (Figure 2F) and either remains
flat throughout development or secondarily becomes concave or
funnel-shaped due to internal pressures (Figure 2G).
The next cell wall is also originally transverse, and secondarily
assumes a hemispherical orientation due to the expansion of the central
cell (Figure 2H, I).
The third cell wall which forms the cap cell is also transverse,
like the previous two cell walls (Figure 2J). Due to the continuing
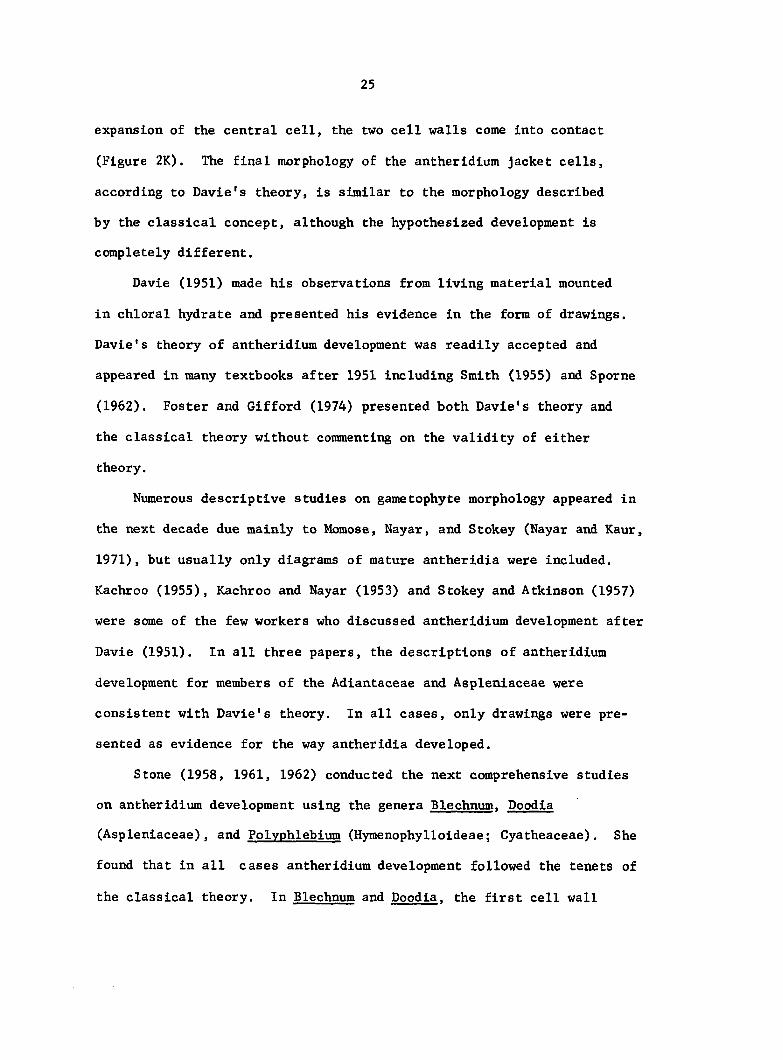
25
expansion of the central cell, the two cell walls come Into contact
(Figure 2K). The final morphology of the antherldium jacket cells,
according to Davie's theory. Is similar to the morphology described
by the classical concept, although the hypothesized development is
completely different.
Davie (1951) made his observations from living material mounted
In chloral hydrate and presented his evidence In the form of drawings.
Davie's theory of antherldium development was readily accepted and
appeared in many textbooks after 1951 including Smith (1955) and Sporne
(1962). Foster and Gifford (1974) presented both Davie's theory and
the classical theory without commenting on the validity of either
theory.
Numerous descriptive studies on gametophyte morphology appeared in
the next decade due mainly to Momose, Nayar, and Stokey (Nayar and Kaur,
1971), but usually only diagrams of mature antherldla were Included.
Kachroo (1955), Kachroo and Nayar (1953) and Stokey and Atkinson (1957)
were some of the few workers who discussed antherldium development after
Davie (1951). In all three papers, the descriptions of antherldium
development for members of the Âdlantaceae and Asplenlaceae were
consistent with Davie's theory. In all cases, only drawings were pre
sented as evidence for the way antherldla developed.
Stone (1958, 1961, 1962) conducted the next comprehensive studies
on antherldium development using the genera Blechnum. Doodia
(Asplenlaceae), and Polvphlebium (Hymenophylloideae; Cyatheaceae), She
found that in all cases antherldium development followed the tenets of
the classical theory. In Blechnum and Doodia. the first cell wall
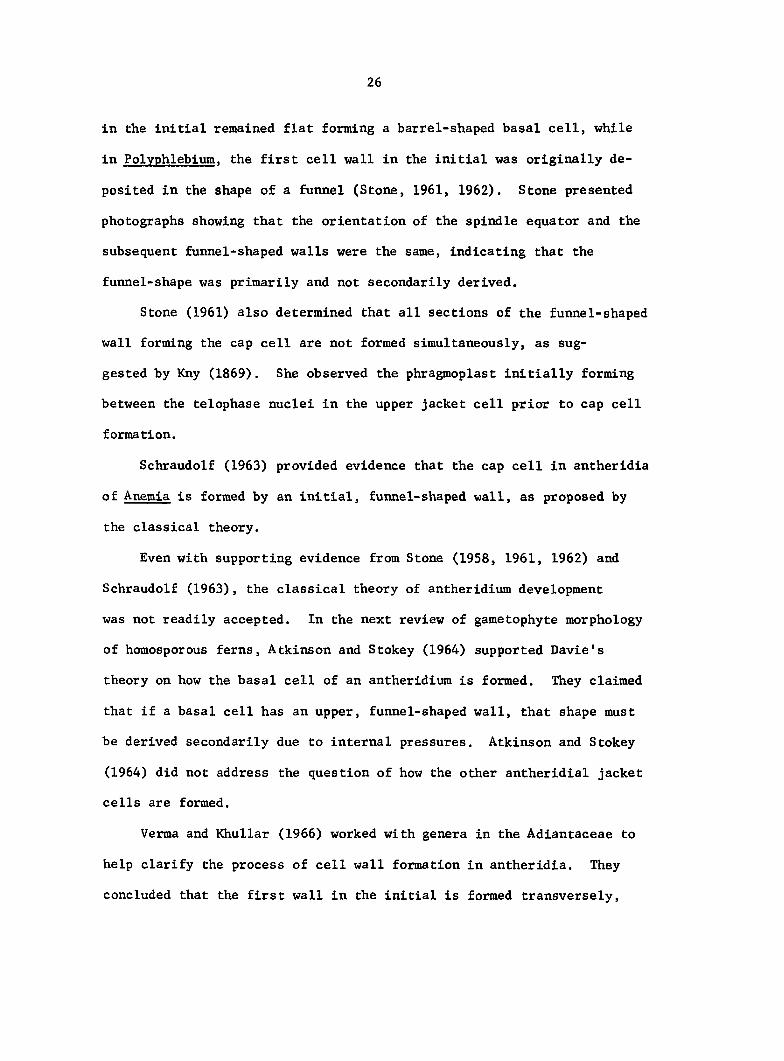
26
in the initial remained flat foming a barrel-shaped basal cell, while
in Polvphlebium. the first cell wall in the initial was originally de
posited in the shape of a funnel (Stone, 1961, 1962). Stone presented
photographs showing that the orientation of the spindle equator and the
subsequent funnel-shaped walls were the same, indicating that the
funnel-shape was primarily and not secondarily derived.
Stone (1961) also determined that all sections of the funnel-shaped
wall forming the cap cell are not formed simultaneously, as sug
gested by Kny (1869). She observed the phragmoplast initially forming
between the telophase nuclei in the upper jacket cell prior to cap cell
formation.
Schraudolf (1963) provided evidence that the cap cell in antheridia
of Anemia is formed by an initial, funnel-shaped wall, as proposed by
the classical theory.
Even with supporting evidence from Stone (1958, 1961, 1962) and
Schraudolf (1963), the classical theory of antheridium development
was not readily accepted. In the next review of gametophyte morphology
of homosporous ferns, Atkinson and Stokey (1964) supported Davie's
theory on how the basal cell of an antheridium is formed. They claimed
that if a basal cell has an upper, funnel-shaped wall, that shape must
be derived secondarily due to internal pressures. Atkinson and Stokey
(1964) did not address the question of how the other antheridial jacket
cells are formed.
Verma and Khullar (1966) worked with genera in the Adiantaceae to
help clarify the process of cell wall formation in antheridia. They
concluded that the first wall in the initial is formed transversely,
27
and In some species Is secondarily displaced downwards to take the
shape of a funnel-shaped wall, which is consistent with Davie's theory.
They claimed that the second wall is formed in the shape of a hemisphere,
as proposed in the classical theory, and they felt that the third wall
which formed the cap cell, is initially formed in a transverse or slightly
concave position, but is not initially in contact with the lower wall of
the upper jacket cell from which it is formed. Their interpretation of
the formation of the third wall is consistent with Davie's theory.
Verma and Khullar (1966) included both drawings and photographs
as evidence for their conclusions. The antheridial cells shown in the
photographs were in a nondividing state.
Verma and Khullar (1966) attributed a theory of antheridium jacket
cell formation to Stone, which is contrary to the interpretations pre
sented by Stone, herself (1958, 1961, 1962). Stone's theory, according
to Verma and Khullar (1966) , claimed that the first cell division in the
initial is transverse, the second division is hemispherical, and the
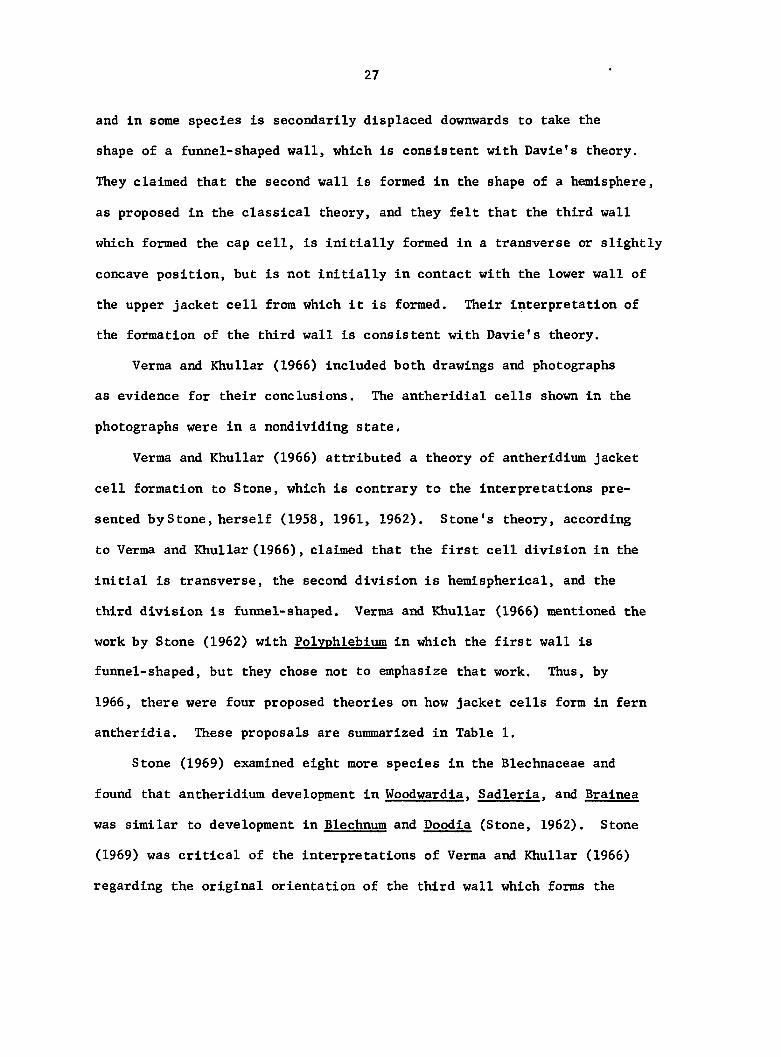
third division is funnel-shaped. Verma and Khullar (1966) mentioned the
work by Stone (1962) with Polvphlebium in which the first wall is
funnel-shaped, but they chose not to emphasize that work. Thus, by
1966, there were four proposed theories on how jacket cells form in fern
antheridia. These proposals are summarized in Table 1.
Stone (1969) examined eight more species in the Blechnaceae and
found that antheridium development in Woodwardia. Sadleria. and Brainea
was similar to development in Blechnum and Doodla (Stone, 1962). Stone
(1969) was critical of the interpretations of Verma and Khullar (1966)
regarding the original orientation of the third wall which forms the
28
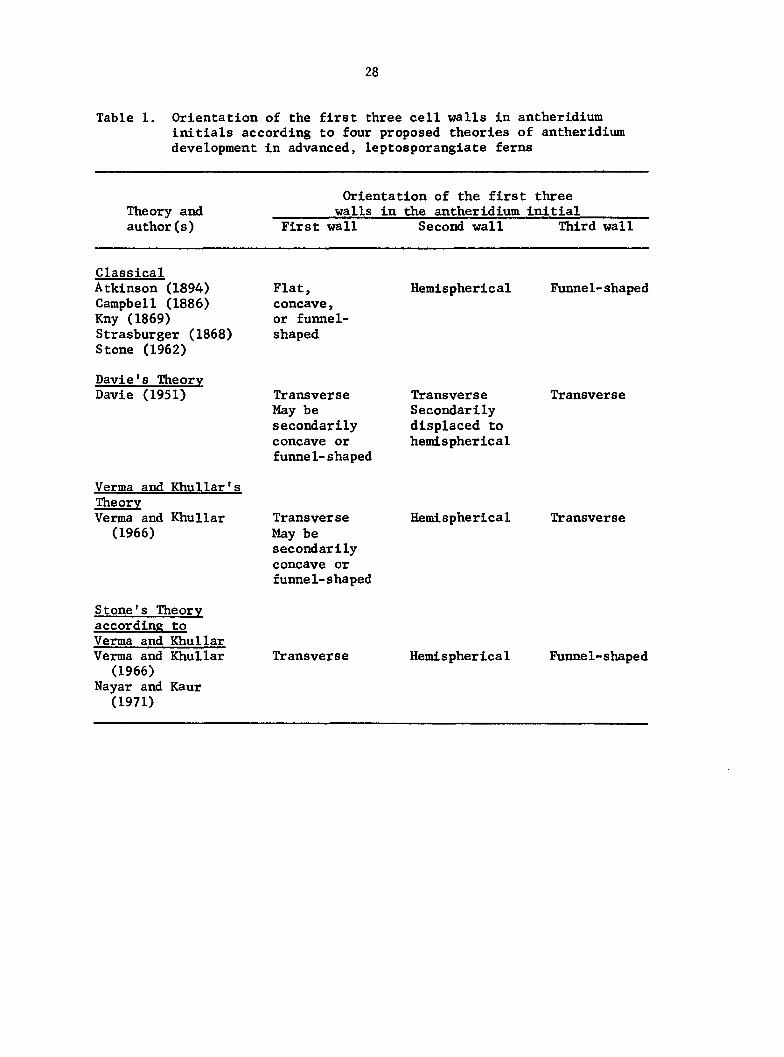
Table 1. Orientation of the first three cell walls in antheridium initials according to four proposed theories of antheridium development in advanced, leptosporangiate ferns
Orientation of the first three Theory and walls in the antheridium initial author(s) First wall Second wall Third wall
Classical Atkinson (1894) Campbell (1886) Kny (1869) Strasburger (1868) Stone (1962)
Davie's Theory Davie (1951)
Verma and Khullar's Theory Verma and Khullar (1966)
Flat, concave, or funnel-shaped
Transverse May be secondarily concave or funnel-shaped
Transverse May be secondarily concave or funnel-shaped
Hemispherical Funne1-shaped
Transverse Secondarily displaced to hemispherical
Hemispherical
Transverse
Transverse
Stone's Theory according to Verma and Khullar Verma and Khullar (1966)
Nayar and Kaur (1971)
Transverse Hemi s pherlca1 Funnel-shaped
29
cap cell. Stone (1969) claimed that it is impossible to determine the
manner in which a wall is laid down from a study of the cells after
cytokinesis has been completed for some time.
Schraudolf (1968) presented persuasive evidence that the first
cell wall in Polvpodium antheridia is initially funnel-shaped. He
included LM photographs which show metaphase chromosomes oriented at
a 40° angle to the base of the initial, the same angle at which the
subsequent wall forms. Schraudolf concluded that the wall begins to
form on one side of the initial and then proceeds circularly until the
advancing edges meet. Schraudolf (1968) also contended that the second
wall is hemispherical and the third wall is funnel-shaped, in agreement
with the classical theory.
Even with the convincing evidence of Stone (1958, 1961, 1962, 1969)
and Schraudolf (1963, 1968), the next and most recent treatise on
gametophyte morphology by Nayar and Kaur (1971) endorsed the theory
proposed by Verma and Khullar (1966). Nayar and Kaur (1971) also pre
sented a theory by Stone as misinterpreted by Verma and Khullar (1966).
However, Sporne (1975), in the latest edition of his textbook,
included both Davie's theory and the observations by Stone (1962).
Sporne (1975) supported the interpretations of Stone (1962), that for
at least three genera in the Blechnaceae and Hymenophylloideae, the
classical theory of antheridium development is correct.
In a study on gametophytes in the Schizaeaceae, Bierhorst (1975)
provided supporting evidence for the classical theory of antheridium
development. He determined that the cap cell in Actinostachvs antheridia
is formed by a funnel-shaped wall and that the wall begins as a
30
phragmoplast between the telophase nuclei and proceeds to encircle the
nucleus of the future cap cell.
Schraudolf and Richter (1978) are the only workers to present
ultrastructural data on fern antheridia. In Polvpodium and Platvcerium
(Polypodiaceae), they found plasmodesmata trasversing the wall where
the funnel-shaped wall is in contact with the basal wall of the
antheridium. If, as Davie (1951) contended, the funnel-shaped wall is
secondarily formed, plasmodesmata would not traverse the wall in the
area of contact.
Plasmodesmata also traversed the contact wall between the cap cell
and the central, spermatogenous cell, indicating that the cap cell also
is formed initially by a funnel-shaped wall (Schraudolf and Richter, 1978).
The last published information on antheridium morphology was pro
vided by Leung and Nâf (1979), using Onoclea sensibilis. Their observa
tions were made from whole mounts of gametophytes, fixed and stained
with pyronin Y and methyl green. According to Leung and Naf, the
antheridium initials of Onoclea arise as hemispherical outgrowths.
The first cell wall formed in the initial is funnel-shaped, according to
the classical theory. They felt, however, that the wall forms in a
vertical manner, from the base to the rim. They suggested that as the
funnel-shaped wall forms, it increases in diameter and height until
the circular, upper rim intersects the mid-region of the outer, curved
wall of the initial. This contradicts the interpretation by Schraudolf
(1968), who claimed that the funnel-shaped wall forms laterally
beginning at one side of the initial and circling around until the
edges meet.
31
Leung and Naf (1979) then concluded that the second wall Is formed
transversely, according to Davie's theory. They claimed that the wall
first forms from a transversely oriented phragmoplast in the upper
region of the upper cell, then moves down to complete cell wall forma
tion, and finally is pushed back up to the original position of the
phragmoplast by internal pressures. Speculations on the genesis of the
second wall are lacking in previous studies.
Leung and Naf (1979) were unable to follow the formation of the
cap cell wall, but did observe that the equator of the spindle ap
paratus was oriented perpendicularly to the upper and lower walls of
the upper jacket cell. This position was previously noted by Stone
(1961), Schraudolf (1968), and Bierhorst (1975), who all claimed that
the subsequent funnel-shaped wall begins as a phragmoplast between the
telophase nuclei and proceeds to form in a lateral, circular fashion
around the nucleus of the future cap cell. Leung and NSf (1979), con
tended that the wall probably forms simultaneously in all areas, as
suggested by Kny (1869).
Most of the studies on antheridium development have dealt mainly
with the orientation of the cell walls. Only a few of the studies
mentioned the concomi^ht' cytoplasmic changes which occur during
development. Stone (1958, 1961) noticed a dense accumulation of cyto
plasm in the region of the forming initial in Polvphlebium and Blechnum.
Verraa and Khullar (1966) indicated in their drawings that the initial
protuberance was densely cytoplasmic. Bierhorst (1975) reported an ac
cumulation of cytoplasm in the bulge that formed the initials in
Actingstachvs. Similarly, in Onoclea, Leung and NSf (1979) found that
32
cytoplasm rich in RNA accumulates ahead of the mother nucleus which
forms the initial.
In the expanded initials. Stone (1961, 1962) found a polar distribu
tion of cytoplasm resulting in a large vacuolate region in the basal
portion of the cell. Leung and Nâf (1979) reported the presence of a
"bouquet" of RNA anterior to the nucleus in the initials of Onoclea.
Stone (1961), Schraudolf (1968), and Leung and NSf (1979) all
noted that the nucleus in the initial appears roich larger than the
nucleus in the vegetative mother cell.
The only other reports of cytoplasmic changes during development
pertain to the upper cell in the two-celled antheridium. Stone (1961,
1962) reported a polar distribution of cytoplasm in the upper cell, with
a vacuolate region occurring in the anterior portion. Leung and Naf
(1979) found that a "bouquet" of RNA reappears and is located in the
basal portion of the upper cell. Atkinson (1894) and Verma and Khullar
(1966) both presented drawings which indicate that a dense region of
cytoplasm occurs in the basal region of the upper cell.
Spermatogenesis
Spermatogenesis can be divided arbitrarily into two phases, the
divisional phase and the differentiation phase. During the divisional
phase, the central spermatogenous cell undergoes a number of mitoses
to form a specified number of spermatid cells. During the differentia
tion phase, the spermatid cells are transformed into spermatozoids.
Very little information is available on cellular changes during

33
the divisional phase. Reportedly, antheridla of advanced, lepto-
sporangiate ferns produce either 16 or 32 spermatids (Bell and Duckett,
1976; Bower, 1923; Eames, 1936; Foster and Gifford, 1974; Nayar and Kaur,
1971). Anemia was reported to produce 8, 16, or 32 spermatids (Voeller
and Weinberg, 1967). The minimum number of spermatids produced per
antheridium was reported for 5 species of Drvnaria (Polypodiaceae) with
4-8 spermatids (Nayar, 1965).
Bierhorst (1975) claimed that the spermatogenous cells divide
synchronously. According to Atkinson (1894), Campbell (1886), and
Stone (1961), the first three sets of mitoses follow a consistent
pattern, with the first division oriented longitudinally, the second
set of mitoses oriented longitudinally and perpendicularly to the first
division, and the third set of mitoses oriented transversely to all
the previous divisions resulting in 8 spermatogenous cells. Bower
(1923) and Campbell (1913) claimed that the second set of mitoses is
oriented transversely, while the third set is oriented longitudinally
and perpendicularly to the first longitudinal division.
Most ultrastructural studies Involving spermatogenesis have per
tained only to the differentiation phase (Bell, 1979b; Duckett, 1975),
but Duckett (1975) also noted some changes during the divisional
phase. The few changes mentioned Included a change in the appearance of
the mitochondria, the dedifferentiatlon of the chloroplasts into
proplastlds, and a change in Golgi body activity correlated with the
cell cycle.
The transformation of spermatids into spermatozoids involves many
34
profound changes within the cell. The angular, meristematic spermatids
round up, much of their cytoplasm degenerates, the nuclear chromatin
condenses, the nucleus elongates and coils into 2-3 gyres, and numerous
flagella form. The ultrastructure of these events has been well-
documented in the homosporous ferns, Pteridium. Drvopteris. and
Ceratopteris (Bell, 1974, 1979b; Bell and Duckett, 1976; Duckett,
1975; Duckett et al., 1979; Schedlbauer et al., 1973) and in one
heterosporous fern, Marsilea (Hep1er, 1976; Mizukami and Gall, 1966;
Myles, 1979; Myles and Bell, 1975; Ifyles and Hepler, 1977).
Because the differentiation phase of spermatogenesis was not an
integral part of this study, events during this phase are not detailed
in the literature review. The literature pertinent to the differences
found in Onoclea spermatogenesis are incorporated into the Discussion.
35
MATERIALS AND METHODS
Culture Conditions
Spore collection
Fertile fronds of Pteridium aquilinum (L.) Kuhn were collected
along a trail in Backbone State Park near the Primitive Camping Upper
Area, Delaware Co., Iowa., on June 29, 1980. The fronds were placed
in large manila envelopes to dry. The envelopes were pressed manually
to dislodge the spores from the sporangia and were collected in a glass
vial and stored in a refrigerator at 4°C.
Fertile fronds of Onoclea senslbilis L. were collected from a small,
dense stand of plants growing along the east side of County Road S70
about 7 miles north of Highway 30, Story Co., Iowa, on November 14,
1980. The fronds were soaked in a dilute solution of Tween 80 (2 drops/
100 ml) for 2 min and rinsed twice in double distilled water (d.H^O).
They were then sterilized in 10% Clorox for 3 min, rinsed twice in
sterilized d.H^O and once in sterilized tap water. The fronds were
placed in glassine envelopes to dry. The amount of pressure necessary
to separate the spores from the sporangia resulted in a mixture of spores
and fine pieces of sporangium walls and fronds. That mixture was sieved
through a double layer of 0.37 mm wire mesh onto a piece of weighing
paper. To remove the very fine pieces of nonspore tissue still present,
the weighing paper was agitated and tilted. It was found that the
spores were more strongly attracted to the paper than the nonspore
material. The spores could then be collected and stored at 4°C.
36
Spore sowing and transferring
All spores were sown on culture medium containing 8.0 gm of Difco
Bacto Agar per liter of nutrient medium composed of Bold's macronutrients
(Bold, 1967), Nitsch's micronutrients (Nitsch, 1951), and a supplement
of ferric chloride (1 drop of 1% FeCl^/liter; Appendix C). The medium
was autoclaved for 15 min and poured into sterile, disposable, plastic
petri plates to solidify.
If the spores were to be sown sterilely, 0.015 gm of Pteridium or
Onoclea spores were placed in a 15 ml tapered centrifuge tube with 4
ml of the previously described dilute Tween 80 solution and capped with
a piece of aluminum foil. After shaking for 1 min, the suspension was
centrifuged for 1 min, until the spores formed a pellet at the bottom
of the tube. The supernatant was pipetted off and the spores were
rinsed twice with d.HgO, using the centrifugation procedure. The second
d.HgO rinse was replaced with tap water for 24 hr at room temperature
to allow fungal spores to germinate. The spores were then spun down
into a pellet and the tap water removed, being replaced by a TL filtered
solution of calcium hypochlorite. The centrifuge tube was shaken
vigorously for 30 sec and then centrifuged. The sterilant was pipetted
off and replaced by sterile d.H^O. The spores were in the sterilant
for less than 2 min. Following two rinsings in sterile d.H^O, the
spores were immersed in 10 ml of Bold and Nitsch nutrient medium.
Multispore cultures of Pteridium gametophytes were obtained by
pipetting 1 ml aliquots of the spore suspension onto the culture medium
contained in 100 x 15 mm petri plates. This method of sowing is termed
liquid-sowing and for this study, liquid-sowing also implies a 1 day
37
incubation period in tap water. This procedure and all other procedures
requiring sterile techniques were performed within a Plexiglas,
sterile, transfer hood.
Multispore cultures of Onoclea gametophytes were obtained by
pipetting 0.5 ml aliquots of spore suspension onto agar medium con
tained in 60 X 20 mm petri plates.
All Pteridium cultures were sown sterilely. For comparison pur
poses, Onoclea spores were sown both sterilely and unsterilely. Two
unsterile sowing methods were used. One method followed the steriliza
tion procedure described above with the omission of the calcium hypo
chlorite step (liquid-sowing). The other method involved sealing dry
spores in glasslne envelopes. Small holes were made in the envelope
with a straight pin and the spores were tapped onto the agar medium
(dry-sowing).
In some preliminary experiments, Onoclea gametophytes or germinating
spores were transferred from multispore cultures onto agar in either
60 X 20 mm petri plates, where each plate received nine gametophytes
spaced 1 cm apart, or onto agar in 100 x 15 mm petri plates, where each
plate received 24 gametophytes spaced 1 cm apart. These resultant
cultures are referred to as "transferred multispore cultures." The
germinating spores consisted of a small rhizoid protruding from the
spore wall. The gametophytes that were transferred were composed of
three to six prothalllal cells and one basal rhizoid. Only one stage
was present per plate. Transfers were made with the aid cf. a sterilized
dissecting needle and a Bausch and Lomb dissecting microscope fitted
with a 20X objective lens.
38
Both the multispore and transferred multlspore cultures were placed
in continuous fluorescent light at an intensity of 350 ft. c. To
prevent the agar from drying out too rapidly, the plates were placed
in clear plastic vegetable crispers.
Antheridiogen (Apt) collection
Eighteen multispore cultures of Pteridium, sown on September 24,
1980, were collected on November 15, 1980 and frozen overnight. After
thawing, the resultant liquid fraction was collected, Millipore-filtered
using HA, 0,45 M-m filters, and au toe laved for 15 min at 15 psi.
This sterile liquid extract contained A^^ and in this undiluted form,
it is referred to as 100% A^^. Dilutions were made by adding portions
of the extract to various quantities of sterile nutrient medium.
Apt treatments
To obtain background information on the biology of both treated
and untreated Onoclea gametophytes in culture, the following preliminary
experiments were performed.
Transferred multispore cultures of young gametophytes were treated
with 2 ml of either 100%, 10%, 1%, 0.1%, or 0.01% A^^ 3 days after spore
transfer to determine a general optimal range of A^^ concentrations.
Transferred multispore cultures of either germinating spores or
young gametophytes were treated with 1 ml of 100% or 50% A^^ to compare
the effects of treatment on two different developmental stages of
gametophytes. In order to determine the best means of application,
the Ap^ was applied to the media of the transferred cultures either 2 days
before transfer and allowed to soak into the agar or it was applied to
39
the cultures on the day of transfer.
The following preliminary experimental conditions were designed to
determine the optimal concentration of the antherldiogen, the optimal
time of application, and the effects of spore sterilization on un-
transferred spore cultures. For each experimental condition, plates
of untreated gametophytes were used as controls.
1) Sterilized multlspore cultures were treated with 1 ml of
either 100%, 50%, 25%, 10%, or 1% A^^ 4 days after sowing.
2) Sterilized multlspore cultures were treated with 1 ml of 25%
A^^ on the day of sowing or 6 days after sowing.
3) Unsterlllzed multlspore cultures were treated with 1 ml of
25% A^^ on the day of sowing.
After observing the growth and reproductive responses of the cul
tured gametophytes In the preliminary experiments, six different culture
and treatment conditions were selected to analyze comparative growth
data in detail. The six different conditions include the following:
1) Sterilized multlspore cultures treated with 1 ml of 25% A^^
on the day of sowing,
2) Sterilized multlspore cultures treated with 1 ml of 25% A^^
4 days after sowing,
3) Sterilized multlspore cultures untreated,
4) Unsterlllzed multlspore cultures, sown according to the
procedure used for sterilized spores minus the step Involving the
sterllant, untreated,
5) Unsterlllzed multlspore cultures, sown by tapping spores
from glasslne envelopes onto dry agar, treated with 1 ml of 25%
40
on the day of sowing, and
6) Unsterlllzed multlspore cultures, sown as described for
condition 5, untreated.
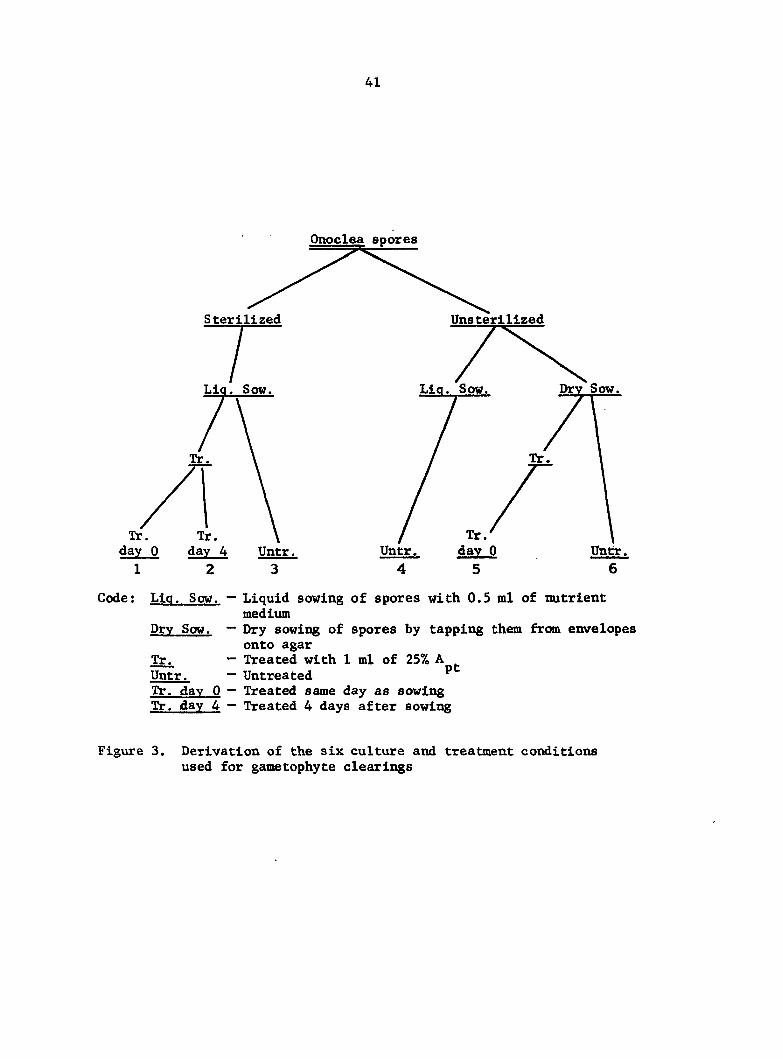
For the sake of clarity, a diagram of the derivation of the six
culture conditions Is shown In Figure 3.
Gametophytes were collected from these cultures on certain days
and cleared. The gametophyte clearing technique is described In Ap
pendix D. The number of game tophy tes collected and the days on which
they were collected are summarized in Table D.l.
Gametophytes fixed for light microscopy (LM), transmission electron
microscopy (TEM), or scanning electron microscopy (SEM) were all col
lected from sterilized multlspore cultures that were treated with 1 ml
of 25% Ap^ 4 days after sowing (condition 2).
Light Microscopy (LM)
Cleared gametophytes
Semipermanent slides were made of cleared gametophytes, collected
from the six different culture conditions, by the following procedure.
The gametophytes were placed into a drop of 1% aqueous acid fuchsin on
a slide and cover-slipped. A few drops of Hoyer's clearing solution
were added to one edge of the cover slip and drawn slowly through the
stain with a tissue wick placed at the opposite edge of the cover slip
(Appendix D).
Within the next few days, photographs were taken of the cleared
gametophytes on a Leltz Wetzlar Ortholux research microscope equipped
41
Onoclea spores
Unsterlllzed Sterilized
Dry Sow Liq. Sow. Liq. Sow.
Untr Untr. Untr.
Code: Liq. Sow. — Liquid sowing of spores with 0.5 ml of nutrient medium
Dry Sow. — Dry sowing of spores by tapping them from envelopes onto agar
Tr. — Treated with 1 ml of 25% A Untr. — Untreated ^ Tr. day 0 — Treated same day as sowing Tr. day 4 — Treated 4 days after sowing
Figure 3. Derivation of the six culture and treatment conditions used for gametophyte clearings
42
with phase-contrast optics. Kodak Plus-x ASA 125 and Pan-x ASA 32
film were used in the attached Leitz Orthomat automatic camera. A
living gametophyte, prior to being cleared, is shown in Figure 4. A
cleared and stained gametophyte is shown in Figure 5.
A sketch was made of each gametophyte before it was photographed,
and antheridium locations and the number of nuclei present in each
antheridium were noted. It was necessary to focus through the
anteridia to determine the number of nuclei present, which could not,
in all cases, be determined from the photographs. The information
from each sketch was transferred to the corresponding photograph. The
photographs were traced onto transparent acetate sheets with a water-
resistant, felt-tipped pen to clarify the position of the prothallial
cell walls, the location of antheridia, and the number of cells present
in each antheridium. A tracing of the cleared gametophyte shown in
Figure 5 is shown in Figure 6. From these drawings, the following
growth data were collected: the total number of prothallial cells per
gametophyte, the total number of antheridia per gametophyte, the number
of cells within each antheridium, the relative location of each
antheridium (Figure 7), and the area of each gametophyte. Methods of data
collection, analyses, and presentation are discussed in Appendix D.
Cytochemis try
In order to locate the nuclear DN/^ and the cytoplasmic RNA, within
prothallial and antheridial cells of gametophytes, a combination stain
of methyl green and pyronin Y (modified from Long and Taylor, 1956) was
used according to the following procedure outlined in detail in Ap-
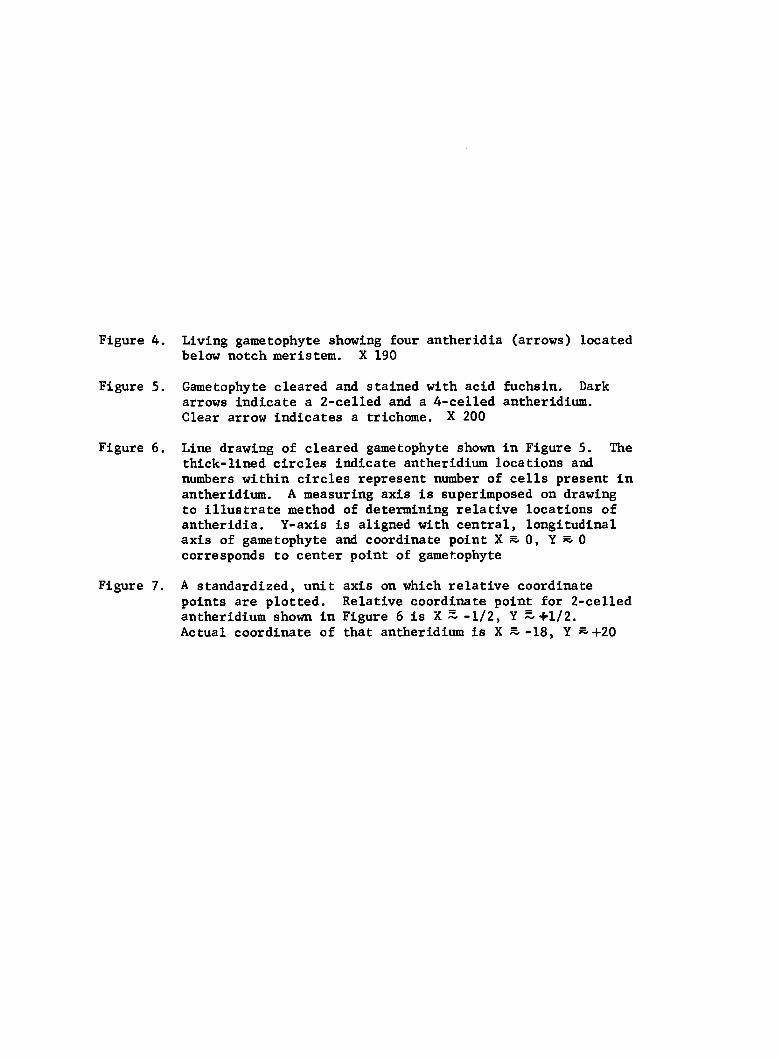
Figure 4. Living gametophyte showing four antheridia (arrows) located below notch meristem. X 190
Figure 5. Gametophyte cleared and stained with acid fuchsin. Dark arrows indicate a 2-celled and a 4-celled antheridium. Clear arrow indicates a trichome. X 200
Figure 6. Line drawing of cleared gametophyte shown in Figure 5. The thick-lined circles indicate antheridium locations and numbers within circles represent number of cells present in antheridium. A measuring axis is superimposed on drawing to illustrate method of determining relative locations of antheridia. Y-axis is aligned with central, longitudinal axis of gametophyte and coordinate point X 0, Y R 0 corresponds to center point of gametophyte
Figure 7. A standardized, unit axis on which relative coordinate points are plotted. Relative coordinate point for 2-celled antheridium shown in Figure 6 is X ~ -1/2, Y +1/2. Actual coordinate of that antheridium is X s,-18, Y +20
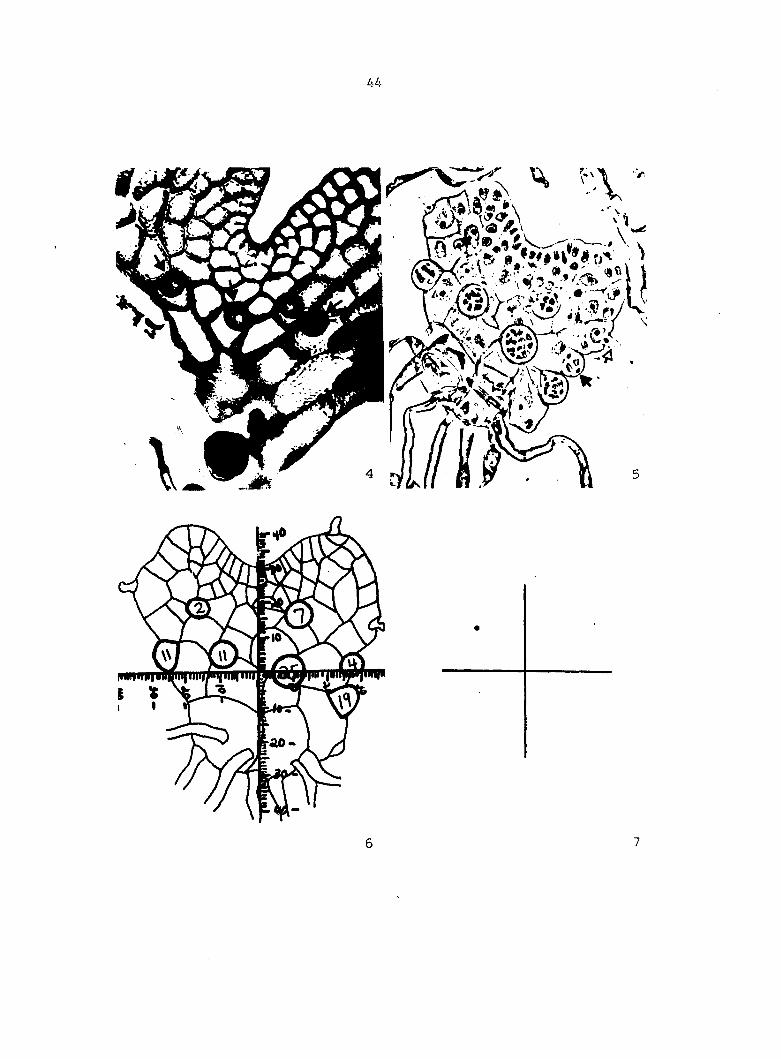
44
45
pendix E. Nine-day-old treated and untreated gametophytes were fixed
In a 3:1 absolute ethanol-glacial acetic acid mixture for 2 hr at room
temperature. They were hydrated through an ethanol dilution series.
The gametophytes were stained for 45 mln in methyl green/pyronln Y at
room temperature. They were rinsed 4X in distilled water, 15 mln each,
and placed on a slide with a drop of water and a cover-slip.
Photographs were taken using the microscopic setup previously
described. Kodak Ektachrome ASA 50 tungsten film was used with an 82A
filter.
Azure B (modified from Flax and Hlmes, 1952; Jacqmard et al.,
1972) was also used to observe the nucleic acid components in the cells
of the gametophytes. The procedure (Appendix E) entailed fixing the
treated and untreated gametophytes in 3:1 ethanol-glacial acetic acid
and hydratlng to water through an ethanol dilution series. The gameto-
phytes were then placed in a solution of azure B for 2 hr at 500C.
After four rinses in water, 15 rain each, the gametophytes were dehydrated
up to absolute tertiary butyl alcohol (TBA) through a TBA series. After
three changes in 100% TBA, 7 mln each, they were put through a series
of TBA:xylene until the gametophytes were in pure xylene. They were
slowly infiltrated with the xylene-soluble, mounting medium Plcolyte,
then placed on slides with pure Plcolyte and cover-slipped to form
permanent slides.
Resin embedded material
One to two weeks after treatment, gametophytes were collected
and fixed with either 3% glutaraldehyde in a phosphate buffer (0.05 M,
46
pH 7.0; Glauert, 1975), or with a combination of 3% glutaraldehyde and
0.5% paraformaldehyde in the same buffer (Hall, 1978).
In both cases, they were fixed for 2 hr at room temperature,
rinsed in buffer 4X, 20 min each, and placed into buffered 1% osmium
tetroxide for 45 min. The gametophytes were then rinsed 4X in buffer,
5 min each, and in d.HgO twice, 5 min each (Appendix E).
Due to the small size of the prothalli, they were placed into
porous, styrene baskets (Flo-Thru Specimen capsules, #9-00-09-50,
American Optical Corp.) before dehydration. Dehydration to absolute
ethanol consisted of a series of changes in 10% increases of ETCH be
ginning with 10% ETCH, After three changes in 100% ETCH, the gameto
phytes were tediously removed from the baskets and placed into a solution
of 100% ETCH and gradually infiltrated with propylene oxide. After
three changes in pure propylene oxide, they were slowly infiltrated
and then embedded with Spurr's epoxy resin (Spurr, 1969).
Sections were cut at 1 to 2 nm with a glass or diamond knife on
a Reichert 0M-U2 ultramicrotome. To obtain a serial order of both
stained and unstained sections, pairs of slides were used for mounting
sections. The slides were divided into regions; regions 1, 2, and 3
occur from left to right on the upper half of the slide; regions 4, 5,
and 6 occur from left to right on the bottom half of the slide.
For every six sections that were cut, three were placed in a drop
of sterile distilled water in each of two corresponding regions on the
pair of slides. When all six regions were filled (18 sections per
slide), the slide pairs were placed on a heating plate to dry. One
slide from each pair was stained with toluidine blue 0 (Appendix E).
47
Both the stained and unstained slides of each pair were mounted
using Permount mounting medium. Unstained sections were obtained to
be viewed with Nomarski interference contrast optics.
Photographs were taken on either a Leitz Wetzlar Ortholux micro
scope equipped with bright field optics or on a 1966 model Zeiss photo-
microscope equipped with Nomarski interference contrast optics.
Transmission Electron Microscopy (TEM)
The resin embedded material prepared for LM was also used for TEM.
Gray and silver sections were cut using glass and diamond knives on a
Reichert 0M-U2 ultramicrotome. The sections were chloroformed and col
lected on 300 mesh copper grids. They were stained for 30 min in
methanolic uranyl acetate (Stempak and Ward, 1964), followed by 1 hr of
staining in lead citrate (Reynolds, 1963).
Observations were made on an Hitachi HU-llC TEM, Images were re
corded on 3-1/4 X 4 in. Dupont Cronar Ortho S Litho sheet film.
Scanning Electron Microscopy (SEM)
Except for some three-week-old gametophytes observed in the living
state with SEM, the gametophytes were processed for SEM in the following
way. One- to four-week-old protahlli were fixed with 3% glutaraldehyde
in a phosphate buffer (0.05 M, pH 7.0) for 2 hr at room temperature and
post-fixed with 1% osmium tetroxide, in the same phosphate buffer. After
dehydration in an ethanol dilution series, the gametophytes were slowly
infiltrated with either Freon TF(113) or amyl acetate. They were
48
critical point dried with liquid carbon dioxide and mounted on brass
discs with silver paint. The preparations were coated with about 15 ran
of gold-palladium in a Polaron E5100 sputter coating unit.
The live specimens were prepared for observation by simply removing
them from culture, quickly placing them onto a piece of magnetic tape
that was silver-painted to a brass disc, and immediately viewing and
photographing them with a JEOL JSM-35 SEM at an accelerating voltage of
5 to 8 kV. The fixed specimens were viewed at an accelerating voltage
of 20 kV.
Images were recorded on 3-1/4 x 4 in. Polaroid type 665 positive/
negative film. Kodak Kodabromide paper (F series), or Kodak Poly-
contrast paper was used for positive prints made during this study.
49
RESULTS
Preliminary Experiments
Preliminary experiments revealed that the following five variable
factors affect the vegetative and reproductive responses of Onoclea
gametophytes grown in culture: 1) concentration of 2) method of
applying A^^, 3) time of A^^ application, 4) the act of transferring
gametophytes, and 5) sterilization of spores. Quantitative data were
not collected from the preliminary experiments. The information re
ported in this section comes from casual observations. These qualitative
data, reported in the following subsections, were used to determine
relevant, external factors which influence gametophyte growth and
reproduction. These factors were then incorporated into the design of
later experiments to quantify their effects on gametophyte growth and
reproduction. The quantified information is reported in the Gametophyte
Growth Data section and the Antheridium Developmental Data section.
Concentration of Apt
High concentrations of A^^, when applied to the transferred multi-
spore cultures, are more effective at inducing antheridia than lower
concentrations. When the cultures are treated with 100%, 50%, 10%,
1%, 0.1%, or 0.01% Ap^, only the 100% and 50% A^^ elicit a strong
response in terms of the number of antheridia produced per gametophyte
during the first week of treatment. The 10% A^^ induce far fewer
antheridia per gametophyte during the same time period, while the
responses to concentrations lower than 10% are negligible.
When nontransferred multispore cultures are treated with 100%,
50
50%, 25%, 10%, and 1% the three highest concentrations all induce
numerous antheridia per gametophyte during the first week after treat
ment. The lower concentrations induce far fewer antheridia per
gametophyte during the same time period.
In order to conserve the amount of A^^, to insure that the
same source was used in the entire study, the lowest concentration of
Ap^ that elicits the strongest response (25% A^^) was selected to be
used in the later experiments.
Method of applying Ap;-
It is found that the method of applying A^^ affects the repro
ductive responses of the gametophytes in the transferred multispore
cultures. If the A^^ is allowed to soak into the agar before the
young gametophytes are transferred to it, as opposed to being applied
to the surface of the agar after the gametophytes are transferred,
fewer antheridia are initiated per gametophyte during the first week
after treatment. For the later experiments, the method of applying
the Ap^ onto the surface of gametophytes already growing on agar is
used.
Time of Ap^ application
The first attempt to determine the best time to apply A^^ was
made with transferred multispore cultures. Cultures of germinating
spores and cultures of young gametophytes (3-5 prothallial cells, 1
rhizoid per gametophyte) were treated with 100% A^^ the day they were
transferred. Germinating spores do not grow beyond the 2-celled
stage. However, the young gametophytes have between 20 to 40 cells 4 days
51
after treatment with three to four antheridia per gametophyte. It is not
known what prevents the germinating spores from growing. The nontreated,
germinating spores that are transferred grow normally during the first
few weeks.
To obtain more information on an optimal time to apply non-
transferred, sterile, multispore cultures were treated with 25% at
different times in their development. The antheridiogen was applied
to the cultures either on the day they were sown, 4 days after sowing, or
6 days after sowing. Most of the spores treated on the day of sowing or
the prothalli treated 4 days after sowing, grew normally and produced 2-10
antheridia per gametophyte during the first week after treatment. How
ever, very few gametophytes treated 6 days after sowing produce antheridia.
The gametophytes that are induced have very few antheridium initials
during the first week after treatment. For the later experiments,
cultures are treated with 25% A^^ either on the day of sowing or 4 days
after sowing.
Transferring gametophytes
Gametophytes in transferred, multispore cultures grow more slowly
than gametophytes in nontransferred, multispore cultures. Also, after
2-3 wk of growth in the transferred cultures, many of the gametophytes
die. Few, if any, gametophytes die in the nontransferred cultures.
The primary reason for transferring the gametophytes is to obtain
a group of morphologically similar gametophytes which will have the same
growth rates and responses to A^^. However, it was found that, although
the gametophytes are similar on the day of transfer, they proceed to
52
grow at different rates and respond differently to with respect to
the number of initials produced and the location of the initials on the
thalli. Lacking any advantages, transferred multispore cultures are
not used in the later experiments.
Spore sterilization
The first observable effect of calcium hypochlorite applied for
2 min is the removal of the perispore layer of the spore. The intact
perispore of an unsterilized spore is shown in Figures 8 and 9, with a
typical jagged appearance, due to a reticulate pattern of deposition.
Unsterilized spores are dark brown in appearance. After sterilization,
the spores turn bright green revealing the internal cytoplasmic components
at the LM level. SEM micrographs of sterilized spores reveal the dis-
apperance of much of the reticulate material of the perispore (Figures
10 and 11). The exine layer below the perispore is shown in Figures
12 and 13 after the perispore was physically cracked off of a nonsterilized
spore.
If the spores are sterilized for less than 2 min, there is no ob
servable change in the morphology of the gametophytes, although the
gametophytes appear to grow much more slowly than gametophytes in un
sterilized cultures. If the spores are sterilized for more than 2 min,
morphological abnormalities do occur in which the typical cordate shape
of the thallus becomes highly branched. The branched gametophytes,
however, are still capable of initiating antheridia in response to
In the later experiments, both sterilized and unsterilized spores
are sown to produce multispore cultures, in order to quantify the ef-
Figures 8-9. Unsterilized spore of 0. sensibills showing jagged, peaked appearance of outer, perispore layer
8 .
9.
Figures 10-11.
X 1,118
X 8,250
Sterilized spores of 0. sensibills revealing disappearance of much of perispore layer
10. X 690
11. X 10,200
Figures 12-13. Unsterilized spore of 0. sensibllis showing exlne layer below perispore layer which has been physically cracked off
12.
13.
X 1,070
X 10,320
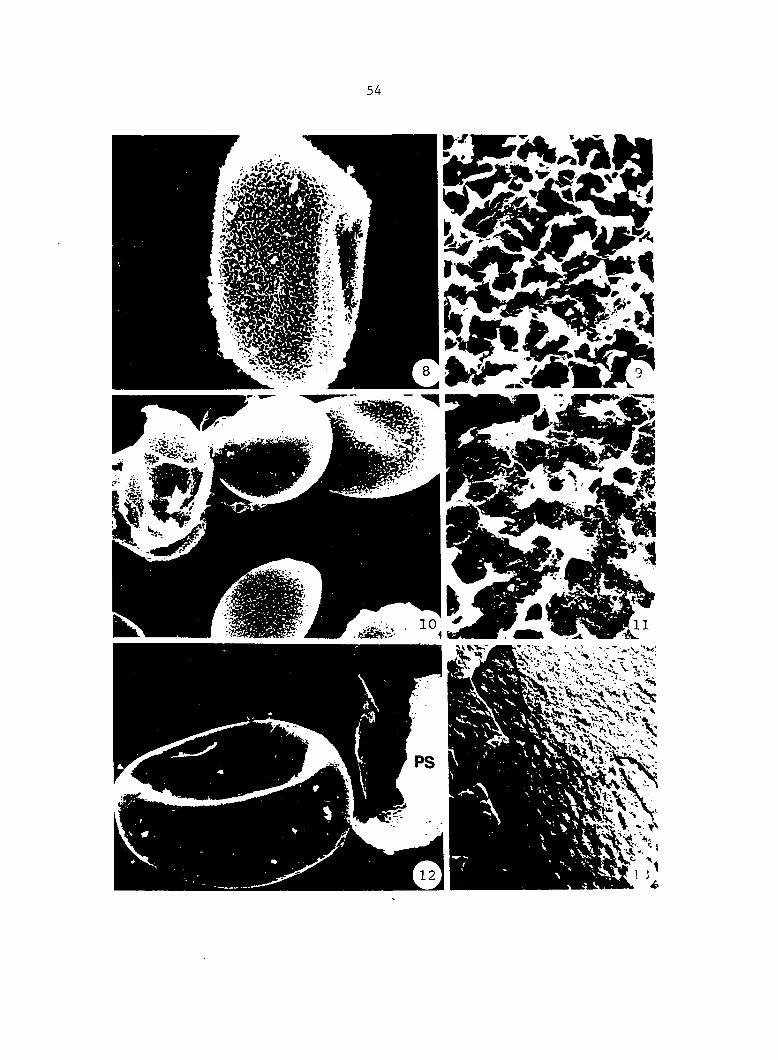
54
55
facts of spore sterilization.
In the preliminary experiments, the unsterillzed spore cultures
were sown by tapping the spores onto dry agar from glasslne envelopes
(dry-sown). The sterilized spores were sown suspended in a liquid solu
tion after one day of incubation in tap water (liquid-sown). For a more
direct comparison between sterilized and unsterillzed spore cultures in
later experiments, unsterillzed spores were also sown suspended in liquid
after one day of incubation in tap water. However, this liquid-sowing
of unsterillzed spores applied only to the cultures that were not
treated with A . The unsterillzed spore cultures that were A -treated pt pt
were dry-s own and Immediately treated with 1 ml of 25% A^^. Although
this procedure superficially transforms the dry-sown cultures into
liquid-sown cultures, they are recognized as being different from the
other liquid-sown cultures due to the fact that they lack a one-day
incubation in tap water. The effects of an Incubation period versus no
incubation period were investigated by comparing data from dry-sown, un
sterillzed spore cultures and liquid-sown, unsterillzed spore cultures.
Gametophyte Growth Data
Quantitative data are obtained from cleared gametophytes collected
daily to investigate the effects of the following variable factors on
gametophyte growth; 1) dry-sowing (no incubation period) versus liquid-
sowing (one-day incubation period), 2) spore sterilization versus no
sterilization, 3) A^^ treatment (day 0) versus no treatment of un
sterillzed spore cultures, 4) A^^ treatment (day 0) versus no treatment
56
of sterilized spore cultures, and 5) treatment (day 4) versus no
treatment of sterilized spore cultures. The effects of the variable
factors were studied in depth in order to determine an optimal culture
and treatment regime for growing gametophytes to be processed and sec
tioned for viewing with LM, TEM, and SEM.
The results presented in this section are expressed in terms of
the average number of vegetative cells produced per gametophyte, the
average total number of cells (vegetative and antheridial) produced per
gametophyte, and the average area formed per gametophyte. These data
are obtained directly from drawings of cleared gametophytes collected
daily from the six culture conditions.
Mean values and confidence Intervals (0.01 significance level)
determined for these expressions of growth rates are summarized in Ap
pendix F, Tables F.1-F.6. The t-test for unpaired observations and
equal variances is used as a test for significant differences between
means at the significance level of either 0.05 or 0.01. If the t-test
is used, the significance level is given. In some cases, linear regres
sion analysis is used. The results are presented in the form of regres-
2 slon equations and r values.
Effects of no incubation versus one-day incubation
To compare the effects of dry-sowing (no incubation period)
versus liquid-sowing (one-day incubation period), gametophytes were col
lected from untreated, unsterilized spore cultures that were either
dry-sown or liquid-sown (culture conditions 4 and 6). The method of
57
sowing does not affect the average number of vegetative cells produced
per gametophyte until after 6 days in culture (Figure 14). After 5 days
of growth, the gametophytes grown in liquid-sown cultures have an
average of 18.9 cells compared to 18.5 cells per gametophyte grown in
dry-sown cultures. From 6-11 days in culture, the average number of cells
per gametophyte grown in liquid-sown cultures is significantly higher
than in dry-sown cultures (P < 0.01). After 11 days in culture, the
average number of cells per gametophyte from liquid-sown cultures is
231.4 cells compared to 186.0 cells per gametophyte from dry-sown
cultures.
There is no significant difference, however, in the average area
per gametophyte from dry-sown versus liquid-sown cultures during the first
11 days in culture (Figure 15). After 5 days in culture, the average
2 area per gametophyte grown in liquid-sown cultures is 0.021 sq mm (mm )
and the average area per gametophyte grown in dry-sown cultures is
2 0.019 mm . After 11 days in culture, the averages are 0.214 and 0,215
2 mm , respectively.
The relationship between the number of cells per gametophyte and
the area per gametophyte is analyzed using linear regression analysis.
For gametophytes grown in liquid-sown cultures, the equation for the
regression line is Y = 918X + 2030 with an r^ value of 0.9779. For
gametophytes grown in dry-sown cultures, the equation for the regres
sion line is Y = 1168X - 5084 with an r^ value of 0.9771. In each cul
ture condition, the area of the gametophyte is highly dependent on the
number of cells produced per gametophyte.
Although the effects of an incubation period are minimal, the
Figures 14-17. Vegetative gametophyte growth data
14. Average number of vegetative cells per gametophyte in liquid-sown versus dry-sown cultures, unsterilized and untreated (culture conditions 4 and 6)
15. Average area per gametophyte in liquid-sown versus dry-sown cultures, unsterilized and untreated (culture conditions 4 and 6)
16. Average number of vegetative cells per gametophyte in sterilized versus unsterilized, untreated cultures (culture conditions 3 and 4)
17. Average area per gametophyte in sterilized versus un-ierilized, untreated cultures (culture conditions 3
and 4)
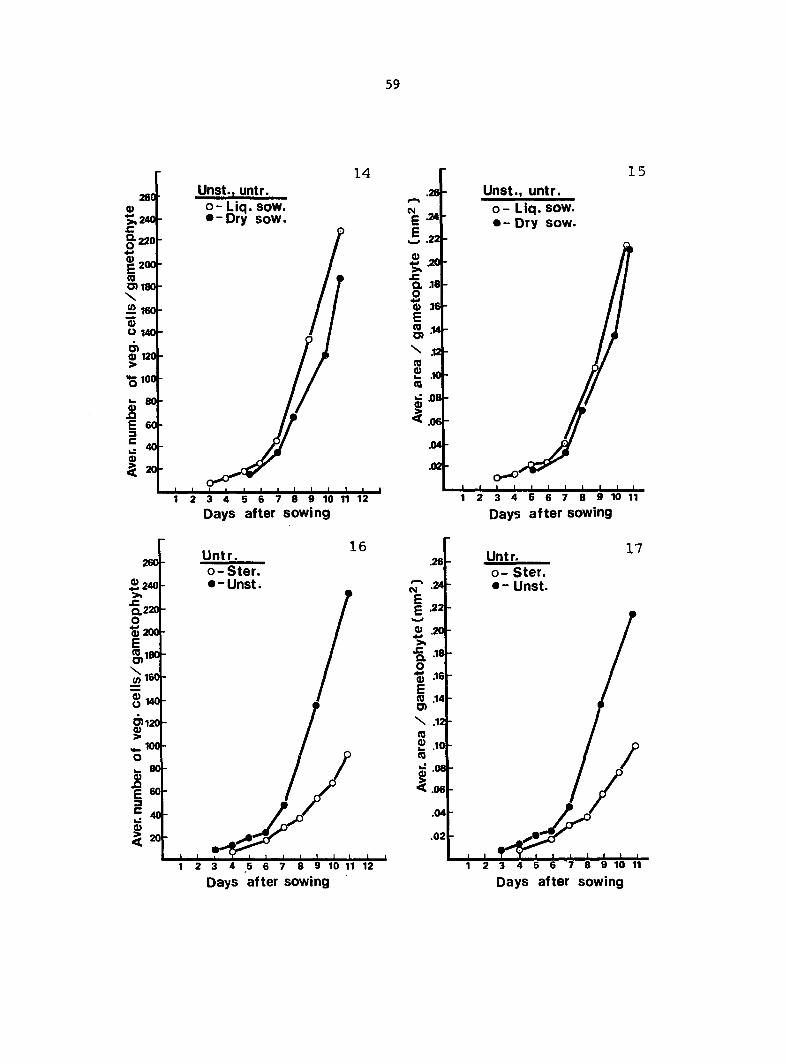
59
14
260 ' a> >,2401-
•220
I 200-(0 0)180#-\ i£ 160h a> O 140-
ô> 0) 120H > •5100-
;
Unst., untr. o- Liq. sow. • -Dry sow.
' •
1 2 3 4 5 6 7 8 9 1 0 1 1 1 2
Days after sowing
.26 -
-£.24
»B .221
•q. 18
2 Q) .16|-E 8) \ .12-
(0
g < .06
.04
.02
15
Unst., untr. o- Liq. sow. • - Dry sow.
o— I I _L 1 2 3 4 5 6 7 8 9 1 0 1 1
Days after sowing
o-Ster. - Unst i
o- Ster • - Unst
0) 200 -
«180»-
ra .14
£ .10-
8 9 1 0 1 1
Days after sowing Days after sowing
60
tendency for incubated cultures to produce gametophytes with slightly
more cells per unit area is considered when analyzing data from A^^-
treated, sterile and unsterile spore cultures that are either liquid-
sown or dry-sown, respectively (culture conditions 1 and 5).
Effects of spore sterilization
To determine the effects of spore sterilization on gametophyte
growth rates, data are obtained from untreated, liquid-sown gametophytes
grown from either sterilized spores or unsterilized spores (culture
conditions 3 and 4). Spore sterilization strongly affects the average
number of vegetative cells produced per gametophyte during the first
eleven days in culture (Figure 16), The gametophytes grown from
sterilized spores have significantly fewer cells (P < 0.01) than
gametophytes grown from unsterilized spores. Four days after sowing,
the gametophytes from sterilized spore cultures have an average of
only 4.5 cells compared to 10.6 cells per gametophyte grown in un
sterilized spore cultures. Seven days later, the averages are 91.1
and 231.4 cells, respectively. The gametophytes from unsterilized
spore cultures have an average of more than 2.5 times as many cells
as gametophytes from sterilized spore cultures after 11 days of
growth.
The average area per gametophyte during the same time period is
graphed in Figure 17. The average area per gametophyte grown in sterilized
spore cultures is significantly smaller (P < 0.01) than the average area
per gametophyte grown in unsterilized spore cultures. After 4 days in
culture, the average area of gametophytes grown in sterilized spore
61
2 2 cultures is 0.007 mm as compared to 0.013 mm per gametophyte grown in
unsterilized spore cultures. Seven days later, the averages are 0.021
2 and 0.100 mm , respectively.
The relationship between the number of vegetative cells per gameto
phyte and the area per gametophyte is analyzed using linear regression
analysis. For gametophytes grown in sterilized cultures, the equation
for the regression line is Y = 1078X + 197 with an r^ value of 0.952.
For gametophytes grown in unsterilized cultures, the equation of the
regression line is Y = 918X + 2030 with an r^ value of 0.978. In each
culture condition, the area of the gametophyte is highly dependent on
the number of cells produced per gametophyte.
In view of the dependency of gametophyte area on cell number and
the significant difference between each of the corresponding variables
due to sterilization versus unsterilization, the inhibition of gameto
phyte growth in sterilized cultures is attributed to an inhibition of
cell division.
Effects of Apt treatment (day 0) versus no treatment of unsterilized
spore cultures
Within the first 4 days of growth, there is no significant difference
in the average number of vegetative cells per treated or untreated
gametophytes (culture conditions 4 and 5; Figure 18). From 5-11 days in
culture, there are significantly fewer vegetative cells per treated
gametophyte compared to untreated gametophyte (P <0.01). After 5 days in
culture, treated gametophytes have an average of 13.94 vegetative cells
compared to 18.90 vegetative cells per untreated gametophyte. After 11
days in culture, the averages are 101.50 and 231.40 cells, respectively.
Figures 18-21. Gametophyte growth data
18. Average number of vegetative and total cells per gametophyte In Ap^-treated versus untreated, unsterilized cultures (culture conditions 4 and 5). Apt treatment occurred on day 0
19. Comparison of average areas per gametophyte in treated and untreated, sterilized and unsterilized cultures (culture conditions 1-5)
20. Average number of vegetative and total cells per gametophyte In treated versus untreated, sterilized cultures (culture conditions 1 and 3). Ap^ treatment occurred on day 0
21. Average number of vegetative and total cells per gametophyte in treated versus untreated, sterilized cultures treated four days after sowing (culture conditions 2 and 3)
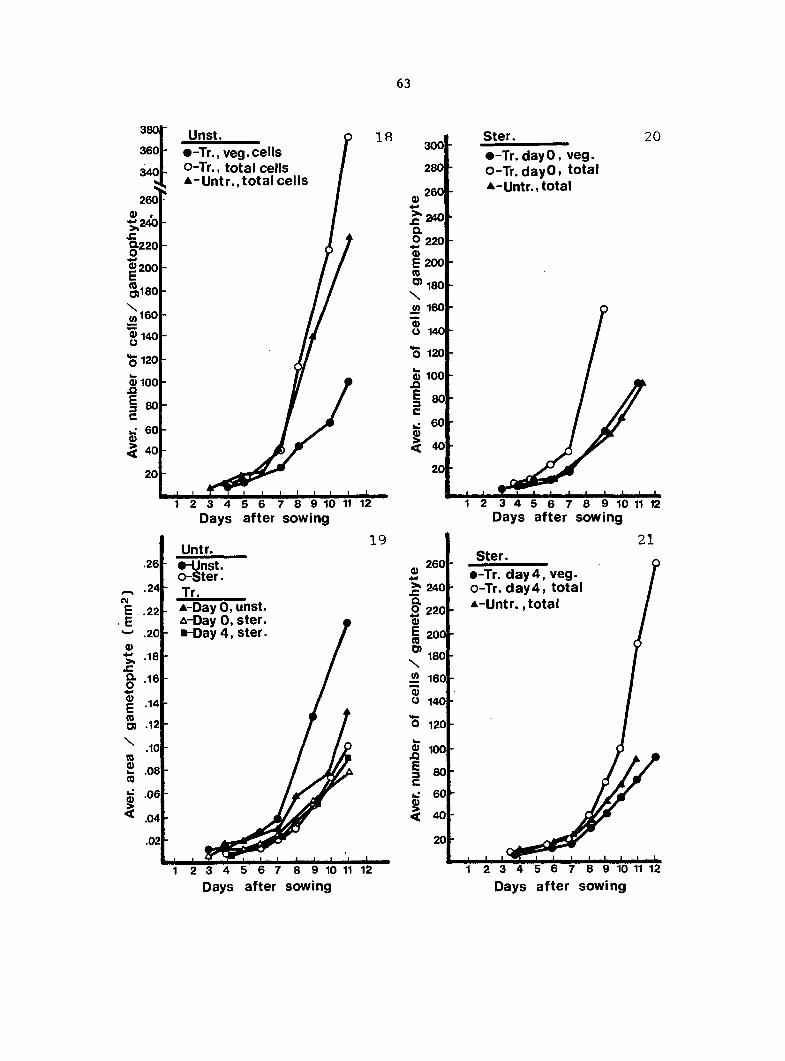
63
Ster. •-Tr. dayO, veg. o-Tr. day0> total A-Untr., total
Unst. -Tr., veg. cells
o-Tr., total cells A-Untr., total cells
? 240
2 220
O 140
5 120
0) 100 0)100
kJ 60
2 3 4 5 6 7 8 9 10 11 12 Days after sowing
1 2 3 4 5 6 7 8 9 10 11 12 Days after sowing
21 Ster. Untr,
•-Unst. o-Ster. Tr.
• Tr. day 4, veg o-Tr. day 4, total A-Untr. .total A-Day 0, unst
A-Day 0, ster •-Day 4, ster
a .16
u E 5) .12 O 120
« 100
1 2 3 4 5 6 7 8 9 10 11 12 Days after sowing
1 2 3 4 5 6 7 8 9 10 11 12 Days after sowing
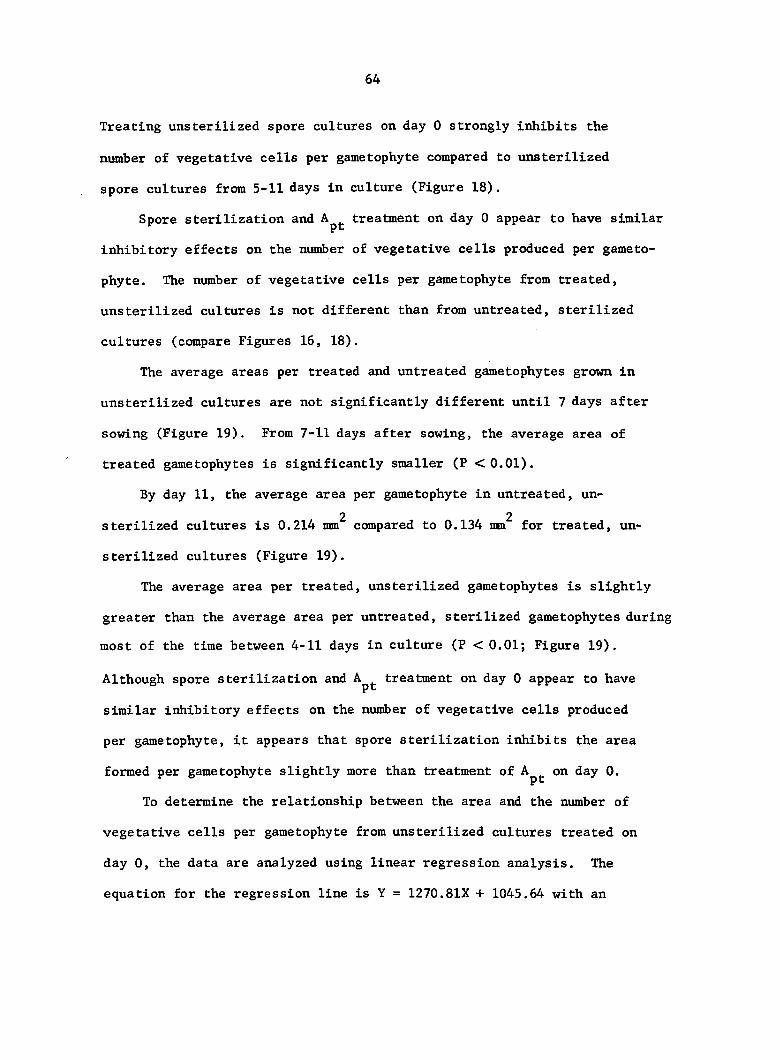
64
Treating unsterilized spore cultures on day 0 strongly inhibits the
number of vegetative cells per gametophyte compared to unsterilized
spore cultures from 5-11 days in culture (Figure 18).
Spore sterilization and treatment on day 0 appear to have similar
inhibitory effects on the number of vegetative cells produced per gameto
phyte. The number of vegetative cells per gametophyte from treated,
unsterilized cultures is not different than from untreated, sterilized
cultures (compare Figures 16, 18).
The average areas per treated and untreated gametophytes grown in
unsterilized cultures are not significantly different until 7 days after
sowing (Figure 19). From 7-11 days after sowing, the average area of
treated gametophytes is significantly smaller (P <0.01).
By day 11, the average area per gametophyte in untreated, un-
2 2 sterilized cultures is 0.214 mm compared to 0.134 nm for treated, un
sterilized cultures (Figure 19).
The average area per treated, unsterilized gametophytes is slightly
greater than the average area per untreated, sterilized gametophytes during
most of the time between 4-11 days in culture (P < 0.01; Figure 19).
Although spore sterilization and A^^ treatment on day 0 appear to have
similar inhibitory effects on the number of vegetative cells produced
per gametophyte, it appears that spore sterilization inhibits the area
formed per gametophyte slightly more than treatment of A^^ on day 0.
To determine the relationship between the area and the number of
vegetative cells per gametophyte from unsterilized cultures treated on
day 0, the data are analyzed using linear regression analysis. The
equation for the regression line is Y = 1270.81X + 1045.64 with an
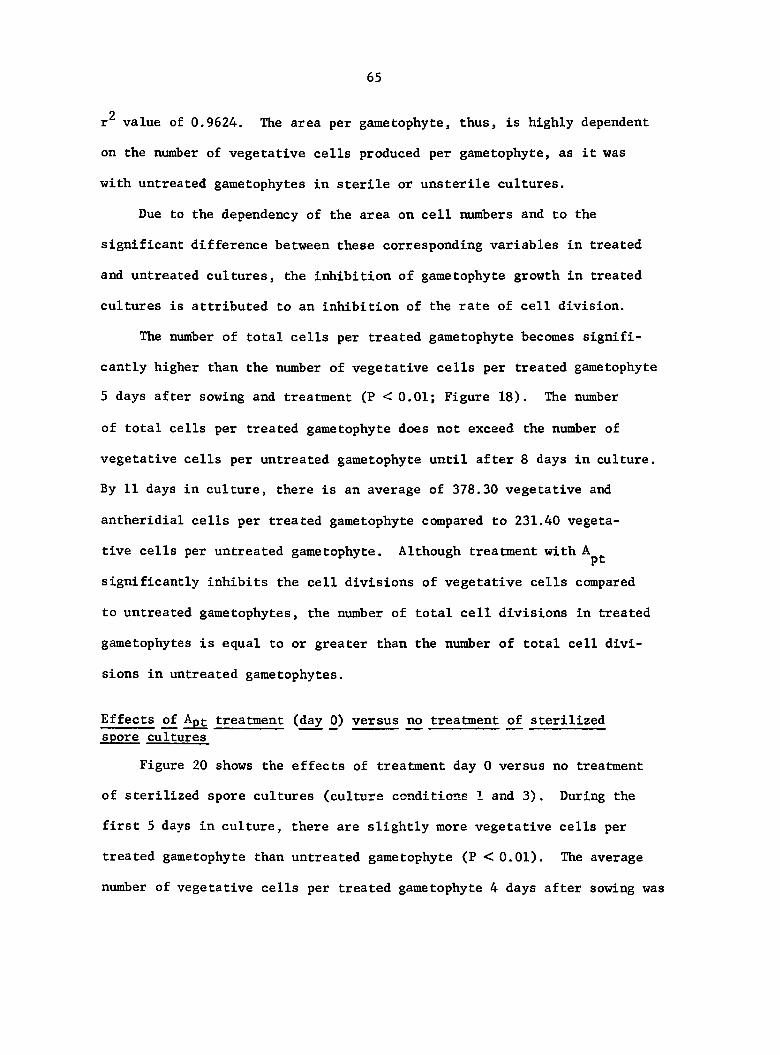
65
2 r value of 0.9624. The area per gametophyte, thus, is highly dependent
on the number of vegetative cells produced per gametophyte, as it was
with untreated gametophytes in sterile or unsterile cultures.
Due to the dependency of the area on cell numbers and to the
significant difference between these corresponding variables in treated
and untreated cultures, the inhibition of gametophyte growth in treated
cultures is attributed to an inhibition of the rate of cell division.
The number of total cells per treated gametophyte becomes signifi
cantly higher than the number of vegetative cells per treated gametophyte
5 days after sowing and treatment (P <0.01; Figure 18). The number
of total cells per treated gametophyte does not exceed the number of
vegetative cells per untreated gametophyte until after 8 days in culture.
By 11 days in culture, there is an average of 378.30 vegetative and
antheridial cells per treated gametophyte compared to 231.40 vegeta
tive cells per untreated gametophyte. Although treatment with
significantly inhibits the cell divisions of vegetative cells compared
to untreated gametophytes, the number of total cell divisions in treated
gametophytes is equal to or greater than the number of total cell divi
sions in untreated gametophytes.
Effects of Apt treatment (day 0) versus no treatment of sterilized spore cultures
Figure 20 shows the effects of treatment day 0 versus no treatment
of sterilized spore cultures (culture conditions 1 and 3). During the
first 5 days in culture, there are slightly more vegetative cells per
treated gametophyte than untreated gametophyte (P <0.01). The average
number of vegetative cells per treated gametophyte 4 days after sowing was
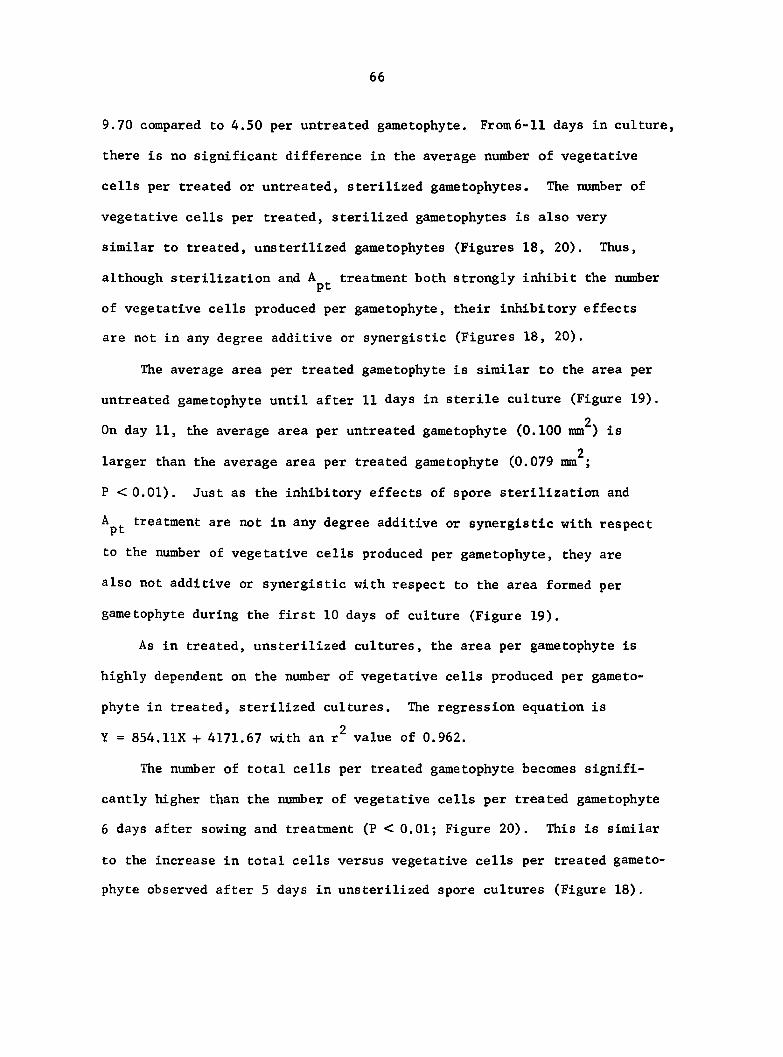
66
9.70 compared to 4.50 per untreated gametophyte. From6-11 days in culture,
there is no significant difference in the average number of vegetative
cells per treated or untreated, sterilized gametophytes. The number of
vegetative cells per treated, sterilized gametophytes is also very
similar to treated, unsterilized gametophytes (Figures 18, 20). Thus,
although sterilization and treatment both strongly inhibit the number
of vegetative cells produced per gametophyte, their inhibitory effects
are not in any degree additive or synergistic (Figures 18, 20).
The average area per treated gametophyte is similar to the area per
untreated gametophyte until after 11 days in sterile culture (Figure 19).
2 On day 11, the average area per untreated gametophyte (0.100 mm ) is
2 larger than the average area per treated gametophyte (0.079 mm ;
P <0.01). Just as the inhibitory effects of spore sterilization and
treatment are not in any degree additive or synergistic with respect
to the number of vegetative cells produced per gametophyte, they are
also not additive or synergistic with respect to the area formed per
gametophyte during the first 10 days of culture (Figure 19).
As in treated, unsterilized cultures, the area per gametophyte is
highly dependent on the number of vegetative cells produced per gameto
phyte in treated, sterilized cultures. The regression equation is
Y = 854.IIX + 4171.67 with an r^ value of 0.962.
The number of total cells per treated gametophyte becomes signifi
cantly higher than the number of vegetative cells per treated gametophyte
6 days after sowing and treatment (P < 0.01; Figure 20). This is similar
to the increase in total cells versus vegetative cells per treated gameto
phyte observed after 5 days in unsterilized spore cultures (Figure 18).
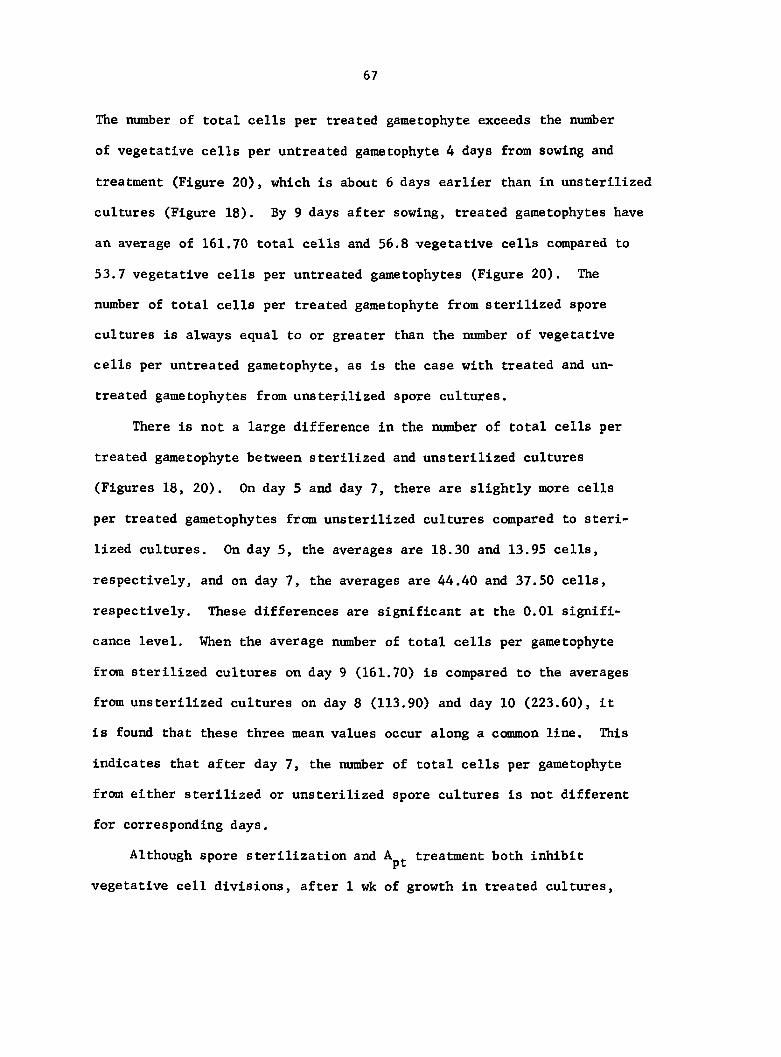
67
The number of total cells per treated gametophyte exceeds the number
of vegetative cells per untreated gametophyte 4 days from sowing and
treatment (Figure 20), which is about 6 days earlier than in unsterilized
cultures (Figure 18). By 9 days after sowing, treated gametophytes have
an average of 161.70 total cells and 56.8 vegetative cells compared to
53.7 vegetative cells per untreated gametophytes (Figure 20). The
number of total cells per treated gametophyte from sterilized spore
cultures is always equal to or greater than the number of vegetative
cells per untreated gametophyte, as is the case with treated and un
treated gametophytes from unsterilized spore cultures.
There is not a large difference in the number of total cells per
treated gametophyte between sterilized and unsterilized cultures
(Figures 18, 20). On day 5 and day 7, there are slightly more cells
per treated gametophytes from unsterilized cultures compared to steri
lized cultures. On day 5, the averages are 18.30 and 13.95 cells,
respectively, and on day 7, the averages are 44.40 and 37.50 cells,
respectively. These differences are significant at the 0.01 signifi
cance level. When the average number of total cells per gametophyte
from sterilized cultures on day 9 (161.70) is compared to the averages
from unsterilized cultures on day 8 (113.90) and day 10 (223.60), it
is found that these three mean values occur along a common line. This
indicates that after day 7, the number of total cells per gametophyte
from either sterilized or unsterilized spore cultures is not different
for corresponding days.
Although spore sterilization and treatment both inhibit
vegetative cell divisions, after 1 wk of growth in treated cultures,
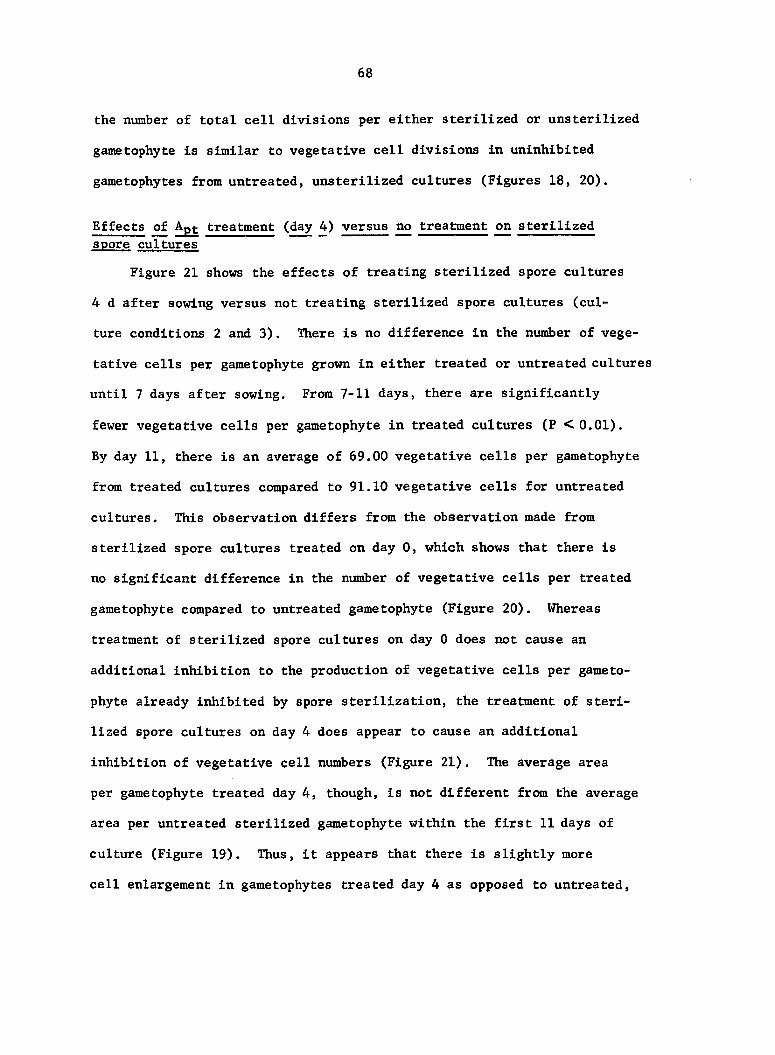
68
the number of total cell divisions per either sterilized or unsterilized
gametophyte is similar to vegetative cell divisions in uninhibited
gametophytes from untreated, unsterilized cultures (Figures 18, 20).
Effects of Apt treatment (day 4) versus no treatment on sterilized
spore cultures
Figure 21 shows the effects of treating sterilized spore cultures
4 d after sowing versus not treating sterilized spore cultures (cul
ture conditions 2 and 3). There is no difference in the number of vege
tative cells per gametophyte grown in either treated or untreated cultures
until 7 days after sowing. From 7-11 days, there are significantly
fewer vegetative cells per gametophyte in treated cultures (P <0.01).
By day 11, there is an average of 69.00 vegetative cells per gametophyte
from treated cultures compared to 91.10 vegetative cells for untreated
cultures. This observation differs from the observation made from
sterilized spore cultures treated on day 0, which shows that there is
no significant difference in the number of vegetative cells per treated
gametophyte compared to untreated gametophyte (Figure 20). Whereas
treatment of sterilized spore cultures on day 0 does not cause an
additional inhibition to the production of vegetative cells per gameto
phyte already inhibited by spore sterilization, the treatment of steri
lized spore cultures on day 4 does appear to cause an additional
inhibition of vegetative cell numbers (Figure 21). The average area
per gametophyte treated day 4, though, is not different from the average
area per untreated sterilized gametophyte within the first 11 days of
culture (Figure 19). Thus, it appears that there is slightly more
cell enlargement in gametophytes treated day 4 as opposed to untreated.
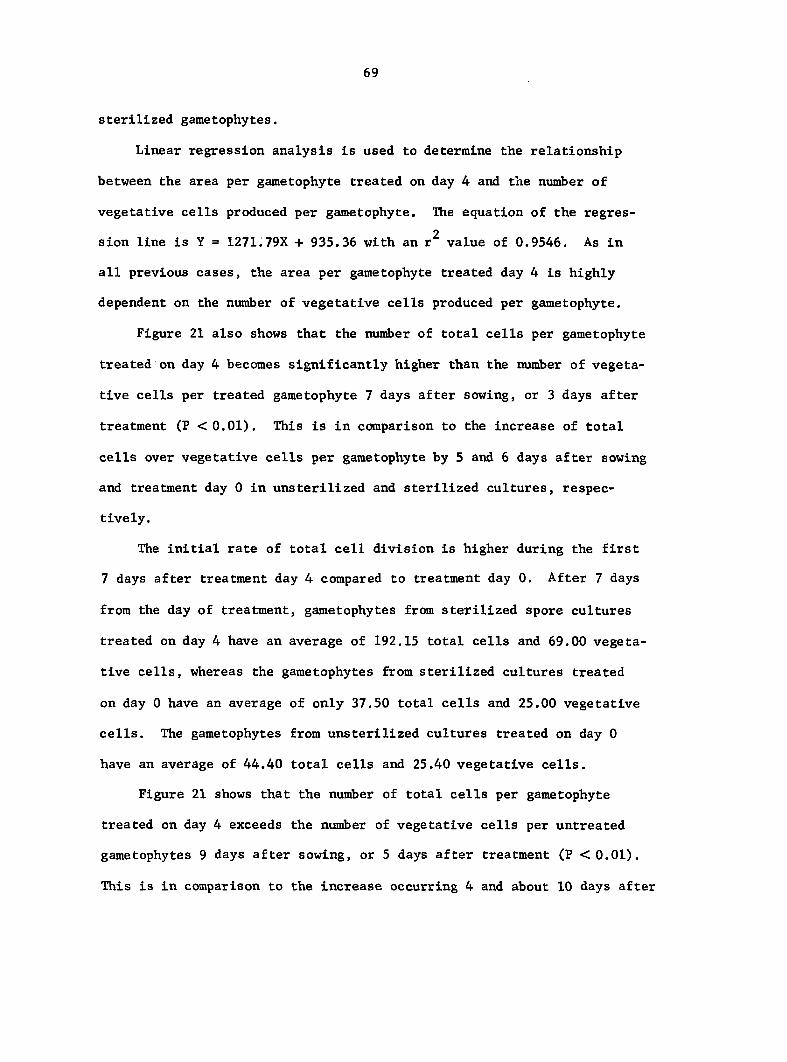
69
sterilized gametophytes.
Linear regression analysis is used to determine the relationship
between the area per gametophyte treated on day 4 and the number of
vegetative cells produced per gametophyte. The equation of the regres
sion line is Y = 1271.79X + 935.36 with an r^ value of 0.9546. As in
all previous cases, the area per gametophyte treated day 4 is highly
dependent on the number of vegetative cells produced per gametophyte.
Figure 21 also shows that the number of total cells per gametophyte
treated on day 4 becomes significantly higher than the number of vegeta
tive cells per treated gametophyte 7 days after sowing, or 3 days after
treatment (P <0.01). This is in comparison to the increase of total
cells over vegetative cells per gametophyte by 5 and 6 days after sowing
and treatment day 0 in unsterilized and sterilized cultures, respec
tively.
The initial rate of total cell division is higher during the first
7 days after treatment day 4 compared to treatment day 0. After 7 days
from the day of treatment, gametophytes from sterilized spore cultures
treated on day 4 have an average of 192.15 total cells and 69.00 vegeta
tive cells, whereas the gametophytes from sterilized cultures treated
on day 0 have an average of only 37.50 total cells and 25.00 vegetative
cells. The gametophytes from unsterilized cultures treated on day 0
have an average of 44.40 total cells and 25.40 vegetative cells.
Figure 21 shows that the number of total cells per gametophyte
treated on day 4 exceeds the number of vegetative cells per untreated
gametophytes 9 days after sowing, or 5 days after treatment (P <0.01).
This is in comparison to the increase occurring 4 and about 10 days after
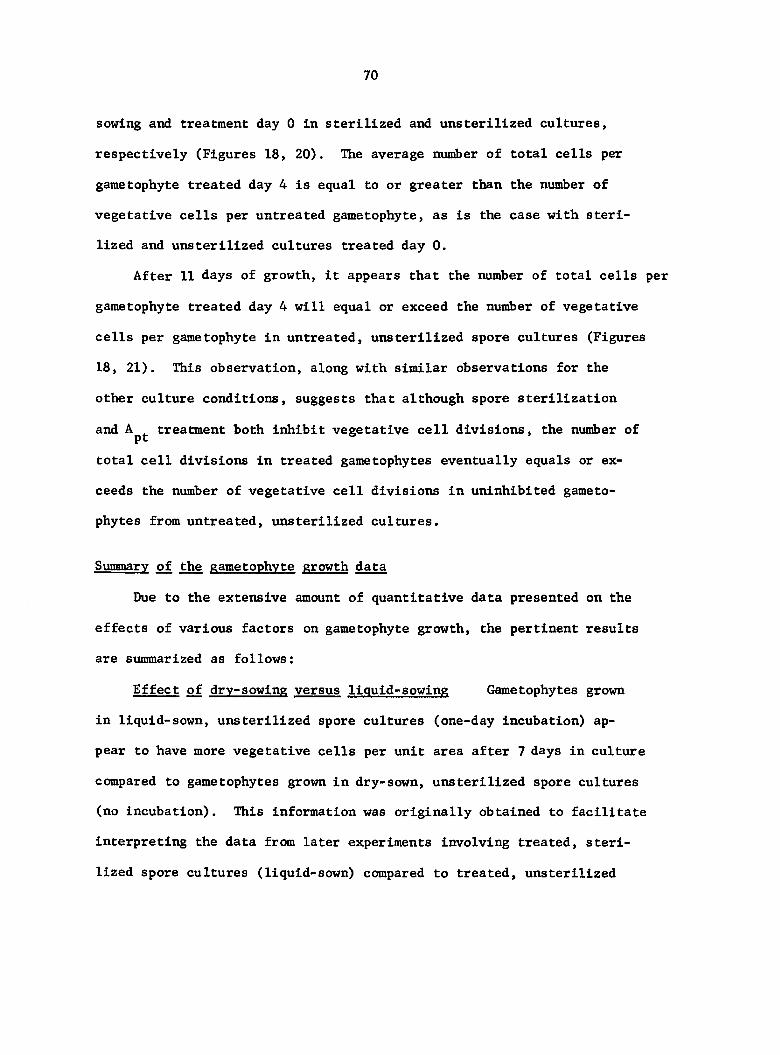
70
sowing and treatment day 0 in sterilized and unsterilized cultures,
respectively (Figures 18, 20). The average number of total cells per
gametophyte treated day 4 is equal to or greater than the number of
vegetative cells per untreated gametophyte, as is the case with steri
lized and unsterilized cultures treated day 0.
After 11 days of growth, it appears that the number of total cells per
gametophyte treated day 4 will equal or exceed the number of vegetative
cells per gametophyte in untreated, unsterilized spore cultures (Figures
18, 21). This observation, along with similar observations for the
other culture conditions, suggests that although spore sterilization
and treatment both inhibit vegetative cell divisions, the number of
total cell divisions in treated gametophytes eventually equals or ex
ceeds the number of vegetative cell divisions in uninhibited gameto-
phytes from untreated, unsterilized cultures.
Summary of the gametophyte growth data
Due to the extensive amount of quantitative data presented on the
effects of various factors on gametophyte growth, the pertinent results
are summarized as follows:
Effect of dry-sowing versus liquid-sowing Gametophytes grown
in liquid-sown, unsterilized spore cultures (one-day Incubation) ap
pear to have more vegetative cells per unit area after 7 days in culture
compared to gametophytes grown in dry-sown, unsterilized spore cultures
(no incubation). This Information was originally obtained to facilitate
interpreting the data from later experiments involving treated, steri
lized spore cultures (liquid-sown) compared to treated, unsterilized
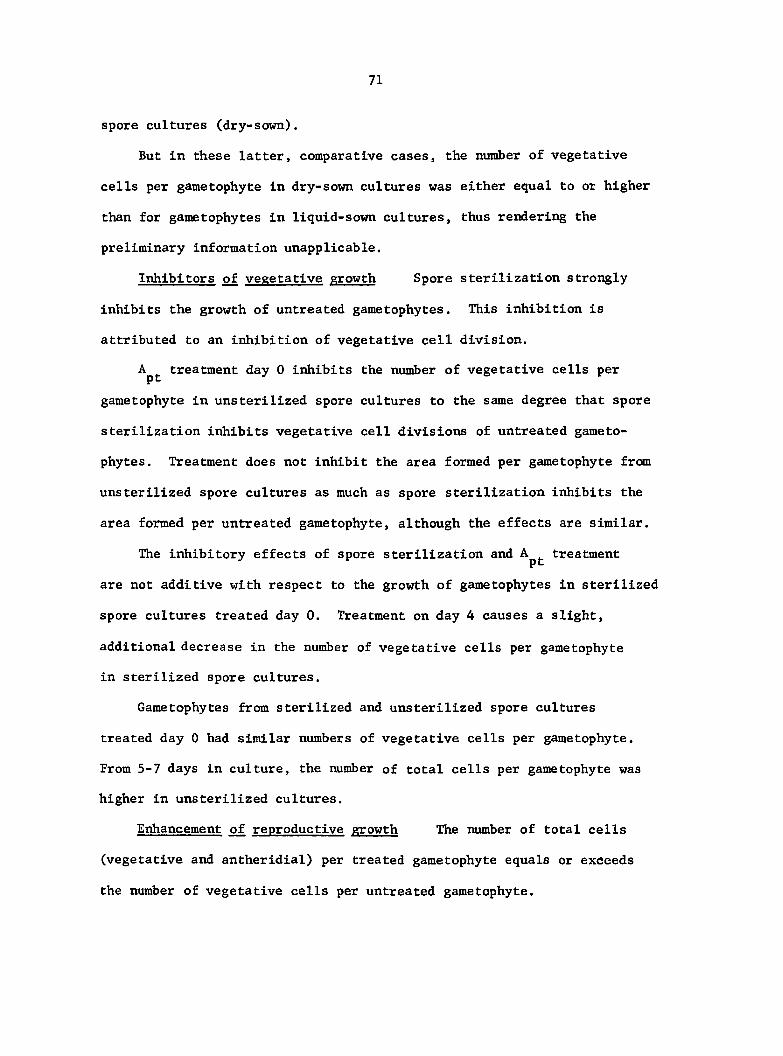
71
spore cultures (dry-sown).
But in these latter, comparative cases, the number of vegetative
cells per gametophyte in dry-sown cultures was either equal to or higher
than for gametophytes in liquid-sown cultures, thus rendering the
preliminary information unapplicable.
Inhibitors of vegetative growth Spore sterilization strongly
inhibits the growth of untreated gametophytes. This inhibition is
attributed to an inhibition of vegetative cell division.
treatment day 0 inhibits the number of vegetative cells per
gametophyte in unsterilized spore cultures to the same degree that spore
sterilization inhibits vegetative cell divisions of untreated game to
phy te s . Treatment does not inhibit the area formed per gametophyte from
unsterilized spore cultures as much as spore sterilization inhibits the
area formed per untreated gametophyte, although the effects are similar.
The inhibitory effects of spore sterilization and treatment
are not additive with respect to the growth of gametophytes in sterilized
spore cultures treated day 0. Treatment on day 4 causes a slight,
additional decrease in the number of vegetative cells per gametophyte
in sterilized spore cultures.
Gametophytes from sterilized and unsterilized spore cultures
treated day 0 had similar numbers of vegetative cells per gametophyte.
From 5-7 days in culture, the number of total cells per gametophyte was
higher in unsterilized cultures.
Enhancement of reproductive growth The number of total cells
(vegetative and antheridial) per treated gametophyte equals or exceeds
the number of vegetative cells per untreated gametophyte.
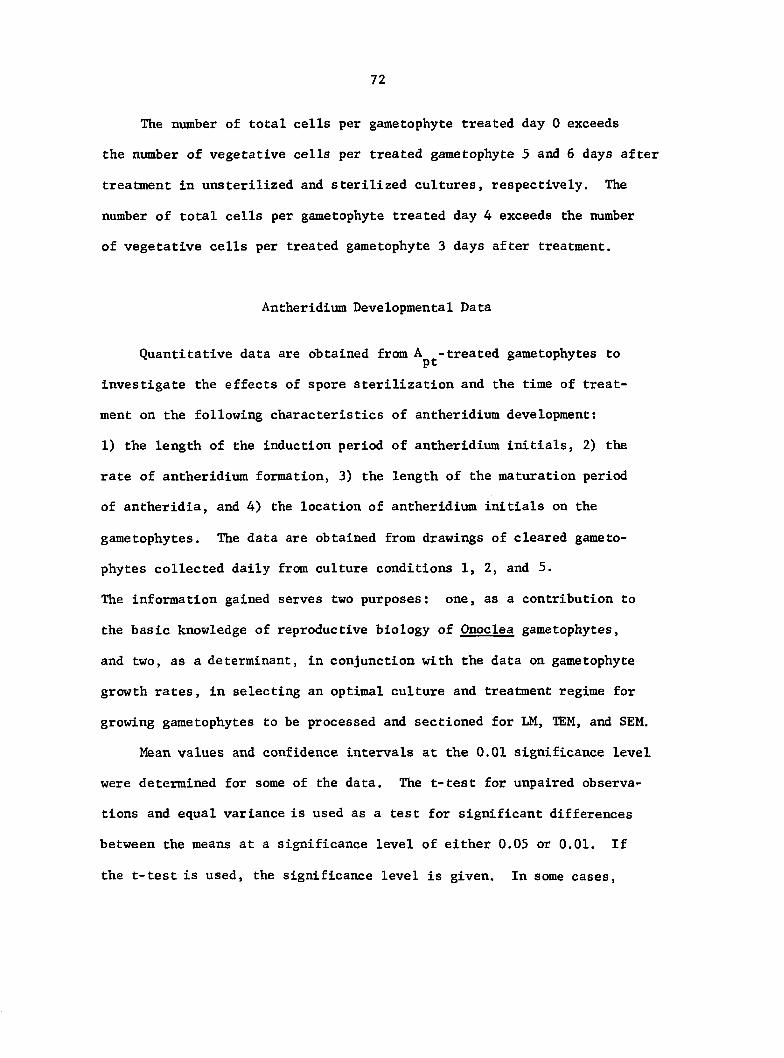
72
The number of total cells per gametophyte treated day 0 exceeds
the number of vegetative cells per treated gametophyte 5 and 6 days after
treatment in unsterilized and sterilized cultures, respectively. The
number of total cells per gametophyte treated day 4 exceeds the number
of vegetative cells per treated gametophyte 3 days after treatment.
Antheridium Developmental Data
Quantitative data are obtained from treated gametophytes to
investigate the effects of spore sterilization and the time of treat
ment on the following characteristics of antheridium development;
1) the length of the induction period of antheridium initials, 2) the
rate of antheridium formation, 3) the length of the maturation period
of antheridia, and 4) the location of antheridium initials on the
gametophytes. The data are obtained from drawings of cleared game to
phy te s collected daily from culture conditions 1, 2, and 5.
The information gained serves two purposes: one, as a contribution to
the basic knowledge of reproductive biology of Onoclea gametophytes,
and two, as a determinant, in conjunction with the data on gametophyte
growth rates, in selecting an optimal culture and treatment regime for
growing gametophytes to be processed and sectioned for LM, TEM, and SEM.
Mean values and confidence intervals at the 0.01 significance level
were determined for some of the data. The t-test for unpaired observa
tions and equal variance is used as a test for significant differences
between the means at a significance level of either 0.05 or 0.01. If
the t-test is used, the significance level is given. In some cases,
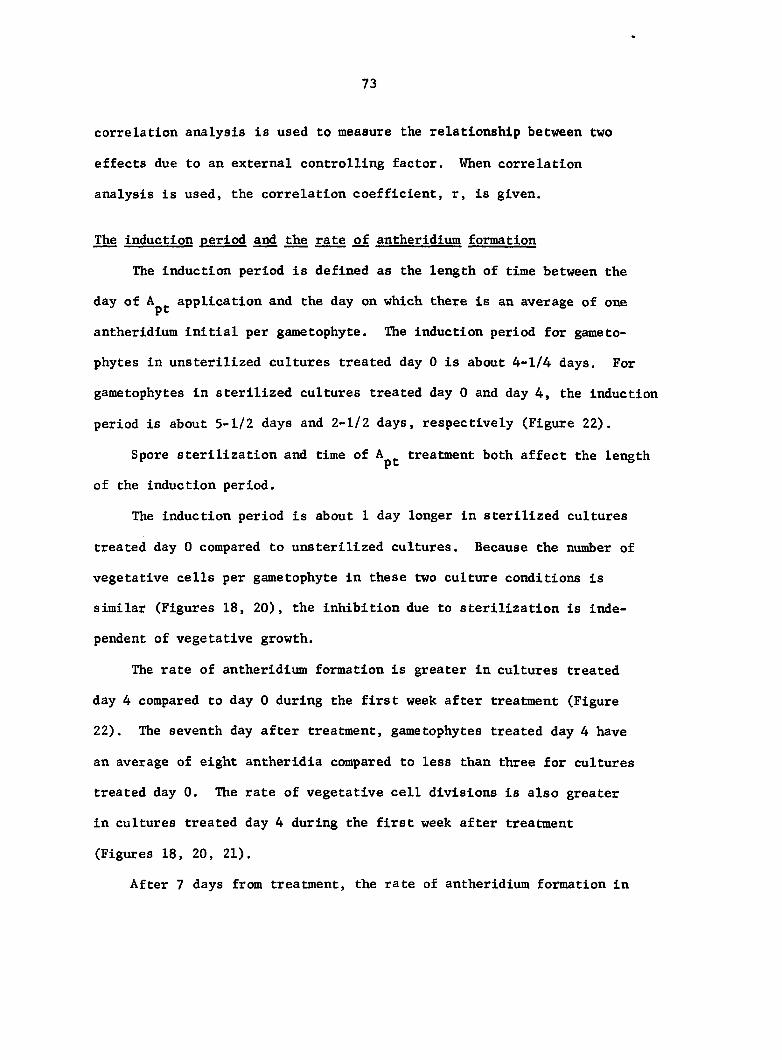
73
correlation analysis is used to measure the relationship between two
effects due to an external controlling factor. When correlation
analysis is used, the correlation coefficient, r, is given.
The induction period and the rate of antheridium formation
The induction period is defined as the length of time between the
day of application and the day on which there is an average of one
antheridium initial per gametophyte. The induction period for gameto
phytes in unsterilized cultures treated day 0 is about 4-1/4 days. For
gametophytes in sterilized cultures treated day 0 and day 4, the induction
period is about 5-1/2 days and 2-1/2 days, respectively (Figure 22).
Spore sterilization and time of treatment both affect the length
of the induction period.
The induction period is about 1 day longer in sterilized cultures
treated day 0 compared to unsterilized cultures. Because the number of
vegetative cells per gametophyte in these two culture conditions is
similar (Figures 18, 20), the inhibition due to sterilization is inde
pendent of vegetative growth.
The rate of antheridium formation is greater in cultures treated
day 4 compared to day 0 during the first week after treatment (Figure
22). The seventh day after treatment, gametophytes treated day 4 have
an average of eight antherldla compared to less than three for cultures
treated day 0. The rate of vegetative cell divisions is also greater
in cultures treated day 4 during the first week after treatment
(Figures 18, 20, 21).
After 7 days from treatment, the rate of antheridium formation in

Figure 22. The average number of antheridia per gametophyte following treatment with Ap^ in three culture conditions: culture condition 1 (o), culture condition 2 (•), and culture condition 5 (A)
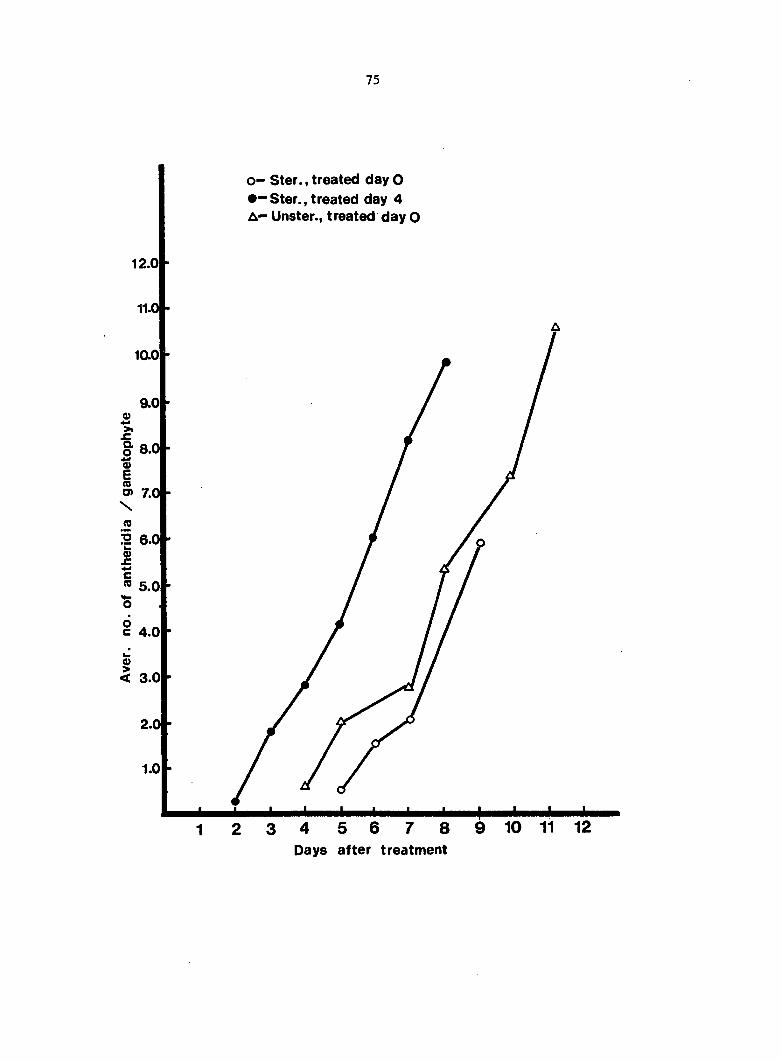
75
O- Ster., treated day O #— Ster., treated day 4 A— Unster., treated day O
12.0
11.0
9.0
8.0
o> 7.0
3 6.0 I " 5.0
c 4.0
< 3.0
2.0
1.0
Days after treatment
76
cultures treated day 0 Increases to equal the rate found In cultures
treated day 4 (Figure 22). The rate of vegetative cell divisions also
begins to increase after the first week of treatment in cultures treated
day 0 (Figures 18, 20).
This concomitant increase in vegetative cells with the number of
antheridia indicates that a possible correlation exists between the two
variables. The average number of cells present when the first initial
forms varies among the three treated culture conditions (Figure 23),
Gametophytes with one antheridium in unsterilized cultures have a
lower average of cells (11.6) than gametophytes in sterilized cultures
treated day 0 (17.1; P <0.01).
Although it appears that there is an initial threshold of numbers
of vegetative cells that a treated gametophyte needs to produce before
forming antheridia, there apparently are other requirements which need
to be met before antheridium initiation can occur. Spore sterilization
initially interferes with the ability of the gametophytes to meet those
requirements.
The average number of cells per gametophyte with one antheridium
from sterilized cultures treated day 4 is 20.2 which is significantly
higher than for unsterilized and sterilized cultures treated day 0
(P <0.01, P <0.05, respectively). Gametophytes treated on day 4 have
an average of five vegetative cells (Figure 21). Even though treatment
on day 4 reduces the induction period by about 3 days in sterilized cul
tures, 2 days are still necessary for the induction of antheridial
initials. This observation supports the earlier supposition that the
number of vegetative cells per gametophyte is not the only determining
Figure 23. Average number of vegetative cells per gametophyte with respect to number of antheridia present per gametophyte in sterilized and unsterilized cultures treated on day 0 and day 4
Figure 24. Average area per gametophyte with respect to number of antheridia present per gametophyte in sterilized and unsterilized cultures treated on day 0 and day 4
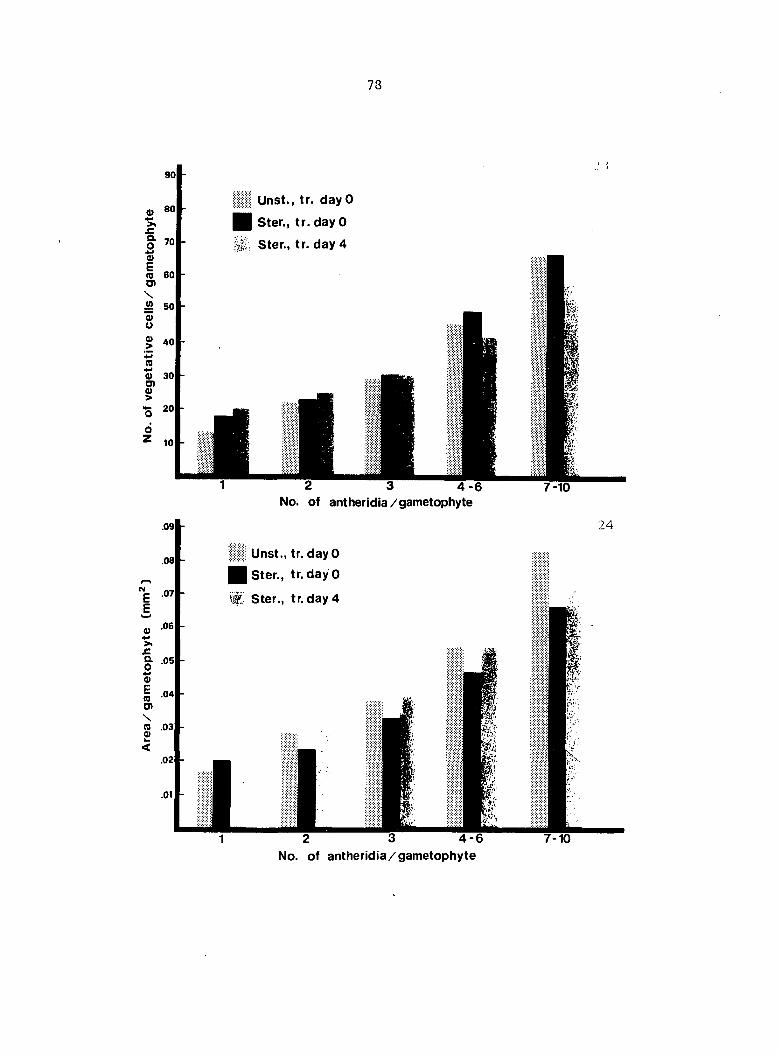
78
Unst., tr. day 0
g Ster., tr. day 0
If Ster., tr. day 4
2 3 4 - 6 No. of antheridia/gametophyte
Unst., tr. day 0
m Ster., tr. day 0
# Ster., tr. day 4
No. of antheridia/gametophyte
7-10
24
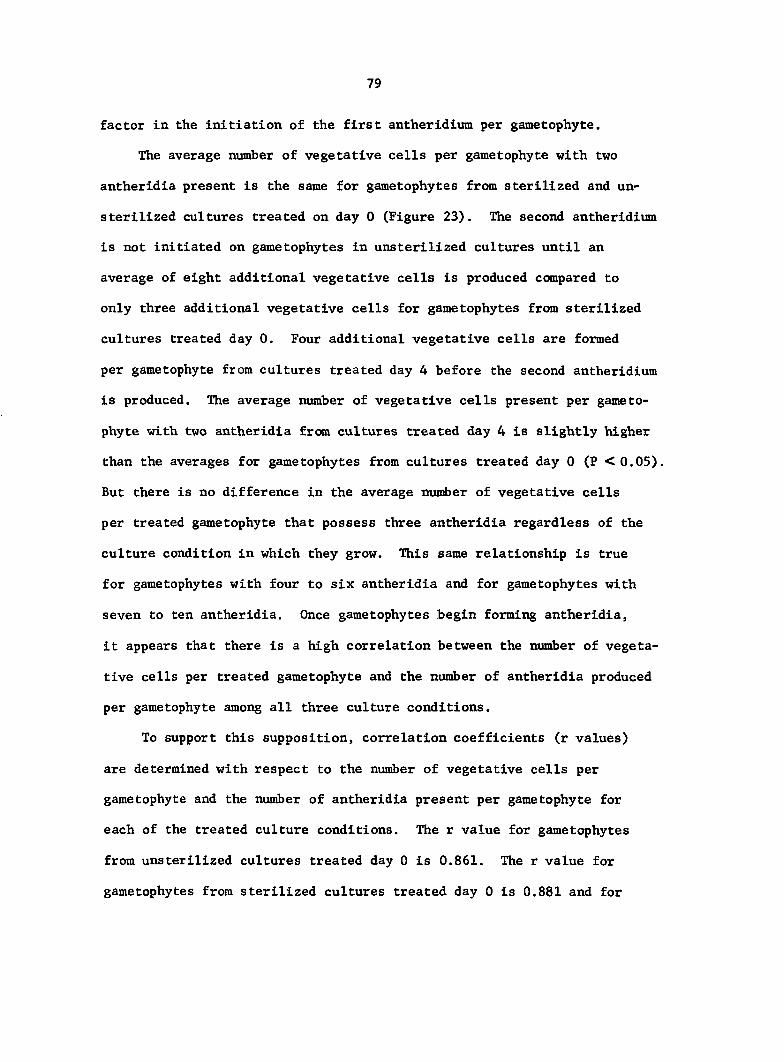
79
factor in the initiation of the first antheridium per gametophyte.
The average number of vegetative cells per gametophyte with two
antheridia present is the same for gametophytes from sterilized and un-
sterilized cultures treated on day 0 (Figure 23). The second antheridium
is not initiated on gametophytes in unsterilized cultures until an
average of eight additional vegetative cells is produced compared to
only three additional vegetative cells for gametophytes from sterilized
cultures treated day 0. Four additional vegetative cells are formed
per gametophyte from cultures treated day 4 before the second antheridium
is produced. The average number of vegetative cells present per gameto
phy te with two antheridia from cultures treated day 4 is slightly higher
than the averages for gametophytes from cultures treated day 0 (P <0.05).
But there is no difference in the average number of vegetative cells
per treated gametophyte that possess three antheridia regardless of the
culture condition in which they grow. This same relationship is true
for gametophytes with four to six antheridia and for gametophytes with
seven to ten antheridia. Once gametophytes begin forming antheridia,
it appears that there is a high correlation between the number of vegeta
tive cells per treated gametophyte and the number of antheridia produced
per gametophyte among all three culture conditions.
To support this supposition, correlation coefficients (r values)
are determined with respect to the number of vegetative cells per
gametophyte and the number of antheridia present per gametophyte for
each of the treated culture conditions. The r value for gametophytes
from unsterilized cultures treated day 0 is 0.861. The r value for
gametophytes from sterilized cultures treated day 0 is 0.881 and for
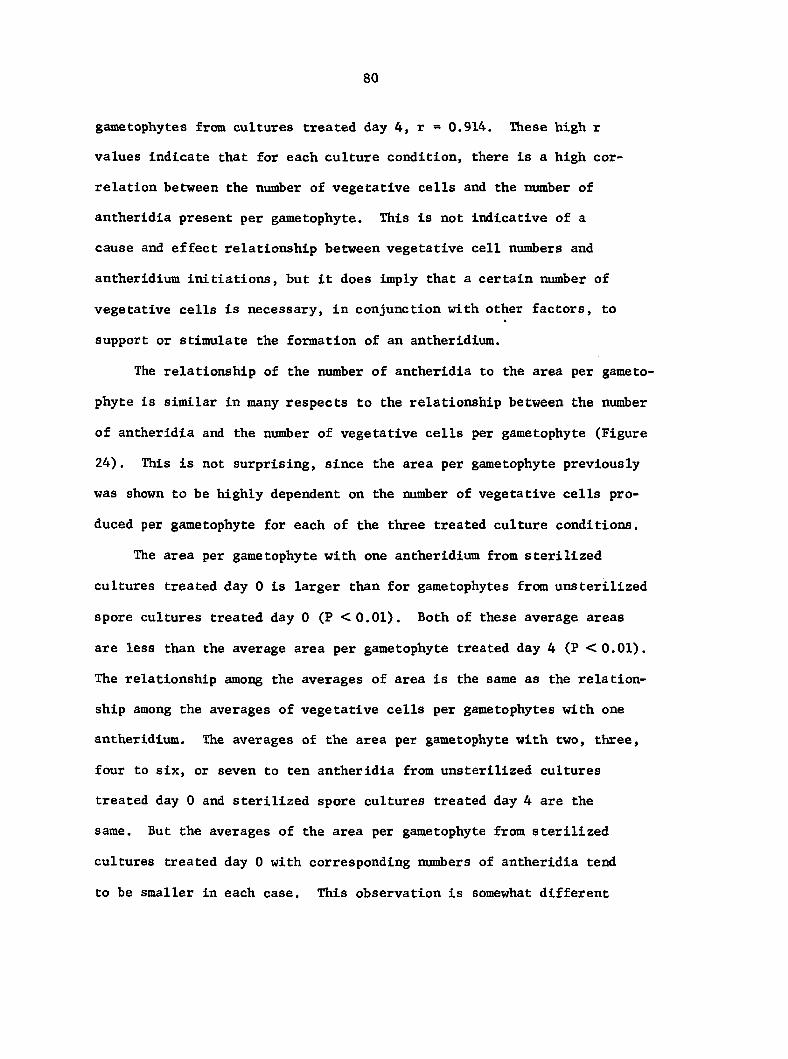
80
gametophytes from cultures treated day 4, r = 0.914. These high r
values indicate that for each culture condition, there is a high cor
relation between the number of vegetative cells and the number of
antheridia present per gametophyte. This is not indicative of a
cause and effect relationship between vegetative cell numbers and
antheridium initiations, but it does imply that a certain number of
vegetative cells is necessary, in conjunction with other factors, to
support or stimulate the formation of an antheridium.
The relationship of the number of antheridia to the area per gameto
phyte is similar in many respects to the relationship between the number
of antheridia and the number of vegetative cells per gametophyte (Figure
24), This is not surprising, since the area per gametophyte previously
was shown to be highly dependent on the number of vegetative cells pro
duced per gametophyte for each of the three treated culture conditions.
The area per gametophyte with one antheridium from sterilized
cultures treated day 0 is larger than for gametophytes from unsterilized
spore cultures treated day 0 (P <0.01). Both of these average areas
are less than the average area per gametophyte treated day 4 (P <0.01).
The relationship among the averages of area is the same as the relation
ship among the averages of vegetative cells per gametophytes with one
antheridium. The averages of the area per gametophyte with two, three,
four to six, or seven to ten antheridia from unsterilized cultures
treated day 0 and sterilized spore cultures treated day 4 are the
same. But the averages of the area per gametophyte from sterilized
cultures treated day 0 with corresponding numbers of antheridia tend
to be smaller in each case. This observation is somewhat different
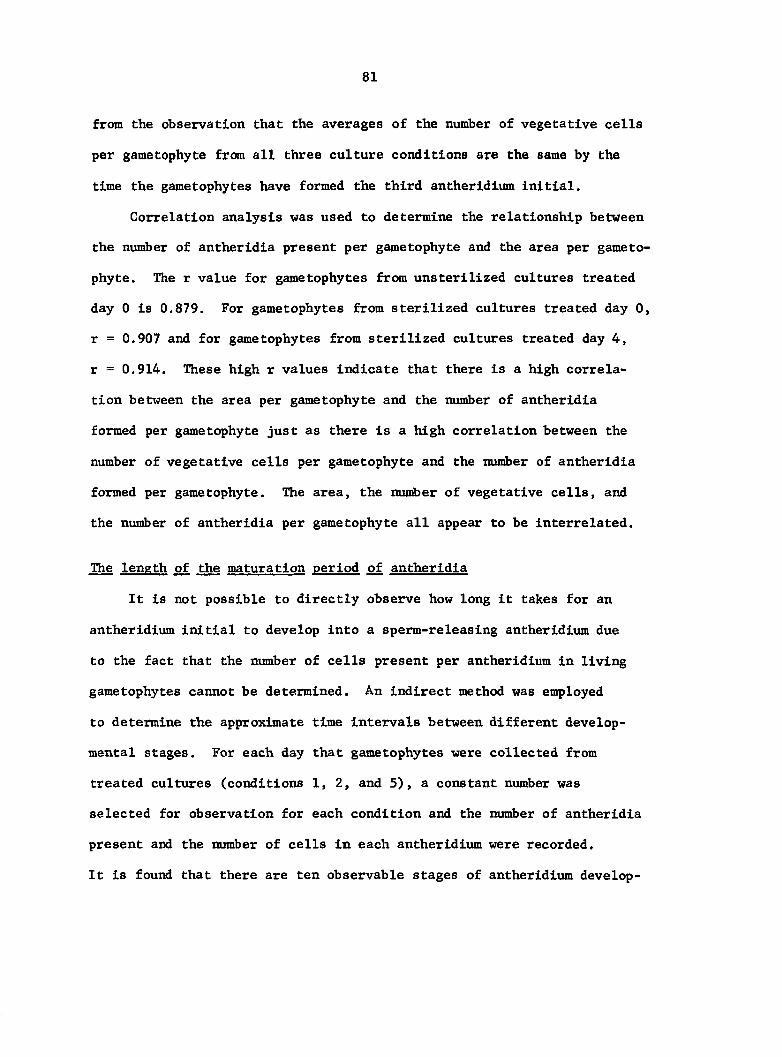
81
from the observation that the averages of the number of vegetative cells
per gametophyte from all three culture conditions are the same by the
time the gametophytes have formed the third antheridium initial.
Correlation analysis was used to determine the relationship between
the number of antherldla present per gametophyte and the area per gameto
phyte. The r value for gametophytes from unsterilized cultures treated
day 0 is 0.879. For gametophytes from sterilized cultures treated day 0,
r = 0.907 and for gametophytes from sterilized cultures treated day 4,
r = 0.914. These high r values indicate that there is a high correla
tion between the area per gametophyte and the number of antherldla
formed per gametophyte just as there is a high correlation between the
number of vegetative cells per gametophyte and the number of antherldla
formed per gametophyte. The area, the number of vegetative cells, and
the number of antherldla per gametophyte all appear to be interrelated.
The length of the maturation period of antherldla
It is not possible to directly observe how long it takes for an
antheridium initial to develop into a sperm-releasing antheridium due
to the fact that the number of cells present per antheridium in living
gametophytes cannot be determined. An indirect method was employed
to determine the approximate time intervals between different develop
mental stages. For each day that gametophytes were collected from
treated cultures (conditions 1, 2, and 5), a constant number was
selected for observation for each condition and the number of antherldla
present and the number of cells in each antheridium were recorded.
It is found that there are ten observable stages of antheridium develop-
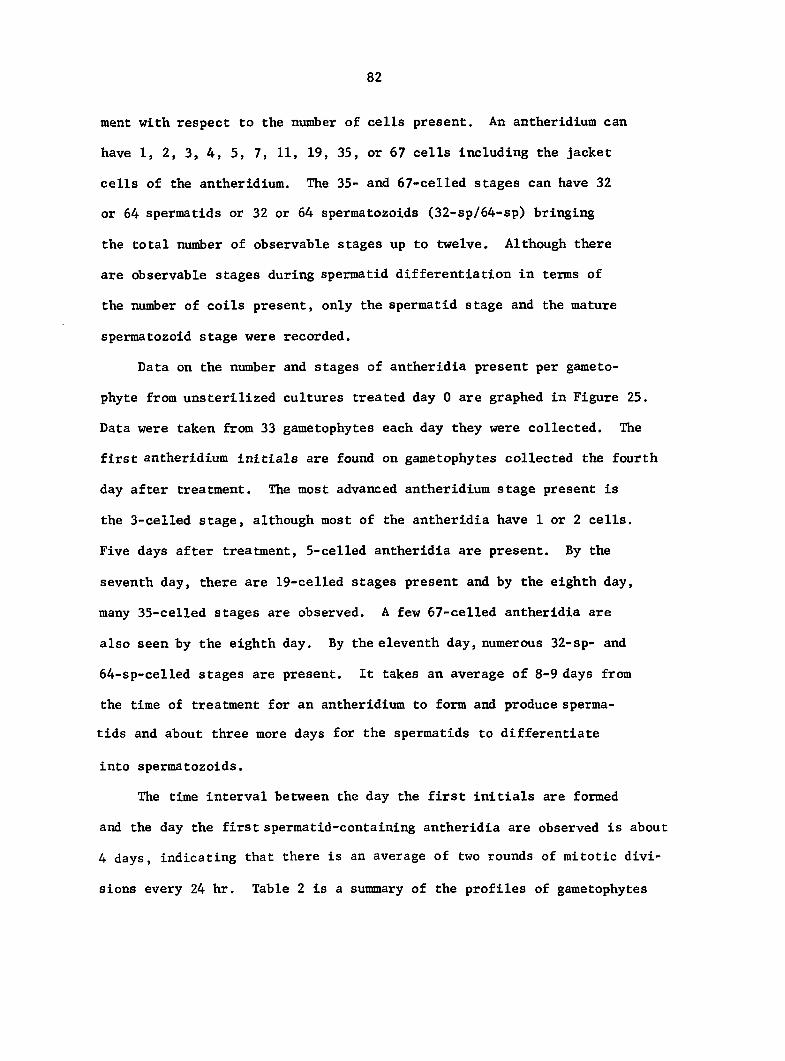
82
ment with respect to the number of cells present. An antheridium can
have 1, 2, 3, 4, 5, 7, 11, 19, 35, or 67 cells including the jacket
cells of the antheridium. The 35- and 67-celled stages can have 32
or 64 spermatids or 32 or 64 spermatozoids (32-sp/64-sp) bringing
the total number of observable stages up to twelve. Although there
are observable stages during spermatid differentiation in terms of
the number of coils present, only the spermatid stage and the mature
spermatozoid stage were recorded.
Data on the number and stages of antheridia present per gameto-
phyte from unsterilized cultures treated day 0 are graphed in Figure 25.
Data were taken from 33 gametophytes each day they were collected. The
first antheridium initials are found on gametophytes collected the fourth
day after treatment. The most advanced antheridium stage present is
the 3-celled stage, although most of the antheridia have 1 or 2 cells.
Five days after treatment, 5-eelled antheridia are present. By the
seventh day, there are 19-celled stages present and by the eighth day,
many 35-celled stages are observed. A few 67-celled antheridia are
also seen by the eighth day. By the eleventh day, numerous 32-sp- and
64-sp-celled stages are present. It takes an average of 8-9 days from
the time of treatment for an antheridium to form and produce sperma
tids and about three more days for the spermatids to differentiate
into spermatozoids.
The time interval between the day the first initials are formed
and the day the first spermatid-containing antheridia are observed is about
4 days, indicating that there is an average of two rounds of mitotic divi
sions every 24 hr. Table 2 is a summary of the profiles of gametophytes

Figure 25. Number and stages of antheridia present per 33 gametophytes collected daily from un-sterilized cultures treated on day 0
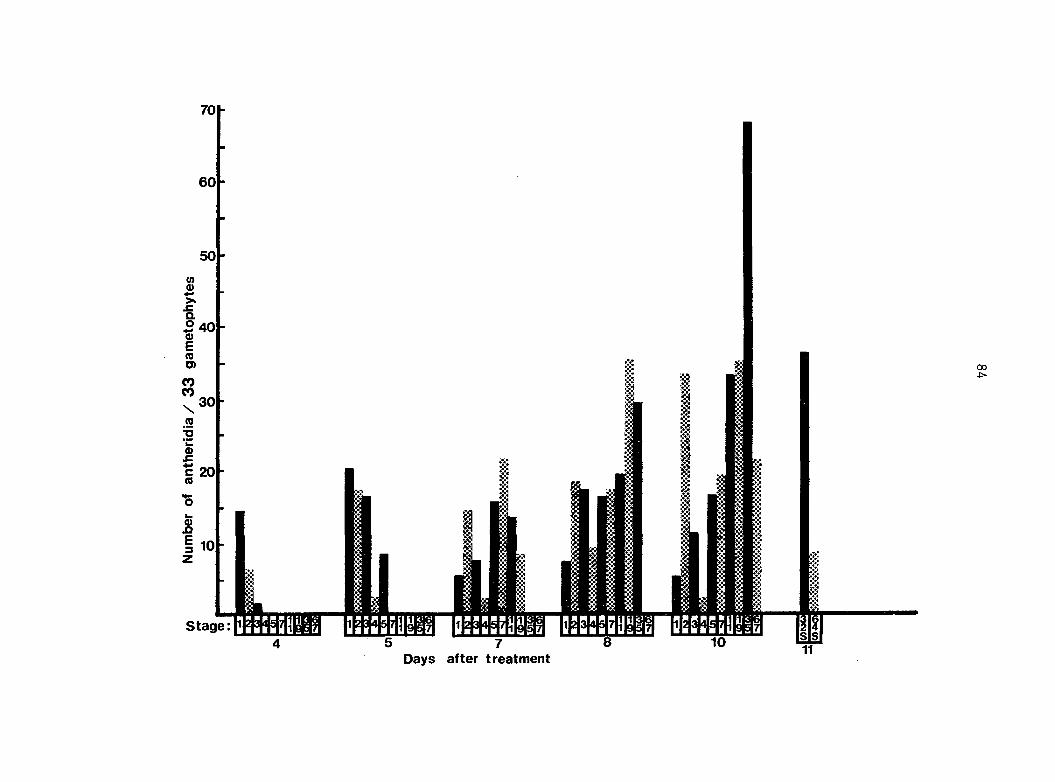
Days after treatment
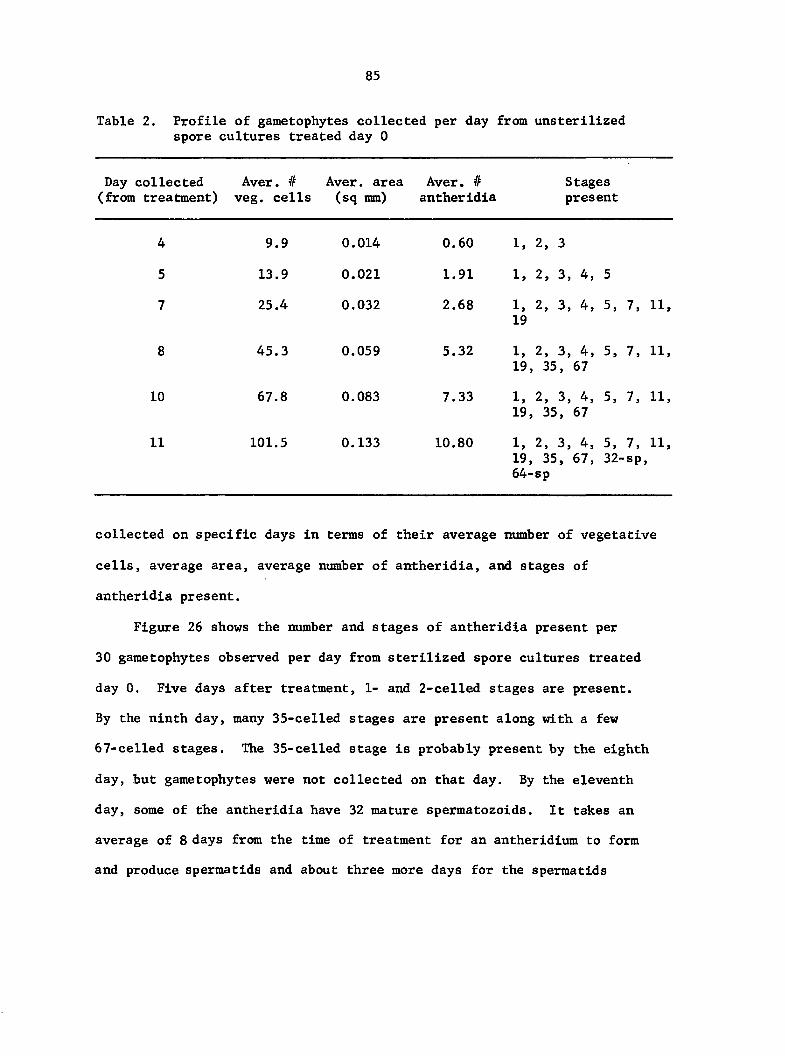
85
Table 2. Profile of gametophytes collected per day from unsterilized spore cultures treated day 0
Day collected (from treatment)
Aver. # veg. cells
Aver. area (sq mm)
Aver. # antheridia
Stages present
4 9.9 0.014 0.60 1, 2, 3
5 13.9 0.021 1.91 1, 2, 3, 4, 5
7 25.4 0.032 2.68 1, 2, 3, 4, 19
5, 7, 11,
8 45.3 0.059 5.32 1, 2, 3, 4, 19, 35, 67
5, 7, 11,
10 67.8 0.083 7.33 1, 2, 3, 4, 19, 35, 67
5, 7, 11,
11 101.5 0.133 10.80 1, 2, 3, 4, 19, 35, 67, 64-s p
5, 32-
7, •sp
11,
collected on specific days in terms of their average number of vegetative
cells, average area, average number of antheridia, and stages of
antheridia present.
Figure 26 shows the number and stages of antheridia present per
30 gametophytes observed per day from sterilized spore cultures treated
day 0. Five days after treatment, 1- and 2-celled stages are present.
By the ninth day, many 35-celled stages are present along with a few
67-celled stages. The 35-celled stage is probably present by the eighth
day, but gametophytes were not collected on that day. By the eleventh
day, some of the antheridia have 32 mature spermatozoids. It takes an
average of 8 days from the time of treatment for an antheridium to form
and produce spermatids and about three more days for the spermatids

Figure 26. Number and stages of antheridia present per 30 gametophytes collected daily from sterilized cultures treated on day 0
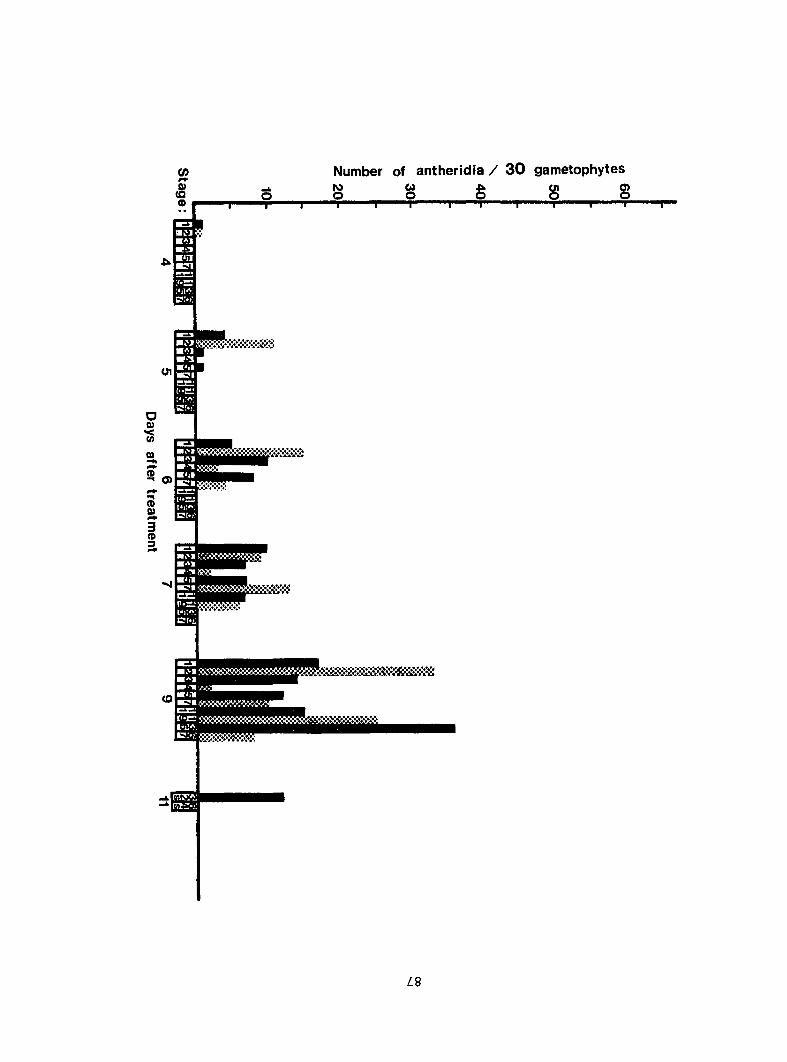
Number of antheridia / 30 gametophytes
a 8 ë Ê 8 8
ox
% (O
JIT m
^8
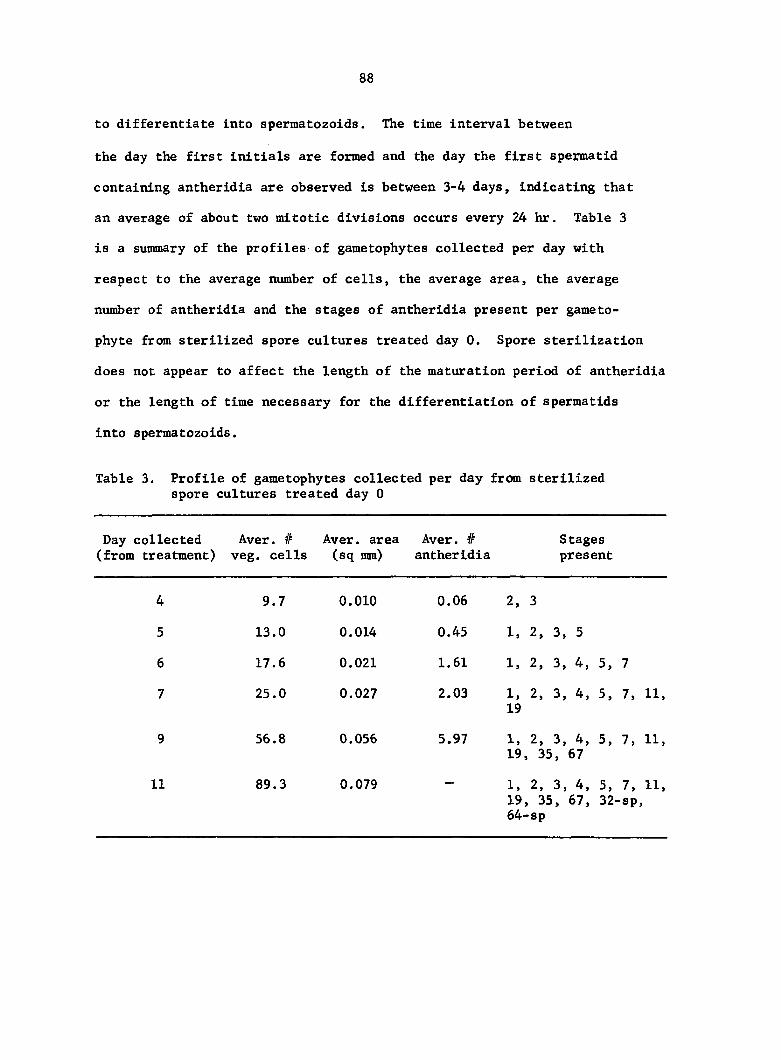
88
to differentiate into spermatozoids. The time interval between
the day the first initials are formed and the day the first spermatid
containing antheridia are observed is between 3-4 days, indicating that
an average of about two mitotic divisions occurs every 24 hr. Table 3
is a summary of the profiles of gametophytes collected per day with
respect to the average number of cells, the average area, the average
number of antheridia and the stages of antheridia present per gameto-
phyte from sterilized spore cultures treated day 0. Spore sterilization
does not appear to affect the length of the maturation period of antheridia
or the length of time necessary for the differentiation of spermatids
into spermatozoids.
Table 3. Profile of gametophytes collected per day from sterilized spore cultures treated day 0
Day collected Aver. # Aver, area Aver. # Stages (from treatment) veg. cells (sq mm) antheridia present
4 9.7 0.010 0.06 2, 3
5 13.0 0.014 0.45 1, 2, 3, 5
6 17.6 0.021 1.61 1, 2, 3, 4, 5, 7
7 25.0 0.027 2.03 1, 2, 3, 4, 19
5, 7, 11,
9 56.8 0.056 5.97 1, 2, 3, 4, 19, 35, 67
5, 7, 11,
11 89.3 0.079 1, 2, 3, 4, 19, 35, 67, 64-sp
5, 32-
7, 11, •sp.
89
Figure 27 shows the number and stages of antheridia present per 26
gametophytes collected per day from sterilized spore cultures treated
day 4. Two days after treatment, 1- and 2-celled stages are present
and by the sixth day, antheridia containing 32 spermatids are ob
served. By the seventh day, there are antheridia present with 64 sperma
tids. It takes an average of three more days for both the 32 and the
64 spermatids to differentiate into 32 and 64 spermatozoids,
respectively. It takes an average of 9-10 days from the time of treatment
for an antheridium to form and produce mature spermatozoids. This about
2 days less than for gametophytes from cultures treated day 0.
The time interval between the day the first initials are formed
and the day the first spermatids are observed is about 4 days, indicating
that an average of about two mitotic divisions occurs every 24 hr.
Table 4 is a summary of the profiles of game tophytes collected per day
with respect to the average number of cells, the average area, the
average number of antheridia, and the stages of antheridia present per
gametophyte from sterilized spore cultures treated day 4. The length of
the maturation period, including the time intervals for cell divisions
and cell differentiation, is not affected due to the time of treat
ment.
Location of antheridium initials
The locations of initials (1- and 2-celled stages) on gametophytes
were observed daily for both pragmatic and theoretical reasons. Prag
matically, the information enhances the ability to predict which
regions or cells will most likely produce antheridia before the
Figure 27. Number and stages of antheridia present per 26 gametophytes collected daily from sterilized cultures treated on day 4
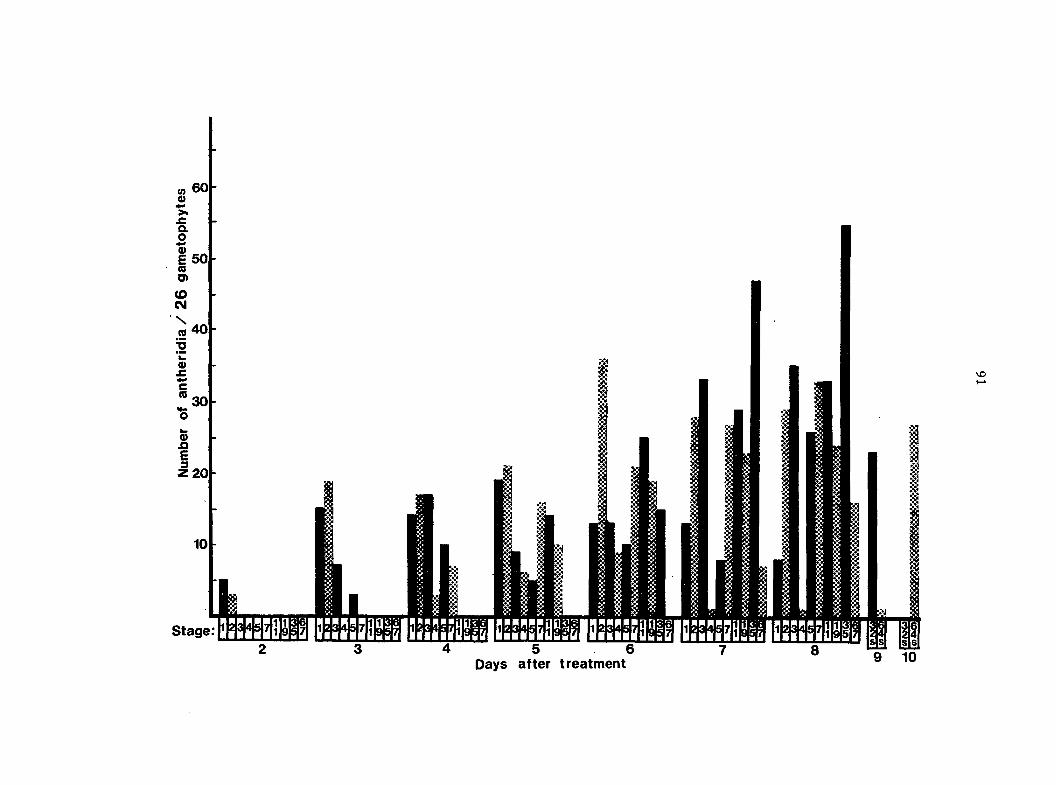
iBBBSBiaigMSMMMffi, Days after treatment
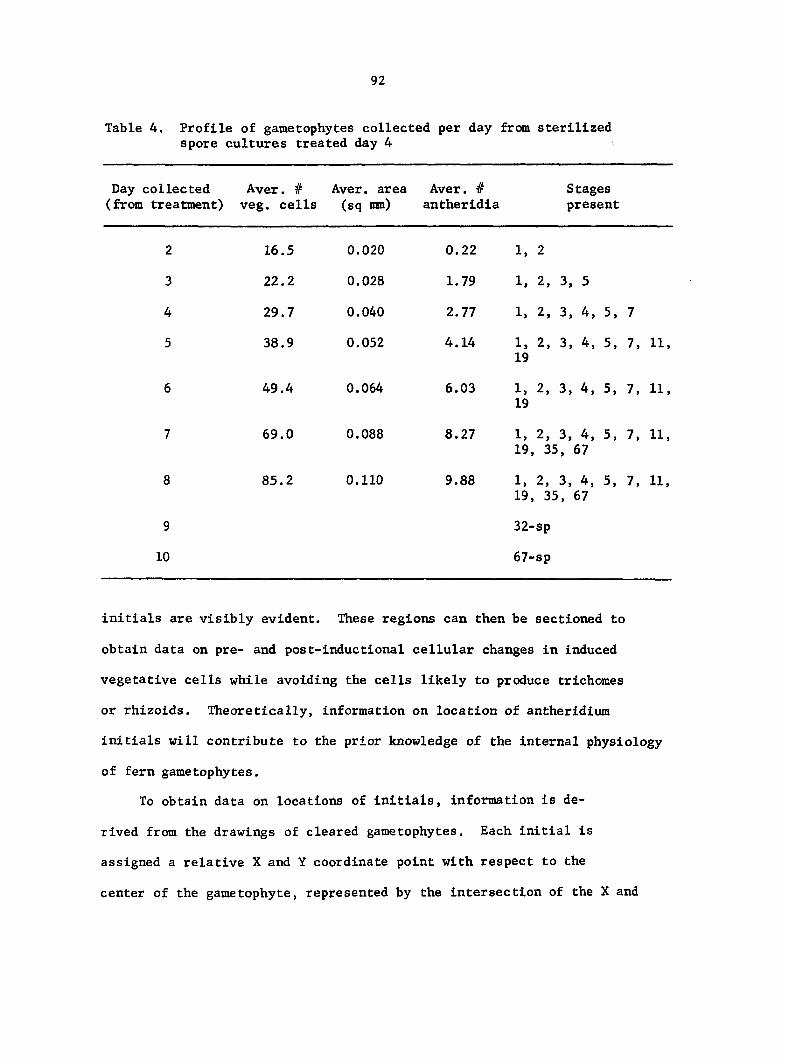
92
Table 4, Profile of gametophytes collected per day from sterilized spore cultures treated day 4
Day collected Aver. # Aver, area Aver. # Stages (from treatment) veg. cells (sq mm) antheridia present
2 16.5 0.020 0.22 1, 2
3 22.2 0.028 1.79 1, 2. 3, 5
4 29.7 0.040 2.77 1, 2, 3, 4, 5, 7
5 38.9 0.052 4.14 1. 19
2, 3, 4, 5, 7, 11,
6 49.4 0.064 6.03 1, 19
2, 3, 4, 5, 7, 11.
7 69.0 0.088 8.27 1, 19.
2, 35 3, 4, 67
5, 7, 11,
8 85.2 0.110 9.88 1. 19,
2, 3, 35,
4, 67
5, 7, 11,
9 32-sp
10 67-sp
initials are visibly evident. These regions can then be sectioned to
obtain data on pre- and post-induetional cellular changes in induced
vegetative cells while avoiding the cells likely to produce trichomes
or rhizoids. Theoretically, information on location of antheridium
initials will contribute to the prior knowledge of the internal physiology
of fern gametophytes.
To obtain data on locations of initials, information is de
rived from the drawings of cleared gametophytes. Each Initial is
assigned a relative X and Y coordinate point with respect to the
center of the gametophyte, represented by the intersection of the X and
93
Y axes, and the margins of the gametophyte, represented by the coordinate
extremes. The initials present on n number of gametophytes observed
each day are plotted on a two-dimensional coordinate system for each
culture condition. The value for n (the number of gametophytes ob
served) is given below each graph.
Figure 28 shows the location of antheridium initials on gametophytes
from unsterilized cultures treated day 0. The majority (86%) of the
initials formed on gametophytes the fourth day after treatment are
produced by peripheral cells, all of which are located in the upper half
of the gametophytes. Drawings of nine of the gametophytes collected on
the fourth day are shown in Figure 29, showing the location and stage
of the antheridium initials.
On the fifth day after treatment, 76% of the initials are located
on peripheral cells, but again most of the induced cells are located
in the upper half of the gametophytes. By the tenth day, only 24% of
the initials are induced on peripheral cells, but with the majority
(83%) of all the induced cells occurring on the upper half of the
gametophytes. Initials are never formed on anterior, marginal cells of
the gametophytes, regions which correspond to the notch meristem and
outer wings of the gametophytes. With time, the preferred locations
of antheridium initials shift from upper peripheral cells to upper
central cells below the notch meristem region. A summary of the data on
the location of initials on gametophytes from unsterilized spore cul
tures treated day 0 is given in Table 5.
Figure 30 shows the relative locations of antheridium initials on
gametophytes collected daily from sterilized cultures treated day 0.
Figures 28 A-E. Relative location of antheridium initiais (1- and 2-celled) on gametophytes collected from unsterilized cultures treated on day 0, plotted on standardized, unit axes
A. Relative location of initials from 49 gametophytes collected 4 days after treatment
B. Relative location of initials from 33 gametophytes collected 5 days after treatment
C. Relative location of initials from 47 gametophytes collected 7 days after treatment
D. Relative location of initials from 44 gametophytes collected 8 days after treatment
E. Relative location of initials from 36 gametophytes collected 10 days after treatment
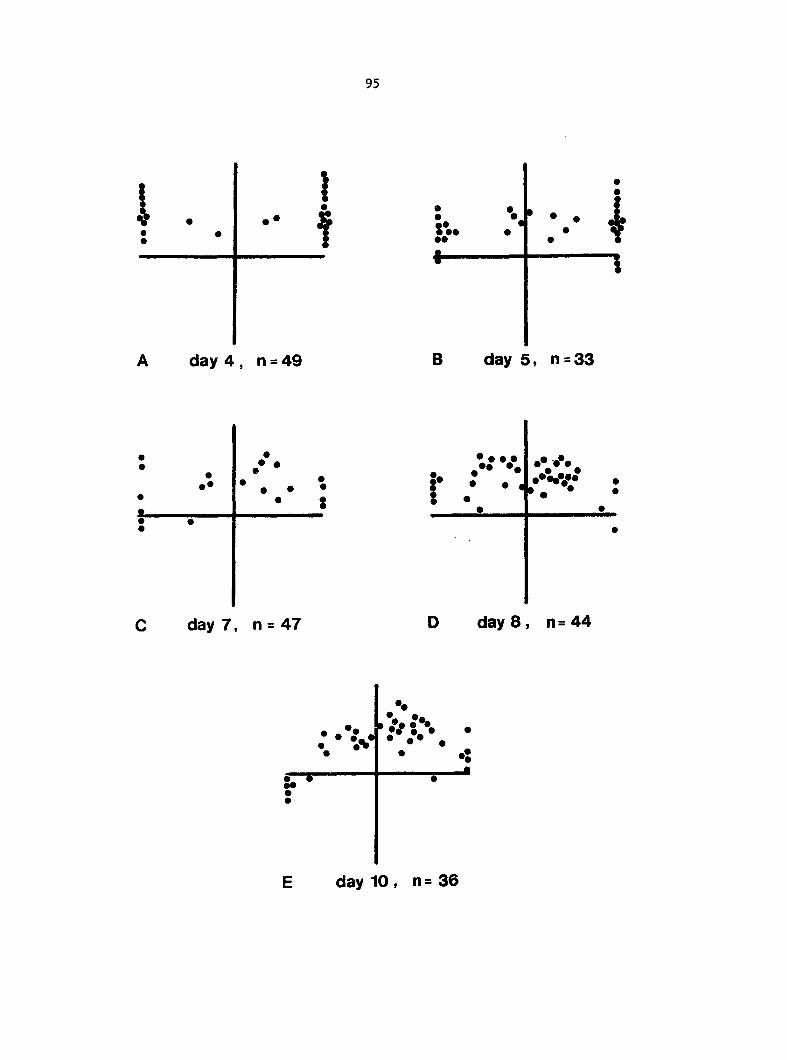
95
I e
\ " I h' •
••
•
—#
•
•
• •
\
A day 4 , n = 49 B day 5, n = 33
• •
• •
C day 7, n = 47
;•••••*. • • i
# #
# e
D day 8, n= 44
. # #
* .
-j#
E day 10, n= 36

Figure 29. Drawings of nine representative gametophytes collected 4 days after treatment in unsterilized cultures treated on day 4 showing location and number of cells in first-formed initials. X 215
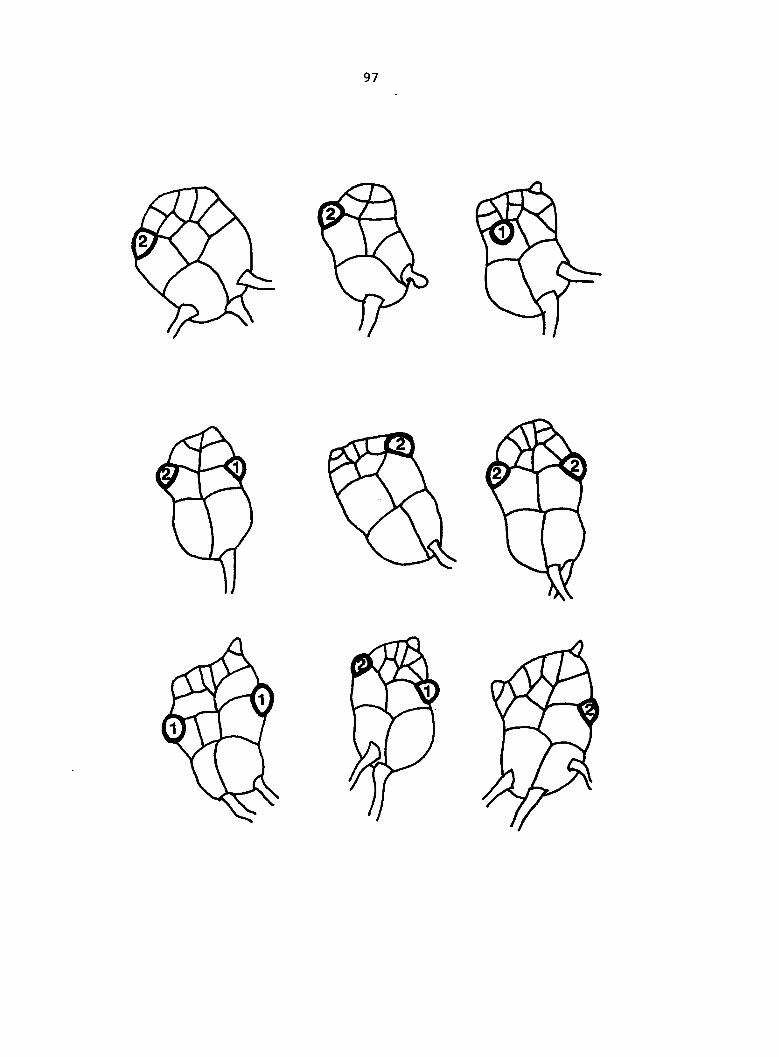
97
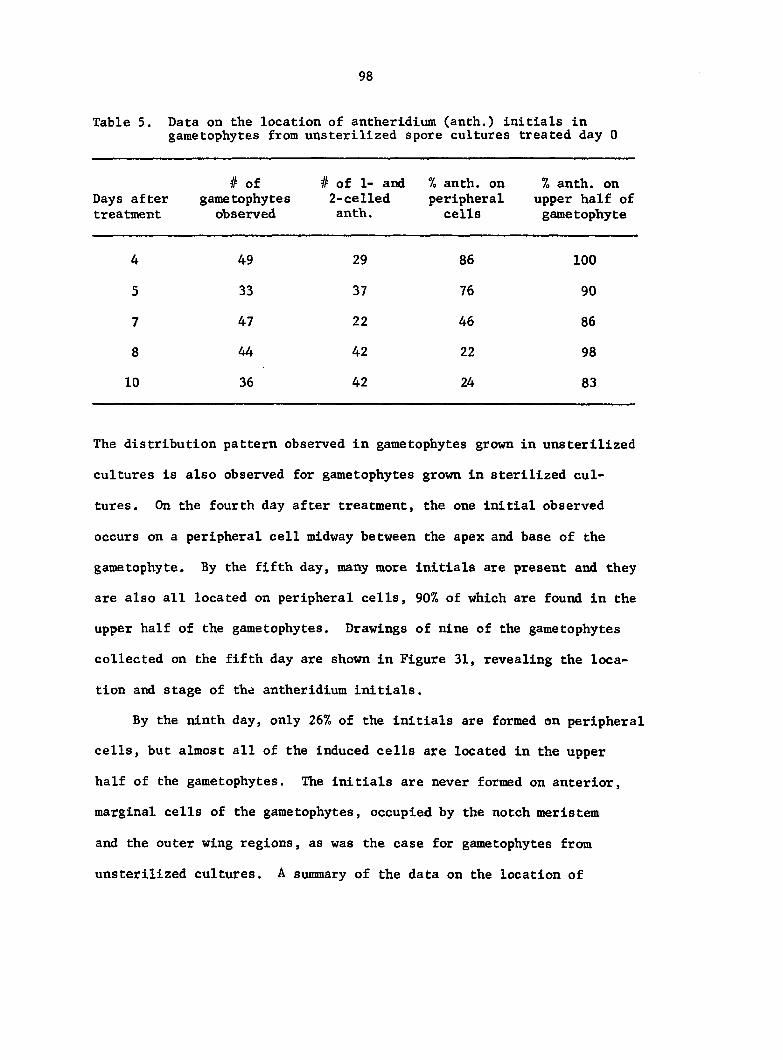
98
Table 5, Data on the location of antheridium (anth.) initiais in gametophytes from unsterilized spore cultures treated day 0
# of # of 1- and % anth. on % anth. on Days after gametophytes 2-celled peripheral upper half of treatment observed anth. cells gametophyte
4 49 29 86 100
5 33 37 76 90
7 47 22 46 86
8 44 42 22 98
10 36 42 24 83
The distribution pattern observed in gametophytes grown in unsterilized
cultures is also observed for gametophytes grown in sterilized cul
tures. On the fourth day after treatment, the one initial observed
occurs on a peripheral cell midway between the apex and base of the
gametophyte. By the fifth day, many more initials are present and they
are also all located on peripheral cells, 90% of which are found in the
upper half of the gametophytes. Drawings of nine of the gametophytes
collected on the fifth day are shown in Figure 31, revealing the loca
tion and stage of the antheridium initials.
By the ninth day, only 26% of the initials are formed on peripheral
cells, but almost all of the induced cells are located in the upper
half of the gametophytes. The initials are never formed on anterior,
marginal cells of the gametophytes, occupied by the notch meristem
and the outer wing regions, as was the case for gametophytes from
unsterilized cultures. A summary of the data on the location of
Figures 30 A-E. Relative location of antheridium initiais (1- and 2-celled) on gametophytes collected from sterilized cultures treated on day 0, plotted on standardized, unit axes
A. Relative location of initials on 32 gametophytes collected 4 days after treatment
B. Relative location of initials on 40 gametophytes collected 5 days after treatment
C. Relative location of Initials on 33 gametophytes collected 6 days after treatment
D. Relative location of initials on 30 gametophytes collected 7 days after treatment
E. Relative location of initials on 33 gametophytes collected 9 days after treatment
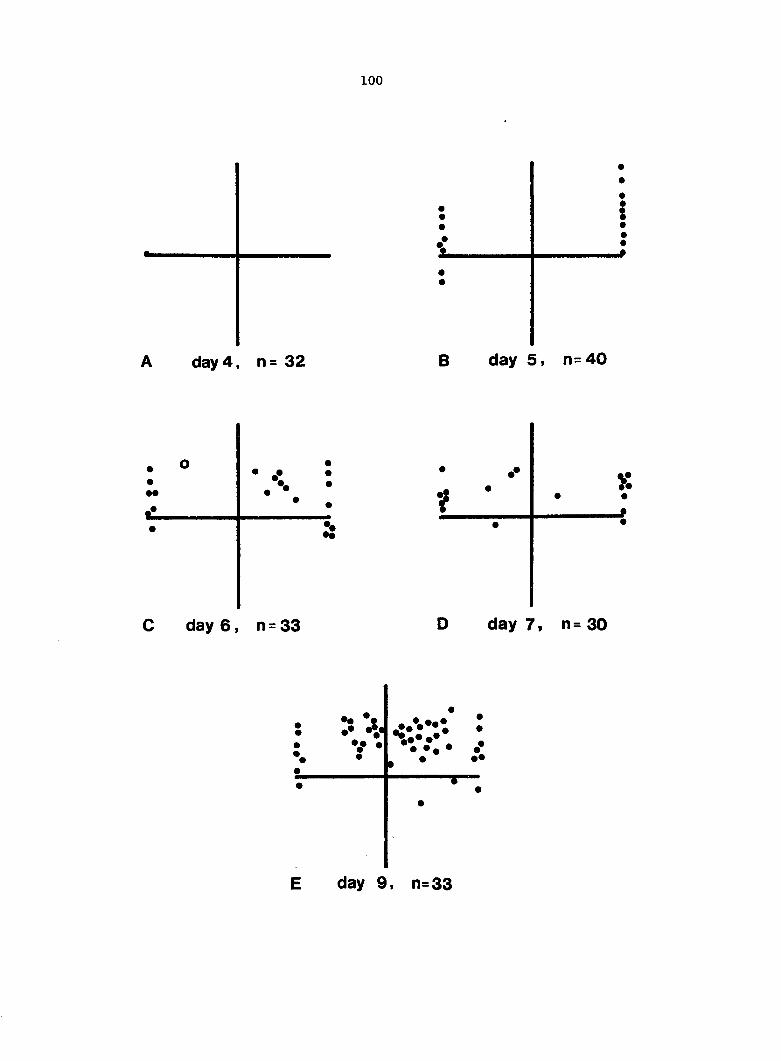
100
day 4, n= 32 B day 5, n= 40
• o e e #
day 6, n = 33
>:
#
day 7, n= 30
# e
V • e
e
E day 9, n=33

Figure 31. Drawings of nine representative gametophytes collected 5 days after treatment from sterilized cultures treated on day 0 showing location and number of cells in first-formed initials. X 255
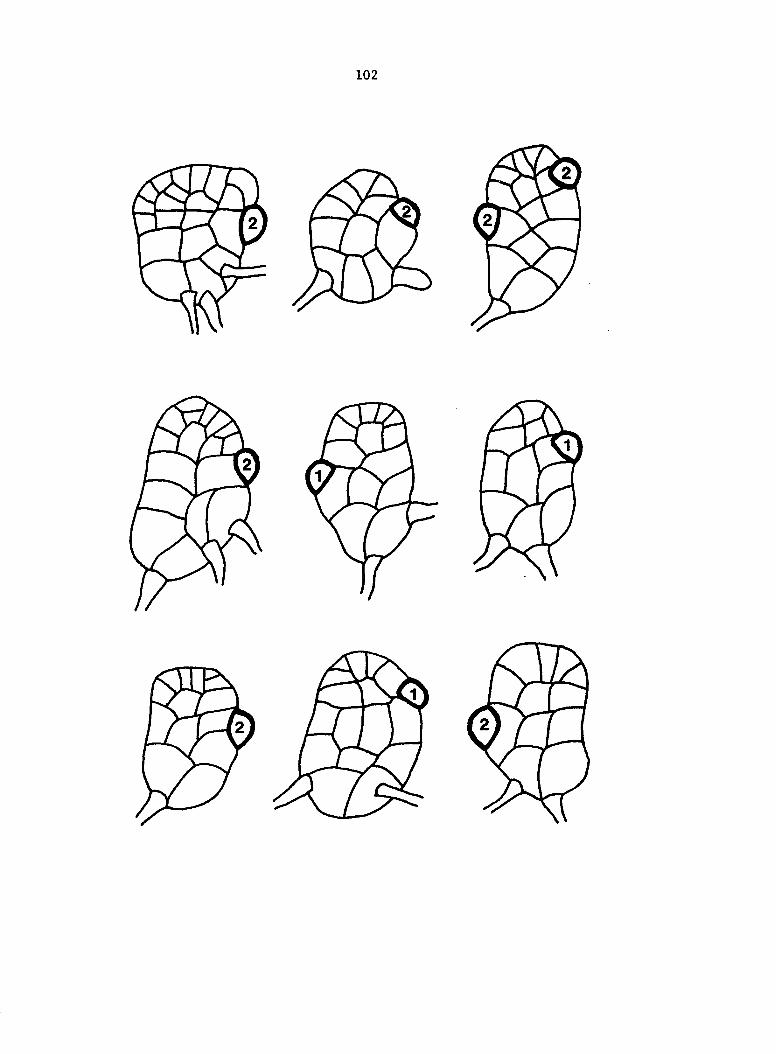
102
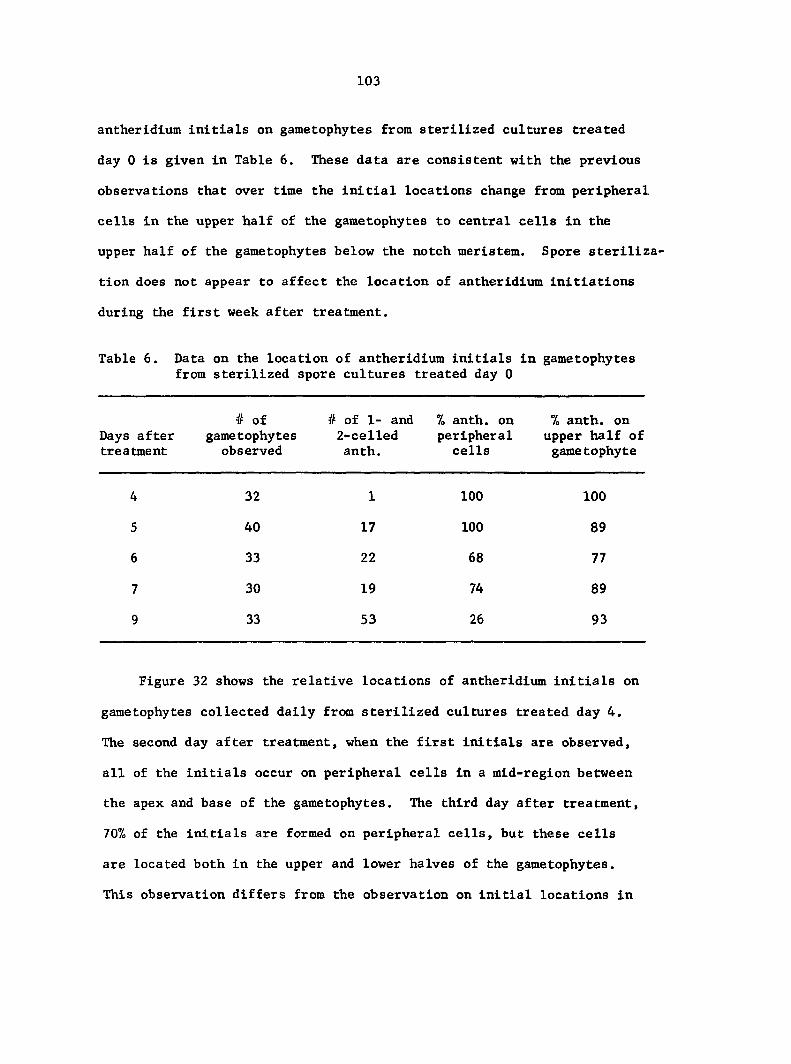
103
antheridium initials on gametophytes from sterilized cultures treated
day 0 is given in Table 6. These data are consistent with the previous
observations that over time the initial locations change from peripheral
cells in the upper half of the gametophytes to central cells in the
upper half of the gametophytes below the notch meristem. Spore steriliza
tion does not appear to affect the location of antheridium initiations
during the first week after treatment.
Table 6. Data on the location of antheridium initials in gametophytes from sterilized spore cultures treated day 0
Days after treatment
# of gametophytes observed
# of 1- and 2-celled anth.
% anth. on peripheral cells
% anth. on upper half of gametophyte
4 32 1 100 100
5 40 17 100 89
6 33 22 68 77
7 30 19 74 89
9 33 53 26 93
Figure 32 shows the relative locations of antheridium initials on
gametophytes collected daily from sterilized cultures treated day 4.
The second day after treatment, when the first initials are observed,
all of the initials occur on peripheral cells in a mid-region between
the apex and base of the gametophytes. The third day after treatment,
70% of the initials are formed on peripheral cells, but these cells
are located both in the upper and lower halves of the gametophytes.
This observation differs from the observation on initial locations in
Figures 32 A-G. Relative location of antheridium initiais (1- and 2-celled) on gametophytes collected from sterilized cultures treated on day 4, plotted on standardized, unit axes
A. Relative location of initials from 45 gametophytes collected 2 days after treatment
B. Relative location of initials from 49 gametophytes collected 3 days after treatment
C. Relative location of initials from 44 gametophytes collected 4 days after treatment
D. Relative location of initials from 28 gametophytes collected 5 days after treatment
E. Relative location of initials from 31 gametophytes collected 6 days after treatment
F. Relative location of initials from 26 gametophytes collected 7 days after treatment
G. Relative location of initials from 31 gametophytes collected 8 days after treatment
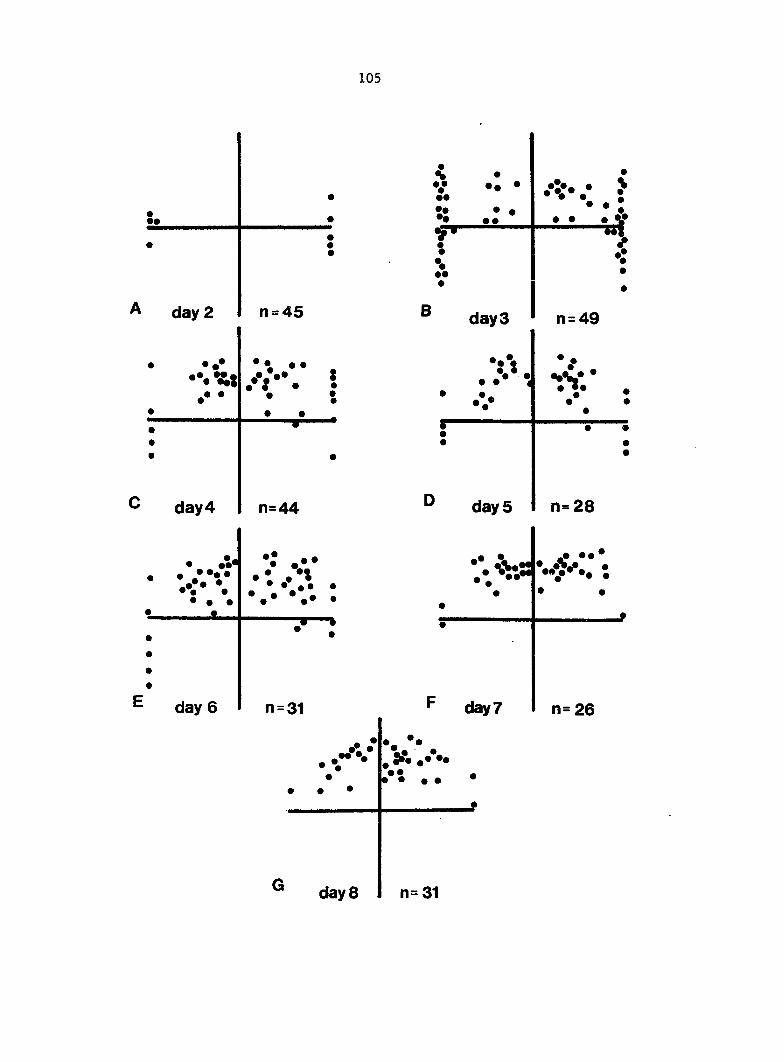
105
• ee
e
e
e e
day 2 n = 45
• ••• * • • • .
•• • : e • • e e e
day4
•
n=44
V
•• r •• ee e
#e
B days
# •
r
• • • #
n= 49
•îV.*
days n=28
•:«
• • •
•; • •
»• •
y
day 6 n = 31 day?
•? •• . :
n= 26
.-•V
day 8
•• •
• • • #
n=31
106
gametophytes treated day 0, where it is shown that the induced peripheral
cells are located mainly in the upper half of the gametophytes. Drawings
of nine of the gametophytes collected the third day after treatment
from cultures treated day 4 are shown in Figure 33 revealing the loca
tion and stage of the initials. The difference in the locations of
induced peripheral cells is attributed to the fact that the gametophytes
treated day 4 versus day 0 have more vegetative cells per gametophyte
when the first initials are forming. Most of those additional vegeta
tive cells are located in the notch meristem and wing regions where
antheridia do not form.
The eighth day after treatment, 90% of the initials are formed on
central cells, with the majority occurring in the upper half of the
gametophytes. Initials are not formed on anterior marginal cells of
the gametophytes, as was the case in the other culture conditions.
A summary of the data on the location of initials in gametophytes from
sterilized cultures treated day 4 is given in Table 7. The basic
trends reported for gametophytes from cultures treated day 0 are also
observed for gametophytes from cultures treated day 4. The preferred
location for antheridium initiations shifts in time from lateral,
peripheral cells to central cells below the notch meristem.
The only differentiating cell types that antheridia can be confused
with are the early stages in the formation of trichomas and rhizoids.
But due to the fact that trichomes and rhizoids occur in predictable
regions of the thalli, these regions were conveniently avoided while
studying antheridium development. Rhizoids are always produced by
cells in the basal region of the gametophytes. Trichomes, which form

Figure 33. Drawings of nine representative gametophytes collected 3 days after treatment from sterilized cultures treated on day 4 showing location and number of cells present in first-formed initials. X 255
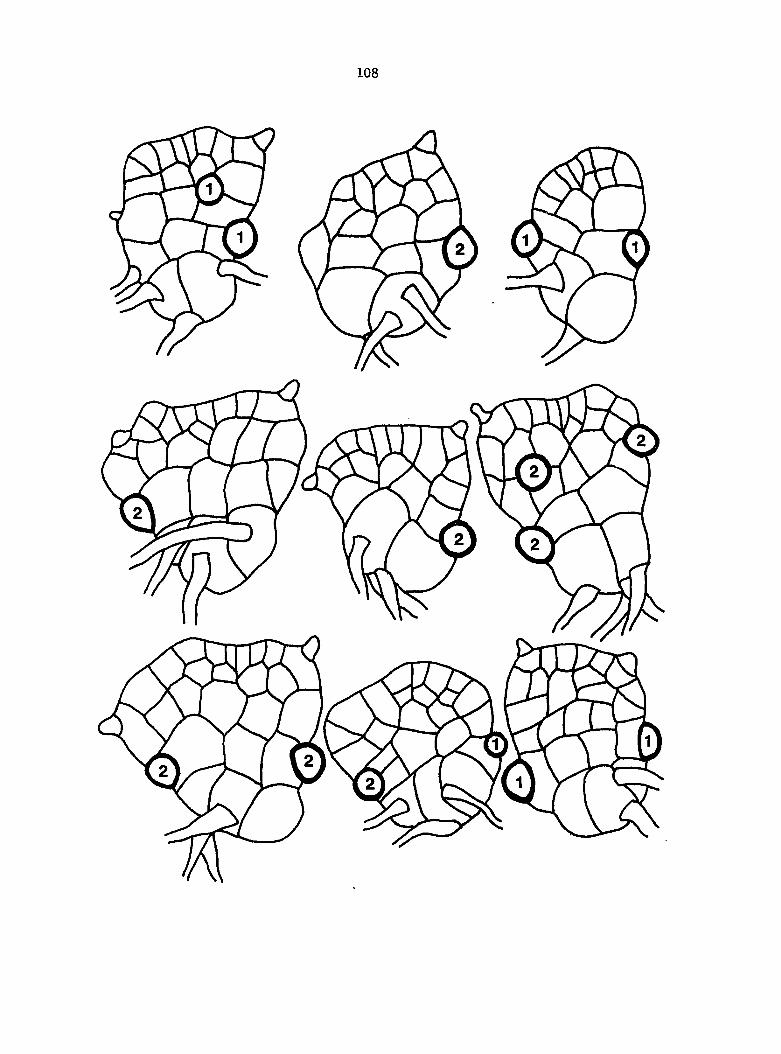
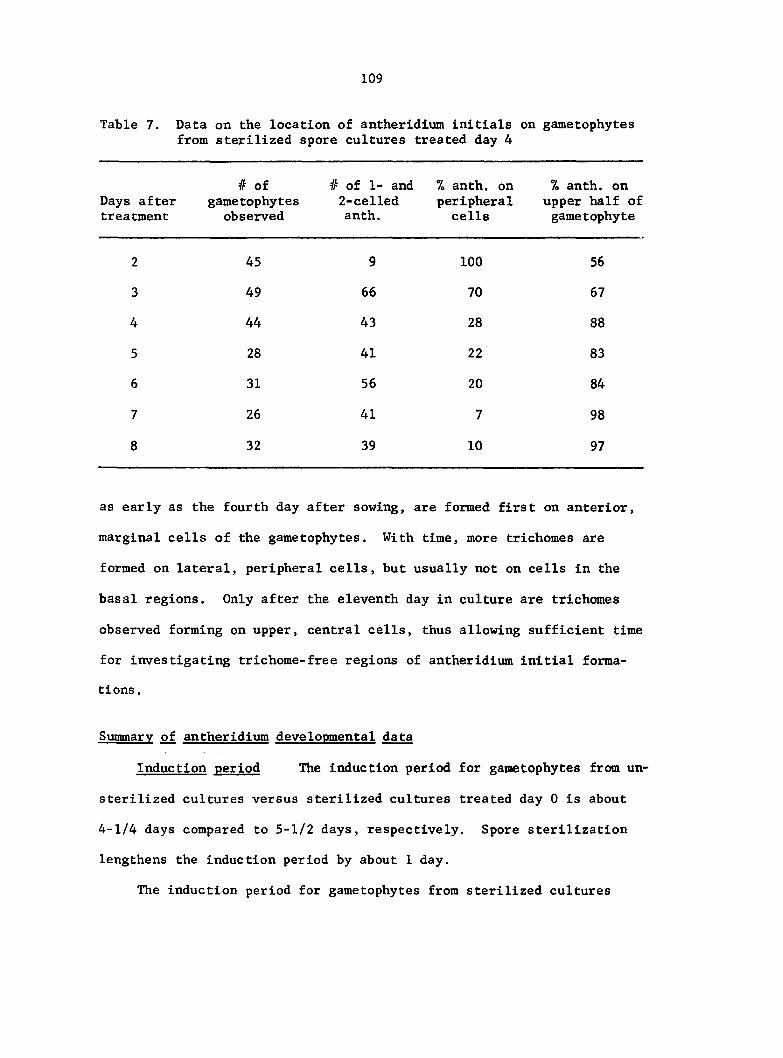
109
Table 7. Data on the location of antheridium initiais on gametophytes from sterilized spore cultures treated day 4
Days after treatment
# of gametophytes observed
# of 1- and 2-celled anth.
% anth. on peripheral cells
% anth. on upper half of gametophyte
2 45 9 100 56
3 49 66 70 67
4 44 43 28 88
5 28 41 22 83
6 31 56 20 84
7 26 41 7 98
8 32 39 10 97
as early as the fourth day after sowing, are formed first on anterior,
marginal cells of the gametophytes. With time, more trichomes are
formed on lateral, peripheral cells, but usually not on cells in the
basal regions. Only after the eleventh day in culture are trichomes
observed forming on upper, central cells, thus allowing sufficient time
for investigating trichome-free regions of antheridium initial forma
tions .
Summary of antheridium developmental data
Induction period The induction period for gametophytes from un-
sterilized cultures versus sterilized cultures treated day 0 is about
4-1/4 days compared to 5-1/2 days, respectively. Spore sterilization
lengthens the induction period by about 1 day.
The induction period for gametophytes from sterilized cultures
110
treated day 4 is about 2-1/2 days. Treatment on day 4 versus day 0 in
sterilized cultures shortens the induction period by about 3 days.
The average number of vegetative cells per gametophyte with
one antheridium from unsterilized cultures treated day 0 is 11.6 cells.
The average for sterilized cultures treated day 0 is 17.1 cells and the
average for sterilized cultures treated day 4 is 20.2 cells. Although
it appears necessary for gametophytes to surpass a threshold of numbers
of vegetative cells before forming their first initial, it is apparent
that other factors are also involved in determining the length of the
induction period and the formation of antheridium initials.
Rate of antheridium initiations Once the initials begin to form
in sterilized and unsterilized cultures treated day 0, the rate of
formation is similar.
Both the rate of antheridium formation and the rate of vegeta
tive cell divisions are higher in cultures treated day 4 compared to
day 0 during the first 7 days after treatment.
Correlation analysis shows that for each culture condition,
the number of vegetative cells per gametophyte is highly correlated
with the number of antheridia present. After the first two initials
are formed, the gametophytes produce the same average number of additional
vegetative cells before the next initial is formed, regardless of the
culture condition.
Correlation analysis also shows that for each culture condi
tion, the area per gametophyte is highly correlated to the number of
antheridia present per gametophyte. This is not surprising, due to
Ill
the fact that the area per gametophyte was shown to be highly dependent
on the number of vegetative cells produced per gametophyte.
Length of maturation period The 12 observable stages in antherid-
ium development include the 1-, 2-, 3-, 4-, 5-, 7-, 11-, 19-, 35-, and
67-celled stages and the 32 and 64 spermatozoid stages (32-sp and 64-sp).
In cultures treated day 0, gametophytes form antheridia with
32 and 64 spermatids on the eighth and ninth days after treatment,
respectively. In cultures treated day 4, gametophytes form antheridia
with 32 or 64 spermatids on the sixth and seventh days after treat
ment, respectively.
For each culture condition, there is about 4 days between the
day the first initials are observed and the day that the first spermatid-
containing antheridia are observed, indicating that an average of two
mitotic divisions occur every 24 hr in order to complete the cell-
forming phase of antheridium development.
Three days are necessary for spermatids to differentiate into
spermatozoids, regardless of the culture condition in which the gameto
phytes grow.
Location of antheridium initials The first formed initials occur
mainly on lateral, peripheral cells of the gametophytes. On gametophytes
treated day 0, the induced peripheral cells are located mainly in the upper
half of the gametophytes. On gametophytes treated day 4, the induced
peripheral cells are located both in the upper and lower halves of the
gametophytes.
No antheridia are ever formed on anterior, marginal cells of
the gametophytes, areas occupied by the forming notch meristem and the
112
wings of the gametophytes.
The preferred location of antheridium initials shifts from
peripheral cells to central cells in the upper half of the gameto
phytes below the notch meristem during the 5 days following the first
day of initiations.
Rhizoids and trichomas occurred in consistently predictable
regions and thus were conveniently avoided while studying antheridium
development.
Selection of the optimal culture and treatment regime
The information on gametophyte growth and antheridium development
presented above was used in determining an optimal culture and treatment
regime for growing gametophytes to be sectioned and/or viewed with LM,
TEM, or SEM, From the beginning, it was deemed desirable to grow
gametophytes in axenic conditions to assure definition of the system,
but not at the expense of disturbing the normal growth patterns of the
gametophytes. Although spore sterilization is found to inhibit the
vegetative growth rate of gametophytes, this inhibition is not evident
after sterilized and unsterilized spore cultures are treated with
Spore sterilization also lengthens the induction period by one day,
but the duration of the division and differentiation phases of antheridium
development is not affected, nor are the locations of the initials af
fected compared to unsterilized cultures. The one extra day in the
induction period for gametophytes from sterilized spore cultures is
considered acceptable in return for the maintenance of uncontaminated
gametophyte cultures. Thus, spore sterilization was adopted as part of
113
the optimal culturing procedures.
The optimal day on which to treat sterilized cultures is shown to
be the fourth day after sowing. Treatment day 4 results in the highest
rate of antheridium formation and the shortest induction period. Ideally,
during a shorter induction period, the cellular changes are more
concentrated and more easily detected.
Thus, for growing gametophytes to be processed for LM, TEM, and S EM,
the culture and treatment regime consisted of treating sterilized cul
tures with 1 ml of 25% the fourth day after sowing. The gameto
phytes were harvested between 6-12 days after treatment.
Vegetative Cell Development and Structure
The development of treated and untreated Onoclea gametophytes
follows a modified "Aspidium-type" prothallial developmental pattern
as described by Nayar and Kaur (1971). The first division of the
bilateral spore is an unequal division in a plane perpendicular to the
longitudinal axis of the spore, forming a small rhizoidal cell and a much
larger prothallial cell (Figures 34A, B). The prothallial cell then
divides one or two times in a plane parallel to the first division,
resulting in a filament of two or three cells with an elongating basal
rhizoid (Figures 34C, D). These filament-forming, transverse divisions
occur within two to three days after sowing. The cells of the filament
then divide longitudinally with respect to the long axis of the filament
to form a plate of four or six cells (Figures 34E, F). The cells of
the plate continue to divide both transversely and longitudinally and
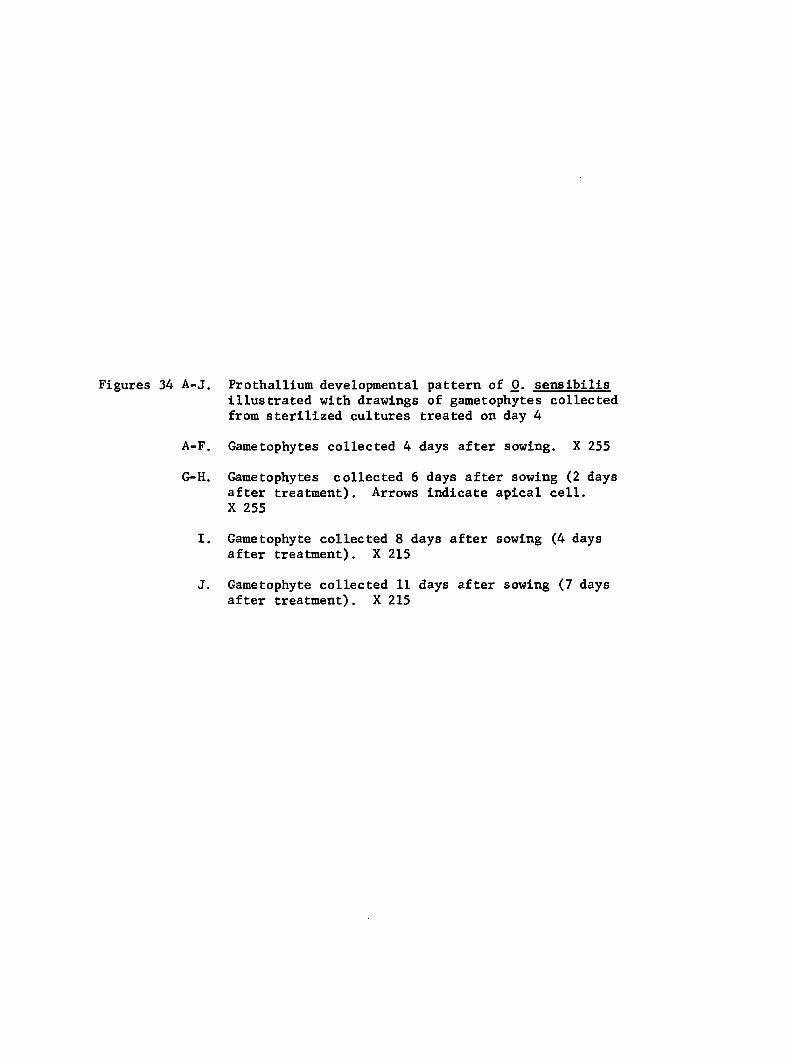
Figures 34 A-J. Prothallium developmental pattern of 0. sensibilis illustrated with drawings of gametophytes collected from sterilized cultures treated on day 4
A-F. Gametophytes collected 4 days after sowing. X 255
G-H. Gametophytes collected 6 days after sowing (2 days after treatment). Arrows indicate apical cell. X 255
I. Gametophyte collected 8 days after sowing (4 days after treatment). X 215
J. Gametophyte collected 11 days after sowing (7 days after treatment). X 215
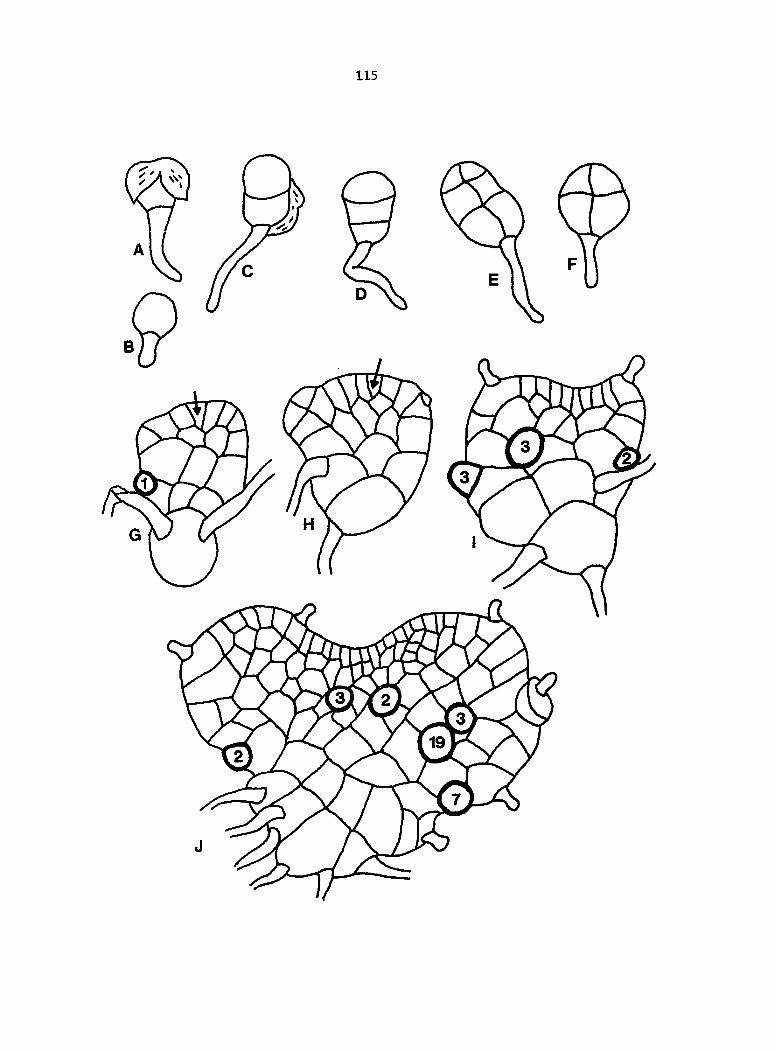
115
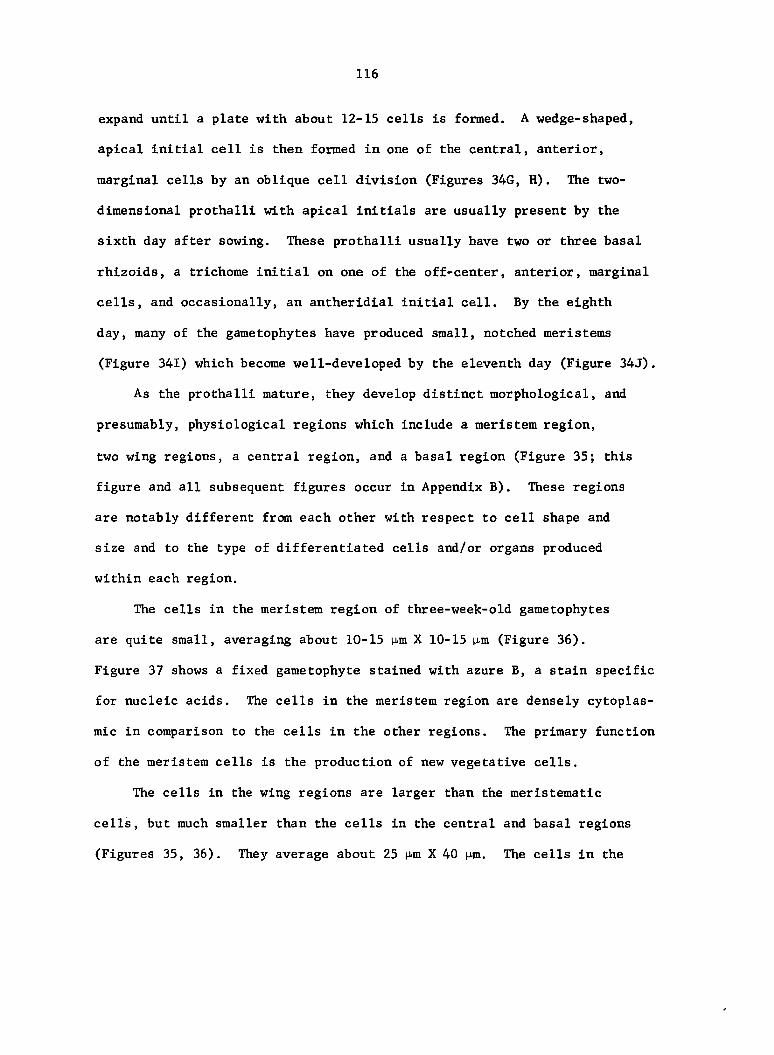
116
expand until a plate with about 12-15 cells is formed. A wedge-shaped,
apical initial cell is then formed in one of the central, anterior,
marginal cells by an oblique cell division (Figures 34G, H). The two-
dimensional prothalli with apical initials are usually present by the
sixth day after sowing. These prothalli usually have two or three basal
rhizoids, a trichome initial on one of the off-center, anterior, marginal
cells, and occasionally, an antheridial initial cell. By the eighth
day, many of the gametophytes have produced small, notched meristems
(Figure 341) which become well-developed by the eleventh day (Figure 34J).
As the prothalli mature, they develop distinct morphological, and
presumably, physiological regions which include a meristem region,
two wing regions, a central region, and a basal region (Figure 35; this
figure and all subsequent figures occur in Appendix B). These regions
are notably different from each other with respect to cell shape and
size and to the type of differentiated cells and/or organs produced
within each region.
The cells in the meristem region of three-week-old gametophytes
are quite small, averaging about 10-15 p-m X 10-15 p,m (Figure 36).
Figure 37 shows a fixed gametophyte stained with azure B, a stain specific
for nucleic acids. The cells in the meristem region are densely cytoplas
mic in comparison to the cells in the other regions. The primary function
of the meristem cells is the production of new vegetative cells.
The cells in the wing regions are larger than the meristematic
cells, but much smaller than the cells in the central and basal regions
(Figures 35, 36). They average about 25 p-m X 40 pm. The cells in the
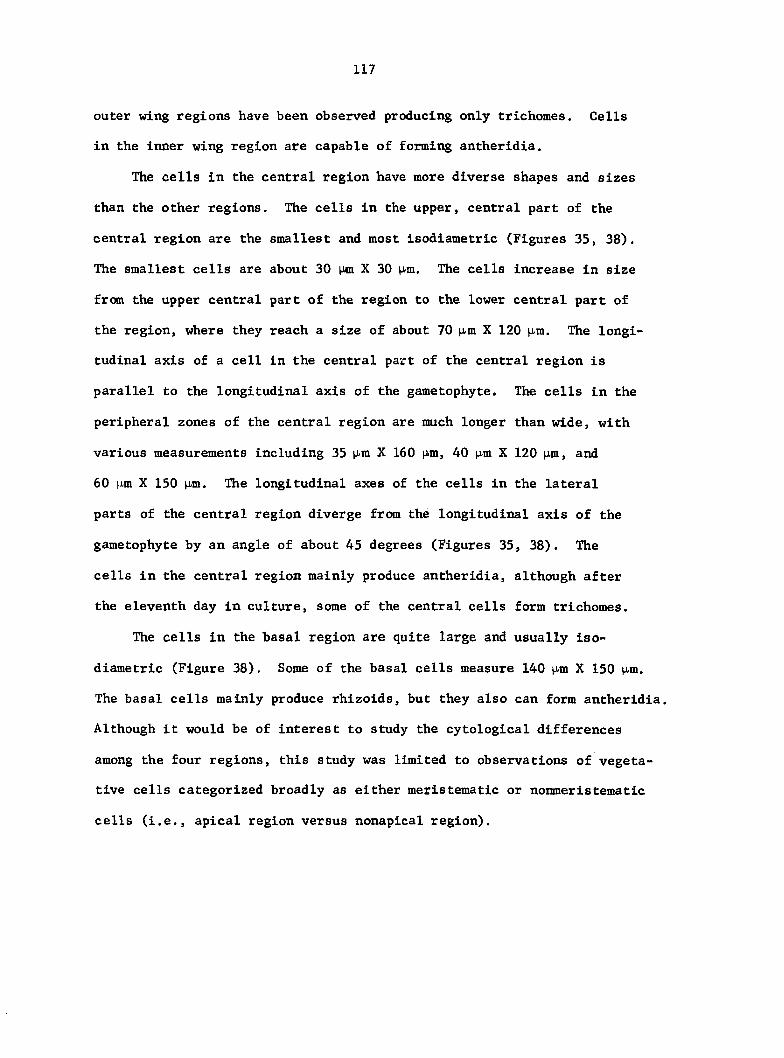
117
outer wing regions have been observed producing only trichomes. Cells
in the inner wing region are capable of forming antheridia.
The cells in the central region have more diverse shapes and sizes
than the other regions. The cells in the upper, central part of the
central region are the smallest and most isodiametric (Figures 35, 38).
The smallest cells are about 30 pm X 30 M-ni. The cells increase in size
from the upper central part of the region to the lower central part of
the region, where they reach a size of about 70 im X 120 p,m. The longi
tudinal axis of a cell in the central part of the central region is
parallel to the longitudinal axis of the gametophyte. The cells in the
peripheral zones of the central region are much longer than wide, with
various measurements including 35 jJ-m X 160 nm, 40 p-m X 120 |im, and
60 tim X 150 M-m. The longitudinal axes of the cells in the lateral
parts of the central region diverge from the longitudinal axis of the
gametophyte by an angle of about 45 degrees (Figures 35, 38). The
cells in the central region mainly produce antheridia, although after
the eleventh day in culture, some of the central cells form trichomes.
The cells in the basal region are quite large and usually iso
diametric (Figure 38). Some of the basal cells measure 140 jj-m X 150 p,m.
The basal cells mainly produce rhizoids, but they also can form antheridia.
Although it would be of interest to study the cytological differences
among the four regions, this study was limited to observations of vegeta
tive cells categorized broadly as either meristematic or nonmeristematic
cells (i.e., apical region versus nonapical region).
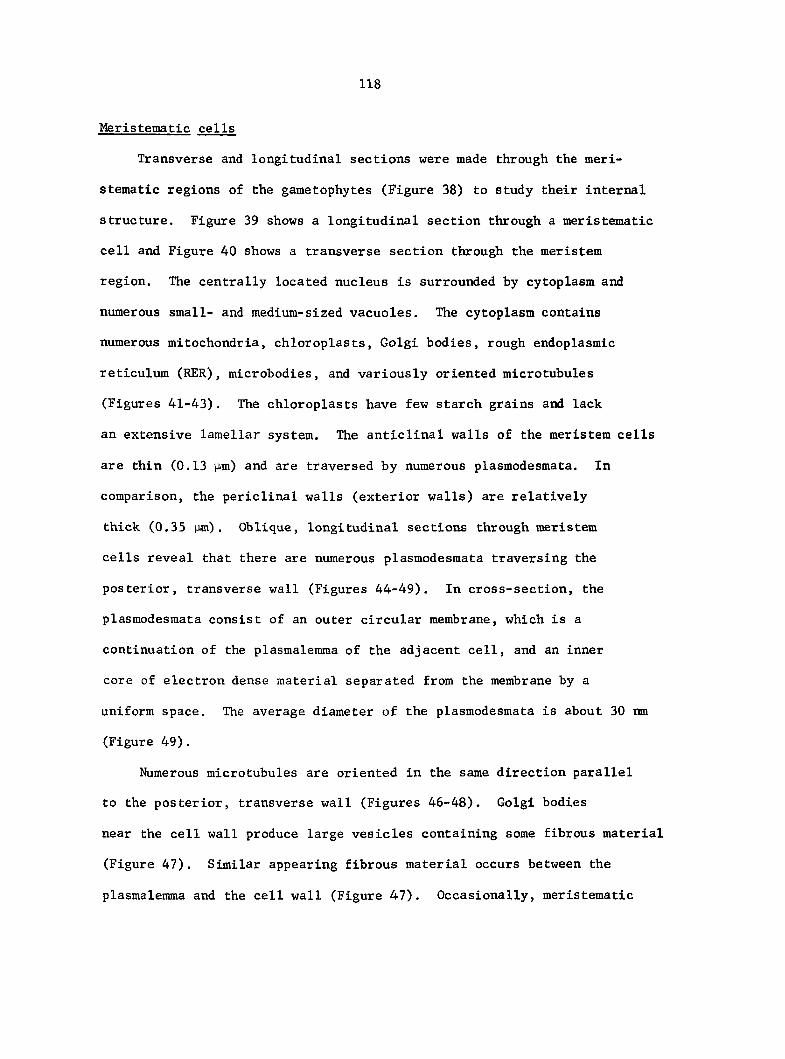
118
Meristematic cells
Transverse and longitudinal sections were made through the meri
stematic regions of the gametophytes (Figure 38) to study their internal
structure. Figure 39 shows a longitudinal section through a meristematic
cell and Figure 40 shows a transverse section through the meristem
region. The centrally located nucleus is surrounded by cytoplasm and
numerous small- and medium-sized vacuoles. The cytoplasm contains
numerous mitochondria, chloroplasts, Golgi bodies, rough endoplasmic
reticulum (RER), microbodies, and variously oriented microtubules
(Figures 41-43). The chloroplasts have few starch grains and lack
an extensive lamellar system. The anticlinal walls of the meristem cells
are thin (0.13 nm) and are traversed by numerous plasmodesmata. In
comparison, the periclinal walls (exterior walls) are relatively
thick (0.35 gtm) . Oblique, longitudinal sections through meristem
cells reveal that there are numerous plasmodesmata traversing the
posterior, transverse wall (Figures 44-49). In cross-section, the
plasmodesmata consist of an outer circular membrane, which is a
continuation of the plasmalemma of the adjacent cell, and an inner
core of electron dense material separated from the membrane by a
uniform space. The average diameter of the plasmodesmata is about 30 nm
(Figure 49).
Numerous microtubules are oriented in the same direction parallel
to the posterior, transverse wall (Figures 46-48). Golgi bodies
near the cell wall produce large vesicles containing some fibrous material
(Figure 47). Similar appearing fibrous material occurs between the
plasmalemma and the cell wall (Figure 47). Occasionally, meristematic
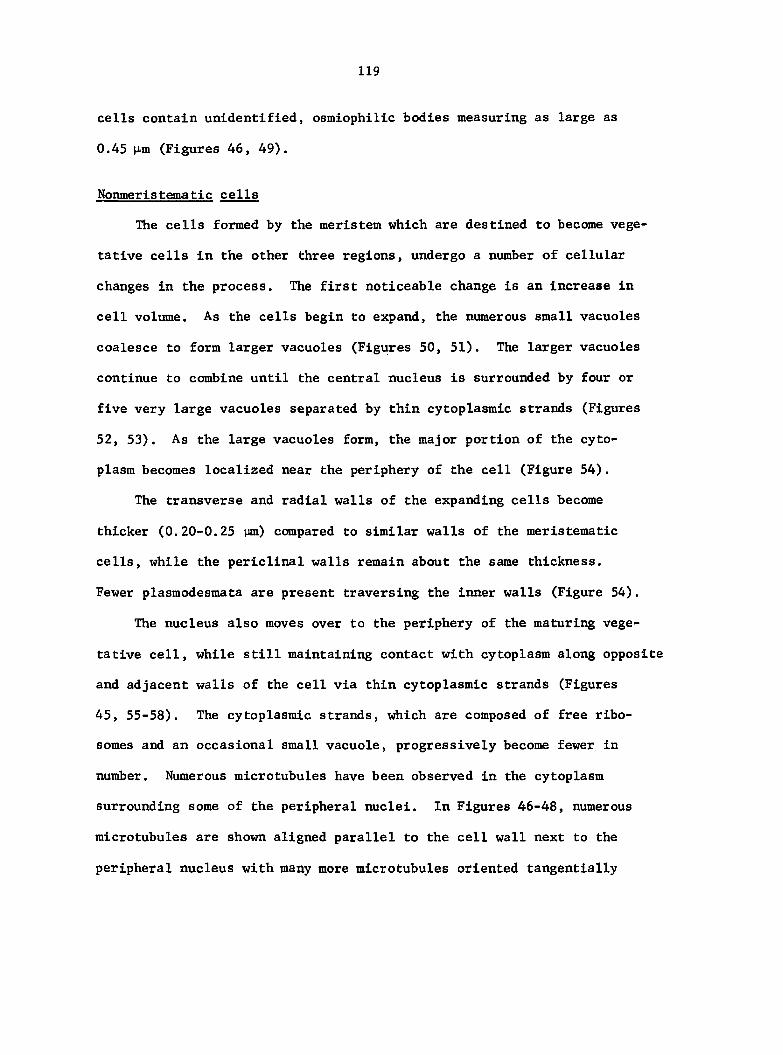
119
cells contain unidentified, osmlophllic bodies measuring as large as
0.45 M-m (Figures 46, 49).
Nonmerlstematic cells
The cells formed by the meristem which are destined to become vege
tative cells in the other three regions, undergo a number of cellular
changes in the process. The first noticeable change is an increase in
cell volume. As the cells begin to expand, the numerous small vacuoles
coalesce to form larger vacuoles (Figures 50, 51). The larger vacuoles
continue to combine until the central nucleus is surrounded by four or
five very large vacuoles separated by thin cytoplasmic strands (Figures
52, 53). As the large vacuoles form, the major portion of the cyto
plasm becomes localized near the periphery of the cell (Figure 54).
The transverse and radial walls of the expanding cells become
thicker (0.20-0.25 pm) compared to similar walls of the merlstematlc
cells, while the periclinal walls remain about the same thickness.
Fewer plasmodesmata are present traversing the inner walls (Figure 54).
The nucleus also moves over to the periphery of the maturing vege
tative cell, while still maintaining contact with cytoplasm along opposite
and adjacent walls of the cell via thin cytoplasmic strands (Figures
45, 55-58). The cytoplasmic strands, which are composed of free ribo-
somes and an occasional small vacuole, progressively become fewer in
number. Numerous microtubules have been observed in the cytoplasm
surrounding some of the peripheral nuclei. In Figures 46-48, numerous
microtubules are shown aligned parallel to the cell wall next to the
peripheral nucleus with many more microtubules oriented tangentially
120
to the nuclear membrane envelope.
In the much expanded, vacuolate cells of the central and basal
regions of the gametophytes, the cytoplasm is distributed in a very
thin layer around the periphery of the cells and thin cytoplasmic
strands are no longer apparent (Figures 59-61). Figure 62 shows a
transverse section through a region of mature vegetative cells revealing
nuclei in various positions along the cell walls. The nuclei have
elongated and flattened (Figures 62-64). Nucleoli are present
and occasionally a lobed nucleus is observed (Figure 65).
The organelles which occur in the cytoplasm of the meristematic
cells are also present in the fully expanded vegetative cells. The
many chloroplasts found in the large, vacuolate cells are located,
almost exclusively, in the cytoplasm along the periclinal walls (Figures
55-57, 59-63). Most of the chloroplasts have a well-developed lamellar
system with many grana, along with plastoglobuli and small starch
grains (Figures 64, 66).
Interspersed among the chloroplasts are microbodies and mito
chondria (Figures 67, 68). Some of the mitochondria have accumulated
densely staining, amorphous material (Figures 69, 70). Mitochondria
also occur in the cytoplasm along the inner walls of the cells (Figure
57).
Also present in the ribosome-filled cytoplasm are small vacuoles,
RER, and Golgi bodies. Golgi bodies near the cell walls form vesicles
containing fibrous material, similar in appearance to the material
found between the plasmalemma and the cell wall (Figure 71). Occasionally
present are single-membrane bound organelles containing many tubules
121
and/or vesicles (Figures 72, 73). They are similar in appearance to
paramural bodies as described by Marchant and Robards (1968), although
their membranes are not continuous with the plasmalemma in these micro
graphs. Very few microtubules are observed in highly vacuolate cells,
although they are occasionally seen near a cell wall (Figures 66, 73).
Cellular Changes during the Division Phase
of Antheridium Initiation and Development
Initiation of 1-celled stage
The first-formed antheridium initials typically occur on marginal
cells along the sides of the gametophyte, as reported earlier in the
section on "Antheridium Developmental Data," and during the first week
of initiations, the preferred sites of initiation shift to cells in the
upper, central region of the gametophytes, Regardless of where the
induced vegetative cells are located in the gametophyte, the antheridium
initials predominantly form at the anterior end of the vegetative cells
(Figures 35, 37, 38, 74, 75) with the exception of the cells in the basal
region of the gametophytes. These larger, isodiametric cells do not
appear to have a preferred cellular region for antheridium initiation,
with antheridia occurring both in the anterior and central regions of
the cells (Figure 38).
Marginal cells have three possible cell wall regions from which an
initial can form; dorsal or ventral periclinal wall regions, and curved,
radial wall regions. The initial is usually formed in the anterior,
radial cell wall region (Figures 37, 75). Nonmarginal cells have only
122
two possible anterior cell wall areas from which an initial can arise,
those being the dorsal and ventral periclinal walls. Antheridia are
observed on either, but not both, of these walls in any one cell. In
general, a vegetative cell produces only one antheridium, but if a second
antheridium is formed on a vegetative cell, it usually occurs immediately
posterior to the first-formed antheridium (Figure 35).
Prior to the formation of an initial, the nucleus of the induced
vegetative cell moves into the anterior region of the cell, either in the
transverse-ventral, transverse-dorsal, or transverse-radial corner. When
a nucleus is observed in one of these corners, indicating a high
potential for forming an antheridium, the nucleus is often accompanied
by an increase in cytoplasmic material, Gametophytes stained for DM
(methyl green) and RNÀ (pyronin Y) are shown in Figures 76-87. Nuclei
in anterior, radial-transverse corners of marginal cells are surrounded
by an accumulation of pink-stained cytoplasm, presumably composed of a
large amount of RNA (Figures 76-78, 81, 86). A longitudinal section
through a vegetative cell in the central region of a gametophyte shows
a nucleus in the transverse-dorsal corner of the cell surrounded by an
increased amount of cytoplasmic material (Figure 88). A micrograph of
a similar region reveals the presence of an interphase nucleus, as
evidenced by the highly dispersed chromatin (Figure 89). Between the
nucleus and cell walls are chloroplasts in association with RER, mito
chondria, and many vesicle-forming Golgi bodies. An adjacent section
shows that the cytoplasm next to that nucleus is dense with ribosomes
and mitochondria (Figure 90). A few microtubules are present within the
cytoplasm, oriented in various directions. These cellular conditions
123
are presumed to precede antheridium initiation.
Nuclear division occurs before an antheridium initial cell is
formed. A nucleus in mitotic metaphase is shown in the radial-transverse
corner of a vegetative cell presumably Initiating an antheridium
initial (Figure 77). A nucleus in mitotic telophase is shown in a
similar corner of another vegetative cell (Figure 78). The set of chromo
somes nearest the radial wall is surrounded by a large amount of RNA-
stained cytoplasm. The other set of chromosomes occurs near the inner
periphery of the accumulated cytoplasm near the large central vacuole.
Similar observations are made in transversely sectioned material, showing
a telophase nucleus in one of the vacuolate cells of the central region
embedded in accumulated cytoplasm (Figure 91). The set of chromosomes
nearest the outer wall is surrounded by a large amount of cytoplasm,
while the other set of chromosomes occurs near the inner edge of the
accumulated cytoplasm next to the central vacuole. A thin strand of
cytoplasm traverses the central vacuole between the innermost set of
chromosomes and the opposite cell wall. The phragmoplast is forming
between the two sets of chromosomes at about a 45® angle to the outer
cell wall. The phragmoplast develops into the basal cell wall of an
antheridium initial, resulting in the formation of a small, wedge-
shaped initial at the anterior end of the vegetative cell (Figure 92).
One-celled stage
The basal wall of the initial always forms at an oblique angle
(about 45°) to the outer wall of the vegetative cell, intercepting
the anterior, transverse wall about 10-15 pm from the outer edge of
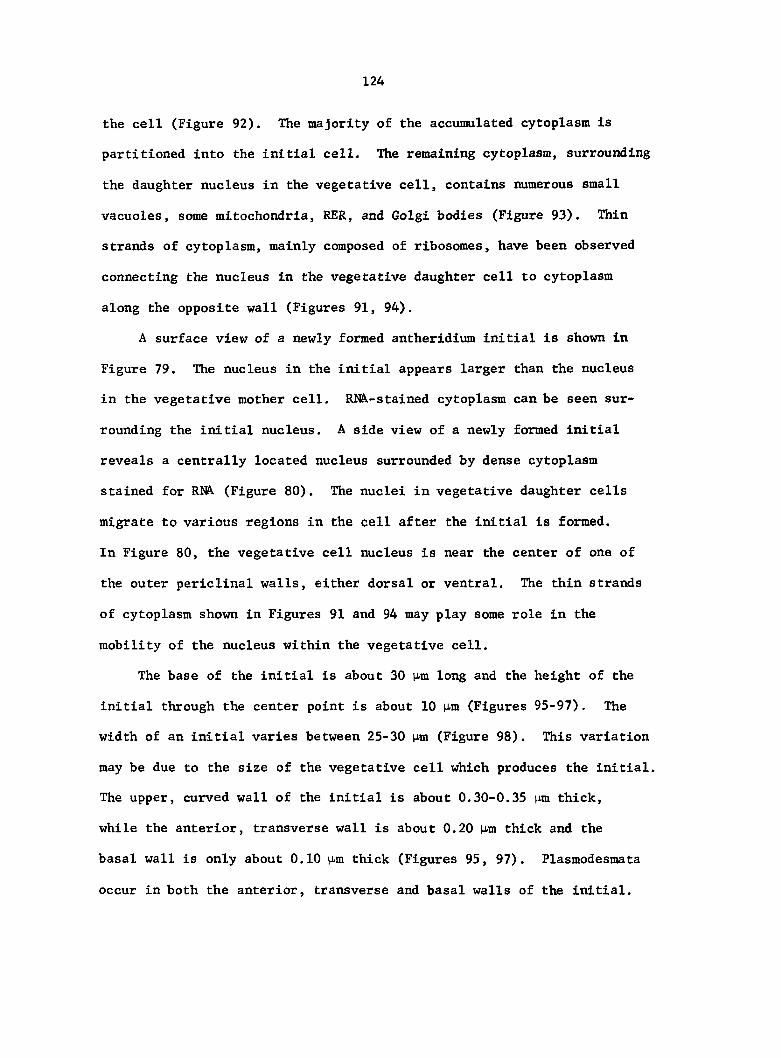
124
the cell (Figure 92). The majority of the accumulated cytoplasm is
partitioned into the initial cell. The remaining cytoplasm, surrounding
the daughter nucleus in the vegetative cell, contains numerous small
vacuoles, some mitochondria, RER, and Golgi bodies (Figure 93). Thin
strands of cytoplasm, mainly composed of ribosomes, have been observed
connecting the nucleus in the vegetative daughter cell to cytoplasm
along the opposite wall (Figures 91, 94).
A surface view of a newly formed antheridium initial is shown in
Figure 79. The nucleus in the initial appears larger than the nucleus
in the vegetative mother cell. RNA-stained cytoplasm can be seen sur
rounding the initial nucleus. A side view of a newly formed initial
reveals a centrally located nucleus surrounded by dense cytoplasm
stained for RN\ (Figure 80). The nuclei in vegetative daughter cells
migrate to various regions in the cell after the initial is formed.
In Figure 80, the vegetative cell nucleus is near the center of one of
the outer periclinal walls, either dorsal or ventral. The thin strands
of cytoplasm shown in Figures 91 and 94 may play some role in the
mobility of the nucleus within the vegetative cell.
The base of the initial is about 30 p-m long and the height of the
initial through the center point is about 10 p.m (Figures 95-97). The
width of an initial varies between 25-30 p-m (Figure 98). This variation
may be due to the size of the vegetative cell which produces the initial.
The upper, curved wall of the initial is about 0.30-0.35 p-m thick,
while the anterior, transverse wall is about 0.20 nm thick and the
basal wall is only about 0.10 m thick (Figures 95, 97). Plasmodesmata
occur in both the anterior, transverse and basal walls of the initial.
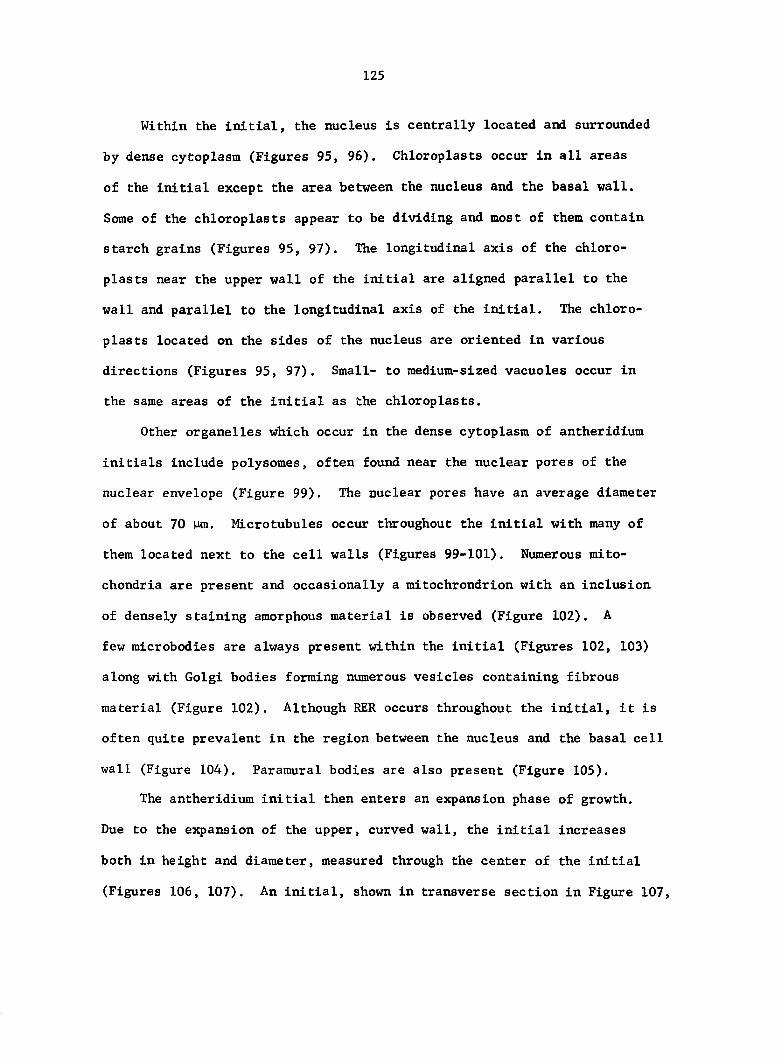
125
Within the initial, the nucleus is centrally located and surrounded
by dense cytoplasm (Figures 95, 96). Chloroplasts occur in all areas
of the initial except the area between the nucleus and the basal wall.
Some of the chloroplasts appear to be dividing and most of them contain
starch grains (Figures 95, 97). The longitudinal axis of the chloro
plasts near the upper wall of the initial are aligned parallel to the
wall and parallel to the longitudinal axis of the initial. The chloro
plasts located on the sides of the nucleus are oriented in various
directions (Figures 95, 97). Small- to medium-sized vacuoles occur in
the same areas of the initial as the chloroplasts.
Other organelles which occur in the dense cytoplasm of antheridium
initials include polysomes, often found near the nuclear pores of the
nuclear envelope (Figure 99). The nuclear pores have an average diameter
of about 70 pm. Microtubules occur throughout the initial with many of
them located next to the cell walls (Figures 99-101). Numerous mito
chondria are present and occasionally a mitochrondrion with an inclusion
of densely staining amorphous material is observed (Figure 102). A
few microbodies are always present within the initial (Figures 102, 103)
along with Golgi bodies forming numerous vesicles containing fibrous
material (Figure 102). Although RER occurs throughout the initial, it is
often quite prevalent in the region between the nucleus and the basal cell
wall (Figure 104). Paramural bodies are also present (Figure 105).
The antheridium initial then enters an expansion phase of growth.
Due to the expansion of the upper, curved wall, the initial Increases
both in height and diameter, measured through the center of the initial
(Figures 106, 107). An initial, shown in transverse section in Figure 107,
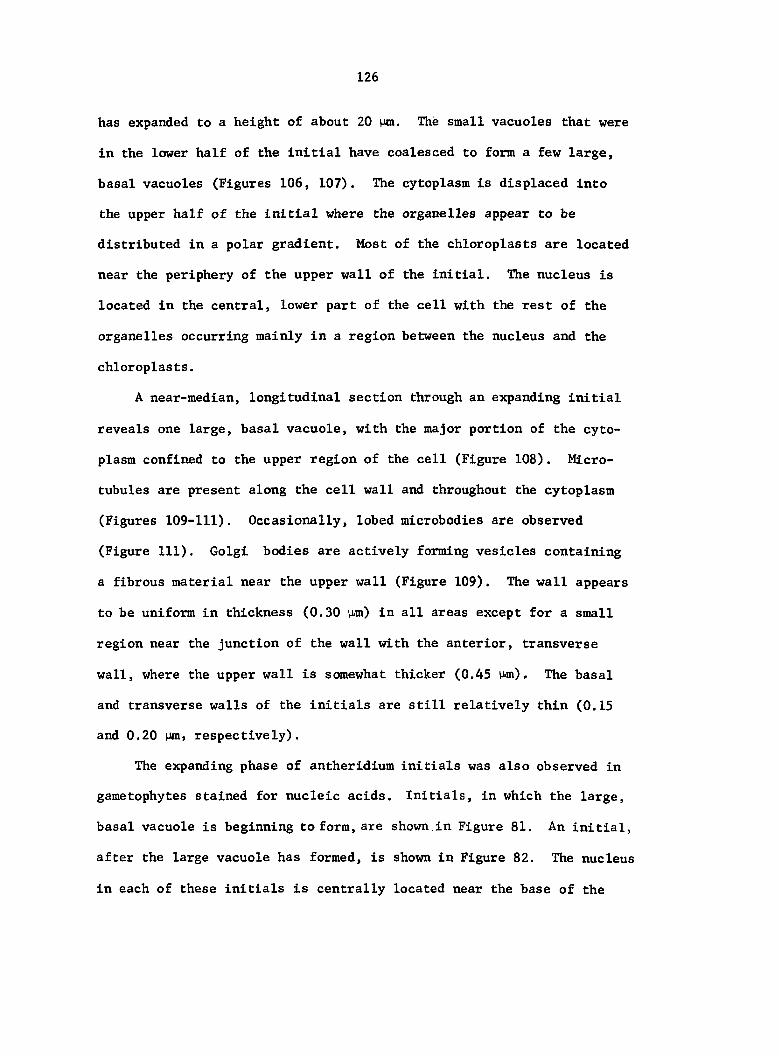
126
has expanded to a height of about 20 |m. The small vacuoles that were
in the lower half of the initial have coalesced to form a few large,
basal vacuoles (Figures 106, 107). The cytoplasm is displaced into
the upper half of the initial where the organelles appear to be
distributed in a polar gradient. Most of the chloroplasts are located
near the periphery of the upper wall of the initial. The nucleus is
located in the central, lower part of the cell with the rest of the
organelles occurring mainly in a region between the nucleus and the
chloroplasts.
A near-median, longitudinal section through an expanding initial
reveals one large, basal vacuole, with the major portion of the cyto
plasm confined to the upper region of the cell (Figure 108). Micro
tubules are present along the cell wall and throughout the cytoplasm
(Figures 109-111). Occasionally, lobed microbodies are observed
(Figure 111), Golgi bodies are actively forming vesicles containing
a fibrous material near the upper wall (Figure 109). The wall appears
to be uniform in thickness (0.30 n,m) in all areas except for a small
region near the junction of the wall with the anterior, transverse
wall, where the upper wall is somewhat thicker (0.45 M-m), The basal
and transverse walls of the initials are still relatively thin (0.15
and 0.20 pm, respectively).
The expanding phase of antheridium initials was also observed in
gametophytes stained for nucleic acids. Initials, in which the large,
basal vacuole is beginning to form, are shown in Figure 81. An initial,
after the large vacuole has formed, is shown in Figure 82. The nucleus
in each of these initials is centrally located near the base of the
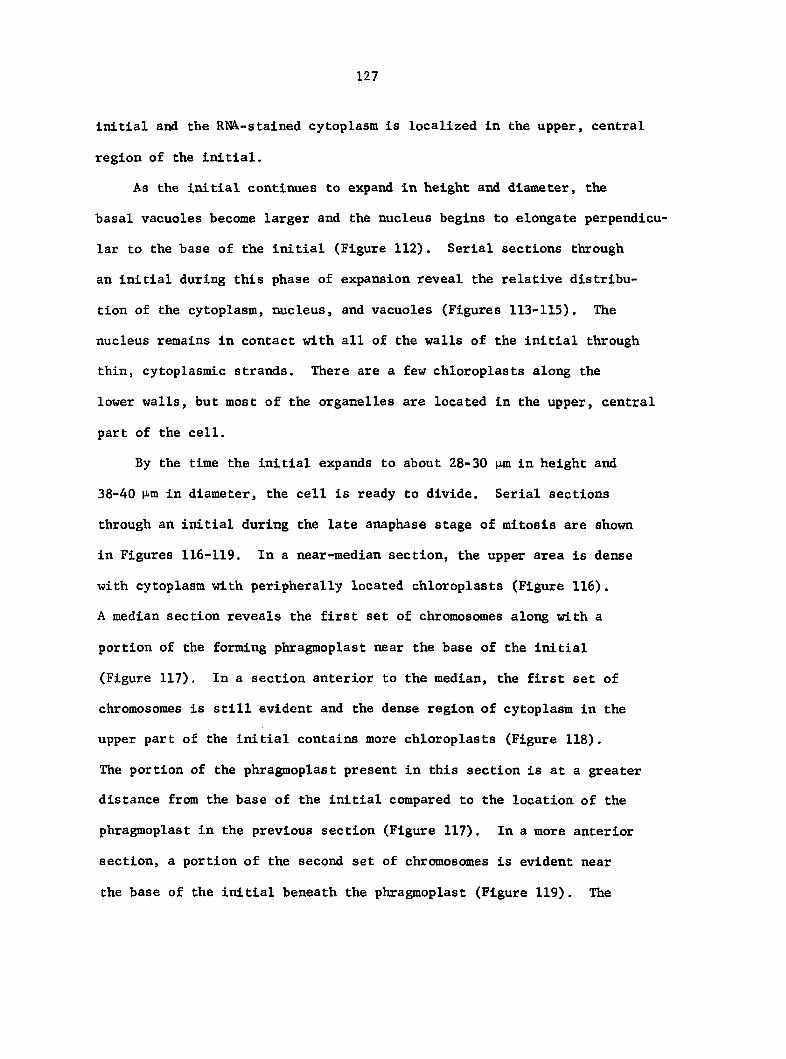
127
Initial and the RN^-stalned cytoplasm Is localized in the upper, central
region of the initial.
As the initial continues to expand in height and diameter, the
basal vacuoles become larger and the nucleus begins to elongate perpendicu
lar to the base of the initial (Figure 112). Serial sections through
an initial during this phase of expansion reveal the relative distribu
tion of the cytoplasm, nucleus, and vacuoles (Figures 113-115). The
nucleus remains in contact with all of the walls of the initial through
thin, cytoplasmic strands. There are a few chloroplasts along the
lower walls, but most of the organelles are located in the upper, central
part of the cell.
By the time the initial expands to about 28-30 pm in height and
38-40 M-m in diameter, the cell is ready to divide. Serial sections
through an initial during the late anaphase stage of mitosis are shown
in Figures 116-119. In a near-median section, the upper area is dense
with cytoplasm with peripherally located chloroplasts (Figure 116).
A median section reveals the first set of chromosomes along with a
portion of the forming phragmoplast near the base of the initial
(Figure 117). In a section anterior to the median, the first set of
chromosomes is still evident and the dense region of cytoplasm in the
upper part of the initial contains more chloroplasts (Figure 118).
The portion of the phragmoplast present in this section is at a greater
distance from the base of the initial compared to the location of the
phragmoplast in the previous section (Figure 117). In a more anterior
section, a portion of the second set of chromosomes is evident near
the base of the initial beneath the phragmoplast (Figure 119). The
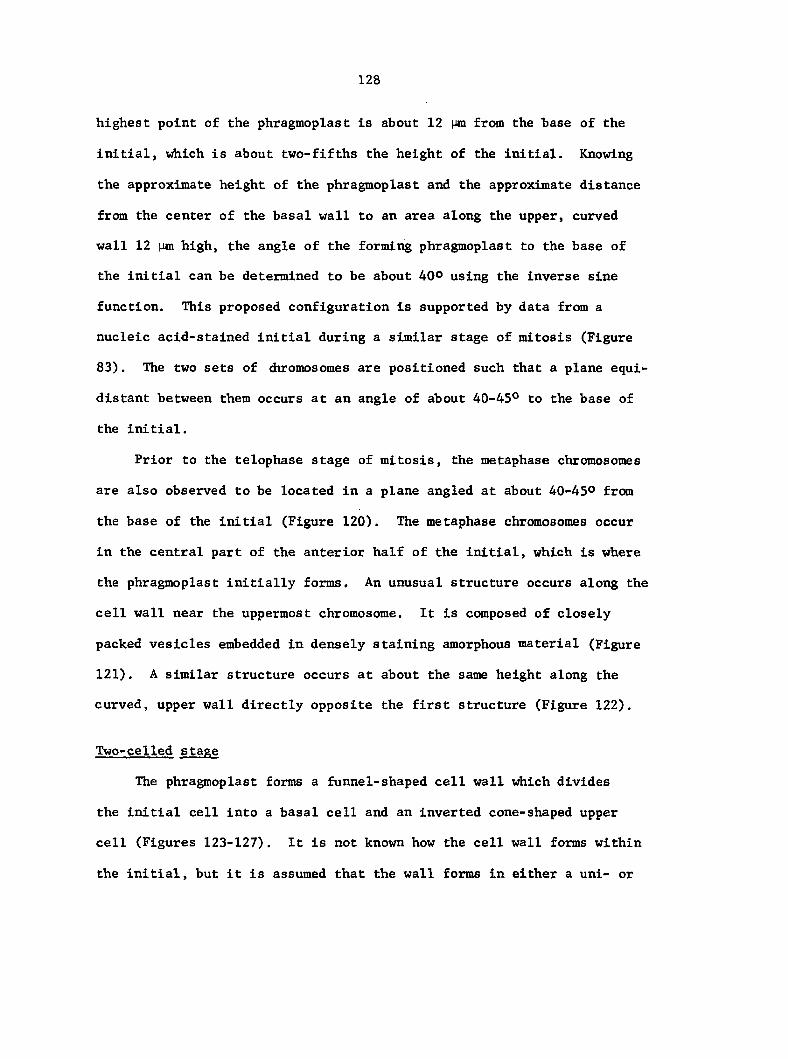
128
highest point of the phragtnoplast is about 12 Mm from the base of the
initial, which is about two-fifths the height of the initial. Knowing
the approximate height of the phragmoplast and the approximate distance
from the center of the basal wall to an area along the upper, curved
wall 12 pm high, the angle of the forming phragmoplast to the base of
the initial can be determined to be about 40° using the inverse sine
function. This proposed configuration is supported by data from a
nucleic acid-stained initial during a similar stage of mitosis (Figure
83). The two sets of diromosomes are positioned such that a plane equi
distant between them occurs at an angle of about 40-45° to the base of
the initial.
Prior to the telophase stage of mitosis, the metaphase chromosomes
are also observed to be located in a plane angled at about 40-45° from
the base of the initial (Figure 120). The metaphase chromosomes occur
in the central part of the anterior half of the initial, which is where
the phragmoplast initially forms. An unusual structure occurs along the
cell wall near the uppermost chromosome. It is composed of closely
packed vesicles embedded in densely staining amorphous material (Figure
121). A similar structure occurs at about the same height along the
curved, upper wall directly opposite the first structure (Figure 122).
Two-celled stage
The phragmoplast forms a funnel-shaped cell wall which divides
the initial cell into a basal cell and an inverted cone-shaped upper
cell (Figures 123-127). It is not known how the cell wall forms within
the initial, but it is assumed that the wall forms in either a uni- or
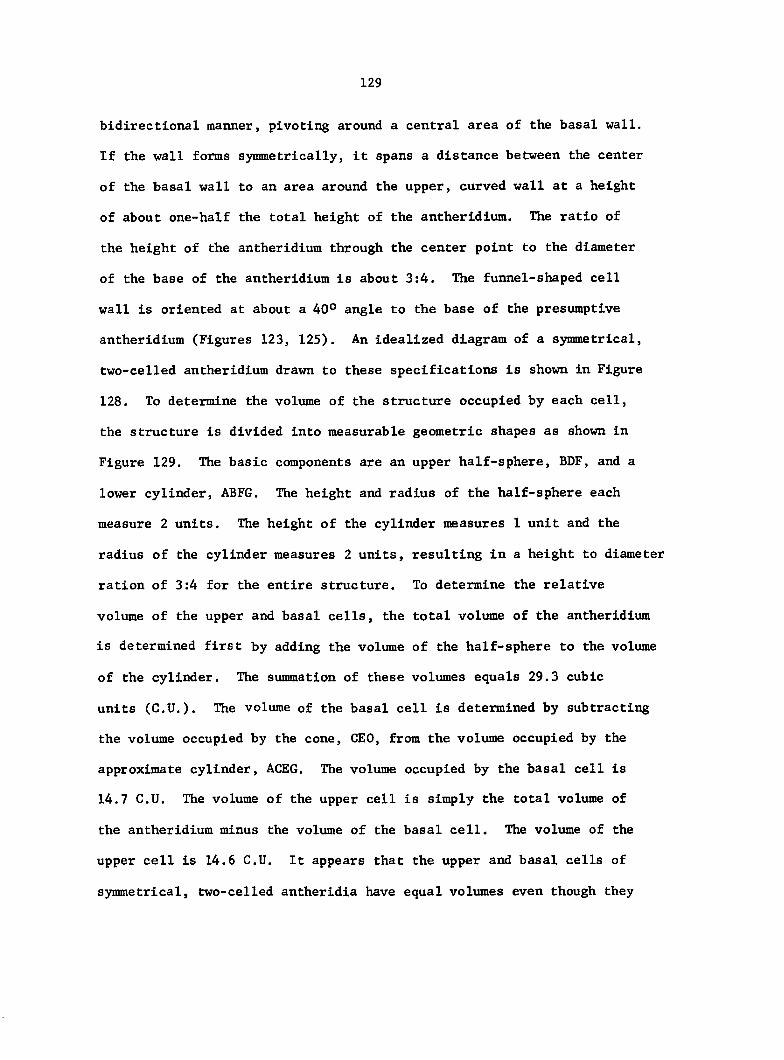
bidirectional manner, pivoting around a central area of the basal wall.
If the wall forms symmetrically, it spans a distance between the center
of the basal wall to an area around the upper, curved wall at a height
of about one-half the total height of the antheridium. The ratio of
the height of the antheridium through the center point to the diameter
of the base of the antheridium is about 3:4. The funnel-shaped cell
wall is oriented at about a 40° angle to the base of the presumptive
antheridium (Figures 123, 125). An idealized diagram of a symmetrical,
two-celled antheridium drawn to these specifications is shown in Figure
128. To determine the volume of the structure occupied by each cell,
the structure is divided into measurable geometric shapes as shown in
Figure 129. The basic components are an upper half-sphere, BDF, and a
lower cylinder, ABFG. The height and radius of the half-sphere each
measure 2 units. The height of the cylinder measures 1 unit and the
radius of the cylinder measures 2 units, resulting in a height to diameter
ration of 3:4 for the entire structure. To determine the relative
volume of the upper and basal cells, the total volume of the antheridium
is determined first by adding the volume of the half-sphere to the volume
of the cylinder. The summation of these volumes equals 29.3 cubic
units (C.U.). The volume of the basal cell is determined by subtracting
the volume occupied by the cone, CEO, from the volume occupied by the
approximate cylinder, ACEG. The volume occupied by the basal cell is
14.7 C.U. The volume of the upper cell is simply the total volume of
the antheridium minus the volume of the basal cell. The volume of the
upper cell is 14.6 C.U. It appears that the upper and basal cells of
symmetrical, two-celled antheridia have equal volumes even though they
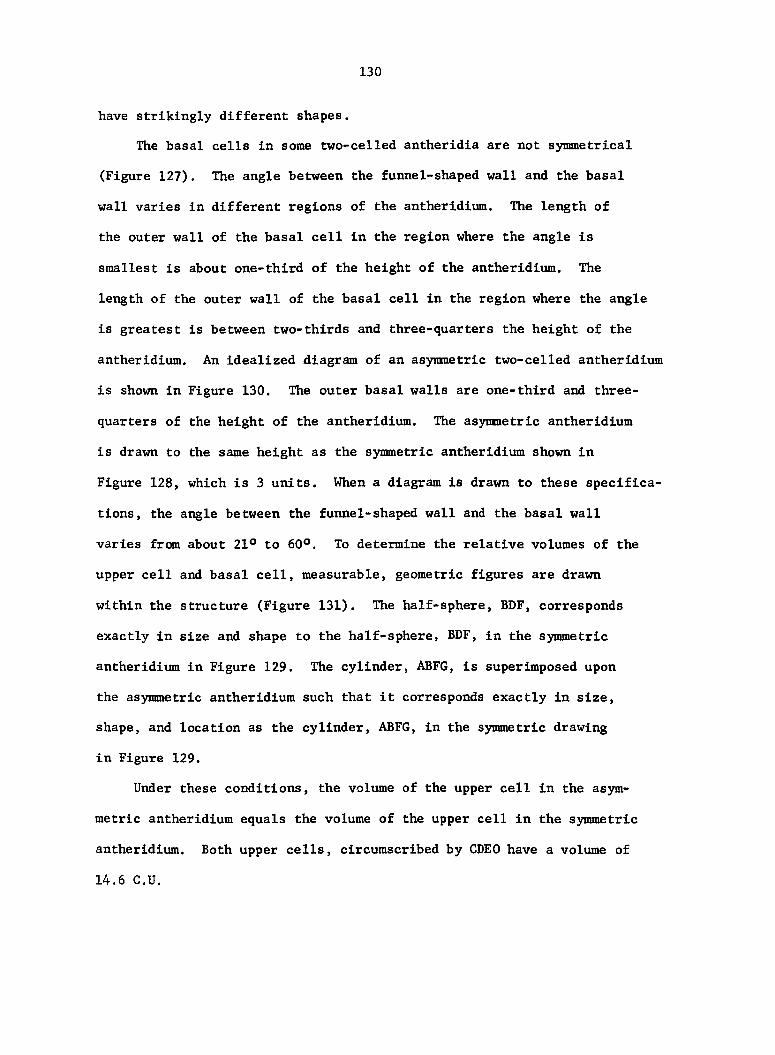
130
have strikingly different shapes.
The basal cells in some two-celled antheridia are not symmetrical
(Figure 127). The angle between the funnel-shaped wall and the basal
wall varies in different regions of the antheridium. The length of
the outer wall of the basal cell in the region where the angle is
smallest is about one-third of the height of the antheridium. The
length of the outer wall of the basal cell in the region where the angle
is greatest is between two-thirds and three-quarters the height of the
antheridium. An idealized diagram of an asymmetric two-celled antheridium
is shown in Figure 130. The outer basal walls are one-third and three-
quarters of the height of the antheridium. The asymmetric antheridium
is drawn to the same height as the symmetric antheridium shown in
Figure 128, which is 3 units. When a diagram is drawn to these specifica
tions, the angle between the funnel-shaped wall and the basal wall
varies from about 21° to 60°. To determine the relative volumes of the
upper cell and basal cell, measurable, geometric figures are drawn
within the structure (Figure 131). The half-sphere, BDF, corresponds
exactly in size and shape to the half-sphere, BDF, in the symmetric
antheridium in Figure 129. The cylinder, ABFG, is superimposed upon
the asymmetric antheridium such that it corresponds exactly in size,
shape, and location as the cylinder, ABFG, in the symmetric drawing
in Figure 129.
Under these conditions, the volume of the upper cell in the asym
metric antheridium equals the volume of the upper cell in the symmetric
antheridium. Both upper cells, circumscribed by CDEO have a volume of
14.6 C.U.
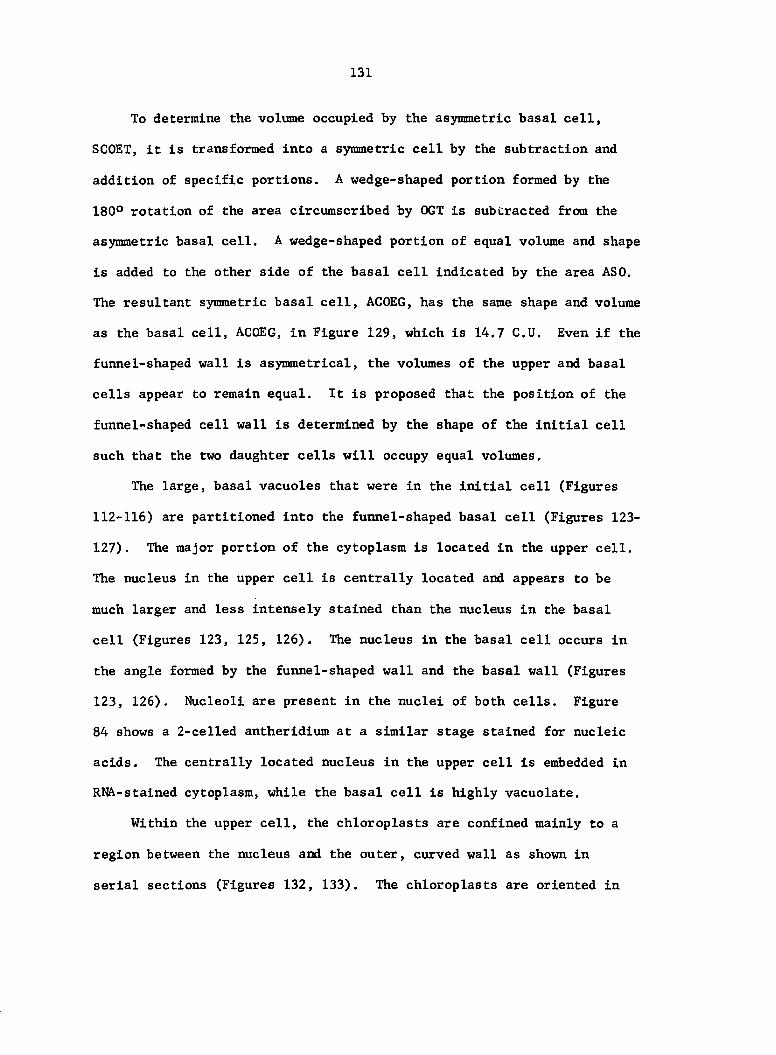
131
To determine the volume occupied by the asymmetric basal cell,
SCOET, it is transformed into a symmetric cell by the subtraction and
addition of specific portions. A wedge-shaped portion formed by the
180° rotation of the area circumscribed by OCT is subtracted from the
asymmetric basal cell. A wedge-shaped portion of equal volume and shape
is added to the other side of the basal cell indicated by the area ASO.
The resultant symmetric basal cell, ACOEG, has the same shape and volume
as the basal cell, ACOEG, in Figure 129, which is 14.7 C.U, Even if the
funnel-shaped wall is asymmetrical, the volumes of the upper and basal
cells appear to remain equal. It is proposed that the position of the
funnel-shaped cell wall is determined by the shape of the initial cell
such that the two daughter cells will occupy equal volumes.
The large, basal vacuoles that were in the Initial cell (Figures
112-116) are partitioned into the funnel-shaped basal cell (Figures 123-
127). The major portion of the cytoplasm is located in the upper cell.
The nucleus in the upper cell is centrally located and appears to be
much larger and less intensely stained than the nucleus in the basal
cell (Figures 123, 125, 126). The nucleus in the basal cell occurs in
the angle formed by the funnel-shaped wall and the basal wall (Figures
123, 126). Nucleoli are present in the nuclei of both cells. Figure
84 shows a 2-celled antheridium at a similar stage stained for nucleic
acids. The centrally located nucleus in the upper cell Is embedded in
RNA-stained cytoplasm, while the basal cell is highly vacuolate.
Within the upper cell, the chloroplasts are confined mainly to a
region between the nucleus and the outer, curved wall as shown in
serial sections (Figures 132, 133). The chloroplasts are oriented in
132
various directions and most of them contain starch grains. Small vacuoles
occur in the same regions as the chloroplasts. In the area between the
nucleus and the lower half of the funnel-shaped wall, only ribosomes,
mitochondria, RER, and some microtubules are found (Figures 132, 134).
Microtubules are abundant around the nuclear envelope (Figure 135) and
are also found along the cell walls (Figure 136). Microbodies and
Golgi bodies are found within the cytoplasm of the upper cell (Figures
132, 133, 137) and occasionally osmiophilic bodies are observed (Figure
138).
The same types of organelles found in the upper cell are also found
in the basal cell, but appear to be fewer in number and occur in a thin
layer of cytoplasm along the cell wall. There is more heterochromatin
present in the nucleus of the basal cell than the nucleus of the upper
cell (Figures 132, 133).
The outer wall of the 2-celled antheridium is thinnest near the
apex (0.25-0,30 lim) and gradually becomes thicker near the base of the
structure (0.35-0.40 pm). The funnel-shaped wall is only about 0.10 nm
thick, while the basal wall of the initial is about 0.20 nm thick.
The latter two walls have very few plasmodesmata and in the region where
they fuse, the combined wall can become quite thick (0.90 pm; Figure 139).
The basal cell will undergo no further divisions. Before the upper
cell divides, many changes will occur within the cytoplasm. Sections
through a 2-celled antheridium in which the upper cell nucleus is in
prophase of mitosis are shown in Figures 140-142. The upper cell
nucleus is much larger than the basal cell nucleus and has moved from
a central location to an upper, central location (Figure 141). Many
133
nuclear pores are evident in the nuclear envelope (Figure 142) and
average about 70 nm in diameter. Large vacuoles are now present in the
region between the nucleus and the sides of the upper cell. Concomitant
with the formation of the vacuoles is a redistribution of the chloro-
plasts which now occur in the cytoplasm immediately surrounding the
nucleus (Figures 140-142). The longitudinal axes of the chloroplasts
which are located between the nucleus and the top of the cell appear to
be oriented parallel to the base of the antheridium. This same orienta
tion holds true for the chloroplasts below the nucleus. The longitudinal
axes of the chloroplasts located between the nucleus and the large
vacuoles appear to be oriented perpendicular to the base of the
antheridium. The largest chloroplasts measure about 5 pm in length.
A major portion of the cytoplasm is localized within the basal
region of the upper cell (Figures 140-142). Figure 143 shows a median
section through this accumulated cytoplasm between the nucleus and the
base of the cell. In the lower portion of this area, the cytoplasm is
composed mainly of mitochondria and ribosomes, with an occasional micro
tubule, small vacuole, and some smooth endoplasmic reticulum (SER;
Figure 144). In the portion of the cytoplasm nearer the nucleus, the
composition changes to mostly SER and ribosomes with some small vacuoles
and microtubules present (Figure 144). An off-median section through this
region is shown in Figure 145. The numerous profiles of mitochondria are
interspersed with an abundance of SER. In three dimensions, the basal
region of the upper cell is visualized as being lined with mitochondria
and filled with ribosomes. A gradient of SER increases from bottom to
top.
134
The cytoplasm surrounding the nucleus, which contains most of the
chloroplasts, also contains some mitochondria, an abundance of SER,
RER, and vesicle-forming Golgi bodies, an occasional microbody and
numerous microtubules (Figures 140, 142, 146, 147). Very few micro
tubules are observed near the walls of the upper cell.
This redistribution stage in antheridium development was also ob
served in nucleic acid-stained gametophytes as shown in Figure 85. The
enlarged nucleus of the upper cell is located in the upper, central
region of the cell with the majority of the RNA-stained cytoplasm oc
curring within the basal portion of the cell.
The size of the antheridium has changed little during the redistribu
tion of cytoplasm leading up to the next cell division. The height of
the antheridium still averages about 28-30 nm and the basal diameter
averages about 38-40 wn.
The nucleus in the upper cell next enters into mitosis as shown
in Figure 148. The centromeres of the metaphase chromosomes are aligned
in a plane parallel to the base of the 2-celled antheridium about 10 pm
from the apex of the upper cell. Telophase of this division is shown
in a nucleic acid-stained antheridium shown in Figure 86. One set of
daughter chromosomes occurs in the upper one-third of the cell and the
other set occurs within the upper portion of the accumulated cytoplasm
in the basal portion of the cell, A plane equi-distant frcm the two
sets of chromosomes occurs parallel to the base of the antheridium and
is presumed to be the orientation of the first formed portion of the
succeeding phragmoplast. The actual formation of the phragmoplast was
not observed, but sections through 3-celled antheridia all reveal
135
the presence of a curved cell wall dividing the newly formed daughter
cells (Figures 149-151).
Three-celled stage
The 3-celled antheridium is comprised of a basal cell, a central
cell, and a cup-shaped upper cell. The curved wall between the upper
and central cells is oriented parallel to the outer curved wall of
the upper cell. The distance between these two parallel curved walls
is about one-fifth the total height of the antheridium, or about 6 nm.
The inner, curved wall intercepts the funnel-shaped wall about 6 im
from the outer edge. An idealized diagram of a 3-celled antheridium
is shown in Figure 152. To determine the relative volumes occupied
by the upper and central cells, the figure is divided into measurable,
geometric shapes in Figure 129.
To determine the volume of the central cell, the volume of the
region circumscribed by points HKN (Figure 129) is first calculated
by adding the volume of the half-sphere (IKM) to the volume of the
cylinder (HIMN), The volume of HKN is 12.0 C.U. Next, the volume of
the area circumscribed by the points HJOLN is calculated by subtracting
the volume of the cone (JLO) from the volume of the approximate
cylinder (HJLN), The volume of HJOLN is 5.0 C.U. Now, the relative
volume of the central cell can be determined by subtracting the volume
of the area, HJOLN, from the volume of HKN. The volume of the central
cell is 7.0 C.U. As calculated earlier, the entire antheridium occupies
a volume of 29.3 C.U,, which means that the central cell occupies about
25% of the total volume.
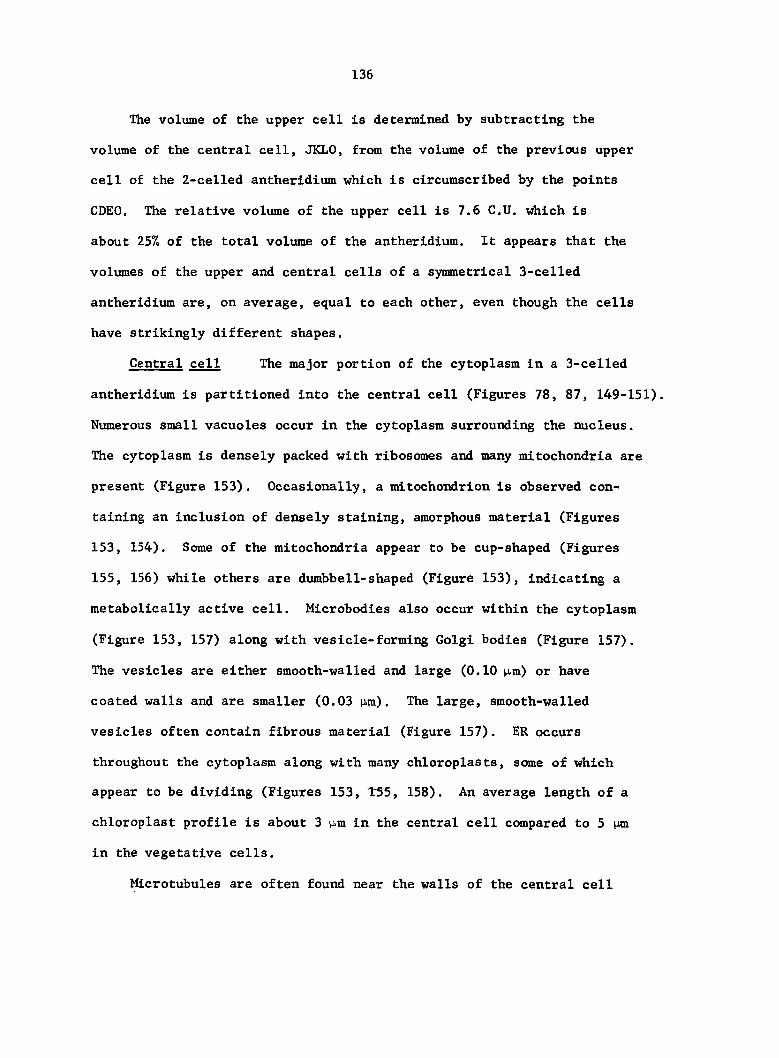
136
The volume of the upper cell is determined by subtracting the
volume of the central cell, JKLO, from the volume of the previous upper
cell of the 2-celled antheridium which is circumscribed by the points
CDEO. The relative volume of the upper cell is 7.6 C.U. which is
about 25% of the total volume of the antheridium. It appears that the
volumes of the upper and central cells of a symmetrical 3-celled
antheridium are, on average, equal to each other, even though the cells
have strikingly different shapes.
Central cell The major portion of the cytoplasm in a 3-celled
antheridium is partitioned into the central cell (Figures 78, 87, 149-151).
Numerous small vacuoles occur in the cytoplasm surrounding the nucleus.
The cytoplasm is densely packed with ribosomes and many mitochondria are
present (Figure 153). Occasionally, a mitochondrion is observed con
taining an inclusion of densely staining, amorphous material (Figures
153, 154). Some of the mitochondria appear to be cup-shaped (Figures
155, 156) while others are dumbbell-shaped (Figure 153), indicating a
metabolically active cell. Microbodies also occur within the cytoplasm
(Figure 153, 157) along with vesicle-forming Golgi bodies (Figure 157).
The vesicles are either smooth-walled and large (0.10 p,m) or have
coated walls and are smaller (0.03 iim). The large, smooth-walled
vesicles often contain fibrous material (Figure 157). ER occurs
throughout the cytoplasm along with many chloroplasts, some of which
appear to be dividing (Figures 153, T55, 158). An average length of a
chloroplast profile is about 3 ii.m in the central cell compared to 5 Mm
in the vegetative cells.
Microtubules are often found near the walls of the central cell
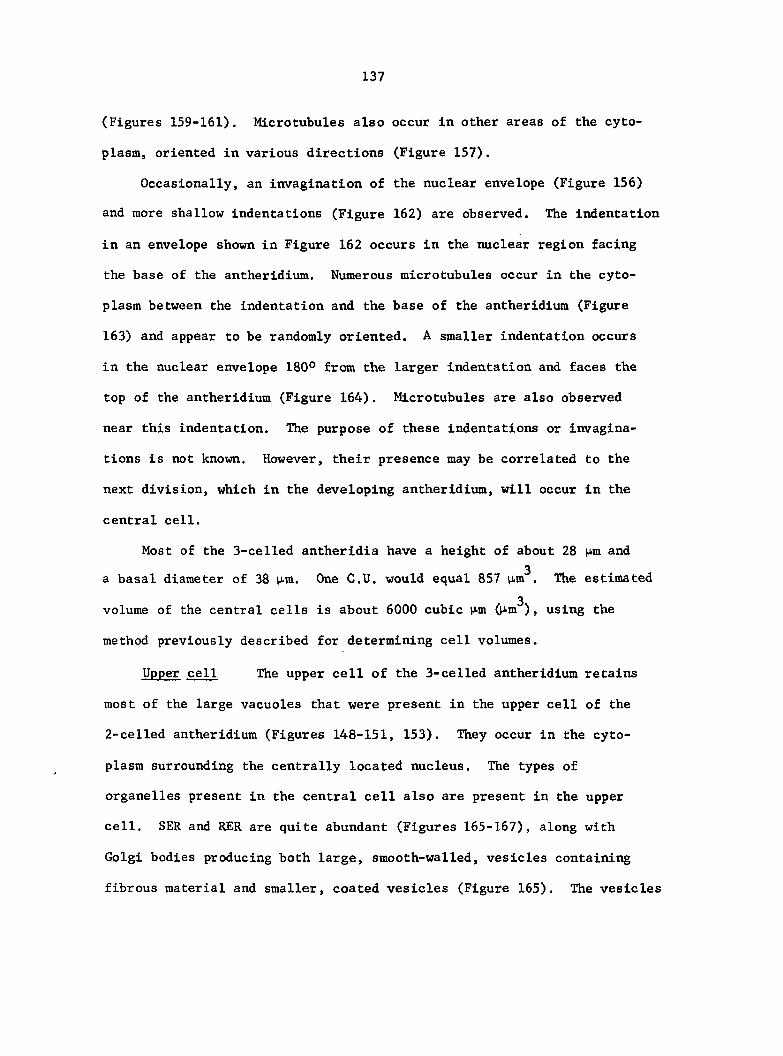
137
(Figures 159-161). Microtubules also occur in other areas of the cyto
plasm, oriented in various directions (Figure 157).
Occasionally, an invagination of the nuclear envelope (Figure 156)
and more shallow indentations (Figure 162) are observed. The indentation
in an envelope shown in Figure 162 occurs in the nuclear region facing
the base of the antheridium. Numerous microtubules occur in the cyto
plasm between the indentation and the base of the antheridium (Figure
163) and appear to be randomly oriented. A smaller indentation occurs
in the nuclear envelope 180° from the larger indentation and faces the
top of the antheridium (Figure 164). Microtubules are also observed
near this indentation. The purpose of these indentations or invagina
tions is not known. However, their presence may be correlated to the
next division, which in the developing antheridium, will occur in the
central cell.
Most of the 3-celled antheridia have a height of about 28 |im and
3 a basal diameter of 38 urn. One C.U. would equal 857 im . The estimated
3 volume of the central cells is about 6000 cubic i^m (^-m ), using the
method previously described for determining cell volumes.
Upper cell The upper cell of the 3-celled antheridium retains
most of the large vacuoles that were present in the upper cell of the
2-celled antheridium (Figures 148-151, 153). They occur in the cyto
plasm surrounding the centrally located nucleus. The types of
organelles present in the central cell also are present in the upper
cell. SER and RER are quite abundant (Figures 165-167), along with
Golgi bodies producing both large, smooth-walled, vesicles containing
fibrous material and smaller, coated vesicles (Figure 165). The vesicles
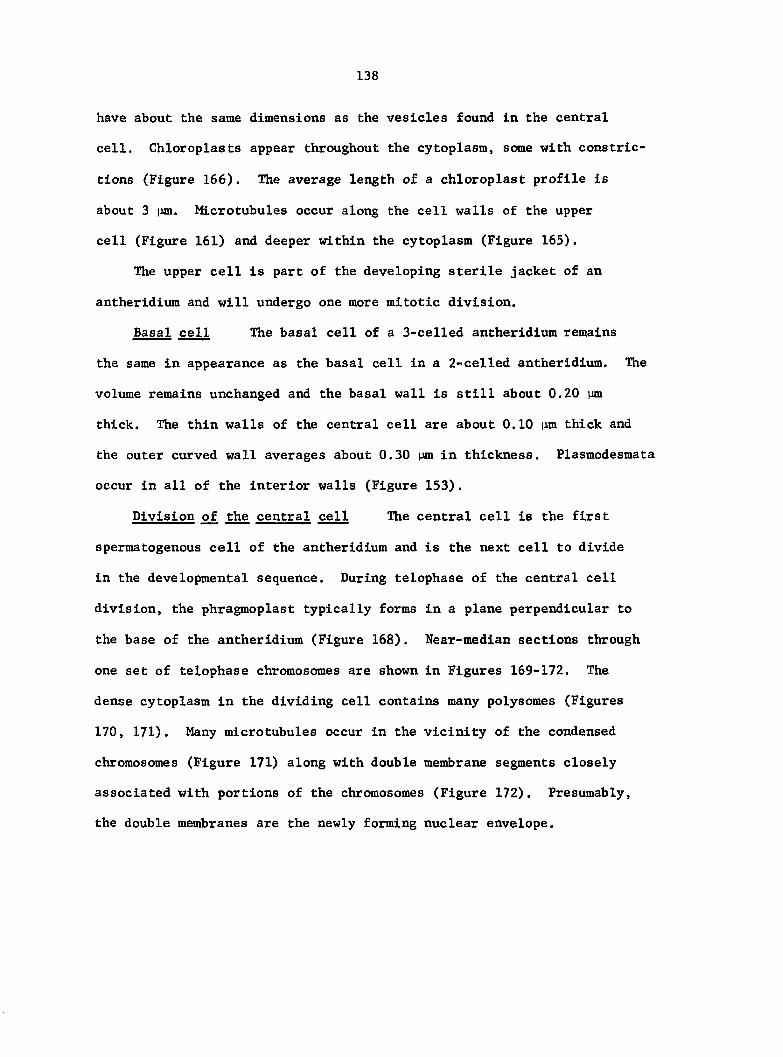
138
have about the same dimensions as the vesicles found in the central
cell. Chloroplasts appear throughout the cytoplasm, some with constric
tions (Figure 166). The average length of a chloroplast profile is
about 3 iJm. Microtubules occur along the cell walls of the upper
cell (Figure 161) and deeper within the cytoplasm (Figure 165).
The upper cell is part of the developing sterile jacket of an
antheridium and will undergo one more mitotic division.
Basal cell The basal cell of a 3-celled antheridium remains
the same in appearance as the basal cell in a 2-celled antheridium. The
volume remains unchanged and the basal wall is still about 0.20 pm
thick. The thin walls of the central cell are about 0.10 |xm thick and
the outer curved wall averages about 0.30 pm in thickness. Plasmodesmata
occur in all of the interior walls (Figure 153).
Division of the central cell The central cell is the first
spermatogenous cell of the antheridium and is the next cell to divide
in the developmental sequence. During telophase of the central cell
division, the phragmoplast typically forms in a plane perpendicular to
the base of the antheridium (Figure 168). Near-median sections through
one set of telophase chromosomes are shown in Figures 169-172. The
dense cytoplasm in the dividing cell contains many polysomes (Figures
170, 171). Many microtubules occur in the vicinity of the condensed
chromosomes (Figure 171) along with double membrane segments closely
associated with portions of the chromosomes (Figure 172). Presumably,
the double membranes are the newly forming nuclear envelope.
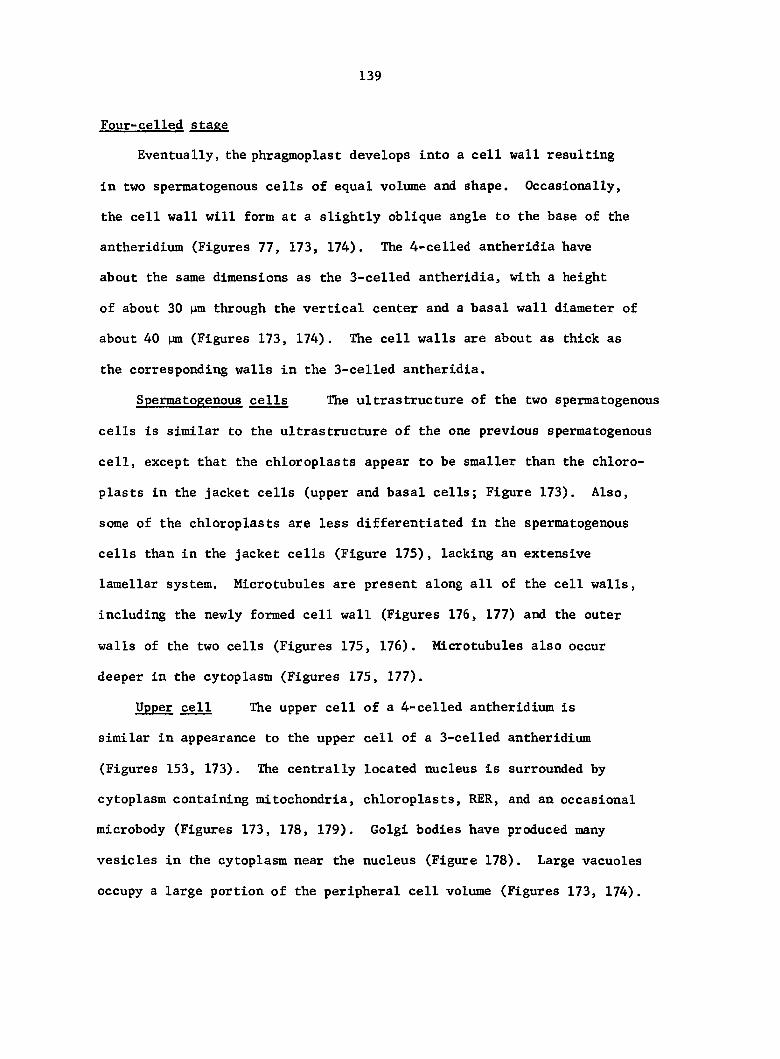
139
Four-celied stage
Eventually, the phragmoplast develops into a cell wall resulting
in two spermatogenous cells of equal volume and shape. Occasionally,
the cell wall will form at a slightly oblique angle to the base of the
antheridium (Figures 77, 173, 174). The 4-celled antheridia have
about the same dimensions as the 3-celled antheridia, with a height
of about 30 pm through the vertical center and a basal wall diameter of
about 40 (Figures 173, 174), The cell walls are about as thick as
the corresponding walls in the 3-celled antheridia.
Spermatogenous cells The ultrastructure of the two spermatogenous
cells is similar to the ultrastructure of the one previous spermatogenous
cell, except that the chloroplasts appear to be smaller than the chloro-
plasts in the jacket cells (upper and basal cells; Figure 173). Also,
some of the chloroplasts are less differentiated in the spermatogenous
cells than in the jacket cells (Figure 175), lacking an extensive
lamellar system. Microtubules are present along all of the cell walls,
including the newly formed cell wall (Figures 176, 177) and the outer
walls of the two cells (Figures 175, 176). Microtubules also occur
deeper in the cytoplasm (Figures 175, 177).
Upper cell The upper cell of a 4-celled antheridium is
similar in appearance to the upper cell of a 3-celled antheridium
(Figures 153, 173). The centrally located nucleus is surrounded by
cytoplasm containing mitochondria, chloroplasts, RER, and an occasional
microbody (Figures 173, 178, 179). Golgi bodies have produced many
vesicles in the cytoplasm near the nucleus (Figure 178). Large vacuoles
occupy a large portion of the peripheral cell volume (Figures 173, 174).
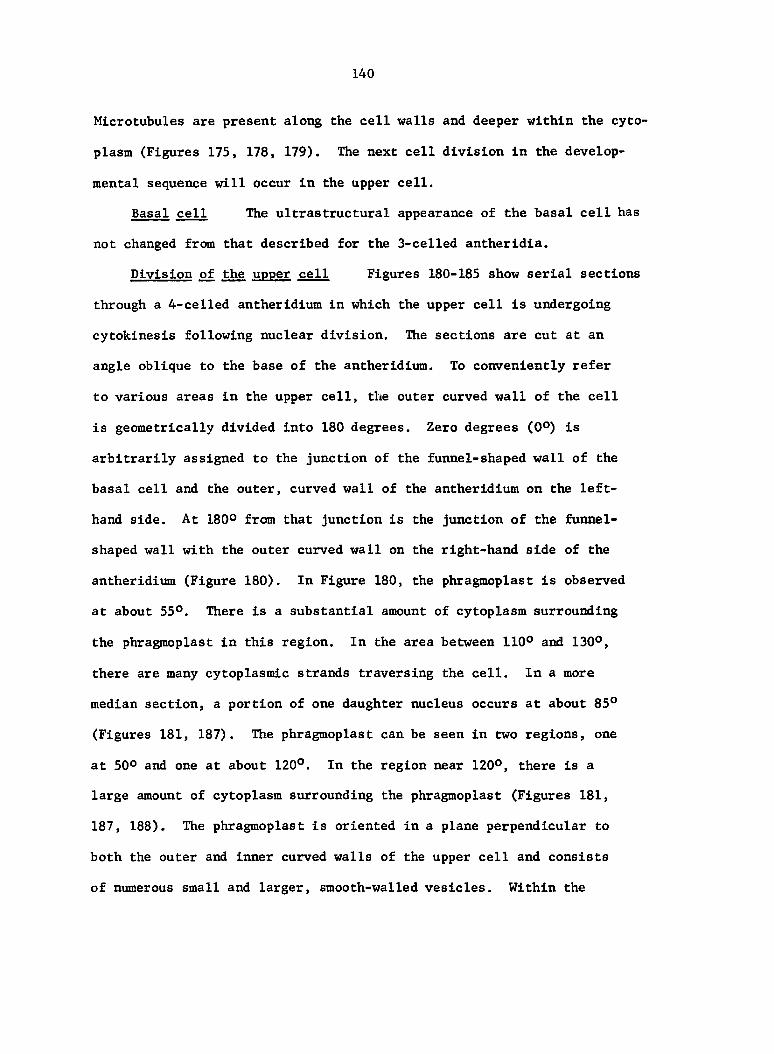
140
Microtubules are present along the cell walls and deeper within the cyto
plasm (Figures 175, 178, 179). The next cell division in the develop
mental sequence will occur in the upper cell.
Basal cell The ultrastructural appearance of the basal cell has
not changed from that described for the 3-celled antheridia.
Division of the upper cell Figures 180-185 show serial sections
through a 4-celled antheridium in which the upper cell is undergoing
cytokinesis following nuclear division. The sections are cut at an
angle oblique to the base of the antheridium. To conveniently refer
to various areas in the upper cell, the outer curved wall of the cell
is geometrically divided into 180 degrees. Zero degrees (0°) is
arbitrarily assigned to the junction of the funnel-shaped wall of the
basal cell and the outer, curved wall of the antheridium on the left-
hand side. At 180° from that junction is the junction of the funnel-
shaped wall with the outer curved wall on the right-hand side of the
antheridium (Figure 180). In Figure 180, the phragmoplast is observed
at about 55°. There is a substantial amount of cytoplasm surrounding
the phragmoplast in this region. In the area between 110® and 130°,
there are many cytoplasmic strands traversing the cell. In a more
median section, a portion of one daughter nucleus occurs at about 85°
(Figures 181, 187). The phragmoplast can be seen in two regions, one
at 50° and one at about 120°. In the region near 120°, there is a
large amount of cytoplasm surrounding the phragmoplast (Figures 181,
187, 188). The phragmoplast is oriented in a plane perpendicular to
both the outer and inner curved walls of the upper cell and consists
of numerous small and larger, smooth-walled vesicles. Within the
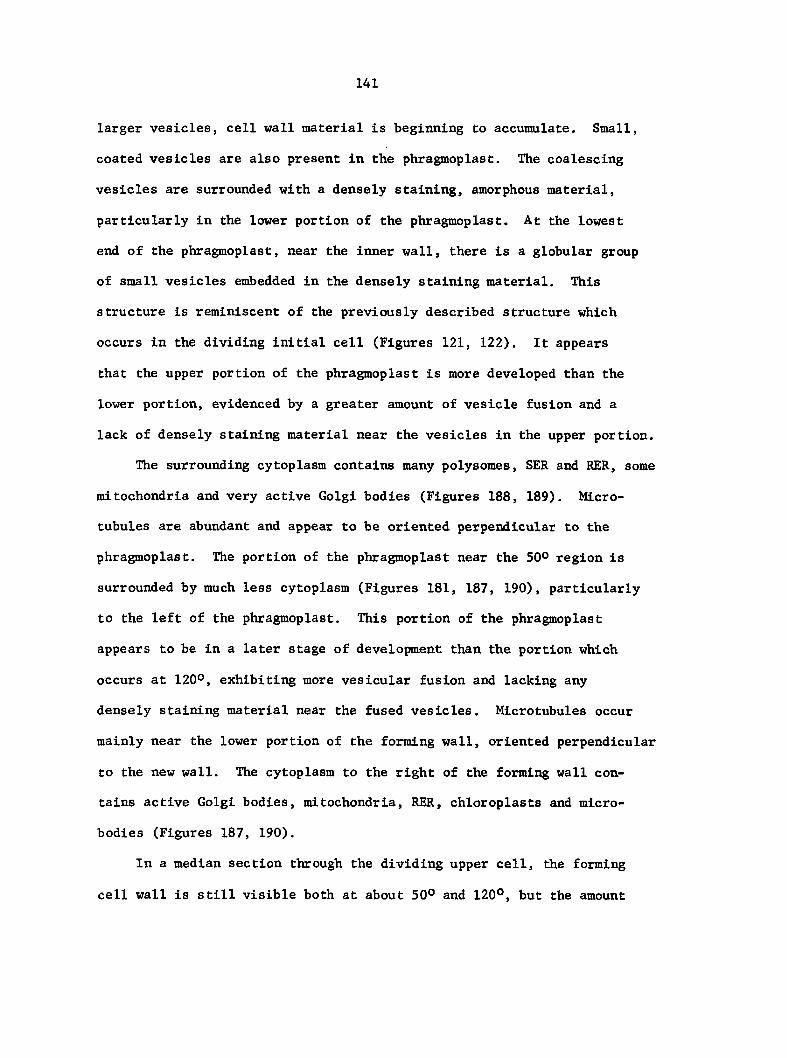
141
larger vesicles, cell wall material is beginning to accumulate. Small,
coated vesicles are also present in the phragmoplast. The coalescing
vesicles are surrounded with a densely staining, amorphous material,
particularly in the lower portion of the phragmoplast. At the lowest
end of the phragmoplast, near the inner wall, there is a globular group
of small vesicles embedded in the densely staining material. This
structure is reminiscent of the previously described structure which
occurs in the dividing initial cell (Figures 121, 122). It appears
that the upper portion of the phragmoplast is more developed than the
lower portion, evidenced by a greater amount of vesicle fusion and a
lack of densely staining material near the vesicles in the upper portion.
The surrounding cytoplasm contains many polysomes, SER and RER, some
mitochondria and very active Golgi bodies (Figures 188, 189). Micro
tubules are abundant and appear to be oriented perpendicular to the
phragmoplast. The portion of the phragmoplast near the 50° region is
surrounded by much less cytoplasm (Figures 181, 187, 190), particularly
to the left of the phragmoplast. This portion of the phragmoplast
appears to be in a later stage of development than the portion which
occurs at 120°, exhibiting more vesicular fusion and lacking any
densely staining material near the fused vesicles. Microtubules occur
mainly near the lower portion of the forming wall, oriented perpendicular
to the new wall. The cytoplasm to the right of the forming wall con
tains active Golgi bodies, mitochondria, RER, chloroplasts and micro-
bodies (Figures 187, 190).
In a median section through the dividing upper cell, the forming
cell wall is still visible both at about 50° and 120°, but the amount
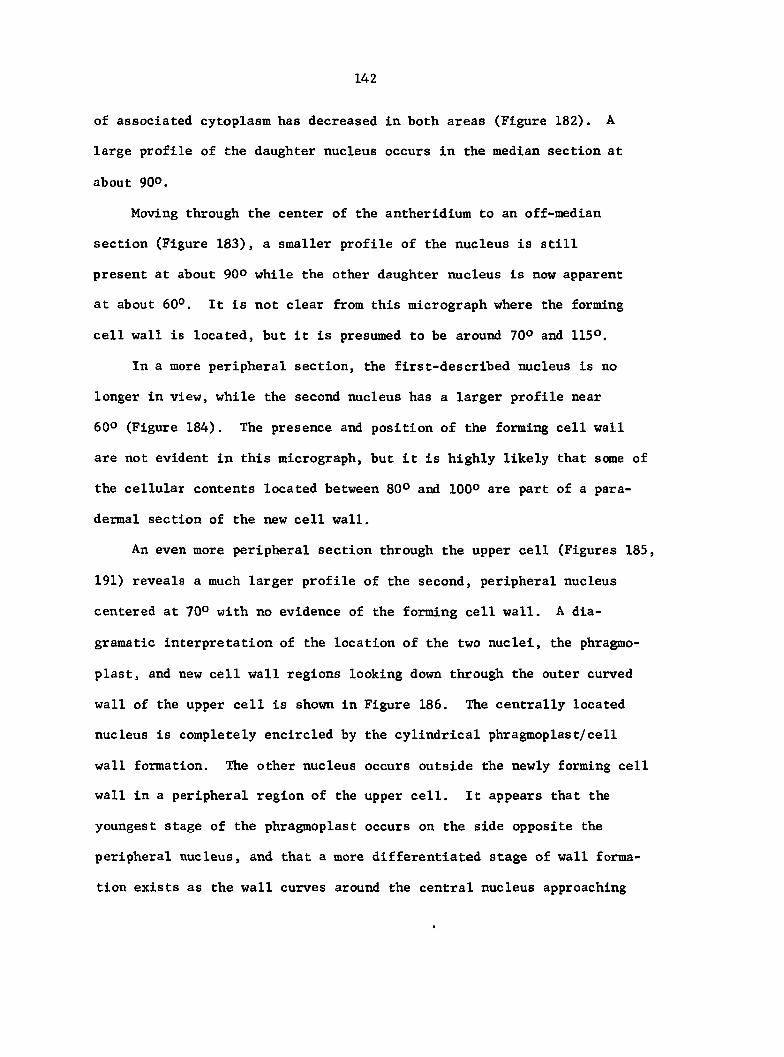
142
of associated cytoplasm has decreased in both areas (Figure 182). Â
large profile of the daughter nucleus occurs in the median section at
about 900.
Moving through the center of the antheridium to an off-median
section (Figure 183), a smaller profile of the nucleus is still
present at about 90° while the other daughter nucleus is now apparent
at about 60°. It is not clear from this micrograph where the forming
cell wall is located, but it is presumed to be around 70° and 115°.
In a more peripheral section, the first-described nucleus is no
longer in view, while the second nucleus has a larger profile near
60° (Figure 184). The presence and position of the forming cell wall
are not evident in this micrograph, but it is highly likely that some of
the cellular contents located between 80° and 100° are part of a para-
dermal section of the new cell wall.
An even more peripheral section through the upper cell (Figures 185,
191) reveals a much larger profile of the second, peripheral nucleus
centered at 70° with no evidence of the forming cell wall. A dia-
gramatic interpretation of the location of the two nuclei, the phragmo-
plast, and new cell wall regions looking down through the outer curved
wall of the upper cell is shown in Figure 186. The centrally located
nucleus is completely encircled by the cylindrical phragmoplast/cell
wall formation. The other nucleus occurs outside the newly forming cell
wall in a peripheral region of the upper cell. It appears that the
youngest stage of the phragmoplast occurs on the side opposite the
peripheral nucleus, and that a more differentiated stage of wall forma
tion exists as the wall curves around the central nucleus approaching
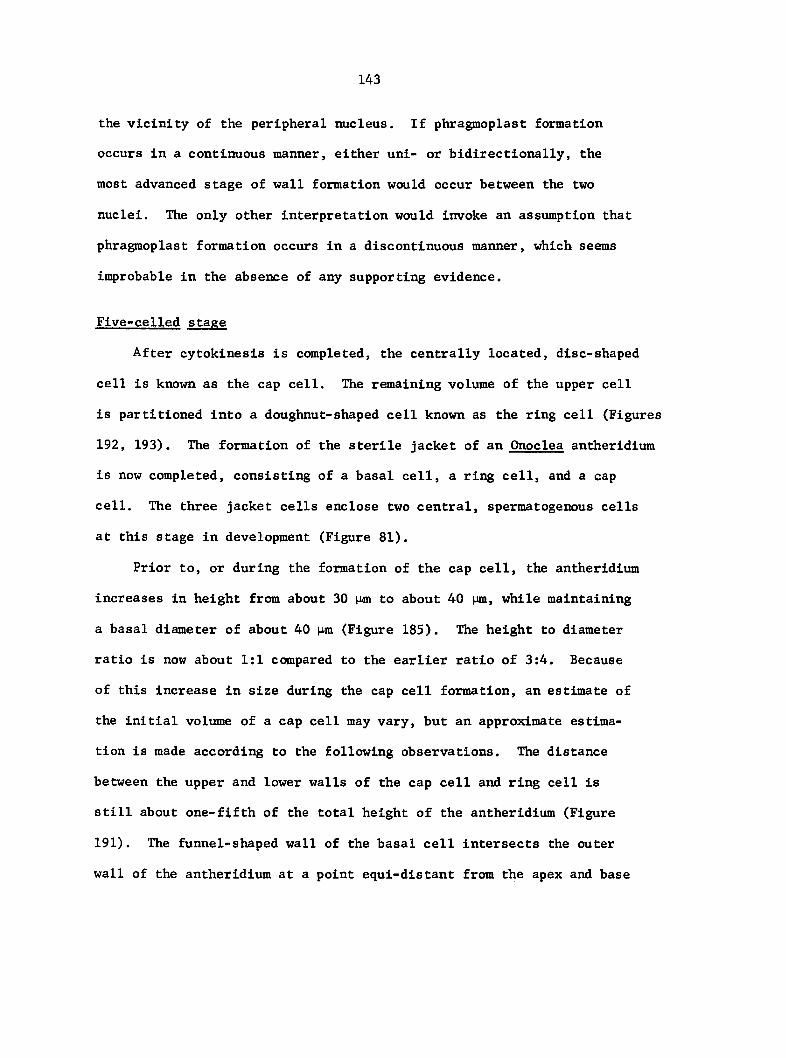
143
the vicinity of the peripheral nucleus. If phragmoplast formation
occurs in a continuous manner, either uni- or bidirectionally, the
most advanced stage of wall formation would occur between the two
nuclei. The only other interpretation would invoke an assumption that
phragmoplast formation occurs in a discontinuous manner, which seems
improbable in the absence of any supporting evidence.
Five-celled stage
After cytokinesis is completed, the centrally located, disc-shaped
cell is known as the cap cell. The remaining volume of the upper cell
is partitioned into a doughnut-shaped cell known as the ring cell (Figures
192, 193). The formation of the sterile jacket of an Onoclea antheridium
is now completed, consisting of a basal cell, a ring cell, and a cap
cell. The three jacket cells enclose two central, spermatogenous cells
at this stage in development (Figure 81).
Prior to, or during the formation of the cap cell, the antheridium
increases in height from about 30 p-m to about 40 pm, while maintaining
a basal diameter of about 40 nm (Figure 185). The height to diameter
ratio is now about 1:1 compared to the earlier ratio of 3:4. Because
of this increase in size during the cap cell formation, an estimate of
the initial volume of a cap cell may vary, but an approximate estima
tion is made according to the following observations. The distance
between the upper and lower walls of the cap cell and ring cell is
still about one-fifth of the total height of the antheridium (Figure
191). The funnel-shaped wall of the basal cell intersects the outer
wall of the antheridium at a point equi-distant from the apex and base
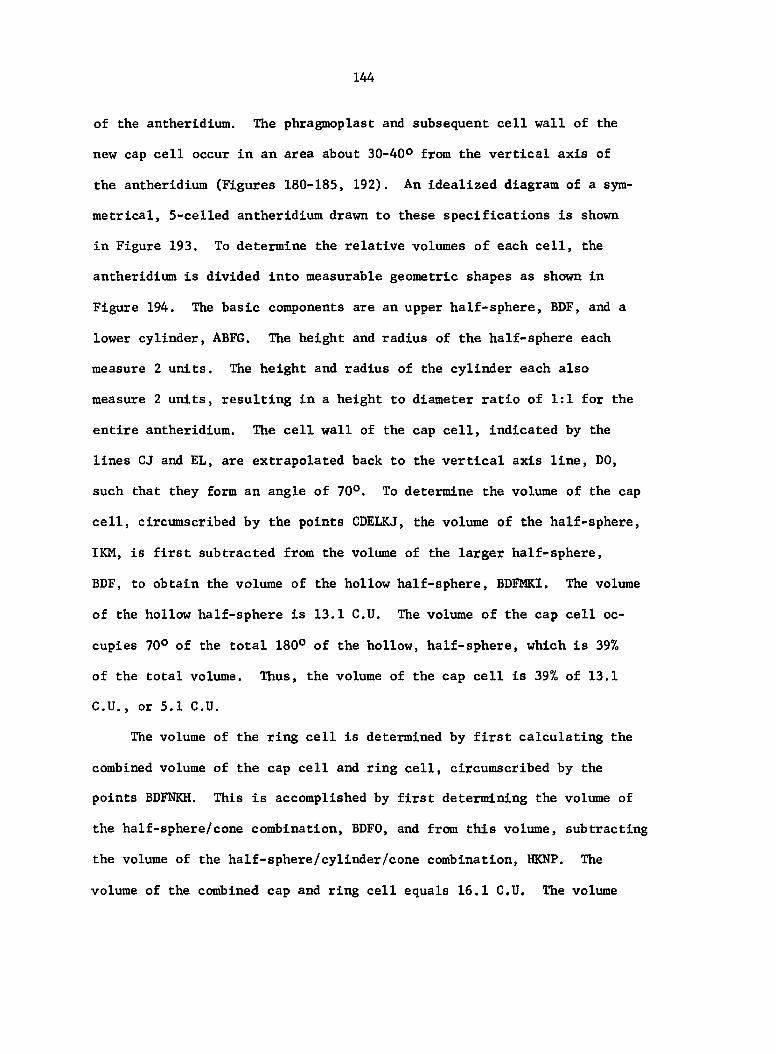
144
of the antheridium. The phragmoplast and subsequent cell wall of the
new cap cell occur in an area about 30-40° from the vertical axis of
the antheridium (Figures 180-185, 192), An idealized diagram of a sym
metrical, 5-celled antheridium drawn to these specifications is shown
in Figure 193. To determine the relative volumes of each cell, the
antheridium is divided into measurable geometric shapes as shown in
Figure 194. The basic components are an upper half-sphere, BDF, and a
lower cylinder, ABFG. The height and radius of the half-sphere each
measure 2 units. The height and radius of the cylinder each also
measure 2 units, resulting in a height to diameter ratio of 1:1 for the
entire antheridium. The cell wall of the cap cell, indicated by the
lines CJ and EL, are extrapolated back to the vertical axis line, DO,
such that they form an angle of 70°. To determine the volume of the cap
cell, circumscribed by the points CDELKJ, the volume of the half-sphere,
IKM, is first subtracted from the volume of the larger half-sphere,
BDF, to obtain the volume of the hollow half-sphere, BDFMKI. The volume
of the hollow half-sphere is 13.1 C.U. The volume of the cap cell oc
cupies 70° of the total 180° of the hollow, half-sphere, which is 39%
of the total volume. Thus, the volume of the cap cell is 39% of 13.1
C.U., or 5.1 C.U.
The volume of the ring cell is determined by first calculating the
combined volume of the cap cell and ring cell, circumscribed by the
points BDFNKH. This is accomplished by first determining the volume of
the half-sphere/cone combination, BDFO, and from this volume, subtracting
the volume of the half-sphere/cylinder/cone combination, HKNP. The
volume of the combined cap and ring cell equals 16.1 C.U. The volume
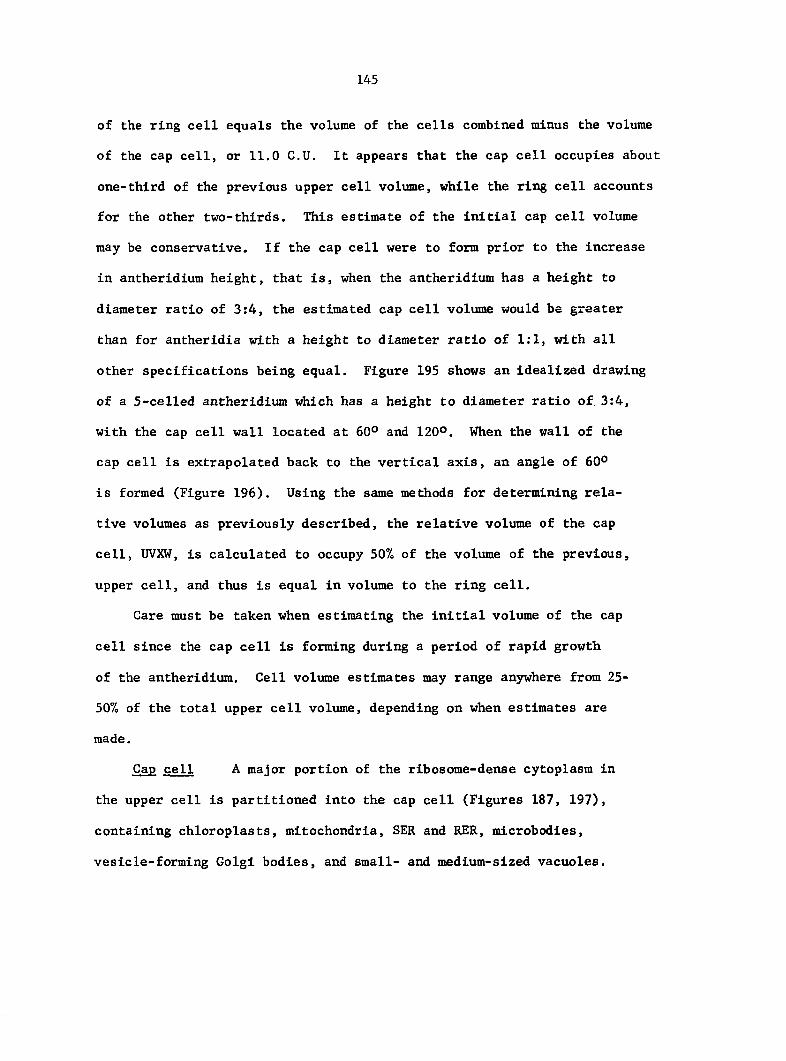
145
of the ring cell equals the volume of the cells combined minus the volume
of the cap cell, or 11,0 C.U. It appears that the cap cell occupies about
one-third of the previous upper cell volume, while the ring cell accounts
for the other two-thirds. This estimate of the initial cap cell volume
may be conservative. If the cap cell were to form prior to the increase
in antheridium height, that is, when the antheridium has a height to
diameter ratio of 3:4, the estimated cap cell volume would be greater
than for antheridia with a height to diameter ratio of 1:1, with all
other specifications being equal. Figure 195 shows an idealized drawing
of a 5-celled antheridium which has a height to diameter ratio of 3:4,
with the cap cell wall located at 60° and 120°. When the wall of the
cap cell is extrapolated back to the vertical axis, an angle of 60°
is formed (Figure 196). Using the same methods for determining rela
tive volumes as previously described, the relative volume of the cap
cell, UVXW, is calculated to occupy 50% of the volume of the previous,
upper cell, and thus is equal in volume to the ring cell.
Care must be taken when estimating the initial volume of the cap
cell since the cap cell is forming during a period of rapid growth
of the antheridium. Cell volume estimates may range anywhere from 25-
50% of the total upper cell volume, depending on when estimates are
made.
Cap cell A major portion of the ribosome-dense cytoplasm in
the upper cell is partitioned into the cap cell (Figures 187, 197),
containing chloroplasts, mitochondria, SER and RER, microbodies,
vesicle-forming Golgi bodies, and small- and medium-sized vacuoles.
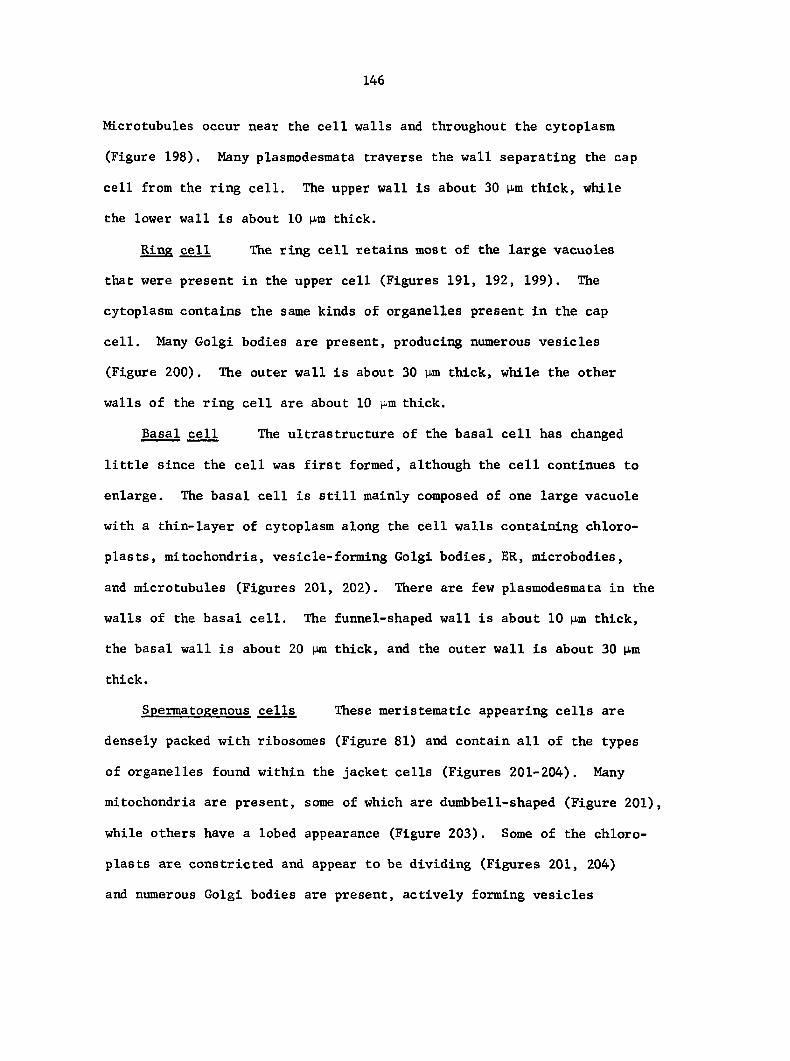
146
Microtubules occur near the cell walls and throughout the cytoplasm
(Figure 198). Many plasmodesmata traverse the wall separating the cap
cell from the ring cell. The upper wall is about 30 pm thick, while
the lower wall is about 10 nm thick.
Ring cell The ring cell retains most of the large vacuoles
that were present in the upper cell (Figures 191, 192, 199). The
cytoplasm contains the same kinds of organelles present in the cap
cell. Many Golgi bodies are present, producing numerous vesicles
(Figure 200) . The outer wall is about 30 lo-m thick, while the other
walls of the ring cell are about 10 i-tm thick.
Basal cell The ultrastructure of the basal cell has changed
little since the cell was first formed, although the cell continues to
enlarge. The basal cell is still mainly composed of one large vacuole
with a thin-layer of cytoplasm along the cell walls containing chloro-
plasts, mitochondria, vesicle-forming Golgi bodies, ER, microbodies,
and microtubules (Figures 201, 202), There are few plasmodesmata in the
walls of the basal cell. The funnel-shaped wall is about 10 |J-m thick,
the basal wall is about 20 pm thick, and the outer wall is about 30 |xm
thick.
Spermatogenous cells These meristematic appearing cells are
densely packed with ribosomes (Figure 81) and contain all of the types
of organelles found within the jacket cells (Figures 201-204). Many
mitochondria are present, some of which are dumbbell-shaped (Figure 201),
while others have a lobed appearance (Figure 203). Some of the chloro-
plasts are constricted and appear to be dividing (Figures 201, 204)
and numerous Golgi bodies are present, actively forming vesicles
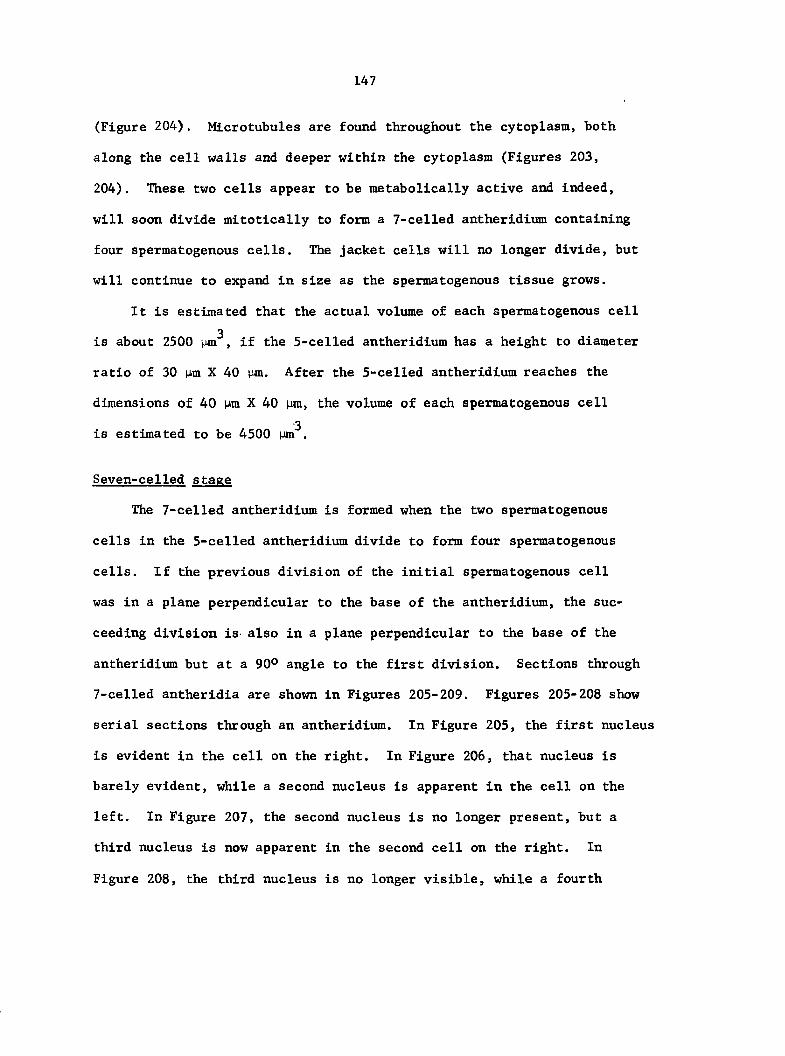
147
(Figure 204), Microtubules are found throughout the cytoplasm, both
along the cell walls and deeper within the cytoplasm (Figures 203,
204). These two cells appear to be metabolically active and indeed,
will soon divide mitotically to form a 7-celled antheridium containing
four spermatogenous cells. The jacket cells will no longer divide, but
will continue to expand in size as the spermatogenous tissue grows.
It is estimated that the actual volume of each spermatogenous cell
3 is about 2500 (jm , if the 5-celled antheridium has a height to diameter
ratio of 30 p,m X 40 pm. After the 5-celled antheridium reaches the
dimensions of 40 pm X 40 lim, the volume of each spermatogenous cell
3 is estimated to be 4500 ptn .
Seven-celled stage
The 7-celled antheridium is formed when the two spermatogenous
cells in the 5-celled antheridium divide to form four spermatogenous
cells. If the previous division of the initial spermatogenous cell
was in a plane perpendicular to the base of the antheridium, the suc
ceeding division is also in a plane perpendicular to the base of the
antheridium but at a 90° angle to the first division. Sections through
7-celled antheridia are shown in Figures 205-209. Figures 205-208 show
serial sections through an antheridium. In Figure 205, the first nucleus
is evident In the cell on the right. In Figure 206, that nucleus is
barely evident, while a second nucleus is apparent in the cell on the
left. In Figure 207, the second nucleus is no longer present, but a
third nucleus is now apparent in the second cell on the right. In
Figure 208, the third nucleus is no longer visible, while a fourth
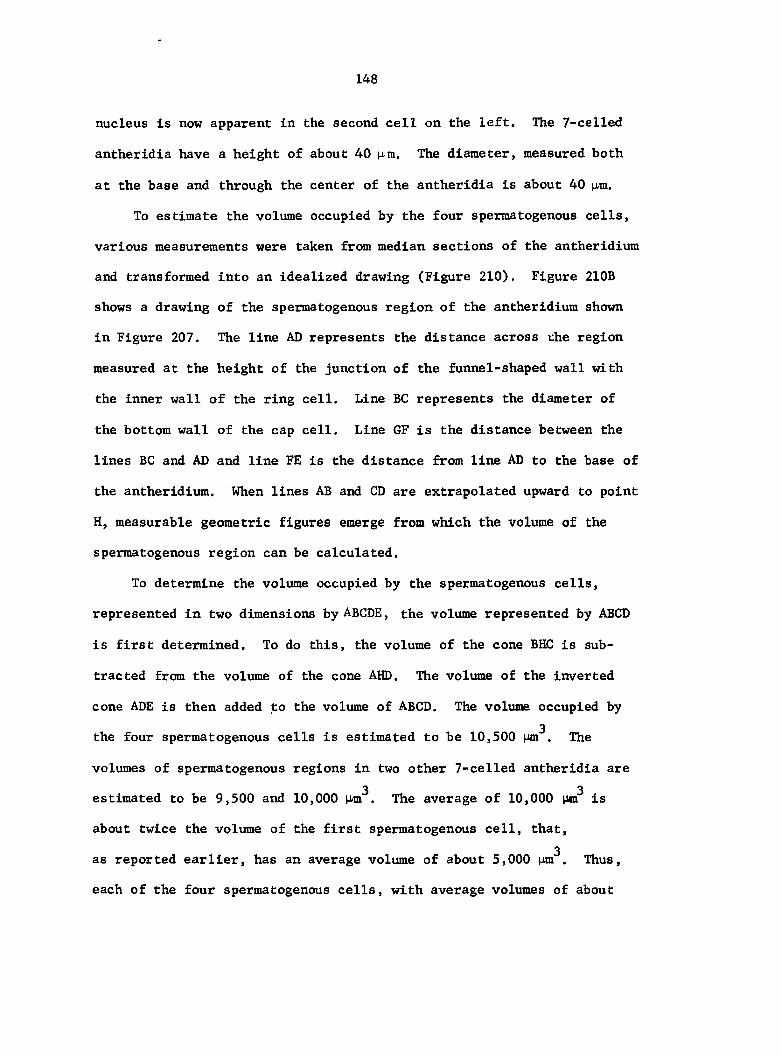
148
nucleus is now apparent in the second cell on the left. The 7-celled
antheridia have a height of about 40 urn. The diameter, measured both
at the base and through the center of the antheridia is about 40 p,m.
To estimate the volume occupied by the four spermatogenous cells,
various measurements were taken from median sections of the antheridium
and transformed into an idealized drawing (Figure 210). Figure 210B
shows a drawing of the spermatogenous region of the antheridium shown
in Figure 207. The line AD represents the distance across the region
measured at the height of the junction of the funnel-shaped wall with
the inner wall of the ring cell. Line BC represents the diameter of
the bottom wall of the cap cell. Line GF is the distance between the
lines BC and AD and line FE is the distance from line AD to the base of
the antheridium. When lines AB and CD are extrapolated upward to point
H, measurable geometric figures emerge from which the volume of the
spermatogenous region can be calculated.
To determine the volume occupied by the spermatogenous cells,
represented in two dimensions by ABCDE, the volume represented by ABCD
is first determined. To do this, the volume of the cone BHC is sub
tracted from the volume of the cone AHD. The volume of the inverted
cone ADE is then added to the volume of ABCD. The volume occupied by
3 the four spermatogenous cells is estimated to be 10,500 pm . The
volumes of spermatogenous regions in two other 7-celled antheridia are
3 3 estimated to be 9,500 and 10,000 urn . The average of 10,000 Mm is
about twice the volume of the first spermatogenous cell, that,
3 as reported earlier, has an average volume of about 5,000 p.m . Thus,
each of the four spermatogenous cells, with average volumes of about
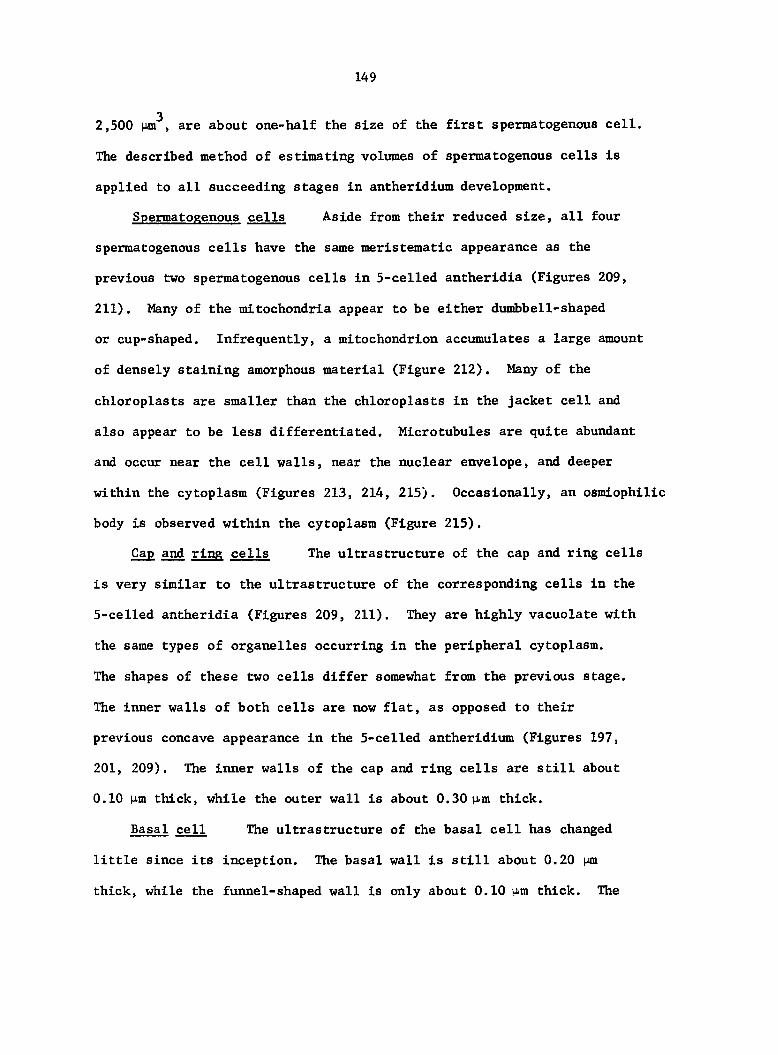
149
3 2,500 pm , are about one-half the size of the first spermatogenous cell.
The described method of estimating volumes of spermatogenous cells is
applied to all succeeding stages in antheridium development.
Spermatogenous cells Aside from their reduced size, all four
spermatogenous cells have the same meristematic appearance as the
previous two spermatogenous cells in 5-celled antheridia (Figures 209,
211). Many of the mitochondria appear to be either dumbbell-shaped
or cup-shaped. Infrequently, a mitochondrion accumulates a large amount
of densely staining amorphous material (Figure 212). Many of the
chloroplasts are smaller than the chloroplasts in the jacket cell and
also appear to be less differentiated. Microtubules are quite abundant
and occur near the cell walls, near the nuclear envelope, and deeper
within the cytoplasm (Figures 213, 214, 215). Occasionally, an osmiophilic
body is observed within the cytoplasm (Figure 215).
Cap and ring cells The ultrastructure of the cap and ring cells
is very similar to the ultrastructure of the corresponding cells in the
5-celled antheridia (Figures 209, 211). They are highly vacuolate with
the same types of organelles occurring in the peripheral cytoplasm.
The shapes of these two cells differ somewhat from the previous stage.
The inner walls of both cells are now flat, as opposed to their
previous concave appearance in the 5-celled antheridium (Figures 197,
201, 209). The inner walls of the cap and ring cells are still about
0.10 p<m thick, while the outer wall is about 0.30 p-m thick.
Basal cell The ultrastructure of the basal cell has changed
little since its inception. The basal wall is still about 0.20 nm
thick, while the funnel-shaped wall is only about 0.10 nm thick. The
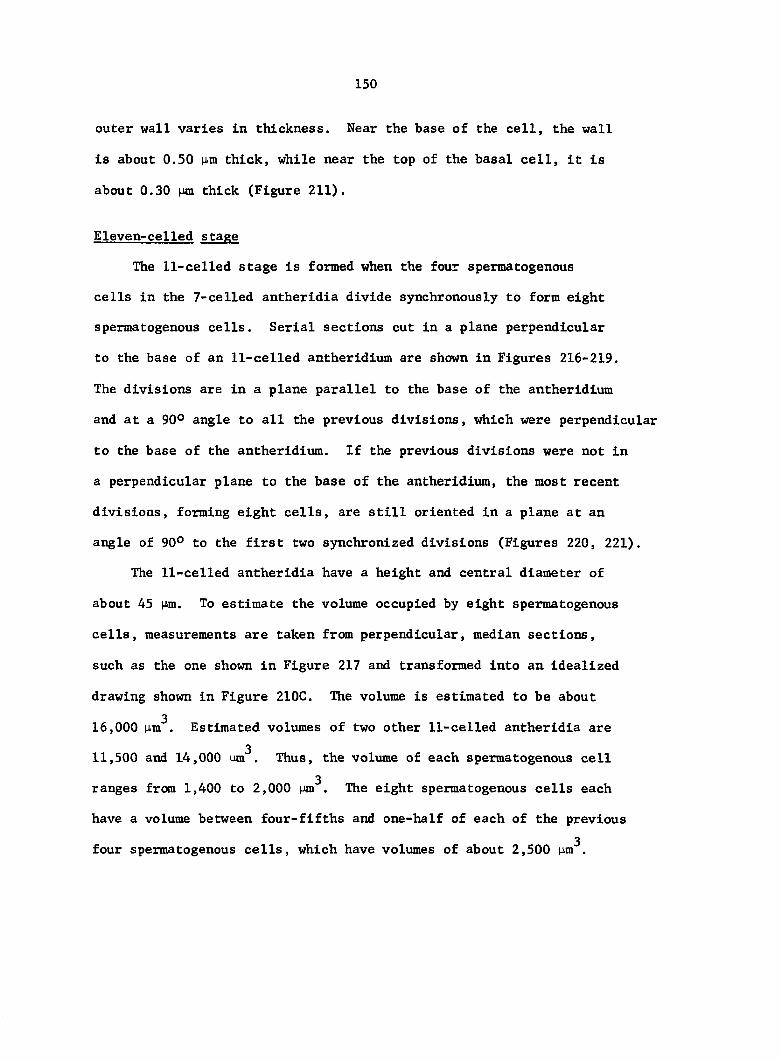
150
outer wall varies in thickness. Near the base of the cell, the wall
is about 0.50 p<m thick, while near the top of the basal cell, it is
about 0.30 pm thick (Figure 211).
Eleven-celled stage
The 11-celled stage is formed when the four spermatogenous
cells in the 7-celled antheridia divide synchronously to form eight
spermatogenous cells. Serial sections cut in a plane perpendicular
to the base of an 11-celled antheridium are shown in Figures 216-219.
The divisions are in a plane parallel to the base of the antheridium
and at a 90° angle to all the previous divisions, which were perpendicular
to the base of the antheridium. If the previous divisions were not in
a perpendicular plane to the base of the antheridium, the most recent
divisions, forming eight cells, are still oriented in a plane at an
angle of 90° to the first two synchronized divisions (Figures 220, 221).
The 11-celled antheridia have a height and central diameter of
about 45 lim. To estimate the volume occupied by eight spermatogenous
cells, measurements are taken from perpendicular, median sections,
such as the one shown in Figure 217 and transformed into an idealized
drawing shown in Figure 210C. The volume is estimated to be about
3 16,000 M-m . Estimated volumes of two other 11-celled antheridia are
3 11,500 and 14,000 mn . Thus, the volume of each spermatogenous cell
3 ranges from 1,400 to 2,000 pm . The eight spermatogenous cells each
have a volume between four-fifths and one-half of each of the previous
3 four spermatogenous cells, which have volumes of about 2,500 p,m .
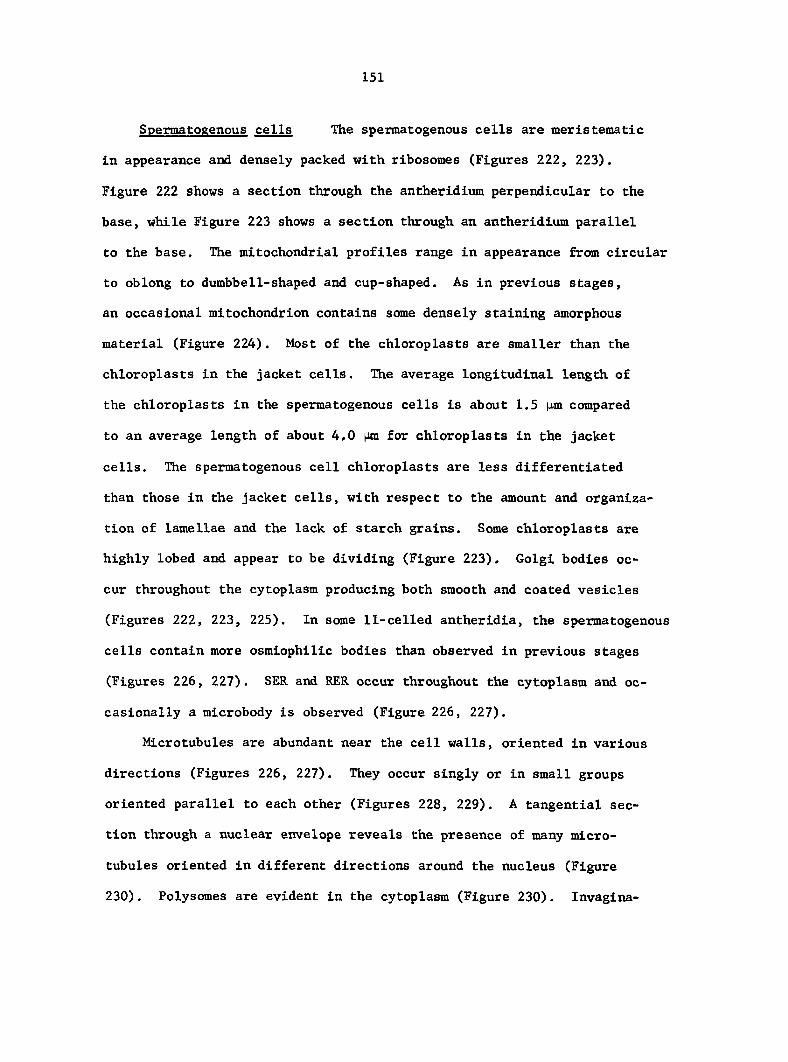
151
Spermatogenous cells The spennatogenous cells are meristematic
in appearance and densely packed with ribosomes (Figures 222, 223).
Figure 222 shows a section through the antheridium perpendicular to the
base, while Figure 223 shows a section through an antheridium parallel
to the base. The mitochondrial profiles range in appearance from circular
to oblong to dumbbell-shaped and cup-shaped. As in previous stages,
an occasional mitochondrion contains some densely staining amorphous
material (Figure 224). Most of the chloroplasts are smaller than the
chloroplasts in the jacket cells. The average longitudinal length of
the chloroplasts in the spermatogenous cells is about 1.5 p.m compared
to an average length of about 4.0 pm for chloroplasts in the jacket
cells. The spermatogenous cell chloroplasts are less differentiated
than those in the jacket cells, with respect to the amount and organiza
tion of lamellae and the lack of starch grains. Some chloroplasts are
highly lobed and appear to be dividing (Figure 223). Golgi bodies oc
cur throughout the cytoplasm producing both smooth and coated vesicles
(Figures 222, 223, 225). In some 11-celled antheridia, the spermatogenous
cells contain more osmiophilic bodies than observed in previous stages
(Figures 226, 227). SER and RER occur throughout the cytoplasm and oc
casionally a microbody is observed (Figure 226, 227).
Microtubules are abundant near the cell walls, oriented in various
directions (Figures 226, 227). They occur singly or in small groups
oriented parallel to each other (Figures 228, 229). A tangential sec
tion through a nuclear envelope reveals the presence of many micro
tubules oriented in different directions around the nucleus (Figure
230). Polysomes are evident in the cytoplasm (Figure 230). Invagina-
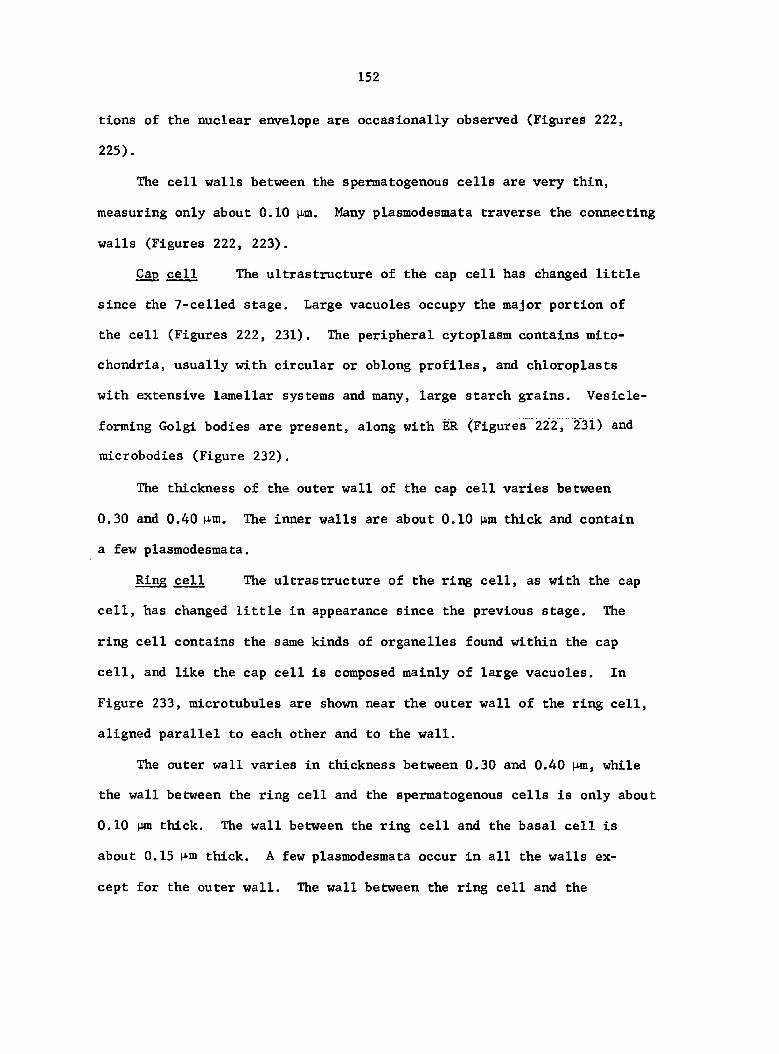
152
tions of the nuclear envelope are occasionally observed (Figures 222,
225).
The cell walls between the spermatogenous cells are very thin,
measuring only about 0.10 p,m. Many plasmodesmata traverse the connecting
walls (Figures 222, 223).
Cap cell The ultrastructure of the cap cell has changed little
since the 7-celied stage. Large vacuoles occupy the major portion of
the cell (Figures 222, 231). The peripheral cytoplasm contains mito
chondria, usually with circular or oblong profiles, and chloroplasts
with extensive lamellar systems and many, large starch grains. Vesicle-
forming Golgi bodies are present, along with ÈR (Figures 222, 231) and
microbodies (Figure 232) .
The thickness of the outer wall of the cap cell varies between
0.30 and 0.40 M-m. The inner walls are about 0.10 p,m thick and contain
a few plasmodesmata.
Ring cell The ultrastructure of the ring cell, as with the cap
cell, has changed little in appearance since the previous stage. The
ring cell contains the same kinds of organelles found within the cap
cell, and like the cap cell is composed mainly of large vacuoles. In
Figure 233, microtubules are shown near the outer wall of the ring cell,
aligned parallel to each other and to the wall.
The outer wall varies in thickness between 0.30 and 0.40 M-m, while
the wall between the ring cell and the spermatogenous cells is only about
0,10 pm thick. The wall between the ring cell and the basal cell is
about 0.15 M-m thick. A few plasmodesmata occur in all the walls ex
cept for the outer wall. The wall between the ring cell and the
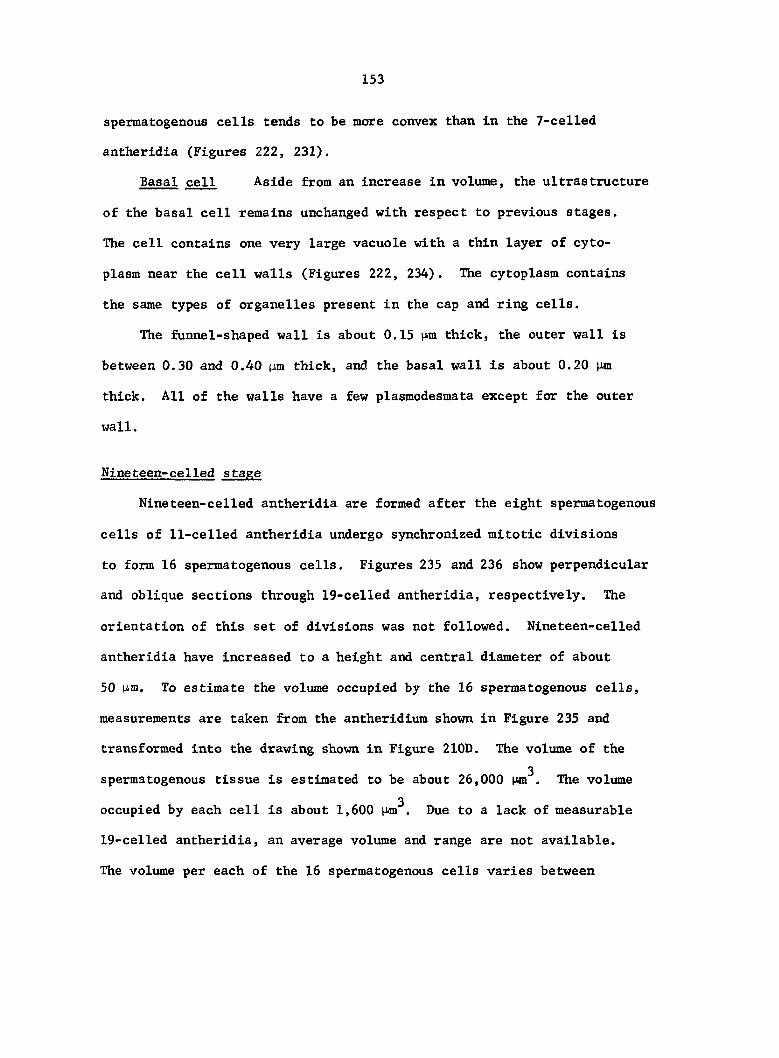
153
spermatogenous cells tends to be more convex than In the 7-celled
antherldia (Figures 222, 231),
Basal cell Aside from an increase in volume, the ultrastructure
of the basal cell remains unchanged with respect to previous stages.
The cell contains one very large vacuole with a thin layer of cyto
plasm near the cell walls (Figures 222, 234). The cytoplasm contains
the same types of organelles present in the cap and ring cells.
The funnel-shaped wall is about 0.15 nm thick, the outer wall is
between 0.30 and 0.40 iim thick, and the basal wall is about 0.20 pm
thick. All of the walls have a few plasmodesmata except for the outer
wall.
Nine teen-celied stage
Nineteen-celled antheridia are formed after the eight spermatogenous
cells of 11-celled antheridia undergo synchronized mitotic divisions
to form 16 spermatogenous cells. Figures 235 and 236 show perpendicular
and oblique sections through 19-celled antheridia, respectively. The
orientation of this set of divisions was not followed. Nineteen-celled
antheridia have increased to a height and central diameter of about
50 M-m, To estimate the volume occupied by the 16 spermatogenous cells,
measurements are taken from the antheridium shown in Figure 235 and
transformed into the drawing shown in Figure 210D. The volume of the
3 spermatogenous tissue is estimated to be about 26,000 pm . The volume
3 occupied by each cell is about 1,600 nm . Due to a lack of measurable
19-celled antheridia, an average volume and range are not available.
The volume per each of the 16 spermatogenous cells varies between
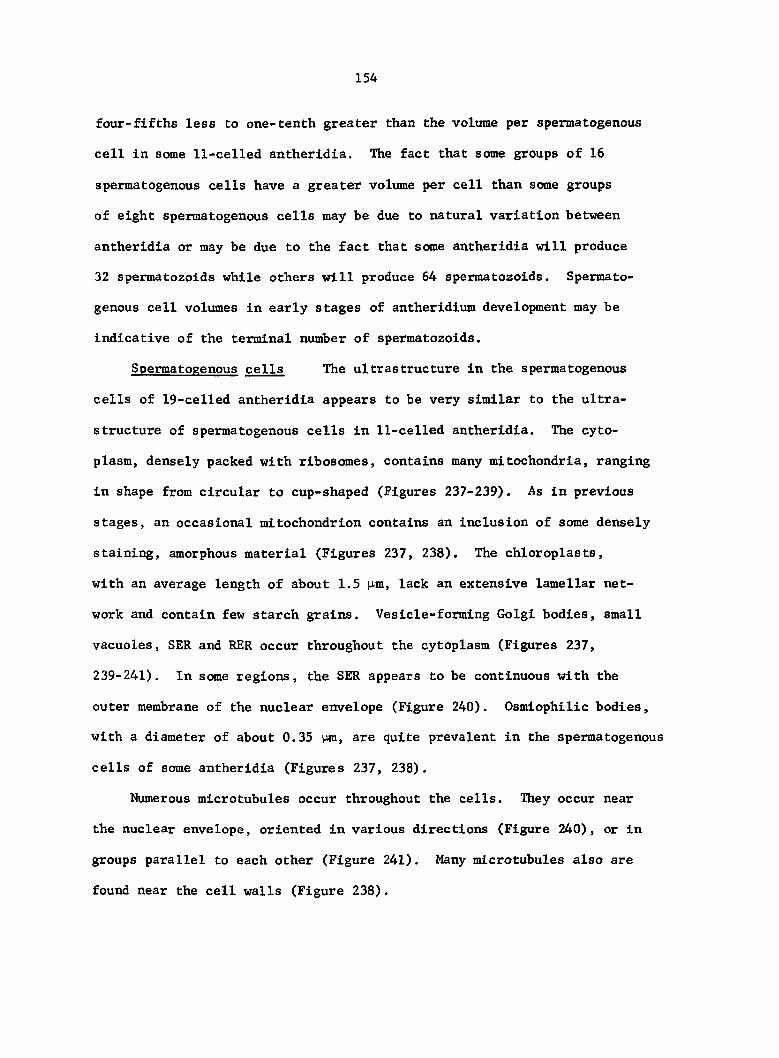
154
four-fifths less to one-tenth greater than the volume per spermatogenous
cell in some 11-celled antheridia. The fact that some groups of 16
spermatogenous cells have a greater volume per cell than some groups
of eight spermatogenous cells may be due to natural variation between
antheridia or may be due to the fact that some antheridia will produce
32 spermatozoids while others will produce 64 spermatozoids. Spermato
genous cell volumes in early stages of antheridium development may be
indicative of the terminal number of spermatozoids.
Spermatogenous cells The ultrastructure in the spermatogenous
cells of 19-celled antheridia appears to be very similar to the ultra-
structure of spermatogenous cells in 11-celled antheridia. The cyto
plasm, densely packed with ribosomes, contains many mitochondria, ranging
in shape from circular to cup-shaped (Figures 237-239). As in previous
stages, an occasional mitochondrion contains an inclusion of some densely
staining, amorphous material (Figures 237, 238). The chloroplasts,
with an average length of about 1.5 pm, lack an extensive lamellar net
work and contain few starch grains. Vesicle-forming Golgi bodies, small
vacuoles, SER and RER occur throughout the cytoplasm (Figures 237,
239-241). In some regions, the SER appears to be continuous with the
outer membrane of the nuclear envelope (Figure 240). Osmiophilic bodies,
with a diameter of about 0.35 pm, are quite prevalent in the spermatogenous
cells of some antheridia (Figures 237, 238).
Numerous microtubules occur throughout the cells. They occur near
the nuclear envelope, oriented in various directions (Figure 240), or in
groups parallel to each other (Figure 241). Many microtubules also are
found near the cell walls (Figure 238).
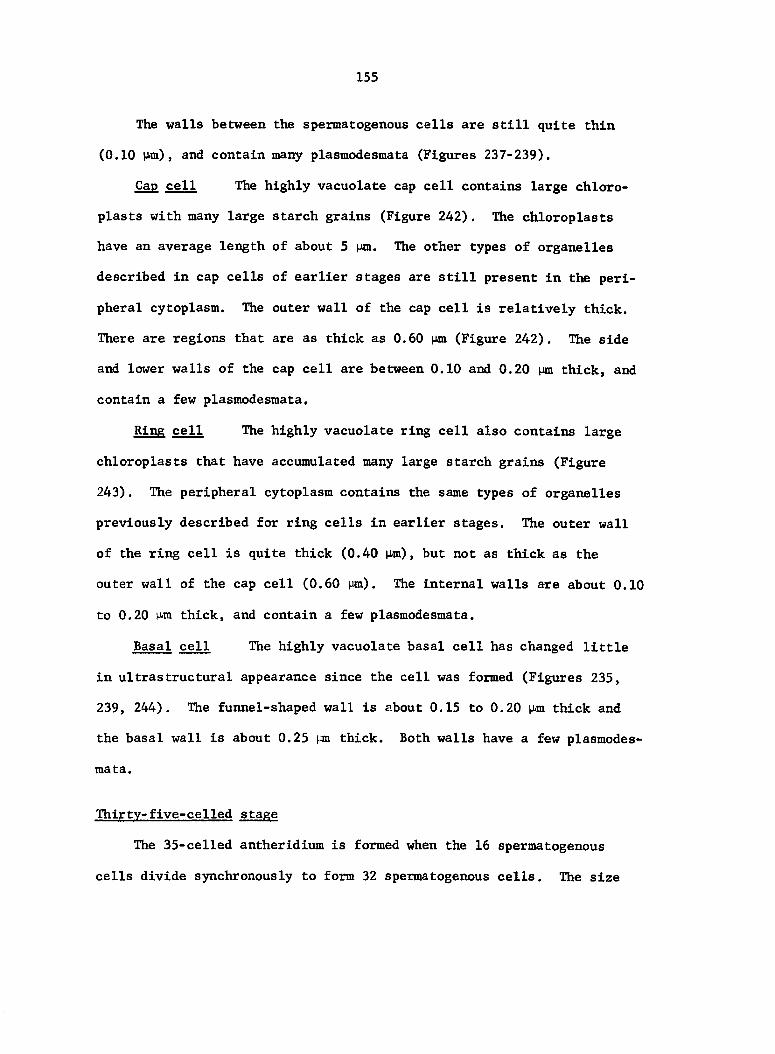
155
The walls between the spematogenous cells are still quite thin
(0.10 pm), and contain many plasmodesmata (Figures 237-239).
Cap cell The highly vacuolate cap cell contains large chloro-
plasts with many large starch grains (Figure 242). The chloroplasts
have an average length of about 5 tm. The other types of organelles
described in cap cells of earlier stages are still present in the peri
pheral cytoplasm. The outer wall of the cap cell is relatively thick.
There are regions that are as thick as 0.60 pm (Figure 242). The side
and lower walls of the cap cell are between 0.10 and 0.20 |m thick, and
contain a few plasmodesmata.
Ring cell The highly vacuolate ring cell also contains large
chloroplasts that have accumulated many large starch grains (Figure
243). The peripheral cytoplasm contains the same types of organelles
previously described for ring cells in earlier stages. The outer wall
of the ring cell is quite thick (0.40 |i.m), but not as thick as the
outer wall of the cap cell (0.60 m). The internal walls are about 0.10
to 0.20 M-m thick, and contain a few plasmodesmata.
Basal cell The highly vacuolate basal cell has changed little
in ultrastructural appearance since the cell was formed (Figures 235,
239, 244). The funnel-shaped wall is about 0.15 to 0.20 pm thick and
the basal wall is about 0.25 pm thick. Both walls have a few plasmodes
mata.
Thirty-five-celled stage
The 35-celled antheridium is formed when the 16 spermatogenous
cells divide synchronously to form 32 spermatogenous cells. The size
156
of the 35-celled antheridia varies. Larger antheridia are shown in
Figures 245 and 246 with a height and central diameter of about 55 um.
Measurements taken from Figure 245 are transformed into the drawing
shown in Figure 210E. The volume occupied by the 32 spermatogenous
3 cells is estimated to be about 36,000 iJun . The volume of the
spermatogenous cells in the antheridium shown in Figure 246 is estimated
3 to be about 33,000 nm . The volume per cell is between 1,100 and 1,000
3 |Jm . Each spermatogenous cell volume is about 35% less than the cell
volume of each of the previous 16 spermatogenous cells. Not all 35-
celled antheridia are this large though.
Figure 247 shows an antheridium that has terminated the division
phase with 32 spermatogenous cells. The 32 cells are in an early
stage of spermatid differentiation, the details of which will be
presented in the section on "Cellular Changes during the Differentiation
Phase of Spermatids." The antheridium in Figure 247 has a height and
central diameter of only 50 im. The volume of the spermatogenous cells
3 is estimated to be about 24,000 M-m , with each cell occupying about
3 750 M-m . Each of these 32 cells is about 50% less in volume than each
of the previous 16 cells. The possibility exists, although conclusive
data are lacking, that the smaller groups of 32 spermatogenous cells
may enter directly into spermatid differentiation, while the larger
groups of 32 spermatogenous cells will divide one more time before
differentiating into spermatozoids.
Due to the limiting amount of observations of this stage in
157
development, it cannot be ascertained that the spermatogenous cells
shown in Figures 245 and 246, which are larger than those in Figure 247,
will divide one more time. If they are going to divide one more time,
the cells are known as spermatid mother cells. If they enter directly
into the differentiation phase, the cells are known as spermatids,
in which case the previous 16 cells are known as spermatid mother cells.
Spermatogenous cells in larger. 35-celled antheridia The cyto
plasm of these cells, densely packed with ribosomes, contains small,
dedifferentiated chloroplasts, with some vesiculate, internal membranes
(Figures 248-250). Numerous mitochondria are present and range in shape
from circular to cup-shaped. As in previous stages, an occasional mito
chondrion is observed with an inclusion of amorphous material (Figure
251). Golgi bodies are abundant and are actively producing vesicles
(Figure 249). Many of the larger, smooth-walled vesicles contain some
fibrous material. ER and small vacuoles occur throughout the
cytoplasm (Figures 248-250), along with some osmiophilic bodies (Figure
250).
A new structure, the blepharoplast, has appeared within the cyto
plasm (Figures 248, 252). The blepharoplast is composed of a circular
mass of densely staining material (presumably spherical in shape),
penetrated by numerous lightly stained channels (Figures 253-255).
Figure 255 reveals a sharply bent channel that extends through the
blepharoplast. A dark staining tubule runs lengthwise through the
center of each channel, with thin filaments radiating out from the
tubule to the sides of the channel (Figures 253-255).
Numerous microtubules occur in the cytoplasm near the blepharoplast
158
oriented perpendicular to the tangent of the blepharoplast (Figures 253-
255). The ends of some of the microtubules appear to terminate in the
outer region of the densely stained material (Figures 253-255). Micro
tubules also occur near the cell walls and the nuclear envelope, either
singly or in small groups oriented parallel to each other (Figures 249,
250).
Early stages in blepharoplast formation are observed in spermatogenous
cells of larger, 35-celled antheridia. An aggregation of moderately
stained, flocculent material, about 0.5 pm in diameter, appears in the
periphery of the cell (Figure 256). Two plaques of densely staining
material arise about 40-50 nm apart from each other in the flocculent
material (Figures 257, 258). Each plaque is triple-layered, with two
dense, plate-like layers separated by a light layer. The distal layer
of each plaque is thicker than the proximal layer. The plaques are
about 200 nm in length.
The distal layers begin to accumulate dense material as the floccu
lent material decreases in amount (Figure 259). Light-staining channels
appear in these growing distal layers (Figure 259), each which begins
to resemble a blepharoplast. Microtubules are found in the area of
these developing blepharoplasts (Figure 260).
Further stages in the development of blepharoplasts were not ob
served in Onoclea. If their development follows the development described
for Marsilea. a heterosporous fern, the two growing distal layers will
become spherical blepharoplasts that will separate at prophase of the
spermatid mother cell division. After moving to opposite poles of the
159
spindle, cytokinesis Insures that each spermatid will have one blepharo-
plast.
In previous studies of spermatogenesis in homosporous ferns,
blepharoplasts always have been observed in both spermatid mother cells
and spermatids. From these studies, it has been determined that at
some point in time, the blepharoplast in spermatid mother cells divides
to form two blepharoplasts. Although only one blepharoplast has been
observed in spermatogenous cells of larger 35-celled antheridia, the
presence of more than one blepharoplast is not ruled out.
As previously mentioned, about one-half of Onoclea antheridia pro
duce 32 sperm. Therefore, about one-half of the 19-celled Onoclea
antheridia contain 16 spermatogenous cells that function as spermatid
mother cells. The fact that no blepharoplasts were observed in spermato
genous cells of 19-celled antheridia is attributed to the small sample
size (2) of the 19-celled stage.
The cell walls between the 32 spermatogenous cells are thicker
than in previous stages, with a thickness of about 0.20 lim (Figures
248, 252). Numerous plasmodesmata still connect the cells.
If the 32 spermatogenous cells are functionally spermatid mother
cells, they will divide one more time to form 64 spermatids.
Sixty-seven-celled stage
Median sections through 67-celled antheridia, cut perpendicular
to the base, are shown in Figures 261 and 262. These antheridia have
a height and central diameter of about 60 M-m. Measurements taken
from the antheridium shown in Figure 261 are transformed into the drawing
160
shown in Figure 210F. The volume of the spermatogenous cells is esti-
3 mated to be about 46,000 pm . The volume of the spermatogenous cells
3 shown in Figure 262 is estimated to be about 51,000 pm . The volume
3 per spermatid varies between 720 and 790 pm , which is about the same
volume estimated for each of the 32 spermatids within smaller, 35-
3 celled antheridia (750 im ).
The volumes per spermatogenous cell for all the stages in the divi
sion phase of antheridium development are shown graphed in Figure 263 on
a logarithmic scale. The average volume of the initial spermatogenous
3 cell is about 5,000 urn . The final cell products of the division phase
3 of development, the spermatids, have a volume of about 750 Mm , whether
they are in groups of 32 or 64. Their volume is about 15% of the volume
of the initial spermatogenous cell.
The volume per spermatogenous cell in the middle stages of develop
ment lie either approximately on or well-below the line drawn between the
initial volume and the volume of each of the 64 spermatids. It is pro
posed that a second line can be drawn parallel to the first line,
representing the developmental pathway terminating with 32 spermatozoids.
It is hypothesized that the initial spermatogenous cell in this pathway
3 will have a volume of about 4,000 ij-m and that the size of the initial
spermatogenous cell is highly correlated to the final number of spermato
zoids produced per antheridium. From the graph, it appears that for
every doubling of cells, the volume per cell decreases by about three-
tenths. A decrease in cytoplasmic volume below a threshold level may
be correlated with a switch from the division phase of development to
a differentiation phase of development.
161
Cellular Changes during the Differentiation of
Spermatids into Spermatozoids
Early spermatids
Blepharoplasts and centrioles The blepharoplast in each spermatid
enlarges as it is transformed into numerous procentrioles (Figures 264-
266). Sets of doublet microtubules forming the procentrioles can be
seen in Figure 266. Eventually, nine sets of triplet microtubules will
form the mature centriole. The procentrioles have a length of about 0.30
P-m and an outer diameter of about 0.15 pm. The inner diameter is about
0.11 p,m. A central tubule is present in the procentrioles with thin
filaments radiating outward along the entire length of the tubule,
spanning the lumen between the central tubule and the sets of micro
tubules. The internal structure of the procentrioles is reminiscent
of the internal structure of the channels in newly formed blepharoplasts.
Cellular features The early spermatids are still angular in
shape and are separated by a uniformly thick cell wall of about 0.20 |J-m
(Figure 264). Many plasmodesmata traverse the adjoining cell walls.
The spermatid nucleus is spherical to oblong with an abundance
of heterochromatin (Figure 264).
Cytoplasmic isolation of spermatids
Initial production of cell wall material The spermatids become
spherical in contrast to the previous angular-shaped cells (Figure 267).
Concomitant with their changing shape, there is a large accumulation of
fibrous cell wall material between the plasmalemma and certain regions
of the previously formed cell wall (Figures 267, 268). Although a
162
few cytoplasmic connections occur where the cell wall remains thinnest,
the spermatids are essentially cytoplasmically isolated.
Internal cellular features Golgi bodies are present forming
numerous vesicles containing fibrous material similar to the material
accumulating outside the plasmalemma (Figures 267, 268). Also present
within the cytoplasm are polysomes, RER, and dedifferentiated chloro-
plasts (Figure 268). Some of the plastlds have a few starch grains and
occasionally some osmiophlllc globull. The few thylakolds present tend
to be somewhat dilated (Figure 268).
Blepharoplasts and multilayered structures (MLS) The procentrioles
have now developed into centrioles which become distributed in a row
along the length of a mlcrotubular platform (Figure 269). The centrioles
are embedded in densely staining, amorphous material from the blepharo-
plast. The mlcrotubular platform consists of closely associated micro
tubules aligned parallel to each other in the same plane. These micro
tubules are part of a larger body known as the multllayered structure
(MLS). To complete the MLS, a layer of lamellar plates is formed sub
tending the microtubule platform (Figure 270). The MLS becomes closely
associated with a mitochondrion (MA), with contact occurring between
the lamellar plates and the mitochondrion (Figure 270), The appearance
of the MLS varies, depending on the plane of section. When a section is
cut perpendicular to the long axis of the microtubules, the lamellar
plates appear as a dense plaque (Figure 271). If the section is cut at
an angle oblique to the long axis of the microtubules, the lamellar
plates are readily apparent (Figure 272). The long axis of the micro
tubule platform Is oriented at an angle of about 40° to the long axis
163
of the lamellar plates (Figure 273).
The mitochondrion and lamellar plates elongate in the same direction
(Figure 274). During this elongation process, microtubules continue
to be added to the platform at a 40° angle to the lamellar plates.
At some point in time, elongation ceases and the number of microtubules
becomes constant. A diagrammatic reconstruction of the MLS at this point
in time is shown in Figure 275 as modified from Duckett (1975). The
lamellar plates are collectively known as the lamellar strip (LS) and
the microtubules are collectively known as the microtubule band (MB).
Either during or after elongation, the entire assemblage of
centrioles, MLS and MA becomes associated with the nucleus in a very
specific way. The mitochondrion moves into a groove formed by an in
dentation of the nuclear envelope (Figures 271, 272). The microtubules,
which extend beyond the lamellar strip, become closely appressed to the
nuclear envelope. In the view shown in Figure 271, there are 85 micro
tubules evident in the MB. The microtubules will continue to elongate
in the direction that the nucleus will elongate and eventually coil.
A diagram of the initial relationship between the MLS and the spherical
nucleus is shown in Figure 276 as modified from Duckett (1975).
The centrioles, now functioning as basal bodies, are distributed in
a row along the MB (Figures 274, 277). Densely staining, amorphous
material occurs between each of the basal bodies and also between the
basal bodies and the MB (Figure 277). The long axes of the basal bodies
are oriented at angles oblique to the long axis of the MB (Figure 278).
Flagella are being formed from the basal bodies. The transition
zone of the flagellum proper is characterized by the appearance of a
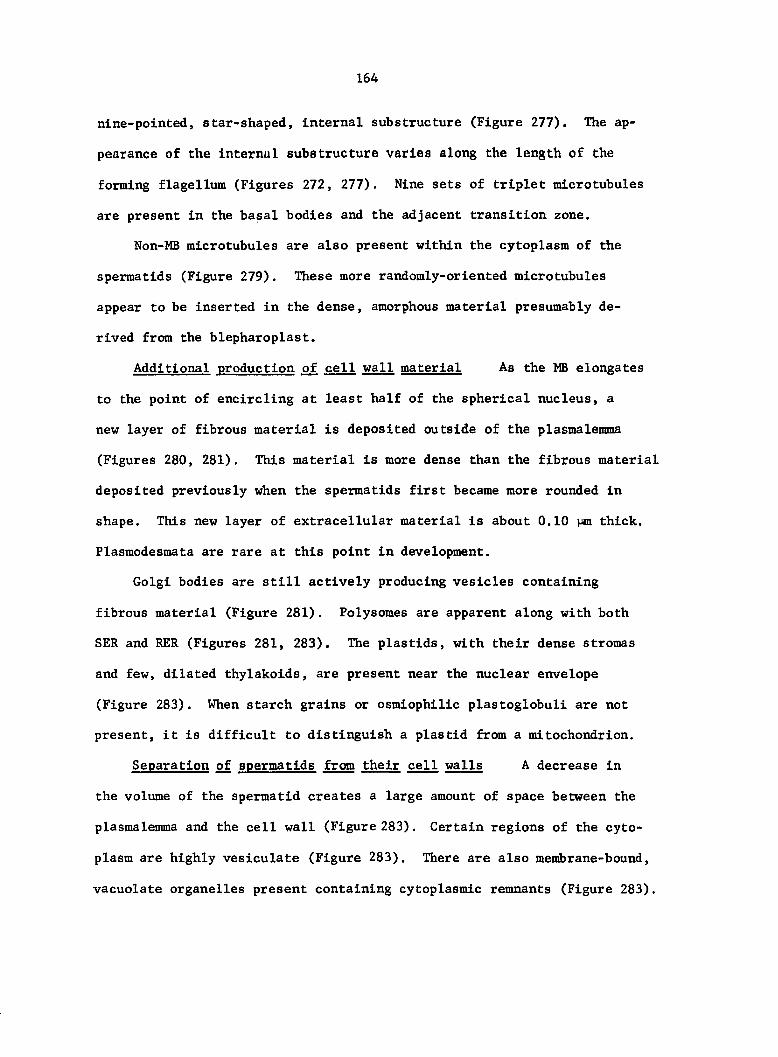
164
nine-pointed, star-shaped, internal substructure (Figure 277). The ap
pearance of the internal substructure varies along the length of the
forming flagellum (Figures 272, 277). Nine sets of triplet microtubules
are present in the basal bodies and the adjacent transition zone.
Non-MB microtubules are also present within the cytoplasm of the
spermatids (Figure 279). These more randomly-oriented microtubules
appear to be Inserted in the dense, amorphous material presumably de
rived from the blepharoplast.
Additional production of cell wall material As the MB elongates
to the point of encircling at least half of the spherical nucleus, a
new layer of fibrous material is deposited outside of the plasmalemma
(Figures 280, 281). This material is more dense than the fibrous material
deposited previously when the spermatids first became more rounded in
shape. This new layer of extracellular material is about 0.10 pm thick.
Flasmodesmata are rare at this point in development.
Golgi bodies are still actively producing vesicles containing
fibrous material (Figure 281). Polysomes are apparent along with both
SER and RER (Figures 281, 283). The plastids, with their dense stromas
and few, dilated thylakolds, are present near the nuclear envelope
(Figure 283). When starch grains or osmlophlllc plastoglobull are not
present, it is difficult to distinguish a plastid from a mitochondrion.
Separation of spermatids from their cell walls A decrease in
the volume of the spermatid creates a large amount of space between the
plasmalemma and the cell wall (Figure 283), Certain regions of the cyto
plasm are highly vesiculate (Figure 283). There are also membrane-bound,
vacuolate organelles present containing cytoplasmic remnants (Figure 283).
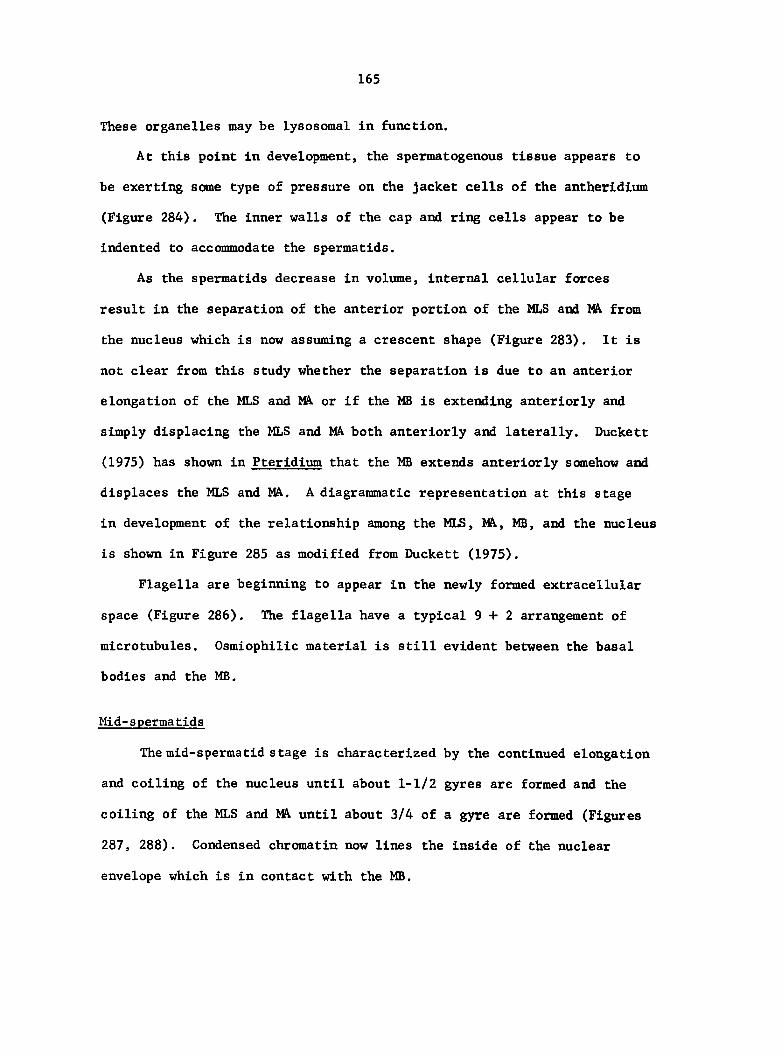
165
These organelles may be lysosomal in function.
At this point in development, the spermatogenous tissue appears to
be exerting some type of pressure on the jacket cells of the antheridium
(Figure 284). The inner walls of the cap and ring cells appear to be
indented to accommodate the spermatids.
As the spermatids decrease in volume, internal cellular forces
result in the separation of the anterior portion of the MLS and from
the nucleus which is now assuming a crescent shape (Figure 283). It is
not clear from this study whether the separation is due to an anterior
elongation of the MLS and M& or if the MB is extending anteriorly and
simply displacing the MLS and MA both anteriorly and laterally. Duckett
(1975) has shown in Pteridium that the MB extends anteriorly somehow and
displaces the MLS and MA. A diagrammatic representation at this stage
in development of the relationship among the MLS, M\, MB, and the nucleus
is shown in Figure 285 as modified from Duckett (1975).
Flagella are beginning to appear in the newly formed extracellular
space (Figure 286). The flagella have a typical 9+2 arrangement of
microtubules. Osmiophilic material is still evident between the basal
bodies and the MB.
Mid-spermatids
The mid-spermatid stage is characterized by the continued elongation
and coiling of the nucleus until about 1-1/2 gyres are formed and the
coiling of the MLS and MA until about 3/4 of a gyre are formed (Figures
287, 288). Condensed chromatin now lines the inside of the nuclear
envelope which is in contact with the MB.
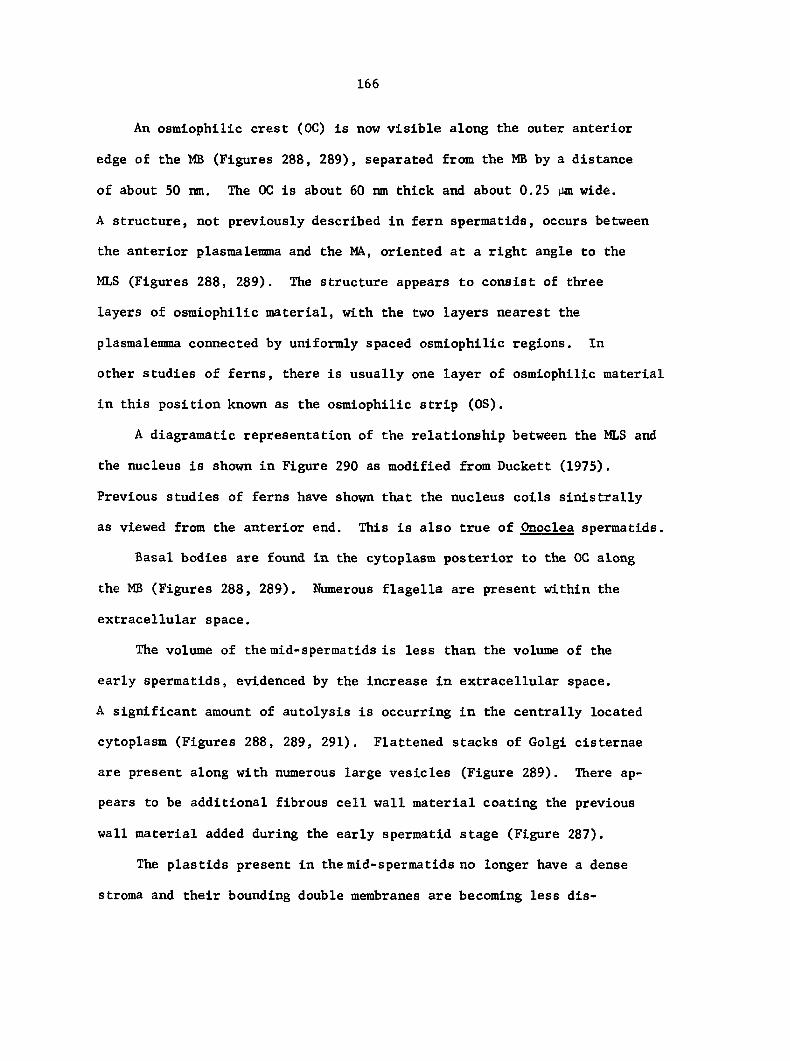
166
An osmlophllic crest (OC) is now visible along the outer anterior
edge of the MB (Figures 288, 289), separated from the MB by a distance
of about 50 ran. The OC is about 60 ran thick and about 0.25 im wide.
À structure, not previously described in fern spermatids, occurs between
the anterior plasmalemma and the MA, oriented at a right angle to the
MLS (Figures 288, 289). The structure appears to consist of three
layers of osmlophllic material, with the two layers nearest the
plasmalemma connected by uniformly spaced osmlophllic regions. In
other studies of ferns, there is usually one layer of osmlophllic material
in this position known as the osmlophllic strip (OS).
A diagramatic representation of the relationship between the MLS and
the nucleus is shown in Figure 290 as modified from Duckett (1975).
Previous studies of ferns have shown that the nucleus coils slnistrally
as viewed from the anterior end. This is also true of Onoclea spermatids.
Basal bodies are found in the cytoplasm posterior to the OC along
the MB (Figures 288, 289). Numerous flagella are present within the
extracellular space.
The volume of the mid-spermatlds is less than the volume of the
early spermatids, evidenced by the Increase In extracellular space.
A significant amount of autolysis is occurring in the centrally located
cytoplasm (Figures 288, 289, 291). Flattened stacks of Golgi clsternae
are present along with numerous large vesicles (Figure 289). There ap
pears to be additional fibrous cell wall material coating the previous
wall material added during the early spermatid stage (Figure 287).
The plastlds present in the mid-spermatlds no longer have a dense
stroma and their bounding double membranes are becoming less dis-
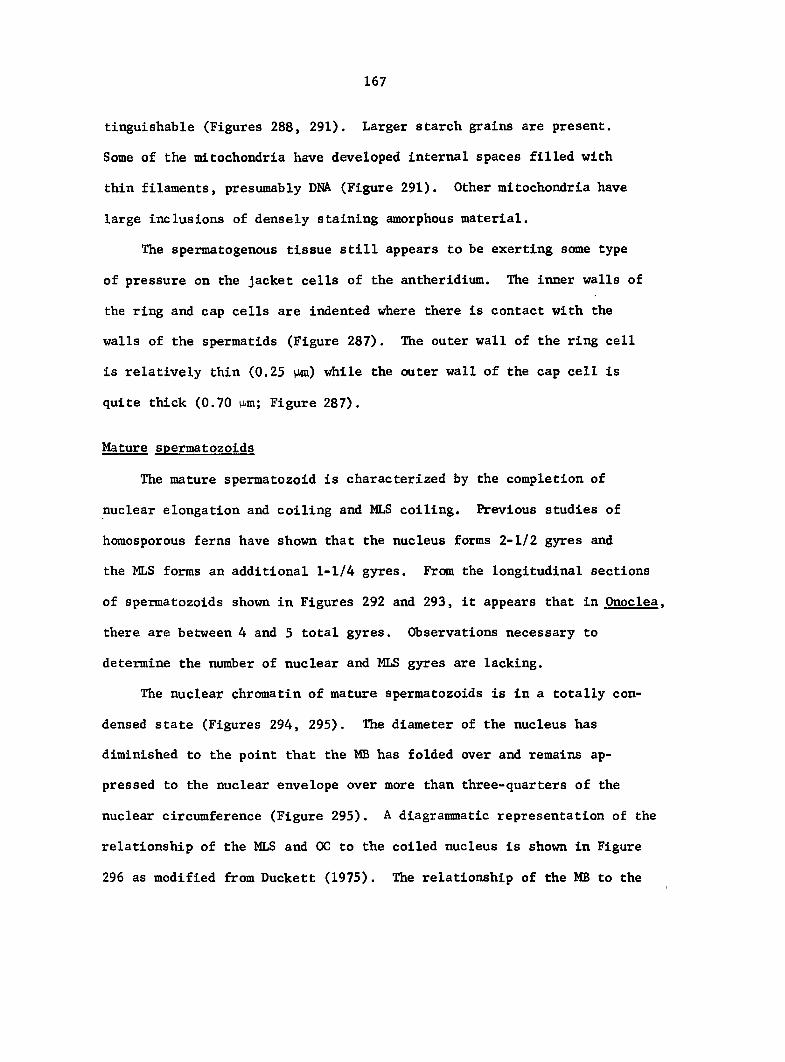
167
tinguishable (Figures 288, 291). Larger starch grains are present.
Some of the mitochondria have developed internal spaces filled with
thin filaments, presumably DNA (Figure 291). Other mitochondria have
large inclusions of densely staining amorphous material.
The spermatogenous tissue still appears to be exerting some type
of pressure on the jacket cells of the antheridium. The inner walls of
the ring and cap cells are indented where there is contact with the
walls of the spermatids (Figure 287). The outer wall of the ring cell
is relatively thin (0.25 pm) while the outer wall of the cap cell is
quite thick (0.70 M-m; Figure 287).
Mature spermatozoids
The mature spermatozoid is characterized by the completion of
nuclear elongation and coiling and MLS coiling. Previous studies of
homosporous ferns have shown that the nucleus forms 2-1/2 gyres and
the MLS forms an additional 1-1/4 gyres. From the longitudinal sections
of spermatozoids shown in Figures 292 and 293, it appears that in Onoclea,
there are between 4 and 5 total gyres. Observations necessary to
determine the number of nuclear and MLS gyres are lacking.
The nuclear chromatin of mature spermatozoids is in a totally con
densed state (Figures 294, 295). The diameter of the nucleus has
diminished to the point that the MB has folded over and remains ap-
pressed to the nuclear envelope over more than three-quarters of the
nuclear circumference (Figure 295). A diagrammatic representation of the
relationship of the MLS and OC to the coiled nucleus is shown in Figure
296 as modified from Duckett (1975). The relationship of the MB to the
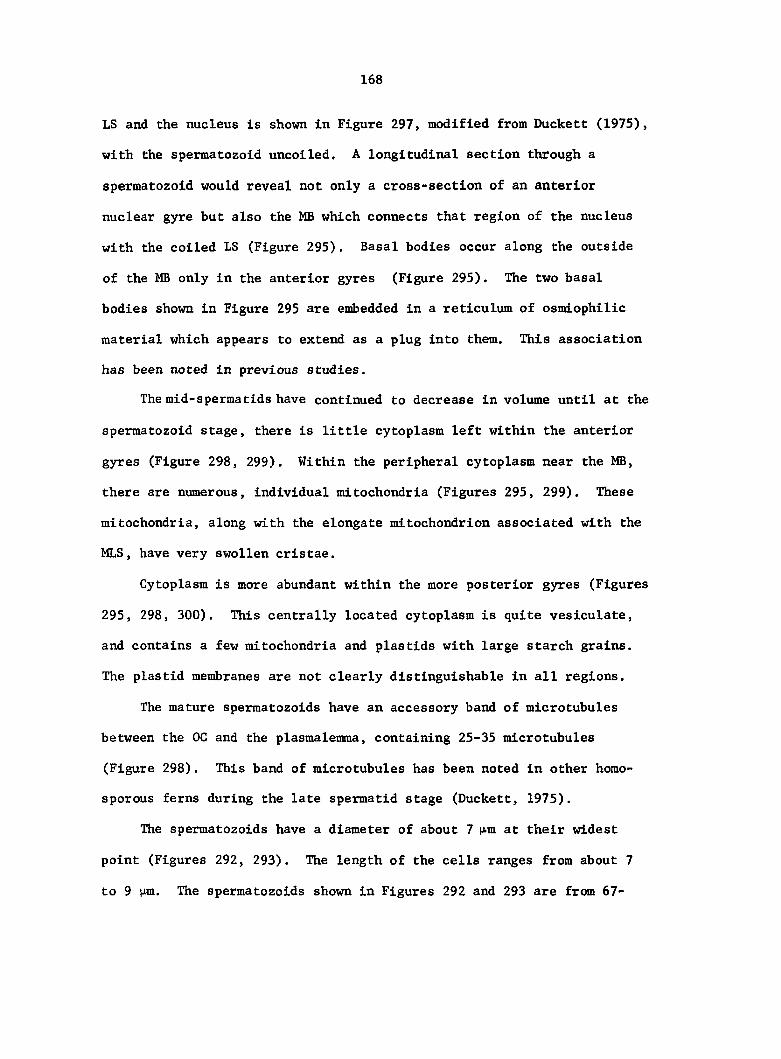
168
LS and the nucleus is shown in Figure 297, modified from Duckett (1975),
with the spermatozoid uncoiled. A longitudinal section through a
spermatozoid would reveal not only a cross-section of an anterior
nuclear gyre but also the MB which connects that region of the nucleus
with the coiled LS (Figure 295). Basal bodies occur along the outside
of the MB only in the anterior gyres (Figure 295). The two basal
bodies shown in Figure 295 are embedded in a reticulum of osmiophilic
material which appears to extend as a plug into them. This association
has been noted in previous studies.
The mid-spermatids have continued to decrease in volume until at the
spermatozoid stage, there is little cytoplasm left within the anterior
gyres (Figure 298, 299). Within the peripheral cytoplasm near the MB,
there are numerous, individual mitochondria (Figures 295, 299). These
mitochondria, along with the elongate mitochondrion associated with the
MLS, have very swollen cristae.
Cytoplasm is more abundant within the more posterior gyres (Figures
295, 298, 300). This centrally located cytoplasm is quite vesiculate,
and contains a few mitochondria and plastids with large starch grains.
The plastid membranes are not clearly distinguishable in all regions.
The mature spermatozoids have an accessory band of microtubules
between the DC and the plasmalemma, containing 25-35 microtubules
(Figure 298). This band of microtubules has been noted in other homo-
sporous ferns during the late spermatid stage (Duckett, 1975).
The spermatozoids have a diameter of about 7 M-m at their widest
point (Figures 292, 293). The length of the cells ranges from about 7
to 9 p.m. The spermatozoids shown in Figures 292 and 293 are from 67-
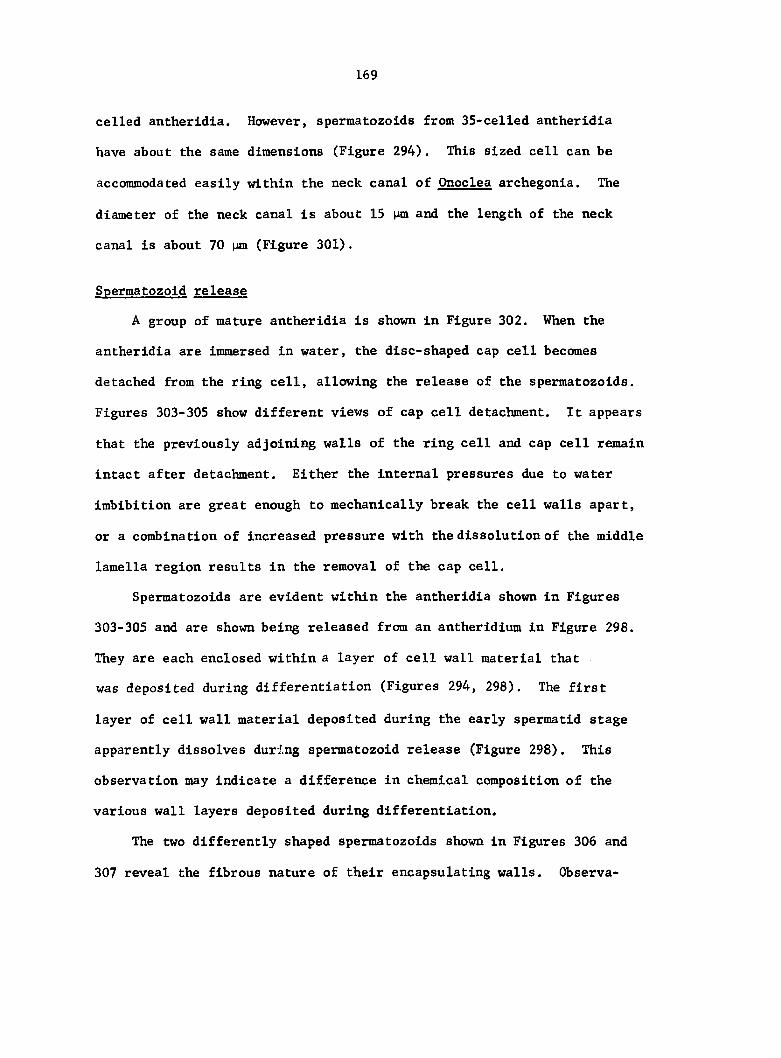
169
celled antheridia. However, spermatozoïde from 35-celled antheridia
have about the same dimensions (Figure 294). This sized cell can be
accommodated easily within the neck canal of Onoclea archegonla. The
diameter of the neck canal is about 15 pm and the length of the neck
canal is about 70 pm (Figure 301).
Spermatozold release
A group of mature antheridia is shown in Figure 302. When the
antheridia are immersed in water, the disc-shaped cap cell becomes
detached from the ring cell, allowing the release of the spermatozoids.
Figures 303-305 show different views of cap cell detachment. It appears
that the previously adjoining walls of the ring cell and cap cell remain
intact after detachment. Either the internal pressures due to water
imbibition are great enough to mechanically break the cell walls apart,
or a combination of increased pressure with the dissolution of the middle
lamella region results in the removal of the cap cell.
Spermatozoids are evident within the antheridia shown in Figures
303-305 and are shown being released from an antheridium in Figure 298.
They are each enclosed within a layer of cell wall material that
was deposited during differentiation (Figures 294, 298). The first
layer of cell wall material deposited during the early spermatid stage
apparently dissolves during spermatozold release (Figure 298). This
observation may indicate a difference in chemical composition of the
various wall layers deposited during differentiation.
The two differently shaped spermatozoids shown in Figures 306 and
307 reveal the fibrous nature of their encapsulating walls. Observa-
170
vations of living spermatozoids during this study have shown that this
wall material is disposed of within 1 min after release, thus allowing
free movement of the flagella. The flagellar movements cause the
spermatozoids to move in an anterior direction along a helical path.
A recapitulation of the entire developmental sequence, beginning
with the formation of an anther idium initial and terminating with the
formation of 32 spermatozoids, is diagrammatically Illustrated in
Figure 308.
171
DISCUSSION AND CONCLUSIONS
Gametophytes of Onoclea sensibilis were Induced to form antherîdia
in order to study many different aspects of developmental biology.
Five general developmental areas of interest emerged during this study.
Correspondingly, the discussion is divided into five sections.
The first section pertains to the growth rate of gametophytes as
affected by spore sterilization and treatment. The second section
concerns the induction period and location of antheridium initials on
the gametophyte in terms of the physiological gradients found within
the thallus. The third section deals with the cellular location of the
initials in terms of cellular and organismal gradients and external
physical forces. The fourth section is reserved for a discussion on
the comparative morphology of fern antheridia. The fifth section per
tains to spermatogenesis in Onoclea compared to spermatogenesis in other
pteridophytes.
Growth of Gametophytes
In the interest of developing an optimal culture condition for
growing antheridiate gametophytes that was also aseptic, it was neces
sary to determine the effects of spore sterilization on the vegetative
growth rate of gametophytes using a dilute solution of calcium hypo
chlorite.
Compared to the control cultures, the gametophytes in the sterilized
cultures grew significantly more slowly due to an inhibition of cell
division. This observation may be related to the claim that Clorox
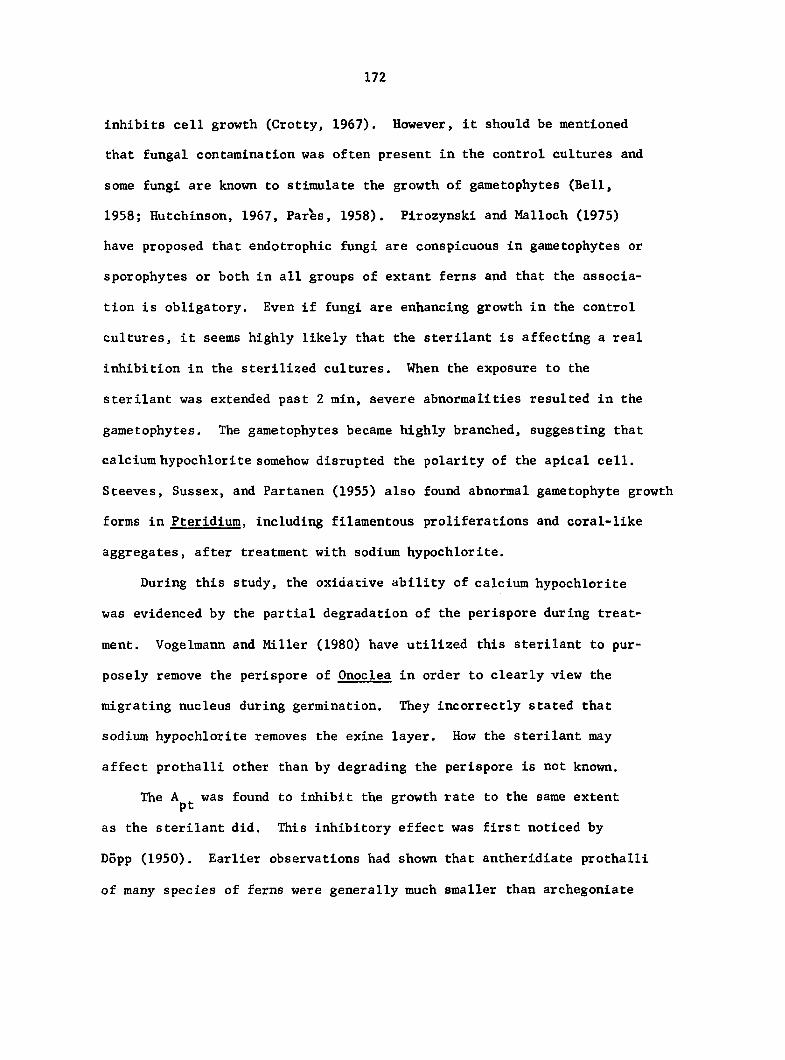
172
inhibits cell growth (Crotty, 1967). However, it should be mentioned
that fungal contamination was often present in the control cultures and
some fungi are known to stimulate the growth of gametophytes (Bell,
1958; Hutchinson, 1967, Pares, 1958). Pirozynski and Malloch (1975)
have proposed that endotrophic fungi are conspicuous in gametophytes or
sporophytes or both in all groups of extant ferns and that the associa
tion is obligatory. Even if fungi are enhancing growth in the control
cultures, it seems highly likely that the sterilant is affecting a real
inhibition in the sterilized cultures. When the exposure to the
sterilant was extended past 2 min, severe abnormalities resulted in the
gametophytes. The gametophytes became highly branched, suggesting that
calcium hypochlorite somehow disrupted the polarity of the apical cell.
Steeves, Sussex, and Partanen (1955) also found abnormal gametophyte growth
forms in Pteridium. including filamentous proliferations and coral-like
aggregates, after treatment with sodium hypochlorite.
During this study, the oxidative ability of calcium hypochlorite
was evidenced by the partial degradation of the perispore during treat
ment. Vogelmann and Miller (1980) have utilized this sterilant to pur
posely remove the perispore of Onoclea in order to clearly view the
migrating nucleus during germination. They incorrectly stated that
sodium hypochlorite removes the exine layer. How the sterilant may
affect prothalli other than by degrading the perispore is not known.
The was found to inhibit the growth rate to the same extent
as the sterilant did. This inhibitory effect was first noticed by
D5pp (1950). Earlier observations had shown that antheridiate prothalli
of many species of ferns were generally much smaller than archegoniate
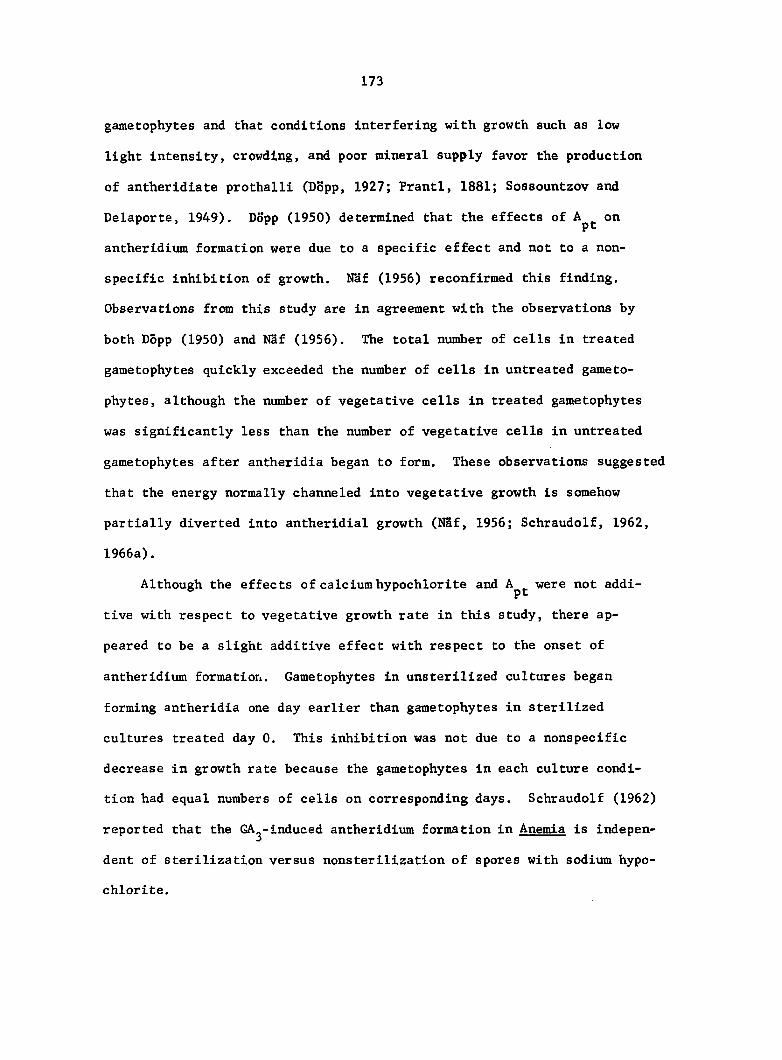
173
gametophytes and that conditions interfering with growth such as low
light intensity, crowding, and poor mineral supply favor the production
of antheridiate prothalli (Dopp, 1927; Prantl, 1881; Sossountzov and
Delaporte, 1949). Dopp (1950) determined that the effects of on
antheridium formation were due to a specific effect and not to a non
specific inhibition of growth. NSf (1956) reconfirmed this finding.
Observations from this study are in agreement with the observations by
both Dopp (1950) and Naf (1956). The total number of cells in treated
gametophytes quickly exceeded the number of cells in untreated gameto
phytes, although the number of vegetative cells in treated gametophytes
was significantly less than the number of vegetative cells in untreated
gametophytes after antheridia began to form. These observations suggested
that the energy normally channeled into vegetative growth is somehow
partially diverted into antheridial growth (Naf, 1956; Schraudolf, 1962,
1966a).
Although the effects of calcium hypochlorite and A^^ were not addi
tive with respect to vegetative growth rate in this study, there ap
peared to be a slight additive effect with respect to the onset of
antheridium formation. Gametophytes in unsterilized cultures began
forming antheridia one day earlier than gametophytes in sterilized
cultures treated day 0. This inhibition was not due to a nonspecific
decrease in growth rate because the gametophytes in each culture condi
tion had equal numbers of cells on corresponding days. Schraudolf (1962)
reported that the GA^-induced antheridium formation in Anemia is indepen
dent of sterilization versus nonsterilization of spores with sodium hypo
chlorite.
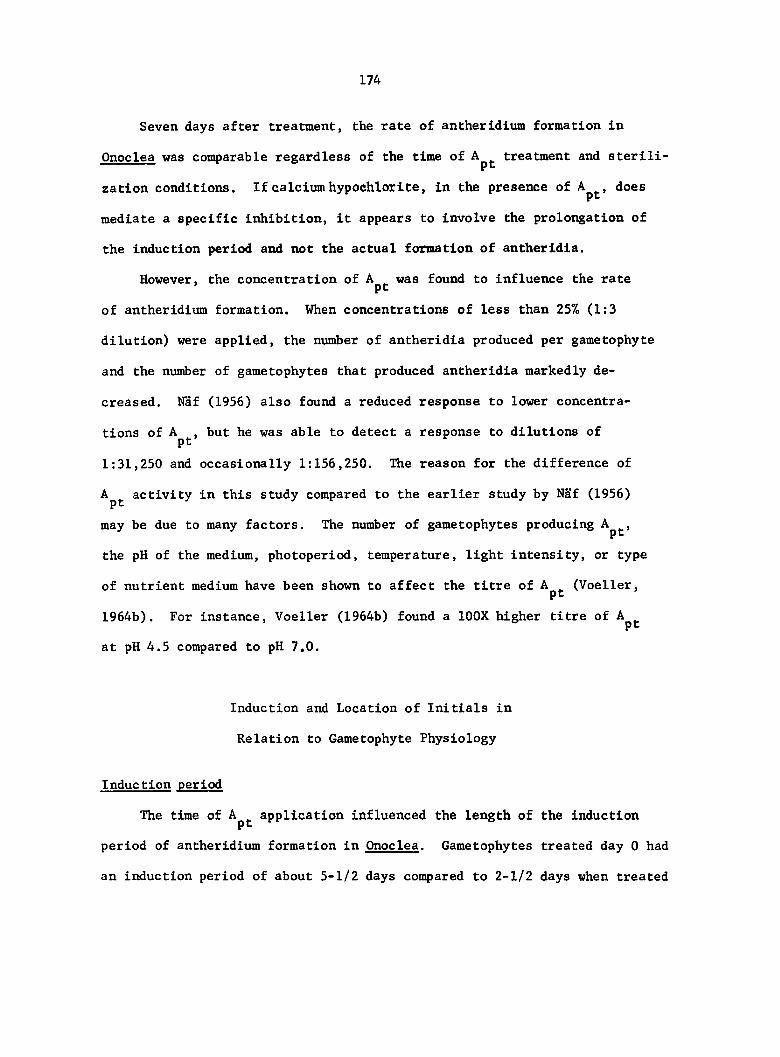
174
Seven days after treatment, the rate of antheridium formation in
Onoclea was comparable regardless of the time of treatment and sterili
zation conditions. If calcium hypochlorite, in the presence of A^^, does
mediate a specific inhibition, it appears to involve the prolongation of
the induction period and not the actual formation of antheridia.
However, the concentration of A^^ was found to influence the rate
of antheridium formation. When concentrations of less than 25% (1:3
dilution) were applied, the number of antheridia produced per gametophyte
and the number of gametophytes that produced antheridia markedly de
creased. Naf (1956) also found a reduced response to lower concentra
tions of Ap^, but he was able to detect a response to dilutions of
1:31,250 and occasionally 1:156,250. The reason for the difference of
Ap^ activity in this study compared to the earlier study by Naf (1956)
may be due to many factors. The number of gametophytes producing A^^,
the pH of the medium, photoperiod, temperature, light intensity, or type
of nutrient medium have been shown to affect the titre of A^^ (Voeller,
1964b). For instance, Voeller (1964b) found a lOOX higher titre of A^^
at pH 4.5 compared to pH 7.0.
Induction and Location of Initials in
Relation to Gametophyte Physiology
Induction period
The time of A^^ application influenced the length of the induction
period of antheridium formation in Onoclea. Gametophytes treated day 0 had
an induction period of about 5-1/2 days compared to 2-1/2 days when treated
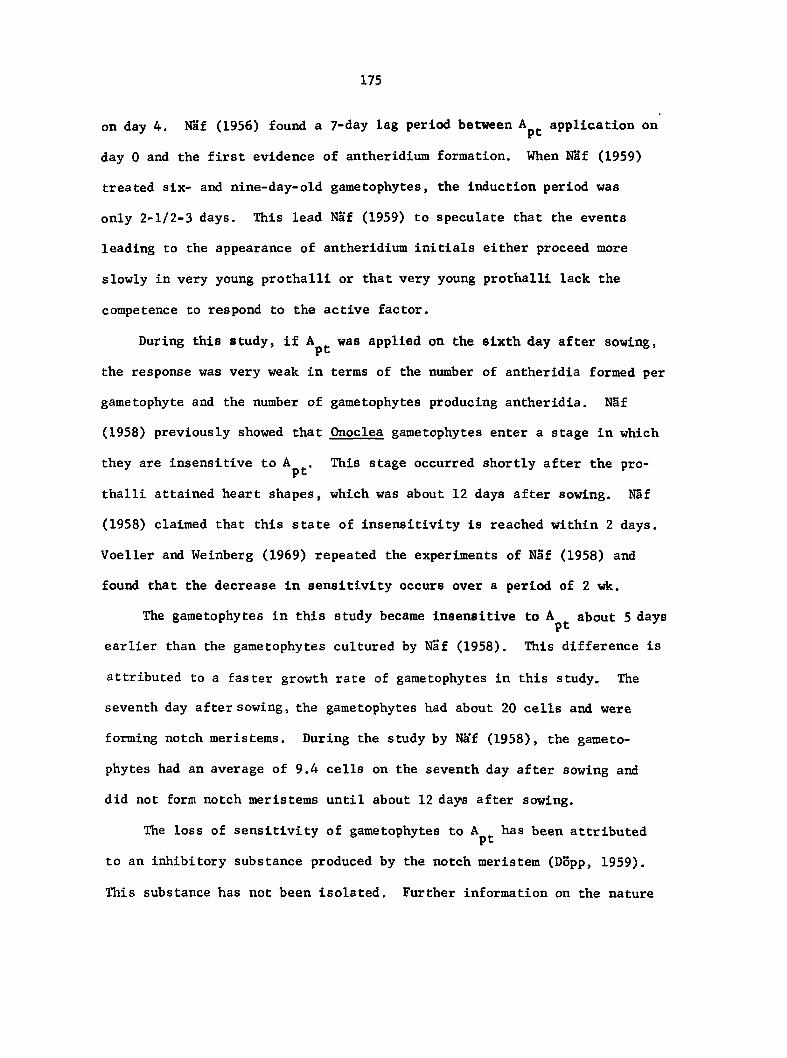
175
on day 4. Naf (1956) found a 7-day lag period between application on
day 0 and the first evidence of antheridium formation. When Naf (1959)
treated six- and nine-day-old gametophytes, the induction period was
only 2-1/2-3 days. This lead Naf (1959) to speculate that the events
leading to the appearance of antheridium initials either proceed more
slowly in very young prothalli or that very young prothalli lack the
competence to respond to the active factor.
During this study, if was applied on the sixth day after sowing,
the response was very weak in terms of the number of antheridia formed per
gametophyte and the number of gametophytes producing antheridia. Naf
(1958) previously showed that Onoclea gametophytes enter a stage in which
they are insensitive to A^^. This stage occurred shortly after the pro
thalli attained heart shapes, which was about 12 days after sowing. N3f
(1958) claimed that this state of insensitivity is reached within 2 days.
Voeller and Weinberg (1969) repeated the experiments of Naf (1958) and
found that the decrease in sensitivity occurs over a period of 2 wk.
The gametophytes in this study became Insensitive to A^^ about 5 days
earlier than the gametophytes cultured by Naf (1958). This difference is
attributed to a faster growth rate of gametophytes in this study. The
seventh day after sowing, the gametophytes had about 20 cells and were
forming notch meristems. During the study by Naf (1958), the gameto
phytes had an average of 9.4 cells on the seventh day after sowing and
did not form notch meristems until about 12 days after sowing.
The loss of sensitivity of gametophytes to A^^ has been attributed
to an inhibitory substance produced by the notch meristem (Dopp, 1959).
This substance has not been isolated. Further information on the nature
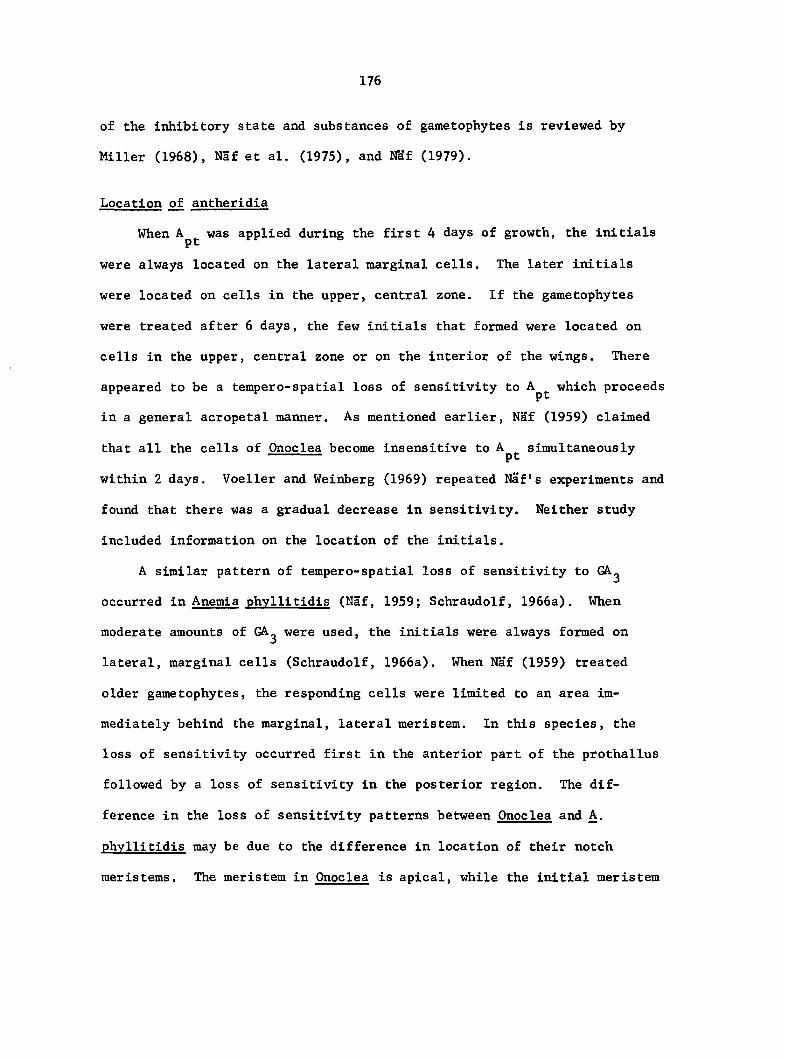
176
of the inhibitory state and substances of gametophytes is reviewed by
Miller (1968), Naf et al. (1975), and iTa'f (1979).
Location of antheridia
When was applied during the first 4 days of growth, the initials
were always located on the lateral marginal cells. The later initials
were located on cells in the upper, central zone. If the gametophytes
were treated after 6 days, the few initials that formed were located on
cells in the upper, central zone or on the interior of the wings. There
appeared to be a tempero-spatial loss of sensitivity to which proceeds
in a general acropetal manner. As mentioned earlier, NSf (1959) claimed
that all the cells of Onoclea become insensitive to A^^ simultaneously
within 2 days. Voeller and Weinberg (1969) repeated Nafs experiments and
found that there was a gradual decrease in sensitivity. Neither study
included information on the location of the initials.
A similar pattern of tempero-spatial loss of sensitivity to GA^
occurred in Anemia phvllitidis (Naf, 1959; Schraudolf, 1966a). When
moderate amounts of GA^ were used, the initials were always formed on
lateral, marginal cells (Schraudolf, 1966a), When Naf (1959) treated
older gametophytes, the responding cells were limited to an area im
mediately behind the marginal, lateral meristem. In this species, the
loss of sensitivity occurred first in the anterior part of the prothallus
followed by a loss of sensitivity in the posterior region. The dif
ference in the loss of sensitivity patterns between Onoclea and A.
phvllitidis may be due to the difference in location of their notch
meristems. The meristem in Onoclea is apical, while the initial meristem
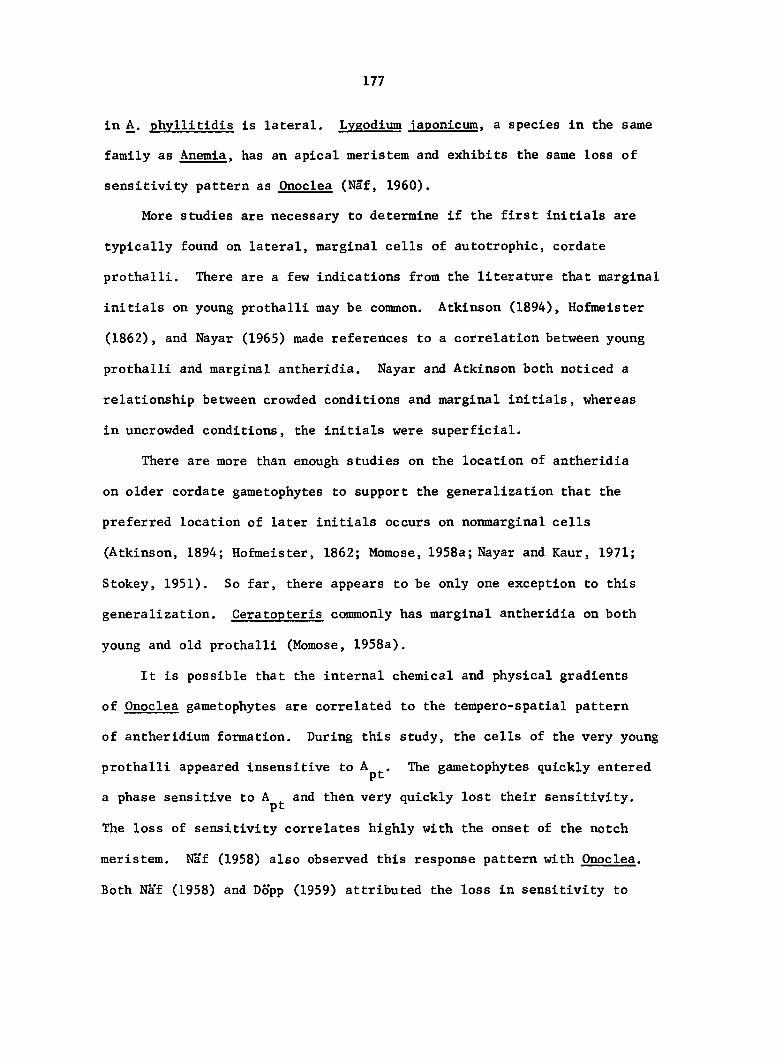
177
in A. phvllitidis is lateral, Lygodium iaponicum. a species in the same
family as Anemia. has an apical meristem and exhibits the same loss of
sensitivity pattern as Onoclea (NSf, 1960).
More studies are necessary to determine if the first initials are
typically found on lateral, marginal cells of autotrophic, cordate
prothalli. There are a few indications from the literature that marginal
initials on young prothalli may be common. Atkinson (1894), Hofmeister
(1862), and Nayar (1965) made references to a correlation between young
prothalli and marginal antheridia. Nayar and Atkinson both noticed a
relationship between crowded conditions and marginal initials, whereas
in uncrowded conditions, the initials were superficial.
There are more than enough studies on the location of antheridia
on older cordate gametophytes to support the generalization that the
preferred location of later initials occurs on nonmarginal cells
(Atkinson, 1894; Hofmeister, 1862; Momose, 1958a; Nayar and Kaur, 1971;
Stokey, 1951). So far, there appears to be only one exception to this
generalization. Ceratopteris commonly has marginal antheridia on both
young and old prothalli (Momose, 1958a),
It is possible that the internal chemical and physical gradients
of Onoclea gametophytes are correlated to the tempero-spatial pattern
of antheridium formation. During this study, the cells of the very young
prothalli appeared insensitive to A^^. The gametophytes quickly entered
a phase sensitive to A^^ and then very quickly lost their sensitivity.
The loss of sensitivity correlates highly with the onset of the notch
meristem. Naf (1958) also observed this response pattern with Onoclea.
Both Naf (1958) and Dopp (1959) attributed the loss in sensitivity to
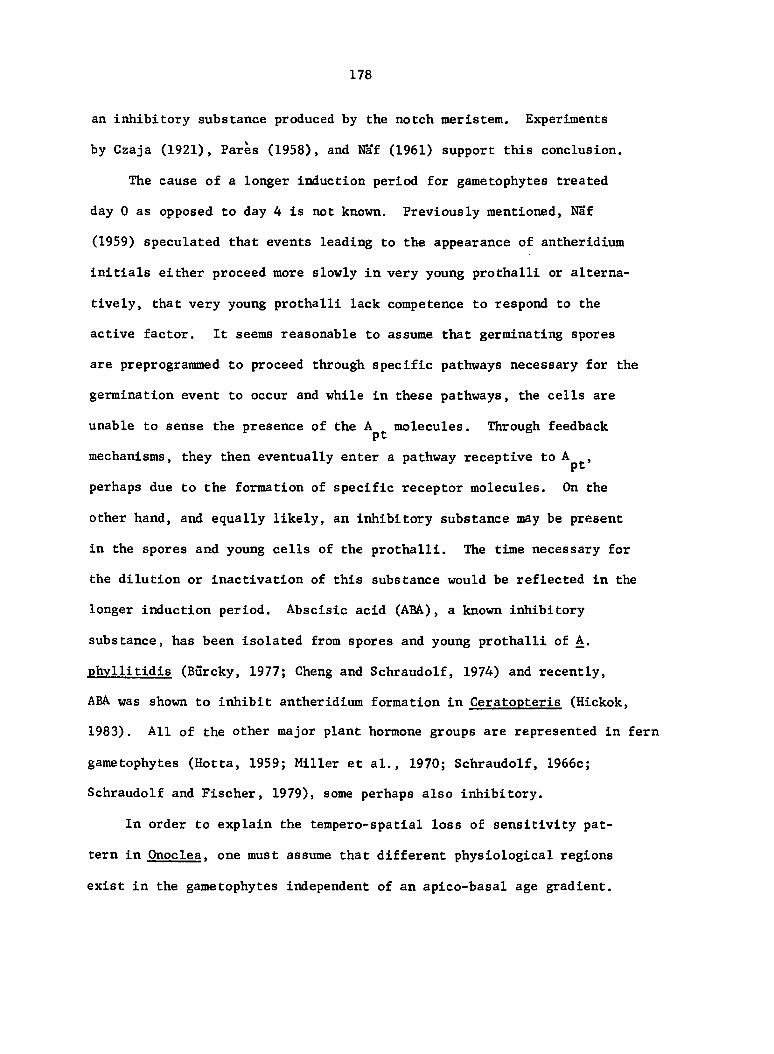
178
an inhibitory substance produced by the notch meristem. Experiments
by Czaja (1921), Pares (1958), and Naf (1961) support this conclusion.
The cause of a longer induction period for gametophytes treated
day 0 as opposed to day 4 is not known. Previously mentioned, Naf
(1959) speculated that events leading to the appearance of antheridium
initials either proceed more slowly in very young prothalli or alterna
tively, that very young prothalli lack competence to respond to the
active factor. It seems reasonable to assume that germinating spores
are preprogrammed to proceed through specific pathways necessary for the
germination event to occur and while in these pathways, the cells are
unable to sense the presence of the molecules. Through feedback
mechanisms, they then eventually enter a pathway receptive to
perhaps due to the formation of specific receptor molecules. On the
other hand, and equally likely, an inhibitory substance may be present
in the spores and young cells of the prothalli. The time necessary for
the dilution or inactivation of this substance would be reflected in the
longer induction period. Abscisic acid (ABA), a known inhibitory
substance, has been isolated from spores and young prothalli of A.
phvllitidis (Burcky, 1977; Cheng and Schraudolf, 1974) and recently,
ABA was shown to inhibit antheridium formation in Ceratopteris (Hickok,
1983). All of the other major plant hormone groups are represented in fern
gametophytes (Hotta, 1959; Miller et al., 1970; Schraudolf, 1966c;
Schraudolf and Fischer, 1979), some perhaps also inhibitory.
In order to explain the tempero-spatial loss of sensitivity pat
tern in Onoclea. one must assume that different physiological regions
exist in the gametophytes independent of an apico-basal age gradient.
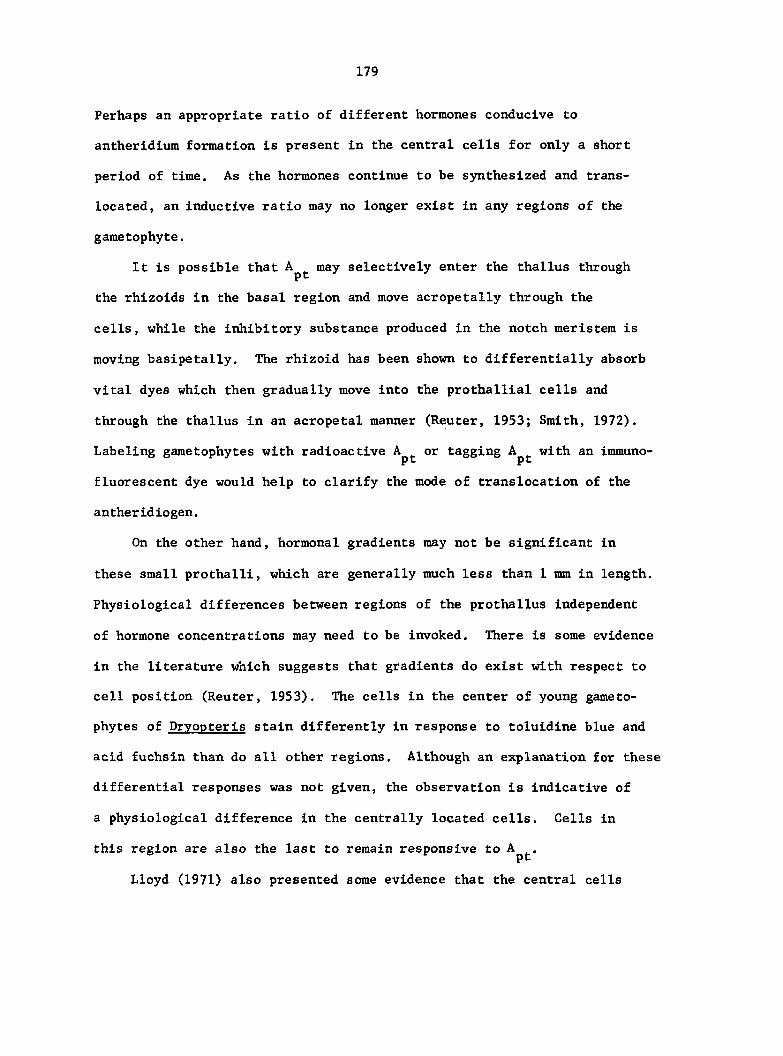
179
Perhaps an appropriate ratio of different hormones conducive to
antheridium formation is present in the central cells for only a short
period of time. As the hormones continue to be synthesized and trans
located, an inductive ratio may no longer exist in any regions of the
gametophyte.
It is possible that may selectively enter the thallus through
the rhizoids in the basal region and move acropetally through the
cells, while the inhibitory substance produced in the notch meristem is
moving basipetally. The rhizoid has been shown to differentially absorb
vital dyes which then gradually move into the prothallial cells and
through the thallus in an acropetal manner (Reuter, 1953; Smith, 1972).
Labeling gametophytes with radioactive A^^ or tagging A^^ with an immuno-
fluorescent dye would help to clarify the mode of translocation of the
antheridiogen.
On the other hand, hormonal gradients may not be significant in
these small prothalli, which are generally much less than 1 mm in length.
Physiological differences between regions of the prothallus independent
of hormone concentrations may need to be invoked. There is some evidence
in the literature which suggests that gradients do exist with respect to
cell position (Reuter, 1953). The cells in the center of young gameto-
phytes of Drvopteris stain differently in response to toluidine blue and
acid fuchsin than do all other regions. Although an explanation for these
differential responses was not given, the observation is indicative of
a physiological difference in the centrally located cells. Cells in
this region are also the last to remain responsive to A^^.
Lloyd (1971) also presented some evidence that the central cells
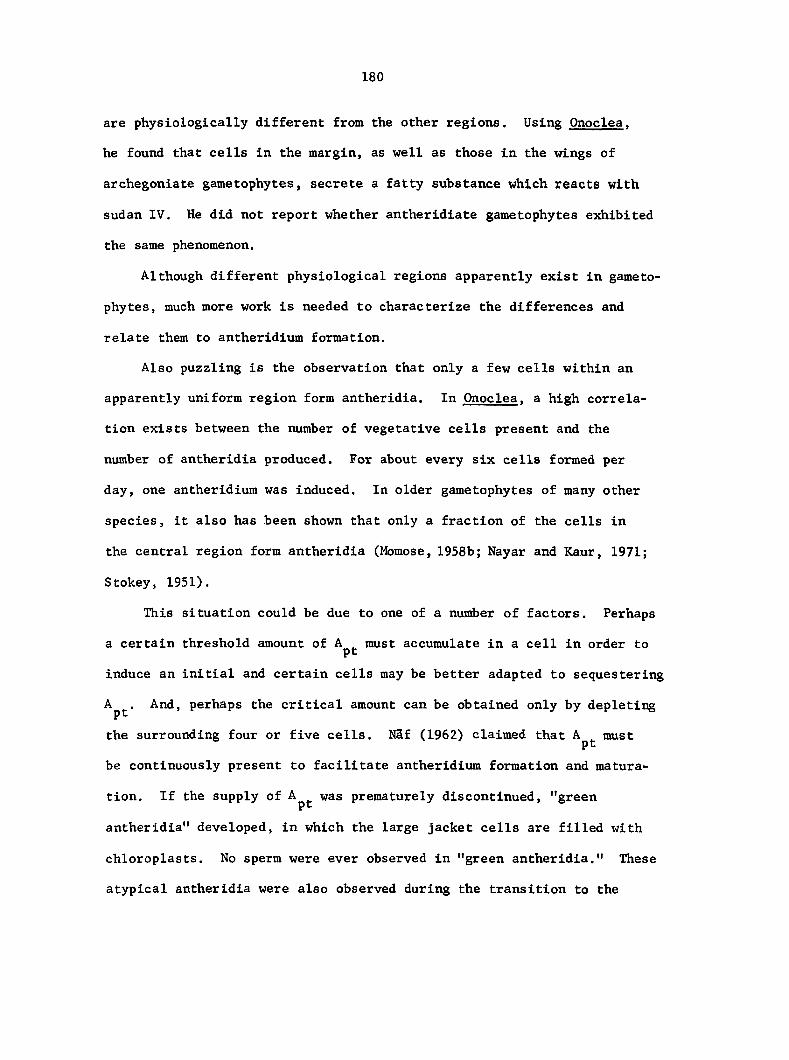
180
are physiologically different from the other regions. Using Onoclea.
he found that cells in the margin, as well as those in the wings of
archegoniate gametophytes, secrete a fatty substance which reacts with
Sudan IV. He did not report whether antheridiate gametophytes exhibited
the same phenomenon.
Although different physiological regions apparently exist in gameto
phytes, much more work is needed to characterize the differences and
relate them to antheridium formation.
Also puzzling is the observation that only a few cells within an
apparently uniform region form antheridia. In Onoclea. a high correla
tion exists between the number of vegetative cells present and the
number of antheridia produced. For about every six cells formed per
day, one antheridium was induced. In older gametophytes of many other
species, it also has been shown that only a fraction of the cells in
the central region form antheridia (Momose, 1958b; Nayar and Kaur, 1971;
Stokey, 1951).
This situation could be due to one of a number of factors. Perhaps
a certain threshold amount of A must accumulate in a cell in order to pt
induce an initial and certain cells may be better adapted to sequestering
Ap^. And, perhaps the critical amount can be obtained only by depleting
the surrounding four or five cells. Nâf (1962) claimed that A^^ must
be continuously present to facilitate antheridium formation and matura
tion. If the supply of A^^ was prematurely discontinued, "green
antheridia" developed, in which the large jacket cells are filled with
chloroplasts. No sperm were ever observed in "green antheridia." These
atypical antheridia were also observed during the transition to the
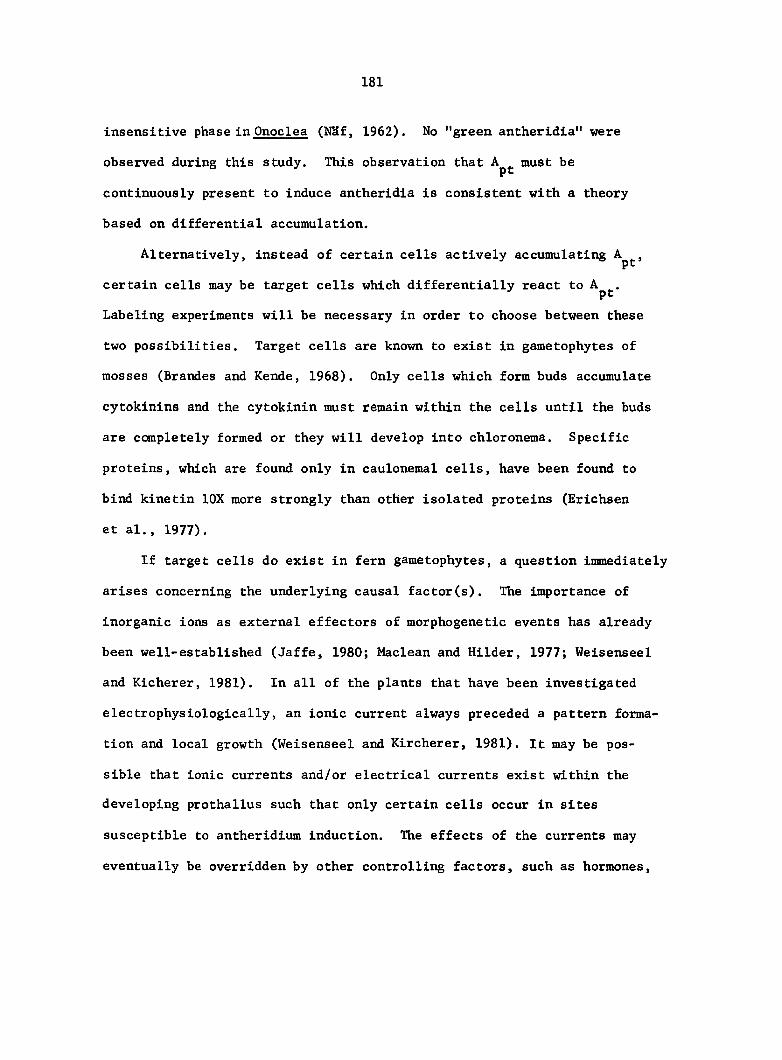
181
insensitive phase in Onoclea (NSf, 1962). No "green antheridia" were
observed during this study. This observation that must be
continuously present to induce antheridia is consistent with a theory
based on differential accumulation.
Alternatively, instead of certain cells actively accumulating A^^,
certain cells may be target cells which differentially react to A^^.
Labeling experiments will be necessary in order to choose between these
two possibilities. Target cells are known to exist in gametophytes of
mosses (Brandes and Kende, 1968). Only cells which form buds accumulate
cytokinins and the cytokinin must remain within the cells until the buds
are completely formed or they will develop into chloronema. Specific
proteins, which are found only in caulonemal cells, have been found to
bind kinetin lOX more strongly than other isolated proteins (Erichsen
et al., 1977).
If target cells do exist in fern gametophytes, a question immediately
arises concerning the underlying causal factor(s). The importance of
inorganic ions as external effectors of morphogenetic events has already
been well-established (Jaffe, 1980; Maclean and Hilder, 1977; Weisenseel
and Kicherer, 1981). In all of the plants that have been investigated
electrophysiologically, an ionic current always preceded a pattern forma
tion and local growth (Weisenseel and Kircherer, 1981). It may be pos
sible that ionic currents and/or electrical currents exist within the
developing prothallus such that only certain cells occur in sites
susceptible to antheridium induction. The effects of the currents may
eventually be overridden by other controlling factors, such as hormones,
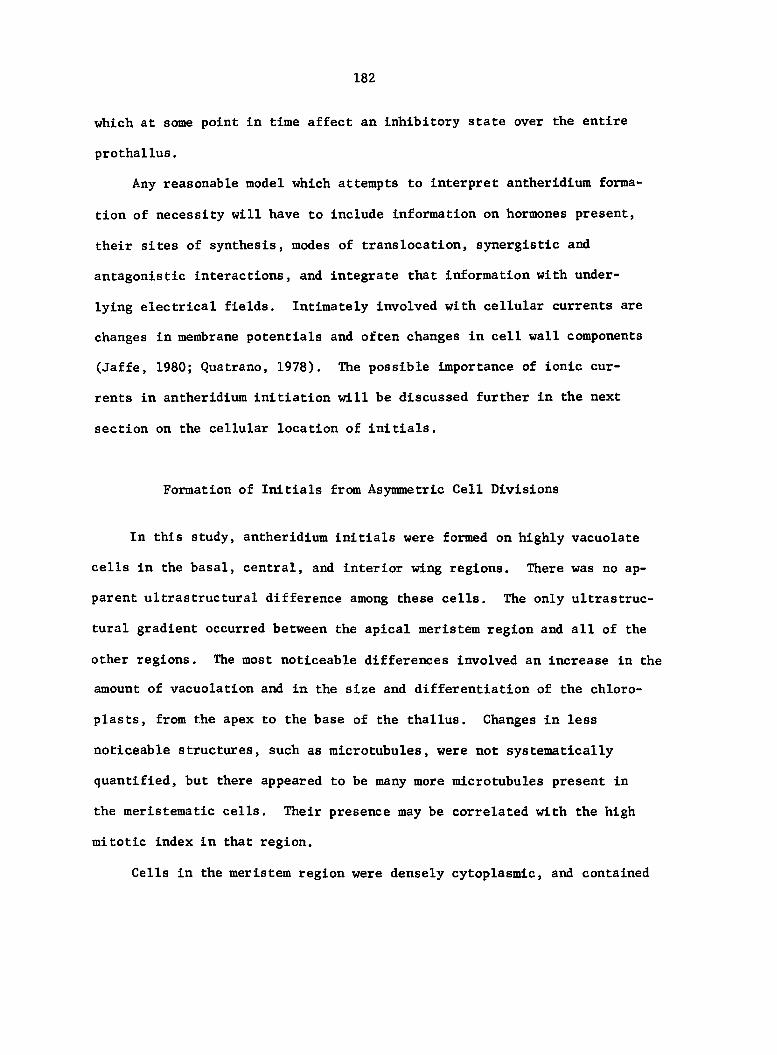
182
which at some point in time affect an inhibitory state over the entire
prothallus.
Any reasonable model which attempts to interpret antheridium forma
tion of necessity will have to include information on hormones present,
their sites of synthesis, modes of translocation, synergistic and
antagonistic interactions, and integrate that information with under
lying electrical fields. Intimately involved with cellular currents are
changes in membrane potentials and often changes in cell wall components
(Jaffe, 1980; Quatrano, 1978). The possible importance of ionic cur
rents in antheridium initiation will be discussed further in the next
section on the cellular location of initials.
Formation of Initials from Asymmetric Cell Divisions
In this study, antheridium initials were formed on highly vacuolate
cells in the basal, central, and interior wing regions. There was no ap
parent ultrastructural difference among these cells. The only ultrastruc
tural gradient occurred between the apical meristem region and all of the
other regions. The most noticeable differences involved an increase in the
amount of vacuolation and in the size and differentiation of the chloro-
plasts, from the apex to the base of the thallus. Changes in less
noticeable structures, such as microtubules, were not systematically
quantified, but there appeared to be many more microtubules present in
the meristematic cells. Their presence may be correlated with the high
mitotic index in that region.
Cells in the meristem region were densely cytoplasmic, and contained
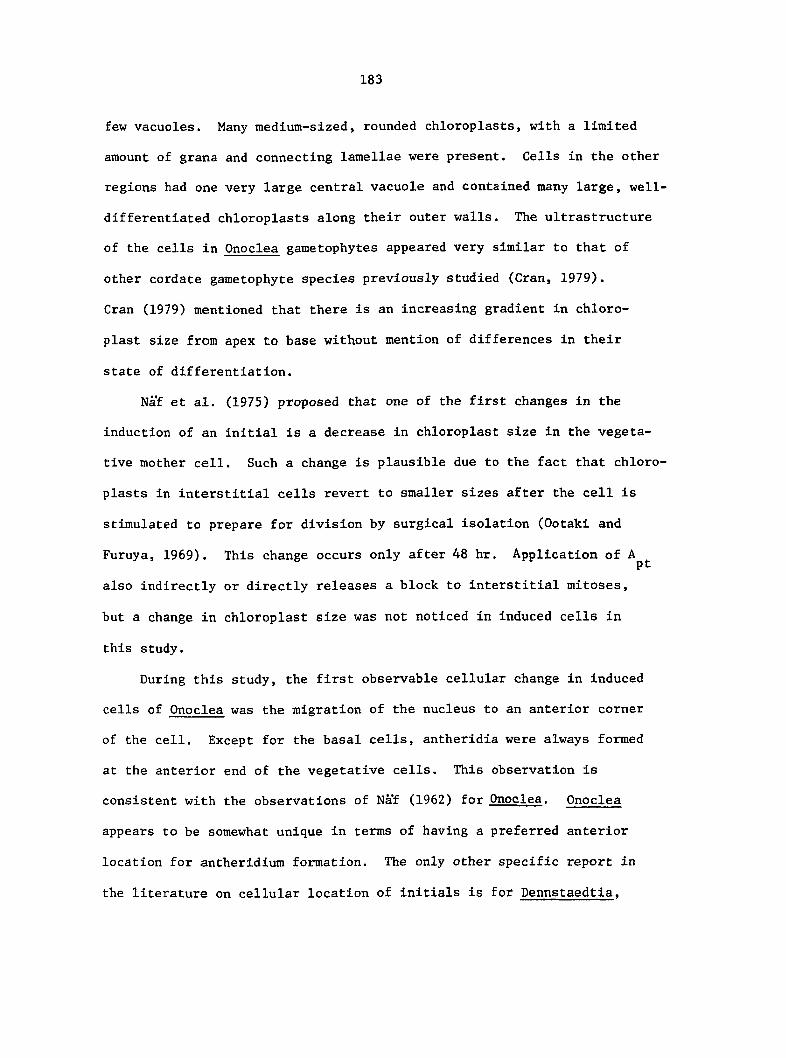
183
few vacuoles. Many medium-sized, rounded chloroplasts, with a limited
amount of grana and connecting lamellae were present. Cells in the other
regions had one very large central vacuole and contained many large, well-
differentiated chloroplasts along their outer walls. The ultrastructure
of the cells in Onoclea gametophytes appeared very similar to that of
other cordate gametophyte species previously studied (Cran, 1979).
Cran (1979) mentioned that there is an increasing gradient in chloro
plast size from apex to base without mention of differences in their
state of differentiation.
Nâ'f et al. (1975) proposed that one of the first changes in the
induction of an initial is a decrease in chloroplast size in the vegeta
tive mother cell. Such a change is plausible due to the fact that chloro
plasts in interstitial cells revert to smaller sizes after the cell is
stimulated to prepare for division by surgical isolation (Ootakl and
Furuya, 1969). This change occurs only after 48 hr. Application of
also indirectly or directly releases a block to interstitial mitoses,
but a change in chloroplast size was not noticed in Induced cells In
this study.
During this study, the first observable cellular change in Induced
cells of Onoclea was the migration of the nucleus to an anterior corner
of the cell. Except for the basal cells, antheridia were always formed
at the anterior end of the vegetative cells. This observation is
consistent with the observations of Nâ'f (1962) for Onoclea. Onoclea
appears to be somewhat unique in terms of having a preferred anterior
location for antherldlum formation. The only other specific report in
the literature on cellular location of initials is for Dennstaedtla,
184
which was reported to have no preferred location for initials (Naf et al.,
1975). However, from published drawings, it appears that Osmunda (At
kinson and Stokey, 1964), Ceratopteris (Nayar and Kaur, 1971), and some
members of the Grammitidaceae (Stone, 1960) may have anteriorly formed
antheridia. Nayar and Kaur (1971) stated that, in general, antheridia
in advanced, leptosporangiate ferns develop toward the middle of the
mother cell.
^ The next noticeable cellular change in antheridium induction is a
large accumulation of RNA-staining cytoplasm surrounding the nucleus in
the anterior corner. A dense accumulation of cytoplasm in the region of
antheridium formation has also been observed in Actinostachys (Bierhorst,
1975), Polyphlebium (Stone, 1958), and Blechnum (Stone, 1961). In
Onoclea, the accumulated cytoplasm is composed of a dense ribosome matrix
containing a large number of mitochondria, some chloroplasts, Golgi
bodies and a few microbodies. Very few microtubules are observed either
along the cell walls or within the cytoplasm. It has previously been
observed that growth in cells of gametophytes occurs in the region where
RNA is most dense (Nakazawa and Tanno, 1965; Ootaki, 1963).
The period of time necessary for these changes to occur and the
sequential order of the changes are not known. Leung and Nk'f (1979)
claimed that a "bouquet" of RNA appears prior to prophase of the migrated
nucleus in Onoclea. However, I viewed this report by Leung and Nâ'f
(1979) with reservations. The reasons for these reservations will be
discussed in the next section where most of their interpretations of
later events are shown to be erroneous. Thus, it is not known whether
185
1) the RN^-stained material accumulates in the anterior corner before
nuclear migration, or 2) whether the migrating nucleus is accompanied
by increasing numbers of organelles and RNA molecules, or 3) whether the
cytoplasm accumulates after the nucleus migrates.
In rhizoid formation in germination of fern spores, which also
entails nuclear migration followed by an asymmetric cell division, an
aggregation of RNA-staining cytoplasm accumulates around the migrating
nucleus (Bassel et al., 1981; Cohen and Crotty, 1979; Gantt and
Arnott, 1965). The RNA is found to first accumulate in the nucleus
before appearing in the cytoplasm (Cohen and Crotty, 1979). They sug
gested that the nucleus is active in directing differentiation and is
not passively caught in differential cytoplasm. More observations on
events prior to the asymmetric cell division, along with labeling experi
ments with RNA precursors, will be necessary to determine if antheridium
formation is analogous in any way to rhizoid formation.
It is known that intense RNA synthesis and accumulation is as
sociated with the prophase stage of mitosis in most organisms during
their normal cell cycle (Mitchison, 1971). Perhaps, the bouquet of RNA
observed by Leung and Naf (1979) is only a reflection of a typical
mitotic division and not an accumulation of RNA specific to antheridium
formation.
To determine if there are specific antheridium-inducing RNA mole
cules present, Schraudolf (1967) treated A. phyllitidis gametophytes,
grown in continuous light with both GA^ and RNA-synthesis inhibitors and
concluded that there was no inhibition of the induction process, al
though further development was affected. But Voeller and Weinberg
186
(1969) repeated Schraudolf's experiments with gametophytes growing in
the dark and concluded that a new species of RNA is a limiting step in
antheridial induction. When Iqbal and Schraudolf (1977) looked for
specific proteins associated with antheridium induction, they found a
quantitative difference in certain protein components but they were un
able to find any qualitative differences. However, they did not rule
out the possibility that special proteins may exist, but in quantities
too small to detect with their methods. The identification of specific
antheridium-inducing RNA or proteins awaits further experimentation.
Because nuclear movement appears to play an integral role in
antheridium induction in Onoclea. either as a determinant of cell
polarity or as a result of factors governing cell polarity, under
standing the basis for the movement will be important in understanding
the induction process. Microtubules have been implicated in nuclear
migration in some developmental systems (Hepler and Palevitz, 1974;
Schmiedel and Schnepf, 1979; Wada and O'Brien, 1975; Zeiger, 1971).
If germinating fern spores are treated with antimicrotubule drugs,
nuclear migration is inhibited and rhizoids fail to form (Vogelmann
et al., 1981). There are other systems, such as guard mother cell forma
tion in onions, in which the premitotic nuclear migration prior to an
asymmetric cell division is unaffected by antimicrotubule drugs
(Hepler and Palevitz, 1974). Due to the few observations of micro
tubules in the vacuolate cells of Onoclea. the importance of micro
tubules in nuclear migration cannot be assessed.
Microfilaments also have been shown to affect nuclear movements
(Britz, 1979; Hepler and Palevitz, 1974). But cytochalasin-b, a pur
187
ported inhibitor of microfilaments, did not affect nuclear movement in
germinating fern spores or the formation of the rhizoids (Vogelmann
et al., 1981). Although microfilaments are reported to occur in all
eucaryotic cells (Hepier and Palevitz, 1974), they are often difficult
to visualize in fixed cells and were not observed in the cells of
Onoclea. The role of microfilaments and microtubules in antheridium
induction awaits further investigation.
The membranes within the cells, including the organellar membranes,
the tonoplast, and the plasmalemma, probably play a major role in
establishing cellular polarity by facilitating intracellular movements
(Poo and Robinson, 1977; Schmiedel and Schnepf, 1980; Weisenseel and
Kicherer, 1981). As the nucleus moves in Onoclea cells, the nuclear
membrane is in very close proximity to the tonoplast and the chloro-
plast membranes at all times. The chloroplasts line the plasmalemma
along the outer wall, often establishing contact between their membranes.
Schmiedel and Schnepf (1980) presented evidence which suggests that
movement of nuclei in Funaria caulonema is inhibited due to a change in
the nuclear envelope, which is brought about by different stages in the
cell cycle.
When Miller and Bassel (1980) treated germinating spores of Onoclea
with membrane active compounds such as methanol, ethanol, or chloro
form, the nuclear movement associated with the periphery of the spore
was inhibited. The initial movement of the nucleus from the center of
the spore to the side of the spore was unaffected. Even though the
nucleus proceeded to divide near the side wall, rhizoid formation did
not occur. Two vegetative cells were formed instead. These observa-
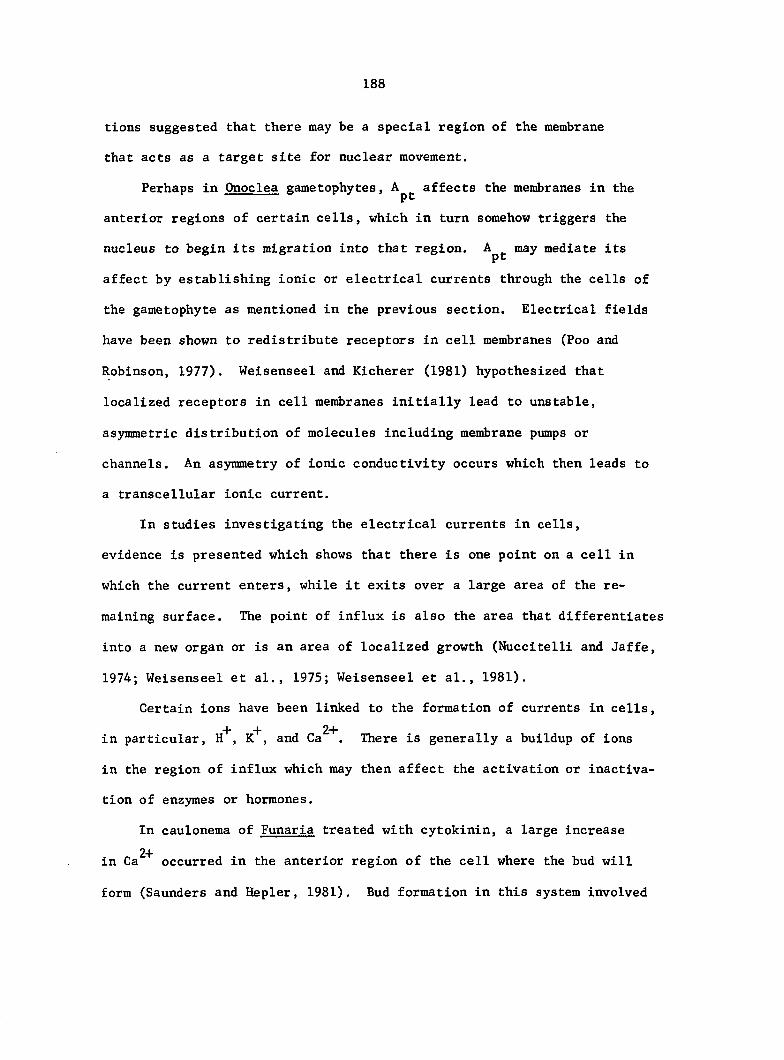
188
tions suggested that there may be a special region of the membrane
that acts as a target site for nuclear movement.
Perhaps in Onoclea gametophytes, affects the membranes in the
anterior regions of certain cells, which in turn somehow triggers the
nucleus to begin its migration into that region. may mediate its
affect by establishing ionic or electrical currents through the cells of
the gametophyte as mentioned in the previous section. Electrical fields
have been shown to redistribute receptors in cell membranes (Poo and
Robinson, 1977). Weisenseel and Kicherer (1981) hypothesized that
localized receptors in cell membranes initially lead to unstable,
asymmetric distribution of molecules including membrane pumps or
channels. An asymmetry of ionic conductivity occurs which then leads to
a transcellular ionic current.
In studies investigating the electrical currents in cells,
evidence is presented which shows that there is one point on a cell in
which the current enters, while it exits over a large area of the re
maining surface. The point of influx is also the area that differentiates
into a new organ or is an area of localized growth (Nuccitelli and Jaffe,
1974; Weisenseel et al., 1975; Weisenseel et al., 1981).
Certain ions have been linked to the formation of currents in cells,
+ + 2+ in particular, H , K , and Ca . There is generally a buildup of ions
in the region of influx which may then affect the activation or inactiva-
tion of enzymes or hormones.
In caulonema of Funaria treated with cytokinin, a large increase
2+ in Ca occurred in the anterior region of the cell where the bud will
form (Saunders and Hepier, 1981). Bud formation in this system involved
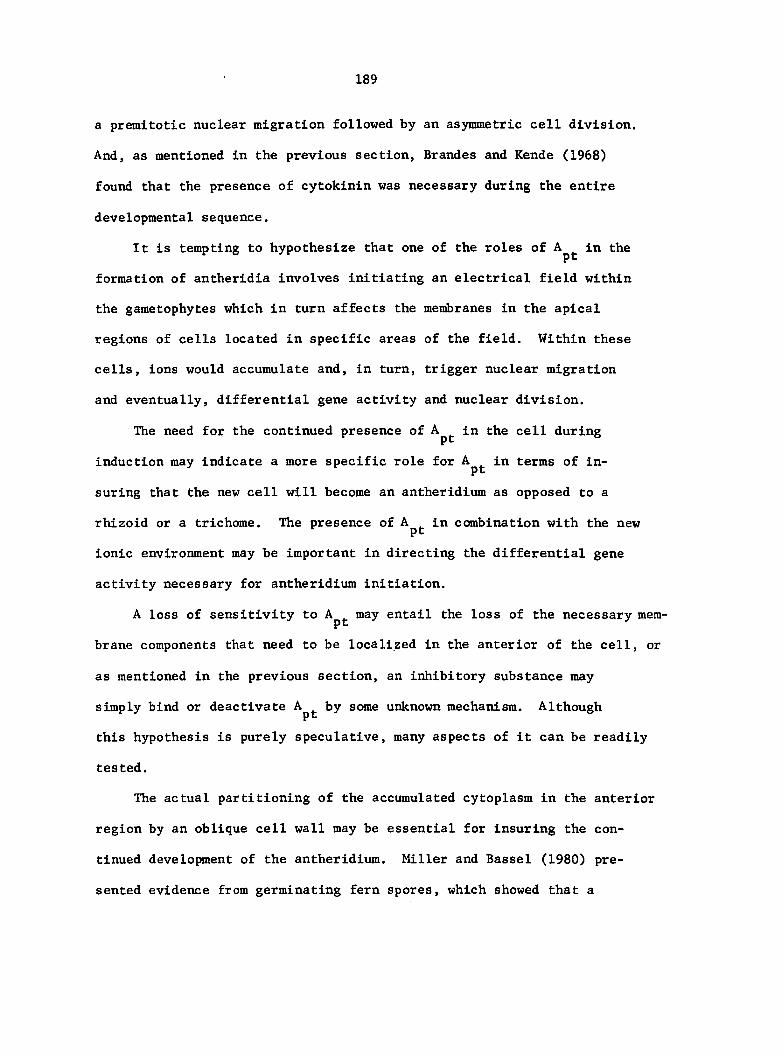
189
a premitotic nuclear migration followed by an asymmetric cell division.
And, as mentioned in the previous section, Brandes and Kende (1968)
found that the presence of cytokinin was necessary during the entire
developmental sequence.
It is tempting to hypothesize that one of the roles of in the
formation of antheridia involves initiating an electrical field within
the gametophytes which in turn affects the membranes in the apical
regions of cells located in specific areas of the field. Within these
cells, ions would accumulate and, in turn, trigger nuclear migration
and eventually, differential gene activity and nuclear division.
The need for the continued presence of A^^ in the cell during
induction may indicate a more specific role for A^^ in terms of in
suring that the new cell will become an antheridium as opposed to a
rhizoid or a trichome. The presence of A^^ in combination with the new
ionic environment may be important in directing the differential gene
activity necessary for antheridium initiation,
A loss of sensitivity to A^^ may entail the loss of the necessary mem
brane components that need to be localized in the anterior of the cell, or
as mentioned in the previous section, an inhibitory substance may
simply bind or deactivate A^^ by some unknown mechanism. Although
this hypothesis is purely speculative, many aspects of it can be readily
tested.
The actual partitioning of the accumulated cytoplasm in the anterior
region by an oblique cell wall may be essential for insuring the con
tinued development of the antheridium. Miller and Bassel (1980) pre
sented evidence from germinating fern spores, which showed that a
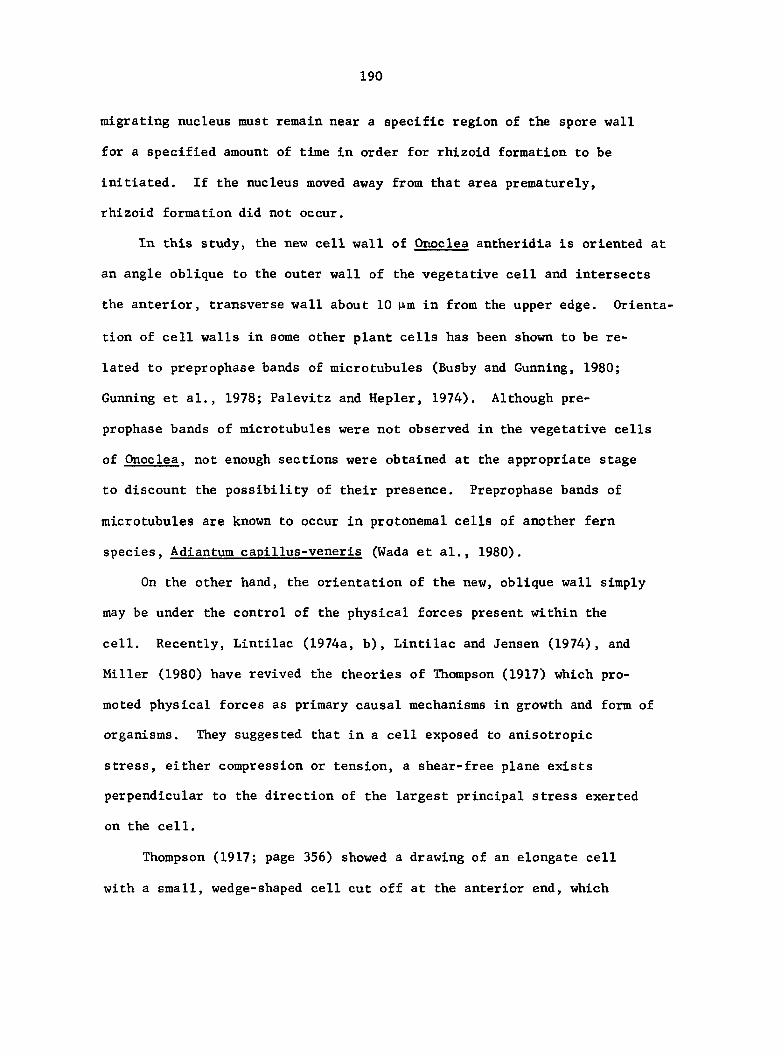
190
migrating nucleus must remain near a specific region of the spore wall
for a specified amount of time in order for rhizoid formation to be
initiated. If the nucleus moved away from that area prematurely,
rhizoid formation did not occur.
In this study, the new cell wall of Onoclea antheridia is oriented at
an angle oblique to the outer wall of the vegetative cell and intersects
the anterior, transverse wall about 10 p.m in from the upper edge. Orienta
tion of cell walls in some other plant cells has been shown to be re
lated to preprophase bands of microtubules (Busby and Gunning, 1980;
Gunning et al., 1978; Palevitz and Hepler, 1974). Although pre
prophase bands of microtubules were not observed in the vegetative cells
of Onoclea. not enough sections were obtained at the appropriate stage
to discount the possibility of their presence. Preprophase bands of
microtubules are known to occur in protonemal cells of another fern
species, Adiantum capillus-veneris (Wada et al., 1980).
On the other hand, the orientation of the new, oblique wall simply
may be under the control of the physical forces present within the
cell. Recently, Lintilac (1974a, b), Lintilac and Jensen (1974), and
Miller (1980) have revived the theories of Thompson (1917) which pro
moted physical forces as primary causal mechanisms in growth and form of
organisms. They suggested that in a cell exposed to anisotropic
stress, either compression or tension, a shear-free plane exists
perpendicular to the direction of the largest principal stress exerted
on the cell.
Thompson (1917; page 356) showed a drawing of an elongate cell
with a small, wedge-shaped cell cut off at the anterior end, which
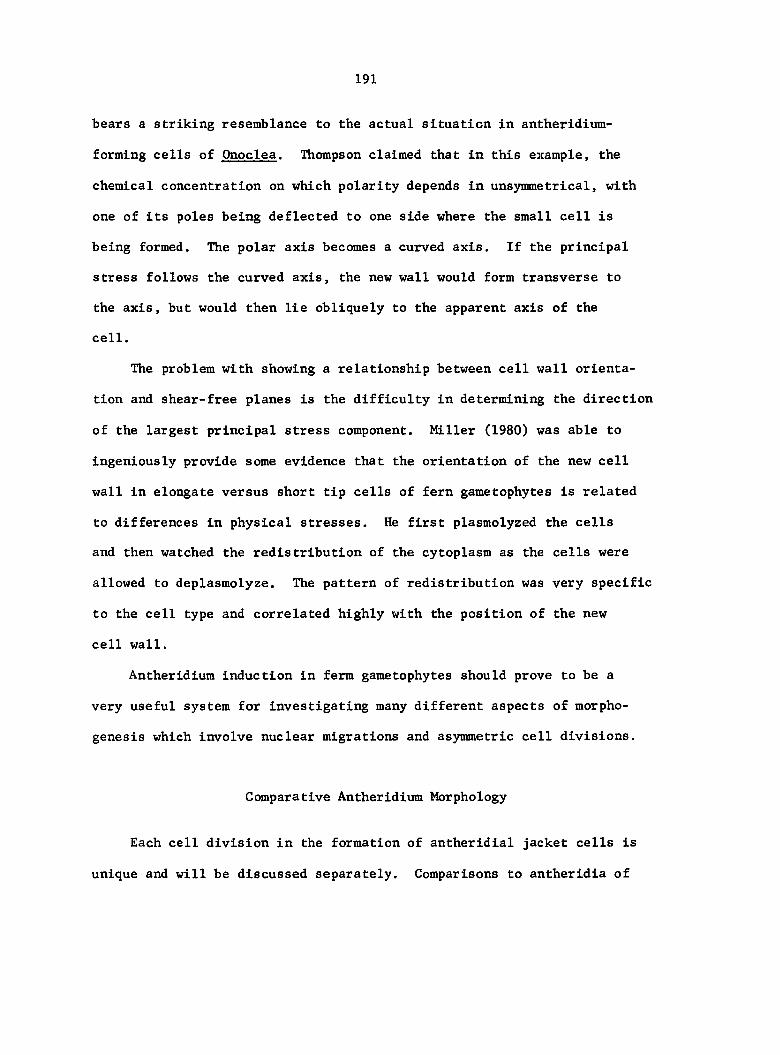
191
bears a striking resemblance to the actual situation in antheridium-
forming cells of Onoclea. Thompson claimed that in this example, the
chemical concentration on which polarity depends in unsymmetrical, with
one of its poles being deflected to one side where the small cell is
being formed. The polar axis becomes a curved axis. If the principal
stress follows the curved axis, the new wall would form transverse to
the axis, but would then lie obliquely to the apparent axis of the
cell.
The problem with showing a relationship between cell wall orienta
tion and shear-free planes is the difficulty in determining the direction
of the largest principal stress component. Miller (1980) was able to
ingeniously provide some evidence that the orientation of the new cell
wall in elongate versus short tip cells of fern gametophytes is related
to differences in physical stresses. He first plasmolyzed the cells
and then watched the redistribution of the cytoplasm as the cells were
allowed to deplasmolyze. The pattern of redistribution was very specific
to the cell type and correlated highly with the position of the new
cell wall.
Antheridium induction in ferm gametophytes should prove to be a
very useful system for investigating many different aspects of morpho
genesis which Involve nuclear migrations and asymmetric cell divisions.
Comparative Antheridium Morphology
Each cell division in the formation of antheridlal jacket cells is
unique and will be discussed separately. Comparisons to antheridia of
192
other species at corresponding stages in development will be made when
possible. Comparisons will be limited to other leptosporangiate ferns
which produce antheridia with five or less jacket cells. The classifica
tion system used for this discussion is adopted from Wagner (1974a, b)
which is shown diagrammatically in Figure 1.
Formation of initials
This study showed that Onoclea forms antheridia by an asymmetrical
cell division at the anterior end of vegetative cells, contrary to previous
reports in the literature. Campbell (1886) claimed that antheridia
in Onoclea arose as papillae, although his accompanying drawing depicts
a wedge-shaped cell at the anterior end of a vegetative cell. More re
cently, Davie (1951) concluded that the initial cell of Onoclea antheridia
began its development as a hemispherical protuberance, which was soon
cut off from the underlying prothallial cell. Leung and Naf (1979)
concluded after a three-year study of Onoclea antheridia, that the
initial arises as a hemispherical outgrowth on a nonspecialized vegeta
tive cell, after which an unequal cell division results in a small
one-celled initial. Leung and Naf (1979) used whole mounts of gameto-
phytes for their entire study which may explain their misinterpreta
tion.
It is difficult to determine from the literature whether a wedge-
shaped initial is typical or atypical in antheridium formation in fern
gametophytes. In early textbooks on ferns, a generalization was made
that antheridium initials of leptosporangiate ferns are produced by a
protuberance or papillae followed by the formation of a cell wall
193
(Atkinson, 1894; Bower, 1923; Campbell, 1913). In the most recent
review of the morphology of homosporous fern gametophytes, Nayar and
Kaur (1971) stated that leptosporangiate-type antheridia develop as a
superficial, thick, papilla-like initial cell formed towards the
middle of the peripheral wall of the mother cell. They noted an exception
in Ceratopteris. which formed wedge-shaped initials at the anterior ends
of mother cells. However, they claimed that eusporangiate-type of anther
idia originate as wedge-shaped initials formed towards one end of a super
ficial prothallial cell. Atkinson and Stokey (1964) also found that
the more primitive ferns which produce antheridia with numerous jacket
cells, form wedge-shaped initials. If these generalizations are true,
that would mean, in terms of antheridium initiation, that Onoclea is more
similar to the primitive ferns than to members in its own advanced family.
This conclusion is difficult to accept.
I have found only three reports in the literature that state or
infer from drawings that leptosporangiate ferns have wedge-shaped initials
(Campbell, 1886; Nayar and Kaur, 1971; Stone, 1961). Aside from the
drawings of Onoclea initials by Campbell (1886) and the reference to
Ceratopteris by Nayar and Kaur (1971), Stone (1961) found that Grammitis.
in the Polypodiaceae, has wedge-shaped initials.
Besides the general references to the leptosporangiate ferns men
tioned above, there are specific references to members of leptosporangiate
families which concluded that initials are formed either as protuberances
or as papillae: Adiantum (Atkinson, 1894; Kachroo and Nayar, 1953; Verma
and Khullar, 1966); Athvrium. Cyathea. Dicksonia. Diellia. Drvopteris.
Onoclea. Pitvrogramma. Polypodium. and Woodwardia (Davie, 1951); and
194
Pteris and Onvchlum (Verma and Khullar, 1966). These genera occur in
all the leptosporangiate families except the Schizaeaceae and the
Osmundaceae. These studies either presented no evidence or only drawings
as evidence that initials arise as protuberances or papillae. This
information, along with the fact that Davie (1951) characterized Onoclea
initials as papillae are reasons to view these reports with serious
reservations. A definite need exists to critically reexamine the forma
tion of antheridia in all of these genera.
However, it should not be inferred that the protuberance-type of
initials do not exist. Unquestionable evidence shows that Actinostachys
(Schizaeaceae; Bierhorst, 1975), Polvphlebium (Gyatheaceae; Stone, 1958),
and Blechnum (Aspleniaceae; Stone, 1961) form a protuberance-type
initial.
According to Bierhorst (1975), in Actinostachys. "the mother cell
of the antheridial initial bulges at the surface. The degree of bulging
determines whether or not the antheridium will be stalked.... The
nucleus of the mother cell assumes a position within the bulge. The
accumulated cytoplasm comes to be present in the antheridium initial."
Stone (1958) claimed that, for Polvphlebium. "the antheridium arises
from a filament cell as an outgrowth which produces a spherical head
either before or after it is cut off from the parent cell. In Blechnum,
Stone (1961) reported that "the antheridium arises from a prothallial
cell as a protuberance, which forms above the nucleus which is enlarged
and surrounded by denser cytoplasmic material than the rest of the cell....
Mitosis occurs and a wall forms in a plane parallel with the surface of
the prothallus if it is a superficial antheridium or perpendicular to
195
the surface if it is a marginal antheridium."
Due to the lack of data from many genera and the probable erroneous
data from a number of other genera, no phylogenetic or developmental
assessments can be made at the present time in terms of the initiation
event in antheridium formation.
Cytology of the initials
The initials of Onoclea are densely cytoplasmic with a centrally
located nucleus. The nucleus appeared to occupy a larger volume than
the nucleus in the mother cell. This observation was also made by Leung
and Naf (1979) for Onoclea. by Stone (1961) for Blechnum and Doodia. and
by Schraudolf (1968) for Polypodium. Nuclear enlargement and chromatin
dispersal have been shown to occur in nuclei transplanted into dif
ferent cytoplasmic environments, indicating an exposure of the genes to
the new regulatory conditions (Gurdon and Woodland, 1970). But nuclear
swelling also has been associated with DM synthesis and mitosis (Gurdon
and Woodland, 1970). The significance of the larger nucleus in the
initial is not known.
In Onoclea. microtubules were evident in the initials, particularly
along the outer, curved wall. Their presence may be important in directing
the distribution of new layers of microfibrils into the cell wall as the
initial rapidly expands both in height and width before the next cell divi
sion. Golgi bodies forming vesicles filled with fibrillar material were
also present. These vesicles may be transporting the new cell wall materi
al or precursors of cell wall material to the plasmalemma. If the initial
is papillate, as in some species, the expansion phase occurs before the
196
first division.
During the expansion of the initial in Onoclea. most of the cyto
plasm became localized in the anterior region of the initial. The
lower region became highly vacuolate. This polar arrangement of cyto
plasm was also noted by Leung and NSf (1979) for Onoclea and Stone (1961,
1962) who observed cytoplasmic polarity in the initials of Blechnum and
Doodia. Atkinson (1894) and Stokey and Atkinson (1957) included
drawings which indicated that a cytoplasmic polarity exists in the
initials of Adiantum and Elaphoelossum. respectively.
Formation of the basal cell
In Onoclea. the metaphase chromosomes and the phragmoplast of the
first division in the initial were lined up at a 41° angle to the base
of the initial. The subsequent cell wall was oriented at the same angle,
intersecting the basal wall near the center. Only rarely was this newly
formed wall transverse (parallel) to the base of the initial. Leung and
Naf (1979) claimed that in Onoclea. the phragmoplast was oriented parallel
to the base of the initial, but that the subsequent cell wall was funnel-
shaped, with the base of the funnel in contact with the center of the
basal wall. They also rarely found a transversely oriented new wall.
They did not present photographic evidence for the presence of trans
verse phragmoplasts and I feel that their interpretation of the orienta
tion is incorrect.
The occurrence of funnel-shaped walls in basal cells is consistent
with the classical theory of antheridium development proposed by Stras-
burger (1869), Campbell (1886, 1913), and Atkinson (1894). Although the
197
classical theory is generally interpreted to mean that the upper wall
of the basal cell is always funnel-shaped, many of the authors ac
credited with the theory actually claimed that the orientation of the
first wall formed in the initial varies from funnel-shaped to more-
or-less transverse (Atkinson, 1894; Campbell, 1886, 1913). The observa
tions made of the first cell wall in Onoclea initials also agrees with
observations of Stone (1962) for Polvphleblum.
Although observations from Onoclea are consistent with the classical
theory, they directly contradict Davie's theory, which states that the
first cell wall of the initial is always oriented transversely to the
base of the initial and either remains in that position or is pushed down
ward by the expanding upper cells. Davie (1951) based his claim on obser
vations of numerous antheridia, many of which had transverse walls and
many others which had walls varying in their degrees of concavity. He
presented no conclusive evidence showing that these differently shaped
walls are ontogenetically related.
Evidence from species other than Onoclea also contradicts Davie's
theory. Stone (1962) showed in Polvphlebium that the mitotic axis of the
first division is oriented at approximately 45° to the basal wall and that
the subsequent cell wall is funnel-shaped. Schraudolf (1968) presented
similar data for Polypodium polvcarpon. Schraudolf and Richter (1978) pre
sented further evidence in Polypodium crassifolium and Platycerium that
the orientation of the funnel-shaped wall is not a secondary trait due
to internal pressures. He showed the presence of plasmodesmata traversing
the basal wall in the region where the angled, funnel-shaped wall inter
sects the basal wall. Plasmodesmata would not traverse the wall if part
198
of the wall had secondarily come into contact with the other part of the
wall. This observation was also made using Onoclea during this study.
Although there is sufficient data to show that at least four different
genera of ferns have antheridia with primary funnel-shaped walls in the
basal cells, there are some species of ferns that typically do produce
disc- or barrel-shaped basal cells due to a transversely oriented new cell
wall (Vittaria. Farrar, Botany Department, Iowa State University, pers.
comm.; Diplazium. Kawasaki. 1957; Blechnum. Stone, 1961). There are other
species that apparently produce both kinds of basal cells with equal fre
quency (Drvopteris. Momose, 1939; Camptosorus. Momose, 1941a; Cvstopteris.
Momose, 1941b; Pentarhizidium. Momose, 1958b; Asplenium. Momose, 1959).
Although the basal cell in antheridia of members of the Schizaeaceae was
always a thin, disc-shaped cell (Atkinson, 1960; Bierhorst, 1975;
Schraudolf, 1963), its development is not analogous to basal cell formation
in the other advanced, leptosporangiate families. In the Schizaeaceae, the
basal cell is not formed until after another division occurs in the
initial, and then the basal cell is derived from the vegetative cell
supporting the initial.
Although it is easy to envision how a transverse wall is formed,
it is much more difficult to imagine how a funnel-shaped wall is de
posited. In fact, very little is known about the process or the
mechanisms controlling the formation of the funnel-shaped wall.
In Onoclea, the phragmoplast was first formed in the region between
the daughter nuclei and spanned the distance from the center of the
base of the initial to a lateral midpoint along the curved cell wall of
the initial. The completion of cytokinesis was not observed. It seems
199
reasonable to assume that the phragmoplast proceeds to form in a pivotal
manner, most likely bidirectionally, until the advancing edges meet and
fuse. The occurrence of small structures composed of densely packed
vesicles embedded in dense staining matrix material near the wall of
the initial at the upper limit of the phragmoplast may be important in
directing the formation of the wall. Similar structures were observed
by Gunning et al. (1978) in cells in the root apices of Azolla. They
felt that they may be microtubule organizing centers (MTOC) and are
probably related to preprophase bands of microtubules. After pre-
prophase bands of microtubules (PPBM) disappear during prophase, it
has been speculated that the site of PPBM is still morphogenetically
active and may have the ability to orient new cell walls (Palevitz and
Hepler, 1974). Perhaps the vesiculate structures observed in Onoclea
initials are MTOC or a reflection of a morphogenetically-active site
along the wall, which serves as a "track" for the developing phragmo
plast and subsequent cell wall.
Kny (1869) and Leung and Naf (1979) felt that the funnel-shaped
wall is formed simultaneously in all parts of the initial. Leung and
Naf (1979) claimed to have visualized an RNA-stained circular ribbon
that occurs just above the base of the initial after the nucleus divides.
They felt that this ribbon rises up in the initial and increases in
diameter until the ribbon is in contact with the curved wall of the
initial about midway between the apex and base of the initial. They
felt that the cell wall is deposited behind the ribbon as it rises and
that the upper nucleus rotates around the ribbon, supplying it with
additional RM. As mentioned earlier, Leung and Naf (1979) only used
200
whole mounts of gametophytes in their observations, a situation in which
artifacts would be difficult to avoid. I consider their interpretation
to be erroneous.
In this study, cytokinesis resulted in a densely cytoplasmic upper
cell with a large, centrally located nucleus and a highly vacuolate basal
cell, with a smaller nucleus. The nucleus in the upper cell was probably
enlarged due to the fact that it was in a state of synthesis prior to
the next mitosis. The nucleus in the lower cell is arrested in its
cycle and normally will undergo no further divisions.
The upper and basal cells were approximately equal in volume in
Onoclea. and from drawings and photographs of other antheridia with
funnel-shaped basal cells, it appears that both cells in other species
also are about equal in volume. No previous studies have investigated
the geometry of the antheridia. In the literature, it is taken for
granted that the basal cell is much smaller than the upper cell in a
typical 2-celled antheridium (Naf, 1962).
The significance of the relationship between equal cell volumes
and funnel-shaped walls is not known. If the laws of physical forces
apply to the orientation of cell walls (Lintilac, 1974a, b; Miller,
1980; Thompson, 1917), then it may be assumed that in an antheridium with
a height to diameter ratio of 3:4, which is positioned at an oblique
angle to the lower vegetative cell, the plane of shear-free stress oc
curs at an angle of about 41° to the base of the initial. Thompson
(1917; page 409) briefly discussed the orientation of cell walls in
antheridia. He made an analogy between the funnel-shaped wall and the
position that a soap bubble would take in a cylindrical dish or beaker.
201
The angles would be similar. Supposedly, the film of soap would lie
in the shear-free plane. He further suggested that if the initial were
a perfect hemisphere, the new cell wall would form in a transverse plane.
Perhaps the orientation of the first cell wall in an initial depends
on the shape of the initial when mitosis is stimulated. Miller's work with
tip cells of fern protonemata supports this supposition (Miller, 1980). In
antheridia with very elongate basal cells, the upper wall of the basal
cell is almost invariably transverse. Examples include Blechnum (Stone,
1961, 1962), Vittaria (Stokey, 1951), and some species of Asplenitim
(Momose, 1959). The shape of the initial in Asplenium when mitosis occurs
is not known, but the initials in Vittaria and Blechnum during division are
much longer than wide, as opposed to the initials of Onoclea (Farrar,
Botany Department, Iowa State University, pers. comm.; Stone, 1961). More
investigations involving the shape of initial cells during mitosis will
be necessary before any assumptions can be made.
The factors controlling the orientation of new cell walls are
probably numerous and interactive. Schraudolf (1967, 1977) found that
RNA and protein synthesis inhibitors greatly affected the cell pattern
in antheridia. The compound, 5-bromodeoxyuridine (BudR) caused antheridia
to resemble short vegetative filaments with transverse walls. BudR
causes AG/TC transitions during DNA replication or transcription. It
is not known how these mutations mediate cell wall orientation.
This observation may not be incompatible with the theory of physical
forces influencing cell wall orientation. The mutations may influence
the expansion of the cell such that when mitosis is triggered, the new
202
cell wall is positioned in response to the physical forces on the shape
of the cell at that point in time.
Formation of the second wall in the initials
Many cytoplasmic changes occurred in the upper cell of the 2-celled
Onoclea antheridium before the next mitosis. The upper portion of the
cell became vacuolate, while the RNA-stained cytoplasm accumulated in
the basal portion of the cell. The chloroplasts, originally in the
upper portion of the cell became distributed tangentially around the
nucleus. Microtubules occurred both near the nuclear envelope and along
the cell walls, but PPMB were not observed. General observations of
this redistribution of cytoplasm have been previously made (Atkinson,
1894; Leung and Naf, 1979; Stone, 1961, 1962).
During metaphase of this division, the chromosomes lined up in the
upper one-third of the cell, parallel to the base of the initial. The
new cell wall was oriented parallel to the outer, curved wall of the
initial and intersected the funnel-shaped wall about 6 pm in from the
edge, thus forming a central, spermatogenous cell and an upper, jacket
cell. Observations of this curved, periclinal wall are consistent
with the classical theory of antheridium development, but contradict
Davie's theory. Davie (1951) stated that the second cell wall is trans
verse, just like the first wall and that it becomes curved secondarily,
due to expansion of the internal cell pushing the wall upward. No
photographic evidence was presented to support Davie's claim.
Most previous observations of the second wall formation are
consistent with the classical theory of development (Atkinson, 1894;
203
Bower, 1923; Campbell, 1913; Nayar and Kaur, 1971; Schraudolf and Richter,
1978; Stone, 1961, 1962; Verma and Khullar, 1966). It appears that there
is less flexibility in the orientation of the second wall as compared
to that of the first wall.
However, there were still some workers who supported Davie's theory
(Atkinson and Stokey, 1964; Kachroo, 1955; Smith, 1955; Sporne, 1962;
Voeller, 1964a, b). There is no convincing evidence from any of these
studies.
In the schizaeaceous ferns, the wall which forms a central
spermatogenous cell and an upper ring cell tends to be oriented trans
versely (Bierhorst, 1975; Schraudolf, 1963). But this wall is actually
the first wall formed in the initials of the schizaeaceous ferns and
not the second wall as in other families, making significant comparisons
difficult.
The complete formation of the phragmoplast and subsequent curved
periclinal wall in Onoclea were not observed, nor have these stages been
followed in previous studies. Most likely, a disc-shaped phragmoplast
which forms between the two nuclei in the upper part of the cell continues
to form along its entire circumference in an outward and downward
direction, following the curvature of the outer wall until it reaches
and fuses with an area on the funnel-shaped wall. Ultrastructural
information is lacking for this stage and it is not known whether PPMB
or vesiculate structures are involved in the cell wall formation.
Leung and Naf (1979) offered an alternative interpretation which
is difficult to accept. Although they agreed that the initial portion
of the phragmoplast is located in the upper portion of the cell oriented
204
parallel to the base of the Initial, they claimed that this portion
physically moves down to the level of the upper rim of the funnel-
shaped wall. The cell wall is then formed at this level and ac
quires its curved, periclinal shape secondarily in response to Increasing
pressures in the central cell or cells. There is no convincing evidence
to support this explanation either from their study or this study.
The volumes of the central spermatogenous cell and the upper jacket
cell were approximately equal in Onoclea and from previously published
drawings and photographs, this relationship may hold for other genera as
well. The significance of the relationship between the cell volumes
and the position of the new cell wall is not known. If a shear-free
plane formed by external physical forces is determining the position
of the wall, the plane must be curved and the axes of principal stresses
must be perpendicular to all points on the surface of the outer curved
wall.
The majority of the dense cytoplasm was partitioned into the central
spermatogenous cell. There were no special cytoplasmic structures in
this meristematic cell to disclose its spermatogenic nature. Oc
casionally, a mitochondrion is observed in the spermatogenous cell
which has an inclusion of densely staining amorphous material. Such
mitochondria were also seen in vegetative cells and in spermatogenous
cells at later stages. The nature and function of these inclusions are
not known, although there is some reason to suspect that the material
may be calcium phosphate precipitate. Mitochondria are known to actively
2+ accumulate Ca in the presence of permeant anions, in particular,
phosphate (Lehninger, 1970). Masses of calcium phosphate have ranged up
205
2+ to 0.3 |4n in diameter. It has been suggested that Ca uptake may be
correlated to a cell's ability to regulate its ionic environment. The
nature and function of these inclusions await further investigation.
In Onoclea. the next division was always observed in the spermato-
genous cell which is consistent with observations by Campbell (1886)
for Onoclea. Leung and Naf (1979) indicated that the next division is
always in the upper jacket cell in Onoclea. Stone (1961) found with
Blechnum that the first division of the spermatogenous cell usually
takes place before the upper jacket cell divides, but occasionally it
divided either simultaneously with or rarely after the upper jacket
cell division. Bierhorst (1975) made similar observations with
Actinostachvs. Schraudolf (1963) stated that in Anemia the central
cell divides before the upper jacket cell, but in Polypodium, his
drawings indicated that the upper cell divides first (Schraudolf, 1968).
Davie (1951) claimed that in Pitvrogramma. the upper jacket cell divides
first and that this sequence of divisions is typical of many other
species, including Onoclea. In general, Nayar and Kaur (1971) claimed
that the upper jacket cell divides first. In summary, it appears that
the order of divisions involving the central cell and the upper jacket
cell are not under strict controls.
Formation of the cap cell
The side wall of the cap cell in Onoclea was in the shape of a modi
fied cylinder, such that each end of the cylinder is perpendicular at the
intersection with the upper and lower walls of the jacket cell. Stages
prior to cytokinesis were not observed in this study, but Leung and N3f
206
(1979) observed that the equator of the spindle apparatus was oriented
perpendicular to the upper and lower walls of the upper jacket cell. This
is the orientation that is predicted from this study due to the shape and
position of the forming cell wall which was observed. Although Leung and
N3f (1979) were unable to follow the development past the spindle stage,
they speculated that the wall probably forms simultaneously in all regions
after division just as Kny (1869) suggested. Evidence from this study
showed that all areas of the wall do not form simultaneously. The
phragmoplast was at different stages in formation in different regions
of the cylinder and the most mature stage of the cell wall appeared to
exist between the two nuclei. It is hypothesized that an initial disc
shaped phragmoplast forms between the nuclei during telophase and that
it continues to grow around its circumference until it fuses with
the upper and lower wall of the ring cell. Then, unknown forces direct
the continued formation at a specific curvature which will result in the
growing edges meeting at a location opposite the two nuclei where they
will fuse.
Bierhorst (1975) supported this hypothesis for cap cell formation.
In Actinostachvs. he found that the entire cap cell wall is not formed
simultaneously, and that the wall forms first between the two nuclei.
Stone (1961, 1962) made similar observations with Blechnum and
Polvphlebium. The earliest phragmoplast was observed between the two
nuclei and after the cell wall began to form between the nuclei, Stone
(1961, 1962) could distinguish a halo of, presumably, phragmoplast
material on the edges of the circular plate. Schraudolf (1963, 1968)
presented drawings which show that the equator of the spindle is oriented
207
perpendicular to the upper and lower walls of the jacket cell and that
the subsequent, cylindrical cap cell wall is oriented in the same
plane. The genera investigated were Polvpodium and Anemia. Thus, it
appears that along with Onoclea. Actinostachys. Anemia. Blechnum.
Polvphlebium. and Polvpodium all form cap cells according to the
classical theory, which claims that the jacket cell divides anticlinally
by means of a funnel cell.
The examples given above contradict Davie's theory, which states
that the cell wall of the cap cell forms transversely and when the upper
wall of the central cell grows or is pushed upward, the two cell walls
come into contact giving the impression of a disc-shaped cap cell and
a ring cell (Davie, 1951). Davie felt that cap cells of all advanced
ferns are formed by a transverse wall. This obviously has been proven
false in this study, and even Davie (1951) included drawings of
Pltvrogramma which show the equator of the mitotic spindle to be oriented
perpendicular to the upper and lower walls of the jacket cell. This
indicates that the cell wall will not be transverse.
Verma and Khullar (1966) studied six species in the Adiantaceae
and concluded that the cap cell is formed by a transverse wall. They
used whole mounts of gametophytes and included photographs of Adiantum
and Pteris antheridia in nondividing stages. The information in the
photographs is inconclusive at best and could be easily misinterpreted.
Stone (1969) was critical of the interpretation of Verma and Khullar
(1966) with respect to the formation of the cap cell. Stone (1969)
claimed that it is impossible to determine the manner in which a wall is
laid down from a study of cells after cytokinesis has been completed
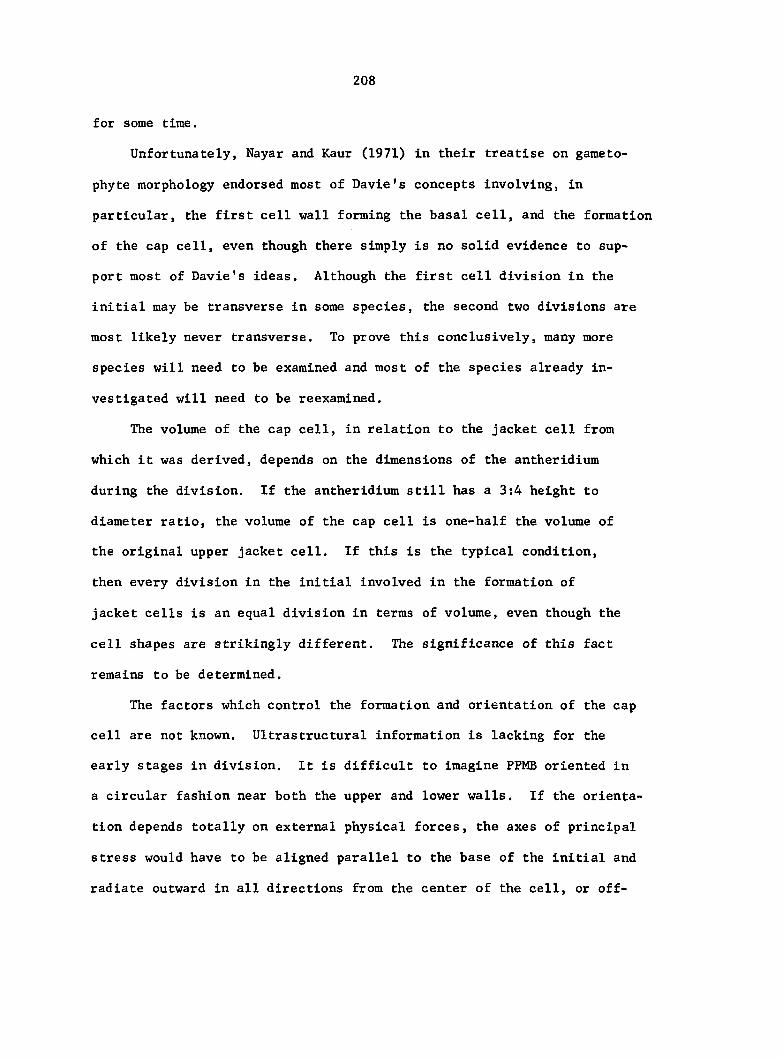
208
for some time.
Unfortunately, Nayar and Kaur (1971) in their treatise on gameto-
phyte morphology endorsed most of Davie's concepts involving, in
particular, the first cell wall forming the basal cell, and the formation
of the cap cell, even though there simply is no solid evidence to sup
port most of Davie's ideas. Although the first cell division in the
initial may be transverse in some species, the second two divisions are
most likely never transverse. To prove this conclusively, many more
species will need to be examined and most of the species already in
vestigated will need to be reexamined.
The volume of the cap cell, in relation to the jacket cell from
which it was derived, depends on the dimensions of the antheridium
during the division. If the antheridium still has a 3:4 height to
diameter ratio, the volume of the cap cell is one-half the volume of
the original upper jacket cell. If this is the typical condition,
then every division in the initial involved in the formation of
jacket cells is an equal division in terms of volume, even though the
cell shapes are strikingly different. The significance of this fact
remains to be determined.
The factors which control the formation and orientation of the cap
cell are not known. Ultrastructural information is lacking for the
early stages in division. It is difficult to imagine PPMB oriented in
a circular fashion near both the upper and lower walls. If the orienta
tion depends totally on external physical forces, the axes of principal
stress would have to be aligned parallel to the base of the initial and
radiate outward in all directions from the center of the cell, or off-
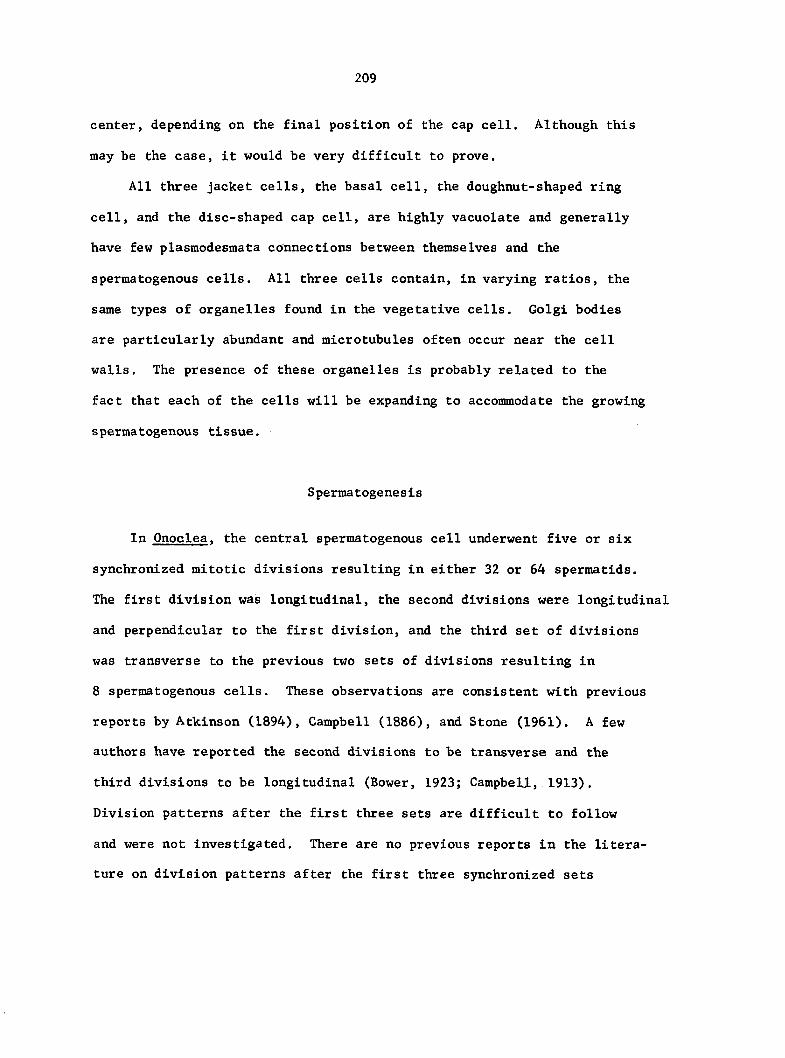
209
center, depending on the final position of the cap cell. Although this
may be the case, it would be very difficult to prove.
All three jacket cells, the basal cell, the doughnut-shaped ring
cell, and the disc-shaped cap cell, are highly vacuolate and generally
have few plasmodesmata connections between themselves and the
spermatogenous cells. All three cells contain, in varying ratios, the
same types of organelles found in the vegetative cells. Golgi bodies
are particularly abundant and microtubules often occur near the cell
walls. The presence of these organelles is probably related to the
fact that each of the cells will be expanding to accommodate the growing
spermatogenous tissue.
Spermatogenesis
In Onoclea. the central spermatogenous cell underwent five or six
synchronized mitotic divisions resulting in either 32 or 64 spermatids.
The first division was longitudinal, the second divisions were longitudinal
and perpendicular to the first division, and the third set of divisions
was transverse to the previous two sets of divisions resulting in
8 spermatogenous cells. These observations are consistent with previous
reports by Atkinson (1894), Campbell (1886), and Stone (1961). A few
authors have reported the second divisions to be transverse and the
third divisions to be longitudinal (Bower, 1923; Campbell, 1913),
Division patterns after the first three sets are difficult to follow
and were not investigated. There are no previous reports in the litera
ture on division patterns after the first three synchronized sets
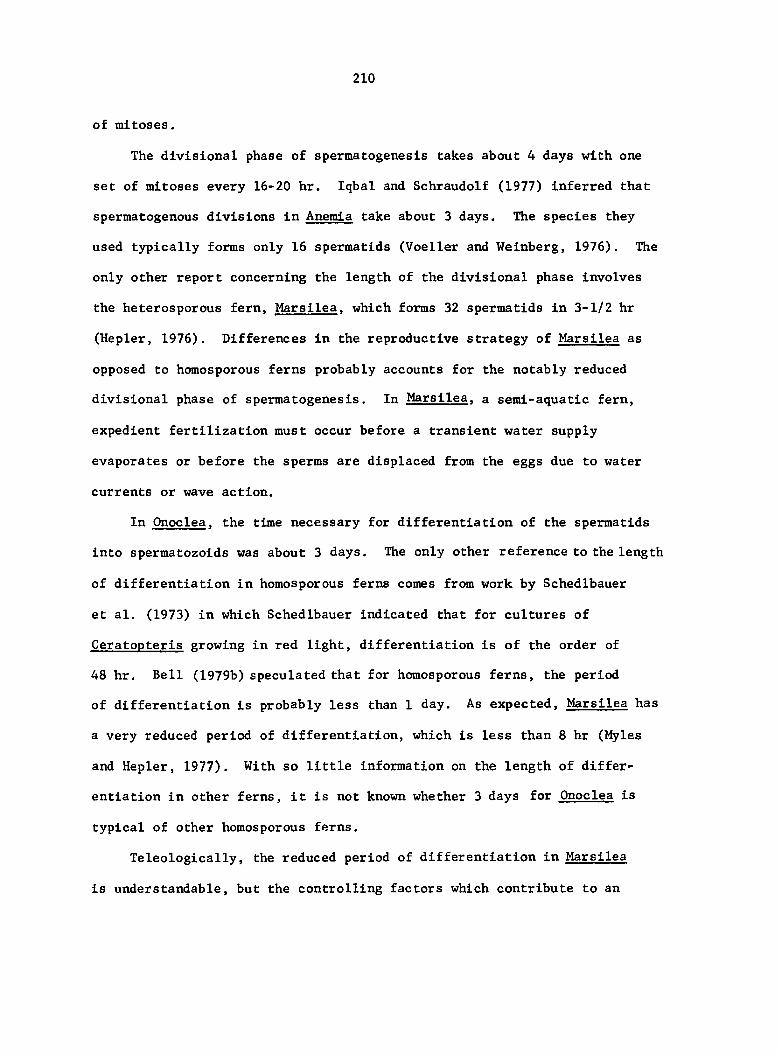
210
of mitoses.
The divisional phase of spermatogenesis takes about 4 days with one
set of mitoses every 16-20 hr. Iqbal and Schraudolf (1977) inferred that
spermatogenous divisions in Anemia take about 3 days. The species they
used typically forms only 16 spermatids (Voeller and Weinberg, 1976). The
only other report concerning the length of the divisional phase involves
the heterosporous fern, Marsilea. which forms 32 spermatids in 3-1/2 hr
(Hepler, 1976). Differences in the reproductive strategy of Marsilea as
opposed to homosporous ferns probably accounts for the notably reduced
divisional phase of spermatogenesis. In Marsilea, a semi-aquatic fern,
expedient fertilization must occur before a transient water supply
evaporates or before the sperms are displaced from the eggs due to water
currents or wave action.
In Onoclea. the time necessary for differentiation of the spermatids
into spermatozoids was about 3 days. The only other reference to the length
of differentiation in homosporous ferns comes from work by Schedlbauer
et al. (1973) in which Schedlbauer indicated that for cultures of
Ceratopteris growing in red light, differentiation is of the order of
48 hr. Bell (1979b) speculated that for homosporous ferns, the period
of differentiation is probably less than 1 day. As expected, Marsilea has
a very reduced period of differentiation, which is less than 8 hr (Myles
and Hepler, 1977). With so little information on the length of differ
entiation in other ferns, it is not known whether 3 days for Onoclea is
typical of other homosporous ferns.
Teleologically, the reduced period of differentiation in Marsilea
is understandable, but the controlling factors which contribute to an
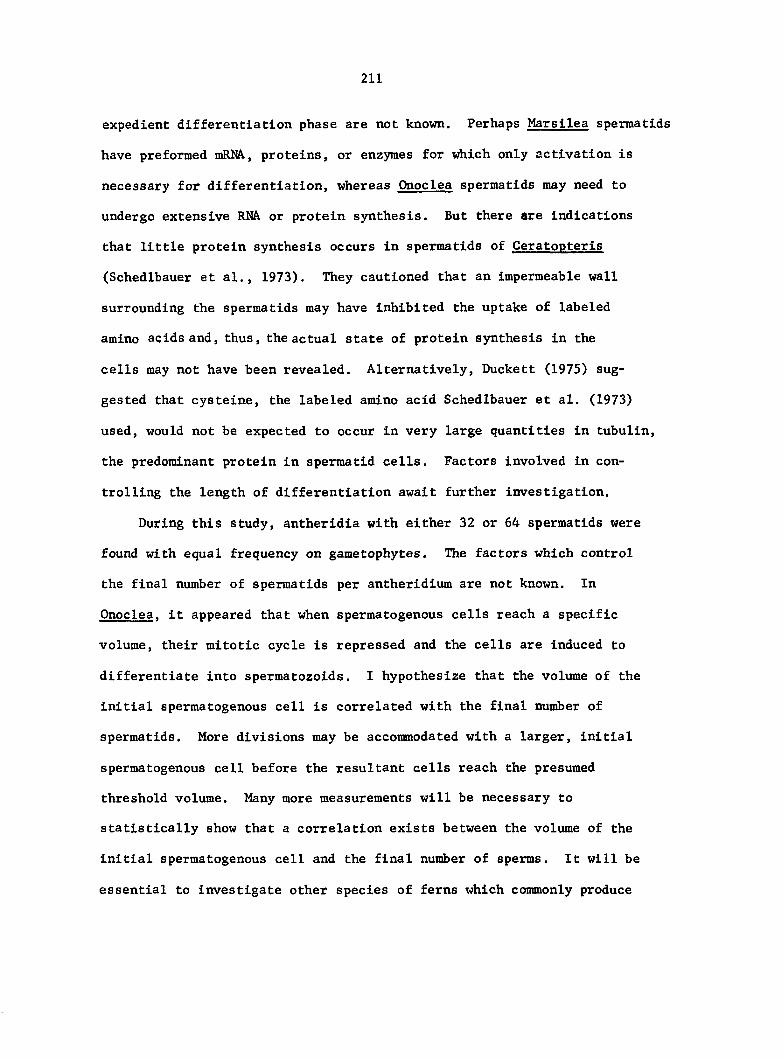
211
expedient differentiation phase are not known. Perhaps Marsilea spermatids
have preformed mRNA, proteins, or enzymes for which only activation is
necessary for differentiation, whereas Onoclea spermatids may need to
undergo extensive RNA or protein synthesis. But there are indications
that little protein synthesis occurs in spermatids of Ceratopteris
(Schedlbauer et al., 1973). They cautioned that an impermeable wall
surrounding the spermatids may have inhibited the uptake of labeled
amino acids and, thus, the actual state of protein synthesis in the
cells may not have been revealed. Alternatively, Duckett (1975) sug
gested that cysteine, the labeled amino acid Schedlbauer et al. (1973)
used, would not be expected to occur in very large quantities in tubulin,
the predominant protein in spermatid cells. Factors involved in con
trolling the length of differentiation await further investigation.
During this study, antheridia with either 32 or 64 spermatids were
found with equal frequency on gametophytes. The factors which control
the final number of spermatids per antheridium are not known. In
Onoclea. it appeared that when spermatogenous cells reach a specific
volume, their mitotic cycle is repressed and the cells are induced to
differentiate into spermatozoids. I hypothesize that the volume of the
initial spermatogenous cell is correlated with the final number of
spermatids. More divisions may be accommodated with a larger, initial
spermatogenous cell before the resultant cells reach the presumed
threshold volume. Many more measurements will be necessary to
statistically show that a correlation exists between the volume of the
initial spermatogenous cell and the final number of sperms. It will be
essential to investigate other species of ferns which commonly produce
212
a different number of sperms per antheridium.
However, there is a paucity of information on the number of spermatids
per antheridium in other species of ferns. Eames (1936) and Bower (1923)
indicated that, in general, homosporous, leptosporangiate fern antheridia
contain 32 sperms. Foster and Gifford (1974) and Nayar and Kaur (1971)
claimed that 16 or 32 sperms per antheridium are common for higher
ferns. Voeller and Weinberg (1967) found that Anemia gametophytes
treated with GA. or A formed antheridia with 16 spermatids. In un-j an
supplemented cultures, they found many antheridia with 16 sperms, some
with 32 sperms, and occasionally an antheridium with 8 sperms. Generally,
only one size of antheridium occurred per gametophyte. Bell and Duckett
(1976) claimed that Pteridium forms 32 sperms per antheridium.
The lowest number of sperms encountered per antheridium was reported
for Drynaria (Polypodlaceae) which has 4-8 sperms (Nayar, 1965). Ac
counts of antheridia with more than 32 sperms in the most advanced ferns
(Aspleniaceae) were not encountered in the literature, Eames (1936;
pp. 280-281) reported that in the Schizaeaceae, there are typically
more than 32 sperms per antheridium and in the Cyatheaceae, there are
commonly antheridia with 64 sperms and possibly some with 256 sperms.
From this study, it is felt that antheridia with 64 sperms is more com
mon in the Aspleniaceae than previously reported.
The size, shape and number of jacket cells in an antheridium also
may be highly correlated with the final number of sperms. Their
ability to expand with the increasing number of spermatogenous cells
may play a key role in determining the final number of sperms. It
would be informative to examine the more primitive groups of ferns
213
with antheridia composed of numerous jacket cells to determine the
volume of the initial spermatogenous cell compared to final number of
sperms.
Not all workers assume that spermatogenous cells divide syn
chronously, as expressed by the geometric progression 2^, where n
equals the number of synchronized divisions (Nayar, 1965). Only in
this study and in a study by Bierhorst (1975) have synchronized divisions
been reported. But it appears from the number of sperms reported for
other species, that, in general, spermatogenous cells divide synchronously.
Studies on other systems which involve synchronized, dividing cells sur
rounded by a nondividing layer of cells, such as sporangia, may provide
relevant information on the factors controlling the final number of dif
ferentiated cells.
The means through which cell volume might influence cell differentia
tion is not known. Perhaps the nuclear : cytoplasmic ratio is important
in the process, due to either a decreased or increased concentration of
a substance in the reduced cytoplasm which then either activates or de-
represses genetic information. Alternatively, the increased proximity
of the nuclear membrane with the plasmalemma may play a role in
inhibiting mitosis and directing differentiation.
Ultrastructure of spermatogenous cells
In Onoclea. the meristematic, spermatogenous cells changed little
in their ultrastructural appearance from the inception of the spermato
genous initial cell to the spermatid mother cell stage. The cytoplasm,
dense with ribosomes, contained numerous pleomorphic mitochondria with
214
dense stromas and vesiculate cristae. Duckett (1975) observed pleo
morphic mitochondria in early spermatogenous cells of Pteridium and
Drvopterls. but described them as having transparent matrices with
short, vesiculate cristae. He noted that the stroma of the mitochondria
became denser in the spermatids. The reason for this discrepancy in
mitochondrial appearance is probably due to fixation artifacts in
Duckett's material. In poorly fixed spermatogenous tissue in Onoclea.
the mitochondria were the first organelles to lose their internal
structure.
The dedifferentiation of chloroplasts during spermatogenesis, as
observed in Onoclea. has also been observed in other ferns and mosses
(Carothers, 1975; Duckett, 1975; Hepler, 1976; Paolillo and Cukierski,
1976). Golgi bodies were present in all of the cells of Onoclea
antheridia, producing large vesicles containing fibrous material,
similar in appearance to material in the cell walls. Active Golgi
bodies are implicated in the formation of the numerous, new cell
walls formed during the divisional phase. Duckett (1975) found Golgi
body behavior to be strictly related to the cell cycle. He found
Golgi bodies with small, marginal vesicles during interphase and large
vesicles during telophase with their contents becoming incorporated
into new cell plates.
There were always numerous microtubules present in the spermato
genous cells of Onoclea. Although definite preprophase bands of micro
tubules have not been identified, small bands of parallel microtubules
occurred near the cell wall in certain regions of the cell. Many micro
tubules were also found oriented tangentially around the nuclei. Observa-
215
tions on microtubule numbers or distribution in spermatogenous cells
of other species are lacking.
RER and SER occurred throughout the cells in Onoclea during the
division phase, as reported for other ferns by Duckett (1975). Mito
chondria with inclusions of densely staining amorphous material were
occasionally observed in the spermatogenous cells of Onoclea. These
inclusions have not previously been reported for any other plant species.
As mentioned earlier, the chemical nature and function of the inclusions
are not known.
Also observed in the older spermatogenous cells of Onoclea were
some osmlophllic bodies. No previous mention has been made of such
bodies in spermatogenous cells, but Hepler (1976) Included micrographs
of Marsilea spermatids containing osmlophllic bodies resembling those
seen in Onoclea. Two large osmlophllic bodies arose novo with the
blepharoplast in Ginkgo (Gifford and Larson, 1980) but their function
is not known and no speculation was offered.
Ultras truetural changes during spermatid differentiation
Many profound changes occurred during differentiation which resulted
in nuclear coiling, chromatin condensation, flagella formation, and the
loss of a great deal of cytoplasm. The formation of a de novo organelle,
the blepharoplast, appeared to be intimately related to all of these
changes. Events during differentiation in Onoclea are very similar to
events previously observed in other homosporous ferns (Bell, 1974, 1979b;
Bell and Duckett, 1976; Duckett, 1975), Epuiseturn (Duckett, 1975), and
Marsilea (Hepler, 1976; Mizukami and Gall, 1966; Myles, 1979; Myles
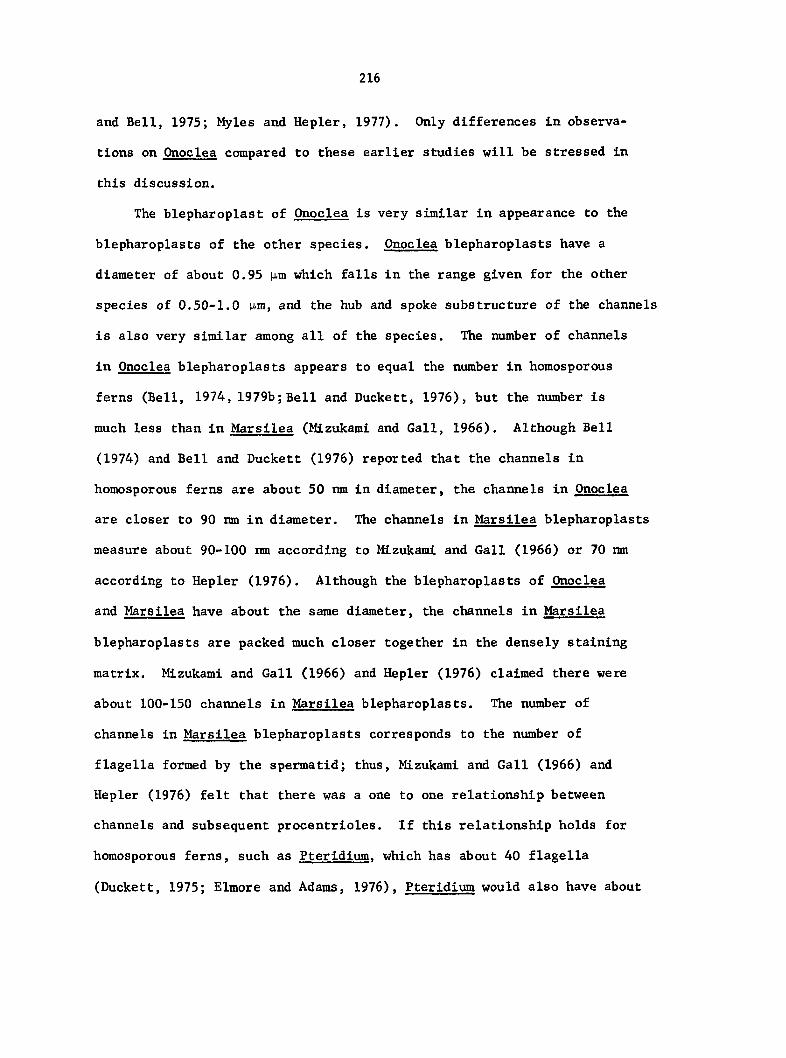
216
and Bell, 1975; My les and Kepler, 1977). Only differences in observa
tions on Onoclea compared to these earlier studies will be stressed in
this discussion.
The blepharoplast of Onoclea is very similar in appearance to the
blepharoplasts of the other species. Onoclea blepharoplasts have a
diameter of about 0.95 |xm which falls in the range given for the other
species of 0.50-1.0 nm, and the hub and spoke substructure of the channels
is also very similar among all of the species. The number of channels
in Onoclea blepharoplasts appears to equal the number in homosporous
ferns (Bell, 1974, 1979b; Bell and Duckett, 1976), but the number is
much less than in Marsilea (Mizukami and Gall, 1966). Although Bell
(1974) and Bell and Duckett (1976) reported that the channels in
homosporous ferns are about 50 nm in diameter, the channels in Onoclea
are closer to 90 nm in diameter. The channels in Marsilea blepharoplasts
measure about 90-100 nm according to Mizukami and Gall (1966) or 70 nm
according to Hepler (1976). Although the blepharoplasts of Onoclea
and Marsilea have about the same diameter, the channels in Marsilea
blepharoplasts are packed much closer together in the densely staining
matrix. Mizukami and Gall (1966) and Hepler (1976) claimed there were
about 100-150 channels in Marsilea blepharoplasts. The number of
channels in Marsilea blepharoplasts corresponds to the number of
flagella formed by the spermatid; thus, Mizukami and Gall (1966) and
Hepler (1976) felt that there was a one to one relationship between
channels and subsequent procentrioles. If this relationship holds for
homosporous ferns, such as Pteridium. which has about 40 flagella
(Duckett, 1975; Elmore and Adams, 1976), Pteridium would also have about
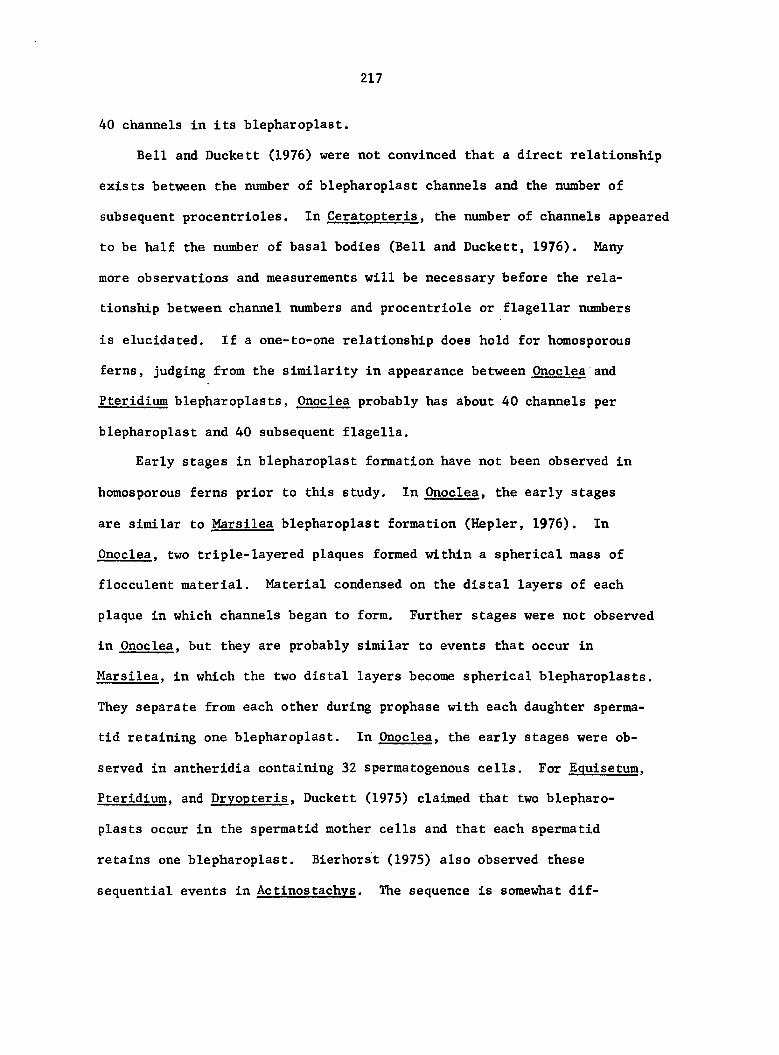
217
40 channels in its blepharoplast.
Bell and Duckett (1976) were not convinced that a direct relationship
exists between the number of blepharoplast channels and the number of
subsequent procentrioles. In Ceratopteris. the number of channels appeared
to be half the number of basal bodies (Bell and Duckett, 1976). Many
more observations and measurements will be necessary before the rela
tionship between channel numbers and procentriole or flagellar numbers
is elucidated. If a one-to-one relationship does hold for homosporous
ferns, judging from the similarity in appearance between Onoclea and
Pteridium blepharoplasts, Onoclea probably has about 40 channels per
blepharoplast and 40 subsequent flagella.
Early stages in blepharoplast formation have not been observed in
homosporous ferns prior to this study. In Onoclea. the early stages
are similar to Marsilea blepharoplast formation (Hepler, 1976). In
Onoclea. two triple-layered plaques formed within a spherical mass of
flocculent material. Material condensed on the distal layers of each
plaque in which channels began to form. Further stages were not observed
in Onoclea. but they are probably similar to events that occur in
Marsilea, in which the two distal layers become spherical blepharoplasts.
They separate from each other during prophase with each daughter sperma
tid retaining one blepharoplast. In Onoclea. the early stages were ob
served in antheridia containing 32 spermatogenous cells. For Equisetum.
Pteridium. and Drvopteris. Duckett (1975) claimed that two blepharo
plasts occur in the spermatid mother cells and that each spermatid
retains one blepharoplast, Bierhorst (1975) also observed these
sequential events in Actinostachys. The sequence is somewhat dif
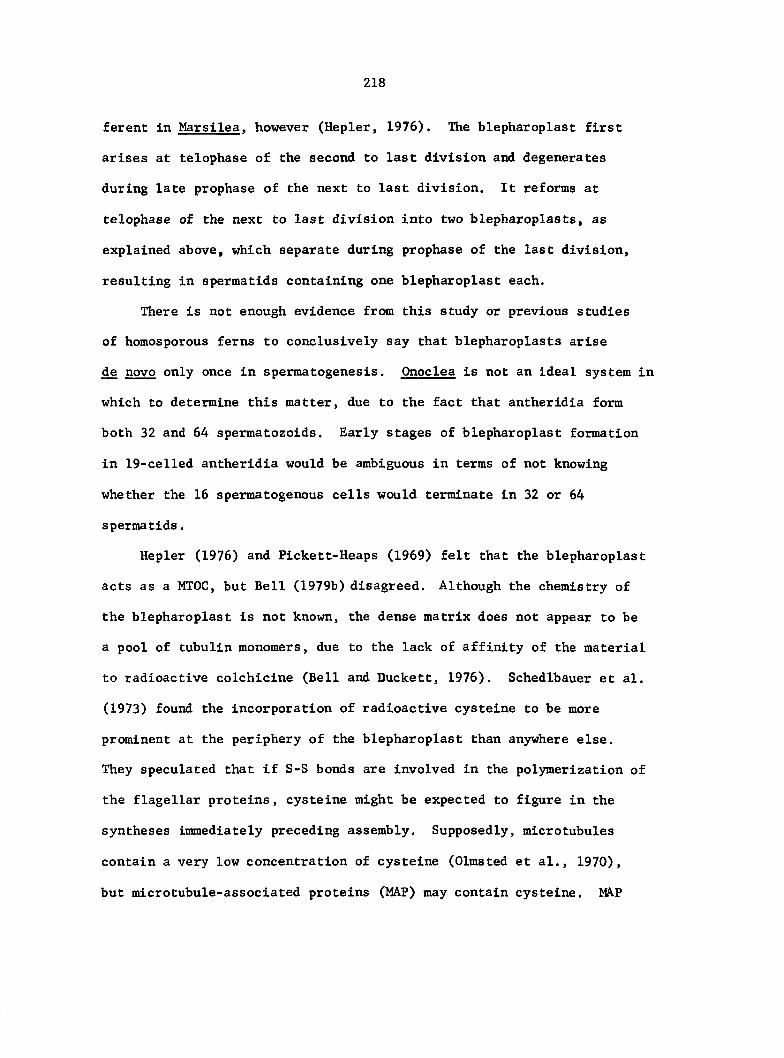
218
ferent in Marsilea. however (Hepler, 1976). The blepharoplast first
arises at telophase of the second to last division and degenerates
during late prophase of the next to last division. It reforms at
telophase of the next to last division into two blepharoplasts, as
explained above, which separate during prophase of the last division,
resulting in spermatids containing one blepharoplast each.
There is not enough evidence from this study or previous studies
of homosporous ferns to conclusively say that blepharoplasts arise
de novo only once in spermatogenesis. Onoclea is not an ideal system in
which to determine this matter, due to the fact that antheridia form
both 32 and 64 spermatozoids. Early stages of blepharoplast formation
in 19-celled antheridia would be ambiguous in terms of not knowing
whether the 16 spermatogenous cells would terminate in 32 or 64
spermatids.
Hepler (1976) and Pickett-Heaps (1969) felt that the blepharoplast
acts as a MTOC, but Bell (1979b) disagreed. Although the chemistry of
the blepharoplast is not known, the dense matrix does not appear to be
a pool of tubulin monomers, due to the lack of affinity of the material
to radioactive colchicine (Bell and Duckett, 1976). Schedlbauer et al.
(1973) found the incorporation of radioactive cysteine to be more
prominent at the periphery of the blepharoplast than anywhere else.
They speculated that if S-S bonds are involved in the polymerization of
the flagellar proteins, cysteine might be expected to figure in the
syntheses immediately preceding assembly. Supposedly, microtubules
contain a very low concentration of cysteine (Olmsted et al., 1970),
but microtubule-associated proteins (MAP) may contain cysteine. MAP
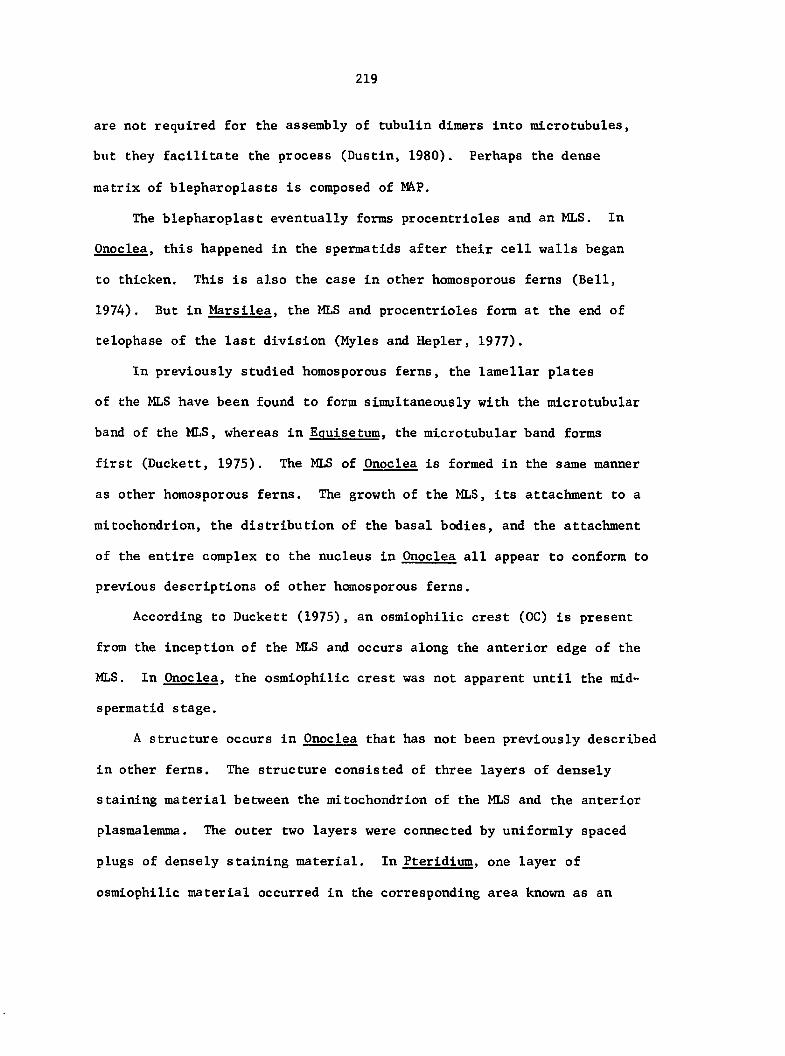
219
are not required for the assembly of tubulin dimers into microtubules,
but they facilitate the process (Dustin, 1980). Perhaps the dense
matrix of blepharoplasts is composed of M^P.
The blepharoplast eventually forms procentrioles and an MLS. In
Onoclea. this happened in the spermatids after their cell walls began
to thicken. This is also the case in other homosporous ferns (Bell,
1974), But in Marsilea. the MLS and procentrioles form at the end of
telophase of the last division (Myles and Hepler, 1977).
In previously studied homosporous ferns, the lamellar plates
of the MLS have been found to form simultaneously with the microtubular
band of the MLS, whereas in Equisetum. the microtubular band forms
first (Duckett, 1975). The MLS of Onoclea is formed in the same manner
as other homosporous ferns. The growth of the MLS, its attachment to a
mitochondrion, the distribution of the basal bodies, and the attachment
of the entire complex to the nucleus in Onoclea all appear to conform to
previous descriptions of other homosporous ferns.
According to Duckett (1975), an osmiophilic crest (OC) is present
from the inception of the MLS and occurs along the anterior edge of the
MLS. In Onoclea. the osmiophilic crest was not apparent until the mid-
spermatid stage.
A structure occurs in Onoclea that has not been previously described
in other ferns. The structure consisted of three layers of densely
staining material between the mitochondrion of the MLS and the anterior
plasmalemma. The outer two layers were connected by uniformly spaced
plugs of densely staining material. In Pteridium. one layer of
osmiophilic material occurred in the corresponding area known as an
220
osmiophilic strip.
Duckett (1975) found that one of the differences between Equlsetum
spermatozoids and homosporous fern spermatozoids is the presence of an
accessory band of microtubules separating the OC and the plasmalemma
in ferns, but not in Equisetum. There are 25 microtubules in the band
in Pteridium and 35 in Drvopteris. Onoclea has an accessory band of
microtubules which has between 25 and 35 microtubules.
The mature spermatozoids of Onoclea appear to have 4 to 5 gyres.
This is consistent with observations made in Pteridium (Duckett, 1975).
In Pteridium. the nucleus occupies 2-1/2 to 3-1/2 gyres, while the MLS
occupies 1-3/4 gyres. It appears that Onoclea has a similar ratio of
nuclear to MLS gyres. In Equisetum. the MLS occupies 2-1/2 gyres and
the nucleus occupies only 1-1/4 gyres, which is definitely different
than Onoclea. Marsilea. on the other hand, has between 8 and 10 gyres,
with the MLS occupying only 3/4 of the anterior gyre (My les and He pier,
1977).
The forces involved in the nuclear coiling and chromatin condensa
tion are not known. Myles and Hepler (1977) presented an in-depth discus
sion on this topic. In summary, they felt that the microtubular ribbon
acts as a guide for nuclear elongation and that a force-generating
system such as actin or actin-like proteins may be situated near the
nuclear envelope. Bell (1979b) generally agreed with the hypothesis
presented by Myles and Hepler (1977) and Duckett et al. (1979) provided
further evidence for the role of microtubules as a "former" for nuclear
coiling in a mutant species of Ceratopteris.
221
Cell wall formation during spermatid differentiation
Throughout the division phase of spermatogenesis in Onoclea. the
cell walls separating the spermatogenous cells were only about 0.10
thick. The walls began to uniformly thicken to about 0.20 pm during
the formation of the blepharoplast in the spermatid mother cells. As
the blepharoplast differentiated into procentrioles and an MLS, a large
amount of fibrous material was differentially deposited between the
plasmalemma and the original cell wall, synchronous with the rounding-
up of the spermatids. A few cytoplasmic connections, much larger in
diameter than plasmodesmata, occurred between the spermatids. A second
uniformly thin layer of fibrillar-granular material was deposited between
the plasmalemma and the previous deposition after the MLS had en
circled about one-half of the spherical nucleus. Golgi bodies were
actively producing vesicles filled with fibrillar material during these
two stages of cell wall deposition. No previous studies have described
these two phases of cell wall deposition. Analysis of the chemical
nature of these two layers was not done during the course of this study,
but it has previously been shown that callose, hemicellulose, and lipids
are all present in the thickened walls between the spermatids of
Ceratopteris (Cave and Bell, 1973). During the early stage in differentia
tion, they found that the thickened walls stained homogeneously for the
three different compounds, but later in differentiation, only a thin
layer stained for hemicellulose and lipids near the spermatozoid, and
no portion of the wall stained for callose. Gorska-Brylass (1968)
found that callose accumulates around spermatids in Adiantum cuneatum.
but that it disappears when the nucleus begins to coil.
222
Cave and Bell (1973) assumed that only one layer of material was
deposited around fern spermatids and, thus, concluded that the deeper
staining of a thin layer later in differentiation was due to loss of
water in that layer which dilutes the interstitial layer. But the fact
that there are probably two chemically different layers deposited during
differentiation, as found in this study, may account for this differential
staining pattern. The first layer may hydrate to a certain extent due
to the hemicellulosic component, but probably not due to the loss of
water in the later, thin layer.
If cell wall deposition in Onoclea during differentiation is similar
to Ceratopteris. the first large deposition of material is probably com
posed of hemicellulose, lipids, and callose, while the second, thinner
layer is probably composed of hemicellulose and lipids. Future studies
will be necessary to confirm these assumptions.
Callose occurs quite often in the plant kingdom, including around
liverwort spores (Gdrska-Brylass, 1969), pteridophyte sperms, eggs,
and megasporocytes (Gdrska-Brylass, 1968; Bell, 1979a), Selaginella micro-
and megaspores (Gorska-Brylass, 1968; Horner and Beltz, 1970), and micro-
and megaspores of higher plants (see Horner and Beltz, 1970). Callose
is known for its sealing properties and often occurs during periods of a
life cycle when the plant is making a transition from the gametophyte
generation to the sporophyte generation or vice versa. Bell (1979a)
speculated that the preparation of a cell, within the tissue of its
parent, for a different phase of growth may be impossible if the cell
continues to suffer the ingress of informational molecules.
The function of hemicellulose in the layer of deposition may be
223
related to the dispersal of the sperms. Hemicellulose is hydrophilic
and the uptake of water is apparently necessary for sperm release. Late
in differentiation, the spermatogenous tissue is observed bulging into
the jacket cells in Onoclea. Bierhorst (1975) also made this observation
with Actinostachvs. This bulging is probably due to the pressure caused
by the absorption of water in the large layer of hemicellulosic material.
A counter-pressure builds up in the jacket cells due to their high
osmotic potential (Igura, 1959, 1960). Presumably, the interaction
between these two pressures plays an important role in sperm release.
Hartman (1931) found that the cap cells in Onoclea antheridia are
removed during dehiscence as opposed to being ruptured. SEH micrographs
from this present study of Onoclea showing antheridia without cap cells
support the earlier observations of Hartman (1931).
The cap cell appears to have a number of special characteristics
compared to the other jacket cells. This study showed that the outer
wall of the cap cell becomes extremely thick during spermatid differentia
tion, sometimes reaching a thickness of about 0.70 pin. This thick wall
may serve as support against the increasing pressure of the spermatogenous
cells. Lloyd (1971) observed an accumulation of waxy material on the
surface of Onoclea antheridia, especially near the margin of the cap
cell, and Hartman (1931) found that the cap cell of Onoclea antheridia
stained much more heavily for sugars than the other jacket cells. Perhaps
all of these features function in strengthening the cap cell, which
may be the most susceptible cell to internal pressures.
However, these special characteristics of cap cells in Onoclea may
indicate that sperm release involves a process not totally dependent on
224
osmotic processes. Hausmann and Paolillo (1977) found that the tip
cells of antheridia in Polytrichum produce very thick walls late in
spermatid differentiation, and that these walls consist of a gel that
swells (Paolillo, 1981). There is also a cuticle around the antheridia
of Polytrichum. just as there appears to be a cuticle around the
antheridia of Onoclea (Lloyd, 1971; Paolillo, 1981), which led Paolillo
(1981) to conclude that the consequential slow exchange of water could
not account for the opening of the antheridia in Polytrichum. As sup
porting evidence, Paolillo (1981) found that Polytrichum antheridia
could open rapidly in hypertonic solutions, which could not be the case
if opening depended on the uptake of water. From observations that
mechanical disturbances set off antheridium openings in Polytrichum.
Paolillo (1981) hypothesized that a disturbance, such as the action of
the first raindrop, sets off a number of reactions within the antheridium
cells. These reactions result in the movement of water from surrounding
antheridial cells into the tip cells and finally, into walls of the tip
cells, which then swell and cause the tip cells to burst.
Perhaps antheridia of Onoclea are also in a metastable condition at
maturity. They presumably would have a large amount of potential energy
stored due to water uptake during growth, in the jacket cells, in the
thick, hemicellulosic walls around the spermatids and possibly in the
space created between the maturing spermatids and the cell walls.
Paolillo and Cukierski (1976) found that as the protoplasts of the
maturing spermatids of Polytrichum withdrew from the cell wall, the
resultant space appeared to be filled with an aqueous solution.
When the cap cells of Onoclea antheridia were developmentally
225
prepared to receive a signal, only after the spermatozoids were mature,
the antheridium would be ready to respond, with an ensuing swelling of
the cap cell wall causing the cap cell to burst from the connecting ring
cell. The remaining stored potential energy in the jacket cells and
sperm mass would be sufficient to force the sperms out of the antheridium
cavity. This mechanical signal process, as opposed to a purely osmotic
process, may better insure the opening of the antheridium only after the
sperms are ready for fertilization. There are probably numerous modifica
tions of these two suggested processes throughout the more primitive
plant groups. As an example, Paolillo (1981) found that in Funaria,
sperms are expelled entirely by the swelling of the sperm mass. Many
more observations of fern antheridia will be necessary to determine con
clusively the method of sperm release.
The presence of lipids in the walls immediately surrounding the
spermatozoids in Ceratopteris (Cave and Bell, 1973) may also be present
around Onoclea spermatozoids and may play an accessory role in sperm
dispersion. Paolillo and Cukierski (1976) found that lipids are present
in the walls surrounding some species of moss sperms as they are released
from antheridia. The lipids cause a dispersion at the air-water inter
face of sperms that are still in their vesicles. In some mosses, the
sperms coat water droplets due to the action of their lipid coats, which
are then splashed to the female plants, reducing the amount of swimming
necessary for fertilization. The role of lipids in fern spermatozoid
dispersion awaits further investigation.
226
BIBLIOGRAPHY
Albaum, H. G. 1938. Inhibitions due to growth hormones in fern prothallia and sporophytes. Amer. J. Bot. 25: 124-133.
Anderson, L. E. 1954. Hoyer's solution as a rapid permanent mounting medium for bryophytes. The Bryologist 57: 242-244.
Atkinson, G. F. 1894. The biology of ferns. Macmillan Co., London.
Atkinson, L. R. 1960. The Schizaeaceae: The gametophyte of Mohria. Phytomorphology 10: 351-367.
Atkinson, L. R., and A. G. Stokey. 1964. Comparative morphology of the gametophyte of homosporous ferns. Phytomorphology 14: 51-70.
Bassel, A. R., C. C. Kuehnert, and J. H. Miller. 1981. Nuclear migration and asymmetric cell division in Onoclea sensibilis spores: An ultra-structural and cytochemical study. Amer. J. Bot. 68: 350-360.
Beisvag, T. 1970. An electron-microscopic investigation of the young gametophytes of the fern Blechnum spicant (L.) Roth. Grana 10: 121-135.
Bell, P. R. 1958. Variations in the germination-rate and development of fern spores in culture. Ann. Bot. 22: 503-511.
Bell, P. R. 1974. Microtubules in relation to flagellogenesis in Pteridium spermatozoids. J. Cell Sci. 15: 99-111.
Bell, P. R. 1979a. The contribution of the ferns to an understanding of the life cycle of vascular plants. Pages 57-85 A. F. Dyer, ed. The experimental biology of ferns. Academic Press, New York.
Bell, P. R. 1979b. Gametogenesis and fertilization in ferns. Pages 471-503 A. F. Dyer, ed. The experimental biology of ferns. Academic Press, New York.
Bell, P. R., and J. G. Duckett. 1976. Gametogenesis and fertilization in Pteridium. Bot. J. Linn. Soc. 73: 47-78.
Bergfeld, R. 1970. Feinstruktur der chloroplasten in der gameto-phytenzellen von Dryopteris filix-mas (L.) Schott nach einwirkung hellroter und blauer strahlung. Z. Pflanzenphysiol. 63: 55-64.
Bierhorst, D. W. 1975. Gametophytes and embryos of Actinostachys pennula, A. wagneri, and Schizaea elegans, with notes on other species. Amer. J. Bot. 62: 319-335.
227
Bold, H. C. 1967. A laboratory manual for plant morphology. Harper and Row, New York.
Bower, F. 0. 1923. The ferns. University Press, Cambridge.
Brandes, H., and H. Kende. 1968. Studies on cytokinin-controlled bud formation in moss protonema. Plant Physiol. 43: 827-837.
Britz, S. J. 1979. Chloroplast and nuclear migration. Pages 170-205 in W. Haupt and M. E. Feinleib, eds. Encyclopedia of Plant Physiology. New Series. Vol. 7. Springer-Verlag, New York.
Burcky, K. 1977. The occurrence of abscisic acid in Anemia phyllitidis (L.) Sw. (Schizaeaceae) during ripening of spores. Z. Pflanzenphysiol. 85: 181-183.
Busby, C. H., and B. Gunning. 1980. Observations on pre-prophase bands of microtubules in uniseriate hairs, stomata complexes of sugar cane, and Cyperus root meristems. Eur. J. Cell Biol. 21: 214-223.
Campbell, D. H. 1886. The development of the antheridium in ferns. Bull. Torrey Bot. Club 13: 49-53.
Campbell, D. H. 1913. The structure and development of mosses and ferns. Macmillan Co., New York.
Carothers, Z. B. 1975. Comparative studies on spermatogenesis in bryophytes. Pages 71-84 J, G. Duckett and P. A. Racey, eds. The biology of the male gamete. Academic Press, New York.
Cave, C. F., and P. R. Bell. 1973. The cytochemistry of the walls of the spermatocytes of Ceratopteris thalictroides. Planta 109: 99-104.
Cheng, C.-Y., and H. Schraudolf. 1974. Nachweis von abscislnsMure in sporen und jungen prothallien von Anemia phyllitidis (L.) Sw. Z. Pflanzenphysiol. 71: 366-369.
3 Cohen, D., and W. Crotty. 1979. H-uridine incorporation in the premitotic stage of rhizoid cell differentiation in Pteris vittata L. Amer. J. Bot. 66: 179-182.
Cran, D. G. 1979. The ultrastructure of fern gametophyte cells. Pages 171-212 A. F. Dyer, ed. The experimental biology of ferns. Academic Press, New York.
Crotty, William J. 1967. Rhizoid cell differentiation in the fern gametophyte of Pteris vittata. Amer. J. Bot. 54: 105-117.
Czaja, A. T. 1921. liber befruchtung, bastardierung, und geschlechtertren-nung bei prothallien homosporer fame. Z. Bot. 13: 545-589.
228
Davie, J. H. 1951. The development of the antheridium in the Poly-podiaceae. Amer. J. Bot. 38: 621-628.
Dopp, W. 1927. Untersuchungen uber die entwicklung von prothallien einheimischer polypodiaceen. Pflanzenforschung 8: 1-58.
Dopp, W. 1950. Eine die antheridienbildung bei farnen fordernde substanz in den prothallien von Pteridium aquilinum (L.) Kuhn. Ber. Dtsch. Bot. Ges. 63: 139-147.
Dopp, W. 1959. iiber eine hemmende und eine fordernde substanz bei der antheridienbildung in den prothallien von Pteridium aquilinum Ber. Dtsch. Bot. Ges. 72: 11-24.
Dopp, W. 1962. Weitere untersuchungen uber die physiologie der antheridienbildung bei Pteridium aquilinum. Planta 58: 483-508.
Duckett, J. G. 1975. Spermatogenesis in pteridophytes. Pages 97-128 in J. G. Duckett and P. A. Racey, eds. The biology of the male gamete. Academic Press, New York.
Duckett, J. G., E. J. Klekowski, Jr., and L. G. Hickok. 1979. Ultra-structural studies of mutant spermatozoids in ferns. I. The mature non-motile spermatozoid of mutation 230X in Ceratopterls thalictroides (L.) Brongn. Gamete Research 2: 317-343.
Dustin, P. 1980. Microtubules. Scientific American 243: 66-76.
Dyer, A. F. 1979. The culture of fern gametophytes for experimental investigation. Pages 253-305 A. F. Dyer, ed. The experimental biology of ferns. Academic Press, New York.
Eames, A. J. 1936. Morphology of vascular plants. McGraw-Hill, New York.
Elmore, H. W., and R. J. Adams. 1976. Scanning electron microscopic observations of the gametophyte and sperm of the bracken fern, Pteridium aquilinum (L.) Kuhn. New Phytol. 76: 519-522.
Emigh, v., and D. Farrar. 1977. Gemmae: A role in sexual reproduction in the fern genus Vittaria. Science 198: 297-298.
Endo, M., K. Nakanishi, U. Naf, W. McKeon, and R. Walker. 1972. Isolation of the antherldlogen of Anemia phyllitidis. Physiol. Plant. 26: 183-185.
Erlchsen, J., B. Knopp, and M. Bopp. 1977. On the action mechanism of Cytokinins in mosses; Caulonema specific proteins. Planta 135: 161-168.
229
Faivre-Baron, M. 1977. Etude cytophysiologique de la regénération du jeune gamétophyte d'une Fougère: le Gymnogramme calomelanos L. I. Caractères infrastructuraux particuliers aux cellules du filament germinatif, en conditions de cultures contrôlées. Beitr. Biol. Pflanzen 53: 103-120.
Faivre-Baron, M. 1981. Effets de l'acide indolyl-acetique exogene et son transport dans le gamétophyte d'une fougère. Z. Pflanzenphysiol. 101: 263-275.
Flax, M. H., and M. H. Himes. 1952. Microspectrophotometric analysis of metachromatic staining of nucleic acids. Physiol. Zool. 25: 297-311.
Foster, A. S., and E. M. Gifford, Jr. 1974. Comparative morphology of vascular plants. W. H. Freeman Co., San Francisco.
Gantt, E., and H. J. Arnott. 1965. Spore germination and development of the young gametophyte of the ostrich fern (Matteuccia struthiopteris). Amer. J. Bot. 52: 82-94.
Gifford, E. M., and S. Larson. 1980. Developmental features of the spermatogenous cell in Ginkgo biloba. Amer. J. Bot. 67: 119-124.
Glauert, A. M. 1975. Fixation, dehydration and embedding of biological specimens. American Elsevier Publishing Co., Inc., New York.
G6rska-Brylass, A. 1968. Occurrence of callose in gametogenesis in Pteridophyta. Bull. Acad. Pol. Sci. Ser. Sci. Biol. 16: 755-759.
Gorska-Brylass, A. 1969. Callose in gametogenesis in liverworts. Bull. Acad. Pol. Sci. Ser. Sci. Biol. 17: 549-554.
Gunning, B. E. S., A. R. Hardham, and J. E. Hughes. 1978. Pre-prophase bands of microtubules in all categories of formative and proliferative cell division in Azolla roots. Planta 143: 145-160.
Gurdon, J. B., and H. R. Woodland. 1970. On the long term control of nuclear activity during cell differentiation. Curr. Top. Dev. Biol. 5: 39-67.
Hall, J. L. 1978. Electron microscopy and cytochemistry of plants. Elsevier/North Holland Biomedical Press, New York.
Hartman, M. E. 1931. Antheridial dehiscence in the Polypodiaceae. Bot. Gaz. 91: 252-276.
Harvey-Gibson, R. J. 1919. Outlines of the history of botany. Macmillan Co., New York.
Hausmann, M. K., and D. J. Paolillo, Jr. 1977. On the development and maturation of antheridia in Polytrichum. The Bryologist 80: 143-148.
230
Hepler, P. K. 1976. The blepharoplast of Marsilea; Its de novo formation and spindle association. J. Cell Sci. 21: 361-390.
Hepler, P. K., and B. A. Palevltz. 1974. Microtubules and microfilaments. Ann. Rev. Plant Physiol. 25: 309-362.
Hickok, L. G. 1983. Abscisic acid blocks antheridiogen-induced antheridium formation in gametophytes of the fern Ceratopteris. Can. J. Bot. 61: 888-892.
Hofmeister, W. 1862. On the germination, development and fructification of the higher cryptogamia, and on the fructification of the Coniferae. Robert Hardwicke, London.
Horner, H. T., and C. K. Beltz. 1970. Cellular differentiation of heterospory in Selaginella. Protoplasma 71: 335-341.
Hotta, Y. 1959. Morphological differentiation and growth substance in the gametophyte of Dryopteris erythrosora. Bot. Mag., Tokyo 73: 69-74.
Howland, G. P., and E. L. Boyd. 1974. Genetic control of photo-morphogenesis. Isolation of nonfilamentous mutants after gamma irradiation of Pteridium aquilinum spores. Radiat. Bot. 14: 281-285.
Howland, G. P., and M. E. Edwards. 1979. Photomorphogenesis of fern gametophytes. Pages 393-434 A. F. Dyer, ed. The experimental biology of ferns. Academic Press, New York.
Hutchinson, S. A. 1967. The effects of volatile fungal metabolites on gametophytes of Pteridium aquilinum. Trans. Br. Mycol. Soc. 50: 285-287.
Igura, I. 1955. Cytological and morphological studies on the gametophytes of ferns. IX. The polar plasmolysis on fern-prothallium (1), (2), (3) and (4). Bot. Mag., Tokyo 68: 119-124; 184-186; 208-212; 289-293.
Igura, I. 1959. Cytological and morphological studies on the gametophytes of ferns. XII. Suction force of the wall cell of antheridium and of the spermatid. Bot. Mag., Tokyo 72: 231-237.
Igura, I. 1960. Cytological and morphological studies on the gametophytes of ferns. XIII. The permeability of the wall cell of antheridium to urea and glycerol. Bot. Mag., Tokyo 73: 1-5.
Iqbal, J., and H. Schraudolf. 1977. Changes in protein biosynthesis during gibberellic acid induced induction and formation of antheridium in the fern Anemia phyllitidls. Develop., Growth and Differ. 19: 85-92.
Jacqmard, A., J. P. Miksche, and G. Bernler. 1972. Quantitative study of nucleic acids and proteins In the shoot apex of Slnapis alba during
231
transition from the vegetative to the reproductive condition. Amer. J. Bot. 59: 714-721.
Jaffe, L. F. 1980. Control of plant development by steady Ionic currents. Pages 381-388 R. M. Spanswick, W. J. Lucas, and J. Dainty, eds. Plant membrane transport: Current Conceptual Issues. Elsevier/ North Holland Biomedical Press, New York.
Jensen, W. A. 1962. Botanical histochemistry. W. H. Freeman Co., San Francisco.
Kachroo, P. 1955. Studies in Davalliaceae. I. Morphology of Leucostegia immersa (Wall.) Presl. J. Indian Bot. Soc. 34: 11-20.
Kachroo, P., and B. K. Nayar. 1953. Studies in Pteridaceae. I. Observations on gametophytes of some species of Adiantum L. Phytomorphology 3: 240-248.
Kawasaki, T. 1957, Studies on the sexual generation of ferns. J. Jpn. Bot. 32: 18-25.
Klekowski, E. J., and R. M. Lloyd. 1968. Reproductive biology of the Pteridophyta. 1. General considerations and a study of Onoclea sensibilis L. Bot. J. Linn. Soc. 60: 315-324.
Kny, L. 1869. Uber den bau und die entwickelung des farrn-antheridiums. Monatsberichte der Koniglich Preussischen Akademie der Wissenschaften zu Berlin 1: 416-431.
Kny, L. 1895. Entwickelung von Aspidium filix-mas Sw. Botanische Wandtafeln 9: 411-438.
Lehninger, A. L, 1970. Mitochondria and calcium transport. Biochemistry 119: 129-138.
Leung, C., and U. Naf. 1979. On the cytology of antheridium formation in the fern species Onoclea sensibilis. I. Cytology of cell plate and cell wall formation. Amer. J. Bot. 66: 765-775.
Lintilac, P. M. 1974a. Differentiation, organogenesis, and the tectonics of cell wall orientation. II. Separation of stresses in a two-dimensional model. Amer. J. Bot. 61: 135-140.
Lintilac, P. M. 1974b. Differentiation, organogenesis, and the tectonics of cell wall orientation. III. Theoretical considerations of cell wall mechanics. Amer. J. Bot. 61: 230-237.
Lintilac, P. M,, and W. A. Jensen. 1974. Differentiation, organogenesis, and the tectonics of cell wall orientation. I. Preliminary observations on the development of the ovule in cotton. Amer. J. Bot. 61: 129-134.
232
Lloyd, R. M. 1971. Systematics of the onocleoid ferns. Uni ver. Calif. Publ. Bot. 61: 1-93.
Long, M. E., and H. C. Taylor. 1956. Nucleolar variability in human neoplastic cells, Ann. N.Y. Acad. Sci. 63: 1095-1106.
Maclean, N., and V. A. Hilder. 1977. Mechanisms of chromatin activation and repression. Int. Rev. Cytol. 48: 1-54.
Marchant, R., and A. W. Robards. 1968. Membrane system associated with the plasmalemma of plant cells. Ann, Bot. 32; 457-471.
Marengo, N. P. 1956. The microscopic structure of the mature spores of the sensitive fern, the ostrich fern, and the royal fern. Amer. Fern J. 46: 97-104.
Marengo, N. P. 1977. Ultrastructural features of the dividing meiocyte of Onoclea sensibilis. Amer. J. Bot. 64: 600-601.
Marengo, N. P. 1979. The fine structure of the pre-meiotic stages of sporogenesis in Onoclea sensibilis. Amer. Fern J. 69: 87-91.
Marengo, N. P., and M. A. Badalamente. 1978. The fine structure of the newly formed spore of Onoclea sensibilis. Amer. Fern J. 68: 52-54.
Miller, J. H. 1968. Fern gametophytes as experimental material. Bot. Rev. 34: 361-440.
Miller, J. H. 1980. Orientation of the plane of cell division in fern gametophytes: The role of cell shape and stress. Amer. J. Bot. 67: 534-542.
Miller, J. H., and A. R. Bassel. 1980, Effects of caffeine on germination and differentiation in spores of the fern, Onoclea sensibilis. Physiol, Plant. 50: 213-220.
Miller, J. H., and P. M. Miller. 1964, Effects of auxin on cell enlargement in fern gametophytes: Developmental stage of the cell and response to auxin. Amer, J. Bot. 51: 431-436.
Miller, J. H., and M, C. Stephani. 1971. Effects of colchicine and light on cell form in fern gametophytes. Implication for a mechanism of light-induced cell elongation. Physiol. Plant. 24: 264-271.
Miller, P, M, , H. C. Sweet, and J. H. Miller. 1970. Growth regulation by ethylene in fern gametophytes. I. Effects on protonemal and rhizoidal growth and interaction with auxin. Amer. J, Bot, 57: 212-217.
Mitchison, J, M, 1971. The biology of the cell cycle. University Press, Cambridge,
233
Mizukami, I., and J. Gall. 1966. Centriole replication. II. Sperm formation in the fern, Marsilea. and the cycad, Zamia. J. Cell Biol. 29: 97-111.
Momose, S. 1939. Studies on the gametophytes of ferns: Further observations on the prothalllum of eudryopteroid ferns. J. Jpn, Bot. 15: 280-292.
Momose, S. 1941a. Studies on the gametophyte of ferns. XXI. On the prothallium of some species of Asplenium and its allied genera. J. Jpn. Bot. 17: 1-11.
Momose, S. 1941b, Studies on the gametophytes of ferns: On the prothallium of some species of Asplenium and allied genera. J. Jpn. Bot. 17: 587-597.
Momose, S. 1958a. The antheridial area of the foliate type prothallium in ferns. J. Jpn. Bot. 33: 1-5.
Momose, S. 1958b. Prothallia of onocleoid ferns. J. Jpn. Bot. 33: 289-296.
Momose, S. 1959. The prothallia of Aspleniaceae. J. Jpn. Bot. 34: 293-302.
My les, D. G. 1979. Structural changes in the sperm of Marsilea vestita before and after fertilization. Pages 129-134 iji J. G. Duckett and P. A. Racey, eds. The biology of the male gamete. Academic Press, New York.
My les, D. G., and P. R. Bell, 1975. An ultrastructural study of the spermatozoid of the fern, Marsilea vestita. J. Cell Sci. 17: 633-645.
Myles, D. G., and P. K. Hepler. 1977. Spermiogenesis in the fern Marsilea; Microtubules, nuclear shaping, and cytomorphogenesis. J. Cell Sci. 23: 57-83.
Nâf, U. 1956. The demonstration of a factor concerned with the initiation of antheridia in polypodiaceous ferns. Growth 20: 91-105.
NSf, U. 1958. On the physiology of antheridium formation in the bracken fern [Pteridium aquilinum (L.) Kuhn]. Physiol. Plant. 11: 728-746.
NSf, U. 1959. Control of antheridium formation in the fern species Anemia phvllitidis. Nature 184: 798-800.
NSf, U. 1960. On the control of antheridium formation in the fern species Lygodium iaponicum. Soc. Exp. Biol. Med. 105: 82-86.
234
Naf, U. 1961. Mode of action of an antheridium-inducing substance in ferns. Nature 189; 900-903.
Naf, U. 1962. Loss of sensitivity to the antheridial factor in maturing gametophytes of the fern Onoclea sensibilis. Phyton 18: 173-182.
Naf, U. 1967. On the induction of a phase inhibitory to antheridium formation in the juvenile prothallus of the fern species Anemia phvllitidis. Z, Pflanzenphysiol. 56: 353-365.
Naf, U. 1969. On the control of antheridium formation in ferns. Pages 97-116 J. E. Gunckel, ed. Current topics in plant science. Academic Press, New York.
Naf, U. 1979. Antheridiogens and antheridial development. Pages 435-470 in A. F. Dyer, ed. The experimental biology of ferns. Academic Press, New York.
Naf, U., K. Nakanishi, and M. Endo. 1975. On the physiology and chemistry of fern antheridiogens. Bot. Rev. 41: 315-359.
Naf, U., J. Sullivan, and M. Cummins. 1974. Fern antheridiogen — Cancellation of a light-independent block to antheridium formation. Dev. Biol. 40: 355-365.
Nakanishi, K., M. Endo, and U. Naf. 1971. Structure of the antheridium-inducing factor of the fern Anemia phvllitidis. J. Am. Chem. Soc. 93: 5579-5581.
Nakazawa, S., and N. Tanno. 1965. Concentration gradients of RN/V in fern protonema in relation to mRN^. Naturwissenschaften 52: 457.
Nayar, B. K. 1965. Gametophytes and juvenile leafs of drynarioid ferns. Bot. Gaz. 126: 46-52.
Nayar, B. K., and S. Kaur. 1971. Gametophytes of homosporous ferns. Bot. Rev, 37: 295-396.
Nitsch, J. P. 1951. Growth and development in vitro of excised ovaries. Amer. J. Bot. 38: 566-577.
Nuccitelli, R., and L. F. Jaffe. 1974. Spontaneous current pulses through developing fucoid eggs. Proc. Nat. Acad. Sci. USA 71: 4855-4859.
Olmsted, J. B., K. Carlson, R. Klebe, F. Ruddle, and J. Rosenbaum. 1970. Isolation of microtubule protein from cultured mouse neuroblastoma cells. Proc. Nat. Acad. Sci. USA 65: 129-136.
Ootaki, T. 1963. Modification of the developmental axis by centrifuga-tion in Pteris vittata. Cytologia 28: 21-29.
235
Ootaki, T. 1965. Branching in fern gametophyte, Pteris vittata. under various light conditions. Cytologia 30: 182-193.
Ootaki, T., and M. Furuya. 1969. Experimentally induced apical dominance in protonemata of Pteris vittata. Embryologia 10; 284-286.
Palevitz, B. A,, and P. K. Hepler. 1974. The control of the plane of division during stomatal differentiation in Allium. I. Spindle reorientation. Chromosoma 46: 297-326.
Paolillo, D. J., Jr. 1981. The swimming sperms of land plants. Bioscience 31: 367-373.
Paolillo, D. J., Jr., and M. Cukierski. 1976. Wall developments and coordinated cytoplasmic changes in spermatogenous cells of Polvtrichum (Musci). The Bryologist 79: 466-479.
Pares, Y. 1958. Etude experimentale de le morphogenese du gametophyte de quelques filicinees. Ann. Sci. Nat. Bot. 19: 1-120.
Partanen, C. 1965. On the chromosomal basis for cellular differentiation. Amer. J. Bot. 52: 204-209.
Pickett-Heaps, J. D. 1969. The evolution of the mitotic apparatus: An attempt at comparative ultrastructural cytology in dividing plant cells. Cytobios 1: 257-280.
Pickett-Heaps, J. D., and D. H. Northcote. 1966. Cell division in the formation of the stomatal complex of the young leaves of wheat. J, Cell Sci. 1: 121-128.
Pirozynski, K. A., and D. W. Malloch. 1975. The origin of land plants: A matter of mycotrophism. Biosystems 6: 153-164.
Poo, M., and K. R. Robinson. 1977. Electrophoresis of concanavalin-A receptors along embryonic muscle cell membrane. Nature 265: 602-605.
Prantl, K. 1881. Beobachtungen liber die ern'dhrung der farnprothallien und die vertheilung der sexualorgane. Bot. Zeitung. 39: 754-758, 770-776.
Pringle, R. B. 1961. Chemical nature of antheridiogen-A, a specific inducer of the male sex organ in certain fern species. Science 133: 284.
Quatrano, R. S. 1978. Development of cell polarity. Ann. Rev. Plant Physiol. 29: 487-510,
236
Reynolds, E. S. 1963. The use of lead citrate at high pH as an electron opaque stain in electron microscopy. J. Cell Biol. 17: 208-212.
Reynolds, T. L. 1979. Apical dominance in Anemia phvllitidis gameto-phytes. Amer. Fern J. 69: 92-94.
Reuter, L. 1953. A contribution to the ce11-physiologic analysis of growth and morphogenesis in fern prothallia. Protoplasma 42: 1-29.
Saunders, M. J., and P. K. Hepler. 1981. Localization of membrane-associated calcium following cytokinin treatment in Funaria using chloro-tetracycline. Planta 152: 272-281.
Schedlbauer, M. D., C. F. Cave, and P. R. Bell. 1973. The incorporation of DL-(3-14c) cysteine during spermatogenesis in Ceratopteris thalictroides. J. Cell Sci. 12: 765-779.
Schmiedel, G., and E. Schnepf. 1979. Side branch formation and orientation in the caulonema of the moss, Funaria hverometrica; Normal development and fine structure. Protoplasma 100: 367-383.
Schmiedel, G., and E. Schnepf. 1980. Polarity and growth of caulonema tip cells of the moss Funaria hverometrica. Planta 147: 405-413.
Schraudolf, H. 1962. Die wirkung von phytohormonen auf keimung und entwicklung von farnprothallien, I. Auslosung der antheridienbildung und dunkeIkeimung bei schizaeaceen durch gibberellinsSure. Biol. Zentralbl. 81: 731-740.
Schraudolf, H. 1963. Einige beobachtungen zur entwicklung der antheridien von Anemia phvllitidis. Flora 153: 282-290.
Schraudolf, H. 1966a. Die wirkung von phy tohormonen auf keimung und entwicklung von farnprothallien. II. Analyse der wechselbeziehung zwischen gibberellin-konzentration, antheridienbildung und physiologischem alter der prothalliumzellen in Anemia phvllitidis. Planta 68: 335-352.
Schraudolf, H. 1966b. Die wirkung von phytohormonen auf keimung und entwicklung von farnprothallien. IV. Die wirkung von unterschiedlichen gibberellinen und von allo-gibberins'dure auf de ausl&sung der antheridienbildung bei Anemia phvllitidis L. und einigen polypodiaceen. PI. Cell Physiol. 7: 277-289.
Schraudolf, H, 1966c. Nachweis von gibberellin in gametophyten von Anemia phvllitidis. Naturwissenschaften 16: 1-2.
Schraudolf, H. 1967. Wirkung von hemmstoffen der DNS-, RNS- und proteinsynthese auf wachstum und antheridienbildung in prothallien von Anemia phvllitidis L. Planta 74: 123-147.
237
Schraudolf, H. 1968. Einige beobachtungen zur ausbildung des antheridiums von polypodiaceen. Flora 157: 379-385.
Schraudolf, H. 1977. Effects of 5-bromodeoxyuridine and 2-aininopurine on antheridium differentiation in Anemia phvllitidis L. Experientia 33: 1161-1162.
Schraudolf, H. , and A. Fischer. 1979. Evidence for cytokinins in gametophytes of the fern Anemia phvllitidis. Plant Sci. Lett. 14: 199-204.
Schraudolf, H., and U. Richter. 1978. Elektronen-mikroskopische analyse der musterbildung im antheiidium der Polypodiaceae. Plant Syst. Evol, 129: 291-297.
Smith, D. L. 1972. Staining and osmotic properties of young gametophytes of Polvpodium vulgare L. and their bearing on rhizoid function. Protoplasma 74: 465-479.
Smith, D. L. 1979. Biochemical and physiological aspects of game to-phyte differentiation and development. Pages 355-392 n A. F. Dyer, ed. The experimental biology of ferns. Academic Press, New York.
Smith, G. M. 1938. Cryptogamic botany. Vol. II. Bryophytes and Pteridophytes. McGraw-Hill, New York.
Smith, G. M. 1955. Cryptogamic botany. Vol. II. Bryophytes and Pteridophytes. McGraw-Hill, New York.
Smith, H. M., and D. S. Smith. 1969. An electron microscopic study of the starch-containing plastids in the fern Todea barbara. J. Cell Sci. 4: 211-221.
Sossountzov, I., and P. Delaporte. 1949. Etude de la sexualité des prothalles de Gvmnogramme calomelanos cultivés in vitro sur le milieu de knop normal. C, R. Acad. Sci. Paris Ser. D 229: 951-953.
Sporne, K. R. 1962. The morphology of pteridophytes. Hutchinson and Co., London.
Sporne, K. R. 1975. The morphology of pteridophytes. Hutchinson and Co., London.
Spurr, A. R, 1969. A low-viscosity epoxy resin embedding medium for electron microscopy. J. Ultrastruct. Res. 26: 31-43.
Steeves, T. A,, I. M. Sussex, and C. R. Partanen. 1955. In vitro studies on abnormal growth of prothalli of the bracken fern. Amer. J. Bot. 42: 232-244.
238
Stempak, J. C. , and R. T, Ward. 1964. An Improved staining method for electron microscopy. J. Cell Biol. 22: 697-701.
Stetler, D. A., and A. E. DeMaggio. 1972. An ultrastructural study of fern gametophytes during one- to two-dimensional development. Amer. J. Bot. 59: 1011-1017.
Stokey, A, G. 1951. The contribution by the gametophyte to classification of the homosporous ferns. Phytomorphology 1: 39-58.
Stokey, A. G., and L. R. Atkinson. 1957. The gametophyte of some American species of Elaphoglossum and Rhipidopteris. Phytomorphology 7: 275-292.
Stone, I. G. 1958. The gametophyte and embryo of Polvphlebium venosum. Austr, J. Bot. 6: 183-203.
Stone, I. G. 1960. Observations on the gametophytes of Grammitis billardieri Willd. and Ctenopteris heterophvlla (Labill.) Tindale (Grammitidaceae). Austr. J. Bot. 8: 11-37.
Stone, I. G. 1961. The gametophyte of the Victorian Blechnaceae. I. Blechnum nudum (Labill.) Luerss. Austr. J. Bot. 9: 20-36.
Stone, I. G. 1962. The ontogeny of the antheridium in some lepto-sporangiate ferns with particular reference to the funnel-shaped wall. Austr. J. Bot. 10: 76-92.
Stone, I. G, 1969. The gametophytes of the Victorian Blechnaceae. II. Doodia aspera R.Br., D. media R.Br., and D. caudata R.Br,: A comparison with three extra-Australian genera, Brainea. Sadleria. and Woodwardia. Austr. J. Bot. 17: 31-57.
Strasburger, E, 1868. Die befruchtung bei den farnkrautern. Mem. I'Acad. Imp. Sci. St. Petersbourg, 7 Serie. 12, No. 3: 1-14.
Takei, M., and R. Tanaka. 1974. On the constancy of DN^ content in prothallial cells of Microlepia marginata. J. Sci. Hiroshima U. Ser. B, Div. 2, 15: 1-7.
Thomas, Lewis. 1974. The lives of a cell. Bantam Books, New York.
Thompson, D. W. 1917. On growth and form. University Press, Cambridge.
Verma, S. C., and S. P. Khullar. 1966. Ontogeny of the polypodiaceous fern antheridium with particular reference to some Adiantaceae. Phytomorphology 16: 302-313.
Voeller, B. R. 1964a. Gibberellins: Their effect on antheridium formation in fern gametophytes. Science 143: 373-375.
239
Voeller, B, 1964b. Antheridiogens in ferns. Pages 665-684 iji J. P. Nitsch, ed. Régulateurs naturels de la croissance végétale. Gif S/Yvette, Paris.
Voeller, B, R., and E. S. Weinberg. 1967. Antheridium induction and the number of sperms per anther idium in Anemia phvllitidis. Amer. Fern J. 57: 107-112.
Voeller, B. R., and E. S. Weinberg, 1969. Evolutionary and physiological aspects of antheridium induction in ferns. Pages 77-93 in J. E. Gimckel, ed. Current Topics in Plant Science. Academic Press, New York.
Vogelmann, T. C. , and J. H. Miller. 1980. Nuclear migration in germinating spores of Onoclea sensibilis; The path and kinetics of movement. Amer. J. Bot. 67: 648-652.
Vogelmann, T. C., and J. H. Miller. 1981. The effect of methanol on spore germination and rhizoid differentiation in Onoclea sensibilis. Amer. J. Bot. 68: 1177-1183.
Vogelmann, T, C., A. R. Bassel, and J. H. Miller. 1981. Effects of microtubule-inhibitors on nuclear migration and rhizoid differentiation in germinating fern spores (Onoclea sensibilis). Protoplasma 109: 295-316.
Wada, M., and T. P. O'Brien. 1975. Observations on the structure of the protonema of Adiantum capillus-veneris L. undergoing cell division following white-light irradiation. Planta 126: 213-227.
Wada, M,, and L. A. Staehelin. 1981. Freeze-fracture observations on the plasma membrane, the cell wall and the cuticle of growing protonemata of Adiantum capillus-veneris L. Planta 151: 462-468.
Wada, M., Y. Mineyuki, A. Kadota, and M. Furuya. 1980. The changes of nuclear position and distribution of circumferentially aligned cortical microtubules during the progression of cell cycle in Adiantum protonemata. Bot. Mag., Tokyo 93: 237-245.
Wagner, W. H,, Jr. 1969. The construction of a classification. Pages 67-103 _in C. G. Sibley, ed. Systematic Biology. National Academy of Science, Washington, D.C.
Wagner, W. H., Jr. 1974a. Fern. Pages 237-248 Encyclopaedia Britannica, Macropaedia. Vol. 7. Helen Hemingway Benton, Publisher, Chicago.
Wagner, W. H. , Jr. 1974b. Structure of spores in relation to fern phylogeny. Annals of the Missouri Botanical Garden 61: 332-353.
240
Weisenseel, M. H. 1979. Growth movements. Pages 485-505 Iji W. Haupt and M, E, Felnleib, eds. Encyclopedia of plant physiology. New series, Vol. 7. Springer-Verlag, New York.
Weisenseel, M. H., and R. M. Kicherer. 1981. Ionic currents as control mechanism in cytomorphogenesis. Pages 381-399 in 0. Kiermayer, ed. Cytomorphogenesis in plants. Springer-Verlag, New York.
Weisenseel, M. H., R. Nuccitelli, and L, F. Jaffe. 1975. Large electrical currents traverse growing pollen tubes. J. Cell Biol. 66: 556-567.
Zeiger, E. 1971. Organelle distribution and cell differentiation in the formation of stomatal complexes in barley. Can. J. Bot. 49: 1623-1625.

241
ACKNOWLEDGMENTS
I first would like to thank the Graduate College of Iowa State
University for their financial assistance, making this study possible.
I would like to thank Dr. Donald Farrar, co-chairman, for his sup
port of and interest in my academic adventures and especially for his
friendship and respect. I would like to thank Dr. Harry T. Horner, Jr.,
co-chairman, for his interest in my goals, enthusiasm for this project,
and for ensuring financial support for this study. I would also like to
thank Dr. Clifford LaMotte, Dr. Robert Chapman, and Dr. Alan Atherly
for serving as members on my committee.
Special thanks go to Bruce Wagner, supervisor of Bessey Hall EM
facility, for his constant good humor and EM expertise.
I would like to express my gratitude to my Texas colleague, Joan E.
Nester, for her interest in my work, her insights, and most of all for
her friendship.
I especially would like to thank Michael J. Krogmeier for numerous,
helpful discussions on data interpretation and presentation, for his
computer expertise, and for his deep understanding and moral support.
To my parents, Joseph and Mabel, I extend my deepest appreciation
for the opportunities that they initially provided for me and for their
continuing support of my efforts.

A light and electron microscopic study of the
development of antheridia in Onoclea sensibilis L.
by
Jane Louise Kotenko
Volume 2 of 2
 Dissertation Submitted to the
Graduate Faculty in Partial Fulfillment of the
Requirements for the Degree of
DOCTOR OF PHILOSOPHY
Major; Botany
Approved :
Iowa State University Ames, Iowa
1983
Signatures have been redacted for privacy.
ii
TABLE OF CONTENTS
APPENDIX A; KEY TO LABELING 242
APPENDIX B; FIGURES 244
APPENDIX C: CULTURE MEDIUM PREPARATION 419
APPENDIX D; GAMETOPHYTE CLEARING TECHNIQUE AND METHODS OF DATA COLLECTION 421
Clearing Technique and Slide Preparation 421
Gametophyte Collection 421
Data Collection and Analysis 421
APPENDIX E: FORMULAE AND SCHEDULES 425
APPENDIX F; MEAN VALUES AND CONFIDENCE INTERVALS 431
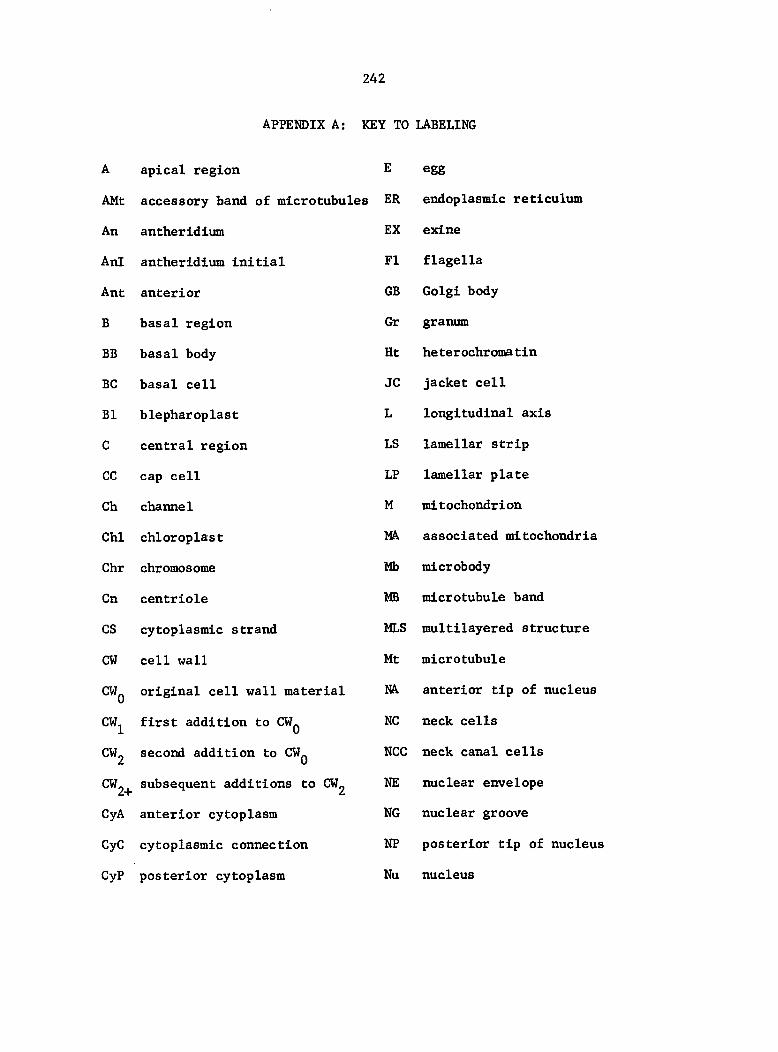
242
APPENDIX A: KEY TO LABELING
A apical region E egg
AMt accessory band of microtubules ER endoplasmic reticulum
An antheridium EX exine
AnI antheridium initial F1 flagella
Ant anterior GB Golgi body
B basal region Gr granum
BB basal body Ht heterochromatin
BC basal cell JC jacket cell
B1 blepharoplast L longitudinal axis
C central region LS lamellar strip
CC cap cell LP lamellar plate
Ch channel M mitochondrion
Chi chloroplast MA associated mitochondria
Chr chromosome Mb microbody
Cn centriole MB microtubule band
CS cytoplasmic strand MLS multilayered structure
CW cell wall Mt microtubule
% original cell wall material NA anterior tip of nucleus
CWi first addition to CWQ NC neck cells
CWg second addition to CW NCC neck canal cells
subsequent additions to CW NE nuclear envelope
CyA anterior cytoplasm NG nuclear groove
CyC cytoplasmic connection NP posterior tip of nucleus
CyP posterior cytoplasm Nu nucleus
243
Nue nucleolus
OB osmlophilic body
OC osmlophilic crest
OG osmlophilic globull
OM osmlophilic material
Pd plasmodesm
Ph phragmoplast
PI plastid
Pos posterior
Pr procentriole
PS perlspore
R rhizold
RC ring cell
RER rough endoplasmic reticulum
S starch
SC spermatogenous cell
SER smooth endoplasmic reticulum
Sp space
Spt spermatid
Spz spermatozoid
T transverse axis
Tr trichome
UC upper cell
V vacuole
VC vegetative cell
vcc ventral canal cell
Ve vesicle
W wing region

244
appendix B: FIGURES
Figure 35. Three-week old gametophyte showing four morphological regions. Antheridia are present on cells in central region, inner wing region, and basal region. Trlchomes occur on margins of wings and on cells in central region, indicated by smaller, dark arrow. Rhizoids only occur in basal region, with one rhizoid labelled with a clear arrow. Two antheridia have arisen from one vegetative cell (larger, dark arrow), with younger antherIdium located posterior to older antheridlum. X 98
Figure 36. A U-shaped, notch merlstem and upper wing regions of a three-week old gametophyte. X 120
Figure 37. A gametophyte during second week of growth, fixed and stained for RNA with azure B. Merlstematlc region stains intensely. Dark arrows Indicate presence of antheridia at varying stages of development. Clear arrows Indicate presumptive sites of antheridlum initiation. All antheridia arise at anterior end of vegetative cells. Marginal cells give rise to antheridia on their radial, anterior wall, compared to nonmarginal cells which give rise to antheridia on either their dorsal or ventral anterior wall, X 160
Figure 38. A three-week old gametophyte showing orientation of transverse and longitudinal sections. Some antheridia formed on cells in basal region are located in a more central position (arrow) than antheridia formed from cells in central and wing regions. X 170
Figure 39. Longitudinal section through merlstematlc region. Nucleus is centrally located surrounded by chloroplasts (arrows) and coalescing vacuoles. Cell posterior to merlstematlc cell has a peripherally located nucleus and a large central vacuole. Chloroplasts occur along the dorsal and ventral walls (arrow). X 825
Figure 40. Transverse section through a merlstematlc region (central three cells) flanked on both sides by cells in upper wing regions. Dark arrow indicates a chloroplast and clear arrow indicates a nucleolus. X 845
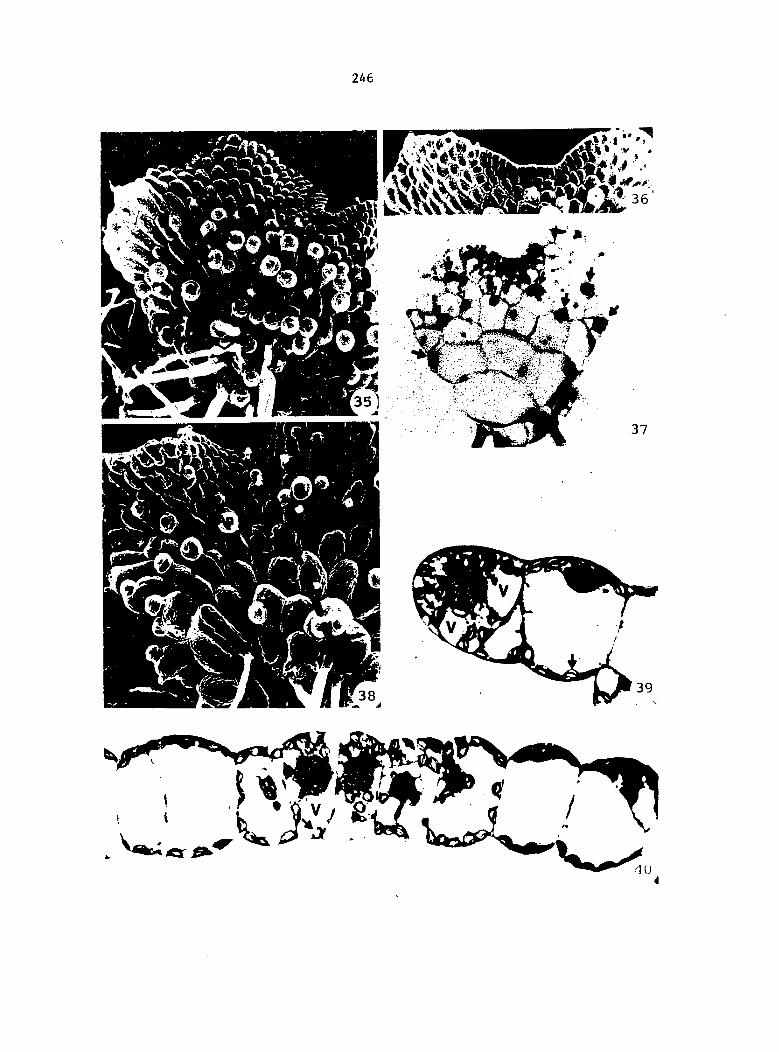
246
Figures 41-43. A meristematic cell of a young, antheridiate gameto-phyte
41. A centrally located nucleus is shown with a large nucleolus. The surrounding cytoplasm contains numerous chloroplasts lacking an extensive lamellar system, many small vacuoles, mitochondria, and Golgi bodies (dark arrow). Flasmodesmata traverse the inner, thin walls (clear arrow). X 12,090
42-43. Higher magnifications of two regions shown in Figure 41. Present within the meristematic cell are micro-bodies, microtubules (small, clear arrow), ER (larger, clear arrow), and Golgi bodies (dark arrow)
42.
43.
X 18,650
X 18,300
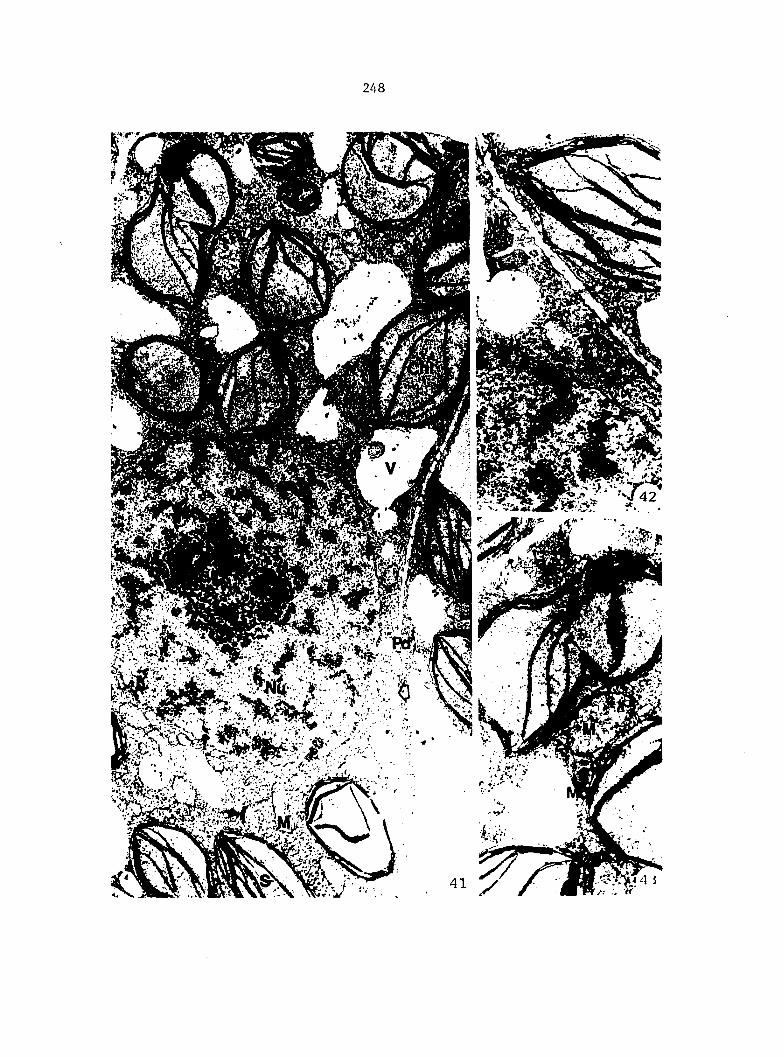
248
Figures 44-45. Longitudinal sections through meristematic cells. Outer, curved, periclinal wall (dark arrows) is much thicker (0.35 n m) than interior walls (0.13 p.m) such as posterior wall shown in Figure 45 (clear arrow)
44. X 6,730
45. X 6,660
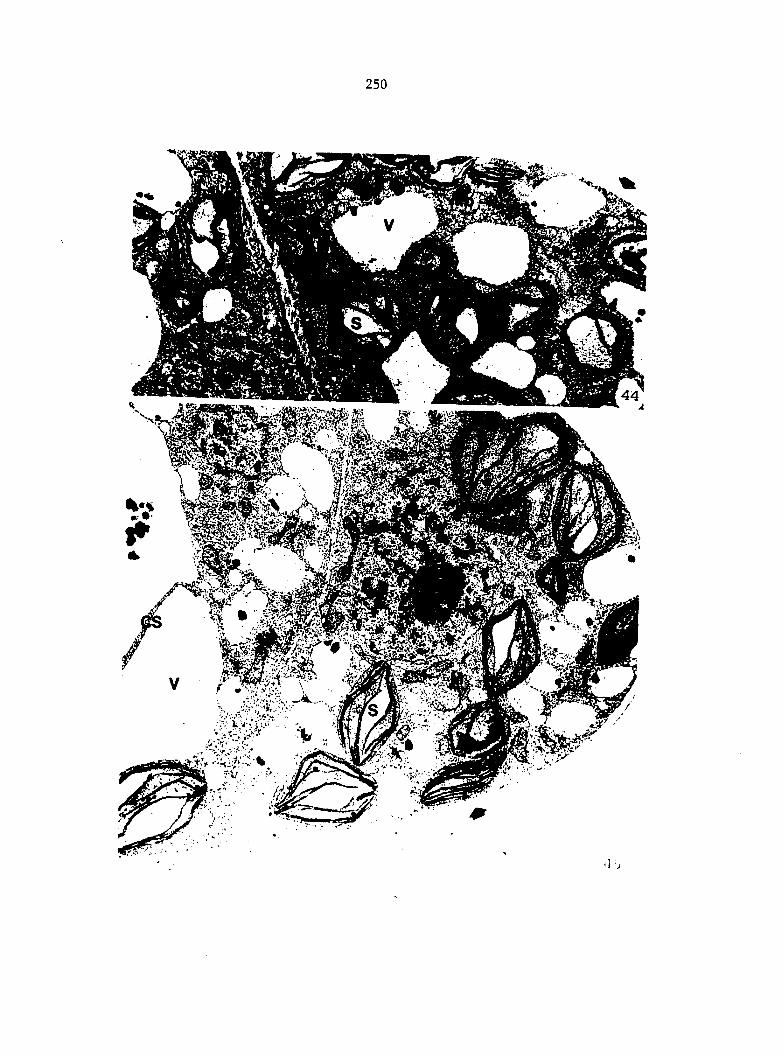
250
Figures 46-49. Higher magnifications of posterior wall of meristematic cell shown in Figure 44 (clear arrow)
46. Near the posterior wall, which is traversed by many plasmodesmata (arrow), are numerous microtubules oriented parallel to each other. In cell on left, posterior to meristematic cell on right, peripheral nucleus is surrounded with microtubules. X 13,440
47. Microtubules are indicated by dark arrows. Golgi bodies are present forming vesicles containing fibrous material (clear arrow on left). Invaginations of the plasmmalemma also contain fibrous material (clear arrow on right). X 48,720
48. Microtubules nearest cell wall are oriented parallel to each other and wall. Next to those microtubules are other microtubules oriented parallel to each other but at a right angle to first-described microtubules. X 44,550
49. An osmiophilic body is shown in meristematic cell. Plasmodesmata (arrow) are composed of an outer, circular membrane and an inner core of electron-dense material. X 45,190
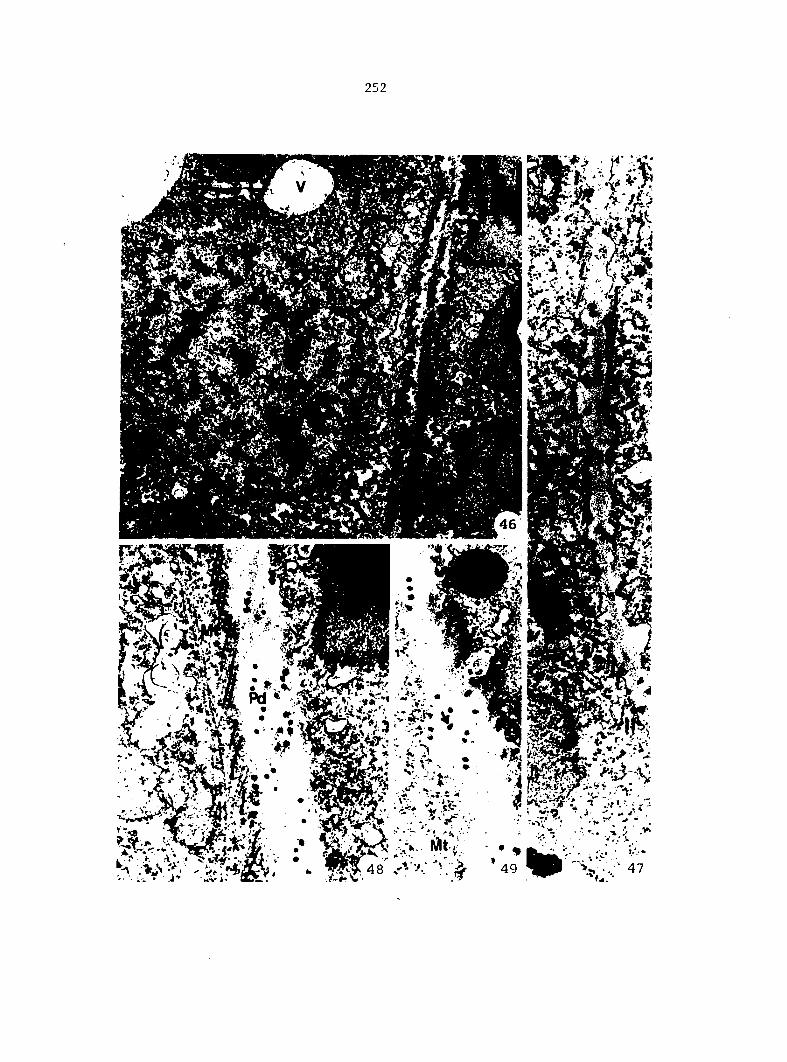
252
Figures 50-51. Meristematic cells differentiating into vacuolate, vegetative cells
50. Small vacuoles are coalescing into larger vacuoles. Many dedifferentiated chloroplasts occur around centrally located nucleus. Numerous plasmodesmata traverse interior, thin walls. X 6,250
51. Two meristematic cells with centrally located nuclei are shown next to a nonmeristematic cell on left with a peripherally located nucleus and a large central vacuole. X 900
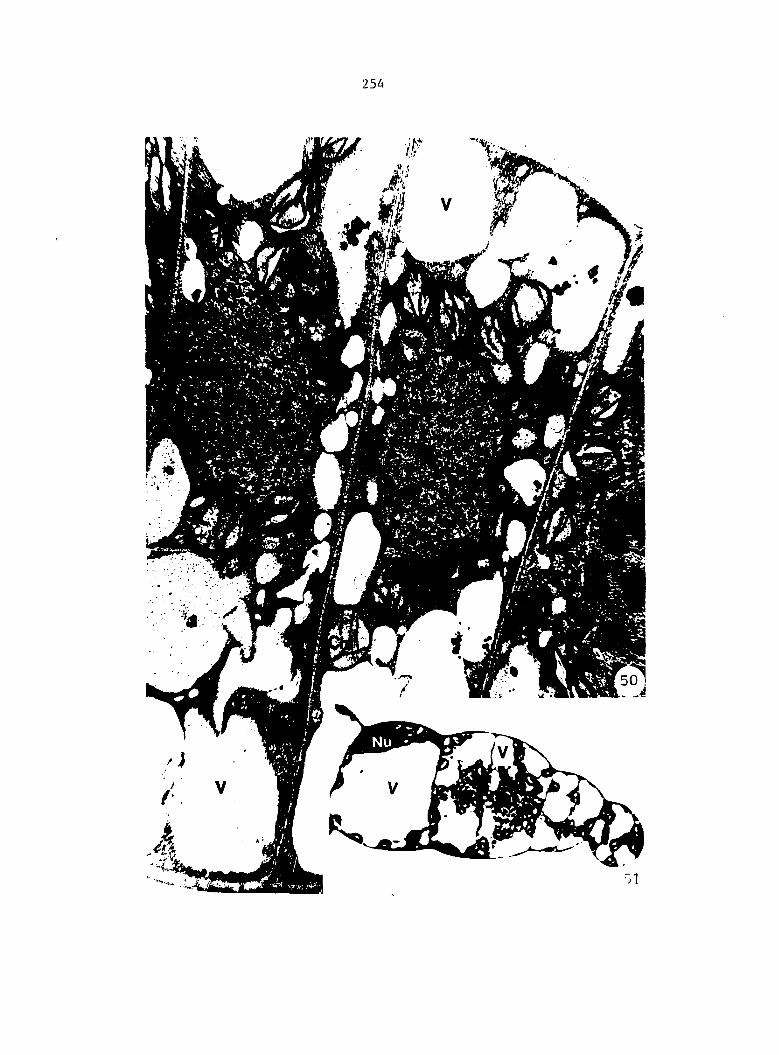
254
Figures 52-54. Transformation of meristematic cells into vacuolate, vegetative cells
52. Longitudinal section through a meristematic cell in which four to five large vacuoles have formed. Cytoplasm is assuming a peripheral location, transiently connected to nuclear region with thin cytoplasmic strands (arrows). X 835
53. Transverse section through meristematic region. X 575
54. Peripheral cytoplasm in a newly formed, vacuolate, vegetative cell revealing chloroplasts lacking extensive lamellar systems and containing little starch. Internal cell walls are thicker (0.20-0.25 ^.m) than in meristematic cells (clear arrows). Periclinal wall (dark arrow) is still about 0.35 w-m thick. X 12,260
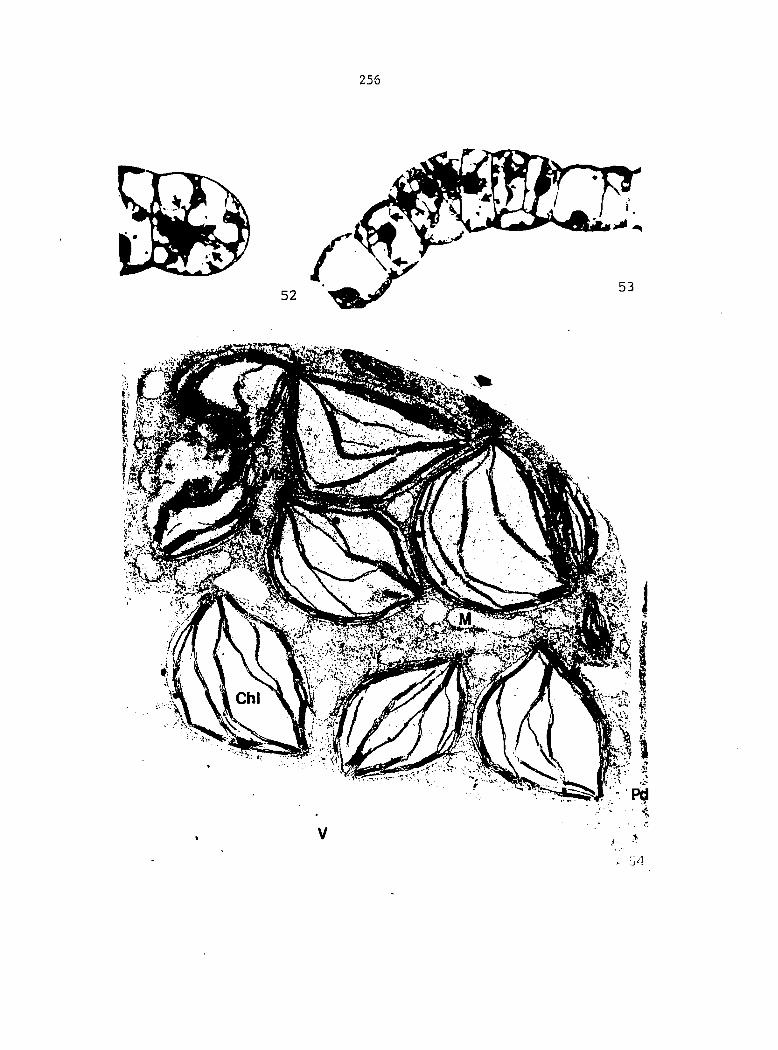
256
Figures 55-58. Vacuolate, vegetative cells showing recently migrated nuclei near cell wall
55-56. Peripheral nuclei still maintain contact with cytoplasm along opposite and adjacent walls through cytoplasmic strands (dark arrows). Clear arrows indicate thin layer of cytoplasm now localized near cell walls
55. X 865
56. X 770
57-58. Cytoplasmic strands are composed mainly of free ribo-soraes and an occasional small vacuole
57. X 7,000
58. X 7,800
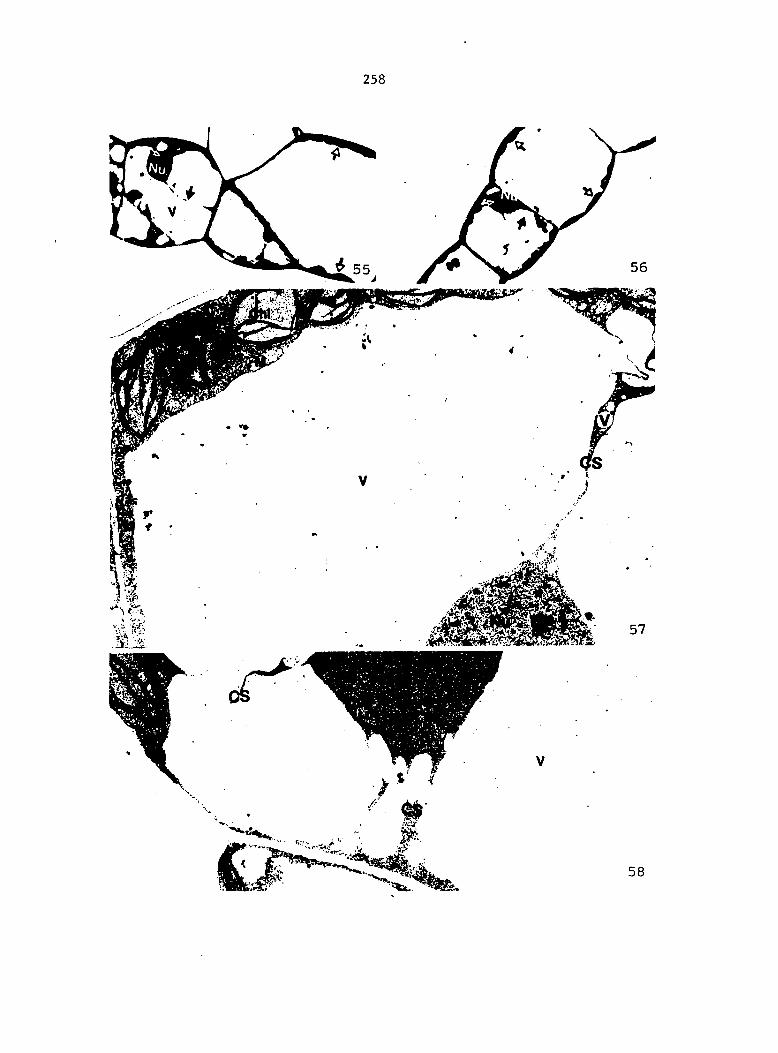
258
Figure 59. A longitudinal section through near center of a young, antheridiate gametophyte. Cells in central and basal regions have one large central vacuole. Chloroplasts (dark arrows) in peripheral cytoplasm are located mainly along periclinal walls (dorsal and ventral). X 435
Figure 60. A paradermal section through a young, antheridiate gameto phyte. No chloroplasts are present along internal walls (clear arrows), but do occur along outer walls (dark arrows). X 305
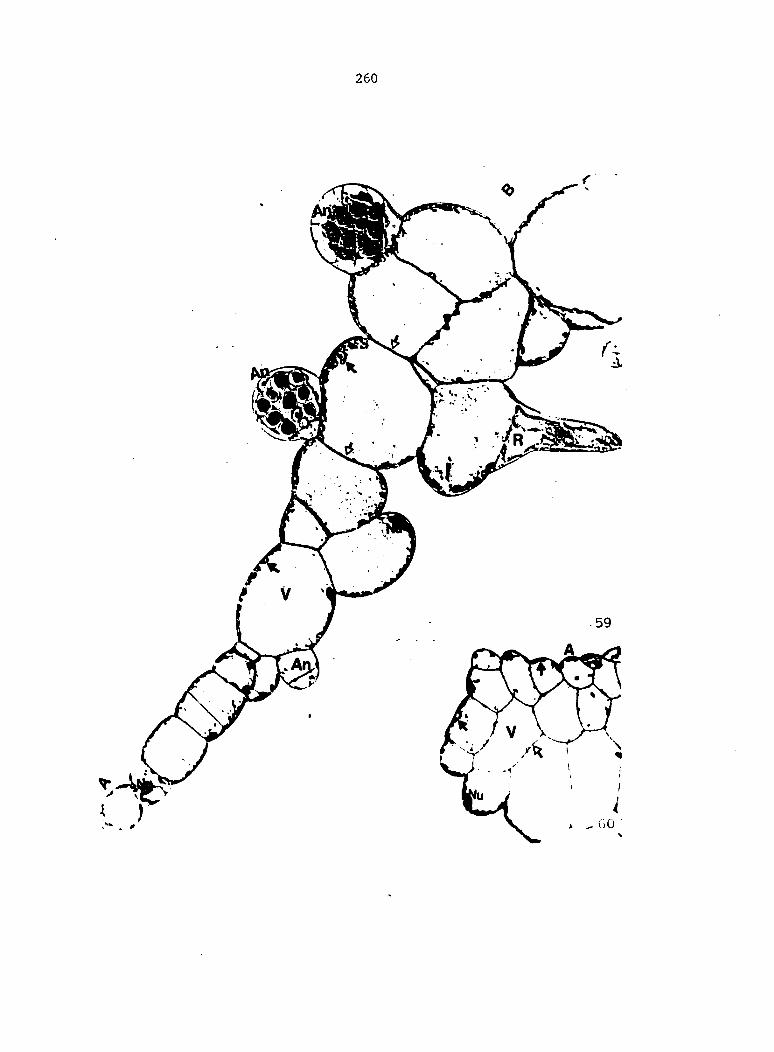
260
.59
Figure 61. A highly vacuolate, mature vegetative cell in a young, antheridiate gametophyte. Chloroplasts are much more differentiated than in younger, meristematic cells. X 6,225
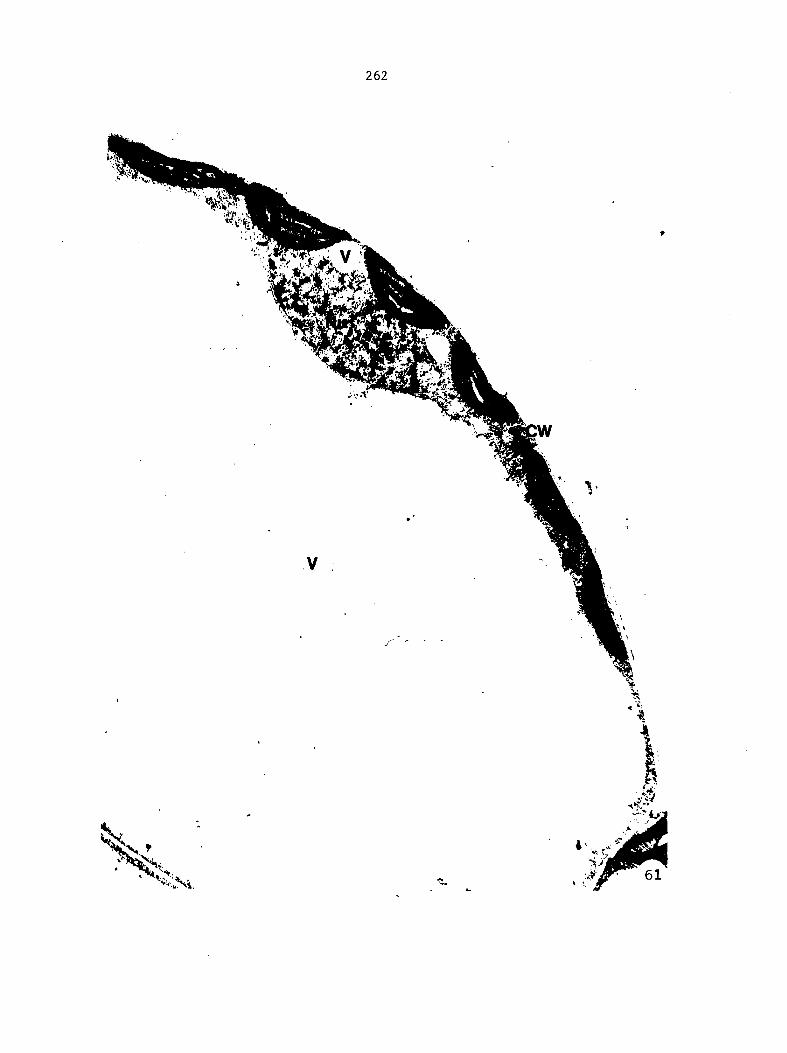
262
Figure 62. Transverse section through mature, vegetative cells revealing different cellular positions of the nuclei (dark arrows). Clear arrow indicates a chloroplast, X 1,315
Figure 63. Highly vacuolate, vegegative cell. Peripheral nucleus is often flat and ellipsoidal and is separated from plasma-lemma by well-differentiated chloroplasts. X 7,570
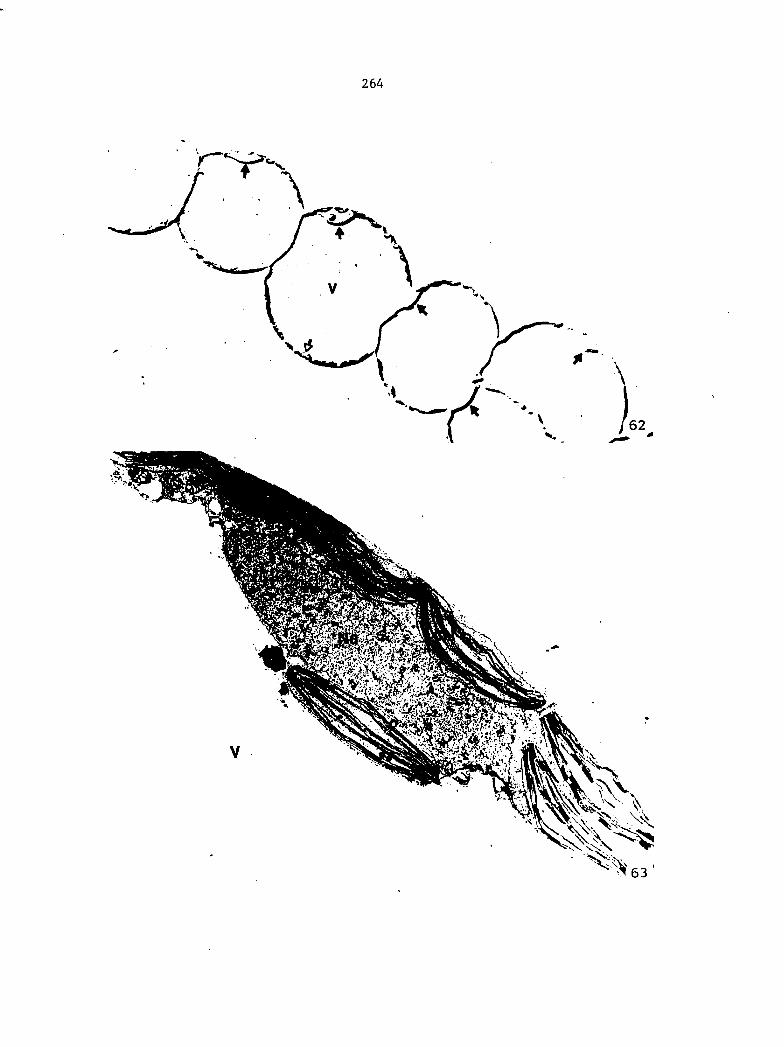
264
Figures 64-66. Portions of mature, vegetative cells
64. Chloroplasts with extensive lamellar systems, plasto-globuli, and some starch grains. Mitochondria and small vacuoles occur with chloroplast and separate ellipsoidal nucleus from plasmalemma. X 11,655
65. A lobed nucleus with an osmiophilic body near nuclear envelope. X 17,035
66. Microtubules occur near cell walls of this vegetative cell. X 25,765
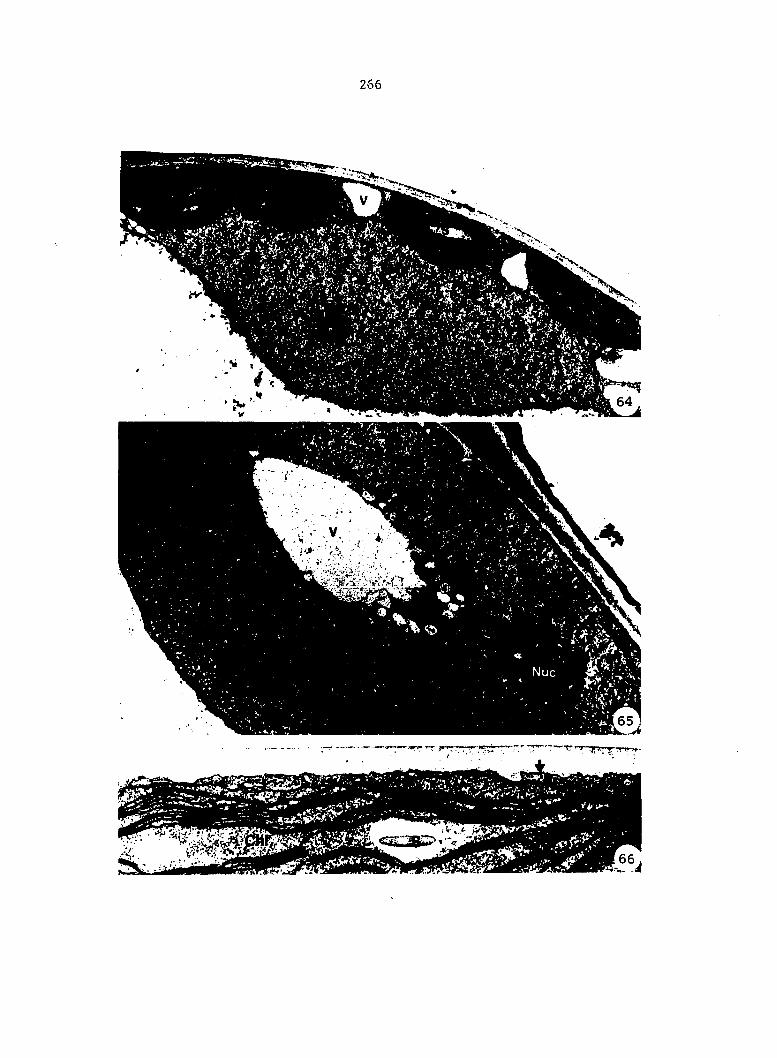
266
Figures 67-73. Cytoplasmic contents in mature, vegetative cells of young, antheridiate gametophytes
67-68. Microbodies. X 22,670
69-70. Mitochondria with densely staining amorphous inclusions (dark arrows)
69. X 12,640
70. X 16,880
71. Golgi body forming vesicles. X 29,025
72-73. Structures containing vesicles and tubules, resembling paramural bodies, although connections with plasmalemma are not evident in these sections
72.
73.
X 31,120
X 26,890
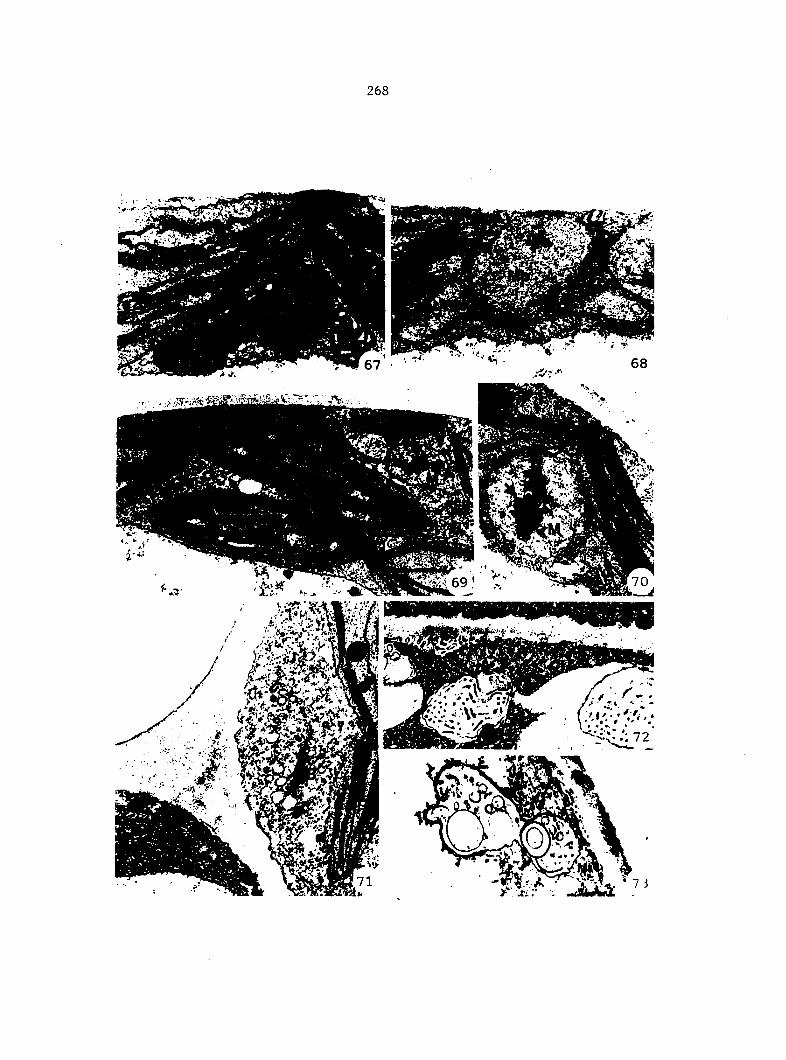
268

Figure 74. Antheridia on anterior, dorsal surface of vegetative cells in central region of a young gametophyte. Dark arrow indicates a presumptive antheridium initial. An antheridium and a trichôme occur on same vegetative cell in lower right-hand corner. X 765
Figure 75. An antheridium developing from anterior, radial corner of a marginal, vegetative cell. X 1,630
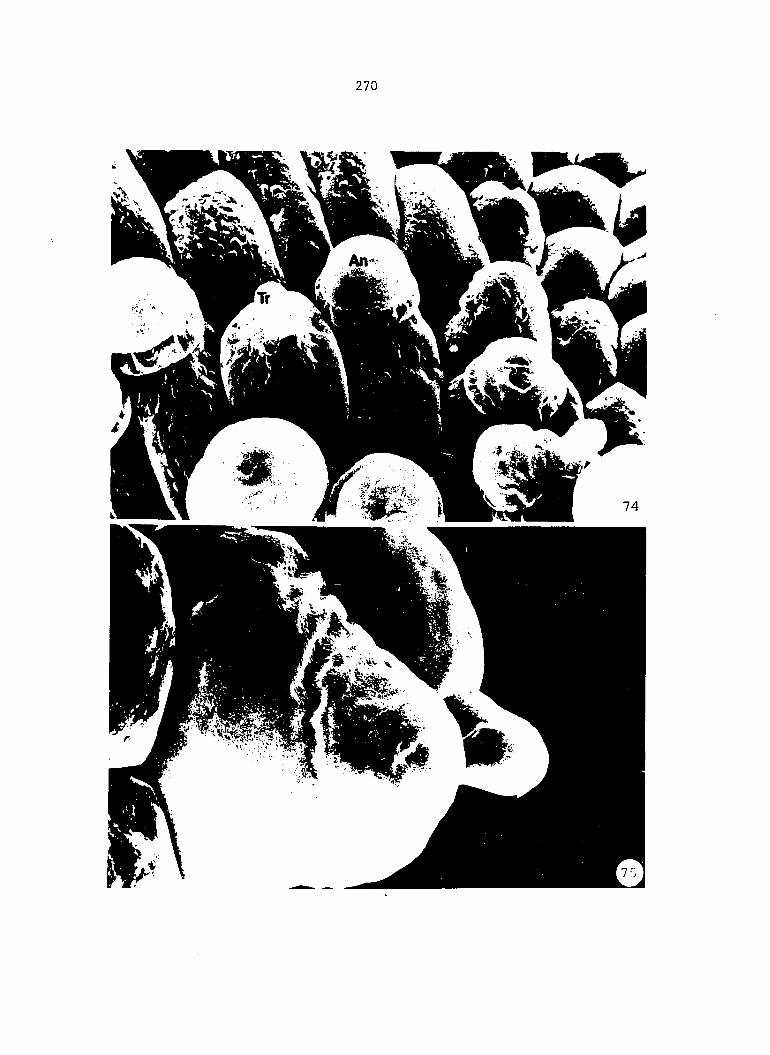
270
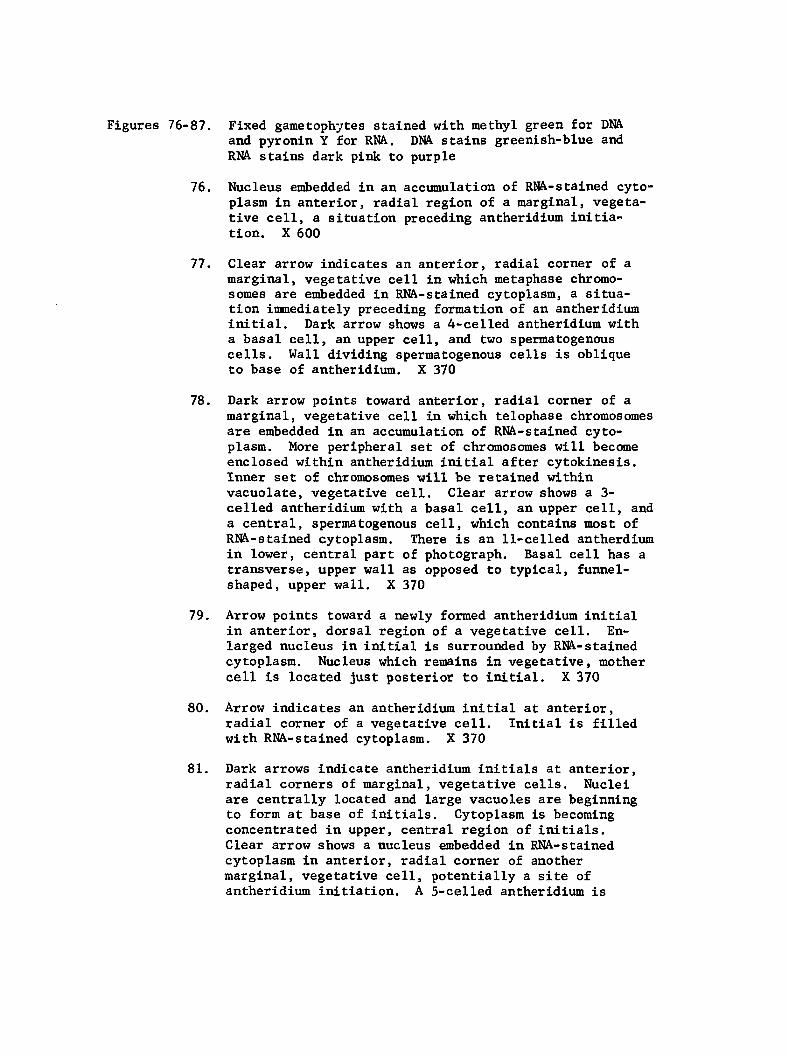
Figures 76-87. Fixed gametophytes stained with methyl green for DNA and pyronin Y for RNA. DNA stains greenish-blue and RNA stains dark pink to purple
76. Nucleus embedded in an accumulation of RN^l-stained cytoplasm in anterior, radial region of a marginal, vegetative cell, a situation preceding antheridium initiation. X 600
77. Clear arrow indicates an anterior, radial corner of a marginal, vegetative cell in which metaphase chromosomes are embedded in RNA-stained cytoplasm, a situation immediately preceding formation of an antheridium initial. Dark arrow shows a 4-celled antheridium with a basal cell, an upper cell, and two spermatogenous cells. Wall dividing spermatogenous cells is oblique to base of antheridium. X 370
78. Dark arrow points toward anterior, radial corner of a marginal, vegetative cell in which telophase chromosomes are embedded in an accumulation of RNA.-stained cytoplasm. More peripheral set of chromosomes will become enclosed within antheridium initial after cytokinesis. Inner set of chromosomes will be retained within vacuolate, vegetative cell. Clear arrow shows a 3-celled antheridium with a basal cell, an upper cell, and a central, spermatogenous cell, which contains most of RNA-stained cytoplasm. There is an 11-celled antherdium in lower, central part of photograph. Basal cell has a transverse, upper wall as opposed to typical, funnel-shaped, upper wall. X 370
79. Arrow points toward a newly formed antheridium initial in anterior, dorsal region of a vegetative cell. Enlarged nucleus in initial is surrounded by RN&-stained cytoplasm. Nucleus which remains in vegetative, mother cell is located just posterior to initial. X 370
80. Arrow indicates an antheridium initial at anterior, radial corner of a vegetative cell. Initial is filled with RNA-stained cytoplasm. X 370
81. Dark arrows indicate antheridium initials at anterior, radial corners of marginal, vegetative cells. Nuclei are centrally located and large vacuoles are beginning to form at base of initials. Cytoplasm is becoming concentrated in upper, central region of initials. Clear arrow shows a nucleus embedded in RNA-stained cytoplasm in anterior, radial corner of another marginal, vegetative cell, potentially a site of antheridium initiation. A 5-celled antheridium is
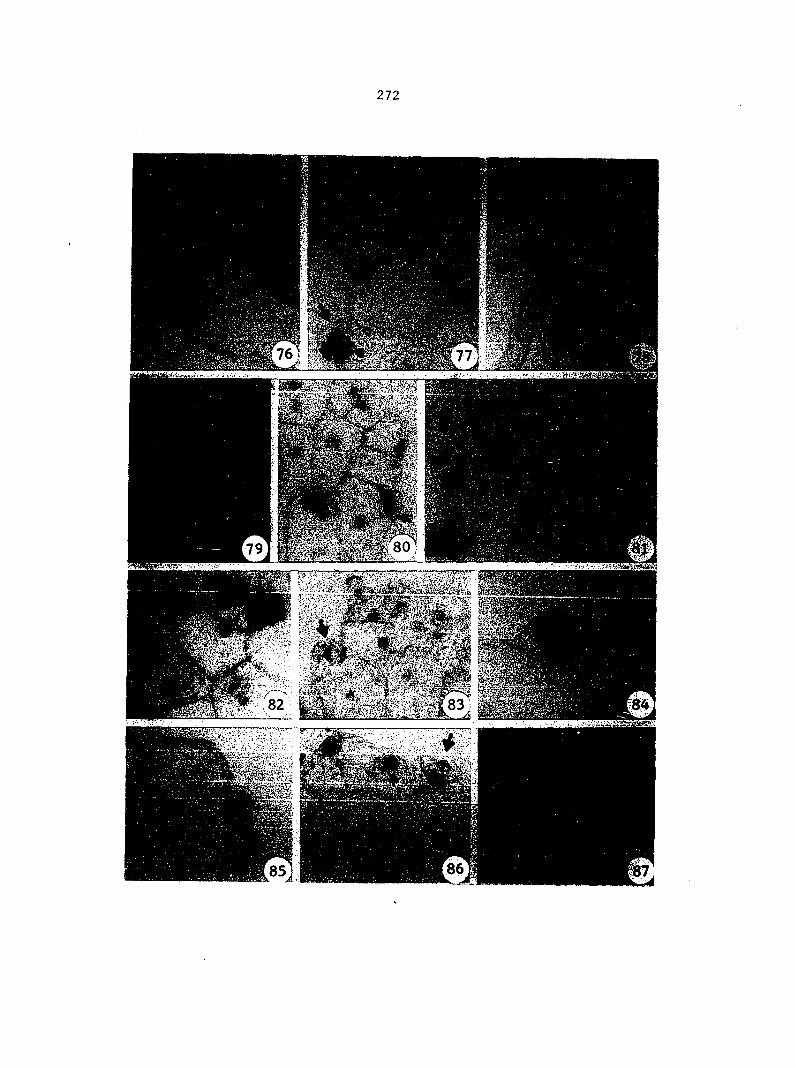
272
.'i Hbs
«N
273
present in lower, left-hand comer, with a basal cell, a ring cell, a cap cell, and two spermatogenous cells. Cell wall dividing spermatogenous cells is perpendicular to base of antheridium. X 370
82. Arrow indicates an expanded initial with large, basal vacuoles and a nucleus in a central, lower position. Cytoplasm has accumulated in upper central region. X 600
83. Initial indicated by arrow has entered into mitotic telophase. A line drawn equidistant between two sets of chromosomes would be oriented at about 40-45° to base of initial. RNAi-stained cytoplasm occurs mostly in upper, left-hand side of initial. X 370
84. A 2-celled antheridium, with a vacuolate basal cell and a densely cytoplasmic upper cell. X 600
85. A 2-celled antheridium in which cytoplasm in upper cell has accumulated in basal region of cell. Nucleus in upper cell is enlarged and less densely stained compared to nucleus in basal cell. Upper cell nucleus is now located in upper, central region of cell. X 370
86. Dark arrow shows a 2-celled antheridium with upper cell in mitotic telophase. Phragmoplast will form in a plane parallel to base of antheridium. Cytoplasm in upper cell is localized in basal region. Clear arrows show nuclei which have migrated to anterior, radial corner of marginal, vegetative cells and are embedded within RNA-stained cytoplasm. X 370
87. Dark arrow shows a 3-celled antheridium with a vacuolate basal and upper cell and a densely cytoplasmic central, spermatogenous cell. Clear arrow indicates a 2-celled antheridium with a vacuolate basal cell and a densely cytoplasmic upper cell. X 370
Figure 88. Arrow indicates nucleus in outer, anterior corner of vacuolate, vegetative cell embedded in cytoplasm containing many chloroplasts. X 880
Figures 89-90. Sections through an outer, anterior corner of a vegetative cell into which a nucleus has migrated. Surrounding nucleus are a large number of mitochondria. Large dark arrows indicate outer, periclinal wall. Smaller, dark arrow indicates presence of some microtubules.
89.
90.
X 10,570
X 8,545
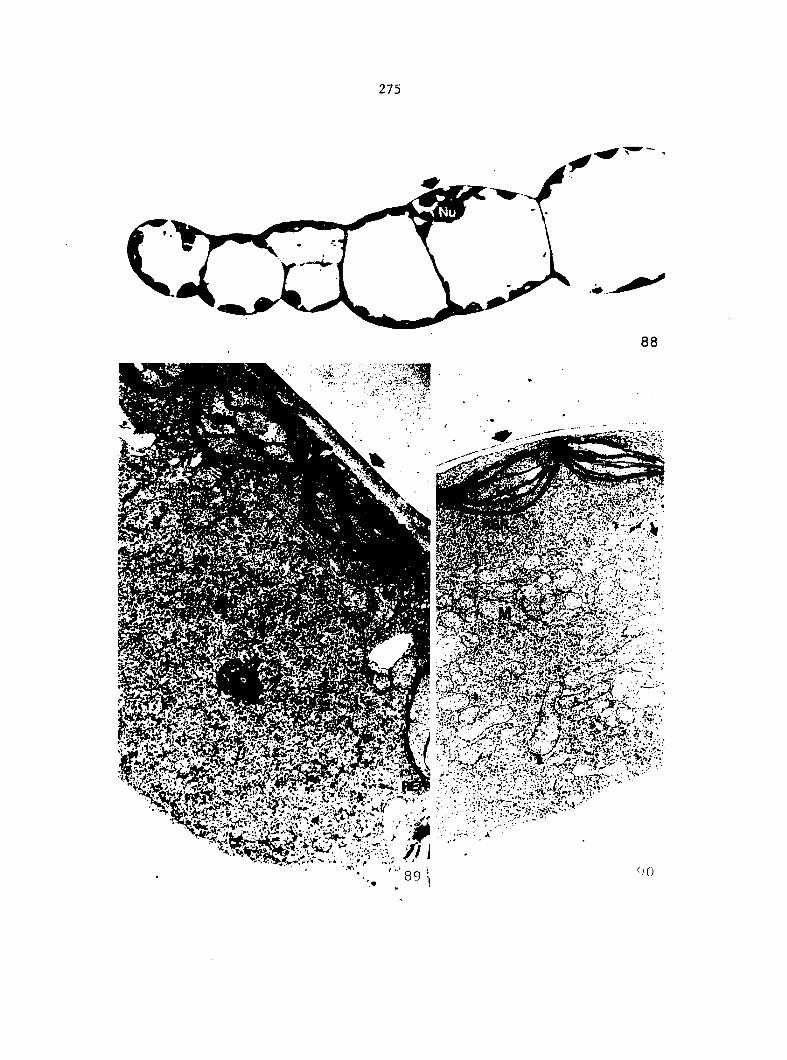
275
Figure 91. A nucleus near periclinal wall of a vegetative cell during telophase of mitosis. Clear arrow indicates innermost set of chromosomes. White arrow indicates outermost set of chromosomes. Phragmoplast forming in region indicated by white star will intersect the outer wall at an oblique angle. A cytoplasmic strand, faintly shown in this photograph, traverses large vacuole from innermost set of chromosomes to opposite wall of vegetative cell (dark arrow). X 780
Figures 92-93, Antheridium initials at anterior end of vegetative cells
92. A small, wedge-shaped antheridium in which basal wall intersects anterior wall of vegetative cell about 10 nm from edge (dark arrow) and periclinal wall of vegetative cell near a central region. Nucleus in vegetative mother cell is located just below initial surrounded by small vacuoles, X 700
93. An antheridium initial densely cytoplasmic with many small vacuoles in lower, anterior region. Nucleus in vegetative, mother cell is surrounded by many small vacuoles, X 8,000
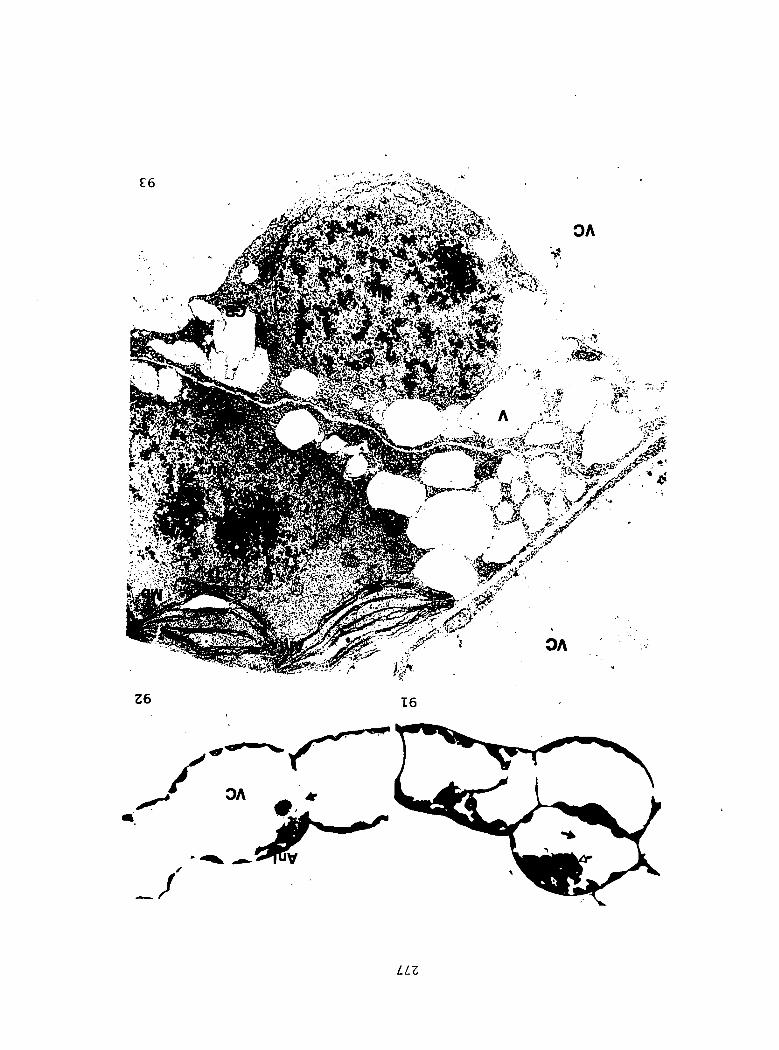
LLZ

Figure 94, Montage of a vegetative, mother cell after formation of an initial towards top of micrograph. Nucleus in mother cell is connected to cytoplasm along opposite wall by a thin, cytoplasmic strand composed mainly of free ribo-somes. X 17,740
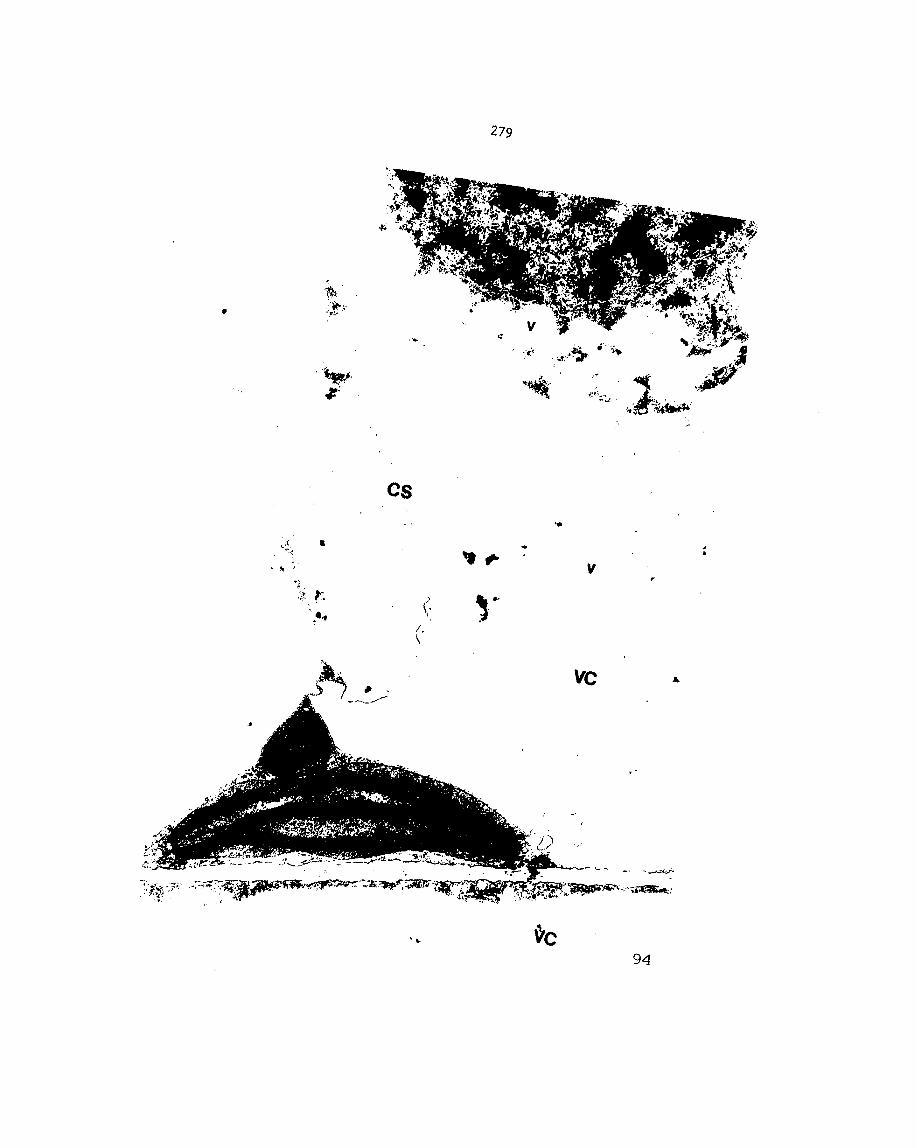
279
c r / . V
94
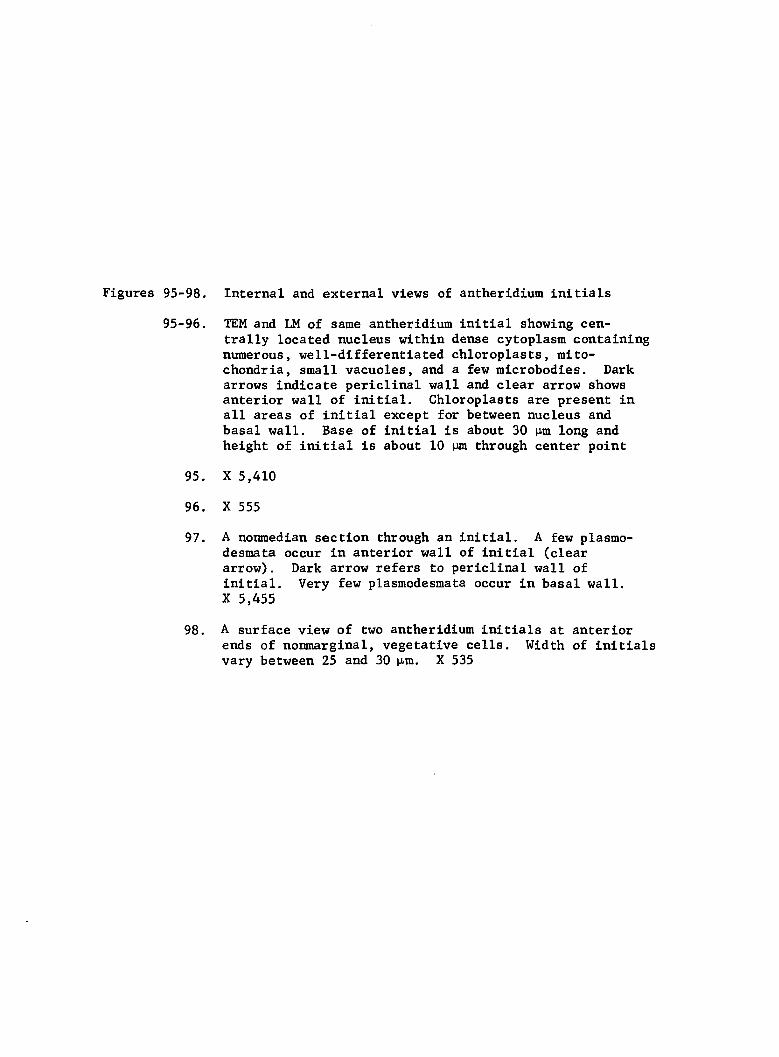
Figures 95-98. Internal and external views of antheridium initials
95-96. TEM and LM of same antheridium initial showing centrally located nucleus within dense cytoplasm containing numerous, well-differentiated chloroplasts, mitochondria, small vacuoles, and a few microbodies. Dark arrows indicate periclinal wall and clear arrow shows anterior wall of initial. Chloroplasts are present in all areas of initial except for between nucleus and basal wall. Base of initial is about 30 nm long and height of initial is about 10 |Jm through center point
95. X 5,410
96. X 555
97. A nonmedian section through an initial. A few plasmo-desmata occur in anterior wall of initial (clear arrow). Dark arrow refers to periclinal wall of initial. Very few plasmodesmata occur in basal wall. X 5,455
98. A surface view of two antheridium initials at anterior ends of nonmarginal, vegetative cells. Width of initials vary between 25 and 30 M-m. X 535
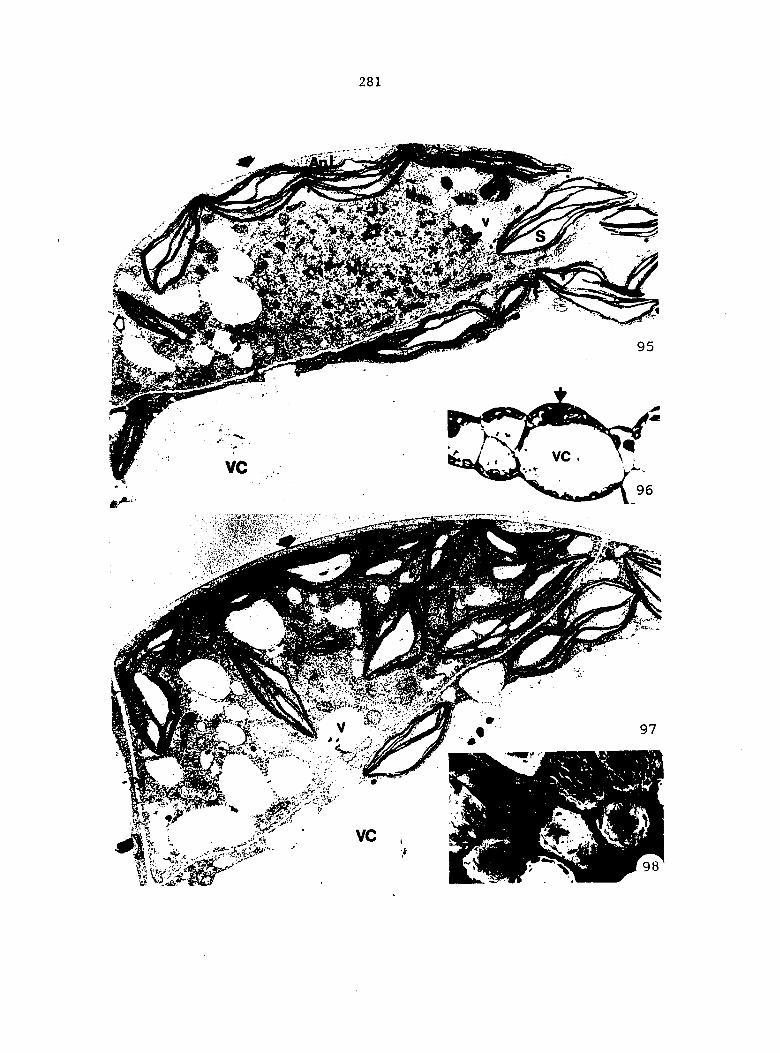
281
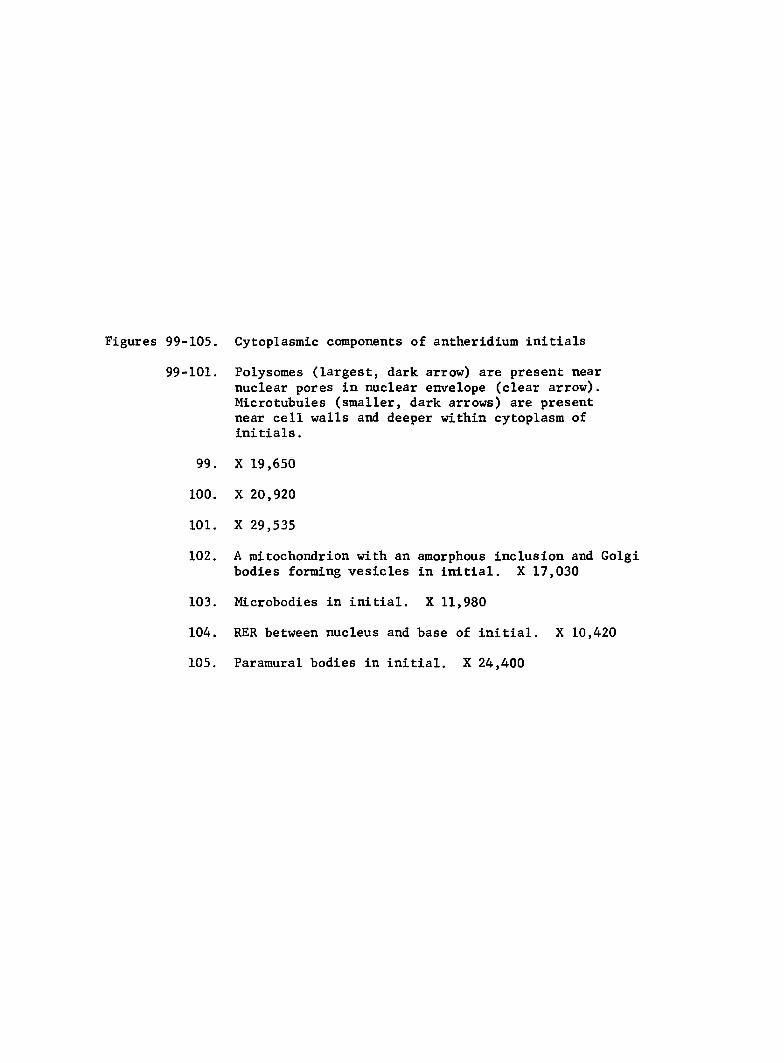
Figures 99-105. Cytoplasmic components of antheridium initials
99-101. Polysomes (largest, dark arrow) are present near nuclear pores in nuclear envelope (clear arrow). Microtubules (smaller, dark arrows) are present near cell walls and deeper within cytoplasm of initials.
99. X 19,650
100. X 20,920
101. X 29,535
102. A mitochondrion with an amorphous inclusion and Golgi bodies forming vesicles in initial. X 17,030
103. Microbodies in initial. X 11,980
104. RER between nucleus and base of initial. X 10,420
105. Paramural bodies in initial. X 24,400
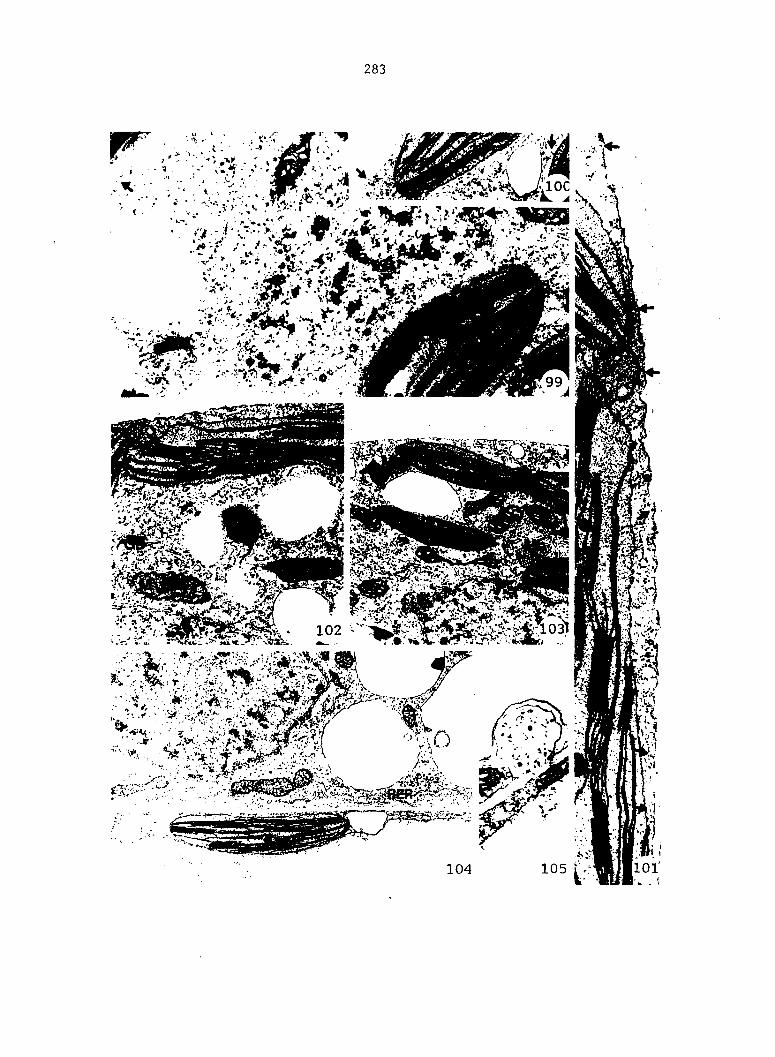
283
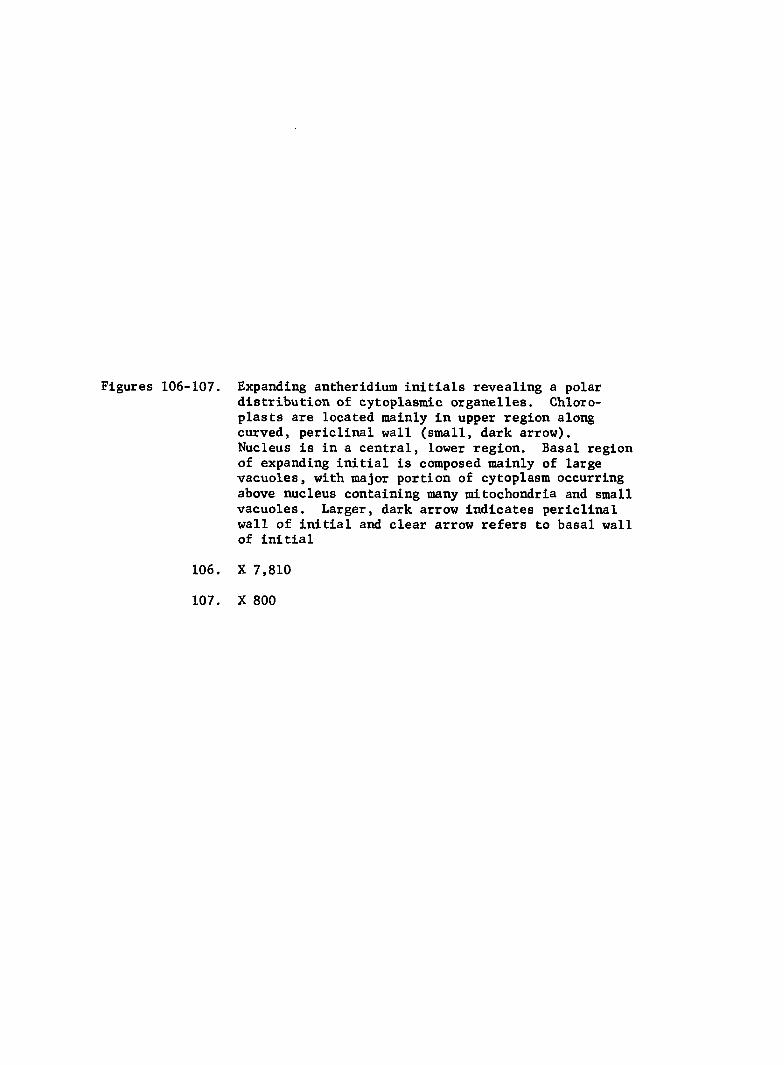
Figures 106-107. Expanding antheridium initials revealing a polar distribution of cytoplasmic organelles. Chloro-plasts are located mainly in upper region along curved, periclinal wall (small, dark arrow). Nucleus is in a central, lower region. Basal region of expanding initial is composed mainly of large vacuoles, with major portion of cytoplasm occurring above nucleus containing many mitochondria and small vacuoles. Larger, dark arrow indicates periclinal wall of initial and clear arrow refers to basal wall of initial
106.
107.
X 7,810
X 800
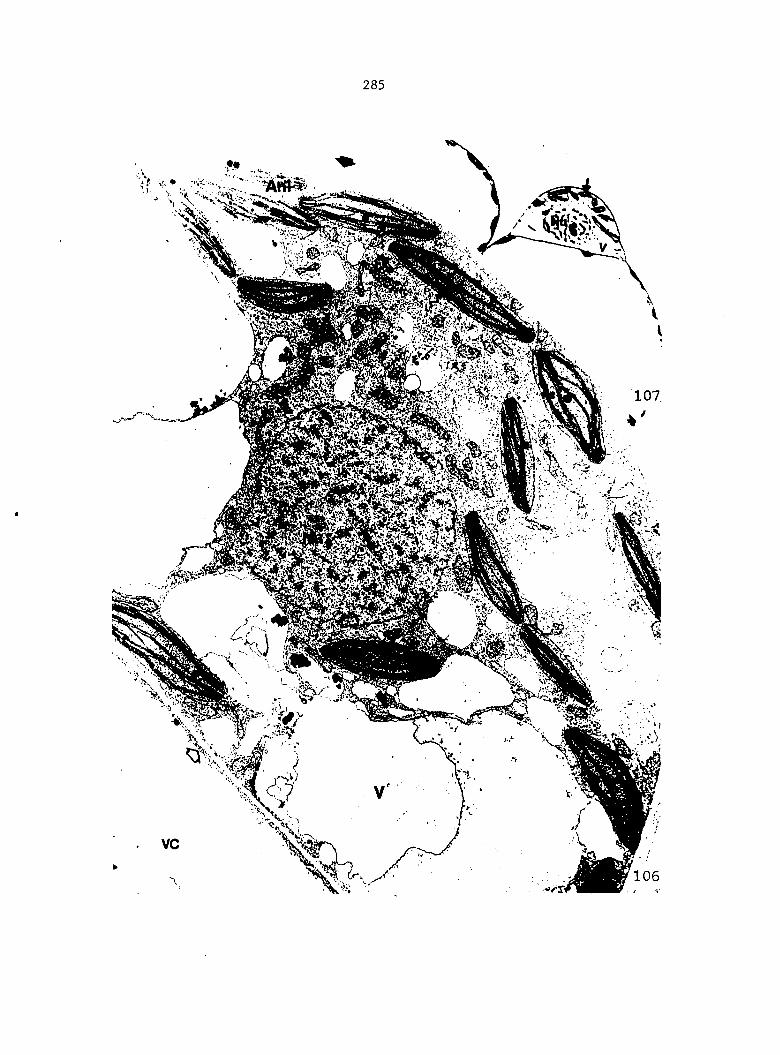
285
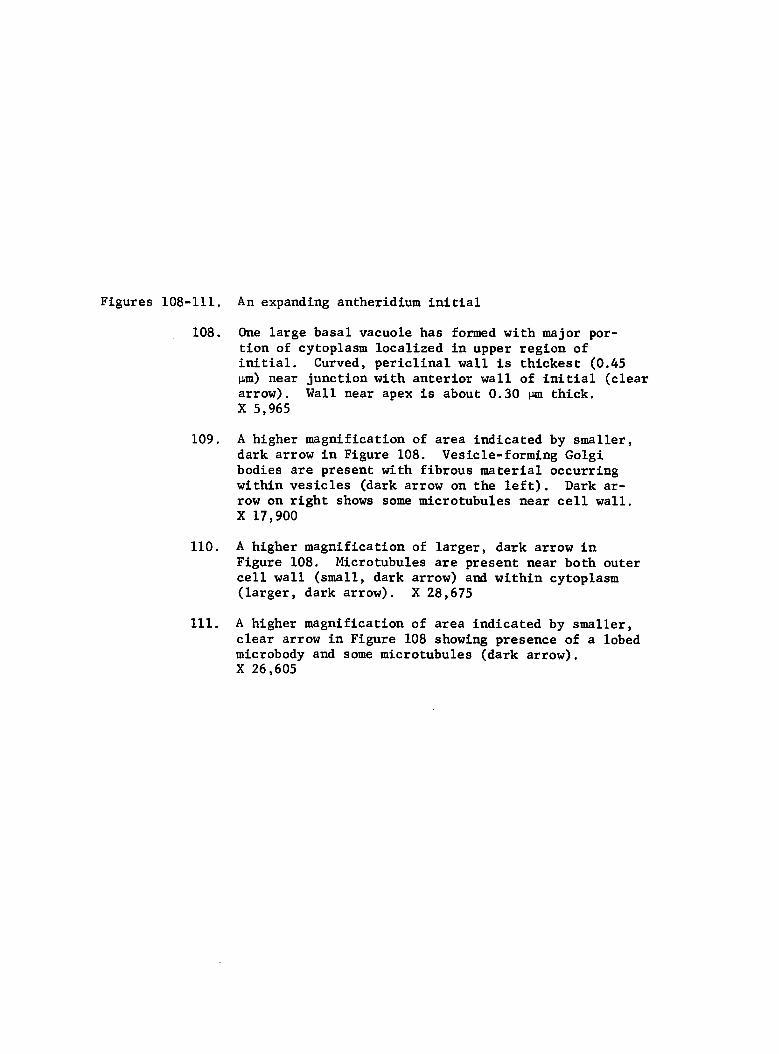
Figures 108-111. An expanding antheridium initial
108. One large basai vacuole has formed with major portion of cytoplasm localized in upper region of initial. Curved, periclinal wall is thickest (0.45 M-m) near junction with anterior wall of initial (clear arrow). Wall near apex is about 0.30 pm thick. X 5,965
109. A higher magnification of area indicated by smaller, dark arrow in Figure 108. Vesicle-forming Golgi bodies are present with fibrous material occurring within vesicles (dark arrow on the left). Dark arrow on right shows some microtubules near cell wall. X 17,900
110. A higher magnification of larger, dark arrow in Figure 108. Microtubules are present near both outer cell wall (small, dark arrow) and within cytoplasm (larger, dark arrow). X 28,675
111. A higher magnification of area Indicated by smaller, clear arrow in Figure 108 showing presence of a lobed microbody and some microtubules (dark arrow). X 26,605
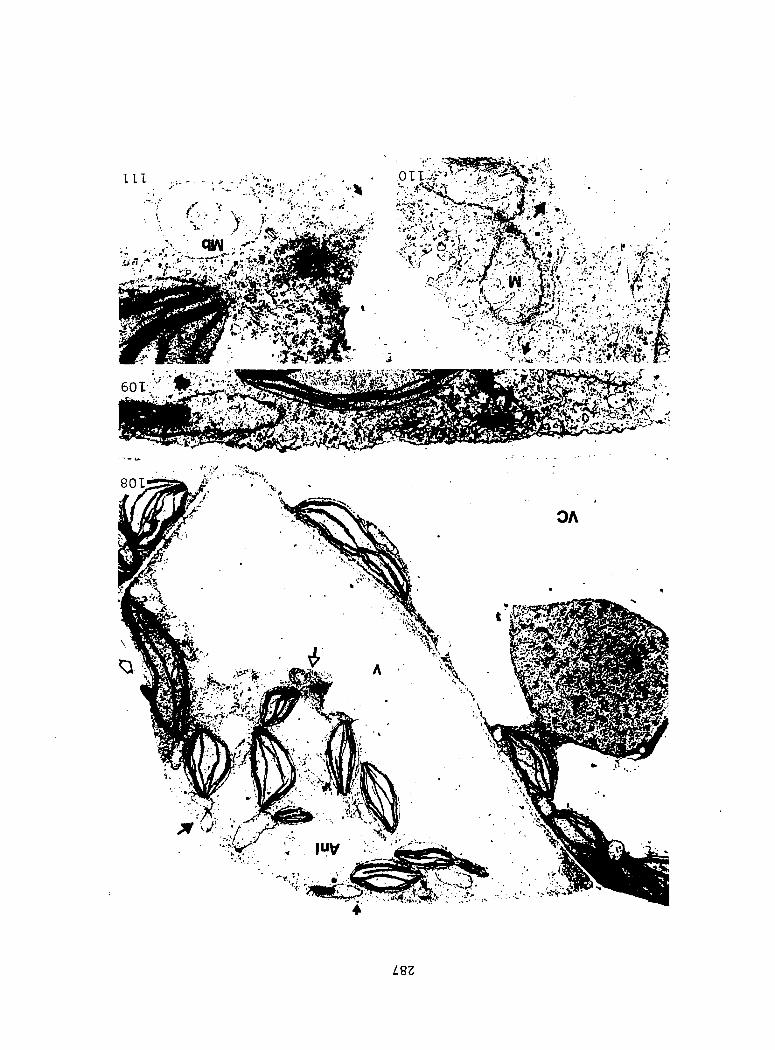
•'!y^
L2Z
Figures 112-115. Antheridium initials near end of expansion phase
112. An expanded initial at anterior end of a vegetative cell (arrow). Nucleus has elongated somewhat in a vertical direction. Base of initial is vacuolate. X 525
113-115. Serial sections through an expanded initial. Most of cytoplasm is localized in upper, central region. Nuclear region remains in contact with all sides of initial through thin cytoplasmic strands (arrows). Nucleolus is quite large. Basal region is highly vacuolate. X 680
Figures 116-119. Serial sections through an antheridium initial during mitotic telophase
116. Near-median section revealing localized cytoplasm in upper, central region with large basal vacuoles. Height of initial is about 28-30 Mm and basal diameter is about 38-40 pm. X 835
117. A more anterior section showing first observed set of chromosomes (clear arrow). A portion of phragmo-plast is apparent near base of initial (dark arrow). X 835
118. A more anterior section showing another portion of phragmoplast at a much higher level above base of initial (dark arrow). Set of chromosomes observed in Figure 117 are still evident above phragmoplast (clear arrow). X 835
119. A more anterior section revealing a portion of second set of chromosomes below phragmoplast (clear arrow). Highest point of phragmoplast is about two-fifths height of antheridium (dark arrow). First-observed set of chromosomes are barely evident above phragmoplast (clear arrow). X 835
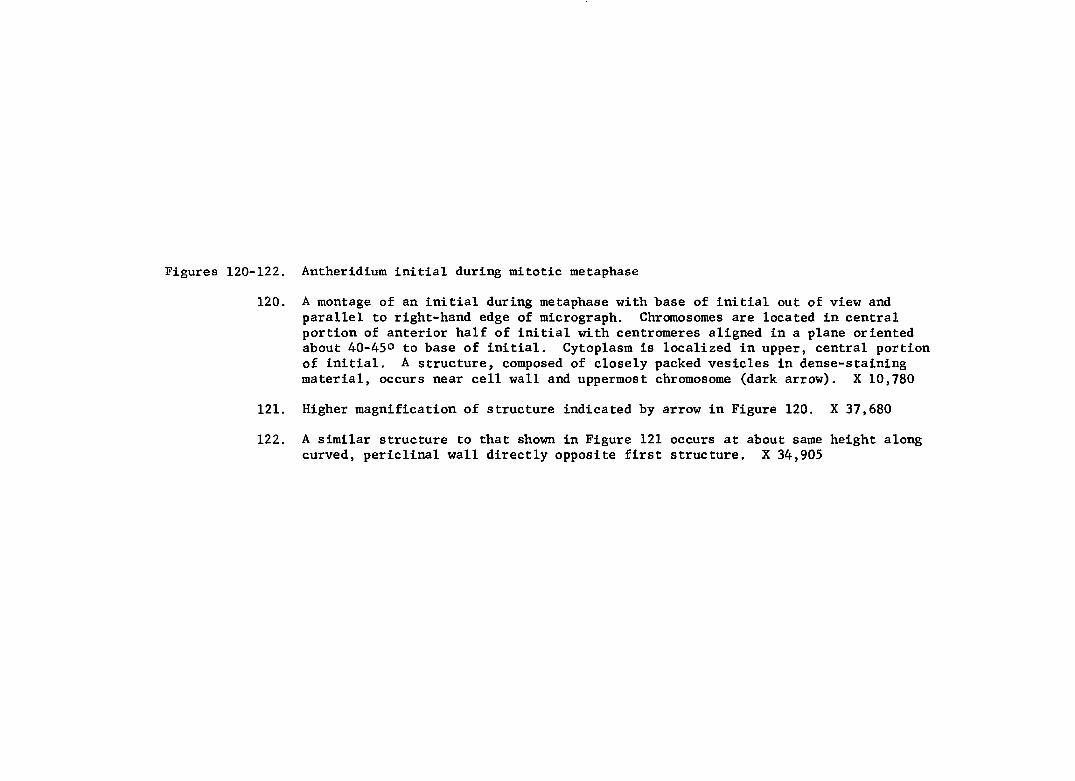
Figures 120-122. Antheridium initial during mitotic metaphase
120. A montage of an initial during metaphase with base of initial out of view and parallel to right-hand edge of micrograph. Chromosomes are located in central portion of anterior half of initial with centromeres aligned in a plane oriented about 40-45° to base of initial. Cytoplasm is localized in upper, central portion of initial. A structure, composed of closely packed vesicles in dense-staining material, occurs near cell wall and uppermost chromosome (dark arrow). X 10,780
121. Higher magnification of structure indicated by arrow in Figure 120. X 37,680
122. A similar structure to that shown in Figure 121 occurs at about same height along curved, periclinal wall directly opposite first structure, X 34,905
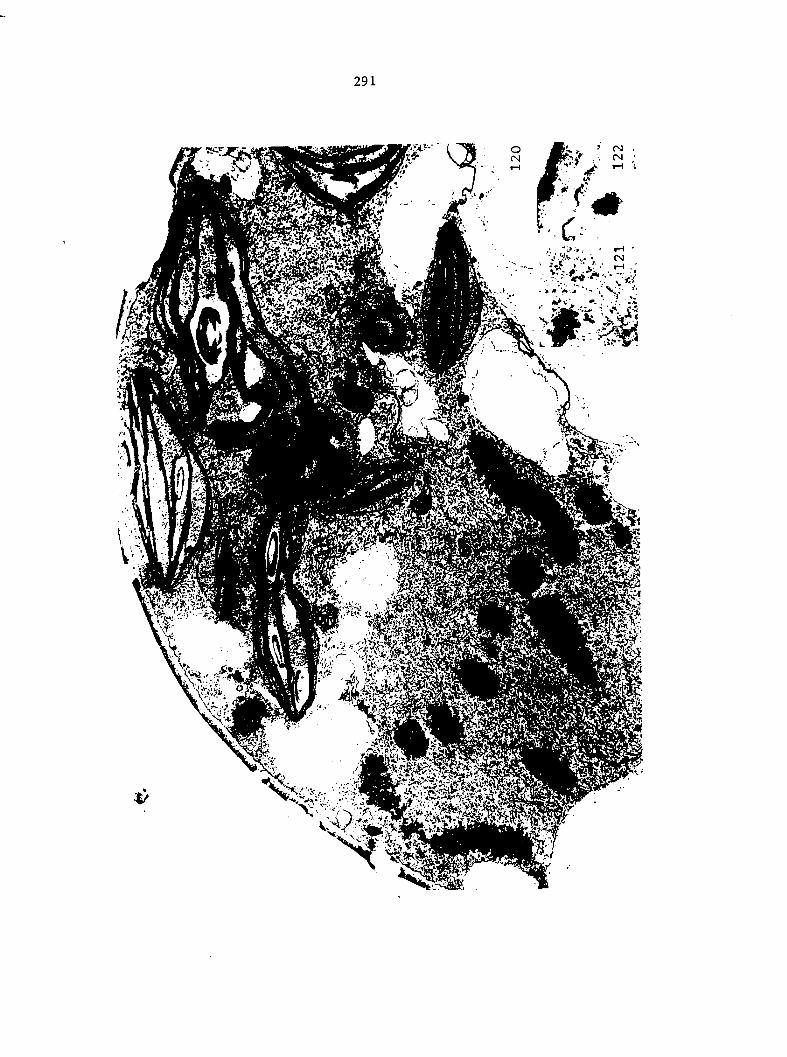
291
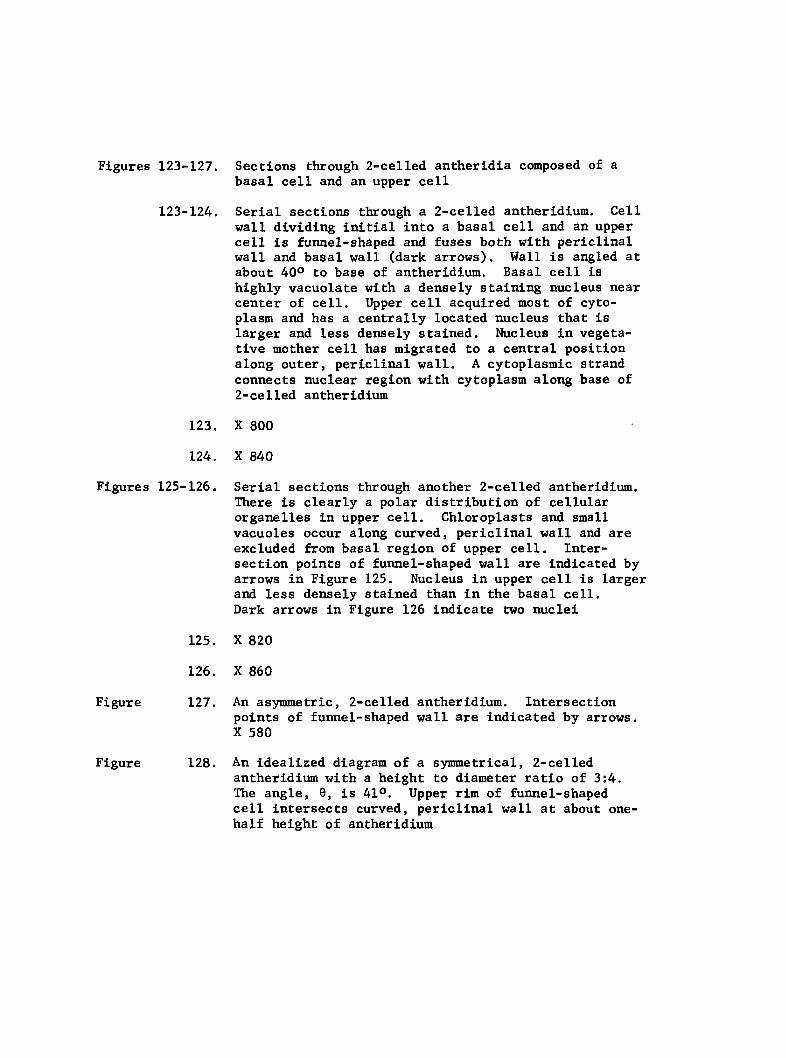
Figures 123-127. Sections through 2-celled antheridia composed of a basal cell and an upper cell
123-124. Serial sections through a 2-celled antheridium. Cell wall dividing initial into a basal cell and an upper cell is funnel-shaped and fuses both with periclinal wall and basal wall (dark arrows). Wall is angled at about 40° to base of antheridium. Basal cell is highly vacuolate with a densely staining nucleus near center of cell. Upper cell acquired most of cytoplasm and has a centrally located nucleus that is larger and less densely stained. Nucleus in vegetative mother cell has migrated to a central position along outer, periclinal wall. A cytoplasmic strand connects nuclear region with cytoplasm along base of 2-celled antheridium
123. X 800
124. X 840
Figures 125-126. Serial sections through another 2-celled antheridium. There is clearly a polar distribution of cellular organelles in upper cell. Chloroplasts and small vacuoles occur along curved, periclinal wall and are excluded from basal region of upper cell. Intersection points of funnel-shaped wall are indicated by arrows in Figure 125. Nucleus in upper cell is larger and less densely stained than in the basal cell. Dark arrows in Figure 126 indicate two nuclei
125, X 820
126, X 860
Figure 127, An asymmetric, 2-celled antheridium. Intersection points of funnel-shaped wall are indicated by arrows. X 580
Figure 128. An idealized diagram of a symmetrical, 2-celled antheridium with a height to diameter ratio of 3:4, The angle, 0, is 41°, Upper rim of funnel-shaped cell intersects curved, periclinal wall at about one-half height of antheridium
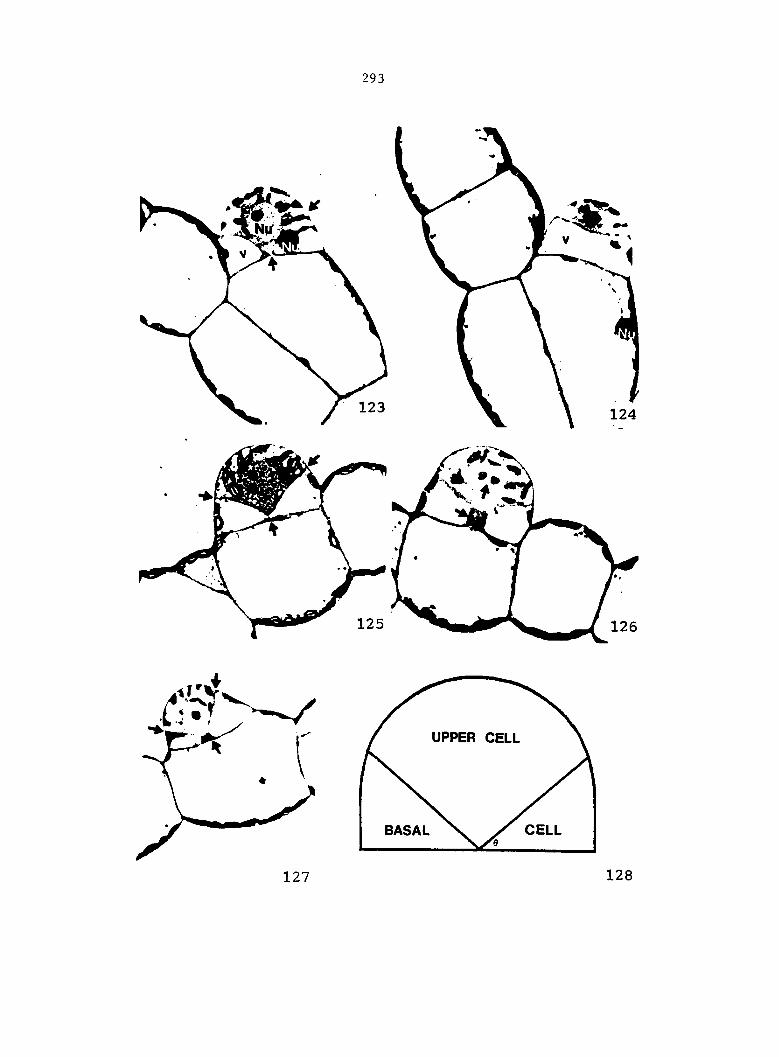
293
127
UPPER CELL
CELL BASAL
128
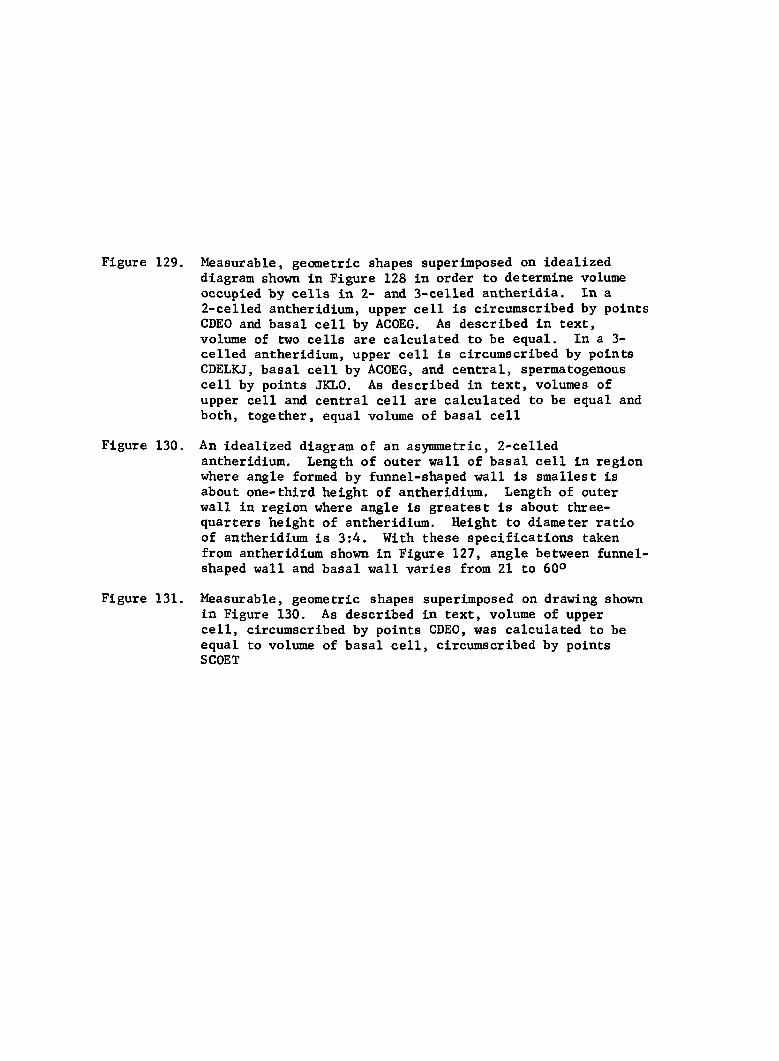
Figure 129. Measurable, geometric shapes superimposed on idealized diagram shown in Figure 128 in order to determine volume occupied by cells in 2- and 3-celled antherldia. In a 2-celled antheridlum, upper cell is circumscribed by points CDEO and basal cell by ACOEG. As described in text, volume of two cells are calculated to be equal. In a 3-celled antheridlum, upper cell is circumscribed by points CDELKJ, basal cell by ACOEG, and central, spermatogenous cell by points JKLO. As described in text, volumes of upper cell and central cell are calculated to be equal and both, together, equal volume of basal cell
Figure 130. An idealized diagram of an asymmetric, 2-celled antheridlum. Length of outer wall of basal cell in region where angle formed by funnel-shaped wall is smallest Is about one-third height of antheridlum. Length of outer wall in region where angle is greatest is about three-quarters height of antheridlum. Height to diameter ratio of antheridlum is 3:4. With these specifications taken from antheridlum shown in Figure 127, angle between funnel-shaped wall and basal wall varies from 21 to 60°
Figure 131. Measurable, geometric shapes superimposed on drawing shown in Figure 130. As described in text, volume of upper cell, circumscribed by points CDEO, was calculated to be equal to volume of basal cell, circumscribed by points SCOET
UPPER CELL
BASAL
Figures 132-133. Serial sections through a 2-celled antheridium. Organelles are polarly distributed in upper cell. Chloroplasts and small vacuoles occur between the centrally located nucleus and curved, periclinal wall. Many mitochondria occur in ribosome-rich cytoplasm between nucleus and funnel-shaped wall. NÏicleus in upper cell has dispersed chromatin, while nucleus in basal cell has more condensed chromatin. Dark arrow indicates funnel-shaped wall and clear arrow indicates basal wall of antheridium
132.
133.
X 5,040
X 5,510
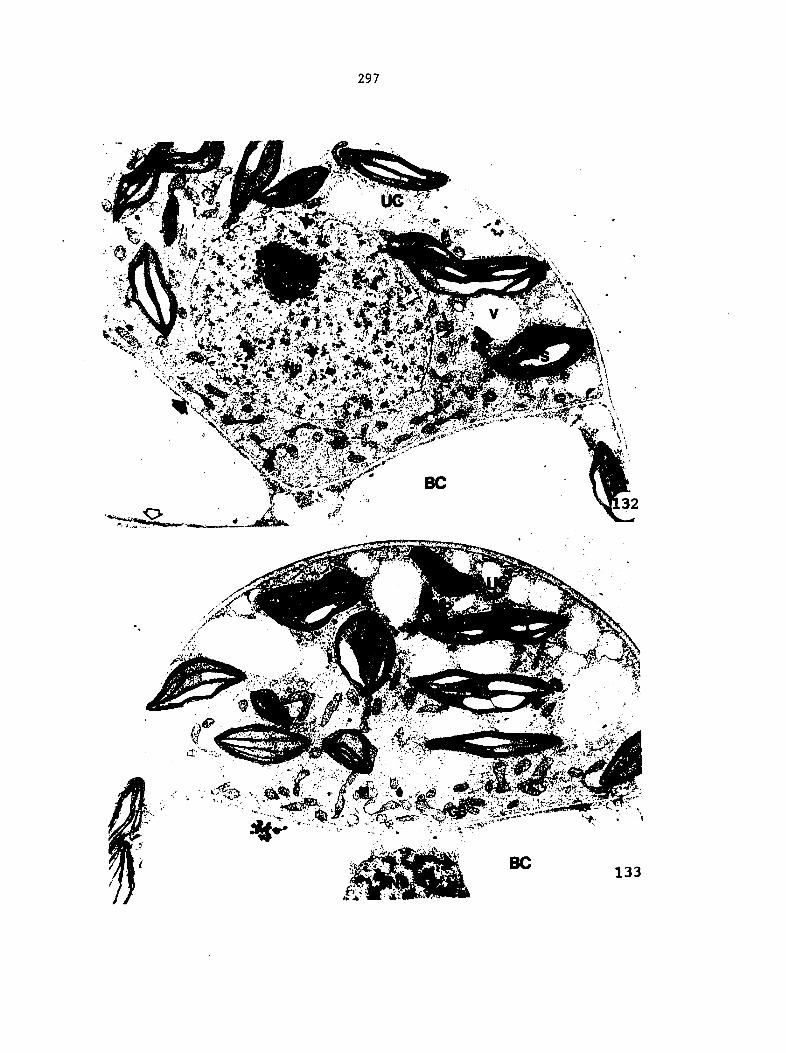
297
Figures 134-139. Cytoplasmic components in cells of 2-celled antheridia
134. Region in upper cell between nucleus and funnel-shaped wall is composed mainly of ribosomes, mitochondria, RER, and microtubules, X 26,950
135. Microtubules (arrows) surround nucleus in upper cell. Part of nuclear envelope with nuclear pores is evident in center of micrograph. X 19,935
136. Microtubules (arrows) are found along periclinal cell wall in upper cell. X 33,945
137. Golgi bodies and microbodies are found in upper cell. X 18,960
138. An occasional osmiophilic body is observed in upper cell. X 18,000
139. Region where funnel-shaped cell contacts the basal wall can become quick thick (0.90 M-ta). X 10,620
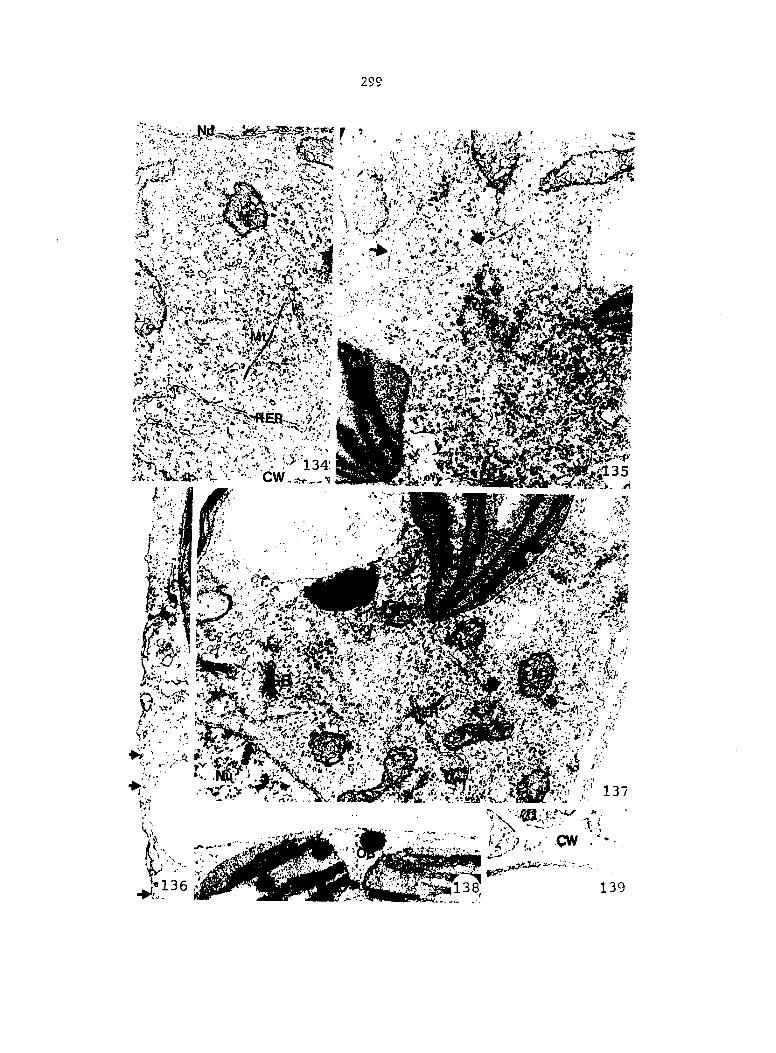
299
1® ' ? . "» . ' ' A' iiP J
IIS

Figures 140-141. TEM and LM of a 2-celled antheridium during mitotic prophase of upper cell. Cytoplasm of upper cell has become redistributed with nucleus assuming an upper, central location (clear arrow). Large vacuoles have formed between nucleus and sides of upper cell and chloroplasts are oriented tangentially around nucleus Major portion of cytoplasm is located in basal region of upper cell. A large number of mitochondria are found near funnel-shaped wall. Dark arrow indicates nucleus in basal cell
140.
141.
X 8,160
X 595
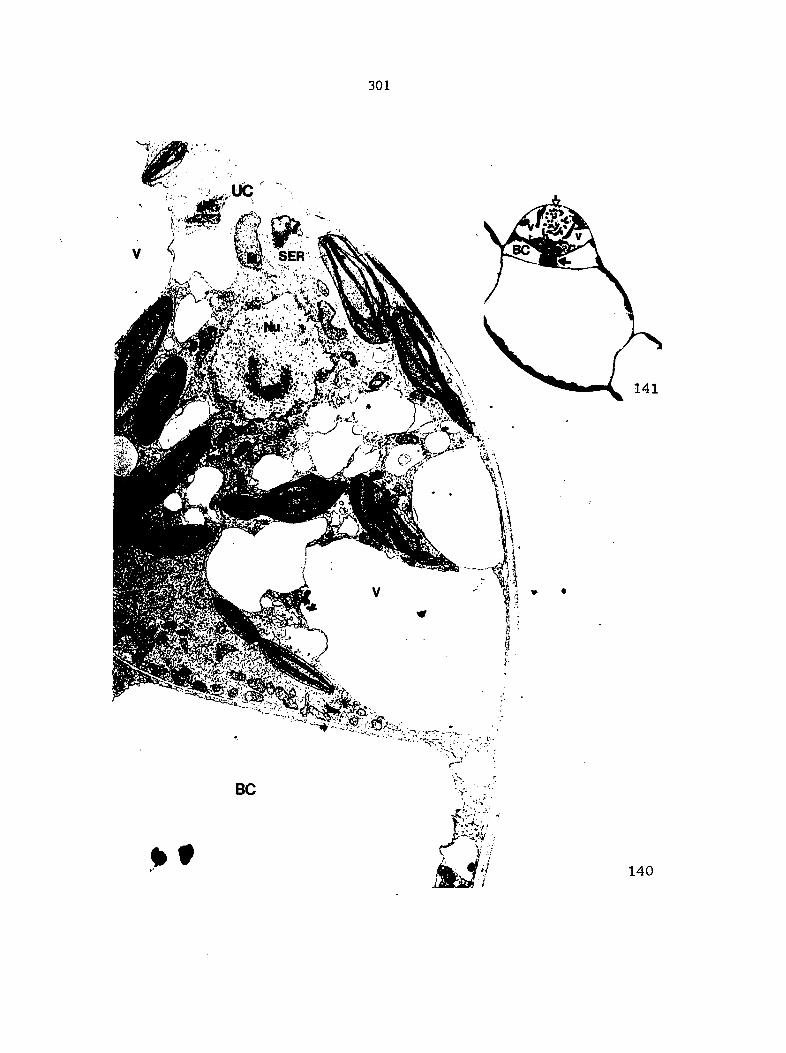
301
Figure 142. A peripheral section through 2-celled antheridium shown in Figures 140 and 141. Many nuclear pores are evident in prophase nucleus (arrow) which measure about 70 nm in diameter. X 11,225
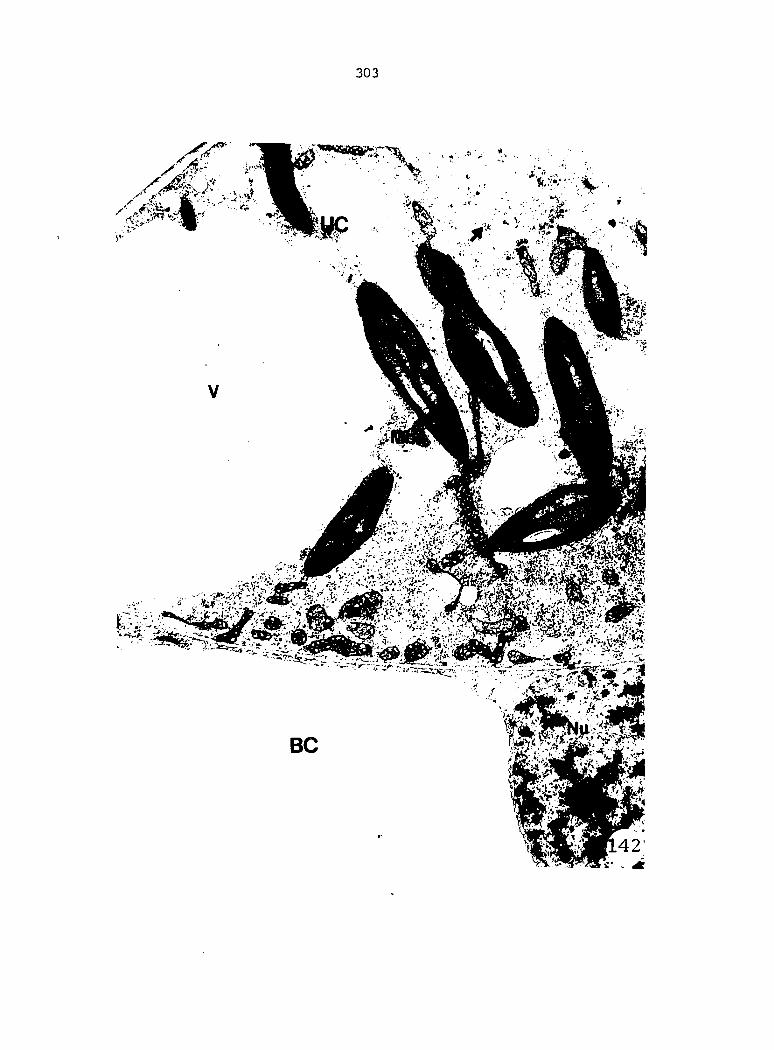
303
Figures 143-145. Cytoplasmic components in cytoplasm which has accumulated in base of upper cell of a 2-celled antheridium
143. Low magnification of basal region in a near-median view showing numerous mitochondria aligned along funnel-shaped wall. X 6,090
144. Higher magnification of right-hand region shown in Figure 143. Near funnel-shaped wall, cytoplasm is composed largely of ribosomes, mitochondria, an occasional, small vacuole, microtubules (arrow), and some SER. Near nucleus, composition consists mainly of ribosomes, SER, and some vacuoles and microtubules. X 23,425
145. A more peripheral section of upper cell shown in Figure 143. SER is quite abundant and is interspersed with mitochondria near funnel-shaped wall. X 35,020
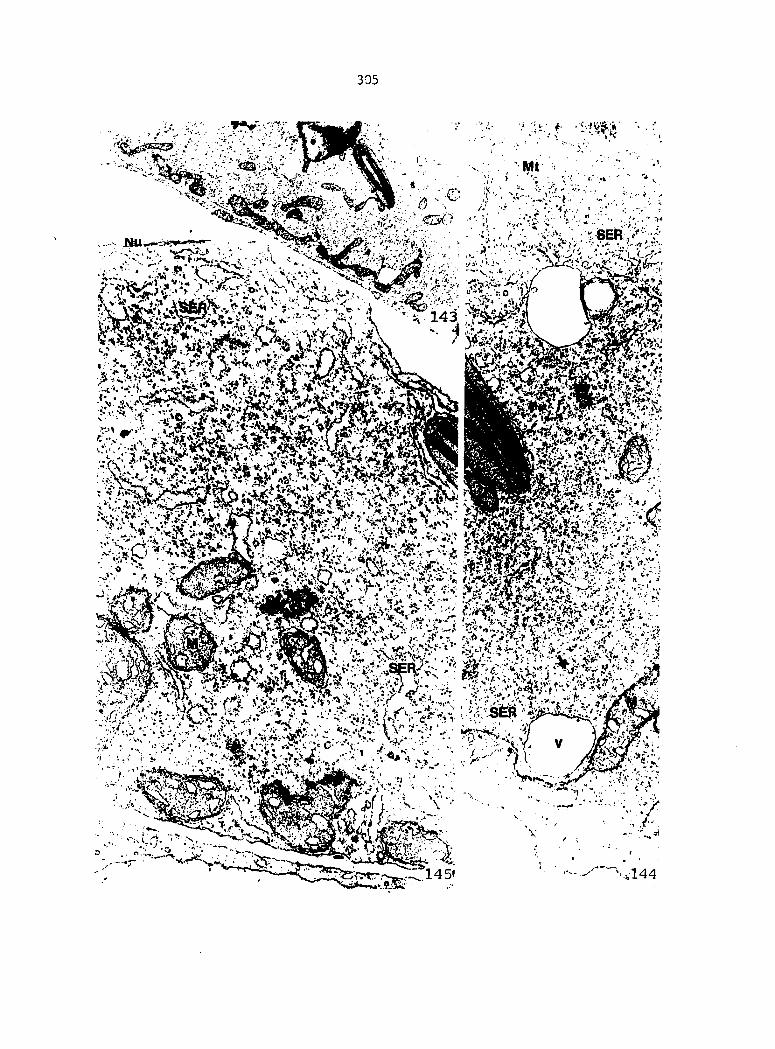
305
143 -1
mm## mmm' ###: m 4
r.'
V
J'fTTTr .\144
Figures 146-147. Cytoplasm surrounding nucleus in upper cell of a 2-celled antheridium containing SER, mitochondria, Golgi bodies, and microtubules
146. X 28,585
147. X 24,735
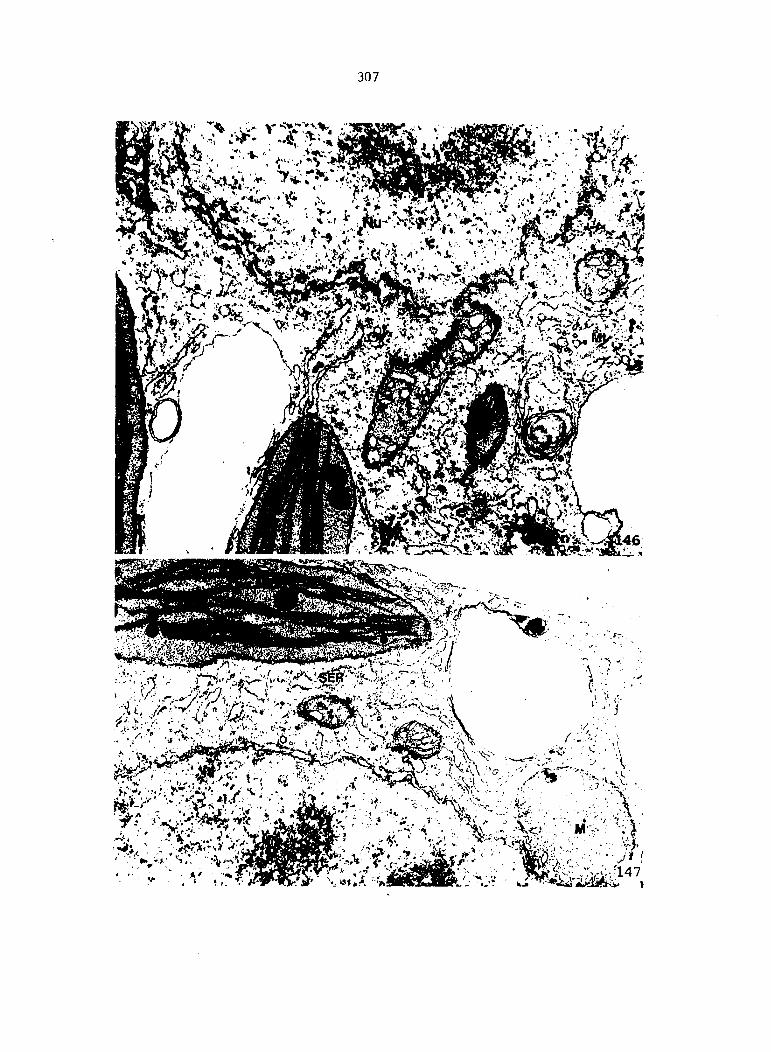
307
Figure 148. Mitosis in upper cell of a 2-ceHed anther id ium. The centromeres of chromosomes are aligned in a plane parallel to base of antheridium about 10 from apex of upper cell (arrow). X 800
Figures 149-151. Three-celled antheridia composed of a basal cell, an upper cell, and a central spermatogenous cell. New cell wall dividing upper cell of 2-celled antheridium into new upper cell and spermatogenous cell is curved and parallel to outer, curved peri-clinal wall, intersecting funnel-shaped wall about 6 Mm in from edge (dark arrows). Nuclei in three cells are indicated either by clear arrows or dark stars. Major portion of the cytoplasm in a 3-celled antheridium is contained within spermatogenous cell where nucleus is largest and less densely stained. Height to diameter ratio of 3-celled antheridia is about 3:4, with an average height of about 30 van and diameter of about 40 w
149. X 770
150. X 910
151. X 770
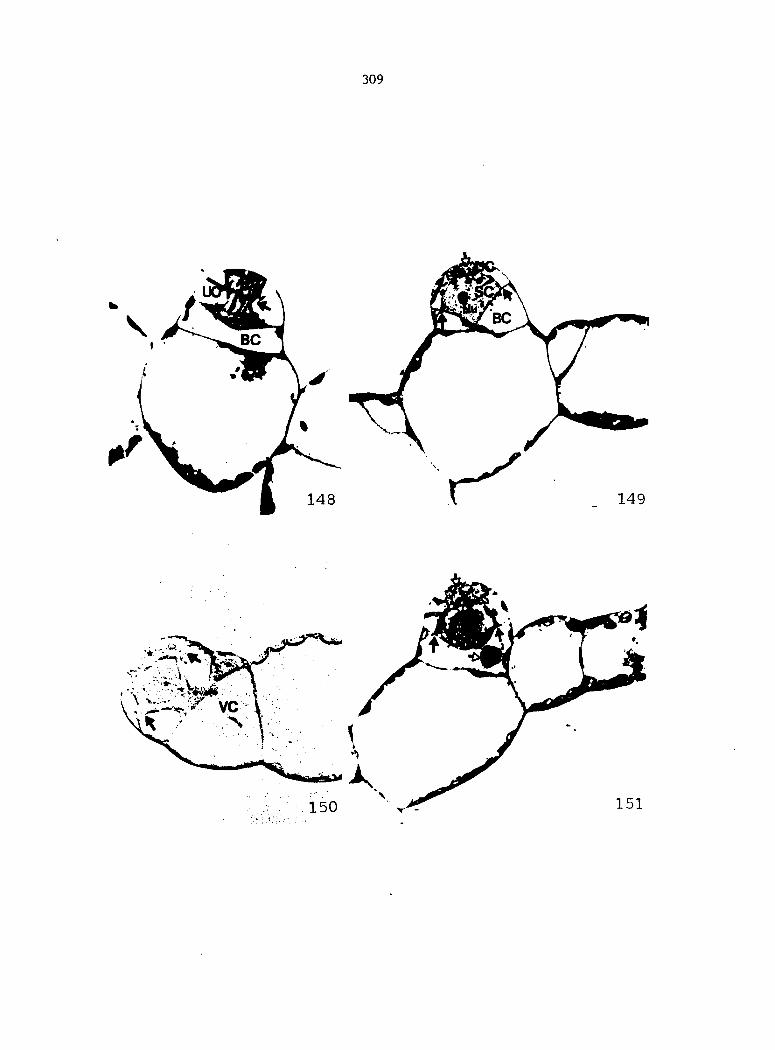
Figure 152. An idealized diagram of a 3-celled antheridium with a height to diameter ratio of 3:4 and distance from upper to lower wall of upper cell measuring one-fifth total height of antheridium. Funnel-shaped wall Intersects outer, periclinal wall at about one-half height of antheridium with the angle measuring about 41°, As mentioned in the legend of Figure 129, upper cell and spermatogenous cell each occupy about 25% of total volume, while basal cell occupies about 50% of the volume.
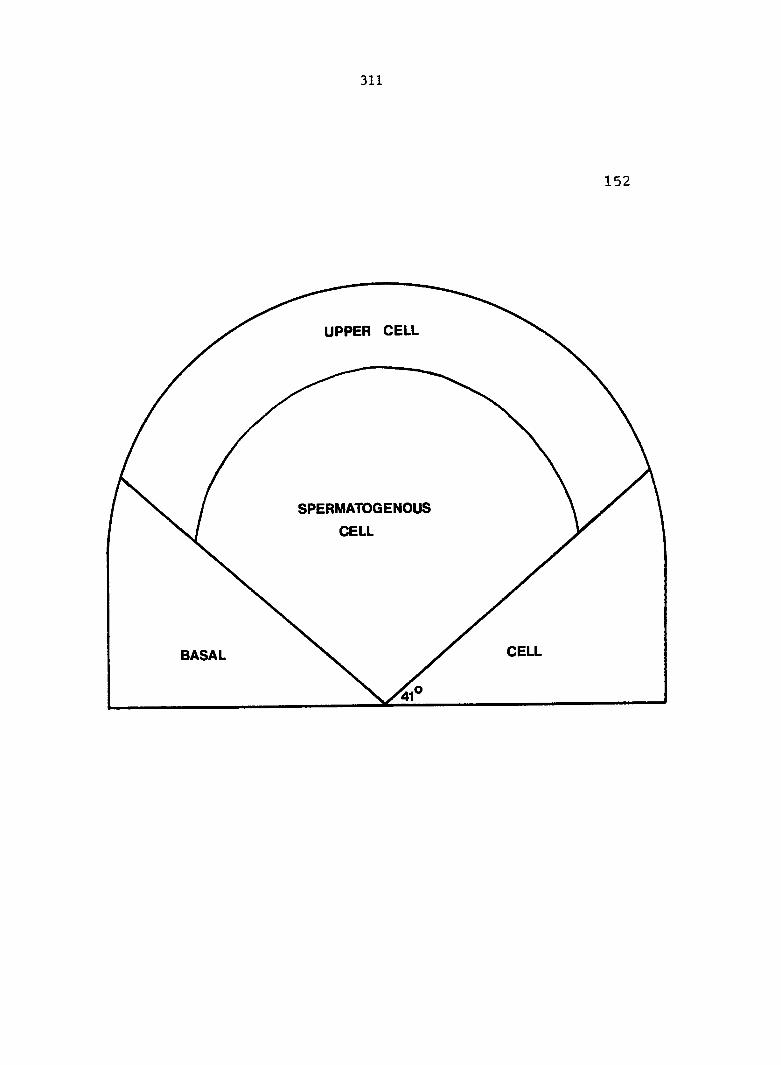
311
152
UPPER CELL
SPERMATOGENOUS
CELL
CELL BASAL
Figure 153. Montage of a 3-celled antheridium. Central spermatogenous cell is densely cytoplasmic. Clear arrow indicates one of many dumbbell-shaped mitochondria present and dark arrow indicates a mitochondrion with a densely staining, amorphous inclusion. Average length of chloroplasts in spermatogenous cell of 3-celled antheridia is about 3 tim compared to 5 Mm in vegetative cells, X 6,740
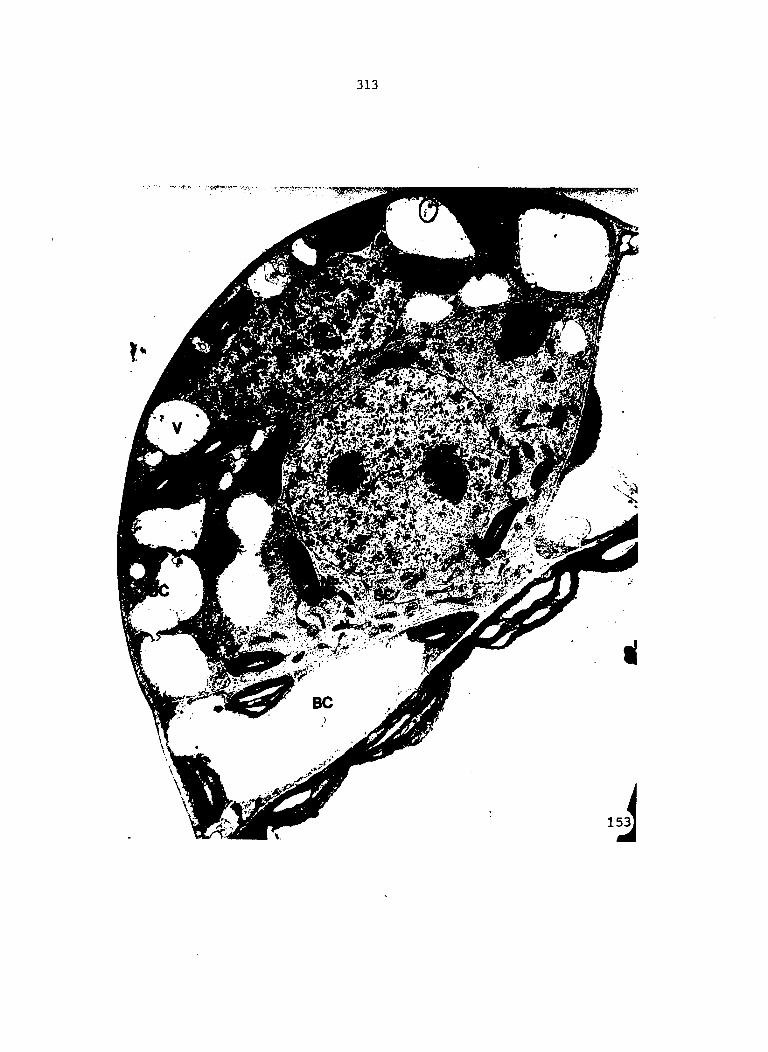
313
Figures 154-158. Cytoplasmic components in spermatogenous cell of 3-celled antheridia
154. Higher magnification of mitochondrion shown in Figure 153. X 17,815
155-156. Smaller, dark arrows point toward cup-shaped mitochondria. Larger, dark arrow points toward an invagination in nuclear envelope
155. X 9,850
156. X 11,950
157. Golgi bodies are present along with coated vesicles (clear arrow) and smooth vesicles (dark arrow). A few microbodies are present along with some microtubules. X 25,655
158. A chloroplast with two constrictions, indicating a dividing plastid. X 6,640
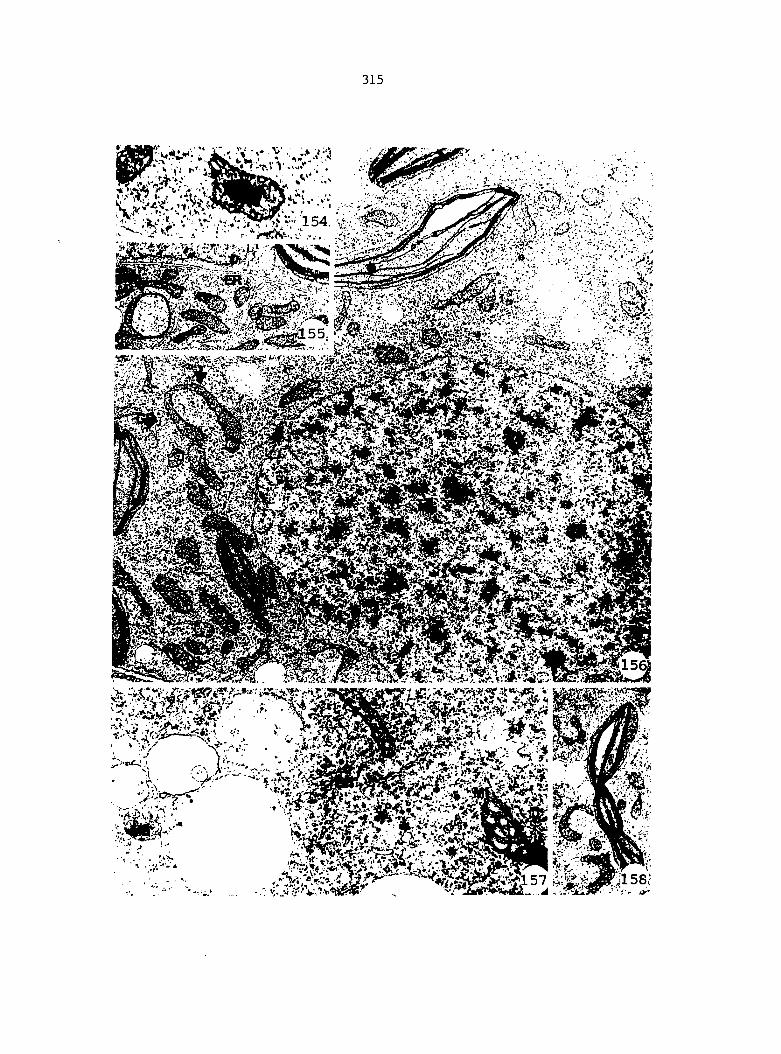
315
Figures 159-161. Location of microtubules in cells of a 3-celled antheridium
159. Microtubules occur parallel in groups or singly along upper, curved wall of spermatogenous cell, indicated by dark arrows, X 19,130
160. Microtubules also occur along funnel-shaped wall in spermatogenous cell, indicated by dark arrows. Note a plasmodesm traversing wall region where funnel-shaped wall contacts basal wall of antheridium. X 17,765
161. Microtubules are shown occurring along walls in spermatogenous cell in upper, right-hand corner of micrograph and along all walls in upper cell, located in left portion of micrograph. X 19,065
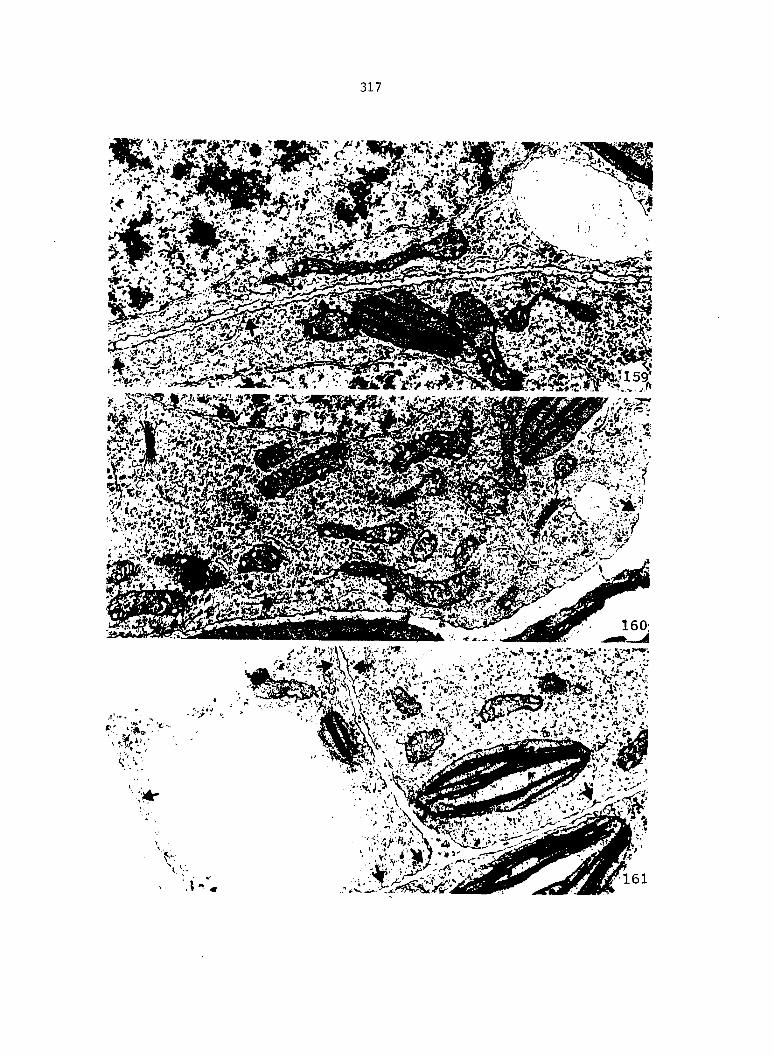
317
'5
Figures 162-163. Low and high magnifications of basal region of a spermatogenous cell in a 3-celled antheridium. Nucleus has an indentation in region facing attenuated base of cell (large, dark arrow). Between indentation and base of cell, cytoplasm consists of abundant ribosomes, mitochondria, Golgi bodies, smooth and coated vesicles, and many microtubules oriented in various directions. This cell would have soon undergone mitosis
162. X 8,335
163. X 38,180
Figure 164. A small indentation (dark arrow) occurs in nuclear envelope 180° from larger indentation shown in Figure 162. A microtubule is shown in vicinity of indentation. X 32,075
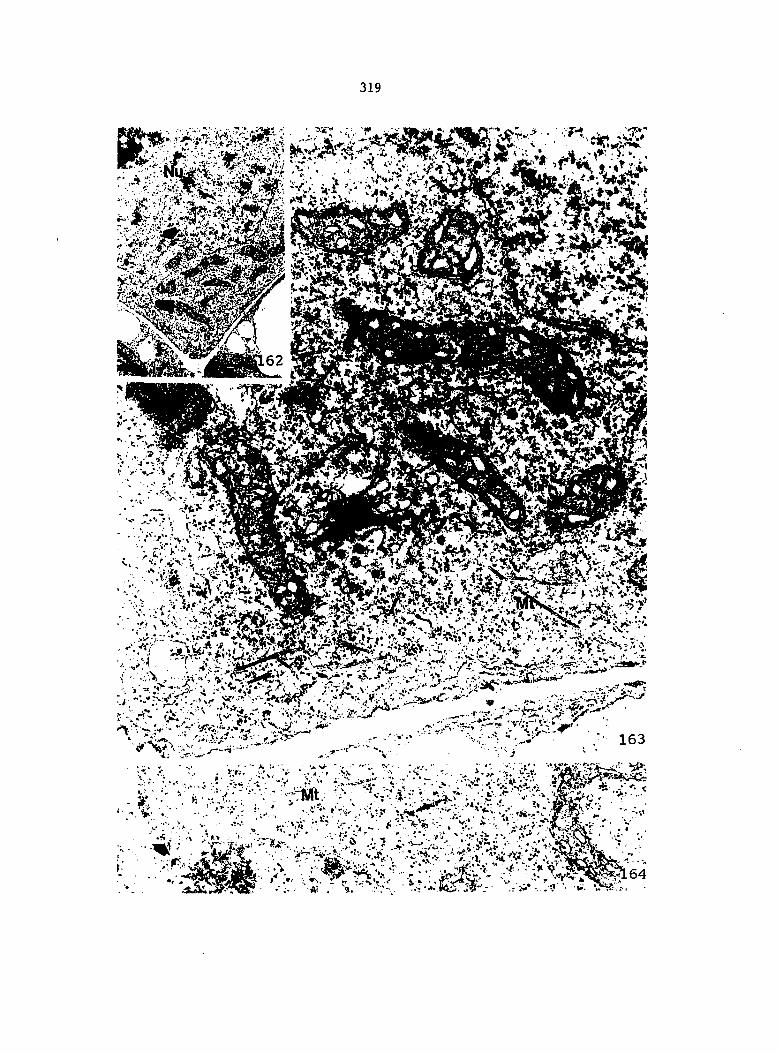
319
mm
»i
Figures 165-167. Cytoplasmic components in upper cell of 3-celled antheridia
165. Upper, dark arrow is located to right of a microtubule and lower, dark arrow is pointing toward a microtubule. Types of organelles present in spermatogenous cell are also present in upper cell. X 22,575
166. Arrow shows a chloroplast with a constriction. X 7,265
167. X 11,145
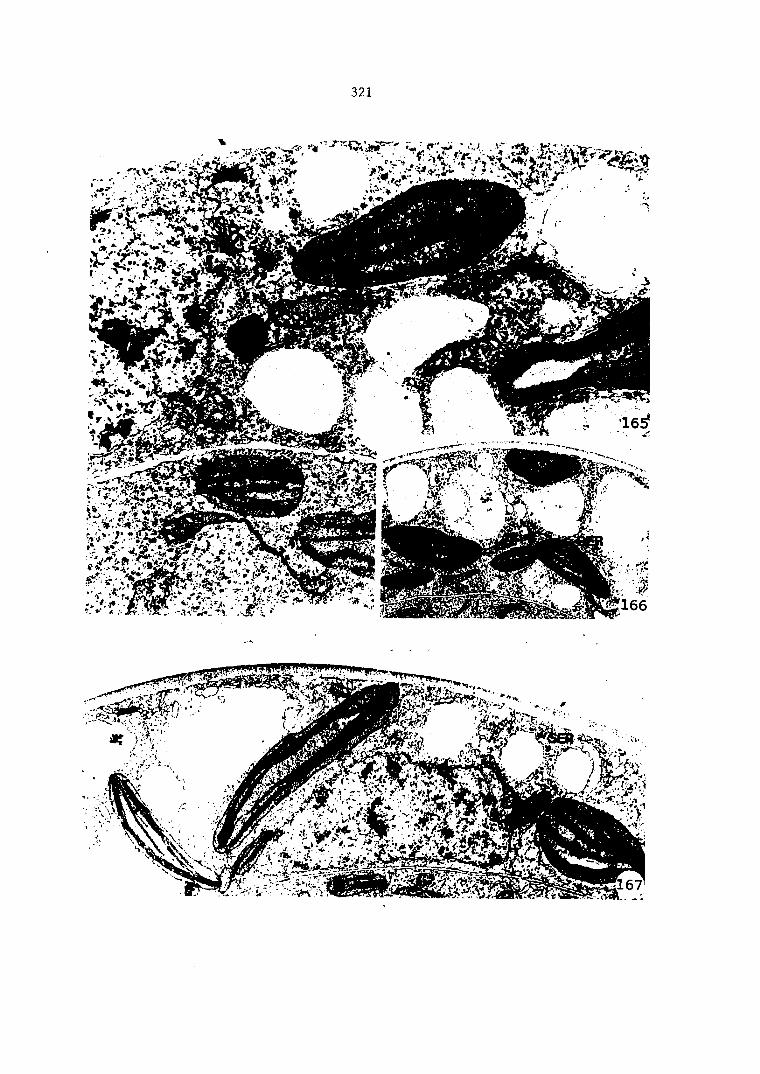
321
M
g#
Figures 168-172. Sections through 3-celled antheridia in which spermatogenous cell is in telophase of mitosis
168. A median, longitudinal section showing phragmoplast (arrow) forming in a plane perpendicular to base of antheridium. X 725
169-170. A nonmedian section through a 3-celled antheridium showing one set of telophase chromosomes.
169. X 910
170. X 8,775
171-172 Higher magnification of chromosomes in central, spermatogenous cell. Dark arrows indicate polysomes. Small, clear arrows indicate microtubules. Large, clear arrow shows a double membrane surrounding chromosome, presumably reassembling into a nuclear envelope
171. X 23,520
172. X 20,155
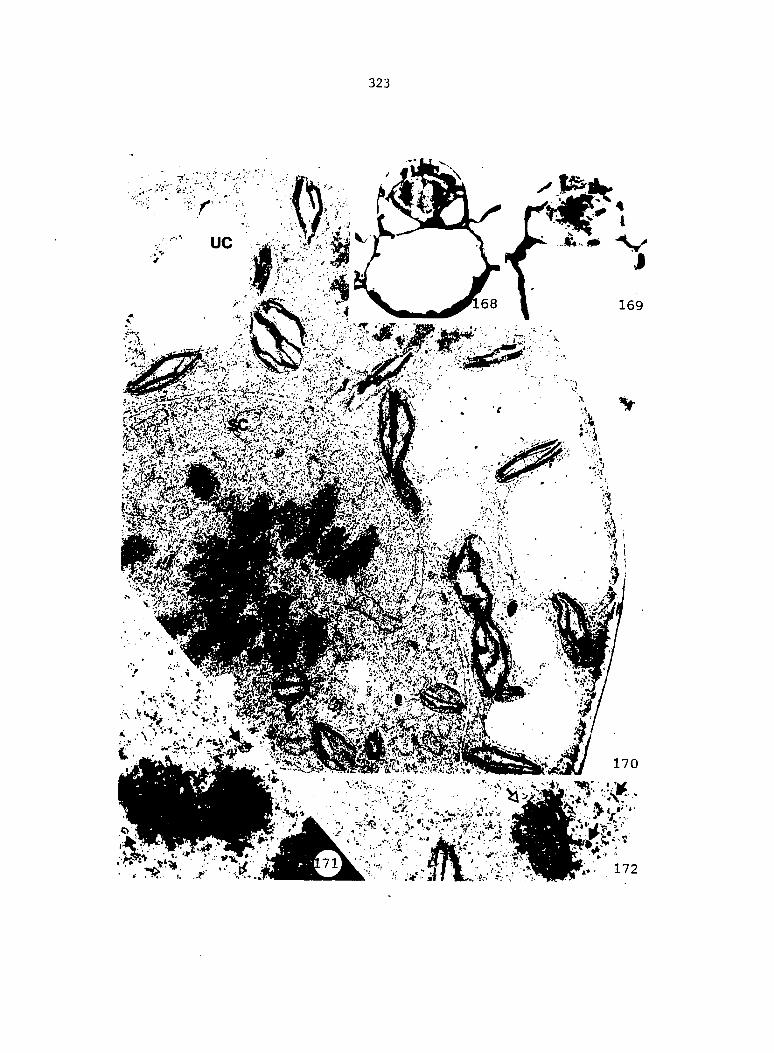
323
4'
m Wi
s
ï 170
.m-6 ÎK iV.ii -

Figures 173-174. TEM and LM of sections through a 4-celled antheridium. In this antheridium, new cell wall separating two spermatogenous cells (larger, dark arrow) is oriented at an angle oblique to base of antheridium. Thus, in some planes of section, such as one shown in Figure 174, one spermatogenous cell nucleus may be positioned above other spermatogenous cell nucleus. Two, lower arrows in Figure 174 point toward nuclei in spermatogenous cells. Upper arrow indicates nucleus in upper cell. Chromatin in spermatogenous cell nucleus is more dispersed than in upper and basal cells. Nucleus in basal cell still has a large nucleolus. Some of chloroplasts are beginning to dedifferentiate in spermatogenous cells (smaller, dark arrow in Figure 173). Four-celled antheridia have a height of about 30 t^m and a diameter of about 40 M-m.
173.
174.
X 6,330
X 715
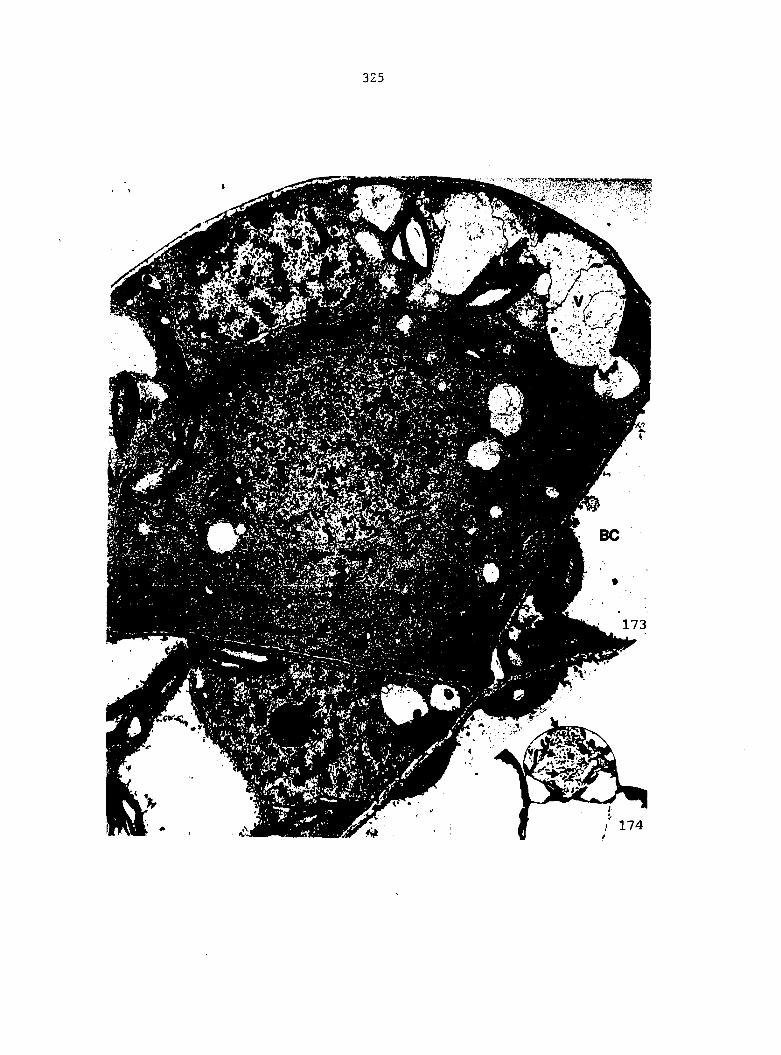
Figures 175-177. Higher magnification of cytoplasmic components in spermatogenous cells of 4-celled antheridium shown in Figure 173
175. Dedifferentiated chloroplast noted in Figure 173. Lamellar system is much reduced and no starch is present. Microtubules are oriented in various directions near both sides of the cell wall separating spermatogenous cells from upper cell (dark arrows). Microtubules also occur deeper within cytoplasm of spermatogenous cell (clear arrow). X 27,485
176. Microtubules occur near new wall which formed two spermatogenous cells (dark arrow) and along funnel-shaped wall (clear arrow). X 26,265
177. Microtubules near new wall in spermatogenous tissue (dark arrow) and deeper within spermatogenous cell cytoplasm (clear arrow). X 37,580
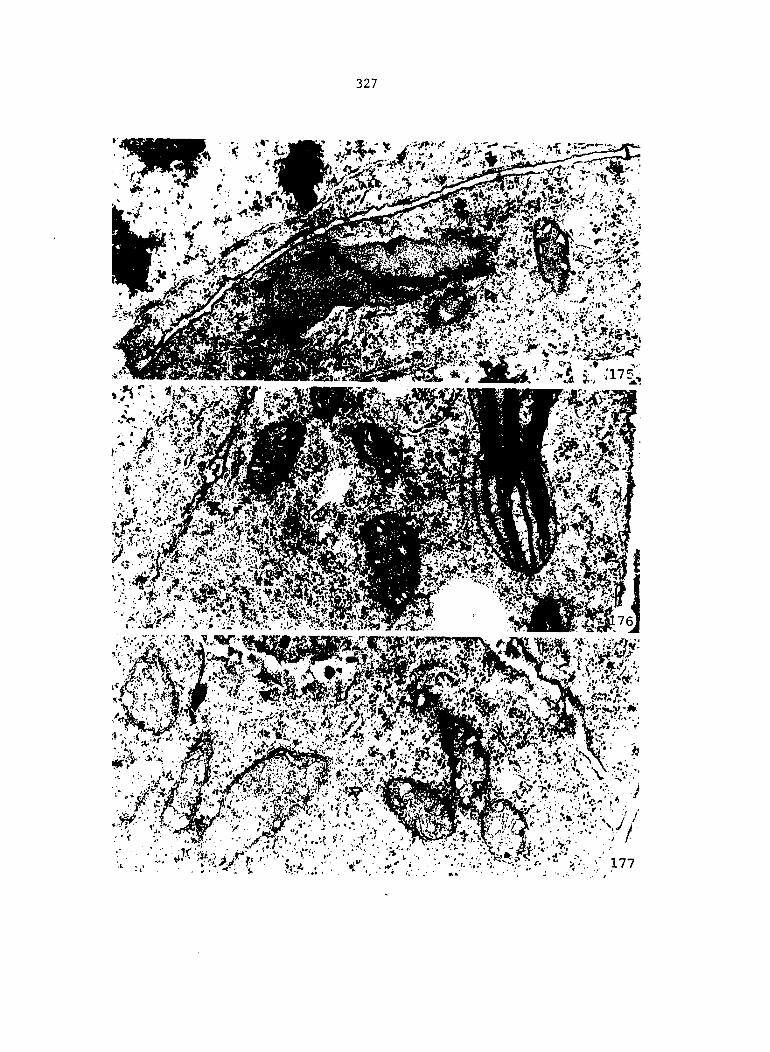
327

Figures 178-179. Cytoplasmic components in upper cell of a 4-celled antheridium. Arrows indicate microtubules within cytoplasm and near nuclear envelope, ttich of cell is composed of large vacuoles, as was case in 3-celled antheridia
178. X 25,835
179. X 21,165
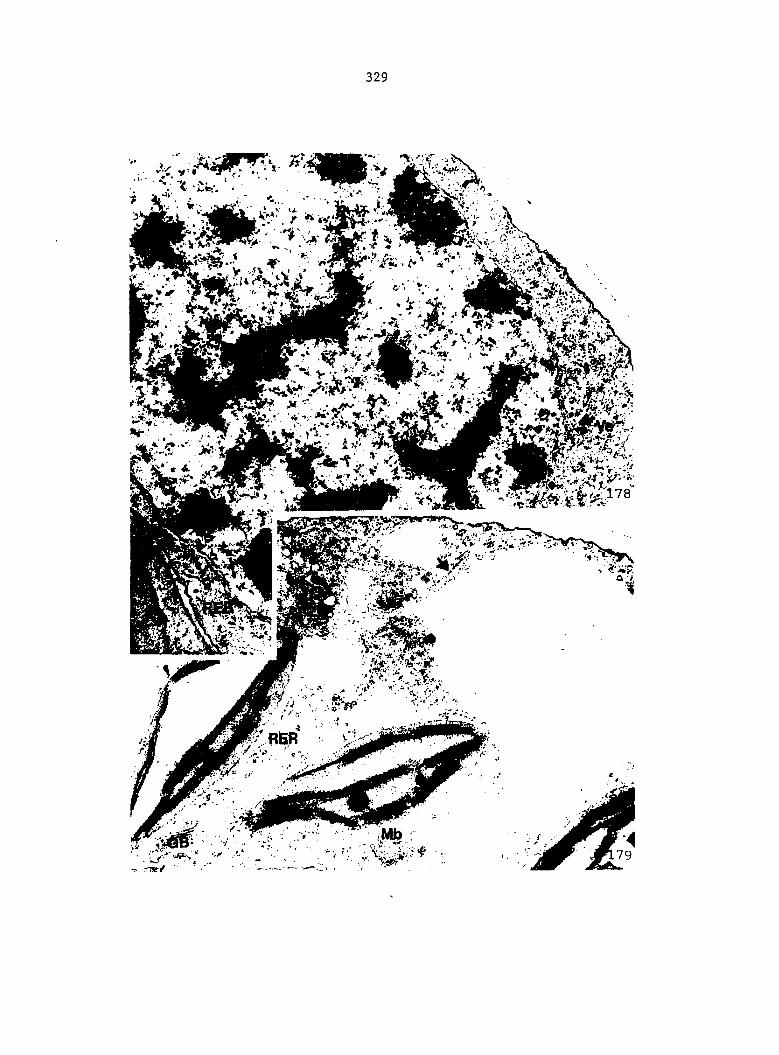
329
Figures 180-185. Serial sections through a 4-celled antheridium in which upper cell is undergoing cytokinesis following division of nucleus in upper cell to form cap cell and ring cell
180. Upper cell is divided into 180 degrees to facilitate referring to various regions within cell. Zero degrees (0°) is arbitrarily assigned to junction of funnel-shaped wall and outer, curved periclinal wall on left-hand side of antheridium. In this periclinal section, a portion of the phragmoplast occurs at about 55° (arrow). X 835
181. In this more median section, phragmoplast occurs at both 50° and 120° (dark arrows). There is a large amount of cytoplasm surrounding phragmoplast at 120°. Phragmoplast is oriented at right angles to both upper and lower cell walls of upper cell. First observed nucleus (clear arrow) will be partitioned into cap cell by cylindrical phragmoplast. X 785.
182. A near-median section showing developing cell wall still at 50° and 120°. There is much less cytoplasm surrounding phragmoplast/cell wall. A larger profile of cap cell nucleus is evident between two arrows. X 785
183. Ring cell nucleus is evident in this section (dark arrow), just to left of still apparent cap cell nucleus (clear arrow). Forming wall is presumed to be about 70° and 115°. X 785
184. Cap cell nucleus is no longer visible, while profile of ring cell nucleus is much larger (dark arrow). A portion of forming cell wall is presumably present just to left of ring cell nucleus. X 695
185. A large profile of ring cell nucleus is present in upper cell at 70° with no evidence of forming cell wall. Height of 4-celled antheridium is about 40 pm and the diameter is still about 40 p,m. X 800
186. A diagrammatic representation of serial sections shown in Figures 180-185 looking down through apex of upper cell showing relative location of nuclei and cell wall/phragmoplast
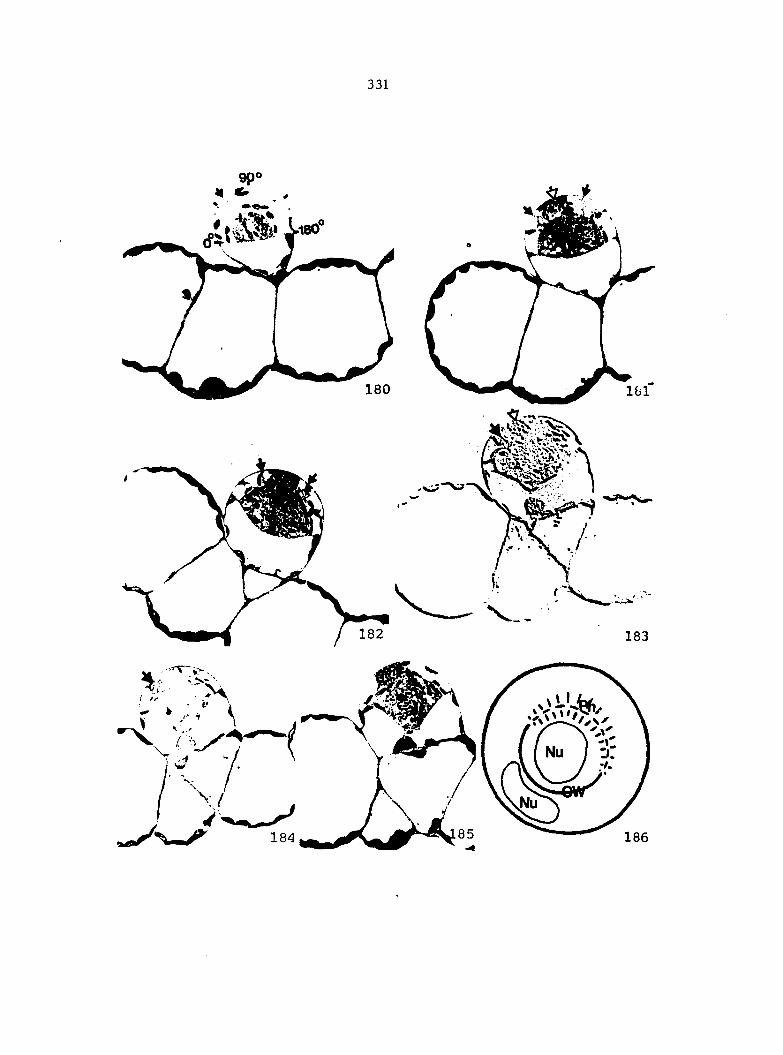
331
Figures 187-188. TEM of section shown in Figure 181
187. Phragmoplast can be identified in both sides of cap cell nucleus. 6,335
188. A higher magnification of portion of phragmoplast occurring on right side of nucleus In Figure 187. Coalescing vesicles are accumulating fibrous cell wall material (larger, clear arrows). More vesicle fusion has occurred In upper portion of upper cell (left side of micrograph). Dense material, present around the vesicles, is most abundant around smaller vesicles. A globular group of small vesicles embedded in densely staining material occurs at lower end of phragmoplast (larger, dark arrow). Smaller, dark arrows indicate coated vesicles, both near phragmoplast and in cytoplasm away from phragmoplast. Smaller, clear arrows show presence of polysomes. Many microtubules are still present and oriented perpendicular to phragmoplast. Bracketed region refers to an area of intense Golgi body activity. X 26,795
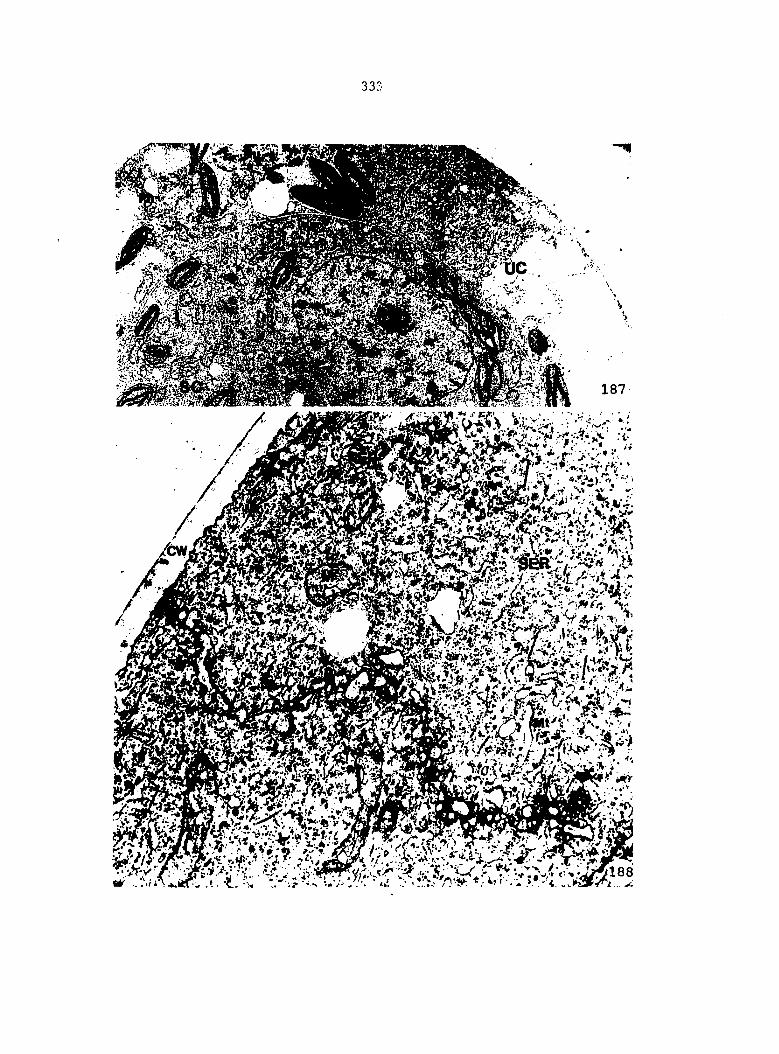
333
Figure 189. A section serial to section shown in Figure 188 in region indicated by bracket. Area in bracket reveals large Golgi body responsible for vesiculate region observed in Figure 188. X 24,975
Figure 190. Higher magnification of phragmoplast shown to left of cap cell nucleus in Figure 187. More vesicle fusion and a lack of dense material around vesicles distinguish this portion of phragmoplast as being more advanced than region shown in Figure 188. Microtubules are more abundant near lower portion of phragmoplast (near bottom of micrograph). X 27,925
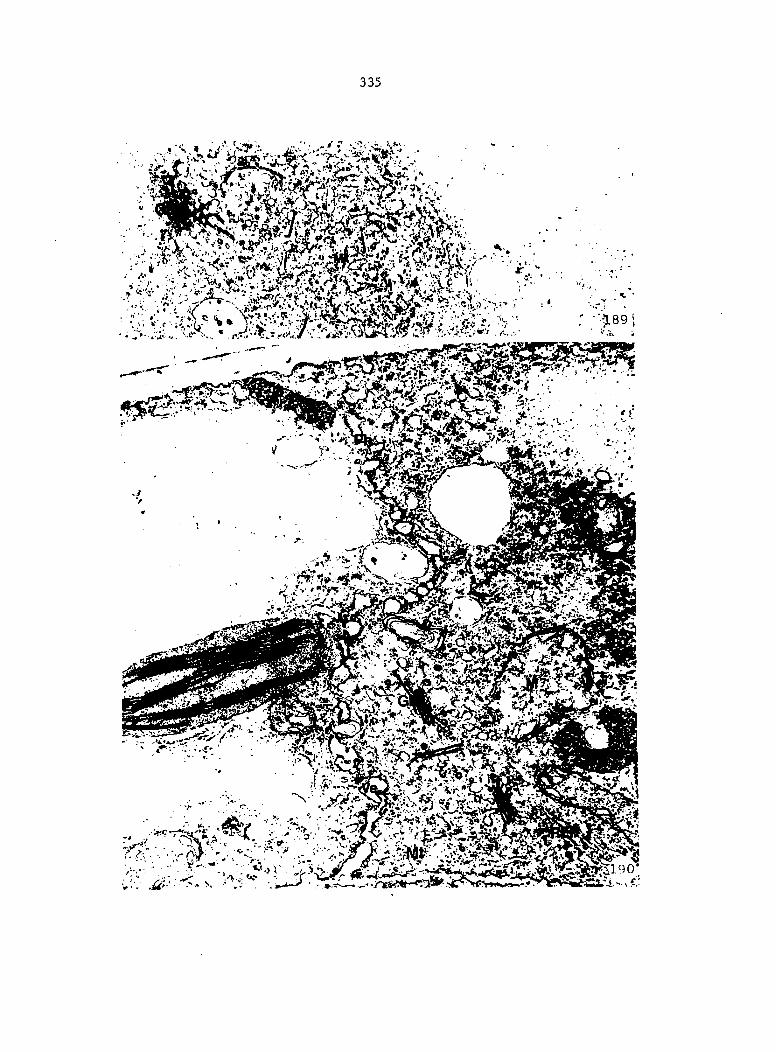
335
m#
Figure 191. TEM of section shown in Figure 185. Chloroplasts in two spermatogenous cells are progressively becoming smaller and less differentiated than chloroplasts in jacket cells and vegetative cells. Microbodies are evident in all three cell types shown in this micrograph. X 6,925
Figure 192. A 5-celled antheridium consisting of a vacuolate basal cell, a vacuolate, doughnut-shaped ring cell, a moderately vacuolate, disc-shaped cap cell, and two, densely cytoplasmic, spermatogenous cells. Arrows indicate location of new cell wall forming cap cell and ring cell. Height to diameter ratio is now about 1:1, both being about 40 |im. X 525
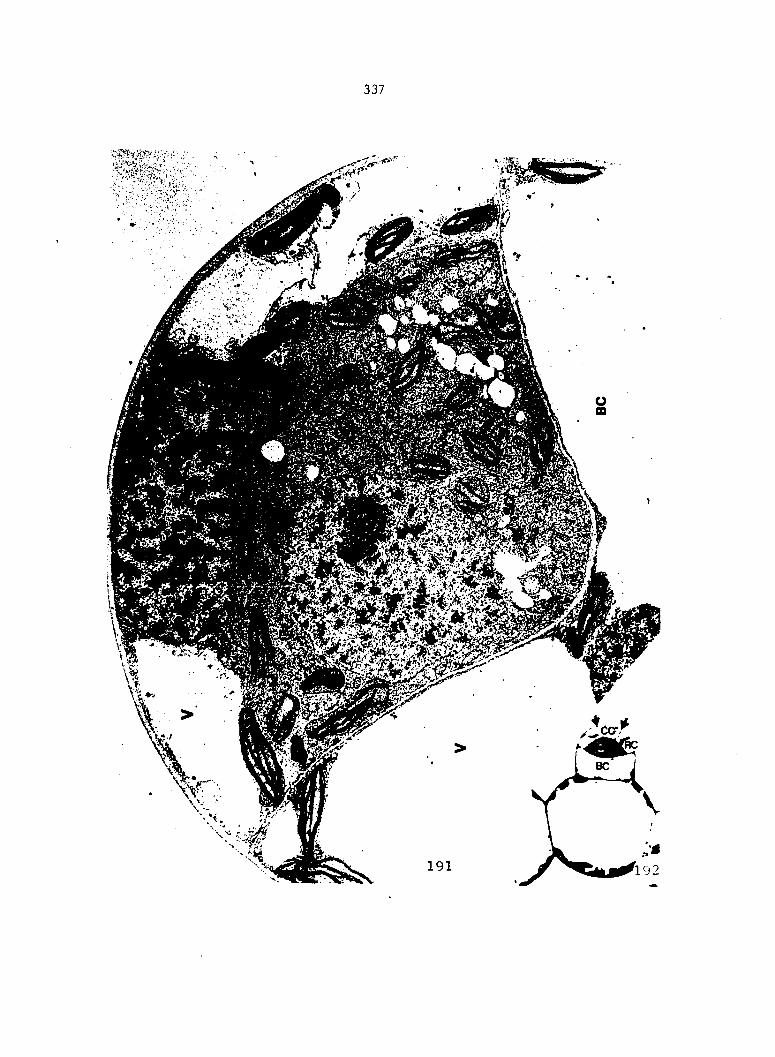
337
Figure 193. Idealized diagram of a 5-celled antheridium drawn according to measurements taken from the sections shown in Figures 180-185 and 192. Height to diameter ratio is 1:1, distance between upper and lower walls of cap cell and ring cell is about one-fifth height of antheridium, and funnel-shaped wall intersects outer, perlcllnal wall at a height of about one-half height of antheridium. Wall of cap cell Is drawn such that a line extrapolated back to vertical axis of antheridium forms an angle of 35°
Figure 194. Measurable geometric shapes superimposed on drawing shown in Figure 193. As described in text, volume of basal cell, ABOFG, was calculated to be 40% of total antheridium volume. Volume of cap cell, CJLE, is about 12% of total volume and ring cell, BCJI-FELM, is about 26% of total volume. Two spermatogenous cells, together, OHKN, occupy 22% of total volume
Figure 195. An idealized diagram of a 5-celled antheridium with a height to diameter ratio of 3:4. Wall of cap cell is drawn at 60° and 120°, perpendicular to upper and lower wall of upper cell. Distance between upper and lower walls of cap cell and ring cell is one-fifth height of antheridium. Funnel-shaped wall intersects outer, perlcllnal wall at a height of about one-half height of antheridium
Figure 196. Measurable geometric shapes are superimposed on drawing shown in Figure 195. When wall of cap cell is extrapolated back to vertical axis, an angle of 30° is formed. As described in text, volume of cap cell, UWXV, and ring cell, CUWJ-VELX, each equal about 12.5% of total volume and each spermatogenous cell, JKO, KOL, has a volume equal to about 12.5% of total volume. Basal cell, ACOEG, occupies about 50% of total volume
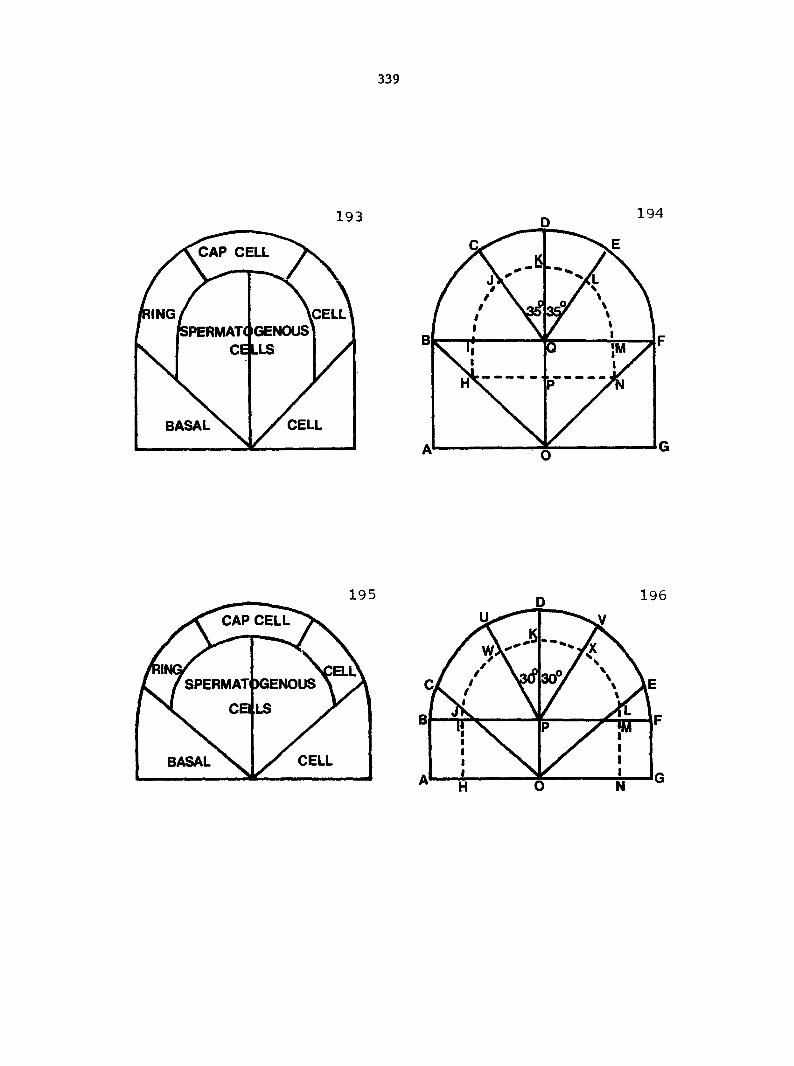
339
194
CAP CELL
ING (CELL iPERMAT( IGENOUS
CE LLS
CELL BASAL
195
CAP CELL
DGENOUS
LS
SPERMAT
CELL BASAL
195
vC / V / >î \
•"tCX \ \t 1 P / |W
y 1 X 1 r 1
H N
Figures 197-200. Cytoplasmic components of cap cell and ring cell in a 5-celled antheridium
197-198. Outer wall of cap cell (largest, dark arrow) is about 0.3 p.m thick, while inner wall (clear arrow) is about 0.1 um thick. Microtubules occur near cell wall and deeper within cytoplasm (smaller, dark arrows). Wall adjoining ring cell and cap cell, located in lower portion of Figure 198, has a number of plasmodesmata and is about 0.1 p.m thick
197. X 13,360
198. X 17,700
199-200. Ring cell is more vacuolate at this stage than cap cell. Outer wall (large, dark arrow) is about 0.3 nm thick, while inner wall is about 0.1 pm thick (clear arrow). Numerous Golgi bodies are present forming many vesicles filled with fibrous material
199. X 8,500
200. X 24,080
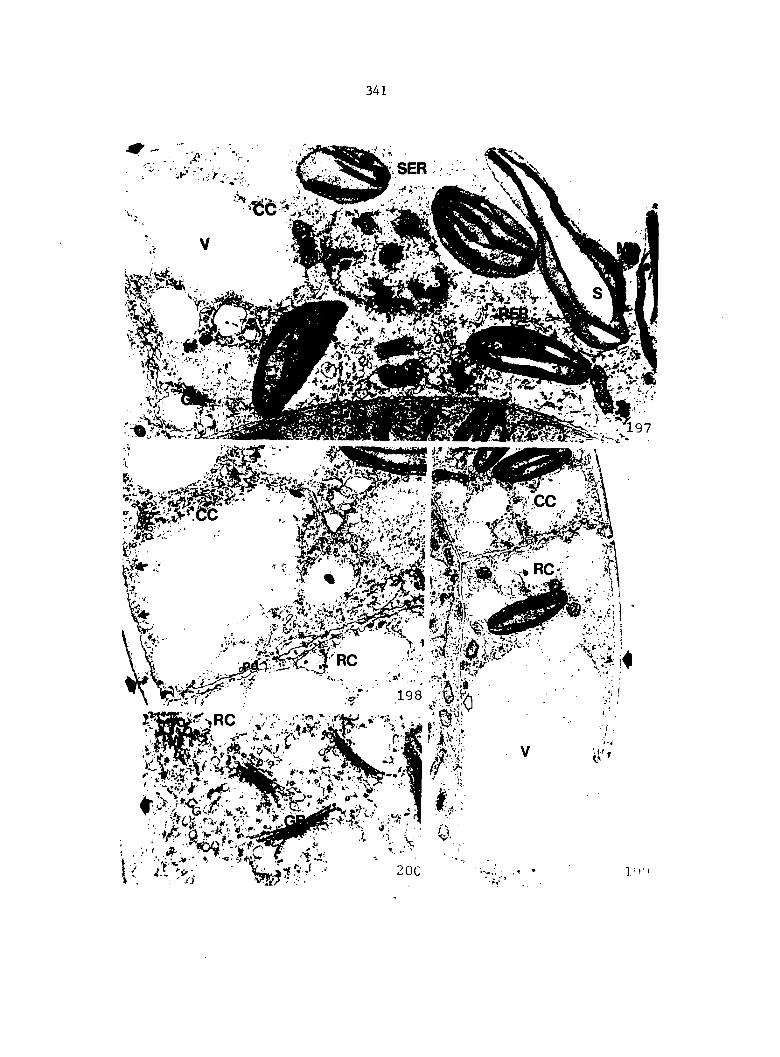
341
Figures 201-202. Cytoplasmic components in cells of a 5-celled antheridium
201. Some chloroplasts in spermatogenous cells are constricted (smaller, clear arrows). Some mitochondria are dumbbell-shaped (dark arrow). Numerous, small vacuoles occur in spermatogenous cells. Inner walls of cap cell and ring cell (large, clear arrow) are still concave, X 6,300
202. A section showing basal portion of a spermatogenous cell and upper portion of basal cell. Few plasmo-desmata occur in connecting funnel-shaped cell. Some microtubules (dark arrows) occur near wall which is about 0.15 p^m thick. X 22,600
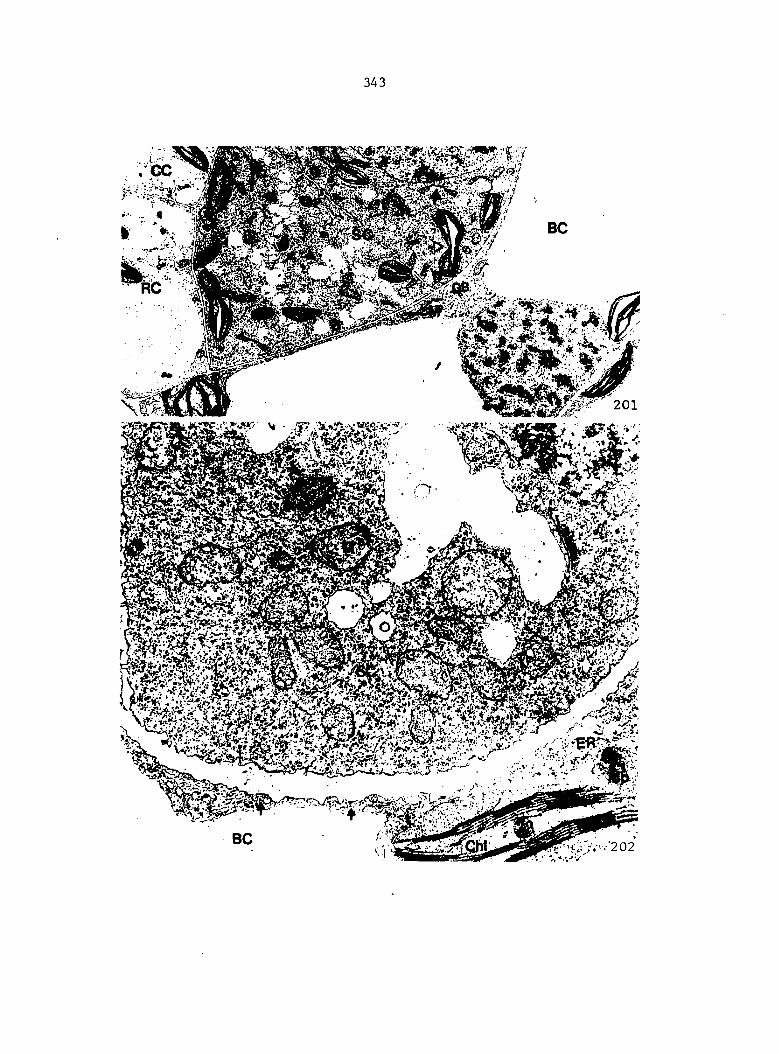
343
mm
Figures 203-204, Cytoplasmic composition of spermatogenous cells in a 5-celled antheridium. Some mitochondria are lobed. Some chloroplasts are constricted (clear arrow). Microtubules (dark arrows) occur along cell walls and deeper within cytoplasm
203. X 19,120
204, X 21,900
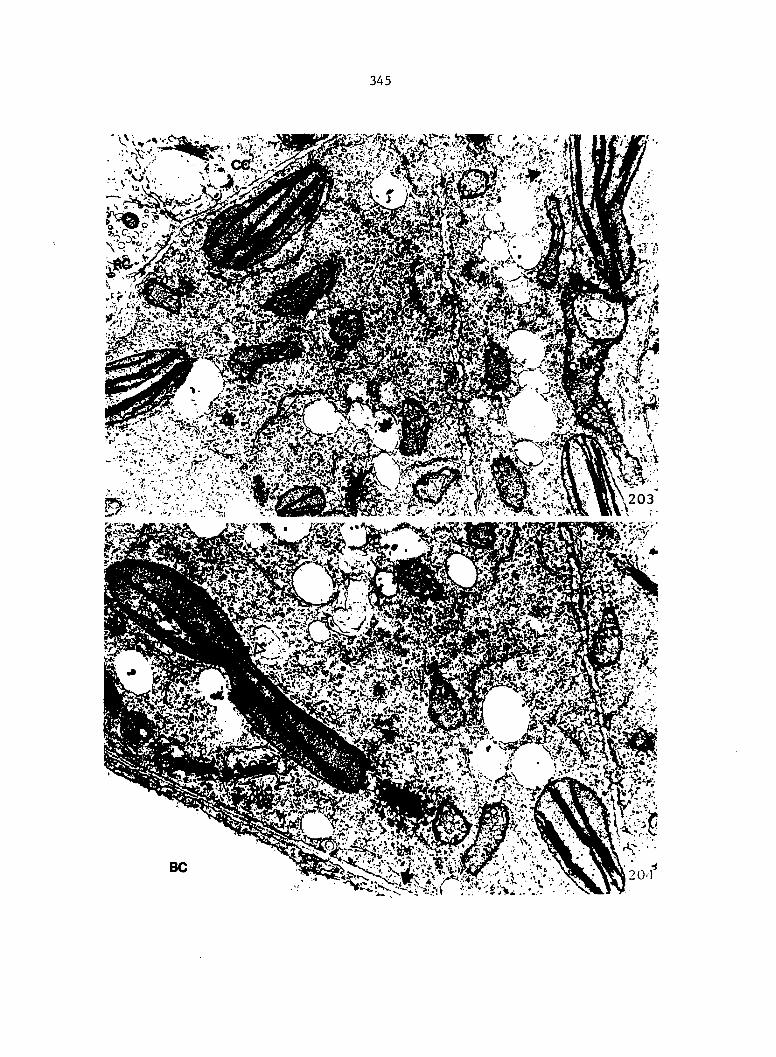
345
mm
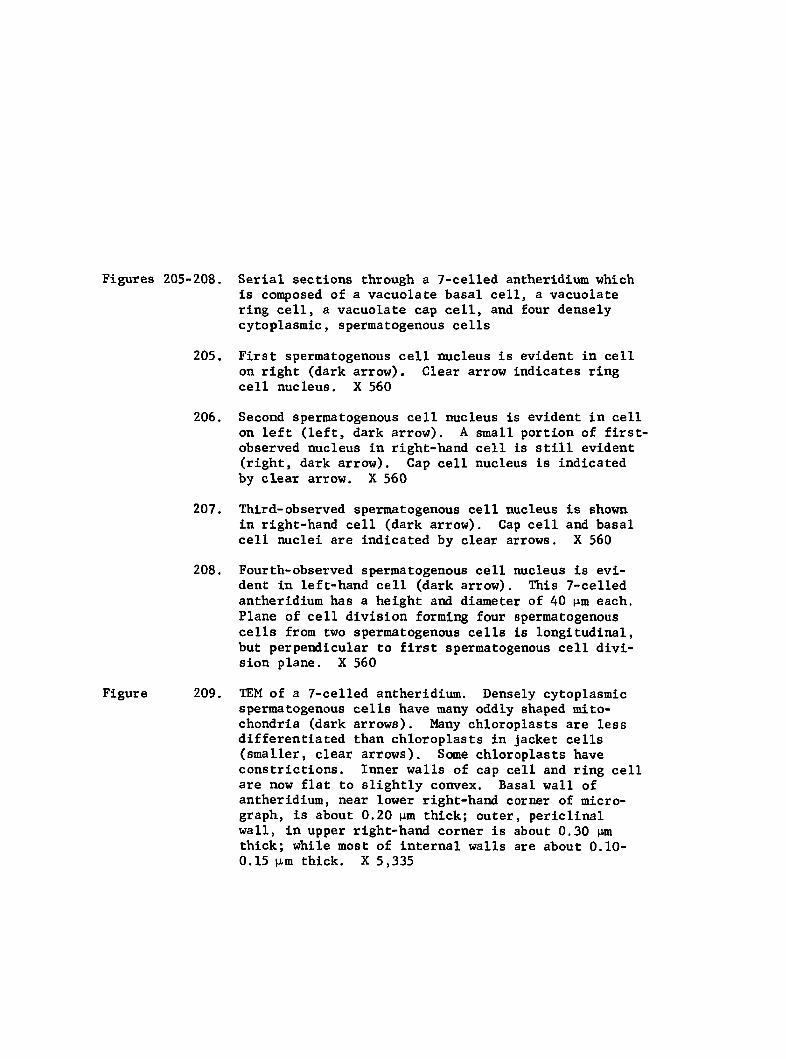
Figures 205-208. Serial sections through a 7-celled antheridium which is composed of a vacuolate basal cell, a vacuolate ring cell, a vacuolate cap cell, and four densely cytoplasmic, spermatogenous cells
205. First spermatogenous cell nucleus is evident in cell on right (dark arrow). Clear arrow indicates ring cell nucleus. X 560
206. Second spermatogenous cell nucleus is evident in cell on left (left, dark arrow). A small portion of first-observed nucleus in right-hand cell is still evident (right, dark arrow). Cap cell nucleus is indicated by clear arrow. X 560
207. Third-observed spermatogenous cell nucleus is shown in right-hand cell (dark arrow). Cap cell and basal cell nuclei are indicated by clear arrows. X 560
208. Fourth-observed spermatogenous cell nucleus is evident in left-hand cell (dark arrow). This 7-celled antheridium has a height and diameter of 40 nm each. Plane of cell division forming four spermatogenous cells from two spermatogenous cells is longitudinal, but perpendicular to first spermatogenous cell division plane. X 560
Figure 209. TEM of a 7-celled antheridium. Densely cytoplasmic spermatogenous cells have many oddly shaped mitochondria (dark arrows). Many chloroplasts are less differentiated than chloroplasts in jacket cells (smaller, clear arrows). Some chloroplasts have constrictions. Inner walls of cap cell and ring cell are now flat to slightly convex. Basal wall of antheridium, near lower right-hand corner of micrograph, is about 0.20 ixm thick; outer, periclinal wall, in upper right-hand corner is about 0.30 p,m thick; while most of internal walls are about 0.10-0.15 M-m thick. X 5,335
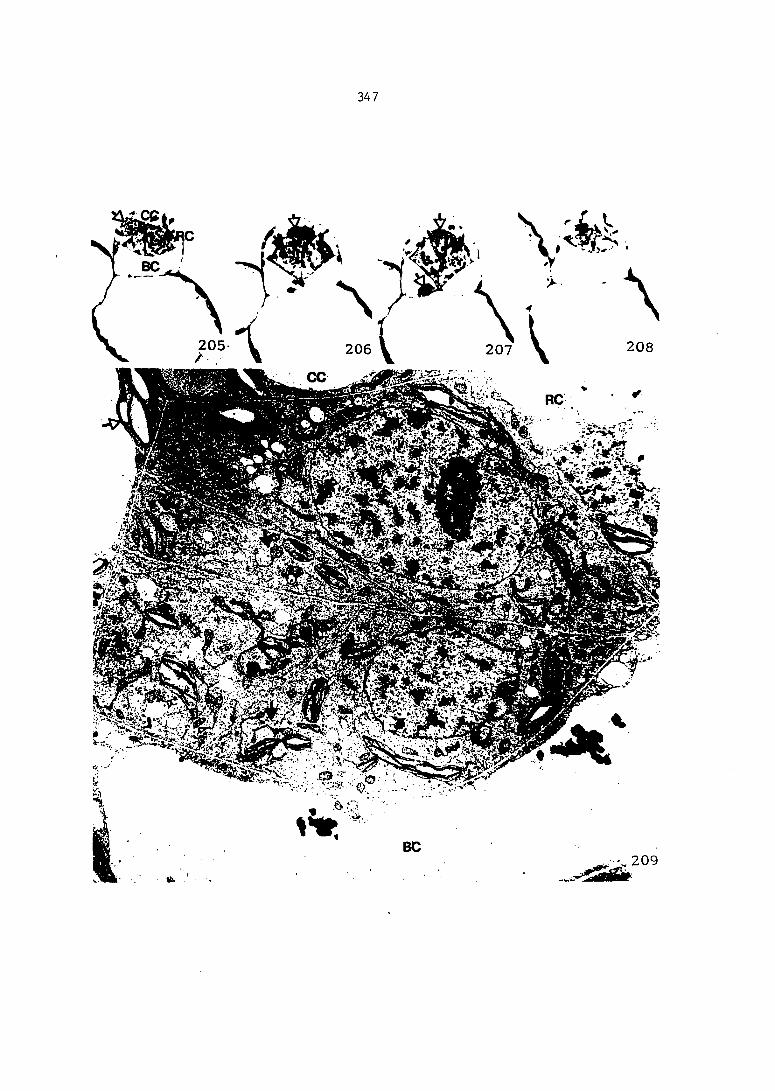
347
m mm
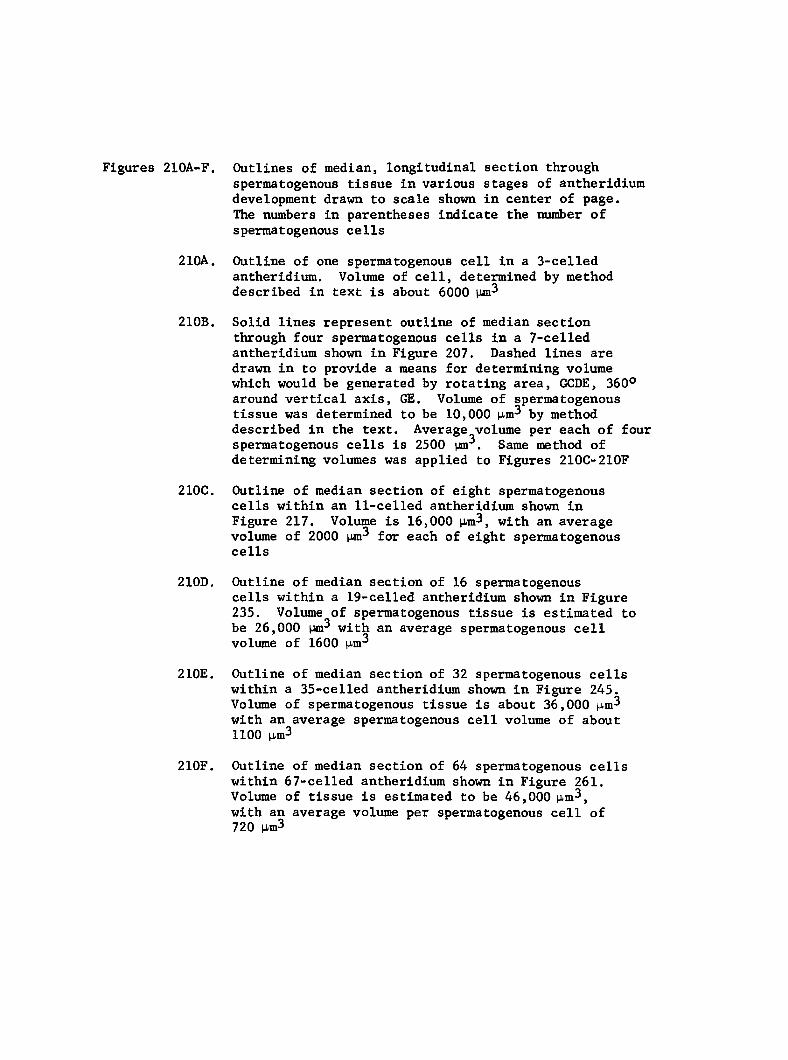
Figures 210A-F.
210A.
210B.
210C.
210D.
210E.
210F.
Outlines of median, longitudinal section through spermatogenous tissue in various stages of antheridium development drawn to scale shown in center of page. The numbers in parentheses indicate the number of spermatogenous cells
Outline of one spermatogenous cell in a 3-celled antheridium. Volume of cell, determined by method described in text is about 6000
Solid lines represent outline of median section through four spermatogenous cells in a 7-celled antheridium shown in Figure 207. Dashed lines are drawn in to provide a means for determining volume which would be generated by rotating area, GCDE, 360° around vertical axis, GE. Volume of spermatogenous tissue was determined to be 10,000 p,m^ by method described in the text. Average volume per each of four spermatogenous cells is 2500 pm . Same method of determining volumes was applied to Figures 210C-210F
Outline of median section of eight spermatogenous cells within an 11-celled antheridium shown in Figure 217. Volume is 16,000 m^, with an average volume of 2000 |jm^ for each of eight spermatogenous cells
Outline of median section of 16 spermatogenous cells within a 19-celled antheridium shown in Figure 235. Volume of spermatogenous tissue is estimated to be 26,000 with an average spermatogenous cell volume of 1600 pm^
Outline of median section of 32 spermatogenous cells within a 35-celled antheridium shown in Figure 245. Volume of spermatogenous tissue is about 36,000 p-m^ with an average spermatogenous cell volume of about 1100 iim^
Outline of median section of 64 spermatogenous cells within 67-celled antheridium shown in Figure 261. Volume of tissue is estimated to be 46,000 m^, with an average volume per spermatogenous cell of 720 |xm3
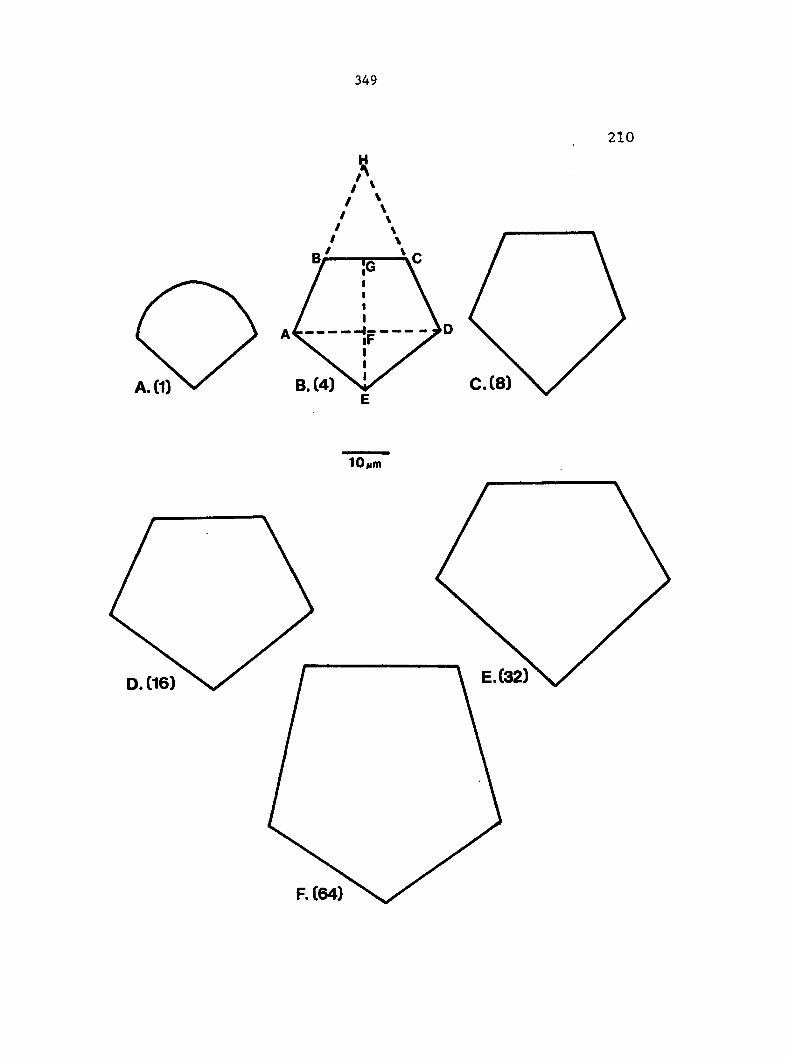
349
210
C.(8) B.(4) A.(1)
10|im
E.(32) D.(16)
F.(64)
Figures 211-212. Section through a 7-celled antheridium
211. Densely cytoplasmic spermatogenous cells contain many oddly shaped mitochondria. Chloroplasts are much smaller than chloroplasts in jacket and vegetative cells. Outer wall of basal cell is thicker near base (0.5 n-m, larger, dark arrow) than near top (0.3 M-m). X 7,250
212. Higher magnification of a region in lower part of spermatogenous cytoplasm shown in Figure 211. A mitochondrion has accumulated some densely staining, amorphous material in central stroma. X 21,860
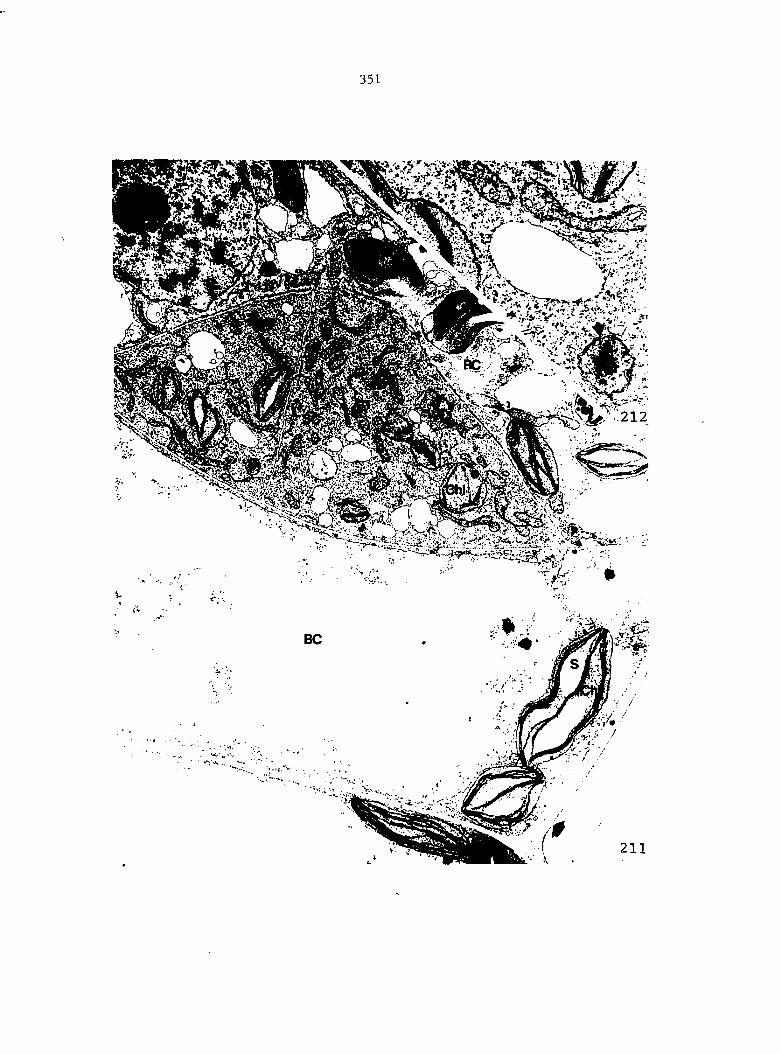
351
m
Figures 213-215. Cytoplasmic composition of spermatogenous cells in 7-celled antheridia. Dark arrows indicate microtubules which occur along cell walls, deeper within cytoplasm, and near nuclear envelope. An osmiophilic body is occasionally observed. Walls between spermatogenous cells are thin (0.1 p,m) and have many pla smode sma ta
213. X 13,940
214. X 24,225
215. X 31,097
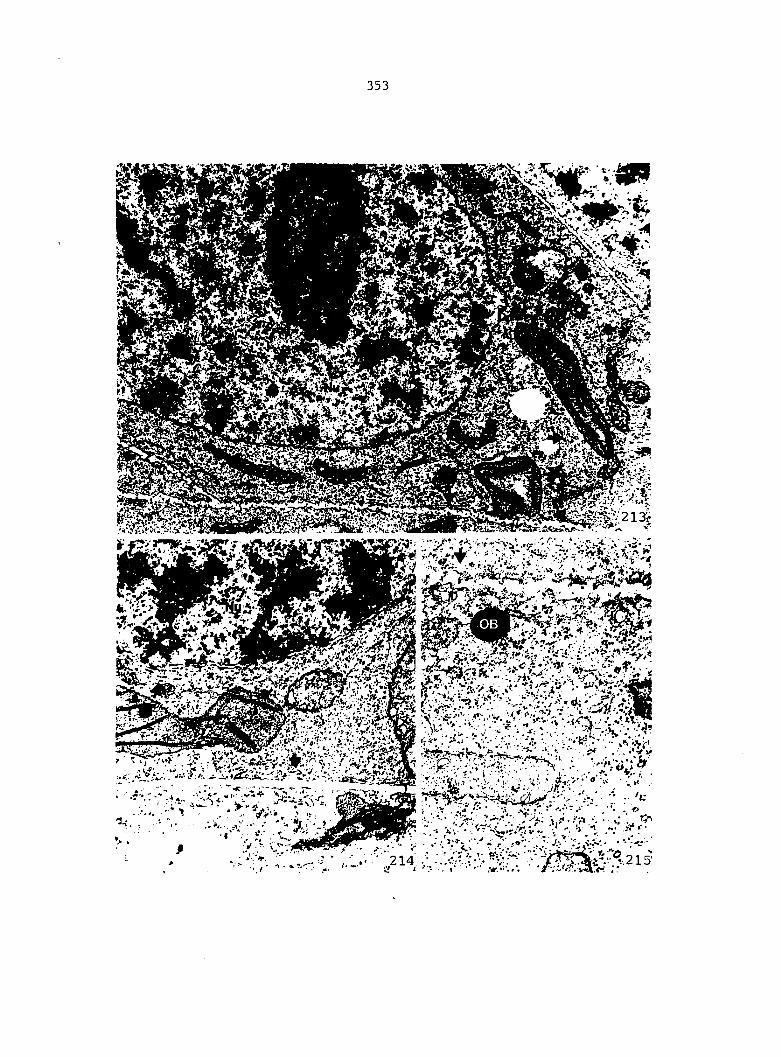
353
Figures 216-221. Longitudinal sections through 11-celled antheridia composed of three jacket cells and eight spermatogenous cells
216-219. Serial sections through an 11-celled antheridium. First four observed spermatogenous cells are present in Figure 216. Second four spermatogenous cells are apparent in Figure 218. Plane of cell divisions resulting in eight spermatogenous cells is parallel to base of antheridium (transverse) and perpendicular to two previous sets of cell divisions. Dark arrow on left in Figure 216 indicates transverse plane. Other arrow indicates one of previous longitudinal, division planes. X 465
220-221. Sections through two 11-celled antheridia in which first two sets of cell divisions were oriented obliquely to base of antheridia. In each case, plane of cell division forming eight spermatogenous cells is still oriented perpendicular to previous two sets of divisions. Arrows indicate different planes of division. Height and central diameter of 11-celled antheridia are about 45 p.m each
220.
221.
X 555
X 565
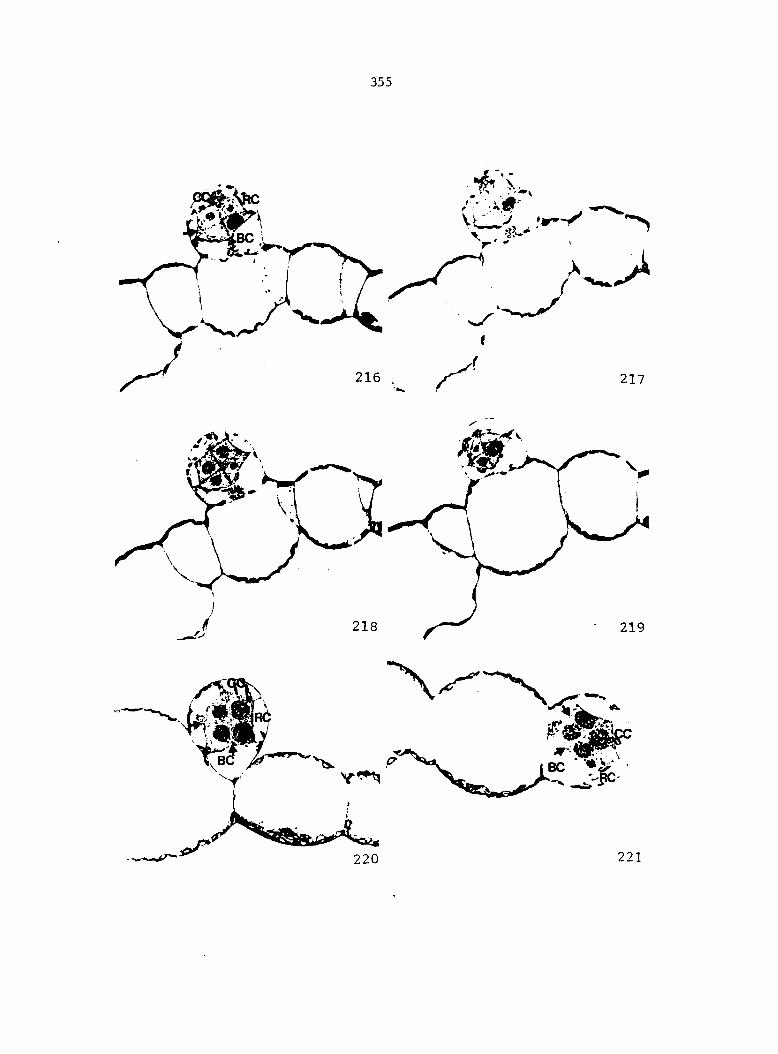
355
r
220
Figure 222. A longitudinal section through an 11-celled antheridium. Although cell walls of spermatogenous cells are at right angles to each other, they are not confluent at center. Dedifferentiating chloroplasts have an average length of about 1.5 pm compared to 4.0 pm in jacket cells. Dark arrow indicates an invagination in nuclear envelope. Inner wall of ring cell (clear arrow) is convex in appearance. Thin walls (0.1 pm) between spermatogenous cells have numerous plasmodesmata. Few plasmodesmata traverse walls between spermatogenous cells and jacket cells. X 9,165
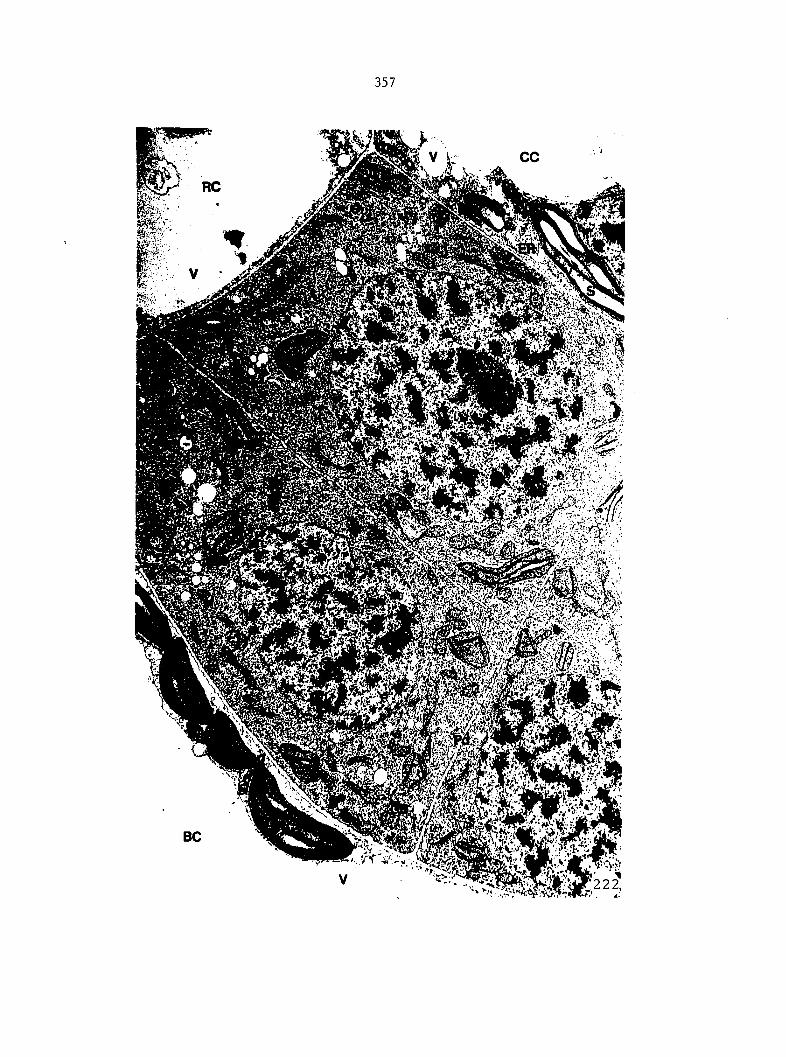
357
«
Figure 223. A transverse section through an 11-celled antheridium. Clear arrows indicate dedifferentiating chloroplasts, some of which are highly lobed. Cell walls shown in micrograph are products of first two sets of longitudinal divisions which result in four spermatogenous cells. These walls also are not confluent in center. X 11,070
Figure 224. Dark arrow indicates a mitochondrion with a dense inclusion observed in spermatogenous cell of an 11-celled antheridium. X 11,015
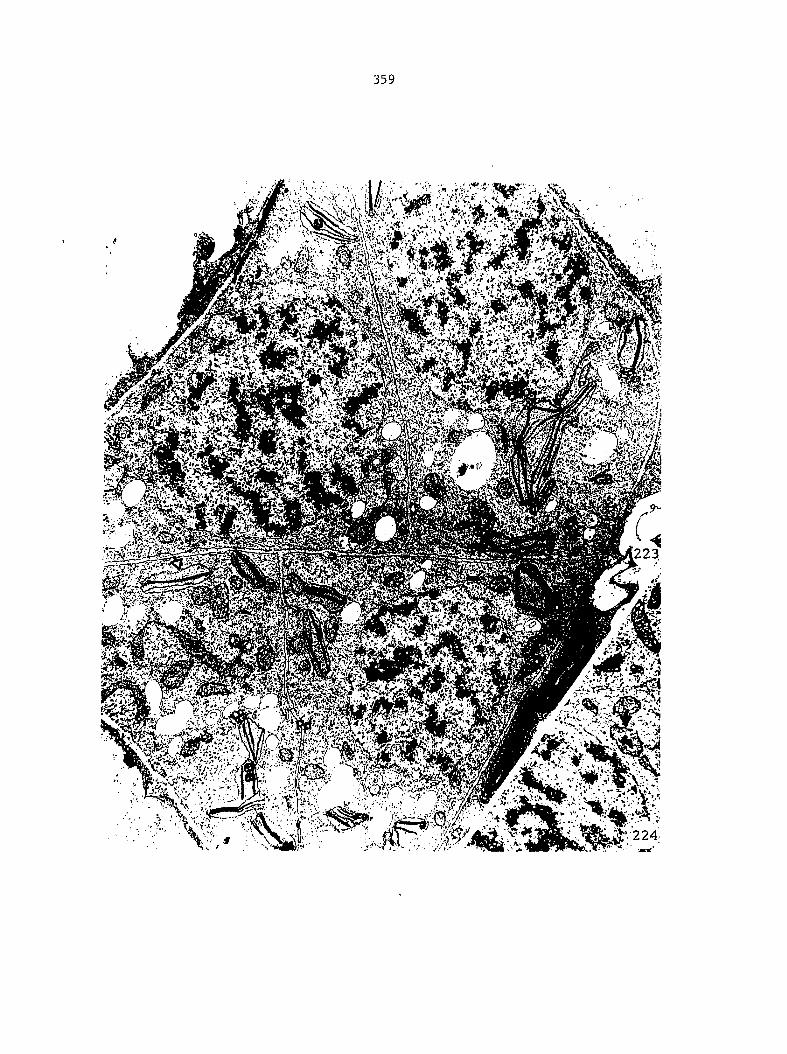
359
Kg
a
Figures 225-227. Cytoplasmic components in cells in 11-celled antheridia
225. A higher magnification of area indicated by arrow in Figure 222 showing more clearly invagination in nuclear envelope (large, dark arrow). Golgi body next to invagination has formed many vesicles containing fibrous material (clear arrow). Some coated vesicles occur near cell wall (smaller, dark arrow). X 28,560
226-227. Section through periphery of spermatogenous tissue in an 11-celled antheridium. Many elongated and oddly shaped mitochondria are present. Dark arrows show osmiophilic bodies. Many microtubules occur near cell wall oriented in various directions
226. X 4,030
227. X 29,895
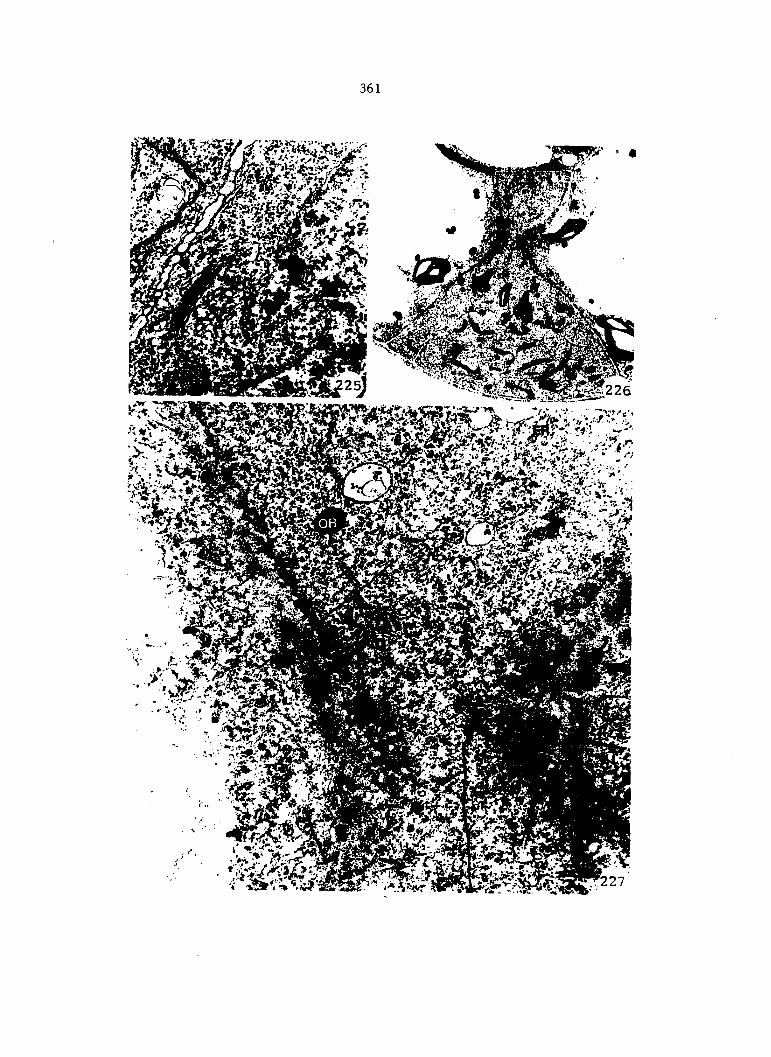
361
Figures 228-230. Cytoplasmic composition of spermatogenous cells in 11-celled antheridia
228-229. Microtubules are abundant, occurring either singly or in groups oriented parallel to each other (dark arrows). Plasmodesmata are present in walls between spermatogenous cells but are few in number in walls between spermatogenous cells and jacket cells. Invaginations in plasmalemma occur containing fibrous material. X 31,110
230. A section through a spermatogenous cell cut tangen-tially through nuclear envelope. A portion of nuclear envelope is evident in center of micrograph, showing some nuclear pores. Microtubules occur around nuclear envelope (dark arrows). Polysomes are present in cytoplasm (clear arrows). X 12,305
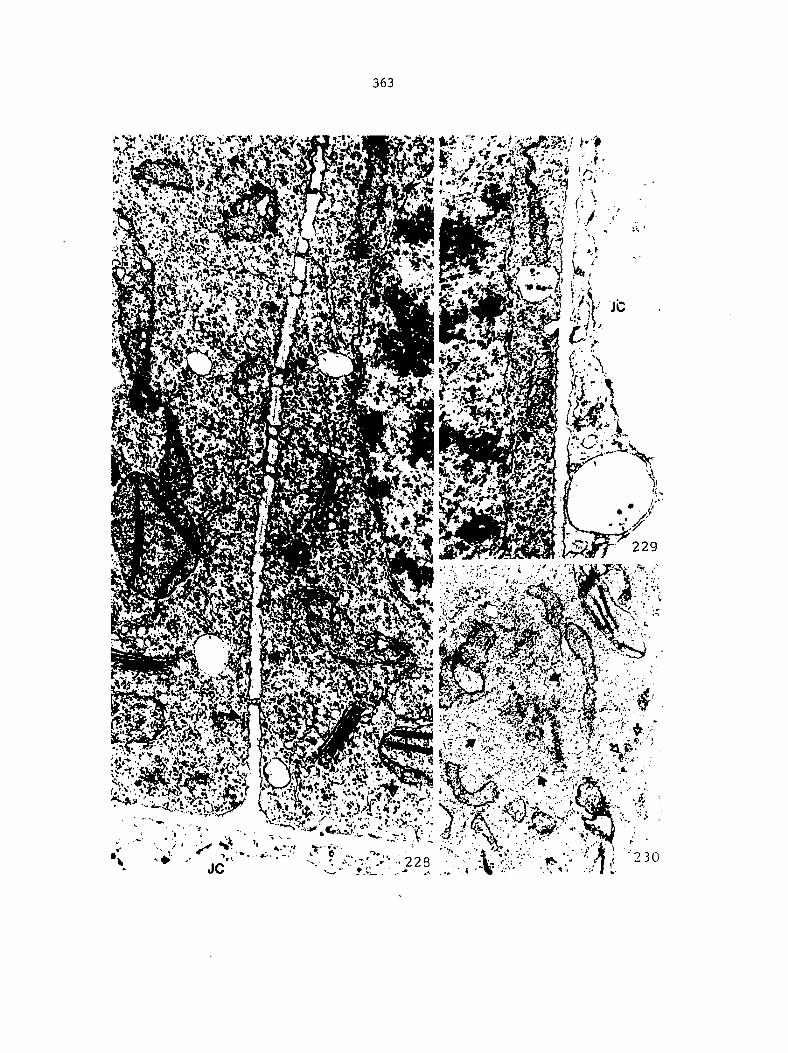
363
Figures 231-234. Cytoplasmic composition of jacket cells in 11-celled antheridia
231. Both cap cell and ring cell are highly vacuolate. Mitochondria are usually circular to oblong and chloro-plasts are well-differentiated and contain numerous starch grains. Thickness of outer wall varies between 0.3 and 0.4 M-m. Vesicle-forming Golgi bodies are present. X 9,455
232. Microbodies occur in jacket cells. X 17,785
233. Microtubules occur along outer wall of ring cell (dark arrows). X 40,745
234. A section through basal cell. Outer wall (larger, dark arrow) is 0.3-0.4 jj-m thick. Basal wall (smaller, dark arrow) is about 0.2 u.m thick, while funnel-shaped wall (clear arrow) is about 0.15 nm thick. Chioro-plasts have very large starch grains. X 4,295
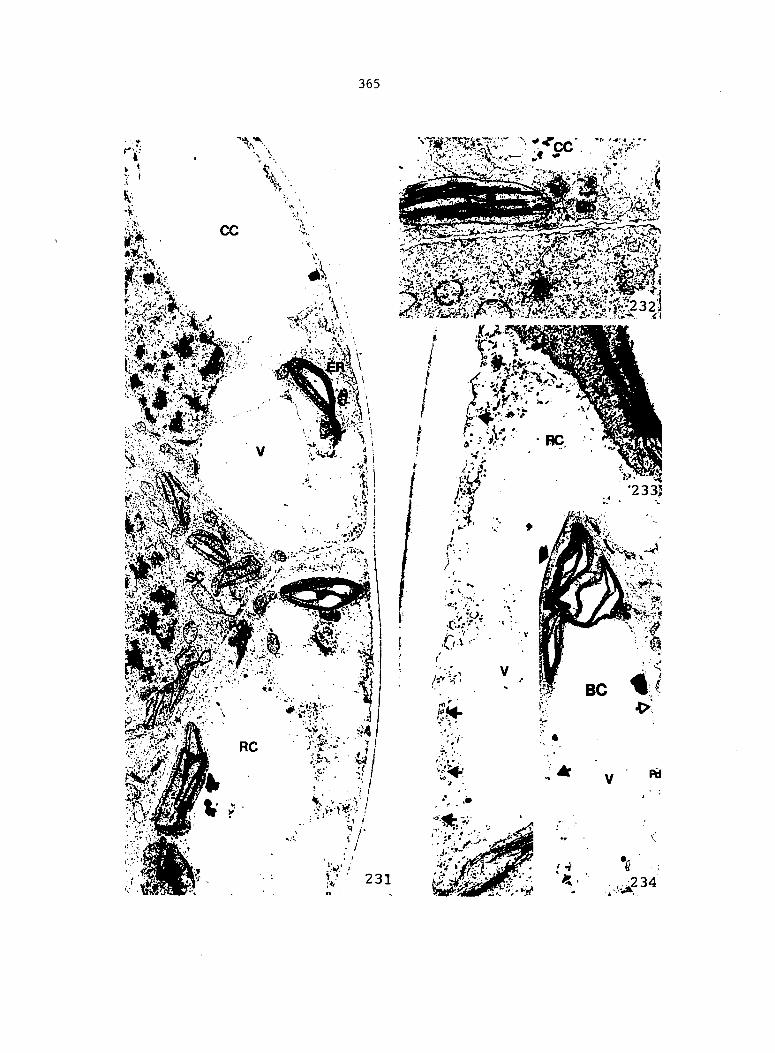
365
Figures 235-238. Sections through 19-celled antheridia, which are composed of three jacket cells, and 16 spermatogenous cells
235. A median, longitudinal section through a 19-celled antheridium showing vacuolate nature of jacket cells and densely cytoplasmic spermatogenous cells. Antheridium has a height and diameter of about 50 urn each. X 405
236. An oblique section through a 19-celled antheridium. Chloroplasts are evident in jacket cells and vegetative cells, but not in spermatogenous cells at this magnification. X 420
237. A TEM of the section shown in Figure 236 revealing the presence of many small plastids containing little starch. Many small vacuoles are also present. X 6,900
238. A higher magnification of lower, left-hand region of spermatogenous tissue shown in Figure 237. A mitochondrion, with a large amount of dense material in stroma is clearly shown along with an osmiophilic body. Microtubules are shown near cell wall (arrows) . X 40,250
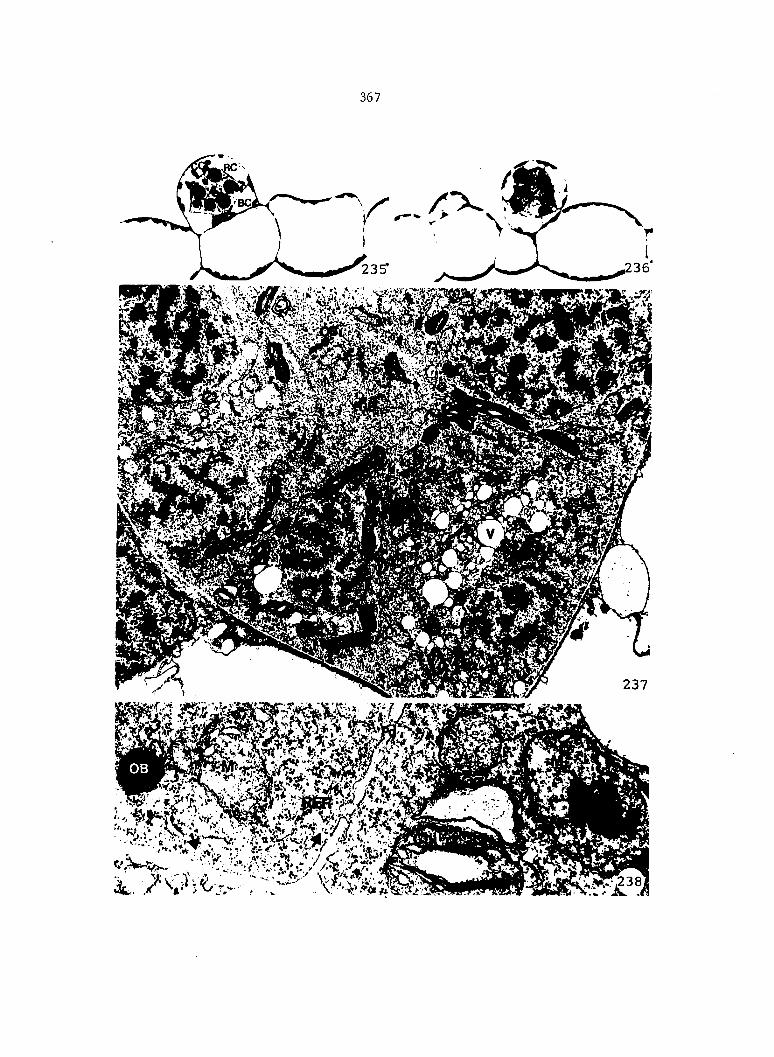
367
Figures 239-241. Cytoplasmic composition of spermatogenous cells in 19-celled antheridia
239. A spermatogenous cell revealing an almost circular nucleus and some cup-shaped and dumbbell-shaped mitochondria. X 6,775
240-241. Microtubules are abundant in spermatogenous cells, both near nucleus and deeper within cytoplasm, sometimes occurring in parallel arrays. SER is present and in some instances, SER appears to be continuous with outer membrane of nuclear envelope (dark arrows). Golgi bodies are forming vesicles containing fibrous material
240.
241.
X 24,905
X 26,825
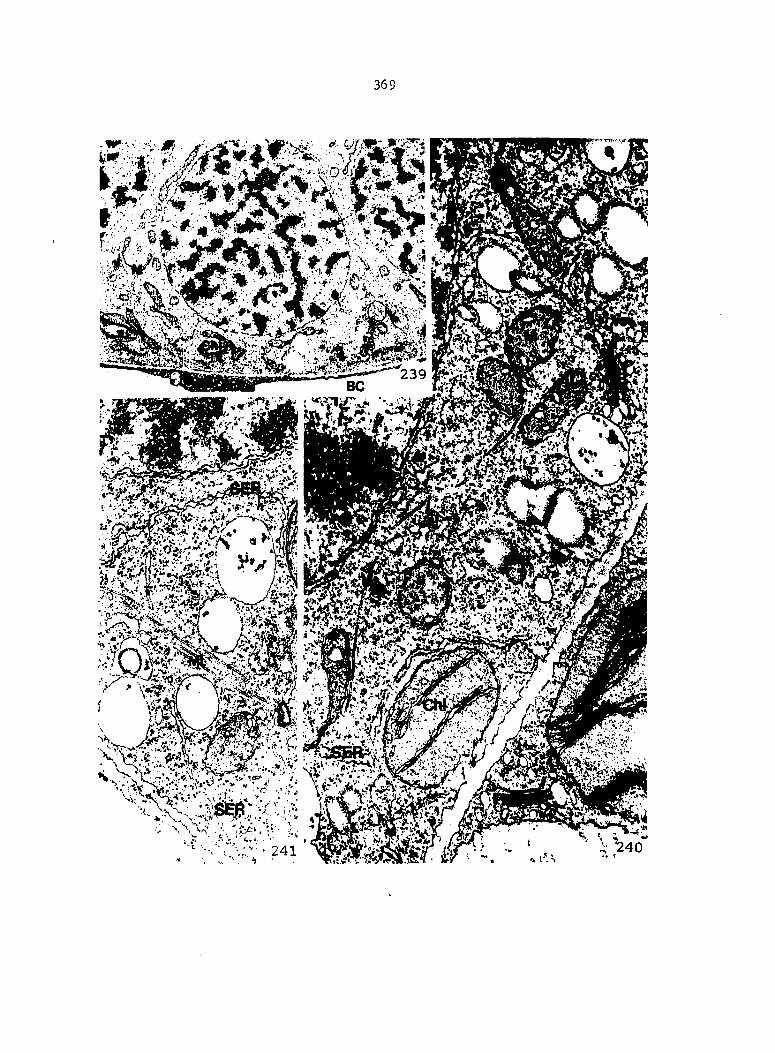
369
k'f:"
m
Figures 242-244. Cytoplasmic composition in jacket cells of a 19-celled antheridium
242. Cap cell has very large chloroplasts with many large starch grains in contrast to plastids in spermatogenous tissue (dark arrow). A major portion of cap cell is comprised of large vacuoles. Outer wall, at top of micrograph, is quite thick (0.6 pm). Inner wall is convex (larger, dark arrow) and is quite thin (0.1 wm). The side wall (clear arrow) is somewhat thicker (0.2 urn). X 7,930
243. Highly vacuolate ring cell also has large chloroplasts with many starch grains. Outer wall (dark arrow) is about 0.4 iJ.m thick, while inner wall is about 0.15 vm thick. X 6,750
244. Section through a portion of basal cell. Basal wall (clear arrow) is about 0.25 M-m thick, while funnel-shaped wall near upper, right-hand corner of micrograph is only about 0.15 nm thick. X 8,500
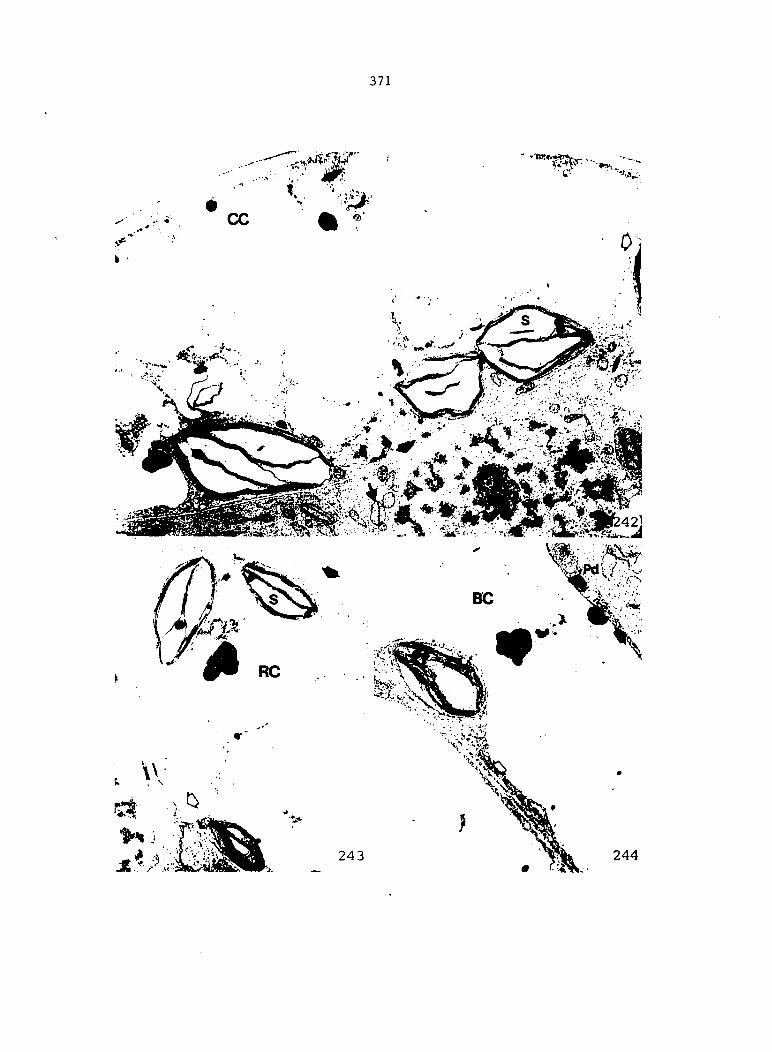
371
Figures 245-248. Sections through 35-celled antheridia, which are composed of three jacket cells and 32 spermatogenous cells
245-246. Median, longitudinal sections through 35-celled antheridia. Spermatogenous cells are angular in shape. Average height and central diameter are each about 55 nm
245. X 480
246. X 246
247. Median, longitudinal section through a 35-celled antheridium in which spermatogenous cells (spermatids) have begun to round up and differentiate into spermatozoids. Height and central diameter are each only about 50 pm. X 480
248. TEM of spermatogenous cells in a 35-celled antheridium. Walls between cells have thickened to about 0.2 pm. Chloroplasts have dilated lamellae. A blepharoplast has arisen de novo in each spermatogenous cell consisting of a spherical mass of densely staining material penetrated by numerous lightly stained channels. Nuclear envelope is slightly indented in area near blepharoplast. X 9,880
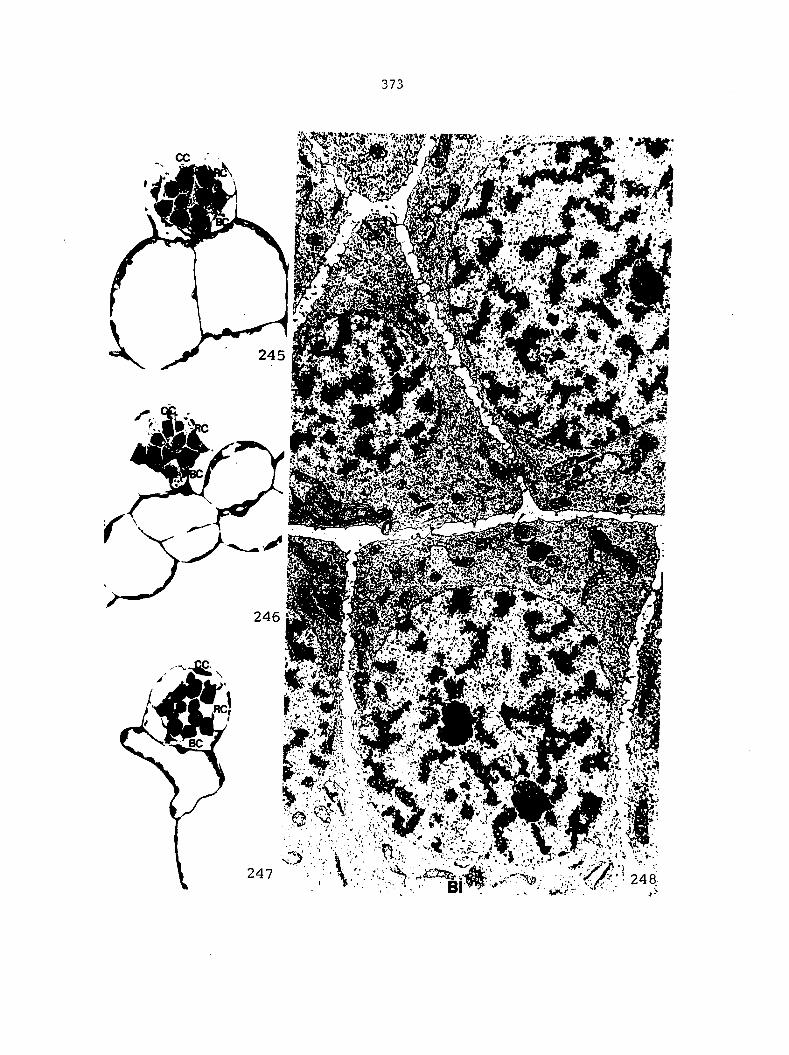
373
Figures 249-251. Cytoplasmic components in spermatogenous cells of 35-celled antheridia
249-250. Microtubules are abundant within cells (dark arrows). Many, active Golgi bodies are present. An occasional osmiophilic body is observed
249. X 16,895
250. X 21,860
251. A mitochondrion with a densely staining amorphous inclusion in central stroma. X 27,100
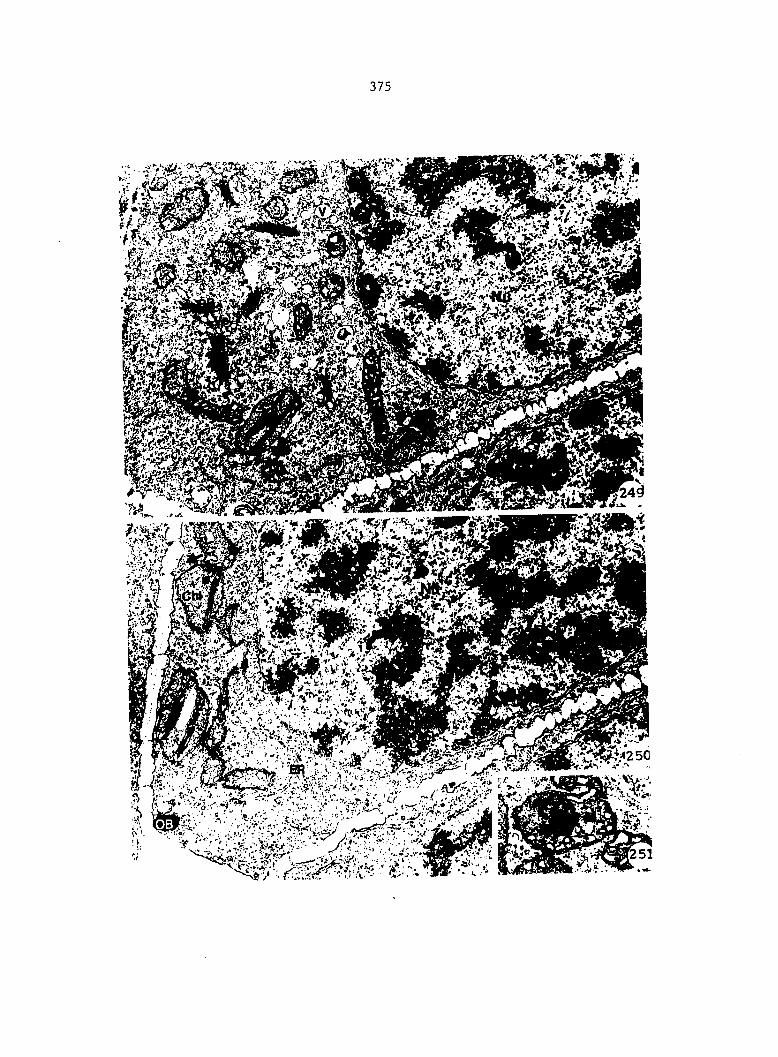
375
Figure 252. A spermatogenous cell in a 35-celled antheridium showing angular nature of cell and location of blepharoplast with respect to other cell components. Nucleus is slightly indented in area near blepharoplast. X 17,160
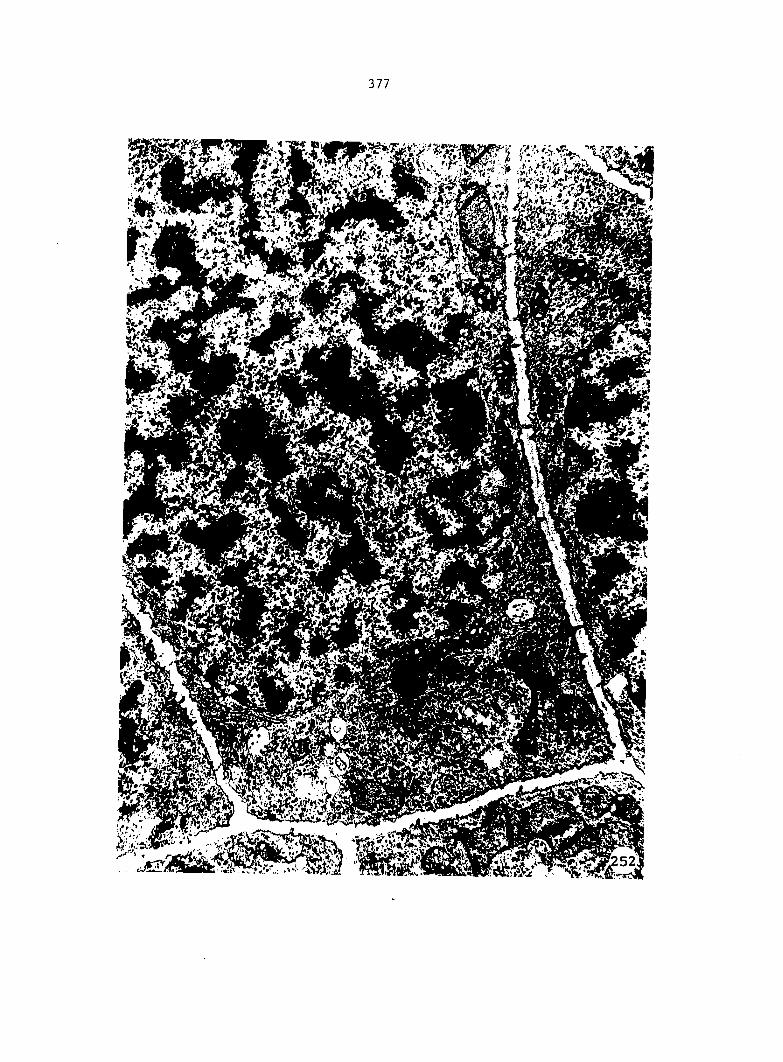
377
Figures 253-255. Higher magnification of blepharoplasts and their immediate, cytoplasmic environment. A tubule occurs in center of each lightly stained channel within blepharoplast (dark arrows) with thin filaments radiating outward from tubule along its entire length. Microtubules are abundant near blepharoplast and are oriented perpendicular to tangent of blepharoplast, appearing to terminate at periphery of structure. Microtubules are also present near nuclear envelope. Some channels in blepharoplast are bent and extend through entire structure (arrow in Figure 255)
253. X 80,135
254. X 48,585
255. X 26,170
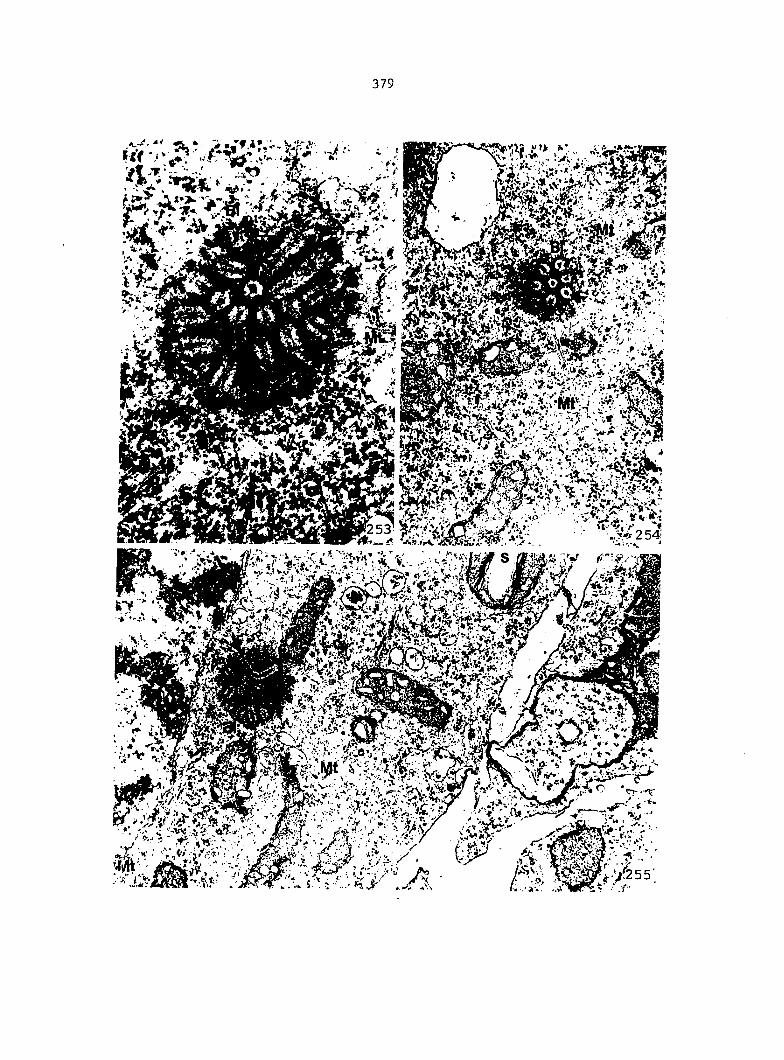
379
-J.
mms£'
S®'
wmm
t
m k#
Figures 256-260. Early stages in formation of a blepharoplast observed in spermatogenous cells of a 35-celled antheridium
256. A circular area of densely staining, flocculent material, measuring 0.5 nm in diameter, arises in spermatogenous cell near cell wall (arrow). Blepharoplast presumably arises novo within this structure. X 16,830
257. Low magnification of spermatogenous cells showing location of a developing blepharoplast (arrow) in cell in upper, left-hand corner. Spermatogenous cells are angular in shape with thin adjoining walls (0.2 pm). Nuclei are spherical in shape. X 4,380
258-260. Serial sections through the area indicated by the arrow in Figure 257
258. Two, trilayered plaques are present surrounded by a small amount of flocculent material. Two plaques are separated by about 40-50 nm. Each plaque consists of two, dense, plate-like layers separated by a light layer. Each plaque is about 200 nm in length. Thicker, distal layer of each plaque is indicated by a clear arrow. X 39,550
259. Adjacent section to section shown in Figure 258. Distal layers have accumulated dense material in this region and channels have begun to form within material (clear arrows). Central tubule in upper channel is evident. Each distal layer presumably gives rise to one blepharoplast. X 53,505
260. Microtubules occur in area near developing blepharoplast which is no longer in view. Plastids and mitochondria both have dilated lamellae. X 27,340
Figures 261-262. Median, longitudinal sections through 67-celled antheridia, composed of three jacket cells and 64 spermatids, Antheridia have a height and central diameter of 60 [J-m each
261,
262.
X 440
X 395
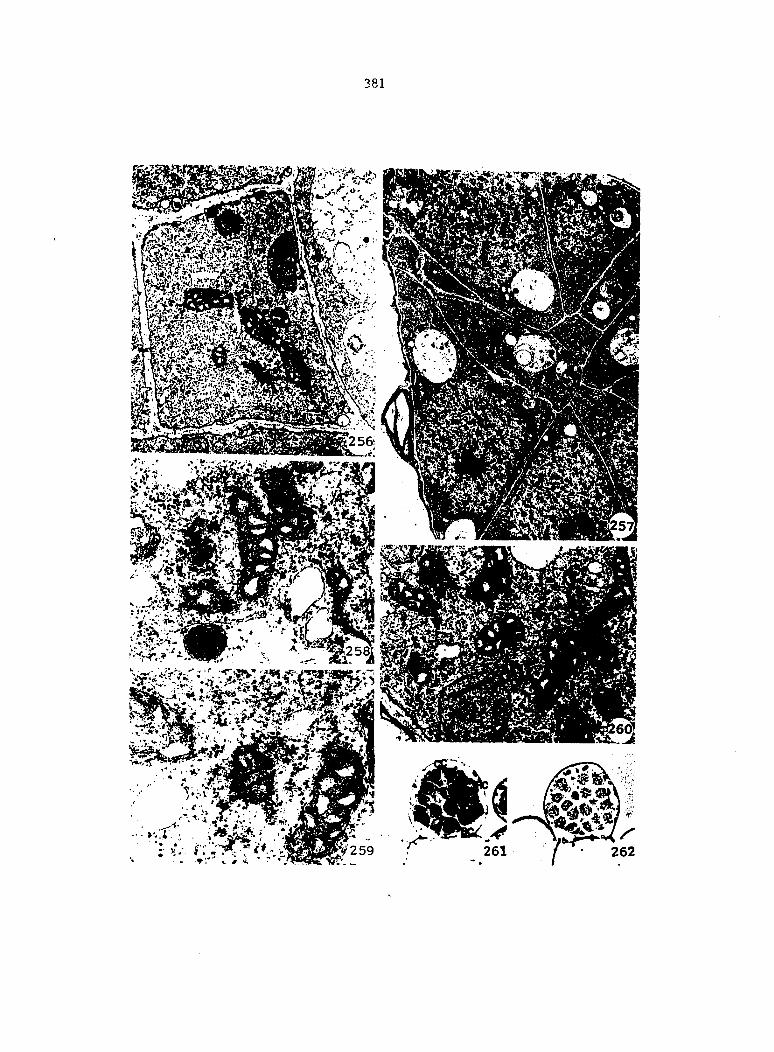
381
m
• ###
Figure 263. A graph of the average volume per spermatogenous cell with respect to number of spermatogenous cells present within antheridium. Dotted line represents a threshold line in terms of volume. Spermatogenous cells which reach this volume leave mitotic cycle and enter their differentiation phase
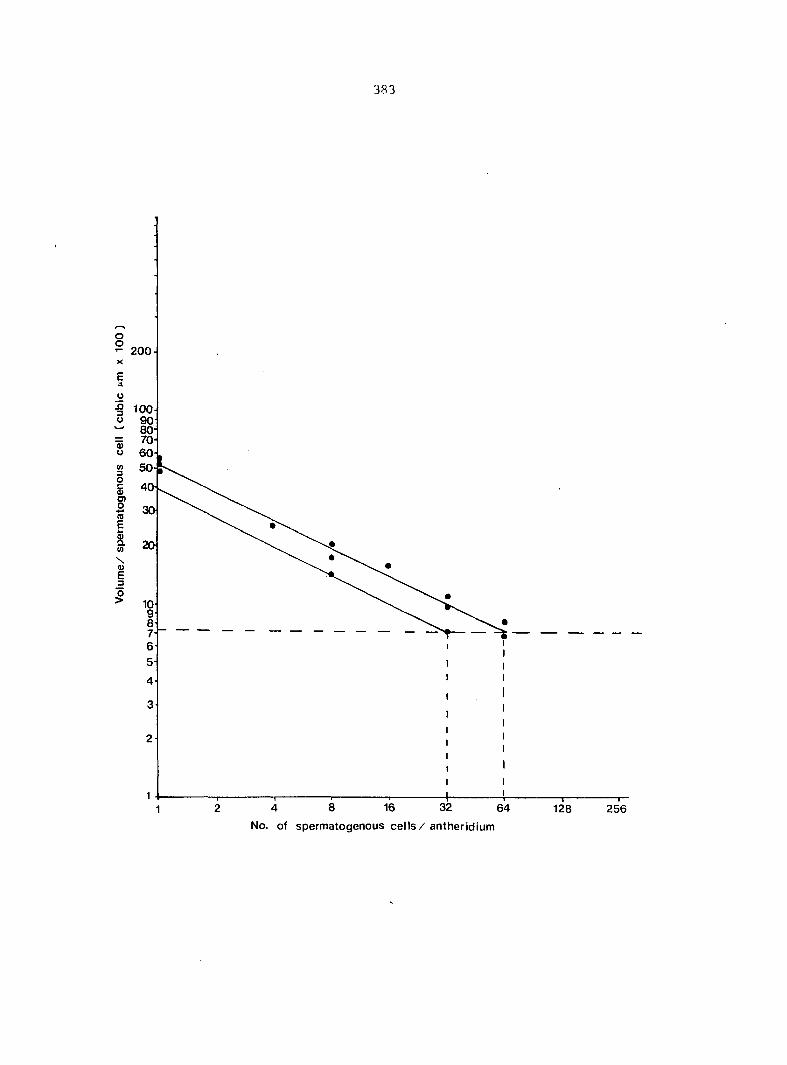
383
4 8 16 32 64
No. of spermatogcnous cells/ antherldlum
128
Figures 264-266, Early spermatid differentiation
264. Section through two spermatids in which blepharoplast is forming procentrioles (dark arrows). Spermatids are still angular in shape and an abundance of heterochromatin occurs within nuclei. X 12,815
265. A higher magnification of area indicated by lower, dark arrow in Figure 264 showing developing procentrioles . Procentrioles have a length of about 0.3 M-m and an outer diameter of about 0.15 P^m. A central tubule (dark arrow) runs length of procentriole, with thin filaments radiating outward along its length. X 36,520
266. Sets of doublet microtubules (arrow) are shown arranged in a cylinder around central tubule. X 46,550
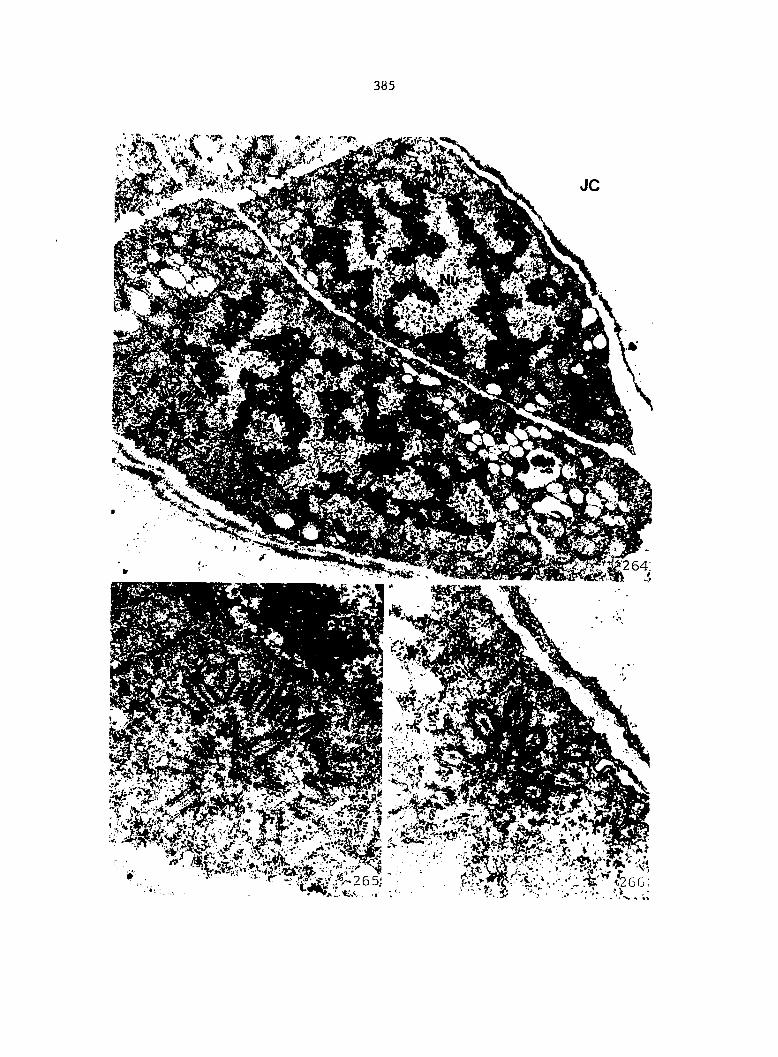
385
Figures 267-268. Stage during which spermatids round up and additional layers of cell wall material are deposited
267. Cytoplasmic connections occur between spermatids in areas where wall remains thin (small, dark arrow). Centriole-MLS complex is forming within each spermatid (larger, dark arrows). X 10,530
268. Plastids in round spermatids have dense matrices, some starch grains, and osmiophilic globuli. Few lamellae present in plastids tend to be dilated (clear arrow). Long-chain polysomes are present (dark arrow) along with numerous vesicles. X 26,350
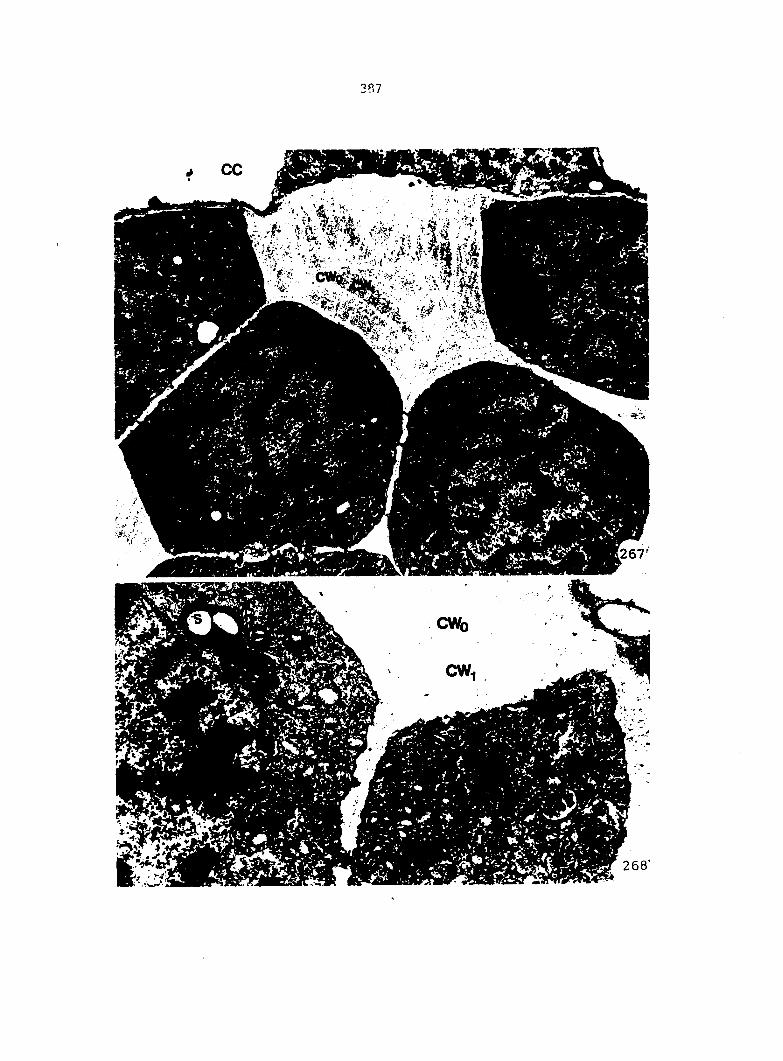
Figure 269. Higher magnification of developing centriole-MLS complex in spermatid in upper, right-hand corner of Figure 267. Centrioles are spreading out in a row within a large accumulation of osmiophilic material located above a microtubular platform (MB). X 45,820
Figure 270. Centrioles, not yet aligned in same plane, are shown above a portion of developing microtubule band. Subtending microtubule band are lamellar plates which have become associated mitochondrion (MA). There is an inclusion within MA. Numerous vesicles occur within cytoplasm containing fibrous material. X 39,535
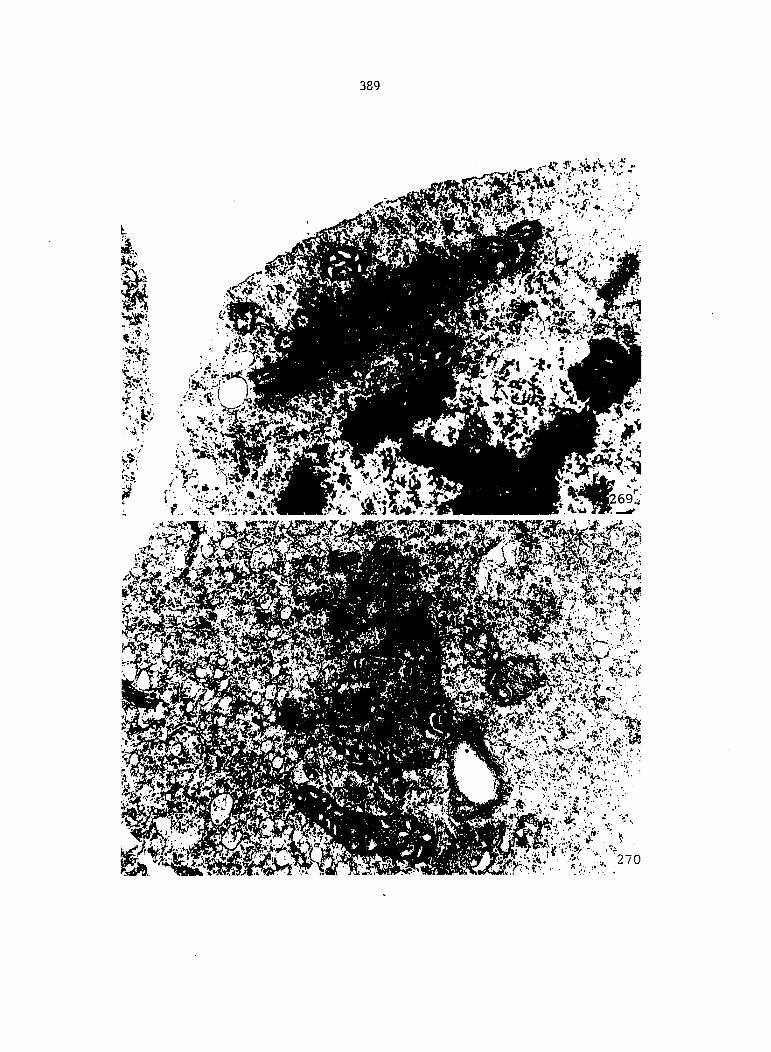
389
Figures 271-272. Association of MLS complex with nucleus in early spermatid stage. and lamellar plates elongate in same direction and fit into a groove formed by nucleus. Microtubules in MB extend beyond MA, and LP and become closely appressed to nuclear envelope. Centrioles, which are beginning to function as basal bodies, are aligned in a row along MB. Eighty-five microtubules are evident in MB in Figure 271. Golgi bodies have formed vesicles containing fibrous material
271. X 34,540
272. X 34,320
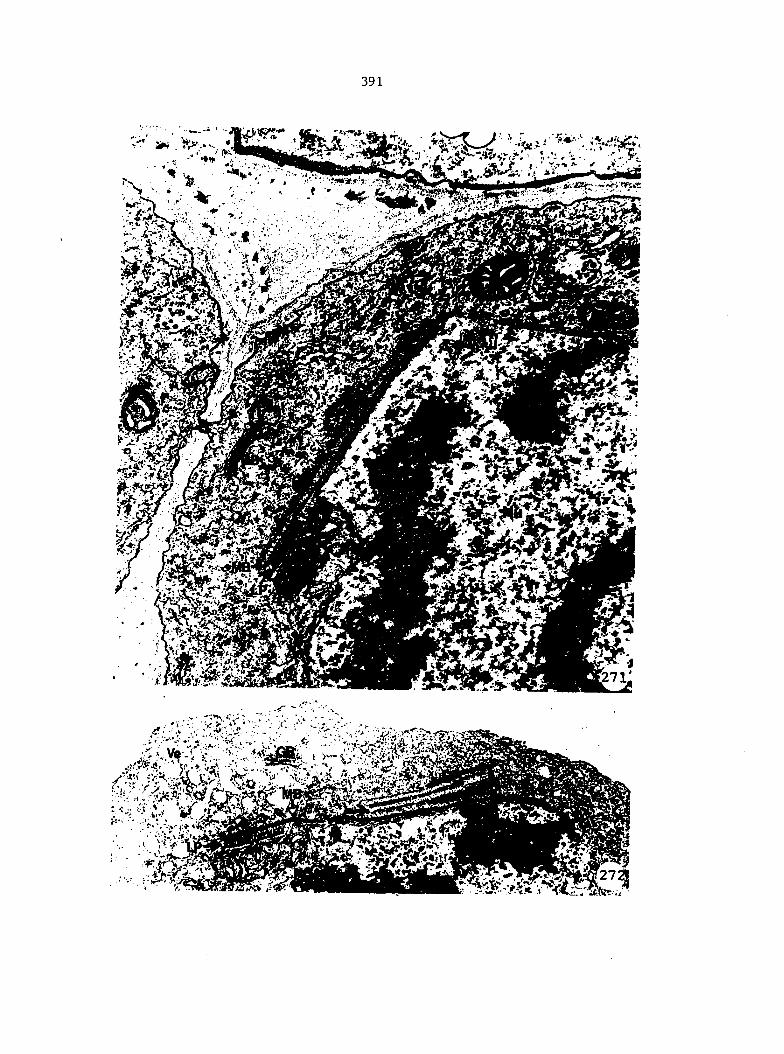
391
iSTJîv-

Figure 273. A section showing orientation of microtubules in MB to lamellar plates of LS. They are oriented at about 40° to each other. Non-MB microtubules occur within cytoplasm near MLS complex in this early spermatid cell. X 34,420
Figure 274. An early spermatid showing an elongating M^ and MLS. Basal bodies are shown arranged in a row above MB. Nuclear to cytoplasmic ratio is very high. Plastids, mitochondria, and active Golgi bodies occur within cytoplasm. Cytoplasmic connections (arrow) are still present traversing thin regions of adjoining cells. X 18,760
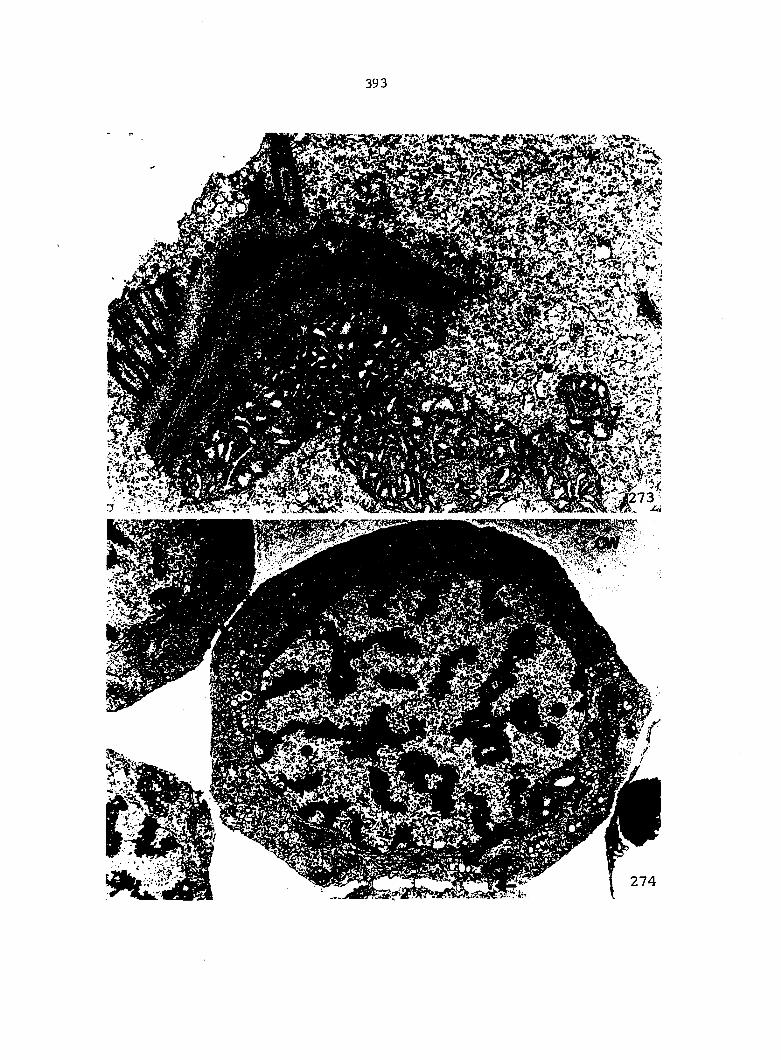
393
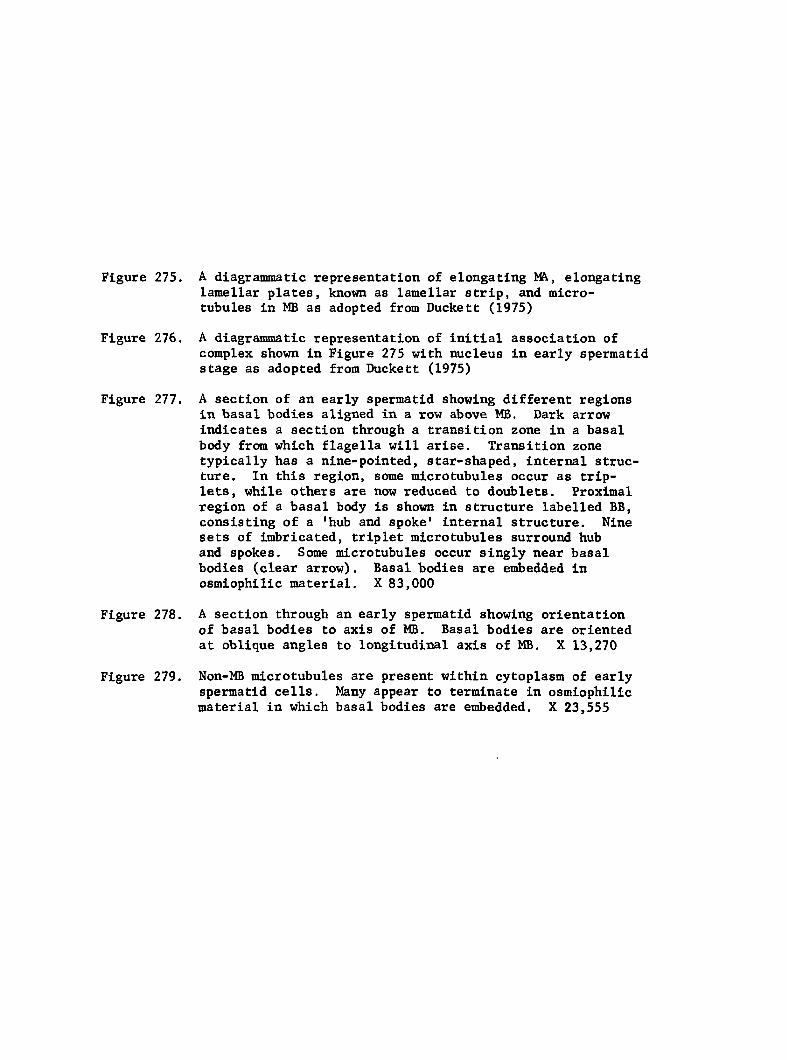
Figure 275. A diagrammatic representation of elongating elongating lamellar plates, known as lamellar strip, and microtubules in MB as adopted from Duckett (1975)
Figure 276. A diagrammatic representation of initial association of complex shown in Figure 275 with nucleus in early spermatid stage as adopted from Duckett (1975)
Figure 277. A section of an early spermatid showing different regions in basal bodies aligned in a row above MB. Dark arrow indicates a section through a transition zone in a basal body from which flagella will arise. Transition zone typically has a nine-pointed, star-shaped, internal structure. In this region, some microtubules occur as triplets, while others are now reduced to doublets. Proximal region of a basal body is shown in structure labelled BB, consisting of a 'hub and spoke' internal structure. Nine sets of imbricated, triplet microtubules surround hub and spokes. Some microtubules occur singly near basal bodies (clear arrow). Basal bodies are embedded in osmiophilic material. X 83,000
Figure 278. A section through an early spermatid showing orientation of basal bodies to axis of MB. Basal bodies are oriented at oblique angles to longitudinal axis of MB. X 13,270
Figure 279. Non-MB microtubules are present within cytoplasm of early spermatid cells. Many appear to terminate in osmiophilic material in which basal bodies are embedded. X 23,555
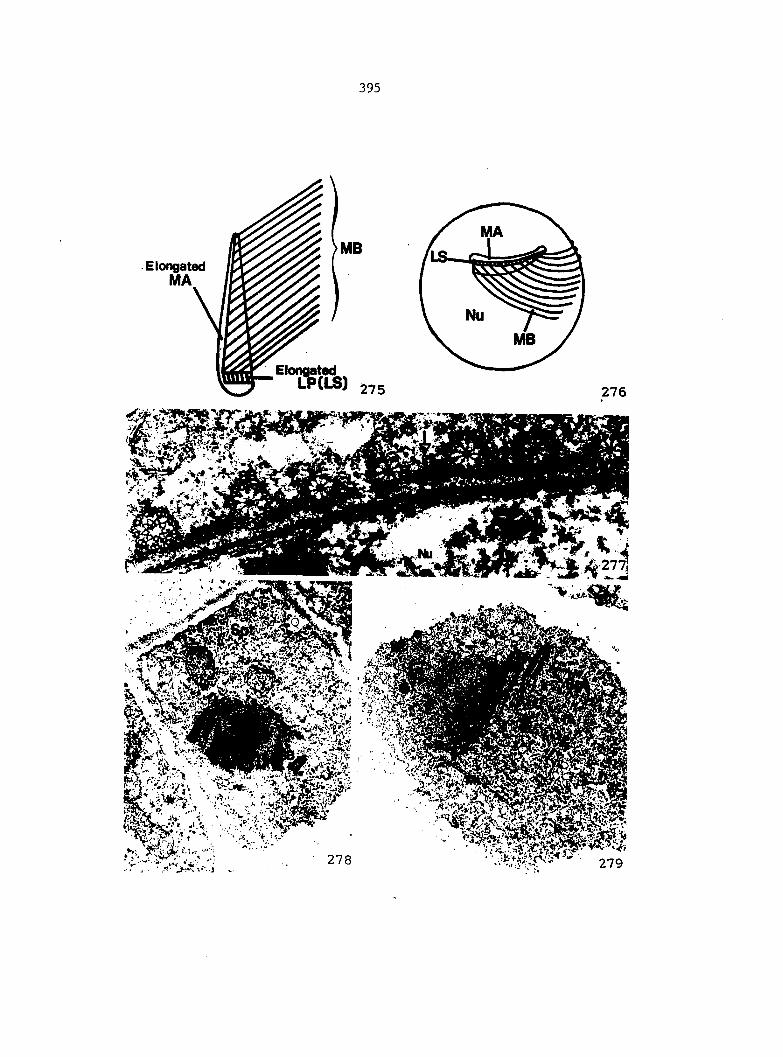
395
Elongated MA
Figures 280-282. Sections of early spermatid cells in which MB extends at least halfway around spherical nucleus
280. Dark arrow indicates MLS within nuclear groove. Clear arrow indicates a portion of MB which has extended around half of nuclear circumference. A second, additional layer of cell wall material has been deposited outside plasmalemma. X 6,265
281. A peripheral section through an early spermatid showing second layer of wall material. Golgi bodies are actively forming vesicles containing fibrous material similar to material in new cell wall layer (dark arrows). Polysomes are also present within cytoplasm (clear arrows). X 17,070
282. Plastids in early spermatids have a very dense matrix and contain some starch grains. Few lamellae present are dilated in appearance. X 21,080
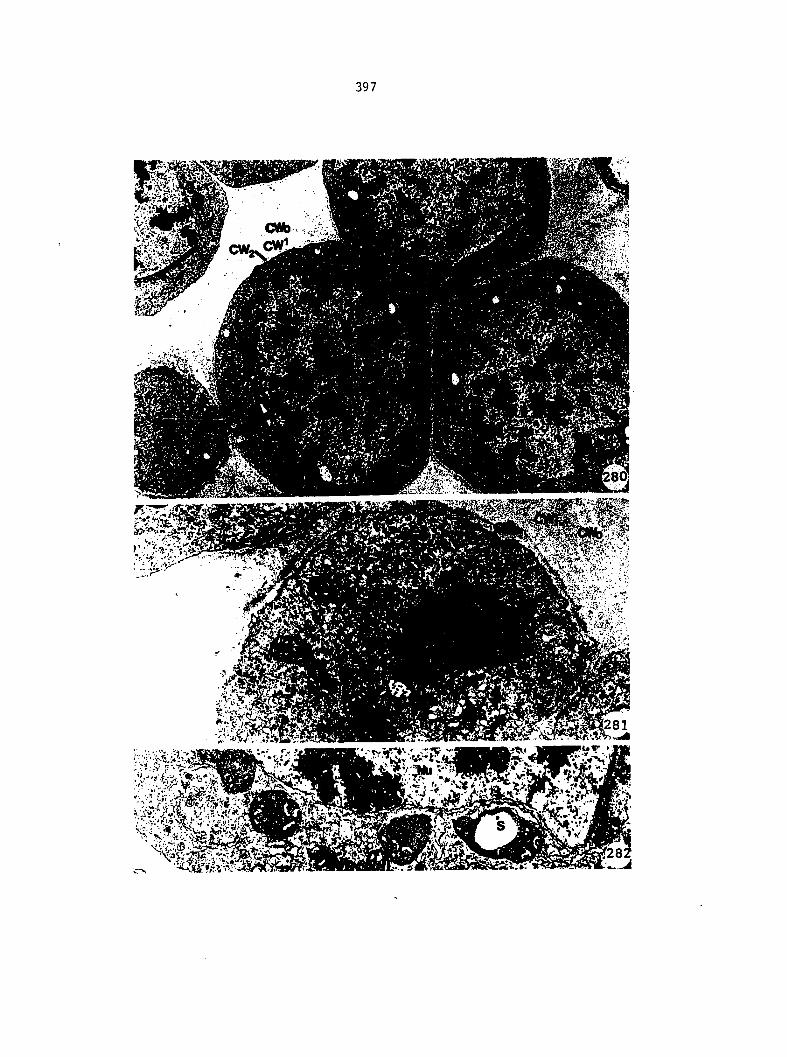
397
m.
«
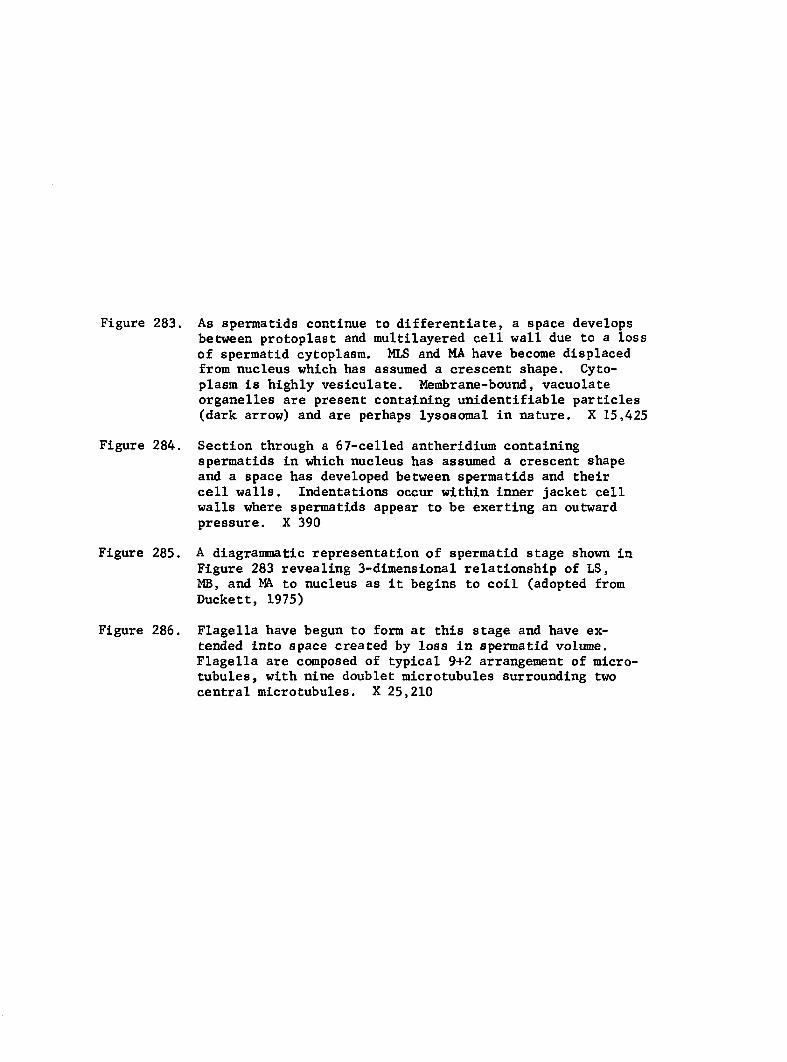
Figure 283. As spermatids continue to differentiate, a space develops between protoplast and multilayered cell wall due to a loss of spermatid cytoplasm. MLS and MA have become displaced from nucleus which has assumed a crescent shape. Cytoplasm is highly vesiculate. Membrane-bound, vacuolate organelles are present containing unidentifiable particles (dark arrow) and are perhaps lysosomal in nature. X 15,425
Figure 284. Section through a 67-celled antheridium containing spermatids in which nucleus has assumed a crescent shape and a space has developed between spermatids and their cell walls. Indentations occur within inner jacket cell walls where spermatids appear to be exerting an outward pressure. X 390
Figure 285. A diagrammatic representation of spermatid stage shown in Figure 283 revealing 3-dimensional relationship of LS, MB, and M& to nucleus as it begins to coil (adopted from Duckett, 1975)
Figure 286. Flagella have begun to form at this stage and have extended into space created by loss in spermatid volume. Flagella are composed of typical 9+2 arrangement of microtubules, with nine doublet microtubules surrounding two central microtubules. X 25,210
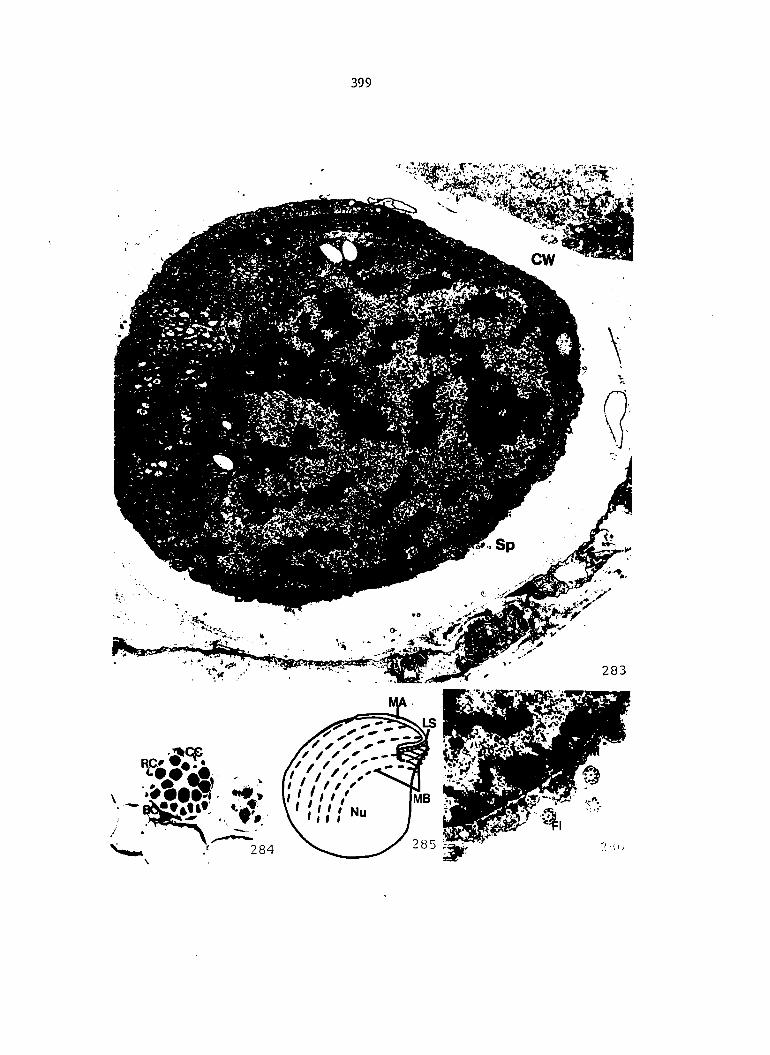
399

Figure 287. The mid-spermatid stage in which nucleus has coiled into about 1-1/2 gyres and MLS/Mk have coiled into about 3/4 gyres. Multilayered cell wall is shown surrounding each mid-spermatid (dark arrows). More than three layers appear to be present now. Numerous flagella are present in space surrounding mid-spermatids. Clear arrow is pointed toward one indentation in inner wall of ring cell. Outer wall of ring cell is only about 0.25 |im thick, while outer wall of cap cell is about 0.7 M-m thick. X 6,750
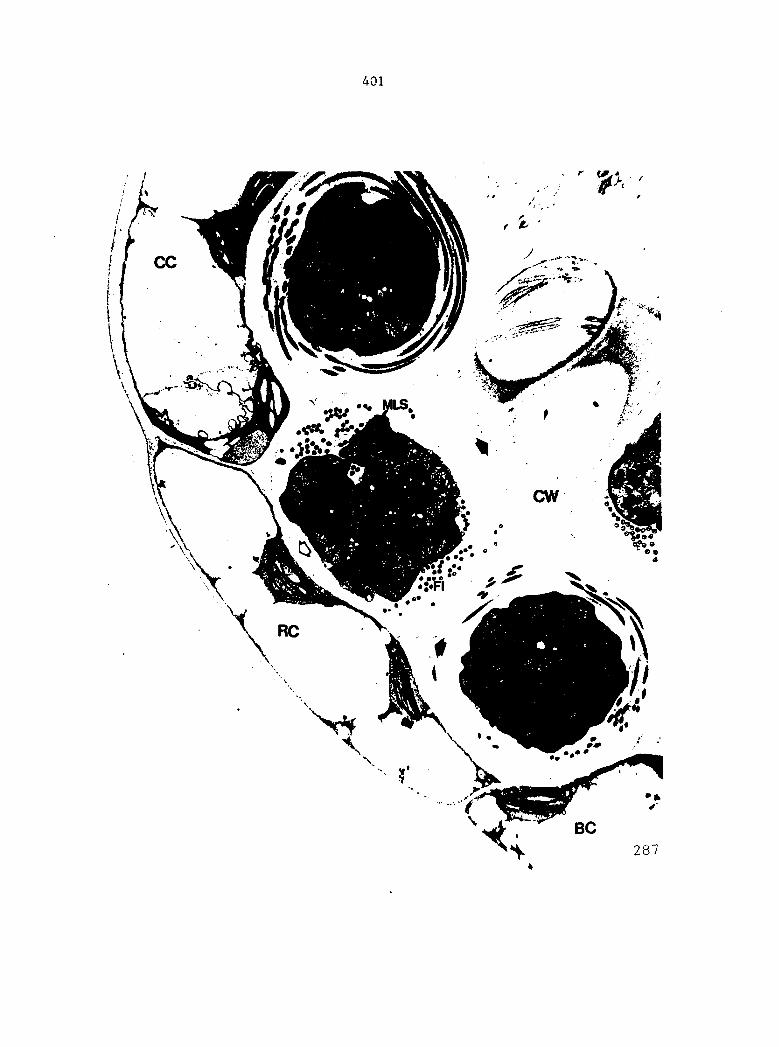
401
Figure 288. A higher magnification of one mid-spermatid shown in Figure 287. Chromatin is condensing along nuclear envelope which is in contact with MB. An osmiophilic crest is now apparent along anterior edge of MLS. OC is about 60 nm thick and 0.25 |im wide. Autolysis is occurring in centrally located cytoplasm (white arrow). Cytoplasm is quite vesiculate in some regions. Matrix of plastids is much less dense than during early spermatid stage. A structure occurs between anterior plasmalemma and consisting of three layers of osmiophilic material, with two layers nearest plasmalemma connected by uniformly spaced dense regions. X 19,855
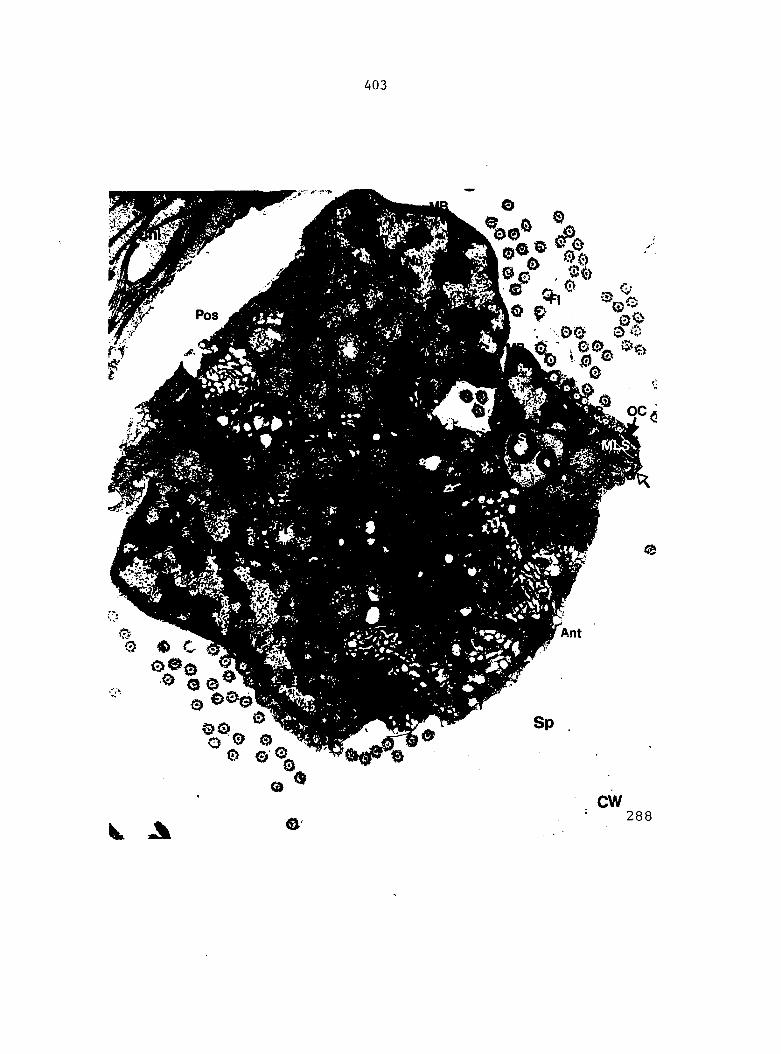
403
cw = 288
Figure 289. A section through anterior region of a mid-spermatid. Trilayered structure described in Figure 288 is more clearly shown in this micrograph (clear arrow). MLS and OC are evident on both sides of spermatid. Autolysis is occurring in central cytoplasm at anterior end of spermatid. X 42,390
Figure 290. A diagrammatic representation of mid-spermatid stage showing relationship of lamellar strip, microtubule band, associated mitochondrion, osmiophillc crest and partially coiled nucleus (adopted frcm Duckett, 1975)
Figure 291. Centrally located cytoplasm in a mid-spermatid. Autolysis is occurring in organelle indicated by large, dark arrow. Vacuole-like organelle containing many, dense granules indicated by clear arrow may be a lysosome. Mitochondria occur both with internal spaces filled with thin filaments (smaller, dark arrow) and densely staining, amorphous material. X 47,000
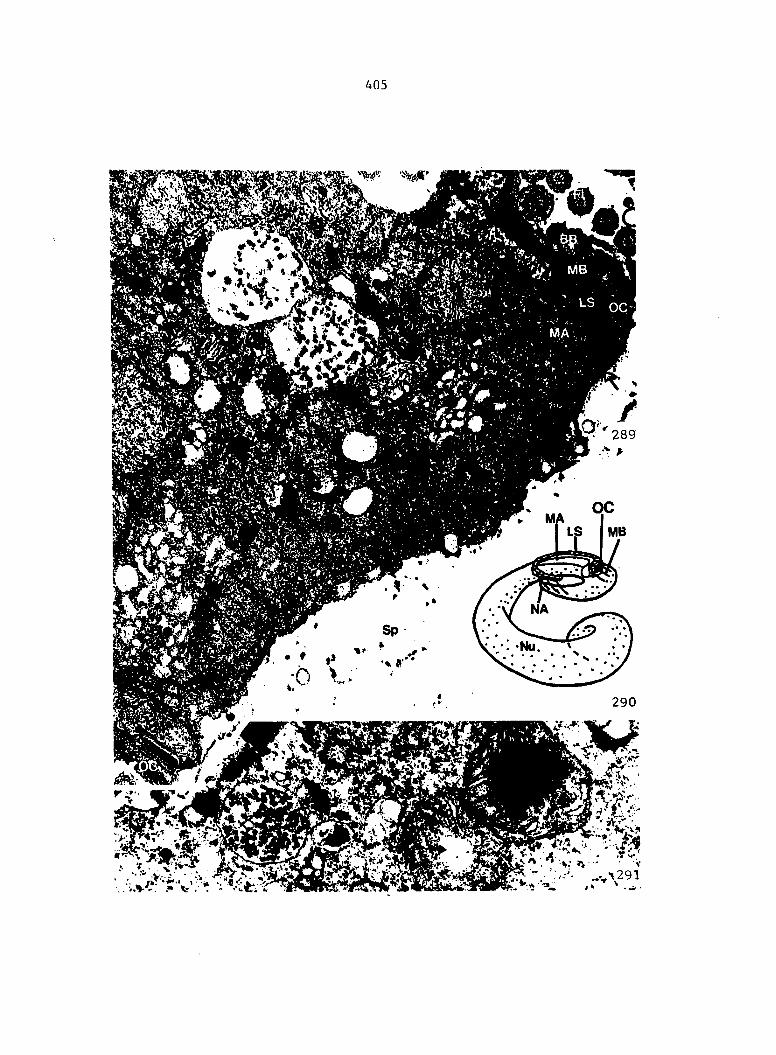
405
1291
Figures 292-293. Sections through 67-celled antheridia releasing mature spermatozoids. Remnants of cap cell are indicated by clear arrow. Dark arrows point toward longitudinal sections through spermatozoids. There are about 4-5 total gyres. Width of spermatozoids at their widest point is about 7 (im. Lengths range from about 7 to 9 Mm
292. X 840
293. X 630
Figure 294. Section through a 35-celled antheridium showing mature spermatozoids within their multllayered, cell wall compartments. Chromatin in colled nuclei is totally condensed. Length and width of these spermatozoids is about same as ones shown in Figures 292 and 293. X 4,900
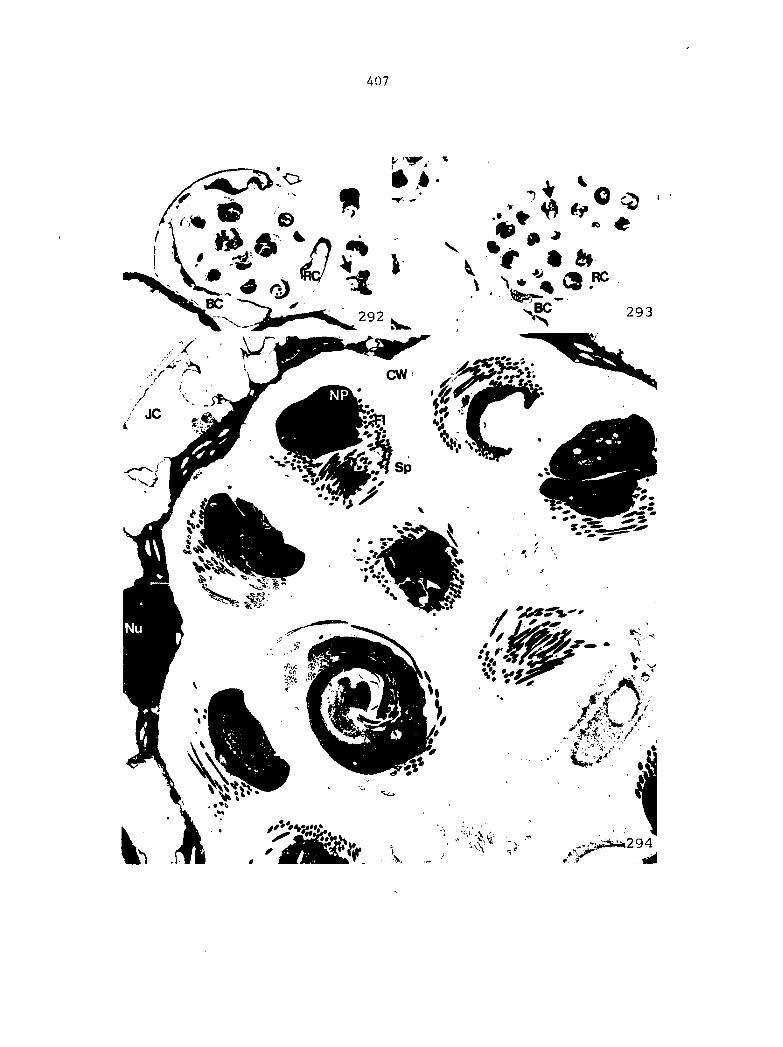
407
t # &
AS.-VV J /
Figure 295. Section through a posterior portion of a mature spermato-zoid. Microtubule band encircles more than three-quarters of nuclear circumference. Double membrane of plastids is indistinguishable in some areas. Large starch grains are present in plastids. Basal bodies are embedded in osmlo-philic material with a plug of osmiophillc material entering base of basal bodies (clear arrows). X 24,390
Figure 296. A diagrammatic representation of a mature spermatozoid showing 3-dlmenslonal relationship ôf coiled MLS to colled nucleus (adopted from Duckett, 1975)
Figure 297. A diagrammatic representation of relationship of microtubule band to lamellar strip and nucleus when mature spermatozoid is uncoiled (adopted from Duckett, 1975)
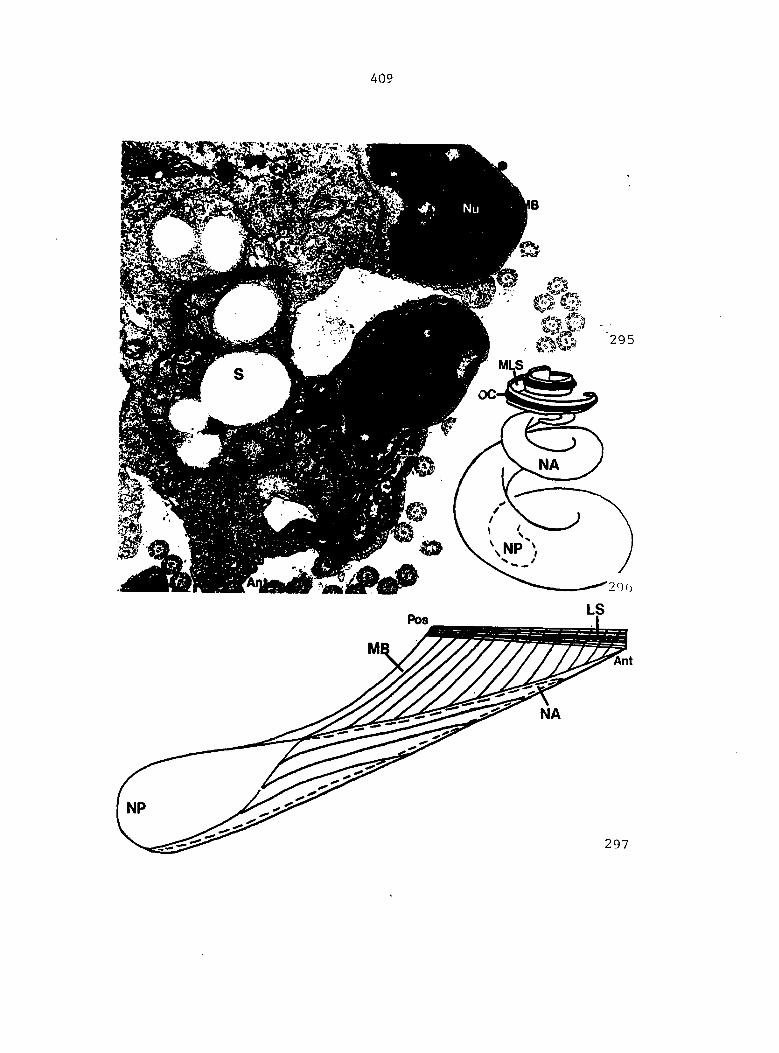
409
Figure 298. A section through an antheridium during spermatozoid release. Direction of sperm departure is indicated by dark arrow. Sperms are ensheathed by cell wall material deposited during differentiation. First addition of cell wall material during early spermatid stage appears to be dissipating. Second and later layers of cell wall material are denser and form a thin layer around sperms. Most cytoplasm in spermatozoid is present within posterior gyres of nucleus. Large starch grains are present in cytoplasm. Basal bodies only occur in anterior gyres. An accessory band of microtubules now exists between osmiophilic crest and plasmalemma (clear arrow). Number of microtubules present in accessory band is between 25-35 (inset)
298.
Inset.
X 7,375
X 40,835
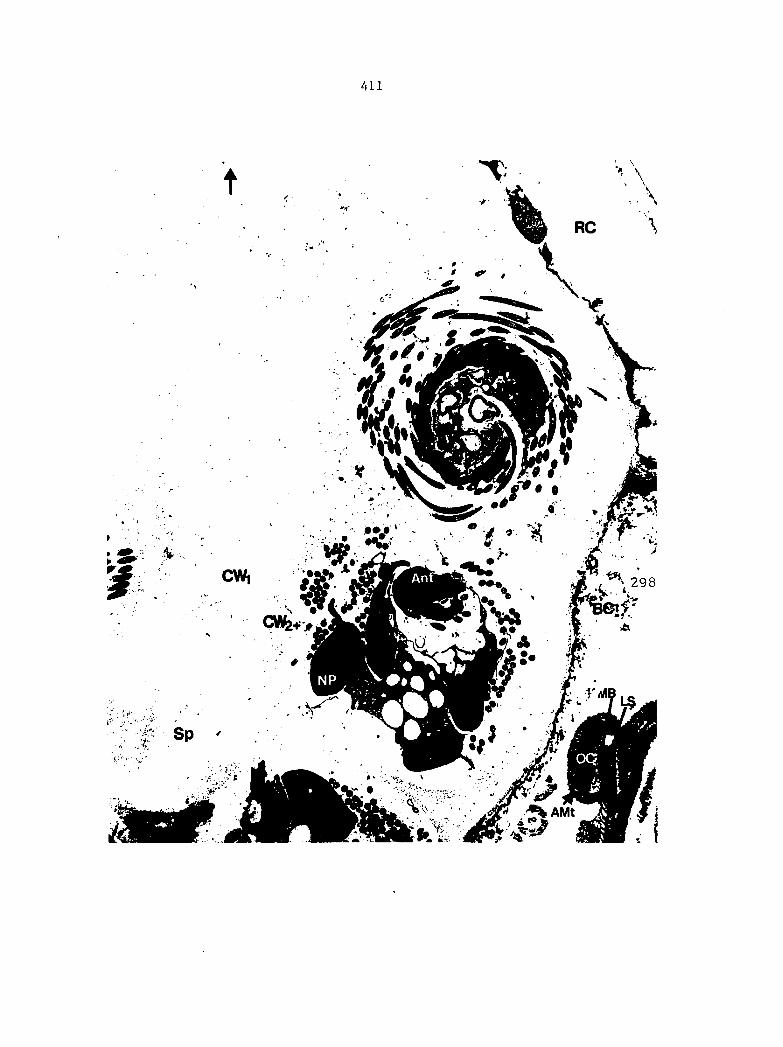
411
M"'
Figure 299. An anterior, transverse section through a spermatozoid showing lack of centrally located cytoplasm. Mitochondria in peripheral cytoplasm have very swollen cristae. X 16,780
Figure 300. An oblique section through a spermatozoid showing presence of cytoplasm in posterior region. A lysosome-like organelle is present in posterior cytoplasm (dark arrow). Double membranes of plastids are difficult to discern. X 25,500
Figure 301. A median, longitudinal section through an archegonium of 0, senslbilis. Diameter of neck canal averages about 15 urn and length of neck canal is about 70 nm. X 350
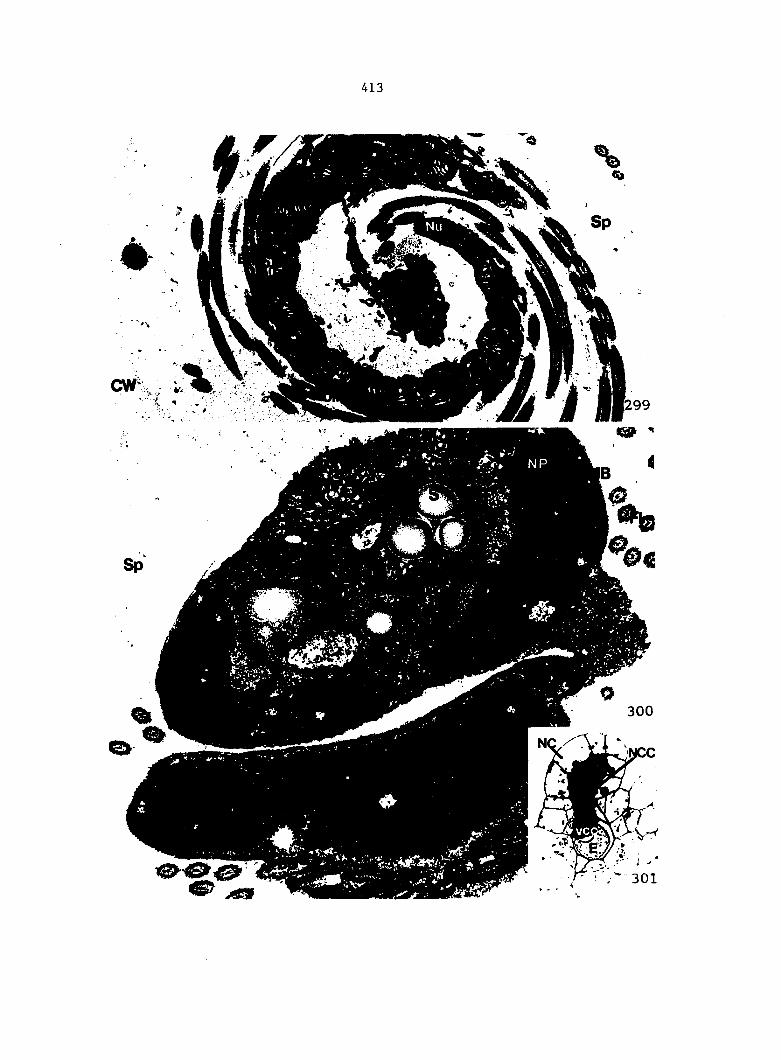
413
Figures 302-305.
302.
External views of mature antheridium
Unfixed, uncoated gametophyte showing many mature antheridia. X 290
303-305. Fixed and coated antheridia in which cap cell is either absent or partially removed. Spermatozoids are evident within antheridia. Side wall of ring cell remains intact after cap cell removal (dark arrows). Side wall of cap cell also appears to be intact during removal
303. X 1,100
304. X 1,560
305. X 1,425
Figures 306-307. Higher magnification of two spermatozoids being released from antheridia. They are ensheathed in fibrous wall material, presumably second and later additions to wall during differentiation
306. X 8,115
307. X 9,400
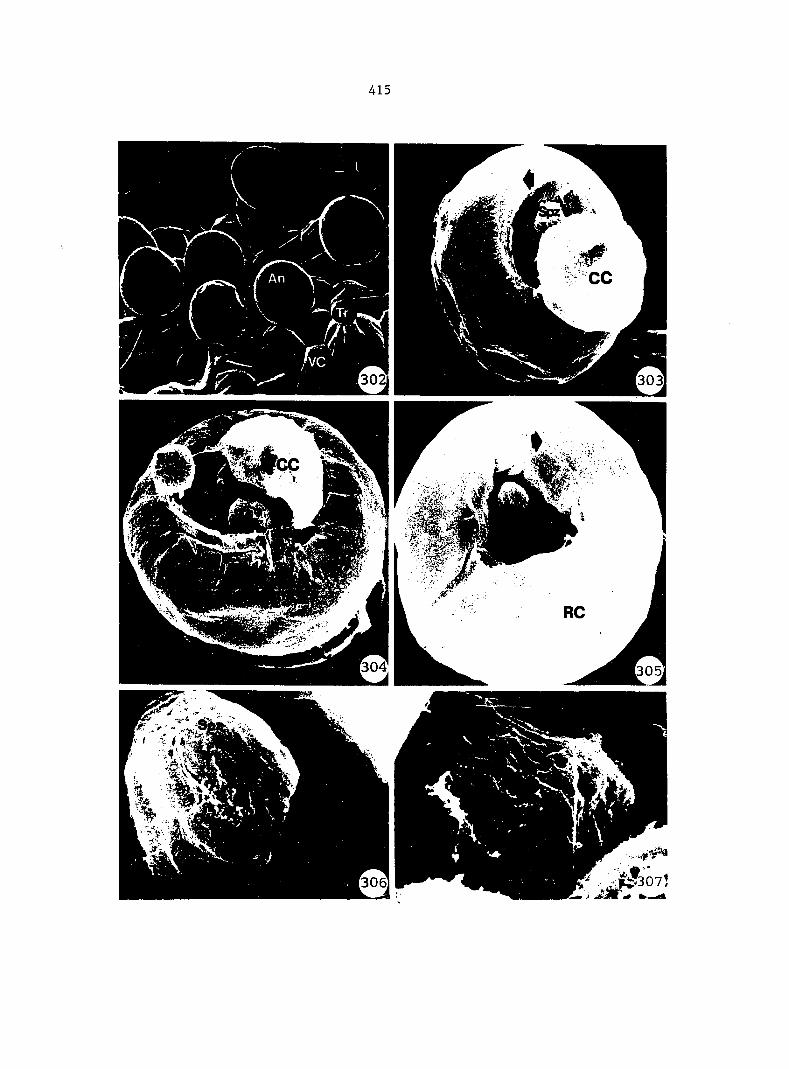
415
Figures 308A-Q. A diagrammatic representation of the entire developmental sequence of antheridia in 0. sensibilis
308A, Nuclear migration to an outer, anterior corner of vegetative mother cell with a concomitant increase in RNA-stained material in that region
308B. Nuclear division
308C. Partitioning of accumulated cytoplasm into a small, wedge-shaped antheridium initial cell
308D. Expansion of antheridium initial to about 28-30 pm in height and 38-40 M-m in diameter. Cytoplasm accumulates in upper, central region of initial
308E. First nuclear division in initial. Phragmoplast is oriented at a 40-45° angle to base of initial
308F. Formation of funnel-shaped cell wall after nuclear division resulting in a 2-celled antheridium composed of a basal cell and an upper cell. Nucleus is enlarged and less densely stained in upper cell
308G. Cytoplasm accumulates in basal portion of upper cell
308H. Nuclear division in upper cell. Phragmoplast is oriented parallel to base of antheridium
3081. Formation of a curved, periclinal wall parallel to outer periclinal wall of antheridium resulting in formation of a 3-celled antheridium. Three-celled antheridium consists of a vacuolate basal cell, an upper, cup-shaped cap cell, and a densely cytoplasmic, central, spermatogenous cell
308J. Nuclear division in spermatogenous cell, perpendicular to base of antheridium
Phragmoplast is oriented in a plane
308K. Formation of longitudinally oriented cell wall in spermatogenous tissue followed closely by nuclear division in upper cell. Phragmoplast is oriented perpendicular to outer and inner walls of upper cell. Dividing nucleus is positioned slightly off-center in upper cell
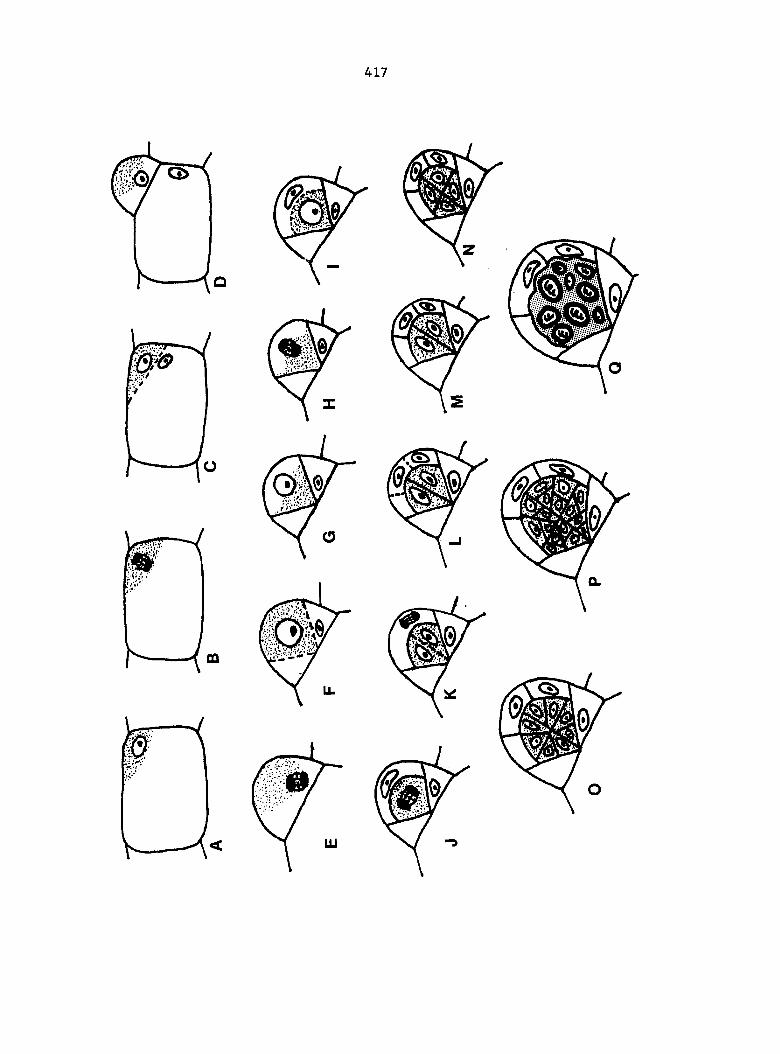
417
308L. Formation of a cylindrical cell wall dividing upper cell into a disc-shaped cap cell and a doughnut-shaped ring cell. Five-celled antherldium consists of a basal cell, a ring cell, a cap cell, and two spermatogenous cells
308M. Two spermatogenous cells divide in a longitudinal plane, perpendicular to first division plane in spermatogenous cell resulting in a 7-celled antheridium. Seven-celled antheridium consists of three jacket cells and four spermatogenous cells
308N. Four spermatogenous cells divide in a transverse plane, perpendicular to first two sets of cell division in spermatogenous tissue resulting in eight spermatogenous cells. Eleven-celled antheridium consists of three jacket cells and eight spermatogenous cells
3080. Eight spermatogenous cells undergo mitotic division resulting in 16 spermatogenous cells enclosed in three jacket cells forming a 19-celled antheridium. In this sequence, these 16 spermatogenous cells function as spermatid mother cells
308P. Sixteen spermatid mother cells divide to form 32 spermatids enclosed in three jacket cells forming a 35-celled antheridium
308Q. Thirty-two spermatids differentiate into 32 spermatozoids. Cap cell is forcibly removed from antheridium and spermatozoids are released into an aqueous environment ensheathed in a layer of cell wall material. Cell wall is soon disposed of, allowing flagellated spermatozoids to swim toward an archegonium
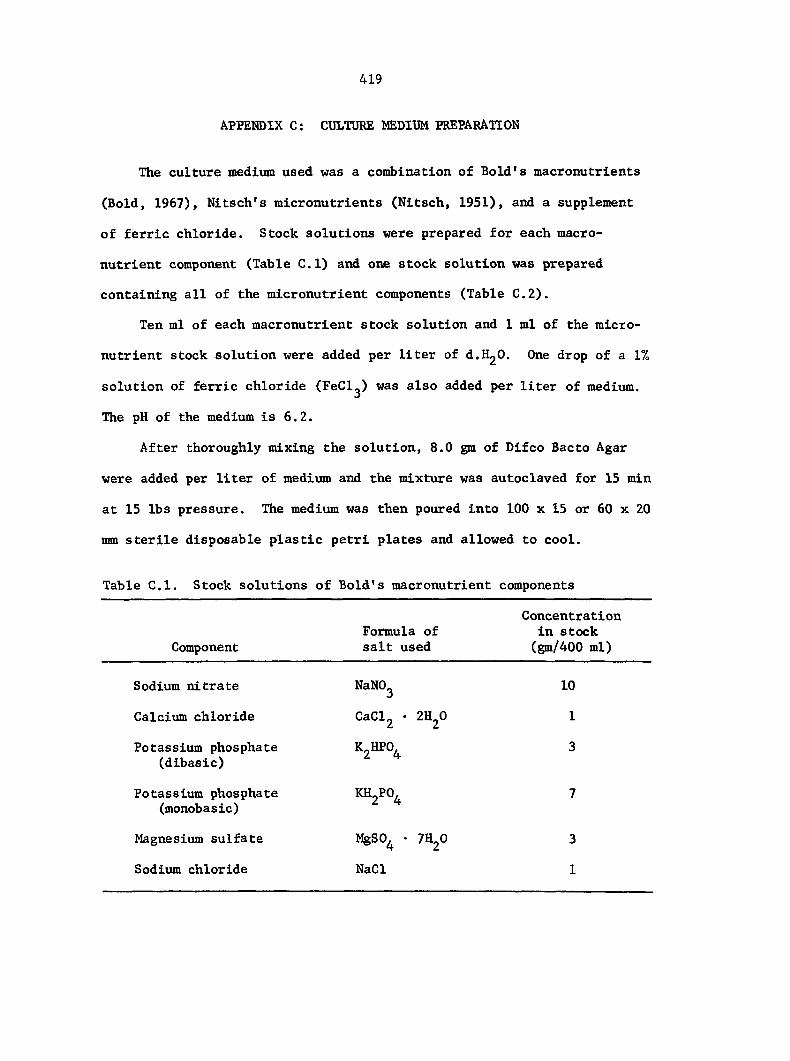
419
APPENDIX C: CULTURE MEDIUM PREPARATION
The culture medium used was a combination of Bold's macronutrlents
(Bold, 1967), Nltsch's mlcronutrients (Nitsch, 1951), and a supplement
of ferric chloride. Stock solutions were prepared for each macro-
nutrient component (Table G.l) and one stock solution was prepared
containing all of the micronutrlent components (Table C,2).
Ten ml of each macronutrient stock solution and 1 ml of the micro-
nutrient stock solution were added per liter of d.HgO. One drop of a 1%
solution of ferric chloride (FeCl ) was also added per liter of medium.
The pH of the medium is 6.2.
After thoroughly mixing the solution, 8.0 gm of Difco Bacto Agar
were added per liter of medium and the mixture was autoclaved for 15 min
at 15 lbs pressure. The medium was then poured into 100 x 15 or 60 x 20
mm sterile disposable plastic petrl plates and allowed to cool.
Table C.l. Stock solutions of Bold's macronutrient components
Concentration Formula of in stock
Component salt used (gm/400 ml)
Sodium nitrate NaNO 10
Calcium chloride CaCl • 1
Potassium phosphate K„HP0, 3 (dibasic)
Potassium phosphate KH PO 7 (monobasic)
Magnesium sulfate MgSO • 7H2O 3
Sodium chloride NaCl 1
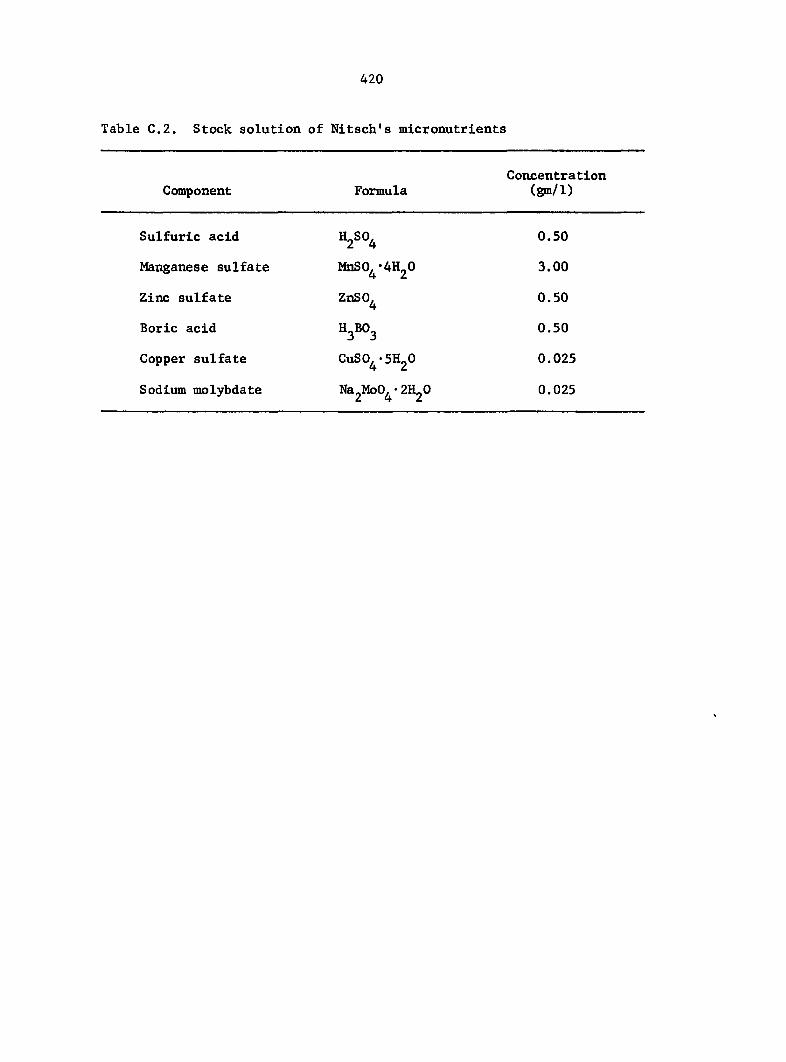
420
Table C.2. Stock solution of Nitsch's micronutrients
Component Formula Concentration
(gm/1)
Sulfuric acid 0.50
Manganese sulfate MnS0 -4H20 3.00
Zinc sulfate ZnSO, 4
0.50
Boric acid H^BOS 0.50
Copper sulfate CuSO -SHGO 0.025
Sodium molybdate NAGMOO^'ZHGO 0.025
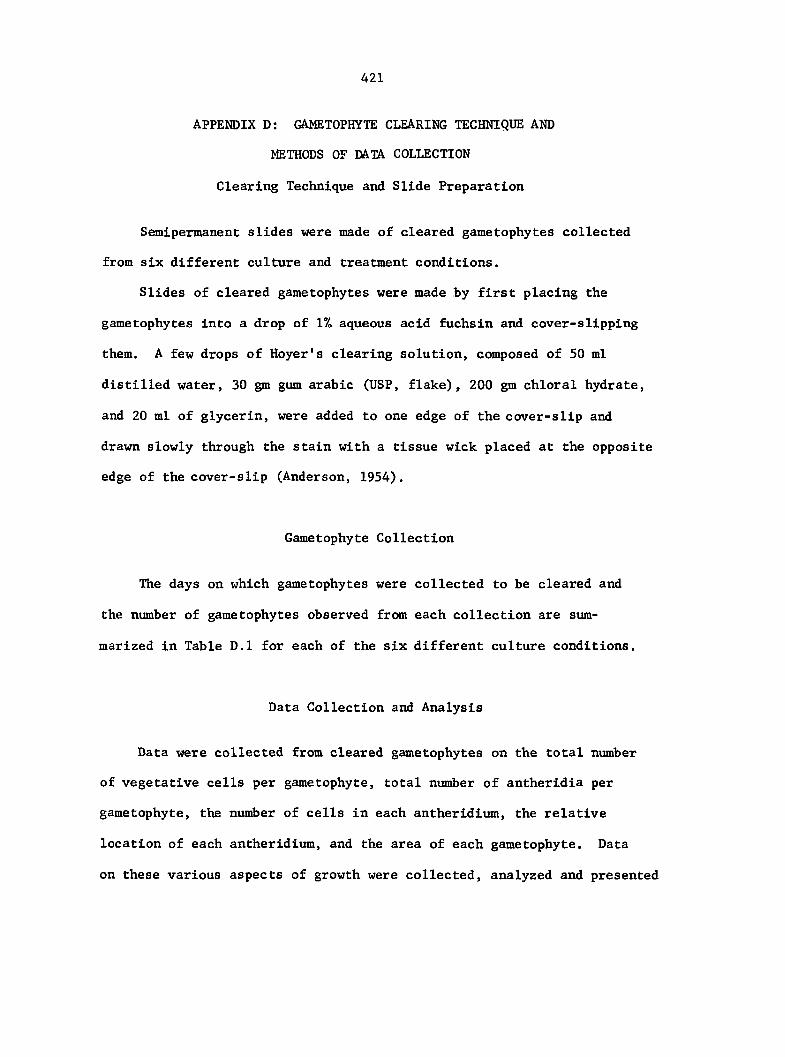
421
APPENDIX D: GAMETOPHYTE CLEARING TECHNIQUE AND
METHODS OF DATA COLLECTION
Clearing Technique and Slide Preparation
Semipermanent slides were made of cleared gametophytes collected
from six different culture and treatment conditions.
Slides of cleared gametophytes were made by first placing the
gametophytes into a drop of 1% aqueous acid fuchsin and cover-slipping
them. A few drops of Hoyer's clearing solution, composed of 50 ml
distilled water, 30 gm gum arabic (USP, flake), 200 gm chloral hydrate,
and 20 ml of glycerin, were added to one edge of the cover-s lip and
drawn slowly through the stain with a tissue wick placed at the opposite
edge of the cover-slip (Anderson, 1954).
Gametophyte Collection
The days on which gametophytes were collected to be cleared and
the number of gametophytes observed from each collection are sum
marized in Table D.l for each of the six different culture conditions.
Data Collection and Analysis
Data were collected from cleared gametophytes on the total number
of vegetative cells per gametophyte, total number of antheridia per
gametophyte, the number of cells in each antheridium, the relative
location of each antheridium, and the area of each gametophyte. Data
on these various aspects of growth were collected, analyzed and presented
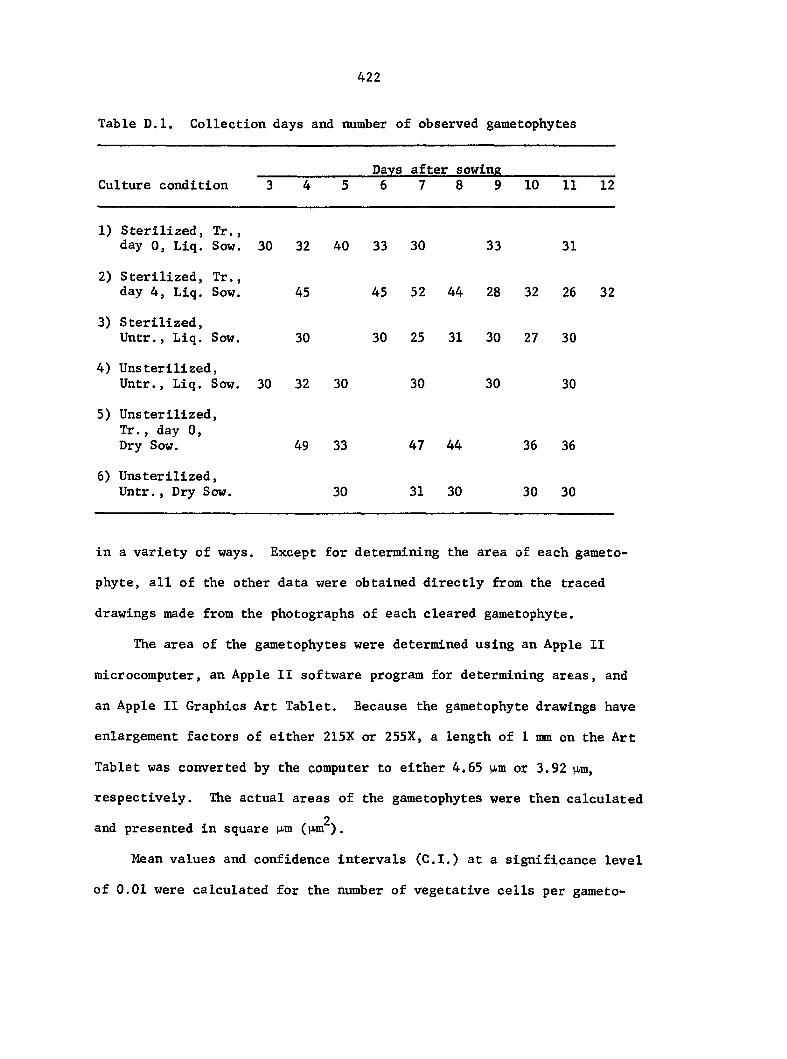
422
Table D,l. Collection days and number of observed gametophytes
Days after sowing Culture condition 3 4 5 6 7 8 9 10 11 12
1) Sterilized, Tr., day 0, Liq. Sow. 30 32 40 33 30 33 31
2) Sterilized, Tr., day 4, Liq. Sow. 45 45 52 44 28 32 26 32
3) Sterilized, Untr., Liq. Sow. 30 30 25 31 30 27 30
4) Unsterilized, Untr., Liq. Sow. 30 32 30 30 30 30
5) Unsterilized, Tr., day 0, Dry Sow. 49 33 47 44 36 36
6) Unsterilized, Untr., Dry Sow. 30 31 30 30 30
in a variety of ways. Except for determining the area of each gameto-
phyte, all of the other data were obtained directly from the traced
drawings made from the photographs of each cleared gametophyte.
The area of the gametophytes were determined using an Apple II
microcomputer, an Apple II software program for determining areas, and
an Apple II Graphics Art Tablet. Because the gametophyte drawings have
enlargement factors of either 215X or 255X, a length of 1 mm on the Art
Tablet was converted by the computer to either 4.65 p,m or 3.92 nm,
respectively. The actual areas of the gametophytes were then calculated
2 and presented in square M-m (ixm ).
Mean values and confidence intervals (C.I.) at a significance level
of 0.01 were calculated for the number of vegetative cells per gameto-
423
phyte, the number of antheridia per gametophyte, the total number of
cells per gametophyte, and the area per gametophyte for each day of
collection. A t-test was used to determine the significant differences
between mean values, with the significance level reported in each case.
Linear regression was used to determine the causal relationship
between the number of vegetative cells per gametophyte and the area
2 per gametophyte. The regression equation and r value is reported in
each case.
The number of vegetative cells per gametophyte and the area per
gametophyte were both bar-graphed with respect to the number of antheridia
present per gametophyte. Correlation analysis was also used to deter
mine the relationship between the number of antheridia present per
gametophyte and either the number of vegetative cells or the area per
gametophyte. In each case, the r value is reported.
Data on the number of antheridia per gametophyte and the number
of cells in each antheridium were combined and presented in bar graphs.
For each day of collection, an equal number of gametophytes, chosen
randomly, were observed and the number of each stage of antheridium
development was recorded and graphed to determine the length of matura
tion of an average antheridium.
Distributions of antheridium initials (1- and 2-celled) over
time were presented using a standardized two-dimensional coordinate
axis. The top and bottom of the Y-axis correspond to the apex and base
of each gametophyte. The ends of the X-axis correspond to the sides of
the gametophyte. The location of the initials on gametophytes from
each collection day were assigned relative coordinate points and plotted
424
on a standardized unit axis.
A measuring axis is superimposed on the drawing of the gametophyte
shown in Figure 6, such that the Y-axis lies on the central, longitudinal
axis of the gametophyte and the point X = 0, Y = 0 corresponds to the
center point of the gametophyte. The relative coordinate point of each
initial is determined in reference to the quadrant in which the initial
occurs.
The actual coordinate point of the two-celled initial shown in
Figure 6 is X = -18, Y = +20, while the relative coordinate point is
X = -1/2, Y = +1/2. This relative point is then plotted on a standardized
unit axis shown in Figure 7. The points for initials on all of the
gametophytes collected on the same day are plotted on the same unit
axis to determine their relative distribution.
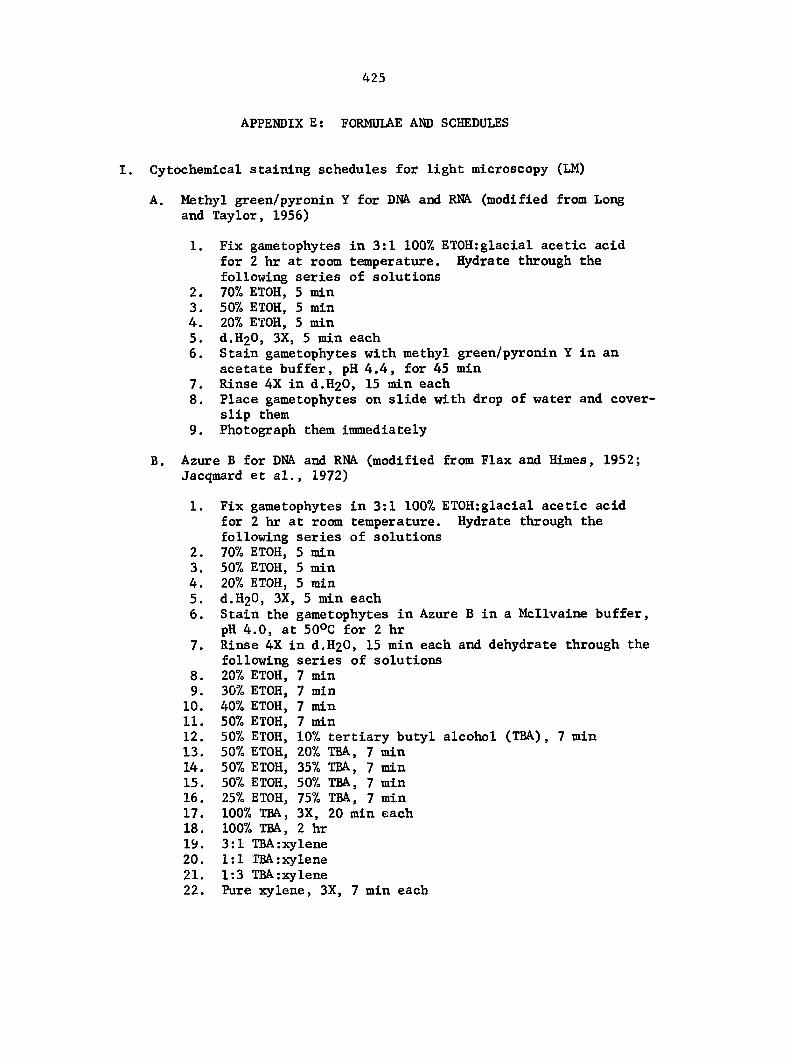
425
APPENDIX E: FORMULAE AND SCHEDULES
I. Cytochemical staining schedules for light microscopy (LM)
A, Methyl green/pyronin Y for DNA and RNA. (modified from Long and Taylor, 1956)
1. Fix gametophytes in 3:1 100% ETOH:glacial acetic acid for 2 hr at room temperature. Hydrate through the following series of solutions
2. 70% ETOH, 5 min 3. 50% ETOH, 5 min 4. 20% ETOH, 5 min 5. d.H20, 3X, 5 min each 6. Stain gametophytes with methyl green/pyronin Y in an
acetate buffer, pH 4.4, for 45 min 7. Rinse 4X in d.H O, 15 min each 8. Place gametophytes on slide with drop of water and cover-
slip them 9. Photograph them immediately
B. Azure B for DNA and RNA (modified from Flax and Himes, 1952; Jacqmard et al., 1972)
1. Fix gametophytes in 3:1 100% ET0H:glacial acetic acid for 2 hr at room temperature. Hydrate through the following series of solutions
2. 70% ETOH, 5 min 3. 50% ETOH, 5 min 4. 20% ETOH, 5 min 5. d.H20, 3X, 5 min each 6. Stain the gametophytes in Azure B in a Mcllvaine buffer,
pH 4.0, at 50°C for 2 hr 7. Rinse 4X in d.H20, 15 min each and dehydrate through the
following series of solutions 8. 20% ETOH, 7 min 9. 30% ETOH, 7 min 10. 40% ETOH, 7 min 11. 50% ETOH, 7 min 12. 50% ETOH, 10% tertiary butyl alcohol (TBA), 7 min 13. 50% ETOH, 20% TBA, 7 min 14. 50% ETOH, 35% TBA, 7 min 15. 50% ETOH, 50% TBA, 7 min 16. 25% ETOH, 75% TBA, 7 min 17. 100% TBA, 3X, 20 min each 18. 100% TBA, 2 hr 19. 3:1 TBA:xylene 20. 1:1 TBA:xylene 21. 1:3 TBA;xylene 22. Pure xylene, 3X, 7 min each
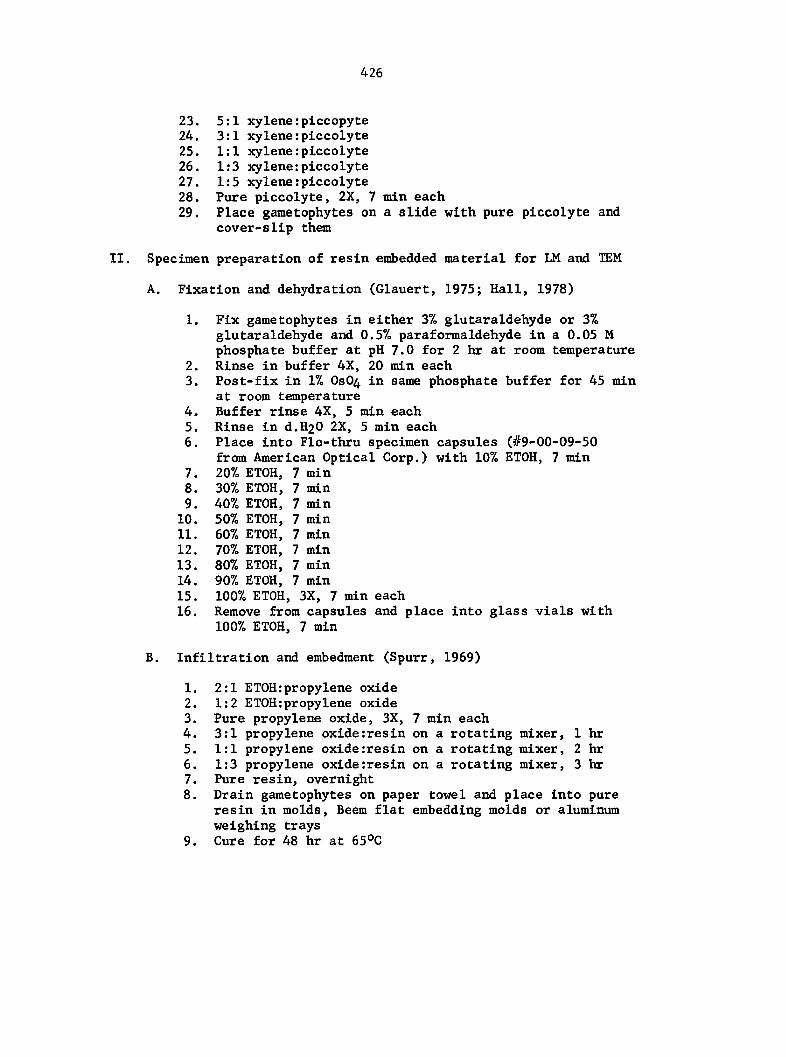
426
23. 5:1 xylene;piccopyte 24. 3:1 xylene :piccolyte 25. 1:1 xylene :piccolyte 26. 1:3 xylene:piccolyte 27. 1:5 xylene :piccolyte 28. Pure piccolyte, 2X, 7 min each 29. Place gametophytes on a slide with pure piccolyte and
cover-slip them
Specimen preparation of resin embedded material for LM and TEM
A. Fixation and dehydration (Glauert, 1975; Hall, 1978)
1. Fix gametophytes in either 3% glutaraldehyde or 3% glutaraldehyde and 0.5% paraformaldehyde in a 0.05 M phosphate buffer at pH 7.0 for 2 hr at room temperature
2. Rinse in buffer 4X, 20 min each 3. Post-fix in 1% OsO in same phosphate buffer for 45 min
at room temperature 4. Buffer rinse 4X, 5 min each 5. Rinse in d.H20 2X, 5 min each 6. Place into Flo-thru specimen capsules (#9-00-09-50
from American Optical Corp.) with 10% ETOH, 7 min 7. 20% ETOH, 7 min 8. 30% ETOH, 7 min 9. 40% ETOH, 7 min 10. 50% ETOH, 7 min 11. 60% ETOH, 7 min 12. 70% ETOH, 7 min 13. 80% ETOH, 7 min 14. 90% ETOH, 7 min 15. 100% ETOH, 3X, 7 min each 16. Remove from capsules and place into glass vials with
100% ETOH, 7 min
B. Infiltration and embedment (Spurr, 1969)
1. 2:1 ETOH;propylene oxide 2. 1:2 ETOH;propylene oxide 3. Pure propylene oxide, 3X, 7 min each 4. 3:1 propylene oxide:resin on a rotating mixer, 1 hr 5. 1:1 propylene oxide:resin on a rotating mixer, 2 hr 6. 1:3 propylene oxide:resin on a rotating mixer, 3 hr 7. Pure resin, overnight 8. Drain gametophytes on paper towel and place into pure
resin in molds, Beem flat embedding molds or aluminum weighing trays
9. Cure for 48 hr at 65°C
427
Sectioning, mounting, and general staining for LM
1. Trim resin block with razor 2. Cut sections 1-2 p.m thick with a glass or diamond knife
on a Reichert 0M-U2 ultramicrotome 3. Collect sections with an orange stick applicator and
place on slides in a drop of d.HgO 4. Place slides on heating plate (70-80OC) to expand and
adhere the sections to the slide 5. Form a puddle on the slides, while on the heating plate,
with toluidine blue 0 (1% toluidine blue 0 in a 1% solution of sodium borate) until the edge of puddle begins to dry (Jensen, 1962)
6. Rinse slide with a stream of d.HgO 7. Dry on heating plate 8. Place cover slip with permount on slide 9. Place slide on warming tray (50-55OC) with lead weights
for 4 days
Sectioning, mounting and staining for TEM
1. Determine regions of the gametophyte to be thin-sectioned by examining the previously cut 1-2 nm sections
2. Cut thin sections having grey to silver interference colors (60-85 nm) using glass or diamond knives using a Reichert 0M-U2 ultramicrotome
3. Expand sections with chloroform fumes and arrange for collection with an eyelash attached to orange stick applicator
4. Collect and dry sections on 300 mesh copper grid 5. Stain grids in 20% uranyl acetate in 100% methanol (Stempak
and Ward, 1964) for 30 mln and rinse in the following series of solutions
6. 100% methanol, 50 dips 7. 100% methanol, 50 dips 8. 100% methanol, 50 dips 9. 50% methanol, 50 dips 10. 50% methanol, 50 dips 11. d.H20, 50 dips 12. d.H20, 50 dips 13. Stain grids with lead citrate (Reynolds, 1963) for 1 hr
by placing grids, section side down, on the surface of a drop of lead citrate on a piece of wax in a petrl plate containing pellets of NaOH
14. Rinse in six changes of d.H O, 50 dips each 15. Air dry and place in grid holders
428
III. Specimen preparation for SEM
A. Fixation and dehydration
1. Fix gametophytes with 3% glutaraldehyde in a 0.05 M phosphate buffer at pH 7.0 for 2 hr at room temperature
2. Rinse in buffer, 4X, 15 min each 3. Post-fix in 1% OSO4 in the same phosphate buffer for
45 min at room temperature 4. Rinse in buffer, 4X, 5 min each 5. Rinse in d.BgO, 2X, 5 min each 6. Place in Flo-thru specimen capsules and dehydrate through
the following series of solutions 7. 10% ETCH, 7 min 8. 20% ETCH, 7 min 9. 30% ETOH, 7 min 10. 40% ETOH, 7 min 11. 50% ETOH, 7 min 12. 60% ETOH, 7 min 13. 70% ETOH, 7 min 14. 80% ETOH, 7 min 15. 90% ETOH, 7 min 16. 100% ETOH, 3X, 7 min each 17. 3:1 ET0H:freon TF 113 or amyl acetate, 15 min 18. 1:1 ET0H;freon TF 113 or amyl acetate, 15 min 19. 1:3 ETOHrfreon TF 113 or amyl acetate, 15 min 20. Pure freon or amyl acetate, 15 min 21. Pure freon or amyl acetate, 2X, 30 min each 22. Pure freon or amyl acetate, overnight at 4°C 23. Place capsules into critical point apparatus 24. Flush system with CO2 7-8X 25. Close system and bring through critical point (310C,
1072 psi) 26. Mount dried specimens on brass discs with silver paint 27. Coat specimens with gold-paladium for 3 min in a Polaron
E5100 Sputter coating unit 28. Store specimens in a desiccator
IV. Formulae of stains for LM, stains for TEM, fixatives, and embedding medium
A. Stains for LM
1, Methyl green/pyronin Y in an acetate buffer (0.1 M, pH 4.4; Modified, Long and Taylor, 1956)
a. Make acetate buffer
1). 3.0 ml glacial acetic acld/500 ml d.H20 2). 6.75 gm sodium acetate/500 ml d.H O 3). 310 ml (1) + 190 ml (2)
429
b. Add 2.5 gm of methyl green to 500 ml of the acetate buffer
c. Extract mixture several times with chloroform to remove the methyl violet
d. Add 1 gm of pyronin Y to the extracted mixture
2. Azure B in Mcllvaine buffer at pH 4.0 (Flax and Himes, 1952; Jacqmard et al., 1972)
a. Make Mcllvaine buffer
1). 24.6 ml 0.1 M citric acid 2). 15.4 ml of 0.2 M disodium phosphate
b. Add 0.25 mg of azure B/1 ml of Mcllvaine buffer
Stains for TEM
1. 20% uranyl acetate in 100% methanol (Stempak and Ward, 1964)
a. Add 10 gm of hydrate uranyl acetate (U02(CH3C00)2*2H20) to 50 ml of absolute acetone-free, methanol and mix with a magnetic stirrer
b. Filter the solution into a glass flask and cork securely
2. Lead citrate (Reynolds, 1963)
a. Boil d.H20 b. Add 30 ml of boiled d.H20 to 1.33 gm of lead nitrate
(Pb(N03)2) and 1.76 gm of sodium citrate Na3(C6H50y)' 2H2O
c. Stir mixture with a magnetic stirrer for 1 min d. Stir intermittently for 30 min e. Add 8 ml of freshly made NaOH and mix gently f. Dilute to 50 ml with boiled d.HgO g. Place solution in a glass tube with a screw-on cap
with a thin layer of mineral oil over the stain
Fixatives
1. 3% glutaraldehyde in phosphate buffer (0.05 M, pH 7.0)
a. Make phosphate buffer (0.1 M, pH 7.0)
1). 13.609 gm KH2P04/liter d.HgO 2), 14.190 gm Na2HP04/liter d.H O 3). 170 ml (1) + 330 ml (2)
430
b. Make phosphate buffer (0.05 M, pH 7.0)
1). 250 ml 0.1 M phosphate buffer 2). 250 ml d.H O
c. Add the following components together
1). 47 ml 0.05 M phosphate buffer 2). 3 ml 50% glutaraldehyde
2. 3% glutaraldehyde and 0.5% paraformaldehyde in a 0.05 M phosphate buffer at pH 7.0 (Hall, 1978)
a. Make 10% paraformaldehyde
1). 10 gm paraformaldehyde/100 ml d.H20 2). Heat to 60-70°C while stirring 3). Add 2-3 drops of 1 N NaOH until solution becomes
clear
b. Add the following components together
1). 2 ml 10% paraformaldehyde 2). 3 ml d.H20 3). 20 ml 0.1 M phosphate buffer 4). 15 ml 8% glutaraldehyde
D. Embedding medium
1. Spurr's epoxy resin (Spurr, 1969)
a. Add the following four components together gravi-metrically to obtain a firm to hard resin
1). 5.0 gm of D.E.R. 736 2), 0.3 gm of DMAE 3). 10.0 gm of VCD 4). 25.0 of NSA
b. Stir with automatic stirrer for 1-2 hr

431
APPENDIX F:
MEAN VALUES AND CONFIDENCE INTERVALS
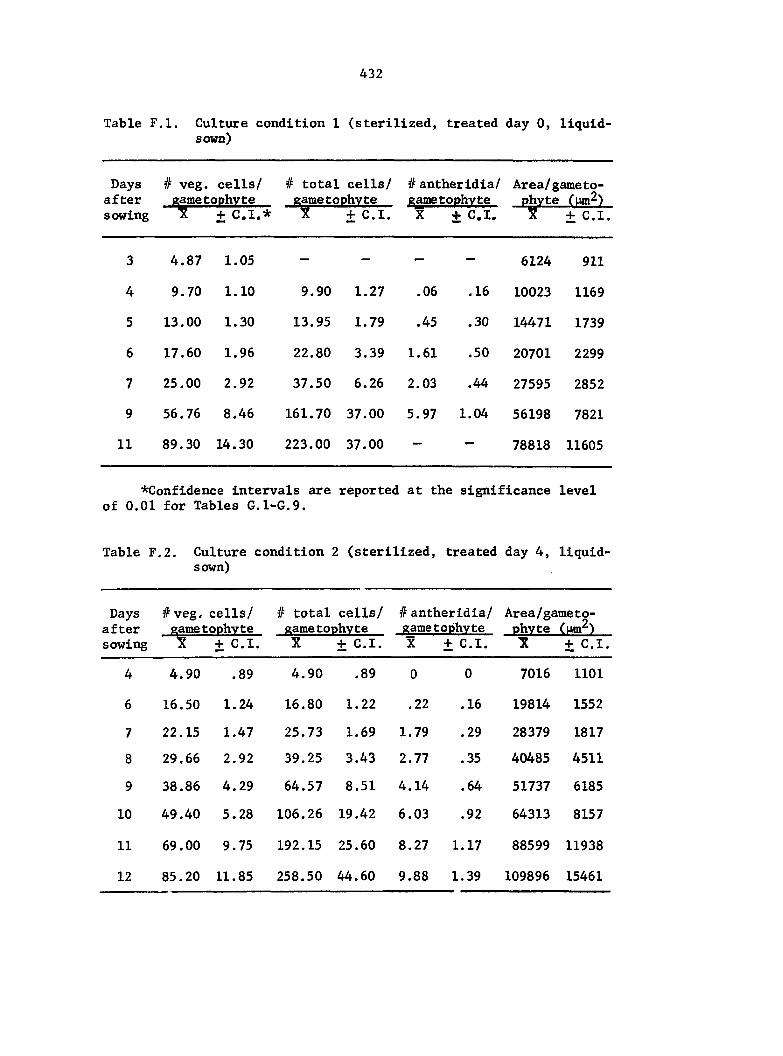
432
Table F.l. Culture condition 1 (sterilized, treated day 0, liquid-sown)
Days # veg. cells/ # total cells/ # anther id ia/ Ârea/gameto-after jametophyte eametophvte gametophvte phvte sowing X + C.I.* X + C.I. X + C.I. "X + C.I.
3 4.87 1.05 6124 911
4 9.70 1.10 9.90 1.27 .06 .16 10023 1169
5 13.00 1.30 13.95 1.79 .45 .30 14471 1739
6 17.60 1.96 22.80 3.39 1.61 .50 20701 2299
7 25.00 2.92 37.50 6.26 2.03 .44 27595 2852
9 56.76 8.46 161.70 37.00 5.97 1.04 56198 7821
11 89.30 14.30 223.00 37.00 — — 78818 11605
•Confidence intervals are reported at the significance level of 0.01 for Tables G.1-G.9.
Table F.2. Culture condition 2 (sterilized, treated day 4, liquid-sown)
Days #veg. cells/ # total cells/ #antheridia/ Area/gameto-af ter sowing X + C.I. X + C.I. X ± C.I. 3 ± C.I.
0 0 7016 1101
.22 .16 19814 1552
1.79 .29 28379 1817
2.77 .35 40485 4511
4.14 .64 51737 6185
6,03 .92 64313 8157
8.27 1.17 88599 11938
9.88 1.39 109896 15461
4 4.90 .89 4.90 .89
6 16.50 1.24 16.80 1.22
7 22.15 1.47 25.73 1.69
8 29.66 2.92 39.25 3.43
9 38.86 4.29 64.57 8.51
10 49.40 5.28 106.26 19.42
11 69.00 9.75 192.15 25.60
12 85.20 11.85 258.50 44.60
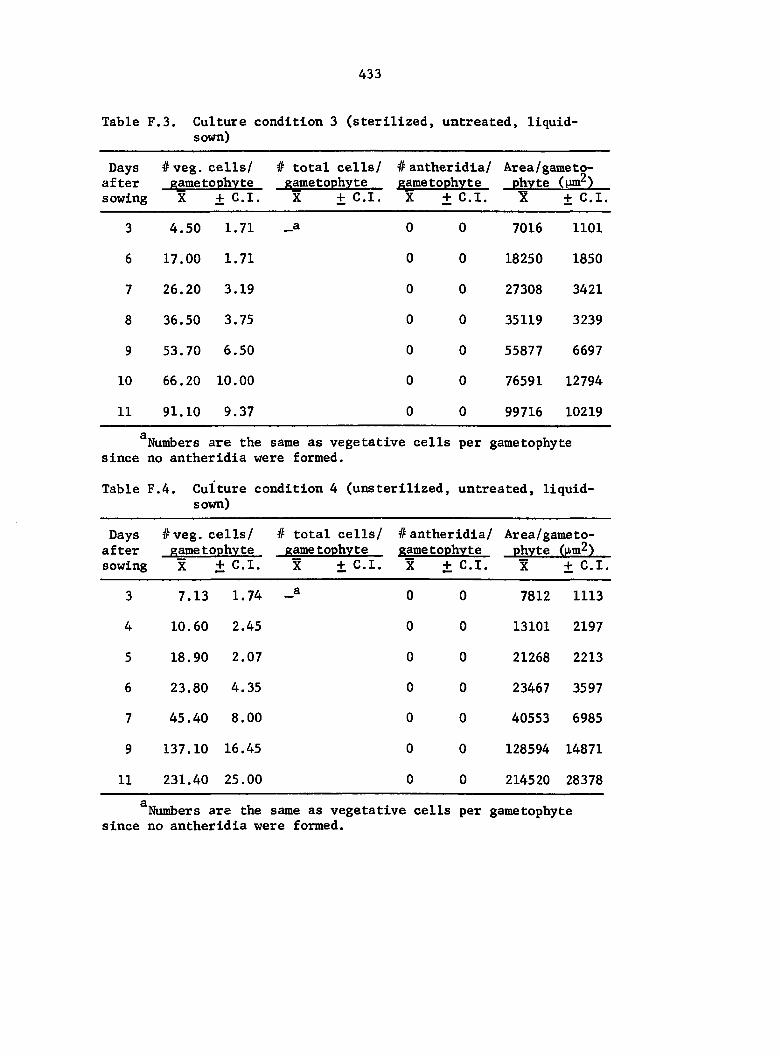
433
Table F,3. Culture condition 3 (sterilized, untreated, liquid-sown)
Days #veg. cells/ # total cells/ # antheridia/ Area/gameto-after egmetophyte gametophyte ggmetophvte phvte sowing X ± C.I. X ± C.I. X + C.I. X + C.I.
3 4.50 1.71 _a 0 0 7016 1101
6 17.00 1.71 0 0 18250 1850
7 26.20 3.19 0 0 27308 3421
8 36.50 3.75 0 0 35119 3239
9 53.70 6.50 0 0 55877 6697
10 66.20 10.00 0 0 76591 12794
11 91.10 9.37 0 0 99716 10219
Numbers are the same as vegetative cells per gametophyte since no antheridia were formed.
Table F.4. Culture condition 4 (unsterilized, untreated, liquid-sown)
Days #veg. cells/ # total cells/ #antheridia/ Area/gameto-after gametophyte gametophyte gametophyte phvte (uim )
~ X + C.I. ~ ~ sowing X + C.I.
3 7.13 1.74
4 10.60 2.45
5 18.90 2.07
6 23.80 4.35
7 45.40 8.00
9 137.10 16.45
11 231.40 25.00
X ± C.I. X + C.I.
0 0 7812 1113
0 0 13101 2197
0 0 21268 2213
0 0 23467 3597
0 0 40553 6985
0 0 128594 14871
0 0 214520 28378
Numbers are the same as vegetative cells per gametophyte since no antheridia were formed.
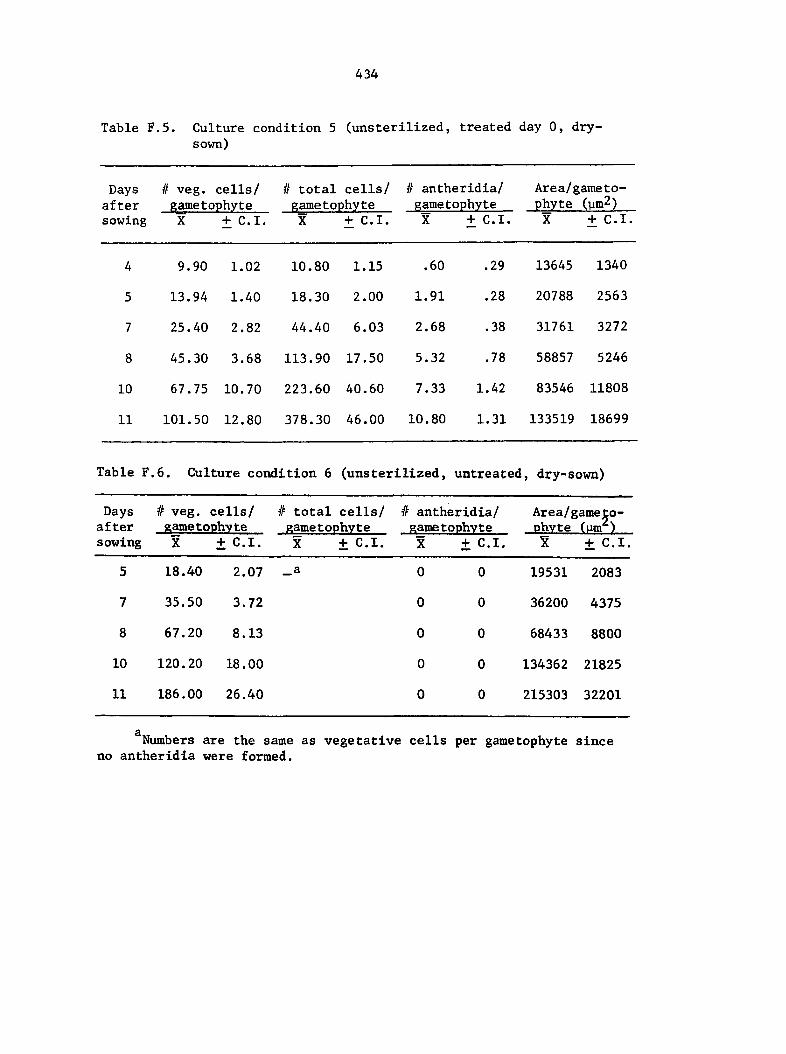
434
Table F.5. Culture condition 5 (unsterllized, treated day 0, dry-sown)
Days # veg. cells/ # total cells/ # antheridia/ Area/gameto-after gametophyte gametophyte gametophyte phyte (yim ) sowing X +C.I. X +C.I. X + C.I. X + C.I.
4 9.90 1.02 10.80 1.15 .60 .29 13645 1340
5 13.94 1.40 18.30 2.00 1.91 .28 20788 2563
7 25.40 2.82 44.40 6.03 2.68 .38 31761 3272
8 45.30 3.68 113.90 17.50 5.32 .78 58857 5246
10 67.75 10.70 223.60 40.60 7.33 1.42 83546 11808
11 101.50 12.80 378.30 46.00 10.80 1.31 133519 18699
Table F, .6. Culture condition 6 (unsterllized, untreated , dry-sown)
Days after
# veg. cells/ eametophvte
# total cells/ eametophvte
# antheridia/ eametophvte
Area/gameto-phvte (um )
sowing X ± C.I. X + C.I. X ± C.I. % + C.I.
5 18.40 2.07 _a 0 0 19531 2083
7 35.50 3.72 0 0 36200 4375
8 67.20 8.13 0 0 68433 8800
10 120.20 18.00 0 0 134362 21825
11 186.00 26.40 0 0 215303 32201
Numbers are the same as vegetative cells per gametophyte since no antheridia were formed.
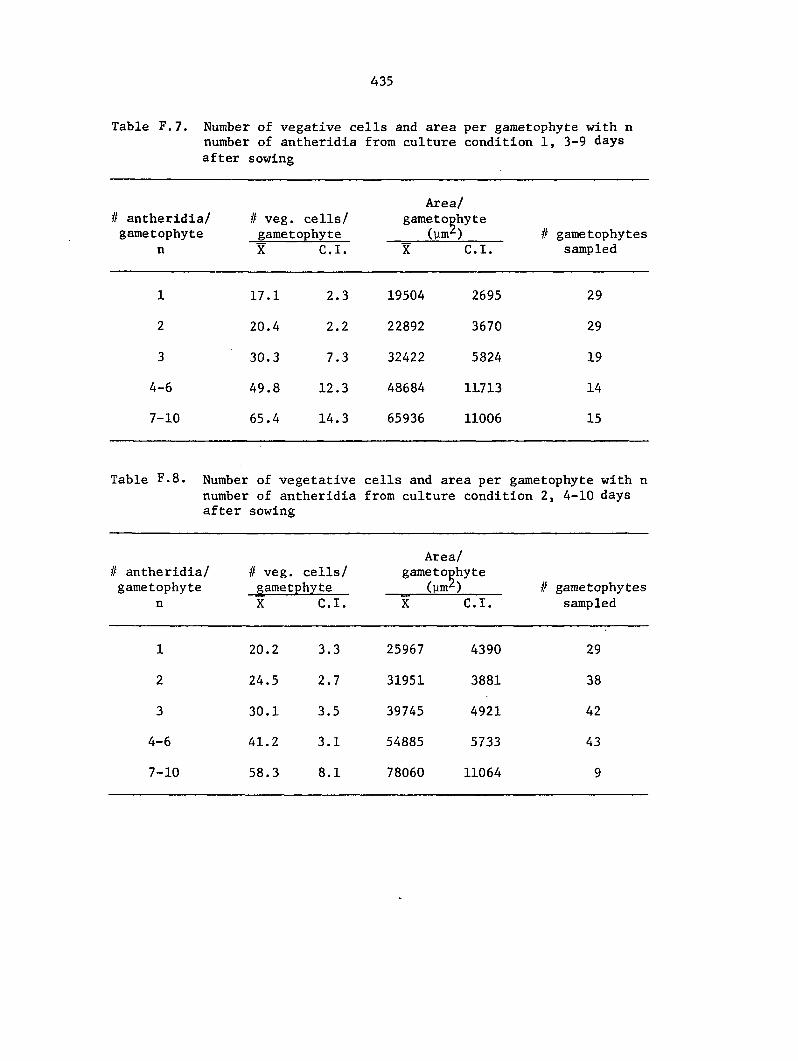
435
Table F.7. Number of vegative cells and area per gametophyte with n number of antheridia from culture condition 1, 3-9 days after sowing
# antheridia/ gametophyte
# veg. cells/ gametophyte
Area/ gametophyte
(ym ) # gametophytes n X C.I. X C.I. sampled
1 17.1 2.3 19504 2695 29
2 20.4 2.2 22892 3670 29
3 30.3 7.3 32422 5824 19
4-6 49.8 12.3 48684 11713 14
7-10 65.4 14.3 65936 11006 15
Table F.8. Number of vegetative cells and area per gametophyte with n number of antheridia from culture condition 2, 4-10 days after sowing
Area/ # antheridia/ # veg. cells/ gametophyte gametophyte ametphyte _ (pmr) # gametophytes
n X C.I. X C.I. sampled
1 20.2 3.3 25967 4390 29
2 24.5 2.7 31951 3881 38
3 30.1 3.5 39745 4921 42
4-6 41.2 3.1 54885 5733 43
7-10 58.3 8.1 78060 11064 9
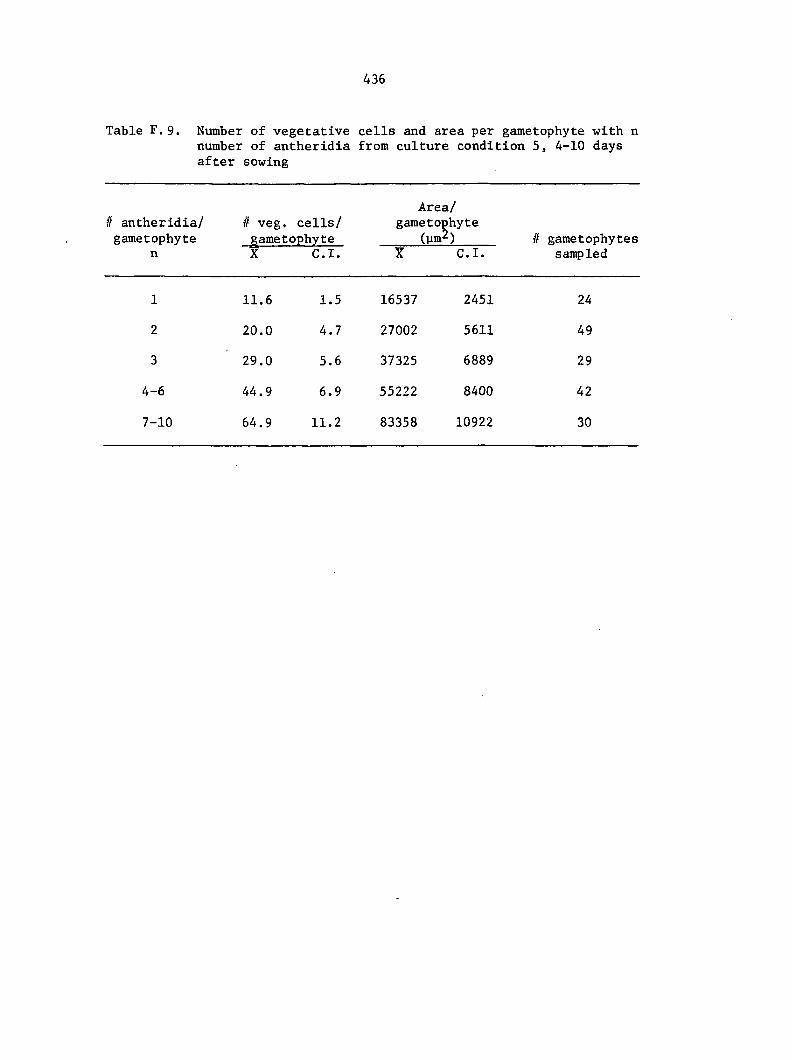
436
Table F. 9. Number of vegetative cells and area per gametophyte with n number of antheridia from culture condition 5, 4-10 days after sowing
Area/ 11 antheridia/ # veg. cells/ gametophyte
(ym2) it gametophytes gametophyte gametophyte gametophyte
(ym2) it gametophytes n X C.I. Y C.I. sampled
1 11.6 1.5 16537 2451 24
2 20.0 4.7 27002 5611 49
3 29.0 5.6 37325 6889 29
4-6 44.9 6.9 55222 8400 42
7-10 64.9 11.2 83358 10922 30


![Microscopic and macroscopic creativity [Comment]](https://static.fdokumen.com/doc/165x107/63222cba63847156ac067f99/microscopic-and-macroscopic-creativity-comment.jpg)