A kinanthropometric analysis of accurate and inaccurate kickers
247
Edith Cowan University Research Online eses: Doctorates and Masters eses 2012 A kinanthropometric analysis of accurate and inaccurate kickers: Implications for kicking accuracy in Australian football Nicolas H. Hart Edith Cowan University is esis is posted at Research Online. hps://ro.ecu.edu.au/theses/481 Recommended Citation Hart, N. H. (2012). A kinanthropometric analysis of accurate and inaccurate kickers: Implications for kicking accuracy in Australian football. Retrieved from hps://ro.ecu.edu.au/theses/481
-
Upload
khangminh22 -
Category
Documents
-
view
4 -
download
0
Transcript of A kinanthropometric analysis of accurate and inaccurate kickers

Edith Cowan UniversityResearch Online
Theses: Doctorates and Masters Theses
2012
A kinanthropometric analysis of accurate andinaccurate kickers: Implications for kickingaccuracy in Australian footballNicolas H. HartEdith Cowan University
This Thesis is posted at Research Online.https://ro.ecu.edu.au/theses/481
Recommended CitationHart, N. H. (2012). A kinanthropometric analysis of accurate and inaccurate kickers: Implications for kicking accuracy in Australian football.Retrieved from https://ro.ecu.edu.au/theses/481

Edith Cowan University
Copyright Warning
You may print or download ONE copy of this document for the purpose
of your own research or study.
The University does not authorize you to copy, communicate or
otherwise make available electronically to any other person any
copyright material contained on this site.
You are reminded of the following:
Copyright owners are entitled to take legal action against persons who infringe their copyright.
A reproduction of material that is protected by copyright may be a
copyright infringement. Where the reproduction of such material is
done without attribution of authorship, with false attribution of
authorship or the authorship is treated in a derogatory manner,
this may be a breach of the author’s moral rights contained in Part
IX of the Copyright Act 1968 (Cth).
Courts have the power to impose a wide range of civil and criminal
sanctions for infringement of copyright, infringement of moral
rights and other offences under the Copyright Act 1968 (Cth).
Higher penalties may apply, and higher damages may be awarded,
for offences and infringements involving the conversion of material
into digital or electronic form.

USE OF THESIS
The Use of Thesis statement is not included in this version of the thesis.

i
A KINANTHROPOMETRIC ANALYSIS OF ACCURATE AND
INACCURATE KICKERS: IMPLICATIONS FOR KICKING
ACCURACY IN AUSTRALIAN FOOTBALL.
NICOLAS H. HART
BSC (EXSPSC), CSCS, ESSAM
A THESIS SUBMITTED TO EDITH COWAN UNIVERSITY
IN FULFILMENT OF THE REQUIREMENTS FOR THE DEGREE OF:
MASTERS BY RESEARCH (SPORTS SCIENCE)
SCHOOL OF EXERCISE AND HEALTH SCIENCES
EDITH COWAN UNIVERSITY
DATE OF SUBMISSION: MARCH, 2012

ii

ii
DECLARATION
I certify that this thesis does not, to the best of my knowledge and belief:
(i). Incorporate without acknowledgement any material previously submitted
for a degree or diploma in any institution of higher education;
(ii). Contain material previously published or written by another person except
where due reference is made in the text; or
(iii). Contain any defamatory material.
Signature:
Date: 6th March 2012

iii
ACKNOWLEDGEMENTS
There are many people I wish to thank and acknowledge, for I would not have survived this
intense and prolonged journey without their encouragement, advice, support and friendship.
To my family, and in particular my loving parents, Pamela and Graeme – Words simply
cannot express my eternal gratitude for your understanding, love and support (emotional
and financial) through-out my entire life to date. Needless to say, this is as much my thesis
as is it yours. Thank you so much for never doubting my professional aspirations, no matter
how unfeasible or irrational they often seemed. I love you all very much, and always will.
To my supervisors (past and present), Dr Jodie Cochrane, Dr Sophia Nimphius, Prof.
Robert Newton and Dr Prue Cormie – Thank you all so much for your dedication to my
cause. You have each inspired me, and continue to inspire me to pursue greatness. The
opportunities I have been afforded through-out my time with each of you have been
remarkable and so genuinely appreciated. In particular, Jodie and Sophia, I cannot thank
you enough for your belief in me as a student, a researcher and a friend. You were ‘saving
graces’ during a very tough and tumultuous time, and I am eternally grateful to you both!
To our wonderful Lab Technicians, Nadija Vrdoljak and Jack Burns – It goes without
saying that this School simply would not function without such fantastic lab technicians.
My project was certainly no ‘walk in the park’ to organise, set-up and manage, and the
support and assistance shown by both of you was incredible. Thank you both so much.
To my fellow postgraduates, thank you for your regular advice and support. In particular,
Harry Banyard, your frequent fun, jokes and laughter were always fantastic. You were a
genuinely positive influence in my time at ECU. If only there were more people like you!
To a valued friend, Tania Spiteri – I don’t think I would have survived this thesis, and all
that has taken place these last two years, had it not been for you. We have, together,
experienced some of the most unique, interesting and ironic moments anyone could ever
dream of. Suffice to say, this will be a lifelong memory, and you a lifelong friend. Thanks!

iv
ABSTRACT
A paucity of research exists investigating the potential relationship between the technical
and temporal strategy of accurate and inaccurate kickers in response to physical parameters
modifiable by athletic conditioning. While recent studies have produced improvements in
performance when kicking for distance following structured resistance training
interventions, no studies have examined the influence of such interventions on the
enhancement of kicking accuracy. It was therefore the purpose of this thesis to extend
scientific understanding of those mechanisms which might underpin accurate kicking
performances through examining kinanthropometric, strength and muscularity profiles of
accurate and inaccurate kickers in Australian Football using a series of research studies. In
particular, studies one and two established valid and reliable measurement protocols, while
studies three, four and five quantified whole-body composition, anthropometrics, segmental
masses of the lower limbs, unilateral and bilateral lower-body strength, and lower limb
kinematics during the drop punt.
Study one established a standardised and reliable body positioning and scan analysis model
using Dual Energy X-ray Absorptiometry (DEXA) to accurately identify and assess
appendicular segmental mass components (upper arm, forearm, hand, thigh, shank and foot
segments); producing very high intra-tester reliability (CV ≤ 2.6%; ICC ≥ 0.941) and very
high inter-tester reliability (CV ≤ 2.4%; ICC ≥ 0.961). This methodological determination
of intralimb and interlimb quantities of lean, fat and total mass could be used by strength
and conditioning practitioners to monitor the efficacy of training interventions; track
athletes during long-term athletic development programs; or identify potential deficiencies
acquired through-out injury onset and during rehabilitation.

v
Study two assessed a portable isometric lower-body strength testing device, successfully
demonstrating its ability to derive valid and reliable representations of maximal isometric
force (peak force) under bilateral and unilateral conditions (CV ≤ 4.7%; ICC ≥ 0.961). This
device was unable to reliably determine rate of force development across either bilateral or
unilateral conditions (CV: 14.5% - 45.5%; ICC: 0.360 – 0.943); and required an extra
second of contraction time to achieve peak force (p < 0.001). The portable apparatus may
provide a more sport-specific assessment of maximal strength in sports where balance is an
important component; such as the support leg during the kicking motion.
Using the methodological approach established in study one; study three was a descriptive
study which assessed the lower limb segmental profile of accurate and inaccurate kickers.
A noticeable difference in leg mass characteristics was evident, with accurate kickers
containing significantly greater quantities of relative lean mass (p ≤ 0.004; r = 0.426 to
0.698), significantly lower quantities of relative fat mass (p ≤ 0.024; r = -0.431 to -0.585),
and significantly higher lean-to-fat mass ratios (p ≤ 0.009; r = 0.482 to 0.622) across all
segments within both kicking and support limbs. To examine how these lower limb
characteristics might adjust biomechanical strategy; study four used the methodological
approach from study one in conjunction with three-dimensional kinematic data. No
relationship was found between foot velocity and kicking accuracy (r = -0.035 to -0.083).
Instead, it was the co-contribution of leg mass and foot velocity which were discriminatory
factors between accurate and inaccurate kickers. A significant and strong correlation was
also found between relative lean mass and kicking accuracy (p ≤ 0.001; r = 0.631). Greater
relative lean mass within accurate kickers may heighten limb control due to reduced
volitional effort and lower relative muscular impulses required to generate limb velocity.

vi
Study five - the final study of the thesis - assessed lower limb strength and muscularity
using methodologies presented in studies one and two. Study five was able to successfully
demonstrate a positive relationship between relative bilateral strength and support-leg
unilateral strength with kicking accuracy outcomes (r = 0.379 to 0.401). A significant
negative relationship was established between strength imbalances and kicking accuracy (p
= 0.002; r = 0.516), supported by the significant positive relationship between the limb
symmetry index for lean mass quantities and kicking accuracy outcomes (p = 0.003 to
0.029; r = 0.312 to 0.402). This highlighted the potential benefit of greater limb symmetry
for strength and muscularity between kicking and support limbs within Australian
Footballers, with particular emphasis placed toward support leg strength.
The general conclusion provided by the thesis promotes the importance and positive
influence of relative lean mass and lower body strength to kicking accuracy production
during the drop punt. The findings provide a valid rationale for strength and conditioning
professionals and skill acquisition coaches to properly consider an athlete’s strength,
muscularity and body mass profiles when attempting to improve kicking performance.
Given the cross-sectional nature of the Thesis, longitudinal resistance training studies
should be attempted in future, to establish interventions which may heighten athletic
conditioning and technical proficiency in football sports, with an express aim to improve
drop punt kicking accuracy.

vii
PUBLICATIONS ARISING FROM THIS THESIS
Published:
Hart, N.H., Nimphius, S., Cochrane, J.L., & Newton, R. U. (2012). Reliability and validity
of unilateral and bilateral isometric strength measures using a customised, portable
apparatus. Journal of Australian Strength and Conditioning. 20 (Suppl. 1), 61-67.
In Review:
Hart, N.H., Nimphius, S., Cochrane, J.L., & Newton, R. U. (2012). A standardised in-vivo
method to identify and assess appendicular segmental mass using Dual Energy X-
Ray Absorptiometry (DEXA). Sports Biomechanics.
Hart, N.H., Nimphius, S., Cochrane, J.L., & Newton, R. U. (2012). Leg Mass
Characteristics of Accurate and Inaccurate Kickers: An Australian Football
perspective. Journal of Sports Sciences.
Hart, N.H., Nimphius, S., Cochrane, J.L., & Newton, R. U. (2012). The influence of leg
mass and foot velocity on kicking accuracy in Australian Football. Journal of
Motor Behavior.
Hart, N.H., Nimphius, S., Cochrane, J.L., & Newton, R. U. (2012). Does lower limb
symmetry enhance technical proficiency? A kicking perspective. Journal of Sports
Sciences.
Conference Presentation:
Hart, N.H., Nimphius, S., Cochrane, J.L., & Newton, R. U. (2011). Reliability and validity
of unilateral and bilateral isometric strength measures using a customised, portable
apparatus. Paper presented at the International Conference on Applied Strength and
Conditioning, Gold Coast, QLD, Australia.

viii
TABLE OF CONTENTS
USE OF THESIS .................................................................................................................. i
DECLARATION ................................................................................................................. ii
ACKNOWLEDGEMENTS ............................................................................................... iii
ABSTRACT ........................................................................................................................ iv
PUBLICATIONS ARISING FROM THIS THESIS ..................................................... vii
TABLE OF CONTENTS ................................................................................................. viii
LIST OF FIGURES .......................................................................................................... xii
LIST OF TABLES ............................................................................................................ xv
LIST OF ABBREVIATIONS ....................................................................................... xviii
CHAPTER ONE - INTRODUCTION ............................................................................ 1
1.0 BACKGROUND ................................................................................................ 1
1.1 PURPOSE OF RESEARCH .................................................................................. 3
1.2 SIGNIFICANCE OF RESEARCH .......................................................................... 4
1.3 RESEARCH QUESTIONS ................................................................................... 5
1.4 RESEARCH STUDIES ....................................................................................... 5
1.5 LIMITATIONS .................................................................................................. 6
CHAPTER TWO - LITERATURE REVIEW ............................................................... 7
2.0 OVERVIEW ..................................................................................................... 7
2.1 KICKING IN SPORT .......................................................................................... 7
2.2 DESCRIPTION OF DROP PUNT ......................................................................... 9
2.3 KINEMATIC PROFILE OF DROP PUNT ............................................................ 12
2.3.1 Biomechanical Characteristics ........................................................ 12
2.3.2 The Kicking Leg ............................................................................... 13
2.3.2.1 Foot Velocity ..................................................................... 13
2.3.2.2 Foot-Ball Contact ............................................................. 15
2.3.3 The Support Leg ............................................................................... 17
2.3.4 The Upper Body ............................................................................... 18
2.3.5 Other Considerations ...................................................................... 20
2.3.5.1 The Approach .................................................................... 20
2.3.5.2 Ball Trajectory .................................................................. 22

ix
2.4 KICKING PERFORMANCE .............................................................................. 23
2.4.1 Kicking Distance ............................................................................. 23
2.4.2 Kicking Accuracy ............................................................................ 27
2.5 SUMMARY .................................................................................................... 30
CHAPTER THREE - STUDY ONE ............................................................................... 33
A STANDARDISED IN-VIVO METHOD TO IDENTIFY AND ASSESS APPENDICULAR
SEGMENTAL MASS USING DUAL ENERGY X-RAY ABSORPTIOMETRY (DEXA).
3.0 ABSTRACT .................................................................................................... 34
3.1 INTRODUCTION ............................................................................................. 35
3.2 METHODS ..................................................................................................... 38
3.2.1 Subjects ............................................................................................ 38
3.2.2 Scan Procedure ................................................................................ 38
3.2.3 Scan Analysis ................................................................................... 41
3.2.3.1 Whole Body Model ............................................................ 43
3.2.3.2 Appendicular Model .......................................................... 43
3.2.4 Sub-region Creation ........................................................................ 44
3.2.5 Statistical Analysis ........................................................................... 47
3.3 RESULTS ....................................................................................................... 47
3.3.1 Intra-tester Reliability ..................................................................... 47
3.3.2 Inter-tester Reliability ...................................................................... 48
3.4 DISCUSSION .................................................................................................. 49
3.5 REFERENCES ................................................................................................. 57
CHAPTER FOUR - STUDY TWO ................................................................................. 64
RELIABILITY AND VALIDITY OF UNILATERAL AND BILATERAL ISOMETRIC STRENGTH
MEASURES USING A CUSTOMISED, PORTABLE APPARATUS.
4.0 ABSTRACT .................................................................................................... 65
4.1 INTRODUCTION ............................................................................................. 66
4.2 METHODS ..................................................................................................... 69
4.2.1 Experimental Approach ................................................................... 69
4.2.2 Participants ...................................................................................... 69
4.2.3 Equipment ........................................................................................ 70
4.2.4 Procedures ....................................................................................... 71
4.2.5 Statistical Analysis ........................................................................... 74
4.3 RESULTS ....................................................................................................... 75
4.4 DISCUSSION .................................................................................................. 77
4.5 PRACTICAL APPLICATIONS ........................................................................... 80
4.6 REFERENCES ................................................................................................. 80

x
CHAPTER FIVE - STUDY THREE .............................................................................. 86
LEG MASS CHARACTERISTICS OF ACCURATE AND INACCURATE KICKERS – AN
AUSTRALIAN FOOTBALL PERSPECTIVE.
5.0 ABSTRACT .................................................................................................... 87
5.1 INTRODUCTION ............................................................................................. 88
5.2 METHODS ..................................................................................................... 90
5.2.1 Participants ..................................................................................... 90
5.2.2 Study Design .................................................................................... 90
5.2.3 Anthropometrics .............................................................................. 91
5.2.4 Scan Procedure ................................................................................ 92
5.2.5 Scan Analysis ................................................................................... 92
5.2.6 Kicking Protocol .............................................................................. 94
5.2.7 Accuracy Determination .................................................................. 96
5.2.8 Statistical Analysis ........................................................................... 97
5.3 RESULTS ....................................................................................................... 98
5.4 DISCUSSION ................................................................................................ 106
5.5 REFERENCES ............................................................................................... 109
CHAPTER SIX - STUDY FOUR .................................................................................. 114
THE INFLUENCE OF LEG MASS AND FOOT VELOCITY ON KICKING ACCURACY IN
AUSTRALIAN FOOTBALL.
6.0 ABSTRACT .................................................................................................. 115
6.1 INTRODUCTION ........................................................................................... 116
6.2 METHODS ................................................................................................... 118
6.2.1 Subjects ........................................................................................... 118
6.2.2 Study Design ................................................................................... 118
6.2.3 Scan Procedure............................................................................... 119
6.2.4 Scan Analysis .................................................................................. 120
6.2.5 Foot Velocity ................................................................................... 120
6.2.6 Kicking Protocol ............................................................................. 123
6.2.7 Accuracy Analysis ........................................................................... 123
6.2.8 Statistical Analysis .......................................................................... 124
6.3 RESULTS ..................................................................................................... 125
6.4 DISCUSSION ................................................................................................ 128
6.5 REFERENCES ............................................................................................... 132

xi
CHAPTER SEVEN - STUDY FIVE ............................................................................. 136
DOES LOWER LIMB SYMMETRY ENHANCE TECHNICAL PROFICIENCY? – A KICKING
PERSPECTIVE.
7.0 ABSTRACT .................................................................................................. 137
7.1 INTRODUCTION .......................................................................................... 138
7.2 METHODS .................................................................................................. 140
7.2.1 Participants .................................................................................... 140
7.2.2 Study Design .................................................................................. 141
7.2.3 Anthropometrics ............................................................................ 142
7.2.4 Strength Assessment ...................................................................... 142
7.2.5 Force-Time Analysis ...................................................................... 144
7.2.6 Scan Procedure .............................................................................. 145
7.2.7 Scan Analysis ................................................................................. 147
7.2.8 Kicking Protocol ............................................................................ 149
7.2.9 Accuracy Analysis .......................................................................... 149
7.2.10 Statistical Analysis ......................................................................... 150
7.3 RESULTS ..................................................................................................... 151
7.3.1 Limb Strength ................................................................................ 151
7.3.2 Limb Mass ...................................................................................... 152
7.3.3 Limb Symmetry .............................................................................. 155
7.4 DISCUSSION ................................................................................................ 156
7.5 REFERENCES ............................................................................................... 159
8.0 - CHAPTER EIGHT - SUMMARY / CONCLUSION ....................................... 170
9.0 - CHAPTER NINE - FUTURE RESEARCH ...................................................... 175
REFERENCES ............................................................................................................... 178
APPENDIX A: CONFERENCE POSTER ( ASCA ) .......................................................... 208
APPENDIX B: MATLAB CODE ( VELOCITIES ) ........................................................... 209
APPENDIX C: ETHICS APPROVAL ............................................................................... 211
APPENDIX D: INFORMATION LETTER ( ALL STUDIES ) .............................................. 212
APPENDIX E: INFORMED CONSENT ( ALL STUDIES ) ................................................. 216
APPENDIX F: PRE-EXERCISE MEDICAL QUESTIONNAIRE ......................................... 217
APPENDIX G: VICON PLUG-IN GAIT MODEL ............................................................. 220

xii
LIST OF FIGURES
Chapter Two
Figure 1. Phases of the drop punt: (A) approach, (B) backswing, (C) wind-up, (D) forward
swing, (E) follow through, and (F) recovery . ..................................................... 11
Figure 2. The summation of speed theory, illustrating correct and incorrect speed transfer
and summation through proximal-to-distal sequencing (Rath, 2005) ....................
............................................................................................................................. 14
Figure 3. A deterministic model of the drop pint when kicking for accuracy or distance .....
............................................................................................................................. 17
Chapter Three
Figure 1. A frontal and side view of correct subject positioning on the scan bed, showing
the positioning device used to internally rotate each thigh ................................ 40
Figure 2. Illustrations of applied (a) whole body scan regions, (b) proposed appendicular
sub-regions; and (c) the resultant combined scan image produced during analysis
............................................................................................................................. 45
Chapter Four
Figure 1. Frontal and side view of set-up and operation for the fixated isometric apparatus
............................................................................................................................. 70
Figure 2. Frontal and side view of set-up and operation for the portable isometric apparatus
............................................................................................................................. 71
Figure 3. Correct subject positioning for bilateral (left) and unilateral (right) testing
conditions ........................................................................................................... 73
Figure 4. Time taken (in seconds) to produce peak force [PF] for each isometric apparatus,
when performing bilateral, and unilateral (non-dominant [ND] and dominant [D]
leg) maximal isometric contractions .................................................................. 77
xiii
Chapter Five
Figure 1. The DEXA scan and analysis process, with (A) a frontal view of the subject
positioning process, illustrating pronated arms, and internally rotated thighs
using a positioning device; and (B) the whole body, and segmental analysis zones
used to define the lower body ............................................................................. 93
Figure 2. The kicking protocol set-up, with the athlete performing the drop punt, over an
obstacle (height: 6 ft), to a stationary human target 20 metres from the kicking
zone (outlined, dimensions: 1.0 m x 0.7 m) ....................................................... 96
Figure 3. A comparison of the absolute thigh mass (A), shank mass (B), leg mass (C), and
relative thigh mass (D), shank mass (E) leg mass (F) for lean, fat and total
kicking leg composition between accurate and inaccurate kicking groups.
Statistical significance (*) was set at p ≤ 0.05 .................................................. 101
Figure 4. A comparison of the absolute thigh mass (A), shank mass (B), leg mass (C), and
relative thigh mass (D), shank mass (E) leg mass (F) for lean, fat and total
support leg composition between accurate and inaccurate kicking groups.
Statistical significance (*) was set at p ≤ 0.05 .................................................. 102
Figure 5. A comparison of the composite mass imbalance [kicking leg – support leg]
between (A) absolute and (B) relative leg mass components between accurate
and inaccurate kickers. Statistical significance (*) was set at p ≤ 0.05 ............ 104
Figure 6. A comparison of the lean-mass ratio of kicking (A) and support (B) legs.
Statistical significance (*) was set at p ≤ 0.05 .................................................. 105
Chapter Six
Figure 1. The DEXA scan and analysis process, with (A) a frontal view of the subject
positioning process, illustrating pronated arms, and internally rotated thighs
using a positioning device; and (B) the whole body analysis zones used to define
the lower limbs ................................................................................................. 120

xiv
Figure 2. The kicking protocol set-up, with the athlete performing the drop punt, over an
obstacle (height: 6 ft), to a stationary human target 20 metres from the kicking
zone (outlined, dimensions: 1.0 m x 0.7 m) ..................................................... 122
Figure 3. A correlational analysis between peak angular foot velocity and total mass of (A)
pooled, (B) accurate, (C) inaccurate kickers; as well as lean mass of (D) pooled,
(E) accurate, (F) inaccurate kickers .................................................................. 127
Figure 4. Correlation analysis between peak angular foot velocity and kicking accuracy ....
........................................................................................................................... 128
Chapter Seven
Figure 1. Isometric apparatus set-up and operation, with (a) correct hip and knee flexion
angles of 140° during a bilateral trial, and (b) an illustration of correct limb
positioning during a left leg unilateral isometric trial as used within this study ....
........................................................................................................................... 144
Figure 2. The DEXA scan and analysis process, with (A) a frontal view of the subject
positioning process, illustrating pronated arms, and internally rotated thighs
using a positioning device; and (B) the whole body, and segmental analysis zones
used to define the lower body ........................................................................... 146
Figure 3. The kicking protocol set-up, with the athlete performing the drop punt, over an
obstacle (height: 6 ft), to a stationary human target 20 metres from the kicking
zone (outlined, dimensions: 1.0 m x 0.7 m) ..................................................... 148
Figure 4. Lean mass imbalance (symmetry index) of the thigh segment, shank segment and
whole leg, showing deficiency (lower mass quantities) in the kicking leg (left)
and support leg (right) ...................................................................................... 156

xv
LIST OF TABLES
Chapter Two
Table 1. Biomechanical movement phase criteria for the drop punt kick using critical
moments of the kicking leg ................................................................................. 10
Chapter Three
Table 1. Subject characteristics of appendicular segmental mass for the upper and lower
limbs ................................................................................................................... 39
Table 2. Standard whole-body cross-sections as defined by Hologic’s whole body model
(Hologic, 2004) ................................................................................................... 41
Table 3. Proposed appendicular cross-sections for each segment, with proximal and distal
boundaries and descriptive landmarks ................................................................ 42
Table 4. Example results provided by DEXA, showing the whole body model outputs (top)
and appendicular model outputs (bottom) .......................................................... 46
Table 5. Intra-tester, between day reliability coefficients for all newly created sub-region
segments of the appendicular skeleton across all composite mass outputs ........ 48
Table 6. Inter-tester reliability coefficients for all newly created sub-region segments of the
appendicular skeleton across all composite mass outputs .................................. 49
Table 7. Review and comparison of subject positioning, segment boundaries, and reliability
data between studies determining appendicular segments using DEXA
technology .......................................................................................................... 52

xvi
Chapter Four
Table 1. Descriptive statistics (Mean and Standard Deviation) for all variables assessed
using the fixated and portable isometric devices .............................................. 76
Table 2. Between trial variance, and intra-tester reliability for peak force [PF], mean force
[MF], and rate of force development [RFD] between each trial type using the
portable isometric device .................................................................................... 76
Table 3. Statistical differences and effect-size calculations between fixated and portable
isometric devices for peak force [PF], mean force [MF], rate of force
development [RFD], and time to peak force [TTPF] ........................................ 77
Chapter Five
Table 1. Subject characteristics for accurate and inaccurate groups .................................. 91
Table 2. Accuracy grading and determination criteria for human target kicking outcomes ..
............................................................................................................................. 97
Table 3. Leg mass characteristics of kicking and support limbs for accurate and inaccurate
kickers ................................................................................................................. 99
Table 4. Correlation coefficients assessing the strength of relationship between leg mass
characteristics and total kicking accuracy scores achieved by all kickers ........ 103
Chapter Six
Table 1. Subject characteristics for accurate and inaccurate groups ................................ 119
Table 2. Accuracy grading and determination criteria for human target kicking outcomes ..
........................................................................................................................... 124
Table 3. Leg mass characteristics of the kicking limb for accurate and inaccurate kickers ...
........................................................................................................................... 125

xvii
Table 4. Correlation coefficients between kicking accuracy and leg mass components .. 126
Chapter Seven
Table 1. Subject characteristics for accurate and inaccurate groups ................................ 142
Table 2. Accuracy grading and determination criteria for human target kicking outcomes ..
........................................................................................................................... 150
Table 3. Strength characteristics for accurate and inaccurate groups with correlations to
kicking accuracy scores...................................................................................... 152
Table 4. Relative leg mass characteristics of the kicking and support limbs for accurate and
inaccurate kickers .............................................................................................. 154
Table 5. Correlation coefficients assessing the strength of relationship between leg mass
characteristics and total kicking accuracy scores achieved by all kickers ....... 155
Table 6. Symmetry Index (imbalance) between kicking and support legs of accurate and
inaccurate kickers ............................................................................................. 155

xviii
LIST OF ABBREVIATIONS
2D - Two-dimensional
3D - Three-dimensional
AFL - Australian Football League
BL - Bilateral
BLD - Bilateral Deficit
BMI - Body Mass Index
BMS - Ballistic Measurement System
cm - Centimetre
CV - Coefficient of Variation
deg/s - Degrees per second
DEXA - Dual Energy X-ray Absorptiometry
ES - Effect Size
ft - Feet
g - Gram
ICC - Intraclass Correlation Coefficient
kg - Kilogram
KL - Kicking Leg, Unilateral
LFR - Lean-to-Fat Ratio
m - Metre
mm - Millimetre
MF - Mean Force
N - Newtons

xix
PF - Peak Force
PPM - Pearsons Product Moment
R - Intraclass Correlation Coefficient
r - Pearsons Product Moment Correlation Coefficient
RFD - Rate of Force Development
SD - Standard Deviation
SI - Symmetry Index
SL - Support Leg, Unilateral
TTPF - Time to Peak Force
ULD - Unilateral, Dominant
ULN - Unilateral, Non-Dominant
WAFL - Western Australian Football League
yrs - Years

xx

1
1.0 - CHAPTER ONE - INTRODUCTION
1.1. Background
Kicking is a fundamental and defining skill in football sports, routinely employed to
achieve effective ball progression and successful scoring sequences (Lees, Asai, Andersen,
Nunome & Sterzing, 2010; Young et al, 2010; Kellis & Katis, 2007a; Hoskins & Pollard,
2003). As the effectiveness of a single kick can often differentiate between winning and
losing a competitive match; the ability to kick a ball accurately, over a desired distance, to
an intended target or location remains a critical component of an athlete’s skill-set (Young
et al, 2010; Ball, 2007a; Reilly & Doran, 2001, Orchard, Walt, McIntosh & Garlick, 1999).
Despite the evident importance of kicking accuracy in football sports, a scarcity of research
has been produced describing the biomechanical or physiological characteristics which
might modify or mediate kicking accuracy production (Young et al, 2010; Sterzing, Lange,
Wachtler, Muller & Milani, 2009; Hennig, Althoff & Hoemme, 2009; Dichiera et al, 2006;
Teixeira, 1999).
While the kicking action requires complex and multidimensional whole body interactions
to be successful (Lees et al, 2010; Naito, Fukui & Maruyama, 2010; Rath, 2005; Shan &
Westerhoff, 2005); the primary end-points that influence and determine ball velocity,
trajectory and directionality involve the generated foot velocity, effective striking mass of
the limb, and quality of foot-ball contact established at the moment of ball impact (Lees et
al, 2010; Young & Rath, 2011; Anderson & Dorge, 2009; Ball, 2008; Ball, 2007b; Kellis &
Katis, 2007a). Given that the air pressure of the ball remains relatively unchanged due to
game-based specifications (Ball, 2008); the time and distance of contact between the foot

2
and ball is largely dependent upon the generated foot velocity and striking mass
characteristics of the kicking limb (Naito et al, 2010; Andersen & Dorge, 2009; Sterzing &
Hennig, 2008; Kellis & Katis, 2007a; Andersen, Dorge & Thomsen, 1999; Tsaousidis &
Zatsiorsky, 1996), which are modifiable through structured training interventions (Young
& Rath, 2011; Ball, 2007b; Perez-Gomez et al, 2008a).
In particular, previous research has focused attention towards the enhancement of kicking
distance, using biomechanical and physiological interventions to improve the magnitude of
generated foot velocity and mechanical work produced during foot-ball impact (Young &
Rath, 2011; Ball, Smith & MacMahon, 2010; Lees et al, 2010; Naito et al, 2010; Baktash et
al, 2009; Smith, Ball & MacMahon, 2009; Ball, 2008; Ball, 2007a; Ball, 2007b; Sterzing &
Hennig, 2008; Kellis & Katis, 2007a; Baker & Ball, 1996; Tsaousidis & Zatsiorsky, 1996).
However, much less is known about the potential influence of these characteristics on the
production of kicking accuracy (Young et al, 2010; Dichiera et al, 2006; Sterzing et al,
2009). Despite an evident improvement in maximal kicking distance following multi-joint,
dynamic lower body strength and power training programs (Campo et al, 2009; Perez-
Gomez et al, 2008a; Manolopoulos, Papadopoulos & Kellis, 2006; Manolopoulos,
Papadopoulos, Salonikidis, Katartzi & Poluha, 2004), prior research has yet to identify
whether such programs will yield positive or negative outcomes when kicking accuracy is
the intention.
More specifically, the lower limb mass profile of an athlete could have a profound impact
on their strength levels and kinanthropometric characteristics, which will subsequently
adjust the biomechanical strategy and athletic behaviour necessary to generate successful

3
kicking performances (Malina & Geithner, 2011; Nevill, Holder & Watts, 2009; Perez-
Gomez et al, 2008b). In particular, strength and conditioning interventions may promote
kicking accuracy for several reasons: 1) Increasing total mass of the kicking limb might
allow a proportionate reduction in foot velocity at a given distance, which could optimise
the speed-accuracy trade-off; 2) Increasing lean mass and total strength of the kicking limb
may enable a proportionate reduction in relative muscular impulse to achieve a given
distance, which may honour the impulse-variability theory (Urbin, Stodden, Fischman &
Weimar, 2011; Schmidt & Lee, 2005); and 3) Increasing the lean mass, total mass and total
strength of the support limb may improve athletic stability and force transference through-
out the kicking motion. These proposed interactions represent only a few possible outcomes
achievable through resistance training interventions, and highlight the need to increase the
scientific and practical understanding towards the manner in which physical conditioning
practices could improve kicking accuracy performance.
1.2. Purpose of Research
The primary purpose of the thesis was to examine the biomechanical and kinanthropometric
characteristics of accurate and inaccurate kickers in Australian Football in order to identify
the potential influences or mediators of kicking accuracy when performing the drop punt
kick. In particular, this thesis has assessed whole body composition and anthropometrics;
lower limb segmental mass; unilateral and bilateral leg strength; and lower limb kinematics
of accurate and inaccurate Australian Footballers. A secondary function of this thesis was
to establish a valid and reliable measurement protocol to locate and quantify segmental
mass components of the lower limbs, as well as the ability to accurately assess maximal
lower body strength using a less stable, portable and customised device.

4
1.3. Significance of Research
A paucity of research exists investigating the potential relationship between the technical
and temporal strategy of accurate and inaccurate kickers in response to physical parameters
which are modifiable by athletic conditioning. While previous studies have established
notable improvements in performance outcomes when kicking for distance following
structured resistance training interventions (Campo et al, 2009; Perez-Gomez et al, 2008a;
Manolopoulos et al, 2006; Manolopoulos, et al, 2004), no studies have examined the
influence of such interventions on the enhancement of kicking accuracy. As a result, this
thesis serves to extend the scientific understanding of those mechanisms which underpin
accurate kicking performances through examining the strength and muscularity profiles of
accurate and inaccurate kickers in Australian Football.
It is anticipated that the information provided in this thesis will provide a valuable insight
into the manner in which an athlete’s strength and body mass characteristics could
potentially adjust the biomechanical strategies and technical capabilities of footballers
performing the drop punt kick under accuracy constraints. This will inevitably improve the
quality of coaching, physical conditioning and skill acquisition strategies employed by
sport scientists in the sporting landscape. Specifically, the acute, cross-sectional outcomes
of this thesis could provide the basis for future longitudinal resistance training studies as a
tool to establish strength and conditioning interventions targeted towards optimising
technical proficiency and capability in football sports.

5
1.5. Research Questions
1) Can composite mass of the lower limbs be identified, segmented and assessed using a
standardised, valid and reliable DEXA protocol?
2) Is a portable isometric strength device able to validly and reliably measure unilateral
and bilateral expressions of strength and power?
3) Will leg mass characteristics of the kicking and support limbs differ between accurate
and inaccurate kickers in Australian Football?
4) Are absolute quantities or relative quantities of lean and fat mass better correlated to
drop punt kicking accuracy?
5) Is there a relationship between peak foot velocity and kicking accuracy when
performing the drop punt?
6) Will a unilateral strength imbalance (lateral dominance effect) differentiate an accurate
kicker from an inaccurate kicker in Australian Football?
7) Are absolute or relative bilateral and unilateral strength characteristics better correlated
to drop punt kicking accuracy?
1.6. Research Studies
A series of five experimental studies have been developed to assess the kinanthropometric
characteristics of Australian Footballers, including anthropometry; whole body
composition; segmental masses of the lower limbs; unilateral and bilateral leg strength; and
lower limb kinematics produced during the kicking action. The first two studies were
necessary to establish standardised, valid and reliable measurement protocols when
examining strength and muscularity profiles of athletes. These methods were subsequently

6
used in the final three studies to quantify the necessary athletic characteristics required by
this research, comparing accurate kickers with inaccurate kickers in Australian Football.
1.7. Limitations
1) The outcomes of this thesis are delimited to the cohort of subjects used; specifically
male athletes participating in the Western Australian Football League, with a minimum
of 5 years playing experience. The applications of these findings are therefore limited to
this population, and might not transfer to other Australian Football competitions.
2) Although 5 years playing experience was a minimum requirement for study
participation; a complete profile of training and playing history was not recorded. While
athletes were recruited from the same league, their prior amount of practise could not be
estimated, and might have held an undetermined influence on established outcomes.
3) A stationary player target over a short 20 metre distance was used to assess kicking
accuracy. Due to the different constraints imposed upon athletes when kicking to
different targets (goal versus player), and distances (short versus long), these findings
are limited to a short distance kick towards a player target.
4) The kicking assessment was performed from an indoor laboratory, with the ball kicked
through an open high-raised passage to a player target situated outside. While
maximum kicking trajectory was not restricted, the width of the door and presence of
expensive and sophisticated equipment surrounding the kicker may have influenced
their kicking proficiency. The impact of this is believed to have been minimal as
extensive familiarisation was provided.

7
2.0 - CHAPTER TWO - LITERATURE REVIEW
2.1. Overview
This literature review has been written to briefly introduce existing literature relating to the
material which has been investigated and disseminated in subsequent chapters of this thesis.
In particular, the literature review has been arranged to present a global overview of three
key areas: 1) the prevalence of kicking in sport, with specific focus on the drop punt; 2) a
detailed, full-body kinematic description of the drop punt; and 3) the biomechanical
characteristics which mediate kicking distance and kicking accuracy performance. This
review will conclude by outlining the current deficiencies in the literature, specifically
concerning the description, influence and characteristics of kicking accuracy within football
sports.
2.2. Kicking in Sport
Kicking is a fundamental skill which requires the co-ordinated integration of complex
motor patterns in order to be skilfully performed; often established in predictive
developmental stages (Naito et al, 2010; Magill, 2008; Teixeira, 1999; Davids, Lees &
Burwitz; Barfield, 1998; Butterfield & Loovis, 1994). In the sporting environment, kicking
actions are highly prevalent, with many technical variations routinely employed to achieve
numerous competitive outcomes (Shaughnessy, 2006; Dawson, Hopkinson, Appleby,
Stewart & Roberts, 2004; Appleby & Dawson, 2002). Football codes, in particular,
legislate that ball progression and scoring sequences must be principally achieved through
foot-to-ball interactions (Coventry et al, 2011; Young et al, 2010; Ball, 2007a; Kellis &
Katis, 2007a; Andersen et al, 1999). Due to the volatile nature of competitive play, a

8
multitude of kicking strategies are used to provide a tactical advantage within the
boundaries of their sports (Ball, 2011; Sterzing & Hennig, 2008; Appleby & Dawson,
2002; Norton, Craig & Olds, 1999; Lees & Nolan, 1998), which may be broadly
categorised as either place kicks or punt kicks, depending on the nature of ball position and
delivery to the foot upon impact (Ball, 2011; Reilly & Doran, 2001; Lees & Nolan, 1998).
Specifically, place kicks require the ball to be struck from a kicking tee, or while positioned
on the ground, and are primarily seen in Soccer, Rugby and American Football (Lees &
Owens, 2011; Witt & Dorsch, 2009; Bezodis, Trewartha, Wilson & Irwin, 2007; Shan &
Westerhoff, 2005). Due to various situational contexts, a multitude of technical expressions
exist for the place kick; in soccer, place kicks can be classified based on loft, speed and
spin, and include the side-kick, instep kick, chip kick and drive kick (Lees & Owens, 2011;
Sterzing & Hennig, 2008; Kellis & Katis, 2007a; Smith, Gilleard, Hammond & Brooks,
2006; Dorge et al, 2002; McLean & Tumilty, 1993), while rugby codes use place kicks
following an awarded penalty or successful try, subsequently requiring a conversion from a
kicking tee (Baktash et al, 2009; Bezodis et al, 2007).
In contrast, punt kicks require the ball to be released by the hands and delivered to the foot,
causing the ball to be struck while it is travelling through space (Ball, 2011; Pavely,
Adams, Francesco, Larkham & Maher, 2010; Hosford & Meikle, 2007). Due to the
inherently greater customisation and control of ball position during hand-release and foot-
contact, a variety of techniques are available to punt kickers as tools to capitalise on
tactically advantageous situations. In particular, these techniques fall under several
classifications on the basis foot-ball contact and subsequent ball rotation through the air,

9
leading to the production of spiral punts, check-side punts, stab punts, drop punts and drop
kicks (Ball, 2011; Pavely et al, 2010; Ball 2008; Hosford & Meikle, 2007; Reilly & Doran,
2001). The most widely used kicking action across all football sports is the drop punt,
featuring as a primary skill in Australian Football and Gaelic Football, while also employed
as a secondary and tertiary skill in Rugby Union, Rugby League, Soccer and American
Football (Ball, 2011; Lithorne & Patel, 2011; Dichiera et al, 2006; Reilly & Doran, 2001;
Davids et al, 2000; Orchard et al, 1999).
2.3. Description of the Drop Punt
Characterised by the backward rotation of the ball through the air, around its transverse,
longitudinal axis (Hosford & Meikle, 2007; Saliba & Hrysomalis, 2001); the drop punt is
preferentially utilised by kickers in order to deliver a ball accurately, over a desired
distance, to an intended target or location (Dichiera et al, 2006; Rath, 2005; Cameron &
Adams, 2003; Saliba & Hrysomalis, 2001). The drop punt is relatively reliable, simple to
execute and faster to perform when compared to other punting techniques (Ball, 2008;
Orchard et al, 1999), providing better ball stability and predictability when travelling
through the air (Ball, 2011; Hosford & Meikle, 2007), making it easier to catch by the
player receiving the ball (Ball, 2011; Dichiera et al, 2006; Saliba & Hrysomalis, 2001;
Orchard et al, 1999). The drop punt is therefore considered to be a desired element of any
football player’s skill-set (Ball, 2007a; Reilly & Doran, 2001; Orchard et al, 1999).
The drop punt is a complex and multidimensional kicking action which involves whole
body interactions in order to be successful (Rath, 2005; Shan & Westerhoff, 2005). As
such, to assist with technique analysis, interpretation and correction, the kicking action
itself is able to be broken down into movement phases (Burkett, 2010; Smith et al, 2006;

10
Lees, 2002; Davids et al, 2000). Previous biomechanical analyses of various kicking
actions have attempted to establish common phases evident between kicking styles,
selectively using the behaviour of the kicking leg as the focal point of phase determination
due to the identifiable and consistent movement pattern produced by this limb across
kicking techniques (Ball, 2008; Reilly & Doran, 2001; Davids et al, 2000; Orchard et al,
1999). However, a lack of consensus exists between studies as to the precise number of
phases used, and the points at which each phase commences. This lack of analytical
consistency can complicate interpretive comparisons between studies in the literature.
Regardless, Orchard and colleagues (1999) presents the most detailed and suitable phase-
based criteria for biomechanical analysis of the drop punt in Australian Football (Reilly &
Doran, 2001), with general descriptions provided in Table 1, while illustrated in Figure 1.
Table 1. Biomechanical movement phase criteria for the drop punt kick using critical
moments of the kicking leg.
Phase of Movement Start Point End Point
Approach Initiation of forward movement Toe-off (into kicking action)
Back Swing Toe-off (into kicking action) Maximum hip extension.
Wind-Up Maximum hip extension Maximum knee flexion
Forward Swing Maximum knee flexion Foot-to-ball contact
Follow-Through Foot-to-ball contact Maximum knee extension
Recovery Maximum knee extension Maximum hip flexion

11
Figure 1. Phases of the drop punt: (A) approach, (B) backswing, (C) wind-up, (D) forward swing, (E) follow through, and (F) recovery.

12
2.4. Kinematic Profile of the Drop Punt
2.4.1. Biomechanical Characteristics
The principal aim of the drop punt is to project a ball accurately over a desired distance, at
a desired velocity, to an intended target or location (Young et al, 2010; Hosford & Meikle,
2007; Dichiera et al, 2006). To achieve this outcome, appropriate force must be imparted
onto the ball as a resultant function of generated foot velocity, effective striking mass, and
the quality of foot-ball contact (Young & Rath, 2011; Andersen & Dorge, 2009; Ball, 2008;
Sterzing & Hennig, 2008; Ball, 2007b; Cameron & Adams, 2003; Andersen et al, 1999).
Given that correct kicking technique involves a series of well timed and controlled whole
body interactions (Naito et al, 2010; Bezodis et al, 2007; Shan & Westerhoff, 2005; Davids
et al, 2000); the successful execution of the drop punt is governed by a complex interaction
of intrinsic biomechanical factors relevant to the entire body (Burkett, 2010; Naito et al,
2010; Hosford & Meikle, 2007; Rath, 2005; Shan & Westerhoff, 2005).
In particular, ball velocity, trajectory and directionality is the end-product of proximal-to-
distal segmentation (Young & Rath, 2011; Kellis & Katis, 2007a; Reilly & Doran, 2001;
Marshall & Elliot, 2000; Putnam, 1993; Putnam, 1991); limb co-ordination and control
(Naito et al, 2010; Cameron & Adams, 2003; Davids et al, 2000; McLean & Tumilty,
1993); foot position, stiffness, and impact restitution (Young & Rath, 2011; Ball, 2007a;
Cameron & Adams, 2003; Dorge et al, 2002; Andersen et al, 1999; Tsaousidis &
Zatsiorsky, 1996); ball drop and contact position (Ball, 2011; Pavely et al, 2010; Hosford &
Meikle, 2007); joint flexibility and range of motion (Hosford & Meikle, 2007; Young,
Clothier, Otago, Bruce & Liddell, 2004); support leg behaviour (Hrysomalis, 2011; Baktash

13
et al, 2009; Orloff et al, 2008; Barfield, 1998); and upper body behaviour (Pavely et al,
2010; Bezodis et al, 2007; Shan & Westerhoff, 2005).
Few formal scientific analyses of the drop punt have been produced to describe these
characteristics, and the manner in which they influence the generation of foot velocity and
foot-ball contact. Understanding the biomechanics of the kicking action can profoundly
improve the coaching process (Smith et al, 2006; Lees, 2002; Barfield, 1998), and better
direct future mechanical investigations necessary for improvements in performance and
technique.
2.4.2. The Kicking Leg
Research has principally focused attention towards the behaviour of the kicking leg when
investigating a variety of performance and technique based indicators concerning the place
kick and punt kick in sport (Young & Rath, 2011; Andersen & Dorge, 2009; Ball, 2008;
Kellis & Katis, 2007a; Dorge et al, 2002; Reilly & Doran, 2001; Lees & Nolan, 1998). In
particular, the development of foot velocity, and subsequent foot-ball collision have
developed into common technical themes apparent within the literature, suitably viewed as
fundamentally important aspects of kicking performance (Young & Rath, 2011; Ball, 2008;
Dorge et al, 2002; Andersen et al, 1999).
2.4.2.1. Foot Velocity
Foot velocity has been identified as a significant contributor to subsequent ball velocity and
kicking distance achieved (Young & Rath, 2011; Campo et al, 2009; Ball, 2008; Perez-
Gomez et al, 2008a; Rath, 2005; Baker & Ball, 1996), accounting for approximately 67%

14
of kicking distance variability when using the drop punt technique (Ball, 2008). In order to
develop high foot speeds, the kicking leg must produce a proximal-to-distal segmental
sequence, commonly identified as a ‘throw-like’ movement pattern (Lithorne & Patel,
2011; Dorge et al, 2002; Marshall & Elliot, 2000; Putnam, 1993; Putnam, 1991). Therefore,
body segments involved in the kicking action are modelled as an open-linked system,
through which the distal segment (the foot) moves freely through space (Andersen &
Dorge, 2009; Nunome, Ikegami, Kozakai, Apriantono & Sano, 2006; Putnam, 1993;
Putnam, 1991).
The production and magnitude of foot velocity established through proximal-to-distal
segmentation can be best explained by the summation of speed theory (Figure 2), which
states that to maximise foot speed, the movement should commence with the proximal
segments (the body and thigh), and progress through the linked chain to more distal
segments (the shank and foot) so that each segment starts its motion at the preceding
segments moment of greatest velocity (Rath, 2005; Lees, 2002; Putnam, 1991). Therefore,
the more distal a segment is, the faster it will eventually move (Orchard et al, 1999;
Putnam, 1993).
Figure 2. The summation of speed theory, illustrating correct and incorrect speed transfer
and summation through proximal-to-distal sequencing (adapted from Rath, 2005).
15
This complex segmental interaction highlights the difficulties inherent within the kicking
leg, as inefficiencies in limb control, co-ordination, joint range of motion and segmental
timing can vastly influence the quality and magnitude of foot velocity produced (Lithorne
& Patel, 2011; Kellis & Katis, 2007a; Davids et al, 2000; Dorge et al, 2002; McLean &
Tumilty, 1993; Young et al, 2004).
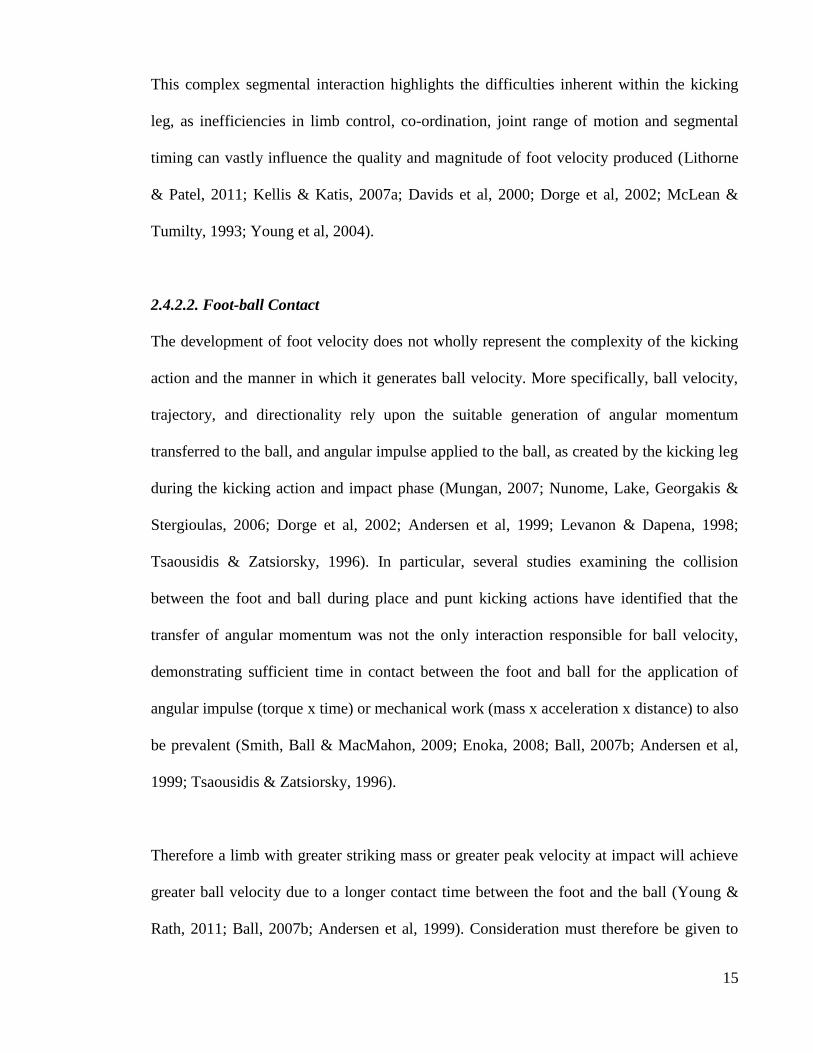
2.4.2.2. Foot-ball Contact
The development of foot velocity does not wholly represent the complexity of the kicking
action and the manner in which it generates ball velocity. More specifically, ball velocity,
trajectory, and directionality rely upon the suitable generation of angular momentum
transferred to the ball, and angular impulse applied to the ball, as created by the kicking leg
during the kicking action and impact phase (Mungan, 2007; Nunome, Lake, Georgakis &
Stergioulas, 2006; Dorge et al, 2002; Andersen et al, 1999; Levanon & Dapena, 1998;
Tsaousidis & Zatsiorsky, 1996). In particular, several studies examining the collision
between the foot and ball during place and punt kicking actions have identified that the
transfer of angular momentum was not the only interaction responsible for ball velocity,
demonstrating sufficient time in contact between the foot and ball for the application of
angular impulse (torque x time) or mechanical work (mass x acceleration x distance) to also
be prevalent (Smith, Ball & MacMahon, 2009; Enoka, 2008; Ball, 2007b; Andersen et al,
1999; Tsaousidis & Zatsiorsky, 1996).
Therefore a limb with greater striking mass or greater peak velocity at impact will achieve
greater ball velocity due to a longer contact time between the foot and the ball (Young &
Rath, 2011; Ball, 2007b; Andersen et al, 1999). Consideration must therefore be given to

16
the effective striking mass of the kicking leg leading into contact between the foot and the
ball (Baktash et al, 2009; Sterzing & Hennig, 2008; Rath, 2005; Andersen et al, 1999;
Barfield, 1998), and the manner in which this modifies the quality of impact, and time of
impact between these two rigid bodies (Ball, 2007b; Nunome et al, 2006b; Rath, 2005;
Andersen et al, 1999). In particular, these qualities might adjust the degree of generated
momentum transferred to the ball by modifying the coefficient of restitution (Young &
Rath, 2011; Andersen et al, 1999; Tsaousidis & Zatsiorsky, 1996).
The coefficient of restitution is a measure of impact elasticity and momentum transfer
between two rigid bodies, in this case, the foot and ball (Enoka, 2008; Dorge et al, 2002;
Andersen et al, 1999). As such, the collision between the foot and the ball is influenced by
the deformability or stiffness of the kicking foot (Young & Rath, 2011; Cameron & Adams,
2003), and the location of ball contact with the foot surface during the striking motion
(Ball, 2011; Lithorne & Patel, 2011; Hosford & Meikle, 2007). Given that the swinging
foot is fixed in plantarflexion at ball impact, with the ball positioned to connect with the
ankle-foot complex (Sterzing & Hennig, 2008; Hosford & Meikle, 2007; Orchard et al,
1999), the exactness of ball delivery to the foot and quality of agonist-antagonist co-
contraction at the ankle joint will determine whether the foot will deform or straighten
(Young & Rath, 2011; Nunome et al, 2006; Lees & Nolan, 1998) and therefore whether the
coefficient of restitution is increased or decreased (Young & Rath, 2011; Andersen et al,
1999). As a result, kicking performance for distance or accuracy may be jeopardised if
there is a subsequent loss of limb control and reduction in ball velocity (Kellis & Katis,
2007a; Cameron & Adams, 2003; Barfield, 1998).

17
Figure 3.A deterministic biomechanical model of the Drop Punt when kicking for accuracy or distance.

18
2.4.3. The Support Leg
The support leg has received limited attention in the literature, with few studies
investigating its behavioural characteristics and contributions to kicking performance
(Young & Rath, 2011; Clagg et al, 2009; Dichiera et al, 2006). As skilled kicking involves
the complex interaction of many body segments, and requires footballers to adopt unipedal
postures (Paillard et al, 2006; Shan & Westerhoff, 2005; Kellis, Gerodimoss, Kellis &
Manou, 2001); the wholesome contribution of the support leg to the kicking motion is
visibly important, however remains largely undefined in punt kicking techniques to date
(Young & Rath, 2011; Baktash et al, 2009; Rath, 2005; Orchard et al, 1999).
Preliminary findings demonstrate the importance of the support leg as a mechanism to
allow athletes to manipulate and lower their centre of gravity in order to provide greater
athletic stability, balance and control (Gstottner et al, 2009; Dichiera et al, 2006; Matsuda,
Demura & Uchiyama, 2008), while also resisting torque developed by the kicking leg when
powerfully striking the ball (Kubo, Muramatsu, Hoshikawa & Kanehisa, 2010; Clagg et al,
2009; Gerbino, Griffin & Zurakowski, 2007; Wong et al, 2007). In particular, the support
leg is positioned in front of the athlete’s centre of mass during the initial plant phase, prior
to the forward rotational motion of the kicking leg, in order to act as an axis of rotation for
the swinging limb (Baktash et al, 2009; Orloff et al, 2008; Barfield, 1998), and to also
provide an external force (ground reaction force) necessary to commence the segmental
sequencing of the kicking leg (Orloff et al, 2008; Sterzing & Hennig, 2008; Kellis, Katis &
Gissis, 2004).

19
Some evidence has been provided to lend support for these functions, with skilful kickers
demonstrating the ability to stabilise the hip and knee joints during active loading, while
producing larger hip flexion and knee flexion angles during the kicking action so as to
allow a more functional lowering of their centre of gravity (Clagg et al, 2009; Dichiera, et
al, 2006; Rahnama, Lees & Bambaecichi, 2005). Skilful kickers also seemingly initiate
contact with the ground using the heel of their foot and commence flexing at the knee, prior
to fully planting the foot, leading to activation of the hip and knee muscles to lock the
system (body) in place (Hosford & Meikle, 2007; Dichiera et al, 2006; Rahnama et al,
2005). The position of the plant leg and the forces in which it generates are therefore
components which influence ball velocity and trajectory (Baktash et al, 2009; Orloff et al,
2008; Sterzing & Hennig, 2008; Kellis et al, 2004; Barfield, 1998).
2.4.4. The Upper Body
Kicking is not mechanically exclusive to the lower limbs (Pavely et al, 2010; Bezodis et al,
2007; Shan & Westerhoff, 2005), with noteworthy contributions from upper body
segments, including the head, arms and trunk (Young & Rath, 2011; Hides et al, 2010;
Marshall & Elliot, 2000; Lees & Nolan, 1998). While the kicking action is a whole body,
multi-joint movement, these upper body interactions have been considerably neglected in
the literature, with few quantitative or qualitative analyses available for all kicking
techniques (Pavely et al, 2010; Rath, 2005; Shan & Westerhoff, 2005). In particular, no
studies have quantified the upper body mechanics of punt kicking techniques which are
characteristically different to place kicks on the basis of ipsilateral (kicking side) arm use
during ball drop and delivery.

20
Preliminary findings, established from place kicking literature, acknowledges the
significant contribution of the upper body to kicking effectiveness, with skilled kickers
using greater trunk rotation and contralateral (non-kicking side) arm extension and
abduction to produce a more effective tension and pre-lengthening stretch through the
musculature of the trunk and pelvis, assisting with force generation and velocity transfer
(Shan & Westerhoff, 2005; Lees & Nolan, 1998). This initial abduction by the contralateral
arm also appears to provide preparatory stability at the moment of ball drop in punt kicking,
prior to a synchronistically forward projection with the kicking leg, presumably for
heightened dynamic, bilateral stability during the rapid striking action (Bezodis et al, 2009;
Rath, 2005; Orchard et al, 1999).
Punt kicking, specifically, uses the ipsilateral arm to control ball drop and delivery to the
foot, while assisting with balance and stability post release (Pavely et al, 2010; Hosford &
Meikle, 2007; Rath, 2005). Together, with head position, trunk rotation, trunk lean, and
contralateral arm activity; the augmentation and control of whole body angular momentum
is able to be achieved (Baktash et al, 2009; Bezodis et al, 2007; Rath, 2005; Marshall &
Elliot, 2000), subsequently producing greater generation and transfer of momentum through
the kicking leg, and into the ball (Pavely et al, 2010; Baktash et al, 2009; Bezodis et al,
2007; Shan & Westerhoff, 2005). While practitioners attempt to theorise the role of the
upper body segments during the kicking motion, formal scientific evidence remains scarce
(Bezodis et al, 2007; Barfield, 1998; Lees & Nolan, 1998), demonstrating a need for further
investigation.

21
2.4.5. Other Considerations
2.4.5.1. The Approach
The drop punt can be performed from either a stationary position, or through the use of a
predetermined approach strategy, which may vary based on length, speed and angle of
approach (Hosford & Meikle, 2007; Kellis & Katis, 2007a; Kellis et al, 2004). However,
the speed and angle of approach form the two main components which can substantially
influence kicking performance, specifically concerning the development of foot velocity
and rotational axis of the kicking leg (Andersen & Dorge, 2009; Orloff et al, 2008; Kellis et
al, 2004). In particular, the approach phase is a preparatory movement (Kellis & Katis,
2007a) that aims to suitably accelerate the body to a selected velocity, prior to planting the
support leg, as a mechanism to generate and transfer greater levels of initial velocity from
the whole body, through the sequential segmentation of the kicking leg, and into the ball
(Andersen & Dorge, 2009; Ball, 2008; Hosford & Meikle, 2007).
Given that the generation of foot velocity is an important component in kicking
performance (Ball, 2008; Sterzing & Hennig, 2008; Levanon and Dapena, 1998), and that
segments of the kicking leg are influenced by whole body momentum developed during the
approach (Andersen & Dorge, 2009); the speed of approach is an important characteristic to
address. In particular, an established run-up approach achieves higher ball speeds than a
stationary kick on the basis of previously established momentum, whereby an optimal,
athlete-specific, self-determined approach speed appears to produce the greatest kicking
outcomes (Andersen & Dorge, 2009). While the speed of approach is dependent on the step
length and step frequency of the kicker (Andersen & Dorge, 2009), the last step length in
particular, has been identified as an important contributor to foot speed, allowing greater

22
lengthening of hip musculature, which subsequently enables them to perform more work
over greater distance, in addition to the evident stretch-shorten effect on the muscle
(Andersen & Dorge, 2009; Andersen et al, 1999).
Furthermore, it has been demonstrated in soccer-based literature that an angled approach is
superior to a straight-line approach (Young & Rath, 2011; Kellis & Katis, 2007a; Barfield,
1998), suggesting an approach angle between 30 to 45° as optimal (Clagg et al, 2009; Kellis
et al, 2004; Barfield, 1998; Lees & Nolan, 1998). This is believed to allow greater rotation
of the pelvic girdle and greater hip extension, which may allow increased force production
over a longer duration to enhance the velocity of the foot (Andersen & Dorge, 2009; Lees
& Nolan, 1998). An angled approach also appears to yield greater directional accuracy
when compared to the straight-line approach, as the adductor muscles of the kicking leg
during straight-line kicking tend to drag the leg across the mid-line of the body, whereas the
angled approach enables the rotational axis of the swinging limb to align with the target
(Andersen & Dorge, 2009; Hosford & Meikle, 2007; Kellis et al, 2004).
The approach phase in Australian Football adopts the pace, tempo and kinematic profile of
a traditional jogging action, and generally consists of 5 or more steps (Orchard et al, 1999;
Mann, Moran & Dougherty, 1986), with athletes employing straight-line, side-step or
angled approaches (Hosford & Meikle, 2007). While previous research has proposed the
ideal approach strategy using a self-selected speed and an oblique approach angle; further
research is needed to examine this using the drop punt kick in Australian Football.

23
2.4.5.2. Ball Trajectory
To project a ball over greater maximal distances the ball must be projected at an
appropriate angle (Linthorne & Patel, 2011; Alam, Subic, Watkins & Smits, 2009).
Traditional projectile motion theory suggests that the ideal angle of release is 45°
(Linthorne & Patel, 2011; Enoka, 2008; Hall, 2007); however, consideration must also be
given to the anticipated release height, landing height, and aerodynamics of the projectile,
which may increase or decrease the optimal angle of release (Linthorne & Patel, 2011;
Alam et al, 2009; Enoka, 2008; Hall, 2007). In the sporting environment, this relationship
has been prominent, with optimal projection angles spanning between 26 – 39° for
throwing sports, including shot-put, javelin, discus and soccer throw-ins (Leigh, Liu,
Hubbard & Yu, 2010; Linthorne & Everett, 2006; Viitasalo, Mononen & Norvapalo, 2003;
Hubbard, de Mestre & Scott, 2001; Linthorne, 2001); while also spanning between 19 – 27°
for jumping sports, including the traditional long jump and standing long jump events
(Linthorne, Guzman & Bridgett, 2005; Wakai & Linthorne, 2005), well below the
conventional 45° angle of trajectory. Conversely, basketball jump shots can vary between
48 to 55° based on distance, due to the requirements of desirable angles of entry into the
basket (Hall, 2007; Miller & Bartlett, 1996), which extends beyond the 45° idealism,
highlighting the specificity of projectile angle, and projectile motion to precise sporting
conditions.
In football sports, the optimal projection angle of punt kicks have been established to sit
between 40 - 45° in soccer (Linthorne & Patel, 2011), and 31 - 39° in rugby union (Holmes,
Jones, Hardland & Petzing, 2006). However, the punt kick in soccer does not appear to
suitably represent the punt kick produced in Australian Football as the soccer ball is

24
aerodynamically dissimilar to the spherical, ellipsoidal shaped ball present in Australian
Football (Alam et al, 2009; Alam, Subic, Watkins, Naser & Rasul, 2008). Therefore, in
Australian Football, the estimated optimal kicking trajectory to maximise distance is
assumed to sit somewhere between 30 to 40° (Hosford & Meikle, 2007; Holmes et al,
2006). Specifically, the generated backward rotation and spherical shape of the ball in
Australian Football considerably modifies its aerodynamic profile by creating a lift effect
(Linthorne & Patel, 2011; Alam et al, 2009; Alam et al, 2008; Ball, 2011). This
subsequently decreases the necessary kicking trajectory required to achieve maximal
distances. A reduced kicking trajectory also has tactical advantages, as it enables a more
direct travel-path for the ball to the target, leading to faster ball progression; improved
penetration of defensive structures; and greater ball stability through air when kicking a
goal (Ball, 2011; Linthorne & Patel, 2011; Ball, 2007a).
2.5. Kicking Performance
2.5.1. Kicking Distance
The ability to kick a ball over greater distances is an important skill to acquire in football
sports (Young & Rath, 2011; Ball, 2007b; Baker & Ball, 1996), tactically enabling
footballers to defensively clear the ball, improve penetration of opposition defences, and
shoot for goal from more distant positions (Ball, 2011; Pavely et al, 2010; Ball, 2008; Ball,
2007b). In particular, players who are able to kick over longer distances are established as
recruiting priorities in Australian Football (Ball, 2008), with longer effective kicks
correlating highly to evident score differences between teams in the competitive
environment (Ball, 2008; Ball, 2007b). In response to these notable advantages, research
has attempted to describe and develop biomechanical strategies to optimise an athlete’s

25
ability to kick for distance, focusing primarily on the significant correlation (p < 0.01)
between the development of foot velocity and subsequent ball velocity achieved (Young &
Rath, 2011; Andersen & Dorge, 2009; Baktash et al, 2009; Sterzing & Hennig, 2008; Ball,
2008; Ball, 2007b; Kellis & Katis, 2007a; Masuda, Kikuhara, Demura, Katsuta &
Yamanaka, 2005; Andersen et al, 1999; Baker & Ball, 1996).
In particular, athletes who achieved greater kicking distances in response to higher foot
velocities exhibited several distinguishing biomechanical characteristics, including greater
hip extension and knee flexion angles during the backswing and wind-up; as well as greater
knee and shank velocities at ball impact (Ball, 2008; Levanon & Dapena, 1998; Baker &
Ball, 1996). These outcomes are notably advantageous for two main reasons: 1) greater hip
extension produces a larger pre-stretch (lengthening) of the hip flexors, which subsequently
creates higher initial limb velocity in response to a greater stretch-shortening effect (Lees et
al, 2010; Hosford & Meikle, 2007); and 2) greater knee flexion reduces the rotational
inertia of the swinging limb, to promote greater angular thigh velocity during the wind-up
and forward swing stages of the kick (Naito et al, 2010; Ball, 2008). As a result, both
characteristics have previously been able to generate greater knee, and shank velocities in
response to an effective and well-timed proximal-to-distal segmental sequence (Naito et al,
2010; Andersen & Dorge, 2009; Putnam, 1993; Putnam, 1991)
While foot velocity is a significant contributor to ball velocity, it is not an exclusive factor,
as the quality of foot-ball contact must also be considered (Ball, 2008; Kellis & Katis,
2007a; Andersen et al, 1999; Levanon & Dapena, 1998; Baker & Ball, 1996). During the
impact phase, the ball is able to remain in contact with the foot for up to 10 - 16

26
milliseconds, subsequently allowing for an approximate knee extension of up to 8 - 20°
(Ball, 2007a; Tsaousidis & Zatsiorsky, 1996). As a result, the strength and power profile of
the hip flexors and knee extensors might successfully produce an additive effect to the
attainment of ball velocity, through the creation of greater foot velocity during the swing
phase, and through the application of greater muscular work on the ball during the contact
phase (Young & Rath, 2011; Ball 2007a; Andersen et al, 1999). Furthermore, assuming
velocity remains unchanged, a limb with greater total mass (effective striking mass) will be
able to generate higher ball velocity; therefore, another potential intervention may seek to
specifically increase lean muscle mass, as this should enable an increase in total limb mass
without compromising limb velocity (Young & Rath, 2011; Ball, 2008; Hosford & Meikle,
2007), however, this has yet to be assessed in kicking literature to date.
Due to the evident contribution and importance of lower limb muscle mass in the
production of maximal, high velocity kicking actions (Perez-Gomez et al, 2008a; Perez-
Gomez et al, 2008b; Ball 2007a; Kellis & Katis, 2007b; Dorge et al, 2002; Dorge et al,
1999; Orchard et al, 1999; Lees & Nolan, 1998), several studies have attempted to examine
whether a relationship exists between lower limb strength and kicking performance using
isokinetic dynamometry (Kellis & Katis, 2007b; Masuda et al, 2005; Masuda, Kikuhara,
Takahashi & Yamanaka, 2003; Cometti, Maffiuletti, Pousson, Chatard & Maffulli, 2001;
Saliba & Hrysomalis, 2001; Aagaard, Simonsen, Trolle, Bangsbo & Klausen, 1996;
Aagaard, Simonsen, Trolle, Bangsbo & Klausen, 1994; Mognini, Narici, Sirtori &
Lorenzelli, 1994). Unfortunately, the contradictory findings from these studies tentatively
render the potential relationship between strength and foot velocity as unclear. However, it
must be acknowledged that the lack of specificity inherent within isokinetic single-joint

27
testing modalities likely accounts for this lack of conclusiveness, as kicking based muscle
function is bi-articular, generating multi-segmental, multi-joint movements (Young & Rath,
2011; Kellis & Katis, 2007b).
Despite the lack of clarity associated with isokinetic strength and kicking performance,
several studies have instead examined whether functionally based strength and conditioning
interventions are able to optimise foot velocity production as a mechanism to enhance
kicking distance and kicking performance (Billot, Martin, Paizis, Cometti & Babault, 2010;
Campo et al, 2009; Perez-Gomez et al, 2008a; Ball, 2007b; Vucetic, Sporis & Jukic, 2007;
Manolopoulos et al, 2006; Manolopoulos et al, 2004; Young et al, 2004; Aagaard et al,
1996). While earlier studies demonstrated no gains in kicking performance following
single-joint strength training interventions (Aagaard et al, 1996; Aagaard et al, 1994), the
overriding conclusion drawn from a multitude of more recent studies demonstrate
significant improvements in kicking distance in response to multi-joint, dynamic, heavy-
resistance and plyometric based training activities (Billot et al, 2010; Campo et al, 2009;
Perez-Gomez et al, 2008; Manolopoulos et al, 2004).
Furthermore, when combining skill-based kicking practice concurrently with resistance
training interventions, even larger kicking performance improvements are evident (Young
& Rath, 2011; Ball 2007b; Manolopoulos et al, 2006), likely in response to an element of
motor learning transference experienced between skill-based training, and subsequent
resistance based strength gains (Young, 2006; Davids et al, 2000). This presents a novel,
and interesting concept for further research efforts, particularly aiming to further
understanding the impact of concurrent skill acquisition and resistance training programs

28
on the subsequent enhancement and modification of kicking performance, and the manner
in which these may adjust the biomechanical profile of an athlete when kicking for
distance.
2.4.2. Kicking Accuracy
The improvement of kicking accuracy and performance remains one of the basic aims of
coaches and athletes in football sports, with considerable time and resources assigned to
developing the kicking skill (Kellis & Katis, 2007a; Dichiera et al, 2006). In particular, the
act of kicking a ball accurately to a specified target could arguably be the most important
skill to master (Ball, 2007b), as the effectiveness of a single kick can often differentiate
between winning or losing a competitive match (Ball, 2007a; Dichiera et al, 2006).
Therefore any kicker who is able to deliver a ball accurately, over greater maximal and sub-
maximal distances becomes a more critical asset to their team (Young & Rath, 2011;
Young et al, 2010; Ball, 2008; Dichiera et al, 2006). Despite the importance of kicking
accuracy in sport, research investigating ways to describe, develop and improve this
technical characteristic remains highly limited (Young et al, 2010; Sterzing et al, 2009;
Dichiera et al, 2006).
Only one study to date has attempted to describe the kinematic strategy employed by
accurate kickers in comparison to inaccurate kickers, identifying evident differences in
lower limb characteristics (Dichiera et al, 2006). In particular, accurate kickers were able to
achieve greater hip and knee flexion angles in the support leg during the support phase of
the kicking motion, while also producing greater anterior pelvic tilt at the moment of
weight acceptance (Dichiera et al, 2006). The functional benefits of these characteristics are

29
two-fold: 1) increased flexion of the hip and knee in the support leg enables accurate
kickers to effectively adjust and lower their centre of gravity to increase or maintain athletic
stability during the kicking task (Dichiera et al, 2006; Rahnama et al, 2005); and 2) greater
anterior pelvic tilt invokes a greater stretch on the trunk and hip flexor muscles during the
backswing of the kick (Hosford & Meikle, 2007; Orchard et al, 1999), subsequently
resulting in less volitional effort to generate an equivalent limb velocity required to reach
the target, which might increase limb control and position while in contact with the ball
(Cameron & Adams, 2003).
In the absence of sufficient biomechanical outcomes relevant to the production of kicking
accuracy, there appear to be several studies which have examined the physiological
influence of acute and longer-term fatigued states on the subsequent generation of kicking
accuracy and kicking technique (Coventry et al, 2011; Young et al, 2010; Kellis, Katis &
Vrabas, 2006; McMorris, Gibbs, Palmer, Payne & Torpey, 1994). While acute fatigue
appears to facilitate kicking accuracy in response to a proposed heightening of arousal
levels (Young et al, 2010; Royal et al, 2006; Lyons, Al-Nakeeb & Nevill, 2006), longer-
term fatigued states appear to considerably diminish and impair kicking accuracy, creating
a breakdown in technique, and an increase in relative muscular exertion (Coventry et al,
2011; Kellis et al, 2006; Lyons et al, 2006; McMorris et al, 1994). Since football matches
often entail continual bouts of repeated high intensity activities over prolonged durations
(Coventry et al, 2011; Wisbey, Montgomery, Pyne & Rattray, 2010; Young et al, 2010), it
would appear more probable that kicking accuracy would be further hampered by fatigue as
games progress into later stages, however, an interaction between higher levels of
endurance-based fitness and improved tolerance to physiological game-based stress has

30
been shown (Young et al, 2010), implicating fitness as a key component to protect against
skill impairment, however further research is necessary.
Despite the positive influence of strength and conditioning programs on the production and
enhancement of kicking distance (Young & Rath, 2011), there appear to be no studies in
the literature examining the ways in which strength and conditioning interventions might
be-able to facilitate and improve kicking accuracy. This seems rather counterintuitive
considering the obvious importance of kicking accuracy in football sports, which are
entirely reliant on efficient ball progression and frequent scoring sequences to generate
successful game-based outcomes. In particular, modifying the quantity and quality of body
mass within an athlete can have a profound impact on the subsequent strength levels and
biomechanical strategies used to generate successful performances (Malina & Geithner,
2011; Nevill et al, 2009; Jones, Bishop, Woods & Green, 2008; Perez-Gomez et al, 2008b;
Gissis et al, 2006; Loucks, 2004), and may potentially be-able to positively influence
kicking accuracy in football sports.
For example, increasing the overall mass of the kicking leg should enable an equivalent
distance to be achieved at a proportionately lower foot velocity. As motor control theory
promotes an evident trade-off between speed of movement and accuracy outcomes
(Nagengast, Braun & Wolpert, 2011; Beilock, Bertenthal, Hoeger & Carr, 2008; Magill,
2008), this might be one potential method to increase kicking accuracy. Another example
might include increasing the overall mass of the support leg, as this might heighten athletic
stability during the dynamic unipedal task of kicking (Burkett, 2010; Dichiera et al, 2006;
Paillard et al, 2006), which could also increase the likelihood of accurate outcomes. Lastly,

31
increasing the quantity of lean mass and lower limb strength might enable a reduced
mechanical effort for a given distance; honouring the theory of impulse-variability by
utilising less percentage of the motor unit pool and lower relative muscular impulses to
achieve greater limb control (Urbin et al, 2011; Schmidt & Lee, 2005) and therefore may
potentially improve kicking accuracy. These examples provide only a basic insight into the
many possible benefits resistance training may provide to enhance kicking performance,
highlighting the need for further research and comprehensive investigation in this area.
2.6. Summary
The kicking action is a defining skill in football sports (Lees et al, 2010; Ball, 2011;
Sterzing & Hennig, 2008). Therefore, the ability to kick accurately over longer distances to
intended targets is highly desirable, however, few scientific investigations have described
the whole-body interactions of the skill, or the manner in which physiological, strength-
based, or skill-based interventions may optimise performance.
This literature review has identified many potential areas of interest for future researchers
and practitioners alike, specifically concerning the kicking landscape, with a focus on the
drop punt kick. In particular, few formal scientific analyses have been produced to
investigate whole-body three-dimensional biomechanical interactions, including the
behaviour of the upper body (head, trunk, ipsilateral arm and contralateral arm); movement
co-ordination of upper body segments concurrently with lower body segments;
contributions of the support leg to foot velocity production and athletic stabilisation; ball
drop and contact characteristics; as well as the inherent differences between these
interactions when accounting for skill level, technical proficiency, or performance

32
outcomes. For example, biomechanical strategies when kicking for distance will differ from
such strategies when kicking for accuracy. In addition, biomechanical strategies when
kicking at player targets will differ from adopted strategies when kicking at goals targets;
even though both requirements have accuracy constraints, and these also require due
consideration.
An evident theme within this literature review illustrates a great lack of understanding as to
how physical conditioning practices influence kicking performance. While there is an
evident role for strength and power training towards the generation of kicking distance,
there is a notable absence of research investigating the manner in which the strength and
muscularity profiles of athletes might influence kicking accuracy. The focus of this thesis
aims to extend the knowledge in this particular area, as a tool to see whether strength and
muscularity profiles of athletes can have positive outcomes for kicking performance, which
may lay the foundation for future longitudinal, intervention based studies.

33
CHAPTER THREE – STUDY ONE
A STANDARDISED IN-VIVO METHOD TO IDENTIFY AND ASSESS
APPENDICULAR SEGMENTAL MASS USING DUAL ENERGY X-RAY
ABSORPTIOMETRY (DEXA).
SPORTS BIOMECHANICS
(IN REVIEW, JANUARY 2012).
Nicolas H. Hart, Sophia Nimphius, Jodie L. Cochrane, Robert U. Newton

34
3.0. Abstract
The popularity of DEXA has intensified in recent times, becoming a mainstream
tool used to accurately and reliably determine body segment parameters and body
composition components. While whole body scan models separate the body into axial and
appendicular regions, there is a need for a standardised appendicular model to further
segmentate the upper and lower extremities. This paper provides a method with clear and
transparent subject positioning guidelines; a standardised appendicular segmentation
model; and clear post-processing regional analysis procedures. To assess methodological
reliability, whole body scans were performed on 15 professional football athletes (age: 21.1
± 3.3 years; mass: 80.6 ± 8.3 kg; height: 1.81 ± 0.07 m; BMI: 24.4 ± 1.3), with all scans
analysed twice by the main investigator on separate days, and by a second investigator a
week following the original analysis. The method presented in this study produced very
high intra-tester reliability (CV ≤ 2.6%; ICC ≥ 0.941) and very high inter-tester reliability
(CV ≤ 2.4%; ICC ≥ 0.961), demonstrating very high methodological reproducibility within
and between researchers. It is therefore strongly recommended that future studies using
DEXA technology to determine body segment parameters and body composition
components utilise the methodological procedure outlined in this paper.

35
3.1. Introduction
The accuracy of biomechanical models and human movement data largely relies on
obtained mechanical values to estimate and replicate the true anatomical structure of its
subjects (Durkin, Dowling & Andrews, 2002; Lee, Koh, Fang, Le & Balasekaran, 2009a;
Pearsall & Costigan, 1999; Pearsall & Reid, 1994; Rao, Amarantini, Berton & Favier,
2006). In particular, body segment parameters and body composition components provide
important data for biomechanists and exercise physiologists in the analysis of human
movement and health status in both sporting and clinical contexts (Dumas, Cheze &
Verriest, 2007; Lee et al., 2009a; Peiffer et al., 2010; Pearsall & Reid, 1994; Rao et al.,
2006). More specifically, segmental anthropometric parameters are routinely estimated for
use within inverse dynamics equations in order to calculate intersegmental forces and net
joint moments during gait, kicking, throwing and striking actions (Davids, Lees & Burwitz,
2000; Ganley & Powers, 2004a; Ganley & Powers, 2004b; Lee, Le, Fang & Koh, 2009b;
Pearsall & Costigan, 1999; Putnam, 1993; Putnam, 1991; Rao et al., 2006), while
composite mass assessments are used to diagnose and monitor health status and changes in
paediatric, athletic, adult and geriatric populations (Abrahamyan, Gazarian & Braillon,
2008; Beaumesnil et al, 2011; Bridge et al, 2009; Fawzy et al, 2011; Miller et al, 2009;
Peiffer et al., 2010; Veale, Pearce, Buttifant & Carlson, 2010).
Body segment parameters, including segmental mass, length, centroids and moments of
inertia (Durkin et al., 2002; Lee et al., 2009a); have historically been generated from
predictive linear and non-linear equations obtained from human cadavers (de Leva, 1996;
Dumas et al., 2007; Hinrichs, 1990; Hinrichs, 1985; McConville, Churchill, Kaleps,
Clauser & Cuzzi, 1980). However, these measures are limited by assumptions of mass

36
uniformity amongst all subject populations (Dumas et al., 2007; Durkin et al., 2002; Reid &
Jensen, 1990), providing a distinct lack of external validity (Pearsall & Reid, 1994), thus
prompting researchers to seek more pragmatic and accurate methods of determining body
segment parameters and body composition components within living humans (Mungiole &
Martin, 1990).
Advancements in technology have enabled scientists to investigate modern in-vivo
techniques, such as magnetic resonance imaging (Bridge et al., 2009; Martin, Mungiole,
Marzke & Longhill, 1989; Mungoile & Martin, 1990; Pearsall, Reid & Ross, 1994),
computed tomography imaging (Huang & Suarez, 1983; Huang & Wu, 1976; Pearsall, Reid
& Livingston, 1996), stereo-photogrammetry (Ackland, Blanksby & Bloomfield, 1988;
Jensen, 1986; Jensen, 1978), gamma-mass scanning (Zatsiorsky & Seluyanov, 1985) and
ultrasound (Lee et al., 2009a; Milburn, 1991). While these measures provide accurate
representations of body segment parameters and body composition components (Durkin et
al., 2002), the inherent radiation, cost, time commitment and scarce availability of
equipment has limited the practicality and industry support of such measurement
techniques (Martin et al., 1989; Pearsall & Reid, 1994). This highlights the need for safer,
more time-efficient and cost-effective assessment tools (Durkin et al., 2002; Peiffer et al.,
2010).
In recent times, a two-dimensional in-vivo imaging technique known as dual energy x-ray
absorptiometry (DEXA) has been used to capture full body projections of mass densities
through x-ray technology (Durkin et al., 2002; Peiffer et al., 2010). In comparison with
previous imaging techniques, it is inexpensive, exposes the participant to substantially less
radiation, is widely available for use, and produces less than 3.2% error when employed to

37
ascertain body segment parameter measures (Durkin & Dowling, 2006; Heymsfield et al.,
1990; Lee et al., 2009a; Pietrobelli, Formica, Wang & Heymsfield, 1996). Dual energy x-
ray absorptiometry functions by emitting two collimated x-ray beams of alternating
frequencies that passes through the individual being scanned (Durkin et al., 2002; Hologic,
2004). The resulting attenuation coefficients are used within a two-compartment model to
differentiate between bone, fat and lean tissue mass (Ganley & Powers, 2004a; Ganley &
Powers, 2001; Pietrobelli et al., 1996). On completion, the scan creates a pixel-by-pixel,
two-dimensional reconstruction of the subject allowing regional analysis to be performed
(Lee et al., 2009b; Ganley & Powers, 2004b).
Presently, full body scans utilise mandatory predefined regions as per a standardised whole
body model which separates the subject into axial and appendicular sections (Durkin et al.,
2002; Heymsfield et al., 1990). This provides useful information when assessing the whole
body in its entirety. However, the determination of body segment parameters and localised
composite measures requires more specific regions to be identified (Lee et al., 2009a;
Ganley & Powers, 2004a). In particular, there is a need for further segmentation of the
upper and lower extremities of the appendicular skeleton to differentiate the upper arm,
forearm, hand, thigh, shank and foot segments. Due to DEXA’s capability to accurately
quantify the mass of defined regions (Glickman, Marn, Supiano & Dengel, 2004; Haarbo,
Gotfredsen, Hassager & Christiansen, 1991; Kohrt, 1998; Lee et al., 2009b), it is the two-
fold purpose of this paper to: 1) present a standardised methodological approach to assess
and analyse in-vivo appendicular segmental mass; and 2) determine the between-day intra-
tester and inter-tester reliability of the proposed regional boundaries and segmental cross-
sections using DEXA technology.

38
3.2. Methods
3.2.1. Subjects
Fifteen professional football athletes (age: 21.1 ± 3.3 years; mass: 80.6 ± 8.3 kg; height:
1.81 ± 0.07 m; BMI: 24.4 ± 1.3) were recruited for participation in this study, with specific
segmental mass characteristics provided in Table 1. All subjects were absent of injury and
contraindication, and were required to wear clothing free of metallic material. Ethics
approval was obtained from the human research ethics committee of Edith Cowan
University. Subjects were notified of potential risks, and provided written informed
consent. Standing height was recorded to the nearest 0.1 centimetre using a wall-mounted
stadiometer, with body mass recorded to the nearest 0.1 kilogram using a standard
electronic weighing scale.
3.2.2 Scan Procedure
Whole body scans were performed using dual energy x-ray absorptiometry (DEXA, QDR-
1500; Hologic Discovery A, Waltham, MA) in order to determine the magnitude and
quality of full body mass distribution (fat, lean and total). In accordance with body
positioning instructions outlined by Hologic’s whole body model (Hologic, 2004), subjects
assumed a stationary, supine position on the scanning bed with both arms pronated by their
side, and hands facing the table. To ensure consistent and reproducible body positioning,
the DEXA operator manually assisted subjects in order to straighten their head, torso and
pelvis; internally rotate and fixate their legs and feet at 45°; and position their arms next to
the body within the DEXA scanning zone (Figure 1). This has been shown to produce a
scan/re-scan coefficient of variation below 1% in our laboratory for body composition
components (Peiffer et al., 2010).

39
Table 1. Subject characteristics of appendicular segmental mass for the upper and lower limbs
LEFT SEGMENTS
Upper Arm Forearm Hand Whole Arm
Lean (g) 2855.7 ± 354.6 1153.0 ± 99.0 416.8 ± 36.1 4425.5 ± 465.3
Fat (g) 338.6 ± 83.9 110.7 ± 22.2 49.9 ± 16.5 499.2 ± 112.3
Total (g) 3194.3 ± 414.0 1263.6 ± 113.2 466.7 ± 44.1 4924.6 ± 542.8
Thigh Shank Foot Whole Leg
Lean (g) 8141.7 ± 990.6 2971.9 ± 259.8 818.3 ± 113.6 11931.9 ± 1221.9
Fat (g) 1156.3 ± 369.6 362.4 ± 126.4 120.3 ± 63.3 1639.0 ± 508.2
Total (g) 9298.0 ± 1243.8 3334.4 ± 333.1 938.6 ± 97.2 13571.0 ± 1558.4
RIGHT SEGMENTS
Upper Arm Forearm Hand Whole Arm
Lean (g) 3064.9 ± 376.6 1203.1 ± 98.4 407.4 ± 46.5 4675.4 ± 471.8
Fat (g) 355.0 ± 77.9 114.3 ± 25.9 69.2 ± 26.7 538.5 ± 104.2
Total (g) 3419.9 ± 432.5 1317.3 ± 117.0 476.6 ± 46.9 5213.9 ± 548.0
Thigh Shank Foot Whole Leg
Lean (g) 8200.7 ± 924.2 2946.1 ± 292.2 794.8 ± 138.2 11941.6 ± 1180.6
Fat (g) 1175.1 ± 380.4 403.8 ± 97.0 161.3 ± 99.4 1740.2 ± 511.0
Total (g) 9375.9 ± 1205.3 3349.9 ± 354.6 956.1 ± 100.8 13681.8 ± 1565.5
Note: Values are expressed as mean ± SD.
37

40
Figure 1. A frontal and side view of correct subject positioning on the scan bed, showing the positioning device used to internally rotate each
thigh.
40

41
3.2.3. Scan Analysis
Using the in-built scan analysis software (Version 12.4; QDR for Windows, Hologic,
Waltham, MA), the scanned full body images were separated into eighteen segments. Six
segments were predefined by Hologic’s standard whole body model (Table 2), as the head,
trunk, left arm, right arm, left leg and right leg regions, as illustrated in Figure 2a. Eight
segments were created using the sub-region analysis tool in order to further define the left
forearm, left hand, right forearm, right hand, left shank, left foot, right shank and right foot
regions as outlined in Table 3. The remaining four segments, defined as the left upper arm,
left thigh, right upper arm and right thigh regions were then determined using the residual
segments located between the proximal boundary of the entire limb defined by the whole
body model, and the proximal boundary of the distal segments defined sub-region analysis
as seen in Figures 2b and 2c. The anatomical boundaries used for these newly created sub-
regions were developed in conjunction with Dempster’s body segment parameter
boundaries for 2D studies (Winter, 1990).
Table 2. Standard whole-body cross-sections as defined by Hologic’s whole body model
(Hologic, 2004).
Region Anatomical Cross-sections Direction of line Number of lines
Head Base of Mandible (cervical region) Horizontal 1
Trunk Peak of Iliac Crest (lumbar region) Horizontal 1
Spine Lateral boundaries of vertebrae Vertical 2
Arms Glenohumeral Joint Diagonal 2
Legs a Femoral Neck
a Diagonal 2
a Mass of pelvis is not included

42
Table 3. Proposed appendicular cross-sections for each segment, with proximal and distal boundaries and descriptive landmarks.
Segment / Region Proximal boundary Distal boundary Basic description a
Upper Arm
Glenohumeral Joint
Humeroulnar Joint
Commences between the head of the Humerus and glenoid fossa of the
Scapula, separating the upper arm from the trunk; Ending at the elbow axis,
noted by the trochlea of the Humerus and olecranon process of the Ulna.
Forearm Humeroulnar Joint Ulnocarpal Joint Commences at the elbow axis (described above); Ending through the wrist
axis, noted by the styloid process of the Ulna, and the base of the Pisiform,
Lunate and Scaphoid carpal bones.
Hand Ulnocarpal Joint Distal Phalanges Commences through the wrist axis (described above); Ending at the most
distal point of the phalanges of the hand.
Thigh b
Femoral Neck b
Tibiofemoral Joint
Commences superior to the greater trochanter of the Femur, crossing the
femoral neck, separating the thigh from the pelvis; Ending through knee
axis, noted as the ‘tibial plateau’ (space between the femoral and tibial
condyles).
Shank Tibiofemoral Joint Talocrural Joint Commences through the knee axis (described above); Ending through the
ankle junction, noted as the articulation between the Talus, Tibia and
Fibula, spanning beneath the medial and lateral malleoli.
Foot Talocrural Joint Distal Phalanges Commences through the ankle junction (described above); Ending at the
most distal point of the phalanges of the foot.
a Further boundary description and instruction is provided in Section 2.3.1 and Section 2.3.2
b Mass of pelvis is not included
42

43
3.2.3.1. Whole Body Model
Scan analysis commences by applying the mandatory, predefined whole body model as
required for the scan analysis software (Hologic, 2004). This is achieved by adjusting the
pre-supplied zones on the scan image (Figure 2a) to accurately separate the axial skeleton
from the appendicular skeleton as per details provided in Table 2. In particular, the whole
body model separates the head, arms and legs from the trunk; while also isolating the spine
and pelvis as separate entities. Of importance to the appendicular model, is the separation
of the arms and legs from the trunk at their most proximal points; the glenohumeral joint
and femoral neck respectively, as this has subsequent implications for segmental analysis.
3.2.3.2. Appendicular Model.
The upper and lower extremities can each be separated into three key segments. Using the
sub-region analysis tool in conjunction with the previously defined extremities in the whole
body model, these segments can easily be assessed. Using a distal-to-proximal approach,
sub-regions should be created to separate and capture the forearms, hands, shanks and feet
of the extremities, totalling eight sub-regions (see Figure 2b for an example). The upper
arm and thigh segments do not require their own sub-regions as these segments are able to
be represented by the residual regions of mass which are yet to be specifically defined by
either whole body or sub-region boundaries (Figure 2b).
Therefore, in order to calculate the upper arm region, the summation of composite mass of
the forearm and hand (assessed using sub-regions) can be deducted from the whole arm
(assessed using the whole body model): Upper arm = total arm – [forearm + hand]. Using
the example data provided in Table 4, the total mass of the right upper arm would equate to

44
2827.3 grams, calculated as: 4554.4 – [ 1232.8 + 494.3 ]. Similarly, the thigh region is also
calculated by using the same process; deducting the summation of the shank and foot mass,
from the whole leg: Thigh = total leg – [shank + foot]. Using the example data provided in
Figure 3, the total mass of the left thigh would equate to 7946.5 grams, calculated as:
12183.3 – [ 3291.1 + 945.7 ]. While the researcher may opt to specifically create new sub-
regions to define the upper arms and thighs using the specifications in Table 3, the process
itself is not a requirement of the appendicular model.
3.2.4. Sub-region Creation
During the sub-region creation and positioning process, zones can be repositioned and
manipulated by modifying the line length, angle and location of boundaries; providing
investigators with full sub-region customisation. Therefore, when adjusting the proximal
and distal boundaries of a sub-region, consideration must be given to the manner in which
the line crosses the specified joint. In particular, the boundary line must: 1) dissect the joint
at its centre, 2) capture all bones within the segment, and 3) not encroach on other sub-
regions. This means the line is positioned at the point of articulation, and is angled to
correspond with the most medial and lateral limits of the articulation. Additionally, the
proximal boundary of the distal segment must be drawn to commence at the same location
as the distal boundary of the proximal segment, specific to line direction, length and angle
(Figure 2b). These factors are important as composite mass is assigned to the scan image on
a pixel-by-pixel basis (Lee et al., 2009b; Ganley and Powers, 2004b). This enables the
prevention of regional loss or overlap, protecting against inflated or deflated segment
outputs, while enabling consistent standards for analysis across scans (Dumas et al., 2007).
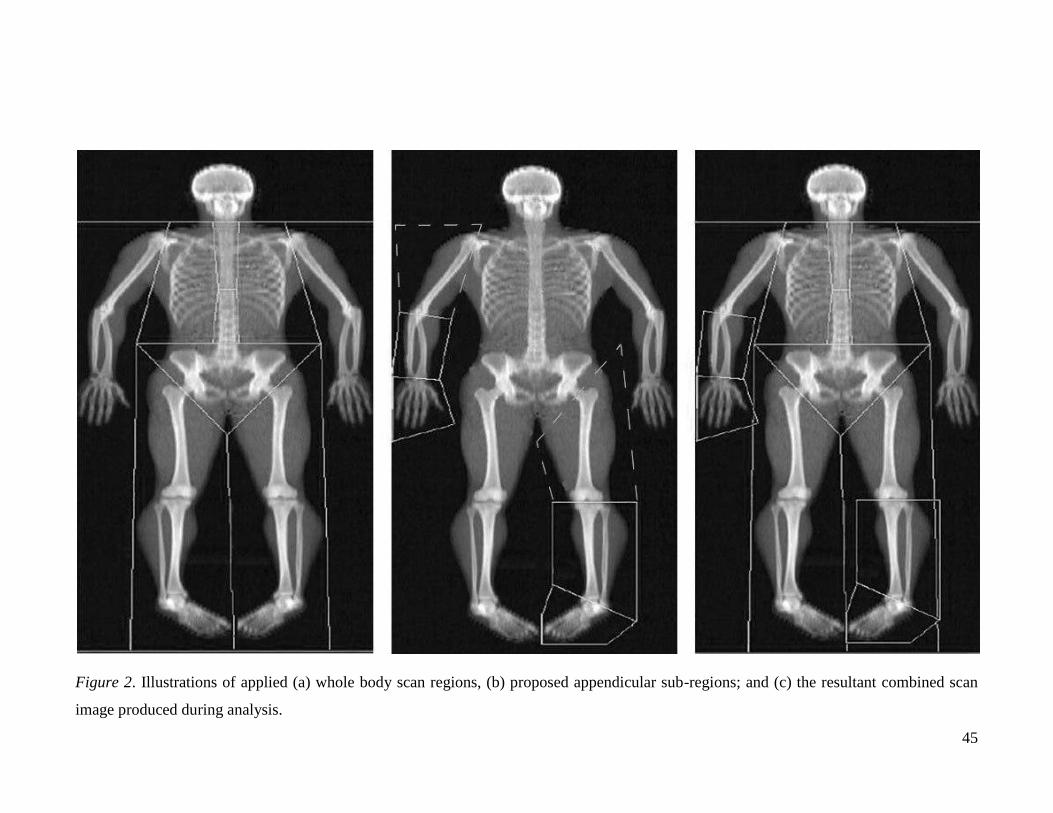
45
Figure 2. Illustrations of applied (a) whole body scan regions, (b) proposed appendicular sub-regions; and (c) the resultant combined scan
image produced during analysis.

46
Table 4. Example results provided by DEXA, showing the whole body model outputs (top) and appendicular model outputs (bottom).
Region BMC (g) Fat (g) Lean (g) Lean+BMC (g) Total Mass (g) % Fat
L Arm 196.76 389.9 3698.9 3895.6 4285.5 9.1
R Arm 212.82 442.6 3899.0 4111.8 4554.4 9.7
Trunk 794.67 1991.1 28261.0 29055.7 31046.8 6.4
L Leg 542.09 1104.0 10537.2 11079.3 12183.3 9.1
R Leg 533.86 1103.9 10877.4 11411.3 12515.2 8.8
Subtotal 2280.20 5031.4 57273.5 59553.7 64585.2 7.8
Head 424.96 890.2 3134.6 3559.5 4449.8 20.0
TOTAL 2705.16 5921.7 60408.1 63113.2 69034.9 8.6
Sub-Region BMC (g) Fat (g) Lean (g) Lean+BMC (g) Total Mass (g) % Fat
L Shank 221.45 360.4 2709.3 2930.7 3291.1 11.0
R Farm 71.89 80.7 1080.2 1152.1 1232.8 6.5
L Foot 68.32 77.6 799.8 868.1 945.7 8.2
R Hand 28.26 116.8 349.3 377.6 494.3 23.6
TOTAL 386.67 634.4 4929.9 5316.6 5951.0 10.7
46

47
All fifteen scans were analysed twice by the same investigator on separate days, and were
re-analysed by a second investigator a week following the initial analysis. All investigators
were required to follow the sub-region analysis method described above in order to assess
the between-day intra-tester and inter-tester reliability for the newly created appendicular
sub-regions.
3.2.5. Statistical Analysis
Body composition outputs were categorised into fat mass (g), lean mass (g) and total mass
(g) values for each of the proposed sub-regions for all scans and subjects using Microsoft
Excel (Microsoft, Redmond, WA). Between day intra-tester and inter-tester reliability were
assessed by calculating the coefficient of variation (CV) and intraclass correlation
coefficient (ICC) using a statistical analysis package (SPSS, Version 17.0; Chicago, IL).
The strength of relationship for ICC coefficients was classified in accordance with Hopkins
(2002): r ± 0.3 is moderate; r ± 0.5 is strong; r ± 0.7 is very strong; r ± 0.9 is nearly perfect;
and r ± 1.0 is perfect. Coefficients of variation below 5% (CV ≤ 5%) are considered highly
reliable, as described by Hopkins (2002; 2000).
3.3. Results
3.3.1. Intra-tester Reliability
Reliability statistics for between day, intra-tester scan analysis across all appendicular
segments are presented in Table 5. Between day, sub-region processing / re-processing
reliability for all body composition components was very high, with all CV percentages
below 2.6%, 2.3% and 2.3% for fat, lean and total mass respectively, between appendicular

48
segments on both dominant and non-dominant limbs. Nearly perfect intra-tester reliability
was additionally confirmed with ICC figures all above 0.993, 0.941 and 0.949 for fat, lean
and total mass respectively.
3.3.2. Inter-tester Reliability
Reliability statistics for inter-tester analysis are presented in Table 6. Sub-region processing
reliability between testers for all body composition components was very high with all CV
percentages below 2.4%, 2.3% and 2.3% for fat, lean and total mass respectively. Nearly
perfect inter-tester reliability was additionally confirmed with all ICC figures above 0.994,
0.947 and 0.961 for fat, lean and total mass components respectively. This demonstrates
high levels of reproducibility between testers.
Table 5. Intra-tester, between day reliability coefficients for all newly created sub-region
segments of the appendicular skeleton across all composite mass outputs.
Region Fat (g) Lean (g) Total (g)
CV (%) ICC (R) CV (%) ICC (R) CV (%) ICC (R)
Left Forearm 1.6 0.994 1.5 0.971 1.7 0.967
Left Hand 1.5 0.998 1.5 0.970 1.5 0.996
Right Forearm 2.1 0.993 2.1 0.941 2.2 0.949
Right Hand 2.6 0.996 2.3 0.957 2.3 0.956
Left Shank 1.5 0.998 0.8 0.992 0.9 0.993
Left Foot 2.2 0.997 1.5 0.990 1.4 0.982
Right Shank 1.2 0.998 0.8 0.993 0.8 0.994
Right Foot 1.5 0.999 1.9 0.989 1.8 0.972

49
Table 6. Inter-tester reliability coefficients for all newly created sub-region segments of the
appendicular skeleton across all composite mass outputs.
Region Fat (g) Lean (g) Total (g)
CV (%) ICC (R) CV (%) ICC (R) CV (%) ICC (R)
Left Forearm 2.2 0.994 2.2 0.947 2.3 0.973
Left Hand 2.4 0.997 2.3 0.952 2.2 0.961
Right Forearm 1.6 0.996 1.5 0.974 1.5 0.977
Right Hand 1.9 0.998 1.7 0.978 1.7 0.967
Left Shank 0.5 1.000 0.5 0.997 0.5 0.997
Left Foot 2.1 0.997 1.7 0.986 1.8 0.974
Right Shank 1.1 0.998 0.7 0.995 0.9 0.996
Right Foot 1.3 0.996 1.8 0.983 1.7 0.979
3.4. Discussion
Despite biomechanical and physiological relevance, precise quantifications of segmental
inertial properties and composite measures of the appendicular skeleton remain largely
inadequate (Durkin & Dowling, 2006; Heymsfield et al., 1990; Wells, 2009). While current
in-vivo techniques provide broad insight into axial and appendicular regions (Fuller,
Laskey & Elia, 1992; Heysmfield et al., 1990; Visser, Fuerst, Lang, Salamone & Harris,
1999), no definitive boundaries have been reliably described and validated to further
distinguish between individual segments of the upper and lower extremities using scan
technology. Several authors have used dual energy x-ray absorptiometry to further define
appendicular segments (Durkin & Dowling, 2006; Ganley & Powers, 2004a; Ganley &

50
Powers, 2004b; Lee et al., 2009a; Lee et al., 2009b; Visier et al., 1999), however,
concerning methodological inconsistencies exist in the literature pertaining to exact subject
positioning and segmental boundaries employed during the scan completion and analysis
process.
To address this notable deficiency, the aim of this study was: 1) to propose a standardised
methodological approach to assess and analyse in-vivo appendicular segmental mass; and
2) to determine the between-day intra-tester and inter-tester reliability of our proposed
segmental cross-sections. When adopting the subject positioning and regional analysis
procedures outlined in our methodology, the results of this study demonstrate very high
reliability. In particular, the scan-rescan coefficient of variation (CV) for the subject
positioning protocol used for this study has routinely produced a score below 1% (Peiffer et
al, 2010), with intra-tester and inter-tester CV scores all valued below 3% and ICC scores
all above 0.941; well within acceptable limits (Hopkins, 2002). The presented method of
this study therefore responds to the need for greater methodological reproducibility,
transparency and consistency to ensure that reported values are truly comparable between
research (Hopkins, 2000), particularly as body segment parameters obtained using DEXA
technology can be used within biomechanical models that are potentially sensitive to data
input fluctuations (Ganley & Powers, 2004a; Lee et al., 2009b; Lenzi et al., 2003; Pearsall
& Costigan, 1999; Rao et al., 2005).

51
To date, previous research has employed a variety of different subject positioning protocols
when using DEXA for whole body scans. While subjects in all studies have adopted lying,
supine positions, there is a lack of consistency within the literature regarding the selected
positioning of upper and lower extremities (Table 7). This creates a specific problem when
using DEXA, as the measurement process is only able to directly quantify fat and fat-free
mass where bone is not present (Wells, 2009), relying on estimation equations to indirectly
fulfil the remaining composition parameters (Pietrobelli et al., 1999; Wells, 2009). As a
result, the precise frontal plane surface area of the upper and lower extremities becomes
critically important to the DEXA operator, and the subsequent accuracy of data outputs.
Currently only two studies assessing appendicular segmental mass have described their
upper extremity positioning protocol (Durkin & Dowling, 2003; Durkin & Dowling, 2002),
placing their subject’s arms by their side, in pronation, with their hands facing the scanning
bed. This is in agreement with the proposed methodology of this paper. However, precise
descriptions of lower extremity positioning are equally as scarce and conflicting. Ganley
and Powers (2004a; 2004b) placed both legs into external rotation with feet in maximal
plantarflexion; Durkin and Dowling (2006) positioned both legs neutrally with feet in slight
dorsiflexion; while Lee and colleagues (2009a; 2009b) presented scan images showing
internal rotation of both legs with neutral foot position; and several authors did not disclose
or demonstrate any subject positioning procedures used within their studies (Table 7). This
increases the likelihood of positional discrepancies amongst research in this area.
Positioning of the lower extremities reported in, and recommended by this study is in
agreement with that used by Lee and colleagues (2009a; 2009b).

52
Table 7. Review and comparison of subject positioning, segment boundaries, and reliability data between studies determining appendicular
segments using DEXA technology.
Author(s) Year Subject Positioning Segment Boundaries Reliability
Lee &
colleagues
2009b
Lying, supine position. No upper or
lower limb position specifications
were provided.
Segmental boundaries for upper and lower
body segments were used. No anatomical
descriptions were provided. A scan image
with segmentation locations was supplied.
No reliability data was
reported in this paper.
Lee &
colleagues
2009a Lying, supine position. No upper
or lower limb position
specifications were provided.
Segmental boundaries for upper and lower
body segments were used. No anatomical
descriptions were provided. A scan image
with segmentation locations was supplied.
No reliability data was
reported in this paper.
Durkin &
Dowling
2006 Lying, supine position with knees
extended, and feet in slight
dorsiflexion. No upper limb
specifications provided.
Shank segmental boundaries used, as
described by Durkin & Dowling (2003).
No reliability data was
reported in this paper.
Ganley &
Powers
2004b Same procedures as described in
Ganley & Powers (2004a).
Lower limb segmental boundaries (Thigh,
Shank, Foot), as described by Dempster b
No reliability data reported.
This study used methods
determined as reliable in
Ganley & Powers (2004a).
49
52

53
Ganley &
Powers
2004a Lying, supine with lower
extremities in external rotation and
maximum plantarflexion. No upper
limb specifications were provided.
Lower limb segmental boundaries (Thigh,
Shank, Foot), as described by Dempster b
Between-day scan analysis
on five scans, producing a
CV range of 0.4% to 6.0%,
with a mean CV score of
2.0%.
Durkin &
Dowling
2003 Lying, supine, with palms facing
the table. No lower limb
specifications provided.
Upper limb (Forearm, Hand) and lower
limb (Thigh, Shank, Foot) segmental
boundaries were described using
customised anatomical landmarks to
segment regions.
No reliability data was
reported in this paper.
Durkin &
Dowling
2002 Lying, supine, with forearms
pronated, palms facing table. No
lower limb specifications were
provided.
No specific description or reference to
identify segmental boundaries used.
No reliability data was
reported in this paper.
Ganley &
Powers
2001 a No subject positioning details were
reported in this abstract.
Lower limb segmental boundaries (Thigh,
Shank, Foot), as described by Dempster b
No reliability data was
reported in this abstract.
Visser &
colleagues
1999 No subject positioning details were
described in this paper.
Only the whole leg and thigh regions were
described, using a horizontal line through
the ischial tuberosity, the knee joint, and
the ankle joint as anatomical locations for
boundary identification.
No reliability data was
reported in this paper.
a Conference abstract only.
b Dempster (1955).

54
The advantages of internally rotating the thigh whilst maintaining neutral foot position is
three-fold: 1) It maximises the available surface area of fat and fat-free mass of the thigh,
shank and foot segments in the frontal plane during the scanning process; 2) provides
greater visibility of the calcaneus, talocrural joint and associated landmarks (Table 3) to
enhance visibility and zoning precision during post-processing regional analysis; and 3)
allows the operator to suitably fixate the subjects feet together to prevent unwarranted
movement or disruption during the scanning process. As DEXA technology is only capable
of measuring uniplanar, two-dimensional projections (Durkin et al., 2002; Durkin and
Dowling, 2003; Lee et al., 2009b; Pietrobelli et al., 1996; Wells, 2009); any inconsistencies
in subject positioning, or unwarranted movement during the scan will subsequently modify
the resultant scan image and data outputs generated, particularly when composite mass has
been redistributed, dually effecting post-processing regional analysis.
Post-processing regional analysis is reliant upon, and a product of, subject positioning
during the scanning process. As composite mass is assigned to the scanned image on a
pixel-by-pixel basis (Ganley & Powers, 2004b; Lee et al., 2009a), it is influenced by the
quantity and distribution of mass viewable in the frontal plane (Durkin et al., 2002; Lee et
al., 2009b). Regional boundaries are subsequently applied to the resultant two dimensional
scan image (Figure 2) in order to define the limits of each area for analysis, as per criteria
outlined using predefined whole body models (Hologic, 2004). Presently, no model exists
for appendicular segmental analysis of the upper and lower extremities using DEXA
technology. Several authors have attempted to differentiate between segments of the
extremities using DEXA; however, inconsistencies exist in the literature regarding selected
anatomical locations for body segmentation.

55
While all authors assessing appendicular mass have segmented the lower extremities using
varying regional descriptors, only two authors have reported written or graphical upper
extremity boundaries (Lee et al, 2009b; Durkin & Dowling, 2003). Ganley and Powers
(2004a; 2004b; 2001) defined lower body segmental boundaries using those described by
Dempster (1955); Durkin and Dowling (2003; 2006) and Vissier and colleagues (1999)
reported their own unique sets of segmental definitions; while Lee and colleagues (2009a;
2009b) provided only graphical image depictions of their regional end-points with no
precise anatomical descriptions or landmarks. These differences in methodological
reporting (graphical versus written) and segmental zoning between studies identify a
notable lack of homogeneity between there precise applications of anatomical cross-
sections to scanned images. This further highlights the need for a standardised and
established appendicular model. The upper and lower body segmental boundaries
recommended within the framework of this study (Figure 2; Table 3) are in agreement with
those used by Ganley and Powers (2004a; 2004b; 2001) and Dempster (1955).
While Ganley and Powers (2004a, 2004b, 2001) only applied segmentations to the lower
limbs, their use of Dempster’s two-dimensional body segment data (Dempster, 1955;
Winter, 1990) provides a suitable and stable reference for expansion to the upper body
segments. Ganley and Powers (2004a) employment of Dempster’s data is supported by
their ability to reliably determine lower body segments using DEXA technology, reporting
a between-day intra-tester coefficient of variation (CV) ranging between 0.4 - 6.0%, with
an average of 2.0%. No other known authors assessing appendicular segmental mass have
reported any reliability data of their methods. In agreement with Ganley and Powers

56
(2004a) reliability data, our proposed upper and lower body segmentation method produced
very high between-day reliability within and between researchers (intra-tester and inter-
tester) for all upper and lower body segments. The reliability data provided by our
methodological process produced an improved CV range between 0.5 – 2.6%, and an
intraclass correlation coefficient (ICC) range between 0.941 – 1.000.
Noteworthy points of distinction between this study to prior studies are considerable, and
include: a written explanation, graphical illustration and photograph of subject positioning;
written descriptions and graphical illustrations of regional boundaries for all upper and
lower appendicular sub-regions; and the determination of methodological and researcher
reliability for scan analysis procedures. This aims to ensure that all procedures are
reproducible and outcomes are comparable across the future research landscape.
In conclusion, this study provides researchers with a standardised, structured, and reliable
model to assess in-vivo appendicular segmental mass using DEXA technology. It is
recommended that future research using DEXA technology to assess appendicular
segments adhere to the guidelines provided in this paper. It is further recommended that
future research focus on technological advancements, with a vision towards vertical 3D
scanning and shape analysis solutions. This will have greater specificity towards subject
mass distribution against gravity in an upright position, and will allow such measures to
transcend across more than one plane of vision.

57
3.5. References
Abrahamyan, D. O., Gazarian, A., & Braillon, P. M. (2008). Estimation of stature and
length of limb segments in children and adolescents from whole-body dual-energy
X-ray absorptiometry scans. Pediatric Radiology, 38(3), 311-315.
Ackland, T. R., Blanksby, B. A., & Bloomfield, J. (1988). Inertial characteristics of
adolescent male body segments. Journal of Biomechanics, 21(4), 319-327.
Beaumesnil, M., Chaillou, E., Wagner, A. C., Rouquette, A., Audran, M., & Ginies, J. L.
(2011). Body composition analysis in patients with cystic fibrosis. Comparison of 3
methods: dual energy x-ray absorptiometry, bioelectrical impedance analysis, and
skinfold measurements. Archives of Paediatrics, 18(4), 370-375.
Bridge, P., Pocock, N. A., Nguyen, T., Munns, C., Cowell, C. T., & Thompson, M. W.
(2009). Prediction of appendicular skeletal and fat mass in children: excellent
concordance of dual-energy X-ray absorptiometry and magnetic resonance imaging.
Journal of Pediatric Endocrinology and Metabolism, 22(9), 795-804.
Davids, K., Lees, A., & Burwitz, L. (2000). Understanding and measuring coordination and
control in kicking skills in soccer: Implications for talent identification and skill
acquisition. Journal of Sports Sciences, 18, 703-714.
de Leva, P. (1996). Adjustments to Zatsiorsky-Seluyanov's segment inertia parameters.
Journal of Biomechanics, 29(9), 1223-1230.
Dempster, W. T. (1955). Space requirements of the seated operator. WADC Technical
Report (TR-59-159). OH: Wright-Patterson Air Force Base.
Dumas, R., Cheze, L., & Verriest, J. P. (2007). Adjustments to McConville et al. and
Young et al. body segment inertial parameters. Journal of Biomechanics, 40(3),
543-553.

58
Durkin, J. L., & Dowling, J. J. (2003). Analysis of body segment parameter differences
between four human populations and the estimation errors of four popular
mathematical models. Journal of Biomechanical Engineering, 125(4), 515-522.
Durkin, J. L., & Dowling, J. J. (2006). Body segment parameter estimation of the human
lower leg using an elliptical model with validation from DEXA. Annals of
Biomedical Engineering, 34(9), 1483-1493.
Durkin, J. L., Dowling, J. J., & Andrews, D. M. (2002). The measurement of body segment
inertial parameters using dual energy X-ray absorptiometry. Journal of
Biomechanics, 35(12), 1575-1580.
Fawzy, T., Muttappallymyalil, J., Sreedharan, J., Ahmed, A., Alshamsi, S. O., Al Ali, M.
S., et al. (2011). Association between Body Mass Index and Bone Mineral Density
in Patients Referred for Dual-Energy X-Ray Absorptiometry Scan in Ajman, UAE.
Journal of Osteoporosis, 2011, 1-4.
Fuller, N. J., Laskey, M. A., & Elia, M. (1992). Assessment of the composition of major
body regions by dual-energy X-ray absorptiometry (DEXA), with special reference
to limb muscle mass. Clinical Physiology, 12(3), 253-266.
Ganley, K. J., & Powers, C. M. (2001). The use of dual energy X-ray absorptiometry in
determining subject-specific anthropometric measures for kinetic analysis during
gait. Gait and Posture, 13, 271-272.
Ganley, K. J., & Powers, C. M. (2004a). Anthropometric parameters in children: a
comparison of values obtained from dual energy x-ray absorptiometry and cadaver-
based estimates. Gait and Posture, 19(2), 133-140.

59
Ganley, K. J., & Powers, C. M. (2004b). Determination of lower extremity anthropometric
parameters using dual energy X-ray absorptiometry: the influence on net joint
moments during gait. Clinical Biomechanics, 19(1), 50-56.
Glickman, S. G., Marn, C. S., Supiano, M. A., & Dengel, D. R. (2004). Validity and
reliability of dual-energy X-ray absorptiometry for the assessment of abdominal
adiposity. Journal of Applied Physiology, 97(2), 509-514.
Haarbo, J., Gotfredsen, A., Hassager, C., & Christiansen, C. (1991). Validation of body
composition by dual energy X-ray absorptiometry (DEXA). Clinical Physiology,
11(4), 331-341.
Heymsfield, S. B., Smith, R., Aulet, M., Bensen, B., Lichtman, S., Wang, J., et al. (1990).
Appendicular skeletal muscle mass: measurement by dual-photon absorptiometry.
American Journal of Clinical Nutrition, 52(2), 214-218.
Hinrichs, R. N. (1985). Regression equations to predict segmental moments of inertia from
anthropometric measurements: an extension of the data of Chandler et al. (1975).
Journal of Biomechanics, 18(8), 621-624.
Hinrichs, R. N. (1990). Adjustments to the segment center of mass proportions of Clauser
et al. (1969). Journal of Biomechanics, 23(9), 949-951.
Hologic. (2004). QDR for Windows XP Reference Manual: Hologic Inc.
Hopkins, W. (2000). Measures of reliability in sports medicine and science. Sports
Medicine, 30, 1-15.
Hopkins, W. (2002). A scale of magnitudes for effect statistics. Retrieved from
http://www.sportsci.org/resource/stats/effectmag.html

60
Huang, H. K., & Suarez, F. R. (1983). Evaluation of cross-sectional geometry and mass
density distributions of humans and laboratory animals using computerized
tomography. Journal of Biomechanics, 16(10), 821-832.
Huang, H. K., & Wu, S. C. (1976). The evaluation of mass densities of human body in vivo
from CT scans. Computers in Biology and Medicine, 6(4), 337-343
Jensen, R. K. (1978). Estimation of the biomechanical properties of three body types using
a photogrammetric method. Journal of Biomechanics, 11(8-9), 349-358.
Jensen, R. K. (1986). Body segment mass, radius and radius of gyration proportions of
children. J Biomech, 19(5), 359-368.
Kohrt, W. M. (1998). Preliminary evidence that DEXA provides an accurate assessment of
body composition. Journal of Applied Physiology, 84, 372-377.
Lee, M. K., Koh, M., Fang, A. C., Le, S. N., & Balasekaran, G. (2009a). Estimation of
Body Segment Parameters Using Dual Energy Absorptiometry and 3-D Exterior
Geometry. 13th International Conference on Biomedical Engineering, 23(5), 1777-
1780.
Lee, M. K., Le, N. S., Fang, A. C., & Koh, M. T. (2009b). Measurement of body segment
parameters using dual energy X-ray absorptiometry and three-dimensional
geometry: an application in gait analysis. Journal of Biomechanics, 42(3), 217-222.
Lenzi, D., Cappello, A., & Chiari, L. (2003). Influence of body segment parameters and
modeling assumptions on the estimate of center of mass trajectory. Journal of
Biomechanics, 36(9), 1335-1341.

61
Martin, P. E., Mungiole, M., Marzke, M. W., & Longhill, J. M. (1989). The use of
magnetic resonance imaging for measuring segment inertial properties. Journal of
Biomechanics, 22(4), 367-376.
McConville, J. T., Churchill, T. D., Kaleps, I., Clauser, C. E., & Cuzzi, J. (1980).
Anthropometric relationships of body and body segment moments of inertia.
Dayton, Ohio: Aerospace Medical Research Laboratory, Wright-Patterson Air
Force Base.
Milburn, P. (1991). Real-time 3-dimensional imaging using ultrasound. Proceeds of the
XIIIth Congress of the International Society of Biomechanics, 1230-1231
Miller, A., Strauss, B. J., Mol, S., Kyoong, A., Holmes, P. H., Finlay, P., et al. (2009).
Dual-energy X-ray absorptiometry is the method of choice to assess body
composition in COPD. Respirology, 14(3), 411-418.
Mungiole, M., & Martin, P. E. (1990). Estimating segment inertial properties: comparison
of magnetic resonance imaging with existing methods. Journal of Biomechanics,
23(10), 1039-1046.
Pavol, M. J., Owings, T. M., & Grabiner, M. D. (2002). Body segment inertial parameter
estimation for the general population of older adults. Journal of Biomechanics,
35(5), 707-712.
Pearsall, D. J., & Costigan, P. A. (1999). The effect of segment parameter error on gait
analysis results. Gait and Posture, 9(3), 173-183.
Pearsall, D. J., & Reid, J. G. (1994). The study of human body segment parameters in
biomechanics. An historical review and current status report. Sports Medicine,
18(2), 126-140.

62
Pearsall, D. J., Reid, J. G., & Livingston, L. A. (1996). Segmental inertial parameters of the
human trunk as determined from computed tomography. Annals of Biomedical
Engineering, 24(2), 198-210.
Pearsall, D. J., Reid, J. G., & Ross, R. (1994). Inertial properties of the human trunk of
males determined from magnetic resonance imaging. Annals of Biomedical
Engineering, 22(6), 692-706.
Peiffer, J. J., Galvao, D. A., Gibbs, Z., Smith, K., Turner, D., Foster, J., et al. (2010).
Strength and functional characteristics of men and women 65 years and older.
Rejuvenation Research, 13(1), 75-82.
Pietrobelli, A., Formica, C., Wang, Z., & Heymsfield, S. B. (1996). Dual-energy X-ray
absorptiometry body composition model: review of physical concepts. American
Journal of Physiology, 271(Endocinol. Metab.), E941-951.
Putnam, C. A. (1991). A segment interaction analysis of proximal-to-distal sequential
segment motion patterns. Medicine and Science in Sports and Exercise, 23(1), 130-
144.
Putnam, C. A. (1993). Sequential motions of body segments in striking and throwing skills:
descriptions and explanations. Journal of Biomechanics, 26 (Suppl. 1), 125-135.
Rao, G., Amarantini, D., Berton, E., & Favier, D. (2006). Influence of body segments'
parameters estimation models on inverse dynamics solutions during gait. Journal of
Biomechanics, 39(8), 1531-1536.
Reid, J. G., & Jensen, R. K. (1990). Human body segment inertia parameters: a survey and
status report. Exercise and Sport Sciences Reviews, 18, 225-241.

63
Veale, J. P., Pearce, A. J., Buttifant, D., & Carlson, J. S. (2010). Anthropometric profiling
of elite junior and senior Australian football players. International Journal of Sports
Physiology and Performance, 5(4), 509-520.
Visser, M., Fuerst, T., Lang, T., Salamone, L., & Harris, T. B. (1999). Validity of fan-beam
dual-energy X-ray absorptiometry for measuring fat-free mass and leg muscle mass.
Health, Aging, and Body Composition Study--Dual-Energy X-ray Absorptiometry
and Body Composition Working Group. Journal of Applied Physiology, 87(4),
1513-1520.
Wells, J. (2009). The limitations of DXA for body composition assessment. Endocrine
Abstracts, 19, S78.
Winter, D. A. (1990). Biomechanics and Motor Control of Human Movement (2nd ed.).
Toronto: John Wiley & Sons, Inc.
Zatsiorsky, V. M., & Seluyanov, V. M. (1985). The mass and inertia characteristics of the
main segments of the human body. In H. Matsui & K. Kobayashi (Eds.),
Biomechanics VIIIB. Champaign, IL: Human Kinetics.


64
CHAPTER FOUR – STUDY TWO
RELIABILITY AND VALIDITY OF UNILATERAL AND
BILATERAL ISOMETRIC STRENGTH USING A
CUSTOMISED, PORTABLE APPARATUS.
JOURNAL OF AUSTRALIAN STRENGTH AND CONDITIONING
(PUBLISHED, VOL 20, SUPPL. 1, PP. 61-67).
Nicolas H. Hart, Sophia Nimphius, Jodie L. Cochrane, Robert U. Newton

65
4.0. Abstract Isometric strength assessments are often limited by the requirement to use large-scale,
fixated equipment which can be expensive and difficult to relocate. Using a new, portable
isometric apparatus, the purpose of this paper was to assess the reliability and validity of
unilateral and bilateral isometric strength measures. Eleven recreationally trained men (age:
24.3 ± 2.2 yrs; mass: 81.1 ± 10.8 kg; height: 180.2 ± 2.8 cm) were required to perform a
total of eighteen maximal isometric squat contractions, consisting of three bilateral [BL]
and six unilateral (dominant [ULD] and non-dominant [ULN]) trials on each isometric
device (fixated and portable). Trials were randomised and counterbalanced between each
condition and apparatus. The portable device was able to validly and reliably measure peak
force (CV < 4.7%; ICC > 0.961) and mean force (CV < 9.3%; ICC > 0.831) across all
bilateral and unilateral conditions. However, the portable device was not able to reliably
assess peak rate of force development (using a 30ms window), with a slightly elevated
prevalence of typical error using BL (CV < 15.2; ICC > 0.943) and ULD (CV < 14.7; ICC
> 0.931) conditions; and was substantially unreliable for ULN (CV < 45.5; ICC > 0.360)
trials. The portable isometric device can therefore be used to successfully measure maximal
lower body isometric strength using peak force and mean force outputs as descriptive
measures.
66
4.1. Introduction
The ability to produce high levels of muscular force and power are considered to be
essential determinants in successful athletic performance across a broad range of sports
(Bevan et al, 2010; Haff et al, 2005; Harris, Cronin & Keogh, 2007; Nimphius, McGuigan
& Newton, 2010). While conjecture continues to exist regarding the precise levels of
strength required to optimise performance (McGuigan, Newton, Winchester & Nelson,
2010; Stone, Moir, Glastier & Sanders, 2002), the overriding conclusion drawn from a
multitude of research upholds the positive relationship between maximal strength and
athletic performance in sports reliant on strength, speed and power (Cronin & Hansen,
2005; Haff et al, 2005; McGuigan et al, 2010; Nimphius et al, 2010; Stone et al, 2002;
Stone et al, 2003; Stone et al, 2005). In order to assess maximal strength, a variety of
measures are available for use, including isotonic, isokinetic and isometric testing
modalities (Izquierdo, Hakkinen, Gonzalez-Badillo, Ibanez & Gorostiaga, 2002; Morrissey,
Harman & Johnson, 1995; Moss & Wright, 1993); however, a lack of consensus remains
concerning the most suitable mechanism to assess muscle function due to inherent
limitations and varying situational contexts (Cronin & Hansen, 2005 Harris et al, 2007;
Morrissey et al, 1995; Moss & Wright, 1993; Nuzzo, McBride, Cormie & McCaulley,
2008).
Despite muscular expressions of strength and power remaining contextually specific
(Baker, Wilson & Carlyon, 1994; Cronin, McNair & Marshall, 2002; Harris et al, 2007;
Morrissey et al, 1995), measures of isometric strength have been shown to correlate well
with dynamic strength when assessed within the same exercise domain (Haff et al, 2005;
Stone et al, 2002; Wilson & Murphy, 1996). This isometric-dynamic relationship is

67
primarily achievable by honouring the premise of positional specificity (Gamble, 2006;
Wilson & Murphy, 1996; Wilson, Murphy & Walshe, 1996), which promotes the deliberate
selection of exact joint angles and body positions in isometric protocols (Haff et al, 1997;
Morrissey et al, 1995; Reilly, Morris & Whyte, 2009) that best correspond with the position
of highest force production within the equivalent dynamic activity (Haff et al, 1997; Nuzzo
et al, 2008). As isometric strength testing has other notable advantages, including high test-
retest reliability (McBride, Cormie & Deane, 2006; McGuigan et al, 2010; Viitasalo,
Saukkonen & Komi, 1980); greater task control (Demura, Miyaguchi, Shin & Uchida,
2010; Manabe, Yokozawa & Ogata, 2003); lower performance variability (McBride et al,
2006; McGuigan et al, 2010; Viitasalo et al, 1980); lower injury risk, incidence and severity
(Blazevich, Gill & Newton, 2002; Demura et al, 2010); and simple test administration and
data analysis processes (Blazevich et al, 2002); this might explain the popularity of
isometric strength measures frequently used in research, clinical and athletic contexts
(Blazevich et al, 2002; Haff et al, 2005; McGuigan et al, 2010; O’Shea & O’Shea, 1989).
While isometric testing protocols have many advantageous characteristics, there are
limitations that require acknowledgement. In particular, the relationship of isometric
strength to athletic performance is not as strong as those exhibited by dynamic strength
testing mechanisms (Blazevich et al, 2002; Cardinale, Newton & Nosaka, 2011; Enoka,
2008). Furthermore, isometric protocols require a force-measuring device in order to
acquire meaningful strength data (Demura et al, 2010; McGuigan et al, 2010). In spite of
these limitations, muscle function tests using isometric protocols can provide necessary
information regarding an athlete’s capacity to produce maximal voluntary forces (Blazevich
et al, 2002; Cardinale et al, 2011). This data can subsequently be used by coaches to

68
produce a complete and proper assessment of an athlete’s training status and so too the
effectiveness of their training programs (Cardinale et al, 2011; Enoka, 2008). In support of
this, previous research has successfully demonstrated the importance of maximal isometric
strength in a variety of athletically and recreationally trained populations (Brughelli,
Cronin, Levin & Chaouachi, 2008; Haff et al, 2005; McGuigan et al, 2010; O’Shea &
O’Shea, 1989; Wilson & Murphy, 1996], using peak force [PF] and rate of force
development [RFD] as descriptive measures of performance.
Historically, these assessment outcomes have been determined using expensive, large-scale,
fixated devices which are notably limited by a lack of transportability, customisability, and
affordability; demonstrating an inherent lack of practicality to real training and testing
scenarios (Demura et al, 2010). In response to these constraints, a portable and fully
customisable isometric assessment device has been developed which is relatively
inexpensive; highly transportable; easy to set-up and administer; and is able to be used in
any location at any given time. Although the portable apparatus has many practical
benefits, the decreased stability of the device presents as a potential limitation as there are
no bar supports to prevent horizontal sway which might influence the athlete’s ability to
produce a true reflection of their maximal force capabilities (McBride et al, 2006). It is
therefore the purpose of this paper to assess the validity and reliability of the newly
developed portable and customisable isometric assessment device in order to determine
whether it is able to facilitate and derive valid representations of maximal strength and rate
of force development characteristics, and whether it is able to do so in a reproducible
manner.

69
4.2. Methods
4.2.1. Experimental Approach
Maximal bilateral and unilateral lower body isometric strength measures were performed
using the isometric squat at preset hip and knee angles of 140° using both fixated and
portable isometric assessment devices, to allow for maximal force production at zero
velocity (Haff et al, 2005; Haff et al, 1997; Nuzzo et al, 2008; Paulus, Reiser & Troxell,
2004). Specific measures (peak force [PF], mean force [MF], rate of force development
[RFD] and time to peak force [TTPF]) were identified using a portable force plate (400
series Performance Plate; Fitness Technology, Adelaide, Australia) sampling at 600Hz, and
data acquisition software (Ballistic Measurement System [BMS]; Fitness Technology,
Adelaide, Australia).
4.2.2. Participants
Eleven recreationally trained men (age: 24.3 ± 2.2 years; mass: 81.1 ± 10.8 kg; height:
180.2 ± 2.8 cm) were recruited for participation in this study. For participation eligibility
into this study, subjects were required to have a minimum of twelve months resistance
training experience, and participate in a recreational football competition. All subjects were
absent of injury, and contraindication at the time of testing, and did not perform any lower
body resistance training or vigorous physical activity within 48 hours prior to their testing
session. The study was approved by the human ethics committee of Edith Cowan
University. All athletes were notified of any potential risks involved, and provided written
informed consent prior to commencement.

70
4.2.3. Equipment
A uniaxial, portable force plate (dimensions: 795 x 795 mm; maximum load: 1000 kg
(9810 N)); standard 20kg Olympic barbell (mass: 20 kg; Australian Barbell Company,
Victoria, Australia); and BMS data acquisition software were required for use across both
isometric devices. The fixated isometric squat trials were performed using a floor-bolted
power rack (Power Cage, Cybex International, MN, USA), with height adjustable bar
supports, as presented in Figure 1. The portable isometric squat trials were performed using
only a load-bearing, fully customisable heavy duty strap (SureTie, Zenith, NSW, Australia)
designed to resist high loads (max: 4218 N (430 kg)), with an anti-retractible locking
mechanism to prevent undue movement (loosening or tightening), and hooks to affix the
strap to the barbell as presented in Figure 2. The primary difference of equipment between
the portable and fixated apparatus involves the exchange of the large-scaled immovable
rack, with the more affordable and transportable heavy duty load-bearing strap.
Figure 1. Frontal and side view of set-up and operation for the fixated isometric apparatus.

71
Figure 2. Frontal and side view of set-up and operation for the portable isometric apparatus.
4.2.4. Procedures
Subjects were required to perform a total of eighteen lower body maximal isometric squat
contractions, consisting of three bilateral [BL]; and six unilateral (dominant [ULD] and
non-dominant [ULN]) trials on each isometric assessment device (fixated and portable).
The order of testing between both devices for all subjects was counterbalanced, with
bilateral and unilateral trial-types fully randomised to negate the effects of muscular
potentiation or fatigue (Hodgson, Docherty & Robbins, 2005; Rassier & MacIntosh, 2000).
Subjects were provided with two minutes of passive recovery between each maximal effort,
with a ten minute period of passive recovery during the changeover of isometric devices.
Subjects were required to complete a sub-maximal familiarisation session one hour prior to
the official testing procedure in order to determine subject-specific bar height settings for
each apparatus, and to acclimatise them with the testing conditions of each isometric
device.

72
At the commencement of the official testing period, participants had their height (cm) and
weight (kg) measured using a wall-mounted stadiometer and electronic weighing scale. A
general dynamic warm-up was provided, prior to a specific warm-up which included
additional familiarisation efforts on each isometric strength device. A five minute recovery
period was subsequently enforced. Prior to testing commencement, subjects were required
to stand on the force plate while holding the barbell and remaining stationary, in order to
offset the total mass of the system to zero within the BMS software. During official trials,
the starting position for each device required the subjects to place slight upward pressure on
the bar so that it is pressing against the supports (fixated device); or is pulling the straps
taught (portable device). This was to ensure that no change in joint-angle was evident
during maximal contraction, thus controlling the maximal contraction to commence at zero
velocity (with no slight countermovement or jolting actions permitted).
For each bilateral trial, subjects adopted a traditional back squat position under the pre-set
height of the bar, eliciting a hip and knee angle of 140° flexion (Figure 4) using a manual
handheld goniometer. For each unilateral trial, subjects were required to reposition the
active leg under their centre of mass, while removing their inactive leg from the force plate
by flexing it at the knee (Figure 4). Due to unilateral repositioning, hip and knee angles of
the active leg must be re-assessed using the goniometer to ensure the current bar-height
settings meet the 140° joint angle criteria. Once subjects were in position, they were
provided with specific instruction (Young, Pryor & Wilson, 1995) to “push as hard and as
fast as you can, until I stay stop” in order to produce a rapid and sustained maximal
contraction for five seconds in duration (Cardinale et al, 2011), and were provided with
time to balance themselves. Once balanced and set in position, subjects were required to

73
state “ready” to the researcher, prompting a 3-second verbal countdown: “3, 2, 1, GO” as
test recording commenced. The researcher, and two research assistants, provided verbal
encouragement to promote maximal efforts; visually monitored athlete technique during
each trial to ensure postural and mechanical compensatory adjustments did not occur; and
ensured athlete safety was maintained. This is particularly important when using the
portable device, as there are no bar supports preventing undesirable horizontal movement
or potential loss of balance during unilateral trials.
Figure 3. Correct subject positioning for bilateral (left) and unilateral (right) testing
conditions.
For each bilateral and unilateral condition, two trials needed to produce peak force outputs
within 5% of each other to be considered legitimate representations of the subjects maximal
force production. If, within the 3 trials provided this was not achieved, a 4th
and 5th
trial per

74
condition was permitted, with two minutes recovery provided per trial. No subject required
more than 3 trials during this study, as adequate familiarisation was provided. For analysis
purposes, the best trial for each condition across both devices was chosen to compare each
athlete’s performance between both isometric apparatus, identified by the trial with the
greatest peak force [PF] output. In addition, within the portable isometric device, the best
two trials for each trial-type were chosen using the same selection criteria in order to assess
its reliability in measuring all dependent variables.
The dependent variables that were chosen for analysis were supplied by the BMS data
acquisition software. The program, using the collected force-time data, identifies peak force
[PF] as the highest force value produced during the maximal isometric contraction, with
mean force [MF] and time to peak force [TTPF] determined from the point of curve
inflection (onset of maximal contraction) to the moment of peak force production. Peak rate
of force development [RFD] was also determined as the highest rate of force development
produced within a 30ms window (epoch) between the onset of contraction and the peak
force value.
4.2.5. Statistical Analysis
Isometric strength outputs, identified as peak force [PF], mean force [MF], peak rate of
force development [RFD] and time to peak force [TTPF] were exported for analysis to
Microsoft Excel (Microsoft, Redmond, WA) and analysed using a statistical analysis
package (SPSS, Version 17.0; Chicago, IL). The portable isometric device was validated by
using a dependent (paired) t-test to examine whether significant differences were prevalent
between the isometric strength outputs obtained from the fixated and portable isometric

75
devices. Statistical significance was set at an alpha level of p ≤ 0.05 (with a 95%
confidence level).
Intra-tester reliability and within-subject reliability for the portable isometric device were
assessed by calculating the coefficient of variation (CV) and intraclass correlation
coefficient (ICC). The strength of relationship for ICC coefficients was classified in
accordance with Hopkins (Hopkins, 2000; Hopkins, 2002; Stone et al, 2002): r ≥ 0.3 is
moderate; r ≥ 0.5 is strong; r ≥ 0.7 is very strong; r ≥ 0.9 is nearly perfect; and r ≥ 1.0 is
perfect. Coefficients of variation below 10% were considered reliable in accordance with
other studies analysing biomechanical, and strength based human movement data
(Augustsson et al, 2006; Cormack, Newton, McGuigan & Doyle, 2008; Cronin, Hing &
McNair, 2004; Hunter, Marshall & McNair, 2004).
4.3. Results
The portable isometric device was only able to reliably determine peak force (CV < 4.7%;
ICC > 0.961) and mean force (CV < 9.3%; ICC > 0.831) outputs under all bilateral and
unilateral conditions. The portable device was therefore unable to reliably assess the peak
rate of force development. Bilateral and dominant-leg unilateral conditions nearly reached
reliable limits (CV < 15.2; ICC > 0.931), while surprisingly large variability was evident
within non-dominant limb, unilateral trials (CV < 45.5; ICC > 0.360). This is likely due to
the recreational training status of subjects, coupled with the reduced stability of the portable
device. The portable device might be suitable for athletes of sub-elite or elite status, though
this requires further investigation.

76
Additionally, the portable isometric device was able to accurately determine all descriptive
measures when compared with the previously validated fixated apparatus (Blazevich et al,
2002). No significant differences (p ≤ 0.05) were found between all strength outputs (peak
force, mean force and peak rate of force development), or between the time to reach peak
force during the more stable, bilateral condition. The only statistical difference noted
between the two devices were found when comparing the times taken to peak force under
both unilateral isometric trials (p < 0.001), with athletes requiring an extra second to
produce maximal strength when using the portable device.
Table 1. Descriptive statistics (Mean and Standard Deviation) for all variables assessed
using the fixated and portable isometric devices.
PF MF RFD TTPF
FIXATED
- BL
- UL (ND)
- UL (D)
2623 (± 653)
1952 (± 482)
1958 (± 411)
1880 (± 471)
1442 (± 429)
1447 (± 403)
8275 (± 4284)
5130 (± 2187)
6268 (± 3234)
2.91 (± 0.62)
2.96 (± 0.55)
3.01 (± 0.53)
PORTABLE
- BL
- UL (ND)
- UL (D)
2583 (± 557)
1989 (± 476)
1974 (± 392)
1797 (± 463)
1496 (± 315)
1466 (± 349)
7521 (± 3856)
4474 (± 1925)
5923 (± 2872)
3.06 (± 0.56) a
4.01 (± 0.48) a
3.94 (± 0.54) a
Note: Values are expressed as mean ± SD. a Statistically significant difference (p ≤ 0.05) found between portable and fixated devices.
Table 2. Between trial variance, and intra-tester reliability for peak force [PF], mean force
[MF], and rate of force development [RFD] between each trial type using the portable
isometric device.
Bilateral Squat Unilateral Squat [ ND ] Unilateral Squat [ D ]
PF a,b
MF a,b
RFD b PF
a,b MF
a,b RFD PF
a,b MF
a,b RFD
b
CV 3.6 8.4 15.2 3.6 9.3 45.5 4.7 6.1 14.5
ICC 0.973 0.906 0.943 0.980 0.831 0.360 0.961 0.950 0.931
Note:
ND = Non-dominant limb, D = Dominant limb.
a Variables within CV criteria (CV < 10%).
b Variables with very strong ICC criteria (ICC > 0.7).

77
Table 3. Statistical differences and effect-size calculations between fixated and portable
isometric devices for peak force [PF], mean force [MF], rate of force development [RFD],
and time to peak force [TTPF].
Bilateral Squat Unilateral Squat [ ND ] Unilateral Squat [ D ]
PF MF RFD TTPF PF MF RFD TTPF PF MF RFD TTPF
P 0.311 0.408 0.352 0.436 0.323 0.377 0.110 0.001a 0.635 0.755 0.538 0.001
a
ES 0.07 0.18 0.18 0.25 0.08 0.14 0.32 2.03c 0.04 0.05 0.11 1.74
b
Note:
ND = Non-dominant limb, D = Dominant limb, ES = Effect Size.
a Statistically significant difference (p ≤ 0.05) found between portable and fixated devices.
b Large effect size (≥ 1.2 to < 2.0) evident between devices (Hopkins, 2000; Hopkins, 2002).
c Very Large effect size (≥ 2.0 to < 4.0) evident between devices (Hopkins, 2000; Hopkins, 2002).
Figure 4. Time taken (in seconds) to produce peak force [PF] for each isometric apparatus,
when performing bilateral, and unilateral (non-dominant [ND] and dominant [D] leg)
maximal isometric contractions.
4.4. Discussion
Maximum isometric strength is an important physical characteristic, contributing to
successful performance in a variety of sporting contexts (Bevan et al, 2010; Brughelli et al,
2008; Haff et al, 2005; Nimphius et al, 2010; Stone et al, 2005]. Previous research has
demonstrated the importance of maximal isometric strength (peak force [PF]) and the
development of power (rate of force development (RFD)) in a variety of athletic (Brughelli

78
et al, 2008; Cronin & Hansen, 2005; Haff et al, 2005; Nuzzo et al, 2008) and recreationally
trained (McGuigan et al, 2010) populations, with these studies demonstrating high
correlations between isometric strength tests and 1-repetition maximum (1RM) tests
(Blazevich et al, 2002; Viitasalo et al, 1980; Wilson et al, 1996). However, these outcomes
have been assessed using expensive, large-scale, fixated devices. As there is a need for
portable testing devices, it was the purpose of this study was to assess the validity and
reliability of force measurements produced when using a new, portable and customisable
isometric strength device. This was examined through using the isometric back squat
exercise to illicit maximal isometric strength under bilateral and unilateral performance
conditions across both portable and fixated isometric apparatus.
The results of this study successfully validate the new portable device when comparing
obtained performance variables against a previously validated isometric device (Blazevich
et al, 2002; McGuigan et al, 2010). In particular, all descriptive measures (peak force, mean
force and rate of force development) were statistically even, with no significant differences
(p ≤ 0.05) between the two devices, producing P-values above 0.737, 0.681 and 0.366
respectively. Interestingly, time taken to reach peak force under unilateral conditions were
significantly different between the two devices with athletes requiring an extra second of
time to achieve peak force production (3 seconds using fixated; 4 seconds using portable).
This was expected as the portable device requires additional balance, with the initial period
of time used by the athlete to stabilise under the bar prior to producing maximal leg drive.
In this regard, athletes using the portable device should be given an extra second of time to
derive their peak force outputs under maximal testing conditions.

79
Furthermore, the portable isometric device has upheld the high reliability of maximal
isometric strength protocols (McGuigan et al, 2010; Viitasalo et al, 1980), producing very
strong correlations (ICC > 0.831) for all descriptive measures. The rate of force
development for the non-dominant limb, during unilateral trials, was the main exception,
with a moderate correlation (ICC > 0.360) that was additionally confirmed by the high
coefficient of variation (CV < 45.5) in this trial type. The typical error prevalent within the
data, which represents a useful measure of reliability within athletic performance
(Blazevich et al, 2002; Hopkins, 2000), was also determined, demonstrating high reliability
for peak force and mean force outputs across both isometric devices (CV < 9.3). The rate of
force development during bilateral and dominant-leg unilateral conditions was only able to
approach acceptable limits (CV < 15.2), however this may have been confounded by the
training status of the recreationally trained men used within this study, who routinely
produce greater performance variability within human movement (Salonikidis et al, 2009).
Similar volatility in rate of force development outputs have also been noted in previous
research featuring maximal isometric strength assessments (McGuigan et al, 2008;
McGuigan et al, 2010; McGuigan & Winchester, 2008), highlighting the need for a
cautious approach when interpreting rate of force development measurements under this
isometric testing scenario, with further research efforts necessary.
The portable isometric apparatus was shown to be an efficient, convenient, valid and
reliable assessment tool for maximal isometric strength, which is able to be used as an
effective indicator of dynamic performance within this population. The findings of this
study substantiate that this new, fully customisable and portable device can be used to
accurately and reliably assess peak force, and mean force outputs under bilateral and
unilateral testing conditions, with rate of force development measures to be interpreted with
80
caution. Users of this device should provide their athletes with an extra second of maximal
effort during unilateral strength trials to ensure the peak is achieved; and should allow
substantial familiarisation to allow the athlete to adapt to the less stable nature of this new
device. Future studies may wish to investigate the reliability of this apparatus when using
the isometric mid-thigh pull or other potential isometric exercises. Further, the unstable
nature of the portable testing apparatus may have application in measures of strength when
balance is an important component of the target sport performance.
4.5. Practical Applications
This apparatus provides strength and conditioning professionals with a more affordable,
pragmatic, portable and easy-to-administer method to test, monitor and train unilateral and
bilateral lower body isometric strength at any customisable joint angle, at any time, and in
any location. In particular, it presents as a suitable alternative to the fixated apparatus
during times when the large-scaled equipment is unavailable or unattainable. Coaches may
wish to invest in portable, height-adjustable bar supports (if convenient) to increase the
stability of the device in the applied, real-world environment. Furthermore, coaches may
also wish to use this device to further assess and develop strength under less stable
conditions as a tool to promote this component within their particular sport.
4.6. References
Augustsson, J., Thomee, R., Linden, C., Folkesson, M., Tranberg, R., & Karlsson, J.
(2006). Single-leg hop testing following fatiguing exercise: reliability and
biomechanical analysis. Scandinavian Journal of Medicine and Science in Sports,
16(2), 111-120.

81
Baker, D., Wilson, G., & Carlyon, B. (1994). Generality versus specificity: a comparison of
dynamic and isometric measures of strength and speed-strength. European Journal
of Applied Physiology and Occupational Physiology, 68(4), 350-355.
Bevan, H. R., Bunce, P. J., Owen, N. J., Bennett, M. A., Cook, C. J., Cunningham, D. J., et
al. (2010). Optimal loading for the development of peak power output in
professional rugby players. Journal of Strength and Conditioning Research, 24(1),
43-47.
Blazevich, A. J., Gill, N., & Newton, R. U. (2002). Reliability and validity of two isometric
squat tests. Journal of Strength and Conditioning Research, 16(2), 298-304.
Brughelli, M., Cronin, J., Levin, G., & Chaouachi, A. (2008). Understanding change of
direction ability in sport: a review of resistance training studies. Sports Medicine,
38(12), 1045-1063.
Cardinale, M., Newton, R., & Nosaka, K. (2011). Strength and Conditioning: Biological
Principles and Practical Applications: Wiley-Blackwell.
Cormack, S. J., Newton, R. U., McGuigan, M. R., & Doyle, T. L. (2008). Reliability of
measures obtained during single and repeated countermovement jumps.
International Journal of Sports Physiology and Performance, 3(2), 131-144.
Cronin, J. B., & Hansen, K. T. (2005). Strength and power predictors of sports speed.
Journal of Strength Conditioning Research, 19(2), 349-357.
Cronin, J. B., Hing, R. D., & McNair, P. J. (2004). Reliability and validity of a linear
position transducer for measuring jump performance. Journal of Strength and
Conditioning Research, 18(3), 590-593.

82
Cronin, J. B., McNair, P. J., & Marshall, R. N. (2002). Is velocity-specific strength training
important in improving functional performance? Journal of Sports Medicine and
Physical Fitness, 42(3), 267-273.
Demura, S., Miyaguchi, K., Shin, S., & Uchida, Y. (2010). Effectiveness of the 1RM
estimation method based on isometric squat using a back-dynamometer. Journal
Strength & Conditioning Research, 24(10), 2742-2748.
Enoka, R. (2008), Neuromechanics of Human Movement (4th ed.). Champaign, IL: Human
Kinetics.
Gamble, P. (2006). Implications and Applications of Training Specificity for Coaches and
Athletes. Journal of Strength and Conditioning, 28(3), 54-58.
Haff, G. G., Carlock, J. M., Hartman, M. J., Kilgore, J. L., Kawamori, N., Jackson, J. R., et
al. (2005). Force-time curve characteristics of dynamic and isometric muscle actions
of elite women Olympic weightlifters. Journal of Strength and Conditioning
Research, 19(4), 741-748.
Haff, G. G., Stone, M. H., O'Bryant, H., Harman, E., Dinan, C., Johnson, R., et al. (1997).
Force-time dependent characteristics of dynamic and isometric muscle actions.
Journal of Strength and Conditioning Research, 11, 269-272.
Harris, N., Cronin, J., & Keogh, J. (2007). Contraction force specificity and its relationship
to functional performance. Journal of Sports Science, 25(2), 201-212.
Hodgson, M., Docherty, D., & Robbins, D. (2005). Post-Activation Potentiation:
Underlying physiology and implications for motor performance. Sports Medicine,
35(7), 585-595.
Hopkins, W. (2000). Measures of reliability in sports medicine and science. Sports
Medicine, 30, 1-15.
83
Hopkins, W. (2002). A scale of magnitudes for effect statistics. Retrieved from
http://www.sportsci.org/resource/stats/effectmag.html
Hunter, J. P., Marshall, R. N., & McNair, P. (2004). Reliability of biomechanical variables
of sprint running. Medicine and Science in Sports and Exercise, 36(5), 850-861.
Izquierdo, M., Hakkinen, K., Gonzalez-Badillo, J. J., Ibanez, J., & Gorostiaga, E. M.
(2002). Effects of long-term training specificity on maximal strength and power of
the upper and lower extremities in athletes from different sports. European Journal
of Applied Physiology, 87(3), 264-271.
Manabe, Y., Yokozawa, T., & Ogata, M. (2003). Effect of load variation on lower muscle
activity and joint torque during parallel squats. Japanese Journal of Physical
Fitness and Sports Medicine, 52, 89-98.
McBride, J., Cormie, P., & Deane, R. (2006). Isometric squat force output and muscle
activity in stable and unstable conditions. Journal of Strength and Conditioning
Research, 20(4), 915-918.
McGuigan, M. R., Newton, M. J., & Winchester, J. B. (2008). Use of isometric testing in
soccer players. Journal of Australian Strength and Conditioning, 16, 11-14.
McGuigan, M. R., Newton, M. J., Winchester, J. B., & Nelson, A. G. (2010). Relationship
between isometric and dynamic strength in recreationally trained men. Journal of
Strength and Conditioning Research, 24(9), 2570-2573.
McGuigan, M. R., & Winchester, J. B. (2008). The relationship between isometric and
dynamic strength in college football players. Journal of Sports Science and
Medicine, 7, 101-105.

84
Morrissey, M. C., Harman, E. A., & Johnson, M. J. (1995). Resistance training modes:
specificity and effectiveness. Medicine and Science in Sports and Exercise, 27(5),
648-660.
Moss, C. L., & Wright, P. T. (1993). Comparison of three methods of assessing muscle
strength and imbalance ratios of the knee. Journal of Athletic Training, 28(1), 55-
58.
Nimphius, S., McGuigan, M. R., & Newton, R. U. (2010). Relationship between strength,
power, speed, and change of direction performance of female softball players.
Journal of Strength and Conditioning Research, 24(4), 885-895.
Nuzzo, J. L., McBride, J. M., Cormie, P., & McCaulley, G. O. (2008). Relationship
between countermovement jump performance and multijoint isometric and dynamic
tests of strength. Journal of Strength and Conditioning Research, 22(3), 699-707.
O'Shea, K., & O'Shea, J. (1989). Functional Isometric Weight Training: Its effects on
Dynamic and Static strength. Journal of Applied Sport Science Research, 3(2), 30-
33.
Paulus, D. C., Reiser, R. F., 2nd, & Troxell, W. O. (2004). Pneumatic strength assessment
device: design and isometric measurement. Biomedical Sciences Instrumentation,
40, 277-282.
Rassier, D., & MacIntosh, B. (2000). Coexistence of potentiation and fatigue in skeletal
muscle. Brazilian Journal of Medical and Biological Research, 33, 499-508.
Reilly, T., Morris, T., & Whyte, G. (2009). The specificity of training prescription and
physiological assessment: a review. Journal of Sports Science, 27(6), 575-589.

85
Salonikidis, K., Amiridis, I. G., Oxyzoglou, N., de Villareal, E. S., Zafeiridis, A., & Kellis,
E. (2009). Force variability during isometric wrist flexion in highly skilled and
sedentary individuals. European Journal of Applied Physiology, 107(6), 715-722.
Stone, M. H., Moir, G., Glaister, M., & Sanders, R. (2002). How much strength is
neccessary? Physical Therapy in Sport, 3, 88-96.
Stone, M. H., O'Bryant, H. S., McCoy, L., Coglianese, R., Lehmkuhl, M., & Schilling, B.
(2003). Power and maximum strength relationships during performance of dynamic
and static weighted jumps. Journal of Strength and Conditioning Research, 17(1),
140-147.
Stone, M. H., Sands, W. A., Pierce, K. C., Carlock, J., Cardinale, M., & Newton, R. U.
(2005). Relationship of maximum strength to weightlifting performance. Medicine
and Science in Sports and Exercise, 37(6), 1037-1043.
Viitasalo, J. T., Saukkonen, S., & Komi, P. V. (1980). Reproducibility of measurements of
selected neuromuscular performance variables in man. Electromyography and
Clinical Neurophysiology, 20(6), 487-501.
Wilson, G. J., & Murphy, A. J. (1996). The use of isometric tests of muscular function in
athletic assessment. Sports Medicine, 22(1), 19-37.
Wilson, G. J., Murphy, A. J., & Walshe, A. (1996). The specificity of strength training: the
effect of posture. European Journal of Applied Physiology and Occupational
Physiology, 73(3-4), 346-352.
Young, W., Pryor, J., & Wilson, G. (1995). Effect of Instructions on Characteristics of
Countermovement and Drop Jump Performance. Journal of Strength and
Conditioning Research, 9(4), 232.

86
CHAPTER FIVE – STUDY THREE
LEG MASS CHARACTERISTICS OF ACCURATE AND INACCURATE
KICKERS: AN AUSTRALIAN FOOTBALL PERSPECTIVE.
JOURNAL OF SPORT SCIENCES
(IN REVIEW, JANUARY 2012).
Nicolas H. Hart, Sophia Nimphius, Jodie L. Cochrane, Robert U. Newton

87
5.0. Abstract
Understanding the influence physical characteristics may have on the generation of kicking
accuracy is notably advantageous. The aim of this paper was to provide a detailed profile of
the lower limb mass characteristics between accurate and inaccurate Australian footballers.
Thirty-one players were recruited from the Western Australian Football League to perform
the drop punt kicks over twenty metres to a player target. Players were separated into
accurate (n = 15) and inaccurate (n = 16) groups, with leg mass characteristics assessed
using whole body DEXA scans. Accurate kickers contained significantly greater relative
lean mass (p = 0.001 to 0.004) and significantly lower relative fat mass (p = 0.001 to 0.024)
across all segments of the kicking and support limbs, while also exhibited significantly
higher lean-to-fat mass ratios within all segments across both limbs (p = 0.001 to 0.009).
Inaccurate kickers displayed significantly larger asymmetries between their kicking and
support limbs than accurate kickers (p = 0.005 to 0.028), showing notably lower lean mass
in their support limb. These results illustrate considerably different lower limb
characteristics between accurate and inaccurate kickers in Australian football,
demonstrating the possible influence segmental mass characteristics may have on the
technical proficiency of the drop punt.

88
5.1. Introduction
Australian football is a fast-paced, dynamic and multidimensional field-based sport
requiring a unique combination of physical, technical, mental and tactical attributes to
successfully compete at the professional level (Young & Pryor, 2007; Young et al, 2005).
The recruitment process of the Australian Football League (AFL) strives to assess these
attributes through a variety of standardised anthropometric, physical fitness and technical
skill-based assessments (Pyne, Gardner, Sheehan & Hopkins, 2006) which are
benchmarked against historical data and reference values to assist with the decision making
process (Keogh, 1999; Nevill, Holder & Watts, 2009; Pyne, Gardner, Sheehan & Hopkins,
2005). Athletic profiling, in this manner, provides a valuable mechanism to identify talent,
player strengths and weaknesses, position suitability, and to assist in the optimal design of
strength and conditioning programmes (Veale, Pearce, Buttifant & Carlson, 2010;
Chaouachi et al, 2009; Pyne et al, 2006).
Alternatively, football sports have also profiled their athletes comparatively to other
populations (Nevill et al, 2009), particularly spanning their developmental pathways,
including senior-to-junior (Veale et al, 2010; Hoshikawa et al, 2009), elite-to-sub elite
(Veale et al, 2010; Keogh, 1999) and starter-to-non starter comparisons (Young et al,
2005). The observations drawn from such investigations are able to provide valuable
descriptive information concerning the potential discrepancies inherent within players
aspiring to reach professional status; or to serve as a benchmark for monitoring athletes
currently within elite ranks. While previous research provides insight into descriptive data
within various levels of playing performance (Veale et al, 2010; Young & Pryor, 2007),
there is an absence of research investigating the applicability of this data to technical

89
proficiency and performance. In particular, no studies to date have attempted to describe
the physical characteristics of accurate and inaccurate kickers in any football code.
The optimisation of kicking performance is an integral focus within Australian football, as
the outcome of a competitive match can often be decided on the basis of a single kick
(Young et al, 2010; Dichiera et al, 2006). In particular, athletes who are able to deliver a
ball more accurately over longer distances to an intended target or location provide a
distinct tactical advantage to their team (Young & Rath, 2011; Ball, 2008). While limited
research has been produced to explore the biomechanical and physiological descriptors of
kicking accuracy outcomes (Young et al, 2010; Dichiera et al, 2006), an absence of
attention has been provided to investigate the link between those parameters modifiable by
athletic conditioning and their subsequent influence on kicking performance. In particular,
the quantity (amount) and quality (composition) of lower limb mass may have a profound
impact on the technical and temporal strategy of an athlete’s kicking action (Young & Rath,
2011).
Given that successful athletes are characteristically different than less successful athletes
(Nevill et al, 2009; Rampini, Impellizzeri, Castagna, Coutts & Wisloff, 2009); and kicking
accuracy is highly important in Australian Football, it seems appropriate to examine the
interrelationships between the physical characteristics of accurate and inaccurate kickers in
relation to their level of technical proficiency. In particular, it is of interest to identify the
potential relationships between leg mass characteristics of accurate and inaccurate kickers
as a tool to better understand the influence it may have on the generation and regulation of
kicking accuracy outcomes. The purpose of this paper is to assess and compare the
segmental characteristics of the lower limbs (kicking leg and support leg) between accurate

90
and inaccurate Australian footballers as a mechanism to identify whether any segmental
characteristics are associated with more consistent and successful kicking performances.
5.2. Methods
5.2.1. Participants
Thirty-one Australian footballers (age: 22.1 ± 2.8 yrs; mass: 85.1 ± 13.0 kg; height: 181.1 ±
7.0 cm; BMI: 25.9 ± 3.2) were recruited from the Western Australian Football League
(WAFL) for participation within this study. All athletes had a minimum of five years total
playing experience, with at least two consecutive years of experience at their current
playing level. Athletes were void of injuries and contraindications at the time of testing;
and were not permitted to perform any strenuous exercise or lower body resistance training
within 48 hours of their assigned testing session. All athletes were notified of the potential
risks involved, and provided written informed consent for participation. Ethics clearance
was provided by Edith Cowan University’s Human Ethics Committee.
5.2.2. Study Design
This study utilised an acute, between groups, cross-sectional design consisting of a single
two hour testing session. Testing sessions commenced with anthropometric measures
including height, weight and limb length; followed by an assessment of whole-body
composition and lower body segmental mass characteristics (lean, fat, total) of the thigh,
shank and foot across both kicking and support limbs using dual energy x-ray
absorptiometry (DEXA). Athletes were then taken through a general dynamic warm-up,
followed by a mechanically specific warm-up (kicking over variable distances), in order to
stabilise their kicking performance (Amiri-Khorasani, Osman & Yusof, 2010). The kicking
protocol (drop punt over 20 metres) was then completed. Subjects were required to wear
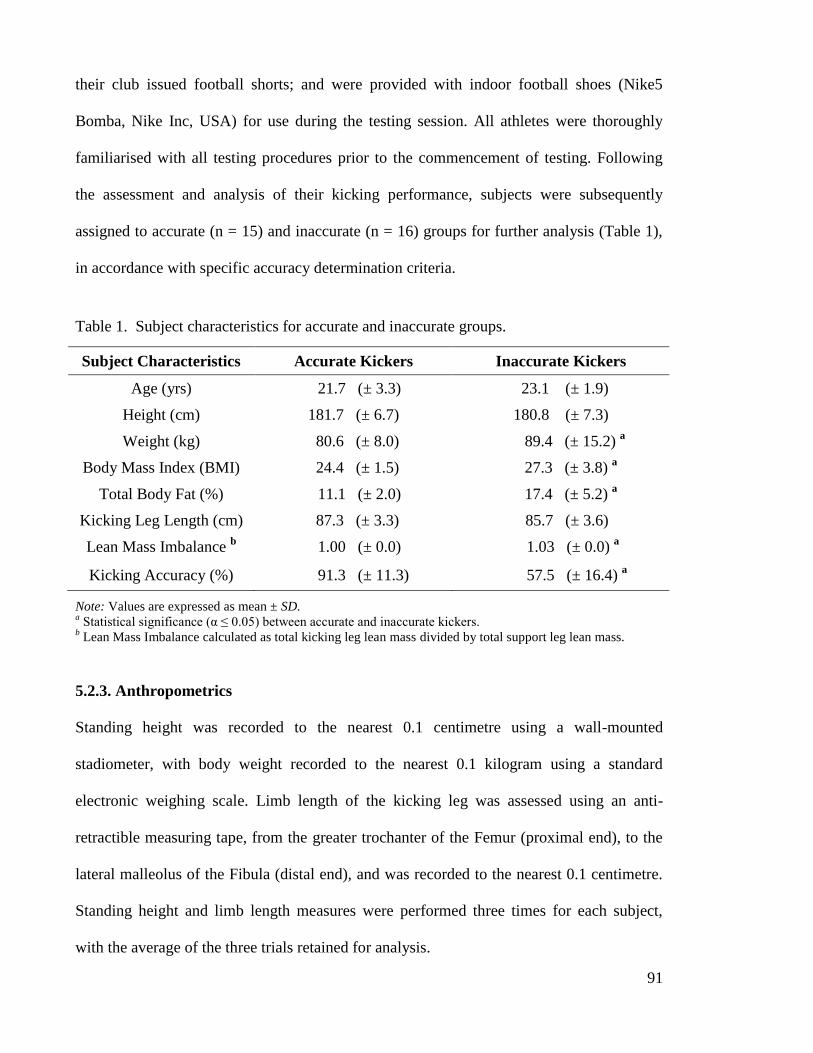
91
their club issued football shorts; and were provided with indoor football shoes (Nike5
Bomba, Nike Inc, USA) for use during the testing session. All athletes were thoroughly
familiarised with all testing procedures prior to the commencement of testing. Following
the assessment and analysis of their kicking performance, subjects were subsequently
assigned to accurate (n = 15) and inaccurate (n = 16) groups for further analysis (Table 1),
in accordance with specific accuracy determination criteria.
Table 1. Subject characteristics for accurate and inaccurate groups.
Subject Characteristics Accurate Kickers Inaccurate Kickers
Age (yrs) 21.7 (± 3.3) 23.1 (± 1.9)
Height (cm) 181.7 (± 6.7) 180.8 (± 7.3)
Weight (kg) 80.6 (± 8.0) 89.4 (± 15.2) a
Body Mass Index (BMI) 24.4 (± 1.5) 27.3 (± 3.8) a
Total Body Fat (%) 11.1 (± 2.0) 17.4 (± 5.2) a
Kicking Leg Length (cm) 87.3 (± 3.3) 85.7 (± 3.6)
Lean Mass Imbalance b 1.00 (± 0.0) 1.03 (± 0.0)
a
Kicking Accuracy (%) 91.3 (± 11.3) 57.5 (± 16.4) a
Note: Values are expressed as mean ± SD. a Statistical significance (α ≤ 0.05) between accurate and inaccurate kickers.
b Lean Mass Imbalance calculated as total kicking leg lean mass divided by total support leg lean mass.
5.2.3. Anthropometrics
Standing height was recorded to the nearest 0.1 centimetre using a wall-mounted
stadiometer, with body weight recorded to the nearest 0.1 kilogram using a standard
electronic weighing scale. Limb length of the kicking leg was assessed using an anti-
retractible measuring tape, from the greater trochanter of the Femur (proximal end), to the
lateral malleolus of the Fibula (distal end), and was recorded to the nearest 0.1 centimetre.
Standing height and limb length measures were performed three times for each subject,
with the average of the three trials retained for analysis.

92
5.2.4. Scan Procedure
Lower body segmental mass and full-body composition components were assessed with
dual energy x-ray absorptiometry (DEXA; Hologic Discovery A, Waltham, WA) using
previously established, standardised and reliable body positioning procedures (Hologic,
2004; Peiffer et al, 2010). In particular, subjects assumed a stationary, supine position on
the scanning bed with both arms pronated by their side, and hands facing the table. To
ensure consistent body positioning, the DEXA operator manually assisted subjects in order
to straighten their head, torso and pelvis; internally rotate and fixate their legs and feet at
45°; and ensured they were located within the DEXA scanning zone (Figure 1a). This has
been shown to produce a scan/re-scan coefficient of variation below 1% in our laboratory
(Peiffer et al, 2010).
5.2.5. Scan Analysis
Whole body scans were analysed using the inbuilt analysis software (Version 12.4; QDR
for Windows, Hologic, Waltham, WA). The predefined, mandatory whole body model
(Hologic, 2004) was applied to the scan image, separating the body into axial and
appendicular sections to determine whole body composition and segmental composition of
the kicking and support legs. Further analysis was performed to specifically identify and
assess the segmental mass characteristics of the thigh and shank regions of the kicking and
support legs using the sub-region analysis tool, in accordance with Dempster’s body
segment parameter boundaries for 2D studies (Winter, 1990). Scan analysis reliability
assessed prior to the current study revealed very high intra-tester reliability (CV ≤ 2.6%;
ICC ≥ 0.941) and very high inter-tester reliability (CV ≤ 2.4%; ICC ≥ 0.961) for segmental
sub-region analysis components.
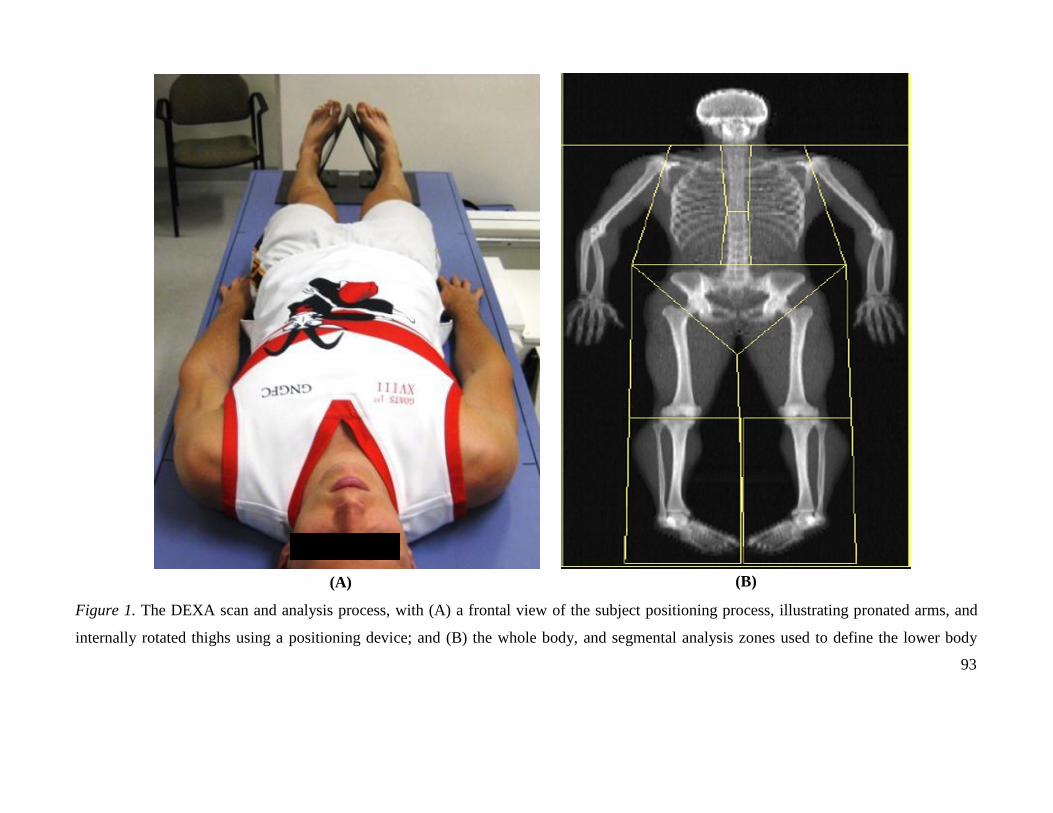
93
Figure 1. The DEXA scan and analysis process, with (A) a frontal view of the subject positioning process, illustrating pronated arms, and
internally rotated thighs using a positioning device; and (B) the whole body, and segmental analysis zones used to define the lower body
(A) (B)
93

94
Due to the lengthening of the shank segment during the kicking motion in response to fixed
plantarflexion of the foot (Orchard, Walt, McIntosh & Garlick, 1999), the shank segment
was represented by the combination of both shank and foot regions in this study (Figure
1b). Segmental mass outputs were categorised into fat mass (g), lean mass (g) and total
mass (g) values for each sub-region across all scans and subjects using Microsoft Excel
(Microsoft, Redmond, WA). Relative lean mass for each segment and limb was calculated
by dividing the amount segmental mass (g) by total body mass (g). The lean-to-fat ratio for
each segment and limb was calculated by dividing the quantity of lean mass (g) over the
quantity of fat mass (g) within the specific limb or segment. The residual difference
between the kicking and support legs for each mass component (lean, fat and total) was
determined by deducting the whole support leg from the whole kicking leg using both
absolute and relative computations.
5.2.6. Kicking Protocol
Kicking technique was assessed using the drop punt kick, performed with an Australian
football (450g, Sherrin, Victoria, AU) inflated to official air pressure specifications (67 –
75 kPa) (Ball, 2008), using an electronic air pump (Air Erupt, Volcano, Taiwan). Athletes
were required to produce ten drop punt kicks to a stationary human (player) target situated
20 metres from the centre of the kicking zone with the intention to deliver the ball as
accurately as possible to the specified target (Figure 2). The twenty meter distance was
chosen to correspond with other kicking accuracy literature in Australian Football (Young
et al, 2010; Dichiera et al, 2006), and to replicate game-based accuracy demands when
kicking to another player, as short kicks are often used to deliver a ball to another player in

95
Australian Football (Dichiera et al, 2006). A life-sized obstacle representing an opposite
player (base-to-head height: 6 ft; base-to-hand height: 7 ft) was positioned between the
kicker and their target to control for minimum kicking trajectory, and to increase game-test
specificity in the laboratory environment as Australian Footballers are regularly required to
kick a ball to another player over an opponent defending space on the field.
Prior to commencing the kicking protocol, subjects completed a series of mechanically
specific warm-up sets (5 drop punt kicks over 20m, 30m and 40m respectively, totalling 15
warm-up trials). Their ten official drop punt trials were then completed with a one minute
recovery provided between each kick. For the trial to be considered successful, the athlete
had to produce an approach consisting of at least two steps prior to planting their foot
within the assigned kicking zone. Any trials which did not meet this criterion were
considered invalid, and a repeat kicking trial subsequently provided until ten successful
kicks were produced. Angle of approach was not standardised, however all athletes
voluntarily self-selected a straight approach.
5.2.7. Accuracy Determination
Kicking accuracy was assessed using a customised numerical scoring system. All kicks
were visually graded immediately following each trial by the lead researcher; the human
target (receiving the ball) and a research assistant. All assigned scores were recorded and
visually confirmed using a two-dimensional digital video camera (MV710I PAL, Canon,
NSW, AU). The scoring system for each kick spanned from 1 (accurate), 2 (moderate) and
3 (inaccurate), and was judged by the location of ball delivery to the target (Table 2).

96
Figure 2. The kicking protocol set-up, with the athlete performing the drop punt, over an obstacle (height: 6 ft), to a stationary human target
20 metres from the kicking zone (outlined, dimensions: 1.0m x 0.7m).

97
Following ten successful kicks, each athlete’s scores were summated, with total scores
ranging between 10 to 30 points. Athletes were classified as either accurate (10 – 18 points)
or inaccurate (19 – 30 points), resulting in fifteen accurate kickers, and sixteen inaccurate
kickers. Kicking accuracy was subsequently determined by calculating the percentage of
accurate trials produced within the ten trial quota. Athlete performance and accuracy
grading reliability assessed prior to the current study revealed very high intra-tester
reliability (CV ≤ 1.6%; ICC ≥ 0.997), inter-tester reliability (CV ≤ 3.3%; ICC ≥ 0.986) and
between-day reliability of kicking performance (CV ≤ 4.2%; ICC ≥ 0.975).
Table 2. Accuracy grading and determination criteria for human target kicking outcomes.
Assigned Score Description of Ball Delivery to Target
1
(Accurate)
The ball is delivered directly to the target, between the waist and head of
the receiving player.
The target should not reach or jump in any direction from their
stationary position for this score to be awarded.
2
(Moderate)
The ball slightly deviates from the target, though not excessively (within
the targets reach). The target may take one step or reach in any direction; jump directly
upwards; or kneel down from their stationary position for this score to
be awarded. No combined “step and reach” or “jump and reach” are
allowed.
3
(Inaccurate)
The ball misses the target by any margin beyond the limits seen within
the ‘Accurate’ or ‘Moderate’ grading criteria. If the target needs to step and reach; jump and reach; or take more than
one step to receive the ball, or, if the ball misses the target zone all
together; it is awarded an inaccurate score.
5.2.8. Statistical Analysis
Independent t-tests were used to determine whether significant differences were prevalent
between subject characteristics (Table 1) and leg mass characteristics (Table 3) of accurate

98
and inaccurate kicking groups. Statistical significance was set at an alpha level of p ≤ 0.05.
Furthermore, Pearson’s product moment (PPM) correlation coefficients (r) were calculated
to determine the strength of relationship between absolute and relative leg mass variables to
total kicking accuracy scores (Table 4), as per accuracy determination criteria. The strength
of relationship was classified in accordance with Hopkins (2002): r ≥ 0.3 is moderate; r ≥
0.5 is strong; r ≥ 0.7 is very strong; r ≥ 0.9 is nearly perfect; and r = 1.0 is perfect. The data
was assessed for normality and scale of measurement. All statistical computations were
performed using a statistical analysis program (SPSS, Version 17.0; Chicago, IL).
5.3. Results
Leg mass characteristics have been provided in Table 3. Significant differences between
accurate and inaccurate kickers for absolute mass and relative mass (proportionate to total
body mass) quantities of the thigh, shank and whole leg segments were evident within the
kicking leg (Figure 3) and support leg (Figure 4). In particular, no significant differences
were noted for absolute lean mass and absolute total mass across all kicking leg and support
leg segments, with only absolute fat mass reaching significance in both kicking (p = 0.001
to 0.013) and support (p ≤ 0.001) legs, demonstrating lower fat mass in accurate kickers
across all segments. When expressed in relative terms (proportionate to total body mass), a
greater interaction between composite mass and kicking accuracy was observed across both
limbs. In particular, lean mass was significantly higher (p = 0.001 to 0.004), and fat mass
was significantly lower (p = 0.001 to 0.024) in accurate kickers across all segments in both
kicking and support limbs. No difference was found in total relative thigh mass for either
limb, however accurate kickers did exhibit significantly higher total relative shank mass (p
= 0.002 to p = 0.013) across both limbs, and higher total relative leg mass (p = 0.048) in the
support leg only.

99
Table 3. Leg mass characteristics of kicking and support limbs for accurate and inaccurate kickers.
LEG MASS
CHARACTERISTICS
Accurate
[ Kicking Leg ]
Inaccurate
[ Kicking Leg ]
Accurate
[ Support Leg ]
Inaccurate
[ Support Leg ]
Absolute Mass of Thigh
- Lean (g)
- Fat (g)
- Total (g)
Absolute Mass of Shank
- Lean (g)
- Fat (g)
- Total (g)
Absolute Mass of Leg
- Lean (g)
- Fat (g)
- Total (g)
8173.8 (± 885.7)
1190.2 (± 355.1)
9625.6 (± 1064.9)
3739.3 (± 364.9)
574.2 (± 168.4)
4655.5 (± 471.9)
11913.1 (± 1170.2)
1764.4 (± 483.3)
14281.2 (± 1495.8)
8246.4 (± 1356.9)
2199.6 (± 898.0) a
10745.8 (± 1985.7)
3559.5 (± 455.0)
809.7 (± 300.4) a
4715.0 (± 655.4)
11805.9 (± 1720.1)
3016.7 (± 1179.5) a
15460.8 (± 2566.8)
8115.6 (± 922.6)
1175.9 (± 363.0)
9601.0 (± 1170.5)
3783.3 (± 362.2)
473.8 (± 121.3)
4596.5 (± 409.3)
11898.9 (± 1183.5)
1649.7 (± 462.7)
14197.5 (± 1511.9)
7967.4 (± 1378.4)
2138.8 (± 838.6) a
10401.60 (± 1942.6)
3507.6 (± 454.1)
855.9 (± 326.8) a
4706.8 (± 643.8)
11474.9 (± 1716.5)
2994.7 (± 1147.0) a
15108.4 (± 2503.9)
95
99

100
Relative Mass of Thigh
- Lean (%)
- Fat (%)
- Total (%)
Relative Mass of Shank
- Lean (%)
- Fat (%)
- Total (%)
Relative Mass of Leg
- Lean (%)
- Fat (%)
- Total (%)
10.14 (± 0.6)
1.46 (± 0.4)
11.93 (± 0.4)
4.65 (± 0.3)
0.71 (± 0.2)
5.78 (± 0.3)
14.79 (± 0.7)
2.16 (± 0.5)
17.71 (± 0.5)
9.36 (± 0.8) a
2.44 (± 0.8) a
12.14 (± 0.7)
4.08 (± 0.5) a
0.90 (± 0.2) a
5.37 (± 0.4) a
13.44 (± 1.1) a
3.35 (± 1.0) a
17.51 (± 0.8)
10.06 (± 0.5)
1.44 (± 0.4)
11.89 (± 0.5)
4.70 (± 0.3)
0.58 (± 0.1)
5.71 (± 0.2)
14.77 (± 0.6)
2.03 (± 0.5)
17.60 (± 0.5)
9.03 (± 0.8) a
2.37 (± 0.7) a
11.75 (± 0.7)
4.01 (± 0.5) a
0.96 (± 0.3) a
5.37 (± 0.4) a
13.05 (± 1.1) a
3.33 (± 1.0) a
17.11 (± 0.8) a
Note: Values are expressed as mean ± SD. a
Statistical significance (α ≤ 0.05) between accurate and inaccurate kickers for each leg

101
Figure 3. A comparison of the absolute thigh mass (A), shank mass (B), leg mass (C), and relative thigh mass (D), shank mass (E) leg mass (F)
for lean, fat and total kicking leg composition between accurate and inaccurate kicking groups. Statistical significance (*) was set at p ≤ 0.05.
101

102
Figure 4. A comparison of the absolute thigh mass (A), shank mass (B), leg mass (C), and relative thigh mass (D), shank mass (E) leg mass (F) for
lean, fat and total support leg composition between accurate and inaccurate kicking groups. Statistical significance (*) was set at p ≤ 0.05.

103
Table 4. Correlation coefficients assessing the strength of relationship between leg mass characteristics and total kicking accuracy
scores achieved by all kickers.
Kicking Thigh Kicking Shank Kicking Leg Support Thigh Support Shank Support Leg
Absolute Mass
- Lean (g)
- Fat (g)
- Total (g)
r = -0.008
r = -0.559 b
r = -0.296
r = -0.009
r = -0.471 c
r = -0.250
r = -0.009
r = -0.552 b
r = -0.295
r = 0.070 .
r = -0.564 b
r = -0.223
r = 0.073 .
r = -0.557 b
r = -0.287
r = 0.077 .
r = -0.569 b
r = -0.248
Relative Mass
- Lean (%)
- Fat (%)
- Total (%)
r = 0.631 b
r = -0.580 b
r = 0.085 .
r = 0.462 c
r = -0.431 c
r = 0.344 c
r = 0.631 b
r = -0.569 b
r = 0.279 .
r = 0.694 a
r = -0.585 b
r = 0.305 c
r = 0.492 b
r = -0.534 b
r = 0.285
r = 0.698 a
r = -0.582 b
r = 0.433 c
a Very strong effect - (r ≥ 0.7).
b Strong effect - (r ≥ 0.5).
c Moderate effect - (r ≥ 0.3).
103

104
Figure 5. A comparison of the composite mass imbalance [kicking leg – support leg] between (A) absolute and (B) relative leg mass
components between accurate and inaccurate kickers. Statistical significance (*) was set at p ≤ 0.05.
(A) (B)
*
*
* *
*
*
101

105
Figure 6. A comparison of the lean-mass ratio of kicking (A) and support (B) legs. Statistical significance (*) was set at p ≤ 0.05.
(A) (B)
* * *
*
*
*
105

106
The lean-to-fat ratio (LFR) was significantly different (p = 0.001 to 0.009) for all segments
across both limbs, demonstrating vastly higher quantities of lean mass relative to fat mass
within accurate kickers. Furthermore, when comparing the residual difference of composite
mass between limbs, inaccurate kickers exhibited significant larger imbalances in absolute
and relative lean and total mass characteristics, favouring their kicking leg when compared
to accurate kickers (p = 0.005 to 0.028). This was further illustrated by the lean mass
imbalance (kicking leg divided by support leg), with accurate kickers showing no
imbalance versus inaccurate kickers showing a significant imbalance (p = 0.002).
Correlation coefficients (r) between leg mass characteristics and subsequent kicking
accuracy ratings are presented in Table 4. Positive correlations were noted between kicking
accuracy scores and relative magnitudes of lean mass for both kicking (r = 0.462 to 0.631)
and support (r = 0.492 to 0.698) limbs, exhibiting moderate to very strong positive
relationships. Conversely, negative correlations were noted between kicking accuracy
scores and relative magnitudes of fat mass within both kicking (r = -0.431 to -0.580) and
support (r = -0.534 to -0.585) limbs, producing moderate to strong negative relationships.
Furthermore, absolute fat mass across all segments of the kicking leg also produced
moderate to strong negative correlations with kicking accuracy (r = -0.471 to -0.559). The
lean-fat ratio further provided moderate-to-large positive correlations with kicking accuracy
outcomes in both kicking (r = 0.482 to 0.606) and support (r = 0.554 to 0.622) limbs.
5.4. Discussion
The results of this study provide support for the hypothesis that successful athletes exhibit
considerably different physical characteristics to their less successful counterparts (Nevill et

107
al, 2009). Specifically, in this study, accurate kickers contained noticeably different leg
mass characteristics than inaccurate kickers across all segments of the kicking and support
limbs, particularly when expressed relative to total body mass. Similar amounts of total leg
mass were evident between accurate and inaccurate kickers; however the composition of
each segment and whole limb vastly differed between the groups with more accurate
athletes exhibiting greater quantities of lean muscle mass and lower quantities of fat mass
when expressed relative to total body mass.
While few studies have reported whole body composition and leg mass data using DEXA
technology to profile and compare athletic populations (Veale et al, 2010; Andreoli et al,
2001), a multitude of research using a variety of body composition and lower limb
estimation techniques are in agreement with the current study (Malina & Geithner, 2011;
Veale et al, 2010; Ooi et al, 2009; Hoshikawa et al, 2009; Andreoli et al, 2001). In
particular, the general conclusion drawn from this body of literature illustrates the positive
relationship evident between greater absolute lean mass and athletic success across a broad
range of sports (Malina & Geithner, 2011; Chaouachi et al, 2009; Bioleau & Lohman,
1977). However, the results of the present study further extend this positive relationship to
also include relative quantities of lean mass.
Specifically, relative lean mass provided the largest difference between accurate and
inaccurate kickers when expressed relative to total body mass, and as a ratio within
individual segments (lean-to-fat ratio), while also producing the strongest correlations with
kicking accuracy ratings. This appears logical, as the primary component of lean tissue is
skeletal muscle mass; an active, contractile, force generating tissue which functionally

108
contributes to skilful movement, and is proportionate to body size (Malina & Geithner,
2011; Hoshikawa et al, 2009; Loucks, 2004; Andreoli et al, 2001). This may also explain a
functional limitation within the support leg of inaccurate kickers, which contained
significantly less absolute and relative lean tissue mass in comparison to the kicking leg. As
force generation is related to muscle size, and intrinsic contractile properties (Hoshikawa et
al, 2009; Perez-Gomez et al, 2008; Andersen & Aagaard, 2006), the inferiority of lean mass
within the support leg of inaccurate kickers may create a physical weakness. In particular, a
reduced strength capacity in response to lower muscle mass within the support leg may
have negative implications towards the effective stabilisation and controlled execution of
the kicking skill within inaccurate kickers which requires further investigation.
Furthermore, previous research has not yet reported absolute or relative quantities of fat
mass within athletic populations across the entire body. As excessive fat mass impacts
negatively on sports requiring the projection of a body through space (Malina & Geithner,
2011; Nevill et al, 2009), the magnitude and distribution of this inert tissue requires
acknowledgement and consideration (Loucks, 2004). In particular, the results of the present
study support this proposition, demonstrating a clearly negative association between fat
mass quantities in all lower limb segments with subsequent kicking performance. While the
modification of leg mass characteristics in favour of greater lean tissue, and reduced fat
tissue appears critically important to performance, it is worthwhile to note that these
physical characteristics, while desirable, do not necessarily create accuracy; rather, they
provide the athlete with an optimal foundation to achieve technical proficiency
(Manolopoulos, Papadopoulos & Kellis, 2006). Given that the kicking action is complex
and multidimensional, and requires the successful integration of whole body interactions to

109
produce a desirable outcome (Shan & Westerhoff, 2005), potential confounding factors
exist; particularly as kinematic strategies, kinetic profiles and muscle activation patterns
were not assessed. Furthermore, this study was limited by the indoor laboratory
environment and specific footwear used during testing which might have modified the
quality of performance
Despite these limitations, the composite differences between accurate and inaccurate
kickers in this study continue to pose some interesting questions for future research to
address. In particular, 1) Will increasing total (absolute) mass of the kicking leg optimise
the speed-accuracy trade-off? 2) Does greater relative lean mass enable heightened
precision due to reduced volitional effort? 3) Will an increase in the lean-to-fat ratio adjust
collision rigidity of the kicking shank (coefficient of restitution) during ball impact in
favour of greater limb control? 4) Will increasing lean mass of the lower limbs enhance
athletic stability during the technical components of the kicking action? and 5) Does a lean
mass imbalance between kicking and support limbs create destabilisation during task
execution? Addressing these questions will provide a more comprehensive overview of the
physical characteristics underpinning skilful performance and kicking accuracy.
In conclusion, the findings of this study demonstrate that segmental mass characteristics
differ between accurate and inaccurate Australian footballers performing the drop punt
kick. This demonstrates an association between segmental mass characteristics may
influence the technical proficiency and movement efficiency of common sporting skills,
such as kicking. Furthermore, relative lean mass may provide an additional and more
appropriate descriptor of athletic conditioning, particularly within sports which are limited

110
by total body mass requirements. Future research aiming to profile athletes are encouraged
to assess and report absolute and relative mass characteristics across the whole body,
inclusive of individual appendicular segments.
5.5. References
Amiri-Khorasani, M., Osman, N. A. A., & Yusof, A. (2010). Kinematics Analysis: Number
of trials necessary to achieve performance stability during soccer instep kicking.
Journal of Human Kinetics, 23, 15-20.
Andersen, L. L., & Aagaard, P. (2006). Influence of maximal muscle strength and intrinsic
muscle contractile properties on contractile rate of force development. European
Journal of Applied Physiology, 96(1), 46-52.
Andreoli, A., Monteleone, M., Van Loan, M., Promenzio, L., Tarantino, U., & De Lorenzo,
A. (2001). Effects of different sports on bone density and muscle mass in highly
trained athletes. Medicine and Science in Sports and Exercise, 33(4), 507-511.
Ball, K. (2008). Biomechanical considerations of distance kicking in Australian Rules
football. Sports Biomechanics, 7(1), 10-23.
Bioleau, R. A., & Lohman, T. H. (1977). The measurement of human physique and its
effects on physical performance. Orthopedic Clinics of North America, 8, 563-581.
Chaouachi, A., Brughelli, M., Levin, G., Boudhina, N. B., Cronin, J., & Chamari, K.
(2009). Anthropometric, physiological and performance characteristics of elite
team-handball players. Journal of Sports Sciences, 27(2), 151-157.
Dichiera, A., Webster, K. E., Kuilboer, L., Morris, M. E., Bach, T. M., & Feller, J. A.
(2006). Kinematic patterns associated with accuracy of the drop punt kick in
Australian Football. Journal of Science and Medicine in Sport, 9(4), 292-298.

111
Hologic. (2004). QDR for Windows XP Reference Manual: Hologic Inc.
Hopkins, W. (2002). A scale of magnitudes for effect statistics. Retrieved from
http://www.sportsci.org/resource/stats/effectmag.html
Hoshikawa, Y., Iida, T., Muramatsu, M., Nakajima, Y., Fukunaga, T., & Kanehisa, H.
(2009). Differences in thigh muscularity and dynamic torque between junior and
senior soccer players. Journal of Sports Sciences, 27(2), 129-138.
Keogh, J. (1999). The use of physical fitness scores and anthropometric data to predict
selection in an elite under 18 Australian rules football team. Journal of Science and
Medicine in Sport, 2(2), 125-133.
Loucks, A. B. (2004). Energy balance and body composition in sports and exercise.
Journal of Sports Sciences, 22(1), 1-14.
Malina, R., & Geithner, C. (2011). Body composition of young athletes. American Journal
of Lifestyle Medicine, 5(3), 262-278.
Manolopoulos, E., Papadopoulos, C., & Kellis, E. (2006). Effects of combined strength and
kick coordination training on soccer kick biomechanics in amateur players.
Scandinavian Journal of Medicine and Science in Sports, 16(2), 102-110.
Nevill, A., Holder, R., & Watts, A. (2009). The changing shape of "successful" professional
footballers. Journal of Sports Sciences, 27(5), 419-426.
Ooi, C. H., Tan, A., Ahmad, A., Kwong, K. W., Sompong, R., Ghazali, K. A., et al. (2009).
Physiological characteristics of elite and sub-elite badminton players. Journal of
Sports Sciences, 27(14), 1591-1599.
Orchard, J., Walt, S., McIntosh, A., & Garlick, D. (1999). Muscle activity during the drop
punt kick. Journal of Sports Sciences, 17(10), 837-838.

112
Peiffer, J. J., Galvao, D. A., Gibbs, Z., Smith, K., Turner, D., Foster, J., et al. (2010).
Strength and functional characteristics of men and women 65 years and older.
Rejuvenation Research, 13(1), 75-82.
Pyne, D. B., Gardner, A. S., Sheehan, K., & Hopkins, W. G. (2005). Fitness testing and
career progression in AFL football. Journal of Science and Medicine in Sport, 8(3),
321-332.
Pyne, D. B., Gardner, A. S., Sheehan, K., & Hopkins, W. G. (2006). Positional differences
in fitness and anthropometric characteristics in Australian football. Journal of
Science and Medicine in Sport, 9(1-2), 143-150.
Rampinini, E., Impellizzeri, F. M., Castagna, C., Coutts, A. J., & Wisloff, U. (2009).
Technical performance during soccer matches of the Italian Serie A league: effect of
fatigue and competitive level. Journal of Science and Medicine in Sport, 12(1), 227-
233.
Shan, G., & Westerhoff, P. (2005). Full-body kinematic characteristics of the maximal
instep soccer kick by male soccer players and parameters related to kick quality.
Sports Biomechanics, 4(1), 59-72.
Veale, J. P., Pearce, A. J., Buttifant, D., & Carlson, J. S. (2010). Anthropometric profiling
of elite junior and senior Australian football players. International Journal of Sports
Physiology and Performance, 5(4), 509-520.
Winter, D. A. (1990). Biomechanics and Motor Control of Human Movement (2nd ed.).
Toronto: John Wiley & Sons, Inc.
Young, W., Gulli, R., Rath, D., Russell, A., O'Brien, B., & Harvey, J. (2010). Acute effect
of exercise on kicking accuracy in elite Australian football players. Journal of
Science and Medicine in Sport, 13(1), 85-89.

113
Young, W. B., Newton, R. U., Doyle, T. L., Chapman, D., Cormack, S., Stewart, G., et al.
(2005). Physiological and anthropometric characteristics of starters and non-starters
and playing positions in elite Australian Rules Football: a case study. Journal of
Science and Medicine in Sport, 8(3), 333-345.
Young, W. B., & Pryor, L. (2007). Relationship between pre-season anthropometric and
fitness measures and indicators of playing performance in elite junior Australian
Rules football. Journal of Science and Medicine in Sport, 10(2), 110-118.
Young, W. B., & Rath, D. A. (2011). Enhancing Foot Velocity in Football Kicking: The
Role of Strength Training. Journal of Strength and Conditioning Research, 25(2),
561-566.
114
CHAPTER SIX – STUDY FOUR
THE INFLUENCE OF LIMB MASS AND FOOT VELOCITY ON
KICKING ACCURACY IN AUSTRALIAN FOOTBALL.
JOURNAL OF MOTOR BEHAVIOR
(IN REVIEW, JULY 2012).
Nicolas H. Hart, Sophia Nimphius, Jodie L. Cochrane, Robert U. Newton

115
6.0. Abstract
In football sports’, kicking a ball accurately over a desired distance to an intended target is
arguably the most important skill to acquire, therefore understanding the potential
mechanisms which underpin kicking accuracy is important. For example, increasing leg
mass to enable a proportionately lower angular velocity might successfully exploit the
speed-accuracy trade-off in favour of greater accuracy. The aim of this paper was to assess
the influence of leg mass and foot velocity on kicking accuracy in Australian Football.
Thirty-one Australian footballers were recruited to perform ten drop punt kicks over twenty
metres to a player target. Athletes were separated into accurate (n = 15) and inaccurate (n =
16) kicking groups, with leg mass characteristics assessed using whole body DEXA scans,
and foot velocity determined using a ten-camera Vicon motion capture system. Results
demonstrated no relationship between foot velocity and kicking accuracy (r = -0.047 to -
0.083). Relative lean mass was positively correlated with kicking accuracy (r = 0.631), with
interactions between leg mass and foot velocity only evident within accurate kickers (r = -
0.670 to -0.701). Given the potential importance of lean mass, and its interaction with foot
velocity within accurate kickers; future research may wish to directly explore the speed-
accuracy and impulse-variability constructs using controlled, with-in subject, resistance
training and skill acquisition studies as possible pathways to heightening kicking accuracy.

116
6.1. Introduction
Football sports require a combination of speed and accuracy in various forms in order to
generate a successful performance; however the act of kicking a ball accurately to a
specified target is arguably the most important skill to master (Ball, 2007b). Any kicker
who is able to deliver a ball accurately over greater maximal and sub-maximal distances
becomes a more critical asset to their team (Young & Rath, 2011; Young et al, 2010; Ball,
2008), particularly as the effectiveness of the kicking skill can often differentiate between
winning or losing a competitive match (Ball, 2007a; Dichiera et al, 2006). Despite the
importance of kicking accuracy in sport, limited attention has been provided in the
literature to investigate ways to describe, develop and improve this technical characteristic
(Young et al, 2010; Dichiera et al, 2006).
Previous research has identified a variety of ways to enhance kicking distance (Young &
Rath, 2011; Baktash, Hy, Muir, Walton & Zhang, 2009; Ball, 2008; Ball, 2007a),
principally focusing attention towards the optimisation of foot velocity as a direct and
comprehensive descriptor for subsequent ball velocity (Ball, 2008; Kellis & Katis, 2007;
Lees & Nolan, 1998; Levanon & Dapena, 1998). However, foot velocity might not resonate
strongly with kicking accuracy intentions. In particular, resultant ball velocity is the product
of applied angular impulse and transferred angular momentum (Baktash et al, 2009;
Sterzing & Hennig, 2008); and while foot velocity is an influential characteristic of kicking
behaviour, it does not wholly represent the complexity of the kicking action. Specifically, it
fails to address the fundamental description of angular momentum which requires the
consideration of both the quantity and distribution of lower limb mass, in addition to the
117
angular foot velocity produced at ball impact (Baktash et al, 2009; Andersen, Dorge &
Thomsen, 1999; Lees & Nolan, 1998).
Therefore, to modify kicking behaviour, an athlete may adjust the speed (angular velocity)
at which the limb travels, or alternatively adjust the striking mass (rotational inertia) of the
limb itself (Young & Rath, 2011; Ball, 2008; Kellis & Katis, 2007). While increasing the
velocity of the kicking limb might improve kicking distance, there is a potential conflict
with kicking accuracy due to an anticipated speed-accuracy trade-off (Nagengast, Braun &
Wolpert, 2011; Beilock, Bertenthal, Hoerger & Carr, 2008; Magill, 2008), prompting a
possible decrease in movement precision at higher limb velocities (Urbin, Stodden,
Fischman & Weimar, 2011; Dean & Maloney, 2007). Instead, a plausible solution may
involve the positive manipulation of striking mass, as this should allow an equivalent
distance to be achieved at a reduced angular velocity (Young & Rath, 2011), effectively
shifting the speed-accuracy continuum towards greater accuracy without compromising
achievable distance. This might honour both distance and accuracy intentions, though is yet
to be scientifically confirmed.
A paucity of research exists investigating the potential relationship between the technical
and temporal strategy of accurate and inaccurate kickers in response to the physical
parameters modifiable by athletic conditioning. Extending the literature to heighten the
scientific understanding of those mechanisms which underpin accurate performance will
inevitably improve the quality of coaching, physical conditioning and acquisition strategies,
with the express aim to enhance athletic performance. In particular, adjusting the quality
(composition) and quantity (amount) of lower limb mass may have a profound impact on an

118
athlete’s kicking action and technical proficiency. It is therefore the purpose of this paper to
investigate the influence and interrelationships of leg mass characteristics and foot velocity
production on kicking accuracy outcomes between accurate and inaccurate kickers; to serve
as a hypothesis-generating study (Bishop, 2008) for future intervention-based, longitudinal
research investigations.
6.2. Methods
6.2.1. Subjects
Thirty-one Australian footballers (age: 22.1 ± 2.8 yrs; mass: 85.1 ± 13.0 kg; height: 181.1 ±
7.0 cm; BMI: 25.9 ± 3.2) were recruited from the Western Australian Football League
(WAFL) for participation in this study. All athletes were required to have a minimum of
five years total playing experience, with two consecutive years of experience at their
current playing level. Athletes were also required to have no injuries or contraindications at
the time of testing; and were not permitted to perform any strenuous exercise or lower body
resistance training within 48 hours of their assigned testing session. All athletes were
notified of the potential risks involved, and provided written informed consent for
participation. Ethics clearance was provided by Edith Cowan University’s Human Ethics
Committee.
6.2.2. Study Design
This study utilised an acute, between-groups, cross-sectional design, consisting of a single
testing session. Sessions commenced with anthropometric measures including height,
weight, joint breadths and limb lengths; followed by an assessment of whole-body
composition and lower body segmental mass characteristics (lean, fat, total) of the kicking
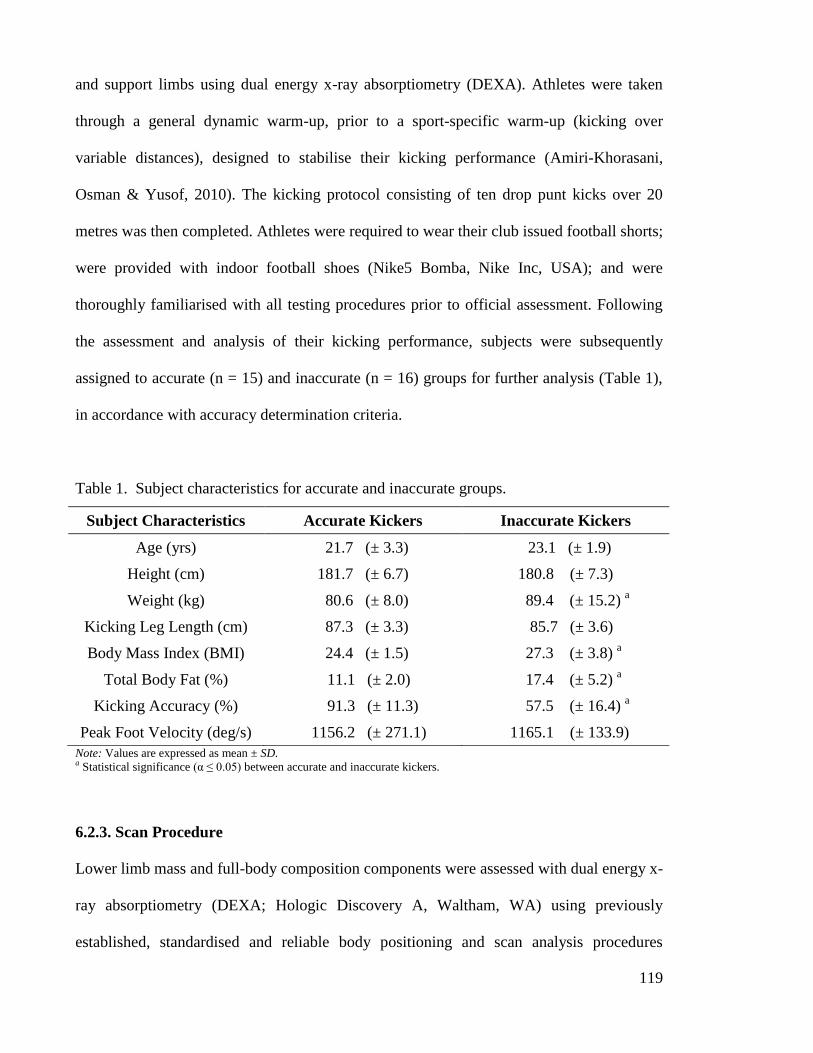
119
and support limbs using dual energy x-ray absorptiometry (DEXA). Athletes were taken
through a general dynamic warm-up, prior to a sport-specific warm-up (kicking over
variable distances), designed to stabilise their kicking performance (Amiri-Khorasani,
Osman & Yusof, 2010). The kicking protocol consisting of ten drop punt kicks over 20
metres was then completed. Athletes were required to wear their club issued football shorts;
were provided with indoor football shoes (Nike5 Bomba, Nike Inc, USA); and were
thoroughly familiarised with all testing procedures prior to official assessment. Following
the assessment and analysis of their kicking performance, subjects were subsequently
assigned to accurate (n = 15) and inaccurate (n = 16) groups for further analysis (Table 1),
in accordance with accuracy determination criteria.
Table 1. Subject characteristics for accurate and inaccurate groups.
Subject Characteristics Accurate Kickers Inaccurate Kickers
Age (yrs) 21.7 (± 3.3) 23.1 (± 1.9)
Height (cm) 181.7 (± 6.7) 180.8 (± 7.3)
Weight (kg) 80.6 (± 8.0) 89.4 (± 15.2) a
Kicking Leg Length (cm) 87.3 (± 3.3) 85.7 (± 3.6)
Body Mass Index (BMI) 24.4 (± 1.5) 27.3 (± 3.8) a
Total Body Fat (%) 11.1 (± 2.0) 17.4 (± 5.2) a
Kicking Accuracy (%) 91.3 (± 11.3) 57.5 (± 16.4) a
Peak Foot Velocity (deg/s) 1156.2 (± 271.1) 1165.1 (± 133.9)
Note: Values are expressed as mean ± SD. a Statistical significance (α ≤ 0.05) between accurate and inaccurate kickers.
6.2.3. Scan Procedure
Lower limb mass and full-body composition components were assessed with dual energy x-
ray absorptiometry (DEXA; Hologic Discovery A, Waltham, WA) using previously
established, standardised and reliable body positioning and scan analysis procedures

120
(Hologic, 2004; Peiffer et al, 2010). Subjects assumed a stationary, supine position on the
scanning bed with both arms pronated by their side, and hands facing the table. To ensure
consistent body positioning, the DEXA operator manually assisted subjects in order to
straighten their head, torso and pelvis; internally rotate and fixate their legs and feet at 45°;
and ensured they were located within the DEXA scanning zone (Figure 1a). This has been
shown to produce a scan/re-scan coefficient of variation below 1% (Peiffer et al, 2010).
Standing height was recorded to the nearest 0.1 centimetre using a wall-mounted
stadiometer, with body mass recorded to the nearest 0.1 kilogram using a standard
electronic weighing scale.
(A) (B)
Figure 1. The DEXA scan and analysis process, with (A) a frontal view of the subject
positioning process, illustrating pronated arms, and internally rotated thighs using a
positioning device; and (B) the whole body analysis zones used to define the lower limbs.

121
6.2.4. Scan Analysis
Whole body scans were analysed using the inbuilt analysis software (Version 12.4; QDR
for Windows, Hologic, Waltham, WA). The predefined, mandatory whole body model
(Hologic, 2004) was applied to the scan image, separating the body into axial and
appendicular sections to determine whole body composition and segmental composition of
the kicking and support legs. Composite mass outputs were categorised into fat mass (g),
lean mass (g) and total mass (g) values for each sub-region across all scans and subjects
using Microsoft Excel (Microsoft, Redmond, WA). Relative lean mass for each limb was
calculated by dividing the amount segmental mass (g) by total body mass (g).
6.2.5. Foot Velocity
Three-dimensional motion analysis of the kicking action was assessed using a ten-camera
optoelectronic device (ViconMX, Vicon, Oxford, UK), sampling at 250 Hz. A previously
validated full body model was used to capture the movement patterns produced, with 39
retroreflective markers positioned on subjects, over specific anatomical landmarks in
accordance with the Vicon Plug-in Gait model. A series of anthropometric measures were
also required to fulfil this model, including joint breadths of the both elbows, wrists, knees
and ankles; as well as leg length of both lower limbs, as defined by the Plug-In Gait model.
Retroreflective markers were positioned on the athlete prior to their sports-specific kicking
based warm-up to allow adequate familiarisation of kicking with markers attached. Official
trials were recorded using the inbuilt data acquisition software (ViconNEXUS, 1.7.1;
Vicon, Oxford, UK). Although peak foot velocity was the only kinematic variable assessed
and required by this study; the full-body model was applied as part of a larger collection
procedure which extends further than the scope of the current paper.

122
Figure 2. The kicking protocol set-up, with the athlete performing the drop punt, over an obstacle (height: 6 ft), to a stationary human target
20 metres from the kicking zone (outlined, dimensions: 1.0m x 0.7m).

123
6.2.6. Kicking Protocol
Kicking technique was assessed using the drop punt kick, performed with an Australian
football (450g, Sherrin, Victoria, AU) inflated to official air pressure specifications (67 –
75 kPa) (Ball, 2008), using an electronic air pump (Air Erupt, Volcano, Taiwan). Athletes
were required to produce ten drop punt kicks to a stationary human (player) target situated
20 metres from the centre of the kicking zone with the intention to deliver the ball as
accurately as possible to the specified target (Figure 2). The twenty meter distance was
chosen to correspond with other kicking accuracy literature in Australian Football (Young
et al, 2010; Dichiera et al, 2006), and to replicate game-based accuracy demands when
kicking to another player, as short kicks are often used to deliver a ball to another player in
Australian Football (Dichiera et al, 2006). A life-sized obstacle representing an opposite
player (base-to-head height: 6 ft; base-to-hand height: 7 ft) was positioned between the
kicker and their target to control for minimum kicking trajectory, and to increase game-test
specificity in the laboratory environment as Australian Footballers are regularly required to
kick a ball to another player over an opponent defending space on the field.
Prior to commencing the kicking protocol, subjects completed a series of mechanically
specific warm-up sets (5 drop punt kicks over 20m, 30m and 40m respectively, totalling 15
warm-up trials). Their ten official drop punt trials were then completed with a one minute
recovery provided between each kick. For the trial to be considered successful, the athlete
had to produce an approach consisting of at least two steps prior to planting their foot
within the assigned kicking zone. Any trials which did not meet this criterion were
considered invalid, and a repeat kicking trial subsequently provided until ten successful
kicks were produced. Angle of approach was not standardised.

124
6.2.7. Accuracy Analysis
Kicking accuracy was assessed using a customised numerical scoring system. All kicks
were visually graded immediately following each trial by the lead researcher; the human
target (receiving the ball) and a research assistant. All assigned scores were recorded and
visually confirmed using a two-dimensional digital video camera (MV710I PAL, Canon,
NSW, AU). The scoring system for each kick spanned from 1 (accurate), 2 (moderate) and
3 (inaccurate), and was judged by the location of ball delivery to the target (Table 2).
Following ten successful kicks, each athlete’s scores were summated, with total scores
ranging between 10 to 30 points. Athletes were classified as either accurate (10 – 18 points)
or inaccurate (19 – 30 points), resulting in fifteen accurate kickers, and sixteen inaccurate
kickers. Kicking accuracy was subsequently determined by calculating the percentage of
accurate trials produced within the ten trial quota.
Table 2. Accuracy grading and determination criteria for human target kicking outcomes.
Assigned Score Description of Ball Delivery to Target
1
(Accurate)
The ball is delivered directly to the target, between the waist and head of
the receiving player.
The target should not reach or jump in any direction from their
stationary position for this score to be awarded.
2
(Moderate)
The ball slightly deviates from the target, though not excessively (within
the targets reach).
The target may take one step or reach in any direction; jump directly
upwards; or kneel down from their stationary position for this score to
be awarded. No combined “step and reach” or “jump and reach” are
allowed.
3
(Inaccurate)
The ball misses the target by any margin beyond the limits seen within
the ‘Accurate’ or ‘Moderate’ grading criteria.
If the target needs to step and reach; jump and reach; or take more than
one step to receive the ball, or, if the ball misses the target zone all
together; it is awarded an inaccurate score.

125
6.2.8. Statistical Analysis
Independent t-tests was used to determine whether significant differences were evident
between subject characteristics, kicking leg mass components, and peak foot velocity
produced by accurate and inaccurate kickers. Statistical significance was set at an alpha
level of p ≤ 0.05. Pearson’s product moment (PPM) correlation coefficient (r) was
calculated to determine the strength of relationship between leg mass variables to peak
angular foot velocities; leg mass variables to kicking accuracy scores; and peak angular
foot velocities to kicking accuracy scores. The strength of relationship was classified in
accordance with Hopkins (2002): r ≥ 0.3 is moderate; r ≥ 0.5 is strong; r ≥ 0.7 is very
strong; r ≥ 0.9 is nearly perfect; and r ≥ 1.0 is perfect. All statistical computations were
performed using a statistical analysis program (SPSS, Version 17.0; Chicago, IL).
6.3. Results
Table 3. Leg mass characteristics of the kicking limb for accurate and inaccurate kickers.
Accurate Kickers Inaccurate Kickers
Absolute Mass
- Lean (g)
- Fat (g)
- Total (g)
11913 (± 1170)
1764 (± 483)
14281 (± 1496)
11806 (± 1720)
3017 (± 1179) a
15461 (± 2567)
Relative Mass
- Lean (%)
- Fat (%)
- Total (%)
14.79 (± 0.7)
2.16 (± 0.5)
17.71 (± 0.5)
13.44 (± 1.1) a
3.35 (± 1.0) a
17.51 (± 0.8)
Note: Values are expressed as mean ± SD. a
Statistical significance (α ≤ 0.05) between accurate and inaccurate kickers.
No significant differences between accurate and inaccurate kickers were visible for
absolute lean mass and absolute total mass across all segments of the kicking leg, with only
absolute fat mass reaching significance (p ≤ 0.001), demonstrating lower fat mass in

126
accurate kickers (Table 3). When expressed relative to body mass, a greater interaction
between composite mass and kicking accuracy was observed. Relative lean mass was
significantly higher (p ≤ 0.001), and relative fat mass was significantly lower (p ≤ 0.001) in
accurate kickers. Furthermore, a strong positive correlation was evident between kicking
accuracy and relative lean mass within the kicking leg (r = 0.631), with strong negative
correlations shown between both absolute and relative quantities of fat mass within the
kicking leg (r = -0.568 to -0.582). All correlation coefficients are presented in Table 4.
Table 4. Correlation coefficients between kicking accuracy and kicking leg mass.
Lean (g) Fat (g) Total (g)
Absolute Mass r = -0.009
r = -0.552 b
r = -0.295
Relative Mass r = 0.631 b
r = -0.569 b
r = 0.279
b Strong effect (r ≥ 0.5) between kicking accuracy and leg mass.
The relationship between peak foot velocity and the magnitude of absolute kicking leg
mass (total, and lean) are presented in Figure 3. Specifically, absolute total mass of the
kicking leg produced a moderate correlation when data was pooled (r = -0.399), a very
strong negative correlation within the accurate group (r = -0.701), and no notable
correlation within the inaccurate group (r = -0.274). Similarly, absolute lean mass of the
kicking leg followed the same trend between groupings with coefficients of r = -0.421, r = -
0.670 and r = -0.228 respectively. No significant correlations were visible between relative
lean or relative total kicking leg mass with peak foot velocity (r = -0.199 to r = 0.284).
Furthermore, no significant correlations were evident between foot velocity and kicking
accuracy, with coefficients r = -0.047, r = -0.035 and r = -0.083 for the pooled (Figure 4),
accurate and inaccurate groups respectively.

127
Figure 3. A correlational analysis between peak angular foot velocity and total mass of (A) pooled, (B) accurate, (C) inaccurate
kickers; as well as lean mass of (D) pooled, (E) accurate, (F) inaccurate kickers.
127

128
Figure 4. Correlation analysis between peak angular foot velocity and kicking accuracy.
6.4. Discussion
The purpose of this study was to investigate the influence and interrelationships of leg mass
and foot velocity on kicking accuracy outcomes between accurate and inaccurate kickers in
Australian Football. The results of this study demonstrated no interaction between peak
foot velocity and kicking accuracy between-subjects; as accurate kickers with various limb
mass characteristics produced vastly different angular foot velocities, ranging between 750
and 1750 degrees per second. Instead, accurate kickers contained significantly greater
quantities of relative lean mass and significantly lower quantities of relative fat mass in
their kicking leg, which might explain their ability to mediate and control foot velocity
production in accordance with heightened limb co-ordination and control.

129
The absence of a relationship between limb velocity and target accuracy in the current
study may be due to the between-subjects design utilised; however these results are also in
agreement with recent literature investigating similar multi-joint dynamic, asymmetrical
motor skills which utilised with-in subject study designs, including the tennis serve and
ground-stroke (Landlinger et al, 2011; Cauraugh, Gabert & White, 1990), fast-bowling in
cricket (Phillips, Portus, Davids & Renshaw, 2011), and shooting in handball (Van den
Tillar & Ettema, 2003), finding no significant correlations with speed of movement and
subsequent accuracy within skilled athletes. A potential explanation might include the
quantity and structure of training provided to experienced athletes, who are specifically
trained to perform accurately at high speeds (Wagner, Pfusterschmied, Klous, von
Duvillard & Muller, 2012); therefore, speed of movement may not be a performance
restriction in expert, elite performers (Nagengast et al, 2011; Phillips et al, 2011). Instead,
other factors might be more influential within these populations, including mental strategy,
movement variability, limb strength, and striking mass (Chelly, Hermassi & Shephard,
2010; Wilson, Simpson, van Emmerik, & Hamill, 2008; Schorer, Fath, Baker & Jaitner,
2007; Manolopoulos, Papadopolulos, & Kellis, 2006; Janelle, 2002); which are factors
modifiable through training interventions and may assist with improving kicking accuracy.
Previous research investigating the interaction between movement speed and target
accuracy have primarily assessed the speed of movement as an isolated entity, without
equal consideration for the striking mass characteristics or proportionate muscular impulses
required to produce the movement (Urbin et al, 2011; Schmidt & Lee, 2005). In Australian
Football, the desired ball velocity required to reach an intended target cannot be wholly
explained by foot velocity or lower limb mass in isolation; rather, it is the controlled co-
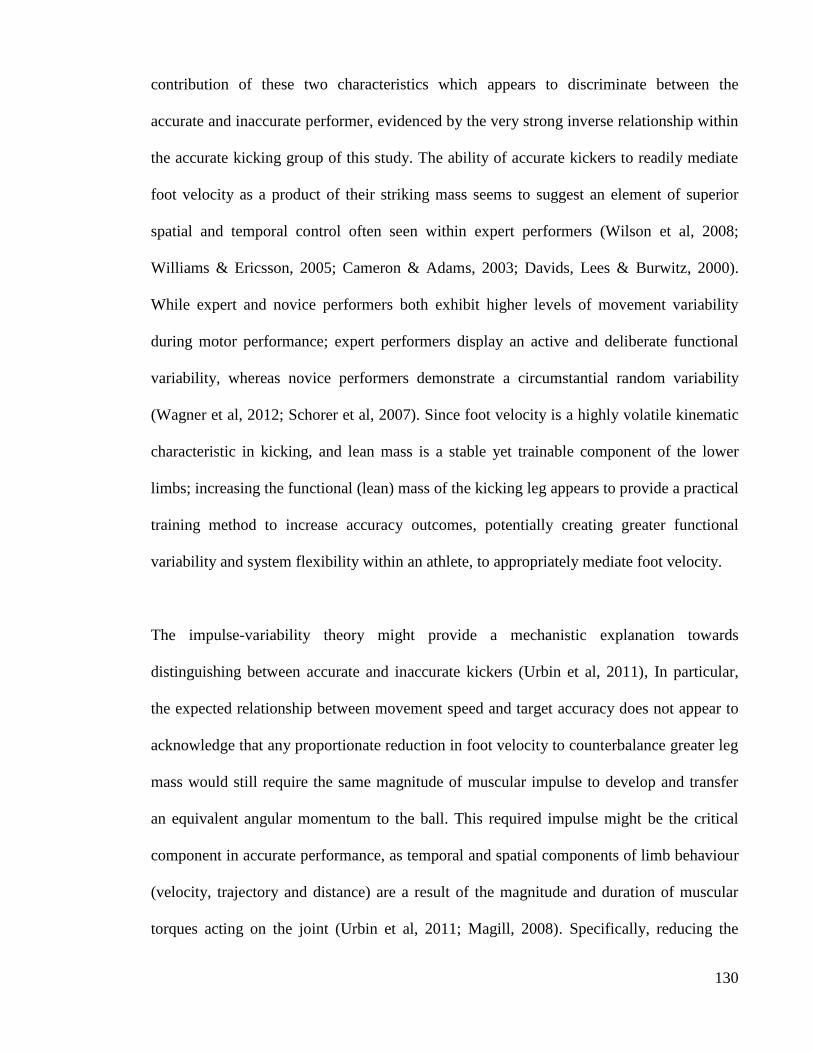
130
contribution of these two characteristics which appears to discriminate between the
accurate and inaccurate performer, evidenced by the very strong inverse relationship within
the accurate kicking group of this study. The ability of accurate kickers to readily mediate
foot velocity as a product of their striking mass seems to suggest an element of superior
spatial and temporal control often seen within expert performers (Wilson et al, 2008;
Williams & Ericsson, 2005; Cameron & Adams, 2003; Davids, Lees & Burwitz, 2000).
While expert and novice performers both exhibit higher levels of movement variability
during motor performance; expert performers display an active and deliberate functional
variability, whereas novice performers demonstrate a circumstantial random variability
(Wagner et al, 2012; Schorer et al, 2007). Since foot velocity is a highly volatile kinematic
characteristic in kicking, and lean mass is a stable yet trainable component of the lower
limbs; increasing the functional (lean) mass of the kicking leg appears to provide a practical
training method to increase accuracy outcomes, potentially creating greater functional
variability and system flexibility within an athlete, to appropriately mediate foot velocity.
The impulse-variability theory might provide a mechanistic explanation towards
distinguishing between accurate and inaccurate kickers (Urbin et al, 2011), In particular,
the expected relationship between movement speed and target accuracy does not appear to
acknowledge that any proportionate reduction in foot velocity to counterbalance greater leg
mass would still require the same magnitude of muscular impulse to develop and transfer
an equivalent angular momentum to the ball. This required impulse might be the critical
component in accurate performance, as temporal and spatial components of limb behaviour
(velocity, trajectory and distance) are a result of the magnitude and duration of muscular
torques acting on the joint (Urbin et al, 2011; Magill, 2008). Specifically, reducing the

131
relative muscular impulses required to produce the kicking action may improve kicking
accuracy through greater limb control, potentially improving the compensatory movement
variability of an athlete, thus increasing their ability to resist undesired perturbations at a
proportionately reduced volitional effort (Phillips et al, 2011; Wagner et al, 2012; Wilson et
al, 2008; Cameron & Adams, 2003). The results of this study appear to indirectly support
this notion, with accurate kickers illustrating significantly greater relative lean mass, and
significantly lower relative fat mass within their lower limbs, producing considerable
correlations with kicking accuracy outcomes as a result.
There are, however, several limitations to this study which require acknowledgement. Limb
co-ordination was not directly measured and was therefore inferred only; the cognitive
component underlying skilled performance was not assessed; and total time spent training
was not recorded; all of which are likely confounding factors in the context of our results.
In conclusion, research investigating the speed-accuracy and impulse-variability
relationships within familiar, asymmetrical, dynamic (acyclic) movement tasks remains
limited; particularly for striking-based activities. Although this study utilised a between-
subject design, it provides considerable insight into the interrelationship and influence of
leg mass and foot velocity on kicking accuracy in Australian Football. In particular, this
hypothesis-generating study provides a suitable premise for future research to directly
explore the speed-accuracy and impulse-variability constructs using controlled, with-in
subject, resistance training and skill acquisition studies. These future intervention-based
research ventures might successfully illustrate greater relationships between the influence
of individual leg mass modifications and their subsequent impact on individual kicking
proficiency outcomes through engaging in practical training programs..

132
6.5. References
Amiri-Khorasani, M., Osman, N. A. A., & Yusof, A. (2010). Kinematics Analysis: Number
of Trials Necessary to Achieve Performance Stability during Soccer Instep Kicking.
Journal of Human Kinetics, 23, 15-20.
Andersen, T. B., Dorge, H. C., & Thomsen, F. I. (1999). Collisions in soccer kicking.
Sports Engineering, 2, 121-125.
Baktash, S., Hy, A., Muir, S., Walton, T., & Zhang, Y. (2009). The effects of different
instep foot positions on ball velocity in place kicking. International Journal of
Sports Science and Engineering, 3(2), 85-92.
Ball, K. (2007a). Use of weighted balls for improving kicking for distance. Journal of
Sports Science and Medicine, 6(Suppl. 10), 44.
Ball, K. (2007b). Foot-ball interaction in Australian Rules football. Journal of Sports
Science and Medicine, 6(Suppl. 10), 46.
Ball, K. (2008). Biomechanical considerations of distance kicking in Australian Rules
football. Sports Biomechanics, 7(1), 10-23.
Beilock, S., Bertenthal, B. I., Hoerger, M., & Carr, T. H. (2008). When does haste make
waste? Speed-accuracy tradeoff, skill level, and the tools of the trade. Journal of
Experimental Psychology: Applied, 14(4), 340-352.
Bishop, D. (2008). An applied research model for the sports sciences. Sports Medicine,
38(3), 253-263.
Cameron, M., & Adams, R. (2003). Kicking footedness and movement discrimination by
elite Australian Rules footballers. Journal of Science and Medicine in Sport, 6(3),
266-274.

133
Cauraugh, J. H., Gabert, T. E., & White, J. J. (1990). Tennis serving velocity and accuracy.
Perceptual and Motor Skills, 70, 719-722.
Chelly, M. S., Hermassi, S., & Shephard, R. J. (2010). Relationships between power and
strength of the upper and lower limb muscles and throwing velocity in male
handball players. Journal of Strength and Conditioning Research, 24(6), 1480-
1487.
Davids, K., Lees, A., & Burwitz, L. (2000). Understanding and measuring coordination and
control in kicking skills in soccer: implications for talent identification and skill
acquisition. Journal of Sports Sciences, 18(9).
Dean, M., Wu, S. W., & Maloney, L. T. (2007). Trading off speed and accuracy in rapid,
goal-directed movements. Journal of Vision, 7(5), 1-12.
Dichiera, A., Webster, K. E., Kuilboer, L., Morris, M. E., Bach, T. M., & Feller, J. A.
(2006). Kinematic patterns associated with accuracy of the drop punt kick in
Australian Football. Journal of Science and Medicine in Sport, 9(4), 292-298.
Hologic. (2004). QDR for Windows XP Reference Manual: Hologic Inc.
Hopkins, W. (2002). A scale of magnitudes for effect statistics. Retrieved from
http://www.sportsci.org/resource/stats/effectmag.html
Janelle, C. M. (2002). Anxiety, arousal and visual attention: a mechanistic account of
performance variability. Journal of Sports Sciences, 20, 237-251.
Kellis, E., & Katis, A. (2007). Biomechanical Characteristics and Determinants of Instep
Soccer Kick. Journal of Sports Science and Medicine, 6, 154-165.
Landlinger, J., Stoggl, T., Lindlinger, S., Wagner, H., & Muller, E. (2011). Differences in
ball speed and accuracy of tennis groundstrokes between elite and high-performance
players. European Journal of Sport Science, 1-8.

134
Lees, A., & Nolan, L. (1998). The biomechanics of soccer: a review. Journal of Sports
Sciences, 16(3), 211-234.
Levanon, J., & Dapena, J. (1998). Comparison of the kinematics of the full-instep and pass
kicks in soccer. Medicine and Science in Sports and Exercise, 30(6), 917-927.
Magill, R. (2008). Motor Learning and Control: Concepts and applications (8th ed.). New
York, NY: McGraw-Hill.
Manolopoulos, E., Papadopoulos, C., & Kellis, E. (2006). Effects of combined strength and
kick coordination training on soccer kick biomechanics in amateur players.
Scandinavian Journal of Medicine and Science in Sports, 16, 102-110.
Nagengast, A. J., Braun, D. A., & Wolpert, D. M. (2011). Risk sensitivity in a motor task
with speed-accuracy trade-off. Journal of Neurophysiology, 105(6), 2668-2674.
Peiffer, J. J., Galvao, D. A., Gibbs, Z., Smith, K., Turner, D., Foster, J., et al. (2010).
Strength and functional characteristics of men and women 65 years and older.
Rejuvenation Research, 13(1), 75-82.
Phillips, E., Portus, M., Davids, K., & Renshaw, I. (2011). Performance accuracy and
functional variability in elite and developing fast bowlers. Journal of Science and
Medicine in Sport.
Schmidt, R., & Lee, T. (2005). Motor Control and Learning: A behavioural emphasis (4th
ed.). Champaign, IL: Human Kinetics.
Schorer, J., Fath, F., Baker, J., & Jaitner, T. (2007). Identification of interindividual and
intraindividual movement patterns in handball players of varying expertise levels.
Journal of Motor Behavior, 39(5), 409-421.
Sterzing, T., & Hennig, E. M. (2008). The influence of soccer shoes on kicking velocity in
full-instep kicks. Exercise and Sport Sciences Reviews, 36(2), 91-97.

135
Urbin, M. A., Stodden, D. F., Fischman, M. G., & Weimar, W. H. (2011). Impulse-
variability theory: implications for ballistic, multijoint motor skill performance.
Journal of Motor Behavior, 43(3), 275-283.
van den Tillaar, R., & Ettema, G. (2003). Instructions emphasizing velocity, accuracy, or
both in performance and kinematics of overarm throwing by experienced team
handball players. Perceptual and Motor Skills, 97(3 Pt 1), 731-742.
Wagner, H., Pfusterschmied, J., Klous, M., von Duvillard, S. P., & Muller, E. (2012).
Movement variability and skill level of various throwing techniques. Human
Movement Science, 31(1), 79-90.
Williams, A. M., & Ericsson, K. A. (2005). Perceptual-cognitive expertise in sport: some
considerations when applying the expert performance approach. Human Movement
Science, 24(3), 283-307.
Wilson, C., Simpson, S. E., van Emmerik, R. E., & Hamill, J. (2008). Coordination
variability and skill development in expert triple jumpers. Sports Biomechanics,
7(1), 2-9.
Young, W., Gulli, R., Rath, D., Russell, A., O'Brien, B., & Harvey, J. (2010). Acute effect
of exercise on kicking accuracy in elite Australian football players. Journal of
Science and Medicine in Sport, 13(1), 85-89.
Young, W. B., & Rath, D. A. (2011). Enhancing Foot Velocity in Football Kicking: The
Role of Strength Training. Journal of Strength and Conditioning Research, 25(2),
561-566

136
CHAPTER SEVEN – STUDY FIVE
DOES LOWER LIMB SYMMETRY ENHANCE TECHNICAL
PROFICIENCY? A KICKING PERSPECTIVE.
JOURNAL OF SPORTS SCIENCES
(IN REVIEW, FEBRUARY 2012).
Nicolas H. Hart, Sophia Nimphius, Jodie L. Cochrane, Robert U. Newton

137
7.0. Abstract
Differential loading patterns experienced by athletes during game-based participation may
produce or exacerbate strength imbalances between the lower limbs in the absence of
suitable strength and conditioning programs. It is currently unknown whether such
imbalances are functionally beneficial or detrimental to performance. The purpose of this
paper was to assess the influence of lower limb symmetry on kicking accuracy in football.
Thirty-one Australian footballers were recruited to perform ten drop punt kicks over twenty
metres to a player target. Athletes were separated into accurate (n = 15) and inaccurate (n =
16) groups, with leg mass assessed using whole body DEXA scans, and leg strength
assessed using an isometric back squat protocol. Accurate kickers were characteristically
different to inaccurate kickers, with significantly higher lean mass (p ≤ 0.004) and
significantly lower fat mass (p ≤ 0.024). Accurate kickers were absent of any significant
strength imbalance or mass asymmetry in their lower limbs, whereas inaccurate kickers
displayed a significant imbalance in strength (p = 0.002) and lean mass (p ≤ 0.029),
favouring their kicking leg, therefore showing a deficiency in their support leg. Greater
lower limb symmetry could increase the capacity of an athlete to be technically proficient
when performing the kicking skill, in favour of greater accuracy.

138
7.1. Introduction
Footballers require a high level of technical expertise and tactical awareness to successfully
compete at the professional level, operating within a dynamic, fast-moving and volatile
environment (Young & Pryor, 2007; Young et al, 2005). Their ability to produce a
technically proficient performance relies upon a suitable foundation of athletic conditioning
and muscular strength, often acquired through-out the systematic developmental pathways
of their sport (Hoshikawa et al, 2009; Iga, George, Lees & Reilly, 2009). However, in the
absence of sufficient physical development, the potential for an athlete to produce a skilful
performance is substantially compromised. In particular, the differential loading patterns
inherent within football sports, under training and competitive contexts, may produce or
exacerbate strength imbalances within and between the lower limbs (Kubo, Muramatsu,
Hoshikawa & Kanehisa, 2010; Newton et al, 2006; Cometti, Maffiuletti, Pousson, Chatard
& Maffulli, 2000), potentially facilitating or diminishing performance outcomes.
In football sports, kicking is the most important and widely used skill (Ball, 2007; Saliba &
Hrysomallis, 2001), routinely employed to deliver a ball accurately, over a desired distance,
to an intended target or location, under a variety of different situational contexts (Ball,
2011; Young & Rath, 2011; Ball, 2008). However, due to the volatile nature of competitive
play, footballers rarely engage their lower limbs with equal preference within the tactical
realm of their sport, selectively utilising the dominant limb for most game-based activities
(Ball, 2011; Zakas, 2006; Cameron & Adams, 2003). As the kicking skill places
considerably different demands on the kicking and support limbs during task execution
(Hides et al, 2010; Young & Rath, 2011; Baczkowski, Marks, Silberstein & Schneider-
Kolsky, 2006; Nunome, Ikegami, Kozakai, Apriantono & Sano, 2006), the regularity of

139
kicking performance may uniquely and specifically develop each limb preferentially for
kicking and support purposes (Stewart, Stanton, Wilson & Hides, 2010; Gstottner et al,
2009; Hoshikawa et al, 2009; Newton et al, 2006; Kearns, Isokawa & Abe, 2001; Sadeghi,
Allard, Prince & Labelle, 2000).
Previous research has attempted to identify whether a laterality effect exists within football,
specifically profiling footballers at various stages of the development cycle, spanning the
full junior-to-senior and recreational-to-professional athletic spectrum (Thorborg, Couppe,
Petersen, Magnusson & Holmich, 2011; Hides et al, 2010; Kubo et al, 2010; Stewart et al,
2010; Veale, Pearce, Buttifant & Carlson, 2010; Hoshikawa et al, 2009; Iga et al, 2009;
Zakas, 2006; Masuda, Kikuhara, Demura, Katsuta & Yamanaka, 2005; Rahnama, Lees &
Bambaecichi, 2005; Masuda, Kikuhara, Takahashi & Yamanaka, 2003; Kearns et al, 2001;
Saliba & Hrysomalis, 2001; McLean & Tumilty, 1993). However, a lack of consensus
remains, with contrasting and contradictory outcomes evident across the research
landscape. Given that some senior, elite footballers can have a visible limb imbalance
(Thorborg et al, 2011; Hides et al, 2010; Stewart et al, 2010), while others can have no limb
imbalance (Kubo et al, 2010; Hoshikawa et al, 2009; Zakas, 2006); there appears to be no
definitive understanding as to whether the potential asymmetry of strength and muscularity
in the lower limbs is favourable to performance, or undesirable to injury incidence (Newton
et al, 2006; Criosier, Forthomme, Namurious, Van-derthommen & Crielaard, 2002;
Theoharopoulos, Tsitskaris, Nikopoulou & Tskalis, 2000; Bennell et al, 1998; Orchard,
Marsden, Lord & Garlick, 1997). Such discrepancies might be explained by the
uncontrollable influence of different strength and conditioning programs underpinning the
physical development of each cohort of athletes, in addition to the notable limitations

140
inherent within common research methodologies and assessment modalities employed to
measure the aforementioned strength and muscularity profiles (Kubo et al, 2010; Veale et
al, 2010; Newton et al, 2006; Zakas, 2006).
While earlier investigations have endeavoured, with limited success, to match strength and
muscularity profiles of athletes to their stage of development or level of profession, no
studies have yet attempted to describe these profiles, or assess lower limb laterality within
athletes of various technical competencies. As successful athletes are characteristically
different to less successful athletes (Nevill et al, 2009; Rampini, Impellizzeri, Castagna,
Coutts & Wisloff, 2009), and as kicking accuracy is critically important in football sports
(Ball, 2007; Dichiera et al, 2006), it seems reasonable to investigate whether lower limb
symmetry or lateral dominance enhances or influences technical proficiency of the kicking
skill. It is therefore the purpose of this study to assess the unilateral and bilateral leg
strength and leg mass characteristics of the kicking and support limbs within accurate and
inaccurate kickers.
7.2. Methods
7.2.1. Participants
Thirty-one Australian footballers (age: 22.1 ± 2.8 yrs; mass: 85.1 ± 13.0 kg; height: 181.1 ±
7.0 cm; BMI: 25.9 ± 3.2) were recruited from the Western Australian Football League
(WAFL) for participation within this study. All athletes had a minimum of five years total
playing experience, with at least two consecutive years of experience at their current
playing level. Athletes were void of injuries and contraindications at the time of testing;
and were not permitted to perform any strenuous exercise or lower body resistance training

141
within 48 hours of their assigned testing session. All athletes were notified of the potential
risks involved, and provided written informed consent for participation. Ethics approval
was provided by Edith Cowan University’s Human Research Ethics Committee.
7.2.2. Study Design
This study utilised an acute, between groups, cross-sectional design consisting of a single
two hour testing session. Testing sessions commenced with anthropometric measures
including height, weight and limb length; followed by an assessment of whole-body
composition and lower body segmental mass characteristics (lean, fat, total) of the thigh,
shank and foot across both kicking and support limbs using dual energy x-ray
absorptiometry (DEXA). Athletes were then taken through a general dynamic warm-up,
prior to a series of lower limb isometric strength measures (unilateral and bilateral).
Following this, a mechanically specific warm-up was provided (kicking over variable
distances), in order to stabilise their kicking performance (Amiri-Khorasani, Osman &
Yusof, 2010). The kicking protocol (drop punt over 20 metres) was then completed.
Subjects were required to wear their club issued football shorts, and were provided with
indoor football shoes (Nike5 Bomba, Nike Inc, USA) for use during the testing session. All
athletes were thoroughly familiarised with all testing procedures prior to the
commencement of testing. Following the assessment and analysis of their kicking
performance, subjects were subsequently assigned to accurate (n = 15) and inaccurate (n =
16) groups for analysis (Table 1), in accordance with specific accuracy determination
criteria.

142
Table 1. Subject characteristics for accurate and inaccurate groups.
Subject Characteristics Accurate Kickers Inaccurate Kickers
Age (yrs) 21.7 (± 3.3) 23.1 (± 1.9)
Height (cm) 181.7 (± 6.7) 180.8 (± 7.3)
Weight (kg) 80.6 (± 8.0) 89.4 (± 15.2) a
Body Mass Index (BMI) 24.4 (± 1.5) 27.3 (± 3.8) a
Total Body Fat (%) 11.1 (± 2.0) 17.4 (± 5.2) a
Kicking Leg Length (cm) 87.3 (± 3.3) 85.7 (± 3.6)
Kicking Accuracy (%) 91.3 (± 11.3) 57.5 (± 16.4) a
Note: Values are expressed as mean ± SD. a Statistical significance (α ≤ 0.05) between accurate and inaccurate kickers.
7.2.3. Anthropometrics
Standing height was recorded to the nearest 0.1 centimetre using a wall-mounted
stadiometer, with body weight recorded to the nearest 0.1 kilogram using a standard
electronic weighing scale. Limb length of the kicking leg was assessed using a non-
retracting measuring tape, from the greater trochanter of the femur (proximal end), to the
lateral malleolus of the fibula (distal end), and was recorded to the nearest 0.1 centimetre.
Standing height and limb length measures were performed three times for each subject,
with the average of the three trials retained for analysis.
7.2.4. Strength Assessment
Unilateral and bilateral lower body isometric strength assessments were performed on both
lower limbs (kicking and support legs) using the isometric back squat exercise at preset hip
and knee joint angles of 140°. These joint angles were assessed using a handheld
goniometer, and were selected on the basis of positional specificity, to best correspond with
maximal force production at zero velocity (Nuzzo, McBride, Cormie & McCaulley, 2008;

143
Haff et al, 2005; Haff et al, 1997). In particular, maximal strength (peak force [PF]) was
identified using a uniaxial force plate (400 series Performance Plate; Fitness Technology,
Adelaide, Australia) sampling at 600Hz; data acquisition software (Ballistic Measurement
System [BMS]; Fitness Technology, Adelaide, Australia); a standard Olympic barbell
(mass: 20kg; Eleiko, Sweden); and a heavy duty strap (SureTie, Zenith, NSW, Australia)
designed to resist high loads (max: 4218N (430kg)), seen in Figure 1. Peak force reliability
using this apparatus was assessed prior to the current study, revealing very high between-
trial, reliability for bilateral (CV ≤ 3.6%; ICC ≥ 0.973) and unilateral (CV ≤ 4.7%; ICC ≥
0.961) isometric conditions (Hart, Nimphius, Cochrane & Newton, 2012). For each
bilateral trial, subjects adopted a traditional back squat position under the pre-set height of
the bar, in order to elicit the previously determined hip and knee flexion angles of 140°
(Figure 1a). For each unilateral trial, subjects were required to reposition the active leg
under their centre of mass while removing their inactive leg from the force plate by flexing
it at the knee (Figure 1b). Due to unilateral repositioning, hip and knee angles were re-
assessed to ensure current bar-height settings met the 140° joint angle criteria.
Athletes were provided with considerable sub-maximal familiarisation (10 minutes duration
interspersed with recovery) of all three trial types [Bilateral, BL; Unilateral (Kicking), KL;
Unilateral (Support), SL], prior to performing a total of nine lower body maximal isometric
contractions: three bilateral and six unilateral (kicking and support limb) trials. All subjects
identified their right leg as the kicking limb and left leg as support limb. The order of
testing was randomised and counterbalanced to negate the effects of muscular potentiation
or fatigue (Hodgson, Docherty & Robbins, 2005; Rassier & MacIntosh, 2000). Subjects
were required to maintain maximal contractions for a period of five seconds, and were

144
provided with two minutes passive recovery between each maximal effort. The
investigator, and two research assistants provided verbal encouragement, and visually
monitored athlete technique during each trial to ensure postural and mechanical
compensatory adjustments did not occur; and ensured athlete safety was maintained.
Figure 1. Isometric apparatus set-up and operation, with (a) correct hip and knee flexion
angles of 140° during a bilateral trial, and (b) an illustration of correct limb positioning
during a left leg unilateral isometric trial as used within this study.
7.2.5. Force-Time Analysis
The best trial for each isometric condition (BL, KL, SL) was chosen for analysis, identified
by the greatest peak force output produced. The force-time data of these trials were
exported for further analysis; with the maximum force output identified as peak force (PF).
Absolute strength (bilateral and unilateral) was represented by peak force, with relative
strength determined by dividing peak force (N) by body weight (N). Unilateral strength
(A) (B)

145
imbalance was assessed by comparing the unilateral peak force produced by each limb; and
was calculated by dividing the peak force of the kicking limb by the peak force of the
support limb. A unilateral imbalance score below 1.0 demonstrates a degree of lateral
strength dominance to the support leg; whereas a score above 1.0 demonstrates a degree of
lateral strength dominance to the kicking leg. In addition, bilateral deficit (BLD) outcomes
were calculated by comparing the bilateral peak force value with the combined unilateral
peak force values. Specifically, bilateral peak force was divided by the sum of unilateral
(left and right limb) outputs, expressed formulaically as BL / [KL + SL]. A bilateral deficit
was represented by a score below 1.0, with bilateral facilitation noted by a score above 1.0.
7.2.6. Scan Procedure
Lower body segmental mass and full-body composition components were assessed with
dual energy x-ray absorptiometry (DEXA; Hologic Discovery A, Waltham, WA) using
previously established, standardised and reliable body positioning procedures (Hologic,
2004; Peiffer et al, 2010). In particular, subjects assumed a stationary, supine position on
the scanning bed with both arms pronated by their side, and hands facing the table. To
ensure consistent body positioning, the DEXA operator manually assisted subjects in order
to straighten their head, torso and pelvis; internally rotate and fixate their legs and feet at
45°; and ensured they were located within the DEXA scanning zone (Figure 2a). This has
been shown to produce a scan/re-scan coefficient of variation below 1% in our laboratory
(Peiffer et al, 2010).

146
Figure 2. The DEXA scan and analysis process, with (A) a frontal view of the subject positioning process, illustrating pronated arms, and
internally rotated thighs using a positioning device; and (B) the whole body, and segmental analysis zones used to define the lower body.
(A) (B)

147
7.2.7. Scan Analysis
Whole body scans were analysed using the inbuilt analysis software (Version 12.4; QDR
for Windows, Hologic, Waltham, WA). The predefined, mandatory whole body model
(Hologic, 2004) was applied to the scan image, separating the body into axial and
appendicular sections to determine whole body composition and segmental composition of
the kicking and support legs. Further analysis was performed to specifically identify and
assess the segmental mass characteristics of the thigh and shank regions of the kicking and
support legs using the sub-region analysis tool, in accordance with Dempster’s body
segment parameter boundaries for 2D studies (Winter, 1990). Due to the extension of the
shank segment during the kicking motion in response to fixed plantarflexion of the foot
(Orchard, Walt, McIntosh & Garlick, 1999), the shank segment was represented by the
combination of both shank and foot regions in this study (Figure 2b).
Scan analysis reliability assessed prior to the current study revealed very high intra-tester
reliability (CV ≤ 2.6%; ICC ≥ 0.941) and very high inter-tester reliability (CV ≤ 2.4%; ICC
≥ 0.961) for segmental sub-region analysis components. Segmental mass outputs were
categorised into fat mass (g), lean mass (g) and total mass (g) values for each sub-region
across all scans and subjects using Microsoft Excel (Microsoft, Redmond, WA). Relative
lean mass for each segment and limb was calculated by dividing the amount segmental
mass (g) by total body mass (g). The symmetry index (SI) for lean and total mass
components was determined using a previously established calculation (Gouwanda &
Senanayake, 2011; Sadeghi et al, 2000; Herzog, Nigg, Read & Olsson, 1989):

148
Figure 3. The kicking protocol set-up, with the athlete performing the drop punt, over an obstacle (height: 6 ft), to a stationary human target
20 metres from the kicking zone (outlined, dimensions: 1.0m x 0.7m).

149
7.2.8. Kicking Protocol
Kicking technique was assessed using the drop punt kick, performed with an Australian
football (450g, Sherrin, Victoria, AU) inflated to official air pressure specifications (67 –
75 kPa) (Ball, 2008), using an electronic air pump (Air Erupt, Volcano, Taiwan). Athletes
were required to produce ten drop punt kicks to a stationary human (player) target situated
20 metres from the centre of the kicking zone with the intention to deliver the ball as
accurately as possible to the specified target (Figure 2). The twenty meter distance was
chosen to correspond with other kicking accuracy literature in Australian Football (Young
et al, 2010; Dichiera et al, 2006), and to replicate game-based accuracy demands when
kicking to another player, as short kicks are often used to deliver a ball to another player in
Australian Football (Dichiera et al, 2006). A life-sized obstacle representing an opposite
player (base-to-head height: 6 ft; base-to-hand height: 7 ft) was positioned between the
kicker and their target to control for minimum kicking trajectory, and to increase game-test
specificity in the laboratory environment as Australian Footballers are regularly required to
kick a ball to another player over an opponent defending space on the field.
Prior to commencing the kicking protocol, subjects completed a series of mechanically
specific warm-up sets (5 drop punt kicks over 20m, 30m and 40m respectively, totalling 15
warm-up trials). Their ten official drop punt trials were then completed with a one minute
recovery provided between each kick. For the trial to be considered successful, the athlete
had to produce an approach consisting of at least two steps prior to planting their foot
within the assigned kicking zone. Any trials which did not meet this criterion were
considered invalid, and a repeat kicking trial subsequently provided until ten successful
kicks were produced. Angle of approach was not standardised.
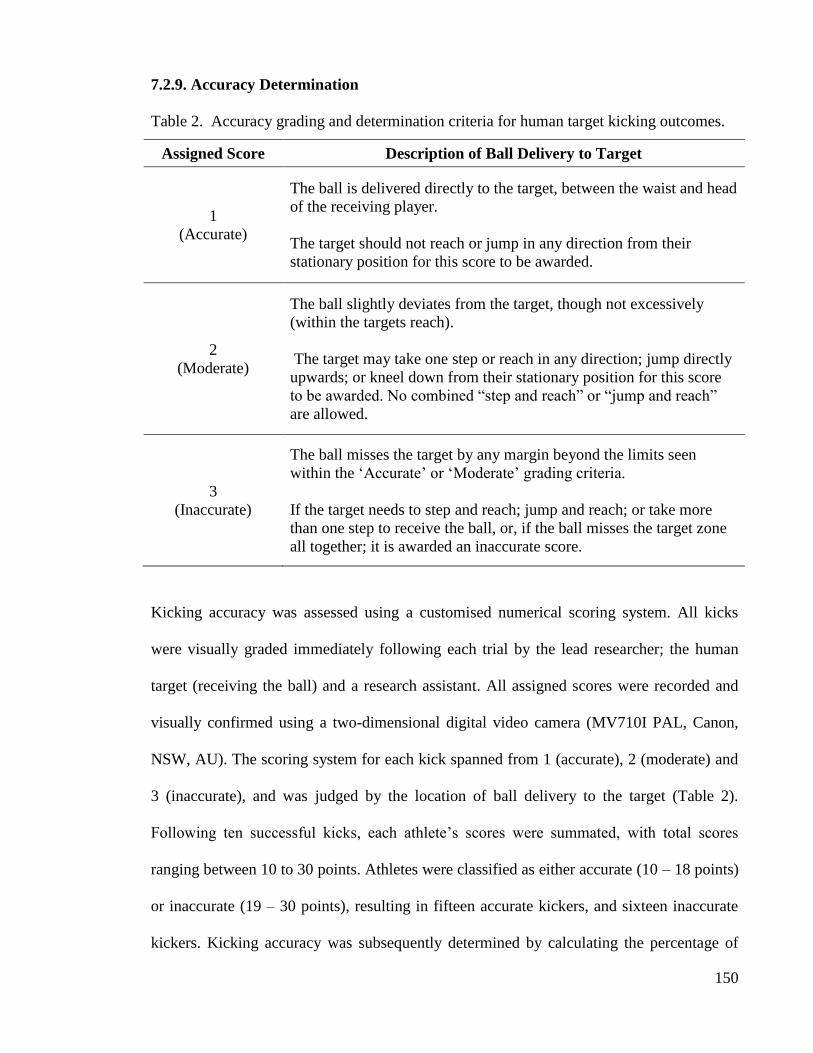
150
7.2.9. Accuracy Determination
Table 2. Accuracy grading and determination criteria for human target kicking outcomes.
Assigned Score Description of Ball Delivery to Target
1
(Accurate)
The ball is delivered directly to the target, between the waist and head
of the receiving player.
The target should not reach or jump in any direction from their
stationary position for this score to be awarded.
2
(Moderate)
The ball slightly deviates from the target, though not excessively
(within the targets reach).
The target may take one step or reach in any direction; jump directly
upwards; or kneel down from their stationary position for this score
to be awarded. No combined “step and reach” or “jump and reach”
are allowed.
3
(Inaccurate)
The ball misses the target by any margin beyond the limits seen
within the ‘Accurate’ or ‘Moderate’ grading criteria.
If the target needs to step and reach; jump and reach; or take more
than one step to receive the ball, or, if the ball misses the target zone
all together; it is awarded an inaccurate score.
Kicking accuracy was assessed using a customised numerical scoring system. All kicks
were visually graded immediately following each trial by the lead researcher; the human
target (receiving the ball) and a research assistant. All assigned scores were recorded and
visually confirmed using a two-dimensional digital video camera (MV710I PAL, Canon,
NSW, AU). The scoring system for each kick spanned from 1 (accurate), 2 (moderate) and
3 (inaccurate), and was judged by the location of ball delivery to the target (Table 2).
Following ten successful kicks, each athlete’s scores were summated, with total scores
ranging between 10 to 30 points. Athletes were classified as either accurate (10 – 18 points)
or inaccurate (19 – 30 points), resulting in fifteen accurate kickers, and sixteen inaccurate
kickers. Kicking accuracy was subsequently determined by calculating the percentage of

151
accurate trials produced within the ten trial quota. Athlete performance and accuracy
grading reliability assessed prior to the current study revealed very high intra-tester
reliability (CV ≤ 1.6%; ICC ≥ 0.997), very high inter-tester reliability (CV ≤ 3.3%; ICC ≥
0.986) and very high between-day reliability of kicking performance (CV ≤ 4.2%; ICC ≥
0.975).
7.2.10. Statistical Analysis
An independent t-test was used for all dependant variables to determine whether significant
differences were evident between the subject characteristics, leg mass characteristics and
leg strength characteristics of accurate and inaccurate kickers. Statistical significance was
set at an alpha level of p ≤ 0.05 (with a 95% confidence level). Correlational analysis was
performed using Pearson’s product moment (PPM) correlation coefficient (r) to determine
the strength of relationship between leg mass and leg strength variables to ranking of
kicking accuracy. The strength of relationship was classified in accordance with Hopkins
(2002): r ± 0.3 is moderate; r ± 0.5 is strong; r ± 0.7 is very strong; r ± 0.9 is nearly perfect;
and r ± 1.0 is perfect. All statistical computations were performed using a statistical
analysis program (SPSS, Version 17.0; Chicago, IL).
7.3. Results
7.3.1. Limb Strength
Leg strength characteristics are presented in Table 3. While no significant differences were
noted between bilateral or unilateral strength characteristics in either absolute or relative
expressions; moderate positive correlations were evident between kicking accuracy, relative
bilateral strength (r ≈ 0.401) and relative unilateral support-leg strength (r ≈ 0.379).

152
Furthermore, unilateral strength imbalance was a noteworthy factor between accurate and
inaccurate groups, with inaccurate kickers demonstrating significantly less strength in their
support leg than their accurate counterparts (p = 0.002). This interaction was additionally
supported by a large negative correlation (r = -0.516) with kicking accuracy.
Table 3. Strength characteristics for accurate and inaccurate groups with correlations to
kicking accuracy scores.
Accurate Inaccurate % Diff ES PPM (r)
Absolute Strength
[BL] – Bilateral (N)
[SL] – Left Unilateral (N)
[KL] – Right Unilateral (N)
2473 (± 475)
1914 (± 426)
1871 (± 389)
2352 (± 770)
1769 (± 531)
1887 (± 545)
4.89
7.57
0.84
0.19
0.30 e
0.03
0.233
0.291
0.122
Relative Strength
[BL] – Bilateral (N/N)
[SL] – Left Unilateral (N/N)
[KL] – Right Unilateral (N/N)
3.13 (± 0.5)
2.44 (± 0.5)
2.38 (± 0.5)
2.76 (± 0.9)
2.09 (± 0.7)
2.21 (± 0.6)
11.82 d
14.34 d
7.14
0.51 e
0.58 e
0.31 e
0.401 c
0.379 c
0.248
Other Characteristics
Unilateral Imbalance (KL/SL)
Bilateral Deficit ([KL+SL]/BL)
0.99 (± 0.1)
0.67 (± 0.1)
1.08 (± 0.1) a
0.64 (± 0.1)
8.33
4.48
0.90 f
0.30 e
-0.516 b
0.103
Note: Values are expressed as mean ± SD, SL = Support Leg, KL = Kicking Leg, ES = Effect Size. a Statistical significance (α ≤ 0.01) between accurate and inaccurate kickers.
b Strong relationship (r ≥ 0.5) with kicking accuracy.
c Moderate relationship - (r ≥ 0.3) with kicking accuracy.
d Percent difference ≥ 10% between Accurate and Inaccurate kickers.
e Small effect size (ES ≥ 0.2) evident between groups (Hopkins, 2000; Hopkins, 2002).
f Moderate effect size (ES ≥ 0.6) evident between groups (Hopkins, 2000; Hopkins, 2002).
7.3.2. Limb Mass
Leg mass characteristics are provided in Table 4. Significant differences were evident
within thigh, shank and whole leg segments of both kicking and support limbs. In
particular, lean mass was significantly higher (p = 0.000 to 0.004), and fat mass was

153
significantly lower (p = 0.000 to 0.024) in accurate kickers across all segments of both
kicking and support limbs, with higher total relative leg mass (p = 0.048) in the support leg
of accurate kickers. This interaction was further evidenced through correlational analysis
(Table 5). Lean mass was positively associated with kicking accuracy, demonstrating
moderate-to-very strong correlations (Kicking: r = 0.462 to 0.631; Support: r = 0.492 to
0.698), while fat mass was negatively associated with kicking accuracy, demonstrating
moderate-to-strong correlations (Kicking: r = -0.431 to -0.580; Support: r = -0.534 to -
0.585). The total mass of the support leg was also positively correlated with kicking
accuracy (r = 0.433).
7.3.3. Limb Symmetry
The symmetry index for lean and total mass components of the thigh, shank and whole
limb segments for accurate and inaccurate kickers are provided in Table 6. Accurate kickers
demonstrated significantly smaller asymmetry than inaccurate kickers, with the most
notable differences visible in lean mass across all segments (Figure 4; p = 0.003 to 0.029),
and total mass in the thigh (p = 0.003) and whole limb (p = 0.0021). The negative
symmetry indices for the inaccurate kickers illustrates the lower mass quantities prevalent
in their support limb (relative to their kicking limb), which corresponds with the weaker
support leg noted by their unilateral strength imbalance. Moderate positive correlations (r =
0.312 to 0.406) were also observed between kicking accuracy and symmetry index scores,
highlighting a potential relationship between reduced asymmetry and enhanced kicking
performance.

154
Table 4. Relative leg mass characteristics of the kicking and support limbs for accurate and inaccurate kickers.
Accurate [ Kicking ] Inaccurate [ Kicking ] Accurate [ Support ] Inaccurate [ Support ]
Thigh Segment
- Lean (%)
- Fat (%)
- Total (%)
Shank Segment
- Lean (%)
- Fat (%)
- Total (%)
Whole Leg
- Lean (%)
- Fat (%)
- Total (%)
10.14 (± 0.6)
1.46 (± 0.4)
11.93 (± 0.4)
4.65 (± 0.3)
0.71 (± 0.2)
5.78 (± 0.3)
14.79 (± 0.7)
2.16 (± 0.5)
17.71 (± 0.5)
9.36 (± 0.8) a
2.44 (± 0.8) a
12.14 (± 0.7)
4.08 (± 0.5) a
0.90 (± 0.2) a
5.37 (± 0.4) a
13.44 (± 1.1) a
3.35 (± 1.0) a
17.51 (± 0.8)
10.06 (± 0.5)
1.44 (± 0.4)
11.89 (± 0.5)
4.70 (± 0.3)
0.58 (± 0.1)
5.71 (± 0.2)
14.77 (± 0.6)
2.03 (± 0.5)
17.60 (± 0.5)
9.03 (± 0.8) a
2.37 (± 0.7) a
11.75 (± 0.7)
4.01 (± 0.5) a
0.96 (± 0.3) a
5.37 (± 0.4) a
13.05 (± 1.1) a
3.33 (± 1.0) a
17.11 (± 0.8) a
Note: Values are expressed as mean (± SD), relative to total body mass.
a Statistical significance (α ≤ 0.05) between accurate and inaccurate kickers.
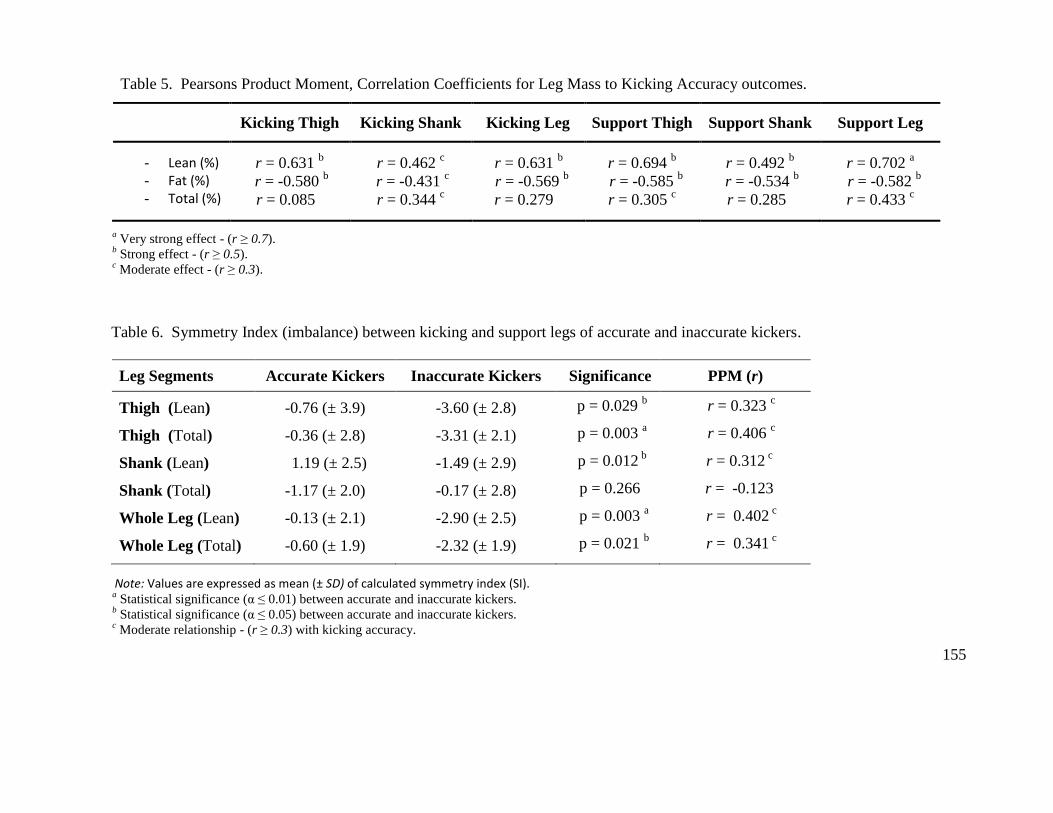
155
Table 5. Pearsons Product Moment, Correlation Coefficients for Leg Mass to Kicking Accuracy outcomes.
Kicking Thigh Kicking Shank Kicking Leg Support Thigh Support Shank Support Leg
- Lean (%) - Fat (%) - Total (%)
r = 0.631 b
r = -0.580 b
r = 0.085 .
r = 0.462 c
r = -0.431 c
r = 0.344 c
r = 0.631 b
r = -0.569 b
r = 0.279 .
r = 0.694 b
r = -0.585 b
r = 0.305 c
r = 0.492 b
r = -0.534 b
r = 0.285
r = 0.702 a
r = -0.582 b
r = 0.433 c
a Very strong effect - (r ≥ 0.7).
b Strong effect - (r ≥ 0.5).
c Moderate effect - (r ≥ 0.3).
Table 6. Symmetry Index (imbalance) between kicking and support legs of accurate and inaccurate kickers.
Leg Segments Accurate Kickers Inaccurate Kickers Significance PPM (r)
Thigh (Lean)
Thigh (Total)
Shank (Lean)
Shank (Total)
Whole Leg (Lean)
Whole Leg (Total)
-0.76 (± 3.9)
-0.36 (± 2.8)
1.19 (± 2.5)
-1.17 (± 2.0)
-0.13 (± 2.1)
-0.60 (± 1.9)
-3.60 (± 2.8)
-3.31 (± 2.1)
-1.49 (± 2.9)
-0.17 (± 2.8)
-2.90 (± 2.5)
-2.32 (± 1.9)
p = 0.029 b
p = 0.003 a
p = 0.012 b
p = 0.266
p = 0.003 a
p = 0.021 b
r = 0.323 c
r = 0.406 c
r = 0.312 c
r = -0.123
r = 0.402 c
r = 0.341 c
Note: Values are expressed as mean (± SD) of calculated symmetry index (SI). a
Statistical significance (α ≤ 0.01) between accurate and inaccurate kickers.
b Statistical significance (α ≤ 0.05) between accurate and inaccurate kickers.
c Moderate relationship - (r ≥ 0.3) with kicking accuracy.
155

156
7.3.3. Limb Symmetry
The symmetry index for lean and total mass components of the thigh, shank and whole
limb segments for accurate and inaccurate kickers are provided in Table 6. Accurate kickers
demonstrated significantly smaller asymmetry than inaccurate kickers, with the most
notable differences visible in lean mass across all segments (Figure 4; p = 0.003 to 0.029),
and total mass in the thigh (p = 0.003) and whole limb (p = 0.0021). The negative
symmetry indices for the inaccurate kickers illustrates the lower mass quantities prevalent
in their support limb (relative to their kicking limb), which corresponds with the weaker
support leg noted by their unilateral strength imbalance. Moderate positive correlations (r =
0.312 to 0.406) were also observed between kicking accuracy and symmetry index scores,
highlighting a potential relationship between reduced asymmetry and enhanced kicking
performance.
Figure 4. Lean mass imbalance (symmetry index) of the thigh segment, shank segment and
whole leg, showing deficiency (lower mass quantities) in the kicking leg (left) and support
leg (right).

157
7.4. Discussion
Despite the tactical advantage provided by the ability to kick competently with both limbs
(Ball, 2011; Haaland & Hoff, 2003), footballers tend to develop and selectively use a
preferred limb for kicking, and a preferred limb for balance and support (Ball, 2011; Kubo
et al, 2010; Gstottner et al, 2009; Iga et al, 2009; Wong et al, 2007; Zakas, 2006). Given
that repetitious asymmetrical activities generate asymmetrical hypertrophic responses in
muscle (Hides et al, 2010; Stewart et al, 2010; Baczkowski et al, 2006), it would be logical
to expect a laterality effect to exist between the kicking and support limbs in response to the
frequency of differential stresses imposed on the lower body by the kicking action in
football sports. Unfortunately, previous research has been unable to distinguish whether a
laterality effect positively exists in football sports (Hides et al, 2010; Kubo et al, 2010;
Hoshikawa et al, 2009; Kearns et al, 2001); and whether it suitably influences performance,
or increases injury incidence and severity (Askling, Karlsson & Thorestensson, 2003;
Bennell et al, 1998; Brocket, Morgan & Proske, 2004; Newton et al, 2006; Orchard et al,
1997). To address this notable disparity within the literature, the purpose of the current
study was to investigate whether lower limb symmetry influenced drop punt kicking
performance within football sports.
The primary findings of this study demonstrated a positive interaction between lower limb
symmetry and kicking performance, providing support for the modification and
manipulation of lower limb strength and muscularity in favour of greater limb symmetry
within football players. Footballers who were identified as accurate kickers produced
characteristically different lower limb strength and segmental mass profiles than their
inaccurate counterparts. In particular, accurate kickers did not have any visible strength

158
imbalances or mass asymmetries across the kicking and support limbs, and contained
greater relative lean mass quantities in all segments across both limbs; whereas inaccurate
kickers contained notable asymmetries in lower limb muscularity and unilateral strength,
particularly favouring their preferred kicking leg. As no significant differences were
evident between the strength of the kicking leg in each group, the visible imbalance within
inaccurate kickers might demonstrate a potential deficiency in their support leg, which
could considerably influence the proficient production of the kicking skill.
In particular, footballers must adopt unipedal postures when kicking (Paillard et al, 2006);
relying on a stable platform to rapidly and accurately swing the kicking leg beneath the
body to strike the ball (Young & Rath, 2011; Dichiera et al, 2006). As the support leg plays
an important role in the generation and maintenance of athletic stability during a kicking
task (Dichiera et al, 2006), any physical weakness may compromise the quality of the
kicking outcome produced. Specifically, lean mass of the support leg importantly stabilises
the hip and knee joints during active loading, adequately supporting total body weight,
while also resisting the torque developed by the kicking leg (Rahmana et al, 2005),
subsequently allowing more skilful athletes to maintain balance as they powerfully kick the
ball (Kubo et al, 2010; Gstottner et al, 2009; Matsuda, Demura & Uchiyama, 2008;
Gerbino, Griffin & Zurakowski, 2007; Wong et al, 2007). Given the high level of physical
conditioning required by footballers to routinely perform the kicking skill (Manolopoulos,
Papadopoulos & Kellis, 2006; Bangsbo, 1994); the notable asymmetry and inferiority of
relative lean mass illustrated within the support leg of inaccurate kickers within this study
might potentially explain their low levels of kicking accuracy and diminished overall
performance.

159
In addition, the reduced magnitude of lean mass within the support leg of inaccurate kickers
provides a plausible explanation for the somewhat proportionate loss of unilateral strength
in the support limb, leading to the evident strength imbalance between limbs. As force
generation is directly related to muscle size (Hoshikawa et al, 2009; Jones, Bishop, Woods
& Green, 2008; Perez-Gomez et al, 2008a; Perez-Gomez et al, 2008b; Andersen &
Aagaard, 2006), a reduced strength capacity in the support leg may functionally limit the
effective stabilisation and control of the kicking skill within inaccurate kickers.
Furthermore, accurate kickers contained significantly greater quantities of relative lean
mass in all segments across both limbs. Given the moderate correlations of relative
strength, and strong-to-very strong correlations of relative lean mass to the production of
kicking accuracy, it could be theorised that higher muscle mass and strength levels will
recruit a lower percentage of the maximum capacity of the system in order to acquire a
given kicking distance. This should enable greater co-ordination and control within the
kicking action as a lower proportion of the motor unit pool is used by each muscle to
achieve the desired performance outcome. This study therefore adds further support for the
notion that strength and muscularity levels are capable of differentiating successful players
from their less successful counterparts (Hoshikawa et al, 2009; Iga et al, 2009; Gissis et al,
2006; Hansen, Bangsbo, Twisk, Klausen & 1999; Tumilty, 1993), whilst also playing a
critical role in kicking performance (Young & Rath, 2011; Manolopoulos et al, 2006;
Bangsbo, 1994).
Although a clear difference in strength was observed between the support leg of accurate
and inaccurate kickers in this study; the non-significant difference in the kicking leg may be
a consequence of the strength assessment used (Young & Rath, 2011). Isometric strength

160
protocols are able to represent dynamic force capabilities if the premise of positional
specificity is honoured (Hart et al, 2012; Gamble, 2006; Haff et al, 1997). In this regard, the
support leg was appropriately assessed as the hip and knee angles used during strength
testing were similar to those experienced during the support phase of the drop punt
(Dichiera et al, 2006). However, kicking leg muscle function is bi-articular; generating
rapid, high-speed, multi-joint and multi-segmental actions which have been difficult to
assess in the literature due to highly specific movement patterns (Young & Rath, 2011;
Kellis & Katis, 2007b; Masuda et al, 2005), which was also a limitation of the current
study. Therefore, to resolve the issue of mechanical specificity, future studies examining
muscle function and strength characteristics of footballers are encouraged to develop
separate strength assessments for the kicking and support limbs based on their
corresponding action during the kicking motion.
In conclusion, this paper demonstrates the importance of developing greater symmetry in
leg strength and muscularity between the kicking and support limbs; in addition to
generating greater levels of relative muscular strength within football players as a tool to
potentially enhance the technical proficiency of the kicking skill in favour of greater
accuracy. As differential stresses are routinely imposed upon the lower limbs during the
performance of many technical skills inherent within football sports, it would seem
appropriate to utilise strength and conditioning interventions, in addition to game-based
loading, as a mechanism to maintain or increase limb symmetry, in an effort to optimise
performance while minimising injury incidence and severity. However, it is worthwhile to
note that while lower limb symmetry does appear desirable, it does not necessarily create
accuracy; rather, the prevalence of symmetry may provide an athlete with the optimal

161
foundation and opportunity to produce technically proficient performances. Further
research needs to be conducted in order to assess the broader influence of lower limb
symmetry, or lateral dominance across a wide range of sport-specific skills found within
football sports, and to assess whether there are positive or negative influences on
subsequent injury risk and severity.
7.5. References
Amiri-Khorasani, M., Osman, A., & Yusof, A. (2010). Kinematic analysis: Number of
trials necessary to achieve performance stability during soccer instep kicking.
Journal of Human Kinetics, 23, 15-20.
Andersen, L. L., & Aagaard, P. (2006). Influence of maximal muscle strength and intrinsic
muscle contractile properties on contractile rate of force development. European
Journal of Applied Physiology, 96(1), 46-52.
Askling, C., Karlsson, J., & Thorstensson, A. (2003). Hamstring injury occurrence in elite
soccer players after preseason strength training with eccentric overload.
Scandinavian Journal of Medicine and Science in Sports, 13(4), 244-250.
Baczkowski, K., Marks, P., Silberstein, M., & Schneider-Kolsky, M. E. (2006). A new look
into kicking a football: an investigation of muscle activity using MRI. Australasian
Radiology, 50(4), 324-329.
Ball, K. (2007). Foot-ball interaction in Australian Rules football. Journal of Sports
Science and Medicine, 6(Suppl. 10), 46.
Ball, K. (2008). Biomechanical considerations of distance kicking in Australian Rules
football. Sports Biomechanics, 7(1), 10-23.

162
Ball, K. (2011). Kinematic comparison of the preferred and non-preferred foot punt kick.
Journal of Sports Sciences, 29(14), 1545-1552.
Bangsbo, J. (1994). The physiology of soccer--with special reference to intense intermittent
exercise. Acta Physiologica Scandinavia, 619, 1-155.
Bennell, K., Wajswelner, H., Lew, P., Schall-Riaucour, A., Leslie, S., Plant, D., et al.
(1998). Isokinetic strength testing does not predict hamstring injury in Australian
Rules footballers. British Journal of Sports Medicine, 32(4), 309-314.
Brockett, C. L., Morgan, D. L., & Proske, U. (2004). Predicting hamstring strain injury in
elite athletes. Medicine and Science in Sports and Exercise, 36(3), 379-387.
Cameron, M., & Adams, R. (2003). Kicking footedness and movement discrimination by
elite Australian Rules footballers. Journal of Science and Medicine in Sport, 6(3),
266-274.
Cometti, G., Maffiuletti, N. A., Pousson, M., Chatard, J. C., & Maffulli, N. (2001).
Isokinetic strength and anaerobic power of elite, subelite and amateur French soccer
players. International Journal of Sports Medicine, 22(1), 45-51.
Croisier, J. L., Forthomme, B., Namurois, M. H., Vanderthommen, M., & Crielaard, J. M.
(2002). Hamstring muscle strain recurrence and strength performance disorders.
American Journal of Sports Medicine, 30(2), 199-203.
Dichiera, A., Webster, K. E., Kuilboer, L., Morris, M. E., Bach, T. M., & Feller, J. A.
(2006). Kinematic patterns associated with accuracy of the drop punt kick in
Australian Football. Journal of Science and Medicine in Sport, 9(4), 292-298.
Gamble, P. (2006). Implications and Applications of Training Specificity for Coaches and
Athletes. Journal of Strength and Conditioning, 28(3), 54-58.

163
Gerbino, P. G., Griffin, E. D., & Zurakowski, D. (2007). Comparison of standing balance
between female collegiate dancers and soccer players. Gait and Posture, 26(4), 501-
507.
Gissis, I., Papadopoulos, C., Kalapotharakos, V. I., Sotiropoulos, A., Komsis, G., &
Manolopoulos, E. (2006). Strength and speed characteristics of elite, subelite, and
recreational young soccer players. Research in Sports Medicine, 14(3), 205-214.
Gouwanda, D., & Senanayake, S. M. (2011). Identifying gait asymmetry using gyroscopes-
-a cross-correlation and Normalized Symmetry Index approach. Journal of
Biomechanics, 44(5), 972-978.
Gstottner, M., Neher, A., Scholtz, A., Millonig, M., Lembert, S., & Raschner, C. (2009).
Balance ability and muscle response of the preferred and nonpreferred leg in soccer
players. Motor Control, 13(2), 218-231.
Haaland, E., & Hoff, J. (2003). Non-dominant leg training improves the bilateral motor
performance of soccer players. Scandinavian Journal of Medicine and Science in
Sports, 13(3), 179-184.
Haff, G. G., Carlock, J. M., Hartman, M. J., Kilgore, J. L., Kawamori, N., Jackson, J. R., et
al. (2005). Force-time curve characteristics of dynamic and isometric muscle actions
of elite women olympic weightlifters. Journal of Strength and Conditioning
Research, 19(4), 741-748.
Haff, G. G., Stone, M. H., O'Bryant, H., Harman, E., Dinan, C., Johnson, R., et al. (1997).
Force-time dependent characteristics of dynamic and isometric muscle actions.
Journal of Strength and Conditioning Research, 11, 269-272.

164
Hansen, L., Bangsbo, J., Twisk, J., & Klausen, K. (1999). Development of muscle strength
in relation to training level and testosterone in young male soccer players. Journal
of Applied Physiology, 87(3), 1141-1147.
Hart, N. H., Nimphius, S., Cochrane, J. L., & Newton, R. U. (2012). Reliability and validity
of unilateral and bilateral isometric strength using a customised, portable apparatus.
Journal of Australian Strength and Conditioning, 20, 61-67.
Herzog, W., Nigg, B. M., Read, L. J., & Olsson, E. (1989). Asymmetries in ground reaction
force patterns in normal human gait. Medicine and Science in Sports and Exercise,
21(1), 110-114.
Hides, J., Fan, T., Stanton, W., Stanton, P., McMahon, K., & Wilson, S. (2010). Psoas and
quadratus lumborum muscle asymmetry among elite Australian Football League
players. British Journal of Sports Medicine, 44(8), 563-567.
Hodgson, M., Docherty, D., & Robbins, D. (2005). Post-Activation Potentiation:
Underlying physiology and implications for motor performance. Sports Medicine,
35(7), 585-595.
Hologic. (2004). QDR for Windows XP Reference Manual: Hologic Inc.
Hopkins, W. (2002). A scale of magnitudes for effect statistics. Retrieved from
http://www.sportsci.org/resource/stats/effectmag.html
Hoshikawa, Y., Iida, T., Muramatsu, M., Nakajima, Y., Fukunaga, T., & Kanehisa, H.
(2009). Differences in thigh muscularity and dynamic torque between junior and
senior soccer players. Journal of Sports Sciences, 27(2), 129-138.
Iga, J., George, K., Lees, A., & Reilly, T. (2009). Cross-sectional investigation of indices of
isokinetic leg strength in youth soccer players and untrained individuals.
Scandinavian Journal of Medicine and Science in Sports, 19(5), 714-719.

165
Jones, E. J., Bishop, P. A., Woods, A. K., & Green, J. M. (2008). Cross-sectional area and
muscular strength: a brief review. Sports Medicine, 38(12), 987-994.
Kearns, C. F., Isokawa, M., & Abe, T. (2001). Architectural characteristics of dominant leg
muscles in junior soccer players. European Journal of Applied Physiology, 85(3-4),
240-243.
Kellis, E., & Katis, A. (2007b). The relationship between isokinetic knee extension and
flexion strength with soccer kick kinematics: an electromyographic evaluation.
Journal of Sports Medicine and Physical Fitness, 47(4), 385-395.
Kubo, T., Muramatsu, M., Hoshikawa, Y., & Kanehisa, H. (2010). Profiles of trunk and
thigh muscularity in youth and professional soccer players. Journal of Strength and
Conditioning Research, 24(6), 1472-1479.
Manolopoulos, E., Papadopoulos, C., & Kellis, E. (2006). Effects of combined strength and
kick coordination training on soccer kick biomechanics in amateur players.
Scandinavian Journal of Medicine and Science in Sport, 16(2), 102-110.
Masuda, K., Kikuhara, N., Demura, S., Katsuta, S., & Yamanaka, K. (2005). Relationship
between muscle strength in various isokinetic movements and kick performance
among soccer players. Journal of Sports Medicine and Physical Fitness, 45(1), 44-
52.
Masuda, K., Kikuhara, N., Takahashi, H., & Yamanaka, K. (2003). The relationship
between muscle cross-sectional area and strength in various isokinetic movements
among soccer players. Journal of Sports Sciences, 21(10), 851-858.
Matsuda, S., Demura, S., & Uchiyama, M. (2008). Centre of pressure sway characteristics
during static one-legged stance of athletes from different sports. Journal of Sports
Sciences, 26(7), 775-779.

166
McLean, B. D., & Tumilty, D. M. (1993). Left-right asymmetry in two types of soccer
kick. British Journal of Sports Medicine, 27(4), 260-262.
Nevill, A., Holder, R., & Watts, A. (2009). The changing shape of "successful" professional
footballers. Journal of Sports Sciences, 27(5), 419-426.
Newton, R. U., Gerber, A., Nimphius, S., Shim, J. K., Doan, B. K., Robertson, M., et al.
(2006). Determination of functional strength imbalance of the lower extremities.
Journal of Strength and Conditioning Research, 20(4), 971-977.
Nunome, H., Ikegami, Y., Kozakai, R., Apriantono, T., & Sano, S. (2006). Segmental
dynamics of soccer instep kicking with the preferred and non-preferred leg. Journal
of Sports Sciences, 24(5), 529-541.
Nuzzo, J. L., McBride, J. M., Cormie, P., & McCaulley, G. O. (2008). Relationship
between countermovement jump performance and multijoint isometric and dynamic
tests of strength. Journal of Strength and Conditioning Research, 22(3), 699-707.
Orchard, J., Marsden, J., Lord, S., & Garlick, D. (1997). Preseason hamstring muscle
weakness associated with hamstring muscle injury in Australian footballers.
American Journal of Sports Medicine, 25(1), 81-85.
Orchard, J., Walt, S., McIntosh, A., & Garlick, D. (1999). Muscle activity during the drop
punt kick. Journal of Sports Sciences, 17(10), 837-838.
Paillard, T., Noe, F., Riviere, T., Marion, V., Montoya, R., & Dupui, P. (2006). Postural
performance and strategy in the unipedal stance of soccer players at different levels
of competition. Journal of Athletic Training, 41(2), 172-176.
Peiffer, J. J., Galvao, D. A., Gibbs, Z., Smith, K., Turner, D., Foster, J., et al. (2010).
Strength and functional characteristics of men and women 65 years and older.
Rejuvenation Research, 13(1), 75-82.

167
Perez-Gomez, J., Olmedillas, H., Delgado-Guerra, S., Ara, I., Vicente-Rodriguez, G., Ortiz,
R. A., et al. (2008a). Effects of weight lifting training combined with plyometric
exercises on physical fitness, body composition, and knee extension velocity during
kicking in football. Applied Physiology, Nutrition and Metabolism, 33(3), 501-510.
Perez-Gomez, J., Rodriguez, G. V., Ara, I., Olmedillas, H., Chavarren, J., Gonzalez-
Henriquez, J. J., et al. (2008b). Role of muscle mass on sprint performance: gender
differences? European Journal of Applied Physiology, 102(6), 685-694.
Rahnama, N., Lees, A., & Bambaecichi, E. (2005). Comparison of muscle strength and
flexibility between the preferred and non-preferred leg in English soccer players.
Ergonomics, 48(11-14), 1568-1575.
Rampinini, E., Impellizzeri, F. M., Castagna, C., Coutts, A. J., & Wisloff, U. (2009).
Technical performance during soccer matches of the Italian Serie A league: effect of
fatigue and competitive level. Journal of Science and Medicine in Sport, 12(1), 227-
233.
Rassier, D., & MacIntosh, B. (2000). Coexistence of potentiation and fatigue in skeletal
muscle. Brazilian Journal of Medical and Biological Research, 33, 499-508.
Sadeghi, H., Allard, P., Prince, F., & Labelle, H. (2000). Symmetry and limb dominance in
able-bodied gait: a review. Gait and Posture, 12(1), 34-45.
Saliba, L., & Hrysomallis, C. (2001). Isokinetic strength related to jumping but not kicking
performance of Australian footballers. Journal of Science and Medicine in Sport,
4(3), 336-347.
Stewart, S., Stanton, W., Wilson, S., & Hides, J. (2010). Consistency in size and
asymmetry of the psoas major muscle among elite footballers. British Journal of
Sports Medicine, 44(16), 1173-1177.

168
Theoharopoulos, A., Tsitskaris, G., Nikopoulou, M., & Tsaklis, P. (2000). Knee strength of
professional basketball players. Journal of Strength and Conditioning Research,
14(4), 457-463.
Thorborg, K., Couppe, C., Petersen, J., Magnusson, S. P., & Holmich, P. (2011). Eccentric
hip adduction and abduction strength in elite soccer players and matched controls: a
cross-sectional study. British Journal of Sports Medicine, 45(1), 10-13.
Tumilty, D. (1993). Physiological characteristics of elite soccer players. Sports Medicine,
16(2), 80-96.
Veale, J. P., Pearce, A. J., Buttifant, D., & Carlson, J. S. (2010). Anthropometric profiling
of elite junior and senior Australian football players. International Journal of Sports
Physiology and Performance, 5(4), 509-520.
Winter, D. A. (1990). Biomechanics and Motor Control of Human Movement (2nd ed.).
Toronto: John Wiley & Sons, Inc.
Wong, P. L., Chamari, K., Chaouachi, A., Mao de, W., Wisloff, U., & Hong, Y. (2007).
Difference in plantar pressure between the preferred and non-preferred feet in four
soccer-related movements. British Journal of Sports Medicine, 41(2), 84-92.
Young, W. B., Newton, R. U., Doyle, T. L., Chapman, D., Cormack, S., Stewart, G., et al.
(2005). Physiological and anthropometric characteristics of starters and non-starters
and playing positions in elite Australian Rules Football: a case study. Journal of
Science and Medicine in Sport, 8(3), 333-345.
Young, W. B., & Pryor, L. (2007). Relationship between pre-season anthropometric and
fitness measures and indicators of playing performance in elite junior Australian
Rules football. Journal of Science and Medicine in Sport, 10(2), 110-118.

169
Young, W. B., & Rath, D. A. (2011). Enhancing Foot Velocity in Football Kicking: The
Role of Strength Training. Journal of Strength and Conditioning Research,
25(2), 561-566.
Zakas, A. (2006). Bilateral isokinetic peak torque of quadriceps and hamstring muscles in
professional soccer players with dominance on one or both two sides. Journal of
Sports Medicine and Physical Fitness, 46(1), 28-3.

170
8.0 – CHAPTER EIGHT – SUMMARY / CONCLUSIONS
The purpose of this thesis was to examine the kinanthropometric characteristics of accurate
and inaccurate kickers in Australian Football in order to identify the potential influences or
determinants of kicking accuracy when performing the drop punt kick. In particular, this
series of research studies assessed the characteristics of Australian Footballers which are
modifiable or influenced by athletic conditioning practices, including whole body
composition; anthropometrics; segmental masses of the lower limbs; unilateral and bilateral
leg strength; and lower limb kinematics produced during the kicking action. Five
investigations were undertaken to establish valid and reliable measurement protocols, and
subsequently quantify the necessary athletic characteristics required by this research.
The first study sought to establish a standardised in-vivo method to reliably quantify the
segmental masses of the appendicular skeleton using DEXA technology. While whole body
models have been routinely applied to separate the body into axial and appendicular
sections, there was a need to create an appendicular model to further identify and examine
the upper and lower extremities. This study established a reliable body positioning and scan
analysis model to accurately identify the upper arm, forearm, hand, thigh, shank and foot
segments, producing very high intra-tester reliability (CV ≤ 2.6%; ICC ≥ 0.941) and very
high inter-tester reliability (CV ≤ 2.4%; ICC ≥ 0.961). The findings of this study provide a
novel method to determine intralimb and interlimb segmental quantities of lean, fat and
total mass, which could be used by strength and conditioning practitioners to monitor the
efficacy of training interventions or identify potential deficiencies acquired through injury
during the competitive season.

171
The second study aimed to determine whether a portable isometric strength device was able
to derive valid and reliable representations of maximal lower limb strength and rate of force
development characteristics under unilateral and bilateral conditions. Given that the
portable isometric strength device contained no bar supports, and was unable to prevent
horizontal sway; a less stable environment may compromise the ability to produce maximal
isometric efforts. The results of this study were able to successfully demonstrate valid and
reliable representations of maximal isometric force (peak force) under bilateral and
unilateral conditions (CV ≤ 4.7%; ICC ≥ 0.961) when using the portable apparatus.
Unfortunately, the portable device was unable to reliably determine the rate of force
development across either bilateral or unilateral conditions (CV: 14.5% to 45.5%; ICC:
0.360 to 0.943), likely due to the increased stabilisation needed during the maximal efforts.
The portable device may therefore provide a more sport-specific assessment of maximal
strength in sports where balance is an important component in the target performance; such
as the function of the support leg during the kicking motion.
Using the methodological approach established in study one; the third study sought to
provide a detailed profile of the lower limb segmental mass characterstics of accurate and
inaccurate kickers in Australian Football to determine whether these sub-groups of athletes
exhibited different physical characteristics. Specifically, this study illustrated a noticeable
difference in leg mass characteristics between accurate and inaccurate kickers. Accurate
kickers contained significantly greater quantities of relative lean mass (p ≤ 0.004; r = 0.462
to 0.698); significantly lower quantities of relative fat mass (p ≤ 0.024; r = -0.431 to -
0.585); and significantly higher lean-to-fat mass ratios (p ≤ 0.009; r = 0.482 to 0.622)
across all segments of the kicking and support limbs. In particular, this study demonstrated

172
the importance of relative quantities of body mass components to performance outcomes;
with the contractile properties of lean mass (skeletal muscle) contributing positively to
skilful movements, and the inert properties of fat mass impacting negatively to sporting
performances requiring the projection of a body through space; both of which appear to be
deterministic characteristics for the kicking skill, and may subsequently adjust the temporal
and technical strategy of Australian Footballers when performing the drop punt.
To examine how these lower limb characteristics may adjust the biomechanical strategy of
Australian Footballers when kicking for accuracy; the fourth study aimed to assess whether
greater overall leg mass could potentially optimise kicking performance in favour of greater
accuracy, by enabling a proportionately lower angular velocity to be produced in order to
achieve a given distance. Using the methodological approach established in study one to
determine leg mass characteristics, in conjunction with three-dimensional kinematic data
obtained from an optoelectronic device, this study did not find a relationship between foot
velocity and kicking accuracy (r = -0.035 to -0.083). In fact, ball velocity was unable to be
explained by either foot velocity or leg mass in isolation; rather, it was the co-contribution
of these characteristics which were the discriminatory factors between accurate and
inaccurate kickers. Furthermore, a significant and strong correlation between relative lean
mass and kicking accuracy (p ≤ 0.001; r = 0.631) was evident. As temporal and spatial
components of kicking limb behaviour (velocity, trajectory, and distance) are a result of the
magnitude and duration of muscular impulses acting on the joints, greater relative lean
mass may afford accurate kickers with improved limb control in response to reduced
volitional effort and lower relative impulses to generate kicking limb velocity.

173
Recognising the evident importance of relative lean mass illustrated in studies three and
four, and the established relationship in the literature between force generation and muscle
size; the fifth and final study of this thesis sought to assess the relationship between lower
limb strength and kicking accuracy performance, with a secondary purpose to examine
lower limb symmetry (muscularity and strength) between the kicking and support limbs of
accurate and inaccurate kickers. Using the lower limb strength and leg mass methodologies
established in studies one and two, this final study successfully demonstrated a positive
relationship between relative bilateral strength and support-leg unilateral strength with
kicking accuracy outcomes (r = 0.379 to 0.401). A significant, negative relationship was
also established between strength imbalances and kicking accuracy (p = 0.002; r = 0.516),
further supported by the significant, positive relationship illustrated by the limb symmetry
index for lean mass quantities and kicking accuracy outcomes (p = 0.003 to 0.029; r =
0.312 to 0.402).
These findings highlight the potential benefit of greater limb symmetry for strength and
muscularity in Australian Footballers as a mechanism to potentially enhance kicking
accuracy, while highlighting the importance of support leg strength toward accuracy
production. Given that differential stresses imposed upon athletes during training and
game-based participation may generate undesirable imbalances; it appears appropriate to
utilise strength and conditioning programs in addition to game-based loading as a
mechanism to reduce and monitor limb imbalances, while increasing overall relative lean
mass across both kicking and support limbs. This may optimise performance, minimise
injury incidence or severity, and potentially enable greater kicking ability across both limbs
(preferred and non-preferred); though these relationships require further research.

174
In summary, the overriding conclusion drawn from the collection of experimental studies
presented in this thesis promotes the importance and positive influence of relative lean
mass and lower body strength to kicking accuracy production during the drop punt. In
particular, accurate kickers displayed greater quantities of relative lean mass and lower
quantities of relative fat mass within their kicking and support limbs; and contained no
significant strength or muscular imbalances between limbs; further supported by
correlational analyses when applied to kicking accuracy outcomes. These characteristics
collectively appear to positively adjust the biomechanical characteristics and strategies of
Australian Footballers, which may subsequently lead to an improved performance of the
drop punt kick. It is important to note that while these characteristics are positively
associated with kicking accuracy, they do not necessarily create accurate performances;
rather they might provide the athlete with an optimal and stable foundation to produce
technically proficient performances.
These findings, in particular, provide a valid rationale for strength and conditioning
professionals and skill acquisition coaches to properly consider an athlete’s strength and
body mass characteristics when attempting to improve kicking performance. Given the
positive influence of multi-joint, dynamic, lower body strength and power interventions on
kicking distance established in the literature; and the positive influence of lower body lean
mass and strength characteristics on kicking accuracy established through-out this thesis;
resistance training programs could potentially improve kicking accuracy outcomes. The
precise nature of these acute cross-sectional outcomes provide a foundation for future
longitudinal resistance training studies as a tool to establish interventions which may
heighten athletic conditioning and technical proficiency in football sports with an express
aim to improve kicking accuracy.


175
9.0 – CHAPTER NINE – FUTURE RESEARCH
The conclusions from this thesis resulted in several interesting findings, however, the
review of the literature and presented experimental outcomes have revealed several
potential areas for future research opportunities:
1) Technological advancements pertaining to body segment parameter and body
composition assessments are still required. While DEXA is able to accurately and
reliably assess quantities of whole body, and segmental mass components, it is limited
by its 2D, frontal plane, field of view during the scan, which may be further confounded
by the impact of gravity on the subsequent redistribution of mass in response to
compression between the supine body and horizontal scan bed. To combat this, future
studies may wish to establish methods and technology to enable standing, vertical 3D
scanning and shape analysis solutions to enable measurements to transcend across more
than plane of vision.
2) Despite the inability of the portable isometric squat device to reliably ascertain peak
rate of force development over a 300 ms window; most rapid and dynamic sporting
skills occur over much shorter time periods (80 – 150ms). Therefore, future research
may wish to assess the rate of force development, and net vertical impulses produced
over shorter time periods (30ms, 50ms, 90ms, 100ms, 150ms) in order to verify whether
this device may be-able to reliably determine rate of force development and impulse
over more practical and relevant time phases.

176
3) The impact of composite mass differences between accurate and inaccurate kickers
requires further attention. While the speed-accuracy trade-off does not appear to explain
visible differences in kicking accuracy, the impulse-variability theory might. We were
only able to infer this indirectly from this thesis. Therefore, future studies may wish to
quantify the muscular impulses prevalent at the hip and knee joints, in conjunction with
lean mass quantities in the thigh and shanks segments when comparing accurate and
inaccurate kickers to directly examine the applicability of this theory.
4) The speed of movement was unable to explain the differences in kicking accuracy
production evident between accurate and inaccurate groups (a between-group analysis).
However, confounding factors likely exist when comparing between groups with
differences in technical ability, training history and previous practise time also
impacting accuracy production. Therefore, future research may increase limb mass
within subjects using resistance training interventions (a within-group analysis), while
properly controlling for these potential confounding factors.
5) The nature of foot-ball contact and phase of collision between the foot and ball is of
notable interest. Due to the relatively consistent air pressure of the ball (governed by
game-based rules and regulations), an athlete may instead be-able to adjust the striking
mass of the limb as a mechanism to manipulate the coefficient of restitution prevalent
during foot-ball collision. As accurate kickers demonstrated higher lean-to-fat ratios in
the shank and foot region; and as lean mass provides a more stable and rigid surface for
impact relative to fat mass; future studies may wish to investigate the relationship
between shank and foot mass characteristics and the coefficient of restitution prevalent
during impact using a high-speed, high sampling frequency digitising method.

177
6) While limb symmetry profiles of muscularity and strength have been positively
associated with kicking accuracy in this thesis; there is a notable lack of consensus in
the literature concerning the positive or negative influences that such symmetry (or
asymmetry) might hold over injury incidence and severity, or over athletic performance
in other football-specific tasks, such as agility manoeuvres, jumping and landing.
Future research may wish to further assess the broader influence of limb symmetry or
lateral dominance across a wider range of sport specific skills.
7) Given the positive influence of multi-joint, dynamic, lower body strength and power
interventions on kicking distance established in the literature; and the positive influence
of lower body lean mass and strength characteristics on kicking accuracy established
through-out this thesis; future studies may wish to employ longitudinal resistance
training studies in order heighten understanding towards the potential influences of
resistance training programs on kicking accuracy outcomes.
8) The outcomes of this thesis are presently applicable to the drop punt kick over a short
distance, and to a player target. It is unknown whether these findings would translate to
longer distances, or to a goal target; both of which require considerable adjustments to
the biomechanical strategies employed. Future research may therefore examine the
potential biomechanical modifications, and physiological impacts provided by varying
distances, and varying target and accuracy constraints.


178
REFERENCES
Aagaard, P., Simonsen, E. B., Trolle, M., Bangsbo, J., & Klausen, K. (1994). Effects of
different strength training regimes on moment and power generation during
dynamic knee extensions. European Journal of Applied Physiology and
Occupational Physiology, 69(5), 382-386.
Aagaard, P., Simonsen, E. B., Trolle, M., Bangsbo, J., & Klausen, K. (1996). Specificity of
training velocity and training load on gains in isokinetic knee joint strength. Acta
Physiologica Scandinavica, 156(2), 123-129.
Abrahamyan, D. O., Gazarian, A., & Braillon, P. M. (2008). Estimation of stature and
length of limb segments in children and adolescents from whole-body dual-energy
X-ray absorptiometry scans. Pediatric Radiology, 38(3), 311-315.
Ackland, T. R., Blanksby, B. A., & Bloomfield, J. (1988). Inertial characteristics of
adolescent male body segments. Journal of Biomechanics, 21(4), 319-327.
Alam, F., Subic, A., Watkins, S., Naser, J., & Rasul, M. (2008). An experimental and
computational study of aerodynamic properties of Rugby balls. WSEAS
Transactions on Fluid Mechanics, 3(3), 279-286.
Alam, F., Subic, A., Watkins, S., & Smits, A. (2009). Aerodynamics of an Australian Rules
Foot Ball and Rugby Ball. Lecture Notes in Computational Science and
Engineering, 72, 103-127.
Amiri-Khorasani, M., Osman, N. A. A., & Yusof, A. (2010). Kinematics Analysis: Number
of trials necessary to achieve performance stability during soccer instep kicking.
Journal of Human Kinetics, 23, 15-20.

179
Andersen, L. L., & Aagaard, P. (2006). Influence of maximal muscle strength and intrinsic
muscle contractile properties on contractile rate of force development. European
Journal of Applied Physiology, 96(1), 46-52.
Andersen, T. B., Dorge, H. C., & Thomsen, F. I. (1999). Collisions in soccer kicking.
Sports Engineering, 2, 121-125.
Andreoli, A., Monteleone, M., Van Loan, M., Promenzio, L., Tarantino, U., & De Lorenzo,
A. (2001). Effects of different sports on bone density and muscle mass in highly
trained athletes. Medicine and Science in Sports and Exercise, 33(4), 507-511.
Appleby, B., & Dawson, B. (2002). Video analysis of selected game activities in Australian
Rules Football. Journal of Science and Medicine in Sport, 5(2), 129-142.
Askling, C., Karlsson, J., & Thorstensson, A. (2003). Hamstring injury occurrence in elite
soccer players after preseason strength training with eccentric overload.
Scandinavian Journal of Medicine and Science in Sports, 13(4), 244-250.
Augustsson, J., Thomee, R., Linden, C., Folkesson, M., Tranberg, R., & Karlsson, J.
(2006). Single-leg hop testing following fatiguing exercise: reliability and
biomechanical analysis. Scandinavian Journal of Medicine and Science in Sports,
16(2), 111-120.
Baczkowski, K., Marks, P., Silberstein, M., & Schneider-Kolsky, M. E. (2006). A new look
into kicking a football: an investigation of muscle activity using MRI. Australasian
Radiology, 50(4), 324-329.
Baker, J., & Ball, K. (1996). Biomechanical considerations of the drop punt. Canberra:
Australian Institute of Sport.

180
Baker, D., Wilson, G., & Carlyon, B. (1994). Generality versus specificity: a comparison of
dynamic and isometric measures of strength and speed-strength. European Journal
of Applied Physiology and Occupational Physiology, 68(4), 350-355.
Baktash, S., Hy, A., Muir, S., Walton, T., & Zhang, Y. (2009). The effects of different
instep foot positions on ball velocity in place kicking. International Journal of
Sports Science and Engineering, 3(2), 85-92.
Ball, K. (2007a). Use of weighted balls for improving kicking for distance. Journal of
Sports Science and Medicine, 6(Suppl. 10), 44.
Ball, K. (2007b). Foot-ball interaction in Australian Rules football. Journal of Sports
Science and Medicine, 6(Suppl. 10), 46.
Ball, K. (2008). Biomechanical considerations of distance kicking in Australian Rules
football. Sports Biomechanics,7(1), 10-23.
Ball, K., Smith, J., & MacMahon, C. (2010). Kick impact characteristics of junior kickers.
Paper presented at the 28th International Conference on Biomechanics in Sport,
Michigan, USA.
Ball, K. (2011). Kinematic comparison of the preferred and non-preferred foot punt kick.
Journal of Sports Sciences, 29(14), 1545-1552.
Bangsbo, J. (1994). The physiology of soccer--with special reference to intense intermittent
exercise. Acta Physiologica Scandinavia, 619, 1-155.
Barfield, W. R. (1998). The biomechanics of kicking in soccer. Clinics in Sports Medicine,
17(4), 711-728.

181
Beaumesnil, M., Chaillou, E., Wagner, A. C., Rouquette, A., Audran, M., & Ginies, J. L.
(2011). Body composition analysis in patients with cystic fibrosis. Comparison of 3
methods: dual energy x-ray absorptiometry, bioelectrical impedance analysis, and
skinfold measurements. Archives of Paediatrics, 18(4), 370-375.
Beilock, S., Bertenthal, B. I., Hoerger, M., & Carr, T. H. (2008). When does haste make
waste? Speed-accuracy tradeoff, skill level, and the tools of the trade. Journal of
Experimental Psychology: Applied, 14(4), 340-352.
Bennell, K., Wajswelner, H., Lew, P., Schall-Riaucour, A., Leslie, S., Plant, D., et al.
(1998). Isokinetic strength testing does not predict hamstring injury in Australian
Rules footballers. British Journal of Sports Medicine, 32(4), 309-314.
Bevan, H. R., Bunce, P. J., Owen, N. J., Bennett, M. A., Cook, C. J., Cunningham, D. J., et
al. (2010). Optimal loading for the development of peak power output in
professional rugby players. Journal of Strength and Conditioning Research, 24(1),
43-47.
Bezodis, N., Trewartha, G., Wilson, C., & Irwin, G. (2007). Contributions of the non-
kicking-side arm to rugby place-kicking technique. Sports Biomechanics, 6(2), 171-
186.
Billot, M., Martin, A., Paizis, C., Cometti, C., & Babault, N. (2010). Effects of an
electrostimulation training program on strength, jumping, and kicking capacities in
soccer players. Journal of Strength and Conditioning Research, 24(5), 1407-1413.
Bioleau, R. A., & Lohman, T. H. (1977). The measurement of human physique and its
effects on physical performance. Orthopedic Clinics of North America, 8, 563-581.

182
Bishop, D. (2008). An applied research model for the sports sciences. Sports Medicine,
38(3), 253-263.
Blazevich, A. J., Gill, N., & Newton, R. U. (2002). Reliability and validity of two isometric
squat tests. Journal of Strength and Conditioning Research, 16(2), 298-304.
Bridge, P., Pocock, N. A., Nguyen, T., Munns, C., Cowell, C. T., & Thompson, M. W.
(2009). Prediction of appendicular skeletal and fat mass in children: excellent
concordance of dual-energy X-ray absorptiometry and magnetic resonance imaging.
Journal of Pediatric Endocrinology and Metabolism, 22(9), 795-804.
Brockett, C. L., Morgan, D. L., & Proske, U. (2004). Predicting hamstring strain injury in
elite athletes. Medicine and Science in Sports and Exercise, 36(3), 379-387.
Brughelli, M., Cronin, J., Levin, G., & Chaouachi, A. (2008). Understanding change of
direction ability in sport: a review of resistance training studies. Sports Medicine,
38(12), 1045-1063.
Burkett, B. (2010). Sport mechanics for coaches (3rd ed.). Champaign, IL: Human
Kinetics.
Butterfield, S. A., & Loovis, E. M. (1994). Influence of age, sex, balance, and sport
participation on development of kicking by children in grades K-8. Perceptual and
Motor Skills, 79(1 Pt 2), 691-697.
Cameron, M., & Adams, R. (2003). Kicking footedness and movement discrimination by
elite Australian Rules footballers. Journal of Science and Medicine in Sport, 6(3),
266-274.
Campo, S. S., Vaeyens, R., Philippaerts, R. M., Redondo, J. C., Benito, A. M., & Cuadrado,
G. (2009). Effects of lower-limb plyometric training on body composition,

183
explosive strength and kicking speed in female soccer players. Journal of Strength
and Conditioning Research, 23(6), 1714-1722.
Cardinale, M., Newton, R., & Nosaka, K. (2011). Strength and Conditioning: Biological
Principles and Practical Applications: Wiley-Blackwell.
Cauraugh, J. H., Gabert, T. E., & White, J. J. (1990). Tennis serving velocity and accuracy.
Perceptual and Motor Skills, 70, 719-722.
Chaouachi, A., Brughelli, M., Levin, G., Boudhina, N. B., Cronin, J., & Chamari, K.
(2009). Anthropometric, physiological and performance characteristics of elite
team-handball players. Journal of Sports Sciences, 27(2), 151-157.
Chelly, M. S., Hermassi, S., & Shephard, R. J. (2010). Relationships between power and
strength of the upper and lower limb muscles and throwing velocity in male
handball players. Journal of Strength and Conditioning Research, 24(6), 1480-
1487.
Clagg, S. E., Warnock, A., & Thomas, J. S. (2009). Kinetic analyses of maximal effort
soccer kicks in female collegiate athletes. Sports Biomechanics, 8(2), 141-153.
Cometti, G., Maffiuletti, N. A., Pousson, M., Chatard, J. C., & Maffulli, N. (2001).
Isokinetic strength and anaerobic power of elite, subelite and amateur French soccer
players. International Journal of Sports Medicine, 22(1), 45-51.
Cormack, S. J., Newton, R. U., McGuigan, M. R., & Doyle, T. L. (2008). Reliability of
measures obtained during single and repeated countermovement jumps.
International Journal of Sports Physiology and Performance, 3(2), 131-144.
Coventry, E., Ball, K., Parrington, L., Taylor, S., Aughey, R., & McKenna, M. (2011). The
effect of a game-specific short term fatigue protocol on kicking in Australian
Football. Portugese Journal of Sport Sciences, 11(Suppl. 2), 69-72.

184
Cronin, J. B., & Hansen, K. T. (2005). Strength and power predictors of sports speed.
Journal of Strength Conditioning Research, 19(2), 349-357.
Cronin, J. B., Hing, R. D., & McNair, P. J. (2004). Reliability and validity of a linear
position transducer for measuring jump performance. Journal of Strength and
Conditioning Research, 18(3), 590-593.
Cronin, J. B., McNair, P. J., & Marshall, R. N. (2002). Is velocity-specific strength training
important in improving functional performance? Journal of Sports Medicine and
Physical Fitness, 42(3), 267-273.
Croisier, J. L., Forthomme, B., Namurois, M. H., Vanderthommen, M., & Crielaard, J. M.
(2002). Hamstring muscle strain recurrence and strength performance disorders.
American Journal of Sports Medicine, 30(2), 199-203.
Davids, K., Lees, A., & Burwitz, L. (2000). Understanding and measuring coordination and
control in kicking skills in soccer: Implications for talent identification and skill
acquisition. Journal of Sports Sciences, 18, 703-714.
Dawson, B., Hopkinson, R., Appleby, B., Stewart, G., & Roberts, C. (2004). Comparison
of training activities and game demands in the Australian Football League. Journal
of Science and Medicine in Sport, 7(3), 292-301.
Dean, M., Wu, S. W., & Maloney, L. T. (2007). Trading off speed and accuracy in rapid,
goal-directed movements. Journal of Vision, 7(5), 1-12.
de Leva, P. (1996). Adjustments to Zatsiorsky-Seluyanov's segment inertia parameters.
Journal of Biomechanics, 29(9), 1223-1230.
Dempster, W. T. (1955). Space requirements of the seated operator. WADC Technical
Report (TR-59-159). OH: Wright-Patterson Air Force Base.
185
Demura, S., Miyaguchi, K., Shin, S., & Uchida, Y. (2010). Effectiveness of the 1RM
estimation method based on isometric squat using a back-dynamometer. Journal
Strength & Conditioning Research, 24(10), 2742-2748.
Dichiera, A., Webster, K. E., Kuilboer, L., Morris, M. E., Bach, T. M., & Feller, J. A.
(2006). Kinematic patterns associated with accuracy of the drop punt kick in
Australian Football. Journal of Science and Medicine in Sport, 9(4), 292-298.
Dorge, H. C., Andersen, T. B., Sorensen, H., Simonsen, E. B., Aagaard, H., Dyhre-Poulsen,
P., et al. (1999). EMG activity of the iliopsoas muscle and leg kinetics during the
soccer place kick. Scandinavian Journal of Medicine and Science in Sports, 9, 195-
200.
Dorge, H. C., Anderson, T. B., Sorensen, H., & Simonsen, E. B. (2002). Biomechanical
differences in soccer kicking with the preferred and the non-preferred leg. Journal
of Sports Sciences, 20(4), 293-299.
Dumas, R., Cheze, L., & Verriest, J. P. (2007). Adjustments to McConville et al. and
Young et al. body segment inertial parameters. Journal of Biomechanics, 40(3),
543-553.
Durkin, J. L., & Dowling, J. J. (2003). Analysis of body segment parameter differences
between four human populations and the estimation errors of four popular
mathematical models. Journal of Biomechanical Engineering, 125(4), 515-522.
Durkin, J. L., & Dowling, J. J. (2006). Body segment parameter estimation of the human
lower leg using an elliptical model with validation from DEXA. Annals of
Biomedical Engineering, 34(9), 1483-1493.

186
Durkin, J. L., Dowling, J. J., & Andrews, D. M. (2002). The measurement of body segment
inertial parameters using dual energy X-ray absorptiometry. Journal of
Biomechanics, 35(12), 1575-1580.
Enoka, R. (2008), Neuromechanics of Human Movement (4th ed.). Champaign, IL: Human
Kinetics.
Fawzy, T., Muttappallymyalil, J., Sreedharan, J., Ahmed, A., Alshamsi, S. O., Al Ali, M.
S., et al. (2011). Association between Body Mass Index and Bone Mineral Density
in Patients Referred for Dual-Energy X-Ray Absorptiometry Scan in Ajman, UAE.
Journal of Osteoporosis, 2011, 1-4.
Fuller, N. J., Laskey, M. A., & Elia, M. (1992). Assessment of the composition of major
body regions by dual-energy X-ray absorptiometry (DEXA), with special reference
to limb muscle mass. Clinical Physiology, 12(3), 253-266.
Gamble, P. (2006). Implications and Applications of Training Specificity for Coaches and
Athletes. Journal of Strength and Conditioning, 28(3), 54-58.
Ganley, K. J., & Powers, C. M. (2001). The use of dual energy X-ray absorptiometry in
determining subject-specific anthropometric measures for kinetic analysis during
gait. Gait and Posture, 13, 271-272.
Ganley, K. J., & Powers, C. M. (2004a). Anthropometric parameters in children: a
comparison of values obtained from dual energy x-ray absorptiometry and cadaver-
based estimates. Gait and Posture, 19(2), 133-140.
Ganley, K. J., & Powers, C. M. (2004b). Determination of lower extremity anthropometric
parameters using dual energy X-ray absorptiometry: the influence on net joint
moments during gait. Clinical Biomechanics, 19(1), 50-56.

187
Gerbino, P. G., Griffin, E. D., & Zurakowski, D. (2007). Comparison of standing balance
between female collegiate dancers and soccer players. Gait and Posture, 26(4), 501-
507.
Gissis, I., Papadopoulos, C., Kalapotharakos, V. I., Sotiropoulos, A., Komsis, G., &
Manolopoulos, E. (2006). Strength and speed characteristics of elite, subelite, and
recreational young soccer players. Research in Sports Medicine, 14(3), 205-214.
Glickman, S. G., Marn, C. S., Supiano, M. A., & Dengel, D. R. (2004). Validity and
reliability of dual-energy X-ray absorptiometry for the assessment of abdominal
adiposity. Journal of Applied Physiology, 97(2), 509-514.
Gouwanda, D., & Senanayake, S. M. (2011). Identifying gait asymmetry using gyroscopes-
-a cross-correlation and Normalized Symmetry Index approach. Journal of
Biomechanics, 44(5), 972-978.
Gstottner, M., Neher, A., Scholtz, A., Millonig, M., Lembert, S., & Raschner, C. (2009).
Balance ability and muscle response of the preferred and nonpreferred leg in soccer
players. Motor Control, 13(2), 218-231.
Haaland, E., & Hoff, J. (2003). Non-dominant leg training improves the bilateral motor
performance of soccer players. Scandinavian Journal of Medicine and Science in
Sports, 13(3), 179-184.
Haarbo, J., Gotfredsen, A., Hassager, C., & Christiansen, C. (1991). Validation of body
composition by dual energy X-ray absorptiometry (DEXA). Clinical Physiology,
11(4), 331-341.
Haff, G. G., Carlock, J. M., Hartman, M. J., Kilgore, J. L., Kawamori, N., Jackson, J. R., et
al. (2005). Force-time curve characteristics of dynamic and isometric muscle actions

188
of elite women Olympic weightlifters. Journal of Strength and Conditioning
Research, 19(4), 741-748.
Haff, G. G., Stone, M. H., O'Bryant, H., Harman, E., Dinan, C., Johnson, R., et al. (1997).
Force-time dependent characteristics of dynamic and isometric muscle actions.
Journal of Strength and Conditioning Research, 11, 269-272.
Hall, S. (2007). Basic Biomechanics (5th ed.). New York: McGraw-Hill.
Hansen, L., Bangsbo, J., Twisk, J., & Klausen, K. (1999). Development of muscle strength
in relation to training level and testosterone in young male soccer players. Journal
of Applied Physiology, 87(3), 1141-1147.
Harris, N., Cronin, J., & Keogh, J. (2007). Contraction force specificity and its relationship
to functional performance. Journal of Sports Science, 25(2), 201-212.
Hart, N. H., Nimphius, S., Cochrane, J. L., & Newton, R. U. (2012). Reliability and validity
of unilateral and bilateral isometric strength using a customised, portable apparatus.
Journal of Australian Strength and Conditioning, 20, 61-67.
Hennig, E., Althoff, K., & Hoemme, A. (2009). Soccer footwear and ball kicking accuracy.
Footwear Science, 1(Suppl. 1), 85-87.
Herzog, W., Nigg, B. M., Read, L. J., & Olsson, E. (1989). Asymmetries in ground reaction
force patterns in normal human gait. Medicine and Science in Sports and Exercise,
21(1), 110-114.
Heymsfield, S. B., Smith, R., Aulet, M., Bensen, B., Lichtman, S., Wang, J., et al. (1990).
Appendicular skeletal muscle mass: measurement by dual-photon absorptiometry.
American Journal of Clinical Nutrition, 52(2), 214-218.

189
Hides, J., Fan, T., Stanton, W., Stanton, P., McMahon, K., & Wilson, S. (2010). Psoas and
quadratus lumborum muscle asymmetry among elite Australian Football League
players. British Journal of Sports Medicine, 44(8), 563-567.
Hinrichs, R. N. (1985). Regression equations to predict segmental moments of inertia from
anthropometric measurements: an extension of the data of Chandler et al. (1975).
Journal of Biomechanics, 18(8), 621-624.
Hinrichs, R. N. (1990). Adjustments to the segment center of mass proportions of Clauser
et al. (1969). Journal of Biomechanics, 23(9), 949-951.
Hodgson, M., Docherty, D., & Robbins, D. (2005). Post-Activation Potentiation:
Underlying physiology and implications for motor performance. Sports Medicine,
35(7), 585-595.
Holmes, C., Jones, R., Harland, A., & Petzing, J. (2006). Ball Launch Characteristics for
Elite Rugby Union Players. The Engineering of Sport 6, 6, 211-216.
Hologic. (2004). QDR for Windows XP Reference Manual: Hologic Inc.
Hopkins, W. (2000). Measures of reliability in sports medicine and science. Sports
Medicine, 30, 1-15.
Hopkins, W. (2002). A scale of magnitudes for effect statistics. Retrieved from
http://www.sportsci.org/resource/stats/effectmag.html
Hosford, G., & Meikle, D. (2007). The Science of Kicking: Kicking for distance and
accuracy in Australian Football. Victoria: B.I.P.E Publications Pty Ltd.
Hoshikawa, Y., Iida, T., Muramatsu, M., Nakajima, Y., Fukunaga, T., & Kanehisa, H.
(2009). Differences in thigh muscularity and dynamic torque between junior and
senior soccer players. Journal of Sports Sciences, 27(2), 129-138.

190
Hoskins, W. T., & Pollard, H. (2003). Injuries in Australian Rules Football: A Review of
the Literature. Australasia Chiropractic Osteopathy, 11(2), 49-56.
Hrysomallis, C. (2011). Balance ability and athletic performance. Sports Medicine, 41(3),
221-232.
Huang, H. K., & Suarez, F. R. (1983). Evaluation of cross-sectional geometry and mass
density distributions of humans and laboratory animals using computerized
tomography. Journal of Biomechanics, 16(10), 821-832.
Huang, H. K., & Wu, S. C. (1976). The evaluation of mass densities of human body in vivo
from CT scans. Computers in Biology and Medicine, 6(4), 337-343
Hubbard, M., de Mestre, N. J., & Scott, J. (2001). Dependence of release variables in the
shot put. Journal of Biomechanics, 34(4), 449-456.
Hunter, J. P., Marshall, R. N., & McNair, P. (2004). Reliability of biomechanical variables
of sprint running. Medicine and Science in Sports and Exercise, 36(5), 850-861.
Iga, J., George, K., Lees, A., & Reilly, T. (2009). Cross-sectional investigation of indices of
isokinetic leg strength in youth soccer players and untrained individuals.
Scandinavian Journal of Medicine and Science in Sports, 19(5), 714-719.
Izquierdo, M., Hakkinen, K., Gonzalez-Badillo, J. J., Ibanez, J., & Gorostiaga, E. M.
(2002). Effects of long-term training specificity on maximal strength and power of
the upper and lower extremities in athletes from different sports. European Journal
of Applied Physiology, 87(3), 264-271.
Janelle, C. M. (2002). Anxiety, arousal and visual attention: a mechanistic account of
performance variability. Journal of Sports Sciences, 20, 237-251.
Jensen, R. K. (1978). Estimation of the biomechanical properties of three body types using
a photogrammetric method. Journal of Biomechanics, 11(8-9), 349-358.

191
Jensen, R. K. (1986). Body segment mass, radius and radius of gyration proportions of
children. Journal of Biomechanics, 19(5), 359-368.
Jones, E. J., Bishop, P. A., Woods, A. K., & Green, J. M. (2008). Cross-sectional area and
muscular strength: a brief review. Sports Medicine, 38(12), 987-994.
Kearns, C. F., Isokawa, M., & Abe, T. (2001). Architectural characteristics of dominant leg
muscles in junior soccer players. European Journal of Applied Physiology, 85(3-4),
240-243.
Kellis, E., & Katis, A. (2007a). Biomechanical Characteristics and Determinants of Instep
Soccer Kick. Journal of Sports Science and Medicine, 6, 154-165.
Kellis, E., & Katis, A. (2007b). The relationship between isokinetic knee extension and
flexion strength with soccer kick kinematics: an electromyographic evaluation.
Journal of Sports Medicine and Physical Fitness, 47(4), 385-395.
Kellis, E., Katis, A., & Gissis, I. (2004). Knee biomechanics of the support leg in soccer
kicks from three angles of approach. Medicine and Science in Sports and Exercise,
36(6), 1017-1028.
Kellis, E., Katis, A., & Vrabas, I. S. (2006). Effects of an intermittent exercise fatigue
protocol on biomechanics of soccer kick performance. Scandinavian Journal of
Medicine and Science in Sports, 16(5), 334-344.
Kellis, S., Gerodimos, V., Kellis, E., & Manou, V. (2001). Bilateral isokinetic concentric
and eccentric strength profiles of the knee extensors and flexors in young soccer
players. Isokinetics and Exercise Science, 9, 31-39.
Keogh, J. (1999). The use of physical fitness scores and anthropometric data to predict
selection in an elite under 18 Australian rules football team. Journal of Science and
Medicine in Sport, 2(2), 125-133.

192
Kohrt, W. M. (1998). Preliminary evidence that DEXA provides an accurate assessment of
body composition. Journal of Applied Physiology, 84, 372-377.
Kubo, T., Muramatsu, M., Hoshikawa, Y., & Kanehisa, H. (2010). Profiles of trunk and
thigh muscularity in youth and professional soccer players. Journal of Strength and
Conditioning Research, 24(6), 1472-1479.
Landlinger, J., Stoggl, T., Lindlinger, S., Wagner, H., & Muller, E. (2011). Differences in
ball speed and accuracy of tennis groundstrokes between elite and high-performance
players. European Journal of Sport Science, 1-8.
Lee, M. K., Koh, M., Fang, A. C., Le, S. N., & Balasekaran, G. (2009a). Estimation of
Body Segment Parameters Using Dual Energy Absorptiometry and 3-D Exterior
Geometry. 13th International Conference on Biomedical Engineering, 23(5), 1777-
1780.
Lee, M. K., Le, N. S., Fang, A. C., & Koh, M. T. (2009b). Measurement of body segment
parameters using dual energy X-ray absorptiometry and three-dimensional
geometry: an application in gait analysis. Journal of Biomechanics, 42(3), 217-222.
Lees, A., & Nolan, L. (1998). The biomechanics of soccer: a review. Journal of Sports
Sciences, 16(3), 211-234.
Lees, A. (2002). Technique analysis in sports: a critical review. Journal of Sports Sciences,
20(10), 813-828.
Lees, A., Asai, T., Andersen, T. B., Nunome, H., & Sterzing, T. (2010). The biomechanics
of kicking in soccer: a review. Journal of Sports Sciences, 28(8), 805-817.
Lees, A., & Owens, L. (2011). Early visual cues associated with a directional place kick in
soccer. Sports Biomechanics, 10(2), 125-134.

193
Leigh, S., Liu, H., Hubbard, M., & Yu, B. (2010). Individualized optimal release angles in
discus throwing. Journal of Biomechanics, 43(3), 540-545.
Lenzi, D., Cappello, A., & Chiari, L. (2003). Influence of body segment parameters and
modeling assumptions on the estimate of center of mass trajectory. Journal of
Biomechanics, 36(9), 1335-1341.
Levanon, J., & Dapena, J. (1998). Comparison of the kinematics of the full-instep and pass
kicks in soccer. Medicine and Science in Sports and Exercise, 30(6), 917-927.
Linthorne, N., & Patel, D. (2011). Optimum projection angle for attaining maximum
distance in a soccer punt kick. Journal of Sports Science and Medicine, 10, 203-
214.
Linthorne, N. P. (2001). Optimum release angle in the shot put. Journal of Sports Sciences,
19(5), 359-372.
Linthorne, N. P., & Everett, D. J. (2006). Release angle for attaining maximum distance in
the soccer throw-in. Sports Biomechanics, 5(2), 243-260.
Linthorne, N. P., Guzman, M. S., & Bridgett, L. A. (2005). Optimum take-off angle in the
long jump. Journal of Sports Sciences, 23(7), 703-712.
Loucks, A. B. (2004). Energy balance and body composition in sports and exercise.
Journal of Sports Sciences, 22(1), 1-14.
Lyons, M., Al-Nakeeb, Y., & Nevill, A. (2006). The impact of moderate and high intensity
total body fatigue on passing accuracy in expert and novice basketball players.
Journal of Sports Science and Medicine, 5, 215-227.
Magill, R. (2008). Motor Learning and Control: Concepts and applications (8th ed.). New
York, NY: McGraw-Hill.

194
Malina, R., & Geithner, C. (2011). Body composition of young athletes. American Journal
of Lifestyle Medicine, 5(3), 262-278.
Manabe, Y., Yokozawa, T., & Ogata, M. (2003). Effect of load variation on lower muscle
activity and joint torque during parallel squats. Japanese Journal of Physical
Fitness and Sports Medicine, 52, 89-98.
Mann, R. A., Moran, G. T., & Dougherty, S. E. (1986). Comparative electromyography of
the lower extremity in jogging, running, and sprinting. American Journal of Sports
Medicine, 14(6), 501-510.
Manolopoulos, E., Papadopoulos, C., Salonikidis, K., Katartzi, E., & Poluha, S. (2004).
Strength training effects on physical conditioning and instep kick kinematics in
young amateur soccer players during preseason. Perceptual and Motor Skills, 99(2),
701-710.
Manolopoulos, E., Papadopoulos, C., & Kellis, E. (2006). Effects of combined strength and
kick coordination training on soccer kick biomechanics in amateur players.
Scandinavian Journal of Medicine and Science in Sports, 16(2), 102-110.
Marshall, R. N., & Elliott, B. C. (2000). Long-axis rotation: the missing link in proximal-
to-distal segmental sequencing. Journal of Sports Sciences, 18(4), 247-254.
Martin, P. E., Mungiole, M., Marzke, M. W., & Longhill, J. M. (1989). The use of
magnetic resonance imaging for measuring segment inertial properties. Journal of
Biomechanics, 22(4), 367-376.
Masuda, K., Kikuhara, N., Demura, S., Katsuta, S., & Yamanaka, K. (2005). Relationship
between muscle strength in various isokinetic movements and kick performance
among soccer players. Journal of Sports Medicine and Physical Fitness, 45(1), 44-
52.

195
Masuda, K., Kikuhara, N., Takahashi, H., & Yamanaka, K. (2003). The relationship
between muscle cross-sectional area and strength in various isokinetic movements
among soccer players. Journal of Sports Sciences, 21(10), 851-858.
Matsuda, S., Demura, S., & Uchiyama, M. (2008). Centre of pressure sway characteristics
during static one-legged stance of athletes from different sports. Journal of Sports
Sciences, 26(7), 775-779.
McBride, J., Cormie, P., & Deane, R. (2006). Isometric squat force output and muscle
activity in stable and unstable conditions. Journal of Strength and Conditioning
Research, 20(4), 915-918.
McConville, J. T., Churchill, T. D., Kaleps, I., Clauser, C. E., & Cuzzi, J. (1980).
Anthropometric relationships of body and body segment moments of inertia.
Dayton, Ohio: Aerospace Medical Research Laboratory, Wright-Patterson Air
Force Base.
McGuigan, M. R., Newton, M. J., & Winchester, J. B. (2008). Use of isometric testing in
soccer players. Journal of Australian Strength and Conditioning, 16, 11-14.
McGuigan, M. R., Newton, M. J., Winchester, J. B., & Nelson, A. G. (2010). Relationship
between isometric and dynamic strength in recreationally trained men. Journal of
Strength and Conditioning Research, 24(9), 2570-2573.
McGuigan, M. R., & Winchester, J. B. (2008). The relationship between isometric and
dynamic strength in college football players. Journal of Sports Science and
Medicine, 7, 101-105.
McLean, B. D., & Tumilty, D. M. (1993). Left-right asymmetry in two types of soccer
kick. British Journal of Sports Medicine, 27(4), 260-262.

196
McMorris, T., Gibbs, C., Palmer, J., Payne, A., & Torpey, N. (1994). Exercise and
performance of a motor skill. Research Supplement, 15, 23-27.
Milburn, P. (1991). Real-time 3-dimensional imaging using ultrasound. Proceeds of the
XIIIth Congress of the International Society of Biomechanics, 1230-1231
Miller, A., Strauss, B. J., Mol, S., Kyoong, A., Holmes, P. H., Finlay, P., et al. (2009).
Dual-energy X-ray absorptiometry is the method of choice to assess body
composition in COPD. Respirology, 14(3), 411-418.
Miller, S., & Barlett, R. (1996). The relationship between basketball shooting kinematics,
distance and playing position. Journal of Sports Sciences, 14(3), 243-253.
Mognini, M., Narici, V., Sirtori, D., & Lorenzelli, F. (1994). Isokinetic torques and kicking
maximal ball velocity in young soccer players. Journal of Sports Medicine and
Physical Fitness, 34, 357-361.
Morrissey, M. C., Harman, E. A., & Johnson, M. J. (1995). Resistance training modes:
specificity and effectiveness. Medicine and Science in Sports and Exercise, 27(5),
648-660.
Moss, C. L., & Wright, P. T. (1993). Comparison of three methods of assessing muscle
strength and imbalance ratios of the knee. Journal of Athletic Training, 28(1), 55-
58.
Mungan, C. E. (2007). Collision of a ball with a barbell and related impulse problems.
European Journal of Physics, 28, 563-568.
Mungiole, M., & Martin, P. E. (1990). Estimating segment inertial properties: comparison
of magnetic resonance imaging with existing methods. Journal of Biomechanics,
23(10), 1039-1046.

197
Nagengast, A. J., Braun, D. A., & Wolpert, D. M. (2011). Risk sensitivity in a motor task
with speed-accuracy trade-off. Journal of Neurophysiology, 105(6), 2668-2674.
Naito, K., Fukui, Y., & Maruyama, T. (2010). Multijoint kinetic chain analysis of knee
extension during the soccer instep kick. Human Movement Science, 29(2), 259-276.
Nevill, A., Holder, R., & Watts, A. (2009). The changing shape of "successful" professional
footballers. Journal of Sports Sciences, 27(5), 419-426.
Newton, R. U., Gerber, A., Nimphius, S., Shim, J. K., Doan, B. K., Robertson, M., et al.
(2006). Determination of functional strength imbalance of the lower extremities.
Journal of Strength and Conditioning Research, 20(4), 971-977.
Nimphius, S., McGuigan, M. R., & Newton, R. U. (2010). Relationship between strength,
power, speed, and change of direction performance of female softball players.
Journal of Strength and Conditioning Research, 24(4), 885-895.
Norton, K. I., Craig, N. P., & Olds, T. S. (1999). The evolution of Australian football.
Journal of Science and Medicine in Sport, 2(4), 389-404.
Nunome, H., Lake, M., Georgakis, A., & Stergioulas, L. K. (2006a). Impact phase
kinematics of instep kicking in soccer. Journal of Sports Sciences, 24(1), 11-22.
Nunome, H., Ikegami, Y., Kozakai, R., Apriantono, T., & Sano, S. (2006b). Segmental
dynamics of soccer instep kicking with the preferred and non-preferred leg. Journal
of Sports Sciences, 24(5), 529-541.
Nuzzo, J. L., McBride, J. M., Cormie, P., & McCaulley, G. O. (2008). Relationship
between countermovement jump performance and multijoint isometric and dynamic
tests of strength. Journal of Strength and Conditioning Research, 22(3), 699-707.

198
Ooi, C. H., Tan, A., Ahmad, A., Kwong, K. W., Sompong, R., Ghazali, K. A., et al. (2009).
Physiological characteristics of elite and sub-elite badminton players. Journal of
Sports Sciences, 27(14), 1591-1599.
Orchard, J., Marsden, J., Lord, S., & Garlick, D. (1997). Preseason hamstring muscle
weakness associated with hamstring muscle injury in Australian footballers.
American Journal of Sports Medicine, 25(1), 81-85.
Orchard, J., Walt, S., McIntosh, A., & Garlick, D. (1999). Muscle activity during the drop
punt kick. Journal of Sports Sciences, 17(10), 837-838.
Orloff, H., Sumida, B., Chow, J., Habibi, L., Fujino, A., & Kramer, B. (2008). Ground
reaction forces and kinematics of plant leg position during instep kicking in male
and female collegiate soccer players. Sports Biomechanics, 7(2), 238-247.
O'Shea, K., & O'Shea, J. (1989). Functional Isometric Weight Training: Its effects on
Dynamic and Static strength. Journal of Applied Sport Science Research, 3(2), 30-
33.
Paillard, T., Noe, F., Riviere, T., Marion, V., Montoya, R., & Dupui, P. (2006). Postural
performance and strategy in the unipedal stance of soccer players at different levels
of competition. Journal of Athletic Training, 41(2), 172-176.
Paulus, D. C., Reiser, R. F., 2nd, & Troxell, W. O. (2004). Pneumatic strength assessment
device: design and isometric measurement. Biomedical Sciences Instrumentation,
40, 277-282.
Pavely, S., Adams, R., Francesco, T., Larkham, S., & Maher, C. (2010). Bilateral clearance
punt kicking in rugby union: Effects of hand used for ball delivery. International
Journal of Performance Analysis of Sport, 10, 187-196.

199
Pavol, M. J., Owings, T. M., & Grabiner, M. D. (2002). Body segment inertial parameter
estimation for the general population of older adults. Journal of Biomechanics,
35(5), 707-712.
Pearsall, D. J., & Costigan, P. A. (1999). The effect of segment parameter error on gait
analysis results. Gait and Posture, 9(3), 173-183.
Pearsall, D. J., & Reid, J. G. (1994). The study of human body segment parameters in
biomechanics. An historical review and current status report. Sports Medicine,
18(2), 126-140.
Pearsall, D. J., Reid, J. G., & Livingston, L. A. (1996). Segmental inertial parameters of the
human trunk as determined from computed tomography. Annals of Biomedical
Engineering, 24(2), 198-210.
Pearsall, D. J., Reid, J. G., & Ross, R. (1994). Inertial properties of the human trunk of
males determined from magnetic resonance imaging. Annals of Biomedical
Engineering, 22(6), 692-706.
Peiffer, J. J., Galvao, D. A., Gibbs, Z., Smith, K., Turner, D., Foster, J., et al. (2010).
Strength and functional characteristics of men and women 65 years and older.
Rejuvenation Research, 13(1), 75-82.
Perez-Gomez, J., Olmedillas, H., Delgado-Guerra, S., Ara, I., Vicente-Rodriguez, G., Ortiz,
R. A., et al. (2008a). Effects of weight lifting training combined with plyometric
exercises on physical fitness, body composition, and knee extension velocity during
kicking in football. Applied Physiology, Nutrition and Metabolism, 33(3), 501-510.
Perez-Gomez, J., Rodriguez, G. V., Ara, I., Olmedillas, H., Chavarren, J., Gonzalez-
Henriquez, J. J., et al. (2008b). Role of muscle mass on sprint performance: gender
differences? European Journal of Applied Physiology, 102(6), 685-694.

200
Phillips, E., Portus, M., Davids, K., & Renshaw, I. (2011). Performance accuracy and
functional variability in elite and developing fast bowlers. Journal of Science and
Medicine in Sport.
Pietrobelli, A., Formica, C., Wang, Z., & Heymsfield, S. B. (1996). Dual-energy X-ray
absorptiometry body composition model: review of physical concepts. American
Journal of Physiology, 271(Endocinol. Metab.), E941-951.
Putnam, C. A. (1991). A segment interaction analysis of proximal-to-distal sequential
segment motion patterns. Medicine and Science in Sports and Exercise, 23(1), 130-
144.
Putnam, C. A. (1993). Sequential motions of body segments in striking and throwing skills:
descriptions and explanations. Journal of Biomechanics, 26(Suppl. 1), 125-135.
Pyne, D. B., Gardner, A. S., Sheehan, K., & Hopkins, W. G. (2005). Fitness testing and
career progression in AFL football. Journal of Science and Medicine in Sport, 8(3),
321-332.
Pyne, D. B., Gardner, A. S., Sheehan, K., & Hopkins, W. G. (2006). Positional differences
in fitness and anthropometric characteristics in Australian football. Journal of
Science and Medicine in Sport, 9(1-2), 143-150.
Rahnama, N., Lees, A., & Bambaecichi, E. (2005). Comparison of muscle strength and
flexibility between the preferred and non-preferred leg in English soccer players.
Ergonomics, 48(11-14), 1568-1575.
Rampinini, E., Impellizzeri, F. M., Castagna, C., Coutts, A. J., & Wisloff, U. (2009).
Technical performance during soccer matches of the Italian Serie A league: effect of
fatigue and competitive level. Journal of Science and Medicine in Sport, 12(1), 227-
233.

201
Rao, G., Amarantini, D., Berton, E., & Favier, D. (2006). Influence of body segments'
parameters estimation models on inverse dynamics solutions during gait. Journal of
Biomechanics, 39(8), 1531-1536.
Rassier, D., & MacIntosh, B. (2000). Coexistence of potentiation and fatigue in skeletal
muscle. Brazilian Journal of Medical and Biological Research, 33, 499-508.
Reid, J. G., & Jensen, R. K. (1990). Human body segment inertia parameters: a survey and
status report. Exercise and Sport Sciences Reviews, 18, 225-241.
Reilly, T., & Doran, D. (2001). Science and Gaelic football: a review. Journal of Sports
Sciences, 19(3), 181-193.
Reilly, T., Morris, T., & Whyte, G. (2009). The specificity of training prescription and
physiological assessment: a review. Journal of Sports Science, 27(6), 575-589.
Royal, K. A., Farrow, D., Mujika, I., Halson, S. L., Pyne, D., & Abernethy, B. (2006). The
effects of fatigue on decision making and shooting skill performance in water polo
players. Journal of Sports Sciences, 24(8), 807-815.
Sadeghi, H., Allard, P., Prince, F., & Labelle, H. (2000). Symmetry and limb dominance in
able-bodied gait: a review. Gait and Posture, 12(1), 34-45.
Saliba, L., & Hrysomallis, C. (2001). Isokinetic strength related to jumping but not kicking
performance of Australian footballers. Journal of Science and Medicine in Sport,
4(3), 336-347.
Salonikidis, K., Amiridis, I. G., Oxyzoglou, N., de Villareal, E. S., Zafeiridis, A., & Kellis,
E. (2009). Force variability during isometric wrist flexion in highly skilled and
sedentary individuals. European Journal of Applied Physiology, 107(6), 715-722.
Schmidt, R., & Lee, T. (2005). Motor Control and Learning: A behavioural emphasis (4th
ed.). Champaign, IL: Human Kinetics.

202
Schorer, J., Fath, F., Baker, J., & Jaitner, T. (2007). Identification of interindividual and
intraindividual movement patterns in handball players of varying expertise levels.
Journal of Motor Behavior, 39(5), 409-421.
Shan, G., & Westerhoff, P. (2005). Full-body kinematic characteristics of the maximal
instep soccer kick by male soccer players and parameters related to kick quality.
Sports Biomechanics, 4(1), 59-72.
Shaughnessy, D. (2006). Possession versus position: Strategic evaluation in AFL. Journal
of Sports Science and Medicine, 5, 533-540.
Smith, C., Gilleard, W., Hammond, J., & Brooks, L. (2006). The application of an
exploratory factor analysis to investigate the inter-relationships amongst joint
movement during performance of a football skill. Journal of Science and Medicine
in Sport, 5, 517-524.
Smith, J., Ball, K., & MacMahon, C. (2009). Foot-to-ball interaction in preferred and non-
preferred leg Australian Rules kicking. Paper presented at the 27th International
Conference on Biomechanics in Sport, Limerick, Ireland.
Sterzing, T., & Hennig, E. M. (2008). The influence of soccer shoes on kicking velocity in
full-instep kicks. Exercise and Sport Sciences Reviews, 36(2), 91-97.
Sterzing, T., Lange, J., Wachtler, T., Muller, C., & Milani, T. (2009). Velocity and
accuracy as performance criteria for three different soccer kicking techniques.
Paper presented at the 27th International Conference on Biomechanics in Sport.
Stewart, S., Stanton, W., Wilson, S., & Hides, J. (2010). Consistency in size and
asymmetry of the psoas major muscle among elite footballers. British Journal of
Sports Medicine, 44(16), 1173-1177.

203
Stone, M. H., Moir, G., Glaister, M., & Sanders, R. (2002). How much strength is
neccessary? Physical Therapy in Sport, 3, 88-96.
Stone, M. H., O'Bryant, H. S., McCoy, L., Coglianese, R., Lehmkuhl, M., & Schilling, B.
(2003). Power and maximum strength relationships during performance of dynamic
and static weighted jumps. Journal of Strength and Conditioning Research, 17(1),
140-147.
Stone, M. H., Sands, W. A., Pierce, K. C., Carlock, J., Cardinale, M., & Newton, R. U.
(2005). Relationship of maximum strength to weightlifting performance. Medicine
and Science in Sports and Exercise, 37(6), 1037-1043.
Teixeira, L. A. (1999). Kinematics of kicking as a function of different sources of
constraint on accuracy. Perceptual and Motor Skills, 88(3 Pt 1), 785-789.
Theoharopoulos, A., Tsitskaris, G., Nikopoulou, M., & Tsaklis, P. (2000). Knee strength of
professional basketball players. Journal of Strength and Conditioning Research,
14(4), 457-463.
Thorborg, K., Couppe, C., Petersen, J., Magnusson, S. P., & Holmich, P. (2011). Eccentric
hip adduction and abduction strength in elite soccer players and matched controls: a
cross-sectional study. British Journal of Sports Medicine, 45(1), 10-13.
Tsaousidis, N., & Zatsiorsky, V. (1996). Two types of ball-effector interaction and their
relative contribution to soccer kicking. Human Movement Science, 15, 861-876.
Tumilty, D. (1993). Physiological characteristics of elite soccer players. Sports Medicine,
16(2), 80-96.

204
Urbin, M. A., Stodden, D. F., Fischman, M. G., & Weimar, W. H. (2011). Impulse-
variability theory: implications for ballistic, multijoint motor skill performance.
Journal of Motor Behavior, 43(3), 275-283.
van den Tillaar, R., & Ettema, G. (2003). Instructions emphasizing velocity, accuracy, or
both in performance and kinematics of overarm throwing by experienced team
handball players. Perceptual and Motor Skills, 97(3 Pt 1), 731-742.
Veale, J. P., Pearce, A. J., Buttifant, D., & Carlson, J. S. (2010). Anthropometric profiling
of elite junior and senior Australian football players. International Journal of Sports
Physiology and Performance, 5(4), 509-520.
Viitasalo, J., Mononen, H., & Norvapalo, K. (2003). Release parameters at the foul line and
the official result in javelin throwing. Sports Biomechanics, 2(1), 15-34.
Viitasalo, J. T., Saukkonen, S., & Komi, P. V. (1980). Reproducibility of measurements of
selected neuromuscular performance variables in man. Electromyography and
Clinical Neurophysiology, 20(6), 487-501.
Visser, M., Fuerst, T., Lang, T., Salamone, L., & Harris, T. B. (1999). Validity of fan-beam
dual-energy X-ray absorptiometry for measuring fat-free mass and leg muscle mass.
Health, Aging, and Body Composition Study--Dual-Energy X-ray Absorptiometry
and Body Composition Working Group. Journal of Applied Physiology, 87(4),
1513-1520.
Vucetic, V., Sporis, G., & Jukic, I. (2007). Muscle strength, kicking and sprint performance
parameters in elite female soccer players. Journal of Sports Science and Medicine,
6, 109-110.

205
Wagner, H., Pfusterschmied, J., Klous, M., von Duvillard, S. P., & Muller, E. (2012).
Movement variability and skill level of various throwing techniques. Human
Movement Science, 31(1), 78-90.
Wakai, M., & Linthorne, N. P. (2005). Optimum take-off angle in the standing long jump.
Human Movement Science, 24(1), 81-96.
Wells, J. (2009). The limitations of DXA for body composition assessment. Endocrine
Abstracts, 19, S78.
Williams, A. M., & Ericsson, K. A. (2005). Perceptual-cognitive expertise in sport: some
considerations when applying the expert performance approach. Human Movement
Science, 24(3), 283-307.
Wilson, C., Simpson, S. E., van Emmerik, R. E., & Hamill, J. (2008). Coordination
variability and skill development in expert triple jumpers. Sports Biomechanics,
7(1), 2-9.
Wilson, G. J., & Murphy, A. J. (1996). The use of isometric tests of muscular function in
athletic assessment. Sports Medicine, 22(1), 19-37.
Wilson, G. J., Murphy, A. J., & Walshe, A. (1996). The specificity of strength training: the
effect of posture. European Journal of Applied Physiology and Occupational
Physiology, 73(3-4), 346-352.
Winter, D. A. (1990). Biomechanics and Motor Control of Human Movement (2nd ed.).
Toronto: John Wiley & Sons, Inc.
Wisbey, B., Montgomery, P. G., Pyne, D. B., & Rattray, B. (2010). Quantifying movement
demands of AFL football using GPS tracking. Journal of Science and Medicine in
Sport, 13(5), 531-536.

206
Witt, J. K., & Dorsch, T. E. (2009). Kicking to bigger uprights: field goal kicking
performance influences perceived size. Perception, 38(9), 1328-1340.
Wong, P. L., Chamari, K., Chaouachi, A., Mao de, W., Wisloff, U., & Hong, Y. (2007).
Difference in plantar pressure between the preferred and non-preferred feet in four
soccer-related movements. British Journal of Sports Medicine, 41(2), 84-92.
Young, W. (2006). Transfer of Strength and Power Training to Sports Performance.
Journal of Sports Physiology and Performance, 2006(1), 74-83.
Young, W., Clothier, P., Otago, L., Bruce, L., & Liddell, D. (2004). Acute effects of static
stretching on hip flexor and quadriceps flexibility, range of motion and foot speed
in kicking a football. Journal of Science and Medicine in Sport, 7(1), 23-31.
Young, W., Gulli, R., Rath, D., Russell, A., O'Brien, B., & Harvey, J. (2010). Acute effect
of exercise on kicking accuracy in elite Australian football players. Journal of
Science and Medicine in Sport, 13(1), 85-89.
Young, W. B., Newton, R. U., Doyle, T. L., Chapman, D., Cormack, S., Stewart, G., et al.
(2005). Physiological and anthropometric characteristics of starters and non-starters
and playing positions in elite Australian Rules Football: a case study. Journal of
Science and Medicine in Sport, 8(3), 333-345.
Young, W. B., & Pryor, L. (2007). Relationship between pre-season anthropometric and
fitness measures and indicators of playing performance in elite junior Australian
Rules football. Journal of Science and Medicine in Sport, 10(2), 110-118.
Young, W., Pryor, J., & Wilson, G. (1995). Effect of Instructions on Characteristics of
Countermovement and Drop Jump Performance. Journal of Strength and
Conditioning Research, 9(4), 232.

207
Young, W. B., & Rath, D. A. (2011). Enhancing Foot Velocity in Football Kicking: The
Role of Strength Training. Journal of Strength and Conditioning Research, 25(2),
561-566.
Zakas, A. (2006). Bilateral isokinetic peak torque of quadriceps and hamstring muscles in
professional soccer players with dominance on one or both two sides. Journal of
Sports Medicine and Physical Fitness, 46(1), 28-35.
Zatsiorsky, V. M., & Seluyanov, V. M. (1985). The mass and inertia characteristics of the
main segments of the human body. In H. Matsui & K. Kobayashi (Eds.),
Biomechanics VIIIB. Champaign, IL: Human Kinetics.

208
APPENDIX A: International Conference on Applied Strength and Conditioning ( ASCA, 2011 )

209
APPENDIX B: MatLAB ( Velocities )
Velocity - Determining Angular Velocity ( Kinematics ).
This function is designed to calculate velocity’s of joint displacements
across the whole time-phase. This has been designed to run with the
standard exportation of all joint angle displacement data from the Vicon
Plug-in Gait model. The four columns "LElbowY" "LElbowZ" "RElbowY"
"ElbowZ" need to be pre-erased before running this code. Selected joint
angles / segments are included below; others can be added following the
standard syntax where applicable.
Function: function [ vel ] = vel ( data )
Sampling Frequency, Column Size, and Finish Point: ColSize = size(data(:,1));
Finish = ColSize(1,1);
Freq = input('What sampling frequency was used? - Number only! -->');
Samp = 1 / Freq;
All 'Key' Kinematic Variables:
Additional Angles can be added using the syntax below.
WA = 3;
WB = 1;
while Finish >= WA
VLHipX(WB) = (data(WA,3) - data(WB,3)) / (Samp * 2);
VLHipY(WB) = (data(WA,4) - data(WB,4)) / (Samp * 2);
VLKneeX(WB) = (data(WA,6) - data(WB,6)) / (Samp * 2);
VLAnkleX(WB) = (data(WA,9) - data(WB,9)) / (Samp * 2);
VRHipX(WB) = (data(WA,12) - data(WB,12)) / (Samp * 2);
VRHipY(WB) = (data(WA,13) - data(WB,13)) / (Samp * 2);
VRKneeX(WB) = (data(WA,15) - data(WB,15)) / (Samp * 2);
VRAnkleX(WB) = (data(WA,18) - data(WB,18)) / (Samp * 2);
VLShoulderX(WB) = (data(WA,21) - data(WB,21)) / (Samp * 2);
VLShoulderY(WB) = (data(WA,22) - data(WB,22)) / (Samp * 2);
VLElbowX(WB) = (data(WA,24) - data(WB,24)) / (Samp * 2);
VRShoulderX(WB) = (data(WA,28) - data(WB,28)) / (Samp * 2);
VRShoulderY(WB) = (data(WA,29) - data(WB,29)) / (Samp * 2);
VRElbowX(WB) = (data(WA,31) - data(WB,31)) / (Samp * 2);
VNeckX(WB) = (data(WA,35) - data(WB,35)) / (Samp * 2);
VSpineX(WB) = (data(WA,41) - data(WB,41)) / (Samp * 2);
VSpineY(WB) = (data(WA,42) - data(WB,42)) / (Samp * 2);
VPelvisX(WB) = (data(WA,59) - data(WB,59)) / (Samp * 2);
VPelvisY(WB) = (data(WA,60) - data(WB,60)) / (Samp * 2);
VPelvisZ(WB) = (data(WA,61) - data(WB,61)) / (Samp * 2);
VLFootX(WB) = (data(WA,65) - data(WB,65)) / (Samp * 2);
VRFootX(WB) = (data(WA,68) - data(WB,68)) / (Samp * 2);
WA = WA + 1;
WB = WB + 1;
end

210
The next step transposes the data, so that the matrix creates columned data (not rows).
LHipX = VLHipX.' ;
LHipY = VLHipY.' ;
LKneeX = VLKneeX.' ;
LAnkleX = VLAnkleX.' ;
RHipX = VRHipX.' ;
RHipY = VRHipY.' ;
RKneeX = VRKneeX.' ;
RAnkleX = VRAnkleX.' ;
LShoulderX = VLShoulderX.' ;
LShoulderY = VLShoulderY.' ;
LElbowX = VLElbowX.' ;
RShoulderX = VRShoulderX.' ;
RShoulderY = VRShoulderY.' ;
RElbowX = VRElbowX.' ;
NeckX = VNeckX.' ;
SpineX = VSpineX.' ;
SpineY = VSpineY.' ;
PelvisX = VPelvisX.' ;
PelvisY = VPelvisY.' ;
PelvisZ = VPelvisZ.' ;
LFootX = VLFootX.' ;
RFootX = VRFootX.' ;
Velocity Outputs:
vel = [ LHipX LHipY LKneeX LAnkleX RHipX RHipY RKneeX RAnkleX LShoulderX
LShoulderY LElbowX RShoulderX RShoulderY RElbowX NeckX SpineX
SpineY PelvisX PelvisY PelvisZ LFootX RFootX ];
Authorship Details:
Written by Nicolas Hart
Edith Cowan University
Email: [email protected]

211
APPENDIX C: Human Ethics Approval
Dear Nicolas Project Number: 5874 HART Project Name: A BIOMECHANICAL AND KINANTHROPOMETRIC ANALYSIS OF THE DROP
PUNT: DETERMINANTS OF KICKING ACCURACY IN AUSTRALIAN FOOTBALL.
Student Number: 10022791 The ECU Human Research Ethics Committee (HREC) has reviewed your application and has granted ethics approval for your research project. In granting approval, the HREC has determined that the research project meets the requirements of the National Statement on Ethical Conduct in Human Research. The approval period is from 8 November 2010 to 30 December 2011. The Research Assessments Team has been informed and they will issue formal notification of approval. Please note that the submission and approval of your research proposal is a separate process to obtaining ethics approval and that no recruitment of participants and/or data collection can commence until formal notification of both ethics approval and approval of your research proposal has been received. Please note the following conditions of approval: The HREC has a requirement that all approved projects are subject to monitoring conditions. This includes completion of an annual report (for projects longer than one year) and completion of a final report at the completion of the project. An outline of the monitoring conditions and the ethics report form are available from the ethics website: http://www.ecu.edu.au/GPPS/ethics/human_ethics_resources.html You will also be notified when a report is due. Please feel free to contact me if you require any further information. Regards Kim Kim Gifkins Research Ethics Officer Edith Cowan University 270 Joondalup Drive JOONDALUP WA 6027 Phone: (08) 6304 2170 Fax: (08) 6304 5044 Email: [email protected]

212
APPENDIX D: Information Letter ( All Studies )
INFORMATION LETTER TO PARTICIPANTS
A biomechanical and kinanthropometric analysis of the drop punt:
Determinants of kicking accuracy in Australian Football
Chief Investigator: Nicolas Hart
School of Exercise and Health Sciences
Edith Cowan University
270 Joondalup Drive, JOONDALUP, WA, 6027
Phone: (08) 6304 5152 , Email: [email protected] Thank you for your expression of interest. This document provides you with details relevant to the study in which you may participate in as a subject. Please read all information contained within this letter carefully, and feel welcome to contact the chief investigator if you have any questions or concerns you wish to raise. Purpose The purpose of this study is to examine the full-body biomechanics of the drop punt kick, to determine the mechanical differences prevalent between skill levels and kicking accuracy. The study also aims to determine which biomechanical variables suitably influence kicking performance. Background Kicking is a fundamental skill, routinely employed in the sporting environment to produce effective ball progression, scoring sequences or tactical advantage. Due to the volatile nature of competitive play, a multitude of kicking strategies are employed which are broadly categorised as place kicks or punt kicks. The drop punt is a widely used kicking technique due to its accuracy and reliability, being a necessary component in any players skill-set. Skilled performance of the drop punt involves a complex interaction of many body segments, governed by intrinsic and extrinsic biomechanical factors, in order to produce accurate ball delivery over variable distances. However, limited research of the drop punt has been undertaken. Skilled kicking involves the co-ordinated behaviour of upper and lower body segments and muscles, highlighting a need for more descriptive analyses. While kinematic variables have received some attention in the literature; kinetic variables and muscle activation variables have yet to be afforded the same level of insight. This will be the first study to provide a scientific investigation to address these notable deficiencies. Specifically, this will be the first study to simultaneously collect kinematic, kinetic and electromyographic data through-out the entire drop punt kick.

213
Methods As a participant in this study, you will be required to attend one testing session for a duration of 3 hours at Edith Cowan University, Joondalup Campus, commencing in the Biomechanics Laboratory, located in Building 19, room 149. The testing session will involve a series of assessments and activities designed to assess your anthropometrics, body composition, maximal voluntary isometric strength, muscle activation levels, and kicking technique. These assessments, while primarily performed in the Biomechanics Laboratory, will also require a visit to the DEXA Laboratory and Physiology Laboratory, all located on the Joondalup Campus.
Subjects Thirty two Australian Football athletes will be recruited for this study. You must currently participate in the AFL, WAFL or WAAFL competitions, and have done-so for at least five years, with the two most recent years at your current playing level. You must be aged between 18 and 30 years; and be void of any injuries obtained within the previous three months. You are required to wear your club issued football shorts, and will be provided with indoor training shoes. You are also required to refrain from any lower body resistance training or vigorous physical activity within 48 hours of our arranged testing session, and will be required to complete a pre-exercise medical questionnaire upon arrival. Once you have a full understanding of your proposed involvement within this study, you will be asked to sign an informed consent document.
Design Anthropometrics Standard anthropometric measures will be taken in order to assess your stature, body mass, segment lengths, and joint breadths and widths. In particular, your height, weight, leg length, hand thickness and joint widths will be assessed using standard equipment including a stadiometer, weight scale, joint calliper and retractable measuring tape.
Anthropometrics Height, Weight, Leg Length, Hand Thickness
Joint Widths (Shoulder, Elbow, Wrist, Knee, Ankle)
Segmental Mass (Fat, Lean, Total) - Kicking Leg & Support Leg
General Warm-up Dynamic Stretching Protocol
MVIC Assessment Isometric Leg Extension and Flexion,
Unilateral & Bilateral Isometric Squats
Specific Warm-Up Subject Preparation & Kicking Drills
Kicking Protocol 20m kicks to Human (Player) Target
Pre-test Measures
Testing Protocol

214
Body Composition and Leg Mass Your body composition and lower limb mass will be assessed using a dual-energy x-ray absorptiometry (DEXA) machine. This is the ‘gold standard’ for measuring body composition, and will span approximately five minutes in duration. You will be required to wear clothing free of metallic material (your club issued football shorts), and will assume a supine position (lying on your back) with your arms by your side. This will provide an accurate measure of your total mass, muscle mass, fat mass, and bone mineral density of your entire body.
General Warm-up, Specific Warm-up and Cool Down You will be required to complete two warm-up sessions, each spanning ten minutes in duration. The general warm-up will be completed first, and will require you to perform a series of dynamic stretches and gentle cardiovascular activities as prescribed by the chief investigator. Later in the testing session, you will be asked to complete a specific warm-up consisting of five practice drop punt kicks without a ball, followed by fifteen actual drop-punt kicks with a ball, spanning 20 metres, 30 metres, and 40 metres in distance. At the conclusion of the whole testing session, you will be required to cool down by performing a series of static stretches and gentle walking activities.
Maximal Voluntary Contraction The level of muscle activation in the lower limbs will be measured by placing small sensory pads (surface electrodes) on the skin. These will remain fixated on your skin for the remainder of the testing session, including the kicking protocol. Eight muscles will be assessed, including the Gluteus Maximus, Gluteus Medius, Rectus Femoris, Vastus Lateralis, Biceps Femoris, Gastrocnemius and Tibialis Anterior. The maximal voluntary contraction (MVC) assessment will require you to perform a maximum effort contraction against resistance whilst seated in a chair, in a stationary position; and with a rigid stationary bar placed across your shoulders in a squat position eliciting a knee angle of 140°, where you will be asked to produce a rapid maximal pushing motion against the
fixated bar.
Kicking Procedures Retroreflective markers will be placed on your skin in various locations in order to identify the head, neck, trunk, arms and legs, to enable full-body three-dimensional motion analysis. Muscle activation measures will also be taken. The kicking protocol will require you to produce ten drop punt kicks. You will start your approach from a stationary position, and perform the drop punt over 20 metres towards a human target. You will be given one minute rest periods between each kicking trial. Water will be provided through-out this procedure.
Potential Risks Dual-energy x-ray absorptiometry (DEXA) scans emit radiation when performed. This will expose you to very low-level radiation. It is important to understand that DEXA scanning is routinely performed in the clinical setting, and produces extremely low levels of radiation dosages per scan. To assist your understanding, a single DEXA scan produces 1 – 6 µSv; a standard flight from Perth to Darwin generates 16 µSv; and daily radiation levels (at sea-level) expose us to 12 – 16 µSv. This study will only require you for one single scan, which will only expose you to an isolated, low-level dosage of 1 – 6 µSv only.

215
Further risks associated with this study are minimal. There is a potential for general muscle soreness in the hours or days following the testing session, due to the maximal efforts produced during isometric testing, and in response to the volume of kicking trials produced. However, due to the training status of all subjects in general, this effect would be scarcely prevalent. Lastly, there is a low risk of muscle strain. However, this is a risk any individual faces during any physical activity. The chief investigator has a bachelor degree in exercise and sport science; is a certified strength and conditioning specialist (CSCS); and holds a senior first aid certificate; which will ensure all warm-up, exercise and cool-down procedures will be programmed, implemented and monitored under appropriate supervision. Potential Benefits As athletes, you will be provided with an insight into the research process behind the sport science profession, and the manner in which it directly impacts your exercise, training and skill development processes in Australian Football. Further to this, your participation will facilitate the potential improvement of the drop punt kicking skill in Australian Football and other football codes. Upon request, you will be provided with your individual results specific to your level of involvement within the study. You will also be exposed to reliable, accurate and sensitive measures of your kicking mechanics, body composition and isometric strength levels free-of-charge, in contrast to what would normally exceed $1000 in assessments.
Privacy and Confidentiality All information collected during this research is private and confidential, and will not be disclosed to any third parties without your express consent, except to meet government, legal or other regulatory authority requirements. A de-identified copy of this data may be used for other research purposes. Your anonymity will, at all times, be safeguarded. Further to this, all data collected during this study will be de-identified to all individuals, except the investigators, and will be stored on a password protected computer, and in a locked cabinet. Original data will be kept for a period of five years, and subsequently destroyed at the end of this time.
Voluntary Participation Involvement in this study is strictly voluntary. Your decision to accept or decline participation in this project will not prejudice you in any way. During your potential involvement, you are free to withdraw your consent and discontinue at any time, again without any prejudice.
Contacting Us If you have any questions or concerns regarding this study, you are always welcome to contact the chief investigator, Mr Nicolas Hart: 6304 2242 (office); 0402 284 459 (mobile); [email protected] (email). Alternatively, you may also contact the projects principal supervisor, Dr Jodie Cochrane: 6304 5860 (office); [email protected] (email). If you wish to speak to an independent person regarding any concerns or complaints about this research project, you may contact the Research Ethics Officer: 6304 2170 (office); [email protected] (email).

216
APPENDIX E: Informed Consent ( All Studies )
INFORMED CONSENT
I, __________________________, consent to participating in the research project entitled:
“A biomechanical and kinanthropometric analysis of the drop punt: Determinants of
kicking accuracy in Australian Football”.
I have carefully read, and clearly understand the content contained within the information
letter and consent form. I agree to participate in this study, and provide my consent freely,
without any undue pressure or expectation. I understand that all study procedures will be
performed as outlined in the information sheet, a copy of which I have retained for my own
records. I have had any and all questions answered to my satisfaction. All questionnaires
pertaining to this study have been completed to the best of my knowledge. I am aware that
I may choose to withdraw from this study at any stage, without any reason or prejudice.
I agree that the data collected from this study may be published, providing my name and
any information containing my identity is removed. This includes data pertaining to the
kinematics, kinetics, muscle activation, anthropometrics and maximal isometric
contractions as outlined in the information letter.
The researcher certifies that the subject has a full understanding of the procedures and
their involvement as a participant, as outlined in this form. The subject has provided verbal
confirmation of their understanding, which meets the researchers’ satisfaction prior to
signing the form.
Participant Name: ________________________ Date (DD/MM/YYYY): ___________
Witness Name: ___________________________ Date (DD/MM/YYYY): ___________
Researchers Name: _______________________ Date (DD/MM/YYYY): ___________
Signatures:
(Participant) _______________ (Witness) _____________ (Researcher) _____________

217
APPENDIX F: Pre-Exercise Medical Questionnaire
PRE-EXERCISE MEDICAL
QUESTIONNAIRE
The following questionnaire is designed to establish a background of your medical history, and identify any injury and/or illness that may influence your testing and performance. Please answer all questions as accurately as possible, and if you are unsure about any aspect of this form, please ask for clarification. All information provided is strictly confidential.
Personal Details Name: __________________________________________________________ Date of Birth (DD/MM/YYYY): _______________ Gender: Male / Female PART A YES / NO DETAILS 1. Are you a male over 45 years, or female Y / N ________________
over 55 years, who has had a hysterectomy ________________ or are postmenopausal? ________________
2. Are you a regular smoker, or have you quit in Y / N ________________ the last 6 months? ________________
3. Did a close family member have heart disease Y / N ________________ or surgery, or stroke before the age of 60 years? ________________
4. Do you have, or have you ever been told you Y / N ________________ have blood pressure above 140/90 mmHg, or do ________________ you currently take blood pressure medication? ________________
5. Do you have, or have you ever been told you Y / N ________________ have a total cholesterol level above 5.2 mmol/L ________________ (200 mg/dL)? ________________
6. Is your BMI (weight/height2) greater than 30? Y / N ________________
PART B YES / NO DETAILS 1. Have you ever had a serious asthma attack Y / N ________________
during exercise? ________________

218
2. Do you have asthma that requires medication? Y / N ________________
3. Have you had an epileptic seizure in the last Y / N ________________ 5 years? ________________
4. Do you have any moderate or severe allergies? Y / N ________________ ________________
5. Do you, or could you reasonably have an Y / N ________________ infectious disease? ________________
6. Do you, or could you reasonably have an infection Y / N ________________ or disease that might be aggravated by exercise? ________________
7. Are you, or could you reasonably be pregnant? Y / N ________________
PART C YES / NO DETAILS 1. Are you currently taking any prescribed or Y / N ________________
non-prescribed medication? ________________
2. Have you had, or do you currently have any of the following:-
Rheumatic Fever Y / N ________________
Heart Abnormalities Y / N ________________
Diabetes Y / N ________________
Epilepsy Y / N ________________
Recurring back pain that will make Y / N ________________ exercise problematic, or where ________________ exercise may aggravate pain? ________________
Recurring neck pain that will make Y / N ________________ exercise problematic, or where ________________ exercise may aggravate pain? ________________
Neurological disorders that would Y / N ________________ make exercise problematic, or where ________________ exercise may aggravate the condition? ________________
Neuromuscular disorders that would Y / N ________________ make exercise problematic, or where ________________ exercise may aggravate the condition? ________________
Recurring muscle/joint injuries that would Y / N ________________ make exercise problematic, or where ________________ exercise may aggravate the condition? ________________

219
A burning or cramping sensation in your Y / N ________________ legs when walking short distances? ________________
Chest discomfort, unreasonable Y / N ________________ breathlessness, dizziness or fainting, or ________________ blackouts during exercise? ________________
PART D YES / NO DETAILS 1. Have you had any influenza in the last week? Y / N ________________
2. Do you currently have an injury that might Y / N ________________
affected, or be affected by exercise? ________________
3. Have you had any minor or major injuries in the Y / N ________________ past 3 months? If so, please list. Has this injury ________________ stopped you training or competing in one or more ________________ sessions? If so, how many? ________________
4. Is there any other condition not previously Y / N ________________ mentioned that may affected your ability to ________________ participate in this study? ________________
________________
Declaration – (to be signed in the presence of the researcher)
I acknowledge that the information provided in this form, is to the best of my knowledge, a true and accurate indication of my current state of health. Participant Name: ____________________________ Date (DD/MM/YYYY): _____________
Signature: _________________________________________________________ Researcher Name: ____________________________ Date (DD/MM/YYYY): _____________
Signature: _________________________________________________________ Practitioner (only if applicable) I, Dr __________________________ have read the medical questionnaire and the information / consent form provided to my patient, Mr / Miss / Ms / Mrs __________ ______________, and clear him / her medically for involvement in exercise testing. Name: ____________________________ Date (DD/MM/YYYY): _____________
Signature: _________________________________________________________
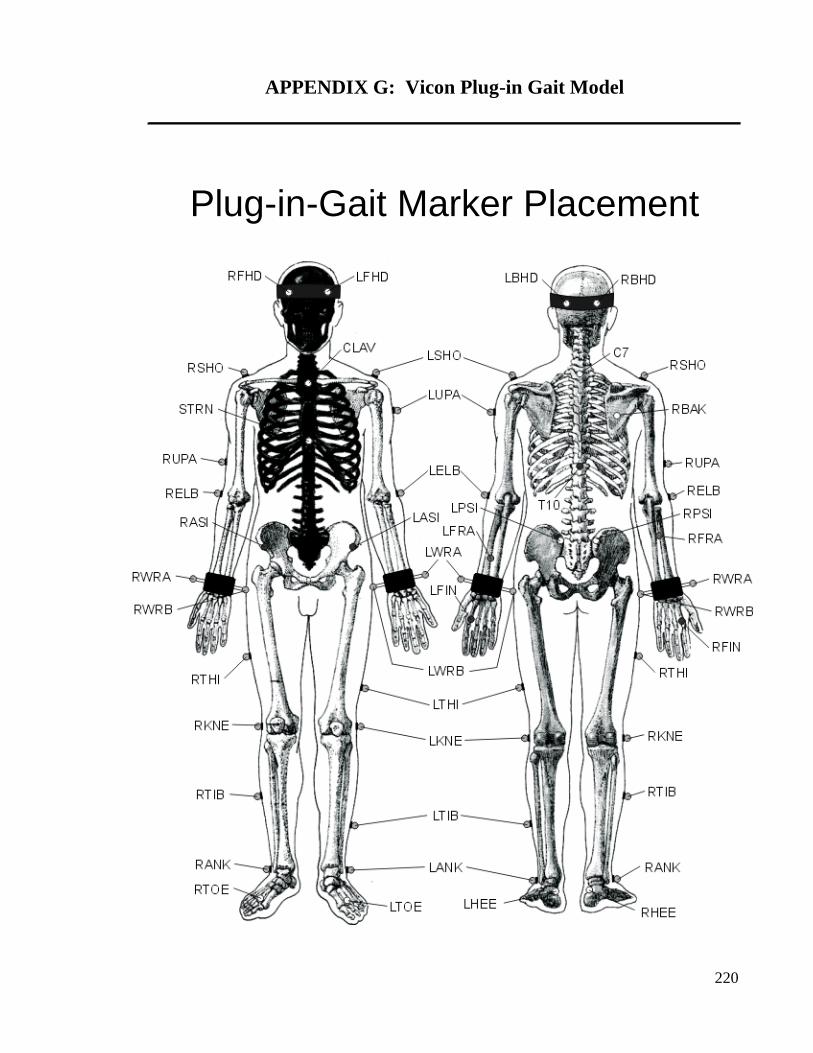
220
APPENDIX G: Vicon Plug-in Gait Model
Plug-in-Gait Marker Placement