Buzzing: post-9/11 Muslim male identity, stereotypes ... - UNSWorks
Upload
khangminh22Category
view
3download
0
https://doi.org/10.1177/09567976211045929
Psychological Science 1 –14© The Author(s) 2022Article reuse guidelines: sagepub.com/journals-permissionsDOI: 10.1177/09567976211045929www.psychologicalscience.org/PS
ASSOCIATION FORPSYCHOLOGICAL SCIENCEResearch Article
Inaccurate stereotypes about social groups are wide-spread (Allport, 1954, Chapter 6; Fiske & Durante, 2016; Stangor & Schaller, 1996). People believe that groups differ from each other even when they do not.
Why is this the case? Explanations for stereotypes’ origins fall into three classes (Hilton & Von Hippel, 1996; S. J. Sherman et al., 2013). Motivational explanations suggest that stereotypes result from humans’ priority on belongingness. For example, the minimal-group paradigm—merely categorizing people into arbitrary groups—causes in-group favoritism (Tajfel et al., 1971); social-identity theory suggests that stereotypes emerge because people need a positive, distinctive collective in-group concept (Brewer, 1999; Tajfel & Turner, 1979). Alternatively, social-dominance theory suggests that stereotypes emerge as legitimizing myths that explain the group hierarchy (Sidanius & Pratto, 1999); similarly, system-justification theory describes stereotypes as pla-cating, explaining, and maintaining the status quo ( Jost & Banaji, 1994). In these explanations, group-serving motivation triumphs over accuracy.
By contrast, cognitive explanations suggest that ste-reotypes emerge even without motivational biases. Limited-capacity human minds create shortcuts via schemas (Fiske & Taylor, 1984) and heuristics (Tversky & Kahneman, 1974). For example, categorization makes out-group members seem interchangeably alike (Taylor et al., 1978). Alternatively, the phenomenon of illusory correlation suggests that selective attention to rarity and negativity links minorities and negative attributes (Hamilton & Gifford, 1976). Here, cognitive efficiency sacrifices accuracy (Macrae & Bodenhausen, 2000).
We propose an alternative that considers minimal conditions sufficient to produce inaccurate stereotypes. Mistaken impressions can result from maximizing the long-term rewards of interactions (i.e., exploring the payoffs from different groups and then letting these
1045929 PSSXXX10.1177/09567976211045929Bai et al.Psychological Science, XX(X)research-article2022
Corresponding Author:Xuechunzi Bai, Princeton University, Department of Psychology and Princeton School of Public and International Affairs Email: [email protected]
Globally Inaccurate Stereotypes Can Result From Locally Adaptive Exploration
Xuechunzi Bai1,2, Susan T. Fiske1,2, and Thomas L. Griffiths1,3 1Department of Psychology, Princeton University; 2Princeton School of Public and International Affairs, Princeton University; and 3Department of Computer Science, Princeton University
AbstractInaccurate stereotypes—perceived differences among groups that do not actually differ—are prevalent and consequential. Past research explains stereotypes as emerging from a range of factors, including motivational biases, cognitive limitations, and information deficits. Considering the minimal forces required to produce inaccurate assumptions about group differences, we found that locally adaptive exploration is sufficient: An initial arbitrary interaction, if rewarding enough, may discourage people from investigating alternatives that would be equal or better. Historical accidents can snowball into globally inaccurate generalizations, and inaccurate stereotypes can emerge in the absence of real group differences. Using multiarmed-bandit models, we found that the mere act of choosing among groups with the goal of maximizing the long-term benefit of interactions is enough to produce inaccurate assessments of different groups. This phenomenon was reproduced in two large online experiments with English-speaking adults (N = 2,404), which demonstrated a minimal process that suffices to produce biased impressions.
Keywordssocial stereotypes, rational analysis, exploration, reinforcement learning, open data, open materials, preregistered
Received 4/30/21; Revision accepted 8/14/21

2 Bai et al.
rewards guide future interactions). Seeking to maximize long-term rewards in an environment in which all groups are equally rewarding suffices to produce inac-curate stereotypes. Our approach is minimal because group-serving motivations or cognitive efficiency are not necessary for stereotypes’ emergence. Our approach is functional because stereotypes emerge as an epiphe-nomenon of an adaptive solution to maximizing long-term reward. The solution is locally adaptive because people learn only as much about each group as needed to identify one that rewards interactions without trying to accurately estimate the rewards from each group. This minimal, functional analysis does not imply that social stereotypes are accurate or morally right. Rather, it helps explain why stereotypes are so widespread: Globally inaccurate impressions can emerge from locally adaptive exploration.
Imagine choosing collaborators from four groups. To work with someone friendly, you need to collect more information. You can ask a small favor from one person each time and then update your group impressions on the basis of their reactions. If more people from one group help, then you might think that group is warmer than other groups. If the goal is interacting with as many friendly people as possible, you might be more likely to interact with people from that group. However, in an environment in which each group is equally and highly likely to help, you may never learn that all groups are equally warm. This adaptive strategy settles quickly on a good-enough decision without incurring the costs of prolonged search for other equally good alternatives. Consequently, a by-product of maximizing interactions with friendly people in an environment with no group differences is inaccurate stereotypes—you form accurate impressions about the group with whom you interact most but form inaccurate impres-sions about the groups with whom you interact less.
Prior work has examined exploratory sampling. Pre-vious theoretical analyses in social settings have shown that evaluation-based sampling exacerbates inaccurate impressions. For example, the hot-stove effect posits that people tend to avoid repeating a negative experience, which prioritizes negativity (Denrell, 2005; Denrell & March, 2001). Such a sampling-based approach could explain why people underestimate the trustworthiness of others: If people falsely believe that others cannot be trusted, they avoid them, and by avoiding them, they cannot disconfirm their false belief (Fetchenhauer & Dunning, 2010). An analysis of experience sampling revealed that even an agent with a Bayesian belief-updating process could form biased impressions when information from one group is always available (Le Mens & Denrell, 2011). (Person perception, as noted, routinely directs attention and weight to negative infor-mation, in the service of avoiding harm—see Fiske,
1980, and Skowronski & Carlston, 1989—but here we focus on a different phenomenon, seeking reward and avoiding its absence.) Complementing this, previous findings using nonsocial settings show that initial biases can become strengthened in reward-rich environments (Harris et al., 2020). When two options predominantly and equally yield positive outcomes, the initial bias is upheld because pursuit of the allegedly superior option reinforces the biased preference.
We based our work on the assumption that impres-sion formation is sequential and uncertain, but we built on earlier results. First, we make minimal assumptions: Besides minimizing motivations or cognitive limitations, we do not assume differences in the initial bias (Harris et al., 2020) or information availability (Le Mens & Denrell, 2011). We investigated social exploration using multiarmed bandits—a standard paradigm for exploring choice strategies. We examined the consequences of solving this problem using Thompson sampling (Thompson, 1933), a standard algorithm with optimality guarantees and existing support from human experi-ments (Gershman, 2018; Schulz et al., 2018). We assumed that all social groups reward interaction equally and that the chances of a reward are high. We show that inaccurate stereotypes can emerge even in
Statement of Relevance
Stereotypes about social groups—inaccurate generalizations—are widespread and consequential, but their origin is puzzling. People often think social groups differ from each other, even in the absence of real group-level differences. Here, we demonstrated how this undesirable outcome can result from unbiased ideal decision-makers merely pursuing their own self-interest. People make choices about whom to interact with on the basis of past interactions, and this is enough to create perceived differences even when there are no actual differences between groups—regardless of whether people’s choices are motivated by factors such as in-group favoritism, cognitive limitations such as selective attention, or information deficits resulting from the rarity of minorities. This occurs because early positive experiences with some groups discourage people from investigating other groups that could yield equally positive experiences. Our evidence comes from both a formal model and two online experiments. The idea that stereotypes can arise merely from this kind of adaptive exploration of the properties of groups motivates theory-driven interventions to reduce intergroup misunderstanding.
Psychological Science, XX(X) 3
such a minimalist setting (see Theoretical Models). Sec-ond, we empirically evaluated the predictions of this model in a social context. Whether people behave according to normative theories becomes a puzzle, especially for decisions involving other humans (Hackel et al., 2020; Lockwood et al., 2020). Two experiments show that participants formed inaccurate stereotypes from our minimal-process paradigm (see Empirical Tests).
All data, code, and materials for this study are avail-able on OSF (https://osf.io/2kv5r/). Additional informa-tion is available on GitHub at https://github.com/baixuechunzi/StereotypeBandit. This study was approved by the Princeton University Institutional Review Board under Protocol No. 10859.
Theoretical Models
Method
Imagine you face k groups of people, and each group is configured such that there is an unknown probability
Which group should I ask next?
Expected Reward Distribution
Prob
abili
ty D
istri
butio
n
Probability
θk θk θk θk
0
2
4
6
8
0.0 0.2 0.4 0.6 0.8 1.0
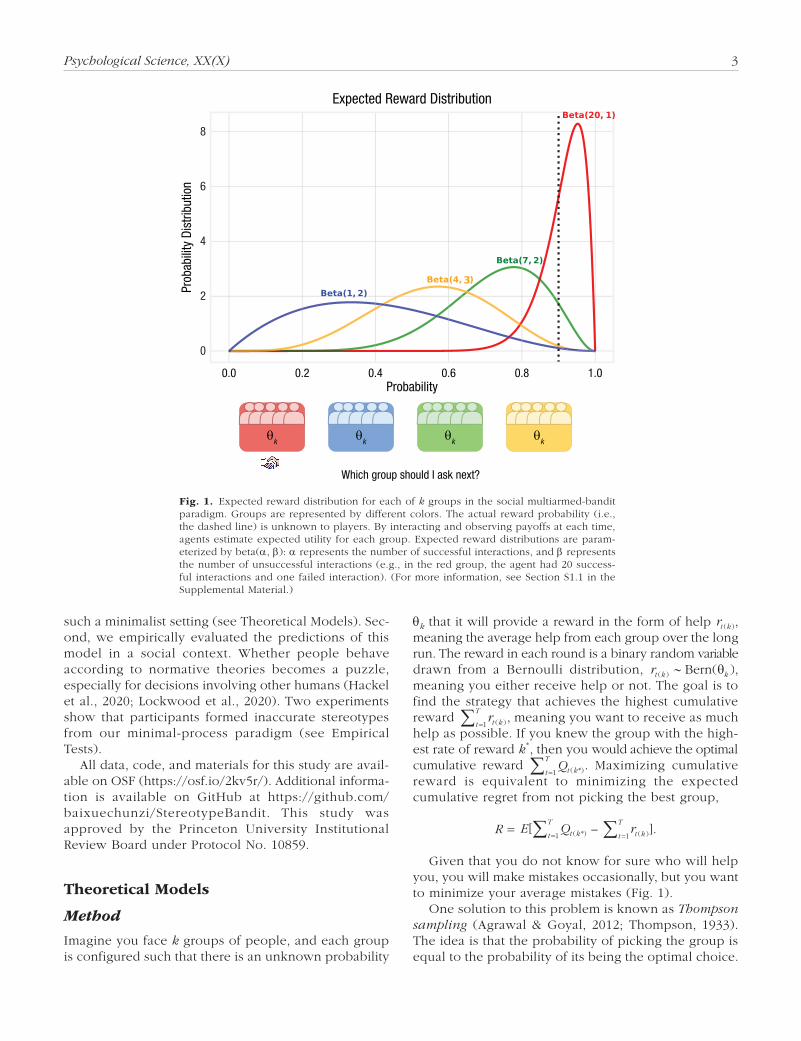
Fig. 1. Expected reward distribution for each of k groups in the social multiarmed-bandit paradigm. Groups are represented by different colors. The actual reward probability (i.e., the dashed line) is unknown to players. By interacting and observing payoffs at each time, agents estimate expected utility for each group. Expected reward distributions are param-eterized by beta(α, b): α represents the number of successful interactions, and b represents the number of unsuccessful interactions (e.g., in the red group, the agent had 20 success-ful interactions and one failed interaction). (For more information, see Section S1.1 in the Supplemental Material.)
θk that it will provide a reward in the form of help rt k( ), meaning the average help from each group over the long run. The reward in each round is a binary random variable drawn from a Bernoulli distribution, rt k k( ) ( )∼ Bern θ , meaning you either receive help or not. The goal is to find the strategy that achieves the highest cumulative reward rt kt
T
( )=∑ 1, meaning you want to receive as much
help as possible. If you knew the group with the high-est rate of reward k *, then you would achieve the optimal cumulative reward ( *)Qt kt
T
=∑ 1. Maximizing cumulative
reward is equivalent to minimizing the expected cumulative regret from not picking the best group,
R = E Qt kt
T[ ( *)=∑ 1
– rt kt
T
( )=∑ 1].
Given that you do not know for sure who will help you, you will make mistakes occasionally, but you want to minimize your average mistakes (Fig. 1).
One solution to this problem is known as Thompson sampling (Agrawal & Goyal, 2012; Thompson, 1933). The idea is that the probability of picking the group is equal to the probability of its being the optimal choice.

4 Bai et al.
The value of θk for each group is assumed to be drawn from a beta distribution, beta(α, b), where α is the num-ber of successes (e.g., being helped) and b is the num-ber of failures (e.g., not being helped). The expected reward of each group is α/α + b, meaning that your expectation about the group in general will change as you accumulate more experiences with being helped or not. At round t, having observed S tk ( ) successes and F tk ( ) failures, the algorithm applies Bayesian inference to update the distribution on θk to beta(α + S tk ( ), b + F tk ( )), meaning that you add S tk ( ) to success if you are being helped and F tk ( ) to failure if you are not being helped. The algorithm then samples values of θk from these distributions and selects the group for which the sampled value is the largest. This is equivalent to choos-ing each group with a probability that corresponds to the probability the agent gives to that group that has the largest actual value of θk. The process repeats1 (a more detailed description appears in Section S1.1 in the Supplemental Material available online).
We explored three main variants of this model that are critical to understanding how inaccurate impressions emerge from locally adaptive exploration. First, we com-pared sampling strategies: Thompson sampling and random sampling. Thompson sampling proceeds as described above, whereas random sampling selects a group each round according to a uniform distribution. Second, we compared the structure of reward distribu-tions across groups, namely, how the agent behaves when the underlying probabilities of reward are differ-ent (e.g., classic bandit setting; Schulz et al., 2018) as opposed to when the underlying probabilities are identi-cal (and reward rich; Harris et al., 2020). The identical-reward condition specifies θk = 0.9 for all k, whereas the different-reward condition specifies θk = {0.1,0.3,0.5,0.9} for each k. Third, we compared models with and with-out prior biases. Prior biases reflect to what extent the model expects one group to be better than the others even before collecting any evidence. The prior-bias con-dition initializes one group with beta(10, 1), meaning that the model expects that group to be more rewarding than the remaining groups, whereas the no-prior condi-tion initializes all groups with beta(1, 1), meaning that the model expects all groups to be equally rewarding.
Results
We ran 50 simulations, each with four groups, over a 40-round game (for other simulations with longer time scales, varying ground-truth success probabilities, and a dynamic programming algorithm, see Sections S1.2–S1.4 in the Supplemental Material). Consider each simu-lation as representing one participant; each participant has 40 chances to select people from one of the four
groups sequentially. Given that each simulation has its own most- to least-selected groups, we rank-ordered the results per simulation to make them comparable. Two critical outputs were examined: (a) the total num-ber of interactions with each group and (b) the esti-mated expected utility for interacting with each group. Number of interactions can be considered as a behav-ioral antecedent of impressions, whereas estimated expected utility can be considered as impressions. Hence, differences between the collective expected util-ity among all groups and that of the ground truth can be considered as reflecting inaccurate stereotypes.
Our results show that the Thompson-sampling model in the identical-reward condition without prior bias, rather than interacting equally and estimating equal rewards for all groups, selectively interacted with one group and estimated that group had higher expected utility than other groups (Figs. 2a and 2b).
To understand why this is, consider a simulated agent with no prior bias, starting the game giving each of the four groups a distribution of beta(1, 1). This assigns equal probability to all values between 0 and 1, so all groups have an expected utility of .5 at the initial round. The agent first samples values from the four distributions and selects the group that has the largest sampled value. Assume that the selected group is red, as in Figure 1, so the agent interacts with one member of the red group and observes its reward. If successful, it updates the distribution of the red group to beta(2, 1), yielding an expected utility of .67 while other groups’ expected utility remains unchanged. Repeating this process, the agent will sample values from the four distributions again and select the group that yields the largest sam-pled value. Given that the red group has a higher expected utility than other groups, it is more likely to yield a larger sampled value and thus be selected again. Say the agent selects the red group again. If the interac-tion is successful, the distribution of the red group will be updated to beta(3, 1) with an expected utility of .75. If unsuccessful, the distribution will be updated to beta(2, 2) with an expected utility of .5. The process repeats. Our particular social environment is based on the assumption that all groups have identical and high rewards, making successful interactions more probable. As a result, the agent will be less likely to explore the other three groups thus be less likely to update their expected utility as needed. Inaccurate impressions about the underexplored groups thus emerged in the identical and high-reward environment, purely as a result of locally adaptive exploration.
To compare, first, the Thompson-sampling model performed as expected in the different-reward condi-tion. It interacted more with the group that had the highest expected utility and estimated expected utility

Psychological Science, XX(X) 5
Group
Tota
l Num
ber o
f Int
erac
tions
a
c
e
g
Tota
l Num
ber o
f Int
erac
tions
Tota
l Num
ber o
f Int
erac
tions
Tota
l Num
ber o
f Int
erac
tions
Round of Interaction
Expe
cted
Util
ity
b
d
f
h
Thom
pson
Sam
plin
g,Id
entic
al R
ewar
d, N
o Pr
ior B
ias
Thom
pson
Sam
plin
g,Di
ffere
nt R
ewar
d, N
o Pr
ior B
ias
Rand
om S
ampl
ing,
Iden
tical
Rew
ard,
No
Prio
r Bia
sTh
omps
on S
ampl
ing,
Iden
tical
Rew
ard,
Prio
r Bia
s
Group 1Group 2Group 3Group 40.0
0.2
0.4
0.6
0.8
1.0
0 5 10 15 20 25 30 35 40
05
10152025303540
05
10152025303540
05
10152025303540
05
10152025303540
Round of Interaction
Expe
cted
Util
ity
0.0
0.2
0.4
0.6
0.8
1.0
0 5 10 15 20 25 30 35 40
Round of Interaction
Expe
cted
Util
ity
0.0
0.2
0.4
0.6
0.8
1.0
0 5 10 15 20 25 30 35 40
Round of Interaction
Expe
cted
Util
ity
0.0
0.2
0.4
0.6
0.8
1.0
0 5 10 15 20 25 30 35 40
1 2 3 4
Group1 2 3 4
Group1 2 3 4
Group1 2 3 4
Fig. 2. (continued on next page)
6 Bai et al.
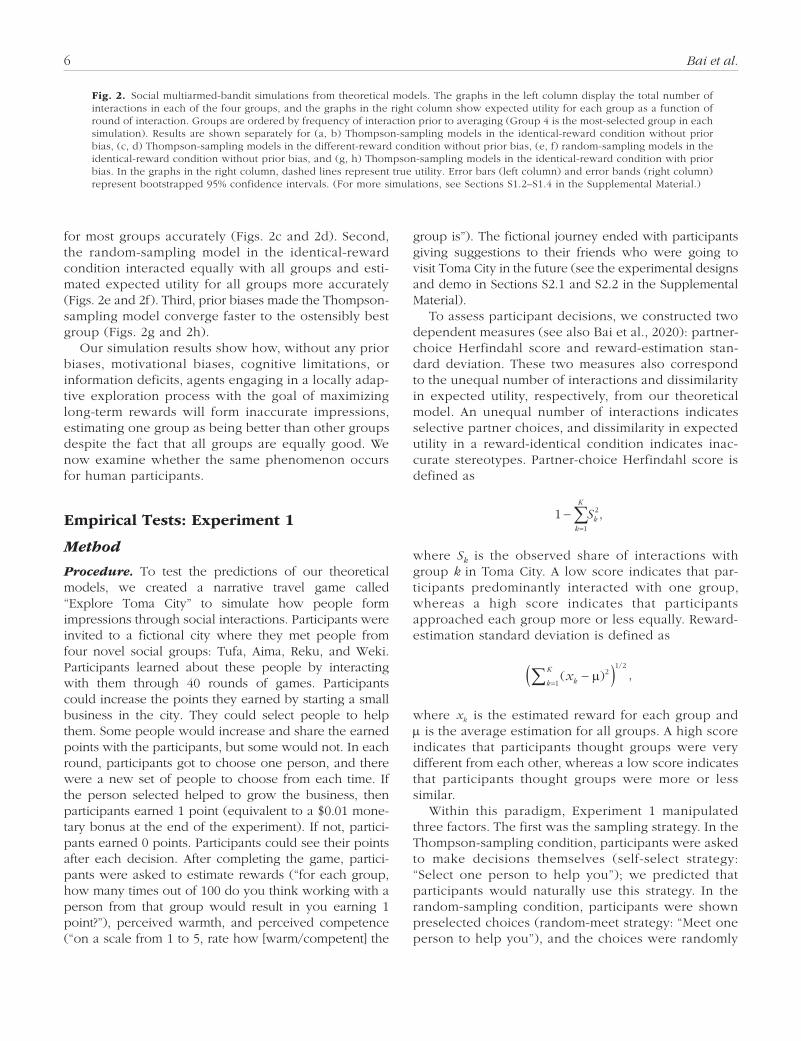
for most groups accurately (Figs. 2c and 2d). Second, the random-sampling model in the identical-reward condition interacted equally with all groups and esti-mated expected utility for all groups more accurately (Figs. 2e and 2f). Third, prior biases made the Thompson-sampling model converge faster to the ostensibly best group (Figs. 2g and 2h).
Our simulation results show how, without any prior biases, motivational biases, cognitive limitations, or information deficits, agents engaging in a locally adap-tive exploration process with the goal of maximizing long-term rewards will form inaccurate impressions, estimating one group as being better than other groups despite the fact that all groups are equally good. We now examine whether the same phenomenon occurs for human participants.
Empirical Tests: Experiment 1
Method
Procedure. To test the predictions of our theoretical models, we created a narrative travel game called “Explore Toma City” to simulate how people form impressions through social interactions. Participants were invited to a fictional city where they met people from four novel social groups: Tufa, Aima, Reku, and Weki. Participants learned about these people by interacting with them through 40 rounds of games. Participants could increase the points they earned by starting a small business in the city. They could select people to help them. Some people would increase and share the earned points with the participants, but some would not. In each round, participants got to choose one person, and there were a new set of people to choose from each time. If the person selected helped to grow the business, then participants earned 1 point (equivalent to a $0.01 mone-tary bonus at the end of the experiment). If not, partici-pants earned 0 points. Participants could see their points after each decision. After completing the game, partici-pants were asked to estimate rewards (“for each group, how many times out of 100 do you think working with a person from that group would result in you earning 1 point?”), perceived warmth, and perceived competence (“on a scale from 1 to 5, rate how [warm/competent] the
group is”). The fictional journey ended with participants giving suggestions to their friends who were going to visit Toma City in the future (see the experimental designs and demo in Sections S2.1 and S2.2 in the Supplemental Material).
To assess participant decisions, we constructed two dependent measures (see also Bai et al., 2020): partner-choice Herfindahl score and reward-estimation stan-dard deviation. These two measures also correspond to the unequal number of interactions and dissimilarity in expected utility, respectively, from our theoretical model. An unequal number of interactions indicates selective partner choices, and dissimilarity in expected utility in a reward-identical condition indicates inac-curate stereotypes. Partner-choice Herfindahl score is defined as
1
1
2−=∑k
K
kS ,
where Sk is the observed share of interactions with group k in Toma City. A low score indicates that par-ticipants predominantly interacted with one group, whereas a high score indicates that participants approached each group more or less equally. Reward-estimation standard deviation is defined as
( ) ,/
xkk
K−( )=∑ µ 2
1
1 2
where xk is the estimated reward for each group and m is the average estimation for all groups. A high score indicates that participants thought groups were very different from each other, whereas a low score indicates that participants thought groups were more or less similar.
Within this paradigm, Experiment 1 manipulated three factors. The first was the sampling strategy. In the Thompson-sampling condition, participants were asked to make decisions themselves (self-select strategy: “Select one person to help you”); we predicted that participants would naturally use this strategy. In the random-sampling condition, participants were shown preselected choices (random-meet strategy: “Meet one person to help you”), and the choices were randomly
Fig. 2. Social multiarmed-bandit simulations from theoretical models. The graphs in the left column display the total number of interactions in each of the four groups, and the graphs in the right column show expected utility for each group as a function of round of interaction. Groups are ordered by frequency of interaction prior to averaging (Group 4 is the most-selected group in each simulation). Results are shown separately for (a, b) Thompson-sampling models in the identical-reward condition without prior bias, (c, d) Thompson-sampling models in the different-reward condition without prior bias, (e, f) random-sampling models in the identical-reward condition without prior bias, and (g, h) Thompson-sampling models in the identical-reward condition with prior bias. In the graphs in the right column, dashed lines represent true utility. Error bars (left column) and error bands (right column) represent bootstrapped 95% confidence intervals. (For more simulations, see Sections S1.2–S1.4 in the Supplemental Material.)

Psychological Science, XX(X) 7
assigned by the program. The second manipulated fac-tor was the structure of the reward distribution. In the different-reward condition, the underlying reward dis-tribution was preprogrammed as .1, .3, .5, and .9 for the Weki, Aima, Tufa, and Reku groups, respectively. In the identical-reward condition, the underlying reward distribution was preprogrammed as .9 for all groups. The third manipulated factor was the existence of prior bias. In the no-prior condition, participants started the game immediately after entering the city. In the prior-bias condition, before the game, participants saw ste-reotype information suggesting that one group was more competent and warmer than others (e.g., “Rekus are wealthy and very generous to their neighbors”). The game and parameters were programmed on Qualtrics using JavaScript (see materials in Section S2.1 of the Supplemental Material).
Our primary hypothesis was that participants in the identical-reward, no-prior-bias condition with self-select strategies would be more likely to interact selectively with one group than with others (i.e., lower partner-choice Herfindahl score) and to be more likely to esti-mate groups to have different expected rewards (i.e., larger reward-estimation standard deviation), compared with participants in the identical-reward, no-prior-bias condition with random-meet strategies. The hypothesis would fail if we did not observe a statistically significant difference between the two conditions.
Participants. Following a power analysis with pilot data (see pilot details in Section S3.1 in the Supplemental Material), we recruited 399 online participants via Ama-zon Mechanical Turk’s CloudResearch high-quality pool. Our goal was to have 50 participants in each of the eight conditions in order to detect medium to large effects. Each participant was randomly assigned to one of the 2 (reward: identical, different) × 2 (strategy: self-select, random-meet) × 2 (prior bias: yes, no) conditions.
Results
We first ran a linear regression with condition as the independent variable (random-meet strategy coded as 0, self-select strategy coded as 1) and with the Herfindahl score as the dependent variable. As predicted, partici-pants in the identical-reward, no-prior bias condition with a self-select strategy, compared with those who had a random-meet strategy, were more likely to show a lower Herfindahl score—b = −0.226, 95% confidence interval (CI) = [−0.306, −0.146], p < .001; random-meet strategy: m = .75, d = 0, n = 45; self-select strategy: m = .52, d = .27, n = 55, Cohen’s d = 1.15. This indicates that they were more likely to interact with one group than
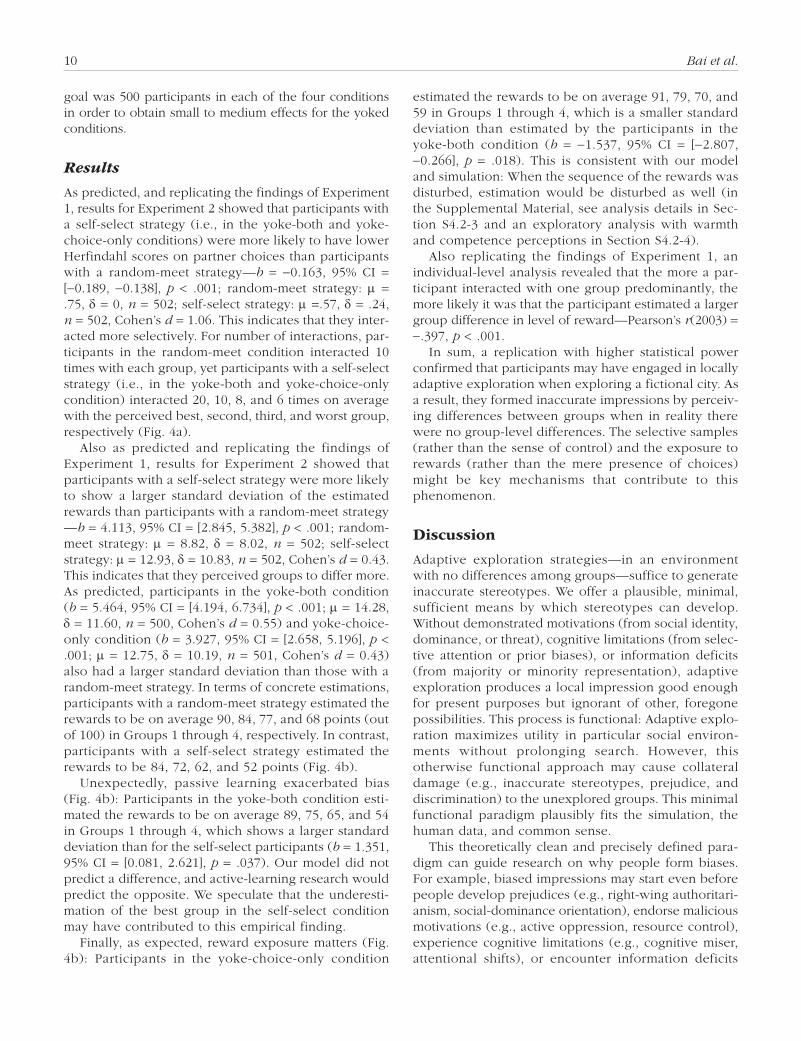
other groups. Across 40 interactions, participants in the random-meet condition interacted 10 times with each group. However, participants with a self-select strategy interacted with the perceived best group on average 22 times and with the second, third, and worst perceived group on average 10, seven, and five times, respectively (Fig. 3a; for plots with individual participants, see Sec-tions S4.1 and S.42 in the Supplemental Material).
We also ran a linear regression with condition as the independent variable (random-meet strategy coded as 0, self-select strategy coded as 1) and with the standard deviation of the estimated rewards as the dependent variable. As predicted, participants with a self-select strategy were also more likely to show a larger standard deviation of the estimated rewards of the four groups than participants with a random-meet strategy—b = 11.354, 95% CI = [7.387, 15.321], p < .001; random-meet strategy: m = 6.60, d = 5.01, n = 45; self-select strategy: m = 17.95, d = 12.61, n = 55, Cohen’s d = 1.14. This indi-cates that they perceived the groups to differ from each other. Participants with a random-meet strategy esti-mated the rewards to be on average 93, 88, 83, and 76 points (out of 100). In contrast, participants with a self-select strategy estimated the rewards to be 86, 67, 57, and 42 points (Fig. 3b).
An individual-level analysis revealed that the more a participant interacted with one group predominantly, the more likely it was that the participant reported a larger standard deviation in reward estimations, Pear-son’s r(98) = −.605, p < .001. This is consistent with previous real-world findings that the less diverse sam-ples people see, the more distinct stereotypes they have (Bai et al., 2020).
Secondary analyses first confirmed that the structure of the reward distribution mattered. Participants in dif-ferent-reward conditions indeed made good choices to interact with the best group and estimated the underly-ing rewards more accurately (Figs. 3c and 3d). Within the context of our design, inaccurate impressions were not absent but were less likely to occur when the under-lying rewards were different rather than identical. Next, prior biases mattered. In identical-reward conditions, par-ticipants with prior biases reported an even larger stan-dard deviation in reward estimations than participants with no priors. Existing stereotypes can produce inac-curate impressions (Figs. 3e and 3f), although existing biases did not have significantly more influence in dif-ferent-reward conditions than identical-reward condi-tions (Figs. 3g and 3h; in the Supplemental Material, see analysis details in Section S4.1-3a for partner choices and Section S4.1-3b for reward estimates).
Exploratory analyses examined perceptions of warmth and competence of Toma groups (Fiske et al.,

8 Bai et al.
a
c
e
g
b
d
f
h
Grou
pRandom-Meet Strategy Self-Select Strategy
Random-Meet Strategy Self-Select Strategy
Random-Meet Strategy Self-Select Strategy
Random-Meet Strategy Self-Select Strategy
Stra
tegy
Self-
Sele
ctRa
ndom
Mee
t
Stra
tegy
Self-
Sele
ctRa
ndom
Mee
t
Stra
tegy
Self-
Sele
ctRa
ndom
Mee
t
Stra
tegy
Self-
Sele
ctRa
ndom
Mee
t
Choice Frequency Choice Frequency
Choice Frequency Choice Frequency
Choice Frequency Choice Frequency
Choice Frequency Choice Frequency
Estimated Reward
Estimated Reward
Estimated Reward
Estimated Reward
Group 1Group 2Group 3Group 4
4
3
2
1
Grou
p
Diffe
rent
Rew
ard,
No
Prio
r Bia
sId
entic
al R
ewar
d, N
o Pr
ior B
ias
Iden
tical
Rew
ard,
Prio
r Bia
sDi
ffere
nt R
ewar
d, P
rior B
ias
4
3
2
1
Grou
p
4
3
2
1
Grou
p
4
3
2
1
0 5 10 15 20 25100806040200
100806040200
100806040200
100806040200
0 5 10 15 20 25
0 5 10 15 20 250 5 10 15 20 25
0 5 10 15 20 25 300 5 10 15 20 25 30
0 5 10 15 20 25 300 5 10 15 20 25 30
Fig. 3. (continued on next page)

Psychological Science, XX(X) 9
2002). Because succeeding in business requires both warmth and competence, one might expect estimated rewards to correlate with perceived warmth and com-petence. This intuition was confirmed, r(397) = .566, p < .001. Similar to reward-estimation standard deviations but with smaller effect sizes (see the analysis details in Section S4.1-4in the Supplemental Material), results showed that participants in the identical-reward condi-tion who made their own choices to interact with Toma people tended to perceive Toma groups as more differ-ent from each other in terms of warmth and competence than those who had randomly met Toma people—b = 0.768, 95% CI = [0.366, 1.170], p < .001; random-meet strategy: m = 1.50, d = 0.87, n = 45; self-select strategy: m = 2.27, d = 1.11, n = 55, Cohen’s d = 0.77.
In sum, confirming the predictions of theoretical model, results showed that human participants explor-ing Toma City with no prior stereotypes perceived sig-nificant differences between Tufas, Aimas, Rekus, and Wekis when in reality there were no group-level differ-ences. Their behaviors are consistent with the pattern of exploration produced by the Thompson-sampling model. Although unintended, inaccurate impressions resulted from locally adaptive exploration.
Empirical Tests: Experiment 2
Method
Procedure. Despite statistically significant and large effect-size differences between the self-select and random- meet conditions in Experiment 1, the precise mechanism underlying these differences was unclear. In Experiment 2, we investigated two possible mechanisms behind the differences between the self-select and the random-meet conditions: (a) active versus passive learning and (b) exposure to choices versus rewards.
First, we explored the role of active versus passive learning. Do the selective samples make participants biased, or does the sense of control make them biased? To address this confound, we added a between-subject yoked design. In the yoke-both condition, participants did not have a chance to select partners but could view only partners selected for them (like the random-meet condition). However, the choices were not randomly drawn from a uniform distribution (unlike the random-meet condition) but were paired from other participants’
responses from the self-select condition (see also Markant & Gureckis, 2014; Prager et al., 2018). Our theoretical model would not predict a difference between the two conditions, but active-learning theories (Bruner, 1961) suggest a difference.
Second, we explored the role of choice exposure and reward exposure. Are the rewards attached to each choice important for the estimations, or is the mere presence of choices sufficient for biased impressions? To address this, we added another between-subject yoked condition. Participants could either encounter the choices and the rewards in the exact sequence (i.e., yoke both), or they could encounter the choices in the same order but the rewards in randomized order (i.e., yoke choice only). Our model predicted that reward order matters, given the sequential feedback of this decision process. Any perturbation of the reward order should then lead participants to form less biased impressions than the exact order (see model details in Section S3.2 in the Supplemental Material), but the mere-exposure hypothesis suggests little difference (Zajonc, 1968).
Therefore, Experiment 2 tested four sampling strate-gies—(a) self-select, (b) yoke-both, (c) yoke-choice-only, and (d) random-meet—with the same game using identical-reward and no-prior designs. We predicted that participants in the self-select, yoke-both, and yoke-choice-only conditions would have a lower Herfindahl score in partner choices and a larger standard deviation in reward estimations than participants in the random-meet condition. Moreover, we predicted that participants in the yoke-both condition would behave similarly to participants in the self-select condition. Finally, we pre-dicted that participants in the yoke-choice-only condition would be less biased than participants in the yoke-both condition. In other words, we expected to see graded standard deviations of the estimated rewards and for the self-select condition to show the biggest effects and the random-meet condition to show the smallest effects. The hypothesis would fail if there were no estimated differ-ences between conditions (see Sections S2.1, S2.2, and S3.2 in the Supplemental Material).
Participants. Following a power analysis with pilot data including the two yoked designs (see details in Sec-tion S3.2), we recruited 2,005 online workers via Amazon Mechanical Turk’s CloudResearch high-quality pool. Our
Fig. 3. Empirical results from the “Explore Toma City” game in Experiment 1. The graphs in the left column display the frequency with which participants chose each of the four groups, separately for the random-meet and self-select conditions. The graphs on the right display estimated reward probability in the final round of the random-meet and self-select conditions, separately for each of the four groups. Groups are ordered by frequency of interaction prior to averaging (Group 1 is the group selected most often by each participant). Results are shown separately for (a, b) the identical-reward condition without prior bias, (c, d) the different-reward condition without prior bias, (e, f) the identical-reward condition with prior bias, and (g, h) the different-reward condition with prior bias. In the graphs in the right column, raw data is shown in the background, and dashed vertical lines represent the ground truth. In all graphs, error bars represent bootstrapped 95% confidence intervals. (For more analyses, see Section S4.1 in the Supplemental Material.)
10 Bai et al.
goal was 500 participants in each of the four conditions in order to obtain small to medium effects for the yoked conditions.
Results
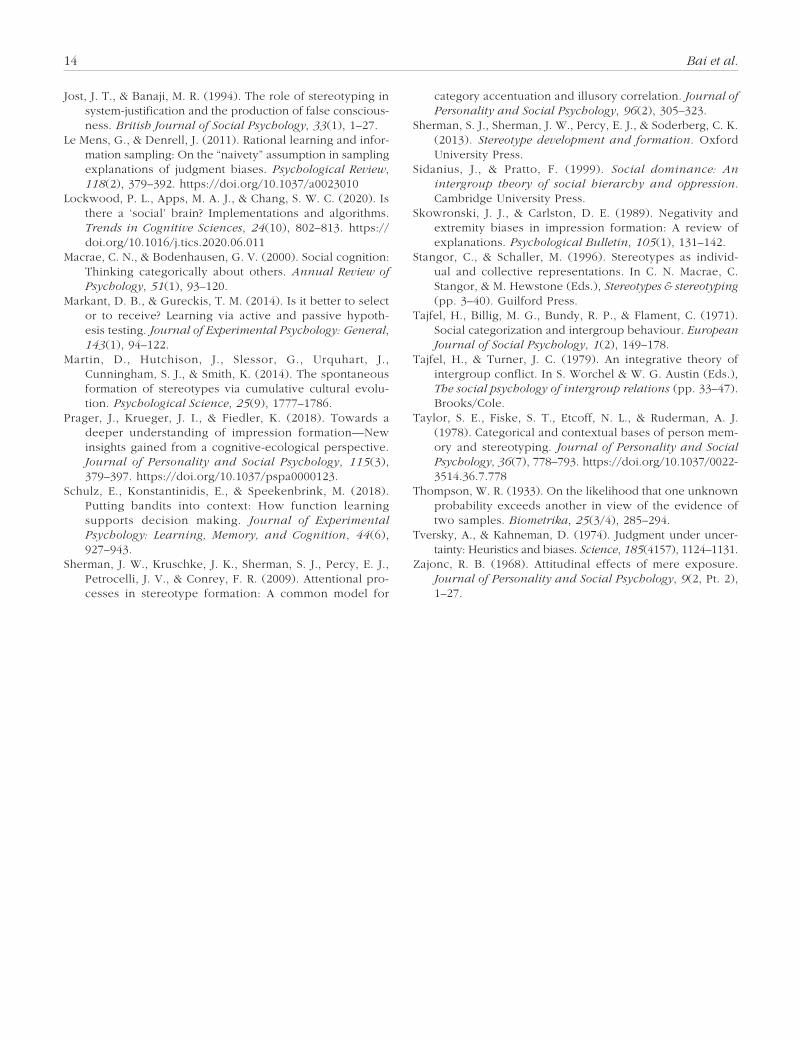
As predicted, and replicating the findings of Experiment 1, results for Experiment 2 showed that participants with a self-select strategy (i.e., in the yoke-both and yoke-choice-only conditions) were more likely to have lower Herfindahl scores on partner choices than participants with a random-meet strategy—b = −0.163, 95% CI = [−0.189, −0.138], p < .001; random-meet strategy: m = .75, d = 0, n = 502; self-select strategy: m =.57, d = .24, n = 502, Cohen’s d = 1.06. This indicates that they inter-acted more selectively. For number of interactions, par-ticipants in the random-meet condition interacted 10 times with each group, yet participants with a self-select strategy (i.e., in the yoke-both and yoke-choice-only condition) interacted 20, 10, 8, and 6 times on average with the perceived best, second, third, and worst group, respectively (Fig. 4a).
Also as predicted and replicating the findings of Experiment 1, results for Experiment 2 showed that participants with a self-select strategy were more likely to show a larger standard deviation of the estimated rewards than participants with a random-meet strategy —b = 4.113, 95% CI = [2.845, 5.382], p < .001; random-meet strategy: m = 8.82, d = 8.02, n = 502; self-select strategy: m = 12.93, d = 10.83, n = 502, Cohen’s d = 0.43. This indicates that they perceived groups to differ more. As predicted, participants in the yoke-both condition (b = 5.464, 95% CI = [4.194, 6.734], p < .001; m = 14.28, d = 11.60, n = 500, Cohen’s d = 0.55) and yoke-choice-only condition (b = 3.927, 95% CI = [2.658, 5.196], p < .001; m = 12.75, d = 10.19, n = 501, Cohen’s d = 0.43) also had a larger standard deviation than those with a random-meet strategy. In terms of concrete estimations, participants with a random-meet strategy estimated the rewards to be on average 90, 84, 77, and 68 points (out of 100) in Groups 1 through 4, respectively. In contrast, participants with a self-select strategy estimated the rewards to be 84, 72, 62, and 52 points (Fig. 4b).
Unexpectedly, passive learning exacerbated bias (Fig. 4b): Participants in the yoke-both condition esti-mated the rewards to be on average 89, 75, 65, and 54 in Groups 1 through 4, which shows a larger standard deviation than for the self-select participants (b = 1.351, 95% CI = [0.081, 2.621], p = .037). Our model did not predict a difference, and active-learning research would predict the opposite. We speculate that the underesti-mation of the best group in the self-select condition may have contributed to this empirical finding.
Finally, as expected, reward exposure matters (Fig. 4b): Participants in the yoke-choice-only condition
estimated the rewards to be on average 91, 79, 70, and 59 in Groups 1 through 4, which is a smaller standard deviation than estimated by the participants in the yoke-both condition (b = −1.537, 95% CI = [−2.807, −0.266], p = .018). This is consistent with our model and simulation: When the sequence of the rewards was disturbed, estimation would be disturbed as well (in the Supplemental Material, see analysis details in Sec-tion S4.2-3 and an exploratory analysis with warmth and competence perceptions in Section S4.2-4).
Also replicating the findings of Experiment 1, an individual-level analysis revealed that the more a par-ticipant interacted with one group predominantly, the more likely it was that the participant estimated a larger group difference in level of reward—Pearson’s r(2003) = −.397, p < .001.
In sum, a replication with higher statistical power confirmed that participants may have engaged in locally adaptive exploration when exploring a fictional city. As a result, they formed inaccurate impressions by perceiv-ing differences between groups when in reality there were no group-level differences. The selective samples (rather than the sense of control) and the exposure to rewards (rather than the mere presence of choices) might be key mechanisms that contribute to this phenomenon.
Discussion
Adaptive exploration strategies—in an environment with no differences among groups—suffice to generate inaccurate stereotypes. We offer a plausible, minimal, sufficient means by which stereotypes can develop. Without demonstrated motivations (from social identity, dominance, or threat), cognitive limitations (from selec-tive attention or prior biases), or information deficits (from majority or minority representation), adaptive exploration produces a local impression good enough for present purposes but ignorant of other, foregone possibilities. This process is functional: Adaptive explo-ration maximizes utility in particular social environ-ments without prolonging search. However, this otherwise functional approach may cause collateral damage (e.g., inaccurate stereotypes, prejudice, and discrimination) to the unexplored groups. This minimal functional paradigm plausibly fits the simulation, the human data, and common sense.
This theoretically clean and precisely defined para-digm can guide research on why people form biases. For example, biased impressions may start even before people develop prejudices (e.g., right-wing authoritari-anism, social-dominance orientation), endorse malicious motivations (e.g., active oppression, resource control), experience cognitive limitations (e.g., cognitive miser, attentional shifts), or encounter information deficits

Psychological Science, XX(X) 11
Estimated Reward
Choice Frequency Choice Frequency Choice Frequency Choice Frequency
Grou
pa
bSelf-Select
Yoke Both
Yoke Choice Only
Random Meet
Self-Select Yoke Both Yoke Choice Only Random Meet
Group 1Group 2Group 3Group 4
4
3
2
1
0 5 10 15 20 0 5 10 15 20 0 5 10 15 20 0 5 10 15 20
100806040200
Fig. 4. Empirical results from the “Explore Toma City” game in Experiment 2. The graphs in (a) display the frequency with which participants chose each of the four groups, separately for the self-select, yoke-both, yoke-choice-only, and random-meet conditions. The graph in (b) displays estimated reward probability in the final round of the four conditions, separately for each of the four groups. Groups are ordered by frequency of interaction prior to averaging. In (b), raw data is shown in the background. Group 1 is the group selected most often by each participant. The dashed vertical line represents the ground truth. In all graphs, error bars represent boot-strapped 95% confidence intervals. (For more analyses, see Section S4.2 in the Supplemental Material.)
(e.g., group-size differences). There are two minimal conditions sufficient for biased impressions to emerge: All groups in the environment are equally likely to result in a successful interaction, and decision-makers make adaptive choices about those interactions.
Of course, people with prior prejudices, malicious motivations, higher cognitive loads, selective atten-tion, or lower accessibility to one group should be even more, not less, likely to form inaccurate impres-sions. Research should test how these factors interact with our basic paradigm. For example, researchers investigating illusory correlation (Hamilton & Gifford, 1976; J. W. Sherman et al., 2009) have assumed asym-metric group sizes. Our paradigm relaxes that assump-tion; even if groups are equal in size, illusory correlations can still emerge as a result of exploratory sampling.
Further insight comes from the observation that both our model and human participants were more likely to form accurate impressions when the underlying rewards were different. This does not necessarily mean that people will never form inaccurate impressions given real group differences. First, the impressions about the least interacted groups were always inaccurate. Second, other mechanisms such as motivational biases and cognitive limitations can still play an important role in those situations. Future work could test more complex combinations.
Another connection is ratio bias—that is, people amplifying proportional trends in large samples (Fiedler et al., 2016). Because the true proportion of rewarding interactions for each group was high in our study, we actually saw the opposite: Proportional trends are reduced in smaller samples. Future work should explore changes in sample size to enrich the current paradigm.

12 Bai et al.
In addition, future experiments should examine behav-iors among participants who do not speak English or who do not work online.
Stereotypes have been described as overgeneralizing some kernel of truth (Allport, 1954). Implicit in that definition is the mean difference between groups. How-ever, our work suggests another possibility: Stereotypes may simply be an accumulation of arbitrary things not based on any truth. In both simulations and experi-ments, the group with whom the agents interacted the most, and thus estimated the most accurately, was com-pletely arbitrary. It depended on the initial interactions, which by construction were random. However, this limited our analysis to individual-level stereotypes, which differ from collective stereotypes on which soci-ety has consensus. Future work could include contex-tual bandits to examine whether people learn mappings between features that make them more likely to gen-eralize certain stereotypes to certain groups (Schulz et al., 2018). Transmission of information between agents and across generations could be another mecha-nism of acquiring collective stereotypes (Martin et al., 2014). Stereotypes about social groups are not unidi-mensional. Future work could test how this paradigm applies to the emergence of complex stereotype con-tents, such as warmth/communion and competence/agency (Abele et al., 2021).
Understanding the origin of inaccurate stereotypes as one consequence of locally adaptive exploration pro-vides new theoretical and pragmatic insights. Theoreti-cally, our paradigm pays homage to Tajfel et al’s (1971) minimal-group paradigm, identifying minimal conditions for stereotypes to emerge. We predict that stereotypes can result from an adaptive solution to a particularly challenging environment (Anderson, 1991). The environ-ment is challenging exactly because social groups can be equally rewarding, so people have multiple ways to maximize long-term rewards from interactions. This goal is at odds with another goal: forming accurate impres-sions. In seeking to maximize rewards, people are driven to strategies that explore only locally—focusing on options already considered—and it is this adaptive exploration that leads to inaccurate impressions. This perspective is intended not to justify stereotypes but rather to demonstrate an even harder, seemingly inno-cent, but almost unavoidable route for biases to emerge. This perspective also encourages researchers to think about how to better modify the social environment and exploration strategies to reduce inaccurate stereotypes.
Pragmatically, our paradigm predicts that even if one could address the subpopulation that has malicious intentions or cognitive limitations or even if the envi-ronment were to equip people with equal information
about all groups, social psychologists should not expect inaccurate stereotypes to naturally disappear. To reduce inaccurate stereotypes, we should first intervene at the environmental level. For example, participants with a random-meet strategy were exposed to diverse repre-sentations of Toma people, so they formed less biased impressions compared with those in the self-select con-dition who were predominantly exposed to one group. Correlational studies show consistent evidence that representational diversity reduces perceived differences among groups (Bai et al., 2020), but more natural experiments are needed to test this hypothesis.
Our analyses also predict a role for strategies that encourage exploration of the environment. Even when the underlying population in a place is diverse, if people just explore on the basis of their past experiences, they will be more likely to behave as our self-select partici-pants did, without noticing that other groups can be equally good. Hence, interventions that motivate explo-ration could combat that all-too-human tendency. From this perspective, the intergroup-contact hypothesis may fulfill this cognitive mechanism by encouraging people to interact more with out-group members in a variety of ways (Allport, 1954). Again, more direct experiments and measures are needed to test this hypothesis.
Drawing on theoretical analysis, simulations, and empirical data, we propose that inaccurate stereotypes can result from locally adaptive exploration. Rather than rebut prior explanations, we provide a complementary perspective, a process that is general and deep, inde-pendent of group motives, cognitive limits, or informa-tion constraints. Perhaps one origin of stereotypes is much simpler than has been thought; even minimal process assumptions can recreate it. However, this sim-plicity is also troubling: If stereotypes can result from each person pursuing their own self-interest, we may need to work harder to create environments in which problematic stereotypes do not develop.
Transparency
Action Editor: Mark BrandtEditor: Patricia J. BauerAuthor Contributions
T. L. Griffiths and X. Bai developed the research idea. S. T. Fiske, T. L. Griffiths, and X. Bai designed the experiments. X. Bai programmed and conducted the simulations and the experiments. X Bai analyzed the data, and all the authors interpreted the data. All the authors wrote the manuscript and approved the final version for submission.
Declaration of Conflicting InterestsThe author(s) declared that there were no conflicts of interest with respect to the authorship or the publication of this article.

Psychological Science, XX(X) 13
FundingX. Bai was supported by the Joint Degree Program in Psychology and Policy, by a Cognitive Science Fellowship, and by the Prize Fellowship in the Social Sciences at Prince ton University. Additional funding was provided by start-up funds to T. L. Griffiths from Princeton University.
Open PracticesAll data and materials have been made publicly available via OSF and can be accessed at https://osf.io/2kv5r/. The design and analysis plans for the experiments were pre-registered at on OSF—pilot experiment: https://osf.io/c87qe/, Experiment 1: https://osf.io/smb2t/, Experiment 2: https://osf.io/8c54b/. This article has received the badges for Open Data, Open Materials, and Preregistration. More information about the Open Practices badges can be found at http://www.psychologicalscience.org/publica tions/badges.
Acknowledgments
We are grateful to Fred Callaway for sharing dynamic pro-gramming code and to Jerker Denrell, Joel Martinez, James Walsh, Kevin McKee, Mark Ho, Robert Hawkins, Gregg Sparkman, Sherry Jueyu Wu, and Alex Koch for stimulating discussions.
Supplemental Material
Additional supporting information can be found at http://journals.sagepub.com/doi/suppl/10.1177/09567976211045929
Note
1. Technically, the problem we consider here has a finite hori-zon over a limited number of interactions, in contrast to the infinite-horizon setting in which Thompson sampling has been shown to be optimal. The optimal finite-horizon solution com-puted by dynamic programming is also consistent with our results, but we focus on Thompson sampling here because of the previous support reported in the psychological literature (e.g., Gershman, 2018; Schulz et al., 2018). Further details are provided in Sections S1.1 and S1.4 in the Supplemental Material.
References
Abele, A. E., Ellemers, N., Fiske, S. T., Koch, A., & Yzerbyt, V. (2021). Navigating the social world: Toward an inte-grated framework for evaluating self, individuals, and groups. Psychological Review, 128(2), 290–314. https://doi.org/10.1037/rev0000262
Agrawal, S., & Goyal, N. (2012, June). Analysis of Thompson sampling for the multi-armed bandit problem. In S. Mannor, N. Srebro, & R. C. Williamson (Eds.), JMLR: Workshop and Conference Proceedings: Conference on Learning Theory (Vol. 23, pp. 39.1–39.26). http://proceed ings.mlr.press/v23/agrawal12/agrawal12.pdf
Allport, G. W. (1954). The nature of prejudice. Addison-Wesley.
Anderson, J. R. (1991). The adaptive nature of human catego-rization. Psychological Review, 98(3), 409–429.
Bai, X., Ramos, M. R., & Fiske, S. T. (2020). As diversity increases, people paradoxically perceive social groups as more similar. Proceedings of the National Academy of Sciences, USA, 117(23), 12741–12749.
Brewer, M. B. (1999). The psychology of prejudice: Ingroup love and outgroup hate? Journal of Social Issues, 55(3), 429–444.
Bruner, J. S. (1961). The act of discovery. Harvard Educational Review, 31, 21–32.
Denrell, J. (2005). Why most people disapprove of me: Experience sampling in impression formation. Psychological Review, 112(4), 951–978. doi:10.1037/0033-295X.112.4.951
Denrell, J., & March, J. G. (2001). Adaptation as information restriction: The hot stove effect. Organization Science, 12(5), 523–538.
Fetchenhauer, D., & Dunning, D. (2010). Why so cynical? Asymmetric feedback underlies misguided skepticism regarding the trustworthiness of others. Psychological Science, 21(2), 189–193.
Fiedler, K., Kareev, Y., Avrahami, J., Beier, S., Kutzner, F., & Hutter, M. (2016). Anomalies in the detection of change: When changes in sample size are mistaken for changes in proportions. Memory & Cognition, 44(1), 143–161.
Fiske, S. T. (1980). Attention and weight in person perception: The impact of negative and extreme behavior. Journal of Personality and Social Psychology, 38(6), 889–906.
Fiske, S. T., Cuddy, A. J. C., Glick, P., & Xu, J. (2002). A model of (often mixed) stereotype content: Competence and warmth respectively follow from perceived status and competition. Journal of Personality and Social Psychology, 82(6), 878–902.
Fiske, S. T., & Durante, F. (2016). Stereotype content across cultures: Variations on a few themes. In M. J. Gelfand, C.-Y. Chiu, & Y.-Y. Hong (Eds.), Handbook of advances in culture and psychology (Vol. 6, pp. 209–258). Oxford University Press.
Fiske, S. T., & Taylor, S. E. (1984). Social cognition. Addison-Wesley.
Gershman, S. J. (2018). Deconstructing the human algorithms for exploration. Cognition, 173, 34–42.
Hackel, L. M., Mende-Siedlecki, P., & Amodio, D. M. (2020). Reinforcement learning in social interaction: The distin-guishing role of trait inference. Journal of Experimental Social Psychology, 88, Article 103948. https://doi.org/ 10.1016/j.jesp.2019.103948
Hamilton, D. L., & Gifford, R. K. (1976). Illusory correlation in interpersonal perception: A cognitive basis of stereotypic judgments. Journal of Experimental Social Psychology, 12(4), 392–407.
Harris, C., Fiedler, K., Marien, H., & Custers, R. (2020). Biased preferences through exploitation: How initial biases are consolidated in reward-rich environments. Journal of Experimental Psychology: General, 149(10), 1855–1877. https://doi.org/10.1037/xge0000754
Hilton, J. L., & Von Hippel, W. (1996). Stereotypes. Annual Review of Psychology, 47(1), 237–271.
14 Bai et al.
Jost, J. T., & Banaji, M. R. (1994). The role of stereotyping in system-justification and the production of false conscious-ness. British Journal of Social Psychology, 33(1), 1–27.
Le Mens, G., & Denrell, J. (2011). Rational learning and infor-mation sampling: On the “naivety” assumption in sampling explanations of judgment biases. Psychological Review, 118(2), 379–392. https://doi.org/10.1037/a0023010
Lockwood, P. L., Apps, M. A. J., & Chang, S. W. C. (2020). Is there a ‘social’ brain? Implementations and algorithms. Trends in Cognitive Sciences, 24(10), 802–813. https://doi.org/10.1016/j.tics.2020.06.011
Macrae, C. N., & Bodenhausen, G. V. (2000). Social cognition: Thinking categorically about others. Annual Review of Psychology, 51(1), 93–120.
Markant, D. B., & Gureckis, T. M. (2014). Is it better to select or to receive? Learning via active and passive hypoth-esis testing. Journal of Experimental Psychology: General, 143(1), 94–122.
Martin, D., Hutchison, J., Slessor, G., Urquhart, J., Cunningham, S. J., & Smith, K. (2014). The spontaneous formation of stereotypes via cumulative cultural evolu-tion. Psychological Science, 25(9), 1777–1786.
Prager, J., Krueger, J. I., & Fiedler, K. (2018). Towards a deeper understanding of impression formation—New insights gained from a cognitive-ecological perspective. Journal of Personality and Social Psychology, 115(3), 379–397. https://doi.org/10.1037/pspa0000123.
Schulz, E., Konstantinidis, E., & Speekenbrink, M. (2018). Putting bandits into context: How function learning supports decision making. Journal of Experimental Psychology: Learning, Memory, and Cognition, 44(6), 927–943.
Sherman, J. W., Kruschke, J. K., Sherman, S. J., Percy, E. J., Petrocelli, J. V., & Conrey, F. R. (2009). Attentional pro-cesses in stereotype formation: A common model for
category accentuation and illusory correlation. Journal of Personality and Social Psychology, 96(2), 305–323.
Sherman, S. J., Sherman, J. W., Percy, E. J., & Soderberg, C. K. (2013). Stereotype development and formation. Oxford University Press.
Sidanius, J., & Pratto, F. (1999). Social dominance: An intergroup theory of social hierarchy and oppression. Cambridge University Press.
Skowronski, J. J., & Carlston, D. E. (1989). Negativity and extremity biases in impression formation: A review of explanations. Psychological Bulletin, 105(1), 131–142.
Stangor, C., & Schaller, M. (1996). Stereotypes as individ-ual and collective representations. In C. N. Macrae, C. Stangor, & M. Hewstone (Eds.), Stereotypes & stereotyping (pp. 3–40). Guilford Press.
Tajfel, H., Billig, M. G., Bundy, R. P., & Flament, C. (1971). Social categorization and intergroup behaviour. European Journal of Social Psychology, 1(2), 149–178.
Tajfel, H., & Turner, J. C. (1979). An integrative theory of intergroup conflict. In S. Worchel & W. G. Austin (Eds.), The social psychology of intergroup relations (pp. 33–47). Brooks/Cole.
Taylor, S. E., Fiske, S. T., Etcoff, N. L., & Ruderman, A. J. (1978). Categorical and contextual bases of person mem-ory and stereotyping. Journal of Personality and Social Psychology, 36(7), 778–793. https://doi.org/10.1037/0022-3514.36.7.778
Thompson, W. R. (1933). On the likelihood that one unknown probability exceeds another in view of the evidence of two samples. Biometrika, 25(3/4), 285–294.
Tversky, A., & Kahneman, D. (1974). Judgment under uncer-tainty: Heuristics and biases. Science, 185(4157), 1124–1131.
Zajonc, R. B. (1968). Attitudinal effects of mere exposure. Journal of Personality and Social Psychology, 9(2, Pt. 2), 1–27.
Copyright © 2022 FDOKUMEN