perceptions of the stereotypes of the millennial generation
139
PERCEPTIONS OF THE STEREOTYPES OF THE MILLENNIAL GENERATION A Thesis by DEANNA LEE BOSSE Submitted to the Office of Graduate and Professional Studies of Texas A&M University in partial fulfillment of the requirements for the degree of MASTER OF SCIENCE Chair of Committee, Billy McKim Committee Members, Tracy Rutherford Kerry Litzenberg Head of Department, Jack Elliot May 2015 Major Subject: Agricultural Leadership, Education, and Communications Copyright 2015 Deanna Lee Bosse
-
Upload
khangminh22 -
Category
Documents
-
view
1 -
download
0
Transcript of perceptions of the stereotypes of the millennial generation

PERCEPTIONS OF THE STEREOTYPES OF THE MILLENNIAL GENERATION
A Thesis
by
DEANNA LEE BOSSE
Submitted to the Office of Graduate and Professional Studies of
Texas A&M University
in partial fulfillment of the requirements for the degree of
MASTER OF SCIENCE
Chair of Committee, Billy McKim
Committee Members, Tracy Rutherford
Kerry Litzenberg
Head of Department, Jack Elliot
May 2015
Major Subject: Agricultural Leadership, Education, and Communications
Copyright 2015 Deanna Lee Bosse

ii
ABSTRACT
The purpose of this study was to assess the perceptions of stereotypes of the
Millennial generation by other generation groups. This study evaluates Millennials’ self-
perception and how other generations view them based on stereotypes to report any
overlaps and/or disconnects. The differences in opinion and the popularity of visiting
socially responsible food and drink establishments were assessed to gain an
understanding of Millennials’ food purchasing motivations and decision processes. This
subject may be of greater interest to companies and organizations in the food and
agriculture industries.
This study was composed of parallel quantitative and a qualitative studies. A
survey questionnaire was distributed using variations of the drop-off/pick-up method and
traditional mail throughout the western United States to collect demographic data and
perceptions of Millennial stereotypes among generation groups. Qualitative interviews
with individuals, companies, and organizations related to the food-agriculture industry
were conducted to provide detailed, in-depth descriptions of perceptions of Millennial
stereotypes, as well as the decisions, motivations, and marketing strategies of socially
responsible companies and organizations with large Millennial customer bases.
Statistically significant differences were found when comparing Millennials to
other generation groups. Millennials view themselves and their generation differently
than other generation groups view Millennials. Social responsibility is important to the

iii
Millennial generation; however, further research is needed to address social
responsibility in their food purchasing decisions.
iv
ACKNOWLEDGEMENTS
This study could not have been possible without the love, generosity, and support
(both emotional and intellectual) of many people. I would like to thank my committee:
Dr. Billy McKim, Dr. Tracy Rutherford, and Dr. Kerry Litzenberg. To my chair, Dr.
McKim, thank you for pushing me and allowing me to prove myself wrong multiple
times, persevere, and achieve a goal. Dr. Rutherford and Dr. Litz, thank you for your
constructive criticism and serving on my committee.
The path to my educational success has been paved by many professors and
mentors in the Agricultural Economics and Agricultural Leadership, Education, and
Communications Departments and Texas A&M University, a university I owe so much
to. Thank you to the ALEC Department for allowing me great opportunities during my
graduate studies.
I would like to take a moment to thank my emotional support team. To my thesis
partner and emotional supporter, Lindy and Clay, thank you. To all of my Maroon Coats,
thank you for giving me educational goals and motivation. I would like to thank my
parents for always believing in me and supporting my dreams. Finally, I would like to
thank God: I am only on this earth to serve You.

v
TABLE OF CONTENTS
Page
ABSTRACT ...................................................................................................................... ii
ACKNOWLEDGEMENTS ..............................................................................................iv
TABLE OF CONTENTS ................................................................................................... v
LIST OF FIGURES ......................................................................................................... vii
LIST OF TABLES ......................................................................................................... viii
CHAPTER I INTRODUCTION AND LITERATURE REVIEW .................................... 1
Introduction ............................................................................................................ 1
Operational Definitions .......................................................................................... 2
Millennial Stereotype Characteristics .................................................................... 2
Millennial Influencers ............................................................................................ 3
Millennial Communication Styles .......................................................................... 7
Theory .................................................................................................................... 8
Design, Measure, and Interpretation .................................................................... 10
Population ............................................................................................................. 14
Purpose ................................................................................................................. 15
Genesis of Generational Research .............................................................. 16
CHAPTER II METHODS ................................................................................................ 21
Research Questions .............................................................................................. 21
Design ................................................................................................................... 22
Measure/Protocol ................................................................................................. 27
Quantitative ................................................................................................ 27
Qualitative .................................................................................................. 29
Instrumentation ..................................................................................................... 33
Population ............................................................................................................. 37
Sample .................................................................................................................. 37
Analyses ............................................................................................................... 39
Aim 1 .......................................................................................................... 40
Aim 2 .......................................................................................................... 46
CHAPTER III RESULTS ................................................................................................ 52

vi
Aim1 ...................................................................................................................... 55
Aim 2 ..................................................................................................................... 69
CHAPTER V DISCUSSION AND CONCLUSION ....................................................... 77
Summary of Study ................................................................................................ 77
Summary of Findings ........................................................................................... 80
Aim 1 .......................................................................................................... 80
Aim 2 .......................................................................................................... 82
Recommendations ................................................................................................ 85
Industry and Practitioners ........................................................................... 85
Academia and Future Research .................................................................. 86
Conclusion ............................................................................................................ 88
REFERENCES ................................................................................................................. 90
APPENDIX A .................................................................................................................. 97
APPENDIX B ................................................................................................................ 110
APPENDIX C ................................................................................................................ 114
APPENDIX D ................................................................................................................ 115
APPENDIX E ................................................................................................................. 116
APPENDIX F ................................................................................................................. 119
APPENDIX G ................................................................................................................ 120
APPENDIX H ................................................................................................................ 121
APPENDIX I .................................................................................................................. 122

vii
LIST OF FIGURES
Page
Figure 1 Social Cognitive Theory ......................................................................... 10
Figure 2 Conceptual Diagram of Millennials. ....................................................... 18
Figure 3 QUAN/QUAL Methods Used For This
Study to Address Research Aims ........................................................... 25
Figure 4 Map of Data Collection ........................................................................... 27
Figure 5 Recode Variables for Generational Groups ............................................ 40
Figure 6 Analysis for Research Question 1 for Aim 1 .......................................... 41
Figure 7 Analysis for Research Question 2 for Aim 1 .......................................... 44
Figure 8 Analysis for Research Question 3 for Aim 1 .......................................... 46
Figure 9 Socially Responsibility Spectrum ........................................................... 48
Figure 10 Analysis of Research Question 4 for Aim 2. .......................................... 49
Figure 11 Qualitative Themes: Personal Interviews ............................................... 64
Figure 12 Qualitative Word Association Findings from Personal Interviews ........ 68
Figure 13 Qualitative Themes of Food Purchasing Behavior from Personal
Interviews ............................................................................................... 74
Figure 14 Qualitative Themes from Corporate Interviews ..................................... 75
Figure 15 Most Perceived Stereotypes of the Millennial Generation ..................... 88

viii
LIST OF TABLES
Page
Table 1 Greatest Areas of Highly Concentrated Millennials ................................ 14
Table 2 Varying Generational Cohorts ................................................................. 19
Table 3 Distribution and Retrieval of Questionnaires ........................................... 38
Table 4 Response and Cooperation Rates of the Larger Study ............................. 54
Table 5 Cell Size ................................................................................................... 55
Table 6 Descriptive Statistics of Millennial Stereotypes: Millennials .................. 56
Table 7 Descriptive Statistics of Millennial Stereotypes: Traditionalists ............. 58
Table 8 Descriptive Statistics of Millennial Stereotypes: Baby Boomers ............ 58
Table 9 Descriptive Statistics of Millennial Stereotypes: Generation X .............. 59
Table 10 MANOVA Millennials Vs. Others Perceptions of Millennial
Stereotypes ............................................................................................... 60
Table 11 ANOVA Millennials vs. Others (Traditionalist, Baby Boomer, and
Generation X) ........................................................................................... 61
Table 12 MANOVA Baby Boomer Vs. Generation X Perceptions of Millennial
Stereotypes ............................................................................................... 65
Table 13 ANOVA Comparing Baby Boomers and Generation X .......................... 66
Table 14 Descriptive Statistics of Food and Drink Establishment Visits ............... 70
Table 15 MANOVA Millennials vs. Others Likeliness to Visit Socially
Responsible Food and Drink Establishments ........................................... 72

1
CHAPTER I
INTRODUCTION AND LITERATURE REVIEW
Introduction
Generational research is not a new concept; in fact, it dates back to Karl
Mannheim (1952). There are many different forms of generational research, each
ranging in length, specialization, framework, and theory (Huntley, 2006; Howe &
Strauss, 2000; Mannheim, 1952). The purpose of studying generations was to understand
the characteristics of each different category of people (Pendergast, 2010).
Millennials, the generation that is quickly moving into the workforce and will,
according to the Pew Research Center (2010), have the largest share of spending power
in the marketplace by 2017, has often been studied by industry and large research firms.
With Millennials quickly making up the majority of decision-makers in the marketplace,
it has become increasingly important to be able to effectively market to them and
understand them as a consumer group.
Millennials have been reported to be concerned with where their food comes
from and how it is marketed to them (Parment, 2013). Smith & Brower (2012)
acknowledged the increasing popularity of the socially responsible trend in food
purchasing with Millennial consumers. The food production and consumption sectors are
a large part of the agricultural industry. To remain current and progressive as marketers
and academics in the food-agriculture field, it is increasingly important to understand
this growing consumer group known as Millennials.

2
Operational Definitions
Traditionalist: An individual born between 1901 and 1944 (Scheid, 2010)
Baby Boomer: An individual born between 1945 and 1960 (Nielsen, 2014; Pew, 2010)
Generation X: An individual born between 1961 and 1979 (Nielsen, 2014)
Millennial: An individual born between 1980 and 1995 (Nielsen, 2014; Pew, 2010;
Deloitte, 2014)
Socially responsible: Refers to a duty every individual or company performs to maintain
a balance between the economy and ecosystems (Smith & Brower, 2012)
Food-agriculture industry: Used to refer to food for consumption. This is food bought at
food retailers, grocery stores, farmer’s markets, restaurants, and convenience stores.
(Smith & Brower, 2012; Smith, 2010)
WOM: Word-of-mouth marketing. The marketing technique used to share information
from consumer to consumer that requires little or no capital expenditure for a company
(Keller, 1998)
Progressive agriculture: A gradual evolution of ideas, findings, or opportunities in
farming agriculture (AgDevONLINE, 2010)
Julian date: The integer assigned to a whole solar day of the year. Julian dates range
from 1 (January 1) to 365 (December 31)
Millennial Stereotype Characteristics
Millennials have most often been studied in industry, rather than through formal
academic research, due to time lags in researchers achieving academic publication.
Industry research allows a larger quantity and real-time assessment of Millennials as a

3
group in a prompt manner. After assessing widely-noted Millennial studies from Nielsen
(2014), Pew (2010), Boston Consulting Group (2012), and articles derived from leading
business consulting firms, the most frequently mentioned common characteristics
describing Millennials included:
Expressive, social, diverse, urban, bargain seeking/ price conscious, healthy,
philanthropic, socially responsible, inclusive, creative, optimistic, motivated,
educated, technological savvy, collaborative.
Millennial Influencers
Nielsen (2014) discovered Millennials would pay a premium for socially
responsible products, which can be defined as products considered to be environmentally
friendly, use sustainable production techniques, and decrease the carbon footprint during
production (Keller, 1998). These findings send a strong message to companies that
produce consumer products. The food-agriculture industry should carefully consider this
finding in their planning, research, and development.
Further, it has been suggested that Millennials have been "taking note of a
company's reputation, reading product labels, and looking for clues on product
packaging to discern if a product is environmentally preferable" (Smith & Brower, 2012,
p. 535). Also, “Some firms are putting corporate social responsibility at the very core of
their existence” (Keller, 1998, p. 176). This shift in corporate strategy has taken place in
consumer goods; however, as pointed out by Smith and Brower (2012), the food-
agriculture industry was increasingly affected by this shift as well.

4
Millennials care about where their food comes from, seeking sustainably
produced goods (Smith & Brower, 2012). Millennials also demand the ability to seek
knowledge through different methods about their food choices and consumer products
(Regine, 2011). The trend of being socially responsible is one that has been consistent
throughout the Millennial generation’s development, although, at first, it was thought to
be simply a fad (Keller, 1998). In a recent study, more than one-half of Millennials
studied indicated they sometimes make an effort to buy “green” or socially responsible
products (Smith, 2010). Millennials seek specific, transparent information about how a
company or a product effects the well-being of the environment. Millennial’s effort to
buy green products supports Nielsen's (2014) claim that Millennials are more socially
responsible than other generations. However, it has been difficult for companies to
effectively communicate their products are sustainable and socially responsible
(Prothero & McDonagh, 1992).
Smith and Brower (2012) claimed Millennial consumers are most influenced by a
company or brand's reputation when they make their purchasing decisions. One way to
build a socially responsible reputation is to support a cause (Keller, 1998). For example,
BCG (2012) reported Millennials were more likely to choose products that support
charitable or philanthropic causes. Many Millennials believed businesses could be doing
more to address society’s environmental and social challenges and concerns, according
to the Deloitte (2014) executive summary. Millennials appeared to be concerned about
doing business with, and even working for, companies with good ethical practices
(Deliotte, 2014).
5
“Engaged employees are those who are fully involved in their work… and are
committed to their own growth and the growth of their company” (Raines & Arnsparger,
2009). Active engagement was defined as the point when individuals were willing to
invest their own personal resources on a task or product beyond those expended during
the consumption or purchase of said thing (Keller, 1998). Obtaining a sense of
achievement and freedom has been shown to influence Millennials’ engagement in tasks
(Raines & Arnsparger, 2009). Allowing Millennials to actively engage in a task in hopes
of achieving something is beneficial by empowering them (Raines & Arnsparger, 2009.
Engagement with Millennials is more than simply communicating; it is important in
building consumer relationships that this group personally be involved and be able to
make decisions (Keller, 1998).
Deloitte (2014) reported Millennials want to work for companies and
organizations that “foster innovative thinking, develop their skills, and make a positive
contribution to society” (p. 2). This preference by Millennials may confirm the more
structured workplace environments that are popular in the agriculture sector, need to
innovate to attract the best Millennial talent. Millennials want to work for a cause with
consistent opportunities to learn and make a difference (Raines & Arnsparger, 2009).
Further, Millennials believe the outlook and attitudes of management could be serious
barriers to innovation, and the reluctance to take risks, reliance on existing ways and
products, and the unwillingness to collaborate with others often hinders growth
(Deloitte, 2014). Millennials typically want more transparent and good communication
channels for change (Deloitte, 2014).

6
Millennials are said to be one of the most technology savvy generations because
of the amount of exposure during their lifetimes. Researchers often predict Millennials
grow bored with the marketplace more quickly due to the constant influx of information
and communication overload (Goman, 2006). Millennial consumers are often viewed as
the trendsetters of today and are growing into the largest and most lucrative demographic
group for marketing professionals to target. Millennials are heavily consumption-
oriented, and account for more than $500 billion in sales; this generation continues to
grow and gain marketplace momentum (Vahie & Paswan, 2006). Now, more than ever,
it could be crucial for companies to connect with this generation to develop brand
loyalty and maintain consistent sales.
It has been reported that word-of-mouth (WOM) marketing resonates highly with
Millennials (Keller, 1998). However, according to Smith and Brower (2012), the
influence of consumer reports saw a declining trend from the years 2009-2011 among
the Millennials sampled.
Millennials were projected to represent the largest share of spending power in the
marketplace, by the year 2017 (Pew, 2010). Therefore, it is increasingly important for
companies who wish to maintain market share to market consumer products to the
Millennial generation. However, Millennials have been found to be quite frugal with
where and how their money is spent (Nielsen, 2014). The shopping habits of Millennials
could drive the creation of more store brands, according to BCG’s (2012) report,
validating Nielsen’s (2014) claim that Millennials were frugal and careful shoppers.

7
Millennial Communication Styles
Academic literature could be inconsistent in defining and describing how the
Millennial generation works, communicates, shops, and prefers consumer products.
However, after reviewing industry-wide reports and studies: e.g., Nielsen (2014), Pew
(2010), Deloitte (2014), and BCG (2012), this researcher noted common research areas
in Millennials’ preferred communication styles. According to the U.S. Chamber of
Commerce Foundation, “Millennials are considered the multitaskers extraordinaire”
(2012, p. 4). As a generation, Millennials are more likely to communicate while doing
more than one thing at a time (Bitley, 2012; Pew, 2010). Although Millennials are able
to multitask, even when communicating, Raines and Arnsparger (2009) said to keep it
simple when it comes to communication styles.
The future landscape of the marketplace may be a participatory economy created
based on the thriving Millennial generation (BCG, 2012). The companies that connect
with Millennials now could thrive in the future, so it is increasingly important to target
this group of consumers. “Research found that 18-26 year olds spend 28% more time
online than 27-40 year olds, read blogs twice as often, and are 50 times more likely to
send text messages” (Brooks, 2005, p. 26).
Millennials are the most digital generation and are often considered media and
tech-rich (Anderson, 2007). Short-form videos were said to be a key element in
marketing strategies, according to the BCG (2012) for Millennials, which supports the
need for marketers to incorporate social inclusion via social networks. Millennials
believe heavily in what is communicated through their inner networks, including their

8
social network following (BCG, 2012). If a company could gain the trust of Millennials
by conveying a relatable message to them in a short video (e.g., Vine or YouTube™),
Millennials may be more likely to share the short video with their networks, which
could, therefore, increase awareness of the company’s brand or product among
millennials through WOM marketing and personal endorsement.
“Generation Y [Millennials] appears to be a notoriously fickle consumer group,
demanding the latest trends in record time” (Brooks, 2005, p. 47). Using instant
messages, text messaging, active email streams, and social networking when
communicating with Millennials is supported by Brooks (2005) claim. In-person
meetings are acceptable for Millennials as long as Millennials are active throughout
(Deloitte, 2014). As a group, Millennials prefer structured, formal processes for change,
along with good communication channels to achieve innovation (Deloitte, 2014).
Theory
Bandura's (1986) social cognitive theory serves as a good theoretical framework
to investigate the perceptions and perspectives of Millennials, in this study. Pajares et al.
(2009) stated, “social cognitive theory is frequently referenced as a framework that
might explain the possible effects of media depiction” (p. 288). The behavior patterns
discussed by Pajares et al. were not tested or reported; however, Pajares et al. suggested
that behavior patterns could be tested with empirical work, in future studies.
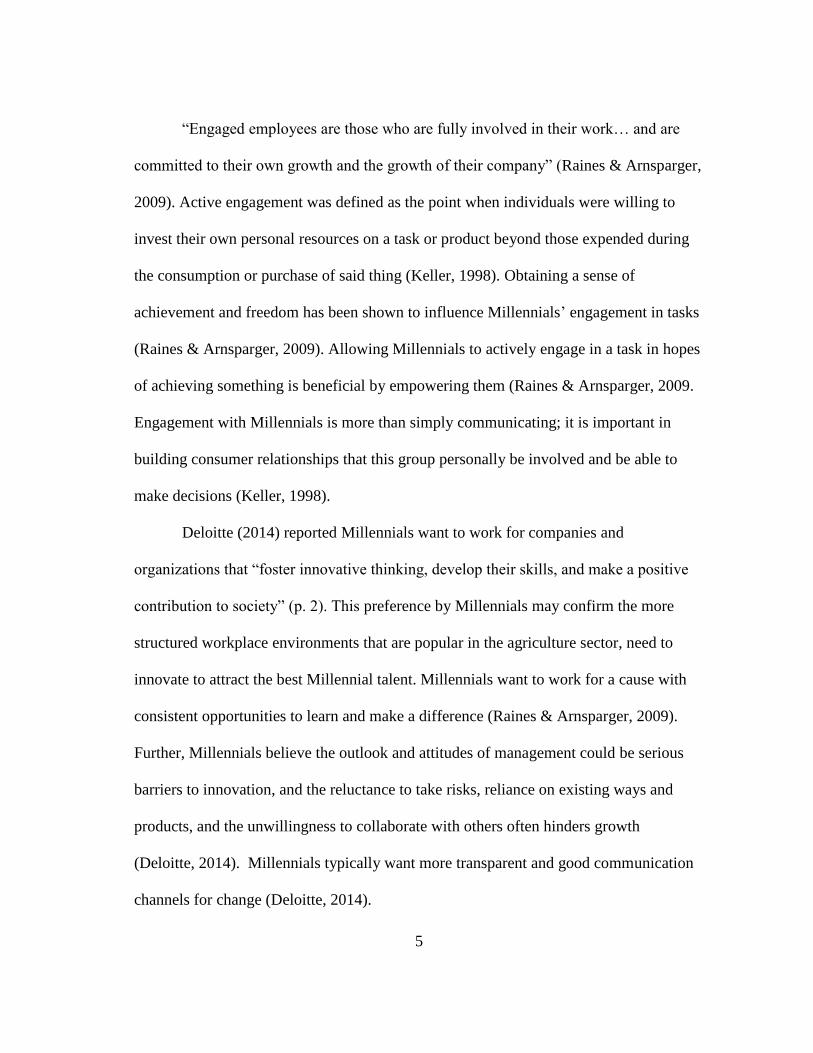
The components of social cognitive theory provided a triadic, reciprocal model
of causation among people to delineate behavioral, environmental, and personal
determinants (Bandura, 1986). Millennials’ personal determinants could be categorized

9
by age, or birth year. Bandura (2009) stated, “most external influences affect behavior
through cognitive process rather than directly” (p. 267). Nielsen (2014) reported
Millennials were more likely to choose social settings where they could interact with
individuals with similar characteristics, supporting Bandura’s (2009) finding that
personal determinants serve as motivators and regulators of behavior.
Due to membership in a generation group and the environment in which an
individual grew up, social cognitive theory could be used to explain an individual’s
behavior. Using social cognitive theory, it can be conceptualized that Millennials’
personal and environmental determinants could affect their behavior and vice-versa,
illustrated in Figure 1. Historically, Millennials’ communication, purchasing behavior,
motivations, and perceptions have been studied (Parment, 2013; Pendergast, 2010; Pew,
2010; Rains & Arnsparger 2009; Smith, 2010).
10
Personal Determinants · Traditionalists (1901-1945)· Baby Boomers (1946-1964)· Generation X (1965-1979)· Millennials (1980-1995)· Internal Motivations· Perceptions
Environmental Determinants · Areas of concentrated
Millennials· Social and political events
exposed to in their lifetime· Baby Boomer parental influence· External communications with
companies
Behavioral Determinants · How Millennials are engaged· Communications· Purchasing behaviors
Figure 1. Social cognitive theory. Illustration of Bandura’s (1986) social cognitive
theory determinants for this study.
Design, Measure, and Interpretation
During the past 75 years, survey research has changed from being a personal
experience for respondents to an impersonal one, which has decreased respondents’
likelihood to respond (Dillman, 2009). Survey research, however, can be costly and
often results in a long time lag due to the time the completed questionnaires spend in
mail transit. Nonetheless, the method of mailing questionnaires through the U.S. Postal
Service has been widely used, despite the challenges associated with assessing public
opinion using mail surveys (Loveridge, 1998; Dillman, 2014).

11
To achieve the personal experience aspect of survey research noted by Dillman
(2009), the design of this study relied heavily on the hand delivery method in multiple
variations in conjunction with a larger study on data collection methods. The hand
delivery method for household surveys, sometimes referred to as the drop-off/pick-up
method (DOPU), is a relatively simple and effective method. DOPU capitalizes on the
benefits associated with personal interviews, without the disadvantages of mail or phone
surveys (Riley & Kiger, 2002). This method, therefore, was easier and more efficient to
streamline among a group of researchers, because of the simplicity of the data collection
process and the ability to train researchers at one point in time.
The hand delivery method has often resulted in significantly higher response
rates (Steele, Bourke, Luloff, Liao, & Krannich, 2001; Allred & Ross-Davis, 2010).
Increases in response rate have been credited to concepts explained by the social
exchange theory pointed out by Dillman (1991). Using face-to-face communication
between the researcher and respondent allows the researcher to further explain the
purpose, scope, and importance of the study and convince the respondent why their
participation matters. Personal contact and follow-ups were reported to positively
influence cooperation (Melvin, 1999). Dillman (2009) stated, social exchange has been
found to be a useful framework for organizing specific actions aimed at improving
response rates. The concept of social exchange has been a widely-noted theoretical
underpinning of survey research for many years and has served as the basis for many of
the recommendations noted in Dillman’s Tailored Design Method (Dillman, Smyth, &
Christian, 2009) for survey research.

12
Again, it should be noted, academic literature has been in conflict with studies
produced by industry on the topics of work, communication, shopping, consumer
product preferences, and motivations of Millennials; e.g., Nielsen (2014), Pew (2010),
Deloitte (2014), and BCG (2012). Industry-led findings have not been empirically driven
in an academic setting, nor a widely accepted theoretical framework been derived from
the outcomes. However, a study by Smith and Brower (2012), completed a longitudinal
comparison of Millennial perceptions over a period of three years. The same sample of
Millennials was used for the duration of the study. However, for this study, the time
constraint limited this study to be conducted longitudinally, due to time constraints.
Deloitte (2014) conducted an international online survey to test 7,800 Millennials
for their Executive Millennial Report. The study was conducted online because of the
popularity of that form of media among the Millennial generation. It should be noted that
all Millennials surveyed by Deloitte were employed full-time and had some form of
college degree, which supports claims by Nielsen (2014), Schield (2010), and Pew
(2010) that the Millennial workforce is growing.
For the Pew Research Center’s The Millennials: Confident, Connected, and Open
to Change (2010), researchers used phone interviews to sample 2,020 adults, with a
larger sub-sample of 18-29 year olds (Millennials). The questionnaire used to structure
the phone interviews was created based on data from more than 20 years of data from
polls on political and social values (Pew, 2010). The instrument used was created based
on constructs of past Pew studies on the specific topic areas addressed (e.g., beliefs,
behaviors, technology, and engagement; 2010). Findings were presented by generation

13
(Millennial, Gen X, Baby Boomer, and Silent). The Millennial sample size was equal to
that of the other three generations combined, and mean and standard deviations were
reported for each question presented.
Data collection methods between Nielsen’s (2014) Millennials--Breaking the
Myths and Pew’s The Millennials: Confident. Connected. Open to Change. were similar.
did (2010). Nielsen relied on specific assessments of demographic information (e.g.,
UPC-coded products, market basket of goods, population, languages, entertainment and
media consumption, and employment) to create the questionnaire used in their 2014
report. Unlike Pew’s (2010) more limited statistics of reporting n values for each
questioned asked, Nielsen (2014) reported frequency, percent, mean, and standard
deviation for each of the areas analyzed.
Regine (2011) studied the consumer food choices of Millennials. In Regine’s
(2011) study, she used inferential (univariate analysis of variance (ANOVA) and a t-test)
and non-parametric (chi square) tests to determine if significant differences existed
between the variables of attitudes towards products, and consumers. Regine’s (2011)
instrument was a two section questionnaire. The first section asked respondents about
demographic variables (e.g., age, income, educational level, and ethnic group), while the
second section asked respondents about their preferences and opinions about grocery
products. By using an sectioned instrument, Regine was able to separate and report
based on generational groups.

14
Population
The purpose of this study was three-fold: 1) describe Millennials’ perceptions of
the communication styles, motivations, and stereotypes of the Millennial generation; 2)
describe how members of other generations (i.e., Traditionalists, Baby Boomers, and
Gen X) perceive the communication styles, motivations, and stereotypes of the
Millennial generation, and then 3) compare Millennials’ responses to those of the other
generations. This population may consist of but is not limited to employers hiring
Millennials, customers who interact with Millennials in a professional setting, and
companies who communicate to Millennials about products (Parment, 2013; Raines &
Arnsparger, 2010; Deloitte, 2014; Smith & Brower, 2012). Nielsen (2014) suggested the
10 markets with the largest number of Millennials, which closely align to the selected
markets sampled for this study, shown in Table 1.
Table 1
Greatest areas of highly concentrated Millennials
City, State
Percent of Population
Defined as Millennial Index for Concentration
Austin, TX 16 120
Salt Lake City, UT 15 117
San Diego, CA 15 117
Los Angeles, CA 14 109
Denver, CO 14 109
Washington, DC 14 109
Houston, TX 14 108
Las Vegas, NV 14 108
San Francisco, CA 14 107
Dallas-Fort Worth, TX 14 106
Note. Nielsen Pop-Facts ® (2013); Nielsen (2014).

15
However, due to the nature of this study and its sampling limitations, the findings
of this study cannot be inferred beyond this study’s respondents. Further, the
respondents may have opinions and experiences with Millennials beyond the scope of
this study, and out of researcher control.
Purpose
The agriculture community and food-agriculture market is ever-evolving and
growing. Marketers must relate to, understand, and engage their customers (Keller,
1998). It is now essential for companies to stay close to their customers and develop
more customers to stay current in the marketplace (Agri-Marketing, 2009). There was
little research in the literature exploring the perceptions of Millennials related to the
food-agriculture industry. Industry studies from Nielsen (2014) and Pew (2010) explored
perceptions of Millennials’ shopping behaviors, bud did not pertain specifically to food.
The lack of research poses a problem, because to effectively serve the next generation of
decision makers and consumers in the food-agriculture sector, marketers in the food
consumption and purchasing industries must understand Millennials as consumers.
The traditional agriculture industry was notorious for implementing the one-size-
fits-all marketing technique, according to the National NAMA News (2009). However,
in today’s marketplace, the one-size-fits-all strategy hurts more than it helps. “Changes
[are] forcing and enabling U.S. farmers and livestock producer to reach out beyond
traditional communities to ensure the success of their enterprises” (National NAMA
News, 2009; Kohl, 2009).

16
The Millennial generation has continued to grow in the workplace and will make
up most of the working class in the coming years (Nielsen, 2014; Pew, 2010).
Understanding Millennials thoughts, motivations, and decision-making processes is
crucial to communicating and targeting them as consumers effectively. According to
2010 U.S. Census Data, each year, one-million Millennials enter the workforce. Nearly
40% of the U.S. workforce will be Millennials by 2020 (Lynkins & Pace, 2013), making
Millennials the largest working class in history to date. Also, Millennials were predicted
to surpass all other generations in total earnings (Pew, 2010). It could be argued,
therefore, that Millennials may have more disposable income through the duration of
their lifetimes and be able to purchase more goods, which could be important to
marketers and communicators in all industries, including food-agriculture. The
importance of understanding Millennials has only grown in importance in food
agriculture.
One of the most valuable pieces of information for any company is the
relationship the company has with its customers (Berry & Seltman, 2008). Obtaining
accurate and correct information is a difficult task. However, the benefits of a company
or organization knowing their target market could increase awareness, allow
customization of communication and marketing strategies, and ultimately positively
affect the company’s bottom line (Mulder & Yaar, 2006).
Genesis of Generational Research
Generational research is not a new concept; it dates back to at least the work of
Mannheim in 1952. There are many different forms of generational research ranging in

17
lengths, specializations, frameworks, and theories (Huntley, 2006; Howe & Strauss,
2000; Mannheim, 1952). The purpose of studying generations was to understand the
characteristics of each different category of people (Pendergast, 2010).
Generations are categorized by the year in which individuals were born. There
was much disagreement regarding which years define each generation. For example,
Schield (2010) defines the Traditionalist generation as those born between 1901 and
1944; whereas, Nielsen (2014) did not define this group as the commonly adopted
Traditionalists at all (Pew, 2010; Deloitte, 2014; Pendergast, 2010). Instead, Nielsen
(2014) defined the previously noted Traditionalist as the Greatest Generation for years
1901-1924 and the Silent Generation for years 1924-1945.
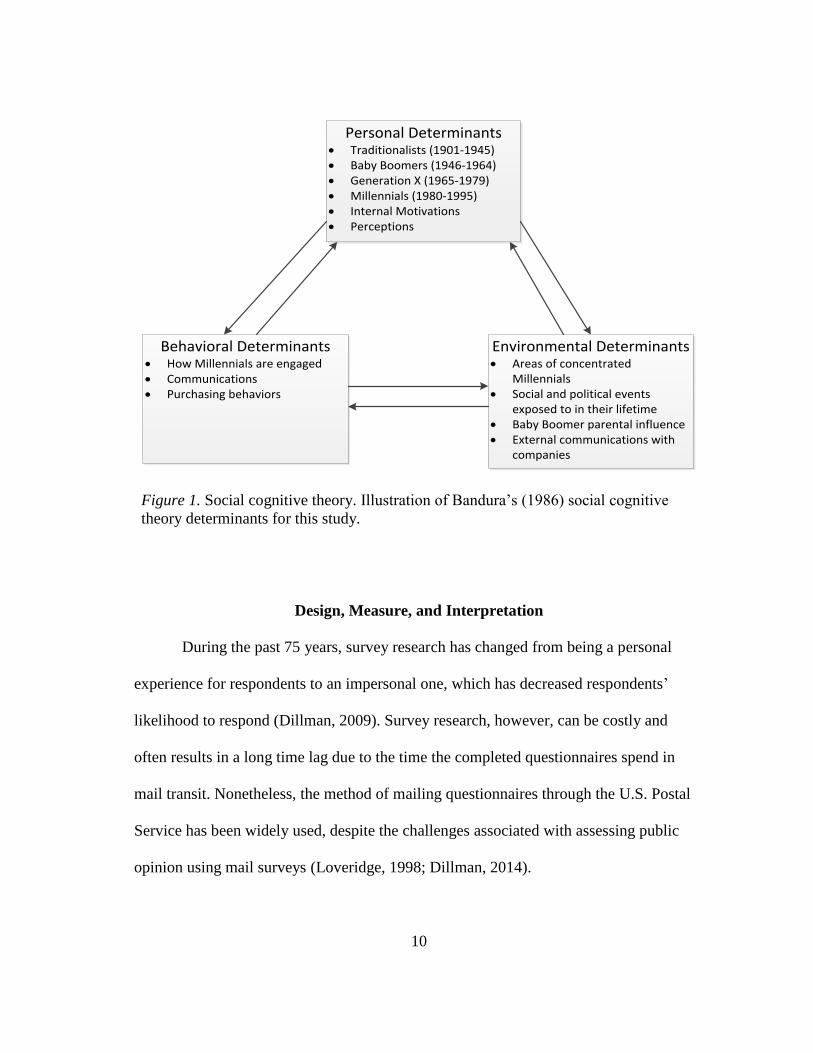
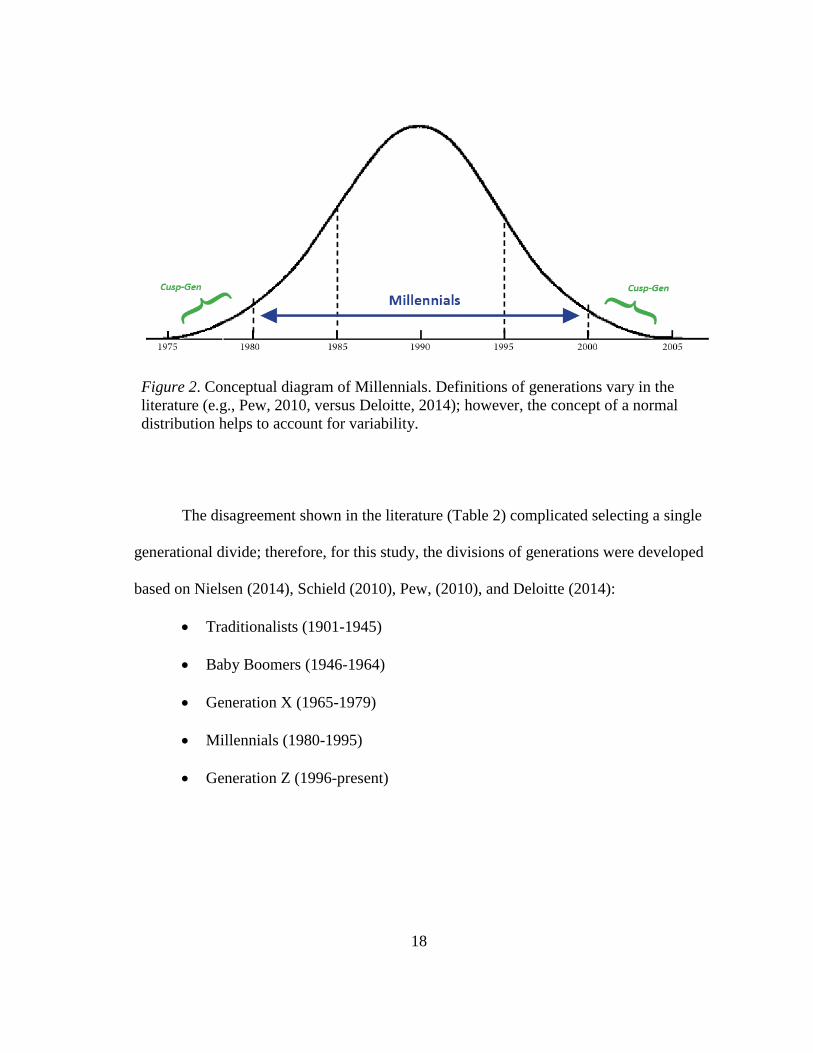
Generation membership is defined by age ranges. Each range of ages reported
varied depending on the research, which causes different age criteria for membership in
generational groups. Concern about generational overlaps can be accounted for by the
concept of normal distribution, which allows overlaps in many definitions of
generational groups. Members who fall in the either of the tail ends of the distribution
are known as a cusp (Kupperschmidt, 2000). A cusp-generation cohort group is defined
as individuals who were born within three-to-five years of each end of a generational
group (Kupperschmidt, 2000; Egri & Ralston, 2004). Cusp-generations are likely to
possess characteristics of the adjacent two generational groups rather than associating
more with either. Figure 2 illustrates the concept of the Millennial generation group
with cusp-generations.
18
Figure 2. Conceptual diagram of Millennials. Definitions of generations vary in the
literature (e.g., Pew, 2010, versus Deloitte, 2014); however, the concept of a normal
distribution helps to account for variability.
The disagreement shown in the literature (Table 2) complicated selecting a single
generational divide; therefore, for this study, the divisions of generations were developed
based on Nielsen (2014), Schield (2010), Pew, (2010), and Deloitte (2014):
· Traditionalists (1901-1945)
· Baby Boomers (1946-1964)
· Generation X (1965-1979)
· Millennials (1980-1995)
· Generation Z (1996-present)

19
Table 2
Varying generational cohorts
Generation This study Nielsena Schieldb Pewc Deloitted
The Greatest —— 1901 – 1924 —— —— ——
The Silent —— 1925 – 1945 —— —— ——
Traditionalist 1901 – 1944 —— < 1945 1901 – 1945 ——
Baby Boomer 1945 – 1960 1946 – 1964 1946 – 1964 1946 – 1964 ——
Generation X 1961 – 1979 1965 – 1976 1965 – 1982 1965 – 1980 ——
Millennial 1980 – 1995 1977 – 1995 1983 – 2000 1980 – Prs. 1983 – Prs.
Generation Z 1995 – Prs. 1995 – Prs. —— —— ——
Note. a Nielsen (2014); b Schield (2010); c Pew Research Center (2010); d Deloitte
(2014); Prs. = present
Generational research is considered “dynamic, socio-cultural theoretical
framework that employs a broad brush-stroke approach, rather than an individual focus”
(Pendergast, 2010, p. 1). The broad approach allows generalizability of a set of
characteristics to a wide range of people. Generational research is most studied in
industry and practice because of the direct interactions companies have with these
different groups of people. Therefore, generational research was usually defined as a
culmination of demographers, the press and media, popular culture, and researchers
(Pendergast, 2010).
For the purposes of this study, Millennials were defined as those individuals born
between 1980 and 1995. Individuals born in the mid-1970s until the millennium, or year
2000 (Deloitte, 2014; Mannheim, 1952; Nielsen, 2014; Parment, 2013; Pendergast,
2010; Pew, 2010; Smith, 2010)were also known as the “Echo Boom” or the “Tech
Generation” because they were mostly children of Baby Boomers and were the first
generation group to live their entire life with what is known today as “modern day

20
technology” (BCG, 2012). Because they were raised with access to the Internet,
Millennials have been accustomed to technology and information being readily available
and are able to tend to multiple devices at one time (BCG, 2012).

21
CHAPTER II
METHODS
The primary purpose of this study was to explore how members of the Millennial
generation perceived stereotypes about themselves (the Millennial generation) and how
people of other generations (Traditionalists, Baby Boomers, and Gen X) perceived
stereotypes of millennials. A secondary purpose of this study was to explore how each
generation perceives socially responsible food and drink establishments, which will help
to understand Millennials’ food purchasing motivations and decisions. This chapter will
describe the research design, measures/protocol, instrumentation, population and sample
used to answer this study’s aims, research questions, and research objectives.
Research Questions
Aim 1: Understand perceived generational differences
RQ.1: What are Millennials’ perceptions of stereotypes of the Millennial
generation?
RO1.1: Describe Millennials’ self-perception of the Millennial
generation.
RO1.2: Describe Millennials’ perception of the Millennial generation.
RQ.2: How is the Millennial generation perceived by other generations?
RO2.1: Describe how Traditionalists perceive the Millennial generation.
RO2.2: Describe how Baby Boomers perceive the Millennial generation.
RO2.3: Describe how Generation X perceive the Millennial generation.

22
RO2.4: Compare how other generations perceive the Millennial
generation.
RQ.3: Are there differences in how generations perceive the Millennial
generation?
RO3.1: Compare how Traditionalists, Baby Boomers, and Generation X
perceive the Millennial generation.
Aim 2: Understand food consumption behavior of generations.
RQ.4: Does social responsibility affect food consumption habits based on
generation?
RO4.1: Describe food and drink establishment consumption by
generations.
RO4.2: Compare Millennial food and drink establishment consumption to
other generations.
Design
This study was composed of two parallel, cross-sectional components, illustrated
in Figure 3. Bryman (2012) noted a cross-section design is best used at single points in
time for quantifiable data to establish patterns of association among variables. A
quantitative study using a survey questionnaire was conducted to assess the stereotypes
of Millennials and address Aim 1. A qualitative study was conducted simultaneously to
provide a deeper understanding of the Millennial generation stereotypes addressed in
Aim 1. Quantitative data in the form of a survey questionnaire, as well as qualitative data
in the form of corporate and personal interviews, were gathered to provide understanding

23
for Aim 2. According to Morse (2003), separate simultaneously quantitative and
qualitative studies can be used when “one is dominate of and forms the basis of the
other” (p. 197).
Conducting a mixed method study was another option for this study; however,
due to the size of the qualitative portion of this study, and the complementary nature of
the questions, two parallel studies were best suited. The reason for conducting parallel
quantitative and qualitative data collection was to better understand the research
problems and further answer the research questions. By using a parallel qualitative
study, the question of “why?” could be addressed, and provide meaningful backing to
the quantitative data.
To address Aim 1, a survey questionnaire was used to measure the relationship
between demographic variables (e.g., age) and generational groups (e.g., Traditionalists,
Baby Boomers, Generation X, Millennials) quantitatively using a paper questionnaire
and the DOPU method. The stereotypes of Millennials were explored further by using
personal qualitative interviews at locations near Bryan/College Station, TX; San
Francisco, CA; and San Diego, CA.
To address Aim 2, the same questionnaire was used to measure food purchasing
preferences and food and drink establishment preferences among generations.
Simultaneously, corporate interviews were conducted with companies in the agricultural
industry that describe themselves as progressive, sustainable, socially responsible,
environmentally friendly, and/or green. These interviews occurred at various locations
(Denver, CO; Los Angeles, CA, San Francisco, CA; San Diego, CA). These interviews

24
were not conducted on a one-on-one basis, but rather in a group of sixteen undergraduate
and graduate students, which limited the ability to explore the overall findings in depth
for this study, depending on the progression of each presentation or meeting. A
combination of presentations and open forum discussions were used to collect corporate
qualitative data. A total of six graduate students compiled transcripts from each
corporate visit. Immediately following the interviews, researchers collaborated and
discussed any disagreements, establishing confirmability as defined by Lincoln and
Guba (1985) as ensuring findings are consistent. It should be noted each researcher’s
notes varied on data collected (e.g., topics, direct quotes) but were all documented to
create an audit trail. Preliminary research was conducted on each company visited to
increase the understanding of information discussed during the interview times.
Conducting this preliminary research allowed a better understanding before and during
corporate interviews, and allowed researchers to more accurately transcribe field notes.

25
Supplementary component of project:
Core component of project:
Corporate interviews(Business)
Collecting supplementary data for Aim 2
Analyzing supplementary data for Aim 2
Research Aims 1 & 2
QUALEnhancing descriptions
(Inductive)
QUANTTheoretical drive &
discussing stereotypes(Deductive)
Interviews
Personal interviews
(Consumer)
Collecting supplementary data for Aim 1
Analyzing supplementary data for Aim 1
Integrating supplementary data for Aim 1
Integrating supplementary data for Aim 2
Research Aim 2
Research Aim 1
Survey
Consumer
Analyzing core data for Aim 1&2
Research results for Aim 1&2
Collecting core data for Aim 1&2
Figure 3. QUAN/QUAL methods, used for this study to address research aims. This
study was composed of two parallel, descriptive, cross-sectional studies.

26
Four data collection methods were used in this study: Drop-off/Pick-up (DOPU),
Drop-off/Mail-back (DOMB), qualitative interviews, and a mail survey. The DOPU and
DOMB are variations of the home delivery method (Dillman, 2007). Quantitative data
used to address the research aims of this study were drawn from a larger study to test
survey data collection methods. Appendix A provides an overview explanation, protocol,
and locations of each type of method used. A limitation section for each different data
collection type is presented respectively following the method. All references to the
differing DOPU methods, regardless of the variety (e.g., DOPU, DOMB, USPS) or
duration (e.g., 2, 3, 24, or 48 hours), were referred to as DOPU.
The same questionnaire (Appendix B) was used for each quantitative data
collection method and qualitative interviews were conducted on a personal basis as well
as on a corporate level. The personal interviews were semi-structured using the questions
outline in Appendix C, while corporate interviews were conducted at the discretion of
the companies involved. The number of students present during corporate interviews and
the time allotted to the group on the ALEC summer research trip affected the interview
type and structure. All of the DOPU varieties followed the same hand-delivery method;
however, they differed in retrieval methods and locations. Data collection locations were
determined by the lead faculty member of the ALEC summer research trip and were
selected purposively for the scope of the larger study, which this study is a small portion
of, as illustrated in Figure 4. Due to the travel schedule, quantitative and qualitative data
were often collected in the same location for this study.

27
Key:
Quantitative Only
Quantitative and Qualitative
Key:
Quantitative Only
Quantitative and Qualitative
Figure 4. Map of data collection. Data were collected in conjunction with the 2014
ALEC summer research trip and fall undergraduate research courses.
Measures/Protocol
Quantitative
The DOPU varieties used the hand delivery method with trained researchers
going door-to-door in a randomly selected location, using face-to-face communication to
determine each respondent’s eligibility, and distributing a questionnaire (Allred & Ross-
Davis, 2011). Potential respondents were then notified that the researcher would return
after a specific period of time (48 hours, 24 hours, 3 hours, 2 hours) to retrieve the
completed questionnaire (Steele et al., 2001; Melevin et al., 1999). The response rate for
this study and the larger study was calculated as follows:

28
𝑅𝑒𝑠𝑝𝑜𝑛𝑠𝑒 𝑅𝑎𝑡𝑒 = 𝑁𝑢𝑚𝑏𝑒𝑟 𝑜𝑓 𝑐𝑜𝑚𝑝𝑙𝑒𝑡𝑒𝑑 𝑠𝑢𝑟𝑣𝑒𝑦𝑠 𝑟𝑒𝑡𝑟𝑖𝑒𝑣𝑒𝑑
𝑁𝑢𝑚𝑏𝑒𝑟 𝑜𝑓 𝑠𝑢𝑟𝑣𝑒𝑦𝑠 𝑑𝑖𝑠𝑡𝑟𝑖𝑏𝑢𝑡𝑒𝑑 𝑋 100
Each group was led by a head researcher who was a graduate student or
undergraduate research scholar trained in proper recording techniques prior to data
collection; this aforementioned researcher served as the decision-maker of the group.
Head researchers recorded the Julian date, zip code, streets, addresses, environmental
observations, and respondents agreement or decline to participate in the survey. These
leaders were also trained to ensure the consistency of the data collection method and
remained the head researcher for the entire duration of data collection, both in summer
and fall. Each student researcher went door-to-door and was instructed to use the
following script outline:
· Introduce yourself and make a connection with Texas A&M University.
· Indicate you are not selling or soliciting anything.
· Give the questionnaire to the resident.
· Indicate “We will be back on (date and time) to pick them up. Please place the
questionnaire in the door hanger bag and leave it on your door.”
· Thank potential respondent for their time.
Within the different variations of the DOPU method, the script (see Appendix D)
was altered to indicate the correct times and dates of retrieval, or if the questionnaire
should be returned by prepaid envelope in the mail. The head researchers answered

29
specific questions and instructed their group members on best practices when
communicating with the residents. A full script can be found in Appendix D.
Malhotra and Grover (1998) defined frame and selection error as “failure to
include all elements in the chosen population and exclude elements belonging to
extraneous populations” (p. 77). Limitation to the accuracy of the DOPU method were
largely attributed to frame and selection error associated with residents not being home,
locked gates, not allowing the researcher to get to the door, unsafe surroundings, and
obstructions to the residence. The amount of time taken to drop off and pick up packages
ranged anywhere between 6 and 12 hours per research group, depending on whether
residents were home and willing to continue conversation after face-to-face rapport was
made. Conversations lasted between 5 and 45 minutes with residents who were home.
The inability to confirm if the resident received the questionnaire was an issue without
creating face-to-face contact when trying to retrieve the questionnaires. When
researchers attempted to retrieve questionnaires, some residents indicated they had never
received the questionnaire.
Qualitative
Qualitative interviews were used to collect in-depth data on thoughts, behaviors,
actions, and perceptions of Millennial stereotypes. In-depth data was collected by
conducting face-to-face interviews in purposive locations during the six week ALEC
summer research trip. Personal interviews allowed researchers to assess eligibility for
the study and create face-to-face rapport, but was costly due to travel expenses and time
consumed. The interviewees were selected purposively based on the potential

30
respondents’ willingness to interview. Researcher bias was acknowledged by attempting
to interview a range of generations by visually assessing each potential respondent and
categorizing them into a generation group before an interview was conducted. Interviews
took place in purposive locations selected for the larger project for the scope of the
ALEC summer research trip.
This study was concerned with perspectives, Millennial and other generations, as
well as the food-agriculture sector. Each personal interview was conducted by two
trained researchers to provide trustworthiness and transferability to the qualitative study,
defined by Lincoln and Guba (1985) as providing evidence of credibility, transferability,
dependability and conformability in this study. Interviews were semi-structured by using
the list of interview questions in Appendix C. However, if the interviewee and/or
researcher wished to explore a question or comment further, a note was made in the field
notes, and the deviation was explored and documented by using an asterisk. Allowing
deviations from the script allowed researchers the freedom to accurately uncover
behaviors, thoughts, and perceptions of the individuals interviewed. Rapport was
established with interviewees by introducing themselves, indicating this was a study
from Texas A&M University, and were collecting data for various projects. If the
interviewee agreed to take 15 to 30 minutes to participate in the interview the
researchers immediately categorized interviewees by year of birth, which allowed the
researchers to categorize interviewees by generation, and therefore, dictated the set of
questions he or she was asked. Locations of personal interviews consisted of farmers
markets, the San Diego County Fair, and public venues related to food.

31
Lincoln and Guba (1985) defined trustworthiness as providing evidence of
credibility, transferability, dependability and conformability in this study. Establishing
trustworthiness is important to ensure that the study is true and dependable (Lindlof &
Taylor, 2011). Lincoln and Guba (1985) defined dependability and confirmability as
showing findings are consistent and a degree of neutrality is reached by researchers,
respectively. Each qualitative interview was conducted by a minimum of two
researchers, this researcher always being included in the pair, to ensure dependability
and transferability of data. Reflexive journals and transcripts were written in Black n’
Red™ notebooks by each researcher involved. Ortlipp (2008) stated, reflective
journaling allows the researcher to acknowledge their own bias and create a notion of
transparency in the research process. The transcripts were discussed and collaborated
together immediately following each qualitative interview, addressing confirmability in
this study. When researchers disagreed, verbal discussion ensued until a consensus was
met.
Corporate interviews were conducted in a group of 16 graduate and
undergraduate students and one faculty member on the ALEC summer research trip. The
six graduate students each took field notes in Black n’ Red™ notebooks for each
interview, and collaborated transcripts immediately following each interview, so
information was at the top of mind. When researchers disagreed, verbal discussion
ensued until a consensus was met. The corporate interview structure varied to
accommodate the larger group of students present. The corporate locations were selected
by the lead faculty member, and were based each company’s claim to be a non-

32
traditional representation of agriculture and progressive in their use of media,
communication, and/or marketing efforts. The structure of the corporate interviews were
a mixture of semi-structured, as graduate students all individually prepared a list of
questions for each meeting or presentation, and unstructured, which occurred when
companies prepared a presentation rather than conducting a round table discussion.
Preparing individual questions allowed each graduate researcher to ask her own points of
interest to accurately uncover opinions and perceptions of her topic.
For this study, interview questions, whether personal or corporate, were asked
based on the quantitative questionnaire used in this study. By basing qualitative
interview questions on the quantitate questionnaire, which was derived heavily from
industry reports and research findings from Nielsen (2014) and Pew (2010), provided
credibility to the study as defined by Bryman (2012) as the acceptance by industry and
academia.
Due to the scope of the larger study, qualitative limitations did exist. By
conducting corporate interviews with a group of graduate and undergraduate researchers
did not allow personal, one-on-one attention to the specific topic at hand. Less time was
spent on the subject of this study than would have been if interviews were private.
Personal interviews were conducted on a convenience basis in purposive locations in
conjunction with the ALEC summer research trip.
Lincoln and Guba (1985) defined trustworthiness as providing evidence of
credibility, transferability, dependability and conformability in this study. Establishing
trustworthiness is important to ensure the qualitative study is true and dependable

33
(Lindlof & Taylor, 2011). Lincoln and Guba (1985) defined dependability and
confirmability as showing that findings are consistent and a degree of neutrality is
reached by researchers, respectively. Each qualitative interview was conducted by a
minimum of two researchers, this researcher always being included in the pair, to ensure
dependability and transferability of data. Reflexive journals and transcripts were written
in Black n’ Red™ notebooks by each researcher involved. Ortlipp (2008) stated,
reflective journaling allows the researcher to acknowledge their own bias and create a
notion of transparency in the research process. The transcripts were discussed and
collaborated together immediately following each qualitative interview, addressing
confirmability in this study. When researchers disagreed, verbal discussion ensued until
a consensus was met.
Instrumentation
Quantitative demographic data were collected to properly assign individuals into
generation groups and provide basic identifying information as defined by Nielsen’s
study Millennials – Breaking the Myths (2014) and the Pew Research Center’s study The
Millennials: Confident. Connected. Open to Change (2010). Demographic questions
were included in each form of the questionnaire used for the larger study conducted on
the ALEC summer research trip. Questions were based on Nielsen’s U.S. Digital
Consumer Report. All three of these publications are widely accepted in academic and
industry settings and, therefore, provide a level of creditability to the study, as defined
by Bryman (2012).

34
A three-section questionnaire was used for this study consisting of a
demographics portion (part of the larger study), Millennial-generation-only portion
(specific to this study), and an all other generations portion (specific to this study). By
taking that approach researchers were able to disaggregate data among the differing
generations and were able to generalize based on the respondent’s generational group.
Using questionnaires containing different questions per generation group have been
popular and used by Nielsen (2014) and Pew (2010).
The generational questions, in the second and third sections of the questionnaire,
included specific questions about purchasing decisions, motivations, and opinions about
Millennials and/or the respondents’ generation. Questions were derived by consulting
literature on food and consumer purchasing behavior among differing generation groups,
with an emphasis on Millennials. A list of stereotype-based statements used to describe
Millennials were tested using Likert scale questions. Many Millennial stereotypes were
noted in academic literature (Barton, Fromm & Egan, 2012; Bitley, 2012; Brooks, 2005;
Byrne, 2007; Goman, 2006; Howe & Strauss, 2000; Huntley, 2006; Lykins & Pace,
2013; Parment, 2013; Pendergast, 2010; Raines & Arnsparger, 2009; Regine, 2011;
Scheid, 2010; Smith, 2010; Smith & Brower, 2012) and practitioner literature (BCG,
2012; Deloitte, 2014; Nielsen, 2014; Pew, 2010). However, respondent fatigue was a
concern; therefore, not all stereotypes were included in the questionnaire because of the
number of total items in the questionnaire, and time it would take a potential respondent
to complete. Bradley and Daly (1994) noted an effect of respondent fatigue;
“…respondent fatigue" may cause people to make choices less carefully as the number

35
of choices increases” (p. 171). Therefore, we attempted to minimize the number of
questions asked to each respondent by only including the Millennial stereotypes
mentioned most frequently in the literature, and attempting to maintain aesthetic appeal
of the questionnaire.
Face validity is “the measure that reflects the content of the concept in question”
(Bryman, 2012, p. 171). For this study, face validity was addressed by having
conversations and consulting faculty and graduate students, in similar disciplines, to
review the questionnaire to determine if the questions asked were adequate based on the
aims, research questions and objectives presented for this study.
Content validity is whether the measure actually determines what it is trying to
test (Collins, 2006). Messick stated, that content validity is established by showing test
items are a sample of a universe in which the investigator is interested (1995, p. 2). By
basing survey questions on those used in previous studies (Nielsen, 2014 and Pew,
2010), as well as consulting the literature for the stereotypes used in the questionnaire
established content validity, and aided in ensuring the instrument measured what was
being tested in this study (Collins, 2006).
Bryman (2012) noted reliability and measurement validity are determined by the
quality of the measures and replicability of the study. For this study, the questionnaire
was refined through six iterations before finalizing the final questionnaire, which was
sent to respondents to establish reliability. The questionnaire was designed to create a 12
page, 8.5” X 7” booklet with a heavy weight color cover.
36
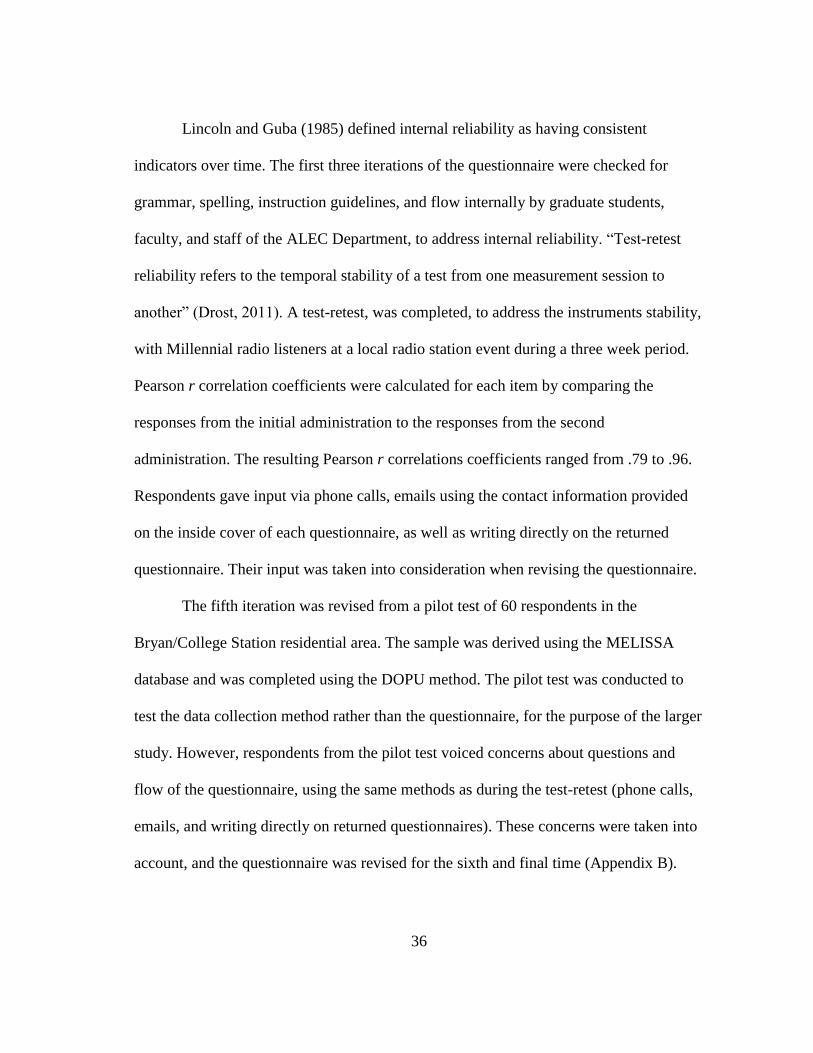
Lincoln and Guba (1985) defined internal reliability as having consistent
indicators over time. The first three iterations of the questionnaire were checked for
grammar, spelling, instruction guidelines, and flow internally by graduate students,
faculty, and staff of the ALEC Department, to address internal reliability. “Test-retest
reliability refers to the temporal stability of a test from one measurement session to
another” (Drost, 2011). A test-retest, was completed, to address the instruments stability,
with Millennial radio listeners at a local radio station event during a three week period.
Pearson r correlation coefficients were calculated for each item by comparing the
responses from the initial administration to the responses from the second
administration. The resulting Pearson r correlations coefficients ranged from .79 to .96.
Respondents gave input via phone calls, emails using the contact information provided
on the inside cover of each questionnaire, as well as writing directly on the returned
questionnaire. Their input was taken into consideration when revising the questionnaire.
The fifth iteration was revised from a pilot test of 60 respondents in the
Bryan/College Station residential area. The sample was derived using the MELISSA
database and was completed using the DOPU method. The pilot test was conducted to
test the data collection method rather than the questionnaire, for the purpose of the larger
study. However, respondents from the pilot test voiced concerns about questions and
flow of the questionnaire, using the same methods as during the test-retest (phone calls,
emails, and writing directly on returned questionnaires). These concerns were taken into
account, and the questionnaire was revised for the sixth and final time (Appendix B).

37
Population
When conducting research on generations, it is important to be able to generalize
to the largest population possible (Pew, 2010). One of the purposes of this study was to
investigate Millennial stereotypes. A liberal approach to generalizability would allow the
results and findings of this study to be generalizable to all Millennials (born 1980-1995),
in the specific or similar demographic areas of the United States as those selected for the
larger study. Conversely, a conservative approach was taken when interpreting and
generalizing the results of this study. Therefore, because of unknown amounts, and
sources of error (e.g., sampling error, non-response error, and frame error), the results
and finding of this study were restricted to the participants of this study.
Another objective was studying characteristics in conjunction with Millennials
food purchasing decisions, perceptions, and food-agriculture industry interactions. The
findings of this study could also be applicable to Millennial food purchasers who shop
and/or eat at food related businesses who claim to be progressive, sustainable, socially
responsible, environmentally friendly, and/or green to the respondents of this study in
geographic areas of the United States sampled.
Sample
The zip codes, streets, and addresses for the larger study were randomly selected
using the MELISSA database for all DOPU data collection. The MELISSA database
system is a user-friendly way to gain clean, correct, and complete contact data based on
geographic locations. A random number generator in Microsoft® Excel was then used to
ensure randomization of the sample locations. Google Maps™ was used to look at the

38
first randomly selected street and neighborhood to insure safety among researchers.
After the first street was randomly selected, the researchers distributed questionnaires to
other residents on nearby and adjacent streets due to convenience and safety of the
researchers.
Sample size for this study, n = 1,550, was approximately one-sixth of the sample
size of the larger study. This sample, specifically for quantitative data collection,
consisted of DOPU, DOMB, and mail (USPS) survey methods. The locations sampled
during data collection and the number of questionnaires retrieved are outlined in Table 3.
Table 3
Distribution and retrieval of questionnaires
Location n a
Bryan/College Station, TX (Pilot) —
Denver, CO 32
San Francisco, CA 37
Fresno, CA 21
San Diego, CA 56
Bryan/College Station, TX 42
Houston, TX 25
Dallas, TX 13
Note. a number of questionnaires retrieved from data collection using DOPU, DOMB, and
mail survey (USPS).
There were 15 personal qualitative interviews and five corporate interviews
conducted. Personal interviews were conducted on a convenience and purposive basis
due to the objectives of the larger study. Interviews for this study were conducted at
research stops on the ALEC summer research trip, making them convenient and

39
purposive. Potential interviewees were selected by a pair of researchers. Granted,
personal biases could have taken place in the selection of interviewees by visually
assessing age; however, visible demographic information was noted in each transcript.
Corporate interviews were selected on a purposive basis in conjunction with the ALEC
summer research trip. The companies were selected based on their position in the non-
traditional agriculture industry by the lead faculty member. Each of the companies
visited made the claim to be one or more of the following: progressive, sustainable,
socially responsible, environmentally friendly, and/or green.
Analyses
Respondent data from the larger study were imported into IBM® SPSS®, version
20, from a Microsoft® Excel spreadsheet. Data included in this study were nominal,
ordinal, and interval. Data were categorized based on research aim and the
corresponding questions and objectives associated with each. The alpha level for
comparisons was set a priori at .05; however, multiple comparisons required adjustment
to the alpha to address inflated Type I error using a Bonferroni correction. Each
adjustment will be addressed by analysis. Analyses and results were presented by Aim
and Research Question in the following chapters.
Due to the large scale of data used in the larger study, variable recodes were
computed specifically for this study to create codes for the differing generational groups,
illustrated in Figure 5. Generation groups (i.e., Millennials, Generation X, Baby
Boomers, and Traditionalists) were based on D001 (year born), which resulted in
recoded variables D001_RC2_B (Traditionalists, Baby Boomers, Generation X, and
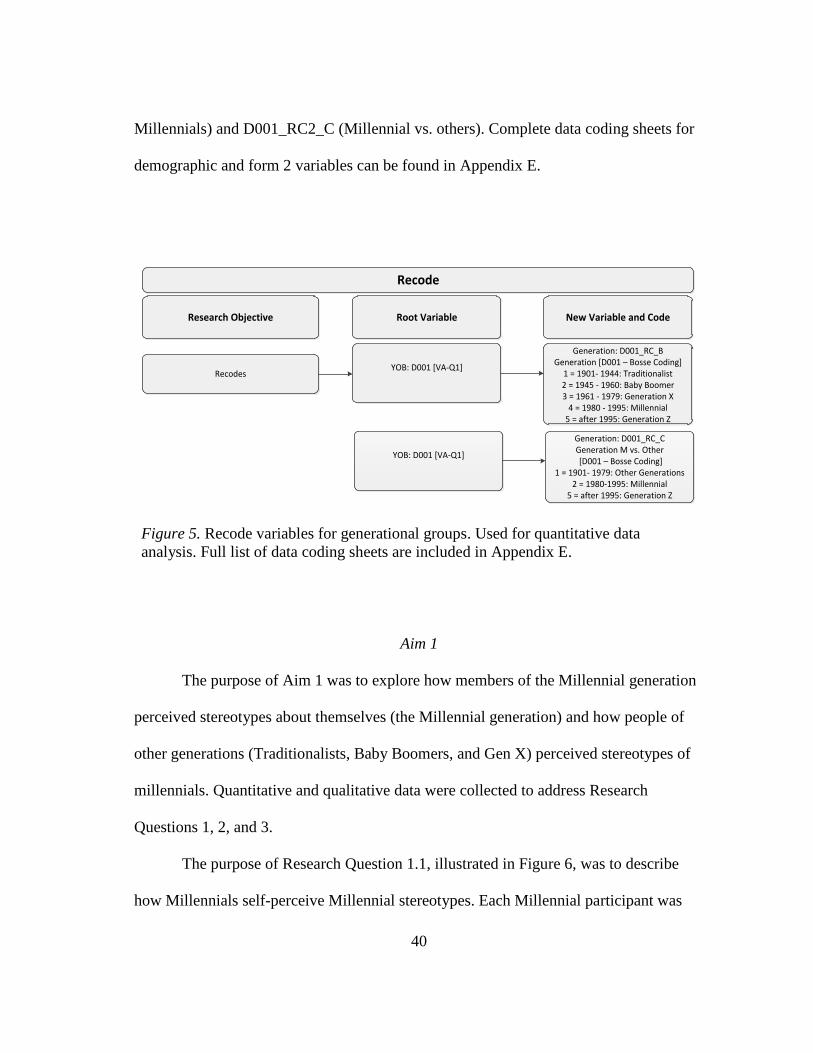
40
Millennials) and D001_RC2_C (Millennial vs. others). Complete data coding sheets for
demographic and form 2 variables can be found in Appendix E.
Recode
Research Objective Root Variable
Recodes YOB: D001 [VA-Q1]
New Variable and Code
Generation: D001_RC_B Generation [D001 – Bosse Coding]
1 = 1901- 1944: Traditionalist2 = 1945 - 1960: Baby Boomer3 = 1961 - 1979: Generation X
4 = 1980 - 1995: Millennial5 = after 1995: Generation Z
YOB: D001 [VA-Q1]
Generation: D001_RC_C Generation M vs. Other [D001 – Bosse Coding]
1 = 1901- 1979: Other Generations2 = 1980-1995: Millennial
5 = after 1995: Generation Z
Figure 5. Recode variables for generational groups. Used for quantitative data
analysis. Full list of data coding sheets are included in Appendix E.
Aim 1
The purpose of Aim 1 was to explore how members of the Millennial generation
perceived stereotypes about themselves (the Millennial generation) and how people of
other generations (Traditionalists, Baby Boomers, and Gen X) perceived stereotypes of
millennials. Quantitative and qualitative data were collected to address Research
Questions 1, 2, and 3.
The purpose of Research Question 1.1, illustrated in Figure 6, was to describe
how Millennials self-perceive Millennial stereotypes. Each Millennial participant was

41
asked how much he or she associated with each millennial stereotype, indicating if each
stereotype was “not at all like me” or “exactly like me.” Descriptive statistics (mean and
standard deviation) were reported for the list of millennial stereotypes (V2_Q008_A to
V2_Q008_I) to describe their self-perception of those stereotypes. Frequencies and
percentages were calculated and reported by generation group as a whole
(D001_RC2_B) and what they believed makes their generation unique from others
(V2_Q009).
RQ1: What are Millennials’ perceptions of stereotypes of the Millennial generation?
Research Objective Variable(s) Analyses
RO1.1: Describe Millennials’ self-perception of the Millennial generation.
Generation D001_RC_BNominal
(Select only group 4: Millennials)
V2_Q008_A V2_Q008_BV2_Q008_CV2_Q008_DV2_Q008_EV2_Q008_FV2_Q008_GV2_Q008_HV2_Q008_I
Interval
RO1.2: Describe Millennials’ perception of the Millennial generation.
Generation D001_RC_BNominal
(Select only group 4)
V2_Q009 Nominal
M, SD
Generation D001_RC_BNominal
(Select only group 4: Millennials)
V2_Q008_A V2_Q008_BV2_Q008_CV2_Q008_DV2_Q008_EV2_Q008_FV2_Q008_GV2_Q008_HV2_Q008_I
Interval
f and % D001_RC_B
NominalBy
V2_Q009Nominal
Aim 1: Understand perceived generational differences.
Figure 6. Analysis for Research Question 1 for Aim 1. Full list of data codes is listed
in Appendix E. Indications of selecting specific groups for analyses are based on filter
variables created and used in SPSS®.
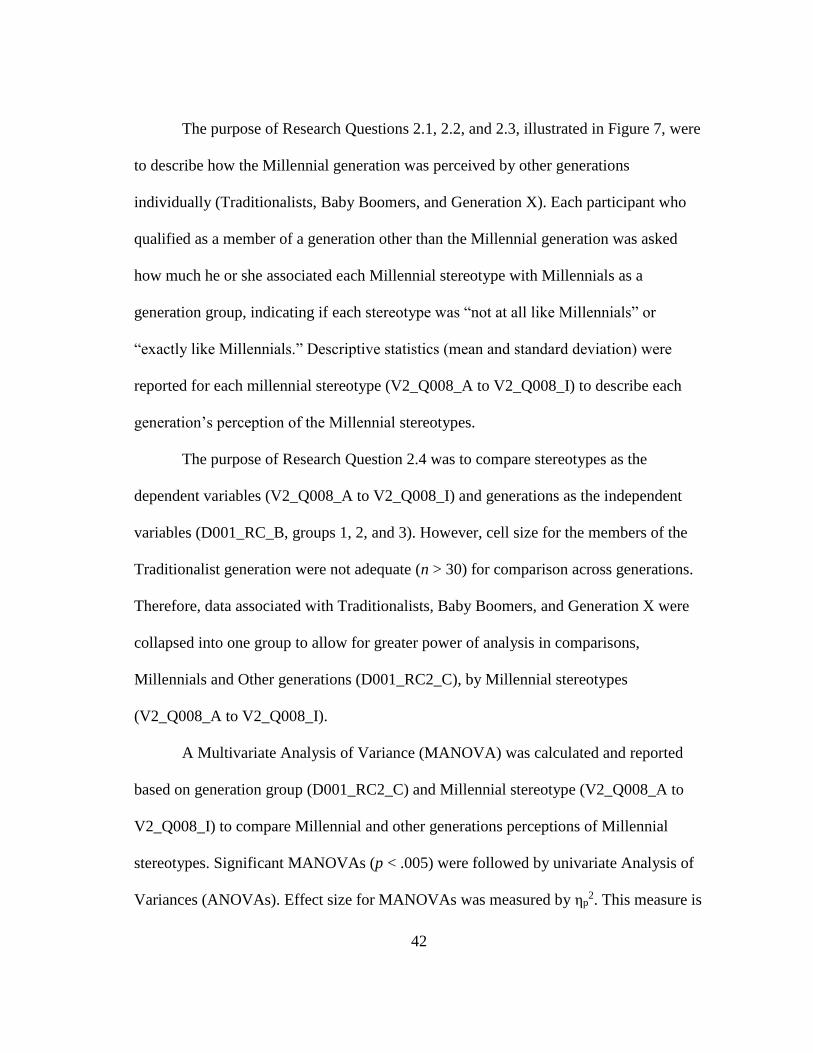
42
The purpose of Research Questions 2.1, 2.2, and 2.3, illustrated in Figure 7, were
to describe how the Millennial generation was perceived by other generations
individually (Traditionalists, Baby Boomers, and Generation X). Each participant who
qualified as a member of a generation other than the Millennial generation was asked
how much he or she associated each Millennial stereotype with Millennials as a
generation group, indicating if each stereotype was “not at all like Millennials” or
“exactly like Millennials.” Descriptive statistics (mean and standard deviation) were
reported for each millennial stereotype (V2_Q008_A to V2_Q008_I) to describe each
generation’s perception of the Millennial stereotypes.
The purpose of Research Question 2.4 was to compare stereotypes as the
dependent variables (V2_Q008_A to V2_Q008_I) and generations as the independent
variables (D001_RC_B, groups 1, 2, and 3). However, cell size for the members of the
Traditionalist generation were not adequate (n > 30) for comparison across generations.
Therefore, data associated with Traditionalists, Baby Boomers, and Generation X were
collapsed into one group to allow for greater power of analysis in comparisons,
Millennials and Other generations (D001_RC2_C), by Millennial stereotypes
(V2_Q008_A to V2_Q008_I).
A Multivariate Analysis of Variance (MANOVA) was calculated and reported
based on generation group (D001_RC2_C) and Millennial stereotype (V2_Q008_A to
V2_Q008_I) to compare Millennial and other generations perceptions of Millennial
stereotypes. Significant MANOVAs (p < .005) were followed by univariate Analysis of
Variances (ANOVAs). Effect size for MANOVAs was measured by ηp2. This measure is

43
more “convenient in multivariate designs in which comparisons are more complex than
simply the differences between a pair of means” (Tabachnick & Fidell, 2013 p. 55).
Measuring effect sized is biased when using η2 (eta squared) because there are no
adjustments made for sample size. For the purpose of this study follow up ANOVA
effect size was calculated and measured by ω2 (omega squared), because accounts for the
variance explained by the model (Field, 2009). Effect size for ANOVAs were calculated
using the following formula to provide a more accurate estimation. When reporting
effect sizes, we used Cohen’s (1988) definitions of effect sizes; small η2 = .01, medium
η2 = .09, and large η2 = .25.
𝑃𝑎𝑟𝑡𝑖𝑎𝑙 η2 =𝑆𝑆𝑏
𝑆𝑆𝑇 + 𝑆𝑆𝑒
ω2 = 𝑆𝑆𝑏 − (𝑑𝑓𝑏)𝑀𝑆𝑅
𝑆𝑆𝑇 + 𝑀𝑆𝑅
A true Bonferroni correction could be calculated to adjust the alpha level to
adjust for multiple comparisons and to account for Type I Error using the first equation
below (Tabachnick & Fidell, 2013). However, Tabachnick & Fidell (2013) noted that an
alternate equation could be used as a “close approximation if all αi are to be the same is
where αfw is the family wise error rate and p is the number of tests” (p. 272). The nine
comparisons for Research Question 2.4 yielded a Bonferroni correction value of (p <
.005).
𝛼 = 1 − (1 − 𝛼1 )(1 − 𝛼2 ). . . (1 − 𝛼𝑝 )
𝛼𝑖 = 𝛼𝑓𝑤/𝑝

44
RO2.1: Describe how Traditionalists perceive the Millennial generation
Generation: D001_RC_B Nominal
(Select only group 1: Traditionalsits)
V2_Q008_A V2_Q008_BV2_Q008_CV2_Q008_DV2_Q008_EV2_Q008_FV2_Q008_GV2_Q008_HV2_Q008_I
Interval
M, SD
V2_Q008_AV2_Q008_BV2_Q008_CV2_Q008_DV2_Q008_EV2_Q008_FV2_Q008_GV2_Q008_HV2_Q008_I
(only Traditionalists)
RQ2: How is the Millennial generation perceived by other generations?
Research Objective Variable(s) Analyses
Aim 1: Understand perceived generational differences.
RO2.2: Describe how Baby Boomers perceive the Millennial generation
Generation: D001_RC_B Nominal
(Select only group 2: Baby Boomers)
Millennial Stereotypes:V2_Q008_A V2_Q008_BV2_Q008_CV2_Q008_DV2_Q008_EV2_Q008_FV2_Q008_GV2_Q008_HV2_Q008_I
Interval
M, SD
V2_Q008_AV2_Q008_BV2_Q008_CV2_Q008_DV2_Q008_EV2_Q008_FV2_Q008_GV2_Q008_HV2_Q008_I
(only Baby Boomers)
RO2.3: Describe how Generation X perceives the Millennial generation
Generation: D001_RC_B Nominal
(Select only group 3: Generation X)
Millennial Stereotypes:V2_Q008_A V2_Q008_BV2_Q008_CV2_Q008_DV2_Q008_EV2_Q008_FV2_Q008_GV2_Q008_HV2_Q008_I
Interval
M, SD
V2_Q008_AV2_Q008_BV2_Q008_CV2_Q008_DV2_Q008_EV2_Q008_FV2_Q008_GV2_Q008_HV2_Q008_I
(only Generation X)
Figure 7. Analysis for Research Question 2 for Aim 1. Full list of data codes is listed
in Appendix E. Indications of selecting specific groups for analyses are based on filter
variables created and used in SPSS®.
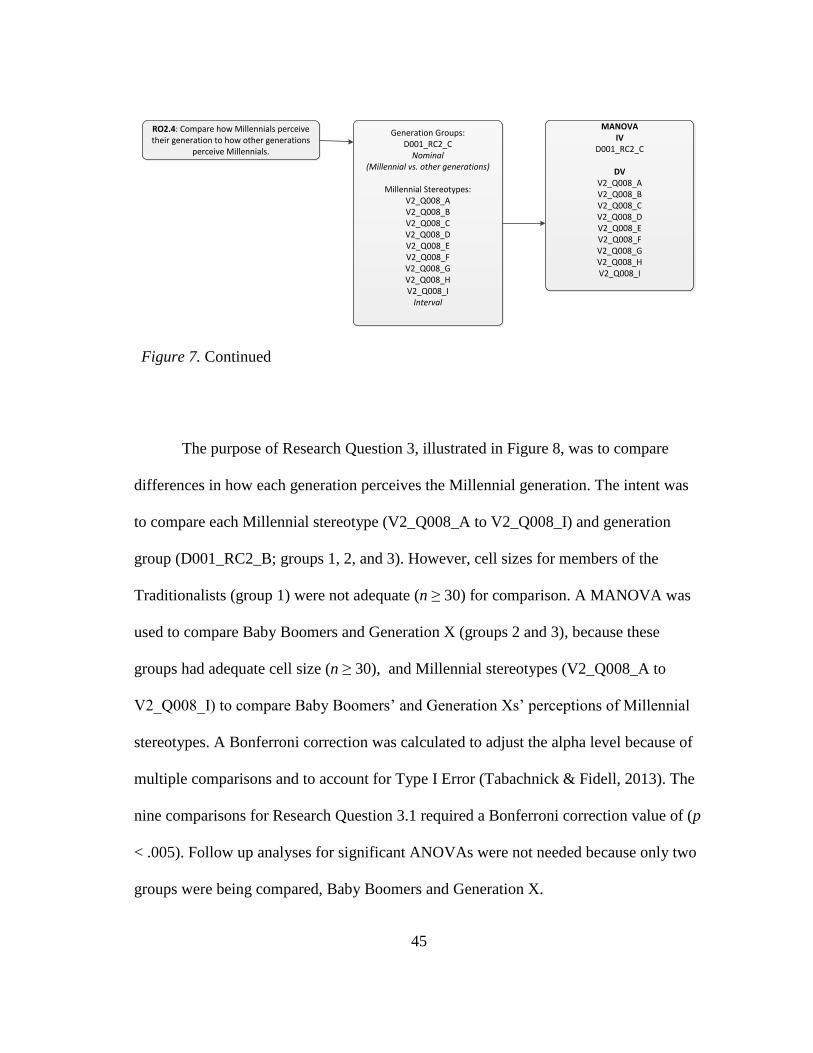
45
Generation Groups: D001_RC2_C
Nominal (Millennial vs. other generations)
Millennial Stereotypes:V2_Q008_A V2_Q008_BV2_Q008_CV2_Q008_DV2_Q008_EV2_Q008_FV2_Q008_GV2_Q008_HV2_Q008_I
Interval
MANOVAIV
D001_RC2_C
DV V2_Q008_AV2_Q008_BV2_Q008_CV2_Q008_DV2_Q008_EV2_Q008_FV2_Q008_GV2_Q008_HV2_Q008_I
RO2.4: Compare how Millennials perceive their generation to how other generations
perceive Millennials.
Figure 7. Continued
The purpose of Research Question 3, illustrated in Figure 8, was to compare
differences in how each generation perceives the Millennial generation. The intent was
to compare each Millennial stereotype (V2_Q008_A to V2_Q008_I) and generation
group (D001_RC2_B; groups 1, 2, and 3). However, cell sizes for members of the
Traditionalists (group 1) were not adequate (n ≥ 30) for comparison. A MANOVA was
used to compare Baby Boomers and Generation X (groups 2 and 3), because these
groups had adequate cell size (n ≥ 30), and Millennial stereotypes (V2_Q008_A to
V2_Q008_I) to compare Baby Boomers’ and Generation Xs’ perceptions of Millennial
stereotypes. A Bonferroni correction was calculated to adjust the alpha level because of
multiple comparisons and to account for Type I Error (Tabachnick & Fidell, 2013). The
nine comparisons for Research Question 3.1 required a Bonferroni correction value of (p
< .005). Follow up analyses for significant ANOVAs were not needed because only two
groups were being compared, Baby Boomers and Generation X.

46
RO3.1: Compare how Traditionalists, Baby Boomers, and Generation X perceive the
Millennial generation.
Generation: D001_RC2_B Nominal
(Select only groups 2 & 3)*cell size was not adequate for group
1 (Traditionalists)
Millennial Stereotypes:V2_Q008_A V2_Q008_BV2_Q008_CV2_Q008_DV2_Q008_EV2_Q008_FV2_Q008_GV2_Q008_HV2_Q008_I
Interval
MANOVAIV
D001_RC2_B
DV V2_Q008_AV2_Q008_BV2_Q008_CV2_Q008_DV2_Q008_EV2_Q008_FV2_Q008_GV2_Q008_HV2_Q008_I
(Baby Boomers and Generation X)
RQ3: Are there differences in how generations perceive the Millennial generation?
Research Objective Variable(s) Analyses
Aim 1: Understand perceived generational differences.
Figure 8. Analysis for Research Question 3 for Aim 1. Full list of data codes is listed
in Appendix E. Indications of selecting specific groups for analyses are based on filter
variables created and used in SPSS®.
Aim 2
The purpose of Aim 2 was to understand food consumption behavior of
generations. Quantitative and qualitative data were collected to address Research
Question 4. Research Question 4.1 was descriptive; therefore, means and standard
deviations were calculated for each generation’s likeliness to visit selected food and
drink establishments (McDonald’s, Panera Bread®, Starbucks®, and Chipotle Mexican
Grill), each ranging in levels of publicized social responsibility.

47
The food and drink establishments used to test socially responsibility in food
choices were selected to provide a spectrum based on public opinion as well as what the
companies self-claim and market themselves to be, shown in Figure 9. Each company
had noted, marketed, or made internal efforts to address social responsibility. However,
this study was concerned with the social responsibility that was addressed in popular
press and widely accepted by consumers.
The food and drink establishments selected to represent the socially responsible
were Starbucks® and Chipotle. Both claim to be environmentally friendly and socially
responsible in sourcing inputs used, according to popular press. Great similarities exist
between Chipotle and Starbuck’s sourcing, structure, and consumer perception
(Mourdoukoutas, 2014 and Mao, 2014)
Panera Bread®, historically, has not been widely-marketed as a socially
responsible company; however, in recent years they have progressed to market that
quality. Panera Bread® announced a new food policy in June 2014 committing to
provide “clean ingredients” (Fortune, 2014; Hanson, 2014). The recent adjustment to
emphasize clean eating and ingredients was believed to be driven by Millennial
consumers, according to popular press (Kowitt, 2014).
Lastly, McDonald’s was selected as the lowest socially responsible
establishment. McDonald’s does not claim to provide food that is sustainably sourced or
socially responsible in their corporate marketing and communications. However,
McDonald’s has not emphasized the social responsibility aspect as much as some of
their competitors, despite their recent 2020 initiative released in April 2014

48
(McDonald’s Corp., 2014). Although philanthropic, as a company, McDonald’s has not
communicated social responsible products and techniques to its consumers in the past.
Those consumers who are not aware of all initiatives set forth by McDonald’s may view
a lack of social responsibility as the case.
Figure 9. Socially responsibility spectrum. For the purpose of this study food and
drink establishments included: Starbucks®, Chipotle, Panera Bread®, and McDonald’s.
Research Question 4.2, illustrated in Figure 10, was comparative. A MANOVA
was used to compare the differences in visiting socially responsible food and drink
establishments (V2_Q010_A to V2_Q010_D) and generation group, Millennials and
others (D001_RC2_C). A Bonferroni correction was calculated to adjust the alpha level
because of multiple comparisons to account for inflated Type I Error (Tabachnick &
Fidell, 2013). The four comparisons for Research Question 4.2 required a Bonferroni
correction value of (p < .0125). Follow up analyses were not needed because no
significant differences were found.

49
RQ4: Does social responsibility affect food consumption habits based on generation?
Research Objective Variable(s) Analyses
RO4.1: Describe food and drink establishment consumption by generation.
Generation Groups: D001_RC_B
(Select groups 1, 2, 3, 4) Nominal
V2_Q010_AV2_Q010_BV2_Q010_CV2_Q010_D
Interval
M, SD D001_RC_B
(Select groups 1, 2, 3, 4) Nominal
V2_Q010_AV2_Q010_BV2_Q010_CV2_Q010_D
Interval
Aim 2: Understand food consumption behavior of generations.
RO4.2: Compare Millennial food and drink establishment consumption to other
generations .
Generation Groups: D001_RC2_C
Nominal (Millennial vs. other generations)
V2_Q010_AV2_Q010_BV2_Q010_CV2_Q010_D
Interval
MANOVA IV
D001_RC2_CNominal
DVV2_Q010_AV2_Q010_BV2_Q010_CV2_Q010_D
Interval
Figure 10. Analysis of Research Question 4 for Aim 2. Full list of data codes is listed
in Appendix E. Indications of selecting specific groups for analyses are based on filter
variables created and used in SPSS®.
Qualitative data in the form of 15 personal interviews were conducted to provide
support for the quantitative data. Interviewees were asked to participate in a word
association conducted by a pair of researchers. The interviewee verbally indicated
whether they believed Millennials as a whole were “yes,” like that stereotype or “no,”
not like that stereotype. Field notes were made of deviations from respondents’ “yes” or
“no” answers. Results were presented as frequency chart for the collective group of

50
interviewees. Interviewees were also asked to describe their own generations and the
Millennial generation as a whole, providing support for Research Questions 2 and 3.
Qualitative data were coded by Julian date, gender, and year born, to split
respondents into generation groups. For example, 171-Male-1995 was an interview
conducted on June 20 with a male born in 1995. Responses were analyzed using the
constant comparative method, often associated with grounded theory, which is described
as “emergent theory grounded in the relationships between the data and the categories
into which they are coded” (Lindlof & Taylor, 2011, p. 250). The process, in which
categories emerge from an ongoing process where the researcher compares the units of
data with each other, is known as the constant comparison method (Lindlof & Taylor,
2011). Using grounded theory approach and the constant comparison method allows the
codes and categories to change and evolve throughout the study; however, the sought
outcome of these analyses was not to develop theory.
Transcripts were typed into a Microsoft® Word table, printed, and cut into slips
of paper with an individual statement on each piece. Responses were then shuffled and
organized into categories that were similar, creating themes. To insure confirmability
and dependability of the qualitative data, theme creation was done by a minimum of two
researchers, myself always being in the pair. When researchers disagreed on themes,
verbal discussion ensued until a consensus was met.
Qualitative data in the form of 15 personal interviews were conducted to provide
support for the quantitative data. Interviewees were asked to discuss his or her food
purchasing preferences and criteria. Also, field notes from five corporate interviews and

51
group meeting were compiled to describe different marketing techniques and beliefs of
progressive, sustainable, socially responsible, environmentally friendly, and/or green
companies when marketing to consumers. Results were presented in figures 11 to 14 as
themes among respondents and were derived using the same methods from Research
Questions 2 and 3 qualitative processes. To ensure trustworthiness of the qualitative
data, theme creation was done by a minimum of two researchers, myself always being
included in the pair. Themes were revised via verbal discussion until consensus was met.

52
CHAPTER III
RESULTS
The primary purpose of this study was to explore how members of the Millennial
generation perceived stereotypes about themselves (the Millennial generation) and how
people of other generations (Traditionalists, Baby Boomers, and Gen X) perceived
stereotypes of millennials. A secondary purpose of this study was to explore how each
generation perceives socially responsible food and drink establishments, which will help
to understand Millennials’ food purchasing motivations and decisions. Millennials have
been described as a generation that supports socially responsible food choices and
organizations (Parment, 2013; Smith & Brower 2012; Smith, 2010). This study also
sought to understand the food purchasing behavior and perceptions among different
generations.
A survey was conducted and used a questionnaire to collect quantitative data
using variations of the DOPU method conducted by Allred and Ross-Davis (2011) and
traditional mail (USPS) during a five month period. This study made up a small portion
of a larger study conducted with the ALEC summer research trip and fall research
courses, therefore, subject selection and samples were selected purposively by the lead
faculty member on the project. Data were analyzed using IBM® SPSS® Statistics,
version 20, and followed the multivariate analysis procedures noted by Tabachnick and
Fidell (2013).

53
Qualitative interviews were conducted with individuals, and companies
organizations that claimed to be progressive, sustainable, socially responsible,
environmentally friendly, and/or green. Interviews were conducted in conjunction with
the ALEC summer research trip at purposive corporate locations, decided on by the lead
faculty member, and purposive and convenient locations dictated by the lead researcher
and duration of the ALEC summer research trip. Qualitative data were sorted into
themes. The constant comparison method and grounded theory approach were used in
theme creation (Lindlof & Taylor 2011).
Data analyses will be presented in two parts, by research aim. Quantitative
results and qualitative themes will be presented for the research questions and objectives
related to aim 1. Following, those results and themes related to aim 2 will then be
presented.
There were a total number of 226 responses for this specific study. The larger
study yielded varying response and cooperation rates outlined in Table 4. The overall
response rate for this study was calculated by dividing the number of Form 2
questionnaires retrieved by the number of Form 2 questionnaires distributed. Because
this study was a part of the larger study on data collection methods, it only could be
assumed that one-sixth of the questionnaires distributed were Form 2, totaling 1,550.
Using the previous assumption, this study yielded an overall response rate of 14.58%.
Two respondents born after 1995 (Generation Z) were excluded for the purpose of this
study. Additionally, there were 22 cases of missing data in the sample of this study that
were excluded.

54
Table 4
Response and Cooperation Rates of the larger study
Method Location Response Rate a (%) Cooperation Rate b (%)
DOMB Denver, CO 9.00 78.12
DOPU San Francisco, CA 9.39 55.28
DOPU Fresno, CA 8.78 70.69
DOPU San Diego, CA 62.82 62.52
DOPU Bryan/College Station, TX 76.43 64.52
DOMB Bryan/College Station, TX 25.57 23.07
USPS Bryan/College Station, TX 18.00 —
DOPU Houston, TX 68.42 48.60
DOMB Houston, TX 22.49 19.20
USPS Houston, TX 2.67 —
DOPU Dallas, TX 64.08 42.04
DOMB Dallas, TX 12.61 10.00
USPS Dallas, TX 2.33 —
Note. a Response rate was calculated by dividing the number of questionnaires
distributed by the number retrieved X 100. b Cooperation rate was calculated by
dividing the number of face-to-face contacts made by the number of questionnaires
retrieved X 100. USPS does not have a Cooperation Rate because no face-to-face
contact was made.
Respondents were recoded into generational groups to compare similarities and
differences among generations. Cell size for Traditionalists (born 1901-1944) was
substantially smaller than those of the other generational groups and, therefore,
Traditionalists were not included in analyses by generation (D001_RC2_B), shown in
Table 5. However, when multivariate analyses were used to compare Millennials with
other generations (D001_RC2_C), Traditionalists were included. Data included in this
study were analyzed conservatively, by using an adjusted alpha level. A Bonferroni
adjustment was calculated and resulted in an adjusted alpha level of .005 (p < .005) to

55
ensure accurate comparison with groups of differing cell sizes, and to protect against
inflated Type I error (Field, 2009). Data included in this study were analyzed
conservatively, by using an adjusted alpha level. In future research, a Bonferroni
adjustment may not be necessary, and, thus, yield more significant findings with an a
priori alpha level of .05. Therefore, results that may have been significant (p < .05)
before the Bonferroni adjustment should be considered for future study.
Table 5
Cell size
Generational Group f %
Traditionalists (1901 – 1944) 24 10.62
Baby Boomers (1945 – 1960) 70 30.97
Generation X (1961 – 1979) 63 27.88
Millennials (1980 – 1995) 45 19.91
Generation Z (1995 – present) 2 0.01
Missing data 22 0.10
Total 226
Note. Generation Z (born 1995 – present) were excluded from this study.
Aim 1
The purpose of Research Aim 1 was to understand perceived generational
differences. This Aim 1 aim was divided into three research questions. Research
Question 1.1 was intended to describe Millennials’ self-perception of stereotypes of the
Millennial generation. Descriptive analysis (mean and standard deviation) was
calculated to describe Millennial’s perception of the stereotypes (V2_Q008_A to
V2_Q008_I) and served as dependent variables for comparisons. Most Millennials

56
agreed the stereotypes of bargain seeking, socially responsible, and healthy were most
accurate to use when describing their generation, shown in Table 6.
Table 6
Descriptive Statistics of Millennial Stereotypes: Millennials
Millennials a
Millennial Stereotype M SD
Expressive 3.43 1.21
Social 3.67 0.98
Diverse 3.57 1.17
Bargain Seeking 3.93 1.22
Socially Responsible 4.10 1.14
Healthy 3.83 0.88
Urban 3.21 1.30
Inclusive 3.68 1.13
Philanthropic (charitable giving) 3.26 1.13
Note. a Individuals born between 1980 and 1995; response scale: 1 = Not at all like me,
5 = Exactly Like me; b Individuals born before 1980 (i.e., Traditionalists, Baby Boomer,
Generation X); response scale: 1 = Not at all like Millennials, 5 = Exactly like
Millennials.
Research Question 1.2 assed what Millennials believed made their generation
unique as a whole. Thirty of the 43 Millennial respondents indicated technology use was
the single most unique descriptor of their generation. This supported the research from
(BCG, 2010; Deloitte, 2014; Nielsen, 2014) that the largest difference of Millennials
compared to other generations was their exposure and use of technology.
The purpose of Research Question 2 was to determine whether differences
existed in how other generations perceived the Millennial generation, as a whole.

57
Research Question 2.1 first sought to describe each generation’s (Traditionalist, Baby
Boomer, Generation X) perceptions of Millennial stereotypes (V2_Q008_A to
V2_Q008_I) using descriptive statistics (mean and standard deviation), as shown in
Tables 7, 8, and 9, respectively.
Traditionalists most frequently associated Millennials with being inclusive,
diverse, healthy, and urban. However, Millennial stereotypes of inclusive, diverse,
healthy, and urban did not yield greater mean scores compared to mean scores from
Baby Boomers and Generation X. Higher mean scores indicated Baby Boomers and
Generation X had a more positive view of Millennials than the Traditionalist generation.
Baby Boomers most frequently associated Millennials with being healthy and urban,
yielding mean scores of 3.40 (SD = 1.14) and 3.47 (SD = 1.17) respectively. Most
frequently, Generation X associated Millennials with being diverse and urban, yielding
mean scores of 3.52 (SD = 0.91) and 3.56 (SD = 0.79) respectively. Generation X,
overall, had the most positive perceptions of Millennials than any other generation
considered.

58
Table 7
Descriptive Statistics of Millennial Stereotypes: Traditionalists
Traditionalists a
Millennial Stereotype M SD
Expressive 2.88 1.31
Social 2.88 1.26
Diverse 3.00 1.18
Bargain Seeking 2.77 1.25
Socially Responsible 2.94 1.18
Healthy 3.00 1.23
Urban 3.00 1.41
Inclusive 3.07 0.80
Philanthropic (charitable giving) 2.25 1.13
Note. a Individuals born between 1901 and 1944; response scale: 1 = Not at all like me,
5 = Exactly Like me; b Individuals born before 1980 (i.e., Traditionalists, Baby Boomer,
Generation X); response scale: 1 = Not at all like Millennials, 5 = Exactly like
Millennials.
Table 8
Descriptive Statistics of Millennial Stereotypes: Baby Boomers
Baby Boomers a
Millennial Stereotype M SD
Expressive 2.87 1.16
Social 2.73 1.22
Diverse 3.21 1.12
Bargain Seeking 2.85 1.23
Socially Responsible 3.13 1.31
Healthy 3.40 1.14
Urban 3.47 1.17
Inclusive 3.25 1.05
Philanthropic (charitable giving) 2.43 1.09
Note. a Individuals born between 1945 and 1964; response scale: 1 = Not at all like me,
5 = Exactly Like me; b Individuals born before 1980 (i.e., Traditionalists, Baby Boomer,
Generation X); response scale: 1 = Not at all like Millennials, 5 = Exactly like
Millennials.

59
Table 9
Descriptive Statistics of Millennial Stereotypes: Generation X
Generation X a
Millennial Stereotype M SD
Expressive 3.44 0.86
Social 3.43 1.08
Diverse 3.52 0.91
Bargain Seeking 2.80 1.15
Socially Responsible 3.46 1.08
Healthy 3.43 0.84
Urban 3.56 0.79
Inclusive 3.17 1.04
Philanthropic (charitable giving) 2.85 0.84
Note. a Individuals born between 1965 and 1979; response scale: 1 = Not at all like me,
5 = Exactly Like me; b Individuals born before 1980 (i.e., Traditionalists, Baby Boomer,
Generation X); response scale: 1 = Not at all like Millennials, 5 = Exactly like
Millennials.
The purpose of Research Question 2.4 was to compare different generational
group’s perceptions of Millennials. A MANOVA was used to compare the mean scores
of independent variables, the Millennial stereotypes (V2_Q008_A to V2_Q008_I) across
conditions and test interactions among dependent variables, generational groups
(Millennials versus others; D001_RC2_C), shown in Table 10. Box’s test of equality of
covariance was not significant (p = .354), which was an indicator that the assumption of
equality of covariance was not violated (Field, 2009). Comparison groups were
approximately equal in size; therefore, data were assumed to be homogeneous and the
analyses were most likely appropriate.
MANOVA results were interpreted using the Hotelling’s trace statistic because
“the Hotelling’s T2 is robust in the two-group situation when sample sizes are equal”

60
(Field, 2009, p. 604). Results of the MANOVA indicated an effect of time of Millennial
stereotypes (V2_Q008_A to V2_Q008_I) on generational groups (Millennials versus
Others) was significant, T2 = .280; F (9 , 143) = 4.453; p < .001 (p < .005); ηp2 = .219 ;
1 – β = .998 ), and a large effect size (ηp2 = .219; Cohen, 1988). MANOVA results for
Millennial stereotype (V2_Q008_A to V2_Q008_I) and generation group
(D001_RC2_C) exceeded the threshold (1 – β ≥ .80) for power of analysis (1 – β =
.998); therefore, significant results were not likely due to chance or error. Significant
differences indicated there were differences in Millennials’ self-perception of their
generation compared to other generations’ (Traditionalist, Baby Boomer, Generation X)
perception of Millennials.
Table 10
MANOVA Millennials vs. Others perceptions of Millennial stereotypes
Millennials a Others b
Millennial Stereotype M SD M SD
Expressive 3.44 1.13 3.14 1.08
Social 3.68 3.06 0.99 1.22
Diverse 3.56 1.18 3.30 1.05
Bargain Shoppers 3.93 1.23 2.82 1.16
Socially Responsible 4.10 1.16 3.23 1.20
Healthy 3.85 0.88 3.37 1.04
Urban 3.24 1.30 3.40 1.08
Inclusive 3.68 1.13 3.15 1.02
Philanthropic (charitable giving) 3.32 1.08 2.64 1.02
Note. a Individuals born between 1980 and 1995; response scale: 1 = Not at all like me,
5 = Exactly Like me; b Individuals born before 1980 (i.e., Traditionalists, Baby Boomer,
Generation X); response scale: 1 = Not at all like Millennials, 5 = Exactly like
Millennials; c With no correction the chance of finding one or more significant
differences in nine tests is 0.3698 (36.98%). Therefore, a Bonferroni adjustment was
calculated and resulted in an adjusted alpha level of 0.0055556 (p ≤ .005).
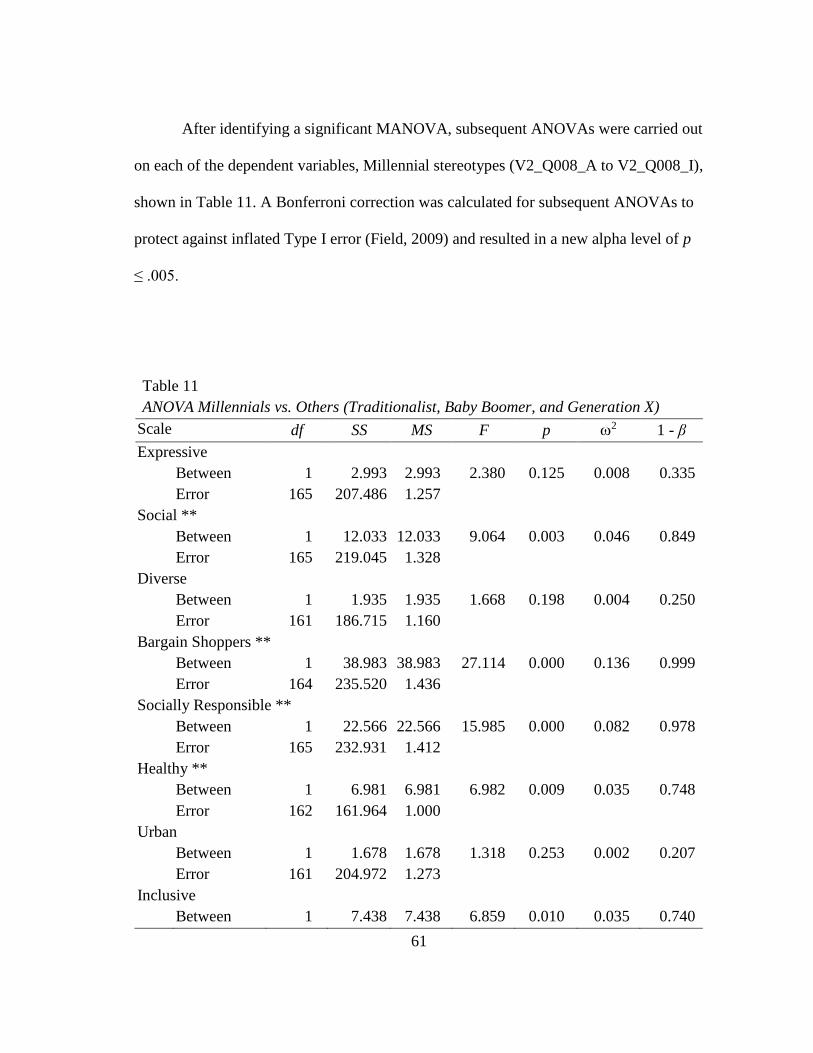
61
After identifying a significant MANOVA, subsequent ANOVAs were carried out
on each of the dependent variables, Millennial stereotypes (V2_Q008_A to V2_Q008_I),
shown in Table 11. A Bonferroni correction was calculated for subsequent ANOVAs to
protect against inflated Type I error (Field, 2009) and resulted in a new alpha level of p
≤ .005.
Table 11
ANOVA Millennials vs. Others (Traditionalist, Baby Boomer, and Generation X)
Scale df SS MS F p 2 1 - β
Expressive
Between 1 2.993 2.993 2.380 0.125 0.008 0.335
Error 165 207.486 1.257
Social **
Between 1 12.033 12.033 9.064 0.003 0.046 0.849
Error 165 219.045 1.328
Diverse
Between 1 1.935 1.935 1.668 0.198 0.004 0.250
Error 161 186.715 1.160
Bargain Shoppers **
Between 1 38.983 38.983 27.114 0.000 0.136 0.999
Error 164 235.520 1.436
Socially Responsible **
Between 1 22.566 22.566 15.985 0.000 0.082 0.978
Error 165 232.931 1.412
Healthy **
Between 1 6.981 6.981 6.982 0.009 0.035 0.748
Error 162 161.964 1.000
Urban
Between 1 1.678 1.678 1.318 0.253 0.002 0.207
Error 161 204.972 1.273
Inclusive
Between 1 7.438 7.438 6.859 0.010 0.035 0.740

62
Significant differences (p < .005) existed between generation group’s perceptions
(Millennials versus Others) for the stereotypes of social, bargain shoppers, socially
responsible, healthy and philanthropic, shown in Table 11. Power of analyses were
adequate (1 – β ≥ .80) for each significant analysis except healthy. The calculated effect
size was small for the healthy stereotype, meaning little variance was explained.
However, philanthropic and socially responsible stereotypes yielded medium effect sizes
and bargain shoppers yielded a large effect size, which strengthened the relationship
between generation group and perceived stereotype.
The purpose of Research Questions 1 was to describe Millennials’ self-
perception of stereotypes of the Millennial generation; while Research Question 2
intended to determine whether differences existed in how other generations perceived
the Millennial generation, as a whole. Qualitative data were collected to provide support
for Research Questions 1 and 2. During qualitative personal interviews, interviewees of
other generations were asked to discuss the differences between their generation and the
Millennial generation. Millennial interviewees were asked to discuss the differences
between his or hertheir generation as a whole compared to others (Traditionalists, Baby
Boomers, Generation X), rather than the personal differences between themselves and
other generations (e.g., the difference between a Millennial daughter and her Baby
Boomer mother). Five qualitative themes emerged after three rounds of revisions, shown
in Figure 11. The themes found were separated into those believed by Millennials versus
those believed by other generations, to provide a deeper understanding of which
perceptions differed among generations.
63
Common themes among other generations (Baby Boomers and Generation X)
were that Millennials were self-absorbed, spoiled, and private. No Millennial
respondents provided explanation or support to these themes. (186-Male-1965) said
“Millennials are in their own litter world, and do not want to set up roots.” Majority of
respondents from other generations used the words spoiled and self-absorbed in
conversation to describe Millennials.
However, answers were synonymous between generations when commenting on
Millennials’ technology use. Millennials recognized they have “never been without it”
(171-Male-1995); whereas, other generations believed they could turn to Millennials to
answer their technology questions and drive trends. “I feel I can reach out to them
[Millennials] with any tech issues I have” (186-Female-1973).
Millennials perceived themselves as more driven than other generations, stating,
“we are very active in our lifestyle” (172-Female-1994) and acknowledging that “we are
more advanced than they were at our age” when speaking about expectations of them as
a generation (186-Female-1992). Overall, Millennials believed there was a higher
expectation of them as a generation as compared to the generations preceding them. One
Millennial even acknowledged, “There is a way-higher expectation of education for us
than it was for our parents” (172-Female-1992).

64
Qualitative ThemesPersonal Interviews: Generation
Key:Green – Believed by other generations
Yellow – Believed by both Millennials and other generationsBlue – Believed by Millennials
Key:Green – Believed by other generations
Yellow – Believed by both Millennials and other generationsBlue – Believed by Millennials
Self-Absorbed
Private
Spoiled
Tech Savvy
Driven
“They are self-absorbed and superficial” (172_M_1965)
“They grew up with technology” (172_F_1974)
“They have a really hard time when the don’t get what they
want” (186_F_1969)
“There is a higher expectation for us” (186_F_1992)
“They keep to themselves most of the time” (172_M_1965)
Figure 11. Qualitative themes: personal interviews. Themes were derived from
qualitative interviews on the differences in perceptions between generation groups.
The purpose of Research Question 3 was to compare the differences in
perception of the Millennial generation by generation group. There was not adequate cell
size (n ≥ 30) for the Traditionalist generation group; therefore, Traditionalists were
omitted from this analysis. To compare Baby Boomer and Generation X perceptions of
Millennial stereotypes, a MANOVA was calculated. The independent variables for this
MANOVA were the Millennial stereotypes (V2_Q008_A to V2_Q008_I), and the
dependent variables were the Baby Boomer and Generation X generation groups

65
(D001_RC2_B; groups 2 and 3). MANOVA results were interpreted using the
Hotelling’s trace statistic (T2) because “the Hotelling’s T2 is robust in the two-group
situation when sample sizes are equal” (Field, 2009, p. 604). Results of the MANOVA
indicated the effect of Millennial stereotypes (V2_Q008_A to V2_Q008_I) on
generational groups (Baby Boomers and Generation X) was significant, T2 = .232; F (9,
88) = 2.266; p = .025; ηp2 = .188 ; 1 – β = .876 ), and a large effect size (ηp
2 = .188;
Cohen, 1988). MANOVA results for Millennial stereotype (V2_Q008_A to V2_Q008_I)
and generational group (Baby Boomer and Generation X) exceeded the threshold for
power of analysis (≥ .80); therefore, significant results were not due to chance or error,
and are shown in Table 12.
Table 12
MANOVA Baby Boomer vs. Generation X perceptions of Millennial stereotypes
Baby Boomers a Generation X b
Millennial Stereotype M SD M SD
Expressive 2.89 1. 40 3.46 0.85
Social 2.74 1.24 3.42 1.09
Diverse 3.13 1.15 3.52 0.87
Bargain Shoppers 2.86 1.22 2.81 1.17
Socially Responsible 3.13 1.34 3.42 1.07
Healthy 3.39 1.18 3.44 0.85
Urban 3.41 1.20 3.56 0.80
Inclusive 3.20 1.07 3.14 1.03
Philanthropic (charitable giving) 2.50 1.13 2.87 0.84
Note. a Individuals born between 1945 - 1960; response scale: 1 = Not at all like
Millennials, 5 = Exactly Like Millennials; b Individuals born between 1961 - 1979
response scale: 1 = Not at all like Millennials, 5 = Exactly like Millennials; c Cell size
for Baby Boomers is n = 46 and Generation X is n = 52.

66
After identifying the significant MANOVA, a subsequent ANOVAs were carried
out on each of the dependent variables, Millennial stereotypes (V2_Q008_A to
V2_Q008_I), shown in Table 13. A Bonferroni correction was applied to each of the
subsequent ANOVAs to protect against inflated Type I error (p < .005; Field, 2009).
Table 13
ANOVA comparing Baby Boomers and Generation X
Scale df SS MS F p 2 1 - β
Expressive **
Between 1 8.906 8.906 8.551 0.004 0.065 0.799
Error 107 111.442 1.042
Social **
Between 1 13.300 13.300 10.014 0.002 0.076 0.821
Error 107 142.113 1.328
Diverse
Between 1 2.587 2.587 2.510 0.116 0.014 0.468
Error 105 108.198 1.030
Bargain Shoppers
Between 1 0.074 0.074 0.052 0.820 -0.009 0.051
Error 105 149.552 1.424
Socially Responsible
Between 1 3.070 3.070 2.140 0.146 0.010 0.220
Error 107 153.535 1.435
Healthy
Between 1 0.024 0.024 0.024 0.878 -0.009 0.057
Error 103 103.538 1.005
Urban
Between 1 0.189 0.189 0.191 0.663 -0.008 0.108
Error 103 102.039 0.991
Inclusive
Between 1 .184 0.184 0.169 0.682 -0.008 0.059
Error 104 113.250 1.089

67
Scale df SS MS F p 2 1 - β
Philanthropic
Between 1 3.774 3.774 4.005 0.048 0.027 0.441
Error 104 98.000 0.942
Note. ** Indicates significant results (p = < .005)
Based on the outcomes of the follow up ANOVAs, there were significant
differences between generation group’s perceptions (Baby Boomer and Generation X)
for the stereotypes of social and expressive, shown in Table 13. However, the only
significant stereotype with adequate power of analyses was social, therefore these results
were most likely not due to chance or error. Calculated effect sizes were medium for the
Table 13 Continued
expressive and social stereotypes, therefore, about nine percent of the variance was
explained by the effect (Field, 2009).
Research Question 3 sought to determine if perceptions of Millennials existed
between other generational groups. Qualitative data were collected to support Research
Question 3.1. A simple dichotomous word association was conducted during qualitative
interviews to assess the same list of Millennial stereotypes used when describing
Millennials as a generation, illustrated in Figure 12. When asked to describe Millennials
as a whole, most respondents believed Millennials were expressive, social, socially
responsible, healthy, and urban.
Due to the small number of interviews conducted, the findings were presented
collectively by frequency because all respondents, regardless of generation, were asked
to explain their opinions on Millennials only. When interviewees hesitated to agree or

68
disagree with a stereotype, they were asked to elaborate. One interviewee indicated
when asked about being a bargain shopper: “Oh yes, I always seek the highest quality
for the best price” (186-Male-1981). Most respondents agreed upon Millennial
stereotypes of social, socially responsible, and healthy. In comparison to the quantitative
results, Millennials strongly believed they were socially responsible in interviews as well
as in the quantitative survey. Both Generation X and Baby Boomers agreed Millennials
were healthy. However, only Generation X and Millennials somewhat believed
Millennials were social, but yielded the highest agreement score in the qualitative
findings.
Figure 12. Qualitative word association findings from personal interviews.
Interviewees consisted of two Baby Boomers, nine Generation X, and four
Millennials.
0123456789
101112131415
QUALITATIVE WORD ASSOCIATION
69
Aim 2
The purpose of Research Aim 2 was to explore food consumption behavior of
generations. This aim consisted of two research questions that described and compared
whether social responsibility effected food and drink establishment consumption habits
based on generation. The purpose of Research Question 4.1 was to describe the
likeliness of each generation to visit socially responsible food and drink establishments.
Analysis for Research Question 4.1 was completed by using four establishments, all
ranging in levels of social responsibility, described in Chapter II. Descriptive statistics
(mean and standard deviation) were first calculated and reported to describe each
generation group’s likeliness to visit one of the four establishments, shown in Table 14.

70
Table 14
Descriptive Statistics of Food and Drink Establishment Visits
Establishment and generation group M SD
Chipotle
Traditionalists 1.917 1.472
Baby Boomers 2.786 1.550
Generation X 3.476 1.635
Millennials 3.600 1.452
McDonald’s
Traditionalists 2.292 1.601
Baby Boomers 2.429 1.440
Generation X 2.317 1.468
Millennials 2.511 1.358
Starbucks
Traditionalists 1.958 1.398
Baby Boomers 2.929 1.671
Generation X 3.651 1.438
Millennials 3.444 1.639
Panera Bread
Traditionalists 2.000 1.318
Baby Boomers 3.129 1.503
Generation X 3.365 1.395
Millennials 2.978 1.588
Note. Generational group’s likeliness to visit food and drink establishments ranging in
social responsibility; response scale: 1 = Not Likely, 5 = Very Likely.
The purpose of Research Question 4.2 was to compare Millennial food and drink
establishment consumption to other generations (Traditionalist, Baby Boomer, and
Generation X). A MANOVA was used to compare the mean scores of the independent
variables, the likeliness to visit one of the four tested socially responsible food and drink
establishments (V2_Q010_A – V2_Q010_D) across conditions and test interactions
among dependent variables of generation group (Millennial versus others;
D001_RC2_C). A Bonferroni adjustment was calculated and resulted in an adjusted

71
alpha level of 0.01 (p. < .01). Box’s test of equality of covariance was not significant (p
= .75 > .01), which was an indicator that comparison groups were approximately equal
in size, data were assumed to be homogeneous and analyses were most likely
appropriate.
MANOVA results were interpreted using the Hotelling’s trace statistic and
indicated the effect of likeliness to visit a socially responsible food and drink
establishment (V2_Q010_A to V2_Q010_D) on generation group (Millennials versus
Others; D001_RC2_C) was not significant, T2 = .044 ; F (4 , 197) = 2.165; p = .074; ηp2
= .042 ; 1 – β = .632 ). MANOVA results for likeliness to visit a socially responsible
food and drink establishment (V2_Q010_A to V2_Q010_D) on generation group
(Millennials versus Others; D001_RC2_C) did not exceed the threshold for power of
analysis (1 – β = .632 ≤ .80); therefore, significant results may have been due to chance
or error.
After identifying the MANOVA as not significant, subsequent analyses were not
needed. Therefore, we determined there were no differences in the likeliness to visit
socially responsible food and drink establishments based on generation group in this
study. Results are shown in Table 15.

72
Table 15
MANOVA Millennial vs. Others likeliness to visit socially responsible food and drink
establishments
Millennials a Others b
Establishment M SD M SD
Chipotle 3.600 1.452 2.930 1.653
McDonald’s 2.511 1.359 2.363 1.468
Starbucks 3.444 1.631 3.070 1.637
Panera Bread 2.978 1.588 3.051 1.497
Note. a Individuals born between 1980 and 1995; response scale: 1 = Not Likely , 5 =
Very Likely; b Individuals born before 1980 (i.e., Traditionalists, Baby Boomer,
Generation X); response scale: 1 = Not Likely, 5 = Very Likely.
Qualitative data were collected to provide support for Aim 2 and Research
Question 4. The purpose of Research Question 4 was to understand food consumption
and purchasing behaviors of generation groups. Qualitative themes among interviewees’
food purchasing criteria were created to provide insight to Research Question 4.1. These
themes emerged from opinions from interviewees on the subject matter (theme) rather
than the specific opinion they had about food consumption and purchasing habits.
Theme creation was executed in three iterations with a pair of graduate researchers to
ensure creditability and dependability of the theme creation as defined by Lincoln and
Guba (1985).
The emergent themes were a combination of all generations due to the small
number of interviews conducted, illustrated in Figure 13. However, the theme of ‘Don’t
Care’ was derived from Millennial interviewees only, who were in the early stages of his
or her collegiate career, and his or her parents still play an active role in decision

73
making. Purpose, quality, and price were common themes among all interviewees,
regardless of generation group.
However, majority of interviewees showed interest in foods that were non-
processed including many fresh options saying “I like real food” (171-Male-1978).
Interviewees also showed interest and stated opinions on how food was produced (e.g.,
organic, sustainable). “We don’t shop at big grocery stores. Instead we go to farmers
markets, local fish markets for sustainable meat and fish” (172-Male-1965). Another
respondent indicating, “no organic, I don’t believe in it (186- Female-1992) when
discussing the products she purchases at a grocery store. Both of these subject matters
are common areas used in marketing strategies with companies that claim to be socially
responsible.
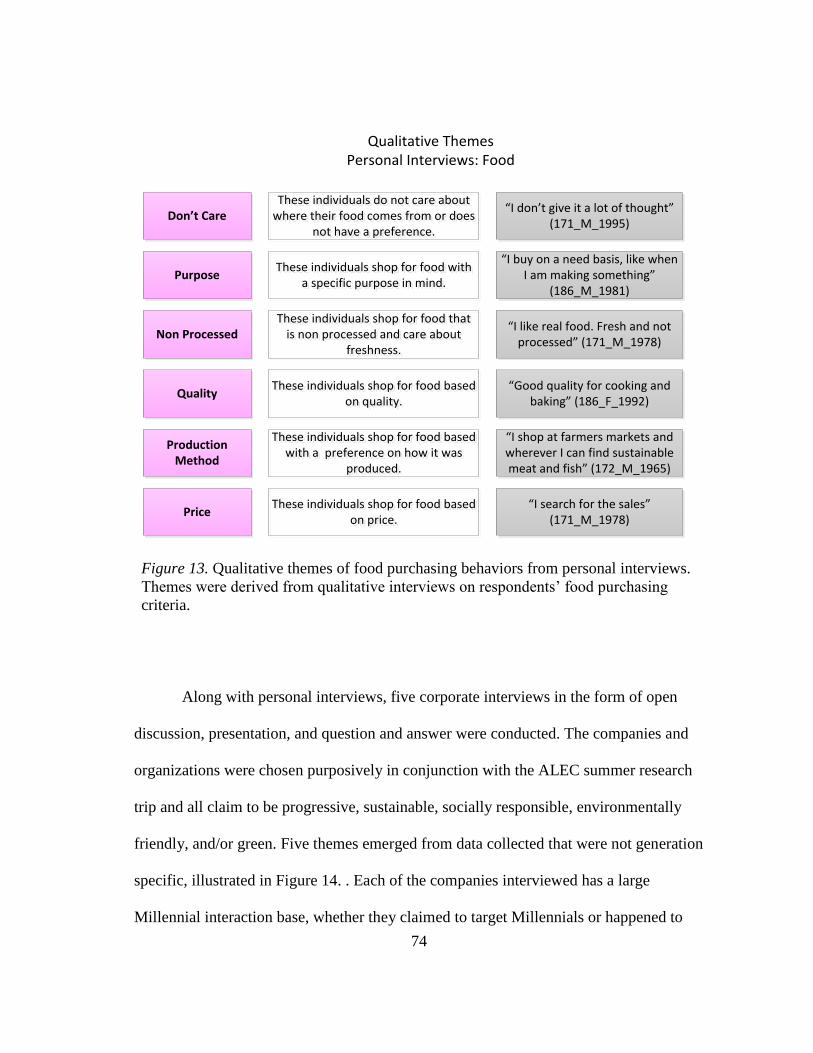
74
Qualitative ThemesPersonal Interviews: Food
Don’t Care
Price
Non Processed
Purpose
Quality
Production Method
These individuals do not care about where their food comes from or does
not have a preference.
These individuals do not care about where their food comes from or does
not have a preference.
These individuals shop for food with a specific purpose in mind.
These individuals shop for food with a specific purpose in mind.
These individuals shop for food that is non processed and care about
freshness.
These individuals shop for food that is non processed and care about
freshness.
These individuals shop for food based on quality.
These individuals shop for food based on quality.
These individuals shop for food based with a preference on how it was
produced.
These individuals shop for food based with a preference on how it was
produced.
These individuals shop for food based on price.
These individuals shop for food based on price.
“I don’t give it a lot of thought” (171_M_1995)
“Good quality for cooking and baking” (186_F_1992)
“I buy on a need basis, like when I am making something”
(186_M_1981)
“I shop at farmers markets and wherever I can find sustainable meat and fish” (172_M_1965)
“I search for the sales” (171_M_1978)
“I like real food. Fresh and not processed” (171_M_1978)
Figure 13. Qualitative themes of food purchasing behaviors from personal interviews.
Themes were derived from qualitative interviews on respondents’ food purchasing
criteria.
Along with personal interviews, five corporate interviews in the form of open
discussion, presentation, and question and answer were conducted. The companies and
organizations were chosen purposively in conjunction with the ALEC summer research
trip and all claim to be progressive, sustainable, socially responsible, environmentally
friendly, and/or green. Five themes emerged from data collected that were not generation
specific, illustrated in Figure 14. . Each of the companies interviewed has a large
Millennial interaction base, whether they claimed to target Millennials or happened to

75
have a large Millennial customer base. It could be argued, since these companies have
large Millennial followings and customer bases, these marketing technique themes that
were developed could pertain to the Millennial generation.
Qualitative ThemesCorporate Interviews
Spark Curosity
Relationships
Social Media
Inclusion
Internal Motivators
Personal Determinants
Marketing Strategies
Environmental Determinants
Figure 14. Qualitative Themes from corporate interviews and interactions as related to
Bandura’s (1986) social cognitive theory.
Marketing strategies that sparked curiosity, had a heavy social media presence,
helped foster relationships, and made consumers/supporters feel included were common
among the companies interviewed. One company stated, “The news won’t run anything
to downgrade their sponsors unless it is colorful enough to gain attention” (189-
76
Corporate) and “[Our marketing] is designed to appeal to an idea and spark curiosity, not
just create dinner table discussions” (157-Corporate). The four marketing strategies
found could be related back to Bandura’s (1986) social cognitive theory as
environmental determinants. Bandura (1986) stated that a person’s environmental
experiences and interactions affect their personal motivations, thoughts, and behaviors.
Along with the marketing strategy themes found, each company interviewed mentioned
they actively try to tap into individuals’ personal motivators, or the things they care
about. If companies are able to understand customer motivations, lifelong customers and
promoters of that company’s message and/or brand could be created.
Data analyses were presented in two sections. The first addressed the research
questions related to Research Aim 1, both quantitatively and qualitatively. The second
addressed research questions related to Research Aim 2, quantitatively and qualitatively,
respectively. Additionally, marketing strategy themes that emerged among corporate
interviews were presented. Chapter V summarizes the findings and results of this study.
An explanation will be given of the meaning of the results for practitioners and
researchers, as well as decision-making criteria moving forward. Recommendations for
future research will be presented to increase scholarly productivity for the Millennial
generation group.
77
CHAPTER V
DISCUSSION AND CONCLUSION
Summary of the Study
The primary purpose of this study was to explore how members of the Millennial
generation perceived stereotypes about themselves (the Millennial generation) and how
people of other generations (Traditionalists, Baby Boomers, and Gen X) perceived
stereotypes of millennials. A secondary purpose of this study was to explore how each
generation perceives socially responsible food and drink establishments, which will help
to understand Millennials’ food purchasing motivations and decisions. The generational
groups involved were Traditionalists (born 1901 – 1944), Baby Boomers (born 1945 –
1960), Generation X (born 1961 – 1979), and Millennials (born 1980 – 1995).
Research has been conducted to discover studies that were created by
practitioners, as well as in an academic setting. Due to the time lag of publication in
academia, generational research has been conducted frequently by industry. Reviews of
relevant scholarly works as well as industry reports and studies on generations have been
reviewed (BCG, 2012; Nielsen, 2014; Pew, 2010; Deloitte, 2014). Many studies
provided information on Millennials, describing who they are, as well as his or her
thoughts, motivations, and behaviors. However, there appeared to be a gap in the
literature comparing Millennial’s self-perceptions to those of other generations.
Therefore, this study used Bandura’s (1986) social cognitive theory to guide our
examination of the perceptions of Millennials as a generation.
78
A conservative approach was taken when analyzing the data and interpreting the
results and findings by using adjusted alpha levels; because of unknown amounts and
sources of error (e.g., sampling error, non-response error, frame error), the results and
finding of this study were restricted to the participants of this study. This population may
consist of but is not limited to employers hiring Millennials, customers who interact with
Millennials in a professional setting, and companies who market their products to the
Millennial customer base. The findings were relevant to Millennials (born between 1980
and 1995) in the specific or similar demographic areas of the United States as those
selected for the larger study. Nielsen (2014) acknowledged the largest 10 U.S. markets
for highly concentrated Millennials. Of the 10 locations, five were sampled in this study
(San Diego, CA; Denver, CO; Houston, TX; San Francisco, CA; Dallas, TX).
The food market landscape is currently changing with the introduction and
increased marketing emphasis on food products and food companies that are socially
responsible, green, sustainable, and progressive (Smith, 2010; Smith & Brower, 2012).
This is a topic that has sparked the interest of both academics and practitioners. Nielsen
(2014) claimed Millennials will pay a premium for socially responsible products.
Products that are considered environmentally friendly, use sustainable production
techniques and decrease the carbon footprint during production are considered socially
responsible (Keller, 1998). Smith (2010) claimed more than one-half of Millennials
indicated they sometimes make an effort to buy green or socially responsible products.
Research Aim 2 was devoted specifically to the concepts related to social responsibility
and is addressed in the following sections.

79
This study can be relevant for individuals and companies involved in the food-
agriculture industry, and beyond. Millennials will represent the largest share of U.S.
spending power by 2017 (Pew, 2010) and it is important for food companies to be able
to market to this segment of consumers. Understanding behaviors, motivations, and
perceptions of a company’s customers is one of the most important factors in a
marketer’s job. We acknowledge there is a segment of the food-agriculture community,
as well as the agriculture industry that this information will not pertain to or interest.
This study can be, however, relevant to companies that claim to be socially responsible
in the products offered and/or the process of production and preparation. This study
could also be relevant to companies that plan to focus marketing efforts to being socially
responsible.
This study was a part of a larger study on data collection methods and, therefore,
limitations in the sampling, methods, and processes existed. Following the social
exchange theory, we noticed an increased response rate. However, this method was not
the most efficient nor cost-effective way to obtain data for this study. For future and
duplicate studies, web-based surveys should be considered for instrumentation. Also, by
conducting this study in conjunction with five other projects, many questions included in
the questionnaire did not directly pertain to this specific study. In the future,
individualizing a project with this scope will allow more focused and specific data to be
collected. Population and sampling may be able to be more refined and focused for the
scope of the study.

80
Summary of Findings
In this section, a summary of the findings was presented for each of the two
research aims associated with this study. Each aim was divided into its specific research
questions and a respective summary of the descriptive and inferential statistics was
given.
Aim 1
The purpose of Research Aim 1 was to understand and describe the perceived
generational differences among Traditionalists, Baby Boomers, Generation X, and
Millennials. For Research Question 1, we described the perceptions of Millennials,
based on stereotypes, and the perception he or she had on the Millennial generation as a
whole. Based on the quantitative results, we concluded Millennials most frequently
associated themselves with being bargain shoppers, socially responsible, and healthy.
This supported our qualitative findings that Millennials, as a whole, were viewed as
healthy and socially responsible, as reported by Nielsen (2014), Pew (2010), Smith
(2010). This study further provided evidence that Millennials were socially responsible
and care about his or her health. Millennials did not, however, associate themselves or
their generation, as a whole, as being urban or philanthropic. When Millennials were
asked “what do you feel makes your generation unique,” most indicated the use of
technology. Qualitatively, each interviewee mentioned technology use when describing
Millennials, therefore, providing support for the quantitative data.
The purpose of Research Question 2 was to describe and compare how each
generation perceived the Millennial generation. Each of the three generations

81
(Traditionalists, Baby Boomers, Generation X) viewed Millennials as urban, based on
the quantitative results. This conclusion created a disconnect in perception, because
Millennials did not describe themselves as urban in our quantitative results.
Traditionalists and Baby Boomers associated Millennials with being healthy, whereas,
Generation X did not. Generation X associated Millennials with being diverse, which
neither of the other generation groups (Baby Boomers and Traditionalists) did. Research
Question 2.4 was comparative. Millennials were compared to a collapsed group of other
generations (Traditionalist, Baby Boomer, and Generation X) by Millennial stereotypes.
Based on the results of a MANOVA, we concluded there were significant differences
between the two groups. Millennials believed their generation was socially responsible,
bargain shoppers and social, but not philanthropic.
The purpose of Research Question 3 was to compare the perceptions of the
Millennial generation from other generation groups, individually. Traditionalists,
included in our sample, did not reach adequate cell size (n ≥ 30) to be compared to Baby
Boomers, Generation X, and Millennials; therefore, Traditionalists were excluded from
this comparison. Based on quantitative results, significant differences existed, with
adequate power of analysis (1 – β ≥ .80), between the Baby Boomer and Generation X
generations. Further, we concluded Baby Boomers did not believe Millennials were
expressive or social, while Generation X did. Qualitatively, Millennials were viewed as
expressive, social, socially responsible, and urban which provided support to the
quantitative data. The qualitative interviews were collapsed into one group which was
not generation specific. The results from the qualitative analyses were interpreted to

82
support the notion that Millennials were expressive and social, supported Generation X’s
perception, socially responsible with the Millennials’ perception, and urban with
Traditionalists, Baby Boomer, and Generation X’s beliefs found in our quantitative data.
Research Questions 1, 2, and 3 provided evidence that there was a disconnect
among generations when discussing perceptions of Millennials. Based on the
quantitative results, we concluded the largest disconnect was not between individual
generation groups, but rather, when comparing Millennials’ perception to other
generation groups. Our interpretation of the results further indicated Millennials did
agree with claims from Deloitte (2014), Pew (2010), and Nielsen (2014) that indicted
Millennials were driven, as a generation. However, the results of this study did not
support Nielsen’s (2014) and Pew’s (2010) claims that Millennials had a greater
philanthropic nature than other generations; we found no statistical difference. Smith’s
(2010) claim that Millennials care more about social responsibility was supported by our
interpretation of the results of this study. Other generations (Traditionalists, Baby
Boomers, and Generation X) disagreed that Millennials were socially responsible at all,
and no statistical differences were found between the generation groups.
Aim 2
Research Aim 2 was to understand food consumption behavior of generations.
The purpose of research question 4 was to determine if social responsibility effected
food and drink establishment consumption habits, among generations. Based on the
quantitative results, research questions associated with Aim 1 supported Smith’s (2010)
hypothesis that Millennials associated with and were more concerned with social

83
responsibility when it comes to his or her food choices. To address research question 4.1,
we described each respondent’s likeliness to visit food and drink establishments that
varied in levels of publicized and marketed social responsibility (Chipotle, McDonald’s,
Starbucks, and Panera Bread).
Based on the results, there was a notable difference between positive support for
the heavily-marketed, socially responsible food and drink establishments (Chipotle,
Starbucks, and Panera Bread) among each generational group. Millennials were most
likely to visit Chipotle, which was arguably the most socially responsible food and drink
establishment included in this study. Based on the quantitative data and findings from
Aim 1, we concluded Millennials were also more likely to support Panera Bread, in
comparison to other generational groups. However, other generations had a greater
likeliness to visit Panera Bread than Millennials. There were no statistical differences
among generational groups’ likeliness to visit one of the socially responsible food and
drink establishments between Millennials and other generations. Therefore, researchers
or practitioners should not base decisions or make assumptions that Millennials will be
more likely to visit Starbucks or Chipotle, based on the findings and results of this study.
The interpretation of qualitative findings further supported that respondents
based food purchasing decisions on whether the food was non-processed, and the
production method used (e.g., organic, sustainable). Support from respondents to make
non-processed and production method important criteria when purchasing food provides
backing to the increased care for sustainable and go green marketing initiatives, as
reported by Smith and Brower (2012), Smith (2010), and Regine (2011).

84
In addition to the findings from personal interviews, marketing technique themes
emerged among corporate interviews. Each of these companies and organizations had a
large Millennial following and/or claimed to market to Millennials, as a generation
group. The themes of using social media (technology use) and inclusion were supported
by the quantitative results of this study. Millennials, overall, positively viewed their
generation as inclusive as well as agreed that technology use was the single most factor
that separated his or her generation from others. The companies and organizations
interviewed all relied somewhat on Millennials internal motivations (thoughts, beliefs,
feelings) to market their products to the generation group. The findings and results of
this study should be important to companies and organizations when creating new
marketing strategies for its large Millennial-customer-base and following.
By using Bandura’s (1986) social cognitive theory to understand the results and
findings of this study, we concluded the triadic, reciprocal model of personal,
environmental, and behavioral determinants each affect one another. Millennials’
internal motivations (their thoughts, motivations, and beliefs) affected the environment
in which they position themselves in, which thereby, affects the way they behave.
An example supported from this study was a Millennials’ concern with socially
responsible food choices effects where they decided to actively purchase food
(Chipotle). By purchasing food at Chipotle, a Millennial may be more apt to take notice
to Chipotle’s image, actions, and marketing strategies in the marketplace.

85
Recommendations
Recommendations based on the findings and results of this study were separated
into recommendations for industry and practitioners, and recommendations for academia
and future researchers respectively.
Industry and Practitioners
Millennials, as a generation, differed from other generations, and should,
therefore, be approached and marketed to differently. In this study, we concluded
Millennials to be socially responsible, bargain seeking, and healthy. As marketers, these
stereotypes should be included in marketing strategies and communications with
Millennials. Millennials viewed themselves as being very different from other
generations and did not want to be lumped into a category with Traditionalists, Baby
Boomers, and/or Generation X.
Marketing strategies used by companies and organizations that have large
Millennial followings and customer bases should be reviewed. Decision makers of
marketing strategies should use consumer research to uncover the internal motivations of
their Millennial customers, based on the results and findings of this study. Technology
use is the best way to communicate with Millennials. However, it is crucial Millennials
feel valued, and that a relationship is created with them as a customer (Keller, 1998). We
further concluded mass marketing techniques that are not individually personalized will
go unnoticed by the Millennial generation.
Millennials indicated they were health conscious and take a more active role in
their food selection than other generation groups. It is important for companies to take

86
this into consideration, especially within the food-agriculture industry. Millennials care
about socially responsible food choices, and will have loyalty to products and companies
that support social responsibility in the marketplace. Marketers of food should highlight
socially responsible factors in their marketing strategies with Millennials. Future
industry studies to explore the levels and importance of social responsibility in the food-
agriculture marketplace would be beneficial to the landscape of the market and its
consumers.
Academia and Future Research
The Millennial generation has moved or is quickly moving out of the classroom
and into the workplace. Continued research on the cusp of the Millennial and Generation
Z generation groups should be conducted to further address communication trends and
motivations among students. This sample would be able to be reached in the collegiate
classroom setting, currently. Professors and researchers who emphasize in marketing
should take this sample into consideration when developing new research scholarship.
The duplication of this study should use a more refined instrument that addresses
only generational inquiries. Using a more developed instrument will allow data collected
to be more focused and have fewer limitations. The sample of this study included five of
the top ten highest concentrated Millennial cities (Nielsen Pop Facts™, 2013). In future
studies of Millennials, a sample of each of the ten cities with the greatest concentrations
may provide a richer sample and more accurate assessment of the generation.
This study yielded a large quantity of quantitative data. However, data were not
collected in the most efficient nor cost effective method. In future research, an online

87
survey may enable researcher to reach a larger percentage of Millennials in differing
geographic areas in a more cost effective and efficient way. To further the
understanding of Millennials, more qualitative interviews would benefit the research
outcomes and give better thick, rich descriptions of the generation group and data
saturation to be reached.
Additional studies should be conducted based on the findings of this study.
Millennials believed they, as a generation, were socially responsible, bargain seeking,
and healthy. These terms could be related to food consumption. Further studies
addressing these factors of food consumption and purchasing decisions should be
explored for the Millennial generation. This future research will give the food-
agriculture industry a better understanding of the purchasing behaviors and motivations
of their largest consumer group, Millennials. This research could also change the way
food-agriculture companies market goods to their Millennial consumers, based on the
results and findings.
The likeliness of generation groups visiting the selected socially responsible food
and drink establishments did not report any statistical significance in this study.
Therefore, future research pertaining to existing socially responsible food and drink
establishments’ customers is needed. We know Millennials care about social
responsibility, based on the findings and results of this study, but do not know if other
generations do as well. Nor do we know the level of care and loyalty Millennials have
for socially responsible food and drink establishments. Millennial’s devotion to social

88
responsibility is a valuable piece of information for these companies to have when
creating budgets and new marketing strategies for its targeted customers.
Conclusion
The results and findings of this study allowed us to conclude there were some
similarities between the stereotypes perceived from each generation group about
Millennials. The descriptive results of this study allowed us to conclude that Generation
X had a more positive view of Millennials than any other generation group. There was
agreement and disagreement among generational groups’ perceptions of Millennial
stereotypes. The stereotypes that yielded the highest mean scores when descriptive
statistics were calculated for each generation are illustrated in Figure 15.
Baby BoomerTraditionalist Generation X Millennial
Diverse
Healthy
Urban
Inclusive
Healthy
Urban
Diverse
Urban
SociallyResponsible
BargainSeeking
Inclusive
Social
Figure 15. Most perceived stereotypes of the Millennial generation. Stereotypes were
derived from each generation group’s descriptive statistics (mean and standard
deviation).

89
Our interpretation of the MANOVA led us believe there were differences in how
Millennials perceived themselves as compared to other generations about the stereotypes
of social responsibility, health, and bargain seeking. Generation X also perceived
Millennials were more positively, compared to the Baby Boomer generation. The
MANOVA calculated to test the likeliness of Millennials to visit socially responsible
food and drink establishments did not yield statistical differences when compared to
other generations. However, it was found that consumers do care about the way their
food is produced, its quality, and if it is non-processed. Socially responsible, sustainable,
progressive, and/or green companies and organizations interviewed tend to use
marketing strategies that are inclusive, build relationships with customers, spark
curiosity, are rooted in some form of social media, and utilize customers’ internal
motivations in order to influence their decision making.
This study was a good first step in relating Bandura’s (1986) social cogitative
theory to generational research. Significant results for the Millennial generation were
reported and given qualitative support. Claims of Millennial stereotypes as reported by
Nielsen (2014), Pew, (2010), and Deloitte (2014) were confirmed or refuted, based on
statistical tests and emergent qualitative themes.

90
REFERENCES
AgDevONLINE. (2010). Progressive agriculture ranking details. AgDevONLINE.
Retrieved from
http://agdevonline.com/index.php?option=com_content&view=article&id=101:p
rogressive-agriculture-ranking-details&catid=44
Allred, S. B., & Ross-Davis, A. (2011). The drop-off and pick-up method: An approach
to reduce nonresponse bias in natural resource surveys. Small-Scale
Forestry, 10(3), 305-318.
Anderson, E. (2007). Connecting with Gen Y. Dealernews, 43(5), 14-14.
Ashton, R. H., & Kramer, S. S. (1980). Students as surrogates in behavioral accounting
research: Some evidence. Journal of Accounting Research, 1-15.
Atkinson, R., & Flint, J. (2001). Accessing hidden and hard-to-reach populations:
Snowball research strategies. Social Research Update, 33(1), 1-4.
Bandura, A. (2009). Social cognitive theory of mass communication. Media Psychology,
3(3), 265-299.
Bandura, A. (1986). Social foundations of thought and action. Englewood Cliffs, NJ.
Barton, C., Fromm, J., & Egan, C. (2012). The millennial consumer: Debunking
stereotypes. The Boston Consulting Group. Retrieved from
https://www.bcgperspectives.com/content/articles/consumer_insight_marketing_
millennial_consumer/
Berry, L.L., Seltman, K.D. (2008). Management lessons from Mayo Clinic: Inside one of
the world’s most admired service organizations. New York, NY: McGraw Hill.

91
Bitley, A. (2012). The Millennial Generation Research Review (M. Hendrix, Ed.). U.S.
Chamber of Commerce Foundation. Retrieved May 15, 2014 from
http://www.uschamberfoundation.org/millennial-generation-research-review
Bradley, M., & Daly, A. (1994). Use of the logit scaling approach to test for rank-order
and fatigue effects in stated preference data. Transportation, 21(2), 167-184.
Brooks, S. (2005). What is so special about echo boomers? Restaurant Business.
104(15), 25-50.
Bryman, A. (2012). Social research methods. Oxford university press. 290-328.
Byrne, P. (2007). Recruiting and retaining the Millennials. Volunteers Corner. 160(2).
14.
Cohen, J. (1988). Statistical power of analysis for the behavioral sciences. (2nd ed.).
Mahwah, NJ: Erlbaum.
Collins, K. M., Onwuegbuzie, A. J., & Sutton, I. L. (2006). A model incorporating the
rationale and purpose for conducting mixed methods research in special
education and beyond. Learning Disabilities: A Contemporary Journal, 4(1), 67-
100.
Deloitte. (2014). Big demands and high expectations: The Deloitte Millennial survey.
Deloitte.
Dillman, D. A. (2000). Mail and internet surveys: The tailored design method (Vol. 2).
New York: Wiley.
Dillman, D. A. (2000). Mail and telephone surveys: The tailored design method. New
York: Wiley.

92
Dillman, D. A. (1991). The design and administration of mail surveys. Annual Review of
Sociology, 225-249.
Dillman, D. A., Smyth, J. D., & Melani, L. (2010). Internet, mail, and mixed-mode
surveys: the tailored design method. Toronto: Wiley & Sons.
Egri, C. P., & Ralston, D. A. (2004). Generation cohorts and personal values: A
comparison of China and the United States. Organization Science, 15(2), 210-
220.
Field, A. (2009). Discovering statistics using SPSS. Sage publications.
Goman, C. K. (2006). Communication for a new age. Strategic Communication
Management, 10(5), 8-9.
Hanson, E. (2014). Panera Bread makes a clean break toward sustainability. 24/7 Wall
Street. Retrieved from http://247wallst.com/general/2014/06/09/panera-bread-
makes-a-clean-break-towards-sustainability/
Howe, N., & Strauss, W. (2009). Millennials rising: The next great generation. Vintage.
Huntley, R. (2006). The world according to Y: Inside the new adult generation. Sydney:
Allen & Unwin.
Keller, K. L., Parameswaran, M. G., & Jacob, I. (2011). Strategic brand management:
Building, measuring, and managing brand equity. Pearson Education India.
Kowitt, B. (2014). What Panera’s move to ‘clean ingredients’ reveals about eating today.
Fortune. Retrieved from http://fortune.com/2014/06/03/what-paneras-move-to-
clean-ingredients-reveals-about-eating-today/

93
Kowitt, B. (2014). Panera takes another step toward ethical meat practices. Fortune.
Retrieved from http://fortune.com/tag/panera-bread/
Kupperschmidt, B. R. (2000). Multigeneration employees: strategies for effective
management. The Health Care Manager, 19(1), 65-hyhen.
Guba, E. G., & Lincoln, Y. S. (1994). Competing paradigms in qualitative
research. Handbook of Qualitative Research, 2(163-194).
Lindlof, T. R., & Taylor, B. C. (2011). Qualitative Communication Research Methods.
Thousand Oaks, CA: Sage Publications.
Loveridge, S. (1998). Publishing research in extension. Journal of Extension, 36(3).
Lykins, L., & Pace, A. (2013). Mastering millennial leadership development. Training +
Development, 42-45.
Malhotra, M. K., & Grover, V. (1998). An assessment of survey research in POM: from
constructs to theory. Journal of Operations Management, 16(4), 407-425.
Mannheim, K. (1952). The problem of generations, in essays on the sociology of
knowledge, New York: Oxford Univ. Press, 276-322.
Mao, V. (2014). Top restaurant stocks Starbucks, Chipotle branch out. Investors
Business Daily. Retrieved from http://news.investors.com/investing-ibd-industry-
themes/120814-729570-starbucks-aims-to-double-food-sales.htm
McDonald's Corp, (2015). McDonald's announces 2020 corporate social responsibility
and sustainability plans. McDonald’s Corporation. Retrieved from
http://news.mcdonalds.com/Corporate/news-stories/McDonald-s-Announces-
2020-Corporate-Social-Respons

94
Melevin, P.T, Dillman, D.A., Baxter, R., & Lamiman, C.E. (1999). Personal delivery of
mail questionnaires for household surveys: A test of four retrieval methods.
Journal of Applied Sociology, 16:69-88.
MELISSA Data. (2014). Zip, city, phone [Data file]. MELISSA DATA. Retrieved from
http://www.melissadata.com/lookups/zipcityphone.asp
Morse, J. M. (2003). Principles of mixed methods and multi-method research
design. Handbook of Mixed Methods in Social and Behavioral Research, 189-
208.
Mourdoukoutas, P. (2014). McDonald's should learn a labor lesson or two from Chipotle
and Starbucks. Forbes. Retrieved from
http://www.forbes.com/sites/panosmourdoukoutas/2014/12/21/mcdonalds-
should-learn-a-labor-lesson-or-two-from-chipotle-and-starbucks/
Mulder, S., & Yaar, Z. (2006). The user is always right: A practical guide to creating
and using personas for the web. New Riders.
National NAMA News. (2009). Agri Marketing, 47(5), 38-41.
Nielsen. (2014). Millennials - breaking the myths. An Uncommon Sense of the
Consumer. Retrieved from
http://www.nielsen.com/dz/en/insights/reports/2014/millennials-breaking-the-
myths.html
Nielsen. (2013). Nielsen Pop-Facts™. The Nielsen Company.
Ortlipp, M. (2008). Keeping and using reflective journals in the qualitative research
process. The Qualitative Report, 13(4), 695-705.

95
Pajares, F., Prestin, A., Chen, J., & Nabi, R. L. (2009). Social cognitive theory and
media effects. Persuasion and Learning, 283-297.
Parment, A. (2013). Generation Y vs. Baby Boomers: Shopping behavior, buyer
involvement and implications for retailing. Journal of Retailing and Consumer
Services, 20(2), 189-199.
Pendergast, D. (2010). 1 Getting to Know the Y Generation. Tourism and Generation Y,
1.
Pew Research Center. (2010). The Millennials: Confident. Connected. Open to change.
Millennials: A Portrait of Generation Next. The Pew Research Center.
Prothero, A., & McDonagh, P. (1992). Producing environmentally acceptable cosmetics?
The impact of environmentalism on the United Kingdom cosmetics and toiletries
industry. Journal of Marketing Management, 8(2), 147-166.
Raines, C., & Arnsparger, A. (2009). Millennials@Work. Retrieved from
http://www.generationsatwork.com/articles_millennials_at_work.php
Regine, K. M. (2011). Generation Y consumer choice for organic foods. Journal of
Global Business Management, 7(1), 1-13.
Riley, P. J., & Kiger, G. (2002). Increasing survey response: The drop-off/pick-up
technique. The Rural Sociologist, 22(1), 6-9.
Scheid, J. (2010). Types of communication styles: Bridging the generation gap.
Millennial Communication. HubSpot.

96
Smith, K. T. (2010). An examination of marketing techniques that influence Millennials'
perceptions of whether a product is environmentally friendly. Journal of
Strategic Marketing, 18(6), 437-450.
Steele, J., Bourke, L., Luloff, A. E., Liao, P. S., Theodori, G. L., & Krannich, R. S.
(2001). The drop-off/pick-up method for household survey research. Community
Development, 32(2), 238-250.
Tabachnick, B.G., & Fidell, L.S. (2013). Using Multivariate Statistics. 6th ed. Pearson.
Vahie, A., & Paswan, A. (2006). Private label brand image: its relationship with store
image and national brand. International Journal of Retail & Distribution
Management, 34(1), 67-84.
Smith, K. T., & Brower, T. R. (2012). Longitudinal study of green marketing strategies
that influence Millennials. Journal of Strategic Marketing, 20(6), 535-551.
DOI:10.1080/0965254X.2012.711345.

97
APPENDIX A
SCOPE OF THE LARGER STUDY
Overview
Undergraduate and graduate student researchers enrolled in a field data collection
research course in the Department of Agricultural Leadership, Education, and
Communications (ALEC) at Texas A&M University helped with the quantitative data
collection for this study. For 37 days during the summer of 2014, researchers, consisting
of six graduate students, eleven undergraduate students, and one faculty member were
part of a domestic study away program conducting field research in the southwestern
United States. During the fall 2014 academic semester another group of students
enrolled in an ALEC research course and collected data in Texas, using the same
methods from summer 2014. Students who were responsible for leading research
projects (lead researchers) and the faculty member remained the same throughout both
sets of data collection. The timeline of data collection is shown in Figure 1.

98
5/15/2014
College Station
Test-Retest
5/31/2014
College Station
Pilot Test
6/11/2014
Denver
Data Collection
6/26/2014
Fresno
Data Collection
7/8/2014
San Diego
Data Collection
6/18/2014
Berkeley & San Francisco
Data Collection
7/5/2014
San Diego
Data Collection
9/20/2014
College Station
Data Collection
10/18/2014
Dallas
Data Collection
9/27/2014
Houston
Data Collection
DecemberNovemberOctoberSeptemberAugustMay June July
Figure 1. Data collection timeline. Data collection for this study as well as the larger
study were collected using this timeline.
Instruments
During the spring 2014 academic semester, the lead researchers met to discuss
the aims of each research project involved in the larger study. The theoretical
frameworks and guidance for each project were established to address the aims of each
project. Each of the lead researchers developed a draft list of survey questions and the
respective responses, based on the aims and theoretical guidance of her project. After
several iterations of reviewing, editing, and revising the draft lists of questions, six
questionnaires were developed; one questionnaire per research project. Due to limited
time, funds, access to geographic areas, and safety risks, it was recognized there had to
be a plan developed to distribute questionnaires as a team rather than individually. The
influence of media was common among each of the research projects. Therefore, six
forms of a two-section questionnaire; the first section of each form was identical

99
assessing demographics; whereas, the second section contained questions unique to each
research project.
In the first (standardized) section of each questionnaire, one set of media
consumption and demographic questions was developed. Many of the media
consumption, frequency of media consumption, and demographics questions included
the first section were drawn from Nielsen’s U.S. Digital Consumer Report; (e.g., How
many working radios do you have in your home?). Using questions drawn from Nielsen
(2014) and Pew (2010) questionnaires allowed data collected to be comparable to the
data collected by Nielsen (2014) and Pew (2010). A conceptual diagram of the forms of
the questionnaire is included in Figure 2. The second section of the each questionnaire
was unique to the individual research projects:
· Form 1: Perceptions of live music events (Millennials)
· Form 2: Perceptions of Millennial stereotypes
· Form 3: Public perceptions of animals and use
· Form 4: Perceptions of meat products in grocery store advertisements
· Form 5: Perceptions of agriculture
· Form 6: Perceptions of radio (Radio listening habits of the public)
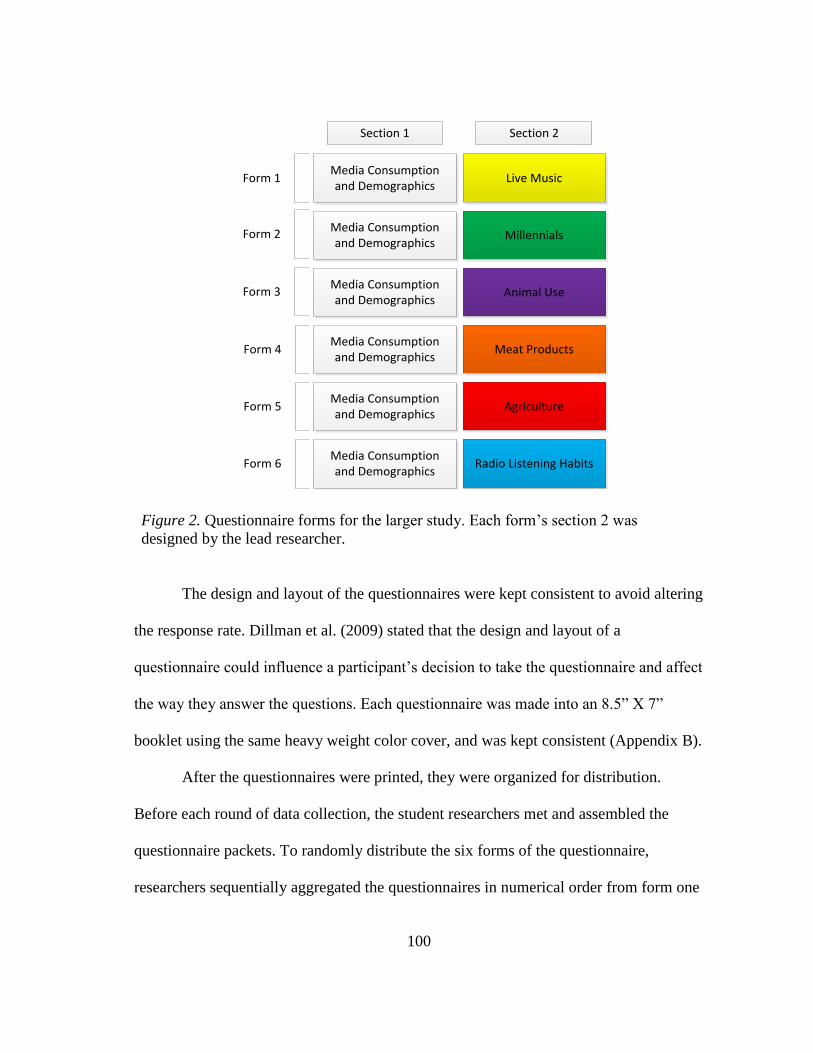
100
Section 1 Section 2
Form 1
Form 2
Form 3
Form 4
Form 5
Form 6
Media Consumption and Demographics
Media Consumption and Demographics
Media Consumption and Demographics
Media Consumption and Demographics
Media Consumption and Demographics
Media Consumption and Demographics
Live Music
Millennials
Meat Products
Animal Use
Agriculture
Radio Listening Habits
Figure 2. Questionnaire forms for the larger study. Each form’s section 2 was
designed by the lead researcher.
The design and layout of the questionnaires were kept consistent to avoid altering
the response rate. Dillman et al. (2009) stated that the design and layout of a
questionnaire could influence a participant’s decision to take the questionnaire and affect
the way they answer the questions. Each questionnaire was made into an 8.5” X 7”
booklet using the same heavy weight color cover, and was kept consistent (Appendix B).
After the questionnaires were printed, they were organized for distribution.
Before each round of data collection, the student researchers met and assembled the
questionnaire packets. To randomly distribute the six forms of the questionnaire,
researchers sequentially aggregated the questionnaires in numerical order from form one
101
to form six. The Julian date (day of the year 001 to 365), zip code, and sample number
were recorded on the back page of each questionnaire as we assembled the packets. The
Julian date, zip code, and sample number allowed researchers to determine when and
where the questionnaires were delivered. Each questionnaire was packed in plastic door
hanging bag with a cover letter (Appendix F). The cover letter, that was included in the
packets, was hand-signed by one of the student researchers.
Sample
Probabilistic and non-probabilistic sampling strategies were used in this study.
The specific sampling methods used in this study could be interpreted in multiple ways.
Multi-stage sampling was used in the quantitative part of this study. A convenience
sample of metropolitan areas in the western United States were selected: Denver, CO;
San Diego, CA; San Francisco, CA; Fresno, CA; Houston, TX; Dallas, TX; and College
Station, TX. Locations selected for data collection were based on the population and
personal lifestyles of the residents inhabiting these areas, decided on by the faculty
member in charge of the larger study. Each location selected for data collection had a
large metropolitan and suburban population, and small rural population. Selecting
diverse populations for data collection produced a stratified sample. Collecting data in
these areas could be somewhat representative of a convenient sample because they were
cities visited during the domestic study away program. Locations in Texas were selected
when the need for more data arose after returning from the domestic study away
program after the summer of 2014.

102
Sample sizes varied among methods because of the size of the larger study being
conducted. A sample size of n = 2,100 per zip coded visited was used for DOPU and
DOMB for all summer 2014 data collection. A sample size of n = 900 per zip code
visited was used for DOPU, DOMB, and mail surveys during the fall 2014 data
collection. Sample sizes were calculated based on the six projects data were being
collected for.
Measures/Protocol
Four quantitative data collection methods were used in this study, each with a
different variation of survey retrieval method. Each zip code was divided into three
differing methods for the purpose of testing different data collection methods. Figure 3
shows an example zip code breakdown.
Figure 3. Example zip code layout. This was used for three method variations
during data collection.
103
Although data collection was completed for six different projects during the
summer and fall of 2014 ALEC research trips, it was difficult to determine the exact
number of each form distributed. Due to experimental design of the larger study (survey
distribution methods experiment) the methods used varied greatly. Table 1 outlines each
location, the type of drop-off/pick-up method, the number of questionnaires distributed
and retrieved, number of contacts made, and the days of the week drop-off and pick-up
occurred.

104
Table 1
Variations between drop-off and pick-up varieties, for larger study data collection.
Drop-off/Pick-up Duration Schedule
Method Location
Duration
between
DO/PU
#
Contacted a
#
Distributed b
#
Retrieved
DOW
DO
DOW
PU
DOPU Bryan/College
Station, TX (Pilot)
48 hours 31 60 27 Sat Mon
DOMB Denver, CO 24 hours 457 2,015 180 Tues —
DOPU Berkeley, CA 48 hours 289 1,498 148 Wed Sat
DOPU San Francisco, CA 48 hours 203 1,270 115 Wed Sat
DOPU Fresno, CA 3 hours 464 1,307 122 Wed Wed
DOPU Ramona, CA 3 hours 257 179 124 Thurs Thurs
DOPU San Diego, CA 3 hours 541 341 205 Sun Sun
DOPU Bryan/College
Station, TX
3 hours 186 157 120 Sat Sat
DOPU Houston, TX 2 hours 214 152 104 Sat Sat
DOPU Dallas, TX 2 hours 157 103 66 Sat Sat
Note. a # Contacted represents the number of residents we made face-to-face contact with and verbally
accepted the survey. b # Distributed represents the number of questionnaires given out, face-to-face
contact was not necessarily made in the DOPU variety. However, face-to-face contact was a qualifier for #
Distributed for the VDOPU variety.

105
Using the DO(48)PU, DO(24)PU, and DOMB variety, questionnaire packages
were left on every door that was deemed safe, whether the resident was home or not.
Packages were not left with residents that face-to-face contact was made who verbally
declined to participate. Using the DO(03)PU and DO(02)PU varieties, questionnaire
packets were only left with residents who face-to-face contact was made with, and
verbally accepted to participate. Table 2 represents the quantitative portion of the larger
study and therefore encompasses all six projects.
Table 2
Distribution and retrieval of the larger study
Method Location # Contacted a # Distributed b # Retrieved
DO(48)PU Bryan/College
Station, TX (Pilot)
31 60 27
DOMB Denver, CO 457 2,015 180
DO(48)PU San Francisco, CA 601 2,768 263
DO(24)PU Fresno, CA 464 1,307 122
DO(03)PU San Diego, CA 798 520 329
DO(02)PU Bryan/College
Station, TX
186 157 120
DO(02)PU Houston, TX 214 152 104
DO(02)PU Dallas, TX 157 103 66
Note. a # Contacted represents the number of residents we made face-to-face contact
with and verbally accepted the survey. b # Distributed represents the number of
questionnaires given out, face-to-face contact was not necessarily made in the
DO(48)PU or DO(24)PU variety. However, face-to-face contact was a qualifier for #
Distributed for the DO(03)PU and DO(02)PU variety.

106
Method Overview and Limitations
Drop-off/Pick-up: Long Duration
Using DO(48)PU and DO(24)PU, researchers went door-to-door and encouraged
potential respondents to complete the given questionnaire and informed residents they
would be back in two days at a specified time to retrieve the completed questionnaire.
Each researcher used for the DOPU method will receive the same materials and training
to ensure transferability or external validity (Lincoln & Guba, 1985). Respondents were
also given/left with a brochure and cover letter about the scope of the projects for his or
her reference indicating they could use the clear plastic door hanger bag to place the
questionnaire in the event of not being home. This method was used for data collection
activities conducted in San Francisco, CA and Fresno, CA. Questionnaires were left at
every household, even if the residents were not home. Questionnaires were not left at the
homes where residents opted out (said no) to participating or had an obstacle to safely
delivering the questionnaire to the front door (e.g., loose dog, locked gate, unsafe
surrounding – including drug dealers).
Limitations
Residents not being home, locked gates not allowing the researcher to get to the
door, unsafe surroundings, and obstructions to the residence were all limitations to the
DOPU method. The amount of time taken to drop-off packages as well as picking them
up ranged anywhere between six and 12 hours per research group. This time was
dependent on if residents were home and continued conversation after face-to-face
rapport was made. Conversations lasted anywhere between 15 and 45 minutes. The

107
inability to confirm if the resident received the questionnaire was an issue without
creating face-to-face contact. When retrieving questionnaires, some residents
encountered said he or she never received the questionnaire.
Drop-off/Pick-up: Short Duration
Using DO(03)PU and DO(02)PU, researchers went door-to-door during the
morning hours and encouraged potential respondents to complete the given
questionnaire and informed residents they would be back that same afternoon to retrieve
the completed questionnaire. Only residents who agreed to participate in the
questionnaire were given a copy with a door hanger bag to place their completed
questionnaire in to be picked up. By giving out questionnaires only to residents who
agreed to participate allowed for much more efficient and cost effective disbursement of
questionnaires. Upon request, a brochure was given about the scope of the projects for
their reference. This method was used for residents in San Diego, CA; Bryan/College
Station, Texas; Houston, Texas; and Dallas, Texas.
Limitations
Residents not being home, locked gates not allowing the researcher to get to the
door, unsafe surroundings, and obstructions to the residence were all limitations to the
DO(03)PU/DO(02)PU method. The amount of time taken to drop-off packages as well
as picking them up ranged anywhere between two to six hours per research group. This
time was dependent on if residents were home and continued conversation after face-to-
face rapport was made. Conversations lasted anywhere between 15 and 45 minutes.
When retrieving questionnaires, some residents encountered said he or she never
108
received the questionnaire although face-to-face communication was created with all
residents using DO(03)PU/DO(02)PU.
Drop-off/Mail-back
Using DOMB, researchers went door-to-door and encouraged potential
respondents to complete the given questionnaire and mail it back by placing the
completed questionnaire in the pre-paid envelope provided at or before the date stated on
the cover letter given, which gave respondents a one week time window. Respondents
were also given a brochure and cover letter about the scope of the projects for their
reference. This method was used for residents in Denver, CO; Bryan/College Station,
TX; Houston, TX; and Dallas, TX. Questionnaires were left at every household, even if
the residents were not home. Questionnaires were not left at the homes where residents
opted out (said no) to participating or had an obstacle to safely delivering the
questionnaire to the front door.
Limitations
Residents not being home, locked gates not allowing the researcher to get to the
door, unsafe surroundings, and obstructions to the residence were all limitations to the
DOMB method. The amount of time taken to drop-off packages ranged anywhere
between six and 12 hours per research group. This time was dependent on if residents
were home and continued conversation after face-to-face rapport was made.
Conversations lasted anywhere between 15 and 45 minutes. The inability to confirm if
the resident received the questionnaire if no one was at home was an issue without
creating face-to-face contact.

109
Mail survey
A copy of the questionnaire was sent out via traditional USPS mail. Enclosed in a
Digital Media Research & Development Lab (a Texas A&M affiliation) envelope
(Appendix G) with the following contents: a questionnaire (Appendix B), pre-paid return
envelope (Appendix H), and a cover letter (Appendix F). Although phone or mail
surveys are often more cost efficient, they do not provide any sense of responsibility
(social exchange) to complete the questionnaire to potential respondents. Mail based
surveys were used to try to achieve different response rates using the same sample
derived for the other data collection methods, which are beyond the scope of this study
and not reported herein.
These resident addresses were selected using the MELISSA database. This
database system is a free database that provides clear, concise, and correct information
based on residential geographic locations. For this study, a random zip code was selected
using a random number generator in Microsoft® Excel. The randomly selected zip codes
were entered into the MELISSA database to generate street names and house numbers to
complete a mail survey sample. Head researchers met and created a mailing list using
those selected addresses, printed labels, and packaged questionnaires to mail out.
Limitations
A mail survey does not allow face-to-face communication to take place, and
therefore does not support the social exchange theory. The inability to confirm if the
resident received the questionnaire was an issue without creating face-to-face contact.

110
APPENDIX B

111

112

113

114
APPENDIX C

115
APPENDIX D
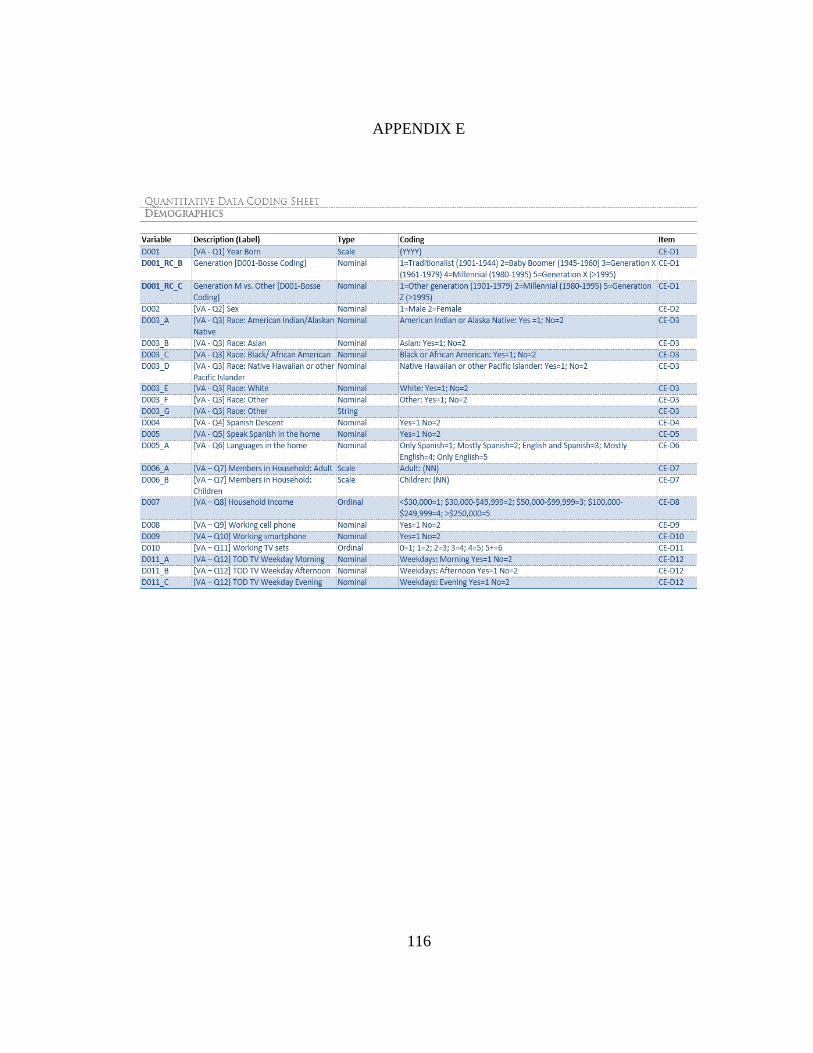
116
APPENDIX E

117
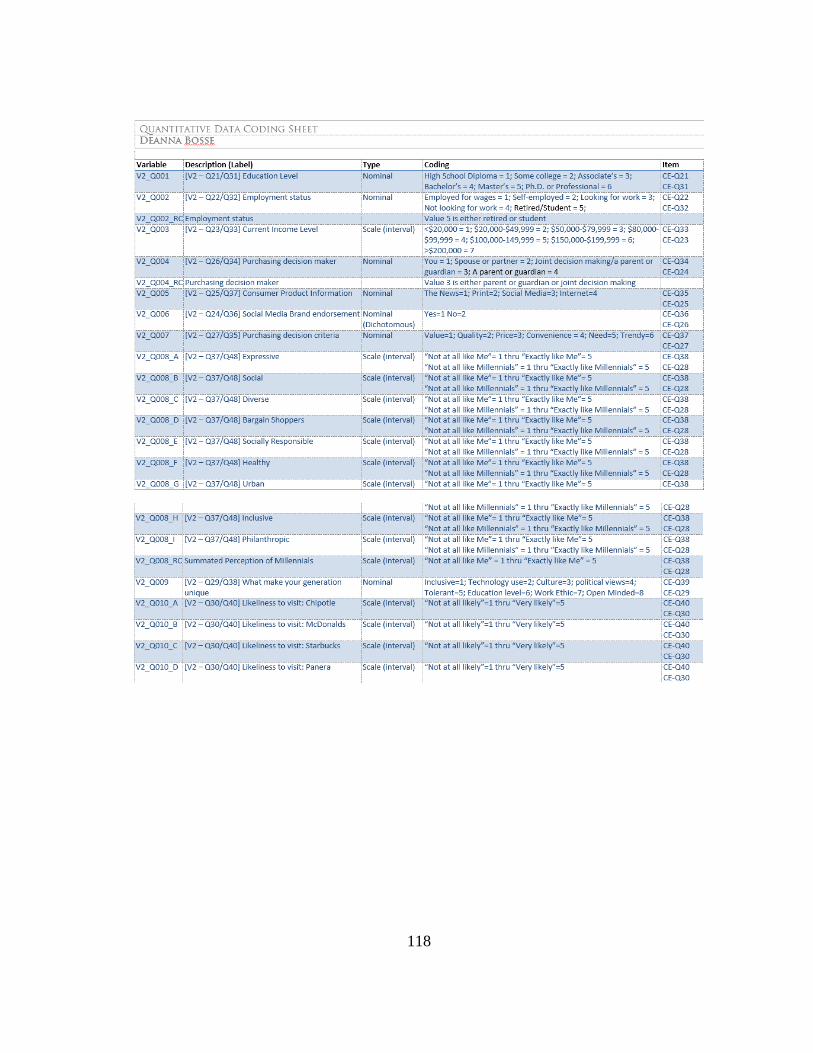
118
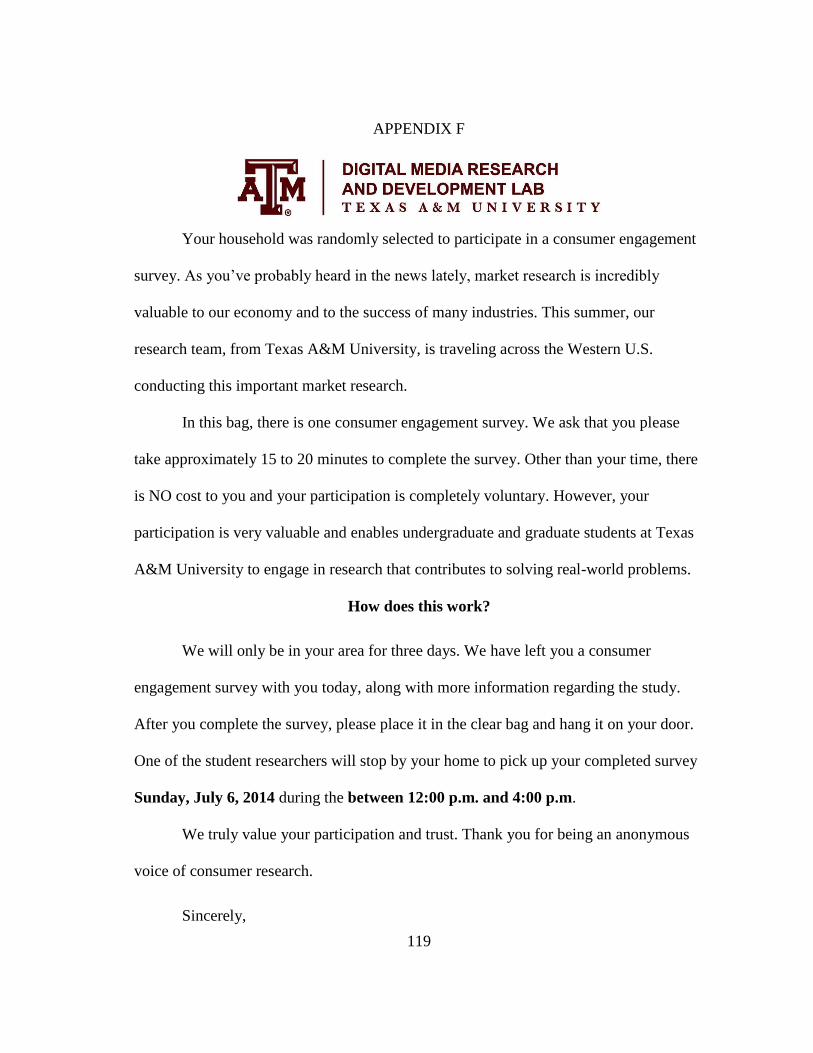
119
APPENDIX F
Your household was randomly selected to participate in a consumer engagement
survey. As you’ve probably heard in the news lately, market research is incredibly
valuable to our economy and to the success of many industries. This summer, our
research team, from Texas A&M University, is traveling across the Western U.S.
conducting this important market research.
In this bag, there is one consumer engagement survey. We ask that you please
take approximately 15 to 20 minutes to complete the survey. Other than your time, there
is NO cost to you and your participation is completely voluntary. However, your
participation is very valuable and enables undergraduate and graduate students at Texas
A&M University to engage in research that contributes to solving real-world problems.
How does this work?
We will only be in your area for three days. We have left you a consumer
engagement survey with you today, along with more information regarding the study.
After you complete the survey, please place it in the clear bag and hang it on your door.
One of the student researchers will stop by your home to pick up your completed survey
Sunday, July 6, 2014 during the between 12:00 p.m. and 4:00 p.m.
We truly value your participation and trust. Thank you for being an anonymous
voice of consumer research.
Sincerely,

120
APPENDIX G

121
APPENDIX H

122
APPENDIX I

123

124
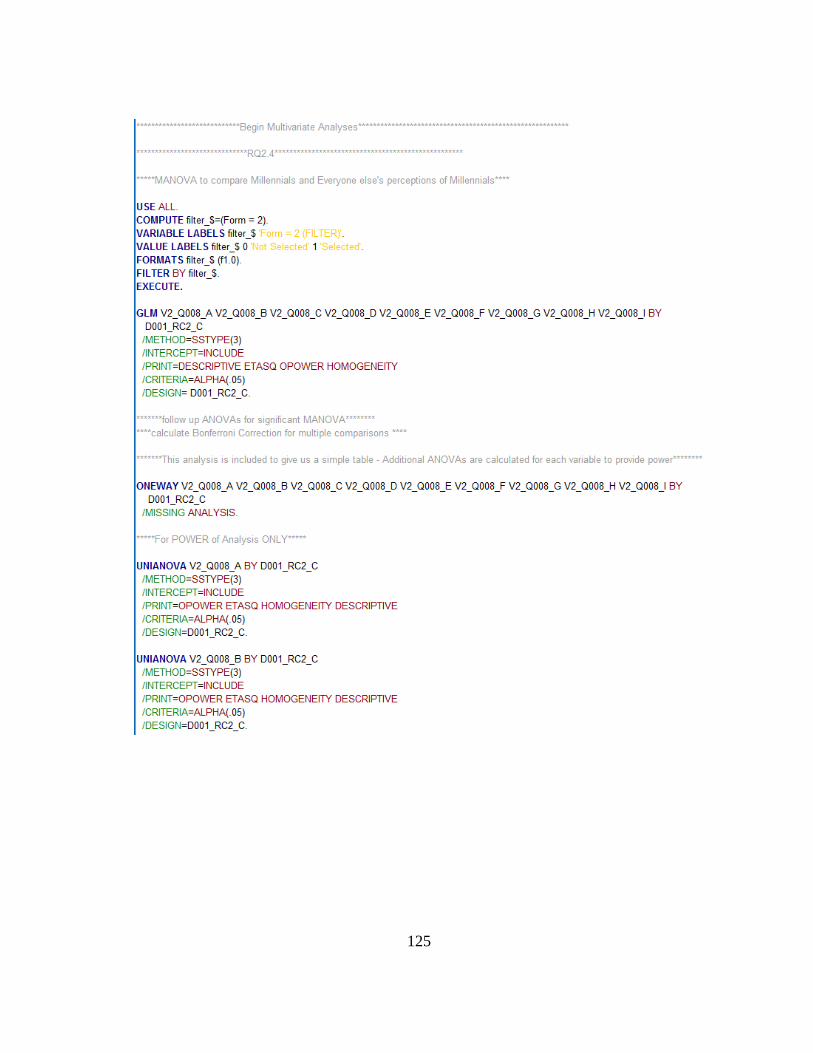
125

126

127

128

129
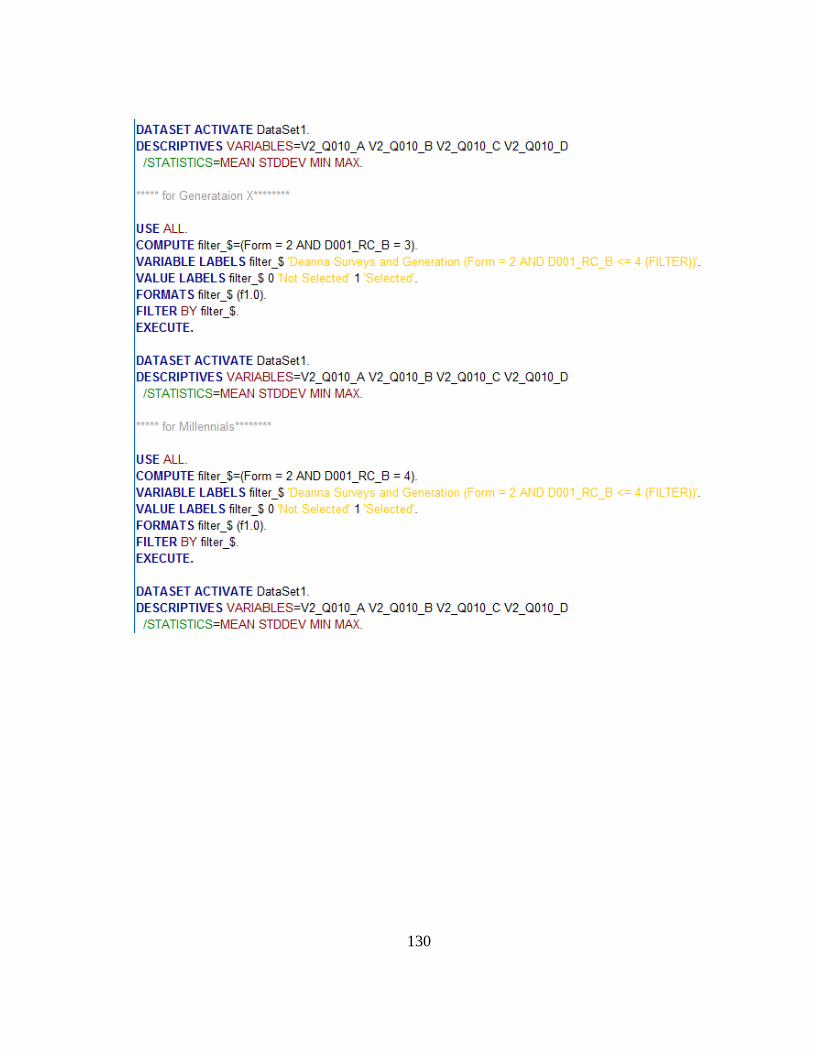
130

131