
A High-Resolution Linkage-Disequilibrium Map of the Human Major Histocompatibility Complex and First...
13
Am. J. Hum. Genet. 76:634–646, 2005 634 A High-Resolution Linkage-Disequilibrium Map of the Human Major Histocompatibility Complex and First Generation of Tag Single-Nucleotide Polymorphisms Marcos M. Miretti, 1 Emily C. Walsh, 2 Xiayi Ke, 3 Marcos Delgado, 1 Mark Griffiths, 1 Sarah Hunt, 1 Jonathan Morrison, 1 Pamela Whittaker, 1 Eric S. Lander, 2 Lon R. Cardon, 3 David R. Bentley, 1 John D. Rioux, 2 Stephan Beck, 1 and Panos Deloukas 1 1 Wellcome Trust Sanger Institute, Hinxton, United Kingdom; 2 Broad Institute of Massachusetts Institute of Technology and Harvard, Cambridge, MA; and 3 Wellcome Trust Centre for Human Genetics, University of Oxford, Oxford, United Kingdom Autoimmune, inflammatory, and infectious diseases present a major burden to human health and are frequently associated with loci in the human major histocompatibility complex (MHC). Here, we report a high-resolution (1.9 kb) linkage-disequilibrium (LD) map of a 4.46-Mb fragment containing the MHC in U.S. pedigrees with northern and western European ancestry collected by the Centre d’Etude du Polymorphisme Humain (CEPH) and the first generation of haplotype tag single-nucleotide polymorphisms (tagSNPs) that provide up to a fivefold increase in genotyping efficiency for all future MHC-linked disease-association studies. The data confirm previously identified recombination hotspots in the class II region and allow the prediction of numerous novel hotspots in the class I and class III regions. The region of longest LD maps outside the classic MHC to the extended class I region spanning the MHC-linked olfactory-receptor gene cluster. The extended haplotype homozygosity analysis for recent positive selection shows that all 14 outlying haplotype variants map to a single extended haplotype, which most commonly bears HLA-DRB1*1501. The SNP data, haplotype blocks, and tagSNPs analysis reported here have been entered into a multidimensional Web-based database (GLOVAR), where they can be accessed and viewed in the context of relevant genome annotation. This LD map allowed us to give coordinates for the extremely variable LD structure underlying the MHC. Introduction Characterization of patterns of linkage disequilibrium (LD) at a fine scale across the genome is central to the optimal design and execution of association studies of common variants that influence susceptibility of com- mon diseases, as well as the understanding of processes such as recombination, mutation, and selection. LD maps report directly on marker correlation in the population and can thus guide marker selection for association stud- ies. It is well established that regions of high LD display low haplotype diversity; thus, common haplotypes can be efficiently tagged with only a subset of all common variants, known as “haplotype tag SNPs” (tagSNPs) (Daly et al. 2001; Johnson et al. 2001; Chapman et al. 2003; Goldstein et al. 2003; Clayton et al. 2004). How- ever, the use of tagSNPs carries some loss of power for Received December 3, 2004; accepted for publication February 2, 2005; electronically published March 1, 2005. Address for correspondence and reprints: Dr. Stephan Beck, The Well- come Trust Sanger Institute, Wellcome Trust Genome Campus, Hinx- ton, Cambridge, CB10 1SA, United Kingdom. E-mail: beck@sanger .ac.uk 2005 by The American Society of Human Genetics. All rights reserved. 0002-9297/2005/7604-0010$15.00 detection of all other common variants, with the excep- tion of completely correlated markers. Many methods exist to identify an optimal set of tagSNPs that are based on observed correlations among an initial set of markers, to avoid the collection of redundant information (see Goldstein et al. [2003] for review). These methods take advantage of high-resolution LD maps that show in- creasing efficiency at higher marker density (Ke et al. 2004a). Several linkage scans and association-mapping stud- ies of most, if not all, autoimmune diseases—such as type 1 diabetes, multiple sclerosis, systemic lupus ery- thematosus (Davies et al. 1994; Marchini et al. 2003; Harbo et al. 2004; Marrosu et al. 2004; Oksenberg et al. 2004)—and infectious diseases like malaria and AIDS (Hill et al. 1991; Carrington and O’Brien 2003) have given strong signals in the major histocompatibility complex (MHC), a biologically and medically impor- tant region on human chromosome 6p that harbors many immune genes. Partly because of these disease studies, this region attracted a lot of attention, partic- ularly with respect to the structure of LD and recom- bination. Whereas, historically, only the classical HLA loci were studied by genotyping, recent systematic ef- forts to characterize LD patterns across the whole of
-
Upload
independent -
Category
Documents
-
view
1 -
download
0
Transcript of A High-Resolution Linkage-Disequilibrium Map of the Human Major Histocompatibility Complex and First...
Am. J. Hum. Genet. 76:634–646, 2005
634
A High-Resolution Linkage-Disequilibrium Map of the Human MajorHistocompatibility Complex and First Generation of Tag Single-NucleotidePolymorphismsMarcos M. Miretti,1 Emily C. Walsh,2 Xiayi Ke,3 Marcos Delgado,1 Mark Griffiths,1Sarah Hunt,1 Jonathan Morrison,1 Pamela Whittaker,1 Eric S. Lander,2 Lon R. Cardon,3David R. Bentley,1 John D. Rioux,2 Stephan Beck,1 and Panos Deloukas1
1Wellcome Trust Sanger Institute, Hinxton, United Kingdom; 2Broad Institute of Massachusetts Institute of Technology and Harvard,Cambridge, MA; and 3Wellcome Trust Centre for Human Genetics, University of Oxford, Oxford, United Kingdom
Autoimmune, inflammatory, and infectious diseases present a major burden to human health and are frequentlyassociated with loci in the human major histocompatibility complex (MHC). Here, we report a high-resolution(1.9 kb) linkage-disequilibrium (LD) map of a 4.46-Mb fragment containing the MHC in U.S. pedigrees withnorthern and western European ancestry collected by the Centre d’Etude du Polymorphisme Humain (CEPH) andthe first generation of haplotype tag single-nucleotide polymorphisms (tagSNPs) that provide up to a fivefold increasein genotyping efficiency for all future MHC-linked disease-association studies. The data confirm previously identifiedrecombination hotspots in the class II region and allow the prediction of numerous novel hotspots in the class Iand class III regions. The region of longest LD maps outside the classic MHC to the extended class I region spanningthe MHC-linked olfactory-receptor gene cluster. The extended haplotype homozygosity analysis for recent positiveselection shows that all 14 outlying haplotype variants map to a single extended haplotype, which most commonlybears HLA-DRB1*1501. The SNP data, haplotype blocks, and tagSNPs analysis reported here have been enteredinto a multidimensional Web-based database (GLOVAR), where they can be accessed and viewed in the contextof relevant genome annotation. This LD map allowed us to give coordinates for the extremely variable LD structureunderlying the MHC.
Introduction
Characterization of patterns of linkage disequilibrium(LD) at a fine scale across the genome is central to theoptimal design and execution of association studies ofcommon variants that influence susceptibility of com-mon diseases, as well as the understanding of processessuch as recombination, mutation, and selection. LD mapsreport directly on marker correlation in the populationand can thus guide marker selection for association stud-ies. It is well established that regions of high LD displaylow haplotype diversity; thus, common haplotypes canbe efficiently tagged with only a subset of all commonvariants, known as “haplotype tag SNPs” (tagSNPs)(Daly et al. 2001; Johnson et al. 2001; Chapman et al.2003; Goldstein et al. 2003; Clayton et al. 2004). How-ever, the use of tagSNPs carries some loss of power for
Received December 3, 2004; accepted for publication February 2,2005; electronically published March 1, 2005.
Address for correspondence and reprints: Dr. Stephan Beck, The Well-come Trust Sanger Institute, Wellcome Trust Genome Campus, Hinx-ton, Cambridge, CB10 1SA, United Kingdom. E-mail: [email protected]
� 2005 by The American Society of Human Genetics. All rights reserved.0002-9297/2005/7604-0010$15.00
detection of all other common variants, with the excep-tion of completely correlated markers. Many methodsexist to identify an optimal set of tagSNPs that are basedon observed correlations among an initial set of markers,to avoid the collection of redundant information (seeGoldstein et al. [2003] for review). These methods takeadvantage of high-resolution LD maps that show in-creasing efficiency at higher marker density (Ke et al.2004a).
Several linkage scans and association-mapping stud-ies of most, if not all, autoimmune diseases—such astype 1 diabetes, multiple sclerosis, systemic lupus ery-thematosus (Davies et al. 1994; Marchini et al. 2003;Harbo et al. 2004; Marrosu et al. 2004; Oksenberg etal. 2004)—and infectious diseases like malaria and AIDS(Hill et al. 1991; Carrington and O’Brien 2003) havegiven strong signals in the major histocompatibilitycomplex (MHC), a biologically and medically impor-tant region on human chromosome 6p that harborsmany immune genes. Partly because of these diseasestudies, this region attracted a lot of attention, partic-ularly with respect to the structure of LD and recom-bination. Whereas, historically, only the classical HLAloci were studied by genotyping, recent systematic ef-forts to characterize LD patterns across the whole of

Miretti et al.: HapMap and tagSNPs of the Human MHC 635
the MHC have been reported at increasing marker den-sities by use of SNPs (Walsh et al. 2003; Stenzel et al.2004). These complement a number of studies of therecombinational rates in the region. In three differentstudies, Cullen and colleagues (1995, 1997, 2002) havemapped recombination rates across the MHC class IIregion and have demonstrated the presence of recom-bination hotspots near HLA-DNA, BRD2 (formerlyRING3), and HLA-DQB1 and within the TAP2 gene.But, perhaps most importantly, examining the relation-ship between LD and recombination with a combina-tion of SNP genotyping and sperm recombination map-ping, Jeffreys et al. (2001) demonstrated directly thecorrelation between regions of low LD and the presenceof recombination hot spots in a discrete 200-kb segmentof the MHC. However, all the studies named abovehave been limited by the unavailability of a dense SNPmap of the entire MHC. Recently, the total number ofknown SNPs across the MHC has risen to 136,000(dbSNP121), mainly through efforts of the HapMapProject (The International HapMap Consortium 2003)and the complete resequencing of the MHC region inhomozygous cell lines, which contributed 150% of theavailable SNPs (Stewart et al. 2004). This vast resourceallowed us to construct a 1.9-kb–resolution LD mapacross the MHC in U.S. pedigrees with northern andwestern European ancestry collected by CEPH and tosuggest a first-generation set of haplotype tagSNPs foruse in association studies. The map shows a high degreeof variability in average LD between MHC subregionsand reveals that the olfactory-receptor gene cluster inthe extended class I region falls within the largestregions of high LD currently known in the human ge-nome. Using Phase 2.1 (Li and Stephens 2003; Craw-ford et al. 2004) and the method described by McVeanet al. (2004), we obtain estimates of recombination ratesacross the entire MHC region and show that 90% ofpredicted peaks (hotspots) correlate with LD breaks.
Material and Methods
DNA Samples and Genotyping
We selected a total of 3,892 SNPs, across a 4.46-Mb region spanning the MHC (human chromosome 6,28,918,812–33,377,873 bp [National Center for Bio-technology Information build 34]), from dbSNP121 andthe International HapMap Project. Selection criteria re-quired that SNPs have spacing 1500 bp and have anassay design for Illumina’s Golden Gate genotyping plat-form (Oliphant et al. 2002). Markers were typed acrossa panel of 190 DNA samples from CEPH families (Utahresidents with ancestry from northern and western Eu-rope); DNA was obtained from the Coriell Cell Repos-itory. In total, 180 founder chromosomes were used for
the haplotype construction. Note that this panel includesall the samples used both by the International HapMapProject and in the map by Walsh et al. (2003) and henceallowed full integration of data on the ∼820 markersgenotyped by this effort (see sample list at the HumanChromosome 6 Project Overview Web site). Genotypingwas performed at a multiplex level of 1,536 SNPs perwell, and data quality was assessed by duplicate DNAs( ) and inheritance tests among parent-child trios.n p 8SNPs with more than two discrepant calls were removed.PEDCHECK (O’Connell and Weeks 1998) and PED-STATS (Center for Statistical Genetics) were used toidentify and remove genotypes that lead to Mendelianinconsistencies. The genotype confidence score for keep-ing data was set to 0.25. Finally, we removed loci with!80% of all possible genotypes, out of Hardy-Weinbergequilibrium ( ) and zero heterozygosity.2x � 10
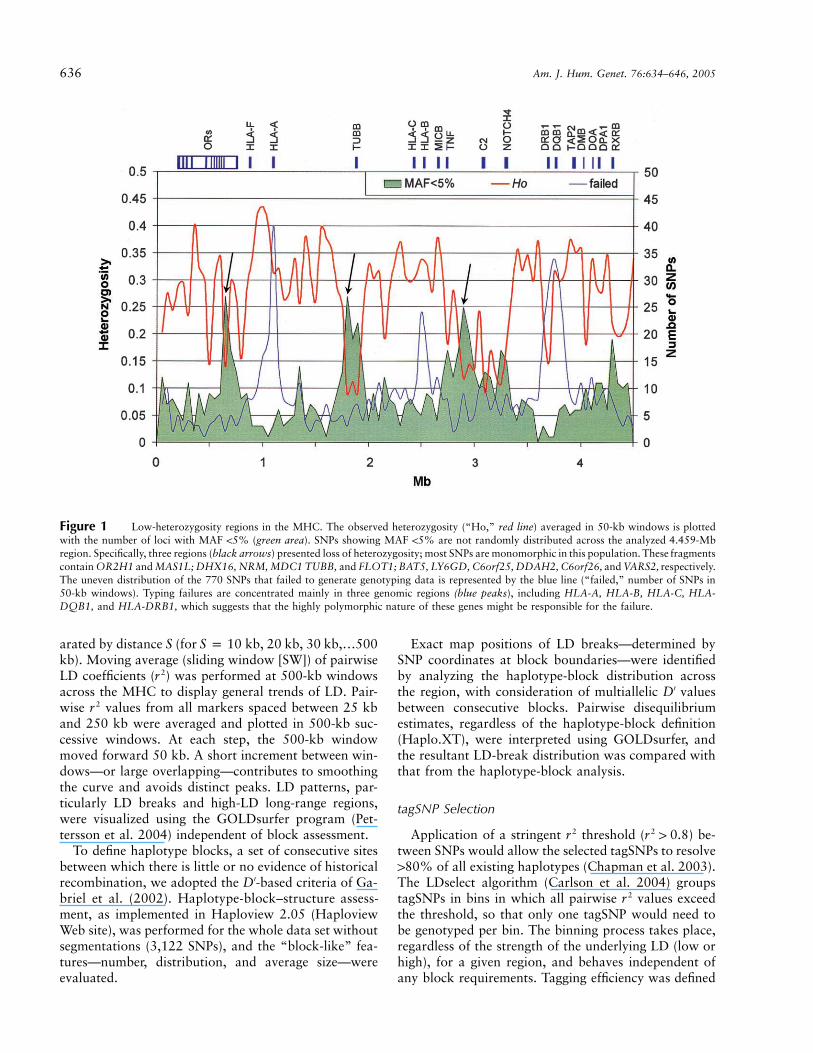
In total, we retained 3,122 SNPs for further analysis.Of those, 787 were either nonpolymorphic or had aminor-allele frequency (MAF) !5% in our sample (5%is the MAF cutoff used by International HapMap Pro-ject). The distribution of these 787 markers is not ran-dom, which suggests variation deserts in three regionsin which the density of such markers is clearly increased(fig. 1, black arrows). Thus, we compared the hetero-zygosity distribution obtained here with that froma genotyping data set of 396 SNPs assayed with theMassEXTEND assay and mass spectrometry (Sequenomplatform) in the same sample (Walsh et al. 2003). Datasets from both platforms showed the same trend, whichsupports the presence of low-heterozygosity regionsrather than genotyping problems. We also observed ahigher failure rate (fig. 1, blue line) around the highlypolymorphic genes HLA-A, HLA-B, HLA-C, HLA-DQB, and HLA-DRB1, which suggests that alternativetyping assays may be needed in these regions. The 2,335loci with MAF �5%—an average spacing of 1 SNP per1.9 kb—were used in all further analyses (marker andraw genotypes are available at the Human Chromosome6 Project Overview Web site and have been submittedto dbSNP).
Estimation of LD
To capture the strength of LD between markers, weestimated two LD measurements on the basis of the pair-wise disequilibrium coefficient—D′ (Lewontin 1964) and
—by using the HaploXT program in the GOLD pack-2rage (Abecasis and Cookson 2000). Nonrecombinant hap-lotypes were derived by employing Merlin (Abecasis etal. 2002) and were then used to estimate haplotype fre-quencies in founder chromosomes. To compare decayrates among MHC regions, the decay of LD was plottedas a function of physical distance. The decay rates rep-resent the average and D′ values for all markers sep-2r
636 Am. J. Hum. Genet. 76:634–646, 2005
Figure 1 Low-heterozygosity regions in the MHC. The observed heterozygosity (“Ho,” red line) averaged in 50-kb windows is plottedwith the number of loci with MAF !5% (green area). SNPs showing MAF !5% are not randomly distributed across the analyzed 4.459-Mbregion. Specifically, three regions (black arrows) presented loss of heterozygosity; most SNPs are monomorphic in this population. These fragmentscontain OR2H1 and MAS1L; DHX16, NRM, MDC1 TUBB, and FLOT1; BAT5, LY6GD, C6orf25, DDAH2, C6orf26, and VARS2, respectively.The uneven distribution of the 770 SNPs that failed to generate genotyping data is represented by the blue line (“failed,” number of SNPs in50-kb windows). Typing failures are concentrated mainly in three genomic regions (blue peaks), including HLA-A, HLA-B, HLA-C, HLA-DQB1, and HLA-DRB1, which suggests that the highly polymorphic nature of these genes might be responsible for the failure.
arated by distance S (for kb, 20 kb, 30 kb,…500S p 10kb). Moving average (sliding window [SW]) of pairwiseLD coefficients ( ) was performed at 500-kb windows2racross the MHC to display general trends of LD. Pair-wise values from all markers spaced between 25 kb2rand 250 kb were averaged and plotted in 500-kb suc-cessive windows. At each step, the 500-kb windowmoved forward 50 kb. A short increment between win-dows—or large overlapping—contributes to smoothingthe curve and avoids distinct peaks. LD patterns, par-ticularly LD breaks and high-LD long-range regions,were visualized using the GOLDsurfer program (Pet-tersson et al. 2004) independent of block assessment.
To define haplotype blocks, a set of consecutive sitesbetween which there is little or no evidence of historicalrecombination, we adopted the D′-based criteria of Ga-briel et al. (2002). Haplotype-block–structure assess-ment, as implemented in Haploview 2.05 (HaploviewWeb site), was performed for the whole data set withoutsegmentations (3,122 SNPs), and the “block-like” fea-tures—number, distribution, and average size—wereevaluated.
Exact map positions of LD breaks—determined bySNP coordinates at block boundaries—were identifiedby analyzing the haplotype-block distribution acrossthe region, with consideration of multiallelic D′ valuesbetween consecutive blocks. Pairwise disequilibriumestimates, regardless of the haplotype-block definition(Haplo.XT), were interpreted using GOLDsurfer, andthe resultant LD-break distribution was compared withthat from the haplotype-block analysis.
tagSNP Selection
Application of a stringent threshold ( ) be-2 2r r 1 0.8tween SNPs would allow the selected tagSNPs to resolve180% of all existing haplotypes (Chapman et al. 2003).The LDselect algorithm (Carlson et al. 2004) groupstagSNPs in bins in which all pairwise values exceed2rthe threshold, so that only one tagSNP would need tobe genotyped per bin. The binning process takes place,regardless of the strength of the underlying LD (low orhigh), for a given region, and behaves independent ofany block requirements. Tagging efficiency was defined

Miretti et al.: HapMap and tagSNPs of the Human MHC 637
Figure 2 SW plot of average across the MHC. Average was calculated from 25 kb to 250 kb in 500-kb SWs, with 50-kb increments2 2r rbetween windows. The SW plot captures trends of LD ( ) by averaging values between a given marker and all the SNPs up to 250 kb.2 2r rAvoiding pairwise comparisons with surrounding markers (25 kb each side) excludes the raising effect of closely linked loci on LD. MHCextended class I, class I, class III, and class II regions (blue, yellow, orange, and green, respectively) present comparatively distinct variationpatterns of long-range LD, which is reflected in the haplotype-block analysis and interferes in the SNP-tagging process.
Figure 3 Decay of LD as a function of distance
as , where nh is the number of tagSNPs selected ton/nh
cover the region and n the total number of genotypedSNPs in the region (Ke et al. 2004a). The first SNP fromeach bin SNP list was selected for the final list, whichwas loaded into the GLOVAR database (Human Ge-nome Server).
Variation of Recombination Rate across the MHCRegion
Phase 2.1 was used for estimation of recombinationrate and hotspot evidence (Li and Stephens 2003; Craw-ford et al. 2004). The region was separated into windowsof 50 SNPs, with 5 SNPs overlapped between neighbor-ing windows. Phased founder haplotypes, which wereobtained by running Merlin, were fed into the program(Abecasis et al. 2002). To rescale population-genetic es-timates, Ne was estimated from a comparison of thegenetic map distance across the MHC region (Cullen etal. 2002) and the estimated population-recombinationrate for the same region (McVean et al. 2004).
Coordinates of recombination hotspots were mappedto the current genome assembly to determine the contextin which hotspots take place (intra- or intergenic), andconsistency was verified by comparison with the hap-lotype-block (boundaries) distribution
Extended-Haplotype Homozygosity Analysis
Initial SNP chromosomal phasing was done using theGenehunter program (Kruglyak et al. 1996). Furtherhaplotype inference of SNP genotyping data was per-
formed using a refinement of the model used in PHASE(Stephens et al. 2001), with allowance for recombination(Fearnhead and Donnelly 2001). Both unphased andmissing SNP data were inferred in this manner. Since wehave a dense set of markers and since most markers arein strong LD with several other markers, we do notbelieve that the phasing has introduced serious bias intoour results. Only independent grandparental chromo-somes from all families were analyzed.
Extended haplotype homozygosity (EHH) analysis(Sabeti et al. 2002) was performed for each haplotype-block allele (Gabriel et al. 2002), by use of Finch soft-ware (P. C. Sabeti, P. Varilly, B. Fry, E. Lander, unpub-lished material) and with centimorgan estimations asdistance. Genetic distances were estimated using the em-pirical sperm recombination map of Cullen et al. (2002).Since the mapping efforts of Cullen et al. (2002) coveredonly a subset of the region analyzed in our study, geneticdistances from marker rs422331 to marker rs1233384(749 kb) were estimated by examination of ancestralrecombination by use of methods of McVean et al.(2004). Outlying variants were chosen on the basis oftwo criteria designed to pick alleles with high EHH val-ues for their frequency class. First, as a simple approx-

Miretti et al.: HapMap and tagSNPs of the Human MHC 639
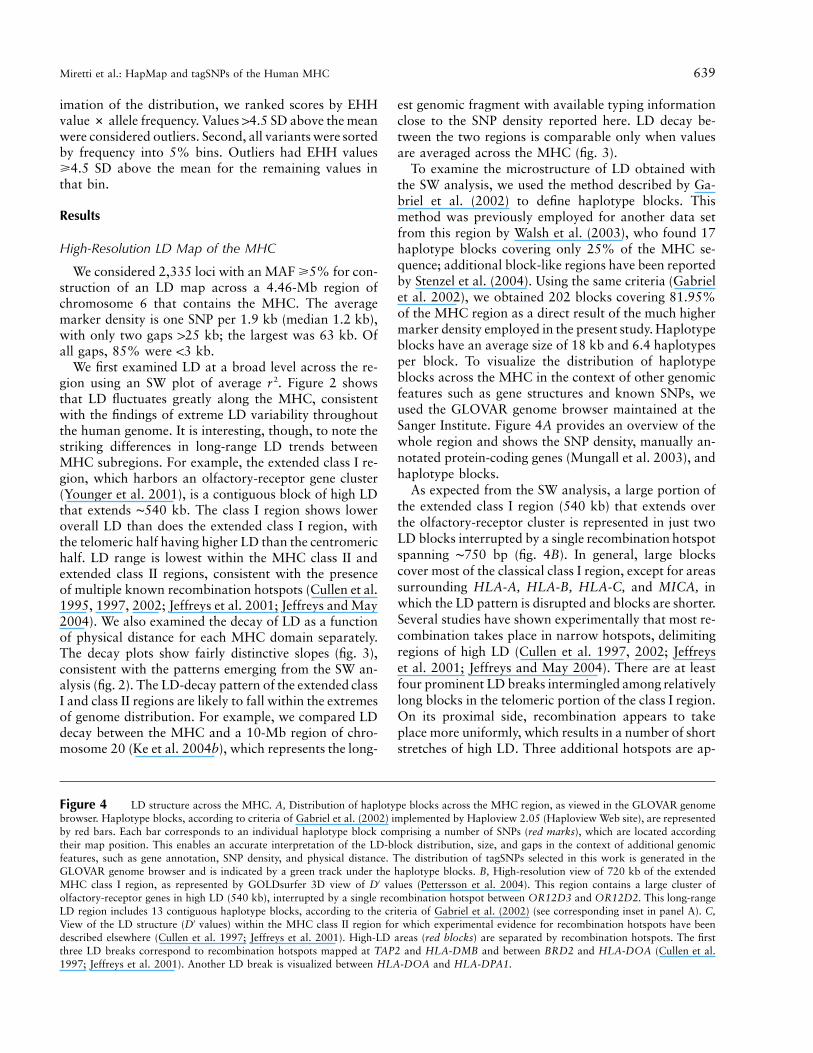
Figure 4 LD structure across the MHC. A, Distribution of haplotype blocks across the MHC region, as viewed in the GLOVAR genomebrowser. Haplotype blocks, according to criteria of Gabriel et al. (2002) implemented by Haploview 2.05 (Haploview Web site), are representedby red bars. Each bar corresponds to an individual haplotype block comprising a number of SNPs (red marks), which are located accordingtheir map position. This enables an accurate interpretation of the LD-block distribution, size, and gaps in the context of additional genomicfeatures, such as gene annotation, SNP density, and physical distance. The distribution of tagSNPs selected in this work is generated in theGLOVAR genome browser and is indicated by a green track under the haplotype blocks. B, High-resolution view of 720 kb of the extendedMHC class I region, as represented by GOLDsurfer 3D view of D′ values (Pettersson et al. 2004). This region contains a large cluster ofolfactory-receptor genes in high LD (540 kb), interrupted by a single recombination hotspot between OR12D3 and OR12D2. This long-rangeLD region includes 13 contiguous haplotype blocks, according to the criteria of Gabriel et al. (2002) (see corresponding inset in panel A). C,View of the LD structure (D′ values) within the MHC class II region for which experimental evidence for recombination hotspots have beendescribed elsewhere (Cullen et al. 1997; Jeffreys et al. 2001). High-LD areas (red blocks) are separated by recombination hotspots. The firstthree LD breaks correspond to recombination hotspots mapped at TAP2 and HLA-DMB and between BRD2 and HLA-DOA (Cullen et al.1997; Jeffreys et al. 2001). Another LD break is visualized between HLA-DOA and HLA-DPA1.
imation of the distribution, we ranked scores by EHHvalue # allele frequency. Values 14.5 SD above the meanwere considered outliers. Second, all variants were sortedby frequency into 5% bins. Outliers had EHH values�4.5 SD above the mean for the remaining values inthat bin.
Results
High-Resolution LD Map of the MHC
We considered 2,335 loci with an MAF �5% for con-struction of an LD map across a 4.46-Mb region ofchromosome 6 that contains the MHC. The averagemarker density is one SNP per 1.9 kb (median 1.2 kb),with only two gaps 125 kb; the largest was 63 kb. Ofall gaps, 85% were !3 kb.
We first examined LD at a broad level across the re-gion using an SW plot of average . Figure 2 shows2rthat LD fluctuates greatly along the MHC, consistentwith the findings of extreme LD variability throughoutthe human genome. It is interesting, though, to note thestriking differences in long-range LD trends betweenMHC subregions. For example, the extended class I re-gion, which harbors an olfactory-receptor gene cluster(Younger et al. 2001), is a contiguous block of high LDthat extends ∼540 kb. The class I region shows loweroverall LD than does the extended class I region, withthe telomeric half having higher LD than the centromerichalf. LD range is lowest within the MHC class II andextended class II regions, consistent with the presenceof multiple known recombination hotspots (Cullen et al.1995, 1997, 2002; Jeffreys et al. 2001; Jeffreys and May2004). We also examined the decay of LD as a functionof physical distance for each MHC domain separately.The decay plots show fairly distinctive slopes (fig. 3),consistent with the patterns emerging from the SW an-alysis (fig. 2). The LD-decay pattern of the extended classI and class II regions are likely to fall within the extremesof genome distribution. For example, we compared LDdecay between the MHC and a 10-Mb region of chro-mosome 20 (Ke et al. 2004b), which represents the long-
est genomic fragment with available typing informationclose to the SNP density reported here. LD decay be-tween the two regions is comparable only when valuesare averaged across the MHC (fig. 3).
To examine the microstructure of LD obtained withthe SW analysis, we used the method described by Ga-briel et al. (2002) to define haplotype blocks. Thismethod was previously employed for another data setfrom this region by Walsh et al. (2003), who found 17haplotype blocks covering only 25% of the MHC se-quence; additional block-like regions have been reportedby Stenzel et al. (2004). Using the same criteria (Gabrielet al. 2002), we obtained 202 blocks covering 81.95%of the MHC region as a direct result of the much highermarker density employed in the present study. Haplotypeblocks have an average size of 18 kb and 6.4 haplotypesper block. To visualize the distribution of haplotypeblocks across the MHC in the context of other genomicfeatures such as gene structures and known SNPs, weused the GLOVAR genome browser maintained at theSanger Institute. Figure 4A provides an overview of thewhole region and shows the SNP density, manually an-notated protein-coding genes (Mungall et al. 2003), andhaplotype blocks.
As expected from the SW analysis, a large portion ofthe extended class I region (540 kb) that extends overthe olfactory-receptor cluster is represented in just twoLD blocks interrupted by a single recombination hotspotspanning ∼750 bp (fig. 4B). In general, large blockscover most of the classical class I region, except for areassurrounding HLA-A, HLA-B, HLA-C, and MICA, inwhich the LD pattern is disrupted and blocks are shorter.Several studies have shown experimentally that most re-combination takes place in narrow hotspots, delimitingregions of high LD (Cullen et al. 1997, 2002; Jeffreyset al. 2001; Jeffreys and May 2004). There are at leastfour prominent LD breaks intermingled among relativelylong blocks in the telomeric portion of the class I region.On its proximal side, recombination appears to takeplace more uniformly, which results in a number of shortstretches of high LD. Three additional hotspots are ap-

640 Am. J. Hum. Genet. 76:634–646, 2005
Table 1
LD-Structure Features and tagSNPs in the MHC, at Different Marker Densities
REGION
HAPLOTYPE BLOCK STRUCTURE SNP TAGGING
NO. OF SNPS
No. ofBlocks
Block Size(kb)
SequenceCoverage
(%)SNPs per
BlockTotal No. of
tagSNPsTagging
Efficiency
Full 5 Full 5 Full 5 Full 5 Full 5 Full 5 Full 5
Extended class I 408 161 22 18 34 35 90 77 17.9 8.3 75 52 5.44 3.10Class I 1106 368 99 46 15 18 82 71 10.1 7 356 180 3.11 2.04Class III 280 142 27 24 23 19 81 60 9.6 5 110 82 2.54 1.73Class II 466 215 48 35 12 19 73 64 8.8 5.3 204 109 2.28 1.97MHCa 2,260 896 202 116 18 26 82 67 10.7 6.7 745 416 3.03 2.15Chromosome 20b 3,372c 2,020 367c 278 18c 20 64c 55 7.8c 5.9 1,338c 1013 2.52c 1.99
NOTE.—“Full” density indicates that all genotyped markers were included, whereas 5-kb density means there was, on average, onemarker per 5 kb. Haplotype-block analysis was performed using Haploview. tagSNPs were selected using LDSelect (Carlson et al.2004), with . Tagging efficiency was defined as , where nh is the number of tagSNPs selected to cover the region,2r threshold p .80 n/nh
and n is the total number of genotyped SNPs in the region (Ke et al. 2004a).a Includes data averaged across the 4.459-kb region covering the complete MHC.b Data from chromosome 20 include a 10-Mb region (Ke et al. 2004a)c Chromosome 20 data at density of one SNP per 3 kb.
parent in the class III region; the most centromeric oneresides after NOTCH4 before the class II border, 70 kb5′ of the hotspot mapped by Stenzel et al. (2004). Withinthe class II region, those recombination hotspots de-scribed elsewhere (Cullen et al. 1997; Jeffrey et al. 2001)at TAP2, HLA-DMB, and between BRD2 and HLA-DOA were clearly identified (fig. 4C). Two additionalhotspots are evident within the centromeric portion ofthe class II region, the stronger one between HLA-DOAand HLA-DPA1 and the other between HLA-DPB1 andHLA-DPB2.
For each MHC subregion and for the region as awhole, table 1 summarizes the number of blocks andblock characteristics, average size, sequence coverage,and number of markers per block. At an average markerdensity of one SNP per 1.9 kb, sequence coverage inblocks is 180% across the MHC, with a slight drop inthe class II region. The corresponding figures at one SNPper 5 kb (table 1), which are indicative of the first phaseof the International HapMap Project, show a net gainof ∼15% in coverage at the higher marker density. Thecorresponding figures from the chromosome 20q study(Ke et al. 2004b) show the same trend and suggest that,because of the extreme variability of LD across the ge-nome, sequence coverage will differ between genomicregions. The average size of blocks in CEPH individualsis 18 kb in both data sets, suggesting that this figuremay represent the genome average.
tagSNP Selection
To exploit the dense LD map described above, weproceeded to select a list of maximally informative SNPsfor each MHC region that can be used for disease-asso-ciation studies. We chose to define tagSNPs through a
process that disregards the strength of the underlyingLD (low or high) in a given region and hence behavesindependent of any block requirements. The caveat inthis analysis is that there is an abundance of methodsfor selecting tagSNPs and that different methods resultin different lists of tagSNPs. The results in table 1 showthat, at the same marker density (one SNP per 5 kb),the tagging efficiency of the whole MHC region (2.15)is slightly higher than that of chromosome 20 (1.99).There is an overall gain in tagging efficiency (40.9%)when the whole MHC data set is used (one SNP per 1.9kb), probably as a consequence of the extensive LD inthe extended class I region. We observed very good cor-relation between tagging efficiency and the strength ofLD in MHC subregions. Specifically, the extended classI and class III regions appear to approach saturationwith only five and three additional tagSNPs necessaryto capture the information provided by the extra 113and 45 assayed SNPs, respectively, in the progressionfrom 1 SNP per 3 kb (70 and 107 tagSNPs, respectively[data not shown]) to full density (table 1). As suggestedelsewhere (Ke et al. 2004a), selection of tagSNPs in high-LD regions is largely robust to variability in marker den-sity. Given the high LD underlying the extended classI region, it appears that many features—number oftagSNPs, block size, sequence coverage, and number ofblocks—come close to steady state at one SNP per 3 kb(data not shown) where increasing SNP density does notresult in further efficiency. A different trend is seen inthe class III region, in which sequence coverage is 60%at one SNP per 5 kb, increases to 73% at one SNP per3 kb, and reaches 81% at full density.
As marker density increases, tagging efficiency alsoincreases in the class I region, but the overall number of
Miretti et al.: HapMap and tagSNPs of the Human MHC 641
tagSNPs is much higher at maximum density here. Thislatter trend is depicted in figure 4A (“tag SNPs”) and isparticularly evident in regions in which LD is low andsequence coverage needs to be improved. In contrast,sequence coverage at full density (90%) in the extendedclass I region experienced only a slight increment com-pared with that at one SNP per 3 kb (89% [data notshown]). Since class II has the shortest LD range andhence the lowest sequence coverage in blocks, the num-ber of tagSNPs increases substantially at maximummarker density (table 1). The relationship between markerdensity and tagSNPs remain constant, which indicatesthat LD is very diffuse across the class II region and thatmore markers will need to be typed. The significantlylarger number of blocks (shorter in average) at maxi-mum marker density is consistent with low LD patternsin class II, in which approximately half of the haplotypeblocks contain 14 SNPs. Differences in the extendedclass I and class III regions can be explained by dissim-ilarities in the underlying LD and LD-block sequencecoverage in each region (table 1). The complete list oftagSNPs generated for each MHC region, as well as theirdistribution, is available at GLOVAR.
Ke et al. (2004a) showed that tagSNPs selected inwestern Europeans (to explain 100% of haplotype di-versity) can explain 96% of haplotype variation in CEPHfounders, who are of western and northern Europeanancestry, and that ∼90% of the tagSNPs selected in onesample would also be selected as tagSNPs in the other.Thus, the MHC list of tagSNPs presented here shouldbe useful for studies involving individuals of western andnorthern European ancestry.
Ancestral Recombination Estimation across the MHCRegion
Previous studies have shown that the rate of recom-bination varies substantially across certain regions of theMHC (Cullen et al. 1997, 2002; Jeffreys and May 2004).Sperm typing within a 200-kb class II fragment (Jeffreyset al. 2001) has determined the location of recombina-tion hot spots and has shown that they correlate verystrongly with LD breaks. The LD map described abovehas the resolution required to accurately map such eventsas shown in figure 4C. Thus, we employed the recentlydescribed method of McVean et al. (2004) to estimatefine-scale recombination-rate variations based on popu-lation-genetic data and to predict the location and in-tensity of hotspots across the whole MHC. Also, wewanted to assess whether the haplotype-block patternreflects genuine recombination-rate variation and whetherblock boundaries are actually delimited by recombina-tion hotspots.
The nature of recombination rates inferred from pat-terns of genetic variation varied immensely across the
region (fig. 5) and showed patterns mirroring the LDpatterns described above. The average recombinationrate for the 4.459-Mb region is 0.66714 cM/Mb, withthe extended class I region showing a very low rate,0.195 cM/Mb. The classic MHC has a rate of 0.7852cM/Mb. More specifically, class I and III recombinationrates are somewhat similar to each other (0.443 cM/Mband 0.469 cM/Mb, respectively), whereas class II has thehighest rate (1.712 cM/Mb). It is worth highlighting theextreme variation in recombination rates—a differenceof up to 4 orders of magnitude. The data suggest thepresence of 29 hotspots—and show 110 times the back-ground recombination rates—corresponding to an av-erage density of one per 150 kb (fig. 5). An additionalrecombination site falling short of the hotspot threshold,sevenfold higher, was observed between HLA-C andHLA-B. In total, hotspots cover only 1.6% of the ge-nomic sequence and have an average size of 2.43 kb.Slightly more hotspots were observed between genesthan within genes ( vs. , respectively).n p 19 n p 11
All but two of the inferred hotspots coincide with thehaplotype-block boundaries we calculated using themethod of Gabriel et al. (2002). Interestingly, we findrecombination hotspots in TAP2 and HLA-DMB andbetween BRD2 and HLA-DOA at the same locationsas reported by sperm-typing analysis (Jeffreys et al.2001; Cullen et al. 2002), (fig. 5, inset). We observedtwo recombination coldspots (0.013 and 0.009, 10 timeslower than the background recombination), both ofwhich overlap with high-LD fragments (fig. 5). In onecase, the lack of recombination perfectly corresponds toone large haplotype block (109 kb) lying in the class III/II border, which contains the C6orf10 gene and is sur-rounded by two hotspots and a diffuse pattern of a num-ber of short LD blocks.
Extended-Haplotype Analysis
Positive selection brings rare alleles to higher fre-quency in relatively few generations, thus affordingfewer opportunities for recombination events to separatean allele from its original chromosomal context. There-fore, haplotype-block alleles showing a high EHH scoreand high frequency in the population may have expe-rienced recent positive selection and could representfunctionally important alleles. To identify potential sig-nals of positive selection in the MHC, we used EHHanalysis, which determines the length of the chromo-somal haplotypes extending from a specific allele at aparticular locus (Sabeti et al. 2002). To control for thehigh positional variation in recombination rates in theMHC that would artificially affect the length of hap-lotypes, we used the sperm-typing recombination mapof the region described by Cullen et al. (2002). Giventhis map, we scanned the MHC, using each haplotype

642 Am. J. Hum. Genet. 76:634–646, 2005
Table 2
EHH Outliers at .3cM and .25cM
The table is available in its entirety in the onlineedition of The American Journal of Human Genetics.
Figure 5 Recombination-rate variation across the MHC. Recombination rates estimated from population-genetic data are far from beinguniform; their distribution fluctuates considerably in both, by scale (cM/Mb) and by map position. Recombination hotspots are represented bypeaks 10 times higher than the local background level of recombination. Peaks enclosed in the inset correspond to hotspots identified by spermtyping (Jeffreys et al. 2001) located at or near TAP2, HLA-DMB, BRD2, and HLA-DOA, observable as LD breaks in figure 4C. Therecombination hotspot between OR12D3 and OR12D2 in the olfactory-receptor gene cluster (“ORs”), inferred from population genetic data,correlates perfectly with the LD break visible in figure 4B. Note the presence of two coldspots showing recombination rates 10 times lowerthan the local background level of recombination.
block as an independent locus from which to determineEHH values, assessing each of the 1,966 alleles exam-ined. Since no similarly large region of the genome hasa direct sperm-based estimate of recombination rate, wecompared the EHH values of haplotype-block alleleswithin the MHC data set with each other and identifiedallelic variants that are outliers, on the basis of statisticalrank of the EHH value relative to allele frequency.
We observed eight alleles at 0.3 cM and six allelesat 0.25 cM that deviate by 14.5 SD from the mean ofthe statistic and also from the meanEHH # frequencyof the 5% frequency bins (table 2 and fig. 6). All 14 ofthese alleles map to a single extended haplotype. Anexample of one of these alleles is shown in figure 7. Amutation on this haplotype may have experienced recentdirectional positive selection. Interestingly, this haplo-type bears allele HLA-DRB1*1501 94% of the time (inone case, the allele was HLA-DRB1*0301). AlthoughHLA-DRB1*1501 is an exciting candidate, we can-not rule out other possibly functional variation on thehaplotype.
Discussion
We genotyped 2,335 loci across the MHC in CEPH pedi-grees. The constructed high-resolution map, one markerper 1.9 kb, provides a comprehensive guide to fine-scalepatterns of LD and recombination, as well as the meansto select optimal marker sets for disease-associationstudies. To that end, we suggested one such set oftagSNPs, although we realize that many investigatorswill use their preferred method.
High and long-range LD has long been interpreted asone of the hallmarks of the MHC (The MHC Sequenc-ing Consortium 1999). The present study revealed thatthe olfactory-receptor gene cluster falls within a 540-kb region of uninterrupted high LD. Ehlers et al. (2000)showed that these polymorphic olfactory loci contribute

Miretti et al.: HapMap and tagSNPs of the Human MHC 643
Figure 6 EHH outliers at 0.3 cM and 0.25 cM
to extended HLA/OR haplotypes, and a recent study byFust et al. (2004) indicates that a specific haplotypeassociated with smoking behavior may even extend tothe central region (class III) of the MHC. The HapMapdata (International HapMap Project) suggest that thisregion of strong LD extends farther toward the telomerefor 350 kb. It will be interesting to determine the fullextent of what appears to be one of the longest regionsof high LD in the genome. It also remains to be inves-tigated whether this LD block—which seems to extendover ∼900 kb, according to the HapMap data (Inter-national HapMap Project)—is also present in otherpopulations.
EHH analysis compares an allele’s frequency “age”to its extended haplotype’s recombinational “age.” Un-der neutral evolution, new variants require a long timeto reach high frequency; during that time, LD adjacentto the new variant will be decreased because of recom-bination. Consequently, common alleles will be sur-rounded by short-range LD. High-frequency variantswithin a long-range LD context may represent variantsunder positive selection. Our EHH analysis identified ahandful of variants in which haplotypes showed com-paratively extended homozygosity, given their popula-tion frequencies. These variants map to a single long-range haplotype that bears HLA-DRB1*1501 94% ofthe time. This haplotype also bears other variants fromthe so-called ancestral DR2 haplotype; however, thecorrelation is best with the HLA-DRB1*1501 allele,which suggests that it or another nearby variant mayhave been responsible for the hypothesized selectiveevent. Variation on the DR2 haplotype has been asso-ciated with susceptibility to multiple sclerosis and sys-temic lupus erythematosus (Barcellos et al. 2003; Heg-garty et al. 2003; Larsen and Alper 2004), whereas ithas been associated with a protective effect for type Idiabetes (Cucca et al. 2001)
Population-based recombination-rate estimates (co-alescent model) provide an average transmission of re-combination rates (female-male) over thousands of gen-erations, whereas pedigree analyses are based on onlya few meioses and sperm-typing measures of recombi-nation in few extant males. We find that pedigree analy-sis, sperm typing, and coalescent approaches identifyidentical recombination hotspots for the 200-kb MHCclass II fragment studied by Jeffreys et al. (2001) (figs.4C and fig. 5, inset) This is in agreement with otherstudies (McVean et al. 2004; Crawford et al. 2004), and
it provides additional weight to the new recombinationhotspots identified in the present study. As a conse-quence of the number of recombination hotspots pre-dicted for the MHC region, we would expect to find afairly disrupted LD pattern. However, extended hap-lotypes exist at relatively high frequency in whites. Inaddition, according to population frequencies, theMHC can be divided into only a few blocks that containnonrandomly associated alleles at different loci (Yuniset al. 2003). We also observed regions that showed ex-cessively long haplotypes, given their population fre-quencies. Selective sweeps and population history (ge-netic drift) can explain the disproportionately long-range LD in some haplotypes, but there is also evidenceindicating a strong influence of recombination activityshaping the LD landscape within the MHC. Specifically,a considerable proportion of recombination hotspotscan be resolved as gene-conversion events (Jeffreys andMay 2004). Additionally, differential intensity in cross-over activity and haplotype-specific recombination pat-terns (Ahmad et al. 2003) could also affect the extentof LD. However, the relationship between haplotype-specific hotspots and population-specific haplotypesobserved in a 75-kb fragment of the MHC class II region(Kauppi et al. 2003) remains to be studied.
Our analysis shows that the number of tagSNPs re-quired to explain variation across large genomic regionsfluctuates and depends on the extent of LD. Highmarker density is required in regions of low LD to allowcomprehensive coverage with tagSNPs. Extrapolating tothe rest of the genome, the International HapMap Pro-ject database will provide efficient tagging in regions ofextended LD already in phase I (one SNP per 5 kb) butwill require the higher density of phase II to achievecomprehensive coverage of the whole genome.
We identified a subset (tagSNPs) of all the typed SNPswith MAF 15% that captures haplotype variation inthis sample. The tags are displayed in the context ofannotated genomic sequence through GLOVAR. As ex-pected, variation in the underlying LD greatly affectsthe SNP-tagging process and efficiency in each MHCsubregion. The highest SNP tagging efficiency (5.44)could be achieved for the extended class I region, whichindicates attainable gains in typing cost for subsequentstudies. Higher efficiency can be obtained by using hap-lotype-based methods (Ke et al. 2004a), although hap-lotypes and their frequencies must be carefully estimatedin regions of complex local LD and recombination pro-file (e.g., the class II region). The list of tagSNPs gen-erated within the context of LD profiles and distributionof recombination hotspot will allow MHC associationstudies to be conducted more efficiently. On the basisof data presented here, given a sufficiently large pop-ulation, it will also be possible to identify rare haplo-types, thus increasing sensitivity for association with

644 Am. J. Hum. Genet. 76:634–646, 2005
Figure 7 Representative EHH outlier. A, EHH by frequency plot at 0.3 cM distance, indicating one of the eight variants at that an outlierwith distance that is 14.5 SD in its frequency bin and per its statistic. This variant is indicated in figure 6 (panel 9) and isfrequency # EHHpart of a block slightly centromeric to the DQB1 gene. B, Haplotype structure of the block containing this haplotype variant. The outlier isthe 37% allele (“GGGT”) indicated in orange in all remaining plots (arrow). C, EHH by distance (cM) plot of all variants in the block. Thearrow indicates the region of extended LD for the orange haplotype. D, Haplotype bifurcation plots of all variants in the block. The arrowindicates the region of interest for the orange haplotype.
MHC-linked disease. In addition, a reduction in allo-reactivity can be envisioned on the basis of the com-plementary information provided by SNP typing. Atleast for the extended haplotypes, which represent25%–30% of all haplotypes in European-derived pop-ulations, patient-donor matching can be improved bythe identification of haplotype-specific and block-spe-cific variation (Yunis et al. 2003).
Acknowledgments
M.M.M. was supported by a Wellcome Trust postdoctoralfellowship. E.W. was supported by a Cancer Research Institutefellowship. J.D.R. was supported by National Institute of Di-abetes and Digestive and Kidney Diseases grant DK64869.M.D., M.G., S.H., J.M., P.W., D.R.B., S.B., and P.D. weresupported by The Wellcome Trust. We thank all members ofthe MHC Haplotype Project Consortium, in particular S. Saw-
cer, J. Trowsdale, and J. Todd. We thank P. Sabeti for allowingthe use of the Finch software prior to publication.
Electronic-Database Information
The URLs for data presented herein are as follows:
Center for Statistical Genetics, http://www.sph.umich.edu/csg/abecasis/PedStats/ (for PEDSTATS)
dbSNP Home Page, http://www.ncbi.nlm.nih.gov/SNP/index.html
GLOVAR Genome Browser, http://www.glovar.org/Homo_sapiens/
Haploview, http://www.broad.mit.edu/mpg/haploview/index.php
Human Chromosome 6 Project Overview, http://www.sanger.ac.uk/HGP/Chr6/
International HapMap Project, http://www.hapmap.org/
Miretti et al.: HapMap and tagSNPs of the Human MHC 645
MHC Haplotype Project, http://www.sanger.ac.uk/HGP/Chr6/MHC/
National Center for Biotechnology Information, http://www.ncbi.nlm.nih.gov/
References
Abecasis GR, Cherny SS, Cookson WO, Cardon LR (2002)MERLIN—rapid analysis of dense genetic maps using sparsegene flow trees. Nat Genet 30:97–101
Abecasis GR, Cookson WOC (2000) GOLD—graphical over-view of linkage disequilibrium. Bioinformatics 16:182–183
Ahmad T, Neville M, Marshall SE, Armuzzi A, Mulcahy-HawesK, Crawshaw J, Sato H, Ling K-L, Barnardo M, GoldthorpeS, Walton R, Bunce M, Jewell DP, Welsh KI (2003) Hap-lotype-specific linkage disequilibrium patterns define the ge-netic topography of the human MHC. Hum Mol Genet 12:647–656
Barcellos LF, Oksenberg JR, Begovich AB, Martin ER, SchmidtS, Vittinghoff E, Goodin DS, Pelletier D, Lincoln RR, BucherP, Swerdlin A, Perick-Vance MA, Haines JL, Hauser SL, forthe Multiple Sclerosis Genetics Group (2003) HLA-DR2dose effect on susceptibility to multiple sclerosis and influ-ence on disease course. Am J Hum Genet 72:710–716
Carlson CS, Eberle MA, Rieder MJ, Yi Q, Kruglyak L, Nick-erson DA (2004) Selecting a maximally informative set ofsingle-nucleotide polymorphisms for association analyses us-ing linkage disequilibrium. Am J Hum Genet 74:106–120
Carrington M, O’Brien SJ (2003) The influence of HLA geno-type on AIDS. Annu Rev Med 54:535–551
Chapman JM, Cooper JD, Todd JA, Clayton DG (2003) De-tecting disease associations due to linkage disequilibriumusing haplotype tags: a class of tests and the determinantsof statistical power. Hum Hered 56:18–31
Clayton D, Chapman J, Cooper J (2004) Use of unphasedmultilocus genotype data in indirect association studies. Ge-net Epidemiol 27:415–428
Crawford DC, Bhangale T, Li N, Hellenthal G, Rieder MJ,Nickerson DA, Stephens M (2004) Evidence for substantialfine-scale variation in recombination rates across the humangenome. Nat Genet 36:700–706
Cucca F, Lampis R, Congia M, Angius E, Nutland S, Bain SC,Barnett AH, Todd JA (2001) A correlation between the rela-tive predisposition of MHC class II alleles to type 1 diabetesand the structure of their proteins. Hum Mol Genet 10:2025–2037
Cullen M, Erlich H, Klitz W, Carrington M (1995) Molecularmapping of a recombination hotspot located in the secondintron of the human TAP2 locus. Am J Hum Genet 56:1350–1358
Cullen M, Noble J, Erlich H, Thorpe K, Beck S, Klitz W, Trows-dale J, Carrington M (1997) Characterization of recombi-nation in the HLA class II region. Am J Hum Genet 60:397–407
Cullen M, Perfetto SP, Klitz W, Nelson G, Carrington M (2002)High-resolution patterns of meiotic recombination across thehuman major histocompatibility complex. Am J Hum Genet71:759–776
Daly MJ, Rioux JD, Schaffner SE, Hudson TJ, Lander ES (2001)
High-resolution haplotype structure in the human genome.Nat Genet 29:229–232
Davies JL, Kawaguchi Y, Bennett ST, Copeman JB, Cordell HJ,Pritchard LE, Reed PW, Gough SCL, Jenkins SC, PalmerSM, Balfour KM, Rowe BR, Farrall M, Barnett AH, BainSC, Todd JA (1994) A genome-wide search for human type-1 diabetes susceptibility genes. Nature 371:130–136
Ehlers A, Beck S, Forbes SA, Trowsdale J, Volz A, Younger R,Ziegler A (2000) MHC-linked olfactory receptor loci exhibitpolymorphism and contribute to extended HLA/OR-haplo-types. Genome Res 10:1968–1978
Fearnhead P, Donnelly P (2001) Estimating recombination ratesfrom population genetic data. Genetics 159:1299–1318
Fust G, Arason GJ, Kramer J, Szalai C, Duba J, Yang Y, ChungEK, Zhou B, Blanchong CA, Lokki ML, Bodvarsson S, Pro-haszka Z, Karadi I, Vatay A, Kovacs M, Romics L, Thor-geirsson G, Yu CY (2004) Genetic basis of tobacco smoking:strong association of a specific major histocompatibilitycomplex haplotype on chromosome 6 with smoking behav-ior. Int Immunol 16:1507–1514
Gabriel SB, Schaffner SF, Nguyen H, Moore JM, Roy J, Blu-menstiel B, Higgins J, DeFelice M, Lochner A, Faggart M,Liu-Cordero SN, Rotimi C, Adeyemo A, Cooper R, WardR, Lander ES, Daly MJ, Altshuler D (2002) The structure ofhaplotype blocks in the human genome. Science 296:2225–2229
Goldstein DB, Ahmadi KR, Weale ME, Wood NW (2003)Genome scans and candidate gene approaches in the studyof common diseases and variable drug responses. TrendsGenet 19:615–622
Harbo HF, Lie BA, Sawcer S, Celius EG, Dai KZ, Oturai A,Hillert J, Lorentzen AR, Laaksonen M, Myhr KM, RyderLP, Fredrikson S, Nyland H, Sorensen PS, Sandberg-Woll-heim M, Andersen O, Svejgaard A, Edland A, Mellgren SI,Compston A, Vartdal F, Spurkland A (2004) Genes in theHLA class I region may contribute to the HLA class II-associated genetic susceptibility to multiple sclerosis. TissueAntigens 63:237–247
Heggarty S, Sawcer S, Hawkins S, McDonnell G, Droogan A,Vandenbroeck K, Hutchinson M, Setakis E, Compston A,Graham C (2003) A genome wide scan for association withmultiple sclerosis in a N. Irish case control population. JNeuroimmunol 143:93–96
Hill AVS, Allsopp CEM, Kwiatkowski D, Anstey NM, TwumasiP, Rowe PA, Bennett S, Brewster D, McMichael AJ, Green-wood BM (1991) Common West African HLA antigens areassociated with protection from severe malaria. Nature 352:595–600
Jeffreys AJ, Kauppi L, Neumann R (2001) Intensely punctatemeiotic recombination in the class II region of the majorhistocompatibility complex. Nat Genet 29:217–222
Jeffreys AJ, May CA (2004) Intense and highly localized geneconversion activity in human meiotic crossover hot spots.Nat Genet 36:151–156
Johnson GC, Esposito L, Barratt BJ, Smith AN, Heward J, DiGenova G, Ueda H, Cordell HJ, Eaves IA, Dudbridge F,Twells RC, Payne F, Hughes W, Nutland S, Stevens H, CarrP, Tuomilehto-Wolf E, Tuomilehto J, Gough SC, Clayton

646 Am. J. Hum. Genet. 76:634–646, 2005
DG, Todd JA (2001) Haplotype tagging for the identificationof common disease genes. Nat Genet 29:233–237
Kauppi L, Sajantila A, Jeffreys AJ (2003) Recombination hot-spots rather than population history dominate linkage dis-equilibrium in the MHC class II region. Hum Mol Genet12:33–40
Ke X, Durrant C, Morris AP, Hunt S, Bentley DR, DeloukasP, Cardon LR (2004a) Efficiency and consistency of haplo-type tagging of dense SNP maps in multiple samples. HumMol Genet 13:2557–2565
Ke XY, Hunt S, Tapper W, Lawrence R, Stavrides G, Ghori J,Whittaker P, Collins A, Morris AP, Bentley D, Cardon LR,Deloukas P (2004b) The impact of SNP density on fine-scalepatterns of linkage disequilibrium. Hum Mol Genet 13:577–588
Kruglyak L, Daly MJ, Reeve-Daly MP, Lander ES (1996) Para-metric and nonparametric linkage analysis: a unified multi-point approach. Am J Hum Genet 58:1347–1363
Larsen CE, Alper CA (2004) The genetics of HLA-associateddisease. Curr Opin Immunol 16:660–667
Lewontin RC (1964) The interaction of selection and linkage.I. General considerations: heterotic models. Genetics 49:49–67
Li N, Stephens M (2003) Modeling linkage disequilibrium andidentifying recombination hotspots using single-nucleotidepolymorphism data. Genetics 165:2213–2233
Marchini M, Antonioli R, Lleo A, Barili M, Caronni M, OriggiL, Vanoli M, Scorza R (2003) HLA class II antigens asso-ciated with lupus nephritis in Italian SLE patients. HumImmunol 64:462–468
Marrosu MG, Sardu C, Cocco E, Costa G, Murru MR, Man-cosu C, Murru R, Lai M, Contu P (2004) Bias in parentaltransmission of the HLA-DR3 allele in Sardinian multiplesclerosis. Neurology 63:1084–1086
McVean GAT, Myers SR, Hunt S, Deloukas P, Bentley DR,Donnelly P (2004) The fine-scale structure of recombinationrate variation in the human genome. Science 304:581–584
Mungall AJ, Palmer SA, Sims SK, Edwards CA, Ashurst JL,Wilming L, Jones MC, et al (2003) The DNA sequence andanalysis of human chromosome 6. Nature 425:805–811
O’Connell JR, Weeks DE (1998) PedCheck: a program foridentification of genotype incompatibilities in linkage analy-sis. Am J Hum Genet 63:259–266
Oksenberg JR, Barcellos LF, Cree BAC, Baranzini SE, BugawanTL, Khan O, Lincoln RR, Swerdlin A, Mignot E, Lin L,Goodin D, Erlich HA, Schmidt S, Thomson G, Reich DE,Pericak-Vance MA, Haines JL, Hauser SL (2004) Mapping
multiple sclerosis susceptibility to the HLA-DR locus in Af-rican Americans. Am J Hum Genet 74:160–167
Oliphant A, Barker DL, Stuelpnagel JR, Chee MS (2002) Bead-Array technology: enabling an accurate, cost-effective ap-proach to high-throughput genotyping. Biotechniques Suppl56–61
Pettersson F, Jonsson O, Cardon LR (2004) GOLDsurfer: threedimensional display of linkage disequilibrium. Bioinfor-matics 20:3241–3243
Sabeti PC, Reich DE, Higgins JM, Levine HZP, Richter DJ,Schaffner SF, Gabriel SB, Platko JV, Patterson NJ, McDonaldGJ, Ackerman HC, Campbell SJ, Altshuler D, Cooper R,Kwiatkowski D, Ward R, Lander ES (2002) Detecting recentpositive selection in the human genome from haplotype struc-ture. Nature 419:832–837
Stenzel A, Lu T, Koch WA, Hampe J, Guenther SM, De La VegaFM, Krawczak M, Schreiber S (2004) Patterns of linkagedisequilibrium in the MHC region on human chromosome6p. Hum Genet 114:377–385
Stephens M, Smith NJ, Donnelly P (2001) A new statisticalmethod for haplotype reconstruction from population data.Am J Hum Genet 68:978–989
Stewart CA, Horton R, Allcock RJN, Ashurst JL, Atrazhev AM,Coggill P, Dunham I, et al (2004) Complete MHC haplotypedisease gene mapping. Genome Res 14:1176–1187
The International HapMap Consortium (2003) The Interna-tional HapMap Project. Nature 426:789–796
The MHC Sequencing Consortium (1999) Complete sequenceand gene map of a human major histocompatibility complex.Nature 401:921–923
Walsh EC, Mather KA, Schaffner SF, Farwell L, Daly MJ,Patterson N, Cullen M, Carrington M, Bugawan TL, ErlichH, Campbell J, Barrett J, Miller K, Thomson G, Lander ES,Rioux JD (2003) An integrated haplotype map of the humanmajor histocompatibility complex. Am J Hum Genet 73:580–590
Younger RM, Amadou C, Bethel G, Ehlers A, Lindahl KF,Forbes S, Horton R, Milne S, Mungall AJ, Trowsdale J, VolzA, Ziegler A, Beck S (2001) Characterization of clusteredMHC-linked olfactory receptor genes in human and mouse.Genome Res 11:519–530
Yunis EJ, Larsen CE, Fernandez-Vina M, Awdeh ZL, RomeroT, Hansen JA, Alper CA (2003) Inheritable variable sizes ofDNA stretches in the human MHC: conserved extended hap-lotypes and their fragments or blocks. Tissue Antigens 62:1–20