A genomic and proteomic study of the spectrum of nonalcoholic fatty liver disease
10
A Genomic and Proteomic Study of the Spectrum of Nonalcoholic Fatty Liver Disease Zobair M. Younossi, 1,2 Ancha Baranova, 2 Katharine Ziegler, 2 Luca Del Giacco, 2 Karen Schlauch, 1,2 Timothy L. Born, 2 Hazem Elariny, 1 Francesco Gorreta, 2 Amy VanMeter, 2 Abraham Younoszai, 1 Janus P. Ong, 1,2 Zachary Goodman, 3 and Vikas Chandhoke 2 Nonalcoholic fatty liver disease (NAFLD) is the most common chronic liver disease, and some of its forms are progressive. This study describes the profiling of hepatic gene expres- sion and serum protein content in patients with different subtypes of NAFLD. Liver biopsy specimens from 98 bariatric surgery patients were classified as normal, steatosis alone, steatosis with nonspecific inflammation, and nonalcoholic steatohepatitis (NASH). Microar- ray hybridizations were performed in triplicate and the microarray expression levels of a selected group of genes were confirmed using real-time quantitative reverse-transcriptase polymerase chain reaction. Serum protein profiles of the same patients were determined by SELDI-TOF mass spectrometry. Of 98 obese patients, 91 were diagnosed with NAFLD (12 steatosis alone, 52 steatosis with nonspecific inflammation, and 27 NASH), and 7 patients without NAFLD served as obese controls. Each group of NAFLD patients was compared with the obese controls, and 22 genes with more than twofold differences in expression levels were revealed. Proteomics analyses were performed for the same group comparisons and revealed twelve significantly different protein peaks. In conclusion, this genomic/proteomic analysis suggests differential expression of several genes and protein peaks in patients within and across the forms of NAFLD. These findings may help clarify the pathogenesis of NAFLD and identify potential targets for therapeutic intervention. (HEPATOLOGY 2005;42:665-674.) N onalcoholic fatty liver disease (NAFLD) is an important cause of chronic liver disease that has gained increasing recognition over the past de- cade. 1-5 NAFLD includes a spectrum of clinico-patholog- ical syndromes associated with varying degrees of risk for progression to cirrhosis. 1,6,7 For example, nonalcoholic steatohepatitis (NASH) is considered potentially progres- sive, whereas patients with liver biopsies showing steatosis alone follow a more benign course with little or no pro- gression. 1,7 Furthermore, burned-out NASH may be an important cause of cryptogenic cirrhosis. 8-10 The current rise in the prevalence of NAFLD and NASH may be related to parallel increases in the prevalence of obesity and metabolic syndrome. 2,4,5 Both endogenous and exogenous factors may influence differential progression of these liver diseases. 11-16 For ex- ample, environmental factors contributing to oxidative stress may compound hepatic injury in some patients, whereas genetic factors may be more important in oth- ers. 17-21 Furthermore, an interaction among these factors may influence the disease course and tip the balance in favor of progression. New genomic and proteomic technologies have the potential to help clarify the complex pathogenic mech- anisms of NAFLD and related progressive liver dis- ease. 22-27 For example, simultaneous assessment of gene expression in a large number of genes and protein peaks can help identify molecular pathways that are active in NAFLD. 23-28 Furthermore, molecular path- ways that protect against disease progression can be differentiated from those that may contribute to the progression of NAFLD. 29 This study relates the pat- terns of gene expression in liver tissue and protein peak Abbreviations: NAFLD, nonalcoholic fatty liver disease; NASH, nonalcoholic steatohepatitis; SELDI-TOF, surface-enhanced laser desorption ionization time of flight; cDNA, complementary DNA; RT-PCR, reverse-transcriptase polymerase chain reaction. From the 1 Center for Liver Diseases, Inova Fairfax Hospital, Falls Church, VA; the 2 Center for the Study of Genomics in Liver Diseases, George Mason University, Manassas, VA; and the 3 Armed Forces Institute of Pathology, Washington, DC. Received February 11, 2005; accepted June 22, 2005. Supported partly by the Liver Disease Outcomes Fund of the Center for Liver Diseases at Inova Fairfax Hospital. Address reprint requests to: Zobair M. Younossi, M.D., M.P.H., Center for Liver Diseases, Inova Fairfax Hospital, 3300 Gallows Road, Falls Church, VA 22042. E-mail: [email protected]; fax: 703-208-6655. Copyright © 2005 by the American Association for the Study of Liver Diseases. Published online in Wiley InterScience (www.interscience.wiley.com). DOI 10.1002/hep.20838 Potential conflict of interest: Dr. Ziegler owns stock in Ciphergen. 665
Transcript of A genomic and proteomic study of the spectrum of nonalcoholic fatty liver disease
A Genomic and Proteomic Study of the Spectrum ofNonalcoholic Fatty Liver Disease
Zobair M. Younossi,1,2 Ancha Baranova,2 Katharine Ziegler,2 Luca Del Giacco,2 Karen Schlauch,1,2 Timothy L. Born,2
Hazem Elariny,1 Francesco Gorreta,2 Amy VanMeter,2 Abraham Younoszai,1 Janus P. Ong,1,2
Zachary Goodman,3 and Vikas Chandhoke2
Nonalcoholic fatty liver disease (NAFLD) is the most common chronic liver disease, andsome of its forms are progressive. This study describes the profiling of hepatic gene expres-sion and serum protein content in patients with different subtypes of NAFLD. Liver biopsyspecimens from 98 bariatric surgery patients were classified as normal, steatosis alone,steatosis with nonspecific inflammation, and nonalcoholic steatohepatitis (NASH). Microar-ray hybridizations were performed in triplicate and the microarray expression levels of aselected group of genes were confirmed using real-time quantitative reverse-transcriptasepolymerase chain reaction. Serum protein profiles of the same patients were determined bySELDI-TOF mass spectrometry. Of 98 obese patients, 91 were diagnosed with NAFLD (12steatosis alone, 52 steatosis with nonspecific inflammation, and 27 NASH), and 7 patientswithout NAFLD served as obese controls. Each group of NAFLD patients was comparedwith the obese controls, and 22 genes with more than twofold differences in expression levelswere revealed. Proteomics analyses were performed for the same group comparisons andrevealed twelve significantly different protein peaks. In conclusion, this genomic/proteomicanalysis suggests differential expression of several genes and protein peaks in patients withinand across the forms of NAFLD. These findings may help clarify the pathogenesis of NAFLDand identify potential targets for therapeutic intervention. (HEPATOLOGY 2005;42:665-674.)
Nonalcoholic fatty liver disease (NAFLD) is animportant cause of chronic liver disease that hasgained increasing recognition over the past de-
cade.1-5 NAFLD includes a spectrum of clinico-patholog-ical syndromes associated with varying degrees of risk forprogression to cirrhosis.1,6,7 For example, nonalcoholicsteatohepatitis (NASH) is considered potentially progres-sive, whereas patients with liver biopsies showing steatosisalone follow a more benign course with little or no pro-
gression.1,7 Furthermore, burned-out NASH may be animportant cause of cryptogenic cirrhosis.8-10 The currentrise in the prevalence of NAFLD and NASH may berelated to parallel increases in the prevalence of obesityand metabolic syndrome.2,4,5
Both endogenous and exogenous factors may influencedifferential progression of these liver diseases.11-16 For ex-ample, environmental factors contributing to oxidativestress may compound hepatic injury in some patients,whereas genetic factors may be more important in oth-ers.17-21 Furthermore, an interaction among these factorsmay influence the disease course and tip the balance infavor of progression.
New genomic and proteomic technologies have thepotential to help clarify the complex pathogenic mech-anisms of NAFLD and related progressive liver dis-ease.22-27 For example, simultaneous assessment ofgene expression in a large number of genes and proteinpeaks can help identify molecular pathways that areactive in NAFLD.23-28 Furthermore, molecular path-ways that protect against disease progression can bedifferentiated from those that may contribute to theprogression of NAFLD.29 This study relates the pat-terns of gene expression in liver tissue and protein peak
Abbreviations: NAFLD, nonalcoholic fatty liver disease; NASH, nonalcoholicsteatohepatitis; SELDI-TOF, surface-enhanced laser desorption ionization time offlight; cDNA, complementary DNA; RT-PCR, reverse-transcriptase polymerasechain reaction.
From the 1Center for Liver Diseases, Inova Fairfax Hospital, Falls Church, VA;the 2Center for the Study of Genomics in Liver Diseases, George Mason University,Manassas, VA; and the 3Armed Forces Institute of Pathology, Washington, DC.
Received February 11, 2005; accepted June 22, 2005.Supported partly by the Liver Disease Outcomes Fund of the Center for Liver
Diseases at Inova Fairfax Hospital.Address reprint requests to: Zobair M. Younossi, M.D., M.P.H., Center for Liver
Diseases, Inova Fairfax Hospital, 3300 Gallows Road, Falls Church, VA 22042.E-mail: [email protected]; fax: 703-208-6655.
Copyright © 2005 by the American Association for the Study of Liver Diseases.Published online in Wiley InterScience (www.interscience.wiley.com).DOI 10.1002/hep.20838Potential conflict of interest: Dr. Ziegler owns stock in Ciphergen.
665
profiles in blood serum in a large cohort of patientswith NAFLD.
Patients and MethodsPatient Selection
We used the Epidemiology of Nonalcoholic FattyLiver Disease Database, which was created by enrollingconsecutive patients undergoing bariatric surgery at InovaFairfax Hospital from October 2001 to May 2002. Ex-tensive clinical and laboratory data were collected on eachpatient after obtaining informed consent. Patients withevidence of excessive alcohol use (�10 g/d) or othercauses of liver disease were excluded. Insulin resistancewas defined as a homeostatic model assessment index(HOMA) greater than 2.2, and diabetes mellitus was de-fined as clinically established disease treated with diet con-trol or antidiabetic medications or both. Two liver biopsyspecimens were obtained at the time of surgery. One spec-imen was sent to the study pathologist for routine patho-logical assessment, and the other was immediately snap-frozen with liquid nitrogen and used later for RNAextraction. Serum was also obtained at the time of liverbiopsy, frozen immediately, and used for biochemical andproteomic analysis. This study was reviewed and fullyapproved by the institutional review board of Inova Fair-fax Hospital.
Pathological AssessmentsEach liver biopsy was fixed in formalin, routinely pro-
cessed, sectioned, and stained with hematoxylin-eosinand Masson’s trichrome. All biopsies were evaluated by asingle hepatopathologist (Z. G.). The degree of steatosiswas assessed in the hematoxylin-eosin–stained sectionsand graded as an estimate of the percentage of tissue oc-cupied by fat vacuoles as follows: 0 � none; 1 � �5%;2 � 6%-33%; 3 � 34%-66%; 4 � �66%. Other histo-logical features evaluated in hematoxylin-eosin sectionsincluded portal inflammation, lymphoplasmacytic lobu-lar inflammation, polymorphonuclear lobular inflamma-tion, Kupffer cell hypertrophy, apoptotic bodies, focalparenchymal necrosis, glycogen nuclei, hepatocellularballooning, and Mallory bodies. Histological featureswere all graded as follows: 0 � none; 1 � mild or few; 2 �moderate; or 3 � marked or many. Fibrosis was assessedwith the Masson trichrome stain. Portal fibrosis and in-tralobular pericellular fibrosis were graded as follows: 0 �none; 1 � mild; 2 � moderate; or 3 � marked. Whenpresent, bridging fibrosis was noted as few or manybridges, and cirrhosis was identified when parenchymalnodules surrounded by fibrous tissue were noted. Cirrho-sis was further categorized as incomplete or established,depending on the degree of loss of acinar architecture.
Each liver biopsy was assigned to one of four diagnosticcategories: (1) steatosis alone, (2) steatosis with nonspe-cific inflammation, (3) NASH, or (4) no fatty liver diseasepresent. NAFLD was defined as a biopsy showing changesconsistent with diagnostic categories 1 to 3. Patients weredefined as having steatosis alone if they had any degree ofhepatocellular fat accumulation as their sole pathology.Patients with steatosis with nonspecific inflammationhad, in addition to fat, spotty hepatocellular dropout withfocal inflammation or Kupffer cell hypertrophy. Nonal-coholic steatohepatitis was identified when, in addition tofat, lobular and hepatocelluar inflammation were identi-fied on the hematoxylin-eosin stain. The presence of leastone unequivocal Mallory body and some degree of zone 3pericellular fibrosis or bridging fibrosis on the trichromestain was also consistent with the diagnosis of NASH.Samples from patients without fatty liver disease that didnot include any of these pathological changes were con-sidered obese controls.
Microarray Technique
RNA Preparation. Total RNA was extracted from 20to 30 mg of liver tissue samples. Total RNA pooled from10 different human cell lines (universal human reference;Stratagene, La Jolla, CA; catalog #740000) was also usedthroughout the experiment as reference RNA. Liver andreference RNAs were amplified with the MessageAmpaRNA Kit (Ambion, Austin, TX).
Reverse Transcription and Sample Labeling. Fourmicrograms of amplified RNA were reverse-transcribedand labeled with Cyanine3 (Cy3, reference sample) orCyanine5 (Cy5, liver sample) dye esters (Amersham Bio-sciences, Piscataway, NJ), according to The Institute forGenomic Research protocol (http://www.tigr.org/tdb/microarray/protocolsTIGR.shtml). The aminoallyl-la-beled complementary DNA (cDNA) samples werehybridized to microarrays after purification.
Array Fabrication. A custom microarray was pro-duced from 5,220 human cDNA clones (Research Genet-ics, Carlsbad, CA) representing many genes potentiallyinvolved in the pathogenesis of NAFLD. The completelist of genes included in this study is available at http://www.gmu.edu/centers/genomics/research/keys. Addition-ally, because cDNA libraries might contain clones withmismatched descriptions, 10 clones from the gene listswere randomly selected and sequenced. The identity of allclones was confirmed.
Prehybridization. Spotted cDNAs were first rehy-drated, denatured, then UV cross-linked to the slide sur-face. Slides were prehybridized in a buffer containing 5�SSC, 0.1% SDS, and 1% bovine serum albumin (Sigma,Research Triangle Park, NC).
666 YOUNOSSI ET AL. HEPATOLOGY, September 2005
Hybridization. The labeled sample cDNA probeswere resuspended in hybridization buffer (25% form-amide, 1� SSC, 0.1% SDS) and combined with a refer-ence probe and applied to a prehybridized microarrayslide. The microarray slide was incubated at 45°C over-night.
Image Analysis. Hybridized slides were scanned withthe confocal laser scanner ScanArray Express HT (Pack-ard BioScience, Boston, MA) using settings of 75% ofphotomultiplier tube, 75% of laser power, and a 10-�mpixel resolution. Images were acquired using ScanArrayExpress 2.0 software (PE Life Sciences, Boston, MA) andprocessed with QuantArray 3.0 software (PE Life Sci-ences) to quantify intensity levels and local backgroundfor both Cy3 and Cy5 channels of each spot.
Quality Control, Processing, and Statistical Anal-ysis of Microarray Data. The microarray study in-cluded 98 total samples: 91 NAFLD patients and 7 non-NAFLD obese controls. Triplicate slide hybridizationsgenerated 319 microarrays. Array quality was assessedwith a protocol designed specifically for this study. Anartificial image of the expression intensity levels of eachmicroarray was generated and examined to identify nota-ble spatial variation. Arrays with any identifiable prob-lems were excluded from the study, leaving 186 high-quality microarrays for the 98 samples.
Microarray data were processed and normalized by firstsubtracting local background intensity levels, generatedby QuantArray image analysis software. Spots with nota-bly high background values were discarded from eacharray (the average percentage of genes discarded was lessthan 0.3%). A filtering process performed on each mi-croarray classified genes as “detected” if their intensitylevels were significantly greater than background or noisevalues.30 A per-chip background threshold for each chan-nel defined as the mean of the negative control intensitiesin each channel on the array provided a useful thresholdfor these customized microarrays.31 Intensity values lowerthan the threshold in either channel were set equal to thethreshold in that channel to avoid the computation ofartificially large expression ratios. Each chip exhibited aclear, significant linear trend in Cy5 versus Cy3 measures,indicating a significant linear dye bias. Expression ratios(Cy5/Cy3) were computed and normalized via linear me-dian normalization (division by the per-chip median ra-tio). Average ratios were then computed across the set ofreplicated arrays of each sample. The average coefficientof variation across all genes with detected triplicate valueswas 26%. The average correlation between all sets of du-plicate arrays was 85.1%.
A comparison of group average expression ratios wasused to assess differential transcriptional activity across
patient groups. Genes exhibiting more than a twofolddifference between group averages were identified, andMann-Whitney rank-sum tests were performed on themedian expression ratios to determine statistical signifi-cance. A multiple testing correction was performed tocontrol the false discovery rate.32
Real-Time Polymerase Chain Reaction AssaysThe differential expression of a group of seven genes
identified by microarray analysis was validated via real-time reverse-transcriptase polymerase chain reaction (RT-PCR). For normalization purposes, 18S ribosomal RNAlevel was tested in parallel with the genes of interest.31
Reactions were performed in a 96-well format in the Bio-Rad iCycler iQ Real Time Detection System (BioRadLaboratories, Hercules, CA). For each gene, three inde-pendent PCR experiments from the same reverse tran-scription sample were performed. The presence of a singlespecific PCR product was verified by melting curve anal-ysis and confirmed on agarose gel.
Biochemical AssaysFasting serum from the time of liver biopsy was used to
measure serum glucose, insulin, leptin, transforminggrowth factor �, tumor necrosis factor �, and hyaluronicacid. Measurements were performed using the Infinityglucose reagent (Sigma-Aldrich, St. Louis, MO), thetransforming growth factor �1 Emax ImmunoAssay kit(Promega Corporation, Madison, WI), an enzyme-linkedprotein-binding assay for hyaluronic acid detection (Cor-genix Inc., Westminster, CO), a human insulin ELISA kitand human leptin ELISA kit (Linco Research, Inc., St.Charles, MO) following the manufacturers’ protocols.Markers were measured in triplicate, and the mean � SDwas computed for each sample. A Kruskal-Wallis test wasperformed across disease groups to detect significant dif-ferences for each biochemical marker.
Proteomic AssaysSerum protein expression profiles were generated for
all NAFLD patients and the obese controls by using a PBSIIC surface-enhanced laser desorption ionization time offlight (SELDI-TOF) mass spectrometer (Ciphergen Bio-systems Inc, Freemont, CA) which was calibrated usingfive standards (bovine insulin, 5,733.6 Da; bovine cyto-chrome C, 12,230.9 Da; equine myoglobin, 16,951.5Da; bovine �-lactoglobulin A, 18,363.3 Da; horseradishperoxidase, 43,240.0 Da). Each serum sample was ana-lyzed in triplicate on two chip surfaces—H50 and IMAC,as recommended by chip manufacturers (Ciphergen Bio-sytems, Inc., Freemont, CA). The H50 chip has a hydro-phobic surface equivalent to a 6-10 carbon alkyl chain,
HEPATOLOGY, Vol. 42, No. 3, 2005 YOUNOSSI ET AL. 667
while the IMAC chips were charged with cupric sulfate tobind proteins with an affinity for copper or doublycharged metal ions. Samples were processed as recom-mended by chip manufacturer, applied to the chip sur-face, washed, and analyzed using Ciphergen’sProteinChip software version 3.1.1. Peak detection re-quired a signal-to-noise ratio greater than 5, and normal-ization was based on the total ion current measuredbetween 2,500 and 150,000 m/z.
Protein peak intensity levels were quantified for 91NAFLD patients and 7 obese controls. All samples were runin triplicate. Within each sample’s triplicates, any spectrumwith a normalization factor more than 1 SD away from themean normalization factor of the three spectra was elimi-nated from the study. For both chip types, the average peakintensity levels across patient groups were compared withoutaveraging triplicate values of individual samples, to maximizestatistical power in subsequent hypotheses tests. Three selec-tions of peaks were chosen for further analysis: those havingmore than 1.5-, 1.7-, and 2-fold statistically significant dif-ferences between group averages. Differences were tested forsignificance using a Mann-Whitney rank-sum test. Addi-tionally, a Kruskal-Wallis multiple group comparison testwas performed for all peaks across all disease groups. In bothcases, the statistical tests were followed by a multiple testingcorrection to adjust the false discovery rate according to Ben-jamini and Hochberg.32
Full access to the genomic and proteomic data can beobtained by contacting the corresponding author.
Results
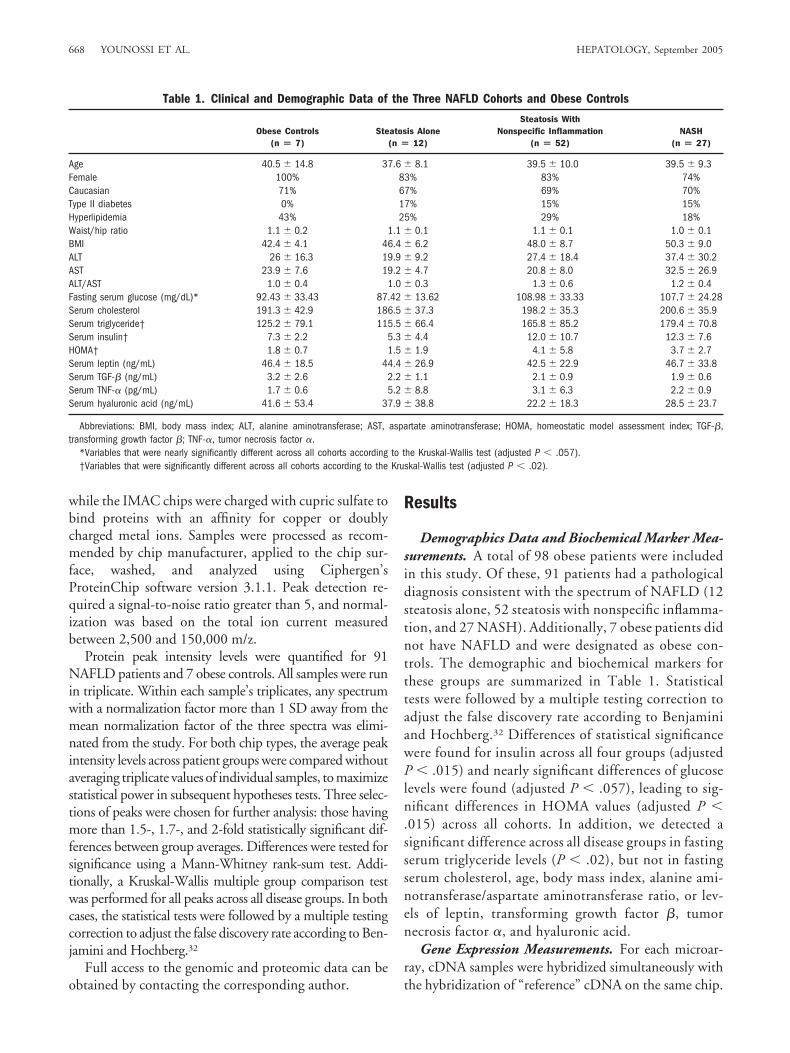
Demographics Data and Biochemical Marker Mea-surements. A total of 98 obese patients were includedin this study. Of these, 91 patients had a pathologicaldiagnosis consistent with the spectrum of NAFLD (12steatosis alone, 52 steatosis with nonspecific inflamma-tion, and 27 NASH). Additionally, 7 obese patients didnot have NAFLD and were designated as obese con-trols. The demographic and biochemical markers forthese groups are summarized in Table 1. Statisticaltests were followed by a multiple testing correction toadjust the false discovery rate according to Benjaminiand Hochberg.32 Differences of statistical significancewere found for insulin across all four groups (adjustedP � .015) and nearly significant differences of glucoselevels were found (adjusted P � .057), leading to sig-nificant differences in HOMA values (adjusted P �.015) across all cohorts. In addition, we detected asignificant difference across all disease groups in fastingserum triglyceride levels (P � .02), but not in fastingserum cholesterol, age, body mass index, alanine ami-notransferase/aspartate aminotransferase ratio, or lev-els of leptin, transforming growth factor �, tumornecrosis factor �, and hyaluronic acid.
Gene Expression Measurements. For each microar-ray, cDNA samples were hybridized simultaneously withthe hybridization of “reference” cDNA on the same chip.
Table 1. Clinical and Demographic Data of the Three NAFLD Cohorts and Obese Controls
Obese Controls(n � 7)
Steatosis Alone(n � 12)
Steatosis WithNonspecific Inflammation
(n � 52)NASH
(n � 27)
Age 40.5 � 14.8 37.6 � 8.1 39.5 � 10.0 39.5 � 9.3Female 100% 83% 83% 74%Caucasian 71% 67% 69% 70%Type II diabetes 0% 17% 15% 15%Hyperlipidemia 43% 25% 29% 18%Waist/hip ratio 1.1 � 0.2 1.1 � 0.1 1.1 � 0.1 1.0 � 0.1BMI 42.4 � 4.1 46.4 � 6.2 48.0 � 8.7 50.3 � 9.0ALT 26 � 16.3 19.9 � 9.2 27.4 � 18.4 37.4 � 30.2AST 23.9 � 7.6 19.2 � 4.7 20.8 � 8.0 32.5 � 26.9ALT/AST 1.0 � 0.4 1.0 � 0.3 1.3 � 0.6 1.2 � 0.4Fasting serum glucose (mg/dL)* 92.43 � 33.43 87.42 � 13.62 108.98 � 33.33 107.7 � 24.28Serum cholesterol 191.3 � 42.9 186.5 � 37.3 198.2 � 35.3 200.6 � 35.9Serum triglyceride† 125.2 � 79.1 115.5 � 66.4 165.8 � 85.2 179.4 � 70.8Serum insulin† 7.3 � 2.2 5.3 � 4.4 12.0 � 10.7 12.3 � 7.6HOMA† 1.8 � 0.7 1.5 � 1.9 4.1 � 5.8 3.7 � 2.7Serum leptin (ng/mL) 46.4 � 18.5 44.4 � 26.9 42.5 � 22.9 46.7 � 33.8Serum TGF-� (ng/mL) 3.2 � 2.6 2.2 � 1.1 2.1 � 0.9 1.9 � 0.6Serum TNF-� (pg/mL) 1.7 � 0.6 5.2 � 8.8 3.1 � 6.3 2.2 � 0.9Serum hyaluronic acid (ng/mL) 41.6 � 53.4 37.9 � 38.8 22.2 � 18.3 28.5 � 23.7
Abbreviations: BMI, body mass index; ALT, alanine aminotransferase; AST, aspartate aminotransferase; HOMA, homeostatic model assessment index; TGF-�,transforming growth factor �; TNF-�, tumor necrosis factor �.
*Variables that were nearly significantly different across all cohorts according to the Kruskal-Wallis test (adjusted P � .057).†Variables that were significantly different across all cohorts according to the Kruskal-Wallis test (adjusted P � .02).
668 YOUNOSSI ET AL. HEPATOLOGY, September 2005
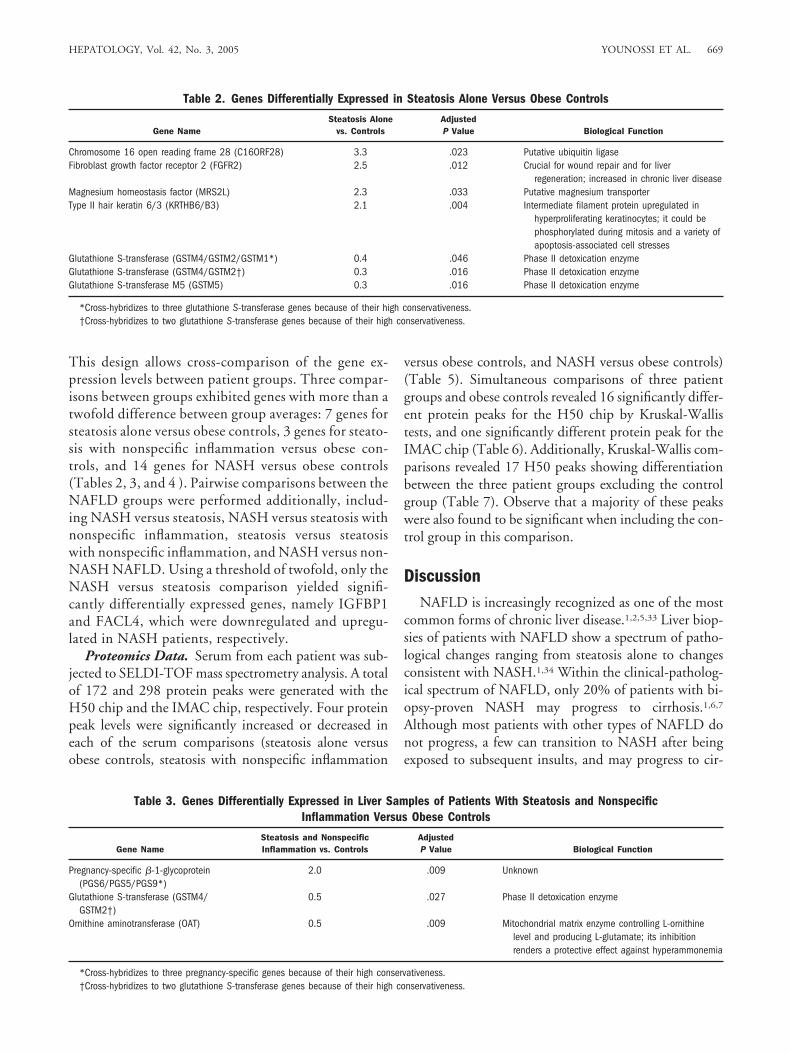
This design allows cross-comparison of the gene ex-pression levels between patient groups. Three compar-isons between groups exhibited genes with more than atwofold difference between group averages: 7 genes forsteatosis alone versus obese controls, 3 genes for steato-sis with nonspecific inflammation versus obese con-trols, and 14 genes for NASH versus obese controls(Tables 2, 3, and 4 ). Pairwise comparisons between theNAFLD groups were performed additionally, includ-ing NASH versus steatosis, NASH versus steatosis withnonspecific inflammation, steatosis versus steatosiswith nonspecific inflammation, and NASH versus non-NASH NAFLD. Using a threshold of twofold, only theNASH versus steatosis comparison yielded signifi-cantly differentially expressed genes, namely IGFBP1and FACL4, which were downregulated and upregu-lated in NASH patients, respectively.
Proteomics Data. Serum from each patient was sub-jected to SELDI-TOF mass spectrometry analysis. A totalof 172 and 298 protein peaks were generated with theH50 chip and the IMAC chip, respectively. Four proteinpeak levels were significantly increased or decreased ineach of the serum comparisons (steatosis alone versusobese controls, steatosis with nonspecific inflammation
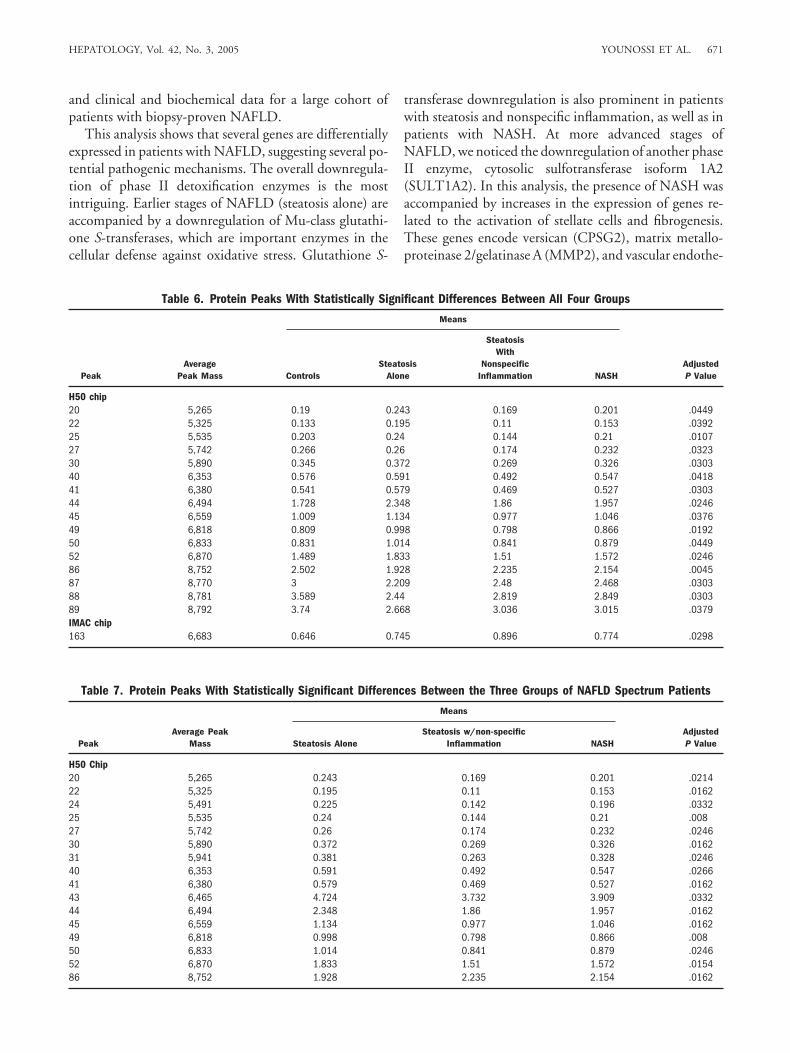
versus obese controls, and NASH versus obese controls)(Table 5). Simultaneous comparisons of three patientgroups and obese controls revealed 16 significantly differ-ent protein peaks for the H50 chip by Kruskal-Wallistests, and one significantly different protein peak for theIMAC chip (Table 6). Additionally, Kruskal-Wallis com-parisons revealed 17 H50 peaks showing differentiationbetween the three patient groups excluding the controlgroup (Table 7). Observe that a majority of these peakswere also found to be significant when including the con-trol group in this comparison.
DiscussionNAFLD is increasingly recognized as one of the most
common forms of chronic liver disease.1,2,5,33 Liver biop-sies of patients with NAFLD show a spectrum of patho-logical changes ranging from steatosis alone to changesconsistent with NASH.1,34 Within the clinical-patholog-ical spectrum of NAFLD, only 20% of patients with bi-opsy-proven NASH may progress to cirrhosis.1,6,7
Although most patients with other types of NAFLD donot progress, a few can transition to NASH after beingexposed to subsequent insults, and may progress to cir-
Table 2. Genes Differentially Expressed in Steatosis Alone Versus Obese Controls
Gene NameSteatosis Alone
vs. ControlsAdjustedP Value Biological Function
Chromosome 16 open reading frame 28 (C16ORF28) 3.3 .023 Putative ubiquitin ligaseFibroblast growth factor receptor 2 (FGFR2) 2.5 .012 Crucial for wound repair and for liver
regeneration; increased in chronic liver diseaseMagnesium homeostasis factor (MRS2L) 2.3 .033 Putative magnesium transporterType II hair keratin 6/3 (KRTHB6/B3) 2.1 .004 Intermediate filament protein upregulated in
hyperproliferating keratinocytes; it could bephosphorylated during mitosis and a variety ofapoptosis-associated cell stresses
Glutathione S-transferase (GSTM4/GSTM2/GSTM1*) 0.4 .046 Phase II detoxication enzymeGlutathione S-transferase (GSTM4/GSTM2†) 0.3 .016 Phase II detoxication enzymeGlutathione S-transferase M5 (GSTM5) 0.3 .016 Phase II detoxication enzyme
*Cross-hybridizes to three glutathione S-transferase genes because of their high conservativeness.†Cross-hybridizes to two glutathione S-transferase genes because of their high conservativeness.
Table 3. Genes Differentially Expressed in Liver Samples of Patients With Steatosis and NonspecificInflammation Versus Obese Controls
Gene NameSteatosis and NonspecificInflammation vs. Controls
AdjustedP Value Biological Function
Pregnancy-specific �-1-glycoprotein(PGS6/PGS5/PGS9*)
2.0 .009 Unknown
Glutathione S-transferase (GSTM4/GSTM2†)
0.5 .027 Phase II detoxication enzyme
Ornithine aminotransferase (OAT) 0.5 .009 Mitochondrial matrix enzyme controlling L-ornithinelevel and producing L-glutamate; its inhibitionrenders a protective effect against hyperammonemia
*Cross-hybridizes to three pregnancy-specific genes because of their high conservativeness.†Cross-hybridizes to two glutathione S-transferase genes because of their high conservativeness.
HEPATOLOGY, Vol. 42, No. 3, 2005 YOUNOSSI ET AL. 669
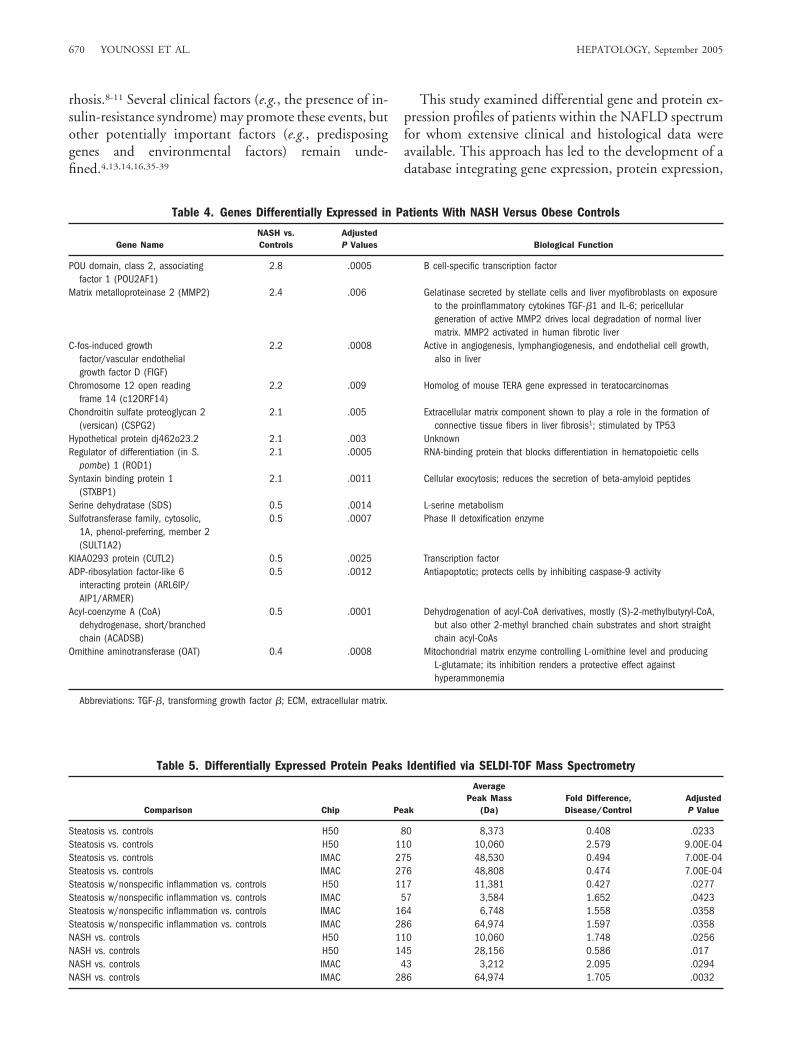
rhosis.8-11 Several clinical factors (e.g., the presence of in-sulin-resistance syndrome) may promote these events, butother potentially important factors (e.g., predisposinggenes and environmental factors) remain unde-fined.4,13,14,16,35-39
This study examined differential gene and protein ex-pression profiles of patients within the NAFLD spectrumfor whom extensive clinical and histological data wereavailable. This approach has led to the development of adatabase integrating gene expression, protein expression,
Table 4. Genes Differentially Expressed in Patients With NASH Versus Obese Controls
Gene NameNASH vs.Controls
AdjustedP Values Biological Function
POU domain, class 2, associatingfactor 1 (POU2AF1)
2.8 .0005 B cell-specific transcription factor
Matrix metalloproteinase 2 (MMP2) 2.4 .006 Gelatinase secreted by stellate cells and liver myofibroblasts on exposureto the proinflammatory cytokines TGF-�1 and IL-6; pericellulargeneration of active MMP2 drives local degradation of normal livermatrix. MMP2 activated in human fibrotic liver
C-fos-induced growthfactor/vascular endothelialgrowth factor D (FIGF)
2.2 .0008 Active in angiogenesis, lymphangiogenesis, and endothelial cell growth,also in liver
Chromosome 12 open readingframe 14 (c12ORF14)
2.2 .009 Homolog of mouse TERA gene expressed in teratocarcinomas
Chondroitin sulfate proteoglycan 2(versican) (CSPG2)
2.1 .005 Extracellular matrix component shown to play a role in the formation ofconnective tissue fibers in liver fibrosis1; stimulated by TP53
Hypothetical protein dj462o23.2 2.1 .003 UnknownRegulator of differentiation (in S.
pombe) 1 (ROD1)2.1 .0005 RNA-binding protein that blocks differentiation in hematopoietic cells
Syntaxin binding protein 1(STXBP1)
2.1 .0011 Cellular exocytosis; reduces the secretion of beta-amyloid peptides
Serine dehydratase (SDS) 0.5 .0014 L-serine metabolismSulfotransferase family, cytosolic,
1A, phenol-preferring, member 2(SULT1A2)
0.5 .0007 Phase II detoxification enzyme
KIAA0293 protein (CUTL2) 0.5 .0025 Transcription factorADP-ribosylation factor-like 6
interacting protein (ARL6IP/AIP1/ARMER)
0.5 .0012 Antiapoptotic; protects cells by inhibiting caspase-9 activity
Acyl-coenzyme A (CoA)dehydrogenase, short/branchedchain (ACADSB)
0.5 .0001 Dehydrogenation of acyl-CoA derivatives, mostly (S)-2-methylbutyryl-CoA,but also other 2-methyl branched chain substrates and short straightchain acyl-CoAs
Ornithine aminotransferase (OAT) 0.4 .0008 Mitochondrial matrix enzyme controlling L-ornithine level and producingL-glutamate; its inhibition renders a protective effect againsthyperammonemia
Abbreviations: TGF-�, transforming growth factor �; ECM, extracellular matrix.
Table 5. Differentially Expressed Protein Peaks Identified via SELDI-TOF Mass Spectrometry
Comparison Chip Peak
AveragePeak Mass
(Da)Fold Difference,Disease/Control
AdjustedP Value
Steatosis vs. controls H50 80 8,373 0.408 .0233Steatosis vs. controls H50 110 10,060 2.579 9.00E-04Steatosis vs. controls IMAC 275 48,530 0.494 7.00E-04Steatosis vs. controls IMAC 276 48,808 0.474 7.00E-04Steatosis w/nonspecific inflammation vs. controls H50 117 11,381 0.427 .0277Steatosis w/nonspecific inflammation vs. controls IMAC 57 3,584 1.652 .0423Steatosis w/nonspecific inflammation vs. controls IMAC 164 6,748 1.558 .0358Steatosis w/nonspecific inflammation vs. controls IMAC 286 64,974 1.597 .0358NASH vs. controls H50 110 10,060 1.748 .0256NASH vs. controls H50 145 28,156 0.586 .017NASH vs. controls IMAC 43 3,212 2.095 .0294NASH vs. controls IMAC 286 64,974 1.705 .0032
670 YOUNOSSI ET AL. HEPATOLOGY, September 2005
and clinical and biochemical data for a large cohort ofpatients with biopsy-proven NAFLD.
This analysis shows that several genes are differentiallyexpressed in patients with NAFLD, suggesting several po-tential pathogenic mechanisms. The overall downregula-tion of phase II detoxification enzymes is the mostintriguing. Earlier stages of NAFLD (steatosis alone) areaccompanied by a downregulation of Mu-class glutathi-one S-transferases, which are important enzymes in thecellular defense against oxidative stress. Glutathione S-
transferase downregulation is also prominent in patientswith steatosis and nonspecific inflammation, as well as inpatients with NASH. At more advanced stages ofNAFLD, we noticed the downregulation of another phaseII enzyme, cytosolic sulfotransferase isoform 1A2(SULT1A2). In this analysis, the presence of NASH wasaccompanied by increases in the expression of genes re-lated to the activation of stellate cells and fibrogenesis.These genes encode versican (CPSG2), matrix metallo-proteinase 2/gelatinase A (MMP2), and vascular endothe-
Table 6. Protein Peaks With Statistically Significant Differences Between All Four Groups
PeakAverage
Peak Mass
Means
AdjustedP ValueControls
SteatosisAlone
SteatosisWith
NonspecificInflammation NASH
H50 chip20 5,265 0.19 0.243 0.169 0.201 .044922 5,325 0.133 0.195 0.11 0.153 .039225 5,535 0.203 0.24 0.144 0.21 .010727 5,742 0.266 0.26 0.174 0.232 .032330 5,890 0.345 0.372 0.269 0.326 .030340 6,353 0.576 0.591 0.492 0.547 .041841 6,380 0.541 0.579 0.469 0.527 .030344 6,494 1.728 2.348 1.86 1.957 .024645 6,559 1.009 1.134 0.977 1.046 .037649 6,818 0.809 0.998 0.798 0.866 .019250 6,833 0.831 1.014 0.841 0.879 .044952 6,870 1.489 1.833 1.51 1.572 .024686 8,752 2.502 1.928 2.235 2.154 .004587 8,770 3 2.209 2.48 2.468 .030388 8,781 3.589 2.44 2.819 2.849 .030389 8,792 3.74 2.668 3.036 3.015 .0379IMAC chip163 6,683 0.646 0.745 0.896 0.774 .0298
Table 7. Protein Peaks With Statistically Significant Differences Between the Three Groups of NAFLD Spectrum Patients
PeakAverage Peak
Mass
Means
AdjustedP ValueSteatosis Alone
Steatosis w/non-specificInflammation NASH
H50 Chip20 5,265 0.243 0.169 0.201 .021422 5,325 0.195 0.11 0.153 .016224 5,491 0.225 0.142 0.196 .033225 5,535 0.24 0.144 0.21 .00827 5,742 0.26 0.174 0.232 .024630 5,890 0.372 0.269 0.326 .016231 5,941 0.381 0.263 0.328 .024640 6,353 0.591 0.492 0.547 .026641 6,380 0.579 0.469 0.527 .016243 6,465 4.724 3.732 3.909 .033244 6,494 2.348 1.86 1.957 .016245 6,559 1.134 0.977 1.046 .016249 6,818 0.998 0.798 0.866 .00850 6,833 1.014 0.841 0.879 .024652 6,870 1.833 1.51 1.572 .015486 8,752 1.928 2.235 2.154 .0162
HEPATOLOGY, Vol. 42, No. 3, 2005 YOUNOSSI ET AL. 671
lial growth factor D (FIGF).31 Furthermore, theexpression of survival factor ARL6IP/RAMER was alsodecreased in NASH, suggesting a shift in cellular ho-meostasis toward apoptosis via an increase in caspase 9activity.39
These results also indicate that the FGFR2 gene encod-ing fibroblast growth factor receptor 2 is significantly up-regulated at earlier stages of NAFLD. This protein servesas a receptor for keratinocyte growth factor synthesized byactivated hepatic stellate cells in chronic liver disease.40
FGFR2 is shown to be expressed exclusively on hepato-cytes40 and may enhance liver regeneration and/or hepa-tocyte survival in patients with steatosis alone. Expressionof type II keratin KRTHB6/B3 was also enhanced, prob-ably indicating its site-specific involvement in protectionor stimulation of inflammation. Previous studies haveshown that keratin phosphorylation increases during cel-lular stress and mitosis as well as in several transgenicmouse models of liver disease.41,42
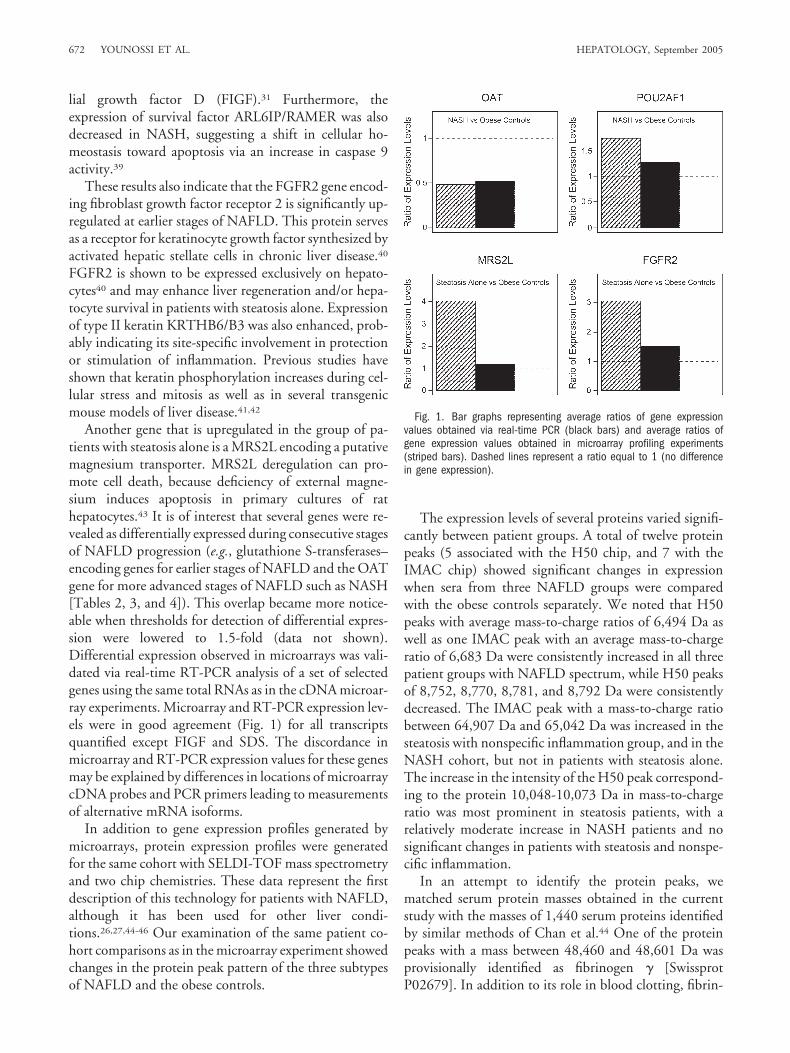
Another gene that is upregulated in the group of pa-tients with steatosis alone is a MRS2L encoding a putativemagnesium transporter. MRS2L deregulation can pro-mote cell death, because deficiency of external magne-sium induces apoptosis in primary cultures of rathepatocytes.43 It is of interest that several genes were re-vealed as differentially expressed during consecutive stagesof NAFLD progression (e.g., glutathione S-transferases–encoding genes for earlier stages of NAFLD and the OATgene for more advanced stages of NAFLD such as NASH[Tables 2, 3, and 4]). This overlap became more notice-able when thresholds for detection of differential expres-sion were lowered to 1.5-fold (data not shown).Differential expression observed in microarrays was vali-dated via real-time RT-PCR analysis of a set of selectedgenes using the same total RNAs as in the cDNA microar-ray experiments. Microarray and RT-PCR expression lev-els were in good agreement (Fig. 1) for all transcriptsquantified except FIGF and SDS. The discordance inmicroarray and RT-PCR expression values for these genesmay be explained by differences in locations of microarraycDNA probes and PCR primers leading to measurementsof alternative mRNA isoforms.
In addition to gene expression profiles generated bymicroarrays, protein expression profiles were generatedfor the same cohort with SELDI-TOF mass spectrometryand two chip chemistries. These data represent the firstdescription of this technology for patients with NAFLD,although it has been used for other liver condi-tions.26,27,44-46 Our examination of the same patient co-hort comparisons as in the microarray experiment showedchanges in the protein peak pattern of the three subtypesof NAFLD and the obese controls.
The expression levels of several proteins varied signifi-cantly between patient groups. A total of twelve proteinpeaks (5 associated with the H50 chip, and 7 with theIMAC chip) showed significant changes in expressionwhen sera from three NAFLD groups were comparedwith the obese controls separately. We noted that H50peaks with average mass-to-charge ratios of 6,494 Da aswell as one IMAC peak with an average mass-to-chargeratio of 6,683 Da were consistently increased in all threepatient groups with NAFLD spectrum, while H50 peaksof 8,752, 8,770, 8,781, and 8,792 Da were consistentlydecreased. The IMAC peak with a mass-to-charge ratiobetween 64,907 Da and 65,042 Da was increased in thesteatosis with nonspecific inflammation group, and in theNASH cohort, but not in patients with steatosis alone.The increase in the intensity of the H50 peak correspond-ing to the protein 10,048-10,073 Da in mass-to-chargeratio was most prominent in steatosis patients, with arelatively moderate increase in NASH patients and nosignificant changes in patients with steatosis and nonspe-cific inflammation.
In an attempt to identify the protein peaks, wematched serum protein masses obtained in the currentstudy with the masses of 1,440 serum proteins identifiedby similar methods of Chan et al.44 One of the proteinpeaks with a mass between 48,460 and 48,601 Da wasprovisionally identified as fibrinogen � [SwissprotP02679]. In addition to its role in blood clotting, fibrin-
Fig. 1. Bar graphs representing average ratios of gene expressionvalues obtained via real-time PCR (black bars) and average ratios ofgene expression values obtained in microarray profiling experiments(striped bars). Dashed lines represent a ratio equal to 1 (no differencein gene expression).
672 YOUNOSSI ET AL. HEPATOLOGY, September 2005
ogen � serves as a depot for active FGF2 factor in theblood47 and may be connected to liver fibrosis.48-50 Therole of fibrinogen � in NAFLD remains speculative andneeds to be defined. We believe that it will be unlikely thata single protein peak will be able to distinguish NASHfrom other types of NAFLD. Therefore, we have startedthe development of a multiple protein panel that will beblindly tested against sera of patients with various formsof chronic liver disease.
A notable shortcoming of the SELDI-TOF analysis isits relative low mass accuracy, which precludes direct se-quence identification of serum proteins. Despite thisshortcoming, these datasets are important prerequisitesand demonstrate that mass spectrometry can be a valuabletool for developing serum diagnostics markers ofNAFLD. The purification and identification of these pro-tein peaks are currently underway.
One possible weakness of this study is the patient pop-ulation enrolled (morbidly obese patients). These patientsmay not represent all patients with NAFLD seen in ouroutpatient clinics. Another potential weakness of thestudy is the relatively small number of morbidly obesecontrols (n � 7), which may not allow for the detection ofsignificant differences in the baseline characteristics of pa-tients and controls. It is also important to note that ourcross-sectional study design may be able to reveal someassociations of gene expression and protein profiles withNAFLD. However, this study design will not be able tomake causal determination of the pathogenesis of differ-ent subtypes of NAFLD. A future study, involving a largecohort of NAFLD patients, with sequential liver biopsiesand serum specimens, will be able to make importantcontributions in elucidating the pathogenesis of NAFLDand the progression of different subtypes of NAFLD.
In conclusion, this research included a simultaneousgenomics and proteomics study of three cohorts of pa-tients with NAFLD. Integrative studies of this kind pro-vide a model for studying complex diseases such asNAFLD and obesity. This approach may contribute tothe identification of diagnostic tools for early diagnosis ofNASH and markers for predicting disease progression tocirrhosis. Future studies of NAFLD patients with sequen-tial biopsies over time will enable us to document changesin hepatic gene expression and protein expression profilesassociated with disease progression.
References1. Matteoni CA, Younossi ZM, Gramlich T, Boparai N, Liu YC, McCul-
lough AJ. Nonalcoholic fatty liver disease: a spectrum of clinical and patho-logical severity. Gastroenterology 1999;116:1413-1419.
2. Falck-Ytter Y, Younossi ZM, Marchesini G, McCullough AJ. Clinicalfeatures and natural history of nonalcoholic steatosis syndromes. SeminLiver Dis 2001;21:17-26.
3. Ludwig J, Viggiano TR, McGill DB, Oh BJ. Nonalcoholic steatohepatitis:Mayo Clinic experiences with a hitherto unnamed disease. Mayo Clin Proc1980;55:434-438.
4. Younossi ZM, Diehl AM, Ong JP. Nonalcoholic fatty liver disease: anagenda for clinical research. HEPATOLOGY 2002;35:746-752.
5. Reid AE. Nonalcoholic steatohepatitis. Gastroenterology 2001;121:710-723.
6. Bacon BR, Farahvash MJ, Janney CG, Neuschwander-Tetri BA. Nonal-coholic steatohepatitis: an expanded clinical entity. Gastroenterology1994;107:1103-1109.
7. Teli MR, James OF, Burt AD, Bennett MK, Day CP. The natural historyof nonalcoholic fatty liver: a follow-up study. HEPATOLOGY 1995;22:1714-1719.
8. Caldwell SH, Oelsner DH, Iezzoni JC, Hespenheide EE, Battle EH,Driscoll CJ. Cryptogenic cirrhosis: clinical characterization and risk factorsfor underlying disease. HEPATOLOGY 1999;29:664-669.
9. Ong J, Younossi ZM, Reddy V, Price LL, Gramlich T, Mayes J, et al.Cryptogenic cirrhosis and posttransplantation nonalcoholic fatty liver dis-ease. Liver Transpl 2001;7:797-801.
10. Bugianesi E, Leone N, Vanni E, Marchesini G, Brunello F, Carucci P, et al.Expanding the natural history of nonalcoholic steatohepatitis: from cryp-togenic cirrhosis to hepatocellular carcinoma. Gastroenterology 2002;123:134-140.
11. Day CP, James OFW. Steatohepatitis: a tale of two “hits”? Gastroenterol-ogy 1998;114:842-845.
12. Ratziu V, Giral P, Charlotte F, Bruckert E, Thibault V, Theodorou I, et al.Liver fibrosis in overweight patients. Gastroenterology 2000;118:1117-1123.
13. Belfiore F, Iannello S. Insulin resistance in obesity: metabolic mechanismsand measurement methods. Mol Genet Metab 1998;65:121-128.
14. Chitturi S, Farrell GC. Etiopathogenesis of nonalcoholic steatohepatitis.Semin Liver Dis 2001;21:27-41.
15. Tilg H, Diehl AM. Cytokines in alcoholic and nonalcoholic steatohepati-tis. N Engl J Med 2000;343:1467-1476.
16. Fong DG, Nehra V, Lindor KD, Buchman AL. Metabolic and nutritionalconsiderations in nonalcoholic fatty liver. HEPATOLOGY 2000;32:3-10.
17. Cortez-Pinto H, Chatham J, Chacko VP, Arnold C, Rashid A, Diehl AM.Alterations in liver ATP homeostasis in human nonalcoholic steatohepati-tis: a pilot study. JAMA 1999;282:1659-1664.
18. George DK, Goldwurm S, MacDonald GA, Cowley LL, Walker NI, WardPJ, et al. Increased hepatic iron concentration in nonalcoholic steatohepa-titis is associated with increased fibrosis. Gastroenterology 1998;114:311-318.
19. Younossi ZM, Gramlich T, Bacon BR, Matteoni CA, Boparai N, O’NeillR, et al. Hepatic iron and nonalcoholic fatty liver disease. HEPATOLOGY
1999;30:847-850.20. Ong JP, Younossi ZM, Speer C, Olano A, Gramlich T, Boparai N.
Chronic hepatitis C and superimposed nonalcoholic fatty liver disease.Liver 2001;21:266-271.
21. Rashid A, Wu TC, Huang CC, Chen CH, Lin HZ, Yang SQ, et al.Mitochondrial proteins that regulate apoptosis and necrosis are induced inmouse fatty liver. HEPATOLOGY 1999;29:1131-1138.
22. Guttmacher AE, Collins FS. Genomic medicine—a primer. N Engl J Med2002;347:1512-1520.
23. Xiao Z, Prieto D, Conrads TP, Veenstra TD, Issaq HJ. Proteomic pat-terns: their potential for disease diagnosis. Mol Cell Endocrinol 2005;230:95-106.
24. Issaq HJ, Conrads TP, Prieto DA, Tirumalai R, Veenstra TD. SELDI-TOF MS for diagnostic proteomics. Anal Chem 2003;75:148A–155A.
25. Issaq HJ, Veenstra TD, Conrads TP, Felschow D. The SELDI-TOF MSapproach to proteomics: protein profiling and biomarker identification.Biochem Biophys Res Commun 2002;292:587-592.
26. Melle C, Kaufmann R, Hommann M, Bleul A, Driesch D, Ernst G, et al.Proteomic profiling in microdissected hepatocellular carcinoma tissue us-ing ProteinChip technology. Int J Oncol 2004;24:885-891.
HEPATOLOGY, Vol. 42, No. 3, 2005 YOUNOSSI ET AL. 673
27. Paradis V, Degos F, Dargere D, Pham N, Belghiti J, Degott C, et al. Identifi-cation of a new marker of hepatocellular carcinoma by serum protein profilingof patients with chronic liver diseases. HEPATOLOGY 2004;41:40-47.
28. Honda M, Kaneko S, Kawai H, Shirota Y, Kobayashi K. Differential geneexpression between chronic hepatitis B and C hepatic lesion. Gastroenter-ology 2001;120:955-966.
29. Collins FS, Guttmacher AE. Genetics moves into the medical mainstream.JAMA 2001;286:2322-2324.
30. Epstein CB, Hale W, Butow R. Numerical methods for handling uncer-tainty in microarray data: an example analyzing perturbed mitochondrialfunction in yeast. Methods Cell Biol 2001;65:439-452.
31. Younossi Z, Gorreta F, Ong J, Schlauch K, Del Giacco L, Elariny H, et al.Hepatic gene expression in patients with obesity related non-alcoholicsteatohepatitis. Liver Int 2005;25:760-771.
32. Benjamini Y, Hochberg Y. Controlling the false discovery rate: a practicaland powerful approach to multiple testing. Journal of the Royal StatisticalSociety Series B. 1995;57:289-300.
33. Angulo P, Lindor KD. Treatment of nonalcoholic fatty liver: present andemerging therapies. Semin Liver Dis 2001;21:81-88.
34. Younossi ZM, Gramlich T, Liu YC, Matteoni C, Petrelli M, Goldblum J,et al. Nonalcoholic fatty liver disease: assessment of variability in patho-logic interpretations. Mod Pathol 1998;11:560-565.
35. James OF, Day CP. Non-alcoholic steatohepatitis (NASH): a disease ofemerging identity and importance. J Hepatol 1998;29:495-501.
36. Powell EE, Cooksley WG, Hanson R, Searle J, Halliday JW, Powell LW.The natural history of nonalcoholic steatohepatitis: a follow-up study offorty-two patients for up to 21 years. HEPATOLOGY 1990;11:74-80.
37. Augulo P, Keach JC, Batts KP, Lindor KD. Independent predictors of liverfibrosis in patients with nonalcoholic steatohepatitis. HEPATOLOGY 1999;30:1356-1362.
38. Grant G, Chandhoke V, Younossi Z. Specific disorders associated withnon-alcoholic fatty liver disease (NAFLD). In: Farrell G, George J, Hall P,McCullough A, eds. Fatty Liver Diseases: Non-Alcoholic Steatohepatitis
and Related Disorders. 1st ed. Malden, MA: Blackwell Publishers, 2004:249-262.
39. Lui HM, Chen J, Wang L, Naumovski L. ARMER, apoptotic regulator inthe membrane of the endoplasmic reticulum, a novel inhibitor of apopto-sis. Mol Cancer Res 2003;1:508-518.
40. Steiling H, Muhlbauer M, Bataille F, Scholmerich J, Werner S, Heller-brand C. Activated hepatic stellate cells express keratinocyte growth factorin chronic liver disease. Am J Pathol 2004;165:1233-1241.
41. Toivola DM, Zhou Q, English LS, Omary MB. Type II keratins arephosphorylated on a unique motif during stress and mitosis in tissues andcultured cells. Mol Biol Cell 2002:13:1857-1870.
42. Omary MB, Ku NO, Toivola DM. Keratins: guardians of the liver. HEPA-TOLOGY 2002;35:251-257.
43. Martin H, Richert L, Berthelot A. Magnesium deficiency induces ap-optosis in primary cultures of rat hepatocytes. J Nutr 2003;133:2505-2511.
44. Chan K, Lucas D, Hise D, Schaefer C, Xiao Z, Janini G, et al. Analysis ofthe human serum proteome. Clinical Proteomics 2004;101-226.
45. Poon TC, Hui AY, Chan HL, Ang IL, Chow SM, Wong N, et al. Predic-tion of liver fibrosis and cirrhosis in chronic hepatitis B infection by serumproteomic fingerprinting: a pilot study. Clin Chem 2005;51:328-335.
46. Xu XQ, Leow CK, Lu X, Zhang X, Liu JS, Wong WH, et al. Molecularclassification of liver cirrhosis in a rat model by proteomics and bioinfor-matics. Proteomics 2004;4:3235-3245.
47. Farrell DH. Pathophysiologic roles of the fibrinogen gamma chain. CurrOpin Hematol 2004;11:151-155.
48. Wells RG, Kruglov E, Dranoff JA. Autocrine release of TGF-beta by portalfibroblasts regulates cell growth. FEBS Lett 2004;559:107-110.
49. Yu C, Wang F, Jin C, Huang X, Miller DL, Basilico C, et al. Role offibroblast growth factor type 1 and 2 in carbon tetrachloride-induced he-patic injury and fibrogenesis. Am J Pathol 2003;163:1653-1662.
50. Sahni A, Francis CW. Plasmic degradation modulates activity of fibrinogen-bound fibroblast growth factor-2. J Thromb Haemost 2003;1:1271-1277.
674 YOUNOSSI ET AL. HEPATOLOGY, September 2005