
Academic Writing Skills - UQ eSpace - University of Queensland
Upload
khangminh22Category
view
10download
0
A Framework for Socialisation of Work Practice for Improving Business Process
Performance
Mukhammad Andri Setiawan
B.Sc, M.Sc.
A thesis submitted for the degree of Doctor of Philosophy at
The University of Queensland in 2014
School of Information Technology and Electrical Engineering

i
Abstract
Due to the competitiveness of today’s ever changing environment, many organisations pursue
continuous improvement of their business processes. This is also essential for achieving the ability to
quickly adapt business processes to changes and new requirements emerging in the business and
regulatory environment. Organisation can undertake business process improvement in two alternative
ways where improvement can be sought externally and can be solicited internally. Both alternatives
imply a learning phase within the organisation so that organisations can develop insights, knowledge
from past activities, and future actions. While many organisations often follow the externally sourced
improvement by employing so-called best practice reference models, it is not uncommon for
externally sourced process improvement to face rejection from employees in the organisation due to
unfamiliarity and the lack of trust. On the other hand, there is evidence that internally driven process
improvement may remove such barriers, as supported by the social theory of positive deviance. The
concept of positive deviance is based on the observation that there are certain individuals within every
group or organisation who have special practices or strategies that enable them to achieve better
performance on certain problems. Positive deviance lets an employee to adopt new approaches from
peers, who are in the same community or organisation. Using this concept, organisations can look
into successful past practices of various activities internally and use those successful past practices
as a baseline towards improving the business process performance. There are several challenges in
the utilisation of positive deviance notions for business process improvement. These include finding
best past practices that will become the source of improvement, identifying the most suitable past
practices in a way that it fits employee’s level of experience, and understanding the complexity of the
business process and its implications for process improvement. This thesis presents an integrated
framework called Socialisation of Work Practice that systematically addresses the above challenges
to achieve internally driven business process improvement. The framework consists of a series of
analytical data driven methods, which can be used to extract and analyse the stored information from
past practices, and elicit them into meaningful recommendations. The applicability of the framework
is evaluated through the development of prototype system, namely PRIMe system. PRIMe has been
successfully used to test the effectiveness and efficiency of the developed methods as well as provide
a usable front-end to business process users.

ii
Declaration by author
This thesis is composed of my original work, and contains no material previously published or
written by another person except where due reference has been made in the text. I have clearly
stated the contribution by others to jointly-authored works that I have included in my thesis.
I have clearly stated the contribution of others to my thesis as a whole, including statistical
assistance, survey design, data analysis, significant technical procedures, professional editorial
advice, and any other original research work used or reported in my thesis. The content of my thesis
is the result of work I have carried out since the commencement of my research higher degree
candidature and does not include a substantial part of work that has been submitted to qualify for
the award of any other degree or diploma in any university or other tertiary institution. I have
clearly stated which parts of my thesis, if any, have been submitted to qualify for another award.
I acknowledge that an electronic copy of my thesis must be lodged with the University Library and,
subject to the General Award Rules of The University of Queensland, immediately made available
for research and study in accordance with the Copyright Act 1968.
I acknowledge that copyright of all material contained in my thesis resides with the copyright
holder(s) of that material. Where appropriate I have obtained copyright permission from the
copyright holder to reproduce material in this thesis.

iii
Publications during candidature
Conference papers:
Setiawan, M. A., & Sadiq, S. (2010). Socialization of work practice through business process
analysis. In 12th International Conference on Enterprise Information Systems, ICEIS 2010 (Vol. 3,
pp. 165-170). Institute for Systems and Technologies of Information, Control and Communication
(INSTICC).
Setiawan, M. A., & Sadiq, S. (2011). Experience driven process improvement. In Enterprise,
Business-Process and Information Systems Modeling (pp. 75-87). Springer Berlin Heidelberg.
Setiawan, M. A., Sadiq, S., & Kirkman, R. (2011, January). Facilitating business process
improvement through personalized recommendation. In Business Information Systems (pp. 136-147).
Springer Berlin Heidelberg.
Setiawan, M. A., Sadiq, S., "Integrated Framework For Business Process Complexity Analysis"
(2013). ECIS 2013 Completed Research. Paper 49.
Journal paper:
Setiawan, M. A., & Sadiq, S. (2013). A Methodology for Improving Business Process Performance
through Positive Deviance. International Journal of Information System Modeling and Design
(IJISMD), 4(2), 1-22.
iv
Publications included in this thesis
Setiawan, M. A., & Sadiq, S. (2010). Socialization of work practice through business process
analysis. In 12th International Conference on Enterprise Information Systems, ICEIS 2010 (Vol. 3,
pp. 165-170). Institute for Systems and Technologies of Information, Control and Communication
(INSTICC) – Incorporated as Chapter 3 and 4.
Contributor Statement of contribution
Mukhammad Andri Setiawan (Candidate) Conceptual framework (80%)
Experiment Design (100%)
Data analysis (100%)
Paper writing (80%)
Shazia Sadiq Conceptual framework (20%)
Paper writing (20%)
Setiawan, M. A., & Sadiq, S. (2011). Experience driven process improvement. In Enterprise,
Business-Process and Information Systems Modeling (pp. 75-87). Springer Berlin Heidelberg –
Incorporated as Chapter 4.
Contributor Statement of contribution
Mukhammad Andri Setiawan (Candidate) Conceptual framework (80%)
Experiment Design (100%)
Data analysis (100%)
Paper writing (80%)
Shazia Sadiq Conceptual framework (20%)
Paper writing (20%)

v
Setiawan, M. A., Sadiq, S., & Kirkman, R. (2011, January). Facilitating business process
improvement through personalized recommendation. In Business Information Systems (pp. 136-147).
Springer Berlin Heidelberg – Incorporated as Chapter 5.
Contributor Statement of contribution
Mukhammad Andri Setiawan (Candidate) Conceptual framework (80%)
Experiment Design (80%)
Data analysis (100%)
Paper writing (80%)
Shazia Sadiq Conceptual framework (20%)
Paper writing (20%)
Ryan Kirkman Experiment Design (20%)
Setiawan, M. A., Sadiq, S., "Integrated Framework for Business Process Complexity Analysis"
(2013). ECIS 2013 Completed Research. Paper 49 – Incorporated as Chapter 6
Contributor Statement of contribution
Mukhammad Andri Setiawan (Candidate) Conceptual framework (80%)
Experiment Design (100%)
Data analysis (100%)
Paper writing (80%)
Shazia Sadiq Conceptual framework (20%)
Paper writing (20%)

vi
Setiawan, M. A., & Sadiq, S. (2013). A Methodology for Improving Business Process Performance
through Positive Deviance. International Journal of Information System Modeling and Design
(IJISMD), 4(2), 1-22 – Incorporated as Chapter 3 & 4
Contributor Statement of contribution
Mukhammad Andri Setiawan (Candidate) Conceptual framework (80%)
Experiment Design (100%)
Data analysis (100%)
Paper writing (80%)
Shazia Sadiq Conceptual framework (20%)
Paper writing (20%)

vii
Contributions by others to the thesis
Professor Shazia Sadiq provided advice on conceptualisation and development of the framework, as
well as reviewing and editing the publications and Thesis prior to submission.
Statement of parts of the thesis submitted to qualify for the award of another degree
None

viii
Acknowledgements
I would firstly like to thank to my supervisor, Professor Shazia Sadiq, for her guidance and advice,
for being a good mentor on how to conduct a good research, for letting me to discuss and to run my
ideas during my candidature, and for her patience towards me all this years.
To my family, my wife, Army Widyastuti and my daughter, Sarah Syamila Setiawan, I thank them
for the supports, encouragements, and understanding.
To the Ministry of Information and Communication Technology, Republic of Indonesia and
Universitas Islam Indonesia, my deepest gratitude for the financial support and the opportunity to
undertake PhD studies at the University of Queensland.

ix
Keywords
Process Improvement, Process Analysis, Process Complexity, Positive Deviance, Organisational
Learning
Australian and New Zealand Standard Research Classifications (ANZSRC)
080608, Information Systems Development Methodologies, 60%
150301, Business Information Management, 30%
150310, Organisation and Management Theory, 10%
Fields of Research (FoR) Classification
0806, Information Systems, 60%
1503, Business and Management, 40%

x
Table of Contents
Chapter 1 Introduction ............................................................................................................... 1
1.1 Research Background ....................................................................................................... 1
1.2 Research Objectives .......................................................................................................... 4
1.3 Thesis Structure ................................................................................................................ 4
Chapter 2 Literature Review ...................................................................................................... 7
2.1 Introduction ...................................................................................................................... 7
2.2 Organisational Learning .................................................................................................... 8
2.2.1 Knowledge Management ........................................................................................... 9
2.2.2 Positive Deviance .................................................................................................... 11
2.2.3 Learning from Experience ........................................................................................ 13
2.3 Business Process Management Systems .......................................................................... 15
2.3.1 Process Analysis ...................................................................................................... 17
2.3.2 Process Improvement ............................................................................................... 19
2.3.3 Process Variants ...................................................................................................... 21
2.3.4 Process Complexity ................................................................................................. 23
2.4 Summary ........................................................................................................................ 25
Chapter 3 Framework of the Socialisation of Work Practices ................................................... 27
3.1 Introduction .................................................................................................................... 27
3.2 Framework Overview ..................................................................................................... 27
3.3 Research Methodology.................................................................................................... 31
3.3.1 Experience-Driven Learning .................................................................................... 33
3.3.2 Personalised Recommendations ............................................................................... 35
3.3.3 Process Complexity ................................................................................................. 36
3.4 Evaluation ....................................................................................................................... 36
3.5 Summary ........................................................................................................................ 39

xi
Chapter 4 Experience-Driven Learning .................................................................................... 41
4.1 Introduction .................................................................................................................... 41
4.2 Discovering Insights from Work Practices through Business Process Analysis ................ 43
4.3 Identification of Best Practice Instances .......................................................................... 46
4.4 Experimental Evaluation ................................................................................................. 56
4.4.1 Scenario Description and Experimental Setup .......................................................... 56
4.4.2 Experimental Results ............................................................................................... 58
4.5 Summary ........................................................................................................................ 62
Chapter 5 Personalised Recommendations ............................................................................... 65
5.1 Introduction .................................................................................................................... 65
5.2 Background..................................................................................................................... 65
5.3 Approach ........................................................................................................................ 66
5.3.1 Identification of the Importance of Activities within the Business Process ............... 67
5.3.2 Constructing User Specific Recommendations ......................................................... 68
5.3.3 Metadata Enrichment ............................................................................................... 70
5.4 Experimental Evaluation ................................................................................................. 71
5.4.1 Identification of Best Past Practices ......................................................................... 72
5.4.2 Defining the Importance of an Activity .................................................................... 74
5.4.3 User Specific Recommendation ............................................................................... 75
5.5 Summary and Evaluation ................................................................................................ 77
Chapter 6 Complexity in Process Performance Improvement ................................................... 79
6.1 Introduction .................................................................................................................... 79
6.2 Complexity in Business Process ...................................................................................... 79
6.3 An Integrated Business Process Complexity Framework ................................................. 83
6.4 Structural Complexity Measurement ............................................................................... 87
6.5 Variance Measurement.................................................................................................... 88
6.6 Measurement of Variance in Performance ...................................................................... 88
6.7 Example Analysis ........................................................................................................... 91

xii
6.8 Summary ........................................................................................................................ 94
Chapter 7 PRIMe Process Improvement Tool........................................................................... 97
7.1 Introduction .................................................................................................................... 97
7.2 Conceptual Approach ...................................................................................................... 97
7.3 PRIMe Tool Implementation ........................................................................................... 98
7.3.1 PRIMe Environment Set-Up .................................................................................... 99
7.3.2 Implementation of the Event Log Processing Module .............................................. 99
7.3.3 Implementation of the Analysis Processing Module ............................................... 102
7.3.4 Implementation of Feedback-Recommender .......................................................... 106
7.4 Management Implementation ........................................................................................ 112
7.4.1 Admin User Management Menu ............................................................................ 112
7.4.2 General User Management Implementation ........................................................... 115
7.5 Prototype System Scalability ......................................................................................... 116
7.6 Summary and Conclusions ............................................................................................ 119
Chapter 8 Conclusion and Recommendations for Future Work .............................................. 120
8.1 Conclusion .................................................................................................................... 120
8.1.1 Summary of Socialisation of Work Practices Framework ....................................... 121
8.2 Limitations and Recommendations for Future Work ..................................................... 122
REFERENCES ........................................................................................................................ 124

xiii
List of Figures
Figure 2.1: Areas of study ............................................................................................................... 7
Figure 2.2: Business process management cycle (Aalst et al., 2003) .............................................. 17
Figure 3.1: Business process management lifecycle (Aalst et al., 2003) ......................................... 29
Figure 3.2: Framework of the socialisation of work practices for business process improvement ... 30
Figure 3.3: Architecture of socialisation of work practices for business process improvement ....... 38
Figure 4.1: Business process management lifecycle (Scheer, 2005) ............................................... 43
Figure 4.2: Example of probability of performance of criterion n on each alternative x ................. 52
Figure 4.3: Bid tendering process .................................................................................................. 57
Figure 4.4: Individuals’ current and expected future performance level ......................................... 62
Figure 5.1: Individual performance classifier................................................................................. 69
Figure 5.2: Expected future users’ performance level .................................................................... 70
Figure 5.3: Bid tendering process .................................................................................................. 72
Figure 5.4: Overall performance comparison of best process vs. Performer B................................ 76
Figure 5.5: Design schematics sub-activity comparison of all performers ...................................... 77
Figure 6.1: Impact of complexity on individuals’ performance (Flood and Carson, 1993) ............. 80
Figure 6.2: Integrated framework of business process complexity ................................................. 84
Figure 6.3: Bid tendering process .................................................................................................. 92
Figure 6.4: Bid tendering process variant samples ......................................................................... 92
Figure 7.1: PRIMe flowchart ......................................................................................................... 98
Figure 7.2: Server specification ..................................................................................................... 99
Figure 7.3: PRIMe login page ..................................................................................................... 100
Figure 7.4: Admin welcome page of PRIMe................................................................................ 100
Figure 7.5: XES upload page ....................................................................................................... 101
Figure 7.6: List of event log files ................................................................................................. 101
Figure 7.7: List of performers...................................................................................................... 102
Figure 7.8: Analysed event log information ................................................................................. 103
Figure 7.9: Performance chart ..................................................................................................... 104
Figure 7.10: Best process IDs ...................................................................................................... 105
Figure 7.11: Average performance .............................................................................................. 105
Figure 7.12: Recommended process ............................................................................................ 107
Figure 7.13: Complexity analysis ................................................................................................ 108
Figure 7.14: Complexity analysis report ...................................................................................... 109

xiv
Figure 7.15: Welcome page for general users .............................................................................. 109
Figure 7.16: Performance analysis ............................................................................................... 110
Figure 7.17: Performance chart of two different process performers ............................................ 111
Figure 7.18: Recommendations for two different process performers .......................................... 112
Figure 7.19: Management menu .................................................................................................. 113
Figure 7.20: Delete analysis confirmation page ........................................................................... 113
Figure 7.21: Edit process performers’ profiles ............................................................................. 114
Figure 7.22: Edit page of process performer’s profile .................................................................. 114
Figure 7.23: Edit page of admin user’s profile ............................................................................. 115
Figure 7.24: General user profile editor ....................................................................................... 115
Figure 7.25: Time to Store to Database ....................................................................................... 116
Figure 7.26: Time to perform analysis on the factor of “number of activities” ............................. 117
Figure 7.27: Time to perform analysis on the factor of “number of instances” ............................. 118
Figure 7.28: Time to perform analysis on the factor of “number of performers” .......................... 118

xv
List of Tables
Table 2.1: Six principles of persuasion (Cialdini, 2001)....................................................... 12
Table 4.1: Partial criteria-specific derived data of simulated execution data......................... 58
Table 4.2: Entropy, degree of diversification and normalised weight of criterion ................. 60
Table 4.3: MCDM ranking on selected instances ................................................................. 60
Table 5.1: Synthesised MCDM rankings using SAW and WP methods ............................... 72
Table 5.2: Entropy, degree of diversification, and normalised weight of activities ............... 74
Table 6.1:Values of CFC metrics from Figure 6.4(a) and (b) ............................................... 93
Table 6.2: Entropy of performance ...................................................................................... 93
Table 7.1: PRIMe tool Time Usage to Store Event Log to Database .................................. 116
Table 7.2: PRIMe tool Time Usage to Analyse an Event Log ............................................ 117

xvi
List of Abbreviations
BPM – Business Process Management
BPMS - Business Process Management System
CFC - Control Flow Complexity
EDL – Experience Driven Learning
MCDM – Multi-Criteria Decision-Making
PRIMe – Process Improvement
SAW – Simple Additive Weighting
WP – Weighted Product
XES – eXtensible Event Stream

1
Chapter 1
Introduction
1.1 Research Background
Due to prevailing competitiveness in today’s business environment, process improvement
continues to be named as the first priority for many organisations when implementing
technology such as a business process management system (BPMS) (Sinur and Hill, 2010;
Zellner, 2011). There are two main approaches to business process improvement, namely,
process-driven improvement and people-driven improvement (Shtub and Karni, 2010). In the
process-driven approach, organisations undertake business process redesign by replacing the
current process with an arguably better process in order to achieve better performance. In the
people-driven approach, human resources are the focus of improvement, and process
improvement is expected to be an organic consequence of improvement on the human
resources front. There is also another approach in process improvement namely product-driven
improvement (Birk, 1998). In this approach, the focuses of improvement actions are on the
quality factors of the product. The present study focuses on business process improvement
driven through the human resources perspective.
Today, a sustainable edge in the competitive business environment can no longer be based
on the implementation of technological breakthroughs such as those implemented in a BPMS.
As the BPMS has become a mature product, most vendors will eventually deliver similar
technologies (Sinur and Hill, 2010). The best practice process templates or so-called reference
models (Rohloff, 2009; Schonenberg et al., 2008) delivered by the business solution vendors
would no longer be the only solution to achieve process improvement even though it helps to
create standard business processes that can be used in various organisations (Reinhartz-Berger
et al., 2010). The issue is that every organisation is not the same even if they are working in a
similar area; hence, the same solution cannot always be applied to a similar organisation.
Furthermore, like the body’s immune defence system, individuals and organisations often resist

2
what is perceived as a “foreign matter” (Carter, 2003) even though the external template
solutions can provide organisations with intellectual capital and competitive value. There is
evidence that when the process improvement approach is driven externally, there is a
significant likelihood of resistance due to misalignment with the organisational culture and
norms (Pascale et al., 2010).
Many psychological and behavioural factors contribute to why people are reluctant to
adopt something that is sourced externally (Zeitlin et al., 1990). Many studies on social
relations show that people tend to interact with others like themselves (McPherson et al., 2001).
Continuous interaction in the working environment within the organisation also creates
similarities in work habits, not because of individual choice, but from social influences which
further makes individuals’ behaviour more similar (Centola et al., 2007). Social homogeneity
within a group of people increases the level of trust and leads to the imitation of habits within
the group (Kleinbaum et al., 2013). People will only work with a new approach if they believe
that the approach is trusted and achievable with the resources that are available. A major
difficulty lies in the fact that the adoption of an externally sourced approach in improving the
business process faces rejection due to unfamiliarity with the approach itself and the lack of
trust. Hence, it can be observed that social factors greatly affect the implementation of new
approaches in an organisation striving to improve its business process.
Substantial research has been conducted on the behaviours related to the adoption of new
approaches within a group of similar people (Marsh et al., 2004). One such behaviour is
positive deviance (Marsh et al., 2004). The concept of positive deviance is based on the
observation that there are certain individuals within every group or organisation who have
special practices or strategies that enable them to achieve better performance on certain
problems (Carter, 2003) even though they have exactly the same resources as others. Positive
deviance is not a typical behaviour, yet the actions of positive deviants can provide benefits
beyond what others in similar circumstances can achieve. As it is behaviour exhibited by peers,
positive deviance can generate greater motivation to achieve higher quality outcomes in social
settings. The knowledge of these positive deviants (also referred to as internal experts) is
important as organisations often face a dynamic environment in order to keep pace with the
level of competitiveness. This forces the individuals who work within the environment to adopt
a degree of improvisation in order to tailor their approach to individual process cases or
instances. It is evident that when such diverse work practices incorporate the creativity and
individualism of knowledge workers, they potentially contribute to the organisation’s
competitive advantage even though they depart from the norms and procedures of the

3
organisation (Vadera et al., 2013). Although deviating from the norms could create harmful
experiences (Lee and Allen, 2002), it also beneficial for the organisation and contributes to
excellence and high performance within the organisation (Spreitzer and Sonenshein, 2004).
The positive deviance concept focuses on these cases of excellence. In the organisational
context, positive deviance could help organisations perform better without having to be dictated
or directed by external sources of process improvement that do not always fit the business
culture and work traditions. From the perspective of business process performance, the positive
behaviours of employees are typically measured by the performance of the processes in which
the individuals are involved. Various criteria define the norms (or expected performance) for a
process.
Unfortunately, the experience of the internal experts as exhibited in their positive practices
or strategies is often overlooked. Even though the practices of these experts constitute the
corporate skill base, the failure to capitalise on these practices to build knowledge obscures the
positive deviant behaviour. The absence of explicit articulation makes this capitalisation a very
difficult task. Knowledge from experience is often regarded as tacit knowledge (Nonaka and
Takeuchi, 1995). Contrary to explicit knowledge, which is in documented form and easily
available, tacit knowledge is owned only by the individuals involved. Polanyi and Sen (1983)
described tacit knowledge as knowledge that cannot be articulated or verbalised. The present
study proposes that the value of tacit knowledge can only be realised if it can provide relevant
and meaningful recommendations for others who are working in similar events. Some studies
have suggested that the relevant practices of colleagues are “interesting”, in the positive sense
of the word, and are regarded as a trustworthy source of knowledge (Stenmark, 2001). Thus,
the present study proposes an approach called the socialisation of work practice.
The socialisation of work practice refers to the capture of the best work practice that has
been experienced by the internal experts to allow current and future users to work at their full
potential. This thesis develops novel methods to capitalise on the knowledge of internal experts
and deliver the knowledge in the form of personalised recommendations, which will be used
as the source of user performance and subsequently business process improvement. To
effectively deliver the recommendations, they need to be matched to the user current profile.
Some studies have suggested a learning process that aligns with the measurement of learners’
performance (Day and Payne, 1987) as well as being matched to a certain situation (Santos and
Boticario, 2008) could achieve a better learning result which business process improvement
could benefit from.
4
1.2 Research Objectives
The premise of this research is that the experiences and knowledge of employees can help
achieve process improvements that are driven from within an organisation rather than
externally. The research seeks to investigate and validate this premise.
This research aims to address the relevance, issues and problems in sharing and delivering
the tacit knowledge, as defined by Polanyi (1967), that is embodied in the experiences and
strategies of successful past business processes as sources of business process improvement. It
conceptualises and formalises a method of capturing the tacit knowledge of experts, and
subsequently delivering it into explicit, sharable and repeatable knowledge in the form of
recommendations for users of the business process of the organisation. It also aims to
personalise the recommendations to suit individual characteristics. To realise these aims, a
software system is proposed to facilitate business process analysis and knowledge sharing. In
summary, the research objectives are as follows:
To investigate and understand the theories and methods relating to business process
improvement, business process analysis, positive deviance, and organisational learning.
To develop a framework for the socialisation of work practices that serves as the theoretical
foundation of internally-driven business process improvement.
To investigate the factors affecting the socialisation of work practices within organisations
and develop an analytical method for identifying the most suitable work practices for
individuals.
To develop a comprehensive model for understanding business process complexity and its
impact on the socialisation of work practice.
To validate the framework and establish the practicality of the methods through the
development of a system prototype and experiments to evaluate the developed methods.
1.3 Thesis Structure
This thesis consists of eight chapters. This introductory chapter began with a discussion of
business process improvement through the socialisation of work practices, including a brief
overview of the supporting theories within this domain. The context of the present study was
outlined.
Chapter 2 reviews the literature related to business process management, business process
analysis and learning within organisations. The chapter explores the current field of theory and

5
practice and identifies the open issues and challenges. It also highlights the gaps found in the
literature and presents the background theories.
Chapter 3 presents the research framework including the conceptual framework that is the basis
of the developed prototype with which the study of the socialisation of work practices for
business process improvement is carried out. It also presents the architecture of the prototype
system based on the framework.
Chapter 4 discusses experience-driven learning (EDL) and presents the concept of knowledge
discovery from within an organisation. This chapter discusses the background theories on
which learning from experience is based and presents the methods to capture the knowledge.
It highlights how business process event logs can be a beneficial knowledge base that can drive
process improvement.
Chapter 5 introduces the process improvement through personalised recommendation
approach. The concept of learning from peers is discussed, including how it can help
organisations improve business process performance effectively through learning that fits the
performers.
Chapter 6 investigates business process complexity and how it affects the comprehension and
performance of a business process. This chapter presents an approach, called the Integrated
Framework for Business Process Complexity that provides a comprehensive view of
complexity beyond the process model/structural view and includes variability and
performance.
Chapter 7 presents the Process Improvement (PRIMe) system and shows how the system helps
to capture the tacit knowledge and convey recommendations to improve the business process.
The system is built as the evaluation mechanism for various methods developed for the
framework for socialisation of work practice. To achieve this purpose, the system delivers
detailed reports, graph visualisations, and personalised recommendations to the relevant users.
Chapter 8 concludes the thesis. A summary is presented and the primary contributions of the
research are outlined. Recommendations for directions of future research are suggested.

6

7
Chapter 2
Literature Review
2.1 Introduction
This chapter presents a review of the literature on organisational learning and business process
management in the context of improvements in business processes. The literature review is
conducted with a focus on the capture and sharing of successful work practices in organisations
that utilise a business process management system, and how they contribute to business process
improvement.
Figure 2.1 presents an overview of the related topics on organisational learning and
business process management systems. The review of the literature on organisational learning
is presented in Section 2.2, including the topics of knowledge management, positive deviance
and learning from experience. The review of the literature on business process management
systems is presented in Section 2.3, with a focus on process analysis, business process
improvement, business process variants and business process complexity.
Figure 2.1: Areas of study

8
2.2 Organisational Learning
Organisational learning is a process of acquiring new insights and knowledge in organisations
that sense new insights and changes based on the information and knowledge they currently
have (Argyris and Schön, 1999). The development of knowledge creation and the capability of
knowledge sharing often form the basis of achieving competitiveness (Holsapple and Singh,
2001). These actions are the driving force behind the vision of organisations that are capable
of thriving in a world of interdependence and change (Kofman and Senge, 1993). To promote
knowledge creation and sharing, a conducive organisational culture should be established
which has the paradigms that stimulate proactive behaviour (Nevis et al., 2000) and social
interaction (Corbett et al., 1999).
Senge et al. (1999) identified five points that represent the study and practice of individuals
and teams in organisations. These are: (1) personal mastery, (2) mental models, (3) shared
vision, (4) team learning, and (5) systems thinking. Senge et al. argued that each individual
who works in an organisation needs to align his/her personal vision with the organisation’s
vision. In relation to mental models, people are asked to reflect upon and talk about their work.
The shared vision establishes a focus on mutual purpose and a sharing of the vision of the future
they seek. This vision is tied to the subsequent point, which is team learning. Team learning
refers to how the individuals interact within the organisation. The last point, system thinking,
refers to change that is initiated from feedback and leads to improvement or stability over time.
Organisational learning itself is a capacity (or process) within an organisation to preserve
or improve performance based on experience (Dibella et al., 1996). This activity involves
knowledge acquisition (the development or creation of skills, insights and relationships),
knowledge sharing (the dissemination to others of what has been acquired by some), and
knowledge utilisation (integration of the learning so that it is assimilated, broadly available,
and can also be generalised to new situations) (Huber, 1991). The concept of organisational
learning is widely researched and has been defined in a number of studies (Argyris and Schön,
1999; Boud et al., 1993; Senge et al., 1999).
In a social system environment in which learning takes place just as in an organisation, the
learning process always starts from the individual (Wang and Ahmed, 2003). Organisational
learning is also founded on the learning process of individuals in the organisation. Hence, the
individual learning process in an organisation facilitates the understanding of organisational
learning (Marquardt, 1996). As learning in an organisation starts from the individual, social
theories that support interaction among individuals are also important. Monge and Contractor
(2001) identified the theories that have been used to explain the networks of individuals within

9
an organisation such as homophily theories, contagion theories, and exchange and dependence
theories. In homophily theory, individuals have choices based on similarity, and have their own
group identity. Homophily has been found among age groups and occurs on many dimensions
such as acquired characteristics (i.e., education and social class), personal attributes like beliefs
and attitudes, and social behaviour (McPherson and Smith-Lovin, 1987). In the contagion
theory, exposure to others leads to the social influence and imitation of others. This theory
suggests that individuals adopt the attitudes or behaviours of others in the social network with
whom they communicate (Scherer and Cho, 2003). In the exchange and dependence theory,
individuals in an organisation exchange valued resources such as their knowledge with other
individuals (Frooman, 1999). All of these theories point to the mechanisms by which
individuals build their interactions, which in turn leads to the building of knowledge within an
organisation.
The concept of organisational learning starts from the individual learning process within
an organisation. Understanding the individual learning process is a good way to begin to
understand organisational learning, but evaluating the individual learning process cannot
capture the whole picture (Gratton et al., 1999). The organisational learning process helps to
transfer knowledge and competence between generations of employees (Van Maanen and
Schein, 1977) in a form of collective learning (Prahalad and Hamel, 2006). This highlights the
necessity for organisations to manage and share the knowledge of individuals, especially
experts who have successful practices, among the rest of the organisation’s stakeholders.
2.2.1 Knowledge Management
Organisational learning is the process of improving actions and activities within an
organisation through better knowledge and understanding (Fiol and Lyles, 1985). This raises
questions about the creation, acquisition and utilisation of the knowledge. Knowledge, whether
stored in computer databases, human brain, or any other media, is the key in processing
information (Kock, 2005). In organisations, knowledge is predominantly captured by means of
individuals working in teams where the organisational knowledge is an assembly of the
knowledge possessed by the individuals who work in the organisation (Kock, 2005). It is
important to note that knowledge can be obtained from external sources or generated internally.
Nonaka and Takeuchi (1995) emphasised the importance of knowledge creation in
organisations and the sharing of knowledge among the parties involved in an organisation. If
the skills and experiences within an organisation are not shared within the organisation, it is
common for the organisation to suffer from the “reinvent the wheel” syndrome (Davenport and

10
Prusak, 2000). In addition, if the knowledge is not accessible, even though it is abundantly
available in the skills and experiences of employees, it will never become a valuable corporate
asset and provide little benefit.
Knowledge is typically categorised as tacit or explicit (Polanyi, 1967). In contrast to
explicit knowledge that is clearly formulated or defined without ambiguity or vagueness, tacit
knowledge, as per Polanyi’s (1967) definition, inhabits the minds of people and is difficult to
articulate. Tacit knowledge is largely unspoken even though it is abundant among people and
is often difficult to describe and transfer (Bollinger and Smith, 2001). Due to the nature of tacit
knowledge, many organisations do not know what they know and knowledge is largely
underutilised (O’Dell and Grayson, 1998). Many organisations do not know that they actually
have the necessary knowledge; this means there is a need to convert the tacit knowledge to an
explicit form through the means of socialisation or externalisation (Nonaka and Takeuchi,
1995) in order to manage the organisational knowledge effectively. This process of capturing,
managing and providing access to an organisation’s knowledge or an enterprise’s information
asset is referred to as knowledge management (Gold et al., 2001).
Knowledge management is about enabling individuals or entire organisations to
collectively create, share and implement knowledge that is embodied from insights and
experiences in order to improve the performance and the outcome of their business objectives
(Alavi and Leidner, 2001). Knowledge management is regarded as an increasingly important
feature for organisations to achieve effectiveness, survivability and competitive strength
(Mårtensson, 2000). Milton et al. (1999) defined knowledge management as the provision of
strategies to get the right knowledge to the right people in the right setup. Van Beveren (2002)
described knowledge management as a practice that has the goal to collect valuable information
and transform it into the knowledge necessary to support decision-making and performance. In
summary, knowledge management according to the definitions provided by these studies
consists of activities that collect an organisation’s own experiences or the experiences of others
to achieve the goal of the organisation. Knowledge management complements other
organisational initiatives, such as business process re-engineering and total quality
management (Pathirage et al., 2004), to gain insights into process improvement.
To socialise or externalise the tacit knowledge, the activities in knowledge management
involve knowledge acquisition, creation, refinement, transfer, sharing and utilisation (King,
2009). In the context of the socialisation of work practices, there needs to be a methodology to
develop the knowledge, a system that supports it, and sharing of the knowledge in such a way
that it will motivate people to improve the quality of their activities. Such motivation can be

11
achieved when people see the knowledge as beneficial and trustworthy. When people trust the
source of knowledge, it is easier for them to absorb and learn something from it (Savolainen,
2008). The challenge here is to determine how knowledge can be both beneficial and trusted.
This in turn requires the identification of who has the authority to be the source of knowledge
in an organisation. These questions are related to the concept of positive deviance, which is
discussed in the next section.
2.2.2 Positive Deviance
Organisational learning introduces change management as the act of renewing an
organisation’s path and structure, and continually adapting to the ever-changing needs in the
environment (Moran and Brightman, 2000; Todnem By, 2005). Today, having good strategies
for managing change is important as marketplace is often experiencing rapid changes. Many
organisations use traditional approaches that allow external parties to determine the best
practices that need to be performed by employees to make the improvement. This approach is
known as the deficit-based approach, as it is based on the perspective of “Why can’t we do
what someone else is doing?” (Tarantino, 2004). However, even though humans are social
creatures, so that they may get cues and ideas of how to act and think from others, people are
also born with ego and often choose their own path and judgement rather than what others want
them to do (Marcia, 1966). This happens particularly when the cues and ideas come from
outsiders whom they do not know very well, thus, there is a lack of trust and familiarity.
Sternin and Choo (2000) and Pascale et al. (2010) presented a different approach to
organisational change management, namely, positive deviance. Positive deviance is a term
used to define behaviours that depart from the norms of a group but exhibit certain positive
characteristics (Spreitzer and Sonenshein, 2004). Positive deviance is an uncommon practice,
yet it can lead to good outcomes when everyone else is facing similar challenges and similar
limitations from the available resources.
Positive deviance is explained as uncommon (good) behaviour that is exhibited by peers.
Peers are known to have greater influences in a community than others do. There is a large
body of knowledge in psychology that supports this statement (Katz and Kahn, 1978). Cialdini
(2001) in his article titled “Harnessing the Science of Persuasion” presented the six principles
of persuasion. Those principles are: liking, reciprocity, social proof, consistency, authority, and
scarcity. Table 2.1 provides a summary of these principles.

12
Table 2.1: Six principles of persuasion (Cialdini, 2001)
Principle Definition Application
Liking People like those who like them Uncover real similarities and
offer genuine praise
Reciprocity People repay in kind Give what you want to receive
Social Proof People follow the lead of similar others Use peer power whenever it’s
available
Consistency People align with their clear
commitments
Make their commitments
active, public, and voluntary
Authority People defer to experts Expose your expertise; do not
assume it’s self-evident
Scarcity People want more of what they can
have less of
Highlight unique benefits and
exclusive information
The six principles of persuasion explain that people will follow the lead of ‘similar’ others.
According to the six principles of persuasion, the persuasion that comes from peers can be
extremely effective (Cialdini, 2001). The effectiveness is achieved since successful performers
and other/prospective performers share a similar challenge and environment, as described by
the positive deviance concept, wherein the positive deviant (the positive deviance exhibitor)
and others share the same settings.
In positive deviance, people who are departing from the norm can be considered to have
greater authority than others since they exhibit successful outcomes and they become the
experts in the field. To explain positive deviance theory further, the case in the following box
illustrates the notion.

13
An external source of improvement that does not have a common organisational culture
and affiliation often faces problems in transferring insights (Katz and Kahn, 1978). In the
organisational context, positive deviance could help organisations to achieve improvement. By
using positive deviance, an organisation is not dictated or directed by external sources, which
do not always fit the business culture and work traditions. The remaining challenge is how to
effectively capture the positive deviance. It is essential for an organisation to identify the
measureable behaviours exhibited in the experience of employees that positively affect the
organisation’s performance.
2.2.3 Learning from Experience
It is important to understand the role of experience in organisational learning, because
experience is a fundamental notion of the work carried out in this study. Experience has the
potential to enrich the knowledge sharing and knowledge transfer between learners, as a
learning process is the process of knowledge transfer between tacit and explicit knowledge.
Boud et al. (1993) argued that “experience is not just an observation, a passive undergoing of
something, but an active engagement with the environment, of which the learner is an important
part”. Each learner forms part of the milieu, enriching it with his or her personal contribution
and creating an interaction, which becomes the individual learning experience as well as the
In the early 1990s, the international NGO Save the Children was assigned to reduce the
widespread problem of childhood malnutrition in Vietnam. In the limited time available, the
NGO had to produce a sustainable approach with little medical equipment and supplemental
food which was only a temporal solution at best with no further sustainability. The NGO found
that even within the poorest communities, there were a few individuals or families who were in
good health. The NGO documented the methods that were used by these families, and
encouraged the rest of the community to carry out the methods. The result was astonishing and
successfully alleviated the childhood malnutrition problem. The approaches from the good
families were within the community’s socio-cultural context and by definition, “culturally
appropriate” (Marsh et al., 2004; Sternin and Choo, 2000). The positive deviance approach
provides an alternative to the implementation of successful “models” which often fail when
they are enabled in “unaccustomed soil” (Sternin and Choo, 2000).
14
shared learning experience. This continuing, complex and meaningful interaction is central to
the understanding of experience.
The performance of organisations and individuals is often improved by doing repetitions
of the same activity. Some studies have shown how repetition-based improvements exist in
organisations (Yelle, 1979); these improvements are documented as knowledge gained from
experience. Successful organisations are described as having the ability to learn and respond
by adapting to change in technologies and practices (Stalk et al., 1992).
The socialisation of work practices uses the learning from experience approach as it
emphasises the value of knowledge by incorporating successful peer learners’ experiences in a
learning system, which can be harnessed by contemporaries through technology and improve
the effectiveness of learning in a domain (Wan et al., 2009). The experiences of individuals in
organisations constitute the corporate skill base and are valuable information resources for
organisational learning and process improvement. The concept of “learning experiences” (Wan
and Sadiq, 2012b) is based on the proposition that learners’ experiences can help improve the
effectiveness of learning for the learners and their peers; through this process, the valuable
information about the experts’ experience is harvested and shared with others in the
organisation and can become one of the sources of business process improvement.
The notion of experience sharing itself is not new. It is commonly found in practice and
has been widely researched (Pathirage et al., 2004). By capturing the experiential lessons of
the enacted business process, the knowledge becomes accessible and sharable within an
organisation and its members, especially those who have yet to experience the activities. The
knowledge is then distributed via socialisation, education, training, imitation and personal or
group movement (Levitt and March, 1988).
The knowledge of the members of an organisation can actually represent the corporate
skill base and is considered a valuable information resource to utilise in the fundamental steps
towards achieving competitiveness (Kock, 2005). However, this knowledge is often regarded
as tacit knowledge (Nonaka and Takeuchi, 1995). In contrast to explicit knowledge that is
written and can be described to others, tacit knowledge is usually not documented anywhere
although it is known by the individuals involved. Polanyi and Sen (1983) defined tacit
knowledge as knowledge that cannot be articulated or verbalised. This tacit knowledge is kept
and recorded in the form of process logs, files and operating procedures where personal
experience matters. Therefore, tacit knowledge is often learned through collaboration that
requires the participation of people (Nonaka and Takeuchi, 1995).
15
One important question that remains is which experiences the employee should adopt.
Evidently, people often choose the sources of improvement they are familiar with or the sources
that exhibit similarity with what they are doing (Guy et al., 2009). A personalised adoption of
experience shows that individuals may learn and absorb differently. It is also evident that
personalised learning can create huge differences in the learning process (Martinez, 2002).
With personalised learning, each learner has a learning path that must conform to the learning
needs of the learner so that the learning process is delivered effectively. The challenges in
effectively delivering personalised learning are to find the minimum proficiency as a standard
for certain roles, to identify activities most critical to success, and to allow employees to self-
assess against the given activities.
2.3 Business Process Management Systems
Business process management is a means to look at and control the business processes that are
present in the organisation. It is incorporating the framework of organisational learning and
knowledge management into a system and raising awareness that knowledge in the business
process holds strategic importance as a resource for gaining competitive value (Armistead et
al., 1999). Business process management is the concept of shepherding the business process
through a multi-step approach. It involves supporting the business process using methods,
techniques and software to design, enact, control and analyse operational processes involving
humans, organisations, applications, documents and other sources of information (Aalst et al.,
2003).
The business process is an ordered set of logically structured activities, linked by
precedence relationships, which uses the resources of the organisation and expresses how the
work is done within an organisation across time and place. Business process is often focused
on repetitive process with strict workflows. It has a beginning, an end and clearly defined inputs
and outputs, and is comprised of three main components: actions, decisions, and controls
(Harrington, 1991; Shtub and Karni, 2010). Similarly dos Santos França (2014) have defined
business process as a sequence of activities that aims at creating products or services, granting
value to the customer, and is generally represented by a business process model.
As a concept, business process management has been interpreted as having several
different meanings. In general, many authors put some or all of the management process
functions into the business process management concept. The term “management process”
itself embraces the five basic functions of managers: planning, organising, staffing, leading,
and controlling (Dessler et al., 2004). The five basic functions that managers perform are in

16
line with the business process management functionality which includes the category of
“management” functionality. Having a mature cross-functional approach, business process
management is process-centred so that it becomes the way to understand, document, model,
analyse, stimulate and execute the end-to-end business processes through the engagement of
all the related resources (Shtub and Karni, 2010). This people-centred focus leads to the main
concerns of business operations which are high leverage and added value (Zairi, 1997).
The difference between general management and business process management is that the
latter has tasks other than the basic five management tasks. Business process management
includes the management of the business process on all organisational levels. Involving
management in the “business process” area is the consequence of the need to create and sustain
improvements in the significant processes that depend heavily on large, complex, cross-
functional business processes (Juran et al., 1999). When an organisation implements business
process management, it generally addresses strategic business issues by making the business
grow but operate in a cost-effective way both in the managerial approach and as an enabler for
a technological solution or IT in the organisation.
In the research community, a BPMS is defined as a system that performs the functionality
historically attributed to a workflow management system (Aalst et al., 2003). This view
emphasises the capability of a BPMS in process enactment. Systems for business process
management have grown to include the management of the performed business processes in
organisations. Not only does the BPMS route documents as executed in a workflow
management system, its scope has been extended to include the automatic allocation of work
to qualified and authorised resources among both human and non-human actors (Reijers, 2006).
Hunt (1996) explained that business process management reaches beyond the process, and
that the following four components should form the basis of effective business process
management: process goal management, performance management, resource management, and
process interface management.
The BPMS is useful to drive the business process in regard to both the management aspect
and learning aspect. It benefits from the corporate culture as it contains the beliefs, expectations
and values that are shared by the organisation’s members and that act to shape the behaviour
of the people in the organisation (Wheelen and Hunger, 2009). Business process management
has become popular in today’s competitive era with many organisations implementing a BPMS
for managing, monitoring, controlling, analysing and optimising their business process (Aalst
et al., 2003). A BPMS allows an organisation to design business process models, execute

17
process instances in accordance with the models, enable users/applications to access task lists
and execute task operations (Yujie et al., 2004).
BPMS is meant to implement business strategies by modelling, developing, deploying and
managing the business process so that organisations can have the benefit of innovation and
optimisation. Quality in business process is fundamental to the organisation’s performance and
competitiveness. Aalst et al. (2003) described the lifecycle of a BPMS including the phases
that support the operational aspect of the business process, as shown in Figure 2.2.
Figure 2.2: Business process management cycle (Aalst et al., 2003)
As the phases work in a cycle, the overall business process can be improved by revamping
various components of the cycle. The process to revamp the various components of the cycle
lies in the diagnosis phase, where the organisation has the chance to analyse the previously
executed processes with the goal of continuously improving the process and related practices
(Biazzo, 2000).
2.3.1 Process Analysis
Business process analysis is a well-studied area. It is an essential part of business process
management in terms of process diagnosis (Lu, 2008). The process analysis gets the
information from all the stakeholders of a business process and the interaction between them,
which can be collected from the current running process as in business process monitoring or
business activity monitoring, or it could be extracted from the event logs or post-execution of
the process as in business process mining (Aalst et al., 2007). It then chooses the proper
information and provides feedback to the stakeholders. Various aspects of the business process
are monitored, managed and optimised. It then reveals the information to be fetched in the
design and/or execution phase, where the goals and priorities are reworked in real-time (on the
fly) or it reuses the best information as a basis of knowledge for other potential users.
18
Process analysis research addresses the need to improve the quality of the business process.
A focus on quality is required for the value creation and delivery that are vital to the
organisation. The efficiency, cost, completeness and confidence level of the business process
are the key to the definition of quality. The performance of an organisation can be measured
through quantitative, measurable indicators. Hornix (2007) stated that performance indicators
rely on time-related factors (e.g., throughput time of a process or service time of an activity),
cost-related factors (e.g., process costs or material costs), or quality-related factors (e.g., error
rates, visiting frequency). The indicators represent how interventions are to be done to boost
the overall performance. These indicators also reflect the critical success factors of the
organisation and help the organisation to define and measure progress towards its
organisational goals.
Business process analysis is an essential prerequisite for smart interventions for
organisational change and is needed to create gradual or incremental change (Biazzo, 2000).
Developing better business process practices in the business process analysis area can be
approached through different means (e.g., redesigning the business process, adopting an
adaptive/flexible business process) (Lu, 2008) or learning from business process experience.
These approaches will help an organisation continue the improvement process to match the
quality demand.
A number of contributions have been made in the general area of business process analysis.
For example, business process mining allows information to be extracted from transaction logs
(Aalst et al., 2007). An audit trail of a BPMS is an example of how it can be used to find models
which describe the process, organisation and products. An audit trail has information about the
events (i.e., who executes the process, what time was taken, which activity and process
instance). All the information can then be analysed in many areas as explained by (Bozkaya et
al., 2009), such as to measure the performance of the process (Hornix, 2007), process discovery
(Günther and Aalst, 2007), process conformance (Rozinat and Aalst, 2005), and social
networks (Aalst et al., 2005).
Some research has proposed the process model as the output of process discovery (Aalst
et al., 2004). From a workflow log, a process model is partly or fully developed. The process
model can then be used later for specific purposes, such as discovering patterns of execution
(Dubouloz and Toklu, 2005) and analysing variances in the process model (Tsai and Chen,
2009). Similarly, interaction patterns can also be learnt to cover the social networks that exist
(Aalst et al., 2004).
19
Most research on business process analysis has focused on the structure of the business
process. The business process itself involves not only the structural aspect, but also the human
aspect that drives it. Hence, questions remain about how to analyse the human aspect of the
business process.
2.3.2 Process Improvement
The basic goal of business process analysis, as stated above, is to increase the quality of current
business processes. The process of increasing the quality is called business process
improvement. Business process improvement is a systematic approach to help any organisation
make significant improvements and to add value to the way the organisation does its business.
The key aim of this approach is to continuously improve the process and related practices, and
reduce unnecessary or not useful actions. Business process analysis has been identified as an
essential prerequisite for gradual and incremental organisational change (Biazzo, 2000). In
general, improving the business process will usually have the goals of reducing costs,
improving productivity, improving competitiveness and reducing service or production time
(Mansar et al., 2009). There is a large body of knowledge on business process assessment and
improvement strategies.
Currently, there are two research approaches to understanding how business process
improvements are implemented (Shtub and Karni, 2010):
1. Business process redesign – This approach focuses on how a business process can be
improved. It includes how to ensure the process designer is qualified to improve the
business process and how the improvement can be integrated into the enterprise process
suite.
2. Performer capability – This approach focuses on how the process performer is qualified to
carry out the process.
In business process redesign, changes to business process occur in the structure. It starts
with the basic question about how things are done, followed by collecting the activities,
decisions and events, and then arriving at the goal of understanding how the current work can
be done better (Mansar and Reijers, 2005). Hammer and Champy (1988) explained the
necessity of radical design to cut costs and increase quality by introducing the business process
redesign that focuses on the analysis and design of workflows and activities within an
organisation to achieve dramatic improvements with certain criteria (such as costs, time and
quality).

20
However, although business process redesign is a popular tool, it has also proven to be a
challenging tool for transforming organisations (Broadbent et al., 1999). Introducing a radical
business process redesign into an organisation also introduces a new learning curve.
Inexperienced performers may struggle to learn the new approach. Hence, another school of
thought that sees improvement from the process performer perspective has started gaining
momentum (Shtub and Karni, 2010).
Many vendors have responded to this situation by offering best practices to improve an
organisation’s performance. However, as previously discussed in relation to positive deviance,
many of these solutions are rejected because there is lack of trust from employees. Employees
reject new practices that are disharmonious with the working environment. This scenario raises
questions about how to make the employees accept the new approach to improve the process
performance and how to gain their trust. It is the aim of the present study to answer these
questions.
The socialisation of work practices is an improvement at the performer level, as it focuses
on improving the business process by having the people who enact the business process follow
the path of successful work practices performed by internal people who are experts in the
domain.
With regard to the aspects of business process improvement, there are several business
process improvement metrics discussed in literature. Below we present a brief discussion on
some of them.
1. Time – The time needed to execute an instance of a business process. It comprises the
service time which shows how long the process takes, the wait time which shows how long
it waits after being synchronised with other activities before proceeding, and the queue time
where nothing happens as resources required unavailable. Decreasing the time needed to
complete an activity is clearly desirable in improving the business process (Mansar et al.,
2006; Shtub and Karni, 2010).
2. Quality – Quality defines how well the activities are commenced from the viewpoint of the
customer who receives the result of the process and the performer who executes the process.
An improved business process will ideally also improve the quality of the service it delivers
(Lockamy III and McCormack, 2004; Mansar et al., 2006).
3. Cost – The issue of cost is usually the primary and most noticeable indicator in business
performance. Intuitively, reducing the cost is the expectation of business process
improvement (Shtub and Karni, 2010).
21
4. Flexibility – In a dynamic environment, adaptation to something new and different is
necessary for a successful organisation. Improving the business process means enhancing
the ability to react to and meet the future demands (Mansar et al., 2006).
5. Resource Utilisation – Resource utilisation discusses the ratio of activity versus availability
of resources in organisation. If the supply of work and resources remain constant, an
improvement in business process leads to the reduction of utilisation (Reijers and Aalst,
2005).
Among above issues, three most important issues, which represent the criteria for assessing
how issues in business process improvement should be addressed, will be discussed further in
the study, time, cost, and flexibility.
2.3.3 Process Variants
As flexibility is a key criterion in improving the business process, a further understanding of
the flexible business process is necessary. A typical BPMS follows rigid graph-based models.
It does not allow flexibility, dynamism and adaptability to occur in the business process. This
makes a typical BPMS fail to react to dynamic changes in the business process to match the
demand that often changes and when exceptional circumstances arise. Some approaches have
been proposed, such as those from Sadiq et al. (2005) and Reichert et al. (2003), to address the
adaptation problem. However, the change implemented increases the overall complexity (Lu,
2008).
A flexible business process is an approach that allows variation and uncertainty. Flexibility
is introduced as a kind of competence to efficiently respond to the changing environment.
Process variants are introduced to address the need to have a flexible business process (Lu,
2008). Some studies have shown the existence of process variants (Lu and Sadiq, 2007) in the
business process research area. Generally, as mentioned previously, a BPMS will produce
records of process activities into log files. The log files record activities and their attributes
(i.e., contributor, time stamp) which further can be used as sources for business process
analysis. Contrary to a typical strict BPMS, a flexible business process produces more than one
type of instance. In a typical BPMS, only one process model is generated, but a flexible
business process can produce more than one type of process model. The schemas of the
activities in the produced process models of the flexible business process are different to each
other, but they perform similar activities. A structural similarity query is launched during the
process mining activity to reveal the process variants. The algorithms presented by Lu (2008)

22
demonstrate the ability to precisely distinguish the complete and partial matches of process
models.
Process variants are basically individually tailored process instances in the business
process. Process variants are complex objects that contain various designs and exceptional
properties. The particular design of a variant is reflective of a knowledge worker’s preferred
work practice. An executed process variant represents the realisation of the process constraints,
and provides valuable knowledge of the organisation at the operational level. Such resources
can provide valuable insight into work practices, help externalise previously tacit knowledge,
and provide valuable feedback on subsequent process design, improvement and evolution (Lu,
2008).
The process variant is closely related to the flexible business process (Lu, 2008). The
flexibility of the business process allows the execution phase process to be executed on the
basis of a loosely or partially specified model, where the full specification is made at runtime
(Sadiq et al., 2005). Process variants are only available when a flexible business process is
introduced into the organisation. As described previously, with their creativity and knowledge,
the flexible business process will allow the users to specify their own approach and
methodology within certain circumstances and with the stated goal of the process. For example,
in the insurance industry, insurance claim processes can be done differently for VIP clients
compared to regular clients, or for insurance policies above a certain amount and below a
certain amount. An executed process variant provides valuable knowledge at the operational
level. The knowledge will be a useful insight into the work practice, and provides feedback to
subsequent users. Without process variants, no best practices would be revealed, as the whole
business process strictly follows the design, and only a little or no tacit knowledge will be
available.
Lu (2008) observed that a process variant contains information from at least three
dimensions:
1. The structural dimension contains the process model on which the process instance is
executed. For a given process variant, the instance-specific process model is adapted from
the design time model during instance adaptation.
2. The behavioural dimension contains execution information such as the set of activities
involved in the process execution (which may differ from the structural dimension due to
choice constructs in the process models), the exact sequence of activity execution, the
performers and their roles in executing these activities, the process-relevant data, and the
execution duration of the process instance and constituent activities.

23
3. The contextual dimension contains descriptive information (annotations) from the process
modeller about the reasoning behind the design of a particular process variant.
The log files generated by these process variants are valuable resources for business
process analysis. As stated above, the tacit knowledge is to be externalised through some means
such as process redesign or knowledge sharing which converts the log files into meaningful
knowledge which is later shared among users, designers and developers. The process variants
help the externalisation part. In application domains where significant amounts of variances
are produced during business process execution, managing the resultant process variants and
subsequently reusing the knowledge from the variants needs to be supported explicitly (Lu and
Sadiq, 2006). However, with the existence of process variants, new challenges have emerged
and presented questions that remain open. For example, which process variant has the most
benefits for organisations? How will process variants affect business process performance?
2.3.4 Process Complexity
The service quality of the business process can be seen from its performance, not only whether
it has satisfied the purpose, but also whether the process is delivered effectively. However, to
deliver the business process effectively, new challenges often arise unexpectedly. It is often
necessary for an organisation to introduce some degree of complexity in a business process
due, for example, to the introduction of new regulations or organisational growth, as well as
due to the introduction of elements in the business process that will lead to process
improvement.
Complexity theory is known in many areas including economics, computer science and
social science. Complexity theory is focused on the significant cognitive aspects that affect the
acceptance and comprehension of a system. Even though complexity is often depicted as factor
that will inhibit success, it has been found to motivate strategic development (Locke et al.,
1981) and innovation in organisations (Damanpour, 1996). From the business process
management perspective, business process complexity is known to have a connection with and
direct impact on process performance (Cardoso et al., 2006). Numerous aspects of complexity
have been studied in the area of business process management. Complexity is considered to be
relevant to the business process model, and is expected to increase as the number of activities
and/or their inter-relationships grows (Cardoso, 2008). At the beginning of the implementation
of the business process, organisations can gain improvement by implementing a complex
process. However, when the complexity is not properly understood, complexity in the business

24
process can increase, and once it reaches its tipping point, it can become detrimental and create
a higher error probability rate in the performance of the business process (Cardoso et al., 2006).
Figure 2.3 presents an inverted U-shape graph of the complexity curve that shows how
complexity starts as a beneficial factor but ends up as a detrimental factor that lowers the
individual’s overall performance (Flood and Carson, 1993).
Figure 2.3: Impact of complexity on individuals’ performance (Flood and Carson, 1993)
In the current state-of-the-art research in business process complexity, many researchers
have focused on the structure of the business process as depicted in the research by Cardoso et
al. (2006), Gruhn and Laue (2006) and Rolón et al. (2009). It is evident that complexity within
a business process could manifest itself in a variety of ways. A business process is represented
through a number of aspects. Business processes are characterised by the data and the data
flow, the control flow within the business process, the assignment of individuals to the process
activities, and applications that perform the process activities, as explained by Heinl et al.
(1999). In a further breakdown of the business process, it is found that the activities that
construct a business process are in fact characterised by a few dimensions: the structure, the
skill and organisational requirements, and the person-process interactions (difficulty,
familiarity and intrinsic interest) (Wood, 1986). From this situation it can be concluded that the
dimension of process complexity is not only determined by the structure as seen in the business
process model complexity, but also in other dimensions. How to define the integrated
complexity framework remains an open question.
Performance
Optimum Point
Complexity

25
2.4 Summary
This chapter has provided a critical review of the related works on business process
improvement and the implementation of business process management systems. The literature
review focused on process improvement through two perspectives, namely, redesigning the
business process, and improving performer capability. From the business process perspective,
improvement is approached through process redesign which often comes from external vendors
and is focused on the analysis and often radical redesign of workflows and activities. Even
though business process redesign is a popular approach, it adds a steep learning curve for
employees. Performers – especially the inexperienced ones – can struggle to adapt to the new
design. In addition, externally-sourced process improvement has drawbacks such as the lack of
trust and familiarity.
The shortcomings of externally-sourced process improvement has opened up the
opportunity to explore sources of improvement from within the organisation. Experience, skills
and knowledge from internal sources can be exploited in many ways to facilitate business
process improvement in an organisation. The research presented in the following chapters is
focused on the internal, performer capability perspective.

26

27
Chapter 3
Framework of the Socialisation of Work Practices
3.1 Introduction
This chapter presents the framework for the socialisation of work practices that is proposed to
enhance the performance of individuals within an organisation and result in business process
improvement. The framework integrates the key techniques and concepts in the literature
including the EDL method, personalised recommendation concept and business process
complexity. The system architecture of the framework is implemented in a system prototype
as an experimental test-bed.
3.2 Framework Overview
We first present the rationale for the framework design as briefly mentioned in the introduction.
Shtub and Karni (2010) present two main forms of business process improvement to keep
businesses competitive in an ever-changing environment: business process redesign and
performer capability improvement.
Business process redesign achieves process improvement by redesigning the current
business process according to criteria such as cutting costs and/or improving the quality of
services. Unfortunately, a radical design in the process also creates challenging conditions that
add new learning curves (Broadbent et al., 1999) due to unfamiliarity with the redesigned
business process. The redesigned business process that is intended to achieve effectiveness or
help the employees do the right things (Anand and Singh, 2011) can arguably lead to
inexperienced employees struggling to enact the redesigned process (Schonenberg et al., 2008;
Setiawan and Sadiq, 2010). A business process itself is characterised by its structure,
organisational requirements, and person-to-process interactions (Wood, 1986). These
characteristics indicate that the factors that affect the quality of the business process are not
only the structure of the process, but also the person who executes the business process. Hence,
it is observed that process improvement can be approached not only from the structural

28
perspective, but also from the perspective of the users who perform the business process
activity.
The premise of the present study is that organisations can make use of the experiences and
knowledge of employees to achieve process performance improvements that are driven
internally from within the organisation rather than externally. The skills and knowledge of
these experts becomes a valuable source of improvement to others. From this valuable
knowledge, the focus is shifted to increasing user performance and productivity such that it
will later manifest as improvement in the business process. However, there are challenges and
issues in capturing and sharing the information which is gathered from the experiences and
knowledge of these experts. Another challenge is how to effectively deliver the knowledge to
employees who are diverse in numerous ways (Tenkasi and Boland Jr, 1996). This also makes
it necessary to identify the factors that affect the learning process. To overcome these
challenges, the present study develops a framework for business process improvement called
the socialisation of work practices.
The first challenge that is addressed by the proposed framework is that the experiences
and knowledge of employees are often not widely available in explicit forms. These skills and
experiences are rarely documented. Hence, the proposed framework presents a method to
capture the tacit knowledge and transform it into explicit knowledge, through the EDL module
which is the basis of the framework. The EDL module has the capability to elicit the behaviour
of the experts in an organisation from the business process logs which record the events and
activities of the business process, and present it in a form that can be shared as the source of
improvement for the relevant stakeholders such as other employees and management.
The next challenge to be addressed by the proposed framework is to deliver the valuable
information, which will be used as the source of learning, in the most effective way. Studies
have shown that individuals have different needs, and learning approaches should take into
account these individual needs by tailoring the approach to the learners’ learning styles (Lu,
2004; Wan and Sadiq, 2012b). This creates a shift from traditional learning to personalised
learning. In personalised learning, each individual in the organisation has a different learning
path reflecting their diverse backgrounds and experiences. In the proposed framework, the
knowledge from the EDL module is transformed into a personalised recommendation for each
individual.
EDL is based on a number of aspects of process performance. Process performance, as an
indicator of the success of a process improvement, often has a direct relationship with the
process complexity (Setiawan and Sadiq, 2013). Thus, a comprehensive understanding of the

29
business process – and how complex it is – is also needed (Damanpour, 1996). Current studies
on process complexity typically focus on a single aspect, namely, process structure. The
proposed framework presents an integrated framework of business process complexity to
address the issue.
Based on the three components of the proposed framework, namely, experience-driven
learning, personalised recommendation and process complexity, a proof of concept system is
developed, called the Process Improvement (PRIMe) system. PRIMe provides an experimental
test-bed and working environment in which to test and analyse the results of the three
components in the framework.
The functionality of the proposed framework is explained with respect to the continual
improvement phase of the business process management lifecycle (Aalst et al., 2003). The
business process management lifecycle, as illustrated in Figure 3.1, starts with process design,
which is then followed by system configuration, then process enactment, and diagnosis. The
proposed framework fits within the diagnosis stage of the business process management
lifecycle. In the diagnosis stage, the activities and events of the business process are analysed
in order to identify the problems and aspects that can help improve the business process. The
proposed framework aims to identify the valuable experiences that can inspire others to also
lift their performances to their full potential.
Figure 3.1: Business process management lifecycle (Aalst et al., 2003)
In the framework of the socialisation of work practices, as illustrated in Figure 3.2, the
business process logs are pre-processed for further analysis. The business process log usually
records information such as the event/activity name, time stamp, and identity of the person
executing the event (Aalst et al., 2007). EDL is the first component introduced in the
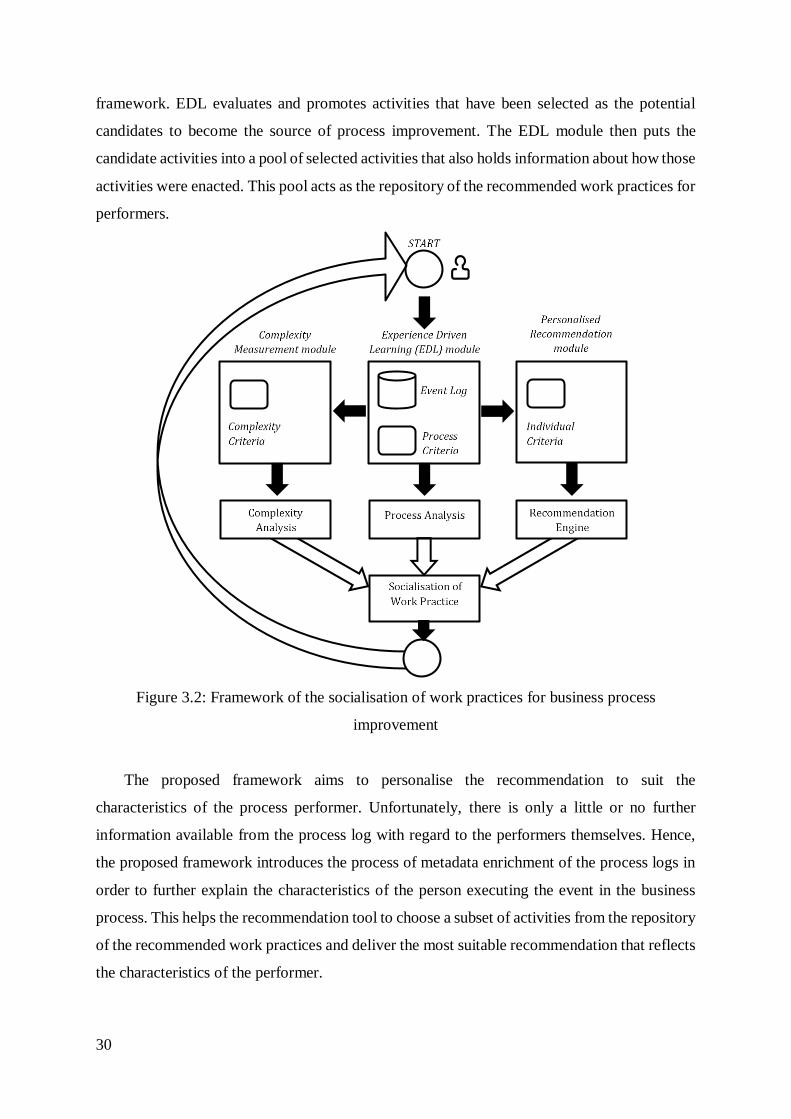
30
framework. EDL evaluates and promotes activities that have been selected as the potential
candidates to become the source of process improvement. The EDL module then puts the
candidate activities into a pool of selected activities that also holds information about how those
activities were enacted. This pool acts as the repository of the recommended work practices for
performers.
Figure 3.2: Framework of the socialisation of work practices for business process
improvement
The proposed framework aims to personalise the recommendation to suit the
characteristics of the process performer. Unfortunately, there is only a little or no further
information available from the process log with regard to the performers themselves. Hence,
the proposed framework introduces the process of metadata enrichment of the process logs in
order to further explain the characteristics of the person executing the event in the business
process. This helps the recommendation tool to choose a subset of activities from the repository
of the recommended work practices and deliver the most suitable recommendation that reflects
the characteristics of the performer.

31
As process performance indicates the success of a business process (Aalst et al., 2007), it
is necessary to understand all the aspects that may impact on the individuals who are
performing the business process. Business process complexity is known to have a direct impact
on and relationship with process performance (Cardoso et al., 2006). The proposed framework
presents a complexity measurement to help the stakeholders (i.e., employees and management)
to better understand the complexity of their business process and its impact on business process
improvement.
Overall, the present study delivers three artefacts to improve process performer capability
and facilitate business process improvement. The research is concerned with the design and
construction of the artefacts, their use, and their evaluation in experimental settings. Design
science (Hevner et al., 2004) is adopted as a guideline methodology for the research, as
explained in the next section.
3.3 Research Methodology
Design science (Hevner et al., 2004) has been extensively used in information systems research
in the past decade. Design means to “decide upon the look and functioning of an object”
(Polanyi and Sen, 1983); hence, design science in information systems research is an activity
that produces new and innovative artefacts as opposed to a naturally conceived object or
artefact. Design science is known for its guidelines and criteria for the evaluation of the
usefulness of an artefact, for connecting the relevance of research to the needs of real-world
problems and for the rigor of the knowledge that shapes the research. In the information
systems research, such artefacts are structurally formed as software, formal logic, or rigorous
mathematics.
According to Hevner and Chatterjee (2010), it is necessary to both justify and evaluate a
developed artefact. To effectively deliver the goal of the present study, the framework for the
socialisation of work practices is developed with well-defined requirements and assumptions.
This is necessary to ensure that the developed tool and artefacts are suitable and justifiable
without limiting the scope which would prevent the tool or artefact from being implemented
on a larger scale. To evaluate the developed artefacts, Hevner et al. (2004) has provided seven
guidelines in conducting the research, and those are: Design as an Artefact, Problem
Relevance, Research Contributions, Research Rigor, Design as a Search Process,
Communication of Research, and Design Evaluation.
According to the first guideline, Design as an Artefact, a design-science research is
expected to produce a viable artefact in the form of a construct, a model, a method, or an

32
instantiation. This first guideline is to make sure that the artefact is created to address an
important organisational problem. In this research, artefacts will be developed in the form of a
framework, methods, and an instantiation of the framework. Socialisation of work practice
approach will provide a comprehensive framework that represents how the system works and
how it produces recommendation of work practices to the stakeholders. The related methods
will be developed based on the knowledge that can be elicited from the past practices exhibited
from business process event log.
The second guideline of Design Science addresses the relevance of the research with a real
world problem. This study focuses on improving the performance of process users in executing
the business process. Some studies in the positive deviance area of research show that people
can learn to improve their practice from their own community. Socialisation of work practice
framework addresses the same real world problem, and aims to provide a desirable/alternative
solution to provide change from within rather than sourcing externally.
The research contribution, together with the research rigour and design as a search process
guidelines, relate to the design and assessment of the research leading to original and
meaningful contributions of the research. This thesis is expected to produce novel strategies to
provide an alternative approach to business process improvement. A combination of
technology-based artefacts e.g. system conceptualisation, organisation-based artefact e.g.
business process management, and people-based artefacts e.g. learning and training is
necessary and significant to achieve a better business process performance. Improving
performance in business process is not solely dependent on the business process itself, but also
from other complex perspectives such as level of experience and socio-cultural environment
within the organisation. This research utilises and proposes necessary augmentations to the
event log of business process management systems with the focus to elicit and to capitalise the
implicit knowledge about work practices and deliver it as a recommendation system to
respective stakeholders.
A very important aspect to the success of the research is communication of the research,
where it is necessary to be able to effectively present the results to all stakeholders in
technology as well as management. The proposed framework will provide the capacity to
extract information that can help managerial audiences in the decision making of how the
business processes can be improved. We will also develop methods with the ability to provide
personalised recommendation for learning and training for individuals performing the business
process tailored to individual’s need. Accordingly, this research targets organisations that
utilise a business process management suite and record the events and activities of the business

33
process in event logs. It also targets organisations that allow individual adaptations and allow
different and/or flexible approaches when executing the business processes. Recently, Gregor
and Hevner (2013) discussed the issue of the propagation of knowledge between individuals
and artefacts. The design science research supports a clearer understanding of the project goals
and the new contributions to be achieved (Gregor and Hevner, 2013).
The functionality of the artefact must be rigorously demonstrated via well-executed
evaluation methods. In the Design Evaluation guideline, design science research presents five
methods of evaluation: observational, analytical, experimental, testing, and descriptive
evaluation. This research employs the experimental approach using the PRIMe system (see
section 3.4) as the test-bed to process artificial and real process logs. The following sections
present the design and development details of proposed methods within the framework.
3.3.1 Experience-Driven Learning
Many organisations undergo many forms of change initiatives to improve their performance.
Among those initiatives are for example, restructuring the organisation, implementing ERP
systems, undertaking audits, etc. However, any major change in the organisation is generally
painful, as people are required to increase their focus and attention towards the requirement of
change. It is not uncommon for any organisation that undergoes a change program to face
resistance (Rock and Donde, 2008). The resistance comes from the pressure on people to have
a better performance and to keep pace with change.
The support to this kind of change initiatives to improve the business process performance
can be solicited both externally and internally. The external source of improvement is
commonly sought from expert advice and successful practice reference models which are
embedded in software solutions (Seethamraju and Marjanovic, 2009). Using external source of
improvement seems the most logical approach as it is assumed that internal people within
organisation are too busy to attain new skills and to teach others requires specific skill set.
However, it is known that hiring external experts can be costly (Rock and Donde, 2008). In
addition to that, while external expert advice and best practice reference models are widely
implemented (Van Beveren, 2002), externally identified best practice strategies often face
rejection due to unfamiliarity with the practices and the perception that they do not fit the
organisational context (Carter, 2003; Dutton et al., 2005).
On the other hand the internal sources of improvement offer valuable and often overlooked
information in the form of the experiences and knowledge of the individuals who perform
various activities within the business process and who can be considered domain experts in

34
particular aspects of the overall operations. At the same time, it is evident that work practices
at the operational level are often diverse (Lu and Sadiq, 2006), incorporating the creativity and
individualism of knowledge workers and potentially contributing to the organisation’s
competitive advantage. In general, the experience of individuals within an organisation is
regarded as the skill and knowledge owned by the individuals based on their understanding of
events within the business process as reflected in daily practices. The engagement of
individuals with their environment builds the experience that involves perceptions, prior
knowledge and influence from peers (Wan and Sadiq, 2012a). Constructed over time, this
engagement is central to the understanding of the notion of experience. This notion of
experience is central to the dissemination of the knowledge from internal sources. The
knowledge becomes easily accessible by organisation’s stakeholders, especially for those who
are about to experience the activities as discussed in Chapter 2 (Section 2.2.3). By its nature,
internal knowledge is disseminated through socialisation and participation within an
organisation; therefore, trust and credibility are needed to ensure that the knowledge will be
absorbed easily (Savolainen, 2008).
Human beings are social creatures who rely heavily on the people around them to get cues
on how to think and how to act. A large body of psychological research suggests that certain
interactions lead people to comply and change (Cialdini, 2001). People follow the lead of
similar others and the persuasion that comes from peers can be extremely effective.
Testimonials from successful performers work best when the successful performer and the
prospective performer share a similar work environment. In addition, people are known to defer
to experts (Cialdini, 2001) who act as the authority. Hence, employing peer influence and
authority within similar circumstances can increase the level of trust. This is the situation
explained by Sternin and Choo (2000) as positive deviance. The example given in Chapter 2
(Section 2.2.2) about the methods utilised by the NGO, Save the Children, illustrated the
concept of positive deviance. Positive deviance provides proven approaches in contrast to the
enforcement of external “models” which often fail due to a lack of fit within the cultural and
social contexts.
In the organisational context, positive deviance could help organisations perform better
without having to be dictated to or directed by external sources of process improvement that
do not always fit the business culture and work traditions. In order to capitalise positive
deviance, it is essential for an organisation to identify the measureable behaviours that
positively affect the performance of the organisation (through its business process). These
behaviours can become the source of knowledge and recommendations for others in order to

35
achieve the expected improvement. The concept of learning from experience and the
exploitation of positive deviance are explained in more detail in Chapter 4.
3.3.2 Personalised Recommendations
The question that arises for individuals considering the adoption of the positive deviants’
behaviours is, “Which behaviour shall I adopt?” This question arises because people often
choose a recommended behaviour based on their familiarity or on the performer’s similarity
with themselves (Guy et al., 2009). Another question that arises is, “How suitable is a
recommended behaviour for a specific person?” Even though known to produce high quality
outcomes, the good experience of one person does not necessarily mean that it is imitable by
others. For example, an experiential lesson from a person with ten years’ experience might not
suit those who have just started to work as a trainee. The lesson may not be entirely practical
as an organisation’s employee base is bound to have a spectrum of experiences ranging from
novice users to experts. The learning medium, such as a recommendation, that does not fit an
individual situation may be counterproductive to the improvement (Lu, 2004).
The framework proposed in this study not only provides experiences as the source of
valuable knowledge, but also provides a recommendation that is suitable to the specific needs
of the individual. The key purpose of the personalised recommendation is to support users in
improving their performance based on their potential and qualifications. It is clear that a
personalised recommendation depends on the skills of users, their current context, and some
prerequisites for understanding the delivered recommendation. This can be done by providing
a recommendation that has an appropriate level of difficulty and content and is tailored to the
individual’s circumstances (Wan and Sadiq, 2012b).
In order to deliver personalised recommendations, we propose that user profiles are added
in the form of metadata to enrich the performer data from the event log. This profile is used to
classify performers into three different levels based on the Bloom taxonomy, namely, the
novice, advanced and expert (Anderson et al., 2000). The user profiling is helpful to determine
whether a performance is aligned with the level of experience. It is assumed that people who
have been working for years should have a higher performance level than those who have just
worked in the organisation. Generally, more experience is reflected into a better performance
(Vecchio, 1987), although this is not always the case.
With the help of the performance classification, performers are targeted with the
personalised recommendation slightly above their current level. For example, for a novice
performer, the most suitable recommendation would be the baseline of advance level, and for

36
advance user, the recommendation is to follow the best past practice. The concept is discussed
in further detail in Chapter 5.
3.3.3 Process Complexity
Complexity is widely studied in many disciplines including computer science, economics and
social science (Setiawan and Sadiq, 2013). While it does not necessarily determine how
effective a system is, complexity is known to include significant cognitive aspects that
contribute to the understandability and, consequently, the overall success of a system.
Complexity is often represented as an obstruction to the achievement of difficult steps and
goals, and as the cause of reduced understandability, but complexity can also serve as stimulus
for strategic development (Locke et al., 1981). Complexity is also positively associated with
innovation in organisations (Damanpour, 1996).
In the framework proposed in this study, employees learn the experiential lessons and
draw the knowledge from experts of the organisation in order to improve their capabilities in
performing the business process. However, as the experiences are coming from a complex
ecosystem, there are complexity factors that may affect the learning process. It is also often
necessary for organisations to introduce some degree of complexity into their business
processes due, for example, to the introduction of new regulations or organisational growth, as
well as due to the introduction of elements in the business process such as process redesign that
will lead to process improvement. Hence, organisations that can successfully implement more
complex processes could also expect to have better business process performance. The key
challenge is the ability to strike the right balance between complexity and performance.
Studying the dynamics of this balance is a key focus of the present study. This concept is
discussed in more detail in Chapter 6.
3.4 Evaluation
Evaluation is an integral part of this research as per the guideline in design science research.
The evaluation ensures that the artefacts developed in this research are not only useful to
business process users but also provide a novel contribution to the information systems and
business process management body of knowledge. Hevner et al. (2004) presented multiple
methods for conducting evaluation and emphasised that the selection of evaluation methods
must be matched appropriately with the designed artefact. The present study uses the
experimental approach as the evaluation method. The research is evaluated with a developed
simulation tool described above, namely, the PRIMe system (Figure 3.3). PRIMe uses artificial

37
data as a test-bed for the research as well as real-world data that act as the external validator to
evaluate the usefulness of the proposed framework.
The PRIMe tool provides the proof of concept of the socialisation of work practices for
business process improvement framework. PRIMe works as an instrument that delivers the
captured knowledge to the relevant groups, namely, management and personnel (employees).
The core components of the proposed architecture are the event log pre-process module, the
process log’s metadata enrichment module, the analysis tool module, and the feedback and
recommender module.
The PRIMe system works with the business process log in eXtensible Event Stream (XES)
format as proposed by the IEEE task mining force1. The XES has been proposed as the standard
for business process logs for its simplicity, flexibility, extensibility and expressivity. The XES
format maintains the general structure of an event log. A log of a process contains a set of
traces that is a specific execution of process instances that holds a sequence of events. The logs
are the main part of this research in the sense that they represent the main experiences of the
individuals interacting with the business process. The logs capture the identity of the
individuals who performed the activities, the amount of time spent, and other relevant data.
1 http://www.xes-standard.org/

38
Figure 3.3: Architecture of socialisation of work practices for business process improvement
The PRIMe tool then converts the process log from XES format to a relational database
format in the pre-processing module. This format enables the metadata enrichment module to
enrich the process log with detailed information about the performer, for example, their years
of experience. The analysis module involves several algorithms to generate the required
outputs. Algorithms developed for the framework perform the data integration, data selection
and data manipulation in this module. These algorithms are linked together in the analysis
module. The analysis module comprehensively delivers the report that is needed by
management and provides feedback and personalised recommendations for individuals
performing the business process.
The recommendation and the feedback are an important part of this tool. A personalised
recommendation is delivered to fit the appropriate learning path for the individuals based on
their current performance. This will ensure that the recommendation suits the specific needs of
the individual according to the individuals’ current performance. Further details of this work
are discussed in Chapter 7.
Management
PRIMe USER INTERFACE
Personnel
Activity Log
BPM / ERP System
Rec
ord
Work Practices DB
Pre
– P
roce
ss
Enriched Log
Analysis Tool
Feedback and Recommender
Feedback and/or recommendation to Users
Pre – Process
Metadata Enrichment
Pre Processed Log
Management Report
Pre – Process
Report
39
3.5 Summary
This chapter presented the framework proposed in this study for business process improvement.
The main goal of the research is to provide an auxiliary means and a novel approach to
improving the business process performance through the socialisation of work practices
framework. To reach this goal, the chapter discussed the various artefacts developed to support
the framework based on the concepts of design science research by Hevner et al. (2004). The
development of the artefacts involved a rigorous review of the literature and a synthesis of the
available methods and techniques into a comprehensive framework that offers an effective
business process improvement method. As a proof of concept, the PRIMe experimental-based
tool was developed, and tests on both synthetic and real-world data were conducted. The next
chapter presents an overview of experience-driven learning, including the demonstration of an
approach to capturing the best experience of internal experts.

40
41
Chapter 4
Experience-Driven Learning
4.1 Introduction
The framework of socialisation of work practices stipulates that the experience of an expert
employee should occupy a central place in organisational learning and considerations for
improvements in business process performance. The acquisition of the knowledge to improve
the business process performance can be sourced either externally or internally. However,
sourcing of improvement internally can have low employee turnover, which in turn enables the
knowledge and experience of the individual to be retained by the organisation (Oliver, 2008).
The study conducted by Oliver (2008) also emphasises the use of internal source of knowledge
rather than external source of knowledge in continuous improvement activities with the usage
of external source of knowledge limited to either strategic or operational problem solving.
The grounding principle of the experience-driven learning presented in this chapter is the
value of promoting the use of an organisation’s internal knowledge for improving process
performance. A complementary theory from social sciences, namely, the theory of positive
deviance (Berggren and Wray, 2002) provides the foundation for the research premise. Positive
deviance is a term used to describe behaviours that depart from the norms of a group yet exhibit
certain positive characteristics (Spreitzer and Sonenshein, 2004). The behaviours of positive
deviants can provide benefits beyond what others in similar circumstances can achieve. As the
positive deviance behaviour is exhibited by peers, it can generate greater motivation to achieve
higher quality outcomes in social settings.
A traditional BPMS is not generally capable of selecting best practice precedents because
all the instances in the traditional BPMS follow the same process model; thus, there is hardly
any variance that can reflect individual or unique approaches. However, complementary work
can be found within the business process management research community that has long
recognised the need to facilitate flexible business activities (Aalst, 1999; Reichert et al., 2003;
Sadiq et al., 2005). It is expected that, by implementing a flexible business process, an
42
organisation can rapidly adjust its business process to suit the changes in the environment and
thereby capitalise on opportunities and/or save on costs. This situation creates business process
variants (Lu and Sadiq, 2006), that is, the same process may have different approaches to
achieve the same goals. Each variant has the same goal but by having different approaches
(such as different time needed, different activity set and/or sequence and different cost), there
is consequently a different level of perceived success. The creativity and individualism of the
knowledge worker are embedded in the variants, but this knowledge is generally only tacitly
available.
The experience of the internal experts as exhibited in their positive practices or strategies,
especially when working with variants, is often overlooked as the knowledge behind the
experience is only tacitly available. Even though knowledge from these experts constitutes the
corporate skill base and shows how the organisation works, the lack of externalisation from
practices to knowledge makes the positive behaviour from these experts become obscured.
Thus, having a flexible process is not always a solution to achieving the most efficient practice
for the organisation. In fact, the more flexible the system, the more an inexperienced user may
struggle to find the best approach to address a particular case. Individuals are required to have
deep knowledge of the process they are working on if they are to be successful (Schonenberg
et al., 2008). In such cases, the dissemination of best practices from reference models
(Hutchinson and Huberman, 1993; Ramesh and Jarke, 2001; Schonenberg et al., 2008)
becomes critically important. The absence of explicit articulation makes this a very difficult
task, as knowledge from experience is often regarded as tacit knowledge (Nonaka and
Takeuchi, 1995). In contrast to explicit knowledge, which is in documented form and easily
available, tacit knowledge is owned only by the individuals involved. Polanyi and Sen (1983)
described tacit knowledge as knowledge that cannot be articulated or verbalised. The present
study proposes that the sharing of knowledge of best practices from peers or expert individuals
within the organisation can also have a significant impact on the productivity and performance
of individual (inexperienced) users (Setiawan et al., 2011), provided the users are able to use
the knowledge to help them learn and acquire new perspectives, or by forming modified or new
practices.
Despite the advantages of this approach, the identification and dissemination of such forms
of knowledge is highly challenging. The challenge in this regard is the identification of the so-
called best past practices of process variants from the potentially large number of instance
executions. This identification is fundamentally dependent on the criteria that define the best.
These criteria are generally extensive and relate to different aspects of the process. These could

43
include criteria such as cost (e.g., dollar value of a shipment process), time (e.g., time taken for
an approval process), popularity (e.g., the frequency of execution of a particular sequence of
field tests in a complaints response process), and so on.
This chapter investigates the utilisation of the experiences and knowledge of an employee
who is expert in enacting the business process as the source of improvement in the current
practices of others. An approach to capturing the best experience of internal experts is
presented. The use of this approach as the foundation of, and the stimulus for, learning is
demonstrated.
4.2 Discovering Insights from Work Practices through Business Process Analysis
Many organisations have implemented BPMS for managing, monitoring, controlling,
analysing and optimising their business processes (Aalst et al., 2003). Business process
management allows organisations to design business process models, execute process instances
in accordance with the models, and enable users/applications to access task lists and execute
task operations (Yujie et al., 2004). The system is meant to implement business strategies by
modelling, developing, deploying and managing the business process so that the organisation
can have the benefit of innovation and optimisation. The quality of the business process is
fundamental to the organisation’s performance and competitiveness. Scheer (2005) depicted
the business process management lifecycle, as shown in Figure 4.1, highlighting the phases
that support the operation of the business process so that continuous improvement within the
organisation is assured.
Figure 4.1: Business process management lifecycle (Scheer, 2005)
44
As the phases work in a cycle, the overall business process can be improved by revamping
various components of the cycle. Business process analysis is the key means to this end. In
business process analysis, the business processes are analysed and mapped (Biazzo, 2000) with
the goal of continuously improving the process and related practices.
Business process analysis is a well-studied area. The process analysis gathers the
information from all the stakeholders in a business process, including information about the
interactions between them. This information can be collected from the currently running
process (as in business process monitoring), or it could be extracted from the event logs or
post-execution of the process (as in business process mining) (Aalst et al., 2007). The process
then chooses the appropriate information and provides feedback to the stakeholders.
Business process analysis contends with the demand to create a better quality business
process. Quality standards should be implemented in the value creation and delivery that are
vital to the organisation. The efficiency, cost, completeness and confidence level of the
business process are key to the definition of quality. Business process analysis is an essential
prerequisite for smart interventions for organisational change and is needed to create
incremental change (Biazzo, 2000).
A number of contributions have been made in the general area of business process analysis.
For example, business process mining allows information to be extracted from transaction logs
(Aalst et al., 2007). An audit trail of a BPMS is an example of how it can be used to find models
which describe the process, organisation and products. An audit trail contains information
about the events, such as who executed the process, what length of time was taken, and which
activity or process instance was completed. The information can then be analysed in many
dimensions, such as measuring the performance of the processes (Hornix, 2007), process
discovery (Günther and Aalst, 2007), process conformance (Rozinat and Aalst, 2005), and
social networks (Aalst et al., 2005). Some research has also provided the process model as the
output of process discovery (Aalst et al., 2004). In process discovery, a process model is
partially or fully developed from a workflow log. The model can be used later for specific
purposes, such as discovering the patterns of execution (Dubouloz and Toklu, 2005) and
analysing variances in the process model (Tsai and Chen, 2009). Similarly, interaction patterns
can also be learnt to discover what social networks exist (Aalst et al., 2004).
At the same time, business processes are quite often characterised by variance. Variance
itself in business process execution is the outcome of many situations. Lu and Sadiq (2007)
gave examples including the disconnection between documented models and business

45
operations, different legal requirements, country-specific regulations, the active change and
exception handling, flexible and ad-hoc requirements, and collaborative and/or knowledge-
intensive work. Various work practices are demonstrated in the real world, and these practices
incorporate the personal approaches and knowledge of workers that are of benefit to the
organisation (Lu and Sadiq, 2006). Different users have different styles and apply different
work practices to accomplish their goals. This especially happens when the organisation has
flexible ways to complete activities. Variances come with consequences: some result in good
processes, and some result in high costs such as when constructed by inexperienced users.
Examples of such variants can be found in many application domains such as healthcare,
e-learning and insurance claims. Consider the insurance claim process in the healthcare
industry as an example. During the insurance claim process, the same goal could be achieved
in multiple ways. As customers vary (e.g., regular or VIP customer, with single or family type
insurance, among many more criteria), the approaches and steps taken to complete the claim
process will be executed differently. In addition, a claims officer will have different approaches
to handling the claims within the constraints of the insurance policy. This situation leads to the
creation of process variants. Each process instance may have a different execution record, even
though it has the same goal (e.g., the handling of an insurance claim in minimum service time
in which to complete the claim and successfully identify fraudulent claims). In the example of
the insurance claim process, some clients might feel dissatisfied by the insurance company
when it takes a long time to process the claim, but the insurance company also needs to
scrutinise the claims carefully to identify fraudulent claims.
Lu and Sadiq (2007) presented a facility for the discovery of preferred variants through
effective search and retrieval based on the notion of process similarity, wherein multiple
aspects of the process variants are compared according to specific query requirements. The
useful feature of their approach was the ability to provide a quantitative measure for the
similarity between process variants. However, the problem is much more complex. The value
of a process variant can only be realised if it provides relevant and meaningful insights for
others who are working in a similar scenario. The insights come from the work practices that
are discovered through business process analysis. The experience of work practices has the
potential to enrich the knowledge sharing and knowledge transfer among employees who can
learn the knowledge of the work practices. Boud et al. (1993) further argued that experience is
not just an observation, a passive undergoing of something, but an active engagement with the
environment, of which the learner is an important part. Each learner forms part of the milieu,
enriching it with his or her personal contribution and creating an interaction, which becomes

46
the individual as well as the shared learning experience. This continuing, complex and
meaningful interaction is central to the understanding of experience.
The insights for improving process performance come from the best work practices as they
represent the optimal achievement that can be followed by others. The notion of the
socialisation of work practices involves the selection of work practices which contain the tacit
knowledge and can later be used as the source of learning. It is proposed that successful
practices from experienced individuals can be used as the source of the learning established in
a comprehensive learning ecosystem (Setiawan and Sadiq, 2010). This knowledge represents
insights into successful practices within an organisation for improving business processes;
being intrinsically driven, it is by definition aligned with the organisational culture and context.
Some research studies have been based on a rationale similar to the one presented in this
study. For example, Schonenberg et al. (2008) developed a recommendation service as an add-
on to a current process mining application. It predicts the next step to be performed in a case
by looking into the execution log. Similarly, Thom et al. (2008) and Mahmod et al. (2008)
proposed the reuse of activity patterns for subsequent process modelling. Others such as
Pawlowski and Bick (2008) attempted to establish the association between business process
management and organisational learning. The work in the present study is set apart from those
works as the focus here is on user-specific learning.
The challenge, however, remains the creation and sharing of knowledge pertaining to
internal expert behaviour. Knowledge creation and sharing (or reuse) is a widely studied topic.
Dixon (2000) provided a guideline for successful knowledge management by offering
knowledge on how to do something better, often called best practice. The best practice provides
other individuals with a positive example of how works or activities should be performed.
4.3 Identification of Best Practice Instances
In the “learning from within” approach, a key aspect of the problem is the definition of the
criteria that underpin the selection of the best process. This section first identifies and defines
a set of criteria to characterise the process, and subsequently uses the criteria to efficiently
analyse and rank the recommendation decision in a way that allows working communities to
effectively utilise the results.
Methods for analysing and/or monitoring a given process against criteria such as time or
cost are widely available in business process analysis tools. However, there can be a number
of criteria that characterise the processes, and can in turn be used for process performance
improvement. In general, business process improvement will be tied to goals, such as reducing
47
costs, improving productivity, improving competitiveness, and reducing service or production
time (Mansar et al., 2009). There is a large body of knowledge on business process assessment
and improvement strategies.
In the method proposed in this chapter, the analysis and ranking procedure commences
once the process mining component has identified the various process models (variants) from
the execution log. These are first grouped against behavioural similarity using the technique
proposed by Lu and Sadiq (2008). The popularity of the various variants (models) is then
determined by calculating the count of instances against each one. Process popularity forms a
benefit attribute. A benefit attribute is an attribute that needs to be maximised e.g. a specific
process variant might be providing a high performance and is widely used, hence there is a
benefit in maximising the use of that process variant across the organisation. A benefit attribute
offers an increasing monotonic utility where the greater the attribute value, the more preference
the attribute is. On the other hand, there is a cost attribute as well. It offers a decreasing
monotonic utility in contrary to the benefit attribute. In the proposed method, this is calculated
as the weighted process based on the time utilised as the cost criterion. The work practice
database captures this information. Finally, the cost and benefit attributes are combined through
a multi-criteria decision-making (MCDM) approach to identify the best process instance found
from the history of instances within the execution log. Some basic explanations are presented
below, followed by some of the considered criteria in order to explain the analysis and ranking
procedures:
Process Model – The process model is a specific process representation (for a set of process
instances). The model is either explicitly designed by previous process designers in a flexible
business process management system (Lu and Sadiq, 2008) or mined from the execution logs.
All process models are referred to as variants, and have the same overall goal. The models may
be grouped based on behavioural similarity, such as that considered in Aalst et al. (2006), Lu
and Sadiq (2008) and van Dongen et al. (2008); that is, they belong to the same domain such
as a customer response or an insurance claim process.
Process Variance – P is a process model variance mined from the execution logs, where P =
{P1, P2, P3, ... , Pn}, Pi represents the model for a process variant. The architecture restricts P
to process models with variances which have the same goal. All the process models are
evaluated based on the behavioural dimension (Lu and Sadiq, 2008) as it contains the
information on execution, such as the set of activities involved in the process execution, the

48
exact sequence of activity execution, the performers and their roles in executing the activities,
the process-relevant data, and the duration of the process instance and constituent activity.
From the reconstructed process model, a number of process instances that follows each process
variance are captured by the execution log.
Process Instance – From each defined or reconstructed process variant model, there can be a
number of process instances captured within the execution log, assumed to contain execution
information such as the set of activity involved in the process execution, the sequence of
activity execution, the resources utilised in executing the activities, the process-relevant data,
and the duration of the process instance and constituent activities. To be selected as the
candidate for the source of experience-driven learning, a process instance needs to be weighted.
We will use the additive weight method (Hwang and Yoon, 1981) which will be discussed later
in this section to weight the process instances.
The selected top-k of process instances will be chosen from the set of process instances,
where k is the maximum number of selected process instances defined by the decision-maker.
The system will then select the process instances with the least weights.
Criteria-Specific Derived Data – The criteria-specific derived data are a dataset retrieved
from the process execution logs and containing the computed values against designated criteria
(namely, process model popularity, cost and currency, as presented below) for each completed
process instance recorded in the log. The detailed working of the calculations from the
execution log is provided in Table 4.1.
Process Model Popularity
Let Pi (i = 1 … m) denote the set of process model variants and Aj (j = 1 ... n) be the set of
process instances. Let F(Aj, Pi) denote that “Aj has the same process structure (behaviour) as
Pi”. Thus, the process popularity R for a given variant i is:
𝑅𝑖 = |𝐴𝑗| where 𝐹(𝐴𝑗,𝑃𝑖), 𝑡ℎ𝑎𝑡 𝐴𝑗 𝑎𝑛𝑑 𝑃𝑖 𝑎𝑟𝑒 𝑏𝑒ℎ𝑎𝑣𝑖𝑜𝑢𝑟𝑎𝑙𝑙𝑦 𝑠𝑖𝑚𝑖𝑙𝑎𝑟 (4.1)
The popularity of the process model shows how many times a particular process (variant)
model has been selected by a user or used previously. A process matching on structural
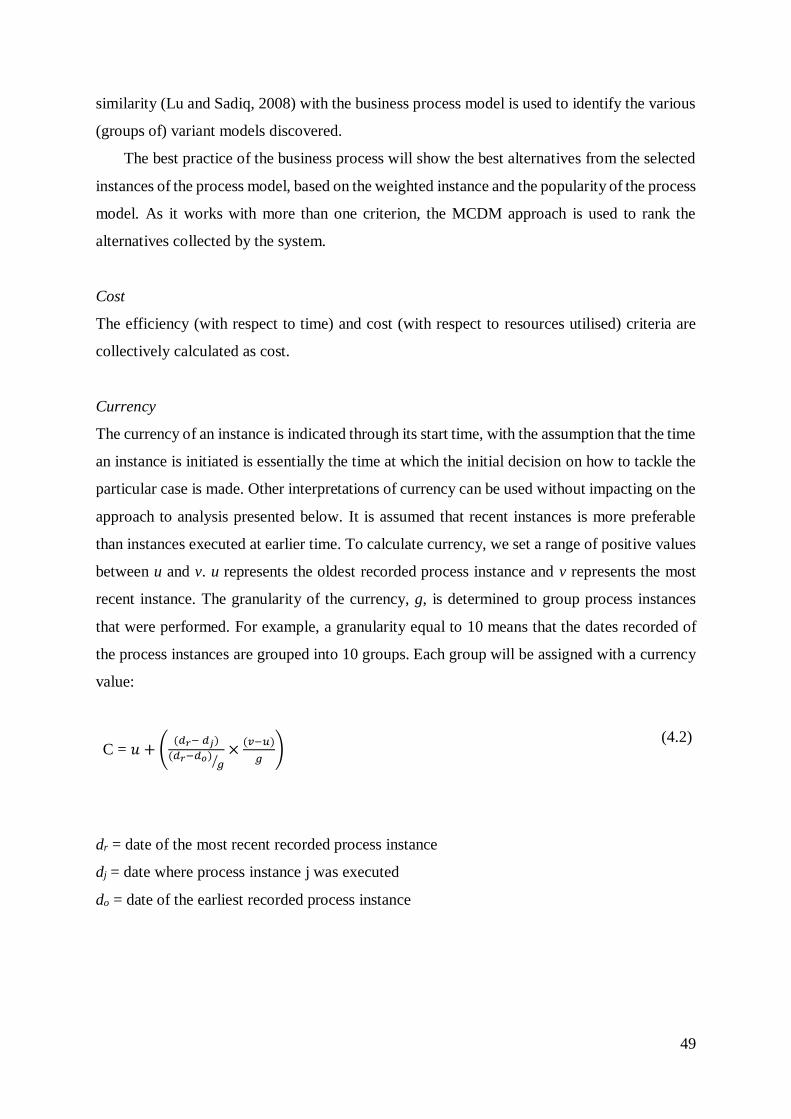
49
similarity (Lu and Sadiq, 2008) with the business process model is used to identify the various
(groups of) variant models discovered.
The best practice of the business process will show the best alternatives from the selected
instances of the process model, based on the weighted instance and the popularity of the process
model. As it works with more than one criterion, the MCDM approach is used to rank the
alternatives collected by the system.
Cost
The efficiency (with respect to time) and cost (with respect to resources utilised) criteria are
collectively calculated as cost.
Currency
The currency of an instance is indicated through its start time, with the assumption that the time
an instance is initiated is essentially the time at which the initial decision on how to tackle the
particular case is made. Other interpretations of currency can be used without impacting on the
approach to analysis presented below. It is assumed that recent instances is more preferable
than instances executed at earlier time. To calculate currency, we set a range of positive values
between u and v. u represents the oldest recorded process instance and v represents the most
recent instance. The granularity of the currency, g, is determined to group process instances
that were performed. For example, a granularity equal to 10 means that the dates recorded of
the process instances are grouped into 10 groups. Each group will be assigned with a currency
value:
C = 𝑢 + ((𝑑𝑟− 𝑑𝑗)
(𝑑𝑟−𝑑𝑜)𝑔⁄×(𝑣−𝑢)
𝑔)
(4.2)
dr = date of the most recent recorded process instance
dj = date where process instance j was executed
do = date of the earliest recorded process instance

50
Multi-Criteria Decision-Making – To select the best process instance, we utilise MCDM.
MCDM is the most well-known branch of decision making. It deals with decision problems
under the presence of a number of decision criteria. Generally, all criteria that represent
different dimensions of the alternatives in MCDM can be classified into two conflicting
categories i.e. benefit and cost. Criteria that are to be maximised are the benefit criteria while
the one that are to be minimised in the cost category criteria. A very ideal solution for an
MCDM problem would be where all benefit criteria are maximised and all cost criteria are
minimised. The multi-criteria decision-making model can be defined as follows:
Let C = {cj | j = 1, ... , n} be the criterion set and let A = {ai | i = 1, ..., m} be the selected set
of process instances. An MCDM approach will evaluate m alternatives, Ai (i=1, 2,...,m), which
are instances of business process, against Cj (j=1,2,...n) where every attribute is independent
of the other and later will be determined the optimal alternative A* with the highest degree of
desirability. A decision matrix, X (M × N), is given as follows:
𝑐1 𝑐2 … 𝑐𝑛
Alt 𝜔1 𝜔2 … 𝜔3
𝑋 =
𝑎1𝑎2⋮𝑎𝑚
[
𝑥11 𝑥21 … 𝑥𝑚1𝑥12 𝑥22 … 𝑥𝑚2⋮ ⋮ ⋮𝑥1𝑛 𝑥2𝑛 … 𝑥𝑚𝑛
] (4.3)
It is also assumed that the decision maker has determined the importance factor or the weights
of relative performance of the decision criteria (denoted as 𝜔𝑗, for j = 1,2,3,..., n) to show the
importance relative to each criterion. Usually, these weights of the criteria are normalised to
add up to one. The importance factor is generally defined by domain experts and represents an
absolute preference of the domain expert. However, it can also be objectively defined from the
set itself using entropy-based criteria weighting.
Entropy-Based Criteria Weighting
The weighting concept is an important part of the MCDM method. Weight of the attribute
determines the relative importance of the attributes or criteria within the given alternatives.
This information reflects the preference of the decision-maker in making the judgement
involving the criteria. A subjective weighting means the decision-maker or expert judges the

51
importance of each criterion based on their knowledge and experiences, and quite often on their
intuition. While such judgement is important, the lack of objectivity in determining the
preference can create problems when the organisation has employee (expert) turnover which
might result in changing criteria preference as the new employees may have different
preferences over the criteria. Thus, an objective preferential method is needed to cater for the
situation. Hwang and Yoon (1981) highlighted a few techniques to develop an objective weight
of criteria, including the eigenvector method, weighted least square method, and entropy
method. The objective weight of criteria may express some qualitative objective characteristic
which indicates that if one criterion is more significant and more useful than another, then the
weight of the first criterion will be greater than that of the second one.
The execution log of business process can be considered to reside within a probability
space of random events where the process instances are characterised by the criteria. The
Shannon entropy of information theory (Shannon and Weaver, 1959) is able to quantify the
expected value of the information of uncertain data such as found in the execution log of
business processes. Hence, in the present study, the entropy method is chosen in order to obtain
the objective weight of criteria. Moreover, when the data within the decision matrix are known
(in this case, the decision matrix is the record of past process instances; i.e., the execution log),
the entropy method is preferable than the other methods (Hwang and Yoon, 1981).
Entropy is an important concept and has been used in many fields. It is generalised in
different applied fields, such as communication theory, mathematics, statistical
thermodynamics, and economics. In the information theory context as described by Shannon
and Weaver (1959), entropy is a measure of the amount of uncertainty in the outcome of a
random experiment, which is represented by a discrete probability distribution, pj. The
expression of entropy (H) of the probability distribution pj with possible values of j {1, … , r),
is thus defined as follows:
𝐻(𝑝1, 𝑝2, … , 𝑝𝑟) = −𝑘 ∑ 𝑝𝑗 ln 𝑝𝑗𝑟𝑗=1 , where k is a positive constant,
and
(4.4)
where
{
∑𝑝𝑗 = 1
𝑟
𝑗=1
𝑝𝑗 ≥ 0

52
By utilising the entropy method, a more objective weighting method is achieved to weight
the criteria used in the multi-criteria analysis (Hwang and Yoon, 1981). This approach does
not necessarily remove the importance of the judgment of an expert to weight the criteria. This
can still be used by applying the a priori weight (preference) to the entropy-generated weight
on the criteria given. The entropy concept is principally useful when there is divergence
between sets of data. Figure 4.2 illustrates the concept of weight entropy.
Suppose there is an example of some probability of performance of certain criteria that are
believed to have an impact on the overall performance of each process variant. In this example,
there are four process variants (A1, A2, A3, and A4). Each variant (typically called an alternative)
has its overall performance determined by five criteria. In the example in Figure 4.2, an
arbitrary figure is provided to represent the probability of criterion n being performed among
alternatives. Figure 4.2 presents that criteria C1, C2, C3, and C4 provide diversity during the
execution of process variants. The diversity shown in the criteria is an indicator of how each
criterion is affecting the performance of each variant differently. If the probability of a
particular criterion has similar values among all the variants, then the criterion does not do
much in the analysis. In the example in Figure 4.2, C5 has the exact same performance
probability on all variants. This indicates that C5 that was thought to have an impact on the
performance of each variant does not really contribute to the overall performance difference of
each variant. Hence this criterion can be eliminated from the performance determination. From
here, it can be seen that entropy is able to provide the required information about how the
criteria are perceived by the evaluated variant.
Figure 4.2: Example of probability of performance of criterion n on each alternative x
C1 C2 C3 C4 C5
A1 0.2299 0.2500 0.3333 0.2136 0.2500
A2 0.2874 0.2188 0.2593 0.2524 0.2500
A3 0.2069 0.1875 0.2222 0.2427 0.2500
A4 0.2759 0.3438 0.1852 0.2913 0.2500
0.0000
0.0500
0.1000
0.1500
0.2000
0.2500
0.3000
0.3500
0.4000
Pro
bab
ilit
y
Probability of Performance of Criterion n on
each Alternative x
A1
A2
A3
A4

53
The method introduced in Hwang and Yoon (1981) is used to obtain the objective weight
w with the possibility of assigning a prior knowledge from experts to obtain subjective weight
w’. Let us consider a different example of a decision matrix X of business processes that has
four alternatives (A) and four criteria (c):
𝑐1 𝑐2 𝑐3 𝑐4
𝑋 =
𝐴1𝐴2𝐴3𝐴4
[
22.5
200175
9 11,0007 13,000
1.8 150 5 12,5002.4 275 5 15,000
]
The degree of deviation of the outcomes of criteria j from alternatives i, pij, is defined as:
𝑝𝑖𝑗 =𝑥𝑖𝑗
∑ 𝑥𝑖𝑗𝑚𝑖=1
, ∀𝑖, 𝑗
(4.5)
Thus, we obtain the degree of deviation of each criterion from each alternative:
𝑐1 𝑐2 𝑐3 𝑐4
𝐴1𝐴2𝐴3𝐴4
[
0.2299 0.2500 0.3462 0.21360.2874 0.2188 0.2692 0.25240.2069 0.1875 0.1923 0.24270.2759 0.3438 0.1923 0.2913
]
The entropy H(j) of the set project outcomes of criterion j is:
𝐻(𝑗) = −𝑘 ∑𝑝𝑖𝑗 ln𝑝𝑖𝑗
𝑚
𝑖=1
; 𝑗 = 1, 2 , 3 , … , 𝑛 (4.6)
where k represents a constant:
𝑘 = 1 ln𝑚⁄ (4.7)
where m is the number of alternatives. This constant will guarantee that 0 ≤ 𝐻(𝑗) ≤ 1.

54
The degree of diversification dj of the information is provided by the outcomes of the
attribute:
𝑑𝑗 = 1− 𝐻(𝑗) (4.8)
The expected objective weight of the criteria is:
𝑤𝑗 =𝑑𝑗
∑ 𝑑𝑗𝑛𝑗=1
(4.9)
From the above formulas, the entropy of each criterion, H(j), the degree of diversification,
dj, and the objective weight of the criteria, wj, are:
𝑐1 𝑐2 𝑐3 𝑐4
𝐻(𝑗)𝑑𝑗𝑤𝑗
[0.9937 0.9810 0.9771 0.99560.0063 0.0190 0.0229 0.00440.1199 0.3611 0.4348 0.0843
]
The weight as indicated above in order of importance is (w3 = 0.4348, w2 = 0.3611, w1 =
0.1199, w4 = 0.0843).
A subjective weight 𝜔𝑗 as a prior judgment of experts can be incorporated in the entropy-
obtained weight to factor the objectivity of the entropy-obtained weight with the subjectivity
of experts; thus, the new weight 𝑤𝑗′ is:
𝑤𝑗′ =
𝜔𝑗𝑤𝑗∑ 𝜔𝑗𝑤𝑗𝑛𝑗=1
(4.10)
If the experts (decision-makers) have the following a priori weight 𝜔𝑗 of:
𝜔𝑗 = (0.25, 0.25, 0.35,0.15)
Then, the subjective weights are:
𝑤′ = (0.1051, 0.3167,0.5338,0.0443)

55
The weight obtained will be utilised in one of the most widely-used MCDM approaches in
many research areas and applications, namely, simple additive weighting (SAW) (Yeh, 2002)
which is also known as the “vector-maximum” problem (Zimmermann, 2001).
Additive Weighting Method – This concept is applied in the present research as it is able to
represent the value of a process instance in a simple yet effective way to portray the
performance of a business process. The aim is to obtain the weighted summation of the
importance factor on each alternative (Fishburn, 1967) that is a selected instance of the process
model. In many cases, SAW has shown acceptable results and it is widely applied because it is
easy to understand and implement (Hwang and Yoon, 1981). In order to compare all the
criteria, the decision matrix X is normalised into a comparable scale:
𝑟𝑜𝑝 =
{
𝑥𝑜𝑝𝑀𝑎𝑥 𝑥𝑜𝑝
𝑖𝑓 𝑝 is a benefit attribute
𝑀𝑖𝑛 𝑥𝑜𝑝𝑥𝑜𝑝
𝑖𝑓 𝑝 is a cost attribute
(4.11)
where rop is normalised rank of selected instance alternative Ao against attribute cp. Each
selected instance will have a preferred value Vo, where:
𝑉0 =∑𝜔𝑝𝑟𝑜𝑝
𝑛
0=1
(4.12)
𝜔p = the weight of criterion p
The preferred value Vo will indicate how the selected top-k instances are ranked. The
higher the Vo value is, the higher its rank among others. It is noted that, for a given process
instance, there is exactly one execution sequence resulting from the execution. In addition,
having the same sequence does not guarantee that two process instances could complete the
process at the same time, as each activity T of each instance might have different times spent,
depending on how the workers performed the activities.

56
4.4 Experimental Evaluation
This section presents an experimental evaluation of the proposed methodology. The evaluation
is based on a case study conducted at a building services consultancy.
4.4.1 Scenario Description and Experimental Setup
An example of a business process in use at a real business is presented in order to demonstrate
the workings of the proposed approach. The business process used in the example is a bid
tendering and completion process in a building services consultancy in Queensland, Australia.
Queensland is currently experiencing economic benefits from the booming mining industry
(Lewis, 2011). The surge in industry activity has brought a level of competitiveness not only
in the mining industry, but also in non-traditional resource areas (Foster, 2012) which also
affects non-mining industries, such as infrastructure industries including building services
consultancies. This newly emerging situation has created a new level of competitiveness which,
in turn, creates a demand for the highest possible level of performance (Luthans and Youssef,
2007). At the same time, the situation is characterised by a large number of new recruitments,
which means that there is significant diversity in workers’ capacity and experience. As such,
providing a means of process improvements based on existing best practice is highly warranted.
Thus, the processes considered for the building services consultancy provide a fertile ground
for conducting an experiment to evaluate the effectiveness of the proposed methodology.
A building services consultancy usually deals with organisations looking to build new
buildings or developments (e.g., a property developer) or organisations looking to retrofit
existing buildings with new electrical, air-conditioning and communication infrastructure (e.g.,
school buildings that need to be upgraded to cope with additional demand caused by increased
enrolment and increased computer usage).
A bid represents a submission by the building services consultancy to an organisation
looking for a contractor to undertake electrical and mechanical design work. This submission
details what services will be rendered, and in what way. First, the opportunity to submit a bid
must be identified. Management must approve this opportunity before continuing to the next
stage. If this is successful, the bid document must be drafted and submitted to the company that
requested the tenders. If the bid is successful, the work detailed in the bid must be completed.
This work is then subjected to internal quality assurance mechanisms before it is released to
the client. The final step in the process is to collect payment from the client. Figure 4.3
illustrates the bid tendering process.
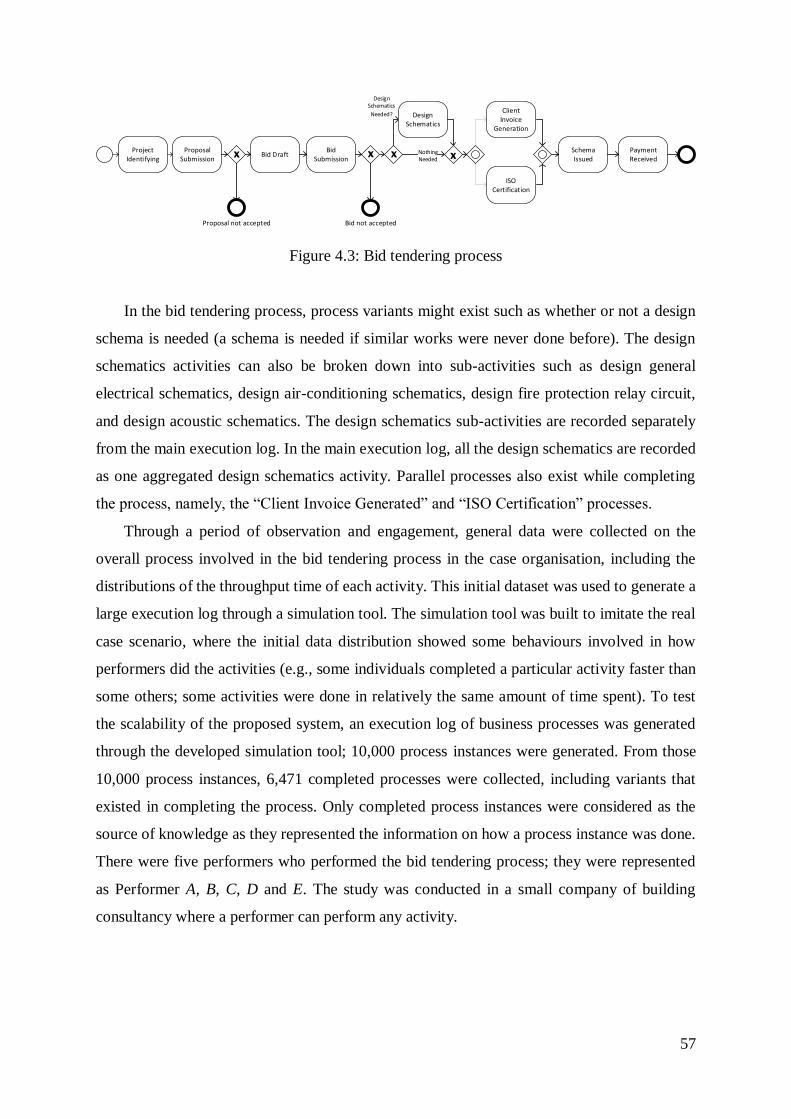
57
NothingNeeded
Project Identifying
Proposal Submission
Bid DraftBid
Submission
Proposal not accepted
Design Schematics
ClientInvoice
Generation
ISO Certification
Bid not accepted
Schema Issued
Design Schematics
Needed?
Payment Received
X X X X
Figure 4.3: Bid tendering process
In the bid tendering process, process variants might exist such as whether or not a design
schema is needed (a schema is needed if similar works were never done before). The design
schematics activities can also be broken down into sub-activities such as design general
electrical schematics, design air-conditioning schematics, design fire protection relay circuit,
and design acoustic schematics. The design schematics sub-activities are recorded separately
from the main execution log. In the main execution log, all the design schematics are recorded
as one aggregated design schematics activity. Parallel processes also exist while completing
the process, namely, the “Client Invoice Generated” and “ISO Certification” processes.
Through a period of observation and engagement, general data were collected on the
overall process involved in the bid tendering process in the case organisation, including the
distributions of the throughput time of each activity. This initial dataset was used to generate a
large execution log through a simulation tool. The simulation tool was built to imitate the real
case scenario, where the initial data distribution showed some behaviours involved in how
performers did the activities (e.g., some individuals completed a particular activity faster than
some others; some activities were done in relatively the same amount of time spent). To test
the scalability of the proposed system, an execution log of business processes was generated
through the developed simulation tool; 10,000 process instances were generated. From those
10,000 process instances, 6,471 completed processes were collected, including variants that
existed in completing the process. Only completed process instances were considered as the
source of knowledge as they represented the information on how a process instance was done.
There were five performers who performed the bid tendering process; they were represented
as Performer A, B, C, D and E. The study was conducted in a small company of building
consultancy where a performer can perform any activity.
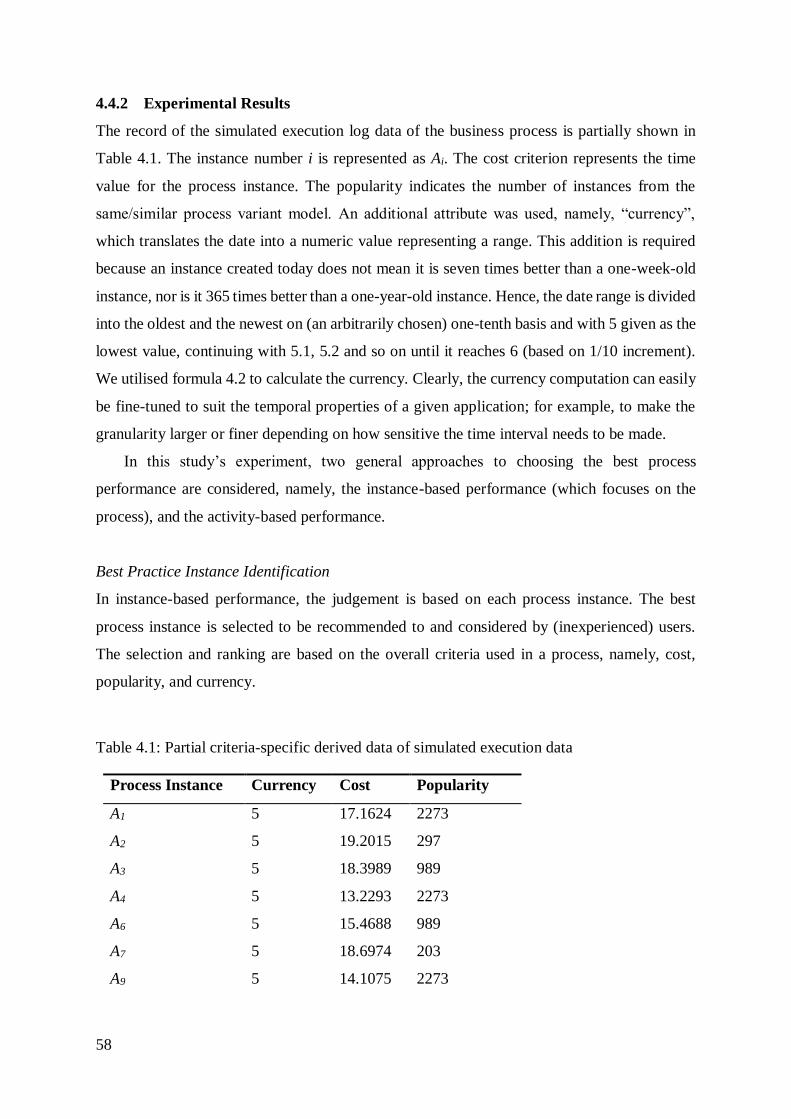
58
4.4.2 Experimental Results
The record of the simulated execution log data of the business process is partially shown in
Table 4.1. The instance number i is represented as Ai. The cost criterion represents the time
value for the process instance. The popularity indicates the number of instances from the
same/similar process variant model. An additional attribute was used, namely, “currency”,
which translates the date into a numeric value representing a range. This addition is required
because an instance created today does not mean it is seven times better than a one-week-old
instance, nor is it 365 times better than a one-year-old instance. Hence, the date range is divided
into the oldest and the newest on (an arbitrarily chosen) one-tenth basis and with 5 given as the
lowest value, continuing with 5.1, 5.2 and so on until it reaches 6 (based on 1/10 increment).
We utilised formula 4.2 to calculate the currency. Clearly, the currency computation can easily
be fine-tuned to suit the temporal properties of a given application; for example, to make the
granularity larger or finer depending on how sensitive the time interval needs to be made.
In this study’s experiment, two general approaches to choosing the best process
performance are considered, namely, the instance-based performance (which focuses on the
process), and the activity-based performance.
Best Practice Instance Identification
In instance-based performance, the judgement is based on each process instance. The best
process instance is selected to be recommended to and considered by (inexperienced) users.
The selection and ranking are based on the overall criteria used in a process, namely, cost,
popularity, and currency.
Table 4.1: Partial criteria-specific derived data of simulated execution data
Process Instance Currency Cost Popularity
A1 5 17.1624 2273
A2 5 19.2015 297
A3 5 18.3989 989
A4 5 13.2293 2273
A6 5 15.4688 989
A7 5 18.6974 203
A9 5 14.1075 2273

59
Process Instance Currency Cost Popularity
A12 5 15.4169 2273
A14 5 22.9928 989
A15 5 19.5887 989
A16 5 22.4053 42
A17 5 12.3748 319
A18 5 22.2133 989
A20 5 11.5014 1480
A4633 5.4 18.1515 2273
A4635 5.4 17.8804 989
A4637 5.4 12.3096 1480
A4639 5.4 20.4924 2273
A4640 5.4 12.9953 319
A4641 5.4 13.076 319
A4644 5.4 18.0938 2273
A4645 5.4 11.7595 1480
A4646 5.4 15.2865 2273
A4648 5.4 17.3077 989
A4649 5.4 31.5389 79
A4650 5.4 9.5557 319
A4652 5.4 16.4101 989
A4657 5.4 16.6777 2273
A9978 5.9 26.214 203
A9980 5.9 16.48 297
A9982 5.9 12.0037 2273
A9983 5.9 18.961 326
A9984 5.9 21.6684 79
A9985 5.9 16.4828 2273
A9986 5.9 15.1163 1480
A9987 5.9 19.9479 203
A9988 5.9 17.1777 1480

60
Process Instance Currency Cost Popularity
A9994 5.9 19.222 989
A9995 5.9 18.2388 2273
A9996 5.9 13.6644 1480
A9997 5.9 16.7862 2273
A10000 5.9 14.5845 1480
Using Equations 4.5, 4.6, 4.7, 4.8 and 4.9 to calculate the objective weight of criteria based
on entropy, the entropy of each criterion H(j), the degree of diversification dj, and the normalised
weight wj are as shown in Table 4.2.
Table 4.2: Entropy, degree of diversification and normalised weight of criterion
Currency Cost Popularity
H(j) 0.99979 0.99654 0.97070
dj 0.00021 0.00346 0.02930
wj 0.00634 0.10504 0.88862
The results indicate that the popularity criterion has the greatest impact among other
criteria, followed by cost, and the last one is currency. Thus, currency holds less significance
for the overall process and the popularity criterion is the most important factor for an individual
user in choosing the variant. This can be interpreted to indicate that people tend to “follow the
crowd” in performing activities.
If the a priori knowledge is incorporated to define the weight set by the experts, 𝜔𝑗, with,
for example, some arbitrary value of 𝜔 = (0.2, 0.6, 0.2), then the subjective weights in the order
of currency, cost and popularity are w' = (0.00524, 0.26041, 0.73435).
Table 4.3: MCDM ranking on selected instances
Instance MCDM SAW score
A2387 0.73031
A2388 0.86314
A2389 0.27257
A2390 0.92665

61
Instance MCDM SAW score
A2391 0.88195
A2392 0.47734
A2393 0.86519
A2394 0.22818
⋮ ⋮
A6176 0.72282
A6177 0.86537
A6178 0.10742
A6179 0.85790
A6180 0.19368
A6181 0.87199
⋮ ⋮
A7939 0.71392
A8261 0.36799
A8262 0.25204
A8263 0.85936
A8264 0.18173
A8265 0.85984
A8267 0.86791
⋮ ⋮
A9572 0.32959
A9755 0.95041
A9756 0.44187
A9757 0.88037
A9758 0.10255
A9760 0.16048
A9761 0.61479
⋮ ⋮
A9939 0.68587
A9953 0.93926
A9954 0.84590

62
Instance MCDM SAW score
A9956 0.84458
A9957 0.85896
A9959 0.43290
A9960 0.84314
A9962 0.64236
A9963 0.62863
Using SAW implementation as shown by Table 4.3, A9755 is found to be the preferred
alternative as it has the highest rank. The result of the ranking is then delivered as a
recommendation for process performance improvement (Setiawan and Sadiq, 2011). This
recommendation allows users to review how the (best) instance was handled; that is, the
selected best practice, process instance A9755, will give users/individuals information and/or
recommendations for best practice.
4.5 Summary
The motivation of this work is based on the premise that the experience of internal experts in
an organisation is beneficial for the improvement of process performance, as is also evidenced
by the notion of positive deviance. The aim of the proposed framework within the context of
business process improvement and user productivity is to develop a means to shift the
performance of users, as illustrated in Figure 4.4. By utilising the knowledge obtained from the
best practice (or positive deviance) found within the organisation, individuals can benefit and
improve their own performance.
Figure 4.4: Individuals’ current and expected future performance level
Performers
Users’ Performance
Current
Performance
Expected Future
Performance

63
This chapter presented a set of methods to systematically and objectively extract and
communicate the knowledge on behaviours of positive deviants. These include multi-criteria
decision-making and entropy. Another important aspect of this approach is the criteria used in
the analysis. So far, the study has used three criteria based on a review of the literature and the
context of the considered scenario, namely, cost/efficiency, currency, and popularity. The
additive weight method from multi-criteria decision making has been used to find the preferred
process instance as best practice. Further, to objectively weight each criterion, an entropy-based
weighting method is used. The entropy weight explains the average information quantity of the
respective criterion. Although only three criteria have been used for this study, it does not limit
the applicability of the method. The criteria can be extended further and the method is still
valid. The next chapter discusses the personalised recommendation approach which provides
a method to recommend learning that fits the performer.

64

65
Chapter 5
Personalised Recommendations
5.1 Introduction
This chapter discusses a personalised recommendation approach to applying experience-driven
learning for business process improvement. A classification of the importance of activities that
significantly affect the business process is proposed. This classification helps business process
performers (employees) to have a greater understanding when executing the business
processes. A method to allocate a recommendation that matches the profile of the business
process performer is also presented.
5.2 Background
The premise of the research is that the experience of internal experts in an organisation is
beneficial for the improvement of business process performance. The experience is delivered
in the form of recommendations that cover aspects such as: How was the overall performance
of the employee? Which process instances are the best past practices?
However, after successfully identifying the best past practices based on certain criteria
such as cost (e.g., dollar value of a shipment process), time (e.g., time taken for an approval
process) and popularity (e.g., the frequency of execution of a particular sequence of field tests
in a complaints response process), questions still remain. Firstly, a process may include a
number of activities and not all of the activities have the same level of influence on the overall
process performance. Identifying what activities in the process generate the greatest impact is
a significant challenge as there is little knowledge on how to define the relative importance of
activities. At the same time, this identification is critical to process users as it allows them to
direct their focus and attention where it matters.
Secondly, it is realistic to assume that individual users will have different backgrounds and
different levels of work capacity and potential. Proposing that certain users can achieve best
practice may be counterproductive, and may demoralise some users. Studies have shown that

66
a recommendation based on the most relevant conditions and information for an individual user
(learner) is preferred (Drachsler et al., 2008) and potentially more productive. This scenario is
commonly found in many domains, including e-commerce applications (Santos and Boticario,
2008), e-learning environments (Tang and McCalla, 2005), and most commonly in sports
environments where the level of the athlete’s training and skill determines which competition
to aspire for. As an individual gains experience in the given domain, expectations of excellence
can also be raised. Thus, recommendations should be delivered to users not only based on their
preferences or on the highest level of achievement, but also based on the current performance
of the users; these are referred to as personalised recommendations.
The personalised recommendation approach has been widely studied in many areas. In
recent years, it has been advocated in e-commerce area for a business entity to have a one-to-
one marketing (Peppers, 1993). A personalised recommendation greatly improves the nature
of one-to-one marketing to treat each customer individually for a better serve. For this purpose,
user profile needs to be created and maintained to match with the individual characteristic.
Example in e-commerce is as shown by Amazon.com (Eirinaki and Vazirgiannis, 2003).
Another area of personalised recommendation is available in the area of e-learning (Zaíane,
2002). Some studies have suggested that a learning process along with the measurement of
learners’ performance (Day and Payne, 1987) and matched to certain situations (Santos and
Boticario, 2008) could achieve better learning results. Business process improvement could
also benefit from this approach.
In the system proposed in the present study, the recommendations extracted from the
analysis of process executions therefore need to be sensitive to an individual user’s level of
experience and capacity. How to determine this capacity and current level of performance is a
significant challenge. The recommended best past practice may not be entirely practical
because an organisation’s employee base is bound to have a spectrum of experiences, ranging
from novice users to experts. A recommendation that does not fit an individual user’s current
level of experience may be counterproductive.
5.3 Approach
The work presented in this chapter is a continuation of the work in Chapter 4 which proposed
the identification of best practices through MCDM, particularly the SAW method (Chapter 4,
Section 4.3). In this section, the work in Chapter 4 is integrated with additional approaches in
order to enhance the identification and delivery of personalised recommendations.

67
The decision-makers’ confidence in choosing the most suitable MCDM method is
increased by synthesising the SAW method with another well-known MCDM method, namely,
the weighted product (WP). This purpose of this synthesis is to create a consensus between the
MCDM methods. The WP method uses multiplication to connect attribute ratings, each of
which is raised to the power of the corresponding attribute weight (Yoon and Hwang, 1995).
This multiplication process has the same effect as the normalisation process for handling
different measurement units. The logic of WP is to penalise alternatives with poor attribute
values (Chen and Hwang, 1992).
The average rank as described by Hwang and Yoon (1981) is used to achieve the
consensus. The average score computed from the two MCDM methods is then utilised to
formulate a personalised recommendation based on best process instances. In the context of
business process analysis, the alternatives are assumed to be process instances, and the criteria
are characteristics which define the process instances’ behaviour. Ranked alternatives as
described in previous work (Setiawan and Sadiq, 2010) are then used as the source of the
“learning from within” approach. Once the best past practices have been identified, the relative
importance of the activities is then identified, followed by construction of the user-specific
recommendation.
5.3.1 Identification of the Importance of Activities within the Business Process
In any process, but especially in processes that are characterised by variance, it is typical to
find a large diversity in the importance and complexity of the process activities. For example,
in a financial institution, the cost of a customer registration activity might not vary, as this is a
relatively simple activity, whereas for another activity such as an insurance claim assessment,
the time and the cost may vary significantly depending on who undertakes it. Thus, the more
intensive or complex the activity is, the more important it is in the performance of the overall
instance. It is necessary to find a way to determine the importance of activities within the
overall process instance. This is similar to the criteria weight problem discussed in Chapter 4
(Section 4.3); hence, the entropy concept is re-utilised to determine the relative importance of
the process activities.

68
Given a matrix Y, with m activities, and on each activity there are n criteria; the activities
are recorded in the execution log that states p number of process instances:
𝐴𝑐𝑡1 𝐴𝑐𝑡2 … 𝐴𝑐𝑡𝑚
𝑐1⋯𝑐𝑛 𝑐1⋯𝑐𝑛 … 𝑐1⋯𝑐𝑛
𝑌 =
𝑝𝑖𝑑1𝑝𝑖𝑑2⋮
𝑝𝑖𝑑𝑝
[
𝑥111⋯ 𝑥11𝑛 𝑥121⋯𝑥12𝑛 ⋯ 𝑥1𝑚1⋯𝑥1𝑚𝑛𝑥211⋯ 𝑥21𝑛
⋮
𝑥221⋯𝑥22𝑛 ⋯
⋮
𝑥2𝑚1⋯𝑥2𝑚𝑛⋮
𝑥𝑝11⋯ 𝑥𝑝1𝑛 𝑥𝑝21⋯𝑥𝑝2𝑛 ⋯ 𝑥𝑝𝑚1⋯𝑥𝑝𝑚𝑛
]
(5.1)
The degree of deviation in the outcomes of activity j from criteria k, pijk, can be defined as:
𝑝𝑖𝑗𝑘 =𝑥𝑖𝑗𝑘
∑ 𝑥𝑖𝑗𝑘𝑝𝑖=1
, ∀𝑖, 𝑗, 𝑘
(5.2)
Each activity within the process instance has criteria that determine the performance of the
respective activity. The entropy Hm of the set project outcomes of activity m is the average
entropy of the criteria within the activity:
𝐻𝑚 =−𝑐 ∑ ∑ 𝑝𝑖𝑗𝑘 ln 𝑝𝑖𝑗𝑘
𝑝𝑖=1
𝑛𝑗=1
𝑛 ; 𝑘 = 1, 2, 3,… , 𝑛 (5.3)
where c represents a constant number of criteria on each activity:
𝑐 = 1 ln𝑛⁄ (5.4)
which will guarantee that 0 ≤ 𝐻𝑚 ≤ 1.
Using Equations similar to Equations 4.8, 4.9 and 4.10, the degree of diversification, dm ,
is obtained; the expected weight of the activity m indicates the complexity of the activity, wm;
and if a priori knowledge is implemented, wm’ is also obtained.
5.3.2 Constructing User Specific Recommendations
The best practice identified from the method explained above is going to form the basis of the
recommendation and is the baseline of high achievement in process performance. It is
achievable for some, but would be not achievable for some others, especially novice or
inexperienced performers. The key idea is that individuals need to be supported to improve
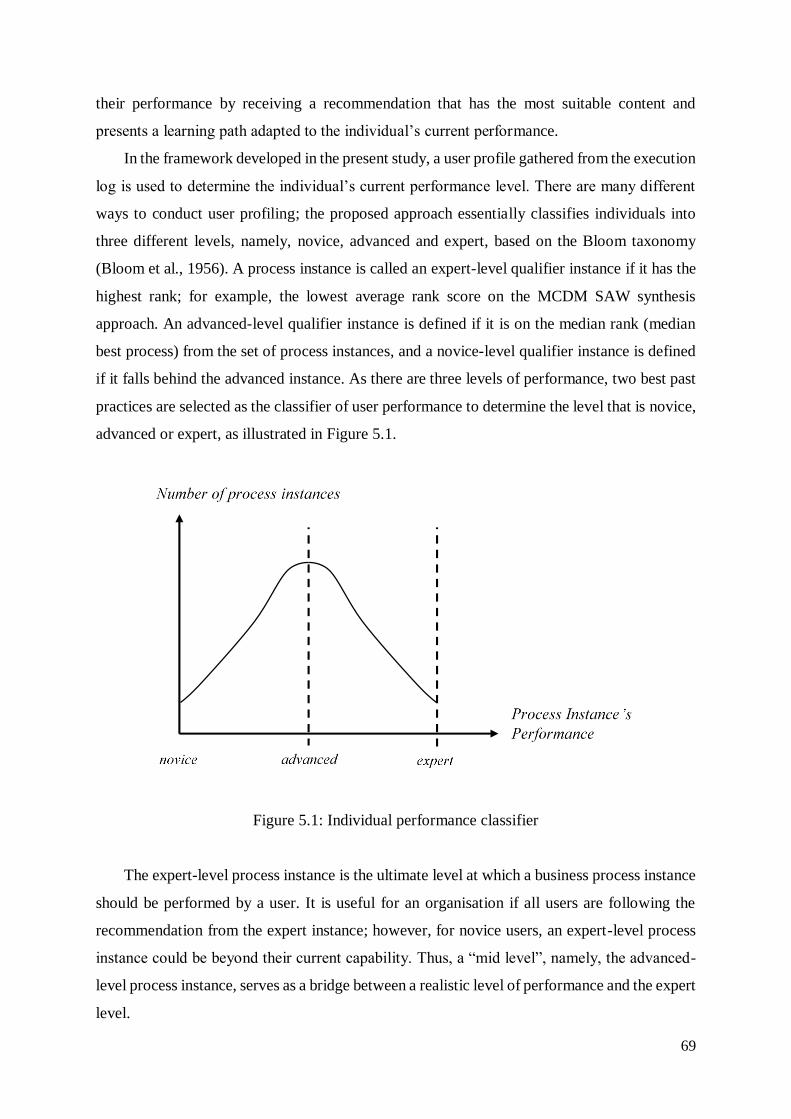
69
their performance by receiving a recommendation that has the most suitable content and
presents a learning path adapted to the individual’s current performance.
In the framework developed in the present study, a user profile gathered from the execution
log is used to determine the individual’s current performance level. There are many different
ways to conduct user profiling; the proposed approach essentially classifies individuals into
three different levels, namely, novice, advanced and expert, based on the Bloom taxonomy
(Bloom et al., 1956). A process instance is called an expert-level qualifier instance if it has the
highest rank; for example, the lowest average rank score on the MCDM SAW synthesis
approach. An advanced-level qualifier instance is defined if it is on the median rank (median
best process) from the set of process instances, and a novice-level qualifier instance is defined
if it falls behind the advanced instance. As there are three levels of performance, two best past
practices are selected as the classifier of user performance to determine the level that is novice,
advanced or expert, as illustrated in Figure 5.1.
Figure 5.1: Individual performance classifier
The expert-level process instance is the ultimate level at which a business process instance
should be performed by a user. It is useful for an organisation if all users are following the
recommendation from the expert instance; however, for novice users, an expert-level process
instance could be beyond their current capability. Thus, a “mid level”, namely, the advanced-
level process instance, serves as a bridge between a realistic level of performance and the expert
level.
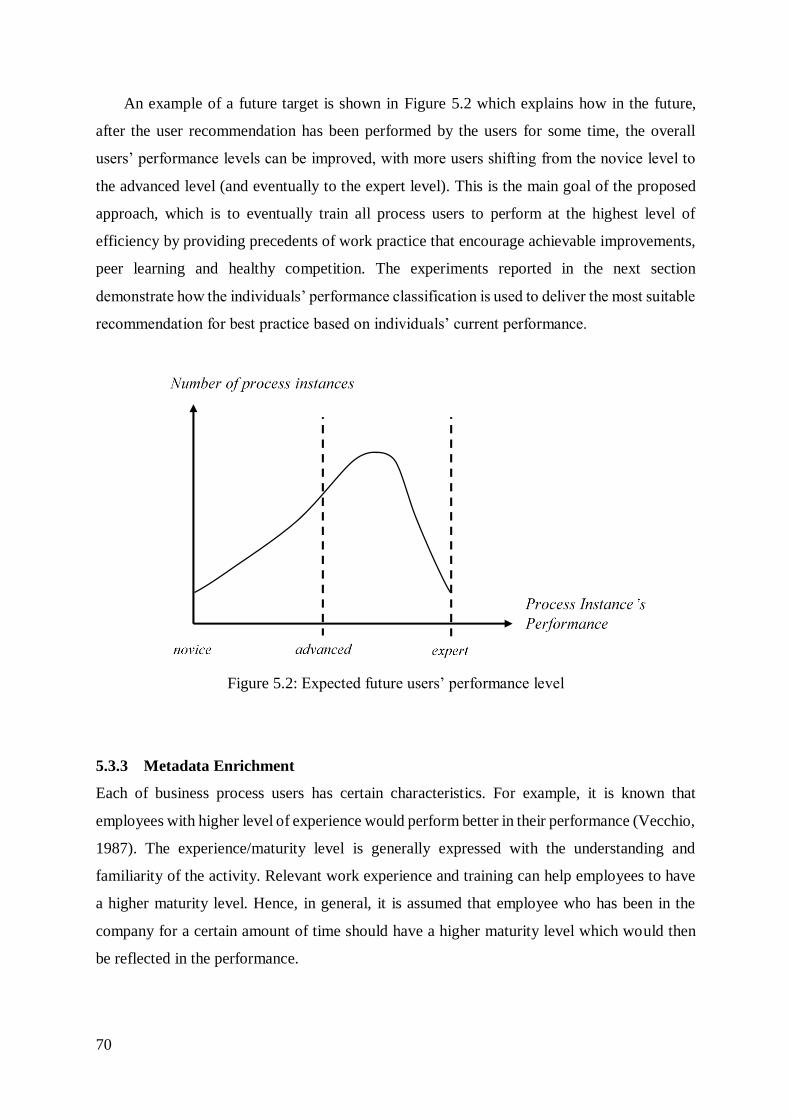
70
An example of a future target is shown in Figure 5.2 which explains how in the future,
after the user recommendation has been performed by the users for some time, the overall
users’ performance levels can be improved, with more users shifting from the novice level to
the advanced level (and eventually to the expert level). This is the main goal of the proposed
approach, which is to eventually train all process users to perform at the highest level of
efficiency by providing precedents of work practice that encourage achievable improvements,
peer learning and healthy competition. The experiments reported in the next section
demonstrate how the individuals’ performance classification is used to deliver the most suitable
recommendation for best practice based on individuals’ current performance.
Figure 5.2: Expected future users’ performance level
5.3.3 Metadata Enrichment
Each of business process users has certain characteristics. For example, it is known that
employees with higher level of experience would perform better in their performance (Vecchio,
1987). The experience/maturity level is generally expressed with the understanding and
familiarity of the activity. Relevant work experience and training can help employees to have
a higher maturity level. Hence, in general, it is assumed that employee who has been in the
company for a certain amount of time should have a higher maturity level which would then
be reflected in the performance.

71
However, the situation can be problematic if an employee who has been working for long
time in the organisation did not exhibit the performance as it should be e.g. an employee who
has been working for more than 5 years but still exhibit the performance of someone who has
just joined the organisation. From the literature, it is evidence that users’ experience should
develop over time (Karapanos, 2013). Karapanos (2009) studies that there is an expectation
that the longer the users interact with the system, the more capable the users are. However, in
reality, some performers might fail to progress as expected.
As with the construction of user specific recommendation section, metadata enrichment
helps conducting user profiling but has a purpose specifically to compare the
experience/maturity level of performers and the level of performance. The metadata
enrichment is an activity to add information of the year a business process user joined the
organisation. From this information, the maturity level is calculated.
Maturity level is defined with the same name as in individual performance classifier,
namely, novice, advanced, and expert. Performer who has the least experience as indicated by
the year of joining is categorised as novice performer. For example we can set the maturity
level as novice for people who joined the organisation for less than 3 years. In contrast,
performer who has longer experience time is categorised as expert performer. Hence we can
set maturity level as expert for those who have been working in the organisation for more than
8 years, and advanced for those in between. Thus a specific recommendation can be given to
the user if the maturity level is not matched under the expected performance level e.g. an
advanced level of user according to the maturity level, but measured as novice level of user
according to the performance level.
5.4 Experimental Evaluation
This section presents an experimental evaluation of the proposed methodology. The evaluation
is based on a case study conducted at a building services consultancy, as discussed in Chapter
4 (Section 4.4.1). The business process used in the example is a bid tendering and completion
process. As illustrated in Figure 5.3, there is an opportunity for process variants to be executed
in activities T4, T5, T6, T7, T8 and T9. A dotted rectangles indicate that activities can be
executed arbitrarily within the boundary.

72
T1 T2 T3
T4
T5
T6
T7
T8
T9
T10 T11
T1: Potential project identified T7: Design fire protection
T2: Proposal submitted T8: Client invoice generated
T3: Bid drafting & submission T9: ISO certification
T4: Design electric schematics T10: Schema issued
T5: Design acoustics schema T11: Payment received
T6: Design air-conditioning
Figure 5.3: Bid tendering process
5.4.1 Identification of Best Past Practices
In this research, an execution log of business processes was generated through the developed
simulation tool. From the 10,000 process instances generated, 6,471 completed process
activities were collected including variants that may exist in completing the activity. Five
performers were recorded as users who did all the activities in completing each process
instance. The users were anonymously identified as Performers A-E. From those past process
instances, all the processes were ranked using MCDM approaches, namely the SAW method
and WP methods, and then synthesised as shown in Table 5.1.
Table 5.1: Synthesised MCDM rankings using SAW and WP methods
Process ID Rank on SAW Rank on WP Average Rank
5272 1 1 1
4765 2 2 2
1802 3 3 3
3362 4 4 4
5390 5 5 5
9953 6 6 6
5601 7 7 7

73
Process ID Rank on SAW Rank on WP Average Rank
1170 8 8 8
8504 9 9 9
5183 10 10 10
6477 11 11 11
512 12 12 12
4753 13 13 13
7181 549 547 548
626 550 554 552
4896 551 548 549.5
6006 552 551 551.5
3636 553 557 555
8030 554 552 553
4457 555 558 556.5
7258 556 553 554.5
1972 557 561 559
2451 558 564 561
9599 559 556 557.5
4214 560 565 562.5
5439 561 562 561.5
9913 562 555 558.5
5102 563 563 563
3053 3226 3226 3226
3525 3227 3227 3227
1497 3228 3229 3228.5
7417 3229 3225 3227
790 3230 3235 3232.5
1984 3231 3232 3231.5
7019 3232 3230 3231
4493 3233 3233 3233
2212 3234 3238 3236

74
Table 5.1 shows some processes were ranked differently according to the result of the
MCDM query using the SAW and WP methods and some were on the same rank. For example,
the rankings for process 5272 and process 4765 were the same using both the SAW and the
WP method. Process 2451 was ranked 558 using the SAW method, but was ranked 564 using
the WP method. These results show that the different MCDM methods give different results.
Hence, synthesising both methods by creating an average ranking from the results of both the
SAW method and the WP method is necessary.
5.4.2 Defining the Importance of an Activity
For the activity based-performance, using Equation 5.3, the importance of each activity can be
identified using entropy-based method. The method is designed to identify which activities
have the most influence relative to other activities. Thus, the selected activities have a
significant impact on the overall performance of the business process. In the experiment, the
entropy of each activity Hm, the degree of diversification dm, and the normalised weight wm are
as shown in Table 5.2.
Table 5.2: Entropy, degree of diversification, and normalised weight of activities
Activity H d w
Potential project identified 0.993189186 0.006810814 0.06640735
Proposal submitted to management 0.99708213 0.00291787 0.028450058
Bid drafted 0.993546764 0.006453236 0.062920871
Bid submitted 0.993090915 0.006909085 0.067365522
Design fire protection relay circuit 0.992603666 0.007396334 0.072116335
Design general electrical schematics 0.979495427 0.020504573 0.199925365
Design acoustic schematics 0.986556025 0.013443975 0.13108254
Design air-conditioning schematics 0.982835053 0.017164947 0.167363071
Client invoice generated 0.996958868 0.003041132 0.029651891
Internal ISO9001 certification requested 0.993268438 0.006731562 0.065634626
Schematics issued 0.998063027 0.001936973 0.018886031
Payment received 0.990749361 0.009250639 0.09019634
75
It is observed that the importance of the activities as determined through the entropy-based
method is aligned with findings in the literature (Setiawan et al., 2011). Another examples are
found in the study conducted by Wang and Lee (2009), where entropy-based method is used
in developing a fuzzy TOPSIS approach for a software outsourcing problem, and also from
study by Ding and Liang (2005) that discusses the utilisation of entropy-based method in a
fuzzy MCDM problem in the liner shipping industry. This gives further confidence that the
method utilised in this study accurately pinpoints activities that have a greater impact on overall
performance. It is also found that if the performance of each performer on some particular
activity does not show much difference, then that particular activity is not complex and tends
to have less impact on the process performance. On the contrary, if a particular activity creates
much performance variance then it is considered to be a complex activity and will impact on
the overall process performance. In this study, there were three activities that had the greatest
impact on overall performance based on the significance of their weight compared to others.
As shown in Table 5.2 above, these activities were “design general electrical schematics”,
“design acoustic schematics” and “design air-conditioning schematics”. It is noted that these
were activities that determined the variance and flexibility of the business process. This
indicates that, in a business process that allows flexibility, employees who are working on the
variant activities should pay more attention to the activities that will affect the overall
performance of the business process.
5.4.3 User Specific Recommendation
To measure individuals’ performance (and classify users), the average time spent by each
individual on each activity is summarised and aggregated. The throughput time criterion (as
part of the cost criterion) is selected for the user profile as the throughput time is directly linked
to the user’s performance, while other criteria (e.g., process popularity, one-time cost and
currency) are independent of the user. The time aggregation of an individual’s average time
spent on activities is the most relevant method for comparing the individual’s performance with
the best process instance performance. It is noted that different criteria could be used for a
different scenario without impacting on the overall methodology presented in this study.
Figure 5.4 shows an example of Performer B’s performance. It is noted that the overall
performance (in terms of time to complete) of the best process instance is better than the
average time taken by Performer B, except in the “design schematics” and “client invoice
generation” activities (some activities have a higher throughput time, caused by the

76
contribution of some performers who did not perform very well on the activities). Even though
Performer B did not perform better than the best past practice, this performer surpassed the
median best process (the advanced-level classifier).
For particular users who already surpass the recommended process on each activity, the
task is to maintain their performance and/or enable them to become peer tutors to others who
still underperform. For underperforming users, the task is to improve their current performance
based on the best practice performance that is closest to them; for example, a performer with
very low performance (novice level) receives a recommendation to achieve an advanced level.
Figure 5.4: Overall performance comparison of best process vs. Performer B
Based on the analysis of the results of the simulation, it is found that among five performers
who worked in the company, Performer E was the best performer (identified as an expert user),
Performer B was at an advanced level, and the rest were at novice level. A deeper investigation
of the data reveals that one of the most influencing activities within the business process was
the “design schematic” activity.
From the chart shown in Figure 5.5, in general, large gaps can be seen between the
performers of the “design general electrical schematics” activity, and the “design air-
conditioning schematics” activity. The gaps between the “design fire protection relay circuit”
and the “design acoustic schematics” activities were quite small. This indicates that some users
were having difficulties in completing the process instances involving some specific sub-
0.0000.5001.0001.5002.0002.5003.0003.5004.0004.500
Ave
rage
Th
rro
ugh
pu
t Ti
me
Business Process Activities
Best Process
Median Best Process
Performer B

77
design schematic activities, even though they were able to perform well in other activities. For
these novice-level users, highly demanding and complex activities such as “design general
electric schematics” and “design air-conditioner schematics” should be avoided.
Figure 5.5: Design schematics sub-activity comparison of all performers
A recommendation is then given to the users at the novice level not to perform these
difficult activities for now, as it will contribute to a worsening of the whole business process
instance. The best past process instance is shared with the users to be used as the recommended
process instance for learning. The recommendation includes some key information for the
users, such as the throughput time to be spent to complete the process instance and which
process variants may be suitable for the specific level of user.
5.5 Summary and Evaluation
The work carried out in this chapter is based on the premise that personalised recommendation
is far better than a generic recommendation to improve business process performance.
Realistically, individual users will have different levels of work capacity and potential and
different experience levels. Personalised recommendation is delivered to help achieve a better
learning results. This chapter presented the set of approaches to provide a personalised
recommendation to business process users. By utilising personalised recommendation, it will
0
0.5
1
1.5
2
2.5
3
3.5
4
4.5
Thro
ugh
pu
t Ti
me
Design Schematics Sub Activities
Performer A
Performer B
Performer C
Performer D
Performer E

78
ensure that only an appropriate practice is communicated to users so what they learn from those
in the past can be connected to possible future performance.
The evaluation conducted in this chapter was intended to provide a clear understanding of
the working of the proposed approach as well as to present a preliminary evaluation of the
developed methods. However, this work is not without limitations. The segregation between
the novice, advanced and expert levels is based on the selection of a specific process instance
which shows how a process instance was performed. As clarified in the discussion above, a
process instance consists of many activities that were performed by multiple users. While the
best past process instance overall is considered to be the best among others, it does not mean
that each activity inside the corresponding process instance is the best among others. To
overcome this limitation, an aggregate of the throughput time spent on activities by users is
proposed to measure the users’ performance against the best past process instance and to
classify which user belongs to which level. This ensures that users can receive the most suitable
recommendation which is closest to their current level of performance.
The methods presented in this chapter incorporated a multiple criteria-based ranking
procedure to identify the best practices from previous instances and provide a personalised
recommendation based on the initial information about the individuals’ current level of
experience. This procedure assists in the development of an effective experience-driven
learning mechanism within an organisation. The next chapter presents an integrated framework
of business process complexity, and discusses how complexity in the business process affects
the business process performance.

79
Chapter 6
Complexity in Process Performance Improvement
6.1 Introduction
This chapter discusses the key challenge of how to strike the right balance between complexity
and performance. To date, studies on the complexity in business processes have primarily
focused on the structural aspect of complexity. However, given the subjective nature of
complexity, it is important to expand the notion beyond the structural dimension in order to
provide a more accurate understanding of process complexity. This chapter presents an
integrated framework for business process complexity analysis that spans across the structural,
variability and performance dimensions.
6.2 Complexity in Business Process
Complexity theory is widely studied in many disciplines including computer science,
economics and social science. While it does not necessarily determine how effective a system
is, complexity has significant cognitive aspects which contribute to the understandability and,
consequently, the overall success of a system. Interestingly, complexity, which is intuitively
viewed as an inhibitor of success, is also being used as the basis of innovation and development
(Damanpour, 1996; Locke et al., 1981). Nevertheless, if complexity is left unchecked, systems
can become over-complicated and organisational performance is affected.
Complexity is a challenging issue in many organisations. Even though it is widely
acknowledged, many organisations treat complexity as an uncontrollable aspect. The business
process flows often carry multiple kinds of complexity that affect the cognitive aspects of the
process performer and contribute to the success of business process implementation.
Complexity occurs in many organisations because of the growth of business process
implementation, the different types of individuals who enact the business process, or external
pressures such as changes in competition and regulations and challenges from the ever-
changing environment.

80
Various aspects of complexity have been studied in the context of business process
management. Complexity is considered inherent to the business process (model), and is
expected to increase as the number of activities and/or their inter-relationships grow (Cardoso,
2008). Complex processes can create a detrimental effect as complexity introduces a higher
rate of error probability in performing activities (Cardoso et al., 2006). Business process
complexity has a direct relationship with business process performance. It is often necessary
to introduce some degree of complexity in a business process due, for example, to the
introduction of new regulations or organisational growth, as well as due to introduction of
elements in the business process that will lead to process improvement. At the beginning,
organisations can gain benefits from implementing a more complex process as it will lead to
better business process performance. However, without properly understanding the
complexity, the complexity in the business process system can proliferate, becoming a
deterrent to success and affecting the efficiency of the business process. Recapping on the
discussion in Chapter 2, Figure 2.3 presents a complexity curve, which is an inverted U-shaped
graph showing that complexity starts as a beneficial aspect, but once it reaches its tipping point,
it will degrade the individual’s performance (Flood and Carson, 1993).
Figure 6.1: Impact of complexity on individuals’ performance (Flood and Carson, 1993)
In recent decades, researchers have promoted many approaches to improve the business
process through skill development, transformation capabilities, and business process
management. Two notable concepts in the literature are business process improvement and
business process redesign (Mansar and Reijers, 2005; Siha and Saad, 2008). Both concepts
focus on the structure of the business process by redesigning the business process model,
introducing improvement stages, process mapping and benchmarking. While those concepts
provide a sound structural overview, according to Zellner (2011), both lack focus on the act of
Performance
Optimum Point
Complexity

81
improvement, as the approaches do not directly consider the process performers, that is, the
people behind the processes. The premise of these concepts is that, as the process model is
structurally improved, process performance improvement will be naturally achieved. However,
true process improvement is often realised with the improvement in the performance of the
process performers. Process redesign offers newly redesigned process models which often are
alien to performers. This situation adds another level of complexity that has to be rectified by
the process performers.
It is evident that complexity within a business process could manifest itself in a variety of
ways. A business process itself is represented through a number of aspects. As explained by
Heinl et al. (1999), business processes are characterised by the data flow, the control flow, the
assignment of individuals to the process activities, and applications that perform the process
activities. In a further breakdown of the business process, it is found that the activities which
construct a business process are characterised by dimensions including: the structure, skill and
organisational requirements; and the person-process interactions, difficulty, familiarity, and
intrinsic interest (Wood, 1986). These dimensions contribute to the complexity of a business
process. To understand complexity better, organisations should first recognise the existence of
complexity on all dimensions of a process and its constituent activities, and then measure the
complexity level. Only then will the impact of the complexity on the process performance be
fully understood.
To our best knowledge, recent studies on business process complexity have dealt primarily
with the structural dimensions of business processes (Cardoso, 2006; Mendling et al., 2007;
Muketha et al., 2010). There is evidence that structural factors influence the ability to
understand the business process (Mendling et al., 2007). An understandable structural
dimension of business process i.e. process model, enhances the knowledge base about causal
connections between process and its sub-processes (Modarres, 2006). It is also to be noted that
the goal of the process model is to change the behaviour of the performer of business process
to the desired process performance (Münch et al., 2012).
In the structural dimension, the common method to measure complexity is through the size
of the process model, the flow within the process model, and the modularisation (Cardoso,
2006). In this structural dimension, some studies such as Cardoso et al. (2006), Rolón et al.
(2009) and Gruhn and Laue (2006b) have encouraged the measurement of the business process
to be conducted through the process model and adapted from the measurement of software
complexity. As in software development, where complexity is measured through factors such
as the size and number of control paths, business process complexity is measured by its number

82
of activities, the existence of handlers (such as event handlers, fault handlers and compensation
handlers), and the number of sub-processes (Cardoso et al., 2006).
In addition, when there is variance in a process model (e.g., to support flexibility in the
business process) (Lu and Sadiq, 2007), the study of structural complexity becomes more
challenging as a large number of process variants may exist within the same process. The
reasons for process flexibility are well studied (Reichert et al., 2003; Sadiq et al., 2005). The
flexibility afforded to process performers is often a consequence of such reasons; however,
with this flexibility comes a degree of uncertainty, which could lead to (perceived) complexity.
According to Campbell (1988) and Schwab and Cummings (1976), complexity can be found
where some specific characteristics such as the presence of multiple potential ways to achieve
the goals (Lu and Sadiq, 2006) exist. Complexity also emerges with the existence of multiple
desired outcomes (Campbell, 1988), and the existence of exception handling (Lohmann, 2008).
At the execution level, person-process interactions, skill level and the inherent nature of
the activity will be some of the factors that contribute to the performance of a given activity
and its (perceived) complexity. Previous studies also indicate the presence of performance-
related dimensions, such as in Wood (1986) where skill, organisational requirements and
person-process interactions were found to be significant factors in influencing process
performance and consequently a key indicator of real or perceived complexity. For example,
consider the buy-sell process in a stock exchange. A stockbroker basically works by buying
and selling shares and other securities in a stock exchange. The process model of buying and
selling stock is usually simple from a structural point of view. However, it carries a high level
of expertise relating to market dynamics (Nagy and Obenberger, 1994), and this level of
expertise influences the performance of different process activities.
As most recent studies on structural complexity focus only on its measurement (Gruhn and
Laue, 2006a; Muketha et al., 2010; Rolón et al., 2009) and reduction (Gruhn and Laue, 2009),
there is a gap in the integral understanding of complexity. As complexity is an inverted U-
shaped graph, it does not always have to be reduced. On the contrary, some organisations may
introduce complexity to improve their performance. In addition, complexity also emerges in
the person-process interactions. As such, there is a need to consider the complexity analysis of
business processes beyond the structural (or model understandability) level.

83
6.3 An Integrated Business Process Complexity Framework
This section introduces the integrated framework of business process complexity. The
proposed framework consists of three dimensions for business process complexity, namely,
structure, variance, and performance. The framework measures structural complexity through
the size of the process models and the number of splits (such as AND, XOR and OR splits)
using the control flow complexity (CFC) metric measurement as the basis, as introduced by
Cardoso (2008). An AND split in the process model is a notation to indicate parallel flows that
allow two activities to be executed in parallel after completing an activity. An XOR split is a
notation to determine only one flow that satisfies the specified condition (True) among a
number of flows that originate from the split. An OR split is a notation to determine that the
subsequent activities can be any flow, and can be more than one activity that originates from
the split.
The process variance is measured through variant distribution. With multiple ways of
enacting the business process, individuals need to find the most suitable variant. As discussed
above, this is a form of complexity that is encountered when process variance is found
(Campbell, 1988). The process performance also reflects a person-process interaction that
results from the nature of the activity (Payne, 1976). Process performance has been widely
studied and includes measurements such as the time to complete and resource utilisation (Aalst,
1998).
The framework uses the following measures for complexity: non-uniform performances
indicate that there is a degree of complexity which results in performance variation; on the
other hand, uniform performances indicate that the process is either too complex (where most
performers perform poorly) or too simple (where most performers excel). To illustrate the three
dimensions of performance variance, process variance and structural complexity, a three-
dimensional model is created as shown in Figure 6.2.
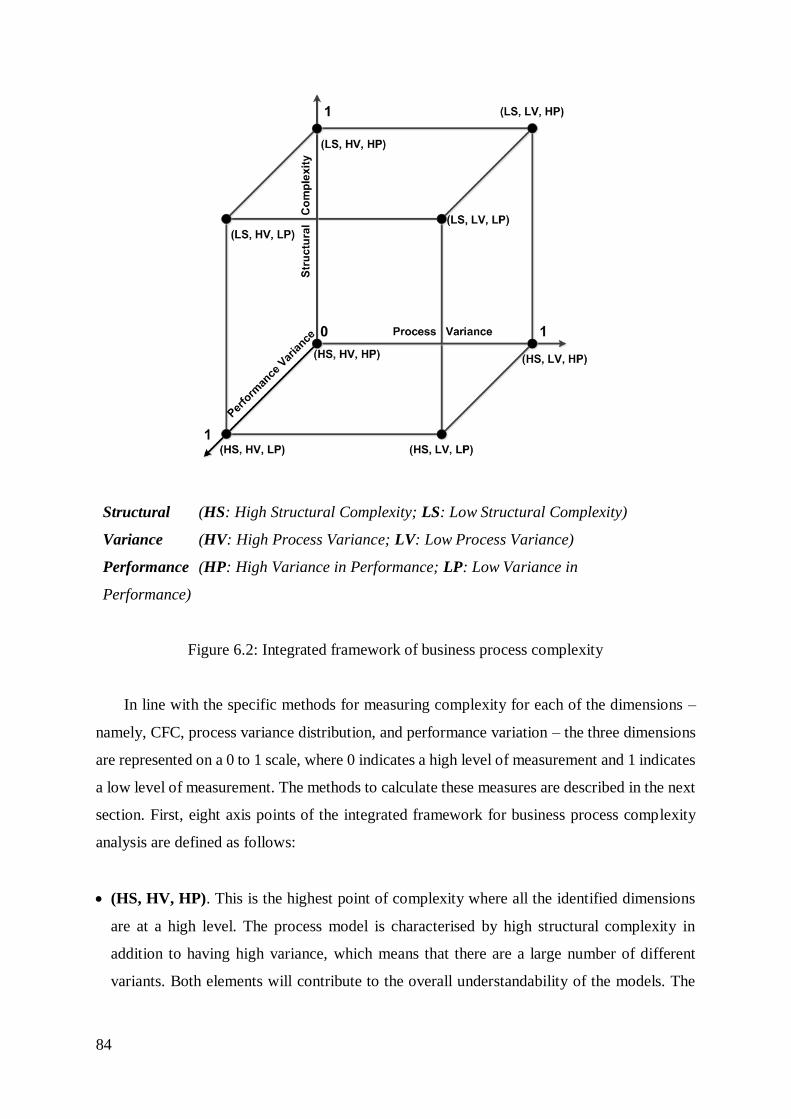
84
Structural (HS: High Structural Complexity; LS: Low Structural Complexity)
Variance (HV: High Process Variance; LV: Low Process Variance)
Performance (HP: High Variance in Performance; LP: Low Variance in
Performance)
Figure 6.2: Integrated framework of business process complexity
In line with the specific methods for measuring complexity for each of the dimensions –
namely, CFC, process variance distribution, and performance variation – the three dimensions
are represented on a 0 to 1 scale, where 0 indicates a high level of measurement and 1 indicates
a low level of measurement. The methods to calculate these measures are described in the next
section. First, eight axis points of the integrated framework for business process complexity
analysis are defined as follows:
(HS, HV, HP). This is the highest point of complexity where all the identified dimensions
are at a high level. The process model is characterised by high structural complexity in
addition to having high variance, which means that there are a large number of different
variants. Both elements will contribute to the overall understandability of the models. The

85
process model characteristics will in turn contribute to both perceived and actual complexity
in performance at the time of execution.
(HS, LV, HP). Process models that have little or no variance can conceivably become rather
complex structurally. Arguably, this could be the result of building a large number of
activities and choices into the process models, which then creates structurally complex
process models (Cardoso, 2008), which in turn may negatively impact on performance as it
increases the cognitive load and results in diminished level of understandability.
(LS, LV, HP). A simple process from the structural point of view is not necessarily always
simple to perform. This point is illustrated in a scenario where what looks simple is not
always simple; for example, the buy-sell process in stock exchange trading. This type of
process requires people with advanced knowledge to perform the activities successfully.
(LS, HV, HP). This point is similar to (LS, LV, HP) except that it introduces flexibility in
performing the business process. Having high process variance requires the selection of the
optimum process activities according to the individuals who perform them (Campbell,
1988). The task to find the “best” variant to suit a particular instance adds a degree of
complexity.
(LS, LV, LP). The nature of this type of process is simple. Structurally, the business
processes are simple, straightforward, less redundant and easy to understand. The absence
of the process variants also amplifies the non-complex status of this process. Basically, this
type of process should have a minimum requirement for high-level skills. It should be able
to be performed by anyone within the organisation. However, the organisation’s
management should be aware that too simple processes lack the stimuli which are the source
of process improvement (Campbell, 1988). The consequence is that the organisation will be
less competitive.
(HS, LV, LP). There is evidence that structural factors influence the ability to understand
and execute the business process (Mendling et al., 2007). Factors such as the individuals’
familiarity with the process, the span of attention and the availability of tools influence the
reception and perception of complexity (Campbell, 1988). The question then arises as to the

86
reasons behind a more-or-less uniform performance. If all performers are under-performing,
then it is likely that structural complexity is an issue that needs to be addressed. If, on the
other hand, most performers are performing well, then the impact of structural complexity is
of lesser importance.
(HS, HV, LP). This point is similar to (HS, LV, LP) above, except that the process model
is also characterised by high variance. Interestingly, if the low variance in performance is
present because most performers are performing at a high level, then this can be viewed as
an ideal situation in which people are able to perform well even though the processes are
structurally complex and contain a high level of variability. An equally likely scenario is that
most performers are performing at a low level.
(LS, HV, LP). The variance level in this type of business process indicates that the business
process model allows significant flexibility in performing the business processes. With low
structural complexity, and a more or less uniform level of performance, the complexity can
be largely attributed to difficulties in finding the best variant to suit a particular instance. It
is noted, however, that uniformity in performance could be due to poor performance by all,
in which case, addressing the complexity due to high variance may become a priority.
As personal factors undeniably influence the performance of individuals (Mendling et al.,
2007), complexity is experienced differently by different performers. Although the structural
complexity and subjective perception of complexity are related, there is no guarantee that both
are identical (Campbell, 1988); even when the structural view seems simple, the process is not
necessarily simple. The real test of complexity lies within the performance of the business
processes. It is necessary to acknowledge that, among other factors, complexity could be a
stimulus for better performance, as a sense of challenge is known to lift performance (Locke et
al., 1981). Unfortunately, when excessive complexity is applied, the performance will decline
to the sub-optimal level again: as Schroder et al. (1967) explained, when the performer cannot
keep up with the demands of the task, the performance will diminish. Achieving the right
balance is indeed a major challenge. The proposed integrated framework can be utilised to
perform a meaningful and accurate analysis of complexity across the different dimensions and
thereby assist organisations in investigating and finding the right balance between complexity

87
and performance. The following sections describe the methods through which the individual
dimensions of complexity can be measured.
6.4 Structural Complexity Measurement
The first axis that needs to be measured is the structural complexity of the business process.
The proposed framework utilises the CFC metrics as introduced by Cardoso (2006). The
metrics are commonly introduced during the development of processes to enhance quality and
maintainability. Mathematically, the CFC is defined as:
𝐶𝐹𝐶 = ∑𝐶𝐹𝐶𝑋𝑂𝑅−𝑠𝑝𝑙𝑖𝑡(𝑎) + ∑𝐶𝐹𝐶𝑂𝑅−𝑠𝑝𝑙𝑖𝑡(𝑎) +∑𝐶𝐹𝐶𝐴𝑁𝐷−𝑠𝑝𝑙𝑖𝑡(𝑎)
= ∑𝑓𝑎𝑛 − 𝑜𝑢𝑡(𝑎) + ∑2𝑓𝑎𝑛−𝑜𝑢𝑡(𝑎)−1 + 1 ∗ 𝑚
(6.1)
where a is an activity within business process k, m is the number of splits, and fan – out
indicates the number of branches.
Cardoso (2006) posited that the higher the value of the CFC, the more complex the process
model. However, no threshold value has been defined to determine the level of complexity.
Sánchez-González et al. (2011) introduced a threshold for CFC but their threshold
measurements are very limited to their case studies and the threshold is based on the cognitive
ability of the individual. Hence, the present study introduces a simple objective CFC threshold
measurement for the structural complexity, measured by:
𝐶𝐹𝐶_𝐶𝑜𝑚𝑝𝑙𝑒𝑥𝑖𝑡𝑦𝑙𝑒𝑣𝑒𝑙 =|𝑠𝑝𝑙𝑖𝑡_𝑐𝑜𝑛𝑡𝑟𝑜𝑙|
𝐶𝐹𝐶
(6.2)
where split_control is a point within the workflow of the process model where a single thread
of control splits into multiple branches. The above formula guarantees that 0 <
𝐶𝐹𝐶_𝐶𝑜𝑚𝑝𝑙𝑒𝑥𝑖𝑡𝑦𝑙𝑒𝑣𝑒𝑙 ≤ 1. It is thereby defined that a process has low structural complexity
if the 𝐶𝐹𝐶_𝐶𝑜𝑚𝑝𝑙𝑒𝑥𝑖𝑡𝑦𝑙𝑒𝑣𝑒𝑙 > 0.5 and high otherwise. If the process is also characterised by
variance (as discussed in the next section), then with m process variants, the
CFC_Complexitylevel value will be:

88
𝐶𝐹𝐶_𝐶𝑜𝑚𝑝𝑙𝑒𝑥𝑖𝑡𝑦𝑙𝑒𝑣𝑒𝑙 =∑ 𝐶𝐹𝐶_𝐶𝑜𝑚𝑝𝑙𝑒𝑥𝑖𝑡𝑦𝑙𝑒𝑣𝑒𝑙𝑖𝑚𝑖=1
𝑚
(6.3)
6.5 Variance Measurement
The next axis of the business process complexity framework relates to process variants. Process
variants show alternatives through which a business process goal is to be achieved. Variants
can include differences in activity sets and paths or a combination of both (Lu et al., 2009). In
order to determine how many variants may exist for a given process scenario, it is often
required to conduct a similarity analysis on the set of variants. There are a number of similarity
functions proposed for process variants (Dijkman et al., 2009; van Dongen et al., 2008).
Without loss of generality, the method used by Lu et al. (2009) and Mahmod et al. (2008) is
utilised as an example to find the similar process variants. Once the similar processes are found,
it is then possible to calculate the distribution of the process variants that are executed by the
performers.
The variance measurement is defined as follows:
𝑝𝑉 = 𝑀𝐴𝑋(𝑃𝑟𝑜𝑐𝑒𝑠𝑠 𝑉𝑎𝑟𝑖𝑎𝑛𝑡 𝑑𝑖𝑠𝑡𝑟𝑖𝑏𝑢𝑡𝑖𝑜𝑛)
𝑖𝑓 𝑝𝑉 ≥ 0.5 𝑡ℎ𝑒𝑛 𝑃𝑉𝑠𝑡𝑎𝑡𝑢𝑠 = 𝐿𝑜𝑤
𝑖𝑓 𝑝𝑉 < 0.5 𝑡ℎ𝑒𝑛 𝑃𝑉𝑠𝑡𝑎𝑡𝑢𝑠 = 𝐻𝑖𝑔ℎ
(6.4)
where pV is a process variant distribution in the execution log of business processes.
For example, suppose that we have three types of process variants. Using similarity
matching, the distribution of the process variants can be calculated. If, for example, the first
variant is found in 95% of all executed process, then the executed business process is said to
have a low variance as only one variant dominated the whole process. If the distribution of
process variants is (0.4, 0.3, and 0.3), then we have a high variance situation. The highest value
of variance distribution occurs when the process variants are in uniform distribution; for
example, 𝑚𝑎𝑥(0.4, 0.3 , 0.3) = 0.4 which is < 0.5, hence the PVstatus is high.
6.6 Measurement of Variance in Performance
Performance is a somewhat subjective aspect of business process complexity and is influenced
by a number of factors such as personal feelings, perception and opinions. Subjective or

89
perceived task complexity (Campbell, 1988) can be used as a validator for structural
complexity measurements as introduced by Cardoso et al. (2006) and Gruhn and Laue (2009)
to determine whether a process is perceived as complex or simple. Since subjective complexity
is indeed a personal factor, it then becomes a qualitative value. Fortunately, this qualitative
value is reflected in the performance of process activities by the performer. To quantify the
subjective complexity, the present study measures the performers’ performance through the
information extracted from the execution log2 of a business process.
Shannon’s entropy of information theory (Shannon and Weaver, 1959) is used as the
method for obtaining the important information about the relevant people-task activities. The
performer’s interaction with the process forms an uncertain value that indicates that various
people work differently in executing the business process. Shannon’s entropy of information
theory is able to quantify the expected value of the information in uncertain data such as found
in the execution log of a business process.
Entropy is an important concept that has been used in many fields such as communication
theory, mathematics, statistical thermodynamics and economics. In the information theory
context, as described by Shannon and Weaver (1959), entropy is a measure of the amount of
uncertainty in the outcome of a random experiment, which is represented by a discrete
probability distribution, pj. The expression of entropy (H) of the probability distribution pj, of
r instances is thus defined as follows:
𝐻(𝑝1, 𝑝2, … , 𝑝𝑟) = −𝑘 ∑ 𝑝𝑗 ℓ𝑛 𝑝𝑗𝑟𝑗=1 , k is a positive constant
(6.5)
where
{
∑𝑝𝑗 = 1
𝑟
𝑗=1
𝑝𝑗 ≥ 0
The entropy concept is principally useful when there is divergence between sets of data.
In business process execution where there are performers of variable skills and experience
levels, the probability of individuals performing differently to each other is high. A complex
process is likely to produce different levels of performance, thus creating divergent records in
2 The IEEE Task Force on Process Mining proposed a standardised format of the execution log, namely the eXtensible Event Stream (Verbeek et al., 2011). The present study utilises this standard.

90
the execution log. On the contrary, simple processes will produce similar values in all records.
The implementation of Shannon’s entropy of information theory can easily determine the
performance variation within the execution logs.
In any process, but especially in processes that are characterised by variance, it is typical
to find a large diversity in the complexity of the process. For example, in a financial institution,
a customer registration process’s cost might not vary as this is a relatively simple process;
whereas, for another process such as insurance claim processing, the time and the cost may
vary significantly depending on who undertakes it. Thus, the more intensive or complex the
process, the more impact it has on the performance of the overall instance. It should be recalled
that complexity is a useful concept to move the performance from sub-optimal to optimal and
that the performance will fall back to sub-optimal again when it exceeds the capability of the
performer (see Figure 2.3 above).
To measure the complexity of an activity based on how it is perceived by individuals, the
concept of defining the objective weight through entropy in MCDM (Hwang and Yoon, 1981)
is borrowed. Weight determines the relative importance of the attributes or criteria within the
given alternatives. A criterion does not function much when all the alternatives have similar
outcomes. A similar situation arises in determining complexity as the result of people-task
interactions. When every individual performs a process in a similar way, there is less
information that can be learnt. This basically tells us that a uniform performance means a
uniform perception of complexity. On the other hand, when there are contrasts within sets of
data inside the log file, it shows that people are performing it differently; some people might
perform well because of skill or experience. Thus, there can be degrees of subjective
complexity between individuals involved.
To calculate the entropy in a given matrix Y of a business process with m executed process
instances p, and x as the performance score of process instances, the approach used in previous
work (Setiawan and Sadiq, 2011) is used to calculate the performance score of the business
process. The performance score is calculated based on the additive weight method (Hwang and
Yoon, 1981) on the basis of the cost and time attributes:
𝑌 =
𝑝1𝑝2⋮𝑝𝑚
[
𝑥1𝑥2⋮𝑥𝑚
]
𝑝𝑒𝑟𝑓𝑜𝑟𝑚𝑎𝑛𝑐𝑒
(6.6)

91
𝐻(𝑝𝑒𝑟𝑓𝑜𝑟𝑚𝑎𝑛𝑐𝑒) = −𝑘 ∑𝑝𝑗 𝑙𝑜𝑔2 𝑝𝑗
𝑚
𝑗=1
where 𝑘 = 1 log2𝑚⁄
(6.7)
The above formula guarantees a value of 0 < 𝐻(𝑝𝑒𝑟𝑓𝑜𝑟𝑚𝑎𝑛𝑐𝑒) ≤ 1. A diverse
performance, as indicated by the smaller value of H(performance), indicating that the process
has a substantial level of complexity as the performance between different people varies
significantly. On the other hand, a uniform performance of the business activity where
𝐻(𝑝𝑒𝑟𝑓𝑜𝑟𝑚𝑎𝑛𝑐𝑒) ≅ 1 indicates two possible interpretations: either the process is too simple
or it is too complicated. When entropy is high (𝐻 ≅ 1), one of the performance scores is
investigated to determine whether the process is too simple or too hard.
6.7 Example Analysis
This section presents an example that provides the requisite datasets needed to analyse the
complexity of a given process through measurement of the three axes of complexity, namely,
the structure, variance and performance. The example is based on the building services
consultancy case study (Setiawan and Sadiq, 2011; Setiawan et al., 2011), as also used in
Chapters 4 and 5. To obtain the required data, the execution data of the bid tendering business
process are collected. This log provides the data for the overall process execution and the
distributions of the throughput time of each activity.
The process that is used as an example follows the lifecycle of a “bid”. A bid represents a
submission by the building services consultancy to an organisation for electrical and
mechanical design work. This submission details what services will be rendered, and in what
way. The bid tendering process, as depicted in Figure 6.3, starts with identifying the
opportunity to submit a bid. This opportunity must first be approved by management. If this is
successful, the bid document is drafted and submitted to the company that requested the
tenders. If the bid is successful, the work detailed in the bid must be completed. This work is
then subjected to internal quality assurance mechanisms before it is released to the client. The
final step in the process is to collect payment from the client.

92
T1: Potential project identified T7: Design fire protection
T2: Proposal submitted T8: Schema issued
T3: Bid drafting &submission T9: ISO certification
T4: Design electric schematics T10: Client invoice generated
T5: Design acoustics schema T11: Payment received
T6: Design air-conditioning
Figure 6.3: Bid tendering process
The bid tendering process allows the existence of process variants for the T4, T5, T6, and
T7 activities, and then the T8 and T9 activities; for example, whether the design schema is
needed or not. Two sample variants are described in Figure 6.4(a) and (b). Both variants have
the same outcome, that is, to deliver the detailed work of the consultancy. In the example, based
on the data distribution finding, it is found that the first variant holds 75% cases (𝑝𝑉 ≥ 0.5);
hence, the variant measurement indicates a low process variance in the case study business
process.
(a)
(b)
Figure 6.4: Bid tendering process variant samples
The CFC from Figure 6.4(a) is then calculated using Equation 6.2, and if is found that the
CFC is 11. The CFC_Complexitylevel-a is 5/11 = 0.4545. The CFC of Figure 6.4(b) is equal to 9,
T1 T2 T3
T4
T5
T6
T7
T8
T9
T10 T11
T1 T2 T3
T4
T5
T6
T7
T8
T9
T10 T11
T1 T2 T3
T4
T5
T6
T7
T8
T9
T10 T11

93
and the CFC_Complexitylevel-b is 5/9 = 0.5556. Using Equation 6.3, it is found that the
CFC_Complexitylevel is 0.5051; hence, the process is a simple business process.
Table 6.1:Values of CFC metrics from Figure 6.4(a) and (b)
CFC Metric Figure 6.4 (a) Value CFC Metric Figure 6. 4(b) Value
CFCXOR-split(afterT2) 2 CFCXOR-split(afterT2) 2
CFCXOR-split(afterT3) 2 CFCXOR-split(afterT3) 3
CFCXOR-split(afterT4) 3 CFCXOR-split(beforeT8T9) 2
CFCOR-split(beforeT4T5) 3 CFCAND-split(beforeT4T5) 1
CFCAND-split(beforeT8T9) 1 CFCAND-split(beforeT6T7) 1
11 9
The last step to be performed is to measure the process performance measurement using
the entropy concept. The performance score of the executed process is presented and then the
entropy is measured. Each process instance performed has a performance score as prescribed
in Table 6.2. The calculation of the performance score is based on Setiawan and Sadiq (2011),
and is computed using the SAW method (Hwang and Yoon, 1981) on the basis of time and
cost attributes.
Table 6.2: Entropy of performance
Process Instance Performance Score pj * log2pj
p1 20 0.196677
p2 20 0.196677
p3 100 0.478616
p4 20 0.196677
p5 100 0.478616
p6 50 0.348004
p7 70 0.413336
p8 20 0.196677
p9 40 0.306397
p10 20 0.196677
𝑯(𝒑𝒆𝒓𝒇𝒐𝒓𝒎𝒂𝒏𝒄𝒆) = −𝒌∑ 𝒑𝒋 𝒍𝒐𝒈𝟐 𝒑𝒋 = 𝒎𝒋=𝟏 0.905604
The entropy of the performance indicates that there is a substantial complexity measured
from the variability found in terms of the business performance distribution. Hence, for this
particular business process, the integrated complexity framework indicates that the business
94
process is at the (LS, LV, HP) point. This type of complexity explains that even though the
business process is not characterised by structural complexity, and there is low variability, there
is a significant variation among the different performers. This description of the complexity
was aligned with the organisational settings within the building services consultancy firm,
where there were several experienced members as well as a large number of trainees and
apprentices. An understanding of the complexity thus allows the management to direct
resources and priorities accordingly in order to improve the overall process performance. That
is, rather than focusing on process redesign or removing variance/flexibility, the focus should
be on better training and induction mechanisms. Hence, the complexity of business process is
not always to be seen as something that needs to be reduced. In cases where the reduction of
complexity is necessary, for example where there is high structural complexity, it can be
reduced using the approach proposed by Gruhn and Laue (2009).
6.8 Summary
This chapter presented an approach for business process complexity analysis that uses an
expanded notion of complexity, well beyond the current understanding that limits process
complexity to the process model structure. The development of the proposed integrated
framework considered factors additional to the process model structure, the variability of the
process, as well as the execution performance measures. Concrete measures were proposed for
computing the complexity value of the structure, process and performance dimensions. The
evaluation of the framework found that the framework is able to provide a more meaningful
and accurate reading of the process complexity.
The proposed framework helps to consider the notion of complexity from both positive
and negative aspects, since the reduction of complexity (e.g., simplification of process models)
is not always the right approach as evidenced in the case study in this chapter. Embracing
complexity and striking the right balance between complexity and performance is the key
feature of the proposed framework.
At the same time, it is also acknowledged that there may be further aspects of business
process complexity beyond the three dimensions considered above. For example, Steinmann
(1976) identified the number of information sources (i.e., cues) that need to be processed by
the process performer as another source of complexity. The amount and nature of the data that
the performers need can also be an indicator. It is also noted that within a dynamic and flexible
environment such as the dynamic case management platform, ad-hoc activities are introduced
(Le Clair and Miers, 2011). The ad-hoc and dynamic activities could potentially add to the

95
complexity within the business process. In future work, business process complexity analysis
could employ these aspects. Further empirical studies could also be conducted to evaluate the
meaningfulness and value of the complexity analysis provided by the integrated framework in
terms of process change and improvement strategies.
The next chapter presents an evaluation of the proposed socialisation of work practices
framework for business process improvement. The evaluation uses a simulation tool, namely,
the PRIMe system, which is developed to provide proof of concept of the framework by
analysing the performance of performers from event log data.

96

97
Chapter 7
PRIMe Process Improvement Tool
7.1 Introduction
The experimental approach is used as the evaluation method in this study. A prototype system,
namely, the Process Improvement (PRIMe) system, is developed for the evaluation. PRIMe is
a web-based system that uses synthetic data as a test-bed for the research as well as real-world
data that acts as the external validator to evaluate the usefulness of the proposed framework.
PRIMe is developed to provide proof of concept of the socialisation of work practice for
business process improvement framework by analysing the performance of process performers
from an event log.
The goal of the PRIMe tool is to operate as an instrument that delivers the knowledge
captured from best past practices to the relevant groups, namely, management and personnel
(employees). The tool allows an organisation’s stakeholders (management and personnel) to
analyse the information, read the report and receive recommendations related to their current
performance. The tool is available online at: https://prime.andrisetiawan.com
7.2 Conceptual Approach
The concept behind the PRIMe tool is that it will aid in the synthesis of best past practices in
the business process performed by positive deviants via the analysis of event logs and the
creation of reports and recommendations for learning purposes. The event logs of an
organisation’s business process contain instances of the business process being performed. The
PRIMe system generates reports and recommendations based on supplied event logs, sets of
metadata from business process performers, and sets of parameters in the process complexity
component.

98
7.3 PRIMe Tool Implementation
The core modules of the PRIMe tool are the event log processing module, analysis processing
module and feedback-recommender module. Figure 7.1 illustrates the flowchart of the system.
PRIMe starts the process in the event log processing module where the event log, which is in
XES format, is processed. To analyse the event log, it first needs to be transformed into a
relational database. Once an event log has been transformed into a relational database, the
process performer profiles are enriched based on the year in which the performer joined the
organisation. After the process performer profile has been added, the tool analyses and
generates reports and recommendations to be used by the business process performers.
Figure 7.1: PRIMe flowchart
The PRIMe tool facilitates the following processes:
Import the event log in XES format into the analysis tool
Remove event log from the system
Specify metadata of business process performers
Specify parameters of business process complexity
Generate a graphical representation of overall performance of a business process
recorded in an event log
Generate a report of the overall business process
Generate a report on a specific process performer
Generate personalised recommendations to process performers.

99
For the purposes of this study, an event log that is publicly available from
3TU.Datacentrum is utilised (http://data.3tu.nl/repository/uuid:da6aafef-5a86-4769-acf3-
04e8ae5ab4fe). The file is an event log consisting of a synthetic event log of a Review Paper
business process, which was created by the Eindhoven University of Technology. This event
log has 236,360 events (activities), from 10,000 recorded process instances.
7.3.1 PRIMe Environment Set-Up
In this study, PRIMe is installed in a server that runs Apache Web Server with the support of
hypertext preprocessor (PHP) language for the scripting language. For the relational database
management, the server runs MariaDB. MariaDB is a fork of MySQL and is chosen as the
relational database management system as it is known to have better performance. The details
of the server are shown in Figure 7.2. The following sections explain the implementation of
each module in the PRIMe system in detail, namely, the event log processing module (Section
7.3.2), analysis processing module (Section 7.3.3) and feedback-recommender module
(Section 7.3.4).
Figure 7.2: Server specification
7.3.2 Implementation of the Event Log Processing Module
The first module of the tool is the event log processing module which presents a login page
(Figure 7.3). There are two types of users who are able to log in to the system: users with
administrative access (hereafter referred to as “admin users”), and general users. Admin users
have the ability to manage the event log, perform analysis, manage process performers’
profiles, manage event logs and read the overall reports and recommendations. General users
have a different level of access which only enables them to maintain their own profile and read
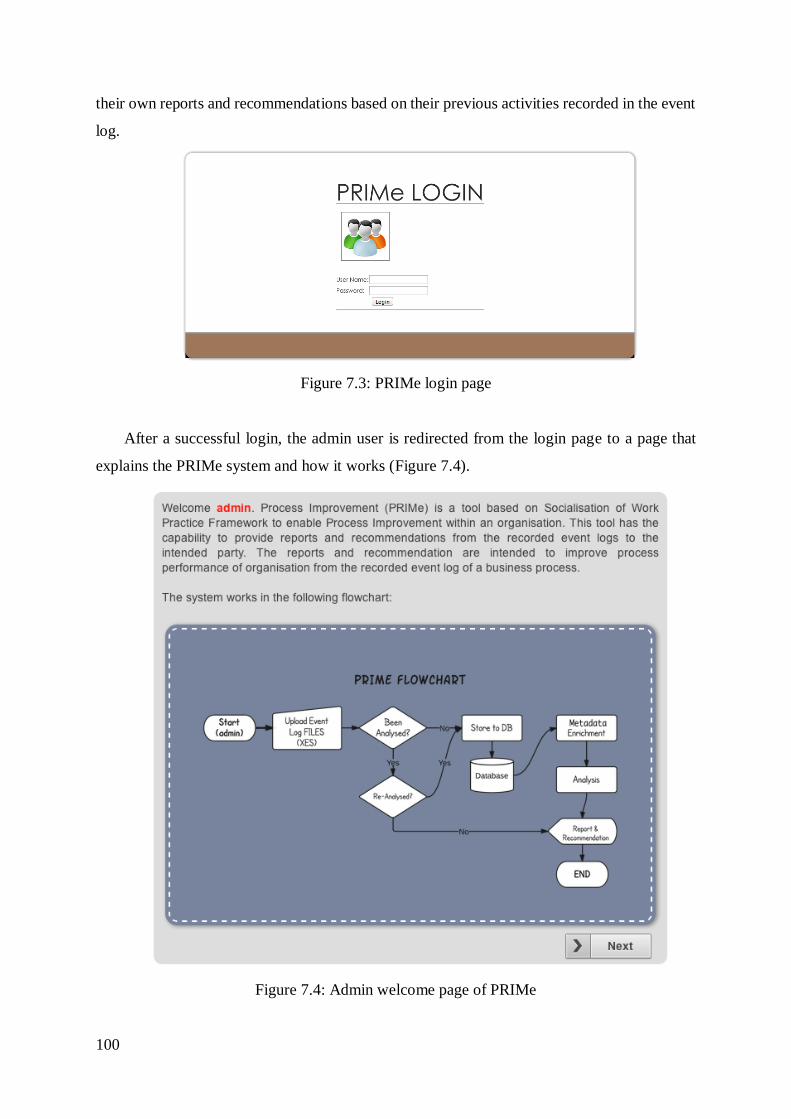
100
their own reports and recommendations based on their previous activities recorded in the event
log.
Figure 7.3: PRIMe login page
After a successful login, the admin user is redirected from the login page to a page that
explains the PRIMe system and how it works (Figure 7.4).
Figure 7.4: Admin welcome page of PRIMe

101
One of the important components of the event log processing module is the event log
upload page. Only admin users are able to upload the event log to the designated folder. The
event log will be stored in the folder named “XES” under the PRIMe tool installation folder.
The tool gives admin users the option to upload the event log in XES format (Figure 7.5). An
admin user who has direct access to the PRIMe installation folder can also upload the event
log file directly to the “XES” folder using a tool such as a file transfer protocol or secure copy
protocol client application. In the present study, all the XES files are kept in the
“thesis\prime\XES” folder.
Figure 7.5: XES upload page
After the event log file has been uploaded, a list of event log files is presented in the
subsequent page of the PRIMe system (Figure 7.6). In this study, a large.xes event log file was
uploaded to the XES folder of PRIMe. PRIMe system assumes that the event log contains only
one business process.
Figure 7.6: List of event log files
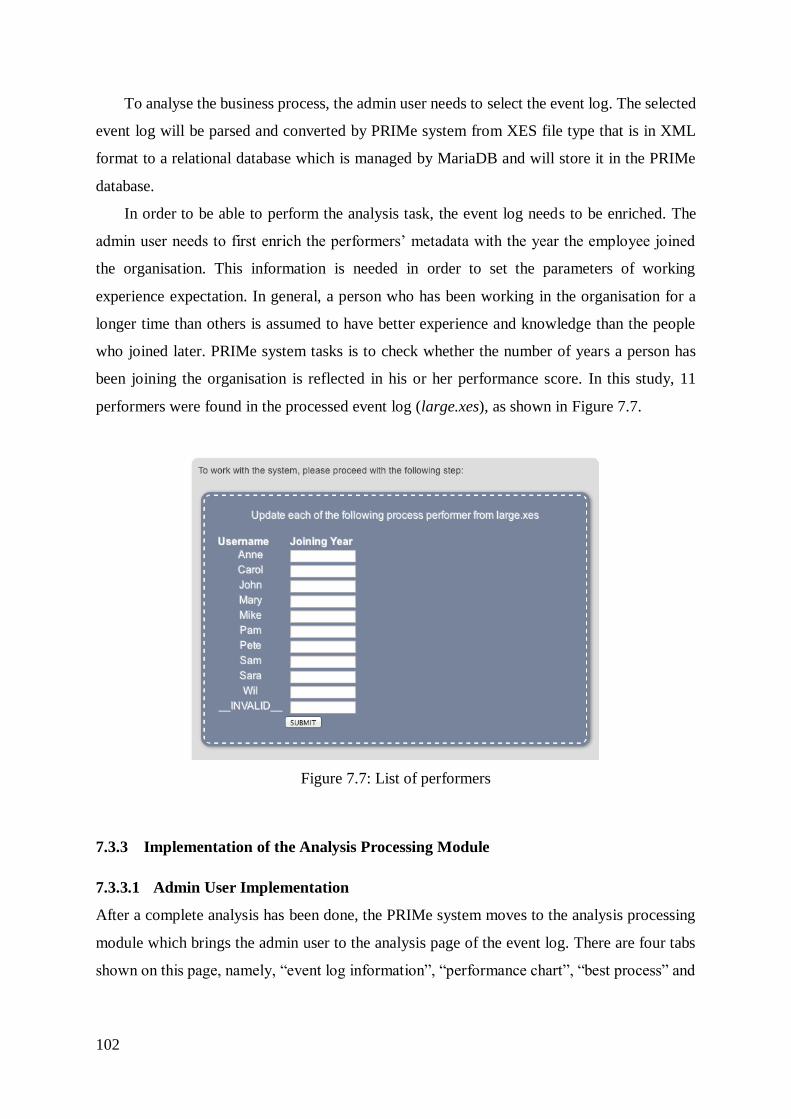
102
To analyse the business process, the admin user needs to select the event log. The selected
event log will be parsed and converted by PRIMe system from XES file type that is in XML
format to a relational database which is managed by MariaDB and will store it in the PRIMe
database.
In order to be able to perform the analysis task, the event log needs to be enriched. The
admin user needs to first enrich the performers’ metadata with the year the employee joined
the organisation. This information is needed in order to set the parameters of working
experience expectation. In general, a person who has been working in the organisation for a
longer time than others is assumed to have better experience and knowledge than the people
who joined later. PRIMe system tasks is to check whether the number of years a person has
been joining the organisation is reflected in his or her performance score. In this study, 11
performers were found in the processed event log (large.xes), as shown in Figure 7.7.
Figure 7.7: List of performers
7.3.3 Implementation of the Analysis Processing Module
7.3.3.1 Admin User Implementation
After a complete analysis has been done, the PRIMe system moves to the analysis processing
module which brings the admin user to the analysis page of the event log. There are four tabs
shown on this page, namely, “event log information”, “performance chart”, “best process” and

103
“average performance”. Each tab contains specific information about the event log being
analysed.
In the first tab of the analysis page (Figure 7.8), Event Log Information, the user is
presented with information about the name of the event log being processed, the number of
events being analysed, and the number of performers who performed the business process. This
information helps the admin user to sense how big the event log is.
Figure 7.8: Analysed event log information
Based on the information in this study’s example, the event log records 11 business
performers who performed 10,000 process instances of a business process. In the second tab,
Performance Chart, the admin user is presented with a performance chart (Figure 7.9).

104
Figure 7.9: Performance chart
In the second tab, the admin user can see the overall performance of all the recorded
business process instances of the analysed business process. The chart itself is presented in bar
graph form, from which the admin user can identify how well the business process instances
were performed across performers. The chart shows the performance score against the process
instance. The performance score has already been calculated by the PRIMe system using the
approach presented in Chapter 4. The relatively uniform result in the performance chart shown
above in Figure 7.9 indicates that most of the process instances were performed in a similar
way with some minor exceptions.
In the third tab, Best Process, as shown in Figure 7.10, the admin user is presented with
the process IDs of the best process instances from the event log. The PRIMe system has already
allocated the process IDs based on the methods presented in Chapter 4 and Chapter 5. The best
past performance is used as the source of knowledge for business process improvement.
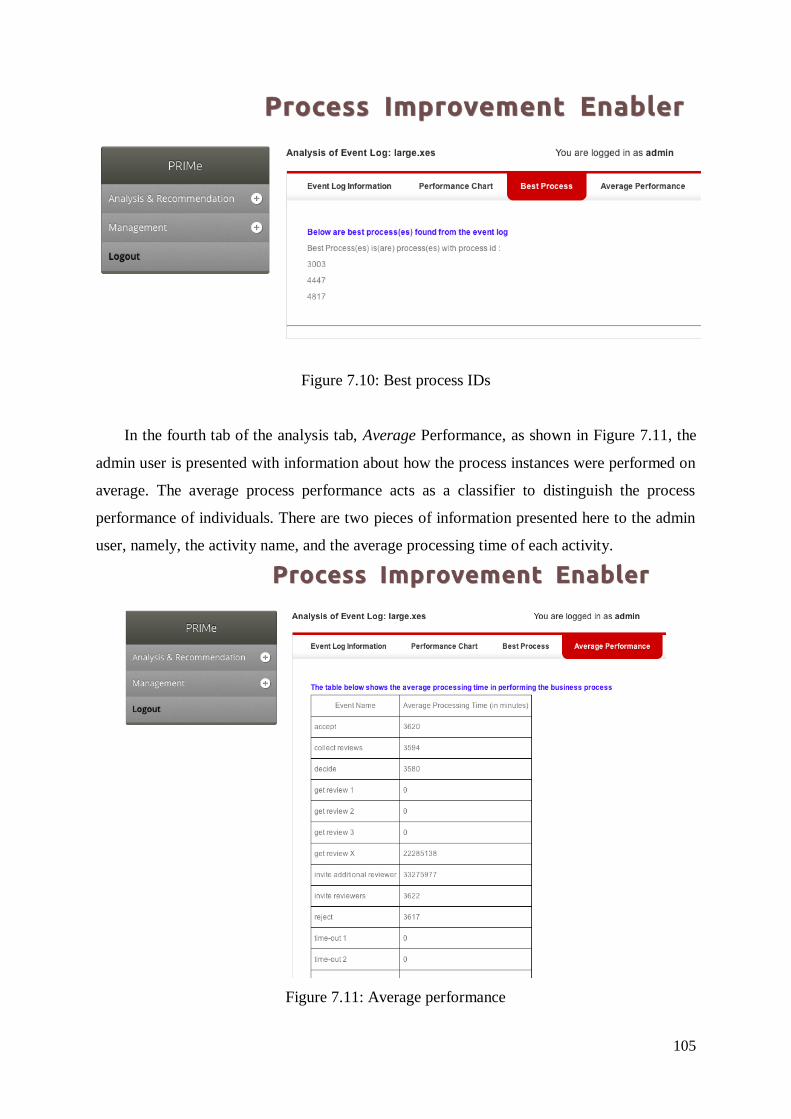
105
Figure 7.10: Best process IDs
In the fourth tab of the analysis tab, Average Performance, as shown in Figure 7.11, the
admin user is presented with information about how the process instances were performed on
average. The average process performance acts as a classifier to distinguish the process
performance of individuals. There are two pieces of information presented here to the admin
user, namely, the activity name, and the average processing time of each activity.
Figure 7.11: Average performance

106
Each event’s average value will be used in the future to cluster the process performers.
The process performers are clustered into novice, advanced and expert performers as explained
in Chapter 5. This classification is useful for delivering the individualised recommendations to
each performer. When a performer logs in to PRIMe as a general user, he/she will receive the
recommendation according to his/her own current process performance. A further explanation
of this procedure is provided in the section on the feedback-recommender for general users.
7.3.4 Implementation of Feedback-Recommender
7.3.4.1 Feedback-Recommender for Admin Users
An admin user is presented with the recommended process page as shown in Figure 7.12. This
page presents a summary of how the activities should take place in order to achieve the best
process performance. The admin user is presented with information on the name of the activity
and how the activity should be performed. The recommended performance is the best
performance found from the recorded event log, but does not necessarily fit all process
performers; for example, the best past practice might not be suitable for novice performers. A
further refinement is necessary in order to generate the personalised recommendation.

107
Figure 7.12: Recommended process
7.3.4.2 Business Process Complexity Recommender
The business process complexity analysis tool is mainly useful for managers who want to
understand more about the business process complexity. This tool will provide users with the
report/recommendation according to complexity as measured by the tool. As discussed in
Chapter 6, Section 6.2, even though complexity is often seen as a negative factor, process
complexity can become a success factor if it is managed properly.
In order to analyse the complexity of the business process, the admin user needs to fill in
some parameters obtained from the business process model (Figure 7.13). The method of
obtaining the parameters was set out in Chapter 6. To obtain the process model from the event
log, admin users can refer to the organisation’s documentation on its process model, or they
can trace the event log to obtain the process model using the process mining (ProM) tool. The
parameters that need to be filled in are the number of splits (where an activity is branched into
two or more paths) and the CFC score. The other complexity aspects, namely, the performance
and variance, are taken from the analysis of the event log.
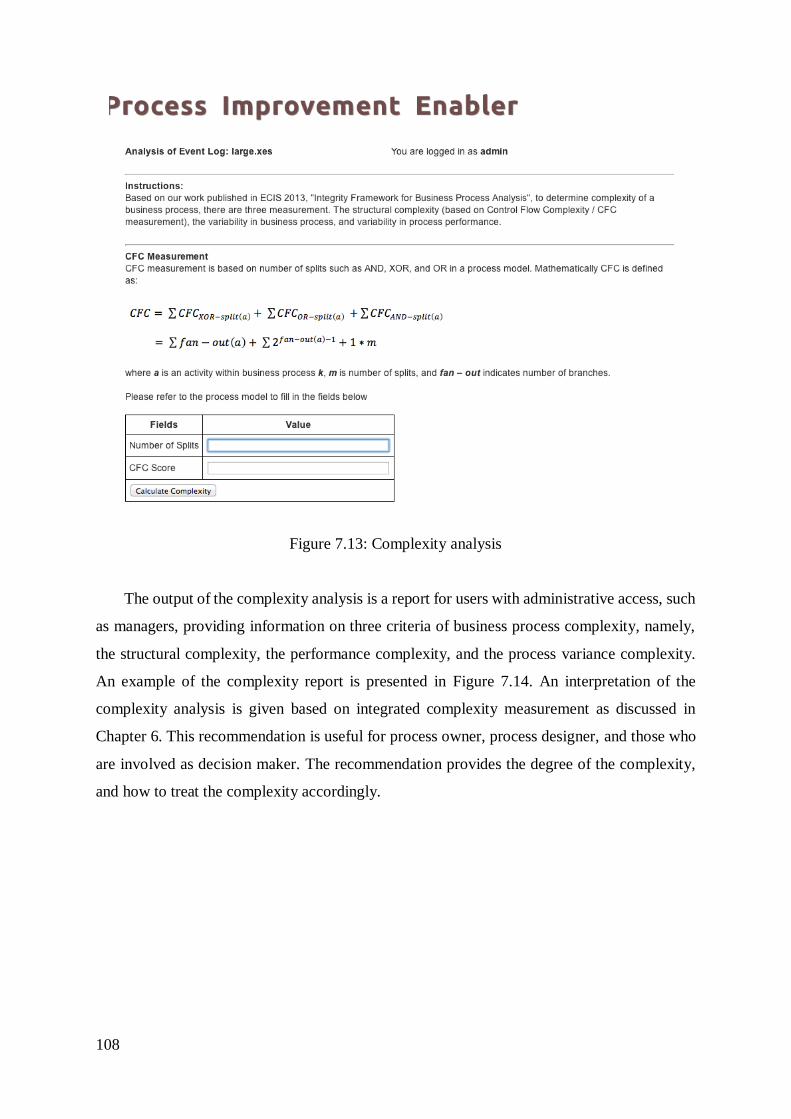
108
Figure 7.13: Complexity analysis
The output of the complexity analysis is a report for users with administrative access, such
as managers, providing information on three criteria of business process complexity, namely,
the structural complexity, the performance complexity, and the process variance complexity.
An example of the complexity report is presented in Figure 7.14. An interpretation of the
complexity analysis is given based on integrated complexity measurement as discussed in
Chapter 6. This recommendation is useful for process owner, process designer, and those who
are involved as decision maker. The recommendation provides the degree of the complexity,
and how to treat the complexity accordingly.

109
Figure 7.14: Complexity analysis report
7.3.4.3 Feedback-Recommender for General Users
After a successful login, general users are directed to the welcome page which explains the
PRIMe system (Figure 7.15). General users are given a menu with two items, namely, “profile”
and “performance analysis”.
Figure 7.15: Welcome page for general users
The performance analysis option presents the general user with three kinds of information
in three different tabs: “performance analysis”, “performance chart” and “recommendation”.
In the performance analysis tab, as shown in Figure 7.16, the general user is presented with
his/her own statistics on performance of the business process. The statistics present information
on how the activities were performed. The general user is also presented with comparisons that
show the average performance for the same activity and the best performance of the same
activity from the same event log. This will help the general user to understand how good his/her
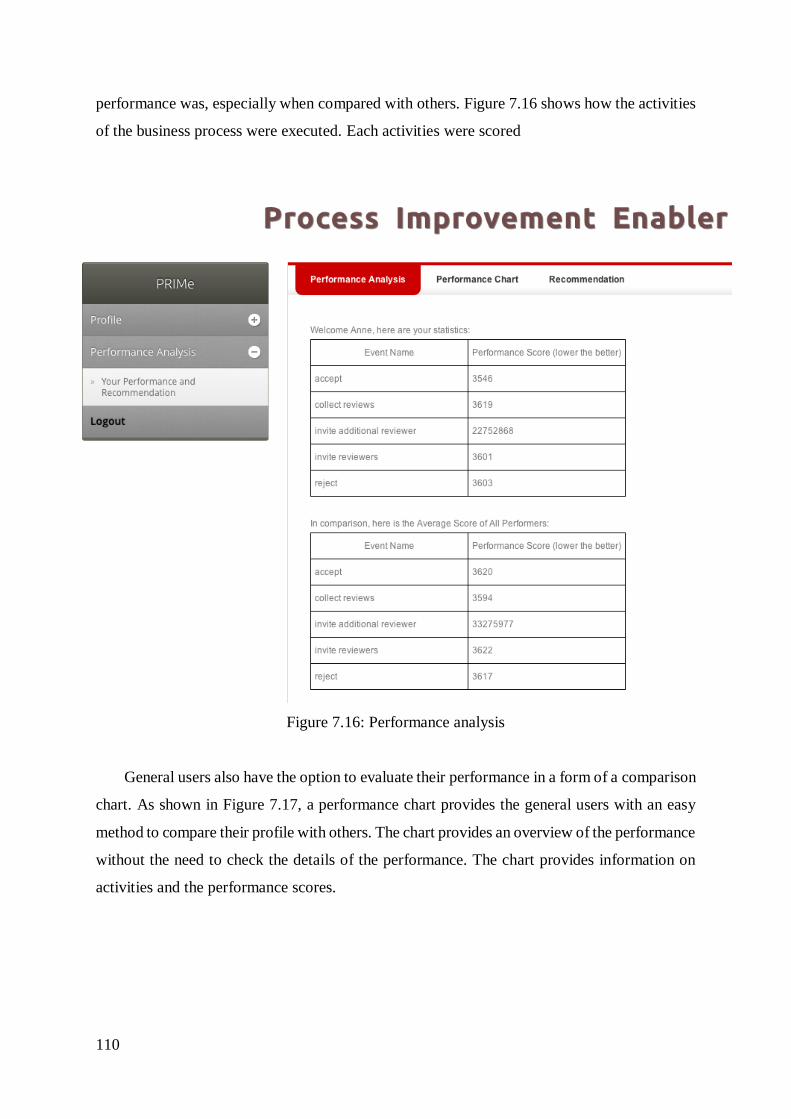
110
performance was, especially when compared with others. Figure 7.16 shows how the activities
of the business process were executed. Each activities were scored
Figure 7.16: Performance analysis
General users also have the option to evaluate their performance in a form of a comparison
chart. As shown in Figure 7.17, a performance chart provides the general users with an easy
method to compare their profile with others. The chart provides an overview of the performance
without the need to check the details of the performance. The chart provides information on
activities and the performance scores.

111
Figure 7.17: Performance chart of two different process performers

112
The last tab of the performance analysis provides a personalised recommendation that
suggests the aim that needs to be achieved by the process performer. Different personalised
recommendations are pre-set by the PRIMe system and delivered to the process performer
according to his/her current performance. Figure 7.18 shows two different recommendations
for two different process performers. In the first one, the performance score was better than
average, and it was recommended that the process performer should aim to achieve the best
performance. The best performance is a reasonable target that can be achieved by this person.
In the second one, the performance score was below average. The best past practice might not
be suitable for this person. Hence, the PRIMe system provides a different recommendation and
suggests that the person aims to improve his/her performance to the average level, which is
considerably easier to achieve.
Figure 7.18: Recommendations for two different process performers
7.4 Management Implementation
7.4.1 Admin User Management Menu
An admin user has privileged access to manage the event log and manage the process performer
list. There are five items on the admin user management menu (Figure 7.19), namely, “analyse
other event log”, “re-analyse event log”, “delete analysis (+ event log)”, “process performer”
and “edit your profile”.

113
Figure 7.19: Management menu
To analyse other event logs, admin users need to click on “analyse other event log” which
will forward the admin user to the XES upload page as shown above in Figure 7.5. Admin
users can also re-analyse the event log when necessary (e.g., if the event log file has just been
replaced directly from the XES folder). The “delete analysis” option can be used to delete the
analysis results of the event log that is currently being analysed and also delete the respective
event log. A confirmation page will prompt the admin user to confirm the delete action (Figure
7.20).
Figure 7.20: Delete analysis confirmation page

114
The management menu allows the admin user to manage the process performers’ profiles
(Figure 7.21) and his/her own profile. To edit a process performer’s profile, the admin user
needs to click on the edit icon in the action column. After the edit page is loaded, the admin
user fills in the form to change any of the details in the profile of the process performer (Figure
7.22) or their own profile (Figure 7.23).
Figure 7.21: Edit process performers’ profiles
Figure 7.22: Edit page of process performer’s profile
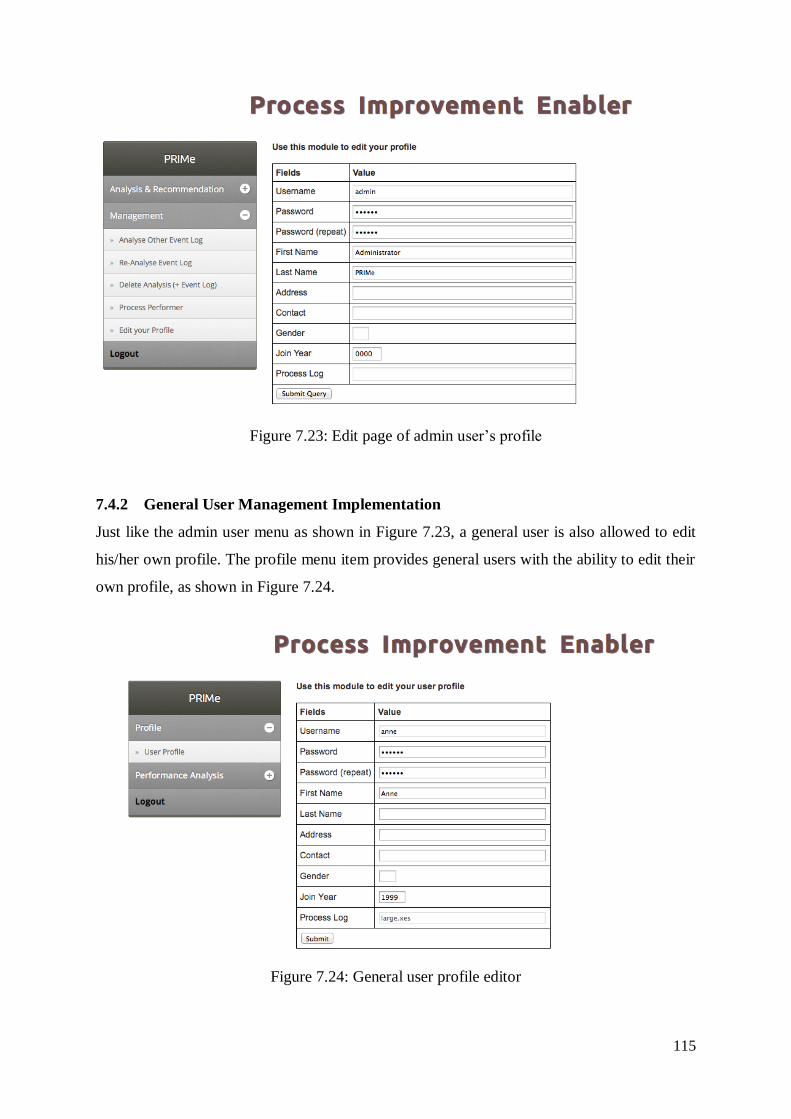
115
Figure 7.23: Edit page of admin user’s profile
7.4.2 General User Management Implementation
Just like the admin user menu as shown in Figure 7.23, a general user is also allowed to edit
his/her own profile. The profile menu item provides general users with the ability to edit their
own profile, as shown in Figure 7.24.
Figure 7.24: General user profile editor

116
7.5 Prototype System Scalability
For the analysis of the PRIMe tool scalability, we shall examine the time consumed to analyse
the event log. Table 7.1 presents the time needed to process the event log file that is in XES
format and then to convert it to relational database.
Table 7.1: PRIMe tool Time Usage to Store Event Log to Database
fileName File Size Number of
Instances
Time to Store to
Database (in seconds)
eventA.XES 10.3 Mbytes 100 5
eventB.XES 69.3 Mbytes 10000 20
eventC.XES 74.1 Mbytes 13087 22
From the data presented by Table 7.1, it can be seen that the process to convert the XES into
relational database and then store it to the database system was relatively fast. Using
interpolating polynomial from presented data above, the processing time from converting XES
to database is following the chart in Figure 7.25. The complexity for this process is O(n2).
Figure 7.25: Time to Store to Database

117
Table 7.2 presents the time needed to analyse an event log. There are factors that may
affect the speed of the analysis e.g. number of instances, number of performers, and number of
activities in a business process.
Table 7.2: PRIMe tool Time Usage to Analyse an Event Log
fileName Number of
Instances
Number of
Performers
Number of
Activities
Time to perform
Analysis (in seconds)
eventA.XES 100 1 68 9
eventB.XES 10000 11 14 30
eventC.XES 13087 69 24 33
From this data, it can be interpreted trivially that the higher the number of instances and
number of performers, the longer it takes to complete the calculation. However, at the number
of activities factor, the interpretation is not as easy as the two other two as it portrayed as an
inverted parabolic chart (Figure 7.26). Thus, it can be assumed that number of instances does
not really affect the performance unlike the two other factors, the number of instances and the
number of performers.
Figure 7.26: Time to perform analysis on the factor of “number of activities”

118
However, the number of instances factor is shown to affect the time in performing the
analysis as depicted in Figure 7.27. The similar situation also applies in the time to perform the
analysis on the factor of number of performers (See Figure 7.28).
Figure 7.27: Time to perform analysis on the factor of “number of instances”
Figure 7.28: Time to perform analysis on the factor of “number of performers”
From the charts above, we can conclude that the complexity of for the analysis process,
the main feature of PRIMe system is O(log N).

119
7.6 Summary and Conclusions
The PRIMe system has been successfully used as the test-bed experiment for the methods and
approaches presented in Chapters 3, 4, 5 and 6. In summary, PRIMe has been implemented as
a prototype system that is able to acquire knowledge from the analysed event logs and deliver
the knowledge accordingly. PRIMe generates reports and recommendations for both managers
and personnel.
The reports and recommendations that are generated for managers (users with
administrative access privileges) will help managers to gain a general overview as well as
insights into the performance of the business process instances executed by the employees as
the business process performers. For general users, PRIMe provides the means to evaluate their
own performance, and provides them with the most suitable recommendation for business
process improvement. PRIMe system also performs well with the complexity of the analysis
function i.e. the core feature of the system is measured as O(log N).

120
Chapter 8
Conclusion and Recommendations for Future Work
8.1 Conclusion
Business process performance plays a crucial role in the competitiveness of an organisation.
Although technological advancements such as those implemented in business process
management systems can improve the performance of a business process, the competitive edge
is difficult to sustain as most organisations eventually adopt similar technologies. Most current
business process improvement methods place an emphasis on redesigning the business process,
which involves the analysis and radical redesign of the process model and activities. However,
not every organisation is the same, even if in the same industry sector. Hence, the same or
similar process improvement solutions from a vendor cannot always deliver the same level of
success. Furthermore, even though process redesign is a pervasive tool, the approach is proven
to add a steep learning curve for employees, especially the inexperienced employees who
struggle to catch up with the new design. In addition, externally sourced process improvement
has its own drawbacks such as the lack of trust and familiarity.
An alternative, and often overlooked, approach that can work as the solution for improving
process performance is a solution from within the organisation. The organisation can identify
experts who perform the business processes with knowledge that constitutes the corporate skills
base and shows how the organisation works at its best. This is aligned with the positive
deviance social theory. In positive deviance, the successful behaviour is identified and
promoted based on the observation that, in any community, there are people whose uncommon
behaviours enable them to find better solutions to a problem than their peers or colleagues.
Exploiting the knowledge from positive deviants in an organisation has unique advantages.
Some studies have suggested that the knowledge of practices carried out by colleagues within
an organisation is regarded as more trustworthy than the knowledge offered by external
sources.

121
However, the lack of explicit articulation obscures this internal knowledge from others.
Therefore, the primary research objective of this thesis was to develop a framework and
consistent methods to capture the best work practice experience from internal experts and
deliver them as recommendations to allow both current and future performers to work at their
full potential. To capitalise on the knowledge of experts, a framework called the socialisation
of work practices framework was developed (Chapter 3). The framework and its methods were
then used (Chapters 4-6) as the conceptual underpinning for the design of a system prototype,
called PRIMe (Chapter 7).
The socialisation of work practices framework is based on organisational learning theories
which explain the concept of acquiring new insights and knowledge from the information and
knowledge that an organisation currently possesses. To gain the new insights, the socialisation
of work practices framework uses an extended notion of the business process event log that
records the events and activities of a business process. The socialisation of work practices
framework is intended to become an enabler of business process improvement by facilitating
the spread of best practices throughout the organization and hence the word “socialisation”.
The interaction among business process users is indeed out of the scope of the thesis. However,
where appropriate, the enabling nature of the framework has been clarified. The next section
summarises the contributions made through the framework and its methods.
8.1.1 Summary of Socialisation of Work Practices Framework
The socialisation of work practices framework consists of three main modules: experience-
driven learning, personalised recommendation, and complexity measurement. The experience-
driven learning module (Chapter 4) is the first and main part of the framework in which the
event log in an eXtensible Event Stream format is analysed. In this module, the framework
successfully captures the best past practices from activities recorded in the business process
event log. In order to capture the best past practices, a set of methods which systematically and
objectively capture the knowledge from internal experts is defined. MCDM methods are
applied to select the best past practices, and the entropy of information theory is used to
objectively weight the importance of the practices based on the three relevant criteria found in
the literature, namely, popularity, cost/efficiency, and currency. Due to the generality of the
presented methods, the three criteria do not limit the applicability of the methods. The
presented methods can be used by other researchers who can extend the criteria further and the
methods will still be valid.
122
The personalised recommendation module (Chapter 5) is designed to cater to different
types of users. Recommendations are delivered and classified based on the user’s performance
in executing a certain type of process instance. The recommendation provided by the PRIMe
system prototype is the one closest to the user’s current level of performance and is therefore
the most achievable. A personalised recommendation not only promotes appropriate learning
paths for an employee, but also provides a means for the employee to self-reflect.
The complexity measurement module (Chapter 6) analyses the business process
complexity beyond most current understandings of business process complexity which limit
the business process complexity concept to the process model complexity point of view. The
present study expands the understanding of business process complexity in a more meaningful
way, with process complexity seen from three perspectives: structural complexity, complexity
caused by process variance, and variance in process performance. Further, the complexity
measurement module considers the notion of complexity from both the positive and negative
aspects. When business process complexity is seen as a negative aspect, steps are taken to
reduce the complexity; however, this was proven to not always be the right approach (Chapter
6).
Finally, this study successfully developed a system prototype, named PRIMe, based on the
socialisation of work practices framework. As an experimental test-bed, PRIMe provides
insightful knowledge to business process users in the form of a report and a personalised
recommendation. The prototype successfully adopts novel strategies to provide an alternative
approach to business process improvement.
8.2 Limitations and Recommendations for Future Work
The methods proposed in this study for improving the performance of business process users
are not without limitations. The positive deviance concept, which is the basis of this research,
requires people within an organisation to interact with the positive deviants who provide them
with knowledge on the best practices or strategies. Although the socialisation of work practices
framework is able to provide business process users with relevant knowledge and information,
it is postulated that a higher level of communication and engagement is required among
business process users and positive deviants. Thus, it is recommended that future research
should focus on the interaction between business process users and positive deviants in order
to improve the learning process. Such interactions can be done in a form of various engagement
programs to create networks of trust and strong professional relationships among co-workers.
The interaction between general business process users and positive deviants, in turn, can boost

123
a positive workplace atmosphere, which enhances employees’ positive perception of their
workplaces. Future research can also investigate additional criteria and factors that influence
the performance of business process users e.g. failure to meet schedule and failure to deliver
required quantity of outcome, capacity utilisation, etc.
The personalised recommendation method adapts a basic approach to classifying and
filtering the most suitable recommendation. However, with the diversity that exists in most
organisations due to factors such as the different backgrounds and interests of employees,
future research could introduce a more advanced technique so that the recommendation
includes a consideration of those diversity factors. This would increase the personalisation
capabilities and effectively pinpoint the most suitable recommendation for each employee.
Finally, the PRIMe tool was developed as a Web-based tool to allow easy accessibility for
users. The framework and the presented methods can also be developed as a plug-in for general
business process management tools. The plug-in can be developed as a module that adds
specific function e.g. reporting and recommendation function in the business process
management tools. Such plug-in development was beyond the scope of this thesis. The
development of the socialisation of work practices framework as a plug-in for business process
management tools would further increase its usefulness to the business process and
organisational learning communities as it adds more functionality to what is already being
delivered by the general purpose tools.

124
REFERENCES
Aalst, W. M. P. V. D. 1998. The application of petri nets to workflow management. The
Journal of Circuits, Systems and Computers, 8, 21-66.
Aalst, W. M. P. V. D. 1999. Flexible workflow management systems: An approach based
on generic process models. Database and Expert Systems Applications.
Aalst, W. M. P. V. D., Hajo, A. R. & Minseok, S. 2005. Discovering social networks from
event logs. Comput. Supported Coop. Work, 14, 549-593.
Aalst, W. M. P. V. D., Hofstede, A. T. & Weske, M. 2003. Business process management:
A survey. Proceedings of the 2003 International Conference on Business Process
Management, June 26-27, Eindhoven, The Netherlands.
Aalst, W. M. P. V. D., Medeiros, A. K. a. D. & Weijters, A. J. M. M. 2006. Process
equivalence: Comparing two process models based on observed behavior. Business
Process Management Journal.
Aalst, W. M. P. V. D., Reijers, H. A., Weijters, A. J. M. M., Dongen, B. F. V., Medeiros,
A. K. a. D., Song, M. & Verbeek, H. M. W. 2007. Business process mining: An
industrial application. Inf. Syst., 32, 713-732.
Aalst, W. M. P. V. D., Weitjers, T. & Maruster, L. 2004. Workflow mining: Discovering
process models from event logs. IEEE Transactions on Knowledge and Data
Engineering, 16, 1128-1142.
Alavi, M. & Leidner, D. E. 2001. Review: Knowledge management and knowledge
management systems: Conceptual foundations and research issues. MIS Quarterly,
107-136.
Anand, A. & Singh, M. 2011. Understanding knowledge management. International
Journal of Engineering Science and Technology, 3, 926-939.
Anderson, L., Krathwohl, D., Airasian, P., Cruikshank, K., Mayer, R., Pintrich, P., Raths, J.
& Wittrock, M. 2000. A taxonomy for learning, teaching, and assessing: A revision
of bloom's taxonomy of educational objectives, abridged edition, Allyn & Bacon.
Argyris, C. & Schön, D. A. 1999. On organizational learning, Wiley-Blackwell.
Armistead, C., Pritchard, J.-P. & Machin, S. 1999. Strategic business process management
for organisational effectiveness. Long Range Planning, 32, 96-106.
125
Berggren, W. L. & Wray, J. D. 2002. Positive deviant behavior and nutrition education.
Food & Nutrition Bulletin, 23.
Biazzo, S. 2000. Approaches to business process analysis: A review. Business Process
Management Journal, 6, 99-112.
Birk, A., Järvinen, J., Komi-Sirviö, S., Oivo, M., Pfahl, D. 1998. PROFES - A product-
driven process improvement methodology. Proceeding of the Fourth European
Software Process Improvement Conference (SPI ‘98), Monte Carlo, 38-44
Bloom, B. S., Krathwohl, D. R. & Masia, B. B. 1956. Taxonomy of educational objectives:
The classification of educational goals, New York, David McKay Company, Inc.
Bollinger, A. S. & Smith, R. D. 2001. Managing organizational knowledge as a strategic
asset. Journal of Knowledge Management, 5, 8-18.
Boud, D., Cohen, R. & Walker, D. 1993. Using experience for learning, Open University
Press.
Bozkaya, M., Gabriels, J. & Werf, J. 2009. Process diagnostics: A method based on
process mining. International Conference on Information, Process, and Knowledge
Management, (eKNOW '09), 22-27.
Broadbent, M., Weill, P. & St. Clair, D. 1999. The implications of information technology
infrastructure for business process redesign. MIS Quarterly, 159-182.
Campbell, D. J. 1988. Task complexity: A review and analysis. Academy of Management
Review, 40-52.
Cardoso, J. 2008. Business process control-flow complexity: Metric, evaluation, and
validation. International Journal of Web Services Research, 5, 49-76.
Cardoso, J. 2006. Process control-flow complexity metric: An empirical validation.
Proceedings of IEEE International Conference on Services Computing (IEEE SCC
06), September 18-22, 2006, Chicago, USA, 167-173, IEEE Computer Society
Press, Los Alamitos.
Cardoso, J., Mendling, J., Neumann, G. & Reijers, H. A. 2006. A discourse on complexity
of process models. Business process management workshops. Springer Berlin /
Heidelberg.
Carter, L. 2003. The change champion's field guide: Strategies and tools for leading
change in your organization, Best Practice Publications, LLC.
126
Centola, D., Gonzalez-Avella, J. C., Eguiluz, V. M. & San Miguel, M. 2007. Homophily,
cultural drift, and the co-evolution of cultural groups. Journal of Conflict
Resolution, 51, 905-929.
Chen, S.-J. J. & Hwang, C. L. 1992. Fuzzy multiple attribute decision making: Methods
and applications, Springer-Verlag New York, Inc. Secaucus, NJ, USA.
Cialdini, R. B. 2001. Harnessing the science of persuasion. Harvard Business Review, 79,
72-81.
Corbett, E. P. J., Myers, N. & Tate, G. 1999. The writing teacher's sourcebook, Oxford
University Press, USA.
Damanpour, F. 1996. Organizational complexity and innovation: Developing and testing
multiple contingency models. Management Science, 42, 693-716.
Davenport, T. H. & Prusak, L. 2000. Working knowledge: How organizations manage
what they know, Harvard Business Press.
Day, R. & Payne, L. 1987. Computer-managed instruction: An alternative teaching
strategy. Journal of Nursing Education, 26, 30-6.
Dessler, G., Futrell, C. & Marks, J. 2004. Management--principles and practices for
tomorrow's leaders, second Canadian edition [by] Dessler, Starke [electronic
resource], Pearson Education Canada.
Dibella, A. J., Nevis, E. C. & Gould, J. M. 1996. Understanding organizational learning
capability. Journal of Management Studies, 33, 361-379.
Dijkman, R., Dumas, M. & García-Bañuelos, L. 2009. Graph matching algorithms for
business process model similarity search. Business Process Management, 48-63.
Ding, J. F., & Liang, G. S. 2005. Using fuzzy MCDM to select partners of strategic
alliances for liner shipping. Information Sciences, 173 (1), 197-225.
Dixon, N. M. 2000. Common knowledge: How companies thrive by sharing what they
know, Harvard Business Press.
dos Santos França, J. B., Netto, J. M., do ES Carvalho, J., Santoro, F. M., Baião, F. A., &
Pimentel, M. 2014. KIPO: the knowledge-intensive process ontology. Software &
Systems Modeling, 1-31.
Drachsler, H., Hummel, H. & Koper, R. 2008. Personal recommender systems for learners
in lifelong learning networks: The requirements, techniques and model.
International Journal of Learning Technology, 3, 404-423.
127
Dubouloz, B. & Toklu, C. 2005. Discovering the most frequent patterns of executions in
business processes described in BPEL. In A. H. H. Ngu, M. Kitsuregawa, E. J.
Neuhold, J-Y. Chung & Q. Z. Sheng (Eds.), Proceedings of the 6th International
Conference on Web Information Systems Engineering (WISE 2005), New York,
USA.
Dutton, J. E., Glynn, M. A. & Spreitzer, G. 2005. Positive organizational scholarship.
Emory University.
Eirinaki, M., & Vazirgiannis, M. 2003. Web mining for web personalization. ACM
Transactions on Internet Technology (TOIT), 3(1), 1-27.
Fiol, C. M. & Lyles, M. A. 1985. Organizational learning. Academy of Management
Review, 10, 803-813.
Fishburn, P. C. 1967. Additive utilities with incomplete product sets: Application to
priorities and assignments. Operations Research, 15, 537-542.
Flood, R. L. & Carson, E. R. 1993. Dealing with complexity: An introduction to the theory
and application of systems science, Springer.
Forster, A., Engels, G., Schattkowsky, T. & Van Der Straeten, R. 2007. Verification of
business process quality constraints based on visual process patterns. In The First
Joint IEEE/IFIP Symposium on Theoretical Aspects of Software Engineering (TASE
2007), IEEE Computer Society, Shanghai, 197-208.
Foster, S. 2012. Mining boom spreads benefits far and wide [Online]. Queensland: The
Courier-Mail Available: http://www.couriermail.com.au/news/queensland/mining-
boom-spreads-benefits-far-and-wide/story-fnbwrpml-1226249237375 [Accessed 17
May 2012].
Frooman, J. 1999. Stakeholder influence strategies. Academy of management review, 191-
205.
Gold, A. H., Malhotra, A. & Segars, A. H. 2001. Knowledge management: An
organizational capabilities perspective. Journal of Management Information
Systems, 18, 185-214.
Gratton, L., Hope-Hailey, V., Truss, K., Stiles, P. & Hailey, V. H. 1999. Strategic human
resource management, Oxford University Press, New York.
Gregor, S. & Hevner, A. R., 2013. Positioning and presenting design science research for
maximum impact. MIS Quarterly, 37(2), 337-356.
128
Gruhn, V. & Laue, R. 2006a. Adopting the cognitive complexity measure for business
process models. 5th IEEE International Conference on Cognitive Informatics (ICCI
2006). IEEE, 236-241.
Gruhn, V. & Laue, R. 2006b. Complexity metrics for business process models.
International Conference on Business Information System (BIS), 2006. 1-12.
Gruhn, V. & Laue, R. 2009. Reducing the cognitive complexity of business process
models. International Conference on Cognitive Informatics, 2009. IEEE, 339-345.
Günther, C. W. & Aalst, W. M. P. V. D. 2007. Fuzzy mining - adaptive process
simplification based on multi-perspective metrics. In G. Alonso, P. Dadam & M.
Rosemann (Eds.), Business Process Management: Proceedings of the 5th
International Conference (BPM 2007), 24-28 September 2007, Brisbane, Australia,
328-343.
Guy, I., Zwerdling, N., Carmel, D., Ronen, I., Uziel, E., Yogev, S. & Ofek-Koifman, S.
2009. Personalized recommendation of social software items based on social
relations. Proceedings of the Third ACM Conference on Recommender Systems,
2009. ACM, 53-60.
Hammer, M. & Champy, J. 1988. Reengineering the corporation, Harper Business.
Harrington, H. J. 1991. Business process improvement: The breakthrough strategy for total
quality, productivity, and competitiveness, McGraw-Hill, Inc.
Heinl, P., Horn, S., Jablonski, S., Neeb, J., Stein, K. & Teschke, M. 1999. A
comprehensive approach to flexibility in workflow management systems. ACM
SIGSOFT Software Engineering Notes, 24, 79-88.
Hevner, A. & Chatterjee, S. 2010. On design theory, Springer.
Hevner, A. R., March, S. T., Park, J. & Ram, S. 2004. Design science in information
systems research. MIS Quarterly, 28, 75-105.
Holsapple, C. W. & Singh, M. 2001. The knowledge chain model: Activities for
competitiveness. Expert Systems with Applications, 20, 77-98.
Hornix, P. T. G. 2007. Performance analysis of business processes through process
mining. Master’s thesis, Eindhoven University of Technology.
Huber, G. P. 1991. Organizational learning: The contributing processes and the literatures.
Organization Science, 2, 88-115.
Hunt, V. D. 1996. Process mapping: How to reengineer your business processes, New
York, John Wiley.

129
Hutchinson, J. & Huberman, M. 1993. Knowledge dissemination and use in science and
mathematics education: A literature review. Directorate of Education and Human
Resources, Division of Research, Evaluation and Dissemination, National Science
Foundation.
Hwang, C.-L. & Yoon, K. 1981. Multiple attribute decision making: Methods and
applications: A state-of-the-art survey, Springer Verlag.
Juran, J. M., Godfrey, A. B., Hoogstoel, R. E. & Schilling, E. G. 1999. Juran's quality
handbook, McGraw Hill, New York.
Karapanos, E., Zimmerman, J., Forlizzi, J., Martens, J. 2009. User Experience Over Time:
An Initial Framework. Proceedings of the SIGCHI Conference on Human Factors
in Computing Systems. 729-738
Karapanos, E. 2013. User experience over time. Modeling Users' Experiences with
Interactive Systems, 57-83. Springer Berlin Heidelberg.
Katz, D. & Kahn, R. L. 1978. The social psychology of organizations.
King, W. R. 2009. Knowledge management and organizational learning, Springer.
Kleinbaum, A. M., Stuart, T. E. & Tushman, M. L. 2013. Discretion within constraint:
Homophily and structure in a formal organization. Organization Science, 24(5),
1316-1336.
Kock, N. 2005. Business process improvement through e-collaboration: Knowledge
sharing through the use of virtual groups, London, Idea Group Publishing.
Kofman, F. & Senge, P. M. 1993. Communities of commitment: The heart of learning
organizations. Organizational Dynamics, 22, 4-23.
Le Clair, C. & Miers, D. 2011. The Forrester Wave™: Dynamic case management, Q1
2011. Available at: http://www.kofax.com/downloads/reports/re-forrester-wave-
case-management-2011-en.pdf
Lee, K. & Allen, N. J. 2002. Organizational citizenship behavior and workplace deviance:
The role of affect and cognitions. Journal of Applied Psychology, 87, 131.
Levitt, B. & March, J. G. 1988. Organizational learning. Annual Review of Sociology, 319-
340.
Lewis, D. 2011. Report reveals Qld mine jobs boom [Online]. ABC Australia. Available:
http://www.abc.net.au/news/2011-11-22/report-reveals-qld-mine-jobs-
boom/3685668 [Accessed 17 May 2012].

130
Lockamy III, A., & McCormack, K. 2004. The development of a supply chain management
process maturity model using the concepts of business process orientation. Supply
Chain Management: An International Journal, 9(4), 272-278.
Locke, E. A., Shaw, K. N., Saari, L. M. & Latham, G. P. 1981. Goal setting and task
performance: 1969–1980. Psychological Bulletin, 90, 125.
Lohmann, N. 2008. A feature-complete Petri net semantics for WS-BPEL 2.0. In M.
Dumas & R. Heckel (Eds.) Web services and formal methods. Springer, Berlin /
Heidelberg.
Lu, J. 2004. A personalized e-learning material recommender system. Proceedings of the
2nd International Conference on Information Technology for Application (ICITA
2004), 8-11 January 2004, Harbin, China
Lu, R. & Sadiq, S. 2006. Managing process variants as an information resource. In
Proceedings of the 4th international conference on Business Process Management,
426-431.
Lu, R. & Sadiq, S. 2007. On the discovery of preferred work practice through business
process variants. In C. Parent, K. Schewe, V. C. Storey and B. Thalheim (Eds.),
Conceptual Modeling - ER 2007: Proceedings of the 26th International Conference
on Conceptual Modeling, 165-180, 5-9 November 2007, Auckland, New Zealand.
Lu, R. 2008. Constraint-based flexible business process management. PhD Thesis, School
of Information Technology and Electrical Engineering, The University of
Queensland.
Lu, R., Sadiq, S. & Governatori, G. 2009. On managing business processes variants. Data
& Knowledge Engineering, 68, 642-664.
Luthans, F. & Youssef, C. M. 2007. Emerging positive organizational behavior. Journal of
Management, 33, 321.
Mahmod, N. M., Sadiq, S. & Lu, R. 2008. Similarity matching of business process
variants. In J. Cordeiro & J. Filiipe (Eds.), International Conference on Enterprise
Information Systems, 2008 Barcelona, Spain.
Mansar, S. & Reijers, H. 2005. Best practices in business process redesign: Validation of a
redesign framework. Computers in Industry, 56, 457-471.
Mansar, S., Reijers, H. & Ounnar, F. 2006. BPR implementation: A decision-making
strategy. Business Process Management Workshops, 421-431. Berlin, Heidelberg,
Springer Verlag.

131
Mansar, S., Reijers, H. & Ounnar, F. 2009. Development of a decision-making strategy to
improve the efficiency of BPR. Expert Systems with Applications, 36, 3248-3262.
Marcia, J. E. 1966. Development and validation of ego-identity status. Journal of
Personality and Social Psychology, 3, 551.
Marquardt, M. J. 1996. Building the learning organization, McGraw-Hill New York.
Marsh, D. R., Schroeder, D. G., Dearden, K. A., Sternin, J. & Sternin, M. 2004. The power
of positive deviance. British Medical Journal, 329, 1177-1179.
Mårtensson, M. 2000. A critical review of knowledge management as a management tool.
Journal of Knowledge Management, 4, 204-216.
Martinez, M. 2002. What is personalized learning? Are we there yet. E-Learning
Developer's Journal. E-Learning Guild (www.elarningguild.com). Available from:
http://www.elearningguild.com/pdf/2/050702dss-h.pdf [8 September 2012]
McPherson, J. M. & Smith-Lovin, L. 1987. Homophily in voluntary organizations: Status
distance and the composition of face-to-face groups. American Sociological
Review, 370-379.
McPherson, M., Smith-Lovin, L. & Cook, J. M. 2001. Birds of a feather: Homophily in
social networks. Annual Review of Sociology, 415-444.
Mendling, J., Reijers, H. & Cardoso, J. 2007. What makes process models understandable?
Business Process Management, 48-63.
Milton, N., Shadbolt, N., Cottam, H. & Hammersley, M. 1999. Towards a knowledge
technology for knowledge management. International Journal of Human-Computer
Studies, 51, 615-641.
Modarres, M. 2006. Predicting and improving complex business processes: values and
limitations of modeling and simulation technologies. Proceedings of the 38th
conference on Winter simulation (pp. 598-603). Winter Simulation Conference.
Monge, P. R. & Contractor, N. S. 2001. Emergence of communication networks. The new
handbook of organizational communication: Advances in theory, research, and
methods, 440-502.
Moran, J. W. & Brightman, B. K. 2000. Leading organizational change. Journal of
Workplace Learning, 12, 66-74.
Muketha, G. M., Ghani, A. a. A., Selamat, M. H. & Atan, R. 2010. A survey of business
process complexity metrics. Information Technology Journal, 9, 1336-1344.

132
Münch, J., Armbrust, O., Kowalczyk, M., & Soto, M. 2012. Prescriptive Process Models.
In Software Process Definition and Management, The Fraunhofer IESE Series on
Software and Systems Engineering. 19-77. Springer Berlin Heidelberg.
Nagy, R. A. & Obenberger, R. W. 1994. Factors influencing individual investor behavior.
Financial Analysts Journal, 63-68.
Nevis, E. C., Dibella, A. J. & Gould, J. M. 2000. Understanding organizations as learning
systems. Knowledge, Groupware, and the Internet, 43.
Nonaka, I. & Takeuchi, H. 1995. The knowledge-creating company: How Japanese
companies create the dynamics of innovation, Oxford University Press.
Nonaka, I. & Takeuchi, H. 1995. The knowledge-creating company: How Japanese
companies create the dynamics of innovation. University of Illinois at Urbana-
Champaign's Academy for Entrepreneurial Leadership Historical Research
Reference in Entrepreneurship.
O’dell, C. & Grayson, C. J. 1998. If only we knew what we know. California Management
Review, 40, 154-174.
Oliver, J. 2008. Knowledge Management Practices to Support Continuous Improvement.
Journal of Knowledge Management Practice, 9(4). Available from:
<http://www.tlainc.com/articl170.htm> [26 August 2010]
Pascale, R. T., Sternin, J. & Sternin, M. 2010. The power of positive deviance, Harvard
Business Press.
Pathirage, C., Amaratunga, R. & Haigh, R. 2004. Knowledge management and
organisational performance: A literature review. Available at:
http://usir.salford.ac.uk/9960/1/knowledge_management.pdf
Pawlowski, J. M. & Bick, M. 2008. Integration of learning and working: Convergent
processes and systems. In H. H. Adelsberger, Kinshuk, J. M. Pawlowski & D. G.
Sampson (Eds.) Handbook on information technologies for education and training.
Springer, Berlin Heidelberg.
Payne, J. W. 1976. Task complexity and contingent processing in decision making: An
information search and protocol analysis. Organizational Behavior and Human
Performance, 16, 366-387.
Peppers, D. 1993. The one to one future: Building relationship one customer at a time.
Currency Doubleday, New York.
Polanyi, M. & Sen, A. 1983. The tacit dimension, Peter Smith, Gloucester, MA.

133
Polanyi, M. 1967. The tacit dimension, New York, Garden City.
Prahalad, C. K. & Hamel, G. 2006. The core competence of the corporation. Strategische
unternehmungsplanung — strategische unternehmungsführung.
Ramesh, B. & Jarke, M. 2001. Toward reference models for requirements traceability.
IEEE Transactions on Software Engineering, 27, 58-93.
Reichert, M., Rinderle, S. & Dadam, P. 2003. Adept workflow management system:
Flexible support for enterprise-wide business processes: Tool presentation, Berlin,
ALLEMAGNE, Springer.
Reijers, H. A. 2006. Implementing BPM systems: The role of process orientation. Business
Process Management Journal, 12, 389-409.
Reinhartz-Berger, I., Soffer, P. & Sturm, A. 2010. Extending the adaptability of reference
models. IEEE Transactions on Systems, Man and Cybernetics – Part A: Systems
and Humans, 40 (5), 1045-1056.
Rock, D. & Donde. R. 2008. "Driving organizational change with internal coaching
programs: part one." Industrial and commercial training 40.1 (2008): 10-18.
Rohloff, M. 2009. Case study and maturity model for business process management
implementation. Business Process Management. Springer.
Rolón, E., Cardoso, J., García, F., Ruiz, F. & Piattini, M. 2009. Analysis and validation of
control-flow complexity measures with BPMN process models. Enterprise,
Business-Process and Information Systems Modeling, 58-70.
Rozinat, A. & Aalst, W. M. P. V. D. 2005. Conformance testing: Measuring the fit and
appropriateness of event logs and process models. Business Process Management
2005. 163-176.
Sadiq, S., Sadiq, W. & Orlowska, M. 2005. A framework for constraint specification and
validation in flexible workflows. Information Systems, 30 (5). 349-378.
Sánchez-González, L., Ruiz, F., García, F. & Cardoso, J. 2011. Towards thresholds of
control flow complexity measures for BPMN models. Proceedings of the 2011
ACM Symposium on Applied Computing, 1445-1450.
Santos, O. C. & Boticario, J. G. 2008. Modelling recommendations for lifelong learning.
First International Conference on the Applications of Digital Information and Web
Technologies (ICADIWT 2008), 4-6 Aug. 2008, 174-179.
134
Savolainen, T. 2008. Sharing tacit knowledge in a project-based organization: Perspective
of trust. International Conference on Productivity and Quality Research, 25-27
June 2008, Oulu, Finland.
Scheer, I. 2005. IDS Scheer AG - business process excellence. [Online]. IDS Scheer AG.
Available at: http://www.ids-scheer.com/ [Accessed 3 August 2009]
Scherer, C. W. & Cho, H. 2003. A social network contagion theory of risk perception. Risk
Analysis, 23, 261-267.
Schonenberg, H., Weber, B., Dongen, B. V. & Aalst, W. M. P. V. D. 2008. Supporting
flexible processes through recommendations based on history. Proceedings of the
6th International Conference on Business Process Management. Milan, Italy:
Springer-Verlag.
Schroder, H. M., Driver, M. J. & Streufert, S. 1967. Human information processing. New
York: Holt, Rinehart & Winston.
Schwab, D. P. & Cummings, L. 1976. A theoretical analysis of the impact of task scope on
employee performance. Academy of Management Review, 23-35.
Seethamraju, R. & Marjanovic, O. 2009. Role of process knowledge in business process
improvement methodology: A case study. Business Process Management Journal,
15, 920 - 936.
Senge, P. M., Kleiner, A., Roberts, C., Ross, R., Roth, G. and Smith, B. 1999. The dance of
change: The challenges to sustaining momentum in a learning organization,
Random House Digital, Inc.
Setiawan, M. A. & Sadiq, S. 2011. Experience driven process improvement. Enterprise,
Business-Process and Information Systems Modeling. Springer Berlin Heidelberg,
2011. 75-87.
Setiawan, M. A. & Sadiq, S. 2013. Integrated framework for business process complexity
analysis. Proceeding of European Conference of Information Systems 2013. Paper
49.
Setiawan, M. A. & Sadiq, S. 2010. Socialization of work practice through business process
analysis. International Conference on Enterprise Information Systems, 8-12 June
2010, Funchal, Madeira - Portugal.
Setiawan, M. A., Sadiq, S. & Kirkman, R. 2011. Facilitating business process improvement
through personalized recommendation. International Conference on Business
Information Systems, 2011, Poznan, Poland.

135
Shannon, C. E. & Weaver, W. 1959. The mathematical theory of communication, The
University of Illinois Press.
Shtub, A. & Karni, R. 2010. Business process improvement. ERP: The dynamics of supply
chain and process management. New York: Springer.
Siha, S. M. & Saad, G. H. 2008. Business process improvement: Empirical assessment and
extensions. Business Process Management Journal, 14, 778-802.
Sinur, J. & Hill, J. B. 2010. Magic quadrant for business process management suites.
Gartner Research, Pub-Date.
Spreitzer, G. M. & Sonenshein, S. 2004. Toward the construct definition of positive
deviance. American Behavioral Scientist, 47, 828.
Stalk, G., Evans, P. & Shulman, L. E. 1992. Competing on capabilities: The new rules of
corporate strategy’. Harvard Business Review.
Steinmann, D. O. 1976. The effects of cognitive feedback and task complexity in multiple-
cue probability learning. Organizational Behavior and Human Performance, 15,
168-179.
Stenmark, D. 2001. Leveraging tacit organizational knowledge. Journal of Management
Information Systems, 17, 9-24.
Sternin, J. & Choo, R. 2000. The power of positive deviance. Harvard Bus Review.
Tang, T. & McCalla, G. 2005. Smart recommendation for an evolving e-learning system.
International Journal on E-learning, 4, 105–129.
Tarantino, D. 2004. Positive deviance as a tool for organizational change. Physician
Executive, 31, 62-63.
Tenkasi, R. V. & Boland Jr, R. J. 1996. Exploring knowledge diversity in knowledge
intensive firms: A new role for information systems. Journal of Organizational
Change Management, 9, 79-91.
Thom, L., Reichert, M., Chiao, C. M., Iochpe, C. & Hess, G. N. 2008. Inventing less,
reusing more, and adding intelligence to business process modeling. Database and
expert systems applications.
Todnem By, R. 2005. Organisational change management: A critical review. Journal of
Change Management, 5, 369-380.
Tsai, C.-Y. & Chen, I. C. 2009. Using genetic process mining technology to construct a
time-interval process model. In B. C. Chien, T. P. Hong, S. M. Chen and M. Ali
(Eds.), Next-generation applied intelligence, Proceedings on the
136
22nd International Conference on Industrial, Engineering and Other Applications
of Applied Intelligent Systems (IEA/AIE 2009), June 24-27, 2009, Tainan, Taiwan.
Vadera, A. K., Pratt, M. G. & Mishra, P. 2013. Constructive deviance in organizations
integrating and moving forward. Journal of Management, 39, 1221-1276.
Van Beveren, J. 2002. A model of knowledge acquisition that refocuses knowledge
management. Journal of Knowledge Management, 6, 18-22.
Van Dongen, B., Dijkman, R. & Mendling, J. 2008. Measuring similarity between business
process models. In Z. Bellahsene & M. Leonard (Eds.), 20th International
Conference on Advanced Information Systems Engineering, Jun 16-20 2008
Montpellier, FRANCE. Springer-Verlag, Berlin, 450-464.
Van Maanen, J. E. & Schein, E. H. 1977. Toward a theory of organizational socialization.
Working papers. Available at: http://dspace.mit.edu/bitstream/
handle/1721.1/1934/swp-0960-03581864.pdf?sequence=1
Vecchio, Robert P. "Situational Leadership Theory: An examination of a prescriptive
theory." Journal of Applied Psychology 72.3 (1987): 444.
Verbeek, H. M. W., Buijs, J. C. a. M., Dongen, B. F. & Aalst, W. M. P. 2011. XEX,
XESame, and PROM 6 information systems evolution. In P. Soffer and E. Proper
(Eds.). Information Systems Evolution (CAiSE Forum 2010, Hammamet, Tunisia,
June 7-9, 2010, Selected Extended Papers), (Lecture Notes in Business Information
Processing, 72, 60-75). Springer, Berlin.
Wan, A.T., Sadiq, S. & Li, X. 2009. Learning from experience: Can e-learning technology
be used as a vehicle? International Conference in E-learning. Toronto, Canada.
Wan, A. T. & Sadiq, S. 2012a. Impact of personalized recommendation and social
comparison on learning behaviours and outcomes. ACIS 2012: Location, location,
location: Proceedings of the 23rd Australasian Conference on Information Systems,
Geelong, 1-10.
Wan, A. T. & Sadiq, S. 2012b. Towards understanding learner experiences in elearning
tools. Proceedings of Pacific Asia Conference on Information Systems. Available
at: http://www.pacis-net.org/file/2012/PACIS2012-171.pdf
Wang, C. L. & Ahmed, P. K. 2003. Organisational learning: A critical review. The
Learning Organization, 10, 8-17.

137
Wang, T. C., & Lee, H. D. 2009. Developing a fuzzy TOPSIS approach based on
subjective weights and objective weights. Expert Systems with Applications, 36 (5),
8980-8985.
Wheelen, T. L. & Hunger, D. J. 2009. Concepts in strategic management & business
policy, Prentice Hall.
Wood, R. E. 1986. Task complexity: Definition of the construct. Organizational Behavior
and Human Decision Processes, 37, 60-82.
Yeh, C. H. 2002. A problem-based selection of multi-attribute decision-making methods.
International Transactions in Operational Research, 9, 169-181.
Yelle, L. E. 1979. The learning curve: Historical review and comprehensive survey.
Decision Sciences, 10, 302-328.
Yoon, K. & Hwang, C. 1995. Multiple attribute decision making: An introduction, Sage
Publications, Inc.
Yujie, M., Shensheng, Z. & Jian, C. 2004. Supporting collaborative work with process
management enhanced corporate portal. IEEE International Conference on
Systems, Man and Cybernetics, 2004, 4206-4213.
Zairi, M. 1997. Business process management: A boundaryless approach to modern
competitiveness. Business Process Management Journal, 3, 64 - 80.
Zaíane, O. R. 2002. Building a recommender agent for e-learning systems. In Computers in
Education, 2002. Proceedings. International Conference on, 55-59. IEEE.
Zeitlin, M. F., Ghassemi, H., Mansour, M., Levine, R. A., Dillanneva, M., Carballo, M. &
Sockalingam, S. 1990. Positive deviance in child nutrition: With emphasis on
psychosocial and behavioural aspects and implications for development, United
Nations University, Tokyo.
Zellner, G. 2011. A structured evaluation of business process improvement approaches.
Business Process Management Journal, 17, 203-237.
Zimmermann, H. J. 2001. Fuzzy set theory - and its applications, Kluwer Academic Pub.
Copyright © 2022 FDOKUMEN