Barriers to successful bus rapid transit expansion - UQ eSpace
36
Accepted Manuscript Title: Barriers to successful bus rapid transit expansion: Developed cities versus developing megacities Authors: Yngrid Yamili Chayacani Mallqui, Dorina Pojani PII: S2213-624X(17)30018-4 DOI: http://dx.doi.org/doi:10.1016/j.cstp.2017.01.004 Reference: CSTP 142 To appear in: Received date: 12-5-2016 Revised date: 22-12-2016 Accepted date: 26-1-2017 Please cite this article as: Mallqui, Yngrid Yamili Chayacani, Pojani, Dorina, Barriers to successful bus rapid transit expansion: Developed cities versus developing megacities.Case Studies on Transport Policy http://dx.doi.org/10.1016/j.cstp.2017.01.004 This is a PDF file of an unedited manuscript that has been accepted for publication. As a service to our customers we are providing this early version of the manuscript. The manuscript will undergo copyediting, typesetting, and review of the resulting proof before it is published in its final form. Please note that during the production process errors may be discovered which could affect the content, and all legal disclaimers that apply to the journal pertain.
-
Upload
khangminh22 -
Category
Documents
-
view
0 -
download
0
Transcript of Barriers to successful bus rapid transit expansion - UQ eSpace

Accepted Manuscript
Title: Barriers to successful bus rapid transit expansion:Developed cities versus developing megacities
Authors: Yngrid Yamili Chayacani Mallqui, Dorina Pojani
PII: S2213-624X(17)30018-4DOI: http://dx.doi.org/doi:10.1016/j.cstp.2017.01.004Reference: CSTP 142
To appear in:
Received date: 12-5-2016Revised date: 22-12-2016Accepted date: 26-1-2017
Please cite this article as: Mallqui, Yngrid Yamili Chayacani, Pojani,Dorina, Barriers to successful bus rapid transit expansion: Developedcities versus developing megacities.Case Studies on Transport Policyhttp://dx.doi.org/10.1016/j.cstp.2017.01.004
This is a PDF file of an unedited manuscript that has been accepted for publication.As a service to our customers we are providing this early version of the manuscript.The manuscript will undergo copyediting, typesetting, and review of the resulting proofbefore it is published in its final form. Please note that during the production processerrors may be discovered which could affect the content, and all legal disclaimers thatapply to the journal pertain.
1
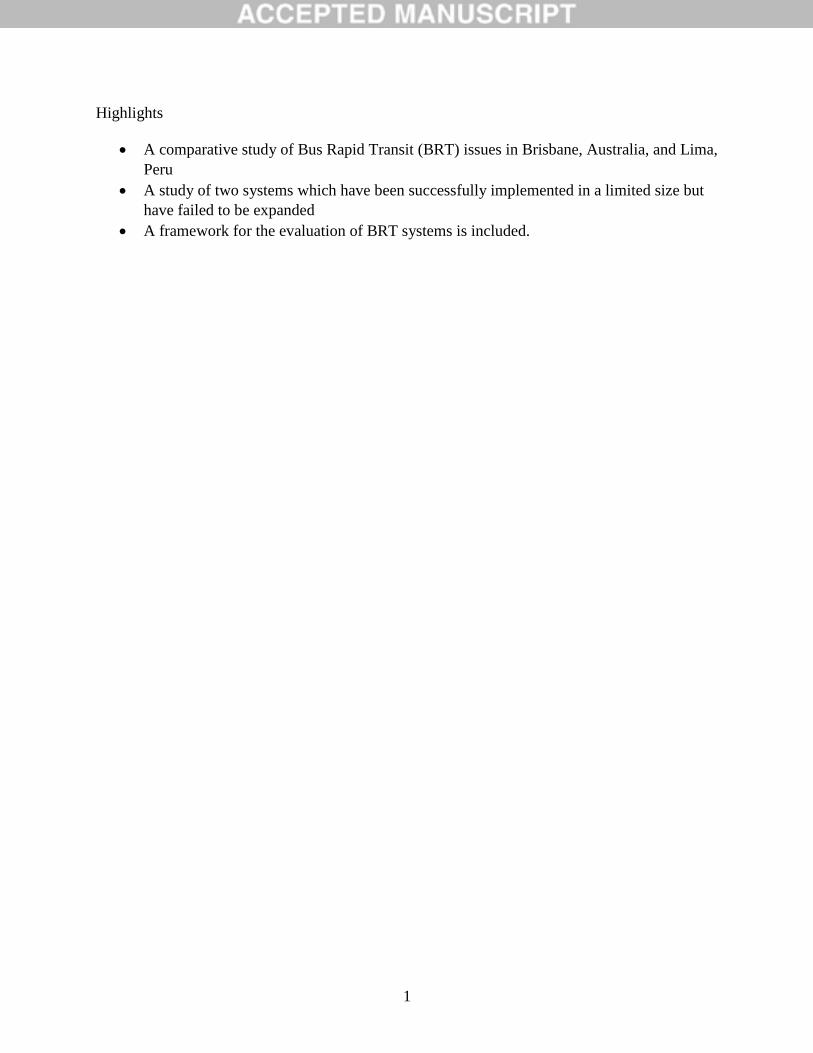
Highlights
A comparative study of Bus Rapid Transit (BRT) issues in Brisbane, Australia, and Lima,
Peru
A study of two systems which have been successfully implemented in a limited size but
have failed to be expanded
A framework for the evaluation of BRT systems is included.

2
BARRIERS TO SUCCESSFUL BUS RAPID TRANSIT EXPANSION: DEVELOPED CITIES
VERSUS DEVELOPING MEGACITIES
Authors
1) Yngrid Yamili Chayacani Mallqui ([email protected])
2) Dorina Pojani ([email protected])
Address (both authors)
The University of Queensland
School of Earth and Environmental Sciences
St Lucia campus, Chamberlain (35)
Brisbane QLD 4072
Australia
Abstract
While the profile of Bus Rapid Transit (BRT) has been raised owing to many success cases,
substantial barriers to its planning and implementation persist. This article compared two
contrasting efforts to implement BRT systems in cities with greatly different circumstances:
Brisbane, Australia, and Lima, Peru. It found that barriers to the creation of citywide BRT
systems in Lima and Brisbane are not the same, given the contextual differences, the different
sizes, and the different level of development of the two cities. However, there is potential for
these two cities, as well as others that are considering BRT, to learn from each other’s pitfalls.
The circumstances in these two case studies are certainly not unique. The findings apply to a
number of cities in similar geo-political and economic contexts.

3
Barriers to Successful Bus Rapid Transit Expansion: Developed
Cities versus Developing Megacities
Introduction
Bus Rapid Transit (BRT) is a low-cost bus-based alternative to metro and tram systems. It
emulates the performance and amenities of modern rail-based transit systems, including
segregated rights of way, closed stations, and pre-board ticketing. However, it has major
advantages over rail-based transit, including much lower construction costs, short
implementation periods (one to three years after conception), accommodation of many route
permutations as well as express and multi-corridor services, flexibility to adapt to a range of
urban conditions. In the last few decades, BRT has become widely used for urban mass transit, in
both developing and developed cities. More than forty cities on six continents have implemented
BRT systems, and at least as many systems are either in the planning or construction stages
(Wright and Hook, 2007; Finn and Muñoz, 2014; Pojani 2014; Global BRTData 2016; Muñoz
and Paget-Seekins 2016; Pojani and Stead 2015).
While the profile of BRT has been raised owing to many success cases, substantial barriers to its
planning and implementation persist. This article compares two contrasting efforts to implement
BRT systems in cities with greatly different circumstances: Brisbane, Australia, and Lima, Peru.
Brisbane is a typical Western city, sprawling and car-oriented, in which it is not feasible to build
new extensive rail-based systems due to their prohibitive costs. Lima is a typical developing
megacity, with scarce financial resources and with large portions of the population relying on
public transport.
These two cases were selected because, in addition to representing “typical” developed and
developing city situations, they share a crucial characteristic: both have implemented limited
BRT systems in last decade (28 km and 26 km respectively), which have been very successful.
But both cities desperately need to extend those systems. Yet there are no concrete plans in place
to do so. The main research question is: What barriers have prevented these two cities from
implementing large-scale BRT system, given that, the BRT lines already in place have been very
well received by the local populations? Both places are understudied, and, therefore, the answers

4
to this question are unknown. In selecting these two cases, the authors’ position was that there is
as much to learn from failure as from success. While transportation policy reviews most often
showcase “best practice,” an analysis of problematic cases can also help decision-makers to
avoid newcomer costs and learn from the mistakes of others (Marsden and Stead, 2011; Mejía-
Dugand et al., 2013).
The authors place BRT issues in the broader context of urban transport problems in Lima and
Brisbane, which helps explain why these projects have been limited. While this article compares
two case studies, their circumstances are certainly not unique. The findings apply to a number of
cities in similar geo-political and economic contexts. The article opens with a review of known
factors that lead to the success or failure of BRT systems worldwide. This is followed by a brief
overview of the two case study contexts. The reminder of the article analyses the processes of,
and experiences with, BRT development in Lima and Brisbane in order to identify the local
barriers and pitfalls.
Theoretical Framework
The present theoretical framework (Table 1) outlines the key factors that lead to the success or
failure of BRT systems – an approach that is missing from other reviews of BRT development. It
is aligned with a theoretical framework set forth in Wu and Pojani (2016), which in turn is
adapted from Lindau et al. (2014). Seven types of factors have been identified in the literature:
(1) institutional and legislative framework, (2) political leadership and commitment, (3)
management of competing modes, (4) public participation, (5) adequate funding and
coordination, (6) quality physical design, and (7) image promotion. The existing studies on BRT
outcomes have tended to focus on developing cites.
Case Studies
Brisbane
Brisbane is the capital of Queensland, a state in eastern Australia. At 1.2 million inhabitants (2
million in the metropolitan area), Brisbane is the third largest city in the country and one of the
fastest growing. The local government area (Southeast Queensland) is also one of the largest in

5
Australia, covering 22.500 sq. km. The city is wealthy; even in low-income neighborhoods,
average household incomes are $45,000/year. Currently Brisbane is experiencing high rates of
in-migration due to its mild subtropical climate and a much more affordable housing market
compared to Sydney and Melbourne. A large navigable river snakes through the city and
eventually pours to the Pacific Ocean, which is a half hour away. Housing in the metropolitan
area is predominately single-family (79%). While residential neighborhoods sprawl in all
directions, jobs and office buildings are concentrated in the CBD. The average density is low, at
about 350 people/sq.km. By international standards, Brisbane is safe, clean, well-maintained, and
lush with parks and vegetation. The city center is well-served by public transport, including
trains (an extensive regional network of 670 km), conventional buses, river ferries, and
bikesharing (150 pods in the inner city). The public transport network extends to most suburbs
but the services are much less frequent outside the inner city. Cycling is limited due to a lack of
adequate road infrastructure and a hilly topography. Car ownership is high: more than 80% of
households in Brisbane own a car. While driving remains by far the preferred travel mode, public
transport use for the commute has grown to 15% likely due to infrastructure and service
improvements, ticketing integration, and parking cost increases in CBD area (BCC 2008 and
2011; ABS 2011; Mees and Dodson 2011; Queensland Government 2011). The first BRT line
opened in 2000, and a total of 25 km (in three lines: Southeast Busway, Northern Busway and
Eastern Busway) have been built up to 2011. The structure of the busway routes is radial and
connects the suburbs to the CBD (Fig. 1). The introduction of BRT has significantly reduced
travel times for passengers who have access to it (Currie 2006; Tanko and Burke 2013).
However, the system remains rather limited in size.
Lima
Lima, the capital of Peru, stretches in linear fashion along the Pacific coast. It comprises 1.7
million inhabitants in the inner city (Lima centro) and 9.7 million in the metropolitan area -
which constitutes nearly one third of the national population. The internal migration from other
parts of the country remains high. Most of the population is employed, largely in the informal
sector (the official unemployment figure is only 7.1% at the moment), meaning that a large mass
of people commute daily in the city. Residential densities are higher than in Brisbane, but sprawl
is also substantial: 76% of dwellings are single-family homes. Home-ownership is also high, at

6
nearly 70%. Peri-urban slums (pueblos jovenes), which are located either in the northern or
southern “cones,” are large, some of them containing more than one million people. Transport
consumes 7-8% of the personal budgets in all districts. Poverty is generally high, with 13% of
the population living under the poverty line, while consumption power is low: monthly
expenditures per person range from $320 in the inner city to $185 in poorer metropolitan
districts. (The average yearly income is approximately $2,200 per capita.) Lack of access to
economic and social opportunities is a major concern. Also, personal security is a huge concern:
each year, 40% of people older than 15 are victims of some form of crime. Workplaces are
spread around the metropolitan area: only 40% of jobs are located in the inner city. Public
transport use is high (its commute modal share is 70-80%), while car ownership and use is low
(150 vehicles per 1000 inhabitants, accounting for only 8-10% of the commute modal share).
The BRT system (Metropolitano) opened in 2006 and now serves 5% of the commute trips (Fig.
2). Other public transport options include a limited metro system, conventional buses, as well as
independent, low-capacity paratransit services (combis, micros, and mototaxis). Only one out of
six planned metro lines is in operation (since 2012); a second line is under construction and
expected to open in 2021. The existing line stretches 34 km and carries 150,000 daily passengers.
Paratransit serves the majority of the urban population. Popular dissatisfaction with public
transport is high, due to its unreliability, low speeds, old vehicle fleet, and poor safety track
record. Traffic safety is a major problem throughout the city: each year at least 12% of people
become involved in an accident. Perhaps for this reason, private bicycle and motorcycle
ownership and use are minuscule (Lima como vamos, 2013 and 2014; World Bank 2003;
Bonifaz, 2013; INEI, 2014; AATE, 2013).
Methodology
The data for this study comes from three main sources: (a) published and unpublished reports (in
English and Spanish) on the respective BRT systems; (b) personal observations of the authors;
and (c) interviews with ten highly knowledgeable informants (five based in Brisbane and five in
Lima). The interviewees were identified through snowball sampling method. They included
public sector managers employed in the planning and transport departments of the respective
cities and transit agencies, local academics with expertise in urban transport and BRT planning,

7
and elected officials (former and current).1 The interviews were semi-structured and were
conducted via telephone in the case of Lima, and in person in Brisbane. The interview language
was Spanish in the case of Lima, and English in the case of Brisbane. The questions asked during
the interviews were informed by the theoretical framework. In order not to lead the interviewees’
opinions and identify relevant conditions not yet discussed in the available literature, follow up
questions were also asked. Each interview lasted about 45-60 minutes. The interviews were
voice recorded, transcribed, translated into English if in Spanish, and then analyzed. The analysis
was manual and followed a standard iterative process used for qualitative data, based on content
analysis theory.
Findings
The analysis of the interview material follows. It is structured according to the theoretical
framework set forth earlier. Assertions are based on the expert opinions collected during the
interviews, which, however, have been critically evaluated by the authors’ based on their
understanding of the two cities’ contexts.
Institutional and Legislative Context
Lack of institutional coordination and integration has constituted a barrier to BRT in both cities.
In Lima four different institutions have a stake in urban transport, including: (1) the Ministry of
Transport and Communications adopts transport-related legislation and establishes transport
norms for all regions and cities in Peru, but also builds and operates rail transport - including,
unusually, Lima’s urban metro system, through its special agency, the Autoridad Autónoma del
Sistema Eléctrico de Transporte Masivo de Lima y Callao (AATE); (2) ProTransporte, an agency
under the Metropolitan Municipality of Lima, manages the BRT system; (3) the Office of Urban
Transport, another agency under the Metropolitan Municipality of Lima, regulates conventional
buses and oversees urban transport management in general, including infrastructure provision
and maintenance – in practice duplicating many of ProTransporte’s functions; and (4) 43
1 Due to privacy concerns, the ethical review committee of the university in which the authors are based prohibits
the disclosure of the names and positions of interviewees. Therefore, this information has been withheld. Also,
privacy guidelines preclude the direct referencing of any interviewee assertions. Therefore, this material has been
presented on an anonymous basis.

8
different districts governments (boroughs), all with some amount of autonomy, are responsible
for issuing operation permits to paratransit drivers.
All these institutions tend to work independently, and in an uncoordinated, and thus financially
and practically inefficient, manner. Decentralization and institutional competition issues are also
persistent. While urban transport management is, in theory, a municipal responsibility, the
national government often does not issue sufficient funding to the Metropolitan Municipality of
Lima to carry out its duties. In the past, efforts to merge Protransporte and the Office of Urban
Transport into one institution failed. Recently2 the national Committee on Transport and
Communications approved a draft law that seeks to create a single transport authority for Lima
and Callao; ratification by the parliament is awaited. Another effort was made to coordinate the
policies of scattered local governments. The Ministry of Economy and Finance was empowered
to issue the final approval of public transport tenders and concessions arranged locally. However,
this is perceived as a move toward re-centralization of power, which is disliked by
municipalities.
To complicate matters, Lima’s conurbation includes Callao, a separate constitutional province,
which encompasses a long and thin stretch of land along the coast, in the westernmost part of the
metropolitan region. Home to Peru’s chief seaport and international airport, Callao has its own
government, independent from the Metropolitan Municipality of Lima. It defines bus routes
within its territory, which are often not complementary to those defined by the Metropolitan
Municipality of Lima. Similarly, as a result of institutions acting territorially, the future metro
line proposed by AATE fully overlaps with the future BRT corridor proposed by ProTransporte
(Fig. 3). Moreover, each public transport system in the metropolitan region, including the BRT,
has its own fare system. As a result, poor BRT patrons who live in peri-urban settlements are
forced to pay multiple full fares, unless the BRT can serve their entire trip (which is unlikely
given the small size of the system).
Overlapping institutional activities and functions are also an issue in Brisbane - between the
Brisbane City Council (local government) and the Queensland Government (state government).
When the BRT was first introduced in 2000, the state was responsible for running rail services in
Brisbane and surroundings and bus services in the hinterland, while the municipality operated
2 On 6 December 2016.

9
bus services within Brisbane. The level of integration and cooperation between the two
institutions was low at the time. As an example, state-subsidized buses which entered into
Brisbane from outer areas were not allowed to pick up passengers within the city even outside
rush hours as the ticketing accounts were separate.
However, in Brisbane many integration issues were overcome or smoothed out with the creation
in 2004 of an umbrella agency, TransLink (included within the Department of Transport of the
Queensland Government), driven by the need to integrate ticketing and fares for all public
transport in Southeast Queensland. However, some glitches remain. For example, there is an
overarching bus service design prescribed by the state, but the municipality has its own design as
well. Consequently, conflicts ensued recently with the state government denying funding for any
urban transport projects that do not comply with its standards.
Land use development is often contentious as well. While the municipality is responsible for
development with the city, as well as the coordination of land-use and transport projects, the
state deals with these issues for the entire Southeast Queensland region. In the case of large and
important projects in Brisbane, which may impact public transport at the regional level, the state
can intervene in local land use decisions. The state can also mandate certain types of local
development – a unique power among the provinces of Australia. The municipality perceives
these actions as encroaching on its authority and autonomy and often conflicts arise. While these
conflicts have not been related to land use development in proximity of the BRT system, they are
negative in that they create an environment of distrust or avoidance between the city and state
governments.
Notwithstanding issues of coordination and integration, both Lima and Brisbane had adequate
technical capacity to develop their BRT systems. In both cases, a combination of foreign and
local experts were retained (by the Metropolitan Municipality of Lima and the Brisbane City
Council respectively). In the case of Lima, the foreign consultants came from Spain and
Colombia (Bogotá’s TransMilenio had served as an inspiration for the Metropolitano). Similarly,
in Brisbane, the foreign consultants were from Ottawa, Canada, which served as the local role
model for the busways. Both cities wisely chose firms with transportation planning expertise in
cities at a similar stage of development or which shared a similar culture. Furthermore, in both
cases significant technical training of the existing local staff took place. For example, drivers

10
were trained to drive on a busway (which is rather different from driving on a regular city street)
and to understand new tools such as CCTV and radio communication. The staff employed in the
Traffic Control Centers was also trained anew on many aspects of the job, including how to
manage the digital display screens in BRT stations.
A lack of adequate legislation in relation to BRT or public transport is not perceived as a barrier
in either city. The interviewees’ position was that policies precede legislation, and if political
will is in place to implement BRT, legal aspects can be adjusted accordingly.
Political Leadership and Commitment
Both projects, especially Lima’s, benefited from strong political support in the planning and
implementation stages. In fact, in both cases, BRT became a political “workhorse.” However,
politicization of BRT planning and implementation was also detrimental as projects were
eventually discontinued once their initial supporters left office. In Lima, in particular, political
rivalries are so strong that often newly elected politicians will block the pet projects of their
predecessors. For this reason, the implementation of some project components was hurried
forward by incumbent politicians. Political vendettas are also common in Lima, with
repercussions on urban transport and citizen welfare.
In Lima, the BRT proponent was Mayor Alberto Andrade Carmona, who, after visiting Bogotá’s
Transmilenio system in 1998, decided to import the concept to Peru. The project appeared to lose
some momentum when Andrade stepped down from office. However, the next Mayor, Luis
Castañeda Lossio, carried the project forward. While he served his term (2003-2010), the first
Metropolitano line (north-center-south) was built (2006-2010), and BRT plans were expanded to
include nine routes across the city. The implementation was certainly not without gaps. For
example, the buses were purchased before the road designs were complete, and the construction
of the platforms was rushed. However, the project was successful, although limited in size.
But the following mayor, Susana Villarán de La Puente, switched focus from BRT to metro
planning and construction. This orientation came as a result of political shifts in upper tiers of
government. A metro system for Lima had been proposed as early as 1980s during the first
presidency of Alan García, and construction of the first line had started in 1986. However, the
project had become paralyzed due to the economic crisis and the line had remained incomplete
until Alan García’s second presidency. Returning to power in 2006, he revived the metro plans

11
and obtained $300 million in financing from the Inter-America Development Bank. The first
metro line (a tren eléctrico of 35 km) opened for operation in 2011 (just days before the end of
García’s mandate). Concessions have been obtained for a few more lines. However, with the
return of Castañeda Lossio’s to Mayoral office in 2015, perhaps the BRT will become, once
again, a centerpiece of public works in Lima.3
Some of these political barriers were evident in Brisbane as well, but not to the same extent as in
Lima, where the political culture is more “vertical.” In Brisbane, in the late 1990s, the vision of
Queensland Premier Robert Borbidge was to upgrade a freeway (M1) which connected the coast
(the City of Gold Coast) with the center of Brisbane in order to ease congestion for commuters.
The main BRT supporter, Councilor Maureen Hayes, who was familiar with, and inspired by, the
Ottawa busway model, pressed for a change of vision toward BRT. With Hayes’ support and the
eventual endorsement by Lord Mayor Jim Soorley, BRT became the preferred option over rail or
road.
Nevertheless, the political turnover at municipal level (the right wing replaced the left wing in
2003 and has stayed in office since) and federal level has resulted in a clear reorientation of
transportation policies in favor of controversial road and tunnel construction and away from
public transport, including BRT. In Brisbane, unlike Lima, it is the policy orientation of a
political party during a certain period rather than the individual personality of a politician which
determines what transportation projects are built.
Management of Competing Modes
Competing modes have been poorly managed in both cities. In Brisbane the main BRT
competitor is the private car whereas in Lima it is other public transport modes. While Lima’s
Metropolitano carries more than 125 million users annually, this seemingly large figure covers
only a minuscule portion of the mobility needs in a megacity of Lima’s size (approximately
3.650 billion trips annually). Although authorities make continuous efforts to add public
transport services, these efforts are not in concert. For example, the plans for the expansion of
the metro system are going forward despite exorbitant costs, as mentioned. There is speculation
that, a preference for rail is due to larger kickbacks that ensue from rail builders and operators,
3 A similar situation was experienced in Bogotá, where TransMilenio’s much needed expansion nearly stalled once
Mayor Enrique Peñalosa, its initial champion, left power, but revived later when he returned.
12
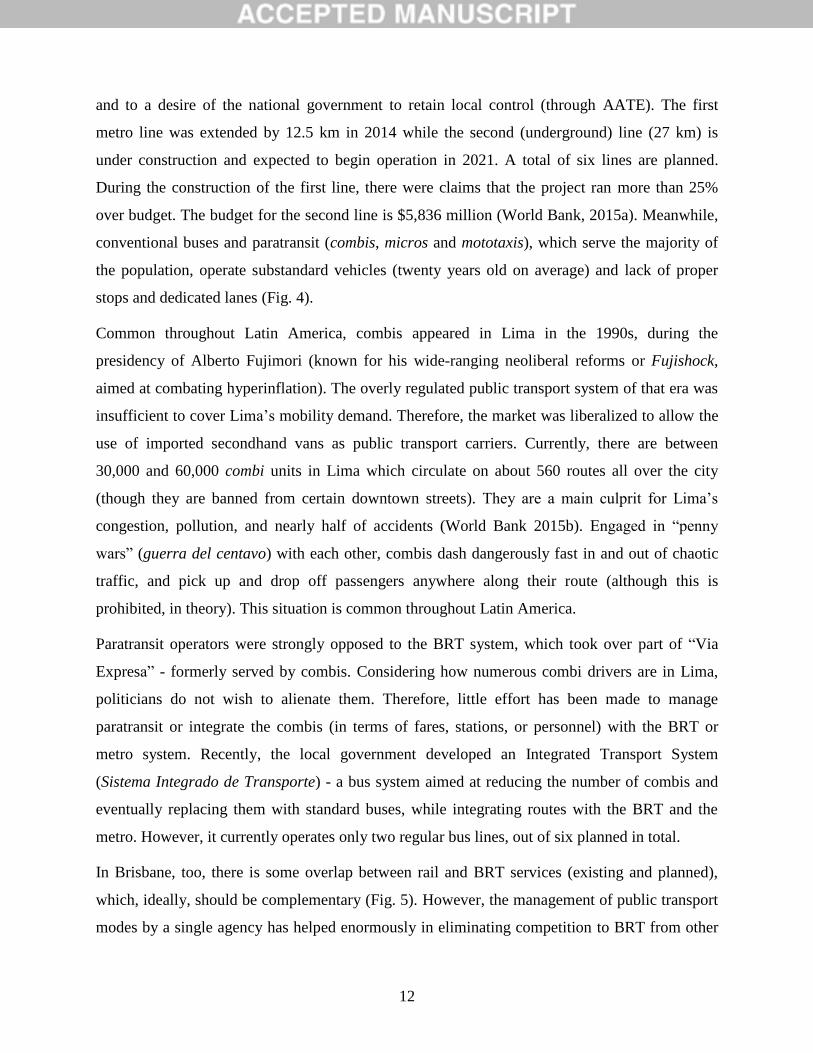
and to a desire of the national government to retain local control (through AATE). The first
metro line was extended by 12.5 km in 2014 while the second (underground) line (27 km) is
under construction and expected to begin operation in 2021. A total of six lines are planned.
During the construction of the first line, there were claims that the project ran more than 25%
over budget. The budget for the second line is $5,836 million (World Bank, 2015a). Meanwhile,
conventional buses and paratransit (combis, micros and mototaxis), which serve the majority of
the population, operate substandard vehicles (twenty years old on average) and lack of proper
stops and dedicated lanes (Fig. 4).
Common throughout Latin America, combis appeared in Lima in the 1990s, during the
presidency of Alberto Fujimori (known for his wide-ranging neoliberal reforms or Fujishock,
aimed at combating hyperinflation). The overly regulated public transport system of that era was
insufficient to cover Lima’s mobility demand. Therefore, the market was liberalized to allow the
use of imported secondhand vans as public transport carriers. Currently, there are between
30,000 and 60,000 combi units in Lima which circulate on about 560 routes all over the city
(though they are banned from certain downtown streets). They are a main culprit for Lima’s
congestion, pollution, and nearly half of accidents (World Bank 2015b). Engaged in “penny
wars” (guerra del centavo) with each other, combis dash dangerously fast in and out of chaotic
traffic, and pick up and drop off passengers anywhere along their route (although this is
prohibited, in theory). This situation is common throughout Latin America.
Paratransit operators were strongly opposed to the BRT system, which took over part of “Via
Expresa” - formerly served by combis. Considering how numerous combi drivers are in Lima,
politicians do not wish to alienate them. Therefore, little effort has been made to manage
paratransit or integrate the combis (in terms of fares, stations, or personnel) with the BRT or
metro system. Recently, the local government developed an Integrated Transport System
(Sistema Integrado de Transporte) - a bus system aimed at reducing the number of combis and
eventually replacing them with standard buses, while integrating routes with the BRT and the
metro. However, it currently operates only two regular bus lines, out of six planned in total.
In Brisbane, too, there is some overlap between rail and BRT services (existing and planned),
which, ideally, should be complementary (Fig. 5). However, the management of public transport
modes by a single agency has helped enormously in eliminating competition to BRT from other

13
public transport operators. But a major BRT competitor remains: the private car. The existing
BRT system serves more than 70 million passengers per year. As in the case of Lima, this figure
constitutes a small amount of the demand in a metropolitan region of two million inhabitants and
a booming tourist industry.
In the Brisbane context, with high incomes and high car ownership, it has been exceedingly
difficult to reduce private car use, “take lanes away from cars,” and stir motorists toward public
transport (conventional buses, ferries, rail, and BRT). While local residents are not averse to
using public transportation as such, they do not do so unless the latter is extremely convenient in
terms of stop locations, and faster and more cost-effective than the private car. At the moment,
Brisbane’s public transport system does not fulfil either requirement. While fuel prices are cheap
(less than $1/liter), bus and BRT fares start at $2.5/ride – and the BRT system is rather limited,
as mentioned. Moreover, the current political climate has favored transport investments that
encourage car use. In the past five years alone, three underground road tunnels have been built
(Clem7, Airport Link, and Legacy Way) at a cost of more than $10 billion. This approach
reduces the funds available to extend the BRT system.
Public Participation
In both cities, extensive communication and public participation activities took place during the
BRT planning process in order to educate the public on the concept of BRT and its impacts, and
to generate public interest and support. Feedback from the community was also received but in a
more limited way. For example, in both Lima and Brisbane, the location of busways was already
determined by the time public consultation campaigns were launched. (In Lima, in particular it is
uncommon for planners to consult with the public on specific design issues, as this is considered
a technical process best left to experts).
However, the BRT systems in both cities had the support of the population. In Lima, business
owners in traditional commercial areas were especially supportive as they believed that BRT
would supply them with more customers and ease the commutes for their employees. Some
episodes of NIMBYism occurred in both cities – by discontented residents along the busway
routes, who were affected during construction. However, these were overcome without
escalating into major conflicts. In Lima, given its rich pre-Columbian history, organizations for
the protection of cultural heritage were involved in the process, requesting to examine the

14
digging in case Inca artefacts were discovered in the subsoil. This imposed some delay in the
BRT implementation.
Adequate Funding and Coordination
In Lima, the BRT was partly funded by the World Bank and the Inter-American Development
Bank, which invested the first $45 million (ProTransporte, 2015). The rest was covered by the
Peruvian national government (the municipal investment was minimal). The final infrastructure
cost was approximately $320 million (Fjellstrom 2015). While much higher than the initial
funding through external sources, the support of the World Bank and the Inter-American
Development Bank were very positive in that they signaled the importance of this system and
sparked its development. However, since the completion of the first corridor, no additional
funding has been raised to extend the system – while funding for metro extensions has been
secured. Therefore, it appears that in the case of Lima, it is not lack for money but rather a
certain political and professional orientation that has been a barrier to the development of a
citywide BRT system so far.
Brisbane’s BRT system was entirely funded through internal sources, mainly from the state. The
total infrastructure costs, which included separate busways, amounted to almost $2,500 million.
Although BRT is more cost-effective than rail-based transit systems, this was a taxing sum even
for a wealthy city like Brisbane. The high costs were due to higher land and labor costs in
Australia but also to somewhat overdesigned system features as the BRT was partly sold as an
interim measure before rail. Therefore, in this case, lack of funding has been the principal barrier
to further BRT extension. A planned Western Busway never broke ground while a few short
extensions to the existing busways (e.g., 7 km in the Northern Busway) are incomplete due to a
funding shortage.
But the problem is political too. At the moment, the Liberal Party (political right wing) has the
majority at the federal and municipal levels, while the Labor Party (political left wing) has the
majority at the state level. While the Labor Party is committed to providing urban public
transport, the Liberal Party tends to favor pro-automobile policies. The present political climate,
combined with a prolonged global financial crisis and soaring land costs in Brisbane in the last
decade, does not bode well for BRT. Moreover, as in Lima, a rail project which will connect the
two sides of the river has been prioritized over BRT.

15
In terms of operations, the Brisbane Busways are subsidized by TransLink – the overseeing
agency, which pools all urban transport revenues and is thus able to support those parts of the
system which provide the most public benefit. By contrast, Lima’s Metropolitano is financially
self-sufficient. Its operating costs are covered by the fares, which are affordable although higher
than in conventional buses. (Fares are uniform for all-length trips; therefore, poor passengers
who live in the peripheries and make longer trips are in effect cross-subsidized through the fares
paid by wealthier individuals who can afford to live in the center and make shorter trips.) The
system designers were conscious that, in the absence of an integrated transport company which
could cross-subsidize operations, the BRT must be able to cover operational costs through fare
box revenues. This was a wise decision which helps BRT’s long-term sustainability. However, it
also means that buses must run in overcrowded conditions along the highest demand portions of
the corridor.
Neither Brisbane nor Lima have applied mechanisms to capture increases in land value resulting
from BRT development (value capture), which could have been used to offset part of the BRT
capital or operational costs. Currently in Brisbane there are no existing statutory planning
mechanisms for Transit Oriented Development (TOD), whether rail-based or BRT-based.
However, value capture (or value sharing) is on the agenda with the Queensland Government
setting up a dedicated unit to examine the prospects. In the case of Lima, due to weak eminent
domain powers, property owners along the proposed BRT corridor were able to extort money
from the public sector during the compensation process. Some of the land for stations had to be
purchased at a higher price than the market price before BRT planning. Running out of funds, the
municipality was forced to route most of the BRT along land in public ownership, cancel one
section of the BRT altogether, and reroute other parts of the corridor through public parks,
landfills, and even a prison yard. Moreover, part of the Lima corridor was inserted in a freeway,
which reduced the potential demand for development as not many trips originate or end in the
strip along the freeway.
Similarly, in Brisbane, the Southeast Busway was designed to run in parallel to an existing
freeway. Here land was in public ownership (thus duplicating services but minimizing private
land acquisition costs). Also, owners requested a “hardship acquisition” – i.e., land acquisition in
the early stages of the BRT design and routing process. In accepting it, the public sector was
forced to purchase properties, which might or might not be used in the future. However, in

16
Brisbane, BRT experts are much more aware than in Lima of value capture mechanisms applied
elsewhere, especially in nearby Asian cites, in order to help cover BRT costs, and might opt for
these in the future.
Quality Physical Design
In both cities, the quality of the BRT systems is very high, which makes these systems atypical.
In the BRT Standard conceived by the Institute for Transportation and Development Policy
(2015), Lima’s BRT is ranked Gold level (the highest) and Brisbane’s BRT is ranked Silver level
(the second highest). A short description of both systems and their operational characteristics
follows – based on data from Fjellstrom (2015), SIBRT (2011), and interviews.
Lima’s Metropolitano has one trunk-feeder corridor of 27km, with eight trunk lines, 23 feeder
routes, 3 terminals, and 38 stations (all with high-level platforms, handicapped access, security
cameras, and security staff). The corridor (COSAC I) serves 350,000 users daily. The peak
frequency is 117 buses/hour. All lines run in the north-south direction through the center. In
total, the corridor crosses 16 districts – all with higher density and mobility demand. However,
the selection of the trunk-feeder was limited to one existing road (Via Expresa) with sufficient
dimensions for BRT implementation. The bus lanes are located in the center of the roadway
along most of the corridor. The Metropolitano offers both regular and express services. Fares are
paid through an electronic prepaid card, which can be purchased and refilled at any station.
Regular commuters pay a flat fee of 2.50 soles per trip ($0.83). Students (20% of users) can
travel at discounted rates; certain public servants can travel for free. The trunk fleet uses about
300 articulated buses, with a capacity of 160 passengers. About 250 smaller buses, with
capacities of 40 and 80 passengers, serve the feeder lines. Buses are and powered by natural gas,
complying with the EURO IV standard. Their average speed in peak hours is 25.5 km/h. BRT
riders from the peripheries can reach the center in a half hour - compared to two hours on
conventional buses.
Brisbane has a 28 km network of three busways (Southeast Busway, Northern Busway, and
Eastern Busway). The network comprises 25 stations, with handicapped access, as in Lima, but
without high-level platforms. Some of the stations are combined with train stations. The stations
are spaced farther apart than in Lima: 1.1 km vs. 0.7 km. There are no express services but
overtaking lanes are present at most stations. The system serves fewer passengers than in Lima:
17
200,000 daily, although the peak frequency is higher: 295 buses/hour. This is due to the fact that
Brisbane’s buses are smaller and much less crowded. The fares (distance-based, starting at $2.5)
are integrated with the rest of public transport in Southeast Queensland and are paid on the
vehicles by using a rechargeable electronic card. BRT buses have their own dedicated roadway
along most of the corridor. The open design aims to provide single seat journeys. Rather than
linear, as in the case of Lima, the network is radial, following Brisbane’s urban form pattern with
a dominant CBD and sprawling concentric suburbs. The routes were selected to run through
areas which were unserved by transit and had higher density (by Brisbane’s suburban standards).
However, the radial form of the system has been criticized as it increases the likelihood of “dead
running” (i.e., buses running empty) outside commute hours or in the counter-commute
direction, which are then perceived to be under-utilized and to contribute to congestion. But
congestion would likely be worse in those corridors if the busways were not present and all the
passengers were using private cars instead. The bus commercial speed is 25 km/h during the
peak. The BRT buses are the same as conventional buses. They have lower capacity than in Lima
(only 60 passengers/bus) but the quality of the vehicles is as high and most are powered by
natural gas. Buses have a system of sound, lights, air conditioning, and preferential seats. The
system comprises 700 CCTV cameras and emergency call buttons at every station – but no
security staff, as criminality is rare in Brisbane. The pedestrian and cyclist access at stations is
also better than in Lima. For example, bicycle parking and bikesharing pods are located at
terminals (King George Square and Royal Brisbane Hospital).
Image Promotion
System promotion has been more than adequate in both cities, especially in Lima.
Advertisements in the media were widespread before the systems opened for operation. While in
Lima the BRT vehicles have a distinctive look compared to conventional buses, in Brisbane they
look the same as the rest of urban buses (which, however, are of high quality). In Brisbane high
transit fares (compared to car operation costs) remain a deterrent to using public transport. In
Lima, the BRT image has also benefited from the fact Latin American cities have been at the
forefront of innovation in BRT planning, with Bogota’s TransMilenio being the most famous
system worldwide. Generally, both systems are well accepted by the population. In fact, in both

18
cities there is demand for their further expansion (World Bank, 2015b; Mulley and Hensher.
2014; Hensher and Mulley 2014).
Summary and Conclusion
Table 2 summarizes and compares the foregoing findings on both cities.
To answer the main research question, this study has identified barriers to the creation of
citywide BRT systems (as opposed to limited BRT corridors) in Lima and Brisbane. The barriers
in the two cities are not the same, given their contextual differences, different sizes, and different
level of development. For example, institutional and public transport policy fragmentation, lack
of coordination, and the politicization of transport are more evident in Lima than in Brisbane,
where a single agency manages all public transport modes, including the busways. Consequently,
while fares are integrated throughout the region in Brisbane, in Lima BRT passengers are forced
to pay double fares if transferring to and from other modes. The main BRT competitor in
Brisbane is the private car while in Lima it is the remaining public transport system (in particular
paratransit). The competitors have been poorly managed in both cities in order to avoid political
frictions with the multitude of motorists in Brisbane’s case and paratransit operators in Lima’s
case. Also, Lima’s existing road layouts, with narrow roadbeds and built-up “urban walls” on
both sides, are a constraint, whereas Brisbane has abundant road space to accommodate
additional BRT (although taking lanes away from cars is politically risky). While both systems
are now approaching full capacity, additional vehicles have been added in Brisbane but not in
Lima. Corruption in urban transport affairs is widespread in Lima, while in Brisbane there is
much more control and oversight.
Generally, the magnitude of problems is greater in Lima due to its scarcer resources, more
complex institutions, and proneness to corruption (see Contraloría General de la República
2016). However, in some respects, it has fared better than Brisbane. For example, its BRT is of a
higher standard than Brisbane’s (Gold vs. Silver) and with a more distinctive identity. Lima has
benefited from some external funding from international organizations whereas Brisbane has
financed its busways through state and municipal funds. Brisbane’s BRT construction was much
more costly due to higher land values and labor costs in Australia. Also, Lima’s Metropolitano is

19
financially self-sufficient whereas Brisbane’s Busways are subsidized like the rest of the public
transport system in the city.
The two cities share some similarities as well, in terms of BRT implementation process and
obstacles. Although BRT is more cost-effective than rail, the expenditures to build the systems
were high relative to the respective budgets of the two cities. High capital costs, coupled with a
preference for rail at the political level, have constituted a major barrier to the extension of the
systems. Neither city has made an attempt to offset capital costs through value capture or TOD.
Public participation activities have taken place in both Lima and Brisbane – although after the
routing was decided upon by technicians. Notwithstanding competition from other modes, both
BRT systems have been positively received by the local populations. In particular people living
in proximity of stations, who are able to make use of the BRTs for their commutes, are very
supportive of this mode. Both cities need to capitalize on their support by engaging in major
promotional platforms in order to expand their BRTs. It is important to recognize that these two
systems are not typical in the sense that their BRTs have been successful; worldwide, there are
many instances of less success where the barriers to extension may well be different.
Based on the analysis and above summary, several rather obvious policy recommendations
emerge: in both places, prioritize high quality public transport, legally ensure project continuity
during periods of political turnover, promote the BRT concept through aggressive publicity
campaigns, secure capital funding by reallocating budgets away from rail and car transport and
by applying value capture mechanisms, and in Lima create a metropolitan agency for public
transport coordination. However, the above analysis cannot avoid displaying some skepticism
regarding the effectiveness of these recommendations for either reducing automobile dependence
in Brisbane or overcoming political rivalries and institutional fragmentation in Lima, and, overall
improving public transport conditions for the masses in both cities.

20
References
_____. 2016. Global BRTData, by Embarq, BRT Center of Excellence Chile, SIMUS, IEA, and
WRI Brazil. Available at: brtdata.org. Last accessed on 12 Dec. 2016.
Australian Bureau of Statistics. (2011) Population Census. Available at: www.abs.gov.au Last
retrieved on 7 Nov. 2015.
Bonifaz, J. L. (2013). Transporte urbano en Lima Metropolitana. Paper presented at Red
Universitaria Iberoamericana de Técnicas Municipales, Bogotá, Colombia, 6 Feb.
Brisbane City Council. (2008). Brisbane City Council Transport Plan for Brisbane 2008-2026
Report.
Brisbane City Council. (2011). Brisbane long-term infrastructure plan 2012-2031. Report.
Contraloría General de la República. 2016. Informe Gestion 2009-2016. Report. Available at:
http://www.contraloria.gob.pe/wps/wcm/connect/76b95b9a-6089-45c7-
9144e7f084230a62/Informe_Gestion_2009_2016.pdf Last accessed on 1 December 2016.
Currie, G. (2006). Bus Rapid Transit in Australasia: Performance, lessons learned and futures.
Journal of Public Transportation 9(3):1-22.
EMBARQ. (2011). Social, environmental and economic impacts of BRT systems: Bus Rapid
Transit case studies from around the world. Report.
Finn, B., & Muñoz, J.C. (2014). Bus Rapid Transit. Research in Transportation Economics,
48:116-125.
Fjellstrom, K. (2015). Bus Rapid Transit information. Available at: www.worldbrt.net Last
retrieved on 1 Jan. 16.
Flores-Dewey, O.A. (2013). Expanding transportation planning capacity in cities of the global
South: public-private collaboration and conflict in Chile and Mexico. Ph.D. thesis,
Massachusetts Institute of Technology, Boston, Ma, USA.
Flores-Dewey, O.A. & Zegras, C. (2012). The cost of inclusion: incorporating existing bus and
paratransit operators into Mexico City’s BRT. Paper presented at 12th
Conference on
Advanced Systems for Public Transport, Santiago, Chile, 23-27 July.
Gilbert, A. (2008). Bus Rapid Transit: Is Transmilenio a miracle cure? Transport Reviews
28(4):439-467.
Heshner, D., & Golob, T. (2008). Bus Rapid Transit systems: A comparative assessment.”
Transportation 35:501-518.
Hensher, D., & Mulley, C. (2014). Modal image: Candidate drivers of preference differences for
BRT and LRT. Transportation DOI:10.1007/s11116-014-9516-7.
Hidalgo, D. & Graftieaux, P. (2008). “Bus Rapid Transit systems in Latin America and Asia:
Results and difficulties in 11 Cities.” Transportation Research Record 2072:77-88.
Hidalgo, D., & Gutierrez, L. (2013). BRT and BHLS around the world: Explosive growth, large
positive impacts and many issues outstanding. Research in Transportation Economics
39(1):8-13.

21
HiTrans. (2005). Best practice guide: Public transport, planning the networks. Report, available
at: www.civitas.no/assets/hitrans2publictransportplanningthe-networks.pdf Last accessed
on 13 Dec. 2016.
Hook, W. (2005). Institutional and regulatory options for Bus Rapid Transit in developing
countries: Lessons from international experience. Transportation Research Board
1939:184-191.
Institute for Transportation and Development Policy. (2015). The Bus Rapid Transit standard.
Report.
Instituto Nacional de Estadística e Informática. (2014). Una mirada a Lima metropolitana.
Report.
Kühn, F. (2002). Bus Rapid or Light Rail Transit for intermediate cities?” Working paper,
Institut National de Recherche sur les Transports et leur Sécurité, Arcueil, France.
Latin American Association of Integrated Transport Systems and BRT (SIBRT). (2011).
Metropolitano technical datasheets. Available at: http://www.sibrtonline.org/en/technical-
datasheets/metropolitano/9 Last retrieved on 10 Oct. 2015.
Lima como vamos. (2013). Evaluando la gestión en Lima. Informe de movilidad. Report.
Lima como vamos. (2014). Quinto informe de percepción sobre calidad de vida. Report.
Lindau, L., Hidalgo, D., & de Almeida Lobo, A. (2014). Barriers to planning and implementing
Bus Rapid Transit systems. Research in Transportation Economics 48:9-15.
Marsden, G., & Stead, D. 2011. Policy transfer and learning in the field of transport: A review of
concepts and evidence. Transport Policy 18(3):492-500.
Mees, P., & Dodson, J. (2011). Public transport network planning in Australia: Assessing current
practice in Australia’s five largest cities. Working paper, Griffith University, Brisbane.
Mejía-Dugand, S., Hjelm, O., Baas, L., & Ríos, R. A. (2013). Lessons from the spread of Bus
Rapid Transit in Latin America. Journal of Cleaner Production 50:82-90.
Mulley, C., & Hensher, D. (2014). Do preferences for BRT and LRT vary across geographical
jurisdictions? A comparative assessment of six Australian capital cities. Case Studies on
Transport Policy 2:1-9.
Muñoz, J.C., & Paget-Seekins, L., eds. (2016). Restructuring public transport through Bus Rapid
Transit: An international and interdisciplinary perspective. Chicago, Il: University of
Chicago Press.
Muñoz, J.C., & Hidalgo, D. (2013). Bus rapid transit as part of enhanced service provision.
Research in Transportation Economics, 39(1):104-107.
Muñoz, J.C., & Gschwender, A. 2008. “Transantiago: A Tale of Two Cities.” Research in
Transportation Economics 22(1):45-53.
Perry, D. (2012). The Brisbane Busway. Successful public transit serves Australia’s fastest
growing region. In the newsletter of Institute for Sustainable Communities.
Pojani, D., & Stead, D. (2015). Sustainable urban transport in the developing world: Beyond
megacities. Sustainability, 7(6):7784-7805.

22
Pojani, D. (2014). Bus Rapid Transit, design and engineering of.” In M. Garrett (ed.)
Encyclopedia of Transportation: Social Science and Policy, pp 322-325. Thousand Oaks,
Ca: Sage.
ProTransporte. (2015). ¿Qué es el Metropolitano? Available at:
http://www.metropolitano.com.pe/index.php/metropolitano/ique-es-el-metropolitano Last
retrieved on 10 Oct. 2015
Queensland Government. (2011). Connecting SEQ 2031: An integrated regional transport plan
for South East Queensland. Report.
Rizvi, A., & Sclar, E. (2014). “Implementing Bus Rapid Transit: A tale of two Indian cities.”
Research in Transportation Economics 48:194-204.
Tanko, M., & Burke, M. (2013). “How did Brisbane get its busways? Findings of a study into
mode-choice decision-making in Brisbane”. Paper presented at Australasian Transport
Research Forum, Brisbane.
Transit Cooperative Research Program. (2003). Bus Rapid Transit, vol. 1&2. Washington DC:
Transportation Research Board.
World Bank. (2003). Situación actual y problemática del transporte publico en Lima
Metropolitana. Report.
World Bank. (2015a). Peru, Lima, Metro line 2 project. Report.
World Bank. (2015b). International Bank for reconstruction and development project appraisal
document on a proposed loan in the amount of US$300 million to the Republic of Peru
for a Lima metro line 2 project. Report.
Wright, L. & Hook, W. (2007). Bus Rapid Transit. Planning Guide. New York: Institute for
Transportation and Development Policy.
Wu, X. & Pojani, D. (2016). “Obstacles to the creation of successful Bus Rapid Transit Systems:
The case of Bangkok.” Research in Transportation Economics.
DOI:10.1016/j.retrec.2016.05.001.

23
Tables
Table 1. Theoretical framework: Key factors for the success or failure of BRT systems, adapted
from Wu and Pojani (2016) and Lindau et al. (2014). The key success factors are in bold font.
KEY FACTORS
1.
Institu
tion
al a
nd
Le
gis
lative
Co
nte
xt
Involvement of a range of city officials and stakeholders whose interests are not necessarily aligned.
Regionally-based transport organizations fare better in terms of co-ordination than decentralized transport departments at the local level.
Often limited in-house technical capacity (esp. in developing cities).
Foreign consultancy services unfamiliar with the local culture, legislation, and political system.
BRT systems are not “turnkey” - no single company can provide all elements from planning to implementation.
Higher market demand for BRT consultancy services than experienced consultants can provide within a reasonable amount of time.
Coordinating a variety of consultants requires bureaucratic sophistication and oversight which local administrations might not possess.
Implementation might fall in the hands of inexperience local road building companies.
Newly created BRT agencies with coordinating and ruling capacity over other departments can overcome these problems.
2.
Po
litic
al L
ea
de
rsh
ip a
nd
Com
mitm
en
t
Commitment of city leaders (e.g., a mayor or governor as a champion) in either conceiving or leading BRT planning and implementation.
Clear signal to the population that the project is auspicious.
Can unlock the resources for planning.
Helps mitigate various risks and obstacles (e.g., cut procedural delays, expedite planning cycles, minimize planning fatigue, helping take advantage of momentum, and maintaining project credibility).
BRT success has propelled the political career of their initial supporters.
Projects that hinge entirely on the support of a single individual, however powerful, face the risk of being discontinued in case of electoral changes (esp. if the inauguration is rushed in order to fit within an electoral cycle and the BRT starts operating before its full completion).
Top-down processes can result in conflicts with stakeholders.
Public participation ensures that multiple stakeholders are invested into a BRT project beyond a political mandate.

24
KEY FACTORS 3
. M
an
age
men
t o
f C
om
pe
tin
g M
od
es
Competition and opposition to BRT from private motorized vehicles (cars and motorcycles) whose owners expect transport planning to give them priority.
In countries with domestic car industries, national governments tend to favor driving because car and motorcycles sales bring substantial tax revenues.
Successful BRT projects are typically complemented by other policies to reduce car traffic.
Opposition to BRT from existing transit operators (bus and rail) who have active associations that promote their products and interests and sabotage competitors (e.g., by organizing bus strikes).
Rail-based urban transport has a higher image and tends to be a favorite mode of users and governments (despite its implementation challenges and costs).
In some developing cities, competition and opposition to BRT from myriad small enterprises, whose driver-owners depend on their vehicle and route for their livelihood.
In some cases, cycling lobbies view BRT as their contestant for scarce road space, rather than as a complementary mode.
Opposition might arise from retail shop owners installed along a BRT route, who fear that loss of on-street parking will negatively impact their turnover.
BRT planners can find a way to incorporate existing public transport operators into a new capitalistic large-scale ownership structure (e.g., by transforming incumbent informal operators into more formal enterprises).
Intermodal facilities (that combine BRT services and the services of some existing operators, such as rail) are crucial.
Broad-based public participation and efforts to raise the image of BRT.
4.
Pu
blic
Pa
rtic
ipa
tion
Communication must be used pervasively throughout the process.
Leading team must emit a sense of transparency and willingness to engage with the media, interest groups (including those of competing transit modes), and the community.
Participation activities (e.g., focus groups, workshops) can be a tool to educate the public on the importance of BRT as a sustainable transport mode, and on how to use the system once it is built.
Participation must raise awareness of the outcomes of rational cost-benefit analyses of various transit options and shape realistic user expectations (e.g., on the likelihood of crowded rides).
Compromises might have to be reached with the car lobby (e.g., widening of some roads, provision of park-and-ride lots at suburban BRT stations, and construction of flyovers or bridges for cars).

25
KEY FACTORS 5
. A
de
qu
ate
Fu
nd
ing
and
Co
ord
ina
tio
n
The public sector typically makes a large upfront investment, either directly (building the infrastructure) or indirectly (providing the road space, the stations, and the bus depots/terminals).
Novel funding sources for new BRT systems must be identified (e.g., public-private partnerships,
transfers from regional or national levels of government, property, fuel, and automobile taxes, value capture from joint development of transit and land use or Transit Oriented Development).
Network planning is crucial.
The size of the operators must not be excessively large since there are limits on the economies of scale obtainable in transit services.
Operators must be provided the right incentives to both provide frequent service even when the service does not provide operational revenue (e.g., by not guaranteeing their income by the public sector and by reviewing contracts periodically) and to limit frequencies so that externalities and operational malfunctions (such as bus bunching) are controlled.
Some roles and functions, such as the user information offices and the headway control system must be handled by a public entity, as least initially until the BRT system runs smoothly.
Fare enforcement should not be left solely with the police because this greatly complicates efforts to fight fare evasion.
Inadequate funding for planning and implementation or very tight financial planning (to avoid operational subsidies) can cripple projects.
Low levels of service (i.e., crowded vehicles with 6-7 standees per sq.m) are detrimental.
Downgrades (e.g., pavement quality, station design, problems with pickpockets) are damaging to BRT image.
Maintenance provisions (e.g., for road surface) must be built into the financial plan.
Land acquisition funding or funding to compensate the owners of land or structures that stand in the right-of-way are normally not provided by multi-nationals or national development banks.
Incumbent operators affected by the BRT might request compensation.
Negotiations with land and building owners tend to be strained and might end up in the courts.
If the planning process is lengthy and involves any disputes, external donors or loaners might freeze their project funding.
BRT fares (typically set at affordable levels) are unlikely to cover the high purchase costs of land.
A first BRT corridor usually meets with high demand as it crosses high density corridors and therefore fares are affordable. Once the service reaches less dense areas, average fares increase due to higher operational costs. Rising fares can lead to decreases in ridership.

26
KEY FACTORS 6
. Q
ua
lity P
hysic
al D
esig
n
Typically, a well-designed BRT system has the following dozen characteristics:
1) segregated busways or bus-only roadways over the majority of the system’s trunk or city center corridors
2) location of the busway in the median of the roadway rather than the curb lane 3) an integrated network of routes and corridors 4) overtaking lanes at stations, which allow an arriving bus to pass those boarding passengers at the
station, enable express routes to skip certain stations, and reduce travel times for some passengers 5) convenient, comfortable, secure, and weather-protected stations, designed to meet present and
future demand 6) articulated vehicles with level access between the platform and vehicle floor at stations 7) nodal stations and terminals to facilitate physical integration between trunk routes, feeder services,
and other mass transit systems 8) pre-board fare collection and fare verification 9) fare integration between routes, corridors, and feeder services 10) distinctive marketing identity for the system by color, markings, and/or vehicle design 11) clean vehicle technologies, which are increasingly available in developing countries 12) courteous and professional staff in uniforms
The project scope must include critical related issues (e.g., parking, non-motorized transport, station area
and corridor development into TOD).
The physical integration with other modes (e.g., through intermodal stations, bicycle parking facilities and
cycle-sharing pods outside stations) is crucial.
In larger cities that have rail systems in place, these can serve as the backbone or major trunk corridor of the system, whereas in medium-size cities, BRT itself can be the backbone.
The system should reach low-income neighborhoods rather than simply covering the central area (e.g.,
though extensive and inexpensive feeder services).
Existing routes should be taken into account when designing the new system.
Sequential integration is preferable to the development of isolated corridors the integration of which is
deferred to a later stage.
It is important to periodically review and revise the system once in operation in order to adjust routes as
needed, construct new connections between corridors, reduce parallel routes or traditional buses, and expand the bus fleet if congestion occurs.
To evaluate and rank systems, the BRT Standard can be used which is based on a wide range of metrics to
establish a common definition of BRT through the BRT Basics. Particularly high-quality corridors are recognized with either Bronze, Silver, or Gold rankings.
7.
Ima
ge
Pro
motio
n
It is important to have shiny, modern vehicles bearing special logos, an easy-to-understand route structure with clearly posted maps and other wayfinding devices, and readily available information on- and off-line.
A good image has to do with smooth project implementation (i.e., minimization of disruptions due to construction works) and a good startup.
In promotional messages, transit users need to hear that their primary needs, such as travel time and/or cost, are properly articulated, acknowledged, and prioritized rather than superseded by more abstract (albeit very important) concerns such as pollution and safety.
Users are often unaware that advanced BRT systems can carry as much passenger volume as rail; have operating speeds comparable to light rail (some even comparable to top metro systems); provide a safer environment for travelers than cars or motorcycles; and offer substantial net benefits to low- and middle-income groups (but not necessarily to very-low-income groups) in terms of travel time reductions and vehicle operating cost reductions - while costing a fraction of rail systems.
Efforts must be made to manage any negative publicity on part of the media, which are keen on encouraging snappy debates on hot topics such as traffic congestion to increase readership or viewing rates.
BRT promotion efforts need to capitalize on the support of any stakeholders that stand to benefit from it (e.g., real estate owners and developers along a proposed route).

27
Additional sources: Kühn 2002; TCRP 2003; HiTrans 2005; Wright and Hook 2007; Gilbert 2008; Hidalgo and
Graftieaux 2008; Muñoz and Gschwender 2008; Hensher and Golob 2008; EMBARQ 2011; Flores-Dewey and
Zegras 2012; Hidalgo and Gutierrez 2013; Muñoz and Hidalgo 2013; Flores-Dewey 2013; Pojani 2014; Rizvi and
Sclar 2014; ITDP 2015; Muñoz and Paget-Seekins 2016.

28
Table 2. Summary of barriers to the creation of citywide BRT systems in Lima and Brisbane.
The principal barriers are in bold font.
BRISBANE LIMA
1.
Institu
tion
al a
nd
Le
gis
lative
Co
nte
xt Some fragmentation and friction among levels of
government over public transport and land use decisions
Fragmentation issues mostly overcome with the creation of an umbrella agency for public transport in the region
Adequate technical capacity and legislative framework
Very fragmented metropolitan government
Overlapping administrative functions
Adequate technical capacity and legislative framework
2.
Po
litic
al
Le
ad
ers
hip
an
d
Com
mitm
e
nt
More horizontal political culture
Political frictions based on ideological orientation
Vertical political culture
Intense political rivalries based on individual personalities of politicians
3.
Ma
nag
em
e
nt
of
Com
pe
tin
g
Mo
des
Principal competitors: private cars and a few rail projects
Poorly managed competing modes
Principal competitors: other public transport operators (informal transport and a few rail projects)
Poorly managed competing modes
4.
Pu
blic
Pa
rtic
ipa
tio
n
Some public participation, mostly in the form of communication
Minor episodes of NIMBYISM
Some public participation, mostly in the form of communication
Minor episodes of NIMBYISM
5.
Ad
equ
ate
Fu
nd
ing
and
Coo
rdin
ation
All funding sources internal
Lack of capital funding is major barrier
High labor and land costs
Operations are subsidized
Fares are high relative to driving
No value capture mechanisms
Some external funding sources (loans from development agencies)
Capital funding is available but stirred toward rail
Lower labor and land costs
Operations are financially self-sufficient
Fares are high relative to other public transport
No value capture mechanisms
6.
Qu
alit
y
Ph
ysic
al
Desig
n
High quality design (Silver Standard) High quality design (Gold Standard)
7.
Ima
ge
Pro
mo
tio
n Broad public support for the system Broad public support for the system

29
Figures
Figure 1. BRT in Brisbane. Source: TransLink (2015).

30
Figure 2. BRT in Lima. Source: AATE (2015).
KEY
BRT (Metropolitano)
Metro Lima – Line 1
Metro Lima – Line 2

31
Figure 3. Proposed metro and BRT lines. Source: El Comercio.

32
Figure 4. Combis in Lima. Source: RPP.

33
Figure 5. BRT and rail in Brisbane (2031). Source: Queensland Government (2011).

34
Figure 6. BRT station in Lima. Photo courtesy of Karl Fjellstrom.

35
Figure 7. BRT station in Brisbane. Photo courtesy of Karl Fjellstrom.