Cellulose-derived porous carbon electrodes for ... - UQ eSpace
172
Cellulose-derived porous carbon electrodes for electrochemical capacitors Hao Lu Master of Engineering A thesis submitted for the degree of Doctor of Philosophy at The University of Queensland in 2019 School of Chemical Engineering
-
Upload
khangminh22 -
Category
Documents
-
view
0 -
download
0
Transcript of Cellulose-derived porous carbon electrodes for ... - UQ eSpace

Cellulose-derived porous carbon electrodes for
electrochemical capacitors
Hao Lu
Master of Engineering
A thesis submitted for the degree of Doctor of Philosophy at
The University of Queensland in 2019
School of Chemical Engineering

i
Abstract
Electrochemical capacitors (ECs), also normally called as supercapacitors are important energy
storage devices with characteristics such as long cycling life, high power density and safety.
Currently, activated carbon is the most popular electrode for fabricating ECs because of its
high specific surface area, good electrical conductivity and low cost. To improve the
electrochemical performance of ECs, especially their energy density, the past decade has
witnessed a great deal of research interest in searching for advanced electrode materials, which
are expected to be sustainable, cost-effective, stable against cycling and of high performance.
Biomass is a carbon-rich, earth-abundant, renewable and low-cost resource for making carbon
materials. Because of the complexity of biomass in terms of chemical composition, source and
physical state, it has been challenging to establish structure-property-performance correlations,
which are important for optimising biomass-derived carbon electrode materials. Biomass
consists mainly of cellulose, lignin and hemicellulose. Cellulose, with a formula of (C6H10O5)n,
is a polysaccharide consisting of a linear chain of glucose units. Being a natural biopolymer,
cellulose is almost inexhaustible. It exists in various forms from micrometric cellulose fibres
to nanocellulose and water/solvent soluble cellulose derivatives, among which microcrystalline
cellulose (MC) is commercially available. Therefore, this PhD project aims to investigate the
feasibility of transforming MC into high value-added carbon electrode materials for new-
generation ECs.
Results obtained in this project have shown that MC-derived carbons display very promising
electrocapacitive properties. It was found that heteroatom-doped porous carbon from MC
exhibits excellent electrochemical performance. Both heteroatom doping and porous structure
were found to play important roles in charge storage. Further improvement on electrocapacitive
properties of the heteroatom-doped carbon was conducted by manipulating the N/O doping
level and introducing intrinsic defects. In 1 M H2SO4 electrolyte, the improved carbon sample
displays a specific capacitance as high as 426 F/g at a current density of 0.25 A/g or 177 F/g at
100 A/g measured using a three-electrode system. About 90 % of its original capacitance was
retained after 60,000 cycles at 5 A/g as measured in a symmetric cell. In addition, the electrode
with a high mass loading of 12 mg/cm2 displays high areal capacitances of 2,518 and 1,128
mF/cm2 at current densities of 0.5 and 50 mA/cm2, respectively, along with a good cycling
stability, making the sample a promising candidate for practical EC application.

ii
The focus of the thesis was then laid on the porous structure. Hierarchical porous carbons
(HPCs) with macropores, mesopores and micropores are believed to be ideal electrode
materials for ECs. To understand the role of pore hierarchy of carbon electrode materials in
capacitive charge storage, HPCs were prepared using the zeolite-template method with
ethylene as the carbon precursor. Results showed that the carbon templated with calcium-
containing nano Beta zeolite displays the best electrocapacitive performance amongst the HPCs
studied. The appropriate amount of micropores provided enough active sites for electric double
layer formation and the rich mesopores enabled the active ions in the micropores to have
nanometer transport distances. And the ordered straight hierarchy templated from the zeolite
further reduced the charge transfer and electrolyte diffusion resistance, which is better for both
rate capability and cycling stability. A symmetric capacitor fabricated with this carbon as both
electrodes exhibits a capacitance of 246 F/g at a current density of 1 A/g after 17, 000 times
cycling.
The electrocapacitive properties of the MC-derived carbons were further improved by using
graphene to prepare composite electrode materials, which were evaluated using different
electrolytes with different cell configurations, including symmetric EC cells and sodium-ion
capacitor (NIC) cells. Microporous and thin graphene oxide layers further interconnected and
covered along the mesoporous carbon network, which provides more electrocapacitive sites
and is beneficial for both the electronic and ionic transport. The NIC built with the obtained
sample as positive electrode exhibits an energy density of 48.1 Wh/Kg at 250 W/Kg and
remains 22.0 Wh/Kg at 18, 080 W/Kg.
In summary, this thesis demonstrates the MC-derived porous carbons for EC electrode
application. The effect of heteroatom doping level was studied, and a relatively low N-doping
level combined with intrinsic defects is recommended for porous carbon materials of good
electrocapacitive performance. Besides, the importance of a hierarchical porous structure for
EC electrodes was further confirmed. In this thesis, MC-derived porous carbons were for the
first time reported as the positive electrode for NICs, which, as a new generation of ECs, bridge
the gap between conventional ECs and ion batteries. As a cost-effective and renewable carbon
source, MC is promising for the sustainable development of ECs. More research focused on
exploring MC-derived carbons of better performance is suggested in future, especially for NIC
positive electrodes.

iii
Declaration by author
This thesis is composed of my original work, and contains no material previously published or
written by another person except where due reference has been made in the text. I have clearly
stated the contribution by others to jointly-authored works that I have included in my thesis.
I have clearly stated the contribution of others to my thesis, including statistical assistance, data
analysis, significant technical procedures, professional editorial advice, and any other original
research work used or reported in my thesis. The content of my thesis is the result of work I
have carried out since the commencement of my research higher degree candidature and does
not include a substantial part of work that has been submitted to qualify for the award of any
other degree or diploma in any university or other tertiary institution. I have clearly stated
which parts of my thesis, if any, have been submitted to qualify for another award.
I acknowledge that an electronic copy of my thesis must be lodged with the University Library
and, subject to the policy and procedures of The University of Queensland, the thesis be made
available for research and study in accordance with the Copyright Act 1968 unless a period of
embargo has been approved by the Dean of the Graduate School.
I acknowledge that copyright of all material contained in my thesis resides with the copyright
holder(s) of that material. Where appropriate I have obtained copyright permission from the
copyright holder to reproduce material in this thesis.

vi
Publications included in this thesis
1. Biomass-derived carbon electrode materials for supercapacitors. Hao Lu, X. S. Zhao,
Sustainable Energy & Fuels, 2017, 1, 1265-1281.
-incorporated as the main content of Chapter 1 and Chapter 2 (90%)
Contributor Statement of contribution
Hao Lu Wrote the review paper (100%)
Edited the paper (80%)
X. S. Zhao Edited the paper (20%)
Provided revision comments/suggestions (100%)
2. Electrocapacitive properties of nitrogen-containing porous carbon derived from
cellulose. Hao Lu, X Sun, RR Gaddam, NA Kumar, X. S Zhao, J. Power Sources,
2017, 360, 634-641.
-incorporated as Chapter 4
Contributor Statement of contribution
Hao Lu Designed experiments (100%)
Material characterisations (50%)
Wrote the paper (100%)
Edited the paper (75%)
Xiaoming Sun Edited the paper (5%)
RR Gaddam Material characterisations (30%)
NA Kumar Edited the paper (5%)
Provided revision comments/suggestions (5%)
X. S. Zhao Edited the paper (15%)
Provided revision comments/suggestions (95%)
3. Zeolite-templated nanoporous carbon for high-performance supercapacitors. Hao Lu,
Kyoungsoo Kim, Yonghyun Kwon, Xiaoming Sun, Ryong Ryoo and X. S. Zhao, J.
Mater. Chem. A, 2018, 6, 10388-10394.

vii
-incorporated as Chapter 6
Contributor Statement of contribution
Hao Lu Designed experiments (70%)
Material characterisations (50%)
Wrote the paper (100%)
Edited the paper (70%)
Kyoungsoo Kim Designed experiments (30%)
Material characterisations (20%)
Yonghyun Kwon Material characterisations (30%)
Edited the paper (5%)
Xiaoming Sun Edited the paper (5%)
Ryong Ryoo Edited the paper (10%)
Provided revision comments/suggestions (30%)
X. S. Zhao Edited the paper (10%)
Provided revision comments/suggestions (70%)
Manuscripts to be submitted and included in this thesis
1. Microcrystalline cellulose-derived porous carbons with defective sites for
electrochemical applications. Hao Lu, Linzhou Zhuang, RR Gaddam, Xiaoming Sun,
Changlong Xiao, Timothy Duignan, Zhonghua Zhu and X. S. Zhao, to be submitted
-incorporated as Chapter 5
Contributor Statement of contribution
Hao Lu Designed experiments (90%)
Material characterisations (50%)
Wrote the paper (100%)
Edited the paper (60%)
Linzhou Zhuang Designed experiments (10%)
Material characterisations (10%)
Edited the paper (5%)

viii
RR Gaddam Material characterisation (30%)
Xiaoming Sun Material characterisations (5%)
Changlong Xiao Edited the paper (5%)
Provided revision comments/suggestions (5%)
Timothy Duignan Edited the paper (10%)
Provided revision comments/suggestions (5%)
Zhonghua Zhu Edited the paper (5%)
Provided revision comments/suggestions (5%)
X. S. Zhao Edited the paper (20%)
Provided revision comments/suggestions (85%)
2. Cellulose-derived porous carbon/graphene oxide composite positive electrode
materials for sodium-ion capacitors. Hao Lu, Yilan Wu, Rohit Ranganathan Gaddam,
Xiaoming Sun, Tim Duignan and X. S. Zhao, to be submitted.
-incorporated as Chapter 7
Contributor Statement of contribution
Hao Lu Designed experiments (90%)
Material characterisations (55%)
Wrote the paper (100%)
Edited the paper (75%)
Yilan Wu Designed experiments (10%)
Edited the paper (5%)
RR Gaddam Material characterisation (30%)
Edited the paper (5%)
Provided revision comments/suggestions (5%)
Xiaoming Sun Material characterisations (5%)
Timothy Duignan Edited the paper (5%)
Provided revision comments/suggestions (5%)
X. S. Zhao Edited the paper (10%)
Provided revision comments/suggestions (90%)

ix
Other publications as a co-author during the PhD candidature
1. Cellulose-derived hierarchical porous carbon for high-performance flexible
supercapacitors. C Wang, X Wang, Hao Lu, H Li and X. S Zhao, Carbon, 2018, 140,
139-147.
2. Improving the Visible-Light Photocatalytic Activity of Graphitic Carbon Nitride by
Carbon Black Doping. L Zhang, Z Jin, Hao Lu, T Lin, S Ruan, X. S. Zhao and Y. J.
Zeng, ACS Omega, 2018, 3(11), 15009-15017.
3. A reduced graphene oxide-NiO composite electrode with a high and stable capacitance.
Xiaoming Sun, Hao Lu, Peng Liu, Thomas E. Rufford, Rohit R. Gaddam, Xin Fan and
X. S. Zhao, Sustainable Energy & Fuels, 2018, 2, 673-678.
4. Improvement on the Electrocapacitive Properties of NiO with Carbon. Y Yang, Hao
Lu, X Sun, Q Zhao, X. H. Liu, H Jiang, B Sun, J Wu, X Zhang, W. J. Jiang and X. S.
Zhao, Chemistry Letters, 2019, 48, 90-93.
5. A flexible graphene-carbon fibre composite electrode with high surface area-
normalized capacitance. Xiaoming Sun, Hao Lu, Thomas E. Rufford, Rohit R. Gaddam,
Timothy Duignan, Xin Fan and X. S. Zhao, Sustainable Energy & Fuels, 2019, under
revision.
Conference proceedings
1. Oral presentation at The ACS Student Conference, 6-7 Dec, 2018, University of Sydney,
Sydney, Australia.
2. Oral presentation at The UQ-IBS/KAIST Workshop on Electrode Materials for Energy
Storage, Jan 2018, University of Queensland, Australia.
3. Poster presentation at The International Symposium on Porous Materials for Energy
and Environment in 2017, Qingdao University, Qingdao, China.
4. Oral presentation at EAIT Postgraduate Conference, June 2017, UQ, Australia.
5. Oral presentation at EAIT Postgraduate Conference, June 2016, University of
Queensland, Australia.

x
Contributions by others to the thesis
Prof George Zhao and Dr Tim Duignan both helped me to prepare the thesis and supplied
useful suggestions on the draft. Thanks Prof Zhonghua (John) Zhu as well as Dr Thomas E
Rufford for the useful suggestions/comments during the Milestone reports.
Statement of parts of the thesis submitted to qualify for the award of another degree
“No works submitted towards another degree have been included in this thesis”.
Research Involving Human or Animal Subjects
“No animal or human subjects were involved in this research”.

ix
Acknowledgements
Firstly, I would like to express my gratitude to Prof X. S. (George) Zhao for giving me the offer
to work in his lab. It is one of the most important opportunities in my life. I wish to thank Prof
Zhao’s professional guidance during my PhD research here. His constructive comments and
suggestions helped me to shape my research direction. I also want to thank Dr Tim Duignan,
my co-supervisor, for his help. I benefited and learned a lot from his effort to improve the
quality of my thesis.
Thanks Prof Zhonghua (John) Zhu and Dr Thomas E Rufford for being two of my my thesis
committee members. Thanks for your valuable suggestions in the last three and a half years. I
also want to thank Prof Ryong Ryoo, Dr Kyoungsoo Kim and Mr Yonghyun Kwon for our
nice cooperation work. Wish we could have more cooperation work in future.
Gratitude also goes to my lab mates for your help and mutual support, including Dr Xiaoming
Sun, Dr Changlong Xiao, Dr Rohit Gaddam, Dr Luhong Zhang, Dr Ashok Nanjundan, Ms
Yilan Wu, Ms Xin Fan, Mr Yerick Rangom and Ms Qinglan Zhao. I also want to thank my
friends, including Dr Haichao Chen, Mr Linzhou Zhuang, Mr Mengmeng Hao, Dr Jie Zhao,
Dr Xuanhe Liu, Dr Huihuang Chen and Dr Ziyong Chang. The assistance from the Centre for
Microscopy and Microanalysis at the University of Queensland are acknowledged. Thanks to
the technical staffs including Ms Ying Yu, Dr Barry Wood, Mr Ron Rasch and Ms Anya Yago.
I am grateful for the University of Queensland-China Scholarship Council and Prof George
Zhao for offering the Scholarship.
Lastly, please allow me to give my appreciation to my mother and elder sister for their love
and support all the time. And thank my father. You are always with me giving me the courage
to continue with my work and life.

x
Financial support
This research was supported by UQ-CSC Program Scholarship, the Australian Research
Council (ARC) projects of DP 103101870 and LF 170110101.
Keywords
Microcrystalline cellulose, biomass, porous carbon, electrochemical capacitors, sodium-ion
capacitors, electrochemistry, energy storage
Australian and New Zealand Standard Research Classification (ANZSRC)
ANZSRC code: 090403, Chemical Engineering Design, 40%
ANZSRC code: 030604 Electrochemistry, 40%
ANZSRC code: 091205, Functional Materials, 20%
Fields of Research (FoR) Classification
FoR code: 0904, Chemical Engineering, 55%
FoR code: 0912, Materials Engineering, 35%
FoR code: 1007, Nanotechnology, 10%

xi
Dedicated to
YOUYU LU, XIMEI GAO, WEI LU and XIANJUN CAO

xii
Table of Contents
Abstract .................................................................................................................................. i
List of Figures ..................................................................................................................... xv
List of Tables................................................................................................................... xviii
List of Abbreviations .......................................................................................................... xx
Chapter 1 Introduction.............................................................................................................. 1
1.1 Background ...................................................................................................................... 2
1.1.1 Electrochemical capacitors (ECs) .............................................................................. 2
1.1.2 Electrode materials for ECs ....................................................................................... 4
1.1.3 Electrolytes for ECs ................................................................................................... 6
1.2 Scope and objectives of this PhD thesis project ............................................................... 7
1.3 Outline of thesis chapters ................................................................................................. 8
1.4 References ........................................................................................................................ 8
Chapter 2 Literature review .................................................................................................... 11
2.1 Biomass and properties .................................................................................................. 12
2.2 Converting biomass into porous carbons ....................................................................... 12
2.2.1 Carbonisation ........................................................................................................... 14
2.2.2 Activation ................................................................................................................ 15
2.2.2.1 Physical activation ............................................................................................ 15
2.2.2.2 Chemical activation .......................................................................................... 20
2.3 Lignocellulose carbon .................................................................................................... 23
2.3.1 Cellulose .................................................................................................................. 23
2.3.1.1 Properties of cellulose ....................................................................................... 23
2.3.1.2 Cellulose-derived carbon for ECs ..................................................................... 24
2.3.2 Lignin....................................................................................................................... 26
2.3.2.1 Properties of lignin ............................................................................................ 26
2.3.2.2 Lignin-derived carbon for ECs ......................................................................... 27
2.3.3 Hemicellulose .......................................................................................................... 28
2.3.4 Lignocellulose-derived composite electrode materials ........................................... 29
2.4 Structure and morphology control.................................................................................. 31
2.4.1 Pore structure ........................................................................................................... 31
2.4.2 Graphitisation degree ............................................................................................... 32
2.5 Doping of heteroatoms in carbon ................................................................................... 33
2.6 Summary ........................................................................................................................ 38

xiii
2.7 References ...................................................................................................................... 39
Chapter 3 Experiment Methods .............................................................................................. 48
3.1 Chemicals and reagents .................................................................................................. 49
3.2 Characterization of materials ......................................................................................... 50
3.2.1 X-ray diffraction ...................................................................................................... 50
3.2.2 Nitrogen sorption analyses ...................................................................................... 50
3.2.3 X-ray photoelectron spectroscopy ........................................................................... 50
3.2.4 Raman spectroscopy ................................................................................................ 50
3.2.5 Scanning electron microscopy ................................................................................. 51
3.2.6 Transmission electron microscopy .......................................................................... 51
3.3 Electrode/electrolyte preparation and cell fabrication ................................................... 51
3.3.1 Aqueous electrolyte ECs ......................................................................................... 51
3.3.2 All-solid-state electrolyte ECs ................................................................................. 52
3.3.3 Organic/IL electrolyte ECs ...................................................................................... 52
3.4 Electrochemical measurement methods ......................................................................... 53
3.4.1 Cyclic voltammetry test (CV) .................................................................................. 53
3.4.2 Galvanostatic charge-discharge test (GCD) ............................................................ 55
3.4.3 Electrochemical impedance spectroscopy test (EIS) ............................................... 56
3.5 References ...................................................................................................................... 57
Chapter 4 Electrocapacitive properties of porous carbons derived from microcrystalline
cellulose ................................................................................................................................... 58
4.1 Introduction .................................................................................................................... 59
4.2 Experiment ..................................................................................................................... 60
4.2.1 Preparation of samples ............................................................................................. 60
4.2.2 Characterisations and electrochemical measurements ............................................ 60
4.3 Results and Discussion ................................................................................................... 60
4.4 Conclusions .................................................................................................................... 70
4.5 References ...................................................................................................................... 70
4.6 Supporting Information .................................................................................................. 73
Chapter 5 Electrocapacitive properties of microcrystalline cellulose-derived porous carbons
with defective sites ................................................................................................................... 77
5.1 Introduction .................................................................................................................... 78
5.2 Experiment ..................................................................................................................... 79
5.2.1 Preparation of samples ............................................................................................. 79
5.2.2 Characterisations and electrochemical measurements ............................................ 80

xiv
5.3 Results and discussion .................................................................................................... 80
5.4. Conclusions ................................................................................................................... 89
5.5 References ...................................................................................................................... 89
5.6 Supporting information .................................................................................................. 91
Chapter 6 Zeolite-templated nanoporous carbon for high-performance ECs ...................... 117
6.1 Introduction .................................................................................................................. 118
6.2 Experiment ................................................................................................................... 119
6.2.1 Preparation of zeolite-templated carbon ................................................................ 119
6.2.2 Characterizations and electrochemical measurements .......................................... 119
6.3 Results and discussion .................................................................................................. 119
6.4 Conclusions .................................................................................................................. 128
6.5 References .................................................................................................................... 129
6.6 Supporting information ................................................................................................ 131
6.7 Reference ...................................................................................................................... 140
Chapter 7 Applications of microcrystalline cellulose-derived porous carbons for hybrid ion
capacitors ............................................................................................................................... 141
7.1 Introduction .................................................................................................................. 142
7.2 Experiment ................................................................................................................... 142
7.2.1 Preparation of samples ........................................................................................... 142
7.2.2 Characterizations and electrochemical measurements .......................................... 143
7.3 Results and discussion .................................................................................................. 144
7.3.1 Morphology and microstructure ............................................................................ 144
7.3.2 Electrochemical performance as capacitive electrodes ......................................... 146
7.3.2.1 Performance as EC electrodes in different electrolytes .................................. 146
7.3.2.2 Performance in a sodium half-cell .................................................................. 149
7.3.2.3 Performance in a sodium ion capacitor ........................................................... 149
7.4 Conclusion .................................................................................................................... 152
7.5 References .................................................................................................................... 153
7.6 Supporting information ................................................................................................ 155
Chapter 8 Conclusions and Recommendations .................................................................... 160
8.1 Conclusions .................................................................................................................. 161
8.2 Recommendations ........................................................................................................ 164
xv
List of Figures
Figure 1.1 Ragone plots of various energy-storage devices. ..................................................... 2
Figure 1.2 Classification of ECs. ............................................................................................... 3
Figure 2.1 Common methods for converting biomass to carbon materials. ………………..13
Figure 2.2 XRD patterns of the activated carbon materials with CO2 and KOH activation. ... 17
Figure 2.3 A scheme showing isolating cellulose from (a) corn husk and (b) bagasse using two
different isolation processes. .................................................................................................... 25
Figure 2.4 Scheme of preparing lignin-derived carbon electrode through (a) template or (b)
template-free method ............................................................................................................... 27
Figure 2.5 Cellulose/SWNT composite electrode through simple rod coating (a) or dipping and
drying (c) method, and their electrochemical performance respectively (b), (d). ................... 29
Figure 2.6 HR-TEM (a), Raman spectra (b), Rate performance (c) and Ragone plot (d) of PGNS
.................................................................................................................................................. 33
Figure 3.1 Schematics for EC configurations of a three-electrode (a) and two-electrode (b)
system EC. 52
Figure 3.2 Schematic illustration of coin cell assembly. ......................................................... 53
Figure 3.3 Typical CV curves of a EC. .................................................................................... 54
Figure 3.4 (a, b, d, e, g, h) Schematic cyclic voltammograms and (c, f, i) corresponding GCD
curves for various kinds of energy-storage materials. ............................................................. 54
Figure 4.1 A scheme showing the preparation of NPCs (a), structure model of NPCs (b), FE-
SEM (c, d) and TEM images (e, f), nitrogen sorption isotherms and pore size distribution curve
(g) of sample NPC-600 61
Figure 4.2 Nitrogen sorption isotherms (a) and the pore size distributions of NPCs calculated
from the DFT method (b). ........................................................................................................ 62
Figure 4.3 FE-SEM, TEM and HR-TEM images of (a) NPC-500, (b) NPC-600, (c) NPC-700
and (d) NPC-800. ..................................................................................................................... 64
Figure 4.4 XPS spectra of NPC-600 (a) and the deconvoluted O 1s (b), N 1s spectra (c) ...... 65
Figure 4.5 CV curves of NPCs (a) and NPC-600 (b) within different voltage windows at 5
mV/s in 1 M H2SO4 aqueous electrolyte. ................................................................................. 66
Figure 4.6 Electrochemical performance of NPC-600 as measured in a symmetric cell using 1
M H2SO4 aqueous electrolyte: (a) CV curves at 5 mV/s in different voltage windows, (b) GCD
curves, (c) Rate capability and cycle performance at 1 A/g, (d) Nyquist plot, (e) Bode plots, (f)
Ragone plot. ............................................................................................................................. 68

xvi
Figure S4.1 FE-SEM image of a commercial microcrystalline cellulose. 73
Figure S4.2 (a) XRD patterns and (b) Raman spectra of NPCs. .............................................. 73
Figure S4.3 STEM-EDS mapping images of C (a), N (b), O (c) and HAADF-STEM image (d)
of sample NPC-600. ................................................................................................................. 74
Figure S4.4 XPS survey spectra of samples prepared at different carbonisation temperatures
(a), and C 1s XPS spectra (b) of sample NPC-600. ................................................................. 75
Figure S4.5 Nitrogen and oxygen contents of samples as a function of carbonisation
temperature. ............................................................................................................................. 75
Figure S4.6 Two-electrode CV curves of NPC-500 (a), NPC-700 (c), NPC-800 (e), and GCD
curves of NPC-500 (b), NPC-700 (d), and NPC-800 (f). ........................................................ 76
Figure 5.1 A scheme showing the preparation process (A) of MC-derived porous carbon with
defects (both N/O doping and intrinsic defects), and explanation of carbon defects for
electrocapacitive performance enhancement of a negative electrode during charging (B) 79
Figure 5.2 (A) FE-SEM image of CNUY-600; FE-SEM (B, C), TEM images (D-G), HAADF-
STEM image (H), STEM-EDS mapping images (I-K) of CNUY-600H; Nitrogen sorption
isotherms (L), pore size distribution (inset in L), XPS survey spectra (M), and Raman spectra
(N) of CNUY-600 and CNUY-600H. ...................................................................................... 81
Figure 5.3 Electrocapacitive properties measured in a three-electrode system: CV curves of
electrodes CNUY-600 and CNUY-600H at 10 (A), 50 (B) and 100 mV/s (inset of B); CV
curves of (C), GCD curves (D, E) of electrode CNUY-600H; Rate capability of electrodes
CNUY-600 and CNUY-600H.................................................................................................. 83
Figure 5.4 Electrochemical performance measured in a symmetric cell within 1 M H2SO4
aqueous electrolyte: CV curves of CNUY-600H at different potential windows at 5 mV/s (A);
CV (B) and GCD curves (C) of CNUY-600H; Rate capability plots (D); Nyquist plot (E), Bode
plots (F) and cycling performance at 5 A/g (G) of CNUY-600H; Ragone plots of symmetric
cells assembled with electrode CNUY-600H (H). ................................................................... 85
Figure 5.5 Mass loading effects on the electrochemical properties of electrode CNUY-600H
measured in a symmetric cell within 1 M H2SO4 aqueous electrolyte: GCD curves (A, B); rate
capability plots (C) with a mass loading of 12 mg/cm2; the correlation of areal capacitance with
mass loading at different current densities (D); influence of mass loading and current density
to areal capacitance (E); gravimetric specific capacitances of different mass loadings at 0.5 A/g
(F); Nyquist plots comparison (G); cycling stability at 30 mA/cm2 (H). ................................ 87
Figure S5.1: FE-SEM images of the sample CNUY-600 91
Figure S5.2: TEM images of the sample CNUY-600. ............................................................. 91

xvii
Figure S5.3 The deconvoluted (A) C 1s, (B) N 1s and (C) O 1s spectra of sample CNUY-600H;
The deconvoluted (D) C 1s, (E) N 1s and (F) O 1s spectra of CNUY-600. ............................ 92
Figure S5.4 XRD patterns of CNUY-600 and CNUY-600H. ................................................. 92
Figure S5.5 The Nyquist plot (A) and Bode plots (B) of CNUY-600H measured in a three-
electrode system using 1 M H2SO4 electrolyte. ....................................................................... 92
Figure S5.6 The electrochemical performance of electrode CNUY-600 measured in a three-
electrode system using 1 M H2SO4 electrolyte: CV (A), GCD curves (B, C), Nyquist plot (D)
and Bode plots (E). .................................................................................................................. 93
Figure S5.7 The electrochemical performance of electrode CNUY-600 measured in a
symmetric cell with 1 M H2SO4 aqueous electrolyte: GCD curves (A) and Nyquist plot (B) 93
Figure S5.8 The equivalent circuit used to fit the Nyquist and Bode plots. ............................ 94
Figure S5.9 The electrochemical performance of CNUY-600H in symmetric cells with 1 M
LiCl electrolyte: GCD (A), CV curves (B), rate capability (C) and Nyquist plot (D) ............. 94
Figure S5.10 The electrochemical performance of CNUY-600H measured in symmetric cells
using 2 M KOH as the aqueous electrolyte: GCD (A), CV curves (B), rate capability plot (C)
and Nyquist plot (D). ............................................................................................................... 95
Figure S5.11 GCD curves of electrode CNUY-600H with a mass loading of (A) 4 mg/cm2 and
(B) 8 mg/cm2. ........................................................................................................................... 95
Figure S5.12 Cycling performance of electrode CNUY-600H having a mass loading of (A) 8
mg/cm2 and (B) 12 mg/cm2 measured in a symmetric EC cell within 1 M H2SO4 aqueous
electrolyte. ................................................................................................................................ 96
Figure S5.13 TEM images of sample CNUY-1100. ................................................................ 97
Figure S5.14 XPS spectrum (A) and Raman spectra (B) of CNUY-1100............................... 97
Figure S5.15 The deconvoluted spectra of (A) C 1s, (B) N 1s and (C) O 1s of the sample
CNUY-1100. ............................................................................................................................ 98
Figure 6.1 (a) A scheme showing the carbon deposition in calcium-containing zeolite templates,
SEM images of (b) template NBZ and (c) resultant carbon replica NBZC, (d) TEM, (e)
HRTEM image of NBZC 120
Figure 6.2 Electrocapacitive properties of different electrode materials measured in a three-
electrode system using 1 M H2SO4 electrolyte: (a) CV curves at 5 mV/s, (b) rate capability, (c)
Nyquist plots. (d) CV, (e) GCD curves and (f) Bode plots of electrode NBZC. ................... 121
Figure 6.3 Nitrogen sorption isotherms (a), pore size distributions calculated using the DFT (b)
and BJH model (c). ................................................................................................................ 122
Figure 6.4 XPS survey spectra of NBZC (a), and the deconvoluted C 1s (b), O 1s (c). ....... 123

xviii
Figure 6.5 Electrocapacitive performance of electrode NBZC in symmetric cells using 1 M
H2SO4 electrolyte: (a) CV, (b) GCD curves, (c) rate capability, (d) Nyquist plot, (e) Bode plots,
and (f) cycling stability at 1 A/g. ........................................................................................... 124
Figure 6.6 Nyquist plots (a), real part capacitance (b) and imaginary capacitance (c) vs.
frequency for electrode NBZC in symmetric cells using 1 M H2SO4 electrolyte. ................ 126
Figure S6.1 Photograph of the carbon deposition rig for carbon synthesis in a large-scale.
N2/ethylene mixture was bubbled through water before reaching a zeolite bed (left inset). A 3
cm-thick bed of zeolite filled in the plug-flow reactor equipped with a fritted disk was used in
the synthesis (right inset). 131
Figure S6.2 SEM images of YZC and BZC, and their separate template. ............................ 132
Figure S6.3 TEM images of YZC and BZC. ......................................................................... 132
Figure S6.4 XRD patterns of YZC, BZC, and NBZC and their separate template. The carbons
show a well-resolved peak at 2θ ≈ 7˚, which corresponds to the (100) or (101) diffraction of
the templates, indicating the ordered micropores in the carbons ........................................... 133
Figure S6.5 (a) Nyquist plot, (b) Bode plots of NBZC measured in a three-electrode system
using 1 M H2SO4 electrolyte. ................................................................................................. 133
Figure S6.6 Nitrogen sorption isotherms (a) and pore size distribution curves calculated using
DFT (b) and BJH model (c). .................................................................................................. 134
Figure S6.7 Raman spectra of YZC, BZC, and NBZC. ......................................................... 134
Figure S6.8 XPS survey spectra of YZC and BZC (a), C 1s envelope of YZC (b) and BZC (c).
................................................................................................................................................ 134
Figure S6.9 STEM-EDS mapping of C (a), O (b) and HAADF-STEM image (c) of NBZC.
................................................................................................................................................ 135
Figure S6.10 Equivalent circuit used for the simulation of EIS data..................................... 135
Figure S6.11 Real part resistance vs frequency (a) and Bode phase angle plots (b) of the
symmetric capacitor with 1 M H2SO4 as the electrolyte of NBZC. ..................................... 136
Figure S6.12 Nitrogen sorption isotherms and textural properties (inset) of NBZC before and
after 1 M H2SO4 treatment for 1 d at 25 °C. .......................................................................... 136
Figure S6.13 XPS survey spectra of original sample NBZC as well as that of soaked after 1
month and 2 months. .............................................................................................................. 136
Figure S6.14 Electrocapacitive performance of electrode NBZC in a symmetric cell with 2 M
LiCl (a, b, c) or 1 M LiPF6 EC/DEC (d, e, f) as electrolyte. ................................................. 137

xix
Figure 7.1 (a, b) FE-SEM images of CZ550 and (c, d) CZG550; TEM images of (e-i) CZG550
144
Figure 7.2 Nitrogen sorption isotherms (a), pore size distribution curves (b), Raman (c) and
XPS survey spectra (d) of samples CZ550 and CZG550. ..................................................... 145
Figure 7.3 The electrochemical performance measured in 1 M H2SO4 electrolyte using a three-
electrode system: CV curves of CZ550 and CZG550 at 10 (a) and 200 mV/s (b); CV (c), GCD
curves (d) of CZG550; Rate capability (e) and Nyquist plots (f) of CZ550 and CZG550. ... 147
Figure 7.4 Electrochemical performance measured in symmetric coin cells with 1 M
NaClO4/EC/PC/FEC organic electrolyte: (a) CV curves of CZ550 and CZG550 at 100 mV/s;
CV (b), GCD curves (c) and Rate capability plot (d) of CZG550. ........................................ 148
Figure 7.5 Electrochemical performance of CZG550 in a sodium half-cell: (a) CV curves at
0.2-20 mV/s, GCD profiles at 0.1-5 A/g (b) and Rate capability (c). Performance of CZG550//
Nb2O4.84F0.32/Carbon nanobelts NIC: CV (d), GCD curves (e), Nyquist plot (f), Rate
performance (g), Cycling performance at 1 A/g (h) and Ragone plots (i). ............................ 151
Figure S7.1 TEM image of CZG550 155
Figure S7.2 XRD profiles of CZ550 and CZG550. ............................................................... 155
Figure S7.3 The deconvoluted C 1s (a) and O 1s (b) spectra of sample CZG550. ................ 156
Figure S7.4 The electrochemical performance of CZ550 measured in 1 M H2SO4 electrolyte
using a three-electrode system: CV (a), GCD curves (b). ..................................................... 156
Figure S7.5 Nyquist plot of CZG550 in a symmetric coin cell within 1 M NaClO4/EC/PC/FEC
organic electrolyte. ................................................................................................................. 157
Figure S7.6 The electrochemical performance of electrode CZ550 measured in symmetric coin
cells with 1 M NaClO4/EC/PC/FEC organic electrolyte: GCD curves at current densities from
0.25 to 5 A/g (a) and Nyquist plot (b). ................................................................................... 157
Figure S7.7 The electrochemical performance of CZG550 measured in symmetric coin cells
using EMIBF4 IL electrolyte within a voltage window of 0-3.6 V: CV (a), GCD curves (b),
Rate capability plot (c) and Nyquist plot (d). ........................................................................ 158
Figure S7.8 The equivalent circuit used for fitting the Nyquist plot of NICs ....................... 158

xviii
List of Tables
Table 2.1 Biomass-derived carbon electrodes for ECs through pyrolysis and/or activation ... 18
Table 2.2. Rate capability of biomass-derived carbon electrodes for ECs versus pore structure
.................................................................................................................................................. 35
Table 2.3 Summary of lignocellulose-derived carbon electrodes for ECs .............................. 36
Table 3.1 Chemicals and reagents used in this thesis project 49
Table 4.1 Textual properties of the NPCs. 63
Table 4.2 Comparison of cellulose-derived carbon materials as electrodes for ECs............... 69
Table 5.1 Textural properties of CNUY-600 and CNUY-600H 80
Table S5.1 N 1s fitting results of CNUY-600 and CNUY-600H. 98
Table S5.2 Specific capacitance values (in F/g) of electrodes CNUY-600 and CNUY-600H
measured in 1 M H2SO4 aqueous electrolyte within a three-electrode system ........................ 98
Table S5.3 Electrochemical performance of electrode CNUY-600 measured in 1 M H2SO4
electrolyte within a two-electrode system ................................................................................ 98
Table S5.4 Electrochemical performance of electrode CNUY-600H measured in 1 M H2SO4
electrolyte within a two-electrode system ................................................................................ 99
Table S5.5 Electrochemical performance of electrode CNUY-600H in a symmetric cell with
1M LiCl as the aqueous electrolyte ......................................................................................... 99
Table S5.6 Specific capacitance values of electrode CNUY-600H in a symmetric cell with 2
M KOH as the aqueous electrolyte .......................................................................................... 99
Table S5.7 Areal capacitance values (mF/cm2) of electrode CNUY-600H of different mass
loadings measured in symmetric cells using 1 M H2SO4 electrolyte....................................... 99
Table 6.1 Textual properties of the samples 122
Table S6. 1 Specific capacitance values of NBZC at different current densities measured in 1
M H2SO4 electrolyte within a three-electrode system. 137
Table S6.2 Comparisons of the preparation and characteristics of various porous carbon
materials as well as their applications in ECs ........................................................................ 138
Table S6.3 Areal specific capacitance values of NBZC at different current densities in all-solid-
state cells using PVA / H2SO4 gel electrolyte. ....................................................................... 140
Table 7.1 Textural properties of CZ550 and CZG550 146
Table S7.1 Specific capacitance values (in F/g) of electrodes CZ550 and CZG550 in 1 M
H2SO4 aqueous electrolyte within a three-electrode system 159

xix
Table S7.2 Electrochemical performance values of CZG550 in symmetric coin cells using 1 M
NaClO4/EC/PC/FEC organic electrolyte ............................................................................... 159
Table 8.1 Comparisons of the typical four electrode materials obtained in chapter 4, 5, 6 and 7.
163

xx
List of Abbreviations
2D Two Dimensions
3D Three Dimensions
ACs Activated Carbons
ACFs Activated Carbon Fibres
AFM Atomic Force Microscope
B Boron
BC Bacterial Cellulose
BET Brunauer-Emmett-Teller
BJH Barrett-Joyner Halenda
BZ Zeolite Beta
BZC Zeolite Beta-templated Carbon
C Capacitance
CAs Carbon Aerogels
CB Carbon Black
CDC Carbon Derived Carbon
CNT Carbon Nanotube
CNUS Cellulose/NaOH/Urea Sol
CV Cyclic Voltammetry
CVD Chemical Vapour Deposition
CNF-RGO Cellulose Nanofibre-reduced Graphene Oxide
DFT Density-functional Theory
DI Deionized
E Energy Density
ECs Electrochemical Capacitors
EDL Electric Double Layer
EDLC Electric Double Layer Capacitance
EG Expanded graphite
EIS Electrochemical Impedance Spectroscopy
ESR Equivalent Series Resistance
f Frequency
GO Graphene Oxide
HPCs Hierarchical Porous Carbons

xxi
HR-TEM High Resolution Transmission Electron Microscopy
HTC Hydrothermal Carbonisation
IL Ionic Liquid
IWS Intelligent Wireless Sensor
K-ACFs Activated Carbon Fibres through KOH
LED Light-emitting Diode
LHPCs Lignin-derived Hierarchical Porous Carbons
LIBs Lithium ion Batteries
LRF Lignin-resorcinol-formaldehyde
MC Microcrystalline Cellulose
MOF Metal Organic Framework aszxbn
MPC Mesoporous carbon
N Nitrogen
NBZ Nano-sized Beta Zeolite
NBZC Zeolite Beta-templated Carbon
NPC Nitrogen-containing cellulose-derived porous carbons
O Oxygen
OCP Open Circuit Potential
OFG Oxygen-containing Functional Groups
OLC Onion-like Carbon
P Phosphorous/Power Density
P/P0 Relative Pressure
PGNSs Porous Graphene like Nanosheets
PSD Pore Size Distribution
PTFE Polytetrafluoroethylene
PANI Polyaniline
PVA Polyvinyl Alcohol
PVs Photovoltaics
Qdl Constant Phase Element
R Resistance
rGO Reduced Graphene Oxide
SBET the Specific Surface Area from BET
SEM Scanning Electron Microscopy
SCs Supercapacitors

xxii
SSA Specific Surface Area
SWNT Single Walled Carbon Nanotube
T Temperature
TC Template Carbon
TEM Transmission Electron Microscopy
TEGO Thermally Expanded Graphite Oxide
TGA Thermal Gravimetric Analysis
TEOS Tetra Ethyl Orthosilicate
v Voltage Scan Rate
V Potential Window/Voltage
ZW Warburg Impedance
XPS X-ray Photoelectron Spectroscopy
XRD X-Ray Diffraction

1
Chapter 1 Introduction

2
1.1 Background
1.1.1 Electrochemical capacitors (ECs)
The environmental impacts of fossil fuels are driving a global increase in the proportion of
renewable and clean energy. The development of renewable energy, such as wind and solar,
relies significantly upon advanced energy storage systems due to the intermittency of
renewables.1-4 Meanwhile, the rapidly growing market for electric vehicles, smart grids,
uninterruptible power supply and portable electronic devices requires advanced energy storage
systems of high performance and low cost.5
Rechargeable batteries and electrochemical capacitors (ECs) represent two of the leading
electrical storage technologies. As it is shown in the Ragone plot in Figure 1. 1, there are
significant differences in the energy and power densities of these two systems. Batteries,
especially lithium-ion batteries (LIBs), have a much higher energy density than ECs and so
they have been widely used in consumer electronics, grid storage and electric vehicles. On the
other hand, ECs have a higher power density than batteries coupled with other distinctive
advantages such as long cycle life (> 100,000 cycles.)6 Therefore, they are used in applications
requiring many rapid charge/discharge cycles and instantaneous high power, and will
increasingly be used in applications in the future as an alternative to batteries.7, 8.
Figure 1. 1 Ragone plots of various energy-storage devices.1

3
Figure 1. 2 outlines different types of ECs, i.e., supercapacitors (SCs).1 ECs can be mainly classified into three types, i.e., electric double-layer
capacitors (EDLCs), pseudocapacitors, and asymmetric ECs.1, 3, 9 The two kinds of symmetric ECs, constructed by using the same positive and
negative electrode materials, are currently the most common, commercially available SC devices.
Figure 1. 2 Classification of ECs.1
Asymmetric ECs can be classified into two types, either systems with two capacitive electrodes or hybrid capacitors.1, 3 Hybrid capacitors have
come to be identified as devices in which one electrode stores charge based on a capacitive mechanism while the other one stores it through a
battery-type Faradaic process. 1, 9 During the charge and discharge processes, asymmetric ECs can take advantage of the two different electrodes
to maximize the operating voltage of the cell device. For example, while the voltage of an aqueous-based symmetric EC is limited to ∼1.2 V, the
voltage of an asymmetric system can be extended to 2.0 V. Currently, the most commonly studied hybrid capacitors
4
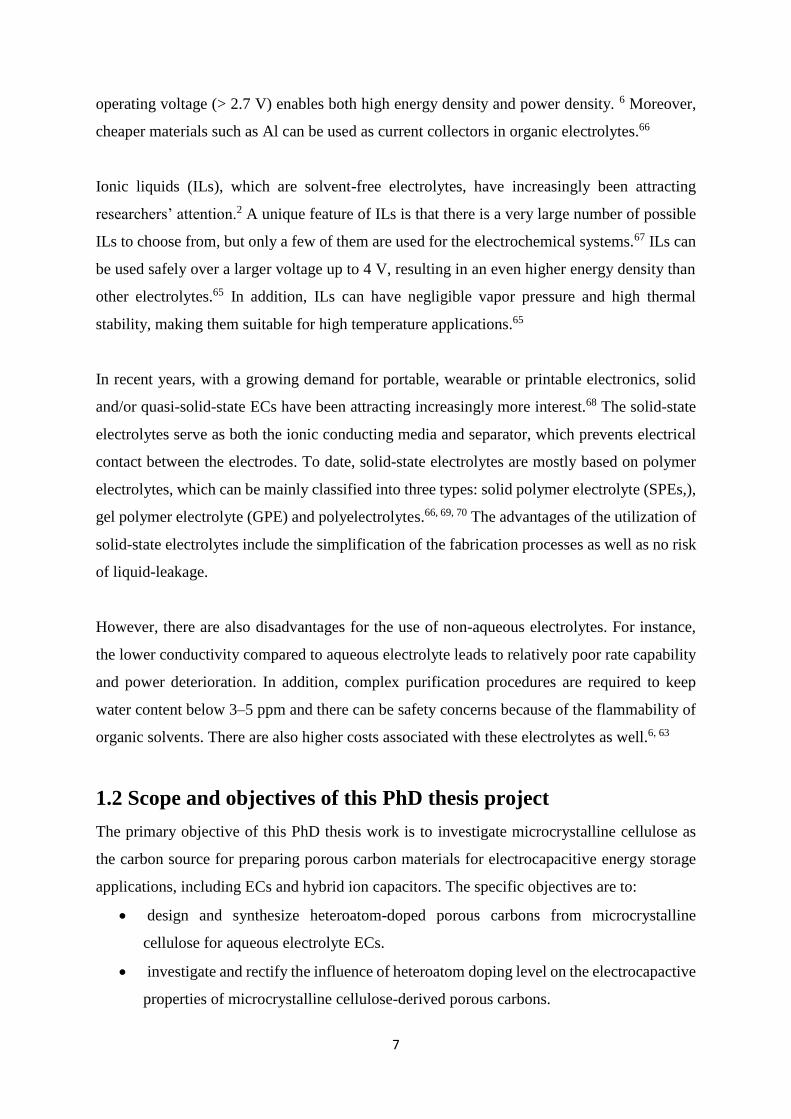
are metal ion capacitors such as sodium-ion capacitors (NICs) and lithium-ion capacitors
(LICs) using a wide voltage (~4.2 V) battery electrolyte. Some researchers have also tried to
broaden the operating voltage through using both different electrodes and different electrolytes
in a device.10, 11 In this thesis project, to further enhance the energy density, MC-derived
carbons will also be applied as the positive electrode for NICs.
Most currently available commercial EC devices typically deliver an energy density of lower
than 10 Wh/Kg. This is value much lower than LIBs, which can provide an energy density
higher than 180 Wh/Kg.12, 13 The issue of low energy density limits ECs’ applications.
Therefore, both the industry and scientific communities are eager to develop new-generation
ECs. The key to success is to find high-performance and co-effective advanced electrode
materials.12-14
1.1.2 Electrode materials for ECs
The energy storage mechanism of capacitive electrodes can be classified into two kinds: the
electrochemical double-layer capacitance (EDLC) and electrochemical pseudocapacitance.
EDLC comes from the electrostatic charge accumulation at the electrode/electrolyte interface.
The latter originates from faradic electron charge-transfer involving redox reactions,
intercalation or electrosorption. The electrode materials for the former are mainly porous
carbons including activated carbons (ACs) while for the latter can be metal oxides, conducting
polymers and porous carbon materials with suitable surface functional groups. It should be
noted that these two mechanisms often function simultaneously.6
Generally, pseudocapacitive materials exhibit a higher specific capacitance than
electrochemical double-layer (EDL) electrode materials. Porous carbon materials that store
energy based primarily on the EDLC mechanism tend to have a better cycle stability and rate
capability. Thus, EDL capacitors can be operated at relatively high charge and discharge rates
with an ultra-high lifetime.6,15 In this context, advanced porous carbon materials derived from
different carbon precursors have been a subject of significant ongoing research.16
Among them, porous carbons derived from biomass, which is a sustainable and cost-effective
source for making carbon electrode materials, are especially promising.17-20 In the past decade,
various biomass-derived porous carbons of good performance have been reported for ECs.21-26

5
However, many factors influence their performance, such as the components of the material
(cellulose, lignin, hemicellulose and so on) and the geographical origin of the biomass. Even
the same type of biomass originating from different places will often have different structures
and components. These factors inhibit biomass’ further commercial application for EC
electrodes. In addition, the dependence of electrochemical performance upon the composition
of lignocellulose is still unclear. Therefore, it is necessary and a growing research area, to
separately study the three main components of lignocellulose (cellulose, lignin and
hemicellulose),27, 28 for the transformation and application of biomass into EC electrodes. 29, 30
In the past few years, some cellulose-derived carbons have been reported for ECs.31-44
However, most of the cellulose used in these reports are nanocellulose, such as cellulose
nanocrystals,34,35 nanofibrils,32, 38, 41, 42 or bacteria nanocellulose, 33, 37, 39, 43 which are costly and
require involving significant energy consumption to produce. Meanwhile, microcrystal
cellulose, the only commercially available cellulose currently, is rarely used because of its poor
solubility in water. So, in this PhD project, microcrystal cellulose (MC) will be selected as the
main carbon precursor.
The performance of porous carbon electrode materials is closely associated with defects
including heteroatom doping, pore structure and electronic conductivity, etc.13, 15 It has been
widely reported and accepted that heteroatom doping is beneficial for the electrochemical
performance improvement of carbon electrode materials.45-50 As a “neighbor” of carbon,
nitrogen is currently one of the most widely investigated heteroatoms.45 Furthermore, it is
important to understand the effect of doping level for the performance enhancement of ECs,
for which currently no consensus has been obtained or confirmed. More research in this area
is needed. Therefore, in the first two chapters of the present thesis project, nitrogen-doping will
be adopted to enhance the capacitance, and then the effect of low N-doping level combined
with carbon intrinsic defects will be studied for further improvement of the electrocapacitive
properties of MC-derived porous carbon materials.
Hierarchical porous carbons (HPCs) are carbon materials that contain multimodal distribution
of micropores, mesopores and/or macropores organised in three dimensions (3D). Carbons of
this type with high SSA are believed to be ideal electrode materials for ECs.51-55 However, it
is currently impossible to synthesise MC-derived HPCs with good control over the pore
structure through physical or chemical activation. So, to examine the effect of varying the pore

6
structure on device performance in this project, the zeolite-template method will be used to
synthesise ordered HPCs of high SSA in a large scale for high performance EC electrodes.56-61
Additionally, it is worth noting that although many HPCs prepared through the zeolite template
method have been reported, actually it has been challenging to selectively deposit carbon in
zeolite micropores for ordered HPCs. So, the currently available HPCs prepared using this
method mainly contain meso-macropores rather than micro-mesopores which are more
desirable for EDLCs.
Electrode materials of good electronic conductivity are favorable for the electron transfer and
ion diffusion, thus improving the electrochemical performance. One method to improve
electrodes’ electronic conductivity is by forming a composite with graphene. Graphene is a 2D
hexagonal lattice of sp2 carbon atoms covalently bonded along the 2D basal plane.62 The unique
2D atom-thick planar structure, high SSA, and outstanding mechanical and electrical properties
render it highly promising for ECs.63, 64 And preparing composite materials with graphene or
reduced graphene oxides (rGO) is an active and promising research direction. In this thesis,
MC-derived carbons will also be composited with rGO for ECs.
1.1.3 Electrolytes for ECs
The performance of ECs is also strongly affected by the electrolyte employed. Many kinds of
electrolytes for ECs have been reported in the literature, which can be categorized as liquids
(aqueous, organic and ionic liquids) and solid/quasi-solid-state electrolytes. But no perfect
electrolyte has yet been developed.65 In this thesis, the electrocapacitive properties of MC-
derived carbons will be studied in both liquid and quasi-solid-state electrolytes.
Aqueous electrolytes, such as sodium sulfate, sulfuric acid or potassium hydroxide, can provide
high capacitance and conductivity, for instance, 0.8 S/cm2 for 1M H2SO4 at 25 °C. But they
have a limited potential window typically up to 1 V because of the water decomposition at 1.23
V, which limits the energy density of the EC devices. The risk of leakage of highly acidic
contents is another big issue limiting its real application.65
Organic electrolytes are the most commonly used electrolytes in commercial cells, such as
solutions of [N(C2H5)4]BF4 in propylene carbonate (PC) or acetonitrile (ACN). The high cell
7
operating voltage (> 2.7 V) enables both high energy density and power density. 6 Moreover,
cheaper materials such as Al can be used as current collectors in organic electrolytes.66
Ionic liquids (ILs), which are solvent-free electrolytes, have increasingly been attracting
researchers’ attention.2 A unique feature of ILs is that there is a very large number of possible
ILs to choose from, but only a few of them are used for the electrochemical systems.67 ILs can
be used safely over a larger voltage up to 4 V, resulting in an even higher energy density than
other electrolytes.65 In addition, ILs can have negligible vapor pressure and high thermal
stability, making them suitable for high temperature applications.65
In recent years, with a growing demand for portable, wearable or printable electronics, solid
and/or quasi-solid-state ECs have been attracting increasingly more interest.68 The solid-state
electrolytes serve as both the ionic conducting media and separator, which prevents electrical
contact between the electrodes. To date, solid-state electrolytes are mostly based on polymer
electrolytes, which can be mainly classified into three types: solid polymer electrolyte (SPEs,),
gel polymer electrolyte (GPE) and polyelectrolytes.66, 69, 70 The advantages of the utilization of
solid-state electrolytes include the simplification of the fabrication processes as well as no risk
of liquid-leakage.
However, there are also disadvantages for the use of non-aqueous electrolytes. For instance,
the lower conductivity compared to aqueous electrolyte leads to relatively poor rate capability
and power deterioration. In addition, complex purification procedures are required to keep
water content below 3–5 ppm and there can be safety concerns because of the flammability of
organic solvents. There are also higher costs associated with these electrolytes as well.6, 63
1.2 Scope and objectives of this PhD thesis project
The primary objective of this PhD thesis work is to investigate microcrystalline cellulose as
the carbon source for preparing porous carbon materials for electrocapacitive energy storage
applications, including ECs and hybrid ion capacitors. The specific objectives are to:
• design and synthesize heteroatom-doped porous carbons from microcrystalline
cellulose for aqueous electrolyte ECs.
• investigate and rectify the influence of heteroatom doping level on the electrocapactive
properties of microcrystalline cellulose-derived porous carbons.

8
• examine the influence of pore hierarchy on the electrocapacitive properties of porous
carbons.
• improve the electrocapacitive properties of cellulose-derived carbons by composite.
• optimize the cell performance using different electrolyte and cell configurations.
1.3 Outline of thesis chapters
This thesis consists of 8 chapters. Chapter 1 briefly introduces the research background, scope
and objectives. Chapter 2 presents a literature review on porous carbon electrodes for ECs,
including biomass-derived porous carbons as EC electrodes. Chapter 3 provides the details of
materials and chemical used, characterization techniques and electrochemical measurement
methods. Chapter 4 reports the design and synthesis of nitrogen-doped porous carbons derived
from MC for ECs. Chapter 5 describes the effect of low N-doping level combined with the
introduction of carbon intrinsic defects on the electrocapactive properties of MC-derived
porous carbons for ECs. Chapter 6 discusses the preparation and electrocapacitive properties
of zeolite-templated hierarchical porous carbon electrode materials. Chapter 7 reports the
preparation of MC-derived porous carbon/graphene oxide composites for symmetric ECs
within different electrolytes and NICs. Chapter 8 provides a summary of key conclusions and
recommendations for future work.
1.4 References
1. Y. Shao, M. F. El-Kady, J. Sun, Y. Li, Q. Zhang, M. Zhu, H. Wang, B. Dunn and R. B.
Kaner, Chem Rev, 2018, 118, 9233-9280.
2. P. Simon and Y. Gogotsi, Nature materials, 2008, 7, 845-854.
3. J. Zhang and X. Zhao, ChemSusChem, 2012, 5, 818-841.
4. Y. Gogotsi and P. Simon, Science, 2011, 334, 917-918.
5. C. Xu, B. Xu, Y. Gu, Z. Xiong, J. Sun and X. Zhao, Energy & Environ Sci, 2013, 6,
1388-1414.
6. L. L. Zhang and X. Zhao, Chem Soc Rev, 2009, 38, 2520-2531.
7. J. R. Miller and P. Simon, Science, 2008, 321, 651-652.
8. J. Chmiola, G. Yushin, Y. Gogotsi, C. Portet, P. Simon and P.-L. Taberna, Science,
2006, 313, 1760-1763.
9. Y. Wang, Y. Song and Y. Xia, Chem Soc Rev, 2016, 45, 5925-5950.
10. P. F. Ortega, Z. González, C. Blanco, G. G. Silva, R. L. Lavall and R. Santamaría,
Electrochimica Acta, 2017, 254, 384-392.
11. P. F. Ortega, G. A. dos Santos Junior, L. A. Montoro, G. G. Silva, C. Blanco and R. L.
Lavall, The Journal of Physical Chemistry C, 2018, 122, 1456-1465.
12. P. Simon, Y. Gogotsi and B. Dunn, Science, 2014, 343, pp. 1210-1211.
13. Z. Yu, L. Tetard, L. Zhai and J. Thomas, Energy & Environmental Science, 2015, 8,
702-730.

9
14. H. C. Chen, Y. Qin, H. Cao, X. Song, C. Huang, H. Feng and X. Zhao, Energy Storage
Materials, 2018.
15. L. L. Zhang, Y. Gu and X. Zhao, J Mater Chem A, 2013, 1, 9395-9408.
16. W. Chen, H. Yu, S.-Y. Lee, T. Wei, J. Li and Z. Fan, Chem Soc Rev, 2018, 47, 2837-
2872.
17. K. Fic, A. Platek, J. Piwek and E. Frackowiak, Materials Today, 2018, 21, 437-454.
18. L. Zhang, Z. Liu, G. Cui and L. Chen, Progress in Polymer Science, 2015, 43, 136-164.
19. Z. Gao, Y. Zhang, N. Song and X. Li, Materials Research Letters, 2016, 1-20.
20. K. Qian, A. Kumar, H. Zhang, D. Bellmer and R. Huhnke, Renewable and Sustainable
Energy Reviews, 2015, 42, 1055-1064.
21. X. Zheng, J. Luo, W. Lv, D. W. Wang and Q. H. Yang, Adv Mater, 2015, 27, 5388-
5395.
22. Y. Gong, Z. Wei, J. Wang, P. Zhang, H. Li and Y. Wang, Scientific reports, 2014, 4.
23. L. Qie, W. Chen, H. Xu, X. Xiong, Y. Jiang, F. Zou, X. Hu, Y. Xin, Z. Zhang and Y.
Huang, Energy & Environmental Science, 2013, 6, 2497-2504.
24. Y. Zhao, W. Ran, J. He, Y. Song, C. Zhang, D.-B. Xiong, F. Gao, J. Wu and Y. Xia,
ACS applied materials & interfaces, 2015, 7, 1132-1139.
25. V. Subramanian, C. Luo, A. Stephan, K. Nahm, S. Thomas and B. Wei, The Journal of
Physical Chemistry C, 2007, 111, 7527-7531.
26. S. Song, F. Ma, G. Wu, D. Ma and J. Wan, J Mater Chem A, 2015, 3, 18154-18162.
27. L. Jabbour, R. Bongiovanni, D. Chaussy, C. Gerbaldi and D. Beneventi, Cellulose,
2013, 20, 1523-1545.
28. X. Wang, C. Yao, F. Wang and Z. Li, Small, 2017, 13, 1702240-1702258.
29. L. Deng, R. J. Young, I. A. Kinloch, A. M. Abdelkader, S. M. Holmes, D. A. De Haro-
Del Rio and S. J. Eichhorn, ACS applied materials & interfaces, 2013, 5, 9983-9990.
30. X. Yang and E. D. Cranston, Chemistry of Materials, 2014, 26, 6016-6025.
31. G. Zu, J. Shen, L. Zou, F. Wang, X. Wang, Y. Zhang and X. Yao, Carbon, 2016, 99,
203-211.
32. C. Yao, A. Hernandez, Y. Yu, Z. Cai and X. Wang, Nano Energy, 2016, 30, 103-108.
33. X. Xu, J. Zhou, D. H. Nagaraju, L. Jiang, V. R. Marinov, G. Lubineau, H. N. Alshareef
and M. Oh, Advanced Functional Materials, 2015, 25, 3193-3202.
34. X. Wu, J. Tang, Y. Duan and K. C. Tam, J Mater Chem A, 2014, 2, 19268-19274.
35. X. Wu, Z. Shi, R. Tjandra, A. J. Cousins, S. Sy, A. Yu, R. M. Berry and K. C. Tam, J
Mater Chem A, 2015, 3, 23768-23777.
36. L. Wei, M. Sevilla, A. B. Fuertes, R. Mokaya and G. Yushin, Advanced Energy
Materials, 2011, 1, 356-361.
37. Y. J. Kang, S.-J. Chun, S.-S. Lee, B.-Y. Kim, J. H. Kim, H. Chung, S.-Y. Lee and W.
Kim, ACS nano, 2012, 6, 6400-6406.
38. Z. Gui, H. Zhu, E. Gillette, X. Han, G. W. Rubloff, L. Hu and S. B. Lee, ACS nano,
2013, 7, 6037-6046.
39. C. Long, D. Qi, T. Wei, J. Yan, L. Jiang and Z. Fan, Advanced Functional Materials,
2014, 24, 3953-3961.
40. L. Jiang, G. W. Nelson, H. Kim, I. Sim, S. O. Han and J. S. Foord, ChemistryOpen,
2015, 4, 586-589.
41. M. Hamedi, E. Karabulut, A. Marais, A. Herland, G. Nyström and L. Wågberg,
Angewandte Chemie International Edition, 2013, 52, 12038-12042.
42. J. Edberg, O. Inganäs, I. Engquist and M. Berggren, J Mater Chem A, 2018, 6, 145-152.
43. L. F. Chen, Z. H. Huang, H. W. Liang, Q. F. Guan and S. H. Yu, Adv Mater, 2013, 25,
4746-4752.
44. C. Wang, X. Wang, H. Lu, H. Li and X. Zhao, Carbon, 2018, 140, 139-147.

10
45. J. P. Paraknowitsch and A. Thomas, Energy & Environmental Science, 2013, 6, 2839-
2855.
46. D. Hulicova‐Jurcakova, M. Seredych, G. Q. Lu and T. J. Bandosz, Advanced functional
materials, 2009, 19, 438-447.
47. D. Hulicova-Jurcakova, A. M. Puziy, O. I. Poddubnaya, F. Suárez-García, J. M. Tascón
and G. Q. Lu, J Am Chem Soc, 2009, 131, 5026-5027.
48. Z. Li, Z. Xu, H. Wang, J. Ding, B. Zahiri, C. M. Holt, X. Tan and D. Mitlin, Energy &
Environmental Science, 2014, 7, 1708-1718.
49. Y. Wen, 2016.
50. F. Sun, X. Liu, H. B. Wu, L. Wang, J. Gao, H. Li and Y. Lu, Nano letters, 2018, 18,
3368-3376.
51. D. W. Wang, F. Li, M. Liu, G. Q. Lu and H. M. Cheng, Angewandte Chemie, 2008,
120, 379-382.
52. L. Gao, L. Xiong, D. Xu, J. Cai, L. Huang, J. Zhou and L. Zhang, ACS Applied
Materials & Interfaces, 2018, 10, 28918-28927.
53. H. Sun, L. Mei, J. Liang, Z. Zhao, C. Lee, H. Fei, M. Ding, J. Lau, M. Li and C. Wang,
Science, 2017, 356, 599-604.
54. X. Zheng, J. Luo, W. Lv, D. W. Wang and Q. H. Yang, Adv Mater, 2015, 27, 5388-
5395.
55. X. Fan, C. Yu, J. Yang, Z. Ling, C. Hu, M. Zhang and J. Qiu, Advanced Energy
Materials, 2015, 5, 14011761.
56. T. Kyotani, T. Nagai, S. Inoue and A. Tomita, Chemistry of materials, 1997, 9, 609-
615.
57. C. J. Meyers, S. D. Shah, S. C. Patel, R. M. Sneeringer, C. A. Bessel, N. R. Dollahon
and E. S. Takeuchi, The Journal of Physical Chemistry B, 2001, 105, 2143-2152.
58. X. S. Zhao, F. Su, Q. Yan, W. Guo, X. Y. Bao, L. Lv and Z. Zhou, J Mater Chem, 2006,
16, 637-648.
59. W. Xia, B. Qiu, D. Xia and R. Zou, Scientific reports, 2013, 3.
60. X. Wen, D. Zhang, T. Yan and L. Shi, J Mater Chem A, 2013, 1, 12334-12344.
61. X. Y. Chen, C. Chen and D. H. Xie, J Mater Chem A, 2013, 1, 10903-10911.
62. K. S. Novoselov, A. K. Geim, S. V. Morozov, D. Jiang, Y. Zhang, S. V. Dubonos, I. V.
Grigorieva and A. A. Firsov, Science, 2004, 306, 666-669.
63. Z. Lei, J. Zhang, L. L. Zhang, N. A. Kumar and X. Zhao, Energy & Environmental
Science, 2016, 9, 1891-1930.
64. X. Sun, 2018.
65. X. Sun, H. Lu, P. Liu, T. E. Rufford, X. Fan and X. Zhao, Sustainable Energy & Fuels,
2018, 2, 673-678.
66. C. Zhong, Y. Deng, W. Hu, J. Qiao and J. Zhang, Chem Soc Rev, 2015, 44, 7484-7539.
67. A. Eftekhari, Energy Storage Materials, 2017, 9, 47-69.
68. H. Lu and X. Zhao, Sustainable Energy & Fuels, 2017, 1, 1265-1281.
69. N. Choudhury, S. Sampath and A. Shukla, Energy & Environmental Science, 2009, 2,
55-67.
70. X. Sun, H. Lu, T. E. Rufford and X. Zhao, Sustainable Energy & Fuels, 2019, 3, 1827-
1832.

11
Chapter 2 Literature review
This chapter has been published as Sustainable Energy & Fuels, 2017, 1,1265-1281, with
necessary update.

12
2.1 Biomass and properties
Biomass most often refers to plants or plant-derived, animal-derived and marine organism-
derived materials.1, 2 Because biomass is earth-abundant, renewable, low-cost, and has an
inherent microstructure, biomass and biomass-derived materials have been investigated for
various applications, such as CO2 capture,3, 4 hydrogen storage,5-7 water treatment,8, 9 catalysis
and energy storage.10-15
The inherent properties of the biomass source influence the conversion treatments for biomass.
The main material properties of biomass include moisture content, proportion of fixed carbon
and volatiles, calorific value, ash/residue contents, cellulose/lignin ratio and the alkali metal
content.16 These properties not only influence the carbon yield through pyrolysis, but also,
significantly affect the porous structure of the biochar, particularly in the case of alkali metal
contetnt.17
Plants or plant-derived biomass is often referred to as lignocellulose, which is mainly
composed of carbohydrate and aromatic polymer, i.e., cellulose, hemicellulose, lignin and
tannin.18 Carbon materials can be prepared directly from lignocellulose or from its derivatives,
such as cellulose, lignin and hemicellulose. In the past two decades, biomass-derived carbons
have been widely studied in a series of applications. 19, 20 In recent years, researchers have also
begun to focus on cellulose, lignin and hemicellulose-derived carbons for energy storage and
other applications. 1, 21 In the following parts, we will firstly provide an overview of the
methods for converting biomass into porous carbons. Then we will focus on lignocellulose-
derived carbons and their applications for ECs. In 2.4 and 2.5, we will give a brief discussion
on structure and morphology control, heteroatoms doping in carbons respectively. In 2.6, we
will also have a short introduction to template carbon.
2.2 Converting biomass into porous carbons
To convert biomass into carbon, different carbonisation methods (e.g., pyrolysis and
hydrothermal carbonisation) and activation methods (e.g., physical and chemical activations)
can be used. As illustrated in Figure 2. 1, both physical and chemical means, or a combination
of both have been employed to transfer biomass into value-added carbon materials. By
controlling parameters involved in the preparation of carbon materials, such as temperature,

13
time, and reagent, different porosities, surface properties, morphologies, and costs can be
obtained.
Pyrolysis and hydrothermal carbonisation (HTC) are the two common methods to carbonise
biomass. Pyrolysis occurs in an inert or limited oxygen atmosphere at elevated temperatures
while the HTC refers to a thermo-chemical process to convert biomass to carbonaceous
material.22, 23
Figure 2. 1 Common methods for converting biomass to carbon materials.
The main pyrolysis products from biomass depend on the temperature, temperature ramping
rate, particle size and catalyst used24. HTC is performed in a pressurized aqueous environment
at a relatively low temperature,25 with or without the aid of a catalyst.26 It mimics the natural
coalification of biomass, although the reaction rate is higher and the reaction time is shorter
compared to the hundreds of years of slow nature coalification of biomass.22 In recent years,
several review articles regrading hydrothermal conversion of biomass have been published.10,
23, 25, 27 As a thermo-chemical conversion technique, the HTC can be influenced by several
parameters, such as temperature, residence time, precursor concentration and catalyst. It uses
subcritical water for the conversion of a biomass to carbonaceous products, resulting in
efficient hydrolysis and dehydration of precursors and bestowing the hydrochar with a high
and tuneable content of oxygen-containing functional groups (OFG).23 Other functionalities,

14
e.g, nitrogen-containing groups, can also be introduced into hydrochars by using dopant-
containing precursors or additives.27 The use of HTC for the conversion of biomass into carbon
materials has received considerable attention for various applications such as catalysis,28, 29
CO2 capture,30, 31 and energy storage.25, 32-37
Activation is a process of converting carbonaceous materials into AC. Both physical and
chemical activation means can be used.38 Physical activation is usually conducted immediately
after the pyrolysis step at high temperatures (up to 1200 °C) in the atmosphere of steam or
CO2.5 Chemical activation is implemented with a chemical agent at a temperature typically
ranging from 450 to 900 °C. The commonly used chemical activation agents include KOH,
NaOH, ZnCl2, FeCl3, H3PO4, and K2CO3.
2.2.1 Carbonisation
Porous carbon materials from biomass are usually obtained by pyrolysis with following
activation to enhance the SSA and pore volume.39-41 But research has also shown that high-
performance carbon electrode materials can be obtained by direct pyrolysis of a biomass
without the activation step.17, 33, 42-45 Beguin and co-workers42, 43 reported a high surface area
EC carbon electrode material prepared from waste seaweeds without activation. Biswal et al.17
demonstrated the preparation of a high SSA microporous carbon without using the activation
step. The plant-leave-derived carbon displayed a high specific capacitance of 400 F/g at 0.5
A/g measured in aqueous 1 M H2SO4 electrolyte. These biomass precursors all have a relatively
high content of impurities such as Na, K, Ca, and Mg, which are known to be good porogens.26
These impurities can act as an activation reagent during the pyrolysis.
The HTC process yields a partially carbonised product, called hydrochar, which has a high
density of oxygen-containing surface functional groups and a low degree of condensation.23
Such HTC hydrochars have been directly used as electrodes for ECs.33, 46-48 However, the HTC-
derived hydrochars possess poorly developed porosity with a low SSA. Thus, subsequent
carbonisation/activation is needed for improving the material’s physical and chemical
properties.26, 32, 34-37, 49-54.
Zhu et al. 49 proposed and demonstrated a hydrothermal assistant pyrolysis procedure to
produce fungi-derived electrode materials for ECs. By HTC at a temperature of 120 °C for 6 h,

15
the product was featured by small particle sizes (50-200 nm), high oxygen content (13.4 wt.%)
and a low surface area (14 m2/g). The hydrochar was further pyrolysed at 700 °C for 3 h to
further increase the porosity and improve the electronic conductivity. The ultimately obtained
carbon material had an SSA of 80 m2/g and an oxygen content of 5 wt.%. Despite the still low
SSA after the pyrolysis, the material exhibited a specific capacitance of 196 F/g at 1 mV/s.
Actually, highly porous carbon materials based on hydrochar normally have a relatively high
amount of heteroatoms.55-57 Thus, the hydrochar from the HTC process is an excellent
precursor for the production of carbon with tuneable surface functionality and porosity.58
Torres et al.59 prepared AC materials doped with N and O heteroatoms by activation of
hydrochars with KOH. It is found that the presence of nitrogen and oxygen improved both the
capacitance and charge transfer especially at high current densities. Wei et al.54 demonstrated
that hydrochars with networks of uniformly distributed oxygen can be efficiently transformed
into microporous carbons with a high SSA and large pore volume of interconnected pores. In
their experiment, the transformation was accomplished via HTC at 230-250 °C for 2 h and
subsequent chemical activation at 700-800 °C for 1 h. The carbon electrode produced from
wood saw dust exhibited both a high capacitance of 236 F/g and a good rate capability in
symmetric two-electrode ECs using organic electrolyte.
2.2.2 Activation
Chemical and physical activation are the two primary methods of obtaining biomass-derived
ACs. Compared with chemical activation, physical activation is simpler and more
environmentally friendly but usually conducted at a higher temperature. Currently, chemical
activation is more commonly used because of lower activation temperature, less activation time,
higher yield, higher SSA and well-developed pores. The chemical activation method does have
several disadvantages, such as the need of water for the necessary post-activation washing to
thoroughly wash away any impurities generated during the activation process and the handling
of the contaminated water.2, 60, 61, 62
2.2.2.1 Physical activation
Physical activation is generally operated under an atmosphere of certain gas, mainly including
air, steam, or CO2. Air activation is usually conducted under relatively low temperature, <
500 °C. Recently, Mitlin and co-workers described the synthesis of high-performance carbon
electrode materials using chicken eggshell membranes as the precursor, which has a high

16
content of nitrogen and a continuous network formed by interwoven and coalescing carbon
fibers.26, 63 They combined the pyrolysis/air activation methods to maintain the interconnected
porous structure of the eggshell membranes. The carbonisation was conducted at 800 °C for 2
h with the subsequent air activation at 300 °C for 2 h. The air activation increased the SSA to
221 m2/g. The macroscopic porous structure was preserved. The resulting electrode material
with 8 wt.% nitrogen displayed a capacitance of 297 F/g in 1 M KOH electrolyte and about
97 % of the original capacitance value was remained after 10000 GCD tests. The air activation
step has also shown to significantly influence the porous properties of biomass-derived
carbon.64-66
Steam is a readily available activating agent used for biomass materials due to its low cost and
the lack of post-activation process to remove by-products.40 The steam activation process is
always combined with pyrolysis as a single step. It can generate rich surface oxygen-containing
groups, which lead to a poor electrical conductivity of the resulting carbon. Some researchers
have systematically studied steam activation of biomass. The activation reactions include C +
H2O CO + H2; CO + H2O CO + H2; C + CO2 2CO.67-72 Li’s group studied
the influence of the steam activation time and water flow rate on the texture and
electrochemical performance of ACs derived from coconut shell71 and corncob residue.70 They
found that the mesoporosity increased considerably with the increase of activation time and
water flow rate, which enabled the sample to have high rate capability and cycle stability. Jin
et al.72 investigated the effect of steam activation time in details for the porosity and surface
area of the activated carbon fibres (ACFs). Steam activation of liquefied wood with various
activation times (20, 60, 100, 140, 180 and 220 min) was conducted. By controlling the
activation time, the mesopore/micropore ratio could be effectively tuned and the micropore and
mesopore surface area increased with the rising activation time before burn-off. The sample
with the highest micropore surface area and a relatively high proportion of mesopores in the
range of 3–4 nm presented a high capacitance of 280 F/g at 0.5 A/g in 0.5 M H2SO4, excellent
rate performance as well as good cyclic stability.
CO2 activation which is based on the controlled gasification of a char with CO2 gas at a high
temperature, is the most commonly used physical activation process. Studies have shown that
smaller sized microporous carbons exhibit a larger capacitance.73 However, CO2 activation-
derived carbon tends to have a high fraction of mesorpores and an increased average pore size,
as the large dimension of CO2 molecule tends to restrict the accessibility of CO2 into

17
micropores.40, 58, 69, 74, 75 Besides, researchers found that, compared with KOH activation, as
seen in Figure 2. 2, CO2 activation could result in a little higher degree of graphitisation with
apparently oriented multilayer domains and graphene sheets stacking in parallel in the structure
of the porous carbons.76 Systematic research have been conducted focusing on CO2 activation
of polymer-derived carbons,69 hard/soft-template carbons75, 77 as well as their applications for
ECs78, 79 and CO2 adsorption.80, 81 However, research focusing on CO2 activation of biomass-
derived carbons for ECs is still relatively less.82, 83
Figure 2. 2 XRD patterns of the activated carbon materials with CO2 and KOH activation.
The inset is a sketch map for the calculation of the R values showing CO2 activation results in
higher graphitization.76
Compared with steam and CO2 activation, air activation needs a lower temperature. But air
activation is less common as the ACs produced with steam or CO2 tend to have a wider pore
size distribution.84, 85 Research has further shown that steam activation produces a larger
development of mesopores and macropores than CO2 activation.84, 86 However, research for
physical activation towards biomass is still relatively insufficient as chemical activation is more
commonly used. For instance, Osswald74 and Yan77 et al. have systematically investigated the
porosity, SSA and stability of carbide-derived carbon materials physically activated using CO2,
air or steam. By contrast, such detailed research on physical activation for biomass is lacking,
especially combined with their further application for EC electrodes.

18
Table 2. 1 Biomass-derived carbon electrodes for ECs through pyrolysis and/or activation
Materials Pre-activation
treatment
Activation agent Activation
Temperature and
time (℃)/(h)
SSA
(m2/g)
C (F/g)
(symmetric
SCs)
Measurements
at
Electrolyte Ref
.
Seaweed pyrolysis NA NA 746 264 2 mV/s 1M H2SO4 43
Eggplant Freeze drying/
pyrolysis
NA NA 950 121 5 mV/s 6M KOH 44
Neem dead leaves pyrolysis NA NA 1230 400 0.5 A/g 1M H2SO4 17
Eggshell membranes pyrolysis air 300/2 221 205 2 A/g 1M H2SO4 63
Corncob NA steam 850/0.75 1210 120 1 A/g 6M KOH 70
Wood NA steam 850/3 3223 247 0.5 A/g 1M H2SO4 72
Coconut shell NA steam 800/1 1532 192 1 A/g 6M KOH 71
Coffee endocarp pyrolysis CO2 800/2 709 176 - 1M H2SO4 83
Fungi HTC/pyrolysis NA NA 80 196 1 mV/s 6M KOH 49
Wood saw dust HTC KOH 800/1 2967 236 1 mV/s TEABF4/AN 54
Pollen HTC KOH 900/1 3037 185 1 A/g TEABF4/AN 36
Tobacco rods HTC KOH 800/1 -2000 263 0.5 A/g 6M KOH 34
Microalgae HTC KOH 700/- 2130 200 0.1 A/g 6M LiCl 57
Human hair Pre-carbonisation KOH 800/2 1306 340 1 A/g 6M KOH 87
Cornstalk core Pre-carbonisation KOH 800/3 2139 317 1 mV/s 6M KOH 88
Bean dregs Pre-carbonisation KOH 700/1 2876 280 0.1 A/g 1M H2SO4 52
Rice bran Pyrolysis/600 KOH 850/1 2475 323 0.1 A/g 6M KOH 89
Ginkgo shells Pyrolysis/600 KOH 700/1 1775 237 2 mV/s 6M KOH 90
Celtuce Pyrolysis/600 KOH 88/1 3404 273 0.5 A/g 6M KOH 91
Broad beans Pyrolysis/800 KOH 650/1 655 202 0.5 A/g 6M KOH 92

19
Pine cone petal NA KOH 750/1.5 3850 198 0.25 A/g 1M LiPF6 93
Corncob NA KOH/NH3 400/- 2900 185 0.4 A/g 1.2M LiPF6 94
Silk fibroin NA KOH 800/3 2557 264 0.1 A/g 1M H2SO4 95
Coffee beans NA ZnCl2 900/1 1021 134 0.05 A/g 1M
TEABF4/AN
96
Coffee beans NA ZnCl2 900/1 1019 368 0.05 A/g 1M H2SO4 97
Sugar cane bagasse NA ZnCl2 900/1 1788 300 0.25 A/g 1M H2SO4 98
Banana fiber NA ZnCl2 800/1 1097 296 0.5 A/g 1M Na2SO4 99
Chestnut shell NA ZnCl2 800/1.5 1987 92 10 A/g 6M KOH 100
Silk NA ZnCl2 900/1 2494 242 0.1 A/g EMIMBF4 101
Coconut shell NA ZnCl2 900/1 1874 276 1 A/g 6M KOH 102
Coffee bean NA H3PO4 800/0.5 742 160 1 A/g 1M H2SO4 103
Cotton stalk NA H3PO4 800/2 1481 114 0.5 A/g 1M
TEABF4/AN
104
Bamboo NA KHCO3 800/1 1425 187 0.5 A/g 6M KOH 105
Rice husk NA Microwave-
assisted ZnCl2
600W/1/3 1552 94 0.05 A/g 1M
Et4NBF4/PC
106
Bagasse pith NA Microwave-
assisted ZnCl2
700W/0.25 - 138 0.2 A/g 1M
EMImBF4
107
Cassava Peel NA KOH/CO2 800/3
800/1
1186 264 - 0.5M H2SO4 108
Oil palm Pre-carbonisation KOH/CO2 800/-
800/3
1704 150 - 1M H2SO4 109

20
2.2.2.2 Chemical activation
KOH Activation
KOH is a commonly used chemical for activating biomass-derived carbons. A rough carbon
surface could be induced by the activation of KOH, which brings about a high SSA and a
porous structure that is advantageous for charge storage.95 The detailed mechanism of KOH
activation is not fully understood because of the complex variables including the experimental
parameters as well as the reactivity of different carbon precursors.76, 110-113 The prominent
reaction occurring between carbon and KOH is proposed as: 6KOH + 2C 2K + 3H2 +
2K2CO3. And proceeds with reactions of K2CO3 +2C 2K + 3CO. 60 In a general view, the
synergistic effect of chemical activation and carbon lattice expansion through K intercalation
leads to the development of a high SSA and porosity of the obtained carbon samples.60
For a given carbon precursor, experimental variables of KOH activation include the activation
temperature and time, mass ratio of KOH/biomass and even the heating rate. The normally
adopted variables are: 1) the KOH/biomass mass ratio ranges from 2 to 5; 2) a heating rate of
3-10 ℃/min; 3) the activation temperature and time are 550 - 900 ℃ and 1 - 4 h, respectively.
Karthikeyan et al93 studied the chemical activation of pine cone petal powders with
KOH/biomass mass ratios of 1, 3 and 5, respectively. The mixture was then pyrolysed at 750 ℃
for 1.5 h under an Ar atmosphere with a heating rate of 5 ℃/min. The highest SSA was obtained
from the sample prepared with a KOH/biomass ratio of 5. A symmetric EC fabricated with this
carbon showed an energy density of about 61 Wh/kg at 0.39 kW/kg and an excellent
capacitance retention in organic electrolyte.
Biomass-derived carbons using a single or two-step KOH-activated process with good
performance have been reported. Li et al.94 described a one-step process for the synthesis of
nitrogen-doping carbons with corncob, KOH, NH3 as carbon source, activating agent and
nitrogen source, respectively. The corncob powders were mixed with KOH in a 1:3mass ratio.
Then the mixture was heated to the desired temperature under N2 or NH3 flow for a certain
time. The obtained sample had a narrow micro- to meso-pore distribution ratio and showed a
high SSA of 2900 m2/g with a moderate N content of 4 wt% and delivered a specific
capacitance of ~185 F/g at 0.4 A/g in organic electrolyte.

21
In comparison, the two-step KOH activation method is more often used to prepare biomass-
derived carbon materials for ECs. Biomass is always pre-treated by HTC34-37, 51, 54, 57, 59, 114, or
pre-carbonisation52, 87, 88, 115, 116 or pyrolysis63, 89-92, 117-120 before KOH activation. Qian et al.87
prepared heteroatom doped porous carbon flakes from human hair fibres using the two-step
KOH method, combining pre-carbonisation with KOH activation. In their experiment, hair
fibres were firstly pre-carbonised at 300 ℃ for 1.5 h and then mixed with KOH (WKOH / Wcarbon
= 2:1) and further activated at 700, 800 or 900 ℃ respectively. In the pre-carbonisation step,
some surface functional groups or unstable components of human hairs, which act as active
sites in the chemical activation with KOH, are likely to decompose, with a moderate amount
of N, O and S retained.52, 116. The material activated at 800 ℃ has an SSA of 1306 m2/g with a
doping of N, O and S, 4.38, 5.39, 1.51%, respectively. The temperature of pre-carbonisation
noticeably affects the chemical composition, surface area and porosity development.115, 116
Further research is needed to study the effect of the pre-carbonisation temperature for the
performance of biomass-derived carbons as EC electrodes.
Hou et al.89 prepared carbons with a micro/mesopores interconnected structure through
pyrolysis and KOH activation in a two-step process. Rice brans were carbonised under N2
atmosphere at a rate of 3 ℃/min to 700 ℃ for 1 h and was then KOH-activated at 850 ℃ for 1
h. Porous carbons with a SSA of 2475 m2/g and a pore volume of 1.21 cm3/g (40% for
mesopores) were obtained. It exhibited high specific capacitance especially at large current
densities in 6M KOH electrolyte, i.e., 265 and 182 F/g at 10 and 100 A/g respectively.
Moreover, an energy density of 70 Wh/kg at 1223 W/kg were obtained in an ionic liquid (IL).
Wang et al.91 used waste celtuce leaves to prepare porous carbons. Pyrolysed at 600 ℃,
followed by KOH activation at 800 ℃ for 1 h, the as-prepared carbon has a high SSA of 3404
m2/g with a pore volume of 1.88 cm3/g. It exhibited specific capacitances of 421 and 273 F/g
at 0.5 A/g in three and two-electrode systems, respectively, as an EC electrode.
Conventionally, precursors and solid KOH, with different mass ratios, are thoroughly
blended or ground in an agate mortar and then carbonised to a certain temperature at a
certain rate and maintained for several hours.34-36, 52, 54, 57, 59, 63, 87, 89, 90, 93, 94, 114, 116-118, 120,
121 Some researchers have tried to modify the conventional method by impregnation the
precursor with KOH aqueous solution and some good results were obtained.51, 88, 91, 92,
115, 119, 122-125 Precursors were firstly pyrolysed or pre-carbonised and then dispersed and
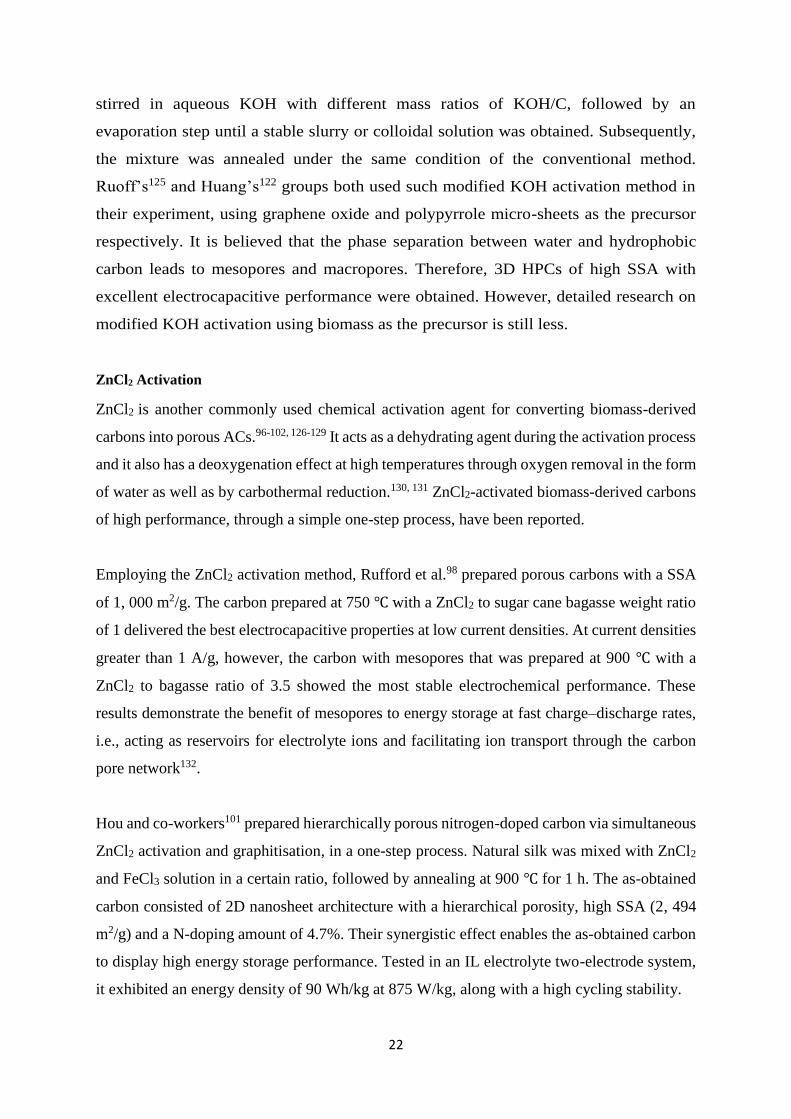
22
stirred in aqueous KOH with different mass ratios of KOH/C, followed by an
evaporation step until a stable slurry or colloidal solution was obtained. Subsequently,
the mixture was annealed under the same condition of the conventional method.
Ruoff’s125 and Huang’s122 groups both used such modified KOH activation method in
their experiment, using graphene oxide and polypyrrole micro-sheets as the precursor
respectively. It is believed that the phase separation between water and hydrophobic
carbon leads to mesopores and macropores. Therefore, 3D HPCs of high SSA with
excellent electrocapacitive performance were obtained. However, detailed research on
modified KOH activation using biomass as the precursor is still less.
ZnCl2 Activation
ZnCl2 is another commonly used chemical activation agent for converting biomass-derived
carbons into porous ACs.96-102, 126-129 It acts as a dehydrating agent during the activation process
and it also has a deoxygenation effect at high temperatures through oxygen removal in the form
of water as well as by carbothermal reduction.130, 131 ZnCl2-activated biomass-derived carbons
of high performance, through a simple one-step process, have been reported.
Employing the ZnCl2 activation method, Rufford et al.98 prepared porous carbons with a SSA
of 1, 000 m2/g. The carbon prepared at 750 ℃ with a ZnCl2 to sugar cane bagasse weight ratio
of 1 delivered the best electrocapacitive properties at low current densities. At current densities
greater than 1 A/g, however, the carbon with mesopores that was prepared at 900 ℃ with a
ZnCl2 to bagasse ratio of 3.5 showed the most stable electrochemical performance. These
results demonstrate the benefit of mesopores to energy storage at fast charge–discharge rates,
i.e., acting as reservoirs for electrolyte ions and facilitating ion transport through the carbon
pore network132.
Hou and co-workers101 prepared hierarchically porous nitrogen-doped carbon via simultaneous
ZnCl2 activation and graphitisation, in a one-step process. Natural silk was mixed with ZnCl2
and FeCl3 solution in a certain ratio, followed by annealing at 900 ℃ for 1 h. The as-obtained
carbon consisted of 2D nanosheet architecture with a hierarchical porosity, high SSA (2, 494
m2/g) and a N-doping amount of 4.7%. Their synergistic effect enables the as-obtained carbon
to display high energy storage performance. Tested in an IL electrolyte two-electrode system,
it exhibited an energy density of 90 Wh/kg at 875 W/kg, along with a high cycling stability.

23
Other Activation reagents
Besides KOH and ZnCl2, several other reagents are also used for biomass chemical activation
for ECs, such as H3PO4103, 104, 133 and KHCO3.
105 Some researchers have also employed
microwave-induced activation106, 134-137 or physiochemical activation108, 109, 138-144 consisting of
a chemical activation step followed by physical activation to further control the porosity
development and tune the PSD of activated carbons.2, 5 However, there is still relatively little
research on their application for biomass-derived EC electrodes.
KOH, ZnCl2 and H3PO4 are the three mainly used chemical activation agent. In comparison,
H3PO4-activated carbons usually have a relatively low SSA of below 1000 m2/g while both
KOH and ZnCl2 activation can easily produce a higher SSA. To enhance the SSA, KOH is a
kind of oxidant, while ZnCl2 is a dehydrating and deoxygenation agent. Currently, KOH-
activation is preferred to be used for biomass-derived ACs for EC electrodes as it can easily
produce hierarchical porous carbons with an even high SSA of beyond 3000 m2/g.
2.3 Lignocellulose carbon
During the past decade, biomass especially lignocellulose has attracted researchers’ huge
interest and research worldwide.1, 43 However, the dependence of electrochemical performance
upon the composition of lignocellulose is still unclear. Therefore, an important and growing
research area is to separately study cellulose, lignin and hemicellulose, three main components
of lignocellulose, for the transformation and application of biomass into EC electrodes.145
Some researchers have conducted such research to some extent and in the following part, we
will give them a brief review separately.
2.3.1 Cellulose
2.3.1.1 Properties of cellulose
As the main skeleton component of lignocellulose, cellulose is one of the most important
natural polymers. Being a natural biopolymer, it is almost inexhaustible and can be mass
produced on an industrial scale.146 Cellulose, with a formula of (C6H10O5)n, is a polysaccharide
consisting of a linear chain of glucose units. Cellulose exists in various forms from micrometric
cellulose fibres to nanocellulose and water/solvent soluble cellulose derivatives. Nanocellulose,
cellulose with one dimension in the nanometre range, has attracted increasingly more attention.
Formed by the repeated connection of D-glucose, nanocellulose has several important

24
properties such as hydrophilicity, high strength and stiffness, broad chemical-modification
capacity, biodegradability and renewability, as well as some specific features of
nanomaterials.1, 146-148 And nanocellulose can be classified into three categories, i.e.,
microfibrillated cellulose, nanocrystalline cellulose and bacterial nanocellulose, based on the
dimensions, preparation methods and functions.146 The structure and morphology of them will
be changed during the activation process according to different additives used. For instance,
KOH/NaOH-induced ethching tend to change the carbon structure to an open morphology and
hierarchically porous structure. As for ZnCl2, dehydration, deoxygenation and crosslinking
reacted during the activation process, leading to an interconnected microporous structure.
2.3.1.2 Cellulose-derived carbon for ECs
Currently, cellulose-derived carbons for EC electrodes have been researched mainly through
two directions. One is the direct utilisation of commercial cellulose as the carbon precursor,46,
54, 55, 59, 149-152 the other is firstly isolating cellulose from lignocellulose by different extraction
processes and then research their electrochemical performance as electrodes after transforming
them into ACs.153-156
Sevilla and coworkers 46, 54, 55, 59 produced activated carbon materials with cellulose as the
carbon precursor. By HTC at 230-250 °C for 2 h and subsequent KOH activation at 700-800 °C
for 1 h, the carbon electrode produced displayed a capacitance of 140 F/g at 10 mV/s and a
good rate capability. Tam et al.150 conducted a one-step pyrolysis on melamine-formaldehyde
cellulose nanocrystals. The sample pyrolysed at 900 ℃ displayed a capacitance of 352 F/g at 5
A/g measured in a three-electrode system with 1M H2SO4 electrolyte. Ji’s group also presented
a one-step method for the fabrication of N-doped porous carbon membranes through
carbonising cellulose papers under NH3 flow.157 They discovered that the doped N played an
important role in the carbon activation process under NH3. Compared with conventional AC,
the N-doping cellulose paper-derived porous carbon exhibited more than double an area
capacitance (90 vs 41 mF/m2).
An interesting route recently has been attracting researchers’ increasing interest, i.e., dissolving
cellulose in other solution, especially in NaOH/urea solution. 151, 152, 158 Zhao et al.151 prepared
meso-microporous activated carbons via the template method in combination with pyrolysis
and ZnCl2 activation, using cellulose and biowaste lignosulphonate as the precursors.

25
Regenerated cellulose was firstly coupled with a silica template and then lignosulphonate was
cast into the composites. Subsequently, ZnCl2 chemical activation method was employed for
further pore structure optimization. The as obtained sample exhibited specific capacitances of
286 and 141 F/g at current densities of 0.25 and 10 A/g, respectively, in 6M KOH electrolyte.
However, the whole procedure of this route is kind of complex when considering the practical
application for cellulose.
Some researchers tried to isolate cellulose from lignocellulose using different isolation
processes and then transform them into ACs as EC electrodes, as shown in Figure 2. 3.153-156
In the approach reported by Wan’s group155 as seen in Figure 2. 3a, corn husks were firstly
added into KOH solution and subsequently refluxed at 80 ℃ for 4h. The obtained colloidal
liquid was filtrated by stainless steel mesh. The obtained solid residue, i.e., cellulose, was
carbonised at 800 ℃ for 1h. The final obtained AC possessed a 3D architecture, a SSA of 928
m2/g, uniform pore size and rich O-doping (17.1 %). It exhibited a specific capacitance of 260
F/g at 1 A/g and maintained at 228 F/g at 10 A/g. Besides, it also displayed an energy density
of 21 Wh/kg at 875 W/kg in Na2SO4 aqueous electrolyte with a voltage window of 1.8 V.
Figure 2. 3 A scheme showing isolating cellulose from (a) corn husk155 and (b) bagasse153
using two different isolation processes.

26
As shown in Figure 2. 3b, Hao et al.153 purified cellulose from bagasse by alkaline
hydrolysis and bleached using sodium chlorite/glacial acetic acid mixture. Then under
vigorous stirring, 7 wt% cellulose was added in a mixture of NaOH/urea/H2O
(7.5:11.5:81) precooled to -12 ℃. The cellulose sol was then freeze dried at -80 ℃ for
12 h. The obtained aerogel was pyrolysed and KOH-activated at different temperatures.
At last, 3D hierarchical porous ACs were obtained and exhibited good performance in
solid state symmetric ECs.
2.3.2 Lignin
2.3.2.1 Properties of lignin
Lignin, constituting 15-35% of the typical dry lignocellulose by weight and 40% by energy, is
the secondly most abundant biopolymer from lignocellulose and the main one based on
aromatic units.18, 159, 160 It is estimated that over 70 million tons of lignin are produced annually
as the low-value by-product in pulp or paper industry.161, 162 Currently, around 95% of them
are directly burned which has a series of disadvantages. The remaining 5% is used for
commercial applications including dispersants, additives, resin and binder compositions, oil
well drilling, carbon black, water treatment, battery expanders and so on.18, 163 Especially, in
recent years, when the new concept of biorefinery emerged, developing the use of lignin as a
high value-added product has aroused researchers’ huge interest for lignin.159, 163
Lignins are high molecular weight, composed of especially coniferyl (C10H12O3), sinapyl
(C11H14O4) and coumaryl (C9H10O2) alcohols. Generally, lignin can be classified into two main
categories, sulfur lignin and sulfur-free lignin. Sulfur lignin includes Kraft lignin (alkali lignin)
and lignosulfonates, while the latter has soda lignin and organosolv lignin.
Holding a C/O ratio of above 2:1, lignin is more energy dense than both cellulose and
hemicellulose. Compared with cellulose, there is a less detailed elucidation of lignin’s structure
by the experimental method. However, the currently commercially available lignin, which is
the by-product of cellulose industry, is more easily to be dissolved into aqueous solvent than
cellulose.164 Therefore, it seems more easily for lignin acting as the carbon precursor for EC
electrodes.

27
2.3.2.2 Lignin-derived carbon for ECs
The lignin-based carbon materials may be a favourable choice for the electrode materials of
ECs, since some surface functional groups may contribute to the pseudocapacitance.163 Some
electrochemically inert functional groups on the carbon surface can improve the wettability of
the carbon electrode, hence to boost the specific capacitance by increasing surface utilisation
and pore access.5, 165 In recent years, some research focusing on lignin-derived carbons for ECs
has been conducted mainly through two routes.
One of the interesting routes is to prepare lignin-based carbon fibres through
electrospinning.166-169 Hu et al.166 prepared AC fibres through both NaOH (Na-ACFs) and KOH
(K-ACFs) activation using low sulfonated alkali lignin as the precursor. The hydrophilic and
high SSA ACFs exhibited large-size nanographites and good electrical conductivity to
demonstrate a good electrochemical performance. K-ACFs displayed a specific capacitance of
344 F/g at 10 mV/s, much higher than Na-ACF. The superior electrochemical properties of EC
constructed with K-ACF over Na-ACF were attributed mainly to the higher microporosity and
more narrowly distributed pore size.
Figure 2. 4 Scheme of preparing lignin-derived carbon electrode through (a) template170 or
(b) template-free method.171

28
Another interesting route is to prepare lignin-derived porous carbons through template170, 172-
175 or template-free171, 176-179 method. As shown in Figure 2. 4a, Saha et al.170 synthesised
mesoporous carbon using the surfactant Pluronic F127, a triblock copolymer, as the template.
Subsequent CO2 physical activation and KOH chemical activation enhanced the SSA of the
pristine mesoporous carbon to 624, 1148 m2/g respectively, with the present of a certain percent
of micropores. The CO2-activated, KOH-activated mesoporous carbon exhibited a capacitance
of 102.3, 91.7 F/g respectively. Zhang et al.171 prepared lignin-derived HPCs (LHPCs) through
a template-free method, as seen in Figure 2. 4b. Lignin was firstly dissolved in KOH solution
and then solidified. In the composite, KOH crystallied into small particles with different sizes.
Then the composites were pyrolysed at 700 ℃ for 2 h when the crystallised KOH particles act
as both template and activation agent. The finally obtained LHPCs consist of a 3D hierarchical
porous network as well as a large amount of oxygen-doping, which contributes to the
pseudocapacitance. It exhibited a capacitance of 165 F/g at 0.05 A/g and remained 123 F/g at
10 A/g. Besides, the hierarchical porous structure enables it to remain over 97 % of the initial
value at 1 A/g after 5000 cycles.
2.3.3 Hemicellulose
Hemicellulose, constituting approximately 20–35% of lignocellulose, is the second most
common polysaccharide in nature. There are different kinds of hemicellulose, including xylan,
xyloglucan, glucomannan and arabinoxylan. Compared with cellulose which is crystalline and
resistant to hydrolysis, hemicellulose has an amorphous structure and is more solvable in dilute
acid or base.180 However, research on hemicellulose is less, as most researchers focus on the
other two main components of lignocellulose, i.e., cellulose and lignin. Therefore, the review
for the application of hemicellulose for EC electrodes here will be relatively brief.
Wang et al.181 and Falco et al.50 extracted hemicellulose from biomass through base and acid
hydrolysis, respectively. In Wang’s experiment, a certain amount of hemp stems powder was
soaked in 6 wt% NaOH aqueous solution with stirring for 12 h at 40 ℃. The hemicellulose was
then isolated by precipitation of filtrate with two volumes of ethanol. The extracted
hemicellulose was added into 5 wt% H2SO4 solution and was then HTC treated at 160 ℃ for
12 h. By contrast, Falco and coworkers impregnated corncob and spruce in diluted acid solution
and the hydrolysed hemicellulose products was HTC treated at 200 ℃ for 24 h. Lastly, both
samples were KOH-activated to increase the SSA and porosity. The finally obtained samples
exhibited a specific capacitance of 240 F/g at 0.1 A/g in 6M KOH and 315 F/g at 0.25 A/g in

29
0.5 M H2SO4, respectively. In any case, more research focusing on hemicellulose-derived
carbon electrode materials for ECs are needed.
2.3.4 Lignocellulose-derived composite electrode materials
Modification to improve EDLC
The effective SSA and charge separation distance are the two main factors that determine
EDLC.182 Increasing the SSA, creating a hierarchical porous structure, enhancing the electrical
conductivity and wettability are several corresponding methods to improve EDLC.61 Besides
the general applied physical or chemical activation methods, researchers have also tried to
enhance EDLC through compositing cellulose-derived or lignin-derived carbons with other
electrochemically functional materials such as CNT and RGO.145, 182-186
Cui’s group made conductive and stretchable SWNT-paper183, 185 and SWNT-textile184
electrodes for ECs by using simple solution processes, as shown in Figure 2. 5. In their study,
paper or ordinary textiles were explored as a platform for ECs by integration with SWNT via
rod coating or dipping and drying method. The coated cellulose films, functioning as both
electrodes and current collectors, show high conductivity, porosity, and robust chemical and
mechanical stability, which lead to high-performance ECs. Deng171 and Kang et al.201 also
researched modification on cellulose-derived carbons with CNTs.
Figure 2. 5 Cellulose/SWNT composite electrode through simple rod coating185 (a) or dipping
and drying184 (c) method, and their electrochemical performance respectively (b), (d).

30
Gao et al.186 reported cellulose nanofiber-reduced graphene oxide (CNF-RGO) hybrid aerogel
as the electrode material for all-solid-state flexible ECs. In their experiment, CNF-RGO hybrid
hydrogels were prepared by acidizing homogeneous solution of CNFs, GO nanosheets with
hydrochloric acid vapor. Then the hybrid aerogel was prepared by supercritical CO2 drying.
The finally obtained flexible ECs exhibited a specific capacitance of 207 F/g at a 5 mV/s
measured in H2SO4/PVA gel electrolyte. It showed a good electrochemical stability under bent
state. The capacitance remained at 207 F/g in bent state (180°) and did not change obviously
after 100 bending cycles.
Biomass-based carbon aerogels represent an important novel research direction in aerogel
development. However, lignin-derived aerogel is brittle and fragile. Xu et al.182 toughened
lignin-resorcinol-formaldehyde (LRF) aerogel using bacterial cellulose (BC) through a
catalyst-free process. The toughened and graphitised lignin-derived aerogel exhibited a core-
shell nanostructure and it can undergo at least 20 % reversible compressive deformation. The
large mesopore ratio and core-shell nanostructure of the sample, with BC-derived carbon
nanofiber as the backbone and LRF-converted carbon as the coating respectively, enable it to
show a high areal capacitance of 62.2 μF/cm2 at 0.5 A/g with a relatively low SSA, 119.4 m2/g.
Modification to improve pseudocapacitance
Combining pseudocapacitance with EDLC in one electrode can significantly improve the
capacitance value thus enhancing the energy density. Pseudocapacitance can be integrated with
lignocellulose-derived carbon through modification with conducting polymers, transition metal
oxides, or heteroatom doping. In general, limited research has currently been done in this
branch.
Both conducting polymer and metal oxides tend to provide a higher capacitance than carbon
materials. However, their electronic conductivity and electrochemical stability are relatively
poor compared with porous carbon. Therefore, researchers coated conductive polymer156, 187-
192 or metal oxides168, 193-196 on cellulose-derived or lignin-derived porous carbons, which
function as the backbone.
Alshareef’s group194 fabricated “sponge supercapacitor” using MnO2-CNT-sponge hybrid
electrode. The porous nature of both cellulose-sponge and the electrodeposited MnO2
nanoparticles is beneficial for the full accessibility of electrolyte to MnO2. The capacitance was

31
dramatically increased to 1230 F/g at 1 mV/s in a three-electrode system. Besides, it also
showed excellent rate capability and cycle stability.
Chen et al.193 incorporated NiO nanoparticles into lignin-derived mesoporous carbon (MPC)
using LC phase-templating preparation method. The obtained core-shell structured NiO@MPC
composite not only increased the utilization of NiO, but also improved its electrical
conductivity and mechanical strength. It displayed a specific capacitance of 880.2 F/g at 1 A/g,
with enhanced rate capability and cycle stability--90.9% and 93.7% of the capacitance value
was maintained at 10 A/g after 1000 GCD tests, respectively.
Another direction to improve the electrochemical performance of lignocellulose-derived
carbon electrode materials is by heteroatom doping. A lot of research has focused on
heteroatom doping, including N, O, S, P, on polymer-derived or biomass-derived carbon
electrode. However, there is still relatively little research on doping heteroatoms in specific
cellulose,157 lignin165, 175, 197 or hemicellulose-derived carbons and more research is required.
2.4 Structure and morphology control
2.4.1 Pore structure
High SSA biomass-derived activated carbons predominantly contain micropores with a high
pore tortuosity, which creates a large resistance to ion transport, leading to poor power density
and rate capability of EC devices.5, 198 In addition, pore geometry and dimension are also
important parameters that determine EC performance.105, 199, 200 Therefore, pore structure
control is important for the electrocapacitive performance of biomass-derived activated
carbons.201
The pore structure of carbon materials can be made to have hierarchical pores in two-dimension
(2D) or three-dimension (3D) to facilitate ion-transport and provide a robust interface for
charge storage.201 The transport behaviour of electrolyte ions in pores is determined to a
significant extent by pore length, pore size and tortuosity. The ion transport time (τ) is given
by equation τ = L2/d,202 where L refers to the ion transport distance and d is the ion transport
coefficient. A porous carbon with macropores, mesopores and micropores well-distributed in
2D or 3D with low-resistant ion-transport paths is ideal for EDLCs. This enables active ions in
micropores to have nanometre transport distances from adjacent mesopores and macropores,

32
thus shortening the transport time.132, 201, 203 Through careful control over the carbonisation and
activation conditions, biomass-derived carbon electrodes with 2D35, 101, 203-206 or 3D63, 89, 105, 118,
153, 171, 207 hierarchical pore structures of high SSA have been reported, as shown in Table 2. 2,
which exhibited both high specific capacitance and excellent rate capability.
Using glucose as a precursor, Zheng et al.205 prepared 2D porous carbon nanosheets with an
excellent capacitive performance. During the activation process, potassium species acted not
only as an activator but also a melt template that led to the oriented nanosheet structure. The
obtained 2D porous carbon exhibited a specific capacitance of 257 and 184 F/g at current
densities of 0.5 and 100 A/g. The large amount of micropores and small mesopores lead to a
high SSA of around 2600 m2/g which gave rise to the high specific capacitance. The interlinked
2D hierarchical porous structure facilitated ion transport, thus enabling the ultrahigh rate
capability. Hao et al.153 prepared bagasse-derived 3D HPC electrode materials. The assembled
solid state symmetric ECs showed a relatively high specific capacitance of 142 F/g at 0.5 A/g
and a good rate capability as well as an excellent capacitance retention of 93.9% over 5000
cycles due to the advantages of hierarchically porous structure that aforementioned.
2.4.2 Graphitisation degree
Improving the graphitisation of AC simultaneously enhances the electric conductivity of the
electrode and its surface wettability towards aqueous electrolyte, which can facilitate ion
diffusion and electron transfer, thus improving the electrochemical performance.102 High-
temperature treatment can enhance the graphitisation but it is of high energy consumption.
Besides, it will also decrease the SSA and pore volume of the AC.
Catalytic graphitisation by means of a transition metal is an effective way to obtain ACs with
a certain graphitisation degree.90 Coupling chemical activation with catalytic graphitisation can
enable the preparation of porous carbons with a high SSA and an excellent electrocapacitive
performance.35, 90, 101, 102, 126, 206 Sun et al.102 synthesised porous graphene-like nanosheets
(PGNSs) with a large SSA via a simultaneous activation-graphitisation route using coconut
shell as the precursor, as shown in Figure 2. 6. FeCl3 and ZnCl2, which serve as a graphitic
catalyst and activating agent respectively, were simultaneously introduced into the skeleton of
the coconut shell through coordination of the metal precursors with the functional groups in
the coconut shell, thus creating simultaneous activation and graphitisation. The obtained
PGNSs possessed good electrical conductivity due to a high graphitisation degree, a SSA of
33
1874 m2/g and a pore volume of 1.21 cm3/g. Acting as a EC electrode with no addition of
conductive additives, it displayed a specific capacitance of 268 F/g at 1 A/g in KOH electrolyte.
An energy density of 54.7 Wh/kg was obtained at 10 kW/kg in organic electrolyte.
Figure 2. 6 HR-TEM (a), Raman spectra (b), Rate performance (c) and Ragone plot (d) of
PGNS.102
2.5 Doping of heteroatoms in carbon
It has been a widely accepted strategy to improve the specific capacitance of carbon electrode
materials through doping with heteroatoms, such as N, O, P, S, and B. There are several
possible mechanisms by which heteroatoms affect the improve the performance. First, the
heteroatoms and surface functional groups can facilitate electrolyte ions transport by enhancing
the wettability of carbon surface towards the electrolyte. Second, the doped heteroatoms
modify the electronic behaviour of the carbon by acting as electron donors or acceptors. Third,
doping with heteroatoms can also allow for faradic reactions between the carbon electrodes
and electrolyte ions.

34
Some researchers obtained heteroatom-doped biomass-derived carbon by mixing biomass
precursor with other heteroatom-containing precursors208-210 or through post-treatment.211
However, as a natural available resource, the most interesting and convenient spot for biomass
is that it can be transformed into heteroatom-contained carbon by a one-step calcination method
without adding any other precursors.34, 51, 91, 92, 101, 155, 212, 213
Hou et al.101 prepared nitrogen-doped hierarchically porous carbon nanosheets via
simultaneous activation and graphitisation, using natural silk. The carbon material exhibited
good performance for both EC and lithium-ion battery. Xu et al.92 prepared S/N-doped porous
carbon materials using broad bean shells, which contain a large amount of amino acids and
vitamins, as the precursor. Broad beans were thermally treated at 800 ℃ for 2 h and then
activated with a KOH ethanol solution at 650 ℃ for 1 h under nitrogen with a heating rate of
3 ℃/min. The doped sulfur increased the space utilisation by a specific electrosorption of
electrolyte ions. The incorporation of nitrogen increased the electrical conductivity as well as
the wettability of the electrode. In addition, both sulphur- and nitrogen-containing groups
contributed to pseudocapacitance. Therefore, the prepared sample exhibited a specific
capacitance of 202 F/g at 0.5 A/g measured in 6 M KOH aqueous electrolyte and remained 129
F/g at 10 A/g despite a moderate SSA (655 m2/g) of the carbon.
In the past few years, cellulose- and lignin-derived carbons with a high heteroatom doping level
have also been reported.150-152, 157, 214, 215 However, it is important to study the effect of doping
level on the performance of ECs. High doping levels may not be fully and efficiently utilised,
while the over-doped heteroatoms may disorder the carbon structure and lower its electrical
conductivity. This increases the electronic and/or ionic diffusion resistance of the electrode
materials, which leads to a relatively poor rate capability and power deterioration. Currently
no consensus has been obtained or confirmed on the effect of doping level for the
electrocapacitive property enhancement. More research in this area are needed.

35
Table 2. 2. Rate capability of biomass-derived carbon electrodes for ECs versus pore structure
Precursor SSA
(m2/g)
Pore structure Smeso+maco/St Vmeso+macro/Vt C1 (F/g)
(symmetric)
C2 (F/g)
(symmetric)
Rate
capability
Electrolyte Ref.
Silk proteins 2557 Microporous 0.34 - 264 (0.1 A/g) 162 (6.2 A/g) 61% 1 M
H2SO4
95
Broad beans 655 Rich in micropores - - 202 (0.25 A/g) 129 (10 A/g) 63% 6 M KOH 92
Sucrose 2094 Microporous - - 224 (0.2 A/g) 91 (20 A/g) 41% 6 M KOH 216
Nutshell 1069 2D microporous - 0.17 261 (0.2 A/g) 97 (8 A/g) 37% 6 M KOH 204
Acacia gum 1832 Microporous 0.11 0.19 272 (1 A/g) 160 (10 A/g) 59% 6 M KOH 217
Glucose 2600 Oriented and interlinked 2D
hierarchical porous
0.31 0.69 257 (0.5 A/g) 184 (100 A/g) 72% 6 M KOH 205
Corn gluten meal
waste
3353 Interconnected
meso/microporous
- - 298 (0.5 A/g) 215 (10 A/g) 72% 6 M KOH 218
Bagasse 2296 Hierarchical porous 0.26 0.33 180 (0.2 A/g) 128 (15 A/g) 71% 6 M KOH 219
Bamboo-based
industrial by-
products
1472 Beehive-like hierarchical
nanoporous
- 0.21 301 (0.1 A/g)
(three
electrode)
192 (100 A/g)
(three
electrode)
64% 6 M KOH 220
Corn husk 867 3D hierarchical porous 0.14 0.27 260 (1 A/g) 228 (10 A/g) 88% 6 M KOH 155
Artemia Cyst
Shells
1758 3D hierarchical porous 0.21 0.30 369 (0.5 A/g)
(three
electrode)
334 (10 A/g)
(three
electrode)
91% 1 M
H2SO4
221
Rice bran 2475 3D porous 0.15 0.39 323 (0.1 A/g) 265 (10 A/g) 82% 6 M KOH 89
Waste wood
shavings
3223 Porous carbon fibre 0.29 0.49 247 (0.5 A/g) 227 (10 A/g) 92% 1 M
H2SO4
72
Gelatin 3012 Hierarchical porous - 0.33 385 (0.05 A/g) 281 (5 A/g) 73% 6 M KOH 222
Lignin-derived
byproducts
2218 Interconnected hierarchical
porous
- - 312 (1 A/g) 254 (80 A/g) 81% 6 M KOH 177
Lignin 907 3D hierarchical porous 0.15 0.21 165 (0.05 A/g) 124 (10 A/g) 75% 1 M
H2SO4
171

36
Table 2. 3 Summary of lignocellulose-derived carbon electrodes for ECs
Main Materials Activation Modification SSA
(m2/g)
C (F/g)
(symmetric)
Measurements
at
Electrolyte Ref.
Lignosulphonate cellulose ZnCl2 NA 856 286 0.25 A/g 6 M KOH 151
Cellulose filter paper NH3 N-doped 1326 120 1 A/g 2 M KOH 157
Bagasse-derived cellulose KOH NA 1892 142 0.5 A/g KOH/PVA Gel 153
Corn husk-derived
cellulose
NA NA 867 260 1 A/g 6 M KOH 155
Cellulose acetate Steam MWNT 1120 145 10 A/g 6 M KOH 145
Paper cellulose NA SWNT - 200 - 1 M H2SO4 185
Textiles NA SWNT - 140 20μA/cm2 Organic electrolyte 184
Bacterial nanocellulose
paper
NA CNT - 50.5 1 A/g Ion gel 223
Cellulose nanofiber NA RGO - 207 5 mV/s H2SO4/PVA 186
Cellulose nanocrystals NA PPy - 336 - 0.1 M KCl 156
Cellulose sponge NA MnO2/CNT - 1000 1 mV/s 1 M Na2SO4 194
Cellulose fibres NA CNT/MnO2 327 10 mV/s 1 M Na2SO4 195
Cellulose nanofibers NA Ni(OH)2 - 172
(asymmetric)
1 mV/s 6 M KOH 196
Low sulfonated alkali
lignin
KOH NA 1400 344 10 mV/s 6 M KOH 166

37
Alcell lignin NA NA 930 116 1 A/g 1 M H2SO4 174
Hardwood kraft lignin CO2 NA 624 102 1 mV/s 6 M KOH 170
Lignin NA NA 803 208 0.1 A/g 6 M KOH 173
Lignin-derived byproducts KOH NA 2218 141 1 A/g EMI-BF4 177
Alkali lignin KOH NA 3775 286 0.2 A/g 6 M KOH 178
Kraft lignin KOH NA 1406 87 0.1 A/g 1.5 M NEt4BF4/ACN 176
Solvent lignin KOH N-doped 3130 306 0.1 A/g KOH/PVA 165
Softwood lignin KOH S/O-doped 1800 231 1 A/g EMI-BF4 197
Lignin NA BC 199 124 0.5 A/g 6 M KOH 182
Solvent lignin KOH Aniline 2265 336 1 A/g 6 M KOH 190
Natural lignin NA rGO/PEDOT - 144 0.1 A/g 0.1 M HClO4 191
Sodium lignosulphonate NA NiO 802 880 (three-
electrode)
1 A/g 6 M KOH 193
Hemp-derived
hemicellulose
KOH NA 3062 240 0.1 A/g 6 M KOH 181
Corncob-derived
hemicellulose
KOH NA 2300 315 0.25 A/g 0.5 M H2SO4 50

38
2.6 Summary
Biomass is a good resource for making functional carbon materials for electrocapacitive energy
storage applications as electrodes, separators, or binders. Recent research has shown that
affordable biomass-derived carbon materials with electrocapacitive properties comparable to
commercial activated carbon can be prepared using simple carbonisation and/or activation
methods. Advanced hierarchical porous biomass-derived carbons of excellent electrocapacitive
performance can be obtained by using the chemical activation methods using, for example,
potassium hydroxide. To enable biomass-derived carbon materials to find practical
applications in energy storage, challenges and issues must be addressed.
First, considering the diversity of biomass resources, fundamental research focusing on the
effect of biomass composition in the electrocapacitive property of resulting carbon is needed.
Perhaps, it could be a good practice to do this kind of research with cellulose-, lignin- and
hemicellulose-derived carbon materials.
Second, the majority of the reported biomass-derived electrode materials of excellent
electrocapacitive performance were prepared at the lab scale. There is a need to do scale-up
research to develop process protocol for further development of the technology.
Third, while hierarchical porous biomass-derived carbons of high specific surface area can be
prepared using the KOH-activation method, it has little control over the pore geometry, pore
size and pore connection. Besides, the KOH-activation method is unfavourable for creating
graphitic carbons, which determines the electrical conductivity and surface wettability towards
an electrolyte. KOH activation in combination of thermal treatment may enable one to prepare
biomass-derived carbons of high specific surface area with appropriate pore structures, good
electrical conductivity and good wettability towards electrolyte.
Forth, there has been an increasing demand for flexible electrochemical capacitor devices with
advantages of portability and flexibility for portable electronics applications. Biomass offers
opportunities for making flexible electrodes as fibres or foams. This will open a new research
area.

39
Fifth, the energy density of electrochemical capacitors could be improved by increasing
electrode capacitance or widening the operation voltage. Adding pseudocapacitive materials to
biomass-derived carbon such as heteroatoms, metal oxides, or conductive polymers, is a future
research direction to increase the capacitance. Widening of the voltage window by using ionic
liquids as electrolytes or configuring asymmetric cells or fabricating hybrid capacitors will be
another effective way to improve both energy density and power density.
This PhD thesis project aims to develop cost-effective and high-performance carbon electrode
materials with hierarchical pores, especially cellulose-derived ones, for electrochemical
capacitor applications. This might move towards the application of biomass for commercial
ECs.
2.7 References
1. L. Zhang, Z. Liu, G. Cui and L. Chen, Progress in Polymer Science, 2015, 43, 136-164.
2. A. M. Abioye and F. N. Ani, Renewable and Sustainable Energy Reviews, 2015, 52,
1282-1293.
3. S. Choi, J. H. Drese and C. W. Jones, ChemSusChem, 2009, 2, 796-854.
4. N. Balahmar, A. C. Mitchell and R. Mokaya, Advanced Energy Materials, 2015, 5.
5. M. Sevilla and R. Mokaya, Energy & Environmental Science, 2014, 7, 1250-1280.
6. A. F. Dalebrook, W. Gan, M. Grasemann, S. Moret and G. Laurenczy, Chemical
Communications, 2013, 49, 8735-8751.
7. C. Zhang, Z. Geng, M. Cai, J. Zhang, X. Liu, H. Xin and J. Ma, International Journal
of Hydrogen Energy, 2013, 38, 9243-9250.
8. Y. Matsumura, M. Sasaki, K. Okuda, S. Takami, S. Ohara, M. Umetsu and T. Adschiri,
Combustion Science and Technology, 2006, 178, 509-536.
9. X. Liao, C. Chen, Z. Wang, R. Wan, C.-H. Chang, X. Zhang and S. Xie, Process
Biochemistry, 2013, 48, 312-316.
10. M.-M. Titirici, R. J. White, N. Brun, V. L. Budarin, D. S. Su, F. del Monte, J. H. Clark
and M. J. MacLachlan, Chemical Society Reviews, 2015, 44, 250-290.
11. E. M. Lotfabad, J. Ding, K. Cui, A. Kohandehghan, W. P. Kalisvaart, M. Hazelton and
D. Mitlin, Acs Nano, 2014, 8, 7115-7129.
12. N. Liu, K. Huo, M. T. McDowell, J. Zhao and Y. Cui, Scientific reports, 2013, 3.
13. A. Jain, V. Aravindan, S. Jayaraman, P. S. Kumar, R. Balasubramanian, S.
Ramakrishna, S. Madhavi and M. Srinivasan, Scientific reports, 2013, 3.
14. D. Larcher and J. Tarascon, Nature chemistry, 2015, 7, 19-29.
15. R. R. Gaddam, D. Yang, R. Narayan, K. Raju, N. A. Kumar and X. Zhao, Nano Energy,
2016, 26, 346-352.
16. D. Mohan, C. U. Pittman and P. H. Steele, Energy & fuels, 2006, 20, 848-889.
17. M. Biswal, A. Banerjee, M. Deo and S. Ogale, Energy & Environmental Science, 2013,
6, 1249-1259.
18. S. Laurichesse and L. Avérous, Progress in Polymer Science, 2014, 39, 1266-1290.
19. Q. Ma, Y. Yu, M. Sindoro, A. G. Fane, R. Wang and H. Zhang, Adv Mater, 2017.
40
20. S. Dutta, A. Bhaumik and K. C.-W. Wu, Energy & Environmental Science, 2014, 7,
3574-3592.
21. L. Jabbour, R. Bongiovanni, D. Chaussy, C. Gerbaldi and D. Beneventi, Cellulose,
2013, 20, 1523-1545.
22. K. Qian, A. Kumar, H. Zhang, D. Bellmer and R. Huhnke, Renewable and Sustainable
Energy Reviews, 2015, 42, 1055-1064.
23. A. Jain, R. Balasubramanian and M. Srinivasan, Chemical Engineering Journal, 2016,
283, 789-805.
24. R. Saidur, E. Abdelaziz, A. Demirbas, M. Hossain and S. Mekhilef, Renewable and
Sustainable Energy Reviews, 2011, 15, 2262-2289.
25. M.-M. Titirici, R. J. White, C. Falco and M. Sevilla, Energy & Environmental Science,
2012, 5, 6796-6822.
26. H. Wang, Z. Li and D. Mitlin, ChemElectroChem, 2014, 1, 332-337.
27. M.-M. Titirici and M. Antonietti, Chemical Society Reviews, 2010, 39, 103-116.
28. M.-M. Titirici, M. Antonietti and A. Thomas, Chemistry of Materials, 2006, 18, 3808-
3812.
29. R. Demir-Cakan, P. Makowski, M. Antonietti, F. Goettmann and M.-M. Titirici,
Catalysis Today, 2010, 150, 115-118.
30. M. Sevilla, J. A. Maciá-Agulló and A. B. Fuertes, Biomass and Bioenergy, 2011, 35,
3152-3159.
31. M. Sevilla and A. B. Fuertes, Energy & Environmental Science, 2011, 4, 1765-1771.
32. L. Zhao, N. Baccile, S. Gross, Y. Zhang, W. Wei, Y. Sun, M. Antonietti and M.-M.
Titirici, Carbon, 2010, 48, 3778-3787.
33. Y. Ren, Q. Xu, J. Zhang, H. Yang, B. Wang, D. Yang, J. Hu and Z. Liu, ACS applied
materials & interfaces, 2014, 6, 9689-9697.
34. Y.-Q. Zhao, M. Lu, P.-Y. Tao, Y.-J. Zhang, X.-T. Gong, Z. Yang, G.-Q. Zhang and H.-
L. Li, Journal of Power Sources, 2016, 307, 391-400.
35. H. Wang, Z. Xu, A. Kohandehghan, Z. Li, K. Cui, X. Tan, T. J. Stephenson, C. K.
King’ondu, C. M. Holt and B. C. Olsen, ACS nano, 2013, 7, 5131-5141.
36. L. Zhang, F. Zhang, X. Yang, K. Leng, Y. Huang and Y. Chen, small, 2013, 9, 1342-
1347.
37. J. Jiang, J. Zhu, W. Ai, Z. Fan, X. Shen, C. Zou, J. Liu, H. Zhang and T. Yu, Energy &
Environmental Science, 2014, 7, 2670-2679.
38. L. L. Zhang and X. Zhao, Chemical Society Reviews, 2009, 38, 2520-2531.
39. P. Simon and Y. Gogotsi, Nature materials, 2008, 7, 845-854.
40. Y. P. Zhai, Y. Q. Dou, D. Y. Zhao, P. F. Fulvio, R. T. Mayes and S. Dai, Adv Mater,
2011, 23, 4828-4850.
41. K. László, A. Bóta and L. G. Nagy, Carbon, 2000, 38, 1965-1976.
42. E. Raymundo‐Piñero, F. Leroux and F. Béguin, Adv Mater, 2006, 18, 1877-1882.
43. E. Raymundo‐Piñero, M. Cadek and F. Beguin, Advanced Functional Materials, 2009,
19, 1032-1039.
44. Z. Li, W. Lv, C. Zhang, B. Li, F. Kang and Q.-H. Yang, Carbon, 2015, 92, 11-14.
45. D. Puthusseri, V. Aravindan, S. Madhavi and S. Ogale, Energy & Environmental
Science, 2014, 7, 728-735.
46. M. Sevilla and A. B. Fuertes, Carbon, 2009, 47, 2281-2289.
47. M. M. Titirici, A. Thomas, S.-H. Yu, J.-O. Müller and M. Antonietti, Chemistry of
Materials, 2007, 19, 4205-4212.
48. S.-H. Yu, X. Cui, L. Li, K. Li, B. Yu, M. Antonietti and H. Cölfen, Adv Mater, 2004,
16, 1636-1640.
49. H. Zhu, X. Wang, F. Yang and X. Yang, Adv Mater, 2011, 23, 2745-2748.

41
50. C. Falco, J. M. Sieben, N. Brun, M. Sevilla, T. Van der Mauelen, E. Morallón, D.
Cazorla‐Amorós and M. M. Titirici, ChemSusChem, 2013, 6, 374-382.
51. T. Wei, X. Wei, Y. Gao and H. Li, Electrochimica Acta, 2015, 169, 186-194.
52. C. Ruan, K. Ai and L. Lu, Rsc Adv, 2014, 4, 30887-30895.
53. L. Zhao, L. Z. Fan, M. Q. Zhou, H. Guan, S. Qiao, M. Antonietti and M. M. Titirici,
Adv Mater, 2010, 22, 5202-5206.
54. L. Wei, M. Sevilla, A. B. Fuertes, R. Mokaya and G. Yushin, Advanced Energy
Materials, 2011, 1, 356-361.
55. M. Sevilla, A. Fuertes and R. Mokaya, Energy & Environmental Science, 2011, 4,
1400-1410.
56. C. Falco, J. P. Marco-Lozar, D. Salinas-Torres, E. Morallón, D. Cazorla-Amorós, M.-
M. Titirici and D. Lozano-Castelló, Carbon, 2013, 62, 346-355.
57. M. Sevilla, W. Gu, C. Falco, M. Titirici, A. Fuertes and G. Yushin, Journal of Power
Sources, 2014, 267, 26-32.
58. S. Roman, J. V. Nabais, B. Ledesma, J. González, C. Laginhas and M. Titirici,
Microporous and Mesoporous Materials, 2013, 165, 127-133.
59. D. Salinas-Torres, D. Lozano-Castelló, M. M. Titirici, L. Zhao, L. Yu, E. Morallón and
D. Cazorla-Amoros, Journal of Materials Chemistry A, 2015, 3, 15558-15567.
60. J. Wang and S. Kaskel, Journal of Materials Chemistry, 2012, 22, 23710-23725.
61. L. L. Zhang, Y. Gu and X. Zhao, Journal of Materials Chemistry A, 2013, 1, 9395-
9408.
62. M. Choi and R. Ryoo, Journal of Materials Chemistry, 2007, 17, 4204-4209.
63. Z. Li, L. Zhang, B. S. Amirkhiz, X. Tan, Z. Xu, H. Wang, B. C. Olsen, C. Holt and D.
Mitlin, Advanced Energy Materials, 2012, 2, 431-437.
64. Y. Gong, H. Wang, Z. Wei, L. Xie and Y. Wang, ACS Sustainable Chemistry &
Engineering, 2014, 2, 2435-2441.
65. D. Jiménez-Cordero, F. Heras, M. A. Gilarranz and E. Raymundo-Piñero, Carbon,
2014, 71, 127-138.
66. Y. Gong, Z. Wei, J. Wang, P. Zhang, H. Li and Y. Wang, Scientific reports, 2014, 4.
67. X.-h. Duan, C. Srinivasakannan, K.-b. Yang, J.-h. Peng and L.-b. Zhang, Waste and
Biomass Valorization, 2012, 3, 131-139.
68. B. del-Campo, M. Morris, D. Laird, M. Kieffer and R. Brown, TECHNOLOGY, 2015,
3, 104-113.
69. J. Górka and M. Jaroniec, Carbon, 2011, 49, 154-160.
70. W.-H. Qu, Y.-Y. Xu, A.-H. Lu, X.-Q. Zhang and W.-C. Li, Bioresource technology,
2015, 189, 285-291.
71. J. Mi, X.-R. Wang, R.-J. Fan, W.-H. Qu and W.-C. Li, Energy & Fuels, 2012, 26, 5321-
5329.
72. Z. Jin, X. Yan, Y. Yu and G. Zhao, Journal of Materials Chemistry A, 2014, 2, 11706-
11715.
73. J. Chmiola, G. Yushin, Y. Gogotsi, C. Portet, P. Simon and P.-L. Taberna, Science,
2006, 313, 1760-1763.
74. S. Osswald, C. Portet, Y. Gogotsi, G. Laudisio, J. Singer, J. Fischer, V. Sokolov, J.
Kukushkina and A. Kravchik, Journal of Solid State Chemistry, 2009, 182, 1733-1741.
75. D. Wu, Y. Liang, X. Yang, C. Zou, Z. Li, G. Lv, X. Zeng and R. Fu, Langmuir, 2008,
24, 2967-2969.
76. H. Wang, Q. Gao and J. Hu, J Am Chem Soc, 2009, 131, 7016-7022.
77. Y. Yan, J. Wei, F. Zhang, Y. Meng, B. Tu and D. Zhao, Microporous and Mesoporous
Materials, 2008, 113, 305-314.

42
78. N. P. Wickramaratne, J. Xu, M. Wang, L. Zhu, L. Dai and M. Jaroniec, Chemistry of
Materials, 2014, 26, 2820-2828.
79. M. Noked, S. Okashy, T. Zimrin and D. Aurbach, Angewandte Chemie International
Edition, 2012, 51, 1568-1571.
80. W. Hao, E. Björkman, M. Lilliestråle and N. Hedin, Applied Energy, 2013, 112, 526-
532.
81. E. David and J. Kopac, Journal of analytical and applied pyrolysis, 2014, 110, 322-
332.
82. E. Taer, M. Deraman, I. A. Talib, A. A. Umar, M. Oyama and R. M. Yunus, Current
Applied Physics, 2010, 10, 1071-1075.
83. J. V. Nabais, J. G. Teixeira and I. Almeida, Bioresource technology, 2011, 102, 2781-
2787.
84. M. Ruiz-Fernández, M. Alexandre-Franco, C. Fernández-González and V. Gómez-
Serrano, Adsorption, 2011, 17, 621-629.
85. M. Song, B. Jin, R. Xiao, L. Yang, Y. Wu, Z. Zhong and Y. Huang, Biomass and
Bioenergy, 2013, 48, 250-256.
86. C. A. Toles, W. E. Marshall, L. H. Wartelle and A. McAloon, Bioresource technology,
2000, 75, 197-203.
87. W. Qian, F. Sun, Y. Xu, L. Qiu, C. Liu, S. Wang and F. Yan, Energy & Environmental
Science, 2014, 7, 379-386.
88. C. Liu, G. Han, Y. Chang, Y. Xiao, M. Li, W. Zhou, D. Fu and W. Hou,
ChemElectroChem, 2016, 3, 323-331.
89. J. Hou, C. Cao, X. Ma, F. Idrees, B. Xu, X. Hao and W. Lin, Scientific reports, 2014,
4.
90. L. Jiang, J. Yan, L. Hao, R. Xue, G. Sun and B. Yi, Carbon, 2013, 56, 146-154.
91. R. Wang, P. Wang, X. Yan, J. Lang, C. Peng and Q. Xue, ACS applied materials &
interfaces, 2012, 4, 5800-5806.
92. G. Xu, J. Han, B. Ding, P. Nie, J. Pan, H. Dou, H. Li and X. Zhang, Green Chemistry,
2015, 17, 1668-1674.
93. K. Karthikeyan, S. Amaresh, S. N. Lee, X. Sun, V. Aravindan, Y. G. Lee and Y. S. Lee,
ChemSusChem, 2014, 7, 1435-1442.
94. B. Li, F. Dai, Q. Xiao, L. Yang, J. Shen, C. Zhang and M. Cai, Energy & Environmental
Science, 2016, 9, 102-106.
95. Y. S. Yun, S. Y. Cho, J. Shim, B. H. Kim, S. J. Chang, S. J. Baek, Y. S. Huh, Y. Tak,
Y. W. Park and S. Park, Adv Mater, 2013, 25, 1993-1998.
96. T. E. Rufford, D. Hulicova-Jurcakova, E. Fiset, Z. Zhu and G. Q. Lu, Electrochemistry
Communications, 2009, 11, 974-977.
97. T. E. Rufford, D. Hulicova-Jurcakova, Z. Zhu and G. Q. Lu, Electrochemistry
Communications, 2008, 10, 1594-1597.
98. T. E. Rufford, D. Hulicova-Jurcakova, K. Khosla, Z. Zhu and G. Q. Lu, Journal of
Power Sources, 2010, 195, 912-918.
99. V. Subramanian, C. Luo, A. Stephan, K. Nahm, S. Thomas and B. Wei, The Journal of
Physical Chemistry C, 2007, 111, 7527-7531.
100. L. Cheng, P. Guo, R. Wang, L. Ming, F. Leng, H. Li and X. Zhao, Colloids and Surfaces
A: Physicochemical and Engineering Aspects, 2014, 446, 127-133.
101. J. Hou, C. Cao, F. Idrees and X. Ma, ACS nano, 2015, 9, 2556-2564.
102. L. Sun, C. Tian, M. Li, X. Meng, L. Wang, R. Wang, J. Yin and H. Fu, Journal of
Materials Chemistry A, 2013, 1, 6462-6470.
103. C. Huang, T. Sun and D. Hulicova‐Jurcakova, ChemSusChem, 2013, 6, 2330-2339.

43
104. M. Chen, X. Kang, T. Wumaier, J. Dou, B. Gao, Y. Han, G. Xu, Z. Liu and L. Zhang,
Journal of Solid State Electrochemistry, 2013, 17, 1005-1012.
105. J. Deng, T. Xiong, F. Xu, M. Li, C. Han, Y. Gong, H. Wang and Y. Wang, Green
Chemistry, 2015, 17, 4053-4060.
106. X. He, P. Ling, J. Qiu, M. Yu, X. Zhang, C. Yu and M. Zheng, Journal of Power
Sources, 2013, 240, 109-113.
107. W.-J. SI, X.-Z. WU, W. XING, J. ZHOU and S.-P. Zhuo, Journal of Inorganic
Materials, 2011, 26, 107-112.
108. A. E. Ismanto, S. Wang, F. E. Soetaredjo and S. Ismadji, Bioresource technology, 2010,
101, 3534-3540.
109. R. Farma, M. Deraman, A. Awitdrus, I. A. Talib, E. Taer, N. Basri, J. Manjunatha, M.
Ishak, B. Dollah and S. Hashmi, Bioresource technology, 2013, 132, 254-261.
110. T. Otowa, R. Tanibata and M. Itoh, Gas separation & purification, 1993, 7, 241-245.
111. E. Raymundo-Pinero, P. Azais, T. Cacciaguerra, D. Cazorla-Amorós, A. Linares-
Solano and F. Béguin, Carbon, 2005, 43, 786-795.
112. W. Qiao, S.-H. Yoon and I. Mochida, Energy & Fuels, 2006, 20, 1680-1684.
113. D. Lozano-Castello, J. Calo, D. Cazorla-Amoros and A. Linares-Solano, Carbon, 2007,
45, 2529-2536.
114. M. Sevilla, L. Yu, C. O. Ania and M. M. Titirici, ChemElectroChem, 2014, 1, 2138-
2145.
115. J. Song, W. Shen, J. Wang and W. Fan, Carbon, 2014, 69, 255-263.
116. L. Chunlan, X. Shaoping, G. Yixiong, L. Shuqin and L. Changhou, Carbon, 2005, 43,
2295-2301.
117. Z. Li, Z. Xu, H. Wang, J. Ding, B. Zahiri, C. M. Holt, X. Tan and D. Mitlin, Energy &
Environmental Science, 2014, 7, 1708-1718.
118. S.-h. Du, L.-q. Wang, X.-t. Fu, M.-m. Chen and C.-y. Wang, Bioresource technology,
2013, 139, 406-409.
119. C. Peng, X.-b. Yan, R.-t. Wang, J.-w. Lang, Y.-j. Ou and Q.-j. Xue, Electrochimica
Acta, 2013, 87, 401-408.
120. M. Galinski, K. Babeł and K. Jurewicz, Journal of Power Sources, 2013, 228, 83-88.
121. K. Kierzek, E. Frackowiak, G. Lota, G. Gryglewicz and J. Machnikowski,
Electrochimica Acta, 2004, 49, 515-523.
122. L. Qie, W. Chen, H. Xu, X. Xiong, Y. Jiang, F. Zou, X. Hu, Y. Xin, Z. Zhang and Y.
Huang, Energy & Environmental Science, 2013, 6, 2497-2504.
123. F.-C. Wu, R.-L. Tseng, C.-C. Hu and C.-C. Wang, Journal of Power Sources, 2005,
144, 302-309.
124. A. Elmouwahidi, Z. Zapata-Benabithe, F. Carrasco-Marín and C. Moreno-Castilla,
Bioresource technology, 2012, 111, 185-190.
125. L. L. Zhang, X. Zhao, M. D. Stoller, Y. Zhu, H. Ji, S. Murali, Y. Wu, S. Perales, B.
Clevenger and R. S. Ruoff, Nano letters, 2012, 12, 1806-1812.
126. D. Zhai, H. Du, B. Li, Y. Zhu and F. Kang, Carbon, 2011, 49, 725-729.
127. Z. Li, K. Zhai, G. Wang, Q. Li and P. Guo, Materials, 2016, 9, 912.
128. X. Wei, X. Jiang, J. Wei and S. Gao, Chemistry of Materials, 2016, 28, 445-458.
129. G. Ma, J. Li, K. Sun, H. Peng, E. Feng and Z. Lei, Journal of Solid State
Electrochemistry, 2016, 1-11.
130. Z. L. Yu, G. C. Li, N. Fechler, N. Yang, Z. Y. Ma, X. Wang, M. Antonietti and S. H.
Yu, Angewandte Chemie, 2016, 128, 14843-14847.
131. Y. Huang, Z. Liu and G. Zhao, Rsc Adv, 2016, 6, 78909-78917.
132. D. W. Wang, F. Li, M. Liu, G. Q. Lu and H. M. Cheng, Angewandte Chemie, 2008,
120, 379-382.

44
133. L. Wang, Y. Guo, B. Zou, C. Rong, X. Ma, Y. Qu, Y. Li and Z. Wang, Bioresource
technology, 2011, 102, 1947-1950.
134. T. Kim, G. Jung, S. Yoo, K. S. Suh and R. S. Ruoff, Acs Nano, 2013, 7, 6899-6905.
135. Y. Zhu, S. Murali, M. D. Stoller, K. Ganesh, W. Cai, P. J. Ferreira, A. Pirkle, R. M.
Wallace, K. A. Cychosz and M. Thommes, Science, 2011, 332, 1537-1541.
136. K. Yang, J. Peng, C. Srinivasakannan, L. Zhang, H. Xia and X. Duan, Bioresource
technology, 2010, 101, 6163-6169.
137. X. He, Y. Geng, J. Qiu, M. Zheng, S. Long and X. Zhang, Carbon, 2010, 48, 1662-
1669.
138. F. Caturla, M. Molina-Sabio and F. Rodriguez-Reinoso, Carbon, 1991, 29, 999-1007.
139. M. Molina-Sabio, M. Gonzalez, F. Rodriguez-Reinoso and A. Sepúlveda-Escribano,
Carbon, 1996, 34, 505-509.
140. F.-C. Wu and R.-L. Tseng, Journal of Colloid and Interface Science, 2006, 294, 21-30.
141. A. Arami-Niya, W. M. A. W. Daud and F. S. Mjalli, Chemical Engineering Research
and Design, 2011, 89, 657-664.
142. X. Li, W. Xing, S. Zhuo, J. Zhou, F. Li, S.-Z. Qiao and G.-Q. Lu, Bioresource
technology, 2011, 102, 1118-1123.
143. M. J. Prauchner and F. Rodriguez-Reinoso, Microporous and Mesoporous Materials,
2008, 109, 581-584.
144. Z. Hu and M. Srinivasan, Microporous and Mesoporous Materials, 2001, 43, 267-275.
145. L. Deng, R. J. Young, I. A. Kinloch, A. M. Abdelkader, S. M. Holmes, D. A. De Haro-
Del Rio and S. J. Eichhorn, ACS applied materials & interfaces, 2013, 5, 9983-9990.
146. D. Klemm, F. Kramer, S. Moritz, T. Lindström, M. Ankerfors, D. Gray and A. Dorris,
Angewandte Chemie International Edition, 2011, 50, 5438-5466.
147. M. Hamedi, E. Karabulut, A. Marais, A. Herland, G. Nyström and L. Wågberg,
Angewandte Chemie International Edition, 2013, 52, 12038-12042.
148. C. Salas, T. Nypelö, C. Rodriguez-Abreu, C. Carrillo and O. J. Rojas, Current Opinion
in Colloid & Interface Science, 2014, 19, 383-396.
149. L. Jiang, G. W. Nelson, H. Kim, I. Sim, S. O. Han and J. S. Foord, ChemistryOpen,
2015, 4, 586-589.
150. X. Wu, Z. Shi, R. Tjandra, A. J. Cousins, S. Sy, A. Yu, R. M. Berry and K. C. Tam,
Journal of Materials Chemistry A, 2015, 3, 23768-23777.
151. Z. Zhao, S. Hao, P. Hao, Y. Sang, A. Manivannan, N. Wu and H. Liu, J. Mater. Chem.
A, 2015, 3, 15049-15056.
152. Y. S. Yun, J. Shim, Y. Tak and H.-J. Jin, Rsc Adv, 2012, 2, 4353-4358.
153. P. Hao, Z. Zhao, J. Tian, H. Li, Y. Sang, G. Yu, H. Cai, H. Liu, C. Wong and A. Umar,
Nanoscale, 2014, 6, 12120-12129.
154. D. Bhattacharya, L. T. Germinario and W. T. Winter, Carbohydrate Polymers, 2008,
73, 371-377.
155. S. Song, F. Ma, G. Wu, D. Ma, W. Geng and J. Wan, Journal of Materials Chemistry
A, 2015, 3, 18154-18162.
156. S. Y. Liew, W. Thielemans and D. A. Walsh, The Journal of Physical Chemistry C,
2010, 114, 17926-17933.
157. W. Luo, B. Wang, C. G. Heron, M. J. Allen, J. Morre, C. S. Maier, W. F. Stickle and
X. Ji, Nano letters, 2014, 14, 2225-2229.
158. G. Zu, J. Shen, L. Zou, F. Wang, X. Wang, Y. Zhang and X. Yao, Carbon, 2016, 99,
203-211.
159. D. D. Laskar, B. Yang, H. Wang and J. Lee, Biofuels, Bioproducts and Biorefining,
2013, 7, 602-626.
160. B. Yu, Z. Chang and C. Wang, Materials Chemistry and Physics, 2016, 181, 187-193.

45
161. Z.-z. Chang, B.-j. Yu and C.-y. Wang, Journal of Solid State Electrochemistry, 2016,
20, 1405-1412.
162. D. Kai, M. J. Tan, P. L. Chee, Y. K. Chua, Y. L. Yap and X. J. Loh, Green Chemistry,
2016, 18, 1175-1200.
163. W.-J. Liu, H. Jiang and H.-Q. Yu, Green Chemistry, 2015, 17, 4888-4907.
164. M. Graglia, J. Pampel, T. Hantke, T.-P. Fellinger and D. Esposito, ACS nano, 2016, 10,
4364-4371.
165. K. Wang, M. Xu, Y. Gu, Z. Gu and Q. H. Fan, Journal of Power Sources, 2016, 332,
180-186.
166. S. Hu, S. Zhang, N. Pan and Y.-L. Hsieh, Journal of Power Sources, 2014, 270, 106-
112.
167. C. Lai, Z. Zhou, L. Zhang, X. Wang, Q. Zhou, Y. Zhao, Y. Wang, X.-F. Wu, Z. Zhu
and H. Fong, Journal of Power Sources, 2014, 247, 134-141.
168. X. Ma, P. Kolla, Y. Zhao, A. L. Smirnova and H. Fong, Journal of Power Sources,
2016, 325, 541-548.
169. M. Ago, M. Borghei, J. S. Haataja and O. J. Rojas, Rsc Adv, 2016, 6, 85802-85810.
170. D. Saha, Y. Li, Z. Bi, J. Chen, J. K. Keum, D. K. Hensley, H. A. Grappe, H. M. Meyer
III, S. Dai and M. P. Paranthaman, Langmuir, 2014, 30, 900-910.
171. W. Zhang, H. Lin, Z. Lin, J. Yin, H. Lu, D. Liu and M. Zhao, ChemSusChem, 2015, 8,
2114-2122.
172. R. Ruiz‐Rosas, M. J. Valero‐Romero, D. Salinas‐Torres, J. Rodríguez‐Mirasol, T.
Cordero, E. Morallón and D. Cazorla‐Amorós, ChemSusChem, 2014, 7, 1458-1467.
173. H. Li, D. Yuan, C. Tang, S. Wang, J. Sun, Z. Li, T. Tang, F. Wang, H. Gong and C. He,
Carbon, 2016, 100, 151-157.
174. D. Salinas-Torres, R. Ruiz-Rosas, M. J. Valero-Romero, J. Rodríguez-Mirasol, T.
Cordero, E. Morallón and D. Cazorla-Amorós, Journal of Power Sources, 2016, 326,
641-651.
175. J. Tian, Z. Liu, Z. Li, W. Wang and H. Zhang, Rsc Adv, 2017, 7, 12089-12097.
176. A. M. Navarro-Suárez, J. Carretero-González, V. Roddatis, E. Goikolea, J. Ségalini, E.
Redondo, T. Rojo and R. Mysyk, Rsc Adv, 2014, 4, 48336-48343.
177. L. Zhang, T. You, T. Zhou, X. Zhou and F. Xu, ACS applied materials & interfaces,
2016, 8, 13918-13925.
178. W. Zhang, M. Zhao, R. Liu, X. Wang and H. Lin, Colloids and Surfaces A:
Physicochemical and Engineering Aspects, 2015, 484, 518-527.
179. J. W. Jeon, L. Zhang, J. L. Lutkenhaus, D. D. Laskar, J. P. Lemmon, D. Choi, M. I.
Nandasiri, A. Hashmi, J. Xu and R. K. Motkuri, ChemSusChem, 2015, 8, 428-432.
180. A. S. Mamman, J. M. Lee, Y. C. Kim, I. T. Hwang, N. J. Park, Y. K. Hwang, J. S.
Chang and J. S. Hwang, Biofuels, Bioproducts and Biorefining, 2008, 2, 438-454.
181. Y. Wang, R. Yang, M. Li and Z. Zhao, Industrial Crops and Products, 2015, 65, 216-
226.
182. X. Xu, J. Zhou, D. H. Nagaraju, L. Jiang, V. R. Marinov, G. Lubineau, H. N. Alshareef
and M. Oh, Advanced Functional Materials, 2015, 25, 3193-3202.
183. L. Hu, H. Wu and Y. Cui, Applied Physics Letters, 2010, 96, 183502.
184. L. Hu, M. Pasta, F. L. Mantia, L. Cui, S. Jeong, H. D. Deshazer, J. W. Choi, S. M. Han
and Y. Cui, Nano letters, 2010, 10, 708-714.
185. L. Hu, J. W. Choi, Y. Yang, S. Jeong, F. La Mantia, L.-F. Cui and Y. Cui, Proceedings
of the National Academy of Sciences, 2009, 106, 21490-21494.
186. K. Gao, Z. Shao, J. Li, X. Wang, X. Peng, W. Wang and F. Wang, Journal of Materials
Chemistry A, 2013, 1, 63-67.
46
187. G. Nystrom, A. Mihranyan, A. Razaq, T. Lindstrom, L. Nyholm and M. Strømme, The
Journal of Physical Chemistry B, 2010, 114, 4178-4182.
188. S. Liu, T. Yu, Y. Wu, W. Li and B. Li, Rsc Adv, 2014, 4, 34134-34143.
189. G. Milczarek and O. Inganäs, Science, 2012, 335, 1468-1471.
190. K. Wang, Y. Cao, X. Wang, M. A. Castro, B. Luo, Z. Gu, J. Liu, J. D. Hoefelmeyer and
Q. Fan, Journal of Power Sources, 2016, 307, 462-467.
191. A. M. Navarro-Suárez, N. Casado, J. C. González, D. Mecerreyes and T. Rojo, Journal
of Materials Chemistry A, 2017, 5, 7137-7143.
192. F. Ajjan, N. Casado, T. Rębiś, A. Elfwing, N. Solin, D. Mecerreyes and O. Inganäs,
Journal of Materials Chemistry A, 2016, 4, 1838-1847.
193. F. Chen, W. Zhou, H. Yao, P. Fan, J. Yang, Z. Fei and M. Zhong, Green Chemistry,
2013, 15, 3057-3063.
194. W. Chen, R. Rakhi, L. Hu, X. Xie, Y. Cui and H. N. Alshareef, Nano letters, 2011, 11,
5165-5172.
195. Z. Gui, H. Zhu, E. Gillette, X. Han, G. W. Rubloff, L. Hu and S. B. Lee, ACS nano,
2013, 7, 6037-6046.
196. J. Cai, H. Niu, Z. Li, Y. Du, P. Cizek, Z. Xie, H. Xiong and T. Lin, ACS applied
materials & interfaces, 2015, 7, 14946-14953.
197. M. Klose, R. Reinhold, F. Logsch, F. Wolke, J. Linnemann, U. Stoeck, S. Oswald, M.
Uhlemann, J. Balach and J. Markowski, ACS Sustainable Chemistry & Engineering,
2017, 5, 4094-4102.
198. Z. Li, D. Wu, Y. Liang, R. Fu and K. Matyjaszewski, J Am Chem Soc, 2014, 136, 4805-
4808.
199. K. Xia, Q. Gao, J. Jiang and J. Hu, Carbon, 2008, 46, 1718-1726.
200. Z. Lei, J. Zhang, L. L. Zhang, N. A. Kumar and X. Zhao, Energy & Environmental
Science, 2016, 9, 1891-1930.
201. X. Zheng, J. Luo, W. Lv, D. W. Wang and Q. H. Yang, Adv Mater, 2015, 27, 5388-
5395.
202. D.-W. Wang, F. Li, M. Liu, G. Q. Lu and H.-M. Cheng, The Journal of Physical
Chemistry C, 2008, 112, 9950-9955.
203. X. Fan, C. Yu, J. Yang, Z. Ling, C. Hu, M. Zhang and J. Qiu, Advanced Energy
Materials, 2015, 5, 14011761.
204. J. Xu, Q. Gao, Y. Zhang, Y. Tan, W. Tian, L. Zhu and L. Jiang, Scientific reports, 2014,
4.
205. X. Zheng, W. Lv, Y. Tao, J. Shao, C. Zhang, D. Liu, J. Luo, D.-W. Wang and Q.-H.
Yang, Chemistry of Materials, 2014, 26, 6896-6903.
206. L. Wang, G. Mu, C. Tian, L. Sun, W. Zhou, P. Yu, J. Yin and H. Fu, ChemSusChem,
2013, 6, 880-889.
207. L. F. Chen, Z. H. Huang, H. W. Liang, H. L. Gao and S. H. Yu, Advanced Functional
Materials, 2014, 24, 5104-5111.
208. M. Seredych, D. Hulicova-Jurcakova, G. Q. Lu and T. J. Bandosz, Carbon, 2008, 46,
1475-1488.
209. D. Hulicova‐Jurcakova, M. Seredych, G. Q. Lu and T. J. Bandosz, Advanced functional
materials, 2009, 19, 438-447.
210. Z. Ling, Z. Wang, M. Zhang, C. Yu, G. Wang, Y. Dong, S. Liu, Y. Wang and J. Qiu,
Advanced Functional Materials, 2016, 26, 111-119.
211. D. Hulicova-Jurcakova, A. M. Puziy, O. I. Poddubnaya, F. Suárez-García, J. M. Tascón
and G. Q. Lu, J Am Chem Soc, 2009, 131, 5026-5027.
212. X. Hong, K. Hui, Z. Zeng, K. Hui, L. Zhang, M. Mo and M. Li, Electrochimica Acta,
2014, 130, 464-469.

47
213. K. Wang, N. Zhao, S. Lei, R. Yan, X. Tian, J. Wang, Y. Song, D. Xu, Q. Guo and L.
Liu, Electrochimica Acta, 2015, 166, 1-11.
214. C. Wang, X. Wang, H. Lu, H. Li and X. Zhao, Carbon, 2018, 140, 139-147.
215. H. Lu, X. Sun, R. R. Gaddam, N. A. Kumar and X. S. Zhao, Journal of Power Sources,
2017, 360, 634-641.
216. L. Mao, Y. Zhang, Y. Hu, K. H. Ho, Q. Ke, H. Liu, Z. Hu, D. Zhao and J. Wang, Rsc
Adv, 2015, 5, 9307-9313.
217. Y. Fan, P. Liu, B. Zhu, S. Chen, K. Yao and R. Han, International Journal of Hydrogen
Energy, 2015, 40, 6188-6196.
218. B.-H. Cheng, K. Tian, R. J. Zeng and H. Jiang, Sustainable Energy & Fuels, 2017, 1,
891-898.
219. H. Feng, H. Hu, H. Dong, Y. Xiao, Y. Cai, B. Lei, Y. Liu and M. Zheng, Journal of
Power Sources, 2016, 302, 164-173.
220. W. Tian, Q. Gao, Y. Tan, K. Yang, L. Zhu, C. Yang and H. Zhang, Journal of Materials
Chemistry A, 2015, 3, 5656-5664.
221. Y. Zhao, W. Ran, J. He, Y. Song, C. Zhang, D.-B. Xiong, F. Gao, J. Wu and Y. Xia,
ACS applied materials & interfaces, 2015, 7, 1132-1139.
222. B. Xu, S. Hou, G. Cao, F. Wu and Y. Yang, Journal of Materials Chemistry, 2012, 22,
19088-19093.
223. Y. J. Kang, S.-J. Chun, S.-S. Lee, B.-Y. Kim, J. H. Kim, H. Chung, S.-Y. Lee and W.
Kim, ACS nano, 2012, 6, 6400-6406.

48
Chapter 3 Experiment Methods

49
3.1 Chemicals and reagents
Chemicals and reagents used in this thesis project are presented in Table 3. 1. All the
chemicals were used without further purification.
Table 3. 1 Chemicals and reagents used in this thesis project
Name Company Purity or grade
Graphite flakes Sigma-Aldrich AR
Microcrystalline cellulose Sigma-Aldrich AR
Sodium nitrate (NaNO3) Merck AR
Zinc chloride (ZnCl2) Sigma-Aldrich LR
Potassium permanganate (KMnO4) Merck AR
Hydroxide peroxide (H2O2) Merck 30 wt %
Hydrochloric acid (HCl) EMSURE 32 wt %
Sulphuric acid (H2SO4) Sigma-Aldrich 98 wt%
Lithium chloride (LiCl) Sigma-Aldrich AR
Expandable graphite Asbury AR
Nickel (II) acetylacetonate
[Ni(acac)2]
Sigma-Aldrich 95 wt %
Potassium hydroxide (KOH) Merck AR
Sodium hydroxide (NaOH) Sigma-Aldrich AR
Urea (CH4N2O) Sigma-Aldrich -
Acetonitrile (CH3CN) Sigma-Aldrich HPLC-GC
Ammonia solution (NH3 H2O) EMSURE 28-30 wt %
Nickel nitrate Ni(NO3)2 Sigma-Aldrich 98 wt %
Sodium sulfate (Na2SO4) Sigma-Aldrich 98 wt %
poly vinyl alcohol (PVA) Sigma-Aldrich -
LiPF6-EC-DMC Sigma-Aldrich battery grade
ethylene carbonate (EC) Sigma-Aldrich 99 %
propylene carbonate (PC) Sigma-Aldrich 99 %
fluoroethylene carbonate (FEC) Sigma-Aldrich 99 %
sodium perchlorate (NaClO4) Sigma-Aldrich 98 %
[BMIM]BF4 Sigma-Aldrich HPLC
EMIMBF4 Sigma-Aldrich HPLC

50
Stainless mesh and nickel foam were purchased from Shenzhen Biyuan Electronic, Co. Ltd,
China. Whatman filter paper (GF/D) was bought from Sigma-Aldrich. Carbon black (CB)
(Vulcan XC 72R) was kindly provided by Cabot Co., USA. Yeast powder was from Lowan
Whole Foods.
3.2 Characterization of materials
3.2.1 X-ray diffraction X-ray diffraction (XRD) patterns for samples in chapter 6 were performed on a Rigaku
Multiplex instrument. Others were on a Bruker D8 Advance X-ray diffractometer. All of them
were operated in the reflection mode with Cu Kα radiation (λ=1.54056 Å) at a step size of
2°/min under a voltage of 40 kV and a current of 30 mA at angel ranging from 5 ~ 80°.
3.2.2 Nitrogen sorption analyses
N2 sorption isotherms were measured using a Micromeritics Tristar II 3020. Ar sorption
isotherms were measured using a Micromeritics ASAP 2020 volumetric adsorption analyzer at
liquid Ar temperature. Samples were degassed at 150 °C under vacuum for 10 h prior to the
measurements. The specific surface areas were calculated using the Brunauer-Emmett-Teller
method. The pore size distribution curves were derived from the density functional theory
(DFT) and/or Barrett–Joyner–Halenda (BJH) model and the total pore volumes (Vtotal) were
estimated from the N2 volumes adsorbed at the maximum relative pressure equal to 0.99.
3.2.3 X-ray photoelectron spectroscopy
X-ray photoelectron spectroscopy (XPS) spectra were acquired on a Kratos Axis Ultra X-ray
photoelectron spectrometer with a 165 mm hemispherical electron energy analyser and
monochromatic Al Kα (1486.6eV) radiation at 225 W (15kV, 15mA). The binding energies
were calibrated using a C-C configuration in C1s excitation at a binding energy of 284.6 eV.
The quantitative analysis of XPS data was performed with a CasaXPS software after Shirley
background subtraction.
3.2.4 Raman spectroscopy
Raman spectra were collected using a Raman spectrometer (Renishaw InVia) with an argon
ion laser source of 514 nm. The intensity ratio of D band (disorder) to G band (graphite in-
plane vibration) was calculated by the intensity of the peaks.

51
3.2.5 Scanning electron microscopy
The morphology of the samples in chapter 6 were observed on a Verios 460 (FEI) Field-
emission scanning electron microscopy (FE-SEM). Others were collected through JOEL 7001.
A sample was pasted on a conductive carbon tape, followed by a plasma treatment. The energy
dispersive X-ray spectroscopy (EDS) technique on the SEM was also conducted for the
elemental content analysis.
3.2.6 Transmission electron microscopy
Transmission electron microscopy (TEM) images of the samples in chapter 4,5,6,7 at different
magnifications were collected on a JEOL 2100 at an acceleration voltage of 200 kV, F20 at an
acceleration voltage of 200 kV, Titan E-TEM G2 (FEI) at an acceleration voltage of 300 kV
and F20 at an acceleration voltage of 200 kV, respectively. A sample was ultrasonication
treated in ethanol and then placed on a holey copper grid. The STEM-energy dispersive
spectrometry (STEM-EDS) and the STEM image performed in a high-angle annular dark field
mode (HAADF-STEM) were also collected for the elemental mapping analysis
3.3 Electrode/electrolyte preparation and cell fabrication
In this thesis project, a series of ECs within aqueous, all-solid-state, organic or ionic liquids
(ILs) electrolyte were assembled and analysed. The working electrode and/or electrolyte
preparation and cell fabrication methods are described as following.
3.3.1 Aqueous electrolyte ECs
The working electrodes were obtained by mixing active materials, CB as a conductive additive
and polytetrafluoro ethylene (PTFE) binder in a certain mass ratio. Then the mixture was
pressed onto the current collector and dried at 60 °C for 48 h. Current collector of stainless-
steel mesh or nickle foam was used for working electrode immersing in acid or alkali
electrolyte, respectively. The active materials mass on the working electrode varies in
following chapters.
In this project, to evaluate the electrocapacitive properties of the working electrode (WE), both
three-electrode and two-electrode cells, as illustrated in Figure 3. 1, are used. For the three-
electrode system, Pt and Ag/AgCl electrodes were used as the counter (CE) and reference (RE)

52
electrode, respectively. For the two-electrode system, symmetric ECs using the same mass
loading on positive and negative electrodes were assembled. A Whatman filter paper (GF/D)
was used as the separator. Different aqueous electrolytes, including 1 M H2SO4, 2 M KOH and
1 M LiCl were used for the project.
Figure 3. 1 Schematics for EC configurations of a three-electrode (a) and two-electrode (b)
system.4, 5
3.3.2 All-solid-state electrolyte ECs
For the all-solid-state ECs, polyvinyl alcohol/H2SO4 gel was used as the electrolyte. The
preparing method is as follows6: 3 g polyvinyl alcohol (PVA) was added into 30 ml 1M H2SO4
aqueous solution and stirred for 1 h. Subsequently, the mixture was heated at 80 ℃ under
vigorous stirring until the whole solution became clear.
The working electrodes and the separator were soaked with the PVA/H2SO4 gel electrolyte and
solidified at room temperature for 24 h before they were assembled together. The working
electrode had area mass loading of ∼2 mg/cm2 and the active material had an area of ∼1 cm2.
3.3.3 Organic/IL electrolyte ECs
For ECs within organic/IL electrolyte in this project, including symmetric cells and hybrid
sodium ion capacitors, the working electrodes were prepared by mixing 70 wt% of active
materials, 20 wt% of CB and 10 wt% of polyvinyldine fluoride (PVDF) in N-methyl
pyrrolidine (NMP) to form a slurry. Subsequently, the mixture was casted onto a current
collector using a doctor blade and dried in a vacuum oven at 80 °C overnight.7 The aluminium
foil and copper foil acted as current collectors in this thesis.

53
Symmetric cells in organic or IL electrolyte, hybrid sodium in capacitors, and sodium half-
cells were all assembled in 2032-type coin cells operated in a glovebox (MBraun Company,
Germany) under ultra-pure Ar atmosphere, where both moisture and oxygen levels were less
than 0.1 ppm. Figure 3. 2 shows the schematic diagram of a coin cell assembling. After
assembly using a crimping machine (MTI company, China), the coin cells were put aside for
12 hours, and were then loaded for electrochemical testing.
Figure 3. 2 Schematic illustration of coin cell assembly.8
3.4 Electrochemical measurement methods
Cyclic voltammetry (CV), galvanostatic charge-discharge (GCD) and electrochemical
impedance spectroscopy (EIS) techniques were employed to investigate the electrochemical
performance of EC cells on an Autolab PGSTAT 3020N workstation at room temperature and
pressure.9
3.4.1 Cyclic voltammetry test (CV)
CV is one of the most extensively used techniques for acquiring both qualitative and
quantitative information about EC electrodes. It can provide several useful pieces of
information including the cyclability of the process, the total capacitance of the electrode under
study by integration of the voltammetric current with respect to time, the optimum potential
window, the electrochemical kinetics of electrodes and an ability to distinguish the capacitive
and diffusion-limited charge storage mechanisms by altering the sweep rate.10

54
An ideal EDLC, as shown in Figure 3. 3, exhibits a rectangular CV curve with current
independent of potential (label 1). For a typical EDLC with certain pseudocapacitive
contribution and resistivity, it shows a quasi-rectangular shape like label 3-4 in Figure 3. 3 or
Figure 3. 4 (a, b). For a pseudocapacitor, its CV profile exhibits a mirror image as shown in
Figure 3. 4 (d, e). In comparison, the CV profile of a battery has a relatively large peak voltage
difference between the cathodic and anodic peak currents, Figure 3. 4 (g, h). But no standard
experimental metrics for ECs and batteries have been proposed, which is also a hot topic in this
area recently.
Figure 3. 3 Typical CV curves of an EC.11
Figure 3. 4 (a, b, d, e, g, h) Schematic cyclic voltammograms and (c, f, i) corresponding GCD
curves for various kinds of energy-storage materials.12
55
The specific gravimetric capacitance of a single electrode, Cs (in F/g), obtained from the CV
data via a three-electrode system was collected according to the following equation:
/ 2sC idu mvV= (Eq. 3. 1)
where, i (in A) is the instantaneous current response, u (in V) is the instantaneous potential, m
(in g) is the mass of the active materials on a single electrode, v (in mV/s) is the scan rate, V
(in V) is the potential window.
3.4.2 Galvanostatic charge-discharge test (GCD)
GCD is tested at different current densities in the same potential window of CV test. Cs (in F/g)
measured on a three-electrode system was calculated from the galvanostatic discharge process
using the following equation:
(Eq. 3. 2)
The Cs value derived from the GCD data measured on a two-electrode system was calculated
from the following equation:
(Eq. 3. 3)
The areal capacitance Ca (in mF/cm2) measured on a two-electrode system was calculated from
the following equation:
(Eq. 3. 4)
where, I (in A) is the instantaneous current, Δt (in s) is the discharge time, m (in g) is the mass
of the active materials on a single electrode, S (in m2) is the superficial area of the active
materials on a single electrode and V (in V) is the potential window.
The energy and power density, E (Wh/Kg) and P (kW/Kg), of an EC cell were calculated from
equations
20.5 / 4 3.6E CV= (Eq. 3. 5)
sC I t mV=
4 2sC I t mV=
4 2aC I t SV=

56
3.6 /P E t= (Eq. 3. 6)
The volumetric energy density, Ev (in mWh/cm3), and volumetric power density, Pv (in
mW/cm3), of an all-solid-state EC were obtained through the following equations:
(Eq. 3. 7)
(Eq. 3. 8)
Where Vdevice is the volume of the whole device.
A Ragone plot providing the energy and power information of an energy storage device is
usually presented in a log-log plot figure. A typical Ragone plot was shown in Fig. 1.1.
3.4.3 Electrochemical impedance spectroscopy test (EIS)
The EIS measurement is usually carried out at an open circuit potential with an amplitude of 5
mV in the frequency range of 10 mHz – 100 kHz. EIS data is commonly analysed by fitting it
to an equivalent electrical circuit model. It also can be used for both qualitative and quantitative
analyses.
The specific capacitance of a cell can be calculated through the EIS data using the following
equation:
"
1
2C
fZ m
−= (Eq. 3. 9)
However, there are some intrinsic limitations for impedance measurements in determining the
EDLC.13 The EIS overestimated the EDLC in dilute electrolyte solutions while underestimated
it in concentrated electrolyte solutions. Therefore, the obtained Nyquist plot and Bode plots are
usually used for a qualitative analysis. Theoretically, in the Nyquist plot, a pure capacitor
displays a vertical line to the real axis in the low frequency range. In comparison, for a battery-
type electrode, it displays a 45° Warburg line because it is diffusion-controlled. While for
pseudocapacitance, in normal case, the plot will show a line with an inclined angle between 45°
and 90° against the real axis.
v deviceE E V=
3.6v v deviceP E V=
57
In general, it has been widely accepted that GCD is the most preferred and reliable technique
for the capacitance value calculation, followed by CV and EIS. CV and EIS are usually used
for qualitative analysis. But in recent years, more techniques or methods have been introduced
for the electrocapacitive property analysis, such as the step potential electrochemical
spectroscopy (SPECS).14
3.5 References
1. C. Luo, S. Wang and H. Liu, Angewandte Chemie International Edition, 2007, 46,
7636-7639.
2. H. Lu, X. Sun, R. R. Gaddam, N. A. Kumar and X. S. Zhao, Journal of Power Sources,
2017, 360, 634-641.
3. S. Park and R. S. Ruoff, Nature nanotechnology, 2009, 4, 217.
4. X. Sun, 2018.
5. Z. Wu, L. Li, J. m. Yan and X. b. Zhang, Advanced Science, 2017, 4, 1600382.
6. X. Lu, M. Yu, G. Wang, Y. Tong and Y. Li, Energy & Environmental Science, 2014,
7, 2160-2181.
7. Y. Wu, X. Fan, R. R. Gaddam, Q. Zhao, D. Yang, X. Sun, C. Wang and X. Zhao,
Journal of Power Sources, 2018, 408, 82-90.
8. P. Liu, 2017.
9. C. Huang, X. Song, Y. Qin, B. Xu and H. C. Chen, Journal of Materials Chemistry A,
2018, 6, 21047-21055.
10. M. Forghani and S. W. Donne, Journal of The Electrochemical Society, 2018, 165,
A664-A673.
11. E. Frackowiak and F. Beguin, Carbon, 2001, 39, 937-950.
12. Y. Gogotsi and R. M. Penner, ACS nano, 2018, 12, 2081-2083.
13. H. Wang and L. Pilon, Electrochimica Acta, 2012, 63, 55-63.
14. A. J. Gibson, M. F. Dupont, R. J. Wood, Q. Gu, A. P. Cameron and S. W. Donne,
Electrochimica Acta, 2018, 260, 630-639.

58
Chapter 4 Electrocapacitive properties of
porous carbons derived from
microcrystalline cellulose
This chapter has been published as Journal of Power Sources, 2017, 360, 634-641

59
4.1 Introduction
Carbon materials are the most popular electrodes for electrochemical capacitors (ECs) due to
their promising properties and stability.1-4 Biomass-derived, especially lignocellulose-derived
porous carbons hold a great promise as EC electrodes.5-13 However, the dependence of the
electrocapacitive performance upon the composition of lignocellulose is still unclear which
inhibits its wide application for ECs. Cellulose, the main component in lignocellulose, is a
cheap polymeric material that is available in the market.14 It is suitable as a carbon source for
manufacturing porous carbon electrode materials for commercial ECs.15-18
Luo et al.15 reported N-doping porous carbon membranes prepared by carbonising cellulose
paper under a NH3 atmosphere, which displayed a specific capacitance of 120 F/g at a current
density of 1 A/g. Zhao et al.16 prepared meso-microporous carbons by using the template
method in combination with carbonisation and ZnCl2 chemical activation. The sample
exhibited a specific capacitance of 246 F/g at 2 mV/s measured in 6 M KOH aqueous
electrolyte within a three-electrode system. Hao et al.17 prepared cellulose-derived porous
carbon aerogels through several steps, including cellulose purification, sol-gel processing,
cellulose regeneration, freeze drying, carbonisation and KOH activation. The product exhibited
a specific capacitance of around 142 F/g at 0.5 A/g in a solid-state symmetric EC. Despite their
considerable performance, these cellulose-derived carbon materials were obtained either by a
relatively complicated process16, 17 or using corrosive gas like NH3,18 making the technology
unfavourable for industrial applications.
Herein, we describe a generalised approach to the preparation of nitrogen-containing
microcrystalline cellulose-derived porous carbons (NPCs). In this route, microcrystalline
cellulose, urea and nickel nitrate were used as the carbon precursor, nitrogen source and
graphitisation catalyst, respectively. The sol-gel processing and freeze-drying methods were
used to control the porous structure of the resulting carbon samples. It was found that the
sample prepared at a relatively mild temperature, namely 600 °C, exhibited the best
electrocapacitive performance due to a three-dimensional hierarchical porous structure with
macropores, mesopores and micropores, an appropriate level of carbonisation, and the
pseudocapacitance contribution from both nitrogen-containing surface functional groups and
nascent hydrogen.

60
4.2 Experiment
4.2.1 Preparation of samples
In a typical procedure, 4 g cellulose powder was added to 48 g NaOH solution (14 wt%) at
0 °C under stirring. After 1 min, 48 g urea solution (24 wt%) was added under stirring for 2
mins to obtain a transparent cellulose/NaOH/urea sol (CNUS). Subsequently, 10 g Ni(NO3)2
aqueous solution (10 wt%) was added to the above CNUS under stirring for 2 h. The sol was
then heated at 40 °C for 36 h. Afterwards, the obtained hydrogel was freeze-dried at -65 °C for
48 h followed by carbonisation at different temperatures for 2 h under N2 flow at a heating rate
of 5 °C/min. The obtained samples were washed with HCl and deionised water to remove
residual chemicals, including nickel. After drying at 60 °C for 48 h, samples were obtained and
are denoted as NPC-T, where T stands for the carbonisation temperature.
4.2.2 Characterisations and electrochemical measurements
The material characterizations, EC assembly and electrochemical measurements were
conducted according to Chapter 3.2-3.4.
In this chapter, the working electrodes were prepared by mixing 85 wt% active materials, 10
wt% carbon black as a conductive additive and 5 wt% polytetrafluoro ethylene (PTFE) binder.
The mass of active materials on each current collector was ∼2 mg. CV scans were obtained at
scan rates in the range of 5 - 200 mV/s. The GCD cycles were performed at current densities
ranging from 0.1 to 10 A/g. The EIS measurement was carried out at an open circuit potential
with an amplitude of 5 mV in the frequency range of 10 mHz to 100 kHz.
4.3 Results and Discussion
Figure 4. 1a schematically shows the preparation process of the NPCs. Cellulose (40 × 15μm,
Figure S4. 1) was firstly dispersed in a NaOH and urea solution to get a transparent
cellulose/NaOH/urea sol (CNUS). Subsequently, Ni(NO3)2 was added to the CNUS and heated
at 40 oC to obtain a cellulose hydrogel. After freeze drying followed by carbonisation at
different temperatures, NPCs with a certain degree of graphitisation were obtained. The porous
structure of the NPC samples is schematically illustrated in Figure 4. 1b. The FESEM images
shown in Figure 4. 1c and d revealed the presence of interconnected macropores, while the
TEM images shown in Figure 4. 1e and f confirmed the presence of mesopores in the samples.

61
The type I nitrogen adsorption isotherm along with the presence of a hysteresis loop indicate
this sample had micropores and mesopores. The pore size distribution calculated by using DFT
model further confirmed the existence of both microproes and mesopores.17, 19, 20
Figure 4. 1 A scheme showing the preparation of NPCs (a), structure model of NPCs (b), FE-
SEM (c, d) and TEM images (e, f), nitrogen sorption isotherms and pore size distribution curve
(g) of sample NPC-600.
Figure 4. 2a shows the adsorption/desorption isotherms of samples obtained at different
carbonisation temperatures. The textural properties of the samples derived from the nitrogen
isotherms are given in Table 4. 1. It is seen from Table 4. 1 that with increasing temperature,
the surface area of mesopores and macropores (Smeso+macro) increased. Among all the samples,
NPS-600 exhibited the highest total SSA and pore volume, as well as microporous surface area,
indicating 600 oC is an optimal carbonisation temperature in regard to pore development. The
H4 type hysteresis loop observed on all samples suggests slit-like pores. Figure 4. 2b shows
the pore size distribution curves of the samples calculated using the DFT model. All samples
exhibited two prominent micropore peaks centred at 1.2 nm and 1.8 nm, and a mesopore peak
centred at 2.5 nm. These micropores originated from the chemical reaction shown in eqn (5).
It can also be seen from Figure 4. 2b that the 600 oC carbonisation temperature maximised the

62
pore development. However, at 500 °C the formation of micropores was not evident in
accordance with what is reported elsewhere.21-24
6NaOH + 2C → 2Na + 3H2 + 2Na2CO3 (Eq. 4. 1)
Upon further increase of the temperature to 700 and 800 °C, the Smeso+macro increased, while the
SSA, micropore volume, and micropore surface area all decreased. At the temperature of
700 °C or higher, the following chemical reactions underwent:
Na2CO3→Na2O+CO2 (Eq. 4. 2)
CO2+C→2CO (Eq. 4. 3)
Na2CO3+2C→2Na+3CO (Eq. 4. 4)
As a result, more carbons were consumed, leading to the collapses of micropores and the
formation of mesopores and macropores. 25 Temperature apparently plays a critical role for the
synthesis of NPCs.
Figure 4. 2 Nitrogen sorption isotherms (a) and the pore size distributions of NPCs
calculated from the DFT method (b).

63
Table 4. 1 Textual properties of the NPCs.
Samples SBET
(m2/g)
Smicro
(m2/g)
Smeso+macro
(m2/g)
Vtotal
(cm3/g)
Vmicro
(cm3/g)
NPC-500 75 6 69 0.16 0.002
NPC-550 456 334 122 0.41 0.17
NPC-575 571 412 159 0.49 0.21
NPC-600 781 520 261 0.68 0.27
NPC-650 575 327 248 0.47 0.17
NPC-700 322 44 278 0.32 0.02
NPC-800 338 9 329 0.62 0.002
SBET: the specific surface area from BET. Smicro: Surface area of micropores calculated by the
t-plot method. Vmicro: volume of micropores calculated by the t-plot method.
Figure 4. 3 shows the FE-SEM, TEM and HR-TEM images of four representative samples,
namely NPS-500, NPC-600, NPC-700, and NPC-800. When the temperature was increased
from 500 °C to 600 °C, a porous structure was significantly improved as reflected by the
electron microscope images shown in Figure 4. 3a-b. When the carbonisation temperature was
further increased to 700 and 800 °C, the porous structure of the carbons became poorly defined.
These results further confirmed that 600 °C is the most suitable carbonisation temperature for
producing hierarchical porous carbon from cellulose. The HR-TEM images in Figure 4. 3a-d
show relatively more clear crystalline lattices with increasing temperature, revealing enhanced
graphitisation degree of the samples, which is in consistence with the XRD and Raman
spectroscopy results. As shown in Figure S4. 2a, the intensity of (002) diffraction peaks
increased as the temperature increased from 500 °C to 800 °C, indicating that the graphitisation
degree of NPCs increased with an increase in temperature. 15 In the Raman spectra (Figure S4.
2b), two bands located at around 1352 cm-1 and 1586 cm-1 correspond to the D and G bands of
carbon respectively. D band is related to the disorder induced by structural defects and
impurities, while the G band corresponds to the stretching bond of sp2 hybrid carbon. 25, 26 The
IG/ID increased from 1.07 to 1.13 as the temperature increased from 500 to 800 °C. The higher
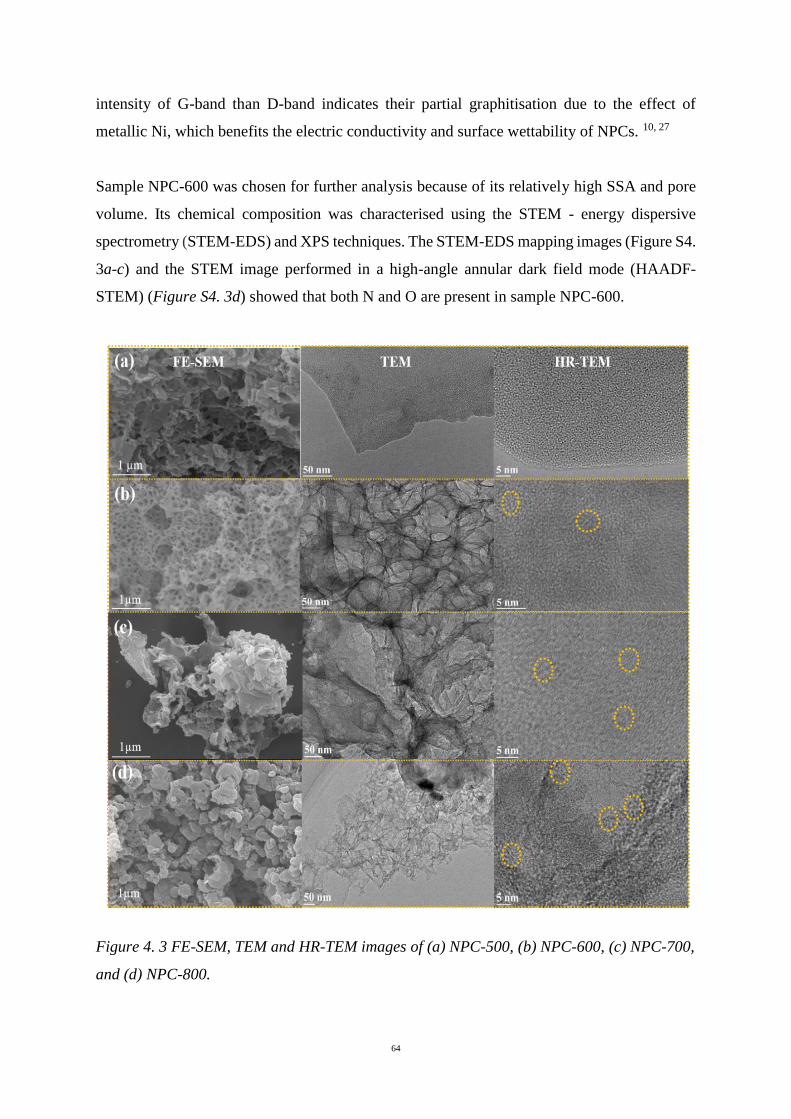
64
intensity of G-band than D-band indicates their partial graphitisation due to the effect of
metallic Ni, which benefits the electric conductivity and surface wettability of NPCs. 10, 27
Sample NPC-600 was chosen for further analysis because of its relatively high SSA and pore
volume. Its chemical composition was characterised using the STEM - energy dispersive
spectrometry (STEM-EDS) and XPS techniques. The STEM-EDS mapping images (Figure S4.
3a-c) and the STEM image performed in a high-angle annular dark field mode (HAADF-
STEM) (Figure S4. 3d) showed that both N and O are present in sample NPC-600.
Figure 4. 3 FE-SEM, TEM and HR-TEM images of (a) NPC-500, (b) NPC-600, (c) NPC-700,
and (d) NPC-800.

65
The XPS survey spectrum of NPC-600 is shown in Figure 4. 4a. The three distinct peaks at
284.6 eV, 400 eV, and 532 eV correspond to binding energies of C 1s, N 1s and O 1s electrons,
respectively, further confirming the presence of both N and O in the sample. A quantitative
analysis of the XPS spectrum showed that the sample contained 79.07 at% C, 9.22 at% N, and
11.71 at% O, respectively. These surface heteroatoms contributed to pseudocapacitance.28
Figure S4. 4b shows the deconvolution of C 1s peak. Four peaks corresponding to C=C/C-C
(284.6 eV), C-O/C-N (285.6 eV), C=O (287.3 eV) and COOH (289.0 eV) can be seen. The O
1s spectrum (Figure 4. 4b) was also fitted to four peaks located at 530.8, 531.9, 533.0, 534.1
eV, corresponding to C=O in carboxyl, C=O in ester or amides, C-O-C and C-OH/N-O-C,
respectively.29 The deconvoluted N 1s spectrum (Figure 4. 4c) revealed the presence of
pyridinic-N (N-6, 398.4 eV), pyrrolic/pyridonic N (N-5, 400.1 eV), quaternary N (N-Q, 401.0
eV) and oxidised N (N-X, 402.7 eV). The presence of the both quaternary and oxidised nitrogen
species (N-Q and N-X) can increase the electron transfer rate because both species carry
positive charge, thus enhancing electron conductivity of the electrode materials. 30-32
Figure 4. 4 XPS survey spectrum of NPC-600 (a) and O 1s (b), and N 1s spectra (c).
The electrochemical performance of some NPC samples was evaluated in a three-electrode
system in 1 M H2SO4 aqueous electrolyte within a potential window between – 0.1 and 0.8 V.
The CV profiles of the NPC samples measured at 5 mV/s are shown in Figure 4. 5a. All
samples exhibit a similar quasi-rectangular shape with a few redox peaks due to
pseudocapacitive redox reactions of nitrogen-containing functional groups.33 Compared with
other NPCs, the potential of irreversible and destructive oxidation as well as hydrogen
evolution of NPC-600 could be shifted to more positive and negative values respectively, as
shown in Figure 4. 5b. The potential window for NPC-600 can be extended to -0.4 - 1.0 V.
Especially on the negative side of CV, the potential of hydrogen evolution shifted to a more
negative value than the thermodynamic potential value for water decomposition, i.e., -0.198 V

66
vs. Ag/AgCl. The reversible electrochemical proton adsorption in NPC-600 contributed to an
additional pseudocapacitance.34, 35 Therefore, due to the contribution of pseudocapacitance
originating from N functional groups and nascent hydrogen,36 combined with EDLC from a
porous structure, NPC-600 showed a good electrochemical performance. The capacitance can
reach 263 F/g at a scan rate of 5mV/s in the three-electrode system.
Figure 4. 5 CV curves of NPCs (a) and NPC-600 (b) within different voltage windows at 5
mV/s in 1 M H2SO4 aqueous electrolyte
Figure 4. 6 shows the electrocapacitive properties of the sample NPC-600 evaluated using a
symmetric two-electrode configuration. The CV curves (Figure 4. 6a) exhibit a quasi-
rectangular shape characteristic of a combined capacitance contribution of EDLC and
pseudocapacitance.33 With the increasing voltage window, the current increased, which can be
ascribed to redox reactions of N functional groups and proton storage.37 A voltage window of
0-1.3V was selected for the two-electrode EC. Figure 4. 6b shows the GCD curves of NPC-
600 at current densities ranging from 0.1 A/g to 10 A/g. All these curves exhibit a quasi-linear
shape confirming both EDLC and pseudocapacitance,38 which is consistent with the CV results.
However, the triangular shape of GCD curves implies that the capacitance was largely
contributed by electric double-layer charge storage mechanism.39, 40 It exhibited a specific
capacitance of 248 F/g at a current density of 0.1 A/g.
Table 4. 2 compares the preparation and electrocapacitive properties of various cellulose-
derived carbon materials. The electrode material prepared in this study displayed a comparable
or better electrochemical performance than other cellulose-derived carbons reported in the
literature. In spite of the dependence of capacitance on the SSA of a carbon electrode, the pore

67
structure of the electrode also plays an important role in determining the charge storage
capacity. 11, 41, 42 The carbon sample prepared in this work possesses macropores, mesopores,
and micro-pores, functioning as ion reservoirs, low-resistant ion-transport paths and active sites
for ion adsorption respectively. Therefore, active ions in micropores have nanometer transport
distances from adjacent mesopores and macropores, which shorten the transport time.43-45
Combined with the pseudocapacitance contribution originating from N surface functional
groups and nascent hydrogen, NPC-600 therefore exhibits a high capacitance value even
though it has a relatively lower SSA compared with other cellulose-derived carbons.
The rate capability of NPC-600 is shown in Figure 4. 6c. This electrode delivered a specific
capacitance of 133 F/g at 10 A/g, which is about 53.6 % of the capacitance measured at 0.1
A/g, indicating this cellulose-derived carbon electrode has a poor rate capability. The cycling
performance of NPC-600 tested at a current density of 1 A/g is shown in Figure 4. 6c. The
sample retained approximately 89.2 % of the initial capacitance after 2000 cycles, showing the
electrode was not very stable against cycling in the electrolyte. Although both the nitrogen-
containing surface groups and the nascent hydrogen enhanced the specific capacitance, the
redox reactions increased the charge transfer resistance, which can be confirmed by the EIS
results in Figure 4. 6d. The poor performance at high current density may also associated with
the stainless-steel current collector used in this study.
Figure 4. 6d shows the Nyquist plot of the NPC-600 electrode. A semicircle in the high
frequency region and an almost vertical line in the low frequency region can be observed. The
almost vertical line in the low frequency region demonstrates that EDLC dominated the
capacitance performance of NPC-600, which is consistent with the GCD results. 26, 46 The
magnified part of Nyquist plot (Figure 4. 6d, inset) shows that it had an equivalent series
resistance (ESR) of around 2.1 Ω and charge transfer resistance (Rct) of 6.4 Ω. Generally, ESR
is a summarisation of the contact resistance, electrolyte resistance and the bulk resistance of
the electrode.17 Rct contains the resistance caused by charge transfer for both EDLC and
pseudocapacitance.2 The relatively low ESR and short Warburg region benefiting from the
good porous architecture and partial graphitisation contribute to the high specific capacitance
of NPC-600. However, the relatively high value of Rct, mainly originating from the faradic
reaction and hydrogen electro-oxidation, influences the rate capability and cycle performance.
The Bode plot in Figure 4. 6e exhibited a low resistance of around 2.2 Ω corresponding to the
ESR at the high frequency. And a high resistance value of about 100 Ω at the low frequency
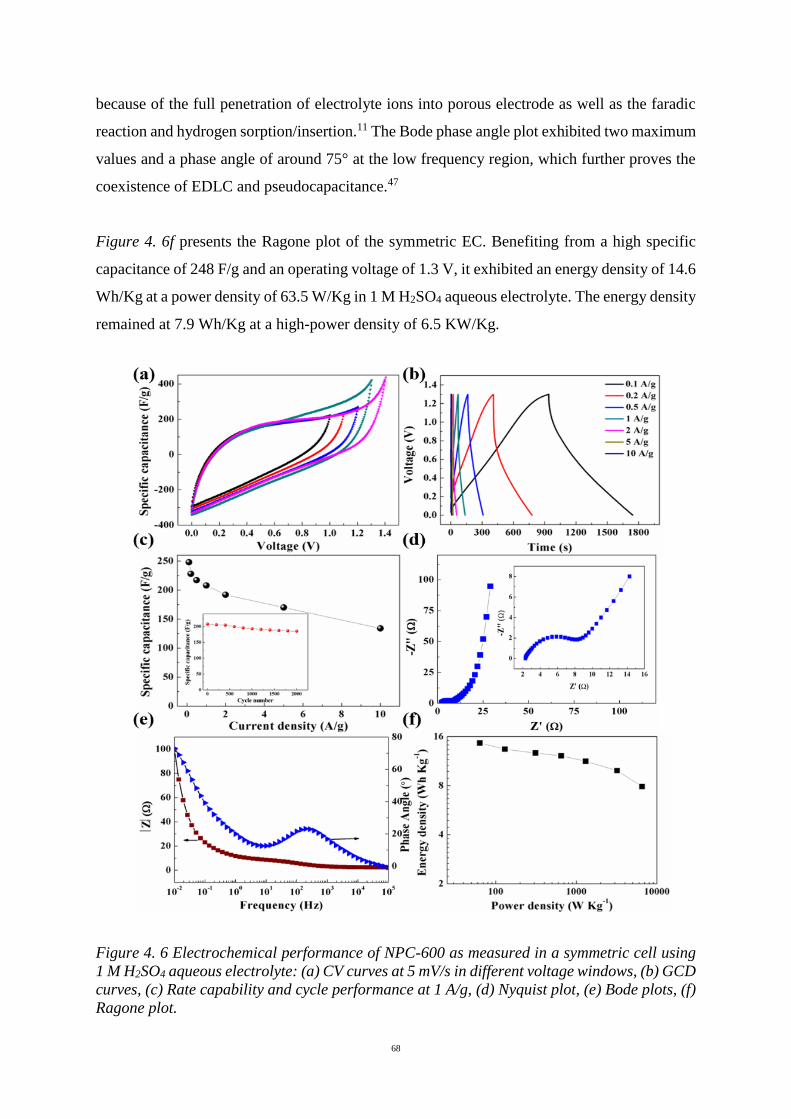
68
because of the full penetration of electrolyte ions into porous electrode as well as the faradic
reaction and hydrogen sorption/insertion.11 The Bode phase angle plot exhibited two maximum
values and a phase angle of around 75° at the low frequency region, which further proves the
coexistence of EDLC and pseudocapacitance.47
Figure 4. 6f presents the Ragone plot of the symmetric EC. Benefiting from a high specific
capacitance of 248 F/g and an operating voltage of 1.3 V, it exhibited an energy density of 14.6
Wh/Kg at a power density of 63.5 W/Kg in 1 M H2SO4 aqueous electrolyte. The energy density
remained at 7.9 Wh/Kg at a high-power density of 6.5 KW/Kg.
Figure 4. 6 Electrochemical performance of NPC-600 as measured in a symmetric cell using
1 M H2SO4 aqueous electrolyte: (a) CV curves at 5 mV/s in different voltage windows, (b) GCD
curves, (c) Rate capability and cycle performance at 1 A/g, (d) Nyquist plot, (e) Bode plots, (f)
Ragone plot.

69
Table 4. 2 Comparison of cellulose-derived carbon materials as electrodes for ECs
Precursor Preparation/
Modification
SSA
(m2/g)
Specific
capacitance
(F/g)
Measurement
conditions
Electrolyte Ref.
Cellulose filter paper Pyrolysis under NH3/N-
doped
1326 120 1 A/g
(two-electrode cell)
2 M KOH 15
Lignosulphonate and
cellulose
Template method,
carbonisation, and ZnCl2
activation/-
856 246 2 5 mV/s
(three-electrode
method)
6 M KOH 16
Bagasse-derived
cellulose
Sol-gel reaction, freeze
drying, carbonisation and
KOH activation/-
1892 142 0.5 A/g
(two-electrode cell)
KOH/PVA
Gel
17
Cellulose filter paper 1500 °C carbonisation/- - 117 1 A/g
(three-electrode
method)
5 M KCl 48
Cellulose acetate Electrospinning,
carbonisation and steam
activation/MWNT
1120
160 0.5 A/g
(two-electrode cell)
6 M KOH 49
Paper cellulose Coating/SWNT - 200 20 μA/cm2
(two-electrode cell)
1 M H2SO4 50
Cellulose nanofiber Cellulose nanofibers
dispersion/RGO
- 207 5 mV/s
(two-electrode cell)
H2SO4/PVA 51
Microcrystal cellulose Freeze drying and
carbonisation/N-doped
781 248 0.1 A/g
(two-electrode cell)
1 M H2SO4 This work
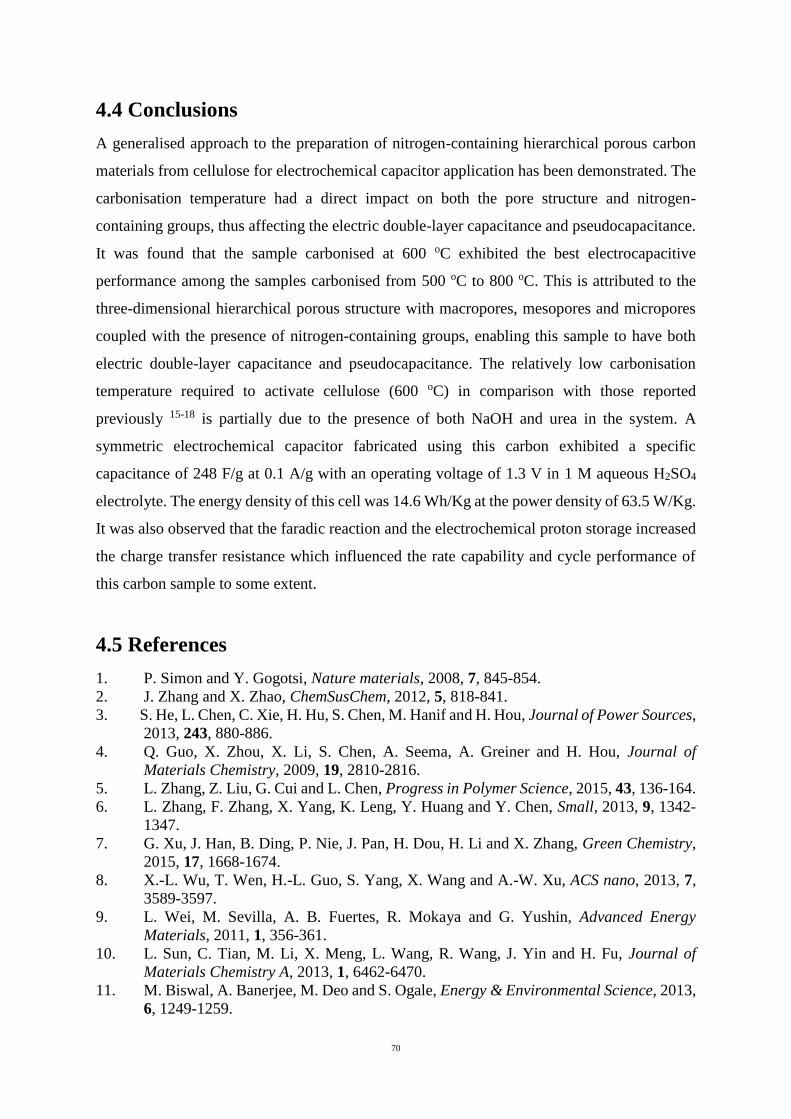
70
4.4 Conclusions
A generalised approach to the preparation of nitrogen-containing hierarchical porous carbon
materials from cellulose for electrochemical capacitor application has been demonstrated. The
carbonisation temperature had a direct impact on both the pore structure and nitrogen-
containing groups, thus affecting the electric double-layer capacitance and pseudocapacitance.
It was found that the sample carbonised at 600 oC exhibited the best electrocapacitive
performance among the samples carbonised from 500 oC to 800 oC. This is attributed to the
three-dimensional hierarchical porous structure with macropores, mesopores and micropores
coupled with the presence of nitrogen-containing groups, enabling this sample to have both
electric double-layer capacitance and pseudocapacitance. The relatively low carbonisation
temperature required to activate cellulose (600 oC) in comparison with those reported
previously 15-18 is partially due to the presence of both NaOH and urea in the system. A
symmetric electrochemical capacitor fabricated using this carbon exhibited a specific
capacitance of 248 F/g at 0.1 A/g with an operating voltage of 1.3 V in 1 M aqueous H2SO4
electrolyte. The energy density of this cell was 14.6 Wh/Kg at the power density of 63.5 W/Kg.
It was also observed that the faradic reaction and the electrochemical proton storage increased
the charge transfer resistance which influenced the rate capability and cycle performance of
this carbon sample to some extent.
4.5 References
1. P. Simon and Y. Gogotsi, Nature materials, 2008, 7, 845-854.
2. J. Zhang and X. Zhao, ChemSusChem, 2012, 5, 818-841.
3. S. He, L. Chen, C. Xie, H. Hu, S. Chen, M. Hanif and H. Hou, Journal of Power Sources,
2013, 243, 880-886.
4. Q. Guo, X. Zhou, X. Li, S. Chen, A. Seema, A. Greiner and H. Hou, Journal of
Materials Chemistry, 2009, 19, 2810-2816.
5. L. Zhang, Z. Liu, G. Cui and L. Chen, Progress in Polymer Science, 2015, 43, 136-164.
6. L. Zhang, F. Zhang, X. Yang, K. Leng, Y. Huang and Y. Chen, Small, 2013, 9, 1342-
1347.
7. G. Xu, J. Han, B. Ding, P. Nie, J. Pan, H. Dou, H. Li and X. Zhang, Green Chemistry,
2015, 17, 1668-1674.
8. X.-L. Wu, T. Wen, H.-L. Guo, S. Yang, X. Wang and A.-W. Xu, ACS nano, 2013, 7,
3589-3597.
9. L. Wei, M. Sevilla, A. B. Fuertes, R. Mokaya and G. Yushin, Advanced Energy
Materials, 2011, 1, 356-361.
10. L. Sun, C. Tian, M. Li, X. Meng, L. Wang, R. Wang, J. Yin and H. Fu, Journal of
Materials Chemistry A, 2013, 1, 6462-6470.
11. M. Biswal, A. Banerjee, M. Deo and S. Ogale, Energy & Environmental Science, 2013,
6, 1249-1259.

71
12. Y. S. Yun, S. Y. Cho, J. Shim, B. H. Kim, S. J. Chang, S. J. Baek, Y. S. Huh, Y. Tak,
Y. W. Park and S. Park, Adv Mater, 2013, 25, 1993-1998.
13. H. Wang, Z. Xu, A. Kohandehghan, Z. Li, K. Cui, X. Tan, T. J. Stephenson, C. K.
King’ondu, C. M. Holt and B. C. Olsen, ACS nano, 2013, 7, 5131-5141.
14. D. Klemm, F. Kramer, S. Moritz, T. Lindström, M. Ankerfors, D. Gray and A. Dorris,
Angewandte Chemie International Edition, 2011, 50, 5438-5466.
15. W. Luo, B. Wang, C. G. Heron, M. J. Allen, J. Morre, C. S. Maier, W. F. Stickle and
X. Ji, Nano letters, 2014, 14, 2225-2229.
16. Z. Zhao, S. Hao, P. Hao, Y. Sang, A. Manivannan, N. Wu and H. Liu, J. Mater. Chem.
A, 2015, 3, 15049-15056.
17. P. Hao, Z. Zhao, J. Tian, H. Li, Y. Sang, G. Yu, H. Cai, H. Liu, C. Wong and A. Umar,
Nanoscale, 2014, 6, 12120-12129.
18. C. Bommier, W. Wang, X. Wang, J. Lu and X. Ji, Nano Energy, 2015, 13, 709-717.
19. S. L. Candelaria, R. Chen, Y.-H. Jeong and G. Cao, Energy & Environmental Science,
2012, 5, 5619-5637.
20. A. D. Roberts, X. Li and H. Zhang, Chemical Society Reviews, 2014, 43, 4341-4356.
21. J. Wang and S. Kaskel, Journal of Materials Chemistry, 2012, 22, 23710-23725.
22. M. Lillo-Ródenas, D. Cazorla-Amorós and A. Linares-Solano, Carbon, 2003, 41, 267-
275.
23. A. Perrin, A. Celzard, A. Albiniak, J. Kaczmarczyk, J. Marêché and G. Furdin, Carbon,
2004, 42, 2855-2866.
24. R.-L. Tseng, Journal of hazardous materials, 2007, 147, 1020-1027.
25. X. Zheng, W. Lv, Y. Tao, J. Shao, C. Zhang, D. Liu, J. Luo, D.-W. Wang and Q.-H.
Yang, Chemistry of Materials, 2014, 26, 6896-6903.
26. Y. Gu, H. Wu, Z. Xiong, W. Al Abdulla and X. Zhao, Journal of Materials Chemistry
A, 2014, 2, 451-459.
27. D. Zhai, H. Du, B. Li, Y. Zhu and F. Kang, Carbon, 2011, 49, 725-729.
28. V. Augustyn, P. Simon and B. Dunn, Energy & Environmental Science, 2014, 7, 1597-
1614.
29. B. Grzyb, C. Hildenbrand, S. Berthon-Fabry, D. Bégin, N. Job, A. Rigacci and P.
Achard, Carbon, 2010, 48, 2297-2307.
30. M. Seredych, D. Hulicova-Jurcakova, G. Q. Lu and T. J. Bandosz, Carbon, 2008, 46,
1475-1488.
31. D. Hulicova‐Jurcakova, M. Seredych, G. Q. Lu and T. J. Bandosz, Advanced functional
materials, 2009, 19, 438-447.
32. C. Long, D. Qi, T. Wei, J. Yan, L. Jiang and Z. Fan, Advanced Functional Materials,
2014, 24, 3953-3961.
33. L.-F. Chen, X.-D. Zhang, H.-W. Liang, M. Kong, Q.-F. Guan, P. Chen, Z.-Y. Wu and
S.-H. Yu, ACS nano, 2012, 6, 7092-7102.
34. E. Raymundo‐Piñero, M. Cadek and F. Beguin, Advanced Functional Materials, 2009,
19, 1032-1039.
35. M. Bichat, E. Raymundo-Piñero and F. Béguin, Carbon, 2010, 48, 4351-4361.
36. K. Fic, E. Frackowiak and F. Béguin, Journal of Materials Chemistry, 2012, 22, 24213-
24223.
37. L. Demarconnay, E. Raymundo-Pinero and F. Béguin, Electrochemistry
Communications, 2010, 12, 1275-1278.
38. L. F. Chen, Z. H. Huang, H. W. Liang, H. L. Gao and S. H. Yu, Advanced Functional
Materials, 2014, 24, 5104-5111.
39. L.-Q. Fan, J. Zhong, J.-H. Wu, J.-M. Lin and Y.-F. Huang, Journal of Materials
Chemistry A, 2014, 2, 9011-9014.

72
40. C. Lei, N. Amini, F. Markoulidis, P. Wilson, S. Tennison and C. Lekakou, Journal of
Materials Chemistry A, 2013, 1, 6037-6042.
41. J. Deng, T. Xiong, F. Xu, M. Li, C. Han, Y. Gong, H. Wang and Y. Wang, Green
Chemistry, 2015, 17, 4053-4060.
42. K. Xia, Q. Gao, J. Jiang and J. Hu, Carbon, 2008, 46, 1718-1726.
43. X. Zheng, J. Luo, W. Lv, D. W. Wang and Q. H. Yang, Adv Mater, 2015, 27, 5388-
5395.
44. D. W. Wang, F. Li, M. Liu, G. Q. Lu and H. M. Cheng, Angewandte Chemie, 2008,
120, 379-382.
45. X. Fan, C. Yu, J. Yang, Z. Ling, C. Hu, M. Zhang and J. Qiu, Advanced Energy
Materials, 2015, 5, 14011761.
46. W. Qian, F. Sun, Y. Xu, L. Qiu, C. Liu, S. Wang and F. Yan, Energy & Environmental
Science, 2014, 7, 379-386.
47. B. E. Conway, Journal of the Electrochemical Society, 1991, 138, 1539-1548.
48. L. Jiang, G. W. Nelson, H. Kim, I. Sim, S. O. Han and J. S. Foord, ChemistryOpen,
2015, 4, 586-589.
49. L. Deng, R. J. Young, I. A. Kinloch, A. M. Abdelkader, S. M. Holmes, D. A. De Haro-
Del Rio and S. J. Eichhorn, ACS applied materials & interfaces, 2013, 5, 9983-9990.
50. L. Hu, J. W. Choi, Y. Yang, S. Jeong, F. La Mantia, L.-F. Cui and Y. Cui, Proceedings
of the National Academy of Sciences, 2009, 106, 21490-21494.
51. K. Gao, Z. Shao, J. Li, X. Wang, X. Peng, W. Wang and F. Wang, Journal of Materials
Chemistry A, 2013, 1, 63-67.

73
4.6 Supporting Information
Figure S4. 1 FE-SEM image of a commercial microcrystalline cellulose.
Figure S4. 2 (a) XRD patterns and (b) Raman spectra of NPCs.

74
Figure S4. 3 STEM-EDS mapping images of C (a), N (b), O (c) and HAADF-STEM image (d)
of sample NPC-600.

75
Figure S4. 4 XPS survey spectra of samples prepared at different carbonisation temperatures
(a), and C 1s XPS spectra (b) of sample NPC-600.
Table S4. 1 Atomic percentage of samples synthesised at different carbonisation temperature
obtained from XPS results
NPC-500 NPC-600 NPC-700 NPC-800
C at% 70.47 79.07 87.96 91.66
N at% 11.95 9.22 2.06 0.70
O at% 17.58 11.71 9.97 7.64
Figure S4. 5 Nitrogen and oxygen contents of samples as a function of carbonisation
temperature.

76
Figure S4. 6 Two-electrode CV curves of NPC-500 (a), NPC-700 (c), NPC-800 (e), and GCD
curves of NPC-500 (b), NPC-700 (d), and NPC-800 (f).
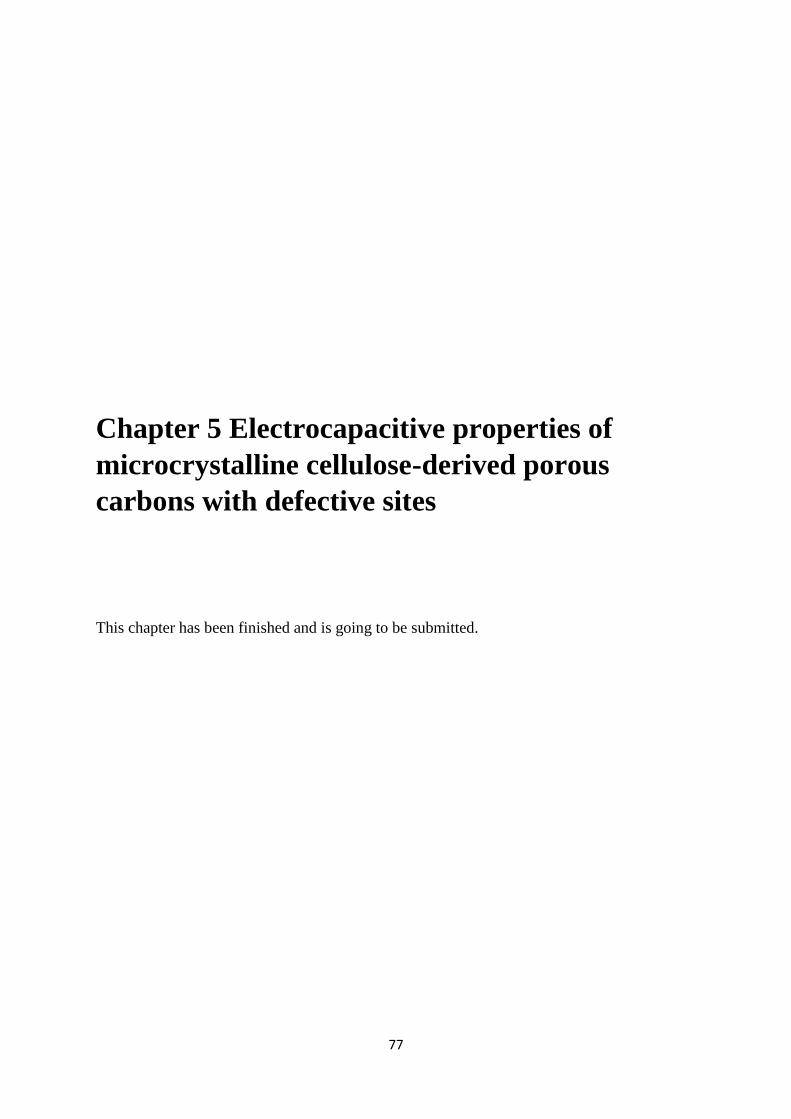
77
Chapter 5 Electrocapacitive properties of
microcrystalline cellulose-derived porous
carbons with defective sites
This chapter has been finished and is going to be submitted.

78
5.1 Introduction
The work in Chapter 4 has shown that Nitrogen-doping could improve the electrocapacitive
properties of MC-derived carbon materials.1-3 However, it is important to understand the effect
of doping level on the performance of EC electrode materials. High doping levels probably
cannot be fully and efficiently utilised, while the over-doped heteroatoms may disorder the
carbon structure and lower its electrical conductivity. This increases the electronic and/or ionic
diffusion resistance of the electrode materials, leading to a relatively poor rate capability and
power deterioration. Our former work confirmed this—the MC-derived porous carbon
exhibited a high specific capacitance of 248 F/g at 0.1 A/g but only moderate rate capability
and cycle stability in a symmetric cell due to a high N/O doping level, 9.22 and 11.71 at%
respectively.4
Defective sites in carbon materials have been shown to play important roles in many
applications, especially in electrochemical applications.5-8 Generally, carbon defects include
intrinsic defects (e.g., vacancies due to removal of heteroatoms) and extrinsic ones (e.g.,
heteroatom doping).6 The importance of defective sites in carbon materials has been realised
in electrocatalytic reactions, including oxygen reduction reaction (ORR), oxygen evolution
reaction (OER) and hydrogen evolution reactions (HER).9-11 Extrinsic defects have also been
shown to improve the electrocapacitive properties of carbon materials.1-3 However, the role of
carbon intrinsic defects in electrocapacitive processes has received few studies.10
With further modification on the synthesis method in Chapter 4, here we demonstrate an
approach to preparing microcrystalline cellulose-derived porous carbons with both nitrogen-
doping of relatively low level and intrinsic defects for electrocapacitive application. As
schematically illustrated in Figure 5. 1, microcrystalline cellulose (MC), a commercially
readily available product, was used as the main carbon precursor. Extrinsic defects (doping of
nitrogen and oxygen) were generated from urea and MC itself. Intrinsic defects were created
in the carbonisation process at 600 °C in an N2/H2 atmosphere, during which partial removal
of the nitrogen and oxygen atoms occurred to leave behind some vacancy sites in the carbon
structure.12 The carbon materials thus-prepared exhibited excellent electrochemical
performance when used as EC electrodes.

79
Figure 5. 1 A scheme showing the preparation process (A) of MC-derived porous carbon with
defects (both N/O doping and intrinsic defects), and explanation of carbon defects for
electrocapacitive performance enhancement of a negative electrode during charging (B). The
yellow colour represents a further modified electronic structure.
5.2 Experiment
5.2.1 Preparation of samples
In a typical procedure, 2 g MC powder was added to 24 g NaOH solution (14 wt%) at 0 °C in
an ice-water bath under stirring. After 1 min, 24 g urea solution (24 wt%) was added under
stirring for 2 min to obtain a cellulose sol. Subsequently, 0.5 g yeast powder was added to the
above sol under stirring for 2 h, the addition of which is mainly for a hierarchical porous
structure.13,14 The mixture was then dried at 40 °C for 48 h. The gel-like product was freeze-
dried at -65 °C for 48 h, followed by carbonisation at 600 °C for 4 h under a N2/H2 flow with
a volume ratio of 4:1 at a heating rate of 5 °C/min. For comparison, the carbonisation was
separately conducted under N2 gas flow. The obtained samples were washed with 1 M HCl
solution and deionised water to remove residual chemicals. After drying at 60 °C for 48 h, two
samples were obtained, denoted as CNUY-600H and CNUY-600 respectively. Sample CNUY-
600H was further thermally treated at 1100 °C under N2 for 2 h to obtain a sample denoted as
CNUY-1100.

80
5.2.2 Characterisations and electrochemical measurements
The material characterizations, supercapacitor assembly, electrochemical measurements were
conducted according to Chapter 3.3-3.5.
In this chapter, the electrochemical performance of ECs were tested in different aqueous
electrolytes, i.e., 1 M H2SO4, 2 M KOH or 1 M LiCl. CV scans were obtained at scan rates in
the range of 5 - 500 mV/s. The GCD cycles were performed at current densities ranging from
0.2 to 100 A/g. The EIS measurement was carried out at an open circuit potential with an
amplitude of 5 mV in the frequency range of 10 mHz to 100 kHz.
5.3 Results and discussion
FE-SEM images shown in Figures 5.2A-C and Figure S5. 1 exhibited that CNUY-600H and
CNUY-600 has the same interconnected macroporous structure. TEM images in Figures 5.2D-
G reveal the ordered multi-layer meso-micropores in sample CNUY-600H. In comparison,
TEM images in Figure S5. 2 show that CNUY-600 exhibited a very similar ordered porous
structure, but with slightly fewer micropores. That is because of the physical activation of H2
gas and is consistent with the BET and porosity results (Figure 5.2L and Table 5. 1). The
ordered multilayer hierarchical pore structure enables an excellent network for both electron
and ion transport and facilitates an efficient utilisation of pseudocapacitance from nitrogenated
and oxygenated functionalities.15-17
Table 5. 1 Textural properties of CNUY-600 and CNUY-600H
Sample
SBET
(m2/g)
Smicro
(m2/g)
Smeso+macro
(m2/g)
Vtotal
(cm3/g)
Vmicro
(cm3/g)
Vmeso+macro
(cm3/g)
IG/ID
CNUY-600 639 481 158 0.56 0.25 0.31 1.04
CNUY-600H 765 609 156 0.66 0.31 0.35 1.17
SBET: the SSA from BET. Vtotal: total pore volume estimated at P/P0= 0.95. Smicro: surface area
of micropores calculated by the t-plot method. Vmicro: volume of micropores calculated by the
t-plot method.
Figure 5.2L shows the N2 adsorption/desorption isotherms of CNUY-600 and CNUY-600H.
The type I nitrogen adsorption isotherm along with a hysteresis loop indicate that they both had
micropores and mesopores. The samples’ textural properties, derived from nitrogen isotherms,
are given in Table 5. 1. It is clear that CNUY-600H has a slightly higher SSA, 765 m2/g, than

81
CNUY-600, 639 m2/g, because of slightly higher Smicro, 609 m2/g vs 481 m2/g. The inset in
Figure 5.2L shows their pore size distributions. CNUY-600 shows two prominent micropore
peaks centred at 1.2 nm and 1.5 nm respectively. In comparison, CNUY-600H shows a more
prominent micropore peak centred at 1.2 nm and some pore peaks at around 2 nm. For both
CNUY-600H and CNUY-600, the relatively high ratio of Smicro provides sufficient sites for
electric double layer capacitance (EDLC). Meanwhile, Vmeso+macro accounts for higher than 50%
of the Vtotal, providing reservoirs for active ions, which is beneficial for both rate capability and
power density.16, 18
Figure 5. 2 (A) FE-SEM image of CNUY-600; FE-SEM (B, C), TEM images (D-G), HAADF-
STEM image (H), STEM-EDS mapping images (I-K) of CNUY-600H; Nitrogen sorption
isotherms (L), pore size distribution (inset in L), XPS survey spectra (M), and Raman spectra
(N) of CNUY-600 and CNUY-600H.

82
The STEM-EDS mapping images (Figures 5.2I-K) and HAADF-STEM image (Figure 5.2H)
show that N and O are uniformly present in the porous structure of CNUY-600H. Figure 5.2
M exhibits the XPS survey spectra of CNUY-600 and CNUY-600H. A quantitative analysis
showed that the latter one contains 89.17 at% C, 3.40 at% N, and 7.43 at% O, much less O, N
and more C than CNUY-600—65.25 at%, 12.36 at%, and 22.39 at% respectively. It is likely
that the removed N/O left behind some vacant sites in the carbon. Then the carbon ring
reorganised for a lower energy and more stable structure, which produced intrinsic defects
including hole and topological defects of various sizes on the carbon structure.5, 6, 10, 12 Besides,
N would preferentially fill the vacant sites created by O removal. The in-situ doped N is more
electrochemically active thus more efficiently utilised during electrochemical reactions.12, 19
The N 1s fitted results of CNUY-600H (Figure S5. 3,Table S5. 1) show that it contains 45.87 %
pyrrolic N (400.0 eV), 35.05 % quaternary N (400.9 eV), and 19.07 % pyridinic N (398.3 eV).
The high proportion of pyrrolic and pyridinic N contributes to pseudocapacitance.2, 4, 20
Figure 5.2N shows the Raman spectra of CNUY-600 and CNUY-600H. The carbon material
with defects normally has a low IG/ID ratio.6, 10, 19, 21, 22 However, sample CNUY-600H has a
higher ratio than CNUY-600 as is seen from Fig. 2N (1.17 vs 1.04). This is probably because
the latter had a higher N/O doping level than the former one, leading to a high D-band intensity.
Although CNUY-600H has intrinsic defects, it still showed a higher IG/ID ratio than CNUY-
600. To verify the hypothesis, sample CNUY-600H was further thermally treated at 1100 °C
for 2 h to obtain sample CNUY-1100, which indeed exhibited a lower IG/ID ratio than CNUY-
600H (see Figure S5. 14B).
Figure 5. 3A and B compare the CV profiles of electrodes CNUY-600H and CNUY-600
measured at 10, 50, 100 mV/s within a potential window between –0.35 and 0.95 V vs.
Ag/AgCl. All lines exhibited a quasi-rectangular shape because of pseudocapacitive faradic
reactions due to oxygen- and/or nitrogen-containing groups. Compared with CNUY-600, the
CV of CNUY-600H showed stronger current densities and more prominent redox peaks,
indicating a better capacitive performance. From their CV profiles, we can see that the current
increase consists of two parts: one at the vertical direction, the other from the redox peaks. The
former implies an enhanced EDLC and the latter reveals increased pseudocapacitance. With a
negative electrode during charging process as an example, as shown in Figure 5. 1B, it is
suggested that the presence of intrinsic defects further changed the electronic structure of the
surrounding carbon atoms. Then the porous structure was more active and more N/O containing

83
surface functional groups could react with proton efficiently due to faster electronic
transmission. These enabled the porous structure and the heteroatoms around the defects to be
more fully and efficiently utilised for charge storage via electrical double-layer and
pseudocapacitive mechanisms respectively.2, 3, 12, 19, 23, 24
Figure 5. 3 Electrocapacitive properties measured in a three-electrode system: CV curves of
electrodes CNUY-600 and CNUY-600H at 10 (A), 50 (B) and 100 mV/s (inset of B); CV curves
(C), GCD curves (D, E) of electrode CNUY-600H; Rate capability of electrodes CNUY-600
and CNUY-600H.

84
Figure 5. 3C shows the CV curves of electrode CNUY-600H at scan rates from 5 to 500 mV/s.
The curve at 500 mV/s still maintains a quasi-rectangular shape, revealing a good rate
capability. Figure 5. 3D and E depict the GCD curves of CNUY-600H at current densities from
0.25 to 100 A/g. All curves demonstrated a quasi-linear shape, further confirming both EDLC
and pseudocapacitance charge storage mechanisms, in agreement with the CV data.25 Figure
5. 3F shows the rate capability of the electrode materials. CNUY-600H exhibited a high
capacitance of 426 F/g at 0.25 A/g and maintained at 177 F/g at 100 A/g, much higher than that
of CNUY-600. For comparison, the electrochemical performance of CNUY-600 is shown in
Figure S5. 6. And detailed specific capacitance values are shown in Table S5. 2.
The electrochemical performance of them was further evaluated in symmetric cells with 1 M
H2SO4 aqueous electrolyte, shown in Figure 5. 4 and Figure S5. 7. Comparing from Figure 5.
4A, a voltage of 1.3 V is selected for the cell. Figure 5. 4B and C show the CV and GCD curves
of CNUY-600H respectively. It can be seen all CV curves have a quasi-rectangular shape while
all GCD curves display a quasi-triangle shape, indicating both EDLC and pseudocapacitance
contributions, consistent with the three-electrode system analysis. Figure 5. 4D gives the rate
capability plots. The electrode CNUY-600H exhibited a high specific capacitance value of 253
F/g at a current density of 0.2 A/g and maintained at 200 F/g at 5 A/g, 148 F/g at 20 A/g,
revealing an excellent rate capability in a symmetric cell. In comparison, these values for
CNUY-600 are 196, 146 and 80 F/g, respectively. For detailed capacitance values at different
current densities, please refer to Table S5. 3 and Table S5. 4

85
Figure 5. 4 Electrochemical performance measured in a symmetric cell within 1 M H2SO4 aqueous electrolyte: CV curves of CNUY-600H at
different potential windows at 5 mV/s (A); CV (B) and GCD curves (C) of CNUY-600H; Rate capability plots (D); Nyquist plot (E), Bode plots (F)
and cycling performance at 5 A/g (G) of CNUY-600H; Ragone plots of symmetric cells assembled with electrode CNUY-600H (H).

86
Figure 5. 4E shows the Nyquist plot of the cell. It consists of a semicircle, a short diffusion
region and an almost vertical line at the high, intermediate and low-frequency region,
respectively. The latter reveals good capacitive performance of the cell. An equivalent circuit
shown in Figure S5. 8 was used to simulate the impedance response.18 Rs stands for the
summarization of contact resistance and electrode resistance. Rct is the charge transfer and mass
transfer resistance.26, 27 Qdl represents the capacitance at high and medium frequency. Zw
represents the Warburg impedance, i.e., diffusion resistance. Qm is the main capacitance at low
frequency. RL is the leakage resistance which is relatively high and usually ignored in the
circuit.28, 29 Figure 5. 4E and F show that excellent fitting results were obtained for both
Nyquist and Bode plots. The cell had low-value Rs and Rct of 2.2 Ω and 2.6 Ω respectively,
similar with that of the cell assembled using CNUY-600 (Figure S5. 7). This demonstrates that
the more efficient utilisation of a relatively low amount doped N/O enabled by the defects on
a hierarchical porous carbon structure did not increase the charge transfer and ion diffusion
resistance. The Bode phase angle plot in Figure 5. 4F exhibit two maximum values and a phase
angle of 84° at low frequency region, which further proves the coexistence of EDLC and
pseudocapacitance.29
Figure 5. 4G shows the cycling stability of CNUY-600H. ~90 % of the initial capacitance was
maintained after 60,000 cycles at 5 A/g, showing the electrode is extremely stable in the
electrolyte against cycling. The Ragone plot of the cell is shown in Figure 5. 4H. It exhibited
an energy density of 14.9 Wh/Kg at 131 W/Kg and remained 8.7 Wh/Kg at a high-power
density of 13,050 W/Kg.
The CNUY-600H electrode was also investigated in a symmetric cell using 1 M LiCl aqueous
electrolyte with a voltage window of 0-1.7 V. As shown in Figure S5. 9, it exhibited a specific
capacitance of 206 F/g at 0.5 A/g and remained 118 F/g at 10 A/g. The cell had a high energy
density of 20.7 Wh/Kg at a power density of 426 W/Kg and maintained at 11.9 Wh/Kg at 9,520
W/Kg (Figure 5. 4F). Besides, the electrode also showed good performance in a cell using 2
M KOH aqueous electrolyte. For detailed information about the performance of the cells using
LiCl or KOH aqueous electrolyte, please refer to Figure S5. 9 and Figure S5. 10, Table S5. 5
and Table S5. 6.
87
Figure 5. 5 Effects of mass loading on electrochemical performance of electrode CNUY-600H
measured in a symmetric cell within 1 M H2SO4 aqueous electrolyte: GCD curves (A, B); rate
capability plots (C) with a mass loading of 12 mg/cm2; the correlation of areal capacitance
with mass loading at different current densities (D); influence of mass loading and current
density to areal capacitance (E); gravimetric specific capacitances of different mass loadings
at 0.5 A/g (F); Nyquist plots comparison (G); cycling stability at 30 mA/cm2 (H).
For the study of the effect of mass loading on performance of CNUY-600H, different loading
levels (4, 8, and 12 mg/cm2) were investigated. The last one represents practical loading level.
Figure 5. 5A-B show the GCD curves at current densities from 0.5 to 50 mA/cm2 and Figure
5. 5C depicts the rate capability of electrode CNUY-600H with a mass loading of 12 mg/cm2.
It exhibited a high areal capacitance of 2,518 mF/cm2 at 0.5 mA/cm2 and retained 1,128 mF/cm2
at 50 mA/cm2. The inset in Figure 5. 5C shows that it also had a good gravimetric capacitance

88
of 202 F/g at 0.1 A/g. The GCD curves of electrodes with a mass loading of 4 and 8 mg/cm2
are provided in Figure S5. 11A and B. The capacitance values are shown in Table S5. 7.
The data were replotted in Figure 5. 5D and E to show the effect of mass loading and current
density on the areal capacitance of electrode CNUY-600H. Figure 5. 5D shows that the areal
capacitance increased linearly with mass loading at current densities up to 20 mA/cm2. Only
slight deviation from linearity rather than a plateau occurred at current densities higher than 30
mA/cm2. Figure 5. 5E shows that the areal capacitance of the electrodes with different mass
loadings gradually decreased with higher current densities, without a steep decrease. It was
proposed that the plateau and steep decrease indicate that the electrolyte ion penetration depth
on a thick electrode at certain current has been reached 16 This suggests that the concentration
effect is not apparent yet here, even with a high mass loading of 12 mg/cm2 at a high current
density of 50 mA/cm2. That reveals the excellent charge transfer and ion transport network of
CNUY-600H.16, 30
Generally, the same electrode with a higher mass loading should exhibit a relatively poor rate
capability due to larger IR drop and ion diffusion resistance.31 But as shown in Figure 5. 5E,
the rate capability worsening of the electrode CNUY-600H along with mass loading increasing
was prominently alleviated. Figure 5. 5F shows the gravimetric specific capacitances of
CNUY-600H with different mass loadings at 0.5 A/g. The gravimetric capacitance decrease
with mass loading increase is also not apparent. Impedance measurements (Figure 5. 5G) show
that thicker electrodes of CNUY-600H with a mass loading of 8 or 12 mg/cm2 had much
smaller Rs and Rct as well as shorter ion diffusion region. The smaller resistance enabled a
relatively small IR drop and the shorter diffusion region demonstrates CNUY-600H’s
capability to sustain the electron transfer and electrolyte transport limitations in thick electrodes
benefitting from the circumvention of heteroatoms over-doping and a nice porous carbon
structure with intrinsic defects.16, 26, 30, 32
Electrode CNUY-600H with a mass loading of 12 mg/cm2 also exhibited a good cycle stability
as seen from Figure 5. 5H. About 81% of the initial areal capacitance was maintained after
50,000 cycles at a current density of 30 mA/cm2.

89
5.4. Conclusions
Porous carbon materials with intrinsic defects and in situ nitrogen doping have been prepared
using microcrystalline cellulose as carbon source. A sample prepared at a carbonisation
temperature of 600 °C with a relatively low nitrogen-doping level exhibited an excellent
electrocapacitive performance in acidic, alkali and neutral electrolytes. In addition, an electrode
with a high mass loading of 12 mg/cm2 displayed high specific capacitances, good rate
capability and cycling stability. It is suggested that the intrinsic defects due to thermal removal
of oxygen and nitrogen species, along with carbon structure reorganisation enabled the carbon
to exhibit such a performance. To the best of our knowledge, this is the best performing
microcrystalline cellulose-derived carbon electrode materials reported so far.
5.5 References
1. L. L. Zhang, X. Zhao, H. Ji, M. D. Stoller, L. Lai, S. Murali, S. Mcdonnell, B. Cleveger,
R. M. Wallace and R. S. Ruoff, Energy & Environmental Science, 2012, 5, 9618-9625.
2. J. P. Paraknowitsch and A. Thomas, Energy & Environmental Science, 2013, 6, 2839-
2855.
3. D. Hulicova‐ Jurcakova, M. Seredych, G. Q. Lu and T. J. Bandosz, Advanced
functional materials, 2009, 19, 438-447.
4. H. Lu, X. Sun, R. R. Gaddam, N. A. Kumar and X. S. Zhao, Journal of Power Sources,
2017, 360, 634-641.
5. J. Kotakoski, A. Krasheninnikov, U. Kaiser and J. Meyer, Physical Review Letters,
2011, 106, 105505.
6. X. Yan, Y. Jia and X. Yao, Chemical Society Reviews, 2018, 47, 7628-7658.
7. A. V. Krasheninnikov, Nature materials, 2018, 17, 757.
8. T. Zhang, S. Mubeen, N. V. Myung and M. A. Deshusses, Nanotechnology, 2008, 19,
332001.
9. Y. Jia, L. Zhang, A. Du, G. Gao, J. Chen, X. Yan, C. L. Brown and X. Yao, Adv Mater,
2016, 28, 9532-9538.
10. X. Yan, Y. Jia, L. Zhuang, L. Zhang, K. Wang and X. Yao, ChemElectroChem, 2018,
5, 1874-1879.
11. H. Xu, D. Cheng, D. Cao and X. C. Zeng, Nat Catal, 2018, 1, 339-348.
12. S. Wang, Z. Xiao, Y. Wang, Y.-C. Huang, C.-L. Dong, J. Ma, S. Shen and Y. Li, Energy
& Environmental Science, 2017, 10, 2563-2569.
13. J. Deng, T. Xiong, F. Xu, H. Wang and Y. Wang, Green Chemistry, 2015, 17, 4053-
4060.
14. T. Q. Zhang, J. Liu, L. B. Huang, X. Xhen, A. M. Cao and J. S. Hu, J Am Chem Soc,
2017, 139, 11248-11253.
15. H. Lu and X. Zhao, Sustainable Energy & Fuels, 2017, 1, 1265-1281.
16. H. Sun, L. Mei, J. Liang, Z. Zhao, C. Lee, H. Fei, M. Ding, J. Lau, M. Li and C. Wang,
Science, 2017, 356, 599-604.
17. X. Song, C. Huang, Y. Qin, H. Li and H. C. Chen, Journal of Materials Chemistry A,
2018, 6, 16205-16212.

90
18. H. Lu, K. Kim, Y. Kwon, X. Sun, R. Ryoo and X. Zhao, Journal of Materials Chemistry
A, 2018, 6, 10388-10394.
19. J. Zhang, Y. M. Sun, J. W. Zhu, Z. K. Kou, P. Hu, L. Liu, S. Z. Li, S. C. Mu and Y. H.
Huang, Nano Energy, 2018, 52, 307-314.
20. Z. Li, Z. Xu, H. Wang, J. Ding, B. Zahiri, C. M. Holt, X. Tan and D. Mitlin, Energy &
Environmental Science, 2014, 7, 1708-1718.
21. L. Zhuang, L. Ge, Y. Yang, M. Li, Y. Jia, X. Yao and Z. Zhu, Adv Mater, 2017, 29.
22. H. Shang, Z. Zuo, H. Zheng, K. Li, Z. Tu, Y. Yi, H. Liu, Y. Li and Y. Li, Nano Energy,
2018, 44, 144-154.
23. H. A. Andreas and B. E. Conway, Electrochimica Acta, 2006, 51, 6510-6520.
24. H. C. Chen, Y. Qin, H. Cao, X. Song, C. Huang, H. Feng and X. Zhao, Energy Storage
Materials, 2018.
25. Y. Gogotsi and R. M. Penner, ACS nano, 2018, 12, 2081-2083.
26. B.-A. Mei, J. Lau, T. Lin, S. H. Tolbert, B. S. Dunn and L. Pilon, The Journal of
Physical Chemistry C, 2018, 122, 24499-24511.
27. X. Sun, H. Lu, P. Liu, T. E. Rufford, R. R. Gaddam, X. Fan and X. Zhao, Sustainable
Energy & Fuels, 2018, 2, 673-678.
28. P. Taberna, P. Simon and J.-F. Fauvarque, Journal of The Electrochemical Society,
2003, 150, A292-A300.
29. C. Masarapu, H. F. Zeng, K. H. Hung and B. Wei, ACS nano, 2009, 3, 2199-2206.
30. K. G. Gallagher, S. E. Trask, C. Bauer, T. Woehrle, S. F. Lux, M. Tschech, P. Lamp,
B. J. Polzin, S. Ha and B. Long, Journal of The Electrochemical Society, 2016, 163,
A138-A149.
31. M. D. Stoller and R. S. Ruoff, Energy & Environmental Science, 2010, 3, 1294-1301.
32. Y. Xia, T. S. Mathis, M.-Q. Zhao, B. Anasori, A. Dang, Z. Zhou, H. Cho, Y. Gogotsi
and S. Yang, Nature, 2018, 557, 409.

91
5.6 Supporting information
Figure S5. 1: FE-SEM images of the sample CNUY-600.
Figure S5. 2: TEM images of the sample CNUY-600.
92
Figure S5. 3 The deconvoluted (A) C 1s, (B) N 1s and (C) O 1s spectra of sample CNUY-600H;
The deconvoluted (D) C 1s, (E) N 1s and (F) O 1s spectra of CNUY-600.
Figure S5. 4 XRD patterns of CNUY-600 and CNUY-600H.
Figure S5. 5 The Nyquist plot (A) and Bode plots (B) of CNUY-600H measured in a three-
electrode system using 1 M H2SO4 electrolyte.

93
Figure S5. 6 The electrochemical performance of electrode CNUY-600 measured in a three-
electrode system using 1 M H2SO4 electrolyte: CV (A), GCD curves (B, C), Nyquist plot (D)
and Bode plots (E).
Figure S5. 7 The electrochemical performance of electrode CNUY-600 measured in a
symmetric cell with 1 M H2SO4 aqueous electrolyte: GCD curves (A) and Nyquist plot (B).

94
Figure S5. 8 The equivalent circuit used to fit the Nyquist and Bode plots.
Figure S5. 9 The electrochemical performance of CNUY-600H in symmetric cells with 1 M
LiCl as the aqueous electrolyte: GCD (A), CV curves (B), rate capability plot (C) and Nyquist
plot (D).

95
Figure S5. 10 The electrochemical performance of CNUY-600H measured in symmetric cells
using 2 M KOH as the aqueous electrolyte: GCD (A), CV curves (B), rate capability plot (C)
and Nyquist plot (D).
Figure S5. 11 GCD curves of electrode CNUY-600H with a mass loading of (A) 4 mg/cm2 and
(B) 8 mg/cm2.

96
Figure S5. 12 Cycling performance of electrode CNUY-600H having a mass loading of (A) 8
mg/cm2 and (B) 12 mg/cm2 measured in a symmetric capacitor cell within 1 M H2SO4 aqueous
electrolyte.
8 mg/cm2: ~78 % of the initial areal capacitance value was maintained after 90000 cycles at a
current density of 30 mA/cm2
12 mg/cm2: ~81 % and ~75% of the initial areal capacitance value was maintained after 50000
and 90000 cycles at a current density of 30 mA/cm2 respectively.

97
Figure S5. 13 TEM images of sample CNUY-1100.
Figure S5. 14 XPS spectrum (A) and Raman spectra (B) of CNUY-1100

98
Figure S5. 15 The deconvoluted spectra of (A) C 1s, (B) N 1s and (C) O 1s of the sample CNUY-
1100.
Table S5. 1 N 1s fitting results of CNUY-600 and CNUY-600H.
Sample
Nitrogen
Pyrrolic N Pyridinic N Quaternary N
CNUY-600 53.94 % 22.03 % 24.03 %
CNUY-600H 45.87 % 19.07 % 35.05 %
Table S5. 2 Specific capacitance values (in F/g) of electrodes CNUY-600 and CNUY-600H
measured in 1 M H2SO4 electrolyte within a three-electrode system
Current density (A/g) 0.25 0.5 1 2 5 10 20 30 50 80 100
CNUY-600 295 255 244 237 220 200 184 161 134 97 80
CNUY-600H 426 378 346 325 309 277 262 254 231 185 177
Table S5. 3 Electrochemical performance of electrode CNUY-600 measured in 1 M H2SO4
electrolyte within a two-electrode system
Current density (A/g) 0.2 0.5 1 2 5 10 15 20
Cm (F/g) 196 192 187 175 146 123 97 80
Energy density (Wh/Kg) 11.5 11.3 10.9 10.3 8.6 7.2 6.8 4.7
Power density (W/Kg) 162 325 643 1301 3259 6480 11657 13015

99
Table S5. 4 Electrochemical performance of electrode CNUY-600H measured in 1 M H2SO4
electrolyte within a two-electrode system
Current density (A/g) 0.2 0.5 1 2 5 10 15 20
Cm (F/g) 253 234 228 216 200 185 167 148
Energy density (Wh/Kg) 14.9 13.7 13.4 12.7 11.7 10.9 9.8 8.7
Power density (W/Kg) 130.5 324.5 651.9 1306.3 3240 6540 9800 13050
Table S5. 5 Electrochemical performance of electrode CNUY-600H in a symmetric cell with
1M LiCl as the aqueous electrolyte
Current density (A/g) 0.5 1 2 5 10
Cm (F/g) 206 174 156 135 118
Energy density (Wh/Kg) 20.7 17.5 15.7 13.6 11.9
Power density (W/Kg) 425.8 851.4 1712.7 4450.9 9520.0
Table S5. 6 Specific capacitance values of electrode CNUY-600H in a symmetric cell with 2 M
KOH as the aqueous electrolyte
Current density (A/g) 0.2 0.5 1 2 5 10 20 30 40 50
Cm (F/g) 176 176 175 168 160 140 128 108 96 80
Table S5. 7 Areal capacitance values (mF/cm2) of electrode CNUY-600H of different mass
loadings measured in symmetric cells using 1 M H2SO4 electrolyte.
Current density (mA/cm2) 0.5 1 2 5 10 15 20 30 40 50
1 (mg/cm2) 243 228 223 210 200 185 162 136 116 74
4 (mg/cm2) 854 831 800 724 647 600 554 462 370 308
8 (mg/cm2) 1775 1713 1661 1523 1416 1339 1231 1150 985 923
12 (mg/cm2) 2518 2465 2338 2246 2000 1846 1723 1569 1354 1128

117
Chapter 6 Zeolite-templated nanoporous carbon
for high-performance ECs
This chapter has been published as Journal of Materials Chemistry A, 2018, 6, 10388-10394

118
6.1 Introduction
One of the reasons for the good performance of the microcrystalline cellulose-derived porous
carbon materials developed in the former two chapters is that they are hierarchical porous carbons
(HPCs). HPCs with micropores, mesopores, macropores well-organised in three-dimension (3D)
are believed to be ideal electrode materials for ECs.1 The micropores provide rich space for
interacting with electrolyte ions. The mesopores and/or macropores function as ion reservoirs and
low-resistant ion-transport tunnels, facilitating fast ion transport to and out of micropores.1-3
However, it is currently impossible to synthesise MC-derived ordered HPCs with good control
over the pore structure through physical and/or chemical activation. So, in order to examine the
effect of varying the pore structure on device performance in this chapter, the zeolite-template
method will be used to synthesise ordered HPCs.
The zeolite template method has been widely used to prepare HPCs.4-9 But in this method, it has
been challenging to selectively deposit carbon in zeolite micropores for preparing highly ordered
HPCs10, 11 because a carbon precursor tends to deposit on the external surface of the template.12
Therefore, the structure of currently available HPCs prepared using the template method contains
mainly meso/macropores rather than micro/mesopores, which are more desirable in the
development of carbon electrode materials for electrical double layer capacitors (EDLCs).13, 14
Recently, we reported the use of nano-sized Beta zeolite as the template to prepare HPCs with a
micropore-mesopore hierarchy.15 Subsequently, we demonstrated that microporous carbons with
graphene-like pore walls can be readily prepared in a large scale by using the lanthanum-containing
zeolite template.16 In this work, we employed calcium-containing nano-sized Beta zeolite as
template and ethylene as the carbon precursor to prepare HPCs. In comparison with other samples
templated from micro-sized zeolites Y and Beta, the nano-sized zeolite Beta template carbon
exhibited the best electrocapacitive performance due to an appropriate amount of micropores and
rich mesopores, which provide sufficient electrochemically active sites and facilitate the ion and
electron transport for both EDLC and pseudocapacitance, respectively.

119
6.2 Experiment
6.2.1 Preparation of zeolite-templated carbon
Both zeolites Y (denoted as YZ) and Beta (denoted as BZ) were purchased from Tosoh Corp.
Nano-sized Beta zeolite (denoted as NBZ) was synthesized as described elsewhere.17 Ethylene was
used as the carbon precursor. A zeolite template (YZ or BZ or NBZ) was placed in a vertical fused
quartz reactor equipped with a fritted disk (see Figure S6. 1). The template was heated to 600 ℃
under dry N2 gas flow. A mixture of ethylene gas, steam and nitrogen was then passed through the
zeolite bed. After the carbon deposition was completed, the gas flow was switched to dry N2 and
the temperature was increased to 850 ℃ and maintained at this temperature for 2 h. The template
was washed away with a HF/HCl solution. Samples were washed with deionised water to remove
residual chemicals and dried at 150 ℃ for 48 h. Three carbon replica of YZ, BZ and NBZ were
obtained and the samples are denoted as YZC, BZC and NBZC, respectively.
6.2.2 Characterizations and electrochemical measurements
The material characterizations, supercapacitor assembly and electrochemical measurements were
conducted according to Chapter 3.3-3.5.
In this chapter, the working electrodes were prepared by mixing 75 wt% active materials, 20 wt%
carbon black as a conductive additive and 5 wt% polytetrafluoro ethylene (PTFE) binder. The mass
of active materials on each current collector was ∼2 mg. CV scans were obtained at scan rates in
the range of 5 - 200 mV/s. The GCD cycles were performed at current densities ranging from 0.1
to 10 A/g. The EIS measurement was carried out at an open circuit potential with an amplitude of
5 mV in the frequency range of 10 mHz to 100 kHz.
6.3 Results and discussion
Figure 6. 1a schematically shows the preparation process of carbon samples using calcium-
containing zeolites as the templates. The SEM images (shown in Figure 6. 1, and Figure S6. 2) and
TEM images (shown in Figure 6. 1 and Figure S6. 3) show that the three samples are good replica
of their separate template. More details about their preparation process and characterisations can

120
be seen in the Supporting Information. In this paper we will mainly focus on the measurement and
interpretation of their electrocapacitive performance.
Figure 6. 1 (a) A scheme showing the carbon deposition in calcium-containing zeolite templates,
SEM images of (b) template NBZ and (c) resultant carbon replica NBZC, (d) TEM, (e) HRTEM
image of NBZC.
Firstly, the electrochemical performance was investigated by using CV, GCD and EIS techniques
in a three-electrode system with 1 M H2SO4 as the aqueous electrolyte at a potential window
between -0.3 and 0.7 V vs. Ag/AgCl. Figure 6.2a shows the CV profiles of samples measured at a
scan rate of 5 mV/s. All of them exhibit a quasi-rectangular shape with redox peaks due to the
pseudocapacitive faradic reactions of oxygen-containing functional groups, especially NBZC,
indicating a better utilisation of oxygen groups on account of a hierarchically porous structure.
Besides, the NBZC electrode showed an increased current density compared with other two
electrodes, suggesting a better capacitive performance.19 The rate capability of them is shown in
Figure 6.2b. The electrode NBZC showed a much better rate capability than YZC and BZC, which
is further supported by EIS results in Figure 6.2c. The Nyquist plots show that the electrode NBZC
had a much smaller charge resistance than the other two electrodes.

121
Figure 6.2 Electrocapacitive properties of different electrode materials measured in a three-
electrode system using 1 M H2SO4 electrolyte: (a) CV curves at 5 mV/s, (b) rate capability, (c)
Nyquist plots. (d) CV, (e) GCD curves and (f) Bode plots of electrode NBZC.

122
Figure 6.3 Nitrogen sorption isotherms (a), pore size distributions calculated using the DFT (b)
and BJH model (c).
Table 6. 1Textual properties of the samples.
Sample SBET (m2/g) Vtotal (cm3/g) Vmicro (cm3/g) Vmicro / Vtotal (%)
YZC 2220 1.12 0.89 79.5
BZC 2770 1.39 0.91 65.5
NBZC 2280 1.95 0.65 33.3
SBET: the specific surface area from BET. Vtotal (cm3/g): total pore volume estimated at P/P0=
0.95. Vmicro: volume of micropores calculated by the t-plot method.
As NBZC showed the best electrocapacitve performance among these three samples, subsequent
investigations were focused on this sample. Figure 6.2d and 2e show the CV and GCD curves of
NBZC, respectively. It can be seen all CV curves exhibit a quasi-rectangular shape while all GCD
curves display a quasi-triangle shape, indicating both electric double layer and pseudocapacitive
contributions. At a faster scan rate, the CV curve was slightly distorted, implying that some
pseudocapacitive species could not participate in the faradic redox reactions at very fast scan
rates.19 However, the electrode still showed a good rate capability as seen from the data in Figure
6.2b and Table S6. 1. The specific capacitance was 307 F/g at a current density of 0.2 A/g, and it
remained 177 F/g at current density of 20 A/g.
Figure 6.3a shows the N2 adsorption/desorption isotherms of NBZC. The presence of a hysteresis
loop indicates the existence of mesopores. The textual properties of the three samples are compared

123
in Table 6. 1. All three samples have a SSA of higher than 2200 m2/g. In comparison with other
two samples, NBZC possesses the highest pore volume (1.95 cm3/g) and lowest ratio of micropore
volume over total pore volume, indicating a significant contribution of mesopores to the total pore
volume. Figure 6.3b and c show the well-controlled pore size distribution of NBZC calculated
from the DFT model and BJH model, respectively. It exhibits prominent micropore and mesopore
peaks centred at 1 nm and 20 nm, respectively. The micropores provide sufficient active sites for
EDLC and mesopores enable active ions in micropores to have nanometre transport distances.1, 20-
23 In comparison, as shown in Figure S6. 6, YZC and BZC only exhibit a prominent micropore
peak centred at 1 nm, which leads to a larger charge resistance and electrolyte diffusion resistance
thus an ordinary rate capability. Moreover, compared with chemical activation, the zeolite template
method can afford a more ordered straight hierarchical porous structure. That enables the carbon
electrode NBZC to have low-resistant, as shown by the Nyquist plots in Figure 6.2c and Figure
S6. 5, ion-transport paths, which is beneficial for both the rate capability and power density.24, 25
Furthermore, the good wettability of NBZC benefitting from a certain degree of graphitization
further enhances the ion transfer efficiency.21 The HRTEM image in Figure 6.2e shows a certain
degree of graphitization of NBZC which is consistent with the Raman spectroscopy results in
Figure S6. 7, showing a much higher intensity of G-band than D-band. This is beneficial for the
surface wettability as well as the electronic conductivity of NBZC as the electrode.26
Figure 6.4 XPS survey spectra of NBZC (a), and the deconvoluted C 1s (b), O 1s spectra (c).
Figure 6.4a and Figure S6. 8a show the XPS survey spectra of the three samples. The quantitative
analysis showed that they contained a similar content of oxygen – 9.9 at%, 10.6 at%, 9.2 at%,
respectively. But as can be seen from the CV profiles in Figure 6.2a, the oxygen functional groups

124
of NBZC were better utilised. That maybe because of the well-organised hierarchically porous
structure, which enables the electrolyte ions to have more sufficient interaction with the oxygen
groups evenly spreading on the carbon NBZC, supported by Figure S6. 9. In summary, the
excellent performance of NBZC is on account of the ordered straight hierarchical porous structure
originating from the zeolite template method and pseudocapacitance contribution from the evenly
spread oxygen-containing surface groups on it, as well as the good wettability towards the
electrolyte.
Figure 6.5 Electrocapacitive performance of electrode NBZC in symmetric cells using 1 M H2SO4
electrolyte: (a) CV, (b) GCD curves, (c) rate capability, (d) Nyquist plot, (e) Bode plots, and (f)
cycling stability at 1 A/g.

125
The electrochemical performance of electrode NBZC was further assessed in a symmetric cell with
1 M H2SO4 as the aqueous electrolyte. As shown in Figure 6.5a, the CV curves exhibit a quasi-
rectangular shape characteristic of a combined contribution of EDLC and pseudocapacitance.26
And the CV curve only shows limited distortion at a high scan rate of 200 mV/s, indicating a good
rate capability of the cell. Figure 6.5b shows the GCD curves of this cell at different current
densities ranging from 0.1 A/g to 10 A/g. All these curves exhibit a quasi-linear shape
demonstrating both EDLC and pseudocapacitance, in consistence with the CV tests. The cell
electrode exhibited a specific capacitance of 170 F/g at 0.1 A/g. Figure 6.5c shows the rate
capability of the symmetric cell. The capacitance at a high current density of 10 A/g remained
approximately 60 % of the value at 0.1 A/g. Comparisons of the preparation, structural and
electrocapacitive properties of NBZC with other HPCs reported recently are shown in Table S6. 2.
Figure 6.5d shows the Nyquist plot of the cell. It consists of a semicircle in the high-frequency
region and an almost vertical line in the low-frequency region. The almost vertical line in the low-
frequency region reveals that EDLC is the dominant capacitance contribution of the cell, consistent
with both CV and GCD results. The equivalent circuit shown in Figure S6. 10 was used to simulate
the impedance response of the cell.27-30 Rs stands for the summarization of contact resistance,
electrolyte resistance and the bulk resistance of the electrode. Rct is the resistance caused by charge
transfer for both EDLC and pseudocapacitance.31 The constant phase element Qdl represents a part
of the capacitance at the high and medium frequency. Zw represents the electrolyte diffusion
resistance, i.e., Warburg impedance.29 Cm is the main capacitance at low frequency. RL is the
leakage resistance which is relatively high and usually ignored in the circuit. Figure 6.5d and e
show that excellent fitting results were obtained for both the Nyquist plot and Bode plots. The
Nyquist plot shows that the cell had low-value Rs and Rct of 1.43 Ω and 2.38 Ω respectively. The
relatively low equivalent series resistance, the sum of Rs and Rct, i.e., 3.81 Ω, and short Warburg
region benefiting from the ordered hierarchical porous structure and certain degree of
graphitization, enable the cell to show a good rate capability.31, 32 The Bode phase angle plot
(Figure 6.5e) exhibit two maximum values and a phase angle of 83° at low frequency region, which
further proves the coexistence of EDLC and pseudocapacitance.33

126
Long cycle life is one of the critical impactors for the application of ECs. As shown in Figure 6.5f,
the specific capacitance of this EC electrode showed an apparent increase after certain cycles. The
capacitance enhancement was further studied through the EIS technique as shown in Figure 6.6
and Figure S6. 11. The electrode retained approximately 120 % of the initial capacitance after
17000 cycles at the current density of 1 A/g. The slight capacitance value fluctuation may be
associated with minor temperature variation during the long-term cycling test to some extent.34-36
Figure 6.6 Nyquist plots (a), real part capacitance (b) and imaginary capacitance (c) vs. frequency
for electrode NBZC in symmetric cells using 1 M H2SO4 electrolyte.
Figure 6.6a shows that the cell exhibited similar Rs but much lower Rct and Zw after certain cycles
the capacitance enhanced. In consistence with Figure 6.6a, Figure S6. 11a also shows that the real
part resistance, containing Rs, Rct and Zw, was much lower. The lower resistance facilitates electron
transport thus enables the cell to exhibit a better electrochemical performance.37 Figure 6.6b
presents the real part specific capacitance (C’) vs. frequency. The C’ showed almost no change in
region 1 and region 2. But in region 3, the value of C’ significantly enhanced. This indicates that
the capacitance improvement is due to a more efficient utilisation of micropores, which means a
higher electrochemically accessible surface area for the cell. The longer soaking time and certain
number of GCD tests enable more micropores, especially the inner-region micropores, to be
accessed by sufficient electrolyte, thus providing more electrochemical active sites.38 Figure 6.6c
presents the imaginary specific capacitance (C’’) vs. frequency. The C’’ showed a maximum value
at a frequency of f0, defining a time constant of τ0 = 1 / f0. It can be seen that the τ0 increased from
3.1 s to 5.7 s. Although the more efficient utilisation of inner-region micropores enhanced the
capacitance value, it also increased the relaxation time due to a relatively lengthening diffusion
pathways for ion transport.39 The Figure S6. 11b further confirms the increase of τ0. Therefore, the

127
cell showed a higher specific capacitance and energy density but meanwhile a reduced power
density to some extent.30, 40
More interestingly, as shown in Figure 6.5f, the specific capacitance at the current density of 1 A/g
further increased to 246 F/g, 153 % of the initial value, shelved another 2 months after the 17000
cycling tests, and it still maintained an excellent cycle stability. The possible reasons for the
superior cycle life of this electrode are: (a) the ordered straight hierarchical porous structure, it
enables an excellent charge transfer and ion transport network20 and facilitates an efficient use of
pseudocapacitance from oxygenated functionalities;6, 34, 41 (b) certain graphitization degree, which
is also beneficial for the electron and ion transfer;42 and (c) a relatively higher H+ concentration
after a long time, which might also contribute to the further capacitance increase. In our future
work, further research on capacitance enhancement after long-term tests will be conducted.
Figure 6.7 shows the electrochemical performance of electrode NBZC in an all-solid-state cell with
PVA/H2SO4 gel as the electrolyte. A high areal specific capacitance of 413 mF/cm2 was obtained
at a current density of 0.25 mA/cm2. And it remained at 380 mF/cm2, 246 mF/cm2, 160 mF/cm2 at
current densities of 1 mA/cm2, 10 mA/cm2, 20 mA/cm2 respectively. Relatively high volumetric
energy density and power density based on the whole device were obtained and three such
capacitors connected in series can light a commercial red light-emitting diode (LED, 2.3 V) as
shown in Figure 6.7d. The all-solid-state cell also exhibited a good cycling stability as shown in
Figure 6.7e. The areal capacitance value remained around 89 % after 3000 cycles at a current
density of 5 mA/cm2. Figure 6.7f shows the CV curves of the cell at a scan rate of 20 mV/s. The
curves showed no visible change at different bending state, demonstrating its potential as a flexible
device.

128
Figure 6.7 Electrocapacitive performance of of NBZC in an all-solid-state symmetric cell with
PVA/H2SO4 gel electrolyte: (a) CV, (b) GCD curves, (c) rate capability, and (d) a Ragone plot (the
inset shows a 2.3 V LED powered by 3 EC cells connected in series), (e) cycling stability at 5
mA/cm2, (f) CV curves at 20 mV/s with different bending angles.
6.4 Conclusions
With ethylene as the carbon source and calcium-containing nano Beta zeolite as the template, 3D
micro/mesoporous carbons of high specific surface area were prepared at a relatively low
carbonization temperature, 600 ℃. The Ca2+ localized in micropores of zeolite can strongly interact

129
with ethylene, leading to selective deposition of carbon in pores instead of on the external surface
of the template. A comparative study of carbons prepared with different zeolite templates indicated
that the sample prepared using nano Beta zeolite displayed the best electrocapacitive performance
because of the well-controlled hierarchical porous structure and pseudocapacitance contribution
from oxygen-containing surface groups evenly spread on it, as well as the good wettability towards
the electrolyte. This carbon exhibited an excellent stability against cycling. The carbon electrode
was cycled 17000 times in a symmetric cell with 120% capacity remained. The EIS data indicates
that the capacitance improvement is due to a more efficient use of micropores. The long soaking
time and certain number cycling tests enabled more micropores to be accessed by sufficient
electrolyte, thus providing more electrochemically active sites. Furthermore, two-month shelfing
time after 17000 cycling tests, this electrode was cycled again at 1 A/g. The capacitance reached
246 F/g and it still maintained an excellent cycling stability. The superior cycle life of this carbon
is on account of the ordered straight micro-mesopore hierarchy, certain graphitization degree and
the relatively higher H+ concentration after a long soaking time. More research on the capacitance
further enhancement after the two-month shelfing time is needed in our future work. This carbon
also exhibited good performance in an all-solid-state EC with PVA/H2SO4 gel as the electrolyte.
A high areal specific capacitance of 413 mF/cm2 was obtained at a current density of 0.25 mA/cm2.
Moreover, the experimental procedure for preparing zeolite-templated carbon can be scaled up as
shown in Figure S6. 1. With 40 g of zeolite template, about 13 g carbon can be obtained.
6.5 References
1. D. W. Wang, F. Li, M. Liu, G. Q. Lu and H. M. Cheng, Angewandte Chemie, 2008, 120,
379-382.
2. X. Zheng, J. Luo, W. Lv, D. W. Wang and Q. H. Yang, Adv Mater, 2015, 27, 5388-5395.
3. X. Fan, C. Yu, J. Yang, Z. Ling, C. Hu, M. Zhang and J. Qiu, Advanced Energy
Materials, 2015, 5, 14011761.
4. T. Kyotani, T. Nagai, S. Inoue and A. Tomita, Chemistry of materials, 1997, 9, 609-615.
5. C. J. Meyers, S. D. Shah, S. C. Patel, R. M. Sneeringer, C. A. Bessel, N. R. Dollahon, R.
A. Leising and E. S. Takeuchi, The Journal of Physical Chemistry B, 2001, 105, 2143-
2152.
6. X. S. Zhao, F. Su, Q. Yan, W. Guo, X. Y. Bao, L. Lv and Z. Zhou, Journal of Materials
Chemistry, 2006, 16, 637-648.
7. W. Xia, B. Qiu, D. Xia and R. Zou, Scientific reports, 2013, 3.
8. X. Wen, D. Zhang, T. Yan, J. Zhang and L. Shi, Journal of Materials Chemistry A, 2013,
1, 12334-12344.

130
9. X. Y. Chen, C. Chen, Z. J. Zhang and D. H. Xie, Journal of Materials Chemistry A, 2013,
1, 10903-10911.
10. Z. Li, D. Wu, Y. Liang, R. Fu and K. Matyjaszewski, J Am Chem Soc, 2014, 136, 4805-
4808.
11. H. Nishihara and T. Kyotani, Adv Mater, 2012, 24, 4473-4498.
12. H. Xu, Q. Gao, H. Guo and H. Wang, Microporous and Mesoporous Materials, 2010,
133, 106-114.
13. J. Chmiola, G. Yushin, Y. Gogotsi, C. Portet, P. Simon and P.-L. Taberna, Science, 2006,
313, 1760-1763.
14. D. Hulicova-Jurcakova, A. M. Puziy, O. I. Poddubnaya, F. Suárez-García, J. M. Tascón
and G. Q. Lu, J Am Chem Soc, 2009, 131, 5026-5027.
15. K. Kim, M. Choi and R. Ryoo, Carbon, 2013, 60, 175-185.
16. K. Kim, T. Lee, Y. Kwon, Y. Seo, J. Song, J. K. Park, H. Lee, J. Y. Park, H. Ihee and S. J.
Cho, Nature, 2016, 535, 131-147.
17. M. Choi, K. Na and R. Ryoo, Chemical Communications, 2009, 2845-2847.
18. X. Lu, M. Yu, G. Wang, Y. Tong and Y. Li, Energy & Environmental Science, 2014, 7,
2160-2181.
19. Z. Lei, L. Lu and X. S. Zhao, Energy & Environmental Science, 2012, 5, 6391-6399.
20. H. Lu and X. Zhao, Sustainable Energy & Fuels, 2017, 1, 1265-1281.
21. L. Qie, W. Chen, H. Xu, X. Xiong, Y. Jiang, F. Zou, X. Hu, Y. Xin, Z. Zhang and Y.
Huang, Energy & Environmental Science, 2013, 6, 2497-2504.
22. M. Biswal, A. Banerjee, M. Deo and S. Ogale, Energy & Environmental Science, 2013, 6,
1249-1259.
23. G. Zhang and X. W. D. Lou, Adv Mater, 2013, 25, 976-979.
24. H. Jiang, J. Ma and C. Li, Adv Mater, 2012, 24, 4197-4202.
25. H. J. Liu, J. Wang, C. X. Wang and Y. Y. Xia, Advanced Energy Materials, 2011, 1,
1101-1108.
26. H. Lu, X. Sun, R. R. Gaddam, N. A. Kumar and X. S. Zhao, Journal of Power Sources,
2017, 360, 634-641.
27. C. Masarapu, H. F. Zeng, K. H. Hung and B. Wei, ACS nano, 2009, 3, 2199-2206.
28. W. Wang, S. Guo, I. Lee, K. Ahmed, J. Zhong, Z. Favors, F. Zaera, M. Ozkan and C. S.
Ozkan, Scientific reports, 2014, 4.
29. S. K. Meher and G. R. Rao, The Journal of Physical Chemistry C, 2011, 115, 15646-
15654.
30. P. Taberna, P. Simon and J.-F. Fauvarque, Journal of The Electrochemical Society, 2003,
150, A292-A300.
31. J. Zhang and X. Zhao, ChemSusChem, 2012, 5, 818-841.
32. A. Di Fabio, A. Giorgi, M. Mastragostino and F. Soavi, Journal of the Electrochemical
Society, 2001, 148, A845-A850.
33. B. E. Conway, Journal of the Electrochemical Society, 1991, 138, 1539-1548.
34. Y. Wang, W. Lai, N. Wang, Z. Jiang, X. Wang, P. Zou, Z. Lin, H. J. Fan, F. Kang and C.-
P. Wong, Energy & Environmental Science, 2017, 10, 941-949.
35. F. Rafik, H. Gualous, R. Gallay, A. Crausaz and A. Berthon, Journal of power sources,
2007, 165, 928-934.
36. S. Dutta, A. Bhaumik and K. C.-W. Wu, Energy & Environmental Science, 2014, 7,
3574-3592.

131
37. Y. Deng, C. Liu, T. Yu, F. Liu, F. Zhang, Y. Wan, L. Zhang, C. Wang, B. Tu and P. A.
Webley, Chemistry of materials, 2007, 19, 3271-3277.
38. L.-F. Chen, Y. Lu, L. Yu and X. W. D. Lou, Energy & Environmental Science, 2017.
39. J. Chmiola, G. Yushin, R. Dash and Y. Gogotsi, Journal of Power Sources, 2006, 158,
765-772.
40. C. Portet, P. L. Taberna, P. Simon, E. Flahaut and C. Laberty-Robert, Electrochimica
Acta, 2005, 50, 4174-4181.
41. C. O. Ania, V. Khomenko, E. Raymundo‐Piñero, J. B. Parra and F. Beguin, Advanced
Functional Materials, 2007, 17, 1828-1836.
42. L. Sun, C. Tian, M. Li, X. Meng, L. Wang, R. Wang, J. Yin and H. Fu, Journal of
Materials Chemistry A, 2013, 1, 6462-6470.
6.6 Supporting information
Figure S6. 1 Photograph of the carbon deposition rig for carbon synthesis in a large-scale.
N2/ethylene mixture was bubbled through water before reaching a zeolite bed (left inset). A 3 cm-
thick bed of zeolite filled in the plug-flow reactor equipped with a fritted disk was used in the
synthesis (right inset).

132
Figure S6. 2 SEM images of YZC and BZC, and their separate template.
Figure S6. 3 TEM images of YZC and BZC.
Figure 6. 1a schematically shows the carbon deposition process using calcium-containing zeolites
as templates. Firstly, the ion exchange for Na+ containing template with Ca
2+ was conducted. Then
the Ca-containing template was heated at 600 ℃ for 1 h under ethylene flow, followed by heat
treatment at 850 ℃ for 2 h under N2 atmosphere. The Ca2+ can promote the ethylene carbonization,

133
which lowers the carbonization temperature, thus preventing the non-selective carbon deposition at
the external surfaces.1, 2 Finally, the sample was washed with HF/HCl solution, which washes away
the zeolite template and simultaneously adds certain content of oxygen-containing surface
functional groups, contributing to pseudocapacitance. The SEM images (Figure 6. 1b-c, Figure
S6. 2) show that the carbon products were all good replica of their separate template. The TEM
images in Figure 6. 1d and Figure S6. 3 show ordered porous structure of the carbons. Especially
the TEM image in Figure 6. 1d and the HRTEM image in Figure 6. 1e show ordered
mesoporous/microporous structure of NBZC, revealing the selective deposition of carbon inside the
template, which was further confirmed by the XRD results in Figure S6. 4. 1, 3, 4
Figure S6. 4 XRD patterns of YZC, BZC, and NBZC and their separate template. The carbons show
a well-resolved peak at 2θ ≈ 7˚, which corresponds to the (100) or (101) diffraction of the templates,
indicating the ordered micropores in the carbons.1, 3, 4
Figure S6. 5 (a) Nyquist plot, (b) Bode plots of NBZC measured in a three-electrode system using
1 M H2SO4 electrolyte.

134
Figure S6. 6 Nitrogen sorption isotherms (a) and pore size distribution curves calculated using
DFT (b) and BJH model (c).
Figure S6. 7 Raman spectra of YZC, BZC, and NBZC.
Figure S6. 8 XPS survey spectra of YZC and BZC (a), C 1s envelope of YZC (b) and BZC (c).

135
Figure S6. 9 STEM-EDS mapping of C (a), O (b) and HAADF-STEM image (c) of NBZC.
The chemical composition of NBZC was characterised using the scanning transmission electron
microscopy - energy dispersive spectrometer (STEM - EDS) and XPS techniques. The STEM -
EDS images, Figure S6. 9a-b, and the STEM image conducted in a high- angle annular dark
field mode (HAADF - STEM), Figure S6. 9c, show that oxygen uniformly presents in the
sample. The XPS survey spectrum of NBZC is shown in Figure 6.4a. The two distinct peaks at
284.4 eV and 532 eV correspond to binding energies of C 1s and O 1s electrons, respectively.
The quantitative analysis of the spectrum showed that it contains 90.8 at% C and 9.2 at% O. The
presence of oxygen was due to partial oxidation of the carbon framework during the zeolite
template removal process using HF/HCl solution. This process involves heat generation and the
heat increases with the amount of washed samples. Therefore, the oxygen content of the carbon
prepared in a large scale is slightly higher than that of the one prepared in a small scale. Figure
6.4b shows the deconvolution of C 1s peak. Four peaks corresponding to sp2 C-C (284.4 eV),
sp3 C-C (285.2 eV), C-O (286.1 eV) and C=O (288.4 eV) can be seen.
1, 5 The O 1s peaks at 531.3
and 532.8 eV correspond to C=O and C-O respectively.6
Figure S6. 10 Equivalent circuit used for the simulation of EIS data

136
Figure S6. 11 Real part resistance vs frequency (a) and Bode phase angle plots (b) of the symmetric
capacitor with 1 M H2SO4 as the electrolyte of NBZC.
Figure S6. 12 Nitrogen sorption isotherms and textural properties (inset) of NBZC before and after
1 M H2SO4 treatment for 1 d at 25 °C.
Figure S6. 13 XPS survey spectra of original sample NBZC as well as that of soaked after 1 month
and 2 months.

137
Figure S6. 14 Electrocapacitive performance of electrode NBZC in a symmetric cell with 2 M LiCl
(a, b, c) or 1 M LiPF6 EC/DEC (d, e, f) as electrolyte.
Table S6. 1 Specific capacitance values of NBZC at different current densities measured in 1 M
H2SO4 electrolyte within a three-electrode system.
Current
density (A/g)
0.
2
0
.
5
1 2 5 10 15 2
0
Cs (F/g) 30
7
2
6
8
2
5
0
2
3
5
21
5
19
9
18
9
17
7

Table S6. 2 Comparisons of the preparation and characteristics of various porous carbon materials as well as their applications in
ECs
Precu
rsor
Carbon-based
electrodes
Pore
structure
Preparation
method
SSA
(m2/g)
Specific capacitance Cycle stability Ref
.
Carbon
nanofibers
Nitrogen-
doped porous
carbon
nanofibers
Micro/meso/macroporo
us
Carbonization 562 202 F/g at 1 A/g, three-
electrode, 6M KOH 97 % retention
after 3000
cycles at
1 A/g
7
Lignin Lignin-derived
porous
carbon
3D hierarchically
porous
KOH activation 907 185 F/g at 0.05 A/g, two-
electrode, 1M H2 SO4
97.3 %
retention
after 5000
cycles at 1
A/g
8
Polypyrro
le sheets
Nitrogen-
doped porous
carbon
3D hierarchically
micro/meso/macroporous
KOH activation 2870 318 F/g at 0.5 A/g, three-
electrode, 6M KOH
95.8 %
retention
after 10000
cycles at 5
A/g
9
Eggshell
membranes
Porous carbon
film
3D macroporous Air activation 221 284 F/g at 0.2 A/g, three-
electrode, 1M H2 SO4
97 %
retention
after
10000 cycles at 4 A/g
10
Pig bone Porous carbon Hierarchically
micro/meso/macroporous
KOH activation 2157 185 F/g at 0.05 A/g, two-
electrode, 7M KOH
- 11
Pitch pillared-porous
carbon nanosheet
3D mesoporous MgO-template 883 289 F/g at 2 mV/s, three-
electrode, 6M KOH
94 % retention
after
10000 cycles at 200 mV/s
12
GO RGO hydrogel
film
Hierarchically
meso/macroporous
Blade-cast and
freeze
drying
1316 71 mF/cm2 at 1 mA/cm2,
two-electrode, 1M H2SO4
98 % retention
after 5000
cycles at 10 mA/cm2
13
Flake
graphit
e
RGO film 3D porous CaCO3-template - ~125 F/g at 0.5 A/g, two-
electrode, 1M H2 SO4
90 % retention
after 5000
cycles at 5
14

A/g
Glucose Porous carbon
hollow
spheres
Micropore shell
with
meso/mcropore
cores
Colloidal
silica hard
template
658 269 F/g at 0.5 A/g, three-
electrode, 6M KOH
92 % after
1000
cycles at
5 A/g
15
Gelatin Nitrogen-doped
porous carbon
Microporous/mesoporo
us
Dual-template 1518 110 F/g at 2 A/g, two-
electrode cell, 1M
EMIMBF 4/AN
98.2%
retention after
10000 cycles at 20 A/g
16
Phenol
ic
resol
Porous carbon
spheres
3D Mesoporous Dual-template 1320 208 F/g at 0.5 A/g, three-
electrode, 2M H2 SO4
~100 %
retention
after 1000
cycles at
1.59 A/g
17
PAN Nitrogen-doped
carbon nanofibers
Hierarchically
micro/mesoporous
Dual-template 699 170 F/g at 1 A/g, two-
electrode, 6M KOH
94 % retention
after 8000
cycles at 1 A/g
18
Coal
tar
pitc
h
Hierarchical
porous
carbon
Hierarchically
micro/mesoporous
Fe2O3-template and
KOH
activation
1330 194 F/g at 0.1 A/g, two-
electrode, 6M KOH
93.2 %
retention
after 1000
cycles at
0.1 A/g
19
Gelatin Porous
carbon
nanoshee
ts
2D porous
carbon
nanosheet
Montmorillonite-
template and
KOH activation
2270 228 F/g at 1 A/g, two-
electrode, 6M KOH
- 20
MOF-5 Porous carbon Microporous/mesoporo
us
MOF-template and
KOH
activation
2222 271 F/g at 2 mV/s, three-
electrode, 6M KOH
- 21
Ethylene Porous carbon 3D hierarchically
micro/mesoporous
calcium-catalysed
zeolite-
template
2280 307 F/g at 0.2 A/g, three-
electrode, 1M H2 SO4
413 mF/cm2 at 0.25
mA/cm2, two-electrode,
PVA/ H2SO4
153 % after
17000 cycles
at 1 A/g
This
work

140
Table S6. 3 Areal specific capacitance values of NBZC at different current densities in all-solid-
state cells using PVA / H2SO4 gel electrolyte.
Current density
(mA/cm2)
0.25 0.5 1 2 5 10 15 20
Ca (mF/cm2) 413 400 380 358 314 246 197 160
6.7 Reference 1. K. Kim, T. Lee, Y. Kwon, Y. Seo, J. Song, J. K. Park, H. Lee, J. Y. Park, H. Ihee and S.
J. Cho, Nature, 2016, 535, 131-147.
2. Z. Yang, Y. Xia and R. Mokaya, J. Am. Chem. Soc., 2007, 129, 1673-1679.
3. K. Kim, M. Choi and R. Ryoo, Carbon, 2013, 60, 175-185.
4. Y. Xia, Z. Yang and R. Mokaya, Nanoscale, 2010, 2, 639-659.
5. L. Sun, C. Tian, M. Li, X. Meng, L. Wang, R. Wang, J. Yin and H. Fu, J. Mater. Chem.
A, 2013, 1, 6462-6470.
6. S. Song, F. Ma, G. Wu, D. Ma, W. Geng and J. Wan, J. Mater. Chem. A, 2015, 3, 18154-
18162.
7. L.-F. Chen, X.-D. Zhang, H.-W. Liang, M. Kong, Q.-F. Guan, P. Chen, Z. Y. Wu and
S. H. Yu, ACS nano, 2012, 6, 7092- 7102.
8. W. Zhang, H. Lin, Z. Lin, J. Yin, H. Lu, D. Liu and M. Zhao, ChemSusChem, 2015, 8,
2114-2122.
9. L. Qie, W. Chen, H. Xu, X. Xiong, Y. Jiang, F. Zou, X. Hu, Y. Xin, Z. Zhang and Y.
Huang, Energy Environ. Sci., 2013, 6, 2497-2504.
10. Z. Li, L. Zhang, B. S. Amirkhiz, X. Tan, Z. Xu, H. Wang, B. C. Olsen, C. Holt and D.
Mitlin, Adv. Energy Mater., 2012, 2, 431-437.
11. W. Huang, H. Zhang, Y. Huang, W. Wang and S. Wei, Carbon, 2011, 49, 838-843.
12. Z. Fan, Y. Liu, J. Yan, G. Ning, Q. Wang, T. Wei, L. Zhi and F. Wei, Adv. Energy Mater.,
2012, 2, 419-424.
13. Z. Xiong, C. Liao, W. Han and X. Wang, Adv. Mater., 2015, 27, 4469-4475.
14. Y. Meng, K. Wang, Y. Zhang and Z. Wei, Adv. Mater., 2013, 25, 6985-6990.
15. Y. Han, X. Dong, C. Zhang and S. Liu, J. Power Sources, 2012, 211, 92-96.
16. X. Y. Chen, C. Chen, Z. J. Zhang and D. H. Xie, J. Mater. Chem. A, 2013, 1, 10903-
10911.
17. Q. Li, R. Jiang, Y. Dou, Z. Wu, T. Huang, D. Feng, J. Yang, A. Yu and D. Zhao, Carbon,
2011, 49, 1248-1257.
18. Q. Wang, Q. Cao, X. Wang, B. Jing, H. Kuang and L. Zhou, J. Solid State. Electrochem.,
2013, 17, 2731-2739.
19. X. He, N. Zhao, J. Qiu, N. Xiao, M. Yu, C. Yu, X. Zhang and M. Zheng, J. Mater. Chem.
A, 2013, 1, 9440-9448.
20. X. Fan, C. Yu, J. Yang, Z. Ling, C. Hu, M. Zhang and J. Qiu, Adv. Energy Mater, 2015,
5, 14011761.
21. J. Hu, H. Wang, Q. Gao and H. Guo, Carbon, 2010, 48, 3599-3606.

141
Chapter 7 Applications of microcrystalline
cellulose-derived porous carbons for hybrid
ion capacitors
This chapter has been finished and under revision for submission.

142
7.1 Introduction
Hybrid ion capacitors (HICs) are relatively new kinds of electrochemical energy storage
devices, which possess intermediate energy densities between ion-batteries and
electrochemical capacitors (ECs) while offering EC-like power densities and cyclability.1, 2 In
general, HICs can be classified into two types: aqueous HICs and metal-ion capacitors such as
sodium-ion capacitors (NICs) and lithium-ion capacitors (LICs).1 As the first modern
embodiment of HICs, LICs are a combination of the high energy density of Lithium-ion
batteries (LIBs) and the high power ECs built with LIB anode and EC cathode.3, 4 Currently,
for the concerning over the limited availability and high cost of lithium resources, NICs have
been emerging as potential substitutes for LICs due to the abundance of metal sodium.5-7
In the past few years, NICs have been increasingly more investigated, especially for NIC
electrode materials.6, 8, 9 However, research was mainly focused on negative electrode materials
for improving the sluggish kinetics of sodium-ion insertion into the negative electrodes.10-17
On the other hand, much less positive-electrode-related research was conducted.14, 18-20
Currently, positive electrode materials utilised in NICs are usually commercial activated
carbons or certain biomass-derived porous carbons.11, 12, 14, 15, 18 To our best knowledge,
microcrystalline cellulose-derived carbon materials as positive electrodes for NICs have never
been investigated and reported to date.
Herein we for the first time report microcrystalline cellulose-derived porous carbon/graphene
oxide composites through a simple ZnCl2 activation method as positive electrodes for NICs.
Microcrystalline cellulose (MC), the main content of lignocellulose having been commercially
available,21 was mixed with graphene oxide suspension and ZnCl2 powder. After freeze drying,
the mixture was carbonised at 550 °C for 2 h under N2 flow at a heating rate of 5 °C/min. The
obtained sample exhibited a mesoporous carbon network with thin microporous reduced
graphene oxide layers fully covered on it. It exhibited good electrochemical performance as a
capacitive electrode for both ECs and NICs.
7.2 Experiment
7.2.1 Preparation of samples
Preparation of GO
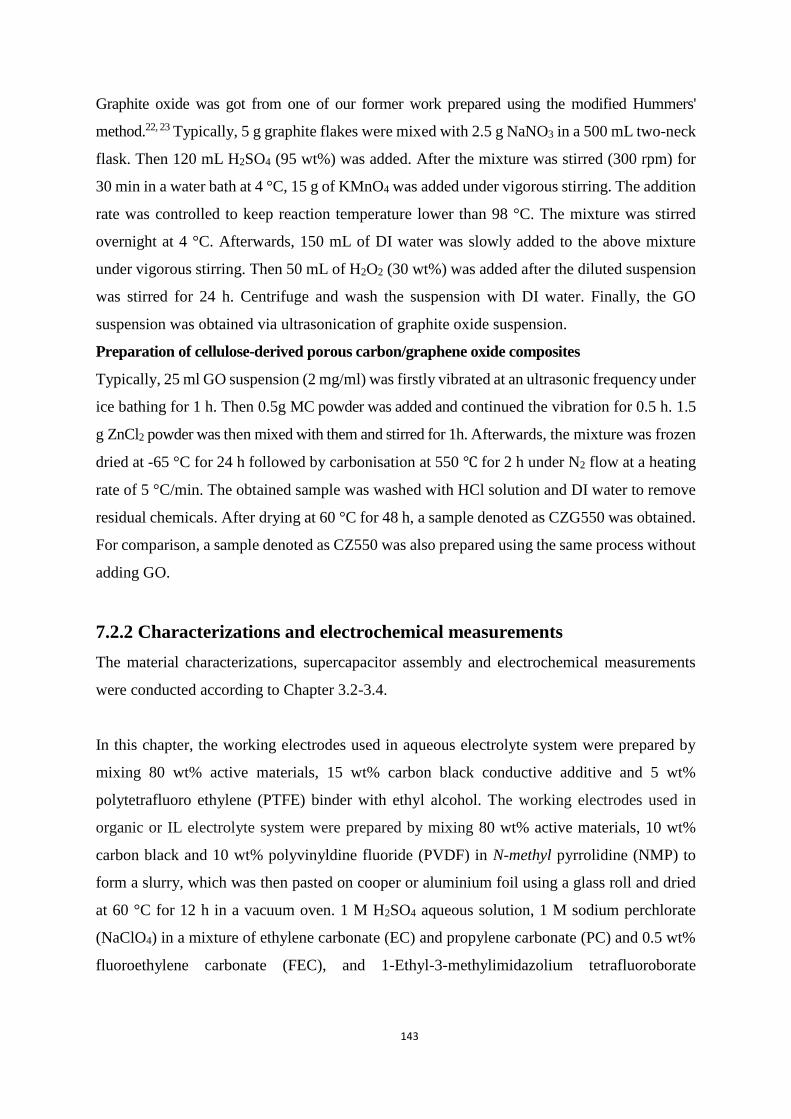
143
Graphite oxide was got from one of our former work prepared using the modified Hummers'
method.22, 23 Typically, 5 g graphite flakes were mixed with 2.5 g NaNO3 in a 500 mL two-neck
flask. Then 120 mL H2SO4 (95 wt%) was added. After the mixture was stirred (300 rpm) for
30 min in a water bath at 4 °C, 15 g of KMnO4 was added under vigorous stirring. The addition
rate was controlled to keep reaction temperature lower than 98 °C. The mixture was stirred
overnight at 4 °C. Afterwards, 150 mL of DI water was slowly added to the above mixture
under vigorous stirring. Then 50 mL of H2O2 (30 wt%) was added after the diluted suspension
was stirred for 24 h. Centrifuge and wash the suspension with DI water. Finally, the GO
suspension was obtained via ultrasonication of graphite oxide suspension.
Preparation of cellulose-derived porous carbon/graphene oxide composites
Typically, 25 ml GO suspension (2 mg/ml) was firstly vibrated at an ultrasonic frequency under
ice bathing for 1 h. Then 0.5g MC powder was added and continued the vibration for 0.5 h. 1.5
g ZnCl2 powder was then mixed with them and stirred for 1h. Afterwards, the mixture was frozen
dried at -65 °C for 24 h followed by carbonisation at 550 ℃ for 2 h under N2 flow at a heating
rate of 5 °C/min. The obtained sample was washed with HCl solution and DI water to remove
residual chemicals. After drying at 60 °C for 48 h, a sample denoted as CZG550 was obtained.
For comparison, a sample denoted as CZ550 was also prepared using the same process without
adding GO.
7.2.2 Characterizations and electrochemical measurements
The material characterizations, supercapacitor assembly and electrochemical measurements
were conducted according to Chapter 3.2-3.4.
In this chapter, the working electrodes used in aqueous electrolyte system were prepared by
mixing 80 wt% active materials, 15 wt% carbon black conductive additive and 5 wt%
polytetrafluoro ethylene (PTFE) binder with ethyl alcohol. The working electrodes used in
organic or IL electrolyte system were prepared by mixing 80 wt% active materials, 10 wt%
carbon black and 10 wt% polyvinyldine fluoride (PVDF) in N-methyl pyrrolidine (NMP) to
form a slurry, which was then pasted on cooper or aluminium foil using a glass roll and dried
at 60 °C for 12 h in a vacuum oven. 1 M H2SO4 aqueous solution, 1 M sodium perchlorate
(NaClO4) in a mixture of ethylene carbonate (EC) and propylene carbonate (PC) and 0.5 wt%
fluoroethylene carbonate (FEC), and 1-Ethyl-3-methylimidazolium tetrafluoroborate

144
(EMIMBF4) were used as the aqueous electrolyte, organic electrolyte and IL electrolyte,
respectively.
For the NICs, a Nb2O4.84F0.32/carbon nanobelts electrode was used as the anode. Before the
NIC cells were assembled, the Nb2O4.84F0.32/carbon nanobelts based battery electrodes were
pre-cycled at 100 mA/g for 3 times at a potential range of 0.01 – 3.0 V (vs. Na+/Na) and finally
discharged to 0.01 V (vs. Na+/Na) in sodium half-cells. Electrochemical measurements were
conducted at room temperature using an Autolab PGSTAT 3020N and a multichannel
potentiostat (VMP3, Biologic).
7.3 Results and discussion
7.3.1 Morphology and microstructure
Figure 7. 1 (a, b) FE-SEM images of CZ550 and (c, d) CZG550; TEM images of (e-i) CZG550.
Figure 7. 1a-b show the FE-SEM images of the sample CZ550 with a 3D interconnected
morphology and a uniform mesoporous structure. FE-SEM images shown in Figure 7. 1c-d
exhibit the sample CZG550 had the same morphology and porous structure with CZ550 except
that thin GO layers well covered on it. TEM images of CZG550 (Figure 7. 1e-i) further reveal
its ordered porous structure. GO layers further interconnected the mesoporous cellulose-
derived carbon network. Besides, thin GO layers covered along the porous carbon network as
shown in Figure 7. 1f-h, which also electronically links these pores together. And as can be
seen from the morphology of GO in Figure 7. 1h and Figure S7. 1, these GO layers were
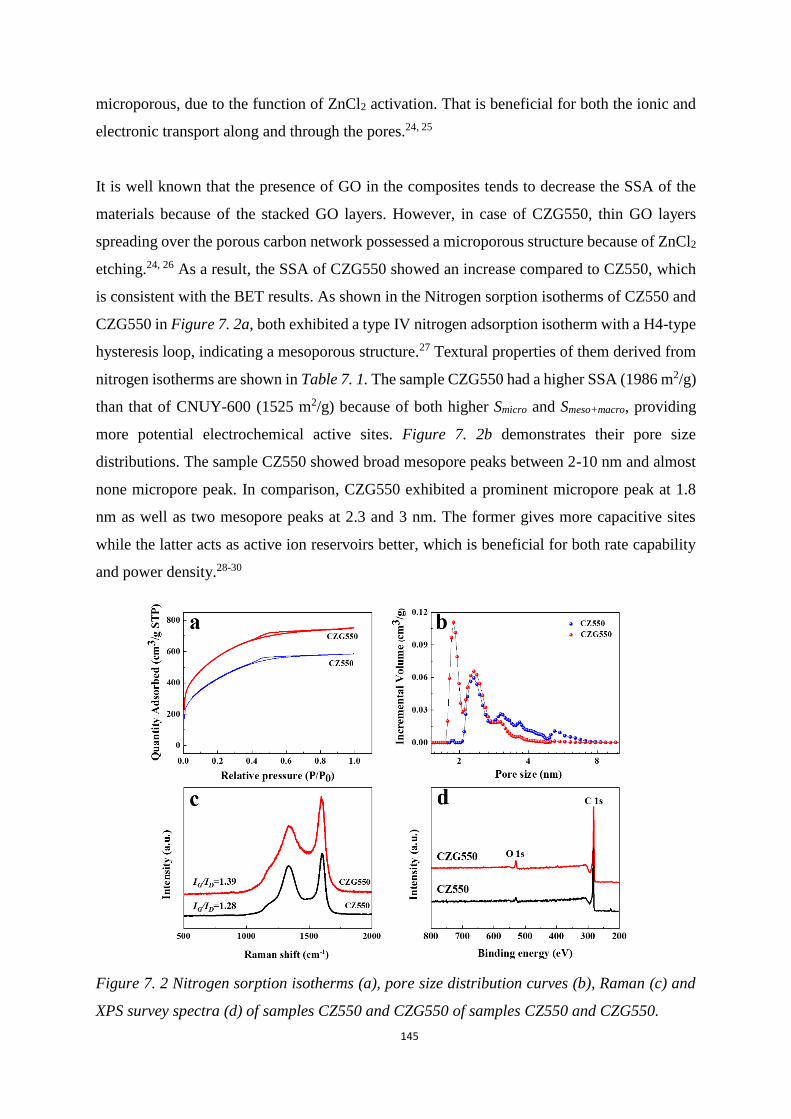
145
microporous, due to the function of ZnCl2 activation. That is beneficial for both the ionic and
electronic transport along and through the pores.24, 25
It is well known that the presence of GO in the composites tends to decrease the SSA of the
materials because of the stacked GO layers. However, in case of CZG550, thin GO layers
spreading over the porous carbon network possessed a microporous structure because of ZnCl2
etching.24, 26 As a result, the SSA of CZG550 showed an increase compared to CZ550, which
is consistent with the BET results. As shown in the Nitrogen sorption isotherms of CZ550 and
CZG550 in Figure 7. 2a, both exhibited a type IV nitrogen adsorption isotherm with a H4-type
hysteresis loop, indicating a mesoporous structure.27 Textural properties of them derived from
nitrogen isotherms are shown in Table 7. 1. The sample CZG550 had a higher SSA (1986 m2/g)
than that of CNUY-600 (1525 m2/g) because of both higher Smicro and Smeso+macro, providing
more potential electrochemical active sites. Figure 7. 2b demonstrates their pore size
distributions. The sample CZ550 showed broad mesopore peaks between 2-10 nm and almost
none micropore peak. In comparison, CZG550 exhibited a prominent micropore peak at 1.8
nm as well as two mesopore peaks at 2.3 and 3 nm. The former gives more capacitive sites
while the latter acts as active ion reservoirs better, which is beneficial for both rate capability
and power density.28-30
Figure 7. 2 Nitrogen sorption isotherms (a), pore size distribution curves (b), Raman (c) and
XPS survey spectra (d) of samples CZ550 and CZG550 of samples CZ550 and CZG550.
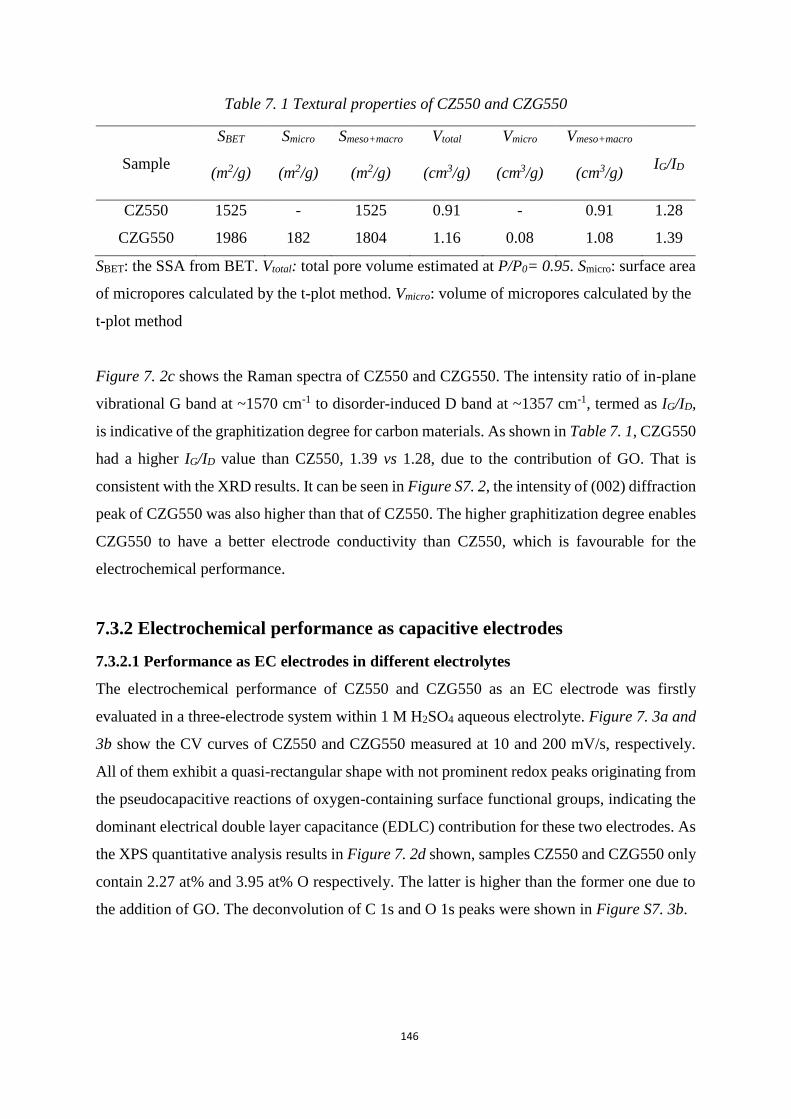
146
Table 7. 1 Textural properties of CZ550 and CZG550
Sample
SBET
(m2/g)
Smicro
(m2/g)
Smeso+macro
(m2/g)
Vtotal
(cm3/g)
Vmicro
(cm3/g)
Vmeso+macro
(cm3/g)
IG/ID
CZ550 1525 - 1525 0.91 - 0.91 1.28
CZG550 1986 182 1804 1.16 0.08 1.08 1.39
SBET: the SSA from BET. Vtotal: total pore volume estimated at P/P0= 0.95. Smicro: surface area
of micropores calculated by the t-plot method. Vmicro: volume of micropores calculated by the
t-plot method
Figure 7. 2c shows the Raman spectra of CZ550 and CZG550. The intensity ratio of in-plane
vibrational G band at ~1570 cm-1 to disorder-induced D band at ~1357 cm-1, termed as IG/ID,
is indicative of the graphitization degree for carbon materials. As shown in Table 7. 1, CZG550
had a higher IG/ID value than CZ550, 1.39 vs 1.28, due to the contribution of GO. That is
consistent with the XRD results. It can be seen in Figure S7. 2, the intensity of (002) diffraction
peak of CZG550 was also higher than that of CZ550. The higher graphitization degree enables
CZG550 to have a better electrode conductivity than CZ550, which is favourable for the
electrochemical performance.
7.3.2 Electrochemical performance as capacitive electrodes
7.3.2.1 Performance as EC electrodes in different electrolytes
The electrochemical performance of CZ550 and CZG550 as an EC electrode was firstly
evaluated in a three-electrode system within 1 M H2SO4 aqueous electrolyte. Figure 7. 3a and
3b show the CV curves of CZ550 and CZG550 measured at 10 and 200 mV/s, respectively.
All of them exhibit a quasi-rectangular shape with not prominent redox peaks originating from
the pseudocapacitive reactions of oxygen-containing surface functional groups, indicating the
dominant electrical double layer capacitance (EDLC) contribution for these two electrodes. As
the XPS quantitative analysis results in Figure 7. 2d shown, samples CZ550 and CZG550 only
contain 2.27 at% and 3.95 at% O respectively. The latter is higher than the former one due to
the addition of GO. The deconvolution of C 1s and O 1s peaks were shown in Figure S7. 3b.

147
Figure 7. 3 The electrochemical performance measured in 1 M H2SO4 electrolyte using a three-
electrode system: CV curves of CZ550 and CZG550 at 10 (a) and 200 mV/s (b); CV (c), GCD
curves (d) of CZG550; Rate capability plots (e) and Nyquist plots (f) of CZ550 and CZG550.
Figure 7. 3c-d and Figure S7. 4a-b show the CV and GCD curves of CZ550 and CZG550. The
quasi-rectangular CV curves and symmetric linear GCD profiles further confirm the main
capacitive contribution from EDLC.31 In addition, CZG550 exhibited CV and GCD profiles
with less distortion than the former at high scan rates and current densities, indicating faster
charge storage kinetics. As shown in the rate capability plots (Figure 7. 3e), the electrode
CZG550 exhibited a specific capacitance of 317 F/g at a current density of 0.2 A/g and
remained 175 F/g at 50 A/g. More information was provided in Table S7. 1.
Figure 7. 3f compares the Nyquist plots of CZ550 and CZG550 electrodes. Both plots consist
of a semicircle, a short diffusion region and an almost vertical line at the high, intermediate
and low-frequency region, respectively. But the latter exhibited smaller equivalent series
resistance which is a summarisation of the contact resistance and electrode resistance (ESR, 1.1
vs 1.3 Ω), much smaller charge transfer resistance (Rct, 0.5 vs 1.2 Ω) than the former. This
further confirms the better electrode conductivity and electronic charge transfer along and over
the porous structure of CZG550 than CZ550, which contributes to the better specific
capacitance and rate capability.

148
Figure 7. 4 Electrochemical performance measured in symmetric coin cells with 1 M
NaClO4/EC/PC/FEC organic electrolyte: (a) CV curves of CZ550 and CZG550 at 100 mV/s;
CV (b), GCD curves (c) and Rate capability plot (d) of CZG550.
The electrochemical performance of CZ550 and CZG550 was further evaluated in symmetric
coin cells using 1 M NaClO4/EC/PC/FEC organic electrolyte. Figure 7. 4a exhibits CV curves
of them within a voltage window of 0-3.0 V at the scan rate of 100 mV/s. Both curves
demonstrated a quasi-rectangular shape due to the dominant EDLC contribution with certain
pseudocapacitance from the reversible redox reactions of sodium-ions with oxygen surface
functional groups. And CZG550 showed a higher current than CZ550, indicative of a higher
specific capacitance value. Figure 7. 4b gives the CV curves of CZG550 at scan rates ranging
from 10 to 1000 mV/s. A well-maintained rectangular shape was still observed at a high scan
rate of 1000 mV/s, demonstrating its good rate capability. Figure 7. 4c and 4d present GCD
curves at various current densities and the corresponding rate capability plots of CZG550. It
exhibited a specific capacitance of 98.7 F/g or a specific capacity of 82.3 mAh/g at 0.1 A/g in
the symmetric coin cell. The values remained 64.8 F/g and 54.0 mAh/g at 5 A/g. The Nyquist
plot of the cell was shown in Figure S7. 5. It had a relatively low ESR of 3.8 Ω and Rct of 7.7

149
Ω in organic electrolyte. For comparison, the electrochemical performance of electrode CZ550
measured in a symmetric coin cell using 1 M NaClO4/EC/PC/FEC organic electrolyte was
shown in Figure S7. 6.
The electrochemical performance of CZG550 in a symmetric coin cell using EMIBF4 IL
electrolyte was also investigated, as shown in Figure S7. 7.
7.3.2.2 Performance in a sodium half-cell
Since CZG550 exhibited better electrochemical performance than CZ550 within both 1 M
NaClO4/EC/PC/FEC organic electrolyte and 1 M H2SO4 aqueous electrolyte, it was then
selected to be tested in a half cell configuration versus Na metal, in a potential window of 1.5-
4.0 V (vs. Na+/Na). Figure 7. 5a shows the CV curves of CZG550 at scan rates from 0.2 to 20
mV/s. The rectangular shape indicates the typical EDLC contribution through
adsorption/desorption of ClO4-1 ions in a sodium half-cell. A part of the capacitance may be
also obtained through pseudocapacitive interactions of Na+ with oxygen surface functional
groups on the electrode material. Figure 7. 5b provides GCD profiles of CZG550 at current
densities ranging from 0.1 A/g to 1 A/g. The symmetric and linear GCD curves further confirm
the dominant EDLC capacitance contribution of CZG550, consistent with the CV results.
Figure 7. 5c shows the rate performance of electrode CZG550. It exhibited a specific capacity
of 64.8 mAh/g at a current density of 0.1 A/g and still maintained at 39.4 mAh/g at 1 A/g. The
good specific capacity and rate capability of CZG550 are attributed to the high SSA and
mesoporous carbon network covered by thin microporous GO layers, which is beneficial for
both the electronic and ionic transport.
7.3.2.3 Performance in a sodium ion capacitor
A hybrid NIC cell was built by using CZG550 as the positive and Nb2O4.84F0.32/carbon
nanobelts as the negative electrodes. Detailed information for the negative electrode materials
please refer to SI. The charge storage mechanism of CZG550//Nb2O4.84F0.32/carbon nanobelts
hybrid device is illustrated as following: For charging, Na+ ions intercalate into the battery
anode electrode, meanwhile ClO4-1 counterions were electrostatically adsorbed on the porous
structure of electrode CZG550. Some Na+ ions may also interact with the oxygen surface
functional groups of electrode materials, contributing to some pseudcapacitance. For

150
discharging, the process was reversible desodiation from the negative electrode and desorption
of ClO4-1 ions from the positive electrode. For the consideration of charge balance, an electrode
mass loading ratio of 1:3 (negative: positive) was selected in this case.
Figure 7. 5d shows the CV curves of the hybrid device at scan rates ranging from 2 to 100
mV/s with a voltage window of 1-4 V. The inset figure demonstrates that the cell exhibited an
asymmetric CV profile with deviation from a rectangular shape of EDLC at 2 mV/s, led by the
battery-type conversion reactions on the anode electrode. And the CV curve still maintained a
similar shape with certain distortion at a high scan rate of 100 mV/s, demonstrating a good rate
performance of the hybrid device. Figure 7. 5e provides GCD curves of the device measured
at different current densities. The symmetric quasi-triangular shape further confirms the
synergistic effect of two different charge storage mechanisms in the device. The linear slope
indicates the dominant capacitive contribution to this device.

Figure 7. 5 Electrochemical performance of CZG550 in a sodium half-cell: (a) CV curves at 0.2-20 mV/s, GCD profiles at 0.1-5 A/g (b) and Rate
capability (c). Performance of CZG550// Nb2O4.84F0.32/carbon nanobelts NIC: CV (d), GCD curves (e), Nyquist plot (f), Rate performance (g),
Cycling performance at 1 A/g (h) and Ragone plots (i).

152
Figure 7. 5f is the Nyquist plot of the hybrid device. It was simulated with an equivalent circuit
model as shown in Figure S7. 8.32-34 The device showed a relatively low ESR of 4.9 Ω and Rct
of 54.8 Ω., Here ESR, the high-frequency intercept on the real axis, includes the contact
resistance, electrode resistance and electrolyte resistance. The ionic diffusion resistance in the
electrolyte accounts for the majority in this system.18 The two depressed quasi-semicircles at
the high to middle frequency region correspond to the resistance of SEI film and the charge
transfer resistance in positive as well as negative electrodes respectively. 32-34 Zw represents the
Warburg impedance, which is mainly the Na diffusion resistance within the negative materials.
18, 35
The device delivered an energy density of 48.1 Wh/Kg with a power density of 250 W/Kg at a
current density of 0.1 A/g and remained 22.6 Wh/Kg at a high-power density of 18, 080 W/Kg.
Moreover, it could give relatively stable energy outputs with rapid current change as illustrated
in Figure 7. 5g. However, the cycling stability of the device needs further improvement. As
demonstrated in Figure 7. 5h, the device remained ~80.1% of the original specific capacity
value after 500 GCD tests at 1 A/g, with an outstanding Coulombic efficiency of ~99.5%.
Figure 7. 5i compares the Ragone plots of three different devices assembled with CZG550
electrodes in this work, i.e., symmetric cells using organic or IL electrolyte and the hybrid NIC
device. It is seen that the hybrid device exhibited higher energy and power densities than the
former two because of an expanded voltage window. But when the power density is higher
than certain value, ~1, 797 W/Kg in this case, the EC using IL electrolyte still showed a higher
energy density than the hybrid device. The comparison further confirms the respective potential
applications of NICs, ECs and batteries based on their own advantages. NICs bridge the gap
between ECs and batteries, rather than replicate them.
7.4 Conclusion
In summary, microcrystalline cellulose-derived porous carbon/graphene oxide composites
were prepared through a general ZnCl2 activation method at a relatively low temperature of
550 °C as positive electrode materials for sodium-ion capacitors (NICs). The sample had a high
specific surface area and large meso-macropore volume, which is beneficial for the rate
performance of NICs by reducing electrolyte ion diffusion resistance. Thin and holey graphene
oxide layers with abundant micropores covered the 3D interconnected cellulose-derived

153
mesoporous carbon network. The sample exhibited good electrochemical performance as
electrochemical capacitor electrodes within different electrolytes and as positive electrode for
NICs for the reasons as following: (a) the uniform mesoporous carbon network offers lots of
ordered ion reservoirs, thus shortens the diffusion distance; (b) the microporous thin graphene
oxide sheets further interconnected and covered along the mesoporous carbon network, which
enhances the electron conductivity of the electrode materials and facilitates electrolyte ions
transport; (c) the increased SSA and pore volume of the materials provide more active sites for
ion adsorption. As far as we know, this is the first report of microcrystalline cellulose-derived
carbon for NIC cathodes. For the sustainable development of NICs, more research focusing on
high-cyclability-high-capacity cellulose-derived carbon cathode materials is needed.
7.5 References
1. J. Ding, W. Hu, E. Paek and D. Mitlin, Chemical reviews, 2018, 118, 6457-6498.
2. Y. Shao, M. F. El-Kady, J. Sun, Y. Li, Q. Zhang, M. Zhu, H. Wang, B. Dunn and R.
B. Kaner, Chem Rev, 2018, 118, 9233-9280.
3. K. Naoi, S. Ishimoto, J.-i. Miyamoto and W. Naoi, Energy & Environmental Science,
2012, 5, 9363-9373.
4. F. Sun, X. Liu, H. B. Wu, L. Wang, J. Gao, H. Li and Y. Lu, Nano letters, 2018, 18,
3368-3376.
5. M. D. Slater, D. Kim, E. Lee and C. S. Johnson, Advanced Functional Materials,
2013, 23, 947-958.
6. S. W. Kim, D. H. Seo, X. Ma, G. Ceder and K. Kang, Advanced Energy Materials,
2012, 2, 710-721.
7. L. Li, Y. Zheng, S. Zhang, J. Yang, Z. Shao and Z. Guo, Energy & Environmental
Science, 2018, 11, 2310-2340.
8. Y. Liu, F. Fan, J. Wang, Y. Liu, H. Chen, K. L. Jungjohann, Y. Xu, Y. Zhu, D. Bigio
and T. Zhu, Nano letters, 2014, 14, 3445-3452.
9. T. Zhang, L. Yang, X. Yan and X. Ding, Small, 2018, 14, 1802444.
10. E. Lim, C. Jo, M. S. Kim, M. H. Kim, J. Chun, H. Kim, J. Park, K. C. Roh, K. Kang
and S. Yoon, Advanced Functional Materials, 2016, 26, 3711-3719.
11. Y. Wu, X. Fan, R. R. Gaddam, Q. Zhao, D. Yang, X. Sun, C. Wang and X. Zhao,
Journal of Power Sources, 2018, 408, 82-90.
12. J. Ding, Z. Li, K. Cui, S. Boyer, D. Karpuzov and D. Mitlin, Nano Energy, 2016, 23,
129-137.
13. H. Hou, X. Qiu, W. Wei, Y. Zhang and X. Ji, Advanced Energy Materials, 2017, 7,
1602898.
14. M. Y. Song, N. R. Kim, S. Y. Cho, H.-J. Jin and Y. S. Yun, ACS Sustainable
Chemistry & Engineering, 2016, 5, 616-624.
15. Z. Le, F. Liu, P. Nie, X. Li, X. Liu, Z. Bian, G. Chen, H. B. Wu and Y. Lu, ACS nano,
2017, 11, 2952-2960.
16. L. She, Z. Yan, L. Kang, X. He, Z. Lei, F. Shi, H. Xu, J. Sun and Z.-H. Liu, ACS
Omega, 2018, 3, 15943-15951.

154
17. N. Kurra, M. Alhabeb, K. Maleski, C.-H. Wang, H. N. Alshareef and Y. Gogotsi, ACS
Energy Letters, 2018, 3, 2094-2100.
18. J. Ding, H. Wang, Z. Li, K. Cui, D. Karpuzov, X. Tan, A. Kohandehghan and D.
Mitlin, Energy & Environmental Science, 2015, 8, 941-955.
19. Q. Wei, Y. Jiang, X. Qian, L. Zhang, Q. Li, S. Tan, K. Zhao, W. Yang, Q. An and J.
Guo, iScience, 2018, 6, 212-221.
20. Y. Dall’Agnese, P.-L. Taberna, Y. Gogotsi and P. Simon, The journal of physical
chemistry letters, 2015, 6, 2305-2309.
21. H. Lu and X. Zhao, Sustainable Energy & Fuels, 2017, 1, 1265-1281.
22. X. Sun, H. Lu, P. Liu, T. E. Rufford, R. R. Gaddam, X. Fan and X. Zhao, Sustainable
Energy & Fuels, 2018, 2, 673-678.
23. S. Park and R. S. Ruoff, Nature nanotechnology, 2009, 4, 217.
24. Y. Zhu, S. Murali, M. D. Stoller, K. Ganesh, W. Cai, P. J. Ferreira, A. Pirkle, R. M.
Wallace, K. A. Cychosz and M. Thommes, Science, 2011, 332, 1537-1541.
25. H. Lu, X. Sun, R. R. Gaddam, N. A. Kumar and X. S. Zhao, Journal of Power
Sources, 2017, 360, 634-641.
26. S. Liu, W. Peng, H. Sun and S. Wang, Nanoscale, 2014, 6, 766-771.
27. C. Huang, X. Song, Y. Qin, B. Xu and H. C. Chen, Journal of Materials Chemistry A,
2018, 6, 21047-21055.
28. C. Wang, X. Wang, H. Lu, H. Li and X. Zhao, Carbon, 2018, 140, 139-147.
29. H. Lu, K. Kim, Y. Kwon, X. Sun, R. Ryoo and X. Zhao, Journal of Materials
Chemistry A, 2018, 6, 10388-10394.
30. X. Song, C. Huang, Y. Qin, H. Li and H. C. Chen, Journal of Materials Chemistry A,
2018, 6, 16205-16212.
31. Y. Gogotsi and R. M. Penner, ACS nano, 2018, 12, 2081-2083.
32. M. S. Park, G. K. Veerasubramani, R. Thangavel, Y. S. Lee and D. W. Kim,
ChemElectroChem.
33. Q. Gui, D. Ba, Z. Zhao, Y. Mao, W. Zhu, T. Lei, J. Tan, B. Deng, L. Xiao and Y. Li,
Small Methods, 2018, 1800371.
34. X. Hu, Y. Liu, J. Chen, J. Jia, H. Zhan and Z. Wen, Journal of Materials Chemistry A,
2019, 7, 1138-1148.
35. H. Li, J. Lang, S. Lei, J. Chen, K. Wang, L. Liu, T. Zhang, W. Liu and X. Yan,
Advanced Functional Materials, 2018, 28, 1800757.

155
7.6 Supporting information
Synthesis of Nb2O5-xFy/Carbon nanosheets
The Nb2O5-xFy/Carbon nanosheets were prepared by a facile ethanol-assisted solvothermal
synthesis described as following: Firstly, 1.0 mL hydrofluoric acid (50 wt%) was added into
30 mL ethylene glycol (98%) under magnetic stirring for 30 min. Then 150 mg niobium powder
(98.5 %) was added to the above solution and stirred for 1 h under ultrasonication. The mixture
was then placed into a 50 mL Teflon-lined stainless autoclave for a hydrothermal treatment at
180 °C for 24 h. Next, after cooling down to room temperature, the mixture from the
hydrothermal treatment was filtered and washed with ethanol and deionised water. The finally
obtained bluish green precipitate was frozen dried for 48 h and lastly pyrolyzed at 800 °C for
2 h under N2 flow.
Figure S7. 1 TEM image of CZG550
Figure S7. 2 XRD profiles of CZ550 and CZG550.

156
Figure S7. 3 The deconvoluted C 1s (a) and O 1s (b) spectra of sample CZG550.
Figure S7. 4 The electrochemical performance of CZ550 measured in 1 M H2SO4 electrolyte
using a three-electrode system: CV (a), GCD curves (b).

157
Figure S7. 5 Nyquist plot of CZG550 in a symmetric coin cell within 1 M NaClO4/EC/PC/FEC
organic electrolyte.
Figure S7. 6 The electrochemical performance of electrode CZ550 measured in symmetric coin
cells with 1 M NaClO4/EC/PC/FEC organic electrolyte: GCD curves at current densities from
0.25 to 5 A/g (a) and Nyquist plot (b).

158
Figure S7. 7 The electrochemical performance of CZG550 measured in symmetric coin cells
using EMIBF4 IL electrolyte within a voltage window of 0-3.6 V: CV (a), GCD curves (b), Rate
capability plot (c) and Nyquist plot (d).
Figure S7. 8 The equivalent circuit used for fitting the Nyquist plot of NICs.

159
Table S7. 1 Specific capacitance values (in F/g) of electrodes CZ550 and CZG550 in 1 M
H2SO4 aqueous electrolyte within a three-electrode system
Current density (A/g) 0.2 0.5 1 2 5 10 20 30 50
CZ550 243 217 204 196 183 175 160 150 120
CZG550 317 288 263 246 230 220 215 210 175
Table S7. 2 Electrochemical performance values of CZG550 in symmetric coin cells using 1
M NaClO4/EC/PC/FEC organic electrolyte
Current density (A/g) 0.1 0.2 0.5 1 2 5
Specific capacitance
(F/g)
98.7 91.0 85.7 80.7 74.9 64.8
Capacity (mAh/g) 82.3 75.8 71.4 67.3 62.4 54

160
Chapter 8 Conclusions and Recommendations

161
8.1 Conclusions
This thesis focuses on developing high-performance porous carbon electrode materials,
especially microcrystalline cellulose (MC) derived ones, for electrocapacitive energy storage
applications. The electrocapacitive properties of the obtained carbons were improved and the
performance of the cells assembled with these carbon electrode materials were enhanced. In
all, the thesis concludes that MC-derived porous carbons are quite promising electrode
materials for the development of electrochemical capacitors (ECs). This part specifically
summarizes the conclusions of preceding work as following:
1. Heteroatom-doping porous carbons from MC were prepared through a generalised
approach for EC electrodes. After freeze drying followed by carbonization at different
temperature, N/O-doping porous carbons with certain degree of graphitization were
obtained. The sample carbonised at 600 oC exhibits a specific gravimetric capacitance
of 263 F/g at a scan rate of 5mV/s measured in a three-electrode system within 1 M
H2SO4 aqueous electrolyte, due to a well-developed porous structure coupled with the
presence of nitrogen-containing functional groups along with nascent hydrogen. A
symmetric cell fabricated using this carbon exhibits an energy density of 14.6 Wh/Kg
at the power density of 63.5 W/Kg in 1 M H2SO4 electrolyte. The relatively low
carbonisation temperature required to activate cellulose (600 oC) in comparison with
previous reports is partially due to the presence of both NaOH and urea in the system.
2. Further improvement on electrocapacitive properties of the MC-derived carbon was
conducted by manipulating the N/O doping level and introducing intrinsic defects at a
carbonisation temperature of 600 °C followed by thermal treatment in a reducing
environment. The improved carbon sample displays a specific capacitance of as high
as 426 F/g at 0.25 A/g or 177 F/g at 100 A/g measured in a three-electrode system using
1 M H2SO4 aqueous electrolyte. About 90 % of its original capacitance was retained
after 60,000 cycles at 5 A/g as measured in a symmetric cell. Additionally, the electrode
with a high mass loading of 12 mg/cm2 displays high areal capacitances of 2,518 and
1,128 mF/cm2 at current densities 0.5 and 50 mA/cm2, respectively, along with a good
cycling stability, making the sample a promising candidate for practical EC application.
It was suggested that the presence of intrinsic defects changed the electronic structure
of the carbon, which enabled the porous structure and the low-amount of doped N/O to

162
be more fully and efficiently utilised for electric double layer capacitance and
pseudocapacitance respectively.
3. To understand the role of pore hierarchy in capacitive charge storage, 3D ordered
microporous, mesoporous and hierarchically porous carbons (HPCs) were prepared
with calcium-containing zeolites as templates and ethylene as the carbon source at a
carbonization temperature of 600 °C. The Ca2+ localized in zeolite micropores can
strongly interact with ethylene, leading to selective deposition of carbon in pores
instead of on the external surface of the template. Comparative study showed that the
HPC shows the best electrocapacitive properties, due to an appropriate amount of
micropores and rich mesopores, which provided sufficient active sites for electric
double layer and enabled the active ions in micropores to have nanometer transport
distances, respectively. The ordered straight hierarchy templated from the zeolite
further decreased the charge transfer and electrolyte diffusion resistance, beneficial for
both the rate capability and cycling stability. A symmetric cell built with this sample
exhibits a specific capacitance of 246 F/g at 1 A/g after 17, 000 times cycling. Besides,
an all-solid-state cell fabricated with this carbon and polyvinyl alcohol/H2SO4 gel as
the electrolyte also displays good performance.
4. MC-derived porous carbon/graphene oxide composites were prepared through a one-
pot ZnCl2 activation method at a relatively low temperature of 550 °C. The sample
shows good performance in different cell configurations including symmetric ECs and
sodium ion capacitors (NICs) within different electrolytes. Microporous thin graphene
oxide layers further interconnected and covered along the mesoporous carbon network,
which provides more electrocapacitive sites and is beneficial for both the electronic and
ionic transport. The hybrid NIC device exhibits higher energy and power densities than
the symmetric cells using organic or IL electrolyte because of a larger voltage window.
But when the power density is higher than certain value, ~1, 797 W/Kg in this case, the
EC using IL electrolyte still shows a higher energy density than the hybrid device. The
comparison further confirms the respective potential applications of NICs, ECs based
on their own advantages. NICs bridge the gap between ECs and batteries, rather than
replicate them.
The electrochemical performance of the key samples in this thesis are listed in Table 8. 1.

Table 8. 1 Comparisons of the typical four electrode materials obtained in chapter 4, 5, 6 and 7.
Electrode
carbon
materials
Doping level
at%
Porous structure Performance in
two-electrode cell
Electrolyte Energy density (Wh/Kg)
@Power density (W/Kg)
Cycling stability Chap
N O
NPC600 9.22 11.71 Micro/meso/macropo
rous
248 F/g at 0.1 A/g 1 M H2SO4 14.6 @63.5 89.2% (2000) at 1 A/g 4
CNUY600H 3.40 7.43 Micro/meso/macropo
rous
253 F/g at 0.2 A/g 1 M H2SO4 14.9 @ 130.5 90% (60000) at 5 A/g 5
206 F/g at 0.5 A/g 1 M LiCl 20.7 @ 425.8
NBZC - 9.2 Micro-mesoporous 170 F/g at 0.1 A/g 1 M H2SO4 5.9 @505.7 153% (17000) at 1 A/g 6
413 mF/cm2 @
0.25 mA/cm2
PVA/H2SO4
gel
-
CZG550 - 3.95 Meso-microporous 64.8 mAh/g @ 0.1
A/g
1 M
NaClO4/EC/
PC/FEC
48.1 @ 250
22.6 @ 18, 080
~80.1% (500) at 1 A/g 7

164
8.2 Recommendations
The performance of the capacitive electrode is still a bottleneck for both symmetric ECs and
hybrid NICs. Although microcrystalline cellulose-derived porous carbons are promising for
ECs, there are still further space to enhance their performance and for the large-scale industrial
production. Based on the results from our thesis, the research recommendations are as
following:
1. The control of heteroatom doping level for electrocapacitive performance enhancement
is an interesting direction for research. It has been confirmed about the effect of
capacitance enhancement through heteroatom doping. However, the work in this thesis
showed that the carbon sample with a lower heteroatom doped amount could even
exhibit better electrocapacitive performance. But detailed study on the effect of
heteroatom-doping level for the electrocapacitive properties was not included. So in the
future work, more associated research is recommended for.
2. Research focusing on intrinsic defects on carbon materials for electrochemical energy
storage has just began recently. More studies are needed.
3. Research on cellulose or lignin-derived carbons for electrochemical energy conversion
and storage applications has been increasing in recent years, for the consideration of
the application of biomass. More studies, such as heteroatom doping or composite with
other materials, are recommended in future.
4. Hybrid sodium ion capacitors (NICs) have been recognized as the most attractive
alternative to the current commercial Lithium ion batteries, due to the wide availability
and accessibility of metal sodium. In chapter 7 we reported the microcrystalline
cellulose-derived porous carbon composited with rGO for NICs. As far as we know,
this is the first report of microcrystalline cellulose-derived carbon for NIC cathodes.
Besides, consistent with the initial point for the promotion of NICs and combined with
the consideration of environmental protection, it will be prospective to assemble NICs
with both cellulose-derived anode and cathode. Much research is needed in this
direction.