A Finite Element Analysis of the Pullout Capacity of Suction ...
97
A Finite Element Analysis of the Pullout Capacity of Suction Caissons in Clay By Christina G. Sgardeli MEng Civil Engineering (2006) Imperial College London Submitted to the Department of Civil and Environmental Engineering in the Requirements for the Degree of MASSACHUSETTS INSTITE OF TECHNOLOGY JUL 2 0 2009 LIBRARIES Partial Fulfillment of Master of Engineering in Civil and Environmental Engineering at the Massachusetts Institute of Technology ARCHIVES February 2009 @ 2009 Christina G. Sgardeli The author hereby grants to MIT permission to reproduce and to distribute publicly paper and electronic copies of this thesis document in whole or in part in any medium now known or hereafter created. Signature of Author Department of Civil and Environmental Engineering A ,f , N January 29, 2009 Certified by Andrew J. Whittle Professor of Civil and Environment Engineering , /§ esis Supervisor Accepted by Daniele Veneziano Chairman, Departmental Committee for Graduate Students J
-
Upload
khangminh22 -
Category
Documents
-
view
2 -
download
0
Transcript of A Finite Element Analysis of the Pullout Capacity of Suction ...

A Finite Element Analysis of the Pullout Capacity of Suction Caissons inClay
By
Christina G. Sgardeli
MEng Civil Engineering (2006)Imperial College London
Submitted to the Department of Civil and Environmental Engineering inthe Requirements for the Degree of
MASSACHUSETTS INSTITEOF TECHNOLOGY
JUL 2 0 2009
LIBRARIES
Partial Fulfillment of
Master of Engineering in Civil and Environmental Engineeringat the
Massachusetts Institute of Technology
ARCHIVESFebruary 2009
@ 2009 Christina G. Sgardeli
The author hereby grants to MIT permission to reproduce and to distribute publicly paper and electronic copiesof this thesis document in whole or in part in any medium now known or hereafter created.
Signature of Author
Department of Civil and Environmental Engineering
A ,f , N January 29, 2009
Certified by
Andrew J. WhittleProfessor of Civil and Environment Engineering
, /§ esis Supervisor
Accepted by
Daniele VenezianoChairman, Departmental Committee for Graduate Students
J

A Finite Element Analysis of the Uplift Capacity of Suction Caissons inClay
By
Christina G. Sgardeli
Submitted to the Department of Civil and Environmental Engineering on January 29, 2009 in partialfulfillment of the requirements for the degree of Master of Engineering in Civil and Environmental
Engineering
Abstract
Suction caissons are increasingly becoming the foundation of choice for offshore structures indeep water. They are used extensively in Tension Leg Platforms and provide the most efficientfoundations for many offshore wind turbine structures. One of their major advantages is theability to withstand large uplift forces by mobilizing shear on their external and internal surfaceand by the suction forces induced in the enclosed soil plug. These suction forces can be reliedupon for short-term loading, while the behaviour of the soil remains undrained, but are morequestionable for the sustained loading induced by storms and loop currents. This study usesfinite element analysis to investigate the uplift capacity of suction caissons under three loadingconditions: a) short-term undrained loading, b) long-term drained loading and c) sustainedloading for short and long periods of time. The study compares the capacity from 5 differentgeometries with length to diameter ratios, L/d = 0.5,0.65,1,2 and 3 under these three loadingconditions. For the sustained loading case, a minimum time under which the load can besustained is established for different load levels. The commercial finite element program Plaxisis used and a Mohr-Coulomb model is assumed for the soil. Comparisons are presentedbetween the results of this study, the theoretical Mohr-Coulomb model predictions and otherfinite element analysis found in the research for undrained and drained loading.
Thesis Supervisor: Andrew J. WhittleTitle: Professor of Civil and Environmental Engineering

Acknowledgements
I would like to express my gratitude to my advisor, Professor Andrew Whittle, for his
continuous support, patience and invaluable guidance throughout the development of this
thesis and throughout my time at MIT. I would like to thank Dr. Eric Adams for giving me the
opportunity to pursue one of the most challenging and enriching experiences at MIT. Special
thanks to Kris Kipp and Jeanette Marchocki for being always approachable and supportive
throughout these years.
I would like to thank all of my friends from the third floor and the MEng class, Giuseppe, Sherif,
Maria, Ray, Naeem, Bruno, Nikos, Ali, Kenneth, Tricie and Siddharth for making my life there so
interesting and enjoyable every day.
I would like to express my deepest gratitude to my family which has always supported me in
every easy or hard choice I have made. Especially, I would like to thank my father, Antony, for
being my inspiration and role model and my mother, Kaiti for all the strength and courage her
unconditional love has given me. I would like to express my deepest gratitude to Giannis
Fostiropoulos whose unconditional support has made all of this possible.
Despina, Shoshanna, Kosta, Stavro, Ruben, Giorgo, Yianni, Antoni, Nikola it has been an honor
to be your friend and I cannot thank you enough for being there throughout the best and worst
of times and for making these years a time I will treasure forever.

Table of Contents
Abstract ................................................................... 2
Acknowledgements...........................................................................................................3
Table of Contents ........................................................................................... ............... 4
List of Figu res .................................................................................................... ...................................... 6
1. Intro d uctio n ............................................................................................... ................................... 8
2. Background, soil model and limit calculation analysis ..................................... .... ........... 20
2.1 Problem description .................................................................................................................... 20
2.2 Lim it equilibrium solutions ..................................................................... .............................. 23
2.2.1 U ndrained response ............................................................................................................ 23
2.2.2 D rained response ................................................................................................................ 26
2.3 Drained capacity; sustained tensile loading ..................................... ..... ............... 29
2.4 Literature review........................................................................................................ 30
3. Numerical Analysis of Caisson Response under Undrained Conditions ..................................... 35
3.1 The finite elem ent m odel ............................................................................................................ 35
3.2 Results of base case geometry analysis .......................................................................... 37
3.2.1 Load-deformation response.......................................................................................... 37
3.2.2 Breakdown of reaction forces ....................................................................................... 38
3.2.3 Failure m echanism .............................................................................................................. 40
3.3 Effect of caisson geometry in undrained response ..................................... ... .......... 45
3.4 Comparison of results with existing research ................................................................... 48
4. Numerical Analysis of Suction Caisson Model under Drained Conditions.......................................... 50
4.1 The finite elem ent m odel............................................................................................................ 50
4.2 Results of Base Case geometry analysis...................................................................................... 51
4.2.1 Load-deformation response................................................................................................ 52
4.2.2 Breakdown of reaction forces ....................................................................................... 53
4.2.3 Failure m echanism .............................................................................................................. 59
4.3 Effect of w all length .................................................................................................. . . .... 63
4.4 Comparisons of results with existing research ..................................... .... ............. 67
5. Numerical Analysis of Suction Caisson under Sustained Loading............................... ........ 69

5.1 The finite element model............................................................................................................ 69
5.2 Base case analysis .................................................. 69
5.2.1 Load deformation response ................................................................ .......................... 70
5.2.2 Capacity under sustained loading ...................................................... 71
5.2.3 Failure mechanism .............................................................................................................. 75
5.3 Sustained loading capacity for L/d ratios = 0.5,1,2 and 3 ...................................... ....... 80
6. Results and Recom mendations........................................................................................................... 89
References ...................................................................................................... ...................................... 91
Appendix A .................................................................................................................................................. 94
Appendix B: Breakdown of undrained loading forces for L/d=0.5,1,2,3 ..................................... ... 95
Appendix C: Breakdown of drained loading forces for L/d=0.5,1,2,3....................... 99

List of Figures
Figure 1-1 Snorre platform foundations ......................................................... .............................................. 11
Figure 1-2 Europipe ............................................................................................................................................ 13Figure 1-3 Na Kika FDS mooring elevation and suction pile configuration (Source: Newlin 2003) ..................... 12
Figure 1-4. Examples of typical diameter and skirt depths reported in the literature ..................................... 13
Figure 1-5 Common suction caisson designs................................................................................................14
Figure 1-6 Forces acting on a suction caisson during installation ..................................... ..... ....... 15
Figure 1-7 Typical elements of suction caissons ........................................................................................... 16
Figure 1-8 Nkossa suction foundation prior to installation.......................................................18Figure 2-1 Undrained shear strength (su) and initial effective stress (a'vo) profiles, y'=11.2kN/m 3 ...... . . .. . . . . ..... 21
Figure 2-2 Forces acting on the caisson under undrained loading .......................................... ...... 23
Figure 2-3 Forces acting on the caisson under drained loading .................................................. 26
Figure 3-1 Axisymmetric model in Plaxis for a cylindrical element (Source: Plaxis v.8 reference manual) ............ 35
Figure 3-2 Base case geometry and finite element mesh ..................................... ...... .................. 36Figure 3-3 Load deformation response for base case geometry..................................... ........ 38
Figure 3-4 Built-up of friction and base resistance forces as applied uplift force increases ................................ 40
Figure 3-5 Shear stresses on external caisson wall at the beginning of uplift loading, (stage A Figure 3.4)...........41Figure 3-6 Shear stresses on external caisson wall corresponding at stage G in Figure 3.4 ............................... 41
Figure 3-7 Development of plastic points during undrained loading for base case geometry ........................... 43
Figure 3-8 Incremental total displacements and deformed mesh at failure ..................................................... 44
Figure 3-9 Effect of caisson geometry on undrained load-deformation response ..................................... 45
Figure 3-10 Mobilization of external side friction. ........................................................................................ 47
Figure 3-11 Mobilization of internal side friction .......................................................................................... 47
Figure 3-12 Comparison of results from current studies with existing literature for undrained loading............49Figure 4-1 Distribution of nodes and stress points in interface elements and their connection to soil elements..51Figure 4-2 Load-deformation response for L/d=0.65 .................................................................................... 52Figure 4-3 The effect of interfaces on the load-displacement response ........................................................... 53
Figure 4-4 Horizontal effective stress distribution on the external caisson wall ....................................... 55Figure 4-5 Horizontal effective stress distribution on the internal caisson wall ..................................... ..........55Figure 4-6 Horizontal displacements at failure ............................................................................................. 56Figure 4-7 Shear stress on external caisson wall...........................................................................................57
Figure 4-8 Shear stress on external caisson wall...........................................................................................57
Figure 4-9 Build-up of friction resistance as applied uplift force increases ..................................... ..... 58
Figure 4-10 Development of plastic points during drained loading .......................................... ...... 60Figure 4-11 Deformed mesh at failure-drained loading case................................. ......... ........ 61Figure 4-12 Vertical displacements at failure-drained loading case.............................................62Figure 4-13 Incremental vertical displacements at failure-drained analysis for base case geometry.................62Figure 4-14 Effect of caisson geometry on drained load-deformation response .................................................. 63
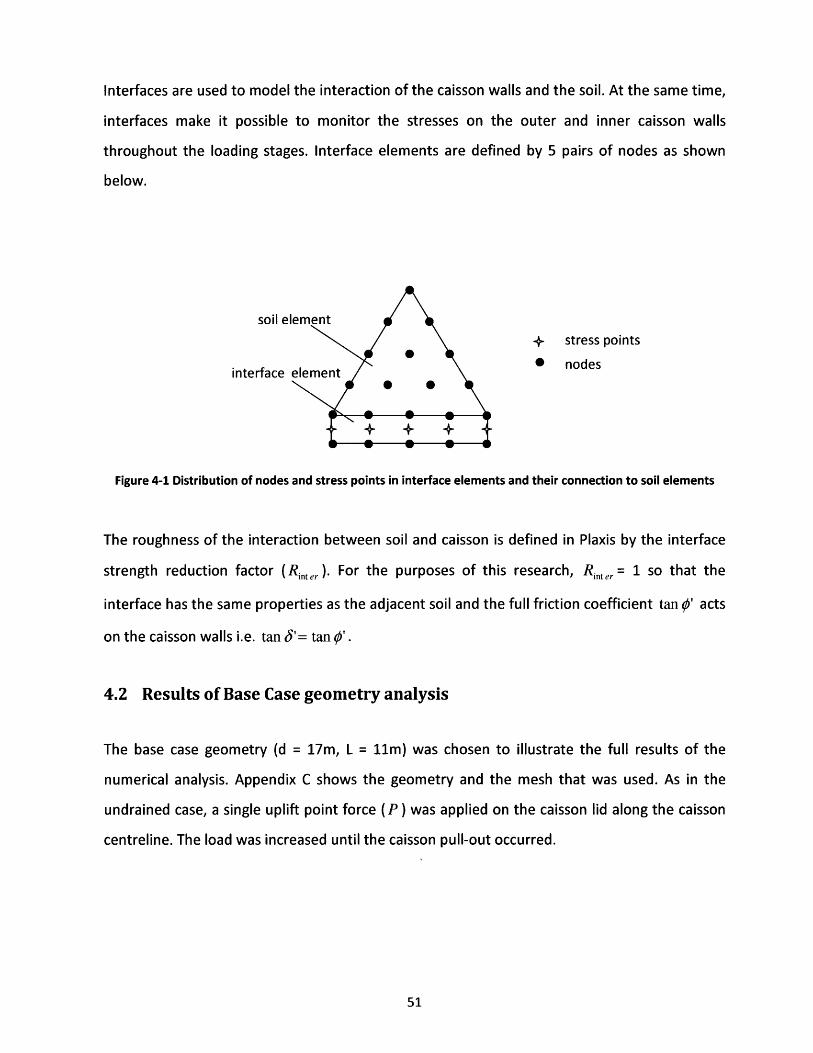
Figure 4-15 Normalized external wall horizontal stress ....................................................... 65Figure 4-16 Mobilization of external side friction ......................................................................................... 66Figure 4-17 Mobilization of internal side friction..........................................................................................67Figure 4-18 Comparison of results from current studies with existing literature for drained loading................68Figure 5-1 Sustained loading displacements for different load levels...........................................70

Figure 5-2 Time displacement curve for P/Pult,undrained=69% ...................................................................... 71
Figure 5-3 Lid displacement and excess pore water pressure with time for base case geometry ...................... 74
Figure 5-4 Development of excess pore pressures with time for P/Pult,undrained=69% ............................................ 77
Figure 5-5 Development of plastic points with time for P/Pult,undrained=69% ......................................................... 78
Figure 5-6 Deformed M esh at t = 45 days........................................................ ............................................. 79
Figure 5-7 Vertical displacement of caisson at t=45.................................................................................... 81
Figure 5-8 Vertical Displacement at t=45days ......................................................................... ..................... 79
Figure 5-9 Sustained loading displacements for different load levels ............................................. 80
Figure 5-10 Lid displacement and Excess Pore Water Pressure with time for L/d=0.5 geometry ....................... 81
Figure 5-11 Sustained loading displacements for different load levels ........................................ ..... 82
Figure 5-12 Lid displacement and excess eore water pressure with time for L/d=1 geometry ........................ 83
Figure 5-13 Sustained loading displacements for different load levels ........................................ ..... 84
Figure 5-14 Lid displacement and excess pore water pressure with time for L/d=2 geometry .......................... 85
Figure 5-15 Sustained loading displacements for different load levels, L/d=3 ......................................... 86
Figure 5-16 Lid displacement and excess pore water pressure with time for L/d=3 geometry ............................. 87
Figure 5-17 Effect of caisson geometry on minimum period over which loads can be sustained.......................88

1. Introduction
1.1Suction piles
Over the last decades, oil and natural gas exploration and production have been moving into
deeper waters (depths from 1,000 to 2,500m). This transition became technologically and
economically viable through the development of innovative structures and foundations,
including suction caissons and anchors. At the same time, there is large growth in wind turbine
projects which are being planned further offshore where the winds are stronger and more
reliable. Here the use of anchors can provide a technical and cost effective solution to make
these projects financially viable.
Suction caissons are hollow cylindrical foundations with a closed top. They are installed by the
action of their buoyant self weight and by applying differential pressure between the caisson
chamber and the surrounding ocean. The terms suction anchors, skirted and bucket
foundations refer to the same general configuration as suction caissons. Details about their
differences are provided in Section 1.2.
Suction caissons and anchors have proven to be competitive alternatives to more traditional
foundation solutions such as piles and drag anchors in various types of soils and for a wide
range of fixed and floating offshore structures. Firstly, there are significant cost savings
compared to traditional piles and anchors. The fabrication costs are usually lower and due to
their small weight, the installation equipment needed is less expensive, while the installation
times become significantly shorter compared to piles. Simplified installation procedures lessen
the risk from storms hence increase installation safety.
At the same time, suction piles have a number of operational advantages over traditional
foundations. In short term loading they can provide a significant uplift resistance due to the
development of suction pressures which can be sustained over significant time periods.

Another advantage of suction foundations is that they can be positioned very accurately and do
not require drag-in operation or proof loading and thus when they are used to anchor floating
structures they help reduce interference issues between the moorings of adjacent structures.
This is particularly important for wind farms, where there is a large density of mooring cables.
Furthermore, suction foundations have environmental and economic benefits as they can be
retracted and potentially redeployed at different sites (Andersen and Jostad, 1999).
1.2 History and types
Shallow water oil production structures historically comprised jacket foundations with steel
frame superstructures which were fixed to the sea floor through driven cylindrical open-ended
steel piles. The discovery of oil in the North Sea, where the soil is generally stiffer than in other
areas such as the Gulf of Mexico, allowed the use of shallow foundations in the design of
massive gravity structures that rely on deadweight for stability. The design of the gravity
platforms introduced the use of vertical walls-called skirt piles- which extended into the
foundation soils in order to increase the lateral stability. A pump was used to remove the water
trapped between the sea floor and the base of the gravity foundation. At the same time, in
Norway, smaller steel tubes with closed tops and open bottoms-termed bucket foundations-
were placed under the legs of the traditional jacket foundations and installed with the aid of
suction (Tjelta, 1994). These first bucket foundations, had depth to diameter ratios that ranged
between 0.5 and 1.5 and were designed to act in compression while tensile loading was
resisted by surcharge applied at their top.
At deeper water sites, the use of jacket foundations became uneconomical and led to the
design of tension leg platforms (TLPs) which are floating structures supported by buoyancy and
tethered to the sea bed. Initially, driven pile foundations were used to anchor TLP structures,
but the evolution from bucket foundations has also led to the deployment of suction caissons
as permanent foundations for TLPs.

The Snorre platform in the North Sea was the first TLP to implement the suction caisson
concept (Fines et al., 1991). The Snorre platform is located in soft clay at a water depth of
310m. The foundations consist of four legs, each one having three bucket foundations as shown
in Figure 1.1. During the design of the platform, two large scale offshore installation trials were
conducted using instrumental steel cylinders that penetrated 22m into the ground. Dead
weights were placed on top of the suction foundations in order to ensure that the loading
remained purely compressive thus leaving the tensile capacity un-utilized (Iskander et al.,
2002). Since then, many studies have examined the potential of suction piles to provide
significant tensile capacity.
In 1995, the piles at the end of the Europipe jacket structure were replaced with bucket
foundations Tjelta (1994). The significance of this project lies in the fact that it was the first time
that bucket foundations were used as the only permanent foundation with suction providing
the primary foundation installation system in dense sand. Similar structures had only been
installed in soft to firm clays (for example Snorre).
The Europipe site in the North Sea consists or a 25m layer of dense to very dense sand overlying
stiff to hard clay at a water depth of 70m. Four suction piles were used at the legs of the jacket
as shown in Figure 1.2. Their diameters were 12m and the skirt length 6m. The largest tensile
load was 13.9MN and the largest compressive load 56.7MN (Bye et al., 1995). Tjelta (1994,
1995) performed a series of field tests, FE analysis and used previous field experience to prove
the feasibility of using suction caissons to provide tensile resistance in dense to very dense
sands.
The Na Kika Floating Development System (FDS) is located in the Gulf of Mexico and was built
to handle oil and gas production from five independent fields located at water depths between
1,400 and 2,300m (Newlin, 2003). As shown in Figure 1.3 it is supported by a semi-taunt
mooring system with suction piles at the bottom which are being loaded predominantly in the
lateral direction. Suction is only used as an installation technique and the underpressure is not

used to provide resistance to tensile loads during service. The platform was designed based on
safety criteria for the whole system (Newlin, 2003). Probability distributions for maximum
mooring line tension was based on results of long term mooring analyses which account for the
global response of the platform when subjected to a Gulf of Mexico environmental database.
For the anchor resistance, a probability distribution function was generated based on limited
existing data on skirted foundations and on random variations in overburden pressure and
undrained shear strength.
310 m depof ater
I D=17m
Figure 1-1 Snorre platform foundations(Source: Zdravkovic et al. 2001)
Figure 1-2 Europipe (Source: Bye et al. 1995)

STFF.
FDS 4124mm GR 4 STUDLESS T-O P
PLATFORM CHAIN
22 mm
S114mm JSS WIRE NOMINAL
ROPE (UPPER)
E
- 51 mm
114mm JSS WIRE @ PADEYE
ROPE (LOWER)
4114mm GR 4STUDLESS
~ROUND CHAIN I E
SUCTIONANCHOR PILE
S@ SHOE
4 4.3m (14')
Figure 1-3 Na Kika FDS mooring elevation and suction pile configuration (Source: Newlin, 2003)
The term suction caisson refers to the cylindrical open bottom foundation installed with the use
of suction at its top part. Other terms which usually refer to the same structure are skirted
foundations or skirted anchors. Usually the terms skirted or suction foundation is used when
the concept is applied to fixed platforms and the term skirted or suction anchors when the
concept is applied to floaters (Andersen and Jostad, 2004).
Suction caissons are typically used in sands as shallow foundations and have length to diameter
ratios, L/d<1. In clays, suction caissons are typically used as anchors and the L/d ratio can be as
large as 6. Randolph and Chen (2007) report that the majority of modern suction caissons have
ratios between 3 and 6. Houlsby and Byrne (2004) present typical diameter and skirt depths
reported in the literature. Suction caissons have smaller wall thickness than the tubular driven

piles they replaced. Chen and Randolph (2007) report that for suction caissons the ratio of
diameter to thickness, d/t is in the range 60-200 while for piles the equivalent range is 30-50.
Diameter, d [m]
Sleipne
4
Iropipe
r T
YME Jack-
lorre TLP
Gullfaks C
Na Kika
-- L/d=l
Figure 1-4. Examples of typical diameter and skirt depths reported in the literature. Source: Houlsby and Byrne(2004)
Suction anchors can be used separately or clustered and have a number of structural features
that improve their performance. Figure 1.5 shows some of the most common designs (Delft
University of Technology). One variation to the original caisson design are flat back anchors
which can be either triangular or square in order to provide horizontal stability during
transportation and prevent deck skidding. As shown in Figure 1.5 internal stiffeners or external
flaps can be used to increase the caisson soil interface area and hence increase the frictional
resistance.

friction anchor
Figure 1-5 Common suction caisson designs (Source: Delft University of Technology)
1.3 Detailed description, installation and loading conditions
During the first stage of the installation, suction caissons penetrate into the soil under their self
weight. Further penetration is achieved by pumping water out of the top part of the caisson
thus creating an underpressure inside the caisson. The difference between the hydrostatic
water pressure outside the caisson and the pressure below its lid induces a penetration force
that pushes the caisson into the required depth. The forces that act on the caisson during
installation are shown in Figure 1.6.
flat-back flap anchorsuction pile

Water pumped out
Underpressure
Side friction
Anchor weight
Tip resistance
Figure 1-6 Forces acting on a suction caisson during installation
Upon installation the shear strength along the outside wall will be reduced to the remoulded
shear strength. After installation, there is a setup in stresses acting on the pile due to
redistribution and dissipation of installation pore pressures and thixotropy (Andersen and
Jostad, 2004). Andersen and Jostad (2004) propose a method to calculate the strength after
installation by assuming that caisson penetration is accommodated by purely inward soil
movement. In this case the radial stress does not change and only shear is applied on the soil
adjacent to the external caisson wall. This method suggests a shear strength between 58-65%
of the intact shear strength after 90% consolidation for normally consolidated clays.
Subsequent field measurements by Andersen et al. (2004) indicate that only 30-50% of the soil
displaced by the caisson tip flows inward during the combined self-weight and suction
installation. For the purposes of this study, it is going to be assumed that the caisson is wished
in place and so the results of the finite element analysis should be viewed in light of this fact.
Figures 1.7 and 1.8 show a suction caisson used in the Nkossa platform (Colliat, 1995) and a
schematic representation of a suction anchor. The main components of a typical suction pile
are shown in Figure 1.7. In some cases, where the loading is mainly horizontal and the vertical

load can be supported by caisson self weight and friction, the caisson lid is retrievable
(Andersen and Jostad, 1999). Since the underpressure is not necessary for the operation of the
foundations, the lid can be retrieved to reduce fabrication costs.
In many cases tethers are attached on the external surface of the caisson which is inside the
soil. A pad-eye is used for that purpose. In addition, caissons can have pad eyes near the lid that
are used during the installation process as shown in Figure 1.7.
Figure 1-7 Typical elements of suction caissons Figure 1-8 Nkossa suction foundation(Source: Delft University of Technology) prior to installation (Source: Colliat, et al. 1995)
Suction foundations may be subjected to permanent loads and high and low frequency cyclic
loads. Loads include vertical, horizontal and moment components. Permanent loads usually
consist of the weight of the caisson structure and the weight or pretension loads from the
platform. High frequency cyclic loads are caused by waves that occur during the design storm.
The design storm is composed of a number of cyclic loads with varying magnitudes (See Section
2.3 for more discussion).

Low frequency cyclic loads can be caused by wind, current, tide, storm surge and waves.
Resonance oscillations may also cause low frequency cyclic loads. The period of these loads is
higher than the wave period and may be several hours or more. Loop current loads may also be
classified as a low frequency load. Due to rate effects, the shear strength of clays may be lower
for long duration loads and low frequency cyclic loads than for high frequency cyclic loads
(Andersen and Jostad, 1999).
1.4 Literature review
Understanding about the behaviour of suction caissons has been obtained by field
measurements, model caisson experiments and finite element analysis. Field tests on small and
full scale caissons have been used to determine the effects of caisson installation and the
subsequent caisson performance. Field tests can provide reliable data given the specific site
characteristics, but have high costs. Examples of field tests include Hogervorst (1980), Tjelta et
al. (1986) and Tjelta (1995) for the purposes of Europipe.
A large number of laboratory tests on suction caissons can be found in the literature. One
category are centrifuge tests which simulate the stress conditions and soil response at the field
scale. Examples of centrifuge caisson tests include Clukey et al. (1995) and Randolph et al.
(1998).
Another category, are tests on model suction caissons under 1-g and controlled laboratory
conditions. (Wang et al. 1977, Steensen-Bach 1992, Rao et al. 1997, EI-Gharbawy and Olson
1999, EI-Gharbawy et al. 1999, Whittle et al. 1998, Byrne and Houlsby 2002). The caissons
studied were of L/d ratio in the range of 2-12 and were tested under various loading conditions.
Some of the early laboratory tests on model suction caissons conducted (for example Finn and
Byrne, 1972 and Wang et al. 1977) were focused on studying caisson feasibility and identifying
important parameters governing their performance. More recent laboratory tests (Rao et al.
1997, EI-Gharbawy and Olson 1999) focus on optimizing their design.

One of the first publications on suction caisson was an experimental and theoretical and finite
element study by Finn and Byrne (1972) which is further discussed in Chapter 2. Recent finite
element studies of caisson behaviour involve axisymmetric and three-dimensional numerical
simulations. Some examples include Sukumaran et al. (1999), Erbrich and Tjelta (1999), El-
Gharbawy and Olson (2000), Zdravkovic et al. (2001) and Deng and Carter (2002). Most of
these studies attempt to determine the caisson capacity under different loading and drainage
conditions. Sukumaran et al. (1999) and Erbrich and Tjelta (1999) used the commercial finite
element code ABAQUS, EI-Gharbawy and Olson (2000) used the commercial finite element code
PLAXIS developed for geotechnical computations, Zdravkovic et al. (2001) used the three
dimensional Fourier series aided finite element method (FSAFEM) and Deng and Carter (2002)
used the finite element software AFENA.
In all cases the suction caisson was wished in place, with no attempt to simulate the
installation process. In addition, a perfectly rigid interface was assumed between the caisson
and the surrounding soil skeleton. The initial state of stress in the soil skeleton was typically
estimated in terms of the submerged unit weight and the lateral earth pressure coefficient at
rest, K0.
Chen and Randolph (2007) note that currently there are no established design guidelines for
the uplift capacity of suction caissons in marine clays. Calculations are usually based on
conventional design methods for open-ended driven piles (e.g. API, 1993) and also on the
results of an industry sponsored study (Andersen et al,. 2005).
1.5 Scope of this study
The purpose of this study is to conduct finite element analysis of the response of suction
caisson subjected to tensile vertical loading under three loading conditions:
(a) undrained loading representing the short term performance of suction caissons in clay

(b) drained loading representing the long term performance of suction caissons
(c) constant sustained loading; in this case excess pore pressures are let to dissipate with
time and this loading condition represents the caisson behaviour in the medium term
Theoretical limit equilibrium models for loading conditions (a) and (b) are presented in
Chapter 2. These solutions are used as a reference when assessing the results of the finite
element analysis. In addition, a number of significant theoretical and finite element studies
on these 3 loading cases are discussed in Chapter 2.
Chapters 3, 4 and 5 present the results of the finite element analysis for each of the three
loading cases. The finite element code Plaxis v.8.5 is used for all the analyses.
Chapter 6 discusses the findings and presents the conclusions of this study.

2. Background, soil model and limit calculation analysis
2.1 Problem description
This research uses finite element analysis to model the response of suction caisson subjected to
tensile vertical loading under three loading conditions:
(a) continuous monotonic tensile loading applied within a relatively short time, such that
there is no migration of pore fluid within the surrounding soil (undrained shear)
(b) continuous monotonic tensile loading, such that the response is fully drained and excess
pore pressure never develop or dissipate instantaneously (drained conditions)
(c) sustained tensile loading such that excess pore water pressures develop instantaneously
after the full load is applied and are allowed to dissipate over time
The caisson is modelled as wished-in-place so that the surrounding soil remains undisturbed
(i.e. no deformations or change of in-situ stresses, pore pressures or soil properties).
Furthermore it is assumed that the shear resistance at all soil-caisson interfaces is controlled by
the shear strength of the soil adjacent to the caisson. A perfectly rough interface is assumed
such that tanS'= tan0', where 6'is the interface friction angle and 0' the internal friction
angle.
The finite element analyses assume that the soil is isotropic and can be characterized by the
Mohr-Coulomb, elastic-perfectly plastic soil model. The Mohr-Coulomb model is generally
considered a rather crude approximation of the behaviour of typical marine clays and the use of
Modified Cam Clay (MCC) or MIT-E3 models has been preferred in similar analysis found
recently in the literature (Deng and Carter, 2002 (MCC) and Zdravkovic et al., 1998 (MIT-E3)).
One of the purposes of this research is to assess the effectiveness of using a simple Mohr-

Coulomb model to predict the ultimate caisson capacity by comparing the results with previous
studies that use more complex models.
An undrained shear strength ratio s, / r'vO =0.33 is used. This ratio is typical of low plasticity Ko
-normally consolidated clays (such as Boston Blue Clay) in triaxial compression (Zdravkovic et al.
2001, Hight et al. 1987). It should be noted that anisotropic models would use a much smaller
undrained shear strength ratio in triaxial extension or direct simple shear modes. Ladd (1992)
shows that medium to high plasticity Ko-normally consolidated clays have on average
undrained strength ratio s, /r'vO =0.2. The effective stress and shear strength profiles for the
current numerical experiments are shown in Figure 2.1.
Stress [kPa]0 100 200 300 400 500 600
-*- su (kPa)
-o-- c'v0 (kPa)
Figure 2-1 Undrained shear strength (se) and initial effective stress (o'vo) profiles, y'=11.2kN/m 3
0
10
20
S30N
40
50
60

The soil strength can also be expressed in terms of the Mohr-Coulomb effective stress
parameters (c',e'). For undrained shearing with dilation angle y/=00 and cohesion c'=O in
plane strain conditions, the following relationship can be used to represent undrained strength
using effective stress parameters:
s, (1 + Ko) sin 0 ' (2.1)cr'v 2
The derivation of this relationship is shown in Appendix A.
The soil is assumed to have a friction angle 0' =280. The friction angle chosen is typical of high
to medium plasticity normally consolidated clays found in the marine environment (Poulos,
1988). The coefficient of lateral earth pressure Ko is obtained by solving Equation 2.1 for the
specified friction angle and undrained strength ratio. This yields K0 =0.49. The assumed
submerged unit weight of the soil, y'=11.2 kN/m 3 . It was assumed that the soil is saturated
and that Darcy's law governs flow of pore fluids through the voids of the soil skeleton. In
offshore problems, the pore pressures at the mudline (Um,,dline ) are very large. Therefore, for the
calculations we define a pore pressure u = u - mudine. Thus initial pore pressure is hydrostatic
with the groundwater table located at the top of the soil surface.
The following section describes each of the three loading conditions and provides a limit
equilibrium analysis which is used to assess the results of the finite element analysis in Chapters
3-5. We expect the limit equilibrium solutions presented here to give the same capacity as the
finite element analysis in Chapters 3-5 apart from the Ko issue and the neglect of the tip
resistance.
22

2.2 Limit equilibrium solutions
2.2.1 Undrained response
Uplift Force
d
Figure 2-2 Forces acting on the caisson under undrained loading
At the end of the caisson installation, the caisson is forced to remain at the soil surface because
of the pressure differential induced during suction installation. In clays, as soon as there is an
uplift force, the suction caisson mobilises significant pullout capacity through the development
of negative changes of pore water pressure inside the soil plug and at the bottom of the
caisson. The length of time these suction changes can be maintained depends on the loading
conditions and the drainage properties of the soil. When the caisson is loaded at a sufficiently
high rate so that fully undrained conditions apply the suction will in theory not break down.
Most previous studies suggest that the undrained response provides the upper limit to the
pullout capacity of suction caissons (ex. Finn and Byrne, 1972 and Deng and Carter, 2002). It is
generally accepted that the ultimate capacity under undrained conditions can be calculated by
assuming a reverse bearing capacity failure mechanism as shown in Figure 2.2. Finn and Byrne
(1972) were the first to suggest this mechanism and argued that the response should be
23

equivalent in tension or compression, the same way it is for a flat punch welded on an identical
material. Subsequent experimental and finite element studies widely confirmed the reverse
bearing capacity theory for suction caissons (for example Wang et al. 1977, Andersen et al.
1993 and others).
The caisson self weight (P,) also contributes to resisting the uplift forces. Under undrained
conditions there is no drainage or change of volume and the soil inside the caisson remains
attached to the lid and the skirt. As the caisson fails forming a reverse bearing capacity
mechanism, the soil plug, which has a weight P, remains attached to the caisson and
contributes to the caisson resistance. At the same time frictional resistance develops at the
external caisson-soil interface (Pf,e, )
Then the ultimate capacity of the caisson (Put,,,ndrained) is expressed as:
ult,undrained =Pb+ Pfex + P + P (2.2)
The bearing capacity ( Pb ) of the caisson is obtained from the classical bearing capacity theory
(Skempton, 1951).
Pb = A~eNcSu(,,p) (2.3)
Where: A: caisson base area
,: shape factor
: : embedment factor
Nc: bearing capacity factor
= 1+ 0.2* D/D = 1.2
Ce = 1+ 0.053(L / d) = 1.18
24

The external friction is obtained from:
Pf,ext= sext fsdAsext
Where f is the skin friction per unit area along the caisson wall, and As,ex,the area of the
external caisson surface. Assuming the soil caisson interface is rough: f, = s, at failure. Thus
the external friction at failure is expressed as:
Pfext =- dLs(,p), (2.4)
In order to compare the results with existing research, it is useful to define the net pullout
capacity:
1Pult(net),undrained = Pult,undrained -Pult -Pc = rdLsU(,) (2.5)
Finite element analysis was used for five different geometries. The base case geometry is a
cylindrical caisson (yc=24kN/m 3 ) with length L = 11m, diameter d = 17m and thickness t =
Im. The caisson axial capacity is calculated using limit equilibrium:
Fb = AseNcs,(tp) = 62,210kN
1P mits = 10,870kNPf ,ext = dLsu(tip) = 10,870kN
2
Pc = y[R2L - (R - t)2(L -t)] = 17,510kN
P, = y' (R-t)2 (L-t)= 18,010kN
Pt,(ne) = Pb + Pf,ex, = 73,080kN
25

2.2.2 Drained response
Uplift Force
Caisson Self
Weight
+ L:3
d
Figure 2-3 Forces acting on the caisson under drained loading
When the caisson is pulled at a sufficiently slow rate or when long term conditions are
considered then excess pore water pressures dissipate fully and the response is drained. In
order to simulate the drained capacity of the caisson, the first scenario in the analysis assumes
that no passive suction develops at the bottom of the caisson after installation and the
application of the full anchor load. Thus, when the drained capacity is reached, the soil plug
inside the caisson remains in its initial position and the caisson slides upwards. In this case the
pull out force is resisted by friction on the internal and external walls of the caisson as well as
by a small force at the tip. Experimental studies in the literature (ex. Luke et al., 2005) find that
the tip resistance is very small in practice. Then the ultimate capacity of the caisson (Pult,drained)
is expressed as:
Pult,drained - Pf,ext + Pfint + PC (2.6)
Where Pf,e, and Pfi,mt are the skin friction on the external and internal walls and Pc is the
submerged weight of the caisson.

Then the net pullout capacity is:
Pult(net),drained Pf,ext +
Pf,int (2.7)
The external and internal skin frictions are obtained from:
Pfext= As,ext fsdAs,ext
Pf,int= As,int fsdAs,int
(2.8a)
(2.8b)
Where f, is the skin friction per unit area along the caisson walls and Asex, and As,int the areas of
the external and internal caisson surface. At any depth z, fs can be expressed as:
fs = "'h tan S' (2.9)
Where c' h is the effective horizontal stress acting on the soil caisson interface friction angle.
At failure: ('h = K r'v (2.10)
It is difficult to estimate the exact value of K considering that the soil has been disturbed and
then reconsolidated. Even when the caisson is assumed to be wished in place, there is some
initial settlement as a result of the caisson self weight. Here it will be assumed Ko conditions
continue to apply during failure and that the vertical effective stress o',vremains constant:
o'Th = Ko(1'vo (2.11)

After solving Equations 2.8-2.9, the external and the internal frictions are:
Pf1ext= 7dLKo tan 'b',l z=L (2.12a)
1Pf,int = I (d - 2t)Ko tan q'(LC'v z=L - toy z=t) (2.12b)
Thus the net pullout capacity is:
Pult(net),drained Pf ,ext + Pint - rK0 tan y' '[dL 2 + (d - 2tX L 2 -t2 (2.13)
223
Finite element analysis was used for five different geometries. The base case geometry is a
cylindrical caisson (yc = 24kN/m 3) with length L = 11m, diameter d = 17m and thickness t = Im.
The caisson axial capacity is calculated using limit equilibrium:
Pf ,ex IrdLKo tan 'o' , z=L =8,650kN
P,int = -z(d- 2t)K0 tan '(Lo', z=L -tr, Lt=) =7,570kN
Pc = y,[R 2L - (R - t)2 (L - t)] = 17,510kN
Pult(net),drained = f,ext
+ Pf,int = 33730kN

2.3 Drained capacity; sustained tensile loading
The maximum tensile load applied to the suction caisson is associated with the maximum wave
in the most extreme storm. These loads will typically occur in just a few seconds (Clukey et al.,
2004) and the response in clays will remain undrained. A further consideration is the cyclic
nature of the storm load and in some cases (e.g. the Gulf of Mexico) loop current loading which
can be sustained for several days or even weeks (Clukey et al., 2004). Cyclic loading can be dealt
with by considering the effects of a characteristic storm to the shear strength of the soil. Det
Norske Veritas (2005) recommendations for the design of suction piles in clays uses a
characteristic storm with a constant wave height that produces the 100-year reduction in shear
strength, and duration of 3 to 6 hours.
For loop current loading the period over which the load is sustained is even longer and the
capacity of the caisson is expected to be between the undrained and the drained capacities
depends on the drainage properties of the soil.
The third loading scenario examined in this study is that of the sustained constant tensile
loading. Immediately after the application of the load, the resisting forces are the ones
described in the undrained loading scenario. During the sustained loading, significant pore
pressure dissipation can occur. This reduction in pore pressures can enhance the external skin
friction (Clukey et al., 2004), but may decrease the influence of the pore pressure reductions
that mobilize the full reverse bearing capacity. Since in many cases the contribution of the
reverse bearing to the overall capacity can be as high as 50%, the dissipation of excess pore
water pressures can have a critical impact on the caisson performance. The finite element
analysis in Chapter 5 examined this reduction in the caisson capacity for a number of different
geometries and predicts the maximum time that a certain load can be sustained before caisson
pull-out occurs.

2.4 Literature review
As discussed in Chapter 2, a significant number of field tests, experimental, finite element and
theoretical research have been reported in the last three decades. Here we introduce the
assumptions and the results of five finite element studies which attempt to establish the
capacity of suction caissons in clays while providing different approaches and looking at
different aspects of caisson behaviour under tensile loading.
Finn and Byrne (1972) were among the first to investigate the performance of suction piles and
set the framework for much of the future research. They conducted laboratory model studies in
order to establish the factors that affect the pullout capacity of the suction caisson and the
mechanisms that develop under different conditions. They suggested two possible failure
mechanisms: a general shear failure and a local shear failure depending on whether drainage
was allowed or not. The general shear failure was a reverse bearing failure which occurred
under undrained conditions. When the sealing against drainage was not perfect or when the
rate of load application was small partial drainage occurred and eventually the caisson slid
upwards. Finn and Byrne observe that the mechanism of general shear failure cannot usually
occur in complete form because the elastic deformations necessary are quite large and
eventually lead to a breakdown in the suction during shallow depth tests.
A large proportion of the research on the axial tensile capacity of suction caissons examines the
axial capacity with the horizontal capacity and investigates the effects of combined horizontal
and vertical loading. One of the first studies to attempt this was by Zdravkovic et al., 2001
followed by a number of papers by Deng and Carter.
Zdravkovic et al. (2001) present a parametric short term pullout capacity analysis and examine
the effects of load inclination, skirt length, caisson diameter, soil adhesion and anisotropy. They
plot combinations of vertical and horizontal loading at failure and examine how horizontal
loading reduces the vertical capacity and vice versa. They find that the vertical and horizontal

capacity curves for different lengths and identical diameters are self similar, and that
controlling for the L/d ratio forces all curves to collapse to a single vertical against horizontal
capacity curve. One of the findings of their finite element analysis is that for tether inclination
smaller than 10 degrees to the horizontal, the vertical capacity can reduce by 20%.
Furthermore, Zdravkovic et al. (2001) is one of the first studies to look at the effects of
anisotropy. They compare results from the anisotropic MIT-E3 and the Modified Cam Clay
models and find that anisotropy reduces the capacity by approximately 22%.
Deng and Carter (2002) present a theoretical investigation of suction caissons under axial
tensile loading for three different soil conditions; undrained, drained and partially drained.
Theoretical limit equilibrium solutions are derived, based on the results of a finite element
study and then validated by previous field experiments and model test results.
Deng and Carter (2002) express the undrained capacity as a function of the caisson L/d ratio
and the characteristics of the soil. Starting from the theoretical limit equilibrium model shown
in section 2.2.1 they transform the equations as follows:
1Equation 2.4 can be expressed as PI,ext = 7rdLs,,ip or Pfext = aA"s's,,, where a is a
constant of proportionality. Then the net caisson capacity can be written as:
Pult(net),undrained = Pb + Pf,ext + AseNcsu(tp) + aAseSu(tip) = Nps esu(tIp) (2.14a)
From finite element predictions the value of NP was expressed as:
," "-0.18
N 9 =7.9 - 0. (2.14b)\d
This result is used to compare the results of the finite element analysis under undrained
conditions presented in Chapter 3.

For the drained case, Deng and Carter (2002) transform Equation 2.9 by introducing a drained
uplift factor (q) to take account of the relationship between the interface angle (6') and the
soil friction angle (0'), and the difference between Ko andv
The dimensionless factor n is introduced to take account of the relationship between the
interface friction angle S'" and the soil friction angle 0', as well as the correlation between the
horizontal effective stress in the soil c'h to the original in situ vertical effective stress o'vo. For
normally consolidated soil Mayne et.al. (1982) approximation is used: Ko = 1-sin i'. Then
Equation 2.9 may be written as:
f, = o'h tan S'= qKo tan 0'= r/y'z(1 - sin ')tan 0' (2.15)
By combining Equations 2.8 and 2.15, the net capacity per unit area is expressed as:
pu(net),drained = 4q (1- sin ')tan ', z1L (2.16a)
It is assumed that n depends only on the L/d ratio and the results of a finite element analysis
are used to obtain an expression for q:
-0.467 = 0.9 1 )I (2.16b)
d
In Chapters 3 and 4 we use Equations 2.14 and 2.16 and compare the net pullout capacity with
the results from our finite element analysis.
One of the more recent and advanced finite element studies is presented by Maniar et al.
(2005). The authors developed a computational procedure which attempts to accurately
simulate the behaviour of suction caisson, including the effects of self-weight and suction

installation into clayey soils. The soil is treated as a two-phase medium consisting of a porous
solid and water. The nonlinear behaviour of the soil skeleton is described by means of a
bounding surface plasticity model. A frictional contact algorithm is used to describe the caisson-
soil interaction and this is based on a slide-line formulation that allows large relative
displacement between the caisson and the soil. Among other results, Maniar et al. (2005)
predict the axial capacity of suction caisson under all three loading conditions described in this
thesis and comparisons with laboratory measurements are provided. In most cases finite
element predictions underestimated experimental results by about 15%. The differences were
generally higher for the undrained loading conditions compared to the drained cases. Their
finite element results for undrained loading indicate that 42-44% of the caisson capacity is due
to forces at the base. In addition the interior friction was assessed to be significantly lower than
the exterior friction and more specifically 3 to 6 times lower.
Clukey et al. (2004) perform centrifuge tests and finite element analysis on typical Gulf of
Mexico clayey soils. Their purpose is to examine the caisson capacity under a sustained tensile
load which is some percentage of the vertical uplift undrained capacity. Their centrifuge tests
find that caissons with smaller L/d ratios under the same P/Pult,undrained experience the same
normalized displacements after shorter holding periods.
The centrifuge results suggest that for an L/d ratio of approximately 4, the displacements are
less than 5% of the diameter for a time period of about 2 months with a sustained load of 81%
of the ultimate undrained capacity. This time increases to about 9 months for displacements
equal to 10% of the diameter. Furthermore, for L/d ratios of about 5, the displacements were
below 5% of the diameter for a time period of about 2 months and a sustained load of 87% of
the ultimate undrained capacity. However, for a displacement of 7%d the holding times for
these tests increased to nearly 2 years.
The results of the finite element study are consistent with the centrifuge tests. The simulations
were performed in ABAQUS using the Modified Cam Clay soil model and a coupled pore

pressure and effective stress solution. The caisson capacity was recorded as the pullout load
when the uplift displacement reached 10% of the caisson diameter. For L/d ratios of
approximately 5 and a loads of 81-87% of the undrained capacity, the holding times are
between 1 and 2 years. Overall the results of this study suggest that for caissons with L/d of 5
the effect of pore pressures dissipation on the foundation holding capacity appear negligible for
holding periods relevant to the loop currents and the cyclic storm loading.

3. Numerical Analysis of Caisson Response under Undrained
Conditions
This chapter describes the axial uplift load response of wished-in-place suction caissons under
undrained conditions, using finite element analysis. The soil response remains fully undrained
until failure occurs.
3.1 The finite element model
All of the finite element analyses were performed using the commercial finite element code
Plaxis v.8.5. An axisymmetric model was used in the analysis. This assumes a uniform radial
cross section and loading around the central axis. An example of the axisymmetric
representation of a cylindrical element is shown in Figure 3.1 below.
Figure 3-1 Axisymmetric model in Plaxis for a cylindrical element (Source: Plaxis v.8 reference manual)
A slightly different mesh was used for each of the 5 geometries considered. The finite element
mesh for a reference geometry of d = 17m and L = 11m is shown in Figure 3.2. The soil is
represented by 690 15-noded triangular elements. The caisson is modelled using dimensionless

5-noded plate elements. The interfaces are represented by 5-noded lines. Boundary conditions
include full fixities at the bottom and vertical rollers at the vertical sides.
-20 ..... - ...... oP . ...... 0101 , - A ....... ...... ....... o0o ...... 0 o, ...... 1. o,o .
30.00-
20.00
10.00-
0.00-
-10.00-
-20.00
Figure 3-2 Base case geometry and finite element mesh
The caisson is modelled as an elastic material. The unit weight is assumed to be yc=24kN/m 3
and Poisson's ratio v=0.151. The caisson is represented by 2D plate elements and a uniform
caisson thickness of t=lm is assumed for both the walls and the lid of the caisson. The caisson is
loaded in tension by applying a single force at the caisson centreline. A condition of no
separation is imposed between the soil and the caisson lid. An interface is assumed between
the soil and the external wall of the caisson. The adhesion coefficient is set to unity so that all of
the shear stresses in the soil are transferred to the caisson wall.
The analyses were performed using 5 different caissons geometries. In order to investigate the
effect of different length (L) to diameter (d) ratios, L/d=0.5, 0.65, 1, 2 and 3. These L/d ratios are
1 The Young's modulus was set to 35*103 GPa 1 in order to ensure that the lid remains rigid during loading such thatall points on the lid undergo equal increments of vertical displacement.

are representative of the suction caisson L/d ratios used in the offshore industry. The diameter
was held constant at d = 17m and the skirt length was varied between L = 8.5m and L = 51m.
The Snorre TLP (see Chapter 1) used suction caissons with similar dimensions (d = 17m and L =
12m) and the intention is to make further comparisons of the predictions of these studies, with
studies on the predicted Snorre platform performance.
The first part of this chapter presents the full results for a base case geometry. The following
sections describe the effects of the different geometries and finally, comparisons are made with
existing literature.
3.2 Results of base case geometry analysis
A base case geometry (d = 17m, L = 11m) was chosen to illustrate the full results of the
numerical analysis.
3.2.1 Load-deformation response
The load-displacement curve is shown in Figure 3.3. At the first stage of the calculations, the
caisson was wished-in-place. The caisson self weight caused an initial settlement of (,= 0.15m.
After the uplift force was applied, this initial displacement is reversed. This initial stage is
omitted in Figure 3.3 and the load deformation curve is plotted from the point at which the
initial installation displacements are reversed. Yielding occurs for loads larger than 70 MN and
the lid displacement at that point is approximately Jv = 0.14m. This corresponds to
deformation to diameter ratio of 6,/d = 0.8%. The ultimate capacity of the caisson is estimated
as Pult,undrained = 110 MN. The net pullout capacity, Put(net),undrained is defined as the pullout capacity
less the caisson self weight and the weight of the soil inside the caisson. Here Pult(net),undrcined
74.4 MN.

140
120
100
20V0.00 0.20 0.40 0.60 0.80 1.00
Lid displacement, 6, [m]
Figure 3-3 Load deformation response for base case geometry
3.2.2 Breakdown of reaction forces
As discussed in Chapter 2, we expect the following forces to be acting on the caisson at failure:
o Caisson self weight Pc = 17,510 kN
o Weight of the soil plug inside the caisson P, = 18,010 kN
o External wall friction Pfex, = 10,870 kN
o Base resistance due to the development of the reverse bearing mechanism P =
62,210kN
Figure 3.4 shows the relative magnitude of the side friction (P,ex) compared to the total
resistance of the caisson (Prot), and the sum of the caisson self weight (Pc) and the weight of

the soil plug inside the caisson (P,). The friction force magnitude was obtained at various
stages during the loading of the caisson, by integrating the shear stress along the external soil-
caisson wall interface. At failure, the external wall friction force is Pext = 11,060kN, within 2%
of the predicted pullout capacity. As shown in Chapter 2, we expect the magnitude of the side
friction to reach 10,870kN. This small deviation could be attributed to resistance along the
internal wall of the caisson and resistance at the caisson tip, both of which are neglected in the
theoretical limit analysis calculations.
In the analysis of the finite element results, it was assumed that at all points during loading the
full caisson weight and the full weight of the soil plug are acting on the caisson. Thus the base
resistance ( P ) was calculated by subtracting the friction force (Pf,ex ) and the plug and caisson
weights ( ,P + P) from the applied uplift force (P,ta,,).

140AB E F
120 -
100 -CD
z 80
060
J0
20
200 50.10 0.20 0.30 0.40 0.50 0.3-20
--- Ptotal ---- Pf,ext
-40 - G Ps+Pc ------- Pf,ext theoretical prediction---------- 6v at Ptotal=Pc+Ps - Pb
-60Lid Displacement 6, [m]
Figure 3-4 Built-up of friction and base resistance forces as applied uplift force increases
3.2.3 Failure mechanism
The initial phase of the calculations results in a net upward side friction due to the caisson self
weight. The remaining part of the caisson self weight is resisted by the forces at the base of the
caisson. Thus, during the first stages of the uplift loading, there is some residual upward
frictional resistance as well as an upward base resistance. These are plotted on Figure 3.5.
Eventually, as the applied anchor force increases, the shear stresses acting on the interface
gradually reverse in direction, Figure 3.6.

MN/m 2
Figure 3-5 Shear stresses on external caisson wall at the beginning of uplift loading, (stage A Figure 3.4)
MN/m 2
42 M
Figure 3-6 Shear stresses on external caisson wall corresponding at stage G in Figure 3.4
41
.i
ii
rI
i
120
100
80
60
40
20

The vertical dotted line on Figure 3.4 indicates the point at which the applied force is exactly
equal to the combined weight of the caisson and soil plug. If there were no time lag between
the wished-in-place installation and the application of the uplift force, then, the friction and
base resistance would be zero at this point. However, as shown in Figure 3.4 some of the
friction resistance is mobilized to balance the residual base force. This effect is more
pronounced in higher L/d caisson geometries which are discussed in Section 3.3.
Figure 3.7 shows the plastic points in the soil at each of the different stages in the loading
process (A,B,C,D,E and F) indicated in Figure 3.4. After the residual friction force is overcome,
the first plastic points appear at the top and the bottom of the external caisson-soil interface,
stage A (PIPut,undr,,in,,ed = 0.32). Plastic points keep developing on that interface until the full
friction capacity in reached, stage D (PIPt,nd,,,ra,,ined = 0.54). Thereafter the reverse bearing
capacity mechanism starts to develop, stage E (PIPt,u,dr,,ain,ed = 0.87). It can be seen that
eventually the reverse bearing capacity mechanism reaches the soil surface. The base force at
that point is Pb = 69.6 MN, 12% higher than estimated by limit equilibrium (Chapter 2, Pb =
62.2 MN). The caisson lid displacement at that point is , = 0.6m which corresponds to 3.5% of
the caisson diameter.

Stage A: P / Pult,undrained =0.32 Stage B: P / Pult,und,,,,raind =0.4
Stage C: P / Pult,undrained =0.45 Stage D: P / Pult,undrained =0.54
Stage E: P / Pult,undrained =0.87 Stage F: P / Pult,u=ndrained =1
Figure 3-7 Development of plastic points during undrained loading for base case geometry
_ i ---~

Figure 3.8 shows the incremental displacements and the mesh deformation for the base case
analysis when the caisson has reached its ultimate capacity. The caisson lid moves vertically
upwards. The soil inside the caisson remains attached to the caisson lid and walls and moves
upward as a plug, as assumed by mechanics of reverse bearing failure.
Figure 3-8 Incremental total displacements and deformed mesh at failure
44
_ I 1 I
,,,,,/,, , ,. :: :•.Il a J ," o - "1111 1 ,"• "
II I , "II1.11 )i
;:! ? ... . ..... ... ..-:./ .: .
• ' •". .''',?';* '. . .i i!"i".i-i

3.3 Effect of caisson geometry in undrained response
The effect of caisson geometry has been established by comparing the results from analyses of
caissons with different length to diameter ratios, L/d. More specifically, the diameter was held
constant at d = 17m and the length was L = 8.5, 11, 17, 34, and 51m. Figure 3.9 compares the
load-deformation responses of the five different geometries. From Figure 3.9 it is apparent
that all of the load-displacement curves have the same characteristic form. The displacement at
yield shows little variation between the different geometries and varies between ( v = 0.13m
(for L/d = 0.5) and J, = 0.19m (for L/d = 3).
700
600
500z
400-60-J
o.r 300
200
100
00 0.2 0.4 0.6
Lid Displacement, 5v [m]
Figure 3-9 Effect of caisson geometry on undrained load-deformation response
0.8

Figure 3.10 shows the relative importance of the friction force (P,ex, ) and the base resistance (
Pb) for different L/d ratios, at different loading stages. The exact values of the forces at
different loading stages for each geometry are shown in Appendix B. For small L/d ratios, Pfext
is only 10-15% of the total caisson capacity. For the L/d = 3 geometry, side friction comprises
50% of the total load when P/Pul,,,dr,,ined = 0.6, before falling to about 40% at failure. Figure
3.11 shows that the relative importance of the base resistance decreases with L/d. Such a
variation is expected as the side friction is proportional to the square of the caisson length (L2)
whereas the base resistance is proportional to the length (L).
60%
40%
20%
0%
-20%
-40%
-60%
-80%
-100%
P/Pult,undrained
Figure 3-10 Mobilization of external side friction.
60%
40%
20%
0%
-20%
-40%
-60%
-80%
-100%
P/Pult,undrained
Figure 3-11 Mobilization of internal side friction

3.4 Comparison of results with existing research
Figure 3.12 summarizes the ultimate pullout capacity predictions from the current analysis with
results from two recent finite element analyses discussed in Chapter 2. Zdravkovic et al. (2001)
predict significantly lower failure loads than Deng and Carter (2002) and significantly lower than
the results of this study. Differences between Zdravkovic et al. (2001) and Deng and Carter
(2002) could be attributed to the respective use of the anisotropic MIT-E3 and isotropic
Modified Cam Clay models respectively. Zdravkovic et al.(2001) use the same undrained
strength ratio in triaxial compression as the current study (s, /Uo'' = 0.33).
The current analysis shows net capacities below the Deng and Carter prediction for L/d<1.5.
This could be attributable to the fact Deng and Carter apply a generalized empirical formula
based on MCC analyses to obtain uplift capacity as a function of L/d ratio. Finite element data
presented in their publication, suggest that their relationship over-predicts the capacity at L/d
ratios smaller than 1. The deviation of Deng and Carter from the results of this research
increases significantly for L/d ratios greater than 2. This could be attributed to the increasing
importance of the friction resistance which is sensitive to the choice of soil model.

700
-4-Current Study600
-- ImLimit Equilibrium Eq.2.15
Z 500 - --*Deng & Carter (2002)
- -Zdavkovic et al. (2001)= 400
U
a 300
200
100
0 I I I I
0 0.5 1 1.5 2 2.5 3 3.5
Length to diameter aspect ratio, L/d
Figure 3-12 Comparison of results from current studies with existing literature for undrained loading

4. Numerical Analysis of Suction Caisson Model under DrainedConditions
This chapter describes the axial uplift load response of wished-in-place suction caissons under
drained conditions, using finite element analysis.
The fully drained response of the suction caisson provides a theoretical lower limit to its uplift
capacity. Drained conditions approximate the caisson behaviour when the uplift load is
sustained until all the excess pore water pressures have dissipated. Given sufficient time, water
flows in from the surrounding soil in order to balance the excess pore water pressures induced
during the caisson installation. Eventually, as pore water pressures dissipate, the suction
between the lid and the soil underneath will break down and the only resisting forces will be
the side friction on the internal and external walls and the caisson self-weight. Thus, under
drained conditions, there is no adhesion between the top or the tip of the caisson and the
adjacent soil element.
The drained response might not accurately represent the long term capacity due to the creep
effects. Experimental evidence (El-Gharbawy, 1998) has shown that prolonged application of
load magnitudes greater than approximately 80% of the measured maximum pullout capacity
under drained conditions resulted in progressive caisson pullout, possibly due to creep effects.
4.1 The finite element model
A number of theoretical drained case scenarios were examined using finite elements analysis
based on the soil model and assumptions described in Chapter 2. The analysis was performed
with caisson length to diameter aspect ratios, L/d = 0.5, 0.65, 1, 2 and 3. The finite element
model assumptions are the same as those described for the undrained loading in Chapter 3.
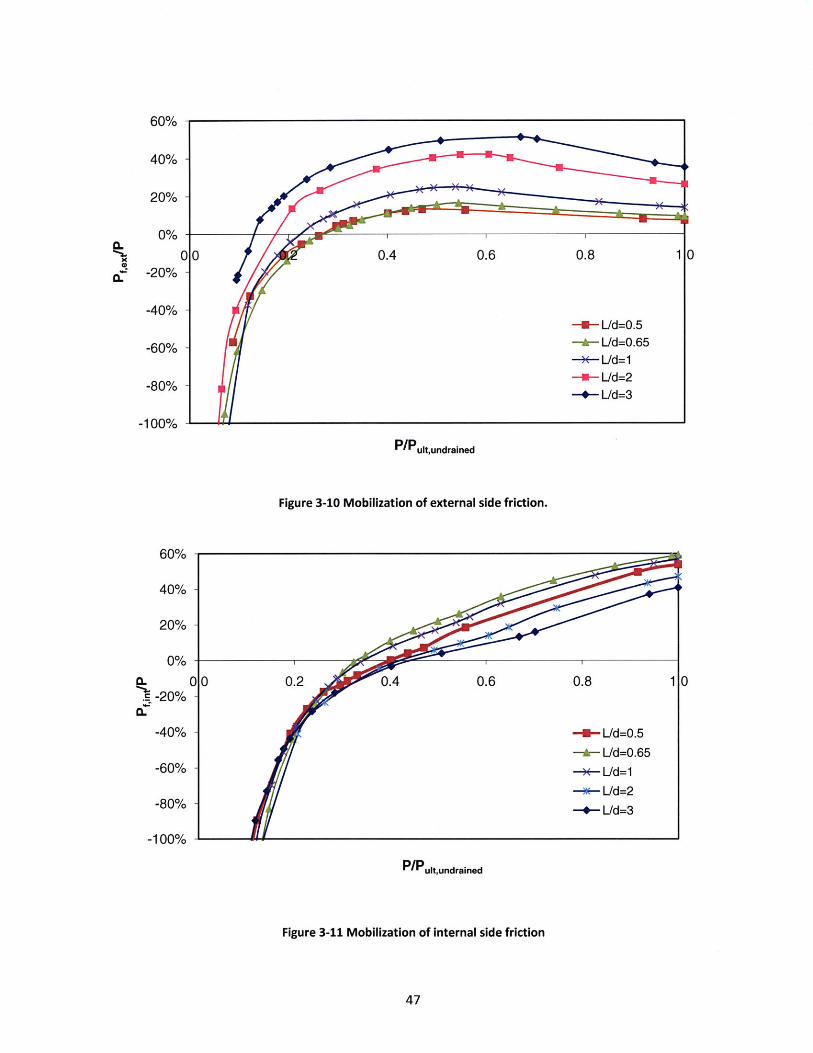
Interfaces are used to model the interaction of the caisson walls and the soil. At the same time,
interfaces make it possible to monitor the stresses on the outer and inner caisson walls
throughout the loading stages. Interface elements are defined by 5 pairs of nodes as shown
below.
soil element
interface element
+*+*
stress points
nodes
Figure 4-1 Distribution of nodes and stress points in interface elements and their connection to soil elements
The roughness of the interaction between soil and caisson is defined in Plaxis by the interface
strength reduction factor (Rinter ). For the purposes of this research, Rine,r= 1 so that the
interface has the same properties as the adjacent soil and the full friction coefficient tan 0' acts
on the caisson walls i.e. tan t'= tan 0'.
4.2 Results of Base Case geometry analysis
The base case geometry (d = 17m, L = 11m) was chosen to illustrate the full results of the
numerical analysis. Appendix C shows the geometry and the mesh that was used. As in the
undrained case, a single uplift point force (P) was applied on the caisson lid along the caisson
centreline. The load was increased until the caisson pull-out occurred.

4.2.1 Load-deformation response
The load-displacement curve is shown in Figure 4.2. At the first stage of the calculations, the
caisson was wished-in-place. The caisson self weight caused an initial displacement of 6, =
0.15m. After the uplift force was applied, this initial displacement is reversed. This initial stage
is omitted in Figure 4.3 and the load deformation curve is plotted from the point at which the
initial installation displacements are reversed. Yielding occurs for loads larger than 31 MN and
the lid displacement at that point is approximately ( = 0.1m. This corresponds to deformation
to diameter ratio of 5 /d = 0.6%. The ultimate capacity of the caisson is estimated as Put,drined
= 34.4MN. For the drained analysis, the net pullout capacity, Pu,,,t(net),drained is defined as the
pullout capacity less the caisson self weight. Here P,It(net),drained = 16.9MN.
40
30
0
Base Case AnalysisL/d=0.65, d=17m
Mohr Coulomb modelsj/'v0=0.33
0.02 0.04 0.06
Lid
0.08 0.10
displacement, 6, [m]
0.12 0.14 0.16
Figure 4-2 Load-deformation response for L/d=0.65
0.00

During the analysis it was observed that the use of interfaces in the finite element program
affects the load deformation response and the ultimate capacity of the caisson. Figure 4.2
shows how the response varies when different interfaces are active.
40
35 1301
Z
25
o 20J
I-0
o 15
O
0.00 0.02 0.04 0.06 0.08 0.10 0.12
Lid Displacement 6, [m]
0.14 0.16
Figure 4-3 The effect of interfaces on the load-displacement response
4.2.2 Breakdown of reaction forces
As discussed in Chapter 2, we expect the following forces to be acting on the caisson at failure:
o Caisson self weight P = 17,511 kN
o External wall friction Pf,ex =8,650 kN
o Internal wall friction Pf,int = 7,570 kN
All interfaces active
---- External and lid interfaces
Internal and lid interfaces
-- Only lid interface
-K No interfaces active
'

These results assume that the horizontal stresses at the interface at failure are a', = a'vo K0 .
Figure 4.4 shows the distribution of the horizontal stress along the external caisson wall at
failure, as obtained by the finite element program. Three sets of data for the horizontal stress
are shown in Figure 4.4. The first set is the stress on the soil-caisson interface. The second and
third set of data was obtained by drawing a cross section within the soil, 0.07 and 0.5 meters
from the interface. Since in Plaxis the caisson is modelled as a dimensionless plate element of
thickness im and radius 8.5m, the horizontal stress at x=8.57m falls within the plate element.
The horizontal stress at x=8.9 should be closer to the realistic value. Nevertheless, Figure 4.4
shows that the x=8.57 set of data is in better agreement with the interface data.
The or'o Ko line is also plotted and it is higher than the finite element prediction. This is due to
the reduction in the vertical effective stress, o',which is belowu'v0 due to acting of stresses
around the caisson. Up to a depth of approximately 6m, the horizontal and vertical stresses on
the external interface at failure are related through K0. After that, the horizontal stress
increases aboveu', Ko. At depths above approximately 8m there is a rapid increase in the
horizontal stress.
We observe very large fluctuations at the tip of the caisson and this is most likely caused by the
complexity of the failure mechanism in this area. These fluctuations reduce the accuracy of the
friction force obtained from the analysis. The same is true for the horizontal stress on the
internal wall shown in Figure 4.5.

40Stress [KPa] 6 0 100
Figure 4-4 Horizontal effective stress distribution on the external caisson wall
Stress [kPa]40
Figure 4-5 Horizontal effective stress distribution on the internal caisson wall
0
2
4
E6N
8
10
12
8
10
12

Figure 4.6 shows arrows of horizontal displacements. There is a pivotal point at around z=8
where the horizontal stresses on the external wall increase and reverse in direction. This helps
explain the sudden increase observed on the horizontal stress in Figure 4.4.
;~L~F4b>
N z =a7
d~--~C- - -l- -- I
_- ca-rcr
~ccCT=r-- Zp T~r-- i)- LC-C-IC- -IC
C - CC- ~-~----13k---
--~- --LI-IC C- L
t C- --)- tC
r---e ~tL~C~ ~-Cc '"'- -
cI--e --~- --
c+-C CCCLI -C-~ C--r
I -C L-r-- C C-C 3,
LCS,CCI-~_-
r- ~-C---C-'C1- C-C'-- --- ,~-rc- ,
-- ,,,- ,,, -r
--
- - -.~-----~rrr- n
r--
Figure 4-6 Horizontal displacements at failure
The shear stress on the external interface at failure is obtained from: f = r' h tan '= h tan '
. Figure 4.7 shows the shear stress on the external wall as obtained from the above equation
and the shear stress as obtained directly from the interface. Figure 4.8 shows the shear stress
obtained directly from a cross section O.lm from the caisson wall and the shear stress obtained
by multiplying the horizontal effective stress on the interface by tan 0'.
56
'I -:" ~- r------r.I-I-I i'-I
U-I- I' ~---~- --
-1 1-:-7---- ~iL:-IY- I ---- -- -r - IC'C'C'rl-
""c;- -:-'I~-- - -- --c~-
CI- ~- 'I''''-"~-11- 1~1--- -- r L
~-, I ___-I-
,- > _i~s
~r
----!
4---
4- "=F4-c - 4-
-I

Stress [kPa]20 30
Figure 4-7 Shear stress on external caisson wall
Stress [kPa]
Figure 4-8 Shear stress on external caisson wall

The friction resistance on the external and internal walls can be obtained by integrating the
shear stress along the interface as shown in Equation 2.3. The resulting forces are P,ext = 7.5MN
and Pf,it = 7MN. The total pullout capacity of the caisson is 34.1MN and the sum of the caisson
self weight and the side friction is Pf,ext + Pf,it +P = 17.5+7.5+7= 32MN. The differences
between the pullout capacity and the sum of the forces could stem from the fluctuations on the
shear stress diagrams and resistance at the caisson tip.
Figure 4.9 shows the relative magnitude of each of the forces at different stages of the loading.
It can be observed that the external wall reaches its frictional capacity before the internal. The
tip resistance remains almost constant.
-10
-20
Lid Displacement 6, [m]
Figure 4-9 Build-up of friction resistance as applied uplift force increases

4.2.3 Failure mechanism
Similarly to the undrained case, the initial phase of the calculations results in a net upward side
friction due to caisson self weight. Thus, during the first stages of the uplift loading, there is
some residual upward friction resistance as shown in Figure 4.9. Eventually, as the applied
anchor force increases, the shear stresses acting on the interface gradually reverse in direction.
Figure 4.10 shows the plastic points in the soil at each of the different stages in the loading
process (A,B,C,D,E and F) indicated in Figure 4.10. During first loading stages, stage A (P/Pult =
0.18), plastic points appear at the caisson tip and at the top of the external wall. The plastic
points then extend upwards and downwards on the external wall and then less rapidly on the
internal wall, stage B (P/Pult = 0.83-0.87). Only after the full frictional resistance on the outside
wall is mobilized, stage E (P/Pult = 0.92) does the friction on the internal wall build up.
59

Stage A: P / Pu,dra,,ined = 0.18 Stage B: P / Pult,drained = 0.64
Stage C: P / Pult,drained = 0.83 Stage D: P / Pu,drained = 0.87ultdrane
Stage E: P / Pult,drained = 0.92 Stage F: P / Pult,drained = 1
Figure 4-10 Development of plastic points during drained loading. Red points are Mohr Coulomb plastic points
and black are tension cut-off points

Figures 4.11, 4.12 and 4.13 show the mesh deformation, the vertical displacements and the
vertical incremental displacements for the base cse analysis when the caisson has reached its
ultimate capacity. The caisson lid slides vertically upwards and the soil below the lid is
detached.
Figure 4-11 Deformed mesh at failure-drained loading case

[m]0.16
0.12
0.8
0.4
0
Figure 4-12 Vertical displacements at failure-drained loading case
,,,,,,
r Ittlll ,I rl~r~tt;Ill(lI I,t t I
;ij iii Iiii ii , II ,ii;,,r rII r rt II ,r,,,I t trrl I I I
r I,:',' ' ' IIIIt ,I r I'I:IIII It r~t IrtIrr t I)111 (I) ,r
t rII Ir
Ii I it
If t
MtttI tt tt ft 8fi tf t.1tI IT . , t t iI Ir f I f F
i ' rt r r
I t , .
Figure 4-13 Incremental vertical displacements at failure-drained analysis for base case geometry
~ -YL

4.3 Effect of wall length
The effect of caisson geometry has been established by comparing results from analyses of
caissons with different length to diameter ratios, L/d. Figure 4.14 compares the load-
deformation responses of the five different geometries. All the load-displacement curves have
similar form.
The displacement at yield shows little variation between the different geometries and varies
between 1 = 0.09m (for L/d = 0.5) and J, = 0.3m (for L/d = 3). Compared to the undrained
loading case the response is stiffer. Also, it was not possible to get the load deformation
response for large deformations because the finite element program indicated a sudden failure,
unlike the undrained case where much larger pre-failure deformations were mobilized.
350
300
250
200
0-6150
o
100
50
00.1 0.2 0.3
Lid Displacement 5, ([m]0.4
Figure 4-14 Effect of caisson geometry on drained load-deformation response

it was observed in the base case analysis that the horizontal force on the external caisson wall is very
close to cr', Ko up a certain depth. In addition, there is a significant fluctuation at larger depths. Figure
4.15 shows the normalized horizontal stress (o-'h / L ) for the different caisson geometries in order to
investigate how these two effects vary with caisson geometry. For all caisson geometries at depths
smaller than 75% of the total length, the horizontal stress at failure varies linearly with depth according
to approximately a'V K 0 . For caissons L/d = 0.5,2 and 3, fluctuations start at a depth of approximately
75% of the total caisson length. For caissons L/d = 1, 0.65, they start at a depth of 94% of the total
caisson length. Therefore, the depth at which the fluctuations occur does not appear to be related to
the caisson geometry.

Normalized horizontal force, o'h/L [kPa/m]
0 2 4 6 8 10
0.0
0.1
0.2
0.3
0.7
0.8
0.9
1.0
12 14
- L/d=3 - L/d=2 - L/d=1 - L/d=0.65 - L/d=0.5
Figure 4-15 Normalized external wall horizontal stress
Figures 4.16 and 4.17 show the effect of caisson geometry on the mobilization of external and internal
wall friction resistance. For all geometries, the full internal friction is mobilized only after the external
friction reaches its maximum value. Eventually, the internal friction will reach the same value as the
external friction. Nevertheless, this can happen at very large displacements at which point the caisson is
considered to have already reached its maximum capacity. Therefore for some of the geometries the
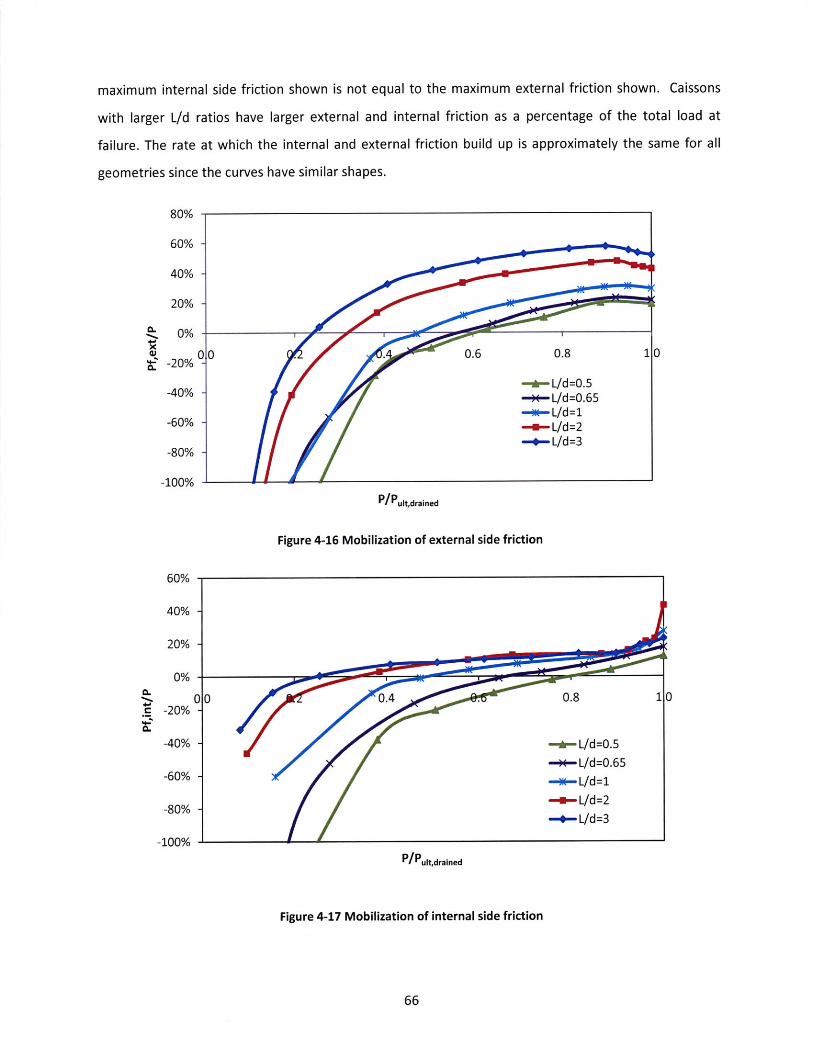
maximum internal side friction shown is not equal to the maximum external friction shown. Caissons
with larger L/d ratios have larger external and internal friction as a percentage of the total load at
failure. The rate at which the internal and external friction build up is approximately the same for all
geometries since the curves have similar shapes.
80%
60%
40%
20%
0%
-20%
-40%
-60%
-80%
-100%
P/Pult,drained
Figure 4-16 Mobilization of external side friction
60%
40%
20%
0%
-20%
-40%
-60%
-80%
-100%P/Pult,drained
Figure 4-17 Mobilization of internal side friction

4.4 Comparisons of results with existing research
Figure 4.18 compares the results of current drained analyses with those predicted by the Deng and
Carter (2002) study. The Deng and Carter predictions are obtained by applying Equation 2.16 to each of
the 5 geometries considered. The net ultimate pullout capacity from these 2 studies are in very good
agreement, with a maximum difference of 9% for L/d = 3. This occurs despite the fact that Deng and
Carter (2002) use the Modified Cam Clay model.
The deviation from the limit calculation is due to the reduction in the vertical stress discussed in section
4.2.2. The difference between the limit calculation prediction and the results of the current study is
highest for L/d = 2 and 3. This is because the reduction in the vertical stress is more significant for these
geometries as shown in Figure 4.15.
Ann
350 -
300 -
250 -
200 -
150 -
100 -
50
0 ~1 -- I
0 0.5 1 1.5 2 2.5 3
Length to diameter apsect ratio, L/d
Figure 4-18 Comparison of results from current studies with existing literature for drained loading
- Current Study
---- Limit Equilibrium Eq. 2.5
-- Deng&Carter (2002)

5. Numerical Analysis of Suction Caisson under SustainedLoading
The finite element analysis in Chapters 3 and 4 established the upper and the lower limits of the
caisson capacity by calculating the capacity under undrained and drained conditions. This part
of the study examines the performance of suction caissons when a tensile load is sustained for
a period of time while pore pressures are allowed to dissipate.
5.1 The finite element model
Finite element analyses are based on the soil model and assumptions described in Chapter 2.
The analyses were performed on different caisson geometries with length to diameter aspect
ratios, L/d = 0.5, 0.65, 1, 2 and 3. The finite element model assumptions are the same as those
described for the undrained loading in Chapter 3. The permeability of the soil is set to
k = 8.64*10 -s5 m/day2.
The first stage of the calculations is the instantaneous loading of the caisson with an uplift force
equal to a percentage of the undrained capacity established in the undrained analysis. This
generates an initial displacement of the caisson and the development of a field of negative
excess pore pressures (Figure 5.4, t = 0). The second stage of the calculations is consolidation
while the initial load is sustained. It is expected that if the load is held for a sufficient time
period, the pore pressures will dissipate and hence the capacity will be below the undrained
loading predictions.
5.2 Base case analysis
The same base case geometry (d = 17m, L = 11m) used in the undrained and drained analyses is
used here. Four load levels are applied to the caisson equal to 57, 69, 80 and 91% of Pt, .drinrd i
2 A typical range for marine clays is 10 -s5 to 10 -6 m/day.

5.2.1 Load deformation response
As discussed in Chapter 2, Det Norske Veritas suggest designing suction caissons by using a
characteristic storm that lasts between 3 and 48 hours. Figure 5.2 shows the lid displacement
after the load has been sustained for 48 hours. Even for a load level of P = 91% P,,ti,ndrained , the
caisson displacement after 2 days is very small. Figure 5.2 also shows as a reference the
displacement if the load is sustained for 20 days. At the highest load level (P = 91% Pult,,,undrained )
the displacement is below 2% of the caisson diameter which suggests that loads very close to
the undrained capacity may be safely sustained for higher periods than those associated with
storms and loop currents.
120
100
80
0 .00-
0.00 0.05 0.10 0.15 0.20 0.25 0.30 0.35
Lid Displacement, 6, [m]
Figure 5-1 Sustained loading displacements for different load levels.
0.40

5.2.2 Capacity under sustained loading
Figure 5.2 shows the finite element prediction of the lid displacement if P = 69% .it,undrained is
sustained for very long periods, in order to examine the conditions under which failure will
eventually occur. Figure 5.2 indicates that the caisson will continue to displace at a constant
rate as the loading period increases, without pullout occurring. As the tensile load is sustained
and the caisson displaces upwards, negative pore pressures increase continuously and
separation between the lid and the soil underneath does not occur. The displacement of the
caisson induces additional negative pore water pressures underneath the caisson lid. The
constant rate at which the caisson displaces indicates that the rate at which excess pore water
pressures dissipate underneath the caisson lid is smaller than the rate at which they increase as
a result of the caisson upward displacement.
2.5
2.0
1.5
1.0
0.5
0.0
0 500 1000 1500 2000 2500
Time [days]
Figure 5-2 Time displacement curve for P/Pult,undrained=69%
3000

Figure 5.3 shows the displacement of the lid and the excess pore pressures (at a reference point
1.7m below the lid at the centreline). The results in Figure 5.3 show that at each load level it is
possible to identify a time after which the excess pore pressures increase (become more
negative) and at the same time, the caisson starts to displace at a constant rate.
Until this occurs, we consider that the caisson is stable that the load can at least be sustained
for that period of time without causing failure of the foundation. Table 5.1 shows the time at
which the pore pressures begin to increase and the displacement at that point. As expected,
the minimum time over which the load can be sustained decreases with increasing load levels.

0.15
0.10
0.05
0.00
0 20
110
- Lid Displacement
Excess PWP
100 '
a
CL
90 w
(a) P/Pult,undrained= 5 7 %
, , , 80
40 60 80 100
Time [days]
--- Lid Displacement160
150CL
a.
a-Cn
140 0
130
0.15
E 0.10
-
•O 0.05
0.000 20 40
Time [days]

0.15 220-0-- Lid Displacement
-- Excess PWP
E 0.10
10210a) 210E
i 0.05
(C) P/Pultundrained=80%0.00 1 200
0 10 20 30
Time [days]
0.15 - 280
* Lid Displacement
-a- Excess PWP
E. 0.10 270
0.05 260 > CLLo -JL
(d) P/Pult~undrained=91 %I0.00 250
0 10 20 30
Time [days]
Figure 5-3 Lid displacement and excess pore water pressure with time for base case geometry. The
displacements shown here for Time>O are the incremental displacements after Time=O.

Table 5.1 Time for excess pore pressure increase, L/d=0.65
5.2.3 Failure mechanism
The process that results in the behaviour observed above is investigated with plots of the
excess pore pressures and other characteristics at different locations and at different times for
a specified load level P=69% Pult.undrained •
Figure 5.4 shows the excess pore water pressures at t=0,5,15 and 45 days. The pore pressures
are dissipating inside the caisson for the first 15 days. At t=45 days all the pore pressures have
increased approximately by the same amount throughout the internal part of the caisson. The
pullout movement of the caisson increases the excess pore water pressures at a rate larger
than the rate at which they can dissipate.
P/Pult, undrained Time (days) bv (m) 6v/d
57% 39 0.157 0.9%
69% 13 0.184 1.1%80% 8 0.241 1.4%91% 7 0.326 2%

kN/m 2
\ 250
115
kN/m 2250
115
t=5days
-20

kN/m 2
250
115
t=15days
-20-1kN/m 2I 250
115
t=45days
-20
Figure 5-4 Development of excess pore pressures with time for P/Pult,undrained=69%

Figure 5.5 shows the development of plastic point inside the soil with time. Initially, most
plastic points develop on the external caisson wall and the plastic points at the tip are the
beginning of the reverse bearing capacity mechanism observed in Chapter 2. With time, the
shearing capacity of the internal caisson wall is reached and plastic points continue to develop
inside the caisson starting from the internal wall and moving towards the centre. As the soil is
allowed to consolidate, plastic points develop directly underneath the caisson lid as increasingly
larger depths.
IF' .a.n
t=Odays
,t15d * t=5daysu i r' 5 DF 5
; I
t=15days t=45day
Figure 5-5 Development of plastic points with time for P/Pult,undrained=69%

Figures 5.6 to 5.8 describe the behaviour of the caisson after pore pressures begin to increase.
The plots are at time t=45days. Figure 5.8 indicates that only the upper part of the soil plug
displaces and the rest of the soil plug has very little displacement. The area over which the
plastic points develop (Figure 5.5, t=45days) is consistent with the area of the soil plug which
undergoes large displacements. The caisson has a total vertical displacement of 0.79 m (Figure
5.7) and the caisson lid does not separate from the adjacent soil (Figure 5.6).
0.79m
Figure 5-6 Deformed Mesh at t=45 days Figure 5-7 Vertical displacement of caisson
at t=45 days
A[m]
1
0
-1
Figure 5-8 Vertical Displacement at t=45days

5.3 Sustained loading capacity for L/d ratios = 0.5,1,2 and 3
Figures 5.9 to 5.16 and Tables 5.2 to 5.5 summarize the effect of the sustained loading on each
of the 4 additional geometries considered. Like in the base geometry case, the excess pore
pressures at a reference point on the caisson centreline and 1.7m underneath the lid, are
shown. It is assumed that the load can at least be sustained until the time when the pore
pressures begin to increase. For all the geometries considered, the displacements at that point
are within 7% of the caisson length. In some cases it is not possible to explain the pattern than
the excess pore water pressures follow. For example, in some cases (L/d = 1 and L/d= 2) the
pore pressures increase twice. Furthermore, finite element results indicate that relatively low
load levels can be sustained for an infinite amount of time. For example, for load levels
P/PlItundrained - 70% and L/d = 2 or L/d = 3, the excess pore water pressures dissipate after
periods in the order of 1000 days and the lid undergoes very small displacements.
120
100
0.05 0.10 0.15 0.20 0.25Lid Displacement, 65(m)
0.30 0.35 0.40
Figure 5-9 Sustained loading displacements for different load levels.
20 1
00.00

0.30 - - Lid Displacement
---- Excess PWP0.25
I P/Pultundrained=6 0 %
50 100
Time [days]
0.30
140 21a
130 3C1
120 OLLI
E0.25
t4-Ca)E
0o..5-
-- 0.20n
110
100 0.15
180s Lid Displacement
--- Excess PWP
auJ
P/Pult undrained70%
1 , 170
0 20 40 60
Time [days]
P/Pultundrained=8 0 %
0 10 20 30CTime [days]
220
(n0.1)Xu210aui
0.40
0.35
0.30
0.25
0.20
0.15
0.10
0.05
0.00200
Lid Displacement
- Excess PWP
P/Pultundrained= 9 1 % I
0 10 20Time [days]
Figure 5-10 Lid displacement and Excess Pore Water Pressure with time for L/d=0.5 geometry. Thedisplacements are absolute in this case and not incremental.
P/Pult, undrained Time (days) 6v (m) 6v /L60% 64 0.167 2%
70% 36 0.192 2%
80% 15 0.241 3%91% 20 0.328 4%
Table 5.2 Time for excess pore pressure increase, L/d=0.5
0.20
0.15
0.10
0.05
0.00
0.30-- Lid Displacement
--- Excess PWP
0.25
0.20
0.15
280
270 LY3..
Co.
260 O
250

200
180 IL/d=ll
160
140
,-20z
0100
0 80L-0° 60c * -4-- P,undrained
40 -- P,drained
--- Sustained Loading-2days20
-20- Sustained Loading-20days
0.00 0.20 0.40 0.60 0.80 1.00 1.20 1.40 1.60 1.80
Lid Displacement, 6,(m)
Figure 5-11 Sustained loading displacements for different load levels.

200 1.20
180
'.
170 v
160
SW1 Rn Lu
0.80
Ea,0
a
." 0.40"o
-J
1.20
E
'0 0.80E
CL)Ea,oa0.
"o" 0.40
0.00
0 20 40 60
Time [days]
2.00
1.60
1.20
E
a 0.80a
0.40
0.00
0 10 20 30
Time [days]
380
370
3:aU)a,
360 Ow
350
0 10 20 30
Time [days]
Figure 5-12 Lid displacement and Excess Pore Water Pressure with time for L/d=1 geometry.
P/Pult. undrained Time (days) 6 v (m) 6v /L68% 25 0.931 5%78% 13 0.981 6%91% 4 1.250 7%
Table 5.3 Time for excess pore pressure increase, L/d=1
0.00
280
270
260 2
C-
250x
240
230

0.10 0.20 0.30 0.40 0.50 0.60 0.70
Lid Displacement, 65(m)
Figure 5-13 Sustained loading displacements for different load levels.
400
350
300
250
200
150
100
50 0
00.00 0.80

0.80
U) 0.40Eo(DCaa-MOo_._U"VV
0.00
1000Time [days]
0.60
, 0.40E
Ea)Ea)0
0.20
0.000.00
0 100 200Time [days]
2000
120 1.50
CaY-0.
0,
U)40 ,oxLu
1.00E10
C
E
M 0.50_1
0.00
0 500 1000Time [days]
280 2.50
2.00
260
W
U)240 C
QW
E1.50
10
E
a)aCO 1.00
CL0.
-o0.50
220 0.00
0 100 200Time [days]
Figure 5-14 Lid displacement and Excess Pore Water Pressure with time for L/d=2 geometry. The displacements
are absolute in this case and not incremental.
P/Pult. undrained Time (days) v, (m) 5v/L
60% inf 0.700 2%70% 142 0.430 1%81% 92 0.606 2%91% 66 0.905 3%
Table 5.3 Time for excess pore pressure increase, L/d=2.
100 -
100
0
,U
80
1500
440
430
a.
420 '
- 410
300

700
L/d=3600
500
L 400
0-1
S3000
200 -- P,undrained
- P,drained
100 -- Sustained Loading-2days
-*- Sustained Loading-20days
0.00 0.20 0.40 0.60 0.80 1.00 1.20
Lid Displacement, 6, [m]
Figure 5-15 Sustained loading displacements for different load levels, L/d=3.

0.30
0.20
0.10
0.00
500Time [days]
1.40
1.20
1.00
0.80
0.60
0.40
0.20
0.00
500Time [days]
1.00
0.
403
(no
xwCU
E
CDS0.50
'I)"oCs..
Vo
0.001 0
1000 500Time [days]
2.00
1.50
WY0..
a
so560U
1.00
0.50
0.00
1000
1000
340
Q_Y
300 -3:CL)i)
xuw
260
0 200Time [days]
Figure 5-16 Lid displacement and Excess Pore Water Pressure with time for L/d=3 geometry. The displacementsare absolute in this case and not incremental.
P/Pult, undrained Time (days) 6v (m) 6v /L62% infinite 0.300 1%70% 609 0.533 1%80% 231 0.572 1%92% 92 1.006 2%
Table 5.5 Time for excess pore pressure increase, L/d=3.

Figure 5.17 summarizes the minimum holding periods and provides comparisons between caissons of
different geometries. The general trend is for the period to increase with increasing L/d ratio. Increasing
the caisson length, increases the drainage path and this makes the dissipation of excess pore water
pressures increasingly harder. The rate at which drainage occurs is related to LZ and this is why caissons
with larger lengths have significantly longer minimum holding periods.
100%
90% -
80%-
70% -
60%-
50% -
40%
100010 100
Minimum period over which load can be sustained [days]
Figure 5-17 Effect of caisson geometry on minimum period over which loads can be sustained
-+ L/d=0.5
- L/d=0.65
--- L/d=l
-0- L/d=3
-*-- L/d=2
i

6. Results and Recommendations
This finite element study examined the capacity of suction caissons under three loading
conditions. The undrained and drained loading analyses established the upper and lower
capacity limits for the 5 geometries examined. It was found that the undrained capacity can be
between 3.6 and 2.3 times the drained capacity for the geometries considered and this ratio
reduces as L/d decreases. This is due to the fact that a large component of the undrained
capacity comes from the base resistance which varies with L2, whereas the internal wall friction
force-unique to the drained case- varies with only with L.
It was found that the predicted undrained capacity matches perfectly the limit equilibrium
solutions and for L/d<1.5 is in very good agreement with the Deng and Carter (2002) results.
For larger L/d ratios, the difference can increase up to 30%. This can be attributed to the fact
that Deng and Carter provide an experimental formula depending only on L/d and to the fact
that they use the MCC model.
The finite element prediction for the drained case is significantly lower than the capacity
estimated by limit equilibrium. An important parameter neglected in the limit calculations is the
reduction in vertical and horizontal effective stresses on the caisson walls that result in an
equivalent reduction to the downward shear force resisting the uplift loading. Nevertheless, the
predicted capacities are in very good agreement with the result of the Deng and Carter (2002)
solution. One of the critical parameters in the drained analysis was the use of interfaces and
their impact on caisson behaviour. An interface had to be introduced between the caisson lid
and the top of the internal soil plug in order to ensure separation occurred during loading.
The final part of this study examined the behaviour of suction caissons under sustained loading
by assuming one of the highest permeabilities encountered in marine clays. The rate at which
negative excess pore pressures develop underneath the caisson lid was found to be smaller
than the rate at which they dissipate and thus the caisson continues to displace at a constant

rate for very large time periods. By establishing the times at which the excess pore pressures
start to increase, it was possible to identify minimum periods over which the load may be safely
sustained by the caisson which are below the duration of storms and loop current loads.
It was found that the displacements of caissons of all geometries are under 3% the diameter for
the maximum period relevant to storm loading (2 days). The only exception is the 5% the
diameter displacement for the 92% P / P,,,undraine, loading of the L/d = 3 caisson. Although it was
not possible to make direct comparisons with the Clukey et al. (2004) results, the results of this
study do not contradict the general findings such as that as L/d increases so does the period
over which specific load levels can be sustained.
Further research could examine the effects of highly permeable layers within the soil as well as
the effects of increasing the overall soil permeability. The presence of a drainage layer within
the soil could have a critical impact on the drainage properties and hence on the capacity of the
caisson under sustained loading.

References
Andersen, K.H. and Jostad, H.P. (1999). 'Foundation Design of Skirted Foundations and Anchors in Clay'.
Proc Offshore Tech Conf, OTC 10824.
Andersen, K.H. and Jostad, H.P. (2004). 'Shear Strength Along Inside of Suction Anchor Skirt Wall in
Clay'. Proc Offshore Tech Conf, OTC 16844.
Bye, A., Erbrich, C. Rognlien, B., Tjelta, T.I. (1995). 'Geotechnical Design of Bucket Foundations'. Proc
Offshore Tech Conf, OTC 7793.
Byrne, B.W., and Houlsby, G.T. (2002). 'Experimental investigations of response of suction caissons to
transient vertical loading'. Journal of Geotech. and Geoenv. Engrg., Vol. 128, No. 11, p. 926-939.
Chen, W. and Randolph, M.F. (2007). 'External radial stress changes and axial capacity for suction
caissons in soft clay'. Geotechnique, 57, No. 6, p.499-511.
Clukey, E. C., Morrison, M. J., Gariner, J., and Cort6, J. F. (1995). 'The response of suction caissons in
normally consolidated clays to cyclic TLP loading conditions'. Proc Offshore Tech Conf, OTC
7996.
Colliat, J-L., Boissard,P., Andersen, K.H., Schroder, K. (1995). 'Caisson foundations as alternative anchors
for permanent mooring of a process barge offshore Congo'. Proc Offshore Tech Conf, OTC 7797,
Houston, p. 919-929.
Delft University of Technology (2007).' A course on suction caisson foundations' Available:
www.offshoreengineering.org. [Accessed 2 0th October 2008].
Deng, W., and Carter, J.P. (2002). 'A theoretical study of the vertical uplift capacity of suction caissons'.
International Journal of Offshore and Polar Engineering. Vol. 12, No. 2, p. 89-97.
Det Norske Veritas (2005). 'Geotechnical Design and Installation of Suction Anchors in Clay'.
Recommended Practice DNV-RP-E303.
El-Gharbawy, S.L. (1998). 'The Pullout Capacity of Suction Caisson Foundations for Tension Leg
Platforms', PhD Dissertation, The University of Texas, Austin.
El-Gharbawy, S., and Olson, R. (1999). 'Suction caisson foundations in the Gulf of Mexico'. Analysis,
Design, Construction, and Testing of Deep Foundations, ASCE Geotechnical Sp. Pub. 88, p. 281-
295.
El-Gharbawy, S.L., Olson, R.E., and Scott, S.A. (1999). 'Suction anchor installations for deep Gulf ofMexico applications'. Proc Offshore Tech Conf, OTC 10992, p. 747-754.
El-Gharbawy, S.L., and Olson, R.E. (2000). 'Modelling of suction caisson foundations'. Proceedings of theInternational Offshore and Polar Engineering Conference, Vol. 2, p. 670-677.

Erbrich, C.T., and Tjelta, T.I. (1999), 'Installation of bucket foundations and suction caissons in sand-
Geotechnical performance'. Proc Offshore Tech Conf, OTC 10990, p. 725-735.
Fines, S., Stove, O., Guldberg, F. (1991) 'Snorre TLP Tethers and Foundation'. Proc Offshore Tech Conf,
OTC 6623. p. 587-597.
Finn, W.D.L., Byrne, P.M. (1972). 'The Evaluation of the Breakout Force for a Submerged Ocean
Platform', Proc Offshore Tech Conf, OTC 1604, Houston, p. 351-365.
Hight, D.W., Jardine, R.J., Gens, C.S. (1987). 'The behaviour of soft clays: Embankments on soft clay. Bull.
Public Work Research Centre, Athens, p. 33-158.
Hogervorst, J. R. (1980), 'Field trials with large diameter suction piles'. Proc Offshore Tech Conf, OTC
3817, p. 217-224.
Houlsby, G. T. and Byrne, B. W. (2005). 'Calculation procedures for installation of suction caissons in
sand'. Proc. ICE Geotech. Engng, Vol. 158, No. 3, p. 135-144.
Iskander, M., EI-Gharbawy, S.L., Olson, R. (2002). 'Performance of suction caissons in sand and clay'.
Canadian Geotechnical Journal, Vol. 39, p. 576-584.
Luke, A.M., Rauch, A.F., Olson, R.E., Mecham, E.C. (2005). 'Components of suction caisson capacity
measured in axial pullout tests', Ocean Engineering, Vol. 32, p.878-891.
Maniar, D.R., Gonzalo Visquez, L.F., Tassoulas, J.L. (2005) 'Suction Caissons: Finite Element Modelling',5th GRACM International Congress on Computational Mechanics.
Mayne, P.W., Kulhawy, F.H. (1982). 'Ko-OCR Relationships in Soils'. J Geotech Eng Div, ASCE, Vol.108,GT6, p.851-873.
Newlin, J. A. (2003). 'Suction Anchor Piles for the Na Kika FDS Mooring System. Part 1: Site
Characterization and Design'. Proc. Int. Symp. on Deepwater Mooring Systems: Concepts, Design,Analysis, and Materials, Houston, p. 55-57.
Poulos, G.H. (1988). Marine Geotechnics. London: Unwin Hyman. p.33-35.
Randolph, M. F., O'Neill, M. P., and Stewart, D. P. (1998). 'Performance of suction anchors in finegrained
calcareous soils'. Proc Offshore Tech Conf, OTC 8831, p.521-529.
Rao, S. N, Ravi, R., and Ganapathy, C. (1977), "Pullout behavior of model suction anchors in soft marine
clays'. Proceedings, Seventh International Offshore and Polar Engineering Conference, Honolulu.
Rune Dyvik, I Knut H. Andersen, Svein Borg Hansen, and Hans Peter Christophersen (1993). 'Field tests of
anchors in clay. I: Description'. J. of Geotech. Engr, Vol. 119, No. 10.
Skempton, A.W. (1951), 'The Bearing Capacity of Clays'. Proc. Building Research Congress, Vol. 1, p. 180-
189.

Steensen-Bach, J. O. (1992). 'Recent model tests with suction piles in clay and sand'. Proc Offshore Tech
Conf, OTC 6844, p. 323-330.
Sukumaran, B., McCarron, W.O., Jeanjean, P., and Abouseeda, H. (1999). 'Efficient finite element
techniques for limit analysis of suction caissons under lateral loads'. Comp. and Geotech, V. 24,
p. 89-107.
Tjelta, T. I., Guttormsen, T. R., and Hermstad, J. (1986). 'Large-scale penetration test at a deepwater
site'. Proc Offshore Tech Conf, OTC 5103, p. 201-212.
Tjelta, T.I. (1994). 'Geotechnical Aspects of Bucket Foundations Replacing Piles for the Europipe 16/11-E
Jacket'. Proc Offshore Tech Conf, OTC 7379.
Tjelta, T.I. (1995). 'Geotechnical Experience from the Installation of the Europipe Jacket with Bucket
Foundations'. Proc Offshore Tech Conf, OTC 7795. p. 897-908.
Vesic, A.S. (1973). 'Analysis of Ultimate Loads of Shallow Foundations'. J. Soil Mechanics & Fdn. Div.,ASCE, Vol. 99, SM2, p.42-73.
Wang, M. C., Demares, K. R., and Nacci, V. A. (1977), "Application of suction anchors in the offshore
technology," Proc Offshore Tech Conf, OTC 3203, pp. 1311-1320.
Whittle, A. J., Germaine, J. T., and Cauble, D. F. (1998). 'Behavior of miniature suction caissons in clay'.
Offshore Site Investigation and Foundation Behaviour'98, SUT, p. 279-300.
Zdravkovic, L., Potts, D. M. & Jardine, R. J. (2001). 'A parametric study of the pull-out capacity of bucket
foundations in soft clay'. Geotechnique, 51, No. 1, p. 55-67.

Appendix A
-1 - 63
2 a
Su
ESP
o h0 O'vO I"1 +C 3
2
For plane stain conditions the effective stress path (ESP) is vertical. In plane strain, E2=0 and Ao'x+ Ao'=O
and the parameter A=0.5.
Assuming such an ESP path yields the following relationship:
S, c'cos 0' (1 + Ko)sin 0 'O - O + 2
'vo 6o 2

Appendix B: Breakdown of undrained loading forces for L/d=0.5,1,2,3
100lIUd=O.5
80
60
z40
S200
O
c 0.)0 0.10 0.20 0.30 0.40 0.50 0.60 0.70---- Ptotal Pfriction
............... full soil and caisson weight - - - friction hand calculation prediction
SPbase - Ps+Pc
-40Lid Displacement 6, [m]
200
150
100
50
0
-50
-100
Lid Displacement 6, [m]

Lid Displacement, 6, [m]
LId=3
0.20 0.30 0.40
-+-- Ptotal-Ps+Pc
- - - Pf,ext theoretical prediction
0.50 0.60--- Pf,ext---------- 6v at Ptotal=Pc+Ps--- Pb
Lid Displacement 6, [m]
500
400
300
200
100
0
-100 i
-200
700
600 -
500 -
400
300
200
100 -
0
0.-100 -
-200
i!
-I I o)0 0.10l

Appendix C: Breakdown of drained loading forces for L/d=0.5,1,2,3
Lid Displacement 6, [m]
Lid Displacement 6, (m)
25 -
20 -
150
0 10
o
0C
0.-5 -
I LJd=0.5
0.08 0.12 0.
-- Ptotal -- Pf,ext --- Pf,int --- Ptip - Pc-10 I
0
-10
-20
III
30
VW" - -_
>t-- r

200 -
- IUL/d=2150
z1 00
cc50
0 50
0. )0 0.05 0.10 0.15 0. 0.25 0. 30
- Ptotal -- Pf,ext - Pc --- Pf,int -- Ptip
-50
Lid Displacement 6, (m)
350
300 L/d=3
250
z
2 200
- 1500-1
L 100
050
0.00 0.10 0.20 0.30 0.40 0.0-50 -
-- Ptotal -- Pf,ext - Pc -*- Pf,int - Ptip
-100
Lid Displacement 56, (m)