Pullout resistance of granular anchors in clay for undrained condition
14
HOSTED BY Pullout resistance of granular anchors in clay for undrained condition $ B.C. O’Kelly a,n , R.B.J. Brinkgreve b,c , V. Sivakumar d a Department of Civil, Structural and Environmental Engineering, Trinity College Dublin, Dublin, Ireland b Geo-Engineering Section, Delft University of Technology, CN Delft, The Netherlands c Research and Projects, Plaxis bv, Computerlaan 14, 2628 XK Delft, The Netherlands d Geotechnical Engineering SPACE, Queen’s University Belfast, Belfast, UK n Corresponding author. Tel.: þ 353 1896 2387; fax: þ353 1677 3072. Received 21 January 2013; received in revised form 2 August 2014; accepted 7 September 2014 Available online 13 December 2014 Abstract Granular anchors (GAs) can resist pullout/uplift forces, compression forces and also provide ground improvement. Under pullout loading, a centrally located tendon transmits the applied surface load to the base of the granular column via a base plate attachment, which compresses the column causing significant dilation of the granular material to occur, thereby forming the anchor. This paper describes a program of field testing and numerical modelling of the pullout resistance of GA installations in overconsolidated clay for the undrained (short term) condition. Pertinent modes of failure are identified for different column length to diameter (L=D) ratios. The applied pullout load is resisted in shaft capacity for short GAs or in end-bulging of the granular column for long GAs. In other words, the failure mode is dependent on the column L=D ratio. A novel modification in which the conventional flat base-plate is replaced by a suction cup was shown to significantly improve the undrained ultimate pullout capacity of short GAs. & 2014 The Japanese Geotechnical Society. Production and hosting by Elsevier B.V. All rights reserved. Keywords: Bulging capacity; Failure; Granular anchor; Uplift; Ultimate capacity 1. Introduction Granular anchors are a relatively new and promising foundation solution, particularly suited for lightly loaded structures. In addition to the improvement provided to the surrounding ground, granular anchors can resist both pullout/ uplift forces and compression forces. Hence they have been adopted, for instance, to prevent foundation uplift caused by flooding (Liu et al., 2006) or to resist foundation heave in expansive clays (Phanikumar et al., 2004, 2008; Sharma et al., 2004; Srirama Rao et al., 2007). Another recent development is the jet mixing anchor pile, a supporting technology particularly suited for foundation pit engineering in soft clay. The ultimate capacity and load–deformation relationship of such piles have been investigated by Xu et al. (2014) using uplift field tests and numerical analyses. The focus of the present study is to investigate the ultimate capacity and load–deformation relationship of granular anchor (GA) foundations under uplift loading. The GA consists of three main components (Fig. 1): a horizontal base plate, a central vertical tendon (metallic rod or stretched cable) and densified granular material introduced into the borehole to form a granular column. Under an applied uplift force (P), the The Japanese Geotechnical Society www.sciencedirect.com journal homepage: www.elsevier.com/locate/sandf Soils and Foundations http://dx.doi.org/10.1016/j.sandf.2014.11.009 0038-0806/& 2014 The Japanese Geotechnical Society. Production and hosting by Elsevier B.V. All rights reserved. E-mail addresses: [email protected] (B.C. O’Kelly), [email protected] (R.B.J. Brinkgreve), [email protected] (V. Sivakumar). Peer review under responsibility of The Japanese Geotechnical Society. Soils and Foundations 2014;54(6):1145–1158
Transcript of Pullout resistance of granular anchors in clay for undrained condition
H O S T E D B Y
Pullout resistance of granular anchors in clay for undrained condition$
B.C. O’Kellya,n, R.B.J. Brinkgreveb,c, V. Sivakumard
aDepartment of Civil, Structural and Environmental Engineering, Trinity College Dublin, Dublin, IrelandbGeo-Engineering Section, Delft University of Technology, CN Delft, The NetherlandscResearch and Projects, Plaxis bv, Computerlaan 14, 2628 XK Delft, The Netherlands
dGeotechnical Engineering SPACE, Queen’s University Belfast, Belfast, UKnCorresponding author. Tel.: þ353 1896 2387; fax: þ353 1677 3072.
Received 21 January 2013; received in revised form 2 August 2014; accepted 7 September 2014Available online 13 December 2014
Abstract
Granular anchors (GAs) can resist pullout/uplift forces, compression forces and also provide ground improvement. Under pullout loading,a centrally located tendon transmits the applied surface load to the base of the granular column via a base plate attachment, which compresses thecolumn causing significant dilation of the granular material to occur, thereby forming the anchor. This paper describes a program of field testingand numerical modelling of the pullout resistance of GA installations in overconsolidated clay for the undrained (short term) condition. Pertinentmodes of failure are identified for different column length to diameter (L=D) ratios. The applied pullout load is resisted in shaft capacity for shortGAs or in end-bulging of the granular column for long GAs. In other words, the failure mode is dependent on the column L=D ratio. A novelmodification in which the conventional flat base-plate is replaced by a suction cup was shown to significantly improve the undrained ultimatepullout capacity of short GAs.& 2014 The Japanese Geotechnical Society. Production and hosting by Elsevier B.V. All rights reserved.
Keywords: Bulging capacity; Failure; Granular anchor; Uplift; Ultimate capacity
1. Introduction
Granular anchors are a relatively new and promisingfoundation solution, particularly suited for lightly loadedstructures. In addition to the improvement provided to thesurrounding ground, granular anchors can resist both pullout/uplift forces and compression forces. Hence they have beenadopted, for instance, to prevent foundation uplift caused byflooding (Liu et al., 2006) or to resist foundation heave in
expansive clays (Phanikumar et al., 2004, 2008; Sharma et al.,2004; Srirama Rao et al., 2007). Another recent developmentis the jet mixing anchor pile, a supporting technologyparticularly suited for foundation pit engineering in soft clay.The ultimate capacity and load–deformation relationship ofsuch piles have been investigated by Xu et al. (2014) usinguplift field tests and numerical analyses.The focus of the present study is to investigate the ultimate
capacity and load–deformation relationship of granular anchor(GA) foundations under uplift loading. The GA consists ofthree main components (Fig. 1): a horizontal base plate, acentral vertical tendon (metallic rod or stretched cable) anddensified granular material introduced into the borehole toform a granular column. Under an applied uplift force (P), the
The Japanese Geotechnical Society
www.sciencedirect.comjournal homepage: www.elsevier.com/locate/sandf
Soils and Foundations
http://dx.doi.org/10.1016/j.sandf.2014.11.0090038-0806/& 2014 The Japanese Geotechnical Society. Production and hosting by Elsevier B.V. All rights reserved.
E-mail addresses: [email protected] (B.C. O’Kelly),[email protected] (R.B.J. Brinkgreve),[email protected] (V. Sivakumar).Peer review under responsibility of The Japanese Geotechnical Society.
Soils and Foundations 2014;54(6):1145–1158
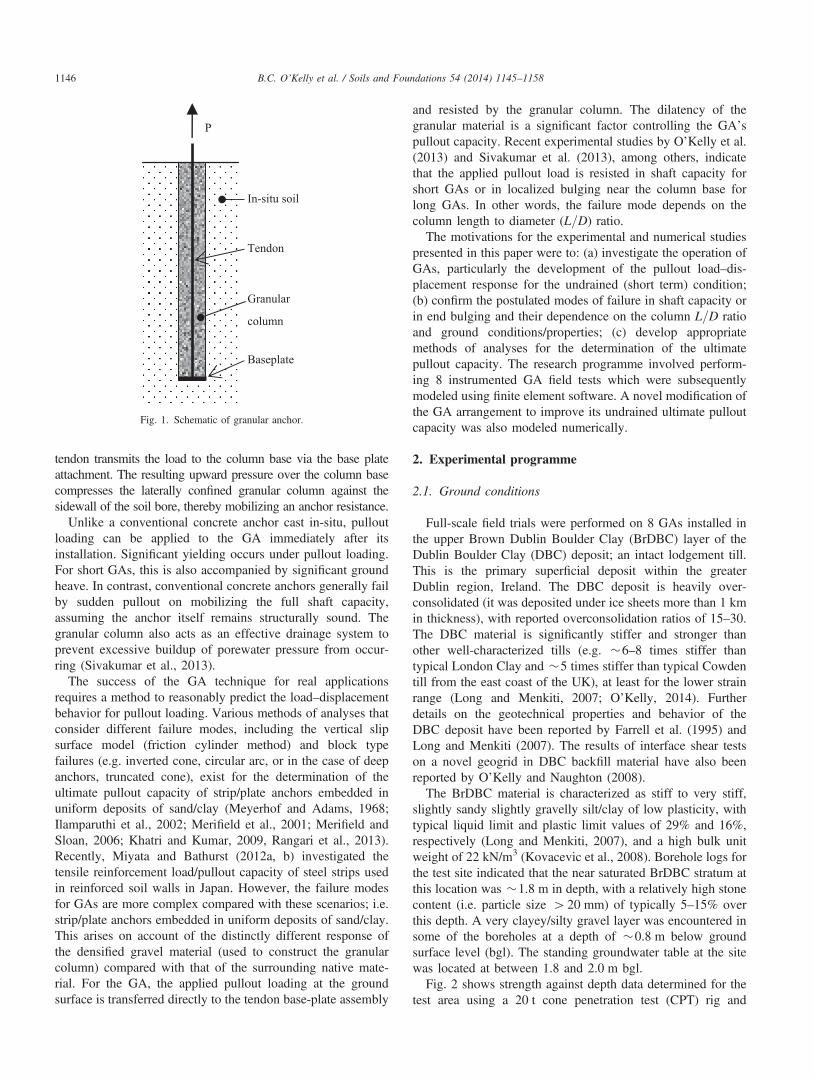
tendon transmits the load to the column base via the base plateattachment. The resulting upward pressure over the column basecompresses the laterally confined granular column against thesidewall of the soil bore, thereby mobilizing an anchor resistance.
Unlike a conventional concrete anchor cast in-situ, pulloutloading can be applied to the GA immediately after itsinstallation. Significant yielding occurs under pullout loading.For short GAs, this is also accompanied by significant groundheave. In contrast, conventional concrete anchors generally failby sudden pullout on mobilizing the full shaft capacity,assuming the anchor itself remains structurally sound. Thegranular column also acts as an effective drainage system toprevent excessive buildup of porewater pressure from occur-ring (Sivakumar et al., 2013).
The success of the GA technique for real applicationsrequires a method to reasonably predict the load–displacementbehavior for pullout loading. Various methods of analyses thatconsider different failure modes, including the vertical slipsurface model (friction cylinder method) and block typefailures (e.g. inverted cone, circular arc, or in the case of deepanchors, truncated cone), exist for the determination of theultimate pullout capacity of strip/plate anchors embedded inuniform deposits of sand/clay (Meyerhof and Adams, 1968;Ilamparuthi et al., 2002; Merifield et al., 2001; Merifield andSloan, 2006; Khatri and Kumar, 2009, Rangari et al., 2013).Recently, Miyata and Bathurst (2012a, b) investigated thetensile reinforcement load/pullout capacity of steel strips usedin reinforced soil walls in Japan. However, the failure modesfor GAs are more complex compared with these scenarios; i.e.strip/plate anchors embedded in uniform deposits of sand/clay.This arises on account of the distinctly different response ofthe densified gravel material (used to construct the granularcolumn) compared with that of the surrounding native mate-rial. For the GA, the applied pullout loading at the groundsurface is transferred directly to the tendon base-plate assembly
and resisted by the granular column. The dilatency of thegranular material is a significant factor controlling the GA’spullout capacity. Recent experimental studies by O’Kelly et al.(2013) and Sivakumar et al. (2013), among others, indicatethat the applied pullout load is resisted in shaft capacity forshort GAs or in localized bulging near the column base forlong GAs. In other words, the failure mode depends on thecolumn length to diameter (L=D) ratio.The motivations for the experimental and numerical studies
presented in this paper were to: (a) investigate the operation ofGAs, particularly the development of the pullout load–dis-placement response for the undrained (short term) condition;(b) confirm the postulated modes of failure in shaft capacity orin end bulging and their dependence on the column L=D ratioand ground conditions/properties; (c) develop appropriatemethods of analyses for the determination of the ultimatepullout capacity. The research programme involved perform-ing 8 instrumented GA field tests which were subsequentlymodeled using finite element software. A novel modification ofthe GA arrangement to improve its undrained ultimate pulloutcapacity was also modeled numerically.
2. Experimental programme
2.1. Ground conditions
Full-scale field trials were performed on 8 GAs installed inthe upper Brown Dublin Boulder Clay (BrDBC) layer of theDublin Boulder Clay (DBC) deposit; an intact lodgement till.This is the primary superficial deposit within the greaterDublin region, Ireland. The DBC deposit is heavily over-consolidated (it was deposited under ice sheets more than 1 kmin thickness), with reported overconsolidation ratios of 15–30.The DBC material is significantly stiffer and stronger thanother well-characterized tills (e.g. �6–8 times stiffer thantypical London Clay and �5 times stiffer than typical Cowdentill from the east coast of the UK), at least for the lower strainrange (Long and Menkiti, 2007; O’Kelly, 2014). Furtherdetails on the geotechnical properties and behavior of theDBC deposit have been reported by Farrell et al. (1995) andLong and Menkiti (2007). The results of interface shear testson a novel geogrid in DBC backfill material have also beenreported by O’Kelly and Naughton (2008).The BrDBC material is characterized as stiff to very stiff,
slightly sandy slightly gravelly silt/clay of low plasticity, withtypical liquid limit and plastic limit values of 29% and 16%,respectively (Long and Menkiti, 2007), and a high bulk unitweight of 22 kN/m3 (Kovacevic et al., 2008). Borehole logs forthe test site indicated that the near saturated BrDBC stratum atthis location was �1.8 m in depth, with a relatively high stonecontent (i.e. particle size 420 mm) of typically 5–15% overthis depth. A very clayey/silty gravel layer was encountered insome of the boreholes at a depth of �0.8 m below groundsurface level (bgl). The standing groundwater table at the sitewas located at between 1.8 and 2.0 m bgl.Fig. 2 shows strength against depth data determined for the
test area using a 20 t cone penetration test (CPT) rig and
In-situ soil
Tendon
Granular
column
Baseplate
P
Fig. 1. Schematic of granular anchor.
B.C. O’Kelly et al. / Soils and Foundations 54 (2014) 1145–11581146
unconsolidated–undrained triaxial compression tests. Thelatter included testing of ‘cored’ and reconstituted specimens.'Cored' specimens were obtained from just below the base ofthe boreholes at final depth using 38 mm diameter samplingtubes. The reconstituted specimens, 100 mm in diameterand 200 mm long, were prepared by standard Proctor-compaction of soil recovered at its in-situ water content usingthe clay-cutter tool during borehole formation. The CPTundisturbed undrained shear strength was determined assu ¼ qc�σvo
� �=Nkt, where: qc is the cone-tip resistance; σvo
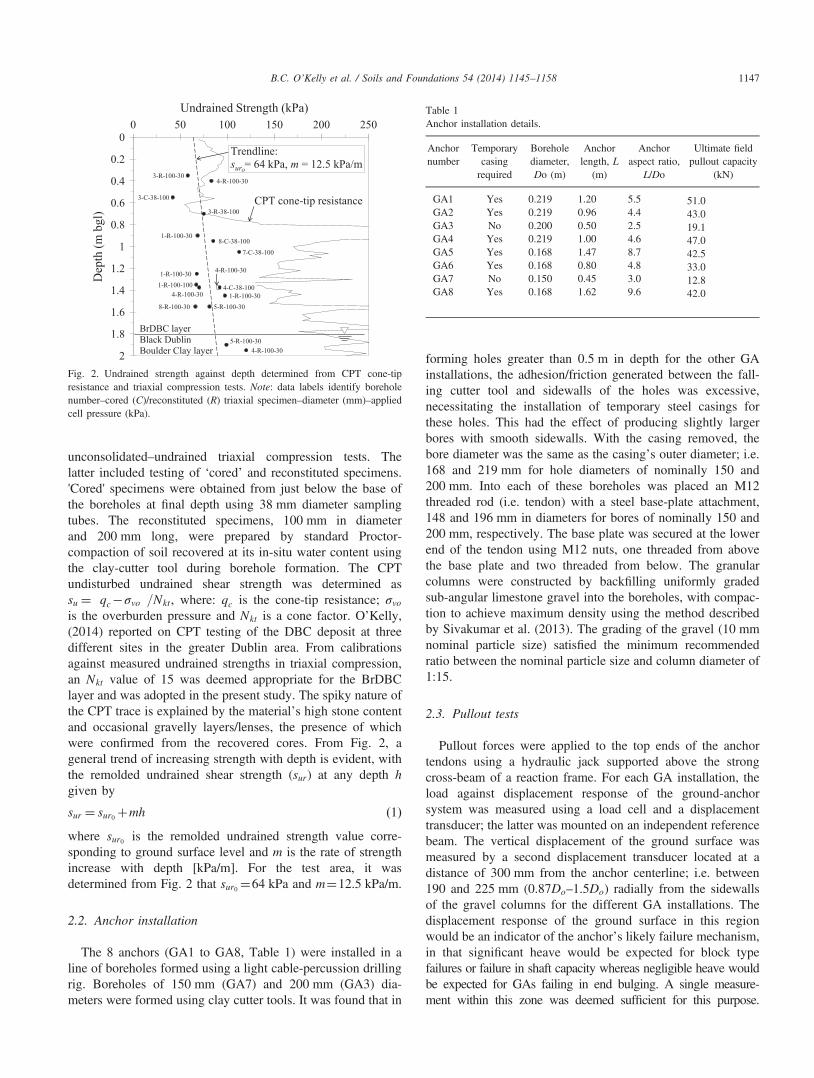
is the overburden pressure and Nkt is a cone factor. O’Kelly,(2014) reported on CPT testing of the DBC deposit at threedifferent sites in the greater Dublin area. From calibrationsagainst measured undrained strengths in triaxial compression,an Nkt value of 15 was deemed appropriate for the BrDBClayer and was adopted in the present study. The spiky nature ofthe CPT trace is explained by the material’s high stone contentand occasional gravelly layers/lenses, the presence of whichwere confirmed from the recovered cores. From Fig. 2, ageneral trend of increasing strength with depth is evident, withthe remolded undrained shear strength (sur) at any depth hgiven by
sur ¼ sur0 þmh ð1Þwhere sur0 is the remolded undrained strength value corre-sponding to ground surface level and m is the rate of strengthincrease with depth [kPa/m]. For the test area, it wasdetermined from Fig. 2 that sur0 ¼64 kPa and m¼12.5 kPa/m.
2.2. Anchor installation
The 8 anchors (GA1 to GA8, Table 1) were installed in aline of boreholes formed using a light cable-percussion drillingrig. Boreholes of 150 mm (GA7) and 200 mm (GA3) dia-meters were formed using clay cutter tools. It was found that in
forming holes greater than 0.5 m in depth for the other GAinstallations, the adhesion/friction generated between the fall-ing cutter tool and sidewalls of the holes was excessive,necessitating the installation of temporary steel casings forthese holes. This had the effect of producing slightly largerbores with smooth sidewalls. With the casing removed, thebore diameter was the same as the casing’s outer diameter; i.e.168 and 219 mm for hole diameters of nominally 150 and200 mm. Into each of these boreholes was placed an M12threaded rod (i.e. tendon) with a steel base-plate attachment,148 and 196 mm in diameters for bores of nominally 150 and200 mm, respectively. The base plate was secured at the lowerend of the tendon using M12 nuts, one threaded from abovethe base plate and two threaded from below. The granularcolumns were constructed by backfilling uniformly gradedsub-angular limestone gravel into the boreholes, with compac-tion to achieve maximum density using the method describedby Sivakumar et al. (2013). The grading of the gravel (10 mmnominal particle size) satisfied the minimum recommendedratio between the nominal particle size and column diameter of1:15.
2.3. Pullout tests
Pullout forces were applied to the top ends of the anchortendons using a hydraulic jack supported above the strongcross-beam of a reaction frame. For each GA installation, theload against displacement response of the ground-anchorsystem was measured using a load cell and a displacementtransducer; the latter was mounted on an independent referencebeam. The vertical displacement of the ground surface wasmeasured by a second displacement transducer located at adistance of 300 mm from the anchor centerline; i.e. between190 and 225 mm (0.87Do–1.5Do) radially from the sidewallsof the gravel columns for the different GA installations. Thedisplacement response of the ground surface in this regionwould be an indicator of the anchor’s likely failure mechanism,in that significant heave would be expected for block typefailures or failure in shaft capacity whereas negligible heave wouldbe expected for GAs failing in end bulging. A single measure-ment within this zone was deemed sufficient for this purpose.
Table 1Anchor installation details.
Anchornumber
Temporarycasingrequired
Boreholediameter,Do (m)
Anchorlength, L
(m)
Anchoraspect ratio,
L/Do
Ultimate fieldpullout capacity
(kN)
GA1 Yes 0.219 1.20 5.5 51.0GA2 Yes 0.219 0.96 4.4 43.0GA3 No 0.200 0.50 2.5 19.1GA4 Yes 0.219 1.00 4.6 47.0GA5 Yes 0.168 1.47 8.7 42.5GA6 Yes 0.168 0.80 4.8 33.0GA7 No 0.150 0.45 3.0 12.8GA8 Yes 0.168 1.62 9.6 42.0
Fig. 2. Undrained strength against depth determined from CPT cone-tipresistance and triaxial compression tests. Note: data labels identify boreholenumber–cored (C)/reconstituted (R) triaxial specimen–diameter (mm)–appliedcell pressure (kPa).
B.C. O’Kelly et al. / Soils and Foundations 54 (2014) 1145–1158 1147
The experimental load–displacement and ground heave responsedata are modelled in the second part of this study to betterunderstand the GAs performance under pullout loading andassociated failure modes. Similar experimental studies performedin the future could consider measuring the ground heave responseat two or more radial distances (each a function of the GA’sdiameter) to provide more experimental data for validation of themodelling. During application of the pullout load, observationswere made of the relative vertical movements between the tops ofthe gravel columns and the surrounding ground surface. The rate ofloading was such that the anchor’s ultimate pullout capacity wasmobilized within a period of 15 min.
3. Experimental results
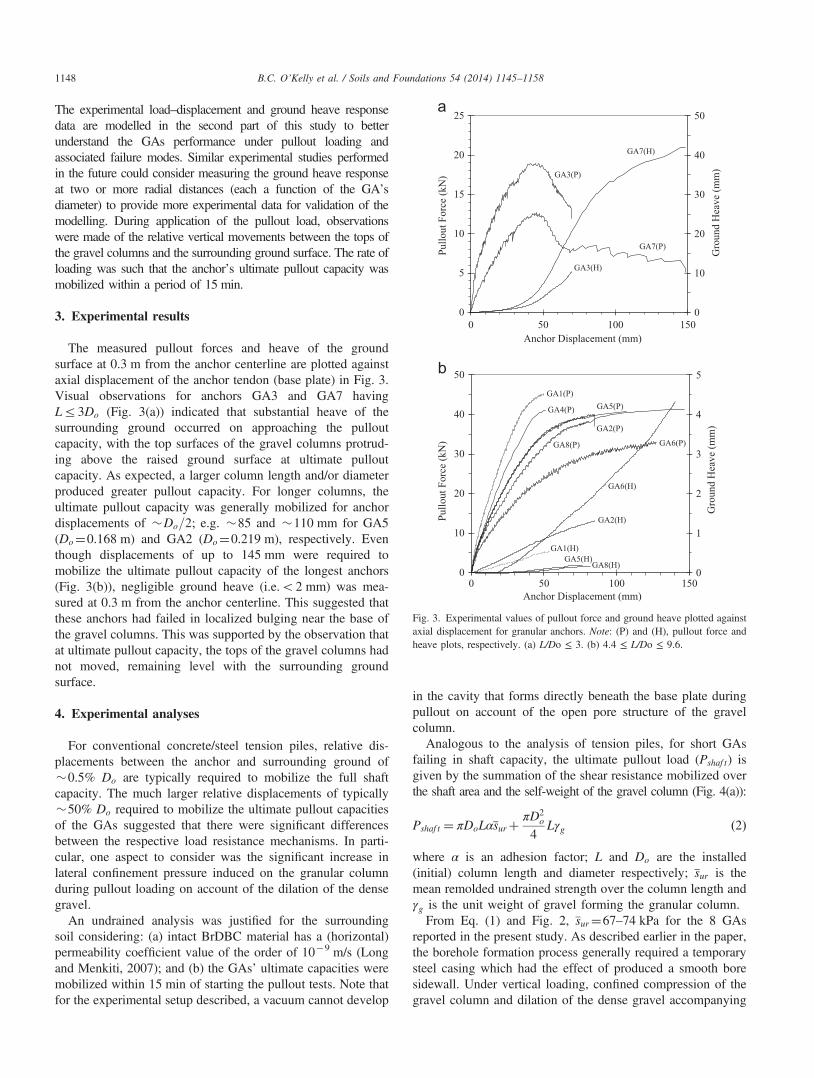
The measured pullout forces and heave of the groundsurface at 0.3 m from the anchor centerline are plotted againstaxial displacement of the anchor tendon (base plate) in Fig. 3.Visual observations for anchors GA3 and GA7 havingLr3Do (Fig. 3(a)) indicated that substantial heave of thesurrounding ground occurred on approaching the pulloutcapacity, with the top surfaces of the gravel columns protrud-ing above the raised ground surface at ultimate pulloutcapacity. As expected, a larger column length and/or diameterproduced greater pullout capacity. For longer columns, theultimate pullout capacity was generally mobilized for anchordisplacements of �Do=2; e.g. �85 and �110 mm for GA5(Do¼0.168 m) and GA2 (Do¼0.219 m), respectively. Eventhough displacements of up to 145 mm were required tomobilize the ultimate pullout capacity of the longest anchors(Fig. 3(b)), negligible ground heave (i.e.o2 mm) was mea-sured at 0.3 m from the anchor centerline. This suggested thatthese anchors had failed in localized bulging near the base ofthe gravel columns. This was supported by the observation thatat ultimate pullout capacity, the tops of the gravel columns hadnot moved, remaining level with the surrounding groundsurface.
4. Experimental analyses
For conventional concrete/steel tension piles, relative dis-placements between the anchor and surrounding ground of�0.5% Do are typically required to mobilize the full shaftcapacity. The much larger relative displacements of typically�50% Do required to mobilize the ultimate pullout capacitiesof the GAs suggested that there were significant differencesbetween the respective load resistance mechanisms. In parti-cular, one aspect to consider was the significant increase inlateral confinement pressure induced on the granular columnduring pullout loading on account of the dilation of the densegravel.
An undrained analysis was justified for the surroundingsoil considering: (a) intact BrDBC material has a (horizontal)permeability coefficient value of the order of 10�9 m/s (Longand Menkiti, 2007); and (b) the GAs’ ultimate capacities weremobilized within 15 min of starting the pullout tests. Note thatfor the experimental setup described, a vacuum cannot develop
in the cavity that forms directly beneath the base plate duringpullout on account of the open pore structure of the gravelcolumn.Analogous to the analysis of tension piles, for short GAs
failing in shaft capacity, the ultimate pullout load (Pshaf t) isgiven by the summation of the shear resistance mobilized overthe shaft area and the self-weight of the gravel column (Fig. 4(a)):
Pshaf t ¼ πDoLαsurþπD2
o
4Lγg ð2Þ
where α is an adhesion factor; L and Do are the installed(initial) column length and diameter respectively; sur is themean remolded undrained strength over the column length andγg is the unit weight of gravel forming the granular column.From Eq. (1) and Fig. 2, sur¼67–74 kPa for the 8 GAs
reported in the present study. As described earlier in the paper,the borehole formation process generally required a temporarysteel casing which had the effect of produced a smooth boresidewall. Under vertical loading, confined compression of thegravel column and dilation of the dense gravel accompanying
0
10
20
30
40
50
0
5
10
15
20
25
0 50 100 150
Gro
und
Hea
ve (m
m)
Pullo
ut F
orce
(kN
)
Anchor Displacement (mm)
GA3(H)
GA7(H)
GA3(P)
GA7(P)
0
1
2
3
4
5
0
10
20
30
40
50
0 50 100 150
Gro
und
Hea
ve (m
m)
Pullo
ut F
orce
(kN
)
Anchor Displacement (mm)
GA1(P)
GA6(H)
GA2(P)
GA6(P)GA8(P)
GA5(P)GA4(P)
GA5(H)GA1(H)
GA2(H)
GA8(H)
Fig. 3. Experimental values of pullout force and ground heave plotted againstaxial displacement for granular anchors. Note: (P) and (H), pullout force andheave plots, respectively. (a) L/Do ≤ 3. (b) 4.4 ≤ L/Do ≤ 9.6.
B.C. O’Kelly et al. / Soils and Foundations 54 (2014) 1145–11581148
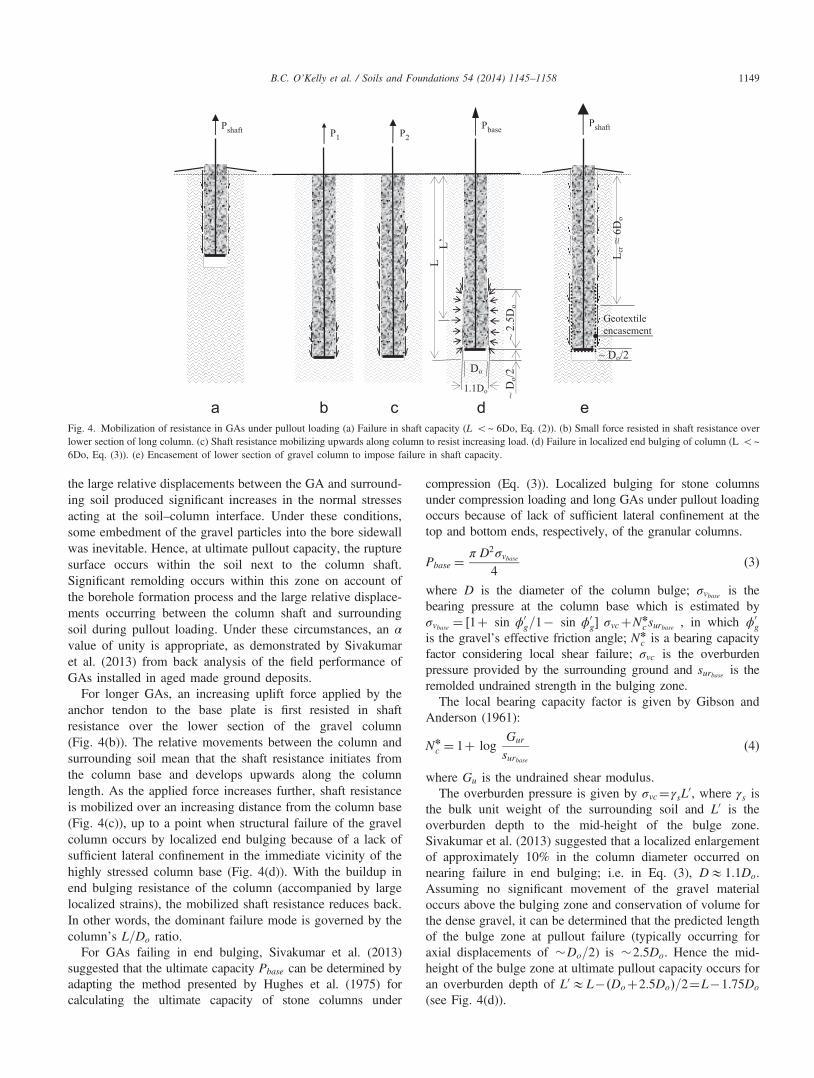
the large relative displacements between the GA and surround-ing soil produced significant increases in the normal stressesacting at the soil–column interface. Under these conditions,some embedment of the gravel particles into the bore sidewallwas inevitable. Hence, at ultimate pullout capacity, the rupturesurface occurs within the soil next to the column shaft.Significant remolding occurs within this zone on account ofthe borehole formation process and the large relative displace-ments occurring between the column shaft and surroundingsoil during pullout loading. Under these circumstances, an αvalue of unity is appropriate, as demonstrated by Sivakumaret al. (2013) from back analysis of the field performance ofGAs installed in aged made ground deposits.
For longer GAs, an increasing uplift force applied by theanchor tendon to the base plate is first resisted in shaftresistance over the lower section of the gravel column(Fig. 4(b)). The relative movements between the column andsurrounding soil mean that the shaft resistance initiates fromthe column base and develops upwards along the columnlength. As the applied force increases further, shaft resistanceis mobilized over an increasing distance from the column base(Fig. 4(c)), up to a point when structural failure of the gravelcolumn occurs by localized end bulging because of a lack ofsufficient lateral confinement in the immediate vicinity of thehighly stressed column base (Fig. 4(d)). With the buildup inend bulging resistance of the column (accompanied by largelocalized strains), the mobilized shaft resistance reduces back.In other words, the dominant failure mode is governed by thecolumn’s L=Do ratio.
For GAs failing in end bulging, Sivakumar et al. (2013)suggested that the ultimate capacity Pbase can be determined byadapting the method presented by Hughes et al. (1975) forcalculating the ultimate capacity of stone columns under
compression (Eq. (3)). Localized bulging for stone columnsunder compression loading and long GAs under pullout loadingoccurs because of lack of sufficient lateral confinement at thetop and bottom ends, respectively, of the granular columns.
Pbase ¼π D2σvbase
4ð3Þ
where D is the diameter of the column bulge; σvbase is thebearing pressure at the column base which is estimated byσvbase ¼ ½1þ sin ϕ0
g=1� sin ϕ0g� σvcþNn
c surbase� �
, in which ϕ0g
is the gravel’s effective friction angle; Nnc is a bearing capacity
factor considering local shear failure; σvc is the overburdenpressure provided by the surrounding ground and surbase is theremolded undrained strength in the bulging zone.The local bearing capacity factor is given by Gibson and
Anderson (1961):
Nn
c ¼ 1þ logGur
surbaseð4Þ
where Gu is the undrained shear modulus.The overburden pressure is given by σvc¼γsL
0, where γs isthe bulk unit weight of the surrounding soil and L0 is theoverburden depth to the mid-height of the bulge zone.Sivakumar et al. (2013) suggested that a localized enlargementof approximately 10% in the column diameter occurred onnearing failure in end bulging; i.e. in Eq. (3), DE1.1Do.Assuming no significant movement of the gravel materialoccurs above the bulging zone and conservation of volume forthe dense gravel, it can be determined that the predicted lengthof the bulge zone at pullout failure (typically occurring foraxial displacements of �Do=2) is �2.5Do. Hence the mid-height of the bulge zone at ultimate pullout capacity occurs foran overburden depth of L0EL� Doþ2:5Doð Þ=2¼L�1:75Do
(see Fig. 4(d)).
Fig. 4. Mobilization of resistance in GAs under pullout loading (a) Failure in shaft capacity (L o~ 6Do, Eq. (2)). (b) Small force resisted in shaft resistance overlower section of long column. (c) Shaft resistance mobilizing upwards along column to resist increasing load. (d) Failure in localized end bulging of column (L o~6Do, Eq. (3)). (e) Encasement of lower section of gravel column to impose failure in shaft capacity.
B.C. O’Kelly et al. / Soils and Foundations 54 (2014) 1145–1158 1149
The ultimate pullout load in shaft capacity increasesproportionally with, and is strongly sensitive to, the column’sL=D ratio. Above a critical aspect ratio L=Do
� �cr, failure in
end bulging is the dominant mechanism, with the GA’scapacity dependent on G=surbase , ϕ0
g and its L=D ratio (seeEq. (3)). As shown later in the paper, for a given columndiameter, the ultimate pullout capacity for failure in endbulging increases only marginally with increasing L=D ratio.
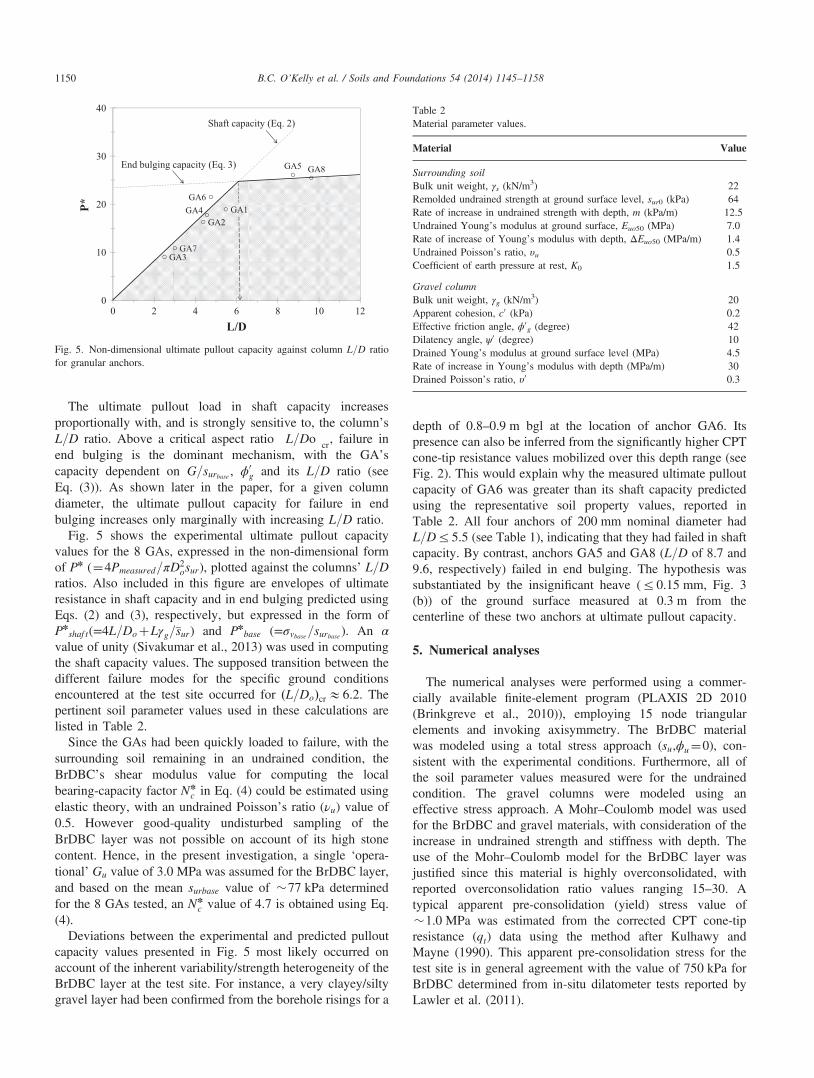
Fig. 5 shows the experimental ultimate pullout capacityvalues for the 8 GAs, expressed in the non-dimensional formof Pn (¼4Pmeasured=πD2
osur), plotted against the columns’ L=Dratios. Also included in this figure are envelopes of ultimateresistance in shaft capacity and in end bulging predicted usingEqs. (2) and (3), respectively, but expressed in the form ofPn
shaf t(=4L=DoþLγg=sur) and Pnbase (=σvbase=surbase ). An α
value of unity (Sivakumar et al., 2013) was used in computingthe shaft capacity values. The supposed transition between thedifferent failure modes for the specific ground conditionsencountered at the test site occurred for ðL=DoÞcrE6.2. Thepertinent soil parameter values used in these calculations arelisted in Table 2.
Since the GAs had been quickly loaded to failure, with thesurrounding soil remaining in an undrained condition, theBrDBC’s shear modulus value for computing the localbearing-capacity factor Nn
c in Eq. (4) could be estimated usingelastic theory, with an undrained Poisson’s ratio (νu) value of0.5. However good-quality undisturbed sampling of theBrDBC layer was not possible on account of its high stonecontent. Hence, in the present investigation, a single ‘opera-tional’ Gu value of 3.0 MPa was assumed for the BrDBC layer,and based on the mean surbase value of �77 kPa determinedfor the 8 GAs tested, an Nn
c value of 4.7 is obtained using Eq.(4).
Deviations between the experimental and predicted pulloutcapacity values presented in Fig. 5 most likely occurred onaccount of the inherent variability/strength heterogeneity of theBrDBC layer at the test site. For instance, a very clayey/siltygravel layer had been confirmed from the borehole risings for a
depth of 0.8–0.9 m bgl at the location of anchor GA6. Itspresence can also be inferred from the significantly higher CPTcone-tip resistance values mobilized over this depth range (seeFig. 2). This would explain why the measured ultimate pulloutcapacity of GA6 was greater than its shaft capacity predictedusing the representative soil property values, reported inTable 2. All four anchors of 200 mm nominal diameter hadL=Dr5.5 (see Table 1), indicating that they had failed in shaftcapacity. By contrast, anchors GA5 and GA8 (L=D of 8.7 and9.6, respectively) failed in end bulging. The hypothesis wassubstantiated by the insignificant heave (r0.15 mm, Fig. 3(b)) of the ground surface measured at 0.3 m from thecenterline of these two anchors at ultimate pullout capacity.
5. Numerical analyses
The numerical analyses were performed using a commer-cially available finite-element program (PLAXIS 2D 2010(Brinkgreve et al., 2010)), employing 15 node triangularelements and invoking axisymmetry. The BrDBC materialwas modeled using a total stress approach (su,ϕu¼0), con-sistent with the experimental conditions. Furthermore, all ofthe soil parameter values measured were for the undrainedcondition. The gravel columns were modeled using aneffective stress approach. A Mohr–Coulomb model was usedfor the BrDBC and gravel materials, with consideration of theincrease in undrained strength and stiffness with depth. Theuse of the Mohr–Coulomb model for the BrDBC layer wasjustified since this material is highly overconsolidated, withreported overconsolidation ratio values ranging 15–30. Atypical apparent pre-consolidation (yield) stress value of�1.0 MPa was estimated from the corrected CPT cone-tipresistance (qt) data using the method after Kulhawy andMayne (1990). This apparent pre-consolidation stress for thetest site is in general agreement with the value of 750 kPa forBrDBC determined from in-situ dilatometer tests reported byLawler et al. (2011).
GA3GA7
GA2GA4GA6
GA1
GA5 GA8
0
10
20
30
40
0 2 4 6 8 10 12
P*
L/D
End bulging capacity (Eq. 3)
Shaft capacity (Eq. 2)
Fig. 5. Non-dimensional ultimate pullout capacity against column L=D ratiofor granular anchors.
Table 2Material parameter values.
Material Value
Surrounding soilBulk unit weight, γs (kN/m
3) 22Remolded undrained strength at ground surface level, sur0 (kPa) 64Rate of increase in undrained strength with depth, m (kPa/m) 12.5Undrained Young’s modulus at ground surface, Euo50 (MPa) 7.0Rate of increase of Young’s modulus with depth, ΔEuo50 (MPa/m) 1.4Undrained Poisson’s ratio, υu 0.5Coefficient of earth pressure at rest, K0 1.5
Gravel columnBulk unit weight, γg (kN/m3) 20Apparent cohesion, c0 (kPa) 0.2Effective friction angle, ϕ0
g (degree) 42Dilatency angle, ψ0 (degree) 10Drained Young’s modulus at ground surface level (MPa) 4.5Rate of increase in Young’s modulus with depth (MPa/m) 30Drained Poisson’s ratio, υ0 0.3
B.C. O’Kelly et al. / Soils and Foundations 54 (2014) 1145–11581150
The Young’s modulus values adopted in the numericalanalyses required special attention. When using a constantstiffness modulus to represent soil behavior (as in the Mohr–Coulomb model), one should choose a value that is consistentwith the stress level and stress path development. The pertinentinput parameters are values of undrained (secant) Young’smodulus at 50% shear strength corresponding to groundsurface level (Euo50) and the rate of increase in this moduluswith depth (ΔEuo50). Both values relate to a reference confin-ing pressure of 100 kPa in the triaxial cell since their valuestend to increase with confining pressure. Since undisturbedsamples were not available, a different approach was adoptedin the determination of these stiffness values. Twelve triaxialspecimens, each 100 mm in diameter and 200 mm long, wereprepared by standard Proctor-compaction of BrDBC materialthat had been recovered at its natural water content fromdifferent depths using the clay cutter tool during boreholeformation. These specimens were tested in unconsolidated–undrained triaxial compression, with the stiffness values at50% shear strength determined from the measured stress–straincurves. The values of Euo50¼7.0 MPa and ΔEuo50¼1.4 MPa/m depth were deduced from regression analysis of the stiffnessvalues at 50% shear strength plotted against depth for the 12triaxial specimens. It is acknowledged that this approachcannot reproduce the inherent structure of the ground andmay result in (significantly) lower values of soil stiffness,especially at small strains. With mean values of LE1.0 andsurbaseE77 kPa for the 8 GAs tested, these stiffness valuesindicate GuE2.8 MPa (from Gu ¼ Eu=3), which is consistentwith the value of 3.0 MPa adopted for the BrDBC layer in theexperimental analyses. For the drained Poisson’s ratio of 0.2reported for BrDBC (Kovacevic et al., 2008), the Euo50 andΔEuo50 values used in the numerical analyses correspond todrained modulus values of 5.6 MPa and 1.1 MPa/m depth,respectively.
Considering the very low confinement pressure, a relativelylow drained Young’s modulus of 4.5 MPa was adopted atground surface level for the dense gravel column. Its value wasconsidered to increase significantly and proportionately withdepth. The ϕ0
g value of 421 adopted is consistent with reportedpeak values for dense sub-angular gravel.
The Mohr–Coulomb model applied in PLAXIS 2D (2010)does not allow for dilatency cutoff; i.e. end of dilatency occurswhen the soil reaches the critical state. The effect of dilatencyangle ψ 0 was investigated by running simulations with input ψ 0
values of 101 and then 51; i.e. moving towards the critical stateψ 0 ¼01 value. The interactions between the gravel and BrDBCmaterials in contact with the top and bottom surfaces,respectively, of the base plate were modeled using an interfacefriction coefficient value of 0.67.
Long and Menkiti (2006, 2007) and Lawler et al. (2011)reported an average coefficient of earth pressure at-rest (K0)value of 1.5 for the BrDBC layer, determined from highquality in-situ dilatometer tests. In previous finite elementanalyses, values of K0¼1.5 (Menkiti et al., 2004; Kovacevicet al., 2008) and 3.0 (Lawler et al., 2011) have been adoptedfor the BrDBC layer. In the absence of data, engineers in
Dublin have assumed K0 values for the BrDBC layer ranging1.0–1.5 in design (Long and Menkiti, 2007). Based on thisevidence, a constant K0 value of 1.5 with depth was adopted inthe present study. For numerical reasons, an undrainedPoisson’s ratio value of 0.495 was employed along with anapparent cohesion c0 value of 0.2 kPa for the gravel.An axisymmetric model with standard fixities and dimen-
sions of 2.5 m in radius and 2.5 m in depth was used for all ofthe simulations. This placed the outer vertical boundary at adistance of at least 11Do from the sidewall of the gravelcolumn and allowed freedom for any of a number of possiblymechanisms to develop in the BrDBC material, withoutsignificant influence from the outer boundary. As for the in-situ condition, the phreatic level was set at 1.8 m bgl.The calculation scheme was performed in three stages: (a)
the initial stresses were generated in the 2.5 m thick BrDBClayer using the K0 procedure; (b) the GA’s gravel column was‘wished-in-place’; (c) the operation of the anchor duringpullout loading (i.e. uniform upward movement of its rigidbase plate) was simulated by means of an upward prescribed-displacement condition acting over the base of the gravelcolumn. The horizontal dimension (width) of the prescribeddisplacement was set equal to that of the base plates used in thefield tests, simulating the initial gap of �10 mm presentbetween the outer rim of the base plate and the bore sidewall.A tension cutoff value of 0 kPa was specified throughout theBrDBC layer; i.e. vacuum cannot develop in the cavity thatforms directly beneath the base plate during pullout. A numberof simulations performed for different mesh densities indicatedthat coarse meshing (with approximately 1100 elements) wasadequate, with pullout failure typically achieved within5000 steps.Simulations were also performed for a modified base-plate
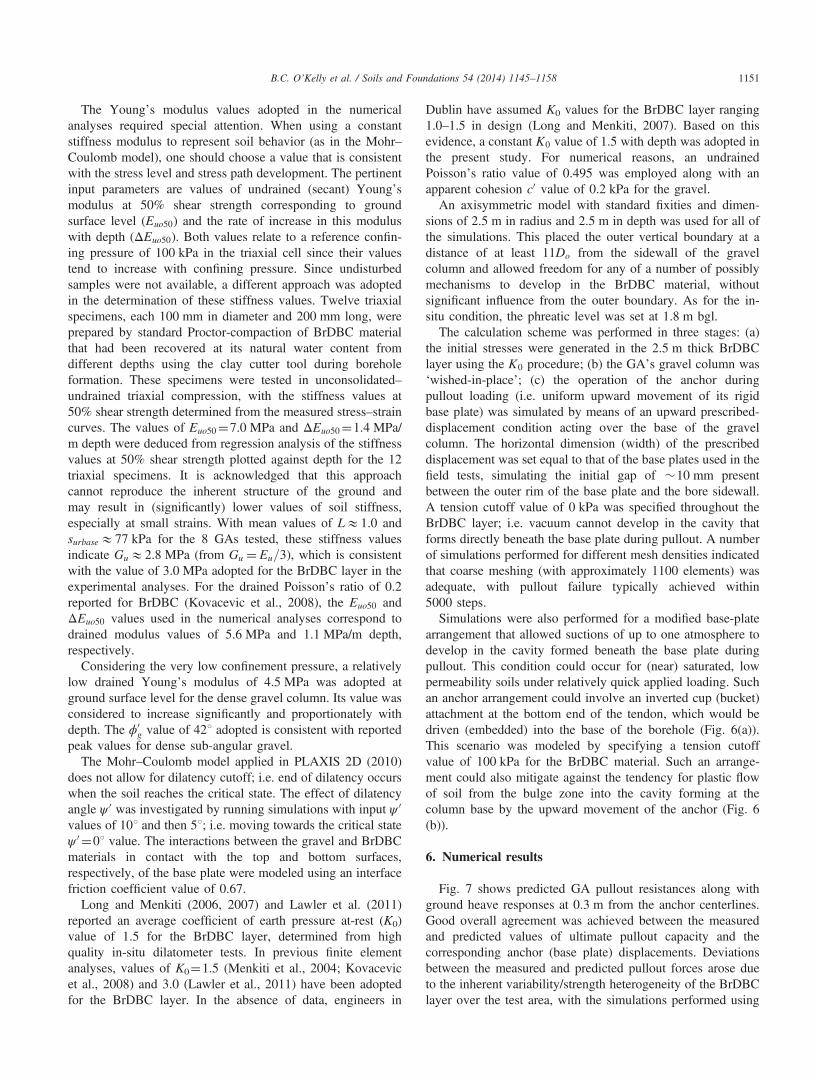
arrangement that allowed suctions of up to one atmosphere todevelop in the cavity formed beneath the base plate duringpullout. This condition could occur for (near) saturated, lowpermeability soils under relatively quick applied loading. Suchan anchor arrangement could involve an inverted cup (bucket)attachment at the bottom end of the tendon, which would bedriven (embedded) into the base of the borehole (Fig. 6(a)).This scenario was modeled by specifying a tension cutoffvalue of 100 kPa for the BrDBC material. Such an arrange-ment could also mitigate against the tendency for plastic flowof soil from the bulge zone into the cavity forming at thecolumn base by the upward movement of the anchor (Fig. 6(b)).
6. Numerical results
Fig. 7 shows predicted GA pullout resistances along withground heave responses at 0.3 m from the anchor centerlines.Good overall agreement was achieved between the measuredand predicted values of ultimate pullout capacity and thecorresponding anchor (base plate) displacements. Deviationsbetween the measured and predicted pullout forces arose dueto the inherent variability/strength heterogeneity of the BrDBClayer over the test area, with the simulations performed using
B.C. O’Kelly et al. / Soils and Foundations 54 (2014) 1145–1158 1151
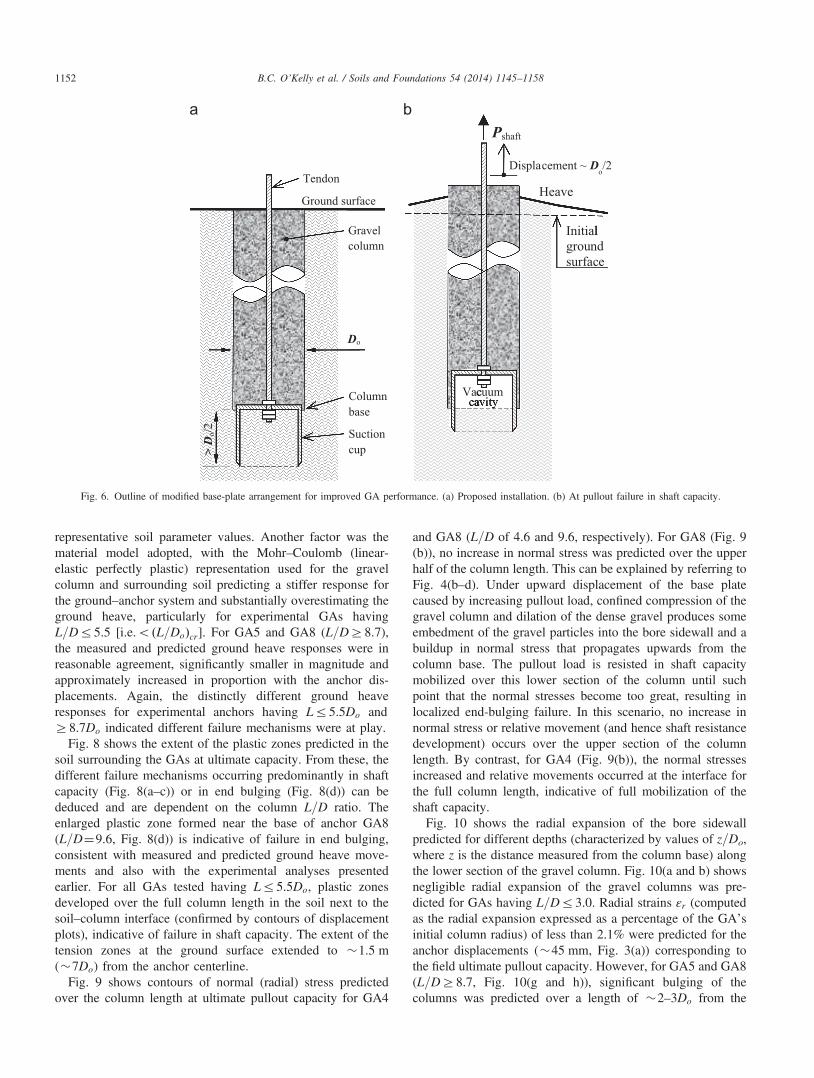
representative soil parameter values. Another factor was thematerial model adopted, with the Mohr–Coulomb (linear-elastic perfectly plastic) representation used for the gravelcolumn and surrounding soil predicting a stiffer response forthe ground–anchor system and substantially overestimating theground heave, particularly for experimental GAs havingL=Dr5.5 [i.e.o ðL=DoÞcr]. For GA5 and GA8 (L=DZ8.7),the measured and predicted ground heave responses were inreasonable agreement, significantly smaller in magnitude andapproximately increased in proportion with the anchor dis-placements. Again, the distinctly different ground heaveresponses for experimental anchors having Lr5.5Do andZ8.7Do indicated different failure mechanisms were at play.
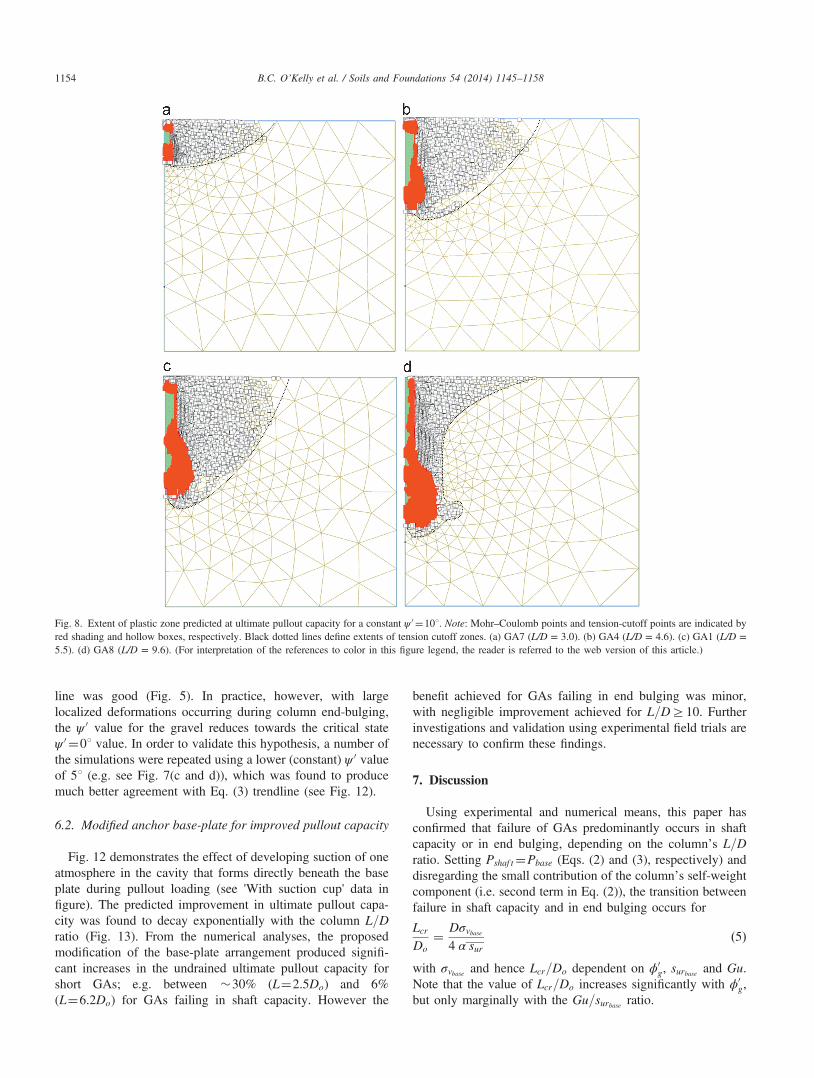
Fig. 8 shows the extent of the plastic zones predicted in thesoil surrounding the GAs at ultimate capacity. From these, thedifferent failure mechanisms occurring predominantly in shaftcapacity (Fig. 8(a–c)) or in end bulging (Fig. 8(d)) can bededuced and are dependent on the column L=D ratio. Theenlarged plastic zone formed near the base of anchor GA8(L=D¼9.6, Fig. 8(d)) is indicative of failure in end bulging,consistent with measured and predicted ground heave move-ments and also with the experimental analyses presentedearlier. For all GAs tested having Lr5.5Do, plastic zonesdeveloped over the full column length in the soil next to thesoil–column interface (confirmed by contours of displacementplots), indicative of failure in shaft capacity. The extent of thetension zones at the ground surface extended to �1.5 m(�7Do) from the anchor centerline.
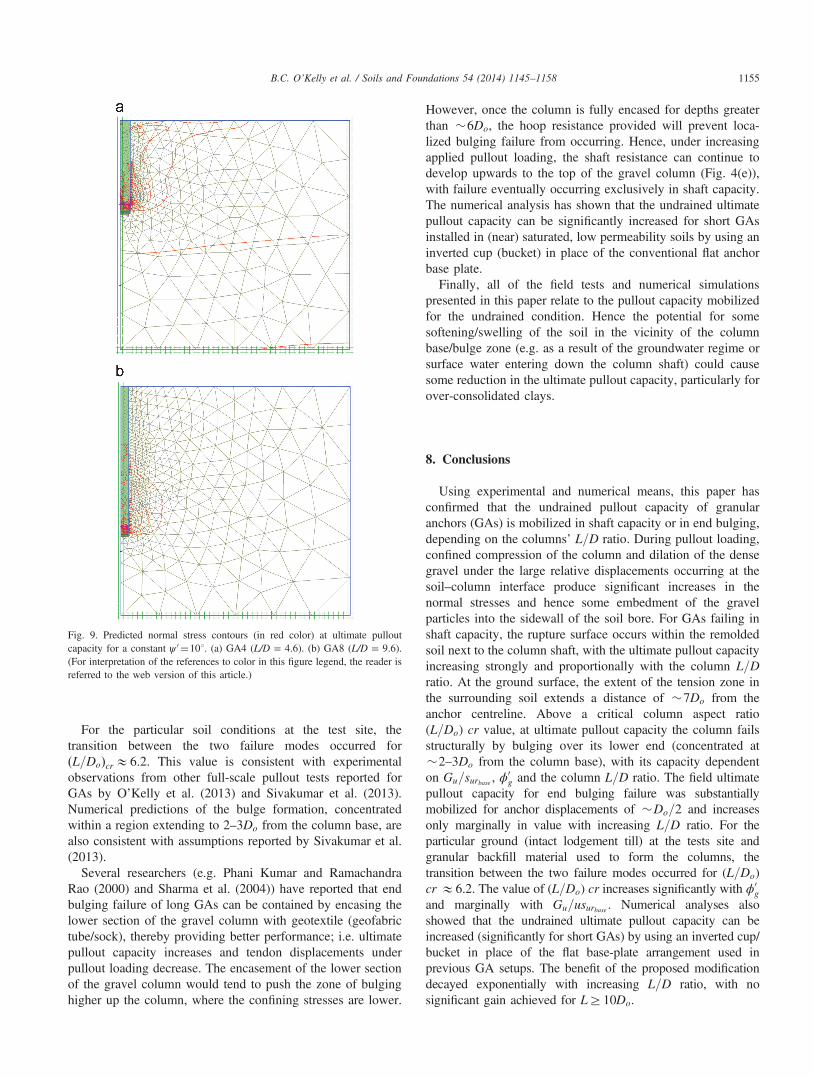
Fig. 9 shows contours of normal (radial) stress predictedover the column length at ultimate pullout capacity for GA4
and GA8 (L=D of 4.6 and 9.6, respectively). For GA8 (Fig. 9(b)), no increase in normal stress was predicted over the upperhalf of the column length. This can be explained by referring toFig. 4(b–d). Under upward displacement of the base platecaused by increasing pullout load, confined compression of thegravel column and dilation of the dense gravel produces someembedment of the gravel particles into the bore sidewall and abuildup in normal stress that propagates upwards from thecolumn base. The pullout load is resisted in shaft capacitymobilized over this lower section of the column until suchpoint that the normal stresses become too great, resulting inlocalized end-bulging failure. In this scenario, no increase innormal stress or relative movement (and hence shaft resistancedevelopment) occurs over the upper section of the columnlength. By contrast, for GA4 (Fig. 9(b)), the normal stressesincreased and relative movements occurred at the interface forthe full column length, indicative of full mobilization of theshaft capacity.Fig. 10 shows the radial expansion of the bore sidewall
predicted for different depths (characterized by values of z=Do,where z is the distance measured from the column base) alongthe lower section of the gravel column. Fig. 10(a and b) showsnegligible radial expansion of the gravel columns was pre-dicted for GAs having L=Dr3.0. Radial strains εr (computedas the radial expansion expressed as a percentage of the GA’sinitial column radius) of less than 2.1% were predicted for theanchor displacements (�45 mm, Fig. 3(a)) corresponding tothe field ultimate pullout capacity. However, for GA5 and GA8(L=DZ8.7, Fig. 10(g and h)), significant bulging of thecolumns was predicted over a length of �2–3Do from the
Fig. 6. Outline of modified base-plate arrangement for improved GA performance. (a) Proposed installation. (b) At pullout failure in shaft capacity.
B.C. O’Kelly et al. / Soils and Foundations 54 (2014) 1145–11581152
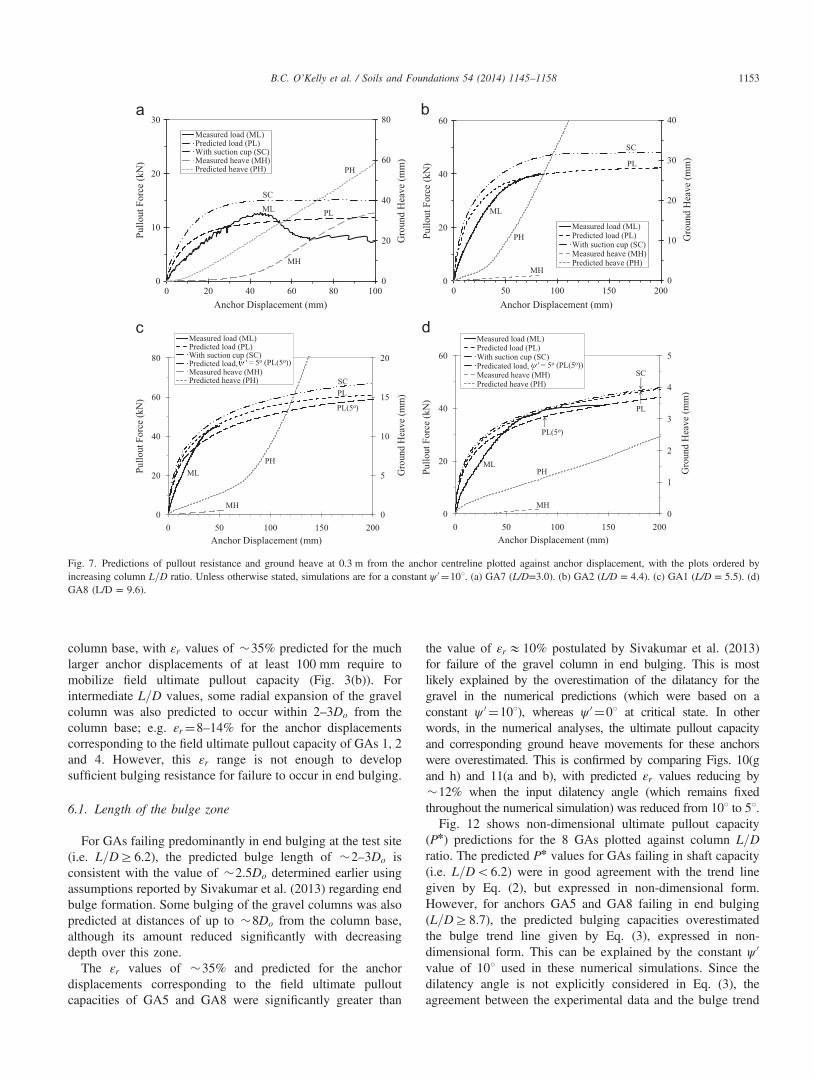
column base, with εr values of �35% predicted for the muchlarger anchor displacements of at least 100 mm require tomobilize field ultimate pullout capacity (Fig. 3(b)). Forintermediate L=D values, some radial expansion of the gravelcolumn was also predicted to occur within 2–3Do from thecolumn base; e.g. εr¼8–14% for the anchor displacementscorresponding to the field ultimate pullout capacity of GAs 1, 2and 4. However, this εr range is not enough to developsufficient bulging resistance for failure to occur in end bulging.
6.1. Length of the bulge zone
For GAs failing predominantly in end bulging at the test site(i.e. L=DZ6.2), the predicted bulge length of �2–3Do isconsistent with the value of �2.5Do determined earlier usingassumptions reported by Sivakumar et al. (2013) regarding endbulge formation. Some bulging of the gravel columns was alsopredicted at distances of up to �8Do from the column base,although its amount reduced significantly with decreasingdepth over this zone.
The εr values of �35% and predicted for the anchordisplacements corresponding to the field ultimate pulloutcapacities of GA5 and GA8 were significantly greater than
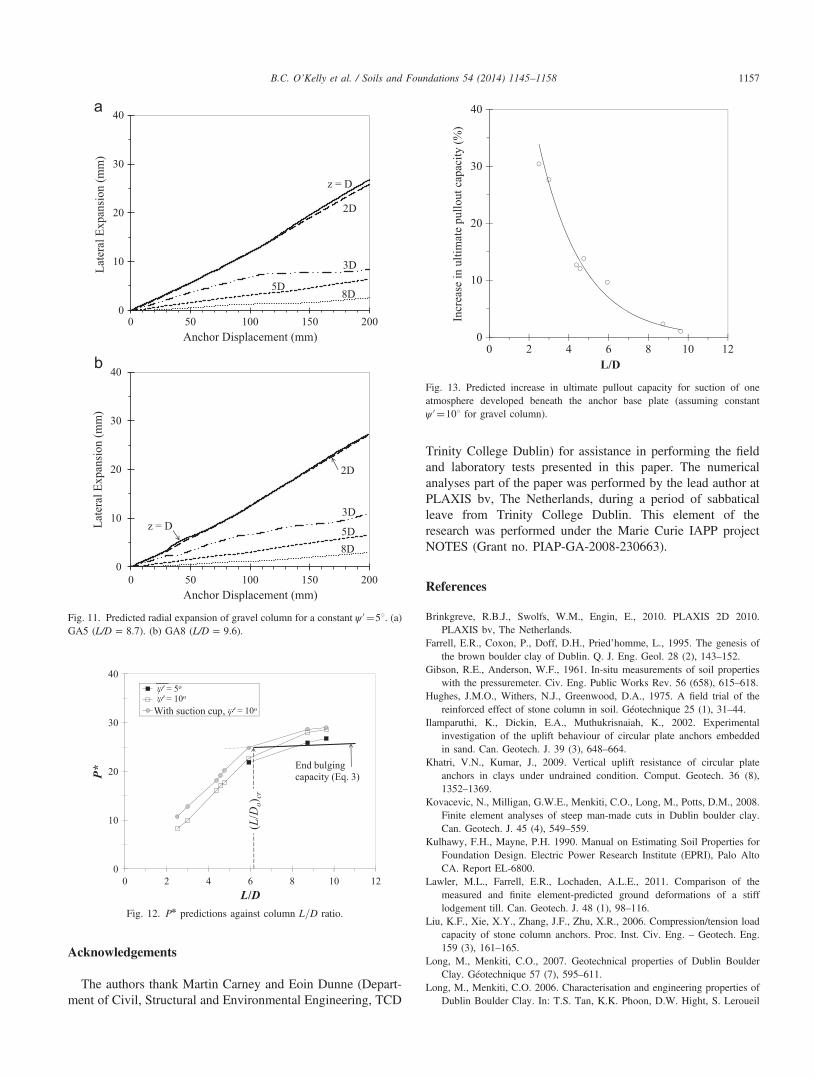
the value of εrE10% postulated by Sivakumar et al. (2013)for failure of the gravel column in end bulging. This is mostlikely explained by the overestimation of the dilatancy for thegravel in the numerical predictions (which were based on aconstant ψ 0 ¼101), whereas ψ 0 ¼01 at critical state. In otherwords, in the numerical analyses, the ultimate pullout capacityand corresponding ground heave movements for these anchorswere overestimated. This is confirmed by comparing Figs. 10(gand h) and 11(a and b), with predicted εr values reducing by�12% when the input dilatency angle (which remains fixedthroughout the numerical simulation) was reduced from 101 to 51.Fig. 12 shows non-dimensional ultimate pullout capacity
(Pn) predictions for the 8 GAs plotted against column L=Dratio. The predicted Pn values for GAs failing in shaft capacity(i.e. L=Do6.2) were in good agreement with the trend linegiven by Eq. (2), but expressed in non-dimensional form.However, for anchors GA5 and GA8 failing in end bulging(L=DZ8.7), the predicted bulging capacities overestimatedthe bulge trend line given by Eq. (3), expressed in non-dimensional form. This can be explained by the constant ψ 0
value of 101 used in these numerical simulations. Since thedilatency angle is not explicitly considered in Eq. (3), theagreement between the experimental data and the bulge trend
0
20
40
60
80
0
10
20
30
0 20 40 60 80 100
Gro
und
Hea
ve (m
m)
Pullo
ut F
orce
(kN
)
Anchor Displacement (mm)
Measured load (ML)Predicted load (PL)With suction cup (SC)Measured heave (MH)Predicted heave (PH)
MH
PH
PLML
SC
0
10
20
30
40
0
20
40
60
0 50 100 150 200
Gro
und
Hea
ve (m
m)
Pullo
ut F
orce
(kN
)
Anchor Displacement (mm)
Measured load (ML)Predicted load (PL)With suction cup (SC)Measured heave (MH)Predicted heave (PH)
SC
PL
ML
MH
PH
0
5
10
15
20
0
20
40
60
80
0 50 100 150 200
Gro
und
Hea
ve (m
m)
Pullo
ut F
orce
(kN
)
Anchor Displacement (mm)
Measured load (ML)Predicted load (PL)With suction cup (SC)Predicted load, Measured heave (MH)Predicted heave (PH)
ML
SCPL
PL(5o)
PH
MH
' = 5o (PL(5o))
0
1
2
3
4
5
0
20
40
60
0 50 100 150 200
Gro
und
Hea
ve (m
m)
Pullo
ut F
orce
(kN
)
Anchor Displacement (mm)
Measured load (ML)Predicted load (PL)With suction cup (SC)Predicated load, Measured heave (MH)Predicted heave (PH)
MH
PHML
PL(5o)
SC
PL
' = 5o (PL(5o))
Fig. 7. Predictions of pullout resistance and ground heave at 0.3 m from the anchor centreline plotted against anchor displacement, with the plots ordered byincreasing column L=D ratio. Unless otherwise stated, simulations are for a constant ψ 0 ¼101. (a) GA7 (L/D=3.0). (b) GA2 (L/D = 4.4). (c) GA1 (L/D = 5.5). (d)GA8 (L/D = 9.6).
B.C. O’Kelly et al. / Soils and Foundations 54 (2014) 1145–1158 1153
line was good (Fig. 5). In practice, however, with largelocalized deformations occurring during column end-bulging,the ψ 0 value for the gravel reduces towards the critical stateψ 0 ¼01 value. In order to validate this hypothesis, a number ofthe simulations were repeated using a lower (constant) ψ 0 valueof 51 (e.g. see Fig. 7(c and d)), which was found to producemuch better agreement with Eq. (3) trendline (see Fig. 12).
6.2. Modified anchor base-plate for improved pullout capacity
Fig. 12 demonstrates the effect of developing suction of oneatmosphere in the cavity that forms directly beneath the baseplate during pullout loading (see 'With suction cup' data infigure). The predicted improvement in ultimate pullout capa-city was found to decay exponentially with the column L=Dratio (Fig. 13). From the numerical analyses, the proposedmodification of the base-plate arrangement produced signifi-cant increases in the undrained ultimate pullout capacity forshort GAs; e.g. between �30% (L¼2.5Do) and 6%(L¼6.2Do) for GAs failing in shaft capacity. However the
benefit achieved for GAs failing in end bulging was minor,with negligible improvement achieved for L=DZ10. Furtherinvestigations and validation using experimental field trials arenecessary to confirm these findings.
7. Discussion
Using experimental and numerical means, this paper hasconfirmed that failure of GAs predominantly occurs in shaftcapacity or in end bulging, depending on the column’s L=Dratio. Setting Pshaf t¼Pbase (Eqs. (2) and (3), respectively) anddisregarding the small contribution of the column’s self-weightcomponent (i.e. second term in Eq. (2)), the transition betweenfailure in shaft capacity and in end bulging occurs for
LcrDo
¼ Dσvbase4 α sur
ð5Þ
with σvbase and hence Lcr=Do dependent on ϕ0g, surbase and Gu.
Note that the value of Lcr=Do increases significantly with ϕ0g,
but only marginally with the Gu=surbase ratio.
Fig. 8. Extent of plastic zone predicted at ultimate pullout capacity for a constant ψ 0 ¼101. Note: Mohr–Coulomb points and tension-cutoff points are indicated byred shading and hollow boxes, respectively. Black dotted lines define extents of tension cutoff zones. (a) GA7 (L/D = 3.0). (b) GA4 (L/D = 4.6). (c) GA1 (L/D =5.5). (d) GA8 (L/D = 9.6). (For interpretation of the references to color in this figure legend, the reader is referred to the web version of this article.)
B.C. O’Kelly et al. / Soils and Foundations 54 (2014) 1145–11581154
For the particular soil conditions at the test site, thetransition between the two failure modes occurred forðL=DoÞcrE6.2. This value is consistent with experimentalobservations from other full-scale pullout tests reported forGAs by O’Kelly et al. (2013) and Sivakumar et al. (2013).Numerical predictions of the bulge formation, concentratedwithin a region extending to 2–3Do from the column base, arealso consistent with assumptions reported by Sivakumar et al.(2013).
Several researchers (e.g. Phani Kumar and RamachandraRao (2000) and Sharma et al. (2004)) have reported that endbulging failure of long GAs can be contained by encasing thelower section of the gravel column with geotextile (geofabrictube/sock), thereby providing better performance; i.e. ultimatepullout capacity increases and tendon displacements underpullout loading decrease. The encasement of the lower sectionof the gravel column would tend to push the zone of bulginghigher up the column, where the confining stresses are lower.
However, once the column is fully encased for depths greaterthan �6Do, the hoop resistance provided will prevent loca-lized bulging failure from occurring. Hence, under increasingapplied pullout loading, the shaft resistance can continue todevelop upwards to the top of the gravel column (Fig. 4(e)),with failure eventually occurring exclusively in shaft capacity.The numerical analysis has shown that the undrained ultimatepullout capacity can be significantly increased for short GAsinstalled in (near) saturated, low permeability soils by using aninverted cup (bucket) in place of the conventional flat anchorbase plate.Finally, all of the field tests and numerical simulations
presented in this paper relate to the pullout capacity mobilizedfor the undrained condition. Hence the potential for somesoftening/swelling of the soil in the vicinity of the columnbase/bulge zone (e.g. as a result of the groundwater regime orsurface water entering down the column shaft) could causesome reduction in the ultimate pullout capacity, particularly forover-consolidated clays.
8. Conclusions
Using experimental and numerical means, this paper hasconfirmed that the undrained pullout capacity of granularanchors (GAs) is mobilized in shaft capacity or in end bulging,depending on the columns’ L=D ratio. During pullout loading,confined compression of the column and dilation of the densegravel under the large relative displacements occurring at thesoil–column interface produce significant increases in thenormal stresses and hence some embedment of the gravelparticles into the sidewall of the soil bore. For GAs failing inshaft capacity, the rupture surface occurs within the remoldedsoil next to the column shaft, with the ultimate pullout capacityincreasing strongly and proportionally with the column L=Dratio. At the ground surface, the extent of the tension zone inthe surrounding soil extends a distance of �7Do from theanchor centreline. Above a critical column aspect ratio(L=Do) cr value, at ultimate pullout capacity the column failsstructurally by bulging over its lower end (concentrated at�2–3Do from the column base), with its capacity dependenton Gu=surbase , ϕ
0g and the column L=D ratio. The field ultimate
pullout capacity for end bulging failure was substantiallymobilized for anchor displacements of �Do=2 and increasesonly marginally in value with increasing L=D ratio. For theparticular ground (intact lodgement till) at the tests site andgranular backfill material used to form the columns, thetransition between the two failure modes occurred for (L=Do)cr E6.2. The value of (L=Do) cr increases significantly with ϕ
0g
and marginally with Gu=usurbase . Numerical analyses alsoshowed that the undrained ultimate pullout capacity can beincreased (significantly for short GAs) by using an inverted cup/bucket in place of the flat base-plate arrangement used inprevious GA setups. The benefit of the proposed modificationdecayed exponentially with increasing L=D ratio, with nosignificant gain achieved for LZ10Do.
Fig. 9. Predicted normal stress contours (in red color) at ultimate pulloutcapacity for a constant ψ 0 ¼101. (a) GA4 (L/D = 4.6). (b) GA8 (L/D = 9.6).(For interpretation of the references to color in this figure legend, the reader isreferred to the web version of this article.)
B.C. O’Kelly et al. / Soils and Foundations 54 (2014) 1145–1158 1155
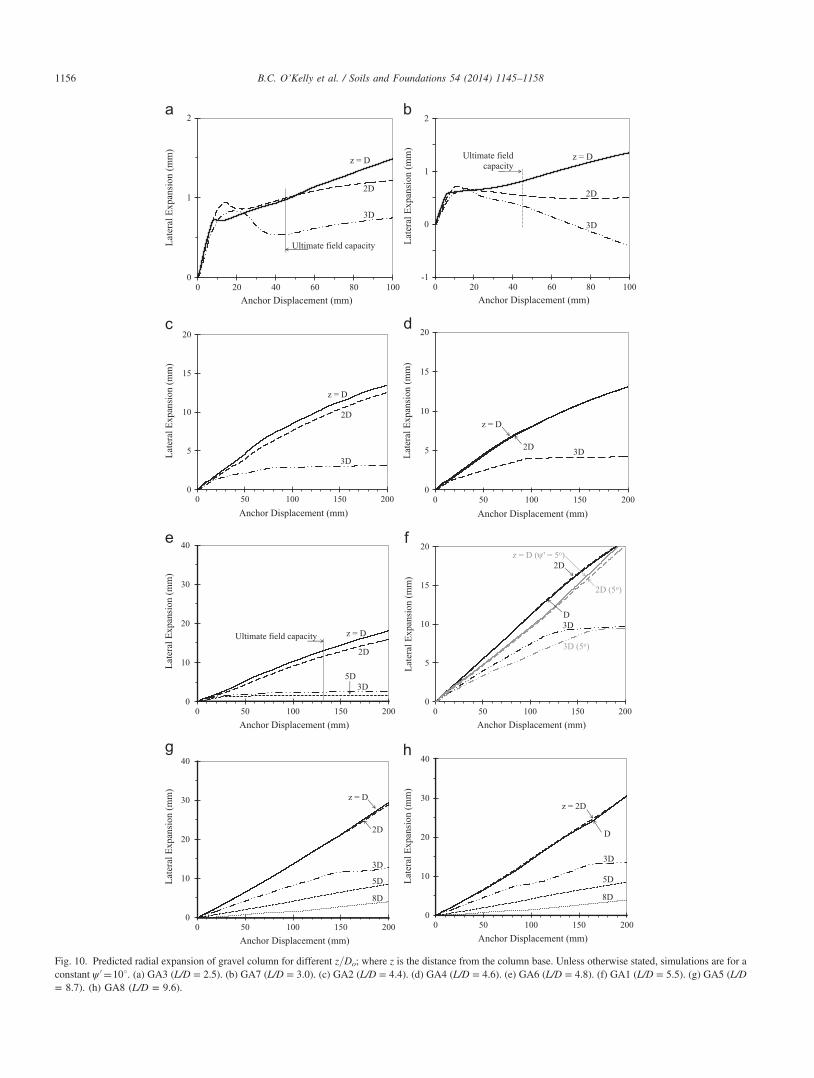
Fig. 10. Predicted radial expansion of gravel column for different z=Do; where z is the distance from the column base. Unless otherwise stated, simulations are for aconstant ψ 0 ¼101. (a) GA3 (L/D = 2.5). (b) GA7 (L/D = 3.0). (c) GA2 (L/D = 4.4). (d) GA4 (L/D = 4.6). (e) GA6 (L/D = 4.8). (f) GA1 (L/D = 5.5). (g) GA5 (L/D= 8.7). (h) GA8 (L/D = 9.6).
B.C. O’Kelly et al. / Soils and Foundations 54 (2014) 1145–11581156
Acknowledgements
The authors thank Martin Carney and Eoin Dunne (Depart-ment of Civil, Structural and Environmental Engineering, TCD
Trinity College Dublin) for assistance in performing the fieldand laboratory tests presented in this paper. The numericalanalyses part of the paper was performed by the lead author atPLAXIS bv, The Netherlands, during a period of sabbaticalleave from Trinity College Dublin. This element of theresearch was performed under the Marie Curie IAPP projectNOTES (Grant no. PIAP-GA-2008-230663).
References
Brinkgreve, R.B.J., Swolfs, W.M., Engin, E., 2010. PLAXIS 2D 2010.PLAXIS bv, The Netherlands.
Farrell, E.R., Coxon, P., Doff, D.H., Pried’homme, L., 1995. The genesis ofthe brown boulder clay of Dublin. Q. J. Eng. Geol. 28 (2), 143–152.
Gibson, R.E., Anderson, W.F., 1961. In-situ measurements of soil propertieswith the pressuremeter. Civ. Eng. Public Works Rev. 56 (658), 615–618.
Hughes, J.M.O., Withers, N.J., Greenwood, D.A., 1975. A field trial of thereinforced effect of stone column in soil. Géotechnique 25 (1), 31–44.
Ilamparuthi, K., Dickin, E.A., Muthukrisnaiah, K., 2002. Experimentalinvestigation of the uplift behaviour of circular plate anchors embeddedin sand. Can. Geotech. J. 39 (3), 648–664.
Khatri, V.N., Kumar, J., 2009. Vertical uplift resistance of circular plateanchors in clays under undrained condition. Comput. Geotech. 36 (8),1352–1369.
Kovacevic, N., Milligan, G.W.E., Menkiti, C.O., Long, M., Potts, D.M., 2008.Finite element analyses of steep man-made cuts in Dublin boulder clay.Can. Geotech. J. 45 (4), 549–559.
Kulhawy, F.H., Mayne, P.H. 1990. Manual on Estimating Soil Properties forFoundation Design. Electric Power Research Institute (EPRI), Palo AltoCA. Report EL-6800.
Lawler, M.L., Farrell, E.R., Lochaden, A.L.E., 2011. Comparison of themeasured and finite element-predicted ground deformations of a stifflodgement till. Can. Geotech. J. 48 (1), 98–116.
Liu, K.F., Xie, X.Y., Zhang, J.F., Zhu, X.R., 2006. Compression/tension loadcapacity of stone column anchors. Proc. Inst. Civ. Eng. – Geotech. Eng.159 (3), 161–165.
Long, M., Menkiti, C.O., 2007. Geotechnical properties of Dublin BoulderClay. Géotechnique 57 (7), 595–611.
Long, M., Menkiti, C.O. 2006. Characterisation and engineering properties ofDublin Boulder Clay. In: T.S. Tan, K.K. Phoon, D.W. Hight, S. Leroueil
0
10
20
30
40
0 50 100 150 200
Late
ral E
xpan
sion
(mm
)
Anchor Displacement (mm)
2D
z = D
8D5D
3D
0
10
20
30
40
0 50 100 150 200
Late
ral E
xpan
sion
(mm
)
Anchor Displacement (mm)
2D
z = D
8D5D
3D
Fig. 11. Predicted radial expansion of gravel column for a constant ψ 0 ¼51. (a)GA5 (L/D = 8.7). (b) GA8 (L/D = 9.6).
Fig. 12. Pn predictions against column L=D ratio.
0
10
20
30
40
0 2 4 6 8 10 12
Incr
ease
in u
ltim
ate
pullo
ut c
apac
ity (%
)
L/D
Fig. 13. Predicted increase in ultimate pullout capacity for suction of oneatmosphere developed beneath the anchor base plate (assuming constantψ 0 ¼101 for gravel column).
B.C. O’Kelly et al. / Soils and Foundations 54 (2014) 1145–1158 1157
(Eds.), Proceedings of the Second International Workshop on Character-isation and Engineering Properties of Natural Soils Taylor and Francis,London, UK, vol. 3, pp. 2003–2045.
Miyata, Y., Bathurst, R.J., 2012a. Analysis and calibration of default steel strippullout models used in Japan. Soils Found. 52 (3), 481–497.
Miyata, Y., Bathurst, R.B., 2012b. Measured and predicted loads in steel stripreinforced c�ϕ soil walls in Japan. Soils Found. 52 (1), 1–17.
Menkiti, C.O., Long, M., Kovacevic, N., Edmonds, H.E., Milligan, G.W.E.,Potts, D.M., 2004. Trial excavation for cut and cover tunnel construction inglacial till: a case study from Dublin. In: R.J. Jardine, D.M. Potts,K.G. Higgins, (Eds.), Skempton Memorial Conference: Advances in Geotech-nical Engineering, Thomas Telford, London, UK, vol. 2, pp. 1090–1104.
Merifield, R.S., Sloan, S.W., Yu, H.S., 2001. Stability of plate anchors inundrained clay. Géotechnique 51 (2), 114–153.
Merifield, R.S., Sloan, S.W., 2006. The ultimate pullout capacity of anchors infrictional soils. Can. Geotech. J. 43 (8), 852–868.
Meyerhof, G.G., Adams, J.I., 1968. The ultimate uplift capacity of foundations.Can. Geotech. J. 5 (4), 225–244.
O’Kelly, B.C., Naughton, P.J., 2008. On the interface shear resistance of anovel geogrid with in-plane drainage capability. Geotext. Geomembr. 26(4), 357–362.
O’Kelly, B.C., Sivakumar, V., Brinkgreve, R.B.J., 2013. Uplift resistance ofgranular anchors in clay under undrained condition. In: Proceedings ofthe First Workshop on Soil–Structure Interaction organised by the MarieCurie IAPP project NOTES, Trinity College Dublin, Dublin, Ireland.⟨http://www.tara.tcd.ie/handle/2262/66938⟩.
O’Kelly, B.C., 2014. CPT testing in Dublin Boulder Clay. In: Proceedings ofthe Third International Symposium on Cone Penetration Testing (CPT’14),
Las Vegas, Nevada, USA, Paper number 2-50, 8 pp. ⟨http://www.cpt14.com/cpt14-papers⟩, ⟨http://www.tara.tcd.ie/handle/2262/68023⟩.
Phani Kumar, B.R., Ramachandra Rao, N., 2000. Increasing pull-out capacityof granular pile anchors in reactive soils using base geosynthetics. Can.Geotech. J. 37 (4), 870–881.
Phanikumar, B.R., Sharma, R.S., Srirama Rao, A., Madhav, M.R., 2004.Granular pile anchor foundation (GPAF) system for improving theengineering behaviour of expansive clay beds. Geotech. Test. J. 27 (3),1–9.
Phanikumar, B.R., Srirama Rao, A., Suresh, K., 2008. Field behaviour ofgranular pile-anchors in reactive soils. Proc. Inst. Civ. Eng. – GroundImprov. 161 (4), 199–206.
Rangari, S.M., Choudhury, D., Dewaikar, D.M., 2013. Seismic uplift capacityof shallow horizontal strip anchor under oblique load using pseudo-dynamic approach. Soils Found. 53 (5), 692–707.
Sharma, R.S., Phanikumar, B.R., Nagendra, G., 2004. Compressive loadresponse of granular piles reinforced with geogrids. Can. Geotech. J. 41(1), 187–192.
Sivakumar, V., O’Kelly, B.C., Madhav, M.R., Moorhead, C., Rankin, B.,2013. Granular anchors under vertical loading/axial pull. Can. Geotech. J.50 (2), 123–132.
Srirama Rao, A., Phanikumar, B.R., Dayakar Babu, R., Suresh, K., 2007.Pullout behavior of granular pile-anchors in expansive clay beds in situ.Geotech. Geoenviron. Eng. 133 (5), 531–538.
Xu, H.-y., Chen, L.-z., Deng, J.-l., 2014. Uplift tests of jet mixing anchor pile.Soils Found. 54 (2), 168–175.
B.C. O’Kelly et al. / Soils and Foundations 54 (2014) 1145–11581158