Career Choice Factors 1 CAREER CHOICE FACTORS OF HIGH SCHOOL STUDENTS
Upload
khangminh22Category
view
1download
0
University of WollongongResearch Online
University of Wollongong Thesis Collection University of Wollongong Thesis Collections
2014
Career anchors and job satisfaction: the role ofpsychological empowerment in the Indonesianpublic university contextM MeilianiUniversity of Wollongong
Research Online is the open access institutional repository for theUniversity of Wollongong. For further information contact the UOWLibrary: [email protected]

i
School of Management, Operations and Marketing
CAREER ANCHORS AND JOB SATISFACTION: THE ROLE OF PSYCHOLOGICAL EMPOWERMENT
IN THE INDONESIAN PUBLIC UNIVERSITY CONTEXT
A thesis submitted in partial fulfilment of the requirements for the award of the Degree of
Doctor of Philosophy
from
University of Wollongong
by
M E I L I A N I
2014

ii
CERTIFICATION
I, Meiliani, certify that this thesis submitted in partial fulfilment of the requirements for
the award of Doctor of Philosophy of the School of Management, Operations and
Marketing, the University of Wollongong, is wholly my own work unless otherwise
referenced or acknowledged. The document has not been submitted for qualifications at
any other academic institution.
M e i l i a n i 30 March 2014

iii
ABSTRACT
The current study aims to examine the direct and indirect effects of psychological empowerment in the relationship between career anchors and job satisfaction within the context of public universities in Indonesia. Schein’s (1978) single career anchors theory, Feldman and Bolino’s (1996) multiple career anchors model, Spreitzer’s (1975) psychological empowerment concept and Locke’s (1976) job satisfaction model were used to form the framework for the study. Concurrent embedded mixed-methods (Creswell & Plano Clark 2011) were employed, in which both quantitative and qualitative data were gathered and analysed. Full-time academics from Indonesian public universities formed the sample for this study. Using web-based and paper-based surveys, data were gathered from 585 academics of 11 universities across three geographical regions (western, central and eastern) of Indonesia. Twenty academics participated in structured face-to-face interviews. Quantitative data were gathered using a survey questionnaire that comprised items from Igbaria and Baroudi’s (1993) career anchor inventory, Sprietzer’s (1995) psychological empowerment scale and Hackman and Oldham’s (1975) general job satisfaction scale. Finally, Schein’s (1990) protocol interview and two open-ended questions were used to collect qualitative data. Exploratory factor analysis was employed to examine the factor structure underlying the three constructs. Twelve factors emerged from the quantitative data, with the analyses finding two new anchors, which were labelled work dedication and balanced-lifestyle. Overall, the other factors were the same as originally constructed from past research. The final factor clusters were used to determine the dominant career anchors using frequency count, and were also used in subsequent hierarchical multiple regression analysis when testing the proposed hypotheses. Thematic analysis was employed to identify themes from the qualitative data. The data analyses revealed several significant results. First, the economic security and service anchors emerged as the most dominant career anchors. Second, the needs-based anchors category was the most preferred groups-based anchor among the respondents. Third, the study found that multiple career anchors existed amongst the participants. Finally, the study also found that all career anchor relationship pairs were grouped in complementary relationship pairing anchors. Statistically, the results indicate that work dedication, managerial competence and pure challenge predicted job satisfaction. Furthermore, meaning and impact predicted job satisfaction. Meaning mediated partially and significantly the effects of work dedication, balanced-lifestyle, managerial competence and pure challenge on job satisfaction; impact mediated partially and significantly the effects of both work dedication and managerial competence on job satisfaction. Meaning and competence moderated balanced-lifestyle and job satisfaction relationship; impact moderated service and job satisfaction relationship; self-determination moderated the service, balanced-lifestyle and pure challenge effect on job satisfaction. Meaning mediated and moderated the balanced-lifestyle effect on job satisfaction. Thematic analysis identified academic atmosphere, academic freedom and creativity, work-family lifestyle, flexible working schedule, skill orientation, running a business, spiritual value and intangible recognition as new anchors. Personal integrity, and motivation and goal orientation were found to reflect the psychological empowerment facets while happiness reflected the job satisfaction dimension. Organisational factors were identified as most influential themes in career development. Based on the findings, a modified framework was proposed.

iv
The findings support and extend the existing knowledge in several ways. First, the new anchor categories, the dominant career anchors, the existence of multiple anchors and complementary anchors contribute to the value of the career anchors concept, and the prediction of a shift in anchor structures. Therefore, more studies are needed to help explicate the value of the career anchors concept as well as help in understanding the shift in career anchors structures. Second, findings from this study help extend the understanding of the concepts of career anchors, psychological empowerment and job satisfaction within a non-Western context, that is, public universities of Indonesia. Third, using data gathered from academics working in public universities adds to the understanding of the three concepts and the existing theories related to self-concept at the workplace. Fourth, the identification of new themes and the emergence of psychological empowerment and job satisfaction dimensions show that the qualitative study supports the quantitative analysis findings. Fifth, cultural values are evident throughout the results showing the need to take into consideration the role and effects of culture during future research on career anchors. Sixth, the identification of the spiritual values theme needs an in-depth exploration to see whether it adds to career anchors concept or is just a reflection of the influence of the participants’ religious inclinations. Finally, the current study extends the career anchor, psychological empowerment and job satisfaction theories used by recommending a need to investigate more job outcomes, such as job stress and strain, disciplines, organisational commitment and job performance. The current study also suggests several future research directions. Future researchers are encouraged to test the proposed modified framework. The emergence of a new career anchor and the identified themes need to be analysed in greater detail. To enable generalisability of this study across a variety of organisational contexts, it is recommended that future studies on career anchors are carried out across many public and private universities and across many geographical locations. Finally, the current study encourages researchers to test a comparative model by treating career anchors as mediators or moderators to find out what roles career anchors might play.

v
ACKNOWLEDGEMENTS
In the process of writing this thesis, I got a lot of support from various parties. I would like to thank people who have supported me throughout my thesis journey.
I would like to thank the Australian Development Scholarship (ADS) - AusAID that provided me with a scholarship to study towards the PhD degree, and especially to Nhan Nguyen, the Australia Awards Scholarships Contact Officer at the University of Wollongong, who has always assisted me with all administrative matters related to my study.
I would like to express my sincere gratitude to my supervisors, Associate Professor Sam Garrett-Jones and Associate Professor Mario Fernando. Your feedback, thoughtful discussions and suggestions for improving the quality of my thesis are invaluable. Thank you for providing a professional supervision climate. I will take your feedback as a lesson learned and try to apply in my workplace.
I would like to thank several Indonesian universities who granted me access to their academic staff and facilitated the process of survey questionnaires and interview administration. I am also grateful to the administrators of the Indonesian academics email list and the Indonesian Students Association based in Australia (PPIA) that allowed me to conduct the online survey. Your assistance is very much appreciated.
I would like also to thank my volunteer research assistants who distributed the hard copy of the questionnaires to academics where they worked and ensured a high response rate.
Special thanks to academics who were the subjects of this study both at the pilot study stage and during the actual study. Thank you so much for your time and willingness to fill out the questionnaire and to be interviewed. Without your participation, this study could not have been possible. Your contribution is greatly appreciated.
I would like also acknowledging Professor HL Mikarsa (UI), Steve A. Nicks (English teacher in Indonesia), Dr. J. Sitompoel (ITB) and Bu Y. Chanafiah (Bahasa Indonesia - Unib), for their discussions of the translated questionnaires and the interview protocol. Their suggestions helped to enhance the quality of the translation.
I thank Associate Professor Marijka Batterham, the Director of the Statistical Consulting Centre of the University of Wollongong, who provided statistical support for my data analysis.
I would like to thank Dr. Shahriar Akter (University of Wollongong) for reviewing my Quantitative Analysis Results Chapter. Your suggestions give extra weight to the analysis. I greatly appreciate it.
I acknowledge the professional editorial assistance of Laura E. Goodin.
I am also grateful to Dr. Gandhi (Unpar) who kindly provided his time and expertise during the preliminary data analysis, and to Bu Ira (UI), pak Lie (Unud), and Professor Max Pattinama (Unpatti) who assisted me during the data collection stage. I am greatly appreciative of your help.

vi
My sincere thanks also go to Phyllis Tibbs who assisted me to proofread my thesis chapters without charge. Thank you for your time and support as it has greatly aided my study. I am also grateful to Bernard Tibbs for his social and spiritual encouragement during my study. I will miss you both.
To Associate Professor Rodney Clarke, thank you for your professional advice, and help me when I was struggling with my study.
A special thanks to the family of Dr. Buyung Kosasih, Ana Suwarto and Peter Kosasih, for their encouragement and support throughout my study. Their moral and social support helped me to focus on my study. Thank you for your care and patience, and for finding time to talk to me. I will miss your yummy food, ci Ana.
To my family, Yenny, Okta, Judist, Yana, and Vio for their moral support, thank you for being there when I need you.

vii
TABLE OF CONTENTS TITLE PAGE i CERTIFICATION ii ABSTRACT iii ACKNOWLEDGEMENT v TABLE OF CONTENTS vii LIST OF TABLES xi LIST OF FIGURES xii Chapter 1 Introduction 1
1.1 Purpose of the study 1 1.2 Background of the study 2 1.3 Career development of academics in Indonesian public university context 4
1.3.1Overview of Indonesia 4 1.3.2 Public higher education systems in Indonesia 5 1.3.3 Academic career promotion system 9
1.4 Problem statement 13 1.5 Significance of the study 15 1.6 Outline of the study 16
Chapter 2 Literature Review and Conceptual Framework 18 2.1 Introduction 18 2.2 Understanding of career: Internal and external career perspectives 18 2.3 Introducing the career anchors theory 21
2.3.1 Dimensions of career anchors 22 2.3.2 Explaining multiple career anchors 25 2.3.3 Factor structures underlying the career anchors 26 2.3.4 Review of studies on career anchors 28
2.4 Redefining the career anchor concept 30 2.4.1 Feldman and Bolino’s concept of career anchors 30 2.4.2 Regrouping career anchor dimensions 32 2.4.3 Career anchor relationship pairs 34
2.5 Job satisfaction and career anchors 36 2.6 Psychological empowerment and job satisfaction 39 2.7 Linking career anchors, psychological empowerment and job satisfaction 43 2.8 The role of demographic data 44 2.9 Conceptual framework and research model 47 2.10 Hypotheses testing 51
Chapter 3 Research Methodology 55 3.1 Introduction 55 3.2 Methodological approach 56 3.3 Research design 58 3.3.1 Survey research 62 3.3.1.1 Survey questionnaire 62 3.3.1.2 Interview 65 3.3.2 Sampling selection and sample size 67 3.3.2.1 Quantitative sampling design 70 3.3.2.2 Qualitative sampling design 72 3.4 Research instruments 73 3.4.1 Instrument development 73

viii
3.4.2 Demographic profiles 76 3.4.3 Schein’s interview protocol 77 3.4.4 Issues on culture related to translated instruments 78 3.5 Data collection method 80 3.5.1 Pre-testing the survey instrument 80 3.5.2 Data Collection procedures 81 3.5.3 Testing validity and reliability in measurement 83 3.6 Data analysis design 87 3.6.1 Statistical analysis design 87 3.6.2 Thematic analysis 91 Chapter 4 Results of Quantitative Analysis 94 4.1 Introduction 94 4.2 Data screening and response rate 94 4.2.1 Paper-based survey 95 4.2.2 Web-based survey 96 4.3 Demographic findings 98 4.4 Construct validity of survey questionnaires 102 4.5 Internal consistency of instruments 107 4.6 Dimensionality of career anchors, psychological empowerment and job 109
satisfaction 4.7 Dominant career anchors 113 4.7.1 Single dominant career anchor 113 4.7.2 Multiple groups-based dominant career anchors 115 4.8 Testing of the research model 118 4.8.1 Testing of assumptions of hierarchical multiple regression analysis 120
4.8.2 Testing the main effects of career anchors and psychological 121 empowerment on job satisfaction
4.8.2.1 The relationship between career anchors and job 121 satisfaction 4.8.2.2 The relationship between career anchors and psychological 123 empowerment 4.8.2.3 The relationship between psychological empowerment 129 and job satisfaction 4.8.2.4 Joint relationship career anchors, psychological 131 empowerment and job satisfaction
4.8.3 Testing of the mediation of psychological empowerment in the 132 career anchors and job satisfaction relationship 4.8.4 The moderation effects of psychological empowerment 138 Chapter 5 Academics’ Perceptions of the Career Anchors 154
5.1 Introduction 154 5.2 Framework for the qualitative analysis 155 5.3 Interview and open-ended questions responses 157 5.4 Thematic analysis of the understanding of academics’ career anchors in 158 achieving career goals 5.5 Thematic analysis of the career history: findings from interviews 160 5.5.1 Demographic profiles 160 5.5.2 Thematic categories 161 5.5.3 Identified macro themes 162 5.5.4 Identified micro themes: personal bias and dominant 162
career anchor

ix
5.5.5 Identified micro themes: organisational bias 172 5.6 Thematic analysis of career motivation: responses from open-ended 173 question 1 5.6.1 Demographic profiles 173 5.6.2 Thematic categories 174 5.6.3 Identified macro themes 176 5.6.4 Identified micro themes: personal bias 176 5.6.5 Identified micro themes: organisational bias 178 5.7 Thematic analysis of institutional supports: responses from open-ended 179
question 2 5.7.1 Demographic profiles 179 5.7.2 Thematic categories 180 5.7.3 Identified macro themes 181 5.7.4 Identified micro themes: personal bias 181 5.7.5 Identified micro themes: organisational bias 182 5.8 The significance of the emergent themes from open-ended questions 183 5.9 Integrating qualitative research results with quantitative research findings 185
Chapter 6 Summary, Discussions and Conclusions 193 6.1 Introduction 193 6.2 Summary of demographic characteristics for the survey 194 6.3 Conclusions and discussions of research questions and hypotheses 195 testing results 6.4 Discussion and implications of the qualitative findings 214 6.5 Indonesian cultural values 220 6.6 Suggested research model 222 6.7 Implications of the current study 225 6.7.1 Implications for theory 225 6.5.2 Implications for methodology 228 6.5.3 Implications for practice 229 Chapter 7 Limitations and Directions for Future research 234 7.1 Introduction 234 7.2 Limitations of the study 235 7.3 Recommendation for further study 237 7.4 Contribution of the study 241 REFERENCES 242 APPENDICES 257 Appendix 1: Differences in academic ranks and levels for some countries 258 Appendix 2: Categories and items on the short form of career anchor inventory 259 Appendix 3: Facets of the psychological empowerment scale 260 Appendix 4: Dimension of the job satisfaction scale 260 Appendix 5: A set of questionnaire 261 Appendix 6: Interview protocol of career anchors (English version) 271 Appendix 7: List of university sample 273 Appendix 8: Missing values examination of the measurement 274 Appendix 9: Demographic background information of respondents 275 Appendix 10: Scree plot of the scales 276 Appendix 11: Correlation matrix 277 Appendix 12: Bivariate correlation of career anchors 277 Appendix 13: Q-Q normal plot 278

x
Appendix 14: Mahalanobis distance scores 279 Appendix 15: Mediation effects 280 Appendix 16: Responses of internal motivation factors (Q1) 283 Appendix 17: Responses of institutional support 285 Appendix 18: Summary of MANOVA outputs for demographic effects 288 Appendix 19: Letters from visited universities 289

xi
LIST OF TABLES
Table 1.1 : A comparison of higher education features between Indonesia 7 and the West
Table 2.1 : Career anchor dimensions and their characteristics 24 Table 2.2 : A summary of the differences between Schein’s and 31 Feldman and Bolino’s career anchor concepts Table 2.3 : Multiple groups-based career anchors 33 Table 2.4 : Psychological empowerment dimensions and their description 41 Table 3.1 : Characteristics of quantitative, mixed and qualitative methods 57 Table 3.2 : Suggested revisions to the questionnaire 80 Table 4.1 : Sample size and response rate 97 Table 4.2 : Respondents’ selected demographic characteristics 100 Table 4.3 : Chi-square test for key demographic variables 102 Table 4.4 : Factors extracted and factor loadings 104 Table 4.5 : Reliability of the measurement scales 107 Table 4.6 : Career anchor order and chi-square test of single career anchor 114 Table 4.7 : Career anchor order and chi-square test of multiple groups- 116
based anchors Table 4.8 : Mutually exclusive and complementary anchors relationships 117 Table 4.9 : Summary of regression outputs for the effects of career anchors 122
on job satisfaction Table 4.10 : Summary of regression outputs for the effects of career anchor 124
on meaning Table 4.11 : Summary of regression outputs on the effects of career anchors 125
on impact Table 4.12 : Summary of regression outputs for the effects of career anchors 127 on competence Table 4.13 : Summary of regression outputs for the effects of career anchors 128
on self-determination Table 4.14 : Summary of regression outputs for the effects of psychological 130 empowerment on job satisfaction Table 4.15 : Summary of regression outputs for the joint effects of career 131
anchors and psychological empowerment on job satisfaction Table 4.16 : Regression outputs for the effects of career anchors and 134
psychological empowerment and job satisfaction Table 4.17 : Summary of regression outputs for the effects of demographic 141
data, career anchors, psychological empowerment, job satisfaction and moderators
Table 4.18 : The roles of psychological empowerment facets on the 148 relationship between career anchors and job satisfaction
Table 4.19 : Summary of quantitative analysis results 152 Table 5.1 : Thematic analysis on career history 161 Table 5.2 : Dominant career anchors for the respondents 163 Table 5.3 : Respondents’ profiles for internal motivation factors 173 Table 5.4 : Thematic analysis of career motivation factors 175 Table 5.5 : Respondents’ profiles for institutional support questions 179 Table 5.6 : Thematic analysis of institutional support on career goals 182 Table 5.7 : Summary of quantitative and qualitative findings of career 187
anchor categories

xii
LIST OF FIGURES Figure 2.1 : Octagonal diagram 35 Figure 2.2 : Conceptual framework 49 Figure 2.3 : Research model 50 Figure 4.1 : Research model analysis for mediation effect of psychological 119
empowerment in the career anchors and job satisfaction relationship
Figure 4.2 : Research model analysis for moderation effects of career 140 anchors, psychological empowerment and job satisfaction relationship
Figure 4.3 : Interaction effect of meaning on balanced-lifestyle and 143 job satisfaction
Figure 4.4 : Interaction effect of service on impact 143 Figure 4.5 : Interaction effect of balanced-lifestyle on competence 144 Figure 4.6 : Interaction effect of balanced-lifestyle on self-determination 145 Figure 4.7 : Interaction effect of service on self-determination 146 Figure 4.8 : Interaction effect of pure challenge on self-determination 146 Figure 4.9 : Modified research framework for quantitative analysis of the 151
relationships between career anchors, psychological empowerment and job satisfaction
Figure 5.1 : Framework of academic understanding of career anchors 156 Figure 5.2 : Modified research framework for qualitative analysis of the 186
relationships between career anchors, psychological empowerment and job satisfaction
Figure 6.1 : Modified research framework of the relationship between career 223 anchors, psychological empowerment and job satisfaction

1
Chapter 1
Introduction
1.1 Purpose of the study The primary purpose of this study was to understand how Indonesian academics view
career anchors and the extent of influence of psychological empowerment and job
satisfaction has on their career development. Specifically, this study aimed to: (1)
investigate the factor structures underlying the career anchors, psychological
empowerment and job satisfaction scales and how this would apply in the Indonesian
academic context; (2) determine whether the manifestation of the career anchors
phenomenon for Indonesian academics can be classified as a single dominant career
anchor or multiple dominant career anchors; (3) examine the relationships between
career anchors, psychological empowerment and job satisfaction by testing the main
effects and the mediation effects of psychological empowerment on the relationships
between career anchors and job satisfaction; and (4) explore Indonesian academics’
perceptions of their careers’ internal development and how their perceptions influence
the way they pursue their career anchors.
The concept of career anchor is defined according to Schein (1978, 1990, 1992, 2006a),
Schein and Van Maanen (2013), and Feldman and Bolino (1996). Career anchors are
measured using Igbaria and Baroudi’s (1993) career anchor inventory and Schein’s
protocol interview. Job satisfaction is measured with the general job satisfaction
measurement of Hackman and Oldham (1975) and validated by Igbaria and Baroudi
(1993) while psychological empowerment is measured using Spreitzer (1995).
In the current study, terms used for the career anchor inventory variables are managerial
competence, technical competence, autonomy, service, entrepreneurial creativity,
lifestyle, pure challenge, economic security and geographical stability. Terms of the
psychological empowerment facets are meaning, impact, competence and self-
determination. Lastly, job satisfaction has one variable called job satisfaction.

2
1.2 Background of the study The world of work is increasingly more complex and competitive. The competition is
not only between organisations and employees, but between and within employees. This
has an impact on both organisational behaviours and employees’ attitudes.
Organisational management will aim to retain high-quality employees, while employees
will look for organisations that can satisfy their personal values and needs. In response,
organisations have focused on issues, such as restructuring career paths, creating
meaningful work strategies, or developing appropriate reward programs to attract
talented highly skilled employees; individuals are more concerned with how to develop
their internal career goals while coping with the demands of an unpredictable career
(Coetzee & Roythorne-Jacobs 2007). In another sense, this change will influence how
employees view their relationship with their employers (the so-called psychological
contract) (Rousseau 1996; Lumley 2009). This new psychological contract ‘has been
subjected to an increase in exchange-base demands, such as flexibility, mobility, self-
reliance, value-added performance, trust and openness and greater responsibility that
both parties look for’ (Lumley 2009, p. 2).
The change indicates that individual employees who still engage with the concept of the
traditional career would experience challenges in their workplace, including those who
work as civil servants. Employees who look for a stable job, a hierarchical path to
promotion, low job demands and a structured salary will find it hard to identify
organisations that want to recruit them. Moreover, those who find themselves depending
strongly on organisations will face ‘a wall’ blocking their career progress. More and
more organisations now use a merit-based system in which rewards or benefits are paid
to talented and high-performing employees. Employees’ only possible attitude in this
career environment is to manage their own internal career motivation (Schein & van
Maanen 2013).
Employees at work, therefore, have to assess their own interests, competencies, skills
and values to improve their chances for career progression. Individuals’
interests/motives, skills/talents and values/attitudes form their occupational self-
concept, known as ‘career anchor’ (Schein 1978, 1996, 2006a; Schein & van Maanen
2013). The anchor will be reflected in their career choices. Self-perceived talents or

3
competencies, motives and values interact, both among themselves and with the
organisational and business environments to produce an individual self-image. Career
anchors not only serve as a guide to choose a career but also influence an individual’s
decision to move from one organisation to another (Schein 1987a; Igbaria & Baroudi
1993). Individuals therefore should understand their own occupational self-concepts and
organisational roles comprehensively in pursuing their internal goals (Baruch 2006).
In line with the dramatic changes in the social, economic and technological
environment, individuals will develop different career anchors in the same occupation
to achieve work satisfaction (Schein 1990; Feldman & Bolino 1996; Baruch 2004b,
2006). They will have different reasons for entering the occupation, different
motivations, and different criteria for success (Gunz & Heslin 2005). In certain cases,
career anchors chosen may not be congruent with the internal self-concept. Byrd’s
(2001) study revealed that individuals pursue certain dominant career anchors because
of family influences and social pressures. If these are incongruent with the individual’s
self-concept, the individuals feel dissatisfaction at work. Understanding one’s career
anchors is important because the fit between individuals’ career anchors and the work
environment will increase their level of job satisfaction (Hsu et al. 2003; Schein 2006a;
Coetzee, Schneider & Tladinyane 2007; Collins 2007; Mays 2007). Hence, it becomes
critical for organisations to make individuals feel psychologically empowered with their
work environment.
It is suggested that organisations provide positive support to employees by giving them
autonomy, flexibility and freedom to perform their tasks. Individuals ‘who feel a strong
sense of control and energy with respect to their jobs’ (Castro, Perinan & Bueno 2008,
p. 1857) will engage with the work and be psychologically happy in the workplace. As
individuals anchor their careers, it is believed that this can give a sense of power to
individuals in terms of meaningful work, competence, self-‐efficacy and impact in the
workplace. Therefore, perceived feelings of empowerment can increase individuals’ job
satisfaction levels (Spreitzer, Kizilos & Nason, 1997; Eylon & Bamberger 2000; Patah
et al. 2009). Conversely, lack of support from organisations may affect individuals’
involvement in organisations and cause dissatisfaction and may indirectly influence
organisational effectiveness. Thus, the significant point for this complex workplace
situation is how individuals view their internal careers in order to be empowered, as this
4
associated with positive attitudinal outcomes in the workplace. Specifically, the career
anchor concept can help individuals to identify their self-concept both in both the past
and future careers (Schein 2006a), and to perceive their degree of job satisfaction
(Smith 2005) and level of empowerment (Collins 2007).
1.3 Career development of academics in the Indonesian public university context
1.3.1 Overview of Indonesia Indonesia, officially the Republic of Indonesia, is the largest archipelago in the world.
Located in Southeast Asia, it consists of 13,700 inhabited islands, including the five
large islands of Sumatera, Java, Kalimantan, Sulawesi and Papua, and 6,000
uninhabited islands (Upton 2012). Although this country has 726 dialects (Lewis 2009),
its official language is Bahasa Indonesia (Indonesian language). The majority of people
embrace Islam as their religion, while Buddhism, Christianity, Catholicism, Hinduism
and Kong Hu Chu are among the minority groups. Indonesia has 500 ethnic groups that
spread throughout the islands (Welch 2012), each of which is unique in terms of
attitudes, clothes, food, songs, rituals, traditional architecture and dance (Chapter 6,
Sub-section 6.5 has a more detailed discussion).
Indonesia’s rich traditional cultures have influenced not only social life but also
governmental style, necessitating a striving for consensus (Magnis-Suseno 1997;
French, Pidada & Victor 2005). This is highlighted in Pekerti and Sendjaya’s (2010, p.
762) study called ‘group and family collectivism’. However, there is a high power
distance between leaders and subordinates in an organisational setting (Gupta et al.
2002; House et al. 2004; Pekerti & Sendjaya 2010). In the government context, this
takes the forms of formalised, centralised and bureaucratic systems based on the
dominant cultures involved in government. Even though autonomy and decentralisation
have been applied at all levels of governmental administration, in practice the
centralised administration is still dominant in all aspects of government life, including
the public higher education sector.

5
1.3.2 Public higher education systems in Indonesia
The public higher education sector in Indonesia in 2011 consisted of 98 institutions
(Direktorat Jenderal Pendidikan Tinggi 2013). They are categorised into three groups:
large universities (>10,000 students), middle-sized universities (5,000-10,000 students)
and small tertiary institutions (<5,000 students) (Direktorat Jenderal Pendidikan Tinggi
2013). There are five types of higher degree institutions: (1) universities that consist of
‘many faculties covering comprehensive disciplines’; (2) institutes that have ‘many
faculties in a single field of study’, such as technology and agriculture; (3) academies
that offer ‘a range of courses below the bachelor’s degree’; (4) polytechnics that provide
‘a range of vocational courses below the bachelor’s degree’; and (5) colleges that offer
vocational education in one discipline at ‘a single faculty institution’ (UNESCO 2006,
p. 35).
The public higher education institutions (hereafter referred to as universities) are under
the control of the Directorate General of Higher Education (hereafter referred to as the
DGHE), or in Indonesian, Direktorat Jenderal Pendidikan Tinggi (hereafter referred to
as Dikti). Unlike Indonesia’ private universities which are market-orientated with
autonomous and flexible curriculum, limited terms employment contracts for some
academics, and own performance evaluation criteria remuneration, its public
universities are similar in many ways to traditional government systems, with
characteristics, such as ‘highly formalised decision-making structure, little mobility,
high level of job security, a uniform pay system, less transparency, and specific pension
schemes’ (Demmke 2005, p. 10). The central government has still significant control
over administration and management including funding (Buchori & Malik 2004; Welch
2012), promotion, recruitment, curriculum and the national entrance test. This leads to
inefficiency and poor initiative in developing education based on market demand
(Buchori & Malik 2004; Nizam 2006).
In an effort to improve the quality of education and their ability to compete in the
educational environment, particularly with private institutions, public tertiary
institutions have been given more power to operate education. Private higher education
institutions primarily have a business orientation to the teaching and learning process.
Despite the fast-growing number of private universities, similar to the situation in other
developing economies, such as in Latin America (Rhoads & Torres 2006), public

6
universities in Indonesia still maintain their traditional approach. While the model of
considering universities as businesses seems unpopular, it should be taken into
consideration (Nizam 2006). There is no doubt that Indonesian public universities need
to undertake this transformation and reformation to be part of the global educational
market. In line with Indonesia’s regional autonomy policy, the Indonesian higher
education system is currently transitioning to a semi-autonomy model that includes a
market demand-oriented approach.
Despite demonstrations and rejections of change, the education laws and the models
offered to the society have already changed many times. The first higher education
reform was the establishment of an autonomous mode of operation in 1999 with the
Higher Education Law or Undang-Undang Perguruan Tinggi (hereafter referred to as
UU PT) number 22 in 1999 (Direktorat Jenderal Pendidikan Tinggi 2013). Some
strategies were applied during 1999-2009 that mirrored the established university
system in the West (Table 1.1). In the face of limited funding, lack of quality of
working conditions and low academic qualifications, the government allowed
universities to implement full tuition fee-paying, develop their own curricula, apply
contract-based recruitment, generate income, build industrial collaboration linkages and
hire talented professors. Only seven of the more reputable universities adopted the
model, including the University of Indonesia, Bandung Institute of Technology, Gadjah
Mada University, Bogor Agricultural University, Airlangga University, the University
of North Sumatera and Indonesia University of Education. The government changed the
status of those universities to a new status, named ‘state owned legal entity’ or Badan
Hukum Milik Negara (hereafter referred to as BHMN) institutions (Welch 2012;
Kusumadewi & Cahyadi 2013).
Because the BHMN was interpreted as commercialisation in education that would lead
to higher tuition fees, the law was rejected by the various parties. Debate and criticism
had raised tensions between the government and third parties, such as students, parents,
politicians and non-profit organisations. On the one hand, many people were afraid that
they could not afford to pay the tuition fees and other costs that were associated with
education. On the other hand, elite politicians and those universities with low capacity
and resources worried about not being able to compete in the educational market. Thus,

7
the law was rescinded by the House of Representative as a certified body about 10 years
later.
Table 1.1: A comparison of higher education features between Indonesia and the West
Factors Indonesia
Netherlands U.S. U.K. Australia Traditional Legal entity
Power
Centralisation: Bureaucratic; unitary; public service
Decentralisation: market-oriented + semi-autonomous
Business like Decentralisat-ion
Business like and vocation, more entrepreneurial
Autonomous + government legislation
Finance
Full government funding
Proportional state support, autonomy, self-generated funding
N/A
State and federal support
Financial freedom
Government support
System
Focus on teaching
Research and entrepreneurship
Research and vocation
Research-oriented
Research-oriented
Research + entrepreneur-ship
Bachelor’s (S1) 4-5yrs, Master’s (S2) 2-3 yrs, Doctorate (S3) 3-4 yrs
S1=3.5-4 yrs, S2=2-3 yrs, S3=3-4 yrs
S1=4-5 yrs before 2002 and 3 yrs; after 2000, S2=1.5-2 yrs; S3=4 yrs
S1=4yrs, S2=2yrs; S3=3yrs
S1=3-4yrs, S2=1-2yrs: S3=3yrs
S1=3 yrs, Honours=1 yr, S2=1-2 yrs, S3=3-4 yrs
By coursework+ final project
By coursework+ final project
By coursework + final paper
By coursework +final project
By coursework+ final major project
By coursework & by Research
Low fee-paying Full fee-paying N/A Full fee-paying N/A Low fee-paying National entrance examination
National + university entrance test
N/A N/A
N/A Success in previous levels
University--> faculty--> department
University--> faculty--> department/ school
N/A
University--> faculty--> department
University--> faculty--> department
University--> faculty--> school
Full-time students Full-time students N/A Full- and part- time students N/A Full- and part-
time students Academic year
September to July September to July September to June
August to May September to July
March to December
Curricu-lum
National standard Create own curriculum/ program/etc.
Create own courses and curriculum
Create own courses and curriculum
Create own courses and curriculum
Create own curriculum/ program/etc.
Others
No rules Industrial collaboration, visiting scholars, exchange lecturers and students, international students
Industrial collaboration, visiting scholars, international students
Industrial collaboration, visiting scholars, international students
Industrial collaboration, international students
Industrial collaboration, visiting scholars, international students
Control of personal habits (mandatory wearing of shoes on campus and in class)
Control of personal habits (mandatory wearing of shoes on campus and in class)
N/A N/A N/A N/A
Source: Buchori & Malik 2004; Nizam 2006; Bot 2010; Lissoni, et al. 2011; Scott 2011; Kusumadewi & Cahyadi 2013; Katers n.d.; www.euroeducation.com N/A = not available
A series of amendments in the new legislation were enacted to accommodate political
and societal voices. The Law on Educational Legal Entity or Undang-Undang Badan
Hukum Pendidikan (hereafter referred to as UU BHP) was legalised at the end of 2008

8
(Kusumadewi & Cahyadi 2013). The law gave each university the freedom to manage
its sources of funding. While not all public universities had fully implemented the
model, in 2010 all universities were planned to operate under the public entity status,
which was renamed Perguruan Tinggi Pemerintah (or PTP), as set out by the Dikti.
This status was similar to the traditional system in which all educational activities were
controlled and evaluated by the central government. Because of the pros and the cons
from the third parties, (Chan 2013), both modes failed before developing into an
effective system.
In 2012, the UU BHP was re-enacted as the Higher Education Law, with amendments
concerning financial management. The new regulation, Government Regulation or
Peraturan Pemerintah (hereafter referred to as PP) number 74, required universities to
follow the rules applicable to the Public Service Agency or Badan Layanan Umum
(hereafter referred to as BLU) in 2012 (Direktorat Jenderal Pendidikan Tinggi 2013).
Universities now had to get their financial plan approved by the Ministry of Education
and Culture, although human resource management was left entirely to the universities
concerned. The system was an embryonic form to establish the public university legal
entity or PTN Badan Hukum (hereafter referred to as PTN BH), which was similar to the
BHMN discussed earlier. The UU PT number 22 was legalised in 2012, and – after a
controversial debate (Chan, 2013) - the PTN BH mode was enacted in March 2013. The
seven top universities were automatically transferred to the new status. In October 2013,
the government transferred the University of Indonesia, Bogor Agricultural University,
Gadjah Mada University and Bandung Institute of Technology to the PT BH mode
(Pikiran Rakyat 2013). However, the government also offers the PT BLU mode to other
universities who find it hard to employ the PT BH mode.
All levels of courses are designed for coursework combined with final projects. There
are no programs by research, as in Australian universities. The system is a combination
of the higher degree systems in countries, such as the U.S., the U.K. and the
Netherlands (Bot 2010; Lissoni et al. 2011; Scott 2011; Katers n.d.). On average, most
universities offer four to five-year undergraduate degree by coursework with a project
report (or skiptie) at the end of the program. However, in the last decade some top
universities, such as the University of Indonesia, have offered undergraduate courses
lasting three to three-and-a-half years. Master’s students usually complete their studies

9
within two to three years, including the production of a mini-thesis in the final semester.
Similarly, doctoral students must write a thesis in the final year of a three-to-five year
program. Table 1.1 sets out some other features.
Although the latest education law has been officially introduced, many academics still
doubt whether it can be implemented, especially concerning finances and transparency.
In addition, a number of universities, with the exception of the seven universities
mentioned earlier, are still reluctant to abandon their traditional status, as they perceive
that resources for universities of the new status are of inadequate quality.
1.3.3 Academic career promotion policy
It has been noted that from the start of the transformation until 2012, the government
had moved from organising its civil servants according to traditional bureaucratic
systems to a performance-based system (Turner & Podge 2007). In particular, the career
promotion system had been firmly anchored in the bureaucratic procedures and central
control (Idrus 1999), which had resulted in the persistence of traits, such as inflexibility,
low levels of innovation, less performance orientation and less autonomy. This does not
appear to be what is required by the legal entity mode, in which academics are free to
exercise their capabilities in pursuing their careers.
Full-time academics at the public universities are categorised as civil servants, or
Pegawai Negeri Sipil (PNS), and employed by the central government, similar to
academics in Estonia (European Commission 2008) and the Netherlands (European
University Institute 2014). Like government employees at public agencies, they are
provided with ‘high level job security, a uniform pay system and a specific pension
scheme’ (Demmke 2005, p. 10). Academics receive some benefits, such as a monthly
salary, a pension and lifetime employment status, along with benefits, such as a rice
allowance and tax subsidies. This condition is different from academics in the
Netherlands, for instance, where academics are recruited based on contract. There are
no differences in terms of the benefits and provisions between academics who achieve
high and low performances (Turner et al. 2009). The only factor that makes the
difference is the academic ranks and levels systems, which is regulated by the central
government. This system does not seem to motivate academics to achieve high
performance and attain high-quality outcomes.

10
With respect to the promotion system, Indonesian’s higher education formally applies a
‘moving up in the hierarchical structure’ stage (Schein 2006a) through promotion in
academic levels (kenaikan golongan) and academic ranks (kenaikan fungsional). No
research career development system is introduced, like the one in Australia, for example
(The higher education academy 2009). In terms of the academic levels (or kenaikan
golongan), every two years, civil servants automatically receive an incremental increase
to a higher level and an increase in salary. However, the increase from one level to the
next is not related to work performances, rather it is taken for granted. A series of
classification levels based on the PP number 99 in 2000 is III/a/b/c/d, IV/a/b/c/d/e. As
of 2005, to improve academic performance, the Dikti took the initiative to add to the
terms of academic ranks promotion, while the academic levels policy remained as in the
traditional mode. When a master’s degree was introduced as a minimum requirement to
be an academic, a person who is accepted as an academic will be appointed at level
III/b. This is absolutely in contrast to the merit-based system applied in Sweden
(European Commission 2008), for instance.
Aligning with the academic level, academics apply for promotion based on the
functional area (jabatan fungsional) ranks ranging from assistant lecturer (or asisten
ahli) to professor (or guru besar) (see Appendix 1). As in Government Regulation
99/2000, promotion is valid only in a department of the faculty in a university where the
academic was recruited and in a linearity of specialisation, not as is the case in some
other countries, such as Australia or the U.S. where promotion is across field of study,
faculty and university (European University Institute 2014). A number of credit points
must be collected and are examined based on the three aspects for all ranks (so-called
three pillars of higher education, or in Indonesian, Tri Dharma Perguruan Tinggi:
teaching, research and community services (Dikti 2009). All criteria are assessed by
internal reviewers within a university. It is almost the same as that in the Netherlands in
which teaching and research are the main criteria for all positions, and in Malaysia, with
the exception of professor level specified into teaching and supervision, research and
innovation, consultation, publication and service to the community and the university
and assessed by external examiners (Sidek et al. 2012). Nevertheless, academics receive
their salaries based on the levels and ranks they achieve.

11
Promotion between academic levels and academic ranks are two different things but
related to one another. Unlike the system in Australia, for example, where a senior
lecturer position is definitely at level C or a lecturer is B, Indonesian academics have
different condition. Academics who are in a classification level of III/b are definitely in
an assistant lecturer rank but those in an assistant lecturer may be at level III/c.
However, for lecturer, the minimum requirement is III/c, and for senior lecturer IV/a.
To support the legal entity mode, some career promotional requirements have been
significantly altered. The Dikti has formally and strictly applied ‘in-line specialisation in
formal education levels’ and publication (Dikti 2009). In other words, an academic’s
educational background must be in one field of study from undergraduate to
postgraduate. Teaching, research and publication should reflect this specialisation (Dikti
2009; Soeparna 2011). Starting in 2012, a senior lecturer (lektor kepala) rank requires a
minimum degree of doctorate and one article written as a first author and published in
an accredited national or international journal. As in Germany (European Commission
2008), the professor title applies for the lifetime. However, to retain the remuneration
until pension, a professor is required to publish at least one international publication per
year beside criteria of teaching, research and service (Suara Merdeka 2013).
In addition, PP number 47 in 2009 requires every academic to produce an academic
certification (Direktorat Jenderal Pendidikan Tinggi 2013) as evident of their
competence as academics and precondition for remuneration. Academics are required to
carry out the three pillars of higher education to remain eligible for remuneration. In
addition to requiring academics to self-evaluate their academic achievement in the form
of a portfolio, since 2012, the Dikti has been requiring tests of English language
proficiency and academic potential test (Direktorat Jenderal Pendidikan Tinggi 2013),
although these requirements do not stipulate a minimum result. No references in other
countries applying this method are found, although Australian academics have the
opportunity to reflect on their career development plans, often through discussions with
their supervisors.
Academics are permitted to work in managerial positions (jabatan struktural). The
structural positions, such as head of school/department, dean or rector, are based on an
election process and not as a promotion. This is somewhat similar to the system in the

12
Philippines (Custodio 2000). There is a significant difference in rewards between the
levels. Recent observation shows that academics who hold doctoral degrees are
significantly more likely to hold various managerial positions. However, there is no
published study to show the reasons behind this observation.
The promotion system is believed to improve the quality of academics, as they compete
by improving their skills and knowledge. However, lifelong tenure without the
possibility of punishment or impeachment contributes to a lower quality of academic
staff (Gunawan 1999). While concurrent employment is technically not permitted, most
talented academics at all ranks have part-time or full-time careers outside of their
universities (Idrus 1999), such as at local government agencies, private companies,
private universities or family businesses (Welch 2012). It is assumed that academics
look for an increase in income, a chance for promotion and self-development or
administrative work (Isaac 1998; La Lopa, Beck & Ghiselli 2009). Therefore, higher
education institutions need to know how to retain and empower academics, especially
those who are highly skilled (Lewis 1999).
A revised policy on promotions, introduced in 2005 as a way to develop the quality of
academics’ careers, has forced a shift in the way academics look at their career paths.
Unlike the traditional career development system, this system gives more freedom to
academics in arranging their own career life at universities. Although the academic
levels system is still applied, functional promotions are assessed heavily on merit, in
which performance criteria assessments become a central point (Directorate General of
Higher Education 2003; Dikti 2009).
This policy has forced academics to consider whether their careers fit with their own
talents, needs and motivation as internal drivers with their universities’ needs. However,
the new policy has come under strong criticism. As Welch (2012) pointed out, the
policy has changed but the civil servants’ mindset can hardly be expected to alter in a
short time. Some argue about the differences of university sizes and resources, the
feelings of disempowerment and dissatisfaction, lack of supportive work climate and
lack of resources. It has been identified that financial matters do not significantly
contribute to these perceptions. It is rather the issue of how to fulfil individual and
organisational needs through empowerment. The new policy of the career promotion is

13
in accordance with the new understanding of the importance of internal motivation as
career progress. This leads to two questions: how do academics view their careers’
values and attitudes toward the institutions?, and how do organisations provide a
psychologically safe work environment by providing autonomy and freedom? It is
argued that academics should understand their own self-concept of occupational internal
careers and self-efficacy by considering positive attitudinal outcomes for achieving their
career goals.
1.4 Problem statement The understanding of the modern career concept has moved away from the traditional
lifetime career development concept. Emerging organisations can no longer fully offer
and guarantee long-term or whole-life employment (Cappellan & Janssens 2005;
Collins 2007). Linear career progression has been replaced by a contemporary
understanding of career in which individuals are encouraged to be less dependent on
organisations and actively look for opportunities to develop own career (Frese & Fay
2001; Raabe, Frase & Beehr 2007) and develop multidirectional career paths (Baruch
2004; Inkson 2004; Cappellan & Janssens 2005). As a result, individuals must
understand their self-occupational concept well enough so that they will choose a career
that reflects their self-image (Dessler 2000). Schein’s occupational self-concept consists
of talents, needs and values – known as career anchors – that can help individuals
identify their personal careers and career-related value (Schein & van Maanen 2013).
Employees’ awareness of career anchors and their own resulting willingness to move
from one organisation to another have forced organisations to provide a psychologically
safe environment at work, as they compete for skilled and talented employees (Schein
2006a).
Psychological empowerment and job satisfaction are viewed as career attitudinal
outcomes in which individuals feel satisfied about their work and jobs. Individuals now
choose jobs and organisations that let them engage their career anchors leading to a
feeling of empowerment, and thus of job satisfaction. This new career development and
its relation to empowerment and job satisfaction is the focus of the current study.

14
Although some studies have examined the concept of career anchors (e.g., Hsu et al.
2003; Bester & Mouten 2006; Coetzee et al. 2007; Danziger, Rachman-Moore &
Valency 2008; Chapman 2009; Singh, Bhattacharjee & Kodwani 2009) and its relation
to job satisfaction (e.g., Igbaria & Baroudi 1993; McMurtrey et al. 2002; Dazinger &
Valency 2006; Steele & Francis-Smythe 2008), little research has been done in the area
of education. Career anchors that have been studied have examined U.S. schools’
principals (Puryear 1996), Singaporean teachers (Tan & Quek 2001), Netherlands
secondary school students (Klapwijk & Rommes 2009), university business students in
Australia (including students from Australia, Malaysia, South Africa, the U.K. and the
U.S.) (Marshall & Bonner 2003) and primary and secondary school teachers in China.
So far, only two studies have been conducted on academics’ career anchors. One was
related to turnover of hospitality and tourism academics in the U.S. (La Lopa, Beck &
Ghiselli 2009), and the other on academic executives in the Philippines (Custodio
2000).
Similarly, psychological empowerment has been studied and linked to the job
satisfaction of private and public service employees (e.g., Collins 2007; Dickson &
Lorenz 2009; Patah et al. 2009; Wang & Lee 2009; Dehkordi et al. 2011; Schermuly,
Schermuly & Meyer 2011; Chung et al. 2012). It has been examined as a mediator in
the relationship between leadership and psychological climate, and various other
attitudinal outcomes (e.g., Liden, Wayne & Sparrowe 2000; Carless 2004; George &
Hancer 2004; Collins 2007; Castro, Perinan & Bueno 2008; Chang, Shih & Lin 2010;
Givens 2011; Zhu et al. 2012). However, there are no published studies of the
relationship between career anchors, psychological empowerment and job satisfaction.
Most studies have been conducted on samples other than academics in higher education
institutions. To the best of researcher’s knowledge, there has been no study so far
published on Indonesian academics’ career anchors, psychological empowerment and
job satisfaction. The present research, therefore, examined:
The relationship between career anchors and job satisfaction and the effects of psychological environment in the Indonesian public higher education context.
15
To address this research problem, this study was designed to explore the following six
issues:
1. The relevance of the career anchor inventory, the psychological empowerment
scale and the job satisfaction scales in the Indonesian academics context.
2. The single and multiple dominant career anchors of Indonesian academics.
3. The talents-based, needs-based and values-based anchors of Indonesian
academics.
4. How do career anchors predict psychological empowerment and job
satisfaction?
5. How do Indonesian academics’ perceptions of their career development
influence the way they pursue their career anchors?
1.5 Significance of the study As there have been no studies on career anchors and psychological empowerment of
academics conducted in Indonesia, this study assists in explaining how Indonesian
academic staff view their internal careers and their feelings of empowerment, and how
these affect their level of job satisfaction. The findings of this study provide a better
understanding for managing academics’ career development programs and, designing an
empowerment strategy to achieve higher levels of job satisfaction. This study also
contributes to filling the gap in the general career anchor literature concerning public
sector academics, as the current literature is limited to addressing career anchors of
managers, professionals and employees in the private sector.
The career anchor, psychological empowerment and job satisfaction theories and
models that have been applied and developed in the U.S. may not reflect individuals’
careers and attitudinal outcomes in situations beyond American borders (Feldman &
Bolino 1996; Budhwar & Baruch 2003; Webber & Ladkin 2009; Chang, Shih & Lin
2010). Hofstede (1991) put forward an argument as to why many western theories
might not be applied to other national contexts, and Ituma and Simpson’s (2007) study
in Nigeria claimed that there are significant differences in career anchors held in the
U.S. and Nigeria. However, studies of psychological empowerment in Malaysia (Ghani

16
et al. 2009) and Germany (Schermuly, Schermuly & Meyer 2011), for instance,
validated the theory and the results were the same as the original concept. Therefore,
there is a need to explore more studies in non-western countries.
1.6 Outline of the study The thesis is structured as follows:
Chapter One presents the purposes, research questions, significance and contribution of
the study. It gives an overview of Indonesian public higher education systems
and describes the career promotion policy for academics. It also defines some
key terms used in the current study.
Chapter Two reviews the relevant research literature on career anchors, psychological
empowerment and job satisfaction. It explains the framework of career anchors
according to Schein’s concept and Feldman and Bolino’s perspective, the
concept of psychological empowerment and the relationship to job satisfaction.
It then discusses previous empirical studies on career anchors. The chapter
presents the dimensions of each of the three concepts, and describes an
octagonal model that measures the strength of the relationships of multiple
anchors. The review concludes by introducing a research framework and model
for the current study and generates a number of proposed hypotheses.
Chapter Three discusses the research methodology applied in this study. It introduces
the research design and a mixed-methods approach. The development of the
instruments used in this present study is also discussed. It presents data
collection and data analysis process. The validity and reliability analyses are
presented, and the statistical tools of factor analysis, Spearman’s rank correlation
coefficients, and hierarchical regression analysis are used for quantitative
analysis. Thematic analysis will be used for the qualitative analysis. It will also
briefly explain the demographic role in the analysis.
Chapter Four presents the results of the statistical analysis. It will summarise the results
of the testing of the career anchor concept and the analysis of the relationship

17
between career anchors and work outcomes. The empirical findings will then be
linked to the interview results
Chapter Five describes the interviews’ results on career events that lead to the choice of
career anchors. It also summarises the respondents’ views on career
development issues through open-ended questions. It discusses how the
academics view their career history, and link their responses to extent literature
on career anchors and outcomes. The chapter concludes by integrating the
qualitative and quantitative results.
Chapter Six summarises and discusses the findings. The implications for theory,
methodology and managerial practice are discussed. It then draws conclusions.
Chapter Seven presents the limitations of the current study and makes recommendations
for future studies.
Key terms
Higher education institutions include universities, institutes and polytechnics. Higher
education institution and university are used interchangeably.
Universities represent university, institute and polytechnics
Academics mean individual academics, who work full time as civil servants, hold
academic ranks from assistant lecturer to professors. Academics and lecturers
are used interchangeably regardless the ranks.
Respondents and participants have the same meaning, which are individuals who
participate in a survey. A term of respondents is used for samples of a survey
questionnaire while a term of participants is used for interview samples.
Organisations and institutions: Organisations are used to refer private sector entities
while institutions are used for the government units, agencies, and departments,
such as universities.

18
Chapter 2
Literature Review and Conceptual Framework
2.1 Introduction The previous chapter introduced the need for conducting this study. It presented the
purposes and background of the study. An overview of Indonesia, the higher education
system and the career promotion system of Indonesian academics were outlined. The
chapter also described the research problem, some issues and the significance of the
study.
This chapter reviews the literature related to the current study. It demonstrates career
meaning, including the concept of internal and external careers. The theory of career
anchor developed by Schein (1977a, 1996, 2006) that serves as a basis for this study is
discussed. It also describes the career anchor categories, multiple career anchors, and
studies on career anchors conducted by Schein and other researchers. The chapter
highlights Feldman and Bolino’s (1996) reframing of the career anchor concept,
including their propositions of complementary and mutually exclusive anchor categories
and the proposed model of the octagonal diagram. The next sections discuss the
literature on psychological empowerment and job satisfaction, linking them to the
career anchors. It also explains the relationships between the career anchors,
psychological empowerment, job satisfaction and demographic data. Finally, the
chapter presents the conceptual framework, the research model and the proposed
hypotheses.
2.2 Understanding of career: internal and external career perspectives The word ‘career’ is generally viewed from either an organisational or an individual
approach (see Greenhause, Callanan & Godshalan 2000). In the organisational
approach, a career is a structure of an organisation where everything that is done refers
to physical appearances. For instance, a series of formal education, and a work journey
from a low level position to top level management are an organisational approach. The
individual approach refers to a series of individual work activities. For instance, a
person is said to have a career if she or he has a profession (e.g., physicians, lawyers)

19
that involves a steady advancement or substantial achievement in social status (e.g.,
professor, high social class) and a structured occupational life (e.g., teachers, guidance
counsellors (Greenhause, Callanan & Godshalan 2000; Schein 2006a). Greenhause,
Callanan & Godshalan (2000, p. 9) defined a career as ‘the pattern of work-related
experiences that span the course of a person’s life’. They argued that the definition
accommodates objective situations (e.g., job position, job duties) and subjective
interpretations (e.g., aspirations, values, needs and feelings) that fit the current changes
in the workplace. If the pattern is regarded as the steps and phases of an individual
occupation, she or he has a career (Schein 2006a, p. 1).
In the literature, authors set forth the differences between the traditional and
contemporary career concepts. The traditional understanding of career has been referred
to a series of job roles arranged within a single organisation through a hierarchical
promotion and a linear progression occupied by an individual throughout her or his
occupational lifetime (Super & Bohn 1971; van Maanen & Baley 1984; Schein 1993;
Cherrington 1995; Hall 1996; Inkson 2004). Ituma and Simpson (2007, p. 979) in their
study of the career anchors of information system’s employees referred the traditional
career to ‘salary, status and secure career ladders within a single organisation…’, while
Coetze and Roythorne-Jacobs (2007) referred to it as functional and managerial career
development. The traditional career path is a flat hierarchy with regular and rigid
systems (Demmek 2005).
By contrast, the contemporary career notion fits to workplace demand in which it is
more business-orientated. Schein (1996), and Adamson, Doherty and Viney (1998)
argued that only individuals with certain anchors pursue hierarchical promotion in the
workplace. Similarly, Cappellan and Janssens (2005) pointed out that an upward-
mobility career progression is not appropriate in the current organisational career
system (Dickmann & Muller-Camen 2006). The reason according to Baruch (2006, p.
125) is that ‘the organizational system is now a model of all change, all dynamic, total
fluidity’. In the international context, managers and academics now have to move
further to in the work-role process (Arnolds 1997, p. 176). Particularly, Schein (1977a,
p. 488) emphasised that a career refers to ‘a set of stages or a path through time that
reflects an individual’s needs, motives and aspirations in relation to work and society’s
20
expectations of what kinds of activities will result in monetary and status rewards for
the career occupant’.
Because a career today is more challenging, stressful, unpredictable, vulnerable and
multidirectional (Baruch 2006, p. 125), individuals need to have a professional
communication with the organisation to make better career choices (Brousseau et al.
1996; Hall 1996; Steele & Francis-Smythe 2006). To do so, individuals should take
responsibility for managing their own careers, and be willing to go beyond the
boundaries of a single organisation (Hall 2002; Baruch 2006; Steele & Francis-Smythe
2006; Smith 2005; Coetzee 2008). Schein (1990, pp. 35-36) stressed that ‘it is
unrealistic to expect managers and organizations to understand employees well enough
to make valid career decisions for them…people must learn to manage their own
careers’. In this case, individuals should have their self-plan of career progression as
well as increase their skills, knowledge and abilities while fulfilling their commitment
to their organisations (Dessler 2000; Dumitrescu 2009).
In a number of studies on careers, researchers have put forward the differences between
an external career (or a structure of an organisation) and an internal career (or a property
of an individual). The external career refers to the interaction between individuals and
organisations or society in various jobs (Greenhause, Callanan & Godshalan 2000, p. 8),
and is often referred to in terms of career stages. Career stages refers to the external
roles defined by organisational policies, such as the number of formal positions held by
individuals in their career stages or career paths (Derr & Laurent 1989; Nicholson 1996;
Schein 2006a; Ituma & Simpson 2007). More specifically, Schein (2006a, p. 3)
emphasised that ‘career stages in the externally defined career are the sequence of roles
and statuses defined by a particular occupation or organization as the way to progress
through the career’. Career stages can entail ‘moving up’ in the hierarchical
organisational structure, ‘moving laterally’ across disciplines, and ‘moving in’ towards
the centre of the organisation (Schein 2006a, p. 2). It depends on a person to choose the
movement that is based on an anchor they perceive. This implies that an individual
should understand her or his internal motivation to climb stages in an occupation.
Conversely, the internal career deals more with the psychological side and refers to a
self-development within a career, career motivation and career orientation (Derr &

21
Laurent 1989; Sparrow & Hiltrop 1996; Chapman 2009). At the same time, internal
career refers to those activities designed to help individuals develop a clearer self-
concept around their own occupational activities, as a set of plans that make sense to the
individual. A limited number of studies discuss the internal career concept (e.g., Super
& Bond 1971; Holland 1973; Schein 1978). Schein (1978) in particular has developed
the internal career concept, called a career anchor, which has since been widely used in
a number of studies (e.g., Custodio 2000; Chang et al. 2011). This study used Schein’s
career anchor concept as the basis for the current study and is discussed in the following
sub-sections.
2.3 Introducing the career anchors theory The theory of the career anchor was conceptualised in a longitudinal study conducted by
Schein (1977a). The study, which began in 1961, used samples of his 44 alumni of
masters’ programs at the Massachusetts Institute of Technology’s (MIT) School of
Management (Schein 1977a, p. 19). The participants were first interviewed using a
protocol interview developed by Schein himself. The aim was to investigate the
participants’ values and attitudes towards their careers as managers. After 12 years,
those participants were invited to be interviewed and took a survey related to their
actual career history. The results showed a clear pattern of each participant’s career
experiences. Schein (2006a, p. 3) suggested that a series of educational levels and actual
work experiences teach an individual to identify her or his ‘self-concept of what [they]
are good at and not good at, want and do not want, and value or do not value’. Schein
then labelled this self-concept as the ‘career anchor’ (Schein 2006b, p. 3).
The self-concept can be thought of as individuals’ reactions to their work experiences,
as expressed by core values in three components (Schein 2006a, p. 3):
(1) Skills and competencies [or talents-based]: You need to learn from each experience what you are good at; that learning comes both from your own assessment and from the feedback you receive from others;
(2) Motives [or needs-based:] You need to learn from each experience what it is you really desire; early in life we think we know what we want, what our career aspirations are, but with each experience we discover that there are things we like or don’t like, that some of our aspirations are unrealistic, and that we develop new ambitions; and

22
(3) Values [or values-based]: You need to learn from each experience what it is you value in the context of what your occupation or organization considers important, what your colleagues value, and how the kind of organizational climate you encounter fits with those values.
Because talents, needs and values are tied together, the self-concept allows individuals
to discover their competencies, help them to determine their needs for careers and
motives and drives them to seek career stability. It is important to realise that this self-
concept is developed through several work experiences (Arthur & Rousseau 1996;
Schein, 1996, 2006a). It means that one’s career anchor cannot be identified in an early
career stage (Schein n.d.). However, the first five years of one’s career are critical for
individuals to learn about themselves, their work environment and their occupation.
The career anchor, therefore, ‘is that a combination of perceived areas of competence,
motives and values that you discover you would not give up if you faced a career
decision that might not allow you to fulfil it’ (Schein & van Maanen 2013, p. 1). It is
significant because it affects an individual’s career choice and decisions to move from
one job to another, shape personal goals in life and define what he or she desires from
the world of work (Schein 1996, 2006a; Marks & Houston 2002; Zaleska & Menezes
2007). It also encompasses how an individual would describe a successful career and
determines the individual’s views of the future (Schein 1980, 1987b, 1990; DeLong
1982; Beck & La Lopa 2001). A measure of career anchors enables an organisation and
an individual to find a match between the organisation’s and individual needs.
2.3.1 Dimensions of career anchors Based on the longitudinal study discussed earlier, Schein (1977b) initially identified
five career anchor categories derived from the self-concept. The five categories are
managerial competence, technical/functional competence, autonomy, security/stability
and entrepreneurial creativity. Delong’s (1982) follow-up study added three more
anchor categories. The identity anchor and the service anchor emerged from female
respondents referring to status and prestige, and to helping others, respectively. Variety
was identified through the respondents who preferred variety of work. However, Schein
(1987a, p. 159) renamed identity as lifestyle and variety as pure challenge after further
investigation.

23
In a subsequent study, DeLong (1982) also proposed that the security/stability anchor
could be split into the economic security and geographical stability anchors. He argued
that the security anchor ‘played an important role in career decision-making to either
remain in a particular geographical location or retain long term benefits’ (DeLong 1982,
p. 60). Igbaria and Baroudi (1993) empirically tested the validity and reliability of
Schein’s anchor categories, including the security/stability anchor, and the results
confirmed the separation of the security/stability anchor. Some later studies have also
confirmed the split (e.g., Custodio 2000; Ramakhrisna & Potosky 2004; Chang & Lin
2008).
Besides the security/stability anchor, the entrepreneurial creativity anchor has also been
split into two anchors. Two studies conducted by Marshall and Bonner (2003) and
Dazinger, Rahman-Moore and Valency (2008) examined found that entrepreneurial
creativity could be separated into two dimensions, as the entrepreneurship anchor and
the creativity anchor. Marshall and Bonner (2003) in their study of graduate students
registered in management courses in Malaysia, South Africa, the U.K., the U.S. and
Western Australia found the strong alphas for the two factors (entrepreneurship = 0.75
and creativity = 0.85). Three items and two items of the respective anchors had strong
correlation. Dazinger, Rahman-Moore and Valency (2008, p. 7) in examining the career
anchor constructs using an Israeli sample claimed that although the construct validity of
the two anchors is modest, the two factors gave ‘a better fit than Schein’s eight-
construct model’. However, the reason for the inappropriate item wording that caused
low validity needs a strong justification especially when they claimed that the sample is
not a cultural issue because the Israeli population constitutes ‘a microcosm
(Maduradam) of Western Europe and North America’ (Dazinger, Rahman-Moore and
Valency (2008, p. 17) that causes the low validity. The separation of this anchor needs
further investigation for the validity and reliability check.
Hence, the nine career anchors that have been confirmed and tested for validity and
reliability (Igbaria & Baroudi 1993) are presented in the current study. The anchor
categories and their characteristics are shown in Table 2.1.

24
Table 2.1: Career anchor dimensions and their characteristics
Categories Items Managerial competence
The process of supervising, influencing, leading and controlling people at all level is… To be in charge of a whole organisation is… To rise to a high position in general management is…
Technical competence
Remaining in my specialized area as opposed to being promoted out of my area of expertise is… Remaining in my area of expertise throughout I will accept a management position only if it is my area of expertise.
Service I want a career in which I can be committed and devoted to an important cause. Being able to use my skills and talents in the service of an important cause is… Using my skill to make the world a better place to live and work in is …
Autonomy The chance to do things my own way and not to be constrained by the rules of an organization is… A career that is free from organization restrictions I do not want to be constrained by either an organization or the business world.
Economic security
An employer who will provide security through guaranteed work, benefits, a good retirement program, etc. is… An organization that will give me long-run stability is…
Geographical stability
Remaining in one geographical area rather than moving because of a promotion is… It is more important for me to remain in my present geographical location than to receive a promotion or new job assignment in another location.
Pure challenge Working on problems that are almost insoluble is… The only real challenge in my career has been confronting and solving tough problems, no matter what area they were in. I feel successful only if I am constantly challenged by a tough problem or a competitive situation.
Lifestyle Developing a career that permits me to continue to pursue my own lifestyle is… A career is worthwhile only if it enables me to lead my life in my own way. Choosing and maintaining a certain lifestyle is more important than career success.
Entrepreneurial creativity
Building a new business enterprise is… I am always on the look out for ideas that would permit me to start and build own enterprise. I have always wanted to start and build up a business of my own.
Source: Igbaria and Baroudi (1993, pp. 53-54)

25
2.3.2 Explaining multiple career anchors
Schein’s (1987a, p. 161) early work demonstrated the existence of multiple career
anchors. He found that one-third of the sample groups held more than one anchor, and
the anchors were correlated to each other. A group of MIT senior executives tended to
have a combination of the managerial competence and technical competence anchors as
their true anchors; a group of female bank vice presidents had the security, managerial
competence, technical competence and service anchors; and a data processing
professional group was more likely to have the security/stability, technical competence,
managerial competence and entrepreneurial creativity anchors. Another indication of
multiple anchors comes from the groups that fell into the anchor category of
‘ambiguity’: alumnae, high-potential women, and strategy and management consultants.
For these groups, Schein (1987b) assumed that the respondents held two or more career
anchors because of inadequate work experiences. The results of Schein’s study shows
that, in fact, individuals can perceive their dominant career anchors differently from the
study options and thus having multiple career anchors is a career option.
Schein’s (2006a) description of the career anchor categories also indicated that an
individual can have more than one anchor. He also noticed that because in a forced-
choice situation, a person may have a combination of several anchors to satisfy herself
or himself. On the one hand, Schein hypothesised that the service career anchor would
appear in those who were working in the public sector. On the other hand, he claimed
that individuals with the security/stability anchor were more suited to working in the
government sector. He said that ‘…government and civil service jobs are often
attractive to these people’ (as security/stability-anchored people) (p. 17), and to these
people, they prefer a tenure system that can be ‘found in schools and universities’ (p.
18). This means that a civil servant can have the service and security/stability anchors at
the same time.
In a very recent study, Schein and van Maanen (2013) also implicitly recognised the
existence of multiple career anchors. They highlighted the shift of career anchors, and
brought the single eight anchor categories into four groups. In contrast, Feldman and
Bolino (1996) explicitly supported the existence of multiple career anchors asserting
that an individual can have main and secondary anchors to face the changes in their life
26
situations. Feldman and Bolino (1996) then reframed Schein’s single career anchors
model. Sub-section 2.4 discusses these aspects in detail.
2.3.3 Factor structures underlying the career anchors The stability of one’s career anchors depends on the current situation and conditions in
the workplace. In studying the career anchors of his students, Schein (1978) concluded
that an individual did not change his or her career anchors and only had one dominant
career anchor dimension. However, in his later research, Schein (1996) predicted that
the structure of the career anchors would shift in the 21st century due to a change in the
technological environment, ‘market conditions and career advancement’ or ‘social
settings’ (Chang et al. 2011, pp. 104 & 114). Arthur, Inkson and Pringle (1999, cited in
Suutari & Taka 2004) stressed that career anchors might not be significant in terms of
‘where they are going, but they can interpret well the pattern of their previous career
episodes and use this pattern as a basis for fresh choice’ (p. 835). To anticipate the shift,
both individuals and organisations need to understand it.
As mentioned in Sub-section 2.3, the concept of the career anchor is based on a series of
studies conducted by Schein and his students on managerial positions. Not all
respondents in the 15 managerial groups anchored on the managerial competence
anchor. Only three out of seven in the group of managers were dominant in managerial
competence. It was not unexpected, however. The reason is that, Schein (1987b) had
predicted that only those individuals who were clearly about to reach a general
management position were likely to be anchored on the managerial competence anchor.
For the rest of the groups, instead of having managerial competence as their primary
anchor, the senior executives and aerospace manager groups had the highest percentage
in the technical/functional competence anchor; physicians in management had the
autonomy anchor; and the middle manager group had the autonomy and managerial
competence anchors. This suggests that individuals will choose their career anchors
according to their job responsibilities, not their positions.
Previous empirical studies examining the idea that career anchors can shift has
generated some evidence. For instance, among the information system personnel, the
technical competence anchor that should be inherent to them has been shown to alter to
managerial competence (Chang et al. 2011), geographical stability (Ramakhrisna &

27
Potoskty 2004) and service (Igbaria & Baroudi 1993). Lifestyle and service become the
dominant anchors held by individuals in industrialised countries, such as the U.S. (e.g.,
Igbaria, Meredith & Smith 1995). In developing countries, the stability/security anchor
is chosen by the majority of information technology individuals in Nigeria (Ituma &
Simpson 2007) and of higher education students in South Africa (Coetzee & Schreuder
2011).
Furthermore, the concept of multiple career anchors suggested by Feldman and Bolino
(1996) is another indication that the career anchor concept has shifted. It suggests that
the work environment can change individuals’ career anchors.
The shifting of career anchors is clearly seen in the emergence of new career anchor
categories. Chang et al. (2011) claimed that as a result of changes in career anchors,
new anchors would emerge among information systems’ employees in the middle or
later career stages. Several new anchors can be identified from the review of previous
studies, for instance, power (Schein 1990), identity (Klapwijk & Rommes 2009), being
marketable (Ituma & Simpson 2007) and salary (Puryear 1996). Baruch (2004b) in his
review of career transition suggested the employability and spiritual purpose anchors.
Three possible reasons for the emergence of new career anchors are (1) the
transformation of career values at the workplace including changes in technology and
work environment; (2) social environment influences; and (3) the variability in the
samples’ background, such as types of job, gender, age or location.
Individuals react differently to changes in the work and social environment (which may
have an impact on their career anchors). Schein (2006b, p. 292) reflected back to his
initial interview work and emphasised that:
Motivation to change does not arise until the change target feels secure enough to accept the disconfirming data because the new things to be learned begin to be feasible. The change target feels ‘psychologically safe’ if he or she can accept a new attitude or value without complete loss of self.
Once an individual feels psychologically safe, he or she can accept new information,
either through identification with others or scanning the environment for new solutions.
The more ambiguous the situation, the more an individual will rely on the perceptions
and judgments of others. Psychologically, this clinical identification may contribute to

28
the choice of an individual’s career anchor. Schein (2006b, p. 293) also highlighted that
mature individuals will form self-management around their motivation, talent and
values (reflected on career anchors) that serve to guide their career decision. He
emphasised that a career anchor links to the individuals’ career choices. This may also
indicate that individuals need feelings of empowerment to satisfy themselves in the
workplace.
2.3.4 Review of studies on career anchors Despite some criticism of Schein’s career anchor concept, his model provides an
understanding of individuals’ internal careers and their work environment. A literature
review using ProQuest, ScienceDirect, BusinessSources, Elsevier, InformaWorld,
EBSCO and unpublished theses, shows that the career anchor concept has been applied
in various fields. Studies have been done in the field of hospitality (e.g., Ross 1995;
Beck & La Lopa 2001; Weber & Ladkin 2009), information technology (e.g., Jiang &
Klein 2000; Chang et al. 2007; Ituma & Simpson 2007; Chang & Lin 2008; Dumitrescu
2009; Chang et al. 2011), business, (e.g., Suutari & Taka 2004; Wong 2007; Messarra,
Mourad & Harake 2009; Kilimnik et al. 2011), research and development (e.g., Igbaria,
Kassicieh & Silver 1999), manufacturing (e.g., Smith 2005), police/military (e.g., Steele
2006; Mays 2007), entrepreneurship (Feldman & Bolino 2000; Dazinger & Valency
2006), engineering (e.g., Singh, Bhattacharjee & Kodwani 2009) and accounting (e.g.,
Hardin, Stocks & Graves 2001).
Schein’s career anchor concept has also been studied in the education field focusing on
educators, school teachers and principals (e.g., DeLong 1982; Puryear 1996; Tan &
Quek 2001). Other studies have examined the career anchors of students (e.g., Klapwijk
& Rommes 2000; Marshall & Bonner 2003; Wong, Fiedler & Liu 2007; Coetzee &
Schreuder 2011). Only two studies have examined the career anchors of academics in
the higher education sector, and these were reviewed in the current study. The two
studies ranked lifestyle in first place. In a study by La Lopa, Beck and Ghiselli (2009),
autonomy ranked second while in a study by Custodio (2000), it was ranked fourth. La
Lopa, Beck and Ghiselli studied the relationship between bio data and career anchors on
the turnover of 337 academics who were members on the Council of Hotel, Restaurant
and Institutional Education in the U.S. Of the total respondents, more than 57 percent of
educators held a doctoral degree, 31.1 percent had a title of associate professor and 30.7

29
percent were assistant professors. They found that the balancing career and family
anchor (or lifestyle anchor) was the most important career anchor. They highlighted
assistant and associate professors’ intention to leave if the head of department could not
satisfy them in balancing career and family life. The results suggested forcing
academics to increase their teaching workload due to the increase of new students
needed to be reconsidered. Further, the finding also reported that the professors did not
tend to have the lifestyle anchor but the authors did not provide reasons and/or further
information why this finding was raised.
La Lopa, Beck and Ghiselli (2009) also paid attention to autonomy as the second
important dominant career anchor. The emergence of this anchor was surprising since
most samples were satisfied with their work environment. They argued that autonomy
and satisfaction were not correlated but that academics would quit for better rewards. It
seems that the first and second order of career anchors complement each other (mean
scores: 4.40 and 4.23) and confirm Feldman and Bolino’s (1996) premise of multiple
career anchors. The study, however, used Beck, La Lopa and Hu’s (2003) instrument,
adapted from Schein’s career orientation inventory, called Important versus Satisfaction
with Career Anchor Needs, and made some changes in the career anchors’ terminology,
such as ‘be a position of leadership’ (for managerial competence) and ‘servicing needs
of others’ (for service). Therefore, it raises questions about the extent to which the
findings can be generalised and compared with other studies.
Custodio (2000) conducted a survey study of career anchors of academic executives in
four state universities and colleges in the Philippines. The results of the study showed
that the lifestyle anchor was the most dominant career anchor among academic
executives, and that the least importance anchor was the organisational stability anchor.
The study also showed that statistically the second-order factor analysis clustered two
factors: Factor 1 (autonomy, geographical security, entrepreneurial creativity, technical
competence and organisational stability) and Factor 2 (lifestyle, sense of service and
managerial competence). As in Schein’s (1990) study, the dominance of the lifestyle
anchor in this study also could be caused by the fact that the sample was more than 50
percent female. Interestingly, however, the output of the first- and second-order factor
analysis of Factor 1 placed economic security as the least important anchor. This
contradicts Schein’s claim that the security/stability anchor would be common in those

30
working in the civil service. It is also surprising that no academics clung to pure
challenge as their dominant anchor. For this, Custodio argued that their respondents
might view challenges in academic work ‘as a natural thing’ (p. 8) – routine work and
easy to do. Although this study falls into the category of academics in the public sector
in the Philippines, it is uncertain whether the findings can be generalised to academics
and public employees in other countries.
In summary, it can be said that the dominant career anchors occur in various
professions. The variations found in the research could be due to the sample types, the
methodology and instruments used, or the specific location of the studies. La Lopa,
Beck and Ghiselli (2009) employed a different instrument from that suggested by
Schein. While La Lopa, Beck and Ghiselli conducted the study in the private sector,
only Custodio’s (2000) study in the Philippines studied the public education sector.
More empirical studies, therefore, are certainly required to further develop an
understanding of career anchors among academics in the non-western public sector.
Previous studies have used a variety of terminology, based on Schein’s original
terminology, to represent the nature of their findings. For example, general managerial
competence, lifestyle integration, challenge, entrepreneurship, service and dedication to
a cause, sense of service, technical/functional competence, autonomy and
independence, job security, organisational stability, geographic security, organisational
security, creativity and security-job tenure. The present researcher used nine career
anchor dimensions and terms as mentioned in Sub-section 1.1. The rationale for using
the nine categories is provided in Chapter 3, Sub-section 3.4.1.
2.4 Redefining the career anchor concept
2.4.1 Feldman and Bolino’s concept of career anchors
The first researchers who criticised Schein’s career anchor concept (1990; 2006a) were
Feldman and Bolino (1996). In disagreeing with Schein’s concept that each individual
has one dominant career anchor, Feldman and Bolino, after 25 years of first concept
published, claimed that, it is possible for individuals to have multiple career anchors
consisting of both major and secondary career anchors due to changes in the work
environment (Kniveton 2004; Suutari & Taka 2004; Ituma & Simpson 2007). Multiple

31
career anchors may satisfy multiple career goals (Chapman 2009). They criticised both
theoretical and methodological perspectives arguing that because Schein’s studies used
small sample sizes, the validity and reliability of data were questionable. They also
pointed out that on the one hand Schein indicated that an individual can only have a
single true career anchor; but on the other hand Schein asserted that because of the life
situation, an individual was allowed to have more than one career anchor. Moreover,
Schein’s speculation on the shift of career anchors’ structures had distorted his own
claim that basically individuals did not change their career anchors. The differences
between career anchor concept developed by Schein’s (1978; 2006a) and Feldman and
Bolino’s (1996) models of career anchors are presented in Table 2.2
Table 2.2: A summary of the differences between Schein’s and Feldman and Bolino’s career anchor concepts
Schein’s concept Feldman & Bolino’s concept
An individual can only have a single dominant career anchor
An individual can have multiple dominant career anchors
Career anchors integrate an individual’s talents, needs and values
Career anchors can be differentiated in talents, needs and/or values groups and can be complementary or mutually inconsistent
An individual’s career anchor is stable and durable throughout her/his life
Not all career anchors are stable
Any relationship between career anchors and age, gender, marital status, or job tenure is implicit.
Explicit speculation on the relationship between career anchors and demographic background
Source: Feldman & Bolino (1996, pp. 89-102)
Although Schein still believed in his single career anchor, his recent study with van
Maanen showed that a person groups her or his career anchor categories (Schein & van
Maanen 2013). Further, despite the criticism, some recent studies have observed
multiple career anchors according to Schein’s concept (e.g., Marshall & Bonner 2003;
Suutari & Taka 2004; Orozco-Atienza 2005; Smith 2005; Ituma & Simpson 2007;
Klapwijk & Rommes 2009). Specifically, Tan and Quek (2001) found that 33 percent of
educators held more than one anchor, and Ramakhrisna and Potosky identified 46
percent of information system’s employees doing the same. These findings are
discussed in the following sub-section.

32
2.4.2 Regrouping career anchor dimensions
In relation to the career anchor dimensions, Feldman and Bolino (1996) regrouped
Schein’s career anchor dimensions. They argued that Schein’s model of career anchors
and its nine anchor dimensions could be grouped into three components:
1. talents-based anchors consisting of managerial competence, technical
competence and entrepreneurial creativity;
2. needs-based anchors consisting of economic security, geographical stability,
autonomy and lifestyle; and
3. values-based anchors consisting of service and pure challenge.
In a recent analysis of the anchor categories, Schein and van Maanen (2013, p. 9)
classified the career anchor categories into groups based on ‘the anchor functions and its
impact on career decision making’. They outlined four groups: (1) competent, including
technical competence and managerial competence; (2) Motives or needs consisting of
autonomy, security/stability, entrepreneurial creativity and service; (3) neither values
nor motives, in which they placed pure challenge; and (4) not specific to a career, in
which they placed lifestyle. They specifically argued that because the pure challenge
anchor was a combination of ‘personality characteristics and problem-solving style’ (p.
14), the anchor could not reflect either values or motives. The lifestyle anchor also could
not be grouped because the anchor was ‘an integration of career and family issues’ (p.
15). The classifications of multiple groups-based anchors according to Schein and van
Maanen (2013) and Feldman and Bolino (1996) are presented in Table 2.3.
Even though Schein and van Maanen did not openly claim that individuals were now
more likely to have multiple anchors, the groupings of career categories indicate the
word ‘multiple’. Because the notion offered by Schein and van Maanen was still in the
early stages, with no further discussion except the regrouped categories, Feldman and
Bolino’s (1996) refinement of career anchors was therefore used as a basis for the
multiple career anchors analysis in the current study.

33
Table 2.3: Multiple groups-based career anchors
Feldman & Bolino’s regroup Schein’s regroup
Categories Multiple groups
Multiple groups Categories Notes
Technical competence
Talents-based Competent
Technical competence
-
Managerial competence Managerial
competence Entrepreneurial creativity Economic security
Needs-based
Needs or Motives
Security/stability Geographical stability Autonomy Autonomy Entrepreneurial
creativity Service
Lifestyle - Lifestyle Integration of
career and family issues
Service Values-based - Pure challenge
Neither Values nor
Motives Pure challenge Sources: Feldman & Bolino (1996, p. 96); Schein & van Maanen (2013, pp. 9-15)
Feldman and Bolino (1996) stated that it was possible for individuals to have two or
more career anchor categories. They argued that the reason behind an individual having
multiple anchor categories was the career anchor concept itself. The concept allows an
individual to hold an anchor category incorporating her or his talents and values or
needs. It means that one can have talents-based and needs-based or values-based
anchors. Multiple career anchors appeared because (1) Schein’s typology included
career anchors that did not solely address career issues; for example, individuals could
hold more than one dominant career anchor, one talents-based and another needs-based;
and (2) individuals might have high levels of personal ambivalence because of two
equally attractive goals (Feldman & Bolino 1996, p. 99). Their argument is also
supported by the current economic situation, in which an individual is likely to have
multiple jobs (Yarnall 1998; Byrd 2001). Thus, many individuals may be trying to
combine multiple career goals and personal interests into some types of viable career
track in relation to career satisfaction (Kniveton 2004; Baruch 2006; Mays 2007).
Limited empirical research was found to examine the multiple groups-based anchors
concept. One study conducted by Kniveton (2004) indicated the existence of the
multiple anchors. Using the interview method, the study examined managers’ career

34
anchors in the U.K., and the results showed that younger participants anchored on
talents-based anchors while older people held needs-based anchors. However, the study
grouped the data on an individual basis. An identified single dominant career anchor
was categorised as talents-based, needs-based and values-based anchors. No overall
results could be compared between the three multiple groups-based anchors to
understand multiple anchors as a whole. The study also used a different group of
samples from that used in the current study sample of academics. Thus, it is uncertain
whether the findings support the idea of multiple groups-based anchors.
2.4.3 Career anchor relationship pairs
The cluster of career anchors’ structures also attracts further attention from the
perspective of the magnitude of the relationships between anchors. Feldman and Bolino
(1996) applied factor analysis to measure the independency of each factor and argued
that individuals with multiple career anchors can be classified as having career anchors
that are either complementary (e.g., technical competence and pure challenge) or
mutually exclusive (e.g., security and entrepreneurial creativity). They stated that ‘some
career orientations are fairly similar to each other while others are quite orthogonal’
(Feldman & Bolino 1996, p. 105). The security, service and lifestyle anchors would
group together while the entrepreneurial creativity anchor would be opposed to the
security anchor. They hypothesised that individuals in a private sector research and
development laboratory might have both the technical competence and pure challenge
anchors, whereas staff researchers from a government service might have the technical
competence and security/stability anchors. Feldman and Bolino took further
examination by drawing the anchor pairs to an octagonal diagram, as shown in Figure
2.1.
Although Schein believed that an individual has only one true career anchor, he
recognised that an individual would have another anchor in fulfilling a feeling of
satisfaction. Schein (1980) then made a prediction of the orthogonal relationships
between the anchors. The pairs were different from those proposed by Feldman and
Bolino. Schein paired managerial competence in opposition to technical competence,
pure challenge to lifestyle, service to entrepreneurial creativity and security/stability to
autonomy. No complementary relationship pairs were presented. However, Chapman
(2009) argued that individuals could not be categorised as having mutually exclusive

35
anchors since most people were more concerned with combining complementary
anchors as proposed by Feldman and Bolino. Nevertheless, further examination is
needed to determine the relationship between multiple career anchors, whether the
anchors are complementary or mutually exclusive (Feldman & Bolino 1996), or whether
of congruent or contradictory dimensions (Suutari & Taka 2004; Barclay 2009). In
addition, Chapman (2009) recommended using statistical analysis to identify the two
types of anchor relationships in a pair.
Figure 2.1: Octagonal diagram Source: Feldman & Bolino (1996, p. 106)
Three key points can be drawn from the above discussion. First, recent studies have
demonstrated that the existence of multiple career anchors, either based on Schein’s
single career anchor, or the needs-based, talents-based, values-based grouping, or the
complementary or mutually exclusive anchors. It means that Schein’s (1978; 1980)
initial claim stating that a person can only hold one stable career anchor can be rejected.
Second, it points to the need to test the validity of the concept of groups of anchors.
Third, it highlighted that further empirical studies are needed to confirm claims of
multiple career anchors and their relationships. The current study took these issues into
account for further investigation.
Managerial competence
Entrepreneurial creativity
Autonomy
Challenge
Technical competenc
e
Security/stability
Service Lifestyle
36
2.5 Job satisfaction and career anchors Job satisfaction has widely been studied by scholars in the organisational behaviour area
(Martin & Roodt 2008; Lumley 2009). Job satisfaction is generally related to
individuals’ attitudes or reaction regarding their job (Robbins 2005). Menon (1999) and
Spector (2008) stated that individuals feel satisfied in their jobs when their perceived
needs are fulfilled and they receive respect from their organisations while job
dissatisfaction occurs when individuals’ perception of their work is discouraged and
their objectives are not accomplished.
Job satisfaction can be described as the result of an interaction between individuals’
emotional responses and organisational environment in the workplace. Ivancevich and
Konopaske (2010) said that fit between individuals and organisations results in a level
of job satisfaction. Instead of referring to the cognitive work satisfaction that values
extrinsic aspects, like payment, pension or work hours, job satisfaction generally
reflects an affective work orientation and attitude toward individuals and employer
(Martin & Roodt 2008). The affective orientation results in organisational effectiveness
(Saari & Judge 2004). Affective work involves individuals’ emotional feelings toward
the content of (the) work (for which) they are responsible. Collins (2007, p. 17) added
the function of job satisfaction to a social exchange by stressing that ‘identifying the
factors that impact job satisfaction can benefit society’ and ‘by understanding the
antecedents to job satisfaction’ individuals can increase the self-efficacy of their
organisations. Individuals will enjoy their work when it fits their abilities and values,
resulting in positive work attitudes such as job satisfaction (Robbins 2005).
Job satisfaction also refers to ‘a pleasure or positive emotional state resulting from the
appraisal of one’s job or job experience’ (Locke 1976, p. 1304). Locke’s concept was
that satisfaction is a reaction to the results of the overall evaluation of one’s job,
whether the job meets one’s values and the values meet one’s needs. For instance, when
an individual values competition, she or he will be happy when a task assignment or a
position provides a situation that allows her or him to compete with others.
Job satisfaction can be measured from two forms. Extrinsic job satisfaction results from
organisation facets, such as culture, relationships, policies, procedures, salary and
organisational support, while intrinsic job satisfaction results from job facets, such as

37
tasks, the nature of the work itself and the degree to which one finds it interesting (Levi
2006, pp. 30-31). The relationship between the intrinsic and extrinsic factors is clear.
For example, an individual might be satisfied with the tasks but not with the relations to
colleagues. Job satisfaction in the current study refers to the intrinsic factors that
measure individuals’ tasks, values and needs.
Conceptually, the job satisfaction model constructed by Locke reflects the outcome of
career anchors. A career anchor is an intrinsic motivation as if an individual works away
from the areas of her or his competencies, motives/needs and values she or he will feel
dissatisfied because they feel that ‘this is not really me’ (Schein 2006a, p. 2; Schein &
van Maanen 2013, p. 1). Locke’s concept is a basis for the understanding of job
satisfaction used by other scholars (e.g., Robbins & Coulter 1996; Susskind et al. 2000)
and has been used in the current study.
Hence, it can be said that higher job satisfaction contributes to individuals’ decisions to
move from one to another organisation. Individuals with lower levels of satisfaction, or
who are completely dissatisfied, will leave their jobs. These types of individuals usually
have strong career decision-making skills that lead them to choose their careers based
on their own career preferences and orientations as reflected in their career anchors and
their economic and social context (Schreuder & Theron 1997; Byrd 2001; Lumley
2007). The congruence between individuals’ motivational career goals and
environmental context can influence the job satisfaction level (Spector 1997).
Schein (1990) recognised the impact of interaction between an internal motivation
toward individuals’ careers and work environment on job satisfaction. He emphasised
that the fit of one’s career anchors and work environment could contribute positively to
career-related outcomes, such as high job satisfaction (Feldman & Bolino 1996; Ellison
& Schreuder 2000; Baruch 2004b; Levi 2006; Dazinger, Rahman-Moore & Valency
2008). Conversely, the major negative outcomes from a mismatch, according to Schein
(1978, p. 107), were turnover, complacency/demotivation and ‘dead wood’ because of
being forced to stay (Igbaria, Kassicieh & Silver, 1999). Unfortunately, Schein’s
assumption has not been empirically tested for validity. Dissatisfaction can also be
influenced by multiple career anchors (Feldman & Bolino 1996; Tan & Quek 2001),
age and workload (Puryear 1996), economic conditions and political situations (Godfrey

38
2005; Ituma & Simpson 2007; La Lopa, Beck & Ghiselli 2009; Singh, Battacharjee &
Kodwani 2009), and changing jobs, work and employers (Elfering, Semmer & Kaelin
2000; Dorman & Zapf 2001). Recent studies have used these variables in examining the
influences of career anchors in various samples and locations other than those examined
in the current study, and support Schein’s proposition. In addition, Bowling, Beehr and
Lepisto (2006, p. 316) stressed that the ‘work environment also affects job satisfaction’.
Furthermore, Feldman and Bolino (1996) claimed that the mutually exclusive career
anchors for individuals would increase risk in their work environment. They proposed
that those individuals who held complementary anchors would have positive career
outcomes. Because the proposition has not yet been tested, more empirical studies are
needed to confirm the claim.
Feldman and Bolino (2000) also emphasised the relationship between their career
anchors typologies and career outcomes. They stated that talents-based, needs-based or
values-based anchors influenced job satisfaction and other career outcomes (p. 97).
They found that career anchors did affect job satisfaction, life satisfaction,
psychological well-being, skill utilisation and career planning towards the individual’s
career motivation (Schein 1990; Feldman & Bolino 2000). However, their research used
a sample of self-employed workers, and thus, it does not add much value to the current
study.
Some other prior studies have also revealed the association between career anchors and
job satisfaction. Igbaria and Baroudi (1993) reported that, with the exception of the
security/stability and service anchors, other career anchors had a statistically significant
correlation with career satisfaction, but this correlation was rather weak and
inconclusive. Similarly, career anchors related to job satisfaction have been found in a
study of school principals (Puryear 1996), school educators (Tan & Quek 2001),
information technology employees (McMurtrey et al. 2002), entrepreneurs (Dazinger &
Valency 2006), and police staff (Steele & Francis-Smythe 2008).
Not only were the samples not academics in higher education institutions (as in the
current study), but reviews have pointed out that each of the studies used different
measurements. Tan and Quek used the Michigan Organizational Assessment
39
Questionnaire and Feldman and Bolino used Hackman and Oldham’s (1975) overall job
satisfaction scale. The present researcher has also taken into account Igbaria and
Baroudi’s (1993, p. 44) suggestion of exploring the relationship between career anchors
and job satisfaction as a job outcome in which understanding of the cause-effect of two
variables was ‘one more step in making’ the career development process manageable.
2.6 Psychological empowerment and job satisfaction The word ‘empowerment’ has become popular, albeit controversial, as a means to
stimulate and manage change in organisations (Conger & Kanungo 1998) and to
increase employees’ satisfaction and performance in the workplace. In leadership,
empowerment has been viewed as sharing of authority and control (Bandura 1997); in
the structural approach, empowerment refers to an involvement in making decision
(Menon 2001); and in the motivational approach, empowerment is seen as enhancing
self-efficacy (Conger & Kanungo 1998). Self-efficacy is a central of concept of
empowerment in which individuals believe in her or his capabilities to perform their
work (Bandura 1997). It directs individuals’ behaviours from inside to produce, succeed
and achieve work outcomes. Because the empowerment state is generated from
individuals’ internal desire, and because it drives individuals to shape work roles
(Thomas & Velthouse 1990), it can be argued that the three approaches reflect personal
intrinsic motivation (Beach 1996). From a psychological perspective, Menon (2001)
posited that empowerment implies that the individual has a sense of autonomy over her
or his work. It can mediate empowering acts and individual outcomes, such as job
satisfaction. The feelings of empowerment or disempowerment of individuals are also
influenced by actual managers’ behaviours, work condition and individual factors
(Collins 2007) leading to the level of job satisfaction.
In the workplace, typically, employees as individuals want to engage in, and have self-
efficacy in their work environment. They want to feel a strong personal efficacy and
control rather than just share power (Conger & Kanungo 1998). Conger and Kanungo
(1998), and Quinn and Spreitzer (1997) emphasised that psychological state plays an
important role in empowering individuals to be effective and creative in achieving
organisations’ goals. Unfortunately, as claimed by Collins (2007), literature on
psychological empowerment is limited, most studies cite the framework of Conger and

40
Kanungo (1988), Zimmerman (1990), Thomas and Velthouse (1990), Spritzer (1995) or
Menon (2001) in studying psychological empowerment.
As discussed earlier, the framework of psychological empowerment is derived from the
work of Thomas and Velthouse (1990) and Conger and Kanungo (1998), who advanced
the notion of self-efficacy by introducing a proactive behaviour orientation (Spreitzer
1997; Lee & Koh 2001; Bordin, Bartram & Casimir 2007). This gives an opportunity to
individuals to use their power in the form of self-efficacy and autonomy to perform
tasks (Spreitzer 1995; Menon & Kotze 2007). Along with changes in the work
environment that promote self-development, the understanding of empowerment is
more concerned with the intrinsic motivation of work-role tasks to increase individuals’
power (Spreitzer 1995; Kraimer, Seibert & Liden 1999). The notion of empowerment is
more a psychological mind-set as Quinn and Spreitzer’s (1997, p. 41) claim that
‘empowerment’ is not something that management does to employees, but rather a
mind-set that employees have about their role in the organisation. Some scholars have
defined psychological empowerment as ability to contribute ideas (Kemp & Dwyer
2001), a subjective state of mind (Potterfield 1999), a cognitive state of mind (Menon
1999) and the intrinsic motivation of work-role tasks (Spreitzer 1995).
Thomas and Velthouse (1990) were the first scholars to outline a psychological
approach to empowerment. They introduced four approaches to examine the
empowerment at the individual level (Thomas & Velthouse 1990, pp. 672-673): (1)
meaningfulness is associated with the values of tasks and activities; (2) impact is related
to ability to ‘make a difference’ to the organisation’s performance by making a
contribution; (3) competence concerns an individual’s ability to perform tasks; and (4)
choice is ‘causal responsibility for (the individual’s own) action’. This approach is
widely accepted by researchers. However, Thomas and Velthouse’s methods tended to
be mainly limited to the cognitive aspect, even though they also included the positive
affective cognition aspect to a lesser degree.
Spreitzer (1995) applied and operationalised the empowerment concept developed by
Thomas and Velthouse (1990) to assess the empowerment from the intrinsic task
motivation perspective. She developed a similar four-facet scale replacing
meaningfulness with meaning and choice with self-determination (Spreitzer 1995, pp.

41
1450-1451). Meaning was developed according to Tymon’s (1988) study, self-
determination used Hackman and Oldham’s (1975) autonomy scale, competence was
built on Jones’ (1986) self-efficacy measure, and impact was established using a
helplessness scale studied by Ashforth (1989). The results showed that meaning,
competence, self-determination and impact cognitions are strong intrinsic task
motivations. Spreitzer, therefore, referred to psychological empowerment ‘as a
motivational construct manifested in four dimensions: meaning, competence, self-
determination and impact’ (p. 1444). The characteristics of each of these facets are
presented in Table 2.4.
Table 2.4: Psychological empowerment dimensions and their description Dimensions Description
Meaning A fit between the requirements of a work role and own belief, values and behaviours.
Competence An individual’s belief in his or her capability to perform activities with skill.
Self-determination
An individual’s sense of having choice in initiating and regulating actions.
Impact The degree to which an individual can influence strategic, administrative, or operating outcomes at work.
Source: Spreitzer (1995, pp. 1443-1444)
The psychological empowerment scale then was validated and the results were reliable
and valid (further discussion on the scale appears in Chapter Three, Sub-section 3.4.1).
Spreitzer argued that an overall construct of the four facets would measure the degree of
empowerment feelings, as Thomas and Velthouse (1990) claimed for their multifaceted
construct of empowerment. In other words, one needs to look at all dimensions, not just
one or two dimensions. Because the current study was based on ideas deriving from
internal career motivation, Spreitzer’s psychological empowerment conceptual
framework was employed.
Psychologically, the feeling of empowerment is essential because it enhances the value
of work and increases the level of job satisfaction (Spreitzer 1996, 1997; Spreitzer,
Kizilos & Nason 1997; Bordin, Bartram & Casimir 2007; Zhu 2008; Dhladhla 2011). A
high feeling of psychological empowerment will increase organisational self-efficacy
since employees experiencing ‘a high level of self-determination or choice in

42
performing a task are more likely to feel empowered and initiate action in an effort to
control or impact outcomes’ (George & Hancer 2004; Collins 2007, p. 25). Thomas and
Tymon (1994, p. 2) asserted that ‘because the task assessments generate intrinsic
rewards associated with the job, they should be positively related to job satisfaction’.
Spreitzer, Kizilos and Nelson (1997) argued that once individuals feel their work is
meaningful, they feel satisfied with the work. Moreover, job satisfaction is the first
anticipated outcome of psychological empowerment in achieving organisational goals
(Spreitzer 1997).
Some studies have examined the relationship of these two constructs in various areas,
with varied findings. For example, Spreitzer, Kizilos and Nason (1997) found no
evidence of a significant relationship between the facet of self-determination and job
satisfaction, while Dickson and Lorenz (2009) found a negative relationship. George
and Hancer’s (2004) study showed that psychological empowerment had a modest
significant influence on job satisfaction in service organisations but they only measured
three dimensions of empowerment (meaningfulness, competence and influence). This
fails to accommodate the multifaceted concept of empowerment. Dickson and Lorenz
(2009) found a positive influence on job satisfaction by meaning and impact, while
Wang and Lee (2009) found that only impact had no influence. In Schermuly,
Schermuly and Meyer’s (2011) study, the results showed that the two strongest
predictors of an outcome, including job satisfaction, were competence and meaning.
Other researchers have found a strong correlation of between the four cognitions (i.e.,
meaning, impact, competence and self-determination) and job satisfaction (e.g., Chan
2003; Carless 2004; George & Hancer 2004; Hechanova, Alampay & Franco 2006;
Meyerson & Kline 2007; Uner & Turan 2010; Chung 2012).
The variability of findings can be due to several reasons. Although all studies reviewed
used the same measurement for psychological empowerment, the backgrounds of the
samples differed, which can lead to different perceptions and attitudinal outcomes. For
instance, Dickson and Lorenz (2009) used students as nonstandard part-time employees
in their study in the U.S. while Schermuly, Schermuly and Meyer (2011) used vice
principals of primary schools. Carless (2004) conducted her study on customer service
employees at a service organisation in Australia. Although Carless’s study is in the
public sector, the sample does not include academics. Moreover, each study uses

43
different instruments of job satisfaction, such as Dickson and Lorenz used the
managerial job satisfaction questionnaire developed by Celluci and DeVries (1978),
while Spreitzer, Kizilos and Nason (1997) applied the job satisfaction scale developed
by Smith, Kendall and Hulin (1969). This present study explored the relationship
between psychological empowerment and job satisfaction on academics in the
Indonesian public higher education context. Psychological empowerment was measured
by using Spreitzer’s (1995) four dimensions.
2.7 Linking career anchors, psychological empowerment and job satisfaction
There is a strong argument from Martin (2008) and Igbaria and Guimareas (1999) that
job satisfaction is an individual’s positive reaction derived from various facets of career
experiences in organisations. Individuals will be satisfied with their jobs when their
needs, beliefs and values are engaged in the workplace. As Schein (2006a, pp. 5-6)
emphasised, when individuals know their career anchors, they empower themselves to
confront career choices and decisions, and thus feel satisfied with their jobs. It is argued
that individuals can apply their anchors to reach higher job satisfaction levels through
higher levels of empowerment in the workplace.
The relationship between career anchors and job satisfaction has been recognised in
some studies (e.g., Feldman & Bolino 2000; Hardin, Stocks & Graves 2001; Dazinger
& Valency 2006; Steele & Francis-Smythe 2008). Studies have shown that having more
than one career anchor and/or a mismatch between career anchors and work-roles lead
to dissatisfaction whereas having one, or having a good match between career anchors
and work-roles leads to greater satisfaction. There is an indication that when
individuals’ career anchors are engaged with their work-roles, they have feelings of
empowerment, which lead to a feeling of satisfaction in the workplace. Carless (2004)
noted that when employees worked in accordance with their beliefs, attitudes and
behaviours (which were represented by career anchors), they would perform tasks more
effectively and achieve higher levels of job satisfaction. Conversely, feelings of
dissatisfaction may be due to the absence of empowerment in applying individuals’
values, needs and abilities to their career (Ding & Lin 2006). As Schein (2006a, p. 49)
determined, ‘employee empowerment has taken on almost fad status’. This indicates
44
that individuals’ occupational concept may influence and interact with empowerment
and satisfaction. Furthermore, studies have strongly highlighted the mediating role of
psychological empowerment between individuals’ behaviours and organisational
attitudes (e.g., Chang, Shih & Lin 2010). It is, therefore, argued that psychological
empowerment may mediate the relationship between career anchors and job
satisfaction.
Some previous studies have treated psychological empowerment as a mediating variable
in various topics. Liden, Wayne and Sparrow (2000) found that the meaning and
competence dimensions mediated the relationship between job characteristics and job
satisfaction (p. 419). Carless’s (2004) study found that self-determination did not
predict the relationship between psychological climate and job satisfaction. Chang, Shih
and Lin (2010) found that psychological empowerment partially mediated the
relationship between organisational empowerment and job satisfaction.
Other scholars measure psychological empowerment as a mediator of the relationship
between types of leadership behaviours and various work outcomes (e.g., Zhu, May &
Avolio 2004; Collins 2007; Castro, Perinan & Bueno 2008; Dhladhla 2011; Lee & Kim
2013). Some studies used psychological empowerment as a mediator between work
environment and emotional exhaustion and intention to stay (e.g., Lee, Weaver &
Hrostowki 2011).
There have been no studies on career anchors that examine psychological empowerment
as a mediating variable in a relationship between career anchors and job satisfaction.
The current study, therefore, addresses this gap.
2.8 The role of demographic data Demographic variables influence the career anchors chosen, the feelings of
empowerment and the degree of job satisfaction. Although Schein (1978) did not clearly
state the influences of demographic variables on career anchors (Feldman & Bolino
1996), the studies with his students found some indications of the effect of gender,
education and work experiences. Some previous studies also showed the selected
45
demographic data on career anchor, psychological empowerment and job satisfaction as
discussed below.
Gender
Schein (1977b) noted that the lifestyle and service anchors emerged from the responses
of female samples. Some empirical studies conducted on the various samples different
from the current study’s respondents have found that gender is related to career anchors
(Feldman & Bolino 2000; Marshall & Bonner 2003; Singh, Bhattacharjee & Kodwani
2009; Weber & Ladkin 2009). Ituma and Simpson (2007) found that females oriented to
being balanced (lifestyle anchor) and males reported being-in-charge (pure challenge
anchor). Dazinger and Valency (2006) also reported that lifestyle was female preferred
anchor, while Weber and Ladkin (2009) found that males valued entrepreneurial
creativity and pure challenge. In relation to psychological empowerment, gender was
found to influence and control individuals’ empowerment (e.g., Spreitzer 1996;
Hechanova, Alampay & Franco 2006; Dickson & Lorenz 2009). Females scored higher
on self-determination in Wang and Zang’s (2012) teacher sample. Feldman and Bolino
(2000) reported that female self-employed respondents scored higher on job
satisfaction. Thus, gender may influence career anchors, psychological empowerment
and job satisfaction.
Education
Schein (1977b) highlighted that highly intellectual individuals tended to hold autonomy
as their career anchor, while less-intellectuals preferred entrepreneurial creativity. The
holding of higher degrees has been found to be related to technical competence and pure
challenge (Singh, Bhattacharjee & Kodwani 2009). However, Feldman and Bolino
(2000), and Ituma and Simpson (2007) reported that educational levels were not
correlated with career anchors. Spreitzer (1996) suggested that education level might be
related to psychological empowerment because well-educated workers felt competent to
perform tasks but simultaneously felt dissatisfaction with part-time jobs (Dickson &
Lorenz 2009). The various results suggest that education may influence career anchors,
psychological empowerment and job satisfaction.

46
Work experiences
Schein (2006a) stated that in order to find their career anchors, individuals need at least
five years of experience in the workplace. However, other studies have demonstrated
that this period could be from three to five years (Puryear 1996, p. 12), or from eight to
10 years (Singh, Bhattacharjee & Kodwani 2009, p. 51). Hardin, Stocks and Graves
(2001), in studying accountants’ anchors, found that work experiences did not influence
career anchors, while May (2007) found the opposite. Although limited research was
found to study the relationships of work experience and the three variables, the current
study argues that work experience influences individuals in deciding their career
anchors, achieving job satisfaction and empowering their competency and values.
Age
A relationship between age groups and career anchors has been found in different
groups of samples. Age was a predictor of technical competence for Australian and
American respondents in a study done by Marshall and Bonner (2003). Older
employees held the being-in-charge and being balanced anchors (Ituma & Simpson
2007). Older hospitality and tourism faculty who held the job security, geographical
location and managerial competence anchors had the lowest turnover intentions (La
Lopa, Beck & Ghiselli 2009). However, Feldman and Bolino (2000) and Singh,
Bhatttacharjee and Kodwani (2009) found that age made no difference in career
anchors. Kniveton (2004) reported that younger participants held talents-based anchors,
while older group oriented to needs-based anchors. Related to psychological
empowerment, Kanter (1977) found that older middle managers felt less empowered,
while Wang and Zang (2012) found that teachers who had been in the field for 21-25
years scored higher on self-determination. Although no studies were reviewed on job
satisfaction, studies of both career anchors and psychological empowerment show that
they are related to age. Thus, age was included as a factor in the present analysis.
Institution size
The researcher has not found any studies examining institution size in relation to career
anchors, psychological empowerment, or job satisfaction. It is predicted that the
institution size variable is likely to be associated with the career anchors, psychological
empowerment and job satisfaction construct.

47
Demographic factors have been treated as control variables in many studies (e.g.,
(Spreizter, Kizilos & Nason 1997; Tan & Quek 2001; Dickson & Lorenz 2009).
Bhattacherjee (2012, p. 12) claimed that ‘…other extraneous variables that are not
pertinent to explaining a given dependent variable, but may have some impact on the
dependent variable…must be controlled for’. The demographic variables in the current
study, therefore, were examined to minimise any possible specious effects on the
dependent variables, as Wook and Won (2013, p. 380) pointed out that the variables
examined ‘may have systematic relationships with the participants’ psychological
resource capacities’.
2.9 Conceptual framework and research model The concept of career anchors has been developing since the concept was first published
(see Sub-sections 2.3, 2.4 and 2.5). Originally, the career anchor concept was developed
from the perspective of single dominant career anchor (Schein 1977a), which
individuals would not give up if they ‘faced a career decision that might not allow them
to fulfil it’ (Schein and van Maanen 2013, p. 1). Career anchor is one’s self-
occupational concept consisting of talents, motives and values and is formed through at
least five years of work experience. From nine anchor categories that he introduced,
Schein, himself, however, also indicated that individuals could have several anchors
before the stability of their career anchor emerged (Schein 2006a). Individual anchors,
therefore, might complement each other. By contrast, Schein further noted that one
anchor might oppose another one, such as managerial competence as opposed to
technical competence. Feldman and Bolino (1996), subsequently, critiqued Schein’s
premise and proposed the multiple career anchors concept for individuals facing
changes in the work environment. They regrouped Schein’s nine categories into three
multiple groups-based anchors and proposed complementary and mutually exclusive
anchors (see Sub-section 2.4.2). Schein and van Maanen (2013) recently categorised
career anchor categories into competence, motives or needs and neither values nor
motives (see Table 2.3). On the one hand, Schein’s single career anchor concept has
been studied widely by researchers (e.g., Weber & Ladkin 2009; Chang et al. 2011); on
the other hand, several studies have found the existence of multiple career anchors (e.g.,
Smith 2005; Ituma & Simpson 2007). Despite the argument of single or multiple

48
dominant anchors, both Schein and Feldman and Bolino agreed that congruence
between one’s career anchors and job environment would lead to higher job satisfaction.
Because career anchor refers to an intrinsic motivation, when individuals have decided
their true anchors, they will empower themselves in the workplace. As discussed earlier
in Sub-section 2.6, empowerment psychologically is a feeling of autonomy over one’s
work and of self-efficacy in the workplace – a concept introduced by Thomas and
Velthouse (1990) and Conger and Kanungo (1998). It reflects individuals’ intrinsic
motivation to provide energy to set and keep work-roles. Psychological state is an
important condition in empowering individuals to perform and achieve organisations’
goals as well as one’s own satisfaction. Deriving from the intrinsic motivation of work-
role tasks, Spreitzer (1995) translated the psychological empowerment concept into four
facets: meaning, impact, competence and self-development (see Table 2.4) and stressed
that all those facets should be measured. Feeling meaningful at work by applying
talents, needs and values (or career anchors) and making contribution to the
organisation will enhance job satisfaction. As Schein (1990) stated, the absence of
individual empathy with content of work caused job dissatisfaction. It shows that fit
between career anchors and work-role will strengthen feelings of empowerment and
impact on job satisfaction levels. The empowerment can, therefore, mediate
empowering action and individuals’ satisfaction.
As discussed in Sub-section 2.8, the decision to choose dominant career anchors and the
feelings of empowerment and satisfaction can be affected by individuals’ demographic
background, such as gender, age, education, work experience and size of institution.
The relationship between career anchors, psychological empowerment, job satisfaction
and demographic variables is shown in Figure 2.2.

49
Figure 2.2: Conceptual framework
Feldman and Bolino's concept
Career anchor typology:
Career anchor context:Single career anchor
Multiple career anchors
Talents-basedNeeds-basedValues-based
ComplementaryMutually inconsistent
Schein's concept:Managerial competenceTechnical competence
Economic securityAutonomy
ServiceLifestyle
Pure challengeGeographical stability
Entrepreneurial creativity
Psychological empowerment facets:
MeaningCompetence
Self-determinationImpact
Demographic data:Age
GenderEducation
Institution sizeWork experience
Attitudinal outcome:Job satisfaction

50
The current study aimed to investigate whether the career anchors of academics
influenced psychological empowerment and job satisfaction (see Figure 2.3). The
concept of career anchors reviewed in Sub-sections 2.5, 2.6 and 2.7 stated that
individuals’ dominant career anchors influenced their perceptions of how they should
behave and be empowered in the workplace; when individuals are empowered in line
with their career anchors, they can achieve the degree of job satisfaction (shown as solid
line arrow ). Every individual, therefore, should observe and understand her or his
career journey before deciding what kind of career they wish to pursue throughout their
life, including their perception of empowerment and satisfaction in the workplace
(shown as dotted line arrows ). The dominant career anchors were examined using
a survey questionnaire and protocol interviews.
Career anchors and psychological empowerment were investigated individually in the
relationship among the three constructs. Career anchor was introduced as a predictor
variable (or an independent variable), and psychological empowerment was used as a
mediator variable (or an intervening variable) in the hypothesis testing to select a
criterion variable (or a dependent variable). The relationships between career anchors,
psychological empowerment and job satisfaction can be illustrated in the research
model (Figure 2.3) below.
Figure 2.3: Research model
Career anchors
Psychological empowerment
Job satisfaction
Career history

51
2.10 Hypothesis testing A hypothesis is defined as a specific prediction of phenomena that can be tested in a
study. It is generally used in quantitative studies to make predictions about an expected
relationship between the variables. It tests between independent variables and dependent
variables. The hypothesis can be stated in terms of null and alternative hypotheses.
According to Sekaran and Bougie (2013, p. 84), a null hypothesis (H0) is defined as ‘a
hypothesis set up to be rejected in order to support an alternate hypothesis’ (HA). The
null hypothesis is expressed ‘in terms of there being no significant relationships
between two variables or no differences between groups’. On the contrary, the
alternative hypothesis refers to a significant relationship between two variables or to
differences that exist between groups, and it uses directional statements (e.g., higher,
lower, positive, negative, more or less) or nondirectional statements (e.g., there is a
relationship between variables X and Y) (Creswell 2009). Whether a study uses null or
alternative hypotheses, and directional or nondirectional statements, depends on the
theoretical basis and nature of the study. It has been strongly suggested in other studies
that dominant career anchors exist, that the anchors influence job satisfaction and that
job satisfaction is a primary outcome of psychological empowerment. Similarly,
previous studies have shown either a positive or negative prediction on the three
variables examined here (see Sub-sections 2.5, 2.6 and 2.7). The current study uses
alternative hypotheses that employ both nondirectional and directional statements.
The patterns of the dominant career anchors have varied in previous studies. Custodio
(2000) reported that the highest rank order of academic executives was lifestyle
integration (lifestyle category), and the lowest rank was organisational stability
(economic security category). La Lopa, Beck and Ghiselli (2009) found that the most
preferred anchor for educators was balancing career and family (lifestyle category), and
the lowest was building a new business or enterprise (entrepreneurial creativity
category). None had the pure challenge anchor. Some other studies showed various
dominant career anchors; for example, pure challenge for executives (e.g., Singh,
Battacharjee & Kodwani 2009) and being stable for management information system
employees (e.g., Ituma & Simpson 2007). One study done by Kniveton (2004)
examined multiple groups-based anchors reported that younger participants tended to

52
hold talents-based anchors and older samples oriented to needs-based anchors. The
proposed hypotheses for the current study, therefore, were:
Hypothesis 1: Indonesian academics score differently on a single dominant career anchor or multiple dominant career anchors.
Hypothesis 2: Indonesian academics score differently on talents-based, needs-based and values-based anchors.
Schein (1992, 2006a) and Feldman and Bolino (1996, 2000) determined that individuals
whose their career anchors fit with their job environment would have positive job
satisfaction. By contrast, incongruence between the two variables would lessen the
feeling of job satisfaction. Individuals feel satisfied when they feel their work is
meaningful when their talents, skills and needs are applied at work (Spreitzer 1997).
According to Spreitzer (1995, 1997) and Spreitzer et al. (1997), feeling empowered
psychologically is important to achieve higher levels of satisfaction at work, and job
satisfaction is the first outcome of psychological empowerment.
Research has indicated that there is a relationship between career anchors, job
satisfaction and psychological empowerment. For example, Igbaria and Baroudi’s
(1993) study showed that managerial competence, technical competence,
entrepreneurship, pure challenge, autonomy and lifestyle had a relationship with job
satisfaction, although the relationship was weak for the information systems
respondents they surveyed. Tan and Quek (2001) reported that security and service were
related positively to extrinsic and intrinsic satisfaction respectively, while a negative
relationship was found between managerial competence and extrinsic satisfaction, and
between autonomy and intrinsic satisfaction in a sample of educators. Some studies
found no relationship between career anchors and job satisfaction (e.g., Steele &
Francis-Smythe 2008), while others found that career anchors were significant
predictors of job satisfaction (e.g., Levi 2006).
Some studies showed a significant relationship between empowerment and job
satisfaction (e.g., Dickson & Lorenz 2009), while the others revealed no significant
correlation (e.g., Meyerson & Kline 2008). Some did report a partial mediating effect of
empowerment (e.g., Carless 2004; Chang Shih & Lin 2010; Dhladhla 2011), while

53
others found self-determination contributed to job satisfaction (Chiang & Jang 2008);
meaning, self-determination and competence predicted job satisfaction (Dehkordi et al.
2011); or competence was the strongest predictor of job satisfaction (Schermuly,
Schermuly & Meyer 2011). However, no studies have investigated the relationship
between career anchors, psychological empowerment and job satisfaction, and the three
variables’ predictive power in the Indonesian context. The study, therefore, proposed a
further series of hypotheses:
Hypothesis 3a: Indonesian academics’ perceptions of career anchor subscales are positively related to job satisfaction.
Hypothesis 3b: Indonesian academics’ career anchor subscales are positively related to psychological empowerment.
Hypothesis 3c: Indonesian academics’ perceptions of psychological empowerment facets are positively related to job satisfaction.
Hypothesis 3d: The mediating role of psychological empowerment facets strongly explains the influence of Indonesian academics’ perceptions of career anchors on job satisfaction.
Career anchors were examined in the current study from the perspective of a single
dominant career anchor as developed by Schein and multiple career anchors as proposed
by Feldman and Bolino (1996). Moreover, the study statistically controls for relevant
demographic characteristics of the sample, as described above.
Summary
This chapter discussed the theoretical framework used in the current study and reviewed
the relevant literature and empirical studies. It presented the traditional and modern
perspective of career, including the differences between external and internal career
orientation. It discussed the development of the career anchor concept, the career anchor
categories and the additions to the merging and separation of the existing career anchor
categories. The reconceptualisation of the career anchors, multiple career anchors, the
relationship of career anchor pairs and the octagonal diagram were also discussed. The
chapter then discussed the job satisfaction model and its relation to career anchors,
followed by the discussion of the psychological empowerment concept and its facets,
and described how the three constructs related to each other. It then reviewed the

54
previous empirical studies and the role of demographic variables. The chapter
concluded by presenting the conceptual model, the proposed research model and the
proposed hypotheses.
The next chapter will discuss the methodology applied to the current study. It will
present the approach, the research design, the sampling technique and sample, the
construct validity and reliability, and the data analysis design.

55
Chapter 3
Research Methodology
3.1 Introduction Chapter One presented the purposes of the study, the research problem and its issues. It
also described the Indonesian higher education system and academics’ career promotion
policy. Chapter Two reviewed the literature on career anchors, psychological
empowerment and job satisfaction. Schein’s career anchor concept (1978, 1990, 2006a)
and the reconceptualisation of career anchors according to Feldman and Bolino (1996)
were discussed in detail. The chapter explained the nine single career anchor categories
and the multiple-groups-based anchors categories (talents-based, needs-based, and
values-based anchors). The other two proposed anchors – complementary and mutually
exclusive career anchors – and their connection with the octagonal diagram were
described. Previous studies on the topic were reviewed. The information gained from
the literature then was used to form the research framework for the current study. The
chapter also presented the proposed research model, followed by the proposed
hypotheses to be tested in this study.
This chapter, Chapter Three, begins with a discussion about the methodology used in
the current study. It explains the mixed-methods approach as the currently emerging
method in research. The chapter provides the various models that fall under this
approach in terms of timing, weighting and mixing of quantitative and qualitative data
collections. It presents the research design chosen for the current study discussing the
survey questionnaire, interview and open-ended questions. The development of research
instruments – the career anchors inventory, the psychological empowerment scale and
the job satisfaction scale – and the interview protocol are also described. The details of
the sampling and data collection procedures are explained. The chapter discusses the
importance of validity measurement and reliability analyses of the instrument used. The
results of the pilot study are reported. The last sub-section presents the data analysis
design, including the tools used for quantitative and qualitative analysis.

56
3.2 Methodological approach A research approach is needed in designing a study to provide guidance about all
aspects of the study (Creswell 2009). Research can be conducted using a qualitative
approach, a quantitative approach, or an integration of those two approaches, known as
mixed-methods research (Bryman 2006). The quantitative approach describes
phenomena in nature, explores possible causal association between phenomena
including demographic data (Cooper & Schindler 2003; Creswell 2009), tests theories
and applies statistical procedures to draw conclusion (Zikmund et al. 2008).
Quantitative researchers attempt to make generalisation from their findings, and the
study can usually be replicated (Babbie 2004; Creswell 2009). Survey and experimental
methods are predominant in this type of research (Creswell 2009). In contrast, the
qualitative approach is useful to researchers who are interested in exploring ‘individual
meaning and the importance of rendering the complexity of situation’ (Creswell 2007,
2009, p. 4). The research is used to study social phenomena, environments and people’s
behaviours (Ticehurst & Veal 2000; Huck 2002; Patton 2002; Murray 2003; Mason
2006). The approach forces researchers to interpret the meaning of the words gathered
through interviews or open-ended questions. Strategies, such as ethnography (Creswell
2007), grounded theory (Strauss & Corbin 1998; Charmaz 2006), case study (Stake
1995; Yin 2006) and narrative research (Clandinin & Connelly 2000) are used to
conduct a qualitative study.
The emerging mixed-methods approach is designed for researchers who collect data
using a combination of the qualitative and quantitative approaches (Yin 2006). Teddlie
and Tashakkori (2009) assert the usefulness of ‘mixed methods as a vehicle for
improving the quality of inferences that are drawn for the quantitative and qualitative
methods’. This approach emphasises ‘the overall strength of a study [that] is greater
than either quantitative or qualitative research’ (Creswell 2009, p. 4). For example,
quantitative methods tend to use statistical analysis, whereas qualitative methods are
done with text analysis, and the mixed methods combine the two types of analysis tools.
A summary of the characteristics of the three methods is presented in Table 3.1.

57
Table 3.1: Characteristics of quantitative, mixed and qualitative methods
Quantitative methods Mixed-methods Qualitative methods
Pre-determined Both pre-determined and emerging methods
Emerging methods
Instrument-based questions Both open- and closed-ended questions
Open-ended questions
Performance data, attitude data, observational data, and census data
Multiple forms of data drawing on all possibilities
Interview data, document data, and audio-visual data
Statistical analysis Statistical and text analysis Text and image analysis
Statistical interpretation Across databases interpretation
Themes, patterns interpretation
Adopted from: Creswell (2009, p. 15)
The three methods also have their own characteristics of research designs. A
quantitative design tests a theory by developing a series of hypotheses and collecting
data to decide whether the hypothesis is supported or rejected. Data are usually gathered
using a questionnaire that examines attitudes, then analysed using statistical tools and
hypothesis testing procedures (Sekaran 2010). In contrast, a qualitative design employs
an interview strategy and explores issues related to individual attitudes (Ghauri &
Gronhaug 2005). Information can be collected through a story using a narrative
approach in which individuals recount their experiences related to the topic researched
(Strauss & Corbin 1998).
A mixed-methods design is chosen by researchers because of the strength of
quantitative and qualitative approaches when they are combined to provide a deeper
understanding. According to Creswell (2009), if the variable is unknown, researchers
can explore the phenomenon to determine the variables, and then the variables are
studied using a larger sample. However, if the variables are known, researchers can
conduct a survey first, followed by interviews with a small number of participants to
obtain more specific data. Open-ended questions can also be added to the research
instrument. The selection of approaches used depends on the nature of the study,
however. The current study was designed to employ the mixed-methods approach to
extend an understanding of the present topic researched.

58
Mixed-methods research is a powerful tool for multidimensional research strategies
(Mason 2006). The weaknesses of one method may be covered by other methods. The
limitations of qualitative methods, such as bias in interpretation of data and small
sample size, can be complemented by the strengths of quantitative methods, which use
large sample sizes and statistical tools to analyse the data (Murray 2003). The results of
quantitative and qualitative data analyses can be used side by side to validate one
another. In the same way, interviews can be used to support statistical results (Creswell
& Plano Clarke 2007).
Career anchors can be studied using either qualitative or quantitative methods, or a
combination of these two methods. Schein (1977b) himself initially used the structured-
interview method to identify individuals’ career anchors. Since then, the career anchor
inventory has been recommended to use a survey combined with the interview strategy
(Schein 1990, 2006a; Schein & van Maanen 2013). In evaluating Schein’s
methodological approach to studying the career anchors, Feldman and Bolino (1996)
reaffirmed the importance of the use of interviews in combination with the career
orientation inventory. Previous empirical studies have selected the method that fit their
studies’ purposes, including qualitative research (e.g., Suutari & Taka 2004),
quantitative studies (e.g., Tan & Quek 2001; La Lopa, Beck & Ghiselli 2009) and
mixed-methods (e.g., Feldman & Bolino 1996; Ituma & Simpson 2007). The current
study explores individuals’ behaviours and attitudes in the work environment and
investigates the relationship among the variables studied. Hence, this study was
designed to employ mixed-methods to attract the advantages of both the qualitative and
quantitative methods (Creswell 2009).
3.3 Research design Research design is a strategy to plan all research procedures for solving research
problems (Babbie 2004; Sekaran 2010; Zikmund 2010), including data collection
methods and procedures, measurement and data analysis (Cooper & Schindler 2006).
More specifically, Cooper and Schindler (2006, p. 139) determined that a study design
at least includes: the degree of the research question, the data collection method, the
power to produce effects, the purpose of the study, the time dimension, the topical
scope, the research environment and the participants’ perceptions of research activity.

59
Sekaran and van Maanen (2013) and Cavana, Delahaye and Sekaran (2001), however,
have recommended that researchers focus only on six factors, which they described in
somewhat different terms as: the study purpose, the types of investigation, the extent of
researcher interference, the study setting, the unit of analysis and the time horizon.
Zikmund (2010) explicitly said that sampling is not included in the design, and that
survey research is a basic research design. He stated that the objective of the study, the
source of information, the research technique and the schedule and cost of research
should be carefully considered.
In addition to the components of research design mentioned earlier, there are several
important factors that have to be considered when designing data collection using a
mixed-methods design. According to Creswell (2009), a good plan of data collection
should consider four aspects: timing (sequentially or concurrently), weighting (priority
given to either quantitative or qualitative, or equal priority to both), mixing (connecting
or integrating the two types of data), and embedding (one form of data is embedded in a
larger study). Creswell (2009, pp. 208-216) and Creswell and Plano Clark (2011, pp.
181-183) suggested six designs based on Teddlie and Tashakkori’s (2009) data
collection procedures. The designs consist of three forms of sequential designs
(sequential explanatory-, sequential exploratory- and sequential transformative designs)
and three forms of concurrent designs (concurrent triangulation-, concurrent embedded-
and concurrent transformative designs).
In the concurrent-triangulation design and the concurrent-embedded design, both
quantitative and qualitative data are collected simultaneously. The concurrent-
triangulation design (also known as convergent design) is applied to examine a
comparative study so as to decide whether the results can be considered confirmation,
differences, or cross-validation (Morgan 1998). Generally, while the two methods
receive equal emphasis, they use different data collection methods. The mixed-methods
design is evident in the interpretation or discussion section when both types of data are
integrated side-by-side, named ‘integrating’ mixed-data. Results of statistical analysis
are presented, followed by quotations of participants’ opinions whether they support the
quantitative analysis results or not.
60
Unlike the concurrent-triangulation design, in which data analysis merges the two
databases, the concurrent-embedded strategy is divided into dominant and supportive
methods. In other words, the main method (either quantitative or qualitative) guides the
study, and the secondary method (either qualitative or quantitative) acts as supporting
data. As a supporting role, the questions are different from the other methods
developed. For example, quantitative methods focus questions on the expected
outcomes of a relationship between variables using a questionnaire, whereas qualitative
methods explore the experiences of individuals in these variables through the interview.
The mixing of methods occurs with the integration of these two types of data in the
form of comparison or parallel analysis. Theoretical perspectives can be used, especially
for the primary method. Due to the different weighting on the two types of data, the
results are also unbalanced, especially when comparing the results. This is a drawback
of this design. As in the sequential-transformative design, the concurrent-transformative
design applies a specific theory. The concurrent-triangulation or embedded approaches,
and the mixing methods of integrating, connecting or embedding data can be used.
There are no fixed rules for designing research. Generally, research design consists of,
at least, the type of investigation, the data collection method, the researcher’s control
variables, the unit of analysis, the time frame, the sampling design, the measurement of
instrument and the data analysis (Cooper & Emory 1995; Babbie 2004; Sekaran 2010;
Sekaran & Bougie 2013). As reviewed in Chapter 2, research on career anchors,
psychological empowerment and job satisfaction have been done in most parts of the
world employing quantitative methods- (e.g., Custodio 2000; La Lopa, Beck & Ghiselli
2009), qualitative methods- (e.g., Suutari & Taka 2004; Chang et al. 2011), and mixed
methods- (e.g., Hardin, Stocks & Graves 2001; Ituma & Simpson 2007) strategies,
which contributed significantly to the theories they used, and to the study objectives.
Due to the nature of this study, the current study was carried out using the mixed-
methods approach and employing the concurrent-embedded mixed-methods procedure
and design. As suggested by Creswell (2009, p. 216):
When time is a problem, I encourage students to think about an embedded model of design. This model emphasizes a major primary form of data (e.g., surveys), and it can include a minor secondary form of data collection (e.g., a few interviews with some of the participants who completed the surveys).
61
The concurrent-embedded design was employed to solve the research problems in the
context of the current study. According to Creswell and Plano Clark (2011, p. 179),
each of the six designs gives space to readers and reviewers to make a quality decision.
The emphasis of the current study was a quantitative approach, while a qualitative
method was used to gather supporting data. Based on the characteristics of concurrent
mixed-methods, the survey was carried out first, followed by collection of qualitative
interview data. This study is unique because the interviews were conducted primarily to
identify the dominant career anchors, following the original source by Schein (1978,
2006a), who used an interview protocol in his study. It was noted from previous studies
that a number of standard interview questions not only would not rule out the
identification of themes as they emerged but could also be used to support the analysis
associated with, for instance, job outcomes (e.g., Hardin, Stocks & Graves 2001), social
construct (e.g., Ituma & Simpson 2007) and career stages (e.g., Chang et al. 2011). Two
new open-ended questions, another form of qualitative data, were also created and
attached to the survey intending to capture perspectives from different angles. Sub-
sections 3.3.1.1 and 3.3.1.2 discussed the use of the survey, the interview and the open-
ended questions.
The two types of data collection were conducted at the same time. Data gathered were
analysed separately, in which survey data as a primary source were analysed using
statistical tools, while the interview (and open-ended questions) data as a secondary
source were analysed using theme analysis. Quotations were extracted to support
identified themes. The integration of data and discussion of the results were done by
comparing one results to the other or residing the results side-by-side (or parallel) of
two data sources (Teddlie & Tashakkori 2009). Creswell (2009, p. 212) emphasised that
this method ‘enables the study to be reduced in scope and manageable for the time and
resources available’. To overcome the disadvantages, it was suggested to compare the
present results to the results of previous studies.
The current study, therefore, was categorised as a field survey employing a cross-
sectional study (at one point in time). Unlike a longitudinal study, which uses the same
people over a long-term period, a cross-sectional study is a form of survey data
collection methods that examines individuals within selected groups or targeted
population at one specific point in time (Tolmie, Muijs & McAteer 2011, Zikmund et al.

62
2013). The data-gathering period can be days, weeks or months (Sekaran & Bougie
2013). The cross-sectional design saves time and captures data concisely without fear
that respondents would change their minds over time. The present research design for
each strategy was developed in the following sub-section.
3.3.1 Survey research
Survey research aims to gather data first-hand. According to Zikmund et al. (2013, p.
185), ‘…surveys attempt to describe what is happening or to learn the reasons’. The
survey provides data that are related to individuals’ thoughts, behaviours and
preferences in the area studied (Babbie 2004, Creswell 2009, Bhattacherjee 2012), and
the data can be both quantitative and qualitative (Sekaran & Bougie 2013). Depending
on the research design, a survey can be done through either interviews (qualitative) or
questionnaires (quantitative) (Gay & Dhiel 2004; Ghauri & Gronhaug 2005; Creswell
2009), or a combination of both strategies (Creswell 2009; Bhattacherjee 2012).
Zikmund et al. (2013) noted that the types of data may vary depending on the purpose
of the research. As previously explained, this study was designed to use the mixed-
methods approach using survey questionnaires, interviews and open-ended questions.
3.3.1.1 Survey questionnaire
A questionnaire is a means for a survey ‘consisting of a set of questions (items)
intended to capture responses from respondents in a standard manner’ (Bhattacherjee
2012, p. 74) and in the form of numeric data (Creswell 2009). There are two types of
self-administered survey instruments: paper-based and web-based questionnaires.
Paper-based questionnaires can be delivered via the postal system, an in-person drop-
off, or hand-delivery to workplaces (Sekaran 2010). The mail survey also provides
confidentiality, anonymity and flexibility in when respondents answer the questions,
reaches a wide range of geographical locations, gains a large number of respondents,
reduces bias, is less time-consuming and provides standard wording (Babbie 2004;
Sekaran 2010; Bhattacherjee 2012; Zikmund et al. 2013). Cooper and Schindler (2006)
added some other advantages, including requiring minimal staff time to process the
results, allowing participants to think about questions and allowing researchers to
contact otherwise-inaccessible participants. In addition, a follow-up notification strategy
as a reminder is strength of the survey method. The questionnaires are usually returned
using self-addressed stamped envelopes provided with the questionnaires (Creswell

63
2009). This method is, however, considered expensive due to the costs incurred. It is not
only for the printing, but also for shipping and postage costs involved (Cooper &
Schindler 2006). A complex and long questionnaire may reduce the response rate.
Although a bias factor cannot be avoided, this method is still considered the best way to
gather data with respondent anonymity and coverage of a large geographical area
(Sekaran 2010).
Where the postal system is unreliable, an in-person drop-off or hand-delivery method
becomes a preferred choice. The in-person drop-off (Zikmund et al. 2008, p. 219) or the
drop-off/pick-up (Riley & Kiger 2002) method can be done in classrooms or other
institutional settings. In addition to saving money on postage and shipping, this method
is believed to increase the response rate (Allred & Ross-Davis 2010). Unlike mail
surveys, the drop-off method allows researchers to meet respondents directly to provide
information about the purpose of the survey and the importance of respondents’
participation (Sekaran & Bougie 2013).
This verbal communication followed by an arrangement to collect completed
questionnaires can be expected to improve the rate of return. Although researchers have
to spend money for printing and travelling, the better rate of return can justify this
expense. Additionally, the cost of a follow-up notice can be excluded. Moreover, when
questionnaires are distributed to respondents, the researchers can use this opportunity to
discuss the possibility of participation in face-to-face interviews with participants.
The second strategy is a web-based survey or a computer-delivered survey (Cooper &
Schindler 2006). The strategy covers an almost limitless geographical area via internet
and email surveys, participation in which is by emails to prospective respondents
(Frickers 2008). Once a soft-copy of the questionnaire is uploaded to a website, and a
procedure for storing completed questionnaires automatically is set up, researchers send
an initial email to the selected email lists inviting the members to participate in the
survey and providing a link to the survey. Alternatively, researchers email to a mutual
link requesting assistance with the research survey, which is attached to the emails.
Some strengths of electronic surveys are the ability to use more complex questionnaires,
the speed of distribution and data collection, the ability to conduct numerous surveys

64
over time, the ability to use the visual stimuli, the possibility of improved respondent
anonymity (Cooper & Schindler 2006) and comprehensiveness – can force respondents
to provide a valid response for all questions. Although accurate emailing lists are a
prerequisite that often takes some effort, the method is still less expensive than the pre-
and post-notification, delivery and printing of paper-based surveys (Ganassali 2008).
However, online surveys also have some limitations: the constraints inherent in
computer security systems, the time required to identify and recruit a sample, the high
cost of survey conversion, the need for respondents to have computer-literacy skills, and
the need for compatible software (Frickers 2011; Zikmund et al. 2013). Nevertheless,
Couper (2011, p. 26) emphasised that mail and electronic surveys are ‘the most
effective’ for a short survey.
The rate of return of the surveys is a crucial concern (Couper 2011). The response rate
can be increased by cross-checking whether questionnaires are easy to read, offering
clear response directions and encouraging respondents to respond (Sekaran 2010).
Encouragement may take the form of follow-ups notifications, the inclusion of self-
addressed, stamped envelopes (for postal surveys) and tangible incentives (e.g., money,
vouchers, bottles of wine). Although a deadline date notice could annoy some
respondents, it may encourage respondents to respond to the survey sooner.
The method used in research depends on the objectives of the studies and the situation
and condition of locations surveyed. It can use just a hard copy questionnaire, an online
survey or mixed-strategies (both a hard copy and an internet surveys). Previous studies
on career anchors, psychological empowerment and job satisfaction have used mail
surveys (e.g., Custodio 2000; Hsu et al. 2003; Carless 2004; Mays 2007; Singh,
Bhattacharjee & Kodwani 2009; Chang, Shih & Lin 2010), online surveys (e.g., Levi
2006; Meyerson & Kline 2007; Dickson & Lorenz 2009; Weber & Ladkin 2009), and
in-person drop-off surveys (e.g., Marshall & Bonner 2003; Steele 2008). Because the
current study would involve visits to targeted universities (for interview purpose), the
researcher chose to use self-administered questionnaires that would be dropped off and
picked up personally. Online and email referral methods were also employed to increase
the response rate. The researcher dropped the questionnaires off to the potential
respondents and made an arrangement to pick up the completed surveys. The web-based
survey was done by storing a soft copy of a research questionnaire in the link specified

65
and the referral email strategy attached the questionnaire to the selected email
addresses. The potential respondents were notified through emails. All participants were
voluntary.
3.3.1.2 Interview
Interviews are a data collection technique to gather information directly from
individuals through an interaction between researchers (interviewers) and participants
(interviewees) (Cooper & Schindler 2006; Creswell & Plano Clark 2011). During the
interaction, a participant is asked to provide information about people, experiences,
cultures, organisations, and the like. The advantages of the interview method are
gaining historical information, controlling questions line-by-line and the ability to use it
with unobserved participants (Creswell 2009). Conversely, in addition to its being time-
consuming and subject to response bias and offering low anonymity, this method makes
it difficult to gain a balanced perspective from respondents. However, it is believed that
its strengths can compensate for its negatives.
Interviews can be conducted in structured (standardised open-ended interview),
unstructured (informal conversational interview), or semi-structured (general interview-
guide approach) format (Goulding 2002; Patton 2002; Sekaran 2010). In the structured
interviewed, according to Teddlie and Tashakkori (2009), the questions are rigorously
worded beforehand and presented in the same order to all participants. It is usually
conducted using protocol questions. Although this strategy is not as flexible as the other
two methods, data gathered from the structured interview can be quantified for easy
comparison with statistical results.
By contrast, in the unstructured and semi-structured interviews, researchers can
elaborate issues in more detail even while participants have a feeling of control during
the interview process. There is no strictness in either the wording of questions or how
they are delivered (Sekaran & Bougie 2013). Problems arise when participants lack
knowledge about the questions asked and the interviewers do not understand the
participants’ responses. Overall, to overcome the disadvantages of the three strategies,
open-ended questions are suggested to encourage participants to express their opinions
freely.

66
Interviews can be conducted either using verbal interviews (e.g., via face-to-face,
telephone, focus groups and internet) or written interviews (e.g., via emails or paper-
based correspondence) (Creswell & Plano Clark 2011). A face-to-face, or personal
interview gains a clearer indication of participants’ actual opinions than focus groups, in
which participants can be influenced others in the group. Moreover, the interviewer has
an opportunity to clarify unclear responses (Zikmund et al. 2013). A telephone
interview is growing in popularity because it can cover large areas. However, this
method can be costly in terms of time as well as money if interviewees’ responses are
too long. Participants can also stop the conversation at any time. Despite some
participants preferring being interviewed by email, the telephone method can gain
sensitive information. Emails can be sent around the world, saving time and travel costs.
However, participants’ access to computers and the compatibility of the software used
become issues. Additionally, the lack of non-verbal communication can create
miscommunication due to cultural differences. Nevertheless, whatever strategy is
chosen, interviewers may still have the opportunity to broaden the questions in the form
of face-to-face and telephone communication (Zikmund et al. 2008, 2013; Zikmund
2010). Researchers generally recommend a documentation procedure of voice
recording, note-taking and transcription (Creswell 2009).
One form of interview technique is the interview protocol. Creswell (2009) stated that
researchers can use an interview protocol for asking questions and recording the
interviews, especially when a structured interview technique is employed. The protocol
generally contains ‘an icebreaker question at the beginning, followed by 4-5’ sub-
questions and ‘probes for 4-5 questions’ (Creswell 2009, p. 183; Cavana, Delahaye &
Sekaran 2001, p. 144) to participants to elaborate their responses. The interview
protocol assists interviewers in ‘staying on the track’. The use of the protocol depends
on the research purpose and approach to solving the research problems.
As discussed in the research design, the interviews in the current study were intended to
investigate the dominant career anchors using the interview protocol developed by
Schein (1990; 1996; 2006a). The questions in the protocol are designed to identify the
dominant career anchors of an individual through their discussion of their work history
and formal education in predicting future career. Schein’s interview protocol provided

67
main and subsequent questions and allowed for follow-up responses where clarification
or more in-depth discussion was called for (Patton 2002, p. 372).
Hence, the current study used a method called a structured interview (also known as a
standardised open-ended interview). Schein (1990) suggested using the interview
protocol in accordance with the career orientation inventory in examining individuals’
career anchors. He argued that questionnaires contained forced-choice questions,
making the identification of dominant career anchors only an approximation. The
emergence of more than one dominant career anchors shows a need for interviews to
elicit further explanation (Smith 2005, p. 46). Some past studies (e.g., Suutari & Taka
2004; Ituma & Simpson 2007; Klapwijk & Rommes 2009; Chang et al. 2011) used
interviews to assess career anchors of their samples. Schein (1978) himself used
interviews in his initial study. For the purposes of this present study, the researcher
employed a person-to-person structured-interview approach using Schein’s interview
protocol.
Employing open-ended questions was intended to capture respondents’ perceptions
‘without predetermining those (perceptions) through prior selection of questionnaire
categories’ (Patton 2002, p. 21). Bhattacherjee (2012, p. 41) stressed that even though
researchers use a highly structured survey questionnaire, open-ended questions are often
included ‘to collect qualitative data that may generate unexpected insights not otherwise
available from structured quantitative data alone’. It can be said that this strategy gives a
chance for participants to express their opinions freely, particularly for those who are
reluctant to answer verbally. In line with the embedded-concurrent design, the current
study also used open-ended questions, the results of which were used to support the
discussion of the quantitative results and the interview findings.
3.3.2 Sampling selection and sample size
Before selecting a sample, the researcher needs to determine the target population.
Population refers to a group of people, organisations, or other units of analysis that
share the same characteristics and are under examination (Zikmund 2003; Teddlie &
Tashakkori 2009; Sekaran 2010). The population in the current study was all Indonesian
academics who were in full employment in the civil service (called Pegawai Negeri

68
Sipil) and had been working more than five years at public higher education institutions.
The individual academics were the unit of analysis (Sekaran & Bougie 2013).
Sampling in the mixed methods design involves a combination of a ‘well-established
qualitative (Qual) and Quantitative (Quant) techniques in creative ways to answer the
research questions’ (Teddlie & Tashakkori 2009, p. 169). Sampling itself is defined as a
process to draw samples from a larger population in a research project (Sekaran 2010).
It is intended to assist ‘researchers to estimate some unknown characteristics of the
population’ (Zikmund et al. 2013, p. 385). Even though Teddlie and Tashakkori (2009)
suggested four forms of sampling (probability-, purposive-, convenience-, and mixed-
methods sampling strategies), there are two major types to draw a sample in relation to
paper-based surveys that have been accepted widely by researchers in social science:
probability and non-probability samplings (Ghauri & Gronhaug 2005; Zikmund et al.
2008). Probability sampling is used if researchers want to make generalisations about a
wider community from a selected sample, usually by random sampling. This technique
is mostly used in quantitative research (Teddlie & Tashakkori 2009). In contrast, non-
probability sampling should be used when the total number of the population is
unknown (Cooper & Emory 1995). Purposive and convenience samplings are two non-
probability techniques often used by qualitative researchers.
There are limited references in the literature to mixed-methods sampling strategies.
According to Creswell and Plano Clark (2011), the only reference is the five sampling
categories proposed by Teddlie and Tashakkori (2009). Basic mixed-methods sampling,
sequential mixed-methods sampling, parallel mixed-methods sampling, multilevel
mixed-methods sampling and sampling using multiple mixed-methods sampling are not
new strategies, but rather a combination of traditional strategies which are already well
known. The first four strategies combine both probability and purposive sampling
methods and their designs. The last strategy is a combination of the other four
strategies. For example, a study that uses multilevel mixed-methods sampling can use
parallel mixed-methods sampling at one stage and sequential mixed-methods sampling
at another. The sampling methods used in the current study are discussed below.
One of the variants of probability random sampling is multistage area sampling. It refers
to two or more stages of area cluster sampling (Zikmund 2003; Sekaran & Bougie 2013;
69
Zikmun et al. 2013). According to Creswell and Plano Clark (2011, p. 393), multistage
area sampling is defined as ‘progressively smaller areas [that] are selected in each
stage’. Because of the cost-effectiveness advantage, it is worthwhile when the
population to be sampled is scattered throughout a large geographical area. It
incorporates characteristics of simple random sampling, area cluster sampling and for
certain cases including proportional sampling. In simple random sampling, each
member of the population has an equal chance of being selected, and this is the most
commonly used because it is easy to apply. Area or geographical cluster sampling is
applied when researchers choose smaller and smaller geographical areas gradually and
randomly until they find an area that is to be listed. Probability proportionate to size
sampling is used if the sample size is not divided equally among the cluster areas. The
probability of any cluster that is to be chosen is proportional to the cluster size.
However, when the sampling is related to the interview technique, each cluster can have
the same number of interviews and the same probability of being involved (Levy &
Lemeshow 2011).
One of the non-probability sampling techniques often used is purposive sampling.
Purposive sampling selects samples based on specific criteria or characteristics relevant
to the study (Sekaran 2010; Creswell & Plano Clark 2011). According to Zikmund
(2003, p. 392), the sample is ‘guaranteed to meet a specific objective’, even though the
representativeness of the sample is still questionable. However, the purposive sampling
method is more suitable for use in selecting interview participants. Hence, random
sampling, multistage area cluster sampling, and purposive non-probability sampling
techniques were applied in the current study.
As the desired population was academics, higher education institutions were considered
for the sampling purposes. These samples were selected because they are professional
educational institutions and provide various characteristics that enable the present
researcher to choose respondents based on the criteria set up. In addition, the present
researcher is an academic at one public university and a member of the Higher
Education Board in Indonesia, which gave the researcher access to lists of academics for
emailing purposes.
Both quantitative and qualitative samplings were used in the current study.

70
3.3.2.1 Quantitative sampling design
Sampling was carried out in two stages:
(a) University sample: The present researcher decided to survey three out of the five
forms of public universities. Universities, institutes and polytechnics were chosen
because those institutions offer a wide range of courses. The variety of subjects ensured
in turn a variety in academics’ demographic data, which were needed for data analysis.
For a paper-based survey, considering the distances in Indonesia over which
respondents were spread, a proportional multistage area cluster sampling technique was
used to select potential universities. Cluster sampling was applied because the
researcher could not find a published list of universities (Cho & Faerman 2010). First,
universities were classified into the western, central and eastern regions, following the
geographical divisions of the Indonesian government administration. Second, in each
region, universities were grouped by island and were chosen using the probability
proportionate to size sampling method because of the diversity of the universities’ sizes.
Each island could have one large and two small universities, or two large, three
medium-sized and one small university, or other combinations. It was planned to survey
a minimum of two universities per region. University participation was voluntary. The
criteria for the universities were: (1) more than one faculty was accredited by the
Directorate General of Higher Education of Indonesia; and (2) the university’s self-
evaluation was reported regularly to the Directorate General of Higher Education of
Indonesia. These two requirements could be accessed through the website of the
Directorate General of Higher Education.
For a web-based survey, internet sampling was used (Zikmund et al. 2013), although
Couper (2011) claimed that the web survey does not link to any sampling methods. It is
assumed that the internet sampling was done simply by posting the soft copy survey to a
selected internet domain. The website chosen was accessible and easy for everyone.
(b) Respondents’ sample: The target sample was chosen for the following reasons: (1)
academics are professionals in their areas of expertise and have higher degree
certificates; (2) career development in the civil service offers structural and/or
functional area positions and specific academic ranks as academics climb the career
ladder; (3) dynamic changes are occurring not only at the organisational level but also at

71
the individual level; in other words, academics must be more active and productive, and
balance both organisational and individual needs. Criteria for the sample were that
respondents held at least a higher degree qualification, taught at public universities and
had full-employment status as civil servants, with a minimum of five years of work
experience. Individuals with higher degrees and a minimum of five years’ experience
are considered to be skilful and mature in making career decisions.
Random sampling was applied to both the paper-based and the web-based surveys. Each
individual academic had an equal chance to be selected for the current study. The
researcher randomly selected academics who were at the universities when the survey
took place. In contrast to the paper-based surveys, in the web-based survey the
researcher simply sent an email to selected email lists and email addresses, individually
inviting the members to participate in the survey.
In terms of sample size, it has been suggested that the ideal sample size should be
between 30 and 500 (Sekaran 2010), or 10 to 50 (Dooley 1995). For a correlation study,
a minimum of 30 responses is needed (Gay & Diehl 1996), while for factor analysis
purposes, a minimum of 300 responses is considered necessary (Tabachnick & Fidell
2007). However, there is no fixed rule about how big a sample should be. According to
Hussey and Hussey (1997), the number in the sample depends on the particular research
area. Previous research can be taken as guidance.
Research on career anchors has applied various sample sizes within a single
organisation. Schein and his students used samples ranging from 14 to 44 graduates.
Past empirical studies reviewed on career anchors and job satisfaction have used various
sample sizes: for example, La Lopa, Beck and Ghisseli (2009) used 337 educators,
Ituma and Simpson’s (2007) sample was 336 information technology employees,
Feldman and Bolino (2000) surveyed 153 self-employed employees, Custodio (2000)
used 114 academic executives, and Igbaria and Baroudi (1993) used 396 employees. It
was noted that previous research on psychological empowerment and job satisfaction
reviewed for the current study used a relatively large sample size. For instance,
Dehkordi et al. (2011) used 156 university employees, Dickson and Lorenz (2009)
researched 262 undergraduate students and Spreitzer, Kiloz and Nason (1997) used 393

72
mid-level employees. Following a suggestion by Tabachnick and Fidell (2007), the
current study aimed to select 300 academics as its sample.
3.3.2.2 Qualitative sampling design
To select interview participants, the current study employed the purposive sampling
method, as one of the most common non-probability sampling strategies used in the
qualitative studies (Ghauri & Gronhauge 2005; Given 2008). The purposive sampling
selects a sample that represents the population in accordance with the criteria that have
been determined in the quantitative sampling design. This technique depends on the
researchers’ judgment (Patton 2002; Sekaran 2010), and thus is subject to weaknesses,
such as bias and difficulty to claim that the sample is representative. However, its
strengths are a wide range of sampling groups, from homogeneous sampling to expert
sampling.
Although the selected sample may not be fully representative of the population, this is
not necessarily a weakness, especially in a mixed-methods study. This is because the
qualitative research is intended to obtain in-depth and extensive information about the
attitude or phenomenon being studied. According to Creswell and Plano Clark (2011, p,
174):
The qualitative idea is not to generalize from the sample (as in quantitative research) but to develop an in-depth understanding of a few people – the larger number of people, the less detail that typically can emerge from any one individual.
Academics were selected to be interviewed in accordance with the objectives of the
study. The researcher determined that one-third of those interviewed were academics
who held managerial positions (e.g., vice-rector, dean, vice-dean, head of department
and head of unit). In addition to responding to the interview questions, it is assumed the
number of academics was sufficient to provide information about the existing career
development policy. The rest were non-managerial persons (academics whose
functional tasks were in teaching and research). In line with the university sample
design, the number of participants was proportional to the number of higher education
institutions in the three geographic regions of Indonesia. All participation was
voluntary.

73
There is no rule for the number of interviews (Patton 2002). It depends on the purpose
of research. One or two interviews may be enough for the narrative technique, and 20 to
30 participants for grounded theory (Creswell 2007). Generally, empirical studies can
be carried out using samples between four and 20 people (Creswell & Plano Clark
2011). According to Teddlie and Tashakkori (2009), the sample size in the mixed-
methods approach is a trade-off: if a study emphasises its quantitative aspects, the
qualitative sample should be smaller. Given (2008) noted that one well-‐placed articulate
informant will often provide more valuable information than many from a larger
sample. Past empirical studies have used various numbers of interview participants.
Studies on career anchors and their relationships to job satisfaction showed, for
example, 10 participants in Chang’s et al. (2011) study, 22 managers in Suutari and
Taka’s (2004) study and 30 workers in Ituma and Simpson’s (2007) study.
Unfortunately, the present researcher did not find any studies on psychological
empowerment and job satisfaction employing the qualitative approach. Hence, this
current study considered 20 participants randomly selected at universities visited.
3.4 Research instruments
3.4.1 Instrument development
Three well-published survey instruments were employed for collecting data in the
current study.
Career anchors inventory
To measure individuals’ career anchors, most studies (e.g., Dazinger, Rahman-Moore &
Valency 2008) used the 41-item career orientation inventory developed by Schein and
DeLong. This tool is chosen because it examines internal factors (needs) and external
factors (life changes), and addresses psychological factors (career direction strategies),
whereas other instruments are ‘skill-based or based on opinions about the organization’
(Mays 2007, p. 38). In a study of career anchors, Igbaria and Baroudi (1993) suggested
using a short form of the career orientation inventory, which they termed the career
anchor inventory. This was used in the current study.
The short form of the career anchor inventory was developed based on two studies of
information system employees and 41 items of career anchor orientation developed by
74
Schein (1985). Study 1 aimed to investigate the structure and content underlying the
career anchors using Sample 1, and then tested the validity and reliability of the results
using Sample 2. By employing factor analysis, Sample 1 produced 25 items and formed
nine categories of career anchors. The only category difference from the eight
categories of Schein was the security/stability anchor, which was split into the economic
security category and the geographical stability category. The other seven categories
remained as the original: managerial competence, technical competence, autonomy,
entrepreneurial creativity, pure challenge, lifestyle and service. The nine anchor
categories had Cronbach’s alphas of between 0.62 and 0.93, which were evident that the
items have high internal consistency on average. Study 2 was conducted a year and half
later to retest the validity and reliability of the career anchors. By employing
confirmatory factor analysis, the results were consistent with Study 1.
The career anchor inventory used a five-point Likert scale format divided into two sets.
The first group, items 1 to 15, was related to career orientations, ranging from 1 = ‘of no
importance’ to 5 = ‘centrally important’. The other group was items 16 to 25 in which
each of the items was related to career preferences, ranging from 1 = ‘not at all true’ to
5 = ‘completely true’. Each of the nine anchors was represented by three items, except
for economic security and geographical stability, which were represented by two items
each (Appendix 2).
The short form of the career anchor inventory has been tested for psychometrics
properties, and there is a strong ‘evidence for its construct validity’ (Igbaria & Baroudi
1993, p. 143). Especially for the two anchors that economic security and geographical
stability are two differences anchors by their own characteristics as explain in Chapter
2, Sub-section 2.3.1. Igbaria and Baroudi also noted that the instrument was intended to
reduce the burden for respondents in filling out the questionnaire by keeping the
statements to a minimum. Instead of using Schein’s 41-item career orientation
inventory, which has not been tested for validity and reliability, the current study
employed the shorter career anchor inventory developed by Igbaria and Baroudi (1993)
because of the logical reasons above.

75
Psychological empowerment
Psychological empowerment was measured by the psychological empowerment scale
developed by Spreitzer (1995). Spreitzer developed and validated 12 items to examine
the four facets of psychological empowerment: meaning, competence, self-
determination and impact (Appendix 3). Each dimension is measured by three items
using a five-point Likert scale, ranging from 1= strongly disagree to 5 = strongly agree.
Spreitzer tested the discriminant and convergent validity of the scale in two samples and
established satisfactory construct validity. A second-order confirmatory factor analysis
showed a good fit of psychological empowerment in the industrial sample while a
moderate fit was found in the insurance sample. It was clearly shown that each of the
four facets loaded on its factor (Spreitzer 1995, p. 1457). Cronbach’s alphas were
satisfactory ranging from 0.73 to 0.85.
In addition to the reliability and validity of the psychological empowerment scale
established in various studies (e.g., Kraimer, Seibert & Liden 1999; Chang & Jang
2008), the scale has ‘the work context in mind’ (Cho & Faerman 2010). The scale built
by Spreitzer is the most comprehensive investigation of the empowerment scale as
asserted by Arneson and Egberg (2006). The psychological empowerment scale was,
therefore, adopted in the current study
Job satisfaction
This study used the overall job satisfaction items developed by Hackman and Oldham
(1975) and retested by Igbaria and Baroudi (1993) to measure employees’ perceptions
in relation to the job satisfaction dimension. The use of this scale can be justified by the
validity of the items, which represent psychological states of experienced
meaningfulness, feelings of responsibility and knowledge of results.
Igbaria and Baroudi (1993) tested the instrument to measure career satisfaction and job
satisfaction. The result clearly distinguished a cluster of relevant items under the
heading of career satisfaction, leaving three of the general job satisfaction items for one
cluster. The scaling of the items ranged from 1 = strongly disagree to 5 = strongly agree.
The alpha of these items was quite high at 0.84. The scale had been used in previous
studies, such as by Feldman and Bolino (2000), and Chang, Shih and Lin (2010), and

76
showed acceptable alphas. For the purpose of the current study, the researcher used
these items to measure overall job satisfaction (see Appendix 4).
For the purposes of the current study, all three instruments were measure using a six-
point Likert scale to both avoid a neutral answer and give more precision (Allen &
Seaman 2007). The neutral choice can be seen as an easy option when a respondent is
unsure, and rather than the expression of a true neutral opinion. From the literature
review, it was found that many studies used an even scale of six points on the career
anchor inventory (e.g., Custodio 2000; Tan & Quek 2001; Marshall & Bonner 2003;
Smith 2005; Mays 2007; Dazinger & Valency 2009; and Coetzee & Schreuder 2011),
compared to the other two instruments, which used odd scales of five and seven points
(e.g., Spreitzer, Janaz & Quinn 1999; Carless 2004; Chiang & Jang 2008).
In addition, there was one open-ended question at the end of each of the set statements
(Appendix 5). The questions, which were optional, asked respondents to comment on
their views of their working life, their career preferences, their feelings about their
current job and their feelings about intrinsic task motivation. Sekaran (2003, p. 213)
pointed out that ‘the end of the questionnaire could include an open-ended question
allowing respondents to comment on any aspect they choose’.
Another two open-ended questions were added to the questionnaire. The questions
asked about: (1) factors influencing individual academics’ career motivation; and (2) the
institutional support, and were placed between the questionnaire items and the
demographic questions. This type of question lets respondents provide more
information related to attitudes, feelings and understanding relevant to the research topic
(Creswell & Plano Clark 2011). The data gathered were analysed in accordance with the
interview and statistical results. These two open-ended questions were also intended for
triangulation purposes, so that unclear responses by respondents in the interviews could
be cross-checked with the written answers.
3.4.2 Demographic profiles Demographic information is needed not only to filter out the respondents based on
predetermined criteria, but also to conduct the data analysis. The demographic data used
in the current study for screening the respondents were: (1) employment status (only

77
full-time civil servants); (2) education (a minimum of bachelor’s degree); (3) type of
university (public higher education institutions); and (4) work experience (no less than
five years’ work experience).
There were five demographic variables that were entered into the analysis model. First,
gender indicated female or male; Second, educational level was grouped into the
bachelor’s degree, master’s degree and doctoral degree; Third, work experience that
was classified into 5-10 years, 11-20 years and 21 years and above; Fourth, institution
size was divided based on the total number of students developed by the Directorate
General of Higher Education, which are small universities (<5,000), medium-sized
universities (5,000-10,000) and large universities (>10,000), and fifth, age was grouped
into ≤ 25 years, 26-45 years, and ≥ 46 years.
The rest of the questions were used to support the analysis. Among them were years to
complete the bachelor’s degree, degree major, place where highest education level was
completed, academic rank, managerial position, marital status, ethnicity and religion.
Specialisation was grouped following the disciplines formulated by the Directorate
General of Higher Education accessed in 2013
(http://evaluasi.dikti.go.id/dok/rumpunilmu).
Both forms of the questionnaire (paper-based and web-based) included a participant
information sheet that had been approved by the Human Resource Ethics Committee of
the University of Wollongong. The questionnaire was presented in Indonesian for the
fieldwork (Appendix 5).
3.4.3 Schein’s interview protocol
Schein’s interview protocol was adapted to the current study. The questions in the
protocol (Appendix 6) were used to find out the job history of the sample, and what they
really wanted from their work, not only in their past career but in their present situation
and future career. Schein (2006a, pp. 28-33) developed four main questions as
icebreakers, with two subsequent questions and some probes in each question, to
investigate the participants’ career anchors. The questions asked about education from
high school to higher degree, included area of specialisation, first job after graduation
and experiences at work, next job, and the reasons behind the change, lessons learned

78
from the new job and a history of work experiences, including work satisfaction,
ambitions, major competencies and career pattern.
The current study adapted this standard structured-interview protocol questions to
identify the dominant career anchors. The interview protocol was presented in English
and Indonesian versions (Appendix 6).
3.4.4 Issues on culture related to translated instruments Translation and interpretation become a major problem when scales developed in the
West are translated into an Eastern culture (Hofstede 1991; Feldman & Bolino 2000;
Bryant & Son 2001). Although some researchers doubt the applicability of the career
anchor inventory when the instrument is used in locations other than western countries,
Schein (n.d.) stressed that the career anchor concept has been used worldwide, by
saying ‘the booklet [questionnaire and its instruction] has been translated into many
other languages and is used in Europe, Latin America and Asia, specifically Japan’ (p.
5). Furthermore, Fock et al. (2011) emphasised that there were differences in the
interpretation of psychological empowerment between individuals with a high
collectivistic culture and those with a low collectivistic culture. Feldman and Bolino
(2000) and Schein (2010) emphasised that each organisation and individual has their
own culture, which affect the two parties’ attitudes in the workplace. These findings
show that culture may influence individuals in giving responses in a study.
In practice, the cultural issues can be minimised. Mays (2007) suggested conducting a
pilot study to accommodate the national settings. Forward translation - that is, where the
document is translated from English by a native speaker of the target language or an
expert bilingual panel convened by an editor can be used (WHO 2013). Fock et al.
(2011) and Brislin (1980) suggested using a back-translation procedure, where the
translated document is retranslated into English, while Ituma and Simpson (2007)
conducted interviews and then revised the original instrument based on the results for
use as a survey questionnaire. Because of the Nigerian cultural context, Ituma and
Simpson (2007) also used face validity to examine the validity of their qualitative study
by employing two independent researchers.
79
The three scales have been applied into some studies using languages other than English
with satisfactory reliability. For example, the career anchor inventory has been
translated into Hebrew (Dazinger & Valency 2006; Dazinger, Rahman-Moore &
Valency 2008); the psychological empowerment scale has been translated into Swedish
with alphas of 0.77-0.90 (Hocwalder & Brucefors 2005), Turkish with alphas of 0.81-
0.88 (Uner & Turan 2010), German with alphas of 0.76-0.82 (Schermuly, Schermuly &
Meyer 2011), and Chinese with alphas of 0.64-0.83 (Fock, et al. 2011). The job
satisfaction scale had been used in German with an alpha score of 0.76 (Schermuluy,
Schermuly & Meyer 2011).
All three instruments and the interview protocol used in the current study were
translated into bahasa Indonesia (Indonesian language) for fieldwork purposes. To
minimise the cultural issues and to increase the validity and reliability, the researcher
combined the forward and backward translation methods, following Ituma and
Simpson’s (2007) approach.
Four steps were undertaken to ensure the validity of the questionnaire and the interview
protocol. Given the present research has bilingual skills (English and Indonesian), the
researcher translated the career anchor inventory, the psychological empowerment scale
and the job satisfaction scale, including the open-ended questions and demographic data
used in the current study. Second, the three scales and the protocol were tested for face
validity by four experts in the fields of management, psychology, Indonesian (language)
and science. The experts had educational backgrounds from overseas and had the
academic rank of senior lecturer or above. They received two versions of the
questionnaires (English and Indonesian). While they did not comment on the translated
interview protocol, changes were made to the translated questionnaire based on their
feedback. Table 3.2 shows the feedback on the questionnaire.
Third, the revised questionnaire was then sent to the Indonesian Laboratory (Lembaga
Bahasa Indonesia) at the University of Bengkulu, Indonesia, for the final check. Some
minor revisions, such as capital letters, punctuation, and spaces were made. The final
revision was ready for a pilot study as a final test of the translated questionnaire. Last,
returned questionnaires from the actual respondents were tested for the validity and

80
reliability. For the interviews, after identifying themes, the backward-translation
strategy was applied.
Table 3.2: Suggested revisions to the questionnaire
3.5 Data collection method Upon receiving approval from the Human Resource Ethics Committee at the University
of Wollongong involving participant information sheet, letters of consent from
participating institutions, survey questionnaire and interview protocol, the researcher
engaged in the fieldwork. A pilot study was first carried out in Indonesia.
3.5.1 Pre-testing the survey instrument The purpose of pre-testing (or piloting) a questionnaire is to find out ‘errors in the
design and improper control of extraneous or environmental conditions’ (Cooper &
Schindler 2006, p. 281) that can be revised before administering the questionnaire to the
actual respondents. Moreover, according to Ticehurst and Veal (2000) and Zikmund
(2010), a pilot study is useful for: (1) testing questionnaire wording, sequencing and
layout; (2) estimating response rate and time needed to complete the questionnaire; (3)
testing the analysis procedure; and (4) gaining familiarity with respondents. This
present pilot study followed the four points above.
The present scales then were piloted with 30 participants who were only from Indonesia
at the 12th Malaysia-Indonesia International Conference on Economics, Management
and Accounting on 13th October 2011 in Bengkulu, Indonesia. The participants,
academics from various universities across geographical areas in Indonesia, had
Original words Translation Revision Addition English Indonesian Indonesian English Indonesian
Organisation Organisasi - /Institution /Institusi To be in charge Bertanggung jawab Terlibat - - Business enterprise Bisnis Usaha (bisnis) - - Independence Kebebasan Tidak tergantung - - My impact Dampak saya Keberadaan saya
berdampak - -
Department Departemen - /Work unit /Unit kerja On demographic data: religion
Bagian informasi demografi: agama
- Kong Hu Chu
Kong Hu Chu

81
different demographic backgrounds in terms of formal education, specialisation,
academic rank, ethnicity and religion. The questionnaires were then distributed to
participants, who voluntarily completed them and had the opportunity to give feedback.
The time required to complete a questionnaire was 15-25 minutes. No feedback was
received. Participants only ticked the forced-choice questions and some demographic
questions.
Because the purposes of the pilot study were not met which were no comments, another
pilot testing was run a week later to a new group consisting of 20 academics from
various fields (agriculture, politics, management, engineering, physics and law) at the
University of Bengkulu, Indonesia. Some minor corrections had been suggested, such as
making margins consistent and correcting minor typos. These corrections were made,
the final questionnaire was then ready to administer to the actual respondents.
3.5.2 Data Collection procedures
There are three procedures that can be selected in conjunction with mixed-methods
(Creswell 2009, pp. 14-15). The procedures are: (1) Sequential mixed-methods: the
results of one method are extended over the other method. The procedure can be done
with a combination of interviews first (qualitative research) and continued with a survey
(quantitative research) or vice versa; (2) Concurrent mixed-methods: the quantitative
and qualitative data collection occur simultaneously, and their analyses are combined,
and the results are integrated at the interpretation stage; and (3) Transformative mixed-
methods: a theoretical lens is applied as an overarching perspective within a design that
includes the quantitative and qualitative data. Teddlie and Tashakkiro (2009, pp. 238-
239) proposed six data collection strategies, which could be combined: observation,
unobtrusive measures, focus groups, interviews, questionnaires and tests.
Interestingly, while Creswell and Plano Clark (2011) argued that there is no reference to
refer to except the one that is drafted by Teddlie and Tashakkiro (2009), Couter (2011)
provided a mixed strategy only for a survey study by stating that the incorporation of
internet and mail surveys is as a part of the mixed mode strategy. The two strategies can
be conducted in the concurrent or sequential mixed methods designs. Zikmund et al.
(2013, p. 229) wrote that ‘a mixed mode survey can employ any combination of two or
more survey methods’. Because the mixed-methods strategy is still relative new

82
(Creswell & Plano Clark 2011), this study used guidelines on those procedures that
were prevalent and recognised widely.
The data collection procedures in the current study were as follows. Unlike Feldman
and Bolino’s (1996) study that conducted interviews first and then distributed the
survey questionnaire, the current study distributed the survey first. The procedure
chosen was adapted from the method designed by Schein (1990) for a workshop in his
book ‘Career anchors: trainer’s manual’ by stating that ‘after all participants have
completed their inventories, then assemble into dyads for the interviewing process’ (p.
5). He stated that after completing the career anchor inventory, all respondents got
together for the interviewing process. Research problems were developed based on the
literature review, and hypotheses were generated from the conceptual reviews. He
argued that the way in discovering one’s career anchor could be applied to any purposes
and settings. Hence, the current study conducted the data collection by simultaneously
sending the self-administrated questionnaire (paper-based and web-based) out to the
respondents to be completed and conducting interviews with randomly selected
participants.
The fieldwork was undertaken in two steps as follows:
a. Self-administrated questionnaire
As discussed earlier, this study used the short form of the career anchor inventory
(Igbaria & Baroudi 1993), the psychological empowerment scale (Spreitzer 1995) and
the job satisfaction scale (Igbaria & Baroudi 1993). In addition, the quantitative
instrument also included open-ended questions and demographic information. All
statements used a six-point Likert scale while the demographic data were in open-ended
and closed-ended formats. Questionnaires were prepared in both an electronic and a
paper-based format, and distributed as follows.
1. Paper-based survey. The researcher visited the targeted universities. At each
prospective university, the researcher gained permission to run the survey and discussed
the administration of the questionnaire. The hard copy of the questionnaire was sent out
to respondents at the selected schools/departments. The respondents volunteered to fill
out the questionnaire, then returned the completed questionnaire directly to the

83
researcher at a face-to-face appointment. These ways are considered the best method to
achieve a greater response rate. Duplication of the respondents was minimised by
asking them on the information sheet only to complete the questionnaire once.
2. Web-based survey. A set of questionnaires was sent out using two strategies. First,
the survey was delivered to all respondents via selected email lists where academics
registered, such as a group of Indonesian academics and the Indonesian Students
Association in Australia. The researcher sent a letter in advance, introducing the
research project and providing a link to the survey questionnaire itself to the coordinator
of each email list. After receiving approved, a questionnaire was sent to the coordinator
to deliver to the email list. However, for the referral email, the present researcher sent
the questionnaire as an attachment via an email directly and individually to the email
accounts listed on the researcher’s list. The survey allowed the respondents three
months to complete the questionnaire. The researcher sent a reminder notice each month
to respondents. It was assumed that within three months, the researcher would get a
reasonable response rate of at least 50 percent. In addition, because the survey was
voluntary, the respondents could withdraw at any time.
b. Interview
The researcher conducted an in-depth structured interview with the participants at each
university, employing the concurrent-embedded strategy as discussed in Sub-section
3.3. The participants were all academics, comprised of both those who held managerial
positions (e.g., vice rector, vice dean, head of departments/schools) and those who
performed functional tasks (teaching, research and community service). As for the
survey questionnaire, the criteria for the interviewees were full-time employment, civil
servants status, and more than five years’ work experience. During the interview, with
permission from the participants, the interview was audio recorded and the researcher
took notes to ensure all data were covered. For analysis purposes, the interview was
transcribed. The interview itself was conducted after the administration of the survey
questionnaire to the respondents during one visit.
3.5.3 Testing validity and reliability in measurement
A good measurement is characterised by having a degree of validity (accuracy) and
reliability (consistency) (Cooper & Schindler 2006; Bhattacherjee 2012; Zikmund et al.

84
2013). In relation to the research design, triangulation validation was used (Cavana,
Delahaye & Sekaran 2001), in which the respondents’ answers to the questionnaire
could be validated in the interview. In this approach, researchers administer the survey
questionnaire to larger numbers of individuals, and interview a selection of them to
gather their views concerning the topic researched. There are several different
approaches to validity and reliability testing in both the quantitative and qualitative
methods (Creswell & Plano Clark 2011), as discussed below.
Quantitative validity and reliability check
Validity refers to the accuracy of a research instrument to measure what it is purported
to measure. It means that ‘the scores received from participants are meaningful
indicators of the construct being measured’ (Cooper & Schindler 2006, p. 210). In
contrast, reliability measures the internal consistency of an instrument in measuring a
concept (Sekaran 2010; Zikmund et al. 2013). Sekaran (2010, p. 171) argued that
‘validity and reliability attest to the scientific rigor applied to the research study’. The
results of testing a given study’s result could be that the results are valid and reliable,
reliable but not valid or neither valid nor reliable.
Internal validity was the main concern for the current study. Internal validity is intended
to determine whether a cause-effect relationship among variables exists (Creswell &
Plano Clark 2011). Construct validity was therefore established to examine the validity
of the career anchor inventory, the psychological empowerment scale and the job
satisfaction scale. Unlike content validity or face validity, which measures the content
of the items using a group of experts, and criterion-related validity that examines
whether the measures correlate with some external measures, construct validity attests
to ‘how well the results obtained from the use of the measure fit the theories which
around the test is designed’ in a predictive way (Sekaran & Bougie 2013, p. 227).
Construct validity takes two forms: discriminant and convergent validity. Discriminant
validity is assessed when two variables are differentiated, while convergent validity is
established ‘when the scores obtained with two different instruments measuring the
same construct are highly correlated’ (Sekaran & Bougie 2013, p. 227). Construct
validity is the strongest validation in measuring ‘individual differences of hypothesized
constructs’ (Westen & Rosenthal 2003, p. 608). Limited construct validity can cause a
85
problem in interpreting the data. Igbaria and Baroudi (1993) noted how crucial construct
validity is in a study by stating that convergent validity should be tested along with
discriminant validity to show how accurate the instrument is. The current study,
therefore, decided to measure the discriminant and convergent validity of the career
anchor inventory, the psychological empowerment scale and the job satisfaction scale.
Factor analysis was used to establish the construct validity of the three instruments.
According to Sekaran and Bougie (2013, p. 227), factor analysis refers to a multivariate
analysis ‘that confirms the dimensions of the concept that have been operationally
defined’, including the identification of the items that are ‘most appropriate for each
dimension’. In contrast to the validity examination of the career anchor inventory and
the job satisfaction scale in which some previous studies used exploratory factor
analysis (e.g., Igbaria & Baroudi 1993; Custodio 2000; Ituma & Simpson 2007), the
majority of previous studies that used the psychological empowerment scale employed
confirmatory factor analysis (e.g., Spreitzer 1995; Chiang & Jang 2008; Dhladhla
2011). It is assumed that not only did those studies follow Spreitzer’s procedures in
testing validity, but the validity of the instrument was also very well established.
Exploratory factor analysis was employed in the current study to discover the nature of
constructs based on data influencing a set of responses, rather than confirmatory factor
analysis which is aimed at testing a specified set of constructs that influence responses
in a predicted way (deCoster 1998).
To measure the consistency of scales, internal consistency reliability was employed.
This measures the ‘consistency between different items of the same construct’
(Bhattacherjee 2012, p. 57). The reliability of a measurement can be seen when the
items and the subsets of the items are highly correlated. The most common test used for
testing internal reliability is Cronbach’s alpha coefficient (Sekaran & Bougie 2013)
developed by Lee Cronbach in 1951, ranging from 0.00 (completely unreliable) to 1.00
(perfectly reliable). There is no rule to determining the minimum alpha score that can be
said to be reliable. An alpha score of 0.8 (Osborn, Christensen & Gunter 2001) or 0.7
(Nunnaly & Bernstein 1994) can be used as a reference. Likewise, Tolmie, Muijs and
McAteer (2011) suggested that alphas between 0.6 and 0.9 covered a range from
adequate to good.
86
The majority of previous studies, including those using the original scales (Igbaria &
Baroudi 1993; Spreitzer 1995; Custodio 2000; Feldman & Bolino 2000; Myerson &
Kline 2008; Dickson & Lorenz 2009), employed Cronbach’s alpha to analyse the
reliability of the three instruments used. The current study therefore used Cronbach’s
alpha coefficient to measure the reliabilities of the career anchor inventory, the job
satisfactory scale, and the psychological empowerment scale. A minimum alpha score
of 0.6 was used as evidence of reliability, as suggested by Nunnaly (1967). A package
of SPSS (Statistical Package for Social Science) software version 19.0 for Windows
was used to analyse the internal reliability.
Qualitative validity and reliability check
Unlike the quantitative data, which used statistical analysis to measure validity and
reliability, the qualitative data were tested using several procedures. Although whether
validity or reliability is more important on the qualitative research has been debated,
Creswell and Miller (2007, cited in Creswell & Plano Clark 2011) suggested three types
of validity procedure. Member-checking approach is done by giving the summary of
findings to the key participants for feedback purposes, while the disconfirming-evidence
approach confirms the accuracy of data by establishing evidence. The third approach is
triangulation, in which researchers construct evidence for codes or themes from multiple
sources or individuals. Creswell and Miller also mention another approach that is
similar to the peer review. Researchers can ask graduate students or faculty who are
familiar with the research topic or independent external auditors or individuals who are
not related to the project, to use their own criteria in reviewing the analysis results.
Although Cooper and Schindler (2006) found that consistency was not expected in the
qualitative studies, this does not mean that reliability is irrelevant. Gibbs (2007)
provided procedures to show the importance of transcript checking to ensure there are
no salient errors, no deviation of codes’ definition and no alteration of codes’ meaning,
and cross-checking of codes. Creswell (2009) encouraged qualitative researchers to use
Gibbs’ procedures. He also recommended one procedure called ‘intercoder agreement’
(p. 191). The procedure needs researchers to find another person for cross-check
purposes. As a reference, Miles and Huberman (1994) recommended a minimum of 80
percent coding consistency as a good level. Therefore, the current study employed
Gibbs’s (2007) and Creswell’s (2009) procedures for qualitative reliability analysis.

87
As discussed in Sub-section 3.4.3, the interview protocol was translated into bahasa
Indonesia (the official language of Indonesia). Two experts in this area - one expert who
graduated from an overseas university and a domestic graduate with English-language
background – were then asked to provide peer review in the form of face validity. Both
experts held at least a doctoral degree. The experts were given the English and
Indonesian versions of the interview protocol and asked to check the wording. Finally,
before using it in the actual survey, the translated and revised interview questions were
sent to the bahasa Indonesia laboratory, accredited the by Indonesian government.
3.6 Data analysis design As discussed in Sub-section 3.2, the current study applied the concurrent-embedded
approach, in which the primary data obtained from the quantitative study and the
qualitative data are treated as supporting information. Although data collection is done
separately, the data analysis and results are combined to compare the similarities and the
differences. Creswell (2009) argued that there is no fixed rule to analyse data from the
quantitative and qualitative approaches. Thus, in conjunction with the study design, the
current study analysed the quantitative and the qualitative data separately. Then the
results of both methods were combined for comparison. In other words, the qualitative
results were quantified by calculating how many times the themes occurred, and
compared with the quantitative results.
At the stage of data analysis, the interpretation of results and the discussion were
presented separately. This is because the weight of the two methods do not allow for a
combination. However, the results were integrated to complement each other where
they should be for an in-depth understanding.
3.6.1 Statistical analysis design
In conducting the statistical design for analysis, the current study referred to three
sources. First, the researcher consulted the Statistical Consulting Centre of the
University of Wollongong. Second, the researcher referred to the statistical literature
(e.g., Baron & Kenny 1986; Miles & Shevlin 2001; Dancey & Reidy 2004; Tabachnick
& Fidell 2007; Creswell 2009; Hair et al. 2010; Creswell & Plano Clark 2011; Siegel
2011; Tolmie, Muijs & McAteer 2011; Soper 2012; Sekaran & Bougie 2013; Zikmund
88
et al. 2013). Third, previous empirical research in the same area was used as a reference
in designing the analysis (e.g., Spreitzer 1995; Custodio 2000; Schein 2006a; Ituma &
Simpson 2007; Meyerson & Kline 2008; Wang & Lee 2009).
In this study, the data gathered were classified into two groups: the quantitative and
qualitative analysis. As discussed earlier, the quantitative data were analysed first. This
study was designed to find out academics’ dominant carer anchors and to test the
proposed hypotheses using statistical tools. The SPSS software package version 19.0 for
Windows was used in analysing the data (Fiddler et al. 2011; Levin, Fox & Forde
2013). The qualitative results were used to support the quantitative findings.
Dominant single career anchor was identified through the highest frequency measured
by the highest mean value attained (Issue 2). Schein and van Maanen (2013 p. 17)
suggested that the ‘highest score’ (of individuals) ‘could be considered as their career
anchors’. Because this study used the six-point Likert scale, a mean value of 3.00 and
above was used as a threshold value to simplify the analysis (Owuor 2001; Hopkins
2002). Following the measurement of single career anchors, multiple career anchors
were determined by more than one of the highest mean values simultaneously with a
cut-off value of 3.00.
Dominant multiple groups-based anchors were also examined by the highest frequency
(Issue 3). Feldman and Bolino’s (1996) multiple career anchor categories were
measured by deriving Schein’s single career anchor typology. The researcher grouped
the single anchor categories into talents-based, needs-based and values-based anchors.
Respondents who had the combination of the three groups were regrouped into a new
multiple groups-based anchors category. For instance, in Schein’s concept, one
respondent has the dominant anchors of managerial competence and technical
competence; those anchor categories are then grouped as the talents-based anchors.
Another respondent had service and autonomy. Because service is a values-based
anchor and autonomy is a needs-based anchor, those anchors are classified into a new
multiple groups-based anchors category. In this study, the frequency of multiple groups-
based anchors was summed and ordered to indicate the highest frequency.

89
The dominant career anchors were then examined for their relationships to identify
complementary and mutually exclusive anchors by pairing the anchors (Feldman &
Bolino 1996). A bivariate Pearson’s correlation matrix analysis was employed to pairs
of anchor categories, and only the significant correlation values were analysed further.
Pearson’s correlations measure the degree of the relationships between variables
(Tabachnick & Fidell 2007; Siegel 2011; Bhattacherjee 2012). It is possible to have two
variables that are strongly related. A positive sign (+) indicates complementary anchors,
while a negative sign (-) indicates mutually exclusive anchors. Based on relationship
pair anchors, an octagonal diagram was drawn, with orthogonal anchor relationship
pairs placed opposite one another and similar anchors clustered together.
Nonparametric statistics was used to test the distribution of the career anchors. A chi-
square test for goodness-of-fit (χ²) was employed to test the frequency distribution of
single career anchors, as conceptualised by Schein (1978) (H1), and multiple groups-
based career anchors, as reframed by Feldman and Bolino (1996) (H2). The chi-square
test for goodness-of-fit was used to assess whether the obtained frequencies differred
significantly from the expected frequencies (Dancey & Reidy 2004). Hence, the
goodness-of-fit test was employed to compare a set of sample frequency distribution of
the current study with a hypothesised distribution.
Hierarchical multiple regression analysis (HMRA) was employed to examine a series of
proposed hypotheses. Hierarchical analysis is ‘theoretical or for testing explicit
hypotheses’ (Tabachnick & Fidell 2007, p. 143). In this study, it was used to test
whether career anchors (Hypothesis 3a) and psychological empowerment (Hypothesis
3b) predicted job satisfaction and whether career anchors predicted psychological
empowerment (Hypothesis 3c) (Steele 2008; Hair et al. 2010; Siegel 2011). The
statistical tool was also used to investigate the mediation effects of psychological
empowerment in the career anchors and job satisfaction relationships (Hypothesis 3d).
Career anchors were measured individually in the forms of nine anchor categories
(managerial competence, technical competence, autonomy, entrepreneurial creativity,
service, lifestyle, pure challenge, economic security and geographical stability) and
psychological empowerment was examined individually based on the four facets
(meaning, competence, self-determination and impact).

90
There are reasons for the use of HMRA as opposed to the popular structural equation
modelling (SEM) that has drawn researchers in the areas other than the study of career
anchors. Unlike structural equation modelling, in which the computer software controls
the variables examined (Hair et al. 2010), in HMRA, the researcher determines the
order of variables entered into the computer. The researcher can see ‘what happens to
the influence of one variable once others have been introduced’ (Tolmie, Muijs &
McAteer 2011, p. 108). Moreover, HMRA is a powerful tool with some important
capabilities: it (1) predicts the effects of predictors (independent variables/X) on
criterion variables (dependent variables/Y) and controls for demographic variables
(Steele 2008), so that the effects occur free from demographic influences (Dencey &
Reidy 2004); (2) offers a better fit for the examination of the interactions of variables;
(3) measures the direction and size of the effects of each variable on the dependent
variables, as well as providing R2 values that can tell the degree to which a set of
variables fits and explains the dependent variables (Neuman 1997); and (4) has also
been used by some recent researchers in examining career anchors and psychological
empowerment topics and their relation to other attitudinal outcomes (e.g., Meyerson &
Kline 2008; Steele & Francis-Smythe 2008; Dekhordi et al. 2011).
In examining the mediators’ roles, the researcher referred to the procedures of Judd and
Kenny (1981), Baron and Kenny (1986), and Kenny, Kashy and Bolger (1998). Four
steps must be undertaken sequentially to regress: (1) the predictor (X) on the criterion
(Y), (2) the predictor (X) on the mediator (Med), (3) the mediator (Med) on the criterion
(Y) when X and Med are the predictors; and to establish (4) the degree of the
relationship between the predictor (X) and the criterion (Y). When the influence of X on
Y controlling for Med is zero, a full mediation occurs. However, when the effect
reduces after Med is introduced, a partial mediation occurs.
Prior to testing the mediation, Pearson’s bivariate correlations should be performed.
This test must show significant correlations between the predictor and the criterion,
between the predictors and the mediators, and between the mediators and the criterion.
The mediation operating in this study began with entering demographic data as control
variables, followed by career anchors and psychological empowerment in the
independent blocks. Job satisfaction was entered in the dependent block.

91
The significance of the mediation effect was tested using Sobel’s test. Sobel’s
calculation can be done using free online software created by Daniel Soper (2012),
available at http://www.danielsoper.com/statcalc3/calc.aspx?id=31. The calculation
requires information on the beta coefficient (ßA) and standard error (SEA) to examine
the relationship between predictor variables and mediating variables, and on the beta
coefficient (ßB) and standard error (SEB) to examine the relationship between the
mediating variables and the criterion variables. To measure the strength of the
relationships, the standardised effect size of Cohen’s ƒ² was used. According to Allen
and Bennet (2010) the ƒ² effect size in HMRA is measured by a formula:
ƒ² =R²AB - R²A /1 - R²AB........................ (Eq.1)
where R²AB is R square in the regression model.
Cohen’s (1988, 1992) criteria for the ƒ² are: 0.02 is considered a small effect 0.15 is considered a medium-sized effect 0.35 is considered a large effect Selected demographic data were considered as extraneous variables. Bhattacherjee
(2012, p. 12) claimed that ‘…other extraneous variables that are not pertinent to
explaining a given dependent variable, but may have some impact on the dependent
variables, must be controlled for’. Similarly, according to Creswell (2009), control
variables are important in the quantitative study because they have the potential to affect
the criterion. By controlling the demographic variables, the effects that occur are purely
from the results of variables studied. As discussed in Chapter 2, demographic data, such
as gender, educational level, work experience, institution size and age have been
identified as influencing the relationship between career anchors and job outcomes, and
between psychological empowerment and attitudinal outcomes. These five variables of
demographic data, therefore, were treated as control variables.
3.6.2 Thematic analysis Thematic analysis was employed to analyse the qualitative data that were gathered
through the interviews and the two open-ended questions (Miles & Huberman 1994;
Braun & Clarke 2006; Fereday & Muir-Cochrane 2006). Thematic analysis is a form of
92
qualitative analysis that concentrates on behaviour patterns. It is done by identifying
themes that emerge during the textual data analysis. The emergence of themes should be
limited to those that reflect the data. Although Howitt and Cramer (2008) said that the
identification of themes is not easy, some procedures to facilitate it have been
introduced. Aronson (1994), Howitt and Cramer (2008), and Braun and Clarke (2006)
suggested similar steps. Braun and Clarke’s (2006, p. 35) six phases were adapted for
the present analysis because they defined the procedure concisely.
First, the researcher familiarises her- or himself with the data: in the case of this study,
the audiotaped data are transcribed in Indonesian, then translated into English. Second,
the researcher generates the initial codes from interesting features and collates data
relevant to each code. Third, the researcher searches for themes: prospective themes are
developed, and similar data are grouped into each corresponding theme; when no
themes are found, new themes are created. Fourth, the researcher reviews the themes:
the emerging themes are examined to evaluate the meaning. Fifth, the researcher defines
and names the themes: the identified themes are re-examined, including their meaning,
using related references; at the end, each theme is named and given a clear definition.
Sixth, the researcher produces the report: the final name of each theme is written down
along with its meaning. At least one quotation from a participant supports each
identified theme.
It is generally recommended that researchers carry out their data collection themselves
(for example, conduct their own in-depth interviews) and do their own data transcription
(Howitt & Crames 2008; Siegel 2011). In the current study, the researcher conducted
the interviews by herself and carried out all steps in identifying themes, both in
responses from the interviews and from the open-ended questions. After identifying
career anchors from the interview, the researcher analysed the responses to the two
open-ended questions. The responses were translated into English manually. Then,
responses for each question were systematically assessed for thematically similar words
and phrases and grouped into themes (thereafter macro) and sub-themes (thereafter
micro) (Muchiri & Cooksey 2009). Finally, the answers from the open-ended question
of each section of the scales were used to support the discussion of the data analysis.
93
Finally, following the thematic analysis, the association of all results with the concepts
of career anchor, psychological empowerment and job satisfaction were discussed,
along with and the results of the survey questionnaires.
Summary
This chapter has discussed the methods and procedures with regards to the mixed-
methods approach used in the current study. It has described the study approaches and
research design. The survey questionnaire and interview, has described including the
administration of the surveys, the mixed-methods sampling strategies and the sample
size were discussed. The development of the career anchor inventory, the psychological
empowerment scale and the job satisfaction scale, as well as the testing of validity and
reliability, were discussed. The interview protocol designed by Schein and how to test
its validity and reliability were also presented. Cultural differences had been anticipated
by describing how these were dealt with. The pilot study was also described and the
results were reported. The mixed-methods data collection procedures for the paper-
based and web-based surveys, and the interviews were explained in detail. The chapter
ended by the discussion of data analysis design, the statistical tools used for the
quantitative analysis and thematic analysis used for the qualitative analysis.
The following chapter presents the quantitative findings. It will describe the response
rate and the demographic information. The chapter will discuss findings related to
research issues and test the proposed hypothesis.
94
Chapter 4
Results of Quantitative Analysis 4.1 Introduction Chapter One presented the purpose of the study, the reasons for conducting the research,
the problem statement and its issues, and the significance of the study. Chapter Two
conceptualised the framework of the study and reviewed theoretical contributions and
empirical studies related to the variables studied. It also formulated hypotheses to be
tested in this study. Chapter Three provided the research method of the study. It
discussed the study approaches, the sampling, the data collection procedure and the data
analysis design. The chapter included the discussion of the instruments construction and
cultural issues.
This chapter reports the findings of the survey questionnaire of this study. It discusses
response rates in terms of the number of online and hard copy questionnaires returned
by the respondents. It presents information regarding the demographic characteristics of
the respondents. It also reports on the construct validity and internal reliability of the
career anchor inventory, psychological empowerment scale and job satisfaction scale.
Analysis of the data begins with an examination of the dominant career anchor from the
single career anchor point of view. It then discusses the multiple career anchor concept
according to Feldman and Bolino (1996), including complementary and mutually
exclusive categories that show the relationship pairs between career anchors. Finally, the
chapter proposes answers to the research questions, the research model and tests the
hypotheses, including the testing of mediating and moderating variables.
4.2 Data screening and response rate Data gathered from the fieldwork using both a web-based survey and a paper-based
survey received an initial screening. The data screening is intended to verify that no
variable was missing and to set up the validated questionnaire for data analysis. First,
the researcher filtered the questionnaires returned manually to determine that they met
the sample criteria. Then, the demographic data were handled separately, as discussed in
Sub-section 4.3. The surveys were then screened for missing responses by conducting a

95
missing values analysis. Following the preliminary data screening, the questionnaires
were counted to determine response rates. The rate of return was established to
determine the total valid number of questionnaires for analysis. The period of data
collection for both methods was undertaken between 25 October 2011 and 31 January
2012. The next two sub-sections give a detailed discussion of each survey method.
4.2.1 Paper-based survey
The paper-based survey using self-administrated questionnaires was distributed to the
potential respondents using an in-person drop-off strategy (Riley & Kiger 2002). By
applying proportional multi-stage cluster sampling, the researcher targeted six
universities in three administrative regions in Indonesia (see Appendix 7): three public
universities (universities A, B and C) in the West, one state institution (university E) in
the Central region and one (university F) in the East. At each of the three western
institutions, the researcher randomly handed the surveys to the respondents, and then
collected them over the following five days. Of the 415 questionnaires distributed, 121
declined to respond, 294 were returned and 27 were eliminated as invalid or not meeting
the criteria, leaving a final number of 267 valid questionnaires. At the other three
universities, the researcher dropped the questionnaires off to a person-in-charge and
collected them within two weeks. A total of 105 surveys were delivered to three
persons-in-charge, and 32 targeted respondents declined to respond the survey. Of the
73 responses, 13 were deleted as invalid or not meeting the criteria. Thus, there were 60
valid questionnaires for data analysis.
The researcher also approached the respondents individually in six other universities
(universities H, I, K, L, M and N). A total of 180 questionnaires were sent out to
persons-in-charge, 102 of which were returned. After five questionnaires were
eliminated because the academics were on probation status, 97 were usable for further
analysis.
Thus, the final sample size, in terms of participating institutions, was 11 public higher
education institutions. These included seven in the West, three in the Central region and
one in the East (Appendix 7).

96
To sum up, of the 700-targeted respondents who received questionnaires, 236
respondents (33.71%) declined to participate in the survey. The most common reasons
for nearly three-quarters of them were loss of the questionnaires and unwillingness to
receive follow-up communications. Of the 464 questionnaires returned, 419 (90.30%)
were included in the data analysis. The other 45 questionnaires (9.70%) were excluded
because respondents were on probation status (4.96%) and had less than five years’
work experience (4.74%).
An examination of missing values of the three scales was also assessed in this method.
All items were answered by the respondents (Appendix 8). Therefore, 419
questionnaires were valid for data analysis, giving a response rate of 66.29 percent (see
Table 4.1).
4.2.2 Web-based survey
As discussed in Chapter Three, the emailing lists and referral email strategies were used
to gather data for the current study using a web–based questionnaire. This questionnaire
was uploaded to http://bit.ly/qisGD5. Three email lists were targeted for participation:
(1) Indonesian academic email list: a closed list that all Indonesian academics from both
public and private institutions can join following approval from the administrator;
(2) Indonesian Students Association email lists in Australia: members of this group
have a wide range of job titles, including many in the academic sector. Of the seven
email lists in seven states in which contacts were made, only four could be contacted.
Of these four, two responded. One was disregarded because there was no further
response from its administrator after having a short communication, and another used
the referral email via a contact person, rather than the web-based survey; and
(3) Faculty and Schools’ email lists at three-targeted universities (see Appendix 7): after
having permission from one university (university D) that the researcher visited, the
survey questionnaire was distributed via the faculty’s email list. At the other two
universities (universities G and J), the contact persons voluntarily attached the survey to
their internal email lists.

97
Another strategy used was to recruit and refer via individual email accounts. The
researcher emailed prospective academics randomly, sending them the participant
information sheet and asking them in the email to follow the link on the sheet to
participate in the survey.
A total of 207 randomly selected academics participated in the survey: 139 respondents
from the website and 68 from referral emails. For the on-line survey, 101 (72.66%) of
139 responses (67.15%) were valid for analysis. The other 38 questionnaires (27.34%)
were taken out because they were from private sector academics, who were not eligible
for this study. The remaining 68 questionnaires (32.85%) were those that had been sent
out to the respondents individually through personal email addresses. All respondents
responded to the survey using the link given on the information sheet. However, only 65
responses (95.59%) were valid for analysis. The exclusion of the three questionnaires
(4.41%) was due to the respondents’ probation status, which made them ineligible.
Hence, the total usable questionnaires for data analysis from the web-based survey were
166 questionnaires, a return rate of 80.19 percent (see Table 4.1).
Furthermore, a careful investigation was done to find out whether there were any
missing values in answering the scales. No respondents skipped the items on the
responses (see Appendix 8). Hence, the final number of useful of surveys, both internet
and hard copy surveys, was 585 questionnaires, a response rate of 87.57 percent. The
details of the sample size and the rate of return are shown in Table 4.1.
Table 4.1: Sample size and response rate
Survey methods Distribution Decline Return Deletion Validity Σ* %** Σ* %** Σ* %** Σ* %** Σ* %**
Paper-based
Drop-off 415 59.29 121 17.29 294 70.84 27 9.18 267 90.82 Person-in-charge 285 40.71 115 16.43 170 59.65 18 10.59 152 89.41 Total 700 100.00 236 33.71 464 66.29 45 9.70 419 90.30
Web-based
Online survey 139 67.15 0 0 139 100.00 38 27.34 101 75.66 Referral emails 68 32.85 0 0 68 100.00 3 4.41 65 95.59 Total 207 100.00 0 0 207 100.00 41 31.75 166 80.19
Total of final survey 907 100 236 26.02 671 73.65 86 12.87 585 87.57 *Frequency for sample size ** Percentage for frequency
The response rate of this study was acceptable and comparable and much higher than
most literature studies. Igbaria and Baroudi (1993), for example, had a final response
rate of 36.90 percent, Coetzee and Schreuder (2011) was 7 percent, Chang, Shih and Lin

98
(2010) was 66.70 percent, Dickson & Lorentz (2009) was 13 percent, Weber and
Ladkin (2009) was 15 percent, Ituma & Simpson (2007) was 67.20 percent, Levy
(2006) was 82.66 percent, Hsu et al. (2003) was 31 percent, Custodio (2000) was 98.28
percent and Feldman and Bolino (2000) was 18 percent.
Overall, it can be said that, both the web-based and the paper-based survey methods
were applicable methods to collect data. However, the referral emails strategy was the
most effective way to get the highest response rate.
4.3 Demographic findings
Demographic background information
On the questionnaires, the respondents were requested to identify a number of
demographic profiles for background information and data analysis. After comparison
with the sample criteria in Sub-sections 4.2.1 and 4.2.2, 12.87 percent of the responses
were discarded from the analysis. The preliminary screening indicated that 38
respondents (5.69%) were dropped from further analysis because they were employed
by private universities, 26 respondents (3.89%) were probationary and 22 (3.29%) had
less than five years’ work experience. Hence, the final effective sample comprised 585
full-time, experienced academics from state higher education institutions.
Respondents’ demographic information gathered for the background of this study
(Appendix 9) included the year of first graduation and the discipline, academic rank,
managerial position, location of the highest degree attained, marital status, religion and
ethnic group. While most variables have some missing values for at least some
respondents, managerial position had a complete set of responses. Only 158 respondents
(27.01%) held a managerial or structural position, the other 427 respondents (72.99%)
clearly identified themselves as lecturers. Ninety-seven respondents (16.58%) did not
provide a date of first graduation, and one respondent (0.17%) did not indicate a
discipline or major. Four respondents (0.68%) did not indicate marital status, 18
respondents (3.08%) did not indicate religion and 160 respondents (27.35%) did not
indicate ethnicity. Since the missing values were only 7.98 percent on average and not
included in the further data analysis, it was concluded that those missing figures would
not affect the analysis as a whole.

99
Of the total 585 respondents, 250 (42.74%) received their first degrees during or before
1990, followed by 159 (27.18%) between 1991 and 2000. The largest groups of
academics, 129 (22.05%), majored in the plant sciences (e.g., agronomy, socioeconomic
agriculture, horticulture, and pest and diseases), followed by 83 (14.19%) in economics
(e.g., management, accounting, and economics development). Of the total academic
respondents, 434 (74.16%) completed their highest degrees in domestic universities and
151 (25.84%) overseas (for example, in Australia, France, Germany, Japan, the U.K.
and the U.S.). Most respondents (442, or 75.56%), indicated Islam as their religion, and
519 respondents (88.72%) were married. Approximately half of the respondents (273,
or 46.67%), held a senior lecturer (lektor kepala) position, which is one step below
professor (guru besar), (the highest academic rank); 193 respondents (32.99%) held the
position of assistant lecturer (lektor). As mentioned earlier, only 158 respondents
(27.01%) held managerial positions, with the majority (87, or 14.87%) being academics,
or assigned as heads of school/department. Finally, 176 (30.09%) referred to themselves
as Javanese; followed by 66 (11.28%) as Malay. It can be said that respondents’
backgrounds were of sufficient diversity to avoid a homogeneous sample.
Characteristics of selected demographic variables
The selected demographic variables considered for further analysis were gender,
education, age, institution size and work experience. For the purposes of analysis, all
variables were coded. Gender was denoted as 1 for female and 2 for male; educational
level was denoted as 1 for a bachelor’s degree, 2 for a master’s degree from an
Indonesian university, 3 for a master’s degree from a foreign university, 4 for a doctoral
degree from an Indonesian university, and 5 for a doctoral degree from a foreign
university; work experience was denoted as 1 for five to10 years, 2 for 11 to 20 years,
and 3 for over 20 years; Institution size was grouped based on Dikti’s categorisation
(Direktorat Jenderal Pendidikan Tinggi 2013) and denoted as 1 for a small university, 2
for a medium-sized university and 3 for a large university; and age group was denoted
as 1 for up to 25 years, 2 for 26 to 35 years, 3 for 36 to 45 years, 4 for 46 to 55 years,
and 5 for 56 years and over. Table 4.2 presents the frequency and percentage of
respondents’ demographic characteristics.

100
Table 4.2: Respondents’ selected demographic characteristics
Description ∑* %**
Gender Female 195 33.33 Male 390 66.67 T o t a l 585 100.00 Educational level Bachelor’s degree 50 8.55 Master’s degree from Indonesian university 305 52.14 Master’s degree from foreign university 64 10.94 Doctoral degree from Indonesian university 78 13.33 Doctoral degree from foreign university 88 15.04 T o t a l 585 100.00 Work experience (in years) 5 to 10 175 29.91 11 to 20 163 27.86 21 and over 247 42.22 T o t a l 585 100.00 Institution size Small (fewer than 5,000 students) 41 7.01 Medium (5,000 to 10,000 students) 247 42.22 Large (over 10,000 students) 297 50.77 T o t a l 585 100.00 Age (in years) 25 and less 16 2.74 26 to 35 108 18.46 36 to 45 171 29.23 46 to 55 255 43.59 56 and over 35 5.98 T o t a l 585 100.00
*Frequency **Percentage
Table 4.2 shows that the sample consisted of 195 females (33.33%) and 390 males
(66.67%). The gender imbalance reflects the composition of the total number of
academics at public higher degree education institutions in Indonesia which is 36.43
percent for female academics and 63.57 percent for male academics as per a 2010 report
published at http://evaluasi.dikti.go.id.
More than half the respondents (305, or 52.14%), held a master’s degree from an
Indonesian tertiary education institution compared to only 64 (10.94%) respondents
who held their master’s degree from an overseas university. Conversely, the number of
doctorates from foreign universities (88, or 15.04%) was only slightly higher than the
number from in-country universities (78, or 13.33%). Overall, as most respondents held
a postgraduate degree, they were well qualified to provide information for the study.
101
Related to work experience, the highest number of respondents (247, or 42.22%) had
worked for more than 21 years at their current higher education institution. The other
two groups were: 175 respondents (29.91%) had worked five to 10 years and 163
respondents (27.86%) had worked 11 to 20 years at their current institution. These
figures indicate that the respondents were mature enough to determine their career
orientation. Schein (1990) pointed out that individuals need at least five years’ work
experience to guide their career choice.
Most respondents (297, or 50.77%) worked at large universities, and 247 respondents
(42.22%) at medium-sized institutions. More than 90 percent of respondents felt that
they had had good opportunities to develop their own careers due to the size of the
institutions.
The largest segment of respondents (255, or 43.59%) were in the age range of 46 to 55
years old, followed by 171 respondents (29.23%) in the age group of 36 to 45 years old
and 108 respondents (18.46%) in the age group of 26 to 35 years old. Consistent with
data on work experience, the respondents’ age groups showed that they were in the
establishment and maintenance stages of their career life cycle (Super 1990), and thus
appropriate in the sample.
To facilitate the analysis, two variables were regrouped. Education was reclassified into
three groups: bachelor’s degree, master’s degree, and doctoral degree. Age was
regrouped into three new groups: 25 years and below, 26 to 45 years and 46 years and
above to correspond to the career life cycle periods that Super (1990, p. 237) identified
as exploration, establishment and maintenance and decline. All selected demographic
variables, including the new regrouped variables, were then tested for their significant
distributions and the results are presented in Table 4.3.
The chi-square tests for goodness-of-fit outputs provide the significant distribution of
the variables. Although the study consisted of more men than women, the statistical chi-
square test for goodness-of-fit suggested a significant difference in the distribution
(χ²[1]=65.000; ρ<0.001). The chi-square test also showed a significant difference in
educational levels (χ²[2]=267.395; ρ<0.001). Similarly, the significant differences were
statistically found in the work experience distribution (χ²[2]=21.169; ρ<0.001) and the

102
institution size distribution (χ²=188.841; ρ<0.001). Finally, there was evidence to
suggest a significant difference in the sample distribution of age ranges (χ²[2]=246.799;
ρ<0.001). At the 0.05 level of significance, all selected demographic variables revealed
that the demographic distribution of respondents statistically approached the sampling
distribution. Hence, the key demographic variables were valid for the study.
Table 4.3: Chi-square test for key demographic variables
Description Chi-square of goodness-of-fit test
Observed N
Expected N Test of statistics
Gender χ² = 65.0001) ρ<.0012) df = 1
1)0 cells (.0%) have expected
frequencies < 5.
2)ρ<.05 is significant.
Female 195 292.5 Male 390 292.5 T o t a l 585 - Educational level
χ² = 267.3951) ρ<.0012) df = 2
Bachelor’s degree 50 195.0 Master’s degree 369 195.0 Doctoral degree 166 195.0 T o t a l 585 - Work experience (in years)
χ² = 21.1691) ρ<.0012) df = 2
5 to 10 175 195.0 11 to 20 163 195.0 21 and above 247 195.0 T o t a l 585 - Institution size
χ² = 188.8411) ρ<.0012) df = 2
Small (fewer than 5,000 students) 41 195.0 Medium (5,000 to 10,000 students) 247 195.0 Large (over 10,000 students) 297 195.0 T o t a l 585 - Age (in years)
χ² = 246.7991) ρ<.0012) df = 2
25 and less 16 195.0 26 to 45 279 195.0 46 and above 290 195.0 T o t a l 585 -
4.4 Construct validity of survey questionnaire
A construct validity assessment is established to define factors underlying the constructs
in the interpretable structures (Meyer & Page 2000; Cavana, Delahaye & Sekaran 2001;
Dancey & Reidy 2004; Bhattacherjee 2012). Each of the three scales used in the current
study was tested for the construct validity through convergent and discriminant validity
(Ghauri & Gronhaug 2005; Sekaran 2010). Convergent validity appears when variables
within a single construct are highly correlated, while discriminant validity is satisfied

103
when variables between a single construct discriminate variables from other constructs
and have low correlation (Meyer & Page 2000; Zikmund et al. 2010; Bhattacherjee
2012). As discussed in Chapter Three, exploratory factor analysis was performed to
measure the construct validity of the career anchor inventory, psychological
empowerment scale and job satisfaction scale. According to Hair et al. (2010), besides
summarising meaningful variables, factor analysis also assesses interrelationships
between variables in a data set.
Prior to factoring the constructs, the Kaiser-Meyer-Olkin measure of sampling adequacy
(KMO-MSA) and Barlett’s test of sphericity were run to measure the factorability of the
data or appropriateness of factor analysis. Using the satisfactory criterion of 0.60 and
higher suggested by the Kaiser measure (Kline 1997), the distribution of the career
anchor inventory (0.729), the psychological empowerment scale (0.808) and the job
satisfaction scale (0.658) were satisfied. The Barlett’s test of sphericity indicated that all
the p-values for three scales were at the significance level of ≤ 0.05 (ρ<0.001), showing
that an identity matrix was not a concern. Hence, the results suggest that the data were
acceptable and suitable for a factor analysis.
Extracting factors were therefore computed. The factor analysis applied the principal
component analysis method to determine the linear relationship of factors and the
orthogonal with varimax rotation to ensure that the factors were linearly uncorrelated.
The criterion of eigenvalues greater than 1 and the scree plots were used to determine
the significant relationship of the extracted factors, and factor loadings at a minimum
level of 0.60 (≥0.60) for convergent validity, and 0.30 and below (≤0.30) for
discriminant validity were considered (Kline 1997; Hair et al. 2010; Zikmund et al.
2010; Bhattacherjee 2012). The scree plots are illustrated in Appendix 10 and the factor
analysis outputs are summarised in Table 4.4.
Correlations between all variables were then explored further by employing a bivariate
correlation matrix. The correlation r-values within the constructs should be higher than
the scores between the constructs, following Igbaria and Baroudi’s (1993, p. 39) rule of
thumb -when they analysed the correlations of a short-form of career anchor inventory-
and no values are above 0.70 (Dancey & Reidy 2004). The correlation matrix in
Appendix 10 presents the outputs, mean and standard deviation of the factors examined.

104
Table 4.4: Factors extracted and factor loadings
Variables Factors
Statistical test 1 2 3 4 5 6 7
Career Anchors:
KMO = .729, χ²= 5213.425, ρ<.001, df = 300;
7 factors were extracted from
eigenvalues > 1; Cumulative
variance explained 64.529%.
Technical competence 1 .673 -.122 .245 .215 -.155 .043 .040 Technical competence 2 .728 -.102 .197 .204 -.106 .052 .009 Technical competence 3 .681 -.032 .288 .250 -.171 -.014 -.035 Geographical stability 1 .687 .101 -.032 -.194 .143 .100 -.015 Geographical stability 2 .696 .195 -.040 -.205 .215 .056 -.005 Autonomy 1 -.263 .698 -.038 .024 -.075 .079 .001 Autonomy 2 -.224 .642 -.012 .012 -.037 .160 .046 Autonomy 3 -.297 .711 .092 .077 .038 .018 -.081 Lifestyle 1 .275 .627 .005 -.001 .081 .023 .189 Lifestyle 2 .236 .706 -.031 .062 .011 .109 .089 Lifestyle 3 .237 .690 .037 -.001 .004 .015 .036 Entrepreneurial creativity 1 .186 -.060 .799 -.098 .062 -.002 .024 Entrepreneurial creativity 2 .098 -.026 .872 .030 .035 .128 .027 Entrepreneurial creativity 3 .059 .161 .842 -.094 .075 .076 -.018 Service 1 .069 -.025 -.021 .813 .084 .035 .100 Service 2 .073 -.027 -.042 .779 .154 .157 .034 Service 3 -.021 .197 -.090 .656 .116 .007 .007 Managerial competence 1 .152 -.033 .076 .189 .753 -.021 .040 Managerial competence 2 -.125 .132 -.031 .006 .801 .040 .049 Managerial competence 3 -.020 -.083 .116 .163 .749 .096 -.027 Pure challenge 1 -.072 .101 -.006 -.030 .002 .751 .101 Pure challenge 2 .070 .079 .043 .055 .077 .782 .061 Pure challenge 3 .185 .049 .183 .198 .035 .712 -.042 Economic security 1 .006 .072 .042 .055 .037 .064 .931 Economic security 2 -.016 .102 -.010 .082 .020 .073 .920 Total variance explained (%) 15.637 13.069 9.237 7.954 6.736 6.299 5.597
Psychological empowerment:
KMO = .808, χ² = 3535.549, ρ<.001, df = 66; 4 factors were extracted from
eigenvalues > 1; Cumulative
variance explained 76.633%.
Meaning 1 .873 .159 .155 .117
Meaning 2 .857 .083 .280 .099 Meaning 3 .866 .119 .175 .142 Impact 1 .158 .858 .105 .117 Impact 2 .108 .835 .008 .249 Impact 3 .076 .906 .044 .074 Competence 1 .252 .033 .840 .057 Competence 2 .223 .013 .889 .073 Competence 3 .098 .109 .711 .244 Self-determination 1 .281 .193 .172 .704 Self-determination 2 .080 .126 .091 .852 Self-determination 3 .035 .117 .112 .840 Total variance explained (%) 37.492 17.228 12.144 9.769
Job satisfaction*: KMO = .658, χ² = 499.520, ρ<.001, df = 3; 1
factor was extracted from eigenvalues >1;
Cumulative variance
explained 64.507%.
Job satisfaction 1 .888
Job satisfaction 2 .887 Job satisfaction 3 .600
Total variance explained (%) 64.507
* No rotated component matrix performed.

105
Factors extracted in Table 4.4 presents the correlated and uncorrelated factors. All items
strongly loaded onto their own factors except items on Factor 1 and Factor 2 of the
career anchor inventory indicating that cross-loadings existed. Five constructs of the
career anchor inventory, four constructs of psychological empowerment and one
construct of job satisfaction were consistent with the original constructs. According to
the definition given in Sub-section 4.4, convergent and discriminant validity were
observed for the measurement model. The two cases in which there was an indication of
cross-loadings will be discussed in Sub-section 4.6.
Career anchor inventory
Table 4.4 clearly shows that the five constructs highly correlated between the items.
Entrepreneurial creativity (Factor 3), service (Factor 4), managerial competence
(Factor 5), pure challenge (Factor 6) and economic security (Factor 7), converged as in
the original constructs. These anchors had factor loadings of 0.799-0.872; 0.565-0.813;
0.749-0.80; 0.712-0.782; and 0.920-0.931 respectively, which accounted for 9.24
percent, 7.95 percent, 6.74 percent, 6.30 percent, and 5.60 percent of the total variance.
Conversely, the emergence of cross-loadings on Factor 1 and Factor 2 determined that
between the items, they were statistically indistinguishable. Items on technical
competence were not discriminated from items on geographical stability, so these two
constructs were merged into one new construct. Similarly, the merging of the autonomy
and lifestyle anchors into another new construct showed a low correlation between these
items. The combined total variance for the seven factors accounted for 64.53 percent.
Moreover, the correlation matrix also demonstrated that all correlation coefficients were
low (Appendix 11). All 21-career anchor variables had correlations between 0.025 and
0.279, below the standard coefficient of 0.7. This confirmed the discriminant validity. In
addition, the mean values ranged from the lowest of 3.772 on Factor 1 to the highest of
5.184 on economic security.
Thus, both factor loadings and correlation matrix coefficients demonstrated the
construct validity of the career anchor inventory. Furthermore, the detailed discussion of
the factors extracted is presented separately as it will answer the most crucial issue of
the research questions.

106
Psychological empowerment scale
The psychological empowerment scale was also valid for the current study. All 12 items
for the four factors had high factor loadings and remained consistent with the original
constructs developed by Spreitzer (1995). No cross-loadings emerged. Three items on
meaning had a high correlation between the items with factor loadings ranging from
0.857 to 0.873 and accounted for 37.49 percent of the total variance. Three items on
impact were also highly loaded between the items with item three having the highest
loading. The values ranged from 0.835 to 0.906, giving the second highest total variance
and explained 17.23 percent of the total variance. Similarly, the remaining two
constructs had high correlations with loadings above 0.70; three items on competence
had loadings of 0.711-0.889 and explained 12.14 percent of the total variance, and three
other items on self-determination had loadings 0.704-0.852 and explained 9.77 percent
of the total variance. These loadings are somewhat similar to those in previous studies
of Ghani, Raja Hussin and Jusoff (2009), for instance. It can be concluded that the items
of each construct are statistically indistinguishable.
Moreover, the correlation matrix shows that all six-factor loadings had low r-values
(0.171 to 0.456), below the requirement of 0.70. The low correlation values also
provided evidence for the discriminant validity. The respondents ranked higher on all
four facets, with the highest mean on competence (5.363) and the lowest mean on
impact (4.077). The convergent and discriminant validity was, therefore, confirmed.
Job satisfaction scale
Factor analysis outputs for job satisfaction were confirmed, but not fully performed.
There was no factor loading for the rotated component matrix result because only one
factor was extracted. The three items remained together in one factor reflecting the
original scale of job satisfaction recommended by Igbaria and Baroudi (1993). The
factor loadings showed higher correlations even though item three scored only 0.60
(0.888, 0.887 and 0.600) and they accounted cumulatively for 64.51 percent of the total
variance. Convergent validity was confirmed. The correlation matrix table also showed
a low r-value of 0.226, meeting the discriminant validity criterion. The respondents
scored high on job satisfaction with an average of 4.421. It was, therefore, concluded
that both convergent and discriminant validity were confirmed.

107
4.5 Internal consistency of instruments
The reliability of the instruments was examined using the internal consistency
measurement. Reliability determines the consistency and stability of a scale when it
measures a concept under different locations and samples (Hair et al. 2010) by
examining the goodness of fit of the scales (Sekaran & Bougie 2013). In this study,
Cronbach’s alpha coefficient (Ghauri & Gronhaug 2005; Allen & Bennett 2010;
Zikmund et al. 2013) was used to test the reliability of the career anchor inventory, the
psychological empowerment scale and the general job satisfaction scale. It has been
suggested to use an alpha value of 0.8 or above (Churchill 1979; Osborne, Christensen
& Gunter 2001). The current study, however, adopted a minimum alpha of 0.6 as
suggested by Nunnaly (1978). The results of reliability analysis are presented in Table
4.5.
Table 4.5: Reliability of the measurement scales
Variables Alpha score
Alpha if item
deleted
Item deleted
Item number in scales
Career anchor inventory:
Factor 1 0.76 - - 5, 12, 20, 14, 18 Factor 2 0.80 - - 2, 7, 21, 10, 19,24 Entrepreneurial creativity 0.83 - - 11, 17,25 Service 0.71 0.77 22 9, 15, 22 Managerial competence 0.71 - - 1, 6, 13 Pure challenge 0.65 - - 4, 16, 23 Economic security 0.87 - - 3, 8
Psychological empowerment scale: Meaning 0.89 - - 1, 2, 3 Impact 0.87 - - 10, 11,12 Competence 0.80 - - 4, 5, 6 Self-determination 0.78 - - 7, 8, 9
Job satisfaction scale: Job satisfaction 0.71 - - 1, 2, 3
Career anchor inventory
After running the factor analysis on a short form of the career anchor inventory
introduced by Igbaria and Baroudi (1993) for the current study, the career anchor
categories were grouped to become seven factors. The alpha coefficients showed that
the seven constructs were high and within the acceptable level. The alpha scores for six
constructs (Factor 1, Factor 2, entrepreneurial creativity, service, managerial

108
competence and economic security) were high, ranging from 0.71 to 0.87 while one
construct (pure challenge) received a moderate alpha coefficient (α=0.65). A detailed
examination of the items indicated that it was possible to improve the alpha coefficient
of the service anchor from 0.71 to 0.77 by removing item 3. The item is ‘a career in
which I can be committed and devoted to a cause’. It is assumed that the respondents
probably found the wording ambiguous. Since the increase was only marginal and the
first alpha score was already at an acceptable level, the three items were, therefore,
retained for further data analysis. In none of the other coefficients could reliability be
enhanced by deleting items.
The alpha coefficients varied somewhat from those found in previous studies. First, the
two new anchors (Factor 1 and Factor 2) have not been reported before, so no
comparison can be made. Second, two career anchors (service and managerial
competence) clearly showed that the alphas for the current study (α=0.71) were lower
than the alphas (α=0.81 and 0.83) found in the study by Igbaria and Baroudi (1993), and
the alphas (α =0.83 and 0.84) by Custodio (2000); only economic security had an alpha
score (α=0.87) that exceeded the original scale (α=0.82) and Custodio’s study (2000)
(α=0.82). In particular, the alpha for entrepreneurial creativity (α=0.83) was slightly
lower than the alpha (α=0.84) in Custodio’s study (2000) and slightly higher than the
one (α=0.82) in the original study. Third, pure challenge received the lowest alpha order
for both the current study (α=0.65) and in the original study (α=0.62) by Igbaria and
Baroudi (1993). Since the previous study had used all three items under pure challenge,
the three items were, therefore, held for data analysis.
Psychological empowerment scale
The reliability calculation of four variables produced high alpha coefficients. The alpha
scores ranged from 0.78 to 0.89. No removal of items was suggested to increase the
alphas. When a comparison was made to the original study conducted by Spreitzer
(1995), the alpha score of meaning (α=0.89) was slightly higher than Spreitzer’s
(α=0.87) while Cronbach’s alpha score for impact (α=0.87) was slightly lower than
Spreitzer’s (α=0.88). The reliability of competence (α=0.80) was also lower than
Spreitzer’s (α=0.81). The alpha score for self-determination (α=0.78) was the lowest,
and similar to that reported in the study by Spreitzer (1995) but the alpha was high at

109
0.81. The present findings were higher than the alpha score found in Collins’s (2007)
study (α=0.62) for meaning, although lower than the one in Chang and Jang’s (α=0.82)
study. Even though there was a variation in the alpha scores, all alpha coefficients in the
current study were found to be acceptable and reliable. Thus, the 12 items of
psychological empowerment were maintained for further data analysis.
Job satisfaction scale
The internal consistency value for job satisfaction was also high. The alpha score was
0.71 and none of the three items needed to be eliminated from the analysis to raise the
alpha. Although the alpha was lower than the original score (α=0.84) introduced by
Igbaria and Baroudi (1993), the score was above the minimum standard of 0.60.
Hence, the three scales used in this study were shown to have a satisfactory internal
consistency. The career anchor inventory now consisted of seven variables with 25
items, the psychological empowerment scale comprised four variables with 12 items
and the job satisfaction scale included one variable with three items.
4.6 Dimensionality of career anchors, psychological empowerment and job satisfaction
This section answers Issue 1 of the research questions in Chapter One.
Issue 1: The relevance of the career anchor inventory, psychological empowerment scale and job satisfaction scale in the Indonesian context.
This question analyses all items underlying each variable of each scale using factor
analysis that was designed to analyse these structures (see Sub-section 4.4). Some
outputs related to this issue are discussed in this Sub-section. However, because the
issue aims to analyse the scales’ items, no hypothesis testing is performed.
Career anchor inventory
Exploratory factor analysis extracted seven factors from nine factors of the career
anchor categories (see Table 4.4). Five factors (entrepreneurial creativity, service,
managerial competence, pure challenge and economic security) were the same as the
original factor structures, while the two new factors emerged during the investigation.
110
Further investigation was, therefore, carried out to examine the factors underlying the
constructs. Seven factors, included Factor 1 and Factor 2 as the new anchors, had been
extracted with eigenvalues greater than 1 and together accounted for 64.53 percent of
the total variance.
Table 4.4 indicates that Factor 1 consisted of two items of the geographical stability
anchor and three items of the technical competence anchor. Those five items then
merged into one new single career anchor with factor loadings from 0.673 to 0.728.
Three items of the original technical competence anchor had loaded higher on the two
items of the original geographical stability anchor. Factor 1 accounted for 15.64 percent
of the variance.
The high loading of technical competence on geographical stability may suggest that
the two anchors are related to each other. It seems that these individuals are unlikely to
move to other places; they strongly show loyalty to their current institutions. As Schein
(2006) pointed out, they prefer to remain in a single organisation and work in their area
of expertise. They feel satisfied when they can use their skills at the current workplace
even though another location is promising. In addition, these people only accept a
technical managerial position that permits them to grow in their specific technical and
functional fields instead of a general managerial promotion. They prefer to work
independently on self-determined goals, free from supervision, asking only for
autonomy and fair access to resources, such as facilities and budgets. These individuals
appreciate their capabilities in technical work, are already settled in one geographic area
and strongly reject promotion or other types of rewards from other institutions.
These people want their pay to reflect their skills, although money is not their top
priority. They expect to be paid on the basis of educational qualifications and work
experience with a professor getting paid more than a faculty member with merely a
doctorate degree (Schein 2006), for example. They are also concerned abot equity
between the earnings of individuals with the same skills and at thw levels. Even though
they would not move to other organisations/institutions, under-payment (when
compared to another individual within the same organisation or other institutions)
would be seen as unfair treatment. However, up-grading skills through training or
education can also be seen as compensation for low financial benefits and generates
111
staff loyalty to organisations/institutions where they work. Further, non-financial
payment is more appreciated in terms of recognition.
In short, these hard workers - as they call themselves - bind themselves psychologically
and emotionally to one workplace with strong attachment to their job titles. Therefore,
they do not distinguish these five items nor the two career anchors of which they are a
factor. This may also be due to the nature of wording of the items in the scale. This new
anchor is, therefore, named ‘work dedication’.
The other new anchor emerged from the merging of autonomy and lifestyle, with factor
loadings ranging from 0.627 to 0.711. Three items of lifestyle were loaded higher on the
three items of autonomy, which accounted for 13.07 percent of the variance. This
merging suggested that individuals want autonomy to manage their work and the chance
to apply their own styles. Job autonomy is required to enable them to express and
implement their skills in order to achieve work goals. Free from supervision, but still
within the rules of the organisations/institutions, is needed by these people.
At the same time, because of the changing social values in real life, this type of
individual wants to integrate their family life and career lives. This does not mean that
their personal life is more important than their career, but, for example when a married
person enters the world of work, taking care of their spouse and children becomes as
important as building a career. Doing personal activities are also important for social
life. So, it takes a balance between a career and family or personal life (e.g., personal
needs) in developing a career. Thus, they require flexibility in work.
In relation to advancement, a promotion will be accepted if the new job gives greater
autonomy in managing work and personal lifestyle. Being a researcher is better than
receiving a managerial position at a university because researchers have more flexible
hours and places of work whereas administrative academics might be expected to
follow ‘office hours’ and always be present in the office, for instance (Schein 2006).
Researchers can set their own time either for work or family. They also will not accept a
promotion to move to another location as it would disturb the stability of the family
situation, such as the removal of children from their existing school and adjustment to a
new school in the new location.

112
In other words, people with this anchor are more concerned with the reality of the
standard of living by seeking autonomy and flexibility at work to balance their work
and family life situation. The anchor is, therefore, labelled as ‘balanced-lifestyle’.
The remaining five anchors represent the original categories. Entrepreneurial creativity,
service, managerial competence, and pure challenge each originally had three items,
and economic security had two original items. Hence, the emergence of the two new
career anchors that have not been reported previously represents a shift of career anchor
structures, particularly for Indonesian academics.
Psychological empowerment scale
The psychological empowerment scale corresponds well to the Indonesian academic
responses. No new factors appeared and the four facets were consistent with the original
constructs introduced by Spreitzer (1995). The factor loadings showed high correlations
between the items for the four variables’ loadings, ranging from 0.704 to 0.906 (see
Sub-section 4.4).
Some previous studies have examined factor structures underlying the psychological
empowerment construct, with varying results. Hocwalder and Brucefors (2005), for
example, found four factors from their Swedish nurse respondents. In Hancer’s (2005)
and Dimitriades’s (2005) studies, three factors were extracted with self-determination
and impact merged into one factor while Col (2008, cited in Unar & Turan 2010)
incorporated meaning and competence into one factor, with the two other remaining the
same as their original dimensions.
Job satisfaction scale
The job satisfaction scale was also shown to apply to Indonesian academics. The only
job satisfaction variable resulted in one factor with its three original items. Two out of
the three items had high factor loadings (0.888 and 0.887) and the third had a 0.600
loading. The total variance explained was 64.51 percent. Although one item had a low
loading, the three items grouped together and were correlated. Igbaria and Baroudi
(1993) found the three items grouped in a single factor, determined that they explained
75.90 percent of the total variance.

113
Thus, even though two new factors emerge on the career anchor inventory, the three
scales used were satisfactory. It, therefore, is appropriate to measure Indonesian
academics’ attitudes in terms of career anchors, psychological empowerment and job
satisfaction.
4.7 Dominant career anchors
The career anchor concept developed by Schein (1978, 1990) is the focus of this study.
The next Sub-sections present the answer to the issues of the research questions and the
results of hypothesis testing. It begins to determine whether there is a dominant career
anchor.
4.7.1 Single dominant career anchor
This sub-section answers Issue 2 of the research questions in Chapter One.
Issue 2: The single or multiple dominant career anchors of Indonesian academics.
Hypothesis 1: Indonesian academics score differently on the single dominant career anchor or multiple dominant career anchors.
As discussed in Chapter Three, the dominant career anchor was measured by the highest
frequency from among the seven career anchors scored by the respondents. The
dominant single career anchor was defined as the highest frequency among the seven
career anchors assessed by averaging the scores for each anchor. When there was more
than one highest mean value, and the values were above the threshold value of 3.00, the
scores were grouped as multiple career anchors. The total number of respondents
anchored on each career anchor was arranged in descending order, from highest to
lowest in order to show the rank order of career anchors. Then, a chi-square test for
goodness-of-fit was performed to test the hypothesis of the different scores between the
numbers of Indonesian academics’ career anchors (see Sub-section 3.6.1). The
frequencies and percentages of the career anchors, and the chi-square test results are
shown in Table 4.6.
Table 4.6 shows the dominant career anchor of academics in public universities in
Indonesia and their significant distribution. It clearly indicates that the highest
frequency was economic security and it became the dominant career anchor in terms of

114
a single career anchor. Nearly half the respondents (42.39%) oriented to this anchor.
The service anchor, as predicted for civil servants (Schein 1990), was ranked second
with 86 respondents (14.70%). It can also be seen that multiple career anchors existed
among 166 respondents (28.38%) and was the second most preferred anchor. Multiple
anchors existed consisting of 60 respondents (10.26%) had two anchors, 83 respondents
(14.19%) academics had three anchors, 14 respondents (2.39%) had four anchors, and
nine (1.54%) had five anchors. This is a crucial finding and needs critical analysis.
Table 4.6: Career anchor order and chi-square test of single career anchors
Career anchors Goodness-of-fit test
Variables ∑* %** Economic security 248 42.39
χ² = 758.5211) ρ<.0012) df = 7
1)0 cells (.0%) have expected
frequencies < 5; Minimum
expected cell frequency is
73.1; 2)ρ<.05 is
significant.
Service 86 14.70 Managerial competence 27 4.62 Entrepreneurial creativity 24 4.10 Work dedication 18 3.08 Pure challenge 12 2.05 Balanced-lifestyle 4 0.68 Multiple career anchors 166 28.38
T o t a l 585 100.00 *Frequency **Percentage
The table also shows the rank order of career anchors of academics according to
Schein’s career anchor concept. The order is economic security, service, managerial
competence, entrepreneurial creativity, work dedication, pure challenge and balanced-
lifestyle. The differences of the frequencies were tested in hypothesis 1.
Table 4.6 also provides the chi-square for the goodness-of-fit test results. There was
evidence through the chi-square test for frequency to suggest a statistically significant
difference between the career anchor scores (χ²[7]=65.000; ρ<0.001) at alpha 0.05. The
hypothesis 1 was, therefore, supported.

115
4.7.2 Multiple groups-based dominant career anchors
This sub-section responds to Issue 3 of the research question in Chapter One.
Issue 3: The talents-based, needs-based and values-based anchors of Indonesian academics.
Hypothesis 2: Indonesian academics score differently on the talents-based, needs-
based and values-based anchors.
As indicated in the study design, the multiple career anchors framework proposed by
Feldman and Bolino (1996) was assessed. Two new factors emerged in the previous
factor analysis (see Table 4.4), which affected the composition of the career anchor
group categories developed by Feldman and Bolino (1996). Work dedication was
excluded from talents-based (for technical competence) and needs-based (for
geographical stability) anchors. They then formed a new group comprised talents-based
and needs-based anchors. By contrast, the balanced-lifestyle anchor remained in the
needs-based anchor group as in Feldman and Bolino’s original grouping.
The shift demonstrated that those who oriented to talents-based and needs-based
anchors would exercise their skills at the workplace based on competencies they gained
from formal education. At the same time they needed a stable work environment and
geographical location to succeed. This group of anchors is, therefore, grouped as
‘commitment-based anchors’.
The final multiple groups-based career anchors categories from the study were:
Talents-based anchors : Managerial competence and Entrepreneurial creativity. Needs-based anchors : Economic security, Autonomy and Lifestyle. Values-based anchors : Service and Pure challenge. Commitment-based anchors : Technical competence and Geographical stability.
Thus, hypothesis 2 was reformulated to become: Hypothesis 2a: Indonesian academics score differently on the talents-based, needs-
based, values-based and commitment-based anchors.
The same strategies as in the assessment of single dominant career anchor were also
applied to the multiple groups-based anchors in the investigation. The results are
presented in Table 4.7.

116
Table 4.7 shows that the highest frequency was the needs-based anchor group, with 253
respondents (43.25%). It was followed by the values-based anchor group, with 102
respondents (17.44%). Surprisingly, the multiple career anchors also occurred in this
multiple groups-based anchors and ranked the second highest, with 154 respondents
(26.32%). The existence of this anchor is exceptional and needs serious attention in the
study of career anchors.
Table 4.7: Career anchor order and chi-square test of multiple groups-based anchors
Multiple groups-based anchors Goodness-of-fit test
Variables ∑* %** Needs-based 253 43.25
χ² = 283.9321) ρ<.0012) df = 4
1)0 cells (.0%) have expected frequencies < 5; Minimum expected cell
frequency is 117.0; 2)ρ<.05 is significant.
Values-based 102 17.44 Talents-based 56 9.57 Commitment-based 20 3.42 Multiple-based 154 26.32 T o t a l 585 100.00
*Frequency **Percentage
Pearson’s chi-square test was computed to test hypothesis 2. The result showed that
there was a statistically significant difference between the scores on talents-based,
needs-based, values-based and commitment-based anchors, or multiple groups-based
anchors anchored by the respondents (χ²[4]=283.932, ρ<0.001) at the significant level of
5 percent. Hypothesis 2 was, therefore, supported.
Following the recommendation of Feldman and Bolino (1996), the current study
investigated the relationships between career anchors to find out which anchors are
paired as complementary and mutually exclusive (Ituma & Simpson 2007; Danziger,
Rahman-Moore & Valency 2008; Chapman 2009). The understanding of the magnitude
of the relationships between the anchors gives meaningfulness for individuals (Feldman
& Bolino 1996) and affects career outcomes (Chapman 2009), such as job satisfaction.
As discussed in Sub-section 3.6.1 of Chapter Three, the bivariate inter-correlation
matrix was, therefore, employed to find out the relationship between the anchors to
identify complementary and mutually exclusive anchors. The magnitudes of the
correlation (r) used Dancey and Reidy’s (2004) suggestion. They consisted of: [a]

117
perfect (r = +/- 1), [b] strong (r = +/- 0.9 to 0.7), [c] moderate (r = +/- 0.6 to 0.4), and
[d] weak (r = +/- 0.3 to 0.1). The negative symbol (-) represented the orthogonal
relationships for the mutually exclusive anchor pairs, while the positive symbol (+)
represented the complementary anchor pairs. Moreover, the relationships of career
anchors were grouped based on the significant values. The same strength of significant
values was paired or matched from row to column. Only the significant results were
analysed denoted by * (at alpha 1%) and ** (at alpha 5%). Moreover, mutually
exclusive relationships were denoted by >< and complementary relationships were
denoted by ~. The summary of the outputs and the relationships of anchors formed are
shown in Table 4.8, while the bivariate correlation matrix output is presented in
Appendix 12.
Table 4.8: Mutually exclusive and complementary career anchor relationships
Types of anchor
Number of anchors 5 anchors 3 anchors 2 anchors
Mutually exclusive - - -
Complementary PC~WD~BLS~EN~SV (ρ<.000;
r = .144, .202, .170, .168)**
ES~SV~PC (ρ<.001;
r = .161, .136, .142)**
EN~WD (ρ=.000; r = .279)**
SV~WD (ρ=.005; r = .117)**
SV~BLS (ρ=.036; r = .087)*
MC~EN (ρ=.030; r = .090)**
MC~SV (ρ=.000; r = .222)**
PC~MC (ρ=.003; r = .122)**
ES~BLS (ρ=.000; r = .161)*
** Correlation is significant at the 0.01 level (2-tailed). * Correlation is significant at the 0.05 level (2-tailed).
Table 4.8 shows that nine of the 20 positive correlation relationships of career anchors
in conjunction with the matrix were found to be significant relationships, indicating that
complementary anchor pairs existed. Of the nine relationships, 22.05 percent of the
sample had seven pairs of anchors (entrepreneurial creativity and work dedication,
service and work dedication, service and balanced-lifestyle, managerial competence and
entrepreneurial creativity, managerial competence and service, pure challenge and
managerial competence, economic security and balanced-lifestyle), 5.47 percent of
academics had one set of three anchors (economic security, service and pure challenge)
118
and 0.68 percent had one set of five anchors (pure challenge, work dedication,
balanced-lifestyle, entrepreneurial creativity and service). However, it is clearly seen
that there was no pair of career anchors with a negative significant correlation of (see
Appendix 12). It means that there was no evidence of a pair of the mutually exclusive
anchors. The magnitude of significant r correlations for the complementary
relationships proposed was considered weak for (r = 0.087 to 0.279). All
complementary relationships of career anchors identified confirmed Chapman’s (2009)
claim that individuals focus on the complementary anchor relationships. As a
consequence, an octagonal model as suggested by Feldman and Bolino (1996) was not
presented, since the model needs at least one orthogonal anchor pair.
4.8 Testing of the research model
Issue 4: How do career anchors predict psychological empowerment and job satisfaction?
This section tested the model and hypotheses proposed in Chapter Two (Hypotheses 3a,
3b, 3c and 3d). The study aimed to test the mediating effects of psychological
empowerment facets in the relationship between career anchors and job satisfaction.
Mediation is performed when researchers want to explain how (or why) a relationship
between the predictor and the dependent variable exists (also termed as criterion)
(Baron & Kenny 1986; Hair et al. 2010; Sekaran & Bougie 2013). The mediator can be
run when one of the relationships between predictor and criterion variables is significant
(Baron & Kenny 1986; Hair et al. 2010). The relationships can be in the form of one-
way arrows (known as direct effect), or a relationship that involves a series of direct
effects with multiple arrows, i.e., between the predictor and the mediator, between the
mediator and the criterion, and between predictor and criterion if the mediator is
controlled for (known as indirect effects) (Hair et al. 2010). As described in Chapter
Three, if the mediator completely explains the relationship between the predictor and
criterion, it is then referred as full mediation. However, if it only partially explains the
relationship, it is called partial mediation (Hair et al. 2010).
Up until this analysis was performed, the researcher has not found any studies testing
psychological empowerment as a mediator in the relationship between career anchors

119
and job satisfaction. However, some studies investigated the mediator in other topics,
such as in leadership (e.g., Dhladhla 2011) and organisational empowerment (e.g.,
Chang, Shih & Lin 2010). Thus, the current study continued to use the mediating model
designed in Chapter Two.
Hierarchical multiple regression analysis was employed (Frazier, Tix & Barron 2004;
Tabachnick & Fidell 2007) to examine the main effects of career anchors and
psychological empowerment on job satisfaction, and to test the mediating facets of
psychological empowerment on the relationships between career anchor subscales and
job satisfaction (George & Hancer 2004; Steele 2008; Wang & Lee 2009; Wook & Won
2013). The statistical model of the test is illustrated in Figure 4.1.
Figure 4.1: Research model for testing the mediation effect of psychological empowerment in the career anchors and job satisfaction relationships
The set of independent variables, therefore, would be entered into HMRA in a
sequential order. Demographic data were entered at step 1 in each HMRA operation and
treated as control variables. Career anchors and psychological empowerment were
entered accordingly based on the purpose of the research model. In summarising and
presenting the outputs and the tables, some main terms and their symbols were used for
all of the testing models: R² (R square) is the percentage of variance explained by

120
regression model, AdjR² (Adjusted R square) is to adjust for a bias in R-square, ∆R² (R
square change) is the improvement in R² when the next predictors are added, ∆F (F-
change) means that the improvement of prediction is found to be significant when
variables are added in that step, ß (ß coefficient) is a raw regression coefficient, before
the data are standardised, β (beta coefficient) is a regression power coefficient, Sig.
(significance) or ρ-value refers to the probability of statistical outputs, tval (t-values is
the individual regression coefficient), part (semi-partial correlation) refers to joint
variance after introducing certain variables and df (degree of freedom) measures how
many values statistically vary in computing. The words ‘block’ and ‘set’ have the same
meaning and are used interchangeably.
All data used for HMRA were computed for standardised scores. This is because
standardised scores are designed for comparison and combination between the outputs
across a series of the tests (Hair et al. 2010) and reduction of multicollinearity to the
minimum values (Cohen et al. 2003). Furthermore, for the purposes of data analysis,
two demographic data of gender and institution size were transformed. A careful
inspection of demographic data on univariate analysis showed that gender (-0.709) and
institution size (-0.640) had negatively skewed distribution. Transformation was then
taken to ‘increase the meaning of relationships’ (Hair et al. 2010, p. 85). Data on gender
and institution size were transformed using base-10 logs (Log10) to diminish the
extreme skewed values and to intensify the homogeneity variance assumption. Log10
gives the natural numbers (Osborne 2002). Nominal variables of demographic
background were coded as dummy variables for the research model analysis by creating
κ – 1 variables and representing by 0 and 1 (Miles & Shevlin 2001). The SPSS version
19.0 for Windows was employed to operate the transformation and dummy coding
processes.
4.8.1 Testing of assumptions of hierarchical multiple regression analysis
Prior to running the statistical operation of HMRA, some requirements should be met.
The classical requirements underlying HMRA are normality, linearity,
homoscedasticity, outlier and multicollinearity (Ghauri & Gronhaug 2005; Tabachnick
& Fidell 2007; Hair et al. 2010). Data for HMRA should be normally distributed, linear
relationship between independent variables or predictors and dependent variables or
criterion variables, and display homogeneous variance. Data also have to be free of

121
outliers and multicollinearity. Normality, linearity and homoscedasticity are tested using
normal Q-Q plots while the last two assumptions can be detected via the Mahalanobis
distance, tolerance (Tol) and variance inflation factor (VIF) values of the HMRA
outputs. Means, standard deviations and correlation scores between the variables are
also computed (see Table 4.6). Multicolinearity exists: (1) when the Mahalanobis values
are greater than chi-square (χ²) statistics, (2) when tolerance is lower than 0.1 and VIF is
greater than 10, and (3) when the correlation r coefficients score is 0.7 and above
(Dancey & Reidy 2004).
An examination of normal Q-Q plots for this study’s data indicated a normal
distribution for all data. Therefore, a group of scatter data fell around the diagonal lines
forming a positive correlation on the graphs (Appendix 13). The normal Q-Q plot
graphs also showed a straight-line relationship between the predictor and the criterion
variables to meet the linearity assumption. Because the plots were reported to approach
normal distribution, homogeneity of variances was assumed. The next step was to test
the research model.
4.8.2 Testing the main effects of career anchors and psychological empowerment on job satisfaction
4.8.2.1: The relationship between career anchors and job satisfaction
The hypothesis to be tested is: Hypothesis 3a: Indonesian academic’s perceptions of career anchor subscales are
positively related to job satisfaction.
Hierarchical multiple regression analysis was carried out to test the main effect of the
career anchor block on predicting job satisfaction. Two additional requirements, outliers
and multicollinearity assumptions, should be checked first before interpreting the
HMRA outputs. Multivariate outliers among the cases were not problematic because the
Mahalanobis distance value (11.979) (Appendix 14) was well below the critical χ²[12] of
32.909 at alpha 0.1 percent. High tolerance values (0.362 to 0.942) indicated that no
strong linear relationship among the independent variables was found. Similarly, the
values of VIF (1.062 to 2.763) revealed that multicollinearity could not be assumed
(VIF>10). The correlation r-values between variables (0.007 to 0.391) also did not

122
exceed 0.7. These findings, therefore, support the other testing assumptions for
regression analysis mentioned in Sub-section 4.8.1. The model testing results are
summarised in Table 4.9.
Table 4.9: Summary of regression outputs for the effects of career anchors on job satisfaction
Step Variable block
Regression model Sub-
variables
Partial F test VIFᵃ) &
Tol.ᵇ) R² AdjR² ∆R² ∆F df sig.∆
F* ß=β1) tval ρ* Part
1 Demogra-phic data
.012 .004 .012 1.417 5,579 .216
1.062- 2.763
& .362 - .942
2 Career anchors
.250 .234 .238 25.895 7,572 <.001 Work dedication
.325 8.244 <.001 .089
Balanced-lifestyle
-.094 -2.496 .013 .008
Managerial competence
.189 5.017 <.001 .033
Pure challenge
.182 4.666 <.001 .029
Overall F test: Fval = 15.873; df = 12, 572; ρ* <.001 a) > 10 or b) < .01 = multicollinearity presented *< .05 = significant Effect size [ƒ²] = .333
1) ß=β ß regression coefficient equal to beta coefficient
A set of demographic data was entered first into the model at the first step. Only 1.2
percent (R²) of the variance in the demographic block (gender, education, work
experience, age and institution size) was accounted for by the variance in job
satisfaction. The proportion of demographic block variance statistically did not give a
significant result in predicting job satisfaction (∆R²=0.012, ∆F[5, 579]=1.417, ρ=0.216).
Next, the predictor of the career anchors block was entered into the first regression
model at the second step. As a result, the R square change increased from 0.012 to
0.238. Career anchors, therefore, accounted for an additional 23.8 percent of the
variance in job satisfaction above and beyond the 1.2 percent explained by the
demographic set. The cumulative increase in the career anchors set was found to
contribute significantly to the prediction of job satisfaction (∆R²=0.238, ∆F[5,
579]=25.895, ρ<0.001). With all predictor variable blocks entered, the 12 predictors
significantly explained 25 percent of the variance in job satisfaction (R²=0.250,
AdjR²=0.234, F[12, 572]=15.873, ρ<0.001). The joint effect of magnitude, using the
formula discussed in Chapter Three (Eq. 1), was considered to be a medium-sized effect
(ƒ²=0.333).
123
A single regression test showed that three anchor variables were significantly and
positively related to job satisfaction while another anchor showed a significant and
negative relationship. The negative value showed an opposite direction in which
predictors increased and criterion variable decreased. Work dedication (tval=8.224,
ρ<0.001, partr=0.298), balanced-lifestyle (tval=-2.496, ρ=0.013, partr=-0.090),
managerial competence (tval=5.017, ρ<0.001, partr=0.182) and pure challenge
(tval=4.666, ρ<0.001, partr=0.169) were found to be significant in the explanation of the
unique variance proportion in job satisfaction. Squared semi-partial (part) correlation
(sr²) values indicated that these significant variables accounted for 8.88 percent, 0.81
percent, 3.31 percent and 2.86 percent respectively of the variance in job satisfaction.
The level of job satisfaction increased when the career orientation of Indonesian
academics was work dedication, managerial competence and pure challenge. However,
the level of job satisfaction decreased when they held balanced-lifestyle as an anchor.
Only four career anchors were significant predictors of job satisfaction. Hypothesis 3a
was, therefore, partially supported.
4.8.2.2 The relationship between career anchors and psychological empowerment
The hypothesis to be tested is:
Hypothesis 3b: Indonesian academics’ perceptions of career anchor subscales are positively related to psychological empowerment.
This section examines the contribution of the career anchor block to the explanation of
the four facets of psychological empowerment. The career anchor set was regressed to
each of the psychological empowerment facets. The requirements of freedom from
outliers and multicollinearity in this model testing were to be identified first. The
multivariate outlier assumption has been met through an examination of the
Mahalanobis distance value (11.979) (Appendix 14) that was less than χ²statistics₍12₎ of
32.909 at alpha 0.1 percent. There was a strong linear relationship among the
independent variables, indicating support for the high tolerance values (0.362 to 0.942).
Similarly, the VIF values revealed that the assumption of no multicollinearity was
satisfied. All values between 1.062 and 2.763 were below 10. No requirements for the
regression analysis were violated. The next step was a series of tests on the main effects
of the career anchor block on meaning, impact, competence and self-determination.

124
Effects of the career anchor set on meaning
Hierarchical multiple regression analysis was employed to test the main effects of the
career anchor block on predicting meaning. The results are reported in Table 4.10.
Table 4.10: Summary of regression outputs for the effects of career anchor on meaning
Step Variable block
Regression model Sub-
variables
Partial F test VIFᵃ) &
Tol.ᵇ) R² AdjR² ∆R² ∆F df sig.∆
F* ß=β1) tval ρ* Part
1 Demogra-phic data
.046 .038 .046 5.555 5,579 <.001 Gender -.107 -2.857 .004 -.102
1.062-
2.763
&
.362- .942
Institution size .109 2.743 .006 .098 2 Career
anchors .276 .261 .230 25.954 7,572 <.001 Work
dedication .259 6.677 <.001 .238
Balanced-lifestyle
-.089 -2.402 .017 -.085
Entrepreneurial creativity
.163 4.303 <.001 .153
Service .204 5.371 <.001 .191 Managerial competence
.139 3.758 <.001 .134
Pure challenge .075 1.972 .049 .070 Overall F test: Fval = 18.153; df = 12, 572; ρ* <.001 a) > 10 or b) < .01 = multicollinearity presented
*< .05 = significant Effect size [ƒ²] = .381 1) ß=β ß regression coefficient equal to beta coefficient
To test the first facet of psychological empowerment, the demographic data set was
entered at the first step. Model 1 explained 4.6 percent of the variance in meaning. The
demographic block statistically significantly contributed to the prediction of meaning
(∆R²=0.046, ∆F[5, 579]=5.555, ρ<0.001). Individually, only gender (tval=-2.857, ρ=0.004,
partr=-0.102) and institution size (tval=2.743, ρ=0.006, partr=0.098) had a statistically
significant effect in the explanation of the variance in meaning. Gender was predictive
of a decrease in meaning, whereas institution size predicted an increase in meaning.
The predictor of career anchor block was then entered into the first regression model at
the second step. The R square change increased from 0.046 to 0.230. The career anchor
set accounted for an additional 23 percent of the variance in meaning over and beyond
the 4.6 percent already accounted for by the demographic set. The career anchor set
contributed significantly to the prediction of meaning (∆R²=0.230, ∆F[7, 572]=25.954,
ρ<0.001). In an overall model, the 12 predictors explained nearly 28 percent of the
variance in meaning (R²=0.276, AdjR²=0.261, F[12, 572]=18.153, ρ<0.001). The total
effect, using the formula discussed in Chapter 3 (Eq. 1), was large (ƒ²=0.381).

125
A single regression test demonstrated that six career anchor dimensions had significant
relationships with meaning. Five career anchor dimensions had positive significant
relationships and one dimension had a negative significant relationship. Work
dedication (tval=6.677, ρ<0.001, partr=0.238), balanced-lifestyle (tval=-2.402, ρ=0.017,
partr=-0.085), entrepreneurial creativity (tval=4.303, ρ<0.001, partr=0.153), service
(tval=5.371, ρ<0.001, partr=0.191), managerial competence (tval=3.758, ρ<0.001,
partr=0.134) and pure challenge (tval=1.972, ρ=0.049, partr=0.070) established
significant effects in the explanation of the unique variance proportion in meaning.
Squared semi-partial correlation (sr²) values indicated that these significant variables
accounted for 5.66 percent, 0.73 percent, 2.34 percent, 3.65 percent, 1.80 percent and
4.9 percent respectively of the variance in meaning. Meaning increased when academics
scored higher on work dedication, entrepreneurial creativity, service, managerial
competence and pure challenge. However, meaning decreased when they anchored on
balanced-lifestyle.
Effects of the career anchor set on impact Hierarchical multiple regression analysis was computed to test the main effect of the
career anchor block on predicting impact. Table 4.11 shows the summary of regression
testing results.
Table 4.11: Summary of regression outputs on the effects of career anchors on impact
Step Variable block
Regression model Sub-
variables
Partial F test VIFᵃ) &
Tol.ᵇ) R² AdjR²
∆R² ∆F df sig.∆
F* ß=β1) tval ρ* Part
1 Demogra-phic data
.040 .031 .040 4.770 5,579 <.001 Work experience
.137 2.228 .026 .082
1.062- 2.763
& .362- .942
2 Career anchors
.221 .205 .182 19.043 7,572 <.001 Work dedication
.200 4.962 <.001 .183
Entrepreneurial creativity
.102 2.582 .010 .095
Managerial competence
.306 7.967 <.001 .294
Overall F test: Fval = 13.530; df = 12, 572; ρ*<.001 a) > 10 or b) <.01 = multicollinearity presented * < .05 = significant Effect size [ƒ²] = .284
1) ß=β ß regression coefficient equal to beta coefficient
To assess the second facet of psychological empowerment, the demographic data set
was entered into the regression model at the first step. Model 1 explained only 4 percent
of the variance in impact. The demographic block statistically significantly contributed
to the prediction of impact (∆R²=0.040, ∆F₍5, 579₎=4.770, ρ<0.001). Individually, only
126
work experience (tval=2.228, ρ=0.026, partr=0.082) had a statistically positive
significant contribution in the explanation of the variance in impact. Work experience
predicted an increase in impact.
The predictor of career anchor block was entered into the first regression model at the
second step. The R square change increased from 0.040 to 0.182 which means that
career anchors accounted for an additional 18.2 percent of the variance in impact, above
and beyond the 4 percent previously accounted for by the demographic set. The
incremental increase on the career anchor set was significant (∆R²=0.182, ∆F[7,
572]=19.043, ρ<0.001). Simultaneously, the 12 predictors explained about 22 percent of
the variance in impact (R²=0.221, AdjR²=0.205, F[12, 572]=13.530, ρ<0.001). The total
effect, using the formula discussed in Chapter Three (Eq. 1), was considered a medium-
sized effect (ƒ²=0.284).
A single regression test indicated that work dedication (tval=4.962, ρ<0.001,
partr=0.183), entrepreneurial creativity (tval=2.582, ρ=0.010, partr=0.095) and
managerial competence (tval=7.967, ρ<0.001, partr=0.294) established positive
significant effects in the explanation of the unique variance proportion in impact.
Squared semi-partial correlation (sr²) values indicated that these significant variables
accounted for 3.35 percent, 0.90 percent and 8.64 percent respectively of the variance in
impact. Impact intensified when Indonesian academics possessed work dedication,
entrepreneurial creativity and managerial competence.
Effects of the career anchor set on competence Hierarchical multiple regression analysis was operated to test the main effects of the
career anchor block on predicting competence. The summary of regression results is
reported in Table 4.12.
To examine the third facet of psychological empowerment, the demographic data set
was entered into the regression model at the first step. Model 1 explained 6.30 percent
of the variance in competence. The demographic block statistically significantly
contributed to the prediction of competence (∆R²=0.063, ∆F[5, 579]=7.833, ρ<0.001).
However, only educational level (tval=3.683, ρ<0.001, partr=0.141) was statistically

127
significant in the explanation of the variance in competence. Educational level was
predictive of an increase in competence.
Table 4.12: Summary of regression outputs for the effects of career anchors on competence
Step Variable block
Regression model Sub-
variables
Partial F test VIFᵃ) &
Tol.ᵇ) R² AdjR² ∆R² ∆F df sig.∆F* ß=β1) tval ρ* Part
1 Demogra-phic data
.063 .055 .063 7.833 5,579 <.001 Education .159 3.683 <.001 .141 1.062- 2.763
& .362 - .942
2 Career anchors
.157 .139 .094 9.071 7,572 <.001 Entrepreneurial creativity
.128 3.131 .002 .120
Service .202 4.914 <.001 .189 Managerial competence
.113 2.82 .005 .108
Overall F test: Fval = 8.874; df = 12, 572; ρ* <.001 a) > 10 or b) <.01 = multicollinearity presented * < .05 = significant Effect size [ƒ²] = .186
1) ß=β ß regression coefficient equal to beta coefficient
The predictor of career anchor block was entered into the first regression model at the
second step. The R square change increased from 0.063 to 0.094. Career anchors
accounted for an additional 9.4 percent of the variance in competence, over and above
the 6.3 percent previously accounted for by the demographic set. The career anchor set
contributed significantly to the prediction of competence (∆R²=0.094, ∆F₍7, 572₎=9.071,
ρ<0.001). Simultaneously, the 12 predictors explained about 16 percent of the variance
in competence (R²=0.157, AdjR²=0.139, F₍12, 572₎=8.874, ρ<0.001). The total effect,
using the formula discussed in Chapter Three (Eq. 1), was considered a medium-sized
effect (ƒ²=0.186).
A single regression test showed that entrepreneurial creativity (tval=3.131, ρ=0.002,
partr=0.120), service (tval=4.914, ρ<0.001, partr=0.189) and managerial competence
(tval=2.820, ρ=0.005, partr=0.108), all established positively significant effects in the
explanation of the unique variance proportion in competence. Squared semi-partial
correlation (sr²) values indicated that these significant variables accounted for 1.44
percent, 3.57 percent and 1.17 percent respectively of the variance in competence.
Competence rose when Indonesian academics perceived entrepreneurial creativity,
service and managerial competence to be important.

128
Effects of the career anchor set on self-determination
Hierarchical multiple regression analysis was performed to test the main effect of the
career anchor block on predicting self-determination. The model testing results are
presented in Table 4.13.
Table 4.13: Summary of regression outputs for the effects of career anchors on self-determination
Step Variable block
Regression model Sub-
variables
Partial F test VIFᵃ) &
Tol.ᵇ) R² AdjR² ∆R² ∆F df sig.∆
F* ß=β1) tval ρ* Part
1 Demogra-phic data
.026 .018 .026 3.087 5, 579 .009 Institution size
.083 2.047 .041 .074
1.062-
2.763 &
.362 - .942
2 Career anchors
.249 .233 .033 24.229 7, 572 <.001 Work dedication
.184 4.645 <.001 .168
Balanced-lifestyle
.307 8.136 <.001 .295
Entrepreneu-rial creativity
.174 4.499 <.001 .163
Service .121 3.112 .002 .113 Managerial competence
.100 2.647 .008 .096
Overall F test: Fval = 15.781; df = 12, 572; ρ* <.001 a) > 10 or b) <.01 = multicollinearity presented * < .05 = significant Effect size [ƒ²] = .332
1) ß=β ß regression coefficient equal to beta coefficient
Finally, in investigating the last facet of psychological empowerment, the predictor
variable of the demographic data set was introduced into the regression model at the
first step. The model explained 2.6 percent of the variance in self-determination. The
demographic block statistically significantly contributed to the prediction of self-
determination (∆R²=0.026, ∆F[5, 579]=3.087, ρ<0.009). However, only institution size
(tval=2.047, ρ=0.041, partr=0.074) was statistically significant in the explanation of the
variance in self-determination. Thus, institution size predicted an increase in self-
determination.
The predictor of career anchor block was entered into the model at the second step. The
R square change increased from 0.026 to 0.333. The career anchor set accounted for an
additional 33.3 percent of the variance in self-determination above and beyond the 2.6
percent previously accounted for by the demographic set. The career anchor set
contributed significantly to the prediction of self-determination (∆R²=0.223, ∆F₍7,
572₎=24.229, ρ<0.001). In an overall model, the 12 predictors explained 25 percent of the
variance in self-determination (R²=0.249, AdjR²=0.233, F₍12, 572₎=15.781, ρ<0.001). The

129
total effect, using the formula discussed in Chapter Three (Eq. 1), was moderate
(ƒ²=0.332).
A single regression test pointed out that work dedication (tval=4.645, ρ<0.001,
partr=0.238), balanced-lifestyle (tval=8.136, ρ<0.001, partr=0.295), entrepreneurial
creativity (tval=4.499, ρ<0.001, partr=0.163), service (tval=3.112, ρ=0.002, partr=0.113)
and managerial competence (tval=2.647, ρ=0.008, partr=0.094) established positive
significant effects in the explanation of the unique variance proportion in self-
determination. Squared semi-partial correlation (sr²) values indicated that these
significant variables accounted for 2.82 percent, 8.70 percent, 2.66 percent, 1.28 percent
and 0.92 percent respectively of the variance in self-determination. Self-determination
strengthened when Indonesian academics held work dedication, balanced-lifestyle,
entrepreneurial creativity, service and managerial competence to be important. Thus,
academics’ perceptions of career anchors were both positively and negatively related to
the three facets of psychological empowerment. Hypothesis 3b was, therefore, partially
supported.
4.8.2.3 The relationship between psychological empowerment and job satisfaction
The hypothesis to be tested is:
Hypothesis 3c: Indonesian academics’ perceptions of psychological empowerment facets are positively related to job satisfaction.
Hierarchical multiple regression analysis was also employed to test the hypothesis of
the main effect of the psychological empowerment facets on predicting job satisfaction.
As in the previous testing, prior to interpreting the HMRA outputs, the outliers and
multicollinearity assumptions must be assessed. No violation of the two assumptions
was detected (Appendix 14). The Mahalanobis value (8.985) was smaller than the
critical χ²[9] of 27.877 at alpha 0.1 percent. High tolerance values (0.365 to 0.912), low
VIF values (1.097 to 2.742), and low correlation r scores (0.171 to 0.456) suggested that
the collinearity diagnosis was well established. These findings, and those findings in
Sub-section 4.8.1 met the multiple regression analysis requirements. Table 4.14 displays
the summary of the statistical test results for psychological empowerment and job
satisfaction.

130
Table 4.14: Summary of regression outputs for the effects of psychological empowerment on job satisfaction
Step Variable block
Regression model Sub-varia-bles
Partial F test VIFᵃ) &
Tol.ᵇ) R² AdjR² ∆R² ∆F df Sig.
∆F* ß=β1) tval ρ* Part
1 Demogra-phic data
.012 .004 .012 1.417 5,579 .216 1.097-2.742
& .365 - .912
2 Psychologi-cal Empower-ment
.499 .249 .237 45.319 4,575 <.001 Meaning .372 8.458 <.001 .089 Impact .177 4.412 <.001 .008
Overall F test: Fval = 17.696; df = 16, 568; ρ* <.001 a) > 10 or b) <.01 = multicollinearity presented *< .05 = significant Effect size [ƒ²] = .332
1) ß=β ß regression coefficient equal to beta coefficient
The first predictor variable set entered into the regression model at the first step was the
demographic set. The demographic block (gender, education, work experience, age and
institution size) jointly accounted for 1.2 percent of the variance in job satisfaction. This
proportion had no statistically significant effect on the prediction of the job satisfaction
variable (∆R²=0.012, ∆F[5, 579]=1.417, ρ=0.216).
The predictor of the psychological empowerment block was introduced into the first
regression model at the second step. The R square change increased from 0.012 to
0.237. Psychological empowerment accounted for an additional 23.7 percent of the
variance in job satisfaction over and beyond the 1.2 percent already accounted for by
the demographic block. The psychological empowerment set had a significant effect on
job satisfaction (∆R²=0.237, ∆F[4, 575]=45.319, ρ<0.001) at a 5 percent significance
level. When all variable blocks were entered simultaneously, the nine predictors
explained approximately 25 percent of the variance in job satisfaction (R²=0.249,
AdjR²=0.237, F[9, 575]=21.170, ρ<0.001). The joint effect of the overall model, using the
formula discussed in Chapter Three (Eq. 1), was medium (ƒ²=0.332).
A single regression test showed that two dimensions of psychological empowerment
revealed significant results. Meaning (tval=8.458, ρ<0.001, partr=0.306) and impact
(tval=4.418, ρ<0.001, partr=0.160) were found to be significant in the explanation of the
unique variance proportion in job satisfaction. Squared semi-partial correlation (sr²)
values indicated that these significant variables accounted for 9.36 percent and 2.56
percent respectively of the variance in job satisfaction. The level of job satisfaction
went up when academics’ perception of meaning and impact increased. Because only

131
two facets of psychological empowerment affected job satisfaction, hypothesis 3c was,
therefore, partially supported.
4.8.2.4 Joint relationship between career anchors, psychological empowerment, and job satisfaction
The researcher extended the analysis to assess the joint effects (Muchiri & Cooksey
2011) of career anchors and psychological empowerment on job satisfaction when
demographic data was controlled. Hierarchical multiple regression analysis was
conducted to regress the joint effects between predictors of career anchors and
psychological empowerment on the criterion of job satisfaction. As with the two
previous tests, outliers and multicollinearity assumptions were first checked. The data
were free of multivariate outliers because the Mahalanobis distance value (15.973)
(Appendix 14) did not exceed the critical χ²[16] of 39.252 at alpha 0.1 percent. Tolerance
values showed a weak relationship among the predictors (0.365 to 0.912) and VIF
values were less than 10 (1.097 to 2.742). It was concluded that multicollinearity was
not an issue. Given satisfactory results for all assumptions including some that were
mentioned previously in Sub-section 4.8.1, the joint effect could be performed. The
model testing results are presented in Table 4.15.
Table 4.15: Summary of regression outputs for the joint effects of career anchors and
psychological empowerment and job satisfaction
Step Variable block
Regression model Sub-
variables
Partial F test VIFᵃ) &
Tol.ᵇ) R² AdjR² ∆R² ∆F df sig.
∆F* ß=β1) tval ρ* Part
1 Demogra-phic data
.012 .004 .012 1.417 5,579 .216
1.069-
2.807 &
.356 -
.935
2 Career anchors and Psycholo-gical empower-ment
.333 .314 .321 24.804 11,568 <.001 Work dedication
.241 6.005 <.001 .206
Balanced-lifestyle
-.082 -2.115 .035 -.073
Managerial competence
.113 2.986 .003 .102
Pure challenge
.159 4.300 <.001 .147
Meaning .242 5.309 <.001 .182 Impact .095 2.358 .019 .081 Competence .096 2.272 .023 .078
Overall F test: Fval = 17.696; df = 16, 568; ρ* <.001 a) > 10 or b) < .01 = multicollinearity presented * < .05 = significant Effect size [ƒ²] = .499
1) ß=β ß regression coefficient equal to beta coefficient
The predictors of career anchors and psychological empowerment blocks were entered
into the first regression model at the second step. The R square change increased from

132
0.012 to 0.321. Career anchors and psychological empowerment accounted for an
additional 32.10 percent of the variance in job satisfaction. There was a statistically
significant effect of career anchors and the psychological empowerment set on job
satisfaction (∆R²=0.321, ∆F[11, 568]=24.804, ρ<0.001) over and above the 1.20 percent
accounted for by the demographic set. With all variables blocks entered, the 16
predictors significantly explained 33.30 percent of the variance in job satisfaction
(R²=0.333, AdjR²=0.314, F[16, 568]=17.696, ρ<0.001). Using the formula discussed in
Chapter 3 (Eq. 1), the joint effect could be described as large (ƒ²=0.499).
A single regression test found positive and negative associations of the predictors. The
career anchor categories of work dedication (tval=6.005, ρ<0.001, partr=0.206),
balanced-lifestyle (tval=-2.115, ρ=0.035, partr=-0.073), managerial competence
(tval=2.986, ρ=0.003, partr=0.102), and pure challenge (tval=4.300, ρ<0.001,
partr=0.147), and the psychological empowerment facets of meaning (tval=5.309,
ρ<0.001, partr=0.182), impact (tval=2.358, ρ=0.019, partr=0.081) and competence
(tval=2.272, ρ=0.023, partr=0.078) established significant effects in the explanation of
the unique variance proportion in job satisfaction. Squared semi-partial correlation (sr²)
values indicated that these significant variables accounted for 4.24 percent, 0.53
percent, 1.04 percent, 2.16 percent, 3.31 percent, 0.66 percent and 2.86 percent
respectively of the variance in job satisfaction. The level of job satisfaction increased
when academics oriented to work dedication, managerial competence and pure
challenge whereas the level of job satisfaction decreased when they possessed
balanced-lifestyle. Further, the level of job satisfaction also increased when those
academics considered meaning, impact and competence that to be important. Thus, there
was a significant effect of joining the four dimensions of career anchors and three
psychological empowerment facets in predicting job satisfaction.
4.8.3 Testing of the mediation of psychological empowerment in the career anchors and job satisfaction relationship
The hypothesis to be tested was:
Hypothesis 3d: The mediating role of psychological empowerment facets strongly explains the influence of Indonesian academics’ perceptions of career anchors on job satisfaction.

133
Since there were more than one significant relationships between the predictors and
criterion variables, test of mediating variables in the current study was carried out
(Baron & Kenny 1986). Baron and Kenny pointed out that the reason to test mediation
is ‘to understand the mechanism through which the initial variable affects the outcome’.
To test the mediating variables of the psychological empowerment facets, the researcher
followed the four steps suggested by Kenny, Kashy and Bolger (1998), Baron and
Kenny (1986) and Judd and Kenny (1981) as follows:
Step 1: Regress that the predictor (X) is significantly correlated with the criterion (Y).
Step 2: Regress that the predictor (X) is significantly correlated with the mediator (M).
Step 3:Regress that the mediator (M) is significantly correlated with the criterion (Y),
when the predictor (X) is controlled (using X and M as predictors).
Step 4: Establish that the strength of the predictor (X) and criterion (Y) relationship is
significantly reduced when the mediator (M) is introduced to the model. The
mediation is complete when the effect of X on Y controlling for M is zero; A
partial mediator appears when the effect of X on Y significantly reduces after M
is introduced.
All steps are computed as follows.
Step 1: Effects of the career anchors on the explanation of job satisfaction
Testing the effect of the career anchors on job satisfaction was described in Sub-section
4.8.2.1. Only four out of seven career anchors were significant: work dedication,
balanced-lifestyle, managerial competence and pure challenge. According to Kenny,
Kashy and Bolger (1998), some experts stress the importance of steps 2 and 3 compared
to step 1, and others believe that step 1 is not important because there are multiple
mediators with inconsistent effects (MacKinnon 2000). Despite some debate, Kenny
(2012) suggested that step 1 could be implied if steps 2 and 3 are significant. The
current study followed Kenny’s suggestion to include step 1 in the analysis.
Step 2: Effects of the career anchors on the explanation of psychological empowerment
Step 2 has been carried out in Sub-section 4.8.2.2. As described, the career anchor block
was tested against each of the four psychological empowerment facets. The work
dedication, balanced-lifestyle, managerial competence and pure challenge anchors, and
the meaning, impact and competence facets were statistically significant. Because more

134
than one significant relationships were found, the test of mediation could be carried out
(Baron & Kenny 1986; Muchiri & Cooksey 2009).
Step 3: Testing of the psychological empowerment facets as the mediators in the effect of career anchors on the explanation of job satisfaction
Before determining whether the psychological empowerment facets completely or
partially mediate the relationship between career anchors and job satisfaction, step 3 of
Baron and Kenny’s (1986) procedure must be computed. Hierarchical multiple
regression analysis was employed to test step 3, and the outputs are summarised in
Table 4.16.
Table 4.16: Regression outputs for the effects of career anchors and psychological
empowerment on job satisfaction
Step Variable block
Regression model Sub-
variables
Partial F test VIFᵃ)&
Tol.ᵇ) R² AdjR² ∆R² ∆F df sig.∆
F* ß=β1) tval ρ* Part
1 Demogra-phic data
.012 .004 .012 1.417 5,579 .216
1.069- 2.807
& .356 - .935
2 Career anchors
.250 .234 .238 25.895 7,572 <.001 Work dedication
.241 6.005 <.001 .206
Balanced-lifestyle
-.082 -2.115 .035 -.073
Managerial competence
.113 2.986 .003 .102
Pure challenge
.159 4.300 <.001 .147
3 Psycholo-gical empower-ment
.333 .314 .083 17.626 4,568 <.001 Meaning .242 5.309 <.001 .182 Impact .095 2.358 .019 .081 Competence .096 2.272 .023 .078
Overall F test: Fval = 17.696; df = 16, 568; ρ* <.001 a) > 10 or b) <.01 = multicollinearity presented * < .05 = significant Effect size [ƒ²] = .499
1) ß= β ß regression coefficient equal to beta coefficient
Even though only some career anchors (work dedication, balanced-lifestyle, managerial
competence and pure challenge) predicted all four facets of the psychological
empowerment (step 1 and step 2), only meaning, impact and competence remained
significant as predictors of job satisfaction (ρ<0.001, ρ=0.019, ρ=0.023) when career
anchor variables were controlled for (step 3). A careful investigation showed that
meaning (β=0.242) mediated the relationship between work dedication (β=0.241),
balanced-lifestyle (β=-0.082), managerial competence (β=0.113) and pure challenge
(β=0.159), and job satisfaction; impact (β=0.095) mediated the relationship between
work dedication and managerial competence on the explanation of job satisfaction, and

135
finally; competence (β=0.096) mediated the relationship between managerial
competence and job satisfaction. The combination effect was large (f²=0.499).
Step 4: Establishing mediation effects
A detailed investigation was calculated to find out the strength of the mediation effect in
the results from step 3. The mediation effect was examined by comparing the initial
standardised beta coefficient for the significant career anchor dimensions when
predicting job satisfaction (denoted with *) and the new beta weight coefficient for the
significant career anchor variables after the significant of the facets of psychological
empowerment were entered (denoted with **) (Miles & Shevlin 2001). The significant
mediation effect was then calculated using the Sobel test. This present study used the
free online calculator of the Sobel test provided by Soper (2012) at
http://www.danielsoper.com/statcalc3/calc.aspx?id=31. The test needs information on
unstandardised beta coefficients (ß) and standard error (SE) values both before (A) and
after (B) mediation variables are introduced (Preacher 2012). The data were included in
Sub-sections 4.8.2.2 and 4.8.3. Because all data in this study have been transformed into
z-score, both unstandardised values and standardised betas give the same values.
Cavana, Delahaye and Sekaran (2001, p. 434) indicated that ‘if you transformed the data
to z-scores prior to your regression analysis, you would get the beta coefficients as your
unstandardised coefficients’. The mediation effect was computed as follows.
Mediation effect 1: Assessment of the significance of the mediation effect of meaning in the relationship between work dedication and job satisfaction
After controlling for meaning, the effect of work dedication appeared to be smaller. The
amount of mediation that could be attributed to the indirect effect was 0.084 (0.325 –
0.241) (Appendix 15, Figure A). It means that meaning only partly accounted for the
relationship between work dedication and job satisfaction. Thus, there was support for
partial mediation. The reduction in beta values was then tested in the raw unstandardised beta for the
significant partial mediation effect. The Sobel test was used to calculate the regression
coefficients of beta A (0.259) and beta B (0.242), and the standard error A (0.039) and
B (0.044). The result was significant with the ρ-value was less than 0.05

136
(Sobelstats=4.236; ρ<0.001). Meaning, therefore, was a statistically significant partial
mediator of the effect of work dedication on job satisfaction.
Mediation effect 2: Assessment of the significance of the mediation effect of impact in
the relationship between work dedication and job satisfaction
After impact was entered into the model, the strength of the work dedication effect
reduced by 0.084 (0.325 – 0.241) (Appendix 15, Figure B). Impact did not fully mediate
the relationship between work dedication and job satisfaction. Thus, there was support
for partial mediation.
The regression coefficients of beta A (0.200) and beta B (0.095) and the standard error
A (0.040) and B (0.040) were calculated. The ρ-value was less than 0.05
(Sobelstats=2.145; ρ=0.032). Impact, therefore, was a statistically significant partial
mediator of the effect of work dedication on job satisfaction.
Mediation effect 3: Assessment of the significance of the mediation effect of meaning in the relationship between balanced-lifestyle and job satisfaction
After controlling for meaning, the effect of balanced-lifestyle on job satisfaction
decreased by -0.082. The amount of mediation was -0.012 (-0.094 – [-0.082])
(Appendix 15, Figure C). Meaning only partly accounted for the relationship between
balanced-lifestyle and job satisfaction. Thus, there was support for partial mediation.
The decrease of the coefficients of beta A (-0.089) and beta B (0.242), and the standard
error A (0.037) and B (0.046) were then calculated. A significant result was found, in
which the Sobel statistic was -2.187 and the ρ-value was 0.029 (ρ<0.05). Meaning,
therefore, was a statistically significant partial mediator of the effect of balanced-
lifestyle on job satisfaction.
Mediation effect 4: Assessment of the significance of the mediation effect of meaning in the relationship between managerial competence and job satisfaction
After meaning was controlled for, the effect of managerial competence was smaller
than the direct effect. The amount of mediation was 0.076 (0.189 – 0.113) (Appendix
15, Figure D). This supports observation that impact only partly accounted for the

137
relationship between managerial competence and job satisfaction. Thus, there was
support for partial mediation.
The regression coefficients of beta A (0.139) and beta B (0.242), and the standard error
A (0.037) and B (0.046) were computed. The resulting Sobel statistic was 3.057, and the
ρ-value was 0.002 (ρ<0.05). Meaning, therefore, was a statistically significant partial
mediator of the effect of managerial competence on job satisfaction.
Mediation effect 5: Assessment of the significance of the mediation effect of impact in the relationship between managerial competence and job satisfaction
The effect of managerial competence diminished after impact was controlled for. The
amount of mediation was 0.076 (0.189 – 0.113) (Appendix 15, Figure E). Impact only
partly accounted for the relationship between managerial competence and job
satisfaction. Thus, there was support for partial mediation.
The raw coefficients of beta A (0.306) and beta B (0.095), and the standard error A
(0.038) and B (0.040) were then computed. The calculation produced 2.278 for the
Sobel statistic, and 0.023 for the ρ-value (ρ<0.05). Impact, therefore, was a statistically
significant partial mediator of the effect of managerial competence on job satisfaction.
Mediation effect 6: Assessment of the significance of the mediation effect of
competence in the relationship between managerial competence and job satisfaction
After introducing competence into the model, the effect of managerial competence on
job satisfaction became smaller. The amount of mediation was 0.076 (0.189 – 0.113),
the same as that for meaning (Appendix 15, Figure F). Competence only partly
accounted for the relationship between managerial competence and job satisfaction.
Thus, there was support for partial mediation.
The regression coefficients of beta A (0.113) and beta B (0.096), and the standard error
A (0.040) and B (0.042) were computed. The results showed that the Sobel statistic was
1.777 and the ρ-value was 0.076. Because the ρ-value was greater than 0.05,
competence, therefore, was a statistically non-significant partial mediator of the effect
of managerial competence on job satisfaction.

138
Mediation effect 7: Assessment of the significance of the mediation effect of meaning in the relationship between pure challenge and job satisfaction
The effect of pure challenge became smaller when meaning was added to the model.
The amount of mediation was 0.023 (0.182 – 0.159) (Appendix 15, Figure G). Meaning
only partly accounted for the relationship between pure challenge and job satisfaction.
Thus, there was support for partial mediation.
The regression coefficients of beta A (0.075) and beta B (0.242) and the standard error
A (0.038) and B (0.046) were computed. The output reported that the Sobel statistic was
1.848 and the ρ-value was 0.006 (ρ<0.05). Meaning, therefore, was a statistically
significant partial mediator of the effect of pure challenge on job satisfaction.
To sum up, after testing the significance of the mediating effect, competence was no
longer considered to be a mediator. Meaning mediated significantly and partially the
relationships between work dedication, managerial competence, pure challenge and
balanced-lifestyle, and job satisfaction; impact mediated significantly and partially the
relationships between work dedication and managerial competence and job satisfaction.
The significant effects were low. The remaining mediating variables of self-
determination and the predictors of service, economic security and entrepreneurial
creativity were not significant in the explanation of job satisfaction. Because the results
were unexpected in which the correlation was low, the researcher decided to carry out
moderation testing (Baron & Kenny 1986). Kim, Kaye and Wright (2001, p. 69)
suggested that moderating effects are presented ‘when there is an unexpected weak
relationship between predictor and dependent variable’.
4.8.4 The moderating effects of psychological empowerment
Testing of the moderating effect was carried out to extend the analysis. Theoretically,
data analysis can be extended to analyse interactions or moderating effects (Mackinnon
2011; Sekaran & Bougie 2013). Baron and Kenny (1986) and Kraemer et al. (2002)
recommended that if the mediators interact with the predictors to cause the criterion
variables, tests of the moderating effect should be run. Mackinnon (2011, p. 417)
concluded that moderator effects are present ‘if the interaction term explains a
statistically significant amount of variance in the dependent variable’. In other words,
unlike tests of mediation effects that explain the relationship between two other

139
variables, a moderator test is conducted to determine when (or under what conditions) a
predictor variable affects a dependent variable (Baron & Kenny 1986). The moderator
affects the strength (enhancing or reducing the strength) or direction (positive or
negative) of the two variables’ relationship. However, ‘unless the moderating variable is
present, the theorized relationship between the other two variables considered will not
be performed’ (Sekaran & Bougie 2013, p. 76). Baron and Kenny (1980, p. 1178) also
stressed that an indication to test moderators was ‘when there is an unexpectedly weak
or inconsistent relation between a predictor and a criterion variable.’ Due to the low
relation and inconsistency results on the mediation test in the current study, the
moderation test was performed.
As with the mediation effects, this study has not found prior studies that examined the
moderation of psychological empowerment on career anchors and their relationships to
job outcomes. However, there are some studies in relation to other variables, such as
leadership and attitudinal outcomes (e.g., Given 2008; Pieterse et al. 2010). Because the
current study is a starting point in the area of career anchors, it analysed these two types
of effects separately to see if the facets of psychological empowerment also act as
moderators or a combination of mediators and moderators. The results were expected to
contribute to the theory and the practice of the career anchor framework.
The current study, therefore, tested whether the psychological empowerment facets also
moderated the relationship between career anchors and job satisfaction. A statistical
model for the moderation testing is illustrated in Figure 4.2.
A new hypothesis was, therefore, formulated:
Hypothesis 3e: The moderating role of psychological empowerment facets strongly explains the influence of Indonesian academics’ perceptions of career anchors on job satisfaction.
Hierarchical multiple regression analysis was employed to test the interaction effect
(Miles & Shelvin 2001) of psychological empowerment on career anchors in the
explanation of job satisfaction. Variable blocks were entered in order sequentially. The
key terms and their symbols that had been used in the main effects and mediation

140
testing for interpreting the outputs (see Sub-section 4.8.1) were also used in the
moderation testing.
Figure 4.2: Research model for testing the moderating effects of the relationship
between career anchors, psychological empowerment and job satisfaction
To conduct a test for moderating effects, new variables were created (Miles & Shevlin
2001). Each of the four facets of psychological empowerment (meaning, impact,
competence and self-determination) was multiplied by each of the seven career anchor
dimensions (work dedication, balanced-lifestyle, entrepreneurial creativity, service,
managerial competence, pure challenge and economic security). The 28 new variables
were entered into the regression model after the steps of demographic data, career
anchors and psychological empowerment blocks.
Hierarchical multiple regression analysis was carried out to test the effects of the 28
moderators on the zero-order correlations between the career anchors block and job
satisfaction. In addition to the assumptions in Sub-section 4.8.1, outliers and
multicollinearity requirements were checked first. No multivariate outliers were
observed because the Mahalanobis distance value (8.895) (see Appendix 15) was less
than the critical chi-square value (χ²[44] of 78.750) at alpha 0.1 percent. High tolerance
values (0.210 to 0.830) indicated that no strong linear relationship among the
Managerial competenceBalanced-lifestyleWork dedicationServicePure challengeEconomic security
Entrepreneurialcreativity
Job satisfaction
A predicto r influences a criterion
A cons truct cons is ts o f several variables
Competence Meaning Impact Self-determination
Careeranchors
Psychological empowerment
Career anchors*
Psychological empowerment
Job satisfaction

141
independent variables was found. Similarly, the VIF values revealed that
multicollinearity could not be assumed. All values were between 1.196 and 4.758.
These findings, therefore, supported the other testing assumptions (i.e., normality,
linearity and homoscedasticity) for regression analysis discussed in Sub-section 4.8.1.
The results are reported in Table 4.17.
Table 4.17: Summary of regression outputs for the effects of demographic data, career anchors, psychological empowerment, job satisfaction and moderators
Step Variable block
Regression model Sub-variables
Partial F test VIFᵃ) &
Tol.ᵇ) R² AdjR² ∆R² ∆F df sig.
∆F* β tval ρ* Part
1 Demogra-phic data
.012 .004 .012 1.412 5,579 .218
1.196 -
4.758 &
.210 -
830
2 Career anchors
.250 .234 .237 25.806 7,572 <.001 Work dedication .192 4.181 <.001 .138 Managerial competence
.098 2.384 .017 .079
Pure challenge .147 3.865 <.001 .128 3 Psycholo-
gical empower-ment
.333 .314 .083 17.637 4,568 <.001 Meaning .240 5.163 <.001 .171 Impact .083 2.030 .043 .067 Competence .125 2.745 .006 .091
4 Moderat-ion
.410 .362 .077 2.520 28,540 <.001 Balanced-lifestyle* Meaning
.106 2.354 .019 .078
Service*Impact .088 1.998 .046 .066 Balanced-lifestyle* Competence
-.235 -4.643 <.001 -.154
Balanced-lifestyle* Self-determination
.124 2.801 .005 .093
Service* Self-determination
-.134 -2.979 .003 -.099
Pure challenge* Self-determination
.120 2.782 .006 .092
Overall F test: Fval = 8.506 df = 44, 540 ρ* < .001 a) > 10 or b) <0.01 = multicollinearity presented * < .05 = significant Effect size [f²] = .695
The demographic data set was entered into the regression model at the first step. The
demographic block (gender, education, work experience, age and institution size)
collectively explained only 0.4 percent of the variance in job satisfaction. The variance
proportion was statistically non-significant (∆R²=0.004, ∆F[5, 579]=1.412, ρ=0.218).
The predictors of career anchor and psychological empowerment blocks were entered
into the regression model at the second step. The R square change increased from 0.012
to 0.237. Career anchors and psychological empowerment accounted for an additional
24 percent of the variance in job satisfaction. There was a statistically significant effect
of career anchors and psychological empowerment sets on job satisfaction (∆R²=0.237,
∆F[7, 572]=25.810, ρ<0.001) over and beyond the 1.20 percent explained by the
demographic set.

142
Next, the interpretation at the third step was identical to that in Sub-section 4.8.3 Step 3.
The combined variance of the career anchors and psychological empowerment blocks
accounted for 8.3 percent of the variance in job satisfaction. The career anchors and
psychological empowerment sets had a statistically significant effect on job satisfaction
(∆R²=0.083, ∆F[4, 568]=17.840, ρ<0.001) above and beyond that explained by the
demographic set.
Lastly, the interpretation of the statistical results was made for the moderating effect at
the fourth step. The 28 moderation variables were entered into the regression model.
The moderation block collectively explained 7.7 percent of the variance in job
satisfaction above and beyond the variance already accounted for by the previous
blocks. The proportion had a statistically significant relationship with job satisfaction
(∆R²=0.077, ∆F[4, 568]=2.520, ρ<0.001). Overall, the predictor blocks explained 41
percent more than the main effect in the variability of job satisfaction (R²=0.410, F[44,
450]=8.506, ρ<0.001). Using the formula discussed in Chapter Three (Eq. 1), the
interaction effect was considered large (ƒ²=0.695).
However, of the 28 variables, only six moderator pairs were significant predictors of job
satisfaction. The significant interaction occurred positively between balanced-lifestyle
and meaning (tval=2.354, ρ<0.019, partr=0.078) and self-determination (tval=2.801,
ρ=0.005, partr=0.093), but negatively with competence (tval=-4.643, ρ<0.001, partr=-
0.154). A positive and significant interaction was also found for service and impact
(tval=1.998, ρ=0.046, partr=0.066), and for pure challenge and self-determination
(tval=2.782, ρ=0.006, partr=0.092). Last, a negative and significant interaction emerged
for service and self-determination (tval=-2.979, ρ=0.003, partr=0.099). The negative
values showed the opposite directions of the relationships in which when the predictor
increased, the criterion variable decreased.
To interpret the data, the significant moderation variables were plotted (Tabachnick &
Fidell 2007) into low (red line) and high (green dotted line) levels of the psychological
empowerment facets. Dummy variables were coded 0 for below mean and 1 for above
mean for each significant interaction (Cohen & Cohen 1983). The results are shown in a
series of figures as follows.

143
a. Moderating effect of meaning on the balanced-lifestyle and job satisfaction relationship
The interaction effect of meaning, balanced-lifestyle and job satisfaction is shown in
Figure 4.3. Figure 4.3 shows that the relationship between balanced-lifestyle and job
satisfaction depended on the level of meaning. At a high level of meaning (green dotted
line), the balanced-lifestyle tendency was positively related to job satisfaction. By
contrast, at a low level of meaning (red line), the balanced-lifestyle tendency was
negative towards job satisfaction. When academics tended to hold balanced-lifestyle, a
high meaning level could slightly increase job satisfaction whereas a low level could
decrease job satisfaction.
Figure 4.3: Interaction effect of meaning on balanced-lifestyle and job satisfaction
b. Moderating effect of impact on the service and job satisfaction relationship
The interaction effect of impact, service and job satisfaction is shown in Figure 4.4.
Figure 4.4: Interaction effect of service on impact
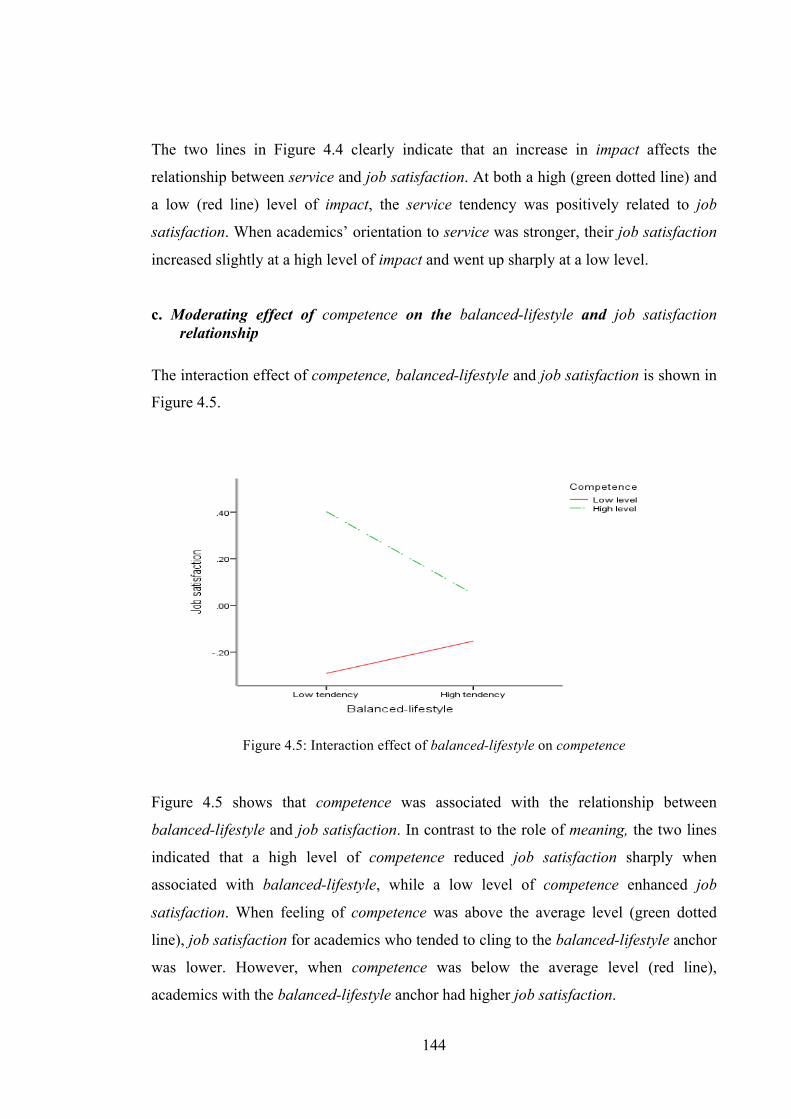
144
The two lines in Figure 4.4 clearly indicate that an increase in impact affects the
relationship between service and job satisfaction. At both a high (green dotted line) and
a low (red line) level of impact, the service tendency was positively related to job
satisfaction. When academics’ orientation to service was stronger, their job satisfaction
increased slightly at a high level of impact and went up sharply at a low level.
c. Moderating effect of competence on the balanced-lifestyle and job satisfaction relationship
The interaction effect of competence, balanced-lifestyle and job satisfaction is shown in
Figure 4.5.
Figure 4.5: Interaction effect of balanced-lifestyle on competence
Figure 4.5 shows that competence was associated with the relationship between
balanced-lifestyle and job satisfaction. In contrast to the role of meaning, the two lines
indicated that a high level of competence reduced job satisfaction sharply when
associated with balanced-lifestyle, while a low level of competence enhanced job
satisfaction. When feeling of competence was above the average level (green dotted
line), job satisfaction for academics who tended to cling to the balanced-lifestyle anchor
was lower. However, when competence was below the average level (red line),
academics with the balanced-lifestyle anchor had higher job satisfaction.

145
d. Moderating effect of self-determination on the balanced-lifestyle and job satisfaction relationship
The interaction effect of self-determination, balanced-lifestyle and job satisfaction is
shown in Figure 4.6.
Figure 4.6: Interaction effect of balanced-lifestyle on self-determination
Figure 4.6 shows two lines in the opposite directions of the balanced-lifestyle and job
satisfaction relationship. At a high level of self-determination (green dotted line),
balanced-lifestyle was positively related to job satisfaction whereas at a low self-
determination level (red line), the anchor was negatively related to job satisfaction.
When academics were more oriented to balanced-lifestyle, a high level of self-
determination slightly raised their job satisfaction; however, a low level of self-
determination reduced their job satisfaction dramatically.
e. Moderating effect of self-determination on the service and job satisfaction relationship
The interaction effect of self-determination, service and job satisfaction is shown in
Figure 4.7. Figure 4.7 shows a positive relationship between self-determination and job
satisfaction. Both at a high (green dotted line) and at a low (red line) levels of self-
determination, the service and job satisfaction relationship was positive. When
academics tended to be strongly anchored to service, a high level of self-determination
contributed slightly to the moderating effect of service on job satisfaction, while a low
level of self-determination raised the positive impact of service on job satisfaction.

146
Figure 4.7: Interaction effect of service on self-determination
f. Moderating effect of self-determination on the pure challenge and job satisfaction relationship
The interaction effect of self-determination, pure challenge and job satisfaction is
shown in Figure 4.8.
Figure 4.8: Interaction effect of pure challenge on self-determination
Figure 4.8 shows a positive relationship between pure challenge and job satisfaction
regardless of the levels of self-determination, either high (green dotted line) or low (red
line). The two levels of self-determination effectively intensified the job satisfaction of
academics who tended strongly to perceive pure challenge as important.

147
Hence, the four facets of psychological empowerment moderated the relationship
between the three categories of career anchors and job satisfaction. Hypothesis 4 was,
therefore, partially supported.
Summary of the model tests
In summary, a series of HMRA tests were performed to examine the effects of career
anchors and psychological empowerment on predicting the job satisfaction of
academics in Indonesian public universities. The results showed that the hypothesis
(H3a) that Indonesian academics’ perceptions of career anchor subscales are
positively related to job satisfaction was partially accepted. It suggested that of the
seven anchors, only work dedication, managerial competence and pure challenge
significantly and positively predicted job satisfaction, while balanced-lifestyle had
significant and negative influence.
The next hypothesis (H3b) that Indonesian academics’ career anchor subscales are
positively related to psychological empowerment was also partially accepted. In a
series of tests of career anchors on each of the psychological empowerment facets, the
results were shown as follows. Work dedication, service, managerial competence and
pure challenge had significant and positive effects on meaning, but a negative effect on
balanced-lifestyle. Work dedication and managerial competence had significant and
positive effects on impact. Service and managerial competence significantly and
positively predicted competence. Lastly, work dedication, balanced-lifestyle, service
and managerial competence were significantly and positively related to self-
determination.
Similar results were also shown in testing the next hypothesis (H3c) that Indonesian
academics’ perceptions of psychological empowerment facets are positively related
to job satisfaction. The hypothesis was only partially supported because only two out
of the four facets were related to job satisfaction. Meaning and impact had a significant
and positive effect on job satisfaction.
Testing the hypothesis (H3d) that the mediating role of psychological empowerment
facets strongly explains the influence of Indonesian academics’ perceptions of
career anchors on job satisfaction was partially supported but had weak relationships.

148
Because the relationships between career anchors and job satisfaction were low when
mediators were introduced and because more than one significant mediating effect was
found, the moderating test was performed. The additional hypothesis (H3e) for
moderation was the moderating role of psychological empowerment facets strongly
explains the influence of Indonesian academics’ perceptions of career anchors on
job satisfaction was partially supported. The summary of the two tests is presented in
Table 4.18.
Table 4.18: The roles of psychological empowerment facets on the relationship between career anchors and job satisfaction
Variables Mediators Moderators Mediator + Moderator
Work dedication Meaning, Impact - Managerial competence Meaning, Impact - Pure challenge Meaning Self-determination - Service - Impact,
Self-determination -
Balanced-lifestyle - Competence, Self-determination
Meaning
Table 4.18 presents the four facets of psychological empowerment as mediators and
moderators. Meaning mediated partially and significantly the effects of the predictors
work dedication, managerial competence and pure challenge on the criterion of job
satisfaction. Impact mediated partially and significantly the effects of the predictors
work dedication and managerial competence on the criterion of job satisfaction. Self-
determination moderated the relationship between the predictors of balanced-lifestyle,
service and pure challenge and the criterion of job satisfaction.
The facets of impact moderated the relationship between the predictor of service and the
criterion of job satisfaction; competence moderated the relationship between the
predictor of balanced-lifestyle and the criterion of job satisfaction; meaning served as
the mediating and moderating variables for the relationship between balanced-lifestyle
and job satisfaction. A closer examination of the interaction effects revealed that when
balanced-lifestyle tended to be high, high levels of meaning, competence and self-
determination increased job satisfaction; however, with a low level for balanced-
lifestyle, the facets reduced job satisfaction. When service increased, both high and low
levels of impact and self-determination raised job satisfaction level. Similarly, when
149
pure challenge increased, both high and low levels of self-determination also increased
job satisfaction. Looked at from the strength of the contribution given, both the direct
effect (between career anchors and job satisfaction) and the indirect effects (when
mediating and moderating variables were entered) had weak contributions. It was
assumed, therefore, that there may have been motivating factors, other than those
investigated in the study, such as academic freedom and academic atmosphere, with a
strong and significant influence on academics’ career development.
Based on the findings from the quantitative analysis, a modified research model is
presented and shown in Figure 4.9. Quantitative analysis showed that career anchors
directly affect job satisfaction and psychological empowerment, and also partially affect
the relationship between the two variables. Statistically, it found seven career anchors
include two new anchors. Five categories were in line with the original model, while
two new anchors were work dedication (previously technical competence and
geographical stability) and balanced-lifestyle (previously autonomy and lifestyle).
Consequently, multiple groups based anchors and their composition changed: talents-
based anchors comprise managerial competence and entrepreneurial creativity, needs-
based anchors include balanced-lifestyle and economic security, values-based anchors
remain the same as the original: pure challenge and service, and commitment-based
anchor, which is a new group consists of work dedication. Four facets of psychological
empowerment (i.e., meaning, impact, competence and self-determination) and job
satisfaction remained the same as the original ones.
The identification of two new anchors and the roles of psychological empowerment
facets as the mediators, the moderators and the mediators and moderators showed that
cultural differences existed in the present subject research. The cultural values attached
to academics’ attitudes were believed to affect academics’ perceptions of their internal
career motivation and the level of job satisfaction in the workplace. Culture, either at the
individual level or organisational level, which was a component of the external careers,
affects individuals in choosing a career. Ethnic differences between one place to other
places show difference in the understanding of something. Indonesians who embrace
leaders should be men or do not criticise the leadership, (Moffat 2012), for instance,
will be different attitudes and behaviours in the workplace from those who uphold
individualism or freedom of speech, as in the western countries, where the concept of

150
career anchors was introduced. This will affect individuals in deciding upon a career.
Therefore, cultural values were entered into the model for further investigation. Sub-
section 6.5 discusses cultural values in more detail.
Summary
This chapter reports the findings from fieldwork and the results from the research
model. Employing the web-based and the paper-based surveys, the study received 585
valid questionnaires giving a high response rate of 87.57 percent. Exploratory factor
analysis outputs showed that the convergent and discriminant validity of the career
anchor inventory, the psychological empowerment scale and the job satisfaction had
significant correlation coefficients within variables in each item. Cronbach’s alpha
coefficients of three scales showed acceptable internal consistency values of the items
and suggested that no item should be removed.
Of the three scales, only the career anchor inventory highlighted a shift in the structures:
four anchor categories merged into two new anchors termed work dedication and
balanced-lifestyle. As a consequence of the merging, a new multiple groups-based
anchor was formed and named commitment-based anchors.
The most dominant career anchor of Indonesian academics was economic security. It
was also found that multiple anchors existed among academics in which needs-based
anchors were at the highest rank of multiple groups-based anchors. The study also
found that no academics held mutually exclusive anchors, suggesting all relationship-
pair anchors were complementary. Statistically, there was a direct relationship effect
between several career anchors and job satisfaction relationship, between several career
anchors and the psychological empowerment facets and between two psychological
empowerment facets and job satisfaction. Psychological empowerment partially and
significantly mediated and moderated the relationships between career anchors and job
satisfaction: meaning and impact played as mediators while self-determination, impact
and competence were as moderators. Meaning, the only psychological empowerment
facet, played its role as mediator and moderator. Table 4.19 presents the issues,
hypotheses and results of the analysis.

151
Influ
ence
s Va
riabl
eCo
nsid
erin
g va
riabl
eCo
nsist
s of
Cons
truc
tPr
opos
ed n
ew a
ncho
rs
Figu
re 4
.9: M
odifi
ed re
sear
ch fr
amew
ork
for q
uant
itativ
e an
alys
is o
f the
rela
tions
hips
bet
ween
ca
reer
anch
ors,
psyc
holo
gica
l em
powe
rmen
t and
job
satis
fact
ion
Car
eer
anch
ors
Psyc
holo
gica
l em
pow
erm
ent
Job
satis
fact
ion
Mea
ning
Impa
ct
Self-
dete
rmin
atio
nC
ompe
tenc
e
Man
ager
ial
com
pete
nce
Bal
ance
d-lif
esty
le
Econ
omic
se
curit
y
Wor
k de
dica
tion
Serv
ice
Pure
ch
alle
nge
Tale
nts-
base
d
Nee
ds-
base
d
Valu
es-
base
d
Com
mit
-men
t-ba
sed
Entre
pren
euria
l cr
eativ
ityJo
b sa
tisfa
ctio
n

152
Table 4.19: Summary of quantitative analysis results
No Issues Hypotheses Results NotesCareer anchor inventory: of nine categories, four anchors merged into two new anchors: 1) work dedication (merging of technical competence and geographical stability) and 2) balanced-lifestyle (merging of autonomy and lifestyle) forming committment-based as a new category of multiple groups-based anchors. The 25 items remained the same as the original. The psychological empowerment and job satisfaction scales examination resulted in the same factors and items as the original ones.
2 The single and multiple dominant career anchors of Indonesian academics.
(H1) --> Indonesian academics score differently on a single dominant career anchor or multiple dominant career anchors.
Supported. The highest rank was economic security
(H2) --> Indonesian academics score differently on the talents-based, needs-based and values-based anchors.
The highest rank was needs-based.
(H2a) --> Indonesian academics score differently on the talents-based, needs-based, values-based and commitment-based anchors.
Supported. A new hypothesis was formulated due to a new multiple groups-based anchor emerged as a result of new scale structures.
(H3a) --> Indonesian academics’ perceptions of career anchor subscales are positively related to job satisfaction.
Partially supported. Of the seven career anchors, only four had significant relationship: work dedication, managerial competence and pure challenge had positive and significant relationship on job satisfcation, while balanced-lifestyle had negative effect.Partially supported. Five out of seven anchors had significant relationships. Work dedication, service, managerial competence and pure challenge had positive and significant relation to meaning, but negative effect on balanced-lifestyle. Work dedication and managerial competence had positive and significant effects on impact.Service and managerial competence predicted positively competence.Work dedication, balanced-lifestyle, service and managerial competence were positively and significantly related to self-determination.
(H3c) --> Indonesian academics’ perceptions of psychological empowerment facets are positively related to job satisfaction.
Partially supported. Two out of four psychological empowerment facets had a direct effect. Meaning and impact had positive and significant effect on job satisfaction.
(H3d) --> The mediating role of psychological empowerment facets strongly explains the influence of Indonesian academics’ perceptions of career anchors on job satisfaction.
Partially supported. Two out of four facets of psychological empowerment played a role as mediators on three out of seven anchors and job satisfaction relationship. Meaning and impact mediated the effect of work dedication, managerial compatence and pure challenge on job satisfaction.Partially supported. Three out of four psychological empowerment facets served as moderators on three out of seven anchors and job satisfaction relationships. Self-determination moderated the effect of pure challenge, service and balanced-lifestyle on job satisfaction.Impact moderated the relationship between service and job satisfaction.Competence moderated the relationship between balanced-lifestyle and job satisfaction.Meaning mediated and moderated only balanced-lifestyle and job satisfaction relationship.when balanced-lifestyle tended to be high, high levels of meaning, competence and self-determination increased job satisfaction; however, at a low level for balanced-lifestyle, the facets dropped job satisfaction. When service increased, both high and low levels of impact and self-determination raised job satisfaction level. When pure challenge increased, both high and low levels of self-determination increased job satisfaction.
New hypothesis was fomulated because of the unexpected weak relationship between the predictor and the criterion variable.
Examining the structure of each scale.
1
How do career anchors predict psychological empowerment and job satisfaction?
4
No hypothesis statedThe relevance of the career anchor inventory, the psychological empowerment scale and the job satisfaction scales in the Indonesian academics context.
(H3b) --> Indonesian academics’ career anchor subscales are positively related to psychological empowerment.
The talents-based, needs-based and values-based anchors of Indonesian academics.
3
(H3e) --> The moderating role of psychological empowerment facets strongly explains the influence of Indonesian academics’ perceptions of career anchors on job satisfaction.

153
The next chapter will analyse and discuss the qualitative research data of the interviews
and the two open-ended questions on the questionnaire. The qualitative findings will be
presented in the form of themes and be used to support the results of the quantitative
analysis.
154
Chapter 5
Academics’ perceptions of the career anchors
5.1 Introduction The previous chapters introduced the background of the study, the theoretical
framework, the methodology and the results of the quantitative data. Chapter One
outlined the aims, the background and the research problem of the study. Chapter Two
reviewed the previous studies on career anchors, psychological empowerment and job
satisfaction, and developed the framework, the research model and the hypotheses.
Chapter Three discussed the research design for the current study including the study
approach, the sample, the data collection method and procedures, and the data analysis
design. Chapter Four presented the results of the quantitative data analysis. It began by
presenting the response rates of the surveys, and the demographic background
characteristics. The psychometric measurement of the three instruments (the career
anchor inventory, the psychological empowerment scale and the job satisfaction scale)
used was tested. The chapter also examined the dominant and multiple career anchors
and then identified the career anchor relationship pairs. Finally, testing the effects of
predictors on the criterion was performed including the testing of mediators and
moderators.
This chapter, Chapter Five, discusses the results of the qualitative data. It presents the
analysis design of the data gathered. It provides the responses and the demographic
profiles of the participants from the interviews and the two open-ended questions on the
questionnaire. The chapter then identifies the macro and micro themes and displays
some examples of the responses. The emergent themes from the interviews are defined
and related to the career anchor concept to identify dominant career anchors. A number
of other themes from the written responses are used to strengthen the analysis. This
chapter also presents the contribution of the qualitative results to the theory. Finally, the
chapter compares the results that are associated with the quantitative results and draws a
conclusion.

155
5.2 Framework for the qualitative analysis
This chapter discussed and solved issue 5 of the research question in Chapter One.
Issue 5: How do Indonesian academics’ perceptions of their career development influence the way they pursue the career anchors?
The qualitative question is intended to explore how or why factors related to the career
development of academics from the viewpoints of different respondents. The responses
are used to strengthen the findings revealed in the quantitative analysis in Chapter Four.
In addition, it is also strength of the mixed method as used in this study.
Academics’ understanding of their career goals is rooted in their understanding of career
anchors and the match between the needs of academics and their organisations. It is
suggested that an individual should be better able to understand her or his self-image of
what she or he is ‘good at’ (in the form of talents or competencies), ‘what motivates’
her or him (in the form of needs) and ‘what values’ she or he has learned (Schein & van
Maanen 2013, p. 1). If an individual has a clear self-image of the three components of
the occupational self-concept (talents/competence, needs/motives and values), ‘the
individual has anchored her or his career’ (Schein 2006a, p. 1). Individuals who have
identified their career anchors need to communicate this to their workplaces because the
self-concept is one’s interest, not an organisation’s or an employer’s interest. Moreover,
Schein (1978, p. 2) discovered that the concept of career focuses on ‘the interaction of
the individual and the organization over time’. In other words, on the one side,
individuals need organisations to exercise their skills and competencies, give security
and provide career opportunities and continuity; on the other side, organisations need to
benefit from individuals’ performances in order to grow. Individuals need an interaction
with organisations at work as they maximise their career anchors to achieve their own
goals. The framework of the analysis of the relationships between the variables for the
current study is presented in Figure 5.1.
The current study analysed the academics’ understanding of career goals using the
qualitative data. It attempted to uncover any aspects within career anchors that were not
covered in the quantitative analysis. First, academics’ dominant career anchors were
identified through their work histories and experiences. An interview using Schein’s

156
interview protocol was employed to collect the data (see Appendix 6). Schein and van
Maanen (2013, p. 19) pointed out that ‘an interview protocol is needed to analyse your
career history and determine more precisely what your anchor is’.
Figure 5.1: Framework of academic understanding of career anchors
Following Schein’s (1978) work in finding an individual career anchor, the respondents
in the current study were interviewed to obtain their actual work history, including their
educational background. Schein (1978) established the concept of career anchor initially
based on the educational and employment history of interviewed participants. They
were asked to trace their employment and the reasons for choosing the jobs they had
held since completing their first degree including the dynamics encountered during the
course of their employment history. The respondents then were asked to predict their
desired job in the future. This step identified themes that emerged and classified them
with reference to the career anchor categories. Then, the anchors were counted to
determine the respondents’ dominant career anchors. Themes that could not be
characterised into one of the anchor categories were grouped into new categories.
Second, the interaction between the individuals and the organisations (denoted )
was examined through the factors that affected the individual career motivation and the
support provided by the institutions in the development of their careers. At this step,
Career
history
Career motivation factors
Institutional supports
Career goals

157
data collected via written answers also identified their themes. All discovered themes
were used to support the discussion of the identified dominant career anchors. Finally,
the identified career anchors were linked to the interaction (denoted ), including to
the quantitative findings, to understand the career goals of academics.
5.3 Interview and open-ended questions responses
Qualitative data were collected in two ways: face-to-face interviews and open-ended
questions on the questionnaire (Patton 2002). Biased opinions in interviews can be
clarified through the answers given on the questionnaires. Similarly, unclear written
answers on the questionnaire can be checked via interviews.
As discussed in Chapter Three, Schein’s structured interview protocol was used to
identify academics’ career anchors. Interviews were conducted with 20 lecturers on-site
at six universities: three each at four of the universities, and four each at the other two
universities. Each interview took 25 to 35 minutes. Those who participated in the
interviews have a varied demographic background as explained in Sub-section 5.4.1.
Survey respondents were asked to respond to open-ended questions on the
questionnaire. Question 1 asked for the factors that influenced their internal career
motivations. Of the total 585 valid questionnaires, 94 (16,07%) were discarded due to
blank answers (77, or 13.16%) and vague responses (17, or 2.91%). It was pointed out
that those deleted answers required further justification if they were to be used for the
analysis (Miles & Hubermann 1994). Some deleted examples given by the respondents
are ‘read books and journals; community’s need to change; up–to-date; profession; and
literature to benefit community’. Thus, 491 surveys (83.93%) were used for further
analysis. More detailed examination revealed of the total 491 valid surveys, the
researcher found 676 responses that included multiple answers.
Finally, the respondents were asked to give responses to question 2, which related to the
institutional supports given to academics in achieving career goals. A total of 192
questionnaires were excluded from the analysis because 185 respondents (31.62%) left
the answer blank and seven questionnaires (1.20%) were removed. The reason for
deletion is that those answers needed further justification if they were to be included in
the analysis. Some examples of deleted responses were ‘Low academic atmosphere due

158
to academic political issues; advanced innovation and technology, and unified nation; if
I am not working in this present institution, I may not think to develop myself, educate
community and do community services; and institutional development in general’.
Thus, 393 (67.18%) of the total of 585 valid respondents were acceptable for analysis.
Further assessment obtained 462 responses indicating that there were some respondents
who gave more than one answer.
5.4 Thematic analysis of the understanding of academics’ career anchors in achieving career goals
Thematic analysis is one form of qualitative research. All responses given by the
respondents were analysed using thematic analysis, which emphasises identifying
themes and/or patterns of behaviours (Aronson 1994) that reflect the textual data
(Howitt & Cramer 2008). It can group similar meanings of responses conceptually into
meaningful themes. Miles and Huberman (1994, p. 127) stated that:
a conceptually clustered matrix has its own rows and columns arranged to bring together items that “belong together.” This outcome can happen in two ways: conceptual –the analyst may have some a priori ideas about items that derive from the same theory or relate to the same overarching theme; or empirical –during early analysis you may find that informants answering different questions are tying them together or are giving similar responses. The basic principle, however, is conceptual coherence.
The analysis is ordered based on the concept, and not on persons or roles (Miles &
Huberman 1994). It is possible that the responses given are vague and imprecise, and
some are overlapping (Bernard 1994). These could mean that not all themes that
emerged are labelled. According to Ryan and Bernard (2003, p. 85), identifying themes
is a four-step process: (1) discovering themes and subthemes; (2) winnowing themes to
a manageable few; (3) building hierarchies of themes or code books; and (4) linking
themes into a theoretical model. The researcher is therefore considered the person who
is most familiar with the textual data, and thus has the right to build themes that reflect
them (Howitt & Cramer 2008). Six procedures introduced by Howitt and Cramer (2008)
mentioned in Chapter Three are an extension of Ryan and Bernard’s. As suggested by
Howitt and Cramer (2008) and implemented by Muchiri and Cooksey (2009), the
thematic analysis in the current study was done manually by the researcher.

159
Data gathered were analysed based on the steps described in the Sub-section 3.6.1 in
Chapter Three. Data were transcribed, listed and coded, and themes were identified.
Then, similar responses were combined into ‘micro themes’ as a higher order, which in
turn were integrated into ‘macro themes’ as the highest order (Muchiri & Cooksey
2009). Because respondents were free to discuss all aspects of their academic lives, the
identified macro and micro themes were, therefore, classified as reflecting an internal or
external career orientation, following the understanding of internal and external career
meanings discussed in Chapter Two. In addition, the terms of ‘theme’ and ‘category’
are used interchangeably.
Macro and micro themes that emerged from the interviews were used as the benchmark
or reference point to the themes from the two open-ended questions. If the responses
were not covered by the existing labels, they were categorised into the new themes.
Then, the micro themes were supported with some examples, and the number of
samples (symbolised N) and the percentages (symbolised %) were counted. Howitt and
Cramer (2008) argued that ‘there is no reason why researchers cannot give numerical
indications of the incidence and prevalence of each theme in their data’. Similarly,
Ghauri and Gronhaug (2005, p. 109) asserted that ‘…it is possible to quantify
qualitative data’. Siegel (2011, p. 727) in his book Practical Business Statistics
emphasised that qualitative data could be summarised by using frequencies or
percentages to ‘preserve information in a more useful way in a smaller space’. In
addition, for the demographic profiles, the number of respondents who chose the
categories given was obtained from the calculation of the descriptive statistics on the
SPSS software version 19.0 for Windows.
The themes that emerged were then analysed for their validity and reliability (Ryan &
Bernard 2003). As discussed in Chapter Three, triangulation validity and the bilingual
peer approach were employed, while the reliability analysis adopted Gibb’s (2007)
procedures. All macro and micro themes were tabulated and presented in tables, and
then were validated based on the concept and the linguistic-semantics by either ‘local
experts’ (Jehn & Doucet 1997 in Bernard & Ryan 2010, p. 72) or ‘experts and novices’
(Barkin, Ryan & Gelberg 1999 in Bernard & Ryan 2010, p. 72). For the purpose of the
current study, the themes were judged by two experts: one academic who had a degree
in English, and another who spoke English and had completed a degree overseas that

160
specialised in organisational psychology. This process aimed to determine whether the
themes accurately captured the responses, and whether those themes measured the same
thing.
Feedback from the two experts suggested that the themes of academic freedom and
academic creativity should be combined into one theme designated academic freedom
and creativity. The reason is that academics who perceived themselves to be
independent and felt autonomous would feel free to create and innovate with their ideas.
The remaining themes were adopted without change for the analysis.
5.5 Thematic analysis of the career history: findings from interviews
5.5.1 Demographic profiles
Career histories of academics of various backgrounds were gathered through 20
interviews. There were eight female participants (40%) and 12 male participants (60%).
All participants had postgraduate qualifications. Of them, 12 participants (60%) had
completed their master’s degree, while eight participants (40%) had attained a doctoral
degree with a ratio of domestic to overseas graduates of 10 (50%) to two (10%) for
master’s and six (30%) to two (10%) for doctorates. The majority of participants
specialised in the fields of plant sciences and economics. Five participants (25%)
studied in the areas of plant science (e.g., agronomy and forestry) and 10 (50%) in
social science (e.g., law, management, accounting and economic development). Three
(15%) studied in education (educational technology and language), and the rest majored
in either science or tourism. Most respondents were in the established stage of their
career cycle: 14 (70%) were senior lecturers and three (15%) were lecturers and
professors; 16 participants (80%) had over 20 years of work experience and the
remaining four participants (20%) had worked at the current organisations between 11
and 20 years. Of the 20 interviewees, only five participants (25%) held managerial
positions, such as vice dean, head of department or head of postgraduate studies. With
such a diverse set of participant demographics, it was considered that there would be a
variety of responses for analysis.
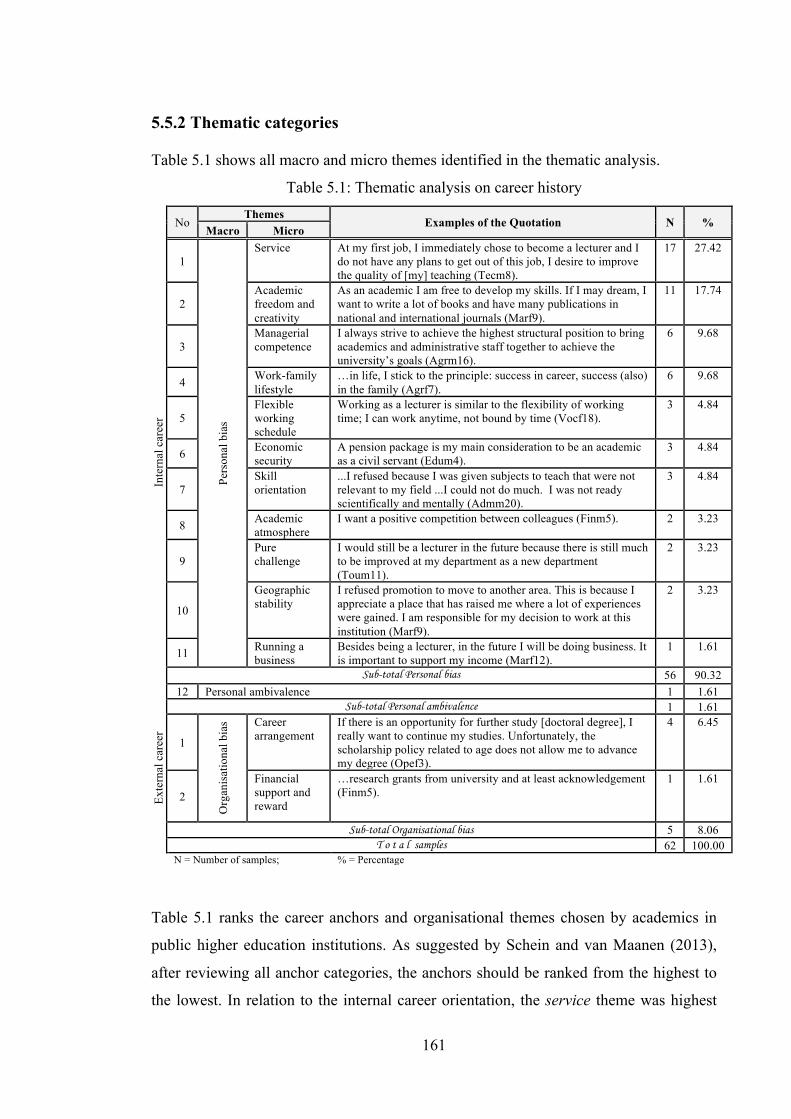
161
5.5.2 Thematic categories Table 5.1 shows all macro and micro themes identified in the thematic analysis.
Table 5.1: Thematic analysis on career history
Inte
rnal
car
eer
No Themes
Examples of the Quotation N % Macro Micro
1
Pers
onal
bia
s
Service At my first job, I immediately chose to become a lecturer and I do not have any plans to get out of this job, I desire to improve the quality of [my] teaching (Tecm8).
17 27.42
2 Academic freedom and creativity
As an academic I am free to develop my skills. If I may dream, I want to write a lot of books and have many publications in national and international journals (Marf9).
11 17.74
3 Managerial competence
I always strive to achieve the highest structural position to bring academics and administrative staff together to achieve the university’s goals (Agrm16).
6 9.68
4 Work-family lifestyle
…in life, I stick to the principle: success in career, success (also) in the family (Agrf7).
6 9.68
5 Flexible working schedule
Working as a lecturer is similar to the flexibility of working time; I can work anytime, not bound by time (Vocf18).
3 4.84
6 Economic security
A pension package is my main consideration to be an academic as a civil servant (Edum4).
3 4.84
7 Skill orientation
...I refused because I was given subjects to teach that were not relevant to my field ...I could not do much. I was not ready scientifically and mentally (Admm20).
3 4.84
8 Academic atmosphere
I want a positive competition between colleagues (Finm5). 2 3.23
9 Pure challenge
I would still be a lecturer in the future because there is still much to be improved at my department as a new department (Toum11).
2 3.23
10
Geographic stability
I refused promotion to move to another area. This is because I appreciate a place that has raised me where a lot of experiences were gained. I am responsible for my decision to work at this institution (Marf9).
2 3.23
11 Running a business
Besides being a lecturer, in the future I will be doing business. It is important to support my income (Marf12).
1 1.61
Sub-total Personal bias 56 90.32 12 Personal ambivalence 1 1.61
Sub-total Personal ambivalence 1 1.61
Exte
rnal
car
eer
1
Org
anis
atio
nal b
ias Career
arrangement If there is an opportunity for further study [doctoral degree], I really want to continue my studies. Unfortunately, the scholarship policy related to age does not allow me to advance my degree (Opef3).
4 6.45
2 Financial support and reward
…research grants from university and at least acknowledgement (Finm5).
1 1.61
Sub-total Organisational bias 5 8.06
T o t a l samples 62 100.00
N = Number of samples; % = Percentage
Table 5.1 ranks the career anchors and organisational themes chosen by academics in
public higher education institutions. As suggested by Schein and van Maanen (2013),
after reviewing all anchor categories, the anchors should be ranked from the highest to
the lowest. In relation to the internal career orientation, the service theme was highest

162
ranked, while the running a business theme was the least-often chosen theme by
academics. The next ranked themes in the hierarchy in descending order are academic
freedom and creativity, managerial competence, work-family lifestyle, flexible working
schedule, economic security, skill orientation, academic atmosphere, pure challenge
and geographical stability. Contrary to the internal career orientation themes, the career
management and financial support and reward themes of the external career factors
also appeared to influence academics’ career decision. The characteristics of each theme
that emerged are described below.
5.5.3 Identified macro themes
Two macro themes were identified. The first was personal bias as an internal career.
Personal bias highlights academics’ insights into their competencies and skills, their
motives or needs, and their attitudes and values to be actualised for career decisions
(Schein 1978, 1992, 2006a; Schein & van Maanen 2013). The second macro theme, as
an external career factor, was organisational bias, in which each academic expected real
support from their institutions in improving their career. The micro themes, discussed
below, provide a more detailed understanding of the macro themes.
5.5.4 Identified micro themes: personal bias and dominant career anchors
From the Personal bias macro theme, 12 micro themes including personal ambivalence
emerged. Managerial competence, running a business and skill orientation are
classified into talents-based anchors. Work-family lifestyle, flexible working schedule,
academic freedom and creativity, economic security and geographical stability were
classified as needs-based anchors. Pure challenge, service and academic atmosphere
were categorised as values-based anchors.
As discussed in Sub-section 5.2, the interviews were conducted to find out the dominant
career anchors of Indonesian academics at public universities. The results were grouped
as reflecting an internal career orientation. Personal bias, as shown in Table 5.1,
emerged because all the responses were associated with self-insight that reflected the
individual occupational self-concept as introduced by Schein (2006a). Psychologically,
academics recognise their competencies and talents (grouped in talents-based anchors),
require motivation and ambition (grouped in needs-based anchors) and understand their
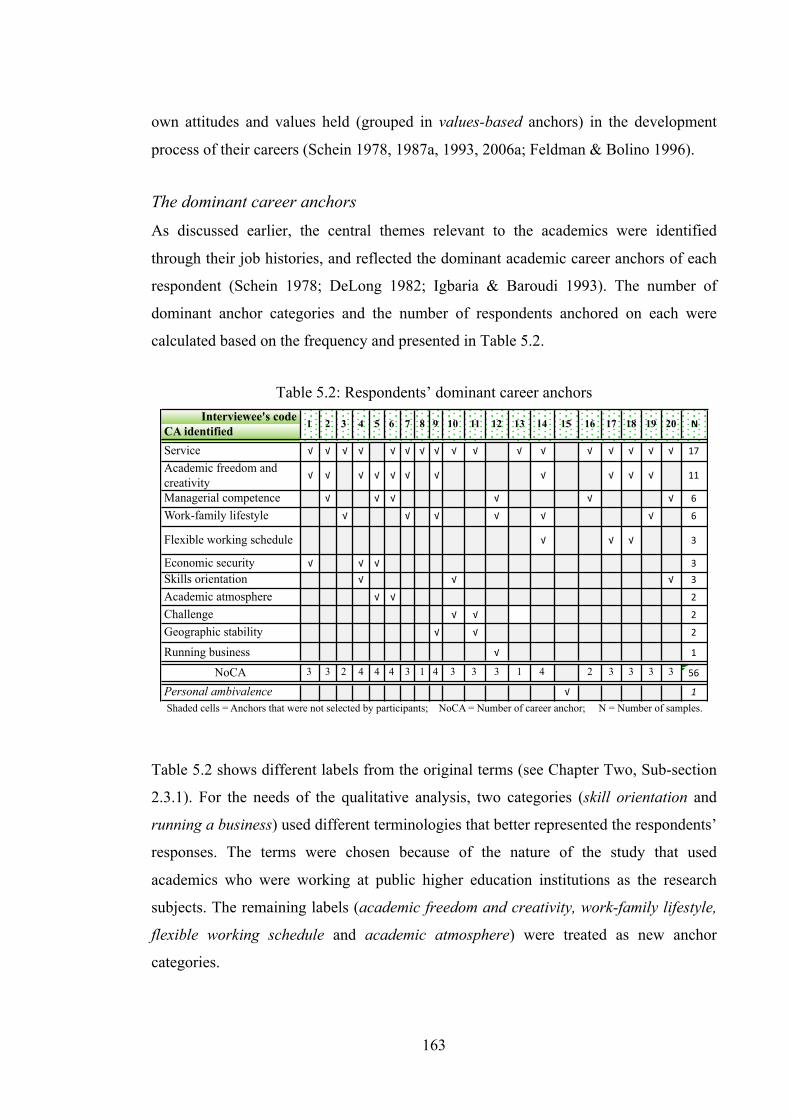
163
own attitudes and values held (grouped in values-based anchors) in the development
process of their careers (Schein 1978, 1987a, 1993, 2006a; Feldman & Bolino 1996).
The dominant career anchors As discussed earlier, the central themes relevant to the academics were identified
through their job histories, and reflected the dominant academic career anchors of each
respondent (Schein 1978; DeLong 1982; Igbaria & Baroudi 1993). The number of
dominant anchor categories and the number of respondents anchored on each were
calculated based on the frequency and presented in Table 5.2.
Table 5.2: Respondents’ dominant career anchors
Table 5.2 shows different labels from the original terms (see Chapter Two, Sub-section
2.3.1). For the needs of the qualitative analysis, two categories (skill orientation and
running a business) used different terminologies that better represented the respondents’
responses. The terms were chosen because of the nature of the study that used
academics who were working at public higher education institutions as the research
subjects. The remaining labels (academic freedom and creativity, work-family lifestyle,
flexible working schedule and academic atmosphere) were treated as new anchor
categories.
Interviewee's codeCA identifiedService ! ! ! ! ! ! ! ! ! ! ! ! ! ! ! ! ! "#
Academic freedom and creativity
! ! ! ! ! ! ! ! ! ! ! ""
Managerial competence ! ! ! ! ! ! $
Work-family lifestyle ! ! ! ! ! ! $
Flexible working schedule ! ! ! %
Economic security ! ! ! %Skills orientation ! ! ! %
Academic atmosphere ! ! &
Challenge ! ! &
Geographic stability ! ! &
Running business ! "
NoCA 3 3 2 4 4 4 3 1 4 3 3 3 1 4 2 3 3 3 3 '$
Personal ambivalence ! !
116 7 8 9 10
Shaded cells = Anchors that were not selected by participants; NoCA = Number of career anchor; N = Number of samples.
19 20 !13 14 15 16 17 18121 2 3 4 5

164
Of the 11 identified dominant career anchors, the highest rank order was service (17
respondents, or 29.82%), followed by academic freedom and creativity (11 respondents,
or 19.30%). Two anchors (i.e., managerial competence and work-family lifestyle) were
ranked in third place with each anchor nominated by six respondents (10.53%); the
fourth position was occupied by three anchors (i.e., flexible working schedule, economic
security and skills orientation), with each anchor chosen by three respondents (5.26%);
and the fifth position was also occupied by three anchors (i.e., academic atmosphere,
pure challenge and geographical stability), with each anchor chosen by two
respondents (3.51%). The dominant career anchor with the lowest rank was running a
business, which was selected by only one respondent (1.75%). Personal ambivalence
was also attached to one respondent (1.75%); in other words, this respondent had
difficulty in expressing a dominant career anchor.
As Table 5.2 indicates, while two respondents perceived a single career anchor, the
majority had multiple anchors. Of those with more than one career anchor: five
participants (25%) were oriented to four career anchors, 10 participants (50%) held
three anchors, and two participants (10%) had two career anchors. The remaining
respondent had a high level of personal ambivalence.
The description of each anchor that is the same as the original labels extended the
explanation given by Schein (2006a, pp. 7-25) while the new anchor categories
description were provided according to the interview results. Each of the anchor
description is as follows:
Service: As expected, the most preferred career anchor selected by academics as
government employees is service. Schein and van Maanen (2013, p. 17) determined that
‘if one score stands out, (indicated by the highest scores), that is what you can begin to
consider as your career anchor’. There are some academics who see this theme as
important in their careers. They desire to serve the community in a wider context by
improving the quality of the teaching environment. Academics as employees of
governmental higher education institutions have an obligation to serve the stakeholders:
students –through teaching, and society –through the application of research results.
They feel satisfied when their work is beneficial or acknowledged by colleagues and
others. They will still work even when unpaid. For them, money is not a key issue. This

165
group also has the intention to back the institution’s mission and goals. Here are some
examples of the participants’ comments:
My commitment is to keep on going to serve community through teaching my students and conducting research even if these are not got paid in terms of extra money…except [my] regular monthly salary. I feel happy if I can help my students to solve their assignments and other academic matters, including social problems (Foom8).
Being a lecturer at a public university is more like working as a civil servant at a public organisation … highly demanding work with low pay. However, I am happy with this job…because I can produce books and conduct research… I can also help and transfer knowledge and skills to my students and colleagues. Money is not my focus but serving people is number one (Edum6).
I switched from a private company to a public institution because I like to serve people. I will enjoy my career if what I am doing is beneficial to others and those people appreciate my work (Marf9).
This anchor reflects an important characteristic of civil servants, which is serving the
community at public institutions, including the higher education sector. Civil servants
either as employees at government institutions or as academics at higher education
institutions have the same interest in this dominant career anchor as observed by Schein
(1990, 2006a).
Academic freedom and creativity: The academic freedom and creativity anchor is a
new proposed anchor category that reflects a typical characteristic of academics.
Academics consider intellectual freedom to underpin the teaching and learning process,
which includes teaching, research and community services. They tend to be free in
expressing or communicating ideas within their disciplines, not only without undue
interference, but also without pressure from superiors, society, political and other
special-interest groups, and the law including university regulations. They undertake the
creation and innovation of academic products (e.g. books, papers) and services (e.g.,
counsellors, advisers) and present them to students, colleagues and other communities.
However, if there is a decline in academic productivity, such as no publications due to
lack of autonomy, they would question the role of institutions in promoting their
academic careers. These people, therefore, do not set money as their target. Money will
come as their products are published. The following quotes are two examples that
reflect the selection of the anchor and reinforce the merging of the two themes:

166
…What I am looking for as an academic is satisfaction through autonomy to implement my ideas … freedom of expression in academic world, I mean (Finm5).
Although the present job gives me a salary far less than before, I am able to develop myself and work for my future career independently... I feel free to express what I have [regarding my ideas] (Agrm2).
Academics need independence and freedom to be creative and innovative in academic
work. This requires that they can both teach and research without any constraint
(Robinson & Moulton 2002). Success for them means, for example, that they are able to
produce publications/books, transfer new ideas to colleagues, students and other
communities and design quality courses. As validated above, this career anchor is a
combination of the autonomy and entrepreneurial creativity anchors.
Managerial competence: The managerial competence anchor was third on the career
anchor hierarchy. Some academics pursue their careers through managerial positions.
These academics see themselves as having ability to supervise, control, organise, direct,
lead and influence people. They demonstrate that they have skills to solve problems,
motivate academics and students to perform, communicate institutional goals and
behave as a role model. This group also claims that they can control their feelings to act
reasonably and without bias to all academic and administrative staff. Having those
competencies, they are able to reach the top management level. In other words, these
academics want to contribute to the success of the institutions through managing people
and administrative work. Getting a higher level or rank is also viewed as promotion. For
them, holding managerial positions means an opportunity to earn extra income (on top
of their regular monthly salary). It is not surprising that there were six academics who
thought this anchor was important to them. They stressed that they wanted to manage
the institutions or practice the leadership skills by occupying the highest position. For
instance, one participant commented:
I am sort of an individual who likes to manage people and change my university to a better-quality standard. So, I never reject any kinds of managerial positions when it is offered and... I am doing it [serving as an administrator] now (Agrm2).
167
In addition to implementing the three pillars of higher education (teaching, research and
community service), academics are also allowed to occupy managerial positions. The
positions should be viewed as part of a need to apply the three basic areas of
competencies ‘based on analytical skills, interpersonal and group skills, and the
emotional capacity’ (Schein 2006a; Schein & van Maanen 2013, p. 10) instead of an
ambition to reach top management.
Work-family lifestyle: Some academics wanted to prioritise family over work. The
work-family lifestyle anchor was ranked fourth. Academics with this category look at
life not only for work but also for personal attachment. They, therefore, want a balanced
work life (career and ambition in teaching, research and community service) and
family/personal life, including social activities (e.g., family, friends, health, childcare
options, holidays and leisure activities). For married couples with or without families,
where both members of the couple are employed full time, a serious conflict of interest
may arise between the priority given to workplace commitments and the priority given
to family needs when family problems arise, e.g., a child is seriously ill, or one spouse’s
job is transferred. For some couples, the family has a higher priority than the workplace,
and one parent (in this case) will choose to take time away from work to care for the
family member. So, promotion to another geographical area is not their aim or ambition.
One participant exemplified this anchor:
I had to leave my previous university to follow my husband who is working in another place… I then [found] work at one university in the same location as my husband (Marf9).
Work-family lifestyle is one of the two anchors split from lifestyle. Work-family
lifestyle-oriented academics would develop their careers so that they integrate the two
needs. The other anchor category split from lifestyle is flexible working schedule.
Flexible working schedule: Some other respondents were motivated by flexibility in
time and place of work. This anchor placed fifth. This is a lifestyle preference of
academics who want to be flexible while still working within institutional rules,
restrictions and job performance requirements. Academics with this anchor are not
autonomy-anchored because they still obey institutional rules. Performance is examined
not only by academics’ presence at their universities but also by outcomes. Except for

168
the standard required teaching hours in classes or laboratories and consultation times,
they prefer flexibility in terms of time, location and how they work to meet their career
needs. Academics consider that while they are away doing research projects either at
home or at other locations, institutions should consider their performance, for example.
Academics believe that a rigid schedule would limit them or become a blockage to
developing their talents and applying their values in advancing their careers. One
participant commented:
Working as a lecturer has flexible time because I can work at home at the moment, as there is no teaching in the classroom or scheduled meetings (Ecom14).
This group would develop careers if a career situation allowed them to have autonomy
in managing their own work schedule.
Economic security: Qualitative data shows that the respondents who chose security
were only concerned with the amount of pay and the long-term economic benefit
package. This anchor category was ranked sixth. Academics who choose this theme
need secure employment and finance at the institutions they work for. They prefer to
have attractive long-term employment benefits, such as a pension package and health
insurance. The type of job is not so important as long as the institutions can assure their
financial security after retirement. These people may not be willing to perform some
tasks because they understand that they will not be fired due to the long-life
employment status. Their career advancement is usualy steady or slow. In addition, they
also rely heavily on their monthly salary. One participant commented:
A pension package is my main consideration to be an academic as a civil servant (Edum4).
In relation to the security/stability anchor category, the present findings confirmed the
separation of this anchor. The security/stability anchor was split into two categories
labelled the economic security anchor and the geographical stability anchor.
Skill orientation: Academics with this anchor are only motivated to grow in their
careers in the area of their specialisation. The anchor category was ranked seventh.
Some only teach or research based on the field of their formal educational, regardless of
169
offers of higher incomes if they work in other fields. However, others focus on their
technical and functional skills to develop their careers by getting extra work (e.g.,
faculty web designer, university counsellor). These people, in general, feel happy when
they have an opportunity to exercise their talents/skills and to be challenged in their area
of expertise. Managerial positions are not their concern, but leading people to work in
the same area of interest, such as becoming the head of the university computer
laboratory, is much appreciated. Thus, promoting them based on their interest is
preferred rather than giving extra money for the achievement. One participant
commented:
...I refused [a promotion] because I was given subjects to teach that are not relevant to my field, ... I was not ready scientifically and mentally (Admm20).
Academic atmosphere: It is surprising that the academic atmosphere anchor as a typical
anchor of academics was only ranked eighth out of the 11 anchors. This anchor was also
classified in the internal factors whereas other authors might regard it as an external
factor. Academics with this theme require a supportive academic work environment to
build a positive relationship between and among academics and students. It is believed
that such a conducive academic climate can promote trust among academics and
accelerate academics’ career choices. Having support from colleagues in collaborative
research, sharing knowledge, building teamwork, developing quality education and
creating positive competition are viewed as forms of a positive working atmosphere.
These people respect individual work, but recognise that working together enhances
their career goals. One participant commented:
Without the support of colleagues, collaborative work is not going to happen so that [one’s] career will stagnate. Teamwork is needed to support one another (Edum6).
The proposed new anchor was only considered important by two respondents, who
argued that without a positive academic climate, it is impossible to operate the teaching
and learning process. Nizam (2006, p. 77) emphasised that a conducive academic
atmosphere would create ‘healthy relationships’ between and within academic
communities to develop quality of teaching and research and ‘a mutual trust’. Sharing
the same beliefs and values boosts academics’ careers by extending academics’
knowledge and skills.

170
Pure challenge: This anchor ranked ninth. Success for academics means they can
handle the tough or complex problems in the teaching and learning process, including
students’ problems either personal or academic. Pure challenge-oriented academics are
also obsessed by learning new things. They are happy to overcome problems even
outside of the area of their expertise and win competitions over tough opponents in the
multifaceted academic situation. Winning research grants among colleagues who are
from higher academic ranks or from well-known universities, for instance, is more
important than the money itself. However some academics with this anchor find hard to
advance in their career. Interestingly, these people regard both money and challenge as
a form of benefit. One participant stated:
I would still be a lecturer in the future because there is still much to be improved at my department as a new department (Toum11).
Geographical stability: Academics with this theme make geographical stability a
central motivation to pursue their careers. Academics feel strong loyalty to the
institution that has supported them in developing their academic career, making them
more likely to remain at their institutions. They are not generally interested in
promotions or salary increases offered by other institutions even if the current
institution does not provide enough resources and opportunity for developing careers.
Considering the current career situation in which more and more people are in dual
career couples, family care or their spouse’s career may also be their reason to stay. One
participant commented:
Yes. I even refused a promotion to another place although it was promising. My reason is loyalty. I have decided to work and grow at this university so I should dedicate [myself] to the institution where I grow my career (Vocf18).
This anchor category was regarded as a trade-off benefit for the economic and
employment security guarantee that academics receive.
Running a business: As expected, only one respondent chose the running a business
anchor as an important theme in deciding a career, causing the anchor category to have
the lowest rank. Some academics choose to run a business to exercise their skills as a
side job. These academics have entrepreneurship skills and are willing to take risks for
the sake of generating money. They merely do academic tasks based on the minimum

171
required workload and use the remaining time to run their business. In addition to
looking for extra incomes, these people also want to exercise their skills in business for
future opportunities. Because a sense of businesses is more to them than their public
sector work, academics might choose the anchor either because of security reasons (e.g.,
pension and lifelong employment) or because no other job opportunities were available
at the time. One participant commented:
Besides being a lecturer, in the future I will be doing business to exercise my skill. It is important to support my income (Marf12).
Following the separation of the creativity anchor from the entrepreneurial creativity
anchor, and the emergence of the running a business anchor, the entrepreneurial
creativity anchor in the current study was broken down into two anchor categories: the
running a business and academic freedom and creativity anchors. As discussed earlier,
creativity was joined to the academic freedom theme (Sub-section 5.4). The career
anchor was not expected to appear since it is opposed to the characteristics of many
academics who work in the public education sector.
In spite of the identified dominant career anchors, some academics face an ambiguous
career situation to decide which job would be the key career for them. This may result
when the present work undertaken does not conform to an academic’s expectation or
does not accommodate her/his talents and motivation, but she/he still wants to stay and
work in the current institution. It could be because she/he has too many career goals that
could lead her/him to be a multiple career anchors-oriented person. These individuals
are categorised in the ‘personal ambivalent’ theme (hereafter personal ambivalence)
suggested by Feldman and Bolino (1996, p. 99). A strong statement expressed by a
participant was:
Once I left my job in the private sector, I applied to become a lecturer in a public university in another geographical area; I thought it was great. In fact, I am stuck now and am getting older... moving, it is a bad idea. I am worried people will think I am corrupt... moving to a private sector does not matter for me if it should be somewhere else, wherever I am willing to do so... my plan before retirement [is that] I have to change the current job. I do not want to do business because business requires a big investment, however, if I work for a company and some of the income can be saved then I will work.

172
Hence, the current study showed that academics identified their career anchors that
could enable them to advance their careers. While academics’ anchors fell for the most
part within Schein’s career anchor typology, some new anchor categories also emerged.
In terms of the number of career anchors held by each respondent, most academics
(90%) had more than one anchor category, with between two and four anchors.
5.5.5 Identified micro themes: organisational bias
There are two themes under the organisational bias theme: career arrangement and
financial support and reward.
Career arrangement: Academics think that what the researchers call the ‘hardware’ of
career arrangement (e.g., career system and policy, training, education, publications) is
crucial in achieving career goals. They argue that though an academic has a very strong
internal motivation, if the institution does not establish a clear and transparent career
path system, motivation will be diminished or useless. They, therefore, expect
institutions to create positive competition for each individual academic, for instance, to
further their study to the highest level of education, join skills enhancement training, do
research and produce publications, and hold structural positions. Institutions may
establish a reasonable teaching load so as to give the opportunity for research, and have
no age limit to get a scholarship for further studies or training under scholarship
schemes.
Financial support and reward: Most academics consider that this theme is important to
achieve their career goals. They need financial support from their institutions, especially
for research and publications. It does not mean that the academics have no funds to do
their activities. Academics, however, argue that the involvement of institutions is
because the results of the research and publications will raise the institutions’ image.
Those who choose this theme do so as a consequence of the benefits received, such as
rice allowance and tax subsidies, that are unrelated to their achievement. This is not
only burden the institutions but also inhibits them from developing their own career.
They also value appreciation in the form of extra money, like bonuses.
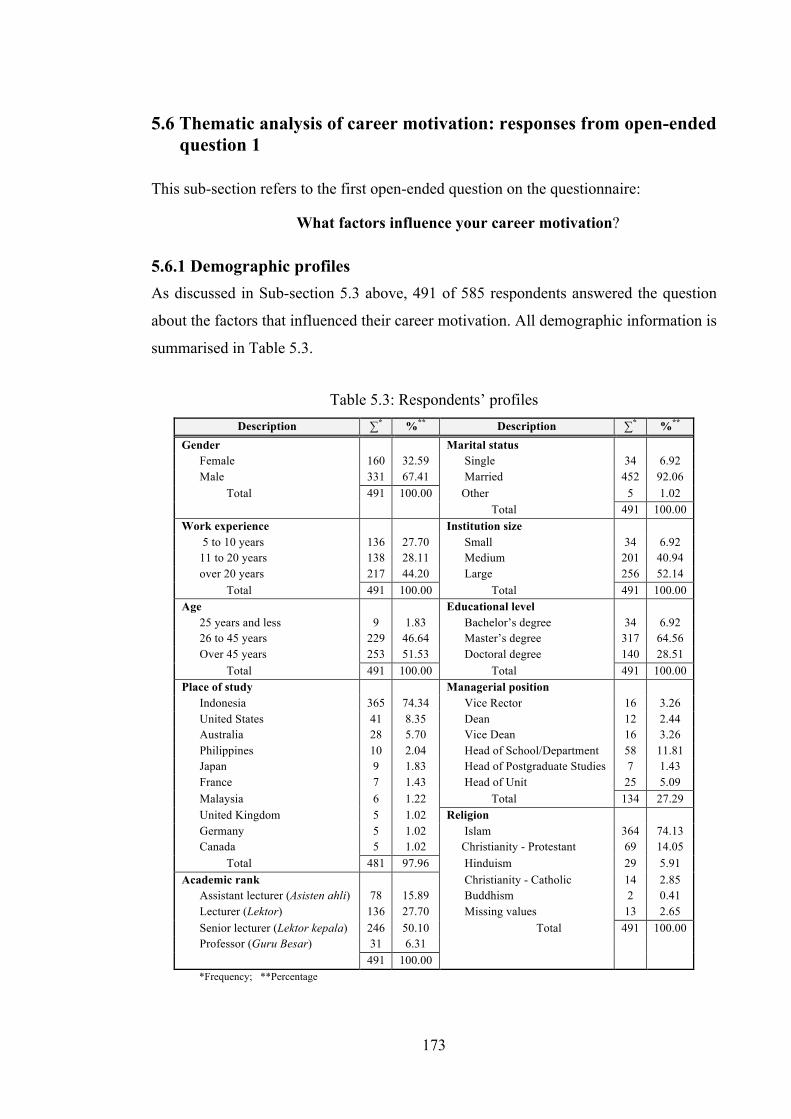
173
5.6 Thematic analysis of career motivation: responses from open-ended question 1
This sub-section refers to the first open-ended question on the questionnaire:
What factors influence your career motivation?
5.6.1 Demographic profiles As discussed in Sub-section 5.3 above, 491 of 585 respondents answered the question
about the factors that influenced their career motivation. All demographic information is
summarised in Table 5.3.
Table 5.3: Respondents’ profiles Description ∑* %** Description ∑* %**
Gender
Marital status
Female 160 32.59 Single 34 6.92 Male 331 67.41 Married 452 92.06 Total 491 100.00 Other 5 1.02 Total 491 100.00 Work experience
Institution size
5 to 10 years 136 27.70 Small 34 6.92 11 to 20 years 138 28.11 Medium 201 40.94 over 20 years 217 44.20 Large 256 52.14 Total 491 100.00 Total 491 100.00 Age
Educational level
25 years and less 9 1.83 Bachelor’s degree 34 6.92 26 to 45 years 229 46.64 Master’s degree 317 64.56 Over 45 years 253 51.53 Doctoral degree 140 28.51 Total 491 100.00 Total 491 100.00 Place of study
Managerial position
Indonesia 365 74.34 Vice Rector 16 3.26 United States 41 8.35 Dean 12 2.44 Australia 28 5.70 Vice Dean 16 3.26 Philippines 10 2.04 Head of School/Department 58 11.81 Japan 9 1.83 Head of Postgraduate Studies 7 1.43 France 7 1.43 Head of Unit 25 5.09 Malaysia 6 1.22 Total 134 27.29 United Kingdom 5 1.02 Religion
Germany 5 1.02 Islam 364 74.13 Canada 5 1.02 Christianity - Protestant 69 14.05 Total 481 97.96 Hinduism 29 5.91 Academic rank
Christianity - Catholic 14 2.85
Assistant lecturer (Asisten ahli) 78 15.89 Buddhism 2 0.41 Lecturer (Lektor) 136 27.70 Missing values 13 2.65 Senior lecturer (Lektor kepala) 246 50.10 Total 491 100.00 Professor (Guru Besar) 31 6.31
491 100.00 *Frequency; **Percentage

174
Table 5.3 showed that more than half respondents, (331, or 67.41%), were males and
160 respondents (32.59%) were females. Most respondents (452, or 92.06 %) were
married. A large proportion of respondents (217, or 44.20%) had worked more than 20
years with their present institutions. Out of 491 respondents, 256 (52.14%) worked at
large higher education institutions and 201 (40.94%) worked at medium-sized higher
education institutions. There was only a slight difference in the number of samples in
each age group: 229 respondents (46.64%) in the 26-45 group and 253 (51.53%) in the
over 45 group.
Three hundred and seventeen respondents (64.56%) had a master’s degree and only 140
respondents (28.51%) had a doctoral degree. More than three-quarters of the
respondents (365, or 74.34%), had only studied in domestic universities, while 116
(23.62%) completed their studies at overseas universities, such as in the U.S., Australia,
the Philippines, Japan and France. Furthermore, of the 491 respondents, 134 (27.29%)
held managerial position, such as vice rector, dean, vice dean, head of
schools/departments, head of postgraduate studies or head of units; 246 respondents
(50.10%) held the academic rank of senior lecturer (lektor kepala) and 139 (27.70%)
held the rank of the assistant lecturer (lektor). Approximately 364 respondents (74.13%)
listed Islam as their religion. The profiles indicate that the respondents came from a
wide range of demographic backgrounds at the mature career level.
5.6.2 Thematic categories The same steps of the thematic analysis that had been done in the interview analysis
were applied to analyse Question 1. Table 5.4 displays all macro and micro themes
identified and examples of relevant comments, while the completed results are shown in
Appendix 16.
It is surprising that the two most preferred themes come from the organisational bias
macro theme as the external career. The career arrangement and organisational structure
themes were the main focus of the respondents. They mentioned the themes 99 times
(14.64%) and 70 times (10.36%) respectively. It seems that the respondents depended
heavily on the institutions to advance their careers. In other words, intrinsic career
development is less important where institutional factors are perceived as deficient –i.e.,

175
it is a hierarchy of needs and career anchors will not come strongly into play if external
factors are not accommodated.
Table 5.4: Thematic analysis of career motivation factors
No Themes Summary of short phrases Samples
Macro Micro N %
Inte
rnal
car
eer
1
Pers
onal
bia
s
Academic atmosphere
Supportive work environment, collegiality, teamwork, sharing knowledge. 64 9.47
2 Managerial competence
Manage the community, work for better life, to be a role model for students, employers’ attention, attitude of the leader, leader’s support.
56 8.28
3 Personal integrity
Accomplishment, discipline, honesty, self-actualisation, capability, trust, intention to develop talents, personality, likes and dislikes.
48 7.10
4 Work-family lifestyle
Family, support from extended family, family and work should have the same priority. 47 6.95
5 Intangible recognition
Appreciation of hard work, reputation, recognition of performance. 43 6.36
6 Academic freedom and creativity
Freedom of expression, opportunity to express new ideas, innovation, creativity. 41 6.07
7 Motivation and goal orientation
Intrinsic self-motivation, intent to develop knowledge; life is a positive change, real hope, personal target, realistic goals.
38 5.62
8 Happiness Love of job, caring atmosphere, positive feel, job satisfaction, holidays. 33 4.88
9 Spiritual values Doing your work based on religious teachings, reward at the end of life. 19 2.81
10 Economic security
Pension, certainty of future, financial security, health insurance. 16 2.37
11
Pure challenge Success in overcoming complicated problems, ability to compete, teaching is an important challenge, publications are a challenge to reach a higher academic rank.
15 2.22
12 Flexible working schedule
Flexibility in setting the work schedule, flexibility in the workplace: either at university or at home. 15 2.22
13
Service Want to dedicate myself to the institution, intentions to improve institutional quality, intentions to achieve the institution’s vision, want to help institution achieve its goals.
13 1.92
Sub-total personal bias 448 66.27
Exte
rnal
car
eer
1
Org
anis
atio
nal b
ias
Career arrangement
Career path system, experience, academic rank requirements, field training-related, research and publications, linear career progression, structural levels, career opportunity and continuity.
99 14.64
2
Organisational structure
Workload, type of work, job descriptions, open management, advanced technology for teaching media & research, laboratory equipment, government policies or rules, organisational culture, the readiness of the organisation to continue to learn and innovate.
70 10.36
3 Financial support and reward
Salary, incentive, compensation, bonus, need money to grow my career. 59 8.73
Sub-total organisational bias 228 33.73
T o t a l samples 676 100.00
N = number of samples; % = percentage

176
In terms of personal bias as the focus of the study, the most preferred theme is academic
atmosphere (9.47%). It was followed by managerial competence (8.28%), personal
integrity (7.10%), work-family lifestyle (6.95%), intangible recognition (6.36%),
academic freedom and creativity (6.07%), and motivation and goal orientation (5.62%).
This, in a descending order, was followed by happiness (4.88%), spiritual values
(2.81%), economic security (2.37%), pure challenge (2.22%) and flexible working
schedule (2.22%). Interestingly, service (1.92%) was the least-preferred theme chosen
by the respondents.
5.6.3 Identified macro themes
Two macro themes identified in the analysis were the same as those identified in the
interview: personal bias and organisational bias. The understanding of them follows
what has been discussed in Sub-section 5.5. However, the micro themes identified
within each macro theme differed, as described as follows.
5.6.4 Identified micro themes: personal bias There were 13 micro themes that emerged under the personal bias macro theme. Even
though three micro themes identified in the career history interviews did not appear (i.e.,
skill orientation, geographical stability and running a business), the other eight themes
and characteristics remained the same (i.e., academic atmosphere, work-family lifestyle,
academic freedom and creativity, managerial competence, economic security, pure
challenge, flexible working schedule and service). Five new themes emerged: personal
integrity, intangible recognition, motivation and goal orientation, happiness and
spiritual values. These new themes are described below
Personal integrity: This theme relates to one’s personal beliefs and values. Academics
appreciate consistency in performing their duties and perceive that there is a moral
responsibility to maintain such consistency. Discipline, honesty, trust, confidence, like
and dislike are some examples that fall into this category. These people declare
themselves as open-minded. They accept diversity and respect others’ opinion.
Conversely, judging, blaming and conflict are not of interest to them. Academic
misconduct – such as cheating is also absolutely prohibited. However, these people
have high level of self-resilience in facing difficult conditions. Training, collaborative
177
research and strong team work, for instance, increase academic personal integrity and
accelerate their career goal. In terms of promotion, they will accept a new job
appointment if the new work environment fits their values, even if it is more poorly
paid.
Intangible recognition: Academics with this theme have a strong need for recognition
of the work they accomplish regardless of tangible rewards. These people value
communication with superiors and build a career based on respectful and credible
gratitude. Like in the service anchor, individuals with the intangible recognition theme
are not driven to work hard by the prospect of promotion, because such increases in
salary and promotion are not based on what they value in their work. They may also
have slow career improvement because they are easily demotivated. Encouragement to
work productively and to pursue personal career growth opportunities, therefore, is
desirable. A conspicuous thank-you or acknowledgement for the contribution they make
or value added to the work team and the institutions, for example, would satisfy them. A
career is meaningfulness if appreciation in the form of money is not a priority.
Motivation and goal orientation: Academics will act based on a psychological drive to
reach their desired goals. They initiate to learn, innovate and improve competency to
master academic tasks. In response to changes in the workplace, they build self-
motivation to develop themselves with realistic expectations and goals under the
circumstances that they encounter. They work in the area of their abilities and skills and
are happy to increase their workload. Like in the pure challenge anchor, these people
enjoy facing challenges in order to achieve in the workplace. Thus, this theme refers to
individuals who build a strong motivation to achieve their goal and success. In terms of
promotion, they accept a new placement or job that can result in the career success.
Happiness: Some academics have characterised themselves as individuals who value
inner happiness by loving and enjoying the work, and having positive feelings towards
life. Happiness is often associated with psychological satisfaction. They believe that
with happiness they can be productive in achieving career goals and, ultimately, job
satisfaction. Having a feeling of happiness can overcome problems at work and control
emotions to reach career success. To be happy in the workplace, there is a need for a
match between individual and institutional needs. They seek institutions that can create
178
a conducive work atmosphere that contributes to their feeling of happiness and
satisfaction. These people will accept new work with a positive work climate. They will
move to another geographical location as long as the new place provides work
environment that makes them happier and healthier. Individuals with this theme do not
focus on money for their career development.
Spiritual values: This theme is related to the context of religion and the inner life
values. It is believed to direct one’s life, including work. Some academics adhere to
religious instructions regarding work (Farros 2011; Jamilazzaini 2013), while others
interpret working hard as a result in a reward at the end of life. These people feel a
sense of spirituality at work that help them attain their career goals when they start work
with prayer, for instance. In the work environment, spiritual values are usually
interpreted as integrity, honesty, trust and respect that can bring staff moral support in
climbing their career ladder. It is not clear whether spiritual valued-persons are
concerned with financial rewards as a growing number of people believe that values and
ethics should put on the top of priority, including spirituality. It seems that these people
do not prefer any particular types of work but will choose a job that gives them more
room to exercise the spiritual values.
5.6.5 Identified micro themes: organisational bias There were three micro themes under the organisational bias theme. Of the three
themes, only one was new, namely organisational structure, while career arrangement,
and financial support and reward were the same as the two themes discovered in the
career history analysis. The new theme is defined as follows.
Organisational structure: Institutions design effective institutional rules and policies on
teaching and research, particularly reasonable academics’ task-related work, to give
latitude to academics to improve their careers and performances. Academics expect that
institutions will provide a predictable and understandable academic environment
through open management, less bureaucratic administration, clear job descriptions,
manageable task allocation and advanced teaching and research instruments. Effective
structure will enhance them in climbing their career goals.

179
5.7 Thematic analysis of institutional supports: responses from open-ended question 2
This Sub-section refers to the second open-ended question on the questionnaire:
How well does your institution support your career goals? 5.7.1 Demographic profiles
Three hundred and ninety-three respondents answered the second question out of the
total 585. Demographic data of the respondents are presented in Table 5.5.
Table 5.5: Respondents’ profiles for institutional support questions
Description N % Description N %
Gender
Marital status
Female 131 33.33 Single 28 7.12 Male 262 66.67 Married 362 92.11 Total 393 100.00 Others 3 0.76 Total 393 100.00 Work experience
Institution size
5 to 10 years 107 27.23 Small 27 6.87 11 to 20 years 115 29.26 Medium 157 39.95 over 20 years 171 43.51 Large 209 53.18 Total 393 100.00 Total 393 100.00 Age
Educational level
25 years and less 3 0.76 Bachelor’s degree 23 5.85 26 to 45 years 189 48.09 Master’s degree 267 67.94 Over 45 years 201 51.15 Doctoral degree 103 26.21 Total 393 100.00 Total 393 100.00 Place of study
Managerial position
Indonesia 296 60.29 Vice Rector 4 0.81 United States 26 5.30 Dean 9 1.83 Australian 25 5.09 Vice Dean 15 3.05 Philippines 8 1.63 Head of School/Department 52 10.59 Japan 8 1.63 Head of Postgraduate Studies 4 0.81 Malaysia 6 1.22 Head of Unit 21 4.28 France 5 1.02 Total 105 21.38 United Kingdom 3 0.61 Religion
Germany 3 0.61 Islam 287 73.03 Total 380 77.39 Christianity - Protestant 64 16.28 Academic rank
Hinduism 24 6.11
Assistant lecturer (Asisten Ahli) 63 16.03 Christianity - Catholic 9 2.29 Lecturer (Lektor) 114 29.01 Missing values 9 2.29 Senior lecturer (Lektor Kepala) 189 48.09 Total 393 100.00 Professor (Guru Besar) 27 6.87 Total 393 100.00
N= number of samples; % = percentage

180
The number of men was greater than the number of women, that is 331 male
respondents (67.41%) compared to 160 female respondents (32.59%). Almost all of the
respondents were married (362, or 92.11%). On average, the respondents had sufficient
work experience: 115 respondents (29.26%) had 11 to 20 years’ work experience and
171 respondents (43.51%) had over 20 years’ work experience. There were 209
respondents (53.18%) who provided answers came from large universities, and 157
respondents (39.95) came from medium-sized universities. The age range of
respondents was appropriate to be able to decide on and develop a career: 189 (48.09%)
were aged 26 to 45 years and 201 (51.15%) were aged over 45 years. The majority of
respondents (267, or 67.94) had a master’s degree, i.e., followed by those with a
doctoral degree (103, or 29.21%). More than half of the respondents (296, or 60.29%)
attended universities in Indonesia, and 313 respondents (22.61%) completed the study
in foreign countries, such as the U.S., Australia and the Philippines. Of all of the
respondents, only 105 respondents (21.38%) held the managerial positions of vice rector
to head of unit with the greatest number in the position of head of schools/departments,
that is 52 respondents (10.59%). Nearly half of the respondents (189, or 48.09%), held
the academic rank of senior lecturer (lektor kepala), followed by lecturer (lektor), with
114 respondents (29.01%). Finally, the majority of respondents (287, or 73.03%)
indicated that their religion was Islam. The demographic backgrounds imply that the
data gathered could give meaningful results because the samples are not homogeneous.
5.7.2 Thematic categories There are two types of answers given by the respondents to the question about how their
institutions support the career development of academics. First, the respondents
answered using the phrases: very supportive/supportive and less supportive. Such
answers did not give an idea of what the institutions did or did not do to address the
career development of their academics. The responses (174, or 46.77%) could not be
carried on to the thematic analysis. Second, the respondents expressed their opinions of
what kinds of support they received from the institutions toward their career. From
these respondents (198, or 53.23%), several themes emerged. Thus, the thematic
analysis was based on the second set of answers. Table 5.6 presents the macro and
micro themes, instances of summary responses of the respondents, the number of
respondents and the percentages.
181
As in the results of the motivating factors analysis, the organisational factors dominate
the answers of respondents. The most chosen theme is career arrangement (44
respondents, or 22.22%), followed by organisational structure (33 respondents, or
16.67%) and financial support and reward (32 respondents, or 16.16%). It is argued
that the institutions play an active role in supporting the career development of
academics.
5.7.3 Identified macro themes It is clear from the study that only two macro themes emerged from Question 2, namely
personal bias and organisational bias. These themes have the same meaning as in the
two previous analyses.
5.7.4 Identified micro themes: personal bias Table 5.6 displays the six emergent micro themes. Four themes were similar to the ones
found in the previous two analyses, while two themes were new. The micro themes of
academic atmosphere, and academic freedom and creativity have the same meaning as
for interviews and Question 1. The intangible recognition micro theme is the same as
that found for Question 1. Personal ambivalence appeared with only three respondents.
Self-determination: Academics are likely to take responsibility for developing their
own career lifecycles. They are strongly self-motivated to determine career goals by
updating their skills and remaining employable in the workplace. For them, career
improvement is related to their self-concept and is not the institutions’ or leaders or
seniors’ responsibilities. They, therefore, attempt to change from dependence on the
institutions to the application of their own talents and values in making career choices.
Impact: This theme is considered important for academics who want to increase control
over their talents, needs and values and to make an impact on their institutions.
Academics need to exercise their skills and competencies by involving themselves in
academic matters in their institutions. In this sense, autonomy is a key notion in the
workplace. A feeling that what academics have becomes invaluable for institutions will
encourage academics to improve their performance in pursuing their career goals. This
theme, alongside the academic freedom and creativity theme in which there was an

182
increase in independency and autonomy, would be a positive indicator of
empowerment.
Table 5.6: Thematic matrix of institutional support for career goals
No Themes Examples of summary of short phrases Sample
Macro Micro Responses N %
Inte
rnal
car
eer
1
Pers
onal
bia
s
Academic freedom and creativity
Freedom to express ideas and be creative and innovative in research, community service and teaching.
20 10.1
2
Academic atmosphere
Creating a positive working environment, such as competition and teamwork, sharing knowledge and experiences, developing skills together with other colleagues.
18 9.1
3 Impact Involvement in making decision for institutional
policies; empowering potential academics even if they are young.
14 7.07
4
Managerial competence
Coordinating research activities, and managing responses to cases; clear vision for developing academics' careers; opportunities to sit on structural positions and climb to a higher level.
13 6.57
5
Self-determination
Institutions give freedom to me to develop my career. I believe, it is not institutions’ responsibility... Academics should seek challenge to transform themselves from external motivation into internal motivation for their own sake. Academics have to be self-motivated to grow.
13 6.57
6 Intangible recognition
Non-financial appreciation 8 4.04
Sub-total personal bias 86 43.43
1 Personal ambivalence No support and I do not care but I need career
counselling. 3 1.52
Sub-total Personal ambivalence 3 1.52
Exte
rnal
car
eer 1
Org
anis
atio
nal b
ias Career
arrangement Clear career policy; further education rule, improving skills via research and training.
44 22.22
2 Organisational structure
Provide facilities but needs more resources; open management, no double standard.
33 16.67
3 Financial support and reward
Limited financial support for research, publications, workshops and further study; monetary reward.
32 16.16
Sub-total organisational bias 109 55.05
Total Personal bias + Organisational bias + Personal ambivalence 198 100.00
No = Number of samples; % = Percentage
5.7.5 Identified micro themes: organisational bias
Three micro themes that showed up under organisational bias were the same as those
for Question 1. These three themes were career arrangement, organisational structure,
and financial support and reward. The meanings of the three themes, therefore, follow
the description given in Sub-sections 5.4.2 and 5.4.3.

183
5.8 The significance of the emergent themes from the open-ended questions
As discussed, thematic analysis was employed to analyse the internal career motivations
and the institutional supports in the career development of academics. Table 5.4 and
Table 5.6 show that some themes were consistent with the dominant career anchors and
the others were an extension of the anchor categories. Moreover, some of the other
themes were also associated with the psychological empowerment and job satisfaction
concepts, the two variables that were also examined for the quantitative analysis in the
current study. Although three themes did not show up in the open-ended response
analysis (skill orientation, running a business and geographical stability), eight themes
that reflected the career anchor categories had been identified in the analysis (academic
freedom and creativity, academic atmosphere, work-family lifestyle, flexible working
schedule, pure challenge, managerial competence, economic security and service).
Intangible recognition and spiritual values were categorised as needs-based anchors.
Impact and self-determination clearly reflected two of four facets of psychological
empowerment. Personal integrity, as well as motivation and goal orientation were
associated with the psychological empowerment facets (Spreitzer 1997). Lastly,
happiness is a characteristic of job satisfaction (Hackman & Oldham 1975; Schermuly,
Schermuly & Meyer 2011).
Intangible recognition was an important factor for 6.5 percent of respondents. In
contrast to the recognition described by Schein (2006a) as a consequence having each
anchor category, intangible recognition in this study is part of a ‘need’ in supporting
academics’ careers. Recognition of performances at work that academics want is not in
tangible forms (e.g., money); however, saying ‘thank-you’ for what academics have
achieved can give a morale boost to perform better. The proposed new intangible
recognition anchor is classified as needs-based anchors.
Another interesting point is the emergence of the spiritual values theme. Although only
a few (2.81%) of the respondents chose the theme, it attracts attention. A detailed
analysis of the responses (see Table 5.4) and the demographic data show that the
spiritual values theme seems to relate to the respondents’ faith, in this case, as Muslims.
Academics who chose the theme stated that working was one of the ‘religious

184
instructions’ (Farros 2011; Jamilazzaini 2013) or ‘Islamic obligations’ (Mujahid n.d.)
and it was treated at an individual level (Ahmad & Owoyemi 2012). Therefore, working
– in their case - in the higher education sector, is an application of their religious
obligation. It is noted that the large number of Muslim respondents, nearly three-
quarters, (see Table 5.3) allowed the emergence of the theme. Spiritual values
considered as a new anchor theme is grouped in needs-based anchors.
Personal integrity and motivation and goal orientation contributed to the extent of the
psychological empowerment concept (Spreitzer 1995). It is assumed that academics
want to be involved and have self-efficacy in the work environment. They also want to
have control in their workplace rather than just to share the power. Feeling empowered
is very important because it will improve their performance at work and have an impact
on satisfaction. A form of satisfaction in the current study is happiness, which was
revealed through the thematic analysis. Academics who sought a caring atmosphere or a
positive feeling, or who took holidays, did this not only for their intrinsic worth but also
because these things gave them pleasure.
Interestingly, as indicated in the interview findings, the results of the two open-ended
questions also point to organisational bias as a key factor in career advancement. The
respondents thought that the institutions should take apart in improving their careers
(see Tables 5.1, 5.3 and 5.5). They revealed three main factors that they felt affected
their career movements (forward, backward or stagnation): career arrangement,
organisational structure, and financial support and reward. Management transparency,
a cross-discipline career policy instead of a linear career progression, a meritocracy
system and grants for academic travels, for example, need to be applied professionally
to support academic careers. If academics do not develop their careers progressively, it
is not necessarily caused by a lack of self-concept, but it may be because the rules of the
institutions are considered as a threat. Despite the demands of career development
through the examination of individual academics’ talents, motivations and values, some
organisational factors could not be avoided in determining academics’ career goals. The
findings demonstrate that academics depended strongly and significantly on their
institutions’ supports in developing their careers.

185
To sum up, there is a relationship between dominant career anchors, empowerment and
satisfaction in achieving career goals. Some themes of the internal career orientation
that were identified from career histories and the open-ended questions, showed how
academics looked at their internal career motivation. Particularly, the emergence of the
organisational factors that were grouped into the external career indicated that
academics’ cultural values influenced their attitudes. The emerging themes that
reflected career anchors, psychological empowerment and job satisfaction, therefore,
indicate that the variables examined in the current study are important and need to be
recognised. A suggested research model based on the findings is presented in Figure
5.2.
5.9 Integrating qualitative research results with quantitative research findings
As described in Chapter 3, Sub-section 3.6, the results of the qualitative analysis were
found to support the discussion of the quantitative analysis findings (Creswell & Plano
Clark 2011; Creswell 2009). The concurrent-embedded design, which has been
employed in the current study occurs when researchers integrate the quantitative and
qualitative data in the form of comparison or parallel. Table 5.7 summarises the
quantitative and qualitative findings related to the dominant career anchors and the
factors that influenced respondents’ career goals. The discussions begin with the
dominant career anchors.
The results of the survey data analysis showed that of the seven career anchors,
economic security was the most preferred anchor, while service that characterised those
employed in government institutions was ranked second (see Table 4.6, Chapter Four).
However, academics’ perception shown in the qualitative analysis placed service first
and economic security sixth (see Table 5.6) among their multiple anchors. In other
words, each type of analysis produced different results, which is a strength of the mixed
method approach (see Table 5.7).

186
Figu
re 5
.2: M
odifi
ed re
sear
ch fr
amew
ork
for q
ualit
ativ
e an
alys
is o
f the
rela
tions
hips
bet
ween
car
eer a
ncho
rs, p
sych
olog
ical
em
powe
rmen
t and
job
satis
fact
ion
Influ
ence
s Va
riabl
eCo
nsist
s of
Cons
ider
ing
varia
bles
Bord
er b
etwe
en in
tern
al a
nd e
xter
nal c
aree
rCo
nstr
uct
Prop
osed
new
anc
hors
Inte
rna
l ca
reer
ori
enta
tion
Car
eer
anch
ors
Psyc
holo
gica
l em
pow
erm
ent
Job
satis
fact
ion
Pers
onal
inte
grat
ion
Mot
ivat
ion
and
goal
orien
tatio
n
Hap
pine
ss
Impa
ct
Self-
dete
rmin
atio
n
Man
ager
ial
com
pete
nce
Run
ning
a
busin
ess
Aca
dem
ic fr
eedo
man
d cr
eativ
ity
Wor
k-fa
mily
lif
esty
le
Flex
ible
wor
king
sc
hedu
le
Econ
omicsecurity
Skill
orie
ntat
ion
Geo
grap
hica
l st
abilit
y
Aca
dem
ic
atm
osph
ere
Serv
ice
Pure
cha
lleng
e
Tale
nts-
base
d
Nee
ds-
base
d
Valu
es-
base
d
Fina
ncial
su
ppor
t and
re
war
d
Care
er
arra
ngem
ent
Org
anisa
tiona
lfa
ctor
s
Spiri
tual
valu
es
Inta
ngib
le re
cogn
ition
External career
Org
anist
aiona
l st
ruct
ure

187
Tabl
e 5.
7: S
umm
ary
of q
uant
itativ
e an
d qu
alita
tive
findi
ngs o
f car
eer a
ncho
r cat
egor
ies
M
acro
th
emes
D
imen
sion
s Q
uant
itativ
e fin
ding
s Q
ualit
ativ
e fin
ding
s
D
omin
ant c
aree
r an
chor
s (S
urve
y)**
D
omin
ant c
aree
r an
chor
s
(Int
ervi
ew)*
* C
aree
r m
otiv
atio
n fa
ctor
s (Q
1)**
* I
nstit
utio
nal s
uppo
rt
(Q2)
***
Internal career
Personal bias
Econ
omic
secu
rity*
Ec
onom
ic se
curit
y (1
) Ec
onom
ic se
curit
y 6)
Ec
onom
ic se
curit
y
Serv
ice*
Se
rvic
e (2
) Se
rvic
e (1
)
M
anag
eria
l com
pete
nce*
M
anag
eria
l com
pete
nce
(3)
Man
ager
ial c
ompe
tenc
e (3
) M
anag
eria
l com
pete
nce
Entre
pren
euria
l cre
ativ
ity*
Entre
pren
euria
l cre
ativ
ity (4
) R
unni
ng a
bus
ines
s (11
)
Te
chni
cal c
ompe
tenc
e*
Wor
k de
dica
tion
(5)
Skill
s orie
ntat
ion
(7)
Geo
grap
hica
l sta
bilit
y*
Geo
grap
hica
l sta
bilit
y (1
0)
Pure
cha
lleng
e*
Pure
cha
lleng
e (6
) Pu
re c
halle
nge
(9)
Pure
cha
lleng
e
Aut
onom
y*
Bal
ance
d-lif
esty
le (7
)
Life
styl
e*
Wor
k-fa
mily
life
styl
e (4
) W
ork-
fam
ily li
fest
yle
Flex
ible
wor
king
sche
dule
(5)
Flex
ible
wor
king
sche
dule
Aut
onom
y +
Entre
pren
euria
l cre
ativ
ity
A
cade
mic
free
dom
and
cr
eativ
ity (2
) A
cade
mic
free
dom
and
cr
eativ
ity
Aca
dem
ic fr
eedo
m a
nd
crea
tivity
N
ew a
ncho
r cat
egor
y
Aca
dem
ic a
tmos
pher
e (8
) A
cade
mic
atm
osph
ere
A
cade
mic
atm
osph
ere
Pr
opos
ed n
ew a
ncho
r ca
tego
ries
Inta
ngib
le re
cogn
ition
In
tang
ible
reco
gniti
on
Spiri
tual
val
ues
Ps
ycho
logi
cal e
mpo
wer
men
t Se
lf-de
term
inat
ion#
Se
lf-de
term
inat
ion
Impa
ct#
Im
pact
Pr
opos
ed n
ew fa
cets
Pe
rson
al in
tegr
ity
M
otiv
atio
n an
d go
al o
rient
atio
n
Prop
osed
new
dim
ensi
on o
f job
satis
fact
ion
Hap
pine
ss
External career
Organisational bias
Org
anis
atio
nal f
acto
rs
C
aree
r arr
ange
men
t C
aree
r arr
ange
men
t C
aree
r arr
ange
men
t Fi
nanc
ial s
uppo
rt an
d re
war
d Fi
nanc
ial s
uppo
rt an
d re
war
d Fi
nanc
ial s
uppo
rt an
d re
war
d
O
rgan
isat
iona
l stru
ctur
e
Org
anis
atio
nal s
truct
ure
*C
aree
r anc
hor c
ateg
orie
s wer
e ad
vanc
ed b
y Ig
baria
and
Bar
oudi
(199
3) a
ccor
ding
to S
chei
n an
d D
eLon
g’s (
1982
) orig
inal
cat
egor
ies
**
( ) C
aree
r anc
hor h
iera
rchy
des
cend
ing
orde
r, st
artin
g w
ith n
o. 1
for t
he m
ost d
omin
ant a
ncho
r
**
*Ope
n-en
ded
ques
tion
on th
e qu
estio
nnai
re
#
Psyc
holo
gica
l em
pow
erm
ent f
acet
s acc
ordi
ng to
Spr
eitz
er’s
(199
5)!

188
There are three points to be considered. First, the methods design for the current study
has pointed out the unbalanced weighting between the quantitative and qualitative
results and has provided a solution for this condition (see Sub-section 3.3, Chapter
Three). Second, both service and economic security are common amongst those
working in public organisations (Schein 1982, 1990, 2006a). Thus, in practice, service
and economic security are complementary. Third, a detailed investigation points out that
the different rank orders are because of: (a) the merging of four anchors (technical
competence, geographical stability, autonomy and lifestyle) into two proposed new
anchors (work dedication and balanced-lifestyle) on the quantitative analysis; (b) the
combination of two anchors (autonomy and entrepreneurial creativity) into a proposed
new anchor (academic freedom and creativity); and (c) the separation of the lifestyle
anchor into the work-family lifestyle and flexible working schedule anchors, and the
entrepreneurial creativity anchor into the running a business and academic freedom and
creativity anchors, respectively, in the qualitative analysis. The other themes on the
qualitative analysis better reflect of the original anchors created by Schein. Thus,
academics’ dominant career anchors, based on the survey data were extended in more
detail in the interviews.
The extent to which survey respondents reported multiple career anchors (28.38%) was
supported by the findings from the qualitative analysis (35.71%). Academics who were
included in this category held between two and four career anchor categories (Table
5.6). In terms of the multiple groups-based anchors, the clustering of a single career
anchor category fits Feldman and Bolino’s (1996) reconceptualisation except for work
dedication. Considering the fact that skills orientation and geographical stability clearly
emerged in the qualitative analysis, and taking into consideration Schein and van
Maanen’s (2013, p. 19) notion that ‘an interview protocol to analyse your career history
and determine more precisely what your anchor is’, the two anchors would be
considered in future analysis. Hence, the multiple groups-based anchors are: [1] talents-
based anchors which consists of managerial competence, skill orientation and running
a business; [2] needs-based anchors, includes balanced-lifestyle, which in turn includes
work-family lifestyle and flexible working schedule, academic freedom and creativity,
economic security, intangible recognition and spiritual values; and [3] values-based
anchors which comprises service, pure challenge and academic atmosphere. These

189
results show that a single career anchor was not adequate for academics to achieve their
career goals (Schein 2006a).
In relation to psychological empowerment, impact and self-determination were two
facets of psychological empowerment Spreitzer (1995) identified. These two facets,
which also emerged through the qualitative analysis, were tested as mediators and
moderators in the quantitative analysis. The qualitative analysis also uncovered the
personal integrity, and motivation and goal orientation themes as two potential facets
augmenting the existing four facets described in the literature.
Academics designated happiness as a form of job satisfaction in the qualitative analysis.
Job satisfaction was the only job outcome examined in the quantitative analysis as a
criterion variable. Happiness, the finding from the qualitative analysis, can be added to
the job satisfaction construct to enhance the feelings of satisfaction that related not only
from the task assignments but also from the expression of happiness.
Theme identification, therefore, shows support for both confirmation and extension of
career anchors, psychological empowerment and job satisfaction.
A series of tests was conducted to investigate the relationships between career anchors,
psychological empowerment and job satisfaction. Hierarchical multiple regression
analysis was used for this purpose. Career anchors accounted for nearly 24 percent of
the variance in job satisfaction; this was considered a small contribution. The thematic
findings showed the reasons for the weak contribution by identifying a number of the
other categories and themes that influenced academics’ job satisfaction in achieving
their career goals. Some examples are work-family lifestyle and flexible working
schedule (category of lifestyle), academic freedom and creativity (categories of
autonomy and entrepreneurial creativity), academic atmosphere (a proposed new
category), intangible recognition and spiritual values (new characteristics), including
happiness, which is a characteristic of job satisfaction, and personal ambivalence.
Intangible recognition and spiritual values were two characteristics which appeared
from the open-ended questions and are considered as new anchors.
190
Similarly, psychological empowerment also contributed directly, although to a
relatively weak extent (nearly 24%), to job satisfaction and played a weak role as
mediating and moderating variables in a relationship between career anchors and job
satisfaction. This is supported by the results of the qualitative analysis, which reported
that personal integrity, along with motivation and goal orientation were the other
characteristics of psychological empowerment that may contribute to the degree of
influence. The two themes would be considered to add to the four existing facets of
psychological empowerment.
In addition to a number of categories and characteristics that emerged through the
qualitative analysis, it is known that the small contribution of career anchors and
psychological empowerment to job satisfaction is also due to the external career factors.
The qualitative findings demonstrated that the external factors of organisational aspects
affected the magnitude of the contribution. Each of the three themes of organisational
bias (career arrangement, organisational structure and financial support and reward)
(see Tables 5.3 and 5.5) has a greater effect than any of the 14 themes of personal bias.
As discussed, it can be concluded that the results of the analysis of the qualitative data
support the results of the statistical analysis. Five major factors point to the cause of the
different themes identified, the results and the contribution to the concepts. First, the
quantitative method used a forced choice survey in which the respondents must give
only one response from the choice provided by the researcher (Wivagg 2008; Brown &
Maydeu-Olivaes 2011). On the other hand, the qualitative method allows free responses
and less control, which gives the respondents the chance to elaborate on an answer as
much as they want (Richardson 2002). The written responses allowed more time to
answer the questions compared with the interview in which academics answered the
questions directly after the interviewee asked them. Although bias was an issue, the data
were crosschecked with the quantitative results and contributed significantly to the
statistical outputs.
The second factor is the circumstances of the academics when they answered the
questions. For instance, academics who were facing complicated administration work
for promotion could have answered with factors that affected their career advancement,
such as bureaucracy, leadership and career system.

191
The third factor is the type of research subjects, which also dictated the themes
identified. Rather than autonomy and entrepreneurial creativity, academic freedom and
creativity are more reflective of academics’ attitudes as public servants. Although there
were several new themes that emerged, most of the themes reflected an extension of the
career anchor concept. Some reflected the psychological empowerment and job
satisfaction facets, two constructs that had been analysed for the quantitative
examination. The different terms used from the original labels were only intended to
better represent the subjects of the current study.
Fourth, because of the identification of a number of new themes, it was necessary to
incorporate the new themes in amending the measurement of the career anchor
inventory, the psychological empowerment scale and the job satisfaction scale. It is also
essential to extend the concepts of career anchors, psychological empowerment and job
satisfaction from the academics’ perspective.
Last, culture is found to shape academics’ perception in their career decisions. Both
quantitative and qualitative findings indicate that academics’ cultural background and
institutional culture influence the responses. The emergence of the work dedication
anchor, and the spiritual values and career arrangement themes, for example, reflects
how academics from different local cultural values, including the institutional culture
background, and various interests view the concept of their career goals. This cultural
factor needs further investigation.
Summary
Chapter Five presented the results of the qualitative analysis in which the data were
collected through interviews with academics on their career history and through two
open-ended questions related to their career advancement. Thematic conceptual analysis
was employed to identify themes and grouped them into career anchor categories,
internal motivation factors and institutional support in achieving the career goals. The
categories were identified and then grouped into macro and micro themes, for which
concise explanations were developed and some of these are an extension of Schein’s
original explanations. The macro themes of personal bias and organisational bias
emerged from the analysis. The study found 21 micro themes consisting of six new

192
anchor categories, two anchor categories that were needed to be considered, five
categories that remains the same as the original constructs, two new facets of
psychological empowerment, two facets that had the same meaning as the original
scales, and last, one dimension which emerged for the job satisfaction scale. From the
external career factors, three themes appeared to represent the organisational factors that
influenced respondents’ career development. Each micro theme was counted for
frequency and percentage. The chapter then continued by discussing the dominant
career anchors obtained from the interviews and supported by the findings of the themes
from the two written questions, including their contribution to the career anchor
concept. The cultural issue also was discussed. The chapter concluded by comparing the
quantitative findings to the qualitative results.
The next chapter will discuss the findings of the current study from both the quantitative
and qualitative points of views. It will summarise and discuss the findings. It then draws
conclusions and presents the implications of the study and its contribution to
understanding of the topic.

193
Chapter 6
Summary, Discussions and Conclusions
6.1 Introduction
Chapter One explained the background of the study. It presented the purposes of the
study, the career development system for Indonesian academics, the research problem,
the research questions and the significance of the study.
Chapter Two discussed the conceptual framework of the study by reviewing the
literature on career, career anchors, multiple career anchors, psychological
empowerment and job satisfaction. It also reviewed the previous studies related to the
variables analysed and presented the role of demographic data on those studies. It was
followed by presenting the study framework, the research model and the proposed
hypotheses.
Chapter Three designed the methodology of the current study. The chapter discussed the
quantitative and qualitative approaches, including the survey questionnaire and the
interview. It described the sampling method and the sample size, the construction of the
career anchor inventory, the psychological empowerment scale, the job satisfaction
scale and Schein’s interview protocol. Issues on the culture and the translated
instruments were also justified. The data collection method, the validity and reliability
of the instruments, and the statistical tool used were discussed. The chapter also
reported the pilot study conducted prior to the actual fieldwork. The thematic
conceptual analysis for the analysis of the qualitative data was discussed.
Chapter Four reported the findings from the quantitative analysis. The chapter provided
the response rate from both the online and paper-based surveys, followed by the
description of the demographic data of the respondents. It tested the validity and
reliability of the three scales used. The chapter assessed the applicability of the data
collection instruments to the Indonesian academics context. The dominant career
anchors and the multiple career anchors were also presented. Hierarchical multiple
regression analysis was employed to examine the effects of relationships between career
194
anchors and psychological empowerment on job satisfaction, including the tests of
mediation and moderation effects of psychological empowerment.
Chapter Five analysed the interview results and the responses to the two open-ended
questions. It presented the framework for analysis, the responses and the demographic
profiles. The procedures of thematic analysis were presented in order to identify themes
that had emerged, and then the themes were classified into the macro and micro themes.
The chapter also discussed the dominant career anchors and the significance of the
emerging themes to the career anchor concept. The chapter finally incorporated the
quantitative findings and the qualitative results.
Chapter Six concludes the current study by emphasising the key and important findings.
It summarises the findings from the quantitative analysis, discusses the results and
draws conclusions. It then presents the contributions of the study. The chapter also
shows the findings of the qualitative analysis and discusses their implications. It
highlights the implications for theory, methodology and practices. Finally, the chapter
proposes a modified research model based on the study findings.
6.2 Summary of demographic characteristics for the survey questionnaire
The demographic backgrounds of the respondents gathered from the survey
questionnaire were described as follows. The total sample of respondents who met the
criteria was 585 respondents (87.57%), which consisted of 166 respondents who filled
out the online questionnaire and 419 who completed the hard-copy survey, representing
11 public universities in Indonesia. Of the total respondents, the number of male
respondents was greater than the number of female respondents by the ratio of 66.67%:
33.33%. In terms of age, most of the respondents (73%) were in the age range of 36-55
years. Approximately 89 percent of the respondents were married, 76 percent professed
Islam and the largest single group (30%) were Javanese. Of the 585 respondents, about
63 percent held a master’s degree, including those who had completed their studies at
universities overseas (e.g., Australia, the U.S., France and Germany), and most of them
had a specialisation in plant sciences (e.g., agronomy, socioeconomic agriculture and
horticulture). Most respondents worked in medium-sized and large universities. Those

195
in medium-sized universities constituted 42 percent and in large were 51 percent. The
majority of respondents (70%) have worked for more than 10 years. Nearly half (47%)
held in the academic rank of senior lecturer, and one-third (33%) of the samples held the
professor title, and only 27 percent held managerial positions (e.g., vice dean, head of
school/department or head of unit). In the current study, selected demographic data were
used as control variables: gender, education, work experience, institution size and age.
6.3 Conclusions and discussions of research questions and hypothesis testing results
The current study investigated the problem of:
The relationship between career anchors and job satisfaction and the effects of the psychological environment in the Indonesian public higher education context.
To address the problem, five issues were raised and seven hypotheses analysed. There
was no proposed hypothesis for Issues 1 and 5. Of the seven hypotheses, only two were
significantly supported while the other five were partially supported. Below are the
summary and conclusions of the analysis that has been done in Chapter Four and Five,
followed by the discussion.
Issue 1: The relevance of the career anchor inventory, the psychological empowerment scale and the job satisfaction scale in the Indonesian academic context.
The current study employed three instruments to collect the data: the career anchor
inventory, the psychological empowerment scale and the job satisfaction scale. The
relevance of the instruments was measured by examining the structure and content
underlying each scale. In other words, the issue investigated whether the items tapped
into the same phenomena. Because Issue 1 was designed to find out whether the items
underlying the constructs of the instruments had shifted, no hypothesis testing was
formulated. This investigation employed exploratory factor analysis.
Career anchor inventory
The results of the exploratory factor analysis indicated that the structure and content of
career anchors had changed, despite the fact that the scores of all items were reliable.
196
The results reported that five out of nine anchor categories, (entrepreneurial creativity,
service, managerial competence, pure challenge and economic security) were
confirmed as separate variables. The other four anchors (technical competence,
geographical stability, autonomy and lifestyle) formed two new anchors (work
dedication and balanced-lifestyle).
Technical competence and geographical stability were merged into one new anchor
labelled work dedication. This is a key contribution to the career anchor concept, since
no published studies has been found by the researcher with which to compare this
construct. The construct, therefore, should be considered for further empirical studies.
The finding suggests that the work dedication anchor reflects academics who want to
focus more on skills in their area of specialisations or use all their abilities and talents
for the growth of their present institutions. These individuals want to be free to carry out
their duties without too much interference from the rules of the institutions. Work
dedication-oriented academics will do their best based on their specialisation in their
own way, with strong loyalty and dedication to the universities where they work. Any
forms of promotion or an attractive compensation package offered by other universities
are ignored.
The characteristics of work dedication-anchored academics are in accordance with the
characteristics of the academics as civil servants in Indonesia. Because the promotion
system adheres to the linear career system (Dikti 2009, Soeparna 2011), the majority of
academics carry out their duties, such as teaching and research, only with regard to their
expertise. Beyond their expertise, all work will be rejected because it would not provide
any benefits in terms of promotion. Besides working only in their specialisation, the
results of their work are also dedicated to the universities where they belong as
reciprocation because they have advanced their careers with their universities’ support.
The remaining two anchors, autonomy and lifestyle, showed that their relationships
could not be separated, and thus, the variables were incorporated into another new
anchor named balanced-lifestyle. This is also a key contribution to the career anchor
concept. To the best of the researcher’s knowledge, no previous studies have been

197
published on this new balanced-lifestyle anchor. It should, therefore, be considered for
further investigation.
The result shows that balanced-lifestyle reflects the characteristics of academics who
want a high level of freedom and independence at work and to have control over their
own working schedule. Based on a study conducted by the University of Toronto
(reported by Kemick 2008), these people usually bring their work home so that they can
also interact with the family and participate in social events. With the rapid changes in
the economic situation and social values in actual life, balanced-lifestyle-anchored
academics attempt to integrate autonomy with the need to balance work, family and
career.
Other important characteristics of academics at universities are autonomy and academic
freedom. They want to be free to perform academic assignments but still comply with
the rules set by the universities for academic achievement. As noted previously,
academics have autonomy in teaching and research. Academics will be on campus when
required, such as for teaching in the classroom or in the laboratory, meetings and
consultation time. For the rest of the time, they want to work at home. They think that
they can work on academic tasks outside of office hours and can freely set when to start
and when to stop work and when to have family time. With the high demand for a
balance of career, family and work, it is significant that the study claims that the
academics ask for the freedom to determine the work schedule to achieve a balanced
lifestyle.
Hence, the present findings proved Schein’s (1996; 2006a, pp. 43-48) premise that
technical competence, geographical stability, autonomy and lifestyle would experience
changes in the 21st century due to the workplace behaviours, such as downsizing,
rightsizing, collaborative climate, sociocultural values and technology changes. The
results also confirmed Schein’s notion that if two or more anchors incorporated or
corresponded with each other (1990, p. 33; 1992, p. 208; 2006a, p. 34) or could not be
fitted into the existing anchor categories (Schein 1990b, p. 4) or were ‘some
combination’ of the categories (Schein & van Maanen 2013, p. 17), new anchor
categories could be constructed. Furthermore, needs-based anchors, as suggested by

198
Feldman and Bolino (1996), were evident through the merging of autonomy and
lifestyle.
Only a few researchers have investigated the structures and content of career anchors
inventory as stated by Dazinger, Rahman-Moore and Valency (2008). They argued that
their study was ‘the first rigorous test’ of the structures of Schein’s career orientation
inventory. The claim needs elaboration because Igbaria and Baroudi (1993) tested the
same instrument, producing a revised scale called a short form of the career anchor
inventory, which was employed in the current study and other previous studies (e.g.,
Hsu et al. 2003). The findings also confirmed Schein’s (n.d.) claim on the career
orientation inventory that has been used worldwide with satisfactory reliability in
languages other than English, such as in Swedish (Holdsworth & Cartwright 2002), in
Hebrew (Dazinger & Valency 2006) and in Chinese (Chang et al. 2010). These
findings, therefore, challenged Hofstede’s (1991), and Bryant and Son’s (2001)
arguments that attempting to use the questionnaires in Eastern cultures and languages
would create problems.
In short, the current study recognised that the structures of career anchors have been
shifted by identifying the two new career anchor categories but the new structures were
reliable. Despite the emergence of new anchors, all 25 items under seven anchors were
valid and reliable (see Tables 4.4 and 4.5.) as in the original scale of the short form of
career anchor inventory developed by Igbaria and Baroudi (1993). In addition, the
cumulative variance explained was at the satisfactory level. The career anchor
inventory, therefore, is applicable to the current study.
Psychological empowerment scale
In contrast to the results of the investigation of the career anchors inventory, a more
detailed examination of the psychological empowerment scale confirmed the 12 items
proposed by Spreitzer’s (1995). Spreitzer’s four facets are meaning, impact, competence
and self-determination and in the current study, the facets have significant correlations
ranging from 0.704 to 0.906. The results were also classified as highly reliable, which
meant that no items were eliminated, and that the items were highly correlated, with
alpha scores ranging from 0.71 to 0.91. This indicates that the Indonesian academics
consider that these four factors are important to their feeling of being empowered in

199
their workplace. Academics believe in the meaning of their work goals so that they
work in accordance with their own values and the feeling that they can influence the
results of the work in the workplace (Spreitzer 1995; Meyerson & Kline 2007;
Dewettinck & van Ameijde 2008; Dhladhla 2011). Their confidence in their capabilities
to perform better and their sense that they have control over their task assignments
make academics feel empowered (Meyerson & Kline 2008; Dhladhla 2011).
The present results pointed to Spreitzer’s (1995) premise that the four facets of
psychological empowerment were reflections of employees’ perceptions of the work
environment. However, these were partly supported by Menon’s (1999) proposition that
psychological empowerment was a cognitive state manifested in a sense of perceived
control, competence and goal internalisation. In contrast to the type of education sector
examined in the current study, Ghani, Raja Hussin and Jusoff’s (2009, p. 163) study
was at private universities in Malaysia. They concluded that the four facets of
psychological empowerment could be used in a private context. Although the shift in
the structures, such as the merging of self-determination and impact (Dimitriades 2005;
Collins 2007), had occurred in few previous studies, the results of the current study
supported findings from the literature by Spreitzer in which all 12 items loaded on the
four respected facets of meaning, impact, competence and self-determination. It seems
plausible that differences in results are due to differences in how individuals translate
the words underlying the scale.
As with the career anchor inventory, the results indicated that the psychological
empowerment scale that was translated into Bahasa Indonesia (Indonesian language)
was satisfactory. The results were in line with the studies conducted by Akbat et al.
(2000) in Iranian, Hocwalder and Brucefor (2005) in Swedish, Uner and Turan (2010)
in Turkish and Fock et al. (2011) in Chinese. In other words, despite concerns expressed
by Hofstede (1991), Feldman and Bolino (2000), and Bryant and Son (2001) that
culture became a main problem when the scale was used in locations other than English-
speaking countries, this difficulty did not arise in the current study.
Job satisfaction scale
Similarly, the results of this study confirmed the investigation of the job satisfaction
scale developed by Hackman and Oldham (1975) and validated by Igbaria and Baroudi

200
(1993). Exploratory factor analysis produced a one-dimensional factor with three items
and received high factor loadings (0.60 to 0.89) and high reliability (α=0.70).
Indonesian academics are generally satisfied with their current job, and happy with the
tasks they perform (Locke 1976; Ivancevich & Matteson 2002; Lumley 2009). The
findings supported Igbaria and Baroudi’s (1993) investigation that the three items
clearly measured the employee’s satisfaction with the job. The result was also in line
with the results of studies reported by Feldman and Bolino (2000) and by Schermuly,
Schermuly and Meyer (2011) that the three items were satisfactory and reliable (α =0.76
and 0.85 respectively).
As in the other two scales that discussed culture, because the factor loadings and the
alpha score of job satisfaction scale were at a satisfactory level, issues associated with
translating the instrument could be ignored. The present results supported the results of
the translated scale studied by Schermuly, Schermuly and Meyer (2011), who found
that the job satisfaction scale translated into German was highly reliable (α=0.76).
To sum up, the results of the investigation of the structures underlying the three data
collection instruments were significant. The findings were consistent with previous
studies, which had various aims and were done in different countries using translated
scales (e.g., Holdsworth & Cartwright 2002; Chang, Shih & Lin 2010; Uner & Turan
2010). The results, however, challenged the statement given by Bryant and Son (2001)
that questionnaires that are developed based on Western cultures cannot be applied to
studies conducted in Eastern cultures. It is argued that those scales are built for
assessment at the individual level regardless of whether the research subjects are from
the developed, less developed or newly industrialised countries or from the West or the
East. Thus, the three scales are interpretable for academic subjects at public universities
in Indonesia.
Issue 2: The single and multiple dominant career anchors of Indonesian academics.
Hypothesis 1: Indonesian academics score differently on the single dominant career anchor or multiple dominant career anchors.
The results in the Table 4.6, Sub-section 4.7.1 of Chapter Four, presented the sequence
of the career anchor category from the highest to the lowest frequency among

201
Indonesian academics. Of the single career anchor, economic security was first, having
been chosen by 42.39 percent of respondents, followed by service, managerial
competence, entrepreneurial creativity, work dedication, pure challenge and balanced-
lifestyle. The service anchor as a characteristic of public institutions was placed at the
second rank, and selected by 14.70 percent of academics. The lowest dominant career
anchor was balanced-lifestyle and was chosen by 0.68 percent of academics.
The hypothesis testing of the differences between the frequencies of the dominant career
anchors employing the chi-square for goodness-of-fit test indicated that the proposed
hypothesis was accepted (see Table 4.6). Thus, Indonesian academics scored differently
on the single dominant career anchor and multiple dominant career anchors.
The emergence of the economic security anchor as a dominant career anchor might be a
trend among government employees in Indonesia. They generally seek permanent job
security to avoid layoffs, receive a full, regular salary based on years of service and
rank, are less motivated to perform, prefer promotion based on seniority and have health
insurance and pension programs. As stated by Schein, the security/stability anchor is
more associated with jobs in government and service sectors, and as public servants
strive for financial security at certain life stages (Schein 2006a, p. 17). Feldman and
Bolino (1996, p. 102) and Chapman (2009) also stressed that security/stability was more
easily found in government institutions.
Overall, Schein (1990, 2006a) emphasised that not all individuals who had jobs in the
public service had the service anchor, and not every type of work of an individual
always necessarily matched the career anchors held. These results also challenged
Schein’s (2006a, p. 24) speculation that money was to be the main focus at the
beginning of the individual’s entering the workforce, and that this would shift after
some time due to changes in life environment. However, Schein noted that for some
people, economic security dominated throughout their careers. The demographic
characteristics of the current study that showed nearly 50 percent of academics were in
the 45 years and above age group, more than 20 years of work experience and in the
academic rank of senior lecturer (lektor kepala) – one below the highest rank of
professor – supported Schein’s claim to being economic security-anchored individuals.

202
It is claimed that although academics tend to be in the mature stage of their career life
cycle (Super 1990), the security issue still dominates among Indonesian academics.
However, these results are contrary to the finding of a study conducted by Custodio
(2000) about the career anchors of Filipino academic executives at public universities.
She found that economic security was ranked lowest. Similarly, La Lopa, Beck and
Giselli (2009) also placed economic security fourth; however, they argued that even
though economic condition was not an issue, academics would leave their present
universities for a better salary. The results did not reflect Schein’s (1990) claim that
only one dominant career anchor linked to a specific job-related field.
Further attention is given to two studies conducted in developing countries. Like the
current study, which was conducted in Indonesia, Custodio (2000) was conducted in the
Philippines. While the former found that academics had an economic security anchor,
the latter found that they had a lifestyle integration orientation. The two studies’
differing results challenged Ituma and Simpson’s (2007) claim that economic security
has become the most dominant anchor in developing countries, as in their information
technology sample in South Africa. The current study argues that the different findings
were due to each individual having unique attitudes and behaviours. In addition, the
social and economic backgrounds of countries contribute to individuals’ perceptions of
their career lives.
Although geographical stability was combined with technical competence into one new
anchor, the emergence of economic security as a single anchor showed that
geographical stability and economic security are diverse. The present results reinforced
DeLong’s (1982, p. 60) findings and validated Igbaria and Baroudi’s (1993) study and
others (e.g., Custodio 2000) that geographical stability and economic security were two
substantial and distinct themes in meaning.
That the service anchor only ranked second is unexpected, as one of the characteristics
that distinguishes the public sector from other sectors is that of serving the public. It is
assumed that academics considered the service anchor as axiomatic for a civil servant.
They viewed other factors as more important and significant in influencing their career
development. The result undermined Schein’s premise of service as a key anchor for

203
public organisations (Schein 1990, 2006a). It is assumed that service is intended for
employees who work in public service institutions, primarily in administration.
Issue 3: The talents-based, needs-based and values-based anchors of Indonesian academics.
Hypothesis 2: Indonesian academics score differently on the talents-based, needs-based, values-based and commitment-based anchors.
The issue was to examine whether multiple career anchors existed among Indonesian
academics at public universities. The consequence of merging four career anchor
categories (technical competence, geographical stability, autonomy and lifestyle) into
two new anchors through factor analysis (see Table 4.4, Chapter Four) changed the
composition of the multiple groups-based career anchor categories as set out by
Feldman and Bolino (1996). Commitment-based anchors emerged as the new multiple
groups-based anchors to accommodate the technical competence and geographical
stability anchors. More empirical studies are, therefore, needed to investigate the
composition.
The calculation of frequency showed that, of all academics who were investigated in
this study, the largest group (43.25%) inclined to needs-based anchors (see Table 4.7,
Chapter Four). Values-based anchors were second (17.44%), the talents-based anchors
third (9.57%) and the commitment-based anchors last (3.42%). In terms of multiple
groups-based anchors, multiple career anchors ranked second (26.32%). The highest
combination of multiple anchors was anchors from two groups-based for 21.54 percent
of academics, followed by three groups for 4.62 percent. The results of the chi-square
test of goodness-of-fit showed that the hypothesis was supported. Hence, Indonesian
academics scored statistically differently on talents-based, needs-based, values-based
and commitment-based anchors.
It is noted that these results cannot be used to claim that academics are oriented to
needs-based anchors. Despite the fact that this study was exploratory in nature, the
emergence of multiple career anchors as the second largest anchor, both in the single
dominant anchor analysis and multiple groups-based anchor analysis, indicated that
academics combined talents-based, needs-based and values-based anchors to satisfy

204
multiple goals. Many academics develop multidirectional ways to develop their careers.
These results, on the one hand, supported Schein’s (2006a, p. 5) argument that ‘talents,
motives, and values become intertwined so it may be hard to figure out what your
anchor is. Talents without motivation gradually atrophy’. On the other hand, Schein
(1980, 1990) proposed that after five to 10 years and having some work experience,
individuals’ careers become more stable and are unlikely to change with time. The
inconsistency of Schein’s view was criticised by Feldman and Bolino (1996), who later
suggested testing the multiple career anchors concept empirically.
With regards to the single career anchor and multiple career anchors views, the current
study suggests that academics tend to have multiple career anchors. In spite of Schein’s
early research claim of one anchor for one individual during her/his career journey, the
existence of multiple anchors emphasised his prediction that multiple career anchors
would dominate individuals in the technological era. This result also supported Feldman
and Bolino’s (1996) criticism that it was impossible for individuals to have just one
career anchor to face the challenges of a complex life. The initial research conducted by
Schein (1977b) had indicated the existence of multiple career anchors, with 23 percent
of the samples holding two anchors and nine percent holding three.
Up until the results of the current study were reported, the researcher has only found
one similar empirical study that discusses the topic in detail. Contrary to the current
study, a study conducted by Kniveton (2004) with 540 business managers found talents-
based, needs-based and values-based anchors were held in equal number. The
differences in the two studies may be due to the different characteristics of the samples
(Kniveton 2004). The present results correspond with previous research that also
highlighted the existence of multiple career anchors, with populations, such as primary
school of educators, managers, information technology/system employees and students
(Tan & Quek 2001; Marshall & Bonner 2003; Ramakhrisna & Potosky 2003; Suutari &
Taka 2004; Smith 2005; Ituma & Simpson 2007).
In light of the existence of multiple career anchors, the degree of their relationships was
observed. The results failed to identify ideal pairs to create an octagonal diagram. The
bivariate correlation matrix showed that all significant correlation values were positive
and weak, reflecting only the complementary relationships observed. There were seven

205
anchor pairs (entrepreneurial creativity and work dedication; service and work
dedication; service and balanced-lifestyle; managerial competence and entrepreneurial
creativity, managerial competence and service, pure challenge and managerial
competence, economic security and balanced-lifestyle), one set with three anchor
relationships (economic security, service and pure challenge) and another set with five
anchor relationships (pure challenge, work dedication, balanced-lifestyle,
entrepreneurial creativity and service). It is noted that no orthogonal relationship pairs
were found. In other words, there were no mutually exclusive relationship pairs.
The career anchor relationships results were also an indication of the existence of
multiple groups-based anchors. The importance of multiple groups-based anchors for
academics was emphasised by placing them on the second rank of the career anchor
patterns. The findings suggest that in achieving their career goals, academics have at
least two anchors that complement or are correlated with each other. For example, in
addition to serving stakeholders (reflected in service and grouped in values-based
anchors), academics also pursue either a managerial career to exercise their leadership
skills (reflected in managerial competence and grouped in talents-based anchors) or in
running a business (reflected in entrepreneurial creativity and grouped in talents-based
anchors). As interviewed, academics who have competency in management studies and
are happy to work in the information technology area might take an additional job in the
information technology centre at their universities to fulfil their values and needs.
It is claimed that the complementary anchor relationships are more common (Feldman
& Bolino 1996). As discussed earlier, limited studies have investigated complementary
and mutually exclusive anchors (Chapman 2009, p. 25). Both the managerial
competence anchor that complementing the entrepreneurial creativity anchor and the
pure challenge anchor complementing the managerial competence anchor supported
Feldman and Bolino’s (1996) claim; this complement was also found in a study done by
Chapman (2009). The remaining pairs in the current study are exclusive to those two
studies and have a significant contribution to the career anchor relationship concept.
Because the current study found no orthogonal pairs, an octagonal diagram could not be
created. The different results might be ascribed to the differences of sample
characteristics, the scale measurement and the analysis design. Unlike the current study,
which used (1) academics as public servants who worked for public universities, (2) the

206
25 items of the short form of career anchor inventory published by Igbaria and Baroudi
(1993) and (3) a bivariate correlation matrix, Feldman and Bolino’s (1996) study
provided only a framework and propositions with respect to this topic. They applied
Schein’s (1990) 41-item career orientation inventory and proposed factor analysis to
determine the independency of career anchor categories. However, even though the
same inventory applied to Chapman’s (2009) empirical study, he used an indices
threshold method to investigate the relationships. It draws attention to the fact that more
empirical research needs to be done if complementary and mutually exclusive anchors
can be shown to be two other dimensions of career anchors.
In conclusion, the results of this study revealed that academics tended to have multiple
career anchors. Needs-based anchors were regarded as the most important multiple
groups-based anchors, and the degree of the anchor relationships was evident in
complementary anchors. The current study argues that the single career anchor tended to
be less popular than multiple career anchors. The findings that all were complementary
strengthened the existence of multiple career anchors.
Issue 4: How do career anchors predict psychological empowerment and job satisfaction?
Five hypotheses were tested in relation to Issue 4. Three hypotheses tested the main
effects of career anchors, psychological empowerment and job satisfaction, one
hypothesis examined the mediation effects and one assessed the moderating effects.
Before presenting the summary, discussion and conclusion of each hypothesis, the
effect of demographic variables will be discussed for the evidence of control variables.
The effects of selected demographic variables across the variables researched in the
current study were tested by employing multivariate analysis of variance (MANOVA).
(Appendix 18). All demographic variables gender, education, work experience,
institution size and age) were associated with certain career anchors, psychological
empowerment and job satisfaction dimensions. Female academics were more likely to
hold service for their dominant anchor than males. Academics with a bachelor’s degree
preferred to have work dedication and entrepreneurial creativity to guide and constrain
their career decisions rather than academics with a master’s degree or doctorate degree.
Academics with a master’s degree were more likely to be empowered when they felt

207
their work to be meaningful resulting in increased job satisfaction than those who held a
bachelor’s or doctorate degree. Academics who had worked for their universities for
between 11 to 20 years were more confident and had a stronger belief in their
capabilities to perform tasks at work than those with five to 10 years’ work experience,
or more than 20 years’. Academics who worked at large universities were more likely to
orient to service and the meaning facet rather than academics at small to medium-sized
of universities, whereas those who worked at small universities were more likely to
orient to pure challenge than those from medium-sized to large universities.
These findings indicate the existence of substantial differences on selected demographic
variables across the career anchors, psychological empowerment and job satisfaction
variables. As Mitchell (1985, p. 196, cited in Spreizter, Kizilos & Nason 1997, p. 693)
said, ‘these demographic measures were included to actively try to conceptualize and
measure those variables that may serve as potential confounds’. Demographic variables
were, therefore, used as control variables in HMRA (Tan & Quek 2001; Dickson &
Lorenz 2009; Bhattacherjee 2012).
A. The relationship between career anchor and job satisfaction
Hypothesis 3a: Indonesian academics’ perceptions of career anchor subscales are positively related to job satisfaction.
The HMRA results reported that after controlling for the demographic variables, only
four out of seven career anchor predictors were significant. Work dedication,
managerial competence and pure challenge were significantly and positively related to
job satisfaction while the balanced-lifestyle anchor significantly and negatively
predicted job satisfaction. In contrast, service, economic security and entrepreneurial
creativity did not predict job satisfaction. The hypothesis was not fully supported
because only four out of seven anchor categories had significant relationships. Career
anchors, therefore, were significantly and partially related to job satisfaction.
Indonesian academics who oriented to work dedication, managerial competence and
pure challenge were associated with an increase in the job satisfaction level. The results
suggest that academics who have a high dedication to the university where they work,
work in their area of expertise, have ambition to achieve higher managerial positions,

208
feel challenged to do new tasks (e.g., creating a more effective teaching method, writing
a book), solve complex problems and compete with tough opponents will feel satisfied
in their workplace. The present results confirm Schein’s (1978; 1990) premise, and
Feldman and Bolino’s (1996) assumption that individual career anchors are correlated
significantly with job satisfaction. Those who achieve a match between the career
anchors and work environments will be positively correlated with job satisfaction. Work
dedication predicted job satisfaction and was found to be the first contributed to the
career anchor concept.
In line with Schein’s and Feldman and Bolino’s propositions, which stated that the
incongruence of career anchors and work setting would lead to dissatisfaction, the
current study found a negative relationship between the balanced-lifestyle anchor and
job satisfaction. In other words, academics who held the balanced-lifestyle anchor
would had a significant decrease in job satisfaction. Academics who wanted to be free
from the university rules, have their own schedule in the teaching environment, and
balance work, career and family needs would feel unhappy in their jobs. This was a
major contribution to the concept of career anchors, and the study was the first to report
that the balanced-lifestyle anchor was a predictor of job satisfaction in the negative
direction. Typically, Indonesian academics have lifelong employment, linear career
path, tight process control, centralistic arrangement and bureaucratic policies. Since
most rules are controlled by the central government (e.g., salary and workload
regulations, recruitment and promotion procedures, fringe benefits, pension
arrangements), the desire to balance career, family and work needs is far from easy to
implement. Only institutions with decentralisation policies might be able to support
work and family balance.
It was noted that Schein’s theory and Feldman and Bolino’s propositions did not point
to the specific career anchor category as the current study did. One possible explanation
was that they focused on the overall notion of career anchors. As a consequence, they
identified no single anchor category was that might be an indicator of job satisfaction.
In reviewing the literature on career anchors, the present researcher did not find any
studies relevant to the finding of work dedication and balanced-lifestyle in the current
study. Small number studies employing different research methodologies from the

209
current study either found evidence (e.g., Feldman & Bolino 2000, Tan & Quek 2001,
Dazinger & Valency 2006, Lumley 2009) or did not find evidence (e.g., Steele 2008)
for a relationship between career anchors and job satisfaction. None of the previous
studies indicated the existence of the work dedication and balanced-lifestyle anchors
that the current study found. This current study was the first to examine academics at
public universities and the relationships between career anchor subscales and job
satisfaction. Hence, the findings cannot be directly compared.
Thus, the career anchor chosen and the job satisfaction level attained in the current
study reflected the characteristics of academics at public universities in Indonesia. It is
imperative that management at either the university level or the central government
level should understand academics’ dominant career anchors of work dedication,
managerial competence, pure challenge and balanced-lifestyle to modify the existing
career policy for academics so that they can increase their job satisfaction and indirectly
improve their job performance.
B. The relationship between career anchors and psychological empowerment
Hypothesis 3b: Indonesian academics’ perceptions of career anchor subscales are positively related to psychological empowerment.
Hierarchical multiple regression analysis showed that more than 50 percent of career
anchor categories had positive and negative relationships to the psychological
empowerment facets. The results indicated that six out of seven anchors were
significantly related to the four psychological empowerment facets. The hypothesis,
therefore, was partly supported.
The entrepreneurial creativity and managerial competence anchors were associated
positively with the four facets of psychological empowerment (meaning, competence,
impact and self-determination); the work dedication anchor was positively related to
meaning, impact and self-determination; the pure challenge anchor was predictive of
only meaning; the service anchor was positively correlated to meaning, competence and
self-determination; and the balanced-lifestyle anchor had a negative relation to meaning
but a positive correlation to self-determination. Career anchors, therefore, were
significantly and partially related to the psychological empowerment facets. These

210
suggested that by having the entrepreneurial creativity, managerial competence, work
dedication, pure challenge and service anchors, academics would have higher feelings
of meaning, impact, competence and self-determination in the way they improved their
careers. However, those academics who perceived the balanced-lifestyle anchor had two
choices of empowerment: to report higher self-determination or lower meaning.
This is another key contribution of the current study to the career anchor theory and the
psychological empowerment concept. Up until the results were reported, the researcher
has not found any published research on the predictive correlation between career
anchors and psychological empowerment, nor have any previously found the two new
anchors: work dedication and balanced-lifestyle. The current study calls for more
empirical studies to explore the relationships between career anchors and psychological
empowerment.
C. The relationships between psychological empowerment and job satisfaction
Hypothesis 3c: Indonesian academics’ perceptions of psychological empowerment facets are positively related to job satisfaction.
The statistical computation of HMRA revealed that the hypothesis was partially and
significantly supported for only two single facets of psychological empowerment.
Perception of meaning and impact at work explained weak but significant variance
beyond perception of competence and self-determination in predicting job satisfaction.
Indonesian academics’ perception of meaning and impact had effects on feelings of job
satisfaction. Contrary to expectations, competence and self-determination did not
contribute to job satisfaction. On the one hand, the findings were in line with Spreitzer’s
(1995) concept that when employees can derive meaning from their job and can
influence job outcome, they will be motivated and will have greater job satisfaction. On
the other hand, these results partially supported Spreitzer’s (1996) study that meaning
was the strongest predictor of job satisfaction. However, these were partially contrary to
Spreitzer’s (1995) previous findings that self-determination (in sample 1) and
competence (in sample 2) were associated with job satisfaction.
In the current study, academics who had meaningful jobs and found a fit between their
beliefs and values and the universities’ goals to perform work, and had the possibility to

211
influence the universities’ or faculties’ strategic plan or administrative work, felt a
higher level of job satisfaction. Despite the low level of the feelings of meaning and
impact, which made academics feel only slightly connected to their work and outcomes,
they were more likely to be loyal, service-oriented and work-committed people. They
would be more satisfied with their current universities, if they could do more
meaningful work and have more chances to be involved in making decisions for the
better performance of their universities.
It was surprising that competence and self-determination did not predict job satisfaction,
since the two facets were important attributes to academics. As Virtanen (2002, p. 77)
stressed, competence was ‘a kind of human capital or resources that can transform into
productivity’ and ‘inherently related to teaching and researching’; similarly, Spreitzer,
Kizilos and Nason (1997, p. 697) emphasised that self-determination was a main facet
of empowerment. This may be because academics construed that having the ability to
perform academic tasks was as not important as having a sense of meaningful work and
having influence in their faculties or universities to feel satisfied at their workplace.
Four possible reasons are that they: (1) felt that they were capable and skilful to perform
tasks in their academic environment; (2) experienced overwork in teaching; (3) handled
multiple roles; and (4) did not expect to have control over how their work was done.
Until these results were reported, however, the present researcher had not found any
studies done on the same subject. The current study, therefore, was the first to make a
contribution to the psychological empowerment concept from the point of view of
academics as government servants in the public higher education sector.
D. The mediation effects of psychological empowerment
Hypothesis 3d: The mediating role of psychological empowerment facets strongly explains the influence of Indonesian academics’ perceptions of career anchors on job satisfaction.
Hierarchical multiple regression analysis and Sobel’s test demonstrated that the
psychological empowerment facets played significant roles as partial mediators to the
influence of certain career anchors on job satisfaction. Meaning and impact were the
only two significant mediators, while competence was an insignificant facet and self-

212
determination did not predict the relationship in the mediation-model testing. Meaning
and impact, therefore, mediated the effects of work dedication, managerial competence
and pure challenge on job satisfaction. It suggested that academics who tended to hold
the work dedication, managerial competence and pure challenge anchors could increase
the level of job satisfaction indirectly by having the feelings of meaning and impact.
The results are in line with the concept of those anchors, in which individuals who
concentrate on the intrinsic content of work are oriented to control workplace situation
will feel their talents and values to be tested and will have an impact on job satisfaction
(Schein 2006a). In developing their job characteristics model, Hackman and Oldham
(1980) found that the meaningfulness and responsibility for outcomes that individuals
experienced mediated job characteristics and job satisfaction. The outcome stated that
when an individual works in accordance with their attitudes and values they are happy.
Individuals who felt responsible for work outcomes also experience job satisfaction.
The findings also supported Ding and Lin’s (2006) opinion that without being
empowered to apply values, needs and abilities (reflected career anchors) to their career
development, individuals feel unhappy. Academics feel happy when their dominant
career anchors are in line with their values in the teaching and research areas. Sharing
skills and knowledge with colleagues, influencing policy, controlling people around
them and being involved in decision-making to improve their institutions increase the
level of job satisfaction. It is imperative that academics realise that the two
psychological empowerment facets of impact and meaning mediate between the work
dedication, managerial competence and pure challenge career anchors effect and the
level of job satisfaction. The absence of the competence and self-determination facets
was unexpected.
The review of the literature on career anchors, psychological empowerment and job
satisfaction did not find any studies that tested any hypotheses comparable to those of
this study. This is the first study that concerns the predictive correlation of career
anchors, including work dedication, managerial competence and pure challenge, on job
satisfaction and that investigated psychological empowerment individually as
mediators. It is worthwhile to have further studies using career anchors individually as
predictors on the mediation model of psychological empowerment.

213
E. The moderating effects of psychological empowerment
Hypothesis 3e: The moderating role of psychological empowerment facets strongly explains the influence of Indonesian academics’ perceptions of career anchors and job satisfaction.
The testing of moderating effects reported that three facets of psychological
empowerment moderated the influence of three career anchors on job satisfaction. The
hypothesis is, therefore, partially supported. Impact positively and significantly
influenced the service anchor; however, self-determination showed a negative but
significant association. Competence had a negative but significant association with the
balanced-lifestyle anchor while self-determination positively and significantly
influenced on the balanced-lifestyle anchor. Last, self-determination positively and
significantly influenced the pure challenge anchor.
Despite a weak interaction on all moderators, some patterns emerged. A high feeling of
meaning and self-determination and a low feeling of competence enhanced the job
satisfaction of those academics with a balanced-lifestyle orientation. By contrast, low
feelings of meaning and self-determination and high feelings of competence decreased
the job satisfaction of those academics who had the balanced-lifestyle anchor. Both high
and low feelings of impact strengthened the job satisfaction of service-anchored
academics. The same pattern was shown for both high and low levels of self-
determination, in which were associated with increased job satisfaction for those
academics with the pure challenge anchor.
The current study also identified another important finding. Meaning played roles as
both a mediator and a moderator for both balanced-lifestyle. Academics who tended to
cling to the balanced-lifestyle anchor could indirectly have slightly higher job
satisfaction through having high feelings of meaning at work, whereas low-level
feelings could decrease job satisfaction.
Thus, it seems that increasing academics’ empowerment through high feelings of
meaning, self-determination, competence and impact could also increase their
confidence in managing people, developing skills, balancing work and family lives, and
facing and solving tough problems. Consequently, these situations could help academics

214
achieve greater job satisfaction at work. Conversely, restricting academics’
empowerment through those four feelings would reduce their satisfaction. These results
also explain why competence and self-determination do not mediate the relationship
between career anchors and job satisfaction. It is imperative for academics to
understand their level of feelings of empowerment to meet their career anchors to
achieve greater of job satisfaction.
It has been stated in reviewing the literature that no studies have been conducted on the
relationship between career anchors and job satisfaction through the moderating
variables of the psychological empowerment facets. As in the findings of the mediating
effect, these findings are also the first to claim the results of the moderating effects
model. It is imperative to conduct further studies using career anchors as predictors in
testing the moderating effects of the psychological empowerment facets.
6.4 Discussion and implications of the qualitative findings
Issue 5: How do Indonesian academics’ perceptions of their career development influence the way they pursue the career anchors?
There was no hypothesis proposed for Issue 5. This issue was designed to explore
academics’ perceptions through their career history to find out the dominant career
anchors and factors that influenced them to achieve their career goals. The answers to
the issue were also used as supporting data and information for the quantitative analysis
in the current study. This subsection summarises and discusses the findings presented in
Chapter Five and suggests the implications for the current study.
As expected, service was identified as the most dominant career anchor among
academics. This indicates that individuals who decide to become academics at public
universities are expected to serve the community and are dedicated to the field of
specialisation to bring about community a better world (Schein 1990, 2006a), even
though they receive less income than their counterparts in the private sector. It is not
surprising that tangible rewards, such as incentives and honoraria are not important to
them.

215
The findings of dominant career anchors were in line with Schein’s (1978, 1990, 2006a)
notion by stating that individuals found their career anchors after exploring a number of
patterns through career decisions that they made and a number of reasons underlay the
decisions. Service being shown to be the most dominant career anchor also strengthens
Schein’s (1996, 2006a), and Schein and van Maanen’s (2013) premise that service was
a ‘brand’ of government employees, and that more and more people wanted to do
something in a broader context (e.g., working on a new drug, reducing poverty).
Individuals work not only to gain promotions but also to apply their own values.
Academics would leave managerial positions for the chance to do something better for
human beings. None of the previous studies reviewed here found the same dominance
of service as a career anchor. Custodio’s (2000) study ranked it second; La Lopa, Beck
and Ghiselli (2009) ranked it third. The result suggests that using academics’ values in
teachings and research would give satisfaction to service-anchored academics.
The existence of multiple career anchors (see Table 5.7, Chapter Five) among
academics in this study reflects the trend that the prevalence of single anchor careers is
declining. Indonesian academics generally have at least two anchors. The assumption is
likely that a lecturer position may not be the first choice when applying to be an
academic, and/or it may be because academics’ incomes are small, causing academics to
look for additional jobs within their careers in order to fulfil their values or needs.
Welch (2012, p. 35) emphasised that ‘public academics preserved a second job either at
a private higher education institutions and/or elsewhere’. These results answer the
proposition of Feldman and Bolino (1996) by arguing that people would have two or
more anchors to face a complex career situation and social life. The proposed notion
needs to be considered even though Schein still believed that one’s dominant anchor
never changes, even when her/his career might change (2006a, p. 36). With the findings
on this type of anchor but no detailed examination by other research (e.g., Tan & Quek
2001; Marshall & Bonner 2003; Ituma & Simpson 2007), it is imperative to have
serious further exploration in a study of career anchors.
The current study discovered a new proposed anchor, academic freedom and creativity,
that reflects a characteristic of academics. It determined that academics should be free
of external interference (Henkel 2005), and free to teach, do research and discover new
ideas (Robinson & Moulton 2002). Autonomy itself reflects the academics’ freedom to

216
behave appropriately in the teaching environment. The autonomy anchor and the
creativity anchor enlarge Schein’s (2006a) and Schein and van Maanen’s (2013)
concept of the entrepreneurial creativity anchor. The separation has also been
demonstrated in previous studies (Marshall & Bonner 2003; Dazinger, Rachman-Moore
& Valency 2008), which have stated that the entrepreneurial creativity anchor was two
separate anchors, each of which had different characteristics. As academic freedom and
creativity is considered to be a new anchor, further empirical study is needed.
As a consequence of this separation, the current study substituted entrepreneurship with
the running a business anchor to represent the behaviour of academics as public
servants for the purpose of qualitative analysis. Entrepreneurship in organisations and
government administration (not companies) was emphasised as a means to create
products, services and jobs by Marshall and Bonner (2003). When this is related to
academics, it refers to the freedom to create innovative products and services in the
academic environment through research, publications and teaching. This is because
Indonesian academics are not allowed to run businesses (as a company), especially
those who are at the academic rank of senior academic and upwards. By contrast,
academics who want to exercise their business skills could be self-employed or have
creativity-related, home-based businesses, such as bakery, hairdresser, or fashion line.
As Schein (n.d.) pointed out entrepreneurial-oriented people who are academics have
side jobs to be prepared for future opportunies. Similarly, Marshall and Bonner (2003)
stressed that running businesses for academics means generating money, not building an
enterprise.
As expected, the running a business anchor was ranked last. The anchor contradicted
with the academic function to serve the community. The identification of the academic
freedom and creativity anchor and the running a business anchor, and a clear distinction
of entrepreneurship and creativity extended Schein’s (2006a) notion that creativity
could be interpreted in different ways by the various anchor groups. These also
confirmed findings reported by Marshall and Bonner (2003) concerning public
university students.
The lifestyle anchor was also broken down into two anchor categories: work-family
lifestyle and flexible working schedule. Academics made a clear distinction between

217
these two anchors, one was for life purposes and the other was for working conditions.
The findings reinforced Schein’s (2006a) premise that more people now would like to
integrate their family/personal life with their career/work life due to changes in social
life. More and more Indonesian academics have a dual-career family life, in which both
wife and husband are in full career development mode. A conflict of interest may be
problematic. Work-family lifestyle-anchored academics desire to balance their personal
and professional lives. The finding supports Schein and van Maanen’s (2013, p. 15)
point that lifestyle was related ‘to the integration of career and family issues’. The
lifestyle anchor has become more prevalent as more families are finding that they must
meet the demands of two different, equally valued careers. The importance of the
combination of work and family lives was also found in a study by Custodio (2000) for
the lifestyle integration anchor, which she ranked first, and by La Lopa, Beck and
Ghiselli (2009) for the balancing career and family anchor, which they also ranked first.
Contrary to the findings reported by these two studies, which still used the same scale
for the lifestyle anchor that had been developed by Schein (1982), the current study
suggested revising the scale to fit the work-family lifestyle anchor. The proposed new
work-family lifestyle anchor, therefore, needs further exploration.
While the demand for flexible of working hours is high, people with the flexible
working schedule anchor still accept institutional rules and restrictions. Academics are
fully concerned with their working schedules in facing the competitive of the world of
work. Being civil servants in Indonesia, academics are required to be present every
working day during standard working hours. These people feel that working at home
when there is no explicit reason to travel to workplace would help them be more
efficient and effective to keep up their job performance. A flexible working schedule
was important also in Feldman and Bolino’s (2000) study of self-employed employees.
In contrast to the present finding, the employees raised the issue of the exchange of
increasing the flexibility to work on their own schedule, as well as increasing the
limited vacation days and time off. These findings suggest that the reconceptualisation
of Schein’s career concept as suggested by Feldman and Bolino (1996), by considering
the concept of talents-based, needs-based, and values-based anchors needs to be taken
into account.

218
The emergence of academic atmosphere as a dominant career anchor complements the
other two anchors that could be expected to be attached to Indonesian academics: the
service, and the academic freedom and creativity anchors. Together, they are the three
basic characteristics of academics. This is associated with the three pillars of higher
education (teaching, research and community service) so that in pursuing a career,
academics must satisfy the three elements. Contrary to the competitiveness notion,
academic atmosphere in the forms of research and teamwork among colleagues still
dominates in the teaching environment. This is because all the rules and policies related
to academics are considered to be centralised so that the individual’s work or
competition is not accommodated so easily. The argument supported Schein’s (2006a,
p. 47-48) analysis of future job/role in that the competitive climate was better developed
for organisations that did not adhere to a centralistic policy system. Up to the time of
this study, no previous studies have been reported on this anchor. The identification of
the academic atmosphere anchor category, therefore, needs to be explored further,
including its inclusion in the values-based anchors.
The current study validated the separation of the economic security and geographical
stability anchors, as reported by DeLong (1982) and Igbaria and Baroudi (1993).
Academics regarded the economic security anchor in the form of a pension package as
the reason for being government employees. To academics, it is fair that government
institutions demand dedication and loyalty in exchange for a pension and lifelong
employment. Remaining in the present institution is a must because of government
regulations. However, academics are allowed to move to other universities as set out in
government regulations, such as following the transfer of one’s spouse’s job.
Academics, therefore, distinguished between economic concerns and loyalty to the
institution. Although Schein (1987; 2006a) developed one category of security/stability,
the present findings confirmed DeLong’s (1982) study and other previous research (e.g.,
Custodio 2000; Chang & Lin 2008) that separated the anchors.
The identification of the spiritual values theme was as expected. It is understandable
that in a country where religious teachings are very strongly attached to a country’s
administration, these teachings would influence the spiritual life of its people as well as
their career life. It is observed that Indonesian administration is implicitly conducted
based on religious values (Sihombing & Pongtuluran 2011). In Indonesia, where the

219
majority of people (±86%) are Muslims, and almost every government organisation
applies the teachings of Islam (Pekerti & Sendjaya 2010; Kyes 2012), it is possible that
the teachings influence people’s attitude in the workplace. In addition, nearly three-
quarters of the respondents were Muslim, strengthening the case for the emergence of
the theme (see Tables 5.2 and 5.4, Chapter Five). It is expected that some academics
regard spiritual values as an important theme because working (in this case as lecturers)
is part of a Muslim’s obligation (Ahmad & Owoyemi 2012; Jamilazzaini 2013). It could
imply that Baruch’s (2004) suggestion of spiritual purposes should be taken into
account for further and more empirical studies to claim this theme as an anchor and
extend Schein’s (1987b, 1992, 2006a) and Schein and van Maanen’s (2013) career
anchor theory and categories from a religious point of view.
The study also identified the personal integrity, motivation and goal orientation, impact
and self-determination themes. Impact and self-determination are two of the four facets
of psychological empowerment (Spreitzer 1995). Personal integrity, along with
motivation and goal orientation are components of psychological empowerment, while
happiness is a characteristic of job satisfaction. The findings imply that career anchors
cannot be separated from empowerment and job satisfaction. Empowerment was
necessary to ensure that the career anchors held by academics guide them to achieve job
satisfaction. It is speculated that, on the one hand, academics interpreted the four facets
of psychological empowerment and the concept of talents-based, needs-based and
values-based anchors as being similar to each other. On the other hand, whether the
emerging themes would be part of either of the two constructs, or the existing four
facets would be treated as less important aspects, still needs to be investigated further by
conducting more empirical studies, particularly with academics at public universities as
the research subjects.
It is surprising that organisations are still expected to play an active role in the
development of academic careers through career arrangement, organisational structure
and financial support and reward. Academics have the perception that the universities
where they work give less attention and support to these matters. If academics have the
support of their institutions (e.g., up-to-date journals, books, computer databases), they
are more responsible for the work and will feel more empowered. This suggests that
educational background, work experience and academic rank (see Table 5.4, Chapter
220
Five) are not significant in supporting academic careers. Whether this is due to the
inherent characteristics of civil servants, – for example, the perception that all matters
relating to work are the responsibility of the government still requires further study.
In the meantime, leaders need to encourage academics to explore their talents, needs
and values, and develop them through teaching and research to achieve their own career
goals. The findings proved Schein’s (1978) theory and some other previous studies’
claims (e.g., Levi 2006; Dazinger, Rahman-Moore & Valency 2008) that the needs of
individuals and the work environment need to fit in the context of a progression in one’s
career motivation.
Overall, the findings enhanced the results of the quantitative analysis. The existence of
some new anchors through the merging of two anchors and the separation of one anchor
into two, and the identification of a number of themes, including organisational factors,
confirmed the prediction of the role of career anchors in relation to psychological
empowerment and job satisfaction. The results of the qualitative analysis, therefore,
deepen the understanding of career anchors from academics’ perceptions as civil
servants in the context of Indonesian public universities in particular. Thus, academics
should recognise their talents, needs and values and their dominant career anchors to
develop future career paths. At the same time, universities should support academics in
such ways as a reasonable teaching workload (not overload), an equal opportunity to
attend training and conferences, the availability of laboratory equipment for teaching
and research, and the accommodation of multiple career directions. In relation to
academics’ job performance, human resources committees should conduct job analysis
carefully so that recruitment meets the universities’ needs.
6.5 Indonesian cultural values Indonesia comprises over 300 ethnics groups, and every ethnicity, such as Javanese,
Bataknese, Bengkulunese, or Balinese, has its own unique culture (Magnis-Suseno
1996; Moffatt 2012). Diversity can be in the form of, for example, language, folk songs,
attitude, behaviours, religious faiths, food/clothing/traditional dance, sexuality,
ceremonial events and customs (Moffatt 2012). Indonesian society is known for
hospitality, family-oriented values and a desire to avoid conflict, respect for elders and

221
superiors, shaking hands in greeting while bowing, no use of the left hand in any kinds
of activities in public and the importance of academic and professional titles for status
(Moffat 2012). Some other traditions are associated with Islamic practices, such as no
pork at restaurants, and not wearing sandals or shoes in the home. Some other cultures
have adopted aspects of the Javanese culture (Indonesia’s largest ethnic group). Magnis-
Suseno (1996) and the majority of Indonesians claimed that Javanese culture represents
Indonesia as a whole. Aspects include, for example, no negative emotion or anger in
public, no criticisms of leaders, hierarchical social structures, smiling even in a situation
of anger or negative feedback and a strong reluctance to say ‘no’ even when one
disagrees with something (Moffat 2012).
While culture can be defined as customs and rights (Schein 2010) or policies, practices
and principles (Cooke 1995) plus beliefs (Handy 1993), some studies classify cultures
in several dimensions. A number of studies on the culture of Indonesia by several
researchers (e.g., Magnis-Suseno 1997; Gupta et al. 2002; Giles 2003; House et al.
2004; Pekerti & Sendjaya 2010; Sihombing 2013) have come to a generally accepted
conclusion that Indonesians like to work according to bergotong royong, or ‘mutual
assistance among members of a community’ (Pekerti & Sendjaya 2010, p. 761), and to
show mutual respect, and with a high degree of societal tolerance (Magnis-Suseno
1997). These three aspects reflect the collectivism dimension developed by Hofstede
(1980).
The cultural orientation of Indonesian society is toward group and family collectivism,
as opposed to the individualism dimension that was ranked 47 out of 53 countries
sampled. Hofstede (1980) explained that hierarchical structures are strong where leaders
have the power to make a final decision, and to control subordinates. Moreover,
Indonesians, both male and female, are willing to offer support to strangers, particularly
older people, compared to, for example, the British, who show higher in individualism,
and among whom females are more likely than males to offer support (Giles 2003).
Recent studies have shown that Indonesian culture is slowly changing, especially for
those who living in big cities. Along with changes in the social and economic
environment, culture also alters. Religious fanaticism, for example, especially among

222
the majority group, is becoming more common (Rahayu 2012). Tolerance of differences
is beginning to decline, and militants and anarchists are becoming more prevalent.
There is growing feeling that leaders should be Muslim (Giles 2010), and recently the
wearing of the hijab (headscarf) during all activities outside the home (such as, sport or
education) has become more common for female Muslims. In addition to the traditional
cultural values that attach to society and still apply to people other than those living in
large cities, Sihombing (2013, p. 101) found seven dimensions of culture among
respondents in large cities (Jakarta, Bandung, Semarang and Surabaya): ‘mutual
assistance (gotong royong), democracy (demokrasi), religion (agama), harmony
(harmoni), hospitality (ramah tamah), religious fanatism (fanatisme keagamaan) and
individualism (individualisme). A shift from the collective to individualistic values has
become a trend in countries in Asia (Zhang & Shavitt cited by Hawkins &
Mothersbaugh 2010), such as Japan and China are currently oriented to individualism
and materialism (Faure 2012).
Although Hofstede (1980) denied that the individual values established the national
values, the cultural diversity of individual values – which reflects that of the Indonesian
nation – ‘… makes studies of Indonesian culture an enormous task’ (Pekerti and
Sendjaya 2010, p. 760), ‘an extremely vast and complex…jigsaw puzzle’ (Dewi
Fortuna Anwar’s words in Epstein 2010, p. 1). It has been recognised that there are
cultural differences between organisations (e.g., Feldman & Bolino 2000), between
countries (e.g., Sower & Sower 2005; Schein 2006a) and between West and East (e.g.,
Hofstede 1980; Pekerti & Sendjaya 2010). The identification of spiritual values, for
instance, showed how the majority of Muslims in Indonesia affected their career
decision. Hence, culture should be considered when a study employs a theory
constructed in a different culture to that targeted in the research.
6.6 Suggested research model
The current study uncovered novel findings. In addition to the findings of two new
anchors in the quantitative findings, several new themes emerged from the qualitative
findings. Thus, the current study proposes a modified research model. The model
merges the revised model for the quantitative study and a new model for the qualitative
study shown in Figure 6.1.

223
Influ
ence
s Va
riabl
eCo
nsist
s of
Cons
ider
ing
varia
bles
Bord
er b
etwe
en in
tern
al a
nd e
xter
nal c
aree
rCo
nstr
uct
Prop
osed
new
anc
hors
Fig
ure
6.1:
Mod
ified
rese
arch
fram
ewor
k of
the
rela
tions
hips
bet
ween
car
eer a
ncho
rs, p
sych
olog
ical
em
powe
rmen
t and
job
satis
fact
ion
Inte
rna
l ca
reer
ori
enta
tion
Car
eer
anch
ors
Psyc
holo
gica
l em
pow
erm
ent
Job
satis
fact
ion
Pers
onal
inte
grat
ion
Mot
ivat
ion
and
goal
orien
tatio
n
Hap
pine
ss
Mea
ning
Impa
ct
Self-
dete
rmin
atio
n
Com
pete
nce
Man
ager
ial
com
pete
nce
Run
ning
a
busin
ess
Aca
dem
ic fr
eedo
man
d cr
eativ
ity
Wor
k-fa
mily
lif
esty
le
Flex
ible
wor
king
sc
hedu
le
Econ
omicsecurity
Skill
orie
ntat
ion
Geo
grap
hica
lstability
Aca
dem
ic
atm
osph
ere
Serv
ice
Pure
cha
lleng
e
Tale
nts-
base
d
Nee
ds-
base
d
Valu
es-
base
d
Fina
ncial
su
ppor
t and
re
war
d
Care
er
arra
ngem
ent
Org
anisa
tiona
lfa
ctor
s
Spiri
tual
valu
es
Inta
ngib
le re
cogn
ition
External career
Org
anist
aiona
l st
ruct
ure
Job
satis
fact
ion

224
Figure 6.1 presents a proposed research model for the relationships between career
anchors, psychological empowerment and job satisfaction, linking organisational
factors and cultural values. Five original anchor categories remain in the analysis,
while six new anchors have emerged from the interviews. Schein (2006a) and Schein
and van Maanen (2013) determined that Schein’s interview protocol could identify
new anchor categories from the respondents. The work dedication and balanced-
lifestyle anchors were dropped from the model since the interviews clearly uncovered
skill orientation, geographical stability, work-family lifestyle and academic freedom
and creativity as more appropriate anchors. According to Schein (2006a) career
anchors found through interviews are stronger than those identified with a
questionnaire. The interview explores phenomena in-depth, while the questionnaire
is forced-choice questions. In the same way, commitment-based anchors were also
eliminated. Two new themes emerged (spiritual values and intangible recognition)
from the open-ended questions, which were considered for proposal as new anchors.
Hence, considering that the two themes are strongly significant factors reflecting
Indonesian behaviours, the current study suggests including them in the model,
although they still need to be supported by further research in other contexts.
All four facets of psychological empowerment are clearly assessed, and the two
themes that emerged from the open-ended questions are also included in the model.
Based on Quinn and Spreitzer’s (1997) concept, Collins (2007, p. 25) stated that
‘empowerment involves employees taking the initiative to respond autonomously to
job related challenges with the encouragement and support of management’. In
addition to the two new facets, organisational factors seem to be involved and
influenced in the empowerment process. Like the career anchor categories, the
themes need further research from the literature.
Three items of the general job satisfaction measured in the scale need some more
indicators related to the task-role. The happiness theme was shown in the absence of
indicators to measure the feelings of pleasure when one completes tasks. Happiness,
therefore, is added to the job satisfaction construct.
As in the job satisfaction approaches, in which organisational factors and culture are
included in the external factors (Levi 2006), the current study also grouped

225
organisational factors and culture into the external career factors. The factors are
included because they are the most significant in their effect on respondents’ career
decisions. This shows how Indonesian academics as civil servants view their career
development in their institutions. Organisational factors can play roles as mediators
or moderators in the relationship of the three constructs.
As discussed, cultural values were revealed in the analysis and should be expressed.
From a research standpoint, cross-cultural values need an in-depth examination,
especially in Indonesia where there are huge local subcultures. Cultural studies can
be measured in the individual culture level which is when they are combined in some
way to represent a national culture level. To characterise more precisely a pattern of
cultural influences in the relationships, they need to be incorporated in the measures
and are considered as an external factors.
6.7 Implications of the current study
6.7.1 Implications for theory
The present findings extend the concept of career anchors introduced by Schein
(1978, 1990) and a study of psychological empowerment by Spreitzer (1995), thus
introducing psychological empowerment into the relationship between career
anchors and job satisfaction. A review of the literature showed that only a handful of
studies have investigated career anchors and job outcomes, and there has been no
study with respect to the three variables from academics’ perceptions in the public
higher education sector. The results of this study, therefore, extend the studies on the
three variables from the viewpoint of academics as civil servants in the context of
public higher education, especially in Indonesia, and in Southeast Asia in general
where previous studies used managers, employees and students (not academics) in
private sectors or service organisations (not public organisations).
The current study proposed work dedication, balanced-lifestyle, academic freedom
and creativity, work-family lifestyle, flexible working schedule, academic atmosphere
and running a business as new career anchor categories. These confirm Schein’s
(1990, 2006a), and Schein and van Maanen’s (2013) notion that if none of the
original anchors could be fitted to the emerging themes, new anchors could be

226
formed. By contrast, the findings also question Schein’s theory that individuals do
not change their anchors, instead changing their career to adapt to circumstances.
This implies that these proposed new anchors should be studied empirically to
further confirm the suggested categories.
The findings that the economic security and service anchors were the dominant
career anchors in both the quantitative and qualitative studies in the current research
reinforced one another and supported Schein’s (1990, 2006a) theory on the preferred
career anchor of civil servants. On the one hand, the security/stability anchor (called
economic security in the current study) is attractive to civil service and government
employees. On the other hand, civil servants seek primarily the anchor of service.
This also implies that what has been proposed by Schein more than 30 years ago
since he and DeLong (1982) broke down the security/stability anchor can still be
applied now, especially to academics in Indonesia, but also in developing countries
in general. It reiterates further the implication of Schein’s claim that his career
anchor concept was applicable anywhere and in any condition and situation.
The finding of multiple career anchors and the merging of the autonomy and lifestyle
anchors into a new category that reflected needs-based anchors also supported
Schein’s (2006a, p. 35) theory that this reflected a variety of career situations.
Individuals were likely to fill talents-based first, followed by needs-based and
values-based anchors. This takes into account Feldman and Bolino’s (1996)
proposition that individuals have at least two anchors and their recategorisation of
career anchors into talents-based, needs-based and values-based anchors. This
suggests that more empirical studies are needed to conduct an in-depth analysis of
these anchors. Moreover, Feldman and Bolino’s (1996) premise that individuals’
anchors could be drawn on an octagonal diagram based on their relationship pairs did
not work in the current study. This may be due either to the fact that the current study
only found the complementary relationships or that the diagram has some conditional
aspects. An appropriate statistical computation should be considered. This could
suggest that further studies are needed in regards to the diagram.
The direct effects on the career anchor categories and job satisfaction relationships
showed a moderate contribution both in a positive and negative direction. The
227
average effect was considered medium-sized. Only work dedication, managerial
competence, pure challenge, service and balanced-lifestyle predicted job satisfaction
and the work dedication anchor was the most substantial predictor of job satisfaction.
The findings – particularly the comments on organisational factors through the
interviews – suggest a lack of attention to the internal motivation driver in
individuals’ career advancement. There is a need to match individuals’ needs with
organisational needs (Schein 2006a). It also implies that anchors have not been found
that can ‘fit’ (but not ‘match’) the working environment (Carless, 2004; Ding & Lin,
2006; Schein, 2006a; Collins, 2007).
Furthermore, a sense of meaningful work (meaning facet) and control over the work
that affects the institutions (impact facet) have a low direct effect on happiness in the
workplace (job satisfaction), while capability (competence facet) and autonomy (self-
determination facet) do not necessarily satisfy academics in improving their careers.
The insignificance of competence and self-determination show that they may be
ambiguous facets associated with job satisfaction. By contrast, flexibility at work,
autonomy and family life are not a priority to achieve job satisfaction, although
academics view their work as important. In the case of this study, if conditions are
imposed that constrain work practice, this will lower job satisfaction. In relation to
mediation and moderation, the indirect effects contributed less than the direct effects.
The results suggested that psychological empowerment did not play a significant role
in determining job satisfaction. The inconsistency of each career anchor category
might be caused by the degree of job satisfaction or the combination of categories. It
is also possible that job satisfaction may not be the first outcome of psychological
empowerment, as claimed by Spreitzer (1995). The current study confirms Feldman
and Bolino’s (2000) and Schein and van Maanen’s (2013) by emphasising that there
are other more suitable outcomes (Feldman & Bolino 2000) for these relationships.
Another implication shows that two facets (competence and self-determination) that
were not mediators and one facet (meaning) that was not a moderator could be better
matched with other potential career outcomes, such as organisational commitment,
organisational citizenship behaviour, job performance, occupational stress and job
strain. The presence of a negative relationship and interactions could then be due to
the influence of other job outcomes.

228
Thus, it can be implied that while academics assume meaning, impact, competence
and self-determination are of central importance, in fact they are not significant in
reaching their career goals. The academics in the current study considered them less
valuable as factors to achieve their career goals. However, these implications do not
mean that psychological empowerment can be ignored, especially when its reliability
and validity has been shown to be high. It is assumed that there are other factors
acting as drivers to these predictive relationships, as there were a number of new
factors identified through the interviews. It is imperative to replicate this study
longitudinally to get a more grounded understanding.
6.5.2 Implications for methodology
Satisfactory results with high scores on the construct validity and reliabilities of the
short form of career anchor inventory, the psychological empowerment scale and the
general job satisfaction scale have two implications. First, they show that the back
and forward translation strategy was appropriate. Researchers can use this method,
especially when the scales are applied to cultures in which English is used as a
second language. Second, the construct validity examination through exploratory
factor analysis resulted in two new cluster constructs (work dedication and balanced-
lifestyle). This shows that how government employees interpreted the scale may
differ from how private sector employees perceived the constructs. The findings
suggest that research instruments developed in western cultures, especially in the
U.S., and generally derived from research subjects in the private sector, may be
applicable in some way to Indonesian academics at public higher education
institutions. The scales, however, need some refinement when considering cultural
issues.
The current study augments the data collection methods (survey questionnaire and
interview) that were suggested by Schein (1990), and Feldman and Bolino (1993). In
addition to the two methods, an online survey method was employed to collect data
for the current study. In particular, a web-based survey was used in the hope of
involving all lecturers at all universities throughout Indonesia, but it did not run
smoothly due to the low availability of internet connectivity. Consequently, this
method was treated as an alternative method. It is suggested that other researchers

229
who want to use this method should first observe the use of the internet and the
internet connection itself in prospective research locations.
The results of mediation and moderation testing showed a clearer picture of the role
of career anchors, psychological empowerment and job satisfaction. Although
psychological empowerment contributed only weakly to its relationship with the
other two variables, the four facets of psychological empowerment not only played
roles as mediators, but also as moderators. Career anchors are also assumed to have
an impact on career outcomes other than job satisfaction. The tests of the mediator
and moderator provide an extension method to research career anchors because the
majority of researchers only examine the dominance of an individual’s particular
career anchor.
The interview method gave some valuable results. Specifically, it found some
additional anchor categories and themes on career anchor, psychological
empowerment and job satisfaction constructs that supported the quantitative analysis.
These rich findings contributed to a more thorough understanding of Indonesian
academics’ career goals. Employing the interview method along with the self-
administrated survey as a mixed-methods strategy could be adopted by other studies
to capture a broader understanding of the intended constructs.
The current study also used two open-ended questions that were added to the
questionnaire. The inclusion of the open-ended questions on the questionnaire was
considered helpful to fill the gaps in the statistical analysis. It also found some
valuable information that was not covered in the interviews. It is suggested that other
researchers can use this method to explore further information, particularly in
individuals who are introverts, and in cultures where individuals rarely express their
feelings or thoughts, let alone criticise or express ideas openly in the institutions
where they work (or to a third party, such as researchers) (Pekerti & Sendjaya 2010).
6.5.3 Implications for practice
The findings in this study provided significant implications for managerial practices
in the context of public higher education institutions, both from academics as public
servants and universities as the institutions. The economic security anchor category

230
emerged as a dominant career anchor among academics; this was unexpected.
Consistent with the characteristics of the anchor category that reflected the
characteristics of academic work (e.g., lifelong employment, monthly salary and
increases based on the length of employment, regular promotion, seniority-based
activities, pension package, steady job performance), academics are more concerned
with meeting their own need to feel safe and secure instead of serving the
community, which is a core value of the public sector. The service category is
axiomatic for them. In terms of the groups-based anchors, needs-based anchors
(economic security, autonomy and lifestyle) also dominated their career choices.
This implies that institutions should pay more attention to the dominant career
anchors of academics in developing policies and programs. Because there is a
guarantee of monthly salary, pension scheme and employment status, the policies
and programs might be concerned with improving academics’ performance in the
workplace. An appropriate reward policy and competitive research grants, for
instance, could be expected to improve academic performance. Institutions should
also be expected to develop a flexible career policy instead of the existing linear
career progression to meet the needs of work and personal lives. In addition to the
present new criteria of job performance evaluation indicators (called Penilaian
Prestasi Kerja = Work performance appraisal) – service orientation, discipline,
integrity, leadership, commitment and teamwork –, the task-based criteria are
urgently needed. The career satisfaction scale developed by Greenhause,
Parasuraman and Womley (1990) and the employee performance scale that was
constructed based on basic core tasks and developed by Tsui, et al. (1997) used as a
guide to revise the performance appraisal. It is believed that this will be able to
change the mindset of economic security-anchored academics to be more willing to
explore their talents, competencies and values to compete in the workplace.
Academics with this anchor may find it difficult to deal with present and future work-
life situations in which many institutions or organisations, including those in the
public sector, are not going to offer a lifelong employment package.
At the same time, to accommodate the service anchor, the central government or
persons who are in charge of policymaking could consider some academic activities
that can improve the job performance of service-anchored people. Paid study leave

231
for a semester, as is done in many universities in developed countries, for example,
could be adopted. The present policy’s 12-days off in a year are meaningless to
academics.
The emergence of multiple career anchors reflects Indonesian academics’ career
situations, as they face changes in the academic world due to sociotechnological
trends. This can be interpreted as a lack of institutional support for academics,
uninteresting academic jobs and unclear organisational objectives, so that academics
feel the need to look for a career that matches their talents-based, needs-based and
values-based anchors. It is suggested that academics could look for a suitable
position within their institutions and improve employability.
Academic freedom and creativity ranked third in the dominant career anchor pattern.
Human resource managers should pay attention to and maximise academics’ anchors
so that they can apply their anchors to accelerate the achievement of both their own
career goals and the institutions’ goals. The university management can do things
like distribution of teaching load based on the standard set up by the central
government, assign appropriate subjects to teach, offer travel grants to support
academic interests, such as conferences and paid sabbatical leave as mentioned
earlier.
The present findings suggest that academics feel more satisfied if they can perform
academic tasks optimally (i.e., teaching, research and community service) in
accordance with the current institution based on their specialisation (work
dedication), balancing work, career and family lives (balanced-lifestyle), solving
tough problems (pure challenge), holding structural positions and other
administrative work (managerial competence) and serving the community (service).
On the other hand, the level of job satisfaction did not increase significantly when
the prediction and interaction roles of feelings of meaningful work, impact on
outcome, self-determination and competence were imposed. Economic security and
entrepreneurial creativity were excluded from the model due to the insignificant
results. It is also argued that the dependence of academics on the institutions in
improving their careers is still high. This implies that academics need to examine
their competencies, motives and values to evaluate whether they have fulfilled the
232
responsibility as academics. Using academics’ job descriptions and the three pillars
of higher education (teaching, research and community service) can help them find
out what they want from the work.
Overall, it can be said that the internal career orientation has not been a major driver
in career development. This study has also revealed the absence of the service career
anchor as a preferred anchor for public servants, and weak relationships in the
indirect and interaction testing. These suggest that there are other external factors
that significantly affect these relationships. The qualitative findings pointed to the
organisational factor as an external career that was most influential. It is assumed
that factors, such as a linear career policy, a lack of communication and transparency
and teaching overload discourage academics from maximising their career anchors.
Another speculation is that financial matters are related to the use of funding for
academic activities, such as support for research and conferences, not money for
basic needs.
In other words, a linear career path policy, a single organisation, lifelong
employment and a pyramid career advancement model may contribute significantly
to academics’ career decisions and job satisfaction. Institutions, instead of the central
government, need to develop policies that psychologically motivate and empower
academics in pursuing their careers, and should become more academic market-
oriented, such as having specialisations across areas of expertise, and various career
roadmaps with multidirectional career paths. Institutions can support individual
academics as they compete for research grants to enhance feelings of competence
through teachings and publications, and to involve academics in designing teaching
and research programs, for instance, and other meaningful empowerment programs
and interventions. Involving academics in making decisions that could increase the
quality of academics themselves has been found by Sukirno and Siengthai (2011) to
significantly influence academics’ performance.
Summary This chapter presented the discussions and implications of the current study. It
summarised, discussed and drew conclusions from the findings on the construction
of the career anchor inventory, the psychological empowerment scale and the job

233
satisfaction scale. The emergence of the two merged anchors was presented. The
single dominant career anchors and the multiple groups-based anchors followed by
the hypothesis testing results were also described. The chapter summarised the
results of testing the hypotheses concerning both direct and indirect effects of
mediating and moderating variables of psychological empowerment in predicting
relationships between career anchors and job satisfaction. It then continued with a
discussion of the results. The chapter also presented a proposed model based the
findings of the quantitative and qualitative analyses. In addition to the internal career
motivation model, the model also showed the two external factors of organisational
factors and cultural values that emerged during the data analysis. This was followed
by a discussion of the implications of the qualitative findings. The chapter concluded
by discussing the theoretical, methodological and practical implications of the
current study.
The next chapter will discuss the limitations of the study. It will also present a
possible direction for future study.

234
Chapter 7
Limitations and Directions for Future Research
7.1 Introduction Chapter One, besides presenting the aim of the study, described the research
questions and the significance of the study. The chapter also discussed the career
policy of academics in Indonesia, including the Indonesian higher education systems.
Chapter Two discussed the conceptual framework of the study and reviewed the
literature regarding to the career anchors theory, the psychological empowerment
concept and their relation to of satisfaction. It presented the model of the study and
proposed hypotheses. Chapter Three dealt with the study’s research methodology,
discussing it from a mixed-methods approach. The quantitative and qualitative
approaches were highlighted. It then discussed the research design, consisting of
survey questionnaire, interview, sampling and sample size. The language issues
concerning the translated research instruments were outlined. The pilot study results
were reported. The statistical tools and the qualitative analysis method used in the
current study were presented. Chapter Four presented the quantitative analysis
findings. The chapter described the rate of return of questionnaires and information
from the biographical data collected. It reported the results of the validity and
reliability testings. The dominant career anchors and a series of statistical tests were
discussed. The chapter then interpreted and discussed the results. Chapter Five
analysed the qualitative findings. It identified the respondents’ dominant career
anchors from the interview results and showed the direct quotations related to the
dominant anchors. It also discussed the themes that emerged from the open-ended
questions. The integration of the quantitative and qualitative findings was explained.
Chapter Six drew conclusions from the findings and discussed the contributions and
the implications for theory, methodology and practice.
Chapter Seven is the last chapter of the current study covering only two Sub-
sections. First, the chapter discusses the limitations of the study. Second, the chapter
makes recommendations for future research based on the present findings to address
the limitation.

235
7.2 Limitations of the study While the current study has been designed carefully, it has some unavoidable
limitations. At the time of the data collection stage (October 2011 to January 2012),
the application of the higher education legislation amendment (after the legislation of
state-owned entity was abolished in 2005) was delayed. The amendment currently
has a valid legal basis but its implementation is still being discussed at the central
government level. At the same time, the existing career promotion policy was being
reformulated by the Directorate General of Higher Education. As a consequence,
some universities currently implement the ‘traditional’ legislation in which all acts
are controlled by the central government and some still use the state-owned legal
entity legislation, in which the implementation is based on the autonomy principle
(or decentralisation system) (Supriyanto & Suparjo 2010). This condition may affect
academics in performing academic tasks, and is assumed to have had an indirect
impact on both the questionnaire and the interview surveys. It is believed that the two
open-ended questions could minimise the limitations.
The current study was exploratory in nature employing a cross-sectional study, at a
given point in time. It used a group of academic samples with certain criteria set out
for the current study at public higher education institutions in Indonesia. The results,
therefore, cannot be generalised to a wider community of education-sector contexts.
The use of concurrent-embedded mixed-methods has issues concerning the unequal
sample size and findings. The study recruited larger samples for the quantitative
study and fewer for the qualitative. However, because the two methods have
different aims – the quantitative method is for a generalisation of findings and the
qualitative method explores an in-depth phenomena – the present researcher has
strong confidence in the results, as argued by Creswell and Plano Clark (2011, p.
183). In addition, the present findings were discussed and referenced to previous
studies.
In conjunction with the web-based survey, including referral emails and the response
rate issue, internet speed and access in some geographical areas were moderately
slow or very slow. Most of the prospective respondents, therefore, were not able to
download the questionnaire and submit their answers. The slow connection was

236
assumed to discourage respondents to take part in the online survey. Consequently,
its response rate was considered low (see Table 4.1, Chapter Four). However, the
limitation was overcome by the paper-based strategy in which it received a high
response rate (see Table 4.1, Chapter Four). Overall, the rate of return for the current
study was acceptable to carry out the analysis.
The internet samples using random sampling are assumed to indicate the
characteristics of respondents, such as that they tended to be younger academics who
were more familiar with the internet compared to their older counterparts, and were
more critical towards any policies or decisions. The strategy was considered one of
the effective ways to increase the response rate, and any biases they introduced were
outside the researcher’s control. To verify the data, the researcher conducted a
univariate analysis to find the trend of the data and test the significance of
demographic data. All data were significant enough to carry out further analysis. In
addition, the selected demographic variables that were treated as control variables in
statistical analysis helped control the demographic issue.
The sizes of the university may also be of concern relative to the opportunity of
academics to develop their careers. The respondents were selected from small,
medium-sized and large universities. Compared to medium-sized and small
institutions, large universities usually give more autonomy to their academics in
managing careers, but have a more competitive academic environment. Medium-
sized and small universities, however, give more room for their academics to explore
and exercise their talents and values to reach their goals. This condition was assumed
to influence respondents when they filled out the questionnaires or when they were
interviewed. Because the size of the university is out of the present researcher’s
control, it is considered to be a limitation of the study. To minimise the bias, a
multistage area cluster sampling technique was applied to the current study for the
universities sampling.
Schein’s interview protocol that was adopted in the study only investigated
academics’ dominant career anchors. Although several themes referred to the
dimensions of psychological empowerment (e.g., personal integrity) and job

237
satisfaction (e.g., happiness), it is recommended for future studies to develop
questions to measure the two constructs in conjunction with the interview protocol.
The current study interviewed 20 academics for the qualitative analysis. Although
the previous studies also used small number of samples, between 10 and 25
participants (e.g., Suutari & Taka 2004; Chang et al. 2011), the sample size of the
current study is considered small compared to the total number of academics in all
public universities in Indonesia (±70,000 people). There are some constraints to
collecting the data to some areas. This limitation can be accepted because the state
universities in Indonesia are spread over a wide geographical area and transport to
some locations is limited and expensive. The limited number of samples has been
accommodated by providing the open-ended questions on the survey questionnaires
that were distributed to all universities using the online survey to capture more
responses.
7.3 Recommendations for further study Exploratory factor analysis found two new anchors: work dedication and balanced-
lifestyle. It is suggested that follow-up studies on these findings be carried out and to
analyse their reliability and validity for those who want to use these anchors.
It has been verified that the majority of the respondents tended to hold multiple
career orientations. Multiple career anchors have been evident through the findings
of both the quantitative and qualitative analysis. Previous studies also recognised the
existence of multiple anchors (e.g., Marshall & Bonner 2003; Smith 2005; Ituma &
Simpson 2007), but no further information, such as how the anchors were measured
and what the combination of the anchors were, was found. An in-depth research on
multiple career anchors is, therefore, recommended, using a longitudinal study
design.
The octagonal diagram cannot be created in the current study. It is because all career
anchor relationship pairs were grouped as complementary career anchors, and no
pairs were revealed as mutually exclusive anchors. Because the pairing used
Pearson’s correlation matrix, it is suggested to use other statistical analyses for future
studies to pair the anchors.

238
The investigation of career anchors in predicting psychological empowerment and
job satisfaction in the current study was the first study conducted. Further, the results
for the main effects, the mediating effects and the moderating effects yielded weak
correlations. It is premature to conclude that career anchors have little influence on
academics’ career development even though the qualitative analysis determined the
strong influence of organisational factors. The present researcher believes that there
are some other internal motivations that have not been explored. It, therefore, is
imperative to replicate this research in the future using a larger sample and more
universities involved to have a greater understanding of the relationships.
The quantitative analysis of the current study that used seven anchors, including the
two new anchors from the factor analysis results, resulted in statistically low
contributions for the relationships between career anchors, psychological
empowerment and job satisfaction. It is suggested that future research use nine
anchor categories, as in the original source developed by Igbaria and Baroudi (1993),
and the results can be compared with the present findings. In relation to the
suggestion, confirmatory factor analysis could be considered to employ for the
validity check.
The influence of cultural values in the current study framework has been discussed.
As Feldman and Bolino (2000) stated that each organisation has its own culture.
Future research is, therefore, suggested to examine the degree of cultural effects on
the career anchors, psychological empowerment and job satisfaction relationships. In
addition to Hofstede’s (1980) typology, some other references can be used, such as
Schein’s (2010) pattern of shared basic assumptions, Cooke’s examination of
organisations’ norms and goals (Cooke & Lafferty 1995), and Handy’s model
explaining the importance of understanding needs and employees’ motivation within
them (Handy, 1993). In the proposed model, cultural values can be tested as mediator
or moderator.
Thematic analysis produced five new dominant career anchors: academic freedom
and creativity, work-family lifestyle, flexible working schedule, academic atmosphere
and running a business. The study also identified the spiritual values and intangible
recognition themes that were considered to be included in the anchor categories. It
239
seems imperative to replicate the study, and to follow up the new scale with a
validity and reliability analysis.
The findings of the personal integrity and motivation and goal orientation themes
were reported as components of psychological empowerment, while happiness was a
component of job satisfaction. Whether these themes are parts of the two constructs
or are factors identified under other constructs that have not been investigated, more
empirical studies are needed to clarify this ambiguity.
Job satisfaction is the only job outcome that was analysed in the current study. It is
suggested to include other job outcomes, such as organisational commitment,
organisational citizenship behaviours, job stress, strain, job effectiveness,
absenteeism, and job performance, to determine how they are influenced by career
anchors.
The current study was confined to 11 out of 34 provinces in Indonesia. It is
suggested that future studies replicate this study in universities not included in the
current study. Because each province has at least two public higher education
institutions with diverse characteristics, universities and academics from every
province and geographical location should be represented. Future studies should also
consider a longitudinal research design to expand the concept of career anchors from
the academic perspective at public higher education institutions. This would enable
better generalisation of the findings. It is also recommended academics in the private
higher education sector to be examined as a comparison, to enable a conclusion that
is more meaningful and gives a more comprehensive understanding of career
anchors.
Samples were chosen based on university sizes (small, medium-sized and large)
along with the geographical zones (western, central & eastern regions). It is noted
that each of the university sizes and regions has different characteristics. Future
research examines the cluster of the university sizes and geographical locations, and
compares their results. The results can be used to suggest refinements of career
policy.

240
The current study gives a large amount of coverage to the quantitative method while
the qualitative method is limited to some extent. The qualitative findings through the
interviews and the open-ended questions, however, uncovered factors that strongly
enhanced the quantitative findings. It is vital to employ these methods for future
research, including interviewing more participants to get an inclusive notion of the
career anchors and psychological empowerment concepts and their impact on
satisfaction from Indonesian academics’ perspectives. It is also suggested to employ
the sequential mixed-methods approach to improve the balance of results between
quantitative and qualitative analysis.
In relation to the small contribution of psychological empowerment in predicting the
relationships between career anchors and job satisfaction, the current study assumed
that there is a possibility of psychological empowerment that is not appropriate as a
mediator or moderator. It is, therefore, suggested that future research examine
psychological empowerment as a predictor and career anchors as moderators and
mediators in predicting job satisfaction, and/or between demographic variables and
job satisfaction in the context of Indonesian public universities. Using more
attitudinal outcomes is recommended.
The influence of demographic characteristics was not examined in the research
model in this study. Some selected demographic, variables including gender,
education, age, institution size and experiences, however, were treated as control
variables. Previous studies revealed that selected demographic factors influenced
career anchors, psychological empowerment and job satisfaction. There is a need to
explore demographic factors in the future as moderators, mediators and/or predictors
related to the relationships of career anchors, psychological empowerment and job
satisfaction. It might help in understanding the demographic role in individuals’
career decisions.
A new research model has been introduced based on the present findings to explore
the research topic. The model was an incorporation of the quantitative and qualitative
findings. The results of qualitative analysis found eight new career anchor categories,
and proposed two anchor categories, two facets of psychological empowerment and
one dimension of job satisfaction. The study also determined a strong influence of

241
organisational factors and cultural values on the relationships between career
anchors, psychological empowerment and job satisfaction. It is imperative to
empirically test the proposed model for the future research direction and to employ a
longitudinal study research design.
7.4 Contributions of the study
Previous literature has examined the influence of single dominant career anchors and
the power of psychological empowerment at work in increasing the job satisfaction
level of employees in the public and private sectors. The current study is the first
study to investigate academics’ career anchors and their relation to psychological
empowerment and job satisfaction at Indonesian public universities. The findings
suggested that the single dominant career anchors concept is challenged whereas the
multiple career anchors concept is supported. The relationship pair anchors identified
challenge the octagonal diagram of career anchors. However, the study proposes that
organisational factors are more important than occupational self-concept (i.e., career
anchors) in developing careers causing a moderate role of psychological
empowerment in mediating and moderating the relationships of the other two
constructs. The career anchors will increase or decrease the job satisfaction level
depending on whether a low or high level of psychological empowerment exists. The
study advances the career anchor categories from the single and multiple anchors
perspectives, questioning the stability of career anchors, and extending the
psychological empowerment and job satisfaction dimensions. The results contribute
to the academics’ understanding of the importance of career anchors which create a
match between institutional and individual needs, and to the understanding of why
revising existing career policy might be crucial in improving career outcomes and
efficiency of the public universities, – i.e., focusing on performance-based
evaluation, autonomous curriculum and multidisciplinary career paths. The study
also shows the benefit of using open-ended questions in addition to two types of the
self-administrative surveys and the interview method. Finally, the results support the
notion of cultural influences that have not been fully explored in the current study.

242
References Adamson, SJ, Doherty, N & Viney, C 1998, ‘The meanings of career revisited: implications for theory
and practice’, British Journal of Management, vol. 9, pp. 251-259. Ahmad, S & Owoyemi, MY 2012 ‘The concept of Islamic work ethic: an analysis of some salient
points in the prophetic tradition’, International Journal of Business and Social Science, vol. 3, no. 20, pp. 116-123, viewed 29 August 2013 <http://www.ijbssnet.com/journals/Vol_3_No_20_Special_Issue_October_2012/12.pdf>.
Akbar, E, Saeid, S, Mehdi, A & Saeid, A 2010, ‘Importance of the relationship between psychological empowerment of employees and human respources productivity in government organizations’, European Journal of Economics, Finance and Administrative Sciences, iss. 26, pp. 44-56.
Allen, E & Seaman, C 2007, ‘Likert Scales and Data Analyses’, Quality Progress, pp. 64-65. Allen, P & Bennet, K 2010, PASW Statistics by SPSS: a practical guide version 18.0, Cengage
Learning, Australia. Allred, SB & Ross-Davis, A 2010, ‘The drop-off and pick-up method: an approach to reduce
nonresponse bias in natural resource survey’, Small-scale Forestry, DOI 10.1007/s11842-010-9150-y, viewed 20 January 2011, <http://www.human-dimensions.org/storage/DOPU%20Method%20SSF_2011.pdf>.
Amey, M 1996, ‘The institutional marketplace and faculty attrition’, Though & Action, vol. 12, no. 1, pp. 23-35.
Arneson, H & Egberg, K 2006, ‘Measuring empowerment in working life: a review’, Work, vol. 26, iss. 1, pp. 37-46.
Arnolds, J 1997, Managing careers into 21st century, Paul Chapman Publishing, London. Aronson, J 1994, ‘A pragmatic view of thematic analysis’, vol. 2, No. 1, viewed 5 April 2011,
<http://www.nova.edu/ssss/QR/BackIssues/QR2-1/aronson.html>. Arthur, MB & Rousseau, DM 1996, ‘A career lexicon for the 21st century’, The Academy of
Management Executive, vol. X, no. 4, pp. 28-39. Arthur, MB, Inkson, K & Pringle, JK 1999, ‘The new careers, individual actions and economic
change’, Sage, London, cited in Suutari, V & Taka, M 2004, ‘Career anchors of managers with global careers’, Journal of Management Development, vol. 23, no. 9, pp. 833-847.
Ashforth, BE 1989, ‘The experience of powerlessness in organizations’, Organizational Behavior and Human Decision Processes, vol. 43, pp. 207-242.
Babbie, E 2004, ‘The Practice of Social Research’, Wadsworth/Thomson Learning, Belmont. Bandura, A 1997, ‘Self-efficacy: the exercise of control. Freeman, New York. Barclay, WB 2009, ‘Underlying factor structure of Schein’s career anchor model’, unpublished PhD
dissertation, Brigham Young University, Utah, U.S. Barkin, S, Ryan, G, & Gelberg, L 1999, ‘What clinicians can do to further youth violence primary
prevention: A qualitative study’, Injury Prevention, vol. 5, pp. 53-58, cited in Bernard, HR & Ryan, GW 2010, Analyzing qualitative data: systematic approaches, Sage, California.
Baron, R & Kenny, D 1986, ‘The moderator-mediator variable distinction in social psychological research: conceptual, strategic and statistical consideration’, Journal of Personality and Social Psychology, vol. 51, no. 6, pp. 1176-1182.
Baruch, Y 2004a, Managing careers: theory and practice, Prentice-Hall, Harlow. Baruch, Y 2004b, ‘Transforming career-from linear to multidirectional career paths: organizational and
individual perspective’, Career Development International, vol. 9, no. 1, pp. 58-73. Baruch, Y 2006, ‘Career development in organizations and beyond: balancing traditional and
contemporary viewpoints’, Human Resource Management Review, vol. 16, pp. 125-138. Beach, AJ 1996, ‘Empowerment to the people: creating an atmosphere for growth’, Empowerment in
Organizations, vol. 4, iss. 1, pp. 29–33. Beck, J, La Lopa, JM & Hu, A 2003, ‘Career anchors of hospitality educator’, Journal of Hospitality
and Tourism Educator, vol. 15, no. 4, pp. 6-13. Beck, J & La Lopa, JM 2001, ‘An exploratory application of Schein’s career anchors inventory to hotel
executives operating committee members’, International Journal of Hospitality Management, vol. 20, no. 1, pp. 15-28.

243
Berber, M, Wittekind, A, Grote, G & Staffelbach, B 2009, ‘Exploring types of career orientation: a latent class analysis approach’, Journal of Vocational Behavior, vol. 75, pp. 303-318.
Bernard, HR 1994, Research methods in anthropology: Qualitative and quantitative approaches, 2nd edn, Alta Mira, Walnut Creek.
Bester, CL, Phil, T & Mouton, T 2006, ‘Differences regarding job satisfaction and job involvement of psychologists with different dominant career anchors’, South African Nursing, vol. 29, no. 3, pp. 50-55.
Bishop, K 2000, ‘Understanding employee empowerment in the workplace: exploring the relationship between transformational leadership, employee perceptions of empowerment and key work outcomes’, unpublished PhD thesis, University of Claremont, California.
Baron, RM & Kenny, DA 1986, ‘The Moderator-Mediator Variable Distinction in Social Psychological Research: Conceptual, Strategic, and Statistical Considerations, Journal of Pesonality and Social Psychology, vol. 51, no. 6, pp. 1173-1182.
Bordin, C, Bartram, T & Casimir, G 2007, ‘The antecedents and consequences of psychological empowerment among Singaporean IT employees’, Management Research News, vol. 30, no. 1, pp. 34-46.
Bot, I 2010, European university reform: ten propositions in search of an answer, viewed 13 June 2011, <http://www.eurozine.com/articles/2010-07-01-bot-en.html>.
Bowling, NA, Beehr TA & Lepisto LR 2006, ‘Beyond job satisfaction: a five-year prospective analysis of the dispositional approach to work attitudes’, Journal of Vocational Behavior, vol. 69, pp. 315-330.
Braun, V & Clarke, V 2006, ‘Using thematic analysis in psychology’, Qualitative Research in Psychology, vol. 3, pp. 77-101.
Brislin, RW 1980, ‘Translation and content analysis of oral and written materials’, in Triandis, HC & Berry, JW (eds), Handbook of cross-cultural psychology, Allyn and Bacon, MA, pp. 389-444.
Brown, A & Maydeu-Olivaes, A 2011, ‘Item reponse modelling of forced choice questionnaires’, Educational and Psychological Measurement, vol. 7, no. 3, pp. 460-502.
Bryant, M & Son, JH 2001, ‘Proper human relationships: Korean principals’ leadership style’, paper presented at the Annual meeting of American Educational Research Association, Seattle, the U.S., April 10-14.
Bryman, A 2006, ‘Integrating quantitative and qualitative research: how is it done?’. Qualitative Research, vol. 6, no. 1, pp. 97-113.
Buchori, M & Malik, A 2004, ‘The evolution of higher education in Indonesia’, in Altbach, PG & Umakoshi, T (eds), ‘Asian Universities: historical perspective and contemporary challenges’, Johns Hopkins University Press, the U.S., pp. 253-272.
Budhwar, PS & Baruch, Y 2003, ‘Career management practices in India: an empirical study’, International Journal of Manpower, vol. 24, no. 6, pp. 699-719.
Byrd, L 2001, ‘An examination of the relationships between personality types and career anchors’, unpublished doctoral dissertation, Walden University, the U.S.
Cappellan, T & Janssens, M 2005, ‘Career paths of global managers: towards future research’, Journal of World Business, vol. 40, pp. 348-360.
Carless, SA 2004, ‘Does psychological empowerment mediate the relationship between psychological climate and job satisfaction?’ Journal of Business and Psychology, vol. 18, no. 4, pp. 405-425.
Castro, CB, Perinan, MV & Bueno, JCC 2008, ‘Transformational leadership and followers’ attitudes: the mediating role of psychological empowerment’, International Journal of Human Resource Management, vol. 19, no. 10, pp. 1842-1863.
Cavana, RY, Delahaye, BL & Sekaran U 2001, Applied business research: qualitative and quantitative methods, John Wiley & Sons, Australia.
Celluci, AJ & DeVries, DL 1978, ‘Measuring management satisfaction: a manual for the JSQ technical report II. Center of Creative Leadership, in Conger, JA & Kanungo, RN 1988, ‘The empowerment process: integrating theory and practice’, Academy of Management Review, vol. 13, pp. 471-482.
Chan, B 2013, ‘Alasan PTN harus berbadan hukum’ (Reasons for public university legal entity), Kompas, 25 June 2013, p. 7.
Chan, YH 2003, ‘A nomological network approach to the study of antecedents, moderator, mediator and outcomes of psychological empowerment’, the University of Memphis, Memphis.

244
Chang, CLH, Chen, V, Klein, G & Jiang, JJ 2011, ‘Information system personnel career anchor changes leading to career changes’, European Journal of Information Systems, vol. 20, pp. 103-117.
Chang, IC, Hwang, HG, Liu, CF & Siang, SH 2007, ‘A study of career anchors and job characteristic preferences of IS students’, The Journal of Computer Information Systems, vol. 47, no. 3, pp. 24-34.
Chang, CL & Lin, I 2008, ‘Career anchors, national culture and leave intent of MIS professional in Taiwan’, viewed 16 October 2010, <http://www.pacis-net.org/file/2008/PACIS2008_Camera-Ready_Paper_044.pdf>.
Chang, LC, Shih, CH & Lin, SM 2010, ‘The mediating role of psychological empowerment on job satisfaction and organizational commitment for school health nurses: a cross sectional questionnaire survey’, International Journal of Nursing Studies, vol. 47, pp. 427-433.
Chapman, JR 2009, A partial response to Feldman and Bolino’s critique of Schein’s career anchor theory, Unpublished doctoral thesis, Brigham Young University, Utah, UMI no. 3356502.
Charmaz, K 2006, Constructing grounded theory: a practical guide through qualitative analysis, Sage, London.
Cherrington, DJ 1995, The management of human resource, Prentice-Hall, New Jersey. Chiang, CF & Jang, S 2008, ‘The antecedents and consequences of psychological empowerment: The
case of Taiwan’s hotel companies’, Journal of Hospitality and Tourism Research, vol. 32, no. 1, pp. 40-61
Cho, T & Faerman, SR 2010, ‘An integrative approach to empowerment: construct definition, measurement and validation’, Public Management Review, vol. 12, iss. 1, pp. 33-51.
Choong, YO & Lau, TC 2011, ‘The effect of psychological empowerment on job satisfaction: the development of conceptual framework’, International Journal of Academic Research, vol. 3, no. 2, pp. 873-878.
Churchill, GA 1979, ‘A paradigm for developing better measures of marketing constructs’, Journal of Marketing Research, vol. 16, pp. 64-73.
Coetzee, M 2008, ‘Psychological career resources of working adults: a South African survey’, SA Journal of Industrial Psychology, vol. 34, no. 2, pp. 10-20.
Coetzee, M & Roythorne-Jacobs, H 2007, Career counselling and guidance in the workplace: a manual for career practitioners, Cape Town, Juta, SA.
Coetzee, M, Schneider, D & Tladinyane, R 2007, ‘Organisational commitment and its relation to career anchors’, Southern African Business Review, vol. 11, no. 1, pp. 65-86.
Coetzee, M & Shreuder, D 2011, ‘The relation between career anchors, emotional intelligence and employability satisfaction among workers in the service industry’, Southern African Business Review, vol. 15, no. 3, pp. 76-97.
Collins, MD 2007, ‘Understanding the relationships between leader-member exchange (LMX), psychological empowerment, job satisfaction, and turnover intent in a limited-service restaurant environment’, unpublished PhD dissertation, The Ohio State University, viewed 06 June 2011, <http://etd.ohiolink.edu/send-pdf.cgi/Collins%20Michael.pdf?osu1180519045>.
Cohen, J 1988, Statistical power analysis for the behavioural sciences, 2nd edn, Erlbaum, Hillsdale, NJ. Cohen, J 1992, ‘A power primer’, Psychological Bulletin, vol. 112, pp. 155-159. Cohen, J & Cohen, P 1983, Applied multiple regression/correlation analysis for the behavioral
sciences, 2nd edn, Erlbaum, Hillsdale, NJ. Col, G 2008, ‘The effects of perceived empowerment on employee performance’, Dogus Universitesi
Dergisi, vol. 9, no. 1, pp. 35-49, cited in Uner, S & Turan, S 2010, ‘The construct validity and reliability of the Turkish version of Spreitzer’s psychological empowerment scale’, Public Health, vol. 10, p. 117-124.
Conger, JA & Kanungo, RN 1998, ‘The empowerment process: integrating theory and practice’, Academy of Management Review, vol. 13, pp. 471-482.
Cooke, RA & Lafferty, JC 1995, Organizational culture inventory, Human Synergistic International, Plymouth, MI.
Clandinin, DJ & Connelly, FM 2000, Narrative inquiry: Experience and story in qualitative research, Jossey Bass, San Francisco, CA.

245
Cooper, DR & Emory, CW 1995, Business research methods, Irwin, the U.S. Cooper, PS & Schindler, DR 2006, Business research methods, McGraw-Hill, New York. Couper, M 2011, Web survey methodology: interface design, sampling and statistical inference,
EUSTAT, Donostia, Spain. Creswell, JW 2007, Qualitative inquiry and research design: choosing among five approaches, Sage,
Thousand Oaks. Creswell, JW 2009, Research design: qualitative, quantitative and mixed methods approaches, 3rd edn,
Sage, London. Creswell, JW & Miller, DI 2007, ‘Determining validity in qualitative inquiry’, Theory into Practice,
vol. 39, no. 3, pp. 124-130. Creswell, JW & Plano Clark, VL 2007, Designing and conducting mixed methods research, Sage,
Thousand Oaks. Creswell, JW & Plano Clark, VL 2011, Mixed methods research: designing and conducting, Sage, Los
Angeles. Custodio, LP 2000, ‘Career anchors of Filipino academic executives,’ Catanduanes: College of
Business and Accountancy, viewed 20 April 2011, <http://www.google.com.au/url?sa=t&rct=j&q=&esrc=s&frm=1&source=web&cd=1&cad=rja&ved=0CCkQFjAA&url=http%3A%2F%2Fbusiness.flinders.edu.au%2Fresearch%2Fpapers%2F00-13.doc&ei=525zUsH6HIjUkwXLoQE&usg=AFQjCNHGP3iMDxbl7-NdMbGVilUFbO7svQ&bvm=bv.55819444,d.dGI>.
Dancey, C & Reidy, J 2004, Statistics without Maths for Psychology: using SPSS for Windows, Prentice Hall, London.
Danzinger, N, Rachman-Moore, D & Valency, R 2008, ‘The construct validity of Schein’s career anchors orientation inventory’, Career Development International, vol. 13, no. 1, pp. 7-19.
Danziger, N & Valency, R 2006, ‘Career anchors: distribution and impact on job satisfaction, the Israel case’, Career Development International, vol. 11, no. 4, pp. 293-303.
DeCoster, J 1998, Overview of Factor Analysis, viewed 24 March 2012, <http://www.stat-help.com/factor.pdf>.
Dehkordi, LF, Kamrani, MN, Ardestani, HA & Adbolmanafi, S 2011, ‘Correlation between psychological empowerment with job satisfaction and organizational commitment’, Interdisciplinary Journal of Contemporary Research in Business, vol. 3, no. 7, pp. 808-822.
DeLong, DJ 1982, ‘The career orientation of MBA alumni: a multidimensional model’, in Katz, R (ed) 1982, Career issues in career orientations, Prentice-Hall, New York, pp. 50-64.
Demmke, C 2005, Are civil servants different because they are civil servants?’, European Institute of Public Administration, Luxembourg.
Derr, CB & Laurent, A 1989, ‘The internal and external career: a theoretical and cross-cultural perspective’, in Arthur, MB, Hall, DT & Lawrence, BS (eds), The handbook of career theory, Cambridge University Press, Cambridge.
Dessler, G 2000, Human resource management, Prentice-Hall, New Jersey. Dewettinck, K & van Ameijde, M 2011, ‘Linking leadership empowerment behaviour to employee
attitudes and behavioural intentions’, Personnel Review, vol. 40, no. 3, pp. 284-305. Dhladhla, TJ 2011, ‘The influence of leader behaviour, psychological empowerment, job satisfaction
and organizational commitment on turnover intention’, unpublished Master’s thesis, University of Stellenbosch, South Africa, viewed 26 March 2012, <http://scholar.sun.ac.za/handle/10019.1/6583>.
Directorate General of Higher Education 2003, Higher education long-term strategy 2003-2010, Directorate General of Higher Education, Jakarta.
Dickmann, M & Muller-Camen, M 2006, ‘A typology of international human resource management strategies and process,’ The International Journal of Human Resource Management, vol. 17, no. 4, pp. 580-601.
Dickson, KE & Lorenz, A 2009, ‘Psychological empowerment and job satisfaction of temporary and part-time nonstandard workers: a preliminary investigation’, viewed 09 June 2011, <http://www.ibam.com/pubs/jbam/articles/vol10/no2/JBAM_10_2_2.pdf>.

246
Dimitriades, Z 2005, ‘Employee empowerment in the Greek context’, International Journal of Manpower, vol. 26, no. 1, pp. 80-92.
Dikti 2009, Pedoman operasional penilaian angka kredit kenaikan jabatan fungsional dosen ke Lektor Kepala dan Guru Besar’ Direktorat Pendidikan Tinggi-Kemendiknas, Jakarta.
Direktorat Jenderal Pendidikan Tinggi 2013, Direktorat Jenderal Pendidikan Tinggi, Jakarta, viewed 28 October 2013, <www.dikti.go.id>.
Ding, CG & Lin, CP 2006, ‘Comparing the effects of determinants of turnover intentions between Taiwanese and U.S. hospital employees’, Human Resource Development Quarterly, vol. 17, no. 4, pp. 403-421.
Dorman, C & Zapf, D 2001, ‘Job satisfaction: a meta-analysis of stabilities’, Journal of Organizational Behavior, vol. 22, pp. 483-504.
Dumitrescu, DM 2009, Human resources profile in the virtual organization based on the career anchors of Edgar Schein, Annals of DAAM for 2009 and Proceedings of the 20th International DAAAM Symposium, vol. 20, no. 1, p. 0755.
Duvall, CK 1999, ‘Develop individual freedom to act: empowerment in the knowledge organization’, Participation and Empowerment: An International Journal, vol. 7, iss. 8, pp. 204-212.
Elfering, A, Semmer, NK & Kaelin, W 2000, ‘Stability and change in job satisfaction at the transition from vocation training into real work’, Swiss Journal of Psychology, vol. 59, pp. 256-271.
Epstein, SJ 2010, ‘Introduction: understanding Indonesia’, Journal of Indonesia Social Science and Humanities, vol. 3, pp. 1-9.
European University Institute, 2014, ‘Academic careers by country’, Viewed: 20 February 2014, <http://www.eui.eu>.
Eropean Commission 2008, Higher education governance in Europe, Eurydice, Belgium, DOI 10.2766/29900, viewed 20 February 2014, <http://eacea.ec.europa.eu/education/eurydice/documents/thematic_reports/091EN.pdf>.
Eylon, D & Bamberger, P 2000, ‘Empowerment cognitions and empowerment acts: recognizing the importance of gender’, Group and Organization Management, vol. 25, pp. 354-372.
Farros, A 2011, ‘Dosa terhapus ketika bersusah payah mencari nafkah’, published 21 May 2011, viewed 26 June 2013 <http://rahmawan.com/2011/05/21/hadits-dosa-dihapus-cari-nafkah/>.
Faure, GO 2012, China: new values in a changing society, viewed 2 September 2013, <http://www.ceibs.edu/ase/Documents/EuroChinaForum/faure.htm>
Feldman, DC & Bolino, MC 1996, ‘Career within career: reconceptualising the nature of career anchors and their consequences’, Human Resource Management Review, vol. 6, no. 2, pp. 89-112.
Feldman, DC & Bolino, MC 2000, ‘Career patterns of the self-employed: career motivations and career outcomes’, Journal of Small Business Management, vol. 38, no. 3, pp. 53-67.
Fereday, J & Muir-Cochrane, E 2006, ‘Demonstrating rigor using thematic analysis: a hybrid approach of inductive and deductive coding and theme development’, International Journal of Qualitative Methods, vol. 5, pp. 1-11.
Fiddler, L, Hecht, L, Nelson, EE, Nelson, EN & Ross, J 2011, SPSS for Windows Version 19.0: A Basic Tutorial, viewed 4 April 2012, <http://ssric.org/files/spss_v19.pdf>.
Field, L, Hecht, L. Nelson, EE, Nelson, EN & Ross, J 2011, SPSS for Windows version 19.0: A basic tutorial, viewed 20 August 2012, <http://www.ssric.org/trd/spss19>.
Fricker, RD 2008, ‘Sampling methods for web and e-mail surveys’, in Fielding, NF, Lee, RM & Blank, G (eds) 2008, Online research methods (handbook), DOI <http://dx.doi.org/10.4135/9780857020055>, viewed 13 October 2013 <http://faculty.nps.edu/rdfricke/docs/5123-Fielding-Ch11.pdf>, pp. 195-217.
Fock, H, Chiang, F, Au, KY & Hui, MK 2011, ‘The moderating effect of collectivistic orientation in psychological empowerment and job satisfaction relationship’, International Journal of hospitality Management, vol. 30, pp. 319-328.
Frase, M & Fay, D 2001, ‘Personal initiative: an active performance concept for work in the 21st century’, Research in Organizational Behavior, vol. 23, pp. 133-187.
Frazier PA, Tix AP & Barron KE 2004, ‘Testing moderator and mediator effects in counselling psychology research’, Journal of Counselling Psychology, vol. 51, pp. 115–134.
247
French, DC, Pidada, S & Victor, A 2005, ‘Friendships of Indonesian and United States youth’, International Journal of Behavioural Development, vol. 29, pp. 304-313.
Ganassali, S 2008, ‘The influence of the design of web survey questionnaires on the quality of responses’, Survey Research Methods, vol. 2, no. 1, pp. 21-32.
Gay, LR & Diehl, PL 1996, Research methods for business and management, Simon & Schuste, Pte. Ltd., Singapore.
George, RT & Hancer, M 2004, ‘The impact of selected organizational factors on psychological empowerment of non-supervisory employees working in full-service restaurants’, Journal of Foodservice Business Research, vol. 2, no. 2, pp. 35-47.
Gerber, M, Wittekind, A, Grote, G & Staffelbach, B 2009, ‘Exploring types of career orientation: a latent class analysis approach’, Journal of Vocational Behavior, vol. 75, pp. 303-318.
Ghani, NAA, Raja Hussin, TABS & Jusoff, K 2009, ‘Antecedents of Psychological Empowerment in the Malaysian Private Higher Education Institutions’, International Education Studies, vol. 2, no. 3, pp. 161-165.
Gibbs, G. 2007, Analyzing qualitative data, (The Sage Qualitative Research Kit) Sage, London. Giles, S 2003, ‘Social support provision and cultural values in Indonesia and Britain’, Journal of
Cross-Cultural Psychology, vol. 34, no. X, pp. 1-6. Given, LM (Ed) 2008, The Sage Encyclopedia of Qualitative Research Methods, Sage, Thousand
Oaks, CA, vol. 2, pp. 697-‐698, viewed 20 December 2012, <http://www.sfu.ca/~palys/Purposive%20sampling.pdf>.
Godfrey, EH 2005, ‘The effect of job satisfaction, intention to leave and career anchors on ethical perception of accounting professionals within the Institute of Management Accountants’, unpublished DBA dissertation, Nova South Eastern University, Florida.
Greenhause, JH, Callanan, GA & Godshalh, VM 2000, Career management, 3rd (edn), Thomson – South Western, Ohio.
Greenhaus, JH, Parasuraman, S & Wormley, WM 1990, ‘Effects of race on organizational experiences, job performance evaluations and career outcomes’, Academy of Management Journal, vol. 33, no. 1, pp. 64-86.
Guest, G, MacQueen, KM & Namey, EE 2012, Applied Thematic Analysis, Sage, Los Angeles, viewed 18 April 2013, <http://www.sagepub.com/books/Book233379#tabview=samples>.
Gunawan, H 1999, ‘Dosen kita dan kiprahnya dalam penelitian’ (Academic lecturers and research orientation), Suara Pembaharuan, 13 April 1999, viewed 19 October 2010, <http://zkarnain.tripod.com/KIPRAH.HTM>.
Gunz, HP & Heslin, PA 2005, ‘Reconceptualizing career success’, Journal of Organizational Behaviour, vol. 26, pp. 105-111.
Gupta, V, Surie, G, Javidan, M & Chhokar, J 2002, ‘Southern Asia cluster: where the old meets the new?’ Journal of World Business, vol. 37, pp. 16-27.
Hackman, JR & Oldham, GR 1975, ‘Motivation through the design of work: testing of a theory’, Organizational Behaviour and Human Performance, vol. 11, pp. 250-279.
Hackman, JR & Oldham, GR 1980, Work redesign, Addison-Wesley, Reading, MA. Hair, JF, Black, WC, Babin, BJ, Anderson, RE & Tatham, RL 2010, 7th (edn), Multivariate data
analysis, Prentice-Hall, New Jersey. Hall, DT 1996, ‘Protean careers of the 21st century’, The Academy of Management Executives, vol. X,
no. 4, pp. 8-16. Hall, DT 2002, Careers in and out of organizations’, Sage, Thousand Oaks. Hancer, M 2005, ‘Dimensions of the Turkish version of the Psychological Empowerment Scale’,
Psychological Report, vol. 97, no. 2, -pp. 645-50. Handy C 1993, Understanding organizations, Penguin Books, London. Hardin, JR, Stocks, MH & Graves, OF 2001, ‘The effect of match or mismatch between the career
anchors and the job settings of CPAs: an empirical analysis’, Advance in Accounting, vol. 18, pp. 119-148.
Hawkins, DI & Mothersbaugh, DL 2010, Consumer behavior: building marketing strategy, 7th (edn), McGraw-Hill/Irwin, NY.

248
Hechanova, M, Alampay, R & Franco, E 2006, ‘Psychological empowerment, job satisfaction, and performance among Filipino service workers’, Asian Journal of Social Psychology, vol. 9, pp. 92-78.
Henkel, M 2005, ‘Academic identity and autonomy in a changing policy environment’, Higher Education, vol. 49, pp. 155-176.
Hochwalder, J & Brucefors, AB 2005, ‘Psychological empowerment at the workplace as a predictor of ill health’, Personality and Individual Differences, vol. 39, no. 7, pp. 1237-1248.
Holdsworth, I & Cartwright, S 2003, ‘Empowerment, stress and satisfaction: an exploratory study of a call centre’, Leadership & Organization Development Journal, vol. 24, no. 3, pp. 131-140.
Hofstede, G 1980, Culture’s consequences: International differences in work-related values, Sage, California.
Hofstede, G 1991, Cultures and Organizations: software of the mind, McGraw-Hill, New York. Holland, JL 1973, Making vocational choices: a theory of careers, Prentice-Hall, Englewood Cliff. Hopkins, WG 2002, ‘A scale of magnitudes for effects statistics’, viewed 12 September 2013,
<http://www.sportsci.org/resource/stats/effectmag.html> House, RJ, Hanges, PJ, Javidan, M, Dorfman, PW & Gupta, V (eds) 2004, Culture, leadership and
organizations: the GLOBE study of 62 societies, Sage, London. Howitt, D & Cramer, D 2008, Introduction to research methods in psychology, 2nd edn, Pearson,
Boston, viewed 24 February 2013, <http://wps.pearsoned.co.uk/ema_uk_he_howitt_resmethpsy_2/77/19811/5071812.cw/>.
Hsu, MK, Chen, HG, Jiang, JJ & Klein, G 2003, ‘Career satisfaction for managerial and technical anchored IS personnel in later career stages’, Database for Advances in Information Systems, vol. 34, no. 4, pp. 64-72.
Hsu, MK, Jiang, JJ, Klein, G & Tang, Z 2003, ‘Perceived career incentive and intent to leave’, Information & Management, vol. 40, pp. 361-369.
http://www.eurydice.org, 2008, Higher education governance in Europe, European Commission, Viewed 20 February 2014.
Huck, SW 2004, Reading statistics and research, 4th edn, Pearson/Allyn and Bacon, Boston. Hussey, J & Hussey, R 1997, Business research: a practical guide for undergraduate and
postgraduate students, MacMillan Press, Hampshire. Idrus, N 1999, ‘Towards quality higher education in Indonesia’, Quality Insurance in Education, vol.
7, no. 3, pp. 134-140. Igbaria, M & Baroudi, JJ 1993, ‘A short-form measure of career orientations: a psychometric
evaluation’, Journal of Management Information Systems, vol. 10, no. 2, pp. 131-154. Igbaria, M & Guimaraes, T 1999, ‘Exploring differences in employee turnover intentions and its
determinants among telecommuters and non-telecommuters’, Journal of Management Information Systems, vol. 16, no. 1, pp. 147–164.
Igbaria, M, Kassicieh, S & Silver, M 1999, ‘Career orientation and career success among research and development and Engineering professionals’, Journal of Engineering and Technology Management, vol. 16, no. 1, pp. 29-54.
Igbaria, M, Meredith, G & Smith, D 1995, ‘Career orientations of information systems employees in South Africa’, International Journal of Strategic Systems, vol. 4, no. 4, pp. 319-340.
Inkson, K 2004, ‘Images of career: nine key metaphor’, Journal of Vocational Behavior, vol. 65, pp. 96-111.
Issac, DJ 1998, ‘The relationship of institutional, organizational and work-related factors in faculty intention to leave among liberal arts college,’ Dissertation Abstract International A, vol. 58, no. 11-A, p. 4204.
Ituma, A & Simpson, R 2007, ‘Moving beyond Schein’s typology: individual career anchors in the context of Nigeria’, Personnel Review, vol. 36, no. 6, pp. 978-995.
Ivancevich, JM & Matteson, MT 2002, Organizational Behavior and Management, 6th (edn), McGraw-Hill, New York.
Jamilazzaini 2013, ‘Benarkah kerja adalah ibadah?’ published 12 February 2013, viewed 26 June 2013, <http://www.jamilazzaini.com/benarkah-kerja-ibadah/>.

249
Jehn, KA & Doucet, L 1996, ‘Developing Categories from Interview Data: Consequences of Different Coding and Analysis Strategies in Understanding Text, Part 2, Cultural Anthropology Methods Journal, vol. 9, no. 1, pp. 1–7, cited in Bernard, HR & Ryan, GW 2010, Analyzing qualitative data: systematic approaches, Sage, California.
Jiang, JJ & Klein, G 2000, ‘Supervisor support and career anchor impact on the career satisfaction of the entry-level information system professional’, Journal of Management Information Systems, vol. 16, no. 3, pp. 219-240.
Judd, CM & Kenny, DA 1981, ‘Process analysis: estimating mediation in treatment evaluations’, Evaluation Review, no. 5, pp. 602-619.
Kanter, RM 1977, Men and women of the corporation, Basic Books, New York, viewed 20 May 2011, <http://glmw.info/organizations/files/Kanter_document.PDF>.
Katers, N n.d., ‘How does a European university differ from an American university’, viewed 15 June 2011, <http://www.ehow.com/how-does_4587899_european-university-differ-american-university.html>.
Kemick, A 2008, ‘Job autonomy and work/life balance’, viewed 16 Augustus 2012, <http://www.medicalnewstoday.com/release/132644.php>.
Kemp, S & Dwyer, L 2001, ‘An examination of organizational culture-the regent hotel, Sydney’, International Journal of Hospitality Management, vol. 20, pp. 77-93.
Kenny, D. A., Kashy, D. A., & Bolger, N. 1998, ‘Data analysis in social psychology’, In D. Gilbert, S. Fiske, & G. Lindzey (Eds.), The handbook of social psychology, McGraw-Hill, New York, vol. 1, pp. 233-263.
Kim, JS, Kaye, J & Wright, LK 2001, Moderating and mediating effects in causal models, Issue in Metal Helath Nursing, vol. 22, pp. 63-75.
Kilimnik, ZM, De Oliveira, LCV, Sant’anna, ADS & Barros, DTR 2011, ‘Career paths, images and anchors: a study with Brazilian professionals’, The Qualitative Report, vol. 16, no. 1, pp. 147-161.
Klapwijk R & Rommer, E 2009, ‘Career orientation of secondary school students (m/f) in the Netherlands’, Int J Techno Des Educ, vol. 19, pp. 403-418.
Kline, P 2000, An easy guide to factor analysis, Routledge, London. Kniveton, BH 2004, ‘Managerial career anchors in a changing business environment’, Journal of
European Industrial Training, vol. 28, no. 7, pp. 564-573. Kraemer HC, Wilson GT, Fairburn CG & Agras WS 2002, ‘Mediators and moderators of treatment
effects in randomized clinical trials’, Archives of General Psychiatry, vol. 59, pp. 877-883. Kraimer, ML, Seibert, SE & Liden, RC 1999, ‘Psychological empowerment as a multidimensional
construct: a test of construct validity’, Educational and Psychological Measurement, vol. 59, pp. 127-142.
Krieger, E 2008, ‘Undertsanding Indonesian religion’, in Indonesian volcano culture, viewed 8 September 2013, <http://ngm.nationalgeographic.com/geopedia/Indonesian_Volcano_Culture>.
Kusumadewi, LR & Cahyadi, A 2013, The crisis of public universities un Indonesia today, viewed 20 August 2013, <http://www.isa-sociology.org/universities-in-crisis/?p=1010>.
Kuter, U & Yilmaz, C 2001, ‘Survey Methods: Questionnaires and Interviews’, viewed 14 June 2011, <http://www.otal.umd.edu/hci-rm/survey.html>.
La Lopa, JM, Beck, J & Ghiselli, R 2009, ‘The role of biodata and career anchors on turnover intentions among hospitality educators’, Journal of Culinary Science & Technology, vol. 7, pp. 196-206.
Lee, JW & Kim, DW 2013, ‘Mediating effects of psychological empowerment on the relationship between Nurse’s self-leadership and organizational commitment’, Health and Social welfare Review, vol. 33, no. 2, pp. 366-400.
Lee, M & Koh, J 2001, ‘Is empowerment really a new concept?’, International Journal of Human Resource Management, vol. 12, pp. 684-695.
Lee, J, Weaver, C & Hrostowki, S 2011, ‘Psychological empowerment and child welfare worker outcomes: A path analysis’, Child and Youth Care Forum, vol. 40, no. 6, pp. 479-497.
Levi, O 2006, The effect of moderator variables on the zero-order correlation between congruence of career anchors, job satisfaction and psychological well-being, unpublished PhD thesis, Alliant International University, California.

250
Levy, PS & Lemeshow 2011, Sampling of Populations: Methods and Applications, John Wiley & Sons, New York.
Levin, J, Fox, JA & Forde, SR 2013, An SPSS 19 companion book to elementary statistics for social scientists, 11th (ed), Allyn & Bacon, California.
Lewis, MP (ed) 2009, Ethnologue: Languages of the World, 16th (edn), SIL International, Dallas, Tex., viewed 30 January 2012, <http://www.ethnologue.com>.
Liden, RC, Wayne, SJ & Sparrowe, RT 2000, ‘An examination of the mediating role of psychological empowerment on the relations between the job, interpersonal relationships and work outcomes’, Journal of Applied Psychology, vol. 85, no. 3, pp. 407-416.
Lissoni, F, Mairesse, J, Montobbio, F & Pezzoni, M 2011, ‘Scientific productivity and academic promotion: a study on French and Italian physicists’, Industrial and Corporate Change, pp. 1-42, DOI: 10.1093/icc/dtq073.
Locke, EA 1976, The nature and consequences of job satisfaction, in Dunnetter, MD (ed), Handbook of industrial and organizational psychology, Rand-McNally, Chicago, pp. 1297-1349.
Lumley, EJ 2009, ‘Exploring the relationship between career anchors, job satisfaction and organizational commitment’, unpublished Master’s thesis, University of South Africa, South Africa, viewed 19 November 2011, <http://uir.unisa.ac.za/bitstream/handle/10500/3455/dissertation_lumley_e.pdf?sequence=1>.
Magnis-Suseno, F 1996, ‘Budaya dan pengaruhnya terhadap budaya perusahaan Indonesia’, Usahawan, no. 7, Juli.
Magnis-Suseno, F 1997, Javanese ethics and world view: the Javanese idea of the good life, Gramedia Pustaka Utama, Jakarta.
Marks, G & Houston, DM 2002, ‘The determinants of young women’s intentions about education, career development and family life’, Journal of Education and Work, vol. 15, no. 3, pp. 321-336.
Marshall, V & Bonner, D 2003, ‘Career anchors and the effects of downsizing: implications for generations and cultures at work: a preliminary investigation’, Journal of European Industrial Training, vol. 27, no. 6, pp. 281-291.
Martin, A & Roodt, G 2008, ‘Perceptions of organisational commitment, job satisfaction and turnover intentions in a post-merger South African tertiary institution’, SA Journal of Industrial Psychology, vol. 34, no. 1, pp. 23-31.
Martin, SS 2008, ‘Relational and economic antecedents of organizational commitment’, Personnel Review, vol. 37, no. 6, pp. 589-608.
Mason, J 2006, ‘Mixing Methods in a Qualitatively-Driven Way’, Qualitative Research, vol. 6, no. 1, pp. 9-26.
Mays, SD 2007, ‘Anchoring careers through leadership and motivation-exploring factors that improve employee satisfaction and retention’, unpublished doctoral thesis, University of Phoenix, UMI Microform 3278608.
MacKinnon, DP 2008, Introduction to statistical mediation analysis, Earlbaum, New Jersey. MacKinnon, DP 2011, ‘Integrating mediators and moderators in research design’, Research on Social
Work Practice, published online 13 July 2011, viewed 17 February 2012, <http://rsw.sagepub.com/content/early/2011/07/08/1049731511414148>, DOI: 10.1177/1049731511414148.
McMurtrey, ME, Grover, V, Teng, JTC & Lighter, NJ 2002, ‘Job satisfaction of information technology workers: the impact of career orientation and task automation in a case environment’, Journal of Management Information System, vol. 19, no. 2, pp. 273-302.
Messarra, L, Mourad, M & Harake, NA 2009, ‘The linkage between professionals’ goal orientation and career anchors’, International Journal of Business Research, vol. 9, no. 1, pp. 50-56.
Menon, ST 1999, ‘Psychological empowerment: definition, measurement, and validation’, Canadian Journal of Behavioural Science, vol. 31, no. 3, p. 161.
Menon, ST 2001, ‘Employee empowerment: an integrative psychological approach’, Journal of Applied Psychology, vol. 50, no. 1, pp. 153-180.
Menon, ST & Kotze, E 2007, Human resource integration in the South African military: a view from the trenches, Human Resource Management, vol. 46, no. 1, pp. 71-94.
Meyer, D & Page, C 2000, Applied research design for business and Management, McGraw-Hill Book Company Australia, Sydney.
251
Meyerson, SL & Kline, TJB 2008, ‘Psychological and environment empowerment: antecedents and consequences’, Leadership & Organization Development Journal, vol. 29, no. 4, pp. 444-460.
Miles J & Shevlin M 2001, Applying regression & correlation: a guide for students and researchers, Sage, London.
Miles, MB & Huberman, AM 1994, Qualitative data analysis: an expanded sourcebook, Sage Publication, Thousand Oaks, CA.
Moffatt, A (ed) 2012, Indonesian cultural profile, Diversicare, Queensland, Australia. Morgan, DL 1998, ‘Practical strategies for combining qualitative and quantitative methods:
Applications to health research’, Qualitative Health Research, vol. 8, no. 3, pp. 362-376. Muchiri, MK & Cooksey, RW 2011, ‘Examining the effects of substitutes for leadership on
performance outcomes’, Leadership & Organization Development Journal, vol. 32, iss. 8, pp. 817-836.
Muchiri, M & Cooksey, R 2009, ‘Thematic analyses of employee perceptions of leadership: further support for the construct of effective leadership within local councils of Australia’ in N Beaumont, (ed) 23rd ANZAM Conference 2009 ‘Sustainability Management and Marketing’. ANZAM 2009 Conference, Melbourne, Victoria, 1-4 December 2009, pp. 1-27.
Mujahid, AB n.d., ‘Muslim misperception about social service’, viewed 29 August 2013, <http://www.islamicstudies.info/socialservice/socialservice.php>.
Murray, L 2003, ‘Qualitative research interviews: therapeutic benefits for the participants’, Journal of Psychiatric and Mental Health Nursing, vol. 10, iss. 2, pp. 233-236.
Neuman, W 1997, Social research methods: qualitative and quantitative approaches, 3rd (edn), Allyn & Bacon, Needham Heights, MA.
Nicholson, N 1996, Careers in a new context, in Warr, P (ed), Psychology at work, Penguin, London, pp. 161-187.
Nizam 2006, ‘The need for higher education reform’, in Higher education in East Asia, Bangkok: UNESCO, pp. 35-68.
Nunnally, JC 1967, Psychometric theory, 1st (edn), McGraw-Hill, New York. Nunnally, JC & Bernstein, IH 1994, Psychometric theory, McGraw-Hill, New York. Oronzco-Atienza, GR 2005, ‘Measures of career anchors revised: a comprehensive career orientations
inventory’, unpublished PhD dissertation, Alliant International University, Los Angeles, viewed 20 April 2011, <http://gradworks.umi.com/31/82/3182136.html>.
Osborne, JW 2002, A brief primer on best practices in the use and interpretastion of data transformations, viewed 20 January 2014, <http://pareonline.net/htm/osbourne/transformations_new.htm>.
Osborne JW, Christensen WR & Gunter J 2001, Educational psychology from a statistician's perspective: A review of the power and goodness of educational psychology research. Paper presented at the national meeting of the American Education Research Association (AERA), Seattle, WA.
Owuor, CO 2001, ‘Implications of using Likert data in multiple regression analysis’, unpublished PhD dissertation, Graduates Studies Faculty, Educational and Counselling Psychology and Special Education Department, university of British Columbia, viewed 12 September 2013, <https://circle.ubc.ca/bitstream/handle/2429/13778/ubc_2001-715140.pdf?sequence=1>.
Patah, M, Radzi, SM, Abdullah, R, Adzmy, A, Zain, RA & Derani, N 2009, ‘The influence of psychological empowerment on overall job satisfaction of front office receptionists’, International Journal of Business and Management, vol. 4, no. 11, pp. 167-176.
Patton, M 2002, Qualitative Research and Evaluation Methods, 3rd (edn), Sage, Thousand Oaks, CA. Pekerti, AA & Sendjaya, S 2010, ‘Exploring servant leadership across culture: comparative study in
Australia and Indonesia’, International Journal of Human Resource Management, vol. 21, no. 5, pp. 754-780.
Pieterse, AN, Knippenberg, DV, Schippers, M & Stam, D 2010, ‘Transformational and transactional leadership and innovative behaviour: the moderating role of psychological empowerment’, Journal of Organizational Behavior, vol. 31, pp. 609-623.
Pikiran Rakyat 2013, Perubahan statuta PTN Badan Hukum berimplikasi positif (Public legal entity status gives positive impact), Pikiran Rakyat, viewed 1 November 2013 <http://www.pikiran-rakyat.com/node/256866>.

252
Potterfield, T 1999, The business of employee empowerment, Quorum Books, London. Puryear, PJ 1996, ‘Career anchors of North Carolina Principals’, unpublished doctoral dissertation,
University of North Carolina, Greensboro. Qiunn, RE & Spreitzer, GM 1997, ‘The road to empowerment: seven questions every leader should
consider’, Organizational Dynamics, vol. 26, iss. 2, pp. 37-49. Raabe, B, Frase, M & Beehr TA 2007, ‘Action regulation theory and career self-management’, Journal
of Vocational Behavior, vol. 70, pp. 297-311. Rahayu, M 2012, Masyarakat tanpa Negara, Kompas, 10 viewed July, 2013,
<http://politik.kompasiana.com/2012/02/14/masyarakat-tanpa-negara/> Ramakrishna, H & Potosky, D 2004, ‘Structural shift in career anchors of information systems
personnel: a preliminary empirical analysis’, The Journal of Computer Information Systems, vol. 42, no. 2, pp. 83-89.
Rhoads, RA & Torres, CA (eds) 2006, The university, the state and the market: the political economy of globalization in the Americas, Stanford University Press, Stanford CA.
Richardson, JV 2002, ‘Open versus closed ended questions: in the reference environment’, viewed 17 June 2013, <http://polaris.gseis.ucla.edu/jrichardson/dis220/openclosed.htm>.
Riley PJ & Kiger G 2002, ‘Increasing survey response: the drop-off/pick-up technique’, Rural Sociol, Vol. 22, pp. 6–10. Robbins, SP 2005, Organizational behavior: concepts, controversies, and applications, 11th (edn),
Prentice Hall, New Jersey. Robbins, SP & Coulter, M 1996, Management, 5th edn, Prentice-Hall, Englewood Cliffs, NJ. Robinson, G & Moulton, J 2002, ‘Academic freedom’, viewed 1 September 2013,
<http://sophia.smith.edu/~jmoulton/Acadfree.pdf>. Ross, G 1995, ‘Management values, work preference ideals and personality needs as predictors of
hospitality employee career anchors’, Hospitality Research Journal, vol. 19, no. 1, pp. 61-79. Rothman, S, Coetzer, EP 2002, ‘The relationship between personality dimensions and job satisfaction’,
Journal of the Southern African Institute for Management Scientists, vol. 11, iss. 1, pp. 29-42. Rousseau, DM 1996, ‘Changing the deal while keeping the people’, Academy of Management
Executive, vol. 10, pp. 50-61. Ryan, GW & Bernard, HR 2003, ‘Techniques to identify themes’, Fields Methods, vol. 15, no. 1, pp.
85-109. Ryan, GW & Bernard, HR n.d., ‘Techniques to identify themes in qualitative data’, viewed 10 April
2013, <http://www.analytictech.com/mb870/readings/ryan-bernard_techniques_to_identify_themes_in.htm>.
Saari, LM & Judge, TA 2004, ‘Employee attitudes and job satisfaction’, Human Resource Management, vol. 43, no. 4, pp. 395-407.
Schein, EH 1977a, ‘How career anchor hold executives to their career path’, Personnel, vol. 52, no. 3, pp. 11-24.
Schein, EH 1977b, ‘Career anchors and career path: a panel study of management school graduates’, in Van-Maanen, J (ed), Organizational careers: some new perspectives, John Wiley & Sons, London, pp. 49-64.
Schein, EH 1978, Career dynamics: matching individual and organizational needs, Addison-Wesley Publishing Company, Inc., Philippines.
Schein, EH 1980, ‘Career theory and research: some issues for the future,’ in Derr, CB (ed) 1980, Work, family and the career, C. Praeger, New York.
Schein, EH 1987a, ‘Increasing organizational effectiveness through better human resource planning and development’, in Schein, EH (ed) 1987, ‘The art of managing human resources’, Oxford University Press, New York.
Schein, EH 1987b, ‘Individual and careers,’ in Lorsch, JW (ed) 1987, ‘Handbook of organizational behavior’, Prentice-Hall, Inc., New Jersey.
Schein, EH 1990, Career anchors: trainer’s manual, Pfeiffer and Company, Sydney. Schein, EH 1992, ‘Career anchors and job/role planning: the links between career planning and career
development’, in Montross, DH & Shinkman, CJ (eds) 1992, Career development: theory and practice, Charles C: Thomas Springfield.

253
Schein, EH 1993, Career anchors: discovering your real values, University Associates, San Diego Schein, EH 1996, ‘Career anchor revisited: implications for career development in the 21st century’,
The Academy of Management Executive, vol. X, no. 4, pp. 80-88. Schein, EH 2006a, Career anchors: participant workbook, Pfeiffer, California. Schein, EH 2006b, ‘From brainwashing to organizational therapy: a conceptual and empirical journey
in search of systemic health and a general model of change dynamics, a drama in five acts’, Organization Studies, vol. 27, no. 2, pp. 287-301.
Schein, EH 2010, Organizational culture and leadership, Jossey Bass Wiley, U.S. Schein, EH & van Maanen, J 2013, Career anchors (self-assessment): The changing nature of work
and careers, John Wiley & Sons, San Francisco. Schein, EH n.d., Career Anchors and Job/Role Planning: frequently asked questions, viewed 16
August 2012, <http://media.johnwiley.com.au/product_data/excerpt/7X/07879838/078798387X-1.pdf>.
Schermuly, CC, Schermuly, RA & Meyer, B 2011, ‘Effects of vice-principals' psychological empowerment on job satisfaction and burnout’, International Journal of Educational Management, vol. 25, no. 3, pp. 252-264.
Schreuder, A & Theron, A 1997, Careers: An organizational perspective, Juta, Cape Town. Scott, P 2011, ‘UK universities could learn a lot from Europe’, The Guardian, 1 March, viewed 12
June 2011, <http://www.guardian.co.uk/education/2011/mar/01/>. Sekaran, U 2010, Research methods for business: a skill building approach, John Wiley & Sons, New
York. Sekaran, U & Bougie, R 2013, Research methods for business: a skill building approach, 6th edn, John
Wiley & Sons, New York. Sidek, S, Dora, MT, Kudus, N & Hassan MA 2012, ‘Academic career in the Malaysian higher
education: becoming a professor’, Journal of Human Capital Development, Vol. 5, No. 2 ISSN: 1985-7012.
Siegel, AF 2011, Practical business statistics, McGraw-Hill, Boston. Sihombing, SO 2013, ‘Identifying changing in Indonesian values and its impact to Indonesian
consumer behavior’, The Internet Journal of Language, Society and Culture, iss. 36, pp. 101-109. Sihombing, SO & Pongtuluran, FD 2011, ‘Understanding Indonesian values: a preliminary research to
identify Indonesian culture’, Paper presented at International Conference Political Economy of Trade Liberalization in Developing East Asia: Sustainability, Governance, and the Role of Small Business, 24-25 November, Universitas Brawijaya, Malang
Singh, MK, Bhattacharjee, V & Kodwani, AD 2009, ‘Mapping career anchors in a large engineering company: a study’, Paradigm, vol. XIII, no. 2, pp. 51-56.
Smith, DL 2005, ‘The relationship between career anchors and a team’s ability to meet organizational goals: a case study’, unpublished doctoral dissertation, Capella University, Minneapolis.
Smith, PC, Kendall, LM & Hullin, CL 1969, The Measurement of satisfaction in work and retirement, Rand McNally, Chicago.
Soeparna 2011, ‘Pembinaan karier dosen: pedoman penilaian angka kredit kenaikan jabatan lector kepala dan guru besar’ (Development of academics’ careers: credit score assessment guidelines for promotion to senior lecturer and professor titles), viewed 10 October 2012, <http://uripsantoso.files.wordpress.com/2011/08/pembinaan-karier-dosen115924230311.pdf>.
Soper, DS 2012, ‘Sobel Test Calculator for the Significance of Mediation (Online Software)’, viewed 15 January 2012, <http://www.danielsoper.com/statcalc3>.
Sparrow, P & Hiltrop, JM 1996, European Human Resource Management in Transition, Prentice hall, London.
Spector, PE 2008, Industrial and Organisational Behaviour, 5th edn, John Wiley & Sons, New Jersey Spreitzer, GM 1995, ‘Psychological empowerment in the workplace: dimensions, measurement and
validation’, Academy of Management Journal, vol. 38, no. 5, pp. 1442-1465. Spreitzer, GM 1996, ‘Social structural characteristics of psychological empowerment’, Academy of
Management Journal, vol. 39, pp. 483-504. Spreitzer, GM 1997, ‘Toward a common ground in defining empowerment’, Research in
Organizational Change and Development, vol. 10, pp. 31-62.

254
Spreitzer, GM, Kizilos, MA & Nason, SW 1997, ‘A dimensional analysis of the relationship between psychological empowerment and effectiveness, satisfaction, and strain’, Journal of Management, vol. 23, no. 5, pp. 679-704.
Spreitzer, GM, Janaz, SD, and Quinn, RE 1999, ‘ Empowered to lead: The role of psychological empowerment in leadership’, Journal of Organizational Behavior, vol. 20, pp. 511-526.
Stake, R 1995, The art of case study research, Sage, Thousand Oaks, pp. 49-68. Steele, C & Francis-Smythe, J 2006, ‘Flexible career planning for police staff-combining career
anchors and competences’, Proceeding of the British Psychological Society’s 2007 Occupational Psychology Conference, Glasgow.
Steele, C & Francis-Smythe, J 2008, ‘Investigating the role of career anchors in job satisfaction and organisational commitment: A PJ fit approach’, Proceeding of the British Psychological Society Annual Conference, Dublin.
Strauss, A & Corbin, J 1998, Basics of qualitative research: Techniques and procedures for developing grounded theory, 2nd edn, Sage, Thousand Oaks, CA. Suara Merdeka, 2013, ‘Tak hasilkan jurnal international, tunjangan guru dicabut’ (No articles
published in international journals, remuneration stopped), Suara Merdeka - online 15 May 2013, viewed 15 May 2013, <http://www.suaramerdeka.com/v1/index.php/read/news_smg/2013/05/15/157015/Tak-Hasilkan-Jurnal-Internasional-Tunjangan-Guru-Besar-Dicabut>.
Sukirno, DS & Sienthai, S 2011, Does participative decision making affect lecturer performance in higher education?’, International Journal of Educational Management, vol. 25, no. 5, pp. 494-508. DOI 10.1108/09513541111146387.
Super, DE 1990, A life span, life-space approach to career development, in Brown, D & Brooks, L (eds), Career choice and development, Jossey–Bass, San Francisco.
Super, DE & Bohn, MJ 1971, Occupational psychology, Tavistaock Publications, London. Supriyanto, J & Suparjo 2010, Badan Layanan Umum: sebuah pola pemikiran baru atas unit pelayanan
masyarakat, viewed 22 November 2011, <www.perbendaharaan.go.id>. Susskind, AM, Borchgrevink, CP, Kacmar, KM & Brymer, RA 2000, ‘Customer service employees’
behaviour intentions and attitudes: an examination of construct validity and a path model’, International Journal of Hospitality Management, vol. 19, pp. 53-77.
Suutari, V & Taka, M 2004, ‘Career anchors of managers with global careers’, Journal of Management Development, vol. 23, no. 9, pp. 833-847.
Tabachnick, BG & Fidell, LS 2007, Using multivariate statistics, Pearson education, Boston. Tan, HH & Quek, BC 2001, ‘An exploratory study on the career anchors of educators in Singapore’,
The Journal of Psychology, vol. 135, iss. 5, pp. 527-545. Teddlie, C & Tashakkori, A 2009, Foundations of mixed methods research: integrating quantitative
and qualitative approaches in the social and behavioural sciences, Sage, California. The higher education academy 2009, Reward and recognition of theaching in higher education;
institutional policies and their implementation, GNIE, CETL, Viewed 18 February 2014 <http://www.heacademy.ac.uk/assets/documents/rewardandrecog/rewardandrecognition_2.pdf>.
Thomas, K & Tymon, W 1994, ‘Does empowerment always work: understanding the role of intrinsic motivation and personal interpretation’, Journal of Management System, vol. 6, no. 3.
Thomas, KW & Velthouse, BA 1990, ‘Cognitive elements of empowerment: an interpretive model of intrinsic task motivation’, Academy of Management Review, vol. 15, no. 4, pp. 666-681.
Ticehurst, GW & Veal, AJ 2000, Business research methods: a managerial approach, Addison Wesley Longman, Australia.
Tolmie, A, Muijs, D & McAteer, E 2011, Quantitative methods in educational and social research using SPSS’, McGraw Hill-Open University Press, England.
Tsui, AS, Pearce, JL, Porter, LW & Tripoli, AM 1997, ‘Alternative approaches to the employee-organization relationship: does investment in employees par off?’, Academy of Management Journal, vol. 40, no. 5, pp. 1089-1121.
Turner, M, Imbaruddin, A, Handoko, H, Sutiyono, W & Meiliani 2009, ‘Human resource management and regional autonomy’, Policy Briefs, Crawford School of Economic and Government-Australian National University, Australia.

255
Turner, M & Podger, O 2007, Decentralisation in Indonesia: redesigning the state, Asia Pacific Press-ANU, Australia.
Uner, S & Turan, S 2010, ‘The construct validity and reliability of the Turkish version of Spreitzer’s psychological empowerment scale’, Public Health, vol. 10, p. 117.
UNESCO 2006, ‘Higher education in South-East Asia’, UNESCO Asia and Pacific Regional Bureau for Education, Thailand.
Upton, GA 2009, ‘Creating a distinct Indonesian leadership model,’ Unpublished master thesis, Royal Roads University, Canada.
Virtanen, T 2002, Competency assessment in Finnish higher education, in Competency management in the public sector: European variations on a theme, Horton, S, Hondeghem, A & Farnham, D (Eds) 2002, IIAS-EGPA, IOS Press, Netherlands, pp. 77-90, viewed 20 July 2013 <http://books.google.com.au/books?id=zRWcRAApWL8C&pg=PA77&lpg=PA77&dq=competence+is+an+attribute+of+academics&source=bl&ots=zd-2XEBmSB&sig=cZV7CIh2yGaKA8Z3BLp75t68JMQ&hl=en&sa=X&ei=1XXqUd7WBsnDkgW-1oCQAg&ved=0CGYQ6AEwCQ#v=onepage&q=competence%20is%20an%20attribute%20of%20academics&f=false>.
Wang, G & Lee, PD 2009, ‘Psychological empowerment and job satisfaction: an analysis of interactive effects’, Group & Organization Management, vol. 34, no. 3, pp. 271-296.
Wang, JL & Zang, DJ 2012, ‘An exploratory investigation on psychological empowerment among Chinese teachers’, Advance in Psychology Study, vol. 1, no. 3, pp. 13-21.
Weber, K & Ladkin, A 2009, ‘Career anchors of convention and exhibition industry professionals in Asia’, Journal of Convention & Event Tourism, vol. 10, pp. 243-255.
Welch, A 2012, ‘The limits of regionalism in Indonesian higher education’, Asian Education and Development Studies, vol. 1, no. 1, pp. 24-42, viewed 10 October 2013, <www.emeraldinsight.com/2046-3162.htm>.
Westen, D & Rosenthal, R 2003, Quantifying construct validity: two simple measures, Journal of Personality and Social Psychology, vol. 84, no. 3, pp. 608–618, Viewed 10 October 2013 <http://dash.harvard.edu/bitstream/handle/1/3708469/Rosenthal_QuantifyingConstruct.pdf?sequence=1>.
WHO 2013, Process of translation and adaption of instrument, viewed 15 January 2013, <http://www.who.int/substance_abuse/research_tools/translation/en/>.
Wivagg, J 2008, Forced choice, viewed 17 June 2013, <http://srmo.sagepub.com/view/encyclopedia-of-survey-research-methods/n193.xml>.
Wook, LJ & Won KD 2013, ‘Mediating Effects of Psychological Empowerment on the Relationship between Nurse’s Self Leadership and Organizational Commitment’, Health and Social Welfare Review. Vol. 33, no. 2, pp. 366-400.
Wong, ALY 2007, ‘Making career choice: a study of Chinese managers’, Human Relations, vol. 60, no. 8, pp. 1211-1233.
Wong, RM, Fiedler, AM & Liu, CH 2007, ‘Exploring the motivation of students in choosing information systems as their major’, Issues in Information Systems, vol. VIII, no. 1, pp. 198-203.
World Higher Education Database n.d., ‘The Netherlands’, viewed 10 June 2011 <http://www.euroeducation.net/prof/netherco.htm>.
Yarnall, J 1998, ‘Career anchors: results of an organisational study in the UK’, Career Development International, vol. 3, no. 2, pp. 56-61.
Yin, RK 2006, ‘Mixed methods research: are the methods genuinely integrated or merely parallel?’, Research in the Schools, vol. 13, no. 1, pp. 41-47.
Zaleska, KJ, De Menezes, L 2007, 'Human resources development practices and their association with employee attitudes: between traditional and new careers', Human Relations, vol. 6, no. 7, pp. 987-1018.
Zhu, W 2008, ‘The effect of ethical leadership on follower moral identity: the mediating role of psychological empowerment’, Leadership Review, vol. 8, pp. 62-73.
Zhu, W, May, DR & Avolio, BJ 2004, ‘The impact of ethical leadership behavior on employee outcomes: the roles of psychological empowerment and authenticity’, Journal of Leadership & Organizational Studies, vol. 11, no. 1, pp. 16-26.
Zikmund, WG 2003, Business research method, Thomson, South Western, Ohio.

256
Zikmund, WG 2010, Business research method, Harcourt Brace Jovanovich College Publishers, Fort Worth.
Zikmund, WG, Babin, BJ, Carr, JC & Griffin, M 2008, Business research method, South-Western Cengage Learning, Australia.
Zikmund, WG, Babin, BJ, Carr, JC & Griffin, M 2013, Business research method, South-Western Cengage Learning, Australia.

257
Appendices
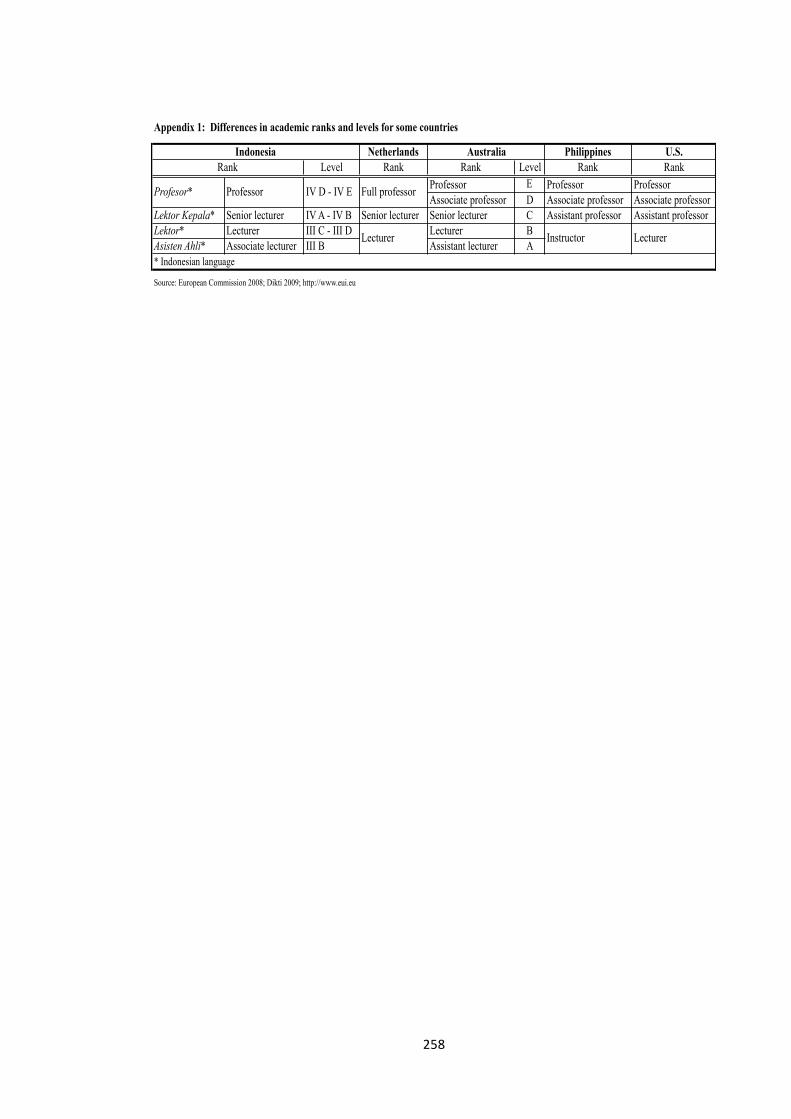
258
Netherlands Philippines U.S.Level Rank Rank Level Rank Rank
Professor E Professor ProfessorAssociate professor D Associate professor Associate professor
Lektor Kepala* Senior lecturer IV A - IV B Senior lecturer Senior lecturer C Assistant professor Assistant professorLektor* Lecturer III C - III D Lecturer BAsisten Ahli* Associate lecturer III B Assistant lecturer A
Source: European Commission 2008; Dikti 2009; http://www.eui.eu
Appendix 1: Differences in academic ranks and levels for some countries
Instructor Lecturer
* Indonesian language
AustraliaRank
Indonesia
Full professor
Lecturer
Profesor* Professor IV D - IV E

259
Appendix 2: Categories and Items on the short form of career anchor inventory
Categories Items Managerial competence
The process of supervising, influencing, leading and controlling people at all level is… To be in charge of a whole organisation is… To rise to a high position in general management is…
Technical competence
Remaining in my specialized area as opposed to being promoted out of my area of expertise is… Remaining in my area of expertise throughout I will accept a management position only if it is my area of expertise.
Service I want a career in which I can be committed and devoted to an important cause. Being able to use my skills and talents in the service of an important cause is… Using my skill to make the world a better place to live and work in is …
Autonomy The chance to do things my own way and not to be constrained by the rules of an organization is… A career that is free from organization restrictions I do not want to be constrained by either an organization or the business world.
Economic security
An employer who will provide security through guaranteed work, benefits, a good retirement program, etc. is… An organization that will give me long-run stability is…
Geographical stability
Remaining in one geographical area rather than moving because of a promotion is… It is more important for me to remain in my present geographical location than to receive a promotion or new job assignment in another location.
Pure challenge Working on problems that are almost insoluble is… The only real challenge in my career has been confronting and solving tough problems, no matter what area they were in. I feel successful only if I am constantly challenged by a tough problem or a competitive situation.
Lifestyle Developing a career that permits me to continue to pursue my own lifestyle is… A career is worthwhile only if it enables me to lead my life in my own way. Choosing and maintaining a certain lifestyle is more important than career success.
Entrepreneurial creativity
Building a new business enterprise is… I am always on the look out for ideas that would permit me to start and build own enterprise. I have always wanted to start and build up a business of my own.
Source: Igbaria and Baroudi (1993, pp. 53-54).

260
Appendix 3: Facets of the psychological empowerment scale
Facets Items Meaning The work I do is very important to me.
My job activities are personally meaningful to me. The work I do is meaningful to me.
Competence I am confident about my ability to do my job. I am self-assured about my capabilities to perform my work activities.
I have mastered the skills necessary for my job. Self-determination
I have significant autonomy in determining how I do my job. I can decide on my own how to go about my work. I have considerable opportunity for independence and freedom. in how I do my job.
Impact My impact on what happens in my department is large. I have a great deal of control over what happens in my department.
I have significant influence over what happens in my department.
Source: Spreitzer (2009, p. 1465).
Appendix 4: Dimension of the job satisfaction scale
Dimension Items Job satisfaction
Generally speaking, I am very satisfied with this job. I am generally satisfied with the kind of work I do in this job. Most people on this job are very satisfied with the job.
Source: Oldham and Hackman (1975, p. 51).

261
Appendix 5: A set of questionnaire
(Participant Information sheet – English version)
October 2012 Dear Respondents,
As a PhD candidate in the School of Management and Marketing, the University of Wollongong, Australia, I am currently conducting research on career motivation and individual’s outcome. The specific aim of this study is to explore how employees in Indonesia think about their career goals. I would like to seek your support to take a part in this important survey. Your employer has agreed that I may approach you to request your participation by completing the attached questionnaire. The questionnaire should take approximately 20-25 minutes to complete. Your participation in this survey is completely voluntary. You may withdraw from the survey at any time without any risk to your current or future employment with your institution.
Please be assured that your responses will be kept strictly confidential. No individual or personal details will be identified. You are not asked to identify yourself in the survey. Data gathered will be stored in the secured cabinet and location and reported in the aggregated. So that, all answer will be confidential to me as the researcher and my two supervisors. The data will be destroyed after five years.
Your responses are important to the success of this research. Please ensure that you answer all the questions and kindly return it to the researcher. By completing and returning the questionnaire, it is indicated your willingness and understanding to participate in this survey.
You only need to feel this questionnaire once. Please leave this survey if you have already completed one.
Thank you for taking the time to participate in this study. Your support is greatly appreciated. Should you have any further queries, please feel free to contact me or one of my supervisors: Associate Professor Samuel Garrett-Jones on +61242214359, by email: [email protected] and Associate Professor Mario Fernando on +61242214053, by email: [email protected].
This study has been approved by the Human Research Ethics Committee of the University of Wollongong. If you require any further information concerning the survey, please contact the research service office on +61242213386, fax: +61242214338, [email protected] Sincerely yours, Meiliani Telp.: +61415087484 Email: [email protected]
School of Management and Marketing University of Wollongong Northfield Avenue, Wollongong, NSW 2522 Australia Phone: +61 2 4221 3707 Fax: +61 2 4221 4154 Email: smm-‐[email protected]

262
A. Listed below are descriptive statements describing your view of career orientation. Please tick (√) clearly in the box that best indicates the importance of each item. The scale is numbered as 1 = of no importance to 6 = centrally important.
Of no Centrally importance important
1 2 3 4 5 6 1. The process of supervising, influencing, ☐ ☐ ☐ ☐ ☐ ☐ leading and controlling people at all level is…
2. The chance to do things my own way and not ☐ ☐ ☐ ☐ ☐ ☐ to be constrained by the rules of an organization is… 3. An employer who will provide security through ☐ ☐ ☐ ☐ ☐ ☐ guaranteed work, benefits, a good retirement program, etc. is… 4. Working on problems that are almost insoluble is…☐ ☐ ☐ ☐ ☐ ☐ 5. Remaining in my specialized area as opposed to ☐ ☐ ☐ ☐ ☐ ☐ being promoted out of my area of expertise is… 6. To be in charge of a whole organization is… ☐ ☐ ☐ ☐ ☐ ☐ 7. A career that is free from organization restrictions ☐ ☐ ☐ ☐ ☐ ☐ 8. An organization that will give me long-run ☐ ☐ ☐ ☐ ☐ ☐
stability is… 9. Using my skill to make the world a better place ☐ ☐ ☐ ☐ ☐ ☐ to live and work in is … 10. Developing a career that permits me to continue ☐ ☐ ☐ ☐ ☐ ☐ to pursue my own lifestyle is… 11. Building a new business enterprise is… ☐ ☐ ☐ ☐ ☐ ☐ 12. Remaining in my area of expertise throughout ☐ ☐ ☐ ☐ ☐ ☐ my career is … 13. To rise to a high position in general management ☐ ☐ ☐ ☐ ☐ ☐
is… 14. Remaining in one geographical area rather than ☐ ☐ ☐ ☐ ☐ ☐ moving because of a promotion is… 15. Being able to use my skills and talents in the ☐ ☐ ☐ ☐ ☐ ☐ service of an important cause is… # Other comments on your view of your working life (optional): _______________________________________________________________________________________________________________________________________________________________________________________________________________________________________________________________

263
B. Listed below are descriptive statements about your career preferences. Please tick (√) clearly in the box that best indicates the truth of each item. The scale is numbered as 1 = not at all true to 6 = completely true.
Not at Completely all true true
1 2 3 4 5 6 16. The only real challenge in my career has been ☐ ☐ ☐ ☐ ☐ ☐ confronting and solving tough problems, no
matter what area they were in. 17. I am always on the look out for ideas that would ☐ ☐ ☐ ☐ ☐ ☐ permit me to start and build own enterprise. 18. It is more important for me to remain in my ☐ ☐ ☐ ☐ ☐ ☐ present geographical location than to receive a promotion or new job assignment in another location. 19. A career is worthwhile only if it enables me to ☐ ☐ ☐ ☐ ☐ ☐ lead my life in my own way. 20. I will accept a management position only if it ☐ ☐ ☐ ☐ ☐ ☐ is my area of expertise. 21. I do not want to be constrained by either an ☐ ☐ ☐ ☐ ☐ ☐ organization or the business world. 22. I want a career in which I can be committed ☐ ☐ ☐ ☐ ☐ ☐ and devoted to an important cause. 23. I feel successful only if I am constantly ☐ ☐ ☐ ☐ ☐ ☐ challenged by a tough problem or a competitive
situation.
24. Choosing and maintaining a certain lifestyle ☐ ☐ ☐ ☐ ☐ ☐ is more important than career success. 25. I have always wanted to start and build up a ☐ ☐ ☐ ☐ ☐ ☐ business of my own. # Other comments on your career preferences (optional): ____________________________________________________________________________________________________________________________________________________________________________________________________________________ C. For each of the following statements, please indicate your degree of agreement or disagreement by
ticking (√) clearly in the box that best represent your feelings. The scale is numbered as 1 = strongly disagree to 6 = strongly agree
Strongly Strongly disagree agree
1 2 3 4 5 6 26. Generally speaking, I am very satisfied with ☐ ☐ ☐ ☐ ☐ ☐
this job.
27. I am generally satisfied with the kind of work I ☐ ☐ ☐ ☐ ☐ ☐ do in this job.
28. Most people on this job are very satisfied with ☐ ☐ ☐ ☐ ☐ ☐ the job.

264
# Other comments on your feeling about current job (optional): _______________________________________________________________________________________________________________________________________________________________________________________________________________________________________________________________ D. For each statement, I would like you to rate your own intrinsic task motivation by ticking (√) clearly
the appropriate response. The scale is numbered as 1 = strongly disagree to 6 = strongly agree. Strongly Strongly disagree agree
1 2 3 4 5 6 29. The work I do is very important to me. ☐ ☐ ☐ ☐ ☐ ☐ 30. My job activities are personally meaningful ☐ ☐ ☐ ☐ ☐ ☐ to me 31. The work I do is meaningful to me. ☐ ☐ ☐ ☐ ☐ ☐ 32. I am confident about my ability to do my job. ☐ ☐ ☐ ☐ ☐ ☐ 33. I am self-assured about my capabilities to ☐ ☐ ☐ ☐ ☐ ☐
perform my work activities. 34. I have mastered the skills necessary for my job. ☐ ☐ ☐ ☐ ☐ ☐ 35. I have significant autonomy in determining how ☐ ☐ ☐ ☐ ☐ ☐ I do my job. 36. I can decide on my own how to go about my ☐ ☐ ☐ ☐ ☐ ☐ work. 37. I have considerable opportunity for independence ☐ ☐ ☐ ☐ ☐ ☐ and freedom in how I do my job. 38. My impact on what happens in my department ☐ ☐ ☐ ☐ ☐ ☐ is large. 39. I have a great deal of control over what happens ☐ ☐ ☐ ☐ ☐ ☐ in my department. 40. I have significant influence over what happens ☐ ☐ ☐ ☐ ☐ ☐ in my department. # Other comments on your feeling about intrinsic task motivation (optional): _______________________________________________________________________________________________________________________________________________________________________________________________________________________________________________________________ C. Your opinion We would be interested in anything you might have to say in response to the following questions. 1. What factors influence your internal career motivation? ______________________________________________________________________________________________________________________________________________________________________ 2. How well does your institution support your career motivation or goals?
_________________________________________________________________________________________________________________________________________________________________

265
Demographic Background
1. Your employment status at this institution: ☐ Contract ☐ Probation ☐ Permanent ☐ Private employee ☐ Other (please specify)_______
2. Your gender: ☐ Female ☐ Male
3. When did you complete your first degree? (year)____________________________________________
4. What was your first degree discipline or major: ____________________________________________
5. What is the highest level of education you have attained: ____________________________________
5a. Where did you obtain this degree: ☐ Indonesia ☐ Other country (name) ____________
6. How long have you been working with this institution?_____________Years ____________ Months
7. Your institution type: ☐ Public university ☐ Private university ☐ Other (please specify)_______
8. Your institution size: ☐ Small (< 5,000 students) ☐ middle-sized (5,000-10,000 students)
☐ Large (>10,000 students)
9. Your structural or managerial position(s) held at present? ____________________________________
10. Your present functional position: ☐ Asisten Ahli ☐ Lektor ☐ Lektor Kepala ☐ Profesor ☐ Other (please specify)_________________________________
11. Your age: ☐<25 y.o.☐ 25-35 y.o. ☐ 36-45 y.o. ☐ 46-55 y.o. ☐ >56 y.o.
12. Your marital status: ☐ Single ☐ Married ☐Other (please specify)__________________
13. Your ethnicity (please specify) ________________________________________________________
14. Your religion: ☐ Islam ☐ Catholic ☐ Protestant ☐ Buddhism ☐ Hinduism
☐ Kong Hu Chu ☐ Other (please specify)______________________
Your participation and cooperation in this study is greatly appreciated.
Thank you.

266
(Participant Information Sheet – Indonesian version)
Oktober 2011 Bapak/Ibu dosen yang saya hormati, Pada saat ini saya sedang melakukan penelitian dengan topik orientasi karir internal di tempat kerja, dalam rangka penyelesaian disertasi program doktor di School of Management and Marketing, University of Wollongong, Australia. Penelitian ini bertujuan untuk mengeksplorasi bagaimana pengembangan konsep diri yang meliputi: bakat, motivasi dan sikap dalam memilih karir. Data yang terkumpul akan digunakan untuk keperluan analisis studi, dan hasilnya akan dilaporkan dalam tesis dan dipublikasikan melalui tulisan ilmiah pada jurnal dan/atau konferensi.
Sehubungan dengan hal tersebut, saya mohon dukungan Bapak/Ibu untuk berpartisipasi dalam penelitian ini dengan cara mengisi kuesioner yang tersedia. Pengisian kuesioner hanya membutuhkan waktu 20-25 menit. Jawaban Bapak/Ibu akan dijaga kerahasiaannya. Tidak ada data pribadi yang akan diidentifikasi termasuk nama dan universitas di tempat Bapak/Ibu bekerja. Jawaban Bapak/Ibu sangat penting bagi keberhasilan penelitian ini. Oleh karena itu, saya mohon kesediaan Bapak/Ibu untuk mengisi semua pertanyaan dan pernyataan yang terdapat di dalam kuesioner. Dengan mengisi dan mengembalikan kuesioner kepada saya, berarti Bapak/Ibu telah menyatakan kesediaan ikut dalam survei ini. Partisipasi Bapak/Ibu adalah sukarela.
Bapak/Ibu hanya diminta untuk mengisi kuesioner ini ‘sekali’. Jika pengisian dan pengembalian kuesioner telah dilakukan, dimohon untuk tidak mengisinya kembali. Partisipasi Bapak/Ibu pada survei ini sangat saya hargai dan saya ucapkan terima kasih.
Penelitian ini telah disetujui oleh Human Research Ethics Committee, University of Wollongong. Akan tetapi, jika Bapak/Ibu masih mempunyai pertanyaan lanjut sehubungan dengan survei ini, silakan hubungi pembimbing saya: Associate Professor Sam Garrett-Jones (telp.: +61242214359, email: [email protected]) dan Associate Professor Mario Fernando (telp.: +61242214053, email: [email protected]) atau Research Service Office (telp.: +61242213386, faks.: +6142214338, email: [email protected]).
Hormat saya, Meiliani Telp.: +6281298265510 Email: [email protected] Dosen Jurusan Manajemen Universitas Bengkulu
School of Management and Marketing University of Wollongong Northfields Avenue, Wollongong, NSW 2522 Australia Phone: +61 2 4221 3707 Fax: +61 2 4221 4154 Email: smm-‐[email protected]

267
A. Pernyataan-pernyataan di bawah ini menggambarkan pandangan individual Bapak/Ibu yang berkaitan dengan orientasi karir dalam dunia kerja. Skala pilihan dimulai dari 1 = sangat tidak penting sampai 6 = sangat penting. Silahkan merespon dengan cara memberi tanda √ pada satu kotak yang paling sesuai dengan pendapat Bapak/Ibu.
Sangat Sangat tidak penting penting
1 2 3 4 5 6 1. Proses mensupervisi, mempengaruhi, memimpin ☐ ☐ ☐ ☐ ☐ ☐ dan mengontrol orang-orang pada semua tingkat adalah... 2. Kesempatan melakukan sesuatu menurut cara saya ☐ ☐ ☐ ☐ ☐ ☐ sendiri dan tidak dibatasi oleh peraturan organisasi/institusi adalah... 3. Pimpinan yang akan menyediakan rasa aman ☐ ☐ ☐ ☐ ☐ ☐ melalui jaminan pekerjaan, tunjangan, program pensiun yang baik, dll. adalah... 4. Mengerjakan berbagai permasalahan yang hampir ☐ ☐ ☐ ☐ ☐ ☐
tidak memiliki jalan keluarnya adalah… 5. Tetap berada dalam bidang keahlian saya daripada ☐ ☐ ☐ ☐ ☐ ☐ dipromosikan di luar bidang keahlian saya adalah... 6. Terlibat terhadap keseluruhan organisasi/institusi ☐ ☐ ☐ ☐ ☐ ☐ adalah… 7. Suatu karir yang bebas dari batasan aturan ☐ ☐ ☐ ☐ ☐ ☐ organisasi/institusi adalah..... 8. Suatu organisasi/institusi yang akan memberikan ☐ ☐ ☐ ☐ ☐ ☐ saya stabilitas pekerjaan jangka panjang adalah… 9. Menggunakan kemampuan saya untuk membuat ☐ ☐ ☐ ☐ ☐ ☐ dunia lebih baik sebagai tempat tinggal dan bekerja adalah... 10. Mengembangkan karir yang memungkinkan ☐ ☐ ☐ ☐ ☐ ☐
saya untuk terus mengejar gaya hidup saya sendiri adalah… 11. Membangun suatu usaha (bisnis) baru adalah... ☐ ☐ ☐ ☐ ☐ ☐ 12. Tetap berada dalam bidang keahlian saya ☐ ☐ ☐ ☐ ☐ ☐
sepanjang karir saya adalah… 13. Untuk naik ke posisi yang tinggi pada tingkat ☐ ☐ ☐ ☐ ☐ ☐
manajerial umum adalah... 14. Tetap berada dalam satu wilayah geografis ☐ ☐ ☐ ☐ ☐ ☐ daripada pindah ke wilayah lain karena suatu promosi adalah... 15. Mampu menggunakan keahlian dan bakat ☐ ☐ ☐ ☐ ☐ ☐ saya dalam membantu suatu hal yang penting adalah...

268
# Jika Bapak/Ibu mempunyai pendapat lain tentang orientasi kerja, silahkan kemukakan di sini: _______________________________________________________________________________________________________________________________________________________________________________________________________________________________________________________________ B. Pernyataan-pernyataan di bawah ini berhubungan dengan pandangan individual Bapak/Ibu terhadap preferensi karir. Skala pilihan dimulai dari 1 = tidak benar sama sekali sampai 6 = sangat benar. Silahkan memberi tanda √ pada satu kotak yang paling sesuai dengan pendapat Bapak/Ibu.
Tidak benar Sangat sama sekali benar
1 2 3 4 5 6 16. Satu-satunya tantangan nyata dalam karir saya ☐ ☐ ☐ ☐ ☐ ☐
adalah ketika menghadapi dan menyelesaikan masalah sulit dalam segala bidang. 17. Saya selalu mencari ide yang memungkinkan ☐ ☐ ☐ ☐ ☐ ☐
untuk memulai dan membangun usaha (bisnis) sendiri. 18. Lebih penting bagi saya untuk tetap berada pada ☐ ☐ ☐ ☐ ☐ ☐
lokasi geografis kerja sekarang daripada menerima Promosi atau pekerjaan baru di lokasi lain. 19. Suatu karir akan bernilai jika karir tersebut ☐ ☐ ☐ ☐ ☐ ☐ memungkinkan saya untuk menjalankan hidup dengan cara saya sendiri. 20. Saya akan menerima posisi managerial jika ☐ ☐ ☐ ☐ ☐ ☐
sesuai dengan bidang keahlian saya. 21. Saya tidak ingin dibatasi oleh organisasi/ ☐ ☐ ☐ ☐ ☐ ☐ institusi atau dunia bisnis dalam berkarir. 22. Saya menginginkan karir di mana saya terikat ☐ ☐ ☐ ☐ ☐ ☐ dan mengabdi pada suatu hal yang penting. 23. Saya merasa berhasil jika saya ditantang terus ☐ ☐ ☐ ☐ ☐ ☐ menerus oleh masalah yang rumit atau situasi yang kompetitif. 24 Memilih dan mempertahankan suatu gaya ☐ ☐ ☐ ☐ ☐ ☐ hidup tertentu adalah lebih penting daripada suatu karir yang berhasil. 25. Saya selalu berkeinginan memulai dan ☐ ☐ ☐ ☐ ☐ ☐ membangun bisnis saya sendiri. # Jika Bapak/Ibu mempunyai pendapat lain tentang preferensi karir, silahkan kemukakan di sini: _______________________________________________________________________________________________________________________________________________________________________________________________________________________________________________________________
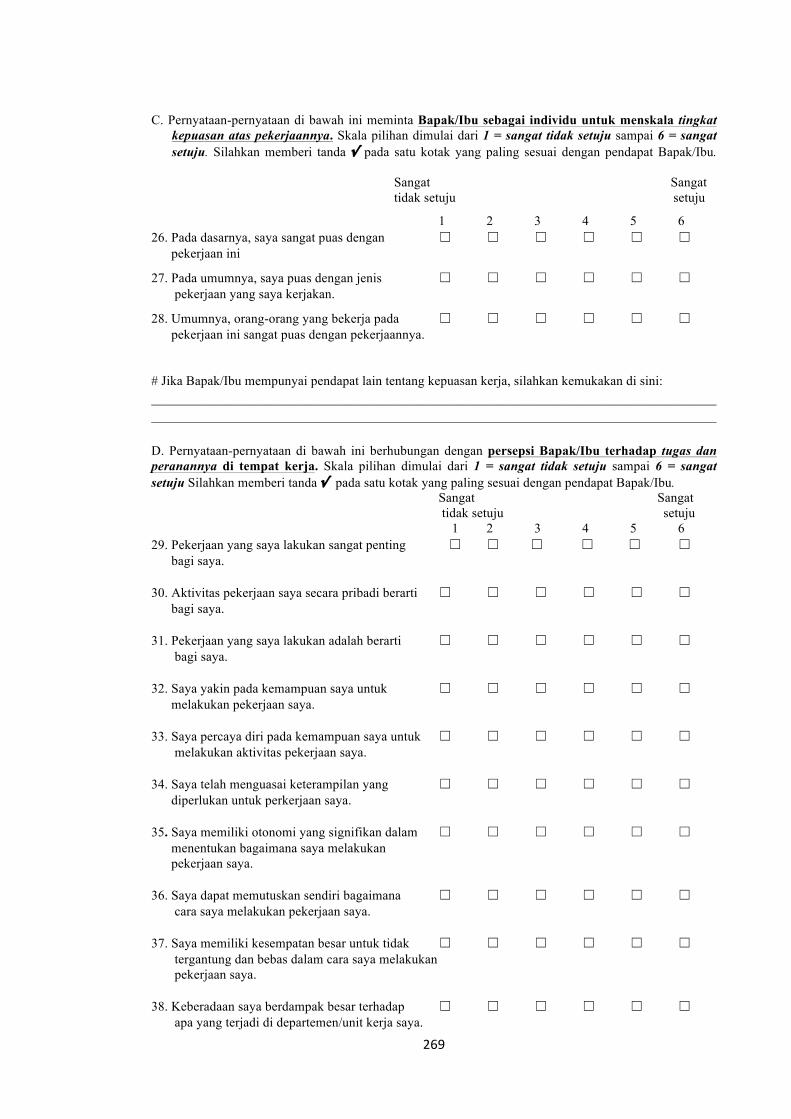
269
C. Pernyataan-pernyataan di bawah ini meminta Bapak/Ibu sebagai individu untuk menskala tingkat kepuasan atas pekerjaannya. Skala pilihan dimulai dari 1 = sangat tidak setuju sampai 6 = sangat setuju. Silahkan memberi tanda √ pada satu kotak yang paling sesuai dengan pendapat Bapak/Ibu. Sangat Sangat
tidak setuju setuju
1 2 3 4 5 6 26. Pada dasarnya, saya sangat puas dengan ☐ ☐ ☐ ☐ ☐ ☐ pekerjaan ini
27. Pada umumnya, saya puas dengan jenis ☐ ☐ ☐ ☐ ☐ ☐ pekerjaan yang saya kerjakan.
28. Umumnya, orang-orang yang bekerja pada ☐ ☐ ☐ ☐ ☐ ☐ pekerjaan ini sangat puas dengan pekerjaannya.
# Jika Bapak/Ibu mempunyai pendapat lain tentang kepuasan kerja, silahkan kemukakan di sini: __________________________________________________________________________________________________________________________________________________________________________ D. Pernyataan-pernyataan di bawah ini berhubungan dengan persepsi Bapak/Ibu terhadap tugas dan peranannya di tempat kerja. Skala pilihan dimulai dari 1 = sangat tidak setuju sampai 6 = sangat setuju Silahkan memberi tanda √ pada satu kotak yang paling sesuai dengan pendapat Bapak/Ibu.
Sangat Sangat tidak setuju setuju
1 2 3 4 5 6 29. Pekerjaan yang saya lakukan sangat penting ☐ ☐ ☐ ☐ ☐ ☐ bagi saya. 30. Aktivitas pekerjaan saya secara pribadi berarti ☐ ☐ ☐ ☐ ☐ ☐ bagi saya. 31. Pekerjaan yang saya lakukan adalah berarti ☐ ☐ ☐ ☐ ☐ ☐ bagi saya. 32. Saya yakin pada kemampuan saya untuk ☐ ☐ ☐ ☐ ☐ ☐ melakukan pekerjaan saya. 33. Saya percaya diri pada kemampuan saya untuk ☐ ☐ ☐ ☐ ☐ ☐ melakukan aktivitas pekerjaan saya. 34. Saya telah menguasai keterampilan yang ☐ ☐ ☐ ☐ ☐ ☐ diperlukan untuk perkerjaan saya. 35. Saya memiliki otonomi yang signifikan dalam ☐ ☐ ☐ ☐ ☐ ☐ menentukan bagaimana saya melakukan pekerjaan saya. 36. Saya dapat memutuskan sendiri bagaimana ☐ ☐ ☐ ☐ ☐ ☐ cara saya melakukan pekerjaan saya. 37. Saya memiliki kesempatan besar untuk tidak ☐ ☐ ☐ ☐ ☐ ☐ tergantung dan bebas dalam cara saya melakukan pekerjaan saya. 38. Keberadaan saya berdampak besar terhadap ☐ ☐ ☐ ☐ ☐ ☐ apa yang terjadi di departemen/unit kerja saya.

270
39. Saya memiliki kontrol yang besar atas apa yang ☐ ☐ ☐ ☐ ☐ ☐ terjadi di departemen/unit kerja saya. 40. Saya memiliki pengaruh yang signifikan atas ☐ ☐ ☐ ☐ ☐ ☐ apa yang terjadi di departemen/unit kerja saya. # Jika Bapak/Ibu mempunyai pendapat lain tentang tugas dan peranannya di tempat kerja, silahkan kemukakan di sini: __________________________________________________________________________________________________________________________________________________________________________ E. Opini sendiri 1. Faktor-faktor apa saja yang mempengaruhi motivasi karir internal Bapak/Ibu?
_________________________________________________________________________________________________________________
___________________________________________________________________________________________________________
2. Seberapa besar institusi/organisasi sekarang mendukung motivasi karir internal Bapak/Ibu? (Mohon penjelasan)
__________________________________________________________________________________________________________________________________________________________________________
Informasi Demografi
1. Status pekerjaan Bapak/Ibu pada institusi/organsiasi ini: ☐ Kontrak ☐ CPNS ☐ PNS ☐ Dosen Swasta ☐ Lainnya (sebutkan)____ 2. Jenis kelamin Bapak/Ibu: ☐ Perempuan ☐ Pria 3. Tahun Bapak/Ibu menyelesaikan kuliah S1 (Sarjana): (sebutkan)______________________________ 4. Jurusan bidang keahlian Bapak/Ibu saat S1: (sebutkan)______________________________________ 5. Jenjang pendidikan tertinggi yang diperoleh Bapak/Ibu: (sebutkan)____________________________ 5a. Di mana Bapak/Ibu memperoleh gelar pendidikan tersebut? ☐ Indonesia ☐ Negara lain (sebutkan)_ 6. Berapa lama Bapak/Ibu bekerja pada perguruan tinggi ini?_______Tahun _______ Bulan 7. Tipe perguruan tinggi tempat Bapak/Ibu bekerja: ☐ PTN ☐ PTS ☐ Lainnya (sebutkan) _______ 8. Jumlah mahasiswa di perguruan tinggi Bapak/Ibu: ☐ <5.000 ☐ 5.000-10.000 ☐ >10.000 9. Jabatan struktural/managerial yang diduduki saat ini: (Sebutkan)______________________________ 10. Jabatan fungsional akademik terakhir Bapak/Ibu: ☐ Asisten Ahli ☐ Lektor ☐ Lektor Kepala ☐ Profesor ☐ Lainnya (sebutkan)_______ 11. Usia Bapak/Ibu saat ini: ☐ ≤25 thn. ☐ 26-35 thn. ☐ 36-45 thn. ☐ 46-55 thn. ☐ ≥56 thn. 12. Status pernikahan Bapak/Ibu: ☐ Lajang ☐ Menikah ☐ Lainnya (sebutkan) _________ 13. Etnis Bapak/Ibu: (Sebutkan) __________________________________________________________ 14. Agama yang diyakini Bapak/Ibu: ☐Buddha ☐Hindu ☐Islam ☐Katolik ☐Kong Hu Chu ☐ Protestan ☐ Lainnya (sebutkan)______________
Terima kasih atas partisipasi dan kerjasama Bapak/Ibu.

271
Appendix 6: Interview protocol of career anchors (English version)
Questions: 1. First Job. What was your first real job after your education?
What were you looking for in your first job? Why did you make that choice?
2. Goals. What were your ambitions or long-range goals when you started your career? How did the first job work out in terms of your goals?
3. Next job. What was your next major change in your job or career? Who initiated the change? What were the reasons? How did you feel about the change? How did it relate to your goals?
4. As you look back over your career and life so far, do you see any major transition points, times when the change seemed more than routine?
What was the transition? Who initiated it?
How do you feel? How did it relate to your goals?
5. As you look back over your career and life so far, can you describe some times that you especially enjoyed or do not enjoy?
What was it about those times that made them enjoyable or do not enjoy? 6. Have you ever refused a job or promotion? If yes, why did you refuse it?
As you look ahead in your career, are there things you avoid or afraid of? What makes you avoid them or afraid of them?
7. Have your ambitions or long-range goals change since you started your career? When? Why?
8. What do you think will actually happen in the next ten years of your career? What are you really good at?
9. Do you have any comments about yourself that you would like to make? Source: Schein (2006a, pp. 38-55).

272
Interview protocol – Indonesian version
Daftar pertanyaan untuk wawancara 1. Perkerjaan pertama kali. Apakah pekerjaan Bapak/Ibu setelah lulus kuliah S1?
Apa yang Bapak/Ibu cari pada pekerjaan tersebut? Mengapa Bapak/Ibu membuat keputusan tersebut?
2. Tujuan. Apakah tujuan jangka panjang ketika Bapak/Ibu memulai karir? Bagaimana hasil pekerjaan pertama terhadap tujuan tersebut?
3. Pekerjaan berikutnya. Perubahan besar apa pada karir Bapak/ibu berikutnya? Siapa yang berinisiatif? Apa alasannya? Bagaimana perasaan Bapak/Ibu terhadap perubahan tersebut? Bagaimana perubahan tersebut jika dihubungkan dengan tujuannya?
4. Jika Bapak/Ibu merefleksikan karirnya kembali, apakah Bapak/Ibu melihat poin pokok perubahan transisi? [waktu ketika perubahan kelihatannya lebih sebagai rutinitas?]
Apakah transisi tersebut? Siapa yang berinisistif? Bagaimana perasaan Bapak/Ibu terhadap perubahan tersebut? Bagaimana perubahan tersebut jika dihubungkan dengan tujuannya?
5. Jika Bapak/Ibu merefleksikan karir kembali, dapatkah Bapak/Ibu menjelaskan kapan waktunya menikmati/tidak menikmati karir tersebut?
Apakah peristiwa tersebut yang membuat Bapak/Ibu menikmati/tidak menikmati karir tersebut?
6. Pernahkah Bapak/Ibu menolak suatu pekerjaan atau promosi? Jika ya, mengapa? Jika Bapak/Ibu melihat ke depan, apakah ada yang dihindari/ditakutkan? Apakah yang membuat Bapak/Ibu menghindarinya?
7. Sudahkah tujuan jangka panjang Bapak/Ibu berubah sejak permulaan?
Kapan? Mengapa? 8. Apa yang Bapak/Ibu pikirkan akan terjadi dengan karirnya dalam 10 tahun
mendatang? 9. Apakah Bapak/Ibu mempunyai pendapat tentang diri sendiri terhadap karir yang
dijalankan?

273
Appendix 7: University samples
Region Institutional Approach Individual approach
West University A (L) University G (L) University B (M) University H (M) University C (M) University I (M) University D (L) University J (L)
University K (L)
Central University E (L) University L (S) University M (M) University N (M)
East University F (M) L = Large size; M = Medium-sized; S = Small size

274
Appendix 8: Missing values examination of the measurement
Statistics
Career anchors N N
Valid Missing Valid Valid Missing
Managerial competence 1 585 0 Job satisfaction 1 585 0
Managerial competence 2 585 0 Job satisfaction 2 585 0
Managerial competence 3 585 0 Job satisfaction 3 585 0
Autonomy 1 585 0 Meaning 1 585 0
Autonomy 2 585 0 Meaning 2 585 0
Autonomy 3 585 0 Meaning 3 585 0
Economic Security 1 585 0 Competence 1 585 0
Economic security 2 585 0 Competence 2 585 0
Pure challenge 1 585 0 Competence 3 585 0
Pure challenge 2 585 0 Self-determination 1 585 0
Pure challenge 3 585 0 Self-determination 2 585 0
Technical competence 1 585 0 Self-determination 3 585 0
Technical competence 2 585 0 Impact 1 585 0
Technical competence 3 585 0 Impact 2 585 0
Service 1 585 0 Impact 3 585 0
Service 2 585 0 Job satisfaction 1 585 0
Service 3 585 0
Entrepreneurship 1 585 0
Entrepreneurship 2 585 0
Entrepreneurship 3 585 0
Geographic stability 1 585 0
Geographic stability 2 585 0
Lifestyle 1 585 0
Lifestyle 2 585 0
Lifestyle 3 585 0

275
Appendix 9: Demographic background information of respondents
Description ∑ % Description ∑ %
Year of first degree completion Marital status 1990 and before 250 42.74 Married 519 88.72 1991 to 2000 159 27.18 Single 56 9.57 2001 and after 79 13.50 Others 6 1.03 Total 488 83.42 Total 581 99.32 First degree major Functional titles Plant sciences 129 22.05 Assistant lecturer 86 14.70 Economics 83 14.19 Lecturer 193 32.99 Engineering 78 13.33 Senior lecturer 273 46.67 Education 70 11.97 Professor 33 5.64 Mathematics & Natural sciences 68 11.62 Total 585 100.00 Social sciences & Humanities 51 8.72 Managerial position Health science 49 8.38 Vice Rector 5 0.85 Language 17 2.91 Dean 12 2.05 Religion & Philosophy 16 2.74 Vice Dean 19 3.25
Animal science 11 1.88 Head of School/Department 87 14.87
Art, Design & Media 9 1.54 Head of Postgraduate Studies 8 1.37
Medicine 3 0.51 Head of Unit 27 4.62 Total 584 99.83 Total 158 27.01 Place of study Ethnicity Indonesia 434 74.19 Javanese 176 30.09 United States 48 8.21 Malay 66 11.28 Australian 34 5.81 Minangkabau 50 8.55 Japan 11 1.88 Ambonese 32 5.47 Philippines 10 1.71 Balinese 23 3.93 France 8 1.37 Batak 19 3.25 Malaysia 8 1.37 Sundanese 17 2.91 United Kingdom 6 1.03 Bugis 12 2.05 Germany 6 1.03 Acehnese 11 1.88 Canada 5 0.85 Chinese 7 1.20 Netherland 4 0.68 Banjar 4 0.68 New Zealand 3 0.51 Flores 3 0.51 Others 8 1.37 Toraja 3 0.51 Total 585 100.00 Others 2 0.34 Religion Total 425 72.65 Islam 442 75.56 Protestant 79 13.50 Hinduism 29 4.96 Catholic 15 2.56 Buddhism 2 0.34 Total 567 96.92
*Frequency **Percentage

276
Appendix 10: Scree plot of the scale

277
Appendix 11: Correlation matrix
**Correlation is significant at the 0.01 level (2-tailed)
F1=factor1, F2=Factor2, EN=Entrepreneurship, SV=Service, MC=Managerial competence, PC=Pure challenge, ES=Economic security, MN=Meaning, IP=Impact, CP=Competence, SD=Self-determination, JS=Job satisfaction
Appendix 12: Bivariate correlation of career anchors
Correlations
WD BLS EN SV MC PC ES WD Pearson Correlation 1 BLS Pearson Correlation -.055 1
Sig. (2-tailed) .188
EN Pearson Correlation .279** .023 1 Sig. (2-tailed) .000 .586
SV Pearson Correlation .117** .087* -.048 1 Sig. (2-tailed) .005 .036 .245
MC Pearson Correlation .025 .045 .090* .222** 1 Sig. (2-tailed) .539 .272 .030 .000
PC Pearson Correlation .144** .202** .170** .168** .122** 1 Sig. (2-tailed) .000 .000 .000 .000 .003
ES Pearson Correlation .025 .161** .028 .136** .071 .142** 1 Sig. (2-tailed) .545 .000 .498 .001 .086 .001
**. Correlation is significant at the 0.01 level (2-tailed). *. Correlation is significant at the 0.05 level (2-tailed).
WD=Work dedication, BLS=Balanced-lifestyle, EN=Entrepreneurship, SV=Service, MC=Managerial competence, PC=Pure challenge, ES=Economic security
F1 F2 EN SV MC PC ES MN IP CP SD JS F1 1 F2 -.055 1 EN .279** .023 1 SV .117** .087* -.048 1 MC .025 .045 .090* .222** 1 PC .144** .202** .170** .168** .122** 1 ES .025** .161** .028 .136** .071 .142** 1 MN .371** -.063 .249** .272** .211** .160** .045 1 IP .231** -.024 .186** .153** .348** .120** .025 .288** 1 CP .007 .110** .110** .263** .197** .078 .131** .456** .171** 1 SD .219** .327** .235** .202** .177** .162** .110** .320** .354** .326** 1 JS .391** -.057 .179** .171** .235** .246** .069 .460** .294** .247** .226** 1 Mean 4.017 3.772 4.070 4.930 4.460 3.858 5.184 5.218 4.077 5.363 4.523 4.421 SD 1.119 .994 1.163 .897 1.058 1.05 1.047 .785 1.207 .647 .888 .843

278
Appendix 13: Q-Q normal plot
Work dedication Balanced-lifestyle
Entrepreneurial creativity Pure challenge
Managerial competence Economic security
Meaning Impact
Self-determination Job satisfaction

279
Appendix 14: Mahalanobis distance scores
Career anchors and job satisfaction relationship, career anchors and psychological empowerment relationship
Minimum Maximum Mean Std. Deviation N
Std. Predicted Value -3.313 2.577 .000 1.000 585
Mahal. Distance 3.295 39.827 11.979 6.269 585
Psychological empowerment and job satisfaction relationship
Minimum Maximum Mean Std. Deviation N
Std. Predicted Value -4.208 1.752 .000 1.000 585
Mahal. Distance 2.736 47.127 8.985 4.922 585
Career anchors, psychological empowerment and job satisfaction relationship
Minimum Maximum Mean Std. Deviation N
Std. Predicted Value -4.333 2.182 .000 1.000 585
Mahal. Distance 4.676 59.937 15.973 8.012 585
Moderators
Minimum Maximum Mean Std. Deviation N
Std. Predicted Value -4.208 1.752 .000 1.000 585
Mahal. Distance 2.736 47.127 8.985 4.922 585
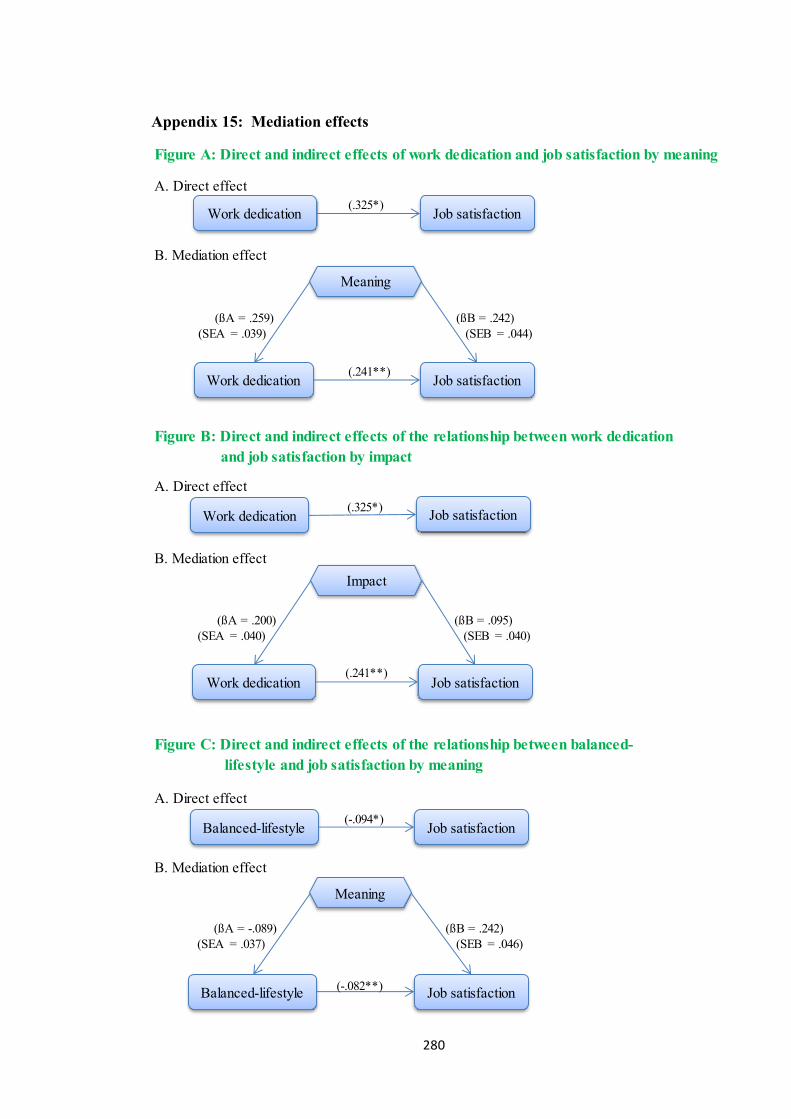
280
Appendix 15: Mediation effects
Figure A: Direct and indirect effects of work dedication and job satisfaction by meaning
A. Direct effect
B. Mediation effect
Figure B: Direct and indirect effects of the relationship between work dedication and job satisfaction by impact
A. Direct effect
B. Mediation effect
A. Direct effect
B. Mediation effect
Figure C: Direct and indirect effects of the relationship between balanced- lifestyle and job satisfaction by meaning
(ßA = .259) (ßB = .242)(SEA = .039) (SEB = .044)
Work dedication Job satisfaction
Work dedication
Work dedication
Work dedication
Job satisfaction
Job satisfaction
Job satisfaction
Job satisfaction
Job satisfaction
Meaning
Meaning
(.325*)
(.241**)
Impact
(ßA = .200) (ßB = .095)(SEA = .040) (SEB = .040)
(.325*)
(.241**)
Balanced-lifestyle
Balanced-lifestyle
(-.094*)
(ßA = -.089) (ßB = .242)(SEA = .037) (SEB = .046)
(-.082**)

281
A. Direct effect
B. Mediation effect
Figure E: Direct and indirect effects of the relationship between managerial competence and job satisfaction by impact
A. Direct effect
B. Mediation effect
Figure F: Direct and indirect effects of the relationship between managerial competence and job satisfaction by competence
A. Direct effect
B. Mediation effect
competence and job satisfaction by meaningFigure D: Direct and indirect effects of the relationship between managerial
Job satisfactionManagerial competence
Job satisfaction
Meaning
(.189*)
Managerial competence
(ßA = .139) (ßB = .242)(SEA = .037) (SEB = .046)
(.113**)
Job satisfactionManagerial competence
Job satisfaction
Impact
(.189*)
Managerial competence
(ßA = .306) (ßB = .095)(SEA = .038) (SEB = .040)
(.113**)
Job satisfactionManagerial competence
Job satisfaction
Competence
(.189*)
Managerial competence
(ßA = .113) (ßB = .096)(SEA = .040) (SEB = .042)
(.113**)

282
Figure G: Direct and indirect effects of the relationship between pure challenge and job satisfaction by meaning
A. Direct effect
B. Mediation effect
Job satisfaction
Job satisfaction
Meaning
Pure challenge
Pure challenge
(.182*)
(ßA = .075) (ßB = .242)(SEA = .038) (SEB = .046)
(-.082**)

283
App
endi
x 16
: R
espo
nses
of
inte
rnal
mot
ivat
ion
fact
ors
(Q1)
Mac
roM
icro
Aca
dem
ic
atm
osph
ere
Sup
port
ive
wor
k en
viro
nmen
t, se
nse
of t
oget
hern
ess
amon
g co
lleag
ues,
col
legi
ality
, tea
m w
ork,
sha
ring
kn
owle
dge,
wor
k cl
imat
e.
1, 3
-9, 4
, 8-9
, 9, 9
-9, 1
0-9,
11,
11-
9, 1
3-9,
17,
18,
20,
22-
9, 2
6, 2
7-9,
28
, 37,
40, 4
1, 4
2, 5
0, 5
3, 5
6-9,
61,
64-
9, 7
2-9,
81-
9, 8
8-9,
95-
9, 1
06-
9, 1
27-9
, 141
, 143
, 145
, 153
-9, 1
67, 1
71, 1
83, 1
86, 1
95, 2
04, 2
09,
211,
215
, 234
, 236
, 240
, 244
, 255
,256
, 257
, 26
2, 2
63, 2
64, 2
77,
296,
301
, 366
, 379
, 381
, 383
, 396
, 413
= 6
4 (9
.47%
).
Bal
anci
ng w
ork
life
Fam
ily, s
uppo
rt f
rom
ext
ende
d fa
mily
, fam
ily a
nd w
ork
shou
ld h
ave
the
sam
e pr
iori
ty.
9, 1
5-9,
17,
20-
9, 2
1-9,
26,
26-
9, 2
7, 2
7-9,
44,
53,
61,
63,
64,
64-
9,
73, 1
88-9
, 06-
9, 1
12-9
, 127
-9, 1
32-9
, 142
, 155
-9, 1
63-9
, 167
, 171
, 17
8, 1
84, 2
00, 2
15, 1
9, 2
04, 2
44, 2
72,
278,
291
, 301
, 340
, 347
, 355
, 35
9, 3
64, 3
66, 3
71, 3
81, 4
00, 4
12 =
47
(6.9
5%).
Rec
ogni
tion
App
reci
atio
n of
har
d w
ork,
rep
utat
ion,
rec
ogni
tion
of
perf
orm
ance
.2,
9, 9
-9, 1
4-9,
20-
9, 2
2-9,
26-
9, 3
0-9,
38,
42-
9, 5
0, 5
2, 5
5-9,
66,
74,
74
-9, 8
2, 8
3-9,
99,
106
-9, 1
19-9
, 135
-9, 1
44, 1
50, 1
54, 1
54-9
, 162
-9,
183,
185
, 217
, 227
, 245
, 249
, 253
, 256
, 257
, 291
, 309
, 332
, 336
, 38
7, 3
99, 4
11 =
43
(6.3
6%).
Soc
ial o
rien
tatio
n
Inte
ntio
n to
ser
ve t
he c
omm
unity
, int
entio
n to
be
bett
er,
inte
ntio
n to
be
a ro
le m
odel
for
stu
dent
, int
entio
n to
su
ccee
d, m
eani
ngfu
l for
oth
ers.
2-9,
4, 5
, 15-
9, 1
6-9,
18-
9, 1
9-9,
21-
9, 2
4-9,
26-
9, 4
4, 4
7, 5
3, 6
4-9,
66
, 72-
9, 7
3, 7
7, 1
27-9
, 153
, 155
-9, 1
67, 1
72, 2
04, 2
29, 2
83, 3
29,
344,
362
, = 2
9 (4
.29%
).
Man
ager
ial
orie
ntat
ion
Inte
ntio
n to
ded
icat
e m
ysel
f to
inst
itutio
n, in
tent
ion
to
achi
eve
the
inst
itutio
n’s
visi
on.
3, 1
9-9,
20-
9, 2
1, 2
3-9,
52,
92-
9, 1
56-9
, 211
, 213
, 263
, 291
, 313
=
13 (
1.92
%).
Mot
ivat
ion
and
Goa
l-or
ient
edS
elf-
intr
insi
c m
otiv
atio
n, s
elf-
deve
lopm
ent,
inte
nd t
o de
velo
p kn
owle
dge;
life
is a
pos
itive
cha
nge,
rea
l hop
e,
pers
onal
tar
get,
real
istic
goa
ls, t
o ac
hiev
e m
y am
bitio
ns.
1, 3
, 14,
16,
36-
9, 5
0, 5
4, 6
1, 7
2-9,
77,
80-
9, 1
36-9
, 145
, 154
-9, 1
60,
161-
9, 2
72, 1
93, 2
12, 2
39, 2
83, 3
36, 3
87, 3
89, 1
5-9,
18-
9, 2
0-9,
21-
9, 3
9, 4
6, 1
07-9
, 136
-9, 1
41-9
, 194
, 236
, 372
, 411
, 412
= 3
8 (5
.62%
)
Per
sona
l in
tegr
ityA
ccom
plis
hmen
t, ac
hiev
emen
t, se
lf-a
ctua
lisat
ion,
ca
pabi
lity,
per
sona
l abi
lity,
ski
lls, c
onfi
denc
e, e
duca
tiona
l qu
alif
icat
ion,
exp
erie
nce,
fie
ld t
rain
ing
-rel
ated
, ex
tens
ive
know
ledg
e, d
ecis
ion
mak
ing,
inte
ntio
n to
de
velo
p ta
lent
s, p
erso
nal i
nteg
rity
, per
sona
lity,
hon
esty
, lik
es a
nd d
islik
es, d
isci
plin
e, t
rust
.
24, 8
2, 1
06-9
, 149
, 155
-9, 1
50, 1
55-9
, 183
, 234
, 13,
13-
9, 1
4-9,
52,
77
, 23-
9, 2
4, 2
6, 3
8, 5
6-9,
71,
74,
82-
9, 8
3,21
1, 2
13, 2
36, 2
44, 2
45,
246,
247
, 305
, 339
, 383
, 400
, 401
, 1, 2
, 3, 1
5, 1
5-9,
17-
9, 2
0-9,
22-
9,
28-9
, 36,
37,
37-
9, 4
7-9,
83-
9, 1
12-9
, 131
-9, 1
32-9
, 149
, 155
-9, 1
68-
9, 1
92, 1
99, 1
60-9
, 177
, 178
, 184
, 186
, 192
, 213
, 253
, 274
, 311
, 334
, 35
6, 3
59, 3
66, 3
73, 3
79, 4
04, 4
09, 1
3-9,
26,
27-
9, 2
8, 3
3-9,
34,
35,
53
, 55-
9, 6
3, 6
6, 8
3-9,
132
-9, 1
44, 1
64, 2
34, 2
44, 2
46, 2
72, 3
46=
95
(14.
05%
).
Cre
ativ
ityF
reed
om o
f ex
pres
sion
, opp
ortu
nity
to
expr
ess
new
id
eas,
inno
vatio
n, c
reat
ivity
.7-
9, 1
5-9,
22-
9, 2
3-9,
34,
38-
9, 4
0-9,
44-
9, 5
1, 6
6-9,
67-
9, 7
2-9,
75-
9, 8
0-9,
81,
81-
9, 9
3-9,
96-
9, 1
08-9
, 111
-9, 1
32-9
, 160
-9, 1
63-9
, 19
0, 2
00, 2
02, 2
34, 3
11, 3
18, 3
55, 3
60, 7
, 8-9
, 10-
9, 1
2, 3
4, 3
8-9,
40
, 78,
360
, 379
= 4
1 (6
.06%
).
Bei
ng a
lead
er
Em
ploy
ers’
att
entio
n, a
ttitu
de o
f th
e le
ader
, lea
der’
s su
ppor
t, le
ader
as
a ro
le m
odel
.4,
9, 9
-9, 1
9-9,
20,
20-
9, 2
8, 3
2, 4
4, 5
6, 5
8-9,
64,
76,
79-
9, 1
36-9
, 16
2-9,
178
, 180
, 209
, 234
, 244
, 264
, 283
, 286
, 363
, 400
, 410
= 2
7 (3
.99%
).
Lov
ing
of jo
b, c
arin
g at
mos
pher
e, h
appi
ness
, pos
itive
fe
el, e
njoy
my
wor
k, h
appy
wor
k lif
e, p
sych
olog
ical
ly
happ
y, jo
b sa
tisfa
ctor
y, h
olid
ays.
3-9,
10-
9, 1
1, 1
1-9,
14,
20,
21-
9, 2
2, 2
3-9,
30-
9, 3
1-9,
42,
44,
46,
48,
51
, 55-
9, 6
3-9,
85-
9, 9
2, 1
06-9
, 111
, 134
-9, 1
45, 1
73-9
, 177
, 200
, 20
4, 2
77, 2
86, 3
79, 3
99, 4
00 =
33
(4.8
8%).
Th
em
es
Su
mm
ary
of
sho
rt p
hra
ses
Co
de
Per
sona
l bi
as
Internal orientation
Hap
pine
ss

284
Man
ager
ial
attit
ude
The
read
ines
s of
org
anisa
tion
to c
ontin
ue to
lear
n an
d in
nova
te, o
rgan
isatio
nal c
ultu
re, f
air p
lay,
tran
spar
ent
info
rmat
ion,
ope
nnes
s, op
ens
man
agem
ent.
17-9
, 32-
9, 1
, 13,
13-
9, 2
6-9,
34,
35,
40,
44,
56-
9, 1
36-9
, 143
, 163
-9,
185,
245
, 247
, 318
, 341
, 355
, 381
=
21 (3
.55%
).
Spiri
tual
val
ues
Und
erst
andi
ng o
f rel
igio
n, w
orki
ng is
relig
ious
obl
igat
ion
for M
uslim
s, fa
ith, d
oing
you
r wor
k ba
sed
on re
ligio
us
teac
hing
s, re
war
d at
the
end
of li
fe, d
estin
y, in
tent
ion
to
achi
eve
relig
ious
com
man
d.
2, 4
, 7, 4
2, 5
3, 5
5-9,
85-
9, 1
53, 1
55, 1
97, 2
19, 2
71, 2
73, 2
83, 2
85,
363,
409
, 411
, 413
= 1
9 (2
.81%
).
Car
eer a
ppro
ach
Opp
ortu
nity
to d
o ca
reer
dev
elop
men
t, de
sire
to g
ain
chan
ces,
futu
re s
tudy
opp
ortu
nity
.3-
9, 4
, 13,
13-
9, 1
4-9,
15-
9, 1
7-9,
22,
22-
9, 3
3-9,
150
, 190
, 192
, 195
, 20
0, 2
91, 3
72, 3
39, 3
40 =
19
(2.8
1%).
Secu
rity
conc
ern
Futu
re li
fe, p
ensio
n, c
erta
inty
of f
utur
e, h
ealth
insu
ranc
e,
finan
cial
ly s
ecur
e.2,
5, 2
2, 2
2-9,
26-
9, 3
0-9,
37,
51,
78,
82,
157
, 186
, 195
, 240
, 268
, 33
4 =
16 (2
.37%
).
Cha
lleng
ing
Com
plic
ated
pro
blem
s, w
ork
chal
leng
e, s
ucce
ss in
ov
erco
min
g pr
oble
ms,
com
petit
ion
amon
g sc
ient
ists
in
the
wor
ld, a
bilit
y to
com
pete
, tea
chin
g is
an im
porta
nt
chal
leng
e, p
ublic
atio
ns a
re a
cha
lleng
e to
reac
h a
high
er
acad
emic
rank
.
24, 3
7, 4
2, 4
4, 1
44, 1
52, 1
86, 2
50, 2
65, 2
69, 2
76, 2
91, 2
94, 3
09, 3
39
= 15
(2.2
2%).
Flex
ibilit
yFl
exib
ility
in s
ettin
g th
e w
ork
sche
dule
, fle
xibi
lity
in th
e w
orkp
lace
: eith
er a
t uni
vers
ity o
r at h
ome.
21-9
, 22,
44,
49-
9, 5
1-9,
58,
60-
9, 7
9-9,
154
-9, 1
62-9
, 204
, 209
, 318
, 34
5, 3
52 =
15
(22%
).
Fina
ncia
l rew
ard
and
supp
ort
Sala
ry, i
ncen
tive,
com
pens
atio
n, b
onus
, fee
, nee
d m
oney
to
gro
w m
y ca
reer
.3-
9, 2
6-9,
37,
44,
46,
74,
81-
9, 1
35-9
, 226
, 240
, 253
, 264
, 272
, 360
, 36
2, 4
00, 4
, 9-9
, 22-
9, 2
3-9,
26,
30-
9, 3
2, 3
7, 3
8, 4
0-9,
41,
42,
48,
51
, 68,
72-
9, 8
0, 8
8-9,
127
-9, 1
39-9
, 141
, 143
, 144
, 150
, 154
-9, 1
62-
9, 1
67, 1
80, 1
85, 1
92, 1
95, 2
11, 2
34, 2
53, 2
68, 2
77, 2
78, 2
91, 3
32,
369,
375
, 185
, 283
, 333
= 5
9 (1
4.64
%).
Car
eer
arra
ngem
ent
Car
eer p
aths
sys
tem
, aca
dem
ic ra
nk re
quire
men
ts,
rese
arch
and
pub
licat
ions
, con
siste
ncy
of s
elf-
com
pete
nce
(line
arity
), ca
reer
con
tinui
ty.
7, 1
0-9,
13-
9, 2
4, 2
7-9,
31-
9, 4
0, 4
0-9,
41,
56,
62,
69-
9, 7
5-9,
78-
9,
81-9
, 161
-9, 1
95, 2
17, 1
65, 2
63, 2
71, 2
83, 2
86, 2
93, 2
96, 2
99, 3
00,
322,
324
, 354
, 355
, 353
, 360
= 3
3 (4
.88%
).
Org
anisa
tiona
l ar
rang
emen
tW
orkl
oad,
type
of w
ork,
job
desc
riptio
ns, m
anag
eria
l po
sitio
ns, s
truct
ural
leve
ls, a
dvan
ced
tech
nolo
gy fo
r te
achi
ng m
edia
& re
sear
ch, t
each
ing
aid,
labo
rato
ry
equi
pmen
t, go
vern
men
t pol
icie
s or
rule
s, un
iver
sity
regu
latio
n.
12-9
, 17,
19-
9, 3
4, 4
3, 7
8, 8
8-9,
112
, 141
, 143
, 171
, 253
, 32-
9, 8
2,
96-9
, 99,
133
-9, 2
68, 2
93, 3
09, 3
46, 3
, 5, 8
-9, 9
, 13,
13-
9, 1
4-9,
26,
32
, 38,
66,
106
-9, 1
32-9
, 152
, 163
-9, 2
12, 2
15, 2
44, 2
77, 3
55, 3
73,
37, 7
5, 1
92, 2
56 =
49
(7.2
5%).
External orientation
Org
anisa
-tio
nal
bias

285
Res
pons
esC
ode
Res
pons
esCo
de...
aver
age.
..bec
ause
eac
h in
divi
dual
has
an
equ
al o
ppor
tuni
ty.
293
= 1
(.22%
)
Uni
vers
ity g
ives
cha
nces
to e
xpan
d m
y ca
reer
.15
3, 5
4, 1
95, 2
53, 2
73, 3
00,
329,
344
= 8
(1.7
3%)
Inst
itutio
n pr
ovid
es m
e th
e op
portu
nity
to
impr
ove
my
skills
via
rese
arch
, tra
inin
gs,
etc.
(287
)(12
5, 1
55, 2
22, 2
87,
307,
320
, 322
, 324
, 328
, 339
, 34
1, 3
52, 3
87, 3
99) =
15
(3.2
5%)
...te
achi
ng is
fully
sup
porte
d.
(322
) = 1
(.22
%)
I fee
l tha
t the
wor
king
clim
ate
curr
ently
le
ads
me
to fo
rmal
ism o
r mor
e bu
reau
crat
ic m
anag
emen
t.
(48-
9) =
1 (.
22%
)W
ork
clim
ate
does
not
rein
forc
e ac
adem
ics
to e
xcel
in w
ritin
g ar
ticle
s fo
r pub
licat
ion.
(8-9
) = 1
(.22
%)
Uni
vers
ity is
tryi
ng to
cre
ate
a co
nduc
ive
wor
king
env
ironm
ent t
o in
crea
se a
cade
mic
pro
duct
ivity
.
(13-
9)(4
4, 2
11) =
3 (.
65%
)C
urre
ntly
it te
nds
to h
ave
a ne
gativ
e co
mpe
titio
n; p
erso
nal v
irtue
is n
o lo
nger
to b
e a
refe
renc
e in
aca
dem
ic
life.
(23)
= 1
(.22
%)
My
inst
itutio
n fo
ster
s a
posit
ive
wor
king
en
viro
nmen
t.(4
2)(1
86-9
, 318
, 391
, 400
) =
5 (1
.08%
)W
ork
clim
ate
tend
s to
disc
oura
ge in
w
ork
perf
orm
ance
.(4
)(17
8, 1
81-9
, 186
, 413
) =
5 (1
.08%
)
I hav
e au
tono
my
to re
ach
my
acad
emic
go
als.
(3
-9)(
52, 1
17-9
, 300
) = 4
(.8
7%)
Self-
conf
iden
ce to
def
end
the
know
ledg
e.
(4)(
202)
= 2
(.43
%)
…th
ere
is fr
eedo
m fo
r cre
ativ
ity in
ac
adem
ic e
nviro
nmen
t. (3
8-9)
(29-
9, 7
7, 2
24, 2
33,
360)
= 6
(1.3
0%)
I am
giv
en th
e fr
eedo
m to
set
my
own
care
er th
roug
h re
sear
ch, s
emin
ars,
com
mun
ity s
ervi
ces.
(352
)(41
0) =
2 (.
43%
)
Dec
ision
is m
ade
free
inte
rven
tion
from
to
p le
ader
.(5
2) =
1 (.
22%
)
Free
dom
to b
e cr
eativ
e an
d in
nova
tive.
(5
2-9)
(77-
9, 1
65-9
, 213
, 360
) =
5 (1
.08%
)
App
endi
x 17
: Res
pons
es o
f ins
titut
iona
l sup
port
(Q2)
Pers
onal
bi
as
Internal career
The
mes
Typ
es o
f sup
port
Supp
ortiv
eL
ess
supp
ortiv
e
Car
eer p
atte
rn
Mac
roM
icro
Aca
dem
ic
atm
osph
ere
Aca
dem
ic
free
dom
and
cr
eativ
ity

286
Tho
se w
ho a
re e
xper
ts a
lway
s ha
ve a
pl
ace
to d
evel
op.
(271
) =
1 (
.22%
)S
uppo
rt c
omes
fro
m c
olle
ague
s an
d le
ader
s pe
rson
ally
.(1
7-9)
(20-
9, 2
13, 4
12)
= 4
Indi
vidu
als’
car
eer
prog
ress
ion
depe
nds
on t
he in
divi
dual
itse
lf.
(76)
= 1
(.2
2%)
My
care
er m
otiv
atio
n is
not
aff
ecte
d by
the
inst
itutio
n; I
am
the
one
in
char
ge o
f m
y ca
reer
dev
elop
men
t.
(18-
9) (
85-9
, 357
) =
3
(.65
%)
I th
ink
that
the
inst
itutio
n do
es n
ot
supp
ort
my
care
er b
ut I
wan
t to
mov
e fo
rwar
d.
(61-
9) =
1 (
.22%
)
Con
trib
utio
n of
inst
itutio
n in
the
de
velo
pmen
t of
lect
urer
s is
stil
l ver
y lim
ited;
gen
eral
ly a
cade
mic
s fi
ght
indi
vidu
ally
in t
heir
car
eer
deve
lopm
ent.
(334
)(16
9, 4
11)
= 3
(.6
5%)
The
re is
no
atte
ntio
n fr
om le
ader
ship
to
em
ploy
ees’
car
eers
. (1
80)(
140,
160
-9, 2
15, 2
56,
319,
337
) =
7 (
1.52
%)
The
re is
no
awar
enes
s; e
very
one
just
do
es h
er/h
is t
ask-
role
s.(2
09)
= 1
(.2
2%)
The
pur
pose
of
wor
k is
not
bec
ause
of
mon
ey.
But
whe
n an
app
reci
atio
n of
an
ach
ieve
men
t is
mea
sure
d by
m
oney
, acc
ompl
ishm
ent
beco
mes
less
m
eani
ngfu
l.
(23-
9) =
1 (
.22%
)
…th
ere
is n
o ap
prec
iatio
n fo
r ha
rd
wor
k(2
6-9)
(36-
9, 6
4-9,
332
, 350
, 35
1, 4
11)
= 7
(1.
52%
)
Inst
itutio
n su
ppor
t is
ver
y sl
ow;
supp
osin
g I
wan
t to
run
fas
t bu
t th
e un
iver
sity
res
pond
s it
slow
ly.
(42-
9)(4
13)
= 2
(.4
3%)
No
mot
ivat
ion
from
inst
itutio
n be
caus
e th
e le
ader
ship
doe
s no
t ha
ve a
cle
ar
visi
on.
(44-
9) =
1 (
.22%
)
Now
aday
s in
stitu
tion
tend
s to
be
pass
ive
in p
rovi
ding
sup
port
to
me.
(75-
9) =
1 (
.22%
)
Car
eer
patt
ern
betw
een
func
tiona
l po
sitio
ns a
nd s
truc
tura
l lev
els
are
diff
eren
t. I
nstit
utio
nal s
uppo
rt is
mor
e fo
cus
on s
uppo
rt t
he t
each
ing
and
lear
ning
pro
cess
.
(193
) =
1 (
.22%
)
Lea
der
supp
ort
Uni
vers
ity s
tron
gly
enco
urag
es m
e to
re
ach
prof
esso
r by
bac
king
up
my
rese
arch
act
iviti
es.
(185) = 1 (.22%)
Rec
ogni
tion
Sel
f-de
velo
p-m
ent
Car
eer
part
ners
hip

287
Som
etim
es in
form
atio
n ju
st s
prea
d ar
ound
cer
tain
peo
ple.
(3
51)
= 1
(.2
2%)
My
univ
ersi
ty a
dapt
s th
e op
en
man
agem
ent s
yste
m a
nd c
reat
es a
co
mpe
titiv
e en
viro
nmen
t
(47)
(274
) =
2 (
.43%
)
Inst
itutio
n pr
ovid
es c
lear
info
rmat
ion
on
care
er.
(143
)(14
5, 1
77)
= 3
(.6
5%)
Con
stru
ctiv
e fe
edba
ckIn
stitu
tion
will
crit
icis
e or
giv
e fe
edba
ck
in m
y ca
reer
. (4
3-9)
(144
, 210
) =
3 (
.65%
)
Dec
isio
n m
akin
g I
am in
volv
ed in
mak
ing
deci
sion
abo
ut
inst
itutio
nal p
olic
ies.
(3
) =
1 (
.22%
)
Invo
lvem
ent i
n pl
anni
ng a
nd e
valu
atio
n of
teac
hing
pro
cess
. (3
) =
1 (
.22%
)
Man
ager
ial
attit
ude
Inst
itutio
n do
es n
ot e
mpo
wer
me
alth
ough
I h
ave
capa
bilit
y an
d ex
perie
nces
in r
estr
uctu
ring
high
er
educ
atio
n in
Ind
ones
ia.
(53)
= 1
(.2
2%)
My
inst
itutio
n pr
iorit
ises
car
eer
adva
ncem
ent o
f se
nior
aca
dem
ics
and
peop
le w
ho a
re c
lose
r to
the
top
man
agem
ent r
athe
r th
an to
the
prom
isin
g ne
w o
r yo
unge
r le
ctur
ers.
(226
) =
1 (
.22%
)
Lim
ited
budg
et to
sup
port
aca
dem
ic
publ
icat
ions
. (4
0) (
298,
303
) =
3 (
.65%
)
Fund
ing
acad
emic
act
iviti
es a
re o
nly
for
cert
ain
peop
le.
(164
)(10
5, 1
08, 3
05)
= 4
(.
87%
)
Lim
ited
fund
to s
uppo
rt a
cade
mic
car
eer
adva
ncem
ent.
(358
, 404
) =
2 (
.43%
)
Fina
ncia
l sup
port
for
act
iviti
es r
elat
ed to
re
sear
ch a
nd p
ublic
atio
ns o
r w
orks
hops
. (3
8)(7
7, 3
39, 3
40, 3
41)
= 5
(1
.08%
)
Faci
litat
ing
acad
emic
eve
nts
eith
er f
or
inst
itutio
nal p
urpo
ses
or in
divi
dual
nee
ds.
(200
)(21
2) =
2 (
.43%
)
Inst
itutio
n su
ppor
t is
in th
e fo
rm o
f fu
ndin
g fo
r fu
rthe
r st
udy.
(6
8)(1
4, 1
15, 2
00, 2
29,
273,
33
9, 3
40, 3
73)
= 9
(1.
95%
)
Lac
k of
fac
ilitie
s fo
r re
sear
ch.
(155
,197
, 332
, 362
, 372
) =
5
Supp
ort b
ut it
nee
ds m
ore
reso
urce
s.
(142
)(40
1) =
2 (
.43%
)
Uni
vers
ity p
rovi
des
faci
litie
s so
I c
an g
et
done
my
wor
k on
tim
e…
(38
)(50
, 115
, 136
-9, 1
45,
155,
249
, 295
, 308
, 330
, 344
, 38
8, 4
00)
= 1
3 (2
.81%
)
No
rese
arch
and
teac
hing
fac
ilitie
s.
(197
) =
1 (
.22%
)
Tra
nspa
renc
y
Organi-‐
sational
bias
Fina
ncia
l su
ppor
t sup
port
N
o fu
ndin
g fo
r ac
adem
ic a
ctiv
ities
.(8
-9)(
95, 3
58)
= 3
(.6
5%)
Tea
chin
g an
d le
arni
ng f
acili
ty
External career

288
Appendix 18: Summary of MANOVA outputs for demographic effects
Demographic variables
MANOVA test
Effect test
Career anchors Psychological empowerment Job satisfaction
F Sig. CA F Sig. PE F Sig. JS F Sig. Gender 1.897 .05 SV 4.457 .004 Education 1.569 .04 WD 6.919 .001 MN 3.337 .036 JS 5.268 .005
EN 3.891 .021 Work Experience
1.199 .023 CP 6.065 .002
Institution size
1.571 .04 SV 4.887 .008 MN 4.434 .012 PC 4.329 .014
Age 1.765 .042 MC 3.451 .011
Estimated marginal mean*
Demographic variables CA PE JS
WD EN SV PC MN CP JS Gender Female 4.85
Male 4.21 Education Bachelor 4.43 4.53 5.16 4.54
Master 4.12 4.13 5.78 4.57 Doctorate 3.34 3.75 4.82 4.09
Work experience 5-10 yrs 5.12 4.92 11-20 yrs 5.4 5.26 >20 yrs 5.28 5.09
Institution size Small 4.76 4.28 5 Medium 4.79 3.79 4.91 Big 5.03 3.96 5.31
Age ≤ 25 yrs 4.02 26-45 yrs 4.63 ≥ 46 yrs 3.48
WD=Work dedication, EN=Entrepreneurial creativity, SV-Service, PC=Pure challenge, MN=Meaning, CP=Competence, JS=Job satisfaction, CA=Career anchors, PE=Psychological empowerment *Only significant effect tests were shown

289
Appendix 19: Letters from visited universities

290

291
.t]:
EAKUUTAS PSIKOLOGIUNIVERSITAS INDONBSIA
Kampus Baru UI - Depok 16424Telp. : (021) 727 0A04,727 0005,786 3520, 786 352j,786 8280. Fax. ; (021) 786 3526E-mail : [email protected] Website: www.psikologi.ui.ac.id
Number : 8008/H2.FB.WD/PPM .OO.O212O1 ISubject : Research permission'
ToProf. lr. Zainal Muktamar, M.Sc., ph D.Rector of Universitas BengkuluJl. W. R. Supratman, Kandang LimunBengkulu 38371A
198703 2002
November 31:h, 2011
l^"4vilg your letter. for granting permission to conduct a research number7927lUN30lPPl2011, dated octobei 19, 2011, herewith we agree for Ms. Meilani toconduct her research at the Faculty of psychology, Universitas lridonesia
Furthermore we would ask Ms. Meilani.to contact Manager of Education and Research,Faculty of Psychology Ul for further explanation
'-lM.A., Psychologisg
.4rt1
IT
Copy to:1. Dean F. Psi. Ul2, Secretary of the Faculty of F. psi. Ul3. Manager of Education and Research F. psi. Ul

292
Copyright © 2022 FDOKUMEN