The use of mini-pile anchors to resist uplift forces in ...
106
University of South Florida Scholar Commons Graduate eses and Dissertations Graduate School 2006 e use of mini-pile anchors to resist upliſt forces in lightweight structures Julio Aguilar University of South Florida Follow this and additional works at: hp://scholarcommons.usf.edu/etd Part of the American Studies Commons is esis is brought to you for free and open access by the Graduate School at Scholar Commons. It has been accepted for inclusion in Graduate eses and Dissertations by an authorized administrator of Scholar Commons. For more information, please contact [email protected]. Scholar Commons Citation Aguilar, Julio, "e use of mini-pile anchors to resist upliſt forces in lightweight structures" (2006). Graduate eses and Dissertations. hp://scholarcommons.usf.edu/etd/2433
-
Upload
khangminh22 -
Category
Documents
-
view
3 -
download
0
Transcript of The use of mini-pile anchors to resist uplift forces in ...

University of South FloridaScholar Commons
Graduate Theses and Dissertations Graduate School
2006
The use of mini-pile anchors to resist uplift forces inlightweight structuresJulio AguilarUniversity of South Florida
Follow this and additional works at: http://scholarcommons.usf.edu/etd
Part of the American Studies Commons
This Thesis is brought to you for free and open access by the Graduate School at Scholar Commons. It has been accepted for inclusion in GraduateTheses and Dissertations by an authorized administrator of Scholar Commons. For more information, please contact [email protected].
Scholar Commons CitationAguilar, Julio, "The use of mini-pile anchors to resist uplift forces in lightweight structures" (2006). Graduate Theses and Dissertations.http://scholarcommons.usf.edu/etd/2433

The Use of Mini-Pile Anchors to Resist Uplift Forces in Lightweight Structures
by
Julio Aguilar
A thesis submitted in partial fulfillment of the requirements for the degree of
Master of Science in Civil Engineering Department of Civil and Environmental Engineering
College of Engineering University of South Florida
Major Professor: A. G. Mullins, Ph.D. Rajan Sen, Ph.D.
Abla Zayed, Ph.D.
Date of Approval: November 6, 2006
Keywords: hurricane, wind, tension, soil strength, foundation design
© Copyright 2006, Julio Aguilar

Acknowledgments
I would like to thank Structural Engineering and Inspections Inc. (SEI) for their
assistance in this project and Mr. Steve Covey, for permitting the documentation which
was carried out. I would also like to thank Dr. Gray Mullins for allowing me to join his
research team, without which I would not have been able to accomplish all I have done. I
would like to thank all of my friends who have been there when I needed an extra hand,
particularly Mr. Daniel Winters, Mr. Michael Stokes, Mr. Newton Casey, Mr. Anthony
Vieira, Mr. Joseph Gadah, and Mr. Andrew Schrader. Finally, I would like to thank my
parents, David and Carolice Aguilar, and my brother David Aguilar Jr. They have always
supported me and always encouraged me to pursue my education as far as possible.

i
Table of Contents
List of Tables ................................................................................................................... iii
List of Figures .................................................................................................................... v
Abstract ........................................................................................................................... vii
Chapter 1 Introduction ....................................................................................................... 11.1 Overview .......................................................................................................... 11.2 Scope of Project ............................................................................................... 31.3 Organization of the Report ............................................................................... 3
Chapter 2 Background ....................................................................................................... 52.1 Foundation Loads in Structures ....................................................................... 52.2 Determination of Wind Loads .......................................................................... 72.3 Different Types of Mini-Piles .......................................................................... 9
Chapter 3 Alternative Foundations .................................................................................. 173.1 Determination of Forces on a 60x100x22ft-7in Building .............................. 17
3.1.1 Analysis Using the Simplified Procedure ....................................... 173.1.2 Analysis Using the Analytical Method ........................................... 223.1.3 Determination of Dead Load ........................................................... 253.1.4 Determination of Uplift Force to be Resisted. ................................ 26
3.2 Incorporation of Both Tension and Compression Forces in Footing Design . 273.2.1 Design of Bulk Footing to Resist Uplift Forces .............................. 273.2.2 Design of Mini-Piles ....................................................................... 28
3.2.2.1 CPT Method ..................................................................... 283.2.2.2 Titan Method ................................................................... 29
3.2.3 Compression in the Footing ............................................................ 303.3 How Testing Can Aid in Safety and Economy .............................................. 31
3.3.1 Safety .............................................................................................. 313.3.2 Economy ......................................................................................... 32
Chapter 4 Construction and Testing ................................................................................ 354.1 Site Investigation ............................................................................................ 354.2 Field Test ....................................................................................................... 354.3 Site Survey ..................................................................................................... 364.4 Mini-Pile Installation ..................................................................................... 37

ii
Chapter 5 Economy of Foundations ................................................................................. 465.1 Mass Concrete Footer .................................................................................... 465.2 Mini-Pile Anchor .......................................................................................... 475.3 Break Even Analysis ...................................................................................... 49
Chapter 6 Conclusion and Summary ............................................................................... 54
References ........................................................................................................................ 56
Appendices ....................................................................................................................... 57Appendix A Mini-Pile Location and Structural Plans of Case Study .................. 58Appendix B Results of CPT Testing .................................................................... 62Appendix C Capacity of Mini-Pile At Each Location Using CPT Method ......... 75Appendix D Mix Proportions for Drilling and Casting ....................................... 85Appendix E Break Even Analysis ........................................................................ 86Appendix F Capacity of a Mini-Pile Based on Soil ............................................. 92Appendix G Cost Per Kip Resisted Based on Soil .............................................. 93

iii
List of Tables
Table 2.1 Possible Load Combinations ............................................................................. 6
Table 2.2 Design Pressures for Different Zones and Speeds ........................................... 13
Table 3.1 Adjustment Factor for Building Height and Exposure, 8 ................................ 21
Table 3.2 Simplified Method ........................................................................................... 22
Table 3.3 Analytical Method ........................................................................................... 24
Table 3.4 Dead Load Calculation .................................................................................... 26
Table 3.5 Minimum Pile Length Using The CPT Method .............................................. 29
Table 3.6 Minimum Pile Length for NE Corner Using The Titan Method ..................... 30
Table 5.1 Construction Cost by Item ............................................................................... 46
Table 5.2 Cost for Each 17kip Mass Concrete Footer ..................................................... 47
Table 5.3 Total Cost Using Mass Concrete Footer .......................................................... 47
Table 5.4 Cost for Each 17kip Mini-Pile ......................................................................... 48
Table 5.5 Total Cost Using Mini-Piles ............................................................................ 48
Table 5.6 Cost per Kip Resisted ...................................................................................... 49
Table B.1 CPT Sounding for NE Corner ......................................................................... 66
Table B.2 CPT Sounding for NW Corner ........................................................................ 68
Table B.3 CPT Sounding for SE Corner .......................................................................... 70
Table B.4 CPT Sounding for SW Corner ........................................................................ 73
Table C.1 Capacity of a Mini-Pile in the NE Corner ....................................................... 75
Table C.2 Capacity of a Mini-Pile in the NW Corner ..................................................... 78
iv
Table C.3 Capacity of a Mini-Pile in the SE Corner ....................................................... 80
Table C.4 Capacity of a Mini-Pile in the SW Corner ...................................................... 83
Table D.1 Mix Design for Mini-Piles .............................................................................. 85
Table E.1 Break Even Analysis of Project ....................................................................... 86
Table F.1 Capacity of a Mini-Pile in Soft Sand ............................................................... 92
Table G.1 Cost Per Kip Resisted (General Soil Properties) ............................................ 93

v
List of Figures
Figure 1.1 Change in Cement Prices .................................................................................. 1
Figure 1.2 Florida Wind Speed Map .................................................................................. 2
Figure 2.1 MWFRS Wind Influence Zones ..................................................................... 12
Figure 2.2 Classification Based on Method of Construction ........................................... 15
Figure 2.3 Classification Based on Method of Grouting ................................................. 15
Figure 2.4 Relative Relationship Between Mini-Pile Application, Design Concept and Construction Type .......................................................................................... 16
Figure 3.1 USF CPT Truck .............................................................................................. 33
Figure 3.2 Results from the NE CPT Sounding ............................................................... 33
Figure 3.3 Soil Classification Chart ................................................................................. 34
Figure 3.4 Soil Classification for NE Corner ................................................................... 34
Figure 4.1 Installed Mini-Pile .......................................................................................... 40
Figure 4.2 Williams Form Bar ......................................................................................... 40
Figure 4.3 Anchor Installation ......................................................................................... 41
Figure 4.4 Static Load Test Setup .................................................................................... 42
Figure 4.5 Load Test Results ........................................................................................... 42
Figure 4.6 Site Layout ...................................................................................................... 43
Figure 4.7 SPT Drill Rig .................................................................................................. 44
Figure 4.8 Centralization Tabs ......................................................................................... 45
Figure 4.9 Load Transfer Connection................................................................................45

vi
Figure 5.1 Soil/Site Specific Break Even Analysis .......................................................... 52
Figure 5.2 Mini-Pile Anchor Capacity Based on Soil Type ............................................ 52
Figure 5.3 Foundation Cost Per Force Resisted (Using Titan Method) ........................... 53
Figure A.1 Site Layout ..................................................................................................... 58
Figure A.2 Roof Framing Plan ......................................................................................... 59
Figure A.3 Front and Rear Elevations ............................................................................. 60
Figure A.4 Side Elevations .............................................................................................. 61
Figure B.1 CPT Sounding for NE Corner ........................................................................ 62
Figure B.2 CPT Sounding for NW Corner ...................................................................... 62
Figure B.4 CPT Sounding for SW Corner ....................................................................... 63
Figure B.3 CPT Sounding for SE Corner ........................................................................ 63
Figure B.5 Soil Classification for NE Corner .................................................................. 64
Figure B.6 Soil Classification for NW Corner ................................................................. 64
Figure B.7 Soil Classification for SE Corner ................................................................... 65
Figure B.8 Soil Classification for SW Corner ................................................................. 65

vii
The Use of Mini-Pile Anchors to Resist Uplift Forces in Lightweight Structures
Julio Aguilar
ABSTRACT
In the state of Florida one of the primary factors which influences design of
structures is the effect of hurricane force winds on structures. These forces can be
greater than any other force encountered throughout the lifetime of said structure. For
this reason, designing a structure to resist such forces can greatly increase the cost and
time required for completing construction projects. Traditionally, large concrete footings
have been utilized to resist wind-induced uplift forces. These footings do little more than
act as large reaction masses to weigh down the building. An alternative and little-used
method for resisting these large uplift forces is the use of mini-pile anchors. Mini-pile
anchors generate side shear at the interface between the pile and the soil which resists the
uplift forces.
This thesis provides an overview of the design methods used to estimate wind-
induced uplift forces and several foundation options used to withstand these forces.
More traditional/less complicated foundations are compared to the more sophisticated
mini-pile method which makes more efficient use of construction materials. The cost
efficiency of each method is evaluated which provides a guideline for where and when a
given foundation option is appropriate.
Finally, a case study where the new method was used is presented which
documents the design and construction procedures.

1
Chapter 1 Introduction
1.1 Overview
This thesis explores a more cost effective foundation design for resisting the uplift
forces generated by hurricane force winds. This as well as other alternate methods are
being considered throughout the state because of the increase in the cost of labor and
construction materials in recent years, Figure 1.1 is the change in the cost of cement from
1900 to 2002.
Additionally, in the wake of the recent hurricane seasons, there have been
increased/heightened restrictions on the wind loads which are being used in the design of
buildings in hurricane prone areas. The American Society of Civil Engineers Code for
Figure 1.1 Change in Cement Prices(Adapted from USGS Mineral Cost of Cement [4])

2
Wind Loads (ASCE 2002) [1] requires the state of Florida to design structures to
withstand winds of no less than 90 miles per hour along the northern portion of the state,
and these values increase as the location of the structures nears the coast. For instance, in
the southern tip of Florida, the code specifies that buildings withstand minimum
hurricane force winds of no less than 150 miles per hour. See Figure 1.2
These contours show higher design wind speeds than previous codes; making
new, more efficient construction methods essential. This phenomenon is particularly
problematic for light-weight steel structures where the self weight is not sufficient to
offer considerable uplift resistance.
Figure 1.2 Florida Wind Speed Map(Adapted from ASCE 7-02)
3
1.2 Scope of Project
The aim of this thesis was to compare the use of mini-piles with that of large
concrete footings for their resistance to uplift forces. Also considered was the design
method which is used, along with the benefits of these methods. The “CPT”[2] and
“Titan”[3] methods were both considered to determine if there were any specific benefits
which one method may generate.
A case study was performed in Bradenton, Florida at a location where an existing
structure was being relocated and renovated to meet the newer building codes. This
structure was a 60ft x 100ft steel building with a peak roof height of 22ft-7 in consisting
of a structural steel internal frame. Soil characteristics were determined by performing
CPT tests in the approximate locations of the 4 corners of the structure. A test mini-pile
was constructed based on the calculated values to confirm if these values were in line
with the field conditions. Finally, production installation of all the mini-pile anchors was
performed.
1.3 Organization of the Report
This report is organized into five subsequent chapters. Chapter 2 gives the
background on applications where tension loads develop in structures and foundations
and when they do not. Also included are examples of the different types of mini-piles,
and an explanation of how wind loads are determined. Chapter 3 discusses the design of
foundations for structures resisting both uplift and compressive forces for the different
foundation methods as well as how testing can increase the quality assurance and
economy of a structure. Chapter 4 gives a general overview of the structure for which
the case study was done. The construction and testing of the mini piles is explained as

4
well as the choice of anchor length and steel which was used. Chapter 5 is an
explanation of the economy of the alternative foundations. Finally, chapter 6 gives the
conclusions which were determined after all of the testing was done and after the
structure was completely installed.
5
Chapter 2 Background
2.1 Foundation Loads in Structures
The loads a foundation is likely to experience stem from a number of sources and
manifest themselves in axial compression, axial tension, lateral/shear and/or bending
moments. Further, depending on the probability of one or more load types being applied
at one time, most contemporary design codes group load types in a variety of occurrences
called load cases. Simply stated, load cases assemble all possible load combinations and
discard improbable conditions such as people standing on a roof during a hurricane.
Typical load types for Florida structures include: permanent structure weight,
called dead loads; movable loads like people, furnishings, or equipment, live loads; wind-
induced loads, both pressure and suction; and water or rain loads. By combining these
loads in common combinations a range of possible loadings are developed for a given
foundation based on the magnitude of the load and geometry used to withstand these
loads. Table 2.1 shows load combinations/cases recommended by the American Institute
of Steel Construction (AISC, 2002).

6
Table 2.1 Possible Load CombinationsPOSSIBLE LOAD COMBINATIONS
Case Load Combination
1 1.4*(Dead Load)
21.2*(Dead Load)+1.6*(Live Load)
+
0.5*[(Roof Live Load) or (Snow Load) or Rain Load)]
3
1.2*(Dead Load)+1.6*[(Roof Live Load) or (Snow Load) or (Rain Load)]
+
[0.5*(Live Load) or 0.8*(W ind Load)]
41.2*(Dead Load)+1.6*(W ind Load)+0.5(Live Load)
+
0.5*[(Roof Live Load) or (Snow Load) or (Rain Load)]
5 1.2*(Dead Load)+/-1.0*(Earthquake Load)+0.5*(Live Load)+0.2*(Snow Load)
6 0.9*(Dead Load)+/-[1.6*(W ind Load) or 1.0(Earthquake Load)]
In table 2.1 load multipliers (eg. 1.2, 1.6, 0.5, etc.) have been established statistically
based on the probably of more than one loading condition occurring at the same instance
in time.
It is conceivable, because of its size and weight, to overlook the fact that there
may be instances throughout the service life where tensile forces may develop within the
foundation. In most structures, only wind loads cause uplift loads in a foundation by
overturning, pure suction uplift, or a combination of both.
The Florida building codes all require that structures be able to withstand
pressures from winds for speeds ranging from 90mph to 150mph depending on the
location. Figure 1.1 shows the Florida Wind Speed Map wherein the southernmost tip of
Florida is most likely to experience the highest wind speeds. These speeds generate wind
pressures from 12.8psf to 49.4psf for 90 to 150mph, respectively on the windward side.
Also, the velocity of the wind as it passes around the structure can create a vacuum on its
leeward side, and these forces can range from -16.9psf to -60.0psf again respectively, as
shown in Table 2.2.

7
2.2 Determination of Wind Loads
Loads such as live load, dead load, and rain loads are relatively straightforward
computations and are either simple calculations of volume and density or prescribed live
load values based on the application. Wind load computations are more rigorous
involving the wind speed, wind direction, surrounding structures, topography, and
structural shape/geometry.
The first factor is the wind velocity. The direct velocity with which the wind
impacts a structure will tend to generate positive pressures on the windward side and
negative pressures on the leeward side of a structure. There is a direct relationship
between the wind velocity and the wind load, as an increase in velocity will generate a
corresponding increase in pressure.
The direction from which the wind is impacting the structure will also play a
significant factor on the wind loads being analyzed. If the wind is blowing parallel to the
shorter walls of a building, the forces generated will be less than that of the larger walls,
as there is less surface area. This is not to say that the pressure will be different, as the
pressure is a function of the velocity, however the total force which will need to be
resisted will be smaller due to the smaller area being affected.
The exposure of the building to these forces will also determine the pressures
which will be exerted. If the building is located in an area surrounded by trees, if the
ground is uneven, or if the building is located on the leeward side of another building
being affected, then the wind pressures generated will not be similar to those of a
structure which was constructed in a flat open field. This is because the turbulence

8
generated by the interaction of the wind with these other terrain features may decrease
the pressure which the wind will exert on the structure.
The topography of the terrain is also very important when determining the wind
loads which will be generated. If a structure is located on the windward side of a hill in
an otherwise flat area, then the velocity of the wind as it crosses over the mountain will
be greater than that of wind which has been unimpeded similar to how the wind above
the wing of an airplane is traveling at a faster velocity than that below it due to the shape.
Alternately, a structure located on the leeward side of a hill may have a significant
portion of the wind being blocked by the hill, and therefore the pressure exerted across its
surface will be less than expected based on the wind velocity.
The rigidity of a structure also plays a key role in the force which will be exerted
during wind gusts. The dynamic impact of gusts on rigid structures is less significant
than that of flexible structures. This is because the gusting will be more likely to
generate movement in a flexible structure than in a rigid one, and this movement can lead
to a failure of the system to resist the loads being exerted upon it.
When these factors are taken into consideration along with others, an accurate
picture of the interaction of the wind with a structure can be determined. The ASCE 07
standard for analysis of wind loads takes all of the above properties into consideration
along with the “Importance Factor”, “Exposure Category”, “Internal Pressure
Coefficient”, and “External Pressure Coefficient”. The code utilizes all these properties
and incorporates them with the shape of the building to locate the critical areas that will
be affected by wind on a structure, and can be utilized to calculate the positive and
negative pressures which will be experienced due to the wind. The structure is then

9
designed to resist these values which have been calculated. Figure 2.1 has the zones of
influence.
2.3 Different Types of Mini-Piles
The types of mini-piles typically used in construction can be classified by three
different systems. The first system of classification is by the method used for
construction, and the second method is by the behavior of the piles. The third system of
classification is the classification of piles by method of grouting.
Classification by construction method gives a clear understanding of how each
pile is made as well as the use of that specific design, Figure 2.2 has the different
construction methods used. ‘Pushed’ or ‘driven’ piles are constructed by driving
prefabricated piles into the ground either by hammering or through the use of hydraulic
rams. These piles are often used to transfer light loads to the soil in a range from 3 to 30
tons.
‘Compaction grouted’ piles are made by forcing the grout into the hole and
generating a bulb on concrete at the base of the pile. These piles are excellent for the
development of loads at shallow depths as the compaction increases the density of the
soil which therefore increases its capacity. They are typically used for loads in the range
of 15 to 75 tons.
‘Jet grouted’ piles are created by filling the shaft with concrete traveling at a high
velocity. This has the effect of greatly increasing the density of the soil far beyond the
ability of other methods utilized while installing mini-piles. One benefit of jet grouting is
that the capacity of the piles after construction can range from 50 to 150 tons.

10
‘Post grouted’ piles are piles which have been modified after being cast in place.
There is a void in the center of the shaft which runs connects from the tip to the surface,
and concrete is then pumped under high pressure through this hole to increase the skin
friction and the end bearing capacities of the piles in the range of 40 to 100 tons.
‘Pressure grouted’ piles are constructed using concrete pumped into the shaft
under high pressure. This pressure has the effect of increasing the density of the soil so
that the pile is capable of generating larger resistive loads through skin friction from 25
to 75 tons.
Finally, ‘Drilled, End Bearing’ piles are piles constructed by drilling down to
either bedrock or extremely dense soil, and then casting the pile in the hole which is
generated. This type of shaft works by transferring loads directly to the tip of the pile
and then into the soil, and does not rely on skin friction to resist significant loads. The
capacity of ‘Drilled, End Bearing’ piles ranges from 50 all the way to over 500 tons
depending on the diameter of the pile and the material below the pile tip.
Classification by behavior is based on the concept that piles will fall into only two
categories, referred to as ‘Cases’, Figure 2.3 illustrates the various Cases. ‘Case 1’ refers
to piles which directly resist loads which are applied on them, which is done either by an
individual pile, or by a pile grouping. The loads will be applied axially and then be
transferred to the soil.
‘Case 2’, by the classification based on behavior, is said to be of a “Reticulated
root pile structure”. This form of pile behavior utilizes piles installed in a specific pattern
for the purposes of confining the soil structure in the vicinity of the pile. The purposes of
this can be for underpinning, stabilization, or earth retention.
11
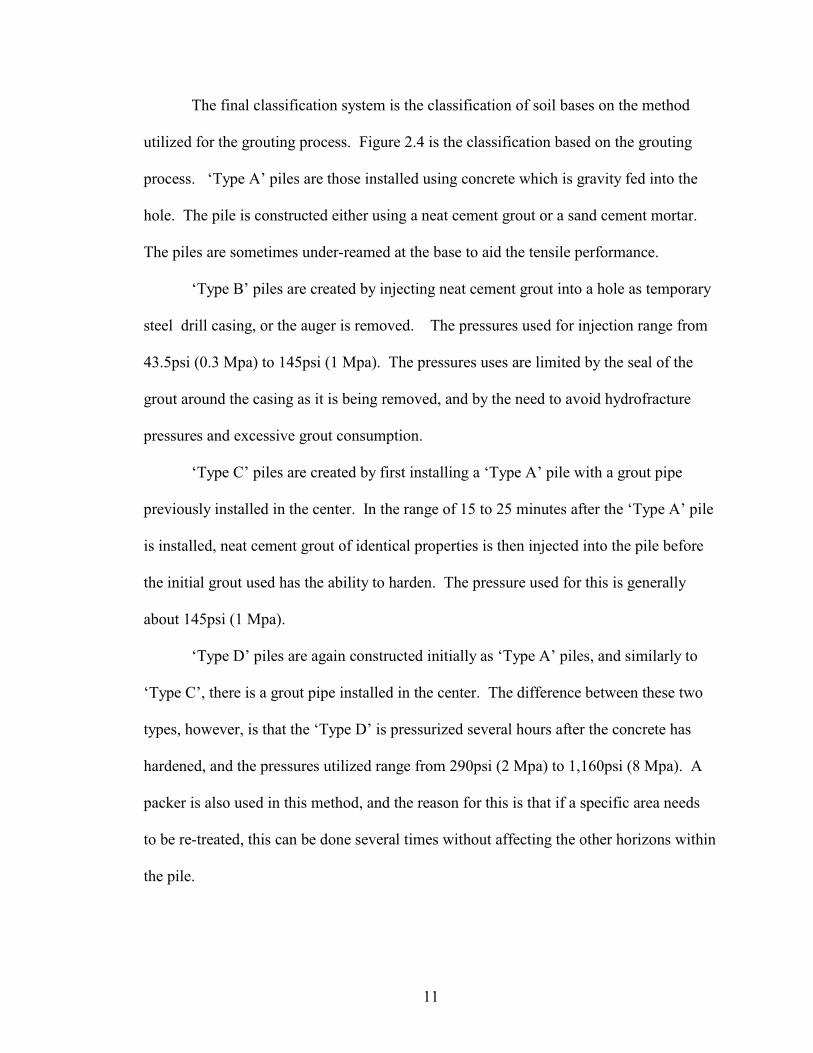
The final classification system is the classification of soil bases on the method
utilized for the grouting process. Figure 2.4 is the classification based on the grouting
process. ‘Type A’ piles are those installed using concrete which is gravity fed into the
hole. The pile is constructed either using a neat cement grout or a sand cement mortar.
The piles are sometimes under-reamed at the base to aid the tensile performance.
‘Type B’ piles are created by injecting neat cement grout into a hole as temporary
steel drill casing, or the auger is removed. The pressures used for injection range from
43.5psi (0.3 Mpa) to 145psi (1 Mpa). The pressures uses are limited by the seal of the
grout around the casing as it is being removed, and by the need to avoid hydrofracture
pressures and excessive grout consumption.
‘Type C’ piles are created by first installing a ‘Type A’ pile with a grout pipe
previously installed in the center. In the range of 15 to 25 minutes after the ‘Type A’ pile
is installed, neat cement grout of identical properties is then injected into the pile before
the initial grout used has the ability to harden. The pressure used for this is generally
about 145psi (1 Mpa).
‘Type D’ piles are again constructed initially as ‘Type A’ piles, and similarly to
‘Type C’, there is a grout pipe installed in the center. The difference between these two
types, however, is that the ‘Type D’ is pressurized several hours after the concrete has
hardened, and the pressures utilized range from 290psi (2 Mpa) to 1,160psi (8 Mpa). A
packer is also used in this method, and the reason for this is that if a specific area needs
to be re-treated, this can be done several times without affecting the other horizons within
the pile.

12
For this project the ‘Type A’, ‘Case 1' anchors were though to be the most
economical while also providing adequate axial capacity to withstand wind-induced
uplift forces via side shear resistance.
Figure 2.1 MWFRS Wind Influence Zones(Adapted from ASCE 7-02)

13
Table 2.2 Design Pressures for Different Zones and SpeedsMain Wind Resisting System - Simplified Design
Design Wind Pressures
Exposure B at h = 30 ft. with I = 1.0
Basic
Wind
Speed
(mph)
Roof
Angles
(deg.)
Loa
d
Case
Zones
Horizontal Pressures Vertical Pressures Overhangs
O H O HA B C D E F G H E G
85
0 - 5 1 11.5 -5.9 7.6 -3.5 -13.8 -7.8 -9.6 -6.1 -19.3 -15.1o
10 1 12.9 -5.4 8.6 -3.1 -13.8 -8.4 -9.6 -6.5 -19.3 -15.1o
15 1 14.4 -4.8 9.6 -2.7 -13.8 -9.0 -9.6 -6.9 -19.3 -15.1o
20 1 15.9 -4.2 10.6 -2.3 -13.8 -9.6 -9.6 -7.3 -19.3 -15.1o
25 1 14.4 2.3 10.4 2.4 -6.4 -8.7 -4.6 -7.0 -11.9 -10.1o
2 ----- ----- ----- ----- -2.4 -4.7 -0.7 -3.0 ----- -----
30 - 45 1 12.9 8.8 10.2 7.0 1.0 -7.8 0.3 -6.7 -4.5 -5.2o
2 12.9 8.8 10.2 7.0 5.0 -3.9 4.3 -2.8 -4.5 -5.2
90
0 - 5 1 12.8 -6.7 8.5 -4.0 -15.4 -8.8 -10.7 -6.8 -21.6 -16.9o
10 1 14.5 -6.0 9.6 -3.5 -15.4 -9.4 -10.7 -7.2 -21.6 -16.9o
15 1 16.1 -5.4 10.7 -3.0 -15.4 -10.1 -10.7 -7.7 -21.6 -16.9o
20 1 17.8 -4.7 11.9 -2.6 -15.4 -10.7 -10.7 -8.1 -21.6 -16.9o
25 1 16.1 2.6 11.7 2.7 -7.2 -9.8 -5.2 -7.8 -13.3 -11.4o
2 ----- ----- ----- ----- -2.7 -5.3 -0.7 -3.4 ----- -----
30 - 45 1 14.4 9.9 11.5 7.9 1.1 -8.8 0.4 -7.5 -5.1 -5.8o
2 14.4 9.9 11.5 7.9 5.6 -4.3 4.8 -3.1 -5.1 -5.8
100
0 - 5 1 15.9 -8.2 10.5 -4.9 -19.1 -10.8 -13.3 -8.4 -26.7 -20.9o
10 1 17.9 -7.4 11.9 -4.3 -19.1 -11.6 -13.3 -8.9 -26.7 -20.9o
15 1 19.9 -6.6 13.3 -3.8 -19.1 -12.4 -13.3 -9.5 -26.7 -20.9o
20 1 22.0 -5.8 14.6 -3.2 -19.1 -13.3 -13.3 -10.1 -26.7 -20.9o
25 1 19.9 3.2 14.4 3.3 -8.8 -12.0 -6.4 -9.7 -16.5 -14.0o
2 ----- ----- ----- ----- -3.4 -6.6 -0.9 -4.2 ----- -----
30 - 45 1 17.8 12.2 14.2 9.8 1.4 -10.8 0.5 -9.3 -6.3 -7.2o
2 17.8 12.2 14.2 9.8 6.9 -5.3 5.9 -3.8 -6.3 -7.2
110
0 - 5 1 19.2 -10.0 12.7 -5.9 -23.1 -13.1 -16.0 -10.1 -32.3 -25.3o
10 1 21.6 -9.0 14.4 -5.2 -23.1 -14.1 -16.0 -10.8 -32.3 -25.3o
15 1 24.1 -8.0 16.0 -4.6 -23.1 -15.1 -16.0 -11.5 -32.3 -25.3o
20 1 26.6 -7.0 17.7 -3.9 -23.1 -16.0 -16.0 -12.2 -32.3 -25.3o
25 1 24.1 3.9 17.4 4.0 -10.7 -14.6 -7.7 -11.7 -19.9 -17.0o
2 ----- ----- ----- ----- -4.1 -7.9 -1.1 -5.1 ----- -----
30 - 45 1 21.6 14.8 17.2 11.8 1.7 -13.1 0.6 -11.3 -7.6 -8.7o
2 21.6 14.8 17.2 11.8 8.3 -6.5 7.2 -4.6 -7.6 -8.7
120
0 - 5 1 22.8 -11.9 15.1 -7.0 -27.4 -15.6 -19.1 -12.1 -38.4 30.1o
10 1 25.8 -10.7 17.1 -6.2 -27.4 -16.8 -19.1 -12.9 -38.4 30.1o
15 1 28.7 -9.5 19.1 -5.4 -27.4 -17.9 -19.1 -13.7 -38.4 30.1o
20 1 31.6 -8.3 21.1 -4.6 -27.4 -19.1 -19.1 -14.5 -38.4 30.1o
25 1 28.6 4.6 20.7 4.7 -12.7 -17.3 -9.2 -13.9 -23.7 -20.2o
2 ----- ----- ----- ----- -4.8 -9.4 -1.3 -6.0 ----- -----
30 - 45 1 25.7 17.6 20.4 14.0 2.0 -15.6 0.7 -13.4 -9.0 -10.3o
2 25.7 17.6 20.4 14.0 9.9 -7.7 8.6 -5.5 -9.0 -10.3

14
Table 2.2 (Continued)
130
0 - 5 1 26.8 -13.9 17.8 -8.2 -32.2 -18.3 -22.4 -14.2 -45.1 -35.3o
10 1 0.2 -12.5 20.1 -7.3 -32.2 -19.7 -22.4 -15.1 -45.1 -35.3o
15 1 33.7 -11.2 22.4 -6.4 -32.2 -21.0 -22.4 -16.1 -45.1 -35.3o
20 1 37.1 -9.8 24.7 -5.4 -32.2 -22.4 -22.4 -17.0 -45.1 -35.3o
25 1 33.6 5.4 24.3 5.5 -14.9 -20.4 -10.8 -16.4 -27.8 -23.7o
2 ----- ----- ----- ----- -5.7 -11.1 -1.5 -7.1 ----- -----
30 - 45 1 30.1 20.6 24.0 16.5 2.3 -18.3 0.8 -15.7 -10.6 -12.1o
2 30.1 20.6 24.0 16.5 11.6 -9.0 10.0 -6.4 -10.6 -12.1
140
0 - 5 1 31.1 -16.1 20.6 -9.6 -37.3 -21.2 -26.0 -16.4 -52.3 -40.9o
10 1 35.1 -14.5 23.3 -8.5 -37.3 -22.8 -26.0 -17.5 -52.3 -40.9o
15 1 39.0 -12.9 26.0 -7.4 -37.3 -24.4 -26.0 -18.6 -52.3 -40.9o
20 1 43.0 11.4 28.7 -6.3 -37.3 -26.0 -26.0 -19.7 -52.3 -40.9o
25 1 39.0 6.3 28.2 6.4 -17.3 -23.6 -12.5 -19.0 -32.3 -27.5o
2 ----- ----- ----- ----- -6.6 -12.8 -1.8 -8.2 ----- -----
30 - 45 1 35.0 23.9 27.8 19.1 2.7 -21.2 0.9 18.2 -12.3 -14.0o
2 35.0 23.9 27.8 19.1 13.4 -10.5 11.7 -7.5 -12.3 -14.0
150
0 - 5 1 35.7 -18.5 23.7 -11.0 -42.9 -24.4 -29.8 -18.9 -60.0 -47.0o
10 1 40.2 -16.7 26.8 -9.7 -42.9 -26.2 -29.8 -20.1 -60.0 -47.0o
15 1 44.8 -14.9 29.8 -8.5 -42.9 -28.0 -29.8 -21.4 -60.0 -47.0o
20 1 49.4 -13.0 32.9 -7.2 -42.9 -29.8 -29.8 -22.6 -60.0 -47.0o
25 1 44.8 7.2 32.4 7.4 -19.9 -27.1 -14.4 -21.8 -37.0 -31.6o
2 ----- ----- ----- ----- -7.5 -14.7 -2.1 -9.4 ----- -----
30 - 45 1 40.1 27.4 31.9 22.0 3.1 -24.4 1.0 -20.9 -14.1 -16.1o
2 40.1 27.4 31.9 22.0 15.4 -12.0 13.4 -8.6 -14.1 -16.1
170
0 - 5 1 45.8 -23.8 30.4 -14.1 -55.1 -31.3 -38.3 -24.2 -77.1 -60.4o
10 1 51.7 -21.4 34.4 -12.5 -55.1 -33.6 -38.3 -25.8 -77.1 -60.4o
15 1 57.6 -19.1 38.3 -10.9 -55.1 -36.0 -38.3 -27.5 -77.1 -60.4o
20 1 63.4 -16.7 42.3 -9.3 -55.1 -38.3 -38.3 -29.1 -77.1 -60.4o
25 1 57.5 9.3 41.6 9.5 -25.6 -34.8 -18.5 -28.0 -47.6 -40.5o
2 ----- ----- ----- ----- -9.7 -18.9 -2.6 -12.1 ----- -----
30 - 45 1 51.5 35.2 41.0 28.2 4.0 -31.3 1.3 -26.9 -18.1 -20.7o
2 51.5 35.2 41.0 28.2 19.8 -15.4 17.2 -11.0 -18.1 -20.7

15
Figure 2.2 Classification Based on Method of Construction(Adapted from Hayward Baker Inc. 2003 PP18 [6])
Figure 2.3 Classification Based on Method of Grouting(Adapted from ISSMFE, TC-17 [7])

16
Figure 2.4 Relative Relationship Between Mini-Pile Application, Design Concept andConstruction Type(Adapted from ISSMFE TC-17)

17
Chapter 3 Alternative Foundations
3.1 Determination of Forces on a 60x100x22ft-7in Building
The structure used for the case study done in this thesis was a 60ft x 100ft steel-
framed building with a peak roof height of 22ft 7in. The structure was being relocated to
6308 44 Avenue East, Bradenton, Florida, and it was also being upgraded to the currentth
building code which consisted of a higher design wind than when the building was
originally constructed. While there were modifications done to the frame of the structure
to resist these forces, the scope of this thesis will only consider how these forces will act
on the foundation, and therefore all calculations done will be based on determining the
wind load on the structure solely for the foundation design.
The determination of forces was done in accordance with ASCE 7-02
(ASCE,2002) and the method used for calculations was the Main Wind Force-Resistance
System (MWFRS). The building could have been designed using the ‘simplified’
method according to the code, however the accuracy of these results would need some
form of variation, and therefore both the ‘simplified’ and the ‘Analytical’ method were
used to obtain the forces upon the structure.
3.1.1 Analysis Using the Simplified Procedure
To use the simplified method, there were certain requirements which needed to be
met by the structure. The first such requirement is that the structure be a simple
diaphragm as determined in section 6.2 of the code. To be a simple diaphragm the code
requires that the building be enclosed or partially enclosed with winds transmitted

18
through floor and/or roof diaphragms to the vertical MWFRS. Because this building
consists of a steel frame, the forces acting upon the roof will then be transferred through
the beams to the columns and from there directly into the foundation. For this reason, the
structure can be classified as a simple diaphragm.
The second requirement is that the building meets the classification in section 6.2
for a ‘low rise’ building. The code stipulates that an enclosed or partially enclosed
building having a mean roof height of less than 60ft, and that the mean roof height be
less than the least horizontal dimension. This particular structure has a mean roof height
of 21ft 3.5in and the least horizontal dimension is 60ft, therefore this requirement was
also met.
The third requirement is that the building is enclosed in accordance with section
6.2 and conforms to the wind-born debris provisions of section 6.5.9.3. An enclosed
building, according to the code, is one which does not comply with the requirements for
an open or partially enclosed building. An open building is one which has each wall
being at least 80% open, a condition which this structure does not meet. A partially
enclosed structure is one which has the total area of openings which receive positive
external pressures being greater than the sum of the openings in the remainder of the
structure by more than 10%, and that the total area of openings in a wall which receives
positive external pressure exceeds 4ft or 1% of the area of the wall, whichever is2
smaller, and that the percentage of openings in the remainder of the building is less than
20%. The structure being designed does not contain any windows, and all of the doors
are pull down shutters, therefore the conditions for a partially encloses structure are also
not met, and therefore the building is termed as being ‘enclosed’.

19
The code requires that a building be a regularly shaped building or structure,
which is defined in the code as having no unusual geometrical irregularity or spatial
form. Because this building is a simple rectangle, it can be classified as a regularly
shaped structure.
The simplified method also states that a building must not be classified as flexible
in order for it to be used. Flexible structures are defines as slender structures with a
natural frequency of less than 1Hz. Since this building is not slender, it can therefore not
be classified as flexible.
The sixth requirement for the simplified method is that “the building does not
have response characteristics making it subject to across-wind loading, vortex shedding,
instability due to galloping or flutter; and does not have a site location for which
channeling effects or buffeting in the wake of upwind obstructions warrant special
consideration.” This building does not have any specific response characteristics which
would generate across-wind loading or vortex shedding. The building does not have any
instability due to galloping or flutter, and is not located in an area where channeling
effects or buffet requires any special consideration; therefore it also meets this
requirement of the code.
The seventh requirement is that “the building structure has no expansion joints or
separations”. This structure contains no expansion joints or separations, therefore passes
this requirement.
The eighth requirement of the code is that the building is not subject to the
topographical effects as described in section 6.5.7 of the code. This building is located

20
on level terrain with no nearby significant changes in elevation, and therefore is not
subject to any topographical effects.
The final requirement for utilization of the simplified method is that the building
has a relatively symmetrical cross section in each direction and that the roof is flat or
either hipped or gabled in nature with an angle of less than 45 . This particular structureo
has an angle of only 4.9 , and therefore meets all of the qualifications for utilization of o
the simplified method.
The first step in the simplified method is the determination of the basic wind
speed in accordance with section 6.5.4. From this section the design wind speed for
Bradenton, Florida was determined to be 130 mph.
The importance factor for the structure was then determined from section 6.5.5 of
the code. Since the building falls into Category I based on the classifications of table 1-1
of ASCE 7-02, and is in a hurricane prone region with wind velocities over 100mph, the
importance factor “I” of the structure is 0.77.
The exposure category for this structure is obtained from section 6.5.6 of the
code. Because the structure is in a suburban area with closely spaced obstructions the
size of single-family dwellings, the exposure category of this structure was determined to
be category “B”.
The height and exposure adjustment coefficient, “8” was then determined from
Table 3.1. Because the mean roof height of the structure was 22ft 7in, and of exposure
category “B”, Table 3.1 assigns all buildings under this category being less than 30ft in
height an adjustment factor of 1.0; therefore the height and exposure adjustment factor
for this building (8) is 1.0

21
Table 3.1 Adjustment Factor for Building Height and Exposure, 8Mean roof height (ft) Exposure
B C D
15 1 1.21 1.47
20 1 1.29 1.55
25 1 1.35 1.61
30 1 1.4 1.66
35 1.05 1.45 1.7
40 1.09 1.49 1.74
45 1.12 1.53 1.78
50 1.16 1.56 1.81
55 1.19 1.59 1.84
60 1.22 1.62 1.87
The determination of the wind pressure for MWFRS is then done according to
section 6.4.2.1 of the code, the formula is as follows:
s s30p = 8Ip (Eq. 3.1)
where in this case 8 = 1.0, and I = 0.77.
s30The value for p horizontally across region “A” of the structure is 26.8psf, and
likewise, the value longitudinally across region “A” is also 26.8psf. In the roof areas, the
value for zone “E” was -32.2psf, and the value for zone “B” was -13.9psf (see Table 2.1
& Figure 2.1).
s30 After multiplying the values for p by the exposure adjustment factor and the
importance factor, it was determined that the walls of the structure would develop
horizontal and vertical pressures both of 20.6psf, and that the roof would experience a
pressure of -24.8psf in zone “A”, and -10.7psf in zone “E”. Table 3.2 shows the
calculations for the simplified method.

22
Table 3.2 Simplified Method
SIMPLIFIED METHOD
Wall Areas
Horizontal A 26.8 psf
Longitudinal A 26.8 psf
Roof Areas
Horizontal A -32.2 psf
Horizontal B -13.9 psfValues Multiplied by importance Factor
I = 0.77
Horizontal A 20.636 psf
Longitudinal A 20.636 psf
Roof Areas
Horizontal A -24.794 psf
Horizontal B -10.703 psf
3.1.2 Analysis Using the Analytical Method
The next step in the process was to compare the simplified method to the
Analytical Procedure as described in section ASCE 7-02 section 6.5. The first step in
dthis procedure was to determine the basic wind speed “V” and directionality factor “K ”
in accordance with section 6.5.4 of the code. From these sections, “V” was determined
dto be 130mph, and “K ” was determined to be 0.85.
Step two was to determine the importance factor “I” of the structure in
accordance with section 6.5.5. The importance factor for this structure was again
determined to be 0.77.
Step three was to determine the exposure category or categories and the velocity
pressure exposure coefficients in accordance with section 6.5.6. The structure was
determined to have category “B” exposure, and a velocity pressure exposure coefficient
h“K ” of 0.7.
ztThe topographical factor “K ” was then determined from section 6.5.7 of the
code. This value was determined to be 1.

23
Step five was to determine the gust effect factor in accordance with section 6.5.8
of the code. The determination of this gave a result for “G” as 0.85.
Step six was to determine the enclosure classification of the structure, in
accordance with section 6.5.9. The results of this, similar to those of the simplified
method, are that the building is to be classified as an “enclosed” structure.
piStep seven was to determine the internal pressure coefficient GC in accordance
with section 6.5.11.1 of the code. These were determined to be +0.18 and -0.18.
The eighth step in the analysis was to obtain the external pressure coefficients
pfGC in accordance with section 6.5.11.2. These were determined to be -0.43 in section
4e and 0.61 in section 1e for the walls; with -1.07 in section 2e and -0.53 in section 3e of
the roof.
The ninth step was the determination of the velocity pressure in accordance with
section 6.5.10 in the code. The formula for this is as follows:
z z zt dq = 0.00256 K K K V I (psf) (Eq. 3.2)2
The worst case pressures exerted on the wall based on the calculations were +15.7psf and
-12.1psf in the transverse direction. Longitudinally, the worse case loads were
determined to be +15.7psf and -12.1psf. The roof, however experienced negative
pressures in all cases, and in both the transverse and longitudinal direction the value of
the negative pressure was determined to be -24.8psf, which is the same value determine
by utilizing the simplified method. Table 3.3 shows the values obtained using the
analytical method.

24
Table 3.3 Analytical MethodDESIGN PROCEDURE
1) From Section 6.5.4
Determine basic wind Speed V 130 mph
Determine Directionality Factor Kd 0.85
2)From Section 6.5.5
Determine the Building Category I
Determine the Importance Factor I 0.77
3)From Section 6.5.6
Determine Exposure Category B
Determine Kz or Kh 0.7
4) Determine topographic factor Kzt 1
5) Determine the Gust Effect Factor G 0.85
6) Determine the enclosure classification ENCLOSED
7) Determine the Internal Pressure coefficient
Gcpi 0.18
-0.18
8) Determine the External Pressure Coefficient
Gpf 4e -0.43
1e 0.61
Roof 2e -1.07
3e -0.53
determine qz, qz = 0.00256 Kz Kzt Kd V^2 I
= 0.00256 * 0.7 * 1 * 0.85 * (130 * 130) * 0.77
19.821402
qh = qz
p = qh (GCpf) - Gcpi)
Transverse Wall
worse case p = qh (1e - (+/-) 0.18)
positive on wall 15.658907 psf for wall
worst case p = qh (4e - (+/-) 0.18)
negative on wall -12.091055 psf for wall
Longitudinal Wall
worse case p = qh (1e - (+/-) 0.18)
positive on wall 15.658907 psf for wall
worst case p = qh (4e - (+/-) 0.18)
negative on wall -12.091055 psf for wall
Transverse Roof
worst case p = qh (2e - (+/-) 0.18)
roof uplift 1 -24.776752 psf
worst case P = qh(3e - (+/-) 0.18)
roof uplift 2 -14.073195 psf
USE WORST CASE, ASSUME 24.77 PSF ON ROOF
Longitudinal Roof
worst case p = qh (2e - (+/-) 0.18)
roof uplift 1 -24.776752 psf
worst case P = qh(3e - (+/-) 0.18)
roof uplift 2 -14.073195 psf

25
3.1.3 Determination of Dead Load
The determination of the dead loads of the structure began with the calculation of
the roof load over the column with the largest tributary area. This area was right above
the interior columns of the structure.
The area of load which each roof column would receive was determined to be
25ft x 30 ft, or 750ft . The weight of the roof over this area contributed a load of2
0.75kips to the foundation of the structure.
The second step in the analysis was to determine the weight of the purlins which
support the roof. The purlins used were L7.5x3.75x0.125 with a weight of 4.57plf. These
purlins were also spread over the tributary area, and it was determined that there would
be 8 purlins each 25ft long which would contribute to the load on the foundation. The
weight of these turned out to be approximately 0.92kips.
The girders used were W8x10, and the tributary length of each girder was 30ft
long. These girders have a weight of 10plf, and therefore the weight of the girders was
0.3kips.
The weight of the columns was then determined. The columns used were W8x21,
and were 20ft in length. With a weight of 21plf, the weight of the columns was
determined to be 0.42 kips.
This structure also contained side purlins connected to the columns. These were
8x2.5 Z, with a weight of 4.95plf. These purlins had a tributary width of 25ft, and each
column had 4 purlins mounted on it. The weight of these purlins was determined to be
approximately 0.50kips. The total weight of the frame of the building being analyzed

26
was determined to be 2.89 kips, based on the calculations. Table 3.4 is the calculation of
the dead load.
Table 3.4 Dead Load Calculation
SELF WEIGHT
ROOF WEIGHT
Tributary Width 25 ft
Tributary Length Per Wall 30 ft
Tributary Roof Area 750 ft^2Weight of 26 gauge steel siding 1 psf
Roof Weight 0.75 kips
FRAME WEIGHTTop Purlins (L 7.5 x 3.75 x 0.125)
Number of Purlins 8
Tributary Width of Purlins 25 ftWeight of Purlin 4.57 plf
Purlin Weight 0.914 kips
Girder ( W8x10)
Tributary Length 30 ftWeight 10 plf
Girder Weight 0.3 kips
Column (W8x21)
Length 20 ftWeight 21 plf
Column Weight 0.42 kips
Side Purlins
Number of Purlins 4
Tributary Width of Purlin 25 ftWeight 4.95 plf
Side Purlin Weight 0.495 kips
TOTAL WEIGHT 2.879 kips
3.1.4 Determination of Uplift Force to be Resisted
From the calculations done in section 3.1.1 and 3.1.2, it was concluded that the
uplift force acting on the building would be 24.8psf. When this load is multiplied over
750ft , which is the tributary roof area over the interior columns, an uplift force of2
18.6kips obtained. This 18.6kips is the upward force which will be exerted on the

27
structure during a hurricane with wind speeds of 130 miles per hour. At this point, the
only resistance which exists to this large uplift force is the self weight of the structure.
This self weight was calculated as 2.89kips. The net uplift force which needed to be
restrained was therefore the difference between the total uplift force and the self weight
of the building. This net uplift force was therefore 15.71kips, however, the designers
specified that the foundation be required to resist an uplift force of 17kips.
3.2 Incorporation of Both Tension and Compression Forces in Footing Design
The tensile forces in this structure are so large that they govern that design. For
this reason, the initial analysis of mini-piles vs bulk footings shall be focused on
designing the foundation to resist these forces.
3.2.1 Design of a Mass Concrete Footing to Resist Uplift Forces
The first step in designing the footing to resist the forces is the determination of
the factored load to be resisted. The safety factor incorporated in the foundation design
of this structure using a mass concrete footing is 1.5, and the code allows only 80% of the
dead load to be utilized to resist uplift forces, therefore the load to be resisted is 32kips,
which is 32,000 pounds. The unit weight of concrete is 150pcf, and therefore the total
volume of concrete needed to resist the uplift forces in this structure will be 213.4 cubic
feet per column.
The 213.4 cubic feet of concrete required to resist the load can be constructed
using a bulk footing at the base of each column. If this is done, the footing required
would be six feet deep, and have a cross sectional area of 36ft (6ft x 6ft x 6ft).2
Considering that this volume of concrete is required for just one footing, the total volume

28
of concrete needed to resist the 140 kips of uplift for the entire structure was calculated to
be 1750 cubic feet.
3.2.2 Design of Mini-Piles
The first step in the design of the mini-piles was a site evaluation. Cone
Penetration Tests (CPT) were performed at each of the four corners of the proposed
foundation in accordance with ASTM D-3441 (ASTM, 1996) [8] see Figure 3.1. Figure
3.2 shows the results from the NE sounding.
Using correlations developed by Robertson and Campanella (1983)[10], the tip
stress and friction ratio were used to identify the soil type from 12 pre-defined regions in
Figure 3.3. These classifications also help to convert the CPT data to equivalent
Standard Penetration Test resistance values, (N) also shown in Figure 3.2. Figure 3.4
shows the CPT data plotted on the Robertson & Campanella’s classification chart and
shows mostly low friction ratio (cohesion less) soils. Figure 3.4 shows the values
converted to soil type. Similar results for all four CPT soundings can be found in the
Appendix (Fig B-5 through B-8) along with interpreted results.
With the soil stratification and strength identified from the CPT data, a
spreadsheet was designed to determine the capacity of the shaft as a function of its length
using both the “CPT” method and the “Titan”method.
3.2.2.1 CPT Method
Design using the CPT method utilizes the side shear forces directly measured
from the CPT tests to determine the capacity of the min-pile. The diameter of the anchor
is determined prior to construction, and in this case was 6in. From this, the perimeter
29
was calculated to be 1.57ft. The perimeter times the length is the area in contact with the
soil, and is therefore responsible for the side shear which develops.
Knowing that the shaft has a perimeter of 1.57ft / linear ft, we can multiply this2
value by the side shear determined by the CPT test to develop the skin friction of the
mini-pile at a given depth. By adding up the capacity of the shaft up to a given depth, the
capacity of that depth can be determined. This was done to develop the capacity of the
shaft up to the maximum depth of which the CPT machine was able to achieve (between
17ft and 19ft). The total capacity of the shaft for a given depth was calculated on the
same spreadsheet, and then a “VLOOKUP” function was used to obtain the minimum
depth required to resist the factored uplift force. The CPT method determined this
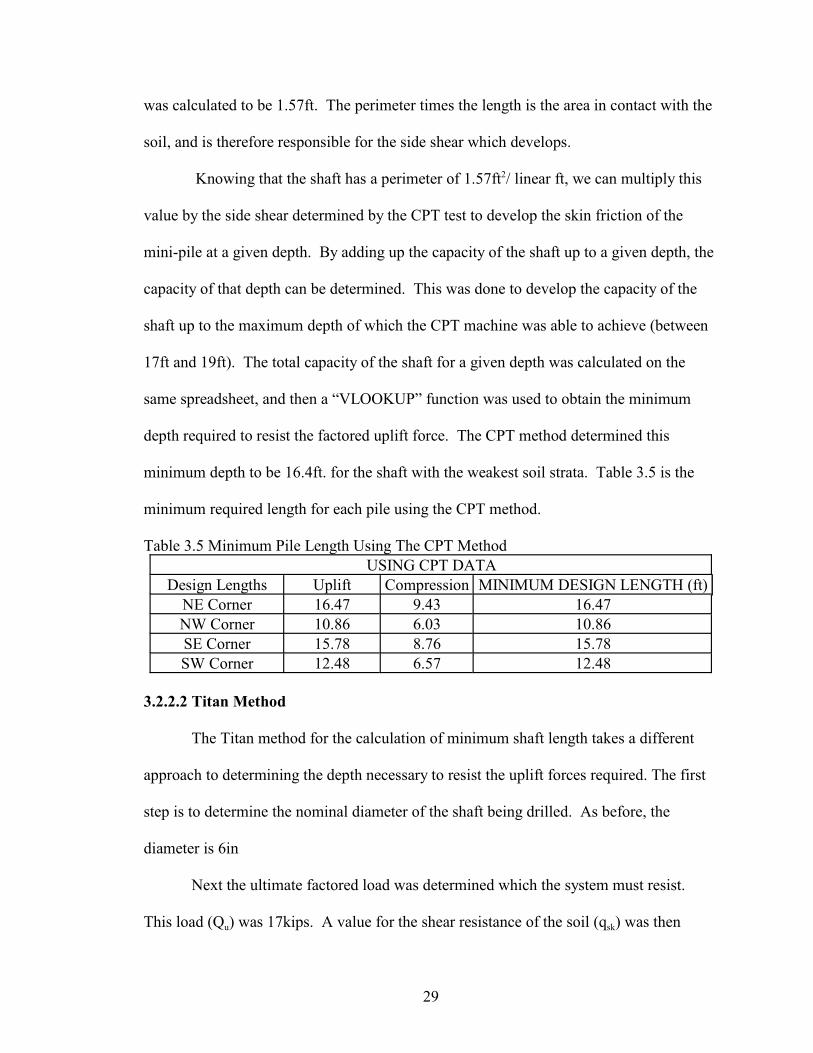
minimum depth to be 16.4ft. for the shaft with the weakest soil strata. Table 3.5 is the
minimum required length for each pile using the CPT method.
Table 3.5 Minimum Pile Length Using The CPT MethodUSING CPT DATA
Design Lengths Uplift Compression MINIMUM DESIGN LENGTH (ft)NE Corner 16.47 9.43 16.47NW Corner 10.86 6.03 10.86SE Corner 15.78 8.76 15.78SW Corner 12.48 6.57 12.48
3.2.2.2 Titan Method
The Titan method for the calculation of minimum shaft length takes a different
approach to determining the depth necessary to resist the uplift forces required. The first
step is to determine the nominal diameter of the shaft being drilled. As before, the
diameter is 6in
Next the ultimate factored load was determined which the system must resist.
u skThis load (Q ) was 17kips. A value for the shear resistance of the soil (q ) was then

30
determined based on its classification. This particular site had 15ft of sand to silty sand,
followed by at least 2ft of very stiff clay or clayey silts, with limestone being below that.
Because of this, a value for the density was determined to be 91.8lbs/ft . 3
The soil type is then also used to determine the grout body factor of the shaft.
The grout body factor is said to be the true diameter of the shaft based on the expansion
of the concrete into the surrounding soils, therefore there is an amplification in the
diameter and surface area of a mini-pile specific to each soil type. For this particular
soil, the grout body factor is 1.5, which produced a grout body diameter (d) of 0.22m.
The Titan method then utilizes a formula to calculate the length of the
shaft. The formula which is used is the following:
u skL = Q / (B x d x q ) (Eq. 3.3)
The calculations done based on this formula generated a minimum required length of 9.2
ft. Table 3.6 is the minimum pile length using the Titan method.
Table 3.6 Minimum Pile Length for NE Corner Using The Titan Method
USING TITAN METHOD
d = 0.1524 m
Qu 151.239534 KN
qsk 150 KN/m^3Grout Body Factor 1.5
Grout Body Diameter 0.2286 mRequired Pile Length 2.80675 mRequired Pile Length 9.2 ft
3.2.3 Compression in the Footing
The maximum compressive force which the foundation is expected to resist was
determined to be 10kips. When combined with the end bearing of the mini-pile, the
capacity in compression is far greater than 17 kips, therefore no special modification is
needed for the structure to resist the 10kip compression load. As for the pressure placed

31
on the concrete, the area of the shaft is 0.78ft, and when the 10 kips is distributed over
this area, there is a compressive force of 12, 800psf, which is only 88.4psi, which can
easily be resisted by the concrete.
3.3 How Testing Can Aid in Safety and Economy
3.3.1 Safety
Testing can play an important role in quality assurance, especially in the design of
foundations. This is because unless adequate testing is done, there is no way of knowing
exactly what the properties of the soil are beneath the surface. If the design is done using
strictly a bulk footing, then there is no need for testing, as the only force responsible for
the resistance of the forces is gravity. For mini-piles, however testing should be used to
confirm soil shear strength values.
The Titan method recommended a shaft length of only 9.2ft to resist 17kips of
uplift force. This was based on a lot of assumptions. One assumption is that the
effective diameter of the shaft was in fact 1.5 times that of the nominal bore hole
diameter. Without testing, a shaft could be constructed based on the assumption that the
soil is relatively consistent in nature, and this could lead to a structural failure when full
design loads are realized..
The design using the CPT method begins with an evaluation of the site using the
CPT data. This gives you the exact profile of the soil beneath the surface, and the exact
tested value for the skin friction which the soil is capable of generating. By using the
CPT method, each shaft is built to meet the characteristics of a specific location. This
leads to a much safer design, and testing which is discussed in chapter 4 confirms that the
CPT method is conservative in its values for ultimate capacity.

32
Both methods are empirical and cannot be expected to fully predict the exact side
shear development in the anchors/mini-piles. As a result, testing provides a means to
confirm design assumptions prior to full construction.
3.3.2 Economy
As safety, economy, and uncertainty are all linked in the design of foundations,
testing provides a means by which to eliminate uncertainty and help assign reasonable
safety factors. Higher safety factors cause higher costs and vice versa. Therein, a no
testing approach typically employs safety factors no less than 3.0; whereas testing
programs have associated safety factors no greater than 2.0. As the frequency of testing
increases to 100% verification, the safety factor can fall as low as 1.0. Mini-piles are
easily tested and it is not unreasonable to test every anchor/mini-pile. As the safety
factor is directly related to anchor lengths and the associated cost, testing mini-pile
anchors can lead to cost savings ranging from 50% to 200% and above, while reducing
uncertainty to near zero.
Service Load Ultimate - Anchor P <= P / S. F. (Eq. 3.4)
1.0 < S. F. < 3.0
100% > f > 0%
Where the Safety Factor ranges from 1 to 3 for testing frequency of 100 to 0%
respectively.

33
Figure 3.1 USF CPT Truck
Figure 3.2 Results from the NE CPT Sounding

34
Figure 3.3 Soil Classification Chart(Adapted from Robertson & Campanella)
Figure 3.4 Soil Classification for NE Corner

35
Chapter 4 Construction and Testing
4.1 Site Investigation
Prior to the design and construction of the mini-piles for this project, a site
investigation was done to determine the soil characteristics. On October 18 , 2004 Coneth
Penetration Tests were performed at the locations of the 4 corners of the proposed
foundation, in accordance with ASTM D-3441. The results of the test were that the soil
below the foundation consisted of 15ft of sand to silty sand with 2 to 5ft of very stiff clay
to clayey silts beneath that. Between 17ft and 19ft penetration refusal was encountered
by the CPT machine, indicating that this was the top of the limestone. The data from
these tests was then used to determine the worst case minimum shaft length of the mini-
piles. This concluded that the worst case minimum shaft length needed was 17ft, and the
designers recommended that the shafts therefore be extended to a depth of 20ft for added
safety, based on the fact that the greatest cost involved in the installation of the mini piles
is the mobilization, and therefore adding three feet onto each shaft would generate a
significantly stronger pile for only a small increase in cost.
4.2 Field Test
On October 28, 2005 an out of position test mini-pile was installed 10 ft. east of
the proposed SE corner. This test pile was drilled using a 4in diameter bit, and had a
nominal design diameter of six inches (when in sand). The embedment length was 22ft
3in, and the overall anchor length was 26ft 3in as shown in Figure 4.1. A single Williams
Form Bar was placed in the center of the shaft, with a tensile strength of 150ksi, shown in

36
Figure 4.2. The borehole was made using a CME-45 drill rig typically used for
performing SPT tests. While the hole was being drilled, a weak concrete mixture
consisting of a 0.88 water to cement ratio was used as the drilling fluid in order to
prevent the sides from collapsing and to flush soil debris to the surface. At the desired
drilling depth, a stronger mixture consisting of a 0.45 water to cement ratio was pumped
through the drill stem into the hole, which forced the weaker/less dense concrete to rise
to the surface. Following this, the drill stem was removed, and the threaded anchor bar
was placed into the hole. A portion of the bar was left exposed at the top, for the purpose
of testing. Figure 4.3 shows the anchor installation process.
On November 2, 2005 the capacity verification test was performed in accordance
with ASTM D-1143 (ASTM 1996), Figure 4.4 shows the test setup. The first of the two
load cycles which were performed generated an uplift force of 43kips, while the second
one went up to 64kips, Figure 4.5 shows the load test results. These tests resulted in no
significant permanent deformation of the shaft, and there were no indications that the pile
was close to failure, even though it was stressed to almost four times the design load.
The testing also concluded that at 17kips, the upward displacement of the pile was only
1/8in, concluding that the mini-piles were more than adequate to resist the design loads.
4.3 Site Survey
Following the confirmation that the mini-pile design was adequate, the site survey
was done to mark off the footprint of the building. The survey started by marking off the
4 corners of the building, and once this was established, the locations for all 16 mini-piles
were marked off. Figure 4.6 shows the site plan and location of all columns/anchors.

37
The next step was to ensure that all of the piles would end at the exact same
elevation, to ensure that they would all have the same relative height to the top of the
slab, thereby ensuring proper load distribution. The first step in this process was to
determine the highest point of the ground within the footprint of the area, and have that
be the benchmark for the site. From there, the height of the slab was determined relative
to the ground. The tops of the piles were required to be 20in below the top of the slab, so
notes were made for the adjustment of each pile so that they could all end at the same
height, relative to the finished slab elevation.
4.4 Mini-Pile Installation
After the survey was completed, the next step was to install the piles. The
installation was doing using a water truck, to provide the necessary water for the grout,
and a SPT drill rig, to drill the holes and pump the concrete. Figure 4.7 is the SPT drill
rig.
The installation began by first positioning the drill rig over the position of each
hole (accurate to within one inch). The second step was to install the “mud pan”, which
is used to re-circulate the grout, around the hole to ensure there is a watertight seal
between the pan and the earth’s surface. After the pan was secure, an initial amount of
cement with a water to cement ratio of 0.88 was poured into the pan and allowed to
circulate through the pump mounted onto the SPT machine. After grout circulation was
established, the drilling commenced. The drill rods used for construction were each 5ft
long, and therefore 4 bars had to be used to drill down 20ft from the surface of the earth.
The level of grout in the mud pan was monitored, as less grout would return to the
surface because of the increased volume of the hole, and when the volume of the pan was

38
low, more cement and water of the same consistency was added to compensate for the
change in volume. Once the drill bit reached the desired depth of 20ft, a stronger
concrete grout consisting of a 0.45 water to cement ratio was pumped into the mud pan
and then circulated into the hole. The weaker cement grout was discarded as it rose to
the surface, and pumping continued until the stronger grout had filled the entire volume
of the mini-pile as evidenced by the change in slurry color (from greyish to greenish). At
this point, the removal of the drilling rods began. While the rods were being lifted out of
the ground, grout was continuously pumped into the hole through the tip of the drill bit to
ensure that there would be no voids left by the removal process. When the final rod,
containing the drill head, was removed; the steel bar was installed into the shaft.
The bar used for these mini-piles was a #7 reinforcement bar, with a yield
capacity of 60ksi. The area of a #7 bar is 0.6in , therefore the maximum tensile force2
will be only 28ksi for the designed uplift force, making the bar acceptable even with the
specified safety factor of 2 for the substructure design. The bar was picked up by the
boom on the drill rig, and hoisted until it was perfectly vertical. It was then centered over
the hole, and slowly lowered to ensure that it did not enter the shaft at an angle, and
centralizing tabs were attached to the bar at the top and bottom to assure adequate cover,
shown in Figure 4.8. Once in, the hook on the top of the reinforcing bar was set to the
right height, as determined during the site survey, and then the pile was left to harden.
After the reinforcement was placed in the ground, the remaining grout was
discarded, and the seal of the mud pan with the ground was broken. The equipment was
relocated to the site of the next mini-pile, and the process was repeated until all piles

39
were completed. On average, it required about 1 hour to relocate the equipment, drill a
hole, and install the anchor rod.
Following the hardening of the concrete, the formwork was then put in place for
the construction of the slab. The area around each mini-pile was dug out so that a special
connection could be made to ensure that there would be a proper transfer of force from
the columns to the piles, this connection is shown in Figure 4.9. After this was done, all
of the reinforcement was placed and tied, and then the entire slab was poured in a single
monolithic fashion.

40
Figure 4.1 Installed Mini-Pile
Figure 4.2 Williams Form Bar

41
Figure 4.3 Anchor Installation

42
Figure 4.4 Static Load Test Setup
Figure 4.5 Load Test Results

43
Figure 4.6 Site Layout(Courtesy of Structural Engineering and Inspections, Tampa)

44
Figure 4.7 SPT Drill Rig

45
Figure 4.8 Centralization Tabs
Figure 4.9 Load Transfer Connection

46
Chapter 5 Economy of Foundations
5.1 Mass Concrete Footer
Following the calculation of the uplift force which the footing must resist, a
volume of concrete required for the mass concrete footer was determined. The cost of
these footers is both a function of the volume of concrete poured, and the dimensions of
the footer. It was assumed that the footer resisting the 17 kips of force would require a
footing with a volume of 216 cubic ft This generated values which could be used to
estimate the total cost of the project. Table 5.1 is the estimated construction cost by item.
Table 5.1 Construction Cost by ItemESTIMATION OF FOOTER CONSTRUCTION COSTS
Pour Concrete 174 $/CY6 CY/MH
Rebar Weight/CY of Concrete 172 LB/CYPurchase Cost 0.8 $/LBTie In Place 0.13 $/LBLabor $15 $/HR
The dimensions of the footer were used to also generate estimated values for the
labor costs required to produce each footer. These values, combined with the cost of the
raw materials were then used to produce a cost for each footer to be built. The estimated
cost of each footer in the project was determined to be $2,691.68. To resist the entire 140
kips required in this design would therefore cost $21, 807.59. Table 5.2 is the cost per
footer, and Table 5.3 is the total cost of the project using a mass concrete footing.

47
Table 5.2 Cost for Each 17 Kip Mass Concrete FooterMASS CONCRETE FOOTER
Footer Volume 216.00 ft^3 8.00 yd^3Footer Length 6.00 ftFooter Width 6.00 ftFooter Height 6.00 ft
SET REINFORCEMENTReinforcement weight 1376.00 LbsReinforcement Cost 1100.80 $Labor Cost 178.88 $
POUR CONCRETEConcrete Cost 1392.00 $Labor 1.33 MHLabor Cost 20.00 $TOTAL COST $ 2,691.68
Table 5.3 Total Cost Using Mass Concrete FooterMASS CONCRETE FOOTER
Footer Volume 1750.00 ft^3 64.81 yd^3Footer Length 6.00 ftFooter Width 6.00 ftFooter Height 48.61 ft
SET REINFORCEMENTReinforcement weight 11148.15 lbsReinforcement Cost 8918.52 $Labor Cost 1449.26 $
POUR CONCRETEConcrete Cost 11277.78 $Labor 10.80 MHLabor Cost 162.04 $TOTAL COST $ 21,807.59
5.2 Mini-Pile Anchor
The determination of the cost of each footer using mini-piles differs from that of
the mass concrete footing. This is because there is no formwork or excavation, and the
volume of material used is measured in bags of cement rather than cubic yards of
concrete. Also, there is no labor cost per activity, and instead there is an initial
mobilization cost and an “operational” cost per foot drilled. To determine the cost per

48
min-pile in this project, the mobilization cost was divided by the number of piles to
generate the cost per pile.
Based on the same assumptions made for the calculation of the mass concrete
footer, the material costs were calculated to determine the cost per pile. With each pile
receiving an equal share of the mobilization cost, it was determined that the cost per pile
resisting 17 kips was $1,723.50. This value is 64% of that for the mass concrete footer.
The project cost after designing each footing based on the NE (worst case) sounding and
drilling to the minimum required length is therefore $15,624.00, which is a savings of
28% of the original foundation cost. Table 5.4 is the cost per 17 kip mini-pile, and Table
5.5 is the total cost of the project using mini-piles.
Table 5.4 Cost for Each 17kip Mini-Pile
MINI-PILE INSTALLATION
Mobilization 5000 $/Project
Operation 80 $/ft
Concrete 0.5 Bags/ft
6 $/Bag
# Piles 16
Pile Length 17 ftMobilization cost 312.5 $/Pile
Labor 1360 $/Pile
Concrete Used 8.5 Bags
Concrete Cost 51 $/PileTOTAL COST $1,723.50 $/Pile
Table 5.5 Total Cost Using Mini-Piles
Mini-Pile Installation Cost
Total Drill Length 128 ft
Mobilization 5,000.00 $
Operation 10,240.00 $
Concrete 64 Bags
384 $TOTAL COST $15,624.00

49
5.3 Break Even Analysis
From the costs calculated for both types of footings, it is obvious that it is more
economical to use mini-piles for large projects, however the mobilization costs
associated with constructing the mini-piles makes it possible that there will not always be
instances where the mini-piles are a cheaper alternative to mass concrete footings. This
is because the cost of one 17 kip mass concrete footing is $2,691.68, while the cost of
mobilization alone for the equipment to install the mini-piles is $5,000.
A break even analysis is therefore necessary to determine if there is a specific
force which must be resisted at which one option is more economical than the other. The
first step to determine this was to determine the cost per kip resisted by the mass concrete
footer. This was done by dividing the total cost of the project by the force resisted. This
gave the mass concrete footer a value of $155.77 per kip resisted. This value is linear
from the origin, as a force of 0 kips will require $0. Table 5.6 shows the footer cost per
kip resisted as well as that for the mini-piles.
Table 5.6 Cost Per Kip Resisted
COST PER KIP RESISTED
MASS CONCRETE
Total Load Resisted 140 kips
Cost of Mass Concrete Footing 21,807.59 $
Cost Per Kip Resisted 155.77 $/Kip
MINI-PILE
Total Length of Mini-piles 128 ft
Cost Per Ft. Drilled 80.00 $
Total Drilling Cost 10,240.00 $
Total Concrete Cost 384 $
Cost Per Kip Resisted (W/O Mob.) 75.89 $/Kip
The determination of the cost per kip resisted by the mini-piles differs from that
of the concrete footing due to the mobilization cost. To do the analysis of cost per kip

50
resisted, the mobilization cost was subtracted from the total cost of the project. The
remaining value was then divided by the total force resisted, and this generated a value of
$75.89 per kip resisted. The reason why the mobilization cost was subtracted before the
determination was done was that this cost is constant and must be paid regardless of the
force resisted (or number of anchors installed). The calculation of the cost per kip
resisted by the mini-pile system is therefore the addition of the mobilization cost with the
product of the cost per kip resisted and the number of kips resisted. When plotted, this
value is also linear, however does not begin from the origin of the graph, but rather is
shifted up by $5000.
The results of the plots show that the break even point for this specific project,
based on the soil conditions, the break even force for the design is going to be 63.59kips,
at a cost of $9,749.68. Figure 5.1 is the results of the break even analysis.
After the break even analysis was done, an attempt was made to determine if
there are any common soil types for which the used of mini-piles would not be
economical. This was done by determining the capacity of mini-piles in soils with
typical properties. As no in-situ values are available for this, the CPT method could not
be utilized for this analysis, and therefore the Titan method was used to generate the
graph for Figure 5.2. The data generated was then used to plot a graph of the cost of a
foundation as a function of the required resistive load, shown in Figure 5.3. This graph
has a different break even point from the case study, because the CPT Method is more
conservative than the Titan method, however it can clearly be seen that a harder/denser
soils can resist loads for a lower price than would be required for the same type of
foundation constructed in a softer soil. This graph is based on certain soil assumptions,

51
and can therefore only be used a proof that there is a point for all soils at which a mass
concrete footing would be a less economical option to that of a mini-pile.
One significant characteristic of the graph is that regardless of the soil type, the
mass concrete footer is the more economical choice for resisting light loads, and the
savings in foundation design can only be realized when designing for the resistance of
large uplift forces.

52
Figure 5.1 Soil/Site Specific Break Even Analysis
Figure 5.2 Mini-Pile Anchor Capacity Based on Soil Type (Titan Method)

53
Figure 5.3 Foundation Cost Per Force Resisted (Using Titan Method)

54
Chapter 6 Conclusion and Summary
The Conclusion of this thesis is that the use of mini-piles can be economical in
any soil type provided the force required to resist is larger than the break even point
specific to that soil. This break even point is site specific as it is will be determined
solely by the soil in that specific location. Because of this, a mini-pile foundation might
be more economical for resisting a given load in one spot, and not in another because of
the difference in the soil at the different sites. However, it was also concluded that there
is a break even point associated with each soil type, and therefore there will be a point at
which a foundation will be more economical were it constructed using mini-piles vs
using a mass concrete footer.
Not mentioned in this study were savings associated with the time required for
foundation construction. Had a mass concrete footer been utilized, there would have
been a certain time required to excavate the foundation and fabricate the reinforcement
cage needed for the footers. Mini-piles, however, do not require any excavation prior to
installation, and therefore saves time in construction. For the case study, a crew of 4 men
installed all of the anchors in 2 days, while casting of the mass concrete footer would
have taken 4.
To summarize, mini-piles are very economical for resisting uplift forces, as once
the mobilization cost is recovered, the cost per kip resisted is far less than that of a mass
concrete footer. There are also foreseeable benefits to increased utilization of mini-pile
anchors. This is because the cost of a foundation constructed using mini-piles is affected

55
less by the increase in the cost of cement, than that of a mass concrete footer, which will
make mini-pile anchors a much more economical option as the price of cement increases.

56
References
[1] ASCE 7-02 Minimum Design Loads for Buildings and Other Structures, Reston,Virginia, 2003.
[2] Gunaratne, M. The Foundation Engineering Handbook. CRC Press. 2006.
[3] “Drilled and pressure grouted TITAN Micro Piles”, The Con-Tech Systems Ltd.Website. <http://www.contechsystems.com/> Last Accessed on 27 October 2006.
[4] “USGS Mineral Cost of Cement”, The United States Geological Survey MineralsInformation Website.<http://minerals.usgs.gov/minerals/pubs/commodity/cement/> Last Accessed on27 October 2006.
[5] Manual of Steel Construction Load and Resistance Factor Design. Prepared bythe American Institute of Steel Construction Inc. 2003.
[6] “MICROPILES Project Support From the Ground Down”, The Hayward BakerGeotechnical Construction Website.<http://www.haywardbaker.com/services/micropiles.htm> Last Accessed on 27 October 2006.
[7] “Micropiles”, The International Society for Soil Mechanics and GeotechnicalEngineering Website. <http://tc17.poly.edu/mp.html> Last Accessed on 27 October 2006.
[8] “Standard Test Method for Deep, Quasi-Static, Cone and Friction-ConePenetration tests of Soil”, D3441-94. Annual Book of ASTM Standards, Volume04.08, American Society for Testing and Materials. 1996.
[9] “Standard Test Method for Piles Under Static Axial Compressive Load”, D1143-81. Annual Book of ASTM Standards, Volume 04.08, American Societyfor Testing and materials. 1996.
[10] Robertson, P.K. and Campanella, R.G., “Interpretation of Cone Penetration Tests.Part I: Sand”, Canadian Geotechnical Journal, Vol. 20, No. 4, Nov. 1983, pp. 718 - 733.

57
Appendices
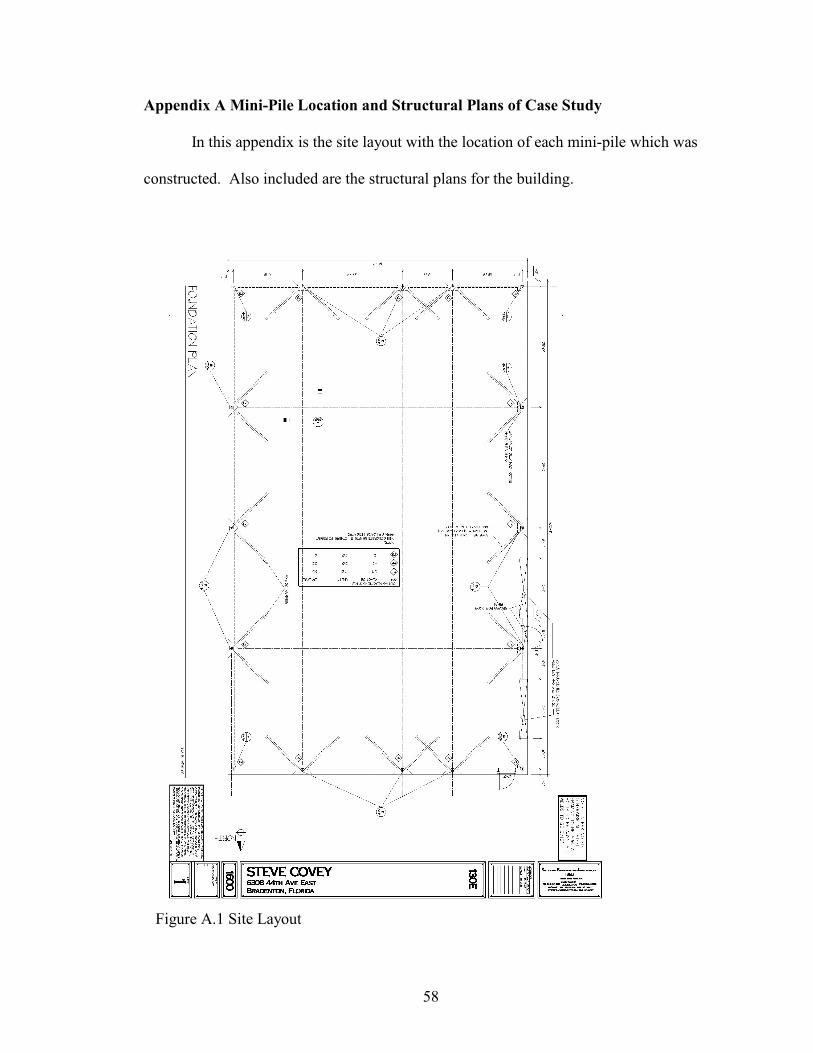
58
Appendix A Mini-Pile Location and Structural Plans of Case Study
In this appendix is the site layout with the location of each mini-pile which was
constructed. Also included are the structural plans for the building.
Figure A.1 Site Layout
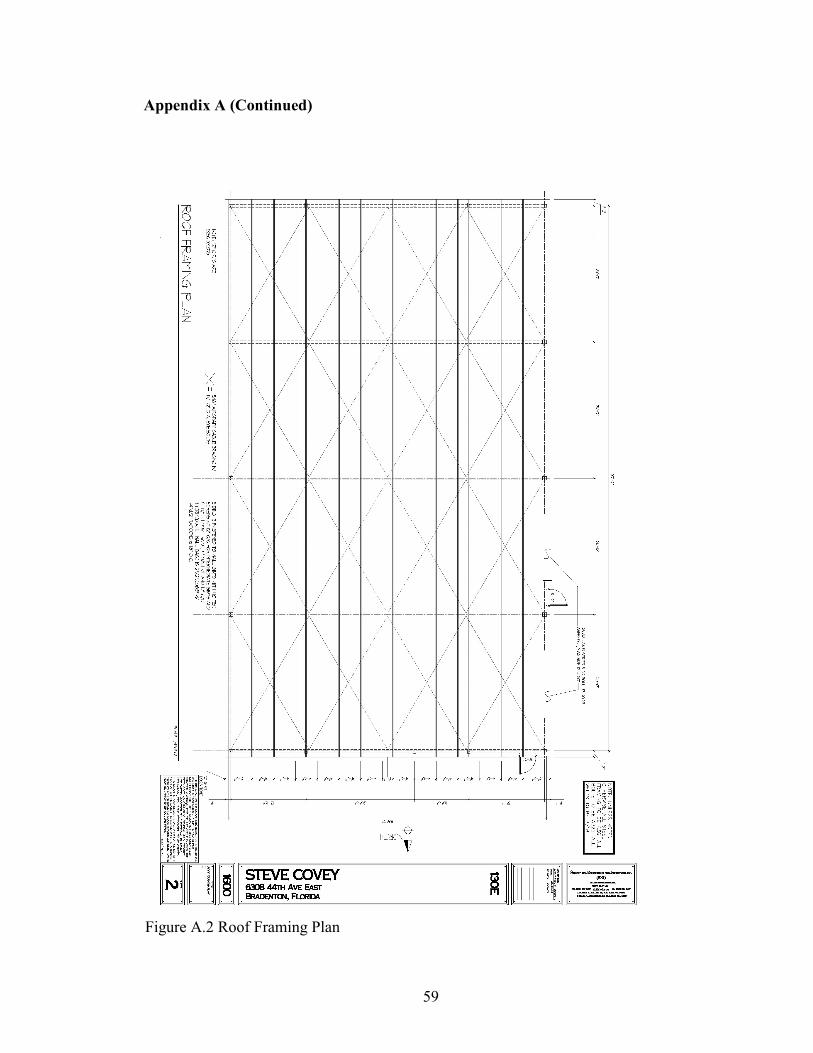
59
Appendix A (Continued)
Figure A.2 Roof Framing Plan

60
Appendix A (Continued)
Figure A.3 Front and Rear Elevations

61
Appendix A (Continued)
Figure A.4 Side Elevations

62
Appendix B Results of CPT Testing
This appendix shows the graphical and digital results for the CPT tests which
were performed for this project.
Figure B.1 CPT Sounding for NE Corner
Figure B.2 CPT Sounding for NW Corner

63
Appendix B (Continued)
Figure B.4 CPT Sounding for SW Corner
Figure B.3 CPT Sounding for SE Corner

64
Appendix B (Continued)
Figure B.5 Soil Classification for NE Corner
Figure B.6 Soil Classification for NW Corner

65
Appendix B (Continued)
Figure B.7 Soil Classification for SE Corner
Figure B.8 Soil Classification for SW Corner
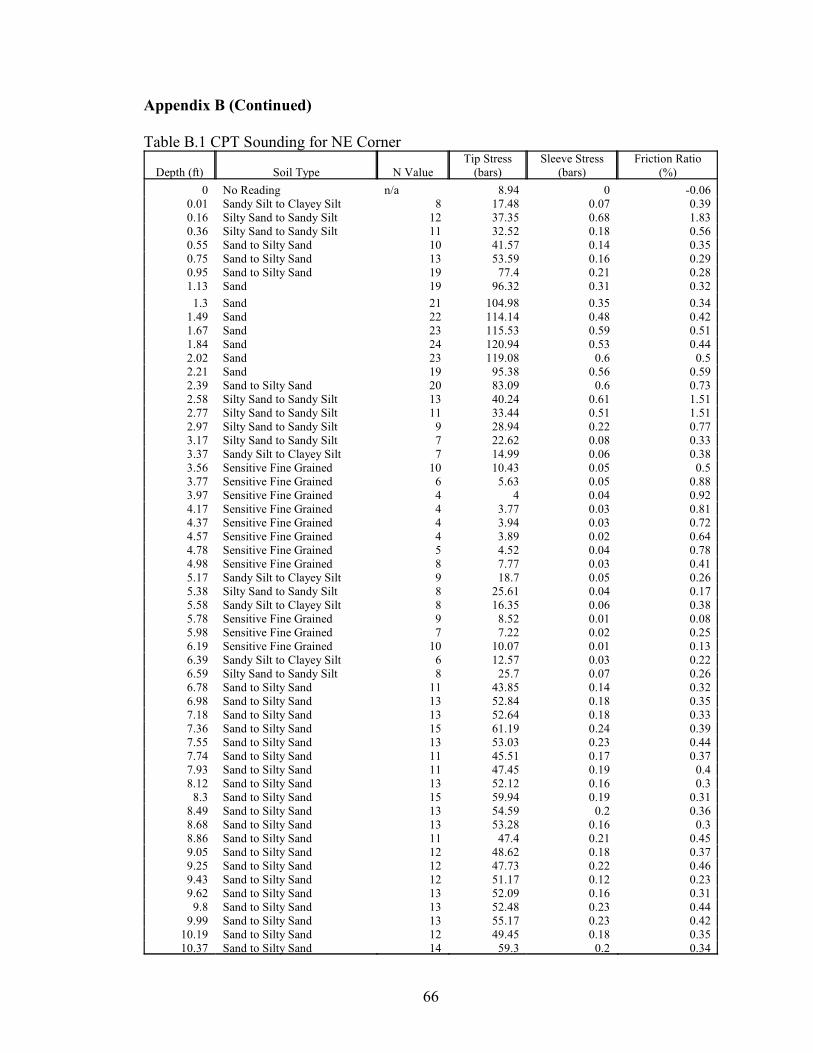
66
Appendix B (Continued)
Table B.1 CPT Sounding for NE Corner
Depth (ft) Soil Type N ValueTip Stress
(bars)Sleeve Stress
(bars)Friction Ratio
(%)
0 No Reading n/a 8.94 0 -0.060.01 Sandy Silt to Clayey Silt 8 17.48 0.07 0.390.16 Silty Sand to Sandy Silt 12 37.35 0.68 1.830.36 Silty Sand to Sandy Silt 11 32.52 0.18 0.560.55 Sand to Silty Sand 10 41.57 0.14 0.350.75 Sand to Silty Sand 13 53.59 0.16 0.290.95 Sand to Silty Sand 19 77.4 0.21 0.281.13 Sand 19 96.32 0.31 0.32
1.3 Sand 21 104.98 0.35 0.341.49 Sand 22 114.14 0.48 0.421.67 Sand 23 115.53 0.59 0.511.84 Sand 24 120.94 0.53 0.442.02 Sand 23 119.08 0.6 0.52.21 Sand 19 95.38 0.56 0.592.39 Sand to Silty Sand 20 83.09 0.6 0.732.58 Silty Sand to Sandy Silt 13 40.24 0.61 1.512.77 Silty Sand to Sandy Silt 11 33.44 0.51 1.512.97 Silty Sand to Sandy Silt 9 28.94 0.22 0.773.17 Silty Sand to Sandy Silt 7 22.62 0.08 0.333.37 Sandy Silt to Clayey Silt 7 14.99 0.06 0.383.56 Sensitive Fine Grained 10 10.43 0.05 0.53.77 Sensitive Fine Grained 6 5.63 0.05 0.883.97 Sensitive Fine Grained 4 4 0.04 0.924.17 Sensitive Fine Grained 4 3.77 0.03 0.814.37 Sensitive Fine Grained 4 3.94 0.03 0.724.57 Sensitive Fine Grained 4 3.89 0.02 0.644.78 Sensitive Fine Grained 5 4.52 0.04 0.784.98 Sensitive Fine Grained 8 7.77 0.03 0.415.17 Sandy Silt to Clayey Silt 9 18.7 0.05 0.265.38 Silty Sand to Sandy Silt 8 25.61 0.04 0.175.58 Sandy Silt to Clayey Silt 8 16.35 0.06 0.385.78 Sensitive Fine Grained 9 8.52 0.01 0.085.98 Sensitive Fine Grained 7 7.22 0.02 0.256.19 Sensitive Fine Grained 10 10.07 0.01 0.136.39 Sandy Silt to Clayey Silt 6 12.57 0.03 0.226.59 Silty Sand to Sandy Silt 8 25.7 0.07 0.266.78 Sand to Silty Sand 11 43.85 0.14 0.326.98 Sand to Silty Sand 13 52.84 0.18 0.357.18 Sand to Silty Sand 13 52.64 0.18 0.337.36 Sand to Silty Sand 15 61.19 0.24 0.397.55 Sand to Silty Sand 13 53.03 0.23 0.447.74 Sand to Silty Sand 11 45.51 0.17 0.377.93 Sand to Silty Sand 11 47.45 0.19 0.48.12 Sand to Silty Sand 13 52.12 0.16 0.3
8.3 Sand to Silty Sand 15 59.94 0.19 0.318.49 Sand to Silty Sand 13 54.59 0.2 0.368.68 Sand to Silty Sand 13 53.28 0.16 0.38.86 Sand to Silty Sand 11 47.4 0.21 0.459.05 Sand to Silty Sand 12 48.62 0.18 0.379.25 Sand to Silty Sand 12 47.73 0.22 0.469.43 Sand to Silty Sand 12 51.17 0.12 0.239.62 Sand to Silty Sand 13 52.09 0.16 0.31
9.8 Sand to Silty Sand 13 52.48 0.23 0.449.99 Sand to Silty Sand 13 55.17 0.23 0.42
10.19 Sand to Silty Sand 12 49.45 0.18 0.3510.37 Sand to Silty Sand 14 59.3 0.2 0.34

67
Appendix B (Continued)
Table B.1 (Continued)10.54 Sand to Silty Sand 17 68.68 0.97 1.41
10.73 Sand to Silty Sand 16 64.52 0.59 0.91
10.92 Sand to Silty Sand 12 49.59 0.29 0.58
11.1 Silty Sand to Sandy Silt 12 37.46 0.29 0.77
11.29 Silty Sand to Sandy Silt 12 36.77 0.33 0.89
11.48 Sand to Silty Sand 9 39.13 0.17 0.42
11.67 Sand to Silty Sand 10 41.32 0.22 0.54
11.85 Silty Sand to Sandy Silt 11 34.72 0.31 0.88
12.03 Sand to Silty Sand 10 41.32 0.18 0.43
12.22 Sand to Silty Sand 9 35.55 0.23 0.64
12.41 Sand to Silty Sand 12 47.76 0.15 0.31
12.59 Sand to Silty Sand 10 42.38 0.13 0.3
12.77 Silty Sand to Sandy Silt 13 40.93 0.43 1.04
12.96 Sandy Silt to Clayey Silt 15 29.92 0.48 1.6
13.15 Sand to Silty Sand 10 42.07 0.24 0.56
13.33 Silty Sand to Sandy Silt 14 41.57 0.39 0.93
13.51 Silty Sand to Sandy Silt 11 32.94 0.32 0.98
13.71 Sandy Silt to Clayey Silt 12 24.59 0.36 1.45
13.89 Silty Sand to Sandy Silt 13 40.63 0.52 1.28
14.07 Silty Sand to Sandy Silt 9 28.97 0.34 1.17
14.25 Sandy Silt to Clayey Silt 15 30.28 0.68 2.24
14.43 Sand to Silty Sand 17 68.02 0.55 0.81
14.62 Silty Sand to Sandy Silt 13 38.8 0.55 1.42
14.8 Sand to Silty Sand 14 59.22 0.51 0.86
14.97 Sand to Silty Sand 12 47.98 0.42 0.88
15.16 Sand to Silty Sand 15 60.89 0.48 0.79
15.35 Sandy Silt to Clayey Silt 8 15.65 0.25 1.6
15.53 Sandy Silt to Clayey Silt 6 12.49 0.22 1.76
15.72 Silty Clay to Clay 3 7.49 0.17 2.25
15.91 Silty Clay to Clay 3 6.3 0.14 2.29
16.11 Silty Clay to Clay 3 6.72 0.17 2.47
16.29 Sandy Silt to Clayey Silt 7 14.35 0.21 1.45
16.47 Sandy Silt to Clayey Silt 20 40.13 0.96 2.4
16.66 Silty Clay to Clay 26 53.2 2.32 4.36
16.84 Clay 26 26.34 1.46 5.55
17.01 Silty Sand to Sandy Silt 15 45.07 1.01 2.23
17.18 Silty Sand to Sandy Silt 21 65.1 1.38 2.12
17.34 Sand to Silty Sand 41 164.01 2.23 1.36
17.48 Silty Sand to Sandy Silt 59 177.16 4.33 2.44
17.61 Sand to Clayey Sand 84 168.34 6.3 3.74
17.72 Very Stiff Fine Grained 135 135.09 7.68 5.68
17.84 Very Stiff Fine Grained 121 120.74 5.48 4.54
17.99 Sandy Silt to Clayey Silt 48 96.46 3.2 3.31
18.13 Silty Sand to Sandy Silt 40 119.94 3.62 3.02
18.28 Silty Sand to Sandy Silt 47 141.53 4.34 3.06
18.44 Sandy Silt to Clayey Silt 52 104.59 3.37 3.22
18.6 Silty Sand to Sandy Silt 44 134.48 3.36 2.5
18.75 Silty Sand to Sandy Silt 43 128.96 4.17 3.24
18.89 Very Stiff Fine Grained 121 120.58 5.85 4.85
19.01 Silty Sand to Sandy Silt 59 178.44 5.52 3.09
19.28 Sensitive Fine Grained -33 -32.8 1.04 -3.16
31.54 Sensitive Fine Grained -1 -1.03 0.03 -2.72

68
Appendix B (Continued)
Table B.2 CPT Sounding for NW Corner
Depth (ft) Soil Type N ValueTip Stress
(bars)Sleeve Stress
(bars)Friction Ratio
(%)
0 No Reading n/a 20.2 0.04 0.2
0.09 Sand to Silty Sand 15 59.61 0.34 0.580.29 Sand to Silty Sand 19 77.42 0.29 0.38
0.49 Sand 21 108.45 0.24 0.23
0.66 Sand 26 131.43 0.31 0.23
0.83 Sand 29 148.8 0.36 0.24
1.01 Sand 32 159.68 0.44 0.28
1.18 Sand 31 154.82 0.48 0.31
1.35 Sand 23 118.69 0.56 0.47
1.53 Sand to Silty Sand 19 77.48 0.5 0.64
1.73 Sand 16 81.09 0.51 0.63
1.92 Sand 21 107.67 0.43 0.4
2.1 Sand 23 119.02 0.43 0.36
2.28 Sand 21 105.34 0.48 0.45
2.47 Sand to Silty Sand 20 83.14 0.57 0.68
2.67 Sand to Silty Sand 16 67.3 0.58 0.862.85 Silty Sand to Sandy Silt 15 45.65 0.49 1.073.05 Sandy Silt to Clayey Silt 10 19.76 0.26 1.323.26 Clayey Silt to Silty Clay 6 12.93 0.39 3.043.46 Clayey Silt to Silty Clay 9 18.82 0.56 2.983.65 Silty Sand to Sandy Silt 11 35.08 0.6 1.73.85 Silty Sand to Sandy Silt 10 30.86 0.37 1.24.05 Silty Sand to Sandy Silt 7 22.89 0.29 1.274.26 Silty Sand to Sandy Silt 8 24.25 0.12 0.5
4.45 Sand to Silty Sand 11 43.76 0.15 0.34
4.65 Sand to Silty Sand 12 47.76 0.14 0.29
4.85 Sand to Silty Sand 12 49.09 0.13 0.27
5.05 Sand to Silty Sand 11 46.51 0.1 0.21
5.24 Sand to Silty Sand 11 45.1 0.1 0.22
5.43 Sand to Silty Sand 8 34.91 0.17 0.485.63 Silty Sand to Sandy Silt 10 30.41 0.16 0.53
5.84 Sand to Silty Sand 9 37.02 0.19 0.5
6.03 Sand to Silty Sand 10 39.93 0.16 0.4
6.22 Sand to Silty Sand 12 48.12 0.09 0.19
6.43 Sand to Silty Sand 12 48.2 0.17 0.34
6.63 Sand to Silty Sand 11 44.43 0.13 0.29
6.83 Sand to Silty Sand 11 46.4 0.23 0.49
7.01 Sand to Silty Sand 14 58.36 0.23 0.4
7.21 Sand to Silty Sand 15 61.25 0.29 0.47
7.41 Sand to Silty Sand 13 55.45 0.27 0.49
7.6 Sand to Silty Sand 15 62.8 0.19 0.3
7.78 Sand to Silty Sand 17 68.82 0.28 0.41
7.98 Sand to Silty Sand 16 64.22 0.29 0.46
8.17 Sand to Silty Sand 17 71.4 0.36 0.5
8.36 Sand to Silty Sand 17 69.07 0.36 0.52
8.54 Sand to Silty Sand 17 69.32 0.37 0.53
8.93 Sand to Silty Sand 15 59.75 0.21 0.35

69
Appendix B (Continued)
Table B.2 (Continued)9.12 Sand to Silty Sand 17 69.71 0.23 0.34
9.31 Sand to Silty Sand 14 59.44 0.34 0.58
9.5 Sand to Silty Sand 11 46.98 0.29 0.61
9.7 Sand to Silty Sand 10 41.79 0.26 0.62
9.89 Sand to Silty Sand 10 42.57 0.22 0.5110.09 Sand to Silty Sand 14 55.56 0.12 0.21
10.28 Sand to Silty Sand 15 60.69 0.34 0.56
10.49 Sand to Silty Sand 14 58.55 0.2 0.34
10.67 Sand to Silty Sand 15 59.64 0.34 0.57
10.86 Sand to Silty Sand 15 60.3 0.27 0.45
11.05 Sand to Silty Sand 17 70.02 0.25 0.3511.25 Silty Sand to Sandy Silt 16 48.2 0.5 1.0411.44 Silty Sand to Sandy Silt 14 44.37 0.37 0.84
11.63 Sand to Silty Sand 10 42.85 0.24 0.55
11.82 Sand to Silty Sand 9 37.21 0.24 0.6412.02 Sandy Silt to Clayey Silt 13 26.47 0.35 1.3312.21 Sandy Silt to Clayey Silt 13 26.67 0.44 1.6412.39 Silty Sand to Sandy Silt 13 38.91 0.28 0.72
12.59 Sand to Silty Sand 9 39.38 0.15 0.37
12.78 Sand to Silty Sand 11 46.07 0.15 0.32
12.97 Sand to Silty Sand 13 53.48 0.16 0.2913.16 Silty Sand to Sandy Silt 10 30.94 0.33 1.0713.36 Silty Sand to Sandy Silt 9 28.22 0.25 0.8813.56 Silty Sand to Sandy Silt 10 31.55 0.16 0.5113.74 Silty Sand to Sandy Silt 11 34.52 0.5 1.4513.92 Silty Sand to Sandy Silt 11 34.99 0.56 1.6
14.11 Sand to Silty Sand 14 56.11 0.13 0.2414.31 Silty Sand to Sandy Silt 11 34.97 0.32 0.9114.49 Silty Sand to Sandy Silt 8 23.92 0.26 1.114.68 Clayey Silt to Silty Clay 7 14.24 0.31 2.19
14.88 Clay 6 6.47 0.25 3.89
15.08 Clay 7 6.58 0.2 3.04
15.27 Clay 6 5.74 0.18 3.19
15.46 Clay 6 6.3 0.25 3.9715.66 Clayey Silt to Silty Clay 5 9.8 0.22 2.2615.85 Silty Sand to Sandy Silt 13 38.66 0.55 1.4316.03 Silty Sand to Sandy Silt 33 100.87 2.13 2.1116.19 Very Stiff Fine Grained 69 69.43 3.47 4.99
16.37 Clay 51 50.9 2.73 5.3616.55 Sandy Silt to Clayey Silt 47 94.1 3.32 3.52
16.7 Very Stiff Fine Grained 102 101.6 4.09 4.0316.84 Silty Sand to Sandy Silt 63 189.37 6.17 3.26
16.96 Sand to Clayey Sand 93 185.82 7.5 4.0417.08 Silty Sand to Sandy Silt 66 199.5 5.58 2.79
17.19 Sand to Silty Sand 61 244.43 5.66 2.3117.29 Sandy Silt to Clayey Silt 42 83.89 2.23 2.66
17.37 Sensitive Fine Grained -74 -74.12 0.48 -0.65
29.27 Sensitive Fine Grained -1 -0.94 0.14 -14.89
29.27 Sensitive Fine Grained -1 -0.94 0.14 -14.52
29.27 Sensitive Fine Grained -1 -1 0.14 -14.08
29.27 Sensitive Fine Grained -1 -1 0.14 -14.08

70
Appendix B (Continued)
Table B.3 CPT Sounding for SE Corner
Depth (ft) Soil Type N ValueTip Stress
(bars)Sleeve Stress
(bars)Friction
Ratio (%)
0 No Reading n/a 12.04 0 0.01
0.02 Silty Sand to Sandy Silt 9 28.22 0.08 0.29
0.17 Sand to Silty Sand 8 35.1 0.21 0.59
0.35 Sand to Silty Sand 10 41.38 0.11 0.25
0.52 Sand to Silty Sand 13 54 0.08 0.140.7 Sand to Silty Sand 16 64.08 0.08 0.12
0.87 Sand to Silty Sand 17 71.32 0.13 0.18
1.05 Sand to Silty Sand 19 76.76 0.17 0.22
1.22 Sand 16 81.03 0.23 0.28
1.38 Sand 16 82.67 0.26 0.31
1.56 Sand 15 78.29 0.28 0.35
1.74 Sand to Silty Sand 19 75.62 0.28 0.37
1.91 Sand to Silty Sand 17 71.35 0.25 0.35
2.08 Sand to Silty Sand 17 70.43 0.24 0.34
2.25 Sand to Silty Sand 18 72.26 0.26 0.37
2.44 Sand to Silty Sand 17 71.07 0.32 0.46
2.61 Sand to Silty Sand 16 66.96 0.35 0.53
2.78 Sand to Silty Sand 16 65.83 0.37 0.57
2.97 Sand to Silty Sand 14 57.33 0.38 0.66
3.15 Sand to Silty Sand 12 50.28 0.24 0.48
3.33 Sand to Silty Sand 11 43.71 0.2 0.45
3.49 Sand to Silty Sand 9 37.1 0.24 0.64
3.68 Silty Sand to Sandy Silt 10 31.64 0.27 0.85
3.87 Silty Sand to Sandy Silt 11 33.02 0.37 1.12
4.04 Clayey Silt to Silty Clay 10 19.93 0.57 2.85
4.22 Clayey Silt to Silty Clay 6 12.88 0.37 2.88
4.41 Sandy Silt to Clayey Silt 7 13.88 0.09 0.62
4.6 Sandy Silt to Clayey Silt 7 14.68 0.06 0.42
4.78 Sandy Silt to Clayey Silt 7 14.68 0.06 0.4
4.97 Sandy Silt to Clayey Silt 11 21.78 0.12 0.54
5.15 Silty Sand to Sandy Silt 8 25.61 0.11 0.41
5.35 Silty Sand to Sandy Silt 9 26.86 0.04 0.13
5.53 Silty Sand to Sandy Silt 11 32.61 0.03 0.1
5.72 Silty Sand to Sandy Silt 8 25.2 0.03 0.14
5.91 Sand to Silty Sand 8 35.24 -0.01 -0.03
6.1 Sand to Silty Sand 11 44.65 0.08 0.19
6.29 Silty Sand to Sandy Silt 8 25.78 0.07 0.29
6.48 Sandy Silt to Clayey Silt 8 16.07 0.09 0.55
6.87 Sandy Silt to Clayey Silt 8 16.37 0.04 0.22
7.06 Sandy Silt to Clayey Silt 7 14.35 0.04 0.28
7.25 Sandy Silt to Clayey Silt 10 21.09 0.06 0.28
7.45 Sand to Silty Sand 11 43.71 0.12 0.28
7.64 Sand to Silty Sand 13 54 0.14 0.26
7.82 Sand to Silty Sand 14 57.92 0.13 0.23
8.01 Sand to Silty Sand 17 68.1 0.17 0.25
8.2 Sand to Silty Sand 16 67.49 0.2 0.29
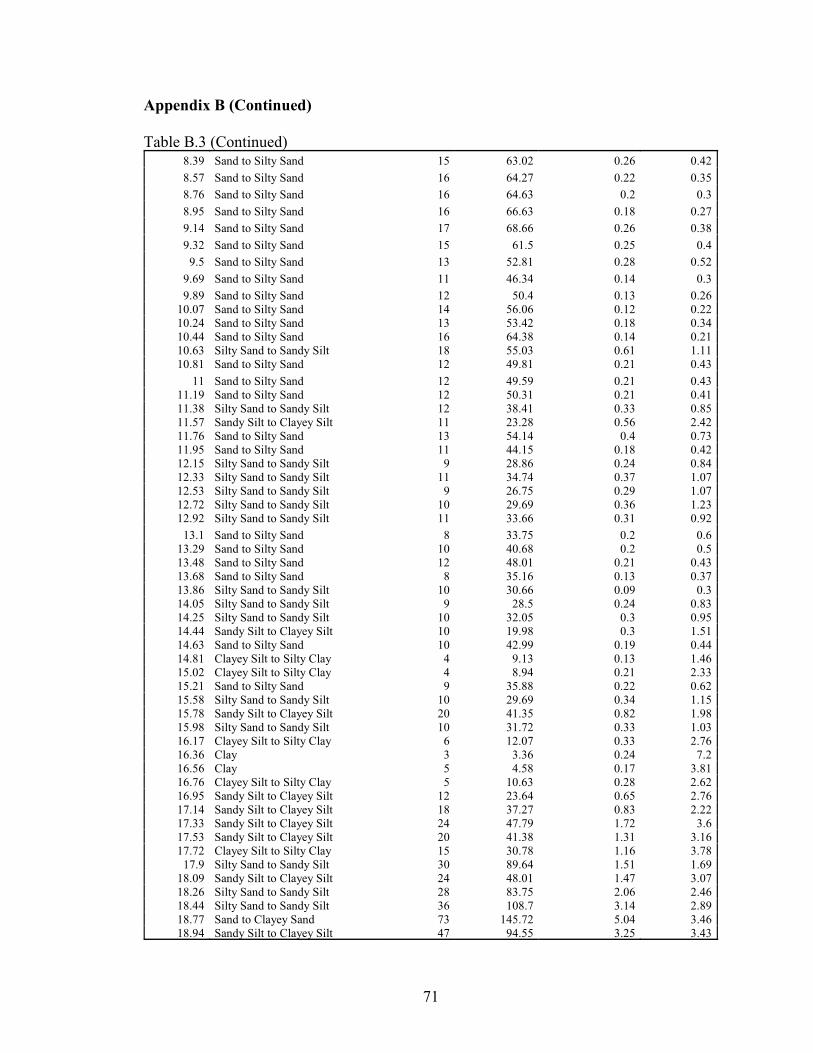
71
Appendix B (Continued)
Table B.3 (Continued)8.39 Sand to Silty Sand 15 63.02 0.26 0.42
8.57 Sand to Silty Sand 16 64.27 0.22 0.35
8.76 Sand to Silty Sand 16 64.63 0.2 0.3
8.95 Sand to Silty Sand 16 66.63 0.18 0.27
9.14 Sand to Silty Sand 17 68.66 0.26 0.38
9.32 Sand to Silty Sand 15 61.5 0.25 0.4
9.5 Sand to Silty Sand 13 52.81 0.28 0.52
9.69 Sand to Silty Sand 11 46.34 0.14 0.3
9.89 Sand to Silty Sand 12 50.4 0.13 0.2610.07 Sand to Silty Sand 14 56.06 0.12 0.2210.24 Sand to Silty Sand 13 53.42 0.18 0.3410.44 Sand to Silty Sand 16 64.38 0.14 0.2110.63 Silty Sand to Sandy Silt 18 55.03 0.61 1.1110.81 Sand to Silty Sand 12 49.81 0.21 0.43
11 Sand to Silty Sand 12 49.59 0.21 0.4311.19 Sand to Silty Sand 12 50.31 0.21 0.4111.38 Silty Sand to Sandy Silt 12 38.41 0.33 0.8511.57 Sandy Silt to Clayey Silt 11 23.28 0.56 2.4211.76 Sand to Silty Sand 13 54.14 0.4 0.7311.95 Sand to Silty Sand 11 44.15 0.18 0.4212.15 Silty Sand to Sandy Silt 9 28.86 0.24 0.8412.33 Silty Sand to Sandy Silt 11 34.74 0.37 1.0712.53 Silty Sand to Sandy Silt 9 26.75 0.29 1.0712.72 Silty Sand to Sandy Silt 10 29.69 0.36 1.2312.92 Silty Sand to Sandy Silt 11 33.66 0.31 0.92
13.1 Sand to Silty Sand 8 33.75 0.2 0.613.29 Sand to Silty Sand 10 40.68 0.2 0.513.48 Sand to Silty Sand 12 48.01 0.21 0.4313.68 Sand to Silty Sand 8 35.16 0.13 0.3713.86 Silty Sand to Sandy Silt 10 30.66 0.09 0.314.05 Silty Sand to Sandy Silt 9 28.5 0.24 0.8314.25 Silty Sand to Sandy Silt 10 32.05 0.3 0.9514.44 Sandy Silt to Clayey Silt 10 19.98 0.3 1.5114.63 Sand to Silty Sand 10 42.99 0.19 0.4414.81 Clayey Silt to Silty Clay 4 9.13 0.13 1.4615.02 Clayey Silt to Silty Clay 4 8.94 0.21 2.3315.21 Sand to Silty Sand 9 35.88 0.22 0.6215.58 Silty Sand to Sandy Silt 10 29.69 0.34 1.1515.78 Sandy Silt to Clayey Silt 20 41.35 0.82 1.9815.98 Silty Sand to Sandy Silt 10 31.72 0.33 1.0316.17 Clayey Silt to Silty Clay 6 12.07 0.33 2.7616.36 Clay 3 3.36 0.24 7.216.56 Clay 5 4.58 0.17 3.8116.76 Clayey Silt to Silty Clay 5 10.63 0.28 2.6216.95 Sandy Silt to Clayey Silt 12 23.64 0.65 2.7617.14 Sandy Silt to Clayey Silt 18 37.27 0.83 2.2217.33 Sandy Silt to Clayey Silt 24 47.79 1.72 3.617.53 Sandy Silt to Clayey Silt 20 41.38 1.31 3.1617.72 Clayey Silt to Silty Clay 15 30.78 1.16 3.78
17.9 Silty Sand to Sandy Silt 30 89.64 1.51 1.6918.09 Sandy Silt to Clayey Silt 24 48.01 1.47 3.0718.26 Silty Sand to Sandy Silt 28 83.75 2.06 2.4618.44 Silty Sand to Sandy Silt 36 108.7 3.14 2.8918.77 Sand to Clayey Sand 73 145.72 5.04 3.4618.94 Sandy Silt to Clayey Silt 47 94.55 3.25 3.43

72
Appendix B (Continued)
Table B.3 (Continued)19.09 Sand 30 153.24 1.9 1.2419.25 Silty Sand to Sandy Silt 44 133.26 3.86 2.919.42 Silty Sand to Sandy Silt 37 111.67 3.11 2.7919.61 Sandy Silt to Clayey Silt 32 65.02 2.08 3.2119.79 Sandy Silt to Clayey Silt 31 63.19 1.98 3.1419.96 Sand to Silty Sand 33 131.71 2.42 1.8420.14 Sand 39 196.59 2.14 1.0920.29 Sand to Silty Sand 64 255.75 4.32 1.6920.43 Sand to Silty Sand 67 267.82 6.28 2.3420.55 Sand to Silty Sand 60 241.18 5.62 2.3320.59 Sand 32 159.82 1.54 0.9620.59 Sand 29 148.69 1.2 0.8120.59 Sand 29 148.99 1.23 0.8220.59 Sand 29 149.11 1.24 0.8320.59 Sand 29 149.19 1.25 0.8420.59 Sand 29 149.19 1.24 0.8320.59 Sand 29 149.13 1.25 0.8420.59 Sand 29 149.02 1.25 0.8420.59 Sand 29 148.97 1.25 0.8420.59 Sand 29 147.05 1.18 0.820.62 Sandy Silt to Clayey Silt 8 15.76 -0.09 -0.5820.66 Sensitive Fine Grained -66 -65.55 -0.07 0.1120.67 Sensitive Fine Grained -67 -66.66 -0.04 0.0620.75 Sensitive Fine Grained -50 -49.59 -0.12 0.2420.78 Sensitive Fine Grained -36 -36.49 -0.29 0.7820.79 Sensitive Fine Grained -27 -27.06 -0.23 0.8420.79 Sensitive Fine Grained -16 -15.54 -0.07 0.4820.85 Sensitive Fine Grained -7 -7.05 0.07 -0.96

73
Appendix B (Continued)
Table B.4 CPT Sounding for SW Corner
Depth (ft) Soil Type N ValueTip Stress
(bars)Sleeve Stress
(bars)Friction Ratio
(%)
0 No Reading n/a 0 0 00.02 Silty Sand to Sandy Silt 8 26.25 0.21 0.78
0.2 Silty Sand to Sandy Silt 9 29.3 0.33 1.130.4 Silty Sand to Sandy Silt 9 28.69 0.2 0.69
0.59 Silty Sand to Sandy Silt 9 28.36 0.14 0.490.78 Sand to Silty Sand 9 37.46 0.14 0.370.97 Sand to Silty Sand 15 61.66 0.15 0.241.16 Sand 15 78.81 0.19 0.241.34 Sand 19 95.6 0.23 0.241.51 Sand 22 113.25 0.22 0.21.87 Sand 25 127.46 0.37 0.292.05 Sand 25 128.24 0.42 0.332.22 Sand 24 119.8 0.48 0.4
2.4 Sand 21 109.17 0.51 0.462.59 Sand 20 100.71 0.46 0.452.76 Sand 20 100.93 0.38 0.382.93 Sand 20 102.21 0.48 0.473.12 Sand 20 102.18 0.41 0.4
3.3 Sand 18 94.05 0.52 0.553.48 Sand to Silty Sand 23 92.63 0.71 0.763.65 Sand to Silty Sand 21 83.67 0.64 0.763.84 Sand to Silty Sand 16 64.3 0.39 0.614.03 Sand to Silty Sand 11 46.65 0.33 0.714.22 Silty Sand to Sandy Silt 8 25.09 0.27 1.064.41 Silty Sand to Sandy Silt 12 38.16 0.3 0.784.61 Sand to Silty Sand 9 39.35 0.19 0.484.81 Sandy Silt to Clayey Silt 10 19.79 0.31 1.58
5 Clayey Silt to Silty Clay 6 12.29 0.34 2.745.19 Sandy Silt to Clayey Silt 6 11.85 0.06 0.515.39 Sandy Silt to Clayey Silt 6 13.43 0.08 0.625.59 Silty Sand to Sandy Silt 7 23.45 0.07 0.35.78 Silty Sand to Sandy Silt 7 22.37 0.09 0.415.97 Silty Sand to Sandy Silt 9 28.94 0.05 0.166.17 Silty Sand to Sandy Silt 9 29.19 0.04 0.136.38 Sand to Silty Sand 8 33.86 0.16 0.466.57 Sand to Silty Sand 12 49.9 0.07 0.146.75 Sand to Silty Sand 14 59.36 0.1 0.176.95 Sand to Silty Sand 14 56.92 0.11 0.197.34 Silty Sand to Sandy Silt 8 24.45 0.07 0.297.52 Sandy Silt to Clayey Silt 10 19.56 0.06 0.317.73 Sandy Silt to Clayey Silt 10 21.17 0.09 0.457.93 Silty Sand to Sandy Silt 9 29.22 0.09 0.328.12 Sand to Silty Sand 11 46.73 0.17 0.37
8.3 Sand to Silty Sand 13 55.11 0.23 0.42
8.5 Sand to Silty Sand 13 53.56 0.18 0.348.69 Sand to Silty Sand 15 59.53 0.09 0.158.87 Sand to Silty Sand 15 59.86 0.16 0.279.05 Sand to Silty Sand 14 55.53 0.12 0.219.25 Sand to Silty Sand 13 52.37 0.19 0.369.44 Sand to Silty Sand 12 50.2 0.14 0.289.63 Sand to Silty Sand 11 46.76 0.13 0.289.82 Sand to Silty Sand 13 51.56 0.17 0.33
10.01 Sand to Silty Sand 15 60.08 0.14 0.2310.21 Sand to Silty Sand 14 58.22 0.19 0.33
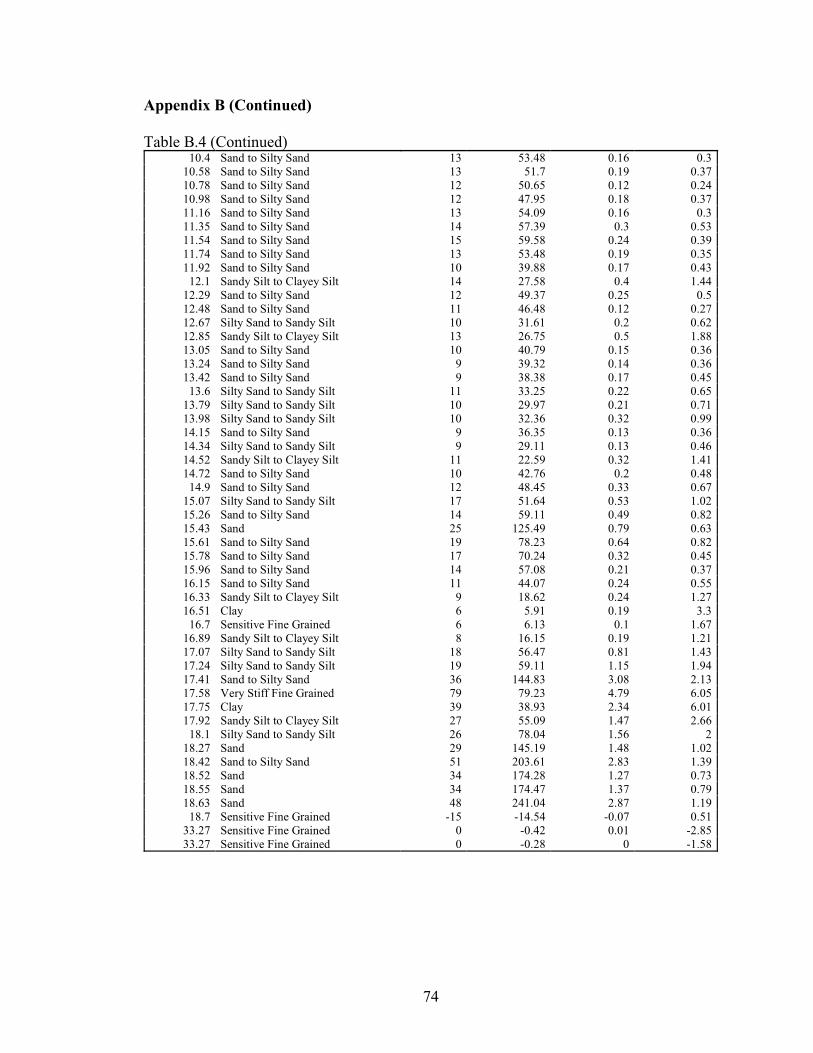
74
Appendix B (Continued)
Table B.4 (Continued)10.4 Sand to Silty Sand 13 53.48 0.16 0.3
10.58 Sand to Silty Sand 13 51.7 0.19 0.3710.78 Sand to Silty Sand 12 50.65 0.12 0.2410.98 Sand to Silty Sand 12 47.95 0.18 0.3711.16 Sand to Silty Sand 13 54.09 0.16 0.311.35 Sand to Silty Sand 14 57.39 0.3 0.5311.54 Sand to Silty Sand 15 59.58 0.24 0.3911.74 Sand to Silty Sand 13 53.48 0.19 0.3511.92 Sand to Silty Sand 10 39.88 0.17 0.43
12.1 Sandy Silt to Clayey Silt 14 27.58 0.4 1.4412.29 Sand to Silty Sand 12 49.37 0.25 0.512.48 Sand to Silty Sand 11 46.48 0.12 0.2712.67 Silty Sand to Sandy Silt 10 31.61 0.2 0.6212.85 Sandy Silt to Clayey Silt 13 26.75 0.5 1.8813.05 Sand to Silty Sand 10 40.79 0.15 0.3613.24 Sand to Silty Sand 9 39.32 0.14 0.3613.42 Sand to Silty Sand 9 38.38 0.17 0.45
13.6 Silty Sand to Sandy Silt 11 33.25 0.22 0.6513.79 Silty Sand to Sandy Silt 10 29.97 0.21 0.7113.98 Silty Sand to Sandy Silt 10 32.36 0.32 0.9914.15 Sand to Silty Sand 9 36.35 0.13 0.3614.34 Silty Sand to Sandy Silt 9 29.11 0.13 0.4614.52 Sandy Silt to Clayey Silt 11 22.59 0.32 1.4114.72 Sand to Silty Sand 10 42.76 0.2 0.48
14.9 Sand to Silty Sand 12 48.45 0.33 0.6715.07 Silty Sand to Sandy Silt 17 51.64 0.53 1.0215.26 Sand to Silty Sand 14 59.11 0.49 0.8215.43 Sand 25 125.49 0.79 0.6315.61 Sand to Silty Sand 19 78.23 0.64 0.8215.78 Sand to Silty Sand 17 70.24 0.32 0.4515.96 Sand to Silty Sand 14 57.08 0.21 0.3716.15 Sand to Silty Sand 11 44.07 0.24 0.5516.33 Sandy Silt to Clayey Silt 9 18.62 0.24 1.2716.51 Clay 6 5.91 0.19 3.3
16.7 Sensitive Fine Grained 6 6.13 0.1 1.6716.89 Sandy Silt to Clayey Silt 8 16.15 0.19 1.2117.07 Silty Sand to Sandy Silt 18 56.47 0.81 1.4317.24 Silty Sand to Sandy Silt 19 59.11 1.15 1.9417.41 Sand to Silty Sand 36 144.83 3.08 2.1317.58 Very Stiff Fine Grained 79 79.23 4.79 6.0517.75 Clay 39 38.93 2.34 6.0117.92 Sandy Silt to Clayey Silt 27 55.09 1.47 2.66
18.1 Silty Sand to Sandy Silt 26 78.04 1.56 218.27 Sand 29 145.19 1.48 1.0218.42 Sand to Silty Sand 51 203.61 2.83 1.3918.52 Sand 34 174.28 1.27 0.7318.55 Sand 34 174.47 1.37 0.7918.63 Sand 48 241.04 2.87 1.19
18.7 Sensitive Fine Grained -15 -14.54 -0.07 0.5133.27 Sensitive Fine Grained 0 -0.42 0.01 -2.8533.27 Sensitive Fine Grained 0 -0.28 0 -1.58

75
Appendix C Capacity of Mini-Pile At Each Location Using CPT Method
This appendix contains the tables which determine the capacity of a mini-pile at
each location as a function of its length using the CPT method.
Table C.1 Capacity of a Mini-Pile in the NE CornerDepth (ft) Tip Stress (bars) Sleeve Stress (bars) Friction Ratio (%) fs (ksf) Qs/L (kips)
0 0 0 0 0 0.000
0.01 17.48 0.07 0.39 0.547616 0.009
0.16 37.35 0.68 1.83 1.170106 0.284
0.36 32.52 0.18 0.56 1.018791 0.605
0.55 41.57 0.14 0.35 1.302311 0.993
0.75 53.59 0.16 0.29 1.678876 1.521
0.95 77.4 0.21 0.28 2.424799 2.283
1.13 96.32 0.31 0.32 3.017528 3.137
1.3 104.98 0.35 0.34 3.288829 4.015
1.49 114.14 0.48 0.42 3.575795 5.083
1.67 115.53 0.59 0.51 3.619341 6.107
1.84 120.94 0.53 0.44 3.788827 7.119
2.02 119.08 0.6 0.5 3.730556 8.174
2.21 95.38 0.56 0.59 2.988079 9.066
2.39 83.09 0.6 0.73 2.603056 9.802
2.58 40.24 0.61 1.51 1.260645 10.179
2.77 33.44 0.51 1.51 1.047613 10.492
2.97 28.94 0.22 0.77 0.906637 10.777
3.17 22.62 0.08 0.33 0.708643 10.999
3.37 14.99 0.06 0.38 0.469609 11.147
3.56 10.43 0.05 0.5 0.326753 11.244
3.77 5.63 0.05 0.88 0.176377 11.303
3.97 4 0.04 0.92 0.125313 11.342
4.17 3.77 0.03 0.81 0.118107 11.379
4.37 3.94 0.03 0.72 0.123433 11.418
4.57 3.89 0.02 0.64 0.121867 11.456
4.78 4.52 0.04 0.78 0.141603 11.503
4.98 7.77 0.03 0.41 0.24342 11.580
5.17 18.7 0.05 0.26 0.585836 11.754
5.38 25.61 0.04 0.17 0.802314 12.019
5.58 16.35 0.06 0.38 0.512215 12.180
5.78 8.52 0.01 0.08 0.266916 12.264
5.98 7.22 0.02 0.25 0.226189 12.335
6.19 10.07 0.01 0.13 0.315474 12.439
6.39 12.57 0.03 0.22 0.393795 12.563
6.59 25.7 0.07 0.26 0.805133 12.816
6.78 43.85 0.14 0.32 1.373739 13.226
6.98 52.84 0.18 0.35 1.655379 13.746
7.18 52.64 0.18 0.33 1.649114 14.265
7.36 61.19 0.24 0.39 1.91697 14.807
7.55 53.03 0.23 0.44 1.661332 15.303
7.74 45.51 0.17 0.37 1.425744 15.729

76
Appendix C (Continued)
Table C.1 (Continued)7.93 47.45 0.19 0.4 1.486521 16.1738.12 52.12 0.16 0.3 1.632823 16.660
8.3 59.94 0.19 0.31 1.877809 17.191
8.49 54.59 0.2 0.36 1.710204 17.7028.68 53.28 0.16 0.3 1.669164 18.2008.86 47.4 0.21 0.45 1.484954 18.620
9.05 48.62 0.18 0.37 1.523175 19.075
9.25 47.73 0.22 0.46 1.495293 19.545
9.43 51.17 0.12 0.23 1.603061 19.998
9.62 52.09 0.16 0.31 1.631883 20.486
9.8 52.48 0.23 0.44 1.644101 20.951
9.99 55.17 0.23 0.42 1.728374 21.467
10.19 49.45 0.18 0.35 1.549177 21.954
10.37 59.3 0.2 0.34 1.857759 22.479
10.54 68.68 0.97 1.41 2.151617 23.054
10.73 64.52 0.59 0.91 2.021292 23.657
10.92 49.59 0.29 0.58 1.553563 24.121
11.1 37.46 0.29 0.77 1.173553 24.453
11.29 36.77 0.33 0.89 1.151936 24.797
11.48 39.13 0.17 0.42 1.225871 25.163
11.67 41.32 0.22 0.54 1.294479 25.550
11.85 34.72 0.31 0.88 1.087713 25.857
12.03 41.32 0.18 0.43 1.294479 26.223
12.22 35.55 0.23 0.64 1.113716 26.556
12.41 47.76 0.15 0.31 1.496232 27.003
12.59 42.38 0.13 0.3 1.327687 27.378
12.77 40.93 0.43 1.04 1.282261 27.741
12.96 29.92 0.48 1.6 0.937338 28.021
13.15 42.07 0.24 0.56 1.317975 28.414
13.33 41.57 0.39 0.93 1.302311 28.783
13.51 32.94 0.32 0.98 1.031949 29.075
13.71 24.59 0.36 1.45 0.770359 29.317
13.89 40.63 0.52 1.28 1.272863 29.677
14.07 28.97 0.34 1.17 0.907577 29.933
14.25 30.28 0.68 2.24 0.948616 30.202
14.43 68.02 0.55 0.81 2.130941 30.805
14.62 38.8 0.55 1.42 1.215532 31.167
14.8 59.22 0.51 0.86 1.855253 31.692
14.97 47.98 0.42 0.88 1.503125 32.094
15.16 60.89 0.48 0.79 1.907571 32.663
15.35 15.65 0.25 1.6 0.490286 32.810
15.53 12.49 0.22 1.76 0.391289 32.920
15.72 7.49 0.17 2.25 0.234648 32.990
15.91 6.3 0.14 2.29 0.197367 33.049
16.11 6.72 0.17 2.47 0.210525 33.116
16.47 40.13 0.96 2.4 1.257199 33.598
16.66 53.2 2.32 4.36 1.666658 34.096
16.84 26.34 1.46 5.55 0.825183 34.329

77
Appendix C (Continued)
Table C.1 (Continued)17.01 45.07 1.01 2.23 1.41196 34.70617.18 65.1 1.38 2.12 2.039463 35.251
17.34 164.01 2.23 1.36 5.13813 36.543
17.48 177.16 4.33 2.44 5.550095 37.764
17.61 168.34 6.3 3.74 5.273781 38.842
17.72 135.09 7.68 5.68 4.23212 39.57317.84 120.74 5.48 4.54 3.782561 40.286
17.99 96.46 3.2 3.31 3.021913 40.999
18.13 119.94 3.62 3.02 3.757498 41.825
18.28 141.53 4.34 3.06 4.433873 42.870
18.44 104.59 3.37 3.22 3.276611 43.694
18.6 134.48 3.36 2.5 4.21301 44.754
18.75 128.96 4.17 3.24 4.040078 45.706
18.89 120.58 5.85 4.85 3.777548 46.537
19.01 178.44 5.52 3.09 5.590195 47.591
19.28 -32.8 1.04 -3.16 -1.02756 47.155
31.54 -0.97 0.03 -2.67 -0.03039 46.570
31.54 -0.83 0.01 -1.37 -0.026 46.570
31.54 -1.17 0.04 -3.64 -0.03665 46.570
31.54 -1.03 0.03 -2.72 -0.03227 46.570

78
Appendix C (Continued)
Table C.2 Capacity of a Mini-Pile in the NW CornerDepth (ft) Tip Stress (bars) Sleeve Stress (bars) Friction Ratio (%) fs (ksf) Qs/L (kips)
0 0 0 0 0 0.0000.09 59.61 0.34 0.58 1.8674711 0.2640.29 77.42 0.29 0.38 2.4254255 1.026
0.49 108.45 0.24 0.23 3.397538 2.0940.66 131.43 0.31 0.23 4.1174589 3.1940.83 148.8 0.36 0.24 4.6616289 4.4391.01 159.68 0.44 0.28 5.0024792 5.8541.18 154.82 0.48 0.31 4.8502243 7.1501.35 118.69 0.56 0.47 3.7183382 8.1431.53 77.48 0.5 0.64 2.4273051 8.8301.73 81.09 0.51 0.63 2.5403998 9.628
1.92 107.67 0.43 0.4 3.373102 10.6362.1 119.02 0.43 0.36 3.7286765 11.690
2.28 105.34 0.48 0.45 3.3001074 12.6242.47 83.14 0.57 0.68 2.6046225 13.4012.67 67.3 0.58 0.86 2.1083846 14.0642.85 45.65 0.49 1.07 1.4301301 14.4693.05 19.76 0.26 1.32 0.6190443 14.663
3.26 12.93 0.39 3.04 0.405073 14.7973.46 18.82 0.56 2.98 0.5895958 14.9823.65 35.08 0.6 1.7 1.0989915 15.3103.85 30.86 0.37 1.2 0.9667867 15.6144.05 22.89 0.29 1.27 0.7171014 15.8394.26 24.25 0.12 0.5 0.7597077 16.0904.45 43.76 0.15 0.34 1.3709199 16.4994.65 47.76 0.14 0.29 1.4962325 16.9704.85 49.09 0.13 0.27 1.5378989 17.4535.05 46.51 0.1 0.21 1.4570723 17.9115.24 45.1 0.1 0.22 1.4128996 18.3335.43 34.91 0.17 0.48 1.0936658 18.6595.63 30.41 0.16 0.53 0.9526891 18.9595.84 37.02 0.19 0.5 1.1597682 19.3416.03 39.93 0.16 0.4 1.2509331 19.7156.22 48.12 0.09 0.19 1.5075106 20.1656.43 48.2 0.17 0.34 1.5100169 20.6636.63 44.43 0.13 0.29 1.3919097 21.1016.83 46.4 0.23 0.49 1.4536262 21.5587.01 58.36 0.23 0.4 1.8283109 22.0757.21 61.25 0.29 0.47 1.9188492 22.678
7.41 55.45 0.27 0.49 1.737146 23.2247.78 68.82 0.28 0.41 2.1560034 24.4217.98 64.22 0.29 0.46 2.0118939 25.053
8.17 71.4 0.36 0.5 2.23683 25.7218.36 69.07 0.36 0.52 2.1638354 26.3678.54 69.32 0.37 0.53 2.1716674 26.9828.74 59.83 0.27 0.46 1.8743633 27.571
8.93 59.75 0.21 0.35 1.871857 28.1309.12 69.71 0.23 0.34 2.1838854 28.7829.31 59.44 0.34 0.58 1.8621453 29.338
9.7 41.79 0.26 0.62 1.3092034 30.1899.89 42.57 0.22 0.51 1.3336394 30.587
10.09 55.56 0.12 0.21 1.7405921 31.13410.28 60.69 0.34 0.56 1.9013055 31.70110.49 58.55 0.2 0.34 1.8342632 32.30710.67 59.64 0.34 0.57 1.8684109 32.835

79
Appendix C (Continued)
Table C.2 (Continued)10.86 60.3 0.27 0.45 1.8890875 33.39911.05 70.02 0.25 0.35 2.1935971 34.05411.25 48.2 0.5 1.04 1.5100169 34.52911.44 44.37 0.37 0.84 1.3900301 34.94411.63 42.85 0.24 0.55 1.3424113 35.34511.82 37.21 0.24 0.64 1.1657205 35.69312.02 26.47 0.35 1.33 0.8292562 35.95312.21 26.67 0.44 1.64 0.8355218 36.20312.39 38.91 0.28 0.72 1.2189784 36.54812.59 39.38 0.15 0.37 1.2337026 36.93512.78 46.07 0.15 0.32 1.4432879 37.36612.97 53.48 0.16 0.29 1.6754295 37.866
13.16 30.94 0.33 1.07 0.969293 38.15613.36 28.22 0.25 0.88 0.8840804 38.43413.56 31.55 0.16 0.51 0.9884032 38.74413.74 34.52 0.5 1.45 1.0814478 39.050
13.92 34.99 0.56 1.6 1.096172 39.36014.11 56.11 0.13 0.24 1.7578226 39.88514.31 34.97 0.32 0.91 1.0955454 40.22914.49 23.92 0.26 1.1 0.7493694 40.44114.68 14.24 0.31 2.19 0.4461129 40.57514.88 6.47 0.25 3.89 0.2026931 40.63815.08 6.58 0.2 3.04 0.2061392 40.70315.27 5.74 0.18 3.19 0.1798236 40.75715.46 6.3 0.25 3.97 0.1973674 40.81615.66 9.8 0.22 2.26 0.3070159 40.91215.85 38.66 0.55 1.43 1.2111463 41.27416.03 100.87 2.13 2.11 3.1600706 42.16816.19 69.43 3.47 4.99 2.1751135 42.71516.37 50.9 2.73 5.36 1.5946029 43.166
16.55 94.1 3.32 3.52 2.947979 43.99916.7 101.6 4.09 4.03 3.1829401 44.750
16.84 189.37 6.17 3.26 5.932612 46.055
16.96 185.82 7.5 4.04 5.821397 47.15317.08 199.5 5.58 2.79 6.2499661 48.33117.19 244.43 5.66 2.31 7.6575399 49.65517.29 83.89 2.23 2.66 2.6281186 50.06817.37 -74.12 0.48 -0.65 -2.3220426 49.77629.27 -0.94 0.14 -14.89 -0.0294485 49.22529.27 -0.94 0.14 -14.52 -0.0294485 49.22529.27 -1 0.14 -14.08 -0.0313282 49.22529.27 -1 0.14 -14.08 -0.0313282 49.225

80
Appendix C (Continued)
Table C.3 Capacity of a Mini-Pile in the SE CornerDepth (ft) Tip Stress (bars) Sleeve Stress (bars) Friction Ratio (%) fs (ksf) Qs/L (kips)
0 0 0 0 0 0.0000.02 28.22 0.08 0.29 0.8840804 0.0280.17 35.1 0.21 0.59 1.0996181 0.2870.35 41.38 0.11 0.25 1.2963589 0.6540.52 54 0.08 0.14 1.6917202 1.106
0.7 64.08 0.08 0.12 2.0075079 1.6730.87 71.32 0.13 0.18 2.2343237 2.2701.05 76.76 0.17 0.22 2.4047489 2.9511.22 81.03 0.23 0.28 2.5385201 3.6291.38 82.67 0.26 0.31 2.5898982 4.2801.56 78.29 0.28 0.35 2.4526809 4.9741.74 75.62 0.28 0.37 2.3690348 5.6441.91 71.35 0.25 0.35 2.2352636 6.2412.08 70.43 0.24 0.34 2.2064417 6.8302.25 72.26 0.26 0.37 2.2637722 7.4352.44 71.07 0.32 0.46 2.2264917 8.1002.61 66.96 0.35 0.53 2.097733 8.6602.78 65.83 0.37 0.57 2.0623322 9.2112.97 57.33 0.38 0.66 1.7960429 9.7473.15 50.28 0.24 0.48 1.5751794 10.1933.33 43.71 0.2 0.45 1.3693535 10.5803.49 37.1 0.24 0.64 1.1622744 10.8723.68 31.64 0.27 0.85 0.9912227 11.1683.87 33.02 0.37 1.12 1.0344555 11.4774.04 19.93 0.57 2.85 0.62437 11.6444.22 12.88 0.37 2.88 0.4035066 11.7584.41 13.88 0.09 0.62 0.4348347 11.888
4.6 14.68 0.06 0.42 0.4598973 12.0254.78 14.68 0.06 0.4 0.4598973 12.1554.97 21.78 0.12 0.54 0.6823271 12.3595.15 25.61 0.11 0.41 0.8023139 12.5865.35 26.86 0.04 0.13 0.8414741 12.8515.53 32.61 0.03 0.1 1.021611 13.1405.72 25.2 0.03 0.14 0.7894694 13.3755.91 35.24 -0.01 -0.03 1.104004 13.705
6.1 44.65 0.08 0.19 1.3988019 14.1236.29 25.78 0.07 0.29 0.8076397 14.3646.48 16.07 0.09 0.55 0.5034434 14.5146.68 14.46 0.02 0.14 0.4530051 14.6566.87 16.37 0.04 0.22 0.5128418 14.8097.06 14.35 0.04 0.28 0.449559 14.9447.25 21.09 0.06 0.28 0.6607107 15.1417.45 43.71 0.12 0.28 1.3693535 15.5717.64 54 0.14 0.26 1.6917202 16.0767.82 57.92 0.13 0.23 1.8145265 16.5908.01 68.1 0.17 0.25 2.1334471 17.227
8.2 67.49 0.2 0.29 2.1143369 17.8588.39 63.02 0.26 0.42 1.9743001 18.4478.57 64.27 0.22 0.35 2.0134603 19.0178.76 64.63 0.2 0.3 2.0247384 19.6218.95 66.63 0.18 0.27 2.0873947 20.2459.32 61.5 0.25 0.4 1.9266813 21.432
9.5 52.81 0.28 0.52 1.6544397 21.9009.69 46.34 0.14 0.3 1.4517465 22.3339.89 50.4 0.13 0.26 1.5789388 22.830
10.07 56.06 0.12 0.22 1.7562561 23.32610.24 53.42 0.18 0.34 1.6735498 23.773

81
Appendix C (Continued)
Table C.3 (Continued)10.44 64.38 0.14 0.21 2.0169064 24.40710.63 55.03 0.61 1.11 1.7239881 24.92210.81 49.81 0.21 0.43 1.5604552 25.363
11 49.59 0.21 0.43 1.553563 25.82711.19 50.31 0.21 0.41 1.5761193 26.29811.38 38.41 0.33 0.85 1.2033143 26.65711.57 23.28 0.56 2.42 0.7293194 26.87511.76 54.14 0.4 0.73 1.6961061 27.38111.95 44.15 0.18 0.42 1.3831379 27.79412.15 28.86 0.24 0.84 0.9041304 28.07812.33 34.74 0.37 1.07 1.08834 28.38612.53 26.75 0.29 1.07 0.838028 28.65012.72 29.69 0.36 1.23 0.9301328 28.92712.92 33.66 0.31 0.92 1.0545056 29.259
13.1 33.75 0.2 0.6 1.0573251 29.55813.29 40.68 0.2 0.5 1.2744292 29.93813.48 48.01 0.21 0.43 1.5040645 30.38713.68 35.16 0.13 0.37 1.1014978 30.73413.86 30.66 0.09 0.3 0.9605211 31.00514.05 28.5 0.24 0.83 0.8928523 31.27214.25 32.05 0.3 0.95 1.0040672 31.58714.44 19.98 0.3 1.51 0.6259365 31.77414.63 42.99 0.19 0.44 1.3467972 32.17614.81 9.13 0.13 1.46 0.286026 32.25715.02 8.94 0.21 2.33 0.2800737 32.35015.21 35.88 0.22 0.62 1.1240541 32.685
15.4 43.74 0.24 0.54 1.3702933 33.09415.58 29.69 0.34 1.15 0.9301328 33.35815.78 41.35 0.82 1.98 1.295419 33.76515.98 31.72 0.33 1.03 0.9937289 34.07716.17 12.07 0.33 2.76 0.3781308 34.19016.36 3.36 0.24 7.2 0.1052626 34.22116.56 4.58 0.17 3.81 0.1434829 34.26616.76 10.63 0.28 2.62 0.3330182 34.37116.95 23.64 0.65 2.76 0.7405975 34.59217.14 37.27 0.83 2.22 1.1676002 34.94117.33 47.79 1.72 3.6 1.4971723 35.38817.53 41.38 1.31 3.16 1.2963589 35.79517.72 30.78 1.16 3.78 0.9642805 36.083
17.9 89.64 1.51 1.69 2.8082555 36.87818.09 48.01 1.47 3.07 1.5040645 37.32718.26 83.75 2.06 2.46 2.6237326 38.02818.44 108.7 3.14 2.89 3.40537 38.991
18.6 168.14 2.92 1.73 5.2675153 40.31518.77 145.72 5.04 3.46 4.5651382 41.53518.94 94.55 3.25 3.43 2.9620767 42.32619.09 153.24 1.9 1.24 4.8007259 43.45819.25 133.26 3.86 2.9 4.1747894 44.50719.42 111.67 3.11 2.79 3.4984146 45.44219.61 65.02 2.08 3.21 2.0369564 46.05019.79 63.19 1.98 3.14 1.9796259 46.61019.96 131.71 2.42 1.84 4.1262308 47.71220.14 196.59 2.14 1.09 6.1588012 49.45420.29 255.75 4.32 1.69 8.0121746 51.34320.43 267.82 6.28 2.34 8.3903054 53.18920.55 241.18 5.62 2.33 7.5557235 54.61420.59 148.99 1.23 0.82 4.6675812 54.92820.59 149.11 1.24 0.83 4.6713406 54.928

82
Appendix C (Continued)
Table C.3 (Continued)20.59 149.19 1.25 0.84 4.6738468 54.92820.59 149.19 1.24 0.83 4.6738468 54.92820.59 149.13 1.25 0.84 4.6719672 54.92820.59 149.02 1.25 0.84 4.6685211 54.92820.59 148.97 1.25 0.84 4.6669547 54.92820.59 147.05 1.18 0.8 4.6068046 54.92820.62 15.76 -0.09 -0.58 0.4937317 54.95220.66 -65.55 -0.07 0.11 -2.0535603 54.82220.67 -66.66 -0.04 0.06 -2.0883345 54.79020.75 -49.59 -0.12 0.24 -1.553563 54.59420.78 -36.49 -0.29 0.78 -1.1431642 54.54020.79 -27.06 -0.23 0.84 -0.8477398 54.52720.79 -15.54 -0.07 0.48 -0.4868395 54.52720.85 -7.05 0.07 -0.96 -0.2208635 54.506

83
Appendix C (Continued)
Table C.4 Capacity of a Mini-Pile in the SW CornerDepth (ft) Tip Stress (bars) Sleeve Stress (bars) Friction Ratio (%) fs (ksf) Qs/L (kips)
0 0 0 0 0 0.000
0.02 26.25 0.21 0.78 0.822364 0.0260.2 29.3 0.33 1.13 0.9179148 0.2850.4 28.69 0.2 0.69 0.8988047 0.568
0.59 28.36 0.14 0.49 0.8884664 0.8330.78 37.46 0.14 0.37 1.1735525 1.1840.97 61.66 0.15 0.24 1.9316938 1.7601.16 78.81 0.19 0.24 2.4689716 2.4981.34 95.6 0.23 0.24 2.9949712 3.3451.51 113.25 0.22 0.2 3.5479131 4.292
1.7 122.16 0.41 0.34 3.8270469 5.4351.87 127.46 0.37 0.29 3.9930861 6.5022.05 128.24 0.42 0.33 4.0175221 7.6382.22 119.8 0.48 0.4 3.7531125 8.6412.59 100.71 0.46 0.45 3.1550581 10.5502.76 100.93 0.38 0.38 3.1619503 11.3952.93 102.21 0.48 0.47 3.2020503 12.2503.12 102.18 0.41 0.4 3.2011105 13.206
3.3 94.05 0.52 0.55 2.9464126 14.0403.48 92.63 0.71 0.76 2.9019266 14.8603.65 83.67 0.64 0.76 2.6212264 15.5613.84 64.3 0.39 0.61 2.0144001 16.1624.03 46.65 0.33 0.71 1.4614582 16.5984.22 25.09 0.27 1.06 0.7860233 16.8334.41 38.16 0.3 0.78 1.1954822 17.1904.61 39.35 0.19 0.48 1.2327627 17.5774.81 19.79 0.31 1.58 0.6199841 17.772
5 12.29 0.34 2.74 0.385023 17.8875.19 11.85 0.06 0.51 0.3712386 17.9985.39 13.43 0.08 0.62 0.4207371 18.1305.59 23.45 0.07 0.3 0.7346451 18.3615.78 22.37 0.09 0.41 0.7008107 18.5705.97 28.94 0.05 0.16 0.9066367 18.8416.17 29.19 0.04 0.13 0.9144687 19.1296.38 33.86 0.16 0.46 1.0607712 19.4796.57 49.9 0.07 0.14 1.5632747 19.945
6.75 59.36 0.1 0.17 1.859639 20.4716.95 56.92 0.11 0.19 1.7831984 21.0327.15 45.62 0.07 0.15 1.4291902 21.4817.34 24.45 0.07 0.29 0.7659733 21.7107.52 19.56 0.06 0.31 0.6127786 21.883
7.73 21.17 0.09 0.45 0.663217 22.1028.12 46.73 0.17 0.37 1.4639645 22.827
8.3 55.11 0.23 0.42 1.7264944 23.3158.5 53.56 0.18 0.34 1.6779358 23.842
8.69 59.53 0.09 0.15 1.8649648 24.3998.87 59.86 0.16 0.27 1.8753031 24.9309.05 55.53 0.12 0.21 1.7396522 25.4229.25 52.37 0.19 0.36 1.6406553 25.9379.44 50.2 0.14 0.28 1.5726732 26.4079.63 46.76 0.13 0.28 1.4649043 26.8449.82 51.56 0.17 0.33 1.6152795 27.327
10.01 60.08 0.14 0.23 1.8821953 27.889
10.21 58.22 0.19 0.33 1.823925 28.46210.4 53.48 0.16 0.3 1.6754295 28.962

84
Appendix C (Continued)
Table C.4 (Continued)10.58 51.7 0.19 0.37 1.6196654 29.42010.78 50.65 0.12 0.24 1.5867708 29.91910.98 47.95 0.18 0.37 1.5021848 30.39111.16 54.09 0.16 0.3 1.6945397 30.87011.35 57.39 0.3 0.53 1.7979226 31.40711.54 59.58 0.24 0.39 1.8665312 31.96411.74 53.48 0.19 0.35 1.6754295 32.49111.92 39.88 0.17 0.43 1.2493667 32.844
12.1 27.58 0.4 1.44 0.8640304 33.08912.29 49.37 0.25 0.5 1.5466708 33.55112.48 46.48 0.12 0.27 1.4561325 33.98512.67 31.61 0.2 0.62 0.9902829 34.281
12.85 26.75 0.5 1.88 0.838028 34.51813.05 40.79 0.15 0.36 1.2778753 34.92013.24 39.32 0.14 0.36 1.2318229 35.28713.42 38.38 0.17 0.45 1.2023744 35.627
13.6 33.25 0.22 0.65 1.041661 35.92213.79 29.97 0.21 0.71 0.9389047 36.202
13.98 32.36 0.32 0.99 1.013779 36.50514.15 36.35 0.13 0.36 1.1387783 36.80914.34 29.11 0.13 0.46 0.9119625 37.08214.52 22.59 0.32 1.41 0.7077029 37.28214.72 42.76 0.2 0.48 1.3395917 37.703
14.9 48.45 0.33 0.67 1.5178489 38.13215.07 51.64 0.53 1.02 1.6177857 38.564
15.26 59.11 0.49 0.82 1.851807 39.11715.43 125.49 0.79 0.63 3.9313697 40.16815.61 78.23 0.64 0.82 2.4508013 40.86115.78 70.24 0.32 0.45 2.2004893 41.44915.96 57.08 0.21 0.37 1.7882109 41.95416.15 44.07 0.24 0.55 1.3806316 42.36716.33 18.62 0.24 1.27 0.5833302 42.53216.51 5.91 0.19 3.3 0.1851494 42.584
16.7 6.13 0.1 1.67 0.1920416 42.64116.89 16.15 0.19 1.21 0.5059496 42.79217.07 56.47 0.81 1.43 1.7691007 43.293
17.24 59.11 1.15 1.94 1.851807 43.78717.41 144.83 3.08 2.13 4.5372561 45.00017.58 79.23 4.79 6.05 2.4821294 45.66317.75 38.93 2.34 6.01 1.2196049 45.98817.92 55.09 1.47 2.66 1.7258678 46.450
18.1 78.04 1.56 2 2.4448489 47.14118.27 145.19 1.48 1.02 4.5485342 48.35618.42 203.61 2.83 1.39 6.3787248 49.86018.52 174.28 1.27 0.73 5.4598702 50.71818.55 174.47 1.37 0.79 5.4658225 50.97518.63 241.04 2.87 1.19 7.5513375 51.925
18.7 -14.54 -0.07 0.51 -0.4555113 51.87533.27 -0.42 0.01 -2.85 -0.0131578 51.57333.27 -0.28 0 -1.58 -0.0087719 51.573

85
Appendix D Mix Proportions for Drilling and Casting
This appendix contains a table with the mixing proportions for the cement used in
the drilling and casting of the mini piles.
Table D.1 Mix Design for Mini-Piles 40 gallons 62.4 lb /ft
ft 7.48 gal/ft3 8.342246 lbs/gal
21 5.347594 ft3
Volume (ft3)
Drilling Batch 1 bag 94 lbs of cement 0.478225 10 gallons 83.4 lbs of water 1.336538 w/c 0.887234
177.4 lbs per batch
1.814764 ft3 per batch
Required Volume 8.02139 ft3 per batch
No. of Bags / Anchor 4.4 bags
Volume (ft3)
Grouting Batch 2 bags 186 lbs of cement 0.946276 10 gallons 83.4 lbs of water 1.336538 w/c 0.448387
269.4 lbs per batch
2.282814 ft3 per batch
Required Volume 5.5 ft3 per batch
No. of Bags / Anchor 4.8 bags

86
Appendix E Break Even Analysis
In this appendix is the table with the values used for the break even analysis of the
foundation used in the case study.
Table E.1 Break Even Analysis of Project
LOAD (kips)
COST
M.C.F. MINI-PILE
0 $0.00 $5,000.00
1 $155.77 $5,075.89
2 $311.54 $5,151.77
3 $467.31 $5,227.66
4 $623.07 $5,303.54
5 $778.84 $5,379.43
6 $934.61 $5,455.31
7 $1,090.38 $5,531.20
8 $1,246.15 $5,607.09
9 $1,401.92 $5,682.97
10 $1,557.69 $5,758.86
11 $1,713.45 $5,834.74
12 $1,869.22 $5,910.63
13 $2,024.99 $5,986.51
14 $2,180.76 $6,062.40
15 $2,336.53 $6,138.29
16 $2,492.30 $6,214.17
17 $2,648.06 $6,290.06
18 $2,803.83 $6,365.94
19 $2,959.60 $6,441.83
20 $3,115.37 $6,517.71
21 $3,271.14 $6,593.60
22 $3,426.91 $6,669.49
23 $3,582.68 $6,745.37
24 $3,738.44 $6,821.26
25 $3,894.21 $6,897.14
26 $4,049.98 $6,973.03
27 $4,205.75 $7,048.91
28 $4,361.52 $7,124.80
29 $4,517.29 $7,200.69
30 $4,673.06 $7,276.57
31 $4,828.82 $7,352.46
32 $4,984.59 $7,428.34
33 $5,140.36 $7,504.23
34 $5,296.13 $7,580.11
35 $5,451.90 $7,656.00
36 $5,607.67 $7,731.89
37 $5,763.43 $7,807.77
38 $5,919.20 $7,883.66
39 $6,074.97 $7,959.54
40 $6,230.74 $8,035.43
41 $6,386.51 $8,111.31
42 $6,542.28 $8,187.20
43 $6,698.05 $8,263.09
44 $6,853.81 $8,338.97

87
Appendix E (Continued)
Table E.1 (Continued)45 $7,009.58 $8,414.86
46 $7,165.35 $8,490.74
47 $7,321.12 $8,566.63
48 $7,476.89 $8,642.51
49 $7,632.66 $8,718.40
50 $7,788.43 $8,794.29
51 $7,944.19 $8,870.17
52 $8,099.96 $8,946.06
53 $8,255.73 $9,021.94
54 $8,411.50 $9,097.83
55 $8,567.27 $9,173.71
56 $8,723.04 $9,249.60
57 $8,878.80 $9,325.49
58 $9,034.57 $9,401.37
59 $9,190.34 $9,477.26
60 $9,346.11 $9,553.14
61 $9,501.88 $9,629.03
62 $9,657.65 $9,704.91
63 $9,813.42 $9,780.80
64 $9,969.18 $9,856.69
65 $10,124.95 $9,932.57
66 $10,280.72 $10,008.46
67 $10,436.49 $10,084.34
68 $10,592.26 $10,160.23
69 $10,748.03 $10,236.11
70 $10,903.80 $10,312.00
71 $11,059.56 $10,387.89
72 $11,215.33 $10,463.77
73 $11,371.10 $10,539.66
74 $11,526.87 $10,615.54
75 $11,682.64 $10,691.43
76 $11,838.41 $10,767.31
77 $11,994.17 $10,843.20
78 $12,149.94 $10,919.09
79 $12,305.71 $10,994.97
80 $12,461.48 $11,070.86
81 $12,617.25 $11,146.74
82 $12,773.02 $11,222.63
83 $12,928.79 $11,298.51
84 $13,084.55 $11,374.40
85 $13,240.32 $11,450.29
86 $13,396.09 $11,526.17
87 $13,551.86 $11,602.06
88 $13,707.63 $11,677.94
89 $13,863.40 $11,753.83
90 $14,019.17 $11,829.71
91 $14,174.93 $11,905.60
92 $14,330.70 $11,981.49
93 $14,486.47 $12,057.37
94 $14,642.24 $12,133.26
95 $14,798.01 $12,209.14
96 $14,953.78 $12,285.03

88
Appendix E (Continued)
Table E.1 (Continued)99 $15,421.08 $12,512.69
100 $15,576.85 $12,588.57
101 $15,732.62 $12,664.46
102 $15,888.39 $12,740.34
103 $16,044.16 $12,816.23
104 $16,199.92 $12,892.11
105 $16,355.69 $12,968.00
106 $16,511.46 $13,043.89
107 $16,667.23 $13,119.77
108 $16,823.00 $13,195.66
109 $16,978.77 $13,271.54
110 $17,134.54 $13,347.43
111 $17,290.30 $13,423.31
112 $17,446.07 $13,499.20
113 $17,601.84 $13,575.09
114 $17,757.61 $13,650.97
115 $17,913.38 $13,726.86
116 $18,069.15 $13,802.74
117 $18,224.91 $13,878.63
118 $18,380.68 $13,954.51
119 $18,536.45 $14,030.40
120 $18,692.22 $14,106.29
121 $18,847.99 $14,182.17
122 $19,003.76 $14,258.06
123 $19,159.53 $14,333.94
124 $19,315.29 $14,409.83
125 $19,471.06 $14,485.71
126 $19,626.83 $14,561.60
127 $19,782.60 $14,637.49
128 $19,938.37 $14,713.37
129 $20,094.14 $14,789.26
130 $20,249.91 $14,865.14
131 $20,405.67 $14,941.03
132 $20,561.44 $15,016.91
133 $20,717.21 $15,092.80
134 $20,872.98 $15,168.69
135 $21,028.75 $15,244.57
136 $21,184.52 $15,320.46
137 $21,340.28 $15,396.34
138 $21,496.05 $15,472.23
139 $21,651.82 $15,548.11
140 $21,807.59 $15,624.00
141 $21,963.36 $15,699.89
142 $22,119.13 $15,775.77
143 $22,274.90 $15,851.66
144 $22,430.66 $15,927.54
145 $22,586.43 $16,003.43
146 $22,742.20 $16,079.31
147 $22,897.97 $16,155.20
148 $23,053.74 $16,231.09
149 $23,209.51 $16,306.97
150 $23,365.28 $16,382.86

89
Appendix E (Continued)
Table E.1 (Continued)153 $23,832.58 $16,610.51
154 $23,988.35 $16,686.40
155 $24,144.12 $16,762.29
156 $24,299.89 $16,838.17
157 $24,455.65 $16,914.06
158 $24,611.42 $16,989.94
159 $24,767.19 $17,065.83
160 $24,922.96 $17,141.71
161 $25,078.73 $17,217.60
162 $25,234.50 $17,293.49
163 $25,390.27 $17,369.37
164 $25,546.03 $17,445.26
165 $25,701.80 $17,521.14
166 $25,857.57 $17,597.03
167 $26,013.34 $17,672.91
168 $26,169.11 $17,748.80
169 $26,324.88 $17,824.69
170 $26,480.65 $17,900.57
171 $26,636.41 $17,976.46
172 $26,792.18 $18,052.34
173 $26,947.95 $18,128.23
174 $27,103.72 $18,204.11
175 $27,259.49 $18,280.00
176 $27,415.26 $18,355.89
177 $27,571.02 $18,431.77
178 $27,726.79 $18,507.66
179 $27,882.56 $18,583.54
180 $28,038.33 $18,659.43
181 $28,194.10 $18,735.31
182 $28,349.87 $18,811.20
183 $28,505.64 $18,887.09
184 $28,661.40 $18,962.97
185 $28,817.17 $19,038.86
186 $28,972.94 $19,114.74
187 $29,128.71 $19,190.63
188 $29,284.48 $19,266.51
189 $29,440.25 $19,342.40
190 $29,596.02 $19,418.29
191 $29,751.78 $19,494.17
192 $29,907.55 $19,570.06
193 $30,063.32 $19,645.94
194 $30,219.09 $19,721.83
195 $30,374.86 $19,797.71
196 $30,530.63 $19,873.60
197 $30,686.39 $19,949.49
198 $30,842.16 $20,025.37
199 $30,997.93 $20,101.26
200 $31,153.70 $20,177.14
201 $31,309.47 $20,253.03
202 $31,465.24 $20,328.91
203 $31,621.01 $20,404.80
204 $31,776.77 $20,480.69

90
Appendix E (Continued)
Table E.1 (Continued)207 $32,244.08 $20,708.34
208 $32,399.85 $20,784.23
209 $32,555.62 $20,860.11
210 $32,711.39 $20,936.00
211 $32,867.15 $21,011.89
212 $33,022.92 $21,087.77
213 $33,178.69 $21,163.66
214 $33,334.46 $21,239.54
215 $33,490.23 $21,315.43
216 $33,646.00 $21,391.31
217 $33,801.76 $21,467.20
218 $33,957.53 $21,543.09
219 $34,113.30 $21,618.97
220 $34,269.07 $21,694.86
221 $34,424.84 $21,770.74
222 $34,580.61 $21,846.63
223 $34,736.38 $21,922.51
224 $34,892.14 $21,998.40
225 $35,047.91 $22,074.29
226 $35,203.68 $22,150.17
227 $35,359.45 $22,226.06
228 $35,515.22 $22,301.94
229 $35,670.99 $22,377.83
230 $35,826.76 $22,453.71
231 $35,982.52 $22,529.60
232 $36,138.29 $22,605.49
233 $36,294.06 $22,681.37
234 $36,449.83 $22,757.26
235 $36,605.60 $22,833.14
236 $36,761.37 $22,909.03
237 $36,917.13 $22,984.91
238 $37,072.90 $23,060.80
239 $37,228.67 $23,136.69
240 $37,384.44 $23,212.57
241 $37,540.21 $23,288.46
242 $37,695.98 $23,364.34
243 $37,851.75 $23,440.23
244 $38,007.51 $23,516.11
245 $38,163.28 $23,592.00
246 $38,319.05 $23,667.89
247 $38,474.82 $23,743.77
248 $38,630.59 $23,819.66
249 $38,786.36 $23,895.54
250 $38,942.13 $23,971.43
251 $39,097.89 $24,047.31
252 $39,253.66 $24,123.20
253 $39,409.43 $24,199.09
254 $39,565.20 $24,274.97
255 $39,720.97 $24,350.86
256 $39,876.74 $24,426.74
257 $40,032.50 $24,502.63
258 $40,188.27 $24,578.51

91
Appendix E (Continued)
Table E.1 (Continued)261 $40,655.58 $24,806.17
262 $40,811.35 $24,882.06
263 $40,967.12 $24,957.94
264 $41,122.88 $25,033.83
265 $41,278.65 $25,109.71
266 $41,434.42 $25,185.60
267 $41,590.19 $25,261.49
268 $41,745.96 $25,337.37
269 $41,901.73 $25,413.26
270 $42,057.50 $25,489.14
271 $42,213.26 $25,565.03
272 $42,369.03 $25,640.91
273 $42,524.80 $25,716.80
274 $42,680.57 $25,792.69
275 $42,836.34 $25,868.57
276 $42,992.11 $25,944.46
277 $43,147.87 $26,020.34
278 $43,303.64 $26,096.23
279 $43,459.41 $26,172.11
280 $43,615.18 $26,248.00
281 $43,770.95 $26,323.89
282 $43,926.72 $26,399.77
283 $44,082.49 $26,475.66
284 $44,238.25 $26,551.54
285 $44,394.02 $26,627.43
286 $44,549.79 $26,703.31
287 $44,705.56 $26,779.20
288 $44,861.33 $26,855.09
289 $45,017.10 $26,930.97
290 $45,172.87 $27,006.86
291 $45,328.63 $27,082.74
292 $45,484.40 $27,158.63
293 $45,640.17 $27,234.51
294 $45,795.94 $27,310.40
295 $45,951.71 $27,386.29
296 $46,107.48 $27,462.17
297 $46,263.24 $27,538.06
298 $46,419.01 $27,613.94
299 $46,574.78 $27,689.83
300 $46,730.55 $27,765.71

92
Appendix F Capacity of a Mini-Pile Based on Soil
This appendix contains the table with the values used to determine the capacity of
a mini-pile based on the type of soil it is in.
Table F.1 Capacity of a Mini-Pile Based on Soil
ft. clay silt sand medium and coarse cobbles
1 4.599205 4.599205 7.391579 13.14058
6 27.59523 27.59523 44.34947 78.84351
11 50.59125 50.59125 81.30737 144.5464
16 73.58728 73.58728 118.2653 210.2494
21 96.5833 96.5833 155.2232 275.9523
26 119.5793 119.5793 192.1811 341.6552
31 142.5753 142.5753 229.139 407.3581
36 165.5714 165.5714 266.0968 473.0611
41 188.5674 188.5674 303.0547 538.764

93
Appendix G Cost Per Kip Resisted Based on Soil
This appendix contains the table used to calculate the cost of a foundation
required to resist a certain uplift force as a function of the type of soil used.
Table G.1 Cost Per Kip Resisted (General Soil Properties)Kips Soft Sand Medium Sand Hard Sand Soft Clay Medium Clay Hard Clay Concrete
Footer
0 5000 5000 5000 5000 5000 5000 0
1 5047 5043.143 5039.711 5026.269 5018.459 5014.791 155.77
2 5094 5086.286 5079.422 5052.538 5036.918 5029.582 311.54
3 5141 5129.429 5119.133 5078.807 5055.377 5044.373 467.31
4 5188 5172.572 5158.844 5105.076 5073.836 5059.164 623.08
5 5235 5215.715 5198.555 5131.345 5092.295 5073.955 778.85
6 5282 5258.858 5238.266 5157.614 5110.754 5088.746 934.62
7 5329 5302.001 5277.977 5183.883 5129.213 5103.537 1090.39
8 5376 5345.144 5317.688 5210.152 5147.672 5118.328 1246.16
9 5423 5388.287 5357.399 5236.421 5166.131 5133.119 1401.93
10 5470 5431.43 5397.11 5262.69 5184.59 5147.91 1557.7
11 5517 5474.573 5436.821 5288.959 5203.049 5162.701 1713.47
12 5564 5517.716 5476.532 5315.228 5221.508 5177.492 1869.24
13 5611 5560.859 5516.243 5341.497 5239.967 5192.283 2025.01
14 5658 5604.002 5555.954 5367.766 5258.426 5207.074 2180.78
15 5705 5647.145 5595.665 5394.035 5276.885 5221.865 2336.55
16 5752 5690.288 5635.376 5420.304 5295.344 5236.656 2492.32
17 5799 5733.431 5675.087 5446.573 5313.803 5251.447 2648.09
18 5846 5776.574 5714.798 5472.842 5332.262 5266.238 2803.86
19 5893 5819.717 5754.509 5499.111 5350.721 5281.029 2959.63
20 5940 5862.86 5794.22 5525.38 5369.18 5295.82 3115.4
21 5987 5906.003 5833.931 5551.649 5387.639 5310.611 3271.17
22 6034 5949.146 5873.642 5577.918 5406.098 5325.402 3426.94
23 6081 5992.289 5913.353 5604.187 5424.557 5340.193 3582.71
24 6128 6035.432 5953.064 5630.456 5443.016 5354.984 3738.48
25 6175 6078.575 5992.775 5656.725 5461.475 5369.775 3894.25
26 6222 6121.718 6032.486 5682.994 5479.934 5384.566 4050.02
27 6269 6164.861 6072.197 5709.263 5498.393 5399.357 4205.79
28 6316 6208.004 6111.908 5735.532 5516.852 5414.148 4361.56
29 6363 6251.147 6151.619 5761.801 5535.311 5428.939 4517.33
30 6410 6294.29 6191.33 5788.07 5553.77 5443.73 4673.1
31 6457 6337.433 6231.041 5814.339 5572.229 5458.521 4828.87
32 6504 6380.576 6270.752 5840.608 5590.688 5473.312 4984.64
33 6551 6423.719 6310.463 5866.877 5609.147 5488.103 5140.41
34 6598 6466.862 6350.174 5893.146 5627.606 5502.894 5296.18
35 6645 6510.005 6389.885 5919.415 5646.065 5517.685 5451.95
36 6692 6553.148 6429.596 5945.684 5664.524 5532.476 5607.72
37 6739 6596.291 6469.307 5971.953 5682.983 5547.267 5763.49
38 6786 6639.434 6509.018 5998.222 5701.442 5562.058 5919.26
39 6833 6682.577 6548.729 6024.491 5719.901 5576.849 6075.03
40 6880 6725.72 6588.44 6050.76 5738.36 5591.64 6230.8
41 6927 6768.863 6628.151 6077.029 5756.819 5606.431 6386.57

94
Appendix G (Continued)
Table G.1 (Continued)42 6974 6812.006 6667.862 6103.298 5775.278 5621.222 6542.34
43 7021 6855.149 6707.573 6129.567 5793.737 5636.013 6698.11
44 7068 6898.292 6747.284 6155.836 5812.196 5650.804 6853.88
45 7115 6941.435 6786.995 6182.105 5830.655 5665.595 7009.65
46 7162 6984.578 6826.706 6208.374 5849.114 5680.386 7165.42
47 7209 7027.721 6866.417 6234.643 5867.573 5695.177 7321.19
48 7256 7070.864 6906.128 6260.912 5886.032 5709.968 7476.96
49 7303 7114.007 6945.839 6287.181 5904.491 5724.759 7632.73
50 7350 7157.15 6985.55 6313.45 5922.95 5739.55 7788.5
51 7397 7200.293 7025.261 6339.719 5941.409 5754.341 7944.27
52 7444 7243.436 7064.972 6365.988 5959.868 5769.132 8100.04
53 7491 7286.579 7104.683 6392.257 5978.327 5783.923 8255.81
54 7538 7329.722 7144.394 6418.526 5996.786 5798.714 8411.58
55 7585 7372.865 7184.105 6444.795 6015.245 5813.505 8567.35
56 7632 7416.008 7223.816 6471.064 6033.704 5828.296 8723.12
57 7679 7459.151 7263.527 6497.333 6052.163 5843.087 8878.89
58 7726 7502.294 7303.238 6523.602 6070.622 5857.878 9034.66
59 7773 7545.437 7342.949 6549.871 6089.081 5872.669 9190.43
60 7820 7588.58 7382.66 6576.14 6107.54 5887.46 9346.2
61 7867 7631.723 7422.371 6602.409 6125.999 5902.251 9501.97
62 7914 7674.866 7462.082 6628.678 6144.458 5917.042 9657.74
63 7961 7718.009 7501.793 6654.947 6162.917 5931.833 9813.51
64 8008 7761.152 7541.504 6681.216 6181.376 5946.624 9969.28
65 8055 7804.295 7581.215 6707.485 6199.835 5961.415 10125.05
66 8102 7847.438 7620.926 6733.754 6218.294 5976.206 10280.82
67 8149 7890.581 7660.637 6760.023 6236.753 5990.997 10436.59
68 8196 7933.724 7700.348 6786.292 6255.212 6005.788 10592.36
69 8243 7976.867 7740.059 6812.561 6273.671 6020.579 10748.13
70 8290 8020.01 7779.77 6838.83 6292.13 6035.37 10903.9
71 8337 8063.153 7819.481 6865.099 6310.589 6050.161 11059.67
72 8384 8106.296 7859.192 6891.368 6329.048 6064.952 11215.44
73 8431 8149.439 7898.903 6917.637 6347.507 6079.743 11371.21
74 8478 8192.582 7938.614 6943.906 6365.966 6094.534 11526.98
75 8525 8235.725 7978.325 6970.175 6384.425 6109.325 11682.75
76 8572 8278.868 8018.036 6996.444 6402.884 6124.116 11838.52
77 8619 8322.011 8057.747 7022.713 6421.343 6138.907 11994.29
78 8666 8365.154 8097.458 7048.982 6439.802 6153.698 12150.06
79 8713 8408.297 8137.169 7075.251 6458.261 6168.489 12305.83
80 8760 8451.44 8176.88 7101.52 6476.72 6183.28 12461.6
81 8807 8494.583 8216.591 7127.789 6495.179 6198.071 12617.37
82 8854 8537.726 8256.302 7154.058 6513.638 6212.862 12773.14
83 8901 8580.869 8296.013 7180.327 6532.097 6227.653 12928.91
84 8948 8624.012 8335.724 7206.596 6550.556 6242.444 13084.68
85 8995 8667.155 8375.435 7232.865 6569.015 6257.235 13240.45
86 9042 8710.298 8415.146 7259.134 6587.474 6272.026 13396.22
87 9089 8753.441 8454.857 7285.403 6605.933 6286.817 13551.99
88 9136 8796.584 8494.568 7311.672 6624.392 6301.608 13707.76
89 9183 8839.727 8534.279 7337.941 6642.851 6316.399 13863.53
90 9230 8882.87 8573.99 7364.21 6661.31 6331.19 14019.3

95
Appendix G (Continued)
Table G.1 (Continued)92 9324 8969.156 8653.412 7416.748 6698.228 6360.772 14330.84
93 9371 9012.299 8693.123 7443.017 6716.687 6375.563 14486.61
94 9418 9055.442 8732.834 7469.286 6735.146 6390.354 14642.38
95 9465 9098.585 8772.545 7495.555 6753.605 6405.145 14798.15
96 9512 9141.728 8812.256 7521.824 6772.064 6419.936 14953.92
97 9559 9184.871 8851.967 7548.093 6790.523 6434.727 15109.69
98 9606 9228.014 8891.678 7574.362 6808.982 6449.518 15265.46
99 9653 9271.157 8931.389 7600.631 6827.441 6464.309 15421.23
100 9700 9314.3 8971.1 7626.9 6845.9 6479.1 15577
101 9747 9357.443 9010.811 7653.169 6864.359 6493.891 15732.77
102 9794 9400.586 9050.522 7679.438 6882.818 6508.682 15888.54
103 9841 9443.729 9090.233 7705.707 6901.277 6523.473 16044.31
104 9888 9486.872 9129.944 7731.976 6919.736 6538.264 16200.08
105 9935 9530.015 9169.655 7758.245 6938.195 6553.055 16355.85
106 9982 9573.158 9209.366 7784.514 6956.654 6567.846 16511.62
107 10029 9616.301 9249.077 7810.783 6975.113 6582.637 16667.39
108 10076 9659.444 9288.788 7837.052 6993.572 6597.428 16823.16
109 10123 9702.587 9328.499 7863.321 7012.031 6612.219 16978.93
110 10170 9745.73 9368.21 7889.59 7030.49 6627.01 17134.7
111 10217 9788.873 9407.921 7915.859 7048.949 6641.801 17290.47
112 10264 9832.016 9447.632 7942.128 7067.408 6656.592 17446.24
113 10311 9875.159 9487.343 7968.397 7085.867 6671.383 17602.01
114 10358 9918.302 9527.054 7994.666 7104.326 6686.174 17757.78
115 10405 9961.445 9566.765 8020.935 7122.785 6700.965 17913.55
116 10452 10004.588 9606.476 8047.204 7141.244 6715.756 18069.32
117 10499 10047.731 9646.187 8073.473 7159.703 6730.547 18225.09
118 10546 10090.874 9685.898 8099.742 7178.162 6745.338 18380.86
119 10593 10134.017 9725.609 8126.011 7196.621 6760.129 18536.63
120 10640 10177.16 9765.32 8152.28 7215.08 6774.92 18692.4
121 10687 10220.303 9805.031 8178.549 7233.539 6789.711 18848.17
122 10734 10263.446 9844.742 8204.818 7251.998 6804.502 19003.94
123 10781 10306.589 9884.453 8231.087 7270.457 6819.293 19159.71
124 10828 10349.732 9924.164 8257.356 7288.916 6834.084 19315.48
125 10875 10392.875 9963.875 8283.625 7307.375 6848.875 19471.25
126 10922 10436.018 10003.586 8309.894 7325.834 6863.666 19627.02
127 10969 10479.161 10043.297 8336.163 7344.293 6878.457 19782.79
128 11016 10522.304 10083.008 8362.432 7362.752 6893.248 19938.56
129 11063 10565.447 10122.719 8388.701 7381.211 6908.039 20094.33
130 11110 10608.59 10162.43 8414.97 7399.67 6922.83 20250.1
131 11157 10651.733 10202.141 8441.239 7418.129 6937.621 20405.87
132 11204 10694.876 10241.852 8467.508 7436.588 6952.412 20561.64
133 11251 10738.019 10281.563 8493.777 7455.047 6967.203 20717.41
134 11298 10781.162 10321.274 8520.046 7473.506 6981.994 20873.18
135 11345 10824.305 10360.985 8546.315 7491.965 6996.785 21028.95
136 11392 10867.448 10400.696 8572.584 7510.424 7011.576 21184.72
137 11439 10910.591 10440.407 8598.853 7528.883 7026.367 21340.49
138 11486 10953.734 10480.118 8625.122 7547.342 7041.158 21496.26
139 11533 10996.877 10519.829 8651.391 7565.801 7055.949 21652.03
140 11580 11040.02 10559.54 8677.66 7584.26 7070.74 21807.8

96
Appendix G (Continued)
Table G.1 (Continued)142 11674 11126.306 10638.962 8730.198 7621.178 7100.322 22119.34
143 11721 11169.449 10678.673 8756.467 7639.637 7115.113 22275.11
144 11768 11212.592 10718.384 8782.736 7658.096 7129.904 22430.88
145 11815 11255.735 10758.095 8809.005 7676.555 7144.695 22586.65
146 11862 11298.878 10797.806 8835.274 7695.014 7159.486 22742.42
147 11909 11342.021 10837.517 8861.543 7713.473 7174.277 22898.19
148 11956 11385.164 10877.228 8887.812 7731.932 7189.068 23053.96
149 12003 11428.307 10916.939 8914.081 7750.391 7203.859 23209.73
150 12050 11471.45 10956.65 8940.35 7768.85 7218.65 23365.5
151 12097 11514.593 10996.361 8966.619 7787.309 7233.441 23521.27
152 12144 11557.736 11036.072 8992.888 7805.768 7248.232 23677.04
153 12191 11600.879 11075.783 9019.157 7824.227 7263.023 23832.81
154 12238 11644.022 11115.494 9045.426 7842.686 7277.814 23988.58
155 12285 11687.165 11155.205 9071.695 7861.145 7292.605 24144.35
156 12332 11730.308 11194.916 9097.964 7879.604 7307.396 24300.12
157 12379 11773.451 11234.627 9124.233 7898.063 7322.187 24455.89
158 12426 11816.594 11274.338 9150.502 7916.522 7336.978 24611.66
159 12473 11859.737 11314.049 9176.771 7934.981 7351.769 24767.43
160 12520 11902.88 11353.76 9203.04 7953.44 7366.56 24923.2