Evaluating wireless sensor node longevity through Markovian techniques
Upload
independentCategory
view
2download
0
1
A Comprehensive Approach to Software Aging and Rejuvenation on a Single Node Software
System
P.K. Saravakos1, G.A. Gravvanis1, V.P. Koutras2, A.N. Platis2
Abstract - The phenomenon of software aging is dominant in modern software systems, affecting their behavior and leading to major and minor failures, which hamper their overall performance. The effects of software aging on software systems are associated with major failures in the recent past, encouraging scientists to work towards proposing vital solutions to the problem. A preventive and proactive solution to software aging is software rejuvenation involving the restoration of a system to a clean internal state. In this paper both software aging and rejuvenation are been modeled and analyzed using homogenous continuous time Markov chains and ARIMA models.
Index Terms- ARIMA models, Continuous Time Markov Chains, Software aging, software rejuvenation
—————————— ——————————
1 INTRODUCTION HE rise of the software industry in the past decades resulted in the development of novel software systems with much more promising attributes over a
greater field of application. The complexity of the contemporary software modules was refrained in their design, allowing users to take advantage of the user-friendly environment, the increased reliability or availability and the vast potentials of the new software projects. However software failures curtailed the high performance of the modern software products reducing at the same time their overall reliability and increasing the cost due to unavailability of the software. The cause of failures has been unknown, as hardware was primarily indicted. Nonetheless the transient nature of failures, which rarely appeared after a system reboot or an application restart, turned the spotlight onto software revealing a phenomenon reported as software or process aging [13]. As software processes are been executed over a long period of time, minor inherent design flaws accumulate manifesting themselves as decaying phenomena such as memory leaks, data corruption, disk space fragmentation, and accumulation of calculation and round-off errors. The occurrence of software flaws is a result of the increased complexity of the current software systems, since the debugging and testing stages in the process of software development are inadequate to reveal all flaws owing to the greater extent of the source code. In addition to that, owing to the variety and amount of software products available, it is quite implausible to predict the interaction of the software applications
running in the same operational environment and thus uncover faults caused in the operational software environment.
Software aging does not affect software directly, although it does hamper the smooth execution of the software by deteriorating the operational environment the software is been executed in. It must be noted that the operational environment of an application is formed by the interaction of all different software running in a system, including all running applications and the operating system. Conclusively the term software aging refers to the degradation of the operational environment of the software. The term process aging is more accurate to describe the phenomenon, then again the term software aging has been established in literature. A proactive technique to counteract software aging was proposed by Huang et al. [8] as software rejuvenation and was stated as a “periodic preemptive rollback of continuously running applications to prevent failures”. Software rejuvenation counteracts the phenomenon of software aging by restoring the software to a former state where no faults have emerged. The restoration to the former, cleaner, state is been accomplished in copious ways depending on the entity rejuvenated i.e. garbage collection, flushing operating system kernel tables and reinitializing internal data structures. Analogous to software aging, software rejuvenation concentrates in rejuvenating the operational environment. The later does not exclude the fact of terminating and restarting active processes, given that processes do contribute in the formation of the operational environment. An extreme but noticeably effective way to rejuvenate is a system reboot.
2 RELATED WORK Over the recent years, remarkable research effort focused on proposing a diversity of ways to comprehend and
T
———————————————⎯⎯⎯⎯⎯⎯⎯⎯⎯⎯⎯⎯⎯⎯⎯⎯⎯⎯⎯ • 1 Department of Electrical and Computer Engineering, School of
Engineering, Democritus University of Thrace, 12, Vas. Sofias street, GR 67100 Xanthi, Greece; Email: [email protected], [email protected]
• 2 Department of Financial and Management Engineering, Business School, University of the Aegean, 31, Fostini street, GR 82100 Chios, Greece; Email: [email protected], [email protected]

2
analyze the phenomenon of software aging as well as numerous rejuvenation policies and techniques studied on many different software systems. Huang et al. [8], regard a degradation phenomenon as a two‐step failure model. From the clean state the software system jumps into a degraded state from which two actions are possible: rejuvenation with return to the clean state or transition to the complete failure state. They model a four‐state process as a CTMC and derive the steady‐state system availability and the expected operation cost per unit time in the steady state. Avritzer and Weyuker [1], discuss the aging in telecommunication switching software where the effect manifests as gradual performance degradation. Garg et al. [6], introduce the idea of periodic rejuvenation (deterministic interval between successive rejuvenations) into the Huang et al.ʹs model [8], and represent the stochastic behavior by using a Markov regenerative stochastic Petri net. Garg et al. [7], present a measurement‐based approach for detecting and estimating trends and times to exhaustion of operating system resources due to software aging. Dohi et al. [4], and Suzuki et al. [14], extend the seminal two‐step software degradation models in Huang et al. [8] and Garg et al. [6], respectively, by using semi‐Markov processes. In the work by Dohi et al. [5], software rejuvenation models are formulated using semi‐Markov processes and optimal rejuvenation schedules that maximize availability and minimize cost are derived analytically. Vaidyanathan and Trivedi [15], take the system workload into account for building a model to estimate resource exhaustion times. Cassidy et al. [3], have developed an approach to rejuvenation for large online transaction processing servers. Using pattern recognition methods, they find that 13 out of several monitored parameters deviate from “normal” behavior just prior to a crash, providing sufficient warning to initiate rejuvenation. Li et al. [12], present an approach based on time series analysis to predict resource usage trends in a Web server while subjecting it to an artificial workload. Several papers have dealt with determining the optimal times to perform preventive maintenance of operational software systems, through analytical models. The accuracy of this approach is determined by the assumptions made in the model for capturing aging. Bobbio et al. [2], present fine grained degradation models where one can identify the current degradation level based on the observation of a system parameter. Optimal rejuvenation policies based on a risk criterion and an alert threshold are then presented. V.P. Koutras et al. [11] apply two rejuvenation techniques and calculate the total expected downtime cost for each technique on a computer system whose degradation is been modeled based on the amount of free memory with the aim of proposing an optimal rejuvenation policy for such a computer system. V.P. Koutras et al. [10] study a cluster system, where software rejuvenation is performed when the node’s software experiences degradation. The cluster system is
been modeled by Continuous Time Markov Chains and two techniques are been examined and compare in order to determine the best configuration to maximize the system’s availability
This paper elucidates the process of the analysis and modeling of the phenomenon of software aging examined on two personal desktop computer systems with commercial specifications. The examined systems are been compared based on the way they experience aging in accordance with several statistical metrics. The model employed for modeling software aging was a homogenous Continuous Time Markov Chain. In addition to that we study the implementation of software rejuvenation on the most contemporary software system of the two examined.
The main contributions of this paper are twofold; firstly we introduce a comprehensive methodology for comparing the effects of software aging on two software systems based on custom statistical metrics anchored in the measurements retrieved from detailed observation and secondly we study software rejuvenation on a single node, a personal computer maintained off‐line for the entire duration of the experiments founded on a measurement‐based model.
3 EXPERIMENTAL SETUP This section comprises of two separate subsections devoted to each one of the two monitored systems. The first system is based on a low specifications hardware system running under the operating system of Microsoft® Windows 98, abbreviated as MsWin98, while the second one is based on a high specifications hardware system running under the operating system of Microsoft® Windows xp, abbreviated as MsWinXP. The MsWin98 system is used to monitor a system which is prone to failure due to the older version of the software installed in combination with the low hardware specifications. The observations from the later system are used as feed for the MsWinXP system in order to develop the methodology of monitoring a system and recording the effects of aging. The MsWinXP is the core of our study, being a modern software system with contemporary, resource demanding applications.
Both systems remained off‐line in order to maintain the experimental environment unchanged for the duration of the experiments. Furthermore the MsWinXP was structured based on the same principles used in the MsWin98 system to facilitate the comparison of the two systems on common grounds. The raw statistical data undergo series of statistical transformations with the view of reaching a comprehensible level of details.
3.1 Data Collection on the MsWin98 System In order to monitor the performance of the system we employ the System Monitor application, provided
3
together with the operating system with the purpose of avoiding compatibility issues of the OS with the monitoring process. System Monitor is able to record several parameters with a sample rate of a second but the number of the observed parameters, defined as variables in the rest of the paper, had to be selected so that we could acquire adequate extent of information without allowing the monitoring process to burden the system. Therefore from the available set of variables we selected 17 variables, three monitoring OS kernel activity and the rest the OS memory management.
Subsequently, the methodology of testing the system had to be determined and the system as well as the applications had been tested in five separate categories of tests, four relevant to monitoring the standard behavior of the system and one relevant to monitoring the behavior of the system planned to crash. The duration of each test session starts with the start of logging and ends with the end of logging. After each test session in order to reassure that the test sessions remain independent the system is been rebooted and in case a crash test results in a failure the system is been restored by initiating maintenance procedures and then by rebooting the system once again. The variables observed during the crash test are the following ones: Processor Usage%, Threads, Virtual Machines, Allocated memory, Discards, Disk cache size, Instance faults, Locked memory, Locked non‐cache pages, Maximum disk cache size, Other memory, Page faults, Pages mapped from cache, Swap file in use, Swap file size, Swappable memory, Unused physical memory.
The first category of tests is the most essential monitoring session where the system remains idle for the duration of the session. In those tests called idle system sessions, the system is been initiated from a robust state and allowed to operate without any other application in the foreground. The second, third and fourth test categories are conducted to investigate the behavior of several applications in the operating system environment and are called application test sessions. In the second category of tests, idle application tests, the user starts an application at the beginning of the test session and does not interact with the application until the end of a predefined time interval when the application is being terminated and the monitoring ends. In the third category of tests, second execution tests, the user starts an application twice in the same test session. In the third category of tests, file execution tests, the user starts an application and loads a file typical of the application. Unlike the rest tests the user does interact with the application according to a predefined sequence of actions similarly characteristic of the application. It is essential that the importance of restricting the user from taking any initiative is been highlighted with the aim of preserving the procedure as objective as possible. All user’s interactions are been documented for that purpose. The fifth category of tests, called crash tests, obtain information from the previous test
sessions and exploits it to lead the system to a crash. The user commences the logging process and then starts several applications in a predefined sequence, named crash pattern. The user is allowed to interact with the applications as described in the file execution tests and terminate and re‐execute the applications. The purpose of the crash tests is to lead a system to a failure and as a result the duration of the crash tests varies. Each and every crash test is characteristic of the heavy workload exerted on the system.
The heavy workload is been applied on the system in order to burden the system, forcing it to express its inherent faults faster and thus deteriorate and eventually crash. During the crash test it is crucial that is been assured that the system does not crash due to the heavy workload but due to the manifestation of software faults. For that purpose a heavy but not critical workload is been exerted on the system.
3.2 Data Collection on the MsWinXP System The Windows XP operating system together with
high performance hardware establishes a highly robust system regardless of the fact that the OS is not fully updated to service pack 3. The application employed for monitoring the system is called Performance Monitor and is a part of the Microsoft Management Console. The sample rate remains set at one second and the variables selected are similar to the ones selected to the MsWin98 system. Nonetheless the different technology employed at the design of the MsWinXP OS resulted in a different set of observable variables and only seven variables common in both systems where included in the eight variables totally observed in the MsWinXP system.
The variables monitored in the MsWinXP system consist of the following ones: Processor Time%, Threads, Committed memory in use%, Cache Bytes%, Cache Bytes Peak, Cache Faults/sec (not found in the MsWin98 system), Page Faults/sec, Available KB The methodology employed for the test sessions in the MsWin98 system is applied in the MsWinXP, then again the average duration of each session has been significantly increased. The above mentioned increase is founded on the specifications of the new applications used; applications which demand more resources and more time to come to full operational state, hence to be launched, loaded and fully available for interaction with the user, necessitating an increase of the duration of the sessions. In order to compare the two systems, apart from selecting similar variables, it was essential that several common programs had been selected. In addition to the initial number of five tests in the MsWin98 another set of test sessions classified as rejuvenation tests has been conducted. The characteristics of the rejuvenation tests will be described in Section 4 as long as they involve the execution software rejuvenation application.
4
At this point it should be clarified that the systems compared are regarded as independent software systems, insulated from any kind of network and analogous I/O interactions from unauthorized users. The major differences between the two systems were anticipated and taken under consideration in the design of the data collection program and methodology and of the each and every test session.
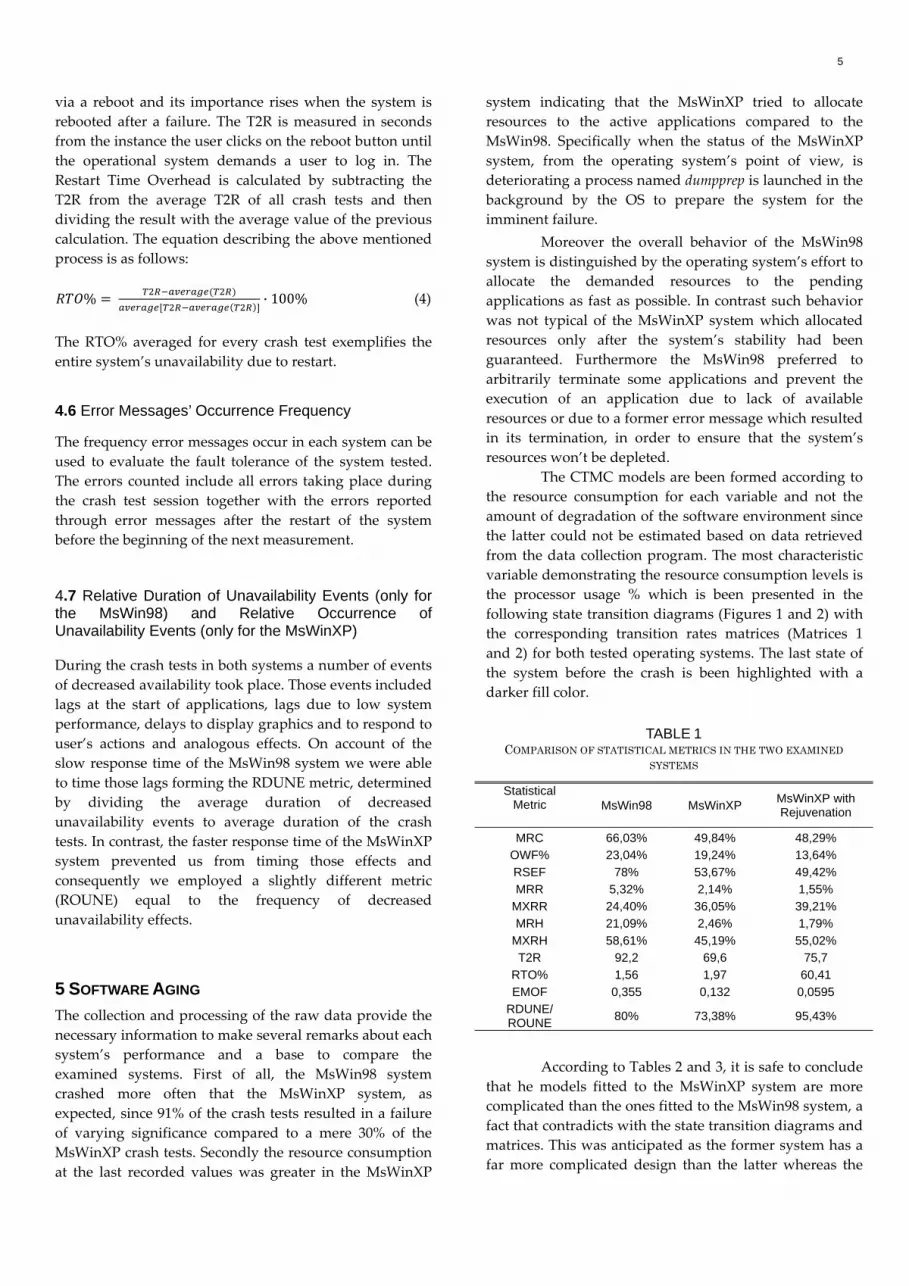
4 STATISTICAL METRICS The statistical metrics are simple but crucial results of statistical calculations which capture several facets of the system’s behavior during the various test sessions. The use of statistical metrics is not equally important in both systems since some common characteristics are more dominant in one system than another. Moreover the evaluation of any system cannot be based solely on the statistical metrics. The metrics ought to be used in conjunction with information derived from the overall behavior of the system hence a combination of both objective and partially subjective criteria. The statistical metrics exercised only in the crash tests will be described in this paper given that the metrics used during the application tests were calculated in order to determine their future use and significance in those tests. The calculated values of all statistical metrics are demonstrated in Table 1.
4.1 Mean Resource Consumption
The mean (average) resource consumption, MRC, is calculated using the average value of each variable in every crash test divided to the maximum value of the corresponding variable in the same crash test. The MRC is calculated to express the average levels of consumption of each variable. The averaged MRC for all variables in every test provides us with the same information for the entire system.
(1)
where is the average value of a variable in each crash test and std(x) the standard deviation of a variable in each crash test
4.2 Workload Factor (WF %)
The workload factor is employed to measure the amount of workload exerted on each system depicting the effort of the system to counterbalance the effect of software aging. The workload factor is defined as follows:
% %
(2)
Firstly the workload factor is calculated for each variable in every crash test. Then the average workload factor for all variables in a crash tests provides us with a measure of the workload in the specific test. Lastly the average workload factor for all crash test and all variables provides us a measure regarding the system’s workload (Overall Workload Factor %).
4.3 Smooth Execution Factor (SEF)
The smooth execution factor is used to measure whether the system is overexploiting the available resources or not exploiting an adequate amount of resources to allocate to active applications. The smooth execution factor is calculated for each variable by the following equation:
%· , %·
(3)
where is the average value of a variable in each crash test and std(x) the standard deviation of a variable in each crash test
The average value of the SEF for every variable in each crash test aids us towards estimating the smoothness of the execution in a single crash test. The SEF of a crash test divided by the average SEF of all crash tests provides us with a metric to compare the behavior of the system in every crash test. The later metric is called Relative Smooth Execution Factor and the average of the RSEFs for all crash tests of a system can be used to compare the smoothness of execution in the two examined systems.
4.4 Resource Release and Hold Metrics
[Mean Resource Release (MRR), Maximum Resource Release (MXRR), Mean Resource Hold (MRH) and Maximum Resource Hold (MXRH)]
The study of the differenced data supplies us with information regarding the ability of the system to capture (hold) and release resources. The release and hold metrics are adequate to make some valid conclusions and are initially calculated for each variable in every crash test and finally expanded via averaging to the entire system. With regard to the mean resource release and hold, a system able to release averagely more resources than it holds is a system able to allocate its resources in an effective way. On the other hand the maximum resource release and hold rates illustrate a system’s ability to allocate and disallocate greater amount of resources and can be used to estimate its flexibility in terms of resource allocation.
4.5 Time to Restart (T2R) and Restart Time Overhead%
The time to restart is a typical attribute of the system, portraying its ability to restore the system to a clean state
5
via a reboot and its importance rises when the system is rebooted after a failure. The T2R is measured in seconds from the instance the user clicks on the reboot button until the operational system demands a user to log in. The Restart Time Overhead is calculated by subtracting the T2R from the average T2R of all crash tests and then dividing the result with the average value of the previous calculation. The equation describing the above mentioned process is as follows:
% · 100% (4)
The RTO% averaged for every crash test exemplifies the entire system’s unavailability due to restart.
4.6 Error Messages’ Occurrence Frequency
The frequency error messages occur in each system can be used to evaluate the fault tolerance of the system tested. The errors counted include all errors taking place during the crash test session together with the errors reported through error messages after the restart of the system before the beginning of the next measurement.
4.7 Relative Duration of Unavailability Events (only for the MsWin98) and Relative Occurrence of Unavailability Events (only for the MsWinXP)
During the crash tests in both systems a number of events of decreased availability took place. Those events included lags at the start of applications, lags due to low system performance, delays to display graphics and to respond to user’s actions and analogous effects. On account of the slow response time of the MsWin98 system we were able to time those lags forming the RDUNE metric, determined by dividing the average duration of decreased unavailability events to average duration of the crash tests. In contrast, the faster response time of the MsWinXP system prevented us from timing those effects and consequently we employed a slightly different metric (ROUNE) equal to the frequency of decreased unavailability effects.
5 SOFTWARE AGING The collection and processing of the raw data provide the necessary information to make several remarks about each system’s performance and a base to compare the examined systems. First of all, the MsWin98 system crashed more often that the MsWinXP system, as expected, since 91% of the crash tests resulted in a failure of varying significance compared to a mere 30% of the MsWinXP crash tests. Secondly the resource consumption at the last recorded values was greater in the MsWinXP
system indicating that the MsWinXP tried to allocate resources to the active applications compared to the MsWin98. Specifically when the status of the MsWinXP system, from the operating system’s point of view, is deteriorating a process named dumpprep is launched in the background by the OS to prepare the system for the imminent failure.
Moreover the overall behavior of the MsWin98 system is distinguished by the operating system’s effort to allocate the demanded resources to the pending applications as fast as possible. In contrast such behavior was not typical of the MsWinXP system which allocated resources only after the system’s stability had been guaranteed. Furthermore the MsWin98 preferred to arbitrarily terminate some applications and prevent the execution of an application due to lack of available resources or due to a former error message which resulted in its termination, in order to ensure that the system’s resources won’t be depleted.
The CTMC models are been formed according to the resource consumption for each variable and not the amount of degradation of the software environment since the latter could not be estimated based on data retrieved from the data collection program. The most characteristic variable demonstrating the resource consumption levels is the processor usage % which is been presented in the following state transition diagrams (Figures 1 and 2) with the corresponding transition rates matrices (Matrices 1 and 2) for both tested operating systems. The last state of the system before the crash is been highlighted with a darker fill color.
According to Tables 2 and 3, it is safe to conclude
that he models fitted to the MsWinXP system are more complicated than the ones fitted to the MsWin98 system, a fact that contradicts with the state transition diagrams and matrices. This was anticipated as the former system has a far more complicated design than the latter whereas the
TABLE 1 COMPARISON OF STATISTICAL METRICS IN THE TWO EXAMINED
SYSTEMS
Statistical Metric MsWin98 MsWinXP MsWinXP with
Rejuvenation
MRC 66,03% 49,84% 48,29% OWF% 23,04% 19,24% 13,64% RSEF 78% 53,67% 49,42% MRR 5,32% 2,14% 1,55%
MXRR 24,40% 36,05% 39,21% MRH 21,09% 2,46% 1,79%
MXRH 58,61% 45,19% 55,02% T2R 92,2 69,6 75,7
RTO% 1,56 1,97 60,41 EMOF 0,355 0,132 0,0595
RDUNE/ ROUNE 80% 73,38% 95,43%

6
resource usage is increased in the MsWin98 OS. The progress of both systems is illustrated in Figures 3 and 4 regarding two most characteristic variables (committed memory in use % and processor time % respectively) out of the six common in both systems variables.
To summarize the above mentioned remarks the MsWin98 invested in a more reliable system, which tried to avoid an imminent crash using all means available,
ignoring the effect of its actions to the quality of services and the total availability. On the contrary the MsWinXP invested in a user‐friendly environment, with high quality of services and adequate balance between reliability and availability. The MsWinXP is not designed to confront an imminent crash but to create a checkpoint where it will be able to return swiftly after a crash.
Fig. 1 State transition diagram of the MsWin98 degradation model
Mat.1 Transition rates matrix for the MsWin98 system degradation model

7
Fig.2 State transition diagram of the MsWinXP degradation model
Mat 2. Transition rates matrix for the MsWinXP system degradation model
Fig.3 Comparison of the Committed Memory in use % variable during crash tests in both examined averaged systems
Fig 4 Comparison of the Processor Time% variable during crash tests in both examined averaged systems
8
6 SOFTWARE REJUVENATION The first step in incorporating software rejuvenation to any system is to consider the available policies and select the most suitable for the examined system. The data collection program allows us to monitor several resources and alert when the values of those variables exceed some user‐defined limits. Therefore it is beyond doubt that a convenient and probably effective rejuvenation policy will have a closed loop design and will be based on instantaneous workload. The rejuvenation process will be initiated when the seven out of the eight observed variables, a number decided after series of preliminary tests, exceed the limits set at an alert level, allowing the with the operating system and can perform several vital tasks. In particular when a variable exceeds the limits set the predefined file, called flag file, unique for every variable is been copied by a batch file to a file folder supervised by a batch file, running in the background (daemon batch file). At the time more than six flag files are found in the file folder, the daemon batch file is entitled to ask permission to instigate the software rejuvenation procedure. In the meantime the user can save his work before consenting to rejuvenation. All processes in the user’s domain are being killed and restarted before the preventive maintenance procedures begin. The maintenance procedures include a disk check, a disk defragment and a NTFS file system check and. As soon as the maintenance procedures finish, the user’s consent is needed to reboot the system in order to restart the remaining processes registered in the system, local and network services domain.
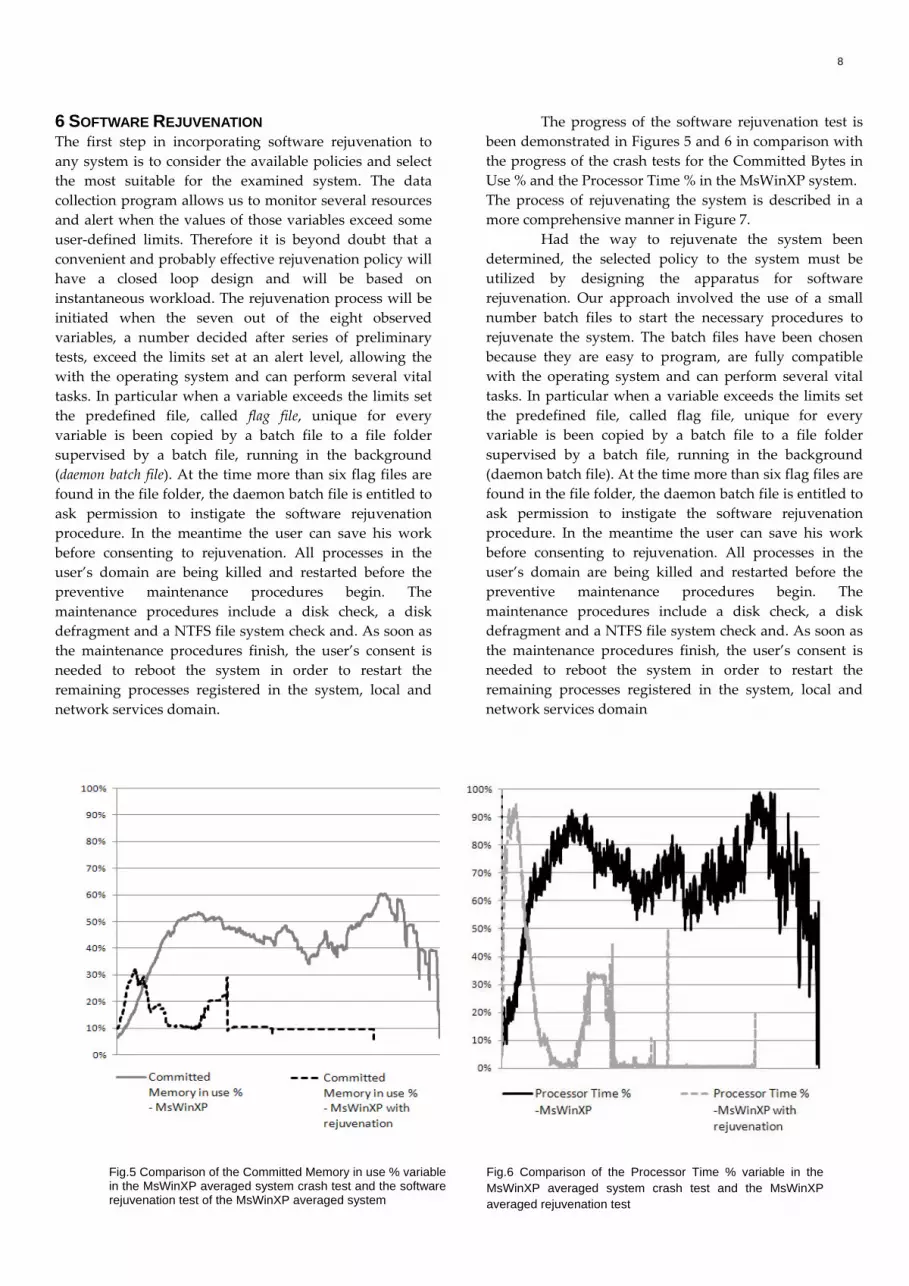
The progress of the software rejuvenation test is been demonstrated in Figures 5 and 6 in comparison with the progress of the crash tests for the Committed Bytes in Use % and the Processor Time % in the MsWinXP system. The process of rejuvenating the system is described in a more comprehensive manner in Figure 7. Had the way to rejuvenate the system been determined, the selected policy to the system must be utilized by designing the apparatus for software rejuvenation. Our approach involved the use of a small number batch files to start the necessary procedures to rejuvenate the system. The batch files have been chosen because they are easy to program, are fully compatible with the operating system and can perform several vital tasks. In particular when a variable exceeds the limits set the predefined file, called flag file, unique for every variable is been copied by a batch file to a file folder supervised by a batch file, running in the background (daemon batch file). At the time more than six flag files are found in the file folder, the daemon batch file is entitled to ask permission to instigate the software rejuvenation procedure. In the meantime the user can save his work before consenting to rejuvenation. All processes in the user’s domain are being killed and restarted before the preventive maintenance procedures begin. The maintenance procedures include a disk check, a disk defragment and a NTFS file system check and. As soon as the maintenance procedures finish, the user’s consent is needed to reboot the system in order to restart the remaining processes registered in the system, local and network services domain
Fig.5 Comparison of the Committed Memory in use % variable
in the MsWinXP averaged system crash test and the software rejuvenation test of the MsWinXP averaged system
Fig.6 Comparison of the Processor Time % variable in the MsWinXP averaged system crash test and the MsWinXP averaged rejuvenation test

9
Fig. 7 Flow chart of the software rejuvenation technique implemented
The rejuvenation tests, as observed in Figures 5
and 6, are tests focused on studying the effects of software rejuvenation on a system, where the aging phenomenon is existent and hence a smaller resource consumption and duration compared to the crash tests in the same system is anticipated. Furthermore the time spent in starting the application has changed since during the software rejuvenation test the user did not have to wait until an application reached its full operational status before starting the next application in the execution sequence.
This approach has been adopted for the reason that no faults occurred during the preliminary software rejuvenation tests, when the interval between executing two applications was small unlike the crash tests.
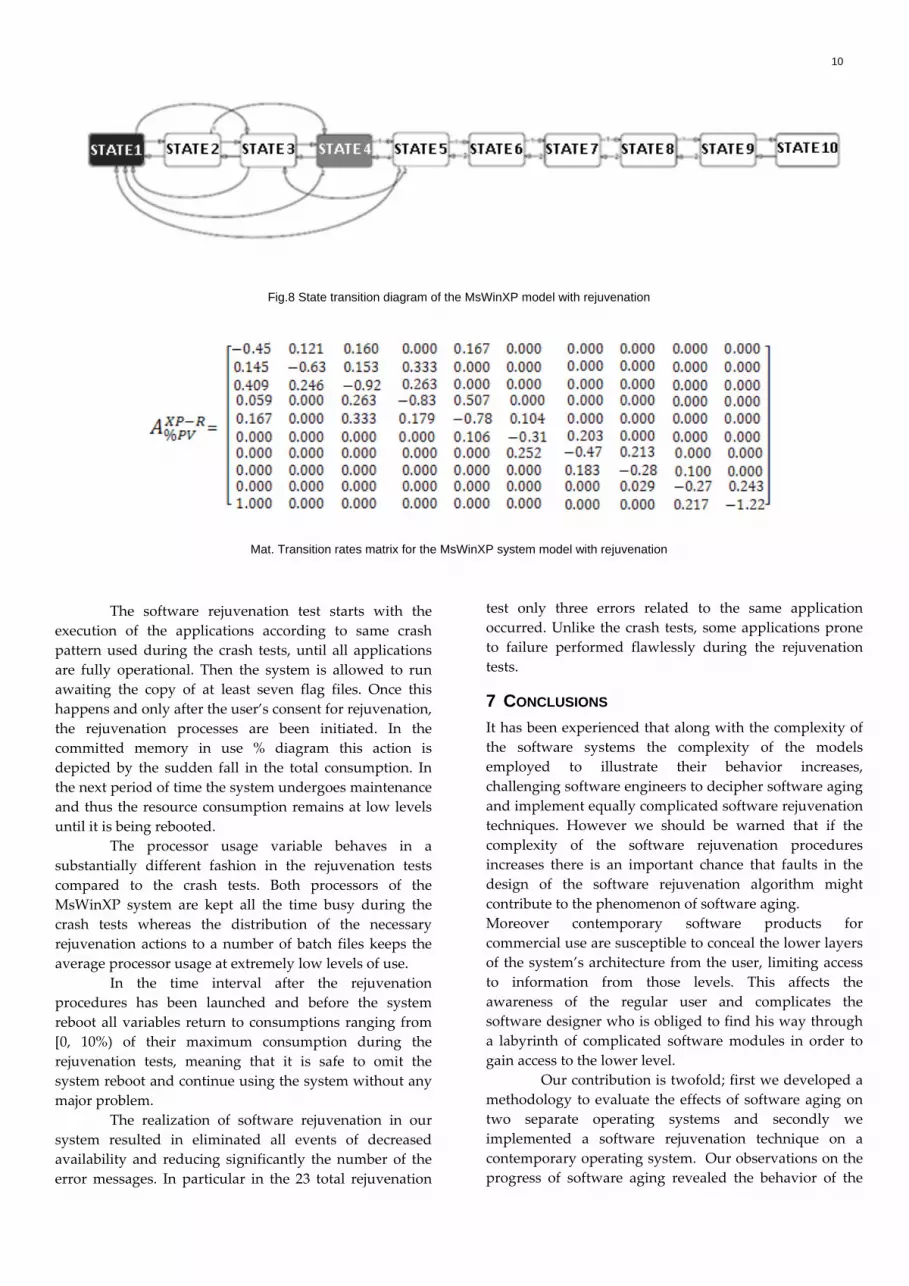
The results of the modeling procedure in the MsWinXP system with rejuvenation for all eight variables are demonstrated in Table 4. In the state transition diagram (Figure 8) the system starts at state 4, analogous to processor usage between 30%‐40% and stops after rejuvenation at state, analogous to a processor usage
between 0%‐ 10%. The corresponding transition rates matrices are been illustrated in Matrix 3.
TABLE 4 ARIMA MODELS FITTED ON EACH
VARIABLE OF THE MSWINXP SYSTEM WITH REJUVENATION
Variable ARIMA Model Processor Time% Damped Trend
Threads ARIMA(1,1,7) Committed memory in
use% ARIMA (2, 1, 16)
Cache bytes ARIMA (0, 1, 9) Cache bytes peak ARIMA (1, 1, 1) Cache faults /sec ARIMA (0, 1, 16) Page faults/ sec ARIMA (1, 1, 3)
Available KB ARIMA (0, 1, 17)
10
Fig.8 State transition diagram of the MsWinXP model with rejuvenation
Mat. Transition rates matrix for the MsWinXP system model with rejuvenation
The software rejuvenation test starts with the execution of the applications according to same crash pattern used during the crash tests, until all applications are fully operational. Then the system is allowed to run awaiting the copy of at least seven flag files. Once this happens and only after the user’s consent for rejuvenation, the rejuvenation processes are been initiated. In the committed memory in use % diagram this action is depicted by the sudden fall in the total consumption. In the next period of time the system undergoes maintenance and thus the resource consumption remains at low levels until it is being rebooted.
The processor usage variable behaves in a substantially different fashion in the rejuvenation tests compared to the crash tests. Both processors of the MsWinXP system are kept all the time busy during the crash tests whereas the distribution of the necessary rejuvenation actions to a number of batch files keeps the average processor usage at extremely low levels of use.
In the time interval after the rejuvenation procedures has been launched and before the system reboot all variables return to consumptions ranging from [0, 10%) of their maximum consumption during the rejuvenation tests, meaning that it is safe to omit the system reboot and continue using the system without any major problem.
The realization of software rejuvenation in our system resulted in eliminated all events of decreased availability and reducing significantly the number of the error messages. In particular in the 23 total rejuvenation
test only three errors related to the same application occurred. Unlike the crash tests, some applications prone to failure performed flawlessly during the rejuvenation tests.
7 CONCLUSIONS It has been experienced that along with the complexity of the software systems the complexity of the models employed to illustrate their behavior increases, challenging software engineers to decipher software aging and implement equally complicated software rejuvenation techniques. However we should be warned that if the complexity of the software rejuvenation procedures increases there is an important chance that faults in the design of the software rejuvenation algorithm might contribute to the phenomenon of software aging. Moreover contemporary software products for commercial use are susceptible to conceal the lower layers of the system’s architecture from the user, limiting access to information from those levels. This affects the awareness of the regular user and complicates the software designer who is obliged to find his way through a labyrinth of complicated software modules in order to gain access to the lower level.
Our contribution is twofold; first we developed a methodology to evaluate the effects of software aging on two separate operating systems and secondly we implemented a software rejuvenation technique on a contemporary operating system. Our observations on the progress of software aging revealed the behavior of the
11
monitored software systems and highlighted the importance of a strict and extensive monitoring in order to define the development of the system’s monitored parameters in close proximity to the point of a crash. Furthermore the analysis of the system has been a valuable tool employed to determine the selection of the appropriate policy which entailed the incorporation of an effective software rejuvenation technique.
REFERENCES [1] A. Avritzer and E.J. Weyuker, “Monitoring smoothly
degrading systems for increased dependability,” Empirical Software Eng., 2, 1997, pp.59‐77.
[2] A. Bobbio, A. Sereno, and C. Anglano, “Fine Grained Software Degradation Models for Optimal Rejuvenation Policies,” Performance Evaluation, 46, 2001, pp. 45‐62.
[3] K. Cassidy, K. Gross, and A. Malekpour, “Advanced Pattern Recognition for Detection of Complex Software Aging in Online Transaction Processing Servers,” Proc. Conf. Dependable Systems and Networks (DSN 2002), 2002.
[4] T. Dohi, K. Goševa‐Popstojanova and K.S.Trivedi, “Estimating software rejuvenation schedule in high assurance systems,” The Computer J., 44, 2001, pp.473‐485.
[5] T. Dohi, K. Goševa ‐Popstojanova, and K.S. Trivedi, “Statistical Non‐Parametric Algorithms to Estimate the Optimal Software Rejuvenation Schedule,” Proc. 2000 Pacific Rim Int’l Symp. Dependable Computing (PRDC 2000), 2000.
[6] S. Garg, M. Telek, A. Puliafito and K.S. Trivedi, “Analysis of software rejuvenation using Markov regenerative stochastic Petri net,” Proc. 6th Intl. Symp. on Software Reliab. Eng., 1995, pp. 24‐27.
[7] S. Garg, A. van Moorsel, K. Vaidyanathan, K. Trivedi, “A Methodology for Detection and Estimation of Software Aging,” Proc. Ninth Int’l Symp. Software Reliability Eng., 1998, pp. 282‐292.
[8] Y. Huang, C. Kintala, N. Kolettis, and N.D. Fulton, “Software Rejuvenation: Analysis, Module and Applications,” In Proceedings of the 25th Symposium on Fault Tolerant Computing (FTCS‐25), 1995, pp.381–390.
[9] Y. Huang, C. Kintala, N. Kolettis, and N. D. Fulton, “Software rejuvenation: Analysis, module and applications,” In Proc.of 25th IEEE Intl. Symposium on Fault‐Tolerant Computing, 1995, pp. 381‐390.
[10] V. P. Koutras, A. N. Platis, “Applying software rejuvenation in a two node cluster system for high availability”, International Conference on Dependability of Computer Systems (DEPCOS‐RELCOMEXʹ06), (ed.)© 2006, IEEE Computer Society Press, ISBN 0 415 38340 4, 2006, pp. 175‐182.
[11] V.P. Koutras, A.N. Platis, G.A. Gravvanis, “Software rejuvenation for resource optimization based on explicit approximate inverse preconditioning”, Journal of Applied Mathematics and Computation, Vol. 189, (1), John L. Casti, Melvin Scott (eds.)© 2007, Elsevier, 2007, pp. 163‐177.
[12] L. Li, K. Vaidyanathan, and K.S. Trivedi, “An Approach to Estimation of Software Aging in a Web Server,” Proc. Int’l Symp. Empirical Software Eng. (ISESE 2002), 2002.
[13] D.L. Parnas, “Software Aging,” Proceedings of the Int’l Conference on Software Engineering, Sorrento, Italy, 1994, pp. 279‐287.
[14] H. Suzuki H., T. Dohi, K. Goševa‐Popstojanova and K.S. Trivedi, “Analysis of Multi Step Failure Models with Periodic Software Rejuvenation,” In Advances in Stochastic Modelling (Eds. J.R. Artalejo and A. Krishnamoorthy), Notable Publications, Neshanic Station, 2002, pp. 85‐108.
[15] K. Vaidyanathan and K.S. Trivedi, “A Measurement‐Based Model for Estimation of Resource Exhaustion in Operational Software Systems,” Proc. 10th IEEE Int’l Symp. Software Reliability Eng., 1999, pp. 84‐93.
Copyright © 2022 FDOKUMEN