Rejuvenation of the disposable soma: Repeated injury extends lifespan in an asexual annelid
43
COLLEGE OF NATURAL AND COMPUTATIONAL SCIENCE DEPARTMENT OF STATISTICS RESEARCH PROJECT ON THE AGRICULTURAL (CROP) PRODUCTION IN THE CASE OF INDIGINEOUS SEEDS. PREPARED BY: - ASINAKU DATA ID: - 021/11 SUB MITTED TO: - STATISTICS DEPARTMENT ADVISOR: - AMBACHEW MISSANEW(M.Sc) MAY: - 29/09/2006E.C
Transcript of Rejuvenation of the disposable soma: Repeated injury extends lifespan in an asexual annelid

COLLEGE OF NATURAL AND COMPUTATIONAL SCIENCE
DEPARTMENT OF STATISTICS
RESEARCH PROJECT ON THE AGRICULTURAL (CROP) PRODUCTION IN THE CASE OF INDIGINEOUS SEEDS.
PREPARED BY: - ASINAKU DATA
ID: - 021/11
SUB MITTED TO: - STATISTICS DEPARTMENT
ADVISOR: - AMBACHEW MISSANEW(M.Sc)
MAY: - 29/09/2006E.C

DILLA ETHIOPIA.

Acknowledgment
First & most of all, I would like to say thanks for my almighty God who gave me the courage & patience for the completion of thispaper. Then my special appreciation and thanks warmly goes my advisor AMBACHEW MISSANEW (MSc) for his useful advice and continuous assistance to carry out this study. My special thanks also extended to my family who help me financially and morally throughout my education carries. Finally, I am also very interested to offer my heartily gratitude to Akalu Bafa, statistician in Offa woreda finance and economic office, for his generous hospitality during the time of data collection and my friends for their moral & material support.

Abstract
This study focus on Offa woreda Agriculture: crop types, production factor& amount of production. In order to identify theproblem, the secondary data obtained from Offa woreda agricultural office and analysis of collected data is performed by the soft ware Microsoft word 2007 and statistical soft ware called MINITAB. In addition, the study used descriptive statistics to show the amount & inferential statistics to analyzethe data in order to identify main type of crop & that of main factor of crop production. The finding of this paper shows that the main condition of water access for the production of crop in the woreda is summer season production. This condition of water access gives a high amount of production in almost all kebeles ofthe woreda.

Acronyms:
SNNRP: Southern Nation Nationalities and Peoples’ Republic
ANOVA: Analysis of variances


CHAPTER ONE
INTRODUCTION
BACK GROUND OF THE STUDY
Agriculture is one of the most important occupations and is carried throughout country. More than 85% the population in the country is leading their life in agriculture and this is one of the most bases of the development for the urban and rural area of the world. (Tadale, 2002).
In a recent year, agriculture contributes about 50% of GDP and 90% of total foreign exchange earnings. As result developing agricultural sector is very crucial to the country’s economic benefit (Tefera, 2006).
Farmers in developing country are depending on farm income and they are characterized by low income and deficiency in supply of food. This is because the technological backwardness, rapid population growth, decline in productivity of crops. Ethiopia is one of among the nations in developing of the world and characterized by low income. The country is predominantly based on agricultural activities and withgood climatic condition, fertile soil for crop production. Although the country has favorable climate and rich in natural resource food security problem is

not eliminated. The individual or house hold income is low. The income generated from farming, particularly from crop production is not satisfactory. At the sometime on the other hand the country is characterizedby fast growing populations, which influence the per capital income of the country. According to the Ethiopian central statistics agency, 1994 the population of Ethiopia was estimated 53.5 million. Out of the close to 46 million was lived in rural parts of the country. While, remain 7.5 million of the population was lived in urban parts of the country. (Oxfam, 2002).
1.2 Statement of the problem.
Ethiopia has been experienced in traditional seed (indigenous seed) for the production of crop. Even though indigenous seed have high coverage in crop production of the country.
Is there crop production variation in different season?
Which crop type is suitable/gives high amount of yieldsat various environments?
Is there variation in amount of yield production among various kebeles?

What are factors that affect the crop production?
Objective of the study
General objective
The general objective of the study is asses the overallstructure and performance of crop production in Offa woreda.
Specific objective
To compare crop production among certain places.
To identify the crop type that give high yields with across cretin places.
To determine effect of environment on crop production.
Hypothesis to be tasted
The total mean amount of crop production in summer season & using winter season is insignificance.
The mean amount of crop production under the given fertilizer condition and crop type are equal.
Significance of the study
The main importance of this study is to identify the factor that affect the crop production and used to givesome information which used to increase productivity inthis area. It also provides information about the extension programs development for agricultural policy makers in the area. In addition to this, it gives hint and invites the researcher to develop a good work area.

Therefore more comprehensive by providing information about the study.
Scope of the study
Crop production (agricultural production) is the main economic activity in Ethiopia. This study mainly focuses on crop production and factors that contributesfor it and influences this production in Offa woreda. More ever, focuses on the type of crops which gives high production (yield) in the area.
Limitation of the study
Limitation of data availability & un willingness of theworkers in the office
Shortage of references in indigenous agricultural product
Lack of experience
Lack of resource materials
Shortage of time
Access of packages

CHAPTER TWO
LITERATURE REVIEW
Crop production is the production of temporary and permanent crops, which involves under the main categoryof cereal crops, crop seeds, pulses crops, vegetable and oil seeds. Temporary crop production is the production of seasonal crops, where as permanent crop production which have long life. (Ethiopian economics grade 12-text book, 2002).
Crops can be classified in to different categories based on their type and use.
According to this, we can find these different with respect to their element in Oxfam priest, 1995 and explained as follows.
Cereals: - cereals involve rice, maize, wheat, sorghum,milt, burley, oat, rye and teff, which is endemic to Ethiopia.

Pluses: - this class involves real bean, lentils, soybeans, groundnuts, winged bean, and temporary bean for hot and dry area.
Roots and Tubers: - it includes crops such as cassava, yam, taro, potato and sweet potato.
Vegetables:-This class includes cabbage, tomato, onion and green papers.
The persist details of crop production and techniques are varies accordance with particular characteristics of the environment and needs of the farmers. According to Oxfam priest, 2002 demonstration, the general principle of the cultivation out lined below.
Maintaining Fertility
There are number of ways in which soil fertility can bemaintained.
Minimum tilling: - pulping is used to kill weeds, aerates and to improve drainage of soil, provide good tilling and bring insects larva and pests to the surface where the expose to eat by rodents (economics grade 12-text book, 2002).

Cropping system: - mono cropping or continuous croppingof one the same land encourages on large scale farms using mechanization requires irrigation, chemical fertilizers, pesticides and herbicides and has adverse environmental effect. It increases soil erosion. Reducethe ability of soil to retain moisture and nutrients and encourages the building up of weeds, pests and disease.
Small-scale farmers’ use few external inputs are like to use varied cropping system which includes crop rotation, intercropping, and fallowing on their land. (Ethiopian economics for grade 12-text book, 2002).
Crop rotation: - different crop with different nutrients and seasonal requirements are plant on each plot of land in each year.
Crop rotation can interrupt the biological cycle of pests and the continuous development of the population.For this reason, species having as a few common pests as possible are chose to follow one another in the rotation. This measure is very important for the control of soil born diseases and pests such as nematodes.
Inter cropping: - different crops usually only two are plant on the same land at the same land. My be do in alternative raw, by mixed seeding depending on the types of crops. This maximizes the land use by growing quick mature crops in between those who take a long

time to mature, spreading both food income over the year, increasing pest predators, suppresses weeds with appropriate crops as protection for other more valuableinter cropping crops.
Fallowing: - plot of land which left uncultivated for one or more years allow soil fertility to re establish itself and to starve out pests and disease.
This is the principle of shifting cultivation system. In selecting agricultural system live stocks are pasture on fallow land and their drug adds to the nutrients available.
Seed selection
In traditional cultivation system, farmers have known anumber of local verities suitable for each sit. This improve the production according these own priorities through selection and propagation techniques.
Pest control
Crops are subjected to wide verity of pests particularly birds and rodents which damage and attack various parts of crops and fungal disease.
There are organic biological methods of pest control. Some of these are:-
Crop diversity, crop rotation and inter cropping helps to prevents to building up of the disease and pests in the soil.

Traditional seeds verities, organic pesticides and pestpredators are important method to control pests.
Pest predators can be encouraged by providing them withhabitats and organic pesticides can be use by farmers to prevent insects.
Modern Farm Inputs
The present day attempts increasing agricultural productivity rest strongly on introduction of modern inputs other than traditional agricultural practices ofthe country. It was demonstrated by Ethiopian economic association 200/2001, that the two most commonly used inputs to increase crop production in Ethiopia were fertilizers and improved seeds.
Fertilizer: - the two most important types of fertilizers where almost exclusively used in the country. The first and until recently use the one predominant in the country is DAP, which contains 18% nitrogen. The second one is UREA, which contains 46% nitrogen. These are the two most important kinds of fertilizer used in crop production to increase crop yield.
Improved seeds: - is other types of farms input and improve production. According to the Ethiopian economicassociation 2000/2001, the study report indicates therewas insignificant improvement in seed production in theyear. The amount of product consumed was much greater than the amount of product in the year. Because the

seed used where non hybrid type that retains the genetic potential in the second and in subsequent generation and thus unable to give high yield hectare.
Types of crop production in Ethiopia.
There are three types of crops. These are as follows:-
Cereals: - cereal production is one of the most dominant crop categories in Ethiopia. These involve theproduction of maize, tef, wheat, barley and sorghum. They are produce for domestic consumption and sometimesforeign export.
Pluses: - involves pea, been, and lentil. According to the explanation of Ethiopia economic association. Pulses are the second most important food crop of the country coverage about 11.3% of the cultivated area compare with the other categories. The average growth rate of pulses production was 0.16 during the year 2000/2001.
Oil seeds: - it is the third most important category offood crops, which involve verities of oil crops. This category contains nug, linseed, fenugreek, rapeseed, sunflower, groundnuts and seasoms. The most important oil seeds are nug and linseeds in terms of amount of output. Oilseeds grow during the “winter“season accountfor 99% of the total annual oilseed output. The remaining 1%growth during the “summer” season. The average yield of oilseeds was 3.7 quintal per hectare

with an average growth rate of production is 0.12% during the period.
Factors That Affect Crop Production.
Crop types
Effect of environment (kebele’s) on crop production.
Water access (summer & winter).
CHAPTER THEREE
3. Methodology
3.1 Study Area and Population
Offa woreda is located in wolaita zone. The climatic condition of this woreda is mostly dega and there is seasonal rain. According to Ethiopian central agency ofstatistics census the woreda has total population of 103,870. From which almost 9844 are dwellers of rural areas (Ethiopia central statistics agency, 2002).
This woreda consists 25 rural kebele. Keeping in mind this woreda and other general concepts about the shortage of food prevailed low income in rural economy of Offa woreda, the study tries to asses with particular emphasis on agricultural production.
Method of data collection

Based on the type and origin of data, statistical data sources may be classified as primary sources of data and secondary source of data. A primary source of data refers to data collected by the investigators for the first time. It can be collected by different techniquesof data collection methods. And secondary data refers to data, which are not collected for the first time. This data obtained from sources such as magazine, documents, recourses, etc. in this research the researcher used secondary sources of data.
Study variables
Dependent variable
Crop yields (production).
Independent variable
Crop types
Water access (summer seasons & winter seasons)

Environment (kebele’s) on crop production
3.4 method of data analysis
There are different types of statistical data analysis method. For this reason, the researcher used in this research methods like: - Descriptive statistics, analysis of variance (ANOVA). Like completely randomized design & completely randomized block design.
Descriptive statistics
It is one of the statistical analysis which deals with deals with describing characteristics of a set of data by the method of organizing, presenting (by using table, graph, chart) and analyzing by using statisticaltendency (average, proportion, percentage, ratio) and measure of variation.
3.4.1 Completely randomized design (CRD)
It is the simplest design which uses only two essentialprinciple of field experimentation via, replication andrandomization. In this design whole of the experimentalmaterial, supposed to be homogenous, is divided in two number of experimental units depending on the number oftreatments and number of replication of each treatments. The treatments are then allocated randomly to the units in the entire material.

3.4.2 Analysis of completely randomized design.
For the analysis of this design we use the additive model:
Уіј=µ +αі +єіј where
Уіј =is the value of production of the kebeles in the jth replicate of the ith treatment (water access).
µ = is the general mean effect.
αi = is the effect due to the ith treatment.
Єij = is the random error.
Then, Yi=∑yij and Y..=∑∑ yij
Where yi=is total of the ith treatment (water access)
Y=is grand total
Total number of observation, N=∑n
Total SS=∑∑ yij2 -c.f, where c.f (correlation coefficient)
=y..2
n
Treatment SS=∑yi.ni
-c.f., Error SS=Total SS-Treatment SS
We are interested in testing the hypothesis,
HO: µ1=µ2=…. =µ9 against, the alternative hypothesis, it set the following analysis of variance
source D.F SS MS F

Treatment n-1 Ʃyi./ni-c.f
S2t S2t/S2e
Error N-n Deference S2eTotal N-1 ƩƩy2ij-c.fWhere: - s2t =is the mean square of treatment.
S2e = is the mean square of error.
Decision Rule
If calculated mean square for treatment and errors respectively division or the calculated value of F- is greater than the table value of Fα (n-1), (N-n) or p-value is less than α, denoted the level of significance, the hypothesis HO, and is rejected.
Fisher’s least significance difference.
If the null hypothesis is rejected, there is at least one inequality among the mean of the treatment group (among the treatment effect). To decide which pairs of treatment are different we use fisher’s least significance difference. This multiple comparisons is applies for further comparison of mean number of production of crop for different type of water access.
Hypothesis: - HO: yi = yj (the mean crop production of ith & jth type of water access is equal)
H1: not HO

Test statistics: - t = (y1-y2)/ SP (2/n) 1/2
Decision: - Reject Ho if p-value less than α- level or the calculated t-value less than tabulated or the difference between the two not include zero.
3.4.3 Completely Randomized Blok Design (CRBD).
This design is one of the design in which the treatmentare randomly allocated separately to each of this blockin order to minimizes the random error which could be occurred due to this blocks.
Analysis of completely randomized block design.
The analysis of completely randomized block design is the one similar to analysis of two way classified data.For this design we use the linear additive model:
Mode: yij = µ+αi + βj + єіј, where
Yij = is the value of the production in the ith treatment in the jth block.
µ = is the general mean effect.
αi = the effect due to ith treatment.
Βj = the effect due to the jth block.
Єij =random error.
Source D.F SS MS FTreatment n-1 Ʃyi./ni- S2t S2t/s2e

c.fError N-n Deference S2eBlock n-1 Ʃyj./ni-
c.fS2b S2b/s2e
Total N-1 ƩƩy2ij-c.fWhere s2e = is the mean square for error and
S2t = is the mean square of treatment.
Decision
If the calculated value of F is greater than table value Fα (nj-1) (N-n) or p-value is less than the smallest level significance (α) where α denotes the level of significance, the hypothesis Ho is rejected and it can be inferred that the treatment effect are significantly different from one other and for the block Ho is rejected and it can be inferred that the effect significantly remove the variability due to block.

CHAPTER FOUR
Result & discussion.
Descriptive Statistics: production by crop types.
Variable croptype N Mean SE Mean TrMean StDev Minimum Q1 Median
Product 1 42 1922 229 1880 1487 179 943 1084
2 42 689.6 66.3 686.1 429.6 115.0 225.5 760.0
3 42 681.8 76.6 669.2 496.3 100.0 197.3 632.5
4 42 1091.7 34.9 1084.3 225.9 760.0 878.0 1125.0
5 42 508.0 68.8 466.4 446.1 110.0 175.8 353.0
6 42 1009.0 53.5 1011.1 346.5 260.0 899.5 1078.0
Variable crop type Q3 Maximum

product 1 3393 4470
2 1121.3 1375.0
3 1130.3 1495.0
4 1262.5 1570.0
5 600.3 1695.0
6 1181.3 1750.0
Interpretation:
The above descriptive statistics show the mean, media, standard deviation, minimum and maximum values for the crop types. The calculated mean value of cereals, pulses, oil seeds, fruits, vegetableand roots is 1922, 689.6, 681.8, 1091.7, 508.0 & 1009.0 respectively. The trend mean for all type of crop is approximately the same as theirmean shows absences of extreme value. From the value of their standarddeviation, the amount of crop production of cereals shows more variation in the kebels of the woreda, but fruits show less variation.From six types of crop, the maximum amount of production is gathered from cereal and its amount is 4470, this value shows that cereal is the main product of the woreda.

Descriptive Statistics: production by seasons.
Variable season N Mean SE Mean TrMean StDev Minimum Q1 Median
product 1 126 1247.7 93.0 1140.6 1044.0 195.0 598.0 1125.0
2 126 719.6 39.1 706.0 439.1 100.0 225.5 877.0
Variable season Q3 Maximum
product 1 1271.3 4470.0
2 996.5 1750.0
Interpretation:
The above descriptive statistics show the mean, median, standard deviation, minimum and maximum values for the two seasons. The calculated mean value of production in summer and winter is 1247.7 and719.6 respectively. The trend mean for the seasons is approximately the same as their mean shows absences of extreme value. From the valueof their SD, the amount of crop production by summer shows more v variation in the kebeles of the woreda, the winter season shows less variation. From the two water access the maximum amount of production is gathered by summer season and its amount is 4470, this value shows higher amount of production in the woreda is gathered by summer season.

The indicated bar diagram shows that the crop production in the kebeles of the woreda. And it shows that, the higher production of crop is gathered from kebele 5and that of the lower crop production isgathered from kebele 2.

Interpretation:
The above indicated pie-chart shows the amount of crop production using two water accesses. And it shows that, in the Offa wreda, high amount of production of crop is gathered from summer season and less amount of crop production is gathered from winter season.
One-way ANOVA: product versus season
Source DF SS MS F P
season 1 17573954 17573954 27.40 0.000
Error 250 160354990 641420
Total 251 177928944

Individual 95% CIs for Mean Based on
Pooled StDev
Level N Mean StDev -------+---------+---------+---------+--
1 126 1247.7 1044.0 (-----*-----)
2 126 719.6 439.1 (-----*----)
-------+---------+---------+---------+--
15 750 1000 1250
Pooled St Dev = 800.9
Interpretation:
Ho: μ summer = μ winter
H1: μ summer ≠ μ winter
The above MINITAB output shows the P-value of the analysis of variance of water access is less
than our smallest level of significance (α-value), this implies we reject our null hypothesis
and accept our alternative one. Then we can conclude that different in the kind of water access
has significant effect on the amount of production. The individual 95% confidence interval for
means based on the pooled standard deviation is also shows non-over lapped CI, which supports
the above decision in the positive manner. To decide which pairs of water access kinds is
different we use further analysis using fisher’s pair wise comparisons and so the MINITAB output
for this test is given as follows:

Grouping Information Using Fisher Method
season N Mean Grouping
1 126 1247.7 A
2 126 719.6 B
Means that do not share a letter are significantly different.
Fisher 95% Individual Confidence Intervals
All Pair wise Comparisons among Levels of season
Simultaneous confidence level = 95.11%
season = 1 subtracted from:
season Lower Center Upper ---------+---------+---------+---------+
2 -726.9 -528.2 -329.4 (-------*-------)
---------+---------+---------+---------+
-500 -250 0 250
The above fisher’s pair wise comparison contains the confidence interval of the difference for the treatment group. This allows assessing the practical significant differences among mean of crop production committed on the two water access combination are do not include zero, this implies that there is perfect significance difference between two water access conditions.
One-way ANOVA: product versus crop type

Source DF SS MS F P
crop type 5 54453441 10890688 21.70 0.000
Error 246 123475503 501933
Total 251 177928944
Individual 95% CIs for Mean Based on
Pooled StDev
Level N Mean StDev ----+---------+---------+---------+-----
1 42 1921.9 1486.8 (---*----)
2 42 689.6 429.6 (----*---)
3 42 681.8 496.3 (----*---)
4 42 1091.7 225.9 (---*---)
5 42 508.0 446.1 (---*---)
6 42 1009.0 346.5 (---*---)
----+---------+---------+---------+-----
500 1000 1500 2000
Pooled StDev = 708.5
Grouping Information Using Fisher Method
croptype N Mean Grouping
1 42 1921.9 A
4 42 1091.7 B

6 42 1009.0 B
2 42 689.6 C
3 42 681.8 C
5 42 508.0 C
Means that do not share a letter are significantly different.
Fisher 95% Individual Confidence Intervals
All Pair wise Comparisons among Levels of crop type
Simultaneous confidence level = 64.01%
crop type = 1 subtracted from:
crop type Lower Center Upper -----+---------+---------+---------+----
2 -1536.9 -1232.4 -927.8 (---*----)
3 -1544.7 -1240.1 -935.6 (---*----)
4 -1134.7 -830.2 -525.7 (---*---)
5 -1718.4 -1413.9 -1109.4 (----*---)
6 -1217.5 -913.0 -608.4 (---*---)
-----+---------+---------+---------+----
-1400 -700 0 700
crop type = 2 subtracted from:

Croptype Lower Center Upper -----+---------+---------+---------+----
3 -312.3 -7.8 296.7 (---*---)
4 97.6 402.1 706.7 (----*---)
5 -486.1 -181.5 123.0 (---*----)
6 14.9 319.4 623.9 (----*---)
-----+---------+---------+---------+----
-1400 -700 0 700
croptype = 3 subtracted from:
croptype Lower Center Upper -----+---------+---------+---------+----
4 105.4 409.9 714.4 (---*---)
5 -478.3 -173.8 130.7 (----*---)
6 22.7 327.2 631.7 (----*---)
-----+---------+---------+---------+----
-1400 -700 0 700
croptype = 4 subtracted from:
croptype Lower Center Upper -----+---------+---------+---------+----
5 -888.2 -583.7 -279.2 (----*---)
6 -387.2 -82.7 221.8 (----*---)
-----+---------+---------+---------+----
-1400 -700 0 700

crop type = 5 subtracted from:
crop type Lower Center Upper -----+---------+---------+---------+----
6 196.4 501.0 805.5 (---*----)
-----+---------+---------+---------+----
-1400 -700 0 700
Interpretation:
HO: μ cereal=μ pulses =.....=μ roots.
H1: at least one inequality.
The above MINITAB out-put shows the P-value of the analysis of variance of crop type is less than our smallest level of significance (α-value), this implies we reject our null hypothesis and accept our alternative one. Then we can concluded that different in the kind of crop type has a significant effect on the crop production. The individual 95% confidence interval for the means based on the pooled SD is also shows non-over lapped CI, which supports the above decision in the positive manner. The above fisher’s pair wise comparison contains the CI of the difference for each pair of treatment group. This allows assessing the practical significant difference among mean of production committed on different crop type. The difference between the mean numbers of production committed on different crop type combination are do not include zero, this implies that there is perfect significance difference between of all crop type.
Two-way ANOVA: product versus crop type, season

Source DF SS MS F P
croptype 5 54453441 10890688 35.08 0.000
season 1 17573954 17573954 56.62 0.000
Interaction 5 31402831 6280566 20.23 0.000
Error 240 74498718 310411
Total 251 177928944
Interpretation:
HO: μ1 =μ2 =.....=μ6
H1: Not HO
And for blocks:
HO: β1=β2=0(block effect is insignificant).
H1:βj≠0, for j=1&2(block effect is significant).
The above MINITAB out-put shows the P-value of the analysis of variance of crop type is less than our smallest level of significance (α-value), this implies we reject our null hypothesis and accept our alternative one. Then we can concluded that different in the kind of crop type has a significant effect on the amount of crop production. And the p- value of season is less than our smallest level of significance (α-value); this implies we reject our null hypothesis. Then we conclude that, theblock effect is significant.
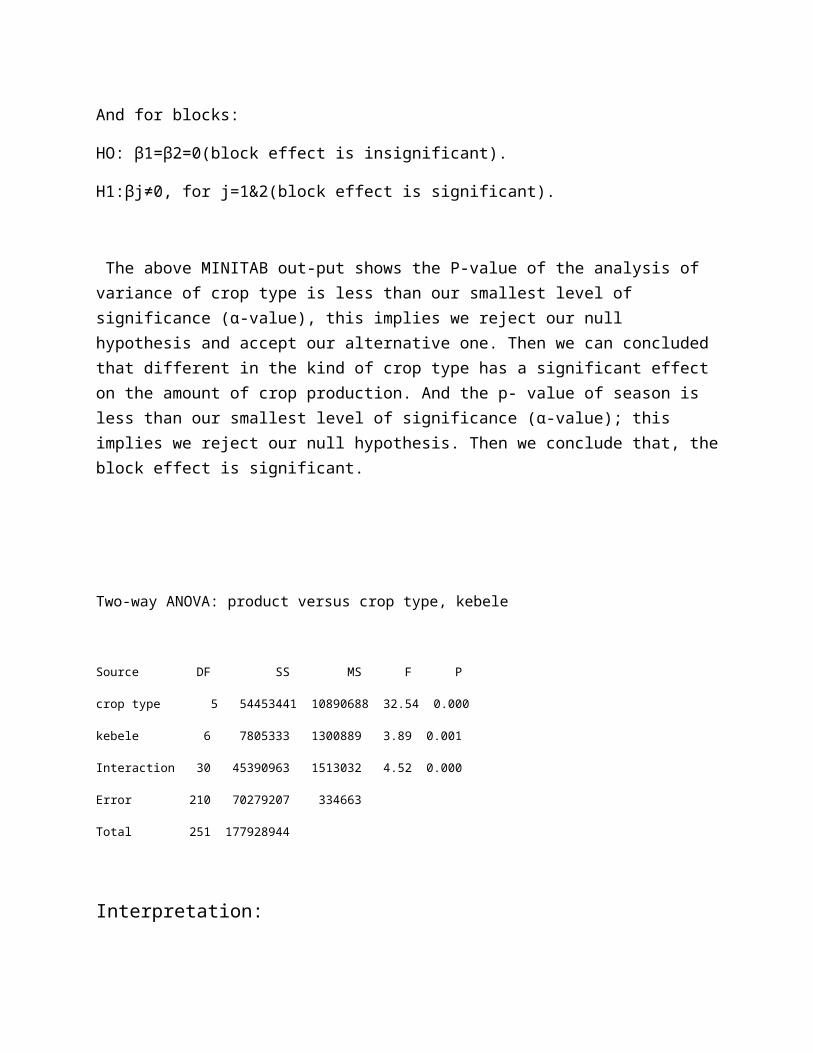
Two-way ANOVA: product versus crop type, kebele
Source DF SS MS F P
crop type 5 54453441 10890688 32.54 0.000
kebele 6 7805333 1300889 3.89 0.001
Interaction 30 45390963 1513032 4.52 0.000
Error 210 70279207 334663
Total 251 177928944
Interpretation:

HO: μ1 =μ2 =.....=μ6
H1: Not HO
And for blocks:
HO: β1=β2=.......=β7=0 (block effect is insignificant).
H1:βj≠0, for j=1, 2......7 (block effect is significant).
The above MINITAB out-put shows the P-value of the analysis of variance of crop type is less than our smallest level of significance (α-value), this implies we reject our null hypothesis and accept our alternative one. Then we can concluded that different in the kind of crop type has a significant effect on the amount of crop production. And the p- value of kebele is less than our smallest level of significance (α-value); this implies we reject our null hypothesis. Then we conclude that, theblock effect is significant effect on the amount of crop production
Two-way ANOVA: product versus season, kebele
Source DF SS MS F P
season 1 17573954 17573954 27.94 0.000
kebele 6 7805333 1300889 2.07 0.058
Interaction 6 2863053 477176 0.76 0.603
Error 238 149686604 628935

Total 251 177928944
Interpretation:
HO: μ1 =μ2 =.....=μ6
H1: Not HO
And for blocks:
HO: β1=β2=.......=β7=0 (block effect is insignificant)
H1:βj≠0, for j=1, 2......7 (block effect is significant.
The above MINITAB out-put shows the P-value of the analysis of variance of season is less than our smallest level of significance (α-value), this implies we reject our null hypothesis and accept our alternative one. Then we can conclude that different in the kind of season has a significant effect on the amount of crop production. And the p- value of kebele is greater than our smallest level of significance (α-value); this implies we do not reject our null hypothesis. Then we conclude that, the different type of kebeles is insignificant effect on the crop production.

Chapter Five
Conclusion & Recommendation.
5.1 conclusions.
From the above results and discussion there are so manyfactors that affect the amount of crop production. As it is clearly seen from this result, the production of crop in the Offa woreda has significance difference forthe summer season and winter season conditions. Generally the higher crop produced in almost all Keble’s of the woreda is gathered from the summer season compared to that of winter season. Under the condition where the different in kebele’s for the production is out of consideration: the difference in the type of crop used has significant effect on the amount of crop produced.
In addition to this as stated in the above results the crop types has significance effect on the crop production in the Offa woreda.That of the cereal crop type is the most produced crop type in the woreda, and that of the fruit is the less produced crop type in theworeda.

From the above results, both difference in water access(summer season& winter season) and type of crop have their own effect on the amount of crop produced. Also they have an interaction effect on the amount of crop produced.
5.2 Recommendation
The farmers should assess a desirable form what is being demonstrated as for his selection criteria and more over the majority of the house hold who own small land of holding can easily adopt the technology & raisehis productivity & production relatively with better quality.
Farmers should use selected seeds to increase the amount of crop produced in the kebeles. Farming demonstration, participatory evaluation of technology &information in form that can be utilized by the intended clientele farmers are essential tools in achieving the sustained growth in agricultural productivity, especially, to increase the amount of crop production by using selected seeds.
The choice of growing a particular crop type to a particular area and that of the selected seed & that ofthe water access condition is very necessary in order to earn maximum amount of production. The selection of

variety & replication method that maximize amount of production is also very necessary.
In order to maximize the yield the organization of the woreda should use more productive (improved) seeds suchas:
High yield bearing seeds under the given environmental condition.
Early maturing seeds, better resistance to lodging, drought.
Flood &salinity tolerance seeds, greater tolerance to insects & disease.
The organization should also teach the modern way of production.

References
A first course in the Design of Experiment by Donald c. Weber & john H Skilling, 2nd edition.
Free web sites like : early warning.usgs.gov/adds/pubs/EthProductionOutlook.pdf
Basic statistics- B.L.AGRAWAL
Gupta J.P(1982)
Montgomery,(Design and Analysis of Experiment), 5th edition.