
A Comparative Study of Capital Market Failure and ...
233
A Comparative Study of Capital Market Failure and Institutional Innovation Thesis by Robert Joseph Cull In Partial Fulfillment of the Requirements for the Degree of Doctor of Philosophy California Institute of Technology Pasadena , California 1993 (Subn1itted 2 October 1992)
-
Upload
khangminh22 -
Category
Documents
-
view
0 -
download
0
Transcript of A Comparative Study of Capital Market Failure and ...
A Comparative Study of Capital Market Failure and
Institutional Innovation
Thesis by Robert Joseph Cull
In Partial Fulfillment of the Requirements for the Degree of
Doctor of Philosophy
California Institute of Technology Pasadena, California
1993 (Subn1itted 2 October 1992)

11
Acknowledgements
This study could not have been completed without the generous finan cial
support of the Division of Humanities and Social Sciences. In addition to a
series of research and teaching assistantships, the Division provided fellow
ship money through the Anna and James McDonnell Memorial Scholarship
Fund. I also gratefully acknowledge financial support from the Alfred P .
Sloan Foundation during my final year at Caltech. The Sloan Fellowship
allowed me to concentrate solely on the research and writing needed to com
plete this dissertation.
On a more personal level , I owe a large debt of gratitude to my principal
advisor, Lance Davis . In short , he has taught me most of what I know about
being a competent researcher. His creativity, tenacity, and attention to detail
have been instrumental in my scholarly development. In addition , I must
thank .Lance for taking me to Amersterdam - I only hope I did not di sgrace
him too terribly. During the course of the past two years we have worked
together extensively, a.nd his patience with me has been extraordinary. For
my part, I have enjoyed our interaction immensely. It will be strange not to
see him every day.

111
Similarly, I owe much to both Eric Hughson and Phil Hoffman. As both
friend and advisor, Eric has provided consistent encouragement. In addition ,
his contribution to my intellectual development has been substantial. With
regard to Phil , he was never too busy to offer advice or instruct me in some
of the more subtle areas of medieval French agriculture. Despite our differ
ences - he's a. Cubs fa.n, I'm a White Sox fa.n - I very much enjoyed our
collaboration.
Although my collaborative efforts with Peter Bossa.erts have only recently
truly gotten under wa.y, his advice ha.s been greatly appreciated a.t various
points during the past two years. His patience in allowing me the time to
complete other projects is also gratefully acknowledged. Other members of
the Social Science faculty - most notably David Grether, Morgan Kousser ,
and John Ledyard - have offered valuable advice, particularly at the most
difficult junctures in my tenure at Caltech.
I would be remiss not to mention the secretarial help that has gone into
this research. In particular , Anne Fenska., Marta Goodman , Eloisa. lmel,
and Rosy Meiron have all contributed to the completion of the manuscripts
that comprise this study. Also, I thank Laurel Auchampa.ugh, the Division 's
Graduate secretary, for all her help. Like many students in the Division, I
would often have been lost were it not for her.
Graduate school isn't easy - at least it wasn ' t for me. As a student, the
need to commiserate with someone is often overwhelming. My classmates
Peng Lian, Charles Noussa.ir, Jeff Prisbrey, and Langche Zeng - were all great
outlets. I take a certain pride in the fact that all five of us made it through
the program; I think it speaks well for our sense of teamwork. Students

IV
from other classes - Shawn Kantor, Skip Lupia, Mark Olson, Jean-Laurent
Rosenthal, Mike Udell, and Kristen Szakaly, to name but a handful - were
also very helpful.
In a similar vein, my housemates - Bryan, Dave, Don, Jeremy, Laszlo,
and Stuart - provided the sort of levity that made my years here fun. Finally,
and, no doubt, most importantly, I must thank my parents. In their own
way, each provided humor and perspective, especially when things seemed
bleak.
v
Abstract
Comprised of two separate projects, this study examines imperfections in
early capital markets. The first concerns the insurance benefits associated
with the scattered landholdings of medieval peasant farmers while the second
traces the evolution of securities markets in the United States. In particular ,
the second focuses on both the development of the New York Stock Exchange
and the role of the London Stock Exchange in channeling capital to U.S.
firms.
Previous research suggests that scattered holdings may have reduced vari
ation in annual agricultural yields. The argument hinges on the notion that
yields were not too highly correlated on separate plots of land within the
same village. To this point, however , researchers have lacked the sort of data
necessary to adequately test this hypothesis.
Tithe records from two villages in northern France- Onnaing and Qua rou
ble - provide the basis for constructing a time series of financial returns on
individual plots of land. Using these returns, a portfolio analysis is und<>r
taken to measure the reduction in yield variances associated with scattering.
The results suggest that it was crop diversification. not scattering, t hnt pro-
VI
vided insurance benefits to peasant farmers.
In the second project, data from the London Stock Exchange indicate
that, in the nineteenth and early twentieth centuries, British capital funded
many ventures in the emerging American West. Many of these ventures,
moreover, were not able to attract finance through the aegis of the premier
domestic capital market- the New York Stock Exchange.
Financial data from a number of stock exchanges- most notably the New
York, the London, and the Boston - and institutional descriptions drawn
from various published sources, suggest that, in an effort to relieve uncer
tainty and establish wider markets for their securities, the Governors of the
New York exchange developed a set of trading rules and vetting procedures
which excluded securities from small new companies. Not surprisingly, these
firms were often located in the West.
Contents
1 Introduction
1.1 An Outline
1.2 References .
Vll
2 New Evidence for an Old Controversy: Scattered Landhold-
ings and Open Fields
2.1 Introduction .
2.2 The Problem
2.3 The Evidence from Onnaing and Quarouble
2.4 A Portfolio Analysis
2.5 Conclusions
2.6 Figures .
2.7 Tables .
2.8 References
3 One Market, Two Markets, Three Markets, Four? The Net
work of Finance: Capital Market Integration - the U.S. and the
1
8
15
18
18
19
21
32
49
50
52
60
U.K, 1865-1913 65
Vlll
3.1 Introduction . 65
3.2 The Problem: 66
3.3 American Capital Called on the London Stock Exchange. 75
3.4 American Issues Traded on the London vs. New York Exchange101
3.5 Returns on American Shares Listed on the London Exchange . 111
3.6 Conclusions 123
3.7 Figures . 124
3.8 Tables . 137
3.9 References 163
4 London and New York- A Tale of Two Exchanges 166
4.1 Introduction . . . . . . . 166
4.2 Institutional Differences 167
4.3 Institutional Differences: Additional Quantitative Evidence 187
4.4 Conclusions 199
4.5 Tables . . 201
4.6 References 207
5 Conclusions
5.1 References
211
. 222

lX
List of Tables
Table 2.1 Wheat Yield Correlations 1701-1790
Table 2.2 Labor Inputs
Table 2.3 Average Return on each Royage 1701-1790
Table 2.4 Ratio of Profits to Rental Value of Land
Table 2.5 Mean-Variance Efficient Portfolios, Royages
Table 2.6 Returns Correlations Matrix, Royages
Table 2. 7 Returns Correlations Matrix, Taques
Table 2.8 Mean-Variance Efficient Portfolios, Taques
Table 3.1 Foreign Investment UK to USA, Various Estimates
Table 3.2 US Capital called on London Exchange, Breakdown
Table 3.3 Capital Called by US Firms by Industry
Table 3.4 Capital Called by US Transportation Industry
Table 3.5 Capital Called by US Agricultural/Extractive Industry
Table 3.6 Capital Called by US Public Utilities Industry
Table 3. 7 Capital Called by US Financial Industry
Table 3.8 Number of US Stock Issues, LSE, NYSE
52
53
54
55
56
57
58
59
137-40
141
142-3
144-5
146-7
148-9
150-1
152
X
Table 3.9 Percentage Breakdown Rails/Non-Rails LSE, NYSE 153
Table 3.10 Percentage of Issues Jointly Traded LSE, NYSE 154
Table 3.11 Number of Bond Issues LSE, NYSE 155
Table 3.12 Bond Issues Traded LSE, NYSE 1870, 1910 156
Table 3.13 Returns on US Firms, Descriptive Statistics 157
Table 3.14 Mean Return, Standard Deviation by Industry 158
Table 3.15 Volatility Rankings, US Common Stock Issues, 1880-9 159
Table 3.16 Volatility Rankings, US Common Stock Issues , 1900-9 160-1
Table 3.17 Returns Statistics by Year 162
Table 4.1 US Securities Markets, Sales in 1910 201
Table 4.2 Percentage of Issues Disappearing from Returns Sample 202
Table 4.3 US Land Firm Volatility Boston and London Exchanges 203
Table 4.4 Mine Volatility Comparisons Boston and London 204
Table 4.5 American Mines, Common Stock Listings 205
Table 4.6 Services Advertised by Boston Bankers and Brokers 206
Table 5.1 Expected Return Loss Associated with Scattering 213
Xl
List of Figures
Figure 2.1 Mean-Variance Frontier, Portfolios from all Royages 50
Figure 2.2 Mean-Variance Frontiers, Portfolios from Taques 51
Figure 3.1 Total US Capital Calls 124
Figure 3.2 Capital Called US Transportation Industry 125
Figure 3.3 Capital Called by US Government 126
Figure 3.4 Capital Called by US Manufacturing/Commercial Industry 127
Figure 3.5 Capital Called by US Agricultural/Extractive Industry 128
Figure 3.6 Capital Called by US Mining Industry 129
Figure 3.7 Capital Called by US Financial/Land/Develop. Industry 130
Figure 3.8 Capital Called by US Agricultural Industry 131
Figure 3.9 Capital Called by US Chemical/Petroleum Industry 132
Figure 3.10 Capital Called by US Public Utilities 133
Figure 3.11 Capital Called by US Financial Industry 134
Figure 3.12 Returns on US Common Stock Issues, 1880-9 135
Figure 3.13 Returns on US Common Stock Issues, 1900-9 136

1
Chapter 1
Introduction
Markets take time to develop, and capital markets are certainly no exception.
In other markets buyers may simply evaluate tangible assets; in the case of
capital markets , however, they are compelled to evaluate uncertain invest
ment opportunities. Trading hard-earned savings for paper claims on unseen
assets may seem commonplace to the modern reader; but , if that market is
to operate efficiently, a high degree of institutional coni.plexity is necessary.
It is necessary, first , to coordinate suppliers and demanders of capital, and,
second, to inspire the requisite trust between parties to these trades.
Suppliers of capital bring their savings to the market for a variety of rea
sons. At the simplest level , interest on savings provides earnings on balances
that might otherwise remain idle. For some, investment may appear to be
a road to wealth. In other instances, inter-country capital transfers may be
designed to achieve political goals not directly connected to profitability. For
example, capital flows from Great Britain to her colonies provided reason-
2
able rates of return to investors; but they were fostered by politicians whose
desires included the development of a British Empire. 1 Beginning at the
turn of the century, the capital transfers from the United States to Latin
America can perhaps be viewed in a similar light. Certainly there have been
many charges of dollar diplomacy. 2 Modern financial analysis has added
other motives to the list: as a means of diversifying one's portfolio of assets
to minimize risk or to smooth consumption across time periods to name just
two.3
Although clearly a diverse group, those who demand capital face one com
mon problem, for whatever reason, they are unable or unwilling to commit
a sufficient portion of their individual reserves to fund a given project and
must borrow from others. Some may need funds for just a short time - for
1 Based on au analysis of 377 bills before the House of Commons from 1859 to 1910, Davis and Huttenback conclude that., "Broadly speaking, the Conservatives as opposed to the Liberals were the pro-imperia.l party, and from 1868 to 1906 (the years 1886 and 1895 aside) their assumption of this position was a strong one." Of those bills that dealt directly with imperial matters, forty-four percent of the imperial divisions dealt with military matters, eighteen percent with administrative and tax matters, and thirty-eight percent with actual capital transfers in the form of loans and other non-military subsidies. Lance Davis and Robert Huttenback, Mammon and the Pursuit of Empire: The Political Economy of British Imperialism, 1860-1912, (Cambridge: Cambridge University Press, 1986). pp. 268-272.
2That these flows were not large and yet warranted U.S. military intervention underscores the point that capital markets and politics are often inextricably linked. See Lance E. Davis and Robert Cull, "Interna.t.iona.l Capital Movements and American Economic Growth," forthcoming in the Cambridge Economic History of the United States, Stanley Engerman and Robert Gallman, (eds.).
3 See Harry M. Markowitz, Mean- Variance Analysis in Portfolio Choice and Capital Markets, (Oxford: Basil Blackwell, 1987.) on diversification and 'tVilliam A. Brock, "Asset Prices in a Production Economy," in John J. McCall (ed.), The Economics of Information and Uncertainty, (Chicago: Univ. of Chicago Press, 1982) or Robert E. Lucas, Jr., "Asset Prices in an Exchange Economy," Econometrica 46: 1429-45, for examples of consumption based intertemporal pricing applications.
3
example, modern investment companies turn to the money market to finance
their day to day trade positions. Others require capital for longer periods
a firm that floats a. bond issue to expand its operations, for example. De
manders need not operate on such a grand scale either. Consider the student
investing in her own human capital who requires a series of bank loans to
complete her education.
In light of the diverse incentives of both suppliers and demanders of capi
tal, the task of matching the right saver with the right borrower is, of course,
quite complicated. At their inceptions and in their early developments these
markets were confronted by this fundamental problem, the problem addressed
in this thesis; that is, how to match savers and borrowers - the suppliers and
the demanders of capital - given an environment characterized by severe in
formational asymmetry. In the absence of institutions designed to solve this
problem, those who demanded capital were likely to have much better infor
mation about the prospects of success for their ventures than did potential
suppliers. The management of a. railroad that issued bonds in the late nine
teenth century, for example, probably knew more about the probability that
it would repay the debt in a timely fashion than those investors who initiall:y
bought the bonds. Correctly perceiving that they were at an informational
disadvantage, suppliers of capital were right to be skeptical:
"In the exercise of your profession there is probably not one of
you who will not be asked at some time or other to become agent,
either for the sale of the bonds of a. mortgage company in the
United States or those of a rail way com pa.ny. If for a mortgage
4
company, you will be told that the district in which it does busi
ness is the only in which mortgages are of value in the United
States, and certainly the most thriving and prosperous , though
in need of money. You will not be told that the virgin soil has
been worked out, and that the land produces only one-half of
what it did twenty years ago, yet this may be the case... If on
the other hand, it be a railway company, you will be told that it
possesses advantages superior to any other railway in the United
States, and though possibly not yet built, it has a magnificent
future before it. 4
The evolution of capital markets, therefore, has hinged crucially on questions
of information - that is, on the ability of individuals and society to devise
institutions that elicit truthful revelation of information.
The evolution of such institutions has been long and arduous; and, claims
by modern financial analysts about the completeness of asset markets aside,
it is still anything but finished. In contrast, one notable theorist, Kenneth
Arrow, has proven that the co-ordination necessary to achieve a general equi
librium in markets can be attained in well-behaved economies free of such
impediments a.s externalities, indivisibilities, and increasing returns to scale,
but only with a.n array of prices corresponding to a comprehensive set of
futures markets, a set spanning every contingency. Of course, Arrow himself
notes the wide gulf between theoretical paradigm and empirical investigation:
4 William John Menzies, "America As a Field for Investment," Lecture delivered to the Chartered Accountants Students' Society, 18th February, 1892. (Edinburgh: William Blackwood and Sons) . p. 3.
5
"In my own thinking, the model of general equilibrium under
uncertainty is as much a normative ideal as an empirical descrip
tion. It is the way the actual world differs from the criteria of the
model which suggests social policy to improve the efficiency with
which risk bearing is allocated." 5
While the world does not at present, and, for that matter, almost certainly
will never satisfy the criteria of Arrow's model, in the case of capital markets,
it comes closer than it once did. Futures markets do exist (although there
are not terribly many) and increased capital flows suggest that risk bearing
is better allocated, at least better than the time each individual was forced
to bear his own risk and to rely solely on his individual resources.
These institutional developments, however, grew out of far more humble
beginnings. Some recent research has focused on the evolution of capital
markets and early attempts to circumvent informational asymmetry. Naomi
Lamoreaux's work on the importance of kinship networks in capita.! formation
in New England suggests one way individuals could draw on collective funds,
pool risk, and resolve informational asymmetries. 6 Paul Milgram, Doug
North and Barry Weinga.st 's treatment of the pivotal role of medieval law
merchants in reputation building in credit markets highlights another early
institutional solution to informational asymmetries. 7 Among the virtues of
5 Kenneth Arrow, "General Economic Equilibrium: Purpose Analytic Techniques, Collective Choice," American Economic Review, 64 (June, 1974) pp. 253-72.
6 Naomi Lamoreaux, "Banks, Kinship, and Economic Development: The New England Case," Journal of Economic History, September, 1986, pp. 647-667.
7 Paul R. Milgrom, Douglass C. North and Barry R. Weingast, "The Role oflnstitutions in the Revival of Trade: The Law :Merchant, Private Judges, and the Champagne Fairs,"
6
these studies is their focus on information, the critical element in establish
ing capital markets. Often these studies focus on one institution, describe its
workings, and discuss both its pervasiveness and effectiveness. As a result,
however, the dynamic flavor of institutional response in capital markets, a.
focus of this study, is somewhat de-emphasized.
Less institutional approaches to the study of capital markets doubtless
have provided insight, but they also have their shortcomings. For example, a.
theoretical approach to the study of financial markets often involves assump
tions about efficiency, completeness of markets, and uniformity of agents.
Such assumptions are practical - they provide mathematical tractability and
allow researchers to derive interesting results. Moreover, some of .this theoret
ical literature has been quite attuned to the role of informational asymmetry
and to the role of institutions in the way private information is revealed in
financial markets. That the results of many of these theoretical studies hinge
critically on institutional assumptions suggests the importance of examining
institutional structure in capital markets in deta.il. 8
Of course, researchers have not confined themselves solely to theoretical
treatments of financial markets - the treasure trove of data generated by the
world's financial markets provides a. ready laboratory. Reliance on this data
Economics f3 Politics, Volume 2, No. 1, March, 1990, pp. 1-24. For a similar example see Avner Greif, "Reput.a.tion and Coalitions in Medieval Ttade: Evidence on the Maghribi Traders," The Journal of Eco11omic History, Vol. XLIX, No. 4 (Dec. 1989).
8 For an example of how tax shields affect firms' optimal capital structures see, F. Modigliani and M.H. Miller, "Corporate Income Ta.xes and the Cost of Capital: A Correction," Am.erica11 Economic Review, 52: 433-443. (June, 1963). For a recent example of how institutional structure within the capital market itself affects equilibrium, see Daniel Bernhardt and Eric N. Hughson, "Discrete Pricing and Institutional Design of Dealership Markets," mss. 1992.
7
has often meant that investigators focus on measures of risk and return to
explain behavior and they have ignored uncertainty - here risk preferences
refer to attitudes toward investment opportunities when the distribution of
returns is commonly known while uncertainty results from alack of knowledge
by one or both parties to an exchange about the distribution of returns to a
venture. Because the operation of even a primitive capital market required
some resolution of informational asymmetries, a research approach concerned
solely with risk and return is often insufficient. Of course, risk and return are
far more reliably measured than uncertainty and informational asymmetry;
one can hardly blame empirica.l researchers for the route they've chosen.
The point here is not to dismiss other approaches to the study of capital
markets, but to suggest that there is a substantial benefit to an institutional
analysis that distinguishes between the role of uncertainty and that of risk
and return. The distinction was espoused long ago by Frank Knight, who
noted that some risks cannot be quantified, at least not by all parties to a
transaction. These risks , he argued, should be thought of differently from
others, and thus he termed this so rt of risk "uncertainty. " 9 In early capi
tal markets, however, these "uncertainties" were often better known to the
entrepreneur than to prospect ive investors in a venture. Examining how
individuals resolved these asymmetries is a major focus of this study.
The focus on uncertainty does not imply that traditional measures of risk
and return are neglected here; techniques and measures from the field of fi
nance are employed to help describe the evolution of institutions designed to
9Frank H. Knight , Risk, Uncertainty, and Profit, (New York: Harper & Row: New York, 1965), reprinted version of 1921 edition. pp. 43-44.
8
curb informational asymmetry and, thus, permit growth in capital transfers.
This marriage of simple finance and empirical institutional research is useful
in studying of capital markets. The thesis is composed of two separate stud
ies, each drawn from different points in history, and therefore, from different
points in the evolution of capital markets - the questions each attempts to
answer and the methods employed differ.
1.1 An Outline
Chapter Two analyzes an institution endemic to peasant farming in much
of the world: scattered landholdings. In particular, a portfolio analysis is
undertaken to determine whether scattered holdings contributed to reduc
tions in the variance of agricultural return. Scattering was never common
in the United States. Consequently, when most of us think of farming, we
think of individual farmers operating large, contiguous pieces of land. It is
interesting to note, however, that contiguous holdings are a relatively recent
development - scattered holdings persisted in some areas of England into
the eighteenth century and in France until the nineteenth century. More
over, there are reports of scattered holdings in Ireland as late as the 1960's.
Nor should it be thought that scattering was solely a European develop
ment; instances of scattered holdings occur throughout Asia and Africa. In
parts of Formosa, Pakistan, Bangladesh, Thailand, and Korea they are still
in evidence. 10 Although, on the surface, scattering may seem an archaic
10Donald N. :McCloskey, "English Open Fields as Behavior Towards Risk," in Research in Economic History: An Annual Compilation of Research, Vol 1. (Greenwich, Conn.:

9
institution, its pervasiveness and persistence make it a subject worthy of
investigation by modern commentators.
Among economists, the theory of risk reduction via scattered holdings
was first suggested by Donald McCloskey. McCloskey argued that medieval
farmers held scattered strips of land to reduce the variance of their overall
yields. While scattering may have reduced variance, it also induced ineffi
ciency since it carried with it at least four types of negative externalities.
First, drainage was needed for each of a peasant's strips of land; yet, drain
ing one owner's strips increased flooding on adjacent strips. Consolidation
of holdings would have he! peel alleviate this problem, si nee less land would
have been needed for drainage ditches as the systems beca.me less complex.
Second, and somewhat less important, farmers lost time walking around from
plot to plot in the course of their duties. Third, to move between fields re
quired pathways, and these pathways took land out of cultivation. Fourth,
since under the open field system peasants could not harvest their crop at
their own discretion, communal harvesting meant that some peasants were
forced to harvest their crop prematurely, while others were forced to wait
until after their crop was overripe before harvesting.
McCloskey suggests that these inefficiencies were not great, at least not so
great that peasants were unwilling to forgo the loss in average yield in return
for the insurance provided by scattering. In characterizing the nwtivation
for farmers to reduce variance in yields he states,
"The simplest way of bringing the gain in lower variability of
JAI Press, 1976). pp. 126-8. Cited hereafter as McCloskey, "English Open Fields."
10
income and the loss in lower average income into the same unit
of account is to measure their contributions to avoiding disaster.
On this view the peasant's purpose was to reduce the probability
of his income falling below the level that exposed him to debt ,
hunger, disease, or in the limit, death by starvation. He sought,
in short, safety first." 11
The modern reader may wonder why such an elaborate, inefficient system
persisted. Why didn't peasants rely instead on credit and insurance markets
in bad times? The short answer may be that these markets were not as
yet sufficiently developed. Scattered holdings, therefore, may have been an
institutional response to perceived failures in the capital market. Although
this argument has intuitive appeal, output data from individual plots of land
within villages has proved scarce; and, as a result, empirical tests of the
"scattering as risk aversion" hypothesis have been less than satisfying.
The data set used in Chapter Two, however , permits reliable estimates
of grain output on plots of land in two villages in northeast France ( Onnaing
and Quarouble) over the ninety year period1701-1790. When combined with
data on prices and wages, the output figures can be converted into financial
returns for each plot of land; and financial theory enables construction of land
portfolios that minimize portfolio variance for a given mean return. The use
of estimated returns, as opposed to simple output correlations, has the virtue
of also capturing the price fluctuations that farmers encountered. Further,
the returns make it possible to distinguish the benefits of scattering from
11 McCloskey, "English Open Fields", p. 131.
11
those produced by crop diversification; and they do so with greater accuracy
than the output figures.
The portfolio analysis demonstrates that scattered holdings provided rel
atively little insurance. Contrary to McCloskey's claims, on these plots,
returns were highly correlated; so highly correlated, in fact, that holding a
diversified land portfolio typically contributed to variance reductions of only
five to ten percent relative to consolidated holdings. On the basis of this
evidence, it is clear that, at least in these two villages, scattering was not an
institution that contributed greatly to risk reduction; and thus the institution
was almost certainly not a response to capital market failure.
Chapters Three and Four attack a. different problem - the evolution of
the domestic American capital market - but each from a. slightly different
perspective. Chapter Three emphasizes the role of British portfolio finance
in American economic development. Drawing on Lance Davis and Robert
Huttenback's series on capital calls on the London Stock Exchange from
1865-1914, yearly estimates of the level of British portfolio finance directed
towards the United States are derived. The Capital Called series differs from
the standard capita.! export series in two major ways: it deals only with
portfolio finance; and it relies on more direct measures, namely the records
of the London Stock Exchange, of British capita.! exports. The principal
advantage of the new Capital Called series is that, unlike the standard series,
it can be disaggregated to display the industrial and spatial breakdown of
the flows to the U.S. Among other findings, the disaggregated series clearly
reveals, for example, the extent to which Britain aided the development of
America's rail network and the nation 's westward expansion.
12
Chapter Three goes on to compare the range of American firms drawing
finance in London with that of companies listed on the premiere domestic
American capital market - the New York Stock Exchange. The most strik
ing result of these comparisons is tha.t smaller American firms (in terms of
capitalization) located in the emerging West and primarily engaged in eco
nomic activities linked to the land (agricultural firms, investment companies
dealing in land and mortgages, and mining firms, to cite but a few examples)
were able to attract finance across the Atlantic in London but not across
the country in New York. Attempts to resolve this puzzle and, at the same
time, explain the American need for British capital are the twin foci of the
remainder of the thesis.
Chapter Three closes with a comparison of the return characteristics of
the firms neglected by the New York Stock Exchange with those of American
railroad issues- an industry whose firms were able to attract finance in both
London and New York. The study indicates that the puzzle of apparent
capital market failure cannot be explained by risk alone. Although some of
the land-based firms (the mines) exhibited higher variability on their returns
than the railroads, others (the investment companies and agricultural firms)
exh ibited less.
The a.na.lysis in Chapter Four suggests that the American need for British
finance was due, at least in part, to imperfections in the domestic capital mar
ket. While capita.! accumulation wa.s not a. major problem in the U.S. from
1865-1914 (the savings rate among Americans was g1·eate1· than that of the
British) , direct ing those accumulations towards prospective ventures proved
13
far more difficult. 12 Matching prospective borrowers and lenders - deman
ders and suppliers of capital - required a complex institutional framework
designed to resolve informational asymmetries; and that structure evolved
only slowly. When viewed in this light, the actions of the New York Stock
Exchange- in particular the decision by its Governing Committee to exclude
many land-based firms - become much less puzzling. In short, the Exchange
developed stringent admission guidelines because a. NYSE listing was a signal
to prospective investors of the quality of a security.
Although a number of scholars have studied the history of the New York
Stock Exchange during the late nineteenth century and they have provided a
rich description of that institution, they have only hinted at possible economic
explanations of the evolution of the structure of the Exchange. 13 Rana.ld
Michie, for example, notes, " a. strong prejudice against volatile securities or
those of unproven companies," but fails to emphasize the economic signifi
cance of their exclusion: in order to develop large, depersonalized, national
securities markets, the directors of the Exchange had to create institutions
capable of signa.ling, at least to some extent, the "quality" of a particular
investment opportunity. Othervvise, skeptical American investors would have
12 Lance Davis and Robert Gallman, "Savings, Investment, and Economic Growth: The United States in the Nineteenth Century," forthcoming in .John .James and Mark Thomas ( eds. ), Capitalism and Social Progress , Essays in Honor of !'of ax H artwe/1, (Chicago: U niversity of Chicago Press , 1992).
13See Ranald C. Michie, The London and New York Stock Exchanges, 1850-1914, (London: Allen & Unwin, 1987). Paul \Vyckoff, Wall Street and the Stock Markets: A Chronology 1644-1971, (Philadelphia, 1982). Edmund C. Stedman (ed.) The New York Stock Exchange: Its History, its Contrib1dion to National Prosperity, and its Relation to American Finance at the Outset of the Twentieth Century, (New York, 1969). Sereno S. Pratt , The Work of Wall Street, (New York, 1903).
14
chosen to hold onto to their sa.vings. 14
In sum, institutional description combined with an emphasis on the eco
nomics of information provide plausible explanations for the puzzles arising
in Chapter Three. 15 Chapter Four also includes data and descriptions drawn
from a number of sources - some published, others original - that further
portray the position of the Ne\\" York Stock Exchange in the domestic cap
ital market. These data. indicate that, although there were some American
investors with tastes similar to the British , they tended to be geographically
clustered; and as a result did not find it economically burdensome to use
local stock exchanges- i.e., the Boston, the Philadelphia, or the San Fran
cisco- when dea.ling in land-based securities. Their numbers were, however,
small relative to the number of investors holding securities listed on the New
York market. Chapter Four demonstrates that the smaller exchanges and
the London Exchange clearly played a role very distinct from that of Nevv
York in the evolution of the domestic capital market. Finally, Chapter Five
provides an attempted synthesis of the results from Chapters Two, Three,
and Four and offers some concluding remarks.
14 Michie, Loudou and New York, p. 198. 15 A similar approach, a.lthough one with less reliance on financial data, is taken in
Jonathan Barron Baskin, "The Development of Corporate Financial 1\'larkets in Britain and the United St.at.es. 1600-1914: Overcoming Asymmetric Information," Business History Review, Vol. 62 (2), Summer, 1988.

15
1. 2 References
Arrow, Kenneth, 1974. "General Economic Equilibrium: Purpose Analytic
Techniques, Collective Choice," Ame1·ican Economic Review, 64.
Baskin, Jonathan Barron, 1988. "The Development of Corporate Financial
Markets in Britain and the United States, 1600-1914: Overcoming Asym
metric Information," Business History Review, Vol. 62 (2).
Bernhardt, Daniel and Eric N. Hughson, "Discrete Pricing and Institutional
Design of Dealership Markets," mss. 1992.
Brock, William A. 1982. "Asset Prices in a Production Economy," in John J.
McCall (ed.), The Economics of Information and Uncertainty, Chicago:
Univ. of Chicago Press.
Davis, Lance and Robert Huttenback, 1986. Mammon and the Pu1·suit of
Empire: The Political Economy of B1·itish Imperialism, 1860-1912, Cam
bridge: Cambridge University Press.
Davis, Lance and Robert Gallman, 1992. "Savings, Investment, and Eco
nomic Growth: The United States in the Nineteenth Century," forth
coming in John James and Mark Thomas (eds.), Capitalism and So
cial Progress, Essays in Hono1· of Max Hartwell, Chicago: University
of Chicago Press.
Davis, Lance E. and Robert Cull, 1992. "International Capital Movements
and American Economic Growth," forthcoming in the Cambridge Eco
nomic History of the United States, Stanley Engerman and Robert Gall
man, (eds.).
Greif, Avner, 1989. "Reputation and Coalitions in Medieval Trade: Evidence
16
on the Maghribi Traders," The Journal of Economic History, Vol. XLIX,
No.4.
Grossman, Sanford, 1976. "On the Efficiency of Competitive Stock Markets
Where Trades Have Diverse Information," The Journal of Finance, Vol.
XXXI, No.2.
Hellwig, Martin F., 1980. "On the Aggregation of Information in Competitive
Markets," Journal of Economic Theory, 22.
Hoffman, Philip T., Gilles Postel-Vinay, and Jean-Laurent Rosenthal, 1992.
"Private Credit Markets in Paris, 1690-1840," The Journal of Economic
History, Vol. 52, No. 2.
Johnson, A.S., "Rent in Modern Economic Theory." Publications of the
American Economic Association, 3rd Series, Vol III no. 4.
Knight, Frank H., 1965. Risk, Unce1'tainty, and Profit, New York: Harper &
Row, reprinted version of 1921 edition.
Lamoreaux, Naomi, 1986. "Banks, Kinship, and Economic Development:
The New England Case," Journal of Economic History.
Lucas, Robert E., Jr., "Asset Prices in an Exchange Economy," Econometrica
46: 1429-45.
Markowitz, Harry M. 1987. Mean- Va1·iance Analysis in Portfolio Choice and
Capital Markets, Oxford: Basil Blackwell.
McCloskey, Donald N., 1976. "English Open Fields as Behavior Towards
Risk," in Research in Economic History: An Annual Compilation of Re
search, Vol 1. Greenwich, Conn.: JAI Press.
Menzies, William John, 1892. "America As a Field for Investment," Lecture
delivered to the Chartered Accountants Students' Society, Edinburgh:
17
William Blackwood and Sons.
Michie, Ranald C. 1987. The London and New York Stock Exchanges, 1850-
1914, London: Allen & Unwin.
Milgrom, Paul R., Douglass C. North and Barry R. Weingast, 1990. "The
Role of Institutions in the Revival of Trade: The Law Merchant, Private
Judges, and the Champagne Fairs," Economics & Politics, vol. 2, No. 1,
pp. 1-24.
Modigliani, Franco and Merton H. Miller, "Corporate Income Taxes and the
Cost of Capital: A Correction," American Economic Review, 52: 433-443.
(June, 1963) .
Pratt, Sereno S., 1903. The Work of Wall Street, New York: D. Appleton &
Co.
Rosenthal, Jean-Laurent, 1992. "Credit Markets and Economic Change in
Southeastern France, 1630-1788," mss.
Stedman, Edmund C., 1969. The New York Stock Exchange: Its History,
its Contribution to National Prosperity, and its Relation to Ame1·ican
Finance at the Outset of the Twentieth Century, New York: Greenwood
Press, (copyright 1905).
Thiinen, H. von, 1826. "Der Isolirte Staat."
Willett, A.H., "The Economic Theory of Risk and Insurance," Columbia
University Studies in Political Science, vol. XIV, no. 2.
Wyckoff, Paul, 1982. Wall Street and the Stock Markets: A Ch1·onology
1644-1971, Philadelphia.
18
Chapter 2
New Evidence for an Old
Controversy: Scattered
Landholdings and Open Fields
2.1 Introduction
This chapter investigates whether peasant farmers gained insurance benefits
by holding plots of land scattered throughout a. village. Using data drawn
from the tithe records of two French villages, series of returns are constructed
for individual plots of land. A portfolio analysis is then undertaken to quan
tify potential variance reductions in yearly agricultural return achievable by
holding "optimal" portfolios. The results demonstrate that, once crop rota
tions within the villages are accounted for, little additional variance reduc
tion could be obtained through scattering. The data. only permit a. test of
19
the insurance hypothesis, and thus no competing explanation for scattering
is tested in this chapter. Speculation as to why scattered holdings persisted
is offered in Chapter Five.
2.2 The Problem
In a. celebrated series of articles, Donald McCloskey has sought to elucidate
the most puzzling mystery of medieval and early modern agriculture - the
scattered holdings that prevailed across the open fields of northern Europe.
While historians had long invoked population growth, inheritance laws, the
difficulties of plowing, or a. primeva.l spirit of egalitarianism to explain why
peasants dispersed their holdings throughout the open fields, McCloskey ar
gued that the practice served as insurance against agricultural risk . In the
jargon of finance, the scattered plots of land were a diversified portfolio that
protected a. peasant against vveather , pests , and natural disasters. A strip
of land in a. damp hollow might bear fruit in searing drought, while one on
a. sunny hillside might do so in frost or flood. Still others might let crops
survive locusts or hail. For a. cautious peasant, dispersing plots of land must
have seemed a better strategy than risking hunger when the harvest dipped
perilously low. 1
The virtue of McCloskey's argument is that it accounts for a major ob
stacle to technological change. To be sure, the open fields were far from
universal in Europe, particularly before the later Middle Ages , and the rigid-
1 McCloskey 1972, 1975, 1976, 1989, 1991.
20
ity of open field farming should not be exaggerated. Grain yields did improve
on the open fields; farming practices on them -contrary to what is often as
sumed - were not always hemmed in by unyielding regulation. 2 Even so,
there is no denying tha.t the scattered plots exacted a heavy toll, particu
larly in the eighteenth and nineteenth centuries. They exacerbated strife
between neighbors and forced farmers to adopt defense practices that left
everyone worse off. They bred strategic behavior that blocked improvements
such a.s drainage, and they so complicated the tasks of planting, grazing, or
harvesting that new crops and innovative practices were discouraged. 3
In a discipline a.s contentious as economic history, it is perhaps not sur
prising that McCloskey's argument, despite its merits, has never convinced
all the practitioners. Scholars trained as traditional historians have long
remained skeptical, and among those schooled as economists, several (most
2 Recent work by both historians and archeologists suggests that although the scattered fields and open field fanning date quite far back in some places (as in parts of England) they were by and large an invention of the later l\tliddle Ages; even then they were unknown in much of Europe (Rosener (1986] pp. 57-61, 130; Cha.pelot and Fossier (1985] pp. 50, 170-174; Abel (1978] pp. 19-20, 73-83). Grain yields apparently rose on English open fields (Allen and 0 Gra.da (1988]; Yelling (1977] pp. 146-173). The yield figures here, though, are somewhat controversial; for the controversy, see Allen (1988], Overton (1979, 1984] , Turner (1982, 1984]. As for the regulation of open field farming, it is often a<>sumed that the grazing rights and t.he communal crop rotations associated with t.he open fields restricted innovation, but such was not the case, for example, in much of France; see the masterful discussion in l'deuvret (1977-88] (2 ( T exte): 11-46). l'vloreover, it was quite possible to have open fields and scattered holdings without either grazing rights or communal crop rotations: Thirsk [l!J64).
3 See Ault [1972); 1\Ieuvret [1977-88), vol. 2 ( Texte): 38, 107-108; and Hoffman [1988). There is abundant. evidence of the disputes brought on by scattering in nineteenth-century France, where, because the loser paid the winner's legal fees, the costs of litigation could exceed the value of the land fought over: Hottenger (nd], (France) Ministere des finances [1891], and Boulay [1902).
21
notably Stefano Fenoaltea) have devised intriguing alternative explanations. 4
The resulting controversy has never died down, in large part because both
McCloskey and his critics lacked the sort of evidence that would settle the
debate. They lacked it for an obvious reason: it seemed impossible to find.
Yet the necessary evidence does exist, or at least something close to it. With
this new data., and with tools more powerful than those McCloskey himself
employed, his reasoning can therefore be to the test.
2.3 The Evidence from Onnaing and
Quarouble
McCloskey's story revolves about the variance of grain yields, gram being
the major crop on the open fields. Bad weather, pests, and natural disasters
caused yields to S\ving wildly, but a peasant could reduce the variation by
scattering his holdings to take advantage of microclimat.es and local differ
ences in the incidence of plant disease and other calamities. Conceivably, he
might even be able to the reduce the variance of his grain output to that of
the village as a whole.
For this story to work, though, requires that the yields on separate strips
of land in the village not be too closely correlated, for if the yields on sep
arate strips do rise and fall together, then scattering provided no insurance
and no compensation for the burden of farming dispersed holdings. Nearly
4 For one historian's skepticism, see \Vilson [1977], p. 37. For Fenoa.ltea's views, see his most recent contribution to the debate (Fenoalt.ea. [1988]), which contains an excellent summary of the literature on the open fields.

22
the whole argument, at least in McCloskey 's formulation, therefore depends
on the correlation between yields on different plots within the typical open
field village. McCloskey maintains that this correlation -call it R-was, for
typical plots , probably about 0.60 , but he admits that the evidence is far
from perfect. 5 Since medieval and early modern farmers did not record the
grain produced on each individual strip of land, McCloskey is forced to rely
on evidence from nineteenth-century agronomy experiments and from the
records of manorial farms in order to estimate R. Neither source is entirely
reliable.
The agronomy experiments correlate yields on individual plots of land ,
but since they involve late nineteenth-century methods of cultivation, they
make for a rather strained comparison with medieval and early modern farm
ing, as McCloskey himself acknowledges. If one were to overlook such diffi
culties and simply extend the experimental correlations back into the past,
then R would be perhaps 0.80 or so, a dauntingly high correlation. Mc
Closkey argues, not unpersua.sively, that this is merely an upper bound for
R, because the experimenters carefully controlled the methods of cultivation
and thereby eliminated sources of variation among plots. But the variation
among the plots ma.y also have been reduced by the very different agricultural
techniques utilized in open field farming. 6 If so, then R may have indeed been
5 McCloskey (1989]. pp. 39-43; (1916], pp. 145-53. 6 McCloskey (1989] (pp. 39-40). The common practice of sowing mas lin (mixed rye and
wheat) was but one technique of traditional open field farming that reduced the variation in yields among plots. One reason farmers planted maslin was t.ha t. t.h e sturdier stalks of rye prevented the wind and rain from beating down the fragile wheat. The maslin would therefore diminish yield variations due t.o differences in exposure among plots. See Meuvret [1977 -88], vol. 1 ( Texte): 148, and J>assim, for this and other techniques of plowing, sowing,
------------------------- --- --
23
as high as .SO.
The evidence from the manorial records is also imperfect. It concerns,
not the individual strips of land within a. single village, but entire farms
located in separate villages. The problem here is the distance between the
farms: because they lay in separate communities, the distance between them
was far greater than that between typical strips in a single village's open
fields. Unfortunately, the distance and the output correlation are related.
As the distance between manorial farms increases, the output correlation
falls; presumably, the correlation R between typical strips does the same.
McCloskey is therefore forced to extrapolate from the distance-correlation
relationship for manorial farms in order to estimate R for strips, but even
though he restricts himself to nearby farms, he is still dealing with properties
that are much further apart than the strips in an open field village. His
extrapolation is thus quite risky; as he himself adn1its, the 0.60 estimate for
R that he derives from the extrapolation "may be too low to represent the
correlation facing a peasant in one open field in a. village." 7
What are needed, obviously, are yields from plots of land that are much
closer together- precisely the evidence that seems impossible to find. Yet
such evidence does exist and has been located, surprisingly, in published
documents . It. comes from the unusual tithe records unearthed by Morineau
for his study of the evolution of French grain yields. 8 The records in question
and harvesting that. might. have also lessened the variation among plots. 7 McCloskey [1989) pp. 40-41. 8 Morineau [1971), pp. 32- 35, 97-162. His evidence comes from the Archives
departementales du Nord in Lille [henceforth AD Nord), 4 G 3456-3457, 5379-5731 , which we have also examined. Though rare, similar sources can occasionally be found in tithe
24
concern the tithe levied by the Cathedral of Cambrai in two northern French
villages, Onna.ing and Quarouble. Located only 4 kilometers outside the
city of Valenciennes, the two villages were adjacent, their centers a. mere 2
kilometers apart. The villages and their environs (part of the area. known
as the Haina.ult) had come to the classic three-field crop rotation rather late
in the Middle Ages, but the three-field regime was certainly established by
the sixteenth century, a.s were the hallmarks of open-field farming, including
grazing on the stubble. The region was also one of scattered holdings, with
typical plots measuring between roughly 0.1 and 1.0 hecta.res. 9
The Cathedra.! possessed the right to a.n 8-percent tithe on certain parcels
of land knovvn as taques in Onnaing and Quarouble. There were 27 of the
taques, covering 49 percent of the surface of Onna.ing and 39 percent of
Quarouble. Unlike most tithe owners, who leased their tithe rights out for
a. fixed cash rent over a number of years, the Cathedral of Ca.mbrai insisted
records and in the documents concerning seigneurial clues such as the champart, but they always seem to lack t.he virtues of l\1orineau's documents. \-\' hereas his sources track grain yields on separate parcels of Janel for centuries, most other records stop after a short time or make it exceedingly difficult to follow the yield on the same parcel of land. That was the case, for example, with the champart records in the Archives clepartementales clu Calvados (Caen), H 2873- 2874, and with those in the Archives departementa.Jes des Yvelines (Versailles), 55 J 348-351. Other sorts of documents that would shed light on scattering are also rare-in particular, evidence that operating farms (as opposed to owned farm land) were actually scattered. Landownership was certainly scattered, but whether the operating farms were is not clear , because the rental market could have rearranged holdings considerably.
9 Sivery [1977] (pp. 88-89, 98-106, 112, 132); Ivlorineau [1971] (pp. 34, 98); Lefebvre [1959] (pp. 47, 90-91, 210-217); Demangeon [1905] (pp. 345-57). The local agriculture was not, however, rigid and backwards. By the end of the eighteenth century, for example, loca.l farmers had adopted a number of progressive techniques, such as the planting of clover, the preparation of seed with arsenic, the use of a wide variety of fertilizers, and intensive hand cultivation of small plots.
25
on collecting its tithe in kind one year at a time, and it did so separately for
each taque. By the eighteenth century, the process of collection had settled
down to a. routine. On the eve of the harvest, the cathedral would auction off
the right to collect the tithe on each taque to the highest bidder, with bids
made not in money, but in grain-wheat if the standing crop on the taque was
wheat, oats if it was oats. The highest bidder had the right to 8 percent of
the crop on the taque after the grain farmers had harvested it; he owed the
Cathedral either the amount of grain he had bid or a cash payment equal to
the bid times the post harvest price of grain in nearby Valenciennes, where
his payment was due. 10
In the eighteenth century it was the cash that changed hands, although
the Cathedra.! continued to insist on bids in kind. 11 The bidders were by and
large residents of Onnaing and Quarouble, presumably farm owners whose
10 Archives Departementales clu Nord, 4 G 3456; Morineau [1971], pp. 32-35, 97-162. The cash payments were based on the November 30 price for wheat and the Christmas price for oats- the elates when the wheat and oats payments were due in Valenciennes. In addition to the tithe rights on the 27 taques, the Cathedral possessed similar rights on parcels known as the espiliers. Areas are not available for the espiliers, in contrast to the taques, but the espiliers appear to have been smaller bits of dispersed land, sometimes outside the usual crop rotation. In the eighteenth century the espiliers produced 25 to 30 percent of the total tithe income from both taques and espiliers: Morineau [1971], p. 98. Vle will use the espiliers for some but. not. all of our calculations below.
11 The Cathedral considered s\\'itching to long-term cash leases at the end of the Old Regime, but the Revolution cut short. the project: Morinea.u [1971] , p. 100-102. It probably adhered to the in-kind bids, even though the tithe \\'as actually paid in cash, because it wished to protect. its tithe rights against legal attack. \Vhen in-kind seigneurial dues were let out on long term cash leases in the region of Onnaing and Quarouble, the lease sometimes paved the way for a legal argument that the rights to the dues themselves had lapsed; the Cathedral might have feared the same fate for its tithe rights if they were leased for cash. See Lefebvre [1959], p. 148-50. The eighteenth-century auctions stipulated that the tithe be levied in kind and that bids be made in kind, but final payment had to be in cash: AD Nord, 4 G 3456.
26
workers were a.lready out in the fields bringing their own harvested gram
into local barns. For them the marginal cost of hauling in a little additional
grain from the taques was low, all the more so since they probably bid on
the taques where their own crop stood. With the marginal cost of bringing
the tithe in near zero, it is reasonable to assume that the highest bidder
would offer an amount equal to 8 percent of the quantity of grain standing
on the taque. Such an argument assumes, of course, that competition among
the bidders would drive their profits down to zero, but the bidders were
numerous and no one seemed to monopolize the tithe collection. On July
26, 1707, for example, the cathedral auctioned off the right to the tithe on 7
taques planted in wheat and 11 planted in oats to a total of 21 high bidders
- usually, a separate high bidder for each taque. 12
The winning bids thus furnish an estimate of 8 percent of the grain output
on each taque. But what precisely were the ta.ques? Averaging 41 hectares
in size, they were too large to be individual strips of land. Rather, each
12 AD Nord, 4 G 3456, July 26, 1707, and passim; because a few of the tithe rights were won by joint bidders, there \Yere more high bidders than taques. Conceivably, one individual could have monopolized collection of the tithe on each taque, but a perusal of the eighteenth-century auction records suggests that was not. the case. Unfortunately, the auction records do not list. the number of individuals who bid for each taque, but lVIorineau argues that it was probably large because numerous individuals usually had holdings on each taque: Morincau [1971], p. 34, 102. For evidence that the high bidders were local farmers. sec ibid, p. 102, and AD Nord, 4 G 3456, July 9, 1784, where all 11 of the high bidders for t.aques in Onnaing were from Onna.ing, and all 9 in Quarouble were from Quarouble. Presumably bidders would have adjusted their bids slightly to reflect the difference between the farm gate price and the Valenciennes price for grain, but this adjustment can be safely ignored because Valenciennes was a mere 4 kilometers away. It also seems rea<>onable to ignore the risks involved in the collection process. They were minimal-the grain was ready for harvest and the bidders did not have to guess the future price of grain-and with a handful of risk neutral bidders the auction should have soon pushed very close to eight percent of the grain on the taque.
27
taque was a group of adjacent strips, all sown with the same crops and in
all likelihood ploughed in parallel-what was termed a furlong in England, or
a quarfier or delle, to cite but two of the common names in other parts of
France. Indeed, on occasion the Cathedral even called the taques "quartiers."
Each taque therefore included the holdings of a number of individuals and
each was planted with a. single crop or left fallow in any given year. The crop
would of course change with the three-field rotation, shifting from wheat to
oats and then to fallow before beginning the cycle anew. In turn, each ta.que
belonged to one of the three larger land units in each village that made up
the three field system - units called great fields in England and known in
Ha.inault as royages. Each myage included all the taques and other parcels
that were sown with the same crop and moved through the crop rotation
together. 13
Without a map, it is impossible to tell how close the taques were, nor
whether the ones in a given royage happened to be nearer than the others.
Unfortunately, no suitable map depicts the taques, but whatever their lo
cation in Onna.ing and Quarouble, they had to be closer than McCloskey's
manorial farms. The distance between two taques located within one of the
villages would be comparable to that between individual strips, and even
13For the size of the taques. see the corrected areas in l'viorineau [1982] 2:625-643. For the use of the word •·quartiers" t.o describe the ta.ques, see AD Nord, 4 G 3442, and for the peculiar meaning of the word roya.ge in Haina.ult, see Godefroy, Dictionnaire dt1
jran(ais medieval, s.v. "royage'' . One taque, known as Dessous-la.-Crete, seemed to have two parts: 35 hectares in the first. royage in Onnaing and 20 hectares in the second roya.ge in Onna.ing. Each part wa<; counted for our purposes as a. separate ta.que. All areas here concern only the taques and not the additional parcels known as espiliers, for which no areas are available.
28
if we took one taque in Onnaing and a second in Quarouble, the distance
would be relatively small. The two villages, after all, were only 2 kilometers
apart, whereas few of McCloskey's farms stood within 3 kilometers of one
another. Indeed, the closest of his farms were 2.4 kilometers apart-further
than Onnaing and Quarou ble. 14
Correlating the grain output of all the ta.ques over a number of years
provides us with an estimate for R. To be sure, such a. calculation raises
certain questions. In the first place, for some taques , the winning bidder had
to pay a. small, fixed amount of grain to the local priest; for such taques , the
winning bid and hence the assumed grain output would be artificially reduced
each year by the same small constant. Yet although the grain output would
be a bit lower, the correlations between the grain output of different taques
would not be affected, for subtracting a constant would leave the correlations
unchanged.
A second problem is that the winning bids involve the bidder's estimate of
the grain output, an estimate that was undoubtedly made with error. Unlike
the subtraction of a constant, the error would affect the calculation of R. If
14 McCloskey, [1989] pp. 40-43. So as to be consistent with McCloskey, the distance between Onnaing and Quarouble is measured here as the distance between their centers. Old-Regime maps of Onnaing and Quarouble, which one would expect to show the taques, concern only meadows, woods , and adjoining land, not the whole villages: AD Nord, 4 G 3454, 3510, 3520. The Cathedral's eighteenth-century terrier did list the taques, but unlike some terri ers of the period , it lacked maps: AD Nord, 4 G 3442. Tax records are of no help either: right through the Revolution they too lacked maps. One could consult the nineteenth-century cadastre- it was unfortunately not available to researchers during our stay at the AD Nord-but that would be of little help, for even if holdings had not been consolidated, the taques would ha.ve disappeared and all one could do would be to reason by analogy with qum·tier names. Cf. Lefebvre (1959], pp. xvii-x..xi, for what one can expect of the documents in the region.

29
the actual time series of grain outputs for taque i is y; and the time series
derived from the winning bids is :r;, then:
Xi= Yi + e; (2.1)
where e; is the error resulting from the use of the winning bids. If the e; are
independent of the Yi and one another - a reasonable assumption - then:
(2.2)
The value of R derived from the winning bids is the expression on the left of
(2.2) averaged over all pairs of taques, while the trueR is the average of the
expression on the right of (2.2).
The bids therefore lead to an underestimate of R, though by only a small
margin because the errors e; are likely to be tiny. After all, the farmers who
bid on the tithe knew well how to estimate the amount of grain standing in
a. field. They made such estimates frequently, not only when they bid on the
tithe but when they evaluated relatives' estates or testified in court. The
errors they made - the ei- would be minor. The magnitude of the errors is
reduced even further if we restrict ourselves - as we shall- to the tithe records
of the eighteenth century, when the delay between the tithe auction and the
a.ctua.! harvest was at most a. matter of days. In earlier centuries , the tithe
rights were sold off in May or June, but in the eighteenth century the auctions
took place in .] uly, the month when harvesting began. In 1707, for instance,
the tithe was auctioned off on July 26, perhaps moments before the onset of
30
the harvest. 15
Under such conditions the errors ei were in all likelihood minuscule. Sup
pose, for example, that they were normally distributed with mean zero and
standard deviation equal to 10 percent of the average yield on a taque. Un
der these assumptions, the winning bidders would be within 20 percent of
the true yield roughly 95 percent of the time-hardly unreasonable accuracy
for experienced bidders competing against one another only a day or two, or
perhaps even hours, before the harvest. Equation (2 .2) then implies that we
underestimate R by only 15 percent. 16
McCloskey's R concerns a single crop, and we shall limit ourselves to cal
culating it for wheat. 17 The calculation entails correlating wheat yields from
the eighteenth century for each pair of taques that grew wheat simultane
ously and then averaging the correlations over all the pairs. The correlations
also permit a test of another of McCloskey's ideas, for if he is correct, then
15 l'l'lorineau (1971], pp. 100-104; AD Nord, 4 G 3456. A second reason for restricting the analysis to the years 1701-1790 is that. before the eighteenth century the tithe rights were sometimes sold for several years at a time and the payments subsequently reduced in case of disaster. One additional cause for ''"orry-as it turns out, a groundless one-is the accuracy of Morineau's publication of the original figures from Onnaing and Quarouble. JVIorineau's calculations with the data have been att.acked as inaccurate, and one might therefore worry about the accuracy of his publication, which we relied upon for our calculations. ·while his arithmetic may have contained errors, a comparison with the original manuscript sources suggests that the ra"· published data itself was transcribed with reasonable accuracy. The decimal tenths in his tables have. however, been converted to the eighths they actually are.
16This calculation uses the coefficient of variation of the winning bids -in other words, the standard deviation of Xi in equation (2.1) divided by its mean . \Vhen estimated by averaging over all the taques and espiliers, the coefficient of variation turns out to be 0.275. The calculation here concerns eighteenth-century wheat yields only.
17McCloskey does consider correlations between different crops, but it is the single crop R that is "critical.'': (1976], 132-36, 145.
31
the correlations should decline with the distance between taques. The pre
cise distance between each pair of taques remains unknown, but we can at
least distinguish those pairs with both taques in the same village, which
would have been closer on average than the pairs spanning both Onnaing
and Quarouble. Presumably, their correlations would be higher too.
What then do the correlations reveal? When both taques lay m the
same village, R was a low 0.47:3 (Table 2.1). For the pairs spanning the two
villages, it was lower still-0.:386-just as McCloskey's relationship between
yield correlations and distance would suggest. Nor does the smaller R for
taques in different villages appear to be a statistical fluke-or at least that
is what is suggested by a regression of the correlations on a constant and a
dummy variable for taques lying in the same village. 18 Since Onnaing and
Quarouble are only 2 kilometers apart, the lower R for taques spanning the
two villages is probably the figure relevant to open field agriculture. The pairs
of taques that lay within the same village and grew wheat at the same time
were necessarily in the same royage and thus perhaps closer than individual
strips needed to be, particularly if the royage was compact. The pairs that
spanned the t.wo villages, by contrast, were probably no further apart than
typical peasant holdings.
With such a low R, even large errors in the bidders' estimates of the
18If 1· is the yield correlation calcula t.cd from the winning bids for a pair of taques and :: is a dummy variable that. is 1 when both t.aques lie in the same village, then 7' = .386 + .087 z (n = 224, R 2 = .03) and the t-st.atistic of ::'s coefficient is 2.69. The t-statistic assumes, of course, that the pairs of taques within a single village and the pairs spanning two villages have observed yield correlations that are normally distributed with the same variance but different means. All yield correla t.ions here use data both from the ta.ques and from the parcels known as espiliers.
32
yields would be unlikely to raiseR to unsettling levels. If the bidders' errors
had a standard deviation of l.S percent of the crop - incredible sloppiness,
given the circumstances - then the true R would be 0 .. 548, or 0.672 if we
were to '..ttilize the higher , though somewhat less reasonable, estimate based
on taques in the same village. If they erred with a standard deviation of 10
percent - and they probably achieved greater accuracy than that - then the
true R would be 0.444 or 0 . .544, depending on which estimate of R we used. 19
All of the figures are obviously low , most even lying below McCloskey's own
estimates. His argument, apparently, is vindicated on all counts, but before
judging the debate closed, the evidence should be analyzed in a. different way,
for as we shall see, the simple output correlations for a single crop conceal
far more than they reveal.
2.4 A Portfolio Analysis
Several quest ions remain unanswered. First , how do we judge whether R is
low enough? Equivalently, how do we gauge the effectiveness of the insurance
that scattering provides? McCloskey did so in a relatively simple way, by
measuring how much scattering reduced the likelihood of disaster, which he
defined as a. crop equal to half the normal. 20 But the likelihood of disaster
is not the only yardstick for eva luating insurance. It might suit a world of
self sufficient farm ers, but such a world , if it ever existed, was long gone
19Because yields rose in the eighteenth century, the output series were non stationary. As a result, the correlat.ions here may actually overstate the relationship between output on different taques. For further discussion, see below.
20 McCloskey [1916], pp. 131-32. 143.
33
from vVestern European agriculture by the early modern period. By the
eighteenth century, for example, most peasants in the Haina.ult - the region
of Onnaing a.nd Quarouble - worked as agricultural laborers. Perhaps only
1 or 2 percent of them were independent. 21 The independent ones were by
and large engaged in commercial agriculture, and they might well prosper
when the harvest fell to half the normal, because of the inelastic demand for
grain. Only the fa.rm laborers would suffer, but they ha.d little or no land to
scatter anyway.
The evidence from other parts of Europe is similar. Self sufficiency, even
m the late ]'diddle Ages, wa.s surprisingly rare; many peasants hired labor
and marketed their crops. Furthermore, even self sufficient peasants might
have defined disaster differently or reacted to it in different ways. 22
What we need, therefore, is a. more supple yardstick, one that takes into
account the costs and profits of farming and allows for differences in wealth
and in aversion to risk. One obvious technique is to rely upon portfolio
analysis from the field of finance. The early modern landholder's problem
could be rephrased as that of choosing an optima.! portfolio of land holdings
based on the expected financial returns from farming and their variances.
Of course such a. portfolio analysis entails certain theoretical assumptions
- none more drastic though than McCloskey's focus on averting disaster -
and to a historian it may seem anachronistic when applied to the world of
early modern la.nclholders. 23 But it is, after all, merely a. model, a way of
21 Lefebvre [1959], pp. 37,289. 22 For a discussion, see Newberry and St.iglitz [1981]. 23If McCloskey's way of t.hinking seems preferable, one could instead construct a frontier
34
thinking about the problem - our way of thinking, rather than his - which
can nevertheless shed light on the difficulties they faced. While it might not
be reality a.s perceived by the landholders, it could well reveal the advantages
that they discerned in scattering their holdings. And as we shall see, it has
the great advantage of permitting comparison with other available forms of
msurance.
The portfolio analysis reqmres time series of financial returns for each
parcel or field where the landholder might own land - for example, each
ta.que. The output of each parcel is not enough, for we need to know what
the financial return to farming each parcel is, returns after the crops are sold
and the labor paid. If we only examine output fluctuations, as McCloskey
does, then we merely take into account the risks affecting physical output,
but we ignore the changes in wages and prices, which, given inelastic demand,
might have compensated the landholder for a. drop in output. If we calculate
returns, the price changes are obviously taken into account. 24
The portfolio analysis also resolves a more vexing problem with the out-
put series. The problem is that average grain yields changed over time in
Onnaing and Quarouble; in particular, they rose in the eighteenth century. It
that marks the tradeoff between t.he expected return and the probability of disaster ; the result.s would be the same. For the theoretical assumptions involved in mean variance analysis and other ways of analyzing risk, particularly in primitive economies, see Newberry and Stiglitz [1981]. Despite their warnings about the dangers of mean-variance analysis, they end up using it. because it prO\·idcs a good approximation. Using the approximation is certainly justified for our returns sample, because the single period returns are drawn from nearly normal distributions.
24 1'\'lcCloskey is certainly a\\·are of the dangers of ignoring price fluctuations. In his sample, price fluctuations can be safely neglected, since they are small relative to the output fluctuations.
35
is therefore difficult to derive reliable estimates of R from the output series,
because the output correlations confound the short term fluctuations of out
put that interest us with the long term change in yields. In technical terms,
the output series are not stationary and they give inconsistent estimates of
R. McCloskey avoids such difficulties by restricting his attention to short
output series that run for only a few years, but such short output series,
though they may be close to stationary, rob his estimates of precision. 25 For-
tunately, our series of financial returns involve no such complications. They
are stationary, even though the output series and the price series themselves
are not. Vve can therefore employ the full 90 years of financial returns from
the eighteenth century in order to sharpen the accuracy of our calculations.
The returns circumvent another serious obstacle as well. If we restrict
the calculation of R to a. single crop such as wheat, then we overlook the
effects of the crop rotation. But once the other crops are included, R is
much higher. Suppose, for example, that we correlate the output for entire
roya.ges rather than for taques. For wheat alone (on the roy ages growing
wheat simultaneously), the correlations average 0.714; for oats , they average
0. 757. But if we correlate not just wheat or oats but the entire output for
the roya.ges on the same crop rotation, then the average correlation jumps to
over 0.95.
25 McCloskey argues that. correlating short output series fits the peasants' own expectations, but. the peasants of course \Yere not correlating any series, short or long. They evaluated scattering not by calculating correlations but by looking to their experience, experience that may have passed from father to son and stretched over generations. Our task is quite different.: to det.ermine \Yhet.her scattering had any benefits by measuring parameters such as R as accurately as possible. The accuracy is easier to achieve with long output series.

36
It is the alternation of crops and fallow that is responsible for the increase.
Because each crop has a different average yield, the output correlation is
pushed upward by the regular variation in average yields. It is boosted even
higher by the fallow every third year. One could limit one's attention to a
single crop and thereby ignore the crop rotation's effect on output, but that
would be tantamount to underestimating R and overestimating the value of
sca.ttering. 26 V/ith the financia.l return series, by contrast, no such difficulties
arise. Unlike the output series, the returns take into account wheat, oats, and
fallow as well, for they measure each year's financial contribution, whatever
the crop. That is a powerful argument in their favor.
To use the returns, we recast the landholder's dilemma. as a. portfolio
problem, imagining tha.t the landlord cares only about high mean returns
and low return variances. He will then arrange his holdings so that, at any
given level of return for his entire land portfolio, his return variance will
be minimized. In mathematical terms, the landowner faces the following
minimization problem:
ITII11 '" W.:...JW (2.3)
subject to
l'w 1 (2.4)
I :::w = ll (2.5)
26 McCloskey's solution to the problem is to use correlations of different crops such as wheat and oat.s, but. in doing so, he overlooks the alternation of fallow.
37
and
Wi ~ 0 '-c/ i (2.6)
for each component w; of u.·. Here u.• is a. vector of portfolio weights telling
what fraction of his property lies in each parcel where he can own land , .B
is the variance-covariance matrix of financial returns for all the parcels , ::: is
the vector of expected returns for the parcels, and p is the expected return
of his entire portfolio. Constraint (2.4) simply means that the weights sum
to 1, while (2.6) says that the weights must be non-negative-in the language
of finance, the landowner cannot sell short his assets. Given a. return p on
his portfolio. equation (2 .. 5) implies that the landowner chooses weights w to
minimize the return variance (2.:3). He does so, it is worth stressing, whatever
his own tastes and attitude toward risk . There are, of course, a number of
solutions to the minimization problem. The solutions trace out a surface
known as the mean-variance efficient frontier, and given the landlord's own
level of risk aversion , he simply chooses the p a.nd thew on the mean-variance
efficient frontier that maximize his own expected utilityY Our formulation
of the landowner's probl em thus allows for great differences in tastes and in
attitudes toward risk.
Ideally, one would like to solve problem (2.:3) for each taque and allow
the landowner to spread his land out over all 27 taques. Working with all
27 taques , though, obscures the results without changing any of the conch1-
27For a discussion of portfolio analysis, see Markowitz [1987] . In our case, the portfolio weight.s are non-negative, and riskless borrowing and lending are not possible. Under these conditions, the m ean-variance frontier is a. set. of parabolic sections with kinks at the joints. The number of kinks equals t.hc number of portfolio weights that equal zero. See Dybvig [1984] for details.

38
s1ons. The analysis is, therefore, restricted to a. choice among smaller groups
of taques and among the six royages in Onnaing and Qua.rouble. Despite
the restriction, we can still determine whether the optima.! portfolios- those
along the mean-variance efficient frontier-are scattered a.nd vvhether scatter
ing really does contribute to reducing the portfolio va.ria.nce. 28
The first step in the portfolio analysis is to convert the grain yield figures
into series of returns for each ta.que, or for each roya.ge if we a.re solving the
portfolio problem for the roya.ges. Ideally, the returns should incorporate the
total revenue and the total costs incurred on a. given taque or roya.ge, with
revenues a.ncl costs based on the market prices of grain, land, labor, and capi
ta.!. Unfortunately, despite efforts to find better data, some of the price series
are far from perfect. The series of returns are thus only approximations- al
beit reasonable ones- to the actual returns.
To calculate total revenue, the wheat and oats output of each taque or
roya.ge was multiplied by the price of wheat and oats in the city of Mont
didier. Montdidier la.y 100 kilometers from Onnaing a.nd Qua.rouble, but it
proved impossible to find usable price series for closer markets. Prices proved
unreliable in Valenciennes , which wa.s only 4 kilometers from Onna.ing a.nd
Quarouble, and the same was true in other nearby markets, such a.s Doua.i
and Lille. In the end, Montdidier wa.s the closest market whose prices could
be trusted; although the distance from Montdidier to Onna.ing a.nd Quarou
ble wa.s not small. the !Vlontcliclier price a.ncl that in Onna.ing and Qua.rouble
28Calculat.ions for all 27 t.aques are available from the author; they do not change the results.
39
appear to have been closely correlated. 29
To calculate total costs, we begin with estimated labor inputs derived
by George Grantham. The numbers used were those Grantham gives for
the region that included Onnaing and Quarouble -the French department
of the Nord (Table 2.2).30 The next step was to combine Grantham's labor
29The Valenciennes prices would seem the obvious ones to use for the two villages, because Valenciennes was practically next door. Some seventeenth-century prices from Valenciennes are published in Morineau [1971], p. 103, but the published series stops before our own period, the eighteenth century. While additional prices for the eighteenthcentury may well exist in the manuscript Morineau used, the prices from Valenciennes leave much t.o be desired. In the first place, the units for oats are not entirely clear (on this, see Sivery [1977], pp. 64-65 ), and, worse yet, the prices seem suspiciously repetitive, particularly aft.er 1650. Prices series from other nearby markets suffered from even more serious problems. In Douai and Lille-the two other obvious markets-intractable problems with units and monetary conversions rendered available price series useless. That left 1\llontdidier as the closest market with reliable prices-slightly closer than Charleville and much closer than Abbeville. The l'vlontdidier prices did correlate highly with the available Valenciennes prices ( r = 0. 70 for wheat, 0.50 for oats, 0.69 for wheat when differenced, 0.36 for oats when differenced), and their movement seemed particularly close before 1650, when the Valenciennes prices seemed more reliable. The Montdidier prices are taken from de Beauville [1875] 2:501.
30 Grantham [l!HJl ], pp. 8-10. The estimates used are Grantham's for stiff soils circa 1750. Grantham's figure for threshing combines an estimate of the time required for threshing a hectoliter of grain and a figure for average yil'lds. He reports t.hat threshing operations consumed one man day per hectoliter of output. and that average yields in the Nord were seventeen hectoliters per hectare. Since we already have yield estimates in hectoliters, we multiply these yields by Grantham's man days per hectoliter estimate in calculating the costs for threshing.
Labor inputs for oats were not. exactly the same as for wheat, which benefited from more manure and more plowing. Grantham attributed fallow plowing and manuring operations (both of '"hich came after the oa.t.s but before the wheat) to wheat production. In constructing the returns here, oats were treated in two different ways. The first assumes the same amount of plowing for oats as for wheat and the second places plowing used in oat production at half of Grantham's wheat plowing input figure. In both cases, all manuring operations were attributed to wheat and none to oats. The results presented here will be for the returns figures computed assuming the same plowing for oat production, although the conclusions hold up regardless of which oat return measure is employed. Harvest.ing costs \Yere assumed t.o be the same for both crops, for in contrast to most parts of France, the scythe was used for both wheat and oats in the Nord in the eighteenth
40
inputs with an appropriate local wage series in order to compute total labor
costs, but finding such a. series proved difficult. The regional archives (the
departmental archives of the Nord) did not seem to have a suitable source
for eighteenth-century unskilled wages- wages paid in cash with tasks spec
ified - and no appropriate published series exists for the region. We were
therefore forced to rely on the wages of unskilled laborers in Paris. As could
be expected, Parisian wages were higher than those in the countryside near
Onna.ing and Quarouble: eighteenth-century evidence suggested that On
naing and Quarouble wages ran only 65 percent of what they did in Paris.
\Ve therefore set the wage series equa.l to 65 percent of the Parisian senes;
variations in this figure led to similar results. 31
Capita.! costs posed similar problems beca.use there was no local pnce
series for the major component of agricultural capital - livestock. The only
century. Threshing oats took slightly less time but the differences were small enough to ignore. For details, see Meuvret (1977-88], 1 (Texte): 166-69, 1 (Notes): 175, note 11; Tessier (1787-1821) s.v. "Bat.tage".
31 Guignet (1977) (p. 566) contains wages for female lace makers in Valenciennes, but we need the wages of unskilled males. Furthermore, his series only covers the years 1748-1774. The evidence that local wages were 65 percent of those in Paris comes from a variety of sources. Young (1931) reported that wages were 0.6 livre/day in Picardie, which lay between Paris and the Hainault. Paris wages at the time were near 1.25 livre/day, suggesting that. countryside wages were only fift.y percent of Paris wages. De yon (1967) noted that workers in the city of Amiens , also between Paris and the Haina.ult, received 0.6 livre/day in 1700-20. Paris wages during this period were hovering just below 1 livre/day. In the 1720s Deyon estimated wages in Amicus to be 0.8 livre/day while Paris wages were somewhat over 1 livre/day. Deyon suggests that wages in the countryside around Amicus were lower than these estimates. Lefebvre (1959) estimated wages for unskilled laborers in the Nord during the 1780s at about 0.625 livre/day if one takes into account board usually granted to agricultural laborers in this area. Given these estimates, 65 percent of Paris wages seemed a not. inappropriate estimate for Onnaing and Quarouble. In any event, the conclusions here are not sensitive to the 65 percent scale factor. VVe tried scale factors ranging from 55 to 75 percent; the results were not greatly changed.
41
recourse was to use accounting information from the Paris Basin, where agri
cultural technology was similar. There the rental cost of capital did not
vary greatly in the eighteenth century, and the accounting information sug
gests that it absorbed about 22 percent of total costs. Here capital costs are
assumed to be the same. 32
To figure the cost of land required a. local land rental series, but such a.
series proved impossible to find. The loca.l ecclesia.stica.l archives-typically
the best source for rental data-contained only isolated leases for Onnaing
and Quarouble and lacked anything like a. rental series for the two villages.
Tax records shed no light on the rental rate of land either; worse yet, much
of the regional lease information was contaminated by the custom known as
mauvais gd, which restricted rent increases and kept the rental rates stated in
leases below the market price of land. The only alternative was to rely upon
a decennia.! rent series from :34 villages in the vicinity of the city of Amiens.
On a.verage, these villages lay slightly over 100 kilometers from Onnaing and
Quarouble, and their rent levels were lower than in Onnaing and Quarouble.
In fact, the few usable leases found from Onnaing and Quarouble implied
that rent in the :3 -~ villages was lower by a. factor of approximately 2.5. The
time series from the 34 villages was, therefore, multiplied by 2.5 to derive
an overall rental trend; it was then corrected for differences in land quality
among taques in Onna.ing and Qua.rouble via differences in average yields.
Changing the 2.5 sca.le factor did not disturb the results. 33
32The capital share here is net of seed; it did not vary greatly in the eighteenth century. See Hoffman [1991b] and Hoffman [1991a] (pp. 27-32).
33For mauvais gre and the rental market.. see Lefebvre [1959] and Hoffman [1991]. The
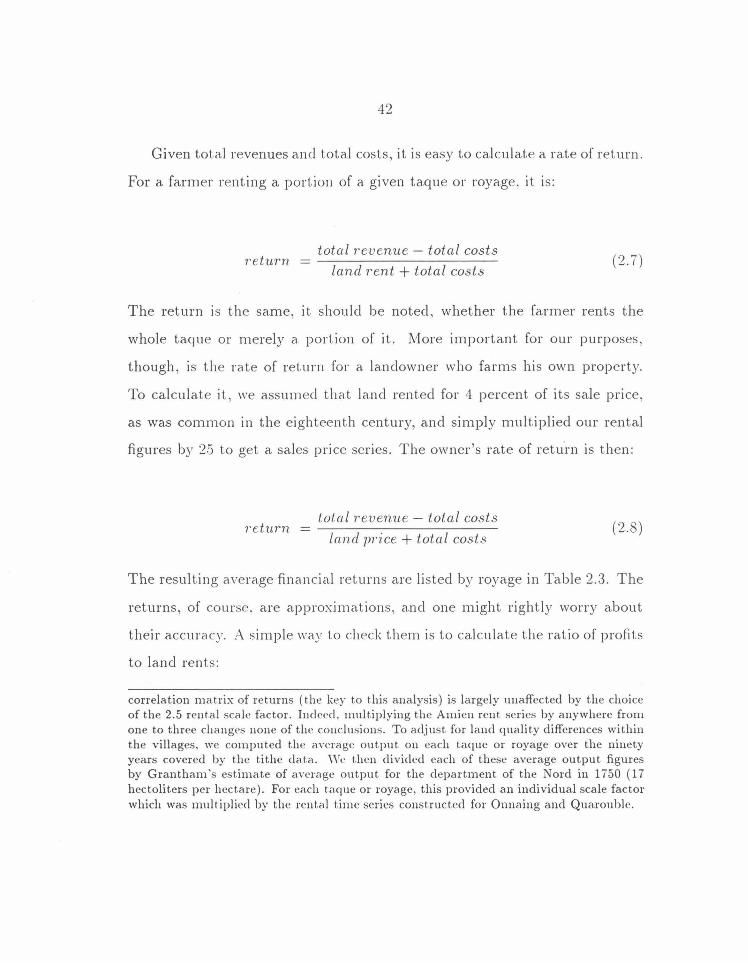
42
Given total revenues and total costs, it is easy to calculate a. rate of return.
For a. farmer renting a portion of a. given ta.que or royage, it is:
1·eturn total1·evenue - total costs
land 1·ent + total costs (2.7)
The return is the same, it should be noted, whether the farmer rents the
whole taque or merely a. portion of it. More important for our purposes,
though, is the rate of return for a. landowner who farms his own property.
To calculate it , we assumed that land rented for 4 percent of its sale price,
as was common in the eighteenth century, and simply multiplied our rental
figures by 2.5 to get a. sales price series. The owner's rate of retu.rn is then:
return total revenue- total costs
land price + total costs (2.8)
The resulting average financial returns are listed by royage in Table 2.3. The
returns, of course. are approximations, and one might rightly worry about
their accuracy. A simple \\·ay to check them is to calculate the ratio of profits
to land rents:
correlation matrix of returns (the key to this analysis) is largely unaffected by the choice of the 2.5 rent.al scale factor. Indeed, multiplying the Amien rent series by anywhere from one to three changes none of the conclusions. To adjust for land quality differences within the villages, we computed the aYcrage output on each taque or royage over the ninety years covered by t.he tithe dat.a. \Vc then divided each of these average output figures by Grantham's estimate of average output for the department of the Nord in 1750 ( 17 hectoliters per hectare). For each taque or royage, this provided an individual scale factor which was mult.iplied by the rental time series constructed for Onna.ing and Qua.rouble.

43
total1·evenue- total costs
land rent (2.9)
If the revenues and costs are accurate, then the returns will be accurate
too. But the difference between revenues and costs will be profits. With
a. competitive rental market for land, the profits will be siphoned off by
landlords, leaving the ratio (2.9) close to one. If the ratio is indeed close to
one, it will lend credence to the returns. Ratios for each royage appear in
Table 2.4.
Although the ratio exceeds one on each royage, it does so by only a. small
margin. The excess might reflect slight errors in the prices or land values
or - more likely still - entrepreneurial profits, which would prevent all the
earnings from flowing to the landlord. In addition, the land market might
not have been perfectly competitive because of mauva£s gd; if so, the ratio
would remain well above one. 3-1 In any event, the ratio is close enough to one
to support confidence in the financial returns. Also supportive of the returns
is their level. For owners they in fact hover close to the rate prevailing on
long term loans - further evidence in their favor.
Once calculated for each taque and royage, the returns make clear the
benefits of holding separate plots of land. A landowner. for example, could
cut his risks drastically merely by :-;preading his holdings among the six roy-
34 Returns are computed not on ly for royages, but also for the individual taques that comprise royage 3 (in Onnaing) and royage 6 (in Quarouble). The average of the ratio test is 1.19 for the taques in royage 3 and 1.28 for those in royage 6.
44
ages. To see why it suffices to solve the portfolio problem (2.3) for the
roy ages.
For various portfolio returns fl, we can calculate the portfolio weights
that minimize the landlord's portfolio variance and thereby trace out points
along the mean- variance efficient frontier; a number of such points are listed
in Table 2 .. 5 and depicted in Figure 2.1. From the frontier, it is obvious that
farming different royages greatly reduced the portfolio variance. To achieve
an expected return of 0.055, for example, a landowner could consolidate
all his holdings in royage one in Onnaing; his portfolio would then have
a variance of .00-1297. \Vere he instead to adopt a mean-variance efficient
portfolio, he \\"Ould spread his holdings according to the weights shown in
Table 2.6. opposite the expected return of 0.055. He would then own land in
royages one, three. four, five, and six, and his portfolio variance would fall to
.0007.53. Compared to the portfolio consolidated in royage one, the variance
would have drop1wd 82.5 p<"rcent..
At first glance, the dramatically lo\\"er variance might appear to support
McCloskey·s argument about scattering, but a closer look at the evidence
suggests otltenYise. \t\That we have to examine are the correlations between
the financial returns of the various royages. \Vhen the correlations are low or
negative, the landowner can indeed cut his portfolio variance by scattering
his holdings. But when they are highly correlated, scattering does little to
spread his risk.
For the royages, the returns correlations are either over 0.97 -and hence
far too high - or else negative (Table 2.6). If scattering really did reduce
risks, then why would some of the correlations be nearly one? Such high
45
correlations might be understandable for royages within the same village,
where the effects of scattering would be muted, but the pairs of royages with
high correlations (royages one and four, royages two and five, and royages
three and six) all la.y in different villages. In separate villages, where the
effects of scattering would presumably be most pronounced, the correlations
should be low or negative, but certainly not above 0.97.
To be sure, there are other royages with negative correlations. But what
distinguished them was not scattering but the crops they grew. In every case,
if a pair of royages had a. negative correlation, then the royages grew different
crops. In Onnaing, for example, royages one and two were never sown with
the same crops: they marched through the crop rotation one year apart.
Their return correlation was -0.242. Like royages one and two, many of the
royages with negative correlation lay in the same village. The same was true
of royages four, five, and six in Qua.rouble. If McCloskey's argument about
scattering were correct, the correlations would not clip so lovv for royages
within a single ,·illage.
Apparently. what did reduce risk was not scattering but the crop diversi
fication inherent in the three-field system. The royages with low correlations
never grew the same crops. Those with high correlations (royages one and
four, two and fi,·e, and three and six) always did (Table 2.6). Whether
the royages were in different villages mattered little- contrary to what Mc
Closkey's argument would lead us to expect. After all, if he were correct ,
the correlations should have been consistently high for royages in the sa.me
46
village and consistently low for royages in different villages .35 It is clear that
a landowner did not have to scatter his fields wildly to reduce his risk; rather ,
he simply had to farm land in each of the three parts of the crop rotation.
The crop rotation gave him the necessary crop diversification, and he did not
have to sow dozens of addi tiona.) crops.
Here McCloskey might counter that scattering across roya.ges is not a
fair test. The royages, he might say, were too large and heterogeneous.
Encompassing a. wide variety of soils, they would already have exhausted
the benefits of scattering. If so, then little would be gained by holding land
in different royages , beyond the benefits of crop diversification. The results
here, he might conclude, would come as no surprise.
Yet it is not so easy to dismiss the evidence from the royages. If they seem
too large - keep in mind that they are hardly larger than the manorial farms
McCloskey himself uses - then the analysis can be repeated for the ta.ques ,
which are certainly small enough to reveal the benefits of scattering. And if
scattering mattered, independently of crop diversification, then its benefits
should stand out even on ta.ques sown with the same crops. In other words ,
a landowner should be able to reduce his portfolio's variance by spreading
his holdings across different taques, and he should be able to do so even if
35 l\1cCloskey docs not deny the importance of growing different crops, and he might rightly argue that both scattering and crop diversification reduced risk. The issue then is whether scattering provided much additional insurance. If it did , then we could detect the effect of scattering by looking at. the returns correlations between royages growing different crops. These correlations should be much lower when the royages are in different villages and the effect of scattering is more pronounced. For the royages, though, they are hardly lower at all: they average -0.230 for royages in the same village and -0.233 for different villages, which suggests that scat.t.ering's contribution was minimal. Output correlations for taques lead to t.he same conclusion.
47
the taques grew identical crops.
V./a.s this possible on the taques? Consider, for example, the taques in
royage three in Onna.ing. They all grew the same crops, year in and year out.
If the royages "·ere indeed large and heterogeneous, then the six ta.ques in
roya.ge three must have offered considerable opportunity for diversification by
scattering alone. The returns correlations suggest, however, that these taques
provided little in the wa.y of insurance. Although their returns correlations
are not as close to one a.s some from the roya.ges, they are still quite high:
they range from 0.743 to 0.960 (Table 2.7). None are negative. And the
correlations are just a.s large for the other taques that grow the same crops
- for instance, those in royage six in Quarouble.
There is a.not.her way to appreciate how meager were the benefits to scat
tering across the taques in royage three: solving the portfolio problem. If we
solve it for a. landowner who can divide his holdings among these taques, we
quickly see how little insurance scattering brings in the absence of crop eli
versification (Table 2.8). The solution with the lowest possible variance -one
that might appeal to an ultra. cautious landowner - had an expected return of
0.412 and a variance of .002-167. lt was scattered, but one could do almost as
well without any scattering a.t all, simply by holding land in a. single taque,
taque five, \\'hich returned .0404 and had a. variance of .0025:3. Similarly a
landowner could concentrate his land in taque three and achieve a return
of .0507 and a. variance of .OOL1194. To get a. similar return (.0505) along
the mean variance frontier, he would have to scatter his holdings over three
ta.ques, yet his portfolio ,.<Hia.nce would diminish only slightly to .003943.
Gone were the gigantic recluct.ions in variance that a. landowner could enjoy
48
by holding different roya.ges and diversifying his crops!
One might argue that limiting the landowner to the taques in royage three
is too restrictive. \iVhy not let him range over the eleven taques in royages
three and six? Although they all grew the same crops, they spread over two
villages and so offered ample opportunity for scattering to work its supposed
magic. Yet adding the five extra taques from royage six did little to reduce
the portfolio variance (Figure 2.2). Usually it declined by less than 5 or 6
percent with the addition of the extra taques, even though they allowed the
landowner to hold land in Quarouble instead of just Onnaing.36
Not that scattering was cotnpletely ineffective. If we consider the port
folios made up of land from the taques in royage three, we see that many
along the mean-variance efficient frontier involved some scattering (Table
2.8). Furthermore, holding a. scattered portfolio was clearly superior to con
centrating one's land in a plot such as ta.que four. 37 But by and large,
scattering did little to reduce the portfolio's variance, and as insurance it
paled to insignificance besides crop diversification. After all, a. landowner
could protect himself simply by rotating his crops; he did not have to scatter
his fields.
36The royage six taques did contribute somewhat. more at higher rates of return. \Vith only taques from royage three. for example, the highest achievable expected return was .0534 with a .006013 variance. \\'ith the addition of taques from roya.ge six, the optimal portfolio of assets "·ith nearly the same return (.0535) included land in taques three, six, seven, and nine: it.s variance was .04 738, some 22 percent below that of the portfolio restricted to t.he taques from royage three.
37In equilibrium. t.he price of taque four would presumably decline enough so that it too would be held. The imputed rent. on t.aque four is probably too high and the return too low - a sign that. "·e undoubtedly erred slightly in correcting for rent differences among the taques. Such errors, though, should not disturb our results, because the returns correlations matrix would remain nearly the same.
49
2.5 Conclusions
On the basis of the results for taques, it is impossible to conclude that scat
tering provided much in the way of insurance. This is somewhat unfortunate.
McCloskey's description of scattering as a response to market failure to pro
vide insurance opportunites is quite compelling. Yet, it seems that returns
on parcels of land within theses villages were too highly correlated to sub
stantiate his claims. Certainly, scattering provided something in the way of
portfolio variance reduction since returns were not perfectly correlated across
taques. Yet , the magnitude of this reduction does not appear to have been
large enough to have counterbalanced the inefficiencies associated with scat
tering. This analysis suggests that scattering cannot be explained solely by
risk aversion on the part of peasants.
If scattering provided so little insurance, why did it persist? The answer
may lie with Fenoaltea.'s ideas, revised to take into account the imperfections
of the pre-industrial labor market. Or it may lie with the workings of the land
market, as Bruce Campbell has proposed. 38 But for the moment scattering
remains what it. has long been, a matter of mystery.
38Campbell [1980]. He attributes scattering at. least in part to the workings of the land market, but he fails to explain why buyers did not prefer consolidated holdings. If they did, then the land market should have led to concentration, unless it was obstructed by some intriguing imperfection.
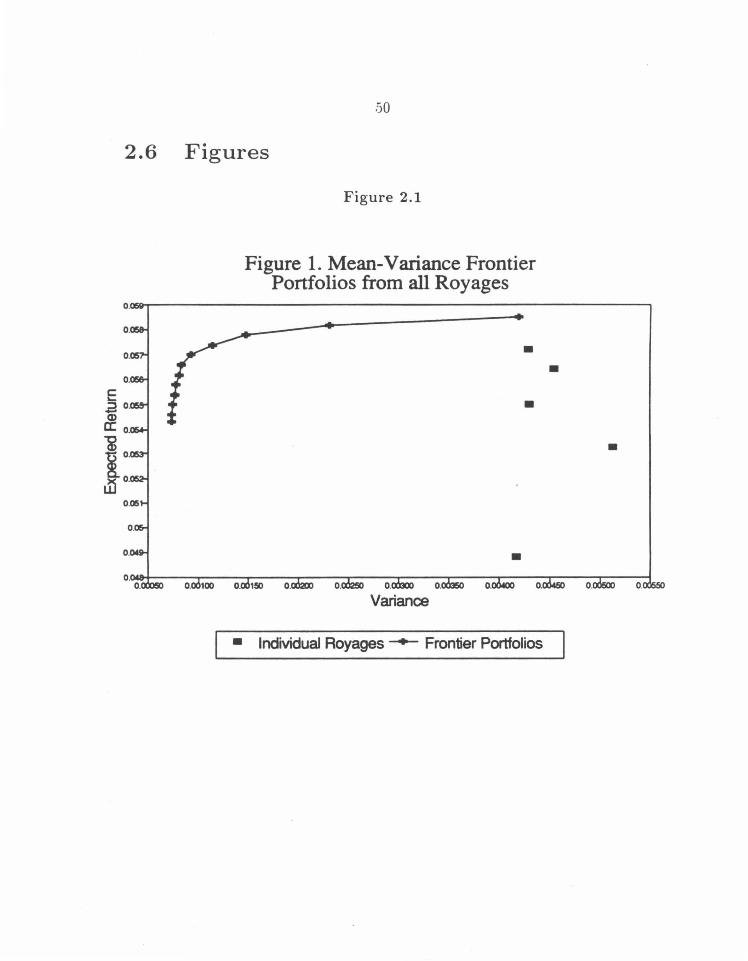
.so
2.6 Figures
0.
0.
0.
0.
c: '-.a 0. Cl> a: 0.
i io. Lti 0.
Figure 2.1
Figure 1. Mean-Variance Frontier Portfolios from all Royages
•
•
j • Individual Royages --+- Frontier Portfolios
•
•
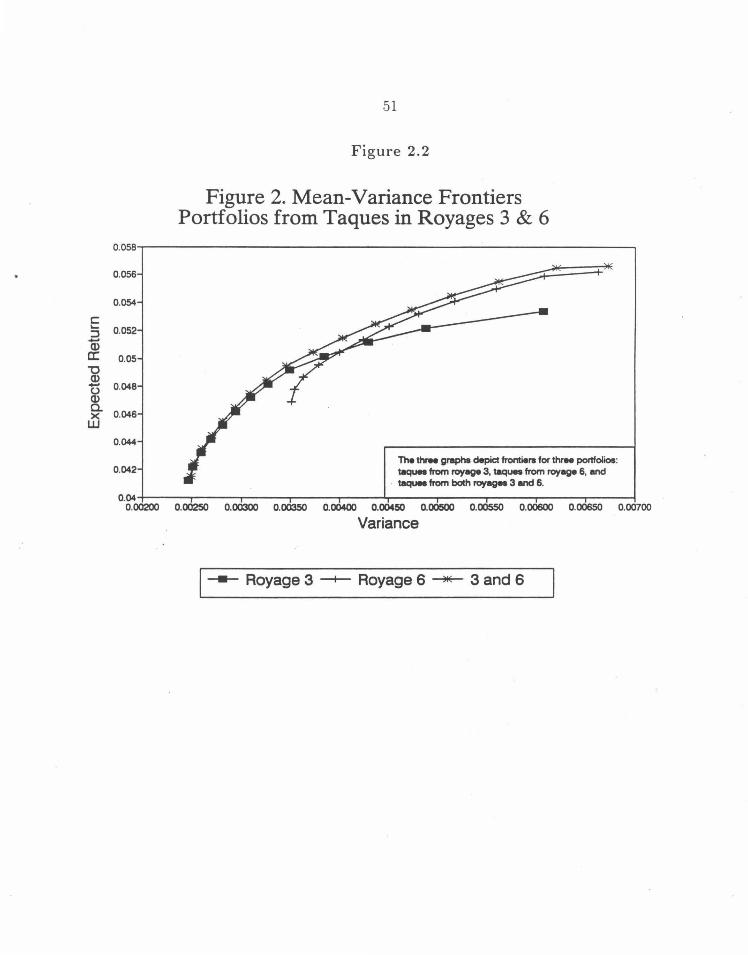
0.058
0.056
0.054
c .... 0.052 :J -Q.) a: 0.05 "0 Q.) - 0.048 (.) Q.) Q.
0.046 X w
0.044
0.042
0.04 0.00200
51
Figure 2.2
Figure 2. Mean-Variance Frontiers Portfolios from Taques in Royages 3 & 6
0.00250 0.00300 0.00350
The ttv.. grapha depict frontiers for thrM portfola: UlqUM from royage 3, taqun from royage 6, and
· t.quM from both royages 3 and 6.
0.00400 0.00450 0.00500 0.00550 0.00600 0.00650 0.00700
Variance
1-- Royage 3 -+- Royage 6 ~ 3 and 6

52
2.7 Tables
Table 2.1. VVheat Yield Correlations 1701-1790
Average correlation
Number of pairs
Standard deviation
Source: Morineau [1971]
Pairs of ta.ques within one
village
0.473
106
0.249
Pairs with one taque in
Onna.ing and one in
Quarouble
0.386
118
0.234
Note: The wheat yield correlations are averaged over all pa1rs of taques
growing wheat simultaneously including the espiliers. Both here and in all
subsequent calculations, data from 1740 were eliminated because the 1740
tithe was commuted to a. monetary pa.yment.
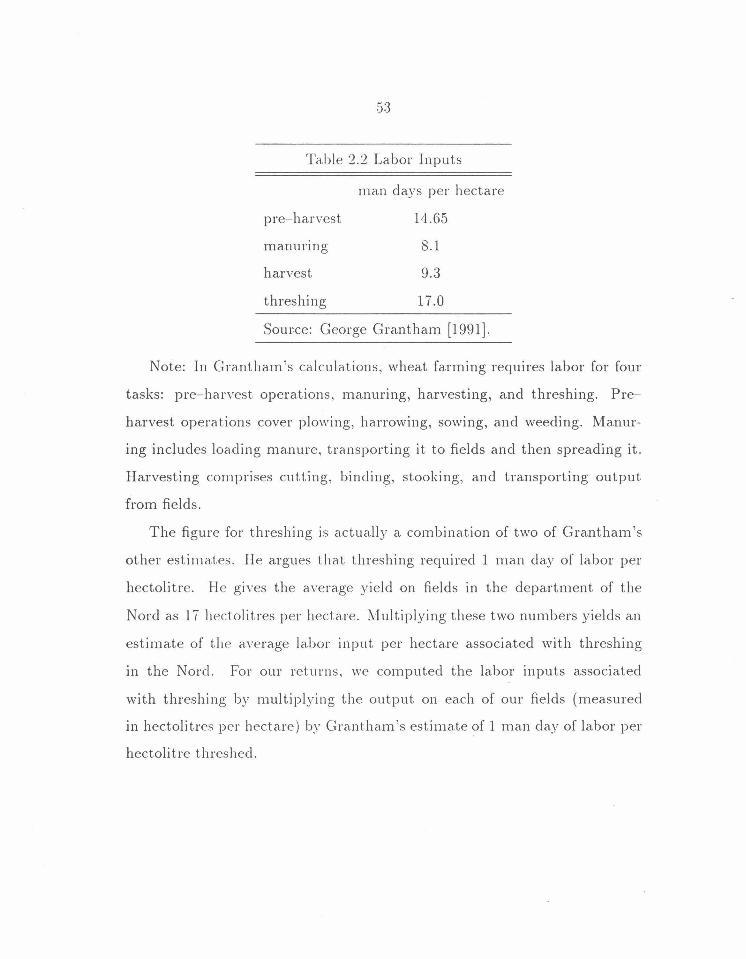
.s:3
Table 2.2 Labor Inputs
pre- harvest
ma.nunng
harvest
man days per hectare
14.65
8.1
9.3
threshing 17.0
Source: George Grantham [1991].
Note: In Grantham 's ca.lcu lations, wheat farming requires labor for four
tasks: pre-harvest operations, manuring, harvesting, and threshing. Pre
harvest operations cover plowing, harrowing, sowing, and weeding. Manur
ing includes loading manure, transporting it to fields and then spreading it.
Harvesting comprises cutting, binding, stooking, and transporting output
from fields.
The figure for threshing is actually a combination of two of Grantham's
other est im ates. He argues that threshing required 1 man day of labor per
hectolitre. He gives the average yield on fields in the department of the
Nord as 17 hectolitres per hectare. lVlultiplying these two numbers yields an
estimate of the average labor input per hectare associated with threshing
in the Nord. For our returns, \·Ve computed the labor inputs associated
with threshing by multiplying the output on each of our fields (measured
in hectolitres per hectare) by Grantham's estimate of 1 man day of labor per
hectolitre threshed.
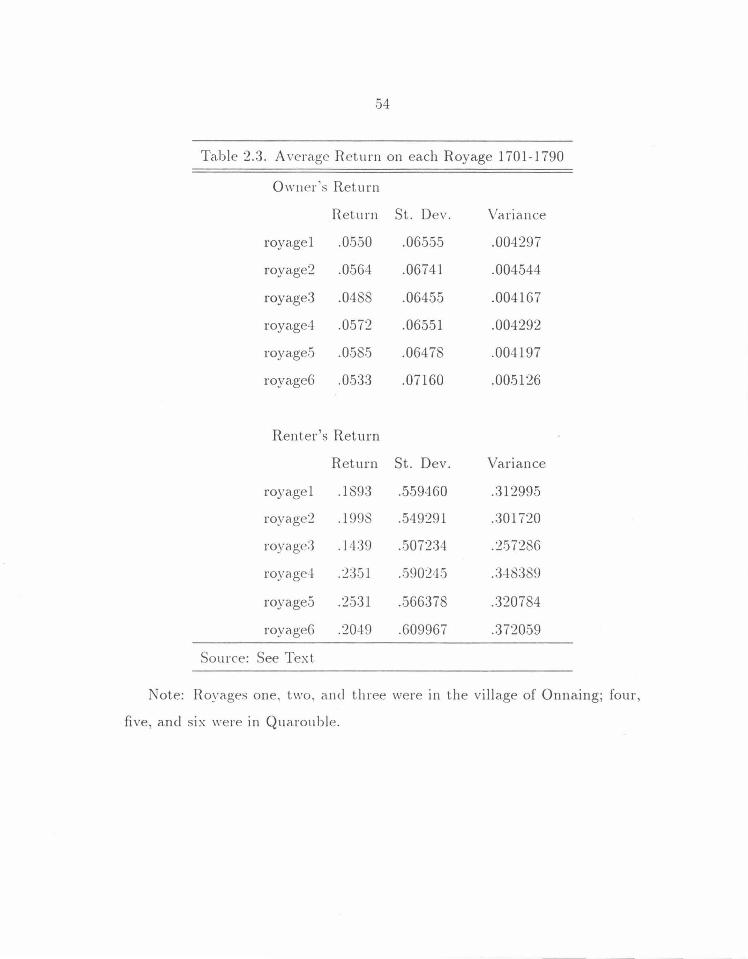
Ta.ble 2.3. Average Ret urn on ea.ch Roya.ge 1701-1790
Owner 's Return
Return St. Dev. Variance
roya.ge1 .0550 .06555 .004297
royage2 .0564 .06741 .004544
roya.ge3 .0488 .06455 .004167
roya.ge4 .0572 .065.51 .004292
roya.ge.5 .0585 .06478 .004197
roya.ge6 .0.5:33 .07160 .00.5126
Renter's Return
Return St. Dev. Va.ria.nce
roya.ge1 .1893 .5.59460 .312995
roya.ge2 .1998 .549291 .:301720
royagc:3 .1 <1:39 .. 5072:34 .2.57286
roy age-l . 2:351 .. 590245 .3-18389
roya.ge5 .2531 .566378 .320784
royageG .20-19 .609967 .372059
Source: See Text
Note: Royages one. two, a.nd three were in the village of Onna.ing; four ,
five, a.nd six were in Qua.rouble.
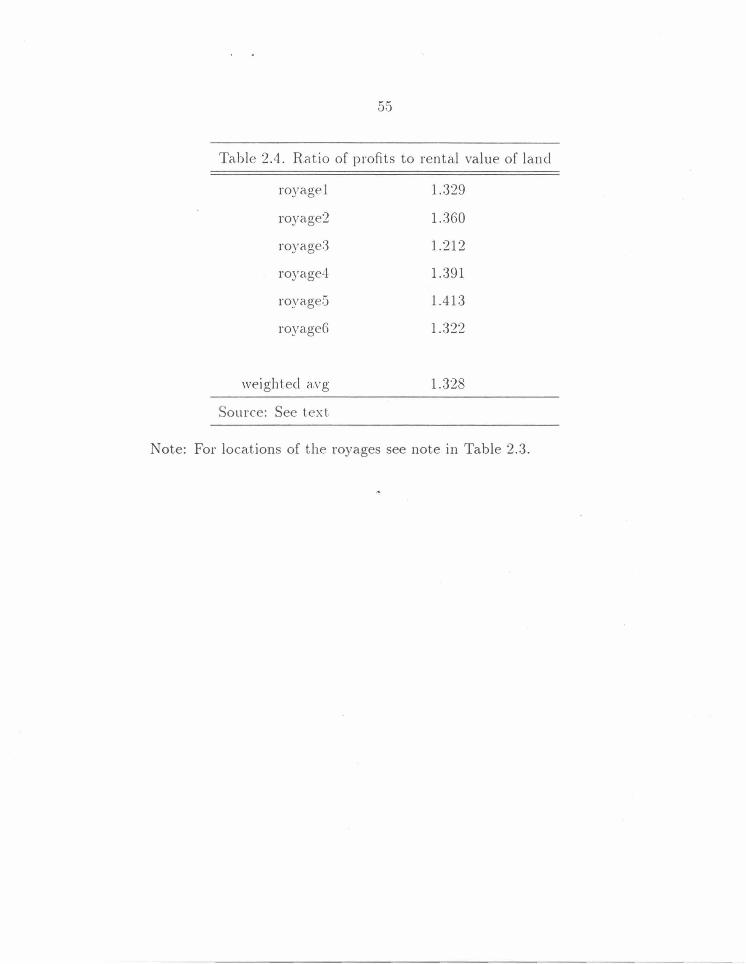
5.5
Table 2.4. Ratio of profits to rental value of land
roy age 1 1.329
royage2 1.360
royage:3 1.212
royage4 1.391
royage:j 1.413
royageG 1.:322
weighted avg 1.328
Source: See text.
Note: For locations of the royages see note in Table 2.3.
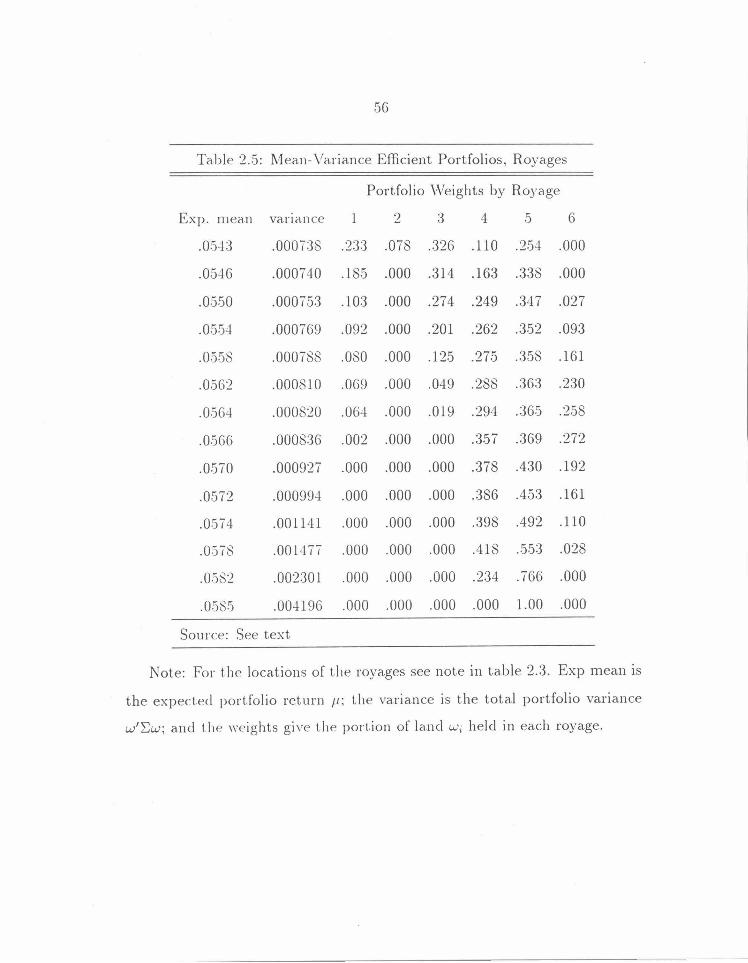
56
Table 2 .. 5: Mean-Variance Efficient Portfolios, Royages
Portfolio \!\'eights by Royage
Exp. n1ea.n va.na.nce 1 2 :3 4 .5 6
.05·'1:3 .0007:38 .2:3:3 .078 .:326 .110 .2.54 .000
.0546 .000740 .18.5 .000 .314 .163 .338 .000
.05.50 .00075:3 .10:3 .000 .274 .249 .347 .027
.0.554 .000769 .092 .000 .201 .262 .352 .093
.0558 .000788 .080 .000 .125 .275 .358 .161
.0562 .000810 .069 .000 .049 .288 .36:3 .230
.0564 .000820 .064 .000 .019 .294 .36-5 .258
.0:366 .000836 .002 .000 .000 .357 .369 .272
.0.570 .000927 .000 .000 .000 .378 .430 .192
.0572 .000994 .000 .000 .000 .386 .453 .161
.0574- .001141 .000 .000 .000 .398 .492 .110
.0578 .001477 .000 .000 .000 .418 .5.5:3 .028
.0582 .002301 .000 .000 .000 .234 .766 .000
.058.5 .004196 .000 .000 .000 .000 1.00 .000
Source: See text
Note: For t.he locations of the roya.ges see note in table 2.3. Exp mean is
the expected portfolio return fl; the variance is the total portfolio variance
w'Ew; and the weights give the portion of land w; held in each royage.
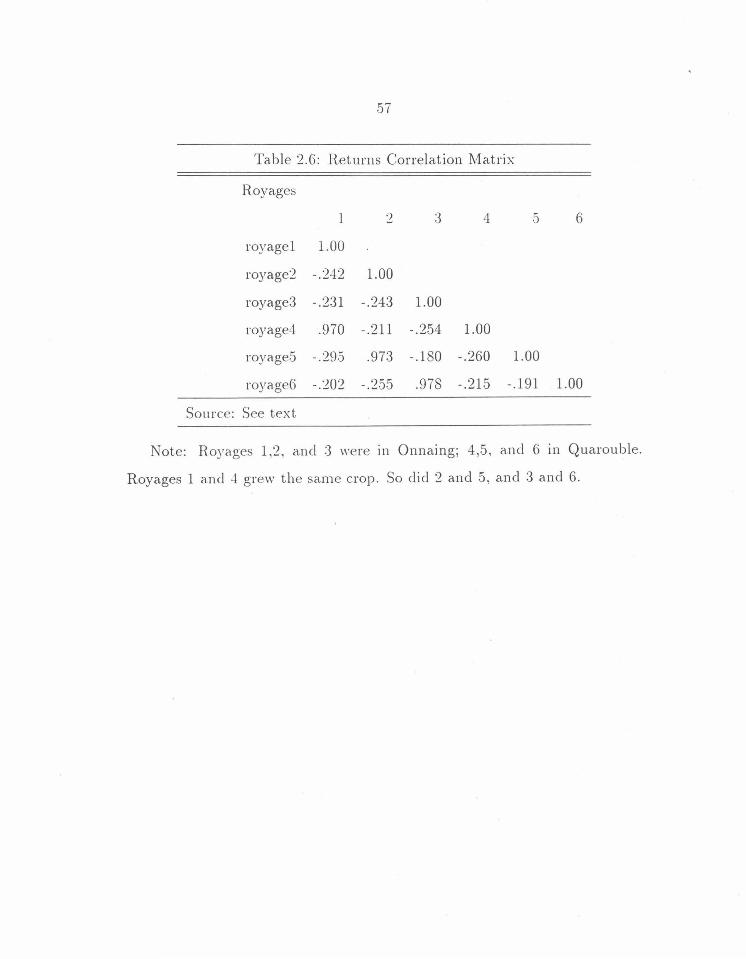
57
Table 2.6: Returns Correlation Matrix
Roy ages
1 2 :3 4 .s 6
royage1 1.00
royage2 -.242 1.00
royage3 -.231 -.243 1.00
royage4 .970 -.211 -.254 1.00
royage5 -. 295 .973 -.180 -.260 1.00
royage6 -.202 -. 255 .978 -.215 -.191 1.00
Source: See text
Note: Royages 1,2, and :3 were in Onnaing; 4,5, and 6 in Quarouble.
Royages 1 and .:j grew the same crop. So did 2 and 5, and 3 and 6.
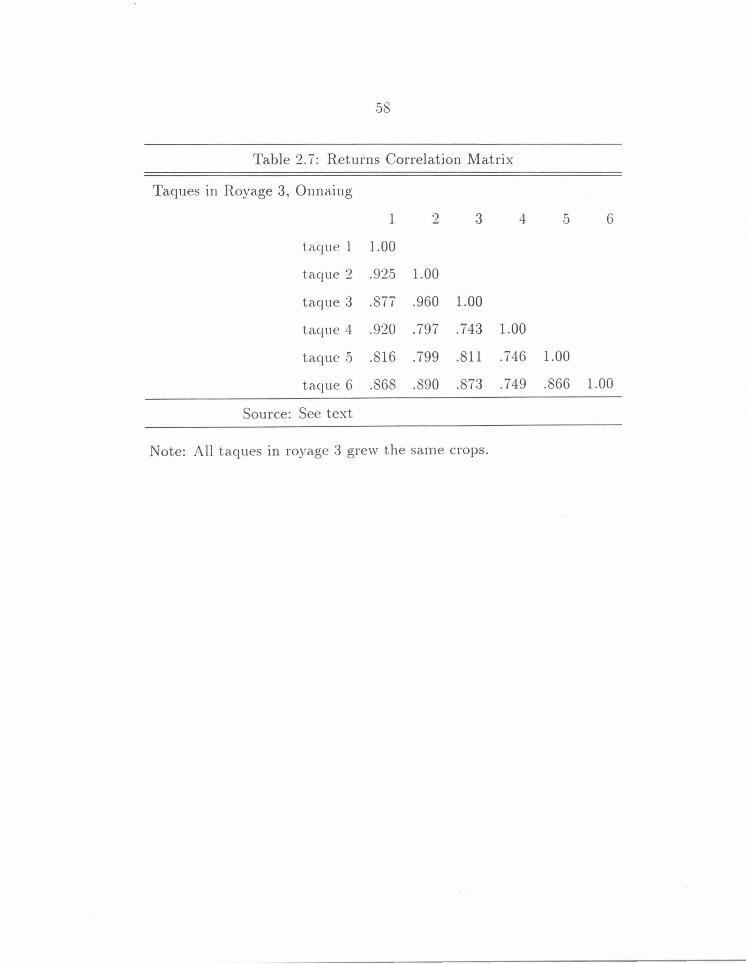
58
Table 2. 7: Returns Correlation Matrix
Ta.ques in Roya.ge 3, Onna.ing
1 2 3 4 5 6
ta.que 1 1.00
ta.que 2 .925 1.00
ta.que 3 .877 .960 1.00
ta.que 4 .920 .797 .743 1.00
ta.que 5 .816 .799 .811 .746 1.00
ta.q ue 6 .868 .890 .873 .749 .866 1.00
Source: See text
Note: All ta.ques in roya.ge 3 grew the same crops.
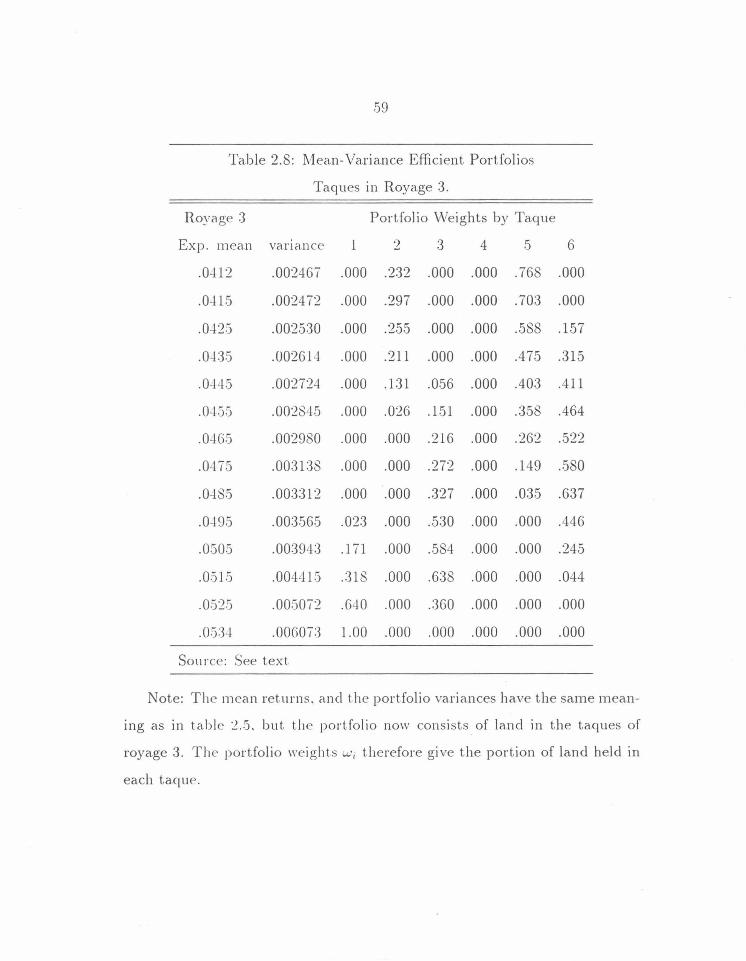
59
Table 2.8: Mean-Variance Efficient Portfolios
Taques in Roya.ge 3.
Royage :3 Portfolio Weights by Taque
Exp. mean vana.nce 1 2 3 4 5 6
.0412 .002467 .000 .2:32 .000 .000 .768 .000
.OcJl5 .002472 .000 .297 .000 .000 .703 .000
.0--125 .0025:30 .000 .255 .000 .000 .588 .157
.0-1:35 .002614 .000 .211 .000 .000 .475 .315
.OcJ45 .002724 .000 .131 .056 .000 .40:3 .411
.0 -1 ~)5 .002845 .000 .026 .151 .000 .358 .464
.0-165 .002980 .000 .000 .216 .000 .262 .522
.0475 .00:31:38 .000 .000 .272 .000 .149 .. 580
.0-18.5 .003:312 .000 .000 .327 .000 .035 .637
.0-195 .00:3565 .02:3 .000 .530 .000 .000 .446
.0505 .00394:3 .171 .000 .584 .000 .000 .245
.0.515 .004415 .:318 .000 .6:38 .000 .000 .044
.0.525 .005072 .6LJ0 .000 .:360 .000 .000 .000
.0.5:3--l .00607:3 1.00 .000 .000 .000 .000 .000
Source: See text.
Note: The mean returns, and t.he portfolio variances have the same mean-
ing as in table :2.5. but the portfolio now consists of Janel in the taques of
royage 3. The portfolio ,,·eights '-'-'i therefore give the portion of land held in
each ta.q ue.
60
2.8 References
Abel, William. 1978. Geschichte der deutschen Landwirtschaft, 3rd edition.
Stuttgart.
Allen, Robert C. 1988. "The Growth of Labor Producti,·ity in Early Modern
English Agriculture." E.1:plorat.ions in Economic Histo ·,·y, 25, 117-46.
Allen, Robert C. 1988. "Inferring Yields from Probate Inventories ," Journal
of Economic Hist01·y, 48, 117-125.
Allen, Robert C., and 0 Gracia, Cormac. 1988. "On the Road Again with
Arthur Young: English, Irish, and French Agriculture during the Indus
trial Re,·olution," Journal of Economic Hist01·y, 48, 9:3-116.
Ault, Warren 0 . 1972. Open Field Fanm:ng in Medieval Engla:nd: A Study
of Village Bv Laws. London.
Bloch, Marc. 1966. H·ench Rural Histo ·ry, trans. Janet Sondheimer. Berke
ley and Los Angeles. First published, 1931.
Boulay, Henry. 1902. De Ia dispersion des pmprietes et des moyens d 'y
1·emedier, Nancy.
BrockwelL Peter .] . and Richard A. Davis. 1987. Time Series: Theory and
Methods. New York.
Campbell, BrucP 1\LS. 1980. ··Population Change and the Genesis of Com
monfielcls'· in Economic History Review, 2nd series, 33 , 174-192.
Chapelot, Jean and Fossier, Robert. 1985. The Village and the House in the
1\fiddle Ages, trans. Henry Cleere. Berkeley and Los Angeles.
de Beauville, Victor. 1875. Histoire de Ia ville de Mont.didie ·r, 3 vols. Paris.
Demangeon. Albert. 190.5. La plaine picarde: Picm·die. A1'fois, Cambresis ,
61
Beauvaisis: Etude de geographie su1· les plaines de c1·we du nm·d de La
France, Paris.
Deyon, Pierre. 1967. A miens, cap£tale provinciale: Ehtde sur la societe
U7'bain e au 17 siecle, P aris.
Dybvig, Philip H. 1984. "Short Sales Restrictions and Kinks on the Mean
Variance Frontier." Journal of Finance, :39 ( 1), 239-44.
Fenoaltea, Stefano. 1988. '"Transaction Costs, vVhig History, and the Com
mon Fields," Politics and Society, 16, 171-240.
[France] Ministere des finances, 1893. Proces-verbau:r de la commission ex
trapadem.entaire du cadastre institue au l\1inistre des financ es ( decret du
30 mai 1891). Docum ents annexes au:z: proces-verbaux, Fascicule 4, Paris .
Grantham, George. 1991. "The Growth of Labor Productivity in Wheat in
the Cinq Grosses Fermes, 1750-1929," in Bruce Campbell and Mark Over
ton , eels .. Land, Labmrr, and Livestock: Studies in European Ag1·icultural
Prodv.cfion, f\Ianchest er.
Guignet, Philippe. 1977. Mines, manufactures et mwriers du Valenci ennois
au XVIII' s iecle, New York .
Hoffman , Philip T. 1988. ·' Institution s and Agriculture 111 Old Regime
France,'' Politics and Society, 16. 2':11-64 .
Hoffman , Philip T. 1990. ··Social History and Agricultural Productivity: The
Paris I3asin , 1450-1800," California Inst itute of Technology Social Science
Working Paper 742.
Hoffman, Philip T. 1991a "Land Rents and Agricultural Productivity: The
Paris Basin , 1450-1789." California Institute of Technology Social Science
\Vorking Paper 7-52 .
62
Hoffman, Philip T. 1991 b "Land Rents and Agricultural Productivity: The
Paris Basin, 14.50-1789,·' Jounwl of Economic Hist01·y, 51 ( 4 ), 771-805.
Hottenger, George. nd. La propriete rumle: Jl1orcellement et remembrement,
Paris-Nancy, pp. 67-70.
Ingersoll, Jonathan E. 1987. The Theory of Financial Decision Making,
Totowa, NJ.
Lefebvre, George. 19.59. Les paysans du .Nord pendant la Revolution
fmnr;aise, Paris. abridged edition, Ba.ri. Origina.lly published 1924.
Markowitz, Harry l\1. 1987. Mean- VaTiance Analysis in Portfolio Choice and
Capital !\Iarl.:fls, Cambridge, l\'IA.
McCloskey, Donald N. 1972. ··The Enclosure of Open Fields: Preface to
a Study of Its Impact on the Efficiency of English Agriculture in the
Eighteenth Century," Journal of Econo·mic Hist01·y, 32, 1.5-35.
McCloskey. Donald N. 1975 ... The Persistence of English Common Fields."
in Europwn Peasants and Their Markets, \Villiam N. Parker and Eric L.
Jones, eels., Princeton. 7:3-160.
McCloskey, Donald N. 1976. "English Open Fields as Behavior Towards
Risk." in Research i11 Economic Hist01·y: An Annual Compilation of
Research. Pend Uselding. eel., volume 1. Greenwich, Conn: JAI Press.
124-170.
McCloskey. Donc-1ld. 1089. '·Til<' Open Fields of England: Rent, Risk, and
the Rat<' of Interest, 1:300- 1815," in David \11/. Ga.lenson, eel., A1arkets in
fhstory: Economic Studies of the Past, Cambridge .. 5-51.
McCloskey, Donald. 1991 ... The Prudent Peasant: New Findings on Open
Fields," The Jounwl of Economic Ihst.oTy, 51 (2), 3.r3-:355.
63
Meuvret, Jean. 1977-88. L e problem e des subsistances a l'epoqu e Louis XIV,
3 vols. Pari s.
Marineau , i\li chael. 1971. L es fau .<:-semblants d 'un dema1-rag e economiqtt e:
Ag1·iculture et dbnogmphie en H ·ance au XVIIr siecle, Paris.
Marineau, i\li chael. 1982. "Cambresis et Hainaut: des freres ennemi s? ," m
Prestations paysann es: Di;nes, rente fonciere et mo1wement de la p1·oduc
tion agricole ri l 'epoque prtindust1·ielle, eel. Joseph Goy and Emmanuel
Le Roy Laclurie, 2 vols. Paris. vol. 2, 625-64:3.
Newberry, David M.G. and Joseph E. Stiglitz. 1981. The Th eo·ry of Com
modity Price Stabili::alion: A Study in the Economics of Risk, Oxford.
Overton, Mark . 1979. ··Estimating Crop Yields from Probate Inventories:
An Example from East Anglia., 1585-1735," Joumal of Economic Hist01·y,
39, 363-78.
Overton, i\lark . 198-!. '·Agricultural Productivity in Eighteenth-Century
England : Some Further Speculations ," Economic History R eview, 2nd
series, 37. 2-1-!-.51.
Rosener, Werner. 1986. Bau en1 im !lfittalt er, Munich.
Si very, Gera rei. 1977. Structures agraires et vie 1"ttmle dans le H ainaut (i, la
fin du Moy en- .-lge, Lill e.
Tessier, Alexandre- Ilenri. 1787-1821. Encyclopedie m eth.odiqu e ou par o1·dre
de mafitrcs: .·lgricultu n, 7 vols. Pari s.
Thirsk, Joan . Hl64 . "The Common Fields." Past and P1·esen t. 29, 3-25.
Turner, Mi chae l. 1982. "Agricultural Productivity in the Eighteenth Cen
tury: E,·ide nce from Crop Yields," Economic Histo1·y R eview, 2nd series ,
3-5, 489-510.
64
Turner, Michael. 1984. ··Agricultural Productivity in Eighteenth-Century
England: Further Strains of Speculation," Economic Hislo1·y Review, 2nd
series, 37, 252-57.
Wilson, C. H. H)/7. "The Historica.l Study of Economic Growth and Decline
in Early lVIodern History," in The Camb1·idge Economic Hist01·y, vol. 5:
The Economic Organi:::ation of Early Modem Eumpe, JVI. Postan, D. C.
Coleman, and Peter Mathias, eels., Cambridge.
Yelling, J. A. 1977. Commo11 Field and Enclosure tn England 1450-1850,
London.
Young, Arthur. 1931. Voyages en France en 1787,1788, et 1789. Henri See
ed. and translator, 3 vols. Paris.
--- ---- --------------------------------------------
65
Chapter 3
One Market, Two Markets,
Three Markets, Four? The
Network of Finance: Capital
Market Integration- the U.S.
and the U.K, 1865-1913
3.1 Intro d u ct ion
This chapter sets out to accomplish four main objectives. The first is to argue
that one recent attempt to measure nineteenth century capital market inte
gration is inadequate because of its focus on correlations in price movements
between similar securities offered by different countries. Such an approach

66
addresses neither the range of securities offerings in respective countries nor
the extent of inter-country capital flows. The present study, however, focuses
on both of these questions for two countries - the United States and Great
Britain- from 186.5-1914. The second aim in the chapter is to quantify the
British contribution to American economic expansion by measuring the capi
tal flows through the London Stock Exchange to U.S. companies. These flows
are then disa.ggregated by region and by industry. \ ,Yhen compared with se
curities listings from the New York Stock Exchange, the disaggregated flows
are used to demonstrate that London serviced a wider array of economic sec
tors and regions in the U.S. than did the New York market. Cataloguing the
listings discrepancies between the two exchanges becomes the third objective
of the chapter . Finally, a simple explanation for the discrepancies is put
forth which suggests that U.S. securities li sted in London were riskier than
those listed in New York. Using price and dividend data from the London
Exchange, returns are calculated for two groups of stocks - those solely listed
in London and those jointly- listed in London and New York. Price volatility
and returns measures from the two groups demonstrate that many "London"
issues were less risky than typical jointly listed issues. The data indicate that
the simple risk/ret.urn explanation is simply inadequate, and must revised.
3.2 The Probletn:
This is the story of two cities and two nations. In 1870 greater London was
a city with a population of more than three million, the political capital of
what was arguably the world's richest country and of what was una.rgua.bly
67
the world's greatest empire. 1
More importantly for this story, it was also the location of "The City''-
the world's un challenged financial center. In the same year, New York vvas a
city of less than one million , the business, but not the political, capital of a
rapidly developing, but certainly not yet fully developed, country and home
of \Vall Street- a. maturing, but yet far from mature, domestic capital market.
In 1914, greater London was a. city of more than seven million people, the
capital of a country that, although still rich, could no longer argue that it
had the highest per capita income; but a city that exercised at least nomi
na.! political control over almost twenty-five percent of the earth's land mass
and that contained a financial center that, while still unquestionably the sin
gle most important capital market, no longer commanded the unchallenged
monopoly position that it had held forty years before. 2 New York was a.
city of more than five milliou people, the business center of the world's lead
ing industrial po\\'er, and the seat of a. highly developed domestic financial
1The question of relative incomes is a difficult. one. If the mea.sure is GNP per capita. (unadjusted for price differences), Drit.ain had the highest per capita income in the world. If an attempt is made to adjust. for differences in purchasing power, the answer-as between the U.K. and the U.S.-lies with the choice of weights and prices. Kuznets speculated that the U.S. may lu1ve passed the U.K. sometime between 1840 and 1869.
In 1870 per capita gross national product was about $250 in the UK and $165 in the US. By 1914, the figure for the US was $408 and that for the UK $365. It. has, however, been estimated that. in 1913 one-tent.h of Dritish national income was earnings on investment abroad. Making a similar adjustment for the 1914 figures , indicates that income in the UK and the US were very similar ($--!08 vs. $402), if price differences are ignored.
In 1870, for example, Britain ami t.he empire encompassed an area of 9,540,000 square miles popula.t.ed . in 1872, by an estimated 205,000,000 persons.
2 It is not clea r "·hat. level of political control Britain exercised over the self governing colonies-Australia. Canada, New Zealand, and South Africa. It is also not clear just how much control was exercised over t.he very underdeveloped colonies in Africa and Asia ..
68
market-a market that, while still not directly challenging its London coun
terpart, was beginning to take on international overtones. The old order had
not yet been swept away, but it had been markedly altered. No longer did
London bankers refer to their New York competitors as hicks, or country
cousms. In fact, when, in 1911, Edward Holden, the managing director of
the Midlands Bank and Britain's most distinguished commercial banker, wa.s
visited by an American colleague, he not only entertained the visitor in his
home but also loaned him both his Rolls Royce a.nd his chauffeur for a tour
of the British Isles.
Recently, Robert Zevin has reintroduced the subject of the degree of inte
gration of nineteenth century international financial markets.3 In a.n impor
tant contribution to the literature on the development of financial markets,
he argues that the evidence indicates no mid-twentieth-century technical or
institutional re\'olution, but shows instead that the capital markets in Ams
terdam, London, New York, and Paris were well integrated by at least the end
of the last century and probably ea.rlier. 4 Nor, suggests Zevin, has the recent
past proclucecl any significantly greater degree of integration. He concludes
that those four markets were at least as well integrated in the decades before
the First \Vorlcl \Var as the world's major financial markets are today. He
argues that t.he i11stitutional structure that provided the foundation for the
3 Robert D. z c,·in. "Are " 'oriel Financial Markets More Open? If So '-'~'hy and with vVhat Effects?" "'orking Paper Number 79 of the '-'~'orld Institute for Development Economics Research of the Unit.ed Nations, October 1989. The paper is t.o be published in Fina11cial Openness and /llational A ufo11omy.
4 Zevin argues "that. financial markct.s were strongly integrated across northwest. Europe by the early tigltteenlh cent.ury, if not sooner."
69
well integrated late nineteenth century transnational market was provided by
the gold standard, and that, the telegraph aside, integration did not depend
on modern innovations in communication or exchange technology.
In the case of the U.S.A. and the U.h .. there is little doubt that there
ha.d been a substantial and long-standing international financial connection
a. connection that, in some dimensions, antedates the adoption of the Federal
Constitution. In the last ana.lysis, the British had absorbed a large part of the
American debts incurred during the Revolutionary \rVar and, within less than
a. quarter cent.ury. those arising out of the Louisiana Purchase- debts that had
initially been funded by the French and Dutch. Those same British financiers
had made temporary loans to tl1e Second Bank of the United States within
three years of the Treaty of Ghent; British mercantile houses had carried
much of the short term debt arising from trade between the two countries;
and investors from Bristol to Edinburgh had rushed to purchase the American
state and state guaranteed bonds issued to finance the transport expansion
of the 18:3Qs. ·5
Although the figures a.re subject to a. significant level of error, it is es
timated that total foreign investment in the U.S. exceeded $250 million in
18.53, had risen to $2 billion by 1883, and may have been as much as $7
billion at the out break of the First World War. 6 Of this total, the British
5 See Lel;md H . .Jenks, The Jlligration of British Cap1tal to 187.5, (London: Thomas Nelson and Sons Ltd .. 1963), Chapt.cr III.
6 The 1853 cst.inl<-tte of $222 million excludes commercial and bank debts and direct ownership of land and business enterprise. The estimates for 1914 range from $4.5 to $7.0 billion. The lower figme is from Reu1cw of Economic Statistics. Vol. I, p. 230 the larger from Harvey E. Fisk, The /ntc7·-AIIy Debts, p. 312. All estimates are reported in Cleona Lewis, Amerira 's Stake in /nlernaliona/Jnvestments, (VVashingt.on D.C.: The Brookings
70
fraction is thought to have been as high as 90 percent in 1861, SO percent in
1881, 70 percent in 1901, and 60 percent in 1911. 7 Thus, British investment
in the U.S. may have been as high as $1.6 billion in 1883 and $3.9 billion in
1914.8
Although the institutional arrangements that structured 19th century
Anglo-American financial transactions makes precise demarcation difficult,
of that total, about $3.4 billion was probably portfolio and the rest direct
investment. For the purposes of this study, the direct-portfolio distinction is
unimportant. The central focus is on the institutional network that linked
American enterprise with British finance; and, to that end, it makes no
difference whether an American company sold its securities in the U.K. or
whether the American firm was opened or purchased by a group of British
promoter/financiers who then marketed the new or reconstructed enterprise's
stocks and bonds in their country.
Nor were the British investments in the United States limited to govern
ment and transport issues. The range and scope of those financial commit
ments is illustrated by Cleona Lewis' estimates of the distribution of direct
investments. In addition to thP finance directed toward railroads, insur-
Institution. 1938), pp. 518-519. 7Thcse proportions are derived from 1\Iatthew Simon, '·The Pat. tern of British Portfolio
Investment. 1865-1914." in J. H. Adler. Capital Movements and Economic Development, (New York: l\Iacmillan. 1967) and '·The Unit.ed Stat.es Balance of Payments 1862-1900" in T1·ends i11 the A111encan Economy in the Nineteenth Cent1t1·y, National Bureau of Economic Research, St.udics In Income \•\'ealth, Vol. 24, (Princeton, N.J.: University Press, 1960) by John H. Dunning, Studies in International h11•estment, (London: Allen & Unwin, 1970), pp. 178-181.
8 iluckley and Roberts put the 1914 figme at $4.0 billion. Pet.er J. Buckley and Brian R. Roberts, Eumpean Direct h11•estmeut i11 the USA before World War I, (New York: St. Mart.in's Press. 1982). p.12.

71
ance compan1es. and banks, she concludes that in 1914 British investment
in land-holding companies probably totaled $40 million, cattle companies $6
million, mining companies $56 million, oil companies $35 million, breweries
and liquor companies $58 million , other miscellaneous commercial and in
dustria.! companies $:36 million , and mortgage companies between $200 and
$250 millionY
The evidence of substantial investment by one country in the economy
of another is not. however, evidence of financial market integration. Such
financial flows may merely reflect a recognition by investors in one country
of potential profit opportunities in another. Opportunities that , because of
institutional failure (or, if one prefers, high transactions costs), cannot be suc
cessfully exploited domesti cally. Zevin recognizes the problem, and he does
not include the magnitude of international capital movements in his measure
of the degree of market integration. Instead, his definition of transnational
integration combines two distinct , but not unrelated, concepts: (1) that the
integrated system is efficient. i.e., that it represents "a single efficient system
for disseminating and responding to information"; and (2) that the assets
traded on tlw n;-1! ional markets (for example, Amsterdam and Paris or Lon
don and New York) are "close but [perhaps] imperfect substitutes" for each
other.
For eviden ce of the first. - tlw efficiency of nineteenth century markets -
Zevin turns 011 Oskar l'v1orgenstern 's studies of the relationship between move
ments of interest rates, bond yields, and stock prices on six pairs of inter-
9 Lcwis. Am er·ica '.s Stake in Jutcnralional Investment, chapter 5.
72
national financial markets (London-Paris, London-Amsterdam, London-New
York, Paris-Amsterdam, Paris-New York, and Amsterdam-New York). 10 For
example, using monthly data. for the years January 1876 to July 1914, Mor
genstern shows that the average correlation between "Nominal Short Rates"
in the six pairs of markets was .54. In contrast, in the more recent past, the
correlation (a. correlation that employs annual, not monthly, data.) between
West Germany, Japan, the US, and the UK was .15 for the years 1960-1970,
.59 for 1971-1980, and .78 for 1981-1987.11 Zevin is interested in world capi
tal market i11tegration, and he is concerned with the London-New York pair
only because it represents one-sixth of his nineteenth century story. In terms
of this discussion. however , the London-New York connection is central; and,
for tha.t city pair, the evidence on British-American integration may be less
compelling than the l\1orgenstern summary figure suggests. While the aver
age for the six city pairs is , indeed, .. 54, the average for the three pairs that
include New York is only .40. 12
Zevin 's e\·idence for the second characteristic of an integrated market,
near perfec t substitutability between assets, is more difficult to assess. Draw
ing on the recent work of Larry Neal , he concludes that "speculative money
10 0skar 1\lorgensteru. Int ernalional Finan cial Tmnsactions a11d Business Cycles, National Durcau of Economic Resea rch. Study in Business Cycles, Vol. 8, (Princeton N.J .: Princeton UniYcrsit.y Press, 1959), pp. 98-123.
11 It is quite possible that. it. is t.hc usc of annual data for the more recent past and monthly dat.a for the earlier period t.hat. gives Zevin his results.
Also, the use of nominal ra t.cs as opposed to real ra t.es ma.y induce artificially high correlations. At. t.he \·cry least.. nominal rat.es produce somewhat. misleading results.
12The figure for New York-London is .45 , New York-Berlin .40. and New York-Paris .36 . In cont.rast. , the average for t.hc t.hrce pairs over the years January 1925 to December 1938 is .93, .77, and .3-l. respectively. See Morgens tern, International Financial Transactions and Busin ess Cycles. p. 105.
moved swiftly from one country to another as early as 1870"; but speculative
money hardly· covers the entire range of paper securities that 'vvould be traded
on a fully integrated ca.pi la.l market. 13 As for the rest, Zevin merely asserts
that "a growing multinational closs of portfolio investors perceived securities
of different national origin but similar characteristics a.s close substitutes be
cause of comparable transactions costs, low information costs and the absence
of serious currency exchange impediments." It is with these latter classes of
securities that questions about the degree of formal structure in the financial
network that connected Britain and America. in the late nineteenth century
do not appear to have been adequately answered.
In short, the eYidence here will indicate that, until the end of the nine
teenth century, at the very least. the London capita.! market wa.s institu
tionally more cJe,·eloped and served a. far more sophisticated group of savers
than its New York competitor. 14 Obviously the two markets did not exist
in isolation, but it. appears that a. substantial fraction of the American se
curities traded in London were not even imperfect substitutes for many of
the stocks and bonds traded in New York. That is to say, while the British
contribution to American capit.al formation was never large, the financial
flows were 1101. tri,·ia.l: and .. more importantly, they were often targeted at
economic act.i,·it iC's that lay outsiclf' the scope of the still embryonic Ameri-
13Larry Neal, '"The Intcgrat.ion and Efficiency of the London and Amsterdam Stock lVIarkets in t.he Eight.eent.h Century,"' Th e Journal of Economic History, March 1987, pp. 97-115.
14 For a. more extensive development. of this point see Lance Davis, "The Capital Markets and Industrial Concrnt.ration: The U.S. and U.K., A Comparative Study," Economic History Reviell'. Second Series. Vol. XIX. No . 2. 1966.

74
can financial market. Moreover, they were particularly important during the
last two decades of the nineteenth century when the American economy was
undergoing a very rapid structural transformation .
The actual size of those transfers is still the subject of some dispute, but
an examination of the American capital called up on the London market
provides some clues as to the magnitude as well as the spatial and industrial
distribution of those financial flows.
7.5
3.3 American Capital Called on the London
Stock Exchange.
Although the actual size of aggrel?ate capital flows to the U.S. is still the
subject of some dispute, a significant portion of the flows from the largest
supplier, Great Britain, was recorded in rich detail. An examination of the
American capital called up on the London market provides clues as to the
magnitude as well as more precise estimates of the spatial and industrial
distribution of those financial flows. 15
John Dunning has reworked and combined the estimates of Albert Im
lah and Matthew Simon to produce a series on British Investment in the
United States between 1861 and 191:3. 16 Lance Davis and Robert Rutten-
150ne word of caut.ion. 'Vhile it. is sometimes possible to unambiguously classify a firm into the appropriate industry-a railroad is usually (but not always) a railroad-there a.re sometimes questions. In particular it is sometimes difficult t.o distinguish between an agricultural firm t.hat. owns several ranches (Agriculture&: Extractive Sector), a. Financial Land and Development Company (also Agriculture & Extractive Sector) that owns a. portfolio of ranches. and a Trust (Finance Sector) that owns of portfolio of ranching securities. ""hen t.hcrc was any doubt the classification adopted by the Stock Exchange Annual Year Book has been employed.
16 John H. Dunning. Studies in fnlenwtional Investment. (London: George Allen & Unwin. 1970). Chi-lpler 4, '·British Investment. in t.he United States 1860/1913. pp. 143-89. Cited hcrcaftn as Dunning. Studies in Iut.ernatioual Investment. By adjusting two other series of ncl capital flows derived using balance of payments estimates, Dunning arrives at est.imatcs of gross capital exports from Britain to the United States. The two series that. fonn t.hc foundation for the Dunning estimates are Albert Imlah's estimates of British uet. forl'igu investment. ( ··forcigu investment. by the U.K. minus investment. by foreigners in t.hc U. r._:. •• ), andl\ Ia t.t.hew Simon's estimates of net capital movements into and out. of the U.S. Imlah ·s estimates are found in Econ om.ic Elements in the Pax Britannica, (Cambridge: Hm\·md Universit.y Press. 1958) pp. 42-81.; Simon 's are from Matthew Simon, "The Unit.ed States Balance of payments 1861/1900," pp. 629-715, in Trends in the Americau Ecoii0111.1J iu the Ni11efeeuth Ce11tury, (Princeton: NBER, 1960). It should be further be not.<'cl t.ha t. the Simon estimate;; have been updated to 1913 by the U.S. Bureau
76
back, drawing on reports in The lnvesto1·s Monthly Manual and The Stock
Exchange Annual Yea1· Book, have produced a series on "Capital Called Up"
in the London market between 186.5 and 1913Y Table 3.1 displays both the
Dunning and the Davis and I-luttenback series as well as the results of an
attempt to merge the two sets of numbers.
The "Capital Called" series (Column 13) reflects the gross export of fi
nance from the U.I\:. to the U.S.; it is, therefore, never negative. Dunning's
estimates of U.l\:. Investment in the U.S. (Column 9) are net figures and show
periods (1876-1880 and1894-1901) when repatriations exceeded new security
purchases. Similarly, the flow estimates based on the Dunning-Imlah totals
and the U.S. proportions reported in Davis and Huttenback (Column 12),
while showing no negative flows. are also net of repatriations. As one might
expect, the estimates based on Capital Call ed (column 1:3) are generally much
above the Tmlah-Dunning based estimates of Total Financial Flows (column
12). For example, most of the $7:31 million difference between columns (12)
of the Census. Refer to Historical Statistics of the United Stales, \Vashington, 1960, p. 564. Each series is. of course. manipulated differently to arrive at the final estimates of gross U.K. capital export to the U.S. That both methods produce strikingly similar final estimates is tnkcn by Dunning as evidence of their accuracy.
17 Lauce Dcl\·is and Robert H ut.tenback. JIJ a mmo11 and the Pursuit of Empire: The Politi cal Econo111y of D1·itish Imperialism. 1860-1912, (Cambridge: Cambridge University Press, 1986 ), pp.3U-/2. Today. it "·otdd be normal t.o estimate flotations. In 19th century Britain, initial flot a t.ions frequently did not require that the purchaser pay the full price "up front.... Instead he was oft. en only asked to make an initial payment. and agree to make further payments (up to the amount of the face value of the security) when called upon in the futnre. Thus a "Capital Call" might represent the entire flotation or only some fraction of that total figure. In fact., there are many instances when the purchaser was never asked for t.he full amount.. One caveat: since the penalty for refusing to pay a call was limit.cd to forfeiture of the security, there is no guarantee that all calls were paid. Examination of the records of the stock exchange indicate that such potential distortions were, in fact., s111all.
77
and (13) for 1877, can be explained by a single $500 million U.S. government
refunding loan .
A comparison of the Dunning-Imlah and the Da.vis-Huttenback estimates
of the U.S. fract.ion of U.E. overseas finance provides some further insight
into the relationship bet\\"een the t\\"o series. One caveat, the Dunning-Imlah
series has been extrapolated by Dunning from a. series of cross section es
timates of British financial capital in the U.S. a.nd of total U.K. financial
capital abroad. 18 In any yea r observations are, therefore, heavily weighted
by past investment decisions. The Oavis-Huttenback series (both U.S. and
total U.K.) relate to new calls alone and carry no historical component.
Not surprisingly, the Davis-Huttenback estimates are much more volatile;
however , the causes of the significant differences in level between the two
series appear to lie elsewhere. \Vhil e both capture the peaks in the flows in
the early '70s and in the '90s, the lmlah series does not capture the minor
peak in the C'arly "80s nor the llOl-so-minor e levat ions in the first and second
quinquennia of t.he present century. Overall , the Da,·is-Huttenback series
indicate a some,,· hat lower fraction of U.K. overseas investment being directed
toward tlw U.S. While a. part. of that difference can be traced to the role of
British invf'st.ment.s made before 186::5 , much of it is associated with the 1880s.
18 Dunning, Slud1es 111 !nt en1alional hn•es tm ent Table 2, p. 151. The total U.K. capital abroad figmes <Ht' from Imlah, t.he estimat.es of U.K. capital abroad are from Jenks (1854), Cairncross (1870 and 1885). Bacon (1899), and Paish (1911). See A.H. lmlah , Economic Elcmenls of the Pax Britannica, (Cambridge, Ma.ss.: 1958); Leland H. Jenks, The Migration of British Capital to 1875, (London and elsewhere: Thomas Nelson & Sons Ltd., 1963) ; A.K. Cairncross, Hom e and Foreign Inves tment 1870-1910, (Cambridge: Cambridge Univ. Press , 1953); Bacon , '·America's International Indebtedness"; G . Paish, "Great Britain's Capit.al Investment in Individual, Colonial, and Foreign Countries." Journal of the Royal Stalislica/ Society, Vol. LXIV, Part II. January, 1911.
78
Between 1865 and 1879 and between 1890 and 1913 the Davis-Huttenback
figures are about. 90 percent of Imlah's. Between 1880 and 1889, however,
they are only about three quarters of the Imlah figure. 19
Although not capturing the net financial flows, the "Capital Called" series
make an important contribution to any attempt to understand the nature of
the relationship between the British and American capital markets. First, the
net figures are aggregates and provide no clue as to the industria.! or spatia.!
distribution within the U.S. of t.he international financial flows. The "Capital
Called" series. on t.he other hand. can be disaggregated by industry and, to
some extent, by location. 20 Second, since repatriations are not reflected in
the data, the Capital Called series mirrors the composition of the demand for
finance at any point in time. Thus, if in a given year the U.S. Government
paid off $100 million in British held debt while American railroads were, for
the first time. able to place $100 million in securities on the London market,
the net series \\'ould. correctly, show no net flow; but the Capital Called series
would, also correctly, indicate that the British had begun to fund American
railways.
Obviously. not. only British, but also continental investors utilized the
London m<nkcL. :-\s a result, reliance on American capital called in London
makes it impossible to clean ly separate British investor sentiments from those
19This diffcrcnc<" remains a pulllllc. aud it. is a subject. of current. research. 20It would. of course be wry useful t.o cx<llnine the industrial and spatia l composition
of the net series, since that. would make it. possible to pinpoint industries and regions from which finance was withdrawn as "·ell as those that. were the new recipients; but any such analysis '"oulcl involve clisaggrega.ting the series into its export and repatriation component.s : aud, given the existing data. t.ha.t. goal cannot be attained.
79
of non-British investors; but external evidence indicates that the London
market was principally used by British investors. Thus, the Capital Called
data used here primarily reflects capital flows from Britain to the U.S.; and,
as a result, it does not appear to overly distort reality to term the capital
calls in London by American firms "British" flows. 21
Table :3.:3 provides a year-by-yea.r industrial breakdown of the Ameri
can flotations and calls; those results are summarized in Table 3.2. Not
surprisingly, given the pattern of American development, railroads were by
far the single most important recipient of British savings. It is easy to see
why Alfred Chandler has clubbed America's railroads "The Nation's First
21 l'vleasuring British foreign portfolio investment has long been a subject rife with controversy. For example, D.C.l\1. Platt took exception to estima.t.es from George Paish on the grounds that. Pe1ish did not sufficiently account for foreign holdings of securities traded on the London market. Platt offered similar criticisms of estimates derived by Leland Jenks; and he criticized estimates derived by J. Fred Rippy on the grounds that the use of nominal values of loans was improper because often the face value of loans had little relation to the cap it a! CJctually invested. In general, Platt called for downward revision of all estimates. Charles Feinstein has countered Piatt arguments. In particular he has offered evidence in support of Paish 's est.imat.es. Fortunately, this work is far more concerned with the industrial and spatial distribution of the flows to the U.S. than with their magnitudes so the question is largely irrelevant.. D.C.M. Plat.t, '·British Portfolio Investment Overseas before 1810: Some Doubts," The Economic I!i.slo1'Y Review, February, 1980. pp. 7,11.12,15. Leland H .. Jenks. The Migration of B1·itish Capital to 1875, (London, 1965); George Paish. ··Great Britc1in's Capital inYest.ment. in Other Lands," Journal of the Royal Statistical Socitly. 12 (1909); .J. Fred Rippy. British fm•estme11ts in Latin America, (Minneapolis, 1959): Charles Feinstein. '·Britain's Overseas Investments in 1913," Economic History Revietc. !\larch 1990.
"\Vith regard t.o t.hc foreign o\\'ncrship of securities listed on the London exchange, Davis and Hut.t.cnback const.rnctecl a sample of shareholders of foreigi1 firms traded on the London market bet.\H'Cll 1883 and 1901 and ca.lcnlated that only 17 % of the shareholders were foreign (t.hat. is. non-U.K. residents); "'hile 83 %were residents of the United Kingdom. Although not. all of these firms \\'ere American. the assumption that the Capital Called series represent.;:; fimn; from British invest.ors appears plausible. Lance E. Davis and Robert A.Hut.t.enhack. Mammon aud the Purstul of Empire, pp. 195. 209.
so
Big Business." 22 Over the years 1865 through 1913, total railroad flotations
exceeded $2.775 billion and averaged almost $57 million (Table 3.4, Figure
3.2). In no year did they total less than $3.2 million, and in 1902 they
reached !1early one hundred Limes that amount. They accounted for about
one-quarter of the total in the 1860's and 70's, about two-thirds of the to
tal in the next two decades, and more than four-fifths of that figure in the
present century.
Railroad construction in t.he United States proceeded in a series of waves
with peaks in 1872. 1879. 1890, 1902, and 1906; the financial data track
that pattern closely but lag it slightly. 23 The "calls" reached $80 million
in 1873, $7~J million in 1881, $89 million in 1890, $291 million in 1902, and
$210 million in 1907. The timing of the waves wa.s primarily dictated by
economic conditions, but the composition of the issues reflects the history of
the construction of the American railroad network.
Although some western and southern roads found their way onto the
London market. t.he first wa.vf' of finance - the wa.ve that peaked in 1873
- was primarily associated with the expansion and near completion of the
networks in t.l1e East and 1\Iid\\"cst. ln the East, most of the major lines were
represented among the twenty railroads that floated their issues on the British
market. That group incluclecl the Chesapeake & Ohio, the B·altimore and
22 Alfred D. Chandler, The flailmad.s: The Nations First Big Business, (New York: Harcourt, Drace & "'orld, 1965).
23 U.S. Department. of Commerce. Hislorical Statistics of the United States: Colonial Times to 1970. ("'ashingt.on. D.C.: GPO, 1975) , Vol. II , p.732. The figures indicate peaks of 7,439 miles in 1872, 5.006 miles in 1879, 6,026 miles in 1902, and 5,523 miles in 1906.
81
Ohio, the Erie, the Pennsylnmia, the Philadelphia and Reading, and the New
York Central; but it was not only the majors that turned to ''The City" for
finance. The stock exchange provided Lhe funding mechanism that permitted
a number of very small lines to raise additional capital. The bonds of the
Perkiomen railroad-a Pennsylvania. line connecting Perkiomen and Emaus
junctions, a distance of 38 .. 5 miles-found their way onto that distant market
as did the issues of the Geneva. & Ithaca ( 4.5 miles) and the Northern Central
of Maryland, a line that connected Baltimore and Sunbury, Pennsylvania.
In the 1\lid\\"est. bet\\"een 1865 and 1875 no fewer than twenty-five rail
roads drew British finance. As in the East, the major lines were well repre
sented- the list included the Burlington, the Chicago and Alton, the Chicago
and NorLimest.crn. the Illinois Central, and the Louis\·ille and Nashville -
but it did not. end there. Issues of roads like the Indiana a.nd Southern, the
\Nest \\' isconsin. the Paris and Dan\·ille, and the St. Louis Tunnel were also
present.
In the South. the Alabama. and Chattanooga, the Cast Tennessee, the
Virginia and Georgia, and the Gah·est.on, Harrisburg, and San Antonio all
tapped the British market. The eight Western roads included the Central Pa
cific, the Oclln:'l' Pacific, the Minneapolis, St. Paul and Pacific, the Northern
Pacific, and tlw Union Pacific, a.s well as the Eaty, the Oregon and California,
and the Omaha Bridge.
\\' hile t!tc East and Mid\\"est continued to draw funds, the geographic
focus of the second wave shifted South and particularly \iVest. The Alabama
and Great Sout lwrn eire\\" substantial blocks of flna.nce, but the Alabama,
New Orlf'ans c-uJcl Texas receiw'd even morf'. To the west there were ftota-

82
tions by the A.T.& S.F., the Chicago, Milwaukee, St. Paul, and Pacific, the
Denver and Rio Grande, the Great Northern, the Northern Pacific, and the
Southern Pacific not to mention those of railroads whose names, while never
well known, h<we long since passed into history- roads like The Central City,
Deadwood, and Eastern and the Texas Trunk.
By 1890 the national network was largely in place. From then until191:3,
the majority of existing railroads were no longer constructing new lines, but
they were in the process of double tracking and otherwise upgrading their
facilities . At the same time, a lthough the demand for finance remained high,
integration and consolidation had dramatically reduced the number of roads
competing for funds. Some small lines including the Colorado Midland , the
Cleveland and Canton, the I~noxville and Cumberland Gap, and the Tonopah
and Tidewater did enter the market; but it was the "majors" that dominated
the list. Between 1905 ancl1909 - a period that saw a total call of $572 million
-only twenty-fivP individual lines were involved.
Thus far only railroads have been mentioned, but the Transport Sector
also contained a fpw issues by canal and clock and tramway and omnibus
companies (Table :3.4). At no Lime could these issues be viewed as large, if
the standard of nwasurement is the funds directPcl to the railroads; but in
the last decade, urban transport, particularly the subways of New York and
Chicago, drew a small, but not insignificant, share of the total.
It is not surprising that llnited States government bodies were the second
largest recipients of London finance. Over the forty-nine year period, public
flotations totaled $1.604 billion; however, unlike railroads, the pattern is not
uniform. Calls were made in only nineteen of the forty-nine years; and while
8:3
they amounted to more than $780 million in 1877 and between $200 and $300
million in 187 L 187:3, and 1876, they totaled a. mere $39,000 in 1885 (Table
3.3). Overall, they averaged $32 million a. year, but the number and size of
calls declined irregularly from seventy and $.522.6 million in the first decade
to four and $2.:3 million in the last (Figure 3.3). Vlhile they accounted for
more than seven-tenths of the total in the 1860's and 70's, their share had
fallen to only six percent in the next two decades, and to a mere one-tenth
of one percent in the opening years of the twentieth century. That decline,
of course, is a reAection of the improved domestic market for this type of
securities .
vVhile the federal government was the largest recipient, the London mar
ket also sen·iced tlte needs of eight states and nine cities. Massachusetts was
by far the hea\·icst user of the London exchange, but the public issues of
Alabama., Arkansas, Georgia, Louisiana, New York, Pennsylvania, and Vir
ginia all found their way to the north shore of the Thames. Among American
cities, St. Louis and Boston were the clear front runners, but the list also in
cludes other major urban centers- Chicago, New York Providence, St. Paul,
and the nation ·s capitol - and two relatively minor cities - Duluth, Minn.
and fall Rin:r. :\lass.
If there is <-1 surprise in Lite Cc1pital Called data. it is in the extent of the
penetration of finance directed by the London market into the other dimen
sions of American economic life at a time when the "frenzied Financiers" of
~'all Street \\·ere expressing little or no interest in any sector of the economy
save railroads. and federal. state and local governments.
Although the figures pale in comparison to the commitments to the Trans-
84
port and Gm·ernment sectors, overall, the British directed almost fifteen per
cent of their finance to l'vianufacturing and Commerce, the Agriculture and
the Extracti1·e industries, finance, and Public Utilities. Moreover, although
the figure for the 1860's and /O's was less than five percent; the total reached
almost twenty percent in the 1800's and 90's - the two decades of most rapid
structural transformation; and it was still almost twenty percent in the first
years of the present century.
Over the five decade period, advances to Manufacturing and Commercial
firms totaled almost $2:31 million - an average of more than $4.5 million a
year. The time pattern of those transfers was, however, not smooth (Table
3.3, Figure:).-!). 1ot surprisingly, there were few transfers in the first years ,
but there was a peak in t.he early 70s with calls reaching $9.6 million in
1874. Finns that provided railroad equipment , particularly the United States
Rolling St.ock Company - a finn organized to provide equipment for the
Atlantic and Great Western Hail road and whose directors had chosen General
George B. l\IcCiella.ncl as president. - got a. not insubstantial share of those
funds. 24 A fe\\' miscellaneous firms, like the Anglo-American Leather Cloth
Company. recei\'C'd small infusions: however, the most numerous recipients
\\'ere associ<lled 11·it.h the inf<1nt American iron and st.eel industry. No fewer
than eight such firms ranging alphabetically from the Alton Coal, Coke, &
Iron Comp<1ny, through the Lehigh ~Wilkes Barre Coal Co., to the Southern
States Coal. Iron, and Land Co. Ltd, received between $24,000 and $8.8
24 For a more detailed description of t.he Unit.cd St.atcs Rolling Stock Company see Mira \Vilkins. Th f 1/is /ory of Fore1g11 !nueslm enl in th e United Stales, Harvard Studies 111
Business History. No. 41, (Cambridge. !\lass.: HarYard Uuiv. Press , 1989), p. 837.

85
million.
The Manufacturing & Commercial sector drew relatively little additional
finance between the first surge and the late SO's (there were, for example, no
such calls in 1878, 1879, or 1880); but overall, between 1882 and 1898, the
sector received almost twelve percent of all British finance. The end of the
ninth and the beginning of the century's tenth decade saw a renewed British
interest in the rapidly expanding manufacturing sector of the American econ
omy. There were $84 million in calls over the three years 1889, 1890, and
1891-inclucling almost $41 million in 1889 alone . That torrent was in large
part a response to the British investor's sudden interest in American brew
eries. Between 1885 and 1894, of the one hundred eighty-seven calls issued
by sixty-five manufacturing and commercial firms, ninety-seven were issued
by the calls of twenty-five breweries. They included nine calls by the Frank
Jones and by the Springfield breweries, seven by the Chicago, the Cincinnati,
the City of Baltimore United, the Illinois United, and the New England, and
six by the llnitecl States Brewing Company. Taken together, American brew
eries received more than $:38.5 million in tha.t one decade alone.
In the case of almost all of these American breweries drawing capital 111
London, the organizers were British. For example, between 1888 and 1891
twenty four British ··synclica.t.es" acquired about eighty American breweries.
Although the largest were the St. Louis Breweries (capitalization £2.85 mil
lion) and the l\'lilwaukee and Chicago Breweries Ltd. (capitalization £2.271
million), the movement toward merger was a national one; the twenty four
were spread from coast to coast - in New England, New York, New Jersey,
Baltimore. Philadelphia, Washington D.C., Cincinnati, Springfield Ohio, De-
86
troit, Indianapolis, Chicago, St. Louis, Denver, and San Francisco. Although
investment declined somewhat from its peak in the early 1890's, Lewis put to
tal investment in 1899 at $/.5 million and the figure for 1914 at $58 million. 2.s
Bre\':erics alone, ho\\'ever, did not account for the entire surge in in
dustrial finance. The other recipients of "London" capital included several
milling companies (Pillsbury- Washburn was probably the best known), Gen
eral Electric. Eastman's, Pullman, and Edison Phonographic. Specifics about
the ownership or at least one or these companies are known. In 1899, the
British purchased Pillsbury mills, the nation's principal flour producer and
launched Pillsbury- \Vashburn \\'ith a capital stock of £1 million and deben
tures of £6:35,000. Of that total the previous American owners received
almost eighty percent. 26 A bout the sa.me time the British purchased a chain
of grain ele\'at.ors in 1\Iinnesota, the Dakotas, and Montana. and organized
the Chicago and Northwest. Graineries Company Ltd; and another British
group acquired t lw City of Ch icago Crain Elevator Line and reorganized its
properties as t.hc C'iLy of Chicago Grain Elevators Ltc!Y
Given the market possibilities underscored by the obvious British inter
est, it is not surprising that, for the first time, the New York Stock Exchange
began to t;.d.;:e <t 1110re serious interest in its department of Unlisted Securi
ties - a clcp<trlrll<'IIL not orgarti%eci until 1885. Although lagging its British
25 \Vilkins. Foruqu luvcslmcul. p. 325. Lewis, America's S'tal.:t. p. 99. 26 Lewis,Amcl'lw·.s Stake, p. 101. \Yilkins, Foreign lnvestm.eut, p. 320. 27\Vilkins. Foretgu [uvestmeul, pp. 319-320 & 323. Neither milling nor the grain ele
vators proved a success. Pillsbmy-\\"ashbum went int.o receivership in 1908; the City of Chicago Grain ElcY<lt.or Comp<tny shed its British connection in 1894; and the Chicago and Nort.IJ\wstcm Grainerics Company \\·ent into liquidation in 1910.
87
counterpart by a generation, the Americans did begin to respond to the po
tential profits offered by the financial demands of the growing manufacturing
sector. 28 By the 1890s and triggered by the explosion of trusts and mergers
-to say nothing of the desire of some owners to take advantage of access to
the developing financial markets to diversify their investment portfolios - the
Department. of Unlisted Securities became one route by which the offerings
of a number of American manufacturing companies finally found their way
on to the until then, not so '·Big Board" .29
The American market's increased ability to handle industrial securities
combined wit.h the competition provided by new investment alternatives that
had opened for British investors - particularly opportunities north of the
49th parallel - appear to have been sufficient to move the center of American
industrial finance a\\"ay from London. There was little American Manufactur-
28 Although. as \\·e shall see in Chapter 4, the NYSE was not the domestic financial institution initially most. responsive to profit opportunities in this and other sectors of the U.S. economy.
29 For an excellent. discussion of t.he evolution of the market for industrial securities, see T. Navin and !\I. Scars, ''The Rise of a :t\Iarket. for Industrial Securities," Business History Review. Vol. 29. 1955. pp. 105-138.
Navin and Se;.ns report that. between 1890 and1893 thirteen firms formed by the organization of trusts or mergers and eight. firms interested in recapitalization issued investment grade preferred st.ocks: and of these about one-half ultimately found their way on to the New York Stock Exchange. The trusts included the American Cotton Oil Company, the America11 Sugar Rdiuiug Company. ;.mel the Na.t.ional Lead Company. The newly merged firms included thl" .-\merican Tobacco Company, t.he American Soda Fountain Company, the American Type Founders ' Company, t.he General Electric Company, the Hecker-Jones Jewell Comp<wy. the Herring-Hall-MarYiu Company, the Michigan Peninsular Car Company, the National Cordage Company, the National Starch Manufacturing Company, the Trenton Potteries Company, the U.S. Leather Company, and the U.S. Rubber Company. The recapitalizations included the Barney and Smith Car Company, the H.B. Claflin Company, the Henry R. \Vort.hingt.on Company, the P. Lorillard Company, the Proctor and Gamble Company. the R.I. Perkins Horse-Shoe Company. the Thurber, \Vhyland Company, and the \Yes tinghouse Electric and lVIanufact.uring Company. p. 118.
88
ing & Commercial activity on the London exchange between 1902 and 1907.
There were no such calls in 1902, 1904, and 1905, and in 1906 they totaled
less than $146,000. Beginning the next year, however, the volume of Ameri
can manufacturing calls began to rise again; the total reached $24.9 million
in 1912 and $.50.-1 million for the five years 1910 through 1914. Unlike the
earlier concentrations- first in railroad equipment and in iron, coal, and steel
in the 1870's and, then, in brewing in the late 1880's and early 90's- there
is little evidence in the pre-war decade of any industrial concentration. The
Indianapolis and the St. Louis breweries are represented, as are the Oglivie
Flour J\1ills: but the list includes an additional almost $7 million of General
Electric securities as well as issues of $21.4 million of the British-American
Tobacco Company, $8.2 million of Bethleham Steel's stocks and bonds, and
even $50,000 of Quaker Oats securities.
The composition of the early manufacturing and commercial calls, with
concentrations in support of iron making, brewing, and milling suggests some
thing about the natural resource intensity of the nineteenth century Ameri
can economy; and that conclusion is underscored by the almost five percent
of finance cha.lllwled to industries that were directly linked to the natural
resource base (mining, financial, land, and development, agricultural, and
petroleum and clwmical firms). 1\loreover, while the figure \Vas only two per
cent in the 1860's and 70's . it. rrached almost eleven percent between 1882
and 1896, and it was still more than five percent in the last sixteen years of
the period.
The almost five percent figure (2 percent to mines, almost 2 percent to
financial, land and development companies, 0.6 percent. to agriculture, and

89
0.4 percent. to petroleum and chemica.ls) translates into a total transfer of
$258 million , or an average of $5.2 million a year. The transfers to the Agri
cultural & Extractive sector mirror the cyclic patterns found in the Railroad
and Manufacturing & Commercial groups (Figure 3.5). There was a peak of
$12.5 million in 1872, and a mass i,·c transfer of $100.9 million in the years
between 1881 <l ml 1891 (calls amounted to $14.8 million in 1882 and 1883
and an almost unbelievabl e %48.9 million in the three years 1889 through
1891 ). Following a slow pe riod in t.h e early 90's, the level of transfers again
increased. They rose to $8 .. 5 million in 1897; and, in a final a run-up in
the years after 1!)0/, the level of Agricultural & Extractive transfers reached
$23.9 million in EllO (Table :3 .. 5). Unlike firms in the lVfanufa.cturing & Com-
mercia] sector, however , these Agricultural & Extractive firms seldom found
a home on \Vall Street in the yea rs before the outbreak of the First World
Vva.r.30
No single st.ory can explain the movements in the sector's totals. That
figure is a composite of mm·ements in four quite different industries. Mines
were the largest. of the four; they attracted a. total of $102.7 million (an
average of %:2.1 1nillion a year). The transfers to firms in the Financial Land
300ft.eu , U.S. Agricultural and Extractive firms "·ere lis t.ed on smaller, more regionallyoriented Anwri ran exchanges ra t her tha n on t.he NYSE. For example, the December 31 , 1910 listings of the Iloston Stock i\Imket. include 51 mining operations but only fifteen railroads . Among those mines arc the Adventure, the Hancock , the Old Dominion, the \Volverine, and the \Yyandott.e. The Consolidat.ed Exchange, !orated in New York , had a special mining s tocks sec tion in their December 31, 1910 listings. That list included the El Paso. t.he Elkron . t.he Tramps. the Tonopah, and the Yellow Jacke t. Although not as extensive as t.he listings on either the Ilos t.on nor the Consolidated, mining stocks listed on the Philadelphia Exchange included the Amalgamated !VIining Company and Tonopah ]'\'lining.
90
& Development sector were, however, almost as large. They drew a total of
$101.1 million - an annual average of $2.0 million. Agriculture accounted
for an additional $:30.9 million ($6HJ thousand annually), and the chemical
petroleum-and- miscellaneous group $22.8 million, or about $455 thousand
a. year.
The pattern of mining calls shows a transfer of $8 .5 million in 1871 and
$7.8 million in 1872, fiye years of substantial flows between 1882 to 1887
(reaching $!5 .1 million in 1887), another surge in the mid 90's ($5.5 million
was called in 1S~J7). and a final crest in the second quinquennium of the
present century tllat culminated in a transfer of almost $12.0 million in 1910
(Table 3 .. 5, Figme :3.6). In the transitional decades (the years 1882 to 1898)
mining investment represented more than three in every one hundred dollars
of British financial transfers.
In the first. ,,·aye of investment 111 American mmmg, the focus was on
gold and silH'r lllines in the far \Vest.: and firms with mines in the states
and territories of Arizona. California, Colorado, l'vlontana, Nevada, Utah,
and \Vyoming all managed to attract British finance. Between 1865 and
1874, sixt.y-t.\\'o American mining companies ranging alphabetically from the
Austin Consolidated Silver !\lines to the Yreka Creek Gold Mining Com
pany of Califor11ia issued nincty-fi\·e calls on the London market. The list
included S2 .. 1:J:).000 for Emma Sih·er !\lining (located in Utah), $1,370,418
for Sierra Hutt.c's Cold l\'lining Limited. $~J7-t,OOO for South Aurora Mining,
and $.58-f,.JOO for Phoenix Quid:sih·er Mining.
This initial outpouring of finance was not, 111 most cases, met with the
expected reciprocal flow of profits. The list of offerings included the notorious
91
Emma., whose Scottish owners were finally forced to sue both its American
and British prornoters for fraud, and Cassels Gold Extracting Company,
about which c-1 London financial journal reported that the British investors
had fallen victim to "gold extraction with a vengea.nce." 31 In the words of
the editors of The Econom.ist, "Looking back over the mining mania. of 1871,
it has been ascertained that out of more than one hundred ventures then
brought forward only ten are now in existence, and but half that number have
ever earned diYidends." 32 The editors of the same magazine also reported
that "there is a pretty general belief that the profits were never honestly
made; that, as a matter of fact, the ore bodies which yielded the dividends
were planted by human hands and not by na.ture.'' 33
Burned. wary. but still hopeful, the British moved somewhat tentatively
back into American mining finance in the mid 1880's. Although well below
the peak level of transfers of the pre,·ious decade, the calls reached $3.0
million in 1886 am] $.5.1 million the next year; over the entire decade, forty
seven mining firms issued eighty-four calls for a total of almost $27.0 million.
Although Gold and Silver continued to dominate the lists, the group included
at least six copper and one quicksilver mine - for example, the Belt Copper
Mines raised S-11 -1.000 and the Arizona Copper Company, while attracting
31 Clark C. Spensc. British h1Nslm e nt.~ and th e Am erican Miuing Frontier, (Ithaca, N.Y.: Cornell University Press. 1958). p . 84.
3 "'·The 1\Iost Risky of All InwstnJt'nt.s··. The Economist, 18 July 1881 , p. 756. The reference is not. only t.o t.he American, bnt. "·orld-wide British mining investments.
33\V. 'I\urent.inc .lr~ckson. The EnterJirisiug Scot: Investors in the American West after 1873, Edinbmgh University Publications: Hist.ory, Philosophy, Economics, No. 22, (Edinburgh: Edinburgh Univ. Press, 1!JG8), p. 142. The quotation is from The Economist, "The Speculation in 1\Iining Shares." 28 January 1888, pp. 105-106.
92
less than $2 million in the SO's, had, by 1914, drawn a total of $9.2 million.
Moreover, e,·en among the precious metals mines, while names like Old Lout,
Sapphire Cold. <1nd Slide and Spur still appeared on the list of calls, those
whose contribution to the American economy was somewhat less transitory.
Nevada Consolidated, for example, began to appear with greater frequency.
It should, howew~r. be noted that the "New" Emma ultimately tapped British
and Scottish investors for almost. another $1.4 million.
During the 1 S90's, mining calls totaled almost $11.7 million; and the
industria.! distribution - hea ,·y in gold and silver, nine calls from five copper
mines. a.nd a smattering of mines producing other metals - looks much like
the pattern of t.he previous decade. While J\llountain Copper did raise over $4
million, the major difference was the evidence of the Alaskan gold rush found
in the offerings of firms like Felix I...:londyke and Golden Klondyke River.
\~! bile there \\"e re no American mining calls in 1913, the years between
1905 and 19t2 saw more financial transfers ($33.9 million) than even the
heady early IO"s ( 820.2 million bet\\'een 1870 and 187.5 ). The mix had ,
however, shifted. Of the eighty-six calls made by a tota.l of twenty-seven
firms, forty-six \Yere made by copper mining companies. If the five calls by
the Duckt0\\' 11 Sulfur, Copper, and Iron Company for a total of $309,000
are incluclccl. t l1osr dema11ds summed to more than $18.8 million, or about
three-fifths of the 111ining total for the years in question.
These later enterprises appear to have fared substantially better than
the get rich quick mining schemes floated in the "roaring 70's". Firms like
Arizona Copper. Duckto\\'n, l'vlountain Copper, Camp Bird, De Lamar, and
the Na.tomas Company of California. all survived until the outbreak of the
Great \Var, and some lasted much longer. For example, in 1916, Arizona
Copper, a firm that had been profitable from the time it was founded in
1882, paid a tax free dividend equal to 80 percent of the initial investments.
The firm was sold to Phelps-Dodge Corporation in 1921.34 The Camp Bird
mine, with John .Jay Hammond as consulting engineer and Herbert Hoover
as chairman of the board, had, by 1911, paid dividends equal to 155 percent
of the initial im·estment; and De Lamar's cumulative dividends were also a
rosy 146 percent .. 3 .s
The British-American Financial Land and Development connection was
established early, and, overall accounted for a total transfer of $101 million, or
about $:2 million a year. \Vhile those figures represent less than two percent
of all finance, the sector drew more than five percent of the total in the years
between 188:2 and 1898. In 1865 the British American Land Company turned
to the London market for more than $1.:3 million, and in 1869 the Nevada
Freehold Properties Trust raised almost $1.6 million. The time pattern of
the sector's financia.l flows followed the pattern observed in mining (Table
3.5, Figure :3.7). There was a peak in the early 70's. Between 1872 and 1874
the Californian Land Investment, the Scottish American Investment, the
Scottish American l\Iortgage, the United States Land and Colonization, and
the United Statr~ !\lortgage Company, together, drew almost $6.2 million.
The 1880's \\·ere a decade of British investment in the American \Nest.
From the lwgii11li11g of 1881 tl1rough the end of 1891 financial land and devel-
34 Buckley <mel Tiobnt.s. Europtllll Dine/ !nt ,estment, p. 58. Lewis, America's Stake, p. 91.
35 Lewis, A111enca · . .,Stake, p. 91.
94
opment calls totaled $50.:3 million, and over $21.1 million wa.s transferred in
1890 alone. The \\"estern flavor of those investments is captured in the names
of the firms that turned to the London market. The list includes the Ari-
zona. Trust and 1\[ortgage, Cedar Valley Land , Iowa. Land, 1\,Iissouri Land a.nd
Live Stock, Ne,·ada Land and Cattle, Oregon Mortgage, Scottish Mortgage
and Land Investment of New Mexico, London and North- \Vest American
Mortgage, San Antonio Land, San Jacinto Estate, South Minnesota Land
Company, Texas Land a.nd Cattle, Texas Land and Mortgage, Trust and
Mortgage of Io\1·a , and \".;es tern Mortgage and lnvestment.36
\".'estern mines and financial land and development companies came early
to the attention of the British investor; however, the lure of agricultural prof
its were muted in the 60's and 70 's and did not become important until the
next decade (Table :3.5, Figure :3.8). Although firms like the Anglo American
Oyster Company did receive small infusions in the 70's, the only important
transfer was the result of an 187 -~ call for %2.50,000 by the South Carolina. Rice
Plantation a ncl Trust. 0 ,·er t.lw en t.i re period, however, despite the fact that
Agricultural calls 11·ere zero in t.11·enty-five of the forty nine years, financial
36 A recent study of foreign invcst.mcnt. in Nebraska indicates that. in 1890 four Scottish, bYelw English. cllld seven American firms had channeled at least. $ 3,419,475 in foreign investment. into Nebraska farm mortgages. That. figure translates into about 3.8 percent of all farm loans in force in t.hat. state. Parallel studies suggest t.hat the comparable figures were 3.1 percent in ~Iinnesot.a, 9.6 percent in North Dakota and 14.5 percent in South Dakota. 1 perceut in Iowa and 2 pncent in Kansas. Larry A. l\'lcFarlane, "British Investment and the Land : Nebraska 18//-1946," Business Jlislory Reuiew, Vol LVII (Summer 1983), pp. 258-292 . The figures for Iowa, Kansas, l'vlinnesota. and the Dakota<> are from Larry A. l\IcFarlane. ··British Investment. in Minnesota Farm Mortgages and Land, 1875-1900," (unpublished mss); '·British Agricultural Investment in the Dakotas, 1877-1953," a.ncl "'British lnn'stuwnt in l\"lid\\"l?:>t.eru Farm Mortgages and Land, Iowa and Kansas," bot.h in Paulllseldiug (cd). llusiucs.s r111d Ecouomic Hist.o1·y, (Urbana., IL: Univ. of Illinois Press, 19/G). pp. 112-12G and 1!JG-198.
transfers to those enterprises totaled $:30.9 million, or about $619,000 a year.
While accounting for far less than one-percent of all transfers in the years
1865 through 1881 and 1899 through 191-l, they amounted to more than two
percent. in tlw seH'nteen years 1882-1898.
Thus thC' 8:30.9 million figure t.urns, i11 large measure, on the industry's
growth in the 1880's. A flotation of the Anglo-American Cattle Company
in 1879 marks Ll1e beginning of the British investors' flirtation with western
cattle ranching. It was 1880, however, before it was possible to speak of a
significant shift in 13ritish finance toward that industry. Total calls exceeded
$1.9 million i11 188:2. %4.7 millio11 in 188:3, and $2.2 million the following year.
The first. eXJWriments were moderately successfuL but falling cattle prices,
severe weat.her. and outbreaks of disease spell ed disaster in the middle years
of the decade (calls averaged less than $400 thousand a year between 1885
and 1887) .
Some firms survi ,·ed. for example, the oldest of the "class of 1880," the
Prairie Cat t.]C' Company, paid di,·iclC'nds of 20.5 percent in 1883 and, while
barely struggli11g through the dis;-1strous SO's, pro,·ed to be a. very profitable
investment i11 t.ll(' years before \Vorld \Var I. The firm continued to operate
until HJl.) \\'l1c11 it sold it.s <lSSf'ts at a substantia l profit. During its thirty
five years of life. the Prairie Cat.Lie Company drew on the London market for
$4.7 millio11. but a shareholder who had participated in the initial offering
and held on until the end could feel satisfied with his choice of investments.
Overall. ho,,·c,·cr. t.he most succC'ssful sing le catt le ranching enterprise was
almost ccrt.ai11ly the Matador Lu1d and Cat.tle Company. That firm posted
substantial profits ea rl y; and. a lthough unprofitable during the depression of

96
the mid-SO's , it survived and proved extremely profitable in the yea rs after
1910. \Vhil e its profits suffered again during the depression of the 1930 's,
the l\1a.ia.dor became a. virtual bonanza. in the 1940's; and \vhen , in 1951 , it
was sold to a. group of New York inYestment bankers , it brought thirty times
the value of the initial invest ment . The Swan Land and Cattle Company, on
the other hand , despite the more than $9.0 million in British finance , barely
struggled on until it was sold to American investors in the 1920 's. 37
The picture for the remaining cattle ranching firms is less rosy. It is es
timated that t.he loss to Briti sh investors between 1884 and 1900 was more
than $18 million.38 As a result. <lgr icultura.l call s after 1890 were fewer in to
tal and in Yolunw. The few sun·iving catt le companies aside, finance went to
lumber compa ni es (for example, the Arkansas Timber and Cotton, Columbia
River Lumber. and the United Sta.t.es Lumber and Cotton) and firm s devel
oping agricultural properties in California and Florida (The Riverside Orange
Company. Ltd .. for example). The United States Lumber and Cotton Com
pany, a firm wi t h a pre- \Vorld War I balance sheet that. reported £3,457,900
in cap ital stock. raised a total of %2.8 million on the London market in 1909
and 1910: and the firm sur vi,·ed through the 1920s. 39
The chem ica l ami petroleum group of t.he Agricultural and Extractive
sector recc i,·ed a t.ot.al of $22 .1 million. or a bout $45.5,000 a year. Those
transfers were. however, almost all concent rated in the twentieth century
37The hist.ory of British invcst.ment in the American range is drawn from Jackson, The Enterprisi11g Sco t. pp. 73-100 , 11-!-138: Buckley and Tiobert.s, E uropean Direct Investment, pp. 59-63; aud Lc,Yis, Amenca·s Slake. pp. 87-88.
38 Jackson. The E 11t erprising Sco t. p. 137. 39 Buckley and Tiobcrt.s . European D1rect !nl'csfm enf. p. 60.
97
(Table :3.5, Figure :3.9). Although there was a single call for $110,000 to a
rock asphalt firm in 1871 and calls totaling almost $400,000 in 1886, 1887,
and 1891 to. firms like Colorado Nitrate, Natural Portland Cement, and Old
Swan Borax , there were no other transfers in the nineteenth century. Be
tween 1900 and 1014, howe\·e r. the industry attracted more than one percent
of all finance. There were peaks of more than $5.5 million in 1904, and
aga.m in 1910 (S::i.5 million) . Those twentieth century transfers were domi
nated by oil companies, particularly those located in California. Recipients
included California Oilfielcls . Pacific Oilfields, the Anglo-California Oil Syn
dicate , the h:ern Tiiver Oilfields of California, the Santa Maria Oilfields of
California. California Am<~lgarna.t.ed Oil, Santa Barbara (Ca.lifornia) Oil , and
the Consolidated Oil Fie ld s of Clllifornia. California firms , however , were
not the only recipients: there ,,·ere also flotations by the 1-..:ansas-Oklahoma
Oil and Refinery Company, Oklahoma Oil , Texas Oilfields, and the Tulsa Oil
Company. Outsidf' of petrol eum , there were issues of the Virginia-Carolina
Chemical, and the American Cyanamid Company.
Some fa cts about the initi <-1 1 proponents of some of these ventures are
known . The Brit ish investors B <~ lfour, \~' illiamson , and Company launched
the Califor11ia Oilfi elds Ltd . with initial capital of more than $1 million
in 1901 ; and. wit.h some c1 id from the Dutch, that enterprise was followed
by Texas Oil fields Ltd . the same year, by Pacific Oilfields in 1907, by the
Oklahoma Oil Company and I\ern River Oilfields in 1910, the Santa Maria
Oilfields (a !ii5.S million ente rprise ) in 1911 , and the I\ansas , Oklahoma Oil
98
and Refining Company in 1912. '10
Given the pattern of urban growth in the United States, American Public
Utilities rec<"in.·dless British financial support than one might have expected.
Overall, firms producing gas and electricity, telephone and telegraph, urban
public transport services, and purified water for public consumption received
$207.4 million. or about %4.1 million a year. That figure amounts to about
1.5 percent of all finance, but eighty percent of the sector's receipts were
concentrated in the years 1898-1914 when the industry accounted for more
than eight percent of the total (Table :3.6, Figure 3.10).
There \\"as an early surge of telegraph finance in the first quinquennium
that culmi11atf'd in transfers of almost $9.0 million in the four years 1865
through 1868. A second \\"ave, diYided in the ratio of about one to three be
tween gas and light and telephone and telegraph companies, peaked at $8.8
million in 1875. The former industry underwrote a flow that crested at $8.7
million in 1889, but. that year was an exception. Finally, however, the year
1907 and those from 1909 on\\"ard witnessed the highest volume of Public
Utility calls obscn·ed at aii.Y time bet\\"een 186.5 and 1913. The figures for
the years l~JO~J t.l1rough 191:1 ,,·ere' *1 1.·1. $11.9, $.').6. $17.7. and $42 .7 million
respectively. Tl1e largest issues ,,·ere made by telephone companies (partic
ularly AT&T <1 ncl Ne\\" York Telephone) and by firms providing electricity
to America11 cit.if's. On the \\"hole, ho\\"ever, while there were public utility
shares tradf'd on both the New York and on the London exchanges, they did
not represent. a significant fraction on either.
40 Le\Yis, A III(J'tfa 's S'ln/;e, pp. 94-98. \\'ilkins. Foreig11 l1lvesfme11t, pp. 285-292.
99
Of all of t.he six sectors, Finance benefited the least from the British finan
cial network. The one and a half percent of London calls that were directed
toward the Financial sector were received by a. handful of commercial banks,
a. few insurance companies, and an assortment of trust companies; however,
it was the last named industry, that received the bulk of the sector's finance.
Calls by Fin<lnce firms aggregated $79.2 million, or about $1.6 million a. year.
The movements were cyclical, mirroring closely the patterns displayed by the
other sectors. although the peaks in the 70's and in the early twentieth cen
tury are less pronounced while those in the 1880's and 90's are more so (Table
3.7, Figure :3.11). In 1873 Financial calls reached $4.9 million. There were,
however, no calls in fi,·e of the six years between 1874 and 1880, but 1882
saw more than ~ 10.0 million channeled into the sector; and the flow averaged
almost $:3.2 million a year for that decade. Subsequently, either British de
mand had shiftPd or t.he American markets for these securities had improved.
At its subsPqucnt peak (in 1890) the total reached only %7.6 million, and the
1911 peak ,,.<1S a mere $2.:3 million.
Of the three industries that constitute the Financial sector, neither the
commercial banks nor the insurance companies were important. Over the
entire period. onh· nine commet-ci<d banks drew funds from the London mar
ket, there ,,·ere 110 calls i11 t.hirt.y-ninc of t.he forty-nine y<"ars a.nd none in the
present ccntury. Of the ninP. flvc (the British and California., the Anglo
Californian. the London Bank of Oregon, the London Bank of Utah, and
the London and San Francisco Bank) were located in the \\'est. There were
even fewer (three) calls by insurance companies; and they, like the 1881 call
for $2·1:3 .. 500 hy tlw Scottish-American Accident Insurance, were relatively

100
small. On the other hand, t.he finance that went to trusts that specialized
in American investments \\'as not trivial. Altogether the trusts received $73
million (almost $1..5 million a year).
101
3.4 Arn.erican Issues Traded on the London
vs. New York Exchange
In light of the significant flows from London it is natural to examme the
state of the domestic Am erican capita l market during this per iod. Although
the domesti c market was graduall y maturing, the process was slow; and,
certain sectors were unable to attract sufficient finance from domestic sources.
Ameri can secur iti es li st ings on the London Stock Exchange are compared
with those li sted on the premier domest ic secur it ies market - the New York
Stock Exchange. Table :3.8 reports the number of American firms whose
stocks were trnd<"d on the N<" w York Stock Exchange and the number that
were traded on the London exchange in 1870, 1880, 1890, 1900, and 1910.41
41 The listiugs of American firms on the London exchange come from the end of year report. of t.he ln NMor 's Monthly Manual: t.he New York issues are those reported in the New Yo rk Ti111es. Though t.hc h11·eslor 's Monthly Manual listings are comprehensive for both stocks e~nd bonds. the .\'ere }'ork Ti 111 es informatiou on st.ock listings is far more comprehcusive t hrtn it s bond infornw t.ion . The heading for t.he 1870 non - railroad stock issues in t.he /','e u: i 'o rk Times read . "Closing Quotations for the City Bank Stocks and Miscellaneous Shares ... Tiailroad lis t.iugs for 1870 were found under the heading, "Closing quotations - Dec. 31." Sampling additional clays in the last week of December yielded no adclitioual stock issues. The 1880 s t.ock issues were found under the heading, "The follmYing t.r~bl e shmYs the highest. and lowest prices of stocks during the past year." As an indication of the !eYe! of mmket. ac tiYit.y in stock issues, of the 105 issues identified in 1880, all but. six were traded dming t.he last week of December. 1880. \Ve rely on this 1880 trade act.i,·ity resu lt. in const ructing the 1890 sa mple as t.he 1890 issues were under the heading. "The follo,,·in g t.a ble shows the range in prices of st.ocks during the past week and furnishc,.; <1 coztlpn rison wit.h t.he dosing figures of the corresponding week a year ago.''
There are no sampling problems <-1Ssoc ia t.ed wit.h the 1900 stock issues as they were found under the hcndiug, ··New York St.ock Exchange, Complete Transactions in Stocks for the Year 1 !JOO... The 1910 stock issues were found under two headings. The first was simply. "The !'lew York Stock Exchange - Saturday," which listed issues which were traded on Decr111bcr 31 , 1910, while the remainder \Yere found under the heading, "Closing quotations for GoYernment. bonds and stocks in which there were no transactions."
102
Due to the thin trading in many NYSE bond issues, using daily bond pnce
data from t.he New Yor/;· Tim es to construct a similar sample may produce
misleading comparisons. Although a. complete listing of bond issues traded on
the NYSE in 1900 has been found, and we have also constructed a sample for
1870 using daily price da.ta. from the full month of December, comparisons of
LSE a.nd NYSE American stock issues ma.y be more likely to yield an accurate
picture of London's contribution Lo portfolio investment in the United States
than are bond comparisons, at le<1s!. for the yea.rs 1880, 1890, a.nd 1910. As
a result, the bond issues will be used mainly as a means of corroborating
conclusions dr<l\\'11 on the basis or the stock issues. ·n
Among the American stocks listed in London in 1870, there were SIX
railroads, L\\'O mining firms (the Colorado Terrible Load and the Eberhardt
& Aurora.), and one telegraph. The twenty-seven stocks li sted in New York
included eleH'n rails. a.nd included among the sixteen issues of thirteen other
firms were the D('laware and II uclson Can<1l. t.\\'o coal and one quicksilver mine
(the American and Pennsylvania. Coal Companies and Quicksilver Mining),
four express companies (Adams, American, \Veils-Fargo, and U.S.), Western
Union. the I3oston Water Po\\'er Company, and the Pacific :rvia.il steamship
In SUJ11. though the .\'ew Vork Ti111c8 informat.ion on stock issues is not consistent across years. evidence inclir<lll'S t.h;-1t <1 rel<-1tiwly complet.e listing was arrived at for each of the years 18/0. 1880. 1890. 1900. and 1910.
42The bo11<l isstH· ,.;amplcs were drawn from t.wo or three clays during the last week in December for t>ach of t.he ye;us in question. <~lthough , in one case the first week of the subsequent ye<~r \Yns employed. \Vhcrcas t.he O\'erlap in stock issue listings was nearly perfect from chty to d<~y, or at. least from week to week. the overlap in bond listings is far from perfect .. For cxmnplc, the 12/31/09 listings include 111 issues. Sampling an additional day, 12/30/09. yields 89 new bond issues. This variability in day to day listings inspires doubts about. using the bond issues to draw conclusions about London's contribution to foreign invl'StJneut. in t.he U.S.
103
line. 43 Only a single stock issue, tlw $100 shares of the New York Central
Railroad, was traded on both exchanges.
The increase in American stock listings from 1870 to 1880 suggests rapid
American economic expansion - an expansion that involved major shifts in
both the geographic and the industrial structures of the economy - and it
is obvious that the financial demands engendered by that expansion were
placing a severe strain on the nation's adolescent capital market. The total
number of shares listed on the 1ew York exchange nearly quadrupled while
American issues on the London exchange more than quintupled. The forty
seven stocks listf'd on the London exchange included eighteen railroads, still
a large percentage of the total U.S. stock listings, but, it was the non-railroad
listings that. increased most. rapidly. In 1870 only three non-railroad firms
were listed in London: t.he 1880 listings include one canal company, two
telegraph companies (Anglo- American Telegraph and Direct U.S. Cable),
two banks (the Anglo-Californian and the London and San Francisco), four
investment trust.s. one ,,.<1gon a.ncl railway carriage company (United States
Rolling St.ock ). and eight mirws.
Although tlw 1880 listings on the New York exchange indicate some in
stitutional responsc to tlw increased demand for finance in the non-railroad
sectors, nearly three-four! lis of the companies listed were railroads. The num
ber of non-railro<Hl listings 11early doubled between 1870 and 1880, but New
York·s appetite for railrond sliiucs \\·as e,·en more voracious- the number of
43Thc otbcr t.wo firms were t.bc i\Iariposi'\ Company and the Canton Co. of Baltimore. Not.e that. New York Cit.y Dank Stocks are not included in Table 3.8 because their listings were only availablt' for 18/U and 1890. In t.he interest of consistency, and for the sake of comparison across ye<trs. the b<tnk listings were eliminated.
104
listings increased from eleven to se\·enty-two. \Vhile the New York rail total
had been twin' that of London, it \\·as now four times as large. Clearly, al
though mucl1 of the expansion of the New York exchange can be traced to an
increasing fo cus on railroad securities (their share of a. much increased total
increased from forty to seventy percent) , the number of non-railroad shares
also increased. In 1880 the list included telephone and telegraph companies,
mines, express companies, a water and power company, and a canal. In 1870
those New York listings outnumbered their London counterparts by more
than five to one. A decade later. although the New York list had risen from
sixteen to tiJirty-OIIe, there were no fewer than twenty-nine such listings on
the British exch<1nge.
In 1890 the number of American stock Issues listed in New Y.ork was
greater than the number listed in London; however, if the focus of atten
tion is tur11ed to the non-railroad sector, the London market was servicing
almost t.wo and <1 l1alf times the number of enterprises supported by the New
York excha11ge. \Vhile railroads still accounted for one-third of the Ameri
can issues on tlw Londo11 market.. the list.ings included seventy-two American
firms drawJJ fron1 at least 11ine different industries. There were two gas and
waterworks. two iron, coal, and steel firms, four telephone and telegraph
companies. sen'll land and building enterprises, seventeen land, mortgage
and financial firms. four trusts. one wagon and railway carriage company,
three mi11es , and eleven breweries. In addition there were nine other en
terprises in cluding Borax Ltd .. the Chicago and Northwestern Granaries,
Eastman·s , .J.&P. Coats. and t.l1e Pillsbury- \Vashburn Flour Mills. Over the
previous two decades, the number of American equity issues traded on the
105
New York exchange more than tripled; over the same period , however , the
number tradPcl on the London exchange increased twelve fold. The financial
demands requi red to support the rapid pace of economic growth was clearly
straining the newer nation's domestic financial network.
The degree of that strain is reAecied in a. comparison of the proportion of
non-railroad American equity issues listed on the two exchanges (see Table
3.9). In 1870, t.lte proportion tilted heavily toward non-rail issues on the New
York exchange ( .. 59) but not on the London market (.33). A decade later the
results were Ycry different. As the demand for finance for new industries -
industries often located in the South and \t\'est - grew, the British reacted
quickly, tlw Ne\\· 'l"ork Stock Exchange mu ch more slowly. The proportion of
non-rails had increased by half, while the fraction in New York had declined
to one-half it s form er le \·el. Nor was the trend reversed over the next decade.
The British figure continued to increase (to two-thirds of the total), but the
Ameri can total cont inued to decl ine (to one in four).
In fact. despite t.h e overall expansion of the New York exchange, the num
ber of non-railroad issues traded declined slightly between 1880 and 1890.
The twent .Y-Ilin e issues that. were listed included those of six firms that had
been listed two clccaclcs pre\·iously (the Delaware and Hudson Canal, Adams
Express, the United States Cxpress, Pacific Mail , Quicksilver Mining , and
\t\Testern Union) and an additional se \·cn issues by five companies Th e Times
referred to as ··unlisted but traded." That latte r group included three issues
of the Ame ri ca n Cotton Oil Company, three of the Sugar Refineries Trust ,
and one of the Distillers and Cattle r eeders Trust. The list of express com
panies now included the Atlanta and that of the iron , coal and steel firms

106
contained the Colorado Coal, Iron , and Steel, the Colorado and Hocking
Coal, and the Tennessee Coal and Iron Companies. The shares of four gas
companies (the Chicago, Consol , Consolidated . and Laclede) were listed as
were nine miscellaneous firms - a. list that in cluded Edison-General Elec
tric, the National Lead Trust, !.he National Linseed Oil Company, and the
Pullman Palace Car Company.
Of the thirty-six U.S. railway stocks listed on the London exchange in
1890, twenty-on e we re also listed in New York; however, the only shares of
"non-railroad'' firms traded on both exchanges were those of the Delaware
and Hud son C'a n<-11. Even if railroads are included in the enumeration, such
jointly trackd issues were rare (sec Table :3.10) . There was almost no overlap
between the t.wo exchanges in 1870; and, while the fraction of jointly traded
issues increased t I! rough the turn of the century, it never exceeded one in nine.
A similar lack of overlap is found in a study of bond issues traded on the two
exchanges. In HJOO, for exam ple , only ten percent of the total was traded on
both markets. Tl1ough the data provide some evidence of increasing market
integration. it. rellla.i ns clear that the London market supplied capital to firms
still in ca pabi P of attracting fina 11ce on the New York exchange.
By 1~00. llO\\'r\·e r, tlw 1'\c\\' York market had begun to respond to
the "non-railroacl"" demands of American enterprise. Over the last decade
of the nine t('ent.h century. total American issues on the London exchange in
creased by c-1bout t\\·ent.y-fiye percent., but the share of "non-rail" enterprises
actually dccli ll<'d slightl_y. On the: ot.l1er side of the oc<""an, the number of
listings 011 the New York St.ock Cxchang<:> rose by more than 130 percent;
and the propor!.ic)ll of '· noll - ra il" issues almost doubled. The New York trend
107
away from rail s continued - albeit more slowly- over the first decade of the
present cent ury; and, in that. latter year, for the first time since 1870, rails
made up less tl1an one half of the total stock listings. The American market
was maturing r<-1p idl y.
The 1900 '·11 011-rail" enumeration for London had an eclectic flair. The list
included ten breweries, nineteen land, mortgage, and investment companies ,
two telephone and telegraph companies. seven investment trusts, an equal
number of mines . two banks , and ten firms listed under, "other companies,"
-including American Thread, Cassell & Co., Fraser & Chalmers, Kodak ,
Redfern, and Spratt's Patent. in aclclition to the previously listed Borax Ltd. ,
J.&P. Coats. Eastman"s, and tlte Pillsbury- Washburn Flour Mills.
The extent to \\"hich the Ne\\" York Stock Exchange had emerged as
a conduit. for C<-lpit<-11 to the prev iously neglected sectors of the American
economy is capt ured in an enumeration of the 1900 listings beginning with
the word '·A merican. " The list includes American Beet Sugar, Arnerican
Car and FoundrY. American Coed. American Cotton Oil , American District
Telegraph , AmC'rican Express. American Ice, American Linseed, American
Malting. American Smelting and 11 efi ning. American Spirits Manufacturing,
American Steel !loop, America11 Telegraph and Cable, American Tin Plate,
American Tobacco. and, finally. American \Voolen.
By 1910 tlw NYSE was certaillly teen - aged, if not , adult. \Vhile Lon
don listed OIIP hundred thirty-three American stock issues (ninety-one "non
rails"), thrf'c hunclrecl and six \\·ere traded on \Vall Street; and, of that num
ber, one hun cl red sixty were from sectors other than rails. American com
mercial and indus! rial firms . bre \\·e ries. irott , coal, and steel firms , investment
108
trusts, and Janel, mortgage, and financia.l firms, however, were still listed in
London, but such firms also appeared on the New York exchange. Despite
the obvious movement toward maturity, however, the same firms were seldom
listed on botlt exchanges. What joint listings there were, were dominated by
rails; the only .. non-rail" equity issues listed on both exchanges were of the
United States St.eel Company, A.T.&T .. Anaconda, and Amalgamated Cop
per.
One addition to the New York listings might have provided a glimpse of
the future for those readers with foresight. The 1910 list included a British
firm - the l_l nderground Electric Ra.il ways of London. On the Big Board
it joined the shares of the Canadian Pacific Railroad, the Cuban-American
Sugar Company. and the Northern Railways of Mexico. In that year the
Board also listed bonds issued by the governments of Argentina, Japan, and
Panama. \Vall Street ha.d begun t.o dip its toes into the waters of international
finance.
Moreover, as far as domestic finance was concerned, the New York list
began to resemble the lists we kno\Y today. The one hundred sixty "non
rail" listings ranged alphabeticct!ly from Allis Chalmers to \Vestern Union.
It incluclecl soJJl<' old friends - ;t!t.!Jougll Adams Express, the Delaware and
Hudson C;-uJ<-d. and Quicksiln"r !\lining had disappeared, both the Pacific
Mail and \\"estern Union remained from the 1870 close. Ft·orn the 1890 ros
ter, American Cot ton Oil was now formally listed, and Colorado and Hocking
Coal a.nd Iron. C:onsolida.t.C"d Gas. Distiller's and Cattle Feeder's Trust (now
Distiller's Securities), General Electric. Laclede Gas, National Lead, North
American, Chicago Cas (now l)<"ople's Gas), a.nd the Pullman Palace Car

109
Co. (now simply the Pullman Company) remained. In addition, since 1890
the exchange had expanded t.o include the offerings of a set of firms that are
still household names today - Allis Chalmers, American Tobacco, Bethlehem
Steel, International Harves ter. Notional Biscuit, Republic Steel , Sears Roe
buck, United States nubber and United States Steel. The New York Stock
Exchange was becoming <1 truly national domestic capital market.
Although the data on bond listings is probably less reliable, they too
confirm the pre-\\·ar trends opparent in the equity market. 44 \Vhile both the
London and Ne\\" York exchanges responded to demands for finance origi
nating in the rail and fed e ral. stote, and local U.S. governments the London
exchange responded more quickly than its New York counterpart to the de
mands of the other sectors of the economy (See Tables 3.11 and 3.12). In
contrast to th e st.ock issues, however , the majority of bond issues were rail
road issues regC~ rcll ess of the year or the exchange under consicleration.45 In
44 For cxe~mple, the decrease in t.ot.al bouds listed on the NYSE from 267 in 1880 to only 170 in 1890. is an oln·ions error. and is likely the product of sampling bias. It is likely that there was a more act.ive me~rket for m<~ny bonds at. year end 1880 as opposed to year end 1890.
45 That. bond lis tings so hem·ily fm·ored railroads throughout the period on the NYSE may be the result of s<~mpling bias. That. is. it. is possible that the markets in railroad bond issues " ·ere more active than those in non-re~ilroml issues. Yet., the complete listings for 1900, indica t.e t b ;-1 t. if <my thing, railroad bonds \Yere slightly more thinly traded than other bond issues. Of t.hc oue hnudrcd sixty-t.hrec bond issues identified through sampling, one hundred t.hirt.y or eighty percl'nt. of them \H'rc railroad issues, whereas, of the five hundred ninety total bond is;;ue:< t.re~ded ou thl' Nc\\" York market in 1900. five hundred and five (86 perceut.) "·ere re~ilro<td issues (see Table 3.12.)'1'
1 Sampling financial data for the entire month of December. 1870 as opposed t.o smnpling during only one week reverses this conclusion. but. not dr<tmatically. The· nYcrage fed eral bond issue t.raded on sixty-three percent of t.hc December tre~ding days. while the s<~me figure for st.ate bonds was seventy percent. and that for railroe~d bouds \YnS seventy-four percent. Of the one hundred twentytwo bond issues idl' ntified through one \Ycck of sampling in 1870, fift.y-eight percent of them were railroad issues: of the issues identified by sampling a whole month of financial

110
any event, as with the equity issues, it appears that it was the turn of the
century before New York began to list substantial numbers of "non-rail"
offerings.
data, fift.y-sen~n percent. were railrmtd issues. It seems safe to conclude that the sampling techniques ClltployL'd did not. owrst a tc the importance of railroad issues in the NYSE bond markets.
3.5
111
Returns on An1erican Shares Listed on
the London E x change
One simple expl<:tna.tion for the listings discrepancies in American issues be
tween the London and New York exchanges could have been that western
issues from small new firms in emerging industries were riskier than securi
ties from more traditional sectors of the U .S. economy (i.e., government and
rails), and tints were too risky for typical American investors. As discussed
in Chapter One. hnight's distinction between risk versus uncertainty must
be borne in mind: risky ventures are t.hose whose expected are (1) commonly
known to all pot.ent.ial investors. and (2) characterized by distributions with
high variances. Uncertainty arises when these distributions of expected re
turns are unknmn1. ln this section. data for American firms' shares traded
on the Londo11 and New York exchanges provides the actual returns distri
butions: and. assuming in,·cst.ors had rational expectations, discrepancies in
the distribul ions could he lp explain t.he listings on the two exchanges.
Price cl;'lt<:l from the Investors .Honthly A!amtal was used to construct two
ten-yea.r sam piPs of returns on the common stock of American railroads, land,
mortgage, a11d fill<tncial firms (hereafter referred to as L}.1F firms), and mines
traded on tlw Loitdon market for two periods, 1880-1889 and 1900-1909.
Although tlw L\fF ai1d mine samples constitute the full list of American
firms in London for l 880 and l900 respectively, the railroads sample contains
only those common stock issues traded on both the London and New York
112
excha.nges.47
13<"cause the New York Stock Exchange carefully vetted its
potentia.! listings. consciously a.Yoicling potentially volatile securities, jointly
listed rails - s!J<Hcs that had successfully withstood this scrutiny - were likely
to exhibit different. returns charact.eristics than those from land-mortgage
finance firms or mines. 48
Table :3.13 furnishes com pa.risons between the three inc! ustries. The least
surprising finding indicates that railroad issues required more capital from
London tha11 did LMF or mine issues. Whether the measure is the capita.]
subscribed t.o tlw common stock issue ("Subscribed"), or the total London
capita.lizat.ioJJ or the firm ( "Tot.<-11 Capita.!"), railroads drew far more capital
than Ll\fF firms and the latter, in turn. drew somewhat more than mines in
47The 1880-89 sample includes five railroads- the Illinois Central, New York, Lake Erie, & 'Vestem, Ohio &: l\Iississippi. Philadelphia & Reading, and the Union Pacific. Also included are fin' L\IF firms - Drit.ish American Land, American Mortgage of Scotland, Colorado l\Iort gage and Inn~st.mcnt. of London. Scottish American Investment, Scottish American l\Iortgagc - r~nd seYcu mining operations including La Plata. l'vlining Co. of New York, Colorado l'uired. Limit.cd. Eberhardt. &: Amora, Limited, Flagstaff Silver, Ruby & Dunderbng Con:;ol.. Lim .. Siena D11ttc;; Gold, Limited. Plumas Eureka, and Richmond Consolidated l\Iiniug. Doth the Ehcrliardt . .\.:: Amora and Flagst.<~ff Silver do not last the entire period in the Loudon listings.
The 1900-09 sample include the follmYing railroads: the Atchison, Topeka & Santa Fe, Baltimore&: Ohio. Chesapeake &: Ohio, Chicago Great '"'estern, Cleveland & Pittsburgh, Denver &: Rio Grande. Eric. Illinois Central, Kansas City Southern. Mexican Central, the l\Iissomi. Kansa,, &: Texas. 1\'."Y. Ccnt.ral & Hudson River, t.he New York, Ontario, & " 'estem. 1\'orfolk <llld \Yest.em. Nort.hern Pacific, PennsylYania, Reading, the Pittsburgh, Fort. \\";.ty!H' &.: Chicago. So11t hem Pacific, Union Pacific, 'Va.bash, and, finally, the vVheeliug S.: Lake Eric. Among the L~IF firms "·ere the British America Corporation, British &: Atueriutu :\Iort.gagc. Cauadian ami American l\Iort.gage and Trust, Edinburgh Americau Laud. l!t\'l':<tors l\Iort.gag<' s~·cmit.y. l\Iat.ador Land and Cattle, Missouri Land and Livestock. Pacific Loan and Iuw,;t.ml'llt, Praric Cattle, Scottish American Investment, Scottish American ~Iortgc1gc. S\\'<tll L<tnd and Cat.t.le, Texas Land and Cattle, Texas Land and 1'\'lort.gage. U.S. Dcbent.me Corporation, U.S. Investment Corporation, and Western Ranches. The l!)UO's mines sample include;; Arizona Copper, Alaska Goldfields, De Lamar, Montana, Lt.d .. ~Iount.ain Copper. and Utah Consolidated.
48See Cll<IJ>Icr 4 for more details on the New York Stock Exchange vetting procedures

113
both the 1880's and 1900's.
The capital structures of the railroads as opposed to those of LMF firms
and mines point to further differences between New York and London is
sues . For the most part, the LMF firms and the mines had trivial capital
structures - structures consisting solely of their respective issues of ordinary
stock . Individual railroads, on the other hand, listed a variety of both debt
and equity issues on the London exchange. As an indication of the complex
ity of railroad capital structures relative to LMF /mining capital structures,
consider the percentage of the total capital structure that is senior to (that
is, paid off first in the event that the issuing firm defaults) the common stock
issue for each of the three firm types ("Senior Oblig."in Table 3.13). For
the 1880's sample only the railroads showed any sign of non-trivial capital
structure - 31.5% of the capital of the average rail was senior to its common
stock issue. The corresponding figure for LMF firms was only one percent
while none of the mines had any senior obligations. By the 1900's all three
industries had moved toward more complex capital structures, though rails
at fifty-four percent senior obligations, still clearly outdistanced LMF firms
at twenty-eight and mines at nineteen .
To compare the relative price volatility of the three types of issues, we
created a simple volatility measure:
volati lity Year High Price - Year Low Price
(Year High Price + Year Low P1·ice)j2 (3 .1)
The results in Table 3.13 suggest that, at least according to this measure, for
the 1880 's mine prices were over twice as yolatile as rail prices, and rails were
114
somewhat more volatile than LMF prices. In the 1900's, however, mines and
rails were equally volatile, although both were less volatile (much less in the
case of mines) than they had been in the 1880's. LMF firms remained the
least volatile, but they too were much less volatile than they had been two
decades before.
The most significant comparison almost certainly involves the level of re
turns. The data in Table 3.13 indicate clearly that in each of the sectors
returns in the second period were much higher than they had been in the
1880's.49 The average return on mine issues was actually slightly negative for
the 1880's, while that for railroads was positive, but quite small. Conversely,
the LMF firms had relatively high expected returns in both periods. The
overall picture one gets from looking simply at average returns and volatil
ities suggests that LMF firms earned high returns with relatively less price
volatility, and, in that sense, they were less risky than both rails and, espe
cially, mines.
Further support for the notion that LMF securities were relatively safe,
stable investments as compared with rails and mines, particularly in the
1880's, can be found in an examination of the variances of the returns in
49The l11vestor 's l\Jonlhly Manual provides t''"o separate data sources on dividends. The first simply gives the amount, either in nominal or percentage terms, of the last four dividends paid and their payment date. The second gives the average percentage of the year's close price represent.ed by the last two dividend payments. In years when the number of dividend payments are unequal to two, the second method yields only approximate dividends. Unfortunately, not all issues report dividends in the first manner, and we therefore are for ced to rely somewhat on the approximate dividends measure. Resulting returns computed using either method contain only slight discrepancies. Moreover, the conclusions reached in this section are unaltered regardless of which dividend measure is used.
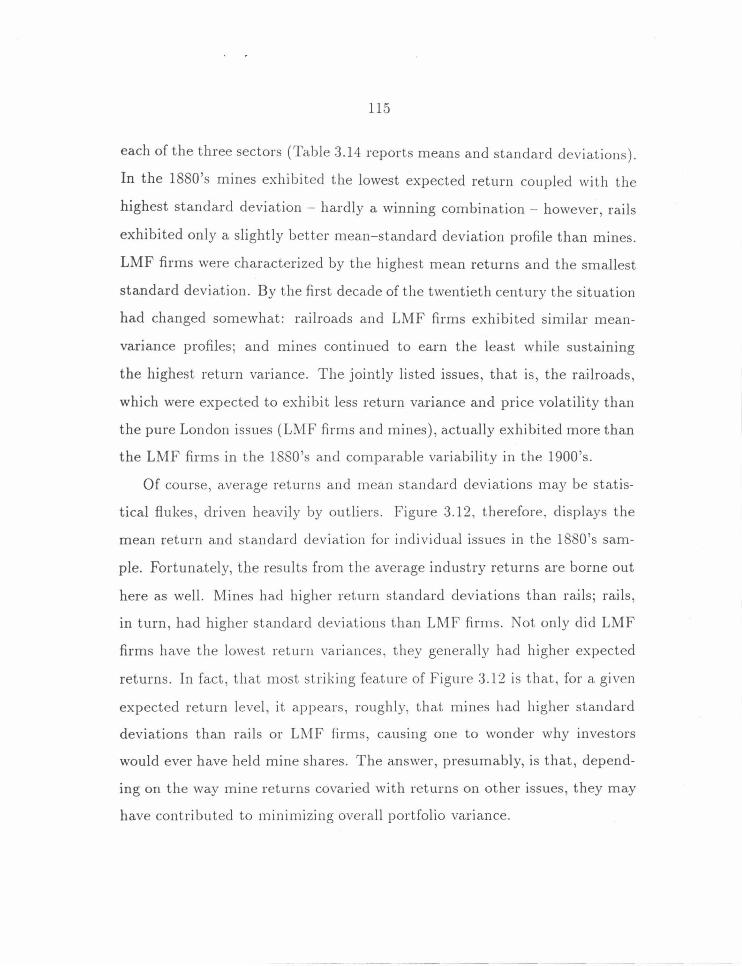
115
each of the three sectors (Table 3.14 reports means and standard deviations).
In the 1880's mines exhibited the lowest expected return coupled with the
highest standard deviation - hardly a. winning combination - however, rails
exhibited only a slightly better mean-standard deviation profile than mines.
LMF firms were characterized by the highest mean returns and the smallest
standard deviation. By the first decade of the twentieth century the situation
had changed somewhat: railroads and LMF firms exhibited similar mean
variance profiles; and mines continued to earn the least while sustaining
the highest return variance. The jointly listed issues, that is, the railroads,
which were expected to exhibit less return variance and price volatility than
the pure London issues (LMF firms and mines), actua.lly exhibited more than
the LMF firms in the 1880 's and comparable variability in the 1900's.
Of course, average returns and mean standard deviations may be statis
tical flukes, driven heavily by outliers. Figure 3.12, therefore, displays the
mean return and standard deviation for individual issues in the 1880's sam-
ple. Fortunately, the results from the average industry returns are borne out
here as well. Mines had higher return standard deviations than rails; rails,
in turn, had higher standard deviations than LMF firms. Not only did LMF
firms have the lowest return variances, they generall y had higher expected
returns. In fact , that most striking feature of Figure :3.12 is that, for a given
expected return level, it appears, roughly, that mines had higher standard
deviations than rails or LMF firms, causing one to wonder why investors
would ever have held mine shares. The ansvver, presumably, is that, depend
ing on the way mine returns cova.ried with returns on other issues, they may
have contributed to minimizing overall portfolio variance.
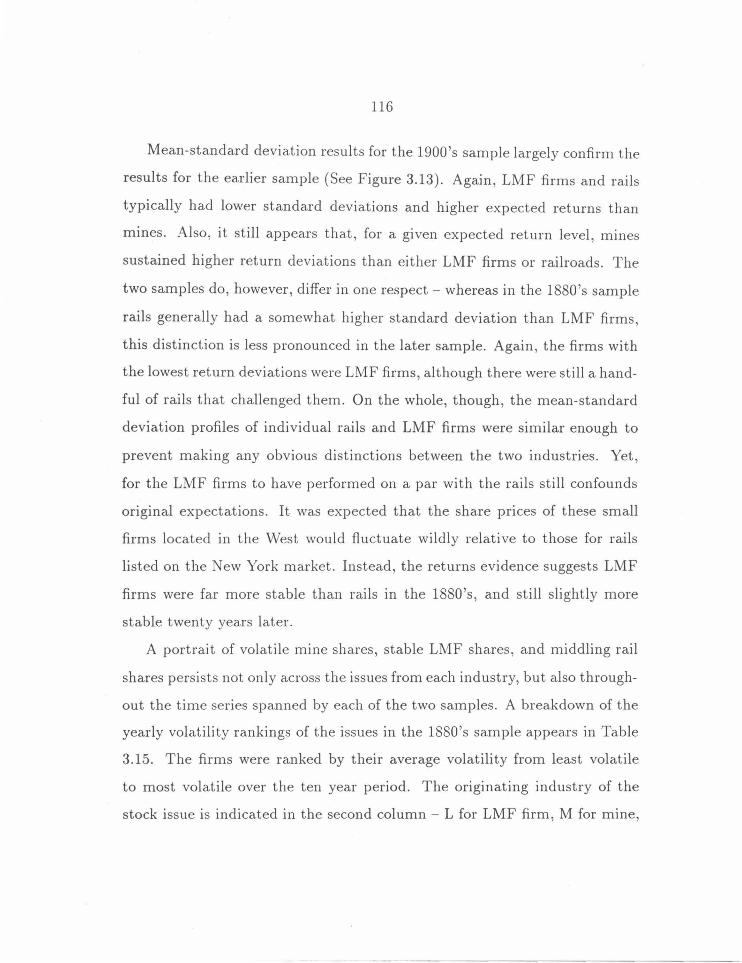
116
Mean-standard deviation results for the 1900's sample largely confirm the
results for the earlier sample (See Figure 3.13). Again, LMF firms and rails
typically had lower standard deviations and higher expected returns than
mines. Also, it still appears that, for a given expected return level, mines
sustained higher return deviations than either LMF firms or railroads. The
two samples do, however, differ in one respect- whereas in the 1880's sample
rails generally had a somewhat higher standard deviation than LMF firms,
this distinction is less pronounced in the later sample. Again, the firms with
the lowest return deviations were LMF firms, although there were still a hand
ful of rails that challenged them. On the whole, though, the mean-standard
deviation profiles of individual rails and LMF firms were similar enough to
prevent making any obvious distinctions between the two industries. Yet,
for the LMF firms to have performed on a par with the rails still confounds
original expectations. It was expected that the share prices of these small
firms located in the West would fluctuate wildly relative to those for rails
listed on the New York market. Instead, the returns evidence suggests LMF
firms were far more stable than rails in the 1880's, and still slightly more
stable twenty years later.
A portrait of volatile mine shares, stable LMF shares, and middling rail
shares persists not only across the issues from each industry, but also through
out the time series spanned by each of the two samples. A breakdown of the
yearly volatility rankings of the issues in the 1880's sample appears in Table
3.15. The firms were ranked by their average volatility from least volatile
to most volatile over the ten year period. The originating industry of the
stock issue is indicated in the second column - L for LMF firm, M for mine,
117
or R for rail - and quartile volatility rankings appear for each year, with 1
signifying least volatile quartile, and 4 the most. 50
Of the five LMF issues in the 1880's sample, none was ranked lower than
seventh in the average volatility rankings. Conversely, of the eight mines in
the sample none was ranked higher than eleventh. With the exception of the
Illinois Central (traditionally a stable issue , and long a favorite of British and
continental investors), the rails tended toward the middle of the rankings. 51
These results further confirm the mean/standard deviation results.
Even within an industry it is difficult to determine whether western shares
were volatile relative to other issues. Although Colorado Mortgage and In
vestment of London was the lowest ranked (most volatile) LMF firm, it is
difficult to draw definitive conclusions about LMF firms because the names
of the other issues reveal little as to their location and no listings of the assets
of these firms has been found. Rails are just as confusing. The two west
ern most - the Union Pacific and the Ohio and Mississippi - were the third
and fourth ranked of the six issues from that industry. Surprisingly, eastern
rails, namely the New York, Lake Erie, and Western and the Philadelphia
and Reading, were the two bottom ranked shares in the industry. Regional
comparisons for mines are more difficult because most operated in the \Vest,
or, at least , not in the East. Although the Eberhardt and the Eberhardt
and A.urora, two mining operations located in Nevada, were ranked among
the bottom three issues overall, the Ruby and Dunderberg - located in Min-
50 Note that for the 1880's sample the Delaware and Hudson Canal was included with the rails because it was a transportation issue.
51 See Lewis, A me rica's Stake, pp. 36-45 on the history of foreign interest in the Illinois Central.
118
nesota - was ranked between them, and the issue ranked fourth from the
bottom, La Plata Mining of New York, actually operated in Colorado.
The quartile rankings indicate that the overall rankings are no fluke ,
but were consistent across the decade. With only minor exceptions, the
most volatile issues remained in quartiles three and four throughout the
decade while the least volatile issues remained in the first two qua.rtiles.
Although La Plata Mining of New York moved up to the second quartile
in its final year in the sample, its four previous years were spent in the
fourth quartile. The Illinois Central, Scottish American Investment, Scottish
American Mortgage, and the Delaware and Hudson Canal remained in the
upper two quartiles throughout the period. With the exception of 1882,
in which the Union Pacific edged its way into the first quartile, it spent
the majority of its time bouncing between the second and third quartiles
eventually ranking eigth in average volatility among the nineteen issues li sted.
The clear separation between the three industries in the average volatility
rankings and the consistency of the rankings throughout the time period
underscore differences between mines , rails , and LMF firms in the 1880 's.
The 1900 's sample produces similar results (Table 3.16). Although one
LMF firm did rank in the bottom half of the forty-one issues listed (Edinburgh
American Land at twenty-two) , the remaining fifteen ranked within the top
twenty. The least volatile firm, Pacific Land and Investment, was not only
an LMF firm but also a western issue. Scottish American Investment and
Scottish American Mortgage remained from the 1880's sample and had the
second and third lowest average volatilities respectively. Joining them in
the top ten were newcomers Investors Mortgage Security and Texas Land
119
and Mortgage, and two cattle companies - Matador Land and Cattle and
Western Ranches.
On the other end of the volatility spectrum, each mine share finished in
the bottom half of the overall rankings. The least volatile, Arizona Copper,
ranked twenty-first, while the most volatile, Alaska Gold, was thirty-eighth .
Yet, whereas in the 1880's sample mines occupied all but one of the bottom
nine spots in the rankings, rails occupied nine of the last eleven spots in the
1900's. Again, the mines were located primarily in the West making regional
comparisons within the industry impossible. Mines, which comprised a little
less than half of the total issues in the 1880's sample, comprised less than
twelve percent (five of forty-one) of the total issues in the 1900 's sample.
Conversely, LMF firms and rails proliferated from the 1880 's to the 1900's -
rails comprised six of nineteen issues in the earlier sample, twenty of forty
one in the latter; LMF firms numbered five in the earlier sample and sixteen
in the latter. While railroads like the Union Pacific and the Illinois Central
and LMF firms like Scottish American Investment and Scottish American
Mortgage appear in both samples, the same cannot be said of any of the
mining shares, indicating, perhaps , further lack of stability in the mining
industry.
Rails were scattered throughout the 1900's volatility rankings. Three of
them, the Illinois Central, the Pennsylvania, and the New York Central and
Hudson River , were among the ten least volatile shares in terms of average
volatility. Another handful including the Baltimore and Ohio, the Norfolk
and Western , and the Southern Pacific finished in the middle of the rankings
(from fifteen to twenty-five); the remaining rails fleshed out twelve of the
120
bottom sixteen spots. Of those rail shares m the top half of the average
volatility rankings, all were located outside the West - four in the East one l
in the Midwest. However, not all eastern rails shares enjoyed such stability.
As in the 1880's rankings , Philadelphia and Reading shares ranked near the
bottom; the Erie Railroad finished dead last.
Just as in the earlier sample, shares in the 1900's sample maintained
their positions in the quartile volatility rankings year in and year out. Of
course, some shares, like those of the Edinburgh American Land Company
did bounce around from quartile to quartile, but such shares were rare. More
typical was Matador Land and Cattle which ranked in the upper two quartiles
in all but one year of the sample (six in the first quartile and three in the
second). Highly volatile shares also maintained positions in the bottom of the
rankings as evidenced by the Missouri, Kansas, and Texas Railroad, and De
Lamar Mining; each ranked in the bottom quartile for over half the decade
and finished in the top half but once.
In sum, the quartile rankings demonstrate that the industry volatility
profiles hold throughout the time series in both the 1880's and 1900's. Stable
LMF shares and volatile mining shares persist, and are consistent not only
cross-sectionally but also through time. The LMF firms were not only more
stable than mines, but also, all but the most traditional American rails. More
importantly, the LMF results demonstrate that initial conjectures regarding
the relative riskiness of western issues were incorrect - at least one western
industry could offer shares more stable than some eastern American rail
shares traded on the New York Stock Exchange.
Consistency in the quartile rankings is valuable because it permits indus-
121
tries with relatively volatile shares to be readily identified. Having identified
volatility distinctions between the three industries, it is possible to glean
some insight as to the way returns in each industry covaried with one an
other, albeit in a less direct fashion than typically employed in financial
research.
A standard tool in finance for measuring covariance in returns between
an individual share and the market as a whole is the Capital Asset Pricing
Model, or CAPM. In the simplest application of the CAPM the following
regression is run:
(3.2)
Here r f is the risk free rate of return in year t, 1·m is the market rate of re
turn, and f3 , the coefficient estimated in the regression, roughly measures the
responsiveness of firms i's returns to changes in the market rate of return (as
suming, of course, little variation in the risk free rate) . Although the British
consols could provide a reasonable time series for the risk free rate, arriving
at a market rate of return is considerably more problematic. 52 As a result ,
direct application of the CAPM model is impractical for the present data
set. Instead, yearly sample mean returns and the yearly return/volatility
correlations are used to, hopefully, make the same point that could be made
if a market return were calculated.
52It would be possible to construct yearly returns for all issues traded in London, though the task would be quite formidable. More importantly, the benefits from such calculations are likely to be minimal, as it is possible to construct an approximate market return by taking average yearly returns from our present samples.
122
One would expect that, if the CAPM holds, in years when the market rate
of return minus the risk free rate of return was positive (1·mt - r ft) 2:: 0,
more volatile, "high Beta" firms performed better than more stable, "low
Beta" issues. Because a market rate of return is impractical to compute for
this time period, the average sample rate of return is used as a proxy. In years
when the sample average return minus the rate of return on British consols
was positive, therefore, volatile shares are expected to have outperformed
stable issues. A crude way to check this intuition is to test whether re
turn/volatility correlations were positive when the quantity rm - r J, as mea
sured by our proxies, was positive. Conversely, in market downturns (as rep
resented by years when this quantity is negative),a negative return/volatility
correlation is expected as high Beta firms presumably sustained the most
damage when the market return declined.
The results of such a calculation for each year in the two samples (Table
3.17) largely confirm expectations. It is striking that, in each year when
the mean return \vas negative, or, alternatively, small enough that the quan
tity nn - 1·j was negative, the returns/volatility correlation was negative,
throughout both the 1880's and 1900's. On the other hand, when the yearly
mean return was positive, the return/volatility correlation was positive, ex
cept for 1880 (by far the smallest sample for any year), 1887 and 1889, years
in which the mea.n sample return was quite close to the consol return rate,
and 1902, when the return volatility correlation was only slightly negative.
Given these results and the previous results on volatilities it seems safe to
conclude that the mines probably had higher Betas than the jointly listed
railroads. The LMF firms, however, make it impossible to conclude that all
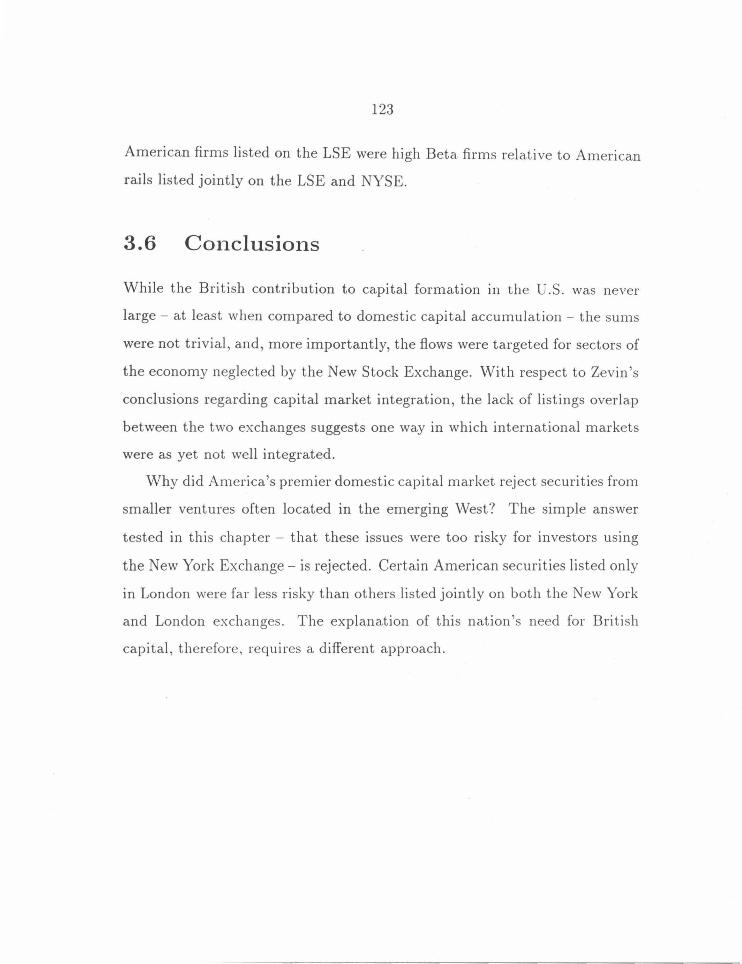
123
American firms listed on the LSE were high Beta firms relative to American
rails listed jointly on the LSE and NYSE.
3.6 Conclusions
While the British contribution to capital formation in the U.S. was never
large- at least when compared to domestic capital accumulation - the sums
were not trivial, and, more importantly, the flows were targeted for sectors of
the economy neglected by the New Stock Exchange. With respect to Zevin 's
conclusions regarding capital market integration, the lack of listings overlap
between the two exchanges suggests one way in which international markets
were as yet not well integrated.
Why did America's premier domestic capital market reject securities from
smaller ventures often located in the emerging West? The simple answer
tested in this chapter - that these issues were too risky for investors using
the New York Exchange- is rejected. Certain American securities listed only
in London were far less risky than others listed jointly on both the New York
and London exchanges. The explanation of this nation's need for British
capital, therefore, requires a different approach.
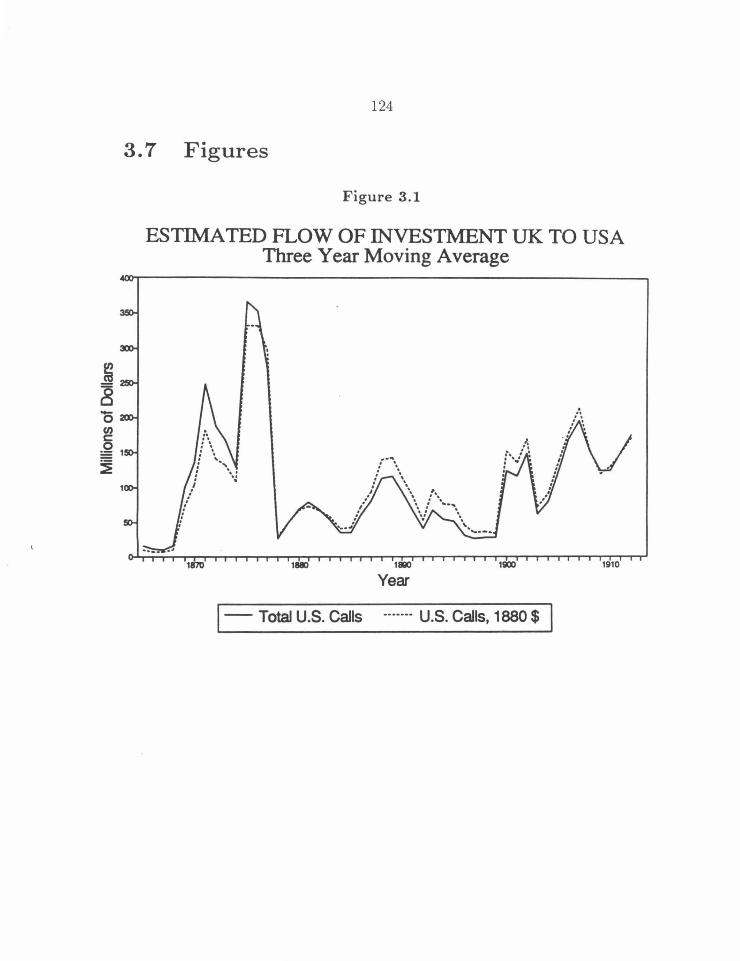
124
3.7 Figures
Figure 3.1
ESTIMATED FLOW OF INVESTMENT UK TO USA Three Year Moving Average
1810 18110 11100 1910
Year
1- Total U.S. Calls ------- U.S. Calls, 1880$
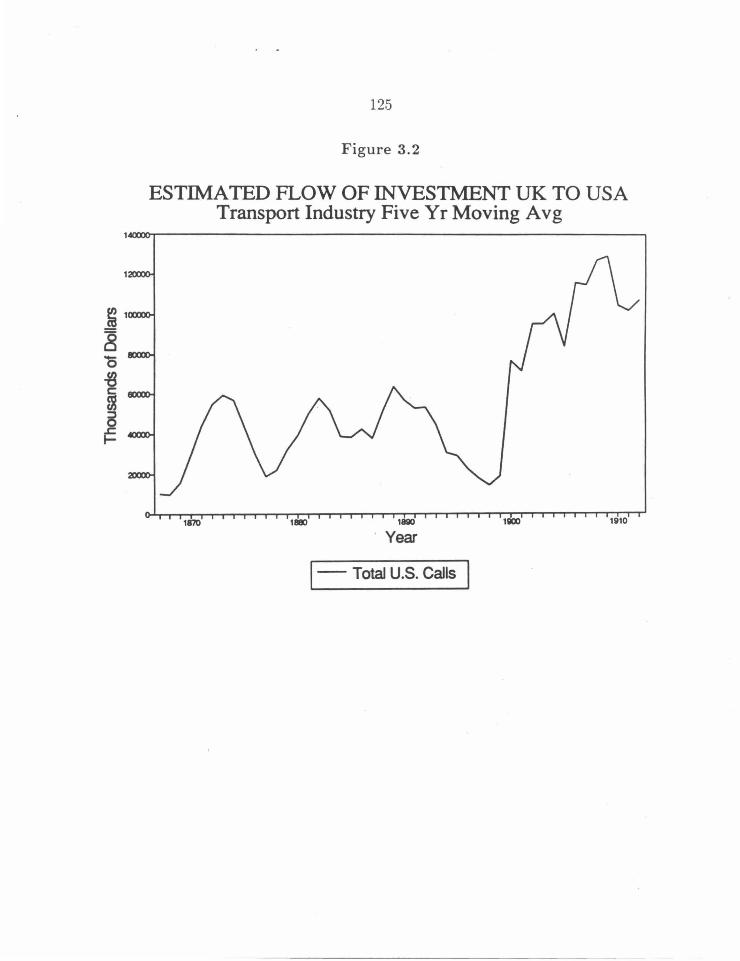
125
Figure 3.2
ESTIMATED FLOW OF INVESTMENT UK TO USA Transport Industry Five Y r Moving A vg
1170 11Bl 1880 11100 1910
· Year
1-Total U.S. Calls I
0 ~1
m ~1
..r::. 1-
126
Figure 3.3
ESTIMATED FLOW OF INVESTMENT UK TO USA Government Five Y r Moving A vg
1870 1111!0 18110 11100 11110
Year
1- Total U.S. Calls I
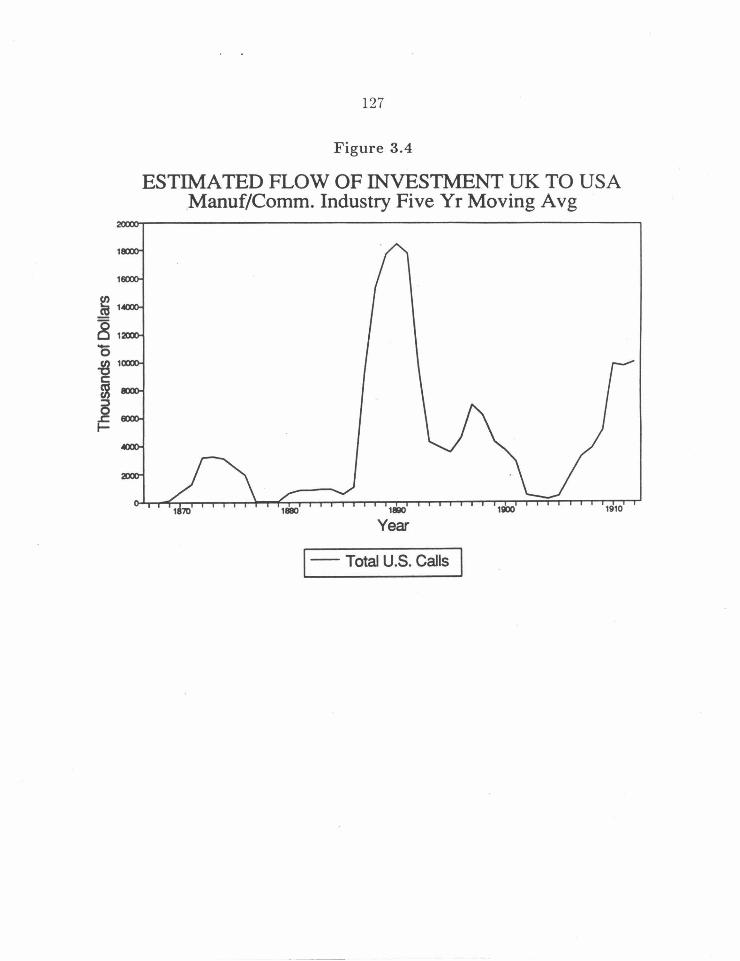
127
Figure 3.4
ESTIM:A TED FLOW OF INVESTMENT UK TO USA .Manuf/Comm. Industry Five Yr Moving Avg
18110 11100 1910
Year
1-Total U.S. Calls I
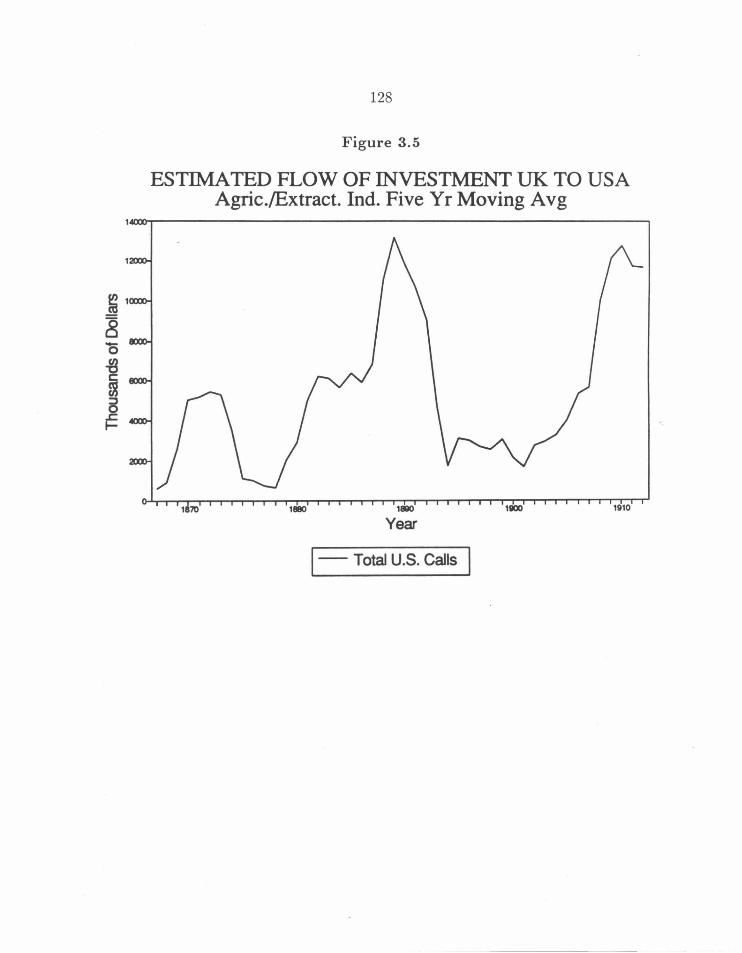
128
Figure 3.5
ESTIMATED FLOW OF INVESTMENT UK TO USA Agric./Extract. Ind. Five Yr Moving Avg
18110 11100 1910
Year
1- Total U.S. Calls
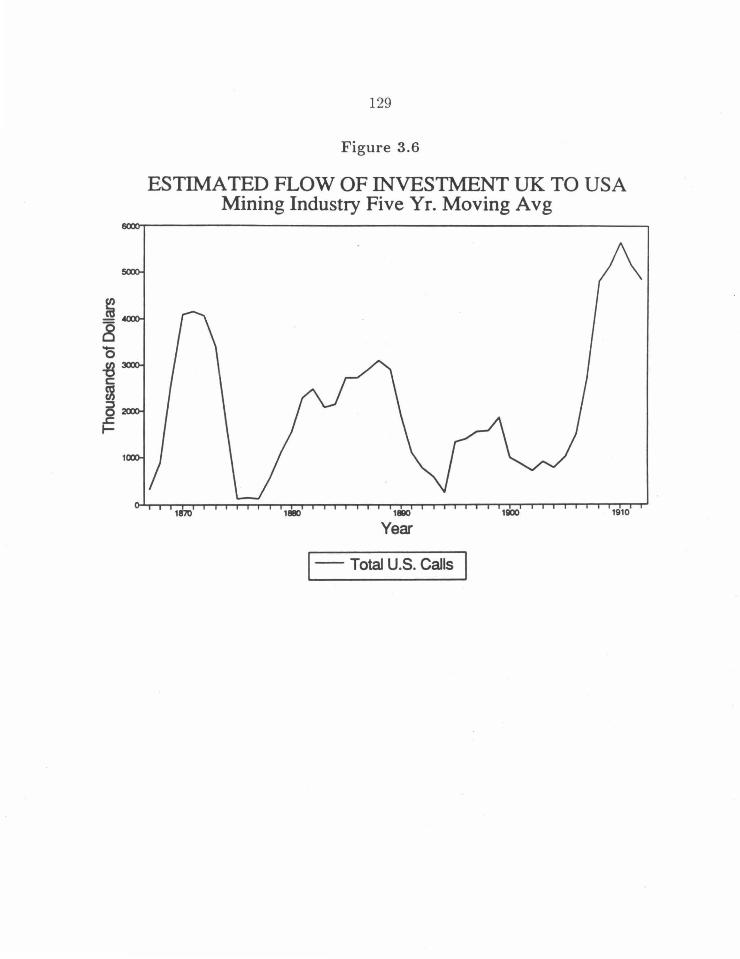
129
Figure 3.6
ESTIMATED FLOW OF INVESTMENT UK TO USA Mining Industry Five Yr. Moving Avg
187'0 18110 18110
Year
1- Total U.S. Calls j
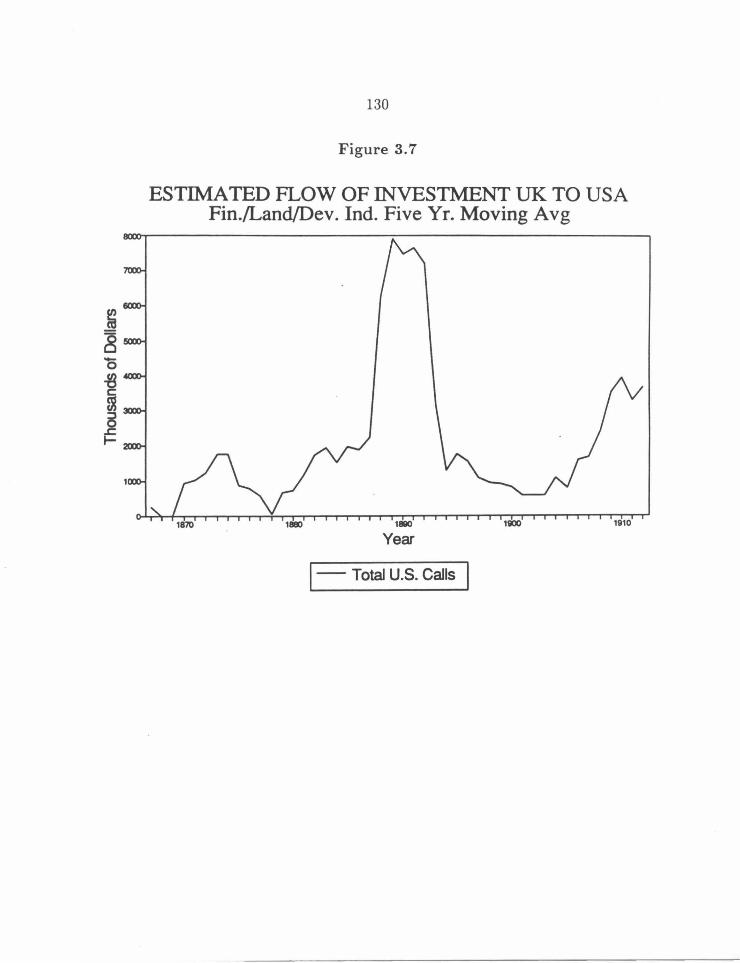
130
Figure 3.7
ESTIMATED FLOW OF INVESTMENT UK TO USA Fin./Land/Dev. Ind. Five Yr. Moving Avg
18110
Year
1-Total U.S. Calls I
11100 1910
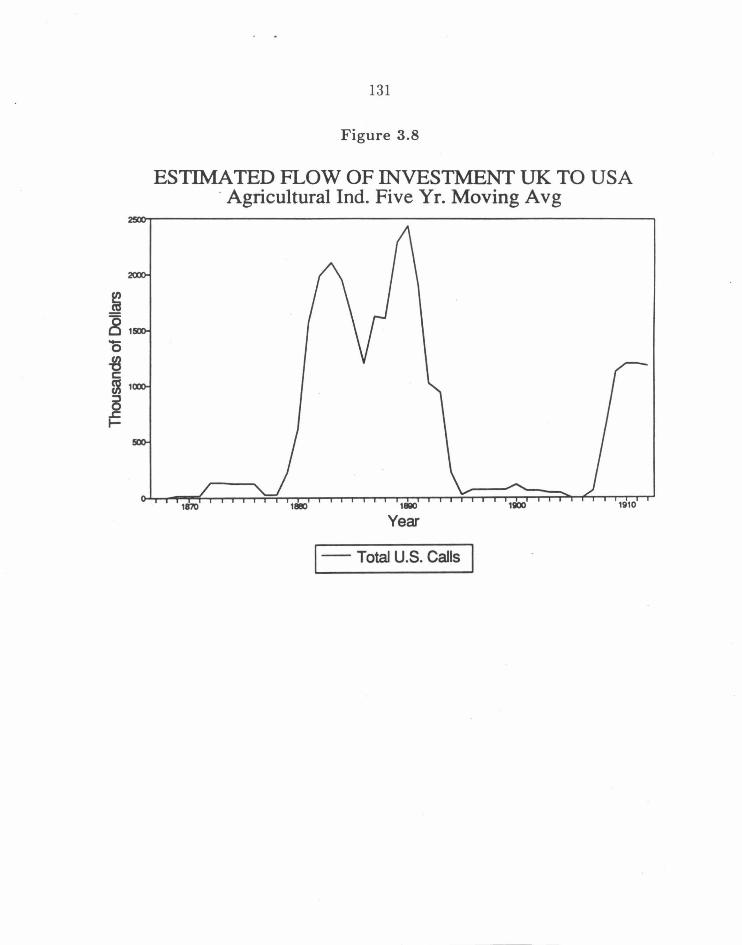
131
Figure 3.8
ESTIMATED FLOW OF INVESTMENT UK TO USA · Agricultural Ind. Five Yr. Moving Avg
1870 181!0 18110 11100
Year
1-Total U.S. Calls I

132
Figure 3.9
ESTIMATED FLOW OF INVESTMENT UK TO USA Chem./Petrol. Ind. Five Yr. Moving Avg
1870 111110 18110 11100 1910
Year
j- Total U.S. Calls I
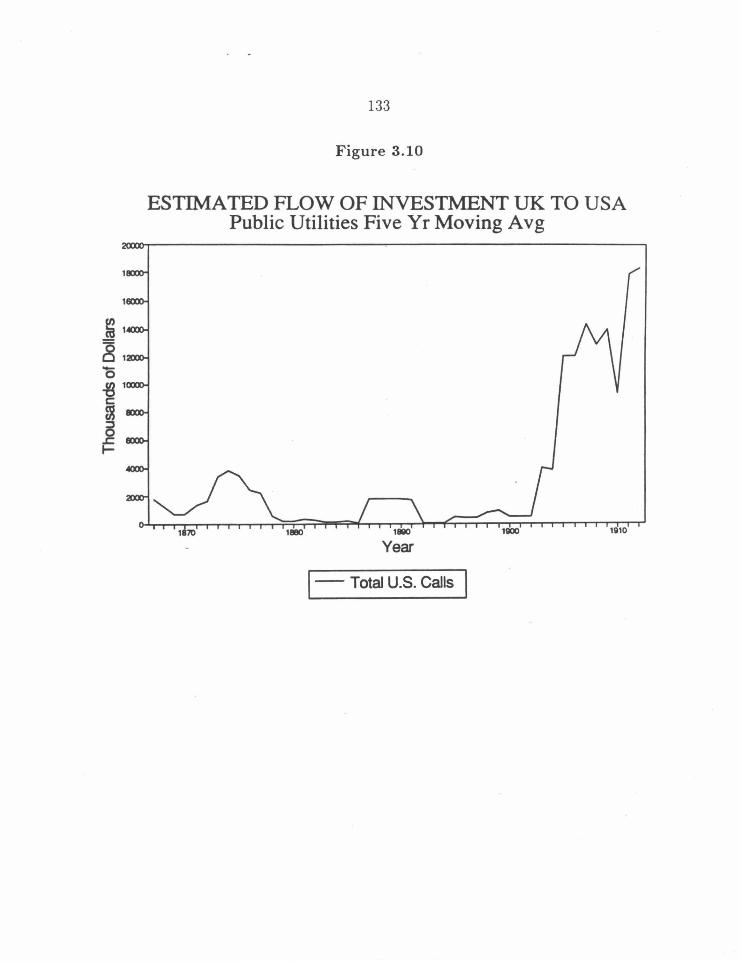
133
Figure 3.10
ESTIM:A TED FLOW OF INVESTMENT UK TO USA Public Utilities Five Yr Moving Avg
11180 18110 11110
Year
1- Total U.S. Calls I
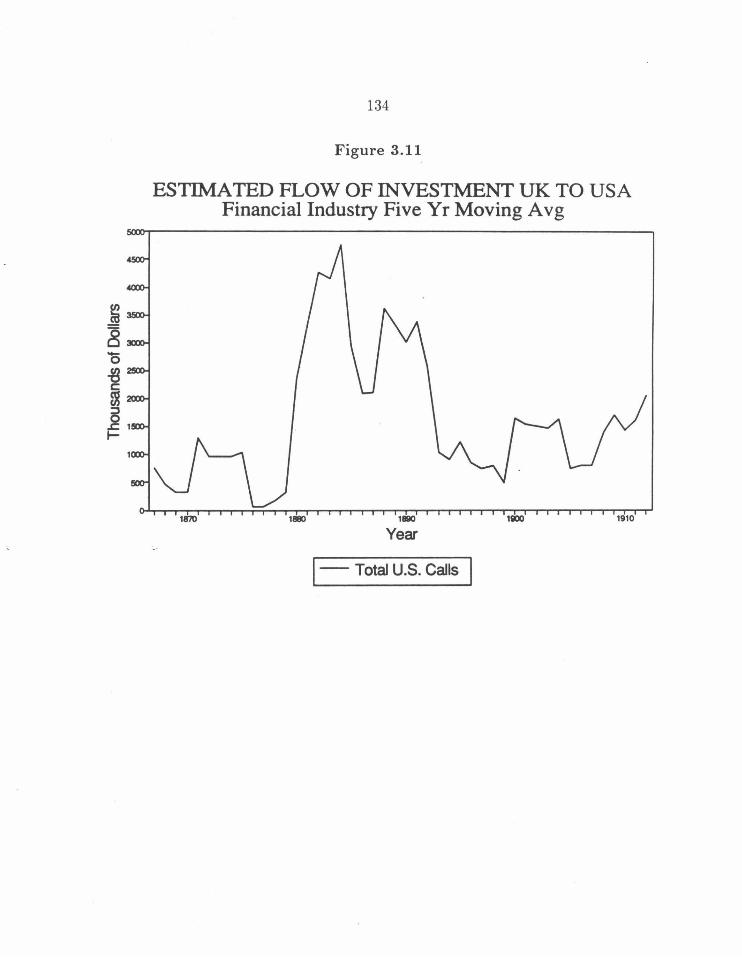
134
Figure 3.11
ESTIMATED FLOW OF INVESTMENT UK TO USA Financial Industry Five Yr Moving Avg
1870 11180 18110 11100 1910
Year
j- Total U.S. Calls I
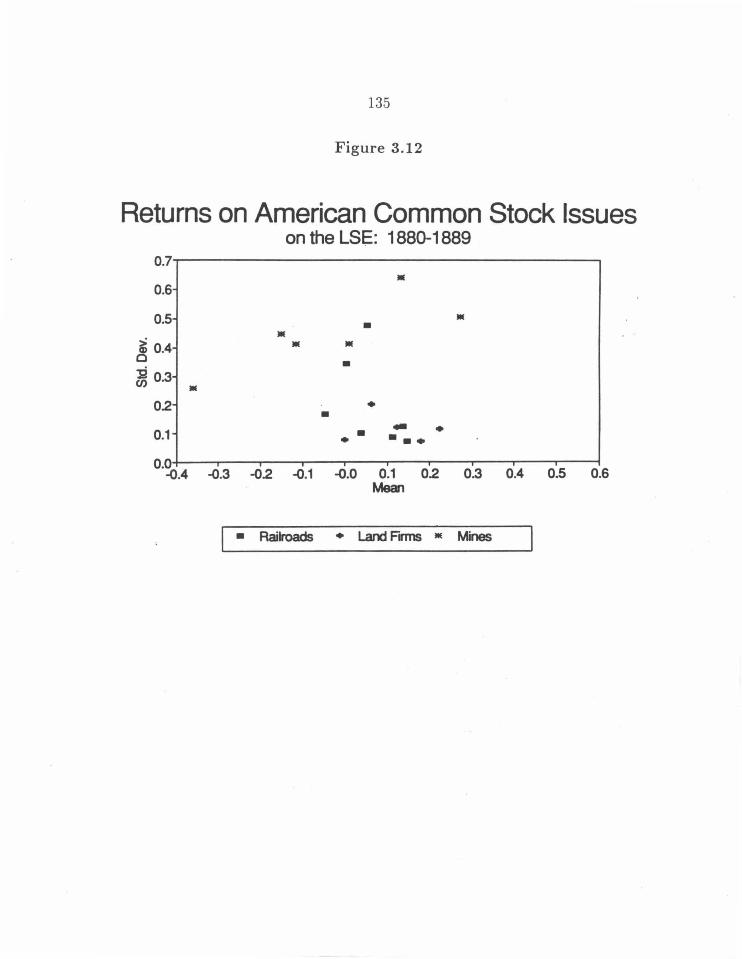
135
Figure 3.12
Returns on American Common Stock Issues on the LSE: 1880-1889
0.7
• 0.6
• 0.5 • • ~ 0.4 • • c ~ 0.3
• •
0.2 • • 0.1 . . .-... 0.0
..().4 ..().3 ..().2 ..().1 ..().0 0.1 0.2 0.3 0.4 0.5 0.6 Meal
• Railroads • Land Fnns • Mines

136
Figure 3.13
Returns on American Common Stock Issues on the LSE: 1900-1909
1.4 . .,..---------------------~-,
1.2-
1.o-
~ o.a~ 0.6
0.4
0.2-
• • • • • . ... .
• • • •• • • . .. . . -·· , • 0.:~-~-~-~-~-~~-~-~-~-~ -o.4 -o.3 -o2 -o.1 -o.o 0.1 02 o.3 o.4 o.s o.6
Mean
• Railroads • Land Firms • Mines

137
3.6 Tables
Table 3.1
Table 3.1 (a). (1) (2) (3) (4) (5) (6) (7) Year Tot.al UK UK UK Share of UK
Foreign Share Investment Total UK Investment Investment Foreign in the US Foreign Investment in the US
in t.he US Investment. (Stock) Investment Going (Stock) in the US (Stock) to the US
(2)X(3) (5)X(6)
( Simoll) (Simon) (Simon) (lmlah) (Imlah) (Imlah)
(millions (millions (millions (millions of of of of
dollars) (percent.) dollars) dollars) (percent) dollars)
1865 710 88.0 666 2644 24.0 635 1866 809 87.5 773 2823 25.0 706 1867 963 87.0 868 3051 26.0 793 1868 1039 86.5 973 3247 27.0 877 1869 1217 86.0 1089 3500 28.0 980 1870 1322 85.5 1172 3735 29.0 1083 1871 1428 85.0 1318 4120 30.0 1236 1872 1683 84.5 1499 4652 30.0 1396 1873 1876 84.0 1607 5091 30.0 1527 1874 1963 83.5 1672 5474 30.0 1642 1875 205-i 83.0 1701 5751 29.0 1668 1876 2056 82.5 1666 5876 28.0 1645 1877 1996 82.0 1562 5947 27.0 1606 1878 1825 81.5 1414 6033 25.0 1508 1879 1607 81.0 1350 6224 23.0 1432 1880 1688 80.5 1341 6422 22.0 1413 1881 1653 80.0 1373 6776 21.0 1423 1882 1779 80.0 1449 7094 20.0 1419 1883 1843 80.0 1524 7357 20.0 1471 1884 1966 80.0 1586 7748 20.0 1550 1885 2012 79.5 1657 8084 20.0 1617 1886 2171 79.0 1813 8510 20.0 1702 1887 2-!34 78.5 2032 8984 21.0 1887 1888 2761 78.0 2238 9480 22.0 2086 1889 2999 77.5 2405 9917 23.0 2281

138
Table 3.1 Cont.
Table 3.1 (a). (1) (2) (3) (4) (5) (6) (7) Year Total UK UK UK Share of UK
Foreigu Share Investment Total UK Investment Investment. Foreign in the US Foreign Investment in the US
in the US Inn'stment (Stock) Investment Going (Stock) in the US (Stock) to the US
(2)X(3) (5)X(6)
(Simon) (Simon) (Simon) (lmlah) (Imlah) (Imlah)
( millio11" (millions (millions (millions of of of of
dollars) ( JWrcent) dollars) dollars) (percent) dollars)
1890 3229 77.0 2550 10449 24.0 . 2508 1891 3416 76.5 2639 10824 25.0 2706 1892 3502 76 .0 2731 11143 25.0 2786 1893 3709 75.5 2i79 11429 25.0 2857 1894 3676 75.0 2824 11639 24.0 2793 1895 3880 74.5 2916 11853 23.0 2726 1896 3974 74.0 2938 12160 22.0 2675 1897 3865 73 .5 2801 12384 21.0 2601 1898 3768 73 .0 2751 12509 20.0 2502 1899 3701 72.0 2665 12738 19.8 2522 1900 3637 71.0 2582 12943 19.6 2537 1901 3614 70.0 2530 13127 19.4 2547 1902 3703 69.0 2555 13307 19.2 2555 1903 385-i 68.0 2621 13548 19.0 2574 1904 3915 67.0 2663 13828 18.8 2600 1905 4134 66.0 2729 14268 18.6 2654 1906 -1371 65.0 2841 14902 18.4 2742 1907 4550 64.0 2914 15733 18.2 2863 1908 4723 63.0 2975 16569 18.0 2982 1909 5078 62.0 3148 17301 17.8 3080 1910 [>421 61.0 3311 18205 17.6 3204 1911 5661 60.0 3397 19268 17.4 3353 1912 5913 59.0 3489 20332 17.0 3456 1913 6166 59.0 3638 21543 17.0 3662
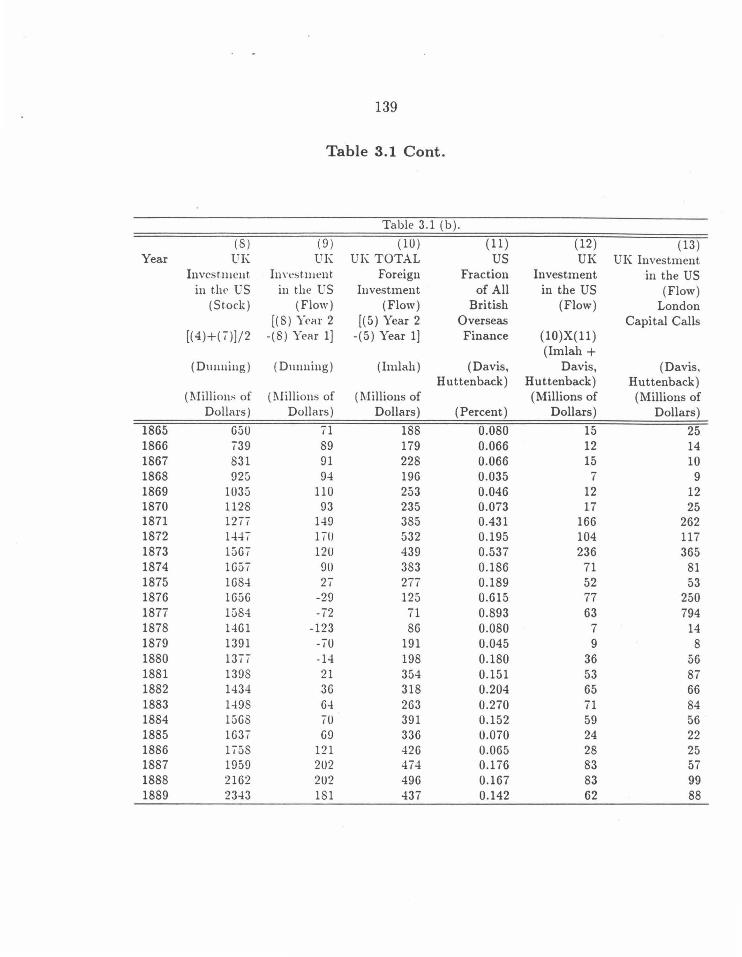
139
Table 3.1 Cont.
Table 3.1 (b).
(8) (9) (10) (11) (12) (13) Year UI~ UK UK TOTAL us UK UK Investment
Invest meut. In n~st men t. Foreign Fraction Investment in the US in the US in t.he US Investment of All in the US (Flow)
(Stock) (Flow) (Flow) British (Flow) London [(8) Year 2 [(5) Year 2 Overseas Capital Calls
[(4)+(7)]/2 -(8) Year 1] -(5) Year 1] Finance (10)X(11) (Imlah +
(Dunning) (Dunning) (Imlah) (Davis, Davis, (Davis, Huttenback) Huttenback) Huttenback)
(l'viillions of ( !\Iillions of ( lVIillions of (Millions of (Millions of Dollars) Dollars) Dollars) (Percent) Dollars) Dollars)
1865 650 71 188 0.080 15 25 1866 739 89 179 0.066 12 14 1867 831 91 228 0.066 15 10 1868 925 94 196 0.035 7 9 1869 1035 110 253 0.046 12 12 1870 1128 93 235 0.073 17 25 1871 1277 149 385 0.431 166 262 1872 1-147 1/lJ 532 0.195 104 117 1873 1567 120 439 0.537 236 365 1874 1657 9lJ 383 0.186 71 81 1875 1684 27 277 0.189 52 53 1876 1656 -29 125 0.615 77 250 1877 1584 -72 71 0.893 63 794 1878 1461 -123 86 0.080 7 14 1879 1391 -70 191 0.045 9 8 1880 1377 -14 198 0.180 36 56 1881 1398 21 354 0.151 53 87 1882 1-134 36 318 0.204 65 66 1883 1498 6-l 263 0.270 71 84 1884 1568 70 391 0.152 59 56 1885 1637 69 336 0.070 24 22 1886 1758 121 426 0.065 28 25 1887 1959 202 474 0.176 83 57 1888 2162 202 496 0.167 83 99 1889 2343 181 437 0.142 62 88
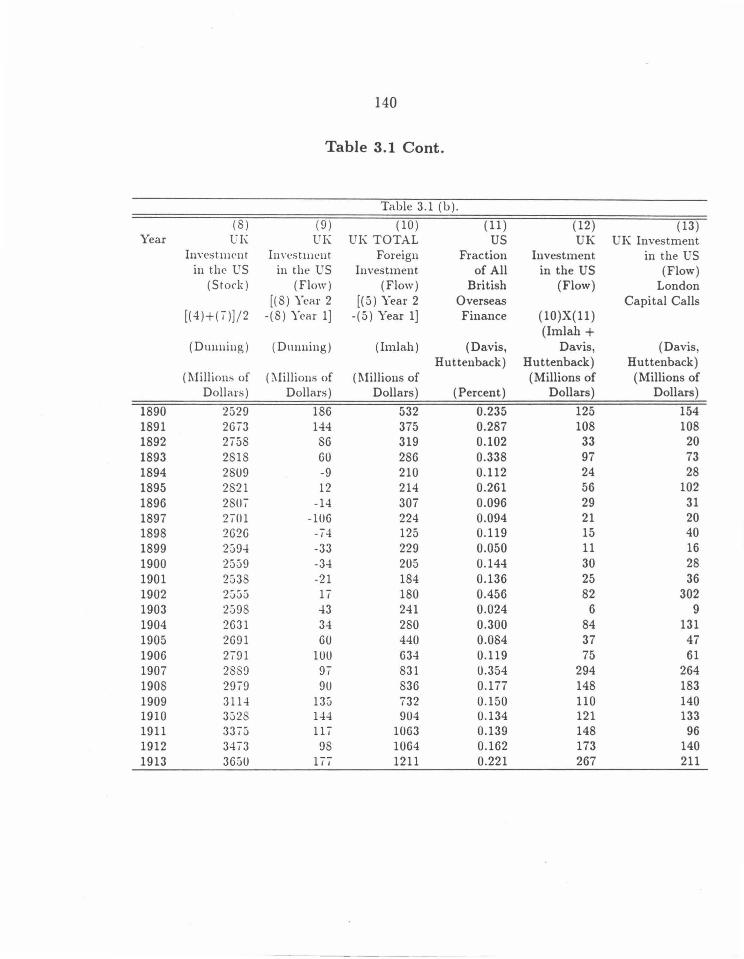
140
Table 3.1 Cont.
Table 3.1 (b).
(8) (9) (10) (11) (12) (13) Year U\: UK UK TOTAL us UK UK Investment
Investment In Yes t.llll'll t. Foreign Fraction Investment in the US in t.hc VS in the l ' S Investment. of All in the US (Flow)
(Stock) (Flow) (Flow) British (Flow) London [(8) Year 2 [(5) Year 2 Overseas Capital Calls
[(4)+(1)] /2 -(8) Year 1] -(5) Year 1] Finance (lO)X(ll) (Imlah +
( Dunniug) ( Dnnuing) (lmlah) (Davis, Davis, (Davis, Huttenback) Huttenback) Huttenback)
( l\lillions of (:\Jillions of ( l\lillions of (Millions of (Millions of Dollars ) Dollars) Dollars) (Percent) Dollars) Dollars)
1890 2529 186 532 0.235 125 154 1891 2613 144 375 0.287 108 108 1892 2158 86 319 0.102 33 20 1893 2818 60 286 0.338 97 73 1894 2809 -9 210 0.112 24 28 1895 2821 12 214 0.261 56 102 1896 2801 -14 307 0.096 29 31 1897 2101 -106 224 0.094 21 20 1898 2626 -14 125 0.119 15 40 1899 2;)9-! -33 229 0.050 11 16 1900 2559 -34 205 0.144 30 28 1901 2538 -21 184 0.136 25 36 1902 2;)55 11 180 0.456 82 302 1903 2598 -!3 241 0.024 6 9 1904 2631 34 280 0.300 84 131 1905 2691 60 440 0.084 37 47 1906 2191 lOU 634 0.119 75 61 1907 2889 91 831 0.354 294 264 1908 2919 90 836 0.177 148 183 1909 311-! 135 732 0.150 110 140 1910 3528 144 904 0.134 121 133 1911 3315 111 1063 0.139 148 96 1912 3413 98 1064 0.162 173 140 1913 3650 111 1211 0.221 267 211
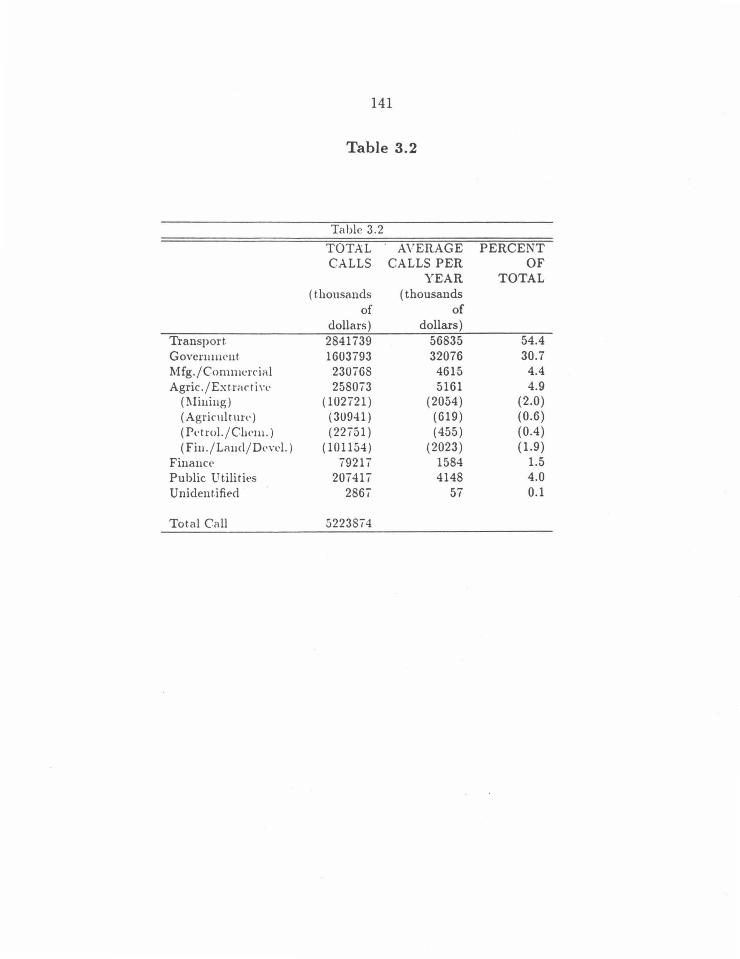
141
Table 3.2
Table 3.2
TOTAL AVERAGE PERCENT CALLS CALLS PER OF
YEAR TOTAL (thousands (thousands
of of dollars) dollars)
Transport. 2841739 56835 54.4 Govcnuncnt 1603793 32076 30.7 lVIfg. I Commercial 230768 4615 4.4 Agric.IExtradin- 258073 5161 4.9
( !\Iiuiug) (102721) (2054) (2.0) (Agricultur\') (30941) (619) (0.6) (Petrol. I Chcm.) (22751) (455) (0.4) ( Fin.IL<mdiDevcl.) ( 101154) (2023) {1.9)
Finauc<' 79217 1584 1.5 Public U t.ilitit>s 207417 4148 4.0 U nident.ified 2867 57 0.1
Total Call 5223874
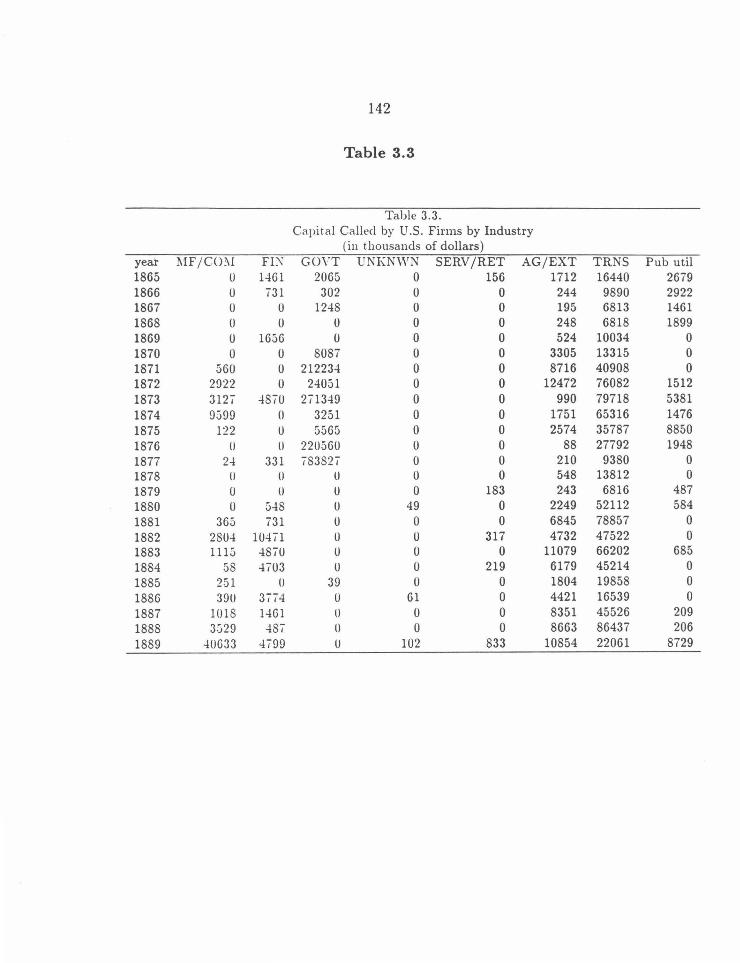
142
Table 3.3
Table 3.3. Capital Called by U.S. Firms by Industry
(in thousands of dollars) year l\IF /CO ?II Fl:'\ GOVT UNKNWN SERV/RET AG/EXT TRNS Pub util 1865 0 1461 2065 0 156 1712 16440 2679 1866 0 131 302 0 0 244 9890 2922 1867 0 0 1248 0 0 195 6813 1461 1868 0 0 0 0 0 248 6818 1899 1869 0 1656 0 0 0 524 10034 0 1870 0 0 8087 0 0 3305 13315 0 1871 560 0 212234 0 0 8716 40908 0 1872 2922 0 24051 0 0 12472 76082 1512 1873 3121 4810 211349 0 0 990 79718 5381 1874 9599 0 3251 0 0 1751 65316 1476 1875 122 0 5565 0 0 2574 35787 8850 1876 () () 220560 0 0 88 27792 1948 1877 24 331 183821 0 0 210 9380 0 1878 () () () 0 0 548 13812 0 1879 0 u 0 0 183 243 6816 487 1880 0 548 0 49 0 2249 52112 584 1881 365 731 0 0 0 6845 78857 0 1882 2804 10411 0 0 317 4732 47522 0 1883 1115 4810 0 0 0 11079 66202 685 1884 58 4703 0 0 219 6179 45214 0 1885 251 0 39 0 0 1804 19858 0 1886 390 3114 0 61 0 4421 16539 0 1887 1018 1461 0 0 0 8351 45526 209 1888 3G29 481 0 0 0 8663 86437 206 1889 40633 4199 0 102 833 10854 22061 8729
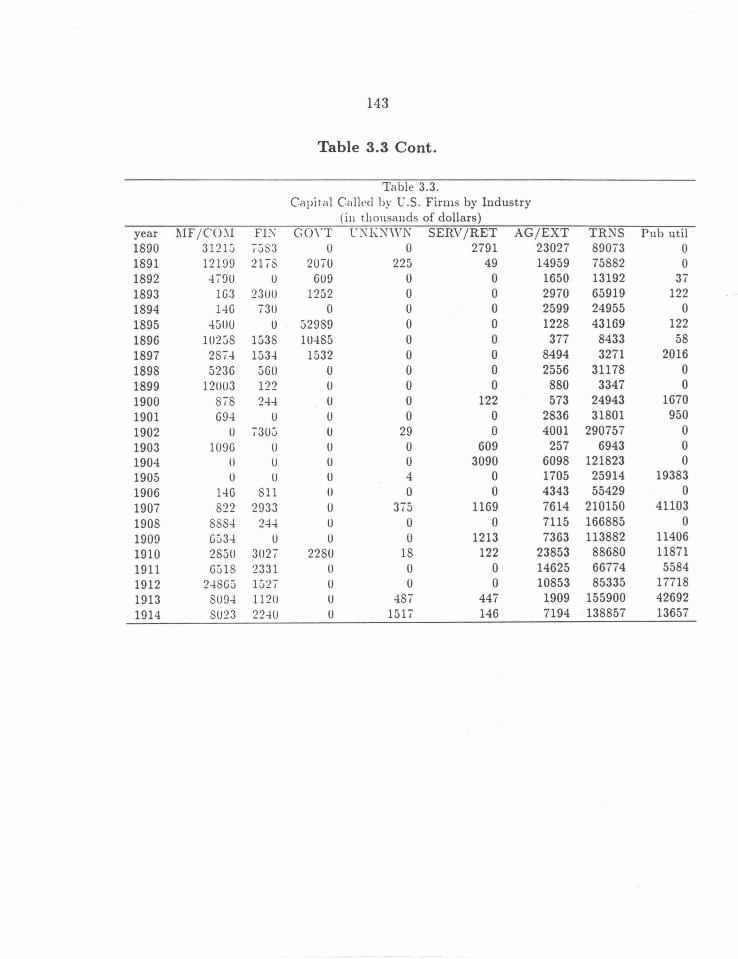
143
Table 3.3 Cont.
Table 3.3. Capir.al Called by U.S. Firms by Industry
(in thousands of dollars) year :t\IF / C0:.\1 FE\ GO\'T l'!\KN\VN SERV/RET AG/EXT TRNS Pub uti! 1890 31210 1583 0 0 2791 23027 89073 0 1891 12199 2118 2070 225 49 14959 75882 0 1892 -1190 0 609 0 0 1650 13192 37 1893 163 2300 1252 0 0 2970 65919 122 1894 1-16 130 0 0 0 2599 24955 0 1895 45()0 0 52989 0 0 1228 43169 122 1896 10238 1538 10485 0 0 377 8433 58 1897 281-1 153-1 1532 0 0 8494 3271 2016 1898 5236 560 0 0 0 2556 31178 0 1899 12003 122 0 0 0 880 3347 0 1900 818 2-1-1 0 0 122 573 24943 1670 1901 69-1 0 0 0 0 2836 31801 950 1902 0 1300 () 29 0 4001 290757 0 1903 1096 0 0 0 609 257 6943 0 1904 0 0 0 0 3090 6098 121823 0 1905 0 () 0 4 0 1705 25914 19383 1906 1-16 811 () 0 0 4343 55429 0 1907 822 2933 0 375 1169 7614 210150 41103 1908 888-1 24-1 0 0 0 7115 166885 0 1909 653-1 0 u 0 1213 7363 113882 11406 1910 285() 3ll21 2280 18 122 23853 88680 11871 1911 6518 2331 0 0 0 14625 66774 5584 1912 2-1865 1521 0 0 0 10853 85335 17718 1913 8()9-1 1120 0 481 447 1909 155900 42692 1914 8023 22-1() 0 1517 146 7194 138857 13657
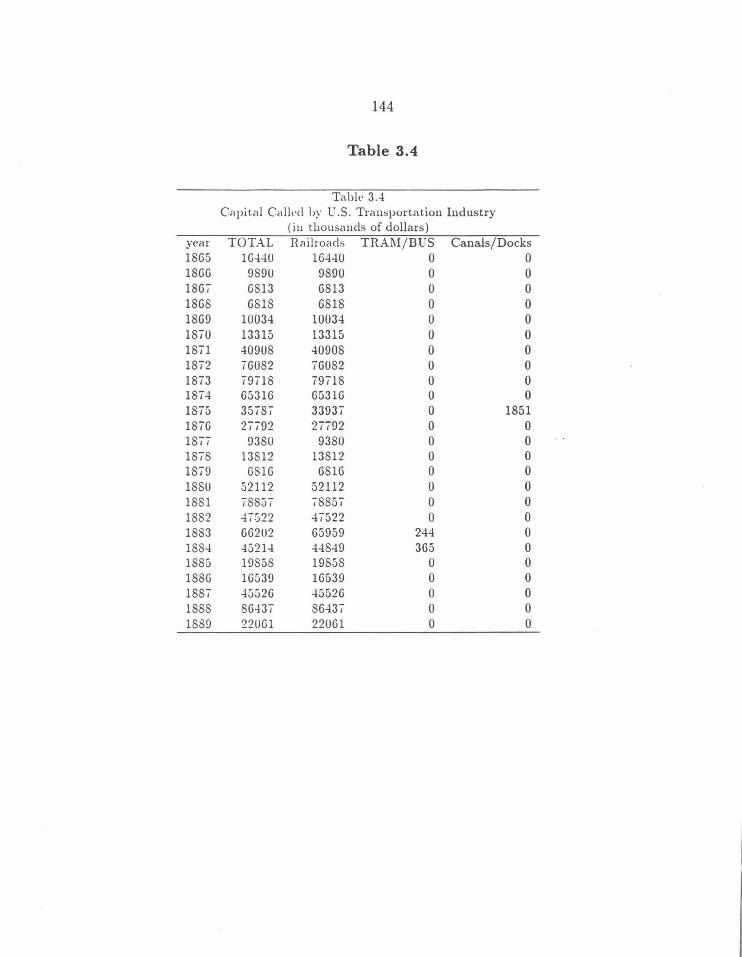
144
Table 3.4
Table 3.4 Capit.al Called by C .S. Transportation Industry
(in thousands of dollars) year TOTAL Railroads TRAM/BUS Canals/ Docks 1865 1G440 16440 0 0 18GG 9890 9890 0 0 1861 G813 6813 0 0 18G8 G818 6818 0 0 18G9 10034 10034 0 0 1810 13315 13315 0 0 1811 40908 40908 0 0 1872 16082 76082 0 0 1873 19118 19718 0 0 1874 65316 6531G 0 0 1875 35787 33937 0 1851 1876 27792 27792 0 0 1877 9380 9380 0 0 1878 13812 13812 0 0 1879 G81G 6816 0 0 1880 52112 52112 0 0 1881 78857 18857 0 0 1882 47G22 47522 0 0 1883 66202 65959 244 0 188-! 4521-! 44849 365 0 188G 19858 19858 0 0 188G 1G539 16539 0 0 1887 45526 45526 0 0 1888 86437 86437 0 0 1889 22061 22061 0 0
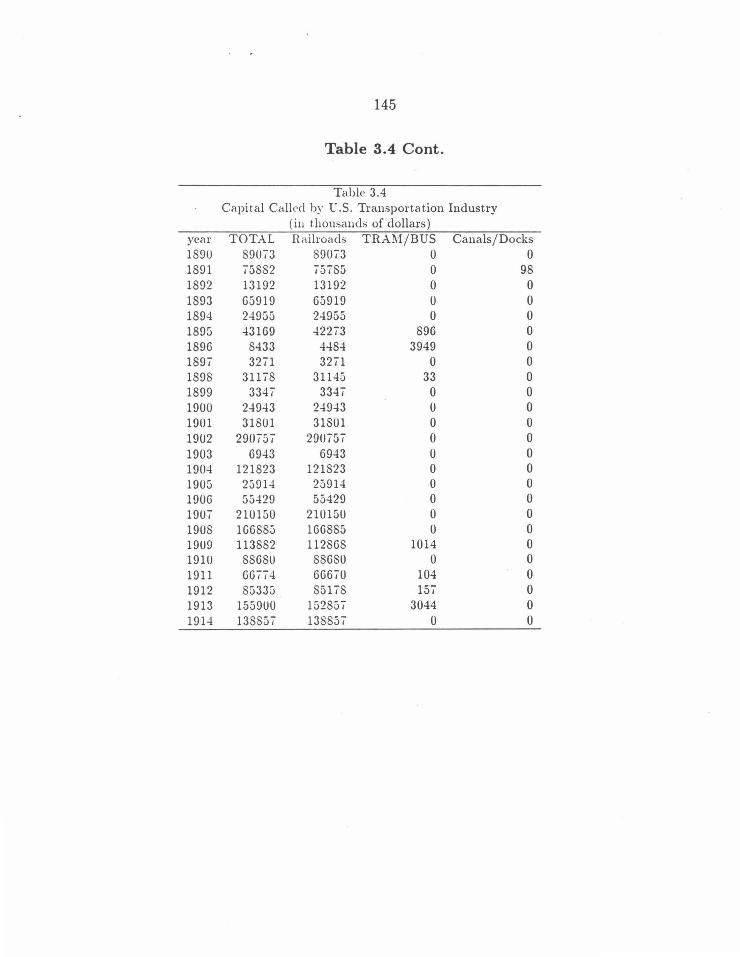
145
Table 3.4 Cont.
Table 3.4 Cnpital Called by l' .S. Transportation Industry
( iu thousands of dollars) ycnr TOTAL nailroads TRA~1/BUS Canals/Docks 1890 89013 89013 0 0 1891 15882 15185 0 98 1892 13192 13192 0 0 1893 65919 65919 0 0 1894 24955 24955 0 0 1895 43169 42213 896 0 1896 8433 4484 3949 0 1891 3211 3211 0 0 1898 31118 31145 33 0 1899 3341 3341 0 0 1900 24943 24943 0 0 1901 31801 31801 0 0 1902 290151 290151 0 0 1903 6943 6943 0 0 1904 121823 121823 0 0 1905 25!Jl4 25!)14 0 0 1906 55429 55429 0 0 1901 210150 210150 0 0 1908 166885 166885 0 0 1909 113882 112868 1014 0 1910 88680 88680 0 0 1911 66114 66610 104 0 1912 85335 85118 151 0 1913 155900 152851 3044 0 1914 138851 138851 0 0
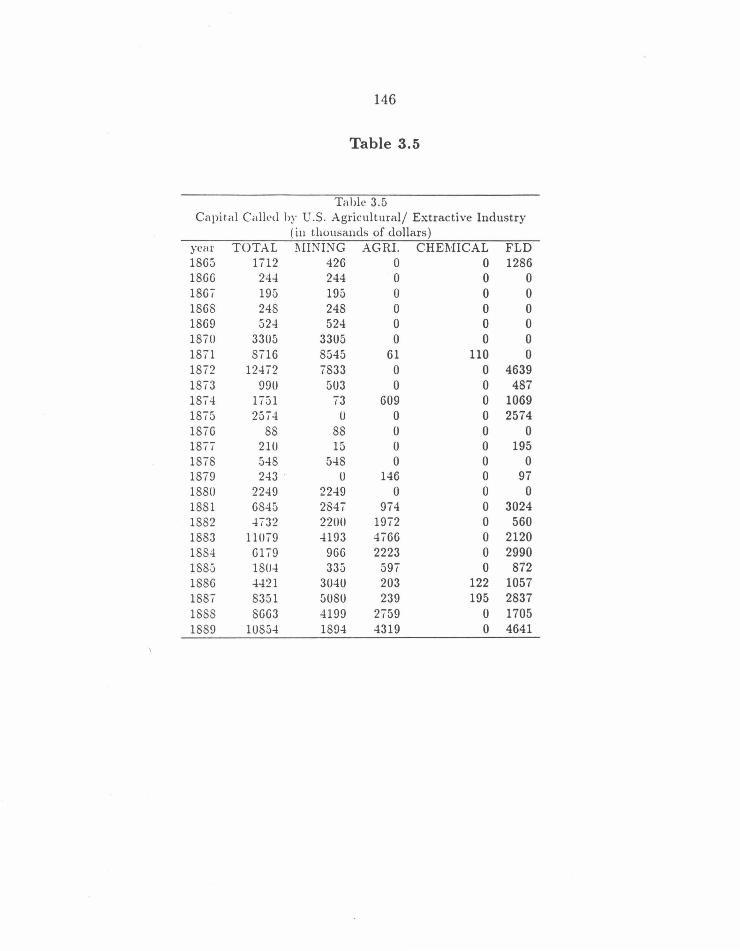
146
Table 3.5
Table 3.5 Capital Called hy U.S. Agricultural/ Extractive Industry
( iu thousands of dollars) ycm TOTAL !~liNING AGRI. CHEMICAL FLD 1865 1712 426 0 0 1286 1866 24-! 244 0 0 0 1867 195 195 0 0 0 1868 248 248 0 0 0 1869 52-! 524 0 0 0 1870 3305 3305 0 0 0 1871 8716 8545 61 110 0 1872 12472 7833 0 0 4639 1873 990 503 0 0 487 1874 1751 73 609 0 1069 1875 2574 0 0 0 2574 1876 88 88 0 0 0 1877 210 15 0 0 195 1878 548 5-!8 0 0 0 1879 243 0 146 0 97 1880 2249 2249 0 0 0 1881 6845 2847 974 0 3024 1882 -!732 220() 1972 0 560 1883 11079 -!193 4766 0 2120 1884 6179 966 2223 0 2990 1885 1804 335 597 0 872 1886 4421 3040 203 122 1057 1887 8351 5080 239 195 2837 1888 8663 4199 2759 0 1705 1889 10854 1894 4319 0 4641
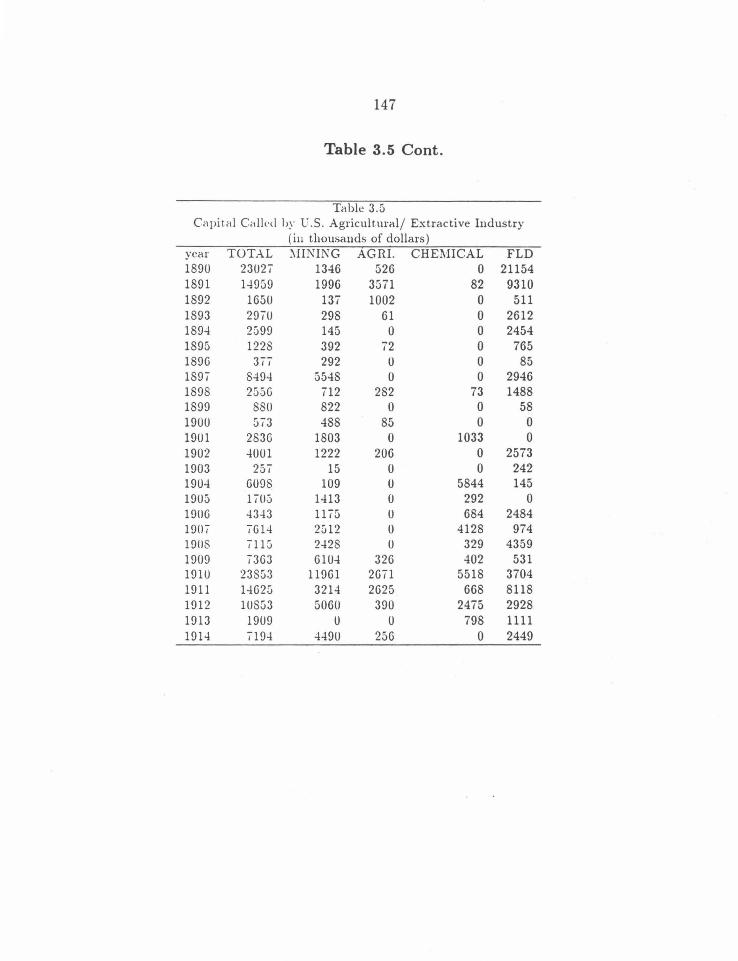
147
Table 3.5 Cont.
Table 3.5 Capital Called by C.S. Agricult.ural/ Extractive Industry
( iu thousands of dollars) year TOTAL ~diNING AGRI. CHE.tviiCAL FLD 1890 23027 1346 526 0 21154 1891 1-!959 1996 3571 82 9310 1892 1650 137 1002 0 511 1893 2970 298 61 0 2612 189-! 2599 145 0 0 2454 1895 1228 392 72 0 765 1896 377 292 0 0 85 1897 849-! 5548 0 0 2946 1898 2556 712 282 73 1488 1899 880 822 0 0 58 1900 573 488 85 0 0 1901 2836 1803 0 1033 0 1902 -!001 1222 206 0 2573 1903 257 15 0 0 242 190-! 6098 109 0 5844 145 1905 1705 1-!13 0 292 0 1906 -!343 1175 0 684 2484 1907 761-1 2512 0 4128 974 1908 7115 2-!28 0 329 4359 1909 7363 610-! 326 402 531 1910 23853 11961 2671 5518 3704 1911 1-!620 3214 2625 668 8118 1912 10853 5060 390 2475 2928 1913 1909 0 0 798 1111 1914 7194 4490 256 0 2449

148
Table 3.6
Table 3.6 Capital CallC'd by U.S. Public Utilities Industry
(in thousands of dollars) year TOTAL GAS/LIGHT TPHN/TGPH WATER\VKS 1865 2GI9 u 2679 0 1866 2922 0 2922 0 186i 1-!61 u 1461 0 1868 1899 0 1899 0 1869 0 0 0 0 18i0 0 0 0 0 1871 u 0 0 0 1872 1512 0 1512 0 18i3 5381 u 5381 0 18i4 14i6 409 950 117 18i5 88::>0 24::>4 6396 0 18i6 19-!8 1948 0 0 18il u ll 0 0 1878 u u 0 0 18i9 -!81 ll 487 0 1880 584 584 0 0 1881 0 u 0 0 1882 u u 0 0 1883 685 514 0 170 1884 u u 0 0 1885 0 0 0 0 1886 u 0 0 0 1881 209 209 0 0 1888 2llG 50 0 156 1889 8129 112G 0 1003
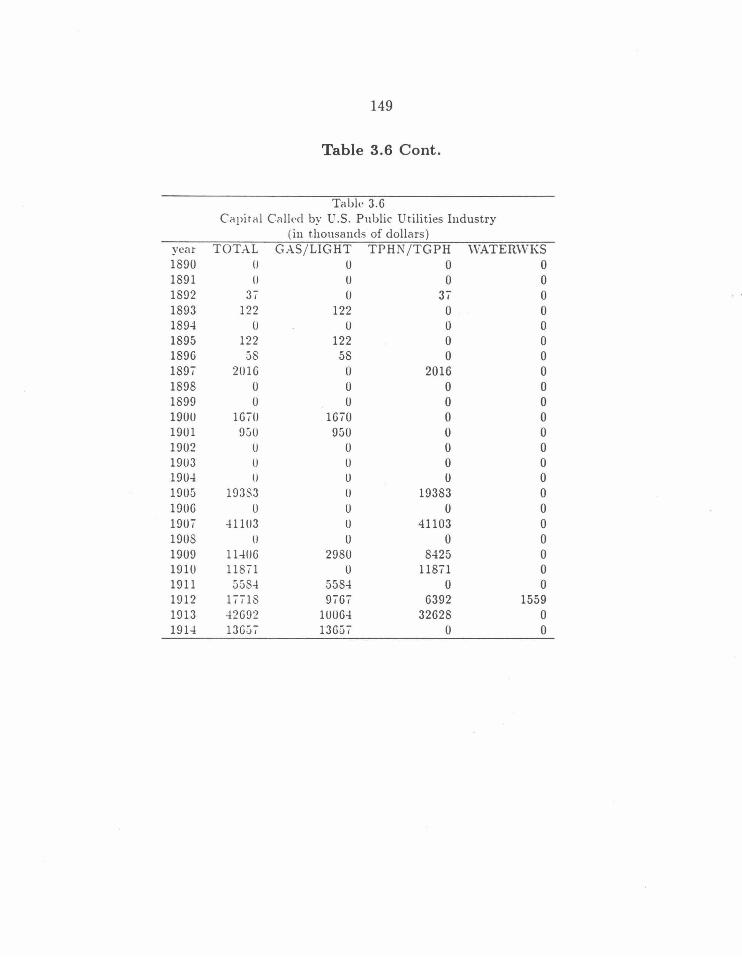
149
Table 3.6 Cont.
Table 3.6 C<lpit<d Cnll\'d by U.S. Public Utilities Industry
(in thousands of dollars) year TOTAL GAS/ LIGHT TPHN/TGPH WATERWKS 1890 0 0 0 0 1891 () 0 0 0 1892 31 0 31 0 1893 122 122 0 0 1894 0 0 0 0 1895 122 122 0 0 1896 58 58 0 0 1891 2016 0 2016 0 1898 0 0 0 0 1899 0 0 0 0 1900 1610 1610 0 0 1901 %0 950 0 0 1902 0 0 0 0 1903 () 0 0 0 1904 0 u 0 0 1905 19383 () 19383 0 1906 u 0 0 0 1901 41103 u 41103 0 1908 u 0 0 0 1909 11406 2980 8425 0 1910 11811 0 11871 0 1911 5584 5584 0 0 1912 11118 9167 6392 1559 1913 42692 10064 32628 0 1914 136jl 13657 0 0

150
Table 3.7
Table 3.7 Capit.al Called by U.S. Financial Industry
(in thousands of dollars) year TOTAL DANI\:S TRUSTS INSURANCE 1865 1-i61 1461 0 0 1866 131 731 0 0 1867 0 0 0 0 1868 0 0 0 0 1869 1656 0 1656 0 1810 0 0 0 0 1871 0 0 0 0 1812 0 0 0 0 1813 4810 730 4140 0 1874 0 0 0 0 1875 0 0 0 0 1876 0 0 0 0 1877 331 331 0 0 1878 0 0 0 0 1879 0 0 0 0 1880 548 548 0 0 1881 131 487 0 244 1882 10471 731 9740 0 1883 4870 0 4870 0 1884 4703 0 4703 0 1885 0 0 0 0 1886 3774 244 3531 0 1887 1461 0 1461 0 1888 487 0 487 0 1889 4799 0 4799 0
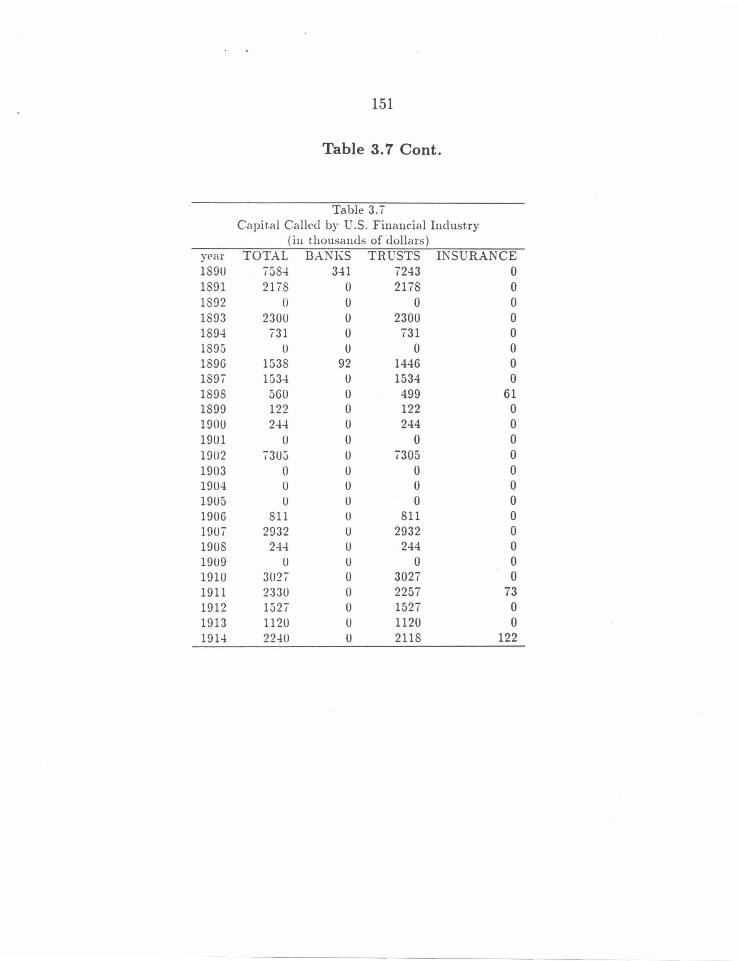
151
Table 3. 7 Cont.
Table 3.7 Capit.nl Called by U.S. Financial Industry
(in thousands of dollars) yrar TOTAL DANKS TRUSTS INSURANCE 1890 158-l 341 7243 0 18!}1 2178 u 2178 0 18!}2 0 0 0 0 1893 2300 0 2300 0 1894 131 0 731 0 18% lJ 0 0 0 1896 1538 92 1446 0 1891 1534 0 1534 0 18!}8 560 u 499 61 18!}9 122 0 122 0 1!>00 2-l-l 0 244 0 1901 0 0 0 0 19ll2 1305 0 7305 0 1903 0 0 0 0 1!>04 0 0 0 0 1905 0 0 0 0 1!>06 811 0 811 0 1!>01 2932 0 2932 0 1908 24-l 0 244 0 1909 0 0 0 0 1!>10 30:?1 0 3027 0 1911 2330 0 2257 73 1912 1521 0 1527 0 1913 1120 0 1120 0 191-l 22-lO 0 2118 122
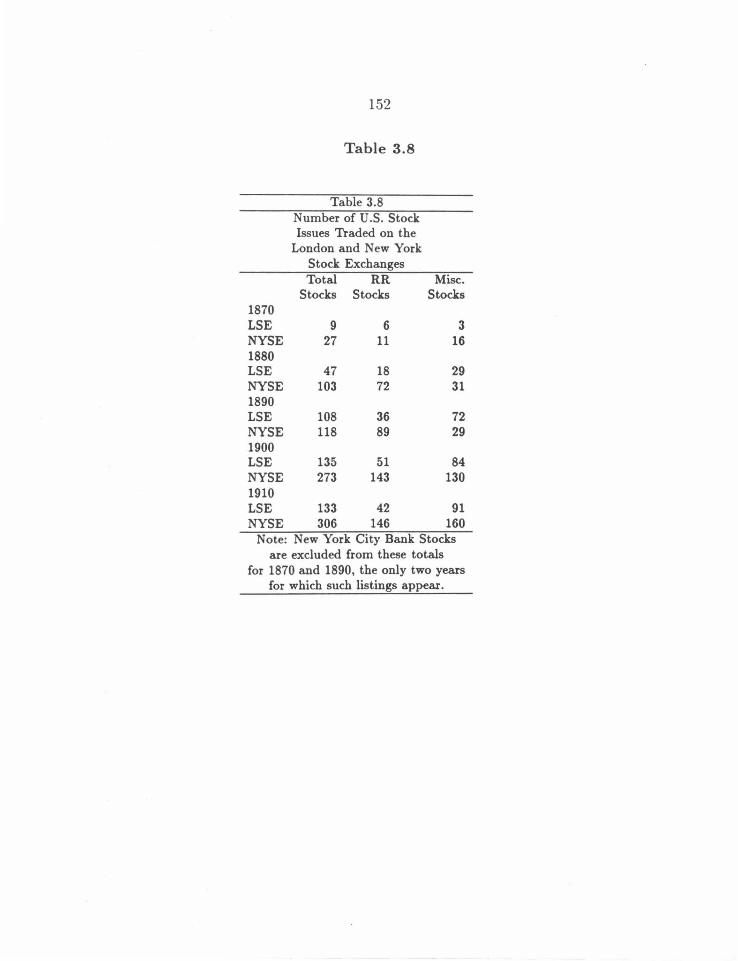
152
Table 3.8
Table 3.8 Number of U.S. Stock Issues Traded on the
London and New York Stock Exchanges Total RR Misc.
Stocks Stocks Stocks 1870 LSE 9 6 3 NYSE 27 11 16 1880 LSE 47 18 29 NYSE 103 72 31 1890 LSE 108 36 72 NYSE 118 89 29 1900 LSE 135 51 84 NYSE 273 143 130 1910 LSE 133 42 91 NYSE 306 146 160
Note: New York City Bank Stocks are excluded from these totals
for 1870 and 1890, the only two years for which such listings appear.
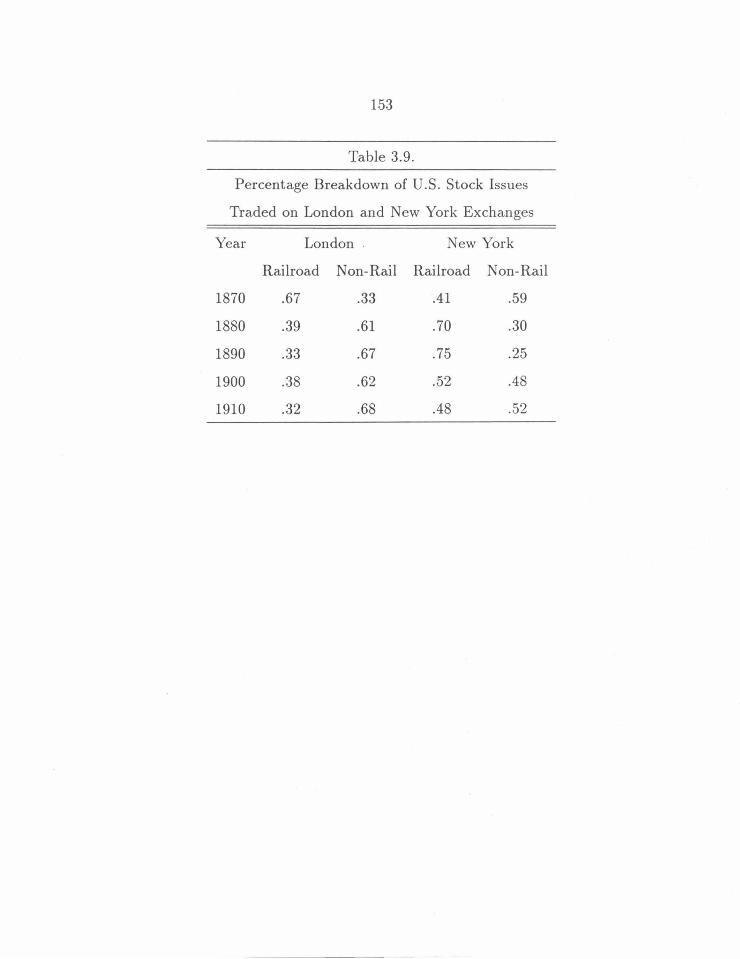
153
Table 3.9.
Percentage Breakdown of U.S. Stock Issues
Traded on London and New York Exchanges
Year
1870
1880
1890
1900
1910
London .
Railroad Non-Rail
.67 .33
.39 .61
.33 .67
.38 .62
.32 .68
New York
Railroad Non-Rail
.41 .59
.70 .30
.75 .25
.52 .48
.48 .52
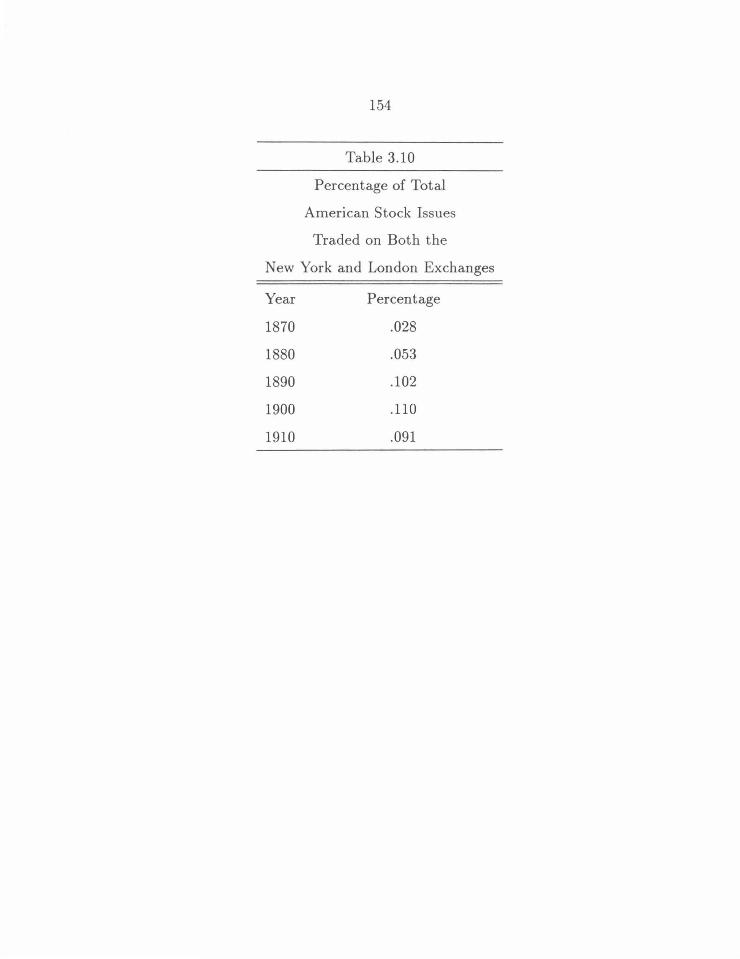
154
Table 3.10
Percentage of Total
American Stock Issues
Traded on Both the
New York and London Exchanges
Year
1870
1880
1890
1900
1910
Percentage
.028
.053
.102
.110
.091
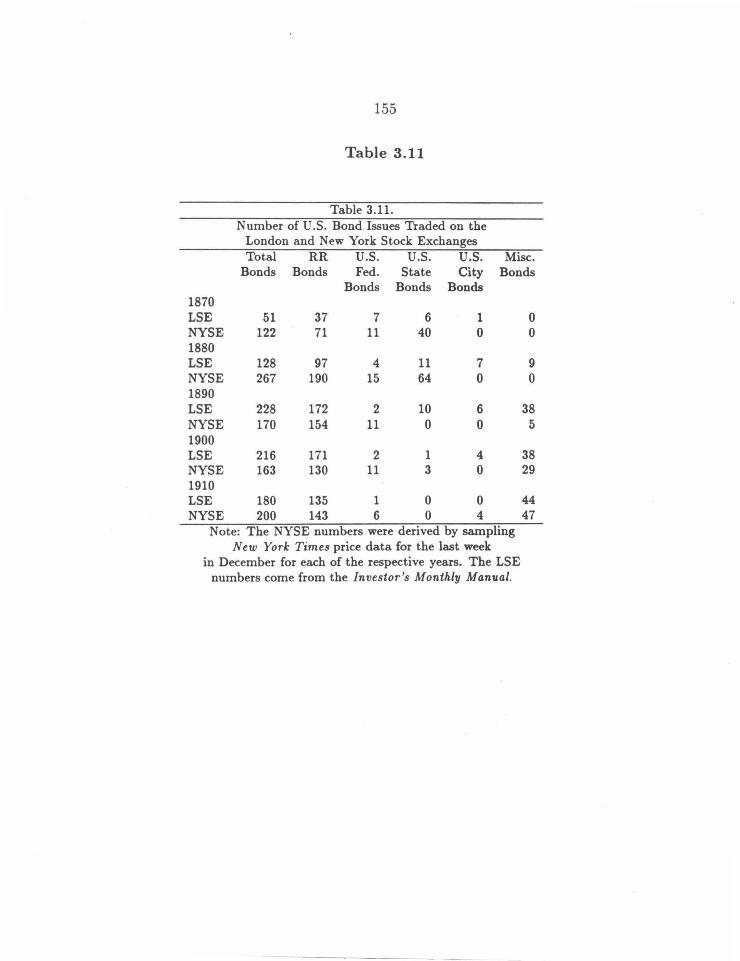
155
Table 3.11
Table 3.11. Number of U.S. Bond Issues Traded on the
London and New York Stock Exchanges Total RR u.s. u.s. u.s. Misc.
Bonds Bonds Fed. State City Bonds Bonds Bonds Bonds
1870 LSE 51 37 7 6 1 0 NYSE 122 71 11 40 0 0 1880 LSE 128 97 4 11 7 9 NYSE 267 190 15 64 0 0 1890 LSE 228 172 2 10 6 38 NYSE 170 154 11 0 0 5 1900 LSE 216 171 2 1 4 38 NYSE 163 130 11 3 0 29 1910 LSE 180 135 1 0 0 44 NYSE 200 143 6 0 4 47
Note: The NYSE numbers were derived by sampling New York Times price data for the last week
in December for each of the respective years. The LSE numbers come from the Investor's Monthly Manual.
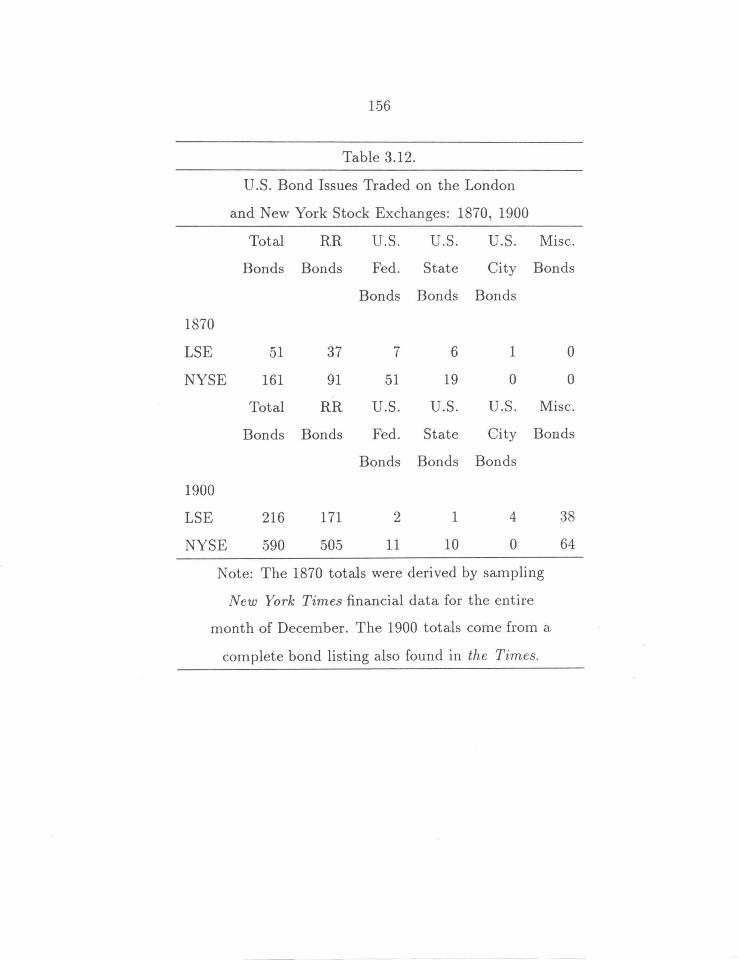
156
Table 3.12.
U.S. Bond Issues Traded on the London
and New York Stock Exchanges: 1870, 1900
Total RR u.s. u.s. U.S. Misc.
Bonds Bonds Fed. State City Bonds
Bonds Bonds Bonds
1870
LSE 51 37 7 6 1 0
NYSE 161 91 51 19 0 0
Total RR u.s. u.s. u.s. Misc.
Bonds Bonds Fed. State City Bonds
Bonds Bonds Bonds
1900
LSE 216 171 2 1 4 38
NYSE 590 505 11 10 0 64
Note: The 1870 totals were derived by sampling
New York Times financial data for the entire
month of December. The 1900 totals come from a
complete bond listing also found in the Times.
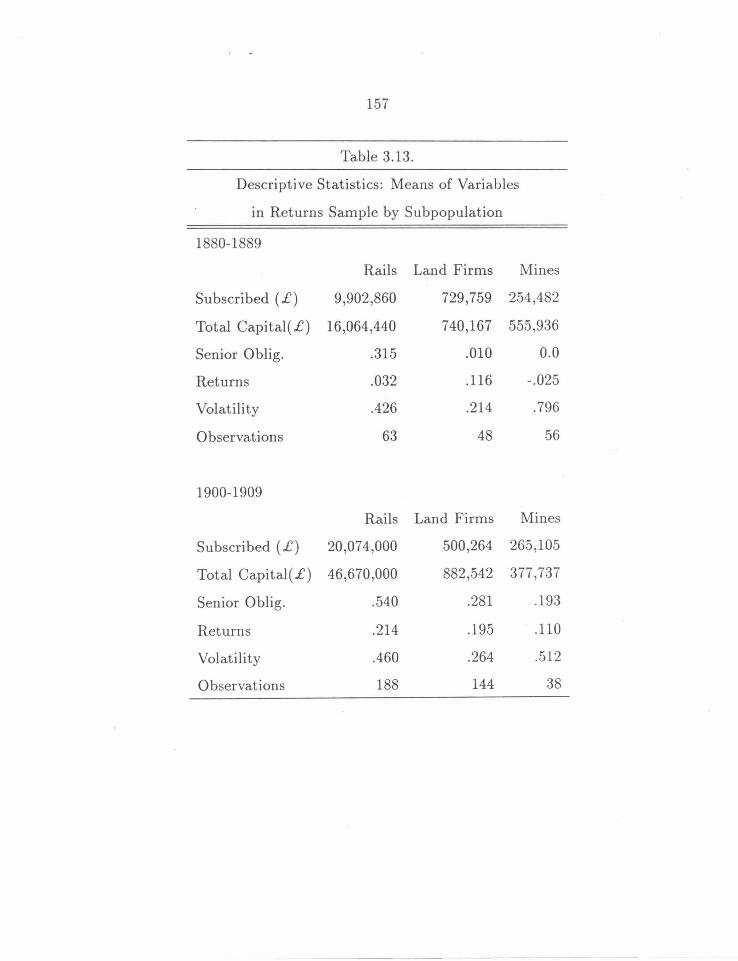
157
Table 3.13.
Descriptive Statistics: Means of Variables
in Returns Sample by Subpopulation
1880-1889
Rails Land Firms Mines
Subscribed ( £) 9,902,860 729,759 254,482
Total Capital(£) 16,064,440 740,167 555,936
Senior Oblig. .315 .010 0.0
Returns .032 .116 -.025
Volatility .426 .214 .796
Observations 63 48 56
1900-1909
Rails Land Firms Mines
Subscribed ( £) 20,074,000 500,264 265,105
Total Capital(£) 46,670,000 882,542 377,737
Senior Oblig. .540 .281 .193
Returns .214 .195 .110
Volatility .460 .264 .512
Observations 188 144 38
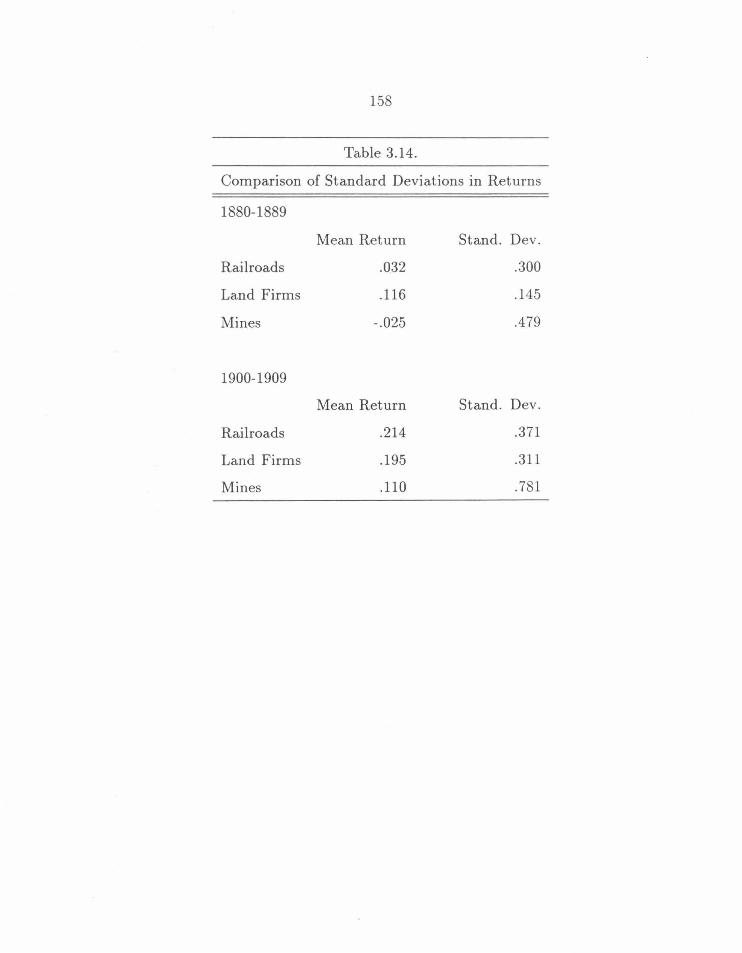
158
Table 3.14.
Comparison of Standard Deviations in Returns
1880-1889
Mean Return
Railroads .032
Land Firms .116
Mines -.025
1900-1909
Mean Return
Railroads .214
Land Firms .195
Mines .110
Stand. Dev.
.300
.145
.479
Stand. Dev.
.371
.311
.781
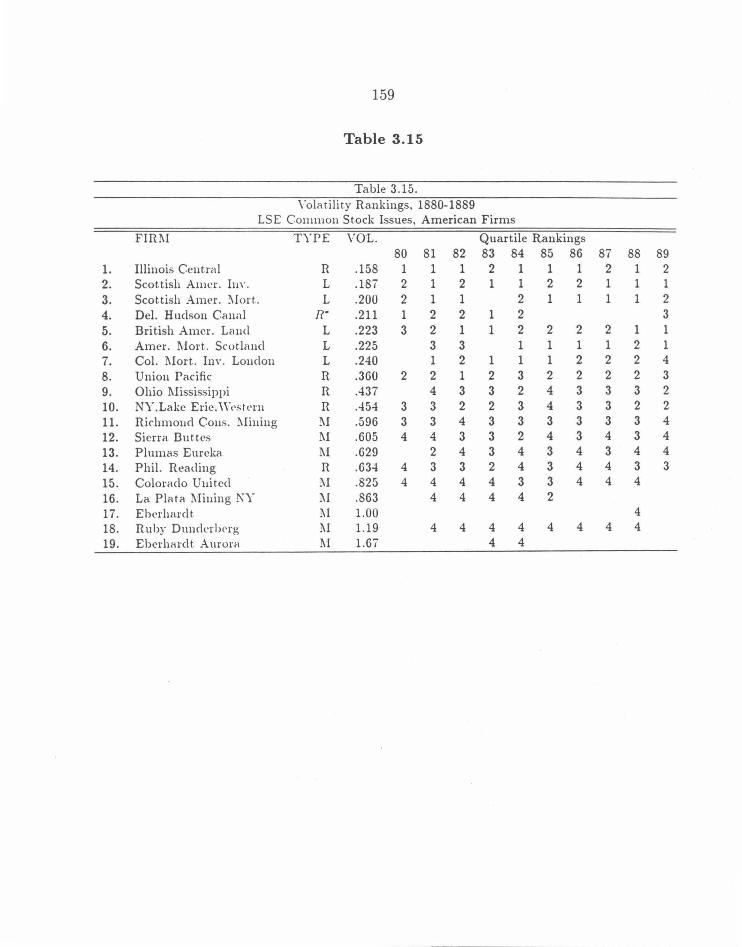
159
Table 3.15
Table 3.15. \'olntilit.y Rankings, 1880-1889
LSE Common Stock Issues, American Firms
FIRJ\1 TYPE VO'L. Quartile Rankings 80 81 82 83 84 85 86 87 88 89
1. Illinois Central R .158 1 1 1 2 1 1 1 2 1 2 2. Scot.t.ish A mer. h1, .. L .187 2 1 2 1 1 2 2 1 1 1 3. Scot.tish Amer. !\Iort .. L .200 2 1 1 2 1 1 1 1 2 4. Del. Hudson Canal w .211 1 2 2 1 2 3 5. British Amcr. Land L .223 3 2 1 1 2 2 2 2 1 1 6. Amer. 1\iort. Scotland L .225 3 3 1 1 1 1 2 1 7. Col. 1\Iort .. InY. London L .240 1 2 1 1 1 2 2 2 4 8. Union Pacific R .360 2 2 1 2 3 2 2 2 2 3 9. Ohio !\'lississippi R .437 4 3 3 2 4 3 3 3 2 10. NY.Lake Erie.\Y,,;;;tl'm R .454 3 3 2 2 3 4 3 3 2 2 11. Riclunouct Cons. !\lining !\I .596 3 3 4 3 3 3 3 3 3 4 12. Sierra Dut.t.es l\1 .605 4 4 3 3 2 4 3 4 3 4 13. Plumas Eureka l\'1 .629 2 4 3 4 3 4 3 4 4 14. Phil. Reading R .634 4 3 3 2 4 3 4 4 3 3 15. Colorado Uuitcd !\I .825 4 4 4 4 3 3 4 4 4
16. La Plat11 !\'lining ~y 1\I .863 4 4 4 4 2 17. Eberhardt. l\1 1.00 4 18. Ruby Dunderbcrg 1\I 1.19 4 4 4 4 4 4 4 4
19. Eberhardt. Amora !\I 1.67 4 4
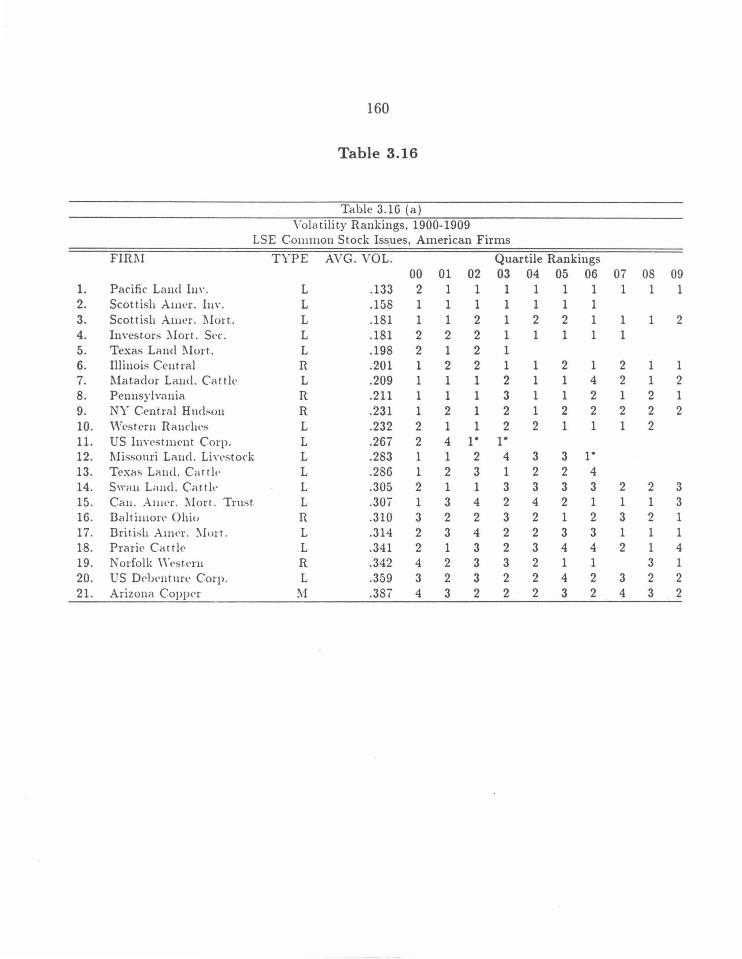
160
Table 3.16
Table 3.16 (a) Volatility Rankings, 1900-1909
LSE Common Stock Iss.ues, American Firms
FIR!\ I TYPE AVG. VOL. Quartile Rankings 00 01 02 03 04 05 06 07 08 09
1. Pacific Land h1v. L .133 2 1 1 1 1 1 1 1 1 1 2. Scot.t.ish Auwr. Iuv. L .158 1 1 1 1 1 1 1 3. Scottish Au1er . .1\Iort. L .181 1 1 2 1 2 2 1 1 1 2 4. Investors l\lort .. St>c. L .181 2 2 2 1 1 1 1 1 5. Texas Land !\Iort. L .198 2 1 2 1 6. Illinois Central R .201 1 2 2 1 1 2 1 2 1 1 7. .1\1atador Laud. Cattlt' L .209 1 1 1 2 1 1 4 2 1 2 8. Pennsy lvnnia R .211 1 1 1 3 1 1 2 1 2 1 9. NY Cen t.ral H ndso11 R .231 1 2 1 2 1 2 2 2 2 2 10. '"'esteru Ra11rht>s L .232 2 1 1 2 2 1 1 1 2 11. US Investment Corp. L .267 2 4 1" 1" 12. Missomi L<llld. Liwstork L .283 1 1 2 4 3 3 1" 13. Texas Lnlld. Ce~tt!.- L .286 1 2 3 1 2 2 4 14. Swe~u L;-md. Ca r.tl<' L .305 2 1 1 3 3 3 3 2 2 3 15. Cau. Allin. l\lort. Tmst. L .307 1 3 4 2 4 2 1 1 1 3 16. Dalt imon· Ohi(J R .310 3 2 2 3 2 1 2 3 2 1 17. Drit.ish Amn. :\I orr . L .314 2 3 4 2 2 3 3 1 1 1 18. Praric Cattle L .341 2 1 3 2 3 4 4 2 1 4 19. Norfolk \\"t'Stt•ru R .342 4 2 3 3 2 1 1 3 1 20. US DclwHtme Corp. L .359 3 2 3 2 2 4 2 3 2 2 21. Arizona Coppt>r !\·I .387 4 3 2 2 2 3 2 4 3 2
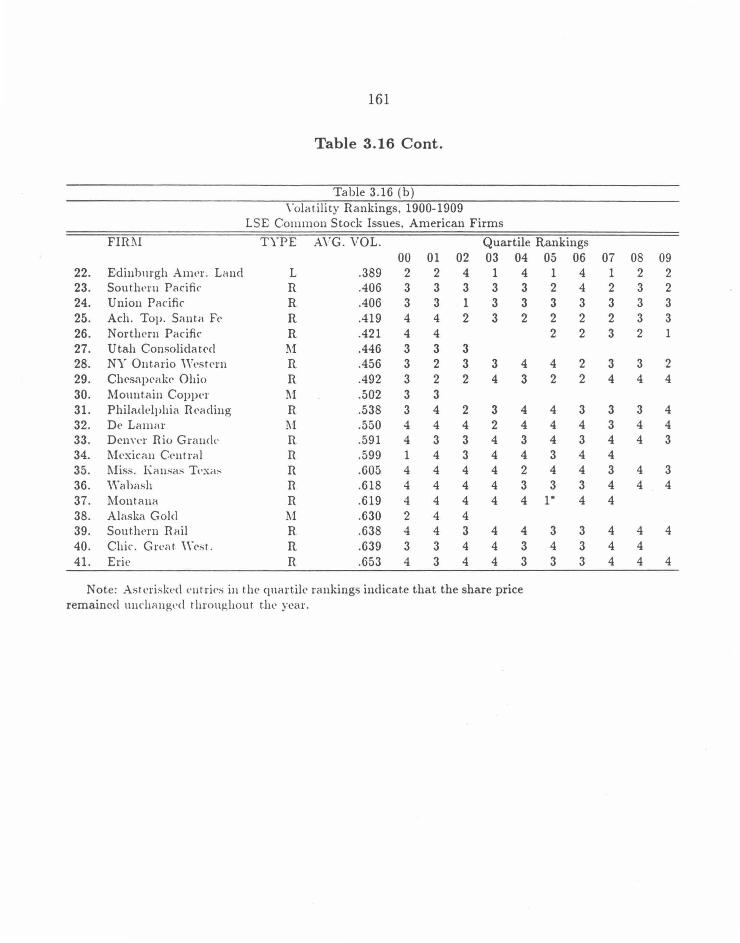
161
Table 3.16 Cont.
Table 3.16 (b) \'olatility Rankings, 1900-1909
LSE Common Stock Issues, American Firms
FIRl\1 TYPE AVG. VOL. Quartile Rankings 00 01 02 03 04 05 06 07 08 09
22. Edinhmgh Anwr. Land L .389 2 2 4 1 4 1 4 1 2 2 23. Sou t.lwm Pacific R .406 3 3 3 3 3 2 4 2 3 2 24. Union Pacific R .406 3 3 1 3 3 3 3 3 3 3 25. Ach. Top. Sant.;., Fc R .419 4 4 2 3 2 2 2 2 3 3 26. N orthcrn Pacific R .421 4 4 2 2 3 2 1 27. Utah Consolidat.cd l\1 .446 3 3 3 28. NY Ont.ario \Vt•stcrn R .456 3 2 3 3 4 4 2 3 3 2 29. Chcsapcakc Ohio R .492 3 2 2 4 3 2 2 4 4 4 30. lVlonnt.ain Coppl'r l\'1 .502 3 3 31. Philadelphia Rt•nding R .538 3 4 2 3 4 4 3 3 3 4 32. Dc Lamnr l\1 .550 4 4 4 2 4 4 4 3 4 4 33. Denn·r n io Graucll' R .591 4 3 3 4 3 4 3 4 4 3 34. Mcxic«n Ccutnd n .599 1 4 3 4 4 3 4 4 35. 1\Iiss. 1\:ansa;; Tt•x;.,,., n .605 4 4 4 4 2 4 4 3 4 3 36. V\'ahash n .618 4 4 4 4 3 3 3 4 4 4 37. Montano n .619 4 4 4 4 4 1* 4 4 38. Alaska Gold l\'1 .630 2 4 4 39. Sont.Jwrn nail R .638 4 4 3 4 4 3 3 4 4 4 40. Chic. Grl'«t \\'cst. R .639 3 3 4 4 3 4 3 4 4 41. Eric n .653 4 3 4 4 3 3 3 4 4 4
Note: Asterisk('d ('lltrics iu the qnartilr rankings indicat.e that the share price remained nnchangt•d t luon!!,hout t.he ye<u .
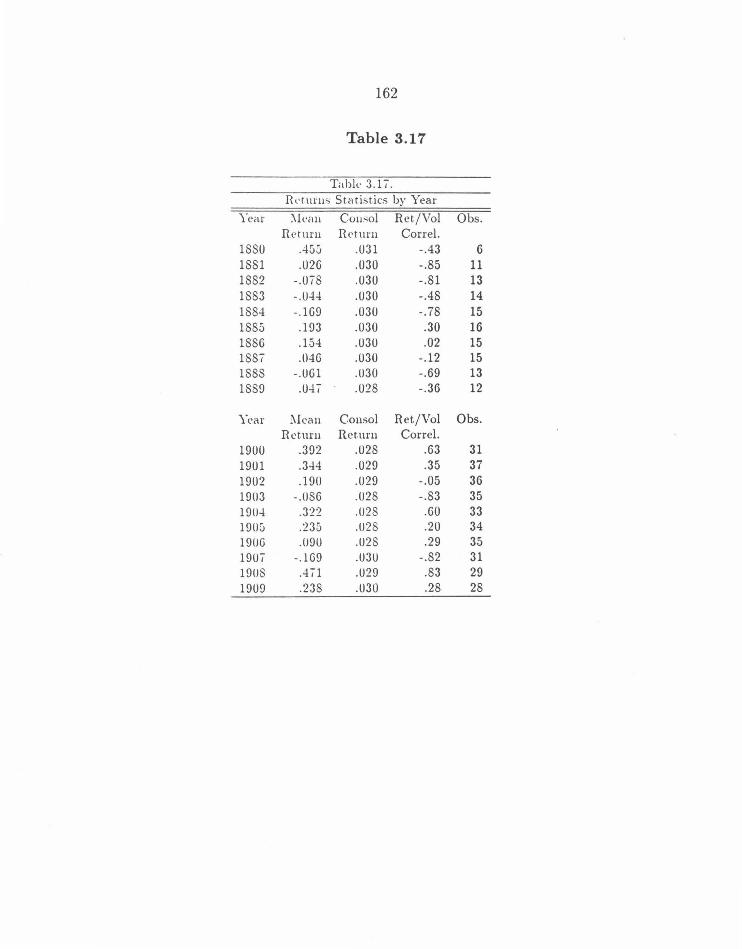
162
Table 3.17
Tabk 3.17. Rl"tmw; Statistics by Year
Year :\ll'C\11 Cou,;oJ Ret./Vol Obs. RN urn Rrturn Correl.
1880 .405 .031 -.43 6 1881 .026 .030 -.85 11 1882 -.078 .030 -.81 13 1883 -.044 .030 -.48 14 1884 -.16!.! .030 -.78 15 1885 .1!.!3 .030 .30 16 1886 .154 .030 .02 15 1887 .046 .030 -.12 15 1888 -.061 .030 -.69 13 188!.! .047 .028 -.36 12
Year !\lean Con sol Ret/Vol Obs. Rct.uru Ret. urn Correl.
1!.!00 .3!.!2 .028 .63 31 1901 .344 .02!.! .35 37 1902 .1!.!0 .029 -.05 36 1!.!03 -.086 .028 -.83 35 1!.!04 .322 .028 .60 33 1!.!05 .235 .028 .20 34 1906 .O!.JO .028 .29 35 1907 -.169 .030 -.82 31 1908 .471 .029 .83 29 1!.!09 .238 .030 .28 28
163
3.9 References
Bacon, N.T. 1897. "America's International Indebtedness", Yale Review, Vol
IX, No. 3.
Buckley, Peter J. and Brian R. Roberts, 1982. European Direct Investm ent
in the USA before World War I, New York: St. Martin's Press.
Cairncross, A.K. 1953. Home and Foreign Investment 1870-1910, Cam
bridge: Cambridge Univ. Press.
Chandler, Alfred D. 1965. The Railroads: The Nations First Big Business,
New York: Harcourt, Brace & World.
Davis, Lance E. 1966. "The Capital Markets and Industrial Concentration:
The U.S. and U.K., A Comparative Study," Economic History Review,
Second Series, Vol. XIX, No. 2.
Davis, Lance and Robert Huttenback, 1986. Mammon and the Pursuit of
Empire: The Political Economy of British Imperialism, 1860-1912, Cam
bridge: Cambridge University Press.
Dunning, John H. 1970. Studies in International Investment, London: Allen
& Unwin.
Feinstein, Charles, 1990. "Britain's Overseas Investments in 1913," Eco
nomic History Review.
Imlah, Albert H. 1958. Economic Elements m the Pax B1·itannica, Cam
bridge: Harvard University Press.
Jackson, W. Turrentine, 1968. The Enterprising Scot: Investors in the Amer
ican West after 1873, Edinburgh University Publications: History, Phi
losophy, Economics, No. 22, Edinburgh: Edinburgh Univ. Press.
164
Jenks, Leland H. 1963. The Migration of British Capital to 1815, London:
Thomas Nelson and Sons Ltd.
Knight, Frank H., 1965. Risk, Uncertainty, and Profit, New York: Harper &
Row, reprinted version of 1921 edition.
Lewis, Cleona. 1938. America's Stake in International Investments, Wash
ington D.C.: The Brookings Institution.
McFarlane, Larry A. 1976. "British Investment in Minnesota Farm Mort
gages and Land, 1875-1900," unpublished mss.
McFarlane, Larry A. 1976. "British Agricultural Investment in the Dako
tas, 1877-1953," in Paul Uselding (ed), Business and Economic Hist01·y,
Urbana, IL: Univ. of Illinois Press, pp. 112-126.
McFarlane, Larry A. 1976. "British Investment in Midwestern Farm Mort
gages and Land, Iowa and Kansas," in Paul Uselding (ed), Business and
Economic History, Urbana, IL: Univ. of Illinois Press, pp. 196-198.
McFarlane, Larry A. 1983. "British Investment and the Land: Nebraska
1877-1946," Business History Review, Vol LVII, pp. 258-292.
Michie, Ranald C. 1987. The London and New York Stock Exchanges, 1850-
1914, London: Allen & Unwin.
Morgenstern, Oskar, 1959. International Financial Transactions and Busi
ness Cycles, National Bureau of Economic Research, Study in Business
Cycles, Vol. 8, Princeton N.J.: Princeton University Press.
Navin, T. and M. Sears, 1955. "The Rise of a Market for Industrial Securities,"
Business History Review, Vol. 29.
Neal, Larry, 1987. "The Integration and Efficiency of the London and Ams
terdam Stock Markets in the Eighteenth Century," The Journal of Eco-
165
nomic History.
Paish, George. 1909. "Great Britain's Capital investment in Other Lands,"
Journal of the Royal Statistical Society, 72.
Paish, George. 1911. "Great Britain's Capital Investment in Individual ,
Colonial, and Foreign Countries." Journal of the Royal Statistical Society,
Vol. LXIV, Part II.
Platt, D.C.M. 1980. "British Portfolio Investment Overseas before 1870:
Some Doubts," The Economic History Review.
Rippy, J. Fred, 1959. British Investments in Latin America, Minneapolis.
Simon, Matthew, 1967. "The Pattern of British Portfolio Investment 1865-
1914," in J. H. Adler, Capital Movements and Economic Development,
New York: Macmillan.
Simon, Matthew, 1960. "The United States Balance of Payments 1862-1900"
in Trends in the American Economy in the Nineteenth Century, National
Bureau of Economic Research, Studies In Income Wealth, Vol. 24, Prince
ton, N.J.: University Press.
Spense, Clark C. 1958. British Investments and the American ]\fining Fron
tier, Ithaca, N.Y.: Cornell University Press.
Wilkins, Mira. 1989. The History of Foreign Investment in the United Stat es,
Harvard Studies in Business History, No. 41, Cambridge, Mass.: Harvard
Univ. Press.
Zevin, Robert B. 1989. "Are World Financial Markets More Open? If So
Why and with What Effects?" Working Paper Number 79 of the World
Institute for Development Economics Research of the United Nations,
forthcoming in Financial Openness and National Autonomy.
166
Chapter 4
London and New York - A
Tale of Two Exchanges
4.1 Introduction
This chapter attempts to explain the listings discrepancies in American se
curities between the New York and London Stock Exchanges from an insti
tutional perspective. In short, the New York exchange set up admittance
and trading rules which prevented securities from small new ventures often
located in the West from obtaining listings. The first part of the chapter
outlines the organization of the New York market and briefly contrasts it
with that in London. The differences between the two markets were clearly
reflected in the objectives that each of the respective ownerships sought to
accomplish. The chapter goes on to explore the ways in which the Board
of Governors of the New York Stock Exchange constructed its trade rules to
167
accomplish particular objectives. Broadly speaking, each of these rules ac
complished at least one of the following objectives: (1) they attracted wider
markets for listed securities, (2) they protected existing markets from rival
exchanges, or (3) they insured that trading profits would not be competed
away within the membership of the exchange. The Board 's desire to accom
plish the first objective precipitated the exclusion of securities from small ,
new firms - strict vetting procedures quelled the doubts of typical American
investors and thus broadened markets in NYSE securities.
The final part of the chapter demonstrates that these neglected securi
ties found homes not only on the London Exchange but also on regional
exchanges in the United States. In particular, price data for securities listed
on the Boston Stock Exchange are shown to be similar to data for American
securities listed in London. The investors in both Boston and London ap
pear to have been able to resolve informational asymmetries for themselves
and did not need to rely solely on NYSE vetting procedures. What is more,
although investors using the Boston Exchange appear to have also invested
in securities suitable for NYSE listing, non-Boston investors did not, for the
most part, hold shares of Boston-listed securities. That is, some subset of
listings remained held by this smaller group of geographically clustered in
vestors through the turn of the century.
4.2 Institutional Differences
Given the size and composition of the flows from savers in Britain to capi
tal using firms in the United States, the question remains - why did those
168
American firms look abroad for financial support when domestic help was so
much closer at hand? The answer to that question is not simple- it has at
least three different but not entirely unrelated components. First, while the
American savings rate was high, it was probably not high enough to have
underwritten the short-term surges in investment demand that marked this
nation's development. Second, British savers were probably more sophisti
cated than their American counterparts. That is, while there may have been
clusters of American savers who were willing to risk their accumulations
in enterprises far removed from their everyday experience, most were not.
Third, the institutional structure of the New York Exchange was different
than that of its London counterpart. That is to say, the New York market
was constrained by an institutional structure and a set of operating rules
that, although designed to reassure investors, made it somewhat difficult to
adjust to rapidly changing demand considerations.
Although there may be some question of "chicken or egg," the evidence
for the first component is relatively straightforward. The surges of foreign
finance were temporally correlated with the Civil War and with periods of
most rapid American growth and structural transformation: 1814-1819, 1832-
1839, 1870-1877, and 1882-1896. Most scholars agree that both the second
and third components contributed to the problem; but, to some extent , they
disagree about the relative weights to be assigned to each; and the evidence
is indirect and somewhat ambiguous.
As early as the mid 1930's, M.M. Poston had become intrigued by ques
tions about the evolution and integration of both national and international
markets; and his concerns have led to a steady flow of work that focuses on

169
questions of institutional innovation and capital market evolution. 1 More
recently, Robert Zevin and Larry Neal have examined the question of the
degree of integration of international capital markets. As noted in Chapter
Three, Zevin concludes that the international markets were well integrated
by at least the end of the last century and probably before. 2 In a similar
vein, Neal argues that, while international markets were reasonably well in
tegrated in the eighteenth century, the international market disintegrated in
the early nineteenth century and was only gradually reintegrated over the
course of that century. 3
Poston concluded that pre-modern capital transfers were usually not
founded on market exchanges between unrelated savers and investors, but
on direct transactions based on personal relations. Before a modern capital
market could develop, it was necessary to educate savers - to prove to them
that investment in depersonalized "symbolic capital" (mobile and divisible
- that is, liquid paper claims on assets rather than the assets themselves)
was as safe as direct ownership of an asset. In the case of Britain, Poston
argued that this educational process began with the sleeping partnerships
1 M.M. Poston, "Some Recent Problems in the Accumulation of Capital," Economic History Review, 1935. See also Poston, an unpublished series of lectures given at the Johns Hopkins University, 1954-55.
2 Robert B. Zevin, "Are World Financial Markets more Open? If So Why and With What Effects," Working Paper Number 79 of the World Institute for Development Economics Research of the United Nations, October 1989, forthcoming in Financial Openness and National Autonomy.
3 Larry Neal, "The Disintegration and Reintegration of International Capital Markets in the 19th Century," mss. February 29. 1982. Craig and Fisher, however, have recently suggested that the American market may have been less well integrated than the British, French, and German. Lee A. Craig and Douglas Fisher, "Integration of the European Business Cycle: 1871-1910," Explorations in Economic History, Vol. 29, No. 2, April 1992, pp. 144-168.
170
of the sixteenth century, but it was not completed until savers had , first ,
come to recognize the profitability of investments in government bonds is
sued during Napoleonic Wars and, then, had discovered the ultimate safety of
investments in railroad securities during the "height of unsafety" - the early
1840's.4 Poston then went on to draw parallels in the ,histories of Russia,
Germany, and France.
In the case of the United States, it has been argued that, because of the
greater geographical distances between savers in the East and investors in
the South and West and because of the marked disparity between the new
expanding industries that required finance and the older traditional activi
ties that were the source of savings, the problem was even more complex.
The educational process in the United States, was, however, similar to that
experienced on the other side of the water - similar, at least , as far as the
North and Midwest were concerned; but, in the U.S., the process was delayed
by at least half a century. Thus, Yankee and Midwestern savers' experience
with the 5-20s during the Civil War provided the same lessons as the British
Napoleonic War debt; and, during the 1870's, 80's, and 90's , their experi
ence with U.S. railroad bonds duplicated the lessons of the Hudson years in
Britain.5 In the South, however, investment in Confederate bonds had not
4 Somewhat later Alexander Gershenkron made a similar case for Germany and Russia. See his Economic Backwardness in Historical Perspective .
5 Lance E. Davis, "Capital Immobilities and finance Capitalism: a Study of Economic Evolution in the United States, 1820-1920," Explorations in Entrepreneurial History , Second Series, Vol. 1, No. 1, Fall 1963, pp.88-105. Recently Kerry Odell has found similar evidence for gradual integration within the Pacific Coast States even before that region was integrated into the national capital market. Kerry A. Odell, "The Integration of Regional and Interregional Capital Markets: Evidence from the Pacific Coast, 1883-1913," The Journal of Economic History, Vol. XLIX, No. 2, June 1989, pp. 297-310.
171
had the same effect on the Southern saver's education. Despite the Southern
experience, to the North, the educational process had proceeded far enough
by the early twentieth century to lead Frank A. Vanderlip, a prominent
New York banker, to argue, that "the whole great Mississippi Valley gives
promise that in some day distant perhaps it will be another New England for
investments. There is developing a bond market there which is of constant
astonishment to eastern dealers," 6
There are, of course, a set of institutional developments that aided the
process of interregional integration. Davis has argued for the role of life
insurance companies and the expansion of the commercial paper market,
Sylla looks at changes in the national banking laws, and James at changes
made by the states in the legal framework of banking. More recently, Clark
and Turner have underscored the role played by the nation's real current
account trade balance as an independent factor. 7
Of course, regional integration- an obvious precondition for interregional
integration- itself developed only slowly. For example, Naomi Lamoreaux, in
a study of New England commercial banking, has shown just how personal-
6 Frank A. Vanderlip was Vice President of the National City Bank. He made the statement in a speech in 1905. He is quoted in G. Edwards, The Evolution of Finance Capitalism, (New York: 1908), p. 185.
7 Lance E. Davis, "The Investment Market, 1870-1914: The Evolution of a National Market," The Journal of Economic History, Vol. XXV, No. 3, September, 1965, pp. 355-393; Richard Sylla, "Federal Policy, Banking Market Structure, and Capital Mobilization in the United states, 1863-1913, The Journal of Economic History, Vol. XXIX, No. 4, December, 1969, pp. 657-686; John James, "The Development of the National Money Market," 1893-1911, The Journal of Economic History, Vol. XXXVI, No. 4, December, 1976, pp. 878-897; William Clark and Charlie Turner, "International Trade and the Evolution of the American Capital Market, 1888-1911," The Journal of Economic History, Vol. XLV, No. 2, June, 1985, pp. 405-410.
172
ized capital remained despite the existence of an apparently depersonalizing
institutional structure.8 From her examination of the records of a number of
nineteenth century New England banks, she concludes that it was not mar
ket forces but kinship connections that structured the loans made by those
institutions.
Drawing on a different body of evidence and making a distinct, but par
allel, argument, Kenneth Snowden has demonstrated that as late as 1890,
after the effects of risk have been netted out, there still remained significant
interregional differences in mortgage interest charges. "Mortgage rates were
substantially higher for borrowers in the South and West and represented a
tangible financial burden. Effective rates of interest on both home and farm
mortgages were 2 to 3 percent higher in many of the western regions than
identical loans would have been in the Northeast. Borrowers in these regions
do not, however, appear to have been the victims of eastern monopoly power.
Instead, I conclude that home as well as farm borrowers paid high rates in
the West and South because of the direct costs of moving funds between
regions and uneven diffusion of financial innovation." 9
8 Naomi Lamoreaux, "Banks, Kinship, and Economic Development: The New England Case," Journal of Economic History, September, 1986, pp. 647-667.
9Kenneth A. Snowden, "Mortgage Rates and American Capital Market Development in the Late Nineteenth Century," Journal of Economic History, September, 1987, pp. 671-692.
Recently Hugh Rockoff and Howard Bodenhorn have shown that there was little difference between short term rates in the North and the Old South in the ante bellum era. Despite the lack of correlation in movements, there is evidence of an integrated market between those two sectors; and, given the dependence of southern cotton factors on northern financial markets that result is not surprising. They make a similar argument for the lVIid West; however, their evidence is much less compelling; and they find no evidence for any significant integration between the Pacific Coast and any other region. Hugh Rockoff and
173
Yet a third avenue of support for the immobility argument can be found
m an examination of the monopoly profits earned by those few American
capitalists who were able to exploit their personal ability to mobilize capital.
The list includes, but is not limited to, Jay Cooke, John D. Rockefeller , and,
of course, J.P. Morgan- who, as late as 1912, was able to control more than
two billion dollars of the savings of Americans willing to put their funds into
enterprises that he backed, even though they were still unwilling to trust
the formal depersonalized financial markets. 10 Moreover, recent work by
Bradford Delong indicates that, given the existing structure of the financial
markets, those savers were almost certainly correct. 11
It seems, therefore, safe to conclude that, until the end of the nineteenth
century, at the very least, the London capital market served a far more
sophisticated groups of savers than its New York competitor. 12 Obviously
the two markets did not exist in isolation, but it appears that a substantial
fraction of the American securities traded in London were not even imperfect
substitutes for many of the stocks and bonds traded in New York. That is
to say, while the British contribution to American capital formation was
never large, the financial flows were not trivial; and, more importantly, they
Howard Bodenhorn, "Regional Interest Rates in Ante Bellum America," paper prepared for NBER Conference on Strategic Factors in Nineteenth Century American Economic History, Cambridge, Mass., March 1 through 3, 1991.
10See Davis , "Finance Capitalism," pp. 588-590; G. Edwards, The Evolution of Finance Capitalism.
11 Bradford DeLong, "Did Morgan's Men Create Value?" paper presented at the 1990 meeting of the National Bureau of Economic Research program in The Development of the American Economy, Boston, Mass., July, 1990.
12 For a more extensive development of this point see Lance Davis, "The Capital Markets and Industrial Concentration: The U.S. and the U.K., A Comparative Study," Economic History Review, Second Series, Vol. XIX, No. 2, 1966.
174
were often targeted at economic activities that lay outside the scope of the
still embryonic American financial market. Moreover, they were particularly
important during the last two decades of the nineteenth century when the
American economy was undergoing a very rapid structural transformation.
While a part of the relatively slow development of the New York market
may merely reflect the preferences of the savers with which the market dealt ,
a part, at least, can be traced to the institutional differences between the New
York and London exchanges. The New York Stock Exchange was organized
(and owned) by a collective to engage in the creation and n1.aintenance of
securities markets. While the London Stock Exchange was organized for
ostensibly the same purposes, it was not owned solely by traders:
[When the LSE) decided to build its own exchange in 1801 it
did so by issuing shares which could be purchased by anyone.
Consequently, there was a divorce between those who used the
building for the conduct of their business - the members - and
those who controlled the building and saw it as a business - the
owners. In 1878, for example, there were 2,009 members of the
London Stock Exchange but only 508 shareholders, a number of
whom were non-members. 13
The New York Stock Exchange building, constructed in 1868, was fully fi
nanced by its membership. Thus the wedge between owners and members
that marked the London market was absent in New York - there, the sets of
13Ranald C. Michie, The London and New York Stock Exchanges , 1850-1914 (London: Allen & Unwin, 1987) , p. 250.
175
owners and of members were identical.
The owner/member cleavage in London was clearly reflected in the ex
change's governing structure. Two committees- the Committee of Trustees
and Managers and the Committee for General Purposes - were jointly vested
with ultimate control over exchange matters. As their names suggest, how
ever, the committees represented different interests: the Trustees and Man
agers Committee represented exchange owners and General Purposes Com
mittee represented members. Inevitably, their interests collided. 14 The iden
tity between owners and mangers of the NYSE meant that there would be
no infighting between the two groups. One committee, the Governing Com
mittee, was final arbiter on all issues affecting the exchange, although it
delegated much of its authority to subcommittees. As a collectively owned
firm, the NYSE adopted policies typical of collectives in general; and those
policies were quite different from the policies of the shareholder-owned Lon
don exchange. 15
On the one hand, the evidence suggests that the rewards associated with
organizing as an efficient cartel were high relative to the costs. On the other
hand, the cartel carefully screened potential issues and implemented rules
that, while providing a valuable service to some, made trading on the NYSE
14See Michie, London and New York, pp. 250-3 on conflicts of interest. Generally, traders were eager to adopt any technological advance which could facilitate increased market activity. Owners resisted many innovations - for instance, ticker tape machines -fearing that their introduction made exchange price quotes readily available to outsiders thus creating a disincentive for non-members to pay fees to join the exchange.
15See Lee Benham and Phillip Keefer, "Voting in Firms: The Role of Agenda Control , Size, and Voter Homogeneity," Economic Inquiry, Vol. XXXIX, October, 1991 on actions taken by collectives.
176
more expensive than on other competing exchanges. Firms willing and able
to sustain these costs were, in effect, buying a signal - a signal that assuaged
the doubts of skeptical investors- and thus, those firms were able to attract
a fairly wide range of relatively unsophisticated investors and, thus, build
a national market for their securities. Of course, some investors felt no
need to rely on NYSE certification to gauge the attractiveness of uncertain
investment opportunities; and some firms were unable or unwilling to bear
the additional costs.
The more sophisticated investors refused to bear the high NYSE trans
action costs and took their business to rival exchanges. It is clear that this
group was small relative to the number of unsophisticated investors - the
NYSE handled the lion's share of transactions in domestic securities (Table
4.1). Because the numbers of sophisticated investors were small, the rival
domestic exchanges were unable to mobilize sufficient capital to meet the de
mands of all the myriad of firms whose growth reflected the transformation of
the industrial profile of the United States. Thus, British entrepreneurs were
given an opportunity to purchase American enterprises, reorganize them as
"free standing companies" and, through the aegis of the London exchange,
raise capital from the relatively more sophisticated British investors. At the
same time, some American firms began to utilize the services of the London
market themselves. From the point of view of the Board of Governors of the
New York market, however, given the relative numbers of the two groups ,
the decision to forgo the business of sophisticated investors in an attempt to
attract the business of larger blocks of relatively unsophisticated investors
appears to have been a sound one.
177
The minimum commission rule provides perhaps the clearest example of
the exchange's desire to impose a single pattern of behavior on its member
ship - a pattern of behavior that would guarantee efficient cartel operation.
NYSE members were permitted to charge no less than one-eighth percent on
every transaction they handled for non-members. The minimum NYSE rate
was high; and members of rival exchanges, in an attempt to divert business
to themselves, frequently undercut NYSE commission; but, because of their
relatively small size, they failed to provide effective competition. Traders
on two rival New York exchanges - the Consolidated and the Curb market
- and those on the Philadelphia Stock Exchange typically charged half the
NYSE commission rate; but when, in 1875, twenty NYSE brokers petitioned
the Governors to charge one-sixteenth percent commission on large volume
trades for non-members, their request was flatly refused. The importance
attached to the minimum commission rule was most clearly stated by the
Governing Committee in 1894; "The Commission Law is the fundamental
principle of the Exchange, and on its strict adherence hangs the financial
welfare and the life of the Institution itsel£." 16 While such language may
seem overly melodramatic, it is nevertheless apparent that NYSE rulemak
ers sought to eliminate any commission competition between its members
differences in commission rates would not be tolerated.
The Governing Committee also attempted to secure higher individual
profits for members by strictly limiting membership. In the wake of its 1869
16NYSE: Governing Committee, April 13, 1894; Constitution of the New York Stock and Exchange Board, February 21, 1820, Article 10. Cited in Michie, London and New York, p. 258.
178
merger with what had been called the 'Open Board,' the committee placed
a 1,060 cap on membership. Between then and 1914 that ca·p was increased
just once (to 1,100). As business on the exchange grew - 1879 stock sales
were $73 million as compared with a pre-World War I high of $262 million in
1906; and bond sales had grown from $571 million in 1879 to a $1,314 million
pre-War peak in 1909 - the price of seats rose. Michie notes, "Reflecting the
fact that membership was restricted, and did not meet demand, was the fact
that the cost of purchasing a place rose [from] between $14,000 and $26,000 in
1880 to between $65,000 and $94,000 in 1910, or approximately fourfold." 17
Restricting membership, a tool employed by many collectives, kept numbers
manageable; and, as seats became increasingly expensive, it guaranteed that
only the relatively wealthy could gain membership. 18
Because it was organized as a traders' cartel, the New York Stock Ex
change was able to pursue a collective strategy designed not only to maximize
short run profits but also to foster rapid growth in the volume of transactions.
In the mid to late nineteenth century, the typical American saver was rela
tively unsophisticated and, therefore, plagued by high levels of uncertainty
about alternative domestic investment opportunities. 19 The informational
asymmetry faced by potential investors was great; and, in an effort to at-
17Michie, London and New York, pp. 194-6; P. Wyckoff, Wall Street and the Stock Markets: A Chronology {1644-1971}, 1st Edition, (Philadelphia: Chilton Book Co. , 1982) pp.150-1; Edmund C. Stedman, The New York Stock Exchange: Its History, its Contribution to National Prosperity, and its Relation to American Finance at the Outset of the Twentieth Century, (New York: Greenwood Press, 1969 (copyright 1905)) pp. 473-4.
18See Benham and Keefer, "The Role of Voting," pp. 708-10 on restricting membership in collectives.
19 Again, the term uncertainty is used in the "Knightian" sense. That is, there was a. lack of knowledge about the distribution of expected returns.
179
tract large national markets for its listed securities, the NYSE devised a set
of procedures and trading rules that were designed to reduce the level of un
certainty. In such an environment, potentially viable firms fa.ced a. standard
problem in their attempts to attract capital:
"Higher quality parties are usually adversely affected by the pres
ence of lower quality parties; either the higher quality parties, are
pooled with the lower quality parties, to their detriment, or they
must invest in signals beyond the point that they would if there
were no informational asymmetry to distinguish themselves from
their low-quality peers.'' 20
Market screening undertaken by the NYSE allowed certain firms to invest in
costly signals to separate their securities from those of competing ventures. 21
A NYSE listing itself became a signal to American investors of the "quality"
of an investment opportunity.
20 David M. Kreps, 1990, A Course in Microeconomic Theory, Chapter 17, "Adverse Selection and Market Signaling", (Princeton, NJ: Princeton University Press, 1990) p. 625-660. The term "quality" appears somewhat pejorative, but in this case it should be taken as a synonym for either unable or unwilling (i.e., could find alternative capital sources to signal.
21 Kreps defines market screening as a situation in which the party to a contract without information proposes a menu of contracts from which the informed party selects. In this context, the NYSE, as representative of unsophisticated investors, was the party to the contract at an informational disadvantage because the firms attempting to list their securities were relatively better informed about the distribution of potential return. The institutional rules imposed costs on those firms. Those firms willing and able to absorb these costs separated themselves from other ventures.
For a treatment of how promoters of one notorious mining venture, the Emma, used their informational advantage to manipulate investors see Clark C. Spence, British Investments and the American Mining Frontier, 1860-1901, (Ithaca, N.Y.: Cornell University Press, 1958) pp. 84. Of course, this firm was listed on the London Stock Exchange; there screening activity was far more la..x than on the NYSE.
180
The most obvious of the NYSE's screening policies was its stringent vet
ting procedure - a procedure that required potential listings to meet high
minimum standards in terms of, "size of capital, number of shareholders,
and proven track record." 22 The exchange made a deliberate effort to at
tract large, widely held and, price wise, relatively stable issues. The rules
also imposed additional costs on securities whose prices dipped below par
value, and they made it virtually impossible to trade a security that did not
generate the required high level of trade volume in sufficiently large trade
blocks. Moreover, an addendum to the commission rules mandated that
commissions would be based not on the market price of the security but on a
minimum $100 par value. Thus, the rule dictated that members demand at
least 12.5 cents on every share traded on behalf of non-members, even if the
share price was well below $100. The importance of par values as a signal
to relatively unsophisticated investors is emphasized in one study of capital
market development:
"A prerequisite for anonymous public markets was the develop
ment of mechanisms to enable outside investors better to estimate
the value of businesses; this has been a very slow and arduous
process, which even today appears far from complete. A rudi
mentary step, when most available accounting data was entirely
unreliable, was the use of par value as a benchmark." 23
22 Michie, London and New York, p. 198. 23Jonathan Barron Baskin, "The Development of Corporate Financial Markets in
Britain and the United States, 1600-1914: Overcoming Asymmetric Information," Business History Review, Vol. 62 (2), Summer, 1988. p. 225.

181
Similarly, the Exchange imposed a mm1mum s1ze requirement for a single
transaction. Although in the 1890's the rules were relaxed to permit mem
bers to deal in "odd lots," until then, members had been prohibited from
dealing in quantities less than the "normal" lot of one hundred stocks or
bonds. 24 In short, a firm that passed the admittance tests and continued to
demonstrate that the market for its issues was active and stable had pur
chased an expensive signal about the probable quality of those issues.
The "par value rule" discriminated not only against $100 securities trad
ing at less than that amount, but also against "low-denomination" securities
issued at values well below $100. Low denomination securities were most
often offered by companies with small capital bases; and there were many
such firms in the industrial, in the land, mortgage, and financial , and in the
mining industries. Even if investors were willing to trade in normal lots, and
it is likely that the small investor preferred odd lots, the par value rule made
purchases or sales very expensive. It is, therefore, not surprising that most
of these securities were listed on exchanges with more liberal trading rules.
Institutional rules are, however, not set in stone; and changing conditions
led to changes in institutional structure. The NYSE did not, for example,
turn away business because of an irrational prejudice against certain types
of securities- they were, in fact, interested in any security that passed their
24 Since most stocks and bonds listed on the NYSE traded near a par value of $100, the value of the smallest allowable transactions was about $10,000. Michie reports that, of the 131 million shares sold on the exchange in 1912, less than nineteen percent were priced at under $50, while 43 percent were over $100. Michie, p. 199. NYSE: Special Committee on Commissions, 1924; Governing Committee, May 11, 1886, April 13, 1887, November, 1902, May 27, 1903, March 16, 1910, March 30, 1910; Special Joint Committee on Copper Stocks, May 18, 1903.
182
"signal" test and, equally importantly, could attract investors from all regions
and all walks of life. As long as a security was of interest to only a small or
to a geographically concentrated group of investors, there were few benefits
to be gained from a listing on the "Big Board", and neither the issuing firms
nor the investors themselves were willing to pay the price of admission. By
the mid 1880's, however, the continued viability of certain industrial, land
mortgage-finance, and mining shares on rival exchanges led the Governing
Committee to conclude that those issues were beginning to attract a broad
range of investors. As a result, in order to permit its members to share
in those potential profits while not diluting the Exchange "quality" signal,
the Board of Governors created the "unlisted department" - a department
designed to permit members to trade in certain securities without granting
those issues an official quotation.
Despite this institutional innovation, by the turn of the century the major
ity of those issues had still not managed to attract a truly national clientele;
and the trade rules (i.e., commission and trade block regulations) were not
weakened. The attractiveness of the new market was obviously limited. Al
though the unlisted department struggled along until 1910, few of its issues
generated any significant trading volume. In 1895, for example, of the sur
prisingly large number of industrial stocks (435) covered by the department,
the securities of just three firms - American Sugar Refining, National Lead,
and U.S. Leather -generated ninety-four percent of the department's $13.6
million sales total. 25 When, in 1910, the unlisted department was dissolved ,
25 Michie, London and New York, pp.198-9; Sereno S. Pratt, The Work of Wall Street, (New York: D. Appleton and Company, 1903) pp. 86, 153.
183
securities from these three firms were added to the quoted listings.
In part, at least, as a result of the Exchange's trading rules, many firms
went unlisted on the NYSE, and they turned to other American exchanges
(the Boston, the Philadelphia, or, perhaps, the Consolidated), or foreign (i.e. ,
London) exchanges. Because potential investors in these enterprises often
tended to be geographically concentrated, some mining and land, mortgage,
and financial firms were adequately served by other - more local - American
exchanges. The San Francisco and the Boston Exchanges and the Curb
Market in New York listed a wide array of mine shares throughout the years
1880-1914. Before the turn of the century, land companies and investment
trusts were also often listed on the Boston Exchange. 26 Other firms - those
whose capital requirements could not be met by domestic savers- turned to
the more broadly based British market. It was not that all mining and land
ventures could not find homes for their sec uri ties in the United States; many
could and did, but that home was not the New York Stock Exchange.
In general, as long as rival exchanges steered clear of transactions in NYSE
issues, peaceful coexistence was possible. For example, the Curb Market
appears to have served as a proving grounds for securities unable to measure
up to the rigorous standards required for an NYSE listing. NYSE brokers ,
moreover, recognized that there were small pockets of investors willing to
channel savings into securities that did not pass the exchange's screening
procedures:
26 Michie, London and New York, pp. 211-12. Joseph G. Martin, A Century of Finance , Martin's History of the Boston Stock and Money Markets. (published by the author, Boston, 1898). pp.196-223.
184
"The Curb existed in uneasy harmony with the New York Stock
Exchange, never officially recognized but extensively utilized by
its membership to fill orders for clients throughout the coun
try ... An estimated 85 percent of the Curb's total business was
on behalf of members of the NYSE, with whom constant contact
was maintained through the use of messenger boys, signalling
from upper office windows, and conveniently sited telephones at
ground-floor window level." 27
Interestingly, this quote not only underscores the tacitly accepted division in
function between the two exchanges, but it also suggests that Curb listings
enjoyed something more than local or regional interest.
The continued existence and viability of regional exchanges indicates that
there was also a fragmentation between investors in different regions of the
country. If there were gains to be had from consolidation of trade activity
in national issues, at some point in the period, one would have expected
the smaller American exchanges to handle only regional listings as national
issues gradually gravitated to New York. Through at least 1910, however,
the Boston Stock Exchange, for example, listed land, mortgage and financial
firms and mining concerns located throughout the country. At least one
market observer, Charles Head, a member of both the New York and Boston
Stock Exchanges, noted the regional fragmentation between investors:
"We do a pretty large business in Boston which does not come
to this city [New York] at all - where the customers are Boston
27Michie, London and New York, pp.206-7.
185
men, and the business is done there. We do a large business Ill
these Boston stocks- in all the copper stocks." 28
The persistence of trade activity unique to a single exchange - the Boston
(and to a lesser extent the Philadelphia)- suggests that the exchange served a
group of relatively sophisticated investors who did not solely rely on the New
York Stock Exchange's "certification" to reduce their uncertainty. Arthur
Johnson and Barry Supple argue that Boston investors' early experience in
the China trade made them particularly suited to investment in the American
West. In their words, those investors were "A close-knit group, accustomed
to managing far-flung enterprises, they appeared on the domestic scene at a
time when the West offered great opportunities to capital and entrepreneurial
talent." 29 In sum, it is quite apparent that not all American savers were equal
in their abilities to evaluate uncertain investment opportunities; and, even
at the turn of the century, the majority, even of those willing to hold paper
securities at all, still demanded "official certification."
The combination of rapid increases in the demand for capital, relatively
unsophisticated investors, and restrictive trade rules meant that firms in
certain sectors of the American economy, particularly corporations located
in the South and West went unserviced by the New York market; they were,
however, often able to attract capital on the London market. 3° Certainly, by
28NYSE: Special Investigation Committee, Continuous Quotations, January 27, 1903; Michie, London and New York, p. 210.
29 Arthur M. Johnson and Barry E. Supple, Boston Capitalists and Western Railroads, (Cambridge, Mass. ,Harvard University Press, 1967) p. 19.
30 Although the London market was less likely to shy away from smaller, more volatile issues with low potential trade volumes than its American counterpart, it has been sug-
186
the end of the period, the New York market had begun to display evidence
of approaching maturity - that is, its traders and specialists had begun to
serve a wider array of enterprises; however, it lagged its London counterpart
by at least two decades. Domestic land, finance and investment companies,
as well as mining, agricultural, and other land based firms , were forced to
retain their London connections until well into the present century.
In the final analysis, except perhaps in the short run, it was not lack
of American savings that led American firms to the London capital market.
While there may still remain questions of the level of American savings in
the ante bellum decades, there is little doubt that the gross savings rate
averaged almost twenty-five (and the net rate more than eighteen) percent
from about 1870 to at least 1908; and these rates were far higher than those
observed in Britain.31 Instead, it was a combination of the organizational
structure of the New York exchange and the perceptions of the majority of
gested that the LSE was also unable to serve the full range of financial requirements of its domestic economy - particularly those of industries characterized by rapid technological innovation and potential economies of scale. "If British capital markets were poor places to buy and sell industrial securities, they, especially London, were very good places to sell government stocks, railroad securities, and municipal and public utility bonds. Substantial markets also existed in London for trading the securities of foreign land, finance , and investment companies - the later two types generally dedicated to financing international trade - and mining, agricultural, and other extractive activities. Foreign industrial assets, however, were traded in Britain with, if anything, even less success than their domestic counterparts." [Vlilliam P. Kennedy, "Notes on Efficiency in Historical Perspective: The Case of Britain, 1870-1914," mss. May, 1981.] Regardless, the point here is not that the LSE serviced all American economic sectors sufficiently, but that it better serviced certain sectors than did the NYSE.
31 Lance Davis and Robert Gallman, "Savings, Investment, and Economic Growth: The United States in the Nineteenth Century," forthcoming in John James and Mark Thomas ( eds. ), Capitalism and Social Progress: Themes and Perspectives, Essays in Honor of Max Hartwell. (Chicago, IL: University of Chicago Press, 1992), Table 2.
187
American savers - savers who were unwilling to risk their accumulations in
enterprises far removed from their usual experience. As those savers became
more sophisticated, the potential economies of scope from a more broadly
based exchange increased; and, ultimately, it paid those who governed the
New York exchange to increase their listings - at least somewhat.
Despite the very high rate of domestic savings, the New York exchange
failed to mobilize sufficient savings to provide finance for the entire range of
investment opportunities then available in the United States. That problem
became particularly acute in the decades following the Civil War as the rapid
transformation of the American economy generated a substantial demand for
finance in sectors of the economy that were well outside the normal experience
of American savers. At the same time, European, and particularly British ,
savers possessed sufficient resources to fill at least part of the gap; but they
appear to have been more comfortable dealing with their local brokers and a
known market than with strangers and strange institutions located thousands
of miles away.
4.3 Institutional Differences: Additional
Quantitative Evidence
The results from Chapter Three indicate that land-mortgage-finance (LMF)
firms, mines, and rails each had distinctive return profiles. They differed in
size of issue, average return, return variance, and price volatility. Mining
and LMF issues were unsuitable for the NYSE, albeit for slightly different
188
reasons:
"The New York Stock Exchange did not discriminate solely on
size and potential turnover; for there was also a strong preju
dice against volatile securities or those of unproven companies ,
because of the risks involved. Sudden price changes could cause
large losses, resulting in the collapse of individual brokerage firms
and undermining the stability of the market, while the failure or
difficulties of quoted companies would reflect badly on the others
lowering their status and discouraging investment. For these rea
sons the Stock Exchange was extremely careful to vet the stocks
and bonds it admitted to quotation, seeking for reasons to refuse
rather than to accept . The securities most affected by this policy
were those of mining companies, which tended by the very nature
of their business to have a.n erratic and often brief life. Oil wa.s
similarly regarded, as were industrial and commercial concerns
until they ha.d proved themselves both individually and a.s a. sec
tor. The [New York] Stock Exchange wa.s not a. market for either
small, new, or risky ventures but one for large, established a.nd
secure corporations or the issues of government, a.t a.ll levels but
with unblemished records." 32
Whereas mines failed on three counts - they were small, new, a.nd risky -
LMF firms failed on two; they were small a.nd new. Although the returns
data. suggests LMF firms were far from volatile, the small size of the issues
32 Michie, London and New York, pp. 198.
189
and the relatively low potential turnover made a New York Stock Exchange
listing impossible.
Results from the 1900's returns sample indicate that LMF and mme
shares were more thinly traded than rail shares. For each firm type, the
percentage of issues having the same December high, low, open , and close
prices was computed for each year. Of the LMF firms, on average, roughly
fifty-one percent experienced no December change in a given year, as com
pared with thirty-seven percent for mine shares, and only one percent for
rail shares. 33 Although it may have been possible to conduct transactions
in these markets without affecting price, it seems highly unlikely. It was
assumed therefore that no price change indicated no market activity for the
month. That LMF and mine issues often generated no trades for an entire
month further underscores their inappropriateness for the NYSE.
Another way to demonstrate that the pure LSE listings (LMF firms and
mines) differed from the jointly listed railroads is to look at defaults. It is easy
to pick out those firms whose common stock issues did not persist throughout
the sample period (see Table 4.2). While one in five of the LMF firms and
half of American mines identified on the LSE in 1880 did not persist through
1889, all of the 1880 American rails did last. While, for the 1900's sample
twenty-one percent of rail issues disappear before 1909, the percentages for
LMF firms and mines are forty-seven and sixty-seven respectively. Of course,
disappearance from the returns sample does not necessarily imply that these
firms defaulted . Fortunately, however, consulting The Register of Defun ct
33Curiously, for the 1880's sample, all issues experienced December price changes in all years.
190
and Other Companies Removed from the Stock Exchange Official Yem· Book
enabled identification of the majority of the disappearing firms as either
having reorganized or defaulted.34
Of the five mines disappearing from the 1880's sample- La Plata Min
ing of New York, the Eberhardt, the Eberhardt & Aurora, Flagstaff Silver ,
and Last Chance Silver of Utah - three ceased operation outright while two
reorganized. The two reorganized firms each went out of business before
the turn of the century. Four of the six mining issues in the 1900's sample
departed previous to 1909 - two were removed from the Register by 1904
(Mountain Copper and Utah Consolidated); the remainder appear to have
discontinued operation by 1916 at the latest. The Registe1· does not disclose
the fate of two of the eight LMF firms departing from the 1900's sample
(Texas Land & Mortgage and Investors Mortgage Security), but it does in
dicate that four others had their final meetings previous to 1910; another
underwent reorganization and subsequently failed in 1919, while the U.S. In
vestment Corporation, the firm with the remaining issue, was not dissolved
until 1968. In contrast to LMF firms and mines, of the five rail issues disap
pearing during from the 1900's listings, the Kansas City Southern and the
Northern Pacific reappeared before 1910, two others were reorganized , and
the Mexican Central had its properties transferred to National Railways of
Mexico in 1909. That mines disappeared from the sample was, perhaps, to
be expected in that ore deposits become exhausted over time. However, the
LMF disappearances are less readily dismissed. LMF firms, therefore, ex hi b-
34 Wilfred S. Wareham (ed); The Register of Defunct and Other Companies Removed from the Stock Exchange Official Year Book, Thomas Skinner & Co., Croydon. 1971.
191
ited a volatility not apparent in price fluctuations, and , most importantly,
not seen in railroads.
In sum, the evidence uncovered here points to differences in issue size ,
trade volume, and probability of default between LMF and mining firms on
the one hand, and rails on the other. Although LMF and mine shares clearly
lacked the requisite qualities for a New York Stock Exchange listing, they
could find homes on other smaller American exchanges - most notably, the
Curb, and the Consolidated in New York City, and exchanges in Boston,
Chicago, Philadelphia, and San Francisco. Again, the business transacted
on these exchanges was trivial compared to that of the NYSE (Table 4.1).
Clearly, no American exchange rivaled NYSE supremacy; however , these
exchanges served their purpose in that they provided markets for shares
from firms with small capital bases - firms often located in the West.
For example, evidence from Martin's History of the Boston Stock and
Money Ma1·kets suggests that at least by the 1880's, the Boston exchange
handled a variety of Land Company, Investment Trust, and Mining Shares. 3 5
Martin reported high and low share prices for a number of "miscellaneous"
companies from 1886 to 1898. Among them were the American Loan and
Trust, Boston Investment Co., Davidson Investment, Farmers Loan and Trust
of Kansas , Massachusetts Loan & Trust , Iowa Railroad Land, Lombard In
vestment, and New England Mortgage Security. Of course, it is impossible
to know from their names what kind of activities these firms engaged in ;
it does, however , seem safe to conclude that, despite their listing on the
35Joseph G. Martin, A Century of Finance , Martin 's History of th e Boston Stock and Money Markets . (Boston, published by the author , 1898) . pp. 196-223.

192
Boston exchange, firms like Iowa Railroad Land and Farmers Loan & Trust
of Kansas engaged in investment activity outside of New England. Martin's
decision to categorize these firms as "miscellaneous" is unfortunate because it
is unenlightening, but the names of at least some of them resemble those from
trusts and investment companies in the 1880's LSE returns sample (Colorado
Mortgage and Investment of London, for example).
Fortunately, Martin provided a separate category for land companies. As
with the miscellaneous firms, he reported yearly high and low share prices
for 1886 to 1898. Among the similarities between the Land Companies in
the Martin sample and those from the Capital Called and Returns samples
taken from the Investor's Monthly Manual are their share prices. Of the
twenty-seven land companies listed by Martin for 1889, twenty-one had share
prices under $10 - the vast majority of these hovered well below $5. With
the exception of British American Land, the five LMF firms in the 1880 's
returns sample all had share prices below $5 throughout 1889. Though price
level comparisons are suggestive of similarities between LMF firms listed in
London and land companies traded in Boston, comparisons based on price
movements would perhaps be preferable. In particular, it would be best if
returns series could be computed for the Boston firms. Unfortunately, while
Martin did report dividend information for many of these firms , he left out
yearly opening and closing prices thus making returns impossible to construct
based solely on his information. The yearly high and low share prices do,
however, permit direct volatility comparisons with the London sample for
193
1886-1889 (Table 4.3.). 36
One difficulty in comparing the Boston and London samples is that Mar
tin and the Investor's Monthly Manual almost certainly used different defini
tions for land companies. For example, the Boston Water Power Co. would
not have been categorized as a land firm had it been listed in London. Fur
ther, whereas London listed land firms tended to concentrate investment in
the West, Boston land firms lacked a particular regional focus. Firms like
Penobscot Bay and Anniston City probably didn't specialize in Western in
vestments; others like Topeka Land and San Diego Land probably did. With
still others - Maverick or Boston Land - it seems impossible to tell. The
wide range of Boston land firms is reflected in yearly share price volatility
rankings of Boston and London firms. While the London firms all ranked
among the least volatile shares, that is, within the top ten, the Boston firms
were more widely dispersed. Five Boston firms - firms such as the Essex
Company and Boston Land - fleshed out the top ten; the remainder and
vast majority of Boston firms ranked well below the London firms. In any
event, the volatility results suggest that there were some shares that were
considered "land" company shares in Boston that exhibited volatility and
share price levels consistent with American land, mortgage, and financial
companies listed in London.
American mine share comparisons between the Boston and London ex
changes are somewhat less problematic than were land company comparisons.
Whereas Martin apparently grouped a wide variety of firms under the general
36 As in Chapter 3, issues are ranked from least volatile to most volatile.
194
heading "Land Companies," most mine firms were found under the relatively
more specific heading, "Michigan Copper Mines." As with the land compa
nies, returns for the Boston mine shares are impossible to compute from
the Martin data. Comparisons based on yearly share price volatilities do ,
however, suggest similarity between American mines listed on the London
exchange and copper mining shares traded in Boston (Table 4.4). Over the
period 1880-1889 the mean yearly volatility for the Boston copper mining
share sample and the London sample were strikingly similar: . 785 for Boston
and .796 for London. The standard deviation for the Boston sample (.514)
was only somewhat greater than for the London sample ( .361 ). Further, the
range between high and low volatility observations in each sample was also
quite similar - subtracting the lowest observation for the highest yielded a
1.15 volatility differential for Boston mines versus 1.07 for London mines -
although the extreme observations for Boston are at a somewhat lower level
than those for London. On the whole, the share volatility comparisons be
tween the Boston and London exchanges suggest that American land and
mining company shares were not unique to London; at least one U.S. ex
change listed issues similar to the London offerings from these industries .
The notion that American savers were risk averse and thus were unwilling
to invest in risky western ventures cannot be entirely correct - some Ameri
can investors found mines and land firms suitable investments; but, as noted
in the previous chapter, these groups of investors tended to be small and
geographically concentrated.
Of course, Boston's was not the only American exchange to list mining
shares; in fact, Martin's heading "Lake Superior Mining Shares" suggests that
195
Boston mining listings catered not to American mining in general, but to a
specific regional subset of mining operations.37 On a number of American
exchanges mining shares were traded throughout the late nineteenth and
early twentieth centuries, and most of those mines were located in areas
other than the Lake Superior region (Table 4.5).
Given both Michie's descriptions of listings on the New York Stock Ex
change and the New York/London listings comparisons in Chapter 3, it may
seem surprising that at year end 1880 ten mining shares were found among
the NYSE daily price data printed in The New York Times. However, on
the same day The Times reported share prices for twenty-eight mining firms
traded on the San Francisco exchange; in addition, Martin's data indicates
that thirty-three copper mine shares were traded in Boston during 1880. The
bulk of American mine listings were on exchanges other than the New York
and London markets; yet, no single one of these "other" exchanges had a
stranglehold on mine listings as evidenced by the roughly equal number of
listings on the Boston and San Francisco exchanges.38
37Martin's data does however indicate that by at least 1886, trading in a handful of non-Michigan or "Miscellaneous Mine Shares" did occur on the Boston exchange.
38Though on the last day of 1880 The Times reported mine data from only New York and San Francisco, this does not imply that no other exchange listed mine shares. Michie notes that after the Civil War:
"The sudden unearthing of minerals and oil created an explosion of interest in the ventures involved, which led in turn to the creation of numerous stock exchanges to cope with the vast turnover in the securities they issued, with which investors hoped to make their fortunes. The exchanges were usually sited either in convenient centres for the mineral fields- such as Virginia City for the Comstock lode and Pittsburgh for the Pennsylvania oil wells - or in populous cities with numerous investors, like San Francisco and Chicago. Most of these exchanges disappeared long before the minerals, but a few did progress to become established securities markets." Michie, p. 211.
196
Boston and San Francisco maintained extensive mme share listings
throughout the 1880's; at year end 1890 The Times reported price quotes
for twenty-four listings in San Francisco while Martin reported thirty cop
per listings and twelve listings under the heading "Miscellaneous Mining"on
the Boston exchange.39 Although twenty years later, at year end 1910, Th e
Times reported no price data from San Francisco, price quotes on mine list
ings from four other American exchanges were reported - an exchange in
Colorado Springs listed twelve mine shares, Boston thirty-four, the Con
solidated Exchange nine, and the Curb market listed twenty-nine shares. 40
Relying on New York Times price data most assuredly understates the num
ber of mine listings on non-NYSE exchanges. For example, Michie reports
that in 1908 the Curb Market quoted prices for one hundred seventy-four
different mining companies but that only seventy had what he considered
an "active" market. 41 The Times data is clearly less comprehensive than
Martin's Boston data, yet it is rich enough to demonstrate that the Boston
experience was not particularly unique - at least with respect to mines. A
number of exchanges serviced sectors of the economy whose firms typically
had small capital bases and whose shares had small trade volume relative to
39The miscellaneous mine listings include the following: Bonanza Development, Bonanza and Montana, Breece, Butte & Boston, Catalpa, Crescent , Don Enrique, Dunkin, Geyser, Lake Superior Iron, Napa, and Santa Fe.
40 Although The Times neglected San Francisco listings at year end 1910, the exchange apparently still was doing some mine business: "The San Francisco Stock Exchange managed to find a succession of mining securities in which to trade, being able to tap an extensive and diverse mineral area, so that it remained a mining exchange throughout the period from its foundation in 1862 to the First World War." Michie, p. 211.
41 Michie , p . 206-7.
197
NYSE shares.
The respective "regional" exchanges and the New York Stock Exchange
did not, however, operate in isolation from one another. While small clusters
of sophisticated investors in New England may have concentrated solely on
Boston Stock Exchange listings, some New Englanders were concerned with
shares listed on the "Big Board". The New York Stock Exchange estimated
that its, "members ... were receiving from 850 to 2,300 domestic cables
a day, especially from connections in other major cities such as Philadel
phia, Boston, Baltimore, St. Louis, Chicago and San Francisco, as well as
small neighboring centres like Hartford, Connecticut and Providence, Rhode
Island." 42 It is, of course, difficult to know whether these 800 to 2,300 cables
are impressive without knowing what percent of overall trade volume they
generated. The point, however, is that some investors outside of the New
York City area utilized the NYSE from at least the beginning of the period
covered in this study. Whether these were unsophisticated investors who
happened to be located in cities with small pockets of relatively sophisti
cated investors, or whether the sophisticated investors themselves made use
not only of their local exchange but also the New York market, is difficult to
know.
Some hints can, however, be found in a somewhat peculiar place - the ad
vertisements chapter of Martin's A HistoTy. It seems that investment banking
and brokerage houses - at least those houses catering to the readership of
Martin's studies - felt the need to emphasize their widespread connections
42 Michie, p. 204.
198
in financial markets throughout the United States and, to a lesser extent,
Europe. Of the thirty firms under the heading "Bankers and Brokers" in
Martin's advertisements, twenty of them advertised trading connections out
side the Boston exchange (Table 4.6). Of the ten that didn 't mention out
side services, at least one, Kidder, Peabody & Co., had connections in other
markets.43 While one stock broker, James R. O'Hara, was relatively vague
about the nature of his connections in other markets, noting simply that he
bought and sold machinery stocks, mining stocks, and inactive or unlisted
stocks and bonds "in all markets," most advertisements were somewhat more
specific. For example, of the 17 advertisements in which membership on any
exchange is mentioned, twelve made mention of membership on at least two
exchanges. Of the five that advertised only Boston Stock Exchange member
ship, three had direct wires to firms with membership on other exchanges.
One of the three, Bright, Sears & Co., had direct wires to members on the
New York Stock Exchange, the Pacific Stock Exchange, the New York Cot
ton Exchange, and the Chicago Board of Trade. Richardson , Hill , & Co. ,
a firm engaged in transactions in "the highest grade of commercial paper ,"
advertised membership on no exchange, choosing rather to emphasize their ,
"direct private wires connecting with New York , Philadelphia, Baltimore,
Washington, Chicago, and New Haven and Bridgeport (Conn.). "
Although the typical advertisement emphasized connections between the
Boston and New York Stock Exchanges, five, including Brown Bros . &
Co.(later to become Brown Bros. Harriman after a 1930 merger with Harri-
43See Vincent P. Carosso, Investment Banking in America: A History, (Cambridge, Mass.: Harvard University Press) . 1970. pp. 1-40.
199
man Brothers), Brown Riley & Co., and A.L. Sweetser & Co., explicitly men
tioned connections to other cities or exchanges along the eastern seaboard.
Four firms - E.C. Hodges & Co. and Lee, Higginson & Co, in addition to
the two previously mentioned - advertised connections in Chicago; the ad
vertisement of Jacob C. Rogers, attorney to the seemingly omnipotent J.P.
Morgan & Co. emphasized connections in London and Paris.
4.4 Conclusions
Securities from companies with relati vely small capital bases - for exam
ple, land companies and mines - were purposefully avoided by the Board
of Governors of the New York Stock Exchange. Market screening under
taken by the exchange allowed certain firms to invest in costly signals to
separate their securities from those of competing ventures; an NYSE listing,
therefore, became a signal to American investors of the "quality" of an in
vestment opportunity. Of course, firms had to be both willing and able to
absorb these costs. Securities from some small firms, although clearly rela
tively stable, high-quality investment opportunities, were unable to satisfy
the NYSE criteria simply because of their size. Apparently, the small trade
volumes these issues did generate were not sufficient to induce the Governors
of the Exchange to change their vetting procedures.
Listings from U.S. exchanges other than the New York Stock Exchange
suggest that these smaller firms did market securities domestically. London ,
therefore was not the only option for these firms. These exchanges probably
catered primarily to a local clientele, although regional divisions between

200
investors were not so cut and dried. The New York exchange received orders
from throughout the country from at least 1870 on, and Boston Banker and
Broker advertisements from 1898 indicate that some subset of investors was
keenly interested in financial services offered not only outside Boston, but
also outside New York.
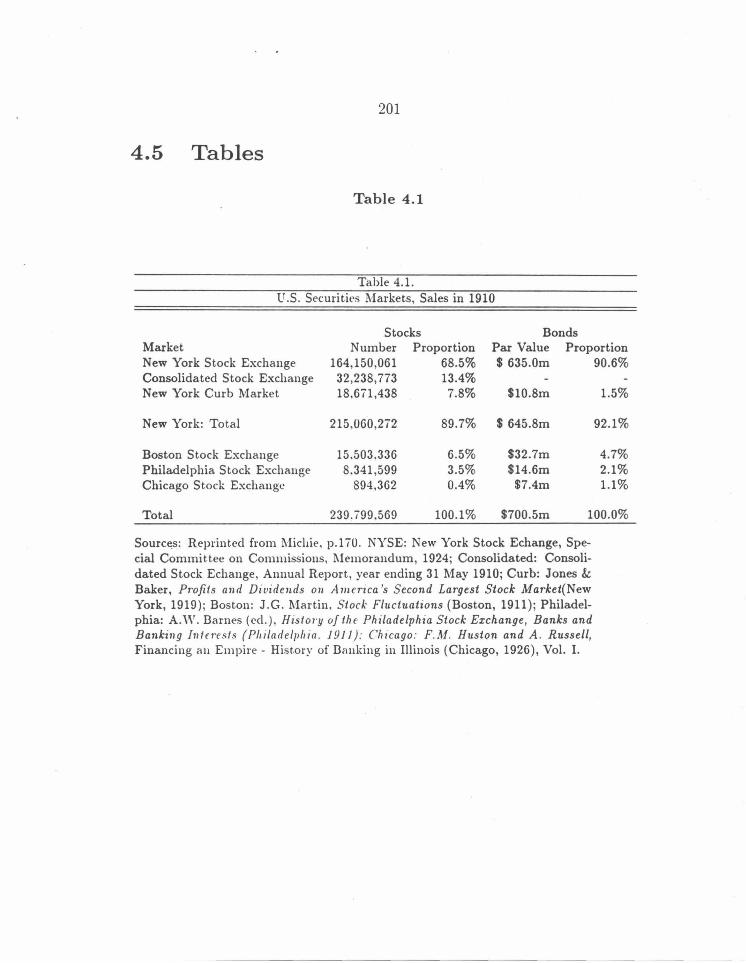
201
4.5 Tables
Table 4.1
Table 4.1. li.S . Securities 1\brkets, Sales in 1910
Stocks Bonds Market Number Proportion Par Value Proportion New York Stock Exchange 164,150,061 68.5% $ 635.0m 90.6% Consolidated Stock Exchange 32,238,773 13.4% New York Curb Market 18,671,438 7.8% $10.8m 1.5%
New York: Total 215,060,2i2 89.7% $ 645.8m 92.1%
Boston Stock Exchange 15.503.336 6.5% $32.7m 4.7% Philadelphia Stock Exchange 8.341,599 3.5% $14.6m 2.1% Chicago Stock Exchange 894,362 0.4% $7.4m 1.1%
Total 239.799,569 100.1% $700.5m 100.0%
Sourc~s: Reprinted from Michie, p.1i0. NYSE: New York Stock Echange, Special Committee on Commissions, 1\lemorandum, 1924; Consolidated: Consolidated Stock Echange, Annual Report, year ending 31 May 1910; Curb: Jones & Baker, Pmfits and Dividends on America 's Second Largest Stock Market(New York, 1919); Boston: J.G. Martin, Stock Fluctuations (Boston, 1911); Philadelphia: A.W. Dames (eel.) , History of th e Philadelphia Stock Exchange , Banks and Banking /nffTe$ I S (Philadelph ia. 1911}: Ch icago: F.M. Huston and A . Russell, Financing au Empire- Hist.ory of D<mking in Illinois (Chicago, 1926), Vol. I.
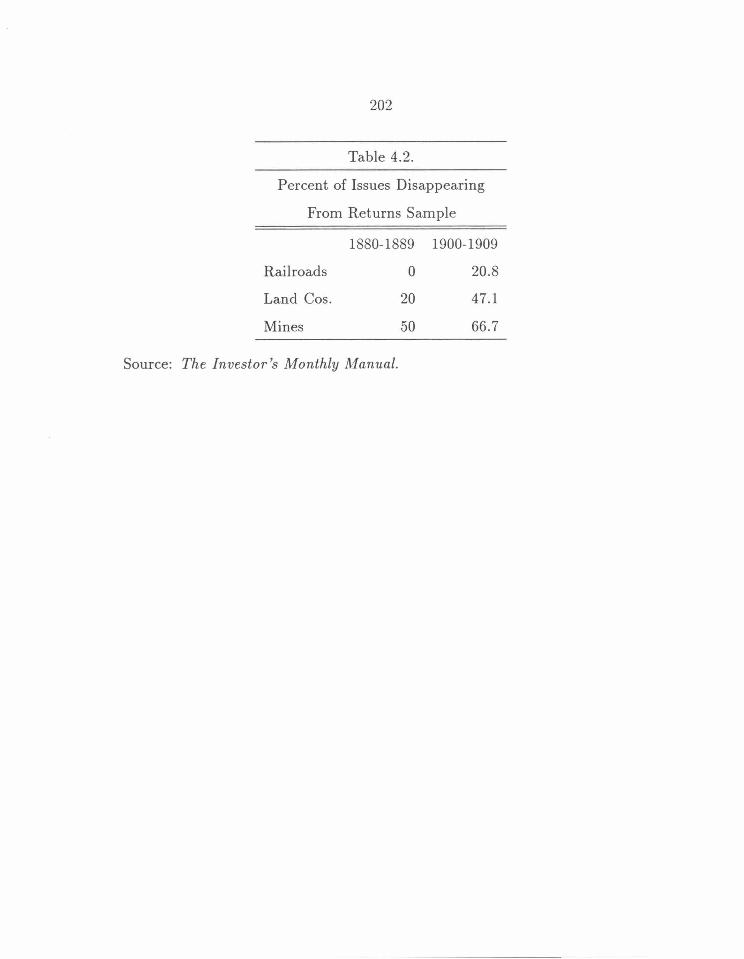
202
Table 4.2.
Percent of Issues Disappearing
From Returns Sample
Railroads
Land Cos.
Mines
1880-1889
0
20
50
Source: The Investor's Monthly Manual.
1900-1909
20.8
47.1
66.7

203
Table 4.3
Table 4.3. U.S. Land Firm Volatility, 1886-89
Boston and Loudon Exchanges
F!Rl'vl EXCHANGE AVG. VOL. 1. Essex B .092 2. Scottish Amer. luv. L .144 3. Scottish Amer. lldort. L .151 4. British Amer. Land L .153 5. Boston \Vharf B .185 6. Amer. 1\lort .. of Scot. L .189 7. Anniston City B .234 8. Colorado Mort.. Im·. London L .336 9. Boston Land B .364 10. New Hampshire B .376 11. Aspinwall B .433 12. Brookline B .434 13. Winthrop Shore B .545 14. East. Boston B .559 15. West End B .580 16. Topeka B .634 17. 1\Iaverick B .674 18. \Vollaston B .686 19. Boston \Vatl'r Power B .705 20. Cutler B .766 21. Payson Park B .769 22. San Diego B .779
Sources: Joseph G. 1\lnrtiu. A His/on; of the Boston Stock and Money Markets; fnvesto1 · 's Monthly Ma11ua/.

204
Table 4.4
Mine Volatility Comparison
Boston, London Exchanges 1880-89
EXCHANGE LOW HIGH MEAN ST. DEY .
Boston
London
. 262
.596
1.41
1.67
.785
.796
.514
.361
Sources: Joseph G. Martin, A History of the Boston Stock and Money Mar
kets; Investor's Monthly Manual.
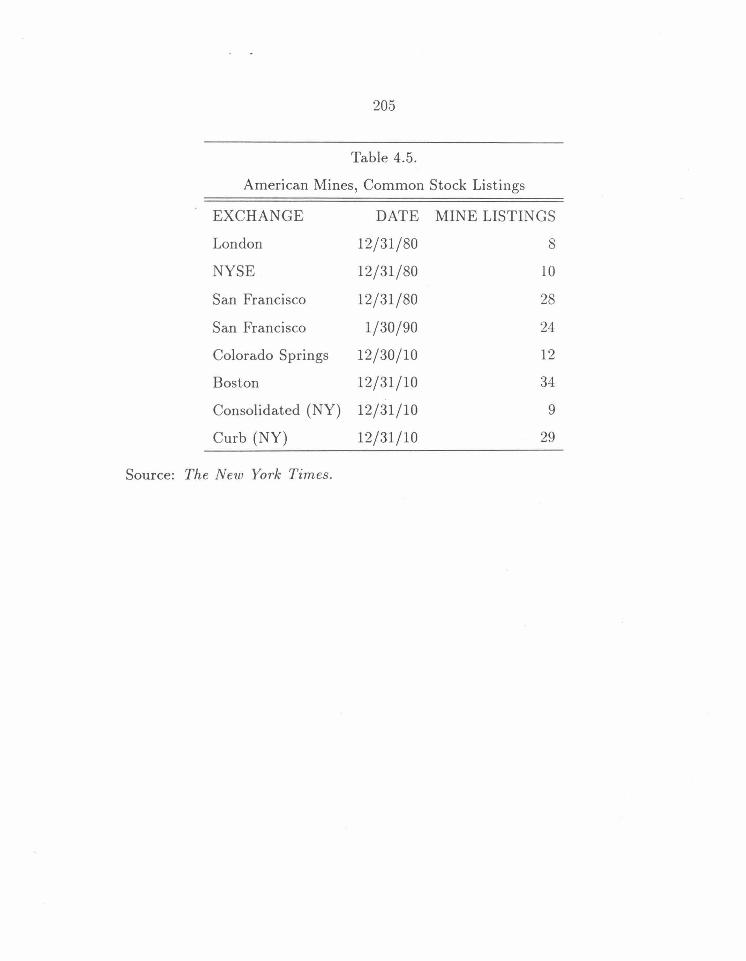
205
Table 4.5.
American Mines, Common Stock Listings
EXCHANGE DATE MINE LISTINGS
London 12/31/80 8
NYSE 12/31/80 10
San Francisco 12/31/80 28
San Francisco 1/30/90 24
Colorado Springs 12/30/10 12
Boston 12/31/10 34
Consolidated (NY) 12/31/10 9
Curb (NY) 12/31/10 29
Source: The New York Times.
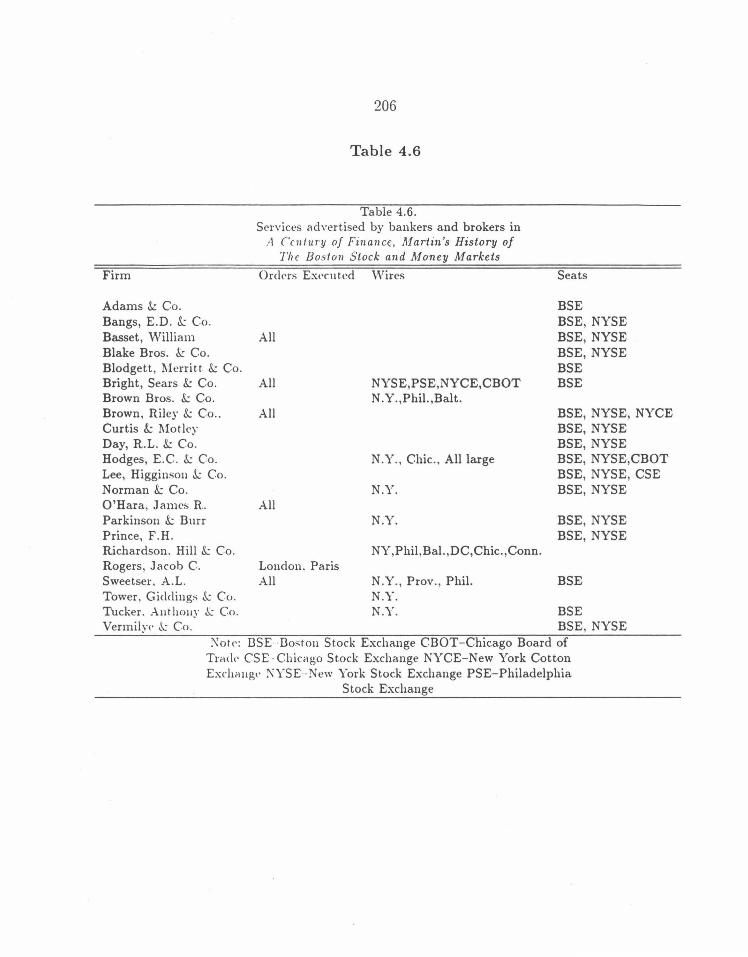
Firm
Adams & Co. Bangs, E.D. &: Co. Basset, William Blake Bros. & Co. Blodgett, :1\Ierrit.t & Co. Bright, Sears &: Co. Brown Bros. &: Co. Brown, Riley &: Co .. Curtis & :1\lot.ley Day, R.L. & Co. Hodges, E.C. &: Co. Lee, Higginson &: Co. Norman & Co. O'Hara, James R. Parkinson & Burr Prince, F.H. Richardson. Hill &: Co. Rogers, Jacob C. Sweetser, A.L. Tower, Giddings&: Cu. Thcker. Authouy .\.: Co. Vermily<' &: Co.
206
Table 4.6
Table 4.6. S<.>rvices advertised by bankers and brokers in
.'\ Cc11lur·y of Finance, Martin's History of ]'he Bosto11 Stock and Money Markets
Orders Ext•cut.ed
All
All
All
All
Loudon. Paris All
\Vires
NYSE,PSE,NYCE,CBOT N.Y.,Phil.,Balt.
N.Y., Chic., All large
N.Y.
N.Y.
NY,Phil,Bal.,DC,Chic.,Conn.
N.Y., Prov., Phil. N.Y. N.Y.
Seats
BSE BSE, NYSE BSE, NYSE BSE, NYSE BSE BSE
BSE, NYSE, NYCE BSE, NYSE BSE, NYSE BSE, NYSE,CBOT BSE, NYSE, CSE BSE, NYSE
BSE, NYSE BSE, NYSE
BSE
BSE BSE, NYSE
~ore: DSE llo;;tou Stock Exchange CBOT-Chicago Board of Tradt• CSE · Chicago Stock Exchange NYCE-New York Cotton Exdwuge :\'YSE-- New York Stock Exchange PSE-Philadelphia
Stock Exchange
207
4.6 References
Baskin, Jonathan Barron, 1988. "The Development of Corporate Financial
Markets in Britain and the United States, 1600-1914: Overcoming Asym
metric Information," Business History Review, Vol. 62 (2) .
Benham, Lee and Phillip Keefer, 1991. "Voting in Firms: The Role of Agenda
Control, Size, and Voter Homogeneity," Economic !nqui1·y, Vol. XXXIX.
Carosso, Vincent P. 1970. Investment Banking in America: A History, Cam
bridge, Mass.: Harvard University Press.
Clark, William and Charlie Turner, 1985. "International Trade and the
Evolution of the American Capital Market, 1888-1911 ," The Joumal of
Economic History, Vol. XLV, No. 2, pp. 405-410 .
Davis, Lance E. 1963. "Capital Immobilities and Finance Capitalism: a
Study of Economic Evolution in the United States, 1820-1920," Explo
rations in Entrepreneurial Histo1·y, Second Series, Vol. 1, No. 1, pp.88-
105.
Davis, Lance E . 1965. "The Investment Market, 1870-1914: The Evolution
of a National Market," The Journal of Economic Hist01·y, Vol. XXV , No.
3, pp. 355-393.
Davis, Lance E. 1966. "The Capital Markets and Industrial Concentration:
The U.S. and the U.K., A Comparative Study," Economic History Review,
Second Series, Vol. XIX, No. 2.
Davis, Lance and Robert Gallman, 1992. "Savings, Investment, and Eco
nomic Growth: The United States in the Nineteenth Century," forth
coming in John James and Mark Thomas (eds.), Capitalism and So-
208
cia/ Progress, Essays m Hono1· of Max Hartwell, Chicago: University
of Chicago Press.
DeLong, Bradford, 1990. "Did Morgan 's Men Create Value?" paper pre
sented at the 1990 meeting of the National Bureau of Economic Research
program in The Development of the American Economy, Boston, Mass .
Edwards, G. 1908. The Evolution of Finance Capitalism, New York.
James, John, 1976. "The Development of the National Money Market ,"
1893-1911, The Journal of Economic History, Vol. XXXVI, No. 4, pp.
878-897;
Johnson, Arthur M. and Barry E. Supple, 1967. Boston Capitalists and
Western Railroads, Cambridge, Mass.: Harvard University Press.
Kennedy, William P. 1981. "Notes on Efficiency in Historical Perspective:
The Case of Britain, 1870-1914," mss .
Knight, Frank H., 1965. Risk, Uncertainty, and Profit, New York: Harper &
Row, reprinted version of 1921 edition.
Kreps , David M. 1990, A Course in Microeconomic The01·y, Chapter 17, "Ad
verse Selection and Market Signaling," Princeton, NJ: Princeton Univer
sity Press. pp. 625-660.
Lamoreaux, Naomi, 1986. "Banks, Kinship, and Economic Development:
The New England Case," Joumal of Economic History, pp. 647-667 .
Lee A. Craig, Lee A. and Douglas Fisher, 1992. "Integration of the European
Business Cycle: 1871-1910," Explomtions in Economic Hist01·y, Vol. 29,
No. 2, pp. 144-168.
Martin , Joseph G. 1898.A Century of Finance, Martin 's Histo1·y of the Boston
Stock and Money Ma1·kets. published by the author, Boston.
209
Michie, Ranald C. 1987. The London and New York Stock Exchanges, 1850-
1914. London: Allen & Unwin.
Neal, Larry, 1982. "The Disintegration and Reintegration of International
Capital Markets in the 19th Century," mss.
Odell, Kerry A. 1989. "The Integration of Regional and Interregional Capital
Markets: Evidence from the Pacific Coast, 1883-1913," The Journal of
Economic History, Vol. XLIX, No. 2, pp. 297-310.
Poston, M.M. 1935. "Some Recent Problems in the Accumulation of Capi
tal," Economic History Review.
Pratt, Sereno S. 1903. The Work of Wall Street, New York: D. Appleton and
Company.
Rockoff, Hugh and Howard Bodenhorn, 1991. "Regional Interest Rates in
Ante Bellum America," paper prepared for NBER Conference on Strate
gic Factors in Nineteenth Century American Economic History, Cam
bridge, Mass.
Snowden, Kenneth A. 1987. "Mortgage Rates and American Capital Mar
ket Development in the Late Nineteenth Century," Journal of Economic
History, pp. 671-692.
Spence, Clark C. 1958. British Investments and the American Mining Fron
tier, 1860-1901, Ithaca, N.Y.: Cornell University Press.
Stedman, Edmund C. 1969. The New Y01·k Stock Exchange: Its Hist01·y,
its Contribution to National Prosperity, and its Relation to American
Finance at the Outset of the Twentieth Century, New York: Greenwood
Press, (copyright 1905).
Sylla, Richard, 1969. "Federal Policy, Banking Market Structure, and Capital
210
Mobilization in the United states, 1863-1913," The Journal of Economic
History, Vol. XXIX, No. 4, pp. 657-686;
Wareham, Wilfred S. (ed); 1971. The Register of Defunct and Other Com
panies Removed from the Stock Exchange Official Year Book, Croydon:
Thomas Skinner & Co.
Wyckoff, Paul, 1982. Wall Street and the Stock Ma1·kets: A Chronology
{1644-1971), 1st Edition, Philadelphia: Chilton Book Co.
Zevin, Robert B. "Are World Financial Markets more Open? If So Why
and With What Effects," 1989. Working Paper Number 79 of the World
Institute for Development Economics Research of the United Nations ,
forthcoming in Financial Openness and National Autonomy._
211
Chapter 5
Conclusions
At one point in the evolution of each of the projects that comprise this study,
the analysis seemed straightforward. In the case of the scattering problem,
it appeared that, given reliable financial returns on plots of land within a
village, a portfolio analysis could clearly demonstrate that scattered holdings
contributed to variance reductions in peasant farmers' overall agricultural
yields. Similarly, in explaining the American need for London capital flows,
it seemed sufficient to demonstrate that the British targeted these flows at
industries and regions neglected by American investors because the ventures
were too risky. Unfortunately, expectations often require serious updating;
and difficult puzzles spur more subtle explanations. In short, the data simply
did not support the simple conjectures; the conclusions that can be drawn
are, however, more enticing.
A simple conclusion that can be drawn from each of the projects - one
that was never in any serious doubt - is that capital markets take time to
212
develop. As mentioned in the introduction, these markets often fail because
the institutional framework required to (1) match demanders and suppliers of
capital and (2) inspire the requisite trust between parties to these exchanges ,
is lacking. Because of the potential informational asymmetries present in cap
ital market transactions, individuals were right to be somewhat skeptical of
one another. In early capital markets, complex institutional frameworks had
not yet evolved, and individuals were compelled to rely on more personal
connections such as kinship networks and simple reputation building tech
niques. Personal connections sufficed, particularly when the scale and scope
of ventures was small, and where typical owners of capital accumulations
tended not to be in search of investment opportunities, at least not far from
home - a place like agrarian medieval France, for example.
Perhaps then, scattering - a relatively complex institutional framework -
was not a response to capital market failure. The portfolio analysis in Chap
ter Two makes it impossible to conclude that scattering across the taques
that comprised the villages of Onnaing and Quarouble did much to reduce
the overall variance of typical landholders' portfolios after accounting for the
effects of crop diversification and the attendant rotation. Of course, it might
be argued that, scattering may have been useful, provided it contributed to
any variance reduction. Such an argument, however, neglects the costs asso
ciated with scattered holdings. The following simple cost-benefit analysis, in
which variance reduction is compared with loss in average yields, might help
settle the debate. In Table 5.1 below, the expected return on each taque in
royage three is compared with that of the mean-variance efficient portfolio
with the same return variance. The efficient portfolios could be comprised
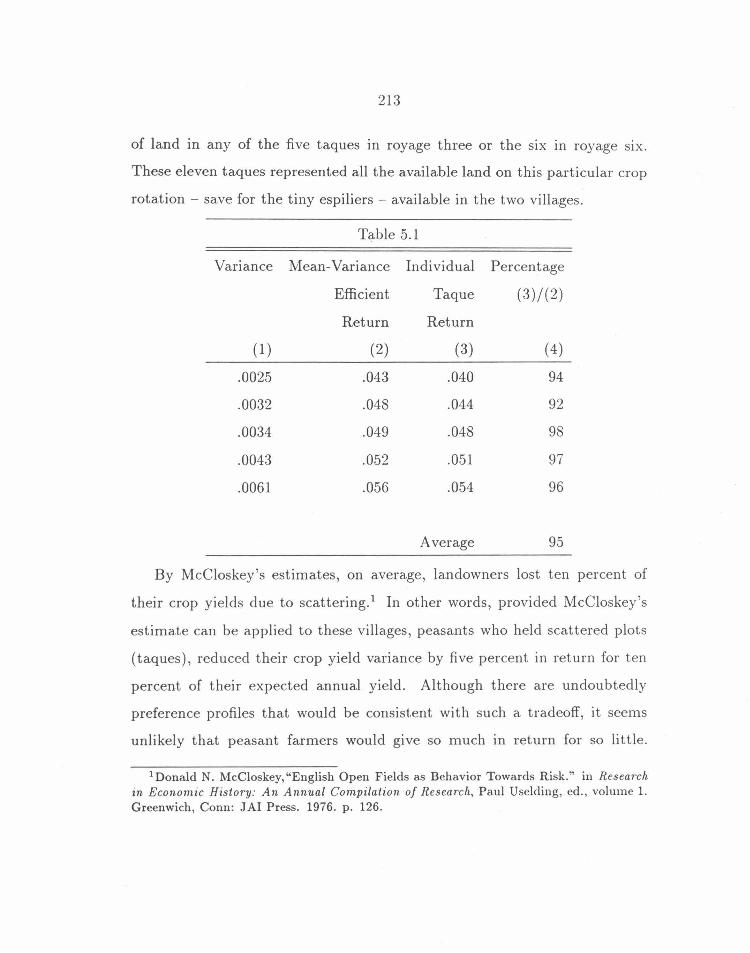
213
of land in any of the five taques in royage three or the six in royage six.
These eleven taques represented all the available land on this particular crop
rotation - save for the tiny espiliers - available in the two villages.
Table 5.1
Variance Mean-Variance Individual Percentage
Efficient Taque (3)/(2)
Return Return
(1) (2) (3) (4)
.0025 .043 .040 94
.0032 .048 .044 92
.0034 .049 .048 98
.0043 .052 .051 97
.0061 .056 .054 96
Average 95
By McCloskey's estimates, on average, landowners lost ten percent of
their crop yields due to scattering. 1 In other words, provided McCloskey 's
estimate can be applied to these villages, peasants who held scattered plots
(taques), reduced their crop yield variance by five percent in return for ten
percent of their expected annual yield. Although there are undoubtedly
preference profiles that would be consistent with such a tradeoff, it seems
unlikely that peasant farmers would give so much in return for so little .
1 Donald N. McCloskey, "English Open Fields as Behavior Towards Risk." in Research in Economic History: An Annual Compilation of Research, Paul Uselding, ed., volume 1. Greenwich, Conn: JAI Press. 1976. p. 126.
214
Scattering, an institution supposedly arising out of perceived market failures,
apparently provided little insurance at a relatively high cost.
How then did peasant farmers subsist in relatively lean years? Recent re
search suggests that credit markets in early modern France, although hardly
depersonalized, did exist. In particular, Hoffman, Postel-Vinay, and Rosen
thal emphasize the critical role that notaries assumed in monitoring credit
worthiness and matching borrowers with lenders. Based on analysis of 8,000
loans in and around Paris from 1690 to 1840 the authors conclude, "Credit,
it turns out was hardly confined to the rich and influential or even to the
world of government finance. In Paris, artisans both lent and borrowed.
Outside the city, farmers went into debt to purchase livestock, and day la
borers did so in times of dearth." 2 Rosenthal, using data from 3600 credit
contracts in Southeastern France, demonstrates that short-term contracts
became increasingly available to larger segments of the population from 1630
to 1788, and that, "credit markets played an important role in the French
countryside." 3 These markets, moreover, were not solely confined to major
urban centers such as Paris; his sample, for example, comes from 1' Isle
sur-Sorgues, in which about 11,000 people lived, and "ninety percent of all
loans were made to and by people who resided within a ten mile radius of
the cathedra.l." 4 To combine the returns data in Chapter One with data on
2 Philip T. Hoffman, Gilles Postel-Vinay, and Jean-Laurent Rosenthal, "Private Credit Markets in Paris, 1690-1840," Journal of Economic History, Vol. 52, No. 2 (June 1992). pp. 293-306.
3 Jean-Laurent Rosenthal, "Credit Markets and Economic Change in Southeastern France 1630-1788," mss. 1992.
4 Rosenthal, "Credit Markets in Southeastern France," p. 19.
215
credit market activity in and around Onnaing and Quarouble would be ideal;
that project, however, lies beyond the scope of this particular study.
One vexing problem still remains - if scattering provided no insurance
benefits, why did it persist? Unfortunately, because no answer can be de
termined on the basis of the data in Chapter Two, the most that can be
offered here is speculation. An alternative explanation for scattered holdings
that focuses on labor rather than capital market imperfections may be ap
propriate. As noted in Chapter One, landowners may have had difficulties in
contracting for labor that made it nearly impossible to harvest all their crops
at once. As a result, it may have been more efficient to contract for a small
number of laborers who would then harvest plots that ripened sequentially.
Scattered holdings may have provided the necessary staggering of ripening
times. One piece of evidence suggestive of labor contract problems in North
eastern France during this period has been found - both the landowner and
the laborer had to post a bond which would be forfeited in the event that the
terms of the contract went unfulfilled. 5 Presumably, these bonds protected
laborers from unexpected termination, and assured landowners that their la
borers would not be hired out from under their noses. Obviously, however ,
much more work must be done before this explanation is anything more than
speculation.
While notaries may have sufficed as intermediaries in early modern French
capital markets, the demands of industrialization would require a more elab-
5 Alexandre-Henri Tessier; Thouin; Bose, s. v. "Arrhes" Encyclopedie methodique ou par ordre de matieres. Agriculture 7 vols. (Paris, 1787-1821), 1:651. For similar contractual agreements between farmers and laborers in this period, see Jean Meuvret, Le probleme des subsistances a l'epoque Louis XIV, 3 Vols., (1977-88) . Paris.
216
orate depersonalized institutional framework to facilitate much larger trans
fers. To be certain, personal connections were still important, even crucial, in
this more complex environment. For example, Brad DeLong indicates that,
in the late nineteenth and early twentieth centuries, because of J .P. Morgan
& Co.'s access to capital, having a member of that firm on the Board of
Directors added roughly thirty percent to the value of a firm's common stock
equity.6 Ron Chernow also notes the vital role played by investment bankers
during this period:
"The merger of industry and finance had made some sense in
the Baronial Age and had given some stability to the American
economy. Companies were then weak and had difficulty tapping
capital markets, especially abroad. Only the banker 's reputation
could reassure skittish creditors." 7
These personal intermediaries clearly eliminated some informational asym
metries in the financial markets; and their contributions are increasingly well
documented. However, parallel developments within the largest institutional
intermediaries- the stock exchanges - also aided capital flows, but have per
haps received less attention from scholars. This study has focused on the role
that the exchanges played - albeit not always very successfully - in rooting
out informational asymmetry in financial markets.
6 J. Bradford DeLong. "Did J.P. Morgan's Men Add Value? An Economist's Perspective on Financial Capitalism." forthcoming in Peter Temin ( ed.) Inside the Business Enterprise: Historical Perspectives on the Use of Information . (Chicago: Univ. of Chicago Press, National Bureau of Economic Research.)
7 Ron Chernow, The House of Morgan, 1990, (Boston: Atlantic Monthly Press), p. 698.

217
Certain investors did not require the aid of the New York Stock Ex
change's strict vetting procedures to evaluate investment opportunities. Per
haps they . had a particular expertise - in mining, for example - or relied
on personal financial intermediaries like J.P. Morgan's men, or perhaps they
attempted to overcome informational asymmetries in some other way. To be
sure, their attempts often failed; consider the notorious "Emma," for exam
ple. It is, however, in this context that much of the capital flowing through
the London Stock Exchange to the United States should be viewed. While
some of the capital was placed in railroad ventures and federal, state, and
municipal government bonds that also traded on the New York exchange, the
vast majority of the issues from U.S. firms traded in London were not jointly
traded; and, although these flows were never large, at least in comparison
with the amount of domestic capital accumulation in the U.S., they were far
from trivial. What is more, these flows took on a greater significance in that
they were targeted for sectors of the economy whose firms could not attract
capital in New York. British investment often supported .land-based ventures
- land, mortgage, and development firms and mines, and later chemical and
petroleum firms - located in the South, the Midwest, and the West. Simi
larly, certain commercial and industrial concerns - in particular breweries -
had success in attracting finance in London but not along the shores of the
Hudson.
Why then did the New York market refuse to help finance these activi
ties? Was the Board of Governors merely responding to investor sentiment by
permitting listings for only those firms able to attract capital? The answer,
somewhat surprisingly, is a qualified yes. For the particular subset of in-
218
vestors the Governors hoped to attract, it appears that only very specialized
listings would suffice. As noted previously, capital accumulation in the U.S.
around the turn of the century was not nearly as substantial a problem as
was mobilization. The typical American investor was somewhat squeamish
at the prospect of trading hard-earned savings for paper claims on unseen
assets. The Governors of the Exchange, therefore, set up rules designed to
insure that offerings on the New York market were relatively safe, stable
investments.8
The Governors of the New York exchange preferred listing securities from
firms with proven track records - issues that generated high trade volume
with relatively little price volatility. Due to their small capital bases and
high share price volatility mines were particularly unsuited for listing. Land,
mortgage, and financial firms, on the other hand, were among the most
stable securities in terms of price movements, but were also excluded form
the exchange. As with breweries, small capital bases precluded a high-volume
market in these securities. On the whole, these rules ensured uniformity in
the kind of securities traded on the exchange; a New York listing, therefore ,
reassured Chernow's "skittish creditors," and those firms that survived the
scrutiny obtained a costly signal which enabled them to attract capital from
a much wider segment of the population.
Of course, members of the exchange often found this environment a bit
restrictive. Although these rules secured for the New York traders cartel a
stranglehold on the largest domestically traded issues, individual traders had
8 These policies were not always sufficient, however. Consider the market panics of 1895 and 1907.
219
incentives to compete with each other not only on commission, but also by
offering trading in different types of securities. However , with the exception
of the "unlisted department," the Board of Governors were loathe to expand
their listings to include new types of securities, and, they steadfastly refused
to alter the minimum commission rule thus prohibiting any price competition
between members. Of course, this meant that traders on other exchanges
could undercut those in New York on any jointly traded issues, perhaps
explaining why joint listings were rare. On the whole, these trade rules
ensured a uniformity of business and behavior on the exchange that, first,
attracted typical American investors, and, second, made sure that the trading
profits generated by these new investors would not be competed away by
members of the exchange.
Some of the fears of typical American investors appear to have been mis
placed regarding land-based ventures in the emerging West. Cattle ranches ,
mortgage companies, and investment trusts earned relatively sizable, steady
returns in the late nineteenth and early twentieth centuries. In fact, as the
data in Chapter Three demonstrate, in terms of return level and volatility, the
London listed land firms outperformed rails listed on both the New York and
London exchanges. Word of such investment opportunities did not, however,
sneak across the Atlantic without leaking. Groups of American investors dis
played the same interest in these securities as their European counterparts.
As noted previously, these groups tended to be small in number and mem
bers tended to be geographically concentrated; and, in the case of Boston
investors, at least, they were accustomed to working with one another to
evaluate investment opportunities far from their New England homes.
220
Of course, these relatively sophisticated American investors needed mar
kets in which to trade their securities - preferably markets on this side of
the ocean. The regional exchanges - most notably Boston, Philadelphia,
Chicago, and San Francisco - in addition to the Curb and the Consolidated
markets in New York offered the ideal homes for these securities. While most
of the "regionals" tended to do a strong business in local issues, many also
found room for issues from firms in land-based sectors of the economy, as
evidenced by the mining and land company listings on the Boston Exchange.
Provided they did not compete directly over issues with the New York Stock
Exchange, these exchanges were free to exploit their unique niches in the fi
nancial network of the U.S. More importantly, along with the London market,
these exchanges were crucial conduits for the capital that initially developed
the West.
In the end, the story of the exchanges, one about fostering capital flow
by circumventing informational asymmetry, further underscores the main
point of this study: often the major obstacle in the establishment of capital
markets was uncertainty as distinct from risk. Although the details differ
from place to place, reliance on personal contacts proved a common response.
For example, it appears that in times of dearth, agricultural laborers in early
modern France could turn to highly personalized credit markets. Similarly,
small groups of sophisticated investors- investors who often knew and trusted
each other well - banded together to exploit investment opportunities 111
the American West. Relatively more elaborate institutional responses to
capital market uncertainty appear to have evolved more slowly. For example,
the data in Chapter Two suggest that peasant farmers' scattered holdings
221
were not a response to insurance and credit market failures. By contrast,
nineteenth century New York Stock Exchange trading rules appear to have
been attempts to alleviate uncertainty in American capital markets and thus
dramatically widen their scope.
222
5.1 References
Chernow, Ron. 1990. The House of !11organ, Boston: Atlantic Monthly Press.
DeLong, J. Bradford, 1992. "Did J.P. Morgan's Men Add Value? An
Economist's Perspective on Financial Capitalism." Forthcoming in Pe
ter Temin ( ed.) Inside the Business Enterprise: Historical Perspectives
on the Use of Information. Chicago: Univ. of Chicago Press, National
Bureau of Economic Research.
Hoffman, Philip T, Gilles Postel-Vinay, and Jean-Laurent Rosenthal, 1992.
"Private Credit Markets in Paris, 1690-1840," Journal of Economic His
tory, Vol. 52, No. 2. pp. 293-306.
McCloskey, Donald N. 1976. "English Open Fields as Behavior Towards
Risk." In Research in Economic Hist01-y: An Annual Compilation of
Research, Paul Uselding, ed., volume 1. Greenwich, Conn: JAI Press.
124-170.
Meuvret, Jean. 1977-88. Le prob!e.me des subsistances a l'epoque Louis XIV,
3 Vols., Paris.
Rosenthal, Jean-Laurent, 1992. "Credit Markets and Economic Change m
Southeastern France 1630-1788," mss.
Tessier, Alexandre-Henri. 1787-1821. Encyclopedie methodique ou pm· 01'd1·e
de matie1·es: AgricultU1·e, 7 vols. Paris.


![Year] Implication of Capital Structure and Efficient market to Large corporations](https://static.fdokumen.com/doc/165x107/631a8adebb40f9952b020de3/year-implication-of-capital-structure-and-efficient-market-to-large-corporations.jpg)