Capital Market Day 2022
25
Siemens Energy is a trademark licensed by Siemens AG. © Siemens Energy, 2022 Capital Market Day 2022 CEO Section Dr. Christian Bruch Chief Executive Officer and President
-
Upload
khangminh22 -
Category
Documents
-
view
0 -
download
0
Transcript of Capital Market Day 2022

Siemens Energy is a trademark licensed by Siemens AG. © Siemens Energy, 2022
Capital Market Day 2022CEO Section
Dr. Christian Bruch
Chief Executive Officer and President

2022-05-24 © Siemens Energy, 2022
CMD | C. Bruch | CEO Section 2
Disclaimer
INFORMATION AND FORWARD-LOOKING STATEMENTS This document contains statements related to our future business and financial performance, and future events or
developments involving Siemens Energy that may constitute forward-looking statements. These statements may be identified by words such as “expect,” “look forward to,”
“anticipate” “intend,” “plan,” “believe,” “seek,” “estimate,” “will,” “project,” or words of similar meaning. We may also make forward-looking statements in other reports, prospectuses,
in presentations, in material delivered to shareholders, and in press releases. In addition, our representatives may from time to time make oral forward-looking statements. Such
statements are based on the current expectations and certain assumptions of Siemens Energy´s management, of which many are beyond Siemens Energy´s control. These are
subject to a number of risks, uncertainties, and other factors, including, but not limited to, those described in disclosures, in particular in the chapter “Report on expected
developments and associated material opportunities and risks” in the Annual Report. Should one or more of these risks or uncertainties materialize, should acts of force majeure,
such as pandemics, occur, or should underlying expectations including future events occur at a later date or not at all, or should assumptions prove incorrect, Siemens Energy´s
actual results, performance, or achievements may (negatively or positively) vary materially from those described explicitly or implicitly in the relevant forward-looking statement.
Siemens Energy neither intends, nor assumes any obligation, to update or revise these forward-looking statements in light of developments which differ from those anticipated. This
document includes supplemental financial measures – that are not clearly defined in the applicable financial reporting framework – and that are or may be alternative performance
measures (non-GAAP-measures). These supplemental financial measures should not be viewed in isolation or as alternatives to measures of Siemens Energy´s net assets and
financial position or results of operations as presented in accordance with the applicable financial reporting framework in its consolidated financial statements. Other companies
that report or describe similarly titled alternative performance measures may calculate them differently. Due to rounding, numbers presented throughout this and other documents
may not add up precisely to the totals provided and percentages may not precisely reflect the absolute figures.

To become the most
valued energy technology
company in the world
Our vision
Key messages
Since the start of Siemens Energy in 2020 we have made substantial operational improvements & portfolio changes
The electricity and energy market is under significant change and will receive substantial investment over the next decades
Siemens Energy is excellent positioned to benefit from these investments
We focus on 5 key levers to create value for our stakeholders
Driving sustainability across our own portfolio and operations will drive profitable growth
2022-05-24 © Siemens Energy, 2022
CMD | C. Bruch | CEO Section 3

2022-05-24 © Siemens Energy, 2022
CMD | C. Bruch | CEO Section 4
Since 2020 we have executed on Phase 1 of our strategy
• Market share gas turbines
from 35% to 44%1
• #1 market position in HVDC2
• 26% order backlog growth in
Industrial Applications3
• €57bn in Gas and Power
• €33bn in SGRE
thereof
• €52bn in Service
• Footprint optimization
(e.g. LeHavre, Olean)
• Cost saving programs fully
on track
• Base productivity of around
5% in FY21
• Plan for significant shift of
R&D towards 5 Fields of
Actions in execution
• Electrolyzer / Blue portfolio
lead factories in Berlin
• Strong ESG Ratings
Healthy
order backlog4
Improved
market position
Operational
improvement
Sustainable
portfolio
1 Market position in terms of number of units ordered for gas turbines >10MW in FY20 vs. H1 FY22 | 2 FY22 position as per current estimation | 3 FY20 vs. H1 FY22 |
4 As of H1 FY22
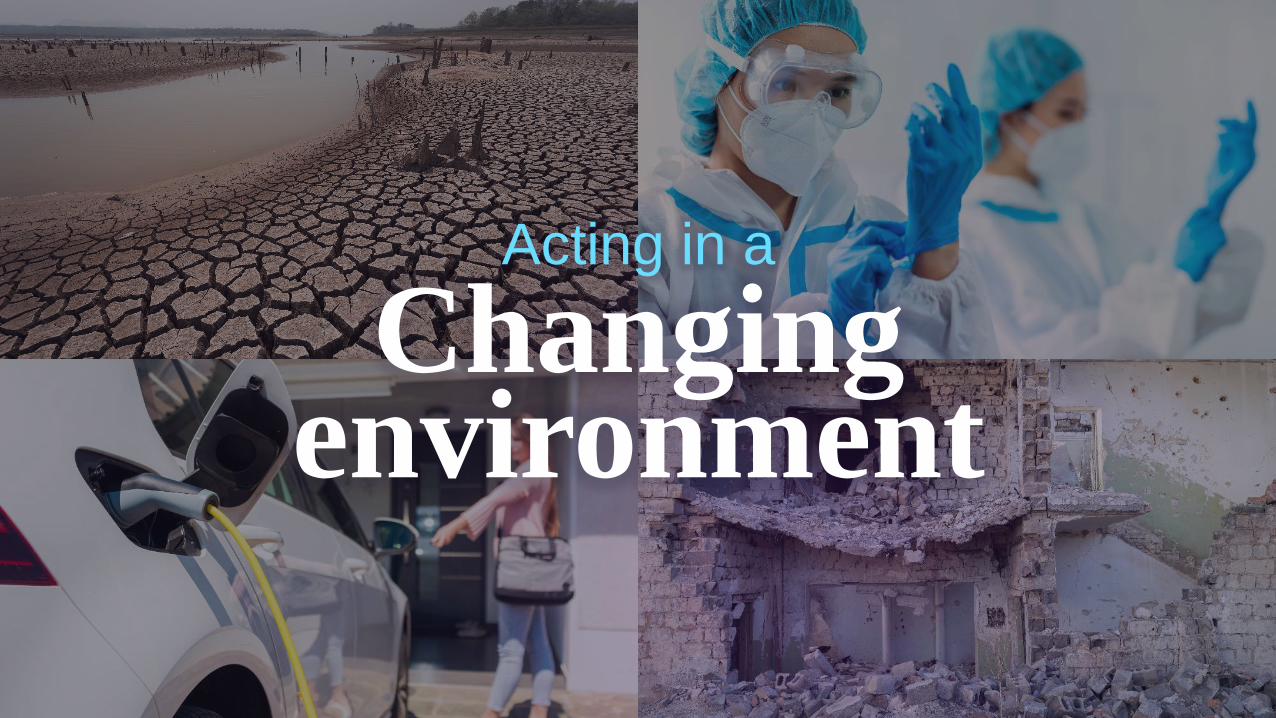
Acting in a
Changingenvironment
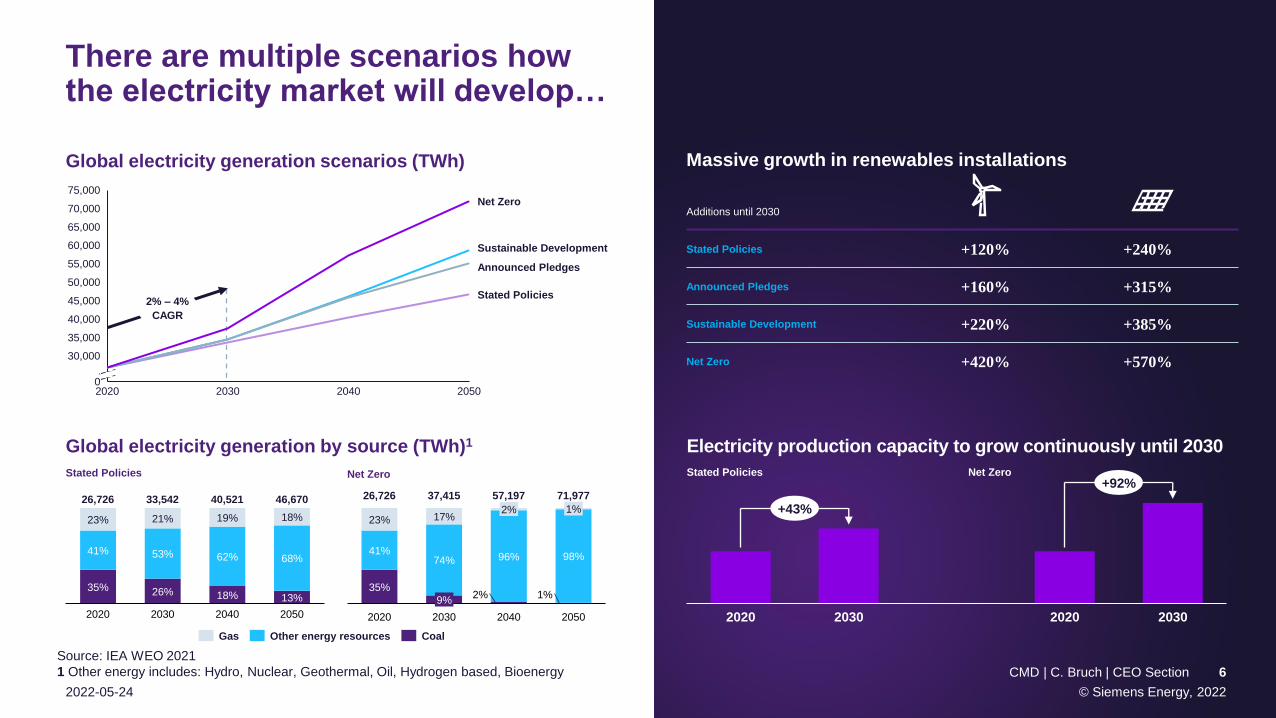
There are multiple scenarios how the electricity market will develop…
Global electricity generation by source (TWh)1
Massive growth in renewables installations
Electricity production capacity to grow continuously until 2030
Additions until 2030
Stated Policies +120% +240%
Announced Pledges +160% +315%
Sustainable Development +220% +385%
Net Zero +420% +570%
2020 2030 20302020
+43%
+92%Stated Policies Net Zero
2050
50,000
35,000
20302020 20400
30,000
40,000
55,000
45,000
60,000
65,000
70,000
75,000
Sustainable Development
Stated Policies
Announced Pledges
Net Zero
2% – 4%
CAGR
Global electricity generation scenarios (TWh)
35% 26% 18% 13%
41% 53% 62% 68%
23% 21% 19% 18%
2020 2030
40,521
2040
46,67033,542
2050
26,726
Stated Policies Net Zero
35%2% 1%
41%74% 96% 98%
23% 17%1%2%
2020
9%
2030 2040 2050
37,41526,726 57,197 71,977
Gas CoalOther energy resources
Source: IEA WEO 2021
1 Other energy includes: Hydro, Nuclear, Geothermal, Oil, Hydrogen based, Bioenergy
© Siemens Energy, 2022
CMD | C. Bruch | CEO Section 6
2022-05-24

2022-05-24 © Siemens Energy, 2022
CMD | C. Bruch | CEO Section 7
… but all of them have common themes
Electricity
production will grow
faster than GDP
Grid investment
will rise to
unprecedented
levels
Production
capacity will grow
• Capacity expansion will be
covered by renewables
• Gas will continue to be a
backbone of electricity
production
• Coal will be phased out
Energy efficiency
will be a competitive
criteria across
industries due to
• Higher cost
• Volatility of supply
• Regional differences

Our purpose and mission
Supporting our customers through the transition to a more sustainable world, based on our innovative technologies and our ability to turn ideas into reality

2022-05-24 © Siemens Energy, 2022
CMD | C. Bruch | CEO Section 9
We support our customers along the value chain
Market growth
(CAGR / €bn, in GW for wind1)
Market position
#1Gas turbines >10MW2
#3#1OnshoreOffshore
Low- or zero-emission
power generation
Transport and storage
of electricity
Reducing CO2 footprint and energy
consumption in industrial processes
Examples • >100GW wind
turbine installations
• Global leader in HVDC installations
• Most comprehensive SF6-free switching
portfolio
• >60,000 Industrial steam units and
>25,000 Compression units in Service
Fleet
#1Leading market
positions
• 7,800 units of
rotating equipment
installed
1 Wind market based on BloombergNEF, 2H 2021 Global Wind Market Outlook; excl. China; gas turbine, transmission and industrial market based on
internal market assessment | 2 Power generation applications in H1 FY22
Market growth1
(CAGR in GW for wind and in €bn for the other projections)
32 35
20302021
50
74
2021 2030
20
43
20302021
Stable
50
74
2021 2030

Growth and security of supply drive investment in generation & transmission
1 IEA WEO 2021, converted from US$ to € as per exchange rate of May 10, 2022
• More than €780bn investment
spending p.a. this decade
• 3,300-5,300GW additions
by 2030 – up to almost
doubling today’s installations
• 37% – 54% renewables share
in installed capacity
by 2030; ~20% gas share
Generation investments (in €bn p.a.)1
Transmission investments (in €bn p.a.)1
• Up to €425bn of T&D
investment annually this
decade
• USD100-240bn investment in
interconnect annually
• Increase in volatility due to
increase share of renewables
• HVDC connections
• Offshore grid connections
• Grid stabilization and storage
requirements
Opportunities for Siemens Energy
• Offshore and Onshore Wind
• Maintenance and upgrade of gas
infrastructure
• Fuel shift (coal to gas)
2016 – 2020 2021 – 2030 2031 – 2040
0
200
400
600
800
Stated Policies Scenario Announced PledgesScenario
Sustainable DevelopmentScenario
0
200
400
600
800
1000
Stated Policies Scenario Announced PledgesScenario
Sustainable DevelopmentScenario
2022-05-24 © Siemens Energy, 2022
CMD | C. Bruch | CEO Section 10

Industry sectors require efficiency improvement, a shift in feedstock & abatement technologies
1 IEA | 2 Assuming 5500 hours operation per year
Industrial processes will have to change for Net Zero to become a reality
• Electrification, Automation
and Digitalization
• Optimization of operations
(e.g., heat pumps, CCUS)
• Usage of green molecules
as feedstock (electrolyzer)
Opportunities for Siemens Energy
Hydrogen-based CCUS-equipped Other
25%
50%
75%
100%
2020 2030 2050 2020 2030 2050 2020 2030 2050
Global industrial production of bulk materials by production route1
Chemicals Steel Cement
Conventional routes
1m ton green steel production
requires 50,000t of green H2
equivalent to
500MW of offshore wind
capacity2
Conversion of 25% of global
steel production requires
250GW capacity
2022-05-24 © Siemens Energy, 2022
CMD | C. Bruch | CEO Section 11

2022-05-24 © Siemens Energy, 2022
CMD | C. Bruch | CEO Section 12
Connecting the dots SE drives benefits from being a global integrated company
Connecting
offerings
Connecting
regions(e.g., Grid infrastructure)
Connecting
industries
Power generation Storage Re-electrificationBring to shore
Offshore Wind Electrolysis/
BatteryH2 gas turbineHVDC
Europe
(56GW of HVDC)1
Asia Pacific3
(43GW of HVDC)1
+140GW by 20302 +48GW by 20302
USA
(19GW of HVDC)1
+51GW by 20302
Chemical industryDistrict Heating
Vattenfall
Berlin Potsdamer Platz
BASF
Ludwigshafen
Know-how transfer between industries
+ e.g., Heat pump
1 Operating projects and projects that are under construction until 2021 | 2 Project announcements with potential awards from 2022 until 2030, some projects will be operational past 2030
3 Excluding China

2022-05-24 © Siemens Energy, 2022
CMD | C. Bruch | CEO Section 13
• Lasting Covid impact
• Geopolitical tensions
• Speed of Permitting Processes
• Rising material and logistics cost1:
• Procurement and Supply Chain
instruments
• Price escalation clauses / indexation in
customer contracts
• Pass through mechanisms in projects
• Synchronous contracting with
customers / suppliers
• Increase in inventory
• Improve pricing power
Initiatives to
address those …
• Regular monitoring of 3,000
key suppliers
• Bundled re-negotiation of contracts
with key suppliers
• Joint negotiations between Gas and
Power and SGRE (for a 50% price
reduction per ton vs. spot market)
• Securing supply for our suppliers
• Bundled renegotiations with sea freight
carriers (for a cut in rate increase by
~50%)
• Bundled shipping to simplify and
secure logistic chains (e.g., from
Shanghai to Hamburg)
… and what it means
Covid-19
Geopolitical tensions
Raw material + logistics shortages
Significant increases in raw
material and logistic prices
Managing market challenges
2022-05-24
2022-05-24 © Siemens Energy, 2022
CMD | C. Bruch | CEO Section 14
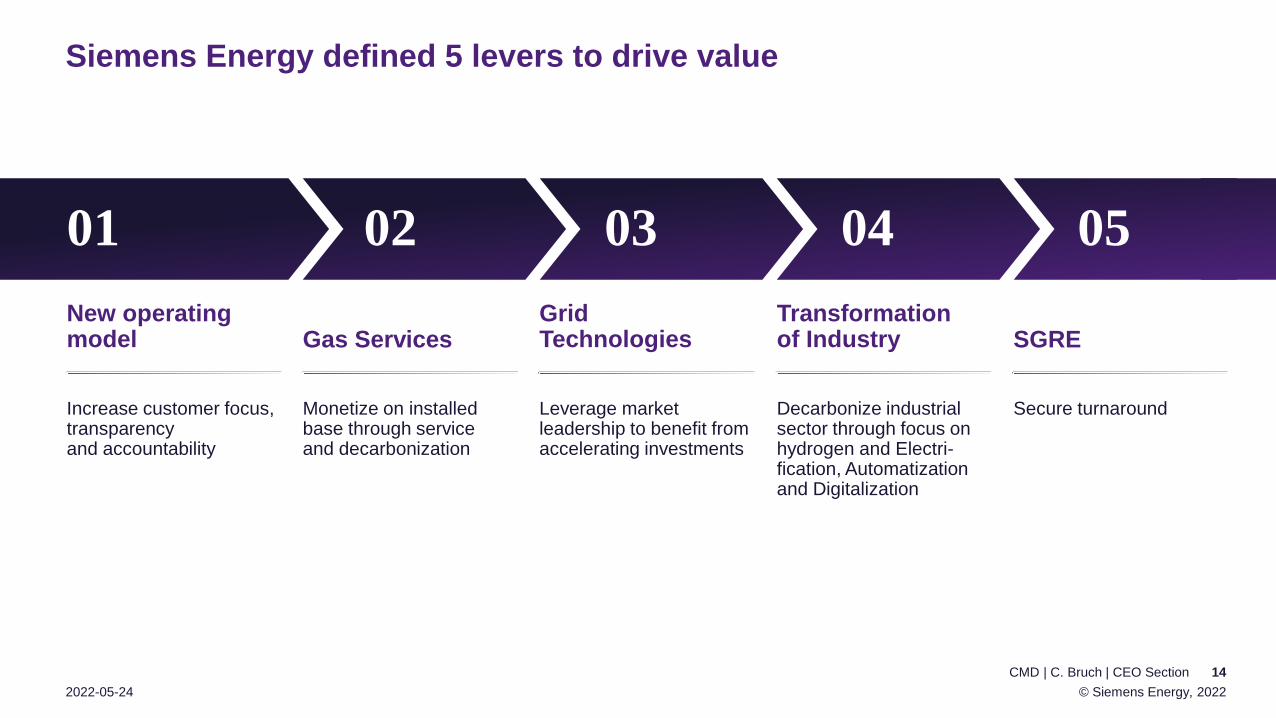
Siemens Energy defined 5 levers to drive value
New operating model Gas Services
GridTechnologies
Transformationof Industry SGRE
Increase customer focus, transparency and accountability
Monetize on installed base through service and decarbonization
Leverage market leadership to benefit from accelerating investments
Decarbonize industrial sector through focus on hydrogen and Electri-fication, Automatization and Digitalization
Secure turnaround
01 02 03 04 05

2022-05-24 © Siemens Energy, 2022
CMD | C. Bruch | CEO Section 15
Adj. EBITA before SI2
+35%Record orderbook1
€57bnFCF3
€2.9bnGP:
New group structure (effective October 1, 2022)to increase customer focus, transparency and accountability
Siemens Energy
SE Executive Board
SGRECEO CFO Global
Functions
Grid
Technologies
Transformation
of Industry
Gas
Services
Reporting Segments
Strategic lever 1
1 Order backlog as end of March FY22 | 2 Adj. EBITA before SI LTM vs. 12 month before spin | 3 FCF before tax cumulative since spin-off (April 1, 2020)
2022-05-24 © Siemens Energy, 2022
CMD | C. Bruch | CEO Section 16
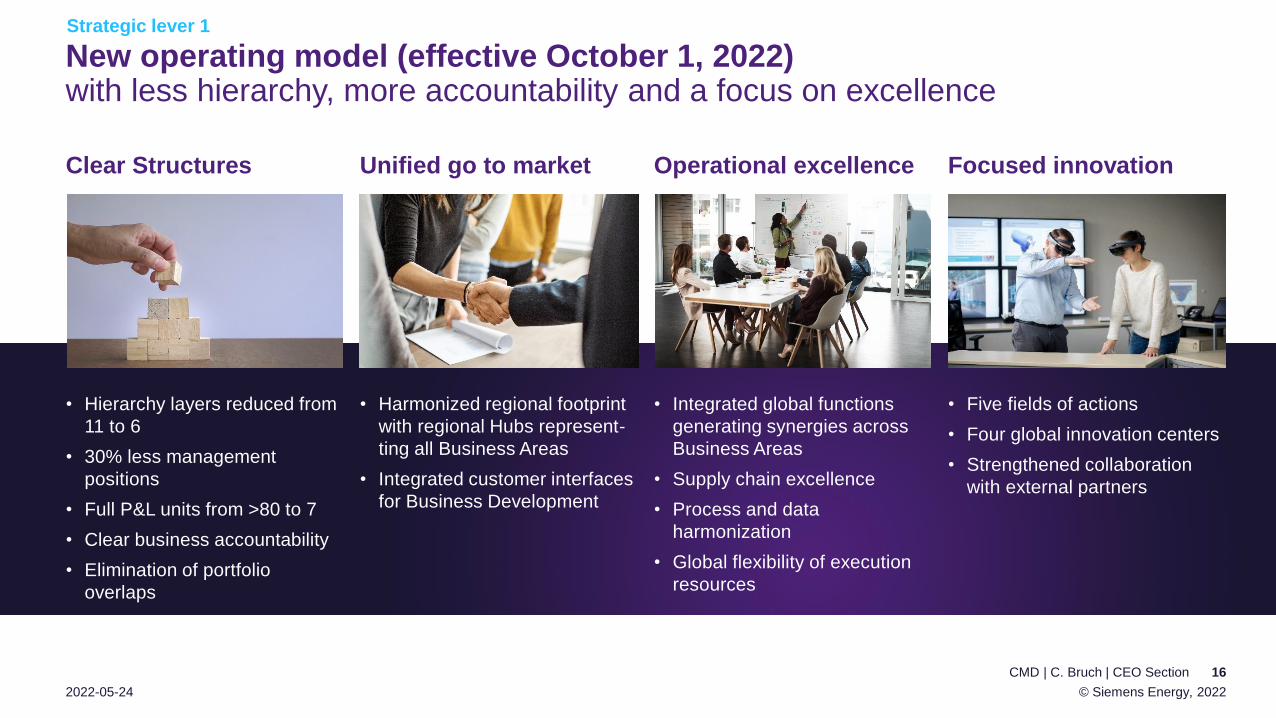
New operating model (effective October 1, 2022)with less hierarchy, more accountability and a focus on excellence
Operational excellence
• Integrated global functions
generating synergies across
Business Areas
• Supply chain excellence
• Process and data
harmonization
• Global flexibility of execution
resources
• Harmonized regional footprint
with regional Hubs represent-
ting all Business Areas
• Integrated customer interfaces
for Business Development
Unified go to market
• Hierarchy layers reduced from
11 to 6
• 30% less management
positions
• Full P&L units from >80 to 7
• Clear business accountability
• Elimination of portfolio
overlaps
Clear Structures
• Five fields of actions
• Four global innovation centers
• Strengthened collaboration
with external partners
Focused innovation
Strategic lever 1

32 34 35
2021 2025 2030
What has changed
in the new group structure? Business Drivers
• Decarbonization of power generation and
district heating
• Service, Mods and Upgrades to increase
efficiency and lower emissions
• Decentralization of energy infrastructure
Portfolio Elements Addressable Market2 Mid-term Targets
GEN
IA
GSGas Turbines
Large Steam Turbines
+ Service
• Large and Industrial Gas
Turbines from 4 – 600 MW
• Large Steam Turbines
• Large Generators
• Heat Pumps
• Modernization and
Upgrades
Stable
Strategic lever 2
Monetize on installed basethrough service and decarbonization
Gas Services
Share of Siemens Energy
total revenue1
€9.0bn 7.0%
Revenue1 Adj. EBITA
margin before SI1
~31%
In €bn
10 – 12%
Revenue growth
Adj. EBITA margin
(as reported)
Stable /modest decline
1 FY21 pro-forma restated figures reflecting new reporting structure, partially
approximated. The pro-forma revenue numbers are rounded to the nearest 50 million
and the profitability number to the nearest half percentage point. | 2 SE estimates2022-05-24 © Siemens Energy, 2022
CMD | C. Bruch | CEO Section 17

What has changed
in the new group structure?
• Growing electricity demand
• Connection of increasing amount of renewable
energy
• Modernization of aging transmission grid
• Grid reliability and resiliency in increasing
network complexity
T
GEN
GT
Complete
Portfolio
Storage
• HVDC transmission
• Grid Stabilization and
Storage
• High voltage switchgears
and transformers
• Grid automation &
digitalization
5062
74
2021 2025 2030
Strategic lever 3
Leverage market leadership to benefit from accelerating investment
Grid Technologies
Share of Siemens Energy
total revenue1
€5.8bn 6.5%
Revenue1 Adj. EBITA
margin before SI1
~20%
Business Drivers
Portfolio Elements Addressable Market2 Mid-term Targets
Revenue growth
Mid single digit
In €bn
2022-05-24 © Siemens Energy, 2022
CMD | C. Bruch | CEO Section 18
1 FY21 pro-forma restated figures reflecting new reporting structure, partially
approximated. The pro-forma revenue numbers are rounded to the nearest 50 million
and the profitability number to the nearest half percentage point. | 2 SE estimates
8 – 10%
Adj. EBITA margin
(as reported)

What has changed
in the new group structure? Business Drivers
• Growing demand for green hydrogen and
derivative fuels
• Increasing electrification and efficiency of
industrial processes
• Optimization demand of heat & power
processes incl. waste heat utilization
• Need for reliable production, transportation
and processing of gas and fuels
Portfolio Elements Addressable Market2 Mid-term Targets
NEB
IA
TI
Complete
Portfolio
GENP-t-X +
Industrial steam
Compression +
EAD
• Hydrogen electrolyzer systems
and Power-to-X solutions
• Integrated EAD solutions and
services
• Industrial steam turbines
and generators
• Turbo & Recip compressors and
service; compression systems
Revenue growth
Mid single digit
20
31
43
2021 2025 2030
Decarbonize industrial sector through focus on hydrogen and EAD
Strategic lever 4
Transformation of Industry
Share of Siemens Energy
total revenue1
€3.9bn -2.5%
Revenue1 Adj. EBITA
margin before SI1
~14%
In €bn
2022-05-24 © Siemens Energy, 2022
CMD | C. Bruch | CEO Section 191 FY21 pro-forma restated figures reflecting new reporting structure, partially approximated. The pro-forma
revenue numbers are rounded to the nearest 50 million and the profitability number to the nearest half percentage
point. | 2 SE estimates | 3 Business Area profitability target range reflects different target ranges of independently
managed businesses. Growth businesses may be margin dilutive to the mid-term Business Area target
6 – 8%
Adj. EBITA margin
(as reported)3

Wind market shows exceptional future growth
Strategic lever 5
Secure turnaroundSiemens Gamesa Renewable Energy
Share of Siemens Energy
total revenue1
€10.2bn -1.0%
Revenue1 Adj. EBITA
margin before SI1
~36%
1 FY21 | 2 BloombergNEF, 2H 2021 Global Wind Market Outlook; excl. China | 3
BloombergNEF, Wind Cumulative Installed Capacity and Forecast by Country (2022);
excl. China
4840
47
FY30FY21 FY25
Annual global onshore wind
installations2 (GW, excl. China)
Annual global offshore
installations2 (GW, excl. China)
Global installed capacity
in wind3 (GW, excl. China)
0%
11
27
FY30FY25
3
FY21
500680
950
FY21 FY25 FY30
Mistral program to be launched as vehicle to achieve long-term vision
Program approach
adjusted to face
recent industry
challenges
Immediate focus on
mitigating short-term
headwinds:
Siemens Gamesa 5.X
and supply chain
Key levers identified
to achieve margin
expansion by mid-term
Transformational
measures to be
explored, in order to
unlock full potential of
SGRE
2022-05-24 © Siemens Energy, 2022
CMD | C. Bruch | CEO Section 20

2022-05-24 © Siemens Energy, 2022
CMD | C. Bruch | CEO Section 21
ESG is a business opportunity
Environment Social GovernanceE S G
Our Targets
Decarbonization
Climate neutral own
operations by 2030
Aspiration of Net Zero value chain
Gender diversity
25% by 2025
30% by 2030 (share of women in top leadership positions)
Safety
Achieve Zero Harm
Become the leader
in our industry
Top 4% B- BRecognition

2022-05-24 © Siemens Energy, 2022
CMD | C. Bruch | CEO Section 22
Our journey to Net Zero creates opportunity
Energy
efficiency &
digitalization
Increasing
renewables &
electrification
Fuel shift
& GHG free
products
Emission
removal
technologies
Portfolio adjust-
ments & emissions
from growth
Coal exit,
business growth
CHP2, methane
leak detection
Transmission, storage,
e-drives
Green fuels,
Blue Portfolio
Carbon
capture
Current portfolio
examples
We believe a decarbonized energy system is possible if all stakeholders embark on that vision
1,3691
2021 – 2030
beyond 2030
1,5001
Reduction measures
20212019
1 FY19 Gas and Power customer emissions calculated based on order intake and lifetime in Mt CO2e | 2 Combined Heat and Power

Our valuesCaring | Agile | Respectful | Accountable
~150
countries are represented
by our employees
€58m
spent in continuing education
in FY21 | €632 per employee
#BetterTogether program
Flexible working | Employee
well-being
Inclusion & Diversity
Everyone has an equal chance
Our people
our base for success
2022-05-24 © Siemens Energy, 2022
CMD | C. Bruch | CEO Section 24
Performance ProcessPortfolio People
CEO priorities

To become the most
valued energy technology
company in the world
Our vision
Key messages
Since the start of Siemens Energy in 2020 we have made substantial operational improvements & portfolio changes
The electricity and energy market is under significant change and will receive substantial investment over the next decades
Siemens Energy is excellent positioned to benefit from these investments
We focus on 5 key levers to create value for our stakeholders
Driving sustainability across our own portfolio and operations will drive profitable growth
2022-05-24 © Siemens Energy, 2022
CMD | C. Bruch | CEO Section 25