Capital market impact of product marketing strategy: Evidence from the relationship between...
13
Capital Market Impact of Product Marketing Strategy: Evidence From the Relationship Between Advertising Expenses and Cost of Capital Manohar Singh Willamette University Sheri Faircloth Ali Nejadmalayeri University of Nevada at Reno To analyze the prospect of afirm's advertising decision af- fecting shareholder wealth, this article investigates the re- lationship between a firm's advertising expenditure and the market-imposed weighted average cost of capital. For a sample of U.S.firms, the results show that advertising ex- penditure is negatively related to the cost of equity and positively related to debt utilization, resulting in a lower weighted average cost of capitaL A higher debt level, how- ever, associates with a lower level offinancial strength. In addition, and plausibly by lowering the cost of capital through product market advertising, firms with higher ad- vertising expenditure experience higher performance in ternts of nmrket value added. Keywords: advertising; cost of capital; capital and prod- uct markets; capital structure; performance Paul Anderson's (1979) observation that "too often marketing tends to focus on sales growth.., it fails to rec- ognize the impact of marketing decisions on... financing cost, debt-to-equity ratios, and stock prices" holds true in Journal of the Academy of Marketing Science. Volume 33, No. 4, pages 432 ~ . DOI: 10.1177/0092070305277380 Copyright 2005 by Academy. of Marketing Science. that the marketing discipline research has traditionally focused on identifying drivers of success in the product market, defined in terms of sales revenue, profit margins, and market share. The more recent trend, however, indi- cates a shift in evaluating the impact of marketing strate- gies on improving market value and stock price (Joshi and Hanssens 2004; Srivastava, Shervani, and Fahey 1998). It is largely accepted that advertising is a means of cre- ating market-based assets, which contributes positively to shareholder wealth. Advertising promotes brand equity, which in turn generates financial value through enhanced cash flows attributable to customer loyalty, increased mar- keting efficiency, brand extensions, and higher margins (Keller 2002). The sources of such advertising-related cash flow augmentations are traced to price premiums (Farquhar 1989) and capturing greater market share (Boulding, Lee, and Staelin 1994). In addition, corporate branding strategy, in contrast to a mixed branding strategy, is positively related to corporate value in terms of Tobin's q (Rao, Agarwal, and Dahlhoff 2004). Previous empirical studies within the marketing literature suggest that changes in marketing expenditures are related to changes in stock prices (Cheng and Chen 1997) in particular, and there is a relationship between marketing strategies and financial value (Chauvin and Hirschey 1993). More recently, Joshi and Hanssens (2004) suggested that adver- tising has a positive, long-run impact on a firm's market value.
-
Upload
independent -
Category
Documents
-
view
2 -
download
0
Transcript of Capital market impact of product marketing strategy: Evidence from the relationship between...
Capital Market Impact of Product Marketing Strategy: Evidence From the Relationship Between Advertising Expenses and Cost of Capital
Manohar Singh Willamette University
Sheri Faircloth Ali Nejadmalayeri University of Nevada at Reno
To analyze the prospect of a firm's advertising decision af- fecting shareholder wealth, this article investigates the re- lationship between a firm's advertising expenditure and the market-imposed weighted average cost of capital. For a sample of U.S.firms, the results show that advertising ex- penditure is negatively related to the cost of equity and positively related to debt utilization, resulting in a lower weighted average cost of capitaL A higher debt level, how- ever, associates with a lower level of financial strength. In addition, and plausibly by lowering the cost of capital through product market advertising, firms with higher ad- vertising expenditure experience higher performance in ternts of nmrket value added.
Keywords: advertising; cost of capital; capital and prod- uct markets; capital structure; performance
Paul Anderson's (1979) observation that "too often marketing tends to focus on sales growth.. , it fails to rec- ognize the impact of marketing decisions on . . . financing cost, debt-to-equity ratios, and stock prices" holds true in
Journal of the Academy of Marketing Science. Volume 33, No. 4, pages 432 ~ . DOI: 10.1177/0092070305277380 Copyright �9 2005 by Academy. of Marketing Science.
that the marketing discipline research has traditionally focused on identifying drivers of success in the product market, defined in terms of sales revenue, profit margins, and market share. The more recent trend, however, indi- cates a shift in evaluating the impact of marketing strate- gies on improving market value and stock price (Joshi and Hanssens 2004; Srivastava, Shervani, and Fahey 1998).
It is largely accepted that advertising is a means of cre- ating market-based assets, which contributes positively to shareholder wealth. Advertising promotes brand equity, which in turn generates financial value through enhanced cash flows attributable to customer loyalty, increased mar- keting efficiency, brand extensions, and higher margins (Keller 2002). The sources of such advertising-related cash flow augmentations are traced to price premiums (Farquhar 1989) and capturing greater market share (Boulding, Lee, and Staelin 1994). In addition, corporate branding strategy, in contrast to a mixed branding strategy, is positively related to corporate value in terms of Tobin's q (Rao, Agarwal, and Dahlhoff 2004). Previous empirical studies within the marketing literature suggest that changes in marketing expenditures are related to changes in stock prices (Cheng and Chen 1997) in particular, and there is a relationship between marketing strategies and financial value (Chauvin and Hirschey 1993). More recently, Joshi and Hanssens (2004) suggested that adver- tising has a positive, long-run impact on a firm's market value.
Singh et al. / ADVERTISING AND COST OF CAPITAL 433
Surprisingly, it seems that the research to date has looked at advertising's positive value contribution to shareholder wealth through cash flow enhancements only, and "there has been little effort to study the direct impact of advertis- ing on stock price" (Joshi and Hanssens 2004). Brand familiarity and perceived brand quality in product markets might spill over to the capital markets where investors may elevate demand for the stock of firms with established brands. In fact, recent evidence suggests that investors favor stocks with higher product market exposure, and higher advertising expenditure leads to increases in trad- ing volume and number of shareholders (Frieder and Subrahmanyam 2001; Grullon, Kanatas, and Weston 2004). Thus, from the market microstructure perspective, higher advertising expenditure is expected to increase the breadth of ownership and improve liquidity, thereby low- ering the cost of equity and improving firm value. This line of research, however, is still in its infancy. More important, the impact on debt holders has not been explor- ed. Except for few recent works such as Day and Fahey (1988), linking advertising expenditure to corporate cost of capital and its determinants remains largely unexplored territory. Furthermore, the existing literature has not con- sidered corporate value as a function of two distinct vari- ables conditioned by advertising expenditure: cash flow augmentation and a firm's weighted average cost of capital (WACC).
The aim of this article is to fill this gap in research by using a unique database to analyze the impact of advertis- ing promotion strategies on a firm's overall cost of capital. In addition, we explore the impact of advertising strategy on the drivers of a firm's cost of capital, namely, corporate capital structure (debt-to-asset ratio), equity risk (market beta), and firm financial strength (Altman's Z-score). 2
Our findings suggest that higher advertising outlays associate with a lower WACC. In addition, advertising seems to be related to higher debt capacity and utilization. In terms of the drivers of the cost of capital, as influenced by advertising expenditure, the results indicate that for firms with greater advertising expense, the cost of equity is lower (in terms of beta) and that Altman's Z-score is ad- versely influenced. Finally, the results suggest that higher advertising contributes significantly to market-based per- formance in terms of the market value added (MVA).
The remainder of this article is organized as follows. The following section provides a theoretical and empirical framework within which the issue is considered, along with information on hypothesis development and the description of models relating advertising expenditure to a firm's cost of capital and the other test variables. The sub- sequent section describes the data collection and method- ology and presents a description of the sample. Finally, we present the results and offer conclusions of the study.
LITERATURE REVIEW
Advertising, Cash Flow Augmentation, and Acceleration
Marketing expenses are aimed at creating customer loyalty, high margins, brand extension, licensing opportu- nities, and increasing revenue generation efficiency. In addition, advertising expenditures are justified in terms of their contribution to creating brand equity (Aaker 1991). Greater advertising intensity, by creating brand loyalty and brand association, has been argued to generate future cash flow and hence shareholder value (Aaker and Jacob- son 1994). Within this perspective, Rao et al. (2004) sug- gested that corporate branding strategy associates posi- tively with Tobin's q. Their results are consistent with other research in the brand assets literature (Barth et al. 1998; Kallapur and Kwan 2004). Mizik and Jacobson (2003) reported that the stock market positively rewards firms when they increase their emphasis on value appro- priation through advertising strategies designed to create competitive barriers, establish customer loyalty, improve margins, and enhance brand equity.
According to Srivastava et al. (1998), advertising can create market-based assets that may accelerate the timeli- ness of cash flow occurrence, thereby improving overall shareholder value. The authors provide a summary of channels through which advertising can add to share- holder value by creating market-based assets: lower costs of sales and services to customers, secure price premiums through creation of perceived value identified with brand equity, and create competitive barriers, thereby enhancing and stabilizing cash flows and generating synergies among assets within a firm to improve productivity that may provide further competitive advantages.
The debate, however, is far from being conclusive. For example, Pauwels, Silva-Risso, Srinivasan, and Hanssens (2004) analyzed the differential impact on a firm's value for two distinct marketing strategies: advertising expendi- ture and new product introductions. Their findings suggest that although both strategies positively affect sales reve- nue in the short and long run, only the strategy of new product introductions has a significant and positive long- term impact on shareholders' wealth. In fact, according to the authors, marketing promotions have a long-term mar- ket performance impact that is not only negative but also more than offsets its short-term benefit. Similarly, Kopalle, Mela, and Marsh (1999) argued that advertising promotions' impact on stimulating long-term growth and profitability may be doubtful. Thus, a pure advertising- intensive marketing approach may not always contribute to corporate value; however, in contrast to new product introductions, advertising promotions may effectively
434 JOURNAL OF THE ACADEMY OF MARKETING SCIENCE FALL 2005
augment product demand without incurring the risks asso- ciated with new products (Blattberg and Neslin 1990).
Advertising, Cash Flow Stability, and Cost of Capital
In the finance literature, the value of a corporation is defined as the sum of the present value of all the cash flows to the fu-m, which is equivalent to discounting future cash flows based on their level of risk. Although research in marketing has explored the link between advertising expenditure and a firm's cash flow, it has not analyzed the impact of advertising on the riskiness of the cash flows that directly determines corporate cost of capital (WACC).
Advertising may have a dual impact on a fu'm's cost of capital. In its first manifestation, advertising may assist in reducing a firm's cost of financing by reducing cash flow variability as suppliers of the capital identify reduced cash flow variability with lower risk. In addition, advertising may influence investor behavior in terms of the perceived riskiness of a firm's stocks and bonds. Specifically, prod- uct market advertising may have a positive spillover effect on investors in financial markets. Corporate advertising increases visibility and familiarity among investors, creat- ing a "home-bias" scenario, in that, other factors being the same, investors are more willing to lend and/or invest in the equity of firms that they are familiar with.
Advertising and Fundamental Risk Reduction
According to Anderson, Fornell, and Mazvancheryl (2004), customer satisfaction not only helps to grow the customer base and enhance future cash flows through cus- tomer retention; it also reduces the cash flow variability and, hence, associates with lower corporate risk. The com- bined impact of greater customer satisfaction is greater corporate value. Similarly, by helping firms increase their sales revenue and market share and facilitating introduc- tion of new products, advertising may augment their cash flows. In addition, advertising may create and sustain product demand, thereby reducing the sensitivity of a ftrm's sales to external shocks. The resulting revenue sta- bility may be seen as risk reduction in terms of reduced cash flow variability. Strong brands can also reduce a firm's vulnerability to competition, thereby reducing the risk of the future cash flows (Rao et al. 2004).
Within this framework of advertising improving the firm's fundamentals and consequent risk reduction, Srivastava et al. (1998) argued that advertising generates shareholder wealth by enhancing and stabilizing a firm's future cash flows. According to the authors, higher degrees of customer satisfaction, loyalty, and retention help reduce the variability of a firm's cash flows as its sus- ceptibility to competitive or other market-based external shocks declines. In addition to the direct contribution to
sales revenue stability, advertising can actually promote stability in a firm's operations by strengthening customer and partnership channels. The authors stress that "it is important to recognize that sustained, long term customer loyalty results in more stable business and therefore a lower cost of capital."
Impact of Advertising on Investor Perception and Behavior
Huberman (2001) suggested that investors' familiarity with a company positively influences their decisions to buy stock in that company. In this framework, if advertis- ing creates product market visibility, then we should expect that, other factors being the same, investors are more likely to buy stock of companies with higher inten- sity of advertising activity. According to Grullon et al. (2004), the advertising exposure consequent increased breadth of ownership and liquidity may help reduce a firm's cost of equity capital. In addition, companies that have higher visibility in the product market have greater stock market liquidity in terms of a lower bid-ask spread, greater depth, and smaller price impacts. One can argue that higher breadth of equity ownership and greater liquid- ity would manifest itself in lower overall cost of equity capital.
Several studies in finance suggest the existence of investor bias, where investors buy stock that they are familiar with. For example, international cross listing by foreign firms on the New York Stock Exchange increases visibility to U.S. investors and is associated with a reduced bid-ask spread and higher liquidity (Kadlec and McConnell 1994). Similarly, according to French and Poterba's (1991) results, investors seem to favor domestic company stocks over similarly placed foreign stocks. There have also been studies (Amihud, Mendelsson, and Lauterbach 1997; Brennan, Chordia, and Subrahmanyam 1998) that suggest stock market liquidity is associated with a lower cost of equity.
Finally, Frieder and Subrahmanyam (2001) proposed a theoretical model and concluded that "investors prefer holding stocks with high recognition and consequently, greater information precision and smaller parameter esti- mation risk" In the same fashion, Merton (1987) and Klein and Bawa (1976, 1977) suggested that investors pre- fer to buy securities that have higher recognition and lower information asymmetries. Thus, it can be argued that increased advertising by a firm causes increased familiar- ity and, hence, investor preference to hold that firm's stock.
HYPOTHESES DEVELOPMENT
Although research in the marketing area has a tradition of linking advertising intensity to corporate value through
Singh et al. / ADVERTISING AND COST OF CAPITAL 435
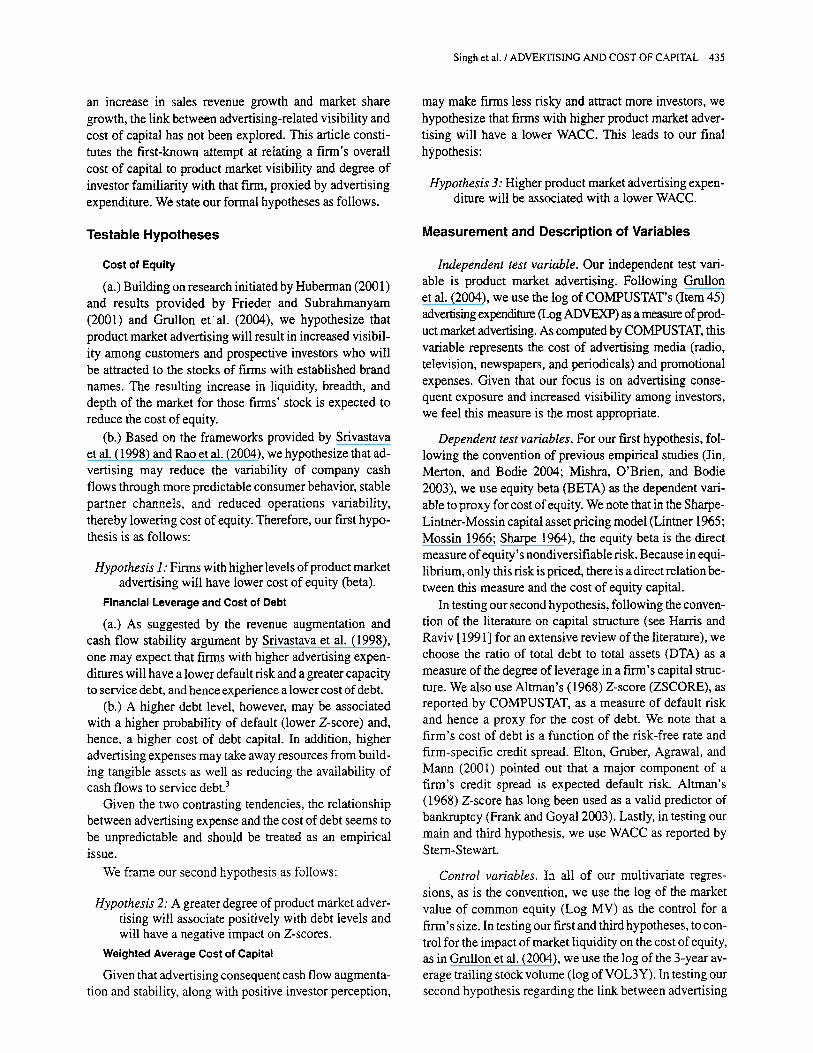
an increase in sales revenue growth and market share growth, the link between advertising-related visibility and cost of capital has not been explored. This article consti- tutes the first-known attempt at relating a firm's overall cost of capital to product market visibility and degree of investor familiarity with that firm, proxied by advertising expenditure. We state our formal hypotheses as follows.
Testable Hypotheses
Cost of Equity
(a.) Building on research initiated by Huberman (2001 ) and results provided by Frieder and Subrahmanyam (2001) and Grullon e ta l . (2004), we hypothesize that product market advertising will result in increased visibil- ity among customers and prospective investors who will be attracted to the stocks of firms with established brand names. The resulting increase in liquidity, breadth, and depth of the market for those firms' stock is expected to reduce the cost of equity.
(b.) Based on the frameworks provided by Srivastava et al. (1998) and Rao et al. (2004), we hypothesize that ad- vertising may reduce the variability of company cash flows through more predictable consumer behavior, stable partner channels, and reduced operations variability, thereby lowering cost of equity. Therefore, our first hypo- thesis is as follows:
Hypothesis 1: Firms with higher levels of product market advertising will have lower cost of equity (beta).
Financial Leverage and Cost of Debt
(a.) As suggested by the revenue augmentation and cash flow stability argument by Srivastava et al. (1998), one may expect that firms with higher advertising expen- ditures will have a lower default risk and a greater capacity to service debt, and hence experience a lower cost of debt.
(b.) A higher debt level, however, may be associated with a higher probability of default (lower Z-score) and, hence, a higher cost of debt capital. In addition, higher advertising expenses may take away resources from build- ing tangible assets as well as reducing the availability of cash flows to service debt. 3
Given the two contrasting tendencies, the relationship between advertising expense and the cost of debt seems to be unpredictable and should be treated as an empirical issue.
We frame our second hypothesis as follows:
Hypothesis 2: A greater degree of product market adver- tising will associate positively with debt levels and will have a negative impact on Z-scores.
Weighted Average Cost of Capital
Given that advertising consequent cash flow augmenta- tion and stability, along with positive investor perception,
may make firms less risky and attract more investors, we hypothesize that firms with higher product market adver- tising will have a lower WACC. This leads to our final hypothesis:
Hypothesis 3: Higher product market advertising expen- diture will be associated with a lower WACC.
Measurement and Description of Variables
Independent test variable. Our independent test vari- able is product market advertising. Following Grullon et al. (2004), we use the log of COMPUSTAT's (Item 45) advertising expenditure (Log ADVEXP) as a measure of prod- uct market advertising. As computed by COMPUSTAT, this variable represents the cost of advertising media (radio, television, newspapers, and periodicals) and promotional expenses. Given that our focus is on advertising conse- quent exposure and increased visibility among investors, we feel this measure is the most appropriate.
Dependent test variables. For our first hypothesis, fol- lowing the convention of previous empirical studies (Jin, Merton, and Bodie 2004; Mishra, O'Brien, and Bodie 2003), we use equity beta (BETA) as the dependent vari- able to proxy for cost of equity. We note that in the Sharpe- Lintner-Mossin capital asset pricing model (Lintner 1965; Mossin 1966; Sharpe 1964), the equity beta is the direct measure of equity's nondiversifiable risk. Because in equi- librium, only this risk is priced, there is a direct relation be- tween this measure and the cost of equity capital.
In testing our second hypothesis, following the conven- tion of the literature on capital structure (see Harris and Raviv [1991] for an extensive review of the literature), we choose the ratio of total debt to total assets (DTA) as a measure of the degree of leverage in a firm's capital struc- ture. We also use Altman's (1968) Z-score (ZSCORE), as reported by COMPUSTAT, as a measure of default risk and hence a proxy for the cost of debt. We note that a firm's cost of debt is a function of the risk-free rate and firm-specific credit spread. Elton, Gruber, Agrawal, and Mann (2001) pointed out that a major component of a firm's credit spread is expected default risk. Altman's (1968) Z-score has long been used as a valid predictor of bankruptcy (Frank and Goya12003). Lastly, in testing our main and third hypothesis, we use WACC as reported by Stem-Stewart.
Control variables. In all of our multivariate regres- sions, as is the convention, we use the log of the market value of common equity (Log MV) as the control for a firm's size. In testing our first and third hypotheses, to con- trol for the impact of market liquidity on the cost of equity, as in Grullon et al. (2004), we use the log of the 3-year av- erage trailing stock volume (log of VOL3Y). In testing our second hypothesis regarding the link between advertising
436 JOURNAL OF THE ACADEMY OF MARKETING SCIENCE FALL 2005
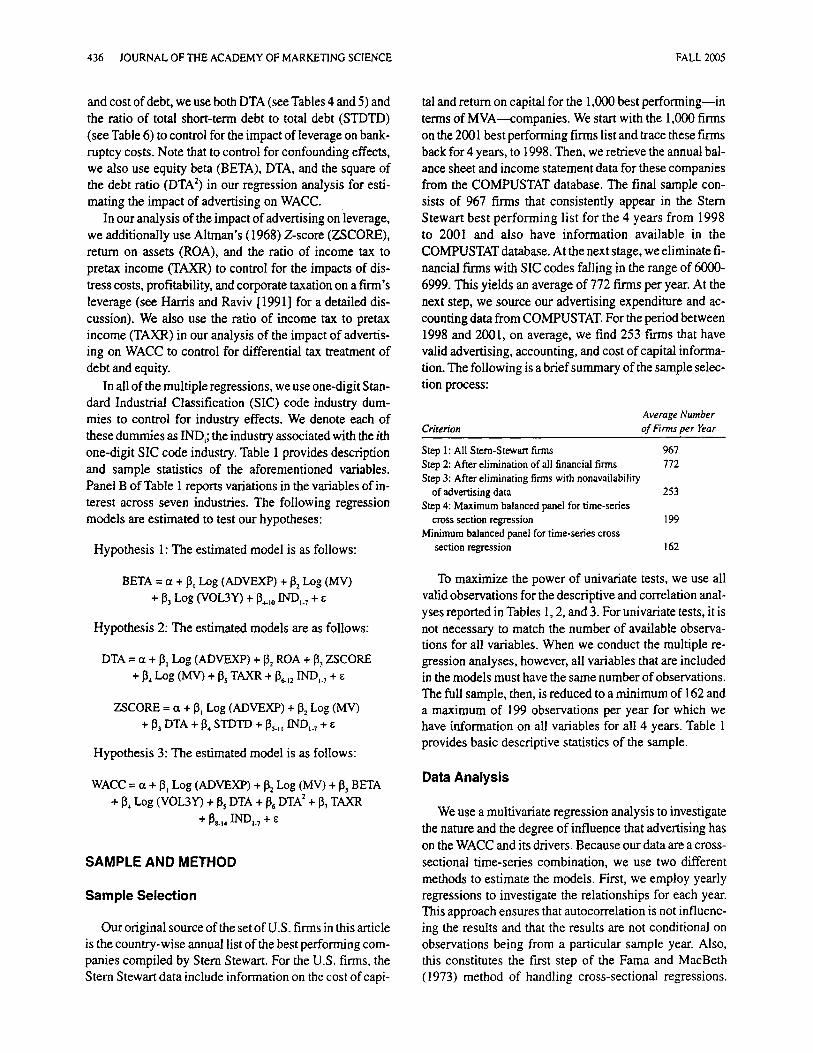
and cost of debt, we use both DTA (see Tables 4 and 5) and the ratio of total short-term debt to total debt (STDTD) (see Table 6) to control for the impact of leverage on bank- ruptcy costs. Note that to control for confounding effects, we also use equity beta (BETA), DTA, and the square of the debt ratio (DTA 2) in our regression analysis for esti- mating the impact of advertising on WACC.
In our analysis of the impact of advertising on leverage, we additionally use Altman's (1968) Z-score (ZSCORE), return on assets (ROA), and the ratio of income tax to pretax income (TAXR) to control for the impacts of dis- tress costs, profitability, and corporate taxation on a firm's leverage (see Harris and Raviv [1991] for a detailed dis- cussion). We also use the ratio of income tax to pretax income (TAX.R) in our analysis of the impact of advertis- ing on WACC to control for differential tax treatment of debt and equity.
In all of the multiple regressions, we use one-digit Stan- dard Industrial Classification (SIC) code industry dum- mies to control for industry effects. We denote each of these dummies as IND,; the industry associated with the ith one-digit SIC code industry. Table 1 provides description and sample statistics of the aforementioned variables. Panel B of Table 1 reports variations in the variables of in- terest across seven industries. The following regression models are estimated to test our hypotheses:
Hypothesis 1: The estimated model is as follows:
BETA = a + 13, Log (ADVEXP) + 13 2 Log (MV) + 13~ Log (VOL3Y) + 13.,o IND,-7 + e
Hypothesis 2: The estimated models are as follows:
DTA = ct + 13~ Log (ADVEXP) + 13_, ROA + 13.~ ZSCORE + 13, Log (MV) + 135 TAXR + 136.,2 IND,., +
ZSCORE = a + 13~ Log (ADVEXP) + 132 Log (MV) + 135 DTA + 13, STDTD + 135,, IND,-7 + e
Hypothesis 3: The estimated model is as follows:
WACC = a + 13, Log (ADVEXP) + 132 Log (MV) + 135 BETA + 134 Log (VOL3Y) + 135 DTA + 136 DTA2 + 137 TAXR
+ 13s.j~ INDa.7 +
SAMPLE AND METHOD
Sample Selection
Our original source of the set of U.S. firms in this article is the country-wise annual list of the best performing com- panies compiled by Stern Stewart. For the U.S. firms, the Stern Stewart data include information on the cost of capi-
tal and return on capital for the 1,000 best performing--in terms of MVA---companies. We start with the 1,000 firms on the 2001 best performing firms list and trace these firms back for 4 years, to 1998. Then, we retrieve the annual bal- ance sheet and income statement data for these companies from the COMPUSTAT database. The final sample con- sists of 967 firms that consistently appear in the Stern Stewart best performing list for the 4 years from 1998 to 2001 and also have information available in the COMPUSTAT database. At the next stage, we eliminate fi- nancial firms with SIC codes falling in the range of 6000- 6999. This yields an average of 772 firms per year. At the next step, we source our advertising expenditure and ac- counting data from COMPUSTAT. For the period between 1998 and 2001, on average, we find 253 firms that have valid advertising, accounting, and cost of capital informa- tion. The following is a brief summary of the sample selec- tion process:
Average Number Criterion of Firms per Year
Step h All Stem-Stewart firms 967 Step 2: After elimination of all financial firms 772 Step 3: After eliminating firms with nonavailability
of advertising data 253 Step 4: Maximum balanced panel for time-series
cross section regression 199 Minimum balanced panel for time-series cross
section regression 162
To maximize the power of univariate tests, we use all valid observations for the descriptive and correlation anal- yses reported in Tables 1,2, and 3. For univariate tests, it is not necessary to match the number of available observa- tions for all variables. When we conduct the multiple re- gression analyses, however, all variables that are included in the models must have the same number of observations. The full sample, then, is reduced to a minimum of 162 and a maximum of 199 observations per year for which we have information on all variables for all 4 years. Table 1 provides basic descriptive statistics of the sample.
Data Analysis
We use a multivariate regression analysis to investigate the nature and the degree of influence that advertising has on the WACC and its drivers. Because our data are a cross- sectional time-series combination, we use two different methods to estimate the models. First, we employ yearly regressions to investigate the relationships for each year. This approach ensures that autocorrelation is not influenc- ing the results and that the results are not conditional on observations being from a particular sample year. Also, this constitutes the f'Lrst step of the Fama and MacBeth (1973) method of handling cross-sectional regressions.
Singh et al. / ADVERTISING AND COST OF CAPITAL 437
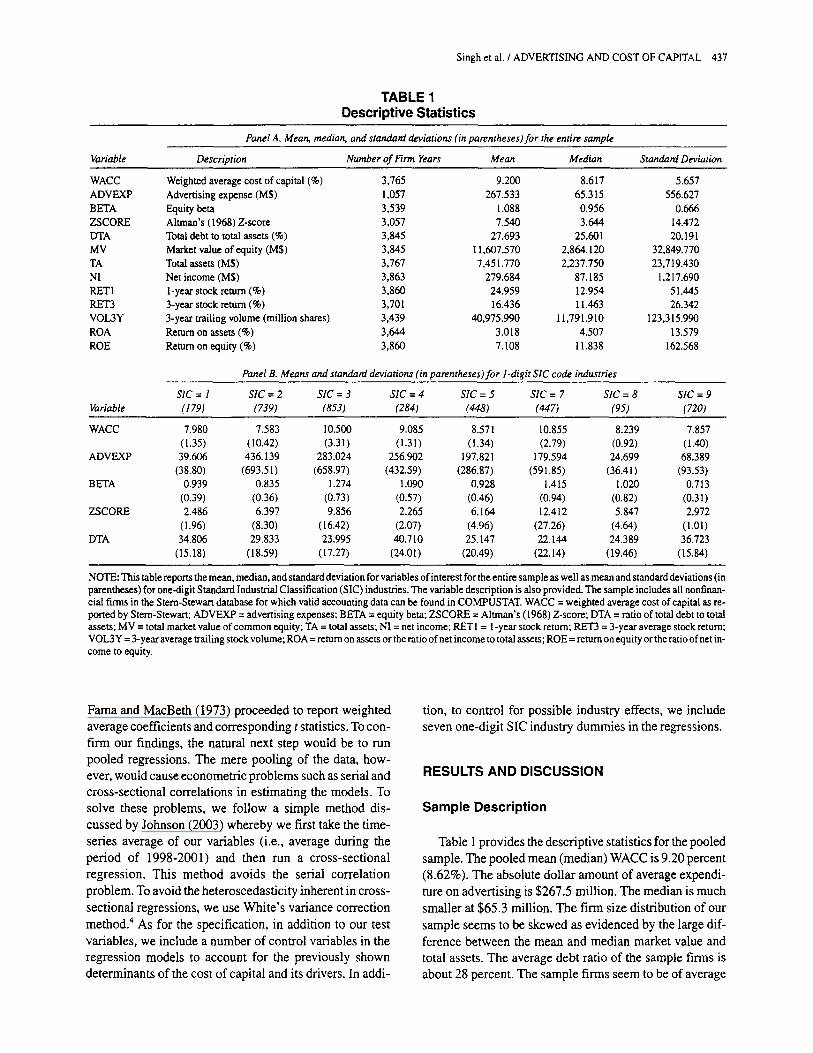
TABLE 1 Descriptive Statistics
Panel A. Mean, median, and standaM deviations (in parentheses)for the entire sample
Variable Description Number of Firm Years Mean Median Standard Deviation
WACC Weighted average cost of capital (%) 3,765 9.200 8.617 5.657 ADVEXP Advertising expense (MS) 1,057 267.533 65.315 556.627 BETA Equity beta 3,539 1.088 0.956 0.666 ZSCORE Altman's (1968) Z-score 3,057 7.540 3.644 14.472 DTA Total debt to total assets (%) 3,845 27.693 25.601 20.191 MV Market value of equity (MS) 3,845 I 1,607.570 2,864.120 32,849.770 TA Total assets (MS) 3,767 7,451.770 2,237.750 23,719.430 NI Net income (MS) 3,863 279.684 87.185 1,217.690 RET1 l-year stock return (%) 3,860 24.959 12.954 51.445 RET3 3-year stock return (%) 3,701 16.436 11.463 26.342 VOL3Y 3-year trailing volume (million shares) 3,439 40,975.990 1 1 , 7 9 1 . 9 1 0 123,315.990 ROA Return on assets (%) 3,644 3.018 4.507 13.579 ROE Return on equity (%) 3,860 7.108 11.838 162.568
Panel B. Means and standard deviations (in parentheses)for l-digit SIC code industries
SIC = 1 SIC = 2 SIC = 3 SIC= 4 SIC = 5 SIC = 7 SIC = 8 SIC = 9 Variable (179) (739) (853) (284) (448) (447) (95) (720)
WACC 7.980 7.583 10.500 9.085 8.571 10.855 8.239 7.857 (1.35) (10.42) (3.31) (1.31) (1.34) (2.79) (0.92) (1.40)
ADVEXP 39.606 436.139 283.024 256.902 197.821 179.594 24.699 68.389 (38.80) (693.51) (658.97) (432.59) (286.87) (591.85) (36.41) (93.53)
BETA 0.939 0.835 1.274 1.090 0.928 1.415 1.020 0.713 (0.39) (0.36) (0.73) (0.57) (0.46) (0.94) (0.82) (0.31)
ZSCORE 2.486 6.397 9.856 2.265 6.164 12.412 5.847 2.972 (1.96) (8.30) (16.42) (2.07) (4.96) (27.26) (4.64) (1.01)
DTA 34.806 29.833 23.995 40.710 25.147 22.144 24.389 36.723 (15.18) (18.59) (17.27) (24.01 ) (20.49) (22.14) (19.46) (15.84)
NOTE: This table reports the mean, median, and standard deviation for variables of interest for the entire sample as well as mean and standard deviations (in parentheses) for one-digit Standard Industrial Classification (SIC) industries. The variable description is also provided. The sample includes all nonfinan- cial firms in the Stem-Stewart database for which valid accounting data can be found in COMPUSTAT. WACC = weighted average cost of capital as re- ported by Stern-Stewart; ADVEXP = advertising expenses; BETA = equity beta; ZSCORE = Altman's (1968) Z-score; DTA = ratio of total debt to total assets; MV = total market value of common equity; TA = total assets; NI = net income; RETI = 1-year stock return; RET3 = 3-year average stock return; VOL3Y = 3-year average trailing stock volume; ROA = return on assets or the ratio of net income to total assets; ROE = return on equity or the ratio of net in- come to equity.
F a m a and MacBeth (1973) proceeded to report weighted
average coefficients and corresponding t statistics. To con-
firm our findings, the natural next step would be to run
pooled regressions. The mere pool ing of the data, how-
ever, would cause econometr ic problems such as serial and
cross-sect ional correlations in es t imat ing the models. To
solve these problems, we fol low a simple method dis-
cussed by Johnson (2003) whereby we first take the t ime-
series average of our variables (i.e., average during the
per iod of 1998-2001) and then run a cross-sect ional
regression. This method avoids the serial correlat ion
problem. To avoid the heteroscedastici ty inherent in cross-
sectional regressions, we use Whi te ' s variance correction
method. 4 As for the specification, in addition to our test
variables, we include a number of control variables in the
regression models to account for the previously shown
determinants of the cost of capital and its drivers. In addi-
tion, to control for possible industry effects, we include
seven one-digi t SIC industry dummies in the recess ions .
RESULTS AND DISCUSSION
Sample Description
Table 1 provides the descriptive statistics for the pooled
sample. The pooled mean (median) WACC is 9.20 percent
(8.62%). The absolute dollar amount of average expendi-
ture on advert is ing is $267.5 mil l ion. The median is much
smaller at $65.3 mill ion. The f irm size distr ibution of our
sample seems to be skewed as evidenced by the large dif-
ference be tween the mean and median market value and total assets. The average debt ratio of the sample firms is
about 28 percent. The sample firms seem to be of average
438 JOURNAL OF THE ACADEMY OF MARKETING SCIENCE FALL 2005
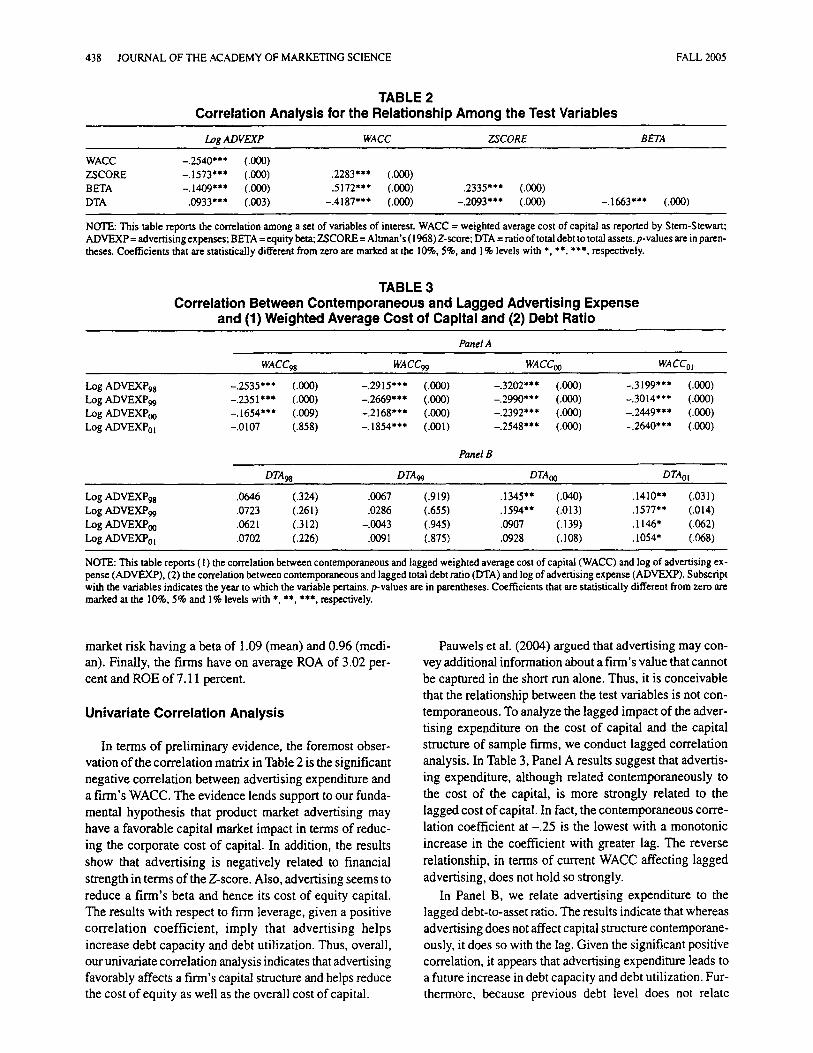
TABLE 2 Correlation Analysis for the Relationship Among the Test Variables
Log ADVEXP WACC ZSCORE BETA
WACC -.2540"** (.000) ZSCORE -.1573"** (.000) .2283"** 6000) BETA -.1409"** 6000) .5172"** 6000) .2335"** 6000) DTA .0933*** (.003) -.4187"** (.000) -.2093*** (.000) -.1663"** 6000)
NOTE: This table reports the correlation among a set of variables of interesL WACC = weighted average cost of capital as reported by Stem-Stewart; ADVEXP = advertising expenses; BETA = equity beta; ZSCORE = Altman's (1968) Z-score; DTA = ratio of total debt to total assets, p-values are in paren- theses. Coefficients that are statistically different from zero are marked at the 10%, 5%, and 1% levels with *, **, ***, respectively.
TABLE 3 Correlation Between Contemporaneous and Lagged Advertising Expense
and (1) Weighted Average Cost of Capital and (2) Debt Ratio
Panel A
WA C C98 WA C C99 WA C Co o WA C Co ~
Log ADVEXPgs -.2535*** (.000) -.2915"** (.000) -.3202"** (.000) -.3199"** (.000) Log ADVEXP99 -.2351"** (.000) -.2669*** (.000) -.2990*** (.000) -.3014"** (.000) Log ADVEXP0o -.1654"** (.009) -.2168"** (.000) -.2392"** (.000) -.2449"** (.000) LOg ADVEXP0I -.0107 (.858) -.1854"** (.001) -.2548*** (.000) -.2640*** 6000)
Panel B
DTA98 DTA99 DTAo o DTAot
Log ADVEXP98 .0646 (.324) .0067 (.919) .1345"* (.040) .1410"* (.031) Log ADVEXP99 .0723 (.261) .0286 (.655) .1594"* (.013) .1577"* (.014) Log ADVEXP00 .0621 6312) -.0043 (.945) .0907 (.139) .1146" (.062) Log ADVEXPol .0702 (.226) .0091 (.875) .0928 (.108) .1054" (.068)
NOTE: This table reports (1) the correlation between contemporaneous and lagged weighted average cost of capital (WACC) and log of advertising ex- pense (ADVEXP), (2) the correlation between contemporaneous and lagged total debt ratio (DTA) and log of advertising expense (ADVEXP). Subscript with the variables indicates the year to which the variable pertains, p-values are in parentheses. Coefficients that are statistically different from zero are marked at the 10%, 5% and 1% levels with *, **, ***, respectively.
market risk having a beta of 1.09 (mean) and 0.96 (medi- an). Finally, the fLrms have on average ROA of 3.02 per- cent and ROE of 7.11 percent.
Univariate Correlation Analysis
In terms of preliminary evidence, the foremost obser- vation of the correlation matrix in Table 2 is the significant negative correlation between advertising expenditure and a firm's WACC. The evidence lends support to our funda- mental hypothesis that product market advertising may have a favorable capital market impact in terms of reduc- ing the corporate cost of capital. In addition, the results show that advertising is negatively related to financial strength in terms of the Z-score. Also, advertising seems to reduce a firm's beta and hence its cost of equity capital. The results with respect to firm leverage, given a positive correlation coefficient, imply that advertising helps increase debt capacity and debt utilization. Thus, overall, our univariate correlation analysis indicates that advertising favorably affects a firm's capital structure and helps reduce the cost of equity as well as the overall cost of capital.
Pauwels et al. (2004) argued that advertising may con- vey additional information about a firm's value that cannot be captured in the short run alone. Thus, it is conceivable that the relationship between the test variables is not con- temporaneous. To analyze the lagged impact of the adver- tising expenditure on the cost of capital and the capital structure of sample firms, we conduct lagged correlation analysis. In Table 3, Panel A results suggest that advertis- ing expenditure, although related contemporaneously to the cost of the capital, is more strongly related to the lagged cost of capital. In fact, the contemporaneous corre- lation coefficient at -.25 is the lowest with a monotonic increase in the coefficient with greater lag. The reverse relationship, in terms of current WACC affecting lagged advertising, does not hold so strongly.
In Panel B, we relate advertising expenditure to the lagged debt-to-asset ratio. The results indicate that whereas advertising does not affect capital structure contemporane- ously, it does so with the lag. Given the significant positive correlation, it appears that advertising expenditure leads to a future increase in debt capacity and debt utilization. Fur- thermore, because previous debt level does not relate
Singh et al. / ADVERTISING AND COST OF CAPITAL 439
TABLE 4 Regression for Weighted Average Cost of Capital as Determined by Advertising Expenditure
White's Variance White's Variance White's Variance White's Variance Time Series Adjusted Corrected 1998 Corrected 1999 Corrected 2000 Corrected 2001 for Cross Section
Panel A. Results without industry dummies Intercept 7.3477***
(6.50) Log ADVEXP -0.3129"**
(-2.81) Log MV -0.0023
(-0.01) BETA 1.3596"**
(3.79) Log VOL3Y 0.3784**
(2.39) DTA -0.0589***
(-3.83) DTA 2 0.0003**
(1.82) TAXR - 1.4010
(-1.09)
Panel B. Results with Industry Dummies (only coefficients on test variable and industry dummies are reported)
Log ADVEXP
Mean industry dummy coefficient a
5.1763*** 7.9697"** 7.2151 *** 8.3871 *** (4.58) (6.68) (6.76) (7.25) -0.5654*** -0.4371"** --0.3244*** -0.3849***
(-5.05) (--.4.05) (-3.2 7) (-3. 70) 0.3666"* 0.3261"* 0.2560 0.2776*
(2.19) (2.12) (1.54) (1.69) 1.3093"** 1.2381"** 1.2829"** 1.4788"**
(3.61 ) (3.53) (4.56) (4.16) 0.3028" 0.1760 0.2169 0.1970
(1.68) (0.97) (1.21) (1.11) 0.0003 -0.0696*** -0.0462*** -0.0661"**
(0.95) (--4.74) (-3.76) (--4.25) -0.0006* 0.0004*** 0.0001 0.0003**
(-1.64) (2.57) (1.38) (2.03) -0.3112 -2.7479*** --4.0357*** -5.4708***
(-0.24) (-2.69) (--4.55) (-3.54)
-0.2506** -0.3375*** -0.3295*** -0.2822*** -0.3233*** (-2.28) (-3.01) (-2.97) (-2. 79) (-2.98)
0.5833 1.1638 0.6615 0.7165 0.7363 (0.68) (1.21) (0.73) (0.84) (0.83)
F-statistic 17.96 13.37 20.67 24.92 23.00 p value .0001 .0001 .0001 .0001 .0001 N 178 178 178 178 178 Adjusted R 2 .4001 .3273 .4362 .4848 .4639
NOTE: This table reports the results of the following regxession:
WACC = ~t + 13, Log (ADVEXP) + 13,. Log (MV) + 13, BETA + 13, Log (VOL3Y) + 13~ DTA + 13~ DTA" + 137 TAXR + 13,.,, IND,., + e
where the dependent variable, WACC, is the weighted average cost of capital as reported by Stem-Stewart. The test variable is log of ADVEXP, the adver- tising expenses. Control variables are log of MV, the total market value of common equity; BETA, the equity beta; log of VOL3Y, the 3-year average trailing stock volume; DTA, the ratio of total debt to total assets; and TAXR, the ratio of income tax to pretax income, t-statistics are in parentheses. The reported co- efficients are White's heteroscedasticity (variance) adjusted. Coefficients that are statistically different from zero axe marked at the 10%, 5% and 1% levels with *, **. ***, respectively. a. Average coefficient and t-statistics for seven industry dummies are also reported.
significantly to future advertising expenditures, we can conclude that advertising strategy adds to debt capacity.
Multivariate Analysis
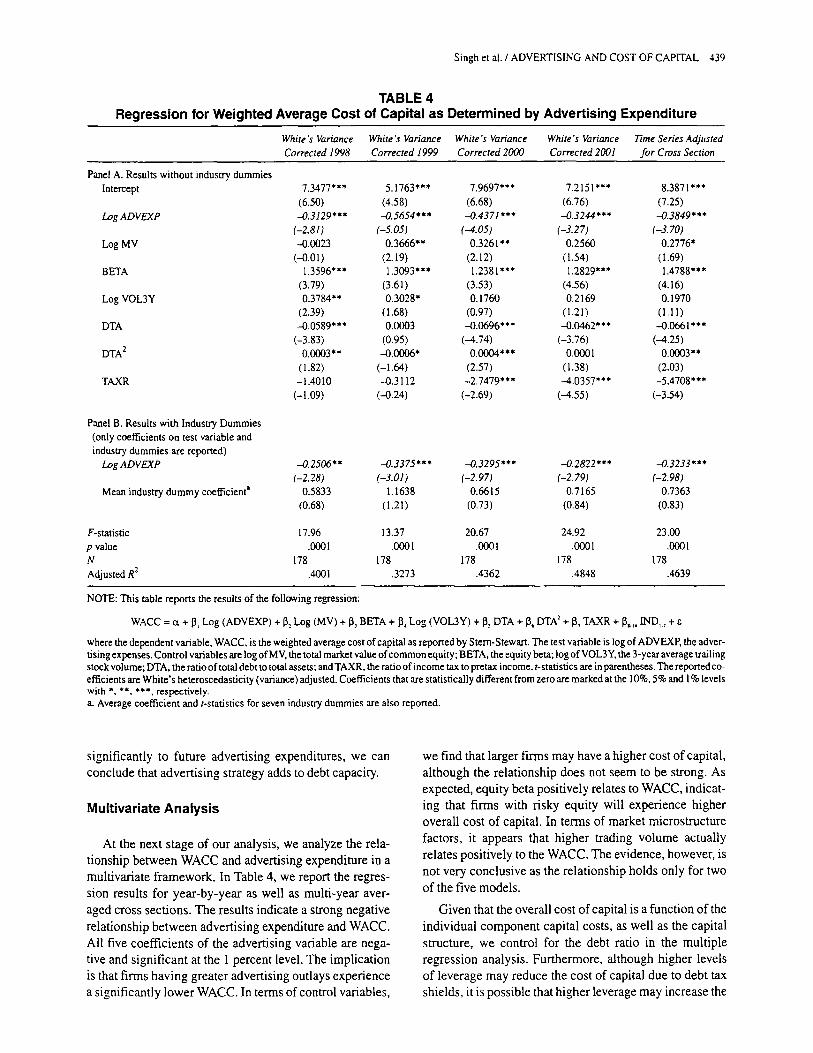
At the next stage of our analysis, we analyze the rela- tionship between WACC and advertising expenditure in a multivariate framework. In Table 4, we report the regres- sion results for year-by-year as well as multi-year aver- aged cross sections. The results indicate a strong negative relationship between advertising expenditure and WACC. All five coefficients of the advertising variable are nega- tive and significant at the 1 percent level. The implication is that firms having greater advertising outlays experience a significantly lower WACC. In terms of control variables,
we find that larger firms may have a higher cost of capital, although the relationship does not seem to be strong. As expected, equity beta positively relates to WACC, indicat- ing that firms with risky equity will experience higher overall cost of capital. In terms of market microstructure factors, it appears that higher trading volume actually relates positively to the WACC. The evidence, however, is not very conclusive as the relationship holds only for two of the five models.
Given that the overall cost of capital is a function of the individual component capital costs, as well as the capital structure, we control for the debt ratio in the multiple regression analysis. Furthermore, although higher levels of leverage may reduce the cost of capital due to debt tax shields, it is possible that higher leverage may increase the

440 JOURNAL OF THE ACADEMY OF MARKETING SCIENCE FALL 2005
TABLE 5 Regression for Capital Structure as Determined by Advertising Expenditure
DTA98 DTA99 DTAoo DTAol
Panel A. Results without industry dummies Intercept 41.537"** (4.57) Log ADVEXPg8 0.1510" (1.72) ROA98 -0.2830*** (--4.10) ZSCORE 98 --0.1410"* (-2.07) Log MVgs --0.1440" (-1.60) TAXR~8 --0.0850 (-1.28)
Panel B. Results with industry dummies (only coefficients on test variable and industry dummies are reported)
Log ADVEXPg8 Mean industry dummy coefficient a
40.07*** (4.60) 34.66*** (4.00) 31.37"** (3.50) 0.1430 (1.58) 0.2020** (2.22) 0.1990"* (2.20)
-0.1930"** (-2.71) -0.1480"* (-2.06) -0.2030*** (-2.85) -0.1410"* (-2.00) --0.1270" (-1.80) -0.1300" (-1.85) --0.1380 (-1.49) -0.1240 (-1.34) --0.0820 (-0.89) -0.0640 (-0.93) --0.0710 (-1.02) --0.0160 (--0.23)
0.1337 (1.41) 0.1495 (1.54) 0.2218"* (2.25) 0.2084* (2.13)* --0.1663 (-1.10) -0.1463 (-0.86) -0.1326 (--0.75) --0.0860 (-0.46)
F-statistic 6.86 4.11 3.61 4.08 p value .000(3 .0010 .0040 .0020 N 199 199 199 199 Adjusted R 2 .1280 .0720 .0610 .0720
NOTE: This table reports the results of the following regession:
DTA = ct + 13, Log (ADVEXP) + 13: ROA + 13, ZSCORE + 13, Log (MV) + [82 TAXR + 13,.,., IND,., + e
where the dependent variable, DTA, is the ratio of total debt to total assets. The test variable is log of ADVEXP, the advertising expenses. Control variables are ROA. the return on assets; ZSCORE, Altman's (1968) Z-score; log of MV, the total market value of common equity; TAXR, the income tax to pretax in- come ratio; and NI, the net income, t-statistics are in parentheses. The reported coefficients are White's heteroscedasticity (variance) adjusted. Coefficients that are statistically different from zero are marked at the 10%, 5%, and 1% levels with *, **, ***, respectively. Subscript with the variables indicates the year to which the variable pertains. a. Average coefficient and t-statistics for seven industry dummies are also reported.
cost of capital due to an increase in the probability of bank- ruptcy. Our results indicate that at lower levels of debt, the weighted average cost of capital is negatively related to leverage, thereby pointing toward tax shield benefits. At higher levels of debt, however, WACC relates positively to the degree of financial leverage, suggesting bankruptcy considerations. We, therefore, observe a nonlinear, U- shaped, relationship between financial leverage and the overall WACC. These results are consistent with the theo- retically predicted relationship between leverage and cost of capital in the presence of bankruptcy costs (Copeland and Weston 1992; Krause and Litzenberger 1973; Modig- liani and Miller 1958). Finally, firms with a higher average tax rate have a lower cost of capital. In Panel B, where we adjust for industry-specific effects, the results pertaining to the test variable are identical to those reported in Panel A.
Overall, the results in Table 4 suggest that a higher degree of advertising facilitates a lower cost of capital. The findings may be driven by either of two factors: it may be that advertising helps cash flow enhancement and stability and thereby reduces cost of capital or that product market visibility, through advertising, may result in a spillover effect on the capital market as it may attract a larger inves- tor base, enhance liquidity, and provide depth with conse- quent reduction in the cost of capital.
Impact of Advertising on Drivers of the Cost of Capital
Capital Structure
To identify the source of favorable impact of advertis- ing on cost of capital, at the fast stage of the analysis, we look at the capital structure as influenced by the firm's advertising expenditures. Given the univariate correlation results (where advertising seems to affect leverage with a lag) in Table 5, column 1, the dependent variable is the contemporaneous 1998 debt ratio, whereas subsequent columns have I-, 2-, and 3-year lagged debt ratios. The results indicate that although advertising does not relate to the contemporaneous debt ratio significantly, it positively contributes to increasing debt capacity and utilization in the subsequent years. It is plausible to argue that fLrmS in a particular tax bracket may increase leverage to capture tax shield benefits, thereby reducing the after-tax cost of debt. It is also possible that a higher debt level may lower a firm's Z-score and consequently generate negative impact on pretax cost of debt. As long as the tax benefits of increasing leverage outweigh the cost in terms of higher pretax cost of debt, it is rational to increase leverage to reduce overall cost of capital. In terms of control variables, consistent with previous research, we find that a firm's
Singh et al. / ADVERTISING AND COST OF CAPITAL 441
TABLE 6 Regression for Z-score as Determined by Advertising Expenditure
White's Variance White's Variance White's Variance White's Variance Time Series Adjusted Corrected 1998 Corrected 1999 Corrected 2000 Corrected 2001 for Cross Section
Panel A. Results without industry dummies Intercept 6.0308
(0.87) Log ADVEXP -3.0416"**
(-3.58) Log MV 1.9256"*
(1.93) DTA -0.1283"**
(-2.46) STDTD 0.1 047"*
(2.09)
Panel B. Results with industry dummies (only coefficients on test variable and industry dummies are reported)
Log ADVEXP
Mean industry dummy coeti~cient a
-0.9778 3.5441' 3.9067*** 7.3646** (-0.16) (1.81) (2.36) (2.12) -3.5002*** -0.3110 -0.5602 -1.3300"**
(--4.55) (-1.23) (-2.86) (-3.1~ 2.5637*** 0.6623*** 0.5639*** 0.6786
(2.97) (2.52) (2.51) (1.43) --0.0003 -0.0943*** -0.0725*** -0.1018"**
(-0.59) (-5.51) (-5.62) (-3.45) 0.1304"** 0.0132 0.0385*** 0.0953***
(2.65) (0.96) (3.42) (3.12)
-2.6917"** -3.3493*** -0.3208** -0.7481"** -1.3023"** (-2.92) (-4.01) (-2.21) (-3.84) (-2.86) -0.5947 1.9473 -5.1031 -1.4673 -1.0826 (0.02) (0.27) (-1.53) (-0.52) (-0.12)
F-statistic 7.18 p value .0001 N 162 Adjusted R 2 .1325
7.33 13.74 18.67 10.30 .0001 .0001 .0001 .0001
162 162 162 162 .1352 .2394 .3038 .1868
NOTE: This table reports the results of the following regression:
ZSCORE = ~t + 13, Log (ADVEXP) + 132 Log (MV) + 13, DTA + 13, STDTD + 13,.,, IND,., +
where the dependent variable, ZSCORE, is Altman's (1968) Z-score. The test variable is log of ADVEXP, the advertising expenses. Control variables are log of MV, the total market value of common equity; DTA, the ratio of total debt to total assets; and STDTD, the ratio of total short-term debt to total debt. t- statistics are in parentheses. The reported coefficients are White's heteroscedasticity (variance) adjusted. Coefficients that are statistically different from zero are marked at the 10%, 5%, and 1% levels with *. **, ***, respectively. a. Average coefficient and t-statistics for seven industry dummies are also reported.
performance and Z-score negatively relate to the debt ratio. Firm size and average tax liabilities, however, do not seem to consistently relate to the capital mix.
Overall, the results in Table 5 suggest that advertising may help create additional debt capacity, which, if used optimally, may result in reduced after-tax cost of debt as well as reduced WACC. It is plausible to relate higher debt capacity to greater volume and stability of future cash flows that advertising may yield.
Financial Strength (Z-score)
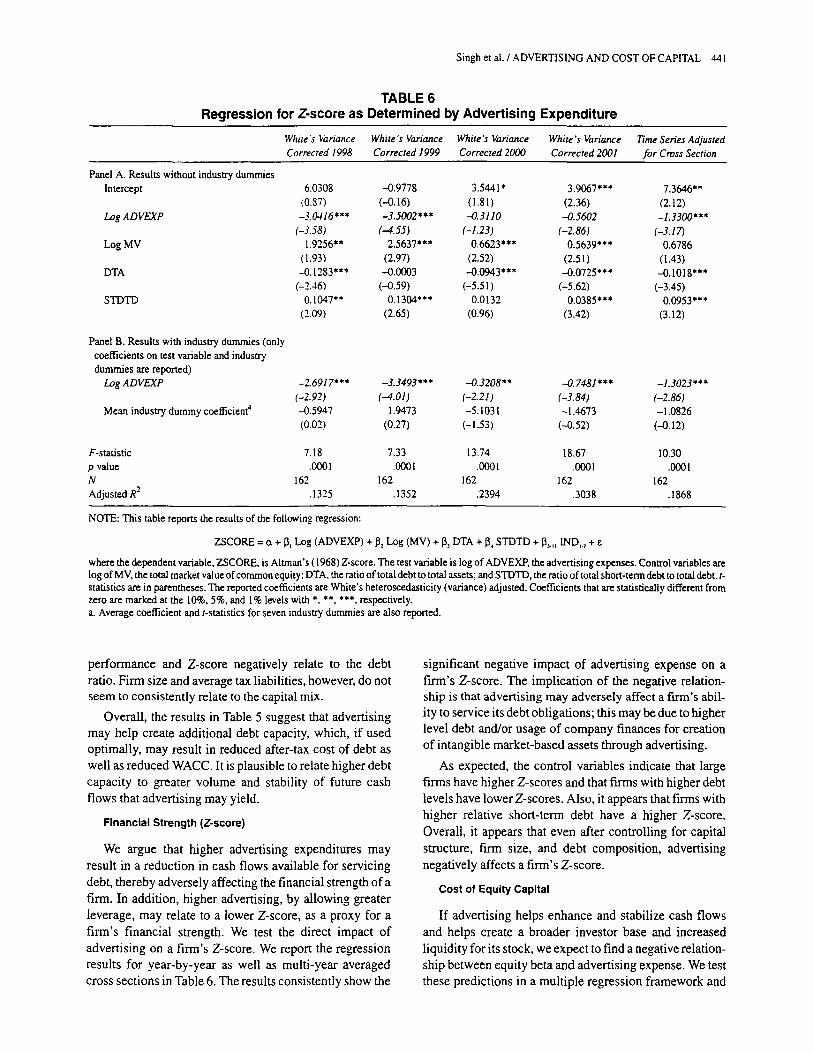
We argue that higher advertising expenditures may result in a reduction in cash flows available for servicing debt, thereby adversely affecting the financial strength of a firm. In addition, higher advertising, by allowing greater leverage, may relate to a lower Z-score, as a proxy for a firm's financial strength. We test the direct impact of advertising on a firm's Z-score. We report the recession results for year-by-year as well as multi-year averaged cross sections in Table 6. The results consistently show the
significant negative impact of advertising expense on a firm's Z-score. The implication of the negative relation- ship is that advertising may adversely affect a ftrm's abil- ity to service its debt obligations; this may be due to higher level debt and/or usage of company finances for creation of intangible market-based assets through advertising.
As expected, the control variables indicate that large firms have higher Z-scores and that fu-ms with higher debt levels have lower Z-scores. Also, it appears that firms with higher relative short-term debt have a higher Z-score. Overall, it appears that even after controlling for capital structure, firm size, and debt composition, advertising negatively affects a firm's Z-score.
Cost of Equity Capital
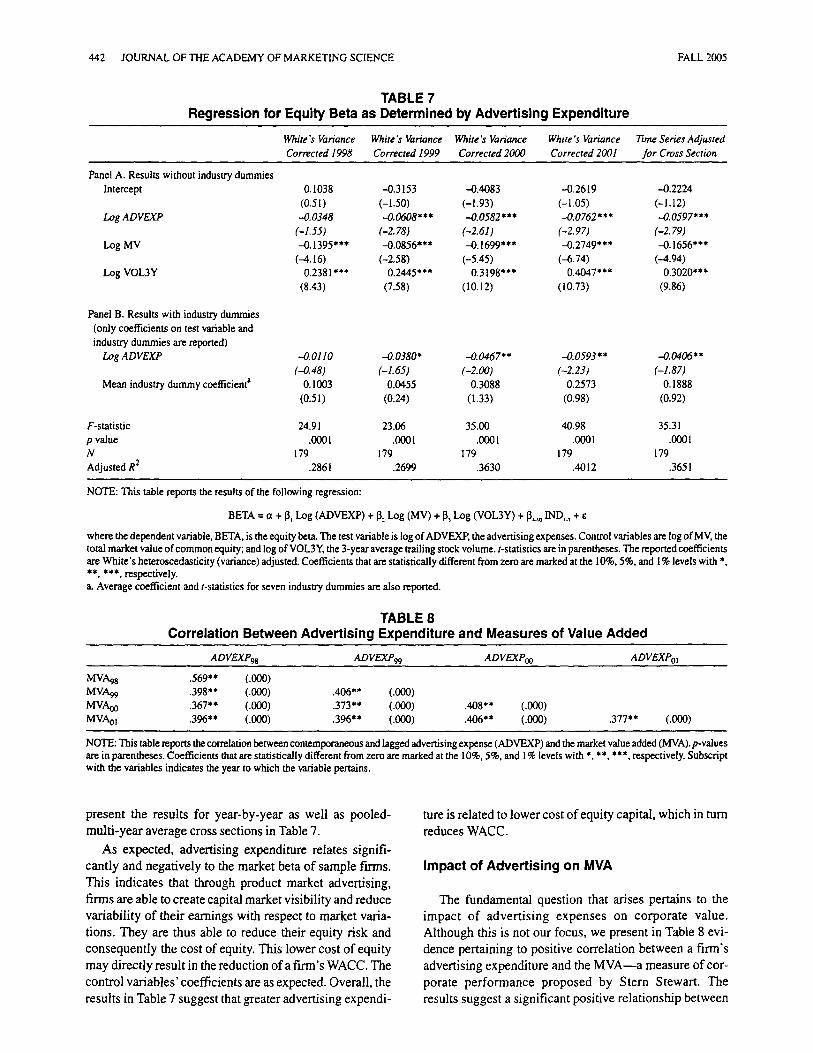
If advertising helps enhance and stabilize cash flows and helps create a broader investor base and increased liquidity for its stock, we expect to find a negative relation- ship between equity beta and advertising expense. We test these predictions in a multiple regression framework and
442 JOURNAL OF THE ACADEMY OF MARKETING SCIENCE FALL 2005
TABLE 7 Regression for Equity Beta as Determined by Advertising Expenditure
White's Variance White's Variance White's Variance White's Variance llme Series Adjusted Corrected 1998 Corrected 1999 Corrected 2000 Corrected 2001 for Cross Section
Panel A. Results without industry dummies Intercept 0.1038
(0.51) Log ADVEXP -.0.0348
(-1.55) Log MV --0.1395"**
(--4.16) Log VOL3Y 0.2381 ***
(8.43)
Panel B. Results with industry dummies (only coefficients on test variable and industry dummies are reported)
Log ADVEXP
Mean industry dummy coefficient a
-0.3153 -0.4083 -0.2619 -0.2224 (-1.50) (-1.93) (-1.05) (-1.12) -0.0608*** .-0.0582*** -0.0762*** .-0.0597***
(-2. 78) (-2.61) (-2. 97) (-2. 79) --0.0856*** -0.1699"** -0.2749*** -0.1656"**
(-2.58) (-5.45) (-6.74) (---4.94) 0.2445*** 0.3198"** 0.4047*** 0.3020***
(7.58) (10.12) (10.73) (9.86)
.-0.0110 --0.0380* -0.0467** --0.0593** .-0.0406** (-0.48) (-1.65) (-2.00) (-2.23) (-1.87)
0.1003 0.0455 0.3088 0.2573 0.1888 (0.51) (0.24) (1.33) (0.98) (0.92)
F-statistic 24.91 23.06 35.00 40.98 35.31 p value .0001 .0001 .0001 .0001 .0001 N 179 179 179 179 179 Adjusted R 2 .2861 .2699 .3630 .40 12 .3651
NOTE: This table reports the results of the following regression:
BETA = ct + [3, Log (ADVEXP) + 13,. Log (MV) + ~ Log (VOL3Y) + ~.~,o IND~.~ +
where the dependent variable, BETA, is the equity beta. The test variable is log of ADVEXP, the advertising expenses. Control variables are log of MV, the total market value of common equity; and log of VOL3Y, the 3-year average trailing stock volume, t-statistics are in parentheses. The reported coefficients are White's heteroscedasticity (variance) adjusted. Coefficients that arc statistically different from zero are marked at the 10%, 5%, and 1% levels with * �9 *, ***, respectively. a. Average coefficient and t-statistics for seven industry dummies are also reported.
TABLE 8 Correlation Between Advertising Expenditure and Measures of Value Added
ADVEXPgs ADVEXP99 ADVEXPoo ADVEXPol
MVA98 .569** (.000) MVA99 .398** (.000) .406** (.000) MVA0o .367** (.000) .373** (.000) .408** (.000) MVAol .396** (.000) .396** (.000) .406** (.000) .377** (.000)
NOTE: This table reports the correlation between contemporaneous and lagged advertising expense (ADVEXP) and the market value added (MVA). p-values are in parentheses. Coefficients that are statistically different from zero are marked at the 10%, 5%, and 1% levels with *, **, ***, respectively. Subscript with the variables indicates the year to which the variable pertains.
present the results for year-by-year as well as pooled- multi-year average cross sections in Table 7.
As expected, advertising expenditure relates signifi- cantly and negatively to the market beta of sample firms. This indicates that through product market advertising, firms are able to create capital market visibility and reduce variability of their earnings with respect to market varia- tions. They are thus able to reduce their equity risk and consequently the cost of equity. This lower cost of equity may directly result in the reduction of a firm's WACC. The control variables' coefficients are as expected. Overall, the results in Table 7 suggest that greater advertising expendi-
ture is related to lower cost of equity capital, which in turn reduces WACC.
Impact of Advertising on MVA
The fundamental question that arises pertains to the impact of advertising expenses on corporate value. Although this is not our focus, we present in Table 8 evi- dence pertaining to positive correlation between a firm's advertising expenditure and the MVA--a measure of cor- porate performance proposed by Stern Stewart. The results suggest a significant positive relationship between
Singh et al. / ADVERTISING AND COST OF CAPITAL 443
advertising expenditures and MVA, implying that firms with higher product market advertising also experience greater performance in terms of MVA.
CONCLUSION
In this article, we address the issue of spillover effects of product market advertising into the capital market. Spe- cifically, we investigate three questions: What is the impact ofa fh'm's product market advertising on its overall cost of capital? How does advertising affect the mix of debt and equity? And, what is advertising's impact on a f'trm's beta and Altman's Z-score? Using a sample of U.S. best performing firms from the Stern Stewart database, we conclude that product market advertising expenditures have a positive spillover impact on capital markets in terms of reducing a firm's overall cost of capital. The impact seems to be significant even after controlling for other determinants of cost of capital. In addition, we find that greater advertising associates with lower cost of equity, higher debt utilization, and lower Altman's Z-score. Finally, in analyzing corporate value contributions of advertising, we find that firms with higher advertising out- lays are also the ones that experience higher performance in terms of MVA.
NOTES
1. We use the term product market advertising to connote advertising to promote product/services output to ultimate (final consumers) or inter- mediate (businesses) actual or potential customers. The term product market is used interchangeably with goods market in the field of econom- ics to differentiate goods (consumable goods and services as outputs--fi- nal or intermediate) market from capital (labor and financial capital) market.
2. The Z-score represents the likelihood of insolvency and is gener- ated through multiple discriminant analysis (Altman, 1968).
3. Whereas point a suggests an increase in debt capacity and usage, point b indicates restricted debt usage.
4. In White's adjustment, the variance-covariance matrix is corrected for cross-sectional correlations. Note that without heteroscedasticity, the off-diagonal elements of the variance-covariance matrix (i.e., cross- sectional correlations) are zero. White's method forces these elements to be zero, whereas the "true" variance measures are estimated.
REFERENCES
Aaker, David A. 1991. Managing Brand Equity: Capitalizing on the Value of a Brand Name. New York: Free Press.
and Robert Jacobson. 1994. "The Financial Information Content oi" Perceived Quality." Journal of Marketing Research 31:191-201.
Altman, Edward. 1968. "Financial Ratios, Discriminant Analysis, and the Prediction of Corporate Bankruptcy." Journal of Finance 23:589- 609.
Amihud, Yakov, Haim Mendelsson, and Beni Lauterbach. 1997. "Market Microstructure and Securities Values: Evidence From Tel Aviv Stock Exchange." Journal of Financial Economics 45:365-390.
Anderson, Eugene W., Claes Fornell, and Sanal K. Mazvancheryl. 2004. "'Customer Satisfaction and Shareholder Value." Journal of Market- ing 68:172-186.
Anderson, Paul F. 1979. "The Marketing Management/Finance Inter- face." American Marketing Association Educators" Conference Pro- ceedings. Eds. Nell Beckwith, Michael Houston, Robert Mittelstaedt, Kent B. Monroe, and Scott Ward. Chicago: American Marketing Association, 325-329.
Barth, Mary E., Michael B. Clement, George Foster, and Ron Kasznik. 1998. "Brand Values and Capital Market Valuation." Review of Ac- counting Studies 3:41-68.
Blattberg, Robert C. and Scott A. Neslin. 1990. Sales Promotion, Con- cepts, Methods andStrategies. Englewood Cliffs, N J: Prenfce Hall.
Boulding, William, Eunkyu Lee, and Richard Staelin. 1994. "Mastering the Mix: Do Advertising, Promotion, and Sales Force Activities Lead to Differentiation?" Journal of Marketing Research 31:159-172.
Brennan, Michael J., Tarun Chordia, and Avanidhar Subrahmanyam. 1998. "Alternative Factor Specifications, Security Characteristics, and the Cross-Section of Expected Stock Returns" Journal of Finan. cial Economics 49:354-373.
Chauvin, Keith W. and Mark Hirschey. 1993. "Advertising, R&D Expen- ditures, and the Market Value of the Firm." Financial Management 22:128-140.
Cheng, Agnes C. S. and Charles J. P. Chen. 1997. "Firm Valuation of Ad- vertising Expense: An Investigation of Scaler Effects." Managerial Finance 23:41-62.
Copeland, Thomas E. and J. Fred Weston. 1992. Financial Theory and Corporate Policy. 3d ed. New York: Addison-Wesley.
Day, George and Liam Fahey. 1988. "Valuing Market Strategies." Jour- nal of Marketing 52:45-57.
Elton, Edwin J., Marun J. Gruber, Deepak Agrawal, and Christopher Mann. 2001. "Explaining the Rate Spread on Corporate Bonds )' Journal of Finance 56:247-277.
Fama, Eugene F. and James MacBeth. 1973. "Risk, Return, and Equilib- rium: Empirical Tests." Journal of Political Economy 81:607-636.
Farquhar, Peter H. 1989. "Managing Brand Equity." Marketing Research 1:24-33.
Frank, Murray Z. and Vidhan K. Goyal. 2003. "Capital Structure Deci- sions)' Working Paper. University of British Columbia, Vancouver, Canada.
French, Kenneth R. and James M. Poterba. 1991. "Investor Diversifica- tion and International Equity Markets.'" American Economic Review 81:222-226.
Frieder, Laura and A. Subrahmanyam. 2001. "Brand Perceptions and the Market for Common Stock." Working Paper. University of Califor- nia, Los Angeles, Anderson School of Management.
Grullon, Gustavo, George Kanatas, and James P. Weston. 2004. "Adver- tising, Breadth of Ownership, and Liquidity." Review of Financial Studies 17:439-461.
Harris, Milton and Artur Raviv. 1991. 'q'he Theory of Capital Structure ." Journal of Finance 46:297-355.
Huberman, Gur. 2001. "Familiarity Breeds Investment." Review of Fi- nancial Studies 14:659-680.
Jin, Li, Robert C. Merton, and Zvi Bodie. 2004. "Do a Firm's Equity Re- turns Reflect the Risk of Its Pension Plan?" Working Paper, Harvard University, Cambridge, MA.
Johnson, Shane. 2003. "Debt Maturity and the Effect of Growth Opportu- nities and Liquidity Risk on Leverage." Review of Financial Studies 16:209-236.
Joshi, Amit and Dominique M. Hanssens. 2004. "Advertising Spending and Market Capitalization." Working Paper, University of California, Los Angeles, Anderson School of Management.
Kadlec, G. B. and J. J. Mc Connell. 1994. "The Effect of Market Segmen- tation and llliquidity on Asset-Prices: Evidence From Exchange List- ings." Journal of Finance 51: [ 1-35.
Kallapur, Sanjay and Sabrina Y. S. Kwan. 2004. "The Value Relevance and Reliability of Brand Assets Recognized by UK Firms ?' Account- ing Review 79:151-172.
Keller, Kevin L. 2002. Strategic Brand Management: Building, Measur- ing, and Managing Brand Equity. Paramus, N J: Prentice Hall.
Klein, Roger W. and Vijay S. Bawa. 1976. "The Effect of Estimation Risk on Optimal Portfolio Choice.'" Journal of Financial Economics 3:215-231.
444 JOURNAL OF THE ACADEMY OF MARKETING SCIENCE FALL 2005
and .1977. "The Effect of Limited Information and Esti- mation Risk on Optimal Portfolio Diversification." Journal of Finan- cial Economics 5:89-111.
Kopalle, Praveen, Cad E Mela, and Lawrence Marsh. 1999. "The Dy- namic Effect of Discounting on Sales: Empirical Analysis and Nor- mafive Pricing Implications" Marketing Science 18:317-332.
Krause, Alan and Robert H. Litzenberger. 1973. "A State-Preference Model of Optimal Financial Leverage." Journal ofb"mance 28 (Sep- tember): 911-922.
Limner, John. 1965. "The Valuation of Risky Assets and the Selection of Risky Investments in Stock Portfolios and Budget Constraints." Re- view of Economics and Statistics 47:13-37.
Merton, Robert C. 1987. =A Simple Model of Capital Market Equilibrium With Incomplete Information:' Journal of Finance 42:483-510.
Mishra, Dev, Thomas J. O'Brien, and Zvi Bodie. 2003. "Risk and ExAnte Cost of Equity Estimates of Emerging Market Firms." Working Pa- per. University of Connecticut, Storrs.
Mizik, Natalie and Robert Jacobson. 2003. "Trading Off Between Value Creation and Value Appropriation: The Financial Implications of Shifts in Strategic Emphasis." Journal of Marketing 67:63-76.
Modigliani, Franco and Melton Miller. 1958. "The Cost of Capital, Cor- poration Finance and the Theory o f Investment." Amer/can Economic Review 48:261-297.
Mossin, Jan. 1966. "Equilibrium in a Capital Asset Market." Econometrica 34:768-783.
Pauwels, KOCh, Jorge Silva-Risso, Shuba Srinivasan, and Dominique M. Flanssens. 2004. "New Products, Sales Promotions, and F'u'm Value: The Case of the Automobile Industry." Journal of Marketing 68 (4): 142-156.
Rao, Vithala R., Manoj K. Agarwal, and Denise Dahlhoff. 2004. "How Is Manifest Branding Strategy Related to the Intangible Value of a Cor- poration?" Journal of Marketing 68:126-142.
Sharpe, William. 1964. "Capital Asset Prices: A Theory of Market Equi- librium Under Conditions of Risk." Journal of Finance 19:425-442.
Srivastava, Rajendra K., Tasadduq A. Shervani, and Liana Fahey. 1998. "Market-Based Assets and Shareholder Value: A Framework for Analysis." Journal of Marketing 62: 2-18.
ABOUT THE AUTHORS
Manohar Singh ([email protected]) is an associate pro- fessor of finance at Willamette University in Salem, Oregon. He holds a Ph.D. in finance from Southern Illinois University at Car- bondale. His published research includes publications in the Journal of Banking and Finance, Financial Review, the Journal of Multinational Financial Management, and the Pacific Basin Finance Journal, among others. His research interests include corporate governance and corporate finance and strategy.
Sheri Fa i rdo th ([email protected]) is an associate pro- fessor of finance at the University of Nevada at Reno. She holds a Ph.D. in finance from the University of Texas at Arlington. Her research interests include corporate finance, investments, and real estate finance. She has published in finance journals such as the Journal of Real Estate Finance and Economics, the Journal of Real Estate Literature, Review of the Academy of Finance, the Journal of the Academy of Finance, and Applied Economics.
Ali Nejadmalayeri ([email protected]) is an assistant professor of finance at the University of Nevada at Reno. He holds an M.B.A. from Texas A&M University and a Ph.D. in finance from the Uni- versity of Arizona. He has published in finance journals such as the Journal of Business, the Journal of Real Estate Finance and Economics, and the Journal of Multinational Financial Manage- ment. He was awarded the College of Business Researcher of the Year Award for 2004.