EXHIBIT 4 – OPERATING EXPENSES - Algoma Power
396
Algoma Power Inc. EB-2019-0019 Exhibit 4 – Operating Expenses Page 1 of 94 May 17, 2019 EXHIBIT 4 – OPERATING EXPENSES 2020 Cost of Service Algoma Power Inc. EB-2019-0019
-
Upload
khangminh22 -
Category
Documents
-
view
1 -
download
0
Transcript of EXHIBIT 4 – OPERATING EXPENSES - Algoma Power
Algoma Power Inc. EB-2019-0019
Exhibit 4 – Operating Expenses Page 1 of 94
May 17, 2019
EXHIBIT 4 – OPERATING EXPENSES 2020 Cost of Service
Algoma Power Inc. EB-2019-0019
Algoma Power Inc. EB-2019-0019
Exhibit 4 – Operating Expenses Page 2 of 94
May 17, 2019
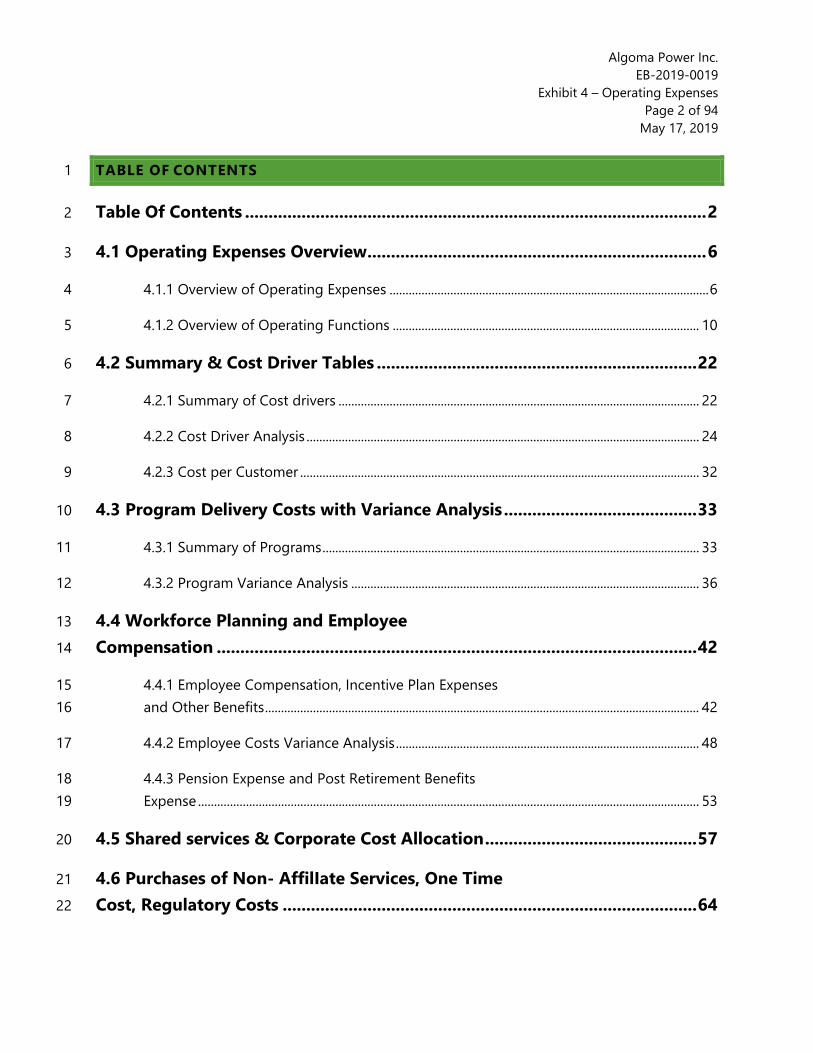
TABLE OF CONTENTS 1
Table Of Contents .................................................................................................. 2 2
4.1 Operating Expenses Overview ........................................................................ 6 3
4.1.1 Overview of Operating Expenses .................................................................................................... 6 4
4.1.2 Overview of Operating Functions ................................................................................................ 10 5
4.2 Summary & Cost Driver Tables .................................................................... 22 6
4.2.1 Summary of Cost drivers ................................................................................................................. 22 7
4.2.2 Cost Driver Analysis ........................................................................................................................... 24 8
4.2.3 Cost per Customer ............................................................................................................................. 32 9
4.3 Program Delivery Costs with Variance Analysis ......................................... 33 10
4.3.1 Summary of Programs ...................................................................................................................... 33 11
4.3.2 Program Variance Analysis ............................................................................................................. 36 12
4.4 Workforce Planning and Employee 13
Compensation ...................................................................................................... 42 14
4.4.1 Employee Compensation, Incentive Plan Expenses 15 and Other Benefits ........................................................................................................................................ 42 16
4.4.2 Employee Costs Variance Analysis ............................................................................................... 48 17
4.4.3 Pension Expense and Post Retirement Benefits 18 Expense ............................................................................................................................................................. 53 19
4.5 Shared services & Corporate Cost Allocation ............................................. 57 20
4.6 Purchases of Non- AffilIate Services, One Time 21
Cost, Regulatory Costs ........................................................................................ 64 22

Algoma Power Inc. EB-2019-0019
Exhibit 4 – Operating Expenses Page 3 of 94
May 17, 2019
4.6.1 Non-Affiliate Services ....................................................................................................................... 64 1
4.6.2 One-Time Costs .................................................................................................................................. 68 2
4.6.3 Regulatory Costs ................................................................................................................................. 70 3
4.7 LEAP, Chartiable & Political Donations ....................................................... 74 4
4.8 Depreciation, Amortization, and Depletion ................................................ 75 5
4.8.1 Overview ................................................................................................................................................ 75 6
4.8.2 Useful Lives Outside of Kinectrics Range .................................................................................. 83 7
4.9 Taxes & Payments in Lieu of Taxes (PILS) .................................................. 84 8
4.9.1 Overview of PILs .................................................................................................................................. 84 9
4.9.2 Acclerated CCA .................................................................................................................................... 85 10
4.10 Other Taxes .................................................................................................. 86 11
4.11 Non- Recoverable and Disallowed Expenses ............................................ 87 12
4.12 Conservation and Demand Management ................................................. 88 13
4.12.1 Conservation and Demand Management 14 Overview ........................................................................................................................................................... 88 15
4.12.2 LRAM Variance Account (LRAMVA) .......................................................................................... 90 16
Appendices ........................................................................................................... 94 17
Algoma Power Inc. EB-2019-0019
Exhibit 4 – Operating Expenses Page 4 of 94
May 17, 2019
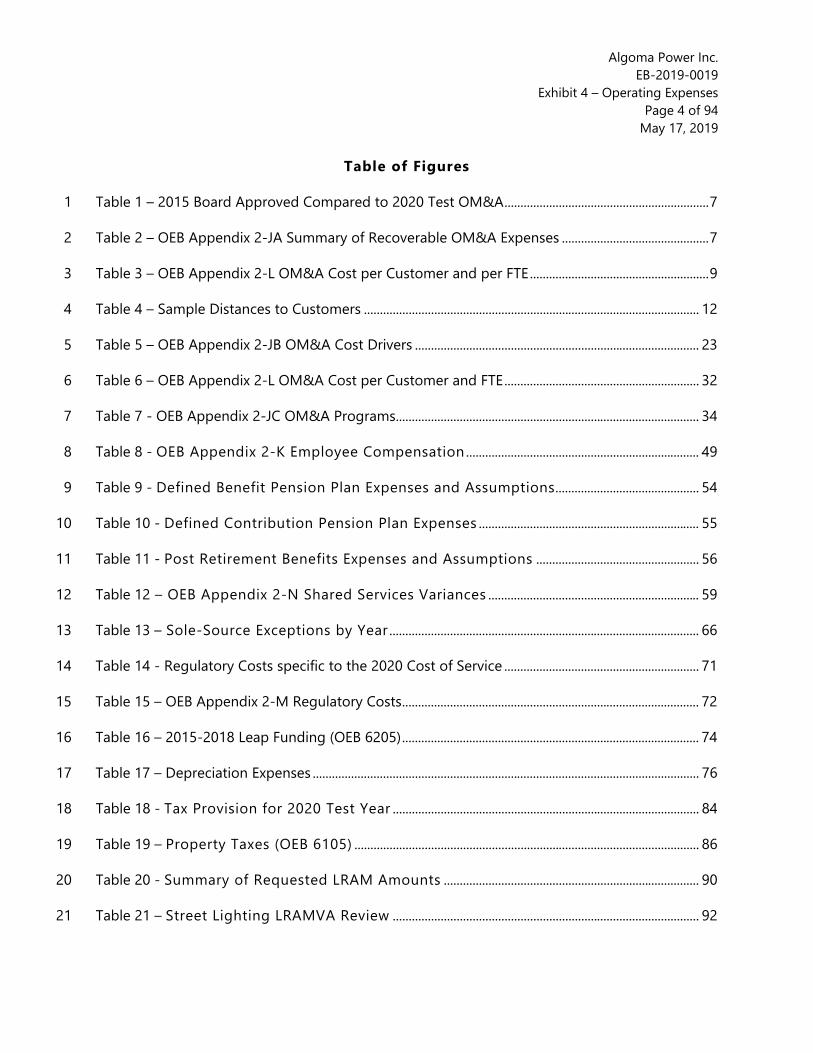
Table of Figures
Table 1 – 2015 Board Approved Compared to 2020 Test OM&A ................................................................ 7 1
Table 2 – OEB Appendix 2-JA Summary of Recoverable OM&A Expenses .............................................. 7 2
Table 3 – OEB Appendix 2-L OM&A Cost per Customer and per FTE ........................................................ 9 3
Table 4 – Sample Distances to Customers ......................................................................................................... 12 4
Table 5 – OEB Appendix 2-JB OM&A Cost Drivers ......................................................................................... 23 5
Table 6 – OEB Appendix 2-L OM&A Cost per Customer and FTE ............................................................. 32 6
Table 7 - OEB Appendix 2-JC OM&A Programs ............................................................................................... 34 7
Table 8 - OEB Appendix 2-K Employee Compensation ......................................................................... 49 8
Table 9 - Defined Benefit Pension Plan Expenses and Assumptions............................................. 54 9
Table 10 - Defined Contribution Pension Plan Expenses ..................................................................... 55 10
Table 11 - Post Retirement Benefits Expenses and Assumptions ................................................... 56 11
Table 12 – OEB Appendix 2-N Shared Services Variances .................................................................. 59 12
Table 13 – Sole-Source Exceptions by Year ................................................................................................. 66 13
Table 14 - Regulatory Costs specific to the 2020 Cost of Service ............................................................. 71 14
Table 15 – OEB Appendix 2-M Regulatory Costs ............................................................................................. 72 15
Table 16 – 2015-2018 Leap Funding (OEB 6205) ............................................................................................. 74 16
Table 17 – Depreciation Expenses ......................................................................................................................... 76 17
Table 18 - Tax Provision for 2020 Test Year ................................................................................................ 84 18
Table 19 – Property Taxes (OEB 6105) ............................................................................................................ 86 19
Table 20 - Summary of Requested LRAM Amounts ................................................................................ 90 20
Table 21 – Street Lighting LRAMVA Review ................................................................................................ 92 21

Algoma Power Inc. EB-2019-0019
Exhibit 4 – Operating Expenses Page 5 of 94
May 17, 2019
Table 22 – kW Demand LRAMVA Review ...................................................................................................... 92 1

Algoma Power Inc. EB-2019-0019
Exhibit 4 – Operating Expenses Page 6 of 94
May 17, 2019
4.1 OPERATING EXPENSES OVERVIEW 1
4.1.1 OVERVIEW OF OPERATING EXPENSES 2
The operating costs found in this Exhibit represent expenditures that are required to maintain 3
and operate API’s distribution system assets at the targeted levels of performance, to meet 4
customer expectations, ensure public and employee safety and provide quality service. These 5
operating costs are necessary to comply with the Distribution System Code, environmental 6
requirements, and government direction. OM&A expenses consist of, but are not limited to: the 7
required expenditures necessary to maintain and operate API’s distribution system assets; the 8
costs associated with metering, billing, and collecting from API’s customers; the costs associated 9
with ensuring the safety of all stakeholders; and costs to maintain distribution service quality 10
and reliability. 11
API’s 2020 Test Year operating costs are projected to be $13,677,187, which represents an 12
increase of $1,372,306 from 2015 Board Approved Cost of Service or 11.2%. A summary of the 13
changes from 2015 Board Approved to 2020 Test can be found in Table 1 below. Table 2 shows 14
an excerpt of Appendix 2-JA from the Chapter 2 filing requirements. 15

Algoma Power Inc. EB-2019-0019
Exhibit 4 – Operating Expenses Page 7 of 94
May 17, 2019
Table 1 – 2015 Board Approved Compared to 2020 Test OM&A 1
2015 Board Approved
2020 Diff
Operations $1,642,392 $1,782,437 140,045 Maintenance $5,118,954 $5,297,810 178,856
Billing and Collecting $1,090,942 $995,414 -95,528 Community Relations $22,102 $96,558 74,456
Administrative and General $4,430,491 $5,504,968 1,074,477 Total $12,304,881 $13,677,187 1,372,306
%Change 11.2%
2
Table 2 – OEB Appendix 2-JA Summary of Recoverable OM&A Expenses 3
Reporting Basis MIFRS MIFRS MIFRS MIFRS MIFRS MIFRS MIFRS
2015 Board Approved 2015 2016 2017 2018 2019 2020
Operations $1,642,392 $1,417,407 $1,296,572 $1,451,821 $1,566,232 $1,790,341 $1,782,437 Maintenance $5,118,954 $4,879,021 $5,064,915 $5,263,562 $5,145,408 $5,225,959 $5,297,810
SubTotal $6,761,346 $6,296,428 $6,361,487 $6,715,383 $6,711,640 $7,016,300 $7,080,247 %Change (year
over year) -6.9% 1.0% 5.6% -0.1% 4.5% 0.9%
%Change (Test Year vs
Last Rebasing Year - Actual)
4.7%
Billing and Collecting $1,090,942 $964,836 $875,602 $874,404 $919,935 $970,387 $995,414
Community Relations $22,102 $24,430 $32,308 $47,552 $141,890 $94,552 $96,558
Administrative and
General+LEAP $4,430,491 $4,529,865 $4,534,507 $4,494,382 $4,361,131 $4,843,215 $5,504,968
SubTotal $5,543,535 $5,519,131 $5,442,417 $5,416,338 $5,422,956 $5,908,154 $6,596,940 %Change (year
over year) -0.4% -1.4% -0.5% 0.1% 9.1% 11.7%
%Change (Test Year vs
Last Rebasing Year - Actual)
19.0%
Total $12,304,881 $11,815,559 $11,803,904 $12,131,721 $12,134,596 $12,924,455 $13,677,187 %Change (year
over year) -4.0% -0.1% 2.8% 0.0% 6.5% 5.8%
4
Algoma Power Inc. EB-2019-0019
Exhibit 4 – Operating Expenses Page 8 of 94
May 17, 2019
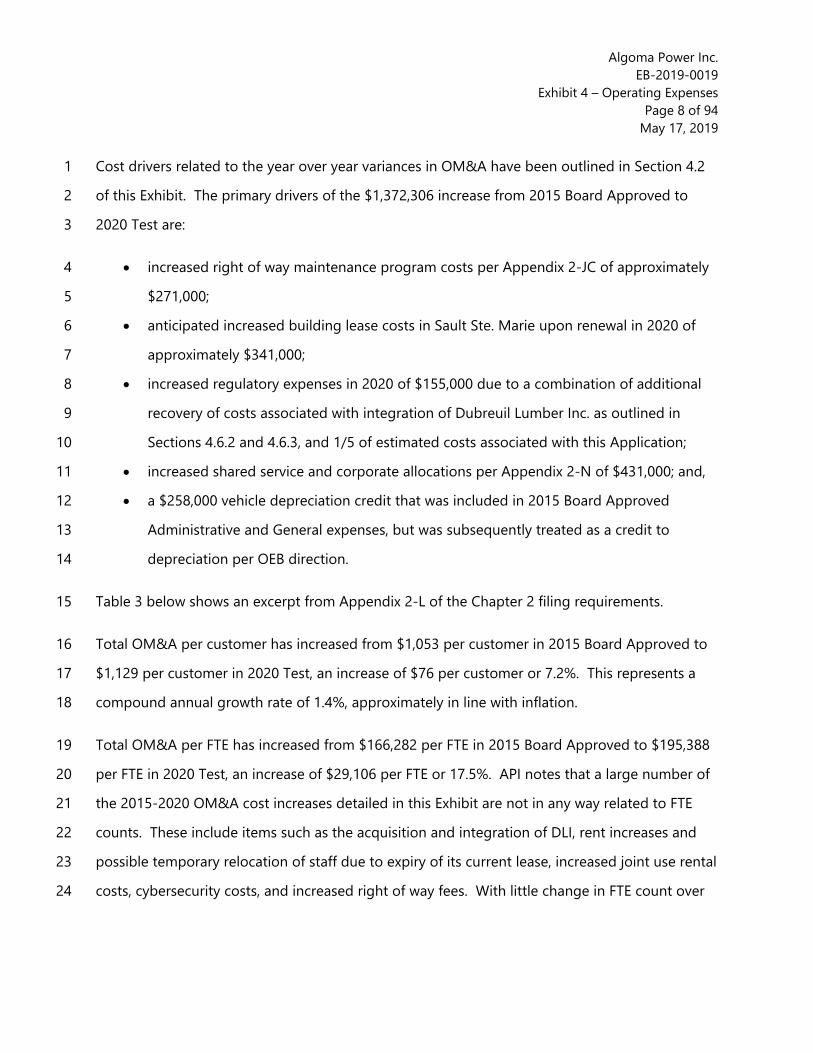
Cost drivers related to the year over year variances in OM&A have been outlined in Section 4.2 1
of this Exhibit. The primary drivers of the $1,372,306 increase from 2015 Board Approved to 2
2020 Test are: 3
• increased right of way maintenance program costs per Appendix 2-JC of approximately 4
$271,000; 5
• anticipated increased building lease costs in Sault Ste. Marie upon renewal in 2020 of 6
approximately $341,000; 7
• increased regulatory expenses in 2020 of $155,000 due to a combination of additional 8
recovery of costs associated with integration of Dubreuil Lumber Inc. as outlined in 9
Sections 4.6.2 and 4.6.3, and 1/5 of estimated costs associated with this Application; 10
• increased shared service and corporate allocations per Appendix 2-N of $431,000; and, 11
• a $258,000 vehicle depreciation credit that was included in 2015 Board Approved 12
Administrative and General expenses, but was subsequently treated as a credit to 13
depreciation per OEB direction. 14
Table 3 below shows an excerpt from Appendix 2-L of the Chapter 2 filing requirements. 15
Total OM&A per customer has increased from $1,053 per customer in 2015 Board Approved to 16
$1,129 per customer in 2020 Test, an increase of $76 per customer or 7.2%. This represents a 17
compound annual growth rate of 1.4%, approximately in line with inflation. 18
Total OM&A per FTE has increased from $166,282 per FTE in 2015 Board Approved to $195,388 19
per FTE in 2020 Test, an increase of $29,106 per FTE or 17.5%. API notes that a large number of 20
the 2015-2020 OM&A cost increases detailed in this Exhibit are not in any way related to FTE 21
counts. These include items such as the acquisition and integration of DLI, rent increases and 22
possible temporary relocation of staff due to expiry of its current lease, increased joint use rental 23
costs, cybersecurity costs, and increased right of way fees. With little change in FTE count over 24
Algoma Power Inc. EB-2019-0019
Exhibit 4 – Operating Expenses Page 9 of 94
May 17, 2019
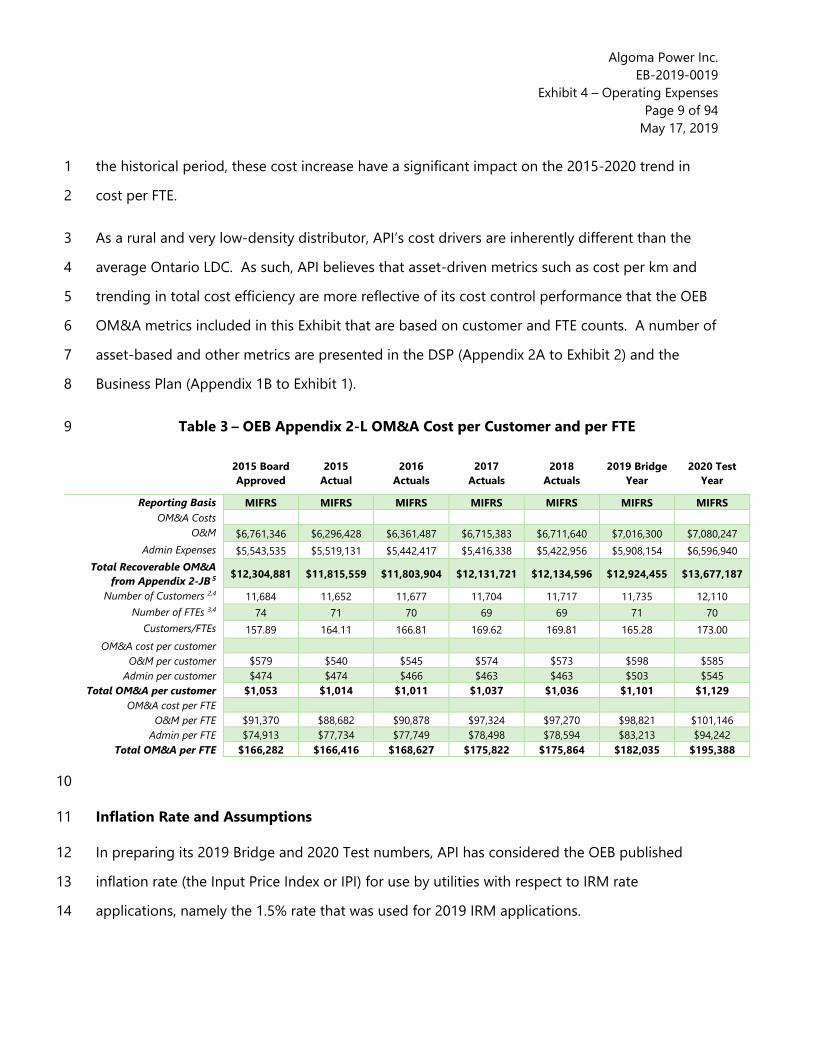
the historical period, these cost increase have a significant impact on the 2015-2020 trend in 1
cost per FTE. 2
As a rural and very low-density distributor, API’s cost drivers are inherently different than the 3
average Ontario LDC. As such, API believes that asset-driven metrics such as cost per km and 4
trending in total cost efficiency are more reflective of its cost control performance that the OEB 5
OM&A metrics included in this Exhibit that are based on customer and FTE counts. A number of 6
asset-based and other metrics are presented in the DSP (Appendix 2A to Exhibit 2) and the 7
Business Plan (Appendix 1B to Exhibit 1). 8
Table 3 – OEB Appendix 2-L OM&A Cost per Customer and per FTE 9
2015 Board Approved
2015 Actual
2016 Actuals
2017 Actuals
2018 Actuals
2019 Bridge Year
2020 Test Year
Reporting Basis MIFRS MIFRS MIFRS MIFRS MIFRS MIFRS MIFRS OM&A Costs
O&M $6,761,346 $6,296,428 $6,361,487 $6,715,383 $6,711,640 $7,016,300 $7,080,247 Admin Expenses $5,543,535 $5,519,131 $5,442,417 $5,416,338 $5,422,956 $5,908,154 $6,596,940
Total Recoverable OM&A from Appendix 2-JB 5 $12,304,881 $11,815,559 $11,803,904 $12,131,721 $12,134,596 $12,924,455 $13,677,187
Number of Customers 2,4 11,684 11,652 11,677 11,704 11,717 11,735 12,110 Number of FTEs 3,4 74 71 70 69 69 71 70
Customers/FTEs 157.89 164.11 166.81 169.62 169.81 165.28 173.00 OM&A cost per customer
O&M per customer $579 $540 $545 $574 $573 $598 $585 Admin per customer $474 $474 $466 $463 $463 $503 $545
Total OM&A per customer $1,053 $1,014 $1,011 $1,037 $1,036 $1,101 $1,129 OM&A cost per FTE
O&M per FTE $91,370 $88,682 $90,878 $97,324 $97,270 $98,821 $101,146 Admin per FTE $74,913 $77,734 $77,749 $78,498 $78,594 $83,213 $94,242
Total OM&A per FTE $166,282 $166,416 $168,627 $175,822 $175,864 $182,035 $195,388
10
Inflation Rate and Assumptions 11
In preparing its 2019 Bridge and 2020 Test numbers, API has considered the OEB published 12
inflation rate (the Input Price Index or IPI) for use by utilities with respect to IRM rate 13
applications, namely the 1.5% rate that was used for 2019 IRM applications. 14

Algoma Power Inc. EB-2019-0019
Exhibit 4 – Operating Expenses Page 10 of 94 May 17, 2019
4.1.2 OVERVIEW OF OPERATING FUNCTIONS 1
To provide a more comprehensive understanding of API’s operations, below is an overview of the 2
functional responsibilities within the organization. 3
OPERATIONS AND MAINTENANCE 4
Operations and Maintenance includes the responsibilities associated with the effective and 5
efficient delivery of all aspects of system engineering and planning, construction, maintenance 6
and operations of the distribution systems. This incorporates the following departments: Line 7
Services, Meter Services, Engineering, Procurement and Materials Management, Fleet and 8
Facilities. API’s Sault Ste. Marie Service Centre is the main operating centre with smaller service 9
centres in both Wawa and Desbarats, Ontario. 10
Engineering 11
API Engineering includes all activities associated with long-term asset management, capital 12
program budgeting, and standards development. The department is located in Sault Ste. Marie 13
and has a variety of technical skilled staff in order to accomplish the activities listed below: 14
Capital / Maintenance Programs 15
• Identify long range capital program and projects 16
• Develop short range capital programs and projects 17
• Develop and manage annual capital budgets 18
• Develop maintenance plans and programs 19
• Coordinate, monitor, report on annual capital program progress 20
• Maintain the Distribution System Plan to ensure alignment of all capital and maintenance 21
programs 22

Algoma Power Inc. EB-2019-0019
Exhibit 4 – Operating Expenses Page 11 of 94 May 17, 2019
Agreements / Corporate Data / Regulatory 1
• Develop and manage asset recording through corporate systems (GIS, SAP) 2
• Develop / negotiate / administer property and access agreements 3
• Manage regulatory compliance to Electrical Safety Authority Reg. 22/04, 4
• Aggregate and report company outage statistics 5
• Develop / negotiate / administrate Joint Use tenant agreements 6
• Develop and manage highway and railway agreements 7
• Assist and participate with rate applications and other OEB matters 8
• Manage property and access engagements, disputes or concerns 9
Engineering 10
• Distribution System planning 11
• Develop designs and standards for overhead, underground, and submarine power line 12
construction 13
• Develop standards for material and equipment specifications 14
• Develop asset management plans and justifications 15
• Manage small and large customer connections 16
• Provide technical support for field level troubleshooting and maintenance 17
• Assist with the development of business processes 18
• Coordinate with customers on technical issues 19
Dispatching 20
The Dispatching function includes internal labour primarily from the lines department, operating 21
costs for radio equipment, and other third party support fees for after-hours customer call 22
centre and dispatch. API has not yet fully implemented its SCADA system. API has described its 23
delay in full SCADA implementation in Section 4.2.2 of this Exhibit as well in the DSP. 24
Algoma Power Inc. EB-2019-0019
Exhibit 4 – Operating Expenses Page 12 of 94 May 17, 2019
Lines 1
The Lines function includes all activities associated with field operations, maintenance, and 2
outage restoration of API distribution line network. In order to accomplish the following 3
activities, there are three service centres positioned at geographically strategic locations, in 4
consideration of the vast service area over which API operates. These dispersed service centres 5
allow for faster response time to customer service and outage demands. Service centres in 6
Wawa, Desbarats and Sault Ste. Marie have equipment, tools and materials inventory to allow 7
for all routine maintenance and outage restoration activities to be dispatched from those 8
locations. A larger inventory of equipment and materials inventory is located at the service 9
centre in Sault Ste. Marie. 10
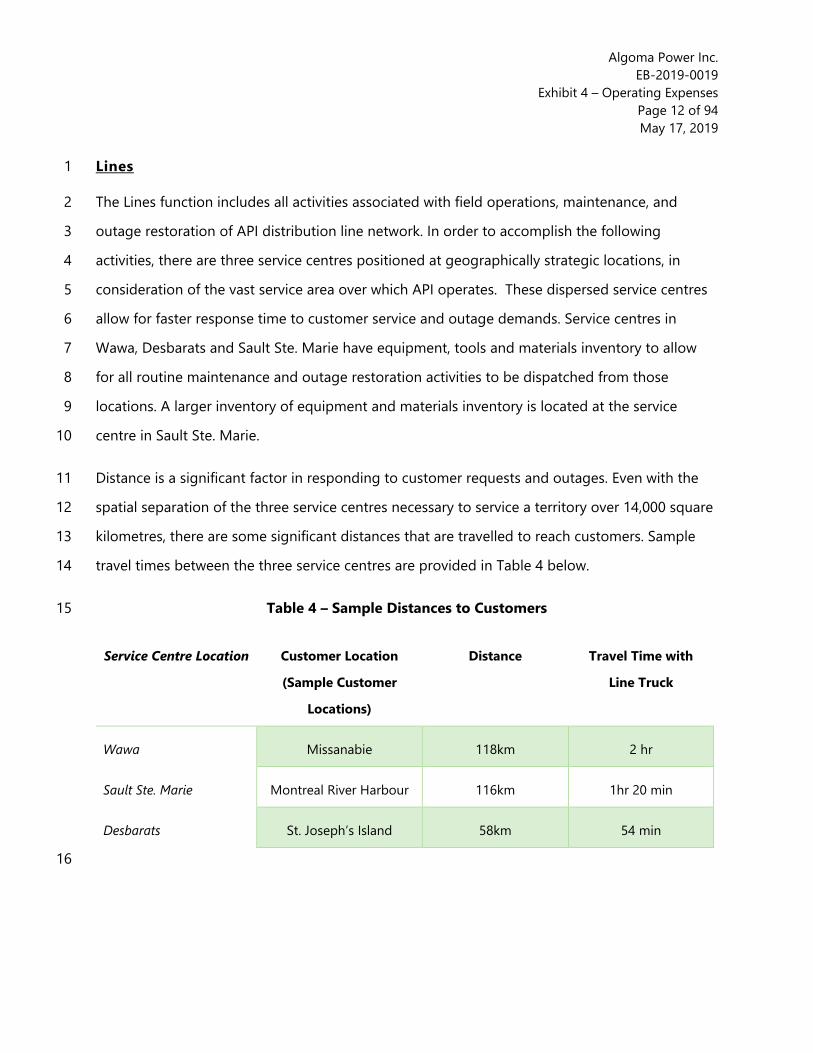
Distance is a significant factor in responding to customer requests and outages. Even with the 11
spatial separation of the three service centres necessary to service a territory over 14,000 square 12
kilometres, there are some significant distances that are travelled to reach customers. Sample 13
travel times between the three service centres are provided in Table 4 below. 14
Table 4 – Sample Distances to Customers 15
Service Centre Location Customer Location
(Sample Customer
Locations)
Distance Travel Time with
Line Truck
Wawa Missanabie 118km 2 hr
Sault Ste. Marie Montreal River Harbour 116km 1hr 20 min
Desbarats St. Joseph’s Island 58km 54 min
16
Algoma Power Inc. EB-2019-0019
Exhibit 4 – Operating Expenses Page 13 of 94 May 17, 2019
Routine Activities of Line Department include: 1
Inspections 2
• Line patrols, utilizing various equipment and methods in order to complete the 3
inspection cycle in a variety of geographic and climate conditions. 4
• On-road line sections are patrolled using pickup truck or equivalent, off road sections 5
are patrolled using all-terrain vehicle, snowmobile or on foot. Approximately ¼ (or 6
460km) of API circuits are off road. 7
Maintenance 8
• Maintenance is performed on pole installations or line hardware (such as switches and 9
connections) as problems are identified through the inspection process or other means. 10
Outage response 11
• Outage response is a significant activity for API's lines function. API's reliability is 12
impacted by the heavily forested terrain and climate of Northern Ontario as well as the 13
vastness of the service area. 14
Operational switching 15
• API has SCADA ready devices installed within its distribution system, but SCADA 16
functionality is not enabled. As a result, there are periodic system switching required for 17
purposes of isolating sections of the API system for maintenance or capital work, or to 18
respond to requests from the Transmitter (Hydro One Sault Ste. Marie) to de-energize 19
certain feeders for worker safety within the Transmission substations. 20
Customer concerns 21
• API responds to customer concerns, which may relate to technical, power quality, or 22
public safety in nature. 23

Algoma Power Inc. EB-2019-0019
Exhibit 4 – Operating Expenses Page 14 of 94 May 17, 2019
Vegetation management 1
Given API’s vast service territory including a significant portion being rural, vegetation 2
management of the distribution Rights-of-Way throughout the API service area is key. In 3
addition to performing field line clearing activities, the department ensures all land issues, 4
notifications and permissions are obtained prior to the field work. The field work completed by 5
API staff is performed for the most part by skilled utility arborist tradespersons. In addition to 6
internal staff, a large portion of the field work is contracted out to companies that specialize in 7
this type of work. Accordingly, the support to manage, administer and monitor these contracts is 8
also performed by this department. Vegetation can interfere with the safe and reliable operation 9
of API’s electrical system. Trees and brush growing in the vicinity of electrical wires increase the 10
risk of injury to the public and API’s employees as vegetation contacts or arcs with power lines. 11
Vegetation can cause electrical service interruptions when branches contact or come in close 12
proximity to power lines. Some examples of these contacts occur when vegetation grows 13
naturally towards the conductor, as well as, during wind storms or with ice or snow build-up 14
which cause movement or failure (breakage) of the vegetation and power lines to sag and/or 15
swing. Trees or branches falling on power lines are also a major causes of power interruption 16
whether through natural tree health decline and/or loading forces on trees, such as wind, snow, 17
and ice. Vegetation can also impede the efforts of staff to locate, inspect, maintain, and repair 18
disruptions to electrical service. 19
The overall objective of API’s Vegetation Management Plan is to manage vegetation in proximity 20
to electrical equipment on a regular schedule to carry out the following: 21
o Enhance public safety near electrical equipment; 22
o Avoid vegetation caused outages thereby sustaining and improving reliability; 23
o Allow worker accessibility to the system; and 24
o Manage and plan vegetation work activities in a least cost sustainable manner. 25

Algoma Power Inc. EB-2019-0019
Exhibit 4 – Operating Expenses Page 15 of 94 May 17, 2019
API has described its Vegetation Management Plan further in the DSP included in Exhibit 2 of this 1
Application. 2
Stations 3
Stations includes all activities associated with maintenance of API distribution stations 4
throughout its system. The stations house various equipment including transformers, switches 5
and protective devices. The electrical trades staff are responsible for completing the following: 6
• Station inspections; 7
• Annual power transformer oil testing; 8
• Transformer and switch testing & maintenance; 9
• Oil containment inspection & maintenance; 10
• Infrared scanning of electrical facilities; 11
• Voltage regulator checks; 12
• Recloser inspection, maintenance and testing; and 13
• Underground facility locates and manage locates 14
15

Algoma Power Inc. EB-2019-0019
Exhibit 4 – Operating Expenses Page 16 of 94 May 17, 2019
Metering 1
There are eight delivery points supplying electricity to the API system. Each of those delivery 2
points are registered IESO metered facilities which require regular maintenance as prescribed by 3
the market rules and are managed by a registered Meter Service Provider (“MSP”). Metering also 4
includes the cost of operating and maintaining the Smart meters and its communication 5
network. 6
API’s O&M costs related to its AMI system are primarily driven by monthly fees associated with 7
operating and maintaining the AMI towers and repeaters. These fees include regular preventive 8
maintenance performed by API’s AMI Vendor (Sensus), Industry Canada RF licensing costs, and 9
other costs associated with each site items such as electrical consumption, communications 10
backhaul and leasing charges for towers owned by third parties. 11
The meter trades and staff are responsible for completing the following: 12
• Meter reading, including meters not in time-of-use or non-communicating; 13
• Meter exchanges as a result of troubleshooting, meter failures/meter communication 14
failures; 15
• Disconnects / reconnects for non-payment, customer vacancies or customer requests; 16
• Annual meter exchange program 17
• Troubleshooting meter communications infrastructure including 8 base stations, 23 18
remote portals and 11 wholesale meter connections; 19
• Supporting annual wholesale meter exchange program (supplement the MSP trade staff); 20
and 21
• Transformer Rated Meter verification 22
Algoma Power Inc. EB-2019-0019
Exhibit 4 – Operating Expenses Page 17 of 94 May 17, 2019
Customer Service 1
Customer Service primarily involves Billing, Collecting, Communication, and Account 2
Maintenance. 3
In 2013, API began utilizing the FortisOntario SAP system for managing its customer information 4
and contact management. Through this implementation, API billing and collecting functions 5
were centralized similarly to the other FortisOntario utilities. Local functions include Account 6
Maintenance, Communication and all associated customer inquiry assistance. 7
Customer Service also involves Community Relations, namely Public Safety programs, Energy 8
Conservation, Communication, and attending regular municipal and First Nations customer and 9
community stakeholder meetings. 10
Materials Management 11
Materials Management includes activities associated with procurement, storage and handling of 12
materials and related distribution hardware that is required for all of the capital and 13
maintenance programs. There is a larger warehouse located in Sault Ste. Marie in addition to 14
two smaller inventory locations in both the Desbarats and Wawa service centres. All three 15
locations include poles, wire, transformers and critical spares inventory. There are dedicated 16
resources that are accountable for all procurement and inventory management including 17
shipping and receiving. 18
Facilities Management 19
As noted earlier, there are three service centres; Sault Ste. Marie, Desbarats, and Wawa. Activities 20
performed in this function involve the operation and maintenance of these facilities including 21
snow removal and yard maintenance 22

Algoma Power Inc. EB-2019-0019
Exhibit 4 – Operating Expenses Page 18 of 94 May 17, 2019
GENERAL AND ADMINISTRATION 1
Health, Safety & Environment 2
An integral component of API’s operations is its Health, Safety & Environment (“HSE”) 3
department and its systematic approach to proactively managing safety and the environment. 4
API utilizes an integrated management system for HSE, consistent with the standards of OHSAS 5
18001 (Health & Safety) and ISO 14001 (Environment) and developed within the context of 6
FortisOntario’s structure. The management system is based upon the premise of “Plan, Do, 7
Check and Act”. Both of these standards have been developed based on a foundation of a 8
strong Internal Responsibility System. This is a key value contained in the Occupational Health 9
and Safety Act. All HS&E responsibilities are identified through the management system and 10
have been clearly assigned to all levels of API and its parent company FortisOntario including: 11
the Board of Directors, the Executive, Departments (Managers, Supervisors and workers) and 12
Committees (Executive Environmental & Safety Committee, Central Environment & Safety 13
Committee, Joint Health & Safety Committee and Environmental Leadership Team). 14
FortisOntario’s corporate HS&E department consists of two full time employees and additional 15
employees with combined responsibilities managing the five FortisOntario business units with 16
approximately 200 employees and 37 facilities (offices & sub-stations) across Ontario. Each of 17
these utilities/service territories inherently possess unique HS&E challenges associated with their 18
geographical location and operational differences, and benefit from a standardized approach to 19
managing HS&E. 20
The following is an overview of the FortisOntario’s HS&E departmental functions. 21
• Hazard Assessment 22
• Legal Compliance 23
• Performance Indicators 24

Algoma Power Inc. EB-2019-0019
Exhibit 4 – Operating Expenses Page 19 of 94 May 17, 2019
• Training 1
• Audits and Inspections 2
One of the core principles consistent to both of the standards associated with the FortisOntario 3
HS&E management system is the need for continual improvement. The HS&E department 4
explores new ideas and facilitates recommendations to improve the system, and to promote 5
HS&E responsibility. In an industry in which technology is evolving rapidly, and in an 6
environment where API’s workers are exposed to risk, it is imperative that API continues to 7
commit the appropriate resources to sustain its current level of HS&E performance. In that 8
regard, API has consistently achieved high levels of success in the areas of health, safety and 9
environmental management as evidenced by its HS&E record. 10
API promotes HSE work practices through many elements of the system including regular 11
workplace inspections and work observations and training throughout its service territory. 12
Training requirements for API include standardized utility sector focused training as well as 13
additional training related to its API service area such as Ice and Water Rescue, Wilderness 14
Advance First Aid, Tree Top Rescue, Snow machine and Off Road Vehicle. 15
Human Resources 16
Headquartered in Fort Erie, the Human Resources department has corporate responsibilities 17
throughout the organization. The priorities of the department are to ensure adequate staffing 18
levels, succession planning and employee retention with a focus on employee development and 19
on-going labour relations. 20
A leadership coaching and development training program has been offered to a number of 21
management and supervisory employees to further develop their management and leadership 22
skill set. A mentoring program has been rolled out to compliment the leadership coaching and 23
development program. 24

Algoma Power Inc. EB-2019-0019
Exhibit 4 – Operating Expenses Page 20 of 94 May 17, 2019
Health plan cost management, pension administration and workplace safety and insurance 1
board administration, and other benefit related activities are managed by the Human Resources 2
department. The company maintains a modified return to work program and regularly tracks, 3
reports and manages human resources in an effort to remain aligned with corporate objectives. 4
API maintains positive labour relations with its represented employees and has a cooperative 5
working relationship with PWU leadership. 6
Corporate Communications and Community Involvement (Community Relations) 7
Community involvement and public relations remain an important core value of API. Continued 8
local community involvement in selective focus areas will aid in achieving the goal of being 9
recognized as a valued member of the community served. 10
The implementation of social media (twitter and Facebook) have provided additional channels 11
to promote API’s community involvement initiatives. 12
API continues presenting Public Electrical Safety and Conservation programs for local 13
elementary students. Each school within the service territory is scheduled to have the 14
presentation every fourth year. 15
Information Technology 16
API utilizes CNPI’s CIS and Enterprise Resource Planning SAP solution as the IT system to 17
provide a fully integrated billing and back office solution. The Information Technology corporate 18
department is responsible for all hardware and software maintenance and programming. The 19
department has continued to focus on developing in-house expertise to reduce the need to 20
utilize third party consultants. 21
Algoma Power Inc. EB-2019-0019
Exhibit 4 – Operating Expenses Page 21 of 94 May 17, 2019
Finance 1
The corporate Finance department supports the accounting and reporting administration of the 2
company. Located centrally in the Fort Erie office, the Finance department is responsible for all 3
company accounts payable, payroll and financial reporting. In addition, the department is 4
responsible for all retail related billing, OEB data collection and reporting as well as monthly 5
financial statements. 6
Regulatory 7
API utilizes the regulatory department of CNPI, an affiliate, to provide regulatory support and 8
assistance with maintaining compliance with its regulatory requirements. API will continue to 9
rely on these internal resources to perform the majority of the regulatory functions which also 10
enhances the development of in-house regulatory competency rather than relying on third party 11
consultants for the core regulatory function.12

Algoma Power Inc. EB-2019-0019
Exhibit 4 – Operating Expenses Page 22 of 94 May 17, 2019
4.2 SUMMARY & COST DRIVER TABLES 1
4.2.1 SUMMARY OF COST DRIVERS 2
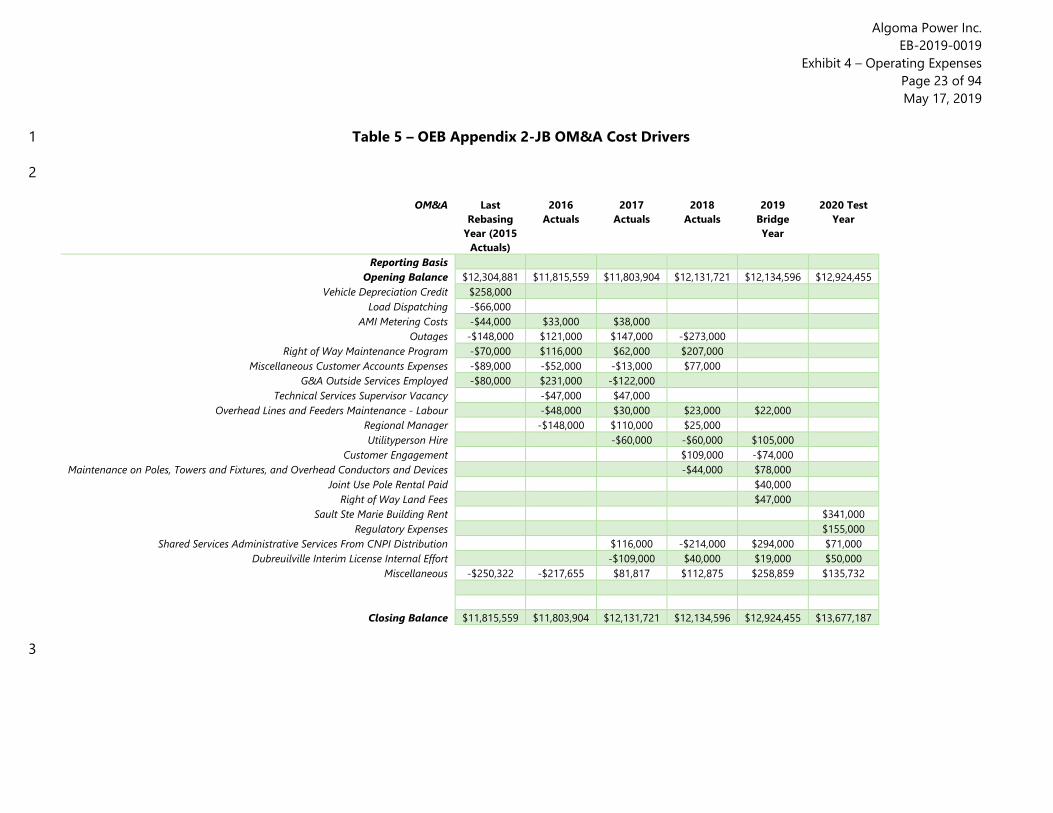
In accordance with the Filing Requirements, OEB Appendix 2-JB – OM&A Cost Drivers, Table 5 3
presented below outlines the key drivers of OM&A costs over the period of 2015 Board 4
Approved to the 2020 Test Year. An overview of the explanations behind the costs drivers are 5
presented in Section 4.2.2. 6
Algoma Power Inc. EB-2019-0019
Exhibit 4 – Operating Expenses Page 23 of 94 May 17, 2019
Table 5 – OEB Appendix 2-JB OM&A Cost Drivers 1
2
OM&A Last Rebasing
Year (2015 Actuals)
2016 Actuals
2017 Actuals
2018 Actuals
2019 Bridge Year
2020 Test Year
Reporting Basis Opening Balance $12,304,881 $11,815,559 $11,803,904 $12,131,721 $12,134,596 $12,924,455
Vehicle Depreciation Credit $258,000 Load Dispatching -$66,000
AMI Metering Costs -$44,000 $33,000 $38,000 Outages -$148,000 $121,000 $147,000 -$273,000
Right of Way Maintenance Program -$70,000 $116,000 $62,000 $207,000 Miscellaneous Customer Accounts Expenses -$89,000 -$52,000 -$13,000 $77,000
G&A Outside Services Employed -$80,000 $231,000 -$122,000 Technical Services Supervisor Vacancy -$47,000 $47,000
Overhead Lines and Feeders Maintenance - Labour -$48,000 $30,000 $23,000 $22,000 Regional Manager -$148,000 $110,000 $25,000 Utilityperson Hire -$60,000 -$60,000 $105,000
Customer Engagement $109,000 -$74,000 Maintenance on Poles, Towers and Fixtures, and Overhead Conductors and Devices -$44,000 $78,000
Joint Use Pole Rental Paid $40,000 Right of Way Land Fees $47,000
Sault Ste Marie Building Rent $341,000 Regulatory Expenses $155,000
Shared Services Administrative Services From CNPI Distribution $116,000 -$214,000 $294,000 $71,000 Dubreuilville Interim License Internal Effort -$109,000 $40,000 $19,000 $50,000
Miscellaneous -$250,322 -$217,655 $81,817 $112,875 $258,859 $135,732
Closing Balance $11,815,559 $11,803,904 $12,131,721 $12,134,596 $12,924,455 $13,677,187
3

Algoma Power Inc. EB-2019-0019
Exhibit 4 – Operating Expenses Page 24 of 94 May 17, 2019
4.2.2 COST DRIVER ANALYSIS 1
The following section provides explanations of the year over year cost variances and drivers as 2
submitted within Appendix 2-JB of the Chapter 2 Filing Requirements. 3
Vehicle Depreciation Credit 4
2015 Board Approved vs 2015 Actuals 5
Increase of $258,000 6
API adopted MIFRS accounting effective January 1, 2013 as submitted within its 2015 cost of 7
service application, EB-2014-0055. This accounting policy change resulted in the inclusion of 8
vehicle depreciation within the burden rates calculated for operational departments. In 9
calculating the 2015 Board Approved revenue requirement, API allocated the offsetting vehicle 10
depreciation credit entry within the General and Administrative expenses OEB 5625. Per Board 11
staff direction issued in 2014, the vehicle credit was to be recorded as a reduction in 12
depreciation expenses which is where API recorded the credit in the 2015 Actuals within this 13
Application; hence the increase of $258,000 between 2015 Board Approved and 2015 Actuals. 14
Load Dispatching 15
2015 Board Approved vs 2015 Actuals 16
Decrease of $66,000 17
API outlined the implementation of a SCADA system in its 2015 cost of service application 18
including an estimate for on-going operating costs. Actual costs in 2015 were significantly less 19
and this negative variance was due to the deferral in SCADA implementation. See Section 4.3.2.2 20
of the DSP, submitted as Appendix 2A in Exhibit 2, for additional information. Costs that have 21
been incurred from 2015 Actuals to 2020 Test for load dispatching have been a combination of 22
internal labour effort, operating costs for radio equipment, and other third party support fees. 23

Algoma Power Inc. EB-2019-0019
Exhibit 4 – Operating Expenses Page 25 of 94 May 17, 2019
Advanced Metering Infrastructure (AMI) Metering Costs 1
2015 Board Approved vs 2015 Actuals, 2015 Actuals vs 2016 Actuals, 2016 Actuals vs 2017 2
Actuals 3
Decrease of $44,000, Increase of $33,000, Increase of $38,000 4
With the implementation of Smart Meters, API anticipated AMI costs to exceed $384,000 in 2015 5
but actual costs did not exceed this level until 2017 when costs exceeded $410,000. This was 6
primarily due to the delayed ramp up in third party data management solution costs. 7
Outages 8
2015 Board Approved vs 2015 Actuals, 2015 Actuals vs 2016 Actuals, 2016 Actuals vs 2017 9
Actuals, 2017 Actuals vs 2018 Actuals 10
Decrease of $148,000, Increase of $121,000, Increase of $147,000, Decrease of $273,000 11
API's outages which are influenced by weather patterns, can vary significantly from one year to 12
the next. There were less than expected outages in 2015, but outage costs increased significantly 13
in 2016 and 2017, and then were reduced again in 2018. 14
Right of Way Maintenance Program 15
2015 Board Approved vs 2015 Actuals, 2015 Actuals vs 2016 Actuals, 2016 Actuals vs 2017 16
Actuals, 2017 Actuals vs 2018 Actuals 17
Decrease of $70,000, Increase of $116,000, Increase of $62,000, Increase of $207,000 18
API's Right of Way maintenance program is a significant portion of API's total OM&A, and total 19
expenditures may vary from year to year depending on multiple factors including forestry zone, 20
weather patterns, and contractor availability and pricing. Although 2015 actuals were slightly 21
under the Board Approved amount, API increased spending in 2016 through to 2018 to ensure 22
the programs were completed as planned. A portion of the increase in 2018 in this account 23
related to a new access trail maintenance program being implemented. 24

Algoma Power Inc. EB-2019-0019
Exhibit 4 – Operating Expenses Page 26 of 94 May 17, 2019
Miscellaneous Customer Accounts Expenses 1
2015 Board Approved vs 2015 Actuals, 2015 Actuals vs 2016 Actuals, 2016 Actuals vs 2017 2
Actuals, 2017 Actuals vs 2018 Actuals 3
Decrease of $89,000, Decrease of $52,000, Decrease of $13,000, Increase of $77,000 4
This account reflects primarily internal labour allocations for the performance of general 5
customer service functions. 2015, 2016 and 2017 actuals were lower than 2015 Board Approved 6
due to a variety of factors including: temporary increased effort allocated to capital projects, less 7
than expected general customer service support from other departments given focus on capital 8
effort during these years, and less than expected general customer service support from API's 9
affiliate. 10
G&A Outside Services Employed 11
2015 Board Approved vs 2015 Actuals, 2015 Actuals vs 2016 Actuals, 2016 Actuals vs 2017 12
Actuals 13
Decrease of $80,000, Increase of $231,000, Decrease of $122,000 14
This account includes various outside services employed including audit, legal, other consultants 15
including pension administration fees, and administrative services. The 2015 Board Approved 16
amount had been estimated based on historical spend. 2015 actual expenditures incurred were 17
less than Board Approved primarily due to less than budgeted other consultants. 2016 increased 18
significantly due to a combination of other consultant fees and increased legal fees for legal 19
matters, while 2017 expenditures returned closer to 2015 Board Approved. 20
Technical Services Supervisor Vacancy 21
2015 Actuals vs 2016 Actuals, 2016 Actuals vs 2017 Actuals 22
Decrease of $47,000, Increase of $47,000 23
In 2016, the Technical Services Supervisor position became vacant and it was not filled until 24
2017. 25

Algoma Power Inc. EB-2019-0019
Exhibit 4 – Operating Expenses Page 27 of 94 May 17, 2019
Overhead Lines and Feeders Operating - Labour 1
2015 Actuals vs 2016 Actuals, 2016 Actuals vs 2017 Actuals, 2017 Actuals vs 2018 Actuals, 2018 2
Actuals vs 2019 Bridge Year 3
Decrease of $48,000, Increase of $30,000, Increase of $23,000, Increase of $22,000 4
Overhead Lines and Feeders operating effort may vary year to year and is influenced by snow 5
conditions and weather patterns. In less optimal weather conditions, patrolling effort becomes 6
less efficient. This is especially relevant given the vast rural distribution network that API 7
maintains as outlined in Exhibit 1. 2016 actual costs were down as compared to 2015 due to 8
more optimal snow and weather conditions that contributed to more efficient patrolling effort, 9
while 2017 through to 2020 are showing generally less efficient patrolling effort likely due to 10
snow and weather, therefore increasing labour costs. Given that line crew work on a 11
combination of capital, operating and maintenance projects, in years where increased operating 12
effort is required for such things as maintaining overhead lines and feeders, less capital work is 13
then able to be completed using internal API resources. 14
Regional Manager 15
2015 Actuals vs 2016 Actuals, 2016 Actuals vs 2017 Actuals, 2017 Actuals vs 2018 Actuals 16
Decrease of $148,000, Increase of $110,000, Increase of $25,000 17
During 2016, API transitioned to a new Regional Manager. During the transition phase, there 18
were times of vacancy in the position, resulting in a lower cost in 2016. 19
Utility Person Hire 20
2016 Actuals vs 2017 Actuals, 2017 Actuals vs 2018 Actuals, 2018 Actuals vs 2019 Bridge 21
Decrease of $60,000, Decrease of $60,000, Increase of $105,000 22
During 2017, API's tool person retired. In place of hiring another individual with the former tool 23
person's same job responsibilities, API reassessed the unfilled position requirements and moved 24
forward with hiring a utility person in 2019. This reassessment resulted in a reallocation of job 25
Algoma Power Inc. EB-2019-0019
Exhibit 4 – Operating Expenses Page 28 of 94 May 17, 2019
functions and lower costs allocated to tool maintenance and slight operational cost savings as 1
reflected in the cost driver table. 2
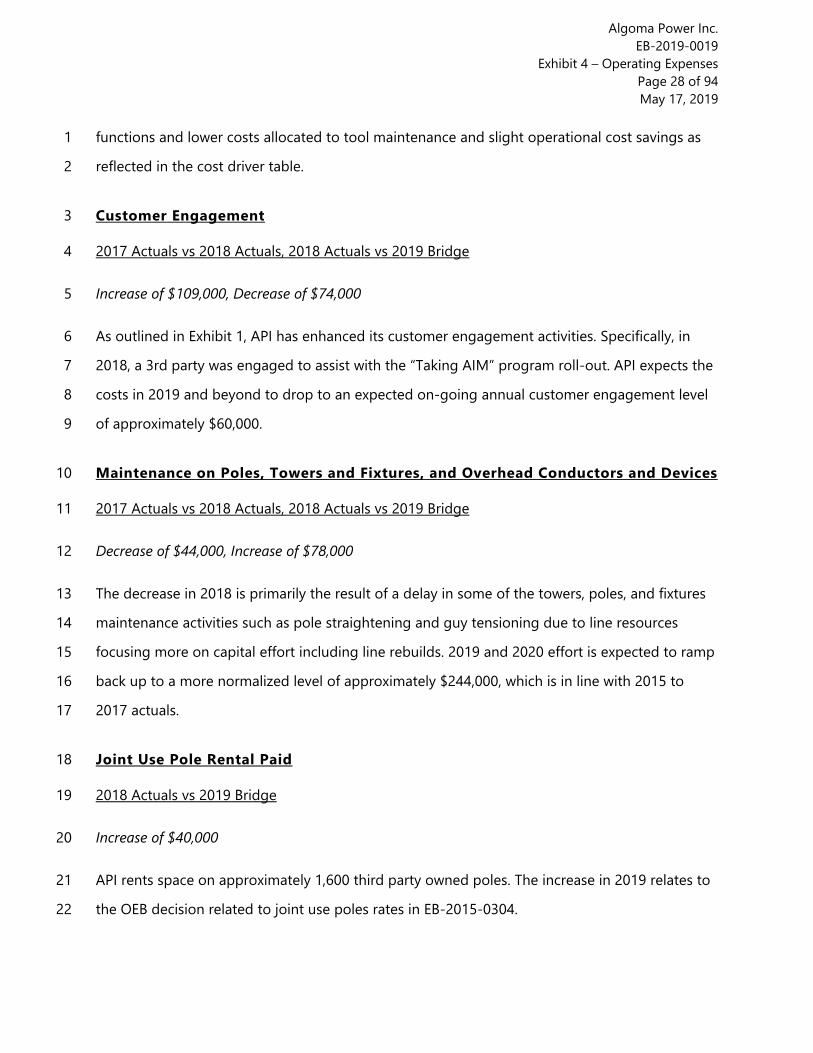
Customer Engagement 3
2017 Actuals vs 2018 Actuals, 2018 Actuals vs 2019 Bridge 4
Increase of $109,000, Decrease of $74,000 5
As outlined in Exhibit 1, API has enhanced its customer engagement activities. Specifically, in 6
2018, a 3rd party was engaged to assist with the “Taking AIM” program roll-out. API expects the 7
costs in 2019 and beyond to drop to an expected on-going annual customer engagement level 8
of approximately $60,000. 9
Maintenance on Poles, Towers and Fixtures, and Overhead Conductors and Devices 10
2017 Actuals vs 2018 Actuals, 2018 Actuals vs 2019 Bridge 11
Decrease of $44,000, Increase of $78,000 12
The decrease in 2018 is primarily the result of a delay in some of the towers, poles, and fixtures 13
maintenance activities such as pole straightening and guy tensioning due to line resources 14
focusing more on capital effort including line rebuilds. 2019 and 2020 effort is expected to ramp 15
back up to a more normalized level of approximately $244,000, which is in line with 2015 to 16
2017 actuals. 17
Joint Use Pole Rental Paid 18
2018 Actuals vs 2019 Bridge 19
Increase of $40,000 20
API rents space on approximately 1,600 third party owned poles. The increase in 2019 relates to 21
the OEB decision related to joint use poles rates in EB-2015-0304. 22

Algoma Power Inc. EB-2019-0019
Exhibit 4 – Operating Expenses Page 29 of 94 May 17, 2019
Right of Way Land Fees 1
2018 Actuals vs 2019 Bridge 2
Increase of $47,000 3
API has many land agreements with financial terms or annual fees associated with them. The 4
increase in 2019 relates to anticipated increases in right of way land fees. 5
Sault Ste. Marie Building Rent 6
2019 Bridge vs 2020 Test 7
Increase of $341,000 8
API's current lease agreement at 2 Sackville Rd, Sault Ste. Marie is set to expire at the end of 9
2019. Given the recent ownership change of the building’s lessor, API has researched lease rates 10
and believes that any new lease agreement starting in 2020 (at either its existing facility or at 11
temporary facilities) will be higher than the existing rates. API is committed to updating lease 12
values during the hearing process as negotiations with its landlord continue. API is planning 13
construction of the proposed new Sault Ste. Marie facility to be completed in 2022, and will 14
consider the impact of any reduction in 2023-2024 facility operating costs when it submits its 15
application for ACM cost recovery of the new facility. 16
Regulatory Expenses 17
2019 Bridge vs 2020 Test 18
Increase of $155,000 19
As outlined in Exhibit 1, API has prepared this Application on the basis of full integration of 20
Dubreuil Lumber Inc., including consideration of relief requested in the related MAAD 21
application (EB-2018-0271). As part of that application, API proposed to record transaction and 22
integration costs of approximately $550,000 in a deferral account, and proposed to dispose of 23
this balance by including it as a one-time cost in the current Application, specifically by 24
including 20% of the costs (approximately $110,000) in its 2020 revenue requirement, such that 25

Algoma Power Inc. EB-2019-0019
Exhibit 4 – Operating Expenses Page 30 of 94
Updated June 3, 2019
the total is amortized over the five-year rate setting term. API has requested that the OEB make 1
a determination on this proposal, as further detailed in Sections 1.3.4 and 1.3.7 of Exhibit 1. 2
Approximately $25,000 of the variance reflects 20% of the increased total one-time costs related 3
to the current Application as compared to API's 2015 cost of service application. See Sections 4
4.6.2 and 4.6.3 for further detail. 5
Shared Services Administrative Services From CNPI Distribution 6
2016 Actuals vs 2017 Actuals, 2017 Actuals vs 2018 Actuals, 2018 Actuals vs 2019 Bridge, 2019 7
Bridge vs 2020 Test 8
Increase of $116,000, Decrease of $214,000, Increase of $294,000, Increase of $71,000 9
Shared services have also been discussed in Section 4.5 of this Exhibit. The increase in 2017 over 10
2016 represents an 8% increase. A portion of the increase was attributable to a slight overall 11
increase in API's share of allocations from Canadian Niagara Power (“CNPI”) that was accepted 12
within CNPI's 2017 cost of service proceeding. Aside from other general increases, additional 13
costs for Health and Safety had been allocated to API as a result of an increased focus and effort 14
in this area. 2018 decreased by $214,000 over 2017 due a combination of factors including: the 15
elimination of IT department staff resulting from restructuring efforts sought to better align 16
resources and more effectively deliver services; a short-term decrease in Finance staffing; and 17
periods of vacancy during progressions and re-assignments of corporate staff that resulted in a 18
temporary decrease in shared service administrative allocations from CNPI as shown in Section 19
4.3.5. 2019 increases over 2018 are related to a combination of factors including: additional IT 20
service costs as a newly contracted Managed Security Service Provider (MSSP) established in 21
order to address requirements of the OEB Cybersecurity Framework, staff hired in Finance to 22
enhance processes and controls over financial and regulatory reporting, a continued increased 23
focus and effort on Health and Safety, and other general increases. The increase in 2020 over 24
2019 primarily represents inflationary increases and a further reversal of the 2018 temporary 25
decreases identified above. 26
Algoma Power Inc. EB-2019-0019
Exhibit 4 – Operating Expenses Page 31 of 94 May 17, 2019
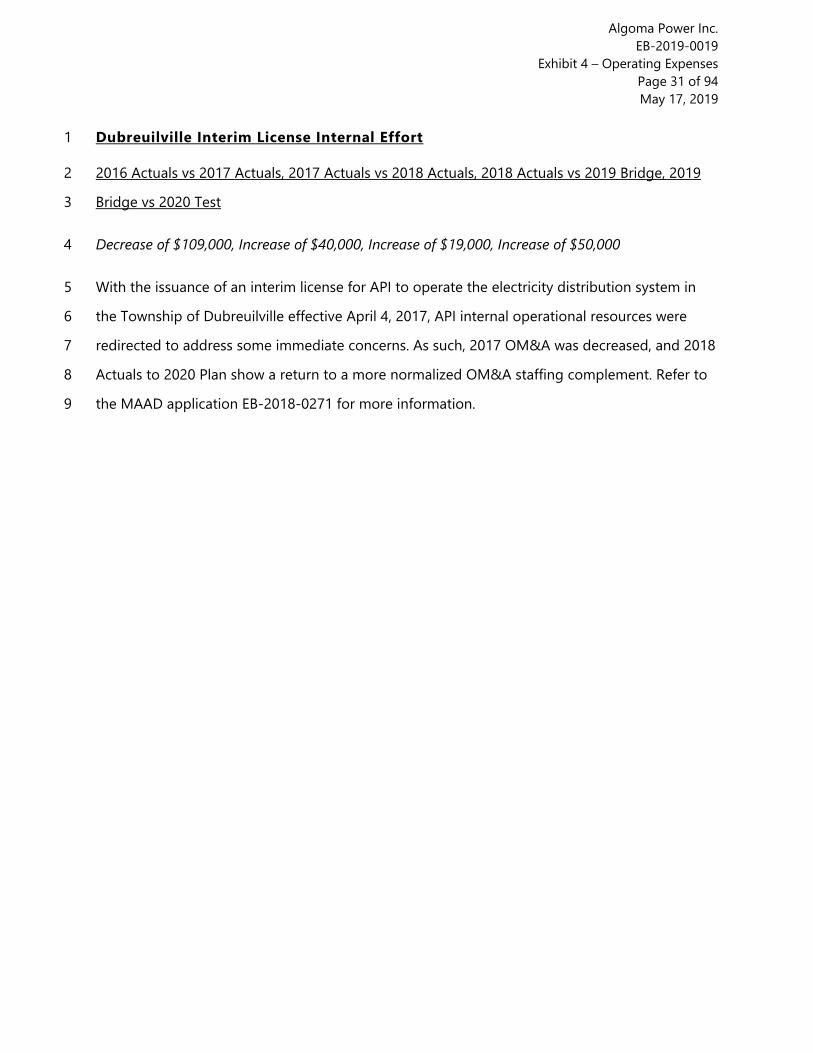
Dubreuilville Interim License Internal Effort 1
2016 Actuals vs 2017 Actuals, 2017 Actuals vs 2018 Actuals, 2018 Actuals vs 2019 Bridge, 2019 2
Bridge vs 2020 Test 3
Decrease of $109,000, Increase of $40,000, Increase of $19,000, Increase of $50,000 4
With the issuance of an interim license for API to operate the electricity distribution system in 5
the Township of Dubreuilville effective April 4, 2017, API internal operational resources were 6
redirected to address some immediate concerns. As such, 2017 OM&A was decreased, and 2018 7
Actuals to 2020 Plan show a return to a more normalized OM&A staffing complement. Refer to 8
the MAAD application EB-2018-0271 for more information. 9
Algoma Power Inc. EB-2019-0019
Exhibit 4 – Operating Expenses Page 32 of 94 May 17, 2019
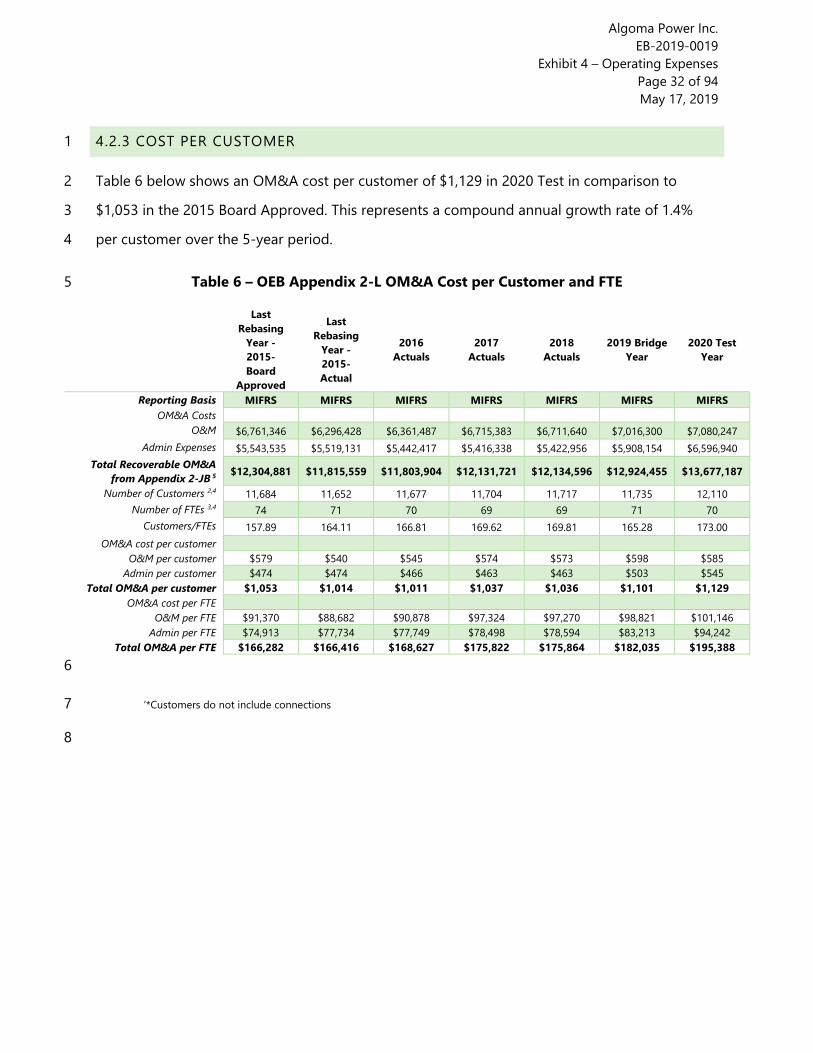
4.2.3 COST PER CUSTOMER 1
Table 6 below shows an OM&A cost per customer of $1,129 in 2020 Test in comparison to 2
$1,053 in the 2015 Board Approved. This represents a compound annual growth rate of 1.4% 3
per customer over the 5-year period. 4
Table 6 – OEB Appendix 2-L OM&A Cost per Customer and FTE 5
Last Rebasing
Year - 2015- Board
Approved
Last Rebasing
Year - 2015- Actual
2016 Actuals
2017 Actuals
2018 Actuals
2019 Bridge Year
2020 Test Year
Reporting Basis MIFRS MIFRS MIFRS MIFRS MIFRS MIFRS MIFRS OM&A Costs
O&M $6,761,346 $6,296,428 $6,361,487 $6,715,383 $6,711,640 $7,016,300 $7,080,247 Admin Expenses $5,543,535 $5,519,131 $5,442,417 $5,416,338 $5,422,956 $5,908,154 $6,596,940
Total Recoverable OM&A from Appendix 2-JB 5 $12,304,881 $11,815,559 $11,803,904 $12,131,721 $12,134,596 $12,924,455 $13,677,187
Number of Customers 2,4 11,684 11,652 11,677 11,704 11,717 11,735 12,110 Number of FTEs 3,4 74 71 70 69 69 71 70
Customers/FTEs 157.89 164.11 166.81 169.62 169.81 165.28 173.00 OM&A cost per customer
O&M per customer $579 $540 $545 $574 $573 $598 $585 Admin per customer $474 $474 $466 $463 $463 $503 $545
Total OM&A per customer $1,053 $1,014 $1,011 $1,037 $1,036 $1,101 $1,129 OM&A cost per FTE
O&M per FTE $91,370 $88,682 $90,878 $97,324 $97,270 $98,821 $101,146 Admin per FTE $74,913 $77,734 $77,749 $78,498 $78,594 $83,213 $94,242
Total OM&A per FTE $166,282 $166,416 $168,627 $175,822 $175,864 $182,035 $195,388
6
‘*Customers do not include connections 7
8

Algoma Power Inc. EB-2019-0019
Exhibit 4 – Operating Expenses Page 33 of 94 May 17, 2019
4.3 PROGRAM DELIVERY COSTS WITH VARIANCE ANALYSIS 1
4.3.1 SUMMARY OF PROGRAMS 2
Although API does not currently track and analyze its costs exactly as presented below, in 3
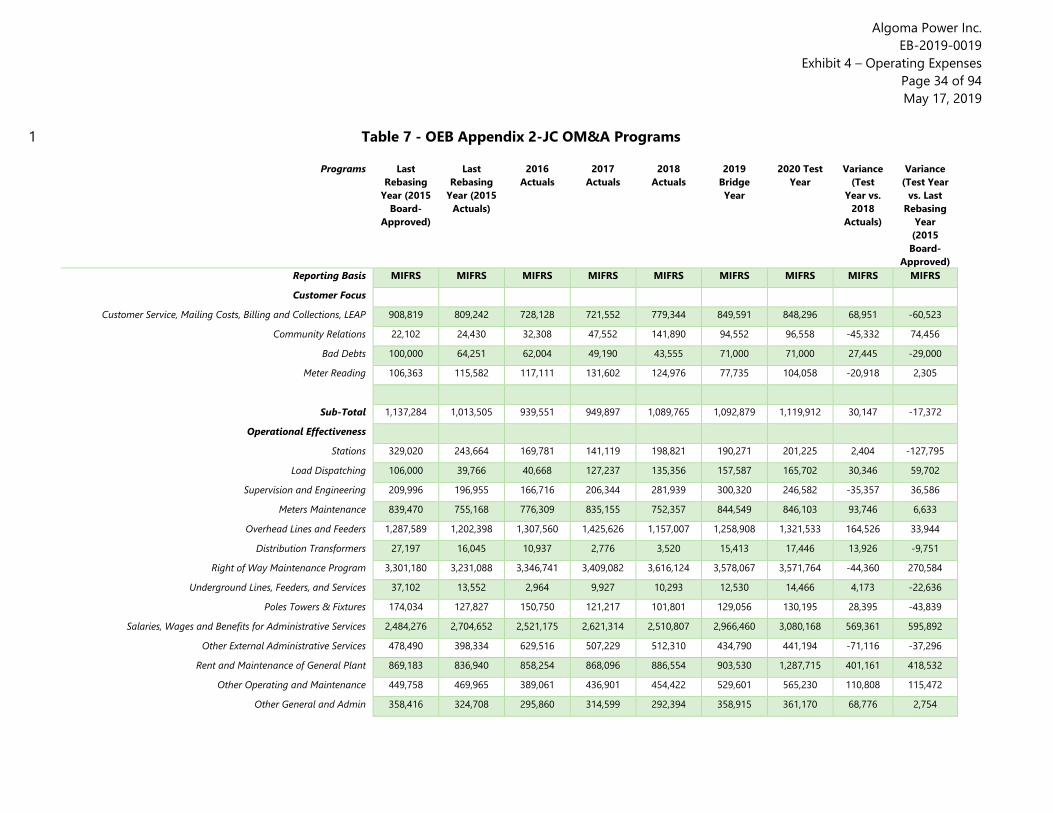
accordance with Chapter 2 filing requirements, API has completed Table 7 below, which shows a 4
summary of the 2015 Board Approved to 2020 Test OM&A programs for 2015 Board Approved 5
to 2020. API has classified its various OM&A components into a series of programs that have 6
considered the RRFE categories of Customer Focus, Operational Effectiveness, and Public 7
Responsiveness. Variance analysis was completed where program variances exceeded the 8
materiality threshold. 9
Algoma Power Inc. EB-2019-0019
Exhibit 4 – Operating Expenses Page 34 of 94 May 17, 2019
Table 7 - OEB Appendix 2-JC OM&A Programs 1
Programs Last Rebasing
Year (2015 Board-
Approved)
Last Rebasing
Year (2015 Actuals)
2016 Actuals
2017 Actuals
2018 Actuals
2019 Bridge Year
2020 Test Year
Variance (Test
Year vs. 2018
Actuals)
Variance (Test Year
vs. Last Rebasing
Year (2015 Board-
Approved) Reporting Basis MIFRS MIFRS MIFRS MIFRS MIFRS MIFRS MIFRS MIFRS MIFRS
Customer Focus
Customer Service, Mailing Costs, Billing and Collections, LEAP 908,819 809,242 728,128 721,552 779,344 849,591 848,296 68,951 -60,523
Community Relations 22,102 24,430 32,308 47,552 141,890 94,552 96,558 -45,332 74,456
Bad Debts 100,000 64,251 62,004 49,190 43,555 71,000 71,000 27,445 -29,000
Meter Reading 106,363 115,582 117,111 131,602 124,976 77,735 104,058 -20,918 2,305
Sub-Total 1,137,284 1,013,505 939,551 949,897 1,089,765 1,092,879 1,119,912 30,147 -17,372
Operational Effectiveness
Stations 329,020 243,664 169,781 141,119 198,821 190,271 201,225 2,404 -127,795
Load Dispatching 106,000 39,766 40,668 127,237 135,356 157,587 165,702 30,346 59,702
Supervision and Engineering 209,996 196,955 166,716 206,344 281,939 300,320 246,582 -35,357 36,586
Meters Maintenance 839,470 755,168 776,309 835,155 752,357 844,549 846,103 93,746 6,633
Overhead Lines and Feeders 1,287,589 1,202,398 1,307,560 1,425,626 1,157,007 1,258,908 1,321,533 164,526 33,944
Distribution Transformers 27,197 16,045 10,937 2,776 3,520 15,413 17,446 13,926 -9,751
Right of Way Maintenance Program 3,301,180 3,231,088 3,346,741 3,409,082 3,616,124 3,578,067 3,571,764 -44,360 270,584
Underground Lines, Feeders, and Services 37,102 13,552 2,964 9,927 10,293 12,530 14,466 4,173 -22,636
Poles Towers & Fixtures 174,034 127,827 150,750 121,217 101,801 129,056 130,195 28,395 -43,839
Salaries, Wages and Benefits for Administrative Services 2,484,276 2,704,652 2,521,175 2,621,314 2,510,807 2,966,460 3,080,168 569,361 595,892
Other External Administrative Services 478,490 398,334 629,516 507,229 512,310 434,790 441,194 -71,116 -37,296
Rent and Maintenance of General Plant 869,183 836,940 858,254 868,096 886,554 903,530 1,287,715 401,161 418,532
Other Operating and Maintenance 449,758 469,965 389,061 436,901 454,422 529,601 565,230 110,808 115,472
Other General and Admin 358,416 324,708 295,860 314,599 292,394 358,915 361,170 68,776 2,754
Algoma Power Inc. EB-2019-0019
Exhibit 4 – Operating Expenses Page 35 of 94 May 17, 2019
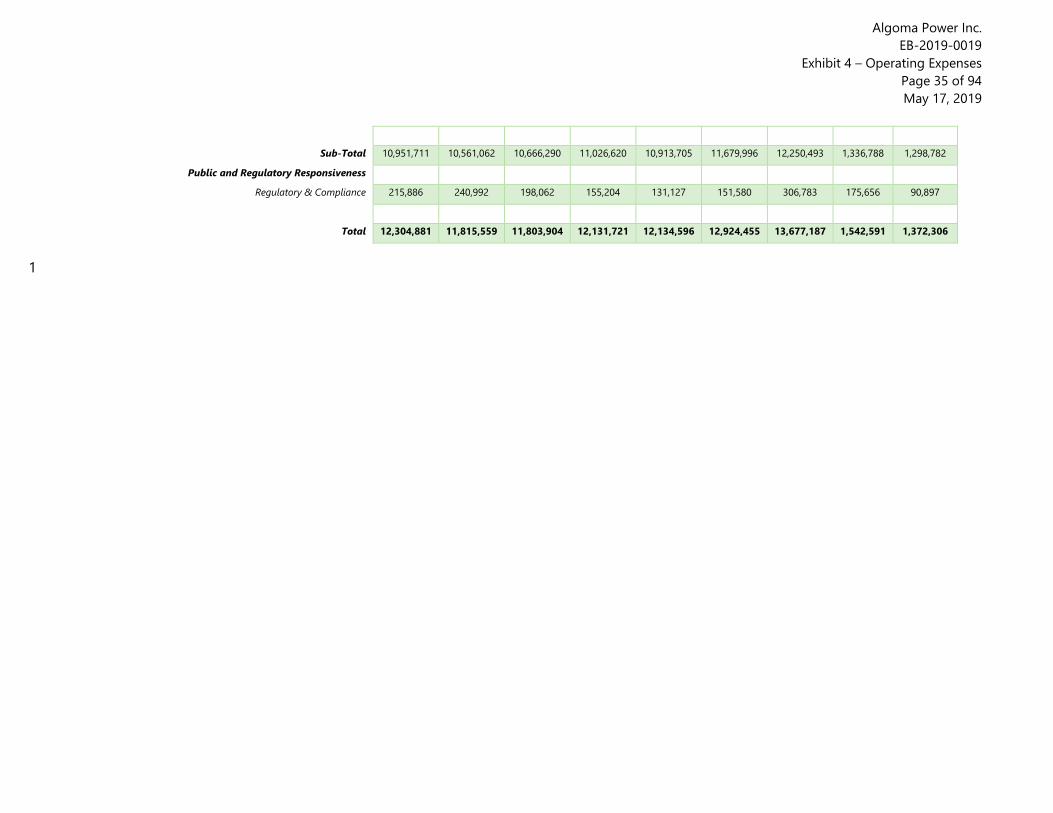
Sub-Total 10,951,711 10,561,062 10,666,290 11,026,620 10,913,705 11,679,996 12,250,493 1,336,788 1,298,782
Public and Regulatory Responsiveness
Regulatory & Compliance 215,886 240,992 198,062 155,204 131,127 151,580 306,783 175,656 90,897
Total 12,304,881 11,815,559 11,803,904 12,131,721 12,134,596 12,924,455 13,677,187 1,542,591 1,372,306
1

Algoma Power Inc. EB-2019-0019
Exhibit 4 – Operating Expenses Page 36 of 94 May 17, 2019
4.3.2 PROGRAM VARIANCE ANALYSIS 1
The following section provides explanations of the significant program variances between either 2
2015 Board Approved and 2020 Test, or 2018 Actuals and 2020 Test. 3
Stations 4
2015 Board Approved vs 2020 Test 5
Decrease of $128,000 6
The primary decrease in stations expense from 2015 Board Approved to 2020 Test is the result 7
of both a shift in labour allocations for API’s electrical maintenance and line staff, and less third 8
party snow removal costs. 9
2015 Board Approved had planned approximately $175,000 in allocated labour to perform 10
operating and maintenance activities on stations. In comparison, 2020 Test year has allocated 11
approximately $80,000 to perform operating and maintenance activities on stations. Of the 12
$95,000 decrease, $75,000 relates to the electrical maintenance staff and $20,000 relates to the 13
lines staff. 14
Generally, throughout the 2015 to 2018 historical actual period, electrical maintenance staff 15
have focused resourcing on maintenance work completed on meters (i.e. meter verifications, 16
AMI Smart meter work, etc.), as well as supported various capital projects including the API 17
Protection Automation Reliability and API Substation/Sub-Transmission Reliability Improvement 18
projects. As a result, less time has been allocation to stations operating and maintenance 19
activities as compared to 2015 Board Approved. Likewise, line staff have been focusing effort on 20
lines related operating, maintenance and capital projects with less effort allocated to stations 21
operations and maintenance. 22
Labour allocation to specific programs is generally within API’s control. API considered the 23
recent historical actual trending as a reasonable basis for 2020 Test year budget and has 24
therefore allocated less internal labour to the stations expense accounts for both electrical 25
maintenance and line staff. This approach allows existing staff levels to complete identified 26

Algoma Power Inc. EB-2019-0019
Exhibit 4 – Operating Expenses Page 37 of 94 May 17, 2019
capital and O&M programs, without securing additional contracted resources, while at the same 1
time maintaining flexibility to re-direct resources to station O&M activities if required in future 2
years. 3
In addition to above, the 2015 Board Approved included approximately $50,000 in third party 4
snow removal costs at the various distribution stations in API’s service territory. Actual costs 5
from year-to-year may vary depending on weather patterns and are generally outside of API’s 6
control. API incurred an average of slightly under $30,000 for actual costs from 2015 to 2018. 7
Based on this trending, 2020 Test year plan includes a $34,000 estimate of snow removal costs, 8
which results in a decrease of approximately $16,000 as compared to 2015 Board Approved. 9
Overhead Lines and Feeders 10
2018 Actuals vs 2020 Test 11
Increase of $165,000 12
The increase in overhead lines and feeders expenses from 2018 Actuals to 2020 Test is the result 13
of a combination of increased pole rental costs, increased right of way land fees and increased 14
overhead work in the Dubreuilville area. 15
As outlined in the cost driver table and the cost driver analysis completed in Section 4.2 of this 16
Exhibit, an increase of $40,000 has been included in 2019 Bridge year related to the increase in 17
joint pole rates resulting from the recent OEB decision, which is outside of API’s control. The 18
increase in costs is expected to persist through 2020 Test year. 19
Also outlined in the cost driver table and the cost driver analysis completed in Section 4.2 of this 20
Exhibit, is an increase of $47,000 that has been included in 2019 Bridge year related to the 21
increase in right of way land fees. The increase in costs is expected to persist through 2020 Test 22
year. In any case involving increases to land use fees, API considers land appraisal values and 23
industry norms for compensation, but also considers whether relocation of assets could lead to 24
a more economical outcome. 25

Algoma Power Inc. EB-2019-0019
Exhibit 4 – Operating Expenses Page 38 of 94 May 17, 2019
Overhead work in the Dubreuilville area for historical and Bridge years will have accumulated in 1
regulatory accounts as per EB-2017-0303/EB-2018-0271. In the 2020 Test year, API has included 2
overhead lines and feeders operating and maintenance costs anticipated for the Dubreuilville 3
area within this program. The requirement to operate the distribution system in the 4
Dubreuilville area was outside of API’s control as a result of the OEB’s decision to appoint API as 5
the interim operator. The decision to acquire and integrate assets in the Dubreuilville area for 6
the 2020 Test Year resulted from API’s consideration that it could operate this system more 7
efficiently on an integrated basis, as compared to indefinite operation under an interim licence, 8
as more fully set out in EB-2018-0271. 9
Right of Way Maintenance 10
2015 Board Approved vs 2020 Test 11
Increase of $271,000 12
The increase of $271,000, or 8.2%, from 2015 Board Approved to 2020 Test year represents a 13
compound annual growth rate of approximately 1.6%. As outlined in the cost driver table and 14
the cost driver analysis completed in Section 4.2 of this Exhibit, expenditures may vary from year 15
to year depending on multiple factors including zone, weather patterns, and contractor 16
availability and pricing. To date, API has experienced moderate contractor rates and pricing 17
increases which has helped to keep the annual growth rate in total program costs relatively in 18
line with inflationary rate increases. Although API has assumed similar trending for the 2020 Test 19
year (i.e. increases in contractor rates roughly equal to inflation), due to the recent departure of 20
one of the key contractors in the region, there is some significant uncertainty about pricing into 21
future years. It is expected that there will likely be an upward pressure on pricing as demand for 22
these types of contractors still remains high in the region. API’s vegetation management 23
program is discussed further in the DSP. The risk of future price increases, the rationale for 24
keeping 2020 forecasts at inflationary levels, and the cost mitigation measures being explored 25
by API to offset future cost pressures are discussed further in the Business Plan. 26
Algoma Power Inc. EB-2019-0019
Exhibit 4 – Operating Expenses Page 39 of 94 May 17, 2019
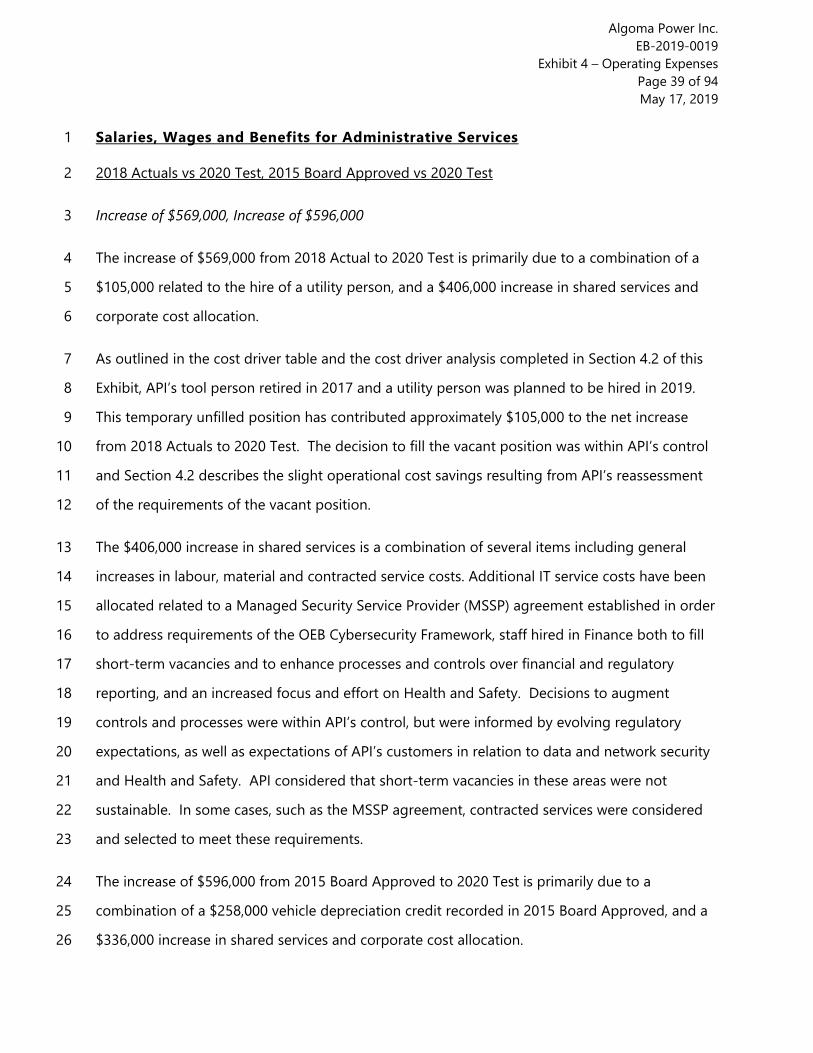
Salaries, Wages and Benefits for Administrative Services 1
2018 Actuals vs 2020 Test, 2015 Board Approved vs 2020 Test 2
Increase of $569,000, Increase of $596,000 3
The increase of $569,000 from 2018 Actual to 2020 Test is primarily due to a combination of a 4
$105,000 related to the hire of a utility person, and a $406,000 increase in shared services and 5
corporate cost allocation. 6
As outlined in the cost driver table and the cost driver analysis completed in Section 4.2 of this 7
Exhibit, API’s tool person retired in 2017 and a utility person was planned to be hired in 2019. 8
This temporary unfilled position has contributed approximately $105,000 to the net increase 9
from 2018 Actuals to 2020 Test. The decision to fill the vacant position was within API’s control 10
and Section 4.2 describes the slight operational cost savings resulting from API’s reassessment 11
of the requirements of the vacant position. 12
The $406,000 increase in shared services is a combination of several items including general 13
increases in labour, material and contracted service costs. Additional IT service costs have been 14
allocated related to a Managed Security Service Provider (MSSP) agreement established in order 15
to address requirements of the OEB Cybersecurity Framework, staff hired in Finance both to fill 16
short-term vacancies and to enhance processes and controls over financial and regulatory 17
reporting, and an increased focus and effort on Health and Safety. Decisions to augment 18
controls and processes were within API’s control, but were informed by evolving regulatory 19
expectations, as well as expectations of API’s customers in relation to data and network security 20
and Health and Safety. API considered that short-term vacancies in these areas were not 21
sustainable. In some cases, such as the MSSP agreement, contracted services were considered 22
and selected to meet these requirements. 23
The increase of $596,000 from 2015 Board Approved to 2020 Test is primarily due to a 24
combination of a $258,000 vehicle depreciation credit recorded in 2015 Board Approved, and a 25
$336,000 increase in shared services and corporate cost allocation. 26

Algoma Power Inc. EB-2019-0019
Exhibit 4 – Operating Expenses Page 40 of 94 May 17, 2019
As outlined in the cost driver table and the cost driver analysis completed in Section 4.2 of this 1
Exhibit, a vehicle depreciation credit of $258,000 was recorded within General and 2
Administrative expenses in 2015 Board Approved, and that account has been mapped to this 3
program for program variance analysis purposes. For 2015 actuals and beyond within this 4
Application, the vehicle depreciation credits have been recorded as a contra to depreciation 5
expenses in OEB 5705. 6
The $336,000 increase in shared services is a combination of several items including general 7
increases in labour, material and contracted service costs. Additional IT service costs have been 8
allocated related to a Managed Security Service Provider (MSSP) agreement established in order 9
to address requirements of the OEB Cybersecurity Framework, staff hired in Finance to enhance 10
processes and controls over financial and regulatory reporting, and an increased focus and 11
effort on Health and Safety, as described above. Offsetting some of the increase in shared 12
services, was the elimination of IT department staff resulting from restructuring efforts sought to 13
better align resources and more effectively deliver services. Shared services have also been 14
discussed in Section 4.5 of this Exhibit. 15
Algoma Power Inc. EB-2019-0019
Exhibit 4 – Operating Expenses Page 41 of 94 May 17, 2019
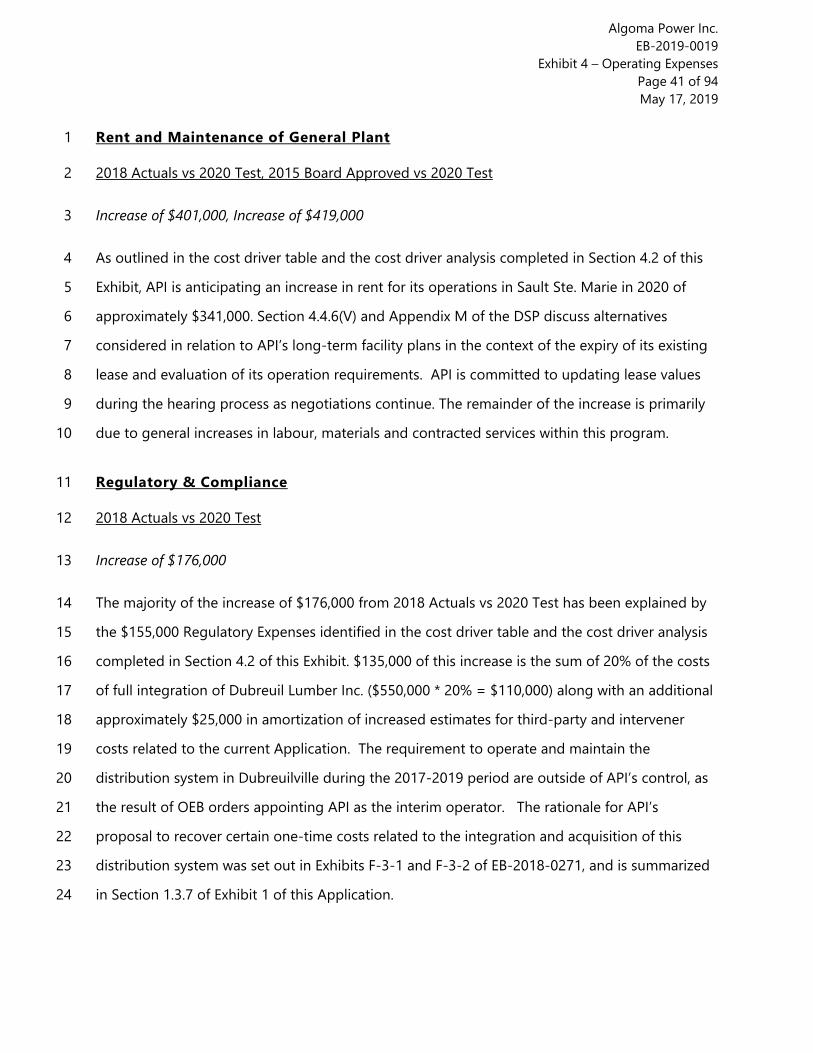
Rent and Maintenance of General Plant 1
2018 Actuals vs 2020 Test, 2015 Board Approved vs 2020 Test 2
Increase of $401,000, Increase of $419,000 3
As outlined in the cost driver table and the cost driver analysis completed in Section 4.2 of this 4
Exhibit, API is anticipating an increase in rent for its operations in Sault Ste. Marie in 2020 of 5
approximately $341,000. Section 4.4.6(V) and Appendix M of the DSP discuss alternatives 6
considered in relation to API’s long-term facility plans in the context of the expiry of its existing 7
lease and evaluation of its operation requirements. API is committed to updating lease values 8
during the hearing process as negotiations continue. The remainder of the increase is primarily 9
due to general increases in labour, materials and contracted services within this program. 10
Regulatory & Compliance 11
2018 Actuals vs 2020 Test 12
Increase of $176,000 13
The majority of the increase of $176,000 from 2018 Actuals vs 2020 Test has been explained by 14
the $155,000 Regulatory Expenses identified in the cost driver table and the cost driver analysis 15
completed in Section 4.2 of this Exhibit. $135,000 of this increase is the sum of 20% of the costs 16
of full integration of Dubreuil Lumber Inc. ($550,000 * 20% = $110,000) along with an additional 17
approximately $25,000 in amortization of increased estimates for third-party and intervener 18
costs related to the current Application. The requirement to operate and maintain the 19
distribution system in Dubreuilville during the 2017-2019 period are outside of API’s control, as 20
the result of OEB orders appointing API as the interim operator. The rationale for API’s 21
proposal to recover certain one-time costs related to the integration and acquisition of this 22
distribution system was set out in Exhibits F-3-1 and F-3-2 of EB-2018-0271, and is summarized 23
in Section 1.3.7 of Exhibit 1 of this Application. 24

Algoma Power Inc. EB-2019-0019
Exhibit 4 – Operating Expenses Page 42 of 94 May 17, 2019
4.4 WORKFORCE PLANNING AND EMPLOYEE COMPENSATION 1
4.4.1 EMPLOYEE COMPENSATION, INCENTIVE PLAN EXPENSES AND OTHER 2 BENEFITS 3
Overview 4
This Section of Exhibit 4 provides an overview of API’s compensation framework including an 5
outline of API’s approach to employee incentive pay. Appendix 2-K (Employee Costs) of the 6
OEB’s Chapter 2 appendices provides a summary of total compensation costs from 2015 Board 7
Approved to 2020 Test Year. Section 4.4.2 of this Exhibit provides explanations of year-over-year 8
variances. Appendix 4A (Korn Ferry1 Letter) projects 2020 salary increases, which has been used 9
as a basis for estimating increases in 2020 over 2019. Section 4.4.3 of this Exhibit outlines the 10
status of API’s pension funding and assumptions used. 11
Base Pay Compensation – Executive, Management, Non-Union Staff 12
Overall compensation for all employees of API is designed to remain competitive with market 13
compensation so as to attract and retain qualified personnel. Overall compensation includes 14
base pay and a portion of the pay which is at risk. The following outlines the process followed by 15
the Company in making changes to Management and Non-Union Compensation. 16
API uses the Korn Ferry’s Job Evaluation method for position evaluation. This method of job 17
evaluation is the most widely used job measurement system in the world. Position evaluations 18
for the Executive positions were established by Korn Ferry. API Management and Non-Union 19
positions are evaluated jointly with Korn Ferry trained personnel. 20
API uses a reference community of participants in the Korn Ferry Compensation Comparison. 21
API uses this reference community to establish the market rates for similar positions in Ontario. 22
To attract and retain qualified staff, the Company sets midpoint salaries using a policy line 23
1 Korn Ferry was previously the Hay Group

Algoma Power Inc. EB-2019-0019
Exhibit 4 – Operating Expenses Page 43 of 94 May 17, 2019
recommended by Korn Ferry management consultants. Actual salaries are set by reference to 1
these recommendations and based on corporate and individual performance. 2
For members of the Executive, the Board of Directors of FortisOntario considers Korn Ferry 3
compensation data and other policies to validate that the compensation practices are market 4
competitive. All Executive salaries are set and all increases must be approved by the Board of 5
Directors of FortisOntario. 6
All salary increases are based on market information provided by the Korn Ferry. The resulting 7
salaries are reflective of base compensation for comparable-sized positions in the national 8
marketplace. All salaries are approved by senior management and/or the Board of Directors as 9
applicable. Executive and Management employees are not paid overtime. Certain Non-Union 10
staff employees are eligible for overtime pay; for example, during emergency storm response 11
situations. 12
Short-term Incentive Compensation Available to Management and Non-Union 13 Staff 14
Description 15
One element of API’s overall compensation package is incentive compensation. Implicit in the 16
analysis contained in Korn Ferry management consultants’ recommendations is the fact that 17
incentive compensation is a normal component of compensation for management positions in 18
Canadian corporations. 19
Incentive compensation for all employees for API reflects an element of compensation put at 20
risk to elicit and sustain continued good performance. The more senior the employee, the 21
greater the percentage of overall compensation is put at risk. 22
Application 23
The short-term incentive (“STI”) plan is available to the Executive, Management and Non-Union 24
staff of API. Unionized employees do not participate in the STI plan and do not receive incentive 25
compensation. 26

Algoma Power Inc. EB-2019-0019
Exhibit 4 – Operating Expenses Page 44 of 94 May 17, 2019
Format 1
API’s STI plan includes both an individual and a corporate component for all Executive, 2
Management and Non-Union staff. Key aspects of this plan together with the targets are 3
outlined below. 4
Minimum Corporate Performance Criterion 5
Prior to any incentive payments being made, a minimum corporate performance criterion, or 6
trigger, must be reached. API must achieve a pre-determined corporate threshold/target as 7
approved by the Board of Directors of FortisOntario Inc. (“FortisOntario”); otherwise, no 8
incentive payments will be made. For more information on these criterion, see “Corporate 9
Targets” below. 10
Payout Summary 11
Basis 12
The STI payout is based on a percentage of annual salary and ranges between 5% and 13
50% depending on position. STI’s objectives are set annually and establish criteria upon 14
which the corporation and the individual performance are to be measured. The 15
objectives are then scored which will result in an STI rating between 0% and 150%. 16
The individual performance component is designed to better reflect the degree of 17
opportunity which employees in each management group have to influence corporate 18
performance. The weighting for the individual component varies by position level and 19
ranges between 30% and 75%. The balance of the weighting is based on a corporate 20
STI scorecard approved annually by the Board of Directors. 21
The incentive regime is structured in a manner that emphasizes the greater ability of 22
the more senior individuals to affect corporate performance by making a greater 23
portion of their compensation dependent on corporate as opposed to individual 24
performance. For the President and CEO, and Vice Presidents, 70% of the incentive 25
Algoma Power Inc. EB-2019-0019
Exhibit 4 – Operating Expenses Page 45 of 94 May 17, 2019
opportunity is based on corporate performance and 30% on individual performance. 1
For Management and Non-Union staff the split is 25% corporate and 75% individual. 2
Corporate Targets 3
Corporate targets may include the following: cost reduction, capital project completion, 4
customer service, safety and environment, regulatory compliance, employee training, 5
and reliability. Accordingly, all corporate incentive payments included in the 2015 6
Actual to 2020 Test Year relate to benefits to ratepayers as described below. Corporate 7
measures have three performance levels and are reflective of key corporate targets or 8
goals. 9
Each of the corporate targets benefits the ratepayers. In particular, the cost reduction 10
measure sets targets for reducing operating costs. The capital project measure sets 11
targets for meeting budgeted capital project costs and completing projects with 12
respect to scope and schedule. These measures are primarily customer-related as they 13
represent a cost reduction target that directly benefits ratepayers through lower rates 14
or rates that could otherwise be higher. Customer service corporate measures ensure 15
efficient and effective levels of service that meet Board standards and service quality 16
indices. Safety and environmental measures benefit the ratepayer by minimizing high 17
risk incidents and promoting a proactive approach to managing safety and the 18
environment. Regulatory compliance primarily benefits ratepayers as it ensures reliable 19
supply of electricity, and efficient customer service at approved rates. Employee 20
training primarily benefits ratepayers by ensuring that ratepayers receive appropriate 21
service levels from employees by keeping abreast of various job-related skills including 22
regulatory, safety and environmental, technical and customer service related policies 23
and procedures. Reliability measures primarily benefit the ratepayer by ensuring a 24
reliable supply of electricity. 25

Algoma Power Inc. EB-2019-0019
Exhibit 4 – Operating Expenses Page 46 of 94 May 17, 2019
Individual Targets 1
Individual targets, like the corporate targets, support the broader design objective of 2
aligning the interests of all stakeholder groups in API with an overall focus on efficient 3
delivery of service to customers. 4
Individual measures are developed in consultation with individuals and their immediate 5
superiors. Each measure has three performance levels, is reflective of key projects or 6
goals and focuses on departmental or divisional priorities. Individual measures may 7
include the following: human resources, safety and environment, reliability, regulatory 8
compliance, customer service, efficiencies, capital project completion, cost reduction 9
and training targets. These measures primarily benefit ratepayers for the reasons 10
discussed herein. Human Resources primarily benefit the ratepayer by ensuring that 11
skilled personnel are recruited and retained to provide safe and reliable service and to 12
maintain service levels. Cost reduction, capital project and efficiency measures relate to 13
maintaining or reducing operating costs which flow directly to the ratepayer through 14
stable rates. Safety and environment, training, reliability, regulatory compliance and 15
customer service measures directly benefit ratepayers in the form of a safe and reliable 16
supply of electricity in compliance with regulations and established customer service 17
levels. 18
Assessment and Payment 19
The Board of Directors of FortisOntario, API’s parent company, approves the corporate 20
targets for all participants and the individual targets for the Executive. Corporate 21
measures are reflective of key corporate targets or goals and are approved annually by 22
the Board of Directors of FortisOntario. Actual corporate performance is assessed and 23
approved annually by the Board of Directors of FortisOntario. Actual performance 24
against individual targets is evaluated by the individual’s immediate superior. The 25
President and Chief Executive Officer makes recommendations in relation to the Vice 26
Presidents’ individual awards. The Board of Directors of FortisOntario makes 27
recommendations and approves the President and Chief Executive Officer award, and 28

Algoma Power Inc. EB-2019-0019
Exhibit 4 – Operating Expenses Page 47 of 94 May 17, 2019
reviews the recommendations and approves payments respecting the Vice Presidents. 1
Payments will be made generally in February, once all corporate and individual 2
performance measures of the financial year have been finalized. API budgets for 3
incentive payments at target payment levels. 4
Other Benefits 5
Other benefits include employer portion of Canadian Pension Plan, employer portion of 6
Employment Insurance, Employee Health Tax expense, WSIB expense, defined 7
contribution pension expense, insurance benefit, extended health and dental care plan 8
expense, defined benefit pension expense, post-retirement benefit, share purchase plan 9
top-up expense, wellness reimbursements (fitness memberships) and employee 10
assistance plan services. 11
Compensation for Unionized Employees 12
Unionized employees of API are represented by the Power Workers Union CUPE Local 13
1000 (“PWU Local 1000”). The terms of employment, including compensation, overtime 14
and benefits are set out within the collective agreement between API and PWU Local 15
1000 entered into January 1, 2017 – December 31, 2019. Unionized employees received 16
2.0% wage increase on January 1, 2017, 2.00% wage increase on January 1, 2018, and 17
2.25% on January 1, 2019. 18

Algoma Power Inc. EB-2019-0019
Exhibit 4 – Operating Expenses Page 48 of 94 May 17, 2019
4.4.2 EMPLOYEE COSTS VARIANCE ANALYSIS 1
API has prepared Appendix 2-K using total FTEs. This includes FTEs that are employees of API, an 2
allocation of FTEs included in the shared services and corporate cost allocations outlined in 3
Section 4.5 of this Exhibit, and time directly charged to API from one of its affiliates within the 4
FortisOntario group. 5
The number of FTEs, not the dollars, for the 2015 Board Approved were restated due to the 6
following reasons: 7
• Seasonal employees were recorded incorrectly as 1.0 FTE in the original Board 8
Approved when they should have been prorated based on time employed during the 9
year 10
• Shared services and corporate cost allocation number of FTEs were overstated due to 11
not correctly reducing the number of FTEs directly charged to billable and capital 12
projects 13
The above corrections were made to the number of FTEs only as it was determined that the 14
dollars for Salary and Wages, and Benefits had been appropriately calculated. The number of 15
FTEs from the 2015 Board Approved (restated) to the 2020 Test Year has decreased by 4 FTEs, a 16
5.4% decrease. 17
Table 8 below is an excerpt from Appendix 2-K that has been submitted as part of this 18
Application: 19

Algoma Power Inc. EB-2019-0019
Exhibit 4 – Operating Expenses Page 49 of 94 May 17, 2019
Table 8 - OEB Appendix 2-K Employee Compensation 1
Last Rebasing Year (2015 Board
Approved)
Last Rebasing Year (2015 Board
Approved Restated)
2015 Actuals
2016 Actuals
2017 Actuals
2018 Actuals
2019 Bridge Year
2020 Test Year
Number of Employees (FTEs including Part-Time) Management (including executive) 15 15 12 11 10 11 11 11
Non-Management (union and non-union) 66 59 59 59 59 58 60 59 Total 81 74 71 70 69 69 71 70
Total Salary and Wages including ovetime and incentive pay Management (including executive) $1,663,095 $1,663,095 $1,593,050 $1,527,913 $1,365,026 $1,464,209 $1,560,527 $1,608,679
Non-Management (union and non-union) $4,722,845 $4,722,845 $5,066,718 $5,078,369 $5,090,533 $5,427,381 $5,671,376 $5,843,490 Total $6,385,940 $6,385,940 $6,659,768 $6,606,283 $6,455,559 $6,891,590 $7,231,903 $7,452,169
Total Benefits (Current + Accrued) Management (including executive) $645,642 $645,642 $446,204 $359,625 $358,614 $388,910 $403,538 $367,350
Non-Management (union and non-union) $2,112,645 $2,112,645 $2,106,901 $1,687,039 $1,888,383 $1,966,521 $2,080,049 $1,760,359 Total $2,758,287 $2,758,287 $2,553,105 $2,046,664 $2,246,996 $2,355,431 $2,483,587 $2,127,710
Total Compensation (Salary, Wages, & Benefits) Management (including executive) $2,308,737 $2,308,737 $2,039,254 $1,887,539 $1,723,640 $1,853,120 $1,964,065 $1,976,029
Non-Management (union and non-union) $6,835,490 $6,835,490 $7,173,619 $6,765,408 $6,978,916 $7,393,902 $7,751,424 $7,603,850 Total $9,144,227 $9,144,227 $9,212,873 $8,652,947 $8,702,556 $9,247,021 $9,715,489 $9,579,879
2
Algoma Power Inc. EB-2019-0019
Exhibit 4 – Operating Expenses Page 50 of 94 May 17, 2019
VARIANCE ANALYSIS - FTES 1
2015 Board Approved (restated) to 2015 Actual 2
There was a 3 (or 4.1%) FTE decrease from 2015 Board Approved (restated) to 2015 Actual. This 3
was primarily due to a 3 FTE decrease in seasonal contract monitor and general labourer 4
positions in the API forestry department. In lieu of temporary hiring of seasonal staff, API has 5
utilized more third-party resourcing to complete its vegetation management program. 6
2015 Actual to 2016 Actual 7
There was a 1 (or 1.4%) decrease in FTE from 2015 Actual to 2016 Actual. This was primarily due 8
to a 0.75 FTE decrease in staff allocated to API through the shared service and corporate 9
allocation. Shared services have been discussed further in Section 4.5 of this Exhibit. The 10
decrease was primarily due to short-term vacancies. 11
2016 Actual to 2017 Actual 12
There was a decrease from 2016 Actual to 2017 Actual of 1 (or 1.4%) FTE. This was due to a 13
combination of a 1.25 FTE decrease due to a vacancy created in the Supervisor Technical 14
Services position and additional temporary vacancies due to employee retirements in the 15
operations group, offset by a partial reversal of the shared service FTE allocation decrease noted 16
in the 2015 Actual to 2016 Actual explanation above. 17
2017 Actual to 2018 Actual 18
Although 2017 Actual to 2018 Actual total FTE did not change, there was an increase of 1 FTE in 19
management with an offsetting decrease of 1 FTE in non-management. The increase in 20
management was primarily due to the vacancies in the Supervisor Technical Service position as 21
well as operational department retirement vacancies being filled. The 1 FTE decrease in non-22
management was primarily due to a 0.75 FTE decrease in shared service FTE allocation which 23
was due to the combination of the elimination of IT department staff resulting from 24
restructuring efforts sought to better align resources and more effectively deliver IT services. 25

Algoma Power Inc. EB-2019-0019
Exhibit 4 – Operating Expenses Page 51 of 94 May 17, 2019
2018 Actual to 2019 Bridge 1
There is a planned increase from 2018 Actual to 2019 Bridge Year of 2 (or 2.9%) FTEs. This is due 2
to a combination of the planned hire of a new utility person within the operations group which 3
replaces the tool person that retired in 2017, and increased shared service FTE allocation. The 4
increase in shared service FTE staff is primarily due to staff hired in Finance to enhance 5
processes and controls over financial and regulatory reporting. 6
2019 Bridge to 2020 Test Year 7
There is a decrease from 2019 Bridge Year to 2020 Test Year of 1 (or 1.4%) FTE, which is 8
primarily due to a planned decrease in a general seasonal labourer in the API Forestry 9
Department. 10
Variance Analysis – Total Compensation 11
Total compensation indicates a compound annual growth rate of 0.8% from 2015 Actual to 2020 12
Test Year. The increase can be explained due to economic and progression adjustments, slightly 13
offset by the overall decline of 1 FTE between 2015 Actual to 2020 Test Year and a decline in 14
benefit costs. 15
Total Salary and Wages 16
Total salary and wages demonstrate a compound annual growth rate of 2.3% year over year 17
from 2015 Actual to 2020 Test Year. Increases are primarily due to individual progressions, 18
economic adjustments and changes to staff mix. Offsetting this increase slightly is an overall 19
decline of 1 FTE. 20
Negotiated collective bargaining unit increases and details regarding non-union and 21
management salary increases and incentive payment structure are described in Section 4.4.1 of 22
this Exhibit. 23

Algoma Power Inc. EB-2019-0019
Exhibit 4 – Operating Expenses Page 52 of 94 May 17, 2019
Total Benefits 1
Total benefits decreased by a compound annual growth rate of negative 3.6% year over year 2
from 2015 Actual to 2020 Test Year. The main contributors are decreases to defined benefit 3
pension plan and post retirement benefit expenses, which are described further in Section 4.4.3 4
of this Exhibit. 5

Algoma Power Inc. EB-2019-0019
Exhibit 4 – Operating Expenses Page 53 of 94 May 17, 2019
4.4.3 PENSION EXPENSE AND POST RETIREMENT BENEFITS EXPENSE 1
Overview 2
API participates in two pension plans: a defined benefit plan, the Retirement Fund of API, and a 3
defined contribution plan, the Defined Contribution Plan of API. 4
Defined Benefit Pension Plan 5
API sponsors the Retirement Fund of API. Regular Power Workers Union employees hired after 6
January 1, 1991 shall become a member of this plan after three (3) months of continuous 7
service. The pension plan is a contributory defined-benefit pension plan whereby the member’s 8
contributions are based on the following: 9
Effective January 1, 2015 to November 27, 2016, members were required to contribute at a rate 10
of 6.5% of gross earnings up to the year’s maximum pensionable earnings (“YMPE”) and 8.5% of 11
gross earnings in excess of YMPE. For the period between November 28, 2016 and December 12
31, 2016, inclusive, 5.0% of gross earnings up to and including the YMPE and 7.0% of gross 13
earnings, if any, in excess of the YMPE. For the 2017 plan year, 5.5% of gross earnings up to and 14
including the YMPE and 7.5% of gross earnings, if any, in excess of the YMPE. For the 2018 plan 15
year, 6.0% of gross earnings up to and including the YMPE and 8.0% of the gross earnings, if 16
any, in excess of the YMPE and for the 2019 plan year and each plan year thereafter, 6.5% of 17
gross earnings up to and including the YMPE and 8.5% of gross earnings, if any, in excess of the 18
YMPE. 19
The members are comprised of current represented employees of the Power Workers Union, 20
certain grandfathered Management and Non-Union employees, pensioners (previous 21
employees) and beneficiaries of employees or pensioners. As of January 1, 2019, there are 33 22
active members and a total of 34 pensioners/beneficiaries receiving a pension. 23
The most recent actuarial valuation for the Retirement Fund of API was December 31, 2017. The 24
actual valuation was filed with the Financial Services Commission of Ontario and has been 25

Algoma Power Inc. EB-2019-0019
Exhibit 4 – Operating Expenses Page 54 of 94 May 17, 2019
included as Appendix 4B within this Exhibit. The valuation showed that the plan had an excess of 1
$5,199,500, on a going-concern basis. 2
Table 9 below outlines Defined Benefit Pension Plan expenses, amounts included in internal 3
labour burden rates that have been allocated to capital, and significant assumptions used from 4
2015 Board Approved to 2020 Test. 5
Table 9 - Defined Benefit Pension Plan Expenses and Assumptions 6
Defined Benefit Pension Plan
2015 Board Approved
2015 Actual
2016 Actual
2017 Actual
2018 Actual
2019 Bridge Year
2020 Test Year
Pension Expense $544,169 $567,041 $244,679 $424,566 $409,364 $385,811 $338,636 Pension Expense
Allocated to Capital $176,526 $212,804 $97,687 $140,699 $172,850 $137,488 $122,164
Significant assumptions used:
Discount rate 4.60% 4.20% 4.00% 3.60% 3.90% 3.70% 3.70% Expected long-term rate of return on plan assets 5.80% 5.75% 5.50% 5.25% 5.25% 5.25% 5.25%
Rate of compensation increase 4.00% 4.00% 3.50% 3.50% 3.50% 3.50% 3.50%
7
The defined benefit pension expense amounts are prepared for API by Mercer (Canada) Limited 8
(“Mercer”). In February 2019, Mercer provided an updated estimate of the 2020 pension expense 9
amount based on current known market information as at January 31, 2019. 10
Defined Contribution Pension Plan 11
This plan is available to full-time, permanent, non-unionized employees after completing three 12
(3) months of employment. As of January 1, 2019 there are 22 members in the plan. Members of 13
the plan may make contributions ranging from 0% to 5% of their basic earnings. API is required 14
to contribute an amount equal to 3% of earnings, in addition to matching the employee’s 15

Algoma Power Inc. EB-2019-0019
Exhibit 4 – Operating Expenses Page 55 of 94 May 17, 2019
contributions to a maximum of 8%. Contributions cannot exceed the overall maximum under the 1
Income Tax Act (Canada). 2
Table 10 below outlines Defined Contribution Pension Plan expenses for 2015 Board Approved 3
to 2020 Test, and amounts that have been included in internal labour burden rates that have 4
been allocated to capital. 5
Table 10 - Defined Contribution Pension Plan Expenses 6
2015 Board
Approved
2015 Actual
2016 Actual
2017 Actual
2018 Actual
2019 Bridge Year
2020 Test Year
Pension Premiums $127,937 $129,849 $121,500 $113,100 $135,359 $120,000 $123,000 Pension Premiums
Allocated to Capital $41,502 $48,731 $48,508 $37,481 $57,154 $42,763 $44,373
7
Post-Retirement Benefits Expense 8
API provides certain health, dental and life insurance benefits, under unfunded defined benefits 9
plans, on behalf of its retired employees. 10
The post retirement benefit expense amounts are prepared for API by Mercer. In January 2019, 11
Mercer provided updated estimates of the 2020 post retirement benefit expense amounts based 12
on the current known market information as at January 31, 2019. 13
Table 11 below outlines Post Retirement Benefits expenses and assumptions used for 2015 14
Board Approved to 2020 Test. 15
16

Algoma Power Inc. EB-2019-0019
Exhibit 4 – Operating Expenses Page 56 of 94 May 17, 2019
Table 11 - Post Retirement Benefits Expenses and Assumptions 1
Post-Retirement Benefits Expense
2015 Board
Approved
2015 Actual
2016 Actual
2017 Actual
2018 Actual
2019 Bridge Year
2020 Test Year
Post-retirement benefit costs $653,000 $819,000 $618,200 $661,200 $759,200 $433,111 $463,411
Post-retirement benefit costs Allocated to
Capital $211,831 $307,361 $246,813 $219,152 $320,566 $154,344 $167,177
Significant assumptions used:
Discount rate 5.00% 4.20% 4.10% 3.70% 3.90% 3.90% 3.90%
2
EB-2015-0040 Report of the Ontario Energy Board: Regulatory Treatment of Pension and 3
Other Post-employment Benefits (OPEBs) Costs 4
API uses the accrual accounting in rate setting for pension and OPEB amounts. As outlined in 5
Exhibits 1 and 9, API has implemented variance accounts, effective January 1, 2018, to track the 6
difference between the forecasted accrual amount in rates and actual cash payment(s) made. 7
API has also calculated carrying charges in accordance with OEB guidance. At the end of the 8
2018, API had accrued $7,452 in interest carrying charges payable back to the rate payer. Refer 9
to Exhibit 9 for further details. 10

Algoma Power Inc. EB-2019-0019
Exhibit 4 – Operating Expenses Page 57 of 94 May 17, 2019
4.5 SHARED SERVICES & CORPORATE COST ALLOCATION 1
API is a wholly owned subsidiary of FortisOntario Inc. (“FortisOntario”). FortisOntario also owns 2
two other regulated distribution businesses licensed by the OEB; Canadian Niagara Power Inc. 3
(“CNPI”) and Cornwall Street Railway Light and Power Company Limited (“Cornwall Electric”). In 4
addition, FortisOntario owns an unregulated district heating plant in Cornwall (i.e., Cornwall 5
District Heating). 6
The business units of the FortisOntario group are as follows: 7
• FortisOntario (includes Executive and Cornwall District Heating) 8 • API; 9 • Cornwall Electric; 10 • CNPI – Distribution; and 11 • CNPI – Transmission. 12
Service Agreements 13
Pursuant to a Services Agreement between FortisOntario and its Board licensed affiliates, API 14
shares certain services with its affiliates. In addition to shared services, certain assets and 15
employees are also shared. The Services Agreement is attached as Appendix 4C. 16
Corporate and Administrative Services – Shared Services 17
In order to maximize efficiencies of scale and avoid duplication, certain administrative and 18
corporate services are shared by the business units. The shared services include executive, 19
finance, information technology, customer service, human resources, health, safety and 20
environmental, regulatory and materials management. Cost-based pricing is used for the shared 21
services. Allocation methodology is regularly reviewed and was most recently approved within 22
Canadian Niagara Power Inc.’s EB-2016-0061 cost of service proceeding. The reasonableness of 23
the allocation methodology had also been reviewed by a third party and the results were 24
included in the BDR report included within CNPI’s proceeding. Any changes that resulted from 25
the BDR report within the CNPI application were incorporated into the 2017 actual allocated 26
amounts. That same methodology has been reflected in 2017 Actuals through to 2020 Test 27
within this Application. 28
Algoma Power Inc. EB-2019-0019
Exhibit 4 – Operating Expenses Page 58 of 94 May 17, 2019
Allocation of Shared Assets 1
In accordance with Board staff's preference as outlined in its submission dated October 17, 2014 2
within EB-2014-0055, API has presented costs related to shared computer hardware and 3
software in OEB 4375 within this Application starting with 2015 Actuals. This change in approach 4
was also outlined in Canadian Niagara Power Inc.’s EB-2016-0061 proceeding. The charged 5
allocated is derived by calculating a return on the shared assets, adding the depreciation 6
expense, and then including a gross up for taxes. 7
Corporate Services – Fortis Inc. 8
Fortis Inc., FortisOntario’s parent company, allocates to the FortisOntario group, and other 9
Fortis-owned companies, costs for strategic planning, finance and administrative services such 10
as costs incurred related to the listing of Fortis shares on the Toronto Stock Exchange and New 11
York Stock Exchange, and charges related to the administration of share purchase plans, and 12
other costs. Consumers benefit from these services by providing API with access to capital, 13
which provides the required capital investment in the API distribution system for a reliable and 14
safe supply of electricity. The charges are allocated to FortisOntario. The charges allocated to 15
FortisOntario are subsequently charged to the five business units within FortisOntario based on 16
relative rate base and relative revenues. Cost-based pricing is used for the charges. 17
Board of Director Related Costs 18
There are no Board of Director-related costs for affiliates included in API’s costs. 19
Variance Analysis 20
Appendix 2-N has been completed for 2015 Board Approved to 2020 Test as part of the Chapter 21
2 Appendices. Table 12 shown below details the variances from the last Board Approved, 2015, 22
to the 2020 Test Year. The materiality threshold used for explanation of variances is $125,000, as 23
calculated in Exhibit 1. 24

Algoma Power Inc. EB-2019-0019
Exhibit 4 – Operating Expenses Page 59 of 94 May 17, 2019
Table 12 – OEB Appendix 2-N Shared Services Variances 1
Year: 2015 Board Approved
Shared Services and Corporate Cost Allocation
Name of Company
Service Offered
Pricing Methodology
% of Corporate
Costs Allocated
Amount Allocated From To
% $ FortisOntario API corporate
services cost based 22% 451,532
FortisOntario API building rent market based 13% 70,123
CNPI-Distribution API administrative services cost based 24% 1,418,934
Fortis Inc. API administrative services cost based 1% 99,820
2
Year: 2015 Actual
Shared Services and Corporate Cost Allocation
Name of Company
Service Offered
Pricing Methodology
% of Corporate
Costs Allocated
Amount Allocated From To
% $ FortisOntario API corporate
services cost based 22% 447,185
FortisOntario API building rent market based 13% 70,123
CNPI-Distribution API administrative services cost based 24% 1,426,761
CNPI-Distribution API shared IT cost based 34% 525,645
Fortis Inc. API administrative services cost based 1% 137,075
3

Algoma Power Inc. EB-2019-0019
Exhibit 4 – Operating Expenses Page 60 of 94 May 17, 2019
1
Year: 2016
Shared Services and Corporate Cost Allocation
Name of Company
Service Offered
Pricing Methodology
% of Corporate
Costs Allocated
Amount Allocated From To
% $ FortisOntario API corporate
services cost based 22% 469,380
FortisOntario API building rent market based 13% 71,525
CNPI-Distribution API administrative services cost based 24% 1,398,626
CNPI-Distribution API shared IT cost based 34% 584,954
Fortis Inc. API administrative services cost based 1% 182,070
2
Year: 2017
Shared Services and Corporate Cost Allocation
Name of Company
Service Offered
Pricing Methodology
% of Corporate
Costs Allocated
Amount Allocated From To
% $ FortisOntario API corporate
services cost based 22% 493,618
FortisOntario API building rent market based 14% 77,411
CNPI-Distribution API administrative services cost based 25% 1,515,070
CNPI-Distribution API shared IT cost based 35% 571,402
Fortis Inc. API administrative services cost based 1% 159,750
3
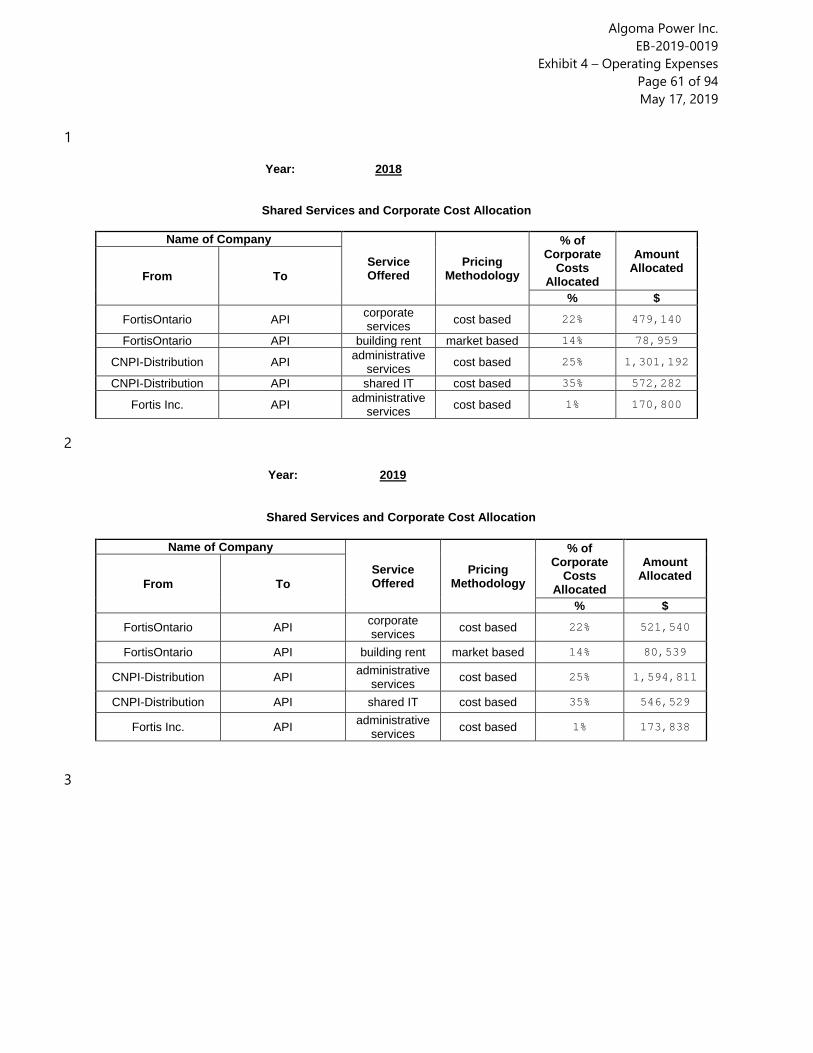
Algoma Power Inc. EB-2019-0019
Exhibit 4 – Operating Expenses Page 61 of 94 May 17, 2019
1
Year: 2018
Shared Services and Corporate Cost Allocation
Name of Company
Service Offered
Pricing Methodology
% of Corporate
Costs Allocated
Amount Allocated From To
% $ FortisOntario API corporate
services cost based 22% 479,140
FortisOntario API building rent market based 14% 78,959
CNPI-Distribution API administrative services cost based 25% 1,301,192
CNPI-Distribution API shared IT cost based 35% 572,282
Fortis Inc. API administrative services cost based 1% 170,800
2
Year: 2019
Shared Services and Corporate Cost Allocation
Name of Company
Service Offered
Pricing Methodology
% of Corporate
Costs Allocated
Amount Allocated From To
% $
FortisOntario API corporate services cost based 22% 521,540
FortisOntario API building rent market based 14% 80,539
CNPI-Distribution API administrative services cost based 25% 1,594,811
CNPI-Distribution API shared IT cost based 35% 546,529
Fortis Inc. API administrative services cost based 1% 173,838
3
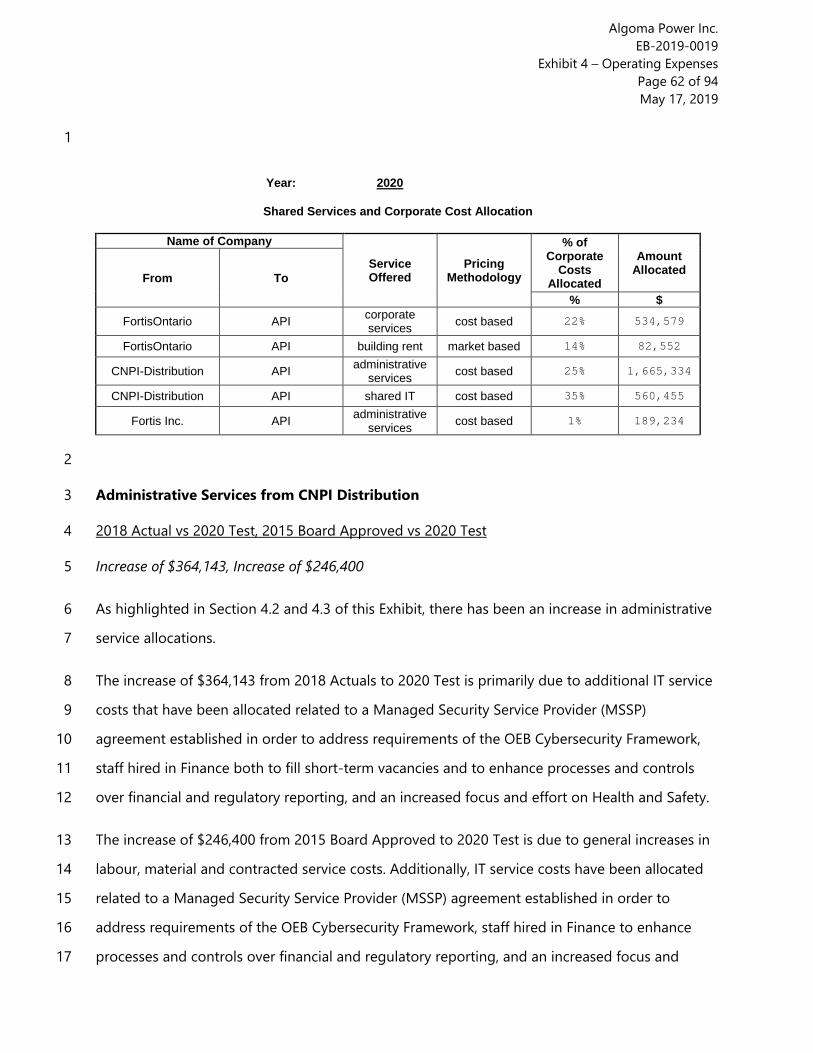
Algoma Power Inc. EB-2019-0019
Exhibit 4 – Operating Expenses Page 62 of 94 May 17, 2019
1
Year: 2020
Shared Services and Corporate Cost Allocation
Name of Company
Service Offered
Pricing Methodology
% of Corporate
Costs Allocated
Amount Allocated From To
% $ FortisOntario API corporate
services cost based 22% 534,579
FortisOntario API building rent market based 14% 82,552
CNPI-Distribution API administrative services cost based 25% 1,665,334
CNPI-Distribution API shared IT cost based 35% 560,455
Fortis Inc. API administrative services cost based 1% 189,234
2
Administrative Services from CNPI Distribution 3
2018 Actual vs 2020 Test, 2015 Board Approved vs 2020 Test 4
Increase of $364,143, Increase of $246,400 5
As highlighted in Section 4.2 and 4.3 of this Exhibit, there has been an increase in administrative 6
service allocations. 7
The increase of $364,143 from 2018 Actuals to 2020 Test is primarily due to additional IT service 8
costs that have been allocated related to a Managed Security Service Provider (MSSP) 9
agreement established in order to address requirements of the OEB Cybersecurity Framework, 10
staff hired in Finance both to fill short-term vacancies and to enhance processes and controls 11
over financial and regulatory reporting, and an increased focus and effort on Health and Safety. 12
The increase of $246,400 from 2015 Board Approved to 2020 Test is due to general increases in 13
labour, material and contracted service costs. Additionally, IT service costs have been allocated 14
related to a Managed Security Service Provider (MSSP) agreement established in order to 15
address requirements of the OEB Cybersecurity Framework, staff hired in Finance to enhance 16
processes and controls over financial and regulatory reporting, and an increased focus and 17
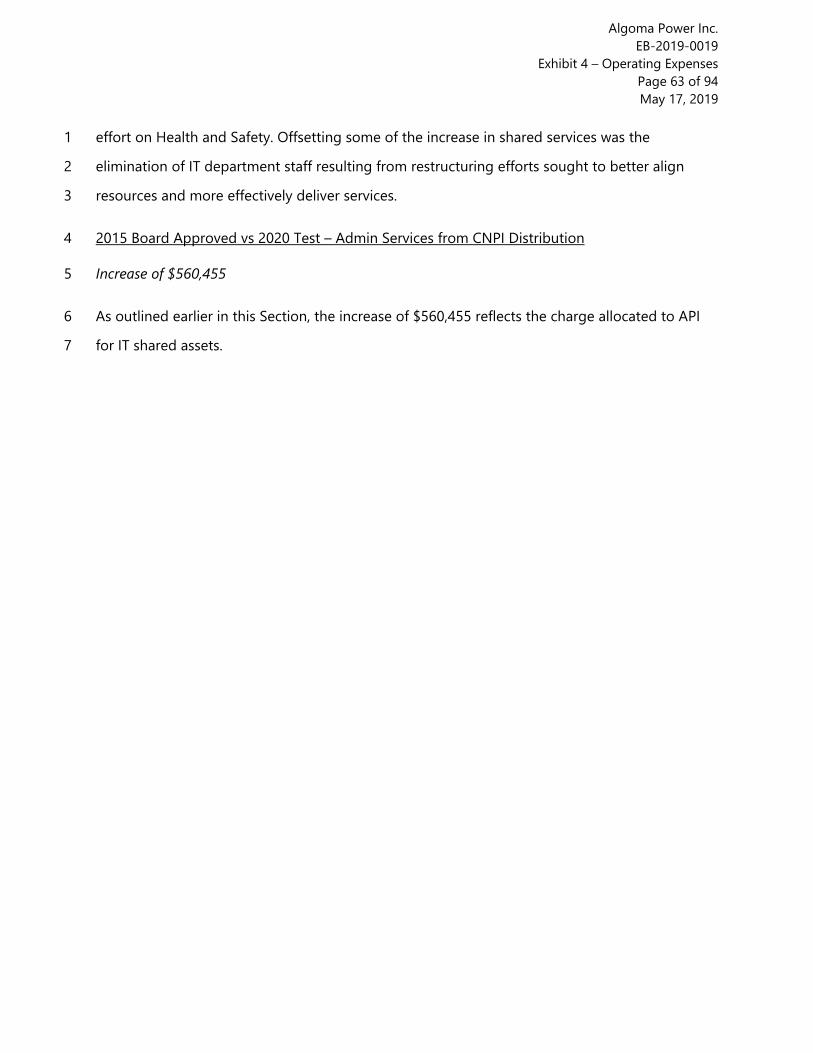
Algoma Power Inc. EB-2019-0019
Exhibit 4 – Operating Expenses Page 63 of 94 May 17, 2019
effort on Health and Safety. Offsetting some of the increase in shared services was the 1
elimination of IT department staff resulting from restructuring efforts sought to better align 2
resources and more effectively deliver services. 3
2015 Board Approved vs 2020 Test – Admin Services from CNPI Distribution 4
Increase of $560,455 5
As outlined earlier in this Section, the increase of $560,455 reflects the charge allocated to API 6
for IT shared assets. 7

Algoma Power Inc. EB-2019-0019
Exhibit 4 – Operating Expenses Page 64 of 94 May 17, 2019
4.6 PURCHASES OF NON- AFFILIATE SERVICES, ONE TIME COST, REGULATORY 1 COSTS 2
4.6.1 NON-AFFILIATE SERVICES 3
FortisOntario Policy MM100 (attached at Appendix 4D to this Exhibit) allows for outsourcing of 4
service expenses primarily through two means: 5
a) Competitive Procurement 6
Policy MM100 states that processes such as a Request for Quotations (“RFQ”), Request 7
for Proposals (“RFP”) and Request for Information (“RFI”) are to be used for purchases 8
over $10,000 (Contract A and Contract B scenario). Depending on the nature of the work 9
and estimated expense, this could be a formal or informal process. 10
Contractors that have met API’s Health, Safety and Environmental requirements are 11
eligible to be included in the competitive bidding process. A bid document is sent to 12
each of the qualified Contractors where they are asked to either provide a detailed 13
proposal on the cost of the project or provide standard rates for labour and equipment 14
to complete the work. 15
The responses are then evaluated by API using a number of criteria which may include: 16
price, health and safety, environment, return on investment, delivery schedule, quality, 17
and methodology. Based upon this evaluation, the Contractor that offers the best value 18
to API is awarded the work. 19
In most cases the procurement process is handled directly by API, however in other 20
cases this process might be managed by affiliates, parent companies, or through the 21
North Eastern Buying Consortium (NEDBC) in order to leverage economies of scale. 22
b) Single/Sole Source 23
Policy MM100 allows for purchases over $10,000 to have a single source of supply 24
provided they meet specific requirements of Section 5.2 of the Policy. API has allowed 25

Algoma Power Inc. EB-2019-0019
Exhibit 4 – Operating Expenses Page 65 of 94 May 17, 2019
that purchases with an annual spend under $10,000 can have a single source of supply 1
in order to facilitate low dollar purchases. 2
As with Competitive Bidding, Contractors are selected through the pre-qualified list and 3
are asked to submit a detailed proposal or rate sheet so all costs are fully understood. 4
Prior to 2018, the Vegetation Management program used a comparative analysis to 5
measure the quoted rates of two primary suppliers against internal rates and historical 6
trends to ensure value. As of late 2017 additional Providers were identified and the 7
process is now being managed through formal competitive procurements. 8
Both procurement methods are subject to the rules and controls that API has built into their ERP 9
system. The purpose being to provide visibility on the acquisition and to have an authorized 10
approval for all goods and services purchased. Approval authorizations are tiered to specific 11
positions within API with specific dollar limitations. Purchases over the $30,000 limit become the 12
responsibility of the API Executives to review and approve. This is done both in the ERP system 13
and by having the VP1A Executive Authorization form signed. The VP1A form again is tiered to 14
specific dollar amounts to provide visibility and to ensure that all high dollar expenses are 15
authorized by one or more of the Executives. 16
API also employs a Corporate Buyer. The buyer is responsible to seek the optimal combination 17
of logistics activities and their attributes such as price, quality, speed and security and to 18
manage the resulting information and monetary flows. Additional responsibilities of the buyer 19
include overseeing the acquisition, use and disposition of goods, materials and services to fulfill 20
internal and external customer needs. The specific duties of the buyer include but are not limited 21
to: 22
a) Administration of the FortisOntario Corporate Purchasing Policy MM100. 23
b) Prepare and administer competitive bidding documents and processes. This includes but 24
is not limited to; issuing the bid, summarizing submissions, assisting with the review and 25
selection process, finalizing and managing any contractual documents and the ongoing 26
maintenance thereof. 27

Algoma Power Inc. EB-2019-0019
Exhibit 4 – Operating Expenses Page 66 of 94 May 17, 2019
c) Review and evaluate purchase orders submitted through the ERP system to ensure 1
reasonableness, accuracy and policy compliance prior to Management approval. 2
d) Prepare and submit the VP1A form for Executive signoff. 3
e) Review and investigate invoices for any price, product or service discrepancies. 4
f) Develop new supply sources and stay abreast of new trends and innovations in routinely 5
purchased supplies, materials, services and equipment. 6
g) Maintain price lists on assigned commodities and negotiate prices and terms. 7
h) Solicit labour and equipment rates for cost comparisons. 8
Table 13 below lists non-affiliated services that were purchased between 2015 and 2018 9
inclusive, that were sole-sourced in accordance with one or more of the exception criteria 10
included in Section 5.2 of API’s purchasing policy; a $125,000 materiality threshold was used. 11
Explanations for these exceptions are provided following the table. 12
Table 13 – Sole-Source Exceptions by Year 13
2016
Account Vendor Nature of Service Exception Criteria Annual Expense
103420 M. MACINTYRE TRUCKING INC.
Equipment Services 5.2(b); (d); (g) $ 271,081.18
103621 PICKARD CONSTRUCTION Equipment Services 5.2(b); (d); (g) $ 266,135.31
103476 POLLARI CONTRACTING Equipment Services 5.2(b); (d); (g) $ 192,071.35
102353 G&W CANADA INC Reclosers 5.2(e) $ 171,509.14
103376 GARDINER MARINE Barging Circuit 4 5.2(b) $ 160,878.10 14
2015
Account Vendor Nature of Service Exception Criteria Annual Expense
102353 G&W CANADA INC Reclosers 5.2(e) $ 270,719.75 103476 POLLARI CONTRACTING Equipment Services 5.2(b); (d); (g) $ 206,375.55 103729 THOMAS & BETTS Reclosers 5.2(e) $ 179,681.30 103594 BULLETPROOF SOLUTIONS
INC. Server Replacement 5.2(d); (g) $ 150,261.91
100333 POWERTEL UTILITIES CONTRACTORS Tracked Vehicle Rentals 5.2(b) $ 132,715.23
103420 M. MACINTYRE TRUCKING INC. Equipment Services 5.2(b); (d); (g) $ 131,756.94
Algoma Power Inc. EB-2019-0019
Exhibit 4 – Operating Expenses Page 67 of 94 May 17, 2019
2017
Account Vendor Nature of Service Exception Criteria Annual Expense
103687 J PROVOST CONTRACTING LTD Equipment Services 5.2(b); (d); (g) $ 151,130.00
100333 POWERTEL UTILITIES CONTRACTORS Tracked Vehicle Rentals 5.2(b) $ 218,329.03
101521 RODAN ENERGY SOLUTIONS INC
Wholesale Meter Replacements 5.2(d) $ 208,479.86
103323 CASE CONSTRUCTION Equipment Services 5.2(b); (d); (g) $ 169,487.49
103324 CASE CONSTRUCTION Snow Plowing Competitive Bid Included in Above
1
2018
Account Vendor Nature of Service Exception Criteria Annual Expense
100333 POWERTEL UTILITIES CONTRACTORS Tracked vehicle rentals 5.2(b) $ 463,979.67
103621 PICKARD CONSTRUCTION Equipment services 5.2(b); (d); (g) $ 359,998.23
103476 POLLARI CONTRACTING Equipment services 5.2(b); (d); (g) $ 205,610.80
103477 POLLARI CONTRACTING Snow plowing Competitive bid Included in above
103420 M. MACINTYRE TRUCKING INC. Equipment services 5.2(b); (d); (g) $ 201,093.21
103421 M. MACINTYRE TRUCKING INC. Snow plowing Competitive bid Included in above
102353 G&W CANADA INC Reclosers 5.2(e) $ 173,825.64
103323 CASE CONSTRUCTION Equipment services 5.2(b); (d); (g) $ 163,615.08
103324 CASE CONSTRUCTION Snow plowing Competitive bid Included in above
2
Reclosers – For three-phase reclosers, API’s Engineering group has approved reclosers supplied 3
by G&W Canada for use up to 35 kV, and reclosers supplied by Thomas & Betts for 44 kV 4
applications. Standardization of this equipment is important to ensure that design clearances 5
are met both during initial installation and replacement, for staff training on associated controls, 6
for stocking of spare parts, and to minimize future SCADA integration issues. 7

Algoma Power Inc. EB-2019-0019
Exhibit 4 – Operating Expenses Page 68 of 94 May 17, 2019
Equipment Services – these services represent a large number of smaller jobs, related to 1
excavation for pole setting, temporary access from roads to right of way, etc. While specific 2
packages of work are not competitively bid, API prequalifies a number of vendors that are able 3
to comply with its Health & Safety and Environmental requirements. Vendor selection for any 4
specific task often depends on contractor availability and/or the availability of specialized 5
equipment at the time each project, or as required during emergencies. API regularly compares 6
pricing across all qualified contractors to ensure that it reflects market rates. These vendors 7
have also recently bid on competitive snow plowing contracts, as reflected in the above table. 8
2015 Server Replacement – API was able to secure preferred pricing at significant discounts 9
from a long-standing IT hardware supplier that also had an ability to supplement IT internal 10
resources for the installation and ongoing support for this hardware. 11
Tracked Vehicle Rentals – these are specialized off-road equipment used for line work in areas 12
not accessible by API’s typical large fleet. Suppliers are limited, and PowerTel Utilities 13
Contractors is currently the only vendor able to supply this equipment in a cost-effective 14
manner, without an obligation to supply a dedicated operator. 15
Barging – this vendor was uniquely qualified (both in terms of experience and equipment) to 16
perform a specific task for laying high-voltage submarine cable in an extremely remote area. 17
Wholesale Meter Replacements – Meter seals expired in 2017 on an above-average number of 18
API’s wholesale meters. As API’s registered MSP, Rodan Energy Solutions was uniquely qualified 19
to replace these meters. 20
4.6.2 ONE-TIME COSTS 21
In compliance with OEB policy and the Filing Requirements, certain costs associated with this 22
Cost of Service application are being amortized over a period of 5 years, by including one-fifth 23
of the total cost in the 2020 Test Year. These regulatory costs, which are explained in detail in 24
the next section, include costs related to consultants, legal representation, and intervenor cost 25
awards. In accordance with the Filing Requirements, API commits to updating these forecasted 26
costs in OEB Appendix 2-M at the Draft Rate Order stage of the proceeding. 27

Algoma Power Inc. EB-2019-0019
Exhibit 4 – Operating Expenses Page 69 of 94 May 17, 2019
In addition to costs associated with the current Application, API has included additional one-1
time costs of $551,520 related to the recovery of costs forecasted to be recorded in its 2
Transaction and Integration Costs Deferral Account, established in EB-2018-0271. The purpose 3
of this account is to track costs associated with API taking control of the distribution business of 4
DLI, one-time costs associated with API’s interim operation of DLI’s distribution system during 5
the 2017-2019 period, and transaction and integration costs associated with API’s proposed 6
acquisition of DLI’s distribution system. In that application, the OEB agreed with API that under 7
the unique circumstances of its MAAD application with Dubreuil Lumber Inc. (“DLI”), it would be 8
appropriate to allow Algoma to establish a deferral account to recover its reasonable transaction 9
and integration costs in lieu of a deferred rebasing period.2 API proposes to recover these costs 10
by including one-fifth of the total costs in the 2020 Test Year, consistent with the approach put 11
forward in the MAAD application. API has therefore requested that the OEB make a 12
determination on this proposal, as a preliminary issue, as further detailed in Sections 1.3.4 and 13
1.3.7 of Exhibit 1. API also identified in its Draft Rate Order in the EB-2018-0271 proceeding, that 14
the total amount of approximately $551,000 remains subject to a number of adjustments, some 15
of which depend on the final outcome of the EB-2018-0271 proceeding. API commits to making 16
any required adjustments pending the outcome of the EB-2018-0271 proceeding, and the OEB’s 17
decision on preliminary issues in the current Application. 18
With the exception of the one-time costs identified above, all other costs presented in the 19
proposed 2020 test year OM&A budget are considered regular year over year expenses. 20
2 Decision and Order EB-2018-0271, April 4, 2019, p.23

Algoma Power Inc. EB-2019-0019
Exhibit 4 – Operating Expenses Page 70 of 94 May 17, 2019
4.6.3 REGULATORY COSTS 1
API’s regulatory costs include four major components. The first two relate to OEB assessment 2
costs and the costs of staffing allocated to regulatory matters through shared service allocations 3
to API. These costs are forecasted based on historical actuals and consideration of labour 4
allocations in the 2020 Test Year. 5
The third major component of API’s regulatory costs is the one-time costs associated with Cost 6
of Service applications. These costs totaled approximately $225,000 for API’s 2015 Cost of 7
Service application, or approximately $45,000 per year amortized over the 2015-2019 period. 8
Forecasted costs for the 2020 Cost of Service are estimated at $353,500, as detailed in Table 14 9
below. These costs include consulting costs for completion of an asset condition assessment, 10
assistance in preparing the Distribution System Plan, application-specific customer engagement 11
activities, and regulatory consulting (load forecast, models and general assistance with the 12
preparation of the Application). They also include intervenor cost awards, OEB costs, and legal 13
costs related to the preparation and review of the Application and all components of the 14
hearing process. 15
The fourth major component of API’s regulatory costs are costs associated with API’s interim 16
operation of and proposed acquisition of DLI’s distribution system, as further detailed in Section 17
4.6.2 above. 18

Algoma Power Inc. EB-2019-0019
Exhibit 4 – Operating Expenses Page 71 of 94 May 17, 2019
Table 14 - Regulatory Costs specific to the 2020 Cost of Service 1
2020
Consultants – METSCO and TESI $73,500.00 Legal $110,000.00
Intervenor and OEB Costs ($32,500 x 4) $130,000.00 Customer Engagement and Other Costs $40,000.00
Total Cost $353,500.00 Total Cost Amortized over 5 years $70,700.00
2
Table 15 on the next page shows Appendix 2-M which details regulatory costs for five historical 3
years, bridge and test year. All regulatory costs listed in Table 15 are tracked in account 5655 – 4
Regulatory Expenses. All one-time costs identified in the 2020 Test Year are amortized over a 5
period of 5 years (2020-2024) such that one-fifth of these costs are included in API’s 2020 6
revenue requirement.7

Algoma Power Inc. EB-2019-0019
Exhibit 4 – Operating Expenses Page 72 of 94 May 17, 2019
Table 15 – OEB Appendix 2-M Regulatory Costs 1
Regulatory Cost Category USoA Account
Last Rebasing
Year (2015 Board
Approved)
Last Rebasing
Year (2015
Actual)
Most Current Actuals
Year 2018
2019 Bridge Year
Annual % Change
2020 Test Year
Annual % Change
(A) (B) (D) (E) (F) (G) (H)=[(G)-(F)]/(F) (I) (J) = [(I)-(G)]/(G) Regulatory Costs (Ongoing)
1 OEB Annual Assessment 5655 $115,000 $123,037 $50,464 $70,800 40.30% $71,904 1.56% 2 OEB Section 30 Costs (OEB-initiated) 5655 $1,000 $10,946 $1,641 $5,496 234.97% $5,416 -1.46% 3 Expert Witness costs for regulatory matters 5655 4 Legal costs for regulatory matters 5655 $3,875 $1,475 -100.00% 5 Consultants' costs for regulatory matters 5655
6 Operating expenses associated with staff resources allocated to regulatory matters 5655 $53,886 $58,504 $34,393 $29,180 -15.16% $48,459 66.07%
7 Operating expenses associated with other resources allocated to regulatory matters 1 5655
8 Other regulatory agency fees or assessments 5655
9 Any other costs for regulatory matters (please define) – Amortization of 2015
Approved One-Time Costs 5655 $44,629 $44,629 $44,629 0.00% -100.00%
10 Intervenor costs 5655 11 OEB Section 30 Costs (Applicant-Originated) 5655 $1,000 20
2

Algoma Power Inc. EB-2019-0019
Exhibit 4 – Operating Expenses Page 73 of 94 May 17, 2019
Regulatory Costs (One-Time) 1 Expert Witness costs 5655 2 Legal costs 5655 $110,000 $110,000 3 Consultants' costs 5655 $40,000 $73,500
4 Incremental operating expenses associated
with staff resources allocated to this application.
5655
5 Incremental operating expenses associated
with other resources allocated to this application.
5655
6 Intervenor costs 5655 $75,000 $130,000 7 OEB Section 30 Costs (application-related) 5655
8 Customer Engagement and Other costs associated with this application 5655 $40,000
9 Recovery of Transaction and Integration Deferral Account (EB-2018-0271) 5655 $551,520
1 Sub-total - Ongoing Costs $170,886 $240,992 $131,127 $151,580 15.60% $125,779 -17.02%
2 Sub-total - One-time Costs $225,000 $0 $0 $0 $905,020
3 Total (Ongoing + 1/5 of One-Time) $215,886 $240,992 $140,088 $151,580 15.60% $306,783 102.39%
Application-Related One-Time Costs Total (2020) Total (2015)
Total One-Time Costs Related to
Application to be Amortized over IRM Period
$905,020 $225,000
1/5 of Total One-Time Costs $181,004 $45,000
1

Algoma Power Inc. EB-2019-0019
Exhibit 4 – Operating Expenses Page 74 of 94 May 17, 2019
4.7 LEAP, CHARTIABLE & POLITICAL DONATIONS 1
As set out in the March 2009, OEB issued Report of the Board: Low Income Energy Assistance 2
Program (the LEAP Report), API has allocated at least 0.12% of its OEB-approved distribution 3
revenue requirement to provide consumers assistance in response to affordability issues. Based 4
on API’s 2015 Board Approved Service Revenue Requirement of $23,282,939, $27,940 was 5
designated as the minimum amount required for LEAP funding for 2015 Actuals to 2019 Bridge. 6
For 2020 Test Year, API has used $27,940 as a placeholder for LEAP funding in OEB 6205, but will 7
adjust this amount through the interrogatory and draft rate order stages of the Application 8
process. 9
In API, the Low-Income Energy Assistance Programs began in 2011 and API has continued to 10
provide support for this program throughout each year presented. API has utilized Ontario 11
Native Welfare Administrators Association (“ONWAA”), a First Nations organization as its lead 12
organization to administer the LEAP program. This program administration has worked well to 13
serve customers either on or off First Nations reserve lands with low incomes. Table 16 below 14
outlines the LEAP funding reported within OEB 6205 for historical years: 15
Table 16 – 2015-2018 Leap Funding (OEB 6205) 16
Year Leap fund received
Distributor 2015 $24,239 2016 $31,641 2017 $27,940 2018 $27,940
17
API confirms that no charitable donations have been included in OM&A expenses for 2020 Test 18
other than the LEAP funding noted above. 19
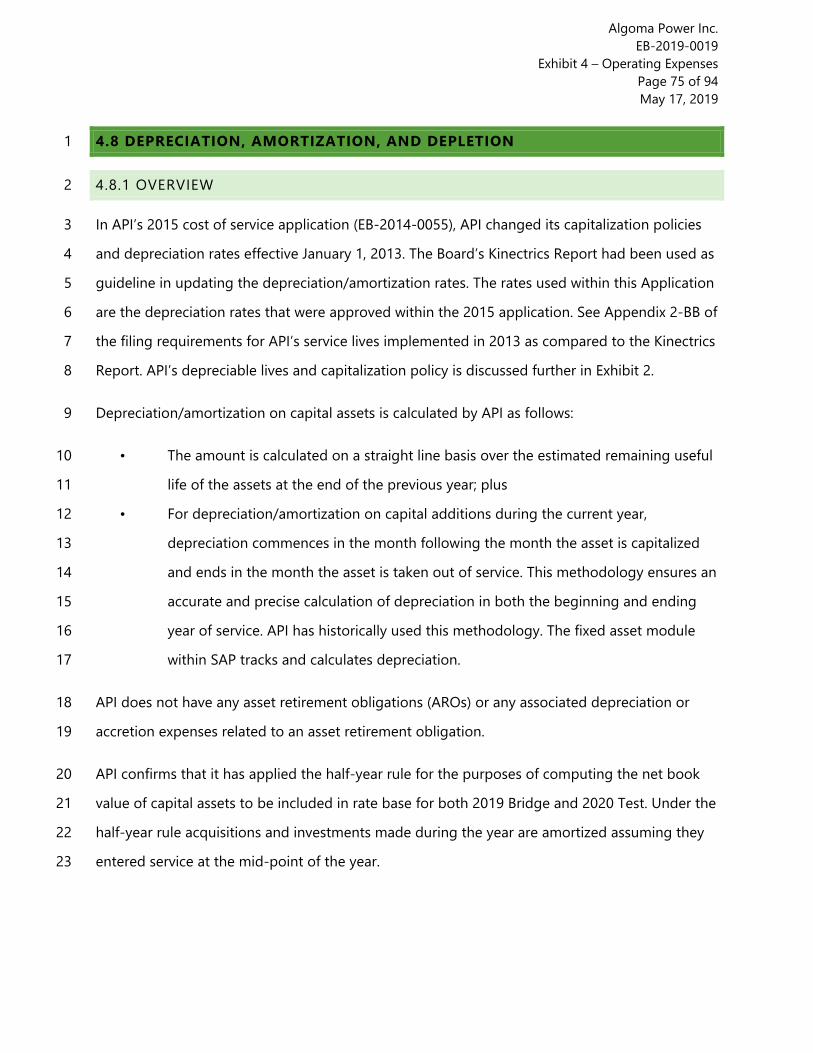
Algoma Power Inc. EB-2019-0019
Exhibit 4 – Operating Expenses Page 75 of 94 May 17, 2019
4.8 DEPRECIATION, AMORTIZATION, AND DEPLETION 1
4.8.1 OVERVIEW 2
In API’s 2015 cost of service application (EB-2014-0055), API changed its capitalization policies 3
and depreciation rates effective January 1, 2013. The Board’s Kinectrics Report had been used as 4
guideline in updating the depreciation/amortization rates. The rates used within this Application 5
are the depreciation rates that were approved within the 2015 application. See Appendix 2-BB of 6
the filing requirements for API’s service lives implemented in 2013 as compared to the Kinectrics 7
Report. API’s depreciable lives and capitalization policy is discussed further in Exhibit 2. 8
Depreciation/amortization on capital assets is calculated by API as follows: 9
• The amount is calculated on a straight line basis over the estimated remaining useful 10
life of the assets at the end of the previous year; plus 11
• For depreciation/amortization on capital additions during the current year, 12
depreciation commences in the month following the month the asset is capitalized 13
and ends in the month the asset is taken out of service. This methodology ensures an 14
accurate and precise calculation of depreciation in both the beginning and ending 15
year of service. API has historically used this methodology. The fixed asset module 16
within SAP tracks and calculates depreciation. 17
API does not have any asset retirement obligations (AROs) or any associated depreciation or 18
accretion expenses related to an asset retirement obligation. 19
API confirms that it has applied the half-year rule for the purposes of computing the net book 20
value of capital assets to be included in rate base for both 2019 Bridge and 2020 Test. Under the 21
half-year rule acquisitions and investments made during the year are amortized assuming they 22
entered service at the mid-point of the year. 23
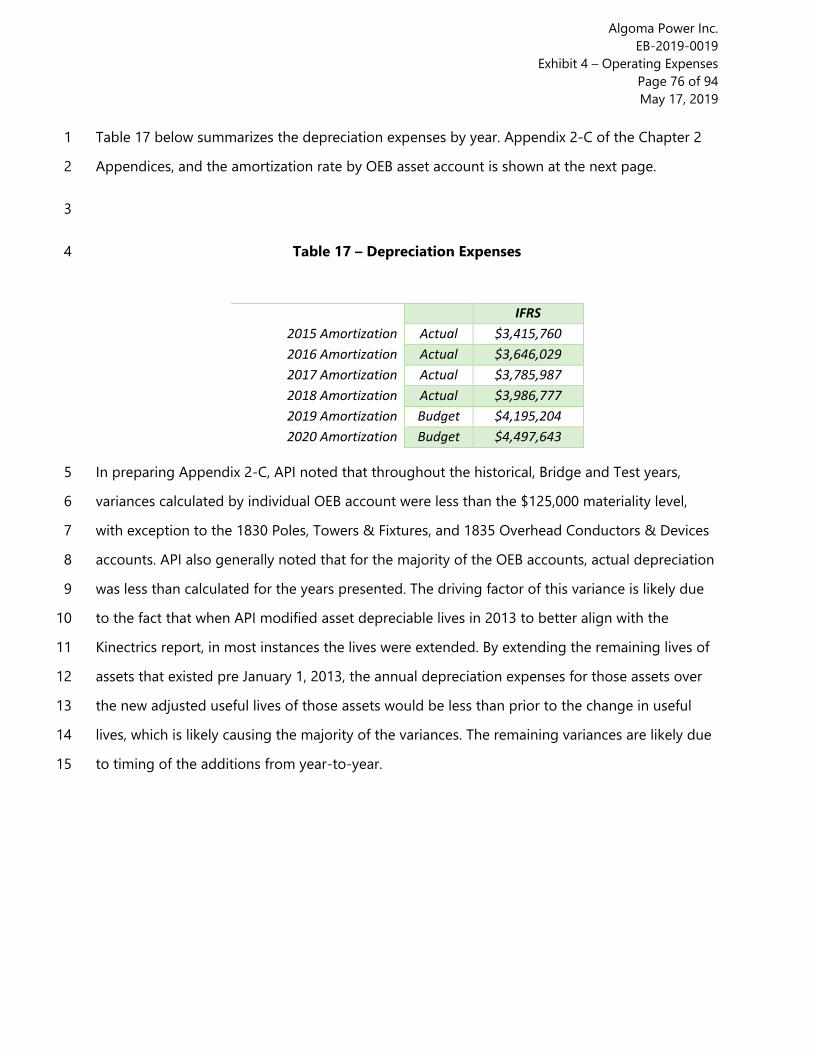
Algoma Power Inc. EB-2019-0019
Exhibit 4 – Operating Expenses Page 76 of 94 May 17, 2019
Table 17 below summarizes the depreciation expenses by year. Appendix 2-C of the Chapter 2 1
Appendices, and the amortization rate by OEB asset account is shown at the next page. 2
3
Table 17 – Depreciation Expenses 4
IFRS
2015 Amortization Actual $3,415,760 2016 Amortization Actual $3,646,029 2017 Amortization Actual $3,785,987 2018 Amortization Actual $3,986,777 2019 Amortization Budget $4,195,204 2020 Amortization Budget $4,497,643
In preparing Appendix 2-C, API noted that throughout the historical, Bridge and Test years, 5
variances calculated by individual OEB account were less than the $125,000 materiality level, 6
with exception to the 1830 Poles, Towers & Fixtures, and 1835 Overhead Conductors & Devices 7
accounts. API also generally noted that for the majority of the OEB accounts, actual depreciation 8
was less than calculated for the years presented. The driving factor of this variance is likely due 9
to the fact that when API modified asset depreciable lives in 2013 to better align with the 10
Kinectrics report, in most instances the lives were extended. By extending the remaining lives of 11
assets that existed pre January 1, 2013, the annual depreciation expenses for those assets over 12
the new adjusted useful lives of those assets would be less than prior to the change in useful 13
lives, which is likely causing the majority of the variances. The remaining variances are likely due 14
to timing of the additions from year-to-year. 15

Year 2015 MIFRS
Opening Regulatory Gross PP&E as at Jan 1, 2015
Less Fully Depreciated
Net for Depreciation Additions Total for Depreciation Years Depreciation Rate2015 Depreciation
Expense Variance 2
(a) (b) (c) (d) (e) = (c) + ½ x (d) 1 (f) (g) = 1 / (f) (h) = (e) / (f) (m) = (h) - (l)1611 Computer Software (Formally known as Account 1925) - 5 yr $966,807 $452,759 $514,048 $9,516 $518,806 5.00 20.00% $103,761 $90,851 $12,911
1611A Computer Software (Formally known as Account 1925) - 10 yr $1,540,526 $0 $1,540,526 $174,910 $1,627,981 10.00 10.00% $162,798 $155,477 $7,3211612 Land Rights (Formally known as Account 1906 and 1806) $20,627,854 $0 $20,627,854 $105,561 $20,680,634 40.00 2.50% $517,016 $526,329 -$9,3131805 Land $568,413 $0 $568,413 $54,756 $595,791 - $0 $0 $01808 Buildings - Fixtures $813,813 $1,845 $811,968 $383,886 $1,003,912 50.00 2.00% $20,078 $17,130 $2,949
1808A Buildings - Components $229,908 $7,500 $222,408 $96,785 $270,800 25.00 4.00% $10,832 $10,961 -$1291810 Leasehold Improvements $0 $0 $0 $0 $0 - $0 $0 $01815 Transformer Station Equipment >50 kV $0 $0 $0 $0 $0 - $0 $01820 Distribution Station Equipment <50 Kv - Stns $9,890,514 $1,233,783 $8,656,731 $2,335,622 $9,824,542 50.00 2.00% $196,491 $137,677 $58,813
1820A Distribution Station Equipment <50 kV - Switches/Breakers $1,446,006 $13,148 $1,432,858 $718,383 $1,792,050 40.00 2.50% $44,801 $31,615 $13,1861825 Storage Battery Equipment $0 $0 $0 $0 $0 - $0 $0 $01830 Poles, Towers & Fixtures $54,990,624 $5,293,506 $49,697,118 $2,128,942 $50,761,590 45.00 2.22% $1,128,035 $877,565 $250,4701835 Overhead Conductors & Devices $27,138,337 $3,089,842 $24,048,495 $3,518,776 $25,807,883 45.00 2.22% $573,509 $447,538 $125,9701840 Underground Conduit $0 $0 $0 $0 $0 - $0 $0 $01845 Underground Conductors & Devices $1,567,812 $59,851 $1,507,961 $201,810 $1,608,866 40.00 2.50% $40,222 $36,037 $4,1851850 Line Transformers $11,904,267 $1,197,236 $10,707,031 $274,945 $10,844,504 40.00 2.50% $271,113 $183,042 $88,0711855 Services (Overhead & Underground) $3,361,906 $866,373 $2,495,533 $0 $2,495,533 40.00 2.50% $62,388 $41,003 $21,3851860 Meters $2,022,670 $510,969 $1,511,701 $30,081 $1,526,741 30.00 3.33% $50,891 $19,120 $31,772
1860A Meters (Smart Meters) $3,546,764 $0 $3,546,764 $45,691 $3,569,609 15.00 6.67% $237,974 $237,184 $7901860B Meters - PT's and CT's $244,424 $9,395 $235,029 $4,725 $237,391 30.00 3.33% $7,913 $6,918 $9951865 Other Installations on Customer's Premises $194,063 $0 $194,063 $0 $194,063 10.00 10.00% $19,406 $19,406 $01875 Street Lighting and Signal Systems $16,523 $16,523 $0 $0 $0 20.00 5.00% $0 $0 $01905 Land $0 $0 $0 $0 $0 - $0 $0 $01908 Buildings & Fixtures $0 $0 $0 $0 $0 - $0 $0 $01910 Leasehold Improvements $43,398 $43,398 $0 $31,962 $15,981 4.00 25.00% $3,995 $3,995 $01915 Office Furniture & Equipment (10 years) $1,437,049 $931,243 $505,806 $18,382 $514,998 10.00 10.00% $51,500 $45,595 $5,9041915 Office Furniture & Equipment (5 years) $0 $0 $0 $0 $0 10.00 10.00% $0 $0 $01920 Computer Equipment - Hardware $1,022,788 $376,317 $646,471 $174,074 $733,508 5.00 20.00% $146,702 $135,421 $11,2801920 Computer Equip.-Hardware(Post Mar. 22/04) $0 $0 $0 $0 $0 5.00 20.00% $0 $0 $01920 Computer Equip.-Hardware(Post Mar. 19/07) $0 $0 $0 $0 $0 5.00 20.00% $0 $0 $01930 Transportation Equipment - 5 Yr $1,269,437 $597,842 $671,595 $57,395 $700,293 5.00 20.00% $140,059 $134,984 $5,075
1930A Transportation Equipment - 10 Yr $3,554,358 $1,872,231 $1,682,127 $381,246 $1,872,751 10.00 10.00% $187,275 $143,974 $43,3011935 Stores Equipment $0 $0 $0 $0 $0 - $0 $0 $01940 Tools, Shop & Garage Equipment $1,866,118 $1,093,995 $772,123 $31,520 $787,883 10.00 10.00% $78,788 $76,460 $2,3291945 Measurement & Testing Equipment $208,449 $100,192 $108,257 $16,667 $116,590 10.00 10.00% $11,659 $11,242 $4171950 Power Operated Equipment $0 $0 $0 $0 $0 - $0 $0 $01955 Communications Equipment $455,982 $14,767 $441,215 $21,575 $452,002 10.00 10.00% $45,200 $44,452 $7481955 Communication Equipment (Smart Meters) $0 $0 $0 $0 $0 10.00 10.00% $0 $0 $01960 Miscellaneous Equipment - 10 yr $125,107 $105,814 $19,293 $6,388 $22,487 10.00 10.00% $2,249 $2,293 -$44
1960A Miscellaneous Equipment - 5 yr $465,748 $465,748 $0 $0 $0 5.00 20.00% $0 $0 $01970 Load Management Controls Customer Premises $0 $0 $0 $0 $0 - $0 $0 $01975 Load Management Controls Utility Premises $0 $0 $0 $0 $0 - $0 $0 $01980 System Supervisor Equipment $5,012 $0 $5,012 $107,182 $58,603 20.00 5.00% $2,930 $249 $2,6811985 Miscellaneous Fixed Assets $0 $0 $0 $0 $0 - $0 $0 $01990 Other Tangible Property $0 $0 $0 $0 $0 - $0 $0 $01995 Contributions & Grants -$626,753 $0 -$626,753 -$157,118 -$705,312 - $0 -$20,758 $20,758etc. $0 $0 $0 $0etc. $0 $0 $0 $0etc. $0 $0 $0 $0
$0 $0 $0 $0Total $150,897,924 $18,354,277 $132,543,647 $10,773,665 $137,930,479 $4,117,585 $3,415,760 $701,825
Determination of Depreciation Expenses
Account Description
2015 Depreciation Expense per Appendix 2-B Fixed Assets, Column
K (l)
Algoma Power Inc. EB-2019-0019
Exhibit 4 – Operating Expenses Page 77 of 94 May 17, 2019
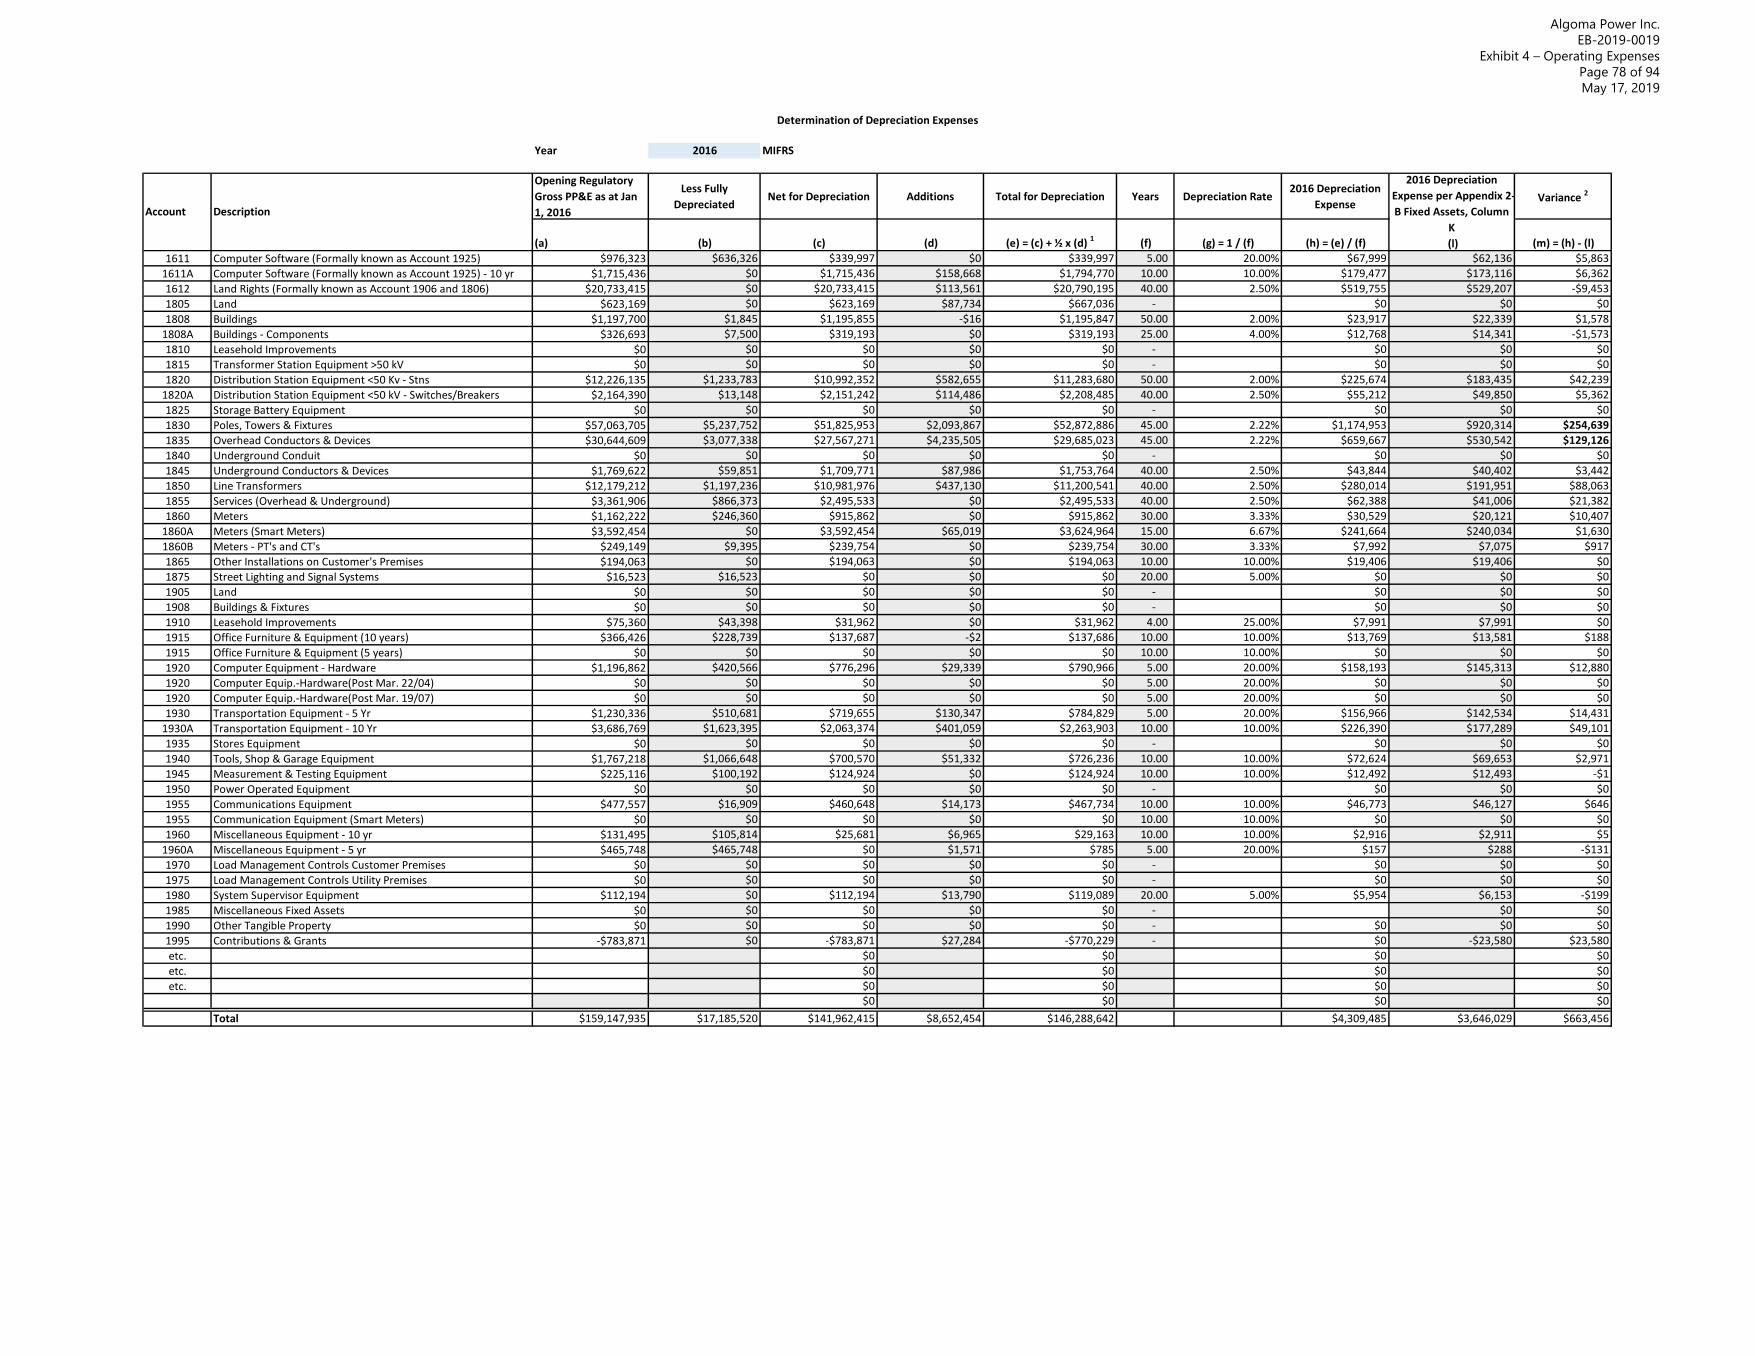
Determination of Depreciation Expenses
Year 2016 MIFRS
Opening Regulatory Gross PP&E as at Jan 1, 2016
Less Fully Depreciated
Net for Depreciation Additions Total for Depreciation Years Depreciation Rate2016 Depreciation
Expense Variance 2
(a) (b) (c) (d) (e) = (c) + ½ x (d) 1 (f) (g) = 1 / (f) (h) = (e) / (f) (m) = (h) - (l)1611 Computer Software (Formally known as Account 1925) $976,323 $636,326 $339,997 $0 $339,997 5.00 20.00% $67,999 $62,136 $5,863
1611A Computer Software (Formally known as Account 1925) - 10 yr $1,715,436 $0 $1,715,436 $158,668 $1,794,770 10.00 10.00% $179,477 $173,116 $6,3621612 Land Rights (Formally known as Account 1906 and 1806) $20,733,415 $0 $20,733,415 $113,561 $20,790,195 40.00 2.50% $519,755 $529,207 -$9,4531805 Land $623,169 $0 $623,169 $87,734 $667,036 - $0 $0 $01808 Buildings $1,197,700 $1,845 $1,195,855 -$16 $1,195,847 50.00 2.00% $23,917 $22,339 $1,578
1808A Buildings - Components $326,693 $7,500 $319,193 $0 $319,193 25.00 4.00% $12,768 $14,341 -$1,5731810 Leasehold Improvements $0 $0 $0 $0 $0 - $0 $0 $01815 Transformer Station Equipment >50 kV $0 $0 $0 $0 $0 - $0 $0 $01820 Distribution Station Equipment <50 Kv - Stns $12,226,135 $1,233,783 $10,992,352 $582,655 $11,283,680 50.00 2.00% $225,674 $183,435 $42,239
1820A Distribution Station Equipment <50 kV - Switches/Breakers $2,164,390 $13,148 $2,151,242 $114,486 $2,208,485 40.00 2.50% $55,212 $49,850 $5,3621825 Storage Battery Equipment $0 $0 $0 $0 $0 - $0 $0 $01830 Poles, Towers & Fixtures $57,063,705 $5,237,752 $51,825,953 $2,093,867 $52,872,886 45.00 2.22% $1,174,953 $920,314 $254,6391835 Overhead Conductors & Devices $30,644,609 $3,077,338 $27,567,271 $4,235,505 $29,685,023 45.00 2.22% $659,667 $530,542 $129,1261840 Underground Conduit $0 $0 $0 $0 $0 - $0 $0 $01845 Underground Conductors & Devices $1,769,622 $59,851 $1,709,771 $87,986 $1,753,764 40.00 2.50% $43,844 $40,402 $3,4421850 Line Transformers $12,179,212 $1,197,236 $10,981,976 $437,130 $11,200,541 40.00 2.50% $280,014 $191,951 $88,0631855 Services (Overhead & Underground) $3,361,906 $866,373 $2,495,533 $0 $2,495,533 40.00 2.50% $62,388 $41,006 $21,3821860 Meters $1,162,222 $246,360 $915,862 $0 $915,862 30.00 3.33% $30,529 $20,121 $10,407
1860A Meters (Smart Meters) $3,592,454 $0 $3,592,454 $65,019 $3,624,964 15.00 6.67% $241,664 $240,034 $1,6301860B Meters - PT's and CT's $249,149 $9,395 $239,754 $0 $239,754 30.00 3.33% $7,992 $7,075 $9171865 Other Installations on Customer's Premises $194,063 $0 $194,063 $0 $194,063 10.00 10.00% $19,406 $19,406 $01875 Street Lighting and Signal Systems $16,523 $16,523 $0 $0 $0 20.00 5.00% $0 $0 $01905 Land $0 $0 $0 $0 $0 - $0 $0 $01908 Buildings & Fixtures $0 $0 $0 $0 $0 - $0 $0 $01910 Leasehold Improvements $75,360 $43,398 $31,962 $0 $31,962 4.00 25.00% $7,991 $7,991 $01915 Office Furniture & Equipment (10 years) $366,426 $228,739 $137,687 -$2 $137,686 10.00 10.00% $13,769 $13,581 $1881915 Office Furniture & Equipment (5 years) $0 $0 $0 $0 $0 10.00 10.00% $0 $0 $01920 Computer Equipment - Hardware $1,196,862 $420,566 $776,296 $29,339 $790,966 5.00 20.00% $158,193 $145,313 $12,8801920 Computer Equip.-Hardware(Post Mar. 22/04) $0 $0 $0 $0 $0 5.00 20.00% $0 $0 $01920 Computer Equip.-Hardware(Post Mar. 19/07) $0 $0 $0 $0 $0 5.00 20.00% $0 $0 $01930 Transportation Equipment - 5 Yr $1,230,336 $510,681 $719,655 $130,347 $784,829 5.00 20.00% $156,966 $142,534 $14,431
1930A Transportation Equipment - 10 Yr $3,686,769 $1,623,395 $2,063,374 $401,059 $2,263,903 10.00 10.00% $226,390 $177,289 $49,1011935 Stores Equipment $0 $0 $0 $0 $0 - $0 $0 $01940 Tools, Shop & Garage Equipment $1,767,218 $1,066,648 $700,570 $51,332 $726,236 10.00 10.00% $72,624 $69,653 $2,9711945 Measurement & Testing Equipment $225,116 $100,192 $124,924 $0 $124,924 10.00 10.00% $12,492 $12,493 -$11950 Power Operated Equipment $0 $0 $0 $0 $0 - $0 $0 $01955 Communications Equipment $477,557 $16,909 $460,648 $14,173 $467,734 10.00 10.00% $46,773 $46,127 $6461955 Communication Equipment (Smart Meters) $0 $0 $0 $0 $0 10.00 10.00% $0 $0 $01960 Miscellaneous Equipment - 10 yr $131,495 $105,814 $25,681 $6,965 $29,163 10.00 10.00% $2,916 $2,911 $5
1960A Miscellaneous Equipment - 5 yr $465,748 $465,748 $0 $1,571 $785 5.00 20.00% $157 $288 -$1311970 Load Management Controls Customer Premises $0 $0 $0 $0 $0 - $0 $0 $01975 Load Management Controls Utility Premises $0 $0 $0 $0 $0 - $0 $0 $01980 System Supervisor Equipment $112,194 $0 $112,194 $13,790 $119,089 20.00 5.00% $5,954 $6,153 -$1991985 Miscellaneous Fixed Assets $0 $0 $0 $0 $0 - $0 $01990 Other Tangible Property $0 $0 $0 $0 $0 - $0 $0 $01995 Contributions & Grants -$783,871 $0 -$783,871 $27,284 -$770,229 - $0 -$23,580 $23,580etc. $0 $0 $0 $0etc. $0 $0 $0 $0etc. $0 $0 $0 $0
$0 $0 $0 $0Total $159,147,935 $17,185,520 $141,962,415 $8,652,454 $146,288,642 $4,309,485 $3,646,029 $663,456
Account Description
2016 Depreciation Expense per Appendix 2-B Fixed Assets, Column
K (l)
Algoma Power Inc. EB-2019-0019
Exhibit 4 – Operating Expenses Page 78 of 94 May 17, 2019

Determination of Depreciation Expenses
Year 2017 MIFRS
Opening Regulatory Gross PP&E as at Jan 1, 2017
Less Fully Depreciated
Net for Depreciation Additions Total for Depreciation Years Depreciation Rate2017 Depreciation
Expense Variance 2
(a) (b) (c) (d) (e) = (c) + ½ x (d) 1 (f) (g) = 1 / (f) (h) = (e) / (f) (m) = (h) - (l)1611 Computer Software (Formally known as Account 1925) $926,690 $837,497 $89,193 $0 $89,193 5.00 20.00% $17,839 $17,804 $35
1611A Computer Software (Formally known as Account 1925) - 10 yr $1,874,104 $0 $1,874,104 -$1,250 $1,873,479 10.00 10.00% $187,348 $188,692 -$1,3441612 Land Rights (Formally known as Account 1906 and 1806) $20,846,976 $0 $20,846,976 $67,628 $20,880,790 40.00 2.50% $522,020 $531,680 -$9,6601805 Land $710,903 $0 $710,903 $0 $710,903 - $0 $0 $01808 Buildings $1,197,684 $24,335 $1,173,349 $136,406 $1,241,552 50.00 2.00% $24,831 $22,073 $2,758
1808A Buildings - Components $326,693 $7,500 $319,193 $295,631 $467,008 25.00 4.00% $18,680 $14,374 $4,3071810 Leasehold Improvements $0 $0 $0 $0 $0 - $0 $0 $01815 Transformer Station Equipment >50 kV $0 $0 $0 $0 $0 - $0 $0 $01820 Distribution Station Equipment <50 Kv - Stns $12,808,791 $1,233,783 $11,575,008 $64,944 $11,607,480 50.00 2.00% $232,150 $194,295 $37,854
1820A Distribution Station Equipment <50 kV - Switches/Breakers $2,278,876 $13,148 $2,265,728 -$44 $2,265,706 40.00 2.50% $56,643 $52,502 $4,1411825 Storage Battery Equipment $0 $0 $0 $0 $0 - $0 $0 $01830 Poles, Towers & Fixtures $59,094,262 $5,174,442 $53,919,820 $1,917,510 $54,878,575 45.00 2.22% $1,219,524 $970,351 $249,1731835 Overhead Conductors & Devices $34,855,529 $3,052,754 $31,802,775 $3,496,590 $33,551,070 45.00 2.22% $745,579 $622,132 $123,4471840 Underground Conduit $0 $0 $0 $0 $0 - $0 $0 $01845 Underground Conductors & Devices $1,857,608 $59,851 $1,797,757 $54,611 $1,825,062 40.00 2.50% $45,627 $42,251 $3,3761850 Line Transformers $12,616,342 $1,197,236 $11,419,106 $254,467 $11,546,340 40.00 2.50% $288,659 $201,674 $86,9841855 Services (Overhead & Underground) $3,361,906 $866,373 $2,495,533 $0 $2,495,533 40.00 2.50% $62,388 $41,012 $21,3761860 Meters $1,162,222 $246,360 $915,862 $0 $915,862 30.00 3.33% $30,529 $20,124 $10,405
1860A Meters (Smart Meters) $3,657,473 $0 $3,657,473 $203,804 $3,759,375 15.00 6.67% $250,625 $244,526 $6,0991860B Meters - PT's and CT's $249,149 $9,395 $239,754 $0 $239,754 30.00 3.33% $7,992 $7,076 $9161865 Other Installations on Customer's Premises $194,063 $0 $194,063 $0 $194,063 10.00 10.00% $19,406 $19,406 $01875 Street Lighting and Signal Systems $16,523 $16,523 $0 $0 $0 20.00 5.00% $0 $0 $01905 Land $0 $0 $0 $0 $0 - $0 $0 $01908 Buildings & Fixtures $0 $0 $0 $0 $0 - $0 $0 $01910 Leasehold Improvements $75,360 $43,398 $31,962 $0 $31,962 4.00 25.00% $7,991 $7,990 $11915 Office Furniture & Equipment (10 years) $366,424 $235,785 $130,639 $19,942 $140,610 10.00 10.00% $14,061 $13,492 $5691915 Office Furniture & Equipment (5 years) $0 $0 $0 $0 $0 10.00 10.00% $0 $0 $01920 Computer Equipment - Hardware $914,084 $341,843 $572,241 $57,830 $601,156 5.00 20.00% $120,231 $112,412 $7,8201920 Computer Equip.-Hardware(Post Mar. 22/04) $0 $0 $0 $0 $0 5.00 20.00% $0 $0 $01920 Computer Equip.-Hardware(Post Mar. 19/07) $0 $0 $0 $0 $0 5.00 20.00% $0 $0 $01930 Transportation Equipment - 5 Yr $1,223,585 $559,053 $664,532 $69,916 $699,489 5.00 20.00% $139,898 $133,301 $6,596
1930A Transportation Equipment - 10 Yr $3,801,260 $1,346,448 $2,454,812 $535,538 $2,722,581 10.00 10.00% $272,258 $214,287 $57,9711935 Stores Equipment $0 $0 $0 $0 $0 - $0 $0 $01940 Tools, Shop & Garage Equipment $1,782,692 $1,103,373 $679,319 $84,941 $721,789 10.00 10.00% $72,179 $67,658 $4,5211945 Measurement & Testing Equipment $225,116 $100,192 $124,924 $0 $124,924 10.00 10.00% $12,492 $12,493 -$11950 Power Operated Equipment $0 $0 $0 $0 $0 - $0 $0 $01955 Communications Equipment $491,730 $16,909 $474,821 $4,600 $477,121 10.00 10.00% $47,712 $47,502 $2101955 Communication Equipment (Smart Meters) $0 $0 $0 $0 $0 10.00 10.00% $0 $0 $01960 Miscellaneous Equipment - 10 yr $138,460 $111,116 $27,344 $4,092 $29,390 10.00 10.00% $2,939 $2,703 $236
1960A Miscellaneous Equipment - 5 yr $467,319 $465,748 $1,571 $22,760 $12,951 5.00 20.00% $2,590 $3,633 -$1,0421970 Load Management Controls Customer Premises $0 $0 $0 $0 $0 - $0 $0 $01975 Load Management Controls Utility Premises $0 $0 $0 $0 $0 - $0 $0 $01980 System Supervisor Equipment $125,984 $0 $125,984 $0 $125,984 20.00 5.00% $6,299 $6,305 -$61985 Miscellaneous Fixed Assets $0 $0 $0 $0 $0 - $0 $0 $01990 Other Tangible Property $0 $0 $0 $0 $0 - $0 $0 $01995 Contributions & Grants -$756,587 -$57,188 -$699,399 -$136,532 -$767,665 - $0 -$25,760 $25,760etc. 0 $0 $0 $0 $0 $0 - $0 $0 $0etc. $0 $0 $0 $0 $0
$0 $0 $0 $0 $0Total $166,891,220 $17,005,874 $149,885,346 $7,153,385 $153,462,038 $4,428,489 $3,785,987 $642,502
Account Description
2017 Depreciation Expense per Appendix 2-B Fixed Assets, Column
K (l)
Algoma Power Inc. EB-2019-0019
Exhibit 4 – Operating Expenses Page 79 of 94 May 17, 2019

Determination of Depreciation Expenses
Year 2018 MIFRS
Opening Regulatory Gross PP&E as at Jan 1, 2018
Less Fully Depreciated
Net for Depreciation Additions Total for Depreciation Years Depreciation Rate2018 Depreciation
Expense Variance 2
(a) (b) (c) (d) (e) = (c) + ½ x (d) 1 (f) (g) = 1 / (f) (h) = (e) / (f) (m) = (h) - (l)1611 Computer Software (Formally known as Account 1925) $926,690 $844,556 $82,134 $19,793 $92,031 5.00 20.00% $18,406 $6,363 $12,043
1611A Computer Software (Formally known as Account 1925) - 10 yr $1,872,855 $0 $1,872,855 $221,083 $1,983,396 10.00 10.00% $198,340 $195,857 $2,4821612 Land Rights (Formally known as Account 1906 and 1806) $20,914,604 $0 $20,914,604 $166,709 $20,997,959 40.00 2.50% $524,949 $533,945 -$8,9961805 Land $710,903 $0 $710,903 $0 $710,903 - $0 $0 $01808 Buildings $1,026,519 $24,335 $1,002,184 $3,806 $1,004,086 50.00 2.00% $20,082 $19,320 $762
1808A Buildings - Components $547,231 $21,442 $525,789 $7,365 $529,471 25.00 4.00% $21,179 $22,061 -$8831810 Leasehold Improvements $0 $0 $0 $0 $0 - $0 $0 $01815 Transformer Station Equipment >50 kV $0 $0 $0 $0 $0 - $0 $0 $01820 Distribution Station Equipment <50 Kv - Stns $12,873,735 $1,233,783 $11,639,952 -$451 $11,639,726 50.00 2.00% $232,795 $195,240 $37,554
1820A Distribution Station Equipment <50 kV - Switches/Breakers $2,278,832 $13,148 $2,265,684 $0 $2,265,684 40.00 2.50% $56,642 $52,505 $4,1371825 Storage Battery Equipment $0 $0 $0 $0 $0 - $0 $0 $01830 Poles, Towers & Fixtures $60,963,303 $5,125,973 $55,837,330 $3,256,224 $57,465,442 45.00 2.22% $1,277,010 $1,016,701 $260,3091835 Overhead Conductors & Devices $38,332,722 $3,033,357 $35,299,365 $2,516,143 $36,557,437 45.00 2.22% $812,387 $677,775 $134,6121840 Underground Conduit $0 $0 $0 $0 $0 - $0 $0 $01845 Underground Conductors & Devices $1,912,219 $59,851 $1,852,368 $13,697 $1,859,216 40.00 2.50% $46,480 $43,056 $3,4241850 Line Transformers $12,602,867 $1,029,312 $11,573,555 $402,401 $11,774,755 40.00 2.50% $294,369 $227,179 $67,1901855 Services (Overhead & Underground) $3,361,906 $866,373 $2,495,533 $0 $2,495,533 40.00 2.50% $62,388 $41,003 $21,3851860 Meters $1,162,222 $246,360 $915,862 $0 $915,862 30.00 3.33% $30,529 $20,122 $10,407
1860A Meters (Smart Meters) $3,861,278 $0 $3,861,278 $42,688 $3,882,622 15.00 6.67% $258,841 $258,574 $2681860B Meters - PT's and CT's $249,149 $9,395 $239,754 $0 $239,754 30.00 3.33% $7,992 $7,074 $9181865 Other Installations on Customer's Premises $194,063 $0 $194,063 $0 $194,063 10.00 10.00% $19,406 $19,406 $01875 Street Lighting and Signal Systems $16,523 $16,523 $0 $0 $0 20.00 5.00% $0 $0 $01905 Land $0 $0 $0 $0 $0 - $0 $0 $01908 Buildings & Fixtures $0 $0 $0 $0 $0 - $0 $0 $01910 Leasehold Improvements $75,360 $43,398 $31,962 $0 $31,962 4.00 25.00% $7,991 $7,991 $01915 Office Furniture & Equipment (10 years) $386,366 $237,245 $149,121 $0 $149,121 10.00 10.00% $14,912 $14,467 $4451915 Office Furniture & Equipment (5 years) $0 $0 $0 $0 $0 10.00 10.00% $0 $0 $01920 Computer Equipment - Hardware $895,084 $348,658 $546,426 $103,552 $598,202 5.00 20.00% $119,640 $113,651 $5,9891920 Computer Equip.-Hardware(Post Mar. 22/04) $0 $0 $0 $0 $0 5.00 20.00% $0 $0 $01920 Computer Equip.-Hardware(Post Mar. 19/07) $0 $0 $0 $0 $0 5.00 20.00% $0 $0 $01930 Transportation Equipment - 5 Yr $1,293,500 $559,053 $734,447 $72,580 $770,737 5.00 20.00% $154,147 $118,933 $35,214
1930A Transportation Equipment - 10 Yr $4,336,798 $1,346,448 $2,990,350 $387,088 $3,183,894 10.00 10.00% $318,389 $267,684 $50,7051935 Stores Equipment $0 $0 $0 $0 $0 - $0 $0 $01940 Tools, Shop & Garage Equipment $1,849,128 $1,156,973 $692,155 $49,353 $716,831 10.00 10.00% $71,683 $69,424 $2,2591945 Measurement & Testing Equipment $225,116 $100,192 $124,924 $16,640 $133,244 10.00 10.00% $13,324 $12,631 $6931950 Power Operated Equipment $0 $0 $0 $0 $0 - $0 $0 $01955 Communications Equipment $496,330 $16,909 $479,421 $0 $479,421 10.00 10.00% $47,942 $47,696 $2461955 Communication Equipment (Smart Meters) $0 $0 $0 $0 $0 10.00 10.00% $0 $0 $01960 Miscellaneous Equipment - 10 yr $73,048 $41,612 $31,436 $5,981 $34,427 10.00 10.00% $3,443 $3,165 $277
1960A Miscellaneous Equipment - 5 yr $490,078 $465,748 $24,330 $2,040 $25,350 5.00 20.00% $5,070 $4,900 $1701970 Load Management Controls Customer Premises $0 $0 $0 $0 $0 - $0 $0 $01975 Load Management Controls Utility Premises $0 $0 $0 $0 $0 - $0 $0 $01980 System Supervisor Equipment $125,984 $0 $125,984 $20,567 $136,268 20.00 5.00% $6,813 $6,731 $831985 Miscellaneous Fixed Assets $0 $0 $0 $0 $0 - $0 $0 $01990 Other Tangible Property $0 $0 $0 $0 $0 - $0 $0 $01995 Contributions & Grants -$893,119 -$57,188 -$835,931 -$69,264 -$870,563 - $0 -$16,679 $16,679etc. $0 $0 $0 $0etc. $0 $0 $0 $0etc. $0 $0 $0 $0
$0 $0 $0 $0Total $173,161,294 $16,783,456 $156,377,838 $7,237,996 $159,996,835 $4,645,151 $3,986,777 $658,374
Account Description
2018 Depreciation Expense per Appendix 2-B Fixed Assets, Column
K (l)
Algoma Power Inc. EB-2019-0019
Exhibit 4 – Operating Expenses Page 80 of 94 May 17, 2019
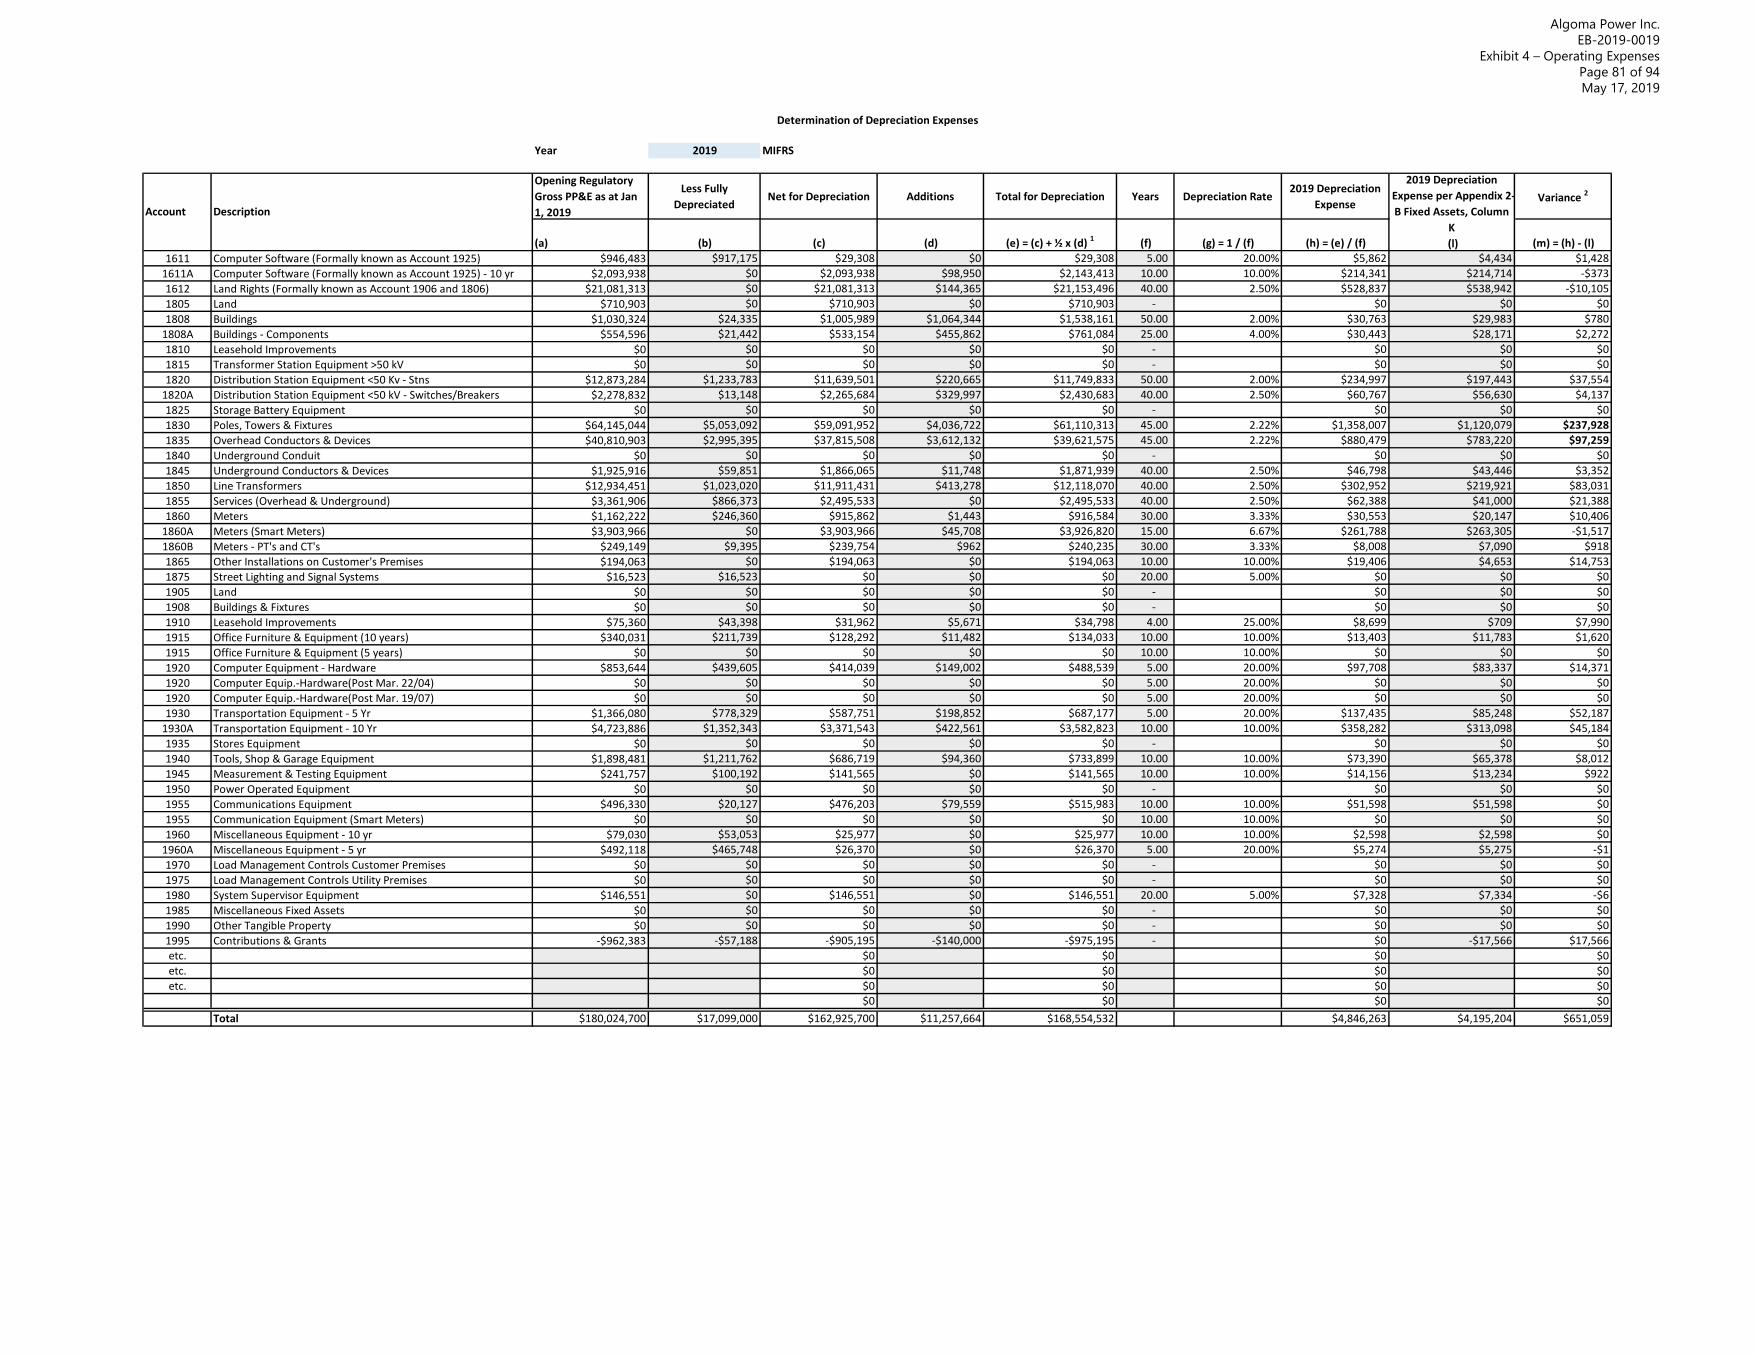
Determination of Depreciation Expenses
Year 2019 MIFRS
Opening Regulatory Gross PP&E as at Jan 1, 2019
Less Fully Depreciated
Net for Depreciation Additions Total for Depreciation Years Depreciation Rate2019 Depreciation
Expense Variance 2
(a) (b) (c) (d) (e) = (c) + ½ x (d) 1 (f) (g) = 1 / (f) (h) = (e) / (f) (m) = (h) - (l)1611 Computer Software (Formally known as Account 1925) $946,483 $917,175 $29,308 $0 $29,308 5.00 20.00% $5,862 $4,434 $1,428
1611A Computer Software (Formally known as Account 1925) - 10 yr $2,093,938 $0 $2,093,938 $98,950 $2,143,413 10.00 10.00% $214,341 $214,714 -$3731612 Land Rights (Formally known as Account 1906 and 1806) $21,081,313 $0 $21,081,313 $144,365 $21,153,496 40.00 2.50% $528,837 $538,942 -$10,1051805 Land $710,903 $0 $710,903 $0 $710,903 - $0 $0 $01808 Buildings $1,030,324 $24,335 $1,005,989 $1,064,344 $1,538,161 50.00 2.00% $30,763 $29,983 $780
1808A Buildings - Components $554,596 $21,442 $533,154 $455,862 $761,084 25.00 4.00% $30,443 $28,171 $2,2721810 Leasehold Improvements $0 $0 $0 $0 $0 - $0 $0 $01815 Transformer Station Equipment >50 kV $0 $0 $0 $0 $0 - $0 $0 $01820 Distribution Station Equipment <50 Kv - Stns $12,873,284 $1,233,783 $11,639,501 $220,665 $11,749,833 50.00 2.00% $234,997 $197,443 $37,554
1820A Distribution Station Equipment <50 kV - Switches/Breakers $2,278,832 $13,148 $2,265,684 $329,997 $2,430,683 40.00 2.50% $60,767 $56,630 $4,1371825 Storage Battery Equipment $0 $0 $0 $0 $0 - $0 $0 $01830 Poles, Towers & Fixtures $64,145,044 $5,053,092 $59,091,952 $4,036,722 $61,110,313 45.00 2.22% $1,358,007 $1,120,079 $237,9281835 Overhead Conductors & Devices $40,810,903 $2,995,395 $37,815,508 $3,612,132 $39,621,575 45.00 2.22% $880,479 $783,220 $97,2591840 Underground Conduit $0 $0 $0 $0 $0 - $0 $0 $01845 Underground Conductors & Devices $1,925,916 $59,851 $1,866,065 $11,748 $1,871,939 40.00 2.50% $46,798 $43,446 $3,3521850 Line Transformers $12,934,451 $1,023,020 $11,911,431 $413,278 $12,118,070 40.00 2.50% $302,952 $219,921 $83,0311855 Services (Overhead & Underground) $3,361,906 $866,373 $2,495,533 $0 $2,495,533 40.00 2.50% $62,388 $41,000 $21,3881860 Meters $1,162,222 $246,360 $915,862 $1,443 $916,584 30.00 3.33% $30,553 $20,147 $10,406
1860A Meters (Smart Meters) $3,903,966 $0 $3,903,966 $45,708 $3,926,820 15.00 6.67% $261,788 $263,305 -$1,5171860B Meters - PT's and CT's $249,149 $9,395 $239,754 $962 $240,235 30.00 3.33% $8,008 $7,090 $9181865 Other Installations on Customer's Premises $194,063 $0 $194,063 $0 $194,063 10.00 10.00% $19,406 $4,653 $14,7531875 Street Lighting and Signal Systems $16,523 $16,523 $0 $0 $0 20.00 5.00% $0 $0 $01905 Land $0 $0 $0 $0 $0 - $0 $0 $01908 Buildings & Fixtures $0 $0 $0 $0 $0 - $0 $0 $01910 Leasehold Improvements $75,360 $43,398 $31,962 $5,671 $34,798 4.00 25.00% $8,699 $709 $7,9901915 Office Furniture & Equipment (10 years) $340,031 $211,739 $128,292 $11,482 $134,033 10.00 10.00% $13,403 $11,783 $1,6201915 Office Furniture & Equipment (5 years) $0 $0 $0 $0 $0 10.00 10.00% $0 $0 $01920 Computer Equipment - Hardware $853,644 $439,605 $414,039 $149,002 $488,539 5.00 20.00% $97,708 $83,337 $14,3711920 Computer Equip.-Hardware(Post Mar. 22/04) $0 $0 $0 $0 $0 5.00 20.00% $0 $0 $01920 Computer Equip.-Hardware(Post Mar. 19/07) $0 $0 $0 $0 $0 5.00 20.00% $0 $0 $01930 Transportation Equipment - 5 Yr $1,366,080 $778,329 $587,751 $198,852 $687,177 5.00 20.00% $137,435 $85,248 $52,187
1930A Transportation Equipment - 10 Yr $4,723,886 $1,352,343 $3,371,543 $422,561 $3,582,823 10.00 10.00% $358,282 $313,098 $45,1841935 Stores Equipment $0 $0 $0 $0 $0 - $0 $0 $01940 Tools, Shop & Garage Equipment $1,898,481 $1,211,762 $686,719 $94,360 $733,899 10.00 10.00% $73,390 $65,378 $8,0121945 Measurement & Testing Equipment $241,757 $100,192 $141,565 $0 $141,565 10.00 10.00% $14,156 $13,234 $9221950 Power Operated Equipment $0 $0 $0 $0 $0 - $0 $0 $01955 Communications Equipment $496,330 $20,127 $476,203 $79,559 $515,983 10.00 10.00% $51,598 $51,598 $01955 Communication Equipment (Smart Meters) $0 $0 $0 $0 $0 10.00 10.00% $0 $0 $01960 Miscellaneous Equipment - 10 yr $79,030 $53,053 $25,977 $0 $25,977 10.00 10.00% $2,598 $2,598 $0
1960A Miscellaneous Equipment - 5 yr $492,118 $465,748 $26,370 $0 $26,370 5.00 20.00% $5,274 $5,275 -$11970 Load Management Controls Customer Premises $0 $0 $0 $0 $0 - $0 $0 $01975 Load Management Controls Utility Premises $0 $0 $0 $0 $0 - $0 $0 $01980 System Supervisor Equipment $146,551 $0 $146,551 $0 $146,551 20.00 5.00% $7,328 $7,334 -$61985 Miscellaneous Fixed Assets $0 $0 $0 $0 $0 - $0 $0 $01990 Other Tangible Property $0 $0 $0 $0 $0 - $0 $0 $01995 Contributions & Grants -$962,383 -$57,188 -$905,195 -$140,000 -$975,195 - $0 -$17,566 $17,566etc. $0 $0 $0 $0etc. $0 $0 $0 $0etc. $0 $0 $0 $0
$0 $0 $0 $0Total $180,024,700 $17,099,000 $162,925,700 $11,257,664 $168,554,532 $4,846,263 $4,195,204 $651,059
Account Description
2019 Depreciation Expense per Appendix 2-B Fixed Assets, Column
K (l)
Algoma Power Inc. EB-2019-0019
Exhibit 4 – Operating Expenses Page 81 of 94 May 17, 2019

Determination of Depreciation ExpensesYear 2020 MIFRS
Opening Regulatory Gross PP&E as at Jan 1, 2020
Less Fully Depreciated
Net for Depreciation Additions Total for Depreciation Years Depreciation Rate2020 Depreciation
Expense Variance 2
(a) (b) (c) (d) (e) = (c) + ½ x (d) 1 (f) (g) = 1 / (f) (h) = (e) / (f) (m) = (h) - (l)1611 Computer Software (Formally known as Account 1925) $946,483 $917,175 $29,308 $0 $29,308 5.00 20.00% $5,862 $3,959 $1,903
1611A Computer Software (Formally known as Account 1925) - 10 yr $2,192,888 $12,073 $2,180,815 $67,912 $2,214,771 10.00 10.00% $221,477 $215,532 $5,9451612 Land Rights (Formally known as Account 1906 and 1806) $21,225,679 $0 $21,225,679 $139,173 $21,295,265 40.00 2.50% $532,382 $542,486 -$10,1041805 Land $710,903 $0 $710,903 $0 $710,903 - $0 $0 $01808 Buildings $2,094,668 $24,335 $2,070,333 $58,061 $2,099,363 50.00 2.00% $41,987 $41,208 $779
1808A Buildings - Components $1,010,457 $85,170 $925,287 $24,883 $937,729 25.00 4.00% $37,509 $37,789 -$2801810 Leasehold Improvements $0 $0 $0 $0 $0 - $0 $0 $01815 Transformer Station Equipment >50 kV $0 $0 $0 $0 $0 - $0 $0 $01820 Distribution Station Equipment <50 Kv - Stns $13,093,948 $1,233,783 $11,860,165 $568,894 $12,144,613 50.00 2.00% $242,892 $205,347 $37,545
1820A Distribution Station Equipment <50 kV - Switches/Breakers $2,627,329 $13,148 $2,614,181 $853,342 $3,040,852 40.00 2.50% $76,021 $71,882 $4,1391825 Storage Battery Equipment $0 $0 $0 $0 $0 - $0 $0 $01830 Poles, Towers & Fixtures $68,541,426 $5,053,092 $63,488,334 $2,537,464 $64,757,065 45.00 2.22% $1,439,046 $1,201,126 $237,9201835 Overhead Conductors & Devices $44,588,623 $2,995,395 $41,593,228 $2,764,319 $42,975,387 45.00 2.22% $955,009 $857,751 $97,2581840 Underground Conduit $0 $0 $0 $0 $0 - $0 $0 $01845 Underground Conductors & Devices $1,937,663 $59,851 $1,877,812 $11,036 $1,883,331 40.00 2.50% $47,083 $43,731 $3,3521850 Line Transformers $13,613,088 $1,023,020 $12,590,068 $417,510 $12,798,824 40.00 2.50% $319,971 $236,938 $83,0331855 Services (Overhead & Underground) $3,361,906 $866,373 $2,495,533 $0 $2,495,533 40.00 2.50% $62,388 $41,018 $21,3701860 Meters $1,163,665 $246,360 $917,305 $2,022 $918,316 30.00 3.33% $30,611 $20,203 $10,408
1860A Meters (Smart Meters) $4,067,814 $0 $4,067,814 $64,029 $4,099,828 15.00 6.67% $273,322 $274,838 -$1,5161860B Meters - PT's and CT's $250,111 $9,395 $240,716 $1,348 $241,390 30.00 3.33% $8,046 $7,129 $9171865 Other Installations on Customer's Premises $194,063 $123,690 $70,373 $0 $70,373 10.00 10.00% $7,037 $1,135 $5,9021875 Street Lighting and Signal Systems $16,523 $16,523 $0 $0 $0 20.00 5.00% $0 $0 $01905 Land $0 $0 $0 $0 $0 - $0 $0 $01908 Buildings & Fixtures $0 $0 $0 $0 $0 - $0 $0 $01910 Leasehold Improvements $81,032 $75,360 $5,672 $4,739 $8,041 4.00 25.00% $2,010 $2,010 $01915 Office Furniture & Equipment (10 years) $351,512 $226,617 $124,895 $8,651 $129,221 10.00 10.00% $12,922 $12,021 $9011915 Office Furniture & Equipment (5 years) $0 $0 $0 $0 $0 10.00 10.00% $0 $0 $01920 Computer Equipment - Hardware $1,002,645 $487,107 $515,538 $227,400 $629,238 5.00 20.00% $125,848 $89,535 $36,3131920 Computer Equip.-Hardware(Post Mar. 22/04) $0 $0 $0 $0 $0 5.00 20.00% $0 $0 $01920 Computer Equip.-Hardware(Post Mar. 19/07) $0 $0 $0 $0 $0 5.00 20.00% $0 $0 $01930 Transportation Equipment - 5 Yr $1,564,932 $1,034,154 $530,778 $211,715 $636,636 5.00 20.00% $127,327 $114,789 $12,538
1930A Transportation Equipment - 10 Yr $5,146,447 $1,632,062 $3,514,385 $449,894 $3,739,332 10.00 10.00% $373,933 $339,513 $34,4201935 Stores Equipment $0 $0 $0 $0 $0 - $0 $0 $01940 Tools, Shop & Garage Equipment $1,992,841 $1,288,497 $704,344 $96,248 $752,468 10.00 10.00% $75,247 $69,323 $5,9241945 Measurement & Testing Equipment $241,757 $109,423 $132,334 $0 $132,334 10.00 10.00% $13,233 $13,234 -$11950 Power Operated Equipment $0 $0 $0 $0 $0 - $0 $0 $01955 Communications Equipment $575,889 $20,127 $555,762 $78,948 $595,236 10.00 10.00% $59,524 $59,498 $261955 Communication Equipment (Smart Meters) $0 $0 $0 $0 $0 10.00 10.00% $0 $0 $01960 Miscellaneous Equipment - 10 yr $79,030 $53,053 $25,977 $0 $25,977 10.00 10.00% $2,598 $2,596 $2
1960A Miscellaneous Equipment - 5 yr $492,118 $465,748 $26,370 $0 $26,370 5.00 20.00% $5,274 $4,986 $2881970 Load Management Controls Customer Premises $0 $0 $0 $0 $0 - $0 $0 $01975 Load Management Controls Utility Premises $0 $0 $0 $0 $0 - $0 $0 $01980 System Supervisor Equipment $146,551 $0 $146,551 $0 $146,551 20.00 5.00% $7,328 $7,334 -$61985 Miscellaneous Fixed Assets $0 $0 $0 $0 $0 - $0 $0 $01990 Other Tangible Property $0 $0 $0 $0 $0 - $0 $0 $01995 Contributions & Grants -$1,102,383 -$57,188 -$1,045,195 -$101,850 -$1,096,120 - $0 -$19,268 $19,268etc. $0 $0 $0 $0etc. $0 $0 $0 $0etc. $0 $0 $0 $0
$0 $0 $0 $0Total $192,209,610 $18,014,343 $174,195,267 $8,485,738 $178,438,136 $5,105,887 $4,497,643 $608,244
Account Description
2020 Depreciation Expense per Appendix 2-B Fixed Assets, Column
K (l)
Algoma Power Inc. EB-2019-0019
Exhibit 4 – Operating Expenses Page 82 of 94 May 17, 2019
Algoma Power Inc. EB-2019-0019
Exhibit 4 – Operating Expenses Page 83 of 94 May 17, 2019
4.8.2 USEFUL LIVES OUTSIDE OF KINECTRICS RANGE 1
As noted in Section 4.8.1, the Board’s Kinectrics Report was used as a guideline in updating API’s 2
depreciation/amortization rates, effective January 1, 2013. These rates have not changed since 3
API’s 2015 Cost of Service application. This section provides explanations for components that 4
are outside the ranges contained in the Kinectrics Report. A table comparing API’s depreciation 5
rates to the Kinectrics Report is provided at Section 2.2.2 of Exhibit 2. 6
A 45-year useful life is used for all types of assets in OEB Account 1835. For overhead primary 7
conductor, this is 5 years less than the Kinectrics minimum of 50 years, matching the useful life 8
of 45 years for poles in recognition that there are often inherent efficiencies in replacing 9
conductor at the same time as the associated poles. For overhead shunt capacitor banks, this in 10
5 years more than the Kinectrics maximum of 40 years; API does not have a sufficient amount of 11
capacitor banks to warrant separating this out as its own component. Other assets in Account 12
1835, such as switches and reclosers, are all within the Kinectrics range 13
A 40-year useful life is used for all types of substation equipment, other than power 14
transformers, which have a 50-year useful life; for Station DC Systems, this exceeds the Kinectrics 15
maximum of 30 years, however API does not have a sufficient amount of DC systems to warrant 16
separating this out as its own component. 17
A 40-year useful life is used for underground primary cable, exceeding the Kinectrics maximum 18
of 30 years. Due to standardization of equipment, these cables are often lightly loaded and in 19
many cases have voltage ratings in excess of operating voltage. Critical installations, such as the 20
supply to thousands of customers on St. Joseph Island, also have spare cables, minimizing the 21
risk of premature replacement. 22
A 30-year useful life is used for all industrial, large commercial, and wholesale meters, as well as 23
all associated components. For Current and Potential Transformers, this is 5 years less than the 24
Kinectrics minimum. 25

Algoma Power Inc. EB-2019-0019
Exhibit 4 – Operating Expenses Page 84 of 94 May 17, 2019
4.9 TAXES & PAYMENTS IN LIEU OF TAXES (PILS) 1
4.9.1 OVERVIEW OF PILS 2
API is required to make payments in lieu of income taxes (“taxes”) based on its taxable income. 3
API files Federal/Provincial tax returns annually. See Appendix 4E of this Exhibit for the 4
completed PILs model as well as Table 18 below for a summary of the tax provision for 2020 5
Test. The income tax rates and capital cost allowance rates used to calculate the taxes on API’s 6
income tax returns are the same rates that have been proposed for the Test period. 7
Table 18 - Tax Provision for 2020 Test Year 8
Particulars Application Determination of Taxable Income
Utility net income before taxes $4,305,854 Adjustments required to arrive at taxable utility income -$3,379,548
Taxable income $926,305 Calculation of Utility income Taxes
Income taxes $245,471 Capital taxes $0
Total taxes Gross-up of Income Taxes $88,503 Grossed-up Income Taxes $333,974
PILs / tax Allowance (Grossed-up Income taxes + Capital taxes) $333,974 Other tax Credits 0
Tax Rates
Federal tax (%) 15.00% Provincial tax (%) 11.50% Total tax rate (%) 26.50%
There were no adjustments (e.g., Tax credits, CCA adjustments) for the Historical, Bridge and 9
Test Years and as such, no supporting schedules and calculations and explanations for “other 10
additions” and “other deductions” were required. 11
API is not claiming tax credits such as Apprenticeship Training Tax Credits or education tax 12
credits. 13
API’s most tax return filed (2017) is presented as Appendix 4F of this Exhibit. 14

Algoma Power Inc. EB-2019-0019
Exhibit 4 – Operating Expenses Page 85 of 94 May 17, 2019
4.9.2 ACCLERATED CCA 1
In November 2018, the Minister of Finance delivered his 2018 Fall Economic Statement and the 2
announcement included a provision for accelerated CCA deductions. The changes were effective 3
for all expenditures incurred after November 20, 2018. 4
A summary of the impact to API is below: 5
• ½ year rule suspended for CCA, with accelerated CCA on capital asset classes at 1.5x 6
previous rate for first year of CCA deduction for expenditures incurred and available 7
for use between November 20, 2018 and December 31, 2023 8
• ½ year rule suspended for CCA for expenditures incurred and available for use 9
between January 1, 2024 and December 31, 2027 10
Within the PILs model provided as Appendix 4E, API has added additional rows in tabs ‘B8 11
Schedule 8 CCA Bridge Year’ and ‘T8 Schedule 8 CCA Bridge Year’ to appropriately calculate the 12
enhanced CCA amounts for expenditures incurred after November 20, 2018, which has 13
effectively reduced the grossed-up PILs amounts being requested for 2020 Test. 14

Algoma Power Inc. EB-2019-0019
Exhibit 4 – Operating Expenses Page 86 of 94 May 17, 2019
4.10 OTHER TAXES 1
The only other taxes than the PILs presented in this Exhibit incurred by API are property taxes, 2
which have not significantly fluctuated between 2015 Board Approved and 2020 Test. 3
Table 19 – Property Taxes (OEB 6105) 4
MIFRS MIFRS MIFRS MIFRS MIFRS MIFRS MIFRS Particular Last Board
Approved 2015 2016 2017 2018 2019 2020
Property Taxes $107,800 $115,453 $112,102 $113,924 $115,938 $119,000 $118,600 5
Algoma Power Inc. EB-2019-0019
Exhibit 4 – Operating Expenses Page 87 of 94 May 17, 2019
4.11 NON- RECOVERABLE AND DISALLOWED EXPENSES 1
API confirms that expenses that are deemed non-recoverable in the revenue requirement (e.g. 2
individual charitable donations) have been appropriately excluded from the regulatory tax 3
calculation. 4

Algoma Power Inc. EB-2019-0019
Exhibit 4 – Operating Expenses Page 88 of 94 May 17, 2019
4.12 CONSERVATION AND DEMAND MANAGEMENT 1
4.12.1 CONSERVATION AND DEMAND MANAGEMENT OVERVIEW 2
Conservation and Demand Management (“CDM”) programs for electricity distributors were first 3
approved by the OEB in 2004 and have expanded since becoming a more important part of the 4
energy policy in Ontario. The Board developed and issued the CDM Code for E l e c t r i c i t y 5
Distributors (the “CDM Code”) on September 16, 2010, to support the CDM framework. The 6
CDM Code sets out the obligations along with requirements, with which electricity 7
distributors must comply in relation to the CDM targets set out in their licenses for January 1, 8
2011, to December 31, 2014, CDM target period. The CDM Code was created in response to a 9
Directive dated March 31, 2010, by the Minister of Energy and Infrastructure pursuant to 10
sections 27.1 and 27.2 of the Ontario Energy Board Act, 1998. Section 12 of the Directive 11
states that lost revenues that result from CDM programs should not act as a disincentive to a 12
distributor. The Board issued detailed guidelines on the lost revenue adjustment 13
mechanism (“LRAM”) related to CDM programs implemented under the CDM code. API 14
calculated the LRAM Variance Account balance (“LRAMVA”) in compliance with the 15
requirements set out in the following guidelines issued by the Board. 16
The Guideline for Electricity Distributor Conservation and Demand Management (EB-2012-0003, 17
the “2012 CDM Guidelines”), dated April 26, 2012, describes the mechanism to capture the 18
difference between the results of actual verified impacts of authorized CDM activities 19
undertaken by the distributor between 2011 and 2014 and the level of activities embedded into 20
rates through the distributor’s load forecast. This guideline also describes the establishment of 21
the LRAM Variance Account and the method to record the related lost revenues. 22
The Conservation and Demand Management Requirement Guidelines for Electricity Distributors 23
(EB-2014-0278, the “2015 CDM Guidelines”), issued by the OEB on December 19, 2014, are 24
applicable to CDM programs beginning January 1, 2015. These guidelines require distributors to 25
continue to rely on the LRAMVA to track and dispose of lost revenues that result from 26
approved CDM programs between 2015 and 2020. 27

Algoma Power Inc. EB-2019-0019
Exhibit 4 – Operating Expenses Page 89 of 94 May 17, 2019
The Report of the OEB: Updated Policy for the Lost Revenue Adjustment Mechanism Calculation: 1
Lost Revenues and Peak Demand Savings from Conservation and Demand Management 2
Programs (EB-2016-0182 – the “LRAMVA Report”), issued on May 19, 2016, outlines the 3
OEB’s policy with respect to the treatment of peak demand savings for the LRAM Variance 4
Account calculation for demand billed customers. 5
API began delivering CDM programs in 2011 to meet the mandated targets. The emphasis has 6
been on Independent Electricity System Operator (IESO) Contracted Province-Wide Programs to 7
residential and general service customers. API has not sought approval for Board-approved 8
CDM programs. 9
API submitted a joint CDM plan with Canadian Niagara Power Inc., which allows aggregation of 10
the assigned energy savings targets and funding for the two LDCs. The most recently approved 11
joint API-CNPI CDM plan forecasts that API will achieve savings of 13,032,997 kWh, or 173.54% 12
of its target. 13

Algoma Power Inc. EB-2019-0019
Exhibit 4 – Operating Expenses Page 90 of 94 May 17, 2019
4.12.2 LRAM VARIANCE ACCOUNT (LRAMVA) 1
On April 26, 2012, the Board issued Guidelines for Electricity Distributor Conservation and 2
Demand Management ("CDM Guidelines"). In keeping with the Directive, the Board adopted a 3
mechanism to capture the difference between the results of actual, verified impacts of 4
authorized CDM activities undertaken by distributors between 2011 and 2014 and the level of 5
activities embedded into rates through the distributor's load forecast in an LRAM variance 6
account. On May 19, 2016, the OEB issued its LRAMVA Report. API has referred to this report 7
and used the OEB’s LRAMVA model in calculating LRAMVA recovery for this Application 8
Table 20 below shows the total LRAMVA recovery sought by API: 9
Table 20 - Summary of Requested LRAM Amounts 10
Description R1 (kWh) Seasonal (kWh)
R2 (kW) Street Lights (kW)
Total
Amount Cleared
2015 Actuals $74,041.87 $10,092.14 $2,839.69 $12,813.04 $99,786.74 2015 Forecast -$13,169.36 -$4,295.82 -$2,356.05 -$540.25 -$20,361.48
Amount Cleared 2016 Actuals $113,481.56 $19,497.69 $2,921.02 $41,176.58 $177,076.85 2016 Forecast -$13,169.36 -$4,410.25 -$2,353.03 -$545.44 -$20,478.09
Amount Cleared 2017 Actuals $169,106.74 $34,726.42 $3,422.12 $50,332.71 $257,587.99 2017 Forecast -$12,486.81 -$4,210.72 -$2,392.67 -$660.89 -$19,751.08
Amount Cleared Carrying Charges $23,519.45 $3,933.55 $262.53 $8,813.23 $36,528.76 Total LRAMVA
Balance $341,324.08 $55,333.01 $2,343.61 $111,388.98 $510,389.68
11
API has used the most recent input assumptions when calculating lost revenue and has relied on 12
the most recent final evaluation report from the Independent Electricity System Operator (IESO) 13
in support of its LRAM calculation for its contracted province-wide CDM programs ("IESO 14
Programs") for 2011-2017. Lost revenues are based on Board approved variable charges and 15
carrying charges through 2019 are requested. API has calculated any carrying charges for the 16
applicable periods using the quarterly rates prescribed by the Board. 17
Algoma Power Inc. EB-2019-0019
Exhibit 4 – Operating Expenses Page 91 of 94 May 17, 2019
API is not currently requesting recovery of lost revenue resulting from Board-approved 1
programs. The IESO-Contracted Province-Wide CDM Programs Final 2017 Results are provided 2
as Appendix 4G of this Exhibit. LRAMVA thresholds from API’s 2015 Cost of Service application 3
(EB-2014-0055) were input in Tab 2 of the LRAMVA model, so that energy savings up to these 4
threshold amounts would offset the total energy savings in the LRAMVA claim period. 5
Since API’s traditional residential customers and its general service customers with demand less 6
than 50 kW are all included in its R1 rate class, 100% of the savings were allocated to this class 7
for CDM programs targeted exclusively toward home and small-business customers. For 8
programs that could have had Seasonal customer uptake, such as coupons and appliance 9
exchanges, the allocation was 93% to R1 and 7% to Seasonal. For programs such as Retrofit, 10
where application-specific information was available for a relatively small number of projects, 11
the allocation to rate classes for each year was based on actual application information. 12
During the process of inputting the IESO’s verified net savings into the LRAMVA model, API 13
made two discrete adjustments to address issues related to savings for Street Lighting and peak 14
demand savings as detailed below. 15
Table 21 below compares API’s actual delivery volumes for the 2015-2017 period and then 16
compares these variances to the IESO verified savings. The results clearly show that the IESO 17
verified savings significantly exceed API’s actual reduction in Street Lighting delivery volumes, 18
likely due to a combination of project timing during each year and differences in IESO 19
assumptions for estimating savings as compared to API’s billing practices for Street Lights. 20
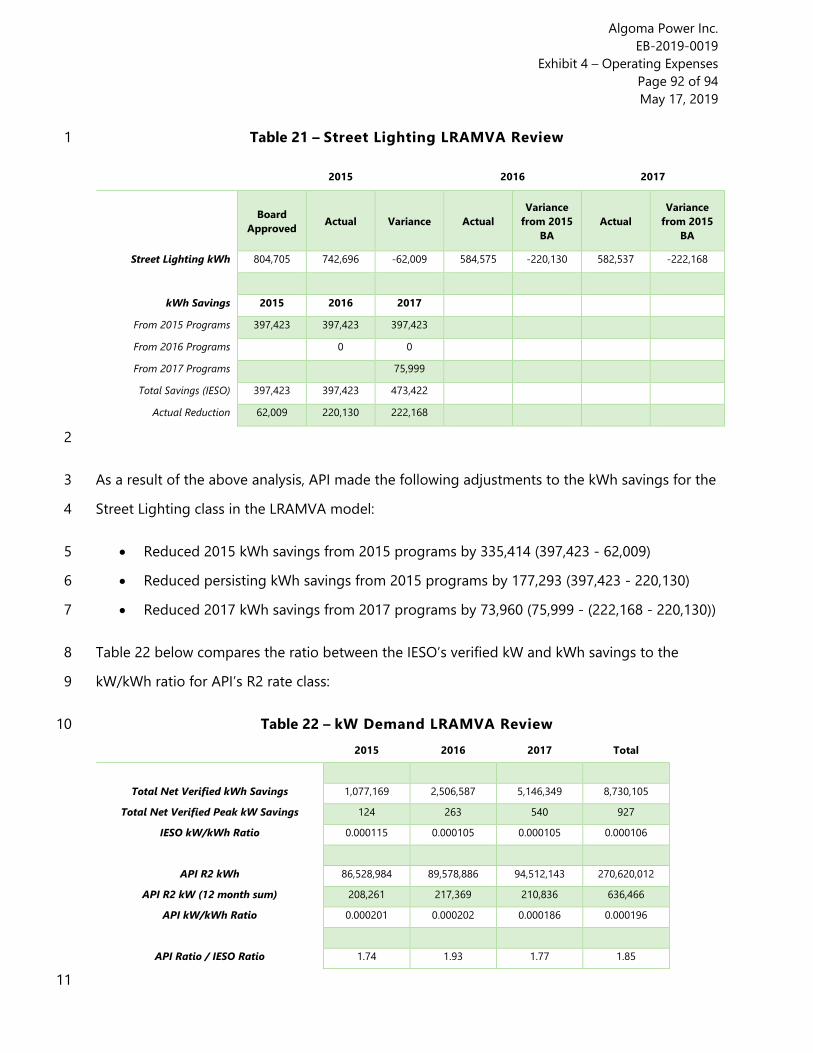
Algoma Power Inc. EB-2019-0019
Exhibit 4 – Operating Expenses Page 92 of 94 May 17, 2019
Table 21 – Street Lighting LRAMVA Review 1
2015 2016 2017
Board Approved Actual Variance Actual
Variance from 2015
BA Actual
Variance from 2015
BA
Street Lighting kWh 804,705 742,696 -62,009 584,575 -220,130 582,537 -222,168
kWh Savings 2015 2016 2017
From 2015 Programs 397,423 397,423 397,423
From 2016 Programs 0 0
From 2017 Programs 75,999
Total Savings (IESO) 397,423 397,423 473,422
Actual Reduction 62,009 220,130 222,168
2
As a result of the above analysis, API made the following adjustments to the kWh savings for the 3
Street Lighting class in the LRAMVA model: 4
• Reduced 2015 kWh savings from 2015 programs by 335,414 (397,423 - 62,009) 5
• Reduced persisting kWh savings from 2015 programs by 177,293 (397,423 - 220,130) 6
• Reduced 2017 kWh savings from 2017 programs by 73,960 (75,999 - (222,168 - 220,130)) 7
Table 22 below compares the ratio between the IESO’s verified kW and kWh savings to the 8
kW/kWh ratio for API’s R2 rate class: 9
Table 22 – kW Demand LRAMVA Review 10 2015 2016 2017 Total
Total Net Verified kWh Savings 1,077,169 2,506,587 5,146,349 8,730,105
Total Net Verified Peak kW Savings 124 263 540 927
IESO kW/kWh Ratio 0.000115 0.000105 0.000105 0.000106
API R2 kWh 86,528,984 89,578,886 94,512,143 270,620,012
API R2 kW (12 month sum) 208,261 217,369 210,836 636,466
API kW/kWh Ratio 0.000201 0.000202 0.000186 0.000196
API Ratio / IESO Ratio 1.74 1.93 1.77 1.85
11
Algoma Power Inc. EB-2019-0019
Exhibit 4 – Operating Expenses Page 93 of 94 May 17, 2019
The analysis above shows that API’s kW/kWh ratio is on average 1.85 times higher than the 1
IESO’s ratio for the 2015 to 2017 period. In order to more accurately reflect the expected peak 2
demand reduction, API calculated peak demand savings in the LRAMVA model by multiplying 3
the IESO’s verified kWh savings by API’s 2015-2017 kW/kWh ratio of 0.000196. 4
For further details, please refer to the enclosed Excel OEB LRAM Work form attached as 5
Appendix 4H and the IESO 2017 Final Report (Appendix 4G). 6

Algoma Power Inc. EB-2019-0019
Exhibit 4 – Operating Expenses Page 94 of 94 May 17, 2019
APPENDICES 1
2
Appendix 4A Korn Ferry 2020 Salary Projection
Appendix 4B Algoma Pension Valuation Report, December 31, 2017
Appendix 4C Services Agreement
Appendix 4D FortisOntario Purchasing Policy MM100
Appendix 4E PILs Work Form
Appendix 4F 2017 Corporate Tax Return
Appendix 4G IESO-Contracted Province-Wide CDM Programs Final 2017 Results
Appendix 4H LRAMVA Work Form
3

Appendix 4A
Algoma Power Inc.
2020 Cost of Service
EB-2019-0019

181 Bay Street, Suite 3810
Toronto, ON M5J 2T3
T: 416.365.1841 www.kornferry.com
© 2019 KORN FERRY (CA) LTD. WWW.KORNFERRY.COM
March 1, 2019 Ms. Kristine Carmichael Director of Corporate and Customer Services FortisOntario Inc. 1130 Bertie Street P. O. Box 1218 Fort Erie, Ontario L2A 5Y2 Re: 2020 Salary Projection for Algoma Power Inc. Korn Ferry (“KF”) has been asked by Algoma Power Inc. (“Algoma Power”) to provide an estimate of base salary increases for 2020. Methodology Annually, KF provides salary increase forecasts based on survey responses from our database participants collated in August / September (the “Compensation Planning Update”) each year, and our most recent Compensation Planning Update (September 2018) only provides forecasts on 2019 salary increases. As 2020 projections from this source will not be available until September 2019, we have conducted various scenario analyses on historical base salary movement as compared to key Canadian economic indicators, including:
1) The relationship between historical industrial base salary movements in the KF database and movements in the Canadian Headline Consumer Price Index (“Headline CPI”);
2) The historical spread between industrial base salary movements in the KF database and the Headline CPI; and
3) The relationship between historical industrial base salary movements in the KF database and Canadian Real Gross Domestic Product (“Real GDP”) growth.
Based on the resulting arithmetic differentials and regression analyses, we have applied our findings to the latest forecasts for Canadian Headline CPI and Real GDP growth in 2020 published by the Bank of Canada and large Canadian financial institutions. A range of projected base salary increases were calculated in consideration of these analyses as well as the historic salary increase pattern among utilities organizations in the KF database. 2020 Salary Forecast Based on currently available information, we project base salary increases to range between 2.37% and 2.99%, with a median of 2.60%, for 2020. Our estimates are based on the projected growth of the Canadian economy, using a compilation of the latest available economic data. It should be noted that currently there is a lot of uncertainty in global economy and geopolitics. Although there are recent signs of easing trade tensions, concerns over potential trade wars and general economic slowdown will likely remain a source of volatility in the near term. As Canada is not immune to these international developments, we would recommend taking a more conservative position in respect of salary forecast. Despite the forecasted upward movements of 2020 GDP and CPI for Canada, we would suggest maintaining the 2020 salary forecasts at the same levels as in 2019, i.e., between 2.40% and 2.60%.
© 2019 KORN FERRY (CA) LTD. WWW.KORNFERRY.COM
Kristine, we trust this is of assistance to you. Please feel free to contact us to discuss the contents of this letter or the underlying analyses supporting our opinion. Best Regards, KORN FERRY (CA) LTD.
Claudio Gardonio Kennedy Lee Associate Client Partner Principal Executive Pay and Governance Executive Pay and Governance

Appendix 4B
Algoma Power Inc.
2020 Cost of Service
EB-2019-0019

i"l ij A t. l- il vii Er\L I ll .;,rFl ll iFl
RETIREMENT FUND OFALGOMA POWER INC.
REPORT ON THE ACTUARIALVALUATION FOR FUNDINGPURPOSES AS ATDECEMBER 31 , 2017
SEPTEMBER 2018
Financial Services Commission of Ontario Registration Number: 1212836
Canada Revenue Agency Registration Number: 1212836
MAKE TOMORROW, TODAY G' MERCER
REPORT ON THE ACTUARIAL VALUATIONFOR FUNDING PURPOSES AS ATDECEMBER 31. 2017
RETIREMENT FUND OF ALGOMA POWERrNc.
Note to reader regarding actuarial valuations:
This valuation report may not be relied upon for any purpose other than those explicitly noted in thelntroduction, nor may it be relied upon by any party other than the parties noted in the lntroduction.Mercer is not responsible for the consequences of any other use. A valuation report is a snapshot ofa plan's estimated financial condition at a particular point in time; it does not predict a pension plan'sfuture financial condition or its ability to pay benefits in the future. lf maintained indefinitely, a plan'stotal cost will depend on a number of factors, including the amount of benefits the plan pays, thenumber of people paid benefits, the amount of plan expenses, and the amount earned on anyassets invested to pay the benefits. These amounts and other variables are uncertain andunknowable at the valuation date. The content of the report may not be modified, incorporated intoor used in other material, sold or otherwise provided, in whole or in part, to any other person orentity, without Mercer's permission. All parts of this report, including any documents incorporated byreference, are integral to understanding and explaining its contents; no part may be taken out ofcontext, used, or relied upon without reference to the report as a whole.
To prepare the results in this report, actuarial assumptions are used to model a single scenario froma range of possibilities for each valuation basis. The results based on that single scenario areincluded in this report. However, the future is uncertain and the plan's actual experience will differfrom those assumptions; these differences may be significant or material. Different assumptions orscenarios within the range of possibilities may also be reasonable, and results based on thoseassumptions would be different. Furthermore, actuarial assumptions may be changed from onevaluation to the next because of changes in regulatory and professional requirements,developments in case law, plan experience, changes in expectations about the future, and otherfactors.
The valuation results shown in this report also illustrate the sensitivity to one of the key actuarialassumptions, the discount rate. We note that the results presented herein rely on manyassumptions, all of which are subject to uncertainty, with a broad range of possible outcomes, andthe results are sensitive to allthe assumptions used in the valuation.
Should the plan be wound up, the going concern funded status and solvency financial position, ifdifferent from the wind-up financial position, become irrelevant. The hypothetical wind-up financialposition estimates the financial position of the plan assuming it is wound up on the valuation date.Emerging experience will affect the wind-up financial position of the plan assuming it is wound up inthe future. ln fact, even if the plan were wound up on the valuation date, the financial position wouldcontinue to fluctuate until the benefits are fully settled.
Decisions about benefit changes, granting new benefits, investment policy, funding policy, benefitsecurity, and/or benefit-related issues should not be made solely on the basis of this valuation, butonly after careful consideration of alternative economic, financial, demographic, and societal factors,including financial scenarios that assume future sustained investment losses.
Funding calculations reflect our understanding of the requirements of Pension Benefits Act(Ontario), the lncome Tax Act, and related regulations that are effective as of the valuation date.Mercer is not a law firm, and the analysis presented in this report is not intended to be a legalopinion. You should consider securing the advice of legal counsel with respect to any legal mattersrelated to this report.
MERCER

REPORT ON THE ACTUARIAL VALUATION
FOR FUNDING PURPOSES AS AT
DECEMBER 31, 2017
CONTENTS
RETIREMENT FUND OF ALGOMA POWER
I NC.
1. Summary of results ..................................................................................................................... 1
2. Introduction ................................................................................................................................. 3
3. Valuation Results - Going Concern ............................................................................................ 7
4. Valuation Results - Hypothetical Wind-Up ............................................................................. .. 11
5. Valuation Results - Solvency............................................................................. . .................. . 13
6. Minimum Funding Requirements ............................................................................................... 15
7. Maximum Eligible Contributions ................................................................................................ 18
8. Actuarial Opinion ....................................................................................................................... 20
Appendix A: Prescribed Disclosure ............................................................................................... 21
Appendix B: Plan Assets ............................................................................................................... 29
Appendix C: Methods and Assumptions - Going Concern ............................................................ 32
Appendix D: Methods and Assumptions - Hypothetical Wind-up and Solvency ............................ 37
Appendix E: Membership Data ..................................................................................................... .42
Appendix F: Summary of Plan Provisions ..................................................................................... 47
Appendix G: Employer Certification ............................................................................................... 51
MERCER
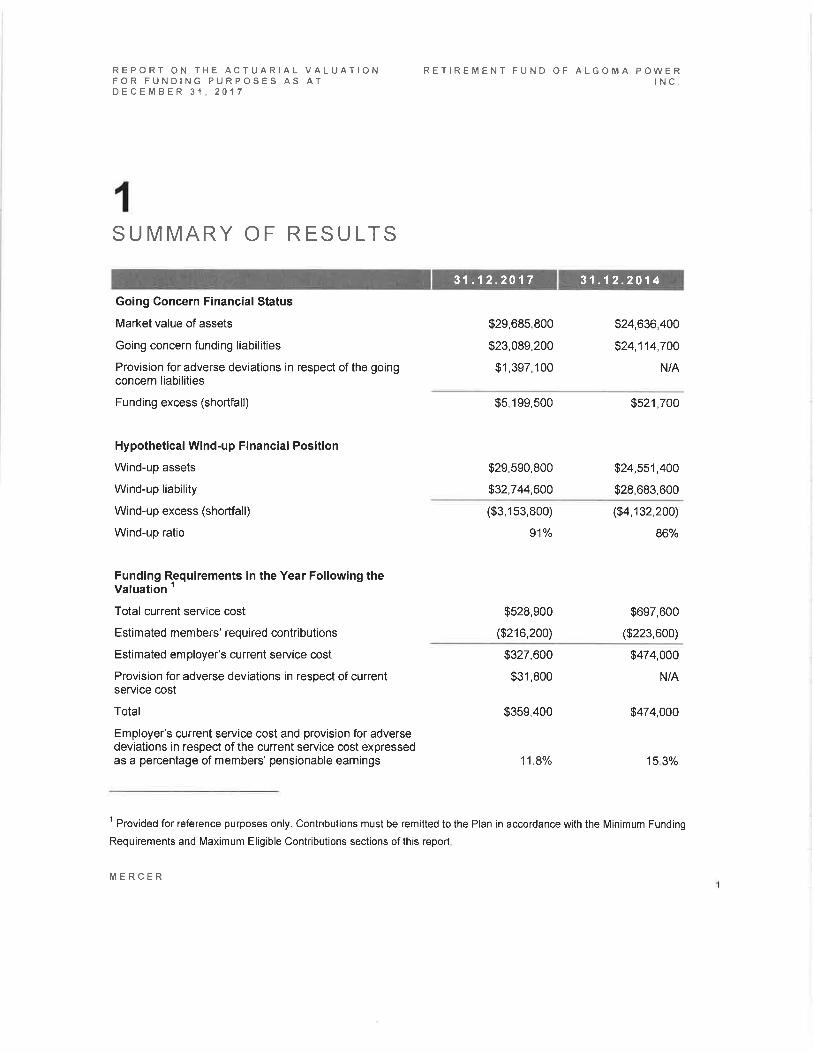
REPORT ON THE ACTUARIAL VALUATIONFOR FUNDING PURPOSES AS ATDECEMBER 31,2O'I 7
RETIREMENT FUND OF ALGOMA POWERtNc.
1SUMMARY OF RESULTS
31.12.2017 31 .12.2014Going Concern Financial Status
Market value of assets
Going concern funding liabilities
Provision for adverse deviations in respect of the goingconcern liabilities
Funding excess (shortfall)
Hypothetical Wind-up Financial Position
Wind-up assets
Wind-up liability
Wind-up excess (shortfall)
Wind-up ratio
Funding Rpguirements in the Year Following theValuation '
Total current service cost
Estimated members' required contributions
Estimated employer's current service cost
Provision for adverse deviations in respect of currentservice cost
Total
Employer's current service cost and provision for adversedeviations in respect of the current service cost expressedas a percentage of members' pensionable earnings
$29,685,800
$23,089,200
$1,397,100
$24,636,400
$24,114,700
N/A
$5,199,500
$29,590,800
$32,744,600
$521,700
$24,551,400
$28,683,600
($3,153,800)
91Yo
$528,900
($216,200)
($4,132,200)
86%
$697,600
($223,600)
$327,600
$31,800
$359,400
11.8o/o
$474,000
N/A
$474,000
15.3%
1 Provided for reference purposes only. Contributions musl be remitted to the Plan in accordance with the Minimum Funding
Requirements and Maximum Eligible Contributions sections of this report.
MERCER

REPORT ON THE ACTUARIAL VALUATIONFOR FUNDING PURPOSES AS ATDECEMBER 31,2O'I 7
RETIREMENT FUND OF ALGOMA POWERlNc.
31.12.2017 31.12.2014Minim um special payments
Estimated minimum employer contribution
Estimated maximum eligible employer contribution
Next required valuation date
$0
$359,400
$3,513,200
31.12.2020
$0
$0
$4,606,200
31.12.2017
2MERCER

REPORT ON THE ACTUARIAL VALUATIONFOR FUNDING PURPOSES AS ATDECEMBER 31,2017
RETIREMENT FUND OF ALGOMA POWERtNc.
2INTRODUCTION
TO FORTISONTARIO INC.
At the request of FortisOntario lnc., we have conducted an actuarial valuation of the Retirement Fund ofAlgoma Power lnc. (the "Plan"), sponsored by FortisOntario lnc. (the "Company"), as at the valuation date,December 31,2017. We are pleased to present the results of the valuation.
PURPOSE
The purpose of this valuation is to determine
The funded status of the Plan as at December 31 , 2017 on going concern, hypothetical wind-up, andsolvency bases;
The minimum required funding contributions from 20'18, in accordance with the Pension Benefits Act(Ontario) (the "Act"); and
The maximum permissible funding contributions from 2018, in accordance with the lncome Tax Act
The information contained in this report was prepared for the internal use of the Company, and for filingwith the Financial Services Commission of Ontario and with the Canada Revenue Agency, in connectionwith our actuarial valuation of the Plan. This report will be filed with the Financial Services Commission ofOntario and with the Canada Revenue Agency. This report is not intended or suitable for any otherpurpose.
ln accordance with pension benefits legislation, the next actuarialvaluation of the Plan will be required asat a date not later than December 31, 2020, or as at the date of an earlier amendment to the Plan.
TERMS OF ENGAGEMENT
ln accordance with our terms of engagement with the FortisOntario lnc., our actuarial valuation of the Planis based on the following materialterms:
It has been prepared in accordance with applicable pension legislation and actuarial standards ofpractice in Canada.
. As instructed by the FortisOntario lnc., we have not reflected a margin for adverse deviations in thegoing concern valuation in excess of the provision for adverse deviation prescribed by the Act.
MERCER3
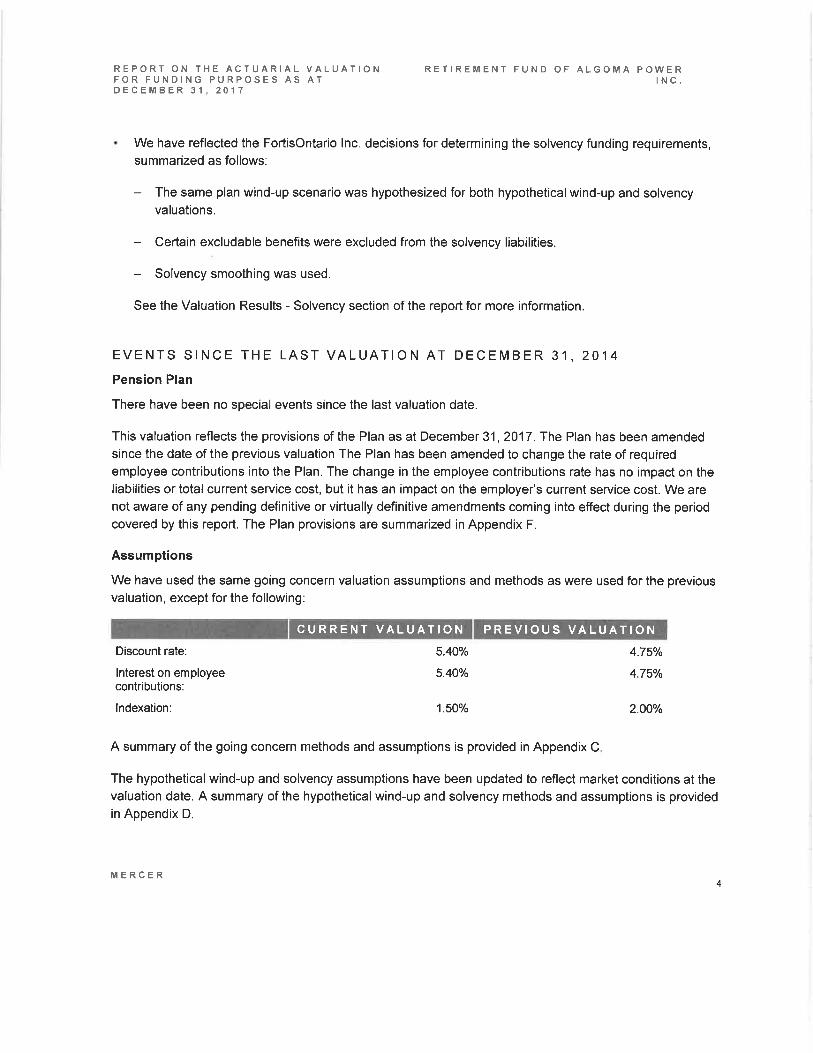
We have reflected the FortisOntario lnc. decisions for determining the solvency funding requirements,summarized as follows:
The same plan wind-up scenario was hypothesized for both hypotheticalwind-up and solvencyvaluations.
Certain excludable benefits were excluded from the solvency liabilities.
Solvency smoothing was used.
See the Valuation Results - Solvency section of the report for more information.
EVENTS SINCE THE LAST VALUATION AT DECEMBER 31, 2014
Pension Plan
There have been no special events since the last valuation date.
This valuation reflects the provisions of the Plan as at December 31,2017 . The Plan has been amendedsince the date of the previous valuation The Plan has been amended to change the rate of requiredemployee contributions into the Plan. The change in the employee contributions rate has no impact on theliabilities or total current service cost, but it has an impact on the employer's current service cost. We arenot aware of any pending definitive or virtually definitive amendments coming into effect during the period
covered by this report. The Plan provisions are summarized in Appendix F.
Assumptions
We have used the same going concern valuation assumptions and methods as were used for the previousvaluation, except for the following:
REPORT ON THE ACTUARIAL VALUATIONFOR FUNDING PURPOSES AS ATDECEMBER 31,2017
Discount rate:
lnterest on employeecontributions:
lndexation:
RETIREMENT FUND OF ALGOMA POWERtNc.
5.40o/o
5.40o/o
4.75o/o
4.75o/o
1.50o/o 2.00To
A summary of the going concern methods and assumptions is provided in Appendix C
The hypothetical wind-up and solvency assumptions have been updated to reflect market conditions at thevaluation date. A summary of the hypothetical wind-up and solvency methods and assumptions is provided
in Appendix D.
4
CURRENT VALUATION PREVIOUS VALUATION
MERCER
REPORT ON THE ACTUARIAL VALUATIONFOR FUNDING PURPOSES AS ATDECEMBER 31.2017
RETIREMENT FUND OF ALGOMA POWERtNc.
Reg u latory Envi ronment and Actua rial Standards
There have been a number of changes to the Act and regulations which impact the funding of the Plan
On December 14, 2017, Bil 177 , Stronger, Fairer Ontario Act, 2017 received Royal Assent. Bil 177
contained amendments to the Act to enable the new funding framework previously announced by theGovernment of Ontario in May, 2017 . The new funding framework changed minimum funding requirementsfrom both a going concern and solvency perspective. The regulations to the Act supporting the new fundingrules were published on April 20, 2018 with effect from May 1,2018. Valuation reports with effect on orafter December 31, 2017 thal are filed on or after May 1, 2018 reflect the new rules. The amendedregulations also allow for a transition from the funding rules that applied immediately before May 1 , 2018 tothe new funding rules over a three-year phase-in period starting in the first year following the valuation dateof this report.
On July 20, 2017 , the Canadian lnstitute of Actuaries released an Exposure Draft with proposed changesto the standards for pension commuted values ("ClA CV Standard"). The impact of any changes to the CIACV Standard will be considered in a future actuarialvaluation, once the amendments are finalized.
At its meeting on June 9,2015, the Actuarial Standards Board (ASB) decided to promulgate the use of thefollowing mortality table with respect of the computation of pension commuted values ("ClA CV Standard"),effective October 1, 2015: Moftality rates equal to the 2014 Canadian Pensioners Mortality Table(CPM2014) combined with moftality improvemenf sca/e CPM lmprovement Scale B (CPM-B). The changeaffects the mortality assumption used to value the solvency and wind-up liabilities for benefits assumed tobe settled through a lump sum transfer. The financial impact of the change in the CIA CV Standard hasbeen reflected in this actuarial valuation on a solvency and hypothetical wind-up basis.
SUBSEQUENT EVENTS
After checking with representatives of the Company, to the best of our knowledge there have been noevents subsequent to the valuation date which, in our opinion, would have a material impact on the resultsof the valuation. Our valuation reflects the financial position of the Plan as of the valuation date and doesnot take into account any experience after the valuation date.
IMPACT OF CASE LAW
This report has been prepared on the assumption that all claims on the Plan after the valuation date will bein respect of benefits payable to members of the Plan determined in accordance with the Plan terms andthat all Plan assets are available to provide for these benefits. lt is possible that court and regulatory
decisions and changes in legislation could give rise to additional entitlements to benefits under the Planand cause the results in this report to change. By way of example, we bring your attention to the followingdecisions:
5MERCER
REPORT ON THE ACTUARIAL VALUATIONFOR FUNDING PURPOSES AS ATDECEMBER 31,2017
RETIREMENT FUND OF ALGOMA POWERtNc.
The Ontario Court of Appeal's 2003 decision in Aegon Canada lnc. and Transamerica Life Canadaversus ING Canada /nc. restricted the use of original plan surplus where two or more pension planswere merged.
The Supreme Court of Canada's 2004 decision in Monsanto Canada lnc. versus Superintendent ofFinancialServices upheld the requirement, with retroactive effect, to distribute surplus on partial plan
wind-up under the Pension Benefits Act (Ontaio).
We are not in a position to assess the impact that such decisions or changes could have on theassumption that all plan assets on the valuation date are available to provide for benefits determined in
accordance with the Plan terms. lf such a claim arises subsequent to the date of this report, theconsequences will be dealt with in a subsequent report. We are making no representation as to likelihoodof such a claim.
AMERCER
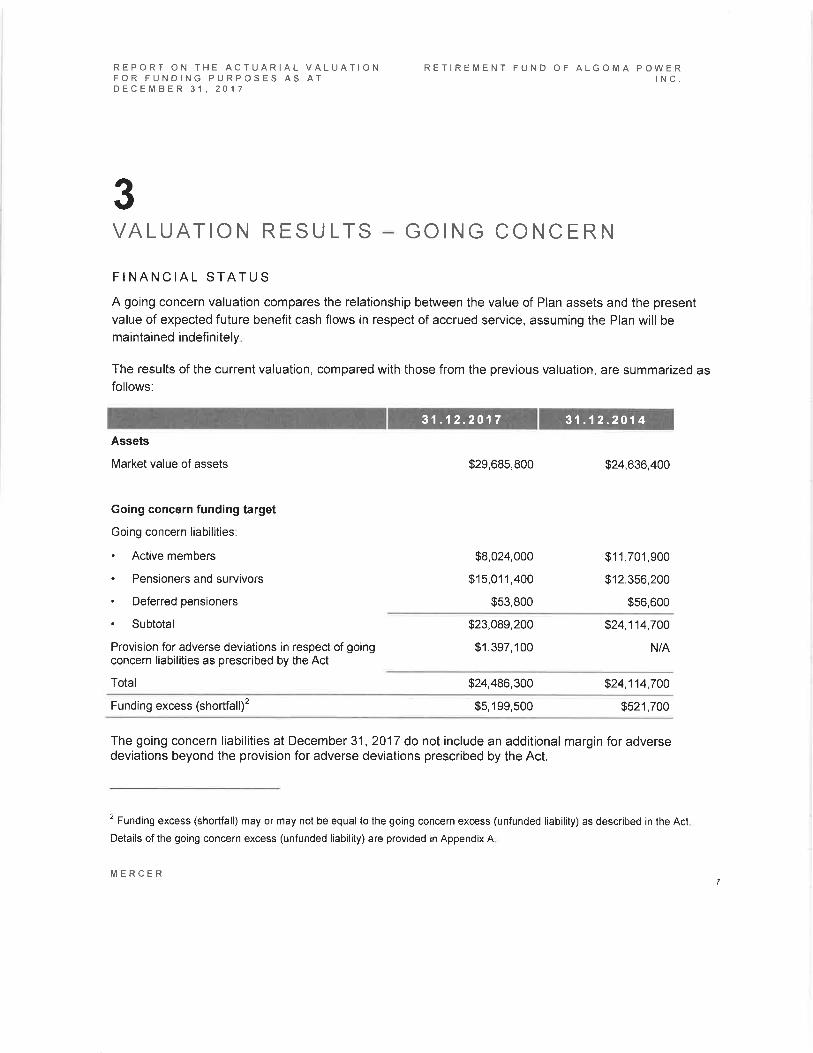
3
REPORT ON THE ACTUARIAL VALUATIONFOR FUNDING PURPOSES AS ATDECEMBER 31, 20.I 7
Assets
Market value of assets
Going concern funding target
Going concern liabilities:
. Active members
. Pensioners and survivors
. Deferred pensioners
. Subtotal
Provision for adverse deviations in respect of goingconcern liabilities as prescribed by the Act
Total
RETIREMENT FUND OF ALGOMA POWERlNc.
$29,685,800 $24,636,400
VALUATION RESULTS GOING CONCERN
FINANCIAL STATUS
A going concern valuation compares the relationship between the value of Plan assets and the present
value of expected future benefit cash flows in respect of accrued service, assuming the Plan will be
maintained indefinitely.
The results of the current valuation, compared with those from the previous valuation, are summarized asfollows:
$8,024,000
$15,011,400
$53,800
$11,701,900
$12,356,200
$56,600
$23,089,200
$1,397,100
$24,114,700
N/A
$24,486,300 $24,114,700
31.12.2017 31 .12.2014
Funding excess (shortfall)2 $5,199,500 $521,700
The going concern liabilities at December 31, 2017 do not include an additional margin for adversedeviations beyond the provision for adverse deviations prescribed by the Act.
2 Funding excess (shortfall) may or may not be equal to the going concern excess (unfunded liability) as described in the Act
Details of the going concern excess (unfunded liability) are provided in Appendix A.
7MERCER
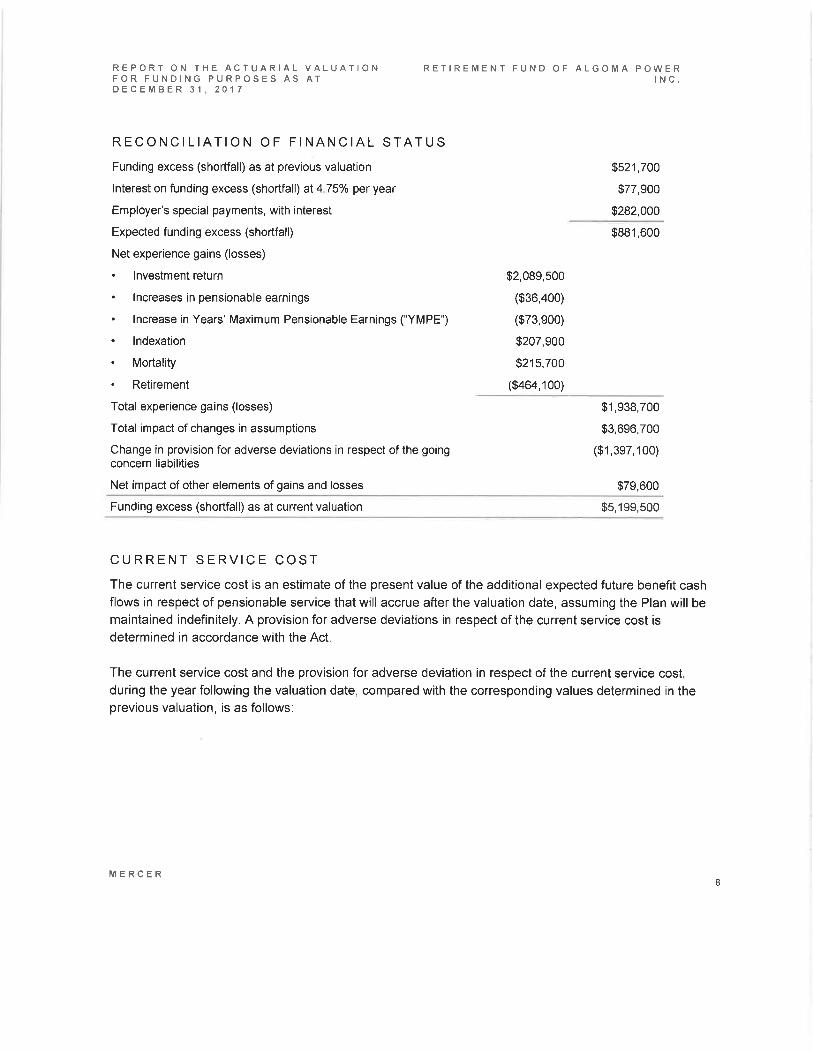
REPORT ON THE ACTUARIAL VALUATIONFOR FUNDING PURPOSES AS ATDECEMBER 31.2017
RECONCILIATION OF FINANCIAL STATUS
Funding excess (shortfall) as at previous valuation
lnterest on funding excess (shortfall) at 4.75% per year
Employer's special payments, with interest
Expected funding excess (shortfall)
Net experience gains (losses)
. lnvestment return
. lncreases in pensionable earnings
. lncrease in Years' Maximum Pensionable Earnings ("YMPE')
. lndexation
. Mortality
. Retirement
Total experience gains (losses)
Total impact of changes in assumptions
Change in provision for adverse deviations in respect of the goingconcern liabilities
Net impact of other elements of gains and losses
RETIREMENT FUND OF ALGOMA POWERtNc.
$521,700
$77,900
$282,000
$881,600
$2,089,500
($36,400)
($73,eoo)
$207,900
$215,700
($464,1 oo)
$1,938,700
$3,696,700
($1,3e7,1oo)
$79,600
Funding excess (shortfall) as at current valuation $5,199,500
CURRENT SERVICE COST
The current service cost is an estimate of the present value of the additional expected future benefit cashflows in respect of pensionable service that will accrue after the valuation date, assuming the Plan will bemaintained indefinitely. A provision for adverse deviations in respect of the current service cost isdetermined in accordance with the Act.
The current service cost and the provision for adverse deviation in respect of the current service cost,during the year following the valuation date, compared with the corresponding values determined in theprevious valuation, is as follows:
8MERCER

REPORT ON THE ACTUARIAL VALUATIONFOR FUNDING PURPOSES AS ATDECEMBER 31,2017
RETIREMENT FUND OF ALGOMA POWERtNc.
2018 201 5
Total current service cost3
Estimated members' required contributions
Estimated employer's current service cost
Estimated members' pensionable earnings
Employer's current service cost expressed as a percentage ofmembers' pensionable earnings
Provision for adverse deviations in respect of the current service cost(based on the percentage defined in Appendix A)
. As a dollar amount per year
. As a percentage of members' pensionable earnings
Employer's current service cost and provision for adverse deviationsin respect of current service cost
. As a dollar amount per year
. As a percentage of members' pensionable earnings
Employer's current service cost as at previous valuation
Demographic changes
Plan amendments
Changes in assumptions
Employer's current service cost as at current valuation
$528,900
($201,300)
$697,600
($223,600)
The key factors that have caused a change in the employer's current service cost excluding the provision
for adverse deviations since the previous valuation are summarized in the following table:
$327,600
$3,057,200
10.7o/o
$31,800
1.1o/o
$359,400
11.8o/o
$474,000
$3,097,000
15.3%
N/A
N/A
$474,000
15.3Yo
15.3o/o
(0.4yo)
0.5%
(4.7o/o)
1O.7o/o
3Total current service cost includes $74,100 in estimated future costs for escalated adjustments as defined in the Act.
IMERCER
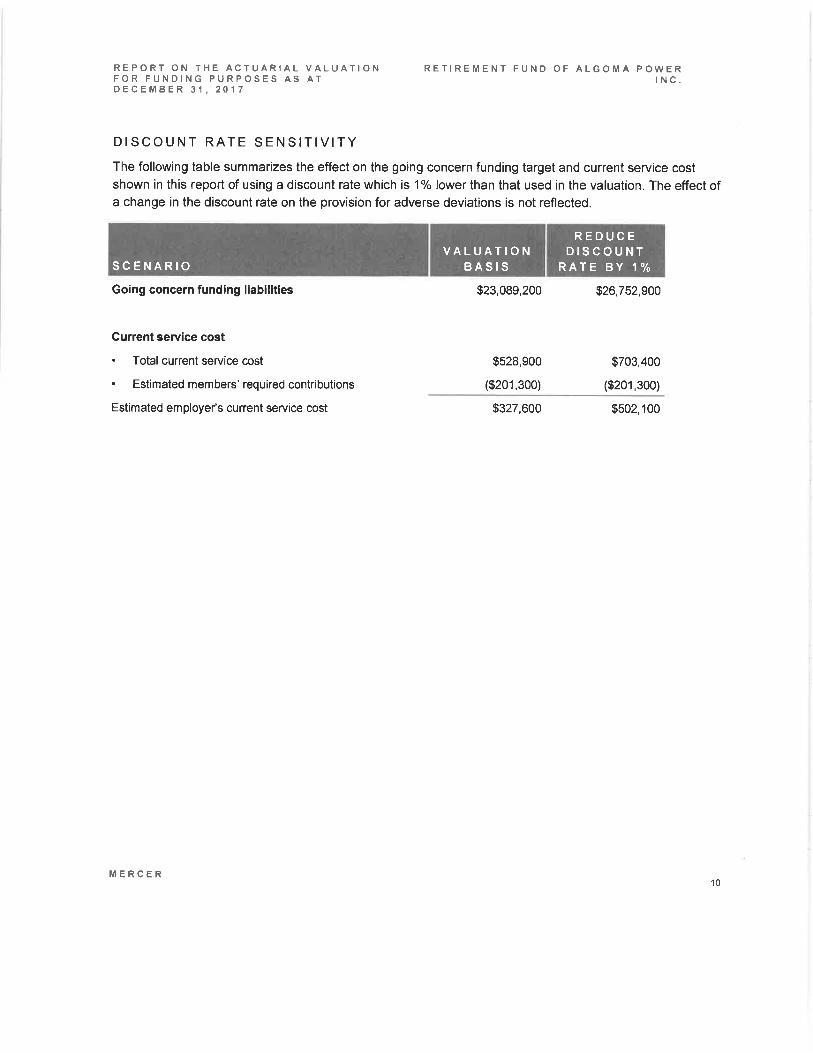
DISCOUNT RATE SENSITIVITY
The following table summarizes the effect on the going concern funding target and current service costshown in this report of using a discount rate which is 1% lower than that used in the valuation. The effect ofa change in the discount rate on the provision for adverse deviations is not reflected.
Going concern funding liabilities $23,089,200 $26,752,900
REPORT ON THE ACTUARIAL VALUATIONFOR FUNDING PURPOSES AS ATDECEMBER 31,2017
Current service cost
. Total current service cost
. Estimated members' required contributions
Estimated employer's current service cost
RETIREMENT FUND OF ALGOMA POWERtNc.
$528,900
($201,300)
$703,400
($201,300)
$327,600 $502,100
VALUATIONBAS'S
REDUCEDISCOUNT
RATE BY 'lYoSCENARIO
MERCER10

4
REPORT ON THE ACTUARIAL VALUATIONFOR FUNDING PURPOSES AS ATDECEMBER 31,2017
Assets
Market value of assets
Termination expense provision
Wind-up assets
Present value of accrued benefits for:
. Active members
. Pensioners and survivors
. Deferred pensioners
Total wind-up liability
RETIREMENT FUND OF ALGOMA POWERtNc.
VALUATION RESULTSHYPOTHETICAL WIND-UP
FINANCIAL POSITION
When conducting a hypotheticalwind-up valuation, we determine the relationship between the respectivevalues of the Plan's assets and its liabilities assuming the Plan is wound up and settled on the valuationdate, assuming benefits are settled in accordance with the Act and under circumstances consistent with thehypothesized scenario on the valuation date. More details on such scenario are provided in Appendix D.
The hypothetical wind-up financial position as of the valuation date, compared with that at the previousvaluation, is as follows:
$29,685,800
($e5,ooo)
$24,636,400
($85,ooo)
$29,590,800
$11,583,300
$21,053,200
$108,100
$24,551,400
$13,775,200
$14,816,700
$91,700
$32,7,14,600 $28,683,600
31.12.2017 31 .12.2014
Wind-up excess (shortfall) ($3,153,800) ($4,132,200)
Transfer Ratio 91o/o 860/o
MERCER11

REPORT ON THE ACTUARIAL VALUATIONFOR FUNDING PURPOSES AS ATDECEMBER 31.2017
RETIREMENT FUND OF ALGOMA POWERtNc.
WIND.UP INCREMENTAL COST
The wind-up incremental cost is an estimate of the present value of the projected change in thehypothetical wind-up liabilities from the valuation date until the next scheduled valuation date, adjusted forthe benefit payments expected to be made in that period.
The hypotheticalwind-up incrementalcost determined in this valuation, compared with the correspondingvalue determined in the previous valuation, is as follows:
Number of years covered by report 3 years 3 years
Total hypothetical wind-up liabilities at the valuation date(A)
Present value at the valuation date of prolectedhypothetical wind-up liability at the next required valuationplus expected benefit payments until the next requiredvaluation (B)
$32,744,600 $28,683,600
$35,733,000 $31,893,400
31.12.2017 31.12.2014
Hypothetical wind-up incremental cost (B - A) $2,988,400 $3,209,800
The incremental cost is not an appropriate measure of the contributions that would be required to maintainthe financial position of the Plan on a hypothetical wind-up basis unchanged from the valuation date to thenext required valuation date, if actual experience is exactly in accordance with the going concern valuationassumptions. This is because it does not reflect the fact that the expected return on plan assets (based onthe going concern assumptions) is greater than the discount rate used to determine the hypothetical wind-up liabilities.
DISCOUNT RATE SENSITIVITY
The following table summarizes the effect on the hypothetical wind-up liabilities shown in this report ofusing a discount rate which is 1% lower than that used in the valuation:
Total hypothetical wind-up liability $32,744,600 $38,601,300
VALUAT IONBAS IS
REDUC EDISGOU NT
RATE BY 1o/oSC E NARIO
MERCER12
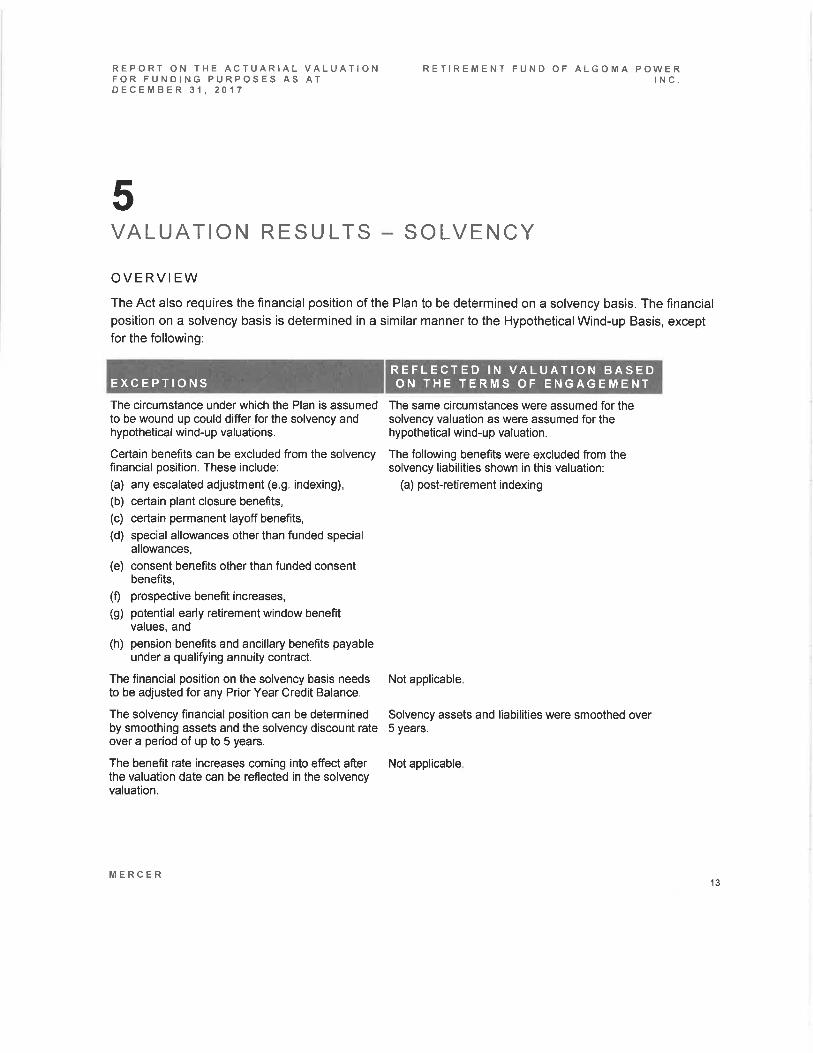
5
REPORT ON THE ACTUARIAL VALUATIONFOR FUNDING PURPOSES AS ATDECEMBER 31,2017
The circumstance under which the Plan is assumedto be wound up could differ for the solvency andhypothetical wind-up valuations.
Certain benefits can be excluded from the solvencyfinancial position. These include:
(a) any escalated adjustment (e.9. indexing),(b) certain plant closure benefits,(c) certain permanent layoff benefits,(d) special allowances other than funded special
allowances,(e) consent benefits other than funded consent
benefits,(f) prospective benefit increases,
(g) potential early retirement window benefitvalues, and
(h) pension benefits and ancillary benefits payableunder a qualifying annuity contract.
The financial position on the solvency basis needsto be adjusted for any Prior Year Credit Balance.
The solvency financial position can be determinedby smoothing assets and the solvency discount rateover a period of up to 5 years.
The benefit rate increases coming into effect afterthe valuation date can be reflected in the solvencyvaluation.
RETIREMENT FUND OF ALGOMA POWERrNc.
VALUATION RESULTS SOLVENCY
OVE RVI EW
The Act also requires the financial position of the Plan to be determined on a solvency basis. The financialposition on a solvency basis is determined in a similar manner to the HypotheticalWind-up Basis, exceptfor the following:
The same circumstances were assumed for thesolvency valuation as were assumed for thehypothetical wind-up valuation.
The following benefits were excluded from thesolvency liabilities shown in this valuation:
(a) post-retirement indexing
Not applicable
Solvency assets and liabilities were smoothed over5 years.
Not applicable
REFLECTED IN VALUATION BASEDON THE TERMS OF ENGAGEMENTEXCEPTIONS
MERCER13
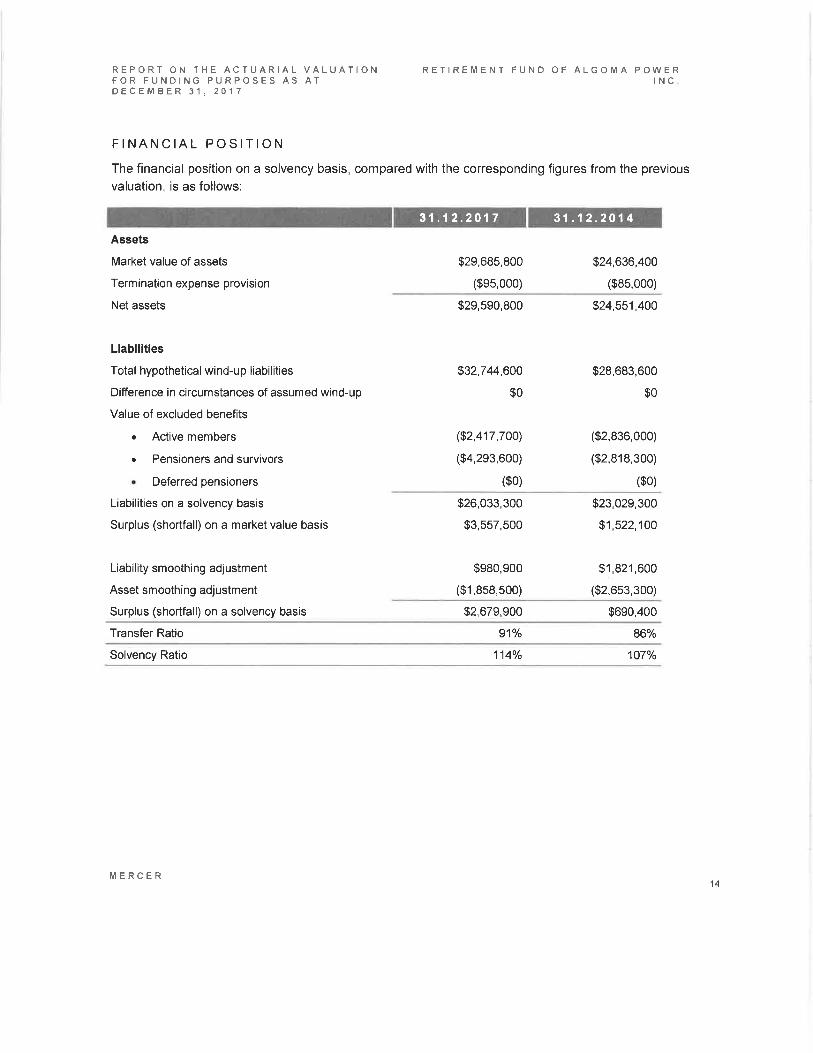
FINANCIAL POSITION
The financial position on a solvency basis, compared with the corresponding figures from the previousvaluation, is as follows:
REPORT ON THE ACTUARIAL VALUATIONFOR FUNDING PURPOSES AS ATDECEMBER 31,2017
Assets
Market value of assets
Termination expense provision
Net assets
Liabilities
Total hypothetical wind-up liabilities
Difference in circumstances of assumed wind-up
Value of excluded benefits
. Active members
. Pensioners and survivors
. Deferred pensioners
Liabilities on a solvency basis
Surplus (shortfall) on a market value basis
Liability smoothing adjustment
Asset smoothing adjustment
Surplus (shortfall) on a solvency basis
RETIREMENT FUND OF ALGOMA POWERlNc.
$29,685,800
($e5,000)
$24,636,400
($85,000)
$29,590,800
$32,744,600
$o
($2,417,7Oo)
($4,2e3,600)
($o)
$24,551,400
$28,683,600
$0
($2,836,000)
($2,818,300)
($01
$26,033,300
$3,557,500
$980,900
($1,858,500)
$23,029,300
$1,522,100
$1,821,600
($2,653,300)
$2,679,900 $690,400
31.12.2017 31 .12.2014
Transfer Ratio 91o/o 86%
Solvency Ratio 114o/o 1O7o/o
MERCER14

REPORT ON THE ACTUARIAL VALUATIONFOR FUNDING PURPOSES AS ATDECEMBER 31,2017
RETIREMENT FUND OF ALGOMA POWERtNc.
6MINIMUM FUNDING REQUIREMENTS
The Act prescribes the minimum contributions that the Company must make to the Plan. The minimumcontributions in respect of a defined benefit component of a pension plan are comprised of going concerncurrent service cost, the provision for adverse deviations in respect of the current service cost and specialpayments to fund any funding shortfall or solvency shortfall that exceeds the level as set out under the Act.
On the basis of the assumptions and methods described in this report, no special payments are required.However, since the available actuarial surplus is zero, the Act requires the employer to contribute thecurrent service cost including the provision for adverse deviations. The determination of the provision foradverse deviations is shown in Appendix A. On the basis of the assumptions and methods described in thisreport, the rule for determining the minimum required employer monthly contributions, as well as an
estimate of the employee and employer contributions, from the valuation date until the next requiredvaluation are as follows:
January 1,2018
January 1,2019
January 1,2020
10.7Yo
10.2%
10.2Yo
1.10k
1.1o/o
1.10h
11.8o/o
11.3%
11.3o/o
a Expressed as a percentage of members' pensionable earnings.
Monthly current service costincluding provision foradverse deviation
EMPLOYER'S CONTRIBUTION RULE
Period beginningProvision foradverse deviation
Monthly current servicecosta
MERCER15

REPORT ON THE ACTUARIAL VALUATIONFOR FUNDING PURPOSES AS ATDECEMBER 31,2017
RETIREMENT FUND OF ALGOMA POWERtNc.
January 1,2018
January 1,2019
January 1,2020
$16,800
$18,600
$19,300
$27,300
$27,000
$27,900
$2,700
$2,700
$2,800
$30,000
$29,700
$30,700
$o
$0
$0
$30,000
$29,700
$30,700
The estimated contribution amounts above are based on projected members' pensionable earnings.Therefore, the actual employer's current service cost and provision for adverse deviations in respect of thecurrent service cost may be different from the above estimates and, as such, the contribution requirementsshould be monitored closely to ensure contributions resume in accordance with the Act.
Appendix A includes details on the determination of the provision for adverse deviations.
OTHER CONSIDERATIONS
Differences Between Valuation Bases
There is no provision in the minimum funding requirements to fund the difference between the hypotheticalwind-up and reduced solvency shortfalls, if any.
ln addition, although minimum funding requirements do include a requirement to fund the going concerncurrent service cost and a provision for adverse deviations in respect of the current service cost, there is norequirement to fund the expected growth in the hypothetical wind-up or solvency liability after the valuationdate, which could be greater than the going concern current service cost.
Timing of Contributions
Funding contributions are due on a monthly basis. Contributions for current service cost and the provision
for adverse deviations including the expense allowance must be made within 30 days following the monthto which they apply. Special payment contributions must be made in the month to which they apply.
5 Notwithstanding the available actuarial surplus in the Plan, the terms of the Plan may require the Company to make current
service cost contributions
Period beginning
ESTIMATED EMPLOYER'S CONTRIBUTIONS
Monthlycurrentservicecost
MonthlyProvision foradversedeviations
Monthly currentservice cost andprovision foradverse deviation
Availableactuarialsurplus_applied"
Minimummonthlycontributions
MonthlyEmployeeContribution
MERCER16

REPORT ON THE ACTUARIAL VALUATIONFOR FUNOING PURPOSES AS ATDECEMBER 31. 2O'I 7
RETIREMENT FUND OF ALGOMA POWERlNc.
Retroactive Contri butions
The Company must contribute the excess, if any, of the minimum contribution recommended in this report
over contributions actually made in respect of the period following the valuation date. This contribution,along with an allowance for interest, is due no later than 60 days following the date this report is filed.
Payment of Benefits
The Act imposes certain restrictions on the payment of lump sums from the Plan when the transfer ratio
revealed in an actuarialvaluation is less than one. lf the transfer ratio shown in this report is less than one,the plan administrator should ensure that the monthly special payments are sufficient to meet the
requirements of the Act to allow for the full payment of benefits, and otherwise should take the prescribed
actions.
Additional restrictions are imposed when
The transfer ratio revealed in the most recently filed actuarial valuation is less than one and the
administrator knows or 'ought to know' that the transfer ratio of the Plan has declined by 10o/o or more
since the date the last valuation was filed.
The transfer ratio revealed in the most recently filed actuarial valuation is greater than or equal to oneand the administrator knows or 'ought to know' that the transfer ratio of the Plan has declined to less
than 0.9 since the date the last valuation was filed.
As such, the administrator should monitor the transfer ratio of the Plan and, if necessary, take theprescribed actions.
Letters of Credit
Minimum funding requirements in respect of required special payments that otherwise require monthlycontributions to the pension fund may be met, in the alternative, by establishing an irrevocable letter ofcredit subject to the conditions established by the Act. Required solvency special payments in excess ofthose met by a letter of credit must be met by monthly contributions to the pension fund.
MERCER17
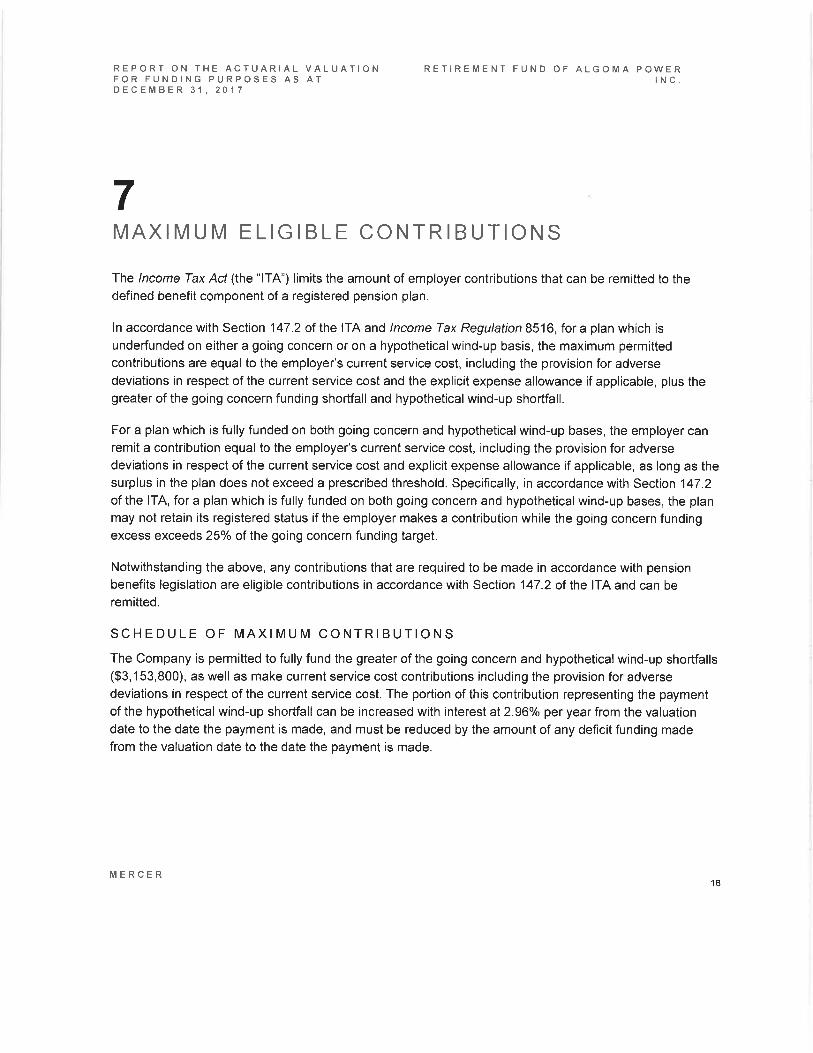
REPORT ON THE ACTUARIAL VALUATIONFOR FUNDING PURPOSES AS ATDECEMBER 31,2017
RETIREMENT FUND OF ALGOMA POWERtNc.
7MAXIMUM ELIGIBLE CONTRIBUTIONS
The lncome Tax Act (the "lTA") limits the amount of employer contributions that can be remitted to thedefined benefit component of a registered pension plan.
ln accordance with Section 147 .2 of the ITA and lncome Tax Regulation 8516, for a plan which is
underfunded on either a going concern or on a hypothetical wind-up basis, the maximum permitted
contributions are equal to the employer's current service cost, including the provision for adversedeviations in respect of the current service cost and the explicit expense allowance if applicable, plus thegreater of the going concern funding shortfall and hypothetical wind-up shortfall.
For a plan which is fully funded on both going concern and hypothetical wind-up bases, the employer canremit a contribution equal to the employer's current service cost, including the provision for adversedeviations in respect of the current service cost and explicit expense allowance if applicable, as long as thesurplus in the plan does not exceed a prescribed threshold. Specifically, in accordance with Section 147.2of the lTA, for a plan which is fully funded on both going concern and hypothetical wind-up bases, the planmay not retain its registered status if the employer makes a contribution while the going concern fundingexcess exceeds 25% of the going concern funding target.
Notwithstanding the above, any contributions that are required to be made in accordance with pension
benefits legislation are eligible contributions in accordance with Section 147.2 of the ITA and can be
remitted.
SCHEDULE OF MAXIMUM CONTRIBUTIONS
The Company is permitted to fully fund the greater of the going concern and hypothetical wind-up shortfalls($3,153,800), as well as make current service cost contributions including the provision for adversedeviations in respect of the current service cost. The portion of this contribution representing the paymentof the hypothetical wind-up shortfall can be increased with interest al2.960/o per year from the valuationdate to the date the payment is made, and must be reduced by the amount of any deficit funding madefrom the valuation date to the date the payment is made.
MERCER18

Assuming the Company contributes the greater of the going concern and the hypothetical wind-up shortfallof $3,153,800 as of the valuation date, the rule for determining the estimated maximum eligible annualcontributions, as well as an estimate of the maximum eligible contributions until the next valuation, are asfollows:
REPORT ON THE ACTUARIAL VALUATIONFOR FUNDING PURPOSES AS ATDECEMBER 31,2017
RETIREMENT FUND OF ALGOMA POWERtN c.
$30,000
$29,700
$30,700
January 1,2018
January 1,2019
January 1,2020
11.8%
11.3o/o
11.3o/o
nla
nla
nla
The employer's current service cost and provision for adverse deviations in respect of the current servicecost shown in the above table was estimated based on projected members' pensionable earnings. Theactual employer's current service cost and provision for adverse deviations will be different from theseestimates and, as such, the contribution requirements should be monitored closely to ensure compliancewith the lTA.
Deficit FundingYear beginning
EMPLOYER'S CONTRIBUTION RULE
Monthly currentservice cost
Monthly current servicecost including provisionfor adverse deviation
ESTIMATEDEMPLOYER'SCONTRIBUTIONS
MERCER19

REPORT ON THE ACTUARIAL VALUATIONFOR FUNDING PURPOSES AS ATDECEMBER 31,2O'I 7
RETIREMENT FUND OF ALGOMA POWERtNc.
8ACTUARIAL OPINION
ln our opinion, for the purposes of the valuations,
. The membership data on which the valuation is based are sufficient and reliable.
. The assumptions are appropriate
. The methods employed in the valuation are appropriate.
This report has been prepared, and our opinions given, in accordance with accepted actuarial practice inCanada. lt has also been prepared in accordance with the funding and solvency standards set by theOntario Pension Benefits Act.
/)Lvt*J
L^-
M. Scott CushingFellow of the Sociely of Actuaries
Fellow of the Canadian lnstitute of Actuaries
September 13,2018
Diana Directo
Fellow of the Society of Actuaries
Fellow of the Canadian lnstitute of Actuaries
September 13,2018
Date Date
MERCER20
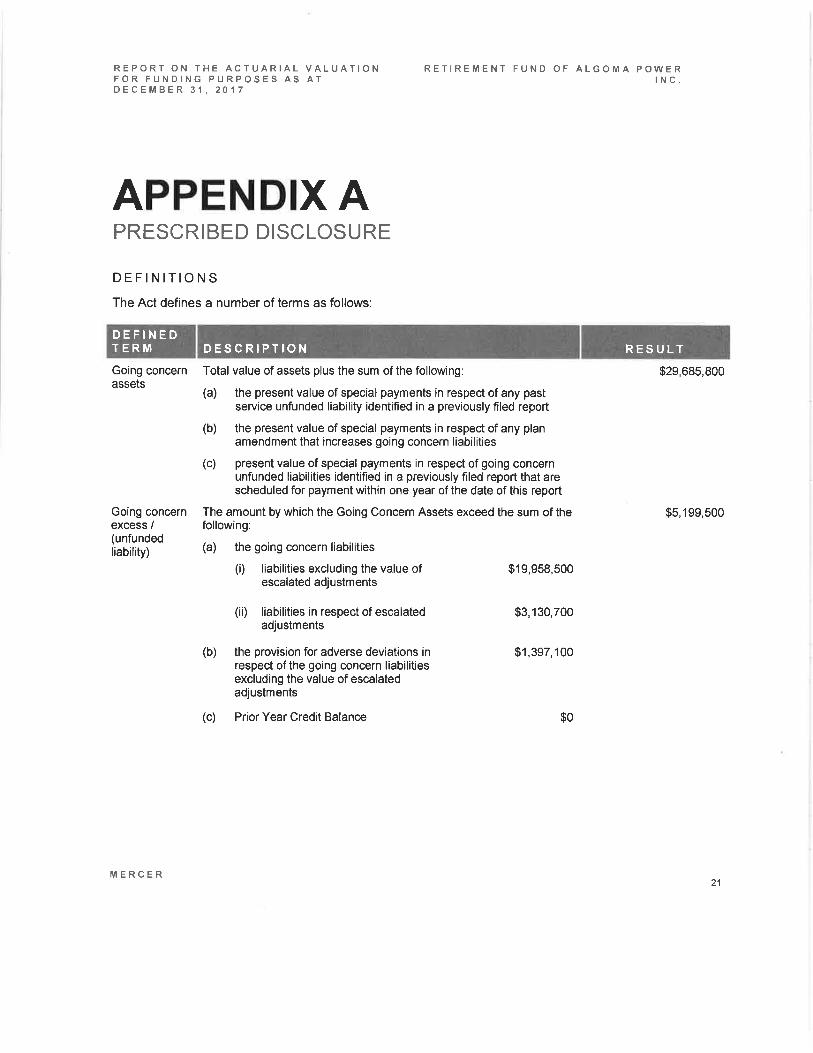
REPORT ON THE ACTUARIAL VALUATIONFOR FUNDING PURPOSES AS ATDECEMBER 31,2017
DEFINITIONS
The Act defines a number of terms as follows:
RETIREMENT FUND OF ALGOMA POWERtNc.
APPENDIX APRESCRIBED DISCLOSURE
DEFINEDTERM DESCRIPTION RESULT
Going concernassets
Going concernexcess /(unfundedliability)
Total value of assets plus the sum of the following:
(a) the present value of special payments in respect of any pastservice unfunded liability identified in a previously filed report
(b) the present value of special payments in respect of any planamendment that increases going concern liabilities
(c) present value of special payments in respect of going concernunfunded liabilities identified in a previously filed report that arescheduled for payment within one year of the date of this report
The amount by which the Going Concern Assets exceed the sum of thefollowing:
(a) the going concern liabilities
(i) liabilities excluding the value of $19,958,500escalated adjustments
(ii) liabilities in respect of escalatedadjustments
$3,130,700
(b) the provision for adverse deviations inrespect of the going concern liabilitiesexcluding the value of escalatedadjustments
$1,397,100
(c) Prior Year Credit Balance $o
$29,685,800
$5,199,500
MERCER21

DEFINEDTERM
REPORT ON THE ACTUARIAL VALUATIONFOR FUNDING PURPOSES AS ATDECEMBER 31,2017
RETIREMENT FUND OF ALGOMA POWERtNc.
Going concernfunded ratio
Transfer Ratio
Solvency Ratio
Prior YearCredit Balance
SolvencyAssets
SolvencyAssetAdjustment
The ratio of.
(a) Total value of assets (excluding letters of credit) less the PriorYear Credit Balance; to
(b) going concern liabilities
The ratio of:
(a) Solvency Assets minus the lesser of the Prior Year CreditBalance and the minimum required employer contrlbutionsincluding the provision for adverse deviations until the nextrequired valuation; to
(b) the sum of the Solvency Liabilities and liabilities for benefits,other than benefits payable under qualifying annuity contracts,that were excluded in calculating the Solvency Liabilities.
The ratio of:
(a) Solvency Assets related to defined benefits and ancillary benefitsplus the total amount of any letters of credit minus the Prior YearCredit Balance
(b) the sum of the Solvency Liabilities related to defined benefits andancillary benefits
Accumulated excess of contributions made to the pension plan inexcess of the minimum required contributions (note: only applies if theCompany chooses to treat the excess contributions as a Prior YearCredit Balance)
Market value of assets including accrued or receivable income andexcluding the value of any qualifoing annuity contracts.
The sum of:
(a) the difference between smoothed value of assets and the marketvalue of assets
(b) the present value of going concern special payments required toliquidate any past service unfunded liability
(c) the present value of going concern special payments identified inDecember 31 , 2014 valuation and scheduled to start from 2018
(d) the present value of going concern special payments (identified inthis report) that are scheduled for payment within 6 years followingthe valuation date
(e) the present value of any previously scheduled solvency specialpayments (excluding those identified in this report)
(0 the total value of all letters of credit in respect of the specialpayments due before the valuation date, subject to the limit of15o/o of solvency liabilities
1.29
0.91
1.14
$29,685,800
($1,858,500)
$0
$0
$0
$0
$0
$o
($1,858,500)
DESC RIPTION RES U LT
MERCER22

REPORT ON THE ACTUARIAL VALUATIONFOR FUNDING PURPOSES AS ATDECEMBER 31- 2017
RETIREMENT FUND OF ALGOMA POWERtNc.
DEFINEDT ERM RES U LTDESC RIPTION
SolvencyLiabilities
SolvencyLiabilityAdjustment
SolvencyDeficiency
Liabilities determined as if the plan had been wound up on thevaluation date, including liabilities for plant closure benefits orpermanent layoff benefits that would be immediately payable if theemployer's business were discontinued on the valuation date of thereport, but, if elected by the plan sponsor, excluding liabilities for,
(a) any escalated adjustment,
$26,033,s00
($e8o,eoo)
$26,033,300
($98o,eoo)
$o
(b)
(c)
(d)
(e)
(0
(s)
(h)
excluded plant closure benefits,
excluded permanent layoff benefits,
special allowances other than funded special allowances,
consent benefits other than funded consent benefits,
prospective benefit increases,
potential early retirement window benefit values, and
pension benefits and ancillary benefits payable under a qualifyingannuity contract.
The amount by which Solvency Liabilities are adjusted as a result ofusing a solvency valuation interest rate that is the average of marketinterest rates calculated over the period of time used in thedetermination of the smoothed value of assets.
The amount, if any, by which the sum of:
(a) the Solvency Liabilities
(b) the Solvency Liability Adjustment
(c) the Prior Year Credit Balance
Exceeds the sum of
(d) the Solvency Assets net of estimated termination expensesu
(e) the Solvency Asset Adjustment
$25,052,400
$29,590,800
($1,858,500)
$27,732,300
$0
6 ln accordance with accepted actuarial practice, for purposes of determining the financial position, the market value of plan assets
was reduced by a provision for estimated termination expenses payable from the Plan's assets that may reasonably be expected lo
be incurred in terminating the Plan and to be charged to the Plan.
MERCER23

DEFINEDTERM
REPORT ON THE ACTUARIAL VALUATIONFOR FUNDING PURPOSES AS ATDECEMBER 31,2017
RETIREMENT FUND OF ALGOMA POWERtNc.
ReducedSolvencyDeficiency /(SolvencyExcess)
The amount by which the sum of.
(a) 85% of the Solvency Liabilities
(b) 85% of the Solvency Liability Adjustment
(c) the Prior Year Credit Balance
Exceeds the sum of:
(d) the Solvency Assets net of estimated termination expensest
(e) the Solvency Asset Adjustment
$22j28,300
($833,800)
$0
$21,294,500
$29,590,800
($1,858,500)
PROVISION FOR ADVERSE DEVIATIONS
The provision for adverse deviations has been established in accordance with regulations taking intoaccount the following parameters:
O.0o/o
0.0o/o
100.0olo
50.0%
O.Oo/o
0.0%
$27,732,300
($6,437,800)
Fixed lncome Component(L)
Alternative lnvestmentComponent(M)
lnvestment Component(N)
lnvestment ComponentFixed lncome %
(P)
lnvestment ComponentAlternative lnvestment %
(o)
Annuity Contract Allocation(R)
The sum of the Plan's target allocation of assets (excludingthose allocated to annuity contacts and meeting theminimum rating requirement) as described in theregulations applicable at the valuation date:
The sum of the Plan's target allocation of assets(excluding those allocated to annuity contacts) meetingrequirements as described in the regulations applicable atthe valuation date:
Plan's target asset allocation for mutual, pooled orsegregated funds
Portion of lnvestment Component (N) that is allocated toinvestment categories accounted for in Fixed lncomeComponent (L)
Portion of lnvestment Component (N) that is allocated toinvestment categories accounted for in Alternative lncomeComponent (M)
Annuity contracts that have been purchased from aninsurance company and excluded from the Fixed lncomeComponent (L) and Alternative lnvestment Component (M)
RESULTDESCRIPT ION
RES U LTSDEFINED AMOUNT
MERCER24
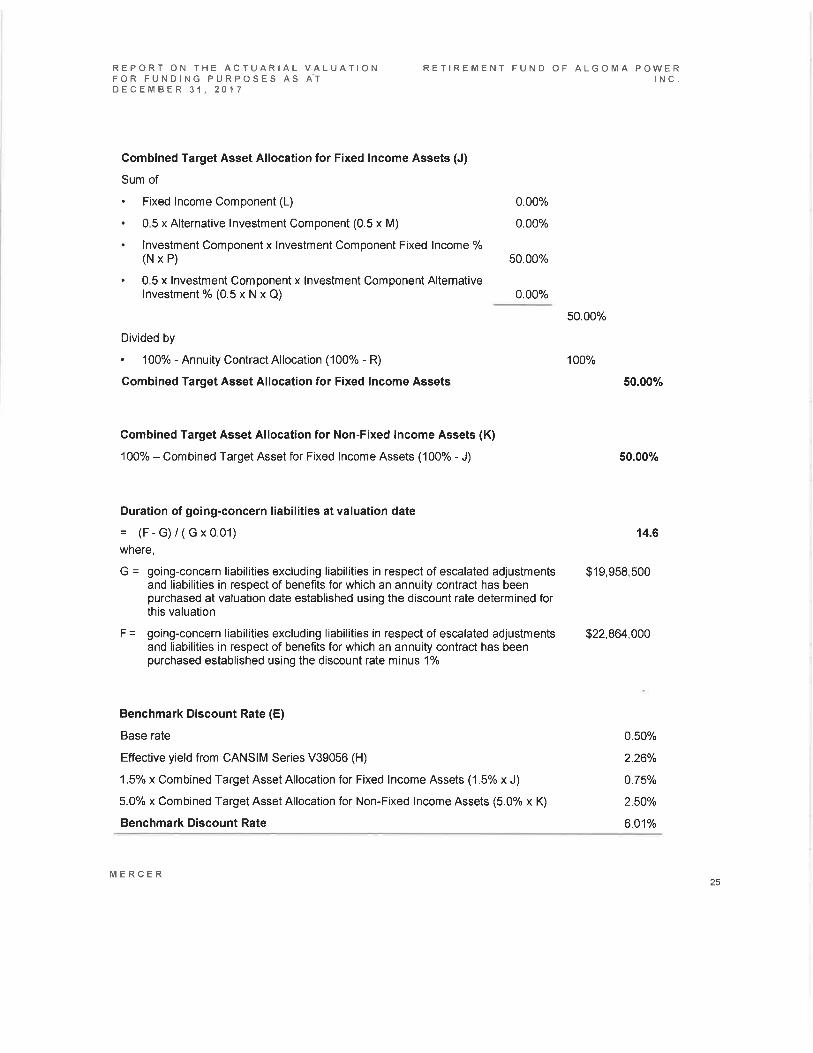
Combined Target Asset Allocation for Fixed lncome Assets (J)
Sum of
. Fixed lncome Component (L)
. 0.5 x Alternative lnvestment Component (0.5 x M)
. lnvestment Component x lnvestment Component Fixed lncome %(NxP)
. 0.5 x lnvestment Component x lnvestment Component Alternativelnvestment%(0.5xNxQ)
REPORT ON THE ACTUARIAL VALUATIONFOR FUNDING PURPOSES AS A'TDECEMBER 3'1 ,2017
RETIREMENT FUND OF ALGOMA POWERlNc
0.00%
0.00o/o
50.00%
50.00%
10oo/o
50.00%
50.00%
14.6
$19,958,500
$22,864,000
0.50o/o
2.260/0
0.750/o
2.50%
6.O1o/o
0.00%
Divided by
. 1)0o/o - Annuity Contract Allocation (100% - R)
Combined Target Asset Allocation for Fixed lncome Assets
Combined Target Asset Allocation for Non-Fixed lncome Assets (K)
looo/o - Combined Target Asset for Fixed lncome Assets (100% - J)
Duration of going-concern liabilities at valuation date
= (F-c)/(cx0.01)where,
G = going-concern liabilities excluding liabilities in respect of escalated adjustmentsand liabilities in respect of benefits for which an annuig contract has beenpurchased at valuation date established using the discount rate determined forthis valuation
f = going-concern liabilities excluding liabilities in respect of escalated adjustmentsand liabilities in respect of benefits for which an annuity contract has beenpurchased established using the discount rate minus'l%
Benchmark Discount Rate (E)
Base rate
Effective yield from CANSIM Series V39056 (H)
1.5o/o x Combined Target Asset Allocation for Fixed lncome Assets (1 .5% x J)
5.0% x Combined Target Asset Allocation for Non-Fixed lncome Assets (5.0% x K)
Benchmark Discount Rate
MERCER25

REPORT ON THE ACTUARIAL VALUATIONFOR FUNDING PURPOSES AS ATDECEMBER 31,2017
RETIREMENT FUND OF ALGOMA POWERtNc.
Provision for Adverse Deviations
(A) 5.0% for a closed plan and 4.0o/o for a Plan that is not a closed plan
(B) Provision based on Combined Target Asset Allocation for Non-Fixed lncomeAssets
(C) Greater of zero and the
Duration of going concern liabilities at valuation date
Multiplied by the excess of:
- Going concern valuation gross discount rate net of activeinvestment management fees (D), less
- Benchmark Discount Rate (E)
14.6
5.50%
6.01o/o
4.00%
3.00%
0.00%
7.00%Provision for Adverse Deviations (A + B + C)
The available actuarial surplus that may be used according to the Act is established as follows:
Available actuarial surplus
Excess of
. Going-concern assets $29,685,800
Over
Excess of
Over
Going-concern liabilities
Provision for adverse deviations in respect of the goingconcern liabilities
Prior Year Credit Balance
$23,089,200
$1,397,100
$0 $24,486,300
$5,199,500 (a)
$29,685,800
Solvency assets excluding the value of any letters of credits and lesser of PriorYear Credit Balance and minimum required employer contributions, includingthe provision for adverse deviations until the next required valuation
Wind-up liabilities x 105o/o $34,381,800
$0 (b)
The available actuarial surplus = the lesser of a) and b) above $o
MERCER26

REPORT ON THE ACTUARIAL VALUATIONFOR FUNOING PURPOSES AS ATDECEMBER 31,2O'I 7
RETIREMENT FUND OF ALGOMA POWERtNc.
TIMING OF NEXT REQUIRED VALUATION
ln accordance with the Act the next valuation of the Plan would be required at an effective date within oneyear of the current valuation date if:
The ratio of solvency assets to solvency liabilities is less than 85%
The employer elected to exclude plant closure or permanent lay-off benefits under Section 5(18) of theregulations, and has not rescinded that election.
Otherwise, the next valuation of the Plan would be required at an effective date no later than three yearsafter the current valuation date.
Accordingly, the next valuation of the Plan will be required as of December 31,2020
TRANSITIONAL RULES
Transitional rules under the Act state that any increase in contributions caused by the new funding rulesabove what the old funding rules determined under the Regulations in effect immediately before May 1,
2018 would have required can be phased-in over the three-year period following the first report filed underthe new framework, with no requirement for an increase in the first year.
The minimum funding requirements that would have been required in each of years 2018,2019 and 2020under the old funding rules would have been higher than minimum funding requirements under the newfunding rules. As such, the transitional rules have no impact on the minimum funding requirements.
SPECIAL PAYMENTS
As the Plan does not have a funding shortall and there is a solvency excess, no special payments arerequired.
MERCER27

PENSION BENEFITS GUARANTEE FUND (PBGF) ASSESSMENT
A PBGF assessment is required to be paid under Section 37 of the Act. The PBGF assessment base isderived as follows:
REPORT ON THE ACTUARIAL VALUATIONFOR FUNDING PURPOSES AS ATDECEMBER 31, 2O17
Solvency assets
PBGF liabilities
Solvency liabilities
Ontario asset ratio
Ontario portion of the fund
PBGF assessment base
Amount of additional liabilig for plant closure and/or permanent layoffbenefits which is not funded and subject to the 2o/o (3% for years after2018) assessment pursuant to s.37(4)
RETIREMENT FUND OF ALGOMA POWERtN c.
$29,685,800
$26,033,300
$26,033,300
IOOTo
$29,685,800
$0
$o
(a)
(b)
(c)
(d)=(b)+(c)
(e)=(a)x(d)
(0 = max(0, (b) - (e))
(g)
MERCER28
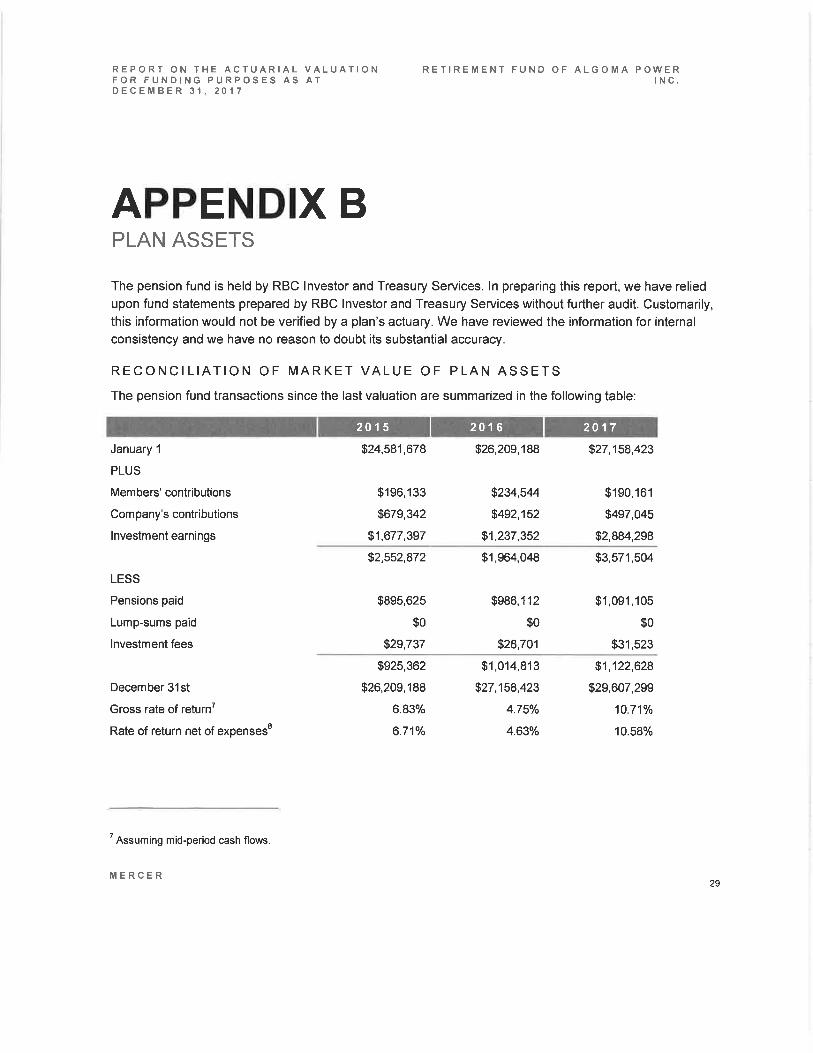
REPORT ON THE ACTUARIAFOR FUNDING PURPOSES ADECEMBER 31.2O17
January 1
PLUS
Members' contributions
Com pany's contributions
lnvestment earnings
LESS
Pensions paid
Lump-sums paid
lnvestment fees
December 31st
Gross rate of returnT
Rate of return net of expensess
7 Assuming mid-period cash flows.
LVSA
ALUATIONT
RETIREMENT FUND OF ALGOMA POWERtN c.
APPENDIX BPLAN ASSETS
The pension fund is held by RBC lnvestor and Treasury Services. ln preparing this report, we have relied
upon fund statements prepared by RBC lnvestor and Treasury Services without further audit. Customarily,this information would not be verified by a plan's actuary. We have reviewed the information for internal
consistency and we have no reason to doubt its substantial accuracy.
RECONCILIATION OF MARKET VALUE OF PLAN ASSETS
The pension fund transactions since the last valuation are summarized in the following table:
$24,581,678 $26,209,188 $27,158,423
$196,133
$679,U2
$1,677,397
$2U,544
$492,152
$1,237,352
$190,161
$497,045
$2,884,298
$2,552,872
$895,625
$0
$29,737
$1,964,048
$986,1 12
$0
$28,701
$3,571,504
$1,091,105
$0
$31,523
$925,362
$26,209,188
6.83%
6.71o/o
$1,014,813
$27,158,423
4.75o/o
4.630/o
$1,122,628
$29,607,299
10.71o/o
10.58%
201 s 2016 2017
MERCER29

The market value of assets shown in the above table is adjusted to reflect in{ransit amounts as follows:
REPORT ON THE ACTUARIAL VALUATIONFOR FUNDING PURPOSES AS ATDECEMBER 31.2017
Market value of invested assets
ln-transit amounts
. Members'contributions
. Company'scontributions
. Expenses
. Benefit payments
RETIREMENT FUND OF ALGOMA POWERtNc.
$29,607,299 $24,581,678
$24,812
$53,684
($01
($01
$18,236
$36,476
($01
($01
CURRENTVALUATION
PREVI OUSVALUATION
Market value of assets adjusted for in-transit amounts $29,68s,795 $24,636,390
We have tested the pensions paid, the lump-sums paid, and the contributions for consistency with themembership data for the Plan members who have received benefits or made contributions. The results ofthese tests were satisfactory.
INVESTMENT POLICY
The plan administrator has adopted a statement of investment policy and procedures. This policy isintended to provide guidelines for the manager(s) as to the level of risk that is consistent with the Plan'sinvestment objectives. A significant component of this investment policy is the asset mix.
The plan administrator is solely responsible for selecting the plan's investment policies, asset allocations,and individual investments.
The constraints on the asset mix and the actual asset mix at the valuation date are provided for informationpurposes:
Equities
Fixed lncome
Cash and cash equivalents
4Oo/o
40o/o
0o/o
50%
50o/o
0o/o
600/o
600/o
ooh
50.9%
48.8o/o
0.3o/o
100% 100o/o
ACTUAL ASSETMIX AS AT
DECEMBER 31,2017MaximumTargetMinimum
INVESTMENT POLICY
MERCER30

REPORT ON THE ACTUARIAL VALUATIONFOR FUNDING PURPOSES AS ATDECEMBER 31,2017
RETIREMENT FUND OF ALGOMA POWERtN c.
Because of the mismatch between the Plan's assets (which are invested in accordance with the aboveinvestment policy) and the Plan's liabilities (which tend to behave like long bonds) the Plan's financialposition will fluctuate over time. These fluctuations could be significant and could cause the Plan tobecome underfunded or overfunded even if the Company contributes to the Plan based on the fundingrequirements presented in this report.
MERCER31
REPORT ON THE ACTUARIAL VALUATIONFOR FUNDING PURPOSES AS ATDECEMBER 31,2017
RETIREMENT FUND OF ALGOMA POWERtNc.
APPENDIX CMETHODS AND ASSUMPTIONS - GOING CONCERN
VALUATION OF ASSETS
For this valuation, we have used the market value of assets.
GOING CONCERN FUNDING TARGET
Over time, the real cost to the employer of a pension plan is the excess of benefits and expenses overmember contributions and investment earnings. The actuarial cost method allocates this cost to annualtime periods.
For purposes of the going concern valuation, we have continued to use the projected unit credit actuarialcost method. Under this method, we determine the present value of benefit cash flows expected to be paidin respect of service accrued prior to the valuation date, based on projected final average earnings. This isreferred to as the funding target. For each individual plan member, accumulated contributions with interestare established as a minimum actuarial liability.
The funding excess or funding shortfall, as the case may be, is the difference between the market orsmoothed value of assets and the funding target. A funding excess on a market value basis indicates thatthe current market value of assets and expected investment earnings are expected to be sufficient to meetthe cash flows in respect of benefits accrued to the valuation date as well as expected expenses -assuming the plan is maintained indefinitely. A funding shortfall on a market value basis indicates theopposite - that the current market value of the assets is not expected to be sufficient to meet the plan'scash flow requirements in respect of accrued benefits, absent additional contributions.
As required under the Act, a funding shortfall and the provision for adverse deviations must be amortizedover no more than 10 years through special payments beginning one year after the valuation date. Afunding excess may, from an actuarial standpoint, be applied immediately to reduce required employercurrent service contributions unless precluded by the terms of the plan or by legislation.
The actuarial cost method used for the purposes of this valuation produces a reasonable matching ofcontributions with accruing benefits. Because benefits are recognized as they accrue, the actuarial costmethod provides an effective funding target for a plan that is maintained indefinitely.
MERCER32
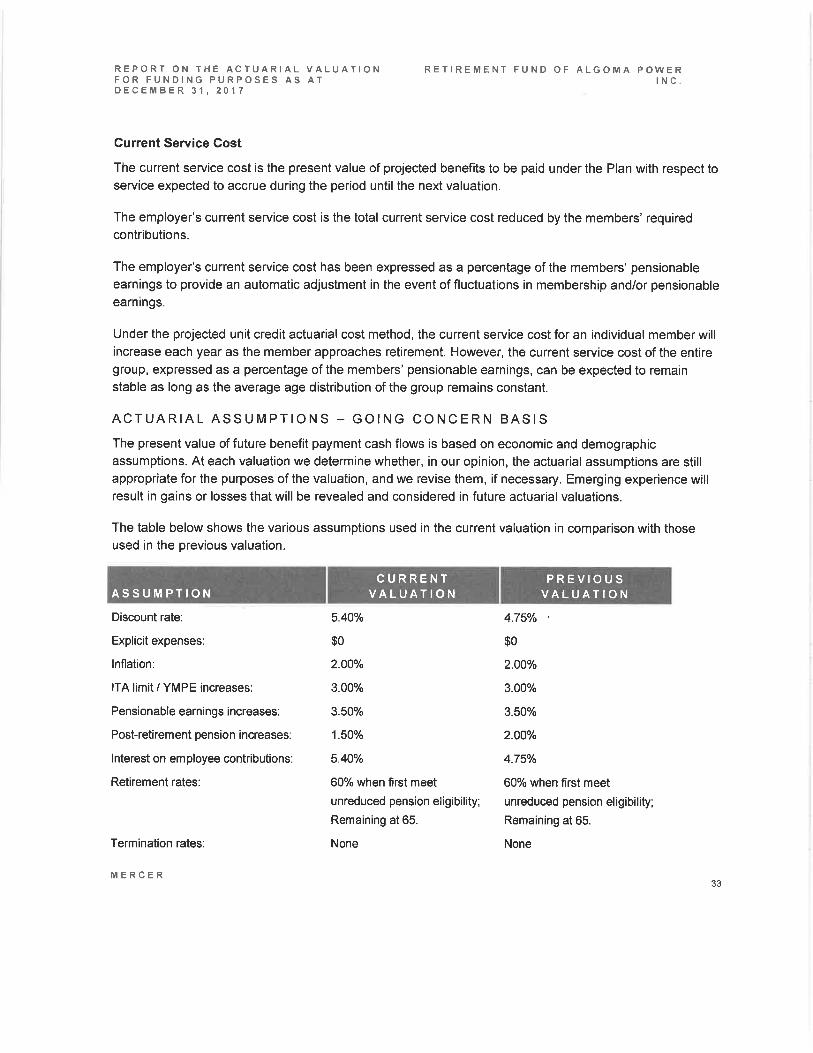
Current Service Cost
The current service cost is the present value of projected benefits to be paid under the Plan with respect toservice expected to accrue during the period until the next valuation.
The employer's current service cost is the total current service cost reduced by the members' requiredcontributions.
The employer's current service cost has been expressed as a percentage of the members' pensionableearnings to provide an automatic adjustment in the event of fluctuations in membership and/or pensionable
earnings.
Under the projected unit credit actuarial cost method, the current service cost for an individual member willincrease each year as the member approaches retirement. However, the current service cost of the entiregroup, expressed as a percentage of the members' pensionable earnings, can be expected to remainstable as long as the average age distribution of the group remains constant.
ACTUARIAL ASSUMPTIONS - GOING CONCERN BASIS
The present value of future benefit payment cash flows is based on economic and demographicassumptions. At each valuation we determine whether, in our opinion, the actuarial assumptions are stillappropriate for the purposes of the valuation, and we revise them, if necessary. Emerging experience willresult in gains or losses that will be revealed and considered in future actuarial valuations.
The table below shows the various assumptions used in the current valuation in comparison with thoseused in the previous valuation.
REPORT ON THE ACTUARIAL VALUATIONFOR FUNDING PURPOSES AS ATDECEMBER 31,2017
Discount rate:
Explicit expenses:
lnflation:
ITA limit / YMPE increases:
Pensionable earnings increases:
Post-retirem ent pension increases:
lnterest on employee contributions:
Retirement rates:
RETIREMENT FUND OF ALGOMA POWERtNc.
5.40o/o
$0
2.OO0A
3.00%
3.5oo/o
1.50%
5.40o/o
60% when first meet
unreduced pension eligibility;
Remaining at 65.
None
4.75o/o
$0
2.00%
3.00%
3.50%
2.00o/o
4.75o/o
60% when first meet
unreduced pension eligibility;
Remaining at 65.
NoneTermination rates:
CURRENTVALUATION
PREVIOUSVALUATIONASSUMPTION
MERCER33
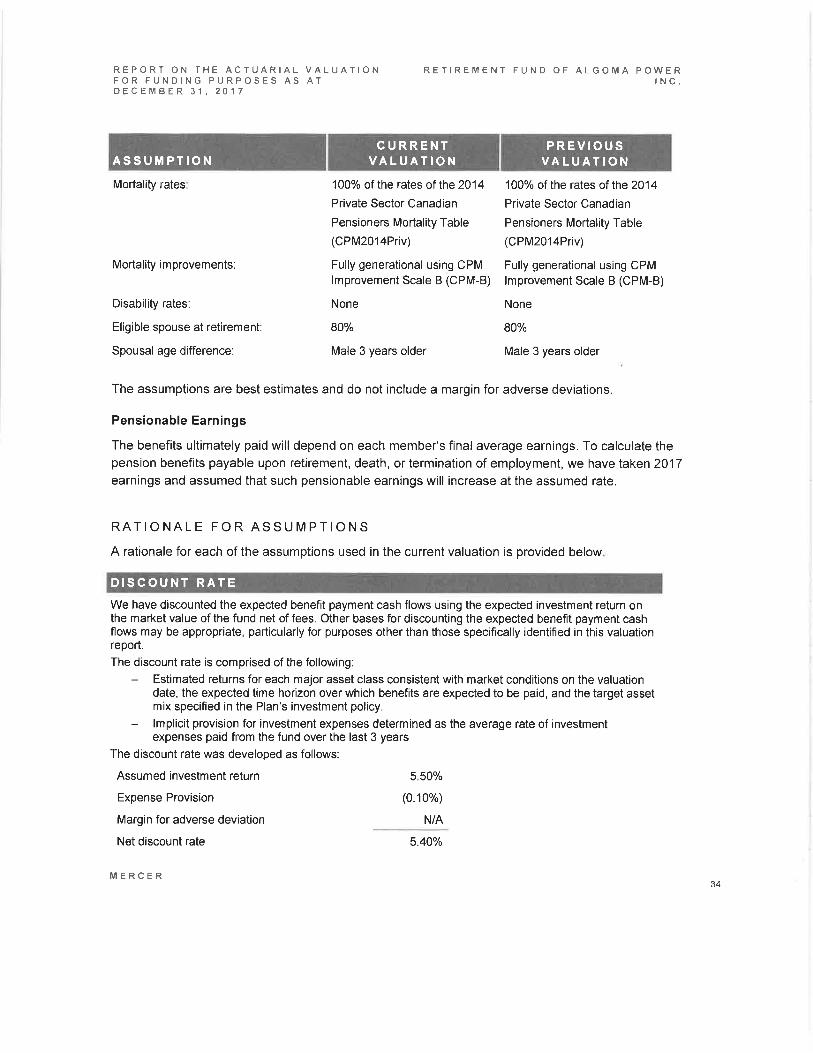
REPORT ON THE ACTUARIAL VALUATIONFOR FUNDING PURPOSES AS ATDECEMBER 31,2017
Mortality rates
RETIREMENT FUND OF ALGOMA POWERtNc.
Mortality improvements:
Disability rates:
Eligible spouse at retirement:
Spousal age difference:
Assumed investment return
Expense Provision
Margin for adverse deviation
Net discount rate
100% of the rates of the 2014
Private Sector Canadian
Pensioners Mortality Table
(CPM2014Priv)
Fully generational using CPMlmprovement Scale B (CPM-B)
None
80%
Male 3 years older
100oh of the rates ofthe 2014
Private Sector Canadian
Pensioners Mortality Table
(CPM2014Priv)
Fully generational using CPMlmprovement Scale B (CPM-B)
None
80%
Male 3 years older
The assumptions are best estimates and do not include a margin for adverse deviations.
Pensionable Earnings
The benefits ultimately paid will depend on each member's final average earnings. To calculate thepension benefits payable upon retirement, death, or termination of employment, we have taken 2017earnings and assumed that such pensionable earnings will increase at the assumed rate.
RATIONALE FOR ASSUMPTIONS
A rationale for each of the assumptions used in the current valuation is provided below
We have discounted the expected benefit payment cash flows using the expected investment return onthe market value of the fund net of fees. Other bases for discounting the expected benefit payment cashflows may be appropriate, particularly for purposes other than those specifically identifled in this valuationreport.
The discount rate is comprised of the following:
- Estimated returns for each major asset class consistent with market conditions on the valuationdate, the expected time horizon over which benefits are expected to be paid, and the target assetmix specified in the Plan's investment policy.
- lmplicit provision for investment expenses determined as the average rate of investmentexpenses paid from the fund over the last 3 years
The discount rate was developed as follows:
5.50%
(0.10%)
N/A
5.40o/o
CURRENTVALUATION
PREVIOUSVALUATIONASS UM PTION
DISCOUNT RATE
MERCERJ4
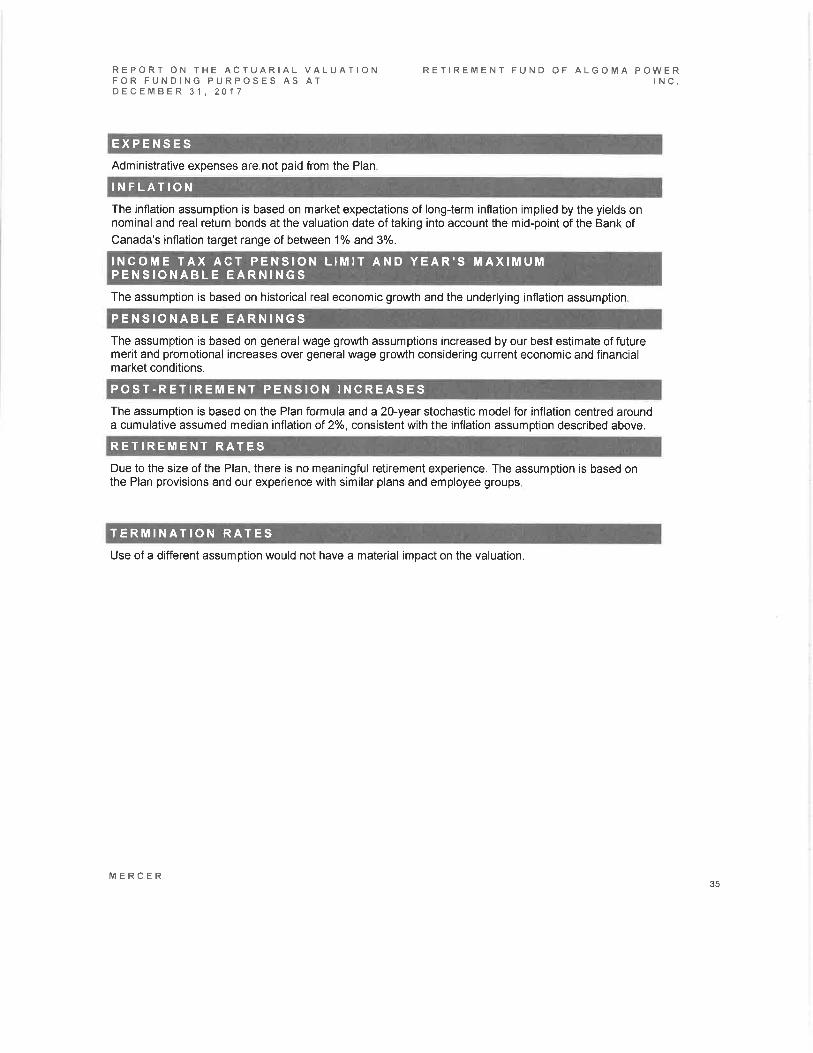
REPORT ON THE ACTUARIAL VALUATIONFOR FUNDING PURPOSES AS ATDECEMBER 31,2017
RETIREMENT FUND OF ALGOMA POWERtNc.
EXPENSES
INFLATIONAdministrative expenses are.not paid from the Plan
The inflation assumption is based on market expectations of long-term inflation implied by the yields onnominal and real return bonds at the valuation date of taking into account the mid-point of the Bank ofCanada's inflation target range of between 1% and3%.
The assumption is based on historical real economic growth and the underlying inflation assumption.
The assumption is based on general wage growth assumptions increased by our best estimate of futuremerit and promotional increases over general wage growth considering current economic and financialmarket conditions.
The assumption is based on the Plan formula and a 2}-year stochastic model for inflation centred arounda cumulative assumed median inflation of 2%, consistent with the inflation assumption described above.
Due to the size of the Plan, there is no meaningful retirement experience. The assumption is based onthe Plan provisions and our experience with similar plans and employee groups.
Use of a different assumption would not have a material impact on the valuation.
INCOME TAX ACT PENSION LIMIT AND YEAR'S iNAXIMUMPENSIONABLE EARNINGS
PENSIONABLE EARNINGS
POST.RETIREMENT PENSION INCREASES
RETIREMENT RATES
TERMINATION RATES
MERCER35

REPORT ON THE ACTUARIAL VALUATIONFOR FUNDING PURPOSES AS ATDECEMBER 31.20'I 7
RETIREMENT FUND OF ALGOMA POWERtNc.
The assumption for the mortality rates is based on the Canadian Pensioners' Mortality (CPM) studypublished by the Canadian lnstitute of Actuaries in February 2014.
Due to the size of the Plan, specific data on plan mortality experience is insufficient to determine themortality rates. After considering plan-specific characteristics, such as the type of employment, theindustry experience, pension and employment income for the plan members, and data in the CPM study,it was determined to use the CPM mortality rates from the private sector without adjustment.
There is broad consensus among actuaries and other longevity experts that mortality improvement willcontinue in the future, but the degree of future mortality improvement is uncertain. Two mortalityimprovement scales were recently published by the Canadian lnstitute of Actuaries (ClA) and may applyto Canadian pension valuations:. The Canadian Pensioners Mortali$ (CPM) study published in February 2014 included CPM
lmprovement Scale B (CPM-B) which is also used for commuted value calculations.. A report released by the Task Force on Mortality lmprovement on September 20,2017 includes an
analysis of the rate of mortality improvement for the Canadian population and provides for mortalityimprovement scale Ml-2017 to be considered for the purpose of reflecting future mortalityimprovement in Canadian actuarial work, while acknowledging that it might be appropriate to usealternative mortality improvement assumptions to reflect the nature of the work.
The CIA Committee on Pension Plan Financial Reporting published a revised version of the EducationalNote on the Selection of Mortality Assumptions for Pension Plan Valuations on December 21 ,2O17. TheEducational Note indicates that given the recent publication of the CPM-B and Ml-2017 improvementscales and the similar data sets used in their development, it may be appropriate to use either scale in theabsence of credible information to the contrary, such as the publication of a successor scale by the ClA.
For the present valuation, we have continued to use the CPM-B scale, which is a reasonable outlook forfuture mortality improvement.
Based on the assumption used, the life expectancy of a member age 65 at the valuation date is 21.6years for males and 24.1 years for females.
The assumption is based on Plan terms and the underlying investment return assumption.
MORTALITY RATES
INTEREST ON EMPLOYEE CONTRIBUTIONS
DISABILITY RATES
Use of a different assumption would not have a material impact on the valuation.
ELIGIBLE SPOUSE
The assumption is based on an industry standard for non-retired members (actual status used forretirees).
The assumption is based on an industry standard showing males are typically 3 years older than theirspouse.
SPOUSAL AGE DIFFERENCE
MERCERJO

REPORT ON THE ACTUARIAL VALUATIONFOR FUNDING PURPOSES AS ATDECEMBER 31,2017
RETIREMENT FUND OF ALGOMA POWERtNc.
APPENDIX DMETHODS AND ASSUMPTIONS- HYPOTHETICAL WIND-UP AND SOLVENCY
HYPOTHETICAL WIND-UP BASIS
The Canadian lnstitute of Actuaries requires actuaries to report the financial position of a pension plan on
the assumption that the plan is wound up on the effective date of the valuation, with benefits determined on
the assumption that the pension plan has neither a surplus nor a deficit.
To determine the actuarial liability on the hypothetical wind-up basis, we have valued those benefits thatwould have been paid had the Plan been wound up on the valuation date, with all members fully vested in
their accrued benefits including, however, the impact of plan amendments with an effective date before thenext scheduled valuation which have been reflected in the going concern valuation results.
The Standards of Practice of the Canadian lnstitute of Actuaries require that the scenario upon which thehypothetical wind-up valuation is based be postulated. However, there are no benefits under the plan
contingent upon the circumstances of the plan wind-up or contingent upon other factors. Therefore, it was
not necessary to postulate a scenario upon which the hypotheticalwind-up valuation is made. No benefitspayable on plan wind-up were excluded from our calculations. The plan wind-up is assumed to occur incircumstances that maximize the actuarial liability.
Upon plan wind-up, members are given options for the method of settling their benefit entitlements. The
options vary by eligibility and by province of employment, but in general, involve either a lump sum transferor an immediate or deferred pension.
The value of benefits assumed to be settled through a lump sum transfer is based on the assumptionsdescribed in Section 3500 - Pension Commuted Values of the Canadian lnstitute of Actuaries' Standardsof Practice applicable for December 31,2017 .
Benefits provided as an immediate or deferred pension are assumed to be settled through the purchase ofannuities based on an estimate of the cost of purchasing dnnuities.
MERCER

REPORT ON THE ACTUARIAL VALUATIONFOR FUNDING PURPOSES AS ATDECEMBER 31,2017
RETIREMENT FUND OF ALGOMA POWERtNc.
The Plan provides for indexing al100o/o of CPI increase, if CPI is less than 2.00o/o, otherwise indexing isequal to 50% of the CPI increase, with a minimum of 2.00% and a maximum adjustment of 5.00%.Therefore the Plan formula is a CPI related formula that provides a cap on the risk to the Plan sponsor of aCPI higher than2.00o/o . However, there is limited data available to provide credible guidance on the costof such a CPI related purchase of annuities in Canada. ln light of these limitations, the basis for the cost ofpurchasing annuities is equal to the non-indexed annuity prory rate determined in accordance with theCanadian lnstitute of Actuaries EducationalNofe. Assumptions for Hypothetical Wind-up and SolvencyValuations with Effective Dates Between December 31, 2017 and December 30, 2018 (the "Educational
Note"), reduced by an assumed inflation adjustment. The best estimate of future inflation is derived formthe difference in the unadjusted average yield on Government of Canada marketable bonds over 10 years(i.e. CANSIM series V39062) to the unadjusted yield on Government of Canada real-return long-termbonds (i.e. CANSIM series V39057) (1.65%). However, we expect that if an insurance company were totake on these obligations they would demand a higher price due to the risk of CPI becoming higher thanthe implied inflation. We have assumed an inflation adjustment of 2.00o/o. The spread between the implied
inflation of 1.65% and the assumed pricing assumption of 2.00o/o is intended to provide for the risk ofinflation being greater than 1.65%. We note that the above basis is theoretical and does not represent thecost of such CPI related indexed annuities can be purchased in today's market.
The Educational Note provides guidance on estimating the cost of annuity purchases assuming a typicalgroup of annuitants. That is, no adjustments for sub- or super-standard mortality are considered. However,it is expected that insurers will consider plan experience and certain plan-specific characteristics whendetermining the mortality basis for a particular group. The Educational Note states that the actuary wouldbe expected to make an adjustment to the regular annuity purchase assumptions where there isdemonstrated substandard or super-standard mortality or where an insurer might be expected to assumeso. ln such cases, the actuary would be expected to make an adjustment to the mortality assumption in amanner consistent with the underlying annuity purchase basis. Given the uncertainty surrounding the
actual mortality basis that would be typical of a group annuity purchase, it is reasonable to assume thatthere is a range of bases that can be expected not to be materially different from the actual mortality basis.Therefore, an adjustment to the regular annuity purchase assumptions would be warranted when the plan'sassumed basis falls outside that range.
ln this context, we have determined that no adjustment to the mortality rates used in the regular annuitypurchase assumptions is required.
We have not included a margin for adverse deviation in the solvency and hypothetical wind-up valuations.
The assumptions are as follows:
FORM OF BENEFIT SETTLEMENT ELECTED BY MEMBER
Lump sum 70o/o of active and deferred members under age 55, and 50% of activemembers over age 55, elect to receive their benefit entitlement in a lumpsum
MERCER38

REPORT ON THE ACTUARIAL VALUATIONFOR FUNDING PURPOSES AS ATDECEMBER 31,2O'I 7
Annuity purchase:
RETIREMENT FUND OF ALGOMA POWERlNc.
All remaining members are assumed to elect to receive their benefitentitlement in the form of a deferred or immediate pension. These benefitsare assumed to be settled through the purchase of deferred or immediateannuities from a life insurance company.
BASIS FOR BENEFITS ASSUMED TO BE SETTLED THROUGH A LUMPSUM
Mortality rates
lnterest rate:
lnflation rate
100% of the rates of the 2014 Canadian Pensioners Mortality Table(CPM2014) with fully generational improvements using CPM Scale B
2.60% per year for 10 years, 3.40o/o per year thereafter (2.5Oo/o per year for'10 years, 3.80% per year thereafter for solvency)
1.25o/o per year for 10 years, 1.80% per year thereafter
(plan indexing excluded for solvency purposes)
BASIS FOR BENEFITS ASSUMED TO BE SETTLED THROUGH THEPURCHASE OF AN ANNUITY
Mortality rates:
Adjustment to mortalityrates:
lnterest rate:
lnflation rate;
100% of the rates of the 2014 Canadian Pensioners Mortality Table(CPM2014) with fully generational improvements using CPM Scale B
No adjustment
3.060/o (3.40Yo for solvency liability adjustment) per year based on a durationol 12.12 years determined for the liabilities assumed to be settled throughthe purchase of an annuity.
1.65% per year plus a margin for risk of CPI being higher than the currentmarket implied inflation, resulting in indexing oI 2.00% per year (planindexing excluded for solvency)
RETIREMENT AGE
Maximum value:
Grow-in
Members are assumed to retire at the age which maximizes the value oftheir entitlement from the Plan, based on the eligibility requirements whichhave been met at the valuation date
The benefit entitlement and assumed retirement age of members whoseage plus service equals at least 55 at the valuation date reflect theirentitlement to grow into early retirement subsidies
OTHER ASSUMPTIONS
Final average earnings:
Family composition:
Maximum pension limit.
Termination expenses:
Calculated using the final pensionable earnings and the assumed rate ofincrease in earnings
Same as for going concern valuation
$2,944.44
$95,000
To determine the hypothetical wind-up position of the Plan, a provision has been made for estimated
termination expenses payable from the Plan's assets in respect of actuarial and administration expensesthat may reasonably be expected to be incurred in terminating the Plan and to be charged to the Plan.
MERCER39

REPORT ON THE ACTUARIAL VALUATIONFOR FUNDING PURPOSES AS ATDECEMBER 31.2O17
RETIREMENT FUND OF ALGOMA POWERtNc.
Because the settlement of all benefits on wind-up is assumed to occur on the valuation date and isassumed to be uncontested, the provision for termination expenses does not include custodial, investmentmanagement, auditing, consulting, and legal expenses that would be incurred between the wind-up dateand the settlement date or due to the terms of a wind-up being contested.
Expenses associated with the distribution of any surplus assets that might arise on an actual wind-up arealso not included in the estimated termination expense provisions.
The provision for termination expenses payable from the Plan's assets determined is not dependent uponthe plan sponsor being solvent or not on the wind-up date. We have also assumed, without analysis, thatthe Plan's terms as well as applicable legislation and court decisions would permit the relevant expenses tobe paid from the Plan.
Although the termination expense assumption is a best estimate, actualfees incurred on an actual plan
wind-up may differ materially from the estimates disclosed in this report.
INCREMENTAL COST
ln order to determine the incremental cost, we estimate the hypothetical wind-up liabilities at the nextvaluation date. We have assumed that the cost of settling benefits by way of a lump sum or purchasing
annuities remains consistent with the assumptions described above. Since the prolected hypothetical wind-up liabilities will depend on the membership in the Plan at the next valuation date, we must makeassumptions about how the Plan membership will evolve over the period until the next valuation.
We have assumed that the Plan membership will evolve in a manner consistent with the going concernassumptions as follows:
Members terminate, retire, and die consistent with the termination, retirement, and mortality rates usedfor the going concern valuation.
Pensionable earnings, the lncome Tax Act pension limit, and the Year's Maximum PensionableEarnings increase in accordance with the related going concern assumptions.
Active members accrue pensionable service in accordance with the terms of the Plan
Cost of living adjustments are consistent with the inflation assumption used for the going concernvaluation.
SOLVENCY BASIS
ln determining the financial position of the Plan on the solvency basis, we have used the smoothed value ofthe assets, smoothed the discount rates to value the liabilities and excluded indexing.
The solvency position is determined in accordance with the requirements of the Act.
VALUATION ASSETS
MERCER40

REPORT ON THE ACTUARIAL VALUATIONFOR FUNDING PURPOSES AS ATDECEMBER 31,2017
RETIREMENT FUND OF ALGOMA POWERtNc.
We have used a smoothed value of the Plan's assets in our valuation of the Plan for solvency purposesand the market value of the Plan's assets for wind-up purposes.
The smoothed value of assets has been determined by recognizing the difference each year between theactual market value and the expected market value (based on he assumed investment return of 4.75o/o
overa5yearperiod.
The asset value provided by this method are related to the market value of assets, with the advantage that,over time, the market-related asset values will tend to be more stable than market values.
December 31,2014
December 31, 2015
December 31,2016
December 31,2017
$24,581,678
$26,209,188
$27,158,423
$29,607,299
$22,448,945
$25,728,679
$27,188,548
$28,034,957
$2,132,733
$480,509
($30,124)
$1,572,342
The smoothed value of assets at December 31,2017 is calculated as the market value less the totalunrecognized difference. The unrecognized difference is calculated as follows:
o 415 x $1,572,342 plusr 3/5 x ($30,124) ptuso 215 x $480,509 plus. 115 x $2,132,733
= $1,858,549
The resulting smoothed value of assets is calculated to be
$29,607,299 + ($1,858,549) + $78,496s = $27,827,246
e Adjustment for in-transit amounts
MARKET VALUEOF ASSETS
EXPECTED VALUEOF ASSETS DIFFERENCE
MERCER41

REPORT ON THE ACTUARIAL VALUATIONFOR FUNDING PURPOSES AS ATDECEMBER 3'1 ,2017
RETIREMENT FUND OF ALGOMA POWERrNc.
APPENDIX EMEMBERSHIP DATA
ANALYSIS OF MEMBERSHIP DATA
The actuarial valuation is based on membership data as at December 31, 2017, provided by FortisOntariolnc.
We have applied tests for internal consistency, as well as for consistency with the data used for theprevious valuation. These tests were applied to membership reconciliation, basic information (date of birth,date of hire, date of membership, gender, etc.), pensionable earnings, credited service, contributionsaccumulated with interest, and pensions to retirees and other members entitled to a deferred pension.
Contributions, lump sum payments, and pensions to retirees were compared with corresponding amountsreported in financial statements. The results of these tests were satisfactory.
lf the data supplied are not sufficient and reliable for its intended purpose, the results of our calculation may
differ significantly from the results that would be obtained with such data. Although Mercer has reviewedthe suitability of the data for its intended use in accordance with accepted actuarial practice in Canada,
Mercer has not verified or audited any of the data or information provided.
MERCER42

Plan membership data are summarized below. For comparison, we have also summarized correspondingdata from the previous valuation.
REPORT ON THE ACTUARIAL VALUATIONFOR FUNDING PURPOSES AS ATDECEMBER 3'1 ,2017
Active Members
Number
Total pensionable earnings for the following year
Average pensionable earnings for the following year
Average years of pensionable service
Average age
Accumulated contributions with interest
RETIREMENT FUND OF ALGOMA POWERtNc.
33
$3,057,200
$92,600
12.4
43.0
$1,908,800
37
$3,097,000
$83,700
14.2
45.7
$2,227,600
Deferred Pensioners
Number
Total annual pension
Average annual pension
Average age
Pensioners and Survivors
Number
Total annual lifetime pension
Total annual temporary pension
Average annual lifetime pension
Average age
37
$1,042,500
$132,600
$28,200
70.9
31
$790,400
$79,500
$2s,500
71.4
*** For confidentiality reasons, information is not shown for groupings with less than two members.
MERCER43

The membership movement for all categories of membership since the previous actuarial valuation is asfollows:
REPORT ON THE ACTUARIAL VALUATIONFOR FUNDING PURPOSES AS ATDECEMBER 31,2017
Total at 31.12.2014
New entrants
Terminations:
. Transfers/lumpsums
. Deferredpensions
Deaths
Retirements
Beneficiaries
Total at 31.12.2017
RETIREMENT FUND OF ALGOMA POWERtNc.
31 69
4
137
4
(3)
0
(3)
8
37
(8)
33
1
71
DEFERREDPENSIONERS
PENSlONERSAND
SURVIVORSACTIVES TOTAL
MERCER44

REPORT ON THE ACTUARIAL VALUATIONFOR FUNDING PURPOSES AS ATDECEMBER 31,2017
RETIREMENT FUND OF ALGOMA POWERtNc.
The distribution of the active members by age and pensionable service as at the valuation date issummarized as follows:
Under 20
20to 24
25to 29
30 to 34
35 to 39
40lo 44
45 to 49
50 to 54
55 to 59
60 to 64
65+
Total
7
1
1
1
3
3
8
2
1
5
7
5
3
1
1
1
2
1
1
2
1
1
2
2
1
8 8 7 3344 1
1
1
MERCER45
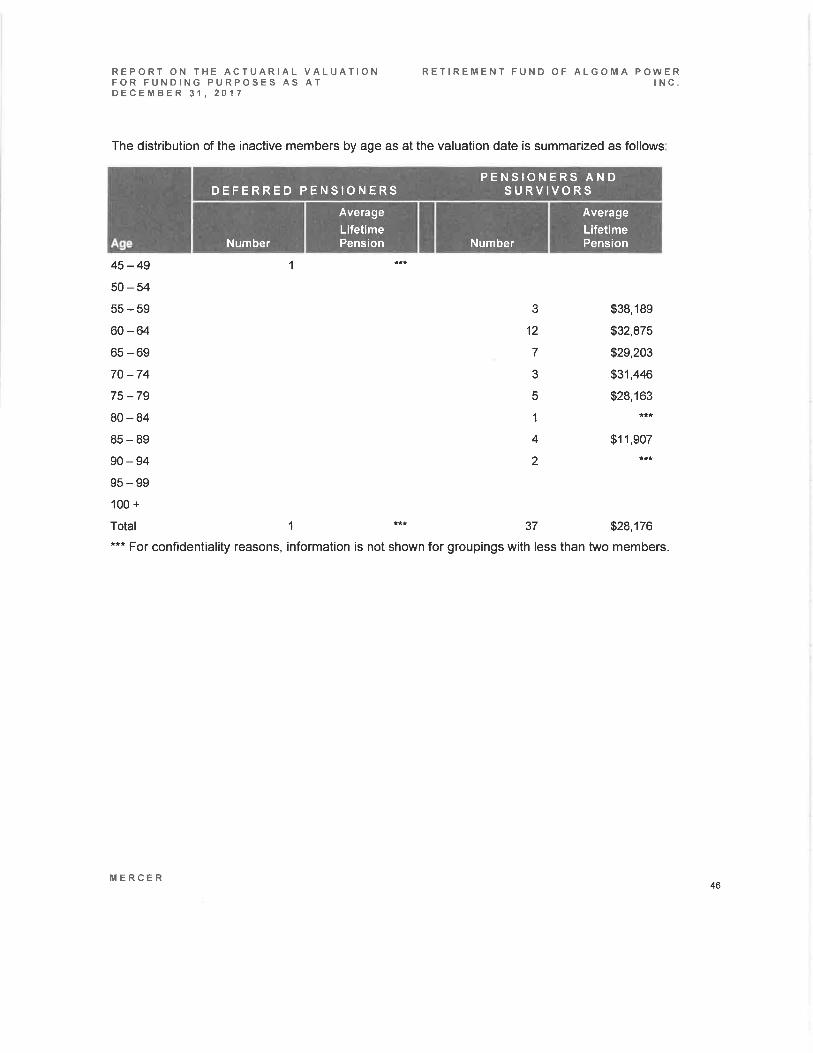
REPORT ON THE ACTUARIAL VALUATIONFOR FUNDING PURPOSES AS ATDECEMBER 31,2O'I 7
RETIREMENT FUND OF ALGOMA POWERtNc.
The distribution of the inactive members by age as at the valuation date is summarized as follows
45-49 1
50*54
55-59 3 $38,189
60-64 12 $32,875
65-69 7 $29,203
70 -74 3 $31,446
75 -79 5 $28,163
80-84 1 ***
85-89 4 $11,907
90-94 2 ***
95-99
100 +
Total 1 *** 37 $28,176*** For confidentiality reasons, information is not shown for groupings with less than two members.
AverageLifetimePension
AverageLifetimePensionNumberNumber
DEFERRED PENSIONERSPENSIONERS AND
SURVIVORS
MERCER46

REPORT ON THE ACTUARIAL VALUATIONFOR FUNDING PURPOSES AS ATDECEMBER 31,2O'I 7
RETIREMENT FUND OF ALGOMA POWERtNc.
APPENDIX FSUMMARY OF PLAN PROVISIONS
Mercer has used and relied on the plan documents, including amendments and interpretations of planprovisions, supplied by FortisOntario lnc.. lf any plan provisions supplied are not accurate and complete,
the results of any calculation may differ significantly from the results that would be obtained with accurateand complete information. Moreover, plan documents may be susceptible to different interpretations, each
of which could be reasonable, and the results of estimates under each of the different interpretations couldvary.
This valuation is based on the plan provisions in effect on December 31,2017 . Since the previousvaluation, the Plan has been amended to change the rate of required employee contributions into the Plan
DB COMPONENT
The following is a summary of the main provisions of the Plan in effect on December 31, 2017. This
summary is not intended as a complete description of the Plan.
Background
Eligibility forMembership
EmployeeContributions
The Plan was created as of July 1, 2009 exclusively for members of the RetirementPlan of Great Lakes Power Limited (the "GLPL Plan") who were formerly employed inthe distribution business of Great Lakes Power Limited.
Each member of the GLPL Plan on June 30, 2009 who was formerly employed in thedistribution business of Great Lakes Power Limited became a member of the Plan onJuly 1, 2009.
Each full{ime employee who is a member of the union becomes member of the Planfollowing completion of three months of Continuous Service.
Each employee, who is a member of the union and is employed on a less than full-time basis, may join the Plan following completion of 24 months of Continuous Serviceprovided that the employee has:
a) earned at least 35% of the YMPE; or
b) worked 700 or more hours. in each of the two immediately preceding consecutive calendar years.
Effective November 28,2016, for the 2018 Plan Year, members are required tocontribute to the Plan at the rate of 6.0% of Gross Earnings up to the YMPE and 8.0%of Gross Earnings in excess of the YMPE. For the 2019 Plan Year and each PlanYear thereafter, members are required to contribute to the Plan at the rate of 6.5%Gross Earnings up to the YMPE and 8.5% of Gross Earnings in excess of the YMPE.
Members may make additional voluntary contributions to the maximum permittedunder the lncome Tax Act.
MERCER47

REPORT ON THE ACTUARIAL VALUATIONFOR FUNDING PURPOSES AS ATDECEMBER 31,2017
RETIREMENT FUND OF ALGOMA POWERrNc.
RetirementDates
PostponedRetirement
NormalRetirementPension
EarlyRetirementPension
Normal Retirement Date. The normal retirement date is the first day of the month coincident with or next
following the member's 65th birthday.
Early Retirement Date. lf a member has been in the Plan for at least two years, the member may choose
to retire as early as age 55.
An active member may postpone retirement beyond the normal retirement date, butnot beyond the end of the calendar year in which they attain age 71. Under thesecircumstances, members are entitled to continue membership in the Plan and havethe right to continue to accrue pension benefits. The pension benefit accrued up toNormal Retirement Date shall be actuarially increased to reflect such postponement.
a) 2.0% of hhe member's average annual Gross Earnings for the five consecutiveyears, during the 10 calendar years preceding Normal Retirement Date thatproduce the highest such average, times the number of years of CreditedService (subject to a maximum of 40 years);
Less
b) 0.7o/o of such earnings not in excess of the average YMPE for the fivecalendar years, immediately preceding the calendat yeat of the NormalRetirement Date, times the number of years of Credited Service sinceJanuary 1, 1966, (maximum 35 years).
Credited Service is equal to Continuous Service from date of employment with theCompany for members who joined the Plan when first eligible prior to January 1,
1991. For other members, Credited Service is equal to Continuous Service from thedate of entry.
ln no event, however, will the members' benefit exceed the applicable maximumpension limits as prescribed by the lncome Tax Act.
lf a member retires early, the member will be entitled to a pension that is calculated
the same way as for a normal retirement. The basic pension payable, however, will
be reduced by 0.25% for each month prior to age 65. Members who have attained
age 55 and for whom the sum of age plus continuous years of service amount to not
less than 85, may retire early with an unreduced pension.
MERCER48

REPORT ON THE ACTUARIAL VALUATIONFOR FUNDING PURPOSES AS ATDECEMBER 31,2017
RETIREMENT FUND OF ALGOMA POWERtNc.
lf a member retires early, the member will be entitled to bridge pension of 0.7% of the
portion of the Member's average annual Gross Earnings not exceeding the average
of the YMPE for the five (5) calendar years immediately preceding the calendar year
in which the Member's early retirement occurs, multiplied by the Member's years of
Credited Service on and after January 1, 1966, to a maximum of thirty-five (35) years
of Credited Service; and the aggregate annual pension to which the Member would
be entitled under the Canada Pension Plan and the Old Age Security Act, had he
attained age 65 at the date the temporary monthly pension commences to be paid,
reduced by % ot 1% for each month by which the date on which the temporary
monthly pension commences to be paid to the Member precedes the Member's
attainment of age 60; and if the Member has not completed ten (10) years of
membership in the Predecessor Plan and the Plan, by 10% for each year by which
the Member's years of membership in the Predecessor Plan and the Plan totals less
than ten (10) years.
Pre-1992 Service Maximum PensionThe member's pension shall not exceed the member's years of pensionable service,
prior to January 1, 1992, to a maximum of 35 years multiplied by the lesser of:
i. $1,7'15; and
ii. 2.0o/o of the average of the member's best three consecutive years'remuneration
Post-l991 Service maximum PensionThe member's pension shall not exceed the member's years of pensionable service,
on or after January 1, 1992, multiplied by the lesser of:
i. $2,944.44 or such greater amount permitted under the lncome Tax Act; and
ii. 2.0Yo of the member's highest average indexed compensation, as defined inthe Income Tax, Act.
Each member who retires from the Plan, will have their pension adjusted annually.
The annual adjustment will be granted in January of each year, based on the
increase in the Consumer Price lndex (CPl) for the 12 months ending the previous
September 30th. lf the CPI increase is less than 2.0%, then the annual adjustment is
equal to 100% of the CPI increase. Otherwise the annual adjustment is equal to 50%
of the CPI increase, with a minimum adjustment of 2.Oo/o and a maximum adjustment
of 5.0%.
Members who have retired less than 12 months prior to the January adjustment will
receive a pro-rata share of the increase based on the number of months since
commencement.
EarlyRetirementBridge Pension
MaximumPension
PostRetirementAdjustment
MERCER49

REPORT ON THE ACTUARIAL VALUATIONFOR FUNDING PURPOSES AS ATDECEMBER 31,2017
RETIREMENT FUND OF ALGOMA POWERtNc.
A member who suffers total and permanent disability will receive, commencing at his
normal retirement date, a pension calculated as for normal retirement,
except that:
a) the service of the member with the Company will include the period duringwhich the member is totally and permanently disabled; and
b) it will be assumed that the member continued to receive remuneration fromthe Company at the rate of his earnings at the time of disability.
Pre-retirement:
For Service Prior to January 1, 1987
. ln the event of death before retirement, the designated beneficiary willreceive a lump sum refund of the member's contributions, if any, with interest.
For service On and After January 1, 1987
. ln the event of death before retirement, the designated beneficiary willreceive the commuted value of the deferred pension plus a refund of excesscontributions, if any. Excess contributions are employee contributions, if any,plus interest, in excess of those required to fund 50% of the commuted valueof the deferred pension.
Post retirement:
. Upon death of the member after retirement, the member's spouse, if thensurviving, will receive an annuity for life equal to 50% of the pension that themember had been receiving. Under the Pension Benefits Act (Ontario),married members must receive a joint and survivor pension that pays at least60% of the amount of pension that member had been receiving, unless boththe member and spouse waive this option. The amount of pension would beactuarially equivalent to the normal form of pension. ln the case of a memberwithout a spouse at retirement, the normal form of pension guarantees aminimum return equal to the membefs contributions with interest to dateretirement. The member may also elect an optional form of pension prior toretirement.
lf the member terminates employment by reason other than death or retirement, he
shall be entitled to a deferred pension, payable from his normal retirement date, equalto his accrued vested pension at his date of termination. ln addition, a member is alsoentitled to a refund of excess contributions, if any.
Notwithstanding the above, a member who is required to or who elects a deferredpension may, in lieu of this deferred pension, elect to:
i. transfer the commuted value of the deferred pension to another registeredpension plan, if the other pension plan permits;
ii. transfer the commuted value to a Locked-ln Retirement Account, or
iii. apply the commuted value to purchase an immediate or deferred annuity.
DisabilityRetirement
Death Benefits
TerminationBenefits
MERCER50
REPORT ON ThE ACTUARIAL VALUATIONFOR FUNDING PURPOSES AS ATDECEMBER 31 2A1/
RETIREMENT FUND OF ALGOMA POWERlNc
APPENDIX GEMPLOYER C ERTI FICATION
With respect to the Report on the Actuarial Valuation for Funding Purposes as at December 31, 2017 of theRetirement Fund of Algoma Power lnc., I hereby certify that, to the best of my knowledge and belief:
The valuation reflects the terms of FortisOntario lnc.'s engagement with the actuary described inSection 2 of this report, particularly the requirement to not include a margin for adverse deviations inthe going concern valuation.
A copy of the official plan documents and of all amendments made up to December 31, 2017 wasprovided to the actuary and is reflected appropriately in the summary of plan provisions containedherein.
The asset information summarized in Appendix B is reflective of the Plan's assets.
The membership data provided to the actuary included a complete and accurate description of everyperson who is entitled to benefits under the terms of the Plan for service up to Decembr 31 ,2017.
All events subsequent to December 31 ,2A17 that may have an impact on the Plan have beencommunicated to the actuary.
t ls t8Date
6[" l',.Name
MERCER5t

MERCER (CANADA) LTMTTED120 Bremner BlvdSuite 800Toronto, Ontario MsJ 0A8+1 416 868 2000www.mercer.ca
Mer@r (Canada) Limiled
MARSH & McLENNANCOMPANIESG'

Appendix 4C
Algoma Power Inc.
2020 Cost of Service
EB-2019-0019


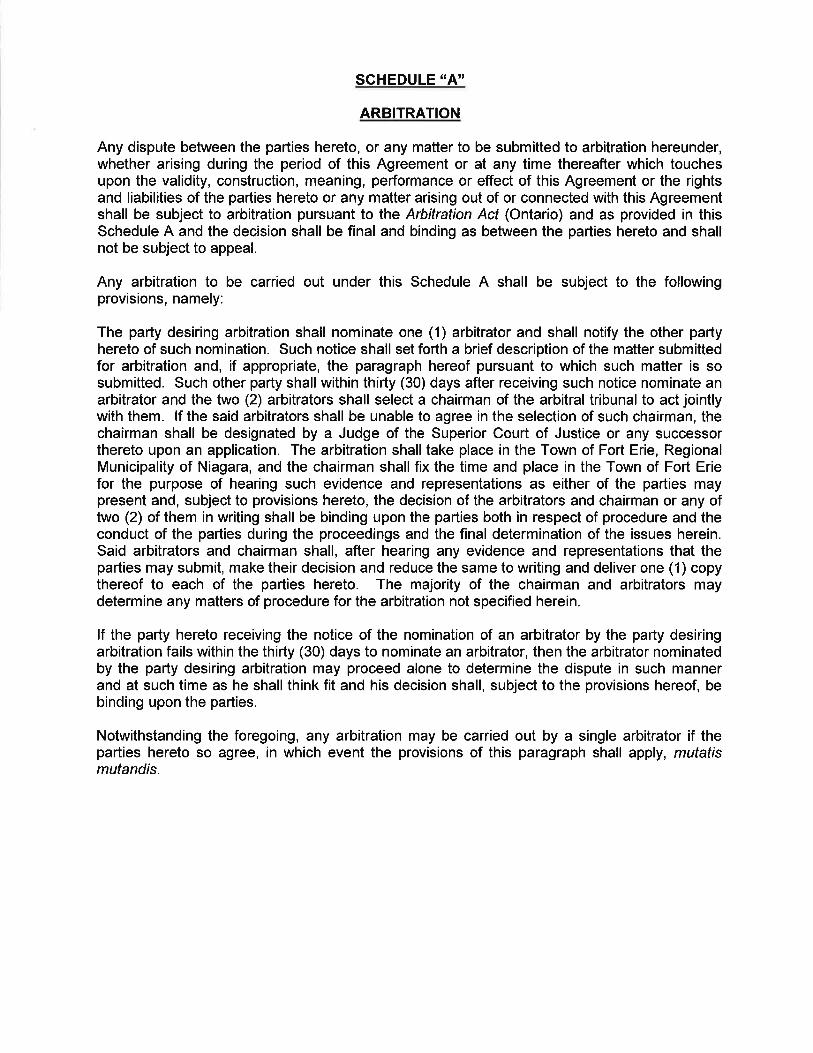

Appendix 4D
Algoma Power Inc.
2020 Cost of Service
EB-2019-0019
MM100
FORTISONTARIO
Purchasing
Policies & Procedures

PURCHASING POLICIES & PROCEDURES
MM Policy: MM100 Owner: VP Operations Issued: 2004.06.01 Revision:
03 Page 1 of 30
Table of Contents
1. Requisitions (REQ) 1.1 What is a Requisition? 1.2 Purchase Orders without Requisitions 1.3 Access of SAP Requisitioning System 1.4 Requisition Approval Process 1.5 Required Material or Service Requisition Information 1.6 Requisition Flow 1.7 Purchasing Requisition Approver
2. Request for Quotations (RFQ) 2.1 When is a RFQ required? 2.2 How many quotations are required? 2.3 Record of Quotations 2.4 Analyzing Quotations
3. Request for Information (RFI)
3.1 What is a Request for Information (RFI)? 3.2 When to use a RFI
4. Request for Proposal (RFP)
4.1 When is a RFP required? 4.2 How many proposals are required? 4.3 Record of Proposals 4.4 Analyzing Proposals
PURCHASING POLICIES & PROCEDURES
MM Policy: MM100 Owner: VP Operations Issued: 2004.06.01 Revision:
03 Page 2 of 30
5. Sole Sourcing
5.1 Limitations under $10,000 5.2 Limitations over $10,000
6. Purchase Orders 6.1 Purchase Orders 6.1.1 Who can Create Purchase Orders? 6.1.2 Limitations of Storekeepers 6.2 Types of Purchase Orders 6.2.1 Standard Purchase Order for Material or Service 6.2.2 Contracts 6.2.3 Blanket Purchase Orders 6.3 Purchasing Authorization 6.3.1 Purchasing Groups 6.3.2 Purchasing Authorization Limits 6.3.3 Purchase Order Creation (see Sect. 1.7 Requisition) 6.3.4 Purchase Order Release (Finance) 6.3.5 Executive Purchasing Authorization-Form VP1A 6.4 Distribution of Purchase Order 6.4.1 File Copy 6.4.2 Supplier Signed Original
7. Receiving of Goods and Services
7.1 Receiving of Goods 7.1.1 Receiving of Goods by Stores 7.1.2 Receiving of Goods by Others 7.1.3 Receiving of Damaged Goods 7.1.4 Bill of Lading and Packing Slips 7.2 Receiving of Services 7.2.1 Receiving of Services by Project Coordinator 7.2.2 Non-Receipt of Services or Sub-Standard Work 7.2.3 Service Statements

PURCHASING POLICIES & PROCEDURES
MM Policy: MM100 Owner: VP Operations Issued: 2004.06.01 Revision:
03 Page 3 of 30
8. Procurement Cards
8.1 Procurement Cards
8.1.1 Contacts 8.1.2 Purpose 8.1.3 Duties & Responsibilities 8.1.4 Controls 8.1.5 Purchase Procedures 8.1.6 Reconciliation, Payment & Merchandise Returns 8.1.7 Dispute Process 8.1.8 Lost or Stolen Cards
8.1.9 Allocation Accounts for Meals
8.2 Fleet Cards 8.2.1 Assignment of Fleet Cards 8.2.2 Fleet Card Goods & Services 8.2.3 Lost or Stolen Fleet Cards 8.2.4 Fuel Receipts
9. Disposition of Scrap Metals 9.1 Disposition of Scrap Metals 9.1.1 Mixed Metal Disposition Procedure 9.1.2 Copper Disposition Procedure
10. Contracting for Goods or Services 10.1 Pre-Project Stage 10.1.1 Creation of Scope and Specification 10.1.2 Tendering Package Creation 10.1.3 Receipt of Bids and Bid Committee 10.1.4 Post Tendering Stage 10.2 Project Management Stage 10.2.1 Pre-Project Start Up 10.2.2 Project Monitoring and Contractor Evaluation 10.3 Invoicing Stage 10.3.1 Invoice Approval

PURCHASING POLICIES & PROCEDURES
MM Policy: MM100 Owner: VP Operations Issued: 2004.06.01 Revision:
03 Page 4 of 30
10.4 Post Project Stage 10.4.1 Post Project Wrap-up 10.4.2 Final Project Management Report 10.4.3 Documentation
11. Contractor Pre-Qualification Form (PQF) 11.1 Purpose 11.2 Roles & Responsibilities
PURCHASING POLICIES & PROCEDURES
MM Policy: MM100 Owner: VP Operations Issued: 2004.06.01 Revision:
03 Page 5 of 30
PROCEDURE
1. Requisitions (REQ) 1.1 What is a Requisition?
Requisitions are a list of required materials or services needed by a department to complete their duties, tasks, assignments or projects.
1.2 Purchase Orders without Requisitions
Under no circumstances will a Purchase Order be created without an approved requisition.
1.3 Access of SAP Requisitioning System
The requisitioning system will be accessed through the company’s SAP system.
1.4 Requisition Approval Process in SAP
If the total value of the requisition is >$10,000, the approver will be his Supervisor. If the total value of the requisition is between $10,000 and $30,000, the approver will be his Manager. For Algoma Power Inc., this will be the Regional Manager. FTSO Supervisor Procurement and Facilities will also have rights to approve requisitions up to $30,000 for approved items. If the total value of the requisition is over $30,000, the approver will be the Vice-President of Operations in most cases.
1.5 Required Material and Service Requisition Information
The following is a check list of the required information needed by the Procurement Department to properly source and process Material or Service requisitions: • Full Description (Material Number or Short Text) • Quantity • Unit Measurement • Account Assignment GL and Cost Centre or Order number • Delivery Date • Net Price

PURCHASING POLICIES & PROCEDURES
MM Policy: MM100 Owner: VP Operations Issued: 2004.06.01 Revision:
03 Page 6 of 30
• Vendor • Purchasing Group Code – ex – FLS (FE Line Services)
1.6 Requisition Flow Once the requisition has been created and saved in SAP, the requester shall notify the next level of approval by way of e-mail. 1) < $10,000– Approver - Supervisor cc: Buyer for that plant 2) > $10,000 and < $30,000 – Approver Manager cc: Supervisor
cc: Buyer for that plant. 3) > $30,000 – Approver – VP cc: Manager cc: Supervisor cc:
Buyer for that plant. VP1A and affiliated documents to be completed and forwarded. See Section 6.3.5 below.
1.7 Purchasing Requisition Approver
The approver verifies the validity of the request and ensures cost center, internal order, GL account, etc. for correctness. He/she selects the line items to approve and releases the requisition for processing to the Procurement Department. The approver replies to the requester that the requisition is now approved cc buyer.
2. Request for Quotations (RFQ) 2.1 When RFQ’s are Required
Request for Quotations are required for any purchases where the anticipated amount will be over $10,000, the scope and specifications are clearly identified and stated, and it does not meet the sole sourcing criteria.
2.2 How many quotations are Required?
It is desirable to have a minimum of three quotations, but no less than two.
2.3 Record of Quotations
All quotations will be filed in the Purchasing Department along with supporting documentation.

PURCHASING POLICIES & PROCEDURES
MM Policy: MM100 Owner: VP Operations Issued: 2004.06.01 Revision:
03 Page 7 of 30
2.4 Analyzing Quotations
Quotations shall be analyzed by Materials Management and the requesting department. The lowest price quote shall be selected unless there are extenuating circumstances upon which this should not occur. e.g. –delivery date, quality factor, warranties, etc.
3. Request for Information (RFI) 3.1 What is a Request for Information (RFI)
Unlike a Request for Quotation (RFQ) or Request for Proposal (RFP), the Request for Information (RFI) does not bind the vendor to any information price given. The request is for informational purposes only.
3.2 When to use a RFI
A Request for Information could be used during the budgetary process or during job planning where estimated cost figures are required only. It should be clearly stated to the vendor that this is a Request for Information Only and any pricing supplied will not be binding or commit the company to this purchase or this vendor.
4. Request for Proposal (RFP)
4.1 When RFP’s are Required
A Request for Proposal is required for any purchases where the anticipated amount will be over $10,000, you wish the vendor to supply the scope and specifications, and it does not meet the sole sourcing criteria.
4.2 How many Proposals are Required?
It is desirable to have a minimum of three proposals, but no less than two.
4.3 Record of Proposals
All proposals must be entered into the SAP system by the Materials Management personnel. Once entered, the vendor proposals will be filed in the Purchasing Department Open File along with the Requisition.

PURCHASING POLICIES & PROCEDURES
MM Policy: MM100 Owner: VP Operations Issued: 2004.06.01 Revision:
03 Page 8 of 30
4.4 Analyzing Proposals
Proposals shall be analyzed by the Materials Management and the requesting department. The lowest price proposal shall be selected unless there is extenuating circumstances upon which this should not occur. e.g. delivery date, quality factor, warranties, etc.
5. Sole Sourcing
Sole sourcing is where only one vendor is chosen to supply a quotation for goods or services. Sole sourcing should only be used where obtaining three quotations is not viable or reasonable. Therefore sole sourcing shall be looked upon as a “method of exception” rather than the “normal method” of procurement.
5.1 Limitations under $10,000
Sole Source Purchasing may be used for purchases where the anticipated price will be under $10,000. The quote from the sole source vendor maybe written or verbal. Any approved method of procurement may be used for Sole Sourcing Purchasing.
5.2 Limitations over $10,000
The following is the criteria to be used when justifying a single source for procurement purposes:
a) The estimated amount of the requested materials, equipment or
services total less than $10,000. This amount shall be considered a limit on an annual basis where the Requesting Department or Purchasing Department can reasonably approximate needs on an annual basis.
b) Only one source of supply has been identified for the requesting
materials, equipment or services, and attempts to either identify additional sources or to modify the request to allow for alternate sources has not been successful.
PURCHASING POLICIES & PROCEDURES
MM Policy: MM100 Owner: VP Operations Issued: 2004.06.01 Revision:
03 Page 9 of 30
c) The requested materials or equipment must be purchased from the
original equipment manufacturer, in order to match or replace existing equipment.
d) The requested material, equipment, or services provide unique
qualifications or technology.
e) The requested material and equipment has been approved as sole source by the Engineering Standards Group.
f) There is an urgent delivery requirement for the requested materials or
service, and there is not sufficient time to solicit competitive bids.
g) Price quotations for the requested goods or services which definitely indicate a low cost provider are on file. Such quotations must be less than one year old, and in the professional judgment of the Buyer, reflect the current market for the requested materials.
6. Purchase Orders
6.1 Purchase Orders The Purchase order is the most common method of procurement used in the company and can be used to procure both materials and services. The Purchase Order, in its entirety, is a binding contract between two parties. When the company issues a Purchase Order to a vendor, the company is agreeing to purchase materials or services for the stipulated quantity, price, delivery, and any other terms specified in the document. The company also agrees to pay to the vendor, in a time agreed to by both parties, the full amount owed to the vendor for delivery of the materials or services. The vendor, in acknowledging the purchase order, also agrees to the quantity, price, delivery and all other terms within the document. The vendor has an obligation to the company to meet all these conditions. Failure to meet any or all conditions could result in the contract (the Purchase Order) to be terminated.

PURCHASING POLICIES & PROCEDURES
MM Policy: MM100 Owner: VP Operations Issued: 2004.06.01 Revision:
03 Page 10 of 30
6.1.1 Who can create Purchase Orders?
The only employees in FortisOntario who can create Purchase Orders are the Supervisor, Procurement & Property/Facilities and the Buyer who belong to the Materials Management Department. All other employees shall be blocked within SAP from producing Purchase Orders.
6.1.2 Limitations of Storekeepers
Storekeepers within FortisOntario can only create Purchase Requisitions for Inventory materials.
6.2 Types of Purchase Orders
6.2.1 Standard Purchase Order for Material or Service
Standard Purchase Orders for material or Service are the most common of all Purchase Orders. Creating a Standard Purchase Order within the SAP system heavily supports the “three-way match”. A “three-way match” occurs when all three documents, the Purchase Order, the Receiving, and the Invoice concur with one another. If at least one document does not agree with any of the other two, the invoice will be blocked for payment. It is essential, if possible, to indicate on the Purchase Order that all materials be delivered to the Stores Department in Fort Erie, Sault Ste. Marie or Cornwall so that proper receiving procedures can be done. If materials are delivered to a different site, all packing slips must immediately be forwarded on to the respective Stores Department for processing.
6.2.2 Contracts Formal contracts, with a minimum value of $50,000.00 can be made for materials only, external labour & materials, or external labour only. All contracts must be processed through the Procurement Department.

PURCHASING POLICIES & PROCEDURES
MM Policy: MM100 Owner: VP Operations Issued: 2004.06.01 Revision:
03 Page 11 of 30
All multi-year contracts must be approved by the Vice President and President during the requisitioning stage regardless of any one singular annual amount i.e. VP1A approval
6.2.3 Blanket Purchase Orders
Blanket Orders are created for frequently used, minimal cost, materials and services with vendors who do not accept the company’s procurement card. Blanket Orders should never be used to purchase assets.
Blanket Orders are created with valid “from” and “to” dates. Each Blanket Order is created with a maximum expected value within the valid time period. Blanket Orders exceeding the maximum expected value before the time period expires, shall be re-assessed for future competitive bidding avenues.

PURCHASING POLICIES & PROCEDURES
MM Policy: MM100 Owner: VP Operations Issued: 2004.06.01 Revision:
03 Page 12 of 30
6.3 Purchasing Authorization 6.3.1 Purchasing Groups
All departments within FortisOntario shall be identified by means of a Purchasing Group designation. ACS Customer Svs API CMS CE Metering Servic
AEL Electrical API COR Corporate
AEN Eng/Planning API CPE CE Planning & Engi
AFF Fleet & Facility CPP CE Prop & Proc
AFN Finance API CRM CE Regional Mgmt
AFS Forestry Svs API ECS EOP Customer Servi
AHE HSE API ELS EOP Line Services
AHR HR API FCR FE Control Room
AIT IT API FCS Fort Erie Customer
ALD Desbarats Line Svs FES FE Electrical Serv
ALS Sault Line Svs FHR Fort Erie Human Re
ALW Wawa Line Svs FIN FE Finance
AMS Metering Svs API FIT IT Fort Erie
APP Purchasing API FLS FE Line Services
ARM Regional Mgmnt API FMS FE Metering Servic
CCS CE Customer Servic FPE FE Planning & Engi
CDV Corp Devlopment FPP FE Prop & Proc
CLS CE Line Services REG Regulatory Affairs Alterations or changes to Purchasing Groups within SAP shall not be made unless authorized in writing at the executive level.
6.3.2 Purchasing Authorization Limits
All Purchasing Groups shall have the same Purchasing Authorization limits. Supervisors will approve all direct report employee requisitions and their own, up to $10,000 Managers – up to $30,000 VP’s – over $30,000 Alterations or changes to Purchasing Authorization Limits within SAP shall not be made unless authorized in writing by the Vice President and President.
PURCHASING POLICIES & PROCEDURES
MM Policy: MM100 Owner: VP Operations Issued: 2004.06.01 Revision:
03 Page 13 of 30
6.3.3 Purchase Order Creation (see 1.7 under Requisition) The buyer lists the approved requisitions for his plant and uses the copy function in SAP to create the purchase order. The buyer will also verify that the vendor, GL account, cost center, internal order etc. are appropriate.
6.3.4 Purchase Order Approver (Finance)
The final purchase order approval will be in the Finance Department, where a Finance employee will verify the validity of the cost center, internal order, GL account etc, select line items to approve and save. Only then, will the hard copy of the purchase order be printed to the Buyer for processing to the vendor.
6.3.5 Executive Purchasing Authorization-Form VP1A
All Purchase Requisitions created with a value over $30,000 require Executive Purchasing Authorization. Purchase Requisitions created within the Operations Division, greater than $30,000 but less than $150,000 shall be authorized in writing and released by the VP of Operations before the final release of the Purchase Department.
Purchase Requisitions created outside the Operations Division, greater than $30,000 but less than $150,000 shall be authorized and released by the VP of Operations only after being authorized writing by the responsible VP through the means of a completed Form VP1A .The Purchasing Department will not release the Purchase Order until the VP of Operations has completed his release procedure, and, they are in receipt of the completed Form VP1A . Purchase Requisitions created for any area, greater than $150,000 but less than $250,000 shall be authorized and released by the VP of Operations only after being authorized in writing by the responsible area VP and one additional VP through the means of a completed Form VP1A .The Purchasing Department will not release the Purchase Order

PURCHASING POLICIES & PROCEDURES
MM Policy: MM100 Owner: VP Operations Issued: 2004.06.01 Revision:
03 Page 14 of 30
until the VP of Operations has completed his release procedure, and, they are in receipt of the completed Form VP1A.
Purchase Orders created for any area, greater than $250,000 shall be authorized and released by the VP of Operations only after being authorized in writing by the responsible area VP and the CEO through the means of a completed Form VP1A .The Purchasing Department will not release the Purchase Order until the VP of Operations has completed his release procedure, and, they are in receipt of the completed Form VP1A . The completed VP1A shall be filed along with the Requisition and Quotes in the Purchasing Department.
6.4 Distribution of Purchase Order
6.4.1 File Copy Upon release and printing of the Purchase Order, Materials Management shall distribute a copy of the Purchase Order to the Purchasing Department which will be attached to the Requisition, Quotes and VP1A (if req’d).
6.4.2 Supplier Signed Original
Upon release and printing of the Purchase Order, Materials Management shall sign the original Purchase Order. The signed original Purchase Order shall be emailed and/or faxed to the Supplier.

PURCHASING POLICIES & PROCEDURES
MM Policy: MM100 Owner: VP Operations Issued: 2004.06.01 Revision:
03 Page 15 of 30
7. Receiving of Goods and Services
7.1 Receiving of Goods 7.1.1 Receiving of Goods by Stores
The preferred method of receiving goods ordered for the company is through the Regional Stores Department. The Storekeeping shall inspect the shipment prior to unloading to assure that the shipment was not damaged during transit. The storekeeper should then match the “Bill of Lading” or “Packing Slip” with what is being unloaded. The Storekeeping shall, as soon as possible, create a goods receipt document in SAP against the Purchase Order.
7.1.2 Receiving of Goods by Others
At times goods are received by others in another site or location other than the Stores Department. The same receiving procedure as for the storekeeper shall also hold true for other receiving goods. The Receiver shall inspect the shipment prior to unloading to assure that the shipment was not damaged during transit. The Receiver should then match the “Bill of Lading” or “Packing Slip” with what is being unloaded. The Receiver shall sign the “Bill of Lading” or “Packing Slip” and forward it on to the Stores Department. The Storekeeper shall, a.s.a.p. create goods receipts document in SAP against the Purchase Order
7.1.3 Receiving of Damaged Goods
Whenever possible, the Storekeeper or the Receiver should not receive or take possession of damaged goods.

PURCHASING POLICIES & PROCEDURES
MM Policy: MM100 Owner: VP Operations Issued: 2004.06.01 Revision:
03 Page 16 of 30
The Storekeeper or Receiver shall indicate on the “Bill of Lading” why the goods were being rejected, sign it and keep a copy of it in the Stores Department. If possible, a digital photograph of the damaged goods should be taken for future reference.
7.1.4 Bill of Lading or Packing Slips
All Bill of Ladings or Packing Slips shall be filed in the Purchasing Department along with the requisition, Quotes, VP1A (if req’d),and Purchase Order.
7.2 Receiving of Services
7.2.1 Receiving of Goods by Project Coordinator The preferred method of receiving goods ordered for the company is by the Project Coordinator responsible for the contractor providing the services. The Project Coordinator shall inspect and assure that the services provided by the contractor satisfy both the term and conditions of the contract, and quality of service provided. The Project Coordinator should then match the Service Statement provided by the contractor with his own field records. The Project Coordinator shall notify the Stores Department in writing that it is appropriate to receive said services against the exiting Purchase Order in SAP for processing.
7.2.2 Non-Receipt of Services or Sub-Standard Work It is the responsibility of the Project Coordinator to ensure that the Services received match the Service Statement provided by the contractor. If there is a discrepancy, then it is the responsibility of the Project Coordinator to rectify it with the contractor. The Project Coordinator is also responsible to ensure that the contractor remedies all sub-standard work provided.

PURCHASING POLICIES & PROCEDURES
MM Policy: MM100 Owner: VP Operations Issued: 2004.06.01 Revision:
03 Page 17 of 30
7.2.3 Service Statements All Service Statements shall be filed in the Operations Department’s File for review if necessary.
8. Procurement Cards
8.1 Procurement Cards
8.1.1 Contacts Financial Analyst Manager of Financial Reporting Manager of Customer Service Manager of T&D Manager of Engineering Supervisor Procurement and Facilities Manager of Cornwall Region Regional Manager of Algoma Power Scotia Bank Card Administration:
Scotia Bank VISA Purchasing Card Program Scotia Plaza 40 King St. Toronto, ON M5H 1H1 Scotia Bank Customer Service: 1-888-823-9657 (8:00 a.m. - 8:00 p.m., Mon. to Fri.)
8.1.2 Purpose The purpose of the Scotia Bank Visa Purchasing Card is to establish a more efficient, cost-effective method for purchasing and processing small dollar transactions.
The program is NOT intended to avoid or bypass appropriate purchasing or pay procedures. Rather, the program complements the existing processes. The card can be used
PURCHASING POLICIES & PROCEDURES
MM Policy: MM100 Owner: VP Operations Issued: 2004.06.01 Revision:
03 Page 18 of 30
for in-store purchases as well as telephone, mail, or fax orders.
The Scotia Bank Visa Purchasing Card should be used whenever possible within the prescribed limits set for each cardholder.
8.1.3 Duties & Responsibilities
Plan Administrator Duties & Responsibilities • Establish and maintain company-wide communication • Assist in normal card usage procedures • Serve as primary contact for cardholders and liaison
between cardholders and Scotia Bank • Assist in problem resolution • Audit program compliance and receipt retention • Distribute training, Purchasing Cards and policy manuals • Set credit limits, single dollar transaction limits and
SIC/MCC code blocking changes. • Generate reports to monitor performance of the program • Co-ordinate reconciled data to A/P
Site Coordinator Duties & Responsibilities: • Initiate and approve card requests for the Purchasing
Cards within their areas of the organization • Ensure the cards issued under their authority are
properly utilized. • Review and sign reconciled Monthly Reconciliation
statements to ensure that receipts and documentation are attached and appropriate accounting codes are indicated
• Ensure that reconciled monthly transactions are received and forwarded to the Program Administrator.
• Co-ordinate any changes between cardholders and Program Administrator

PURCHASING POLICIES & PROCEDURES
MM Policy: MM100 Owner: VP Operations Issued: 2004.06.01 Revision:
03 Page 19 of 30
Cardholder Duties & Responsibilities: • Maintain card security to prevent unauthorized charges
against the account. • Use it only for purchasing of items in accordance with
company policies. • Obtain a receipt at the point of purchase and verify it for
accuracy. Retain receipts and Visa charge slips, and keep a monthly transaction log of card purchases.
• Reconcile receipts and monthly transaction log and forward to your Site Coordinator for review.
• Notify Program Administrator/Site Coordinator of name, telephone, address and division/department changes.
• Report any lost or stolen cards immediately to Program Administrator
8.1.4 Controls Authorization controls are set by The Manager responsible for Materials Management and the Vice President of Operations only. Modifications shall not be done unless written authorization is provided to the Site Co-Coordinator in advance. The controls include: • Monthly credit limits for cardholders • Dollar limits per transaction • Types of purchases that will be allowed (some vendors
have been blocked from usage in the program) For control purposes, the following transactions will be denied: • Stock items available from stores or through approved
ordering systems • Prescription drugs • Health care and medical services • Capital Purchases exceeding $500.00 • Gas Purchases & Vehicle Maintenance (Canada Only) or
any other services which fall under Fleet Services Card Program
• Any product or service considered to be inappropriate use of Company funds
Use of this card for personal purposes is prohibited.
PURCHASING POLICIES & PROCEDURES
MM Policy: MM100 Owner: VP Operations Issued: 2004.06.01 Revision:
03 Page 20 of 30
All transaction details will be transmitted from the Scotia Bank and stored in a database on the computer system. Managers, supervisors and cardholders will be able to view or print various reports from their computers. Contact the Program Administrators or Site Coordinators for details on available reports.
8.1.5 Reconciliation, Payment and Merchandise Returns Each cardholder will receive a monthly statement identifying each transaction made against the card during the previous billing period. The statement will be sent through e-mail. Reconciliation: 1. The cardholder reconciles the credit card receipts to the
transactions listed on their statement. 2. The cardholder verifies that the transactions are correct. 3. The cardholder must enter in the appropriate charge
account numbers into the system. 4. Any discrepancies must be identified and the appropriate
action taken to resolve the problem (see Dispute Process on next page).
5. Cardholder signs reconciled statement and forwards it with receipts attached to the next level of management for their review and approval.
6. Completed statements are forwarded to Program Administrator.
Payment: 1. All non-disputed transactions in the billing period are paid
by the Company. 2. Disputed transactions remain outstanding and remain on
the statement until they are resolved.
PURCHASING POLICIES & PROCEDURES
MM Policy: MM100 Owner: VP Operations Issued: 2004.06.01 Revision:
03 Page 21 of 30
Merchandise Returns:
The merchandise returns process will depend on the suppliers policy, reason for the return, how the purchase was made, i.e. pick up or mail order. In any case, the cardholder contacts the supplier for return policy information. Credit transactions are applied against the cardholder's Visa card and should be reported in the same manner as stated in the Purchase Procedures.
8.1.7 Dispute Process The following steps should be taken for any transactions in dispute:
1. Cardholder contacts supplier directly. 2. Supplier reviews information and either demonstrates the
charge is legitimate, credits the account or continues the dispute.
3. If the dispute continues, contact the Site Co-ordinator with the details.
4. If dispute cannot be resolved at the Site Co-ordinator level, contact the Program Administrator who will work with the Scotia Bank to resolve the dispute.
8.1.8 Lost or Stolen Cards
The following steps must be taken if a card is lost or stolen: 1. The cardholder must notify the Scotia Bank immediately
at 1-888-823-9657. 2. The cardholder notifies the Program Administrator. 3. The card will be cancelled and a replacement issued.
8.1.9 Allocation of Accounts for Meals
A Company can only claim 2.5% of the HST as a business meal as an expense. The remainder is classified as a non-deductible expense. How to calculate: example: total HST is $7.21, multiply $7.21 x (2.5/13) =$1.39 All meals are coded to Cost Element 7802.

PURCHASING POLICIES & PROCEDURES
MM Policy: MM100 Owner: VP Operations Issued: 2004.06.01 Revision:
03 Page 22 of 30
8.2 Fleet Cards 8.2.1 Assignment of Fleet Cards
Each transportation unit or licensed equipment will be issued its own fleet card. The Fleet Supervisor (Cornwall and Fort Erie) or the Supervisor Procurement and Facilities (Algoma Power) shall be responsible for issuing new, lost or stolen fleet cards. Fleet cards are only to be used for the transportation unit or licensed equipment for which they were assigned. The cost centre under which the transportation unit or licensed equipment is assigned shall be responsible for all costs associated with the use of the fleet card.
8.2.2 Fleet Card Goods & Services
Fleet cards are used to purchase either fuel and/or maintenance for the assigned transportation unit or licensed equipment at all participating fuel dispensing or auto and equipment maintenance shops in Canada Only. The card shall not be used for any personal or sundry type items.
8.2.3 Lost or Stolen Fleet Cards
Lost or Stolen Fleet Cards shall be reported immediately to the respective Fleet Supervisor.
8.2.4 Fuel Receipts
Fuel Receipts must be retained and produced upon request for a period of one year by the responsible cost centre or individual.

PURCHASING POLICIES & PROCEDURES
MM Policy: MM100 Owner: VP Operations Issued: 2004.06.01 Revision:
03 Page 23 of 30
9. Disposition of Scrap Metals 9.1.1 Disposition of Scrap Metals
FortisOntario has two types of metal materials that are sold to scrap dealers:
1. Mixed Metals 2. Copper (bare and jacketed)
9.1.2 Mixed Metals Disposition Procedure
• Metals collected and stored in large bin provided by vendor.
• Vendor picks up the bin when full. • Vendor sorts and weighs metals. • Bill of Lading is given to storekeeper at pickup by the
vendor. • Record of pickup is filed in the Stores Department. • When payment is made to FortisOntario, record of
payment is attached to the appropriate Bill of Lading. • Purchasing Department follows up if payment is not
made in a reasonable time frame. Copper Disposition Procedure
• Copper collected and stored in container provided by vendor.
• When bin is full, the bin is weighed by FortisOntario and arrangements are made for pick up.
• Bill of Lading is given to storekeeper at pickup by the vendor.
• Record of pickup is filed in the Stores Department. • When payment is made to FortisOntario, record of
payment is attached to the appropriate Bill of Lading. • Purchasing Department follows up if payment is not
made in a reasonable time frame.
PURCHASING POLICIES & PROCEDURES
MM Policy: MM100 Owner: VP Operations Issued: 2004.06.01 Revision:
03 Page 24 of 30
10.0 Contracting for Goods or Services
When services or goods are required for a project with an estimated value of $50,000.00 or greater. The Four Stages of Contracting listed below will be followed:
10.1 Pre-Project Stage
10.1.1 Creation of Scope and Specification The project owner will define the Scope of the work, clearly defining the description, purpose, time frame, and responsibilities of all parties
The project owner will provide the Specifications and/or Drawings, representing what is required and how the project will be performed or constructed.
Both the Scope of the work and the Specifications will be forwarded to the Purchasing Dept.
Post Tendering Stage
Receipt of Bids & Bid Committee
Tendering Package Creation
Creation of Scope & Specifications 10.1.1
10.1.2
10.1.3
10.1.4
Project Monitoring & Contractor Evaluation
Pre-Project Start Up 10.2.1
10.2.2
Invoice Approvals 10.3.1
Documentation
Final Project Management Report
Post Project Wrap-Up 10.4.1
10.4.2
10.4.3
Pre-Project Stage
10.1
Project Management
Stage
10.2
Invoicing Stage
10.3
Post Project Stage
10.4
PURCHASING POLICIES & PROCEDURES
MM Policy: MM100 Owner: VP Operations Issued: 2004.06.01 Revision:
03 Page 25 of 30
10.1.2 Tendering Package Creation
The Purchasing Dept. will create the Tender Package with the information provided including the Scope, Specifications, and Drawings and send them out to pre-qualified vendors.
10.1.3 Receipt of Bids and Bid Committee
All bids must be received by the Purchasing Dept. before the closing time of the tender. Bids received after the closing time will not be accepted.
A Bid Committee set up by the Purchasing Dept. (typically comprised of the project owner requesting the work, a representative of the Purchasing Dept. and one other representative from the company with no direct relationship to the project) will open the bids and record the results on a bid analysis form. The bid committee will then determine who will be awarded the contract.
10.1.4 Post Tendering Stage
Before awarding the contract, the project owner requesting the contract shall forward a requisition to Purchasing, where the Purchasing Policies & Procedures will be followed: Proper release procedures in SAP, followed by a Purchase Order and the completion of the VP1A by the Vice President of Operations. Once these steps are completed the successful bidder will provide all documentation required as described in the contract and both parties (company & contractor) will sign two copies of the Agreement part of the contract and the contractor will be given the Purchase Order to start work.

PURCHASING POLICIES & PROCEDURES
MM Policy: MM100 Owner: VP Operations Issued: 2004.06.01 Revision:
03 Page 26 of 30
10.2 Project Management Stage 10.2.1 Pre-Project Start Up
The project owner is responsible to have a pre-job meeting with the contractor and shall document the meeting on the Pre-job Meeting Minute form. During the meeting the project owner will ensure that the contractor obtains all necessary permits according to the contract document. The Company’s HSE policy #P-304 “Contractor Health, Safety and Environmental Protection” shall be communicated to the contractor as well as all applicable Health, Safety and Environmental compliance requirements.
10.2.2 Project Monitoring and Contractor Evaluation
The project owner shall monitor all aspects of the project, including site visits, progress of the project, invoice verification for interim progress billing and provide reference documentation. He will also conduct safety observations as per HS&E policies and evaluate the performance of the contractor.
10.3 Invoicing Stage
10.3.1 Invoice Approval
All invoices are initially received by Accounts Payable, the Accounts Payable Clerk will forward the invoice to the project owner for his review. After the invoice has been reviewed and meets with his approval, the project owner will sign the invoice, approving it for payment, and forward the invoice to Purchasing. The Purchasing Dept. will also review the invoice against the original Purchase Order and make SAP entry to create a document number. At this stage it is sent back to accounts payable for processing. (create the cheque for payment).

PURCHASING POLICIES & PROCEDURES
MM Policy: MM100 Owner: VP Operations Issued: 2004.06.01 Revision:
03 Page 27 of 30
10.4 Post Project Stage
10.4.1 Post Project Wrap-Up
This is the last stage of the contracting process. The project (as well as the contractor’s obligations) is finalized and evaluated. The project owner is responsible to ensure all invoices, including hold-backs, have reviewed and paid. He is also responsible to ensure that all excess materials are returned to the Stores Dept. to be credited back to the project. He will also make sure that all deficiencies have been dealt with prior to closure of the project.
10.4.2 Final Project Management Report (Project Owner)
This report will include items like: Cost savings, new procedures, explanation of cost over runs, timelines, final contract evaluation and general overview of how the project went.
10.4.3 Documentation
All documentation of any kind pertaining to this project will be included in the project file under the contract number in the Purchasing Department.

PURCHASING POLICIES & PROCEDURES
MM Policy: MM100 Owner: VP Operations Issued: 2004.06.01 Revision:
03 Page 28 of 30
11.0 Contractor Pre-Qualification Form (PQF)
11.1 Purpose
The purpose of this form is to document the qualifications of contractors having NO PREVIOUS WORK HISTORY with FortisOntario, and who are being considered to do projects in the $50,000.00 range and up, and to gage their suitability to be on or off the Approved Contractors’ List.
11.2 Roles & Responsibilities All FortisOntario personnel entrusted with the hiring of Contractors will have the Contractor complete this form. The Health and Safety Department will either approve or conditionally approve the request and work with the vendor to ensure all necessary facets are completed. Based on certain criteria and vendor performance, the HSE Department may elect NOT to pre-qualify a vendor.

PURCHASING POLICIES & PROCEDURES
MM Policy: MM100 Owner: VP Operations Issued: 2004.06.01 Revision:
03 Page 29 of 30
Record of Change
Date Section Description Updated Approved By 2016.03.15

Appendix 4E
Algoma Power Inc.
2020 Cost of Service
EB-2019-0019

Version 1.10
Utility Name
Assigned EB Number EB-2019-0019
Name and Title
Phone Number 905-871-0330 ext 3208
Email Address
Date
Last COS Re-based Year 2015
Note: Drop-down lists are shaded blue; Input cells are shaded green.
Brian Vander Vloet, Director, Finance
Algoma Power Inc.
This Workbook Model is protected by copyright and is being made available to you solely for the purpose of filing your rate application. You may use and copy this model for that purpose, and provide a copy of this model to any person that is advising or assisting you in that regard. Except as indicated above, any copying, reproduction, publication, sale, adaptation, translation, modification, reverse engineering or other use or dissemination of this model without the express written consent of the Ontario Energy Board is prohibited. If you provide a copy of this model to a person that is advising or assisting you in preparing the application or reviewing your draft rate order, you must ensure that the person understands and agrees to the restrictions noted above.
While this model has been provided in Excel format and is required to be filed with the applications, the onus remains on the applicant to ensure the accuracy of the data and the results.
Ontario Energy Board
Instructions
PurposeThe purpose of this workbook is to calculate the estimated Payment in Lieu of Taxes (PILs) for the Test Year. The calculation of PILs for the Test Year is on tab T0 and is based on the inputs on the other tabs.
Tab S Summary is a summary of the amounts to be transferred to the Data Input Sheet of the Revenue Requirement Workform.
Tab S1 Integrity Checks must be completed after the completion of the PILS calculation in this workbook.
MethodologyTo calculate the PILs for the Test Year:
1) input the balances from the income tax return of the Historical Year in tabs H1 to H13.2) input the balances for the Bridge Year and the Test Year.Inputs should include:
- non-deductible expenses (Schedule 1 - B1 and T1)- loss carryforward (Schedule 4 - B4 and T4)- capital cost allowance (Schedule 8 - B8 and T8)- non-deductible reserves (Schedule 13 - B13 and T13)
3) make any other adjustments and inputs required so that the PILs amount calculated for the Test Year on tab T0 is reasonable.
Other NotesTabs H0 to H13 relate to the Historical Year.Tabs B0 to B13 relate to the Bridge Year.Tabs T0 to T13 relate to the Test Year.
The amounts on tabs H0 to H13 should agree to the tax return filed with the Canada Revenue Agency. Any CRA audit adjustments or corrections should also be reflected.
It is assumed the net income before tax for the Test Year is equal to the Return on Equity. Return on Equity is calculated on tab A.
On tab "A. Data Input Sheet", input the "Rate Base" amount and "Return on Rate Base" amounts.

1
1. InfoS. SummaryA. Data Input SheetB. Tax Rates & Exemptions
Historical Year H0 - PILs, Tax Provision Historical YearH1 - Adj. Taxable Income Historical YearH4 - Schedule 4 Loss Carry Forward Historical YearH8 - Schedule 8 HistoricalH13 - Schedule 13 Tax Reserves Historical
Bridge Year B0 - PILs,Tax Provision Bridge YearB1 - Adj. Taxable Income Bridge YearB4 - Schedule 4 Loss Carry Forward Bridge YearB8 - Schedule 8 CCA Bridge YearB13 - Schedule 13 Tax Reserves Bridge Year
Test Year T0 PILs, Tax Provision Test YearT1 Taxable Income Test YearT4 Schedule 4 Loss Carry Forward Test YearT8 Schedule 8 CCA Test YearT13 Schedule 13 Reserve Test Year
Ontario Energy Board

No inputs required on this worksheet.
Inputs on Service Revenue Requirement WorksheetThe Service Revenue Requirement is in the 'Revenue Requirement Workform' - Tab 3.
ItemWorking Paper
Reference
Adjustments required to arrive at taxable income as below -3,379,548Test Year - Payments in Lieu of Taxes (PILs) T0 245,471 Test Year - Grossed-up PILs T0 333,974 Effective Federal Tax Rate T0 15.0%Effective Ontario Tax Rate T0 11.5%
Calculation of Adjustments required to arrive at Taxable IncomeRegulatory Income (before income taxes) T1 4,305,854Taxable Income T1 926,305Difference calculated -3,379,548 as above
Ontario Energy Board

Integrity Checks
Item
Utility Confirmation (Y/N) Notes
1The depreciation and amortization added back in the application’s PILs model agree with the numbers disclosed in the rate base section of the application Y
2 The capital additions and deductions in the UCC/ CCA Schedule 8 agree with the rate base section for historical, bridge and test years Y
3
Schedule 8 of the most recent federal T2 tax return filed with the application has a closing December 31 historical year UCC that agrees with the opening (January 1) bridge year UCC. If the amounts do not agree, then the applicant must provide a reconciliation with explanations. Distributors must segregate non- distribution tax amounts on Schedule 8. N/A
2018 corporate tax return not yet filed as of cost of service submission date, Schedule 8 2018 draft values input into this model.
4The CCA deductions in the application’s PILs tax model for historical, bridge and test years (as applicable) agree with the numbers in the UCC schedules for the same years filed in the application Y
5 Loss carry-forwards, if any, from the tax returns (Schedule 4) agree with those disclosed in the application N/A6 A discussion is included in the application as to when the loss carry-forwards, if any, will be fully utilized N/A7 CCA is maximized even if there are tax loss carry-forwards Y
8
Accounting OPEB and pension amounts added back on Schedule 1 to reconcile accounting income to net income for tax purposes, must agree with the OM&A analysis for compensation. The amounts deducted must be reasonable when compared with the notes in the audited financial statements, FSCO reports, and the actuarial valuations. Y
9 The income tax rate used to calculate the tax expense must be consistent with the utility’s actual tax facts and evidence filed in the application. Y
The applicant must ensure the following integrity checks have been completed and confirm this is the case in the table below, or provide an explanation if this is not the case:

Test Year Bridge Year
Rate Base S 119,873,438$ 114,788,517$
Return on RatebaseDeemed ShortTerm Debt % 4.00% T 4,794,938$ W = S * T
Deemed Long Term Debt % 56.00% U 67,129,125$ X = S * U
Deemed Equity % 40.00% V 47,949,375$ Y = S * V
Short Term Interest Rate 2.82% Z 135,217$ AC = W * Z
Long Term Interest 4.95% AA 3,322,892$ AD = X * AAReturn on Equity (Regulatory Income) 8.98% AB 4,305,854$ AE = Y * AB T1Return on Rate Base 7,763,963$ AF = AC + AD + AE
Questions that must be answered Historical Year Bridge Year Test Year
No No No
No No No
Yes No No
No No No
No No No
No No No
No No No If Yes, please describe what was the tax treatment in the manager's summary.
No No No
7. Did the applicant pay dividends?
8. Did the applicant elect to capitalize interest incurred on CWIP for tax purposes?
3. Does the applicant have any Capital Gains or Losses for tax purposes?
4. Does the applicant have any Capital Leases?
5. Does the applicant have any Loss Carry-Forwards (non-capital or net capital)?
6. Since 1999, has the applicant acquired another regulated applicant's assets?
1. Does the applicant have any Investment Tax Credits (ITC)?
2. Does the applicant have any SRED Expenditures?
Ontario Energy Board
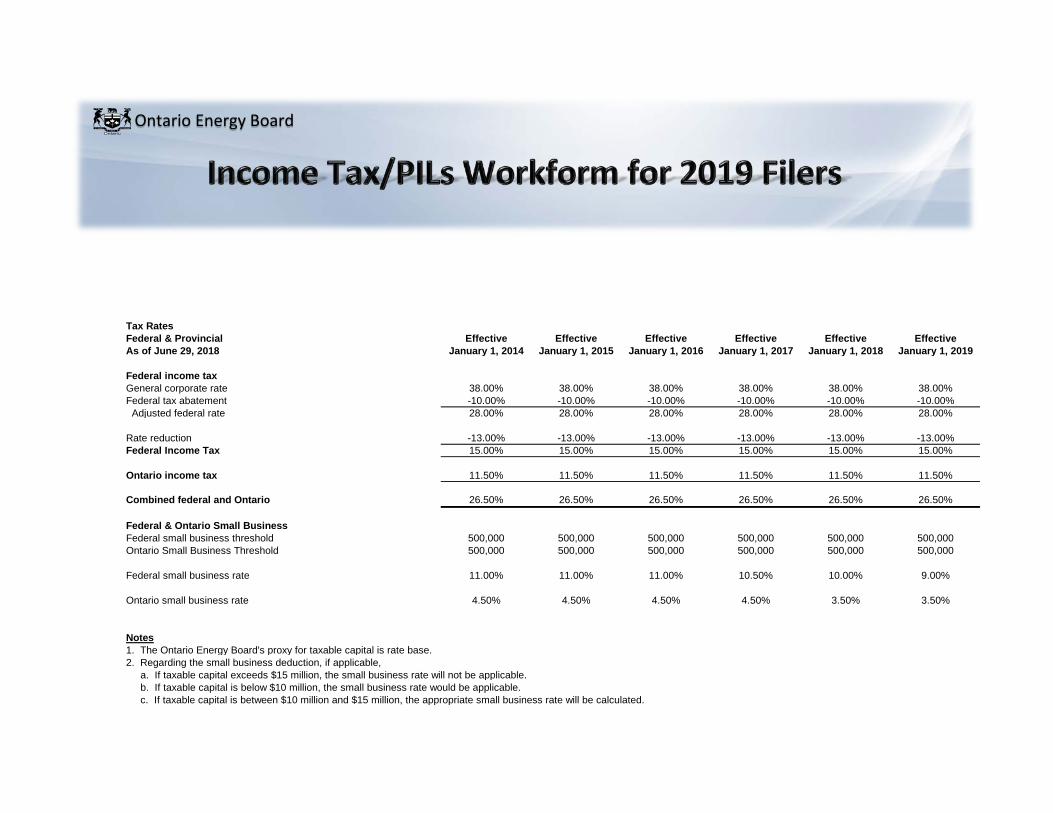
Tax RatesFederal & Provincial Effective Effective Effective Effective Effective EffectiveAs of June 29, 2018 January 1, 2014 January 1, 2015 January 1, 2016 January 1, 2017 January 1, 2018 January 1, 2019
Federal income taxGeneral corporate rate 38.00% 38.00% 38.00% 38.00% 38.00% 38.00%Federal tax abatement -10.00% -10.00% -10.00% -10.00% -10.00% -10.00% Adjusted federal rate 28.00% 28.00% 28.00% 28.00% 28.00% 28.00%
Rate reduction -13.00% -13.00% -13.00% -13.00% -13.00% -13.00%Federal Income Tax 15.00% 15.00% 15.00% 15.00% 15.00% 15.00%
Ontario income tax 11.50% 11.50% 11.50% 11.50% 11.50% 11.50%
Combined federal and Ontario 26.50% 26.50% 26.50% 26.50% 26.50% 26.50%
Federal & Ontario Small BusinessFederal small business threshold 500,000 500,000 500,000 500,000 500,000 500,000Ontario Small Business Threshold 500,000 500,000 500,000 500,000 500,000 500,000
Federal small business rate 11.00% 11.00% 11.00% 10.50% 10.00% 9.00%
Ontario small business rate 4.50% 4.50% 4.50% 4.50% 3.50% 3.50%
Notes1. The Ontario Energy Board's proxy for taxable capital is rate base.2. Regarding the small business deduction, if applicable, a. If taxable capital exceeds $15 million, the small business rate will not be applicable. b. If taxable capital is below $10 million, the small business rate would be applicable. c. If taxable capital is between $10 million and $15 million, the appropriate small business rate will be calculated.
Ontario Energy Board

PILs Tax Provision - Historical YearWires Only
Regulatory Taxable Income H1 2,140,151$ ACombined Tax Rate and PILs Ontario Tax Rate (Maximum 11.5%) 11.50% B
Federal tax rate (Maximum 15%) 15.00% CCombined tax rate (Maximum 26.5%) 26.50% D = B+C
Total Income Taxes 567,140$ E = A * D
Investment Tax Credits -$ FMiscellaneous Tax Credits -$ G
Total Tax Credits -$ H = F + G
Corporate PILs/Income Tax Provision for Historical Year 567,140$ I = E - H
Note: Input the actual information from the tax returns for the historical year.
Ontario Energy Board

Adjusted Taxable Income - Historical Year
T2S1 line # Total for Legal Entity
Non-Distribution Eliminations
Historic Wires Only
Income before PILs/Taxes (A + 101 + 102) 4,381,187 4,381,187Additions:
Interest and penalties on taxes 103 0Amortization of tangible assets 104 3,250,612 3,250,612Amortization of intangible assets 106 736,165 736,165Recapture of capital cost allowance from Schedule 8 107 0Gain on sale of eligible capital property from Schedule 10 108 0Income or loss for tax purposes- joint ventures or partnerships 109 0Loss in equity of subsidiaries and affiliates 110 0Loss on disposal of assets 111 22,190 22,190Charitable donations 112 36,385 8,445 27,940Taxable Capital Gains 113 0Political Donations 114 0Deferred and prepaid expenses 116 0Scientific research expenditures deducted on financial statements 118 0Capitalized interest 119 0Non-deductible club dues and fees 120 0Non-deductible meals and entertainment expense 121 28,669 28,669Non-deductible automobile expenses 122 0Non-deductible life insurance premiums 123 0Non-deductible company pension plans 124 0Tax reserves deducted in prior year 125 0Reserves from financial statements- balance at end of year 126 4,636,206 4,636,206Soft costs on construction and renovation of buildings 127 0Book loss on joint ventures or partnerships 205 0Capital items expensed 206 0Debt issue expense 208 16,632 16,632Development expenses claimed in current year 212 0Financing fees deducted in books 216 0Gain on settlement of debt 220 0Non-deductible advertising 226 0Non-deductible interest 227 0Non-deductible legal and accounting fees 228 0Recapture of SR&ED expenditures 231 0Share issue expense 235 0Write down of capital property 236 0Amounts received in respect of qualifying environment trust per paragraphs 12(1)(z.1) and 12(1)(z.2) 237 0
Interest Expensed on Capital Leases 290 0Realized Income from Deferred Credit Accounts 291 0Pensions 292 0Non-deductible penalties 293 0
294 0295 0
ARO Accretion expense 0Capital Contributions Received (ITA 12(1)(x)) 0Lease Inducements Received (ITA 12(1)(x)) 0Deferred Revenue (ITA 12(1)(a)) 0Prior Year Investment Tax Credits received 0
0
Other Additions
Ontario Energy Board
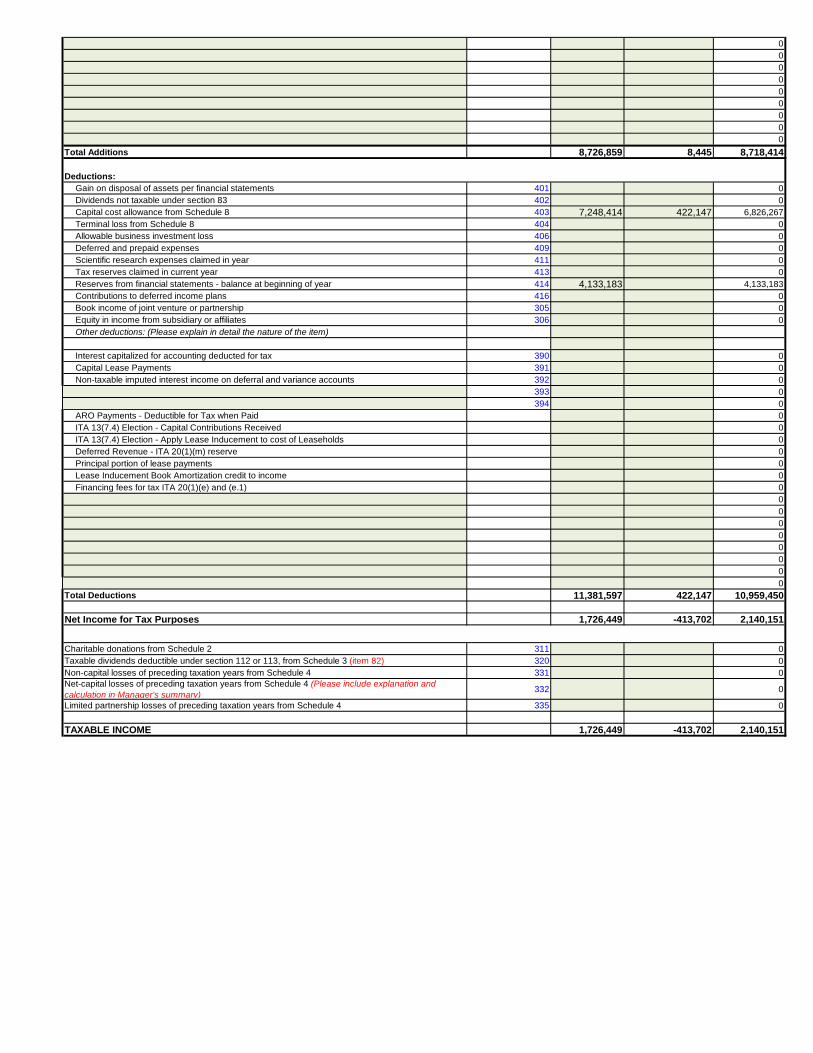
000000000
Total Additions 8,726,859 8,445 8,718,414
Deductions:Gain on disposal of assets per financial statements 401 0Dividends not taxable under section 83 402 0Capital cost allowance from Schedule 8 403 7,248,414 422,147 6,826,267Terminal loss from Schedule 8 404 0Allowable business investment loss 406 0Deferred and prepaid expenses 409 0Scientific research expenses claimed in year 411 0Tax reserves claimed in current year 413 0Reserves from financial statements - balance at beginning of year 414 4,133,183 4,133,183Contributions to deferred income plans 416 0Book income of joint venture or partnership 305 0Equity in income from subsidiary or affiliates 306 0Other deductions: (Please explain in detail the nature of the item)
Interest capitalized for accounting deducted for tax 390 0Capital Lease Payments 391 0Non-taxable imputed interest income on deferral and variance accounts 392 0
393 0394 0
ARO Payments - Deductible for Tax when Paid 0ITA 13(7.4) Election - Capital Contributions Received 0ITA 13(7.4) Election - Apply Lease Inducement to cost of Leaseholds 0Deferred Revenue - ITA 20(1)(m) reserve 0Principal portion of lease payments 0Lease Inducement Book Amortization credit to income 0Financing fees for tax ITA 20(1)(e) and (e.1) 0
00000000
Total Deductions 11,381,597 422,147 10,959,450
Net Income for Tax Purposes 1,726,449 -413,702 2,140,151
Charitable donations from Schedule 2 311 0Taxable dividends deductible under section 112 or 113, from Schedule 3 (item 82) 320 0Non-capital losses of preceding taxation years from Schedule 4 331 0Net-capital losses of preceding taxation years from Schedule 4 (Please include explanation and calculation in Manager's summary) 332 0
Limited partnership losses of preceding taxation years from Schedule 4 335 0
TAXABLE INCOME 1,726,449 -413,702 2,140,151

Schedule 7-1 Loss Carry Forward - Historical
Corporation Loss Continuity and Application
TotalNon-
Distribution Portion
Utility Balance
0 0 B4
TotalNon-
Distribution Portion
Utility Balance
0 0 B4Net Capital Loss Carry Forward DeductionActual Historical
Non-Capital Loss Carry Forward DeductionActual Historical
Ontario Energy Board

Schedule 8 - Historical Year
Class Class Description UCC End of Year Historical per tax returns
Less: Non-Distribution Portion UCC Regulated Historical Year
Working Paper
Reference
1 Distribution System - post 1987 22,403,327.00$ 22,403,327.00$ B81 Enhanced Non-residential Buildings Reg. 1100(1)(a.1) election -$ B8
2 Distribution System - pre 1988 -$ B88 General Office/Stores Equip 450,077.00$ 450,077.00$ B810 Computer Hardware/ Vehicles 1,522,572.00$ 1,522,572.00$ B8
10.1 Certain Automobiles -$ B812 Computer Software 120,438.00$ 120,438.00$ B8
13 1 Lease # 1 -$ B813 2 Lease #2 -$ B813 3 Lease # 3 -$ B813 4 Lease # 4 -$ B814 Franchise -$ B817 New Electrical Generating Equipment Acq'd after Feb 27/00 Other Than Bldgs -$ B842 Fibre Optic Cable -$ B8
43.1 Certain Energy-Efficient Electrical Generating Equipment -$ B843.2 Certain Clean Energy Generation Equipment -$ B845 Computers & Systems Software acq'd post Mar 22/04 504.00$ 504.00$ B846 Data Network Infrastructure Equipment (acq'd post Mar 22/04) 11,403.00$ 11,403.00$ B847 Distribution System - post February 2005 61,082,377.00$ 61,082,377.00$ B850 Data Network Infrastructure Equipment - post Mar 2007 115,361.00$ 115,361.00$ B852 Computer Hardware and system software -$ B895 CWIP -$ B8
14.1 Eligible Capital Property (acq'd pre Jan 1, 2017)1 5,608,524.00$ 5,608,524.00$ -$ B814.1 Eligible Capital Property (acq'd post Jan 1, 2017)1 -$ B8
-$ -$ -$ -$ -$ -$ -$
0SUB-TOTAL - UCC 91,314,583 5,608,524 85,706,059
1 New CCA class 14.1 effective January 1, 2017. The class includes property that was eligible capital property immediately before January 1, 2017. For tax years that end prior to 2027, transitional rules apply to class 14.1 that were acquired before January 1, 2017.
Ontario Energy Board
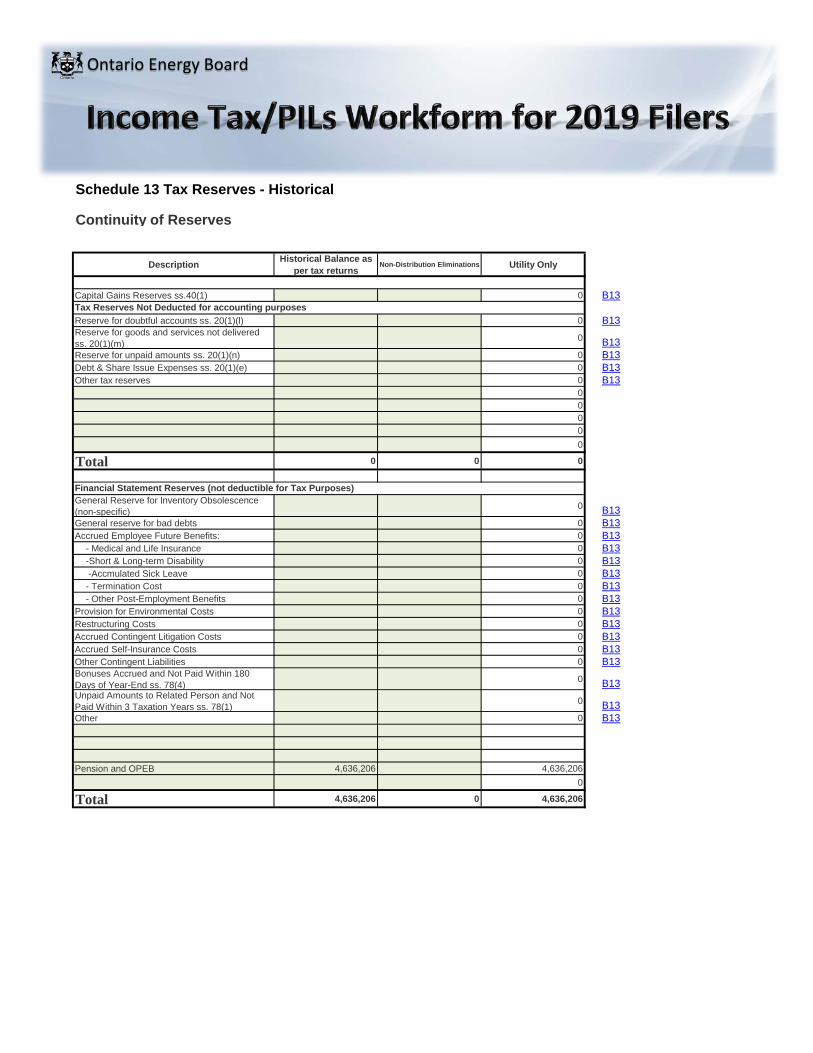
Schedule 13 Tax Reserves - Historical
Continuity of Reserves
Description Historical Balance as per tax returns
Non-Distribution Eliminations Utility Only
Capital Gains Reserves ss.40(1) 0 B13
Reserve for doubtful accounts ss. 20(1)(l) 0 B13Reserve for goods and services not delivered ss. 20(1)(m) 0 B13Reserve for unpaid amounts ss. 20(1)(n) 0 B13Debt & Share Issue Expenses ss. 20(1)(e) 0 B13Other tax reserves 0 B13
00000
Total 0 0 0
General Reserve for Inventory Obsolescence (non-specific) 0 B13General reserve for bad debts 0 B13Accrued Employee Future Benefits: 0 B13
- Medical and Life Insurance 0 B13-Short & Long-term Disability 0 B13 -Accmulated Sick Leave 0 B13- Termination Cost 0 B13- Other Post-Employment Benefits 0 B13
Provision for Environmental Costs 0 B13Restructuring Costs 0 B13Accrued Contingent Litigation Costs 0 B13Accrued Self-Insurance Costs 0 B13Other Contingent Liabilities 0 B13Bonuses Accrued and Not Paid Within 180 Days of Year-End ss. 78(4) 0 B13Unpaid Amounts to Related Person and Not Paid Within 3 Taxation Years ss. 78(1) 0 B13Other 0 B13
Pension and OPEB 4,636,206 4,636,2060
Total 4,636,206 0 4,636,206
Tax Reserves Not Deducted for accounting purposes
Financial Statement Reserves (not deductible for Tax Purposes)
Ontario Energy Board

PILS Tax Provision - Bridge Year
Wires OnlyReference
Regulatory Taxable Income B1 1,149,359$ A
Tax Rate Small Business Rate (If
Applicable)
Taxes Payable
Effective Tax Rate
Ontario (Max 11.5%) 11.5% 11.5% 132,176$ 11.5% BFederal (Max 15%) 15.0% 15.0% 172,404$ 15.0% C
Combined effective tax rate (Max 26.5%) 26.50% D = B + C
Total Income Taxes 304,580$ E = A * D
Investment Tax Credits -$ FMiscellaneous Tax Credits -$ G
Total Tax Credits -$ H = F + G
Corporate PILs/Income Tax Provision for Bridge Year 304,580$ I = E - H
Note:1. This is for the derivation of Bridge year PILs income tax expense and should not be used for Test year revenue requirement calculations.
Ontario Energy Board

Adjusted Taxable Income - Bridge Year
T2S1 line #Working
Paper Reference
Total for Regulated Utility
Income before PILs/Taxes (A + 101 + 102) 4,313,739
Interest and penalties on taxes 103Amortization of tangible assets 104 3,437,114Amortization of intangible assets 106 758,090Recapture of capital cost allowance from Schedule 8 107
Gain on sale of eligible capital property from Schedule 10 108
Income or loss for tax purposes- joint ventures or partnerships 109
Loss in equity of subsidiaries and affiliates 110Loss on disposal of assets 111Charitable donations 112 27,940Taxable Capital Gains 113Political Donations 114Deferred and prepaid expenses 116Scientific research expenditures deducted on financial statements 118
Capitalized interest 119Non-deductible club dues and fees 120Non-deductible meals and entertainment expense 121 25,000Non-deductible automobile expenses 122Non-deductible life insurance premiums 123Non-deductible company pension plans 124Tax reserves deducted in prior year 125 B13 0Reserves from financial statements- balance at end of year 126 B13 5,321,749Soft costs on construction and renovation of buildings 127
Book loss on joint ventures or partnerships 205Capital items expensed 206Debt issue expense 208 16,632Development expenses claimed in current year 212
Financing fees deducted in books 216Gain on settlement of debt 220Non-deductible advertising 226Non-deductible interest 227Non-deductible legal and accounting fees 228Recapture of SR&ED expenditures 231Share issue expense 235Write down of capital property 236Amounts received in respect of qualifying environment trust per paragraphs 12(1)(z.1) and 12(1)(z.2)
237
Additions:
Ontario Energy Board

Adjusted Taxable Income - Bridge Year
Ontario Energy Board
Interest Expensed on Capital Leases 290Realized Income from Deferred Credit Accounts 291
Pensions 292Non-deductible penalties 293
294
295
ARO Accretion expenseCapital Contributions Received (ITA 12(1)(x))Lease Inducements Received (ITA 12(1)(x))Deferred Revenue (ITA 12(1)(a))Prior Year Investment Tax Credits received
Total Additions 9,586,525
Gain on disposal of assets per financial statements 401
Dividends not taxable under section 83 402Capital cost allowance from Schedule 8 403 B8 8,114,700Terminal loss from Schedule 8 404Allowable business investment loss 406Deferred and prepaid expenses 409
Scientific research expenses claimed in year 411
Tax reserves claimed in current year 413 B13 0Reserves from financial statements - balance at beginning of year 414 B13 4,636,206Contributions to deferred income plans 416Book income of joint venture or partnership 305Equity in income from subsidiary or affiliates 306Other deductions: (Please explain in detail the nature of the item)
Deductions:
Other Additions
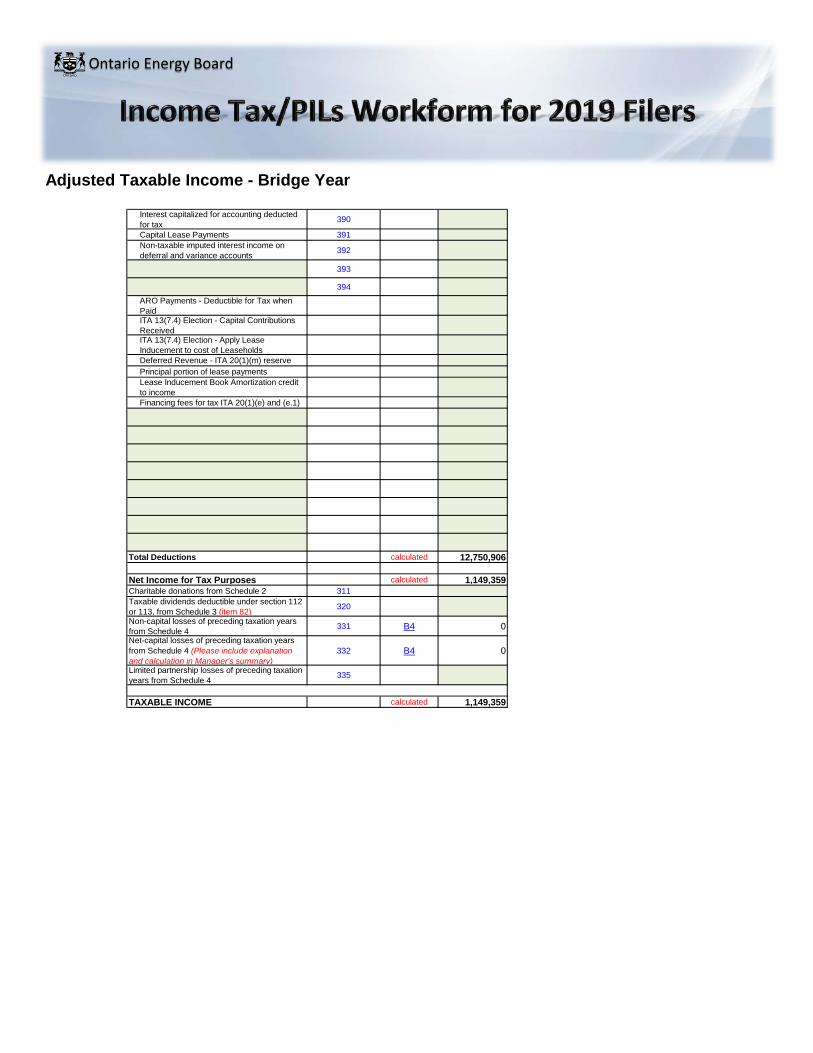
Adjusted Taxable Income - Bridge Year
Ontario Energy Board
Interest capitalized for accounting deducted for tax 390
Capital Lease Payments 391Non-taxable imputed interest income on deferral and variance accounts 392
393
394ARO Payments - Deductible for Tax when PaidITA 13(7.4) Election - Capital Contributions ReceivedITA 13(7.4) Election - Apply Lease Inducement to cost of LeaseholdsDeferred Revenue - ITA 20(1)(m) reservePrincipal portion of lease paymentsLease Inducement Book Amortization credit to incomeFinancing fees for tax ITA 20(1)(e) and (e.1)
Total Deductions calculated 12,750,906
Net Income for Tax Purposes calculated 1,149,359Charitable donations from Schedule 2 311Taxable dividends deductible under section 112 or 113, from Schedule 3 (item 82) 320
Non-capital losses of preceding taxation years from Schedule 4 331 B4 0Net-capital losses of preceding taxation years from Schedule 4 (Please include explanation and calculation in Manager's summary)
332 B4 0
Limited partnership losses of preceding taxation years from Schedule 4 335
TAXABLE INCOME calculated 1,149,359

Corporation Loss Continuity and Application
Schedule 4 Loss Carry Forward - Bridge Year
TotalH4 0
Amount to be used in Bridge Year B1 0B1 0
Balance available for use post Bridge Year calculated 0 T4
TotalH4 0
Amount to be used in Bridge Year B1
Balance available for use post Bridge Year calculated 0 T4Other Adjustments
Other Adjustments
Loss Carry Forward Generated in Bridge Year (if any)
Actual Historical
Loss Carry Forward Generated in Bridge Year (if any)
Net Capital Loss Carry Forward Deduction
Non-Capital Loss Carry Forward DeductionActual Historical
Ontario Energy Board

Schedule 8 CCA - Bridge Year
Class Class DescriptionWorking
Paper Reference
UCC Regulated Historical Year Additions Disposals
(Negative)UCC Before 1/2 Yr
Adjustment
1/2 Year Rule {1/2 Additions Less
Disposals}Reduced UCC Rate % Bridge Year CCA UCC End of
Bridge Year
Working Paper
Reference1 Distribution System - post 1987 H8 22,403,327.00$ 22,403,327$ -$ 22,403,327$ 4% 896,133$ 21,507,194$ T8
1 Enhanced Non-residential Buildings Reg. 1100(1)(a.1) election H8 -$ -$ -$ 6% -$ -$ T82 Distribution System - pre 1988 H8 -$ -$ -$ 6% -$ -$ T88 General Office/Stores Equip H8 450,077.00$ 450,077$ -$ 450,077$ 20% 90,015$ 360,062$ T8
10 Computer Hardware/ Vehicles H8 1,522,572.00$ 1,522,572$ -$ 1,522,572$ 30% 456,772$ 1,065,800$ T810.1 Certain Automobiles H8 -$ -$ -$ 30% -$ -$ T812 Computer Software H8 120,438.00$ 120,438$ -$ 120,438$ 100% 120,438$ -$ T8
13 1 Lease # 1 H8 -$ -$ -$ -$ -$ T813 2 Lease #2 H8 -$ -$ -$ -$ -$ T813 3 Lease # 3 H8 -$ -$ -$ -$ -$ T813 4 Lease # 4 H8 -$ -$ -$ -$ -$ T814 Franchise H8 -$ -$ -$ -$ -$ T817 New Electrical Generating Equipment Acq'd after Feb 27/00 Other Than Bldgs H8 -$ -$ -$ 8% -$ -$ T842 Fibre Optic Cable H8 -$ -$ -$ 12% -$ -$ T8
43.1 Certain Energy-Efficient Electrical Generating Equipment H8 -$ -$ -$ 30% -$ -$ T843.2 Certain Clean Energy Generation Equipment H8 -$ -$ -$ 50% -$ -$ T845 Computers & Systems Software acq'd post Mar 22/04 H8 504.00$ 504$ -$ 504$ 45% 227$ 277$ T846 Data Network Infrastructure Equipment (acq'd post Mar 22/04) H8 11,403.00$ 11,403$ -$ 11,403$ 30% 3,421$ 7,982$ T847 Distribution System - post February 2005 H8 61,082,377.00$ 3,900,246$ 64,982,623$ 1,950,123$ 63,032,500$ 8% 5,042,600$ 59,940,023$ T850 Data Network Infrastructure Equipment - post Mar 2007 H8 115,361.00$ 115,361$ -$ 115,361$ 55% 63,449$ 51,912$ T852 Computer Hardware and system software H8 -$ -$ -$ 100% -$ -$ T895 CWIP H8 -$ -$ -$ 0% -$ -$ T8
14.1 Eligible Capital Property (acq'd pre Jan 1, 2017)1 H8 -$ -$ -$ -$ 7% -$ -$ T814.1 Eligible Capital Property (acq'd post Jan 1, 2017)1 H8 -$ -$ -$ 5% -$ -$ T8
-$ -$ -$ -$ -$ 8 General Office/Stores Equip - Enhanced CCA 105,842$ 105,842$ 52,921-$ 158,763$ 20% 31,753$ 74,090$
10 Computer Hardware/ Vehicles - Enhanced CCA 700,972$ 700,972$ 350,486-$ 1,051,458$ 30% 315,437$ 385,535$ 12 Computer Software - Enhanced CCA 104,622$ 104,622$ -$ 104,622$ 100% 104,622$ -$ 47 Distribution System - post February 2005 - Enhanced CCA 7,224,226$ 7,224,226$ 3,612,113-$ 10,836,339$ 8% 866,907$ 6,357,319$ 50 Data Network Infrastructure Equipment - post Mar 2007 - Enhanced CCA 149,002$ 149,002$ 74,501-$ 223,502$ 55% 122,926$ 26,075$
-$ -$ -$ -$ -$ -$ -$ -$ -$ -$
TOTAL 85,706,059$ 12,184,910$ -$ 97,890,969$ 2,139,898-$ 100,030,867$ 8,114,700$ B1 89,776,269$
1. New CCA class 14.1 effective January 1, 2017. The class includes property that was eligible capital property immediately before January 1, 2017. For tax years that end prior to 2027, transitional rules apply to class 14.1 that were acquired before January 1, 2017
Ontario Energy Board

Schedule 13 Tax Reserves - Bridge Year
Continuity of Reserves
Description Reference Historical Utility Only Eliminate Amounts Not Relevant for Bridge Year
Adjusted Utility Balance Additions Disposals Balance for Bridge
YearChange During the
Year Disallowed Expenses
Capital Gains Reserves ss.40(1) H13 0 0 0 T13 0Tax Reserves Not Deducted for accounting purposesReserve for doubtful accounts ss. 20(1)(l) H13 0 0 0 T13 0Reserve for goods and services not delivered ss. 20(1)(m) H13 0 0 0 T13 0Reserve for unpaid amounts ss. 20(1)(n) H13 0 0 0 T13 0Debt & Share Issue Expenses ss. 20(1)(e) H13 0 0 0 T13 0Other tax reserves H13 0 0 0 T13 0
0 0 0 00 0 0 0
Total 0 0 0 B1 0 0 0 B1 0 00
Financial Statement Reserves (not deductible for Tax Purposes)General Reserve for Inventory Obsolescence (non-specific) H13 0 0 0 T13 0General reserve for bad debts H13 0 0 0 T13 0Accrued Employee Future Benefits: H13 0 0 0 T13 0- Medical and Life Insurance H13 0 0 0 T13 0-Short & Long-term Disability H13 0 0 0 T13 0 -Accmulated Sick Leave H13 0 0 0 T13 0- Termination Cost H13 0 0 0 T13 0- Other Post-Employment Benefits H13 0 0 0 T13 0Provision for Environmental Costs H13 0 0 0 T13 0Restructuring Costs H13 0 0 0 T13 0Accrued Contingent Litigation Costs H13 0 0 0 T13 0Accrued Self-Insurance Costs H13 0 0 0 T13 0Other Contingent Liabilities H13 0 0 0 T13 0Bonuses Accrued and Not Paid Within 180 Days of Year-End ss. 78(4) H13 0 0 0 T13 0Unpaid Amounts to Related Person and Not Paid Within 3 Taxation Years ss. 78(1) H13 0 0 0 T13 0
Other H13 0 0 0 T13 0Pension and OPEB H13 4,636,206 4,636,206 1,184,596 499,053 5,321,749 685,543
0 0 0 0
Total 4,636,206 0 4,636,206 B1 1,184,596 499,053 5,321,749 B1 685,543 00
Bridge Year Adjustments
Ontario Energy Board
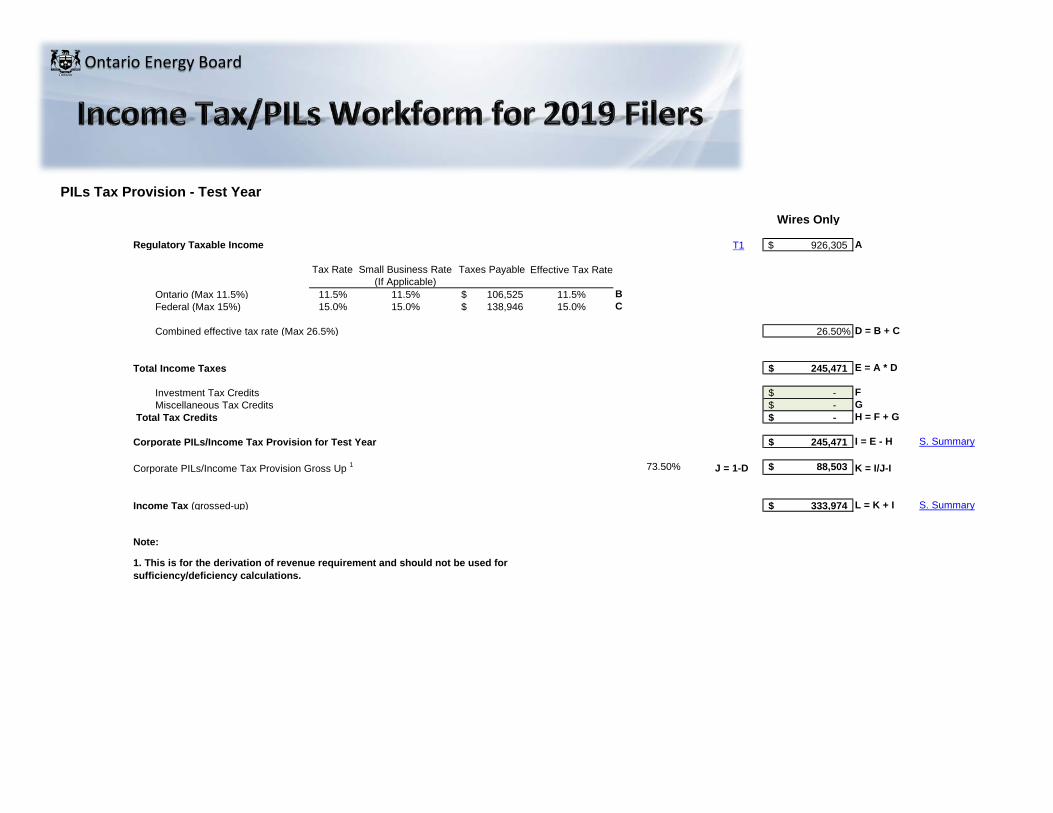
PILs Tax Provision - Test Year
Wires Only
Regulatory Taxable Income T1 926,305$ A
Tax Rate Small Business Rate (If Applicable)
Taxes Payable Effective Tax Rate
Ontario (Max 11.5%) 11.5% 11.5% 106,525$ 11.5% BFederal (Max 15%) 15.0% 15.0% 138,946$ 15.0% C
Combined effective tax rate (Max 26.5%) 26.50% D = B + C
Total Income Taxes 245,471$ E = A * D
Investment Tax Credits -$ FMiscellaneous Tax Credits -$ G
Total Tax Credits -$ H = F + G
Corporate PILs/Income Tax Provision for Test Year 245,471$ I = E - H S. Summary
Corporate PILs/Income Tax Provision Gross Up 1 73.50% J = 1-D 88,503$ K = I/J-I
Income Tax (grossed-up) 333,974$ L = K + I S. Summary
Note:
1. This is for the derivation of revenue requirement and should not be used for sufficiency/deficiency calculations.
Ontario Energy Board
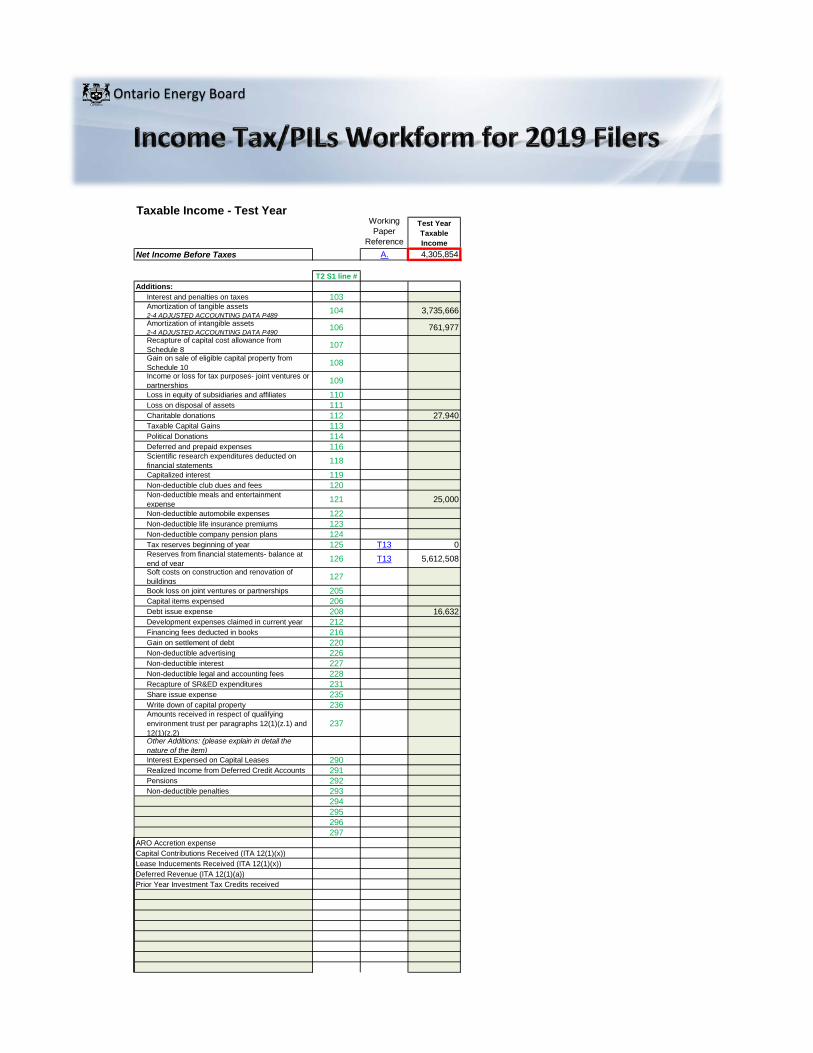
Taxable Income - Test YearWorking Paper
Reference
Test Year Taxable Income
Net Income Before Taxes A. 4,305,854
T2 S1 line #Additions:
Interest and penalties on taxes 103Amortization of tangible assets2-4 ADJUSTED ACCOUNTING DATA P489 104 3,735,666Amortization of intangible assets2-4 ADJUSTED ACCOUNTING DATA P490 106 761,977Recapture of capital cost allowance from Schedule 8 107Gain on sale of eligible capital property from Schedule 10 108Income or loss for tax purposes- joint ventures or partnerships 109Loss in equity of subsidiaries and affiliates 110Loss on disposal of assets 111Charitable donations 112 27,940Taxable Capital Gains 113Political Donations 114Deferred and prepaid expenses 116Scientific research expenditures deducted on financial statements 118Capitalized interest 119Non-deductible club dues and fees 120Non-deductible meals and entertainment expense 121 25,000Non-deductible automobile expenses 122Non-deductible life insurance premiums 123Non-deductible company pension plans 124Tax reserves beginning of year 125 T13 0Reserves from financial statements- balance at end of year 126 T13 5,612,508Soft costs on construction and renovation of buildings 127Book loss on joint ventures or partnerships 205Capital items expensed 206Debt issue expense 208 16,632Development expenses claimed in current year 212Financing fees deducted in books 216Gain on settlement of debt 220Non-deductible advertising 226Non-deductible interest 227Non-deductible legal and accounting fees 228Recapture of SR&ED expenditures 231Share issue expense 235Write down of capital property 236Amounts received in respect of qualifying environment trust per paragraphs 12(1)(z.1) and 12(1)(z.2)
237
Other Additions: (please explain in detail the nature of the item)Interest Expensed on Capital Leases 290Realized Income from Deferred Credit Accounts 291Pensions 292Non-deductible penalties 293
294295296297
ARO Accretion expenseCapital Contributions Received (ITA 12(1)(x))Lease Inducements Received (ITA 12(1)(x))Deferred Revenue (ITA 12(1)(a))Prior Year Investment Tax Credits received
Ontario Energy Board
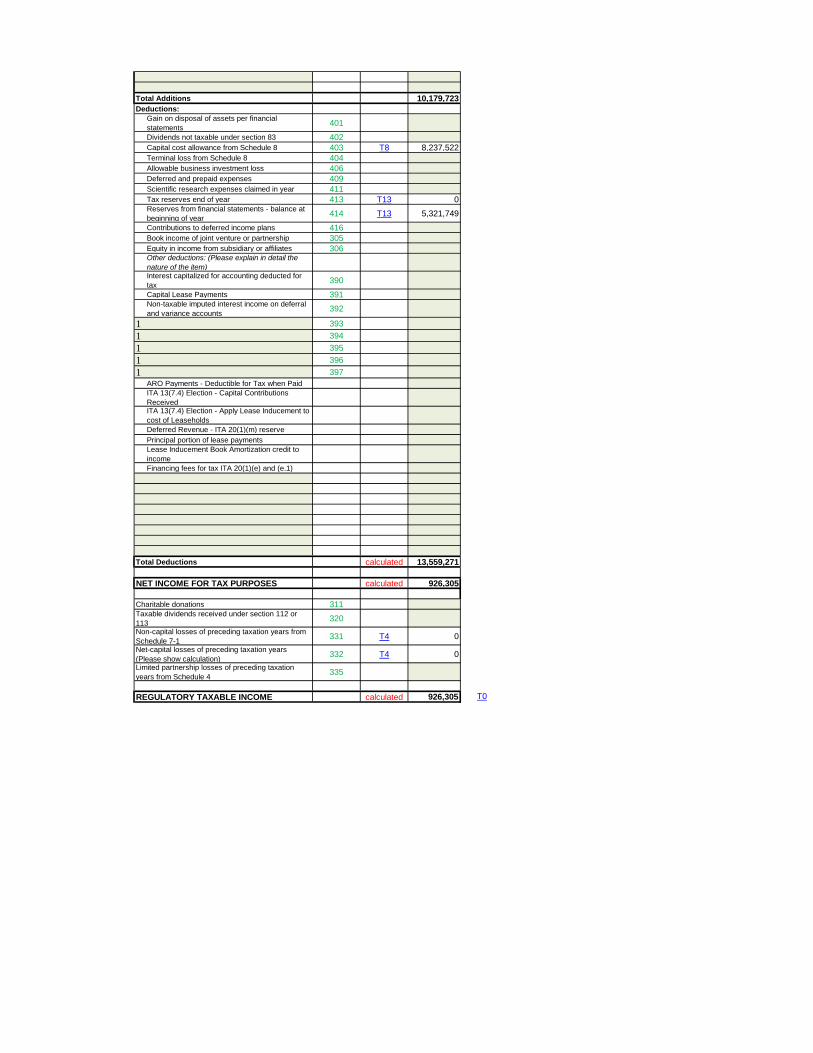
Total Additions 10,179,723Deductions:
Gain on disposal of assets per financial statements 401Dividends not taxable under section 83 402Capital cost allowance from Schedule 8 403 T8 8,237,522Terminal loss from Schedule 8 404Allowable business investment loss 406Deferred and prepaid expenses 409Scientific research expenses claimed in year 411Tax reserves end of year 413 T13 0Reserves from financial statements - balance at beginning of year 414 T13 5,321,749Contributions to deferred income plans 416Book income of joint venture or partnership 305Equity in income from subsidiary or affiliates 306Other deductions: (Please explain in detail the nature of the item)Interest capitalized for accounting deducted for tax 390Capital Lease Payments 391Non-taxable imputed interest income on deferral and variance accounts 392
1 3931 3941 3951 3961 397
ARO Payments - Deductible for Tax when PaidITA 13(7.4) Election - Capital Contributions ReceivedITA 13(7.4) Election - Apply Lease Inducement to cost of LeaseholdsDeferred Revenue - ITA 20(1)(m) reservePrincipal portion of lease paymentsLease Inducement Book Amortization credit to incomeFinancing fees for tax ITA 20(1)(e) and (e.1)
Total Deductions calculated 13,559,271
NET INCOME FOR TAX PURPOSES calculated 926,305
Charitable donations 311Taxable dividends received under section 112 or 113 320Non-capital losses of preceding taxation years from Schedule 7-1 331 T4 0Net-capital losses of preceding taxation years (Please show calculation) 332 T4 0Limited partnership losses of preceding taxation years from Schedule 4 335
REGULATORY TAXABLE INCOME calculated 926,305 T0
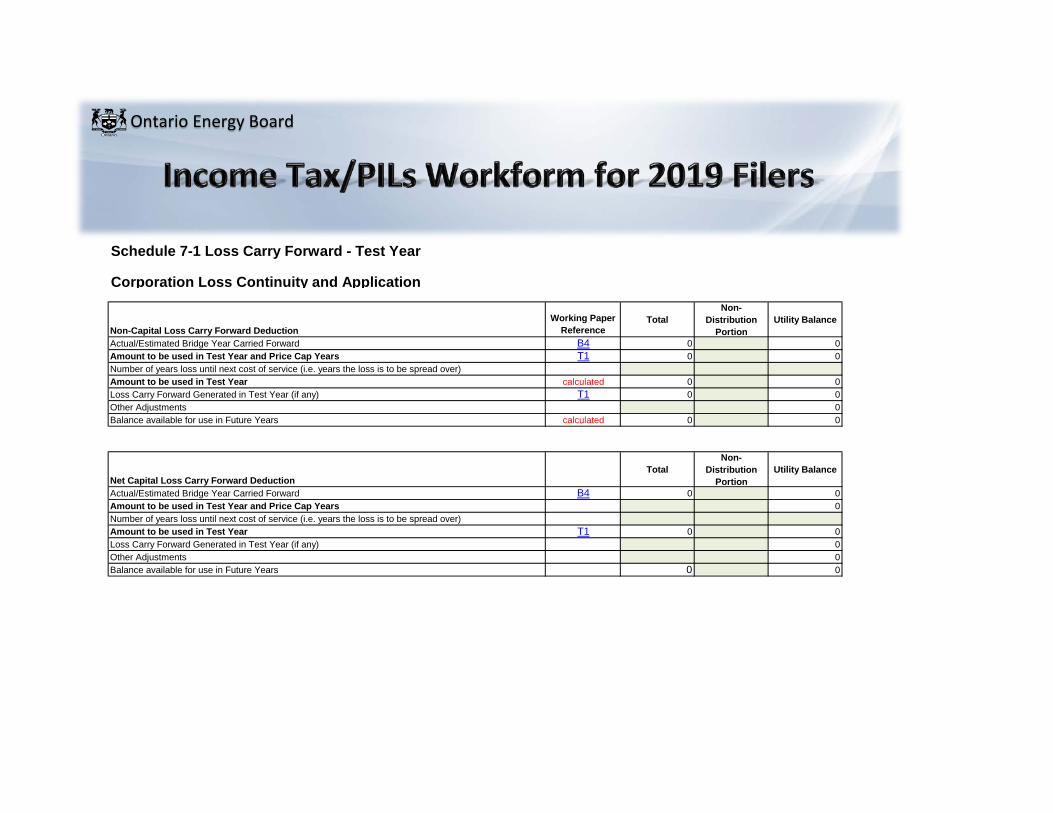
Schedule 7-1 Loss Carry Forward - Test Year
Corporation Loss Continuity and Application
Working Paper Reference
TotalNon-
Distribution Portion
Utility Balance
B4 0 0Amount to be used in Test Year and Price Cap Years T1 0 0Number of years loss until next cost of service (i.e. years the loss is to be spread over)
calculated 0 0T1 0 0
0Balance available for use in Future Years calculated 0 0
TotalNon-
Distribution Portion
Utility Balance
B4 0 0Amount to be used in Test Year and Price Cap Years 0Number of years loss until next cost of service (i.e. years the loss is to be spread over)
T1 0 000
Balance available for use in Future Years 0 0Other Adjustments
Amount to be used in Test Year Loss Carry Forward Generated in Test Year (if any)
Actual/Estimated Bridge Year Carried ForwardNon-Capital Loss Carry Forward Deduction
Loss Carry Forward Generated in Test Year (if any)
Net Capital Loss Carry Forward DeductionActual/Estimated Bridge Year Carried Forward
Amount to be used in Test Year
Other Adjustments
Ontario Energy Board
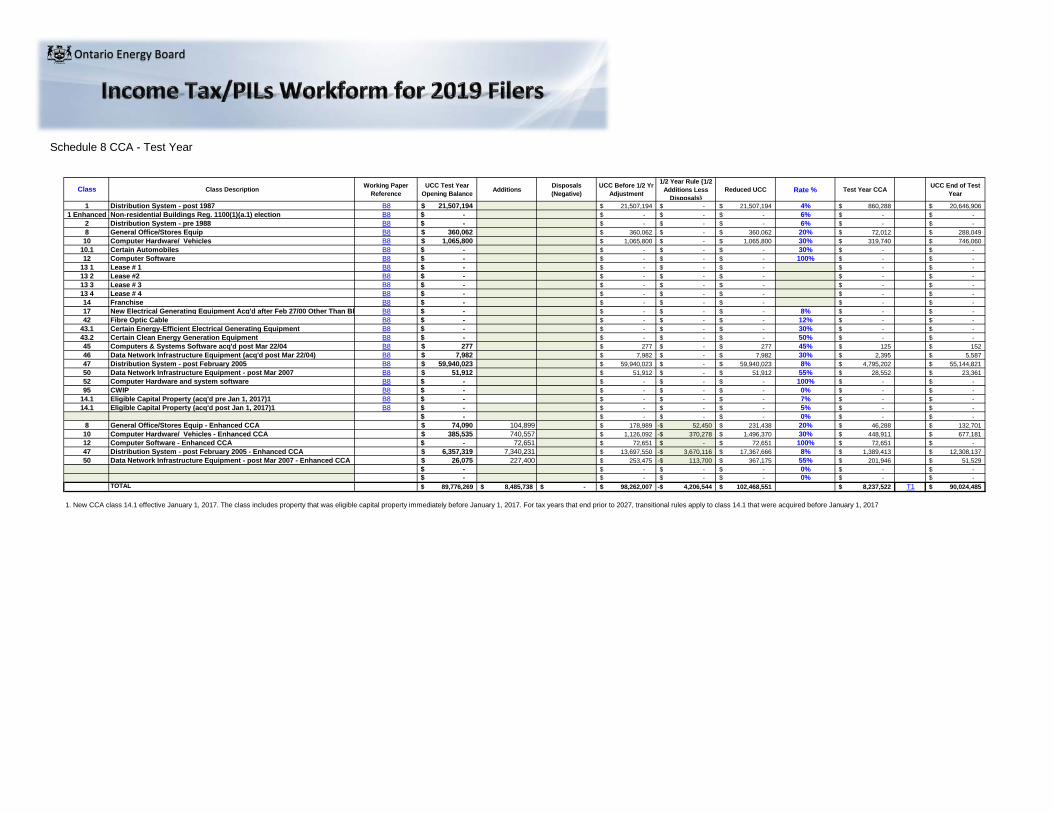
Schedule 8 CCA - Test Year
Class Class Description Working Paper Reference
UCC Test Year Opening Balance Additions Disposals
(Negative)UCC Before 1/2 Yr
Adjustment
1/2 Year Rule {1/2 Additions Less
Disposals}Reduced UCC Rate % Test Year CCA UCC End of Test
Year
1 Distribution System - post 1987 B8 21,507,194$ 21,507,194$ -$ 21,507,194$ 4% 860,288$ 20,646,906$ 1 Enhanced Non-residential Buildings Reg. 1100(1)(a.1) election B8 -$ -$ -$ -$ 6% -$ -$
2 Distribution System - pre 1988 B8 -$ -$ -$ -$ 6% -$ -$ 8 General Office/Stores Equip B8 360,062$ 360,062$ -$ 360,062$ 20% 72,012$ 288,049$ 10 Computer Hardware/ Vehicles B8 1,065,800$ 1,065,800$ -$ 1,065,800$ 30% 319,740$ 746,060$
10.1 Certain Automobiles B8 -$ -$ -$ -$ 30% -$ -$ 12 Computer Software B8 -$ -$ -$ -$ 100% -$ -$
13 1 Lease # 1 B8 -$ -$ -$ -$ -$ -$ 13 2 Lease #2 B8 -$ -$ -$ -$ -$ -$ 13 3 Lease # 3 B8 -$ -$ -$ -$ -$ -$ 13 4 Lease # 4 B8 -$ -$ -$ -$ -$ -$ 14 Franchise B8 -$ -$ -$ -$ -$ -$ 17 New Electrical Generating Equipment Acq'd after Feb 27/00 Other Than Bl B8 -$ -$ -$ -$ 8% -$ -$ 42 Fibre Optic Cable B8 -$ -$ -$ -$ 12% -$ -$
43.1 Certain Energy-Efficient Electrical Generating Equipment B8 -$ -$ -$ -$ 30% -$ -$ 43.2 Certain Clean Energy Generation Equipment B8 -$ -$ -$ -$ 50% -$ -$ 45 Computers & Systems Software acq'd post Mar 22/04 B8 277$ 277$ -$ 277$ 45% 125$ 152$ 46 Data Network Infrastructure Equipment (acq'd post Mar 22/04) B8 7,982$ 7,982$ -$ 7,982$ 30% 2,395$ 5,587$ 47 Distribution System - post February 2005 B8 59,940,023$ 59,940,023$ -$ 59,940,023$ 8% 4,795,202$ 55,144,821$ 50 Data Network Infrastructure Equipment - post Mar 2007 B8 51,912$ 51,912$ -$ 51,912$ 55% 28,552$ 23,361$ 52 Computer Hardware and system software B8 -$ -$ -$ -$ 100% -$ -$ 95 CWIP B8 -$ -$ -$ -$ 0% -$ -$
14.1 Eligible Capital Property (acq'd pre Jan 1, 2017)1 B8 -$ -$ -$ -$ 7% -$ -$ 14.1 Eligible Capital Property (acq'd post Jan 1, 2017)1 B8 -$ -$ -$ -$ 5% -$ -$
-$ -$ -$ -$ 0% -$ -$ 8 General Office/Stores Equip - Enhanced CCA 74,090$ 104,899 178,989$ 52,450-$ 231,438$ 20% 46,288$ 132,701$ 10 Computer Hardware/ Vehicles - Enhanced CCA 385,535$ 740,557 1,126,092$ 370,278-$ 1,496,370$ 30% 448,911$ 677,181$ 12 Computer Software - Enhanced CCA -$ 72,651 72,651$ -$ 72,651$ 100% 72,651$ -$ 47 Distribution System - post February 2005 - Enhanced CCA 6,357,319$ 7,340,231 13,697,550$ 3,670,116-$ 17,367,666$ 8% 1,389,413$ 12,308,137$ 50 Data Network Infrastructure Equipment - post Mar 2007 - Enhanced CCA 26,075$ 227,400 253,475$ 113,700-$ 367,175$ 55% 201,946$ 51,529$
-$ -$ -$ -$ 0% -$ -$ -$ -$ -$ -$ 0% -$ -$
TOTAL 89,776,269$ 8,485,738$ -$ 98,262,007$ 4,206,544-$ 102,468,551$ 8,237,522$ T1 90,024,485$
1. New CCA class 14.1 effective January 1, 2017. The class includes property that was eligible capital property immediately before January 1, 2017. For tax years that end prior to 2027, transitional rules apply to class 14.1 that were acquired before January 1, 2017
Ontario Energy Board

Schedule 13 Tax Reserves - Test Year
Continuity of Reserves
Description Working Paper Reference Bridge Year Eliminate Amounts Not
Relevant for Bridge YearAdjusted Utility
Balance Additions Disposals Balance for Test Year Change During the Year Disallowed Expenses
Capital Gains Reserves ss.40(1) B13 0 0 0 0Tax Reserves Not Deducted for accounting purposesReserve for doubtful accounts ss. 20(1)(l) B13 0 0 0 0 0 0Reserve for goods and services not delivered ss. 20(1)(m) B13 0 0 0 0Reserve for unpaid amounts ss. 20(1)(n) B13 0 0 0 0Debt & Share Issue Expenses ss. 20(1)(e) B13 0 0 0 0Other tax reserves B13 0 0 0 0
0 0 0 00 0 0 0
Total 0 0 0 T1 0 0 0 T1 0 00
Financial Statement Reserves (not deductible for Tax Purposes)General Reserve for Inventory Obsolescence (non-specific) B13 0 0 0 0General reserve for bad debts B13 0 0 0 0Accrued Employee Future Benefits: B13 0 0 0 0- Medical and Life Insurance B13 0 0 0 0-Short & Long-term Disability B13 0 0 0 0 -Accmulated Sick Leave B13 0 0 0 0- Termination Cost B13 0 0 0 0- Other Post-Employment Benefits B13 0 0 0 0Provision for Environmental Costs B13 0 0 0 0Restructuring Costs B13 0 0 0 0Accrued Contingent Litigation Costs B13 0 0 0 0Accrued Self-Insurance Costs B13 0 0 0 0Other Contingent Liabilities B13 0 0 0 0Bonuses Accrued and Not Paid Within 180 Days of Year-End ss. 78(4) B13 0 0 0 0Unpaid Amounts to Related Person and Not Paid Within 3 Taxation Years ss. 78(1) B13 0 0 0 0
Other B13 0 0 0 0Pension and OPEB 5,321,749 5,321,749 802,047 511,288 5,612,508 290,759
0 0 0 0
Total 5,321,749 0 5,321,749 T1 802,047 511,288 5,612,508 T1 290,759 00
Test Year Adjustments
Ontario Energy Board

Appendix 4F
Algoma Power Inc.
2020 Cost of Service
EB-2019-0019
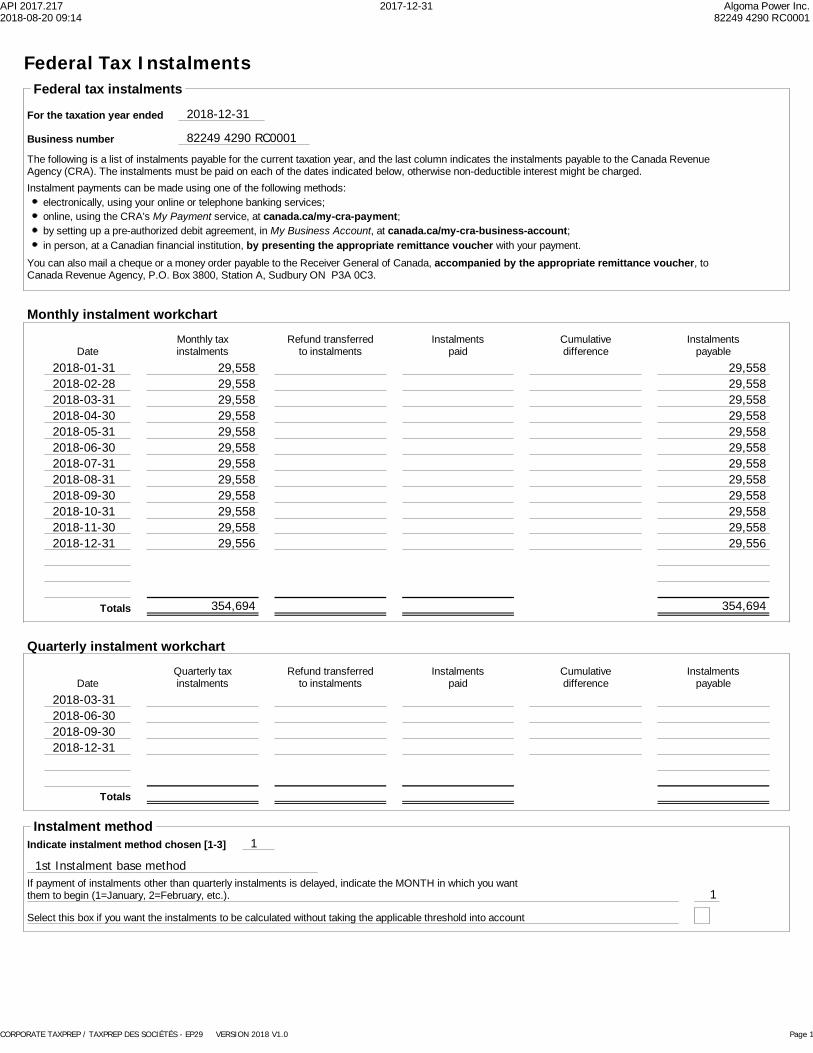
API 2017.217 2017-12-31 Algoma Power Inc.2018-08-20 09:14 82249 4290 RC0001
CORPORATE TAXPREP / TAXPREP DES SOCIÉTÉS - EP29 VERSION 2018 V1.0 Page 1
Federal Tax InstalmentsFederal tax instalments
For the taxation year ended
The following is a list of instalments payable for the current taxation year, and the last column indicates the instalments payable to the Canada RevenueAgency (CRA). The instalments must be paid on each of the dates indicated below, otherwise non-deductible interest might be charged.
Business number
Instalment payments can be made using one of the following methods:electronically, using your online or telephone banking services;online, using the CRA's My Payment service, at canada.ca/my-cra-payment;by setting up a pre-authorized debit agreement, in My Business Account, at canada.ca/my-cra-business-account;in person, at a Canadian financial institution, by presenting the appropriate remittance voucher with your payment.
You can also mail a cheque or a money order payable to the Receiver General of Canada, accompanied by the appropriate remittance voucher, toCanada Revenue Agency, P.O. Box 3800, Station A, Sudbury ON P3A 0C3.
2018-12-31
82249 4290 RC0001
Monthly instalment workchart
DateMonthly taxinstalments
Instalmentspaid
Cumulativedifference
Instalmentspayable
Refund transferredto instalments
2018-01-31 29,558 29,5582018-02-28 29,558 29,5582018-03-31 29,558 29,5582018-04-30 29,558 29,5582018-05-31 29,558 29,5582018-06-30 29,558 29,5582018-07-31 29,558 29,5582018-08-31 29,558 29,5582018-09-30 29,558 29,5582018-10-31 29,558 29,5582018-11-30 29,558 29,5582018-12-31 29,556 29,556
Totals 354,694 354,694
Quarterly instalment workchart
DateQuarterly taxinstalments
Instalmentspaid
Cumulativedifference
Instalmentspayable
Refund transferredto instalments
Totals
2018-06-302018-09-302018-12-31
2018-03-31
Instalment methodIndicate instalment method chosen [1-3]
1st Instalment base method
1
If payment of instalments other than quarterly instalments is delayed, indicate the MONTH in which you wantthem to begin (1=January, 2=February, etc.).
Select this box if you want the instalments to be calculated without taking the applicable threshold into account
1

API 2017.217 2017-12-31 Algoma Power Inc.2018-08-20 09:14 82249 4290 RC0001
CORPORATE TAXPREP / TAXPREP DES SOCIÉTÉS - EP29 VERSION 2018 V1.0 Page 2
Quarterly instalments calculationThe corporation must meet requirements 1 to 5 to be eligible for quarterly instalments for a tax year.
Is the corporation a Canadian-controlled private corporation (CCPC)?
Did the corporation claim any deduction under the section 125, during either the current or previous year?
1 –
2 –3 – Is the corporation's, or any of its associated corporations', taxable income for the current or previous year
less than or equal to $500,000?4 – Is the corporation and any associated corporations' taxable capital employed in Canada
for the current or previous year less than or equal to $10,000,000?5 – Does the corporation have a perfect compliance history in the last 12 months?
If you do not want to use the quarterly instalments option, select this box to go back to monthly instalments.
Yes No
Yes No
Yes No
Yes No
Yes No
XX
1 – 1st Instalment base method1st Instalment base amount (amount N below)
Monthly instalments required÷ 12 =
Quarterly tax instalments required ÷ 4 =
354,694 29,55829,558
354,694
2 – Combined 1st and 2nd instalment base method
2nd Monthly instalment base amountIndicate: Part I tax
A
B
Total
Each of the first two instalment paymentsTotal tax from N belowAmount B above x 2
Each of the remaining ten instalment payments
Part VI, VI.1 and XIII.1 tax
Provincial tax, other than Alberta, Québec and Ontario
1/12 of estimated current year credits (M below /12)
10
÷ 12 =
=
==
÷
–
–
+
+
=
=
Ontario tax +
Federal adjustment for amalgamation, winding up or transfer +
Provincial adjustment for amalgamation, winding up or transfer +
Select this box if you want the first 2 payments* to be calculatedwithout taking the applicable threshold into account?
311,995 26,000
26,000354,69452,000
302,694 30,27030,270
176,908
135,087
2nd Quarterly instalment base amountIndicate: Part I tax
A
B
Total
The first instalment paymentTotal tax from N belowAmount B above
Each of the remaining three instalment payments
Part VI, VI.1 and XIII.1 tax
Provincial tax, other than Alberta, Québec and Ontario
1/4 of estimated current year credits (M below /4)
3
÷ 4 =
=
==
÷
–
–
+
+
=
=
Ontario tax +
Federal adjustment for amalgamation, winding up or transfer +
Provincial adjustment for amalgamation, winding up or transfer +
* It is the first payment if the quarterly instalments are applicable.
311,995 77,999
354,694
354,694 118,232
176,908
135,087
3 – Estimated tax methodInstalment base amount (amount N below)
Monthly instalments required÷ 12 =
Quarterly tax instalments required ÷ 4 =

API 2017.217 2017-12-31 Algoma Power Inc.2018-08-20 09:14 82249 4290 RC0001
CORPORATE TAXPREP / TAXPREP DES SOCIÉTÉS - EP29 VERSION 2018 V1.0 Page 3
Instalment base calculation
Taxable income
1st instalmentbase method
Estimatedtax method
Calculation of tax payableFederal part I tax
Refundable tax on a CCPC's investment incomeSubtotal A
+ += =
Federal tax
Recapture of investment tax credit + +
1,338,469
508,618
508,618
DeductionSmall business deductionInvestment corporation deductionFederal tax abatementManufacturing and processing profits deductionNon-business foreign tax creditBusiness foreign tax creditGeneral tax reductionLogging tax creditInvestment tax credit per Schedule 31
Qualifying environmental trust tax creditSubtotal B
++++++++
+
++++++++
+= =
Eligible Canadian bank deduction + +
133,847
174,001
307,848
Total part I tax payable (A minus B) CPart VI taxPart VI.1 tax
TotalParts I, VI, VI.1 and XIII.1 F
DE1
++
++
Federal tax summary
Part XIII.1 tax + + E2= =
200,770
200,770
Adjustment for short taxation years multiplied by 365 anddivided by the number of days in the year if less than 365
Federal adjustments
Subtotal = =365 / 365 /x x
Federal adjustment for amalgamation, winding up or transferTotal federal tax after adjustments = G
+=
N/A+
365 365200,770
200,770
Provincial/territorial tax other than Alberta, Québec and Ontariobefore provincial refundable tax credits H+ +
Ontario taxIncome taxCorporate minimum tax paid (credited) +
Total Ontario tax = + I
Provincial/territorial tax other than Alberta and Québecbefore provincial refundable tax credits
Harmonized provincial tax (H + I)
= =
K
Total of tax before refundable credits** = =
J
L
Provincial tax
+
Provincial adjustmentsAdjustment for short taxation years multiplied by 365 anddivided by the number of days in the year if less than 365 x 365 / x 365 /
Subtotal = =Provincial adjustment for amalgamation, winding up or transfer
Total provincial tax after adjustments+=
+=
N/A
Special additional tax on life insurance corporations +
153,924
153,924 153,924
153,924
365 365153,924
354,694
153,924
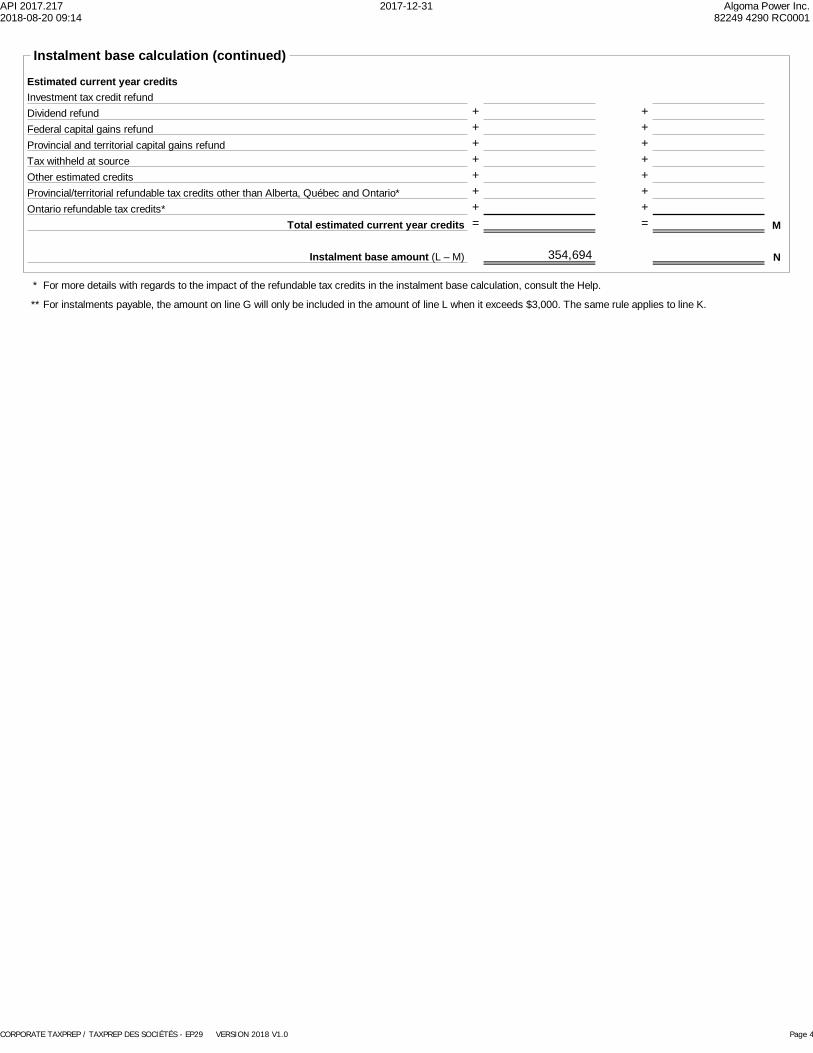
API 2017.217 2017-12-31 Algoma Power Inc.2018-08-20 09:14 82249 4290 RC0001
CORPORATE TAXPREP / TAXPREP DES SOCIÉTÉS - EP29 VERSION 2018 V1.0 Page 4
Instalment base calculation (continued)
Investment tax credit refundEstimated current year credits
Dividend refundFederal capital gains refundProvincial and territorial capital gains refundTax withheld at sourceOther estimated credits
Total estimated current year credits M
(L – M)Instalment base amount N
+++++
+++++
= =
Provincial/territorial refundable tax credits other than Alberta, Québec and Ontario* + +Ontario refundable tax credits* + +
354,694
For more details with regards to the impact of the refundable tax credits in the instalment base calculation, consult the Help.
For instalments payable, the amount on line G will only be included in the amount of line L when it exceeds $3,000. The same rule applies to line K.
*
**
API 2017.217 2017-12-31 Algoma Power Inc.2018-08-20 09:14 82249 4290 RC0001
CORPORATE TAXPREP / TAXPREP DES SOCIÉTÉS - EP29 VERSION 2018 V1.0 Page 1
200T2 Corporation Income Tax ReturnThis form serves as a federal, provincial, and territorial corporation income tax return, unless the corporation is located inQuebec or Alberta. If the corporation is located in one of these provinces, you have to file a separate provincialcorporation return.All legislative references on this return are to the federal Income Tax Act and Income Tax Regulations. This return maycontain changes that had not yet become law at the time of publication.Send one completed copy of this return, including schedules and the General Index of Financial Information (GIFI), to yourtax centre or tax services office. You have to file the return within six months after the end of the corporation's tax year.
Do not use this area055
For more information see canada.ca/taxes or Guide T4012, T2 Corporation – Income Tax Guide.
IdentificationBusiness number (BN) . . . . . . . . . . 001 82249 4290 RC0001
City
2 No1 Yes
To which tax year does this return apply?
Address of head office Has this address changed since the lasttime we were notified? . . . . . . . . . . . .
If yes, provide the datecontrol was acquired . . . . . . . . . . . . .
Mailing address (if different from head office address)
020
Country (other than Canada) Postal or ZIP code
Province, territory, or state
010060 061
012011
018017
016015
063
065
1 Yes 2 No
1 Yes 2 No
Is the corporation a professionalcorporation that is a member ofa partnership? . . . . . . . . . . . . . . . . 067 1 Yes 2 No
Country (other than Canada)
City
c/o021022023
Is this the first year of filing after: Incorporation? . . . . . . . . . . . . . . . Amalgamation? . . . . . . . . . . . . . . .
070 1 Yes 2 No071 1 Yes 2 No
025
027
Province, territory, or state026
Postal or ZIP code028
Has there been a wind-up of asubsidiary under section 88 during thecurrent tax year? . . . . . . . . . . . . . .
Location of books and records (if different from head office address) If yes, complete and attach Schedule 24.072 1 Yes 2 No
032031
Is this the final tax yearbefore amalgamation? . . . . . . . . . . 076 1 Yes 2 No
Country (other than Canada)
City
038Postal or ZIP code
037
036Province, territory, or state
035
Is this the final return up to dissolution? . . . . . . . . . . . . . . . . . 078 1 Yes 2 No
Is the corporation a resident of Canada? 080 1 Yes 2 No
2 No1 Yes082If yes, complete and attach Schedule 91.
081Type of corporation at the end of the tax year (tick one)040Is the non-resident corporationclaiming an exemption underan income tax treaty? . . . . . . . . . . .
If the corporation is exempt from tax under section 149,tick one of the following boxes:
085
If the type of corporation changed duringthe tax year, provide the effectivedate of the change . . . . . . . . . . . . . . 043
Has this address changed since the lasttime we were notified? . . . . . . . . . . .
Has this address changed since thelast time we were notified? . . . . . . . . . 030 1 Yes 2 No
If yes, complete lines 011 to 018.
If yes, complete lines 021 to 028.
If yes, complete lines 031 to 038.
066 1 Yes 2 No
If yes, complete lines 030 to 038 and attach Schedule 24.
Corporation's name002
If an election was made undersection 261, state the functionalcurrency used . . . . . . . . . . . . . . . . 079
Is the date on line 061 a deemedtax year-end according tosubsection 249(3.1)? . . . . . . . . . . . .
Year Month Day
Tax year startYear Month Day
Tax year-endYear Month Day
Year Month Day
Has there been an acquisition of controlresulting in the application ofsubsection 249(4) since the tax yearstart on line 060? . . . . . . . . . . . . . .
If no, give the country of residence on line 081 and complete and attachSchedule 97.
1
5 Other corporation(specify)
Corporation controlled by a public corporation4
3 Public corporation
Other private corporation2
Canadian-controlled private corporation (CCPC)
Exempt under other paragraphs of section 149Exempt under paragraph 149(1)(t)Exempt under paragraph 149(1)(j)Exempt under paragraph 149(1)(e) or (l)1
234
2017-12-312017-01-01
P6B 6J6
ONSault Ste Marie
2 Sackville Road
X
X
X
XFortisOntario
1130 Bertie StreetPO Box 1218
XX
Fort Erie ON
L2A 5Y2 X
1130 Bertie StreetPO Box 1218
X
CA L2A 5Y2
ONFort Erie
X
X
X
X
X
X
Algoma Power Inc.
Do not use this area
095 096 898
¤T2 E (18)

API 2017.217 2017-12-31 Algoma Power Inc.2018-08-20 09:14 82249 4290 RC0001
CORPORATE TAXPREP / TAXPREP DES SOCIÉTÉS - EP29 VERSION 2018 V1.0 Page 2
AttachmentsFinancial statement information: Use GIFI schedules 100, 125, and 141.Schedules – Answer the following questions. For each yes response, attach the schedule to the T2 return, unless otherwise instructed.
Yes Schedule
Is the corporation related to any other corporations? . . . . . . . . . . . . . . . . . . . . . . . . . . . . . . . . . . . . . . . . . . . . . . . . . . . . 150 9X
Does the corporation have any non-resident shareholders who own voting shares? . . . . . . . . . . . . . . . . . . . . . . . . . . . . . . . . . . 151 19
Is the corporation an associated CCPC? . . . . . . . . . . . . . . . . . . . . . . . . . . . . . . . . . . . . . . . . . . . . . . . . . . . . . . . . . . 160 23Is the corporation an associated CCPC that is claiming the expenditure limit? . . . . . . . . . . . . . . . . . . . . . . . . . . . . . . . . . . . . . 161 49
Has the corporation had any transactions, including section 85 transfers, with its shareholders, officers, or employees,other than transactions in the ordinary course of business? Exclude non-arm's length transactions with non-residents . . . . . . . . . . . . . 162 11
44163If you answered yes to the above question, and the transaction was between corporations not dealing at arm's length,were all or substantially all of the assets of the transferor disposed of to the transferee? . . . . . . . . . . . . . . . . . . . . . . . . . . . . . . .
14164Has the corporation paid any royalties, management fees, or other similar payments to residents of Canada? . . . . . . . . . . . . . . . . . . Is the corporation claiming a deduction for payments to a type of employee benefit plan? . . . . . . . . . . . . . . . . . . . . . . . . . . . . . . 165 15Is the corporation claiming a loss or deduction from a tax shelter? . . . . . . . . . . . . . . . . . . . . . . . . . . . . . . . . . . . . . . . . . . . . 166 T5004Is the corporation a member of a partnership for which a partnership account number has been assigned? . . . . . . . . . . . . . . . . . . . . 167 T5013Did the corporation, a foreign affiliate controlled by the corporation, or any other corporation or trust that did not deal at arm's lengthwith the corporation have a beneficial interest in a non-resident discretionary trust (without reference to section 94)? . . . . . . . . . . . . . . 168 22Did the corporation own any shares in one or more foreign affiliates in the tax year? . . . . . . . . . . . . . . . . . . . . . . . . . . . . . . . . . 169 25Has the corporation made any payments to non-residents of Canada under subsections 202(1) and/or 105(1) ofthe Income Tax Regulations? . . . . . . . . . . . . . . . . . . . . . . . . . . . . . . . . . . . . . . . . . . . . . . . . . . . . . . . . . . . . . . . . . 170 29Did the corporation have a total amount over CAN$1 million of reportable transactions with non-arm's length non-residents? . . . . . . . . . . 171 T106
173 50For private corporations: Does the corporation have any shareholders who own 10% or more of the corporation'scommon and/or preferred shares? . . . . . . . . . . . . . . . . . . . . . . . . . . . . . . . . . . . . . . . . . . . . . . . . . . . . . . . . . . . . . .
Is the net income/loss shown on the financial statements different from the net income/loss for income tax purposes? . . . . . . . . . . . . . 201 1Has the corporation made any charitable donations; gifts of cultural or ecological property; or gifts of medicine? . . . . . . . . . . . . . . . . . 202 2Has the corporation received any dividends or paid any taxable dividends for purposes of the dividend refund? . . . . . . . . . . . . . . . . . . 203 3Is the corporation claiming any type of losses? . . . . . . . . . . . . . . . . . . . . . . . . . . . . . . . . . . . . . . . . . . . . . . . . . . . . . . . 204 4Is the corporation claiming a provincial or territorial tax credit or does it have a permanent establishmentin more than one jurisdiction? . . . . . . . . . . . . . . . . . . . . . . . . . . . . . . . . . . . . . . . . . . . . . . . . . . . . . . . . . . . . . . . . . 205 5Has the corporation realized any capital gains or incurred any capital losses during the tax year? . . . . . . . . . . . . . . . . . . . . . . . . . . 206 6
Has the corporation made payments to, or received amounts from, a retirement compensation plan arrangement during the year? . . . . . . 172 ______
Does the corporation earn income from one or more Internet webpages or websites? . . . . . . . . . . . . . . . . . . . . . . . . . . . . . . . . . 180 88XX
i) Is the corporation a CCPC and reporting a) income or loss from property (other than dividends deductible on line 320 of the T2 return), b) income from a partnership, c) income from a foreign business, d) income from a personal services business, e) income referred to in clause 125(1)(a)(i)(C) or 125(1)(a)(i)(B), f) aggregate investment income as defined in subsection 129(4), or g) an amount assigned to it under subsection 125(3.2) or 125(8); orii) Is the corporation a member of a partnership and assigning its specified partnership business limit to a designated member undersubsection 125(8)? . . . . . . . . . . . . . . . . . . . . . . . . . . . . . . . . . . . . . . . . . . . . . . . . . . . . . . . . . . . . . . . . . . . . . . . 207 7Does the corporation have any property that is eligible for capital cost allowance? . . . . . . . . . . . . . . . . . . . . . . . . . . . . . . . . . . . 208 8Does the corporation have any property that is eligible capital property? . . . . . . . . . . . . . . . . . . . . . . . . . . . . . . . . . . . . . . . . 210 10Does the corporation have any resource-related deductions? . . . . . . . . . . . . . . . . . . . . . . . . . . . . . . . . . . . . . . . . . . . . . . . 212 12Is the corporation claiming deductible reserves (other than transitional reserves under section 34.2)? . . . . . . . . . . . . . . . . . . . . . . . 213 13Is the corporation claiming a patronage dividend deduction? . . . . . . . . . . . . . . . . . . . . . . . . . . . . . . . . . . . . . . . . . . . . . . . 216 16Is the corporation a credit union claiming a deduction for allocations in proportion to borrowing or an additional deduction? . . . . . . . . . . . 217 17Is the corporation an investment corporation or a mutual fund corporation? . . . . . . . . . . . . . . . . . . . . . . . . . . . . . . . . . . . . . . . 218 18Is the corporation carrying on business in Canada as a non-resident corporation? . . . . . . . . . . . . . . . . . . . . . . . . . . . . . . . . . . 220 20Is the corporation claiming any federal, provincial, or territorial foreign tax credits, or any federal logging tax credits? . . . . . . . . . . . . . . 221 21Does the corporation have any Canadian manufacturing and processing profits? . . . . . . . . . . . . . . . . . . . . . . . . . . . . . . . . . . . 227 27Is the corporation claiming an investment tax credit? . . . . . . . . . . . . . . . . . . . . . . . . . . . . . . . . . . . . . . . . . . . . . . . . . . . . 231 31
X
232 T661Is the corporation claiming any scientific research and experimental development (SR&ED) expenditures? . . . . . . . . . . . . . . . . . . . . Is the total taxable capital employed in Canada of the corporation and its related corporations over $10,000,000? . . . . . . . . . . . . . . . . 233
Is the corporation subject to gross Part VI tax on capital of financial institutions? . . . . . . . . . . . . . . . . . . . . . . . . . . . . . . . . . . . 238 38Is the corporation claiming a Part I tax credit? . . . . . . . . . . . . . . . . . . . . . . . . . . . . . . . . . . . . . . . . . . . . . . . . . . . . . . . 242 42Is the corporation subject to Part IV.1 tax on dividends received on taxable preferred shares or Part VI.1 tax on dividends paid? . . . . . . . . 243 43Is the corporation agreeing to a transfer of the liability for Part VI.1 tax? . . . . . . . . . . . . . . . . . . . . . . . . . . . . . . . . . . . . . . . . . 244 45Is the corporation subject to Part II – Tobacco Manufacturers' surtax? . . . . . . . . . . . . . . . . . . . . . . . . . . . . . . . . . . . . . . . . . 249 46For financial institutions: Is the corporation a member of a related group of financial institutions with one ormore members subject to gross Part VI tax? . . . . . . . . . . . . . . . . . . . . . . . . . . . . . . . . . . . . . . . . . . . . . . . . . . . . . . . . 250 39
33/34/35Is the total taxable capital employed in Canada of the corporation and its associated corporations over $10,000,000? . . . . . . . . . . . . . . 234 ______
XX
T1131253Is the corporation claiming a Canadian film or video production tax credit refund? . . . . . . . . . . . . . . . . . . . . . . . . . . . . . . . . . . . Is the corporation claiming a film or video production services tax credit refund? . . . . . . . . . . . . . . . . . . . . . . . . . . . . . . . . . . . T1177254Is the corporation subject to Part XIII.1 tax? (Show your calculations on a sheet that you identify as Schedule 92.) . . . . . . . . . . . . . . . . 255 92
API 2017.217 2017-12-31 Algoma Power Inc.2018-08-20 09:14 82249 4290 RC0001
CORPORATE TAXPREP / TAXPREP DES SOCIÉTÉS - EP29 VERSION 2018 V1.0 Page 3
Attachments (continued) Yes Schedule
T1135T1141T1142T1145T1146T1174
Did the corporation own or hold specified foreign property where the total cost amount of all such property, at any time in the year, wasmore than CAN$100,000? . . . . . . . . . . . . . . . . . . . . . . . . . . . . . . . . . . . . . . . . . . . . . . . . . . . . . . . . . . . . . . . . . . . Did the corporation transfer or loan property to a non-resident trust? . . . . . . . . . . . . . . . . . . . . . . . . . . . . . . . . . . . . . . . . . . Did the corporation receive a distribution from or was it indebted to a non-resident trust in the year? . . . . . . . . . . . . . . . . . . . . . . . . Has the corporation entered into an agreement to allocate assistance for SR&ED carried out in Canada? . . . . . . . . . . . . . . . . . . . . . Has the corporation entered into an agreement to transfer qualified expenditures incurred in respect of SR&ED contracts? . . . . . . . . . . Has the corporation entered into an agreement with other associated corporations for salary or wages of specified employees for SR&ED?
260
271
259
264263262261
Did the corporation pay taxable dividends (other than capital gains dividends) in the tax year? . . . . . . . . . . . . . . . . . . . . . . . . . . . . 265 55Has the corporation made an election under subsection 89(11) not to be a CCPC? . . . . . . . . . . . . . . . . . . . . . . . . . . . . . . . . . . 266 T2002
T2002267Has the corporation revoked any previous election made under subsection 89(11)? . . . . . . . . . . . . . . . . . . . . . . . . . . . . . . . . . . Did the corporation (CCPC or deposit insurance corporation (DIC)) pay eligible dividends, or did itsgeneral rate income pool (GRIP) change in the tax year? . . . . . . . . . . . . . . . . . . . . . . . . . . . . . . . . . . . . . . . . . . . . . . . . . 268 53Did the corporation (other than a CCPC or DIC) pay eligible dividends, or did its low rate income pool (LRIP) change in the tax year? . . . . 269 54
Did the corporation have any foreign affiliates in the tax year? . . . . . . . . . . . . . . . . . . . . . . . . . . . . . . . . . . . . . . . . . . . . . . T1134
Additional information
Is the corporation inactive? . . . . . . . . . . . . . . . . . . . . . . . . . . . . . . . . . . . . . . . . . . . . . . . . . . . . . . . . . . . 280 1 Yes 2 NoDid the corporation use the International Financial Reporting Standards (IFRS) when it prepared its financial statements? . . . . 270 1 Yes 2 No
XX
What is the corporation's mainrevenue-generating business activity? . . . . .
284Specify the principal products mined, manufactured,sold, constructed, or services provided, giving theapproximate percentage of the total revenue that eachproduct or service represents. 288
286 %%
%285287289
Did the corporation immigrate to Canada during the tax year? . . . . . . . . . . . . . . . . . . . . . . . . . . . . . . . . . . . . . . . 291 1 Yes 2 No2 No1 Yes292Did the corporation emigrate from Canada during the tax year? . . . . . . . . . . . . . . . . . . . . . . . . . . . . . . . . . . . . . .
Do you want to be considered as a quarterly instalment remitter if you are eligible? . . . . . . . . . . . . . . . . . . . . . . . . . . . 293 1 Yes 2 No
If the corporation was eligible to remit instalments on a quarterly basis for part of the tax year, providethe date the corporation ceased to be eligible . . . . . . . . . . . . . . . . . . . . . . . . . . . . . . . . . . . . . . . . . . . . . . . . . 294
If the corporation's major business activity is construction, did you have any subcontractors during the tax year? . . . . . . . . . . 295 1 Yes 2 No
Year Month Day
Electricity 100.000
XX
Electric Power Distribution221122
Taxable incomeNet income or (loss) for income tax purposes from Schedule 1, financial statements, or GIFI . . . . . . . . . . . . . . . . . . . . 300 A1,392,884
Deduct: Charitable donations from Schedule 2 . . . . . . . . . . . . . . . . . . . . . . . . . . . . . 311 54,415Cultural gifts from Schedule 2 . . . . . . . . . . . . . . . . . . . . . . . . . . . . . . . . . 313Ecological gifts from Schedule 2 . . . . . . . . . . . . . . . . . . . . . . . . . . . . . . . . 314
Taxable dividends deductible under section 112 or 113, or subsection 138(6)from Schedule 3 . . . . . . . . . . . . . . . . . . . . . . . . . . . . . . . . . . . . . . . . . 320Part VI.1 tax deduction* . . . . . . . . . . . . . . . . . . . . . . . . . . . . . . . . . . . . . 325Non-capital losses of previous tax years from Schedule 4 . . . . . . . . . . . . . . . . . 331Net capital losses of previous tax years from Schedule 4 . . . . . . . . . . . . . . . . . 332Restricted farm losses of previous tax years from Schedule 4 . . . . . . . . . . . . . . 333Farm losses of previous tax years from Schedule 4 . . . . . . . . . . . . . . . . . . . . . 334Limited partnership losses of previous tax years from Schedule 4 . . . . . . . . . . . . . 335Taxable capital gains or taxable dividends allocated froma central credit union . . . . . . . . . . . . . . . . . . . . . . . . . . . . . . . . . . . . . . . 340Prospector's and grubstaker's shares . . . . . . . . . . . . . . . . . . . . . . . . . . . . . 350
BCDSection 110.5 additions or subparagraph 115(1)(a)(vii) additions . . . . . . . . . . . . . . . . . . . . . . . . . . . . . . . . . . . . . 355
360Taxable income (amount C plus amount D) . . . . . . . . . . . . . . . . . . . . . . . . . . . . . . . . . . . . . . . . . . . . . . . . Income exempt under paragraph 149(1)(t) . . . . . . . . . . . . . . . . . . . . . . . . . . . . . . . . . . . . . . . . . . . . . . . . . . 370Taxable income for a corporation with exempt income under paragraph 149(1)(t) (line 360 minus line 370) . . . . . . . . . . . Z
Subtotal amount B) (if negative, enter "0") minusSubtotal (amount A
Gifts of medicine made before March 22, 2017, from Schedule 2 . . . . . . . . . . . . . 315
Z.1Taxable income for the year from a personal services business . . . . . . . . . . . . . . . . . . . . . . . . . . . . . . . . . . . . .
54,415 54,4151,338,469
1,338,469
1,338,469
This amount is equal to 3.5 times the Part VI.1 tax payable at line 724 on page 8.*

API 2017.217 2017-12-31 Algoma Power Inc.2018-08-20 09:14 82249 4290 RC0001
CORPORATE TAXPREP / TAXPREP DES SOCIÉTÉS - EP29 VERSION 2018 V1.0 Page 4
Small business deduction
ACanadian-controlled private corporations (CCPCs) throughout the tax year Income from active business carried on in Canada from Schedule 7 . . . . . . . . . . . . . . . . . . . . . . . . . . . . . . . . . . . 400
B405
Taxable income from line 360 on page 3, minus 100/28 (
federal law, is exempt from Part I tax . . . . . . . . . . . . . . . . . . . . . . . . . . . . . . . . . . . . . . . . . . . . . . . . . . . . . minus times the amount on line 636** on page 7, and minus any amount that, because of
) of the amount on line 632* on page 7,
Business limit (see notes 1 and 2 below) . . . . . . . . . . . . . . . . . . . . . . . . . . . . . . . . . . . . . . . . . . . . . . . . . . . 410 C
43.57143
Notes:1.
2.weeks, prorate this amount by the number of days in the tax year divided by 365, and enter the result on line 410.For associated CCPCs, use Schedule 23 to calculate the amount to be entered on line 410.
on line 410. However, if the corporation's tax year is less than 51For CCPCs that are not associated, enter $ 500,000
EBusiness limit reduction:Amount C *** D415 . . . . . . . . . . . . . . . . . . . . . . . . . x =
Reduced business limit (amount C minus amount E) (if negative, enter "0") . . . . . . . . . . . . . . . . . . . . . . . . . . . . . . 425 FBusiness limit the CCPC assigns under subsection 125(3.2) (from line 515 below) . . . . . . . . . . . . . . . . . . . . . . . . . . GAmount F minus amount G . . . . . . . . . . . . . . . . . . . . . . . . . . . . . . . . . . . . . . . . . . . . . . . . . . . . . . . . . . H427
11,250
Small business deduction
Amount A, B, C, or H,whichever is the least
Amount A, B, C, or H,whichever is the least
x
x
Number of days in the tax yearbefore January 1, 2018
Number of days in the tax year
Number of days in the tax year afterDecember 31, 2017, and before January 1, 2019
Number of days in the tax year
Total of amounts 1 and 2 (enter amount I at amount J on page 7) 430
x
x % =
% =
1
2
I
365 17.5365
18365
Calculate the amount of foreign non-business income tax credit deductible on line 632 without reference to the refundable tax on the CCPC'sinvestment income (line 604) and without reference to the corporate tax reductions under section 123.4.
Large corporations***Calculate the amount of foreign business income tax credit deductible on line 636 without reference to the corporation tax reductions under section 123.4.
If the corporation is not associated with any corporations in both the current and previous tax years, the amount to be entered on line 415 is:(total taxable capital employed in Canada for the prior year minus $10,000,000) x 0.225%.If the corporation is not associated with any corporations in the current tax year, but was associated in the previous tax year, the amount to beentered on line 415 is: (total taxable capital employed in Canada for the current year minus $10,000,000) x 0.225%.For corporations associated in the current tax year, see Schedule 23 for the special rules that apply.
**
*
LBusiness limit assigned to
corporation identified incolumn J 4
Specified corporate income and assignment under subsection 125(3.2)
J1Name of corporation receiving the
income and assigned amount
JBusiness number of
the corporationreceiving the
assigned amount
KIncome paid under
clause 125(1)(a)(i)(B) to thecorporation identified in
column J 3
490 500 505
Applicable to tax years that begin after March 21, 2016Except that, if the tax year of your corporation started before and ends on or after March 22, 2016 and in the tax year of a CCPC, you can make anassignment of business limit to that other CCPC if its tax year started after March 21, 2016.
1.
Notes:3. This amount is [as defined in subsection 125(7) specified corporate income (a)(i)] the total of all amounts each of which is income from an active
business of the corporation for the year from the provision of services or property to a private corporation (directly or indirectly, in any manner whatever) if(A) at any time in the year, the corporation (or one of its shareholders) or a person who does not deal at arm's length with the corporation (or one of itsshareholders) holds a direct or indirect interest in the private corporation, and(B) it is not the case that all or substantially all of the corporation's income for the year from an active business is from the provision of services orproperty to
(I) persons (other than the private corporation) with which the corporation deals at arm's length, or(II) partnerships with which the corporation deals at arm's length, other than a partnership in which a person that does not deal at arm's lengthwith the corporation holds a direct or indirect interest.
The amount of the business limit you assign to a CCPC cannot be greater than the amount determined by the formula A – B, where A is the amount ofincome referred to in column K in respect of that CCPC and B is the portion of the amount described in A that is deductible by you in respect of theamount of income referred to in clauses 125(1)(a)(i)(A) or (B) for the year. The amount on line 515 cannot be greater than the amount on line 425.
4.
Total 510 Total 515

API 2017.217 2017-12-31 Algoma Power Inc.2018-08-20 09:14 82249 4290 RC0001
CORPORATE TAXPREP / TAXPREP DES SOCIÉTÉS - EP29 VERSION 2018 V1.0 Page 5
General tax reduction for Canadian-controlled private corporations
Taxable income from page 3 (line 360 or amount Z, whichever applies) . . . . . . . . . . . . . . . . . . . . . . . . . . . . . . . . . . . . Canadian-controlled private corporations throughout the tax year
ALesser of amounts 9B and 9H from Part 9 of Schedule 27 . . . . . . . . . . . . . . . . . . . . . . . . . . BAmount 13K from Part 13 of Schedule 27 . . . . . . . . . . . . . . . . . . . . . . . . . . . . . . . . . . . . C
EAmount used to calculate the credit union deduction (amount F from Schedule 17) . . . . . . . . . . . . FAmount from line 400, 405, 410, or 427 on page 4, whichever is the least . . . . . . . . . . . . . . . . . . GAggregate investment income from line 440 on page 6* . . . . . . . . . . . . . . . . . . . . . . . . . . . .
amounts B to G)addSubtotal ( H
IAmount A minus amount H (if negative, enter "0") . . . . . . . . . . . . . . . . . . . . . . . . . . . . . . . . . . . . . . . . . . . . . . . .
Personal services business income . . . . . . . . . . . . . . . . . . . . . . . . . . . . . . . . . . . . 432 D
% . . . . . . . . . . . . . . . . . JEnter amount J on line 638 on page 7.
* Except for a corporation that is, throughout the year, a cooperative corporation (within the meaning assigned by subsection 136(2)) or a credit union.
General tax reduction for Canadian-controlled private corporations – Amount I multiplied by 13
General tax reductionDo not complete this area if you are a Canadian-controlled private corporation, an investment corporation, a mortgage investment corporation,a mutual fund corporation, or any corporation with taxable income that is not subject to the corporation tax rate of 38%.
Taxable income from page 3 (line 360 or amount Z, whichever applies) . . . . . . . . . . . . . . . . . . . . . . . . . . . . . . . . . . . . K1,338,469
Lesser of amounts 9B and 9H from Part 9 of Schedule 27 . . . . . . . . . . . . . . . . . . . . . . . . . . LAmount 13K from Part 13 of Schedule 27 . . . . . . . . . . . . . . . . . . . . . . . . . . . . . . . . . . . . M
OAmount used to calculate the credit union deduction (amount F from Schedule 17) . . . . . . . . . . . .
amounts L to O)addSubtotal ( P
Amount K minus amount P (if negative, enter "0") . . . . . . . . . . . . . . . . . . . . . . . . . . . . . . . . . . . . . . . . . . . . . . . . . Q
Personal services business income . . . . . . . . . . . . . . . . . . . . . . . . . . . . . . . . . . . . 434 N
1,338,469
RGeneral tax reduction – Amount Q multiplied byEnter amount R on line 639 on page 7.
% . . . . . . . . . . . . . . . . . . . . . . . . . . . . . . . . . . . . . . . . . . . . . 174,00113

API 2017.217 2017-12-31 Algoma Power Inc.2018-08-20 09:14 82249 4290 RC0001
CORPORATE TAXPREP / TAXPREP DES SOCIÉTÉS - EP29 VERSION 2018 V1.0 Page 6
Refundable portion of Part I taxCanadian-controlled private corporations throughout the tax yearAggregate investment incomefrom Schedule 7 . . . . . . . . . . . 440 Ax
B
/
C
=
Foreign non-business income tax credit from line 632 on page 7 . . . . . . . . . . Deduct:Foreign investment incomefrom Schedule 7 . . . . . . . . . . . 445
%
x % =
amount C) (if negative, enter "0") minusSubtotal (amount B D
EAmount A minus amount D (if negative, enter "0") . . . . . . . . . . . . . . . . . . . . . . . . . . . . . . . . . . . . . . . . . . . . . . . . Taxable income from line 360 on page 3 . . . . . . . . . . . . . . . . . . . . . . . . F
Deduct:Amount from line 400, 405, 410, or 427 on page 4,whichever is the least . . . . . . . . . . . . . . . . . . . G
H=/x
Foreign non-business income tax credit from line 632 on page 7 . . . .
I=x
Foreign business incometax credit from line 636on page 7 . .
Subtotal (total of amounts G, H and I) J
amount J) (if negative, enter "0") minusSubtotal (amount F K /x % = L
MPart I tax payable minus investment tax credit refund (line 700 minus line 780 from page 8) . . . . . . . . . . . . . . . . . . . . . . . . N450Refundable portion of Part I tax – Amount E, L, or M, whichever is the least . . . . . . . . . . . . . . . . . . . . . . . . . . . .
2975
30 2 3
8
4
30 2 3
Refundable dividend tax on handRefundable dividend tax on hand at the end of the previous tax year . . . . . . . . . . . . . . . . . 460Deduct: Dividend refund for the previous tax year . . . . . . . . . . . . . . . . . . . . . . . . . . . . 465
OAdd the total of:
Refundable portion of Part I tax from line 450 above . . . . . . . . . . . . . . . . . . . . . . . . . . . . Total Part IV tax payable from Schedule 3 . . . . . . . . . . . . . . . . . . . . . . . . . . . . . . . . . Net refundable dividend tax on hand transferred from a predecessor corporation onamalgamation, or from a wound-up subsidiary corporation . . . . . . . . . . . . . . . . . . . . . 480
R
Refundable dividend tax on hand at the end of the tax year – Amount O plus amount R . . . . . . . . . . . . . . . . . . . . 485
PQ
Subtotal
Subtotal
Dividend refundPrivate and subject corporations at the time taxable dividends were paid in the tax year
Taxable dividends paid in the tax year from line 460 on page 3 of Schedule 3 . . . . . . S/x % =
TRefundable dividend tax on hand at the end of the tax year from line 485 above . . . . . . . . . . . . . . . . . . . . . . . . . . . . . . . UDividend refund – Amount S or T, whichever is less . . . . . . . . . . . . . . . . . . . . . . . . . . . . . . . . . . . . . . . . . . . . . . .
Enter amount U on line 784 on page 8.
38 1 3

API 2017.217 2017-12-31 Algoma Power Inc.2018-08-20 09:14 82249 4290 RC0001
CORPORATE TAXPREP / TAXPREP DES SOCIÉTÉS - EP29 VERSION 2018 V1.0 Page 7
Part I tax550 ABase amount Part I tax – Taxable income from page 3 (line 360 or amount Z, whichever applies) multiplied by % . . . . . . .
Recapture of investment tax credit from Schedule 31 . . . . . . . . . . . . . . . . . . . . . . . . . . . . . . . . . . . . . . . . . . . 602 C
Additional tax on personal services business income (section 123.5) Taxable income from a personal services business . . . . . . . . . . . . . . . . . . x B=%555 560
508,61838
5
Aggregate investment income from line 440 on page 6 . . . . . . . . . . . . . . . . . . . . . . . . . . . . . DTaxable income from line 360 on page 3 . . . . . . . . . . . . . . . . . . . . Deduct:Amount from line 400, 405, 410, or 427 on page 4,whichever is the least . . . . . . . . . . . . . . . . . . . . . . . . . . . . . . .
G
Calculation for the refundable tax on the Canadian-controlled private corporation's (CCPC) investment income(if it was a CCPC throughout the tax year)
E
F amount F) minusNet amount (amount E
H604Refundable tax on CCPC's investment income – / % of whichever is less: amount D or amount G . . . . . . . . . . I amounts A, B, C, and H)addSubtotal (
10 2 3
508,618
Small business deduction from line 430 on page 4 . . . . . . . . . . . . . . . . . . . . . . . . . . . . . . . JFederal tax abatement . . . . . . . . . . . . . . . . . . . . . . . . . . . . . . . . . . . . . . . . . . . . 608Manufacturing and processing profits deduction from Schedule 27 . . . . . . . . . . . . . . . . . . 616Investment corporation deduction . . . . . . . . . . . . . . . . . . . . . . . . . . . . . . . . . . . . . 620
Taxed capital gains 624Additional deduction – credit unions from Schedule 17 . . . . . . . . . . . . . . . . . . . . . . . . . 628Federal foreign non-business income tax credit from Schedule 21 . . . . . . . . . . . . . . . . . . 632
636Federal foreign business income tax credit from Schedule 21 . . . . . . . . . . . . . . . . . . . . . 638General tax reduction for CCPCs from amount J on page 5 . . . . . . . . . . . . . . . . . . . . . .
General tax reduction from amount R on page 5 . . . . . . . . . . . . . . . . . . . . . . . . . . . . . 639Federal logging tax credit from Schedule 21 . . . . . . . . . . . . . . . . . . . . . . . . . . . . . . . 640
Federal qualifying environmental trust tax credit . . . . . . . . . . . . . . . . . . . . . . . . . . . . . 648Investment tax credit from Schedule 31 . . . . . . . . . . . . . . . . . . . . . . . . . . . . . . . . . . 652
K
Part I tax payable – Amount I minus amount K . . . . . . . . . . . . . . . . . . . . . . . . . . . . . . . . . . . . . . . . . . . . . . . . . . L
Deduct:
Subtotal
Enter amount L on line 700 on page 8.
Eligible Canadian bank deduction under section 125.21 . . . . . . . . . . . . . . . . . . . . . . . . 641
133,847
174,001
307,848 307,848
200,770
Privacy statementPersonal information is collected under the Income Tax Act to administer tax, benefits, and related programs. It may also be used for any purpose related tothe administration or enforcement of the Act such as audit, compliance and the payment of debts owed to the Crown. It may be shared or verified with otherfederal, provincial/territorial government institutions to the extent authorized by law. Failure to provide this information may result in interest payable, penaltiesor other actions. Under the Privacy Act, individuals have the right to access their personal information and request correction if there are errors or omissions.Refer to Info Source canada.ca/cra-info-source, personal information bank CRA PPU 047.
API 2017.217 2017-12-31 Algoma Power Inc.2018-08-20 09:14 82249 4290 RC0001
CORPORATE TAXPREP / TAXPREP DES SOCIÉTÉS - EP29 VERSION 2018 V1.0 Page 8
Summary of tax and creditsFederal tax
Part I tax payable from amount L on page 7 . . . . . . . . . . . . . . . . . . . . . . . . . . . . . . . . . . . . . . . . . . . . . . . . 700 200,770Part II surtax payable from Schedule 46 . . . . . . . . . . . . . . . . . . . . . . . . . . . . . . . . . . . . . . . . . . . . . . . . . . 708
Part IV tax payable from Schedule 3 . . . . . . . . . . . . . . . . . . . . . . . . . . . . . . . . . . . . . . . . . . . . . . . . . . . . Part IV.1 tax payable from Schedule 43 . . . . . . . . . . . . . . . . . . . . . . . . . . . . . . . . . . . . . . . . . . . . . . . . . . . 716Part VI tax payable from Schedule 38 . . . . . . . . . . . . . . . . . . . . . . . . . . . . . . . . . . . . . . . . . . . . . . . . . . . . Part VI.1 tax payable from Schedule 43 . . . . . . . . . . . . . . . . . . . . . . . . . . . . . . . . . . . . . . . . . . . . . . . . . . . 724Part XIII.1 tax payable from Schedule 92 . . . . . . . . . . . . . . . . . . . . . . . . . . . . . . . . . . . . . . . . . . . . . . . . . . Part XIV tax payable from Schedule 20 . . . . . . . . . . . . . . . . . . . . . . . . . . . . . . . . . . . . . . . . . . . . . . . . . . . 728
712
720
727
Total federal taxAdd provincial or territorial tax:
Part III.1 tax payable from Schedule 55 . . . . . . . . . . . . . . . . . . . . . . . . . . . . . . . . . . . . . . . . . . . . . . . . . . . 710
200,770
Provincial or territorial jurisdiction . . . 750(if more than one jurisdiction, enter "multiple" and complete Schedule 5)Net provincial or territorial tax payable (except Quebec and Alberta) . . . . . . . . . . . . . . . . . . . . . . . . . . . . . . . . . . 760
770 ATotal tax payableDeduct other credits:
ON
153,924354,694
Investment tax credit refund from Schedule 31 . . . . . . . . . . . . . . . . . . . . . . . . . . . . . 780Dividend refund from amount U on page 6 . . . . . . . . . . . . . . . . . . . . . . . . . . . . . . . 784Federal capital gains refund from Schedule 18 . . . . . . . . . . . . . . . . . . . . . . . . . . . . . 788Federal qualifying environmental trust tax credit refund . . . . . . . . . . . . . . . . . . . . . . . . 792
796Canadian film or video production tax credit refund (Form T1131) . . . . . . . . . . . . . . . . . . Film or video production services tax credit refund (Form T1177) . . . . . . . . . . . . . . . . . . 797Tax withheld at source . . . . . . . . . . . . . . . . . . . . . . . . . . . . . . . . . . . . . . . . . . . 800
Total payments on which tax has been withheld . . . . . . . . . Provincial and territorial capital gains refund from Schedule 18 . . . . . . . . . . . . . . . . . . . 808Provincial and territorial refundable tax credits from Schedule 5 . . . . . . . . . . . . . . . . . . . 812Tax instalments paid . . . . . . . . . . . . . . . . . . . . . . . . . . . . . . . . . . . . . . . . . . . . 840
801
Total credits 890 B
354,694354,694 354,694
amount B) minusBalance (amount A
If the result is positive, you have a balance unpaid.If the result is negative, you have an overpayment.Enter the amount on whichever line applies.Generally, we do not charge or refund a differenceof $2 or less.
Balance unpaid . . . . . .
To have the corporation's refund deposited directly into the corporation's bankaccount at a financial institution in Canada, or to change banking information youalready gave us, complete the information below:
Start Change informationBranch number
910
918914Institution number Account number
Refund code 894 Overpayment
Direct deposit request
For information on how to make your payment, go tocanada.ca/payments.
1
2 NoIf the corporation is a Canadian-controlled private corporation throughout the tax year,does it qualify for the one-month extension of the date the balance of tax is due? . . . . . . . . . . . . . . . . . . . . 896 1 Yes
If this return was prepared by a tax preparer for a fee, provide their EFILE number . . . . . . . . . . . . . . . . . . . . . . . 920
CertificationI, 950
Last name First name951
Position, office, or rank954 ,King Glen Chief Financial Officer
am an authorized signing officer of the corporation. I certify that I have examined this return, including accompanying schedules and statements, and thatthe information given on this return is, to the best of my knowledge, correct and complete. I also certify that the method of calculating income for this taxyear is consistent with that of the previous tax year except as specifically disclosed in a statement attached to this return.
955 956
Is the contact person the same as the authorized signing officer? If no, complete the information below . . . . . . . . . 957 1 Yes 2 No958 959
Date (yyyy/mm/dd) Signature of the authorized signing officer of the corporation Telephone number
Telephone numberName of other authorized person
(905) 871-0330
XHarry Clutterbuck (905) 871-0330
2018-08-20
Language of correspondence – Langue de correspondanceIndicate your language of correspondence by entering 1 for English or 2 for French.Indiquez votre langue de correspondance en inscrivant 1 pour anglais ou 2 pour français. 990 1
API 2017.217 2017-12-31 Algoma Power Inc.2018-08-20 09:14 82249 4290 RC0001
CORPORATE TAXPREP / TAXPREP DES SOCIÉTÉS - EP29 VERSION 2018 V1.0
Schedule of Instalment Remittances
Name of corporation contactTelephone number
Harry Clutterbuck(905) 871-0330
Effectiveinterest date
Description (instalment remittance,split payment, assessed credit)
Amount ofcredit
26,000Federal Installment2017-01-3126,000Federal Installment2017-02-2826,000Federal Installment2017-03-3126,000Federal Installment2017-04-3026,000Federal Installment2017-05-3126,000Federal Installment2017-06-3026,000Federal Installment2017-07-3126,000Federal Installment2017-08-3126,000Federal Installment2017-09-3026,000Federal Installment2017-10-3126,000Federal Installment2017-11-3026,000Federal Installment2017-12-3142,694From FortisOntario Inc. - 10076 8985 RC00012018-06-27
Total instalments credited to the taxation year per T9 B
Total amount of instalments claimed (carry the result to line 840 of the T2 Return) A
354,694
354,694
Transfer
Account numberTaxationyear end Amount
Effectiveinterest date Description
To:
From:
To:
From:
To:
From:
To:
From:
To:
From:

API 2017.217 2017-12-31 Algoma Power Inc.2018-08-20 09:14 82249 4290 RC0001
CORPORATE TAXPREP / TAXPREP DES SOCIÉTÉS - EP29 VERSION 2018 V1.0
GENERAL INDEX OF FINANCIAL INFORMATION – GIFIForm identifier 100Tax year end
Year Month DayBusiness number
Corporation's name
SCHEDULE 100
Algoma Power Inc. 2017-12-3182249 4290 RC0001
Balance sheet information
Account Description GIFI Current year Prior year
AssetsTotal current assets . . . . . . . . . . . . . . . . . . . . . . . . . . . . . . . . . . . . . . 1599 + 12,811,839 13,869,663Total tangible capital assets . . . . . . . . . . . . . . . . . . . . . . . . . . . . . . . . . +2008 152,967,184 146,444,572Total accumulated amortization of tangible capital assets . . . . . . . . . . . . . . . . –2009 62,240,489 59,843,304Total intangible capital assets . . . . . . . . . . . . . . . . . . . . . . . . . . . . . . . . +2178 23,714,149 23,647,770Total accumulated amortization of intangible capital assets . . . . . . . . . . . . . . . –2179 6,950,294 6,212,118Total long-term assets . . . . . . . . . . . . . . . . . . . . . . . . . . . . . . . . . . . . +2589 432,607 454,025Assets held in trust . . . . . . . . . . . . . . . . . . . . . . . . . . . . . . . . . . . . . . +2590*
Total assets (mandatory field) . . . . . . . . . . . . . . . . . . . . . . . . . . . . . . . =2599 120,734,996 118,360,608
LiabilitiesTotal current liabilities . . . . . . . . . . . . . . . . . . . . . . . . . . . . . . . . . . . . 3139 + 15,021,041 6,187,561Total long-term liabilities . . . . . . . . . . . . . . . . . . . . . . . . . . . . . . . . . . . 3450 + 61,335,098 61,424,132Subordinated debt . . . . . . . . . . . . . . . . . . . . . . . . . . . . . . . . . . . . . . 3460 +*Amounts held in trust . . . . . . . . . . . . . . . . . . . . . . . . . . . . . . . . . . . . . 3470 +*
Total liabilities (mandatory field) . . . . . . . . . . . . . . . . . . . . . . . . . . . . . . 3499 = 76,356,139 67,611,693
Shareholder equityTotal shareholder equity (mandatory field) . . . . . . . . . . . . . . . . . . . . . . . 3620 + 44,378,857 50,748,915
Total liabilities and shareholder equity . . . . . . . . . . . . . . . . . . . . . . . . . 3640 = 120,734,996 118,360,608
Retained earningsRetained earnings/deficit – end (mandatory field) . . . . . . . . . . . . . . . . . . . 3849 = 371,076 6,741,134
* Generic item
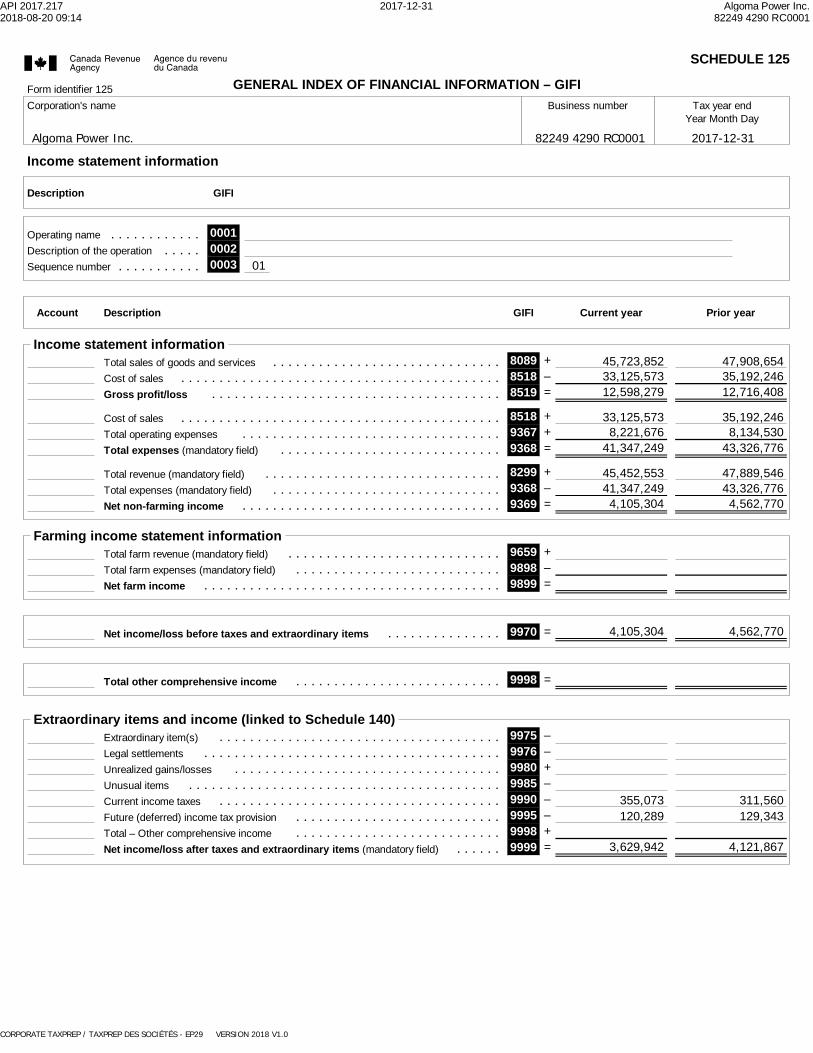
API 2017.217 2017-12-31 Algoma Power Inc.2018-08-20 09:14 82249 4290 RC0001
CORPORATE TAXPREP / TAXPREP DES SOCIÉTÉS - EP29 VERSION 2018 V1.0
GENERAL INDEX OF FINANCIAL INFORMATION – GIFIForm identifier 125Tax year end
Year Month DayBusiness number
Corporation's name
SCHEDULE 125
Algoma Power Inc. 2017-12-3182249 4290 RC0001
Income statement information
Description GIFI
Operating name . . . . . . . . . . . . 0001Description of the operation . . . . . 0002Sequence number . . . . . . . . . . . 0003 01
Account Description GIFI Current year Prior year
Income statement informationTotal sales of goods and services . . . . . . . . . . . . . . . . . . . . . . . . . . . . . . 8089 + 45,723,852 47,908,654Cost of sales . . . . . . . . . . . . . . . . . . . . . . . . . . . . . . . . . . . . . . . . . . 8518 – 33,125,573 35,192,246Gross profit/loss . . . . . . . . . . . . . . . . . . . . . . . . . . . . . . . . . . . . . . 8519 = 12,598,279 12,716,408
Cost of sales . . . . . . . . . . . . . . . . . . . . . . . . . . . . . . . . . . . . . . . . . . 8518 + 33,125,573 35,192,246Total operating expenses . . . . . . . . . . . . . . . . . . . . . . . . . . . . . . . . . . 9367 + 8,221,676 8,134,530Total expenses (mandatory field) . . . . . . . . . . . . . . . . . . . . . . . . . . . . . 9368 = 41,347,249 43,326,776
Total revenue (mandatory field) . . . . . . . . . . . . . . . . . . . . . . . . . . . . . . . 8299 + 45,452,553 47,889,546Total expenses (mandatory field) . . . . . . . . . . . . . . . . . . . . . . . . . . . . . . 9368 – 41,347,249 43,326,776Net non-farming income . . . . . . . . . . . . . . . . . . . . . . . . . . . . . . . . . . 9369 = 4,105,304 4,562,770
Farming income statement informationTotal farm revenue (mandatory field) . . . . . . . . . . . . . . . . . . . . . . . . . . . . 9659 +Total farm expenses (mandatory field) . . . . . . . . . . . . . . . . . . . . . . . . . . . 9898 –Net farm income . . . . . . . . . . . . . . . . . . . . . . . . . . . . . . . . . . . . . . . 9899 =
Net income/loss before taxes and extraordinary items . . . . . . . . . . . . . . . 9970 = 4,562,7704,105,304
Total other comprehensive income . . . . . . . . . . . . . . . . . . . . . . . . . . . 9998 =
Extraordinary items and income (linked to Schedule 140)Extraordinary item(s) . . . . . . . . . . . . . . . . . . . . . . . . . . . . . . . . . . . . . 9975 –Legal settlements . . . . . . . . . . . . . . . . . . . . . . . . . . . . . . . . . . . . . . . 9976 –Unrealized gains/losses . . . . . . . . . . . . . . . . . . . . . . . . . . . . . . . . . . . 9980 +Unusual items . . . . . . . . . . . . . . . . . . . . . . . . . . . . . . . . . . . . . . . . . 9985 –Current income taxes . . . . . . . . . . . . . . . . . . . . . . . . . . . . . . . . . . . . . 9990 – 355,073 311,560Future (deferred) income tax provision . . . . . . . . . . . . . . . . . . . . . . . . . . . 9995 – 120,289 129,343Total – Other comprehensive income . . . . . . . . . . . . . . . . . . . . . . . . . . . 9998 +Net income/loss after taxes and extraordinary items (mandatory field) . . . . . . 9999 = 3,629,942 4,121,867
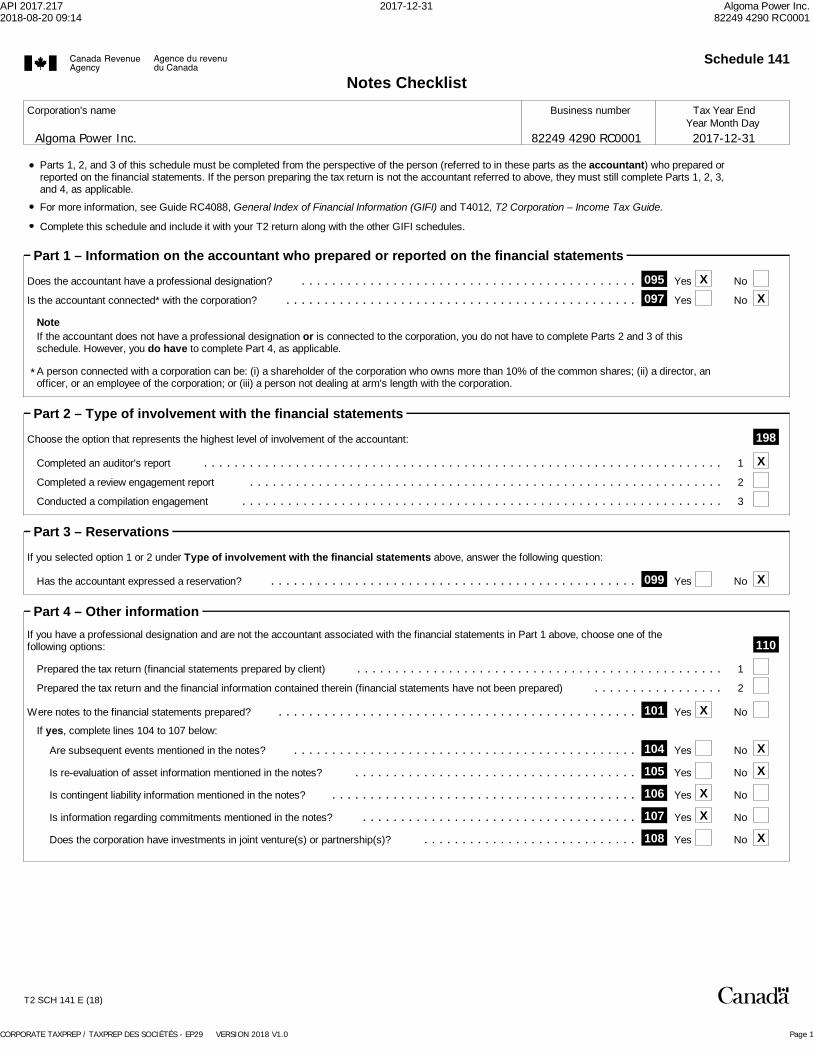
API 2017.217 2017-12-31 Algoma Power Inc.2018-08-20 09:14 82249 4290 RC0001
CORPORATE TAXPREP / TAXPREP DES SOCIÉTÉS - EP29 VERSION 2018 V1.0 Page 1
Schedule 141
Notes Checklist
Year Month DayCorporation's name Business number Tax Year End
2017-12-31Algoma Power Inc. 82249 4290 RC0001
Parts 1, 2, and 3 of this schedule must be completed from the perspective of the person (referred to in these parts as the accountant) who prepared orreported on the financial statements. If the person preparing the tax return is not the accountant referred to above, they must still complete Parts 1, 2, 3,and 4, as applicable.For more information, see Guide RC4088, General Index of Financial Information (GIFI) and T4012, T2 Corporation – Income Tax Guide.
Complete this schedule and include it with your T2 return along with the other GIFI schedules.
Part 1 – Information on the accountant who prepared or reported on the financial statements
Does the accountant have a professional designation? . . . . . . . . . . . . . . . . . . . . . . . . . . . . . . . . . . . . . . . . . . . . 095 Yes No
Is the accountant connected* with the corporation? . . . . . . . . . . . . . . . . . . . . . . . . . . . . . . . . . . . . . . . . . . . . . . Yes No097
* A person connected with a corporation can be: (i) a shareholder of the corporation who owns more than 10% of the common shares; (ii) a director, anofficer, or an employee of the corporation; or (iii) a person not dealing at arm's length with the corporation.
NoteIf the accountant does not have a professional designation or is connected to the corporation, you do not have to complete Parts 2 and 3 of thisschedule. However, you do have to complete Part 4, as applicable.
XX
Part 2 – Type of involvement with the financial statements
Choose the option that represents the highest level of involvement of the accountant: 198
1Completed an auditor's report . . . . . . . . . . . . . . . . . . . . . . . . . . . . . . . . . . . . . . . . . . . . . . . . . . . . . . . . . . . . . . . . . . . . Completed a review engagement report . . . . . . . . . . . . . . . . . . . . . . . . . . . . . . . . . . . . . . . . . . . . . . . . . . . . . . . . . . . . . . 2
3Conducted a compilation engagement . . . . . . . . . . . . . . . . . . . . . . . . . . . . . . . . . . . . . . . . . . . . . . . . . . . . . . . . . . . . . . .
X
Part 3 – Reservations
Has the accountant expressed a reservation? . . . . . . . . . . . . . . . . . . . . . . . . . . . . . . . . . . . . . . . . . . . . . . . . 099 Yes No
If you selected option 1 or 2 under Type of involvement with the financial statements above, answer the following question:
X
Part 4 – Other informationIf you have a professional designation and are not the accountant associated with the financial statements in Part 1 above, choose one of the following options: 110
Prepared the tax return (financial statements prepared by client) . . . . . . . . . . . . . . . . . . . . . . . . . . . . . . . . . . . . . . . . . . . . . . . . Prepared the tax return and the financial information contained therein (financial statements have not been prepared) . . . . . . . . . . . . . . . . .
1
2
Were notes to the financial statements prepared? . . . . . . . . . . . . . . . . . . . . . . . . . . . . . . . . . . . . . . . . . . . . . . . 101 Yes No
If yes, complete lines 104 to 107 below:
Are subsequent events mentioned in the notes? . . . . . . . . . . . . . . . . . . . . . . . . . . . . . . . . . . . . . . . . . . . . . 104 Yes No
Is re-evaluation of asset information mentioned in the notes? . . . . . . . . . . . . . . . . . . . . . . . . . . . . . . . . . . . . . 105 Yes No
Is contingent liability information mentioned in the notes? . . . . . . . . . . . . . . . . . . . . . . . . . . . . . . . . . . . . . . . . 106 Yes No
Is information regarding commitments mentioned in the notes? . . . . . . . . . . . . . . . . . . . . . . . . . . . . . . . . . . . . 107 Yes No
Does the corporation have investments in joint venture(s) or partnership(s)? . . . . . . . . . . . . . . . . . . . . . . . . . . . . 108 Yes No
X
X
X
X
X
X
¤T2 SCH 141 E (18)

API 2017.217 2017-12-31 Algoma Power Inc.2018-08-20 09:14 82249 4290 RC0001
CORPORATE TAXPREP / TAXPREP DES SOCIÉTÉS - EP29 VERSION 2018 V1.0 Page 2
Part 4 – Other information (continued)Impairment and fair value changesIn any of the following assets, was an amount recognized in net income or other comprehensive income (OCI) as aresult of an impairment loss in the tax year, a reversal of an impairment loss recognized in a previous tax year, or achange in fair value during the tax year? . . . . . . . . . . . . . . . . . . . . . . . . . . . . . . . . . . . . . . . . . . . . . . . . . . . . 200 Yes No
If yes, enter the amount recognized: In net incomeIncrease (decrease)
In OCIIncrease (decrease)
X
Property, plant, and equipment . . . . . . . . . . . . . . . . 210 211Intangible assets . . . . . . . . . . . . . . . . . . . . . . . . 215 216Investment property . . . . . . . . . . . . . . . . . . . . . . . 220Biological assets . . . . . . . . . . . . . . . . . . . . . . . . 225Financial instruments . . . . . . . . . . . . . . . . . . . . . . 230 231Other . . . . . . . . . . . . . . . . . . . . . . . . . . . . . . . 235 236
Financial instruments
Did the corporation derecognize any financial instrument(s) during the tax year (other than trade receivables)? . . . . . . . . . . . 250 Yes No
255 Yes NoDid the corporation apply hedge accounting during the tax year? . . . . . . . . . . . . . . . . . . . . . . . . . . . . . . . . . . . . . . 260 Yes NoDid the corporation discontinue hedge accounting during the tax year? . . . . . . . . . . . . . . . . . . . . . . . . . . . . . . . . . .
XXX
Adjustments to opening equity
Was an amount included in the opening balance of retained earnings or equity, in order to correct an error, torecognize a change in accounting policy, or to adopt a new accounting standard in the current tax year? . . . . . . . . . . . . . . 265 Yes No
If yes, you have to maintain a separate reconciliation.
X

82249 4290 RC 000182249 4290 RC 0001
Tax Year End: 2017-12-312017-12-31
Name: Algoma Power Inc.Algoma Power Inc.
BN:
T2 BAR CODE RETURN
Tax Year Start: 2017-01-012017-01-01
Version 2018 v.1.0 EP29 Page 1
1. Basis of accounting and summary of significant accounting policies
Incorporation
Algoma Power Inc. ("API" or the "Company") is engaged in the distribution of
electricity to the area adjacent to Sault Ste. Marie, Ontario and is subject
to the regulations of the Ontario Energy Board ("OEB").
API operated as a division of Great Lakes Power Limited ("GLPL") from January
1, 2009 to June 30, 2009. In order to comply with Section 71 of OEB regulatory
requirements, GLPL split out its distribution division by creating a separate
legal entity called Great Lakes Power Distribution Inc. ("GLPDI"). This entity
began operating as a separate legal entity effective July 1, 2009. On October
8, 2009, there was a change of control as Fortis Ontario Inc.
(the "Parent") acquired 100% of the shares of GLPDI and changed the name to
Algoma Power Inc.
(a) Basis of accounting
These financial statements have been prepared in accordance with the
accounting standards for private enterprises ("ASPE"), as per Part II of the
CPA Handbook - Accounting, which constitutes generally accepted accounting
principles for non-publicly accountable enterprises in Canada.
(b) Significant accounting policies Regulation
The distribution rates of API are based upon cost-of-service rate regulation
by the OEB. Earnings are regulated on the basis of a rate of return on rate
base plus a recovery of all allowable distribution costs of API.
API is subject to Ontario Regulation 335/07, which is the Rural and Remote
Rate Protection subsidy program ("RRRP"). The RRRP is calculated as the
deficiency between the approved revenue requirement from the OEB and current
customer distribution rates adjusted for the average rate increase across the
Province of Ontario. API qualifies for this subsidy because it has less than

82249 4290 RC 000182249 4290 RC 0001
Tax Year End: 2017-12-312017-12-31
Name: Algoma Power Inc.Algoma Power Inc.
BN:
T2 BAR CODE RETURN
Tax Year Start: 2017-01-012017-01-01
Version 2018 v.1.0 EP29 Page 2
seven customers per kilometre and a service area that extends beyond 10,000
kilometres. All general service and large customer classes have been
reclassified as residential class under Ontario Regulation 445/07.
On August 14, 2015, API filed an application with the OEB seeking approval to
change electricity distribution rates, effective January 1, 2016, based on
4GIRM. The OEB calculated the value of the inflation factor for incentive rate
setting, for rate changes effective in 2016, to be 2.1%. The OEB assigned a
stretch factor of 0.6% based on the updated benchmarking study for use for
rates effective in 2016. The resulting net price cap index adjustment for API
was 1.5% (i.e. 2.1% - (0% + 0.6%)). The 1.5% adjustment applies to
distribution rates [fixed and variable charges] uniformly for the Seasonal and
Street Lighting customer classes. The OEB approved the application of the 1.8%
RRRP adjustment factor to the distribution rates for the Residential R-1 and
Residential R-2 classes. The OEB found that the amount of RRRP of $13,678 for
the year commencing January 1, 2016 accurately reflected the OEB's findings
pursuant to the applicable regulations and approved a monthly payment of
$1,140 effective January 1, 2016.
1. Basis of accounting and summary of significant accounting policies
(continued)
(b) Significant accounting policies (continued) Regulation (continued)
Beginning with electricity distribution rates effective in 2016, decoupling of
electricity distribution rates for the Residential customer class was being
introduced; complete decoupling is expected to take eight consecutive years
for residential customers and ten years for seasonal customers to fully
implement.
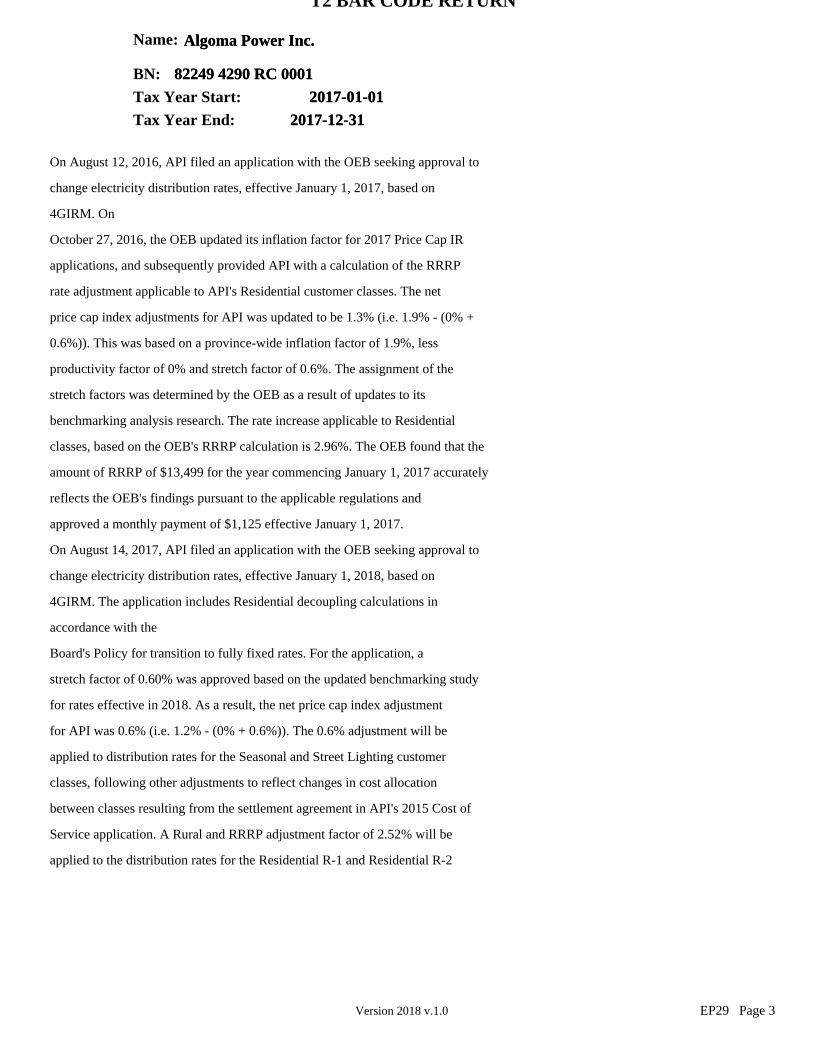
82249 4290 RC 000182249 4290 RC 0001
Tax Year End: 2017-12-312017-12-31
Name: Algoma Power Inc.Algoma Power Inc.
BN:
T2 BAR CODE RETURN
Tax Year Start: 2017-01-012017-01-01
Version 2018 v.1.0 EP29 Page 3
On August 12, 2016, API filed an application with the OEB seeking approval to
change electricity distribution rates, effective January 1, 2017, based on
4GIRM. On
October 27, 2016, the OEB updated its inflation factor for 2017 Price Cap IR
applications, and subsequently provided API with a calculation of the RRRP
rate adjustment applicable to API's Residential customer classes. The net
price cap index adjustments for API was updated to be 1.3% (i.e. 1.9% - (0% +
0.6%)). This was based on a province-wide inflation factor of 1.9%, less
productivity factor of 0% and stretch factor of 0.6%. The assignment of the
stretch factors was determined by the OEB as a result of updates to its
benchmarking analysis research. The rate increase applicable to Residential
classes, based on the OEB's RRRP calculation is 2.96%. The OEB found that the
amount of RRRP of $13,499 for the year commencing January 1, 2017 accurately
reflects the OEB's findings pursuant to the applicable regulations and
approved a monthly payment of $1,125 effective January 1, 2017.
On August 14, 2017, API filed an application with the OEB seeking approval to
change electricity distribution rates, effective January 1, 2018, based on
4GIRM. The application includes Residential decoupling calculations in
accordance with the
Board's Policy for transition to fully fixed rates. For the application, a
stretch factor of 0.60% was approved based on the updated benchmarking study
for rates effective in 2018. As a result, the net price cap index adjustment
for API was 0.6% (i.e. 1.2% - (0% + 0.6%)). The 0.6% adjustment will be
applied to distribution rates for the Seasonal and Street Lighting customer
classes, following other adjustments to reflect changes in cost allocation
between classes resulting from the settlement agreement in API's 2015 Cost of
Service application. A Rural and RRRP adjustment factor of 2.52% will be
applied to the distribution rates for the Residential R-1 and Residential R-2

82249 4290 RC 000182249 4290 RC 0001
Tax Year End: 2017-12-312017-12-31
Name: Algoma Power Inc.Algoma Power Inc.
BN:
T2 BAR CODE RETURN
Tax Year Start: 2017-01-012017-01-01
Version 2018 v.1.0 EP29 Page 4
classes.
Materials and supplies
Materials and supplies are recorded at average cost. Materials and supplies
expensed to operating expense in 2017 were $43 ($27 in 2016).
Utility capital assets and capitalization policy
Distribution assets are those used to distribute electricity at lower voltages
(generally below 50 kilovolts). These assets include poles, towers and
fixtures, low-voltage wires, transformers, overhead and underground
conductors, street lighting, meters, metering equipment and other related
equipment.
1. Basis of accounting and summary of significant accounting policies
(continued)
(b) Significant accounting policies (continued)
Utility capital assets and capitalization policy (continued)
The service life range and average remaining service life of the utility
capital assets are as follows:
Service life range
(years)
Average remaining service life (years)
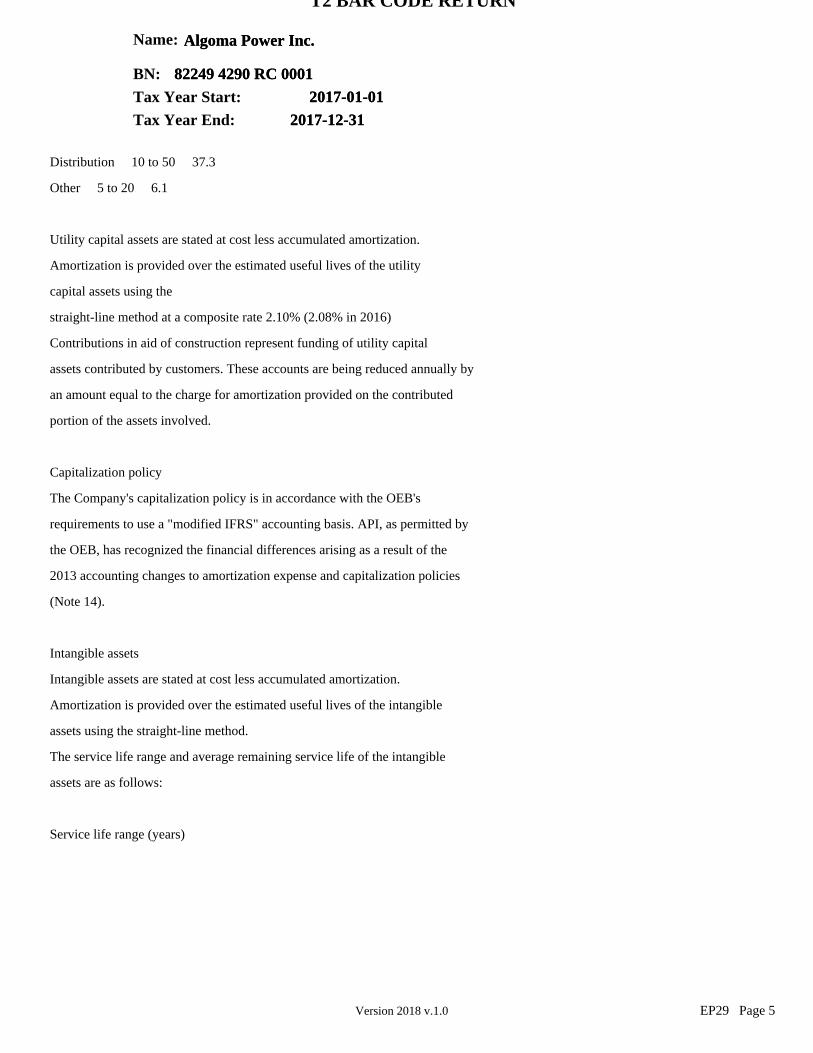
82249 4290 RC 000182249 4290 RC 0001
Tax Year End: 2017-12-312017-12-31
Name: Algoma Power Inc.Algoma Power Inc.
BN:
T2 BAR CODE RETURN
Tax Year Start: 2017-01-012017-01-01
Version 2018 v.1.0 EP29 Page 5
Distribution 10 to 50 37.3
Other 5 to 20 6.1
Utility capital assets are stated at cost less accumulated amortization.
Amortization is provided over the estimated useful lives of the utility
capital assets using the
straight-line method at a composite rate 2.10% (2.08% in 2016)
Contributions in aid of construction represent funding of utility capital
assets contributed by customers. These accounts are being reduced annually by
an amount equal to the charge for amortization provided on the contributed
portion of the assets involved.
Capitalization policy
The Company's capitalization policy is in accordance with the OEB's
requirements to use a "modified IFRS" accounting basis. API, as permitted by
the OEB, has recognized the financial differences arising as a result of the
2013 accounting changes to amortization expense and capitalization policies
(Note 14).
Intangible assets
Intangible assets are stated at cost less accumulated amortization.
Amortization is provided over the estimated useful lives of the intangible
assets using the straight-line method.
The service life range and average remaining service life of the intangible
assets are as follows:
Service life range (years)

82249 4290 RC 000182249 4290 RC 0001
Tax Year End: 2017-12-312017-12-31
Name: Algoma Power Inc.Algoma Power Inc.
BN:
T2 BAR CODE RETURN
Tax Year Start: 2017-01-012017-01-01
Version 2018 v.1.0 EP29 Page 6
Average remaining service life (years)
Software costs 5 to 10 4.8
Land rights and other 40 to 50 29.7
Asset retirement obligations
ASPE requires the recognition of an asset retirement obligation in the period
during which a legal obligation associated with the retirement of a tangible
long-lived asset is incurred and when a reasonable estimate of this amount can
be made.
The Company has determined that there are asset retirement obligations
associated with some parts of its distribution systems; however, none of these
are material requiring recognition under Section 3110 of the CPA Handbook.
1. Basis of accounting and summary of significant accounting policies
(continued)
(b) Significant accounting policies (continued) Revenue recognition
Revenue from the distribution of electricity is recognized on the accrual
basis. Electricity is metered upon delivery to customers and is recognized as
revenue using approved rates when consumed. Meters are read periodically and
bills are issued to customers based on these readings. At the end of the year,
a certain amount of consumed electricity will not have been billed.
Electricity that is consumed but not yet billed to the customers is estimated
and accrued as revenue in the current year.
Unbilled revenue included in accounts receivable as at December 31, 2017 is

82249 4290 RC 000182249 4290 RC 0001
Tax Year End: 2017-12-312017-12-31
Name: Algoma Power Inc.Algoma Power Inc.
BN:
T2 BAR CODE RETURN
Tax Year Start: 2017-01-012017-01-01
Version 2018 v.1.0 EP29 Page 7
$2,857 ($3,337 in 2016).
Foreign currency translation
Monetary assets and liabilities denominated in foreign currencies are
translated into Canadian dollars at the exchange rate prevailing on the
balance sheet date. Gains and losses on translation are included in the
statement of earnings. Revenue and expenses denominated in foreign currencies
are translated into Canadian dollars at the exchange rate prevailing on the
transaction date.
Employee benefit plans
Effective January 1, 2014, the Company has adopted new CPA Handbook
Section 3462, Employee Future Benefits, for its accounting of pension benefits
and other retirement benefits. As allowed under new Section 3462, the Company
has made an accounting policy choice to measure its defined benefit plan
obligations using the funding valuation approach. This approach uses the most
recent completed actuarial valuations prepared for funding purposes as the
basis of measuring defined benefit plan obligations. Even though other
retirement benefits are not funded, Section 3462 requires that such
liabilities can be measured on a basis consistent with funded plans. As well,
the Company is using a roll-forward technique in the years between valuations
to estimate the defined benefit obligations. Pension plan assets are valued at
fair value as of the balance sheet date.
The Company made an application to the OEB to continue to account for pension
and other retirement benefits under the former Section 3461. In December 2013,
the OEB issued a Decision and Order approving the establishment of specific
variance accounts as of January 1, 2013 to recognize the difference in expense
between Sections 3461 and 3462 as long-term regulatory assets or liabilities

82249 4290 RC 000182249 4290 RC 0001
Tax Year End: 2017-12-312017-12-31
Name: Algoma Power Inc.Algoma Power Inc.
BN:
T2 BAR CODE RETURN
Tax Year Start: 2017-01-012017-01-01
Version 2018 v.1.0 EP29 Page 8
for 2013 and future years, which will be disposed of in future cost of service
proceedings, subject to the OEB's prudence review at that time
Income taxes
The Company follows the asset and liability method of accounting for income
taxes. Under this method, future income tax assets and liabilities are
recognized for temporary differences between the tax and accounting bases of
assets and liabilities. Future tax assets and liabilities are measured using
the enacted and the substantively enacted tax rates expected to apply to
taxable income in the period in which temporary differences are expected to be
recovered or settled. The Company recognizes regulatory assets and liabilities
related to future income tax liabilities and assets for the amount of future
income taxes expected to be recovered from customers in future electricity
rates.
1. Basis of accounting and summary of significant accounting policies
(continued)
(b) Significant accounting policies (continued) Use of estimates
The preparation of financial statements in conformity with ASPE requires
management to make estimates and assumptions that affect the reported amounts
of assets and liabilities and disclosure of contingent assets and liabilities
at the date of the financial statements and the reported amounts of revenue
and expenses during the reporting period. Actual results may vary from the
current estimates. These estimates are reviewed periodically and, as
adjustments become necessary, they are reported in earnings in the period in
which they become known.

82249 4290 RC 000182249 4290 RC 0001
Tax Year End: 2017-12-312017-12-31
Name: Algoma Power Inc.Algoma Power Inc.
BN:
T2 BAR CODE RETURN
Tax Year Start: 2017-01-012017-01-01
Version 2018 v.1.0 EP29 Page 9
2. Utility capital assets
Utility capital assets consist of the following:
2017
Cost Accumulated
amortization Net book
value
Distribution Other $
141,863
11,104 $
55,326
6,914 $
86,537
4,190
152,967 62,240 90,727
2016
Cost Accumulated
amortization Net book
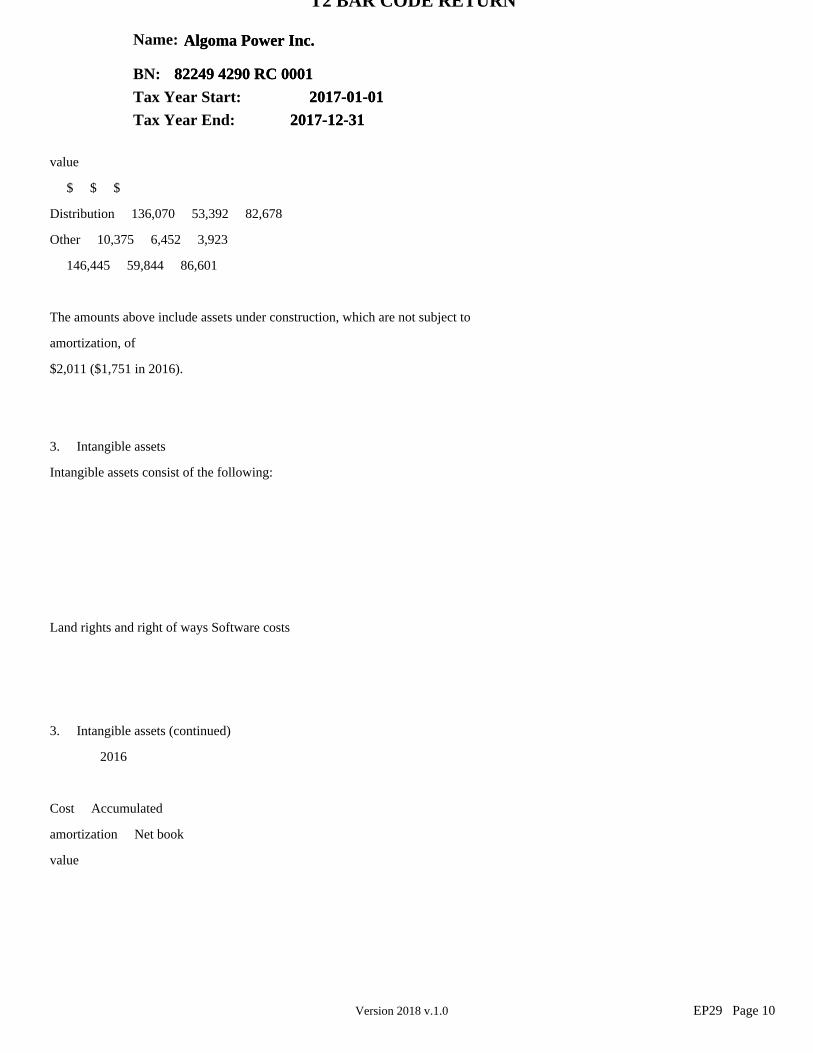
82249 4290 RC 000182249 4290 RC 0001
Tax Year End: 2017-12-312017-12-31
Name: Algoma Power Inc.Algoma Power Inc.
BN:
T2 BAR CODE RETURN
Tax Year Start: 2017-01-012017-01-01
Version 2018 v.1.0 EP29 Page 10
value
$ $ $
Distribution 136,070 53,392 82,678
Other 10,375 6,452 3,923
146,445 59,844 86,601
The amounts above include assets under construction, which are not subject to
amortization, of
$2,011 ($1,751 in 2016).
3. Intangible assets
Intangible assets consist of the following:
Land rights and right of ways Software costs
3. Intangible assets (continued)
2016
Cost Accumulated
amortization Net book
value

82249 4290 RC 000182249 4290 RC 0001
Tax Year End: 2017-12-312017-12-31
Name: Algoma Power Inc.Algoma Power Inc.
BN:
T2 BAR CODE RETURN
Tax Year Start: 2017-01-012017-01-01
Version 2018 v.1.0 EP29 Page 11
$ $ $
Land rights and right of ways 20,847 4,602 16,245
Softw are costs 2,801 1,610 1,191
23,648 6,212 17,436
4. Employee future benefits
The Company maintains a defined benefit pension plan and a defined
contribution pension plan providing pension benefits, and defined benefit
plans providing other retirement benefits.
Information about API's benefit plans is as follows:
Pension benefit plans Other retirement plans
Accrued benefit obligation Balance, beginning of year
Current service costs Finance costs Employee contributions Benefits paid
Actuarial (gains) losses Balance, end of year
Plan assets
Fair value, beginning of year Interest income
Return on plan assets Contributions Benefits paid
Fair value, end of year
Funded status - plan surplus (deficit)
The measurement date for the plan assets and the accrued benefit obligation
was as at December 31, 2017. The effective date of the most recent actuarial

82249 4290 RC 000182249 4290 RC 0001
Tax Year End: 2017-12-312017-12-31
Name: Algoma Power Inc.Algoma Power Inc.
BN:
T2 BAR CODE RETURN
Tax Year Start: 2017-01-012017-01-01
Version 2018 v.1.0 EP29 Page 12
valuation was as at December 31, 2014 and the date of the next required
valuation for funding purposes is as at December 31, 2017, and will be
completed by September 2018.
4. Employee future benefits (continued)
The plan assets held at the measurement date are represented by the following
categories:
Canadian equity funds Foreign equity funds Canadian fixed income funds
As at December 31, 2017, one of the defined benefit pension plans had a net
accrued benefit liability of $321 ($350 in 2016). This plan had no plan assets
in 2017 or 2016.
Pension benefit plans Other retirement plans
Significant assumptions used Discount rate, beginning of year Discount rate,
end of year
Rate of compensation increase Initial health care trend rate Average remaining
service of
active employees (years)
Net benefit expense for the year Current service costs
Finance costs Remeasurement costs Regulatory adjustments

82249 4290 RC 000182249 4290 RC 0001
Tax Year End: 2017-12-312017-12-31
Name: Algoma Power Inc.Algoma Power Inc.
BN:
T2 BAR CODE RETURN
Tax Year Start: 2017-01-012017-01-01
Version 2018 v.1.0 EP29 Page 13
Net benefit expense
The total expense for the Company's defined contribution pension plan for the
year amounted to
$113 ($122 in 2016).
5. Income taxes
The provision for income taxes consists of the following:
Current income taxes Future income taxes
Future income taxes transferred to regulatory assets
During the year, the Company recorded $843 in regulatory assets and a
corresponding decrease to future income tax expense, for the amount of future
income taxes expected to be collected from customers in future electricity
rates.
5. Income taxes (continued)
Future tax assets (liabilities) are comprised of the following:
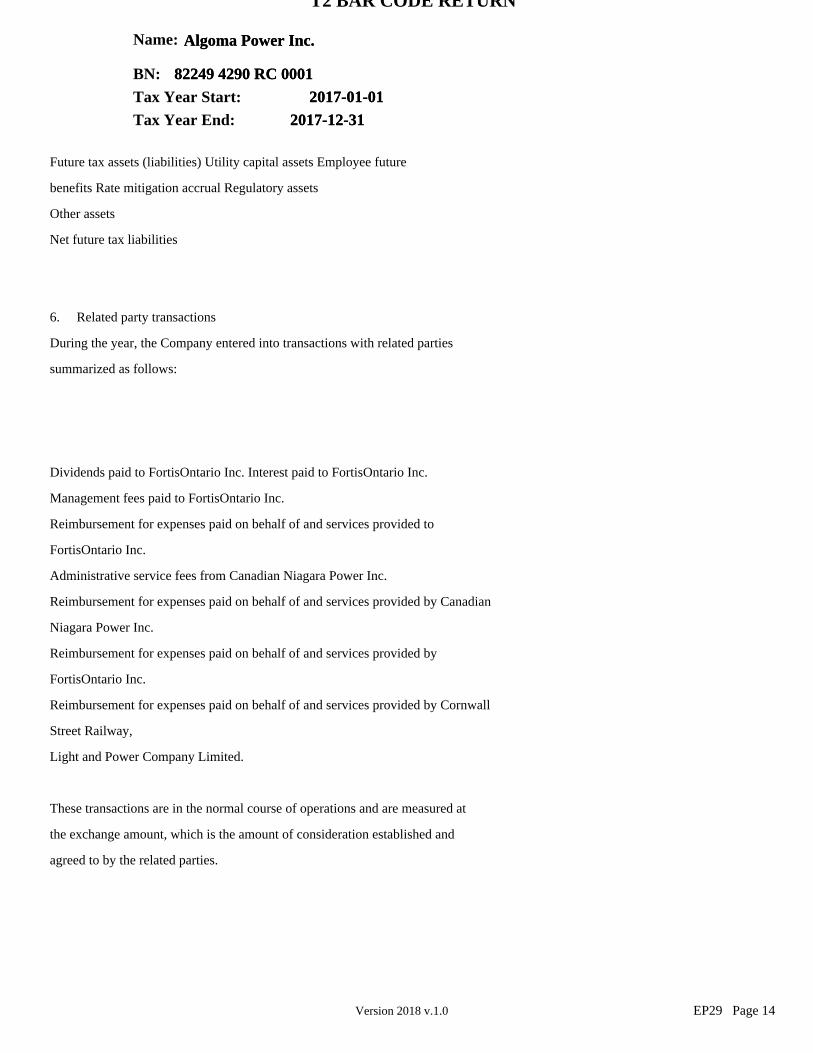
82249 4290 RC 000182249 4290 RC 0001
Tax Year End: 2017-12-312017-12-31
Name: Algoma Power Inc.Algoma Power Inc.
BN:
T2 BAR CODE RETURN
Tax Year Start: 2017-01-012017-01-01
Version 2018 v.1.0 EP29 Page 14
Future tax assets (liabilities) Utility capital assets Employee future
benefits Rate mitigation accrual Regulatory assets
Other assets
Net future tax liabilities
6. Related party transactions
During the year, the Company entered into transactions with related parties
summarized as follows:
Dividends paid to FortisOntario Inc. Interest paid to FortisOntario Inc.
Management fees paid to FortisOntario Inc.
Reimbursement for expenses paid on behalf of and services provided to
FortisOntario Inc.
Administrative service fees from Canadian Niagara Power Inc.
Reimbursement for expenses paid on behalf of and services provided by Canadian
Niagara Power Inc.
Reimbursement for expenses paid on behalf of and services provided by
FortisOntario Inc.
Reimbursement for expenses paid on behalf of and services provided by Cornwall
Street Railway,
Light and Power Company Limited.
These transactions are in the normal course of operations and are measured at
the exchange amount, which is the amount of consideration established and
agreed to by the related parties.

82249 4290 RC 000182249 4290 RC 0001
Tax Year End: 2017-12-312017-12-31
Name: Algoma Power Inc.Algoma Power Inc.
BN:
T2 BAR CODE RETURN
Tax Year Start: 2017-01-012017-01-01
Version 2018 v.1.0 EP29 Page 15
As at December 31, the amounts due from related parties are summarized as
follows:
FortisOntario Inc.
6. Related party transactions (continued)
Details of relationships with related parties are as follows:
" FortisOntario Inc. owns a 100% interest in the capital stock of the
Company
" Cornwall Street Railway, Light and Power Company Limited is a wholly
owned subsidiary of FortisOntario Inc.
" Canadian Niagara Power Inc. is a wholly owned subsidiary of
FortisOntario Inc.
7. Long-term debt
Long-term debt consists of the following:
5.118% senior unsecured notes due on December 16, 2041
Unamortized debt issue costs

82249 4290 RC 000182249 4290 RC 0001
Tax Year End: 2017-12-312017-12-31
Name: Algoma Power Inc.Algoma Power Inc.
BN:
T2 BAR CODE RETURN
Tax Year Start: 2017-01-012017-01-01
Version 2018 v.1.0 EP29 Page 16
The senior unsecured notes bear interest at 5.118% and are repayable at
maturity on December 16, 2041. The senior unsecured notes were issued on
December 16, 2011 and interest is payable semi-annually. Interest expense for
the year amounted to $2,661 ($2,661 in 2016).
8. Capital stock
The authorized and issued shares consist of 90,831,810 common shares without
par value.
9. Amortization
Amortization consists of the following:
Amortization of utility capital assets Amortization of intangible assets
Amortization of contributions in aid of construction Vehicle amortization
allocated
10. Statement of cash flows
The net change in non-cash working capital balances related to operations
consists of the following:

82249 4290 RC 000182249 4290 RC 0001
Tax Year End: 2017-12-312017-12-31
Name: Algoma Power Inc.Algoma Power Inc.
BN:
T2 BAR CODE RETURN
Tax Year Start: 2017-01-012017-01-01
Version 2018 v.1.0 EP29 Page 17
Accounts receivable Income taxes receivable Materials and supplies Regulatory
assets/ liabilities Prepaid expenses
Due to/from related parties
Accounts payable and accrued liabilities
Supplemental cash flow information:
Interest paid Income taxes paid
The restricted cash is a deposit held by the Ministry of Environment for a
Certificate of Approval.
11. Commitments and contingencies
API has a building lease agreement with Hydro One Sault Ste Marie LLP until
December 31, 2019 with annual rent, operating costs and municipal taxes of
$600.
12. Financial risk management
The Company is primarily exposed to credit risk, liquidity risk and market
risk as a result of holding financial instruments in the normal course of
business.
Credit risk - Risk that a third party to a financial instrument might fail to
meet its obligations under the terms of the financial instrument.

82249 4290 RC 000182249 4290 RC 0001
Tax Year End: 2017-12-312017-12-31
Name: Algoma Power Inc.Algoma Power Inc.
BN:
T2 BAR CODE RETURN
Tax Year Start: 2017-01-012017-01-01
Version 2018 v.1.0 EP29 Page 18
Liquidity risk - Risk that an entity will encounter difficulty in raising
funds to meet commitments associated with financial instruments.
Market risk - Risk that the fair value or future cash flows of a financial
instrument will fluctuate due to changes in market prices.
Credit risk
For cash and accounts receivable due from customers, API's credit risk is
limited to the carrying value on the balance sheet.
API is exposed to credit risk from its distribution customers but has various
policies to minimize this risk. These policies include requiring customer
deposits, performing disconnections and using third-party collection agencies
for overdue accounts. API has a large and diversified distribution customer
base which minimizes the concentration of credit risk.
12. Financial risk management (continued)
The aging of the Company's trade and other receivables due from customers is
as follows:
Not past due
Past due 0-30 days Past due 31-60 days
Past due 61 days and over
Less allowance for doubtful accounts
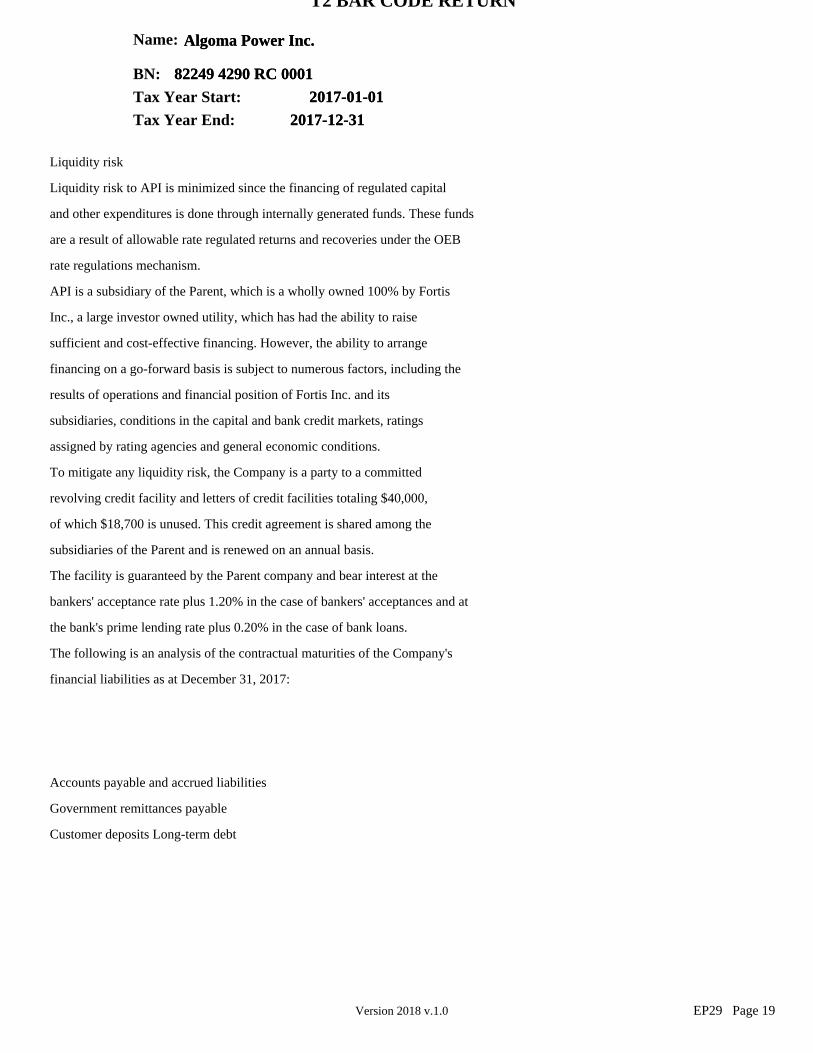
82249 4290 RC 000182249 4290 RC 0001
Tax Year End: 2017-12-312017-12-31
Name: Algoma Power Inc.Algoma Power Inc.
BN:
T2 BAR CODE RETURN
Tax Year Start: 2017-01-012017-01-01
Version 2018 v.1.0 EP29 Page 19
Liquidity risk
Liquidity risk to API is minimized since the financing of regulated capital
and other expenditures is done through internally generated funds. These funds
are a result of allowable rate regulated returns and recoveries under the OEB
rate regulations mechanism.
API is a subsidiary of the Parent, which is a wholly owned 100% by Fortis
Inc., a large investor owned utility, which has had the ability to raise
sufficient and cost-effective financing. However, the ability to arrange
financing on a go-forward basis is subject to numerous factors, including the
results of operations and financial position of Fortis Inc. and its
subsidiaries, conditions in the capital and bank credit markets, ratings
assigned by rating agencies and general economic conditions.
To mitigate any liquidity risk, the Company is a party to a committed
revolving credit facility and letters of credit facilities totaling $40,000,
of which $18,700 is unused. This credit agreement is shared among the
subsidiaries of the Parent and is renewed on an annual basis.
The facility is guaranteed by the Parent company and bear interest at the
bankers' acceptance rate plus 1.20% in the case of bankers' acceptances and at
the bank's prime lending rate plus 0.20% in the case of bank loans.
The following is an analysis of the contractual maturities of the Company's
financial liabilities as at December 31, 2017:
Accounts payable and accrued liabilities
Government remittances payable
Customer deposits Long-term debt

82249 4290 RC 000182249 4290 RC 0001
Tax Year End: 2017-12-312017-12-31
Name: Algoma Power Inc.Algoma Power Inc.
BN:
T2 BAR CODE RETURN
Tax Year Start: 2017-01-012017-01-01
Version 2018 v.1.0 EP29 Page 20
Interest rate risk
Long-term debt is at fixed interest rates thereby minimizing cash flow and
interest rate fluctuation exposure. The Company is primarily subject to risks
associated with fluctuating interest rates on its short-term borrowings. Short
-term borrowings for 2017 and 2016 are nil.
13. Capital management
API manages its capital to approximate the deemed capital structure reflected
in the utility's customer rates or anticipated future rates. API's
distribution rates effective on January 1, 2015 are based on a deemed capital
structure of 60% debt and 40% equity. API's capital structure consists of
third-party debt and common equity, but excludes unamortized debt issue costs.
The managed capital is as follows:
Debt Equity
14. Regulatory assets and liabilities
Regulatory liabilities net of regulatory assets arise as a result of
regulatory requirements.
The Company pays the cost of power on behalf of its customers and recovers
these costs through retail billings to its customers. The cost of power

82249 4290 RC 000182249 4290 RC 0001
Tax Year End: 2017-12-312017-12-31
Name: Algoma Power Inc.Algoma Power Inc.
BN:
T2 BAR CODE RETURN
Tax Year Start: 2017-01-012017-01-01
Version 2018 v.1.0 EP29 Page 21
includes charges for transmission, wholesale market operations and the power
itself from Ontario's Independent Electricity System Operator. The balance of
the retail settlement variance account represents the costs that have not been
recovered from, or settled through, customers as of the balance sheet date.
The OEB's Distribution Rate Handbook and Accounting Procedures Handbook allow
these costs to be deferred and recovered through future rate adjustments as
discussed in note 1. In the absence of rate regulation, these costs would be
expensed in the period they are incurred.
The OEB has the general power to include or exclude costs, revenues, gains or
losses in the rates of a specific period, resulting in the timing of revenue
and expense recognition that may differ in the Company's regulated operations
from those otherwise expected in non-regulated businesses. This change in
timing gives rise to the recognition of regulatory assets and liabilities. The
Company continually assesses the likelihood of recovery of its regulatory
assets and believes that its regulatory assets and liabilities will be
factored into the setting of future rates as discussed in note 1. If future
recovery through rates is no longer considered probable, the appropriate
carrying amount will be written off in the period that the assessment is made.
As of December 31, 2015, as discussed in note 1 under "Utility capital assets
and capitalization policy", API had a regulatory liability in OEB account 1576
of $1,128. These were transitional adjustments related to accounting changes
to amortization and capitalization policy. As a result of the 2015 OEB
Decision and Order, API recorded an additional regulatory liability of $93 in
2017, relating to the regulatory return calculated on the approved cumulative
regulatory liability of $1,379. A reduction of the regulatory liability of
$376 occurred during 2017 due to a repayment to API's customers in the form of
a rate rider, which is set to expire in December 2019. The cumulative
regulatory liability balance as at December 31, 2017 was $560, of which

82249 4290 RC 000182249 4290 RC 0001
Tax Year End: 2017-12-312017-12-31
Name: Algoma Power Inc.Algoma Power Inc.
BN:
T2 BAR CODE RETURN
Tax Year Start: 2017-01-012017-01-01
Version 2018 v.1.0 EP29 Page 22
$385 has been reported as current.
14. Regulatory assets and liabilities (continued)
API recorded the following regulatory assets and liabilities as at December
31:
Current regulatory assets
Amounts approved in current rates
Long-term regulatory assets Amounts approved in current rates
Retail settlement and other variance accounts Future taxes to be recovered
from customers Pension and other retirement benefits
Current regulatory liabilities Transitional accounting adjustments
Long-term regulatory liabilities
Retail settlement and other variance accounts Transitional accounting
adjustments
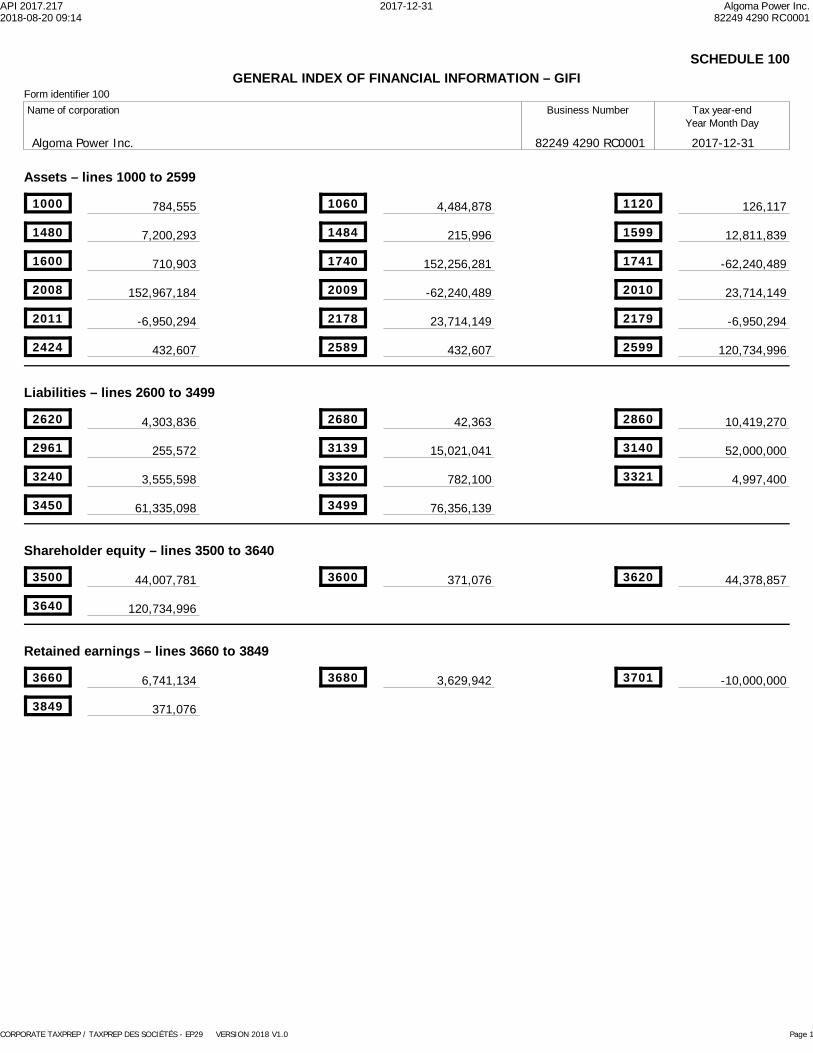
API 2017.217 2017-12-31 Algoma Power Inc.2018-08-20 09:14 82249 4290 RC0001
CORPORATE TAXPREP / TAXPREP DES SOCIÉTÉS - EP29 VERSION 2018 V1.0 Page 1
GENERAL INDEX OF FINANCIAL INFORMATION – GIFISCHEDULE 100
Form identifier 100Tax year-end
Year Month DayBusiness NumberName of corporation
Algoma Power Inc. 2017-12-3182249 4290 RC0001
Assets – lines 1000 to 2599
1000 784,555 126,11711201060 4,484,878
1480 7,200,293 12,811,83915991484 215,996
1600 710,903 -62,240,48917411740 152,256,281
2008 152,967,184 23,714,14920102009 -62,240,489
2011 -6,950,294 -6,950,29421792178 23,714,149
2424 432,607 120,734,99625992589 432,607
Liabilities – lines 2600 to 3499
2620 4,303,836 10,419,27028602680 42,363
2961 255,572 52,000,00031403139 15,021,041
3240 3,555,598 4,997,40033213320 782,100
3450 61,335,098 3499 76,356,139
Shareholder equity – lines 3500 to 3640
3500 44,007,781 44,378,85736203600 371,076
3640 120,734,996
Retained earnings – lines 3660 to 3849
3660 6,741,134 -10,000,00037013680 3,629,942
3849 371,076
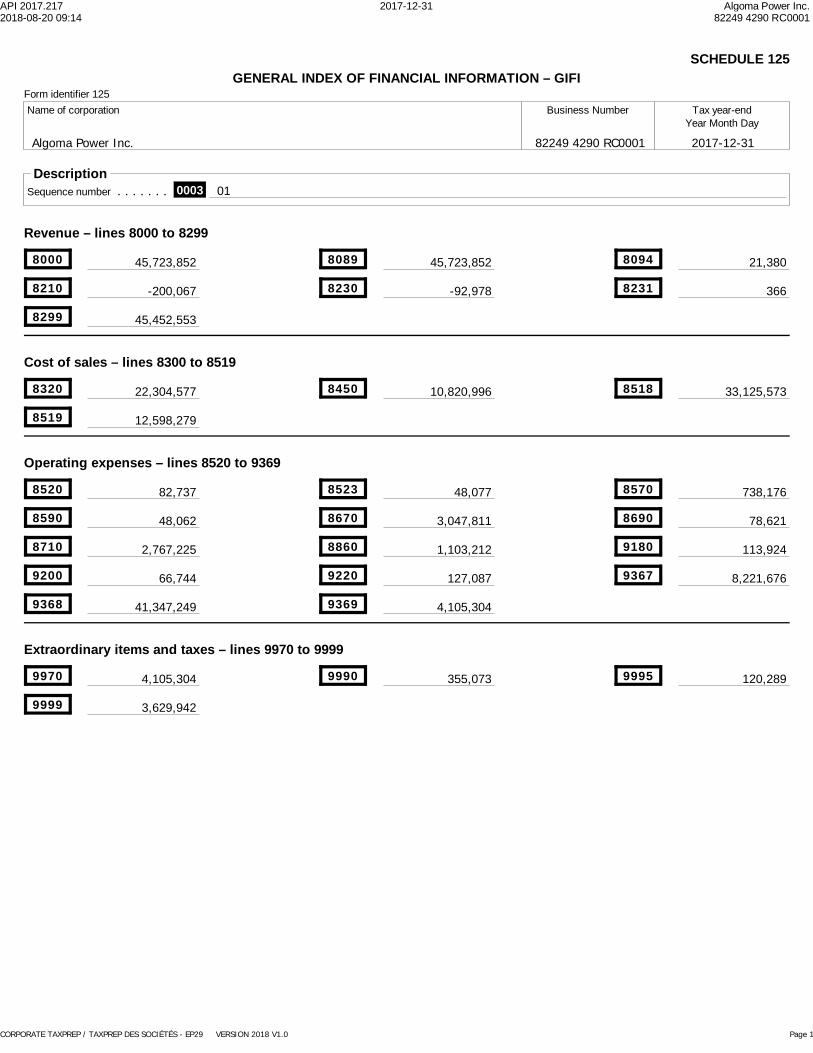
API 2017.217 2017-12-31 Algoma Power Inc.2018-08-20 09:14 82249 4290 RC0001
CORPORATE TAXPREP / TAXPREP DES SOCIÉTÉS - EP29 VERSION 2018 V1.0 Page 1
GENERAL INDEX OF FINANCIAL INFORMATION – GIFISCHEDULE 125
Form identifier 125Tax year-end
Year Month DayBusiness NumberName of corporation
Algoma Power Inc. 2017-12-3182249 4290 RC0001
DescriptionSequence number . . . . . . . 0003 01
Revenue – lines 8000 to 8299
8000 45,723,852 21,38080948089 45,723,852
8210 -200,067 36682318230 -92,978
8299 45,452,553
Cost of sales – lines 8300 to 8519
8320 22,304,577 33,125,57385188450 10,820,996
8519 12,598,279
Operating expenses – lines 8520 to 9369
8520 82,737 738,17685708523 48,077
8590 48,062 78,62186908670 3,047,811
8710 2,767,225 113,92491808860 1,103,212
9200 66,744 8,221,67693679220 127,087
9368 41,347,249 9369 4,105,304
Extraordinary items and taxes – lines 9970 to 9999
9970 4,105,304 120,28999959990 355,073
9999 3,629,942
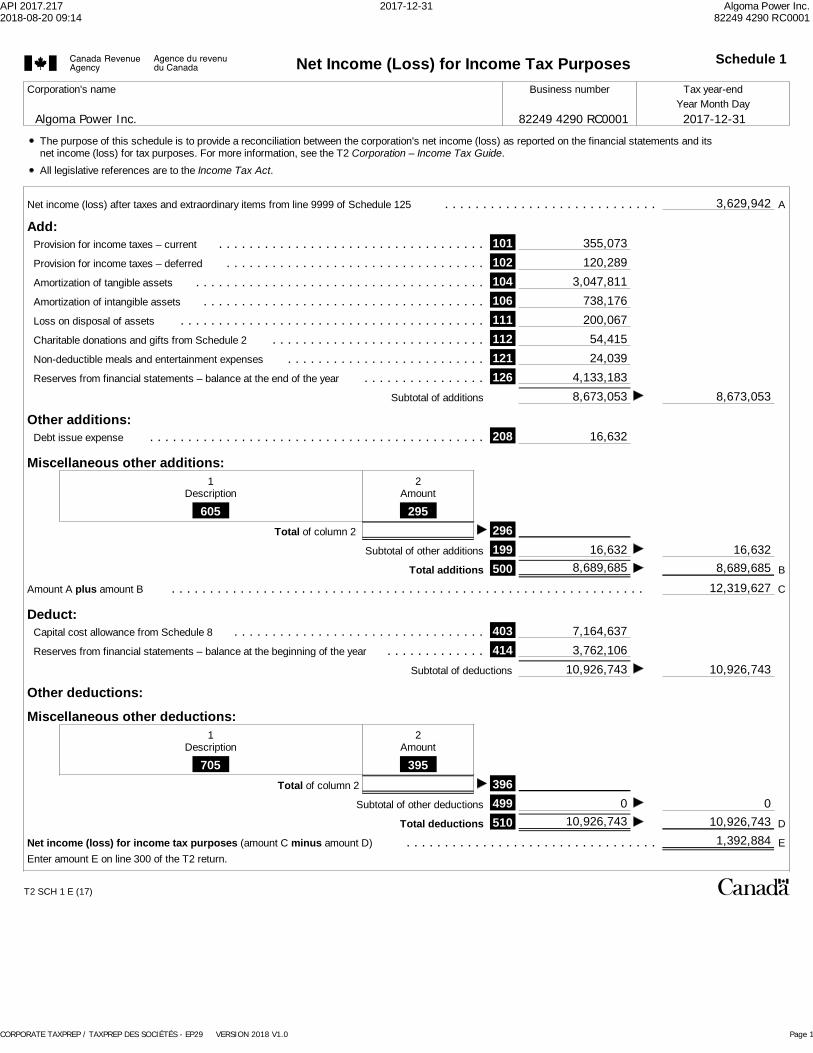
API 2017.217 2017-12-31 Algoma Power Inc.2018-08-20 09:14 82249 4290 RC0001
CORPORATE TAXPREP / TAXPREP DES SOCIÉTÉS - EP29 VERSION 2018 V1.0 Page 1
Net Income (Loss) for Income Tax Purposes Schedule 1
Corporation's name Business number Tax year-endYear Month Day
Algoma Power Inc. 82249 4290 RC0001 2017-12-31
The purpose of this schedule is to provide a reconciliation between the corporation's net income (loss) as reported on the financial statements and itsnet income (loss) for tax purposes. For more information, see the T2 Corporation – Income Tax Guide.All legislative references are to the Income Tax Act.
Net income (loss) after taxes and extraordinary items from line 9999 of Schedule 125 . . . . . . . . . . . . . . . . . . . . . . . . . . . . A3,629,942
Add:Provision for income taxes – current . . . . . . . . . . . . . . . . . . . . . . . . . . . . . . . . . . . 101 355,073
Provision for income taxes – deferred . . . . . . . . . . . . . . . . . . . . . . . . . . . . . . . . . . 102 120,289
Amortization of tangible assets . . . . . . . . . . . . . . . . . . . . . . . . . . . . . . . . . . . . . . 104 3,047,811
Amortization of intangible assets . . . . . . . . . . . . . . . . . . . . . . . . . . . . . . . . . . . . . 106 738,176
Loss on disposal of assets . . . . . . . . . . . . . . . . . . . . . . . . . . . . . . . . . . . . . . . . 111 200,067
Charitable donations and gifts from Schedule 2 . . . . . . . . . . . . . . . . . . . . . . . . . . . . 112 54,415
Non-deductible meals and entertainment expenses . . . . . . . . . . . . . . . . . . . . . . . . . . 121 24,039
Reserves from financial statements – balance at the end of the year . . . . . . . . . . . . . . . . 126 4,133,183
Subtotal of additions 8,673,053 8,673,053
Other additions:Debt issue expense . . . . . . . . . . . . . . . . . . . . . . . . . . . . . . . . . . . . . . . . . . . . 208 16,632
Miscellaneous other additions:
605
1Description
295
2Amount
296 of column 2Total
Subtotal of other additions 199 16,632 16,632
Total additions 500 B8,689,6858,689,685
Amount A plus amount B . . . . . . . . . . . . . . . . . . . . . . . . . . . . . . . . . . . . . . . . . . . . . . . . . . . . . . . . . . . . . . C12,319,627
Deduct:Capital cost allowance from Schedule 8 . . . . . . . . . . . . . . . . . . . . . . . . . . . . . . . . . 403 7,164,637
Reserves from financial statements – balance at the beginning of the year . . . . . . . . . . . . . 414 3,762,106
Subtotal of deductions 10,926,743 10,926,743
Other deductions:Miscellaneous other deductions:
705
1Description
395
2Amount
of column 2Total 396Subtotal of other deductions 499 0 0
Total deductions 510 D10,926,743 10,926,743
Net income (loss) for income tax purposes (amount C minus amount D) . . . . . . . . . . . . . . . . . . . . . . . . . . . . . . . . . EEnter amount E on line 300 of the T2 return.
1,392,884
T2 SCH 1 E (17) ¤

API 2017.217 2017-12-31 Algoma Power Inc.2018-08-20 09:14 82249 4290 RC0001
CORPORATE TAXPREP / TAXPREP DES SOCIÉTÉS - EP29 VERSION 2018 V1.0 Page 1
Schedule 2Charitable Donations and Gifts
Year Month DayCorporation's name Business number Tax year-end
2017-12-31Algoma Power Inc. 82249 4290 RC0001
For use by corporations to claim any of the following:– the eligible amount of charitable donations to qualified donees;– the Ontario, Nova Scotia, and British Columbia food donation tax credits for farmers;– the eligible amount of gifts of certified cultural property;– the eligible amount of gifts of certified ecologically sensitive land; or– the additional deduction for gifts of medicine made before March 22, 2017.
All legislative references are to the federal Income Tax Act, unless otherwise specified.The eligible amount of a gift is the amount by which the fair market value of the gifted property exceeds the amount of an advantage, if any, for the gift.The donations and gifts are eligible for a 5-year carryforward except for gifts of certified ecologically sensitive land made after February 10, 2014, whichare eligible for a 10-year carryforward. Provincial food donation tax credits must be applied in the current tax year.Use this schedule to show a transfer of unused amounts from previous years following an amalgamation or the wind-up of a subsidiary as described undersubsections 87(1) and 88(1).
File a completed copy of this schedule with your T2 Corporation Income Tax Return.For more information, see the T2 Corporation – Income Tax Guide.
Subsection 110.1(1.2) provides as follows:– Where a particular corporation has undergone an acquisition of control, for tax years that end on or after the acquisition of control, no corporation can
claim a deduction for a gift made by the particular corporation to a qualified donee before the acquisition of control.– If a particular corporation makes a gift to a qualified donee pursuant to an arrangement under which both the gift and the acquisition of control is
expected, no corporation can claim a deduction for the gift unless the person acquiring control of the particular corporation is the qualified donee.A gift of medicine made before March 22, 2017 to a qualifying organization for activities outside of Canada may be eligible for an additional deduction.Calculate the additional deduction in Part 5.
Part 1 – Charitable donationsCharity/Recipient Amount ($100 or more only)
Ontario Native Welfare 27,940United Way of Sault St. Marie 12,600Golden Manor 100Canada Helps Organization 450St. Joseph Island Museum 500Power of Pink Charity 100Algoma University 2,600Municipality of Wawa 10,000
Total donations in current tax yearTotal donations of less than $100 eachAdd:
Subtotal
54,415125
54,290
T2 SCH 2 E (11/2017) ¤
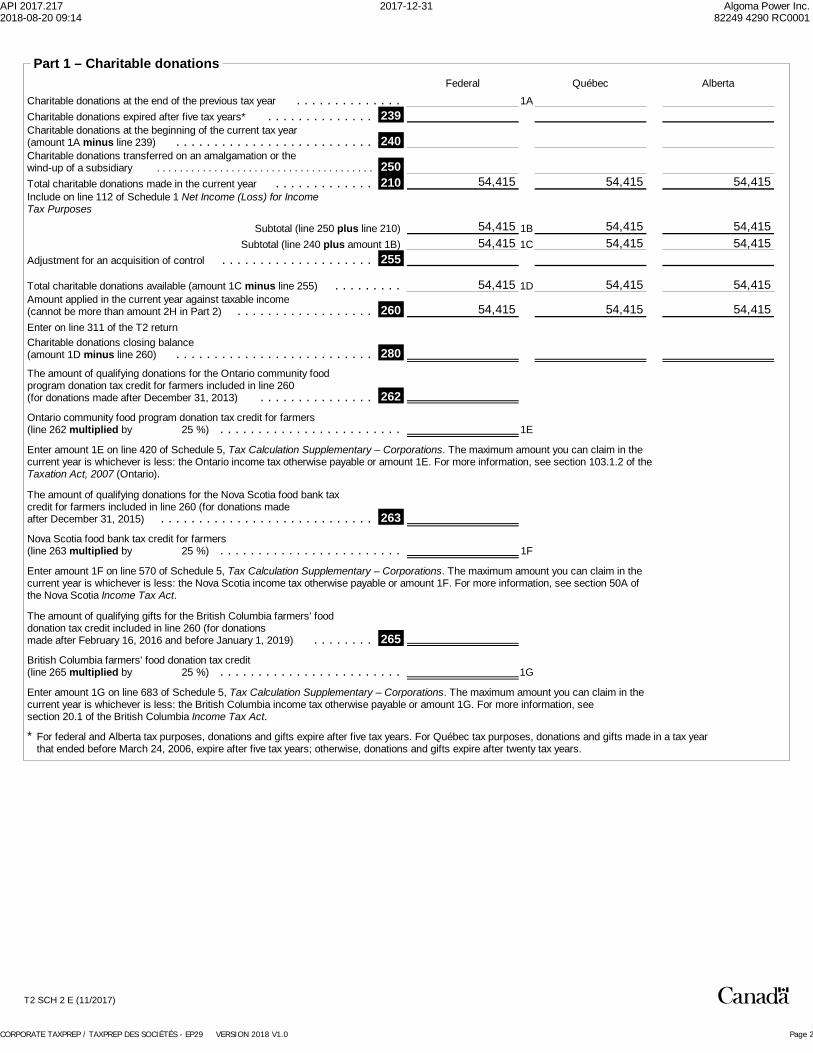
API 2017.217 2017-12-31 Algoma Power Inc.2018-08-20 09:14 82249 4290 RC0001
CORPORATE TAXPREP / TAXPREP DES SOCIÉTÉS - EP29 VERSION 2018 V1.0 Page 2
Part 1 – Charitable donations
British Columbia farmers' food donation tax credit(line 265 multiplied by
Nova Scotia food bank tax credit for farmers(line 263 multiplied by
Charitable donations transferred on an amalgamation or thewind-up of a subsidiary . . . . . . . . . . . . . . . . . . . . . . . . . . . . . . . . . . . . . .
Amount applied in the current year against taxable income(cannot be more than amount 2H in Part 2) . . . . . . . . . . . . . . . . . .
280Charitable donations closing balance(amount 1D minus line 260) . . . . . . . . . . . . . . . . . . . . . . . . . .
260
Total charitable donations available (amount 1C minus line 255) . . . . . . . . .
line 210) plusSubtotal (line 250
Total charitable donations made in the current year . . . . . . . . . . . . .
Charitable donations expired after five tax years* . . . . . . . . . . . . . .
QuébecFederal
210250
240Charitable donations at the beginning of the current tax year(amount 1A minus line 239) . . . . . . . . . . . . . . . . . . . . . . . . . .
239
1D
Charitable donations at the end of the previous tax year . . . . . . . . . . . . . . Alberta
Adjustment for an acquisition of control . . . . . . . . . . . . . . . . . . . . 255
* For federal and Alberta tax purposes, donations and gifts expire after five tax years. For Québec tax purposes, donations and gifts made in a tax year that ended before March 24, 2006, expire after five tax years; otherwise, donations and gifts expire after twenty tax years.
1A
1B amount 1B) plusSubtotal (line 240 1C
The amount of qualifying donations for the Ontario community foodprogram donation tax credit for farmers included in line 260(for donations made after December 31, 2013) . . . . . . . . . . . . . . . 262Ontario community food program donation tax credit for farmers(line 262 multiplied by %) . . . . . . . . . . . . . . . . . . . . . . . . 1E
Enter amount 1E on line 420 of Schedule 5, Tax Calculation Supplementary – Corporations. The maximum amount you can claim in thecurrent year is whichever is less: the Ontario income tax otherwise payable or amount 1E. For more information, see section 103.1.2 of theTaxation Act, 2007 (Ontario).
The amount of qualifying donations for the Nova Scotia food bank taxcredit for farmers included in line 260 (for donations madeafter December 31, 2015) . . . . . . . . . . . . . . . . . . . . . . . . . . . . 263
1F
Enter amount 1F on line 570 of Schedule 5, Tax Calculation Supplementary – Corporations. The maximum amount you can claim in thecurrent year is whichever is less: the Nova Scotia income tax otherwise payable or amount 1F. For more information, see section 50A ofthe Nova Scotia Income Tax Act.
The amount of qualifying gifts for the British Columbia farmers' fooddonation tax credit included in line 260 (for donationsmade after February 16, 2016 and before January 1, 2019) . . . . . . . . 265
1G
Enter amount 1G on line 683 of Schedule 5, Tax Calculation Supplementary – Corporations. The maximum amount you can claim in thecurrent year is whichever is less: the British Columbia income tax otherwise payable or amount 1G. For more information, seesection 20.1 of the British Columbia Income Tax Act.
%) . . . . . . . . . . . . . . . . . . . . . . . .
%) . . . . . . . . . . . . . . . . . . . . . . . .
Include on line 112 of Schedule 1 Net Income (Loss) for Income Tax Purposes
Enter on line 311 of the T2 return
54,415 54,415 54,415
54,41554,41554,415
54,415
54,415 54,41554,415
54,415
54,415 54,415 54,415
54,415
25
25
25
T2 SCH 2 E (11/2017) ¤
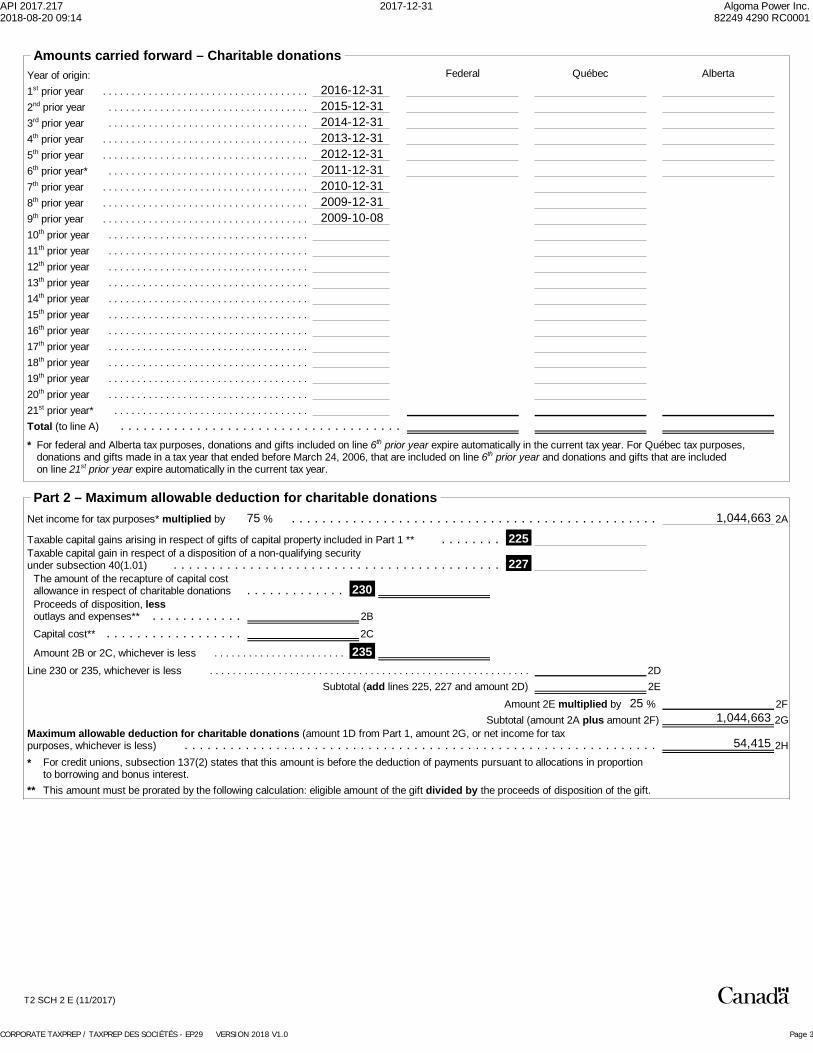
API 2017.217 2017-12-31 Algoma Power Inc.2018-08-20 09:14 82249 4290 RC0001
CORPORATE TAXPREP / TAXPREP DES SOCIÉTÉS - EP29 VERSION 2018 V1.0 Page 3
Amounts carried forward – Charitable donationsAlbertaQuébecFederalYear of origin:
1st prior year . . . . . . . . . . . . . . . . . . . . . . . . . . . . . . . . . . . . 2nd prior year . . . . . . . . . . . . . . . . . . . . . . . . . . . . . . . . . . . 3rd prior year . . . . . . . . . . . . . . . . . . . . . . . . . . . . . . . . . . . 4th prior year . . . . . . . . . . . . . . . . . . . . . . . . . . . . . . . . . . . . 5th prior year . . . . . . . . . . . . . . . . . . . . . . . . . . . . . . . . . . . . 6th prior year* . . . . . . . . . . . . . . . . . . . . . . . . . . . . . . . . . . . 7th prior year . . . . . . . . . . . . . . . . . . . . . . . . . . . . . . . . . . . .
2016-12-312015-12-312014-12-312013-12-312012-12-312011-12-312010-12-31
8th prior year . . . . . . . . . . . . . . . . . . . . . . . . . . . . . . . . . . . . 9th prior year . . . . . . . . . . . . . . . . . . . . . . . . . . . . . . . . . . . . 10th prior year . . . . . . . . . . . . . . . . . . . . . . . . . . . . . . . . . . . 11th prior year . . . . . . . . . . . . . . . . . . . . . . . . . . . . . . . . . . . 12th prior year . . . . . . . . . . . . . . . . . . . . . . . . . . . . . . . . . . . 13th prior year . . . . . . . . . . . . . . . . . . . . . . . . . . . . . . . . . . .
2009-12-312009-10-08
14th prior year . . . . . . . . . . . . . . . . . . . . . . . . . . . . . . . . . . . 15th prior year . . . . . . . . . . . . . . . . . . . . . . . . . . . . . . . . . . . 16th prior year . . . . . . . . . . . . . . . . . . . . . . . . . . . . . . . . . . . 17th prior year . . . . . . . . . . . . . . . . . . . . . . . . . . . . . . . . . . . 18th prior year . . . . . . . . . . . . . . . . . . . . . . . . . . . . . . . . . . . 19th prior year . . . . . . . . . . . . . . . . . . . . . . . . . . . . . . . . . . . 20th prior year . . . . . . . . . . . . . . . . . . . . . . . . . . . . . . . . . . . 21st prior year* . . . . . . . . . . . . . . . . . . . . . . . . . . . . . . . . . .
For federal and Alberta tax purposes, donations and gifts included on line 6th prior year expire automatically in the current tax year. For Québec tax purposes, donations and gifts made in a tax year that ended before March 24, 2006, that are included on line 6th prior year and donations and gifts that are included on line 21st prior year expire automatically in the current tax year.
Total (to line A) . . . . . . . . . . . . . . . . . . . . . . . . . . . . . . . . . . . . . *
Part 2 – Maximum allowable deduction for charitable donations
For credit unions, subsection 137(2) states that this amount is before the deduction of payments pursuant to allocations in proportionto borrowing and bonus interest.
2HMaximum allowable deduction for charitable donations (amount 1D from Part 1, amount 2G, or net income for taxpurposes, whichever is less) . . . . . . . . . . . . . . . . . . . . . . . . . . . . . . . . . . . . . . . . . . . . . . . . . . . . . . . . . . . . . .
2G amount 2F) plusSubtotal (amount 2A2F by multipliedAmount 2E
2E lines 225, 227 and amount 2D)addSubtotal (Line 230 or 235, whichever is less . . . . . . . . . . . . . . . . . . . . . . . . . . . . . . . . . . . . . . . . . . . . . . . . . . . . . . . . 2D
Amount 2B or 2C, whichever is less . . . . . . . . . . . . . . . . . . . . . . . 2352CCapital cost** . . . . . . . . . . . . . . . . . .
Proceeds of disposition, lessoutlays and expenses** . . . . . . . . . . . . 2B
230The amount of the recapture of capital costallowance in respect of charitable donations . . . . . . . . . . . . .
227Taxable capital gain in respect of a disposition of a non-qualifying securityunder subsection 40(1.01) . . . . . . . . . . . . . . . . . . . . . . . . . . . . . . . . . . . . . . . . . . .
2252ANet income for tax purposes* multiplied by
%
% . . . . . . . . . . . . . . . . . . . . . . . . . . . . . . . . . . . . . . . . . . . . . . . . Taxable capital gains arising in respect of gifts of capital property included in Part 1 ** . . . . . . . .
This amount must be prorated by the following calculation: eligible amount of the gift divided by the proceeds of disposition of the gift.
*
**
54,415
1,044,663
1,044,663
25
75
T2 SCH 2 E (11/2017) ¤

API 2017.217 2017-12-31 Algoma Power Inc.2018-08-20 09:14 82249 4290 RC0001
CORPORATE TAXPREP / TAXPREP DES SOCIÉTÉS - EP29 VERSION 2018 V1.0 Page 4
Part 3 – Gifts of certified cultural property
480Gifts of certified cultural property closing balance(amount 3C minus amount 3D) . . . . . . . . . . . . . . . . . . . . . . . .
460Amount applied in the current year against taxable income . . . . . . . . . . .
line 410) plusSubtotal (line 450
410450
440
439
Total gifts of certified cultural property in the current year . . . . . . . . . .
Gifts of certified cultural property transferred on an amalgamationor the wind-up of a subsidiary . . . . . . . . . . . . . . . . . . . . . . . . . .
Gifts of certified cultural property at the beginningof the current tax year (amount 3A minus line 439) . . . . . . . . . . . . .
Gifts of certified cultural property expired after five tax years* . . . . . . . Gifts of certified cultural property at the end of the previous tax year . . . . . . .
Federal Québec Alberta
Adjustment for an acquisition of control . . . . . . . . . . . . . . . . . . . . . . . . . . 455
* For federal and Alberta tax purposes, donations and gifts expire after five tax years. For Québec tax purposes, donations and gifts made in a tax year that ended before March 24, 2006, expire after five tax years; otherwise, donations and gifts expire after twenty tax years.
3A
3B amount 3B) plusSubtotal (line 440 3C
line 460) plusSubtotal (line 455 3D
Include on line 112 of Schedule 1
Enter on line 313 of the T2 return
Amount carried forward – Gifts of certified cultural propertyAlbertaQuébecFederalYear of origin:
1st prior year . . . . . . . . . . . . . . . . . . . . . . . . . . . . . . . . . . . . 2nd prior year . . . . . . . . . . . . . . . . . . . . . . . . . . . . . . . . . . . 3rd prior year . . . . . . . . . . . . . . . . . . . . . . . . . . . . . . . . . . . 4th prior year . . . . . . . . . . . . . . . . . . . . . . . . . . . . . . . . . . . . 5th prior year . . . . . . . . . . . . . . . . . . . . . . . . . . . . . . . . . . . . 6th prior year* . . . . . . . . . . . . . . . . . . . . . . . . . . . . . . . . . . .
2016-12-312015-12-312014-12-312013-12-312012-12-312011-12-31
7th prior year . . . . . . . . . . . . . . . . . . . . . . . . . . . . . . . . . . . . 8th prior year . . . . . . . . . . . . . . . . . . . . . . . . . . . . . . . . . . . . 9th prior year . . . . . . . . . . . . . . . . . . . . . . . . . . . . . . . . . . . . 10th prior year . . . . . . . . . . . . . . . . . . . . . . . . . . . . . . . . . . . 11th prior year . . . . . . . . . . . . . . . . . . . . . . . . . . . . . . . . . . . 12th prior year . . . . . . . . . . . . . . . . . . . . . . . . . . . . . . . . . . .
2010-12-312009-12-312009-10-08
13th prior year . . . . . . . . . . . . . . . . . . . . . . . . . . . . . . . . . . . 14th prior year . . . . . . . . . . . . . . . . . . . . . . . . . . . . . . . . . . . 15th prior year . . . . . . . . . . . . . . . . . . . . . . . . . . . . . . . . . . . 16th prior year . . . . . . . . . . . . . . . . . . . . . . . . . . . . . . . . . . . 17th prior year . . . . . . . . . . . . . . . . . . . . . . . . . . . . . . . . . . . 18th prior year . . . . . . . . . . . . . . . . . . . . . . . . . . . . . . . . . . . 19th prior year . . . . . . . . . . . . . . . . . . . . . . . . . . . . . . . . . . . 20th prior year . . . . . . . . . . . . . . . . . . . . . . . . . . . . . . . . . . . 21st prior year* . . . . . . . . . . . . . . . . . . . . . . . . . . . . . . . . . . Total . . . . . . . . . . . . . . . . . . . . . . . . . . . . . . . . . . . . . . . . . . . * For federal and Alberta tax purposes, donations and gifts included on line 6th prior year expire automatically in the current tax year. For Québec tax purposes,
donations and gifts made in a tax year that ended before March 24, 2006, that are included on line 6th prior year and donations and gifts that are included on line 21st prior year expire automatically in the current tax year.
T2 SCH 2 E (11/2017) ¤

API 2017.217 2017-12-31 Algoma Power Inc.2018-08-20 09:14 82249 4290 RC0001
CORPORATE TAXPREP / TAXPREP DES SOCIÉTÉS - EP29 VERSION 2018 V1.0 Page 5
Part 4 – Gifts of certified ecologically sensitive land
580Gifts of certified ecologically sensitive land closing balance(amount 4C minus amount 4D) . . . . . . . . . . . . . . . . . . . . . . . .
560Amount applied in the current year against taxable income(enter on line 314 of the T2 return) . . . . . . . . . . . . . . . . . . . . . . . . . . . . . .
510
550
540
539
Gifts of certified ecologically sensitive land transferred on anamalgamation or the wind-up of a subsidiary . . . . . . . . . . . . . . . . . . . . . .
Gifts of certified ecologically sensitive land at the beginningof the current tax year (amount 4A minus line 539) . . . . . . . . . . . . .
Gifts of certified ecologically sensitive land expired after5 tax years, or after 10 tax years for gifts made afterFebruary 10, 2014* . . . . . . . . . . . . . . . . . . . . . . . . . . . . . . . .
Gifts of certified ecologically sensitive land at the end of the previous tax year . Federal Québec Alberta
lines 550, 510, and 520)addSubtotal (
Adjustment for an acquisition of control . . . . . . . . . . . . . . . . . . . . . . . . . . 555
* For federal and Alberta tax purposes, donations and gifts made before February 11, 2014, expire after five tax years and gifts made after February 10, 2014, expire after ten tax years. For Québec tax purposes, donations and gifts made during a tax year that ended before March 24, 2006, expire after five tax years; otherwise, donation and gifts expire after twenty tax years.
4A
4B amount 4B) plusSubtotal (line 540 4C
line 560) plusSubtotal (line 555 4D
Total current-year gifts of certified ecologically sensitiveland made before February 11, 2014 (include on line 112of Schedule 1) . . . . . . . . . . . . . . . . . . . . . . . . . . . . . . . . . . Total current-year gifts of certified ecologically sensitiveland made after February 10, 2014 (include on line 112of Schedule 1) . . . . . . . . . . . . . . . . . . . . . . . . . . . . . . . . . . 520
T2 SCH 2 E (11/2017) ¤

API 2017.217 2017-12-31 Algoma Power Inc.2018-08-20 09:14 82249 4290 RC0001
CORPORATE TAXPREP / TAXPREP DES SOCIÉTÉS - EP29 VERSION 2018 V1.0 Page 6
Amounts carried forward – Gifts of certified ecologically sensitive land
Amount of carried forward gifts made on or after February 11, 2014, in the tax year including this date . . . . . . . . . . . . . . . . . AlbertaQuébecFederalYear of origin:
1st prior year . . . . . . . . . . . . . . . . . . . . . . . . . . . . . . . . . . . . 2nd prior year . . . . . . . . . . . . . . . . . . . . . . . . . . . . . . . . . . . 3rd prior year . . . . . . . . . . . . . . . . . . . . . . . . . . . . . . . . . . . 4th prior year . . . . . . . . . . . . . . . . . . . . . . . . . . . . . . . . . . . . 5th prior year . . . . . . . . . . . . . . . . . . . . . . . . . . . . . . . . . . . . 6th prior year* . . . . . . . . . . . . . . . . . . . . . . . . . . . . . . . . . . .
2016-12-312015-12-312014-12-312013-12-312012-12-312011-12-31
7th prior year . . . . . . . . . . . . . . . . . . . . . . . . . . . . . . . . . . . . 8th prior year . . . . . . . . . . . . . . . . . . . . . . . . . . . . . . . . . . . . 9th prior year . . . . . . . . . . . . . . . . . . . . . . . . . . . . . . . . . . . . 10th prior year . . . . . . . . . . . . . . . . . . . . . . . . . . . . . . . . . . . 11th prior year* . . . . . . . . . . . . . . . . . . . . . . . . . . . . . . . . . . 12th prior year . . . . . . . . . . . . . . . . . . . . . . . . . . . . . . . . . . .
2010-12-312009-12-312009-10-08
13th prior year . . . . . . . . . . . . . . . . . . . . . . . . . . . . . . . . . . . 14th prior year . . . . . . . . . . . . . . . . . . . . . . . . . . . . . . . . . . . 15th prior year . . . . . . . . . . . . . . . . . . . . . . . . . . . . . . . . . . . 16th prior year . . . . . . . . . . . . . . . . . . . . . . . . . . . . . . . . . . . 17th prior year . . . . . . . . . . . . . . . . . . . . . . . . . . . . . . . . . . . 18th prior year . . . . . . . . . . . . . . . . . . . . . . . . . . . . . . . . . . . 19th prior year . . . . . . . . . . . . . . . . . . . . . . . . . . . . . . . . . . . 20th prior year . . . . . . . . . . . . . . . . . . . . . . . . . . . . . . . . . . . 21st prior year* . . . . . . . . . . . . . . . . . . . . . . . . . . . . . . . . . . Total . . . . . . . . . . . . . . . . . . . . . . . . . . . . . . . . . . . . . . . . . . . * For federal and Alberta tax purposes, donations and gifts made before February 11, 2014, that are included on line 6th prior year and gifts that are included on
line 11th prior year expire automatically in the current year.The field "Amount of carried forward gifts made on or after February 11, 2014, in the tax year including this date" is used to distinguish the portion of the gifts made in the tax year straddling February 11, 2014, that expires after ten tax years, from the portion that expires in the current tax year.For Québec tax purposes, donations and gifts made during a tax year that ended before March 24, 2006, that are included on line 6th prior year and gifts that are included on line 21st prior year expire automatically in the current tax year.
T2 SCH 2 E (11/2017) ¤

API 2017.217 2017-12-31 Algoma Power Inc.2018-08-20 09:14 82249 4290 RC0001
CORPORATE TAXPREP / TAXPREP DES SOCIÉTÉS - EP29 VERSION 2018 V1.0 Page 7
Part 5 – Additional deduction for gifts of medicine
Additional deduction for gifts of medicine at the end of the previous tax year . . Federal Québec Alberta
Additional deduction for gifts of medicine expired after five tax years* . . . 639Additional deduction for gifts of medicine at the beginning of thecurrent tax year (amount 5A minus line 639) . . . . . . . . . . . . . . . . . 640
650Additional deduction for gifts of medicine made before March 22, 2017 transferred on an amalgamation or the wind-up of a subsidiary . . . . . . Additional deduction for gifts of medicine made before March 22, 2017:
602Proceeds of disposition . . . . . . . . . . . . . . . . . . . . . . . . . . . . Cost of gifts of medicine made before March 22, 2017 . . . . . . . . . . 601
line 601) minusSubtotal (line 602 5BAmount 5B multiplied by 5C% . . . . . . . . . . . . . . . . . . . . . . . Eligible amount of gifts . . . . . . . . . . . . . . . . . . . . . . . . . . . . . 600
Federala x b
c( ) = 610
Additionaldeduction for giftsof medicine madebefore March 22,2017 . . . . . . . .
Québeca x b( ) =
Additionaldeduction for giftsof medicine madebefore March 22,2017 . . . . . . . . . . . . . . . . . . . . . . . . . . .
Albertaa x b( ) =
Additionaldeduction for giftsof medicine madebefore March 22,2017 . . . . . . . . . . . . . . . . . . . . . . . . . . . . . . . . . . . . . . . . . . .
c
cwhere:a is the lesser of line 601 and amount 5Cb is the eligible amount of gifts (line 600)c is the proceeds of disposition (line 602)
line 610) plusSubtotal (line 650
655Adjustment for an acquisition of control . . . . . . . . . . . . . . . . . . . . Amount applied in the current year against taxable income . . . . . . . . . 660
680Additional deduction for gifts of medicine closing balance(amount 5E minus amount 5F) . . . . . . . . . . . . . . . . . . . . . . . .
5A
5D amount 5D) plusSubtotal (line 640 5E
line 660) plusSubtotal (line 655 5F
* For federal and Alberta tax purposes, donations and gifts expire after five tax years. For Québec tax purposes, donations and gifts made in a tax year that ended before March 19, 2007, expire after five tax years; otherwise, donations and gifts expire after twenty tax years.
Enter on line 315 of the T2 return
50
T2 SCH 2 E (11/2017) ¤
API 2017.217 2017-12-31 Algoma Power Inc.2018-08-20 09:14 82249 4290 RC0001
CORPORATE TAXPREP / TAXPREP DES SOCIÉTÉS - EP29 VERSION 2018 V1.0 Page 8
Amounts carried forward – Additional deduction for gifts of medicineAlbertaQuébecFederalYear of origin:
1st prior year . . . . . . . . . . . . . . . . . . . . . . . . . . . . . . . . . . . . 2nd prior year . . . . . . . . . . . . . . . . . . . . . . . . . . . . . . . . . . . 3rd prior year . . . . . . . . . . . . . . . . . . . . . . . . . . . . . . . . . . . 4th prior year . . . . . . . . . . . . . . . . . . . . . . . . . . . . . . . . . . . . 5th prior year . . . . . . . . . . . . . . . . . . . . . . . . . . . . . . . . . . . . 6th prior year* . . . . . . . . . . . . . . . . . . . . . . . . . . . . . . . . . . .
2016-12-312015-12-312014-12-312013-12-312012-12-312011-12-31
7th prior year . . . . . . . . . . . . . . . . . . . . . . . . . . . . . . . . . . . . 8th prior year . . . . . . . . . . . . . . . . . . . . . . . . . . . . . . . . . . . . 9th prior year . . . . . . . . . . . . . . . . . . . . . . . . . . . . . . . . . . . . 10th prior year . . . . . . . . . . . . . . . . . . . . . . . . . . . . . . . . . . . 11th prior year . . . . . . . . . . . . . . . . . . . . . . . . . . . . . . . . . . . 12th prior year . . . . . . . . . . . . . . . . . . . . . . . . . . . . . . . . . . .
2010-12-312009-12-312009-10-08
13th prior year . . . . . . . . . . . . . . . . . . . . . . . . . . . . . . . . . . . 14th prior year . . . . . . . . . . . . . . . . . . . . . . . . . . . . . . . . . . . 15th prior year . . . . . . . . . . . . . . . . . . . . . . . . . . . . . . . . . . . 16th prior year . . . . . . . . . . . . . . . . . . . . . . . . . . . . . . . . . . . 17th prior year . . . . . . . . . . . . . . . . . . . . . . . . . . . . . . . . . . . 18th prior year . . . . . . . . . . . . . . . . . . . . . . . . . . . . . . . . . . . 19th prior year . . . . . . . . . . . . . . . . . . . . . . . . . . . . . . . . . . . 20th prior year . . . . . . . . . . . . . . . . . . . . . . . . . . . . . . . . . . . 21st prior year* . . . . . . . . . . . . . . . . . . . . . . . . . . . . . . . . . . Total . . . . . . . . . . . . . . . . . . . . . . . . . . . . . . . . . . . . . . . . . . . * For federal and Alberta tax purposes, donations and gifts included on line 6th prior year expire automatically in the current tax year. For Québec tax purposes,
donations and gifts made in a tax year that ended before March 19, 2007, that are included on line 6th prior year and donations and gifts that are included on line 21st prior year expire automatically in the current tax year.
Québec – Gifts of musical instrumentsGifts of musical instruments at the end of the previous tax year . . . . . . . . . . . . . . . . . . . . . . . . . . . . . . . . . . . . . . . . . ADeduct: Gifts of musical instruments expired after twenty tax years . . . . . . . . . . . . . . . . . . . . . . . . . . . . . . . . . . . . . . . BGifts of musical instruments at the beginning of the tax year . . . . . . . . . . . . . . . . . . . . . . . . . . . . . . . . . . . . . . . . . . . CAdd:
Gifts of musical instruments transferred on an amalgamation or the wind-up of a subsidiary . . . . . . . . . . . . . . . . . . . . . . . . DTotal current-year gifts of musical instruments . . . . . . . . . . . . . . . . . . . . . . . . . . . . . . . . . . . . . . . . . . . . . . . . . . E
line E) plusSubtotal (line D F
Deduct: Adjustment for an acquisition of control . . . . . . . . . . . . . . . . . . . . . . . . . . . . . . . . . . . . . . . . . . . . . . . . . . GTotal gifts of musical instruments available . . . . . . . . . . . . . . . . . . . . . . . . . . . . . . . . . . . . . . . . . . . . . . . . . . . . . H
Deduct: Amount applied against taxable income (enter this amount on line 255 of form CO-17) . . . . . . . . . . . . . . . . . . . . . . IGifts of musical instruments closing balance . . . . . . . . . . . . . . . . . . . . . . . . . . . . . . . . . . . . . . . . . . . . . . . . . . . . J
T2 SCH 2 E (11/2017) ¤

API 2017.217 2017-12-31 Algoma Power Inc.2018-08-20 09:14 82249 4290 RC0001
CORPORATE TAXPREP / TAXPREP DES SOCIÉTÉS - EP29 VERSION 2018 V1.0 Page 9
Amounts carried forward – Gifts of musical instrumentsQuébecYear of origin:
1st prior year . . . . . . . . . . . . . . . . . . . . . . . . . . . . . . . . . . . . . . . . . . . . . . . . . . . . . . . . . . . . . . . . . . . . . . . . . . . . . . 2nd prior year . . . . . . . . . . . . . . . . . . . . . . . . . . . . . . . . . . . . . . . . . . . . . . . . . . . . . . . . . . . . . . . . . . . . . . . . . . . . . 3rd prior year . . . . . . . . . . . . . . . . . . . . . . . . . . . . . . . . . . . . . . . . . . . . . . . . . . . . . . . . . . . . . . . . . . . . . . . . . . . . . . 4th prior year . . . . . . . . . . . . . . . . . . . . . . . . . . . . . . . . . . . . . . . . . . . . . . . . . . . . . . . . . . . . . . . . . . . . . . . . . . . . . . 5th prior year . . . . . . . . . . . . . . . . . . . . . . . . . . . . . . . . . . . . . . . . . . . . . . . . . . . . . . . . . . . . . . . . . . . . . . . . . . . . . . 6th prior year* . . . . . . . . . . . . . . . . . . . . . . . . . . . . . . . . . . . . . . . . . . . . . . . . . . . . . . . . . . . . . . . . . . . . . . . . . . . . .
2016-12-312015-12-312014-12-312013-12-312012-12-312011-12-31
7th prior year . . . . . . . . . . . . . . . . . . . . . . . . . . . . . . . . . . . . . . . . . . . . . . . . . . . . . . . . . . . . . . . . . . . . . . . . . . . . . . 8th prior year . . . . . . . . . . . . . . . . . . . . . . . . . . . . . . . . . . . . . . . . . . . . . . . . . . . . . . . . . . . . . . . . . . . . . . . . . . . . . . 9th prior year . . . . . . . . . . . . . . . . . . . . . . . . . . . . . . . . . . . . . . . . . . . . . . . . . . . . . . . . . . . . . . . . . . . . . . . . . . . . . . 10th prior year . . . . . . . . . . . . . . . . . . . . . . . . . . . . . . . . . . . . . . . . . . . . . . . . . . . . . . . . . . . . . . . . . . . . . . . . . . . . . 11th prior year . . . . . . . . . . . . . . . . . . . . . . . . . . . . . . . . . . . . . . . . . . . . . . . . . . . . . . . . . . . . . . . . . . . . . . . . . . . . . 12th prior year . . . . . . . . . . . . . . . . . . . . . . . . . . . . . . . . . . . . . . . . . . . . . . . . . . . . . . . . . . . . . . . . . . . . . . . . . . . . .
2010-12-312009-12-312009-10-08
13th prior year . . . . . . . . . . . . . . . . . . . . . . . . . . . . . . . . . . . . . . . . . . . . . . . . . . . . . . . . . . . . . . . . . . . . . . . . . . . . . 14th prior year . . . . . . . . . . . . . . . . . . . . . . . . . . . . . . . . . . . . . . . . . . . . . . . . . . . . . . . . . . . . . . . . . . . . . . . . . . . . . 15th prior year . . . . . . . . . . . . . . . . . . . . . . . . . . . . . . . . . . . . . . . . . . . . . . . . . . . . . . . . . . . . . . . . . . . . . . . . . . . . . 16th prior year . . . . . . . . . . . . . . . . . . . . . . . . . . . . . . . . . . . . . . . . . . . . . . . . . . . . . . . . . . . . . . . . . . . . . . . . . . . . . 17th prior year . . . . . . . . . . . . . . . . . . . . . . . . . . . . . . . . . . . . . . . . . . . . . . . . . . . . . . . . . . . . . . . . . . . . . . . . . . . . . 18th prior year . . . . . . . . . . . . . . . . . . . . . . . . . . . . . . . . . . . . . . . . . . . . . . . . . . . . . . . . . . . . . . . . . . . . . . . . . . . . . 19th prior year . . . . . . . . . . . . . . . . . . . . . . . . . . . . . . . . . . . . . . . . . . . . . . . . . . . . . . . . . . . . . . . . . . . . . . . . . . . . . 20th prior year . . . . . . . . . . . . . . . . . . . . . . . . . . . . . . . . . . . . . . . . . . . . . . . . . . . . . . . . . . . . . . . . . . . . . . . . . . . . . 21st prior year* . . . . . . . . . . . . . . . . . . . . . . . . . . . . . . . . . . . . . . . . . . . . . . . . . . . . . . . . . . . . . . . . . . . . . . . . . . . . Total . . . . . . . . . . . . . . . . . . . . . . . . . . . . . . . . . . . . . . . . . . . . . . . . . . . . . . . . . . . . . . . . * These gifts expired in the current year.
T2 SCH 2 E (11/2017) ¤

API 2017.217 2017-12-31 Algoma Power Inc.2018-08-20 09:14 82249 4290 RC0001
CORPORATE TAXPREP / TAXPREP DES SOCIÉTÉS - EP29 VERSION 2018 V1.0 Page 1
Schedule 8
Capital Cost Allowance (CCA)
Year Month DayCorporation's name Business number Tax year-end
2017-12-31Algoma Power Inc. 82249 4290 RC0001
Is the corporation electing under Regulation 1101(5q)? 101 Yes No
For more information, see the section called "Capital Cost Allowance" in the T2 Corporation Income Tax Guide.
X
Classnumber
*
Undepreciatedcapital cost
at the beginningof the year
(amount fromcolumn 12
of last year'sschedule 8)
Cost ofacquisitions
during the year(new property
must beavailablefor use)
(see note 1below)
Adjustmentsand
transfers
(see note 2below)
Proceeds ofdispositions
during the year(amount not to
exceed thecapital cost)
50% rule (1/2of the amount,if any, by which
the net costof acquisitions
exceedscolumn 5)
(see note3below)
1 2 3 4 5 6 7Reduced
undepreciatedcapital cost
(column 2 pluscolumn 3 plus
or minuscolumn 4 minuscolumn 5 minus
column 6)
8CCArate%
(seenote 4below)
9Recapture ofcapital costallowance(line 107 ofSchedule 1)
(see note 5below)
10Terminal loss
(line 404 ofSchedule 1)
11Capital costallowance
(for decliningbalance method,
column 7multiplied bycolumn 8, or alower amount)
(line 403 ofSchedule 1)
(see note 6below)
12Undepreciated
capital costat the end of
the year(column 6
plus column 7minus
column 11)
200 201 203 205 207 211 212 213 215 217 220
Description
1. 1 24,309,166 0 24,309,166 4 0 0 972,367 23,336,799Pre Feb. 2005 Distribution Equip
2. 8 445,438 131,735 0 65,868 511,305 20 0 0 102,261 474,912General Office/Stores Equipment
3. 10 1,540,261 610,054 0 305,027 1,845,288 30 0 0 553,586 1,596,729Vehicles
4. 47 58,358,499 6,355,017 6,858 3,174,080 61,532,578 8 0 0 4,922,606 59,784,052Distribution Equipment
5. 45 1,665 0 1,665 45 0 0 749 916Computer Equipment
6. 12 79,334 -1,250 0 78,084 100 0 0 78,084Small tools
7. 46 23,272 0 23,272 30 0 0 6,982 16,290
8. 50 105,775 57,830 0 28,915 134,690 55 0 0 74,080 89,525Computers
9. 14.1 6,484,593 0 6,484,593 5 0 0 453,922 6,030,671
Totals 91,348,003 7,154,636 -1,250 6,858 3,573,890 94,920,641 7,164,637 91,329,894

API 2017.217 2017-12-31 Algoma Power Inc.2018-08-20 09:14 82249 4290 RC0001
CORPORATE TAXPREP / TAXPREP DES SOCIÉTÉS - EP29 VERSION 2018 V1.0 Page 2
Note 1. Include any property acquired in previous years that has now become available for use. This property would have been previouslyexcluded from column 3. List separately any acquisitions that are not subject to the 50% rule, see Regulation 1100(2) and (2.2).
Note 3. The net cost of acquisitions is the cost of acquisitions (column 3) plus or minus certain adjustments and transfers from column 4.For information on the exceptions to the 50% rule, as well as how to calculate the amounts to enter in column 6 in those cases,see Interpretation Bulletin IT-285, Capital Cost Allowance - General Comments.
Note 6. If the tax year is shorter than 365 days, prorate the CCA claim. Some classes of property do not have to be prorated. See theT2 Corporation Income Tax Guide for more information.
Enter in column 4, "Adjustments and transfers", amounts that increase or reduce the undepreciated capital cost.Items that increase the undepreciated capital cost include amounts transferred under section 85, or transferred on amalgamation orwinding-up of a subsidiary. Items that reduce the undepreciated capital cost include government assistance received or entitled tobe received in the year, or a reduction of capital cost after the application of section 80. See the T2 Corporation Income Tax Guidefor other examples of adjustments and transfers to include in column 4.
Note 2.
* Class numbers followed by a letter indicate the basic rate of the class taking into account the additional deduction allowed.Class 1a: 4% + 6% = 10% (class 1 to 10%), class 1b: 4% + 2% = 6% (class 1 to 6%).
Enter a rate only if you are using the declining balance method. For any other method (for example the straight-line method, wherecalculations are always based on the cost of acquisitions), enter N/A. Then enter the amount you are claiming in column 11.
Note 4.
Note 5. For every entry in column 9, "Recapture of capital cost allowance", there must be a corresponding entry in column 5, "Proceeds ofdispositions during the year". The recapture and terminal loss rules do not apply to passenger vehicles in Class 10.1.
T2 SCH 8 (17) ¤

API 2017.217 2017-12-31 Algoma Power Inc.2018-08-20 09:14 82249 4290 RC0001
CORPORATE TAXPREP / TAXPREP DES SOCIÉTÉS - EP29 VERSION 2018 V1.0 Page 1
SCHEDULE 9RELATED AND ASSOCIATED CORPORATIONS
Year Month DayName of corporation Business Number Tax year end
2017-12-31Algoma Power Inc. 82249 4290 RC0001
Complete this schedule if the corporation is related to or associated with at least one other corporation.For more information, see the T2 Corporation Income Tax Guide.
Countryof resi-dence(otherthan
Canada)
Business number(see note 1)
Rela-tion-shipcode(see
note 2)
Number ofcommon shares
you own
% ofcommonshares
you own
Number ofpreferred shares
you own
% ofpreferredshares
you own
Book value ofcapital stock
Name
100 200 300 400 500 550 600 650 700. 0395518 B.C. Ltd. 12628 4249 RC00011 3. 10019992 Canada Inc. 73772 1126 RC00012 3. 1228158 Ontario Limited 88706 8690 RC0001 1 100.000 13 2. 16006059 Ontario Inc. 86184 9107 RC00014 3. Advanced Energy Technologies, Inc NR5 3US. Aitken Creek Gas Storage ULC 83434 2552 RC00016 3. BC Gas (Argentina) S.A. NR7 3AR. BC Gas (Malaysia) SDN. BHD. NR8 3MY. Belize Electrical Company Limited NR9 3BZ. Big Chino Valley Pumped Storage LL NR10 3US. Canadian Niagara Power Inc. 87249 8225 RC000211 3. Caribbean Utilities Company, Ltd. NR12 3KY. Central Hudson Electric Transmissio NR13 3US. Central Hudson Enterprise Corp. NR14 3US. Central Hudson Gas & Electric Corp. NR15 3US. Central Hudson Gas Transmission L NR16 3US. CH Energy Group Inc. NR17 3US. Cornwall Street Railway Light and P 12090 6839 RC000118 3. Desert Southwest Storage Holdings NR19 3US. Escavada Leasing Company NR20 3US. Fortis (WP) GP Inc. 80854 1726 RC000121 3. Fortis Alberta Holdings Inc. 86921 0203 RC000122 3. Fortis BC LNG Development Inc. 79802 9898 RC000123 3. Fortis Cayman Inc. NR24 3KY. Fortis Energy (Bermuda) Ltd. NR25 3BM. Fortis Energy Cayman inc. NR26 3KY. Fortis Energy Corporation 10386 4443 RC000127 3. Fortis Energy International (Belize) NR28 3BZ. Fortis Generation Inc. 83967 1096 RC000129 3. Fortis Hawaii Energy Inc 78426 6496 RC000130 3. Fortis Hydro Corporation NR31 3US. Fortis Inc. 10185 2416 RC000132 3. Fortis LNG GP Inc. 80839 2781 RC000133 3. Fortis Properties Corporation 89693 2449 RC000134 3. FortisAlberta Inc. 86929 4520 RC000135 3. FortisBC Alternative Energy Services 81144 5873 RC000136 3. FortisBC Energy Inc. 10043 1592 RC000437 3. FortisBC Holdings Inc. 10534 9740 RC000438 3. FortisBC Huntington Inc. 12974 2870 RC000139 3. FortisBC Inc. 10564 5642 RC000140 3. FortisBC Midstream Inc. 86014 6588 RC000141 3. FortisBC Pacific Holdings Inc. 87170 9101 RC000142 3. FortisLUX Holdings Inc. 82293 1242 RC000143 3

API 2017.217 2017-12-31 Algoma Power Inc.2018-08-20 09:14 82249 4290 RC0001
CORPORATE TAXPREP / TAXPREP DES SOCIÉTÉS - EP29 VERSION 2018 V1.0 Page 2
Countryof resi-dence(otherthan
Canada)
Business number(see note 1)
Rela-tion-shipcode(see
note 2)
Number ofcommon shares
you own
% ofcommonshares
you own
Number ofpreferred shares
you own
% ofpreferredshares
you own
Book value ofcapital stock
Name
100 200 300 400 500 550 600 650 700. FortisOntario District Heating Inc. 89329 1740 RC000144 3. FortisOntario Inc. 10076 8985 RC000345 1. FortisTCI Limited NR46 3TC. FortisUS Holdings Nova Scotia Limit 82872 6091 RC000247 3. FortisUS Inc. NR48 3US. FortisWest Inc. 87470 8209 RC000149 3. Green Power Express LLC NR50 3US. Inland Energy Corp. 11960 8529 RC000151 3. Inland Pacific Energy Services 10249 0554 RC000152 3. International Transmission Compan NR53 3US. ITC Equipment, LLC NR54 3US. ITC Great Plains, LLC NR55 3US. ITC Green Power Express LLC NR56 3US. ITC Grid Development, LLC NR57 3US. ITC Holdings Corporation NR58 3US. ITC Interconnection LLC NR59 3US. ITC Investment Holdings Inc. NR60 3US. ITC Lake Erie Connector LLC NR61 3US. ITC Lake Erie Holdings LLC NR62 3US. ITC Mid-Atlantic Development LLC NR63 3US. ITC Midcontinent Development LLC NR64 3US. ITC Midsouth LLC NR65 3US. ITC Midwest LLC NR66 3US. ITC New York Development LLC NR67 3US. ITC Panhandle Transmission, LLC NR68 3US. ITC Project Holdings LLC NR69 3US. ITC South Central Development LLC NR70 3US. Maritime Electric Company, Limited 12111 9879 RC000171 3. MEH Equities Management Compan NR72 3US. MEH Storage LLC NR73 3US. METC GP Holdings, Inc NR74 3US. Michigan Electric Transmission Com NR75 3US. Michigan Transco Holdings LLC NR76 3US. Millennium Energy Holdings, Inc. NR77 3US. Mt. Hayes (GP) Ltd. 84888 3914 RC000178 3. New York Transmission Holdings Co NR79 3US. Newfoundland Electric Company Lim 12748 1059 RC000180 3. Newfoundland Energy Luxembourg NR81 3LU. Newfoundland Industries Limited 87536 2774 RC000182 3. Newfoundland Power Inc. 10386 4831 RC000183 3. NGIV2, LLC NR84 3US. Powertrusion International, Inc. NR85 3US. San Carlos Resources Inc. NR86 3US. Southwest Energy Solutions, Inc. NR87 3US. Terasen International Inc. 13237 5346 RC000188 3. Tucson Electric Power Company NR89 3US. Tucsonel Inc. NR90 3US. Turks and Caicos Utilities Limited NR91 3TC. Unisource Energy Development Com NR92 3US. Unisource Energy Services, Inc. NR93 3US. UNS Electric, Inc. NR94 3US. UNS Energy Corporation NR95 3US. UNS Gas, Inc. NR96 3US

API 2017.217 2017-12-31 Algoma Power Inc.2018-08-20 09:14 82249 4290 RC0001
CORPORATE TAXPREP / TAXPREP DES SOCIÉTÉS - EP29 VERSION 2018 V1.0 Page 3
Countryof resi-dence(otherthan
Canada)
Business number(see note 1)
Rela-tion-shipcode(see
note 2)
Number ofcommon shares
you own
% ofcommonshares
you own
Number ofpreferred shares
you own
% ofpreferredshares
you own
Book value ofcapital stock
Name
100 200 300 400 500 550 600 650 700. Waneta Expansion General Partner 84815 4001 RC000197 3. Waneta Power General Partner Ltd. 71545 9921 RC000198 3. Wataynikaneyap Power PM Inc. 80650 3967 RC000199 3. West Kootenay Power Ltd. 89427 8670 RC0001100 3
Note 1: Enter "NR" if the corporation is not registered or does not have a business number.Note 2: Enter the code number of the relationship that applies from the following order: 1 - Parent 2 - Subsidiary 3 - Associated 4 - Related but not associated
T2 SCH 9 (11) ¤

API 2017.217 2017-12-31 Algoma Power Inc.2018-08-20 09:14 82249 4290 RC0001
CORPORATE TAXPREP / TAXPREP DES SOCIÉTÉS - EP29 VERSION 2018 V1.0 Page 1
Continuity of financial statement reserves (not deductible)
Description Balance at thebeginning of
the year
Transfer on anamalgamation orthe wind-up ofa subsidiary
Balance at theend of the year
Add Deduct
Financial statement reserves (not deductible)
-424,566-3,205,878 -3,322,912-541,600Accrued Pension Benefit Asset1
173,1896,967,984 7,456,095661,300Accrued Post Retirement Benef2
3
The total opening balance plus the total transfers should be entered on line 414 of Schedule 1 as a deduction.The total closing balance should be entered on line 126 of Schedule 1 as an addition.
Reserves from Part 2 of Schedule 13
Totals 119,7003,762,106 -251,377 4,133,183

API 2017.217 2017-12-31 Algoma Power Inc.2018-08-20 09:14 82249 4290 RC0001
CORPORATE TAXPREP / TAXPREP DES SOCIÉTÉS - EP29 VERSION 2018 V1.0 Page 1
Schedule 33Taxable Capital Employed in Canada – Large Corporations
Year Month DayCorporation's name Business number Tax year-end
2017-12-31Algoma Power Inc. 82249 4290 RC0001
Use this schedule in determining if the total taxable capital employed in Canada of the corporation (other than a financial institution or an insurancecorporation) and its related corporations is greater than $10,000,000.
Unless otherwise noted, all legislative references are to the Income Tax Act and the Income Tax Regulations.Subsection 181(1) defines the terms financial institution, long-term debt, and reserves.
If the corporation was a non-resident of Canada throughout the year and carried on a business through a permanent establishment in Canada, go to Part 4,Taxable capital employed in Canada.
If the total taxable capital employed in Canada of the corporation and its related corporations is greater than $10,000,000, file a completed Schedule 33 withyour T2 Corporation Income Tax Return no later than six months from the end of the tax year.
Subsection 181(3) provides the basis to determine the carrying value of a corporation's assets or any other amount under Part I.3 for its capital, investmentallowance, taxable capital, or taxable capital employed in Canada, or for a partnership in which it has an interest.
Part 1 – CapitalAdd the following year-end amounts:
Reserves that have not been deducted in calculating income for the year under Part I . . . . . . . .
Capital stock (or members' contributions if incorporated without share capital) . . . . . . . . . . . Retained earnings . . . . . . . . . . . . . . . . . . . . . . . . . . . . . . . . . . . . . . . . . . . . . . Contributed surplus . . . . . . . . . . . . . . . . . . . . . . . . . . . . . . . . . . . . . . . . . . . . . Any other surpluses . . . . . . . . . . . . . . . . . . . . . . . . . . . . . . . . . . . . . . .
Deferred unrealized foreign exchange gains . . . . . . . . . . . . . . . . . . . . . . . . . . . . . . .
Any dividends declared but not paid by the corporation before the end of the year . . . . . . . . .
All loans and advances to the corporation . . . . . . . . . . . . . . . . . . . . . . . . . . . . . . . . All indebtedness of the corporation represented by bonds, debentures, notes, mortgages, hypothecary claims, bankers' acceptances, or similar obligations . . . . . . . . . . . . . . . . . . .
All other indebtedness of the corporation (other than any indebtedness for a lease)that has been outstanding for more than 365 days before the end of the year . . . . . . . . . . . .
A
111
110109
101
108107106105104103
112 lines 101 to 112)addSubtotal (
The total of all amounts, each of which is the amount, if any, in respect of a partnership in whichthe corporation held a membership interest at the end of the year, either directly or indirectlythrough another partnership (see note below) . . . . . . . . . . . . . . . . . . . . . . . . . . . . . .
371,076
44,007,781
44,378,85744,378,857
Line 112 is determined by the formula (A – B) x C/D (as per paragraph 181.2(3)(g)) where:A is the total of all amounts that would be determined for lines 101, 107, 108, 109, and 111 in respect of the partnership for its last fiscal period that
ends at or before the end of the year if
(i) to any corporation that held a membership interest in the partnership either directly or indirectly through another partnership, or
is the partnership's deferred unrealized foreign exchange losses at the end of the period,B
(ii) to any partnership in which a corporation described in subparagraph (i) held a membership interest either directly or indirectly throughanother partnership.
Note:
a) those lines applied to partnerships in the same manner that they apply to corporations, andb) those amounts were computed without reference to amounts owing by the partnership
C is the share of the partnership's income or loss for the period to which the corporation is entitled either directly or indirectly through anotherpartnership, andis the partnership's income or loss for the period.D
¤T2 SCH33 E (15)
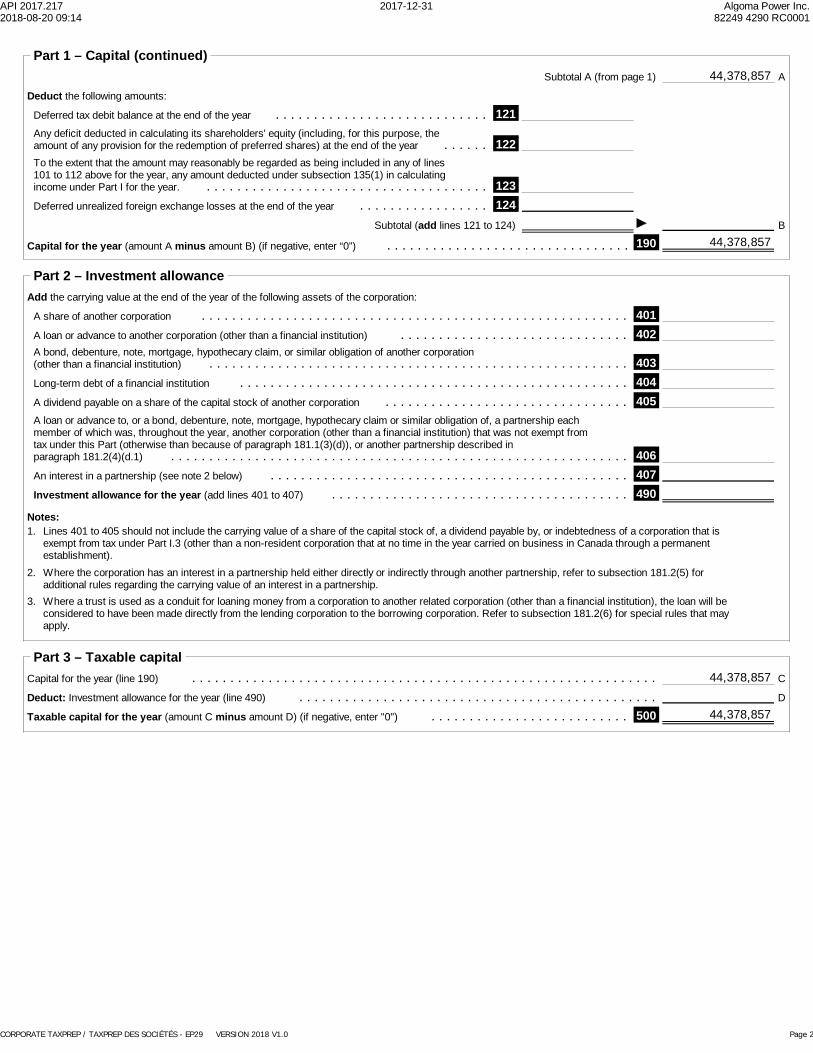
API 2017.217 2017-12-31 Algoma Power Inc.2018-08-20 09:14 82249 4290 RC0001
CORPORATE TAXPREP / TAXPREP DES SOCIÉTÉS - EP29 VERSION 2018 V1.0 Page 2
Part 1 – Capital (continued)Subtotal A (from page 1) A44,378,857
To the extent that the amount may reasonably be regarded as being included in any of lines101 to 112 above for the year, any amount deducted under subsection 135(1) in calculatingincome under Part I for the year. . . . . . . . . . . . . . . . . . . . . . . . . . . . . . . . . . . . . . 123
B
190Capital for the year (amount A minus amount B) (if negative, enter “0”) . . . . . . . . . . . . . . . . . . . . . . . . . . . . . . . . lines 121 to 124)addSubtotal (
124
122
121Deduct the following amounts:
Deferred tax debit balance at the end of the year . . . . . . . . . . . . . . . . . . . . . . . . . . . . Any deficit deducted in calculating its shareholders' equity (including, for this purpose, theamount of any provision for the redemption of preferred shares) at the end of the year . . . . . .
Deferred unrealized foreign exchange losses at the end of the year . . . . . . . . . . . . . . . . .
44,378,857
Part 2 – Investment allowance
A loan or advance to, or a bond, debenture, note, mortgage, hypothecary claim or similar obligation of, a partnership eachmember of which was, throughout the year, another corporation (other than a financial institution) that was not exempt fromtax under this Part (otherwise than because of paragraph 181.1(3)(d)), or another partnership described inparagraph 181.2(4)(d.1) . . . . . . . . . . . . . . . . . . . . . . . . . . . . . . . . . . . . . . . . . . . . . . . . . . . . . . . . . . . .
Add the carrying value at the end of the year of the following assets of the corporation:
A share of another corporation . . . . . . . . . . . . . . . . . . . . . . . . . . . . . . . . . . . . . . . . . . . . . . . . . . . . . . . . A loan or advance to another corporation (other than a financial institution) . . . . . . . . . . . . . . . . . . . . . . . . . . . . . .
Long-term debt of a financial institution . . . . . . . . . . . . . . . . . . . . . . . . . . . . . . . . . . . . . . . . . . . . . . . . . . .
A bond, debenture, note, mortgage, hypothecary claim, or similar obligation of another corporation(other than a financial institution) . . . . . . . . . . . . . . . . . . . . . . . . . . . . . . . . . . . . . . . . . . . . . . . . . . . . . . .
401
404403
402
405A dividend payable on a share of the capital stock of another corporation . . . . . . . . . . . . . . . . . . . . . . . . . . . . . . . .
406
Investment allowance for the year (add lines 401 to 407) . . . . . . . . . . . . . . . . . . . . . . . . . . . . . . . . . . . . . . . 490An interest in a partnership (see note 2 below) . . . . . . . . . . . . . . . . . . . . . . . . . . . . . . . . . . . . . . . . . . . . . . . 407
Notes:Lines 401 to 405 should not include the carrying value of a share of the capital stock of, a dividend payable by, or indebtedness of a corporation that isexempt from tax under Part I.3 (other than a non-resident corporation that at no time in the year carried on business in Canada through a permanentestablishment).
1.
2. Where the corporation has an interest in a partnership held either directly or indirectly through another partnership, refer to subsection 181.2(5) foradditional rules regarding the carrying value of an interest in a partnership.Where a trust is used as a conduit for loaning money from a corporation to another related corporation (other than a financial institution), the loan will beconsidered to have been made directly from the lending corporation to the borrowing corporation. Refer to subsection 181.2(6) for special rules that mayapply.
3.
Part 3 – Taxable capital
Deduct: Investment allowance for the year (line 490) . . . . . . . . . . . . . . . . . . . . . . . . . . . . . . . . . . . . . . . . . . . . . . . Capital for the year (line 190) . . . . . . . . . . . . . . . . . . . . . . . . . . . . . . . . . . . . . . . . . . . . . . . . . . . . . . . . . . . . .
Taxable capital for the year (amount C minus amount D) (if negative, enter "0") . . . . . . . . . . . . . . . . . . . . . . . . . . 500
C
D
44,378,857
44,378,857

API 2017.217 2017-12-31 Algoma Power Inc.2018-08-20 09:14 82249 4290 RC0001
CORPORATE TAXPREP / TAXPREP DES SOCIÉTÉS - EP29 VERSION 2018 V1.0 Page 3
Part 4 – Taxable capital employed in CanadaTo be completed by a corporation that was resident in Canada at any time in the year
610Taxable capital for the year (line 500)
Taxable income earned in Canada
Taxable capitalemployed in Canada 690
Notes:Taxable income
x =
1. Regulation 8601 gives details on calculating the amount of taxable income earned in Canada.2. Where a corporation's taxable income for a tax year is "0," it shall, for the purposes of the above calculation, be deemed
to have a taxable income for that year of $1,000.3. In the case of an airline corporation, Regulation 8601 should be considered when completing the above calculation.
44,378,857 44,378,8571,338,4691,338,469
790Taxable capital employed in Canada (line 701 minus amount E) (if negative, enter “0“) . . . . . . . . . . . . . . . . . . . . . .
Total of all amounts each of which is the carrying value at the end of year of an asset of thecorporation that is a ship or aircraft the corporation operated in international traffic, orpersonal or movable property used or held by the corporation in carrying on any businessduring the year through a permanent establishment in Canada (see note below) . . . . . . . . . . .
Total of all amounts each of which is the carrying value at the end of the year of an asset of the corporation used in the year orheld in the year, in the course of carrying on any business during the year through a permanent establishment in Canada . . . . Deduct the following amounts:Corporation's indebtedness at the end of the year [other than indebtedness described in any ofparagraphs 181.2(3)(c) to (f)] that may reasonably be regarded as relating to a business it carriedon during the year through a permanent establishment in Canada . . . . . . . . . . . . . . . . . . . Total of all amounts each of which is the carrying value at the end of year of an assetdescribed in subsection 181.2(4) of the corporation that it used in the year, or held in theyear, in the course of carrying on any business during the year through a permanentestablishment in Canada . . . . . . . . . . . . . . . . . . . . . . . . . . . . . . . . . . . . . . . . . . .
E
713
711
701
712
lines 711, 712, and 713)addTotal deductions (
To be completed by a corporation that was a non-resident of Canada throughout the yearand carried on a business through a permanent establishment in Canada
Note: Complete line 713 only if the country in which the corporation is resident did not impose a capital tax for the year on similar assets, or a tax for theyear on the income from the operation of a ship or aircraft in international traffic, of any corporation resident in Canada during the year.
Part 5 – Calculation for purposes of the small business deduction
This part is applicable to corporations that are not associated in the current year, but were associated in the prior year.
Taxable capital employed in Canada (amount from line 690) . . . . . . . . . . . . . . . . . . . . . . . . . . . . . . . . . . . . . . . . . . . F
Deduct: . . . . . . . . . . . . . . . . . . . . . . . . . . . . . . . . . . . . . . . . . . . . . . . . . . . . . . . . . . . . . . . . . . . . . . . . . G
amount G) (if negative, enter "0") minusExcess (amount F H
Calculation for purposes of the small business deduction (amount H x 0.225%) . . . . . . . . . . . . . . . . . . . . . . . . . . . . IEnter this amount at line 415 of the T2 return.
10,000,000

API 2017.217 2017-12-31 Algoma Power Inc.2018-08-20 09:14 82249 4290 RC0001
CORPORATE TAXPREP / TAXPREP DES SOCIÉTÉS - EP29 VERSION 2018 V1.0 Page 1
Schedule 500
Ontario Corporation Tax Calculation
Year Month DayCorporation's name Business number Tax year-end
2017-12-31Algoma Power Inc. 82249 4290 RC0001
Use this schedule if the corporation had a permanent establishment, under section 400 of the federal Income Tax Regulations, inOntario at any time in the tax year and had Ontario taxable income in the year.Legislative references are to the federal Income Tax Act and Income Tax Regulations.This schedule is a worksheet only and is not required to be filed with your T2 Corporation Income Tax Return.
Part 1 – Ontario basic income tax
Ontario taxable income * . . . . . . . . . . . . . . . . . . . . . . . . . . . . . . . . . . . . . . . . . . . . . . . . . . . . . . . . . . . . . . . . A
Ontario basic income tax (amount A multiplied by amount B **) . . . . . . . . . . . . . . . . . . . . . . . . . . . . . . . . . . . . . . . C
If the corporation has a permanent establishment only in Ontario, enter the amount from line 360 or amount Z, whichever applies,of the T2 return. Otherwise, enter the taxable income allocated to Ontario from column F in Part 1 of Schedule 5.
*
Ontario basic rate of tax for the year . . . . . . . . . . . . . . . . . . . . . . . . . . . . . . . . . . . . . . . . . . . . . . . . . . . . . . . % B
** If the corporation has a permanent establishment in more than one jurisdiction, or is claiming an Ontario tax credit in addition to Ontario basicincome tax, or has Ontario corporate minimum tax or Ontario special additional tax on life insurance corporations payable, enter amount C online 270 of Schedule 5, Tax Calculation Supplementary – Corporations. Otherwise, enter it on line 760 of the T2 return.
1,338,469
153,924
11.5
Part 2 – Ontario small business deduction (OSBD)
Complete this part if the corporation claimed the federal small business deduction under subsection 125(1).
Amount from line 400 of the T2 return . . . . . . . . . . . . . . . . . . . . . . . . . . . . . . . . . . . . . 1
Amount from line 405 of the T2 return . . . . . . . . . . . . . . . . . . . . . . . . . . . . . . . . . . . . . 2
Amount from line 427 of the T2 return . . . . . . . . . . . . . . . . . . . . . . . . . . . . . . . . . . . . . 3
Enter the least of amounts 1, 2 or 3 . . . . . . . . . . . . . . . . . . . . . . . . . . . . . . . . . . . . . . . D
Ontario domestic factor (ODF): Taxable income for Ontario *Taxable income for all provinces **
E= . . . . . .
Ontario small business income (lesser of amount 4 or amount 5) . . . . . . . . . . . . . . . . . . . . . . F
Amount D multiplied by amount E . . . . . . . . . . . . . . . . . . . . . . . . . . . . . . . . . . . . . . . 4
Ontario taxable income (amount A from Part 1) . . . . . . . . . . . . . . . . . . . . . . . . . . . . . . . . 5
Ontario small business deduction rate for the year
1,338,469.00 1.000001,338,469
1,338,469
Number of days in the tax yearbefore January 1, 2018
Number of days in the tax yearx % G1= %
Number of days in the tax yearafter December 31, 2017
Number of days in the tax yearx % G2= %
G%OSBD rate for the year (rate G1 plus rate G2) . . . . . . . . . . . . . . . . . . . . . . . . . . . . . . . . %
365365
7 7.00000
3658
7.00000 7.00000
Ontario small business deduction (amount F multiplied by rate G) . . . . . . . . . . . . . . . . . . . . . . . . . . . . . . . . . . . . . HEnter amount H on line 402 of Schedule 5.
Includes the offshore areas for Nova Scotia and Newfoundland and Labrador.*** Enter amount A from Part 1.
¤T2 SCH 500 E (18)

API 2017.217 2017-12-31 Algoma Power Inc.2018-08-20 09:14 82249 4290 RC0001
CORPORATE TAXPREP / TAXPREP DES SOCIÉTÉS - EP29 VERSION 2018 V1.0 Page 2
Part 3 – Ontario adjusted small business incomeComplete this part if the corporation was a Canadian-controlled private corporation throughout the tax year and is claiming the Ontario tax credit formanufacturing and processing or the Ontario credit union tax reduction.
Ontario adjusted small business income (lesser of amount D and amount 5) . . . . . . . . . . . . . . . . . . . . . . . . . . . . . . . I
Enter amount I at amount K in Part 4 of this schedule or at amount B in Part 2 of Schedule 502, Ontario Tax Credit for Manufacturing andProcessing, whichever applies.
Part 4 – Credit union tax reduction
Complete this part and Schedule 17, Credit Union Deductions, if the corporation was a credit union throughout the tax year.
Amount N from Part 5 of Schedule 17 . . . . . . . . . . . . . . . . . . . . . . . . . . . . . . . . . . . . . . J
Ontario adjusted small business income (amount I) . . . . . . . . . . . . . . . . . . . . . . . . . . . . . . K
amount K, if negative, enter "0") minusSubtotal (amount J L
Amount L multiplied by amount G . . . . . . . . . . . . . . . . . . . . . . . . . . . . . . . . . . . . . . . . . . . . . . . . . . . . . . . . . . M
Ontario domestic factor (amount E) . . . . . . . . . . . . . . . . . . . . . . . . . . . . . . . . . . . . . . . . . . . . . . . . . . . . . . . . . N
Ontario credit union tax reduction (amount M multiplied by amount N) . . . . . . . . . . . . . . . . . . . . . . . . . . . . . . . . . . OEnter amount O on line 410 of Schedule 5.
1.00000

API 2017.217 2017-12-31 Algoma Power Inc.2018-08-20 09:14 82249 4290 RC0001
CORPORATE TAXPREP / TAXPREP DES SOCIÉTÉS - EP29 VERSION 2018 V1.0 Page 1
Schedule 510
Ontario Corporate Minimum Tax
Year Month DayCorporation's name Business number Tax year-end
2017-12-31Algoma Power Inc. 82249 4290 RC0001
File this schedule if the corporation is subject to Ontario corporate minimum tax (CMT). CMT is levied under section 55 of the Taxation Act, 2007 (Ontario),referred to as the "Ontario Act".Complete Part 1 to determine if the corporation is subject to CMT for the tax year.A corporation not subject to CMT in the tax year is still required to file this schedule if it is deducting a CMT credit, has a CMT credit carryforward,or has a CMT loss carryforward or a current year CMT loss.A corporation that has Ontario special additional tax on life insurance corporations (SAT) payable in the tax year must complete Part 4 of thisschedule even if it is not subject to CMT for the tax year.A corporation is exempt from CMT if, throughout the tax year, it was one of the following:1) a corporation exempt from income tax under section 149 of the federal Income Tax Act;2) a mortgage investment corporation under subsection 130.1(6) of the federal Act;3) a deposit insurance corporation under subsection 137.1(5) of the federal Act;4) a congregation or business agency to which section 143 of the federal Act applies;5) an investment corporation as referred to in subsection 130(3) of the federal Act; or6) a mutual fund corporation under subsection 131(8) of the federal Act.
File this schedule with the T2 Corporation Income Tax Return.
Part 1 – Determination of CMT applicability
Total assets (total of lines 112 to 116) . . . . . . . . . . . . . . . . . . . . . . . . . . . . . . . . . . . . . . . . . . . . . . . . . . . . . . . .
Total assets of the corporation at the end of the tax year * . . . . . . . . . . . . . . . . . . . . . . . . . . . . . . . . . . . . . . . . . 112114Share of total assets from partnership(s) and joint venture(s) * . . . . . . . . . . . . . . . . . . . . . . . . . . . . . . . . . . . . . .
Total assets of associated corporations (amount from line 450 on Schedule 511) . . . . . . . . . . . . . . . . . . . . . . . . . . . 116
Total revenue of the corporation for the tax year ** . . . . . . . . . . . . . . . . . . . . . . . . . . . . . . . . . . . . . . . . . . . . . Share of total revenue from partnership(s) and joint venture(s) ** . . . . . . . . . . . . . . . . . . . . . . . . . . . . . . . . . . . . . Total revenue of associated corporations (amount from line 550 on Schedule 511) . . . . . . . . . . . . . . . . . . . . . . . . . .
142144146
Total revenue (total of lines 142 to 146) . . . . . . . . . . . . . . . . . . . . . . . . . . . . . . . . . . . . . . . . . . . . . . . . . . . . . . .
The corporation is subject to CMT if:– for tax years ending before July 1, 2010, the total assets at the end of the year of the corporation or the associated group of corporations are more than
$5,000,000, or the total revenue for the year of the corporation or the associated group of corporations is more than $10,000,000.– for tax years ending after June 30, 2010, the total assets at the end of the year of the corporation or the associated group of corporations are equal to or more
than $50,000,000, and the total revenue for the year of the corporation or the associated group of corporations is equal to or more than $100,000,000.If the corporation is not subject to CMT, do not complete the remaining parts unless the corporation is deducting a CMT credit, or has a CMT creditcarryforward, a CMT loss carryforward, a current year CMT loss, or SAT payable in the year.
* Rules for total assets– Report total assets according to generally accepted accounting principles, adjusted so that consolidation and equity methods are not used.– Do not include unrealized gains and losses on assets and foreign currency gains and losses on assets that are included in net income for
accounting purposes but not in income for corporate income tax purposes.The amount on line 114 is determined at the end of the last fiscal period of the partnership or joint venture that ends in the tax year of thecorporation. Add the proportionate share of the assets of the partnership(s) and joint venture(s), and deduct the recorded asset(s) for theinvestment in partnerships and joint ventures.
–
– A corporation's share in a partnership or joint venture is determined under paragraph 54(5)(b) of the Ontario Act and, if the partnership or joint venturehad no income or loss, is calculated as if the partnership's or joint venture's income were $1 million. For a corporation with an indirect interest in apartnership or joint venture, determine the corporation's share according to paragraph 54(5)(c) of the Ontario Act.
120,734,996
329,744,771450,479,767
45,452,553
162,196,527207,649,080
** Rules for total revenueReport total revenue in accordance with generally accepted accounting principles, adjusted so that consolidation and equity methods are not used.If the tax year is less than 51 weeks, multiply the total revenue of the corporation or the partnership, whichever applies, by 365 and divide by thenumber of days in the tax year.The amount on line 144 is determined for the partnership or joint venture fiscal period that ends in the tax year of the corporation. If thepartnership or joint venture has 2 or more fiscal periods ending in the filing corporation's tax year, multiply the sum of the total revenue for eachof the fiscal periods by 365 and divide by the total number of days in all the fiscal periods.
–
–
–
A corporation's share in a partnership or joint venture is determined under paragraph 54(5)(b) of the Ontario Act and, if the partnership or joint venturehad no income or loss, is calculated as if the partnership's or joint venture's income were $1 million. For a corporation with an indirect interest in apartnership or joint venture, determine the corporation's share according to paragraph 54(5)(c) of the Ontario Act.
–
¤T2 SCH 510 E (14)
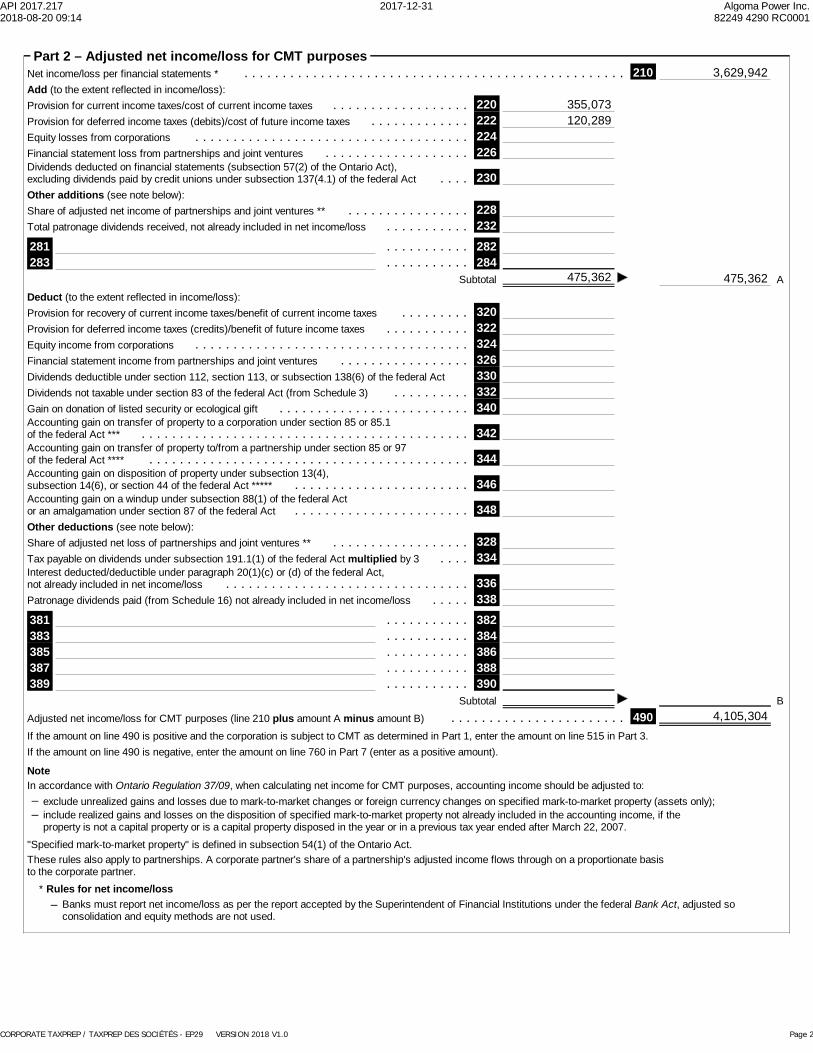
API 2017.217 2017-12-31 Algoma Power Inc.2018-08-20 09:14 82249 4290 RC0001
CORPORATE TAXPREP / TAXPREP DES SOCIÉTÉS - EP29 VERSION 2018 V1.0 Page 2
Part 2 – Adjusted net income/loss for CMT purposes
. . . . . . . . . . .
Net income/loss per financial statements * . . . . . . . . . . . . . . . . . . . . . . . . . . . . . . . . . . . . . . . . . . . . . . . . . . 210
220Add (to the extent reflected in income/loss):Provision for current income taxes/cost of current income taxes . . . . . . . . . . . . . . . . . .
Dividends deducted on financial statements (subsection 57(2) of the Ontario Act),excluding dividends paid by credit unions under subsection 137(4.1) of the federal Act . . . .
Share of adjusted net income of partnerships and joint ventures ** . . . . . . . . . . . . . . . .
230
228232
Subtotal
Total patronage dividends received, not already included in net income/loss . . . . . . . . . . .
Provision for deferred income taxes (debits)/cost of future income taxes . . . . . . . . . . . . . 222Equity losses from corporations . . . . . . . . . . . . . . . . . . . . . . . . . . . . . . . . . . . . 224Financial statement loss from partnerships and joint ventures . . . . . . . . . . . . . . . . . . . 226
Other additions (see note below):
A
282284
281283 . . . . . . . . . . .
3,629,942
355,073120,289
475,362475,362
320Deduct (to the extent reflected in income/loss):Provision for recovery of current income taxes/benefit of current income taxes . . . . . . . . . Provision for deferred income taxes (credits)/benefit of future income taxes . . . . . . . . . . . 322Equity income from corporations . . . . . . . . . . . . . . . . . . . . . . . . . . . . . . . . . . . . 324Financial statement income from partnerships and joint ventures . . . . . . . . . . . . . . . . . 326Dividends deductible under section 112, section 113, or subsection 138(6) of the federal Act 330
332Dividends not taxable under section 83 of the federal Act (from Schedule 3) . . . . . . . . . .
Accounting gain on disposition of property under subsection 13(4),subsection 14(6), or section 44 of the federal Act ***** . . . . . . . . . . . . . . . . . . . . . . . 346
Gain on donation of listed security or ecological gift . . . . . . . . . . . . . . . . . . . . . . . . . 340Accounting gain on transfer of property to a corporation under section 85 or 85.1of the federal Act *** . . . . . . . . . . . . . . . . . . . . . . . . . . . . . . . . . . . . . . . . . . . 342Accounting gain on transfer of property to/from a partnership under section 85 or 97of the federal Act **** . . . . . . . . . . . . . . . . . . . . . . . . . . . . . . . . . . . . . . . . . . 344
Accounting gain on a windup under subsection 88(1) of the federal Actor an amalgamation under section 87 of the federal Act . . . . . . . . . . . . . . . . . . . . . . . 348
. . . . . . . . . . .
Share of adjusted net loss of partnerships and joint ventures ** . . . . . . . . . . . . . . . . . . 328334
Subtotal
Tax payable on dividends under subsection 191.1(1) of the federal Act multiplied by 3 . . . .
Other deductions (see note below):
B
382384
381383 . . . . . . . . . . .
Interest deducted/deductible under paragraph 20(1)(c) or (d) of the federal Act,not already included in net income/loss . . . . . . . . . . . . . . . . . . . . . . . . . . . . . . . . 336Patronage dividends paid (from Schedule 16) not already included in net income/loss . . . . . 338
. . . . . . . . . . . 386388
385387 . . . . . . . . . . . 389 . . . . . . . . . . . 390
Adjusted net income/loss for CMT purposes (line 210 plus amount A minus amount B) . . . . . . . . . . . . . . . . . . . . . . . 490If the amount on line 490 is positive and the corporation is subject to CMT as determined in Part 1, enter the amount on line 515 in Part 3.If the amount on line 490 is negative, enter the amount on line 760 in Part 7 (enter as a positive amount).
NoteIn accordance with Ontario Regulation 37/09, when calculating net income for CMT purposes, accounting income should be adjusted to:
–
"Specified mark-to-market property" is defined in subsection 54(1) of the Ontario Act.
– exclude unrealized gains and losses due to mark-to-market changes or foreign currency changes on specified mark-to-market property (assets only);include realized gains and losses on the disposition of specified mark-to-market property not already included in the accounting income, if theproperty is not a capital property or is a capital property disposed in the year or in a previous tax year ended after March 22, 2007.
These rules also apply to partnerships. A corporate partner's share of a partnership's adjusted income flows through on a proportionate basisto the corporate partner.
4,105,304
* Rules for net income/lossBanks must report net income/loss as per the report accepted by the Superintendent of Financial Institutions under the federal Bank Act, adjusted soconsolidation and equity methods are not used.
–

API 2017.217 2017-12-31 Algoma Power Inc.2018-08-20 09:14 82249 4290 RC0001
CORPORATE TAXPREP / TAXPREP DES SOCIÉTÉS - EP29 VERSION 2018 V1.0 Page 3
Part 2 – Calculation of adjusted net income/loss for CMT purposes (continued)
*** A joint election will be considered made under subsection 60(1) of the Ontario Act if there is an entry on line 342, and an election has been madefor transfer of property to a corporation under subsection 85(1) of the federal Act.
**** A joint election will be considered made under subsection 60(2) of the Ontario Act if there is an entry on line 344, and an election has been madeunder subsection 85(2) or 97(2) of the federal Act.
***** A joint election will be considered made under subsection 61(1) of the Ontario Act if there is an entry on line 346, and an election has been madeunder subsection 13(4) or 14(6) and/or section 44 of the federal Act.
For more information on how to complete this part, see the T2 Corporation – Income Tax Guide.
– Other corporations must report net income/loss in accordance with generally accepted accounting principles, except that consolidation and equitymethods must not be used. When the equity method has been used for accounting purposes, equity losses and equity income are removed frombook income/loss on lines 224 and 324 respectively.
– Corporations, other than insurance corporations, should report net income from line 9999 of the GIFI (Schedule 125) on line 210.
** The share of the adjusted net income of a partnership or joint venture is calculated as if the partnership or joint venture were a corporation and thetax year of the partnership or joint venture were its fiscal period. For a corporation with an indirect interest in a partnership through one or morepartnerships, determine the corporation's share according to clause 54(5)(c) of the Ontario Act.
– Life insurance corporations must report net income/loss as per the report accepted by the federal Superintendent of Financial Institutions or equivalentprovincial insurance regulator, before SAT and adjusted so consolidation and equity methods are not used. If the life insurance corporation is residentin Canada and carries on business in and outside of Canada, multiply the net income/loss by the ratio of the Canadian reserve liabilities divided bythe total reserve liability. The reserve liabilities are calculated in accordance with Regulation 2405(3) of the federal Act.
Part 3 – CMT payable
Adjusted net income for CMT purposes (line 490 in Part 2, if positive) . . . . . . . . . . . . . .
CMT loss available (amount R from Part 7) . . . . . . . . . . . . . Minus: Adjustment for an acquisition of control * . . . . . .
520Adjusted CMT loss available . . . . . . . . . . . . . . . . . . . . . .
515
518
Net income subject to CMT calculation (if negative, enter "0") . . . . . . . . . . . . . . . . . . . C
Deduct:
4,105,304
4,105,304
Amount fromline 520 x
Number of days in the taxyear before July 1, 2010 x % = 1
Number of daysin the tax year
Amount fromline 520 x
Number of days in the taxyear after June 30, 2010 x % = 2
Number of daysin the tax year
Subtotal (amount 1 plus amount 2) . . . . . . . . . . . . . 3
4,105,304365
4,105,304 365365
2.7 110,843
110,843
4
Ontario corporate income tax payable before CMT credit (amount F6 from Schedule 5) . . . . . . . . . . . . . . . . . . . . . . . . . . .
Gross CMT: amount on line 3 above x OAF ** . . . . . . . . . . . . . . . . . . . . . . . . . . . . . . . . . . . . . . . . . . . . . . . 540Deduct:
CMT after foreign tax credit deduction (line 540 minus line 550) (if negative, enter "0") . . . . . . . . . . . . . . . . . . . . . . . . . . . 550Foreign tax credit for CMT purposes *** . . . . . . . . . . . . . . . . . . . . . . . . . . . . . . . . . . . . . . . . . . . . . . . . . . .
DDeduct:
Net CMT payable (if negative, enter "0") . . . . . . . . . . . . . . . . . . . . . . . . . . . . . . . . . . . . . . . . . . . . . . . . . . . . . . . EEnter amount E on line 278 of Schedule 5, Tax Calculation Supplementary – Corporations, and complete Part 4.
* Enter the portion of CMT loss available that exceeds the adjusted net income for the tax year from carrying on a business before the acquisition ofcontrol. See subsection 58(3) of the Ontario Act.
*** Enter "0" on line 550 for life insurance corporations as they are not eligible for this deduction. For all other corporations, enter the cumulative totalof amount J for the province of Ontario from Part 9 of Schedule 21 on line 550.
110,843
110,843
153,924
** Calculation of the Ontario allocation factor (OAF):If the provincial or territorial jurisdiction entered on line 750 of the T2 return is "Ontario," enter "1" on line F.If the provincial or territorial jurisdiction entered on line 750 of the T2 return is "multiple," complete the following calculation, and enter the result on line F:
Ontario taxable income ****Taxable income *****
=
Ontario allocation factor . . . . . . . . . . . . . . . . . . . . . . . . . . . . . . . . . . . . . . . . . . . . . . . . . . . . . . . . . . . . . . F
**** Enter the amount allocated to Ontario from column F in Part 1 of Schedule 5. If the taxable income is nil, calculate the amount in column F as if thetaxable income were $1,000.
*****Enter the taxable income amount from line 360 or amount Z of the T2 return, whichever applies. If the taxable income is nil, enter "1,000".
1.00000

API 2017.217 2017-12-31 Algoma Power Inc.2018-08-20 09:14 82249 4290 RC0001
CORPORATE TAXPREP / TAXPREP DES SOCIÉTÉS - EP29 VERSION 2018 V1.0 Page 4
Part 4 – Calculation of CMT credit carryforward
CMT credit carryforward at the end of the previous tax year * . . . . . . . . . . . . . . . . . . . . . . . Deduct:CMT credit expired * . . . . . . . . . . . . . . . . . . . . . . . . . . . . . . . . . . . . . . . . . . . CMT credit carryforward at the beginning of the current tax year * (see note below) . . . . . . . . . .
650Add:
G
CMT credit available for the tax year (amount on line 620 plus amount on line 650) . . . . . . . . . . . . . . . . . . . . . . . . . . . . .
620
CMT credit carryforward balances transferred on an amalgamation or the windup of a subsidiary (see note below) . . . . . . . .
Deduct:
amount I) minusSubtotal (amount HCMT credit deducted in the current tax year (amount P from Part 5) . . . . . . . . . . . . . . . . . . . . . . . . . . . . . . . . . . . . . .
JAdd:
SAT payable (amount O from Part 6 of Schedule 512) . . . . . . . . . . . . . . . . . . . . . . . . . . . Net CMT payable (amount E from Part 3) . . . . . . . . . . . . . . . . . . . . . . . . . . . . . . . . . .
KSubtotal
* For the first harmonized T2 return filed with a tax year that includes days in 2009:
600
H
I
CMT credit carryforward at the end of the tax year (amount J plus amount K) . . . . . . . . . . . . . . . . . . . . . . . . . . . . . 670 L
– do not enter an amount on line G or line 600;– for line 620, enter the amount from line 2336 of Ontario CT23 Schedule 101, Corporate Minimum Tax (CMT), for the last tax year that ended in 2008.
For other tax years, enter on line G the amount from line 670 of Schedule 510 from the previous tax year.
Note: If you entered an amount on line 620 or line 650, complete Part 6.
Part 5 – Calculation of CMT credit deducted from Ontario corporate income tax payable
CMT credit available for the tax year (amount H from Part 4) . . . . . . . . . . . . . . . . . . . . . . . . . . . . . . . . . . . . . . . . . . .
Ontario corporate income tax payable before CMT credit (amount F6 from Schedule 5) . . . . . . . .
CMT after foreign tax credit deduction (amount D from Part 3) . .
Gross SAT (line 460 from Part 6 of Schedule 512) . . . . . . . . .
line 2 or line 5, whichever applies:Deduct:
M
Is the corporation claiming a CMT credit earned before an acquisition of control? . . . . . . . . . . . . . . . . . . . . . . . . . . .
Enter amount P on line 418 of Schedule 5 and on line I in Part 4 of this schedule.
If you answered yes to the question at line 675, the CMT credit deducted in the current tax year may be restricted. For information on how the deductionmay be restricted, see subsections 53(6) and (7) of the Ontario Act.
2
4
Subtotal (if negative, enter "0") N
Ontario corporate income tax payable before CMT credit (amount F6 from Schedule 5) . . . . . . . . Deduct:
Subtotal (if negative, enter "0") O
CMT credit deducted in the current tax year (least of amounts M, N, and O) . . . . . . . . . . . . . . . . . . . . . . . . . . . . . . . . . . P
675 1 Yes 2 No
Total refundable tax credits excluding Ontario qualifying environmental trust tax credit(amount J6 minus line 450 from Schedule 5) . . . . . . . . . . . . . . . . . . . . . . . . . . . . . . . .
1
For a corporation that is not a life insurance corporation:
For a life insurance corporation:Gross CMT (line 540 from Part 3) . . . . . . . . . . . . . . . . . . . 3
The greater of amounts 3 and 4 . . . . . . . . . . . . . . . . . . . 56
110,843
43,081
153,924
43,081
153,924
153,924153,924
X
110,843

API 2017.217 2017-12-31 Algoma Power Inc.2018-08-20 09:14 82249 4290 RC0001
CORPORATE TAXPREP / TAXPREP DES SOCIÉTÉS - EP29 VERSION 2018 V1.0 Page 5
Part 6 – Analysis of CMT credit available for carryforward by year of origin
6891st previoustax year
* CMT credit that was earned (by the corporation, predecessors of the corporation, and subsidiaries wound up into the corporation) in each of theprevious 10 tax years and has not been deducted.
**
Complete this part if:
Year of origin CMT credit balance *
10th previoustax year
680
9th previoustax year
681
8th previoustax year
682
7th previoustax year
683
6th previoustax year
684
5th previoustax year
685
4th previoustax year
686
3rd previoustax year
687
2nd previoustax year
688
Total **
Must equal the total of the amounts entered on lines 620 and 650 in Part 4.
– the tax year includes January 1, 2009; or– the previous tax year-end is deemed to be December 31, 2008, under subsection 249(3) of the federal Act.
Part 7 – Calculation of CMT loss carryforward
CMT loss carryforward at the end of the previous tax year * . . . . . . . . . . . . . . . . . . . . . . . . Deduct:CMT loss expired * . . . . . . . . . . . . . . . . . . . . . . . . . . . . . . . . . . . . . . . . . . . . CMT loss carryforward at the beginning of the tax year * (see note below) . . . . . . . . . . . . . . .
750Add:
Q
CMT loss available (line 720 plus line 750) . . . . . . . . . . . . . . . . . . . . . . . . . . . . . . . . . . . . . . . . . . . . . . . . . . . . .
720
CMT loss transferred on an amalgamation under section 87 of the federal Act ** (see note below) . . . . . . . . . . . . . . . . .
Deduct:
Subtotal (if negative, enter "0")CMT loss deducted against adjusted net income for the tax year (lesser of line 490 (if positive) and line C in Part 3) . . . . . . . . . .
SAdd:Adjusted net loss for CMT purposes (amount from line 490 in Part 2, if negative) (enter as a positive amount) . . . . . . . . . .
* For the first harmonized T2 return filed with a tax year that includes days in 2009:
700
R
CMT loss carryforward balance at the end of the tax year (amount S plus line 760) . . . . . . . . . . . . . . . . . . . . . . . . . . 770 T
– do not enter an amount on line Q or line 700;– for line 720, enter the amount from line 2214 of Ontario CT23 Schedule 101, Corporate Minimum Tax (CMT), for the last tax year that ended in 2008.
For other tax years, enter on line Q the amount from line 770 of Schedule 510 from the previous tax year.
760
** Do not include an amount from a predecessor corporation if it was controlled at any time before the amalgamation by anyof the other predecessor corporations.
Note: If you entered an amount on line 720 or line 750, complete Part 8.
API 2017.217 2017-12-31 Algoma Power Inc.2018-08-20 09:14 82249 4290 RC0001
CORPORATE TAXPREP / TAXPREP DES SOCIÉTÉS - EP29 VERSION 2018 V1.0 Page 6
Part 8 – Analysis of CMT loss available for carryforward by year of origin
1st previoustax year
* Adjusted net loss for CMT purposes that was earned (by the corporation, by subsidiaries wound up into or amalgamated with the corporation beforeMarch 22, 2007, and by other predecessors of the corporation) in each of the previous 10 tax years that ended before March 23, 2007, and has notbeen deducted.
**
Complete this part if:
Year of origin Balance earned in a tax year endingbefore March 23, 2007 *
10th previoustax year
810
9th previoustax year
811
8th previoustax year
812
7th previoustax year
813
6th previoustax year
814
5th previoustax year
815
4th previoustax year
816
3rd previoustax year
817
2nd previoustax year
818
Total ***
829
Balance earned in a tax year endingafter March 22, 2007 **
820
821
822
823
824
825
826
827
828
Adjusted net loss for CMT purposes that was earned (by the corporation and its predecessors, but not by a subsidiary predecessor) in each ofthe previous 20 tax years that ended after March 22, 2007, and has not been deducted.
*** The total of these two columns must equal the total of the amounts entered on lines 720 and 750.
– the tax year includes January 1, 2009; or– the previous tax year-end is deemed to be December 31, 2008, under subsection 249(3) of the federal Act.
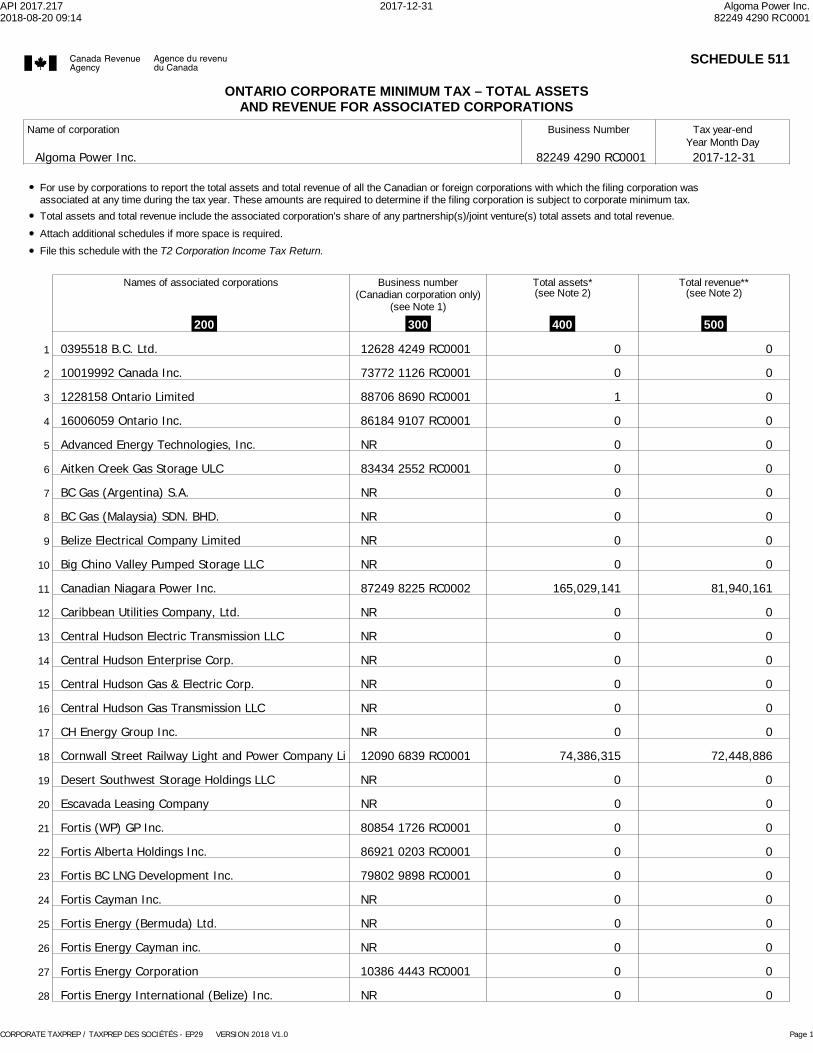
API 2017.217 2017-12-31 Algoma Power Inc.2018-08-20 09:14 82249 4290 RC0001
CORPORATE TAXPREP / TAXPREP DES SOCIÉTÉS - EP29 VERSION 2018 V1.0 Page 1
SCHEDULE 511
ONTARIO CORPORATE MINIMUM TAX – TOTAL ASSETSAND REVENUE FOR ASSOCIATED CORPORATIONS
Year Month DayName of corporation Business Number Tax year-end
2017-12-31Algoma Power Inc. 82249 4290 RC0001
For use by corporations to report the total assets and total revenue of all the Canadian or foreign corporations with which the filing corporation wasassociated at any time during the tax year. These amounts are required to determine if the filing corporation is subject to corporate minimum tax.Total assets and total revenue include the associated corporation's share of any partnership(s)/joint venture(s) total assets and total revenue.Attach additional schedules if more space is required.File this schedule with the T2 Corporation Income Tax Return.
Names of associated corporations Business number(Canadian corporation only)
(see Note 1)
Total assets*(see Note 2)
Total revenue**(see Note 2)
200 300 400 500
1 0395518 B.C. Ltd. 12628 4249 RC0001 0 0
2 10019992 Canada Inc. 73772 1126 RC0001 0 0
3 1228158 Ontario Limited 88706 8690 RC0001 1 0
4 16006059 Ontario Inc. 86184 9107 RC0001 0 0
5 Advanced Energy Technologies, Inc. NR 0 0
6 Aitken Creek Gas Storage ULC 83434 2552 RC0001 0 0
7 BC Gas (Argentina) S.A. NR 0 0
8 BC Gas (Malaysia) SDN. BHD. NR 0 0
9 Belize Electrical Company Limited NR 0 0
10 Big Chino Valley Pumped Storage LLC NR 0 0
11 Canadian Niagara Power Inc. 87249 8225 RC0002 165,029,141 81,940,161
12 Caribbean Utilities Company, Ltd. NR 0 0
13 Central Hudson Electric Transmission LLC NR 0 0
14 Central Hudson Enterprise Corp. NR 0 0
15 Central Hudson Gas & Electric Corp. NR 0 0
16 Central Hudson Gas Transmission LLC NR 0 0
17 CH Energy Group Inc. NR 0 0
18 Cornwall Street Railway Light and Power Company Li 12090 6839 RC0001 74,386,315 72,448,886
19 Desert Southwest Storage Holdings LLC NR 0 0
20 Escavada Leasing Company NR 0 0
21 Fortis (WP) GP Inc. 80854 1726 RC0001 0 0
22 Fortis Alberta Holdings Inc. 86921 0203 RC0001 0 0
23 Fortis BC LNG Development Inc. 79802 9898 RC0001 0 0
24 Fortis Cayman Inc. NR 0 0
25 Fortis Energy (Bermuda) Ltd. NR 0 0
26 Fortis Energy Cayman inc. NR 0 0
27 Fortis Energy Corporation 10386 4443 RC0001 0 0
28 Fortis Energy International (Belize) Inc. NR 0 0
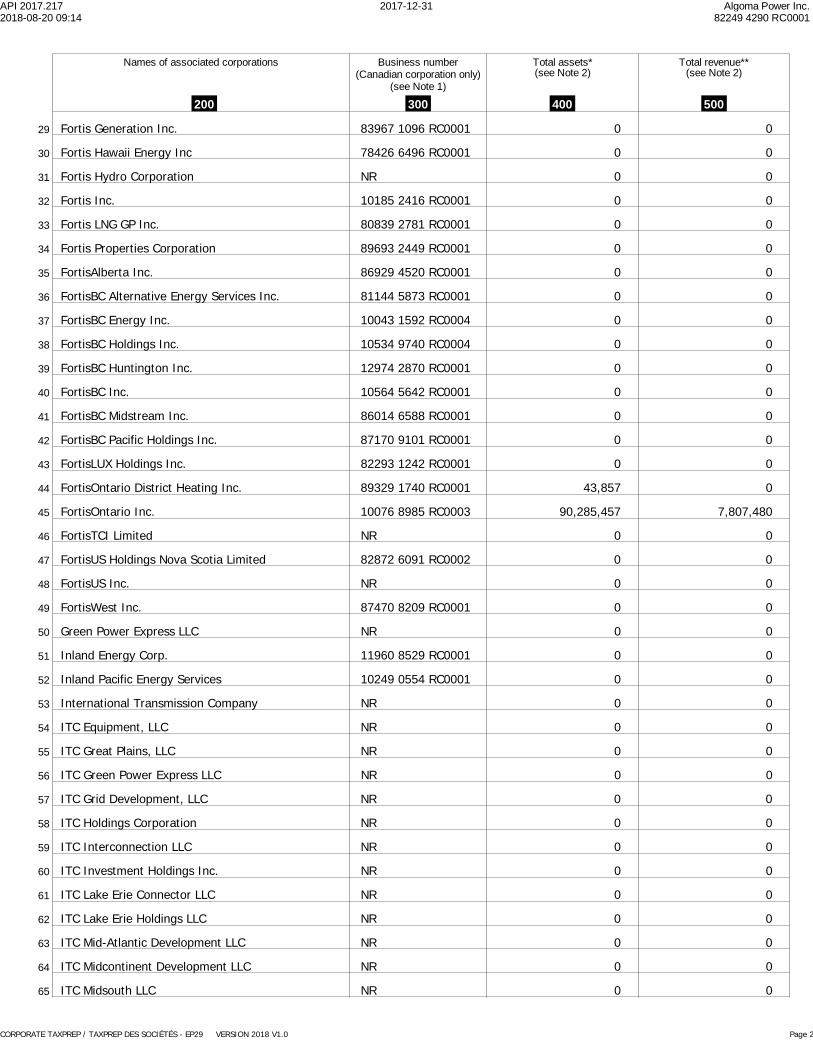
API 2017.217 2017-12-31 Algoma Power Inc.2018-08-20 09:14 82249 4290 RC0001
CORPORATE TAXPREP / TAXPREP DES SOCIÉTÉS - EP29 VERSION 2018 V1.0 Page 2
Names of associated corporations Business number(Canadian corporation only)
(see Note 1)
Total assets*(see Note 2)
Total revenue**(see Note 2)
200 300 400 500
29 Fortis Generation Inc. 83967 1096 RC0001 0 0
30 Fortis Hawaii Energy Inc 78426 6496 RC0001 0 0
31 Fortis Hydro Corporation NR 0 0
32 Fortis Inc. 10185 2416 RC0001 0 0
33 Fortis LNG GP Inc. 80839 2781 RC0001 0 0
34 Fortis Properties Corporation 89693 2449 RC0001 0 0
35 FortisAlberta Inc. 86929 4520 RC0001 0 0
36 FortisBC Alternative Energy Services Inc. 81144 5873 RC0001 0 0
37 FortisBC Energy Inc. 10043 1592 RC0004 0 0
38 FortisBC Holdings Inc. 10534 9740 RC0004 0 0
39 FortisBC Huntington Inc. 12974 2870 RC0001 0 0
40 FortisBC Inc. 10564 5642 RC0001 0 0
41 FortisBC Midstream Inc. 86014 6588 RC0001 0 0
42 FortisBC Pacific Holdings Inc. 87170 9101 RC0001 0 0
43 FortisLUX Holdings Inc. 82293 1242 RC0001 0 0
44 FortisOntario District Heating Inc. 89329 1740 RC0001 43,857 0
45 FortisOntario Inc. 10076 8985 RC0003 90,285,457 7,807,480
46 FortisTCI Limited NR 0 0
47 FortisUS Holdings Nova Scotia Limited 82872 6091 RC0002 0 0
48 FortisUS Inc. NR 0 0
49 FortisWest Inc. 87470 8209 RC0001 0 0
50 Green Power Express LLC NR 0 0
51 Inland Energy Corp. 11960 8529 RC0001 0 0
52 Inland Pacific Energy Services 10249 0554 RC0001 0 0
53 International Transmission Company NR 0 0
54 ITC Equipment, LLC NR 0 0
55 ITC Great Plains, LLC NR 0 0
56 ITC Green Power Express LLC NR 0 0
57 ITC Grid Development, LLC NR 0 0
58 ITC Holdings Corporation NR 0 0
59 ITC Interconnection LLC NR 0 0
60 ITC Investment Holdings Inc. NR 0 0
61 ITC Lake Erie Connector LLC NR 0 0
62 ITC Lake Erie Holdings LLC NR 0 0
63 ITC Mid-Atlantic Development LLC NR 0 0
64 ITC Midcontinent Development LLC NR 0 0
65 ITC Midsouth LLC NR 0 0
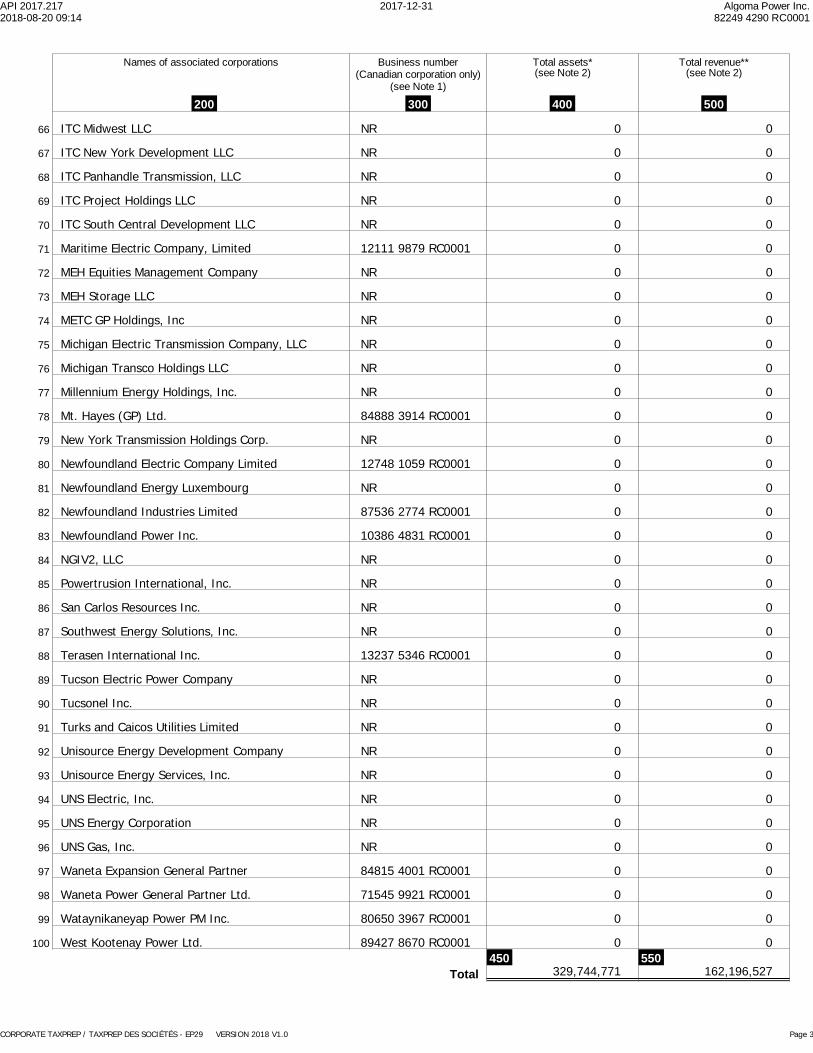
API 2017.217 2017-12-31 Algoma Power Inc.2018-08-20 09:14 82249 4290 RC0001
CORPORATE TAXPREP / TAXPREP DES SOCIÉTÉS - EP29 VERSION 2018 V1.0 Page 3
Names of associated corporations Business number(Canadian corporation only)
(see Note 1)
Total assets*(see Note 2)
Total revenue**(see Note 2)
200 300 400 500
66 ITC Midwest LLC NR 0 0
67 ITC New York Development LLC NR 0 0
68 ITC Panhandle Transmission, LLC NR 0 0
69 ITC Project Holdings LLC NR 0 0
70 ITC South Central Development LLC NR 0 0
71 Maritime Electric Company, Limited 12111 9879 RC0001 0 0
72 MEH Equities Management Company NR 0 0
73 MEH Storage LLC NR 0 0
74 METC GP Holdings, Inc NR 0 0
75 Michigan Electric Transmission Company, LLC NR 0 0
76 Michigan Transco Holdings LLC NR 0 0
77 Millennium Energy Holdings, Inc. NR 0 0
78 Mt. Hayes (GP) Ltd. 84888 3914 RC0001 0 0
79 New York Transmission Holdings Corp. NR 0 0
80 Newfoundland Electric Company Limited 12748 1059 RC0001 0 0
81 Newfoundland Energy Luxembourg NR 0 0
82 Newfoundland Industries Limited 87536 2774 RC0001 0 0
83 Newfoundland Power Inc. 10386 4831 RC0001 0 0
84 NGIV2, LLC NR 0 0
85 Powertrusion International, Inc. NR 0 0
86 San Carlos Resources Inc. NR 0 0
87 Southwest Energy Solutions, Inc. NR 0 0
88 Terasen International Inc. 13237 5346 RC0001 0 0
89 Tucson Electric Power Company NR 0 0
90 Tucsonel Inc. NR 0 0
91 Turks and Caicos Utilities Limited NR 0 0
92 Unisource Energy Development Company NR 0 0
93 Unisource Energy Services, Inc. NR 0 0
94 UNS Electric, Inc. NR 0 0
95 UNS Energy Corporation NR 0 0
96 UNS Gas, Inc. NR 0 0
97 Waneta Expansion General Partner 84815 4001 RC0001 0 0
98 Waneta Power General Partner Ltd. 71545 9921 RC0001 0 0
99 Wataynikaneyap Power PM Inc. 80650 3967 RC0001 0 0
100 West Kootenay Power Ltd. 89427 8670 RC0001 0 0450
Total550
329,744,771 162,196,527

API 2017.217 2017-12-31 Algoma Power Inc.2018-08-20 09:14 82249 4290 RC0001
CORPORATE TAXPREP / TAXPREP DES SOCIÉTÉS - EP29 VERSION 2018 V1.0 Page 4
Enter the total assets from line 450 on line 116 in Part 1 of Schedule 510, Ontario Corporate Minimum Tax.Enter the total revenue from line 550 on line 146 in Part 1 of Schedule 510.
Note 1: Enter ¨NR¨ if a corporation is not registered.
Note 2: If the associated corporation does not have a tax year that ends in the filing corporation's current tax year but was associated with the filingcorporation in the previous tax year of the filing corporation, enter the total revenue and total assets from the tax year of the associatedcorporation that ends in the previous tax year of the filing corporation.
Rules for total assets*Report total assets in accordance with generally accepted accounting principles, adjusted so that consolidation and equity methods are not used.Include the associated corporation's share of the total assets of partnership(s) and joint venture(s) but exclude the recorded asset(s) for theinvestment in partnerships and joint ventures.
––
– Exclude unrealized gains and losses on assets that are included in net income for accounting purposes but not in income for corporate incometax purposes.
Rules for total revenue**Report total revenue in accordance with generally accepted accounting principles, adjusted so that consolidation and equity methods are not used.If the associated corporation has 2 or more tax years ending in the filing corporation's tax year, multiply the sum of the total revenue for each ofthose tax years by 365 and divide by the total number of days in all of those tax years.
––
– If the associated corporation's tax year is less than 51 weeks and is the only tax year of the associated corporation that ends in the filing corporation'stax year, multiply the associated corporation's total revenue by 365 and divide by the number of days in the associated corporation's tax year.
– Include the associated corporation's share of the total revenue of partnerships and joint ventures.– If the partnership or joint venture has 2 or more fiscal periods ending in the associated corporation's tax year, multiply the sum of the total revenue
for each of the fiscal periods by 365 and divide by the total number of days in all the fiscal periods.
T2 SCH 511 ¤

API 2017.217 2017-12-31 Algoma Power Inc.2018-08-20 09:14 82249 4290 RC0001
CORPORATE TAXPREP / TAXPREP DES SOCIÉTÉS - EP29 VERSION 2018 V1.0 Page 1
SCHEDULE 546
CORPORATIONS INFORMATION ACT ANNUAL RETURN FOR ONTARIO CORPORATIONS
Year Month DayName of corporation Business Number Tax year-end
2017-12-31Algoma Power Inc. 82249 4290 RC0001
This schedule should be completed by a corporation that is incorporated, continued, or amalgamated in Ontario and subject to the Ontario BusinessCorporations Act (BCA) or Ontario Corporations Act (CA), except for registered charities under the federal Income Tax Act. This completed schedule servesas a Corporations Information Act Annual Return under the Ontario Corporations Information Act.
This schedule must set out the required information for the corporation as of the date of delivery of this schedule.
Complete parts 1 to 4. Complete parts 5 to 7 only to report change(s) in the information recorded on the Ontario Ministry of Government Services (MGS)public record.
A completed Ontario Corporations Information Act Annual Return must be delivered within six months after the end of the corporation's tax year-end.The MGS considers this return to be delivered on the date that it is filed with the Canada Revenue Agency (CRA) together with the corporation'sincome tax return.
It is the corporation's responsibility to ensure that the information shown on the MGS public record is accurate and up-to-date. To review the informationshown for the corporation on the public record maintained by the MGS, obtain a Corporation Profile Report. Visit www.ServiceOntario.ca for moreinformation.This schedule contains non-tax information collected under the authority of the Ontario Corporations Information Act. This information will be sent to theMGS for the purposes of recording the information on the public record maintained by the MGS.
Part 1 – IdentificationCorporation's name (exactly as shown on the MGS public record)100
Jurisdiction incorporated, continued, or amalgamated,whichever is the most recent
Ontario
Date of incorporation oramalgamation, whichever is themost recent
110Year Month Day
Ontario Corporation No.120Algoma Power Inc.
2009-01-26 2196355
Part 2 – Head or registered office address (P.O. box not acceptable as stand-alone address)
Province/stateMunicipality (e.g., city, town)
Additional address information if applicable (line 220 must be completed first)
Care of (if applicable)200
Street number Suite number230210 220 Street name/Rural route/Lot and Concession number
240
250 Postal/zip code280Country260 270
2
Sault Ste Marie P6B 6J6ON CA
Sackville
Part 3 – Change identifierHave there been any changes in any of the information most recently filed for the public record maintained by the MGS for the corporation with respect tonames, addresses for service, and the date elected/appointed and, if applicable, the date the election/appointment ceased of the directors and five mostsenior officers, or with respect to the corporation's mailing address or language of preference? To review the information shown for the corporation on thepublic record maintained by the MGS, obtain a Corporation Profile Report. For more information, visit www.ServiceOntario.ca.
300 If there have been no changes, enter 1 in this box and then go to "Part 4 – Certification."If there are changes, enter 2 in this box and complete the applicable parts on the next page, and then go to "Part 4 – Certification."1
Part 4 – CertificationI certify that all information given in this Corporations Information Act Annual Return is true, correct, and complete.
451
454
450Last name
Middle name(s)
First name
,
460 Please enter one of the following numbers in this box for the above-named person: 1 for director, 2 for officer, or 3 for other individual havingknowledge of the affairs of the corporation. If you are a director and officer, enter 1 or 2.
Note: Sections 13 and 14 of the Ontario Corporations Information Act provide penalties for making false or misleading statements or omissions.
GlenKing
2
T2 SCH 546 E (10) ¤

API 2017.217 2017-12-31 Algoma Power Inc.2018-08-20 09:14 82249 4290 RC0001
CORPORATE TAXPREP / TAXPREP DES SOCIÉTÉS - EP29 VERSION 2018 V1.0 Page 2
Complete the applicable parts to report changes in the information recorded on the MGS public record.Part 5 – Mailing address
Municipality (e.g., city, town)
Additional address information if applicable (line 530 must be completed first)
Care of (if applicable)510
Street number Suite number540520 530 Street name/Rural route/Lot and Concession number
550
560 Province/state Postal/zip code590Country
500 Please enter one of the following numbers in this box: Show no mailing address on the MGS public record.The corporation's mailing address is the same as the head orregistered office address in Part 2 of this schedule.The corporation's complete mailing address is as follows:
1 -2 -
3 -
570 580
Part 6 – Language of preference600 Indicate your language of preference by entering 1 for English or 2 for French. This is the language of preference recorded on the MGS public
record for communications with the corporation. It may be different from line 990 on the T2 return.

API 2017.217 2017-12-31 Algoma Power Inc.2018-08-20 09:14 82249 4290 RC0001
CORPORATE TAXPREP / TAXPREP DES SOCIÉTÉS - EP29 VERSION 2018 V1.0 Page 1
Corporate Taxpayer SummaryCorporate information
Corporation's name . . . . . . . . . . . . Taxation Year . . . . . . . . . . . . . . . to
Jurisdiction . . . . . . . . . . . . . . . . OCBC AB SK MB ON QC NB NS NO PE NL XO YT NT NU
Corporation is associated . . . . . . . . Corporation is related . . . . . . . . . . . Number of associated corporations . . . Type of corporation . . . . . . . . . . . . Total amount due (refund) federaland provincial* . . . . . . . . . . . . . . .
The amounts displayed on lines "Total amount due (refund) federal and provincial" are all listed in the help. Press F1 to consult the context-sensative help.*
2017-01-01 2017-12-31
Algoma Power Inc.
Ontario
X
Y
Y
100
Corporation Controlled by a Public Corporation
Summary of federal information
Part I tax (base amount) . . . . . . . . . . . . . . . . . . . . . . . . . . . . . . . . . . . . . . . . . . . . . . . . . . . . . . . . . . . . . . . . . .
Net income . . . . . . . . . . . . . . . . . . . . . . . . . . . . . . . . . . . . . . . . . . . . . . . . . . . . . . . . . . . . . . . . . . . . . . . . . Taxable income . . . . . . . . . . . . . . . . . . . . . . . . . . . . . . . . . . . . . . . . . . . . . . . . . . . . . . . . . . . . . . . . . . . . . . .
Dividends paid . . . . . . . . . . . . . . . . . . . . . . . . . . . . . . . . . . . . . . . . . . . . . . . . . . . . . . . . . . . . . . . . . . . . . . . Calculation of income from an active business carried on in Canada . . . . . . . . . . . . . . . . . . . . . . . . . . . . . . . . . . . . . . . . Donations . . . . . . . . . . . . . . . . . . . . . . . . . . . . . . . . . . . . . . . . . . . . . . . . . . . . . . . . . . . . . . . . . . . . . . . . . .
Balance of the low rate income pool at the end of the year . . . . . . . . . . . . . . . . . . . . . . . . . . . . . . . . . . . . . . . . . . . . . .
Balance of the general rate income pool at the end of the year . . . . . . . . . . . . . . . . . . . . . . . . . . . . . . . . . . . . . . . . . . . .
Balance of the low rate income pool at the end of the previous year . . . . . . . . . . . . . . . . . . . . . . . . . . . . . . . . . . . . . . . . .
Balance of the general rate income pool at the end of the previous year . . . . . . . . . . . . . . . . . . . . . . . . . . . . . . . . . . . . . .
Dividends paid – Regular . . . . . . . . . . . . . . . . . . . . . . . . . . . . . . . . . . . . . . . . . . . . . . . . . . Dividends paid – Eligible . . . . . . . . . . . . . . . . . . . . . . . . . . . . . . . . . . . . . . . . . . . . . . . . . .
1,392,884
1,338,469
1,392,884
508,618
54,415
Part IV . . . . . . . . . . . . .
Other* . . . . . . . . . . . . .
Balance due/refund (–)
Credits against part I tax Summary of tax Refunds/creditsSmall business deduction . M&P deduction . . . . . . . . Foreign tax credit . . . . . . Investment tax credits . . . . Abatement/Other* . . . . . .
ITC refund . . . . . . . . . . Dividends refund . . . . . .
Other* . . . . . . . . . . . . Instalments . . . . . . . . .
Part I . . . . . . . . . . . . .
* The amounts displayed on lines "Other" are all listed in the Help. Press F1 to consult the context-sensitive help.
Provincial or territorial tax . .
Part III.1 . . . . . . . . . . . .
307,848
354,694
200,770
153,924
Summary of federal carryforward/carryback informationCarryforward balancesFinancial statement reserve . . . . . . . . . . . . . . . . . . . . . . . . . . . . . . . . . . . . . . . . . . . . . . . . . . . . . . . . . . . . . . . . 4,133,183

API 2017.217 2017-12-31 Algoma Power Inc.2018-08-20 09:14 82249 4290 RC0001
CORPORATE TAXPREP / TAXPREP DES SOCIÉTÉS - EP29 VERSION 2018 V1.0 Page 2
Summary of provincial information – provincial income tax payable
Net income . . . . . . . . . . . . . . . . . . . . . . . . . . . . . . . . . . . . . . . . .
Ontario Québec(CO-17)
Alberta(AT1)
Taxable income . . . . . . . . . . . . . . . . . . . . . . . . . . . . . . . . . . . . . . . 1,392,8841,338,469
% Allocation . . . . . . . . . . . . . . . . . . . . . . . . . . . . . . . . . . . . . . . . . Attributed taxable income . . . . . . . . . . . . . . . . . . . . . . . . . . . . . . . . .
Tax payable before deduction* . . . . . . . . . . . . . . . . . . . . . . . . . . . . . . Deductions and credits . . . . . . . . . . . . . . . . . . . . . . . . . . . . . . . . . . Net tax payable . . . . . . . . . . . . . . . . . . . . . . . . . . . . . . . . . . . . . . .
Attributed taxable capital . . . . . . . . . . . . . . . . . . . . . . . . . . . . . . . . . . Capital tax payable** . . . . . . . . . . . . . . . . . . . . . . . . . . . . . . . . . . . .
Total tax payable*** . . . . . . . . . . . . . . . . . . . . . . . . . . . . . . . . . . . . .
Balance due/Refund (-) . . . . . . . . . . . . . . . . . . . . . . . . . . . . . . . . . . Instalments and refundable credits . . . . . . . . . . . . . . . . . . . . . . . . . . . .
For Québec, this includes special taxes.For Québec, this includes compensation tax and registration fee.
N/AN/A
***
Logging tax payable (COZ-1179)Tax payable . . . . . . . . . . . . . . . . . . . . . . . . . . . . . . . . . . . . . . . . . N/A N/A
N/AN/A
100.001,338,469
153,924
153,924
153,924
153,924
*** For Ontario, this includes the corporate minimum tax, the Crown royalties’ additional tax, the transitional tax debit, the recaptured research anddevelopment tax credit and the special additional tax debit on life insurance corporations. The Balance due/Refund is included in the federalBalance due/refund.
Summary – taxable capital
Taxable capitalused to calculate
line 234 ofthe T2 return
Taxable capitalused to calculate
line 233 ofthe T2 return
Taxable capitalused to calculate
the SR&EDexpenditure limit
for a CCPC(Schedules 31
and 49)
Taxable capitalused to calculatethe business limit
reduction(T2, line 415)
Corporate name
Federal
Algoma Power Inc. 44,378,857 44,378,8570395518 B.C. Ltd.10019992 Canada Inc.1228158 Ontario Limited 1 1 116006059 Ontario Inc.Advanced Energy Technologies, Inc.Aitken Creek Gas Storage ULCBC Gas (Argentina) S.A.BC Gas (Malaysia) SDN. BHD.Belize Electrical Company LimitedBig Chino Valley Pumped Storage LLCCanadian Niagara Power Inc. 55,111,713 53,291,067 53,291,067Caribbean Utilities Company, Ltd.Central Hudson Electric Transmission LLCCentral Hudson Enterprise Corp.Central Hudson Gas & Electric Corp.Central Hudson Gas Transmission LLCCH Energy Group Inc.Cornwall Street Railway Light and Power Company Limited 24,516,051 25,809,050 25,809,050Desert Southwest Storage Holdings LLCEscavada Leasing CompanyFortis (WP) GP Inc.Fortis Alberta Holdings Inc.Fortis BC LNG Development Inc.Fortis Cayman Inc.

API 2017.217 2017-12-31 Algoma Power Inc.2018-08-20 09:14 82249 4290 RC0001
CORPORATE TAXPREP / TAXPREP DES SOCIÉTÉS - EP29 VERSION 2018 V1.0 Page 3
Taxable capitalused to calculate
line 234 ofthe T2 return
Taxable capitalused to calculate
line 233 ofthe T2 return
Taxable capitalused to calculate
the SR&EDexpenditure limit
for a CCPC(Schedules 31
and 49)
Taxable capitalused to calculatethe business limit
reduction(T2, line 415)
Corporate name
Federal
Fortis Energy (Bermuda) Ltd.Fortis Energy Cayman inc.Fortis Energy CorporationFortis Energy International (Belize) Inc.Fortis Generation Inc.Fortis Hawaii Energy IncFortis Hydro CorporationFortis Inc.Fortis LNG GP Inc.Fortis Properties CorporationFortisAlberta Inc.FortisBC Alternative Energy Services Inc.FortisBC Energy Inc.FortisBC Holdings Inc.FortisBC Huntington Inc.FortisBC Inc.FortisBC Midstream Inc.FortisBC Pacific Holdings Inc.FortisLUX Holdings Inc.FortisOntario District Heating Inc. 43,857 43,857 43,857FortisOntario Inc. 198,551,379 207,073,865 207,073,865FortisTCI LimitedFortisUS Holdings Nova Scotia LimitedFortisUS Inc.FortisWest Inc.Green Power Express LLCInland Energy Corp.Inland Pacific Energy ServicesInternational Transmission CompanyITC Equipment, LLCITC Great Plains, LLCITC Green Power Express LLCITC Grid Development, LLCITC Holdings CorporationITC Interconnection LLCITC Investment Holdings Inc.ITC Lake Erie Connector LLCITC Lake Erie Holdings LLCITC Mid-Atlantic Development LLCITC Midcontinent Development LLCITC Midsouth LLCITC Midwest LLCITC New York Development LLCITC Panhandle Transmission, LLCITC Project Holdings LLCITC South Central Development LLCMaritime Electric Company, LimitedMEH Equities Management CompanyMEH Storage LLCMETC GP Holdings, IncMichigan Electric Transmission Company, LLCMichigan Transco Holdings LLCMillennium Energy Holdings, Inc.

API 2017.217 2017-12-31 Algoma Power Inc.2018-08-20 09:14 82249 4290 RC0001
CORPORATE TAXPREP / TAXPREP DES SOCIÉTÉS - EP29 VERSION 2018 V1.0 Page 4
Taxable capitalused to calculate
line 234 ofthe T2 return
Taxable capitalused to calculate
line 233 ofthe T2 return
Taxable capitalused to calculate
the SR&EDexpenditure limit
for a CCPC(Schedules 31
and 49)
Taxable capitalused to calculatethe business limit
reduction(T2, line 415)
Corporate name
Federal
Mt. Hayes (GP) Ltd.New York Transmission Holdings Corp.Newfoundland Electric Company LimitedNewfoundland Energy LuxembourgNewfoundland Industries LimitedNewfoundland Power Inc.NGIV2, LLCPowertrusion International, Inc.San Carlos Resources Inc.Southwest Energy Solutions, Inc.Terasen International Inc.Tucson Electric Power CompanyTucsonel Inc.Turks and Caicos Utilities LimitedUnisource Energy Development CompanyUnisource Energy Services, Inc.UNS Electric, Inc.UNS Energy CorporationUNS Gas, Inc.Waneta Expansion General PartnerWaneta Power General Partner Ltd.Wataynikaneyap Power PM Inc.West Kootenay Power Ltd.
Total 278,223,001 330,596,697 330,596,697
Paid-up capitalused to calculate
the tax creditfor investment
(CO-1029.8.36.IN)
Paid-up capitalused to calculate
the Québecbusiness limit
reduction (CO-771)and to calculatethe additionaldeduction fortransportation
costs of remotemanufacturing
SMEs (CO-156.TR)
Corporate name Paid-up capitalused to calculate
the 1 milliondeduction
(CO-1137.A andCO-1137.E)
Québec
Total
Specified capitalused to calculatethe expenditurelimit – Ontarioinnovation tax
credit(Schedule 566)
Corporate name
Ontario
Total

API 2017.217 2017-12-31 Algoma Power Inc.2018-08-20 09:14 82249 4290 RC0001
CORPORATE TAXPREP / TAXPREP DES SOCIÉTÉS - EP29 VERSION 2018 V1.0 Page 5
Capital usedto calculate theNewfoundlandand Labrador
capital deductionon financialinstitutions
(Schedule 306)
Corporate name
Other provinces
Total

API 2017.217 2017-12-31 Algoma Power Inc.2018-08-20 09:14 82249 4290 RC0001
CORPORATE TAXPREP / TAXPREP DES SOCIÉTÉS - EP29 VERSION 2018 V1.0 Page 1
Five-Year Comparative Summary
Current year 1st prior year 2nd prior year 3rd prior year 4th prior year
Federal information (T2)Taxation year end
Balance due/refund (-)
Net incomeTaxable incomeActive business incomeDividends paid
Donations
LRIP – end of the year
GRIP – end of the year
LRIP – end of theprevious year
GRIP – end of theprevious year
Dividends paid – RegularDividends paid – Eligible
Line 996 – Amendedtax return
1,236,5781,179,3871,236,578
-58,117
2016-12-31
1,655,2431,593,0061,655,243
-181,833
2015-12-31
2,000,000
-673,530
-350,021
2014-12-31
728,858692,489728,858
-175,100
2013-12-31
1,392,8841,338,4691,392,884
2017-12-31
54,415 57,191 39,262 22,975 19,543
2,000,000
Loss carrybacks requested in prioryears to reduce taxable income
Taxable income beforeloss carrybacks N/A
Non-capital lossesN/A
Net capital losses (50%)Restricted farm lossesFarm lossesListed personal propertylosses (50%)
Total loss carried backto prior yearsAdjusted taxable incomeafter loss carrybacks
N/A N/AN/AN/A
N/AN/A
N/A N/A
N/A N/A
N/A N/A
N/A N/A
Taxation year end
1,593,006 692,489297,132
297,132
1,593,006 395,357
2017-12-31 2016-12-31 2015-12-31 2014-12-31 2013-12-31
Losses in the current year carried backto previous years to reduce taxableincome (according to Schedule 4)
Adjusted taxable income beforecurrent year loss carrybacks*
Non-capital lossesNet capital losses (50%)Restricted farm lossesFarm lossesListed personal propertylosses (50%)
Total current year losses carriedback to prior yearsAdjusted taxable incomeafter loss carrybacks
The adjusted taxable income before current year loss carryback takes into account loss carrybacks that were made in prior taxation years.*
N/AN/AN/AN/AN/A
N/A
N/A
N/A
N/AN/AN/AN/AN/A
N/A
N/A
N/A
Taxation year end
1,179,387 1,593,006
1,179,387 1,593,006
2017-12-31 2016-12-31 2015-12-31 2014-12-31 2013-12-31

API 2017.217 2017-12-31 Algoma Power Inc.2018-08-20 09:14 82249 4290 RC0001
CORPORATE TAXPREP / TAXPREP DES SOCIÉTÉS - EP29 VERSION 2018 V1.0 Page 2
Loss carrybacks requested in prioryears to reduce taxable dividendssubject to Part IV taxTaxation year endAdjusted Part IV tax multipliedby the multiplication factor**,before loss carrybacks
Non-capital lossesFarm losses
Total loss carried backto prior years
N/AN/AN/A
N/AAdjusted Part IV tax multipliedby the multiplication factor**,after loss carrybacks N/A
N/AN/AN/A
N/A
N/A
2017-12-31 2016-12-31 2015-12-31 2014-12-31 2013-12-31
Losses in the current year carried backto previous years to reduce taxabledividends subject to Part IV tax(according to Schedule 4)
Adjusted Part IV tax multipliedby the multiplication factor**,before current-year losscarrybacks***
Non-capital lossesFarm losses
Total current year lossescarried back to prior years
N/AN/AN/A
N/AAdjusted Part IV tax multipliedby the multiplication factor**,after loss carrybacks N/A** The multiplication factor is 3 for dividends received before January 1, 2016, and 100 / 38 1/3 for dividends received after December 31, 2015.
N/AN/AN/A
N/A
N/A
Taxation year end
The adjusted Part IV tax multiplied by the multiplication factor before current-year loss carrybacks takes into account loss carrybacks that were made in priortaxation years. This amount is multiplied by the multiplication factor to help you determine the loss amount that must be used to reduce Part IV tax payableto zero.
***
2017-12-31 2016-12-31 2015-12-31 2014-12-31 2013-12-31
Federal taxesTaxation year end 2017-12-31 2016-12-31 2015-12-31 2014-12-31 2013-12-31
Part IVPart I
Other*
* The amounts displayed on lines "Other" are all listed in the help. Press F1 to consult the context-sensative help.
Part III.1
97,873238,950176,908200,770
Credits against part I taxTaxation year end 2017-12-31 2016-12-31 2015-12-31 2014-12-31 2013-12-31
Small business deductionM&P deductionForeign tax creditInvestment tax creditAbatement/other*
* The amounts displayed on lines "Other" are all listed in the help. Press F1 to consult the context-sensative help.
159,2736,000
366,392271,259307,848
Refunds/creditsTaxation year end 2017-12-31 2016-12-31 2015-12-31 2014-12-31 2013-12-31
ITC refundDividend refundInstalmentsOther*
* The amounts displayed on lines "Other" are all listed in the help. Press F1 to consult the context-sensative help.
350,000354,000600,000370,112354,694

API 2017.217 2017-12-31 Algoma Power Inc.2018-08-20 09:14 82249 4290 RC0001
CORPORATE TAXPREP / TAXPREP DES SOCIÉTÉS - EP29 VERSION 2018 V1.0 Page 3
OntarioTaxation year end 2017-12-31 2016-12-31 2015-12-31 2014-12-31 2013-12-31
Income tax payablebefore deduction
Total tax payable*
Net income tax payable
Capital tax payableTaxable capital
Income tax deductions/credits
Balance due/refund**
For taxation years ending before January 1, 2009, this includes the corporate minimum tax and the premium tax. For taxation years ending afterDecember 31, 2008, this includes the corporate minimum tax, the Crown royalties’ additional tax, the transitional tax debit, the recaptured researchand development tax credit and the special additional tax debit on life insurance corporations.
Instalments andrefundable credits
Surtax
Net incomeTaxable income% AllocationAttributed taxable income
*
For taxation years ending after December 31, 2008, the Balance due/Refund is included in the federal Balance due/refund.**
79,636183,196135,630
153,924
153,924
153,924
153,924
135,087
135,087
135,087543
179,217
179,217
179,2173,979
3,979
3,979
77,027
77,904
77,9041,732
877
1,392,884 1,236,578 1,655,243 -673,530 728,8581,338,469 1,179,387 1,593,006 692,489
100.00 100.00 100.00 100.00 100.001,338,469 1,179,387 1,593,006 692,489

82249 4290 RC 000182249 4290 RC 0001
Tax Year End: 2017-12-312017-12-31
Name: Algoma Power Inc.Algoma Power Inc.
BN:
T2 BAR CODE RETURN
Tax Year Start: 2017-01-012017-01-01
Version 2018 v.1.0 EP29 Page 1
1. Basis of accounting and summary of significant accounting policies
Incorporation
Algoma Power Inc. ("API" or the "Company") is engaged in the distribution of
electricity to the area adjacent to Sault Ste. Marie, Ontario and is subject
to the regulations of the Ontario Energy Board ("OEB").
API operated as a division of Great Lakes Power Limited ("GLPL") from January
1, 2009 to June 30, 2009. In order to comply with Section 71 of OEB regulatory
requirements, GLPL split out its distribution division by creating a separate
legal entity called Great Lakes Power Distribution Inc. ("GLPDI"). This entity
began operating as a separate legal entity effective July 1, 2009. On October
8, 2009, there was a change of control as Fortis Ontario Inc.
(the "Parent") acquired 100% of the shares of GLPDI and changed the name to
Algoma Power Inc.
(a) Basis of accounting
These financial statements have been prepared in accordance with the
accounting standards for private enterprises ("ASPE"), as per Part II of the
CPA Handbook - Accounting, which constitutes generally accepted accounting
principles for non-publicly accountable enterprises in Canada.
(b) Significant accounting policies Regulation
The distribution rates of API are based upon cost-of-service rate regulation
by the OEB. Earnings are regulated on the basis of a rate of return on rate
base plus a recovery of all allowable distribution costs of API.
API is subject to Ontario Regulation 335/07, which is the Rural and Remote
Rate Protection subsidy program ("RRRP"). The RRRP is calculated as the
deficiency between the approved revenue requirement from the OEB and current
customer distribution rates adjusted for the average rate increase across the
Province of Ontario. API qualifies for this subsidy because it has less than

82249 4290 RC 000182249 4290 RC 0001
Tax Year End: 2017-12-312017-12-31
Name: Algoma Power Inc.Algoma Power Inc.
BN:
T2 BAR CODE RETURN
Tax Year Start: 2017-01-012017-01-01
Version 2018 v.1.0 EP29 Page 2
seven customers per kilometre and a service area that extends beyond 10,000
kilometres. All general service and large customer classes have been
reclassified as residential class under Ontario Regulation 445/07.
On August 14, 2015, API filed an application with the OEB seeking approval to
change electricity distribution rates, effective January 1, 2016, based on
4GIRM. The OEB calculated the value of the inflation factor for incentive rate
setting, for rate changes effective in 2016, to be 2.1%. The OEB assigned a
stretch factor of 0.6% based on the updated benchmarking study for use for
rates effective in 2016. The resulting net price cap index adjustment for API
was 1.5% (i.e. 2.1% - (0% + 0.6%)). The 1.5% adjustment applies to
distribution rates [fixed and variable charges] uniformly for the Seasonal and
Street Lighting customer classes. The OEB approved the application of the 1.8%
RRRP adjustment factor to the distribution rates for the Residential R-1 and
Residential R-2 classes. The OEB found that the amount of RRRP of $13,678 for
the year commencing January 1, 2016 accurately reflected the OEB's findings
pursuant to the applicable regulations and approved a monthly payment of
$1,140 effective January 1, 2016.
1. Basis of accounting and summary of significant accounting policies
(continued)
(b) Significant accounting policies (continued) Regulation (continued)
Beginning with electricity distribution rates effective in 2016, decoupling of
electricity distribution rates for the Residential customer class was being
introduced; complete decoupling is expected to take eight consecutive years
for residential customers and ten years for seasonal customers to fully
implement.

82249 4290 RC 000182249 4290 RC 0001
Tax Year End: 2017-12-312017-12-31
Name: Algoma Power Inc.Algoma Power Inc.
BN:
T2 BAR CODE RETURN
Tax Year Start: 2017-01-012017-01-01
Version 2018 v.1.0 EP29 Page 3
On August 12, 2016, API filed an application with the OEB seeking approval to
change electricity distribution rates, effective January 1, 2017, based on
4GIRM. On
October 27, 2016, the OEB updated its inflation factor for 2017 Price Cap IR
applications, and subsequently provided API with a calculation of the RRRP
rate adjustment applicable to API's Residential customer classes. The net
price cap index adjustments for API was updated to be 1.3% (i.e. 1.9% - (0% +
0.6%)). This was based on a province-wide inflation factor of 1.9%, less
productivity factor of 0% and stretch factor of 0.6%. The assignment of the
stretch factors was determined by the OEB as a result of updates to its
benchmarking analysis research. The rate increase applicable to Residential
classes, based on the OEB's RRRP calculation is 2.96%. The OEB found that the
amount of RRRP of $13,499 for the year commencing January 1, 2017 accurately
reflects the OEB's findings pursuant to the applicable regulations and
approved a monthly payment of $1,125 effective January 1, 2017.
On August 14, 2017, API filed an application with the OEB seeking approval to
change electricity distribution rates, effective January 1, 2018, based on
4GIRM. The application includes Residential decoupling calculations in
accordance with the
Board's Policy for transition to fully fixed rates. For the application, a
stretch factor of 0.60% was approved based on the updated benchmarking study
for rates effective in 2018. As a result, the net price cap index adjustment
for API was 0.6% (i.e. 1.2% - (0% + 0.6%)). The 0.6% adjustment will be
applied to distribution rates for the Seasonal and Street Lighting customer
classes, following other adjustments to reflect changes in cost allocation
between classes resulting from the settlement agreement in API's 2015 Cost of
Service application. A Rural and RRRP adjustment factor of 2.52% will be
applied to the distribution rates for the Residential R-1 and Residential R-2
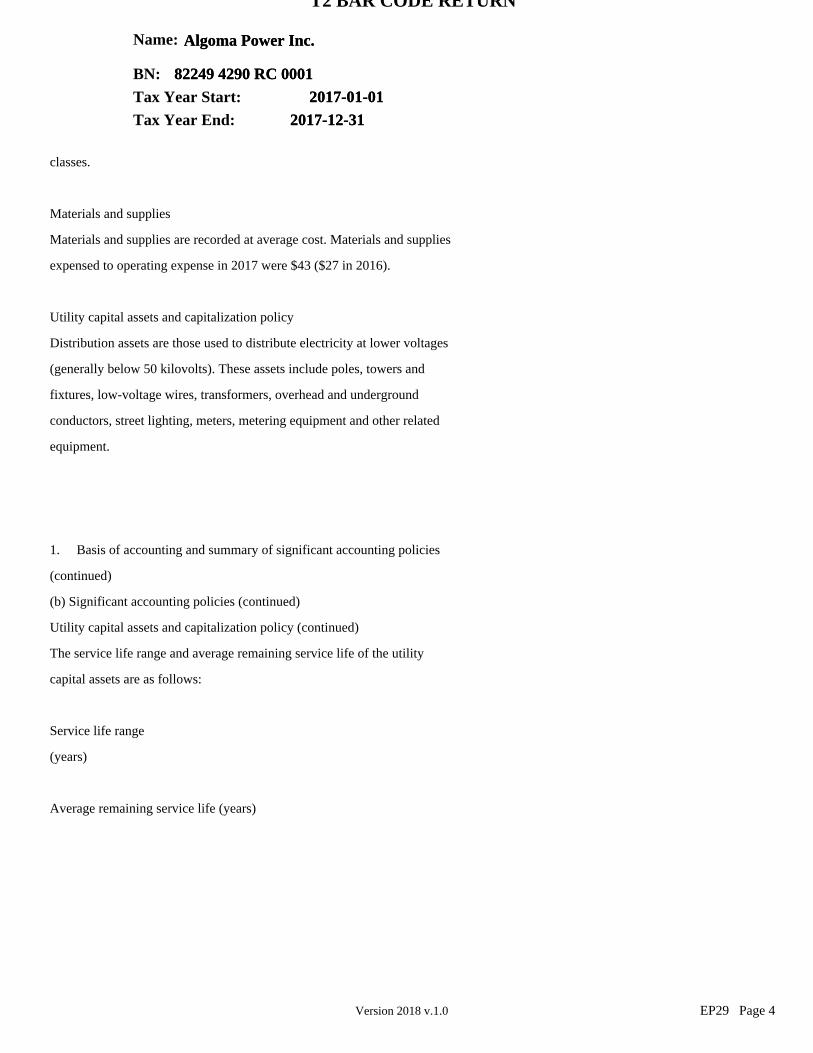
82249 4290 RC 000182249 4290 RC 0001
Tax Year End: 2017-12-312017-12-31
Name: Algoma Power Inc.Algoma Power Inc.
BN:
T2 BAR CODE RETURN
Tax Year Start: 2017-01-012017-01-01
Version 2018 v.1.0 EP29 Page 4
classes.
Materials and supplies
Materials and supplies are recorded at average cost. Materials and supplies
expensed to operating expense in 2017 were $43 ($27 in 2016).
Utility capital assets and capitalization policy
Distribution assets are those used to distribute electricity at lower voltages
(generally below 50 kilovolts). These assets include poles, towers and
fixtures, low-voltage wires, transformers, overhead and underground
conductors, street lighting, meters, metering equipment and other related
equipment.
1. Basis of accounting and summary of significant accounting policies
(continued)
(b) Significant accounting policies (continued)
Utility capital assets and capitalization policy (continued)
The service life range and average remaining service life of the utility
capital assets are as follows:
Service life range
(years)
Average remaining service life (years)

82249 4290 RC 000182249 4290 RC 0001
Tax Year End: 2017-12-312017-12-31
Name: Algoma Power Inc.Algoma Power Inc.
BN:
T2 BAR CODE RETURN
Tax Year Start: 2017-01-012017-01-01
Version 2018 v.1.0 EP29 Page 5
Distribution 10 to 50 37.3
Other 5 to 20 6.1
Utility capital assets are stated at cost less accumulated amortization.
Amortization is provided over the estimated useful lives of the utility
capital assets using the
straight-line method at a composite rate 2.10% (2.08% in 2016)
Contributions in aid of construction represent funding of utility capital
assets contributed by customers. These accounts are being reduced annually by
an amount equal to the charge for amortization provided on the contributed
portion of the assets involved.
Capitalization policy
The Company's capitalization policy is in accordance with the OEB's
requirements to use a "modified IFRS" accounting basis. API, as permitted by
the OEB, has recognized the financial differences arising as a result of the
2013 accounting changes to amortization expense and capitalization policies
(Note 14).
Intangible assets
Intangible assets are stated at cost less accumulated amortization.
Amortization is provided over the estimated useful lives of the intangible
assets using the straight-line method.
The service life range and average remaining service life of the intangible
assets are as follows:
Service life range (years)

82249 4290 RC 000182249 4290 RC 0001
Tax Year End: 2017-12-312017-12-31
Name: Algoma Power Inc.Algoma Power Inc.
BN:
T2 BAR CODE RETURN
Tax Year Start: 2017-01-012017-01-01
Version 2018 v.1.0 EP29 Page 6
Average remaining service life (years)
Software costs 5 to 10 4.8
Land rights and other 40 to 50 29.7
Asset retirement obligations
ASPE requires the recognition of an asset retirement obligation in the period
during which a legal obligation associated with the retirement of a tangible
long-lived asset is incurred and when a reasonable estimate of this amount can
be made.
The Company has determined that there are asset retirement obligations
associated with some parts of its distribution systems; however, none of these
are material requiring recognition under Section 3110 of the CPA Handbook.
1. Basis of accounting and summary of significant accounting policies
(continued)
(b) Significant accounting policies (continued) Revenue recognition
Revenue from the distribution of electricity is recognized on the accrual
basis. Electricity is metered upon delivery to customers and is recognized as
revenue using approved rates when consumed. Meters are read periodically and
bills are issued to customers based on these readings. At the end of the year,
a certain amount of consumed electricity will not have been billed.
Electricity that is consumed but not yet billed to the customers is estimated
and accrued as revenue in the current year.
Unbilled revenue included in accounts receivable as at December 31, 2017 is

82249 4290 RC 000182249 4290 RC 0001
Tax Year End: 2017-12-312017-12-31
Name: Algoma Power Inc.Algoma Power Inc.
BN:
T2 BAR CODE RETURN
Tax Year Start: 2017-01-012017-01-01
Version 2018 v.1.0 EP29 Page 7
$2,857 ($3,337 in 2016).
Foreign currency translation
Monetary assets and liabilities denominated in foreign currencies are
translated into Canadian dollars at the exchange rate prevailing on the
balance sheet date. Gains and losses on translation are included in the
statement of earnings. Revenue and expenses denominated in foreign currencies
are translated into Canadian dollars at the exchange rate prevailing on the
transaction date.
Employee benefit plans
Effective January 1, 2014, the Company has adopted new CPA Handbook
Section 3462, Employee Future Benefits, for its accounting of pension benefits
and other retirement benefits. As allowed under new Section 3462, the Company
has made an accounting policy choice to measure its defined benefit plan
obligations using the funding valuation approach. This approach uses the most
recent completed actuarial valuations prepared for funding purposes as the
basis of measuring defined benefit plan obligations. Even though other
retirement benefits are not funded, Section 3462 requires that such
liabilities can be measured on a basis consistent with funded plans. As well,
the Company is using a roll-forward technique in the years between valuations
to estimate the defined benefit obligations. Pension plan assets are valued at
fair value as of the balance sheet date.
The Company made an application to the OEB to continue to account for pension
and other retirement benefits under the former Section 3461. In December 2013,
the OEB issued a Decision and Order approving the establishment of specific
variance accounts as of January 1, 2013 to recognize the difference in expense
between Sections 3461 and 3462 as long-term regulatory assets or liabilities

82249 4290 RC 000182249 4290 RC 0001
Tax Year End: 2017-12-312017-12-31
Name: Algoma Power Inc.Algoma Power Inc.
BN:
T2 BAR CODE RETURN
Tax Year Start: 2017-01-012017-01-01
Version 2018 v.1.0 EP29 Page 8
for 2013 and future years, which will be disposed of in future cost of service
proceedings, subject to the OEB's prudence review at that time
Income taxes
The Company follows the asset and liability method of accounting for income
taxes. Under this method, future income tax assets and liabilities are
recognized for temporary differences between the tax and accounting bases of
assets and liabilities. Future tax assets and liabilities are measured using
the enacted and the substantively enacted tax rates expected to apply to
taxable income in the period in which temporary differences are expected to be
recovered or settled. The Company recognizes regulatory assets and liabilities
related to future income tax liabilities and assets for the amount of future
income taxes expected to be recovered from customers in future electricity
rates.
1. Basis of accounting and summary of significant accounting policies
(continued)
(b) Significant accounting policies (continued) Use of estimates
The preparation of financial statements in conformity with ASPE requires
management to make estimates and assumptions that affect the reported amounts
of assets and liabilities and disclosure of contingent assets and liabilities
at the date of the financial statements and the reported amounts of revenue
and expenses during the reporting period. Actual results may vary from the
current estimates. These estimates are reviewed periodically and, as
adjustments become necessary, they are reported in earnings in the period in
which they become known.

82249 4290 RC 000182249 4290 RC 0001
Tax Year End: 2017-12-312017-12-31
Name: Algoma Power Inc.Algoma Power Inc.
BN:
T2 BAR CODE RETURN
Tax Year Start: 2017-01-012017-01-01
Version 2018 v.1.0 EP29 Page 9
2. Utility capital assets
Utility capital assets consist of the following:
2017
Cost Accumulated
amortization Net book
value
Distribution Other $
141,863
11,104 $
55,326
6,914 $
86,537
4,190
152,967 62,240 90,727
2016
Cost Accumulated
amortization Net book

82249 4290 RC 000182249 4290 RC 0001
Tax Year End: 2017-12-312017-12-31
Name: Algoma Power Inc.Algoma Power Inc.
BN:
T2 BAR CODE RETURN
Tax Year Start: 2017-01-012017-01-01
Version 2018 v.1.0 EP29 Page 10
value
$ $ $
Distribution 136,070 53,392 82,678
Other 10,375 6,452 3,923
146,445 59,844 86,601
The amounts above include assets under construction, which are not subject to
amortization, of
$2,011 ($1,751 in 2016).
3. Intangible assets
Intangible assets consist of the following:
Land rights and right of ways Software costs
3. Intangible assets (continued)
2016
Cost Accumulated
amortization Net book
value
82249 4290 RC 000182249 4290 RC 0001
Tax Year End: 2017-12-312017-12-31
Name: Algoma Power Inc.Algoma Power Inc.
BN:
T2 BAR CODE RETURN
Tax Year Start: 2017-01-012017-01-01
Version 2018 v.1.0 EP29 Page 11
$ $ $
Land rights and right of ways 20,847 4,602 16,245
Softw are costs 2,801 1,610 1,191
23,648 6,212 17,436
4. Employee future benefits
The Company maintains a defined benefit pension plan and a defined
contribution pension plan providing pension benefits, and defined benefit
plans providing other retirement benefits.
Information about API's benefit plans is as follows:
Pension benefit plans Other retirement plans
Accrued benefit obligation Balance, beginning of year
Current service costs Finance costs Employee contributions Benefits paid
Actuarial (gains) losses Balance, end of year
Plan assets
Fair value, beginning of year Interest income
Return on plan assets Contributions Benefits paid
Fair value, end of year
Funded status - plan surplus (deficit)
The measurement date for the plan assets and the accrued benefit obligation
was as at December 31, 2017. The effective date of the most recent actuarial
82249 4290 RC 000182249 4290 RC 0001
Tax Year End: 2017-12-312017-12-31
Name: Algoma Power Inc.Algoma Power Inc.
BN:
T2 BAR CODE RETURN
Tax Year Start: 2017-01-012017-01-01
Version 2018 v.1.0 EP29 Page 12
valuation was as at December 31, 2014 and the date of the next required
valuation for funding purposes is as at December 31, 2017, and will be
completed by September 2018.
4. Employee future benefits (continued)
The plan assets held at the measurement date are represented by the following
categories:
Canadian equity funds Foreign equity funds Canadian fixed income funds
As at December 31, 2017, one of the defined benefit pension plans had a net
accrued benefit liability of $321 ($350 in 2016). This plan had no plan assets
in 2017 or 2016.
Pension benefit plans Other retirement plans
Significant assumptions used Discount rate, beginning of year Discount rate,
end of year
Rate of compensation increase Initial health care trend rate Average remaining
service of
active employees (years)
Net benefit expense for the year Current service costs
Finance costs Remeasurement costs Regulatory adjustments
82249 4290 RC 000182249 4290 RC 0001
Tax Year End: 2017-12-312017-12-31
Name: Algoma Power Inc.Algoma Power Inc.
BN:
T2 BAR CODE RETURN
Tax Year Start: 2017-01-012017-01-01
Version 2018 v.1.0 EP29 Page 13
Net benefit expense
The total expense for the Company's defined contribution pension plan for the
year amounted to
$113 ($122 in 2016).
5. Income taxes
The provision for income taxes consists of the following:
Current income taxes Future income taxes
Future income taxes transferred to regulatory assets
During the year, the Company recorded $843 in regulatory assets and a
corresponding decrease to future income tax expense, for the amount of future
income taxes expected to be collected from customers in future electricity
rates.
5. Income taxes (continued)
Future tax assets (liabilities) are comprised of the following:

82249 4290 RC 000182249 4290 RC 0001
Tax Year End: 2017-12-312017-12-31
Name: Algoma Power Inc.Algoma Power Inc.
BN:
T2 BAR CODE RETURN
Tax Year Start: 2017-01-012017-01-01
Version 2018 v.1.0 EP29 Page 14
Future tax assets (liabilities) Utility capital assets Employee future
benefits Rate mitigation accrual Regulatory assets
Other assets
Net future tax liabilities
6. Related party transactions
During the year, the Company entered into transactions with related parties
summarized as follows:
Dividends paid to FortisOntario Inc. Interest paid to FortisOntario Inc.
Management fees paid to FortisOntario Inc.
Reimbursement for expenses paid on behalf of and services provided to
FortisOntario Inc.
Administrative service fees from Canadian Niagara Power Inc.
Reimbursement for expenses paid on behalf of and services provided by Canadian
Niagara Power Inc.
Reimbursement for expenses paid on behalf of and services provided by
FortisOntario Inc.
Reimbursement for expenses paid on behalf of and services provided by Cornwall
Street Railway,
Light and Power Company Limited.
These transactions are in the normal course of operations and are measured at
the exchange amount, which is the amount of consideration established and
agreed to by the related parties.

82249 4290 RC 000182249 4290 RC 0001
Tax Year End: 2017-12-312017-12-31
Name: Algoma Power Inc.Algoma Power Inc.
BN:
T2 BAR CODE RETURN
Tax Year Start: 2017-01-012017-01-01
Version 2018 v.1.0 EP29 Page 15
As at December 31, the amounts due from related parties are summarized as
follows:
FortisOntario Inc.
6. Related party transactions (continued)
Details of relationships with related parties are as follows:
" FortisOntario Inc. owns a 100% interest in the capital stock of the
Company
" Cornwall Street Railway, Light and Power Company Limited is a wholly
owned subsidiary of FortisOntario Inc.
" Canadian Niagara Power Inc. is a wholly owned subsidiary of
FortisOntario Inc.
7. Long-term debt
Long-term debt consists of the following:
5.118% senior unsecured notes due on December 16, 2041
Unamortized debt issue costs
82249 4290 RC 000182249 4290 RC 0001
Tax Year End: 2017-12-312017-12-31
Name: Algoma Power Inc.Algoma Power Inc.
BN:
T2 BAR CODE RETURN
Tax Year Start: 2017-01-012017-01-01
Version 2018 v.1.0 EP29 Page 16
The senior unsecured notes bear interest at 5.118% and are repayable at
maturity on December 16, 2041. The senior unsecured notes were issued on
December 16, 2011 and interest is payable semi-annually. Interest expense for
the year amounted to $2,661 ($2,661 in 2016).
8. Capital stock
The authorized and issued shares consist of 90,831,810 common shares without
par value.
9. Amortization
Amortization consists of the following:
Amortization of utility capital assets Amortization of intangible assets
Amortization of contributions in aid of construction Vehicle amortization
allocated
10. Statement of cash flows
The net change in non-cash working capital balances related to operations
consists of the following:

82249 4290 RC 000182249 4290 RC 0001
Tax Year End: 2017-12-312017-12-31
Name: Algoma Power Inc.Algoma Power Inc.
BN:
T2 BAR CODE RETURN
Tax Year Start: 2017-01-012017-01-01
Version 2018 v.1.0 EP29 Page 17
Accounts receivable Income taxes receivable Materials and supplies Regulatory
assets/ liabilities Prepaid expenses
Due to/from related parties
Accounts payable and accrued liabilities
Supplemental cash flow information:
Interest paid Income taxes paid
The restricted cash is a deposit held by the Ministry of Environment for a
Certificate of Approval.
11. Commitments and contingencies
API has a building lease agreement with Hydro One Sault Ste Marie LLP until
December 31, 2019 with annual rent, operating costs and municipal taxes of
$600.
12. Financial risk management
The Company is primarily exposed to credit risk, liquidity risk and market
risk as a result of holding financial instruments in the normal course of
business.
Credit risk - Risk that a third party to a financial instrument might fail to
meet its obligations under the terms of the financial instrument.

82249 4290 RC 000182249 4290 RC 0001
Tax Year End: 2017-12-312017-12-31
Name: Algoma Power Inc.Algoma Power Inc.
BN:
T2 BAR CODE RETURN
Tax Year Start: 2017-01-012017-01-01
Version 2018 v.1.0 EP29 Page 18
Liquidity risk - Risk that an entity will encounter difficulty in raising
funds to meet commitments associated with financial instruments.
Market risk - Risk that the fair value or future cash flows of a financial
instrument will fluctuate due to changes in market prices.
Credit risk
For cash and accounts receivable due from customers, API's credit risk is
limited to the carrying value on the balance sheet.
API is exposed to credit risk from its distribution customers but has various
policies to minimize this risk. These policies include requiring customer
deposits, performing disconnections and using third-party collection agencies
for overdue accounts. API has a large and diversified distribution customer
base which minimizes the concentration of credit risk.
12. Financial risk management (continued)
The aging of the Company's trade and other receivables due from customers is
as follows:
Not past due
Past due 0-30 days Past due 31-60 days
Past due 61 days and over
Less allowance for doubtful accounts

82249 4290 RC 000182249 4290 RC 0001
Tax Year End: 2017-12-312017-12-31
Name: Algoma Power Inc.Algoma Power Inc.
BN:
T2 BAR CODE RETURN
Tax Year Start: 2017-01-012017-01-01
Version 2018 v.1.0 EP29 Page 19
Liquidity risk
Liquidity risk to API is minimized since the financing of regulated capital
and other expenditures is done through internally generated funds. These funds
are a result of allowable rate regulated returns and recoveries under the OEB
rate regulations mechanism.
API is a subsidiary of the Parent, which is a wholly owned 100% by Fortis
Inc., a large investor owned utility, which has had the ability to raise
sufficient and cost-effective financing. However, the ability to arrange
financing on a go-forward basis is subject to numerous factors, including the
results of operations and financial position of Fortis Inc. and its
subsidiaries, conditions in the capital and bank credit markets, ratings
assigned by rating agencies and general economic conditions.
To mitigate any liquidity risk, the Company is a party to a committed
revolving credit facility and letters of credit facilities totaling $40,000,
of which $18,700 is unused. This credit agreement is shared among the
subsidiaries of the Parent and is renewed on an annual basis.
The facility is guaranteed by the Parent company and bear interest at the
bankers' acceptance rate plus 1.20% in the case of bankers' acceptances and at
the bank's prime lending rate plus 0.20% in the case of bank loans.
The following is an analysis of the contractual maturities of the Company's
financial liabilities as at December 31, 2017:
Accounts payable and accrued liabilities
Government remittances payable
Customer deposits Long-term debt

82249 4290 RC 000182249 4290 RC 0001
Tax Year End: 2017-12-312017-12-31
Name: Algoma Power Inc.Algoma Power Inc.
BN:
T2 BAR CODE RETURN
Tax Year Start: 2017-01-012017-01-01
Version 2018 v.1.0 EP29 Page 20
Interest rate risk
Long-term debt is at fixed interest rates thereby minimizing cash flow and
interest rate fluctuation exposure. The Company is primarily subject to risks
associated with fluctuating interest rates on its short-term borrowings. Short
-term borrowings for 2017 and 2016 are nil.
13. Capital management
API manages its capital to approximate the deemed capital structure reflected
in the utility's customer rates or anticipated future rates. API's
distribution rates effective on January 1, 2015 are based on a deemed capital
structure of 60% debt and 40% equity. API's capital structure consists of
third-party debt and common equity, but excludes unamortized debt issue costs.
The managed capital is as follows:
Debt Equity
14. Regulatory assets and liabilities
Regulatory liabilities net of regulatory assets arise as a result of
regulatory requirements.
The Company pays the cost of power on behalf of its customers and recovers
these costs through retail billings to its customers. The cost of power
82249 4290 RC 000182249 4290 RC 0001
Tax Year End: 2017-12-312017-12-31
Name: Algoma Power Inc.Algoma Power Inc.
BN:
T2 BAR CODE RETURN
Tax Year Start: 2017-01-012017-01-01
Version 2018 v.1.0 EP29 Page 21
includes charges for transmission, wholesale market operations and the power
itself from Ontario's Independent Electricity System Operator. The balance of
the retail settlement variance account represents the costs that have not been
recovered from, or settled through, customers as of the balance sheet date.
The OEB's Distribution Rate Handbook and Accounting Procedures Handbook allow
these costs to be deferred and recovered through future rate adjustments as
discussed in note 1. In the absence of rate regulation, these costs would be
expensed in the period they are incurred.
The OEB has the general power to include or exclude costs, revenues, gains or
losses in the rates of a specific period, resulting in the timing of revenue
and expense recognition that may differ in the Company's regulated operations
from those otherwise expected in non-regulated businesses. This change in
timing gives rise to the recognition of regulatory assets and liabilities. The
Company continually assesses the likelihood of recovery of its regulatory
assets and believes that its regulatory assets and liabilities will be
factored into the setting of future rates as discussed in note 1. If future
recovery through rates is no longer considered probable, the appropriate
carrying amount will be written off in the period that the assessment is made.
As of December 31, 2015, as discussed in note 1 under "Utility capital assets
and capitalization policy", API had a regulatory liability in OEB account 1576
of $1,128. These were transitional adjustments related to accounting changes
to amortization and capitalization policy. As a result of the 2015 OEB
Decision and Order, API recorded an additional regulatory liability of $93 in
2017, relating to the regulatory return calculated on the approved cumulative
regulatory liability of $1,379. A reduction of the regulatory liability of
$376 occurred during 2017 due to a repayment to API's customers in the form of
a rate rider, which is set to expire in December 2019. The cumulative
regulatory liability balance as at December 31, 2017 was $560, of which

82249 4290 RC 000182249 4290 RC 0001
Tax Year End: 2017-12-312017-12-31
Name: Algoma Power Inc.Algoma Power Inc.
BN:
T2 BAR CODE RETURN
Tax Year Start: 2017-01-012017-01-01
Version 2018 v.1.0 EP29 Page 22
$385 has been reported as current.
14. Regulatory assets and liabilities (continued)
API recorded the following regulatory assets and liabilities as at December
31:
Current regulatory assets
Amounts approved in current rates
Long-term regulatory assets Amounts approved in current rates
Retail settlement and other variance accounts Future taxes to be recovered
from customers Pension and other retirement benefits
Current regulatory liabilities Transitional accounting adjustments
Long-term regulatory liabilities
Retail settlement and other variance accounts Transitional accounting
adjustments

Appendix 4G
Algoma Power Inc.
2020 Cost of Service
EB-2019-0019

June 29, 2018
To: Ontario’s Local Distribution Companies
At the mid-way point of the Conservation First Framework (CFF) Ontario’s Local Distribution Companies (LDCs) along with the IESO have shown significant progress towards the 2020 CFF 7.0 TWh target. The province has achieved 1.8 TWh of persisting energy savings in 2017, the highest performing year on record. Approximately 20% ($364M) of the allocated $1.835B CFF LDC Conservation Demand Management (CDM) budget was accounted for in 2017. From 2015, LDCs have achieved 4.8 TWh of energy savings, representing 69% of the CFF 7.0 TWh target. The savings realized to date demonstrate the significant efforts made by LDCs and the IESO in delivering and promoting conservation programs across the province.
Key highlights from the 2017 results include:
• The share of residential portfolio savings increased for the third consecutive year, accounting for 46% of 2017 results, while the business portfolio program contributed to 45%, and local/pilot/centrally delivered programs accounting for 9% of 2017 savings.
• The Coupon & Instant Discount residential retail program produced a record achievement of 740 GWh of persisting energy savings, increasing by over 53% of the results from 2016. LED light bulbs remained the most common measure accounting 91% of savings.
• The Retrofit program achieved 663 GWh of persisting energy savings in 2017, which represents a small reduction in savings despite completing approximately half the number projects compared to 2016 results (including adjustments). Lighting continues to represent the majority of results, representing 79% of savings in 2017.
• The Process and Systems Upgrades Program achieved 15 GWh in 2017, but also verified an additional 65 GWh in 2016 completed projects and 11 GWh in 2015 completed projects as part of this year’s evaluation. Behind-the-meter generation projects account for 82% of program savings-to-date.
o The data lag associated with unreported (yet completed) 2017 projects for the Retrofit and Process and Systems Upgrade programs remain an ongoing challenge. Together with the Heating & Cooling program, these programs have approximately 723 GWh in unverified savings yet to be reported by LDCs for which is anticipated to be reported a future verified annual results reports as 2017 adjustments.
Minor revisions were made to the final 2017 results relative to the preliminary 2017 results issued to LDCs on June 1, 2018. Details on the revisions between the 2017 preliminary and final verified results can be found in the 2017 Frequently Asked Questions (FAQs) along with key 2017 evaluation findings and province-wide and local program cost effectiveness test results posted alongside LDC results.
Consistent with prior year evaluation cycles, all 2017 final verified annual results reports will be posted on the IESO website in early July. LDC-specific cost effectiveness test results (program- and portfolio-level) will be available by September 15, 2017. Finally, 2017 EM&V reports will be available later this summer along with key program recommendations to be shared with the Joint Program Operations Committee (JPOC) and associated committees.
I look forward to the continued collaboration with LDCs and stakeholders building off lessons learned and implementing feedback from the mid-term review process to enhance current programs and future efforts.
Sincerely,
Terry YoungVice-President, Policy, Engagement & InnovationIndependent Electricity System Operator
2017 Final Verified Annual LDC CDM Program Results ReportLetter from the Vice-President, Policy, Engagement & Innovation

# Worksheet Name Worksheet Description
1 How to Use This Report Describes the contents and structure of this report
2 Report Summary
A high level summary of the Final 2017 Annual Verified Results Report, including:1) progress toward the LDC's: a) Allocated 2020 Annual Energy Savings Target; b) Allocated 2015-2020 LDC CDM Plan Budget; c) CDM Plan 2015-2020 Forecasts;3) annual savings and spending; 4) Annual FCR Progress;5) annual LDC CDM Plan spending progress; 6) graphs describing: a) contribution to 2020 Target Achievement by program; b) 2017 LDC CDM Plan Budget Spending by Sector; c) annual energy savings persistence to 2020 by year; d) your Allocated Target achievement progress relative to your peers; and e) your LDC CDM Plan Budget Spending progress relative to your peers;
3 LDC RankingsA comprehensive report of each LDC's performance rankings against all other LDCs in major performance categories.
4 LDC Progress
A comprehensive report of 2017 conservation results including:1) activity;2) savings including; a) energy and peak demand; b) net and gross; c) CDM Plan forecasts, verified actuals and relative progress; d) Allocated Target and Target acheivement; and3) spending, including participant incentives and administrative expenses and IESO Value Added Services Costs.
Data is grouped by category and summarized at the LDC level.
5 Province-Wide Progress
A comprehensive report of 2016 conservation results including:1) activity;2) savings including; a) energy and peak demand; b) net and gross; c) CDM Plan forecasts, verified actuals and relative progress; d) Allocated Target and Target acheivement; and3) spending, including participant incentives and administrative expenses and IESO Value Added Services Costs.
Data is grouped by category and summarized at the province wide level.
6 LDC Savings PersistenceA report detailing the gross and net energy and peak demand savings persistence by program and implementation year (2015, 2015 Adjustment, 2016, 2016 Adjustment and 2017) at the LDC Level.
7 Province-Wide Savings PersistenceA report detailing the gross and net energy and peak demand savings persistence by program and implementation year (2015, 2015 Adjustment, 2016, 2016 Adjustment and 2017) at the province wide Level.
8 Methodology A description of the methods used to calculate energy savings, financial results and cost-effectiveness.
9 Reference Table Provides detailing how Province wide Consumer Program results were allocated to specific LDCs.
10 Glossary Definitions for the terms used throughout this report.
2017 Final Verified Annual LDC CDM Program Results ReportTable of Contents

The IESO is pleased to provide you with the 2017 Final Verified Annual LDC CDM Program Results Report.
This report provides: 1) electricity savings; 2) annual Full Cost Recovery funding model program progress; and 3) peak demand savings; 4) IESO Value Added Services Costs in accordance with Section 9.2(b)(i) of the Energy Conservation Agreement.
In addition to the above, this report also provides in greater detail: 1) program participation results including: a) forecasts; b) actuals; and c) progress (forecast versus (vs) actuals);
2) program savings results including: a) net 2020 annual energy and peak demand savings; b) allocated target, target achievement and progress towards target; c) incremental net first year energy and peak demand savings; d) annual net-to-gross and realization rate adjustments; and e) incremental gross first year energy and peak demand savings; and where available reported by: i) forecasts; ii) verified actuals; and iii) progress (forecast vs actuals);
3) program spending including: a) participation incentive spending; b) administrative expense spending (including IESO value-added services costs); c) aggregated total spending; and d) allocated budget, LDC CDM Plan budget spending and progress towards budget; and for each cost: i) forecasts; ii) verified actuals; and iii) progress (forecast vs actuals);
4) program savings results persistence for: a) gross energy savings; b) gross peak demand savings; c) net energy savings; and d) net peak demand savings;
by both the LDC specific level and the province-wide aggregated level for 2017, 2016 including adjustments, and 2015 including adjustments.
This report's format is consistent with the IESO issued Monthly Participation and Cost Report in that it is a dynamic sheet that can be expanded or collapsed by clicking the + button or "Show Detail" feature under the Data tab. Each of the four results categories listed above have been grouped together for easy accessibility.
Please note: 1) Cost Effectiveness Test (CET) results at the: a) province-wide / program level is available and posted separately on LDC Extranet; b) LDC / program level will be available on the LDC Extranet by September 15, 2018; as per the Energy Conservation Agreement, version 3.0;
2) forecasts of: a) activity; b) savings; and c) spending; included in this report are based on approved LDC CDM Plan - Cost Effectiveness Tools as of December 31, 2017 (from the i) Program Design; ii) Budget Inputs; and iii) Savings Results worksheets);
3) Annual FCR Progress only includes Full Cost Recovery funding model program savings results and excludes Pay-for-Performance funding model program savings results;
4) The complete list of approved programs and pilots as of December 31, 2017 approved LDC CDM Plans have been included, however only programs and pilots in market for a sufficient period of time to enable a valid EM&V process will have verified results;
5) 2017 Verified Adjustments to prior years consists of projects completed in the associated year but were not reported to the IESO by previous year's reporting deadlines (March 31, 2016 and April 15, 2017);
6) Pilot program savings are attributed to the LDC where the pilot program project is located in; and
7) This Annual Verified Results Report provides results for the LDC and province only. No aggregated reporting is provided for LDCs that are part of a joint CDM plan;
2017 Final Verified Annual LDC CDM Program Results ReportHow to Use this Report

For: Algoma Power Inc.
Results
# Metric 2015Verified Results
2016Verified Results
2017Verified Results
2015-2017Verified Results
AllocatedTarget / Budget
2015-2017Progress versus
AllocatedTarget / Budget
2015-2020LDC CDM Plan
Forecast
2015-2017Progress versus
2015-2020LDC CDM Plan
Forecast
2017LDC CDM Plan
Forecast
2017Progress versus
2017LDC CDM Plan
Forecast
2015-2017LDC CDM Plan
Forecast
2015-2017Progress versus
2015-2017LDC CDM Plan
Forecast
1 Net Verified Annual Energy Savings Persisting to 2020
1,077 MWh 1,428 MWh 2,232 MWh 4,737 MWh 7,510 MWh 63 % 11,809 MWh 40 % 1,439 MWh 155 % 3,364 MWh 141 %
2LDC Ranking -
Net Verified Annual Energy Savings Persisting to 2020
55 52 47 52 51 40 44 67 48 25 50 20
3 Total Spending ($) $ 99,271 $ 345,886 $ 502,660 $ 947,817 $ 2,107,963 45 % $ 2,470,412 38 % $ 432,758 116 % $ 888,411 107 %
4 LDC Ranking - Total Spending ($)
18 43 48 43 50 5 45 15 48 12 45 9
Annual FCR Progress
# Metric 2015 Program Year
2016 Program Year
2017 Program Year
Total2015-2017
Framework-to-Date
1Net Verified 2020 Annual Energy Savings from Full Cost Recovery Programs
238 MWh 1,319 MWh 2,211 MWh 3,769 MWh
216 MWh 709 MWh 1,436 MWh 2,361 MWh
(2015 Annual Milestone from FCR
Programs)
(2016 Annual Milestone from FCR
Programs)
(2017 Annual Milestone from FCR
Programs)
(Cumulative FCR Milestone)
FCR Progress 159.6 %
2CDM Plan Forecasted Net 2020 Annual Energy Savings from Full Cost Recovery Programs
2017 Final Verified Annual LDC CDM Program Results ReportSummary
57%
5%2%
10%
8%0%0%
17%1%
2017 Target Achievement
Coupons & Instant Discounts Heating & CoolingHome Assistance RetrofitSmall Business Lighting High Performance New ConstructionIndustrial Programs Local Programs & Pilot Programs
50%43%
7%
2017 Budget Spending
Residential ProgramBusiness Program
0
2,000
4,000
6,000
8,000
10,000
12,000
14,000
2015 2016 2017 2018 2019 2020
Net
Ann
ual E
nerg
y Sa
ving
s (M
Wh)
Net Verified Annual Energy Savings Persisting to 2020 by Program Year
0
2
4
6
8
10
12
14
16
Coun
t of L
DCs
Energy Savings Target Achieved
Allocated Target Achievement relative to LDC Community
Other LDCs Algoma Power Inc. Province
0
5
10
15
20
25
Coun
t of L
DCs
2015-2020 Allocated Budget Spent
Allocated Budget Spending Progress relative LDC Community
Other LDCs Algoma Power Inc. Province
45%
51%
4%
2015-2017 Budget Spending
Residential Program
Business Program
54%
6%1%
16%
12%
0%0%10% 1%
2015-2017 Target Achievement
Coupons & Instant Discounts Heating & CoolingHome Assistance RetrofitSmall Business Lighting High Performance New ConstructionIndustrial Programs Local Programs & Pilot Programs
# LDC
Value(kWh)
LDC Ranking(#)
Value(kWh)
LDC Ranking(#)
Value(kWh)
LDC Ranking(#)
Value(kWh)
LDC Ranking(#)
Value(kWh)
LDC Ranking(#)
Value(kWh)
LDC Ranking(#)
Value(kWh)
LDC Ranking(#)
Value(kWh)
LDC Ranking(#)
Value(kWh)
LDC Ranking(#)
Value(kWh)
LDC Ranking(#)
Value(%)
LDC Ranking(#)
Value(%)
LDC Ranking(#)
Value(kWh)
LDC Ranking(#)
Value(%)
LDC Ranking(#)
Value(%)
LDC Ranking(#)
Value(kWh)
LDC Ranking(#)
Value(%)
LDC Ranking(#)
Value(kWh)
LDC Ranking(#)
Value(%)
LDC Ranking(#)
Value($)
LDC Ranking(#)
Value($)
LDC Ranking(#)
Value($)
LDC Ranking(#)
Value($)
LDC Ranking(#)
Value($)
LDC Ranking(#)
Value($)
LDC Ranking(#)
Value($)
LDC Ranking(#)
Value($)
LDC Ranking(#)
Value($)
LDC Ranking(#)
Value($)
LDC Ranking(#)
Value(%)
LDC Ranking(#)
Value(%)
LDC Ranking(#)
Value($)
LDC Ranking(#)
Value(%)
LDC Ranking(#)
Value(%)
LDC Ranking(#)
Value($)
LDC Ranking(#)
Value(%)
LDC Ranking(#)
Value($)
LDC Ranking(#)
Value(%)
LDC Ranking(#)
1 Alectra Utilities Corporation 236 507 877 1 49 683 641 4 7 876 715 4 294 068 233 2 270 546 686 1 66 822 298 2 337 368 984 2 366 739 097 2 998 176 314 1 1 604 550 000 1 23 48 62 44 1 812 764 173 1 20 47 55 52 307 480 120 1 119 47 954 521 164 1 105 56 8 062 897 1 334 653 3 0 1 8 397 550 1 41 915 066 3 5 250 1 41 920 316 3 79 153 678 1 129 471 544 1 414 824 478 1 19 35 31 29 412 907 157 1 19 36 31 31 89 938 374 1 88 43 186 362 886 1 69 532 Algoma Power Inc 1 031 011 54 25 818 58 20 451 43 1 077 279 55 1 285 402 49 142 557 54 1 427 959 52 2 232 142 47 4 737 380 52 7 510 000 51 30 14 63 40 11 809 134 44 19 50 40 67 1 438 618 48 155 25 3 363 519 50 141 20 39 320 20 59 951 10 0 1 99 271 18 344 836 44 1 050 7 345 886 43 502 660 48 947 817 43 2 107 963 50 24 12 45 5 2 470 412 45 20 29 38 15 432 758 48 116 12 888 411 45 107 93 Atikokan Hydro Inc 109 769 64 2 444 66 2 898 50 115 111 64 189 357 65 26 791 65 216 148 64 369 238 63 700 497 64 1 140 000 64 32 6 61 47 1 139 736 65 32 7 61 42 284 658 63 130 38 523 606 64 134 24 0 28 0 27 0 1 0 41 50 265 63 0 24 50 265 63 78 576 66 128 841 66 311 330 64 25 10 41 9 374 401 67 21 26 34 21 95 250 66 82 50 203 831 66 63 634 Attawapiskat Power Corporation 35 822 67 2 343 67 0 54 38 165 67 0 66 151 932 52 151 932 67 81 504 67 271 601 67 510 000 67 16 62 53 57 556 816 66 15 64 49 59 85 726 67 95 56 295 070 67 92 63 0 28 0 27 0 1 0 41 0 66 0 24 0 66 396 208 51 396 208 56 148 832 67 266 2 266 2 1 846 142 51 21 23 21 63 337 342 52 117 10 724 090 50 55 665 Bluewater Power Distribution Corporation 7 755 327 18 268 687 42 104 044 29 8 128 057 27 5 570 598 25 3 159 895 15 8 730 493 24 9 473 952 24 26 332 502 24 62 370 000 17 15 64 42 65 62 370 000 17 15 62 42 64 8 620 634 19 110 52 23 460 544 24 112 51 5 119 27 0 27 0 1 5 119 39 1 340 938 23 0 24 1 340 938 23 2 482 985 18 3 829 042 21 15 838 687 18 16 57 24 62 15 838 687 18 16 58 24 60 2 661 593 20 93 33 5 245 973 19 73 496 Brantford Power Inc 7 457 011 19 1 458 523 21 394 168 19 9 309 702 23 10 499 455 16 1 578 380 27 12 077 835 18 15 051 712 17 36 439 249 18 54 320 000 19 28 21 67 33 54 880 608 20 27 20 66 32 10 927 959 15 138 31 28 688 810 17 127 31 0 28 29 000 18 0 1 29 000 28 1 564 432 19 0 24 1 564 432 19 2 377 568 19 3 971 000 20 14 048 458 19 17 49 28 42 11 591 730 21 21 27 34 22 2 702 600 18 88 44 4 938 885 20 80 417 Burlington Hydro Inc 12 632 309 15 1 975 945 18 56 494 36 14 664 748 18 11 531 861 12 8 290 897 7 19 822 758 10 27 467 720 9 61 955 226 13 99 040 000 10 28 20 63 42 99 040 000 10 28 18 63 39 18 513 596 12 148 27 46 810 503 13 132 26 118 667 15 193 116 4 0 1 311 783 10 2 472 234 9 0 24 2 472 234 9 5 813 359 9 8 597 376 9 25 825 521 10 23 19 33 23 25 825 521 8 23 21 33 24 5 293 074 11 110 17 9 973 036 9 86 328 Canadian Niagara Power Inc 3 502 396 34 5 579 808 8 7 296 45 9 089 500 24 5 553 280 26 2 368 147 18 7 921 427 26 6 976 358 32 23 987 285 27 28 480 000 29 24 38 84 13 24 194 712 33 29 13 99 5 4 095 930 32 170 17 15 083 221 32 159 12 162 334 12 58 069 11 0 1 220 403 11 1 200 961 24 1 470 5 1 202 431 24 1 657 194 27 3 080 028 25 7 355 555 30 23 18 42 8 6 952 818 31 24 14 44 6 1 609 378 31 103 23 3 031 748 29 102 129 Centre Wellington Hydro Ltd 1 581 029 50 109 971 50 -8 233 63 1 682 766 50 1 548 975 47 275 615 47 1 824 590 47 2 651 910 45 6 159 267 48 8 730 000 47 30 12 71 30 8 730 766 47 30 10 71 28 3 001 875 36 88 61 5 612 228 44 110 54 0 28 0 27 0 1 0 41 276 194 46 0 24 276 194 46 345 087 53 621 281 49 2 252 724 48 15 58 28 46 2 190 601 47 16 56 28 41 674 845 38 51 67 950 344 43 65 58
10 Chapleau Public Utilities Corporation 275 333 61 3 485 64 106 53 278 924 61 191 711 64 20 153 67 211 864 65 208 141 65 698 929 65 1 050 000 65 20 53 67 34 1 151 954 64 18 52 61 44 193 881 64 107 53 568 319 63 123 40 0 28 3 354 26 0 1 3 354 40 19 890 65 0 24 19 890 65 42 176 68 65 420 68 298 764 65 14 62 22 63 298 764 68 14 63 22 62 69 743 67 60 62 89 852 68 73 5111 COLLUS PowerStream Corp 1 637 947 48 385 929 36 -65 914 68 1 957 962 49 2 194 349 41 334 254 45 2 528 603 41 7 144 137 31 11 630 702 36 16 860 000 36 42 3 69 32 17 119 142 36 42 3 68 30 3 143 620 35 227 8 9 944 639 36 117 45 157 689 13 0 27 0 1 157 689 14 636 318 30 0 24 636 318 30 1 017 140 35 1 811 147 33 4 446 841 36 23 16 41 11 4 446 841 36 23 19 41 9 998 972 35 102 24 2 245 523 32 81 4012 Cooperative Hydro Embrun Inc 120 443 63 19 234 59 -776 58 138 901 63 730 806 54 37 973 62 768 779 55 473 278 62 1 380 958 62 1 790 000 62 26 30 77 21 1 789 996 62 26 26 77 19 297 783 62 159 24 1 087 283 62 127 32 0 28 0 27 0 1 0 41 61 223 61 0 24 61 223 61 150 562 63 211 785 63 525 743 62 29 7 40 12 525 743 65 29 6 40 12 162 798 64 92 34 220 424 65 96 1813 E L K Energy Inc 1 662 553 46 583 829 32 -6 331 62 2 240 051 44 1 963 393 45 170 870 50 2 134 263 46 2 282 262 46 6 656 576 47 16 200 000 38 14 67 41 66 16 200 009 38 14 66 41 65 1 950 353 41 117 48 5 294 907 45 126 34 0 28 0 27 0 1 0 41 435 083 39 0 24 435 083 39 623 126 42 1 058 209 41 4 273 057 38 15 60 25 59 4 273 057 37 15 61 25 58 649 882 41 96 31 1 104 658 39 96 1914 Energy+ Inc 17 245 241 10 60 025 983 3 2 174 426 9 79 445 650 4 14 252 795 9 3 201 967 14 17 454 762 12 30 417 739 8 127 318 151 5 100 950 000 9 30 13 126 3 173 121 066 6 18 53 74 24 18 899 002 11 161 22 109 978 691 5 116 49 0 28 0 27 0 1 0 41 2 916 887 8 525 12 2 917 412 8 5 659 074 10 8 576 486 10 25 873 071 9 22 22 33 24 22 281 831 11 25 11 38 14 4 525 892 13 125 8 7 408 108 13 116 415 Entegrus Powerlines Inc 38 558 192 6 3 536 019 9 46 251 39 42 140 462 7 14 186 934 10 2 296 797 20 16 483 731 13 15 073 023 16 73 697 216 11 76 830 000 14 20 54 96 8 94 307 344 13 16 60 78 17 11 953 789 14 126 41 67 764 761 9 109 55 374 365 7 60 099 9 0 1 434 464 6 2 370 550 11 0 24 2 370 550 11 2 934 527 16 5 739 541 13 18 695 867 16 16 55 31 33 17 441 107 16 17 50 33 25 3 296 925 15 89 40 6 285 797 17 91 2716 EnWin Utilities Ltd 14 809 440 12 2 675 379 13 1 566 699 12 19 051 518 13 29 365 888 6 5 610 271 9 34 976 159 6 26 944 422 12 80 972 099 10 151 300 000 7 18 58 54 56 154 881 896 7 17 56 52 56 39 325 965 5 69 67 78 738 795 7 103 58 0 28 111 618 6 0 1 111 618 17 2 430 728 10 525 12 2 431 253 10 7 626 948 6 10 169 819 7 38 421 929 7 20 30 26 51 38 421 928 7 20 33 26 49 9 868 968 6 77 53 15 959 414 6 64 6117 Erie Thames Powerlines Corporation 5 180 177 24 922 335 28 2 325 032 8 8 427 543 26 2 555 215 37 1 613 301 26 4 168 516 35 7 616 612 28 20 212 671 30 27 630 000 30 28 22 73 27 36 494 810 26 21 45 55 51 8 092 628 20 94 57 16 797 747 30 120 41 23 149 23 19 384 20 0 1 42 533 24 561 528 36 0 24 561 528 36 1 431 847 31 2 035 908 31 7 104 954 31 20 27 29 40 8 022 275 29 18 45 25 55 1 961 511 27 73 59 2 668 899 31 76 4718 Espanola Regional Hydro Distribution Corporation 502 006 58 14 537 60 -1 644 60 514 899 59 339 978 62 33 488 63 373 466 62 1 047 355 56 1 935 720 60 2 410 000 61 43 2 80 19 2 528 596 61 41 4 77 20 637 971 61 164 19 1 494 440 61 130 27 5 306 26 0 27 0 1 5 306 38 57 969 62 945 9 58 914 62 144 036 64 208 256 64 685 489 61 21 24 30 34 685 489 64 21 25 30 37 162 703 65 89 42 225 978 64 92 2619 Essex Powerlines Corporation 3 819 710 33 1 720 380 20 10 710 254 1 16 250 344 15 7 059 017 23 3 038 974 16 10 097 991 23 7 311 455 30 33 659 790 20 31 430 000 27 23 45 107 5 49 907 838 21 15 63 67 31 6 519 466 27 112 50 24 455 222 23 138 23 176 840 10 6 737 25 0 1 183 577 12 1 818 727 15 525 12 1 819 252 15 2 146 133 22 4 148 962 19 8 532 573 27 25 11 49 4 8 030 233 28 27 9 52 2 1 942 734 28 110 16 4 361 729 22 95 2120 Festival Hydro Inc 4 822 853 27 2 088 958 17 1 835 063 10 8 746 874 25 9 417 074 18 2 170 205 22 11 587 279 20 8 535 424 25 28 869 577 23 34 650 000 25 25 37 83 15 34 711 497 28 25 32 83 10 12 484 139 13 68 68 21 643 814 26 133 25 0 28 8 075 24 0 1 8 075 35 1 003 864 26 0 24 1 003 864 26 1 643 714 29 2 655 653 28 8 768 149 25 19 37 30 36 8 763 560 25 19 41 30 38 2 320 677 23 71 60 3 644 455 24 73 5021 Fort Albany Power Corporation 29 906 68 1 956 68 0 54 31 862 68 0 66 120 880 56 120 880 68 90 196 66 242 938 68 340 000 68 27 28 71 29 373 387 68 24 34 65 34 79 395 68 114 49 276 630 68 88 67 0 28 0 27 0 1 0 41 0 66 0 24 0 66 417 095 49 417 095 53 98 990 68 421 1 421 1 1 682 107 54 25 12 25 57 298 018 54 140 5 643 270 52 65 5922 Fort Frances Power Corporation 254 688 62 11 215 61 356 52 266 259 62 553 935 57 56 523 60 610 458 58 1 091 188 54 1 967 905 59 4 000 000 58 27 25 49 60 4 000 383 59 27 22 49 58 1 083 321 51 101 54 1 692 936 60 116 47 0 28 0 27 0 1 0 41 92 580 57 0 24 92 580 57 216 438 60 309 018 60 1 109 758 57 20 33 28 45 1 119 638 59 19 35 28 44 295 858 55 73 58 503 825 55 61 6423 Greater Sudbury Hydro Inc 6 959 582 20 3 141 790 11 81 244 32 10 182 616 21 9 312 088 19 1 250 155 31 10 562 243 22 10 590 038 21 31 334 897 22 34 740 000 24 30 11 90 11 37 762 673 24 28 15 83 12 6 021 807 29 176 15 25 435 268 19 123 39 112 497 16 0 27 0 1 112 497 16 1 425 683 21 1 470 5 1 427 153 21 1 971 143 26 3 510 793 23 9 672 498 23 20 26 36 19 9 672 497 22 20 28 36 19 2 037 534 26 97 28 3 575 712 25 98 1624 Grimsby Power Incorporated 2 804 724 37 319 119 38 46 384 38 3 170 227 37 2 159 053 42 605 127 36 2 764 180 38 2 122 570 48 8 056 977 42 10 850 000 45 20 55 74 24 10 874 438 45 20 48 74 22 1 764 828 42 120 46 5 666 540 43 142 19 0 28 34 500 16 0 1 34 500 27 292 926 45 0 24 292 926 45 582 443 45 909 869 45 2 894 613 44 20 28 31 28 2 894 596 43 20 31 31 30 667 281 40 87 46 967 403 42 94 2225 Guelph Hydro Electric Systems Inc 58 594 547 4 2 215 864 16 1 328 823 14 62 139 234 6 8 394 053 21 4 672 631 11 13 066 684 17 27 027 155 11 102 233 072 7 99 040 000 10 27 24 103 7 99 031 945 11 27 21 103 4 6 923 256 24 390 2 72 969 005 8 140 21 278 441 8 103 065 7 0 1 381 506 9 1 377 942 22 0 24 1 377 942 22 4 576 979 12 6 336 427 12 24 920 625 11 18 39 25 56 24 914 810 9 18 42 25 54 4 984 747 12 92 37 9 924 301 10 64 6026 Halton Hills Hydro Inc 5 500 566 22 212 955 46 95 775 31 5 809 296 29 4 755 591 29 1 505 241 28 6 260 832 28 7 513 017 29 19 583 145 31 30 940 000 28 24 40 63 38 30 940 000 29 24 33 63 37 4 637 451 30 162 21 15 528 974 31 126 33 0 28 0 27 0 1 0 41 604 017 32 945 9 604 962 32 1 977 168 25 2 582 130 29 8 387 497 28 24 14 31 31 8 387 497 27 24 17 31 33 1 693 484 30 117 11 2 997 163 30 86 3327 Hearst Power Distribution Company Limited 1 510 384 51 985 005 27 78 100 33 2 573 490 40 2 417 972 39 -106 213 68 2 311 759 44 652 226 61 5 537 474 50 3 180 000 60 21 52 174 1 5 182 656 54 13 68 107 3 869 543 55 75 66 3 349 929 51 165 7 0 28 10 063 23 0 1 10 063 34 71 209 59 0 24 71 209 59 257 123 57 338 395 59 843 903 60 30 6 40 13 839 830 63 31 4 40 11 249 293 59 103 21 324 621 63 104 1028 Hydro 2000 Inc 80 683 65 3 633 63 721 51 85 037 65 257 750 63 26 581 66 284 331 63 343 324 64 712 692 63 1 360 000 63 25 36 52 59 1 360 002 63 25 31 52 55 152 649 65 225 10 402 725 65 177 5 0 28 0 27 0 1 0 41 41 957 64 0 24 41 957 64 57 169 67 99 126 67 394 750 63 14 61 25 58 394 750 66 14 62 25 56 65 818 68 87 47 103 786 67 96 2029 Hydro Hawkesbury Inc 1 162 440 53 26 255 57 26 838 42 1 215 533 54 1 339 759 48 144 888 53 1 484 647 51 2 069 510 49 4 769 690 51 7 920 000 50 26 32 60 50 7 919 998 50 26 27 60 45 1 657 274 46 125 43 3 853 684 48 124 38 0 28 0 27 0 1 0 41 189 396 49 0 24 189 396 49 260 471 55 449 867 51 2 139 160 49 12 65 21 65 2 139 160 48 12 64 21 64 469 776 45 55 63 642 701 53 70 5230 Hydro One Networks Inc 220 487 100 2 89 902 682 1 5 797 134 5 316 186 916 1 208 374 078 3 53 798 601 3 262 172 679 3 408 305 696 1 986 665 291 2 1 220 690 000 3 33 5 81 18 1 220 185 369 3 33 6 81 16 180 673 089 3 226 9 638 084 356 3 155 14 1 742 284 3 32 818 17 0 1 1 775 102 4 44 738 829 1 0 24 44 738 829 1 76 046 793 2 122 560 724 2 338 355 409 3 22 20 36 20 319 733 906 3 24 15 38 16 84 648 671 2 90 39 130 932 006 3 94 2331 Hydro Ottawa Limited 57 247 836 5 15 553 929 5 4 963 240 6 77 765 005 5 59 247 505 4 30 703 383 4 89 950 888 4 108 371 101 4 276 086 993 4 394 540 000 4 27 23 70 31 394 586 356 4 27 19 70 29 80 473 174 4 135 35 213 663 755 4 129 28 389 296 6 0 27 0 1 389 296 8 13 469 631 4 0 24 13 469 631 4 24 399 639 4 38 258 566 4 105 242 155 4 23 15 36 18 105 242 155 4 23 18 36 18 30 043 738 4 81 51 43 902 666 4 87 3032 InnPower Corporation 1 850 172 44 132 220 49 -20 275 65 1 962 117 48 2 561 285 36 1 912 925 24 4 474 210 32 3 129 955 43 9 566 282 41 13 010 000 41 24 42 74 25 13 009 980 41 24 35 74 25 2 103 187 39 149 26 5 975 204 40 160 11 0 28 0 27 0 1 0 41 467 510 38 525 12 468 035 38 705 065 38 1 173 100 39 3 680 241 41 19 34 32 27 3 680 241 40 19 37 32 28 745 996 37 95 32 1 379 515 37 85 3533 Kashechewan Power Corporation 40 200 66 2 629 65 0 54 42 829 66 0 66 159 333 51 159 333 66 76 438 68 278 600 66 520 000 66 15 65 54 55 438 286 67 17 55 64 36 89 117 66 86 63 298 461 66 93 62 0 28 0 27 0 1 0 41 0 66 0 24 0 66 413 377 50 413 377 54 155 966 66 265 3 265 3 1 741 263 52 24 16 24 61 315 564 53 131 6 674 000 51 61 6534 Kenora Hydro Electric Corporation Ltd 1 606 080 49 65 793 53 6 323 46 1 678 196 51 552 901 58 138 524 55 691 425 56 924 570 57 3 294 191 55 5 270 000 54 18 60 63 43 5 270 258 53 18 54 63 40 966 288 52 96 55 3 223 319 52 102 60 0 28 0 27 0 1 0 41 124 005 56 0 24 124 005 56 175 672 61 299 677 61 1 407 448 54 12 64 21 64 1 688 937 53 10 67 18 67 341 056 51 52 66 900 462 44 33 6835 Kingston Hydro Corporation 4 445 966 29 1 046 947 25 -41 123 67 5 451 790 32 2 580 410 35 1 656 278 25 4 236 688 34 9 588 664 23 19 277 143 32 34 500 000 26 28 18 56 53 37 182 911 25 26 28 52 57 7 034 716 23 136 32 21 240 885 27 91 64 0 28 17 728 21 0 1 17 728 32 566 812 35 0 24 566 812 35 1 625 809 30 2 210 349 30 8 674 286 26 19 38 25 55 8 631 873 26 19 40 26 53 1 761 544 29 92 36 3 477 795 26 64 6236 Kitchener-Wilmot Hydro Inc 21 865 242 8 2 654 908 14 1 471 693 13 25 991 843 9 14 184 542 11 8 210 790 8 22 395 332 7 39 768 619 6 88 155 794 8 105 710 000 8 38 4 83 14 108 120 625 9 37 5 82 15 19 910 768 8 200 13 56 380 065 11 156 13 0 28 0 27 0 1 0 41 1 754 249 17 1 575 4 1 755 824 17 5 203 439 11 6 959 263 11 27 710 719 8 19 36 25 57 21 241 293 12 24 13 33 27 5 304 361 10 98 26 8 757 155 11 79 4337 Lakefront Utilities Inc 2 239 136 41 280 605 41 -1 409 59 2 518 332 42 1 185 986 50 573 942 39 1 759 928 48 3 139 762 42 7 418 022 43 12 170 000 42 26 33 61 49 12 202 681 42 26 29 61 43 1 323 874 50 237 7 4 615 759 47 161 9 0 28 0 27 0 1 0 41 265 025 47 0 24 265 025 47 552 108 46 817 133 48 3 077 834 42 18 42 27 50 3 063 883 42 18 43 27 48 422 399 49 131 7 762 964 49 107 838 Lakeland Power Distribution Ltd 4 432 710 30 708 780 30 264 688 20 5 406 177 33 2 495 021 38 204 036 49 2 699 057 40 3 643 045 38 11 748 279 35 15 770 000 39 23 47 74 23 15 773 124 39 23 38 74 21 2 005 555 40 182 14 8 049 193 38 146 18 0 28 0 27 0 1 0 41 433 380 40 840 11 434 220 40 622 637 43 1 056 857 42 4 142 391 39 15 59 26 54 4 121 298 38 15 60 26 52 603 854 42 103 22 1 049 293 41 101 1539 London Hydro Inc 28 534 591 7 3 454 236 10 1 673 470 11 33 662 297 8 31 824 871 5 11 767 982 6 43 592 853 5 47 337 598 5 124 592 748 6 196 660 000 5 24 41 63 37 219 747 453 5 22 42 57 49 35 529 300 6 133 36 99 391 640 6 125 36 1 611 279 4 506 532 1 0 1 2 117 811 3 8 721 449 5 525 12 8 721 974 5 10 255 087 5 21 094 872 5 51 192 690 5 20 29 41 10 51 389 905 5 20 32 41 8 10 107 408 5 101 25 20 767 785 5 102 1340 Midland Power Utility Corporation 2 860 953 36 301 878 40 256 922 21 3 419 753 36 2 402 265 40 115 201 57 2 517 466 42 6 072 219 33 12 009 438 34 10 830 000 46 56 1 111 4 10 830 847 46 56 2 111 2 1 660 400 45 366 3 5 762 167 41 208 3 0 28 0 27 0 1 0 41 345 045 43 0 24 345 045 44 874 029 36 1 219 074 38 2 739 690 46 32 4 44 6 2 489 129 44 35 2 49 3 507 918 44 172 2 862 722 46 141 241 Milton Hydro Distribution Inc 9 889 501 16 476 099 34 2 546 769 7 12 912 370 20 6 501 088 24 1 353 829 30 7 854 917 27 14 395 282 18 35 162 569 19 45 360 000 21 32 7 78 20 45 360 000 22 32 8 78 18 9 021 267 17 160 23 25 507 440 18 138 22 0 28 41 699 14 0 1 41 699 25 1 563 222 20 525 12 1 563 747 20 2 080 649 23 3 686 095 22 11 911 927 21 17 45 31 30 11 911 927 20 17 47 31 32 2 808 776 17 74 56 4 722 005 21 78 4442 Newmarket-Tay Power Distribution Ltd 8 218 024 17 840 996 29 709 531 16 9 768 551 22 4 962 518 28 410 328 42 5 372 846 29 8 179 406 27 23 320 803 29 36 240 000 23 23 49 64 36 36 238 371 27 23 41 64 35 6 790 151 25 120 45 20 811 603 28 112 52 51 311 18 0 27 0 1 51 311 21 1 009 481 25 0 24 1 009 481 25 1 648 094 28 2 708 886 27 9 649 555 24 17 48 28 43 9 649 555 23 17 49 28 42 2 246 041 24 73 57 3 306 832 28 82 3943 Niagara Peninsula Energy Inc 12 742 252 14 1 752 111 19 426 660 18 14 921 023 17 10 838 434 14 2 329 562 19 13 167 996 16 15 663 963 15 43 752 981 17 74 440 000 15 21 51 59 51 74 440 000 15 21 44 59 47 18 942 819 10 83 65 39 133 958 15 112 53 0 28 40 000 15 0 1 40 000 26 2 317 811 12 2 100 3 2 319 911 12 3 115 081 15 5 474 992 14 19 056 865 15 16 51 29 39 19 056 865 15 16 52 29 40 5 691 300 9 55 64 8 070 179 12 68 5644 Niagara-on-the-Lake Hydro Inc 2 598 018 39 369 192 37 96 276 30 3 063 486 38 3 401 852 33 586 267 38 3 988 119 36 3 445 058 40 10 496 663 38 11 680 000 43 29 16 90 12 12 187 558 43 28 14 86 8 2 471 690 37 139 30 9 027 755 37 116 46 0 28 0 27 0 1 0 41 424 921 41 525 12 425 446 41 647 548 41 1 072 994 40 2 993 633 43 22 23 36 21 2 221 857 46 29 5 48 4 674 316 39 96 29 1 099 317 40 98 1745 North Bay Hydro Distribution Limited 4 245 690 32 12 427 153 7 -12 739 64 16 660 103 14 4 001 370 31 536 340 40 4 537 710 31 4 952 277 35 26 150 090 25 20 260 000 34 24 39 129 2 29 438 362 31 17 59 89 7 2 404 095 38 206 12 23 078 108 25 113 50 27 296 21 0 27 0 1 27 296 29 713 129 29 420 21 713 549 29 1 095 516 32 1 836 361 32 5 545 424 34 20 31 33 25 5 588 424 34 20 34 33 26 1 321 014 33 83 49 2 061 859 35 89 2946 Northern Ontario Wires Inc 509 731 57 38 057 54 173 815 24 721 603 57 907 761 53 786 827 33 1 694 588 49 1 159 432 52 3 575 623 54 4 310 000 56 27 27 83 16 4 308 417 57 27 24 83 11 934 382 53 124 44 2 390 057 54 150 15 6 212 25 0 27 0 1 6 212 37 156 126 53 0 24 156 126 53 258 548 56 420 886 52 1 174 934 56 22 21 36 22 1 174 934 58 22 22 36 20 291 147 56 89 41 453 485 58 93 2547 Oakville Hydro Electricity Distribution Inc 21 252 248 9 2 499 447 15 177 319 23 23 929 014 10 15 431 935 8 3 329 773 13 18 761 708 11 27 406 067 10 70 096 789 12 92 390 000 12 30 15 76 22 94 942 831 12 29 12 74 23 19 629 076 9 140 29 58 812 351 10 119 44 0 28 77 518 8 0 1 77 518 19 3 120 547 7 0 24 3 120 547 7 6 229 122 8 9 427 187 8 24 575 982 12 25 9 38 16 24 207 742 10 26 10 39 13 6 805 010 8 92 38 10 080 076 8 94 2448 Orangeville Hydro Limited 3 398 117 35 314 840 39 209 678 22 3 922 636 35 2 056 808 43 651 253 35 2 708 061 39 3 752 579 37 10 383 276 39 14 150 000 40 27 29 73 26 14 153 298 40 27 25 73 26 1 717 100 43 219 11 6 329 275 39 164 8 0 28 0 27 0 1 0 41 229 432 48 0 24 229 432 48 668 858 39 898 290 46 3 705 603 40 18 41 24 61 3 320 975 41 20 30 27 46 467 979 47 143 4 820 108 48 110 649 Orillia Power Distribution Corporation 1 662 040 47 246 213 43 63 403 35 1 971 656 47 2 008 907 44 505 795 41 2 514 702 43 2 915 928 44 7 402 286 44 16 580 000 37 18 59 45 64 17 097 223 37 17 57 43 63 1 710 598 44 170 16 4 987 831 46 148 17 0 28 17 378 22 0 1 17 378 33 605 352 31 525 12 605 877 31 599 943 44 1 223 198 37 4 318 856 37 14 63 28 41 3 845 634 39 16 59 32 29 532 482 43 113 15 1 114 081 38 110 550 Oshawa PUC Networks Inc 5 046 074 25 1 182 326 23 9 309 362 3 15 537 761 16 11 449 535 13 2 281 488 21 13 731 023 15 23 039 845 14 52 308 629 15 73 010 000 16 32 9 72 28 73 010 000 16 32 9 72 27 6 553 951 26 352 4 30 753 766 16 170 6 0 28 24 000 19 0 1 24 000 31 1 975 382 14 0 24 1 975 382 14 3 223 405 14 5 222 787 15 19 963 922 14 16 53 26 53 19 918 698 14 16 54 26 51 2 656 044 21 121 9 6 160 566 18 85 3651 Ottawa River Power Corporation 2 779 858 38 156 362 48 39 185 40 2 975 405 39 1 812 492 46 324 075 46 2 136 567 45 2 039 479 50 7 151 451 45 8 720 000 48 23 44 82 17 8 720 046 48 23 37 82 13 1 499 046 47 136 33 5 721 441 42 125 37 0 28 0 27 0 1 0 41 353 106 42 0 24 353 106 42 541 200 47 894 306 47 2 282 373 47 24 13 39 14 1 989 059 49 27 8 45 5 468 258 46 116 13 821 260 47 109 752 Peterborough Distribution Incorporated 4 979 980 26 554 811 33 -27 418 66 5 507 372 31 5 186 524 27 2 825 536 17 8 012 060 25 9 991 247 22 23 510 679 28 37 880 000 22 26 31 62 45 43 287 337 23 23 39 54 53 7 894 991 21 127 40 25 115 223 21 94 61 0 28 43 197 13 0 1 43 197 23 847 015 27 0 24 847 015 27 2 029 153 24 2 919 365 26 9 781 455 22 21 25 30 37 9 489 529 24 21 24 31 35 2 194 825 25 92 35 4 242 996 23 69 5453 PUC Distribution Inc 4 538 096 28 659 247 31 122 189 28 5 319 531 34 8 793 170 20 1 954 397 23 10 747 567 21 8 354 534 26 24 421 633 26 26 410 000 31 32 8 92 9 29 900 412 30 28 16 82 14 6 474 090 28 129 39 20 464 673 29 119 43 58 515 17 0 27 0 1 58 515 20 729 307 28 525 12 729 832 28 2 335 353 21 3 123 700 24 7 440 107 29 31 5 42 7 7 440 107 30 31 3 42 7 2 665 073 19 88 45 3 453 420 27 90 2854 Renfrew Hydro Inc 351 383 60 32 771 55 3 831 49 387 986 60 418 059 61 32 601 64 450 660 61 1 158 591 53 1 997 237 58 4 170 000 57 28 19 48 61 4 170 437 58 28 17 48 60 1 400 411 49 83 64 2 204 596 56 91 65 8 025 24 0 27 0 1 8 025 36 82 258 58 0 24 82 258 58 303 619 54 393 902 57 1 070 574 58 28 8 37 17 1 069 894 61 28 7 37 17 380 306 50 80 52 470 588 56 84 3755 Rideau St Lawrence Distribution Inc 1 353 836 52 95 782 51 -429 57 1 449 189 53 570 963 56 73 934 58 644 897 57 851 479 58 2 945 565 56 5 020 000 55 17 61 59 52 5 027 545 55 17 58 59 48 680 729 60 125 42 2 461 062 53 120 42 0 28 0 27 0 1 0 41 124 517 55 0 24 124 517 55 233 641 58 358 158 58 1 306 239 55 18 44 27 47 1 226 814 57 19 39 29 39 203 657 63 115 14 346 828 62 103 1156 Sioux Lookout Hydro Inc 537 110 56 7 737 62 5 733 47 550 580 58 485 367 60 51 824 61 537 191 60 678 022 60 1 765 793 61 3 700 000 59 18 57 48 62 3 700 469 60 18 51 48 61 781 199 57 87 62 1 964 433 59 90 66 0 28 0 27 0 1 0 41 61 605 60 0 24 61 605 60 122 700 65 184 305 65 1 016 095 59 12 66 18 68 1 093 501 60 11 66 17 68 252 883 58 49 68 512 183 54 36 6757 St Thomas Energy Inc 2 146 544 42 188 013 47 164 586 25 2 499 142 43 4 191 889 30 593 449 37 4 785 338 30 3 418 818 41 10 703 299 37 17 510 000 35 20 56 61 48 17 888 063 35 19 49 60 46 3 714 628 34 92 60 10 410 589 35 103 59 25 415 22 0 27 0 1 25 415 30 579 723 33 0 24 579 723 33 801 503 37 1 406 641 36 4 643 532 35 17 47 30 35 4 586 298 35 17 46 31 36 1 196 268 34 67 61 1 804 761 36 78 4558 Thunder Bay Hydro Electricity Distribution Inc 5 286 985 23 13 266 747 6 608 226 17 19 161 959 12 7 141 247 22 13 110 499 5 20 251 746 9 12 338 187 20 51 751 891 16 48 420 000 20 25 35 107 6 60 329 106 18 20 46 86 9 7 589 245 22 163 20 44 561 597 14 116 48 485 575 5 48 109 12 0 1 533 684 5 2 110 681 13 0 24 2 110 681 13 2 358 821 20 5 003 186 17 12 927 445 20 18 40 39 15 12 369 311 19 19 38 40 10 2 416 300 22 98 27 6 837 532 14 73 4859 Tillsonburg Hydro Inc 1 886 420 43 243 278 44 5 657 48 2 135 355 45 673 753 55 683 155 34 1 356 908 53 3 496 009 39 6 988 272 46 11 310 000 44 31 10 62 46 4 901 901 56 71 1 143 1 741 159 58 472 1 2 225 100 55 314 1 122 716 14 0 27 0 1 122 716 15 158 627 52 0 24 158 627 52 649 208 40 930 551 44 2 881 461 45 23 17 32 26 939 108 62 69 1 99 1 218 641 62 297 1 386 217 61 241 160 Toronto Hydro-Electric System Limited 197 146 346 3 78 444 901 2 9 648 691 2 285 239 938 3 269 366 448 2 94 005 221 1 363 371 669 1 333 338 917 3 981 950 524 3 1 556 050 000 2 21 50 63 39 1 568 163 885 2 21 43 63 38 301 610 238 2 111 51 769 478 292 2 128 30 7 855 850 2 396 666 2 0 1 8 252 516 2 42 611 695 2 4 620 2 42 616 315 2 70 906 732 3 121 775 563 3 396 296 506 2 18 43 31 32 395 720 870 2 18 44 31 34 73 852 676 3 96 30 146 708 281 2 83 3861 Veridian Connections Inc 16 332 332 11 2 693 631 12 988 528 15 20 014 491 11 18 086 912 7 4 090 105 12 22 177 017 8 39 238 776 7 81 430 284 9 152 970 000 6 26 34 53 58 152 970 000 8 26 30 53 54 23 236 766 7 169 18 54 436 562 12 150 16 275 672 9 121 369 5 0 1 397 041 7 4 125 057 6 420 21 4 125 477 6 6 785 675 7 11 308 193 6 40 482 340 6 17 50 28 44 40 482 340 6 17 51 28 43 7 905 508 7 86 48 13 109 152 7 86 3162 Wasaga Distribution Inc 2 385 191 40 26 401 56 130 179 27 2 541 770 41 1 165 103 51 403 863 43 1 568 966 50 1 705 071 51 5 815 807 49 6 320 000 52 27 26 92 10 6 324 470 51 27 23 92 6 689 668 59 247 6 3 625 961 49 160 10 0 28 0 27 0 1 0 41 176 877 50 0 24 176 877 50 357 619 52 534 496 50 1 814 647 52 20 32 29 38 1 573 675 55 23 20 34 23 238 480 60 150 3 454 281 57 118 363 Waterloo North Hydro Inc 12 799 897 13 1 083 855 24 34 220 41 13 917 972 19 10 576 686 15 5 092 211 10 15 668 897 14 24 088 434 13 53 675 303 14 82 380 000 13 29 17 65 35 82 384 212 14 29 11 65 33 8 931 987 18 270 5 24 732 248 22 217 2 0 28 0 27 0 1 0 41 1 816 067 16 1 050 7 1 817 117 16 3 325 358 13 5 142 475 16 21 192 868 13 16 56 24 60 21 192 868 13 16 57 24 59 3 212 039 16 104 20 6 397 486 15 80 4264 Welland Hydro-Electric System Corp 1 729 306 45 230 560 45 55 182 37 2 015 048 46 3 416 423 32 899 045 32 4 315 468 33 4 009 952 36 10 340 469 40 25 500 000 32 16 63 41 67 25 500 101 32 16 61 41 66 4 347 364 31 92 59 13 041 522 33 79 68 163 173 11 0 27 0 1 163 173 13 571 216 34 0 24 571 216 34 1 041 962 34 1 776 351 34 6 584 437 32 16 54 27 49 6 584 434 32 16 55 27 47 967 657 36 108 18 2 076 204 34 86 3465 Wellington North Power Inc 709 927 55 86 269 52 -4 066 61 792 130 56 522 470 59 58 527 59 580 997 59 833 280 59 2 206 407 57 5 890 000 53 14 66 37 68 5 889 998 52 14 65 37 68 890 636 54 94 58 2 123 033 57 104 57 0 28 0 27 0 1 0 41 141 935 54 0 24 141 935 54 151 913 62 293 848 62 1 493 412 53 10 68 20 67 1 493 412 56 10 68 20 66 284 830 57 53 65 433 226 59 68 5766 West Coast Huron Energy Inc 438 855 59 1 041 276 26 11 849 44 1 491 980 52 1 033 396 52 237 540 48 1 270 936 54 1 064 166 55 3 827 081 53 8 080 000 49 13 68 47 63 8 139 126 49 13 67 47 62 786 422 56 135 34 2 011 312 58 190 4 0 28 0 27 0 1 0 41 169 605 51 0 24 169 605 51 231 124 59 400 729 55 2 012 404 51 11 67 20 66 1 978 115 50 12 65 20 65 221 480 61 104 19 395 076 60 101 1467 Westario Power Inc 4 282 957 31 1 285 842 22 71 555 34 5 640 354 30 3 071 071 34 369 881 44 3 440 952 37 5 330 383 34 14 411 689 33 23 010 000 33 23 46 63 41 23 147 585 34 23 40 62 41 4 056 580 33 131 37 11 482 675 34 126 35 0 28 0 27 0 1 0 41 553 926 37 0 24 553 926 37 1 056 818 33 1 610 744 35 6 101 269 33 17 46 26 52 6 101 269 33 17 48 26 50 1 414 428 32 75 55 2 084 266 33 77 4668 Whitby Hydro Electric Corporation 6 210 809 21 410 389 35 161 976 26 6 783 174 28 10 455 293 17 1 367 055 29 11 822 348 19 14 034 240 19 32 639 762 21 58 440 000 18 24 43 56 54 58 440 000 19 24 36 56 50 9 846 731 16 143 28 25 320 361 20 129 29 50 281 19 0 27 0 1 50 281 22 1 690 118 18 420 21 1 690 538 18 2 583 443 17 4 324 262 18 15 860 460 17 16 52 27 48 15 860 460 17 16 53 27 45 3 453 396 14 75 54 6 360 947 16 68 55
LDC Total 1 117 211 477 372 759 951 68 785 651 1 558 757 080 1 152 109 308 357 805 953 1 509 915 261 1 790 833 794 4 859 506 135 6 999 990 000 26 69 7 402 554 217 24 66 1 268 253 723 141 3 844 200 598 126 22 389 524 2 398 698 0 24 788 222 205 478 076 27 300 205 505 376 362 798 888 593 092 486 1 835 264 933 20 32 1 800 344 744 20 33 400 311 151 91 724 466 399 82Independent Electricity System Operator 278 348 16 467 0 294 815 2 045 490 35 884 2 081 374 1 773 007 4 149 196 n/a n/a n/a n/a n/a n/a n/a n/a n/a n/a 0 0 0 0 0 0 0 0 0 n/a n/a n/a n/a n/a n/a n/a n/a n/a n/aProvince-Wide Total 1 117 489 826 372 776 418 68 785 651 1 559 051 895 1 154 154 798 357 841 837 1 511 996 635 1 792 606 801 4 863 655 331 6 999 990 000 26 69 7 402 554 217 24 66 1 268 253 723 141 3 844 200 598 126 22 389 524 2 398 698 0 24 788 222 205 478 076 27 300 205 505 376 362 798 888 593 092 486 1 835 264 933 20 32 1 800 344 744 20 33 400 311 151 91 724 466 399 82
2017LDC CDM PlanSpending Forecast
2017Progress versus2017LDC CDM PlanSpending Forecast
2015-2017LDC CDM PlanSpending Forecast
2015-2017Progress versus2015-2017LDC CDM PlanSpending Forecast
AllocatedBudget
2017ProgressSpending versusAllocatedBudget
2015-2017ProgressSpending versusAllocatedBudget
2015-2020LDC CDM PlanSpendingForecast
2017Progress versus2015-2020LDC CDM PlanSpending Forecast
2015-2017Progress versus2015-2020LDC CDM PlanSpending Forecast
Net Verified Annual Energy Savings Persisting to 2020 Total Spending2015Verified2015Savings
2016Verified2015AdjustmentSavings
Total Verified 2015 Savings
2016Verified2016Savings
TotalVerified2015-2017Savings
AllocatedSavingsTarget
2017Progress Savings versus Allocated Savings Target
2015-2017Progress Savings versus Allocated Savings Target
Total Verified 2016 Spending
2015-2020LDC CDM PlanSavingsForecast
2017Progress versus2015-2020LDC CDM PlanSavings Forecast
2015-2017Progress versus2015-2020LDC CDM PlanSavings Forecast
2017LDC CDM PlanSavingsForecast
2017Progress versus2017LDC CDM PlanSavings Forecast
2016Verified2016Spending
2017Verified2017Spending
TotalVerified2015-2017Spending
2017Verified2015AdjustmentSavings
2017Verified2016AdjustmentSavings
Total Verified 2016 Savings
2017Verified2017Savings
Total Verified 2015 Spending
2015-2017LDC CDM PlanSavingsForecast
2015-2017Progress versus2015-2017LDC CDM PlanSavings Forecast
2015Verified2015Spending
2016Verified2015AdjustmentSpending
2017Verified2015AdjustmentSpending
2017Verified2016AdjustmentSpending
2017 Final Verified Annual LDC CDM Program Results ReportLDC Rankings

Progress ReportFor: Algoma Power Inc.
Programs 2015 2016 2017 2018 2019 2020 Total 2015 Verified
2015 Results
2016 Verified
2015 Results
Adjustments
2017 Verified
2015 Results
Adjustments
Total Verified
2015 Results
2016 Verified
2016 Results
2017 Verified
2016 Results
Adjustments
Total Verified
2016 Results
2017Verified
2017 Results
Total Total Verified
2015 Results
Total Verified
2016 Results
2017Verified
2017 Results
Total
2015-2020 Conservation First Framework Programs Residential Province-Wide Programs
1 Save on Energy Coupon Program Products 6,901 311 311 150 75 35 7,783 6,901 968 - 7,869 28,906 3,238 32,144 28,098 68,111 114 10,336 9,035 9052 Save on Energy Instant Discount Program Products - - - - - - - - - - - - - - 22,003 22,0033 Save on Energy Heating & Cooling Program Equipment 34 37 1 1 1 1 75 34 - - 34 76 - 76 98 208 100 205 9,800 2894 Save on Energy New Construction Program Homes - - 1 1 1 1 4 - - - - - - - - - - -5 Save on Energy Home Assistance Program Homes - 10 10 10 10 10 50 - - - - 4 1 5 39 44 50 390 220
Sub-total: Residential Province-Wide Programs
Business Province-Wide Programs 6 Save on Energy Audit Funding Program Projects - 1 1 1 1 1 5 - - - - - - - - - - - -7 Save on Energy Retrofit Program Projects - 13 50 658 33 42 796 - 1 1 2 9 1 10 10 22 77 20 358 Save on Energy Small Business Lighting Program Projects - 210 210 105 50 25 600 - - - - 28 1 29 33 62 14 16 159 Save on Energy High Performance New Construction Program Projects - - 1 1 1 1 4 - - - - - - - - - - -
10 Save on Energy Existing Building Commissioning Program Projects - - 1 1 1 1 4 - - - - - - - - - - -11 Save on Energy Business Refrigeration Incentive Program Projects - - - - - - - - - - - - - - - -12 Save on Energy Process & Systems Upgrades Program Projects - - 1 1 1 1 4 - - - - - - - - - - -13 Save on Energy Energy Manager Program Projects - - 1 1 1 1 4 - - - - - - - - - - -14 Save on Energy Monitoring & Targeting Program Projects - - 1 1 1 1 4 - - - - - - - - - - -15 Save on Energy Retrofit Program - P4P Projects - - - - - - - - - - - - - - - -16 Save on Energy Process & Systems Upgrades Program - P4P Projects - - - - - - - - - - - - - - - -
Sub-total: Business Province-Wide Programs
Local & Regional Programs 17 Adaptive Thermostat Local Program Homes - - - - - - - - - - - - - - - -18 Business Refrigeration Incentives Local Program Projects - - 6 23 20 16 65 - - - - - - - - - - -19 Conservation on the Coast Home Assistance Local Program Homes - - - - - - - - - - - - - - - -20 Conservation on the Coast Small Business Lighting Local Program Projects - - - - - - - - - - - - - - - -21 First Nations Conservation Local Program Homes - - - - - - - - - - - - - - - -22 High Efficiency Agriculturual Pumping Local Program Projects - - - - - - - - - - - - - - - -23 Instant Savings Local Program Homes - - 1,804 1,202 - - 3,006 - - - - - - - 2,841 2,841 157 15724 OPsaver Local Program Projects - - - - - - - - - - - - - - - -25 Pool Saver Local Program Homes - - - - - - - - - - - - - - - -26 PUMPsaver Local Program Projects - - - - - - - - - - - - - - - -27 RTUsaver Local Program Projects - - - - - - - - - - - - - - - -28 Social Benchmarking Local Program Participants - - - - - - - - - - - - - - - -
Sub-total: Local & Regional Programs
LDC Innovation Fund Pilot Programs 29 Air Source Heat Pump – For Residential Space Heating LDC Innovation Fund Homes - - - - - - - - - - - - - - - -30 Air Source Heat Pump – For Residential Water Heating LDC Innovation Fun Homes - - - - - - - - - - - - - - - -31 Block Heater Timer LDC Innovation Fund Pilot Program Equipment - - - - - - - - - - - - - - - -32 Commercial Energy Management and Load Control (CEMLC) LDC Innovatio Projects - - - - - - - - - - - - - - - -33 Conservation Cultivator LDC Innovation Fund Pilot Program Projects - - - - - - - - - - - - - - - -34 Data Centre LDC Innovation Fund Pilot Program Projects - - - - - - - - - - - - - - - -35 Electronics Take Back LDC Innovation Fund Pilot Program Equipment - - - - - - - - - - - - - - - -36 Energy Reinvestment LDC Innovation Fund Pilot Program Projects - - - - - - - - - - - - - - - -37 Home Energy Assessment & Retrofit LDC Innovation Fund Pilot Program Homes - - - - - - - - - - - - - - - -38 Hotel/Motel LDC Innovation Fund Pilot Program Projects - - - - - - - - - - - - - - - -39 Intelligent Air Technology LDC Innovation Fund Pilot Program Projects - - - - - - - - - - - - - - - -40 OPsaver LDC Innovation Fund Pilot Program Projects - - - - - - - - - - - - - - - -41 PUMPsaver LDC Innovation Fund Pilot Program Projects - - - - - - - - - - - - - - - -42 Residential Direct Install LDC Innovation Fund Pilot Program Homes - - - - - - - - - - - - - - - -43 Residential Direct Mail LDC Innovation Fund Pilot Program Homes - 1 - - - - 1 - - - - 138 - 138 - 138 13,800 13,80044 Residential Ductless Heat Pump LDC Innovation Fund Pilot Program Homes - - - - - - - - - - - - - - - -45 Retrocomissioning LDC Innovation Fund Pilot Program Projects - - - - - - - - - - - - - - - -46 RTUsaver LDC Innovation Fund Pilot Program Projects - - - - - - - - - - - - - - - -47 Small & Medium Business Energy Management System LDC Innovation Fun Projects - - - - - - - - - - - - - - - -48 Solar Powered Attic Ventilation LDC Innovation Fund Pilot Program Homes - - - - - - - - - - - - - - - -49 Toronto Hydro – Enbridge Joint Low-Income Program LDC Innovation Fund Homes - - - - - - - - - - - - - - - -50 Truckload Event LDC Innovation Fund Pilot Program Products - - - - - - - - - - - - - - - -
Sub-total: LDC Innovation Fund Pilot Programs
Centrally Delivered Programs 51 Industrial Accelerator Program Projects - - 1 1 1 1 4 - - - - - - - - - - -52 Save on Energy Energy Performance Program for Multi-Site Customers Projects - - 1 1 1 1 4 - - - - - - - - - - -53 Whole Home Pilot Program Homes - - 1 1 1 1 4 - - - - - - - 28 28 2,800 2,800
Sub-total: Centrally Delivered Programs
Program Enabled Savings 54 Save on Energy Retrofit Program Enabled Savings Claims - - - - - - - - - - - - - - - -55 Save on Energy High Performance New Construction Program Enabled Sav Claims - - - - - - - - - - - - - - - -56 Save on Energy Process & Systems Upgrades Program Enabled Savings Claims - - - - - - - - - - - - - - - -
Sub-total: Program Enabled Savings
Other 57 Non-Approved Program Various - - - - - - - - - - - - - - - -58 Unassigned Program Various - - - - - - - - - - - - - - - -
Sub-total: Other
Sub-total: 2015-2020 Conservation First Framework
Conservation Fund 59 Conservation Voltage Reduction Conservation Fund Pilot Program Projects - - - - - - - - - - - - - - - -60 EnerNOC Conservation Fund Pilot Program Projects - - - - - - - - - - - - - - - -61 Home Depot Home Appliance Market Uplift Conservation Fund Pilot Progr Projects - - - - - - - - - - - - - - - -62 Loblaw P4P Conservation Fund Pilot Program Projects - - - - - - - - - - - - - - - -63 Ontario Clean Water Agency P4P Conservation Fund Pilot Program Projects - - - - - - - - - - - - - - - -64 Performance Based Conservation Fund Pilot Program Projects - - - - - - - - - - - - - - - -65 Social Benchmarking Conservation Fund Pilot Program Participants - - - - - - - - - - - - - - - -66 Strategic Energy Group Conservation Fund Pilot Program Projects - - - - - - - - - - - - - - - -
Sub-total: Conservation Fund
2011-2014+2015 Extension Legacy Framework Programs
Residential Program 67 Appliance Retirement Initiative Appliances 35 - - - - - 35 36 - - 36 - - - - 36 103 10368 Coupon Initiative Products 6,301 - - - - - 6,301 2,350 30 - 2,380 - - - - 2,380 38 3869 Bi-Annual Retailer Event Initiative Products - - - - - - - 3,951 - - 3,951 - - - - 3,95170 HVAC Incentives Initiative Equipment 54 - - - - - 54 54 2 - 56 - - - - 56 104 10471 Residential New Construction and Major Renovation Initiative Homes - - - - - - - - - - - - - - - -
Sub-total: Residential Program
Commercial & Institutional Program 72 Energy Audit Initiative Projects - - - - - - - - - - - - - - - -73 Efficiency: Equipment Replacement Incentive Initiative Projects 597 - - - - - 597 10 1 2 13 - - - - 13 2 274 Direct Install Lighting and Water Heating Initiative Projects 2,840 - - - - - 2,840 115 - - 115 - - - - 115 4 475 New Construction and Major Renovation Initiative Projects - - - - - - - - - - - - - - - -76 Existing Building Commissioning Incentive Initiative Projects - - - - - - - - - - - - - - - -
Sub-total: Commercial & Institutional Program
Industrial Program 77 Process and Systems Upgrades Initiatives - Project Incentive Initiative Projects - - - - - - - - - - - - - - - -78 Process and Systems Upgrades Initiatives - Energy Manager Initiative Projects - - - - - - - - - - - - - - - -79 Process and Systems Upgrades Initiatives - Monitoring and Targeting Initiat Projects - - - - - - - - - - - - - - - -
Sub-total: Industrial Program
Low Income Program 80 Low Income Initiative Homes 331 - - - - - 331 19 - - 19 - - - - 19 6 6
Sub-total: Low-Income Program
Other 81 Aboriginal Conservation Program Homes - - - - - - - - - - - - - - - -82 Program Enabled Savings Claims - - - - - - - - - - - - - - - -
Sub-total: Other
Sub-total: 2011-2014+2015 Extension Legacy Framework Total
#
Participation
Unit of Measure
Forecasted (#) Verified (#) Progress vs Forecast (%)
Participation Group
2015 2016 2017 2018 2019 2020 Total 2015 Verified
2015 Results
2016 Verified
2015 Results
Adjustments
2017 Verified
2015 Results
Adjustments
Total Verified
2015 Results
2016 Verified
2016 Results
2017 Verified
2016 Results
Adjustments
Total Verified
2016 Results
2017Verified
2017 Results
Total Total Verified
2015 Results
Total Verified
2016 Results
2017Verified
2017 Results
Total
181,325 311,000 311,000 150,000 75,000 35,000 1,063,325 181,325 20,432 - 201,757 864,090 97,452 961,542 689,875 1,853,174 111 309 222 231- - - - - - - - - - - - - - 583,733 583,733
34,993 36,795 1,000 1,000 1,000 1,000 75,788 34,993 - - 34,993 69,942 - 69,942 101,120 206,055 100 190 10,112 283- - 1,000 1,000 1,000 1,000 4,000 - - - - - - - - - - -- 20,000 20,000 20,000 20,000 20,000 100,000 - - - - 6,792 - 6,792 51,754 58,546 34 259 146
216,318 367,795 333,000 172,000 97,000 57,000 1,243,113 216,318 20,432 - 236,750 940,824 97,452 1,038,276 1,426,482 2,701,508 109 282 428 295
- 1,000 1,000 1,000 1,000 1,000 5,000 - - - - - - - - - - - -- 130,000 500,000 6,580,000 328,000 417,000 7,955,000 - 1,013 - 1,013 109,850 2,696 112,546 223,856 337,415 87 45 54- 210,000 210,000 105,000 50,000 25,000 600,000 - - - - 126,216 42,410 168,626 176,701 345,327 80 84 82- - 1,000 1,000 1,000 1,000 4,000 - - - - - - - - - - -- - 1,000 1,000 1,000 1,000 4,000 - - - - - - - - - - -- - - - - - - - - - - - - - - -- - 1,000 1,000 1,000 1,000 4,000 - - - - - - - - - - -- - 1,000 1,000 1,000 1,000 4,000 - - - - - - - - - - -- - 1,000 1,000 1,000 1,000 4,000 - - - - - - - - - - -- - - - - - - - - - - - - - - -- - - - - - - - - - - - - - - -- 341,000 716,000 6,691,000 384,000 448,000 8,580,000 - 1,013 - 1,013 236,066 45,106 281,172 400,557 682,742 82 56 65
- - - - - - - - - - - - - - - -- - 36,000 138,000 120,000 96,000 390,000 - - - - - - - - - - -- - - - - - - - - - - - - - - -- - - - - - - - - - - - - - - -- - - - - - - - - - - - - - - -- - - - - - - - - - - - - - - -- - 350,618 233,615 - - 584,233 - - - - - - - 384,362 384,362 110 110- - - - - - - - - - - - - - - -- - - - - - - - - - - - - - - -- - - - - - - - - - - - - - - -- - - - - - - - - - - - - - - -- - - - - - - - - - - - - - - -- - 386,618 371,615 120,000 96,000 974,233 - - - - - - - 384,362 384,362 99 99
- - - - - - - - - - - - - - - -- - - - - - - - - - - - - - - -- - - - - - - - - - - - - - - -- - - - - - - - - - - - - - - -- - - - - - - - - - - - - - - -- - - - - - - - - - - - - - - -- - - - - - - - - - - - - - - -- - - - - - - - - - - - - - - -- - - - - - - - - - - - - - - -- - - - - - - - - - - - - - - -- - - - - - - - - - - - - - - -- - - - - - - - - - - - - - - -- - - - - - - - - - - - - - - -- - - - - - - - - - - - - - - -- 192,703 - - - - 192,703 - - - - 108,513 - 108,513 - 108,513 56 56- - - - - - - - - - - - - - - -- - - - - - - - - - - - - - - -- - - - - - - - - - - - - - - -- - - - - - - - - - - - - - - -- - - - - - - - - - - - - - - -- - - - - - - - - - - - - - - -- - - - - - - - - - - - - - - -- 192,703 - - - - 192,703 - - - - 108,513 - 108,513 - 108,513 56 56
- - 1,000 1,000 1,000 1,000 4,000 - - - - - - - - - - -- - 1,000 1,000 1,000 1,000 4,000 - - - - - - - - - - -- - 1,000 1,000 1,000 1,000 4,000 - - - - - - - 20,741 20,741 2,074 2,074- - 3,000 3,000 3,000 3,000 12,000 - - - - - - - 20,741 20,741 691 691
- - - - - - - - - - - - - - - -- - - - - - - - - - - - - - - -- - - - - - - - - - - - - - - -- - - - - - - - - - - - - - - -
- - - - - - - - - - - - - - - -- - - - - - - - - - - - - - - -- - - - - - - - - - - - - - - -
216,318 901,498 1,438,618 7,237,615 604,000 604,000 11,002,049 216,318 21,445 - 237,763 1,285,403 142,558 1,427,961 2,232,142 3,897,866 110 158 155 152
- - - - - - - - - - - - - - - -- - - - - - - - - - - - - - - -- - - - - - - - - - - - - - - -- - - - - - - - - - - - - - - -- - - - - - - - - - - - - - - -- - - - - - - - - - - - - - - -- - - - - - - - - - - - - - - -- - - - - - - - - - - - - - - -
- - - - - - - - - - - - - - - -
- - - - - - - - - - - - - - - -133,691 - - - - - 133,691 55,570 464 - 56,034 - - - - 56,034 42 42
- - - - - - - 78,121 - - 78,121 - - - - 78,12152,693 - - - - - 52,693 52,693 2,058 - 54,751 - - - - 54,751 104 104
- - - - - - - - - - - - - - - -186,384 - - - - - 186,384 186,384 2,522 - 188,906 - - - - 188,906 101 101
- - - - - - - - - - - - - - - -406,721 - - - - - 406,721 406,839 1,850 2,339 411,028 - - - - 411,028 101 101204,919 - - - - - 204,919 212,109 - 18,113 230,222 - - - - 230,222 112 112
- - - - - - - - - - - - - - - -- - - - - - - - - - - - - - - -
611,640 - - - - - 611,640 618,948 1,850 20,452 641,250 - - - - 641,250 105 105
- - - - - - - - - - - - - - - -- - - - - - - - - - - - - - - -- - - - - - - - - - - - - - - -- - - - - - - - - - - - - - - -
9,061 - - - - - 9,061 9,360 - - 9,360 - - - - 9,360 103 1039,061 - - - - - 9,061 9,360 - - 9,360 - - - - 9,360 103 103
- - - - - - - - - - - - - - - -- - - - - - - - - - - - - - - -- - - - - - - - - - - - - - - -
807,085 - - - - - 807,085 814,692 4,372 20,452 839,516 - - - - 839,516 104 104
1,023,403 901,498 1,438,618 7,237,615 604,000 604,000 11,809,134 1,031,010 25,817 20,452 1,077,279 1,285,403 142,558 1,427,961 2,232,142 4,737,382 105 158 155 141 7,510,000 63
Forecasted (kWh)
Net Incremental 2020 Annual Energy Savings
Verified (kWh) Progress (%) 2015-2020 CFF LDC CDM Plan Allocated Target (kWh)
Progress versus Target (%)
Net Incremental 2020 Annual
Energy Savings
2015 2016 2017 2018 2019 2020 Total 2015 Verified
2015 Results
2016 Verified
2015 Results
Adjustments
2017 Verified
2015 Results
Adjustments
Total Verified
2015 Results
2016 Verified
2016 Results
2017 Verified
2016 Results
Adjustments
Total Verified
2016 Results
2017Verified
2017 Results
Total Total Verified
2015 Results
Total Verified
2016 Results
2017Verified
2017 Results
Total
12 - - - - - 12 12 1 - 13 56 6 62 48 123 108 1,025- - - - - - - - - - - - - - 40 40
17 - - - - - 17 17 - - 17 19 - 19 27 63 100 371- - 1 1 1 1 4 - - - - - - - - - - -- - - - - - - - - - - - - - 4 4
29 - 1 1 1 1 33 29 1 - 30 75 6 81 119 230 103 11,900 767
- - - - - - - - - - - - - - - -- - - - - - - - - - - 12 - 12 24 36- - - - - - - - - - - 28 10 38 40 78- - 1 1 1 1 4 - - - - - - - - - - -- - 1 1 1 1 4 - - - - - - - - - - -- - - - - - - - - - - - - - - -- - 1 1 1 1 4 - - - - - - - - - - -- - 1 1 1 1 4 - - - - - - - - - - -- - 1 1 1 1 4 - - - - - - - - - - -- - - - - - - - - - - - - - - -- - - - - - - - - - - - - - - -- - 5 5 5 5 20 - - - - 40 10 50 64 114 1,280 2,280
- - - - - - - - - - - - - - - -- - - - - - - - - - - - - - - -- - - - - - - - - - - - - - - -- - - - - - - - - - - - - - - -- - - - - - - - - - - - - - - -- - - - - - - - - - - - - - - -- - - - - - - - - - - - - - 60 60- - - - - - - - - - - - - - - -- - - - - - - - - - - - - - - -- - - - - - - - - - - - - - - -- - - - - - - - - - - - - - - -- - - - - - - - - - - - - - - -- - - - - - - - - - - - - - 60 60
- - - - - - - - - - - - - - - -- - - - - - - - - - - - - - - -- - - - - - - - - - - - - - - -- - - - - - - - - - - - - - - -- - - - - - - - - - - - - - - -- - - - - - - - - - - - - - - -- - - - - - - - - - - - - - - -- - - - - - - - - - - - - - - -- - - - - - - - - - - - - - - -- - - - - - - - - - - - - - - -- - - - - - - - - - - - - - - -- - - - - - - - - - - - - - - -- - - - - - - - - - - - - - - -- - - - - - - - - - - - - - - -- - - - - - - - - - - 8 - 8 - 8- - - - - - - - - - - - - - - -- - - - - - - - - - - - - - - -- - - - - - - - - - - - - - - -- - - - - - - - - - - - - - - -- - - - - - - - - - - - - - - -- - - - - - - - - - - - - - - -- - - - - - - - - - - - - - - -- - - - - - - - - - - 8 - 8 - 8
- - - - - - - - - - - - - - - -- - - - - - - - - - - - - - - -- - - - - - - - - - - - - - 5 5- - - - - - - - - - - - - - 5 5
- - - - - - - - - - - - - - - -- - - - - - - - - - - - - - - -- - - - - - - - - - - - - - - -- - - - - - - - - - - - - - - -
- - - - - - - - - - - - - - - -- - - - - - - - - - - - - - - -- - - - - - - - - - - - - - - -
29 - 6 6 6 6 53 29 1 - 30 123 16 139 248 417 103 4,133 1,191
- - - - - - - - - - - - - - - -- - - - - - - - - - - - - - - -- - - - - - - - - - - - - - - -- - - - - - - - - - - - - - - -- - - - - - - - - - - - - - - -- - - - - - - - - - - - - - - -- - - - - - - - - - - - - - - -- - - - - - - - - - - - - - - -
- - - - - - - - - - - - - - - -
- - - - - - - - - - - - - - - -10 - - - - - 10 4 - - 4 - - - - 4 40 40
- - - - - - - 6 - - 6 - - - - 626 - - - - - 26 26 1 - 27 - - - - 27 104 104
- - - - - - - - - - - - - - - -36 - - - - - 36 36 1 - 37 - - - - 37 103 103
- - - - - - - - - - - - - - - -4 - - - - - 4 4 3 1 8 - - - - 8 200 200
46 - - - - - 46 48 - 4 52 - - - - 52 113 113- - - - - - - - - - - - - - - -- - - - - - - - - - - - - - - -
50 - - - - - 50 52 3 5 60 - - - - 60 120 120
- - - - - - - - - - - - - - - -- - - - - - - - - - - - - - - -- - - - - - - - - - - - - - - -- - - - - - - - - - - - - - - -
1 - - - - - 1 1 - - 1 - - - - 1 100 1001 - - - - - 1 1 - - 1 - - - - 1 100 100
- - - - - - - - - - - - - - - -- - - - - - - - - - - - - - - -- - - - - - - - - - - - - - - -
87 - - - - - 87 89 4 5 98 - - - - 98 113 113
116 - 6 6 6 6 140 118 5 5 128 123 16 139 248 515 110 4,133 422
Forecasted (kW) Verified (kW) Progress (%)
Net Incremental 2020 Annual Peak Demand Savings Net Incremental 2020 Annual
Peak Demand Savings

2015 2016 2017 2018 2019 2020 Total 2015 Verified
2015 Results
2016 Verified
2015 Results
Adjustments
2017 Verified
2015 Results
Adjustments
Total Verified
2015 Results
2016 Verified
2016 Results
2017 Verified
2016 Results
Adjustments
Total Verified
2016 Results
2017Verified
2017 Results
Total Total Verified
2015 Results
Total Verified
2016 Results
2017Verified
2017 Results
Total
182,792 311,000 311,000 150,000 75,000 35,000 1,064,792 182,791 20,794 - 203,585 864,090 97,452 961,542 857,052 2,022,179 111 309 276 251- - - - - - - - - - - - - - 806,051 806,051
34,993 36,795 1,000 1,000 1,000 1,000 75,788 34,993 - - 34,993 69,942 - 69,942 101,120 206,055 100 190 10,112 283- - 1,000 1,000 1,000 1,000 4,000 - - - - - - - - - - -- 20,000 20,000 20,000 20,000 20,000 100,000 - - - - 6,792 - 6,792 51,754 58,546 34 259 146
217,785 367,795 333,000 172,000 97,000 57,000 1,244,580 217,784 20,794 - 238,578 940,824 97,452 1,038,276 1,815,977 3,092,831 110 282 545 337
- 1,000 1,000 1,000 1,000 1,000 5,000 - - - - - - - - - - - -- 130,000 500,000 6,580,000 328,000 417,000 7,955,000 - 1,013 - 1,013 111,513 1,032 112,545 223,856 337,414 87 45 54- 210,000 210,000 105,000 50,000 25,000 600,000 - - - - 133,383 44,976 178,359 195,332 373,691 85 93 89- - 1,000 1,000 1,000 1,000 4,000 - - - - - - - - - - -- - 1,000 1,000 1,000 1,000 4,000 - - - - - - - - - - -- - - - - - - - - - - - - - - -- - 1,000 1,000 1,000 1,000 4,000 - - - - - - - - - - -- - 1,000 1,000 1,000 1,000 4,000 - - - - - - - - - - -- - 1,000 1,000 1,000 1,000 4,000 - - - - - - - - - - -- - - - - - - - - - - - - - - -- - - - - - - - - - - - - - - -- 341,000 716,000 6,691,000 384,000 448,000 8,580,000 - 1,013 - 1,013 244,896 46,008 290,904 419,188 711,105 85 59 67
- - - - - - - - - - - - - - - -- - 36,000 138,000 120,000 96,000 390,000 - - - - - - - - - - -- - - - - - - - - - - - - - - -- - - - - - - - - - - - - - - -- - - - - - - - - - - - - - - -- - - - - - - - - - - - - - - -- - 350,618 233,615 - - 584,233 - - - - - - - 384,362 384,362 110 110- - - - - - - - - - - - - - - -- - - - - - - - - - - - - - - -- - - - - - - - - - - - - - - -- - - - - - - - - - - - - - - -- - - - - - - - - - - - - - - -- - 386,618 371,615 120,000 96,000 974,233 - - - - - - - 384,362 384,362 99 99
- - - - - - - - - - - - - - - -- - - - - - - - - - - - - - - -- - - - - - - - - - - - - - - -- - - - - - - - - - - - - - - -- - - - - - - - - - - - - - - -- - - - - - - - - - - - - - - -- - - - - - - - - - - - - - - -- - - - - - - - - - - - - - - -- - - - - - - - - - - - - - - -- - - - - - - - - - - - - - - -- - - - - - - - - - - - - - - -- - - - - - - - - - - - - - - -- - - - - - - - - - - - - - - -- - - - - - - - - - - - - - - -- 192,703 - - - - 192,703 - - - - 108,513 - 108,513 - 108,513 56 56- - - - - - - - - - - - - - - -- - - - - - - - - - - - - - - -- - - - - - - - - - - - - - - -- - - - - - - - - - - - - - - -- - - - - - - - - - - - - - - -- - - - - - - - - - - - - - - -- - - - - - - - - - - - - - - -- 192,703 - - - - 192,703 - - - - 108,513 - 108,513 - 108,513 56 56
- - 1,000 1,000 1,000 1,000 4,000 - - - - - - - - - - -- - 1,000 1,000 1,000 1,000 4,000 - - - - - - - - - - -- - 1,000 1,000 1,000 1,000 4,000 - - - - - - - 20,741 20,741 2,074 2,074- - 3,000 3,000 3,000 3,000 12,000 - - - - - - - 20,741 20,741 691 691
- - - - - - - - - - - - - - - -- - - - - - - - - - - - - - - -- - - - - - - - - - - - - - - -- - - - - - - - - - - - - - - -
- - - - - - - - - - - - - - - -- - - - - - - - - - - - - - - -- - - - - - - - - - - - - - - -
217,785 901,498 1,438,618 7,237,615 604,000 604,000 11,003,516 217,784 21,807 - 239,591 1,294,233 143,460 1,437,693 2,640,268 4,317,552 110 159 184 169
- - - - - - - - - - - - - - - -- - - - - - - - - - - - - - - -- - - - - - - - - - - - - - - -- - - - - - - - - - - - - - - -- - - - - - - - - - - - - - - -- - - - - - - - - - - - - - - -- - - - - - - - - - - - - - - -- - - - - - - - - - - - - - - -
- - - - - - - - - - - - - - - -
15,481 - - - - - 15,481 15,888 - - 15,888 - - - - 15,888 103 103136,872 - - - - - 136,872 56,071 497 - 56,568 - - - - 56,568 41 41
- - - - - - - 80,801 - - 80,801 - - - - 80,80152,693 - - - - - 52,693 52,693 2,058 - 54,751 - - - - 54,751 104 104
- - - - - - - - - - - - - - - -205,046 - - - - - 205,046 205,453 2,555 - 208,008 - - - - 208,008 101 101
- - - - - - - - - - - - - - - -407,941 - - - - - 407,941 407,941 1,850 1,237 411,028 - - - - 411,028 101 101368,957 - - - - - 368,957 368,957 - -164,022 204,935 - - - - 204,935 56 56
- - - - - - - - - - - - - - - -- - - - - - - - - - - - - - - -
776,898 - - - - - 776,898 776,898 1,850 -162,785 615,963 - - - - 615,963 79 79
- - - - - - - - - - - - - - - -- - - - - - - - - - - - - - - -- - - - - - - - - - - - - - - -- - - - - - - - - - - - - - - -
13,607 - - - - - 13,607 13,607 - - 13,607 - - - - 13,607 100 10013,607 - - - - - 13,607 13,607 - - 13,607 - - - - 13,607 100 100
- - - - - - - - - - - - - - - -- - - - - - - - - - - - - - - -- - - - - - - - - - - - - - - -
995,551 - - - - - 995,551 995,958 4,405 -162,785 837,578 - - - - 837,578 84 84
1,213,336 901,498 1,438,618 7,237,615 604,000 604,000 11,999,067 1,213,742 26,212 -162,785 1,077,169 1,294,233 143,460 1,437,693 2,640,268 5,155,130 89 159 184 145
Verified (kWh) Progress (%)Forecasted (kWh)
Net Incremental First Year Energy Savings Net Incremental
First Year Energy Savings

2015 2016 2017 2018 2019 2020 Total 2015 Verified
2015 Results
2016 Verified
2015 Results
Adjustments
2017 Verified
2015 Results
Adjustments
Total Verified
2015 Results
2016 Verified
2016 Results
2017 Verified
2016 Results
Adjustments
Total Verified
2016 Results
2017Verified
2017 Results
Total Total Verified
2015 Results
Total Verified
2016 Results
2017Verified
2017 Results
Total
12 - - - - - 12 12 1 - 13 56 6 62 60 135 108 1,125- - - - - - - - - - - - - - 55 55
17 - - - - - 17 17 - - 17 19 - 19 27 63 100 371- - 1 1 1 1 4 - - - - - - - - - - -- - - - - - - - - - - - - - 4 4
29 - 1 1 1 1 33 29 1 - 30 75 6 81 146 257 103 14,600 857
- - - - - - - - - - - - - - - -- - - - - - - - - - - 12 - 12 24 36- - - - - - - - - - - 28 10 38 42 80- - 1 1 1 1 4 - - - - - - - - - - -- - 1 1 1 1 4 - - - - - - - - - - -- - - - - - - - - - - - - - - -- - 1 1 1 1 4 - - - - - - - - - - -- - 1 1 1 1 4 - - - - - - - - - - -- - 1 1 1 1 4 - - - - - - - - - - -- - - - - - - - - - - - - - - -- - - - - - - - - - - - - - - -- - 5 5 5 5 20 - - - - 40 10 50 66 116 1,320 2,320
- - - - - - - - - - - - - - - -- - - - - - - - - - - - - - - -- - - - - - - - - - - - - - - -- - - - - - - - - - - - - - - -- - - - - - - - - - - - - - - -- - - - - - - - - - - - - - - -- - - - - - - - - - - - - - 60 60- - - - - - - - - - - - - - - -- - - - - - - - - - - - - - - -- - - - - - - - - - - - - - - -- - - - - - - - - - - - - - - -- - - - - - - - - - - - - - - -- - - - - - - - - - - - - - 60 60
- - - - - - - - - - - - - - - -- - - - - - - - - - - - - - - -- - - - - - - - - - - - - - - -- - - - - - - - - - - - - - - -- - - - - - - - - - - - - - - -- - - - - - - - - - - - - - - -- - - - - - - - - - - - - - - -- - - - - - - - - - - - - - - -- - - - - - - - - - - - - - - -- - - - - - - - - - - - - - - -- - - - - - - - - - - - - - - -- - - - - - - - - - - - - - - -- - - - - - - - - - - - - - - -- - - - - - - - - - - - - - - -- - - - - - - - - - - 8 - 8 - 8- - - - - - - - - - - - - - - -- - - - - - - - - - - - - - - -- - - - - - - - - - - - - - - -- - - - - - - - - - - - - - - -- - - - - - - - - - - - - - - -- - - - - - - - - - - - - - - -- - - - - - - - - - - - - - - -- - - - - - - - - - - 8 - 8 - 8
- - - - - - - - - - - - - - - -- - - - - - - - - - - - - - - -- - - - - - - - - - - - - - 5 5- - - - - - - - - - - - - - 5 5
- - - - - - - - - - - - - - - -- - - - - - - - - - - - - - - -- - - - - - - - - - - - - - - -- - - - - - - - - - - - - - - -
- - - - - - - - - - - - - - - -- - - - - - - - - - - - - - - -- - - - - - - - - - - - - - - -
29 - 6 6 6 6 53 29 1 - 30 123 16 139 277 446 103 4,617 1,274
- - - - - - - - - - - - - - - -- - - - - - - - - - - - - - - -- - - - - - - - - - - - - - - -- - - - - - - - - - - - - - - -- - - - - - - - - - - - - - - -- - - - - - - - - - - - - - - -- - - - - - - - - - - - - - - -- - - - - - - - - - - - - - - -
- - - - - - - - - - - - - - - -
2 - - - - - 2 2 - - 2 - - - - 2 100 10010 - - - - - 10 4 - - 4 - - - - 4 40 40
- - - - - - - 6 - - 6 - - - - 626 - - - - - 26 26 1 - 27 - - - - 27 104 104
- - - - - - - - - - - - - - - -38 - - - - - 38 38 1 - 39 - - - - 39 103 103
- - - - - - - - - - - - - - - -4 - - - - - 4 4 3 1 8 - - - - 8 200 200
84 - - - - - 84 84 - -38 46 - - - - 46 55 55- - - - - - - - - - - - - - - -- - - - - - - - - - - - - - - -
88 - - - - - 88 88 3 -37 54 - - - - 54 61 61
- - - - - - - - - - - - - - - -- - - - - - - - - - - - - - - -- - - - - - - - - - - - - - - -- - - - - - - - - - - - - - - -
1 - - - - - 1 1 - - 1 - - - - 1 100 1001 - - - - - 1 1 - - 1 - - - - 1 100 100
- - - - - - - - - - - - - - - -- - - - - - - - - - - - - - - -- - - - - - - - - - - - - - - -
127 - - - - - 127 127 4 -37 94 - - - - 94 74 74
156 - 6 6 6 6 180 156 5 -37 124 123 16 139 277 540 79 4,617 333
Verified (kW)
Net Incremental First Year Peak Demand Savings Net Incremental
First Year Peak
Demand Savings
Forecasted (kW) Progress (%)

2015 2016 2017 2018 2019 2020 Total 2015 Verified
2015 Results
2016 Verified
2015 Results
Adjustments
2017 Verified
2015 Results
Adjustments
Total Verified
2015 Results
2016 Verified
2016 Results
2017 Verified
2016 Results
Adjustments
Total Verified
2016 Results
2017Verified
2017 Results
Total Total Verified
2015 Results
Total Verified
2016 Results
2017Verified
2017 Results
Total
164 100 100 100 100 100 164 164 164 167 167 167 129 -0 67 29133
72 100 100 100 100 100 72 72 70 70 77 - -30 -23100 100 100 100
100 100 100 100 100 100 100 100 - -
100 100 100 100 100100 100 100 100 100 88 88 83 83 83 90 -17 -10100 100 100 100 100 89 89 89 93 -11 -7
100 100 100 100100 100 100 100
100 100 100 100100 100 100 100100 100 100 100
100 100 100 100
89 89 169 79
100 101 101 1
100 100 100 100100 100 100 100100 100 100 100 90 -10
47 47 47 -0164 164 165 164 0
164 16472 72 72 72 -0
88 88 69 149 88 094 94 94 94 -0
100 100 100 -
Net-to-Gross Adjustment - Energy Net-to-Gross
Adjustment - Energy
Forecasted (%) Verified (%) Comparison (%)
2015 2016 2017 2018 2019 2020 Total 2015 Verified
2015 Results
2016 Verified
2015 Results
Adjustments
2017 Verified
2015 Results
Adjustments
Total Verified
2015 Results
2016 Verified
2016 Results
2017 Verified
2016 Results
Adjustments
Total Verified
2016 Results
2017Verified
2017 Results
Total Total Verified
2015 Results
Total Verified
2016 Results
2017Verified
2017 Results
Total
171 171 100 163 165 150 163 130 -9134
71 71 71 68 68 77 -100 100 100 100
100
80 80 11485 83 84 93
100 100 100 100100 100 100 100
100 100 100 100100 100 100 100100 100 100 100
167
100 100
83
40 40 40 -167 200 200 33
150 15070 70 100 71 1
80 80 75 89 991 91 93 90 -1
100 100 100 -
Net-to-Gross
Adjustment - Peak
Demand
Net-to-Gross Adjustment - Peak Demand
Verified (%) Comparison (%)Forecasted (%)
2015 Verified
2015 Results
2016 Verified
2015 Results
Adjustments
2017 Verified
2015 Results
Adjustments
Total Verified
2015 Results
2016 Verified
2016 Results
2017 Verified
2016 Results
Adjustments
Total Verified
2016 Results
2017Verified
2017 Results
Total 2015 Verified
2015 Results
2016 Verified
2015 Results
Adjustments
2017 Verified
2015 Results
Adjustments
Total Verified
2015 Results
2016 Verified
2016 Results
2017 Verified
2016 Results
Adjustments
Total Verified
2016 Results
2017Verified
2017 Results
Total
100 100 100 164 175 165 273 100 100 100 162 200 165 27188 87
100 100 111 111 107 100 100 104 104 61
83 83 56 - - 7
117 117 85 85 111 83 83 11767 90 87 46 63 68
37 8
56 56 89 89
82
100 100 100 100100 100 100 100 100100 100 100 100100 116 101 100 100 100
119 74 118 125 100 11374 41 62 34
74 74 50 50
Realization Rate - Energy
Realization Rate - Peak
Demand
Realization Rate - Energy Realization Rate - Peak Demand
Verified (%) Verified (%)

2015 2016 2017 2018 2019 2020 Total 2015 Verified
2015 Results
2016 Verified
2015 Results
Adjustments
2017 Verified
2015 Results
Adjustments
Total Verified
2015 Results
2016 Verified
2016 Results
2017 Verified
2016 Results
Adjustments
Total Verified
2016 Results
2017Verified
2017 Results
Total Total Verified
2015 Results
Total Verified
2016 Results
2017Verified
2017 Results
Total
111,179 311,000 311,000 150,000 75,000 35,000 993,179 111,179 12,648 - 123,827 517,221 58,332 575,553 664,165 1,363,545 111 185 214 186- - - - - - - - - - - - - - 604,597 604,597
48,560 36,795 1,000 1,000 1,000 1,000 89,355 48,560 - - 48,560 99,872 - 99,872 131,091 279,523 100 271 13,109 324- - 1,000 1,000 1,000 1,000 4,000 - - - - - - - - - - -- 20,000 20,000 20,000 20,000 20,000 100,000 - - - - 6,792 - 6,792 51,754 58,546 34 259 146
159,739 367,795 333,000 172,000 97,000 57,000 1,186,534 159,739 12,648 - 172,387 623,885 58,332 682,217 1,451,607 2,306,211 108 185 436 268
- 1,000 1,000 1,000 1,000 1,000 5,000 - - - - - - - - - - - -- 130,000 500,000 6,580,000 328,000 417,000 7,955,000 - 1,151 - 1,151 134,920 1,249 136,169 249,147 386,467 105 50 61- 210,000 210,000 105,000 50,000 25,000 600,000 - - - - 150,231 50,658 200,889 209,163 410,052 96 100 98- - 1,000 1,000 1,000 1,000 4,000 - - - - - - - - - - -- - 1,000 1,000 1,000 1,000 4,000 - - - - - - - - - - -- - - - - - - - - - - - - - - -- - 1,000 1,000 1,000 1,000 4,000 - - - - - - - - - - -- - 1,000 1,000 1,000 1,000 4,000 - - - - - - - - - - -- - 1,000 1,000 1,000 1,000 4,000 - - - - - - - - - - -- - - - - - - - - - - - - - - -- - - - - - - - - - - - - - - -- 341,000 716,000 6,691,000 384,000 448,000 8,580,000 - 1,151 - 1,151 285,151 51,907 337,058 458,310 796,519 99 64 75
- - - - - - - - - - - - - - - -- - 36,000 138,000 120,000 96,000 390,000 - - - - - - - - - - -- - - - - - - - - - - - - - - -- - - - - - - - - - - - - - - -- - - - - - - - - - - - - - - -- - - - - - - - - - - - - - - -- - 392,190 261,315 - - 653,505 - - - - - - - 228,033 228,033 58 58- - - - - - - - - - - - - - - -- - - - - - - - - - - - - - - -- - - - - - - - - - - - - - - -- - - - - - - - - - - - - - - -- - - - - - - - - - - - - - - -- - 428,190 399,315 120,000 96,000 1,043,505 - - - - - - - 228,033 228,033 53 53
- - - - - - - - - - - - - - - -- - - - - - - - - - - - - - - -- - - - - - - - - - - - - - - -- - - - - - - - - - - - - - - -- - - - - - - - - - - - - - - -- - - - - - - - - - - - - - - -- - - - - - - - - - - - - - - -- - - - - - - - - - - - - - - -- - - - - - - - - - - - - - - -- - - - - - - - - - - - - - - -- - - - - - - - - - - - - - - -- - - - - - - - - - - - - - - -- - - - - - - - - - - - - - - -- - - - - - - - - - - - - - - -- 192,703 - - - - 192,703 - - - - 106,996 - 106,996 - 106,996 56 56- - - - - - - - - - - - - - - -- - - - - - - - - - - - - - - -- - - - - - - - - - - - - - - -- - - - - - - - - - - - - - - -- - - - - - - - - - - - - - - -- - - - - - - - - - - - - - - -- - - - - - - - - - - - - - - -- 192,703 - - - - 192,703 - - - - 106,996 - 106,996 - 106,996 56 56
- - 1,000 1,000 1,000 1,000 4,000 - - - - - - - - - - -- - 1,000 1,000 1,000 1,000 4,000 - - - - - - - - - - -- - 1,000 1,000 1,000 1,000 4,000 - - - - - - - 23,045 23,045 2,305 2,305- - 3,000 3,000 3,000 3,000 12,000 - - - - - - - 23,045 23,045 768 768
- - - - - - - - - - - - - - - -- - - - - - - - - - - - - - - -- - - - - - - - - - - - - - - -- - - - - - - - - - - - - - - -
- - - - - - - - - - - - - - - -- - - - - - - - - - - - - - - -- - - - - - - - - - - - - - - -
159,739 901,498 1,480,190 7,265,315 604,000 604,000 11,014,742 159,739 13,799 - 173,538 1,016,032 110,239 1,126,271 2,160,995 3,460,804 109 125 146 136
- - - - - - - - - - - - - - - -- - - - - - - - - - - - - - - -- - - - - - - - - - - - - - - -- - - - - - - - - - - - - - - -- - - - - - - - - - - - - - - -- - - - - - - - - - - - - - - -- - - - - - - - - - - - - - - -- - - - - - - - - - - - - - - -
- - - - - - - - - - - - - - - -
32,848 - - - - - 32,848 33,723 - - 33,723 - - - - 33,723 103 10383,249 - - - - - 83,249 34,104 302 - 34,406 - - - - 34,406 41 41
- - - - - - - 49,145 - - 49,145 - - - - 49,14573,122 - - - - - 73,122 73,122 2,856 - 75,978 - - - - 75,978 104 104
- - - - - - - - - - - - - - - -189,219 - - - - - 189,219 190,094 3,158 - 193,252 - - - - 193,252 102 102
- - - - - - - - - - - - - - - -464,890 - - - - - 464,890 464,890 2,677 830 468,397 - - - - 468,397 101 101394,161 - - - - - 394,161 394,161 - -175,226 218,935 - - - - 218,935 56 56
- - - - - - - - - - - - - - - -- - - - - - - - - - - - - - - -
859,051 - - - - - 859,051 859,051 2,677 -174,396 687,332 - - - - 687,332 80 80
- - - - - - - - - - - - - - - -- - - - - - - - - - - - - - - -- - - - - - - - - - - - - - - -- - - - - - - - - - - - - - - -
13,607 - - - - - 13,607 13,607 - - 13,607 - - - - 13,607 100 10013,607 - - - - - 13,607 13,607 - - 13,607 - - - - 13,607 100 100
- - - - - - - - - - - - - - - -- - - - - - - - - - - - - - - -- - - - - - - - - - - - - - - -
1,061,877 - - - - - 1,061,877 1,062,752 5,835 -174,396 894,191 - - - - 894,191 84 84
1,221,616 901,498 1,480,190 7,265,315 604,000 604,000 12,076,619 1,222,491 19,634 -174,396 1,067,729 1,016,032 110,239 1,126,271 2,160,995 4,354,995 87 125 146 121
Forecasted (kWh) Verified (kWh) Progress (%)
Gross Incremental
First Year Energy Savings
Gross Incremental First Year Energy Savings

2015 2016 2017 2018 2019 2020 Total 2015 Verified
2015 Results
2016 Verified
2015 Results
Adjustments
2017 Verified
2015 Results
Adjustments
Total Verified
2015 Results
2016 Verified
2016 Results
2017 Verified
2016 Results
Adjustments
Total Verified
2016 Results
2017Verified
2017 Results
Total Total Verified
2015 Results
Total Verified
2016 Results
2017Verified
2017 Results
Total
7 - - - - - 7 7 1 - 8 34 4 38 46 92 114 1,314- - - - - - - - - - - - - - 41 41
24 - - - - - 24 24 - - 24 28 - 28 35 87 100 363- - 1 1 1 1 4 - - - - - - - - - - -- - - - - - - - - - - - - - 4 4
31 - 1 1 1 1 35 31 1 - 32 62 4 66 126 224 103 12,600 700
- - - - - - - - - - - - - - - -- - - - - - - - - - - 15 - 15 21 36- - - - - - - - - - - 33 12 45 45 90- - 1 1 1 1 4 - - - - - - - - - - -- - 1 1 1 1 4 - - - - - - - - - - -- - - - - - - - - - - - - - - -- - 1 1 1 1 4 - - - - - - - - - - -- - 1 1 1 1 4 - - - - - - - - - - -- - 1 1 1 1 4 - - - - - - - - - - -- - - - - - - - - - - - - - - -- - - - - - - - - - - - - - - -- - 5 5 5 5 20 - - - - 48 12 60 66 126 1,320 2,520
- - - - - - - - - - - - - - - -- - - - - - - - - - - - - - - -- - - - - - - - - - - - - - - -- - - - - - - - - - - - - - - -- - - - - - - - - - - - - - - -- - - - - - - - - - - - - - - -- - - - - - - - - - - - - - 36 36- - - - - - - - - - - - - - - -- - - - - - - - - - - - - - - -- - - - - - - - - - - - - - - -- - - - - - - - - - - - - - - -- - - - - - - - - - - - - - - -- - - - - - - - - - - - - - 36 36
- - - - - - - - - - - - - - - -- - - - - - - - - - - - - - - -- - - - - - - - - - - - - - - -- - - - - - - - - - - - - - - -- - - - - - - - - - - - - - - -- - - - - - - - - - - - - - - -- - - - - - - - - - - - - - - -- - - - - - - - - - - - - - - -- - - - - - - - - - - - - - - -- - - - - - - - - - - - - - - -- - - - - - - - - - - - - - - -- - - - - - - - - - - - - - - -- - - - - - - - - - - - - - - -- - - - - - - - - - - - - - - -- - - - - - - - - - - 8 - 8 - 8- - - - - - - - - - - - - - - -- - - - - - - - - - - - - - - -- - - - - - - - - - - - - - - -- - - - - - - - - - - - - - - -- - - - - - - - - - - - - - - -- - - - - - - - - - - - - - - -- - - - - - - - - - - - - - - -- - - - - - - - - - - 8 - 8 - 8
- - - - - - - - - - - - - - - -- - - - - - - - - - - - - - - -- - - - - - - - - - - - - - 6 6- - - - - - - - - - - - - - 6 6
- - - - - - - - - - - - - - - -- - - - - - - - - - - - - - - -- - - - - - - - - - - - - - - -- - - - - - - - - - - - - - - -
- - - - - - - - - - - - - - - -- - - - - - - - - - - - - - - -- - - - - - - - - - - - - - - -
31 - 6 6 6 6 55 31 1 - 32 118 16 134 234 400 103 3,900 1,081
- - - - - - - - - - - - - - - -- - - - - - - - - - - - - - - -- - - - - - - - - - - - - - - -- - - - - - - - - - - - - - - -- - - - - - - - - - - - - - - -- - - - - - - - - - - - - - - -- - - - - - - - - - - - - - - -- - - - - - - - - - - - - - - -
- - - - - - - - - - - - - - - -
5 - - - - - 5 5 - - 5 - - - - 5 100 1006 - - - - - 6 2 - - 2 - - - - 2 33 33
- - - - - - - 4 - - 4 - - - - 437 - - - - - 37 37 1 - 38 - - - - 38 103 103
- - - - - - - - - - - - - - - -48 - - - - - 48 48 1 - 49 - - - - 49 102 102
- - - - - - - - - - - - - - - -5 - - - - - 5 5 4 - 9 - - - - 9 180 180
92 - - - - - 92 92 - -41 51 - - - - 51 55 55- - - - - - - - - - - - - - - -- - - - - - - - - - - - - - - -
97 - - - - - 97 97 4 -41 60 - - - - 60 62 62
- - - - - - - - - - - - - - - -- - - - - - - - - - - - - - - -- - - - - - - - - - - - - - - -- - - - - - - - - - - - - - - -
1 - - - - - 1 1 - - 1 - - - - 1 100 1001 - - - - - 1 1 - - 1 - - - - 1 100 100
- - - - - - - - - - - - - - - -- - - - - - - - - - - - - - - -- - - - - - - - - - - - - - - -
146 - - - - - 146 146 5 -41 110 - - - - 110 75 75
177 - 6 6 6 6 201 177 6 -41 142 118 16 134 234 510 80 3,900 279
Gross Incremental First Year Peak Demand Savings
Verified (kW) Progress (%)
Gross Incremental
First Year Peak
Demand Savings
Savings GroupForecasted (kW)

2015 2016 2017 2018 2019 2020 Total 2015 Verified
2015 Results
2016 Verified
2015 Results
Adjustments
2017 Verified
2015 Results
Adjustments
Total Verified
2015 Results
2016 Verified
2016 Results
2017 Verified
2016 Results
Adjustments
Total Verified
2016 Results
2017Verified
2017 Results
Total Total Verified
2015 Results
Total Verified
2016 Results
2017Verified
2017 Results
Total
33,579 42,539 50,071 24,150 12,075 5,635 168,049 22,371 - - 22,371 49,617 - 49,617 113,155 185,143 67 117 226 147- - - - - - - - - - - - - - 27,734 27,734
8,500 18,800 511 511 511 511 29,344 8,500 - - 8,500 15,050 - 15,050 25,550 49,100 100 80 5,000 177- - 1 1 1 1 4 - - - - - - - - - - -- 1,166 8,000 8,000 8,000 8,000 33,166 - - - - 1,167 - 1,167 25,942 27,109 100 324 296
42,079 62,505 58,583 32,662 20,587 14,147 230,563 30,871 - - 30,871 65,834 - 65,834 192,381 289,086 73 105 328 177
- - 1 1 1 1 4 - - - - - - - - - - -- 15,951 50,000 592,200 33 42 658,226 - - - - 15,952 - 15,952 22,861 38,813 100 46 59- 34,027 33,600 16,800 8,000 4,000 96,427 - - - - 34,027 - 34,027 31,503 65,530 100 94 97- - 1 1 1 1 4 - - - - - - - - - - -- - 1 1 1 1 4 - - - - - - - - - - -- - - - - - - - - - - - - - - -- - 1 1 1 1 4 - - - - - - - - - - -- - 1 1 1 1 4 - - - - - - - - - - -- - 1 1 1 1 4 - - - - - - - - - - -- - - - - - - - - - - - - - - -- - - - - - - - - - - - - - - -- 49,978 83,606 609,006 8,039 4,048 754,677 - - - - 49,979 - 49,979 54,364 104,343 100 65 78
- - - - - - - - - - - - - - - -- - 10,800 41,400 36,000 28,800 117,000 - - - - - - - - - - -- - - - - - - - - - - - - - - -- - - - - - - - - - - - - - - -- - - - - - - - - - - - - - - -- - - - - - - - - - - - - - - -- - 18,419 12,272 - - 30,691 - - - - - - - 29,007 29,007 157 157- - - - - - - - - - - - - - - -- - - - - - - - - - - - - - - -- - - - - - - - - - - - - - - -- - - - - - - - - - - - - - - -- - - - - - - - - - - - - - - -- - 29,219 53,672 36,000 28,800 147,691 - - - - - - - 29,007 29,007 99 99
- - - - - - - - - - - - - - - -- - - - - - - - - - - - - - - -- - - - - - - - - - - - - - - -- - - - - - - - - - - - - - - -- - - - - - - - - - - - - - - -- - - - - - - - - - - - - - - -- - - - - - - - - - - - - - - -- - - - - - - - - - - - - - - -- - - - - - - - - - - - - - - -- - - - - - - - - - - - - - - -- - - - - - - - - - - - - - - -- - - - - - - - - - - - - - - -- - - - - - - - - - - - - - - -- - - - - - - - - - - - - - - -- - - - - - - - - - - - - - - -- - - - - - - - - - - - - - - -- - - - - - - - - - - - - - - -- - - - - - - - - - - - - - - -- - - - - - - - - - - - - - - -- - - - - - - - - - - - - - - -- - - - - - - - - - - - - - - -- - - - - - - - - - - - - - - -- - - - - - - - - - - - - - - -
- - - - - - - - - - - - - - - -- - - - - - - - - - - - - - - -- - - - - - - - - - - - - - - -- - - - - - - - - - - - - - - -
- - - - - - - - - - - - - - - -- - - - - - - - - - - - - - - -- - - - - - - - - - - - - - - -- - - - - - - - - - - - - - - -
- - - - - - - - - - - - - - - -- - - - - - - - - - - - - - - -- - - - - - - - - - - - - - - -
42,079 112,483 171,408 695,340 64,626 46,995 1,132,931 30,871 - - 30,871 115,813 - 115,813 275,752 422,436 73 103 161 130
- - - - - - - - - - - - - - - -- - - - - - - - - - - - - - - -- - - - - - - - - - - - - - - -- - - - - - - - - - - - - - - -- - - - - - - - - - - - - - - -- - - - - - - - - - - - - - - -- - - - - - - - - - - - - - - -- - - - - - - - - - - - - - - -
- - - - - - - - - - - - - - - -
- - - - - - - - - - - - - - - -- - - - - - - - - - - - - - - -- - - - - - - - - - - - - - - -- - - - - - - - - - - - - - - -- - - - - - - - - - - - - - - -- - - - - - - - - - - - - - - -
- - - - - - - - - - - - - - - -- - - - - - - - - - - - - - - -- - - - - - - - - - - - - - - -- - - - - - - - - - - - - - - -- - - - - - - - - - - - - - - -- - - - - - - - - - - - - - - -
- - - - - - - - - - - - - - - -- - - - - - - - - - - - - - - -- - - - - - - - - - - - - - - -- - - - - - - - - - - - - - - -
- - - - - - - - - - - - - - - -- - - - - - - - - - - - - - - -
- - - - - - - - - - - - - - - -- - - - - - - - - - - - - - - -- - - - - - - - - - - - - - - -
- - - - - - - - - - - - - - - -
42,079 112,483 171,408 695,340 64,626 46,995 1,132,931 30,871 - - 30,871 115,813 - 115,813 275,752 422,436 73 103 161 130
Participant Incentive Spending
Forecasted ($) Verified ($)
Participant Incentive Spending
Progress (%)

2015 2016 2017 2018 2019 2020 Total 2015 Verified
2015 Results
2016 Verified
2015 Results
Adjustments
2017 Verified
2015 Results
Adjustments
Total Verified
2015 Results
2016 Verified
2016 Results
2017 Verified
2016 Results
Adjustments
Total Verified
2016 Results
2017Verified
2017 Results
Total Total Verified
2015 Results
Total Verified
2016 Results
2017Verified
2017 Results
Total
- 42,164 9,500 9,500 9,500 9,500 80,164 - 3,623 - 3,623 24,840 - 24,840 21,592 50,055 59 227 97- - - - - - - - - - - - - - - -- 16,244 9,500 9,500 9,500 9,500 54,244 - 3,623 - 3,623 12,622 - 12,622 6,976 23,221 78 73 90- - 3,750 3,750 3,750 3,750 15,000 - - - - - - - 5,789 5,789 154 154- 15,811 10,700 12,350 12,350 12,350 63,561 - 3,538 - 3,538 12,273 - 12,273 13,468 29,279 78 126 110- 74,219 33,450 35,100 35,100 35,100 212,969 - 10,784 - 10,784 49,735 - 49,735 47,825 108,344 67 143 101
- 3,829 4,750 4,750 4,750 4,750 22,829 - 851 - 851 2,978 - 2,978 3,656 7,485 78 77 87- 161,555 165,200 166,100 168,200 168,200 829,255 - 34,740 - 34,740 126,815 1,050 127,865 106,920 269,525 79 65 82- 53,837 20,250 19,250 18,250 17,250 128,837 - 12,224 - 12,224 41,613 - 41,613 29,280 83,117 77 145 112- - 3,750 3,750 3,750 3,750 15,000 - - - - - - - 3,456 3,456 92 92- - 3,750 3,750 3,750 3,750 15,000 - - - - - - - 2,698 2,698 72 72- - - - - - - - - - - - - - 4,155 4,155- 1,352 4,750 4,750 4,750 4,750 20,352 - 1,352 - 1,352 - - - 3,109 4,461 - 65 73- - 3,750 3,750 3,750 3,750 15,000 - - - - - - - 2,946 2,946 79 79- - 3,750 3,750 3,750 3,750 15,000 - - - - - - - 2,830 2,830 75 75- - - - - - - - - - - - - - - -- - - - - - - - - - - - - - - -- 220,573 209,950 209,850 210,950 209,950 1,061,273 - 49,167 - 49,167 171,406 1,050 172,456 159,050 380,673 78 76 88
- - - - - - - - - - - - - - - -- - 7,550 12,650 11,750 10,550 42,500 - - - - - - - - - - -- - - - - - - - - - - - - - - -- - - - - - - - - - - - - - - -- - - - - - - - - - - - - - - -- - - - - - - - - - - - - - - -- 1,449 10,400 4,040 - - 15,889 - - - - 1,449 - 1,449 7,022 8,471 100 68 71- - - - - - - - - - - - - - - -- - - - - - - - - - - - - - - -- - - - - - - - - - - - - - - -- - - - - - - - - - - - - - - -- - - - - - - - - - - - - - - -- 1,449 17,950 16,690 11,750 10,550 58,389 - - - - 1,449 - 1,449 7,022 8,471 100 39 44
- - - - - - - - - - - - - - - -- - - - - - - - - - - - - - - -- - - - - - - - - - - - - - - -- - - - - - - - - - - - - - - -- - - - - - - - - - - - - - - -- - - - - - - - - - - - - - - -- - - - - - - - - - - - - - - -- - - - - - - - - - - - - - - -- - - - - - - - - - - - - - - -- - - - - - - - - - - - - - - -- - - - - - - - - - - - - - - -- - - - - - - - - - - - - - - -- - - - - - - - - - - - - - - -- - - - - - - - - - - - - - - -- - - - - - - - - - - - - - - -- - - - - - - - - - - - - - - -- - - - - - - - - - - - - - - -- - - - - - - - - - - - - - - -- - - - - - - - - - - - - - - -- - - - - - - - - - - - - - - -- - - - - - - - - - - - - - - -- - - - - - - - - - - - - - - -- - - - - - - - - - - - - - - -
- - - - - - - - - - - - - - - -- - - - - - - - - - - - - - - -- - - - - - - - - - - - - - - -- - - - - - - - - - - - - - - -
- - - - - - - - - - - - - - - -- - - - - - - - - - - - - - - -- - - - - - - - - - - - - - - -- - - - - - - - - - - - - - - -
- - - - - - - - - - - - - - - -- - - - - - - - - - - - - - - -- - - - - - - - - - - - - - - -
- 296,241 261,350 261,640 257,800 255,600 1,332,631 - 59,951 - 59,951 222,590 1,050 223,640 213,897 497,488 75 82 89
- - - - - - - - - - - - - - - -- - - - - - - - - - - - - - - -- - - - - - - - - - - - - - - -- - - - - - - - - - - - - - - -- - - - - - - - - - - - - - - -- - - - - - - - - - - - - - - -- - - - - - - - - - - - - - - -- - - - - - - - - - - - - - - -
- - - - - - - - - - - - - - - -
- - - - - - - - - - - - - - - -- - - - - - - - - - - - - - - -- - - - - - - - - - - - - - - -- - - - - - - - - - - - - - - -- - - - - - - - - - - - - - - -- - - - - - - - - - - - - - - -
- - - - - - - - - - - - - - - -- - - - - - - - - - - - - - - -- - - - - - - - - - - - - - - -- - - - - - - - - - - - - - - -- - - - - - - - - - - - - - - -- - - - - - - - - - - - - - - -
- - - - - - - - - - - - - - - -- - - - - - - - - - - - - - - -- - - - - - - - - - - - - - - -- - - - - - - - - - - - - - - -
- - - - - - - - - - - - - - - -- - - - - - - - - - - - - - - -
- - - - - - - - - - - - - - - -- - - - - - - - - - - - - - - -- - - - - - - - - - - - - - - -
- - - - - - - - - - - - - - - -
- 296,241 261,350 261,640 257,800 255,600 1,332,631 - 59,951 - 59,951 222,590 1,050 223,640 213,897 497,488 75 82 89
LDC Administrative Expense Spending
Verified ($) Progress (%)Forecasted ($)
LDC Administrative
Expense Spending
2015 2016 2017 2018 2019 2020 Total 2015 Verified
2015 Results
2016 Verified
2015 Results
Adjustments
2017 Verified
2015 Results
Adjustments
Total Verified
2015 Results
2016 Verified
2016 Results
2017 Verified
2016 Results
Adjustments
Total Verified
2016 Results
2017Verified
2017 Results
Total Total Verified
2015 Results
Total Verified
2016 Results
2017Verified
2017 Results
Total
4,685 - - - - - 4,685 8,008 - - 8,008 5,693 - 5,693 10,362 24,063 171 514- - - - - - - - - - - - - - 1,299 1,299166 - - - - - 166 442 - - 442 741 - 741 1,351 2,534 266 1,527- - - - - - - - - - - - - - - -- - - - - - - - - - - - - - - -
4,851 - - - - - 4,851 8,450 - - 8,450 6,434 - 6,434 13,012 27,896 174 575
- - - - - - - - - - - - - - - -- - - - - - - - - - - - - - - -- - - - - - - - - - - - - - - -- - - - - - - - - - - - - - - -- - - - - - - - - - - - - - - -- - - - - - - - - - - - - - - -- - - - - - - - - - - - - - - -- - - - - - - - - - - - - - - -- - - - - - - - - - - - - - - -- - - - - - - - - - - - - - - -- - - - - - - - - - - - - - - -- - - - - - - - - - - - - - - -
- - - - - - - - - - - - - - - -- - - - - - - - - - - - - - - -- - - - - - - - - - - - - - - -- - - - - - - - - - - - - - - -- - - - - - - - - - - - - - - -- - - - - - - - - - - - - - - -- - - - - - - - - - - - - - - -- - - - - - - - - - - - - - - -- - - - - - - - - - - - - - - -- - - - - - - - - - - - - - - -- - - - - - - - - - - - - - - -- - - - - - - - - - - - - - - -- - - - - - - - - - - - - - - -
- - - - - - - - - - - - - - - -- - - - - - - - - - - - - - - -- - - - - - - - - - - - - - - -- - - - - - - - - - - - - - - -- - - - - - - - - - - - - - - -- - - - - - - - - - - - - - - -- - - - - - - - - - - - - - - -- - - - - - - - - - - - - - - -- - - - - - - - - - - - - - - -- - - - - - - - - - - - - - - -- - - - - - - - - - - - - - - -- - - - - - - - - - - - - - - -- - - - - - - - - - - - - - - -- - - - - - - - - - - - - - - -- - - - - - - - - - - - - - - -- - - - - - - - - - - - - - - -- - - - - - - - - - - - - - - -- - - - - - - - - - - - - - - -- - - - - - - - - - - - - - - -- - - - - - - - - - - - - - - -- - - - - - - - - - - - - - - -- - - - - - - - - - - - - - - -- - - - - - - - - - - - - - - -
- - - - - - - - - - - - - - - -- - - - - - - - - - - - - - - -- - - - - - - - - - - - - - - -- - - - - - - - - - - - - - - -
- - - - - - - - - - - - - - - -- - - - - - - - - - - - - - - -- - - - - - - - - - - - - - - -- - - - - - - - - - - - - - - -
- - - - - - - - - - - - - - - -- - - - - - - - - - - - - - - -- - - - - - - - - - - - - - - -
4,851 - - - - - 4,851 8,450 - - 8,450 6,434 - 6,434 13,012 27,896 174 575
- - - - - - - - - - - - - - - -- - - - - - - - - - - - - - - -- - - - - - - - - - - - - - - -- - - - - - - - - - - - - - - -- - - - - - - - - - - - - - - -- - - - - - - - - - - - - - - -- - - - - - - - - - - - - - - -- - - - - - - - - - - - - - - -
- - - - - - - - - - - - - - - -
- - - - - - - - - - - - - - - -- - - - - - - - - - - - - - - -- - - - - - - - - - - - - - - -- - - - - - - - - - - - - - - -- - - - - - - - - - - - - - - -- - - - - - - - - - - - - - - -
- - - - - - - - - - - - - - - -- - - - - - - - - - - - - - - -- - - - - - - - - - - - - - - -- - - - - - - - - - - - - - - -- - - - - - - - - - - - - - - -- - - - - - - - - - - - - - - -
- - - - - - - - - - - - - - - -- - - - - - - - - - - - - - - -- - - - - - - - - - - - - - - -- - - - - - - - - - - - - - - -
- - - - - - - - - - - - - - - -- - - - - - - - - - - - - - - -
- - - - - - - - - - - - - - - -- - - - - - - - - - - - - - - -- - - - - - - - - - - - - - - -
- - - - - - - - - - - - - - - -
4,851 - - - - - 4,851 8,450 - - 8,450 6,434 - 6,434 13,012 27,896 174 575
IESO Value Added Service Provider Cost / Variable Program Cost Administrative Expense Spending
Forecasted ($) Verified ($)
IESO Value Added Service Provider Cost / Variable Program Cost
Administrative Expense Spending
Progress (%)

2015 2016 2017 2018 2019 2020 Total 2015 Verified
2015 Results
2016 Verified
2015 Results
Adjustments
2017 Verified
2015 Results
Adjustments
Total Verified
2015 Results
2016 Verified
2016 Results
2017 Verified
2016 Results
Adjustments
Total Verified
2016 Results
2017Verified
2017 Results
Total Total Verified
2015 Results
Total Verified
2016 Results
2017Verified
2017 Results
Total
4,685 42,164 9,500 9,500 9,500 9,500 84,849 8,008 3,623 - 11,631 30,533 - 30,533 31,954 74,118 248 72 336 132- - - - - - - - - - - - - - 1,299 1,299166 16,244 9,500 9,500 9,500 9,500 54,410 442 3,623 - 4,065 13,363 - 13,363 8,327 25,755 2,449 82 88 99- - 3,750 3,750 3,750 3,750 15,000 - - - - - - - 5,789 5,789 154 154- 15,811 10,700 12,350 12,350 12,350 63,561 - 3,538 - 3,538 12,273 - 12,273 13,468 29,279 78 126 110
4,851 74,219 33,450 35,100 35,100 35,100 217,820 8,450 10,784 - 19,234 56,169 - 56,169 60,837 136,240 396 76 182 121
- 3,829 4,750 4,750 4,750 4,750 22,829 - 851 - 851 2,978 - 2,978 3,656 7,485 78 77 87- 161,555 165,200 166,100 168,200 168,200 829,255 - 34,740 - 34,740 126,815 1,050 127,865 106,920 269,525 79 65 82- 53,837 20,250 19,250 18,250 17,250 128,837 - 12,224 - 12,224 41,613 - 41,613 29,280 83,117 77 145 112- - 3,750 3,750 3,750 3,750 15,000 - - - - - - - 3,456 3,456 92 92- - 3,750 3,750 3,750 3,750 15,000 - - - - - - - 2,698 2,698 72 72- - - - - - - - - - - - - - 4,155 4,155- 1,352 4,750 4,750 4,750 4,750 20,352 - 1,352 - 1,352 - - - 3,109 4,461 - 65 73- - 3,750 3,750 3,750 3,750 15,000 - - - - - - - 2,946 2,946 79 79- - 3,750 3,750 3,750 3,750 15,000 - - - - - - - 2,830 2,830 75 75- - - - - - - - - - - - - - - -- - - - - - - - - - - - - - - -- 220,573 209,950 209,850 210,950 209,950 1,061,273 - 49,167 - 49,167 171,406 1,050 172,456 159,050 380,673 78 76 88
- - - - - - - - - - - - - - - -- - 7,550 12,650 11,750 10,550 42,500 - - - - - - - - - - -- - - - - - - - - - - - - - - -- - - - - - - - - - - - - - - -- - - - - - - - - - - - - - - -- - - - - - - - - - - - - - - -- 1,449 10,400 4,040 - - 15,889 - - - - 1,449 - 1,449 7,022 8,471 100 68 71- - - - - - - - - - - - - - - -- - - - - - - - - - - - - - - -- - - - - - - - - - - - - - - -- - - - - - - - - - - - - - - -- - - - - - - - - - - - - - - -- 1,449 17,950 16,690 11,750 10,550 58,389 - - - - 1,449 - 1,449 7,022 8,471 100 39 44
- - - - - - - - - - - - - - - -- - - - - - - - - - - - - - - -- - - - - - - - - - - - - - - -- - - - - - - - - - - - - - - -- - - - - - - - - - - - - - - -- - - - - - - - - - - - - - - -- - - - - - - - - - - - - - - -- - - - - - - - - - - - - - - -- - - - - - - - - - - - - - - -- - - - - - - - - - - - - - - -- - - - - - - - - - - - - - - -- - - - - - - - - - - - - - - -- - - - - - - - - - - - - - - -- - - - - - - - - - - - - - - -- - - - - - - - - - - - - - - -- - - - - - - - - - - - - - - -- - - - - - - - - - - - - - - -- - - - - - - - - - - - - - - -- - - - - - - - - - - - - - - -- - - - - - - - - - - - - - - -- - - - - - - - - - - - - - - -- - - - - - - - - - - - - - - -- - - - - - - - - - - - - - - -
- - - - - - - - - - - - - - - -- - - - - - - - - - - - - - - -- - - - - - - - - - - - - - - -- - - - - - - - - - - - - - - -
- - - - - - - - - - - - - - - -- - - - - - - - - - - - - - - -- - - - - - - - - - - - - - - -- - - - - - - - - - - - - - - -
- - - - - - - - - - - - - - - -- - - - - - - - - - - - - - - -- - - - - - - - - - - - - - - -
4,851 296,241 261,350 261,640 257,800 255,600 1,337,482 8,450 59,951 - 68,401 229,024 1,050 230,074 226,909 525,384 1,410 78 87 93
- - - - - - - - - - - - - - - -- - - - - - - - - - - - - - - -- - - - - - - - - - - - - - - -- - - - - - - - - - - - - - - -- - - - - - - - - - - - - - - -- - - - - - - - - - - - - - - -- - - - - - - - - - - - - - - -- - - - - - - - - - - - - - - -
- - - - - - - - - - - - - - - -
- - - - - - - - - - - - - - - -- - - - - - - - - - - - - - - -- - - - - - - - - - - - - - - -- - - - - - - - - - - - - - - -- - - - - - - - - - - - - - - -- - - - - - - - - - - - - - - -
- - - - - - - - - - - - - - - -- - - - - - - - - - - - - - - -- - - - - - - - - - - - - - - -- - - - - - - - - - - - - - - -- - - - - - - - - - - - - - - -- - - - - - - - - - - - - - - -
- - - - - - - - - - - - - - - -- - - - - - - - - - - - - - - -- - - - - - - - - - - - - - - -- - - - - - - - - - - - - - - -
- - - - - - - - - - - - - - - -- - - - - - - - - - - - - - - -
- - - - - - - - - - - - - - - -- - - - - - - - - - - - - - - -- - - - - - - - - - - - - - - -
- - - - - - - - - - - - - - - -
4,851 296,241 261,350 261,640 257,800 255,600 1,337,482 8,450 59,951 - 68,401 229,024 1,050 230,074 226,909 525,384 1,410 78 87 93
Total Administrative Expense Spending
Progress (%)
Total Administrative
Expense Spending
Forecasted ($) Verified ($)

2015 2016 2017 2018 2019 2020 Total 2015 Verified
2015 Results
2016 Verified
2015 Results
Adjustments
2017 Verified
2015 Results
Adjustments
Total Verified
2015 Results
2016 Verified
2016 Results
2017 Verified
2016 Results
Adjustments
Total Verified
2016 Results
2017Verified
2017 Results
Total Total Verified
2015 Results
Total Verified
2016 Results
2017Verified
2017 Results
Total
38,264 84,703 59,571 33,650 21,575 15,135 252,898 30,379 3,623 - 34,002 80,150 - 80,150 145,109 259,261 89 95 244 142- - - - - - - - - - - - - - 29,033 29,033
8,666 35,044 10,011 10,011 10,011 10,011 83,754 8,942 3,623 - 12,565 28,413 - 28,413 33,877 74,855 145 81 338 139- - 3,751 3,751 3,751 3,751 15,004 - - - - - - - 5,789 5,789 154 154- 16,977 18,700 20,350 20,350 20,350 96,727 - 3,538 - 3,538 13,440 - 13,440 39,410 56,388 79 211 158
46,930 136,724 92,033 67,762 55,687 49,247 448,383 39,321 10,784 - 50,105 122,003 - 122,003 253,218 425,326 107 89 275 154
- 3,829 4,751 4,751 4,751 4,751 22,833 - 851 - 851 2,978 - 2,978 3,656 7,485 78 77 87- 177,506 215,200 758,300 168,233 168,242 1,487,481 - 34,740 - 34,740 142,767 1,050 143,817 129,781 308,338 81 60 79- 87,864 53,850 36,050 26,250 21,250 225,264 - 12,224 - 12,224 75,640 - 75,640 60,783 148,647 86 113 105- - 3,751 3,751 3,751 3,751 15,004 - - - - - - - 3,456 3,456 92 92- - 3,751 3,751 3,751 3,751 15,004 - - - - - - - 2,698 2,698 72 72- - - - - - - - - - - - - - 4,155 4,155- 1,352 4,751 4,751 4,751 4,751 20,356 - 1,352 - 1,352 - - - 3,109 4,461 - 65 73- - 3,751 3,751 3,751 3,751 15,004 - - - - - - - 2,946 2,946 79 79- - 3,751 3,751 3,751 3,751 15,004 - - - - - - - 2,830 2,830 75 75- - - - - - - - - - - - - - - -- - - - - - - - - - - - - - - -- 270,551 293,556 818,856 218,989 213,998 1,815,950 - 49,167 - 49,167 221,385 1,050 222,435 213,414 485,016 82 73 86
- - - - - - - - - - - - - - - -- - 18,350 54,050 47,750 39,350 159,500 - - - - - - - - - - -- - - - - - - - - - - - - - - -- - - - - - - - - - - - - - - -- - - - - - - - - - - - - - - -- - - - - - - - - - - - - - - -- 1,449 28,819 16,312 - - 46,580 - - - - 1,449 - 1,449 36,029 37,478 100 125 124- - - - - - - - - - - - - - - -- - - - - - - - - - - - - - - -- - - - - - - - - - - - - - - -- - - - - - - - - - - - - - - -- - - - - - - - - - - - - - - -- 1,449 47,169 70,362 47,750 39,350 206,080 - - - - 1,449 - 1,449 36,029 37,478 100 76 77
- - - - - - - - - - - - - - - -- - - - - - - - - - - - - - - -- - - - - - - - - - - - - - - -- - - - - - - - - - - - - - - -- - - - - - - - - - - - - - - -- - - - - - - - - - - - - - - -- - - - - - - - - - - - - - - -- - - - - - - - - - - - - - - -- - - - - - - - - - - - - - - -- - - - - - - - - - - - - - - -- - - - - - - - - - - - - - - -- - - - - - - - - - - - - - - -- - - - - - - - - - - - - - - -- - - - - - - - - - - - - - - -- - - - - - - - - - - - - - - -- - - - - - - - - - - - - - - -- - - - - - - - - - - - - - - -- - - - - - - - - - - - - - - -- - - - - - - - - - - - - - - -- - - - - - - - - - - - - - - -- - - - - - - - - - - - - - - -- - - - - - - - - - - - - - - -- - - - - - - - - - - - - - - -
- - - - - - - - - - - - - - - -- - - - - - - - - - - - - - - -- - - - - - - - - - - - - - - -- - - - - - - - - - - - - - - -
- - - - - - - - - - - - - - - -- - - - - - - - - - - - - - - -- - - - - - - - - - - - - - - -- - - - - - - - - - - - - - - -
- - - - - - - - - - - - - - - -- - - - - - - - - - - - - - - -- - - - - - - - - - - - - - - -
46,930 408,724 432,758 956,980 322,426 302,595 2,470,413 39,321 59,951 - 99,272 344,837 1,050 345,887 502,661 947,820 212 85 116 107
- - - - - - - - - - - - - - - -- - - - - - - - - - - - - - - -- - - - - - - - - - - - - - - -- - - - - - - - - - - - - - - -- - - - - - - - - - - - - - - -- - - - - - - - - - - - - - - -- - - - - - - - - - - - - - - -- - - - - - - - - - - - - - - -
- - - - - - - - - - - - - - - -
- - - - - - - - - - - - - - - -- - - - - - - - - - - - - - - -- - - - - - - - - - - - - - - -- - - - - - - - - - - - - - - -- - - - - - - - - - - - - - - -- - - - - - - - - - - - - - - -
- - - - - - - - - - - - - - - -- - - - - - - - - - - - - - - -- - - - - - - - - - - - - - - -- - - - - - - - - - - - - - - -- - - - - - - - - - - - - - - -- - - - - - - - - - - - - - - -
- - - - - - - - - - - - - - - -- - - - - - - - - - - - - - - -- - - - - - - - - - - - - - - -- - - - - - - - - - - - - - - -
- - - - - - - - - - - - - - - -- - - - - - - - - - - - - - - -
- - - - - - - - - - - - - - - -- - - - - - - - - - - - - - - -- - - - - - - - - - - - - - - -
- - - - - - - - - - - - - - - -
46,930 408,724 432,758 956,980 322,426 302,595 2,470,413 39,321 59,951 - 99,272 344,837 1,050 345,887 502,661 947,820 212 85 116 107 2,107,963 45
Forecasted ($)
Total 2015-2020 CFF LDC CDM Plan Budget Spending
2015-2020 CFF LDC CDM Plan Allocated Budget ($)
Progress versus Budget (%)
Progress (%)
Total 2015-2020 CFF LDC CDM
Plan Budget
Spending
Spending GroupVerified ($)

Progress ReportFor: Province Wide
Programs 2015 2016 2017 2018 2019 2020 Total 2015 Verified
2015 Results
2016 Verified
2015 Results
Adjustments
2017 Verified
2015 Results
Adjustments
Total Verified
2015 Results
2016 Verified
2016 Results
2017 Verified
2016 Results
Adjustments
Total Verified 2016
Results
2017Verified
2017 Results
Total Total Verified
2015 Results
Total Verified
2016 Results
2017Verified
2017 Results
Total
2015-2020 Conservation First Framework Programs Residential Province-Wide Programs
1 Save on Energy Coupon Program Products 1,492,546 4,932,060 4,370,649 1,338,555 1,271,946 943,135 14,348,891 1,207,534 198,108 - 1,405,642 17,053,287 1,946,392 18,999,679 17,079,623 37,484,944 94 385 391 3472 Save on Energy Instant Discount Program Products - - 1,049,598 1,928,259 376,123 302,918 3,656,898 - - - - - - - 12,087,827 12,087,827 1,152 1,1523 Save on Energy Heating & Cooling Program Equipment 23,586 50,057 47,909 32,026 29,400 28,686 211,664 20,235 2,354 - 22,589 136,617 911 137,528 79,915 240,032 96 275 167 1974 Save on Energy New Construction Program Homes 3,333 7,187 8,319 6,979 8,500 6,967 41,285 - 6 5 11 130 74 204 328 543 0 3 4 35 Save on Energy Home Assistance Program Homes 80,753 15,512 56,654 39,092 37,435 35,128 264,574 1,032 226 - 1,258 5,066 1,500 6,566 6,910 14,734 2 42 12 10
Sub-total: Residential Province-Wide Programs
Business Province-Wide Programs 6 Save on Energy Audit Funding Program Projects 61 293 433 444 443 359 2,033 2 27 2 31 213 207 420 349 800 51 143 81 1027 Save on Energy Retrofit Program Projects 51,299 273,262 347,045 262,455 232,887 228,156 1,395,104 811 2,495 289 3,595 10,690 3,029 13,719 8,783 26,097 7 5 3 48 Save on Energy Small Business Lighting Program Projects 22,186 18,102 72,570 74,811 70,263 60,606 318,538 - - - - 2,421 64 2,485 7,565 10,050 - 14 10 99 Save on Energy High Performance New Construction Program Projects 59 293 4,784 4,647 4,576 4,568 18,927 - 8 3 11 180 61 241 167 419 19 82 3 8
10 Save on Energy Existing Building Commissioning Program Projects - 14 41 38 40 39 172 - - 2 2 - 30 30 6 38 214 15 6911 Save on Energy Business Refrigeration Incentive Program Projects - 306 16,748 21,710 20,262 16,934 75,960 - - - - - - - 1,077 1,077 - 6 612 Save on Energy Process & Systems Upgrades Program Projects 41 3,338 172 170 115 112 3,948 - - - - 1 12 13 16 29 - 0 9 113 Save on Energy Energy Manager Program Projects 47 117 219 377 286 240 1,286 - - - - 69 54 123 77 200 - 105 35 5214 Save on Energy Monitoring & Targeting Program Projects 7 6 26 25 26 23 113 - - - - - - - - - - - - -15 Save on Energy Retrofit Program - P4P Projects 134 1,166 - - - - 1,300 - 61 9 70 472 179 651 253 974 52 56 7516 Save on Energy Process & Systems Upgrades Program - P4P Projects - 5 - - - - 5 - - - - 3 2 5 - 5 100 100
Sub-total: Business Province-Wide Programs
Local & Regional Programs 17 Adaptive Thermostat Local Program Homes - 1,041 5,000 5,000 5,000 5,000 21,041 - - - - - - - - - - - -18 Business Refrigeration Incentives Local Program Projects - - 171 951 665 542 2,329 - - - - 305 - 305 1,191 1,496 696 87519 Conservation on the Coast Home Assistance Local Program Homes - - - - - - - - - - - - 112 112 26 13820 Conservation on the Coast Small Business Lighting Local Program Projects - - - - - - - - - - - - - - - -21 First Nations Conservation Local Program Homes - 750 1,363 747 890 780 4,530 - - - - - - - 2,135 2,135 - 157 10122 High Efficiency Agriculturual Pumping Local Program Projects - - 3,944 5,268 6,581 6,581 22,374 - - - - - - - - - - -23 Instant Savings Local Program Homes - - 16,290 14,037 4,627 2,821 37,775 - - - - - - - 13,146 13,146 81 8124 OPsaver Local Program Projects - - 1 2 2 2 7 - - - - - - - - - - -25 Pool Saver Local Program Homes - - 5,605 6,118 6,008 5,736 23,467 - - - - - - - 1,958 1,958 35 3526 PUMPsaver Local Program Projects - 16 269 168 134 67 654 - - - - 5 1 6 193 199 38 72 7027 RTUsaver Local Program Projects - - 1,606 5,619 5,619 3,211 16,055 - - - - - - - - - - -28 Social Benchmarking Local Program Participants - 1,333,125 2,390,945 3,744,545 4,430,904 4,457,000 16,356,519 - - - - - 764,789 764,789 1,050,385 1,815,174 57 44 49
Sub-total: Local & Regional Programs
LDC Innovation Fund Pilot Programs 29 Air Source Heat Pump – For Residential Space Heating LDC Innovation Fund Homes - - 847 206 206 165 1,424 - - - - 112 112 224 - 224 - 2630 Air Source Heat Pump – For Residential Water Heating LDC Innovation Fun Homes - - - - - - - - - - - - 69 69 - 6931 Block Heater Timer LDC Innovation Fund Pilot Program Equipment - - 4,000 4,285 4,270 4,270 16,825 - - - - - - - 1,599 1,599 40 4032 Commercial Energy Management and Load Control (CEMLC) LDC Innovatio Projects - - - - - - - - - - - - - - - -33 Conservation Cultivator LDC Innovation Fund Pilot Program Projects 1 - - - - 1 2 - - 4 4 - - - - 4 400 40034 Data Centre LDC Innovation Fund Pilot Program Projects - 1 12 - - - 13 - - - - - - - - - - - -35 Electronics Take Back LDC Innovation Fund Pilot Program Equipment - 10,000 - - - - 10,000 - - - - 10,004 - 10,004 - 10,004 100 10036 Energy Reinvestment LDC Innovation Fund Pilot Program Projects - - - 1 - - 1 - - - - - - - - -37 Home Energy Assessment & Retrofit LDC Innovation Fund Pilot Program Homes - 323 6 1,380 2,760 2,760 7,229 - - - - - - - 838 838 - 13,967 25538 Hotel/Motel LDC Innovation Fund Pilot Program Projects - 5 5 7 7 7 31 - - - - - - - 4 4 - 80 4039 Intelligent Air Technology LDC Innovation Fund Pilot Program Projects - - 16 - - - 16 - - - - - - - - - - -40 OPsaver LDC Innovation Fund Pilot Program Projects - 5 - - - - 5 - - - - 5 - 5 - 5 100 10041 PUMPsaver LDC Innovation Fund Pilot Program Projects - 18 - - - - 18 - 10 - 10 - - - - 10 - 5642 Residential Direct Install LDC Innovation Fund Pilot Program Homes - - - - - - - - - - - 322 - 322 - 32243 Residential Direct Mail LDC Innovation Fund Pilot Program Homes - 2 - - - - 2 - - - - 726 - 726 - 726 36,300 36,30044 Residential Ductless Heat Pump LDC Innovation Fund Pilot Program Homes - 1 - - - - 1 - - - - - 94 94 - 94 9,400 9,40045 Retrocomissioning LDC Innovation Fund Pilot Program Projects - 77 - 77 50 30 234 - - - - 75 - 75 - 75 97 9746 RTUsaver LDC Innovation Fund Pilot Program Projects - - - - - - - - - - - 13 - 13 - 1347 Small & Medium Business Energy Management System LDC Innovation Fun Projects - - 133 - - - 133 - - - - - 45 45 754 799 567 60148 Solar Powered Attic Ventilation LDC Innovation Fund Pilot Program Homes - 1,000 - - - - 1,000 - - - - 1,026 - 1,026 - 1,026 103 10349 Toronto Hydro – Enbridge Joint Low-Income Program LDC Innovation Fund Homes - - - - - - - - - - - - - - 300 30050 Truckload Event LDC Innovation Fund Pilot Program Products - 85,178 - - - - 85,178 - - - - 226,443 - 226,443 - 226,443 266 266
Sub-total: LDC Innovation Fund Pilot Programs
Centrally Delivered Programs 51 Industrial Accelerator Program Projects - - 2 2 2 2 8 - - - - - - - - - - -52 Save on Energy Energy Performance Program for Multi-Site Customers Projects - - 5 11 4 4 24 - - - - - - - 39 39 780 78053 Whole Home Pilot Program Homes - - 5,090 2 2 2 5,096 - - - - - - - 10,359 10,359 204 204
Sub-total: Centrally Delivered Programs
Program Enabled Savings 54 Save on Energy Retrofit Program Enabled Savings Claims 5 10 1 1 1 1 19 - 9 9 18 28 14 42 24 84 360 420 2,400 52555 Save on Energy High Performance New Construction Program Enabled Sav Claims - - - - - - - - - 1 1 - 1 1 1 356 Save on Energy Process & Systems Upgrades Program Enabled Savings Claims - - - - - - - - - 1 1 1 1 2 2 5
Sub-total: Program Enabled Savings
Other 57 Non-Approved Program Various - 3,401 46,669 228,390 181,677 185,926 646,063 - - - - - - - - - - - -58 Unassigned Program Various - - 5 21,188 21,189 21,192 63,574 - - - - - - - - - - -
Sub-total: Other
Sub-total: 2015-2020 Conservation First Framework
Conservation Fund 59 Conservation Voltage Reduction Conservation Fund Pilot Program Projects - - 1 - - - 1 - - - - - - - 1 1 100 10060 EnerNOC Conservation Fund Pilot Program Projects 13 - - - - - 13 12 - - 12 - - - - 12 92 9261 Home Depot Home Appliance Market Uplift Conservation Fund Pilot Progr Projects 1 5 - - - - 6 - - - - 4,638 - 4,638 - 4,638 - 92,760 77,30062 Loblaw P4P Conservation Fund Pilot Program Projects 4 - - - - - 4 18 - - 18 - - - - 18 450 45063 Ontario Clean Water Agency P4P Conservation Fund Pilot Program Projects - - - - - - - - - - - 2 2 4 11 1564 Performance Based Conservation Fund Pilot Program Projects 12 30 20 - - - 62 - - - - - - - - - - - - -65 Social Benchmarking Conservation Fund Pilot Program Participants 42,336 - - - - - 42,336 150,258 - - 150,258 - - - - 150,258 355 35566 Strategic Energy Group Conservation Fund Pilot Program Projects 11 - - - - - 11 10 - - 10 - - - - 10 91 91
Sub-total: Conservation Fund
2011-2014+2015 Extension Legacy Framework Programs
Residential Program 67 Appliance Retirement Initiative Appliances 12,318 1,762 1,762 1,762 - - 17,604 14,733 - - 14,733 - - - - 14,733 120 - - 9368 Coupon Initiative Products 3,704,850 1,450,265 2,059,209 1,530,740 1,413,526 1,228,294 11,386,884 2,075,200 413,479 - 2,488,679 - - - - 2,488,679 67 - - 3469 Bi-Annual Retailer Event Initiative Products 459,368 - - - - - 459,368 3,178,024 27,954 - 3,205,978 - - - - 3,205,978 698 69870 HVAC Incentives Initiative Equipment 86,204 44,163 43,275 40,317 40,239 41,290 295,488 102,154 2,507 - 104,661 - - - - 104,661 121 - - 6071 Residential New Construction and Major Renovation Initiative Homes 46,643 - - - - - 46,643 4,012 132 42 4,186 - - - - 4,186 9 9
Sub-total: Residential Program
Commercial & Institutional Program 72 Energy Audit Initiative Projects 374 - - - - - 374 356 199 - 555 - - - - 555 148 14873 Efficiency: Equipment Replacement Incentive Initiative Projects 338,356 84 263 98 72 67 338,940 12,547 1,036 402 13,985 - - - - 13,985 4 - - 474 Direct Install Lighting and Water Heating Initiative Projects 273,640 726 285 295 275 393 275,614 18,643 - - 18,643 - - - - 18,643 7 - - 775 New Construction and Major Renovation Initiative Projects 21,138 - - - - - 21,138 168 141 - 309 - - - - 309 1 176 Existing Building Commissioning Incentive Initiative Projects 11 - - - - - 11 11 4 - 15 - - - - 15 136 136
Sub-total: Commercial & Institutional Program
Industrial Program 77 Process and Systems Upgrades Initiatives - Project Incentive Initiative Projects 17 9 14 15 12 11 78 12 11 1 24 - - - - 24 141 - - 6078 Process and Systems Upgrades Initiatives - Energy Manager Initiative Projects 330 - - - - - 330 424 1 - 425 - - - - 425 129 12979 Process and Systems Upgrades Initiatives - Monitoring and Targeting Initiat Projects 1 - 6 6 6 6 25 2 - - 2 - - - - 2 200 - 29
Sub-total: Industrial Program
Low Income Program 80 Low Income Initiative Homes 1,330,550 - - - - - 1,330,550 15,494 1,012 - 16,506 - - - - 16,506 1 1
Sub-total: Low-Income Program
Other 81 Aboriginal Conservation Program Homes 527,925 - - - - - 527,925 1,586 - - 1,586 - - - - 1,586 0 082 Program Enabled Savings Claims 6 - - - - - 6 14 - -1 13 - - - - 13 217 217
Sub-total: Other
Sub-total: 2011-2014+2015 Extension Legacy Framework
Participation Participation GroupUnit of
MeasureForecasted (#) Verified (#) Progress vs Forecast (%)
#
Total

2015 2016 2017 2018 2019 2020 Total 2015 Verified
2015 Results
2016 Verified
2015 Results
Adjustments
2017 Verified
2015 Results
Adjustments
Total Verified 2015 Results
2016 Verified
2016 Results
2017 Verified
2016 Results
Adjustments
Total Verified 2016 Results
2017Verified
2017 Results
Total Total Verified
2015 Results
Total Verified
2016 Results
2017Verified
2017 Results
Total
38,903,574 178,001,495 94,984,376 34,119,050 31,933,763 26,295,762 404,238,020 31,200,969 4,478,933 - 35,679,902 427,989,595 49,843,524 477,833,119 419,524,601 933,037,622 92 268 442 299- - 16,125,173 27,499,665 5,217,810 3,646,754 52,489,402 - - - - - - - 320,679,244 320,679,244 1,989 1,989
12,452,123 34,611,838 35,224,580 26,149,259 20,750,461 19,504,178 148,692,439 10,181,961 1,384,912 - 11,566,873 76,249,162 744,673 76,993,835 68,318,325 156,879,033 93 222 194 191702,622 3,515,448 8,391,603 8,489,585 8,705,173 8,424,523 38,228,954 - 70,679 285,368 356,047 1,624,371 397,324 2,021,695 1,746,478 4,124,220 51 58 21 33
2,097,128 6,765,544 8,354,009 6,961,063 6,978,355 6,748,178 37,904,277 975,736 275,931 - 1,251,667 7,538,941 1,646,201 9,185,142 8,240,971 18,677,780 60 136 99 10854,155,447 222,894,325 163,079,741 103,218,622 73,585,562 64,619,395 681,553,092 42,358,666 6,210,455 285,368 48,854,489 513,402,069 52,631,722 566,033,791 818,509,619 1,433,397,899 90 254 502 326
749,725 1,683,258 21,717,556 21,467,301 21,393,335 19,546,353 86,557,528 - 2,159,479 173,533 2,333,012 2,799,382 2,720,527 5,519,909 22,801,451 30,654,372 311 328 105 127107,584,112 687,284,278 475,392,019 341,222,708 317,615,797 311,934,463 2,241,033,377 19,147,625 86,577,438 27,630,204 133,355,267 526,174,806 193,252,630 719,427,436 644,099,021 1,496,881,724 124 105 135 118
2,536,644 10,122,906 48,435,244 49,250,125 37,117,997 33,494,523 180,957,439 - - - - 10,760,789 3,197,264 13,958,053 46,428,169 60,386,222 - 138 96 993,329,551 34,177,972 27,335,461 12,419,165 14,622,047 14,474,979 106,359,175 - 478,377 362,083 840,460 18,772,882 12,130,434 30,903,316 46,889,522 78,633,298 25 90 172 121
- - 3,613,637 3,072,421 3,233,983 3,155,847 13,075,888 - - - - - 730,126 730,126 882,273 1,612,399 24 45- 929,399 12,645,282 14,273,270 12,093,790 12,018,288 51,960,029 - - - - - - - 4,715,099 4,715,099 - 37 35
27,359,148 62,541,944 138,664,563 164,921,817 227,685,637 142,528,429 763,701,538 - - 2,287,903 2,287,903 778,676 51,959,167 52,737,843 15,201,978 70,227,724 8 84 11 313,308,985 21,194,899 21,535,763 23,287,693 23,673,707 24,097,696 117,098,743 - - - - 13,429,453 8,425,119 21,854,572 11,776,555 33,631,127 - 103 55 731,237,500 1,125,000 5,584,461 473,338 746,649 2,531,716 11,698,664 - - - - - - - - - - - - -4,516,446 94,159,622 - - - - 98,676,068 - 1,567,230 1,648,218 3,215,448 40,937,376 18,469,815 59,407,191 19,395,821 82,018,460 71 63 83
- 25,420,443 - - - - 25,420,443 - - - - 10,957,531 13,179,466 24,136,997 - 24,136,997 95 95150,622,111 938,639,721 754,923,986 630,387,838 658,182,942 563,782,294 3,696,538,892 19,147,625 90,782,524 32,101,941 142,032,090 624,610,895 304,064,548 928,675,443 812,189,889 1,882,897,422 94 99 108 102
- 181,915 873,750 873,750 873,750 873,750 3,676,915 - - - - - - - - - - - -- - 469,200 2,379,309 1,732,488 1,556,284 6,137,281 - - - - 928,060 - 928,060 4,990,192 5,918,252 1,064 1,261- - - - - - - - - - - - 432,145 432,145 248,138 680,283- - - - - - - - - - - - - - - -- 1,533,750 2,787,335 1,600,365 1,892,800 1,667,850 9,482,100 - - - - - - - 3,328,257 3,328,257 - 119 77- - 4,600,744 6,154,874 7,680,418 7,680,418 26,116,454 - - - - - - - - - - -- - 3,175,550 2,778,174 933,223 561,531 7,448,478 - - - - - - - 1,635,206 1,635,206 51 51- - - - - 40,806,044 40,806,044 - - - - - - - - -- - 7,845,467 8,183,606 8,111,588 7,869,230 32,009,891 - - - - - - - 5,969,040 5,969,040 76 76- 507,496 8,525,939 5,328,712 4,262,969 2,131,485 20,756,601 - - - - 834,022 154,237 988,259 15,947,960 16,936,219 195 187 187- - 2,094,122 7,329,427 7,329,427 4,188,244 20,941,220 - - - - - - - - - - -- - 10,221,578 20,882,217 6,883,313 130,847,814 168,834,922 - - - - - - - 112,500,855 112,500,855 1,101 1,101- 2,223,161 40,593,685 55,510,434 39,699,976 198,182,650 336,209,906 - - - - 1,762,082 586,382 2,348,464 144,619,648 146,968,112 106 356 343
- - 1,399,957 910,594 910,594 728,475 3,949,620 - - - - 205,088 203,083 408,171 - 408,171 - 29- - - - - - - - - - - - 117,155 117,155 - 117,155- - 1,614,988 1,635,045 1,460,702 1,460,702 6,171,437 - - - - - - - 802,485 802,485 50 50- - - - - - - - - - - - - - - -
187,000 - - - - 1,092,825 1,279,825 - - 90,118 90,118 - - - - 90,118 48 48- - - - - - - - - - - - - - - -- 1,308,000 - - - - 1,308,000 - - - - 1,145,480 - 1,145,480 - 1,145,480 88 88- - - 1,781,855 - - 1,781,855 - - - - - - - - -- 903,431 1,256,600 467,291 934,582 934,904 4,496,808 - - - - - - - 374,487 374,487 - 30 17- 1,039,063 1,039,063 1,454,688 1,454,688 1,454,688 6,442,190 - - - - - - - 42,567 42,567 - 4 2- - 1,404,000 - - - 1,404,000 - - - - - - - - - - -- 2,500,000 - - - - 2,500,000 - - - - 2,864,454 - 2,864,454 - 2,864,454 115 115- 616,360 - - - - 616,360 - 667,979 - 667,979 - - - - 667,979 - 108- - - - - - - - - - - 413,538 - 413,538 - 413,538- 592,703 - - - - 592,703 - - - - 347,825 - 347,825 - 347,825 59 59- 3,390,849 - - - - 3,390,849 - - - - - 157,963 157,963 - 157,963 5 5- 2,547,622 - 2,547,622 1,654,300 992,580 7,742,124 - - - - 1,799,960 - 1,799,960 - 1,799,960 71 71- - - - - - - - - - - 370,393 - 370,393 - 370,393- - 199,500 - - - 199,500 - - - - - 60,200 60,200 808,650 868,850 405 436- 199,358 - - - - 199,358 - - - - 178,202 - 178,202 - 178,202 89 89- - - - - - - - - - - - - - 373,136 373,136- 3,262,278 - - - - 3,262,278 - - - - 6,807,732 - 6,807,732 - 6,807,732 209 209
187,000 16,359,664 6,914,108 8,797,095 6,414,866 6,664,174 45,336,907 - 667,979 90,118 758,097 14,132,672 538,401 14,671,073 2,401,325 17,830,495 405 90 35 76
- - 2,000 2,000 2,000 2,000 8,000 - - - - - - - - - - -- - 3,000 1,240,600 3,000 4,000 1,250,600 - - - - - - - 7,921,276 7,921,276 264,043 264,043- - 1,425,852 2,000 2,000 2,000 1,431,852 - - - - - - - 6,600,326 6,600,326 463 463- - 1,430,852 1,244,600 7,000 8,000 2,690,452 - - - - - - - 14,521,602 14,521,602 1,015 1,015
8,571,537 - - - - - 8,571,537 - - - - - - - - - - -- - - - - - - - - - - - - - - -- - - - - - - - - - - - - - - -
8,571,537 - - - - - 8,571,537 - - - - - - - - - - -
- 1,011,917 6,262,374 7,336,733 5,142,919 37,817,825 57,571,768 - - - - - - - - - - - -- - 736,000 25,673,427 25,971,599 165,484,561 217,865,587 - - - - - - - - - - -- 1,011,917 6,998,374 33,010,160 31,114,518 203,302,386 275,437,355 - - - - - - - - - - - -
213,536,095 1,181,128,788 973,940,746 832,168,749 809,004,864 1,036,558,899 5,046,338,141 61,506,291 97,660,958 32,477,427 191,644,676 1,153,907,718 357,821,053 1,511,728,771 1,792,242,083 3,495,615,530 90 128 184 148
- - - - - - - - - - - - - - - -- - - - - - - - - - - - - - - -- 4,559 - - - - 4,559 - - - - 58,726 - 58,726 - 58,726 1,288 1,288
1,085,006 - - - - - 1,085,006 8,311,388 - - 8,311,388 - - - - 8,311,388 766 766- - - - - - - - - - - 188,353 20,783 209,136 364,714 573,850
6,392,465 94,400 94,400 - - - 6,581,265 - - - - - - - - - - - - -- - - - - - - - - - - - - - - -- - - - - - - - - - - - - - - -
7,477,471 98,959 94,400 - - - 7,670,830 8,311,388 - - 8,311,388 247,079 20,783 267,862 364,714 8,943,964 111 271 386 117
- 727,564 727,564 727,564 - - 2,182,692 - - - - - - - - - - - -98,961,816 47,256,416 50,251,115 37,968,101 36,380,854 32,539,656 303,357,958 49,828,856 9,574,814 - 59,403,670 - - - - 59,403,670 60 - - 3010,569,940 - - - - - 10,569,940 72,999,617 627,017 - 73,626,634 - - - - 73,626,634 697 69742,106,099 16,537,874 15,570,627 15,032,393 15,561,012 15,983,226 120,791,231 45,965,427 1,242,212 - 47,207,639 - - - - 47,207,639 112 - - 64
9,316,601 - - - - - 9,316,601 6,305,281 4,563,918 45,342 10,914,541 - - - - 10,914,541 117 117160,954,456 64,521,854 66,549,306 53,728,058 51,941,866 48,522,882 446,218,422 175,099,181 16,007,961 45,342 191,152,484 - - - - 191,152,484 119 - - 65
16,268,994 - - - - - 16,268,994 - 43,557,756 - 43,557,756 - - - - 43,557,756 268 268584,865,956 3,875,985 6,111,684 3,361,861 1,836,750 1,562,230 601,614,466 648,322,776 46,081,737 24,117,569 718,522,082 - - - - 718,522,082 123 - - 121
31,410,621 1,412,482 1,026,545 1,062,564 990,525 1,114,925 37,017,662 32,305,094 - 3,132,763 35,437,857 - - - - 35,437,857 113 - - 10524,668,336 - - - - - 24,668,336 21,792,687 27,358,742 - 49,151,429 - - - - 49,151,429 199 199
- - - 1,000 1,000 1,000 3,000 - 316,077 - 316,077 - - - - 316,077657,213,907 5,288,467 7,138,229 4,425,425 2,828,275 2,678,155 679,572,458 702,420,557 117,314,312 27,250,332 846,985,201 - - - - 846,985,201 129 - - 126
208,200,758 42,393,120 46,382,500 144,488,660 44,278,840 28,142,340 513,886,218 122,704,030 140,191,824 9,012,548 271,908,402 - - - - 271,908,402 131 - - 9220,917,894 - - - - - 20,917,894 25,183,067 - - 25,183,067 - - - - 25,183,067 120 120
- - 1,000 1,000 1,000 3,423,500 3,426,500 - - - - - - - - - - -229,118,652 42,393,120 46,383,500 144,489,660 44,279,840 31,565,840 538,230,612 147,887,097 140,191,824 9,012,548 297,091,469 - - - - 297,091,469 130 - - 93
10,248,103 - - - - - 10,248,103 11,746,825 1,601,364 - 13,348,189 - - - - 13,348,189 130 13010,248,103 - - - - - 10,248,103 11,746,825 1,601,364 - 13,348,189 - - - - 13,348,189 130 130
3,196,965 - - - - - 3,196,965 3,243,409 - - 3,243,409 - - - - 3,243,409 101 101770,041 - - - - - 770,041 7,275,075 - - 7,275,075 - - - - 7,275,075 945 945
3,967,006 - - - - - 3,967,006 10,518,484 - - 10,518,484 - - - - 10,518,484 265 265
1,061,502,124 112,203,441 120,071,035 202,643,143 99,049,981 82,766,877 1,678,236,601 1,047,672,144 275,115,461 36,308,222 1,359,095,827 - - - - 1,359,095,827 128 - - 105
1,282,515,690 1,293,431,188 1,094,106,181 1,034,811,892 908,054,845 1,119,325,776 6,732,245,572 1,117,489,823 372,776,419 68,785,649 1,559,051,891 1,154,154,797 357,841,836 1,511,996,633 1,792,606,797 4,863,655,321 122 117 164 133 6,999,990,000 69
Net Incremental 2020 Annual Energy Savings Net Incremental 2020 Annual
Energy Savings
Progress (%) 2015-2020 CFF LDC CDM Plan Allocated Target (kWh)
Progress versus Target (%)
Verified (kWh)Forecasted (kWh)
2015 2016 2017 2018 2019 2020 Total 2015 Verified
2015 Results
2016 Verified
2015 Results
Adjustments
2017 Verified
2015 Results
Adjustments
Total Verified
2015 Results
2016 Verified
2016 Results
2017 Verified
2016 Results
Adjustments
Total Verified
2016 Results
2017Verified
2017 Results
Total Total Verified
2015 Results
Total Verified
2016 Results
2017Verified
2017 Results
Total
2,536 10,999 6,918 2,325 2,201 1,832 26,811 2,008 294 - 2,302 27,830 3,174 31,004 29,298 62,604 91 282 424 306- - 837 1,557 364 327 3,085 - - - - - - - 22,180 22,180 2,650 2,650
6,626 10,445 8,264 6,240 5,933 5,827 43,335 5,322 711 - 6,033 22,421 220 22,641 19,181 47,855 91 217 232 189136 787 1,425 1,457 1,513 1,448 6,766 - 15 16 31 355 85 440 483 954 23 56 34 41
1,247 4,271 4,731 3,737 3,684 3,637 21,307 204 39 - 243 825 132 957 1,197 2,397 19 22 25 2310,545 26,502 22,175 15,316 13,695 13,071 101,304 7,534 1,059 16 8,609 51,431 3,611 55,042 72,339 135,990 82 208 326 230
155 193 3,612 3,557 3,541 3,247 14,305 - 460 37 497 365 355 720 1,013 2,230 321 373 28 5616,637 94,622 70,960 51,109 49,911 50,090 333,329 2,798 12,377 1,409 16,584 70,440 29,608 100,048 105,820 222,452 100 106 149 122
506 1,493 7,939 8,047 6,844 6,151 30,980 - - - - 2,287 761 3,048 10,244 13,292 - 204 129 134940 6,883 5,367 3,142 3,525 3,582 23,439 - 96 59 155 5,693 2,206 7,899 7,895 15,949 16 115 147 121- - 900 820 896 859 3,475 - - - - - 83 83 80 163 9 18- 118 1,464 1,582 1,332 1,427 5,923 - - - - - - - 643 643 - 44 41
2,987 5,097 20,462 21,348 31,429 17,040 98,363 - - - - 61 4,682 4,743 2,644 7,387 - 93 13 26640 2,821 2,737 3,101 3,193 3,271 15,763 - - - - 1,326 1,610 2,936 1,599 4,535 - 104 58 73149 136 572 44 71 71 1,043 - - - - - - - - - - - - -650 10,959 - - - - 11,609 - 296 305 601 4,197 2,938 7,135 3,090 10,826 92 65 93- 3,434 - - - - 3,434 - - - - 1,596 1,888 3,484 - 3,484 101 101
22,664 125,756 114,013 92,750 100,742 85,738 541,663 2,798 13,229 1,810 17,837 85,965 44,131 130,096 133,028 280,961 79 103 117 107
- 44 210 210 210 210 884 - - - - - - - - - - - -- - - 20 10 6 36 - - - - 117 - 117 623 740- - - - - - - - - - - - 10 10 2 12- - - - - - - - - - - - - - - -- 296 537 308 365 321 1,827 - - - - - - - 277 277 - 52 33- - 1,534 2,052 2,560 2,560 8,706 - - - - - - - - - - -- - 584 494 294 196 1,568 - - - - - - - 256 256 44 44- - - - - 4,922 4,922 - - - - - - - - -- - 4,092 4,092 4,092 4,022 16,298 - - - - - - - 1,142 1,142 28 28- 58 980 612 490 245 2,385 - - - - 75 14 89 2,021 2,110 153 206 203- - 624 2,184 2,184 1,248 6,240 - - - - - - - - - - -- - 1,172 2,435 789 23,259 27,655 - - - - - - - 23,971 23,971 2,045 2,045- 398 9,733 12,407 10,994 36,989 70,521 - - - - 192 24 216 28,292 28,508 54 291 281
- - 144 17 17 14 192 - - - - 4 8 12 - 12 - 8- - - - - - - - - - - - 18 18 - 18- - 3 3 4 4 14 - - - - - - - - - - -- - - - - - - - - - - - - - - -
15 - - - - - 15 - - 12 12 - - - - 12 80 80- - - - - - - - - - - - - - - -- 160 - - - - 160 - - - - 36 - 36 - 36 23 23- - - 208 - - 208 - - - - - - - - -- - - 53 107 107 267 - - - - - - - 59 59- 125 125 176 176 176 778 - - - - - - - 7 7 - 6 3- - 129 - - - 129 - - - - - - - - - - -- 411 - - - - 411 - - - - 2 - 2 - 2 0 0- 70 - - - - 70 - 68 - 68 - - - - 68 - 97- - - - - - - - - - - 29 - 29 - 29- - - - - - - - - - - 23 - 23 - 23- 234 - - - - 234 - - - - - 32 32 - 32 14 14- 200 - 200 130 78 608 - - - - 806 - 806 - 806 403 403- - - - - - - - - - - 27 - 27 - 27- - - - - - - - - - - - 11 11 146 157- 119 - - - - 119 - - - - 199 - 199 - 199 167 167- - - - - - - - - - - - - - 78 78- 204 - - - - 204 - - - - 428 - 428 - 428 210 210
15 1,523 401 657 434 379 3,409 - 68 12 80 1,554 69 1,623 290 1,993 533 107 72 103
- - - - - - - - - - - - - - - -- - 1 207 1 1 210 - - - - - - - - - - -- - 157 - - - 157 - - - - - - - 927 927 590 590- - 158 207 1 1 367 - - - - - - - 927 927 587 587
- - - - - - - - - - - - - - - -- - - - - - - - - - - - - - - -- - - - - - - - - - - - - - - -- - - - - - - - - - - - - - - -
- 173 2,690 2,785 322 12,608 18,578 - - - - - - - - - - - -- - - 12,280 12,286 57,778 82,344 - - - - - - - - -- 173 2,690 15,065 12,608 70,386 100,922 - - - - - - - - - - - -
33,224 154,352 149,170 136,402 138,474 206,564 818,186 10,332 14,356 1,838 26,526 139,142 47,835 186,977 234,876 448,379 80 121 157 133
- - - - - - - - - - - - - - - -- - - - - - - - - - - - - - - -- - - - - - - - - - - 9 - 9 - 9145 - - - - - 145 724 - - 724 - - - - 724 499 499- - - - - - - - - - - 18 3 21 56 77506 42 42 - - - 590 - - - - - - - - - - - - -- - - - - - - - - - - - - - - -- - - - - - - - - - - - - - - -
651 42 42 - - - 735 724 - - 724 27 3 30 56 810 111 71 133 110
- 713 713 713 - - 2,139 - - - - - - - - - - - -6,611 3,368 5,446 4,516 3,975 3,167 27,083 3,257 622 - 3,879 - - - - 3,879 59 - - 25
738 - - - - - 738 5,006 40 - 5,046 - - - - 5,046 684 68422,267 11,290 8,812 8,904 9,297 9,673 70,243 24,035 641 - 24,676 - - - - 24,676 111 - - 58
1,385 - - - - - 1,385 1,113 252 2 1,367 - - - - 1,367 99 9931,001 15,371 14,971 14,133 13,272 12,840 101,588 33,411 1,555 2 34,968 - - - - 34,968 113 - - 57
3,102 - - - - - 3,102 - 9,657 - 9,657 - - - - 9,657 311 31184,243 409 1,044 560 295 248 86,799 92,012 7,033 4,209 103,254 - - - - 103,254 123 - - 120
7,412 368 298 308 288 313 8,987 7,432 - 784 8,216 - - - - 8,216 111 - - 1026,971 - - - - - 6,971 5,188 7,229 - 12,417 - - - - 12,417 178 178
- - - - - - - - 106 - 106 - - - - 106101,728 777 1,342 868 583 561 105,859 104,632 24,025 4,993 133,650 - - - - 133,650 131 - - 129
23,676 5,661 7,163 17,159 5,984 3,958 63,601 13,649 7,545 734 21,928 - - - - 21,928 93 - - 604,982 - - - - - 4,982 5,371 - - 5,371 - - - - 5,371 108 108
- - - - - - - - - - - - - - - -28,658 5,661 7,163 17,159 5,984 3,958 68,583 19,020 7,545 734 27,299 - - - - 27,299 95 - - 66
1,905 - - - - - 1,905 2,064 471 - 2,535 - - - - 2,535 133 1331,905 - - - - - 1,905 2,064 471 - 2,535 - - - - 2,535 133 133
603 - - - - - 603 605 - - 605 - - - - 605 100 10031 - - - - - 31 142 - - 142 - - - - 142 458 458
634 - - - - - 634 747 - - 747 - - - - 747 118 118
163,926 21,809 23,476 32,160 19,839 17,359 278,569 159,874 33,596 5,729 199,199 - - - - 199,199 122 - - 95
197,801 176,203 172,688 168,562 158,313 223,923 1,097,490 170,930 47,952 7,567 226,449 139,169 47,838 187,007 234,932 648,388 114 106 136 119
Net Incremental 2020 Annual Peak Demand Savings
Forecasted (kW)
Net Incremental 2020 Annual
Peak Demand Savings
Verified (kW) Progress (%)
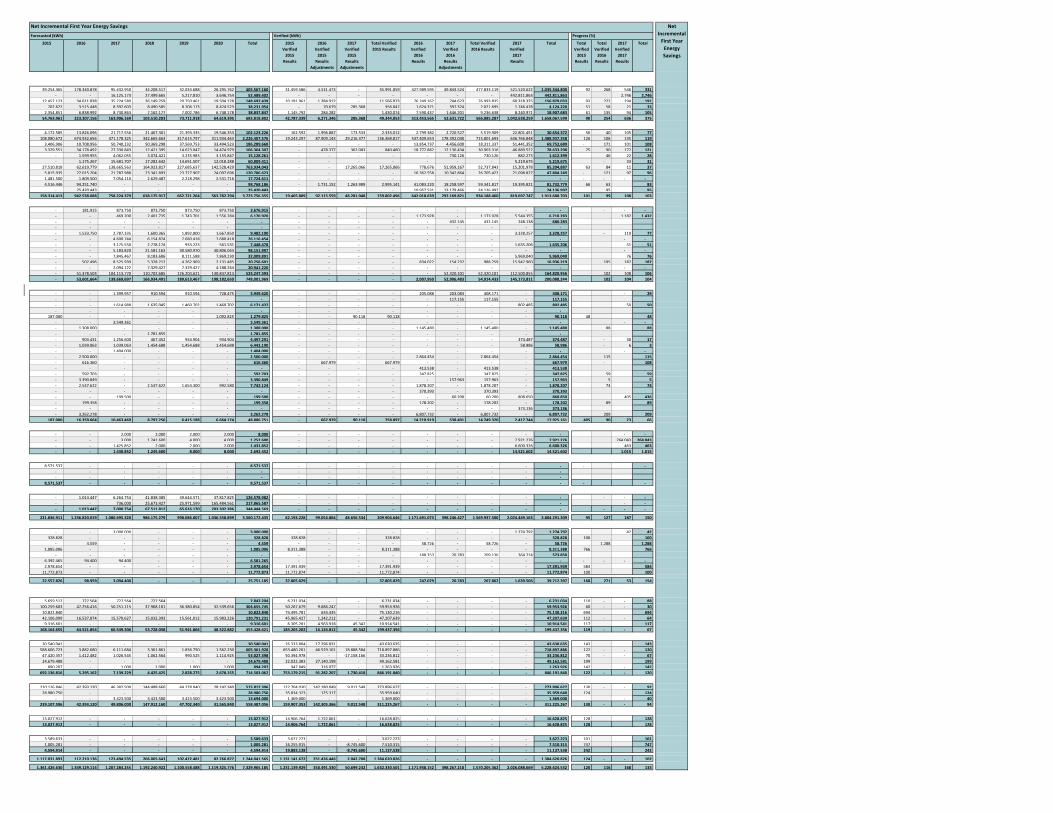
2015 2016 2017 2018 2019 2020 Total 2015 Verified
2015 Results
2016 Verified
2015 Results
Adjustments
2017 Verified
2015 Results
Adjustments
Total Verified 2015 Results
2016 Verified
2016 Results
2017 Verified
2016 Results
Adjustments
Total Verified 2016 Results
2017Verified
2017 Results
Total Total Verified
2015 Results
Total Verified
2016 Results
2017Verified
2017 Results
Total
39,254,365 178,340,878 95,432,950 34,208,517 32,034,688 26,295,762 405,567,160 31,459,586 4,531,473 - 35,991,059 427,989,595 49,843,524 477,833,119 521,520,622 1,035,344,800 92 268 546 331- - 16,125,173 27,499,665 5,217,810 3,646,754 52,489,402 - - - - - - - 442,811,863 442,811,863 2,746 2,746
12,452,123 34,611,838 35,224,580 26,149,259 20,750,461 19,504,178 148,692,439 10,181,961 1,384,912 - 11,566,873 76,249,162 744,673 76,993,835 68,318,325 156,879,033 93 222 194 191702,622 3,515,448 8,392,603 8,490,585 8,706,173 8,424,523 38,231,954 - 70,679 285,368 356,047 1,624,371 397,324 2,021,695 1,746,478 4,124,220 51 58 21 33
2,354,851 6,838,992 8,730,863 7,162,177 7,002,786 6,748,178 38,837,847 1,145,792 284,282 - 1,430,074 7,590,437 1,646,201 9,236,638 8,240,971 18,907,683 61 135 94 10554,763,961 223,307,156 163,906,169 103,510,203 73,711,918 64,619,395 683,818,802 42,787,339 6,271,346 285,368 49,344,053 513,453,565 52,631,722 566,085,287 1,042,638,259 1,658,067,599 90 254 636 375
4,172,585 13,826,096 21,717,556 21,467,301 21,393,335 19,546,353 102,123,226 162,592 1,996,887 173,533 2,333,012 2,799,382 2,720,527 5,519,909 22,801,451 30,654,372 56 40 105 77108,080,672 674,932,656 471,178,325 342,665,663 317,615,797 311,934,463 2,226,407,576 19,243,297 87,909,143 29,216,377 136,368,817 537,409,653 178,392,040 715,801,693 636,766,848 1,488,937,358 126 106 135 119
3,406,906 10,708,956 50,740,232 50,369,298 37,569,753 33,494,523 186,289,668 - - - - 13,854,737 4,456,600 18,311,337 51,441,352 69,752,689 - 171 101 1083,329,551 34,178,492 27,336,843 12,421,395 14,623,047 14,474,979 106,364,307 - 478,377 362,083 840,460 18,772,882 12,130,434 30,903,316 46,889,522 78,633,298 25 90 172 121
- 1,599,955 4,062,055 3,074,421 3,235,983 3,155,847 15,128,261 - - - - - 730,126 730,126 882,273 1,612,399 46 22 28- 1,175,267 15,681,707 17,282,642 14,651,507 12,018,288 60,809,411 - - - - - - - 5,219,675 5,219,675 - 33 31
27,510,818 62,619,779 138,665,563 164,923,817 227,685,637 142,528,429 763,934,043 - - 17,265,066 17,265,066 778,676 51,959,167 52,737,843 15,201,978 85,204,887 63 84 11 375,815,935 22,015,204 21,787,988 23,341,893 23,727,907 24,097,696 120,786,623 - - - - 16,362,558 10,342,864 26,705,422 21,098,827 47,804,249 - 121 97 961,481,500 1,809,500 7,054,110 2,629,487 2,218,298 2,531,716 17,724,611 - - - - - - - - - - - - -4,516,446 94,251,740 - - - - 98,768,186 - 1,731,152 1,263,989 2,995,141 41,083,220 18,258,597 59,341,817 19,395,821 81,732,779 66 63 83
- 25,420,443 - - - - 25,420,443 - - - - 10,957,531 13,179,466 24,136,997 - 24,136,997 95 95158,314,413 942,538,088 758,224,379 638,175,917 662,721,264 563,782,294 3,723,756,355 19,405,889 92,115,559 48,281,048 159,802,496 642,018,639 292,169,821 934,188,460 819,697,747 1,913,688,703 101 99 108 103
- 181,915 873,750 873,750 873,750 873,750 3,676,915 - - - - - - - - - - - -- - 469,200 2,401,735 1,743,701 1,556,284 6,170,920 - - - - 1,173,928 - 1,173,928 5,544,355 6,718,283 1,182 1,432- - - - - - - - - - - - 432,145 432,145 248,138 680,283- - - - - - - - - - - - - - - -- 1,533,750 2,787,335 1,600,365 1,892,800 1,667,850 9,482,100 - - - - - - - 3,328,257 3,328,257 - 119 77- - 4,600,744 6,154,874 7,680,418 7,680,418 26,116,454 - - - - - - - - - - -- - 3,175,550 2,778,174 933,223 561,531 7,448,478 - - - - - - - 1,635,206 1,635,206 51 51- - 5,183,820 21,581,163 30,580,970 40,806,044 98,151,997 - - - - - - - - - - -- - 7,845,467 8,183,606 8,111,588 7,869,230 32,009,891 - - - - - - - 5,969,040 5,969,040 76 76- 507,496 8,525,939 5,328,712 4,262,969 2,131,485 20,756,601 - - - - 834,022 154,237 988,259 15,947,960 16,936,219 195 187 187- - 2,094,122 7,329,427 7,329,427 4,188,244 20,941,220 - - - - - - - - - - -- 51,378,503 104,113,770 110,702,685 126,204,621 130,847,814 523,247,393 - - - - - 52,320,101 52,320,101 112,500,855 164,820,956 102 108 106- 53,601,664 139,669,697 166,934,491 189,613,467 198,182,650 748,001,969 - - - - 2,007,950 52,906,483 54,914,433 145,173,811 200,088,244 102 104 104
- - 1,399,957 910,594 910,594 728,475 3,949,620 - - - - 205,088 203,083 408,171 - 408,171 - 29- - - - - - - - - - - - 117,155 117,155 - 117,155- - 1,614,988 1,635,045 1,460,702 1,460,702 6,171,437 - - - - - - - 802,485 802,485 50 50- - - - - - - - - - - - - - - -
187,000 - - - - 1,092,825 1,279,825 - - 90,118 90,118 - - - - 90,118 48 48- - 3,549,361 - - - 3,549,361 - - - - - - - - - - -- 1,308,000 - - - - 1,308,000 - - - - 1,145,480 - 1,145,480 - 1,145,480 88 88- - - 1,781,855 - - 1,781,855 - - - - - - - - -- 903,431 1,256,600 467,452 934,904 934,904 4,497,291 - - - - - - - 374,487 374,487 - 30 17- 1,039,063 1,039,063 1,454,688 1,454,688 1,454,688 6,442,190 - - - - - - - 58,986 58,986 - 6 3- - 1,404,000 - - - 1,404,000 - - - - - - - - - - -- 2,500,000 - - - - 2,500,000 - - - - 2,864,454 - 2,864,454 - 2,864,454 115 115- 616,360 - - - - 616,360 - 667,979 - 667,979 - - - - 667,979 - 108- - - - - - - - - - - 413,538 - 413,538 - 413,538- 592,703 - - - - 592,703 - - - - 347,825 - 347,825 - 347,825 59 59- 3,390,849 - - - - 3,390,849 - - - - - 157,963 157,963 - 157,963 5 5- 2,547,622 - 2,547,622 1,654,300 992,580 7,742,124 - - - - 1,878,207 - 1,878,207 - 1,878,207 74 74- - - - - - - - - - - 370,393 - 370,393 - 370,393- - 199,500 - - - 199,500 - - - - - 60,200 60,200 808,650 868,850 405 436- 199,358 - - - - 199,358 - - - - 178,202 - 178,202 - 178,202 89 89- - - - - - - - - - - - - - 373,136 373,136- 3,262,278 - - - - 3,262,278 - - - - 6,807,732 - 6,807,732 - 6,807,732 209 209
187,000 16,359,664 10,463,469 8,797,256 6,415,188 6,664,174 48,886,751 - 667,979 90,118 758,097 14,210,919 538,401 14,749,320 2,417,744 17,925,161 405 90 23 66
- - 2,000 2,000 2,000 2,000 8,000 - - - - - - - - - - -- - 3,000 1,241,600 4,000 4,000 1,252,600 - - - - - - - 7,921,276 7,921,276 264,043 264,043- - 1,425,852 2,000 2,000 2,000 1,431,852 - - - - - - - 6,600,326 6,600,326 463 463- - 1,430,852 1,245,600 8,000 8,000 2,692,452 - - - - - - - 14,521,602 14,521,602 1,015 1,015
8,571,537 - - - - - 8,571,537 - - - - - - - - - - -- - - - - - - - - - - - - - - -- - - - - - - - - - - - - - - -
8,571,537 - - - - - 8,571,537 - - - - - - - - - - -
- 1,013,447 6,264,754 41,838,385 39,644,571 37,817,825 126,578,982 - - - - - - - - - - - -- - 736,000 25,673,427 25,971,599 165,484,561 217,865,587 - - - - - - - - - - -- 1,013,447 7,000,754 67,511,812 65,616,170 203,302,386 344,444,569 - - - - - - - - - - - -
221,836,911 1,236,820,019 1,080,695,320 986,175,279 998,086,007 1,036,558,899 5,560,172,435 62,193,228 99,054,884 48,656,534 209,904,646 1,171,691,073 398,246,427 1,569,937,500 2,024,449,163 3,804,291,309 95 127 187 150
- - 3,000,000 - - - 3,000,000 - - - - - - - 1,274,792 1,274,792 42 42328,828 - - - - - 328,828 328,828 - - 328,828 - - - - 328,828 100 100
- 4,559 - - - - 4,559 - - - - 58,726 - 58,726 - 58,726 1,288 1,2881,085,006 - - - - - 1,085,006 8,311,388 - - 8,311,388 - - - - 8,311,388 766 766
- - - - - - - - - - - 188,353 20,783 209,136 364,714 573,8506,392,465 94,400 94,400 - - - 6,581,265 - - - - - - - - - - - - -2,978,654 - - - - - 2,978,654 17,391,939 - - 17,391,939 - - - - 17,391,939 584 584
11,772,873 - - - - - 11,772,873 11,772,874 - - 11,772,874 - - - - 11,772,874 100 100
22,557,826 98,959 3,094,400 - - - 25,751,185 37,805,029 - - 37,805,029 247,079 20,783 267,862 1,639,506 39,712,397 168 271 53 154
5,659,512 727,564 727,564 727,564 - - 7,842,204 6,231,034 - - 6,231,034 - - - - 6,231,034 110 - - 88100,259,603 47,256,416 50,251,115 37,968,101 36,380,854 32,539,656 304,655,745 50,267,679 9,686,247 - 59,953,926 - - - - 59,953,926 60 - - 30
10,822,840 - - - - - 10,822,840 74,495,781 634,435 - 75,130,216 - - - - 75,130,216 694 69442,106,099 16,537,874 15,570,627 15,032,393 15,561,012 15,983,226 120,791,231 45,965,427 1,242,212 - 47,207,639 - - - - 47,207,639 112 - - 64
9,316,601 - - - - - 9,316,601 6,305,281 4,563,918 45,342 10,914,541 - - - - 10,914,541 117 117168,164,655 64,521,854 66,549,306 53,728,058 51,941,866 48,522,882 453,428,621 183,265,202 16,126,812 45,342 199,437,356 - - - - 199,437,356 119 - - 67
30,540,041 - - - - - 30,540,041 26,333,804 17,296,831 - 43,630,635 - - - - 43,630,635 143 143588,606,723 3,882,680 6,111,684 3,361,861 1,836,750 1,562,230 605,361,928 653,480,201 46,529,101 18,888,584 718,897,886 - - - - 718,897,886 122 - - 120
47,420,357 1,412,482 1,026,545 1,062,564 990,525 1,114,925 53,027,398 50,394,978 - -17,158,166 33,236,812 - - - - 33,236,812 70 - - 6724,679,488 - - - - - 24,679,488 22,022,383 27,140,198 - 49,162,581 - - - - 49,162,581 199 199
890,207 - 1,000 1,000 1,000 1,000 894,207 947,849 316,077 - 1,263,926 - - - - 1,263,926 142 - 142692,136,816 5,295,162 7,139,229 4,425,425 2,828,275 2,678,155 714,503,062 753,179,215 91,282,207 1,730,418 846,191,840 - - - - 846,191,840 122 - - 120
210,126,846 42,393,120 46,382,500 144,488,660 44,278,840 28,142,340 515,812,306 122,704,030 142,180,049 9,012,548 273,896,627 - - - - 273,896,627 130 - - 9228,980,750 - - - - - 28,980,750 35,834,323 125,317 - 35,959,640 - - - - 35,959,640 124 124
- - 3,423,500 3,423,500 3,423,500 3,423,500 13,694,000 1,369,000 - - 1,369,000 - - - - 1,369,000 - 40239,107,596 42,393,120 49,806,000 147,912,160 47,702,340 31,565,840 558,487,056 159,907,353 142,305,366 9,012,548 311,225,267 - - - - 311,225,267 130 - - 94
13,027,912 - - - - - 13,027,912 14,906,764 1,722,061 - 16,628,825 - - - - 16,628,825 128 12813,027,912 - - - - - 13,027,912 14,906,764 1,722,061 - 16,628,825 - - - - 16,628,825 128 128
3,589,633 - - - - - 3,589,633 3,627,223 - - 3,627,223 - - - - 3,627,223 101 1011,005,281 - - - - - 1,005,281 16,255,915 - -8,745,600 7,510,315 - - - - 7,510,315 747 7474,594,914 - - - - - 4,594,914 19,883,138 - -8,745,600 11,137,538 - - - - 11,137,538 242 242
1,117,031,893 112,210,136 123,494,535 206,065,643 102,472,481 82,766,877 1,744,041,565 1,131,141,672 251,436,446 2,042,708 1,384,620,826 - - - - 1,384,620,826 124 - - 102
1,361,426,630 1,349,129,114 1,207,284,255 1,192,240,922 1,100,558,488 1,119,325,776 7,329,965,185 1,231,139,929 350,491,330 50,699,242 1,632,330,501 1,171,938,152 398,267,210 1,570,205,362 2,026,088,669 5,228,624,532 120 116 168 133
Net Incremental First Year Energy Savings Net Incremental
First Year Energy Savings
Forecasted (kWh) Verified (kWh) Progress (%)

2015 2016 2017 2018 2019 2020 Total 2015 Verified
2015 Results
2016 Verified
2015 Results
Adjustments
2017 Verified
2015 Results
Adjustments
Total Verified
2015 Results
2016 Verified
2016 Results
2017 Verified
2016 Results
Adjustments
Total Verified
2016 Results
2017Verified
2017 Results
Total Total Verified
2015 Results
Total Verified
2016 Results
2017Verified
2017 Results
Total
2,558 11,009 6,946 2,331 2,207 1,832 26,883 2,025 297 - 2,322 27,830 3,174 31,004 36,136 69,462 91 282 520 339- - 837 1,557 364 327 3,085 - - - - - - - 30,369 30,369 3,628 3,628
6,626 10,445 8,264 6,240 5,933 5,827 43,335 5,322 711 - 6,033 22,421 220 22,641 19,181 47,855 91 217 232 189136 787 1,425 1,457 1,513 1,448 6,766 - 15 16 31 355 85 440 483 954 23 56 34 41
1,261 4,275 4,750 3,747 3,685 3,637 21,355 213 39 - 252 827 132 959 1,197 2,408 20 22 25 2310,581 26,516 22,222 15,332 13,702 13,071 101,424 7,560 1,062 16 8,638 51,433 3,611 55,044 87,366 151,048 82 208 393 255
839 1,970 3,612 3,557 3,541 3,247 16,766 35 426 37 498 365 355 720 1,013 2,231 59 37 28 3516,794 91,708 70,153 51,563 49,911 50,090 330,219 2,828 12,716 1,055 16,599 72,374 26,368 98,742 103,145 218,486 99 108 147 122
720 1,630 8,489 8,319 6,945 6,151 32,254 - - - - 2,612 895 3,507 10,734 14,241 - 215 126 131940 6,883 5,367 3,142 3,525 3,582 23,439 - 96 59 155 5,693 2,206 7,899 7,895 15,949 16 115 147 121- 646 1,109 820 896 859 4,330 - - - - - 83 83 80 163 13 7 9- 159 1,967 2,077 1,748 1,427 7,378 - - - - - - - 734 734 - 37 35
3,014 5,110 20,462 21,348 31,429 17,040 98,403 - - - - 61 4,682 4,743 2,644 7,387 - 93 13 261,062 2,895 2,762 3,102 3,194 3,271 16,286 - - - - 1,510 1,781 3,291 2,848 6,139 - 114 103 91
149 136 608 80 106 71 1,150 - - - - - - - - - - - - -650 10,988 - - - - 11,638 - 341 208 549 4,244 2,874 7,118 3,090 10,757 84 65 92- 3,434 - - - - 3,434 - - - - 1,596 1,888 3,484 - 3,484 101 101
24,168 125,559 114,529 94,008 101,295 85,738 545,297 2,863 13,579 1,359 17,801 88,455 41,132 129,587 132,183 279,571 74 103 115 106
- 44 210 210 210 210 884 - - - - - - - - - - - -- - - 24 12 6 42 - - - - 160 - 160 728 888- - - - - - - - - - - - 10 10 2 12- - - - - - - - - - - - - - - -- 296 537 308 365 321 1,827 - - - - - - - 277 277 - 52 33- - 1,534 2,052 2,560 2,560 8,706 - - - - - - - - - - -- - 584 494 294 196 1,568 - - - - - - - 256 256 44 44- - 625 2,603 3,689 4,922 11,839 - - - - - - - - - - -- - 4,092 4,092 4,092 4,022 16,298 - - - - - - - 1,142 1,142 28 28- 58 980 612 490 245 2,385 - - - - 75 14 89 2,021 2,110 153 206 203- - 624 2,184 2,184 1,248 6,240 - - - - - - - - - - -- 9,851 15,806 20,685 22,980 23,259 92,581 - - - - - 4,887 4,887 23,971 28,858 50 152 112- 10,249 24,992 33,264 36,876 36,989 142,370 - - - - 235 4,911 5,146 28,397 33,543 50 114 95
- - 144 17 17 14 192 - - - - 4 8 12 - 12 - 8- - - - - - - - - - - - 18 18 - 18- - 3 3 4 4 14 - - - - - - - - - - -- - - - - - - - - - - - - - - -
15 - - - - - 15 - - 12 12 - - - - 12 80 80- - 423 - - - 423 - - - - - - - - - - -- 160 - - - - 160 - - - - 36 - 36 - 36 23 23- - - 208 - - 208 - - - - - - - - -- - - 53 107 107 267 - - - - - - - 59 59- 125 125 176 176 176 778 - - - - - - - 12 12 - 10 5- - 129 - - - 129 - - - - - - - - - - -- 411 - - - - 411 - - - - 2 - 2 - 2 0 0- 70 - - - - 70 - 68 - 68 - - - - 68 - 97- - - - - - - - - - - 29 - 29 - 29- - - - - - - - - - - 23 - 23 - 23- 234 - - - - 234 - - - - - 32 32 - 32 14 14- 200 - 200 130 78 608 - - - - 828 - 828 - 828 414 414- - - - - - - - - - - 27 - 27 - 27- - - - - - - - - - - - 11 11 146 157- 119 - - - - 119 - - - - 199 - 199 - 199 167 167- - - - - - - - - - - - - - 78 78- 204 - - - - 204 - - - - 428 - 428 - 428 210 210
15 1,523 824 657 434 379 3,832 - 68 12 80 1,576 69 1,645 295 2,020 533 108 36 86
- - - - - - - - - - - - - - - -- - 1 207 1 1 210 - - - - - - - - - - -- - 157 - - - 157 - - - - - - - 927 927 590 590- - 158 207 1 1 367 - - - - - - - 927 927 587 587
- - - - - - - - - - - - - - - -- - - - - - - - - - - - - - - -- - - - - - - - - - - - - - - -- - - - - - - - - - - - - - - -
- 173 2,691 14,896 12,260 12,608 42,628 - - - - - - - - - - - -- - - 12,280 12,286 57,778 82,344 - - - - - - - - -- 173 2,691 27,176 24,546 70,386 124,972 - - - - - - - - - - - -
34,764 164,020 165,416 170,644 176,854 206,564 918,262 10,423 14,709 1,387 26,519 141,699 49,723 191,422 249,168 467,109 76 117 151 128
- - 570 - - - 570 - - - - - - - - - - -- - - - - - - - - - - - - - - -- - - - - - - - - - - 9 - 9 - 9145 - - - - - 145 724 - - 724 - - - - 724 499 499- - - - - - - - - - - 18 3 21 56 77506 42 42 - - - 590 - - - - - - - - - - - - -505 - - - - - 505 1,649 - - 1,649 - - - - 1,649 327 327
1,055 - - - - - 1,055 1,055 - - 1,055 - - - - 1,055 100 100
2,211 42 612 - - - 2,865 3,428 - - 3,428 27 3 30 56 3,514 155 71 9 123
1,511 713 713 713 - - 3,650 1,027 - - 1,027 - - - - 1,027 68 - - 356,702 3,368 5,446 4,516 3,975 3,167 27,174 3,285 629 - 3,914 - - - - 3,914 58 - - 25
779 - - - - - 779 5,100 41 - 5,141 - - - - 5,141 660 66022,267 11,290 8,812 8,904 9,297 9,673 70,243 24,035 641 - 24,676 - - - - 24,676 111 - - 58
1,385 - - - - - 1,385 1,113 252 2 1,367 - - - - 1,367 99 9932,644 15,371 14,971 14,133 13,272 12,840 103,231 34,560 1,563 2 36,125 - - - - 36,125 111 - - 57
6,144 - - - - - 6,144 5,614 3,684 - 9,298 - - - - 9,298 151 15185,393 411 1,044 560 295 248 87,951 93,596 7,176 2,589 103,361 - - - - 103,361 121 - - 11911,341 368 298 308 288 313 12,916 11,893 - -4,189 7,704 - - - - 7,704 68 - - 64
6,974 - - - - - 6,974 5,222 7,197 - 12,419 - - - - 12,419 178 178419 - - - - - 419 437 106 - 543 - - - - 543 130 130
110,271 779 1,342 868 583 561 114,404 116,762 18,163 -1,600 133,325 - - - - 133,325 121 - - 119
23,885 5,661 7,163 17,159 5,984 3,958 63,810 13,649 7,757 734 22,140 - - - - 22,140 93 - - 606,765 - - - - - 6,765 7,590 - - 7,590 - - - - 7,590 112 112
- - - - - - - - - - - - - - - -30,650 5,661 7,163 17,159 5,984 3,958 70,575 21,239 7,757 734 29,730 - - - - 29,730 97 - - 68
2,048 - - - - - 2,048 2,225 477 - 2,702 - - - - 2,702 132 1322,048 - - - - - 2,048 2,225 477 - 2,702 - - - - 2,702 132 132
623 - - - - - 623 625 - - 625 - - - - 625 100 10058 - - - - - 58 1,145 - -976 169 - - - - 169 291 291
681 - - - - - 681 1,770 - -976 794 - - - - 794 117 117
176,294 21,811 23,476 32,160 19,839 17,359 290,939 176,556 27,960 -1,840 202,676 - - - - 202,676 115 - - 91
213,269 185,873 189,504 202,804 196,693 223,923 1,212,066 190,407 42,669 -453 232,623 141,726 49,726 191,452 249,224 673,299 109 103 132 114
Forecasted (kW)
Net Incremental First Year Peak Demand Savings Net Incremental
First Year Peak
Demand Savings
Verified (kW) Progress (%)

2015 2016 2017 2018 2019 2020 Total 2015 Verified
2015 Results
2016 Verified
2015 Results
Adjustments
2017 Verified
2015 Results
Adjustments
Total Verified
2015 Results
2016 Verified
2016 Results
2017 Verified
2016 Results
Adjustments
Total Verified
2016 Results
2017Verified
2017 Results
Total Total Verified
2015 Results
Total Verified
2016 Results
2017Verified
2017 Results
Total
156 128 128 142 144 143 162 162 162 140 142 140 129 7 12 274 73 78 76 133 59
59 68 59 66 64 63 56 56 56 70 70 70 78 -3 2 1959 61 53 52 52 52 83 50 54 81 78 80 81 -5 19 29
100 100 100 100 100 100 100 100 100 100 100 100 100 - 0 0
91 87 88 87 87 88 98 90 98 91 69 69 69 94 0 -18 776 79 77 77 76 77 76 78 85 79 82 83 82 88 3 3 1292 94 88 88 89 90 93 93 93 94 -1 668 54 62 54 56 57 53 56 54 64 71 67 57 -14 13 -5
100 98 99 98 99 100 100 55 0 -4387 94 95 96 97 100 7
75 82 84 84 86 79 100 100 87 91 91 95 25 9 1180 83 84 83 83 84 86 86 86 72 3 -12
100 100 95 100 100 10075 73 75 80 77 71 80 73 82 2 0
86 81 97 89 4
75 75 75 75 7591 92 93 93 87 87 101 10
100 100 100
100 100 100 100 100 100 -70 70 70 7082 85 89 86 171 8890 90 90 9082 82 82 82 100 18
90 90 90 90 90 100 100 100 101 10 1180 80 80 80
100 100 99 99 99 93 93 82 -7 -18
80 100 100 100 100 100 100100 100
100 100 100 100 175 75
100 100 100 100 -90
100 100 100 -100
100 100 99 99 99 100 -95 95 95 95 95 90 -5
90100 100 100 -100 100 100
93 93100 104 104 4
77 100 100 2371 71 71 71 122 122 51
71 71100 90 90 90 -10
95 100 100 5100
97 97 97 -0
100 100 100 100100 100 100 100 75 -25100 100 100 100 89 -11
98
87 78 96 100 100100 74 74 79
100 100 -64 64 64 -
15 9 9 -6100 100 100 -
86 86 86 65100 100 100
98 99 99 1100 100 100 -
49 47 47 47 47 47 -2153 102 103 100 100 100 164 164 164 11167 164 165 164 -2
52 50 49 48 48 48 51 49 50 -152 49 50 49 50 -3
92 89 88 89 -378 79 79 79 80 80 77 72 87 77 -289 94 94 94 94 94 89 88 89 -055 54 55 55 -195 95 95 95 95 95 95 95 -0
87 100 100 100 100 100 80 79 93 80 -776 75 86 75 -1
100 100 100 100 100 100
100 100 100 100 -
100 100 100 -81 75 75 76 -5
Net-to-Gross
Adjustment - Energy
Comparison (%)
Net-to-Gross Adjustment - Energy
Forecasted (%) Verified (%)
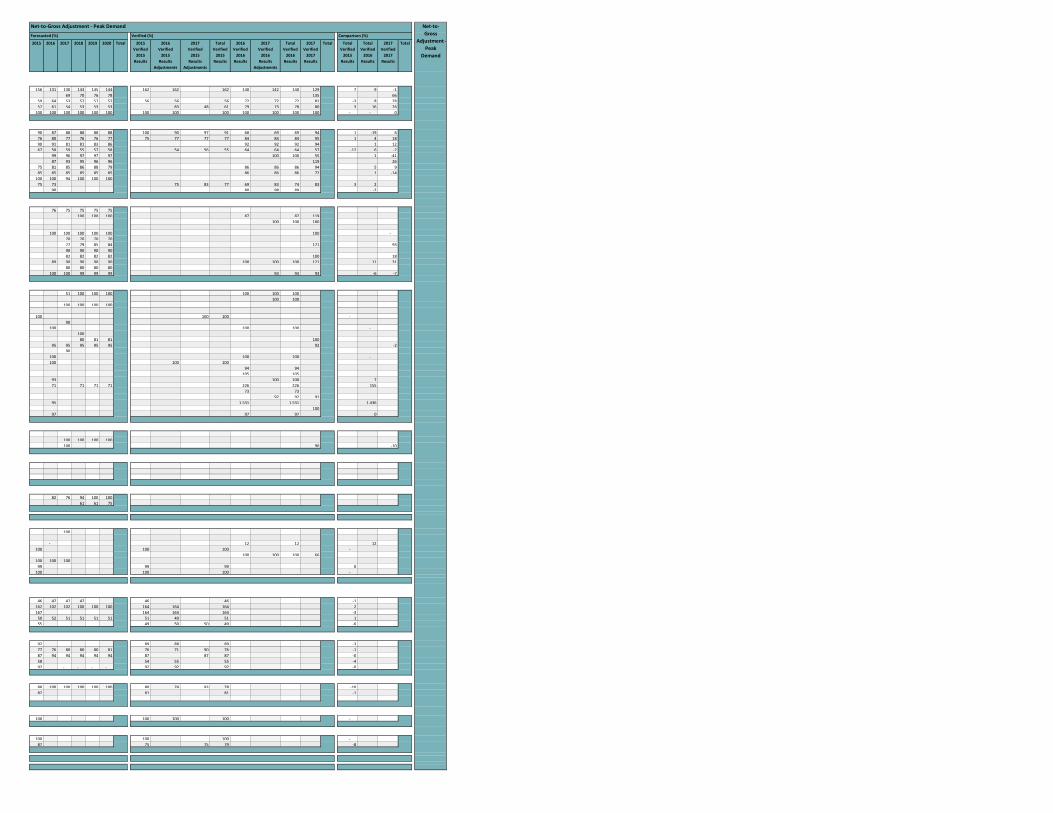
2015 2016 2017 2018 2019 2020 Total 2015 Verified
2015 Results
2016 Verified
2015 Results
Adjustments
2017 Verified
2015 Results
Adjustments
Total Verified
2015 Results
2016 Verified
2016 Results
2017 Verified
2016 Results
Adjustments
Total Verified
2016 Results
2017Verified
2017 Results
Total Total Verified
2015 Results
Total Verified
2016 Results
2017Verified
2017 Results
Total
156 131 130 143 145 144 162 162 162 140 142 140 129 7 9 -169 70 76 78 135 66
59 64 53 57 57 57 56 56 56 72 72 72 81 -3 8 2857 61 54 53 53 53 83 48 61 79 73 78 80 3 16 26
100 100 100 100 100 100 100 100 100 100 100 100 100 - - 0
90 87 88 88 88 88 100 90 97 91 68 69 69 94 1 -19 676 80 77 76 76 77 75 77 77 77 84 84 84 95 1 4 1890 91 81 81 83 86 92 92 92 94 1 1267 58 59 55 57 58 54 56 55 64 64 64 57 -12 6 -2
99 96 97 97 97 100 100 55 1 -4187 93 95 96 96 119 26
75 81 85 86 88 79 86 86 86 94 5 985 85 85 85 85 85 86 86 86 72 1 -14
100 100 94 100 100 10075 73 75 83 77 69 83 74 83 3 2
90 80 98 89 -2
76 75 75 75 75100 100 100 87 87 119
100 100 100
100 100 100 100 100 100 -70 70 70 7077 79 85 84 171 9390 90 90 9082 82 82 82 100 18
89 90 90 90 90 100 100 100 121 11 3180 80 80 80
100 100 99 99 99 94 94 93 -6 -7
51 100 100 100 100 100 100100 100
100 100 100 100
100 100 100 -90
100 100 100 -100
80 81 81 10095 95 95 95 95 92 -2
90100 100 100 -100 100 100
94 94105 105
93 100 100 771 71 71 71 226 226 155
73 7392 92 91
95 1,531 1,531 1,436100
97 97 97 0
100 100 100 100100 90 -10
82 76 94 100 10061 61 75
100
- 12 12 12100 100 100 -
100 100 100 66100 100 100
99 99 99 0100 100 100 -
46 47 47 47 46 46 -1162 102 102 100 100 100 164 164 164 2167 164 164 164 -3
50 52 51 51 51 51 51 49 51 155 49 50 50 49 -6
92 89 88 89 -377 76 80 80 80 81 76 71 90 76 -187 94 94 94 94 94 87 87 87 -058 54 55 55 -492 - - - - 92 92 92 -0
88 100 100 100 100 100 80 74 93 78 -1082 81 81 -1
100 100 100 100 -
100 100 100 -87 75 75 79 -8
Net-to-Gross Adjustment - Peak Demand Net-to-Gross
Adjustment - Peak
Demand
Forecasted (%) Verified (%) Comparison (%)

2015 Verified
2015 Results
2016 Verified
2015 Results
Adjustments
2017 Verified
2015 Results
Adjustments
Total Verified
2015 Results
2016 Verified
2016 Results
2017 Verified
2016 Results
Adjustments
Total Verified
2016 Results
2017Verified
2017 Results
Total 2015 Verified
2015 Results
2016 Verified
2015 Results
Adjustments
2017 Verified
2015 Results
Adjustments
Total Verified
2015 Results
2016 Verified
2016 Results
2017 Verified
2016 Results
Adjustments
Total Verified
2016 Results
2017Verified
2017 Results
Total
100 100 100 167 176 168 275 100 99 100 164 178 165 28288 88
100 119 102 112 112 112 107 100 204 106 108 108 108 7214 100 56 20 18 19 23 78 122 102 89 73 85 168
94 107 97 72 86 75 54 97 100 98 18 12 17 15
100 100 749 100 203 100 100 100 749 100 203 10096 98 99 98 93 95 94 102 81 85 73 83 89 86 88 108
68 2,610 90 87 48 1,597 64 6794 84 90 115 115 115 110 86 98 90 112 115 113 106
100 100 100 77 77 9969 63
100 100 110 100 100 107 97 102 102 -20598 98 98 94 93 94 93 111
94 102 97 102 103 102 103 99 107 102 92 108 97 109101 99 100 103 104 103
61 61 65 61 61 6193 93 79 20 20 13
48 9
35 6
100 83109 109 109 114 85 88 86 104
31 31 31 11 21 1687 87 225 225
37
48 48
54 54 14 14
87 9192 118
104 104109 109 85 85
52 52 9 954 54 129 129
19 19 52 5224 24 49 49
103 103 148 14866 66 66 48 48 47
83 83 5 555 23
130 130 130 130
10070
23 23247 247 243 243
100 100 100 10073 72 72 118 42 38 41 82
100 100 100 100107 107
100 100 100 100100 103 101 100 32 75100 96 100 100 147 100100 119 100 100 206 101
76 97 100 84 187 79 100 149
100 166 100 16699 97 88 99 90 94 71 8971 46 59 3898 98 98 92 96 94
100 100 100 137 137 137
100 100 105 100 94 99 73 95101 97 101 115 115100 100 - -
87 97 88 95 100 96
75 75 84 8487 98 76 72 96 28
Verified (%) Verified (%)
Realization Rate - Energy Realization Rate - Energy
Realization Rate - Peak Demand Realization Rate - Peak
Demand
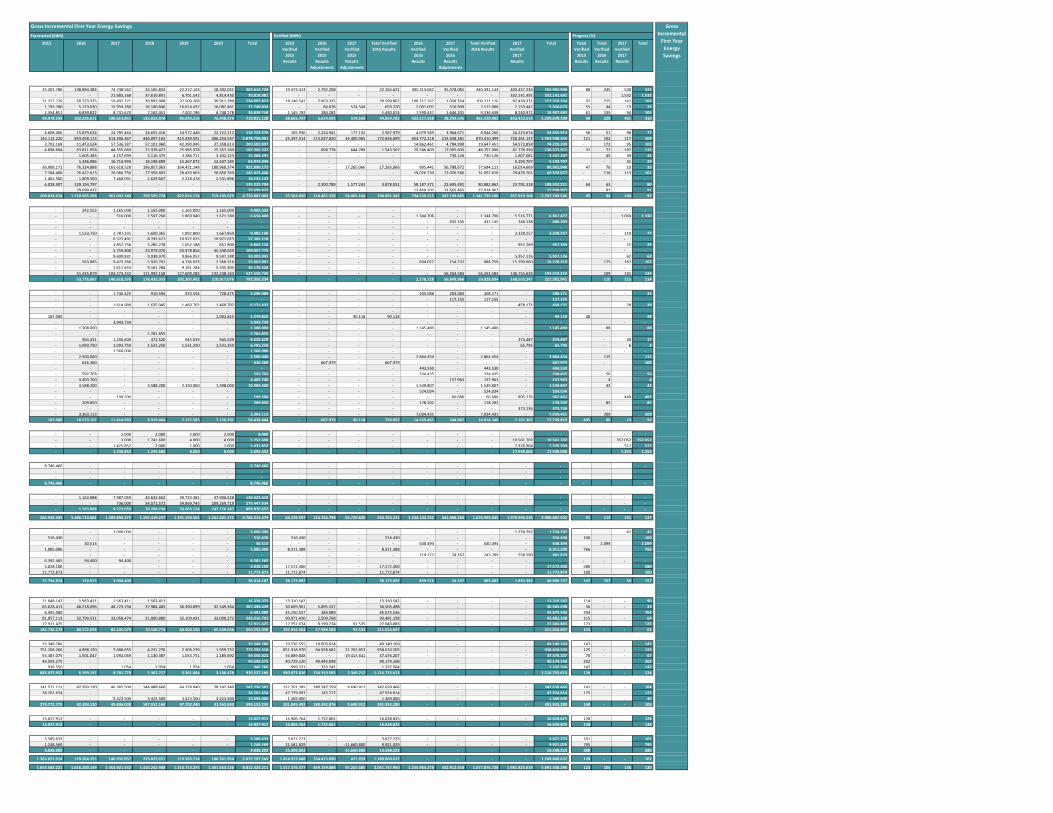
2015 2016 2017 2018 2019 2020 Total 2015 Verified
2015 Results
2016 Verified
2015 Results
Adjustments
2017 Verified
2015 Results
Adjustments
Total Verified 2015 Results
2016 Verified
2016 Results
2017 Verified
2016 Results
Adjustments
Total Verified 2016 Results
2017Verified
2017 Results
Total Total Verified
2015 Results
Total Verified
2016 Results
2017Verified
2017 Results
Total
25,201,786 138,894,384 74,748,562 24,165,832 22,212,143 18,392,021 303,614,728 19,373,413 2,792,208 - 22,165,621 305,313,062 35,078,081 340,391,143 403,437,234 765,993,998 88 245 540 321- - 21,683,168 37,619,841 6,701,542 4,814,430 70,818,981 - - - - - - - 332,141,491 332,141,491 1,532 1,532
21,227,776 50,773,375 59,492,171 39,893,908 32,509,308 30,911,289 234,807,827 18,146,542 2,453,325 - 20,599,867 108,212,762 1,058,354 109,271,116 87,439,371 217,310,354 97 215 147 1651,193,780 5,719,030 15,959,280 16,180,846 16,614,437 16,082,461 71,749,834 - 84,676 574,544 659,220 2,001,097 510,909 2,512,006 2,153,447 5,324,673 55 44 13 232,354,851 6,839,822 8,731,670 7,162,451 7,002,786 6,748,178 38,839,758 1,145,792 284,282 - 1,430,074 7,590,437 1,646,201 9,236,638 8,240,971 18,907,683 61 135 94 105
49,978,193 202,226,611 180,614,851 125,022,878 85,040,216 76,948,379 719,831,128 38,665,747 5,614,491 574,544 44,854,782 423,117,358 38,293,545 461,410,903 833,412,514 1,339,678,199 90 228 461 310
4,608,406 15,879,624 24,785,464 24,655,416 24,572,448 22,222,212 116,723,570 165,936 2,224,941 177,102 2,567,979 4,079,589 3,964,671 8,044,260 24,223,674 34,835,913 56 51 98 77143,112,220 853,458,113 614,396,367 446,097,163 415,439,591 406,254,547 2,878,758,001 25,397,914 113,037,820 34,400,965 172,836,699 654,772,218 215,638,281 870,410,499 720,261,137 1,763,508,335 121 102 117 109
3,702,168 11,413,524 57,536,587 57,101,960 42,390,045 37,358,613 209,502,897 - - - - 14,862,461 4,784,990 19,647,451 54,572,858 74,220,309 - 172 95 1024,898,894 63,811,058 44,355,660 22,978,472 25,985,978 25,353,260 187,383,322 - 898,778 644,789 1,543,567 29,246,403 17,005,603 46,252,006 82,778,399 130,573,972 32 72 187 115
- 1,605,383 4,157,699 3,116,375 3,286,711 3,202,223 15,368,391 - - - - - 730,126 730,126 1,607,081 2,337,207 45 39 41- 1,346,086 16,714,994 18,198,809 15,267,872 12,447,185 63,974,946 - - - - - - - 5,193,707 5,193,707 - 31 29
36,908,171 76,324,888 165,618,528 196,857,063 264,421,148 180,968,374 921,098,172 - - 17,265,066 17,265,066 895,441 56,788,672 57,684,113 16,014,669 90,963,848 47 76 10 337,284,408 26,422,813 26,066,750 27,958,803 28,433,903 28,856,769 145,023,446 - - - - 19,026,230 12,026,586 31,052,816 29,476,261 60,529,077 - 118 113 1011,481,500 1,809,500 7,460,091 2,629,667 2,218,478 2,531,896 18,131,132 - - - - - - - - - - - - -6,028,907 129,194,797 - - - - 135,223,704 - 2,300,789 1,577,242 3,878,031 58,187,371 22,695,491 80,882,862 23,791,318 108,552,211 64 63 80
- 29,699,422 - - - - 29,699,422 - - - - 13,469,502 13,565,465 27,034,967 - 27,034,967 91 91208,024,674 1,210,965,208 961,092,140 799,593,728 822,016,174 719,195,079 4,720,887,003 25,563,850 118,462,328 54,065,164 198,091,342 794,539,215 347,199,885 1,141,739,100 957,919,104 2,297,749,546 95 94 100 97
- 242,553 1,165,000 1,165,000 1,165,000 1,165,000 4,902,553 - - - - - - - - - - - -- - 516,000 2,597,260 1,869,940 1,671,280 6,654,480 - - - - 1,344,706 - 1,344,706 5,516,771 6,861,477 1,069 1,330- - - - - - - - - - - - 432,145 432,145 248,138 680,283- - - - - - - - - - - - - - - -- 1,533,750 2,787,335 1,600,365 1,892,800 1,667,850 9,482,100 - - - - - - - 3,328,257 3,328,257 - 119 77- - 6,572,491 8,792,677 10,972,025 10,972,025 37,309,218 - - - - - - - - - - -- - 3,852,758 3,285,278 1,052,188 651,900 8,842,124 - - - - - - - 957,269 957,269 25 25- - 5,759,800 23,979,070 33,978,856 45,340,049 109,057,775 - - - - - - - - - - -- - 9,600,831 9,938,970 9,866,952 9,597,188 39,003,941 - - - - - - - 5,957,126 5,957,126 62 62- 563,885 9,473,266 5,920,791 4,736,633 2,368,316 23,062,891 - - - - 834,022 154,237 988,259 15,790,060 16,778,319 175 167 167- - 2,617,653 9,161,784 9,161,784 5,235,305 26,176,526 - - - - - - - - - - -- 51,435,879 104,273,242 111,992,158 127,609,284 132,248,163 527,558,726 - - - - - 56,263,584 56,263,584 136,755,626 193,019,210 109 131 124- 53,776,067 146,618,376 178,433,353 202,305,462 210,917,076 792,050,334 - - - - 2,178,728 56,849,966 59,028,694 168,553,247 227,581,941 110 115 114
- - 1,746,425 910,594 910,594 728,475 4,296,088 - - - - 205,088 203,083 408,171 - 408,171 - 23- - - - - - - - - - - - 117,155 117,155 - 117,155- - 1,614,988 1,635,045 1,460,702 1,460,702 6,171,437 - - - - - - - 458,171 458,171 28 28- - - - - - - - - - - - - - - -
187,000 - - - - 1,092,825 1,279,825 - - 90,118 90,118 - - - - 90,118 48 48- - 3,943,734 - - - 3,943,734 - - - - - - - - - - -- 1,308,000 - - - - 1,308,000 - - - - 1,145,480 - 1,145,480 - 1,145,480 88 88- - - 1,781,855 - - 1,781,855 - - - - - - - - -- 903,431 1,256,600 472,520 945,039 945,039 4,522,629 - - - - - - - 374,487 374,487 - 30 17- 1,093,750 1,093,750 1,531,250 1,531,250 1,531,250 6,781,250 - - - - - - - 65,795 65,795 - 6 3- - 1,560,000 - - - 1,560,000 - - - - - - - - - - -- 2,500,000 - - - - 2,500,000 - - - - 2,864,454 - 2,864,454 - 2,864,454 115 115- 616,360 - - - - 616,360 - 667,979 - 667,979 - - - - 667,979 - 108- - - - - - - - - - - 443,530 - 443,530 - 443,530- 592,703 - - - - 592,703 - - - - 334,435 - 334,435 - 334,435 56 56- 4,403,700 - - - - 4,403,700 - - - - - 157,963 157,963 - 157,963 4 4- 3,588,200 - 3,588,200 2,330,000 1,398,000 10,904,400 - - - - 1,539,807 - 1,539,807 - 1,539,807 43 43- - - - - - - - - - - 524,034 - 524,034 - 524,034- - 199,500 - - - 199,500 - - - - - 66,686 66,686 895,776 962,462 449 482- 209,850 - - - - 209,850 - - - - 178,202 - 178,202 - 178,202 85 85- - - - - - - - - - - - - - 373,136 373,136- 3,363,113 - - - - 3,363,113 - - - - 7,034,431 - 7,034,431 - 7,034,431 209 209
187,000 18,579,107 11,414,997 9,919,464 7,177,585 7,156,291 54,434,444 - 667,979 90,118 758,097 14,269,461 544,887 14,814,348 2,167,365 17,739,810 405 80 19 59
- - 2,000 2,000 2,000 2,000 8,000 - - - - - - - - - - -- - 3,000 1,241,600 4,000 4,000 1,252,600 - - - - - - - 10,561,702 10,561,702 352,057 352,057- - 1,425,852 2,000 2,000 2,000 1,431,852 - - - - - - - 7,376,304 7,376,304 517 517- - 1,430,852 1,245,600 8,000 8,000 2,692,452 - - - - - - - 17,938,006 17,938,006 1,254 1,254
8,746,466 - - - - - 8,746,466 - - - - - - - - - - -- - - - - - - - - - - - - - - -- - - - - - - - - - - - - - - -
8,746,466 - - - - - 8,746,466 - - - - - - - - - - -
- 1,163,888 7,987,059 43,632,662 39,733,381 37,906,628 130,423,618 - - - - - - - - - - - -- - 736,000 34,571,572 34,869,743 209,269,719 279,447,034 - - - - - - - - - - -- 1,163,888 8,723,059 78,204,234 74,603,124 247,176,347 409,870,652 - - - - - - - - - - - -
266,936,333 1,486,710,881 1,309,894,275 1,192,419,257 1,191,150,561 1,261,401,172 6,708,512,479 64,229,597 124,744,798 54,729,826 243,704,221 1,234,104,762 442,888,283 1,676,993,045 1,979,990,236 3,900,687,502 91 113 151 127
- - 3,000,000 - - - 3,000,000 - - - - - - - 1,274,792 1,274,792 42 42516,430 - - - - - 516,430 516,430 - - 516,430 - - - - 516,430 100 100
- 30,513 - - - - 30,513 - - - - 640,394 - 640,394 - 640,394 2,099 2,0991,085,006 - - - - - 1,085,006 8,311,388 - - 8,311,388 - - - - 8,311,388 766 766
- - - - - - - - - - - 219,122 24,167 243,289 558,590 801,8796,392,465 94,400 94,400 - - - 6,581,265 - - - - - - - - - - - - -3,028,100 - - - - - 3,028,100 17,572,400 - - 17,572,400 - - - - 17,572,400 580 580
11,772,873 - - - - - 11,772,873 11,772,874 - - 11,772,874 - - - - 11,772,874 100 100
22,794,874 124,913 3,094,400 - - - 26,014,187 38,173,092 - - 38,173,092 859,516 24,167 883,683 1,833,382 40,890,157 167 707 59 157
11,648,142 1,563,411 1,563,411 1,563,411 - - 16,338,375 13,310,542 - - 13,310,542 - - - - 13,310,542 114 - - 9065,628,413 46,218,096 48,723,194 37,984,483 36,390,899 32,549,364 267,494,449 30,609,961 5,895,537 - 36,505,498 - - - - 36,505,498 56 - - 23
6,491,080 - - - - - 6,491,080 45,290,557 384,989 - 45,675,546 - - - - 45,675,546 704 70481,057,113 32,790,531 32,058,474 31,000,880 32,109,431 33,000,272 242,016,701 90,971,430 2,509,768 - 93,481,198 - - - - 93,481,198 115 - - 6417,911,425 - - - - - 17,911,425 12,752,074 9,199,274 92,535 22,043,883 - - - - 22,043,883 123 123
182,736,173 80,572,038 82,345,079 70,548,774 68,500,330 65,549,636 550,252,030 192,934,564 17,989,568 92,535 211,016,667 - - - - 211,016,667 115 - - 61
33,348,786 - - - - - 33,348,786 29,536,555 19,603,614 - 49,140,169 - - - - 49,140,169 147 147751,208,266 4,898,150 7,688,655 4,231,276 2,306,239 1,959,732 772,292,318 851,918,970 64,928,682 21,762,853 938,610,505 - - - - 938,610,505 125 - - 123
53,387,075 1,501,047 1,092,069 1,130,387 1,053,751 1,185,692 59,350,021 56,889,848 - -19,413,641 37,476,207 - - - - 37,476,207 70 - - 6744,593,275 - - - - - 44,593,275 40,729,120 49,445,048 - 90,174,168 - - - - 90,174,168 202 202
938,550 - 1,054 1,054 1,054 1,054 942,766 999,323 333,241 - 1,332,564 - - - - 1,332,564 142 - 142883,475,952 6,399,197 8,781,778 5,362,717 3,361,044 3,146,478 910,527,166 980,073,816 134,310,585 2,349,212 1,116,733,613 - - - - 1,116,733,613 126 - - 124
241,571,121 42,393,120 46,382,500 144,488,660 44,278,840 28,142,340 547,256,581 152,701,395 180,247,159 9,690,912 342,639,466 - - - - 342,639,466 142 - - 10438,201,654 - - - - - 38,201,654 47,779,097 145,717 - 47,924,814 - - - - 47,924,814 125 125
- - 3,423,500 3,423,500 3,423,500 3,423,500 13,694,000 1,369,000 - - 1,369,000 - - - - 1,369,000 - 40279,772,775 42,393,120 49,806,000 147,912,160 47,702,340 31,565,840 599,152,235 201,849,492 180,392,876 9,690,912 391,933,280 - - - - 391,933,280 140 - - 105
13,027,912 - - - - - 13,027,912 14,906,764 1,722,061 - 16,628,825 - - - - 16,628,825 128 12813,027,912 - - - - - 13,027,912 14,906,764 1,722,061 - 16,628,825 - - - - 16,628,825 128 128
3,589,633 - - - - - 3,589,633 3,627,223 - - 3,627,223 - - - - 3,627,223 101 1011,248,569 - - - - - 1,248,569 21,581,829 - -11,660,800 9,921,029 - - - - 9,921,029 795 7954,838,202 - - - - - 4,838,202 25,209,052 - -11,660,800 13,548,252 - - - - 13,548,252 280 280
1,363,851,014 129,364,355 140,932,857 223,823,651 119,563,714 100,261,954 2,077,797,545 1,414,973,688 334,415,090 471,859 1,749,860,637 - - - - 1,749,860,637 128 - - 107
1,653,582,221 1,616,200,149 1,453,921,532 1,416,242,908 1,310,714,275 1,361,663,126 8,812,324,211 1,517,376,377 459,159,888 55,201,685 2,031,737,950 1,234,964,278 442,912,450 1,677,876,728 1,981,823,618 5,691,438,296 123 104 136 120
Gross Incremental
First Year Energy Savings
Forecasted (kWh) Verified (kWh) Progress (%)
Gross Incremental First Year Energy Savings

2015 2016 2017 2018 2019 2020 Total 2015 Verified
2015 Results
2016 Verified
2015 Results
Adjustments
2017 Verified
2015 Results
Adjustments
Total Verified
2015 Results
2016 Verified
2016 Results
2017 Verified
2016 Results
Adjustments
Total Verified
2016 Results
2017Verified
2017 Results
Total Total Verified
2015 Results
Total Verified
2016 Results
2017Verified
2017 Results
Total
1,643 8,395 5,344 1,629 1,517 1,273 19,801 1,247 183 - 1,430 19,852 2,234 22,086 27,948 51,464 87 263 523 335- - 1,205 2,230 477 420 4,332 - - - - - - - 22,501 22,501 1,867 1,867
11,237 16,371 15,688 11,011 10,360 10,203 74,870 9,482 1,260 - 10,742 31,230 307 31,537 23,647 65,926 96 193 151 152237 1,282 2,660 2,731 2,844 2,720 12,474 - 18 33 51 451 116 567 607 1,225 22 44 23 29
1,261 4,275 4,751 3,747 3,685 3,637 21,356 213 39 - 252 827 132 959 1,197 2,408 20 22 25 2314,378 30,323 29,648 21,348 18,883 18,253 132,833 10,942 1,500 33 12,475 52,360 2,789 55,149 75,900 143,524 87 182 256 193
932 2,254 4,096 4,058 4,040 3,673 19,053 35 474 38 547 533 518 1,051 1,076 2,674 59 47 26 3722,100 114,927 91,392 67,683 65,564 65,453 427,119 3,752 16,562 1,376 21,690 85,826 31,406 117,232 108,779 247,701 98 102 119 108
799 1,791 10,432 10,237 8,353 7,191 38,803 - - - - 2,853 974 3,827 11,469 15,296 - 214 110 1171,402 11,821 9,152 5,738 6,224 6,197 40,534 - 178 106 284 8,870 3,437 12,307 13,944 26,535 20 104 152 119
- 650 1,156 842 925 885 4,458 - - - - - 83 83 146 229 13 13 13- 182 2,105 2,197 1,827 1,481 7,792 - - - - - - - 616 616 - 29 27
4,007 6,342 24,107 24,913 35,514 21,599 116,482 - - - - 71 5,469 5,540 2,814 8,354 - 87 12 241,250 3,390 3,236 3,652 3,765 3,859 19,152 - - - - 1,756 2,071 3,827 3,979 7,806 - 113 123 99
149 136 648 80 106 71 1,190 - - - - - - - - - - - - -870 15,147 - - - - 16,017 - 457 252 709 6,140 3,470 9,610 3,732 14,051 81 63 88- 3,807 - - - - 3,807 - - - - 2,002 1,933 3,935 - 3,935 103 103
31,509 160,447 146,324 119,400 126,318 110,409 694,407 3,787 17,671 1,772 23,230 108,051 49,361 157,412 146,555 327,197 74 98 100 97
- 58 280 280 280 280 1,178 - - - - - - - - - - - -- - - 24 12 6 42 - - - - 183 - 183 611 794- - - - - - - - - - - - 10 10 2 12- - - - - - - - - - - - - - - -- 296 537 308 365 321 1,827 - - - - - - - 277 277 - 52 33- - 2,191 2,931 3,657 3,657 12,436 - - - - - - - - - - -- - 754 628 345 233 1,960 - - - - - - - 150 150 20 20- - 695 2,892 4,099 5,469 13,155 - - - - - - - - - - -- - 4,997 4,997 4,997 4,911 19,902 - - - - - - - 1,140 1,140 23 23- 65 1,089 681 544 272 2,651 - - - - 75 14 89 1,675 1,764 137 154 153- - 780 2,730 2,730 1,560 7,800 - - - - - - - - - - -- 9,857 15,819 20,866 23,173 23,451 93,166 - - - - - 5,199 5,199 25,776 30,975 53 163 121- 10,276 27,142 36,337 40,202 40,160 154,117 - - - - 258 5,223 5,481 29,631 35,112 53 109 94
- - 284 17 17 14 332 - - - - 4 8 12 - 12 - 4- - - - - - - - - - - - 18 18 - 18- - 3 3 4 4 14 - - - - - - - - - - -- - - - - - - - - - - - - - - -
15 - - - - - 15 - - 12 12 - - - - 12 80 80- - 470 - - - 470 - - - - - - - - - - -- 160 - - - - 160 - - - - 36 - 36 - 36 23 23- - - 208 - - 208 - - - - - - - - -- - - 66 132 132 330 - - - - - - - 59 59- 132 132 185 185 185 819 - - - - - - - 13 13 - 10 5- - 143 - - - 143 - - - - - - - - - - -- 411 - - - - 411 - - - - 2 - 2 - 2 0 0- 70 - - - - 70 - 68 - 68 - - - - 68 - 97- - - - - - - - - - - 31 - 31 - 31- - - - - - - - - - - 22 - 22 - 22- 251 - - - - 251 - - - - - 32 32 - 32 13 13- 282 - 282 183 110 857 - - - - 366 - 366 - 366 130 130- - - - - - - - - - - 37 - 37 - 37- - - - - - - - - - - - 12 12 160 172- 125 - - - - 125 - - - - 13 - 13 - 13 10 10- - - - - - - - - - - - - - 78 78- 211 - - - - 211 - - - - 442 - 442 - 442 209 209
15 1,642 1,032 761 521 445 4,416 - 68 12 80 953 70 1,023 310 1,413 533 62 30 53
- - - - - - - - - - - - - - - -- - 1 207 1 1 210 - - - - - - - - - - -- - 157 - - - 157 - - - - - - - 1,035 1,035 659 659- - 158 207 1 1 367 - - - - - - - 1,035 1,035 655 655
- - - - - - - - - - - - - - - -- - - - - - - - - - - - - - - -- - - - - - - - - - - - - - - -- - - - - - - - - - - - - - - -
- 212 3,555 15,772 12,306 12,654 44,499 - - - - - - - - - - - -- - - 20,204 20,211 77,078 117,493 - - - - - - - - -- 212 3,555 35,976 32,517 89,732 161,992 - - - - - - - - - - - -
45,902 202,900 207,859 214,029 218,442 259,000 1,148,132 14,729 19,239 1,817 35,785 161,622 57,443 219,065 253,431 508,281 78 108 122 111
- - 570 - - - 570 - - - - - - - - - - -- - - - - - - - - - - - - - - -- 3 - - - - 3 - - - - 73 - 73 - 73 2,433 2,433145 - - - - - 145 724 - - 724 - - - - 724 499 499- - - - - - - - - - - 18 3 21 85 106506 42 42 - - - 590 - - - - - - - - - - - - -510 - - - - - 510 1,661 - - 1,661 - - - - 1,661 326 326
1,055 - - - - - 1,055 1,055 - - 1,055 - - - - 1,055 100 100
2,216 45 612 - - - 2,873 3,440 - - 3,440 91 3 94 85 3,619 155 209 14 126
3,275 1,532 1,532 1,532 - - 7,871 2,256 - - 2,256 - - - - 2,256 69 - - 364,129 3,302 5,343 4,518 3,977 3,168 24,437 2,000 383 - 2,383 - - - - 2,383 58 - - 19
466 - - - - - 466 3,101 25 - 3,126 - - - - 3,126 671 67144,879 21,883 17,337 17,490 18,253 18,979 138,821 47,546 1,295 - 48,841 - - - - 48,841 109 - - 58
2,507 - - - - - 2,507 2,263 508 4 2,775 - - - - 2,775 111 11155,256 26,717 24,212 23,540 22,230 22,147 174,102 57,166 2,211 4 59,381 - - - - 59,381 107 - - 56
6,713 - - - - - 6,713 6,296 4,176 - 10,472 - - - - 10,472 156 156110,663 540 1,297 700 367 307 113,874 122,480 10,059 2,869 135,408 - - - - 135,408 122 - - 120
12,983 392 317 328 306 333 14,659 13,676 - -4,828 8,848 - - - - 8,848 68 - - 6511,948 - - - - - 11,948 9,656 13,036 - 22,692 - - - - 22,692 190 190
455 - 1 1 1 1 459 475 115 - 590 - - - - 590 130 - 129142,762 932 1,615 1,029 674 641 147,653 152,583 27,386 -1,959 178,010 - - - - 178,010 125 - - 123
27,242 5,661 7,163 17,159 5,984 3,958 67,167 17,026 10,540 789 28,355 - - - - 28,355 104 - - 718,245 - - - - - 8,245 9,370 - - 9,370 - - - - 9,370 114 114
- - - - - - - - - - - - - - - -35,487 5,661 7,163 17,159 5,984 3,958 75,412 26,396 10,540 789 37,725 - - - - 37,725 106 - - 78
2,048 - - - - - 2,048 2,225 477 - 2,702 - - - - 2,702 132 1322,048 - - - - - 2,048 2,225 477 - 2,702 - - - - 2,702 132 132
623 - - - - - 623 625 - - 625 - - - - 625 100 10067 - - - - - 67 1,517 - -1,302 215 - - - - 215 321 321
690 - - - - - 690 2,142 - -1,302 840 - - - - 840 122 122
236,243 33,310 32,990 41,728 28,888 26,746 399,905 240,512 40,614 -2,468 278,658 - - - - 278,658 118 - - 92
284,361 236,255 241,461 255,757 247,330 285,746 1,550,910 258,681 59,853 -651 317,883 161,713 57,446 219,159 253,516 790,558 112 93 105 104
Gross Incremental First Year Peak Demand Savings Gross Incremental
First Year Peak
Demand Savings
Savings GroupForecasted (kW) Verified (kW) Progress (%)

2015 2016 2017 2018 2019 2020 Total 2015 Verified
2015 Results
2016 Verified
2015 Results
Adjustments
2017 Verified
2015 Results
Adjustments
Total Verified 2015
Results
2016 Verified
2016 Results
2017 Verified
2016 Results
Adjustments
Total Verified 2016 Results
2017Verified
2017 Results
Total Total Verified
2015 Results
Total Verified
2016 Results
2017Verified
2017 Results
Total
3,592,959 16,695,644 18,087,454 4,655,809 4,314,425 3,408,324 50,754,615 3,845,994 - - 3,845,994 27,891,182 - 27,891,182 67,929,128 99,666,304 107 167 376 260- - 2,219,364 3,734,670 1,091,461 892,363 7,937,858 - - - - - - - 15,235,796 15,235,796 686 686
3,301,165 18,952,591 16,320,239 12,341,624 10,538,463 10,052,110 71,506,192 6,213,250 -35,350 - 6,177,900 32,281,350 - 32,281,350 38,242,200 76,701,450 187 170 234 19950,167 1,741,173 2,486,154 2,532,606 2,635,863 2,556,567 12,002,530 - - - - 631,532 - 631,532 2,492,817 3,124,349 - 36 100 73
530,956 5,217,056 5,897,066 5,289,181 5,227,328 4,967,479 27,129,066 753,158 - - 753,158 4,839,355 - 4,839,355 6,380,412 11,972,925 142 93 108 1037,475,247 42,606,464 45,010,277 28,553,890 23,807,540 21,876,843 169,330,261 10,812,402 -35,350 - 10,777,052 65,643,419 - 65,643,419 130,280,353 206,700,824 144 154 289 217
42,693 1,326,241 1,775,780 1,792,649 1,787,649 1,473,399 8,198,411 6,420 - - 6,420 543,115 - 543,115 2,213,346 2,762,881 15 41 125 886,129,194 84,953,759 74,223,424 55,544,898 49,350,340 48,501,543 318,703,158 2,662,418 - - 2,662,418 56,156,230 - 56,156,230 81,242,263 140,060,911 43 66 109 85
- 2,578,089 12,555,404 11,764,795 8,554,112 7,677,319 43,129,719 - - - - 2,034,251 - 2,034,251 7,360,941 9,395,192 79 59 62336,193 11,888,870 5,590,918 3,747,979 4,116,318 4,127,949 29,808,227 - - - - 1,424,439 - 1,424,439 6,222,187 7,646,626 - 12 111 43
- 347,839 850,810 660,810 683,135 674,686 3,217,280 - - - - 66,640 - 66,640 145,336 211,976 19 17 18- 380,275 3,882,276 4,271,361 3,483,133 2,727,706 14,744,751 - - - - - - - 2,806,910 2,806,910 - 72 66
847,441 9,727,104 29,674,565 36,554,150 49,947,358 26,874,958 153,625,576 16,893 - - 16,893 2,742,147 - 2,742,147 9,929,021 12,688,061 2 28 33 32- 3,477,014 5,507,297 6,109,229 6,320,844 6,548,358 27,962,742 - - - - 1,405,066 - 1,405,066 4,490,224 5,895,290 40 82 66- 107,500 756,852 320,352 244,352 281,852 1,710,908 - - - - 31,816 - 31,816 150,000 181,816 30 20 21
946,699 9,181,235 - - - - 10,127,934 - - - - 272,373 - 272,373 10,431,933 10,704,306 - 3 106- 5,243,894 - - - - 5,243,894 - - - - - - - - - - -
8,302,220 129,211,820 134,817,326 120,766,223 124,487,241 98,887,770 616,472,600 2,685,731 - - 2,685,731 64,676,077 - 64,676,077 124,992,161 192,353,969 32 50 93 71
- 52,050 250,000 250,000 250,000 250,000 1,052,050 - - - - - - - 344,300 344,300 - 138 114- - 154,800 756,362 541,682 483,842 1,936,686 - - - - 136,783 - 136,783 - 136,783 - 88- - - - - - - - - - - - - - 376,753 376,753- - - - - - - - - - - - - - - -- 1,125,000 2,044,500 1,295,500 1,510,000 1,345,000 7,320,000 - - - - - - - 2,559,691 2,559,691 - 125 81- - 1,323,573 1,768,750 2,208,769 2,208,769 7,509,861 - - - - - - - - - - -- - 179,160 215,170 78,368 44,967 517,665 - - - - - - - 129,578 129,578 72 72- - 2,487,187 2,683,816 1,606,269 1,417,733 8,195,005 - - - - - - - 3,863 3,863 0 0- - 2,216,324 2,458,049 2,406,574 2,286,974 9,367,921 - - - - - - - 717,600 717,600 32 32- 104,527 1,756,060 1,097,537 878,030 439,015 4,275,169 - - - - - - - 1,748,774 1,748,774 - 100 94- - 1,163,357 4,071,749 4,071,749 2,326,714 11,633,569 - - - - - - - - - - -- - - - - - - - - - - - - - 120,000 120,000- 1,281,577 11,574,961 14,596,933 13,551,441 10,803,014 51,807,926 - - - - 136,783 - 136,783 6,000,559 6,137,342 11 52 48
- - 2,788,622 2,272,687 2,272,687 1,818,150 9,152,146 - - - - - - - - - - -- - - - - - - - - - - - - - - -- - 47,099 47,719 42,589 42,569 179,976 - - - - - - - - - - -- - - - - - - - - - - - - - - -- - - - - - - - - - - - - - - -- - - - - - - - - - - - - - - -- - - - - - - - - - - - - - - -- - - - - - - - - - - - - - - -- - - 64,200 128,400 128,400 321,000 - - - - - - - - -- - 150,000 210,000 210,000 210,000 780,000 - - - - - - - - - - -- - - - - - - - - - - - - - - -- - - - - - - - - - - - - - - -- - - - - - - - - - - - - - - -- - - - - - - - - - - - - - - -- - - - - - - - - - - - - - - -- - - - - - - - - - - - - - - -- - - 236,775 153,750 92,250 482,775 - - - - - - - - -- - - - - - - - - - - - - - - -- - - - - - - - - - - - - - - -- - - - - - - - - - - - - - - -- - - - - - - - - - - - - - - -- 823,433 - - - - 823,433 - - - - - - - 969,131 969,131 - 118- 823,433 2,985,721 2,831,381 2,807,426 2,291,369 11,739,330 - - - - - - - 969,131 969,131 - 32 25
- - - - - - - - - - - - - - - -- - 1 1 1 1 4 - - - - - - - - - - -- - - - - - - - - - - - - - - -- - 1 1 1 1 4 - - - - - - - - - - -
- - - - - - - - - - - - - - - -- - - - - - - - - - - - - - - -- - - - - - - - - - - - - - - -- - - - - - - - - - - - - - - -
- 248,745 2,686,094 3,143,704 677,179 714,379 7,470,101 - - - - - - - - - - - -- - 146,467 4,875,914 4,966,846 65,928,393 75,917,620 - - - - - - - - - - -- 248,745 2,832,561 8,019,618 5,644,025 66,642,772 83,387,721 - - - - - - - - - - - -
15,777,467 174,172,039 197,220,847 174,768,046 170,297,674 200,501,769 932,737,842 13,498,133 -35,350 - 13,462,783 130,456,279 - 130,456,279 262,242,204 406,161,266 85 75 133 105
- - - - - - - - - - - - - - - -- - - - - - - - - - - - - - - -- - - - - - - - - - - - - - - -- - - - - - - - - - - - - - - -- - - - - - - - - - - - - - - -- - - - - - - - - - - - - - - -- - - - - - - - - - - - - - - -- - - - - - - - - - - - - - - -
- - - - - - - - - - - - - - - -
- 134,670 134,670 134,670 - - 404,010 - - - - - - - - - - - -184,206 7,979,905 7,929,405 5,421,478 4,888,742 4,100,615 30,504,351 - - - - - - - - - - - - -
- - - - - - - - - - - - - - - -2,554,000 10,527,482 12,145,582 10,992,328 10,847,136 11,080,216 58,146,744 - - - - - - - - - - - - -
- - - - - - - - - - - - - - - -2,738,206 18,642,057 20,209,657 16,548,476 15,735,878 15,180,831 89,055,105 - - - - - - - - - - - - -
- - - - - - - - - - - - - - - -668,924 613,343 1,090,392 547,416 288,613 242,029 3,450,717 - - - - - - - - - - - - -254,803 397,332 364,230 377,010 351,450 369,630 2,114,455 - - - - - - - - - - - - -
38,438 - - - - - 38,438 - - - - - - - - - - -- - - - - - - - - - - - - - - -
962,165 1,010,675 1,454,622 924,426 640,063 611,659 5,603,610 - - - - - - - - - - - - -
- 773,065 8,494,800 27,537,632 7,315,168 4,655,168 48,775,833 - - - - - - - - - - - -- - - - - - - - - - - - - - - -- - 125,001 125,001 125,001 125,001 500,004 - - - - - - - - - - -- 773,065 8,619,801 27,662,633 7,440,169 4,780,169 49,275,837 - - - - - - - - - - - -
287,810 - - - - - 287,810 - - - - - - - - - - -287,810 - - - - - 287,810 - - - - - - - - - - -
- - - - - - - - - - - - - - - -- - - - - - - - - - - - - - - -- - - - - - - - - - - - - - - -
3,988,181 20,425,797 30,284,080 45,135,535 23,816,110 20,572,659 144,222,362 - - - - - - - - - - - - -
19,765,648 194,597,836 227,504,927 219,903,581 194,113,784 221,074,428 1,076,960,204 13,498,133 -35,350 - 13,462,783 130,456,279 - 130,456,279 262,242,204 406,161,266 68 67 115 92
Participant Incentive Spending
Participant Incentive Spending
Forecasted ($) Verified ($) Progress (%)

2015 2016 2017 2018 2019 2020 Total 2015 Verified
2015 Results
2016 Verified
2015 Results
Adjustments
2017 Verified
2015 Results
Adjustments
Total Verified
2015 Results
2016 Verified
2016 Results
2017 Verified
2016 Results
Adjustments
Total Verified 2016
Results
2017Verified
2017 Results
Total Total Verified
2015 Results
Total Verified
2016 Results
2017Verified
2017 Results
Total
896,508 4,299,342 5,388,943 3,520,792 3,797,433 3,693,917 21,596,935 202,446 157,526 - 359,972 5,995,690 - 5,995,690 7,165,070 13,520,732 40 139 133 128- - 706,892 536,429 467,485 327,795 2,038,601 - - - - - - - 7,838 7,838 1 1
303,531 2,214,871 1,761,398 1,653,368 1,596,995 1,545,300 9,075,463 200,334 90,273 - 290,607 3,164,430 26,143 3,190,573 3,088,023 6,569,203 96 144 175 15334,952 901,945 1,068,159 1,146,669 1,296,060 1,468,639 5,916,424 16,829 19,272 - 36,101 1,078,795 - 1,078,795 1,360,238 2,475,134 103 120 127 123
117,076 4,054,919 5,263,969 4,375,727 4,385,997 3,979,218 22,176,906 149,262 100,017 - 249,279 2,637,793 - 2,637,793 3,421,916 6,308,988 213 65 65 671,352,067 11,471,077 14,189,361 11,232,985 11,543,970 11,014,869 60,804,329 568,871 367,088 - 935,959 12,876,708 26,143 12,902,851 15,043,085 28,881,895 69 112 106 107
205,667 1,604,897 1,188,440 1,223,802 1,302,048 1,153,784 6,678,638 167,592 43,261 - 210,853 1,527,563 - 1,527,563 1,505,909 3,244,325 103 95 127 1087,329,984 34,539,447 39,893,834 32,648,282 33,376,481 33,629,824 181,417,852 5,895,425 1,454,631 - 7,350,056 35,016,210 27,300 35,043,510 40,967,396 83,360,962 100 101 103 102
92,240 3,511,356 5,469,121 5,575,006 5,041,429 4,415,922 24,105,074 - 75,438 - 75,438 3,299,093 - 3,299,093 6,774,759 10,149,290 82 94 124 112180,260 2,416,311 3,373,000 2,827,861 2,757,579 2,766,386 14,321,397 148,817 41,141 - 189,958 2,893,601 - 2,893,601 3,004,828 6,088,387 105 120 89 102
171 331,219 345,297 323,136 347,684 343,610 1,691,117 - 3,333 - 3,333 526,893 - 526,893 343,785 874,011 1,949 159 100 12910,556 360,277 1,838,814 2,208,766 1,820,714 1,360,787 7,599,914 - - - - - - - 2,589,120 2,589,120 - - 141 117
456,938 4,811,510 4,122,370 4,983,410 4,543,367 5,397,581 24,315,176 341,070 312,940 - 654,010 4,897,016 - 4,897,016 4,128,475 9,679,501 143 102 100 103293,586 1,596,194 2,162,633 2,434,260 2,614,452 2,744,062 11,845,187 156,835 32,158 - 188,993 720,547 - 720,547 953,904 1,863,444 64 45 44 46
13,632 106,694 246,450 238,873 275,490 241,492 1,122,631 9,180 10,326 - 19,506 24,304 - 24,304 213,180 256,990 143 23 87 70182,413 14,381,700 - - - - 14,564,113 - - - - - - - - - - - -
- 1,252,751 - - - - 1,252,751 - - - - 5 - 5 18,934 18,939 0 28,765,447 64,912,356 58,639,959 52,463,396 52,079,244 52,053,448 288,913,850 6,718,919 1,973,228 - 8,692,147 48,905,232 27,300 48,932,532 60,500,290 118,124,969 99 75 103 89
- 75,000 131,246 131,246 131,246 131,246 599,984 - - - - 26,672 - 26,672 133,396 160,068 36 102 78- - 59,967 187,512 213,075 209,401 669,955 - 3,789 - 3,789 404,753 - 404,753 - 408,542 - 681- - - - - - - - - - - 7,021 - 7,021 849,927 856,948- - - - - - - - - - - - - - - -- 1,721,400 1,630,200 1,447,800 1,436,400 1,618,800 7,854,600 - - - - 355,623 - 355,623 1,015,181 1,370,804 21 62 41- - 1,204,007 493,263 356,500 375,657 2,429,427 - - - - - - - 1,162,697 1,162,697 97 97- 4,571 156,153 134,719 85,210 53,794 434,447 - - - - 4,571 - 4,571 149,520 154,091 100 96 96- 91,219 343,739 343,739 343,739 343,739 1,466,175 - - - - - - - 188,064 188,064 - 55 43- - 369,529 341,712 267,186 256,761 1,235,188 - - - - - - - 221,390 221,390 60 60- 211,086 364,855 364,855 364,855 364,855 1,670,506 - - - - 100,075 - 100,075 409,119 509,194 47 112 88- 109,250 125,619 125,619 125,619 125,619 611,726 - - - - - - - 71,402 71,402 - 57 30- 4,105,674 7,867,069 6,355,427 7,610,384 7,427,088 33,365,642 - 1,745 - 1,745 9,214,899 - 9,214,899 13,492,018 22,708,662 224 171 190- 6,318,200 12,252,384 9,925,892 10,934,214 10,906,960 50,337,650 - 5,534 - 5,534 10,113,614 - 10,113,614 17,692,714 27,811,862 160 144 150
- - 428,385 410,428 285,028 281,830 1,405,671 - - - - - - - - - - -- - - - - - - - - - - - - - - -- - 71,275 73,763 73,763 73,763 292,564 - - - - - - - - - - -- - - - - - - - - - - - - - - -- - 17,768 23,232 28,696 34,160 103,856 - - - - - - - - - - -- - - - - - - - - - - - - - - -- - - - - - - - - - - - - - - -- - - - - - - - - - - - - - - -- - - 45,000 90,000 90,000 225,000 - - - - - - - - -- - 55,866 33,123 31,549 32,180 152,718 - - - - - - - - - - -- - - - - - - - - - - - - - - -- - - - - - - - - - - - - - - -- - - - - - - - - - - - - - - -- - - - - - - - - - - - - - - -- - - - - - - - - - - - - - - -- - - - - - - - - - - - - - - -- - - - - - - - - - - - - - - -- - - - - - - - - - - - - - - -- - - - - - - - - - - - - - - -- - - - - - - - 4,194 - 4,194 - - - - 4,194- - - - - - - - - - - - - - - -- - - - - - - - - - - - - - - -- - 573,294 585,546 509,036 511,933 2,179,809 - 4,194 - 4,194 - - - - 4,194 - 1
- - - - - - - - - - - - - - - -- - 59,615 60,116 47,916 34,916 202,563 - - - - - - - - - - -- - 119,500 55,100 25,500 18,000 218,100 - - - - - - - - - - -- - 179,115 115,216 73,416 52,916 420,663 - - - - - - - - - - -
- - 1 1 1 1 4 - - - - - - - - - - -- - - - - - - - - - - - - - - -- - - - - - - - - - - - - - - -- - 1 1 1 1 4 - - - - - - - - - - -
- 1,454,109 3,037,200 3,370,491 2,985,867 2,863,335 13,711,002 - 31,989 - 31,989 - - - 82,281 114,270 - 3 3- - - 2,088,652 1,832,988 23,602,573 27,524,213 - 16,353 - 16,353 - - - - 16,353- 1,454,109 3,037,200 5,459,143 4,818,855 26,465,908 41,235,215 - 48,342 - 48,342 - - - 82,281 130,623 - 3 3
10,117,514 84,155,742 88,871,314 79,782,179 79,958,736 101,006,035 443,891,520 7,287,790 2,398,386 - 9,686,176 71,895,554 53,443 71,948,997 93,318,370 174,953,543 96 85 105 96
- - - - - - - - - - - - - - - -- - - - - - - - - - - - - - - -- - - - - - - - - - - - - - - -- - - - - - - - - - - - - - - -- - - - - - - - - - - - - - - -- - - - - - - - 312 - 312 - - - - 312- - - - - - - - - - - - - - - -- - - - - - - - - - - - - - - -
- - - - - - - - 312 - 312 - - - - 312
24,379 36,395 36,395 36,395 - - 133,564 - - - - - - - - - - - - -84,140 1,914,741 16,953,771 1,911,122 1,926,101 1,941,621 24,731,496 - - - - - - - - - - - - -
- - - - - - - - - - - - - - - -200,548 1,756,660 1,711,940 1,689,230 1,690,115 1,694,838 8,743,331 - - - - - - - - - - - - -
- - 7,000 7,000 7,000 1,000 22,000 - - - - - - - - - - -309,067 3,707,796 18,709,106 3,643,747 3,623,216 3,637,459 33,630,391 - - - - - - - - - - - - -
2,665 - - - - - 2,665 - - - - - - - - - - -310,888 250,774 370,021 379,034 350,089 235,865 1,896,671 - - - - - - - - - - - - -158,012 162,840 167,028 163,821 165,512 167,296 984,509 - - - - - - - - - - - - -
1,111 - - - - - 1,111 - - - - - - - - - - -- - 1 1 1 1 4 - - - - - - - - - - -
472,676 413,614 537,050 542,856 515,602 403,162 2,884,960 - - - - - - - - - - - - -
18,734 859,480 4,842,180 3,752,880 3,758,580 3,739,200 16,971,054 - - - - - - - - - - - - -9,449 - - - - - 9,449 - - - - - - - - - - -
- - 101,000 101,000 101,000 101,000 404,000 - - - - - - - - - - -28,183 859,480 4,943,180 3,853,880 3,859,580 3,840,200 17,384,503 - - - - - - - - - - - - -
74,804 - - - - - 74,804 - - - - - - - - - - -74,804 - - - - - 74,804 - - - - - - - - - - -
- - - - - - - - - - - - - - - -- - - - - - - - - - - - - - - -- - - - - - - - - - - - - - - -
884,730 4,980,890 24,189,336 8,040,483 7,998,398 7,880,821 53,974,658 - - - - - - - - - - - - -
11,002,244 89,136,632 113,060,650 87,822,662 87,957,134 108,886,856 497,866,178 7,287,790 2,398,698 - 9,686,488 71,895,554 53,443 71,948,997 93,318,370 174,953,855 88 81 83 82
LDC Administrative Expense Spending LDC Administrative
Expense Spending
Verified ($) Progress (%)Forecasted ($)

2015 2016 2017 2018 2019 2020 Total 2015 Verified
2015 Results
2016 Verified
2015 Results
Adjustments
2017 Verified
2015 Results
Adjustments
Total Verified
2015 Results
2016 Verified
2016 Results
2017 Verified
2016 Results
Adjustments
Total Verified
2016 Results
2017Verified
2017 Results
Total Total Verified
2015 Results
Total Verified
2016 Results
2017Verified
2017 Results
Total
558,515 1,495,938 3,646,010 494,219 453,832 368,923 7,017,437 1,374,844 - - 1,374,844 2,858,424 - 2,858,424 6,169,225 10,402,493 246 191 169 182- - 1,191,066 2,146,615 365,444 283,695 3,986,820 - - - - - - - 713,457 713,457 60 60
130,193 469,702 901,946 640,463 444,254 400,926 2,987,484 265,798 -1,690 - 264,108 1,038,960 -26,143 1,012,817 1,334,809 2,611,734 203 216 148 174- 24,150 36,316 33,866 35,791 37,716 167,839 - - - - - - - - - - - -
40,346 267,812 414,170 327,768 323,536 270,250 1,643,882 - - - - - - - - - - - - -729,054 2,257,602 6,189,508 3,642,931 1,622,857 1,361,510 15,803,462 1,640,642 -1,690 - 1,638,952 3,897,384 -26,143 3,871,241 8,217,491 13,727,684 225 171 133 150
- 15,399 13,898 13,898 13,898 13,898 70,991 - - - - - - - - - - - -- 1,005,606 662,990 456,143 417,508 388,484 2,930,731 - - - - - - - - - - - -- 101,437 1,326,201 1,268,132 904,194 747,539 4,347,503 - - - - - - - - - - - -- 13,574 4,000 - - - 17,574 - - - - - - - - - - - -- - - - - - - - - - - - - - - -- 262,647 1,138,309 822,492 427,867 194,015 2,845,330 - - - - - - - - - - - -- 1 - - - - 1 - - - - - - - - - - -- - - - - - - - - - - - - - - -- - - - - - - - - - - - - - - -- - - - - - - - - - - - - - - -- - - - - - - - - - - - - - - -- 1,398,664 3,145,398 2,560,665 1,763,467 1,343,936 10,212,130 - - - - - - - - - - - -
- - - - - - - - - - - - - - - -- - 18,000 42,636 17,436 13,836 91,908 - - - - - - - - - - -- - - - - - - - - - - - - - - -- - - - - - - - - - - - - - - -- - - - - - - - - - - - - - - -- - - - - - - - - - - - - - - -- - 1,750 2,450 2,800 1,750 8,750 - - - - - - - - - - -- - 169,600 163,280 69,296 52,736 454,912 - - - - - - - - - - -- - - - - - - - - - - - - - - -- 800 13,445 8,403 6,723 3,361 32,732 - - - - - - - - - - - -- - - - - - - - - - - - - - - -- 3,733,600 4,601,952 4,563,854 4,643,879 4,793,213 22,336,498 - - - - - - - - - - - -- 3,734,400 4,804,747 4,780,623 4,740,134 4,864,896 22,924,800 - - - - - - - - - - - -
- - - - - - - - - - - - - - - -- - - - - - - - - - - - - - - -- - 175 175 175 175 700 - - - - - - - - - - -- - - - - - - - - - - - - - - -- - - - - - - - - - - - - - - -- - - - - - - - - - - - - - - -- - - - - - - - - - - - - - - -- - - - - - - - - - - - - - - -- - - - - - - - - - - - - - - -- - - - - - - - - - - - - - - -- - - - - - - - - - - - - - - -- - - - - - - - - - - - - - - -- - - - - - - - - - - - - - - -- - - - - - - - - - - - - - - -- - - - - - - - - - - - - - - -- - - - - - - - - - - - - - - -- - - - - - - - - - - - - - - -- - - - - - - - - - - - - - - -- - - - - - - - - - - - - - - -- - - - - - - - - - - - - - - -- - - - - - - - - - - - - - - -- - - - - - - - - - - - - - - -- - 175 175 175 175 700 - - - - - - - - - - -
- - - - - - - - - - - - - - - -- - - - - - - - - - - - - - - -- - - - - - - - - - - - - - - -- - - - - - - - - - - - - - - -
- - - - - - - - - - - - - - - -- - - - - - - - - - - - - - - -- - - - - - - - - - - - - - - -- - - - - - - - - - - - - - - -
- 42,150 44,830 44,830 44,830 44,830 221,470 - - - - - - - - - - - -- - - - - - - - - - - - - - - -- 42,150 44,830 44,830 44,830 44,830 221,470 - - - - - - - - - - - -
729,054 7,432,816 14,184,658 11,029,224 8,171,463 7,615,347 49,162,562 1,640,642 -1,690 - 1,638,952 3,897,384 -26,143 3,871,241 8,217,491 13,727,684 225 52 58 61
- - - - - - - - - - - - - - - -- - - - - - - - - - - - - - - -- - - - - - - - - - - - - - - -- - - - - - - - - - - - - - - -- - - - - - - - - - - - - - - -- - - - - - - - - - - - - - - -- - - - - - - - - - - - - - - -- - - - - - - - - - - - - - - -
- - - - - - - - - - - - - - - -
- - - - - - - - - - - - - - - -12,402 776,273 1,340,651 1,079,085 1,061,606 1,008,279 5,278,296 - - - - - - - - - - - - -
- - - - - - - - - - - - - - - -2,524 631,178 618,406 628,388 635,160 650,182 3,165,838 - - - - - - - - - - - - -
- - - - - - - - - - - - - - - -14,926 1,407,451 1,959,057 1,707,473 1,696,766 1,658,461 8,444,134 - - - - - - - - - - - - -
- - - - - - - - - - - - - - - -- - - - - - - - - - - - - - - -- 68,640 64,970 67,780 64,340 68,770 334,500 - - - - - - - - - - - -- - - - - - - - - - - - - - - -- - - - - - - - - - - - - - - -- 68,640 64,970 67,780 64,340 68,770 334,500 - - - - - - - - - - - -
- - - - - - - - - - - - - - - -- - - - - - - - - - - - - - - -- - - - - - - - - - - - - - - -- - - - - - - - - - - - - - - -
- - - - - - - - - - - - - - - -- - - - - - - - - - - - - - - -
- - - - - - - - - - - - - - - -- - - - - - - - - - - - - - - -- - - - - - - - - - - - - - - -
14,926 1,476,091 2,024,027 1,775,253 1,761,106 1,727,231 8,778,634 - - - - - - - - - - - - -
743,980 8,908,907 16,208,685 12,804,477 9,932,569 9,342,578 57,941,196 1,640,642 -1,690 - 1,638,952 3,897,384 -26,143 3,871,241 8,217,491 13,727,684 220 43 51 53
IESO Value Added Service Provider Cost / Variable Program Cost Administrative Expense Spending
Forecasted ($) Verified ($)
IESO Value Added Service Provider Cost / Variable Program Cost
Administrative Expense Spending
Progress (%)

2015 2016 2017 2018 2019 2020 Total 2015 Verified
2015 Results
2016 Verified
2015 Results
Adjustments
2017 Verified
2015 Results
Adjustments
Total Verified 2015
Results
2016 Verified
2016 Results
2017 Verified
2016 Results
Adjustments
Total Verified 2016
Results
2017Verified
2017 Results
Total Total Verified
2015 Results
Total Verified
2016 Results
2017Verified
2017 Results
Total
1,455,022 5,795,280 9,034,953 4,015,011 4,251,265 4,062,840 28,614,371 1,577,290 157,526 - 1,734,816 8,854,114 - 8,854,114 13,334,295 23,923,225 119 153 148 147- - 1,897,958 2,683,044 832,929 611,490 6,025,421 - - - - - - - 721,295 721,295 38 38
433,724 2,684,573 2,663,345 2,293,831 2,041,248 1,946,226 12,062,947 466,132 88,583 - 554,715 4,203,390 - 4,203,390 4,422,832 9,180,937 128 157 166 15934,952 926,095 1,104,475 1,180,535 1,331,851 1,506,355 6,084,263 16,829 19,272 - 36,101 1,078,795 - 1,078,795 1,360,238 2,475,134 103 116 123 120
157,422 4,322,731 5,678,139 4,703,496 4,709,534 4,249,468 23,820,790 149,262 100,017 - 249,279 2,637,793 - 2,637,793 3,421,916 6,308,988 158 61 60 622,081,120 13,728,679 20,378,870 14,875,917 13,166,827 12,376,379 76,607,792 2,209,513 365,398 - 2,574,911 16,774,092 - 16,774,092 23,260,576 42,609,579 124 122 114 118
205,667 1,620,296 1,202,338 1,237,700 1,315,946 1,167,682 6,749,629 167,592 43,261 - 210,853 1,527,563 - 1,527,563 1,505,909 3,244,325 103 94 125 1077,329,984 35,545,053 40,556,825 33,104,426 33,793,989 34,018,308 184,348,585 5,895,425 1,454,631 - 7,350,056 35,016,210 27,300 35,043,510 40,967,396 83,360,962 100 99 101 100
92,240 3,612,793 6,795,322 6,843,138 5,945,622 5,163,460 28,452,575 - 75,438 - 75,438 3,299,093 - 3,299,093 6,774,759 10,149,290 82 91 100 97180,260 2,429,885 3,377,000 2,827,861 2,757,579 2,766,386 14,338,971 148,817 41,141 - 189,958 2,893,601 - 2,893,601 3,004,828 6,088,387 105 119 89 102
171 331,219 345,297 323,136 347,684 343,610 1,691,117 - 3,333 - 3,333 526,893 - 526,893 343,785 874,011 1,949 159 100 12910,556 622,924 2,977,122 3,031,258 2,248,581 1,554,802 10,445,243 - - - - - - - 2,589,120 2,589,120 - - 87 72
456,938 4,811,511 4,122,370 4,983,410 4,543,367 5,397,581 24,315,177 341,070 312,940 - 654,010 4,897,016 - 4,897,016 4,128,475 9,679,501 143 102 100 103293,586 1,596,194 2,162,633 2,434,260 2,614,452 2,744,062 11,845,187 156,835 32,158 - 188,993 720,547 - 720,547 953,904 1,863,444 64 45 44 46
13,632 106,694 246,450 238,873 275,490 241,492 1,122,631 9,180 10,326 - 19,506 24,304 - 24,304 213,180 256,990 143 23 87 70182,413 14,381,700 - - - - 14,564,113 - - - - - - - - - - - -
- 1,252,751 - - - - 1,252,751 - - - - 5 - 5 18,934 18,939 0 28,765,447 66,311,020 61,785,357 55,024,062 53,842,710 53,397,383 299,125,979 6,718,919 1,973,228 - 8,692,147 48,905,232 27,300 48,932,532 60,500,290 118,124,969 99 74 98 86
- 75,000 131,246 131,246 131,246 131,246 599,984 - - - - 26,672 - 26,672 133,396 160,068 36 102 78- - 77,967 230,148 230,511 223,237 761,863 - 3,789 - 3,789 404,753 - 404,753 - 408,542 - 524- - - - - - - - - - - 7,021 - 7,021 849,927 856,948- - - - - - - - - - - - - - - -- 1,721,400 1,630,200 1,447,800 1,436,400 1,618,800 7,854,600 - - - - 355,623 - 355,623 1,015,181 1,370,804 21 62 41- - 1,204,007 493,263 356,500 375,657 2,429,427 - - - - - - - 1,162,697 1,162,697 97 97- 4,571 157,903 137,169 88,010 55,544 443,197 - - - - 4,571 - 4,571 149,520 154,091 100 95 95- 91,219 513,339 507,019 413,035 396,475 1,921,087 - - - - - - - 188,064 188,064 - 37 31- - 369,529 341,712 267,186 256,761 1,235,188 - - - - - - - 221,390 221,390 60 60- 211,886 378,300 373,258 371,578 368,216 1,703,238 - - - - 100,075 - 100,075 409,119 509,194 47 108 86- 109,250 125,619 125,619 125,619 125,619 611,726 - - - - - - - 71,402 71,402 - 57 30- 7,839,274 12,469,021 10,919,282 12,254,262 12,220,301 55,702,140 - 1,745 - 1,745 9,214,899 - 9,214,899 13,492,018 22,708,662 118 108 112- 10,052,600 17,057,131 14,706,516 15,674,347 15,771,856 73,262,450 - 5,534 - 5,534 10,113,614 - 10,113,614 17,692,714 27,811,862 101 104 103
- - 428,385 410,428 285,028 281,830 1,405,671 - - - - - - - - - - -- - - - - - - - - - - - - - - -- - 71,450 73,938 73,938 73,938 293,264 - - - - - - - - - - -- - - - - - - - - - - - - - - -- - 17,768 23,232 28,696 34,160 103,856 - - - - - - - - - - -- - - - - - - - - - - - - - - -- - - - - - - - - - - - - - - -- - - - - - - - - - - - - - - -- - - 45,000 90,000 90,000 225,000 - - - - - - - - -- - 55,866 33,123 31,549 32,180 152,718 - - - - - - - - - - -- - - - - - - - - - - - - - - -- - - - - - - - - - - - - - - -- - - - - - - - - - - - - - - -- - - - - - - - - - - - - - - -- - - - - - - - - - - - - - - -- - - - - - - - - - - - - - - -- - - - - - - - - - - - - - - -- - - - - - - - - - - - - - - -- - - - - - - - - - - - - - - -- - - - - - - - 4,194 - 4,194 - - - - 4,194- - - - - - - - - - - - - - - -- - - - - - - - - - - - - - - -- - 573,469 585,721 509,211 512,108 2,180,509 - 4,194 - 4,194 - - - - 4,194 - 1
- - - - - - - - - - - - - - - -- - 59,615 60,116 47,916 34,916 202,563 - - - - - - - - - - -- - 119,500 55,100 25,500 18,000 218,100 - - - - - - - - - - -- - 179,115 115,216 73,416 52,916 420,663 - - - - - - - - - - -
- - 1 1 1 1 4 - - - - - - - - - - -- - - - - - - - - - - - - - - -- - - - - - - - - - - - - - - -- - 1 1 1 1 4 - - - - - - - - - - -
- 1,496,259 3,082,030 3,415,321 3,030,697 2,908,165 13,932,472 - 31,989 - 31,989 - - - 82,281 114,270 - 3 2- - - 2,088,652 1,832,988 23,602,573 27,524,213 - 16,353 - 16,353 - - - - 16,353- 1,496,259 3,082,030 5,503,973 4,863,685 26,510,738 41,456,685 - 48,342 - 48,342 - - - 82,281 130,623 - 3 3
10,846,567 91,588,558 103,055,973 90,811,406 88,130,197 108,621,381 493,054,082 8,928,432 2,396,696 - 11,325,128 75,792,938 27,300 75,820,238 101,535,861 188,681,227 104 83 99 92
- - - - - - - - - - - - - - - -- - - - - - - - - - - - - - - -- - - - - - - - - - - - - - - -- - - - - - - - - - - - - - - -- - - - - - - - - - - - - - - -- - - - - - - - 312 - 312 - - - - 312- - - - - - - - - - - - - - - -- - - - - - - - - - - - - - - -
- - - - - - - - 312 - 312 - - - - 312
24,379 36,395 36,395 36,395 - - 133,564 - - - - - - - - - - - - -96,542 2,691,014 18,294,422 2,990,207 2,987,707 2,949,901 30,009,793 - - - - - - - - - - - - -
- - - - - - - - - - - - - - - -203,072 2,387,838 2,330,347 2,317,618 2,325,275 2,345,020 11,909,170 - - - - - - - - - - - - -
- - 7,000 7,000 7,000 1,000 22,000 - - - - - - - - - - -323,993 5,115,247 20,668,164 5,351,220 5,319,982 5,295,921 42,074,527 - - - - - - - - - - - - -
2,665 - - - - - 2,665 - - - - - - - - - - -310,888 250,774 370,021 379,034 350,089 235,865 1,896,671 - - - - - - - - - - - - -158,012 231,480 231,998 231,601 229,852 236,066 1,319,009 - - - - - - - - - - - - -
1,111 - - - - - 1,111 - - - - - - - - - - -- - 1 1 1 1 4 - - - - - - - - - - -
472,676 482,254 602,020 610,636 579,942 471,932 3,219,460 - - - - - - - - - - - - -
18,734 859,480 4,842,180 3,752,880 3,758,580 3,739,200 16,971,054 - - - - - - - - - - - - -9,449 - - - - - 9,449 - - - - - - - - - - -
- - 101,000 101,000 101,000 101,000 404,000 - - - - - - - - - - -28,183 859,480 4,943,180 3,853,880 3,859,580 3,840,200 17,384,503 - - - - - - - - - - - - -
74,804 - - - - - 74,804 - - - - - - - - - - -74,804 - - - - - 74,804 - - - - - - - - - - -
- - - - - - - - - - - - - - - -- - - - - - - - - - - - - - - -- - - - - - - - - - - - - - - -
899,656 6,456,981 26,213,364 9,815,736 9,759,504 9,608,053 62,753,294 - - - - - - - - - - - - -
11,746,223 98,045,539 129,269,337 100,627,142 97,889,701 118,229,434 555,807,376 8,928,432 2,397,008 - 11,325,440 75,792,938 27,300 75,820,238 101,535,861 188,681,539 96 77 79 79
Total Administrative Expense Spending
Progress (%)
Total Administrative
Expense Spending
Forecasted ($) Verified ($)

2015 2016 2017 2018 2019 2020 Total 2015 Verified
2015 Results
2016 Verified
2015 Results
Adjustments
2017 Verified
2015 Results
Adjustments
Total Verified 2015
Results
2016 Verified
2016 Results
2017 Verified
2016 Results
Adjustments
Total Verified 2016 Results
2017Verified
2017 Results
Total Total Verified
2015 Results
Total Verified
2016 Results
2017Verified
2017 Results
Total
5,047,981 22,490,925 27,122,407 8,670,820 8,565,690 7,471,164 79,368,987 5,423,284 157,526 - 5,580,810 36,745,296 - 36,745,296 81,263,423 123,589,529 111 163 300 226- - 4,117,322 6,417,714 1,924,390 1,503,854 13,963,280 - - - - - - - 15,957,091 15,957,091 388 388
3,734,889 21,637,164 18,983,583 14,635,456 12,579,711 11,998,335 83,569,138 6,679,382 53,233 - 6,732,615 36,484,740 - 36,484,740 42,665,032 85,882,387 180 169 225 19485,119 2,667,268 3,590,629 3,713,141 3,967,713 4,062,922 18,086,792 16,829 19,272 - 36,101 1,710,327 - 1,710,327 3,853,055 5,599,483 42 64 107 88
688,378 9,539,787 11,575,206 9,992,677 9,936,861 9,216,947 50,949,856 902,420 100,017 - 1,002,437 7,477,148 - 7,477,148 9,802,328 18,281,913 146 78 85 849,556,367 56,335,144 65,389,147 43,429,808 36,974,365 34,253,222 245,938,053 13,021,915 330,048 - 13,351,963 82,417,511 - 82,417,511 153,540,929 249,310,403 140 146 235 190
248,359 2,946,537 2,978,119 3,030,349 3,103,596 2,641,081 14,948,041 174,012 43,261 - 217,273 2,070,678 - 2,070,678 3,719,255 6,007,206 87 70 125 9713,459,178 120,498,812 114,780,248 88,649,324 83,144,329 82,519,851 503,051,742 8,557,843 1,454,631 - 10,012,474 91,172,440 27,300 91,199,740 122,209,659 223,421,873 74 76 106 90
92,240 6,190,882 19,350,726 18,607,933 14,499,735 12,840,779 71,582,295 - 75,438 - 75,438 5,333,344 - 5,333,344 14,135,700 19,544,482 82 86 73 76516,453 14,318,755 8,967,918 6,575,840 6,873,897 6,894,334 44,147,197 148,817 41,141 - 189,958 4,318,040 - 4,318,040 9,227,015 13,735,013 37 30 103 58
171 679,058 1,196,107 983,946 1,030,819 1,018,296 4,908,397 - 3,333 - 3,333 593,533 - 593,533 489,121 1,085,987 1,949 87 41 5810,556 1,003,199 6,859,398 7,302,619 5,731,714 4,282,509 25,189,995 - - - - - - - 5,396,030 5,396,030 - - 79 69
1,304,379 14,538,615 33,796,935 41,537,560 54,490,725 32,272,538 177,940,752 357,963 312,940 - 670,903 7,639,163 - 7,639,163 14,057,496 22,367,562 51 53 42 45293,586 5,073,209 7,669,931 8,543,489 8,935,296 9,292,420 39,807,931 156,835 32,158 - 188,993 2,125,613 - 2,125,613 5,444,128 7,758,734 64 42 71 60
13,632 214,194 1,003,302 559,225 519,842 523,344 2,833,539 9,180 10,326 - 19,506 56,120 - 56,120 363,180 438,806 143 26 36 361,129,112 23,562,935 - - - - 24,692,047 - - - - 272,373 - 272,373 10,431,933 10,704,306 - 1 43
- 6,496,645 - - - - 6,496,645 - - - - 5 - 5 18,934 18,939 0 017,067,666 195,522,841 196,602,684 175,790,285 178,329,953 152,285,152 915,598,581 9,404,650 1,973,228 - 11,377,878 113,581,309 27,300 113,608,609 185,492,451 310,478,938 67 58 94 76
- 127,050 381,246 381,246 381,246 381,246 1,652,034 - - - - 26,672 - 26,672 477,696 504,368 21 125 99- - 232,767 986,510 772,193 707,079 2,698,549 - 3,789 - 3,789 541,536 - 541,536 - 545,325 - 234- - - - - - - - - - - 7,021 - 7,021 1,226,680 1,233,701- - - - - - - - - - - - - - - -- 2,846,400 3,674,700 2,743,300 2,946,400 2,963,800 15,174,600 - - - - 355,623 - 355,623 3,574,872 3,930,495 12 97 60- - 2,527,580 2,262,012 2,565,269 2,584,425 9,939,286 - - - - - - - 1,162,697 1,162,697 46 46- 4,571 337,062 352,339 166,378 100,511 960,861 - - - - 4,571 - 4,571 279,098 283,669 100 83 83- 91,219 3,000,526 3,190,835 2,019,304 1,814,208 10,116,092 - - - - - - - 191,927 191,927 - 6 6- - 2,585,854 2,799,761 2,673,760 2,543,735 10,603,110 - - - - - - - 938,990 938,990 36 36- 316,414 2,134,360 1,470,796 1,249,608 807,231 5,978,409 - - - - 100,075 - 100,075 2,157,893 2,257,968 32 101 92- 109,250 1,288,976 4,197,368 4,197,368 2,452,333 12,245,295 - - - - - - - 71,402 71,402 - 6 5- 7,839,274 12,469,021 10,919,282 12,254,262 12,220,301 55,702,140 - 1,745 - 1,745 9,214,899 - 9,214,899 13,612,018 22,828,662 118 109 112- 11,334,178 28,632,092 29,303,449 29,225,788 26,574,869 125,070,376 - 5,534 - 5,534 10,250,397 - 10,250,397 23,693,273 33,949,204 90 83 85
- - 3,217,008 2,683,115 2,557,715 2,099,980 10,557,818 - - - - - - - - - - -- - - - - - - - - - - - - - - -- - 118,549 121,657 116,527 116,507 473,240 - - - - - - - - - - -- - - - - - - - - - - - - - - -- - 17,768 23,232 28,696 34,160 103,856 - - - - - - - - - - -- - - - - - - - - - - - - - - -- - - - - - - - - - - - - - - -- - - - - - - - - - - - - - - -- - - 109,200 218,400 218,400 546,000 - - - - - - - - -- - 205,866 243,123 241,549 242,180 932,718 - - - - - - - - - - -- - - - - - - - - - - - - - - -- - - - - - - - - - - - - - - -- - - - - - - - - - - - - - - -- - - - - - - - - - - - - - - -- - - - - - - - - - - - - - - -- - - - - - - - - - - - - - - -- - - 236,775 153,750 92,250 482,775 - - - - - - - - -- - - - - - - - - - - - - - - -- - - - - - - - - - - - - - - -- - - - - - - - 4,194 - 4,194 - - - - 4,194- - - - - - - - - - - - - - - -- 823,433 - - - - 823,433 - - - - - - - 969,131 969,131 - 118- 823,433 3,559,191 3,417,102 3,316,637 2,803,477 13,919,840 - 4,194 - 4,194 - - - 969,131 973,325 - 27 22
- - - - - - - - - - - - - - - -- - 59,616 60,117 47,917 34,917 202,567 - - - - - - - - - - -- - 119,500 55,100 25,500 18,000 218,100 - - - - - - - - - - -- - 179,116 115,217 73,417 52,917 420,667 - - - - - - - - - - -
- - 1 1 1 1 4 - - - - - - - - - - -- - - - - - - - - - - - - - - -- - - - - - - - - - - - - - - -- - 1 1 1 1 4 - - - - - - - - - - -
- 1,745,004 5,768,124 6,559,025 3,707,876 3,622,544 21,402,573 - 31,989 - 31,989 - - - 82,281 114,270 - 1 2- - 146,467 6,964,566 6,799,835 89,530,966 103,441,834 - 16,353 - 16,353 - - - - 16,353 - 11- 1,745,004 5,914,591 13,523,591 10,507,711 93,153,510 124,844,407 - 48,342 - 48,342 - - - 82,281 130,623 - 1 2
26,624,033 265,760,600 300,276,822 265,579,453 258,427,872 309,123,148 1,425,791,928 22,426,565 2,361,346 - 24,787,911 206,249,217 27,300 206,276,517 363,778,065 594,842,493 93 78 121 100
- - - - - - - - - - - - - - - -- - - - - - - - - - - - - - - -- - - - - - - - - - - - - - - -- - - - - - - - - - - - - - - -- - - - - - - - - - - - - - - -- - - - - - - - 312 - 312 - - - - 312- - - - - - - - - - - - - - - -- - - - - - - - - - - - - - - -
- - - - - - - - 312 - 312 - - - - 312
24,379 171,065 171,065 171,065 - - 537,574 - - - - - - - - - - - - -280,749 10,670,919 26,223,827 8,411,685 7,876,449 7,050,516 60,514,145 - - - - - - - - - - - - -
- - - - - - - - - - - - - - - -2,757,073 12,915,319 14,475,929 13,309,946 13,172,411 13,425,236 70,055,914 - - - - - - - - - - - - -
- - 7,000 7,000 7,000 1,000 22,000 - - - - - - - - - - -3,062,201 23,757,303 40,877,821 21,899,696 21,055,860 20,476,752 131,129,633 - - - - - - - - - - - - -
2,665 - - - - - 2,665 - - - - - - - - - - -979,812 864,117 1,460,413 926,450 638,702 477,893 5,347,387 - - - - - - - - - - - - -412,816 628,812 596,228 608,611 581,302 605,696 3,433,465 - - - - - - - - - - - - -
39,549 - - - - - 39,549 - - - - - - - - - - -- - 1 1 1 1 4 - - - - - - - - - - -
1,434,842 1,492,929 2,056,642 1,535,062 1,220,005 1,083,590 8,823,070 - - - - - - - - - - - - -
18,734 1,632,545 13,336,980 31,290,512 11,073,748 8,394,368 65,746,887 - - - - - - - - - - - - -9,449 - - - - - 9,449 - - - - - - - - - - -
- - 226,001 226,001 226,001 226,001 904,004 - - - - - - - - - - -28,183 1,632,545 13,562,981 31,516,513 11,299,749 8,620,369 66,660,340 - - - - - - - - - - - - -
362,613 - - - - - 362,613 - - - - - - - - - - -362,613 - - - - - 362,613 - - - - - - - - - - -
- - - - - - - - - - - - - - - -- - - - - - - - - - - - - - - -- - - - - - - - - - - - - - - -
4,887,839 26,882,777 56,497,444 54,951,271 33,575,614 30,180,711 206,975,656 - - - - - - - - - - - - -
31,511,872 292,643,377 356,774,266 320,530,724 292,003,486 339,303,859 1,632,767,584 22,426,565 2,361,658 - 24,788,223 206,249,217 27,300 206,276,517 363,778,065 594,842,805 79 70 102 87 1,835,264,933 32
Total 2015-2020 CFF LDC CDM
Plan Budget
Spending
Spending GroupProgress (%) 2015-2020 CFF
LDC CDM Plan Allocated Budget ($)
Progress versus Budget (%)
Forecasted ($) Verified ($)
Total 2015-2020 CFF LDC CDM Plan Budget Spending

Savings Persistence ReportFor: Algoma Power Inc
Gross Verified Annual Energy Savings (kWh) Gross Verified Annual Peak Demand Savings (kW) Net Verified Annual Energy Savings (kWh) Net Verified Annual Peak Demand Savings (kW)
2015
2016
2017
2018
2019
2020
2021
2022
2023
2024
2025
2026
2027
2028
2029
2030
2031
2032
2033
2034
2035
2036
2037
2038
2039
2040
2041
2042
2043
2044
2045
2046
2047
2048
2049
2050
2015
2016
2017
2018
2019
2020
2021
2022
2023
2024
2025
2026
2027
2028
2029
2030
2031
2032
2033
2034
2035
2036
2037
2038
2039
2040
2041
2042
2043
2044
2045
2046
2047
2048
2049
2050
2015
2016
2017
2018
2019
2020
2021
2022
2023
2024
2025
2026
2027
2028
2029
2030
2031
2032
2033
2034
2035
2036
2037
2038
2039
2040
2041
2042
2043
2044
2045
2046
2047
2048
2049
2050
2015
2016
2017
2018
2019
2020
2021
2022
2023
2024
2025
2026
2027
2028
2029
2030
2031
2032
2033
2034
2035
2036
2037
2038
2039
2040
2041
2042
2043
2044
2045
2046
2047
2048
2049
2050
2015 Verified 2015 Results1 Save on Energy Coupon Program 111 179 110 287 110 287 110 287 110 287 110 287 110 287 110 217 110 217 110 217 103 593 103 209 103 209 100 787 100 787 100 530 26 495 26 495 26 495 26 495 7 7 7 7 7 7 7 7 7 7 6 6 6 6 6 6 2 2 2 2 # # 182 791 181 325 181 325 181 325 181 325 181 325 181 325 181 210 181 210 181 210 170 320 169 688 169 688 165 705 165 705 165 284 43 561 43 561 43 561 43 561 12 12 12 12 12 12 12 12 12 12 10 10 10 10 10 10 3 3 3 3 # #3 Save on Energy Heating & Cooling Program 48 560 48 560 48 560 48 560 48 560 48 560 48 560 48 560 48 560 48 560 48 560 48 560 48 560 48 560 48 560 48 560 48 560 48 560 48 560 - - - - - - - - - - - - - - 24 24 24 24 24 24 24 24 24 24 24 24 24 24 24 24 24 24 24 # # # - - - - - - - - - - - - - - 34 993 34 993 34 993 34 993 34 993 34 993 34 993 34 993 34 993 34 993 34 993 34 993 34 993 34 993 34 993 34 993 34 993 34 993 34 993 - - - - - - - - - - - - - - 17 17 17 17 17 17 17 17 17 17 17 17 17 17 17 17 17 17 17 # # # - - - - - - - - - - - - - -
67 Appliance Retirement Initiative 33 723 33 723 33 723 33 723 19 239 - - - - - - - - - - - - - - - - - - - - - - - - - - - - - - - 5 5 5 5 3 - - - - - - - - - - - - - - # # # - - - - - - - - - - - - - - 15 888 15 888 15 888 15 888 8 953 - - - - - - - - - - - - - - - - - - - - - - - - - - - - - - - 2 2 2 2 1 - - - - - - - - - - - - - - # # # - - - - - - - - - - - - - -68 Coupon Initiative 34 104 33 799 33 799 33 799 33 799 33 799 33 799 33 792 33 792 33 792 30 379 30 223 30 223 30 145 30 145 30 132 11 799 11 799 11 799 11 799 - - 2 2 2 2 2 2 2 2 2 2 2 2 2 2 2 2 1 1 1 1 # # 56 071 55 570 55 570 55 570 55 570 55 570 55 570 55 558 55 558 55 558 49 947 49 690 49 690 49 561 49 561 49 541 19 399 19 399 19 399 19 399 4 4 4 4 4 4 4 4 4 4 3 3 3 3 3 3 1 1 1 1 # #69 Bi Annual Retailer Event Initiative 49 145 47 516 47 516 47 516 47 516 47 516 47 516 47 514 47 514 47 514 42 049 36 566 36 566 36 556 36 556 36 555 23 343 23 343 23 343 23 343 - - 4 4 4 4 4 4 4 4 4 4 3 2 2 2 2 2 1 1 1 1 # # 80 801 78 121 78 121 78 121 78 121 78 121 78 121 78 119 78 119 78 119 69 133 60 118 60 118 60 103 60 103 60 101 38 379 38 379 38 379 38 379 - - 6 6 6 6 6 6 6 6 6 6 4 4 4 4 4 4 2 2 2 2 # #70 HVAC Incentives Initiative 73 122 73 122 73 122 73 122 73 122 73 122 73 122 73 122 73 122 73 122 73 122 73 122 73 122 73 122 73 122 73 122 73 122 73 122 72 840 - - - - - - - - - - - - - - - - - 37 37 37 37 37 37 37 37 37 37 37 37 37 37 37 37 37 37 36 # # # - - - - - - - - - - - - - - 52 693 52 693 52 693 52 693 52 693 52 693 52 693 52 693 52 693 52 693 52 693 52 693 52 693 52 693 52 693 52 693 52 693 52 693 52 490 - - - - - - - - - - - - - - - - - 26 26 26 26 26 26 26 26 26 26 26 26 26 26 26 26 26 26 26 # # # - - - - - - - - - - - - - -73 Efficiency: Equipment Replacement Incentive Initiative 464 890 464 890 463 638 463 638 463 638 463 638 461 728 461 728 461 728 455 503 440 640 440 640 4 271 4 271 4 271 2 017 5 5 5 5 5 5 5 5 5 5 5 5 4 4 4 2 # # # 407 941 407 941 406 839 406 839 406 839 406 839 405 263 405 263 405 263 400 127 387 864 387 864 3 759 3 759 3 759 1 775 4 4 4 4 4 4 4 4 4 4 4 4 4 4 4 2 # # #74 Direct Install Lighting and Water Heating Initiative 394 161 271 669 227 810 226 599 226 599 226 599 226 599 226 599 226 599 226 599 222 337 35 506 92 63 52 52 52 52 52 52 52 52 52 9 - - - - - - - # # # 368 957 254 297 213 243 212 109 212 109 212 109 212 109 212 109 212 109 212 109 208 120 33 236 84 58 48 48 48 48 48 48 48 48 48 8 - - - - - - - # # #80 Low Income Initiative 13 607 10 374 9 867 9 360 9 360 9 360 9 360 9 360 4 365 4 365 4 365 4 365 3 879 3 879 2 938 1 662 1 662 1 662 1 662 1 662 1 662 - - - - - - - - - - - - - - 1 1 1 1 1 1 1 1 1 1 1 1 1 1 - - - - - # # # - - - - - - - - - - - - - - 13 607 10 374 9 867 9 360 9 360 9 360 9 360 9 360 4 365 4 365 4 365 4 365 3 879 3 879 2 938 1 662 1 662 1 662 1 662 1 662 1 662 - - - - - - - - - - - - - - 1 1 1 1 1 1 1 1 1 1 1 1 1 1 - - - - - # # # - - - - - - - - - - - - - -
Subtotal: 2015 Verified 2015 Results 1 222 491 1 093 940 1 048 322 1 046 604 1 032 120 1 012 881 1 010 971 1 010 892 1 005 897 999 672 965 045 772 191 299 830 297 320 296 379 292 578 184 981 184 981 184 699 63 299 1 662 177 148 137 137 135 132 132 132 132 132 130 86 76 76 75 73 65 65 64 4 # # 1 213 742 1 091 202 1 048 539 1 046 898 1 039 963 1 031 010 1 029 434 1 029 305 1 024 310 1 019 174 977 435 792 647 374 820 370 693 369 752 366 049 190 687 190 687 190 484 103 001 1 662 156 130 120 120 119 118 118 118 118 118 113 73 65 65 64 62 49 49 49 6 # #
2016 Verified 2015 Results Adjustments83 Save on Energy Coupon Program 12 648 12 427 12 427 12 427 12 427 12 427 12 427 12 358 12 358 12 358 11 479 11 461 11 461 11 380 11 380 11 251 6 058 6 058 6 058 6 058 1 1 1 1 1 1 1 1 1 1 1 1 1 1 1 1 - - - # # # 20 794 20 432 20 432 20 432 20 432 20 432 20 432 20 318 20 318 20 318 18 872 18 843 18 843 18 710 18 710 18 498 9 960 9 960 9 960 9 960 1 1 1 1 1 1 1 1 1 1 1 1 1 1 1 1 1 1 1 1 # #89 Save on Energy Retrofit Program 1 151 1 151 1 151 1 151 1 151 1 151 1 151 1 151 1 151 1 151 1 151 1 151 1 151 1 151 1 151 544 - - - - - - - - - - - - - - - - - - - - - - - - - - - - - - - - - # # # - - - - - - - - - - - - - - 1 013 1 013 1 013 1 013 1 013 1 013 1 013 1 013 1 013 1 013 1 013 1 013 1 013 1 013 1 013 478 - - - - - - - - - - - - - - - - - - - - - - - - - - - - - - - - - # # # - - - - - - - - - - - - - -
150 Coupon Initiative 302 282 282 282 282 282 282 269 269 269 438 438 438 431 431 396 32 32 32 32 # # # 497 464 464 464 464 464 464 442 442 442 721 721 721 709 709 651 53 53 53 53 # # #152 HVAC Incentives Initiative 2 856 2 856 2 856 2 856 2 856 2 856 2 856 2 856 2 856 2 856 2 856 2 856 2 856 2 856 2 856 2 856 2 856 2 856 2 856 - - - 1 1 1 1 1 1 1 1 1 1 1 1 1 1 1 1 1 1 1 # # # 2 058 2 058 2 058 2 058 2 058 2 058 2 058 2 058 2 058 2 058 2 058 2 058 2 058 2 058 2 058 2 058 2 058 2 058 2 058 - - - 1 1 1 1 1 1 1 1 1 1 1 1 1 1 1 1 1 1 1 # # #155 Efficiency: Equipment Replacement Incentive Initiative 2 677 2 677 2 677 2 677 2 677 2 677 2 677 2 677 2 677 2 677 2 677 2 677 2 677 2 677 2 677 1 244 - - - - - - - - - - - - - - - - - - - - 4 4 4 4 4 4 4 4 4 4 4 4 4 4 4 2 - - - # # # - - - - - - - - - - - - - - 1 850 1 850 1 850 1 850 1 850 1 850 1 850 1 850 1 850 1 850 1 850 1 850 1 850 1 850 1 850 860 - - - - - - - - - - - - - - - - - - - - 3 3 3 3 3 3 3 3 3 3 3 3 3 3 3 1 - - - # # # - - - - - - - - - - - - - -Subtotal: 2016 Verified 2015 Results Adjustments 19 634 19 393 19 393 19 393 19 393 19 393 19 393 19 311 19 311 19 311 18 601 18 583 18 583 18 495 18 495 16 291 8 946 8 946 8 946 6 090 - - 6 6 6 6 6 6 6 6 6 6 6 6 6 6 6 4 1 1 1 # # # 26 212 25 817 25 817 25 817 25 817 25 817 25 817 25 681 25 681 25 681 24 514 24 485 24 485 24 340 24 340 22 545 12 071 12 071 12 071 10 013 5 5 5 5 5 5 5 5 5 5 5 5 5 5 5 3 2 2 2 1 # #
2017 Verified 2015 Results Adjustments237 Efficiency: Equipment Replacement Incentive Initiative 830 830 2 082 2 082 2 082 2 082 3 992 3 992 3 992 3 428 2 082 2 082 1 595 1 595 1 595 741 - - - - - - - - 1 1 1 1 1 1 1 1 1 1 1 1 1 - - - - # # # 1 237 1 237 2 339 2 339 2 339 2 339 3 915 3 915 3 915 3 449 2 339 2 339 1 910 1 910 1 910 887 - - - - - - 1 1 1 1 1 1 1 1 1 1 1 1 1 1 1 1 - - - # # #238 Direct Install Lighting and Water Heating Initiative -175 226 -52 734 -8 875 19 350 19 350 19 350 19 350 19 350 19 350 19 350 19 350 2 753 - - - - - - - - - - - - - - - - - - - - - - - - -41 -13 -2 5 5 5 5 5 5 5 5 1 - - - - - - - # # # - - - - - - - - - - - - - - -164 022 -49 362 -8 308 18 113 18 113 18 113 18 113 18 113 18 113 18 113 18 113 2 577 - - - - - - - - - - - - - - - - - - - - - - - - -38 -12 -2 4 4 4 4 4 4 4 4 1 - - - - - - - # # # - - - - - - - - - - - - - -Subtotal: 2017 Verified 2015 Results Adjustments 174 396 51 904 6 793 21 432 21 432 21 432 23 342 23 342 23 342 22 778 21 432 4 835 1 595 1 595 1 595 741 - - 41 13 1 6 6 6 6 6 6 6 6 2 1 1 1 # # # 162 785 48 125 5 969 20 452 20 452 20 452 22 028 22 028 22 028 21 562 20 452 4 916 1 910 1 910 1 910 887 37 11 1 5 5 5 5 5 5 5 5 2 1 1 1 1 # # #
2016 Verified 2016 Results247 Save on Energy Coupon Program 517 221 517 221 517 221 517 221 517 221 517 221 517 221 517 145 517 145 514 762 508 427 508 061 508 061 505 189 437 230 437 230 192 547 - - - - - 34 34 34 34 34 34 34 34 34 33 32 32 32 32 28 28 12 - # # # - 864 090 864 090 864 090 864 090 864 090 864 090 864 090 863 963 863 963 859 983 849 400 848 788 848 788 843 989 730 454 730 454 321 677 - - - - - 56 56 56 56 56 56 56 56 56 56 54 54 54 54 47 47 20 - # # #249 Save on Energy Heating & Cooling Program - 99 872 99 872 99 872 99 872 99 872 99 872 99 872 99 872 99 872 99 872 99 872 99 872 99 872 99 872 99 872 99 872 99 872 99 872 99 776 - - - - - - - - - - - - - - - - - 28 28 28 28 28 28 28 28 28 28 28 28 28 28 28 28 28 28 28 # # - - - - - - - - - - - - - - - 69 942 69 942 69 942 69 942 69 942 69 942 69 942 69 942 69 942 69 942 69 942 69 942 69 942 69 942 69 942 69 942 69 942 69 942 69 846 - - - - - - - - - - - - - - - - - 19 19 19 19 19 19 19 19 19 19 19 19 19 19 19 19 19 19 19 # # - - - - - - - - - - - - - -251 Save on Energy Home Assistance Program 6 792 6 792 6 792 6 792 6 792 6 792 6 792 6 792 6 792 6 792 6 792 6 792 6 742 6 742 6 742 6 113 6 113 6 113 6 113 6 113 - # # # 6 792 6 792 6 792 6 792 6 792 6 792 6 792 6 792 6 792 6 792 6 792 6 792 6 742 6 742 6 742 6 113 6 113 6 113 6 113 6 113 # # #253 Save on Energy Retrofit Program 134 920 132 907 132 907 132 907 132 907 132 907 132 907 132 907 132 907 132 907 132 907 106 852 43 097 43 097 5 241 587 587 587 587 587 - - 15 15 15 15 15 15 15 15 15 15 15 12 7 7 2 1 1 1 1 1 # - 111 513 109 850 109 850 109 850 109 850 109 850 109 850 109 850 109 850 109 850 109 850 88 315 35 620 35 620 4 332 485 485 485 485 485 - - 12 12 12 12 12 12 12 12 12 12 12 10 5 5 1 1 1 1 1 1 #254 Save on Energy Small Business Lighting Program - 150 231 150 231 150 231 150 231 142 158 118 994 97 793 78 285 56 785 42 506 37 427 20 390 2 395 2 395 308 - - - - - - - - - - - - - - - - - - - - - 33 33 33 33 32 29 26 22 17 13 12 7 1 1 - - - - # # # - - - - - - - - - - - - - - - 133 383 133 383 133 383 133 383 126 216 105 649 86 825 69 505 50 416 37 739 33 230 18 103 2 127 2 127 274 - - - - - - - - - - - - - - - - - 28 28 28 28 28 25 22 19 15 12 10 6 1 1 - - - - # # # - - - - - - - - - - - - - -289 Residential Direct Mail LDC Innovation Fund Pilot Program 106 996 106 996 106 996 106 996 106 996 106 996 106 996 99 298 68 553 68 553 17 710 17 710 17 710 16 367 16 367 14 100 14 100 5 034 5 034 5 034 8 8 8 8 8 8 8 8 7 7 2 2 2 2 2 2 2 1 1 1 # 108 513 108 513 108 513 108 513 108 513 108 513 108 513 101 200 69 840 69 840 20 521 20 521 20 521 19 095 19 095 16 759 16 759 4 883 4 883 4 883 8 8 8 8 8 8 8 8 7 7 2 2 2 2 2 2 2 1 1 1 #Subtotal: 2016 Verified 2016 Results - 1 016 032 1 014 019 1 014 019 1 014 019 1 005 946 982 782 961 581 934 299 882 054 865 392 803 135 759 677 677 877 673 662 565 760 557 902 313 219 111 606 111 510 11 734 - - - - - - - - - - - - - - - 118 118 118 118 117 114 111 107 101 96 89 81 70 70 60 59 43 30 30 2 # - - - - - - - - - - - - - - - 1 294 233 1 292 570 1 292 570 1 292 570 1 285 403 1 264 836 1 246 012 1 221 252 1 170 803 1 154 146 1 089 735 1 052 461 983 740 977 515 830 839 823 753 414 976 81 423 81 327 11 481 - - - - - - - - - - - - - - - 123 123 123 123 123 120 117 114 109 106 97 91 81 81 69 69 42 21 21 2 # - - - - - - - - - - - - - -
2017 Verified 2016 Results Adjustments329 Save on Energy Coupon Program - 58 332 58 332 58 332 58 332 58 332 58 332 58 332 58 327 58 327 58 389 58 428 58 355 58 355 58 205 50 523 50 523 20 548 - - - - - - - - - - - - - - - 4 4 4 4 4 4 4 4 4 4 4 4 4 4 3 3 1 - # # # - - - - - - - - - - - - - - - 97 452 97 452 97 452 97 452 97 452 97 452 97 452 97 444 97 444 97 547 97 612 97 491 97 491 97 239 84 405 84 405 34 328 - - - - - - - - - - - - - - - 6 6 6 6 6 6 6 6 6 6 6 6 6 6 5 5 2 - # # # - - - - - - - - - - - - - -335 Save on Energy Retrofit Program 1 249 3 262 3 262 3 262 3 262 3 262 3 262 3 262 3 262 3 262 3 262 1 812 # # # 1 032 2 696 2 696 2 696 2 696 2 696 2 696 2 696 2 696 2 696 2 696 1 498 # # #336 Save on Energy Small Business Lighting Program - 50 658 50 658 50 658 50 658 47 767 40 862 34 711 30 210 24 736 18 548 17 639 9 395 481 481 141 - - - - - - - - - - - - - - - 12 12 12 12 12 11 10 9 8 6 6 3 - - - - - - # # # - - - - - - - - - - - - - - - 44 976 44 976 44 976 44 976 42 410 36 279 30 818 26 822 21 962 16 468 15 660 8 342 427 427 125 - - - - - - - - - - - - - - - 10 10 10 10 10 9 8 8 6 5 5 3 - - - - - - # # # - - - - - - - - - - - - - -Subtotal: 2017 Verified 2016 Results Adjustments - 110 239 112 252 112 252 112 252 109 361 102 456 96 305 91 799 86 325 80 199 79 329 69 562 58 836 58 686 50 664 50 523 20 548 - - - - - - - - - - - - - - - - - - - 16 16 16 16 16 15 14 13 12 10 10 7 4 4 3 3 1 - # # # - - - - - - - - - - - - - - - 143 460 145 124 145 124 145 124 142 558 136 427 130 966 126 962 122 102 116 711 115 968 107 331 97 918 97 666 84 530 84 405 34 328 - - - - - - - - - - - - - - - - - - - 16 16 16 16 16 15 14 14 12 11 11 9 6 6 5 5 2 - # # # - - - - - - - - - - - - - -
Subtotal: 2017 Verified 2017 Results - - 2 160 995 1 859 511 1 856 695 1 839 561 1 819 602 1 777 420 1 732 575 1 728 018 1 715 589 1 707 726 1 433 451 1 415 957 1 175 767 1 088 777 1 009 574 924 649 491 367 209 173 202 537 57 614 - - - - - - - - - - - - - - - - 234 214 213 212 209 203 197 196 193 190 142 136 113 107 102 96 67 48 44 7 - - - - - - - - - - - - - - - - 2 640 268 2 250 773 2 248 143 2 232 142 2 213 503 2 174 235 2 132 356 2 128 095 2 116 488 2 108 674 1 672 283 1 655 379 1 439 100 1 334 156 1 232 063 1 122 459 541 081 176 477 170 459 56 718 - - - - - - - - - - - - - - - - 277 250 249 248 245 239 233 232 230 228 155 150 124 116 109 102 64 38 36 7 - - - - - - - - - - - - - -
Total 1 067 729 2 187 700 4 348 188 4 073 211 4 055 911 4 008 574 3 958 546 3 888 851 3 807 223 3 738 158 3 666 258 3 385 799 2 582 698 2 470 080 2 224 584 2 014 811 1 811 926 1 452 343 796 618 390 072 215 933 57 614 0 0 0 0 0 0 0 0 0 0 0 0 0 0 142 275 510 497 494 489 482 472 461 453 441 383 313 293 269 247 230 206 162 82 46 7 0 0 0 0 0 0 0 0 0 0 0 0 0 0 1 077 169 2 506 587 5 146 349 4 781 634 4 772 069 4 737 382 4 692 045 4 628 227 4 552 589 4 487 417 4 409 746 4 136 425 3 233 290 3 133 980 2 910 283 2 639 006 2 342 979 1 774 521 825 059 370 818 183 602 56 718 0 0 0 0 0 0 0 0 0 0 0 0 0 0 124 263 540 519 517 515 508 498 489 481 470 416 326 308 281 256 234 197 136 66 38 7 0 0 0 0 0 0 0 0 0 0 0 0 0 0
Net Verified Energy Savings
Net Verified
Peak Demand Savings
Net Verified Savings
# Program / Initiative Name
Gross Verified Energy Savings
Gross Verified
Peak Demand Savings
Gross Verified Savings

Savings Persistence ReportFor: Province Wide
2015
2016
2017
2018
2019
2020
2021
2022
2023
2024
2025
2026
2027
2028
2029
2030
2031
2032
2033
2034
2035
2036
2037
2038
2039
2040
2041
2042
2043
2044
2045
2046
2047
2048
2049
2050
2015
2016
2017
2018
2019
2020
2021
2022
2023
2024
2025
2026
2027
2028
2029
2030
2031
2032
2033
2034
2035
2036
2037
2038
2039
2040
2041
2042
2043
2044
2045
2046
2047
2048
2049
2050
2015
2016
2017
2018
2019
2020
2021
2022
2023
2024
2025
2026
2027
2028
2029
2030
2031
2032
2033
2034
2035
2036
2037
2038
2039
2040
2041
2042
2043
2044
2045
2046
2047
2048
2049
2050
2015
2016
2017
2018
2019
2020
2021
2022
2023
2024
2025
2026
2027
2028
2029
2030
2031
2032
2033
2034
2035
2036
2037
2038
2039
2040
2041
2042
2043
2044
2045
2046
2047
2048
2049
2050
# Program / Initiative Name
Gross Verified Energy Savings
Gross Verified
Peak Deman
d Savings
Gross Verified Savings
Net Verified Energy Savings
Net Verified
Peak Deman
d Savings
Net Verified Savings

General
Savings Calculations
# Project Type
1 Prescriptive Measures and Projects Programs
2 Engineered and Custom Projects / Programs
3 Adjustments to Previous Years' Verified Results
Cost Determination
2015-2020 Conservation First Framework
# Program Attributing Savings to LDCs Project List Date Savings 'start' Date Calculating Resource Savings
1 Save on Energy Coupon ProgramLDC-coded coupons directly attributed to LDC; Otherwise results are allocated based on Consumer Program Allocation Reference Table.
April 15, 2018Savings are considered to begin in the year in which the coupon was redeemed.
2 Save on Energy Instant Discount ProgramResults are allocated based on Consumer Program Allocation Reference Table.
April 15, 2018Savings are considered to begin in the year in which the event occurred.
3 Save on Energy Heating & Cooling ProgramResults directly attributed to LDC based on customer applications and postal code.
April 15, 2018Savings are considered to begin in the year that the installation occurred.
4 Save on Energy New Construction ProgramResults are directly attributed to LDC based on LDC identified in LDC Report
April 15, 2018Savings are considered to begin in the year of the project completion date.
5 Save on Energy Home Assistance ProgramResults are directly attributed to LDC based on LDC identified in the application.
April 15, 2018Savings are considered to begin in the year in which the measures were installed.
6 Save on Energy Audit Funding ProgramProjects are directly attributed to LDC based on LDC identified in the application.
April 15, 2018 Savings are considered to begin in the year of the audit date.
Peak demand and energy savings are determined by the total savings resulting from an audit as reported (reported). A realization rate is applied to the reported savings to ensure that these savings align with EM&V protocols and reflect the savings that were actually realized (i.e. how many light bulbs were actually installed vs. what was reported) (gross). Net savings takes into account net-to-gross factors such as free-ridership and spillover (net).
7 Save on Energy Retrofit ProgramProjects are directly attributed to LDC based on LDC identified in the application.
April 15, 2018Savings are considered to begin in the year of the actual project completion date as reported in the LDC Report
Peak demand and energy savings are determined by the total savings for a given project as reported in the iCON system (reported). A realization rate is applied to the reported savings to ensure that these savings align with EM&V protocols and reflect the savings that were actually realized (i.e. how many light bulbs were actually installed vs. what was reported) (gross). Net savings takes into account net-to-gross factors such as free-ridership and spillover (net). Both realization rate and net-to-gross ratios can differ for energy and demand savings and depend on the mix of projects within an LDC territory (i.e. lighting or non-lighting project, engineered/custom/prescriptive track).
8 Save on Energy Small Business Lighting ProgramResults are directly attributed to LDC based on the LDC specified on the work order.
April 15, 2018Savings are considered to begin in the year of the actual project completion date.
Peak demand and energy savings are determined using the verified measure level per unit assumptions multiplied by the uptake of each measure accounting for the realization rate for both peak demand and energy to reflect the savings that were actually realized (i.e. how many light bulbs were actually installed vs. what was reported) (gross). Net savings take into account net-to-gross factors such as free-ridership and spillover for both peak demand and energy savings at the program level (net).
9Save on Energy High Performance New Construction Program
Results are directly attributed to LDC based on LDC identified in the application.
April 15, 2018Savings are considered to begin in the year of the actual project completion date.
10 Save on Energy Existing Building Commissioning ProgramResults are directly attributed to LDC based on LDC identified in the application.
April 15, 2018Savings are considered to begin in the year of the actual project completion date.
11 Save on Energy Business Refrigeration Incentive ProgramResults are directly attributed to LDC based on LDC identified in the application.
April 15, 2018Savings are considered to begin in the year of the actual project completion date.
12 Save on Energy Process and Systems Upgrades ProgramResults are directly attributed to LDC based on LDC identified in application.
April 15, 2018Savings are considered to begin in the year in which the project was in-service.
13 Save on Energy Energy Manager ProgramResults are directly attributed to LDC based on LDC identified in the application.
April 15, 2018Savings are considered to begin in the year in which the project was completed by the energy manager.
14Save on Energy Monitoring and Targeting Program
Results are directly attributed to LDC based on LDC identified in the application.
April 15, 2018Savings are considered to begin in the year in which the incentive project was completed.
2011-2014+2015 Extension Legacy Framework
# Initiative Attributing Savings to LDCs Project List Date Savings 'start' Date Calculating Resource Savings
1 saveONenergy Appliance Retirement Initiative
2015 Results only. Includes both retail and home pickup stream. Retail stream allocated based on average of 2008 & 2009 residential throughput; Home pickup stream directly attributed by postal code or customer selection.
April 15, 2018Savings are considered to begin in the year the appliance is picked up.
2 saveONenergy Conservation Instant Coupon Booklet2015 Results only. LDC-coded coupons directly attributed to LDC. Otherwise results are allocated based on average of 2008 & 2009 residential throughput.
April 15, 2018Savings are considered to begin in the year in which the coupon was redeemed.
3 saveONenergy Bi-Annual Retailer Event2015 Results only. Results are allocated based on average of 2008 & 2009 residential throughput.
April 15, 2018Savings are considered to begin in the year in which the event occurs.
4 saveONenergy HVAC Incentives2015 Results only. Results directly attributed to LDC based on customer applications and postal code.
April 15, 2018Savings are considered to begin in the year that the installation occurred.
5 saveONenergy Residential New Construction2015 Results only. Results are directly attributed to LDC based on LDC identified in application in the iCon system.
April 15, 2018Savings are considered to begin in the year of the project completion date.
6 saveONenergy Energy Audit2015 Results only. Projects are directly attributed to LDC based on LDC identified in the application.
April 15, 2018 Savings are considered to begin in the year of the audit date.
Peak demand and energy savings are determined by the total savings resulting from an audit as reported (reported). A realization rate is applied to the reported savings to ensure that these savings align with EM&V protocols and reflect the savings that were actually realized (i.e. how many light bulbs were actually installed vs. what was reported) (gross). Net savings takes into account net-to-gross factors such as free-ridership and spillover (net).
7 saveONenergy Efficiency: Equipment Replacement
2015 Results only. Results are directly attributed to LDC based on LDC identified at the facility level in the iCon system.
Projects in the Application Status: "Post-Stage Submission" are included (excluding "Payment denied by LDC"); Please see page for Building type to Sector mapping.
April 15, 2018Savings are considered to begin in the year of the actual project completion date in the iCON system.
Peak demand and energy savings are determined by the total savings for a given project as reported in the iCON system (reported). A realization rate is applied to the reported savings to ensure that these savings align with EM&V protocols and reflect the savings that were actually realized (i.e. how many light bulbs were actually installed vs. what was reported) (gross). Net savings takes into account net-to-gross factors such as free-ridership and spillover (net). Both realization rate and net-to-gross ratios can differ for energy and demand savings and depend on the mix of projects within an LDC territory (i.e. lighting or non-lighting project, engineered/custom/prescriptive track).
Additional Note: project counts were derived by filtering out invalid statuses (e.g. Post-Project Submission - Payment denied by LDC) and only including projects with an "Actual Project Completion Date" in 2015)
8 saveONenergy Direct Installed Lighting2015 Results only. Results are directly attributed to LDC based on the LDC specified on the work order.
April 15, 2018
Peak demand and energy savings are determined using the verified measure level per unit assumptions multiplied by the uptake of each measure accounting for the realization rate for both peak demand and energy to reflect the savings that were actually realized (i.e. how many light bulbs were actually installed vs. what was reported) (gross). Net savings take into account net-to-gross factors such as free-ridership and spillover for both peak demand and energy savings at the program level (net).
9 saveONenergy New Construction and Major Renovation Incentive2015 Results only. Results are directly attributed to LDC based on LDC identified in the application.
April 15, 2018
10 saveONenergy Existing Building Commissioning Incentive2015 Results only. Results are directly attributed to LDC based on LDC identified in the application.
April 15, 2018
11 saveONenergy Process & System Upgrades2015 Results only. Results are directly attributed to LDC based on LDC identified in application.
April 15, 2018Savings are considered to begin in the year in which the incentive project was completed.
12 saveONenergy Energy Manager2015 Results only. Results are directly attributed to LDC based on LDC identified in application.
April 15, 2018
Savings are considered to begin in the year in which the project was completed by the energy manager. If no date is specified the savings will begin the year of the Quarterly Report submitted by the energy manager.
13 saveONenergy Monitoring & Targeting2015 Results only. Results are directly attributed to LDC based on LDC identified in application.
April 15, 2018Savings are considered to begin in the year in which the incentive project was completed.
14 saveONenergy Home Assistance Program2015 Results only. Results are directly attributed to LDC based on LDC identified in the application.
April 15, 2018
15 Aboriginal Conservation Program2015 Results only. Results are directly attributed to LDC based on LDC identified in the application.
April 15, 2018
16 Program Enabled Savings 2015 Results only. April 15, 2018
All results are at the end-user level, i.e. not including losses as a result transmission and distribution lines.
2015 results are based on projects completed between January 1, 2015 and December 31, 2015; 2016 results are based on projects completed between January 1, 2016 and December 31, 2016; and 2017 results are based on projects completed between January 1, 2017 and December 31, 2017.
The 2015 verified results considers projects reported to the IESO between January 1, 2015 and March 31, 2016; the 2016 verified results considers projects reported to the IESO between April 1, 2016 and April 15, 2017; the 2017 verified results considers projects reported to the IESO between April 16, 2017 and April 15, 2018.
Legacy Framework results are based on projects begun prior to an LDC's transition to the Conservation First Framework program and completed by December 31, 2015. Conservation First Framework results are based on projects begun on or after an LDC's transition to the Conservation First Framework program and projects transitioned to the Conservation First Framework through a valid Extension Agreement for eligible Programs.
Peak demand and energy savings are determined using the verified measure level per unit assumption multiplied by the uptake in the market (gross) taking into account net-to-gross factors such as free-ridership and spillover (net) at the measure level.
Costs are determined and allocated to the period based on the date the cost has been reported to the IESO regardless of when the cost was incurred.
E.g. if an LDC reports by the December 2017 IESO Reporting Period: 1) program savings; and 2) Participant Incentives; associated with a 2017 completed project, as well as 3) Administrative Expenses; then: a) the savings; b) expenditures; and c) corresponding cost effectiveness; are attributed to the 2017 program year.
However if the same is reported in or after the January 2018 IESO Reporting Period: only the i) the savings and ii) costs for the purposes of Cost Effectiveness Test calculations will be attributed to the 2017 program year; The expenditures for the purposes of spending reporting (in the Monthly Participation & Cost Report and this Verified Annual LDC CDM Program Results Report) will be allocated to the 2018 program year and will not appear.
Peak demand and energy savings are determined by the total savings from a given project as reported (reported). A realization rate is applied to the reported savings to ensure that these savings align with EM&V protocols and reflect the savings that were actually realized (i.e. how many light bulbs were actually installed vs. what was reported) (gross). Net savings takes into account net-to-gross factors such as free-ridership and spillover (net).
Attributing Savings to LDCs
Gross Reported Savings = Activity * Per Unit Assumption SavingsGross Verified Savings = Gross Reported Savings * Realization RateNet Verified Savings = Gross Verified Savings * Net-to-Gross RatioAll savings are annualized (i.e. the savings are the same regardless of time of year a project was completed or measure installed)
Gross Reported Savings = Reported SavingsGross Verified Savings = Gross Reported Savings * Realization RateNet Verified Savings = Gross Verified Savings * Net-to-Gross RatioAll savings are annualized (i.e. the savings are the same regardless of time of year a project was completed or measure installed)
All variances from the Final Annual Results Reports from prior years will be adjusted within this report. Any variances with regards to projects counts, data lag, and calculations etc., will be made within this report. Considers the annual effect of energy savings.
Peak demand and energy savings are determined using the verified measure level per unit assumption multiplied by the uptake in the market (gross) taking into account net-to-gross factors such as free-ridership and spillover (net) at the measure level.
Peak demand and energy savings are determined by the total savings for a given project as reported in the CDM LDC Report Template. Preliminary unverified net savings are calculated by multiplying reported savings by 2016 Net-to-gross ratios and realization rates.
Peak demand and energy savings are determined by the total savings for a given project as reported (reported). A realization rate is applied to the reported savings to ensure that these savings align with EM&V protocols and reflect the savings that were actually realized (i.e. how many light bulbs were actually installed vs. what was reported) (gross). Net savings takes into account net-to-gross factors such as free-ridership and spillover (net).
Peak demand and energy savings are determined by the total savings from a given project as reported (reported). A realization rate is applied to the reported savings to ensure that these savings align with EM&V protocols and reflect the savings that were actually realized (i.e. how many light bulbs were actually installed vs. what was reported) (gross). Net savings takes into account net-to-gross factors such as free-ridership and spillover (net).
Peak demand and energy savings are determined using the measure level per unit assumption multiplied by the uptake of each measure (gross), taking into account net-to-gross factors such as free-ridership and spillover (net) at the measure level.
Savings are considered to begin in the year of the actual project completion date.
Savings are considered to begin in the year in which the measures were installed.
2017 Final Verified Annual LDC CDM Program Results ReportMethodology
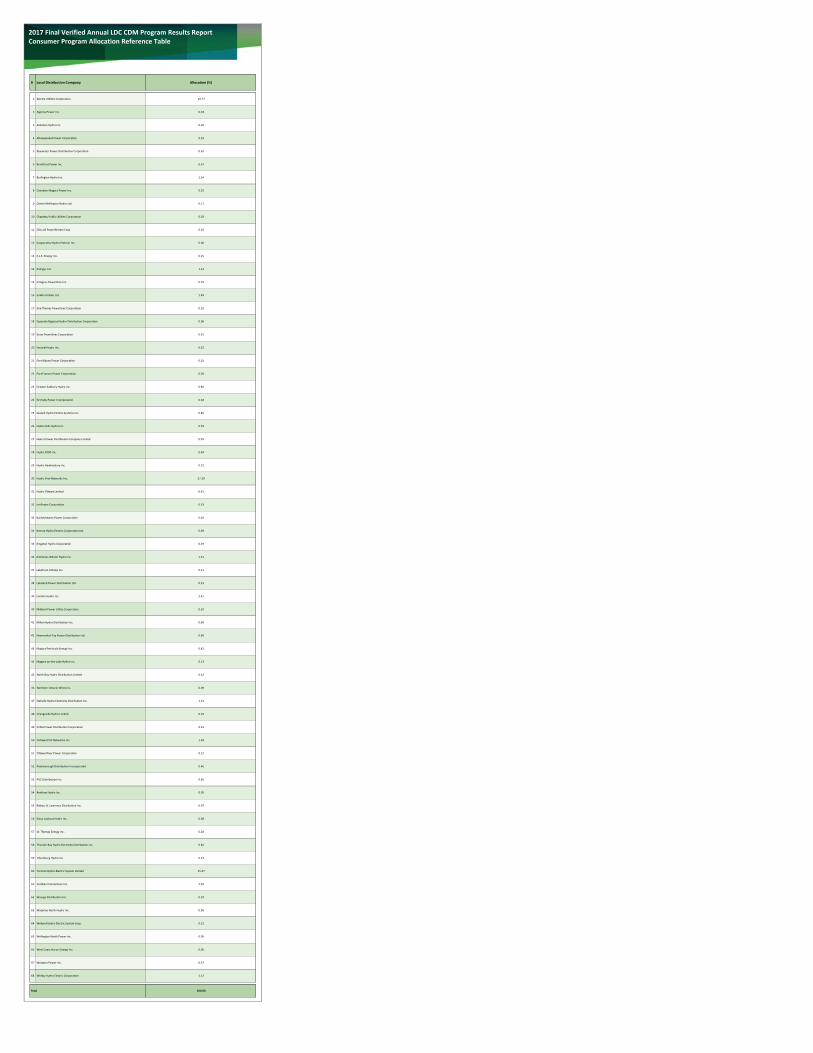
# Local Distribution Company Allocation (%)
1 Alectra Utilities Corporation 19.77
2 Algoma Power Inc. 0.18
3 Atikokan Hydro Inc. 0.02
4 Attawapiskat Power Corporation 0.01
5 Bluewater Power Distribution Corporation 0.62
6 Brantford Power Inc. 0.67
7 Burlington Hydro Inc. 1.34
8 Canadian Niagara Power Inc. 0.35
9 Centre Wellington Hydro Ltd. 0.11
10 Chapleau Public Utilities Corporation 0.03
11 COLLUS PowerStream Corp. 0.25
12 Cooperative Hydro Embrun Inc. 0.06
13 E.L.K. Energy Inc. 0.25
14 Energy+ Inc. 1.12
15 Entegrus Powerlines Inc. 0.70
16 EnWin Utilities Ltd. 1.49
17 Erie Thames Powerlines Corporation 0.32
18 Espanola Regional Hydro Distribution Corporation 0.06
19 Essex Powerlines Corporation 0.61
20 Festival Hydro Inc. 0.32
21 Fort Albany Power Corporation 0.01
22 Fort Frances Power Corporation 0.09
23 Greater Sudbury Hydro Inc. 0.80
24 Grimsby Power Incorporated 0.18
25 Guelph Hydro Electric Systems Inc. 0.85
26 Halton Hills Hydro Inc. 0.59
27 Hearst Power Distribution Company Limited 0.05
28 Hydro 2000 Inc. 0.04
29 Hydro Hawkesbury Inc. 0.15
30 Hydro One Networks Inc. 27.29
31 Hydro Ottawa Limited 6.61
32 InnPower Corporation 0.33
33 Kashechewan Power Corporation 0.02
34 Kenora Hydro Electric Corporation Ltd. 0.09
35 Kingston Hydro Corporation 0.29
36 Kitchener-Wilmot Hydro Inc. 1.51
37 Lakefront Utilities Inc. 0.11
38 Lakeland Power Distribution Ltd. 0.23
39 London Hydro Inc. 2.61
40 Midland Power Utility Corporation 0.10
41 Milton Hydro Distribution Inc. 0.66
42 Newmarket-Tay Power Distribution Ltd. 0.60
43 Niagara Peninsula Energy Inc. 0.82
44 Niagara-on-the-Lake Hydro Inc. 0.13
45 North Bay Hydro Distribution Limited 0.42
46 Northern Ontario Wires Inc. 0.09
47 Oakville Hydro Electricity Distribution Inc. 1.51
48 Orangeville Hydro Limited 0.20
49 Orillia Power Distribution Corporation 0.22
50 Oshawa PUC Networks Inc. 1.48
51 Ottawa River Power Corporation 0.12
52 Peterborough Distribution Incorporated 0.46
53 PUC Distribution Inc. 0.65
54 Renfrew Hydro Inc. 0.05
55 Rideau St. Lawrence Distribution Inc. 0.07
56 Sioux Lookout Hydro Inc. 0.08
57 St. Thomas Energy Inc. 0.28
58 Thunder Bay Hydro Electricity Distribution Inc. 0.82
59 Tillsonburg Hydro Inc. 0.12
60 Toronto Hydro-Electric System Limited 15.57
61 Veridian Connections Inc. 2.39
62 Wasaga Distribution Inc. 0.18
63 Waterloo North Hydro Inc. 0.96
64 Welland Hydro-Electric System Corp. 0.31
65 Wellington North Power Inc. 0.06
66 West Coast Huron Energy Inc. 0.06
67 Westario Power Inc. 0.37
68 Whitby Hydro Electric Corporation 1.12
Total 100.00
2017 Final Verified Annual LDC CDM Program Results ReportConsumer Program Allocation Reference Table
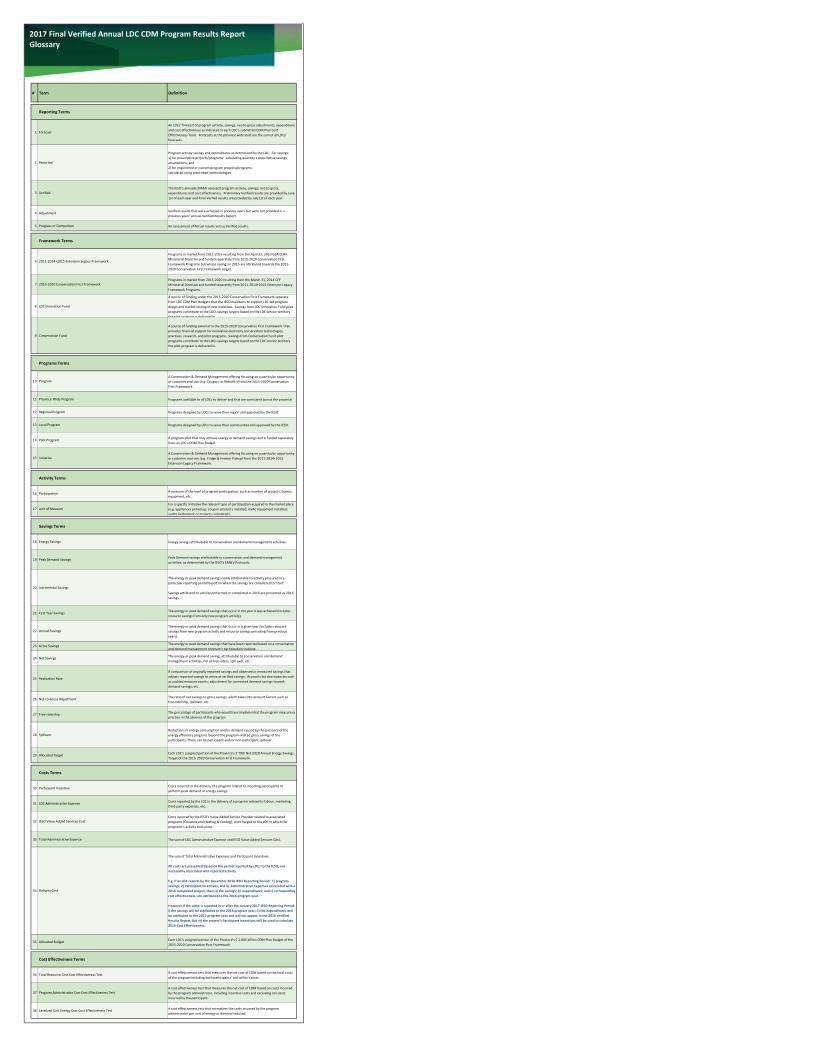
# Term Definition
Reporting Terms
1 Forecast
An LDCs' forecast of program activity, savings, net-to-gross adjustments, expenditures and cost effectiveness as indicated in each LDC's submitted CDM Plan Cost Effectiveness Tools. Forecasts at the province wide level are the sum of all LDCs' forecasts.
2 Reported
Program activity savings and expenditures as determined by the LDC. For savings:1) for prescriptive projects/programs: calculating quantity x prescriptive savings assumptions; and2) for engineered or custom program projects/programs:calculated using prescribed methodologies.
3 VerifiedThe IESO's annually EM&V assessed program activity, savings, net-to-gross, expenditures and cost effectiveness. Preliminary Verified results are provided by June 1st of each year and Final Verfied results are provided by July 1st of each year.
4 Adjustment Verified results that were achieved in previous years but were not provided in a previous years' Annual Verified Results Report.
5 Progress or Comparison An assessment of Actual results versus Verified results.
Framework Terms
6 2011-2014+2015 Extension Legacy Framework
Programs in market from 2011-2015 resulting from the April 23, 2010 GEA CDM Ministerial Directive and funded separately from 2015-2020 Conservation First Framework Programs but whose savings in 2015 are attributed towards the 2015-2020 Conservation First Framework target.
7 2015-2020 Conservation First FrameworkPrograms in market from 2015-2020 resulting from the March 31, 2014 CFF Ministerial Directive and funded separately from 2011-2014+2015 Extension Legacy Framework Programs.
8 LDC Innovation Fund
A source of funding under the 2015-2020 Conservation First Framework separate from LDC CDM Plan Budgets that the IESO maintains to support LDC led program design and market testing of new initiatives. Savings from LDC Innovation Fund pilot programs contribute to the LDCs savings targets based on the LDC service territory the pilot program is delivered in
9 Conservation Fund
A source of funding external to the 2015-2020 Conservation First Framework that provides financial support for innovative electricity conservation technologies, practices, research, and pilot programs. Savings from Conservation Fund pilot programs contribute to the LDCs savings targets based on the LDC service territory the pilot program is delivered in.
Programs Terms
10 ProgramA Conservation & Demand Management offering focusing on a particular opportunity or customer end-use (e.g. Coupon; or Retrofit;) from the 2015-2020 Conservation First Framework.
11 Province-Wide Program Programs available to all LDCs to deliver and that are consistent across the province.
12 Regional Program Programs designed by LDCs to serve their region and approved by the IESO.
13 Local Program Programs designed by LDCs to serve their communities and approved by the IESO.
14 Pilot Program A program pilot that may achieve energy or demand savings and is funded separately from an LDC's CDM Plan Budget.
15 InitiativeA Conservation & Demand Management offering focusing on a particular opportunity or customer end-use (e.g. Fridge & Freezer Pickup) from the 2011-2014+2015 Extension Legacy Framework.
Activity Terms
16 Participation A measure of the level of program participation, such as number of projects, homes, equipment, etc..
17 Unit of MeasureFor a specific initiative the relevant type of participation acquired in the market place (e.g. appliances picked up; coupon products installed; HVAC equipment installed; audits performed; or projects completed;).
Savings Terms
18 Energy Savings Energy savings attributable to conservation and demand management activities.
19 Peak Demand Savings Peak Demand savings attributable to conservation and demand management activities, as determined by the IESO's EM&V Protocols.
20 Incremental Savings
The energy or peak demand savings newly attributable to activity procured in a particular reporting period based on when the savings are considered to 'start'.
Savings attributed to activity performed or completed in 2016 are presented as 2016 savings.
21 First Year Savings The energy or peak demand savings that occur in the year it was achieved (includes resource savings from only new program activity).
22 Annual SavingsThe energy or peak demand savings that occur in a given year (includes resource savings from new program activity and resource savings persisting from previous years).
23 Gross Savings The energy or peak demand savings that have been reported based on a conservation and demand management program's participation tracking.
24 Net Savings The energy or peak demand savings attributable to conservation and demand management activities, net of free-riders, spill over, etc.
25 Realization Rate
A comparison of originally reported savings and observed or measured savings that adjusts reported savings to arrive at verified savings. Accounts for discrepancies such as audited measure counts; adjustment for connected demand savings to peak demand savings; etc.
26 Net-to-Gross Adjustment The ratio of net savings to gross savings, which takes into account factors such as free-ridership, spillover, etc.
27 Free-ridership The percentage of participants who would have implemented the program measure or practice in the absence of the program.
28 SpilloverReductions in energy consumption and/or demand caused by the presence of the energy efficiency program, beyond the program-related gross savings of the participants. There can be participant and/or non-participant spillover.
29 Allocated Target Each LDC's assigned portion of the Province's 7 TWh Net 2020 Annual Energy Savings Target of the 2015-2020 Conservation First Framework.
Costs Terms
30 Participant Incentive Costs incurred in the delivery of a program related to incenting participants to perform peak demand or energy savings.
31 LDC Administrative Expense Costs reported by the LDC in the delivery of a program related to labour, marketing, third-party expenses, etc.
32 IESO Value Added Services CostCosts incurred by the IESO's Value Added Service Provider related to associated programs (Coupons and Heating & Cooling), and charged to the LDC in which the programs's activity took place.
33 Total Administrative Expense The sum of LDC Adminsitrative Expense and IESO Value Added Services Cost.
34 Delivery Cost
The sum of Total Administrative Expenses and Participant Incentives.
All costs are presented based on the period reported by LDCs to the IESO, not necessarily associated with reported activity.
E.g. if an LDC reports by the December 2016 IESO Reporting Period: 1) program savings; 2) Participant Incentives; and 3) Administrative Expenses associated with a 2016 completed project, then: a) the savings; b) expenditures; and c) corresponding cost effectiveness; are attributed to the 2016 program year.
However if the same is reported in or after the January 2017 IESO Reporting Period: i) the savings will be attributed to the 2016 program year; ii) the expenditures will be attributed to the 2017 program year and will not appear in the 2016 Verified Results Report; but iii) the project's Participant Incentives will be used to calculate 2016 Cost Effectiveness;
35 Allocated Budget Each LDC's assigned portion of the Province's $ 1.835 billion CDM Plan Budget of the 2015-2020 Conservation First Framework.
Cost Effectiveness Terms
36 Total Resource Cost Cost Effectiveness Test A cost effectiveness test that measures the net cost of CDM based on the total costs of the program including both participants’ and utility’s costs.
37 Program Administrator Cost Cost Effectiveness TestA cost effectiveness test that measures the net cost of CDM based on costs incurred by the program administrator, including incentive costs and excluding net costs incurred by the participant.
38 Levelized Unit Energy Cost Cost Effectiveness Test A cost effectiveness test that normalizes the costs incurred by the program administrator per unit of energy or demand reduced.
2017 Final Verified Annual LDC CDM Program Results ReportGlossary

Appendix 4H
Algoma Power Inc.
2020 Cost of Service
EB-2019-0019

Worksheet Name Description
1. LRAMVA Summary Tables 1-a and 1-b provide a summary of the LRAMVA balances and carrying charges associated with the LRAMVA disposition. The balances are populated from entries into other tabs throughout this work form.
1-a. Summary of Changes Tables A-1 and A-2 include a template for LDCs to summarize changes to the LRAMVA work form.
2. LRAMVA Threshold Tables 2-a, 2-b and 2-c include the LRAMVA thresholds and allocations by rate class.
3. Distribution Rates Tables 3-a and 3-b include the distribution rates that are used to calculate lost revenues.
3-a. Rate Class Allocations A blank spreadsheet is provided to allow LDCs to populate distributor specific rate class percentages to allocate actual CDM savings to different customer classes.
4. 2011-2014 LRAM Tables 4-a, 4-b, 4-c and 4-d include the template 2011-2014 LRAMVA work forms.
5. 2015-2020 LRAM Tables 5-a, 5-b, 5-c and 5-d include the template 2015-2020 LRAMVA work forms.
6. Carrying Charges Table 6-b includes the variance on carrying charges related to the LRAMVA disposition.
7. Persistence Report A blank spreadsheet is provided to allow LDCs to populate with CDM savings persistence data provided by the IESO.
8. StreetlightingA blank spreadsheet is provided to allow LDCs to populate data on streetlighting projects whose savings were not provided by the IESO in the CDM Final Results Report (i.e., streetlighting projects).
Generic LRAMVA Work Forms
This Workbook Model is protected by copyright and is being made available to you solely for the purpose of filing your application. You may use and copy this model for that purpose, and provide a copy of this model to any person that is advising or assisting you in that regard. Except as indicated above, any copying, reproduction, publication, sale, adaptation, translation, modification, reverse engineering or other use or dissemination of this model without the express written consent of the Ontario Energy Board is prohibited. If you provide a copy of this model to a person that is advising or assisting you in preparing the application or reviewing your draft rate order, you must ensure that the person understands and agrees to the restrictions noted above.
While this model has been provided in Excel format and is required to be filed with the applications, the onus remains on the applicant to ensure the accuracy of the data and the results.
Ontario Energy Board

Tab
LRAMVA Checklist/Schematic Tab
o Highlight changes to this work form made by the LDC, if any, and provide rationale for the change in Tab 1-a.
o Include any necessary assumptions the LDC has to make in its LRAMVA work form in the "Notes" section of the work form.
o Include a copy of initiative-level persistence savings information that was verified by the IESO. Persistence information is available upon request from the IESO.
o Provide documentation or analysis on how rate class allocations were determined by customer class and program each year, inserted in Tab 3-a.
Tab 1. LRAMVA Summary
Tab 1-a. Summary of Changes Distributors should list all significant changes and changes in assumptions in the generic work form affecting the LRAMVA.
Tab 2. LRAMVA Threshold
Tab 3. Distribution Rates Distributors should complete the tables with rate class specific distribution rates and adjustments as applicable.
Tab 3-a. Rate Class Allocations
Tabs 4 and 5 (2011-2020) Distributors should complete the lost revenue calculation for 2011-2014 program years and 2015-2020 program years, as applicable, by undertaking the following:
Tab 6. Carrying Charges
Tab 7. Persistence Report
Tab 8. Streetlighting A tab is provided to ensure LDCs include documentation or data to support projects whose program savings were not provided by the IESO (i.e., streetlighting projects).
o Ensure that the IESO verified savings adjustments apply to the program year it relates to. For example, savings adjustments related to 2012 programs that were reported by the IESO in 2013 should be included in the 2012 program savings table.
o Provide documentation on the LRAMVA threshold by providing the reference and source material from the LDC’s cost of service proceeding where its most recent load forecast was approved.
Instructions
The LRAMVA work form was created in a generic manner for use by all LDCs. There are some elements that are not applicable at this time (i.e., 2017, 2018, 2019 and 2020 related components) but have been included in an effort to avoid major updates in the future. Distributors should follow the checklist, which is referenced in this tab of the work form and listed below:
o Apply the IESO verified savings adjustments to the year it relates to. For example, savings adjustments to 2015 programs will be provided to LDCs with the 2016 Final Results Report. The 2015 savings adjustments should be included in the 2015 verified savings portion of the work form.
o Provide documentation or data substantiating savings from projects that were not provided in the IESO's verified results reports, inserted in Tab 8 (i.e., streetlighting projects), as applicable.
Distributors are required to report any past approved LRAMVA amounts along with the current LRAMVA amount requested for approval. There are separate tables indicating new lost revenues and carrying charges amounts by year and the totals for rate rider calculations.
Distributors should use the tables to display the LRAMVA threshold amounts as approved at a rate class level. This should be taken from the LDC’s most recently approved cost of service application.
A tab is provided to allow LDCs to include documentation or analysis on how rate class allocations for actual CDM savings were determined by customer class and program each year. The rate class allocations would support the LRAMVA rate class allocation figures used in Tabs 4 and 5.
o Input or manually link the savings, adjustments and program savings persistence data from Tab 7 (Persistence Report) to Tabs 4 and 5. As noted earlier, persistence data is available upon request from the IESO.
o Confirm the monthly multipliers applied to demand savings. If a different monthly multiplier is used than what was confirmed in the LRAMVA Report, provide rationale in Tab 1-a and highlight the new monthly multiplier that has been used.
o Input the rate class allocations by program and year to allocate actual savings to customers. If a different allocation is proposed for adjustments, LDCs must provide the supporting rationale in Tab 1-a and highlight the change.
o Provide assumptions about the year(s) in which persistence is captured in the load forecast via the "Notes" section of each table and adjust what is included in the LRAMVA totals, as appropriate.
Distributors are requested to calculate carrying charges based on the methodology provided in the work form. This includes updating Table 6 as new prescribed interest rates for deferral and variance accounts become available and entering any collected interest amounts into the "Amounts Cleared" row to calculate outstanding variances on carrying charges.
Persistence savings report(s) provided by the IESO should be included for the relevant years in the LRAMVA work form. Tab 7 has been created consistently with the IESO’s persistence report.
Ontario Energy Board

Legend Drop Down List (Blue)
Important Checklist
Yes o Highlight changes to this work form made by the LDC, if any, and provide rationale for the change in Tab 1-a
Yes o Include any necessary assumptions the LDC has to make in its LRAMVA work form in the "Notes" section of the work form
Yes o Provide documentation on the LRAMVA threshold by providing the reference and source material from the LDC’s cost of service proceeding where its most recent load forecast was approved
Not Applicable o Include a copy of initiative-level persistence savings information that was verified by the IESO in Tab 7. Persistence information is available upon request from the IESO
Yes o Apply the IESO verified savings adjustments to the year it relates to.
Not Applicable o Provide documentation or data substantiating savings from projects that were not provided in the IESO's verified results reports, inserted in Tab 8 (i.e., streetlighting projects), as applicable
Yes o Provide documentation or analysis on how rate class allocations were determined by customer class and program each year, inserted in Tab 3-a
Work Form Calculations Source of Calculation Inputs (Tables to Complete) Source of Data Inputs Outputs of Data (Auto-Populated)
Actual Incremental CDM Savings by Initiative Tabs "4. 2011-2014 LRAM" and "5. 2015-2020 LRAM" Tables 4-a to 4-d / 5-a to 5-f (Columns D & O) IESO Verified Persistence Results Reports included in Tab 7 (Columns L to BT). Tables 4-a to 4-d / 5-a to 5-f (Columns Y-AL)
+/- IESO Verified Savings Adjustments Tab "4. 2011-2014 LRAM" Tables 4-a to 4-d / 5-a to 5-f (Columns D-M & Columns O-X) IESO Verified Persistence Results Reports included in Tab 7 (Columns L to BT). Tables 4-a to 4-d / 5-a to 5-f (Columns Y-AL)
+ Initiative Level Savings Persistence Tab "4. 2011-2014 LRAM" Tables 4-a to 4-d / 5-a to 5-f (Columns E-M & Columns P-X) IESO Verified Persistence Results Reports included in Tab 7 (Columns L to BT). Tables 4-a to 4-d / 5-a to 5-f (Columns Y-AL)
x Allocation % to Rate Class Tabs "4. 2011-2014 LRAM" and "5. 2015-2020 LRAM" Tables 4-a to 4-d / 5-a to 5-f (Columns Y-AJ) Determined by the LDC
Actual Lost Revenues (kWh and kW) by Rate Class Tabs "4. 2011-2014 LRAM" and "5. 2015-2020 LRAM"
- Forecast Lost Revenues (kWh and kW) by Rate Class Tabs "4. 2011-2014 LRAM" and "5. 2015-2020 LRAM" Tab "2. LRAMVA Threshold" Tables 2-a, 2-b and 2-c
x Distribution Rate by Rate Class Tab "3. Distribution Rates" Table 3 LDC's Approved Tariff Sheets
LRAMVA ($) by Rate Class Tabs "4. 2011-2014 LRAM" and "5. 2015-2020 LRAM" Tables 1-a and 1-b
+ Carrying Charges ($) by Rate Class Tabs "1. LRAMVA Summary" and "6. Carrying Charges" Table 6 Table 6-a
Total LRAMVA ($) by Rate Class Tab "1. LRAMVA Summary"
LRAMVA ($) = (Actual Net CDM Savings - Forecast CDM Savings) x Distribution Volumetric Rate + Carrying Charges from LRAMVA balance
General Note on the LRAMVA ModelThe LRAMVA work form has been created in a generic manner that should allow for use by all LDCs. There are some elements that are not applicable at this time (i.e., 2018, 2019 and 2020 related components). These have been included (but hidden in the work form) in an effort to avoid major
updates in the future. This LRAMVA work form consolidates information that LDCs are already required to file with the OEB. The model has been created to provide LDCs with a consistent format to display CDM impacts, the forecast savings component and, ultimately, any variance between actual CDM savings and forecast CDM savings. The majority of the information required in the LRAMVA work form will be provided to LDCs from the IESO as part of the Final CDM Results each year. Please contact the IESO for any reports that may be required to complete this LRAMVA work form.
The LRAMVA work form is unlocked to enable LDCs to tailor it to their own unique circumstances.
Ontario Energy Board

4 of 25
Legend User Inputs (Green)
Auto Populated Cells (White)
Instructions (Grey)
LDC Name Algoma Power Inc.
Application Details
Please fill in the requested information: a) the amounts approved in the previous LRAMVA application, b) details on the current application, and c) documentation of changes if applicable.
A. Previous LRAMVA Application B. Current LRAMVA Application C. Documentation of Changes
Previous LRAMVA Application (EB#) EB-2014-0055 Current LRAMVA Application (EB#) EB-2019-0019 Original Amount 510,390.00$
Application of Previous LRAMVA Claim 2015 COS Application Application of Current LRAMVA Claim 2020 COS Application Amount for Final Disposition
Period of LRAMVA Claimed in Previous Application 2011-2012 Period of New LRAMVA in this Application 2015-2017
Amount of LRAMVA Claimed in Previous Application 18,864.00$ Period of Rate Recovery (# years) 4
Actual Lost Revenues ($) A 534,452$
Forecast Lost Revenues ($) B 60,591$
Carrying Charges ($) C 36,529$
LRAMVA ($) for Account 1568 A-B+C 510,390$
Table 1-a. LRAMVA Totals by Rate Class
Billing Unit Principal ($) Carrying Charges ($) Total LRAMVA ($)
kWh $317,805 $23,519 $341,324
kWh $51,399 $3,934 $55,333
kw $2,081 $263 $2,344
kWh $102,576 $8,813 $111,389
$0 $0 $0
$0 $0 $0
$0 $0 $0
$0 $0 $0
$0 $0 $0
$0 $0 $0
$0 $0 $0
$0 $0 $0
$0 $0 $0
$0 $0 $0
$473,861 $36,529 $510,390
Street Lights (kWh)
Please input the customer rate classes applicable to the LDC and associated billing units (kWh or kW) in Table 1-a below. This will update all tables throughout the workform.
The LRAMVA total by rate class in Table 1-a should be used to inform the determination of rate riders in the Deferral and Variance Account Work Form or IRM Rate Generator Model. Please also ensure that the principal amounts in column E of Table 1-a capture the appropriate years and amounts for the LRAMVA claim. Column F of Table 1-a should include projected carrying charges amounts as determined on a rate class basis from Table 1-b below.
NOTE: If the LDC has more than 14 customer classes in which CDM savings was allocated, LDCs must contact OEB staff to make adjustments to the workform.
Customer Class
R1 (kWh)
Seasonal (kWh)
R2 (kW)
Total
Ontario Energy Board

5 of 25
Table 1-b. Annual LRAMVA Breakdown by Year and Rate Class
Description LRAMVA Previously Claimed R1 (kWh) Seasonal (kWh) R2 (kW) Street Lights (kWh) Total
kWh kWh kw kWh 0 0 0 0 0 0 0 0 0 02011 Actuals $0.00 $0.00 $0.00 $0.00 $0.00 $0.00 $0.00 $0.00 $0.00 $0.00 $0.00 $0.00 $0.00 $0.00 $0.00
2011 Forecast $0.00 $0.00 $0.00 $0.00 $0.00 $0.00 $0.00 $0.00 $0.00 $0.00 $0.00 $0.00 $0.00 $0.00 $0.00Amount Cleared
2012 Actuals $0.00 $0.00 $0.00 $0.00 $0.00 $0.00 $0.00 $0.00 $0.00 $0.00 $0.00 $0.00 $0.00 $0.00 $0.002012 Forecast $0.00 $0.00 $0.00 $0.00 $0.00 $0.00 $0.00 $0.00 $0.00 $0.00 $0.00 $0.00 $0.00 $0.00 $0.00
Amount Cleared2013 Actuals $0.00 $0.00 $0.00 $0.00 $0.00 $0.00 $0.00 $0.00 $0.00 $0.00 $0.00 $0.00 $0.00 $0.00 $0.00
2013 Forecast $0.00 $0.00 $0.00 $0.00 $0.00 $0.00 $0.00 $0.00 $0.00 $0.00 $0.00 $0.00 $0.00 $0.00 $0.00Amount Cleared
2014 Actuals $0.00 $0.00 $0.00 $0.00 $0.00 $0.00 $0.00 $0.00 $0.00 $0.00 $0.00 $0.00 $0.00 $0.00 $0.002014 Forecast $0.00 $0.00 $0.00 $0.00 $0.00 $0.00 $0.00 $0.00 $0.00 $0.00 $0.00 $0.00 $0.00 $0.00 $0.00
Amount Cleared2015 Actuals $74,041.87 $10,092.14 $2,839.69 $12,813.04 $0.00 $0.00 $0.00 $0.00 $0.00 $0.00 $0.00 $0.00 $0.00 $0.00 $99,786.74
2015 Forecast ($13,169.36) ($4,295.82) ($2,356.05) ($540.25) $0.00 $0.00 $0.00 $0.00 $0.00 $0.00 $0.00 $0.00 $0.00 $0.00 ($20,361.48)Amount Cleared
2016 Actuals $113,481.56 $19,497.69 $2,921.02 $41,176.58 $0.00 $0.00 $0.00 $0.00 $0.00 $0.00 $0.00 $0.00 $0.00 $0.00 $177,076.852016 Forecast ($13,169.36) ($4,410.25) ($2,353.03) ($545.44) $0.00 $0.00 $0.00 $0.00 $0.00 $0.00 $0.00 $0.00 $0.00 $0.00 ($20,478.09)
Amount Cleared2017 Actuals $169,106.74 $34,726.42 $3,422.12 $50,332.71 $0.00 $0.00 $0.00 $0.00 $0.00 $0.00 $0.00 $0.00 $0.00 $0.00 $257,587.99
2017 Forecast ($12,486.81) ($4,210.72) ($2,392.67) ($660.89) $0.00 $0.00 $0.00 $0.00 $0.00 $0.00 $0.00 $0.00 $0.00 $0.00 ($19,751.08)Amount ClearedCarrying Charges $23,519.45 $3,933.55 $262.53 $8,813.23 $0.00 $0.00 $0.00 $0.00 $0.00 $0.00 $0.00 $0.00 $0.00 $0.00 $36,528.76
Total LRAMVA Balance $341,324 $55,333 $2,344 $111,389 $0 $0 $0 $0 $0 $0 $0 $0 $0 $0 $510,390Note: LDC to make note of assumptions included above, if any $473,860.92
In column C of Table 1-b below, please insert a 'check mark' to indicate the years in which LRAMVA has been claimed. If you inserted a check-mark for a particular year, please delete the amounts associated with the actual and forecast lost revenues for all rate classes for that year, up to and including the total. Any LRAMVA from a prior year that has already been claimed cannot be included in the current LRAMVA disposition, with the exception of the case noted below.
If LDCs are seeking to claim true-up amounts that were previously approved by the OEB, please note that the "Amount Cleared" rows are applicable to the LDC and should be filled out. This may relate to claiming the difference in LRAM approved before the May 19, 2016 Peak Demand Consultation, and the lost revenues that would have been incurred after that consultation, as approved by the OEB. If this is the case, reference to the decision must be noted in the rate application. If this is not the case, LDCs are requested to leave those rows blank.
LDCs are expected to include projected carrying charges amounts in row 84 of Table 1-b below. LDCs should also check accuracy of the years included in the LRAMVA balance in row 85.

6 of 25
Legend User Inputs (Green)
Drop Down List (Blue)
Instructions (Grey)
Table A-1. Changes to Generic Assumptions in LRAMVA Work Form
No. Tab Cell Reference1 5. 2015-2020 LRAM Row 3782 5. 2015-2020 LRAM AB1953 5. 2015-2020 LRAM AB208:AB2124 5. 2015-2020 LRAM AB5615 5. 2015-2020 LRAM Columns O to X6789
10etc.
Table A-2. Updates to LRAMVA Disposition
Please document any changes related to interrogatories or questions during the application process that affect the LRAMVA amount.
No. Tab Cell Reference123456789
10etc.
Please document any changes in assumptions made to the generic inputs of the LRAMVA work form. This may include, but are not limited to, the use of different monthly multipliers to claim demand savings from energy efficiency programs; use of different rate allocations between current year savings and prior year savings adjustments; inclusion of additional adjustments affecting distribution rates; etc. All changes should be highlighted in the work form as well.
RationaleDescriptionCorrected formulas to sum 2016 results onlyAdjustment to reduce IESO-verified Street Lighting savings for 2015Adjustment to reduce IESO-verified persisting SL savingsAdjustment to reduce IESO-verified Street Lighting savings for 2017Demand savings based on API actual kW/kWh ratio
Original 2016 formulas included 2015 results and totalsIESO savings significantly exceed actual reduction in load - see 4.12.2 of Exh 4IESO savings significantly exceed actual reduction in load - see 4.12.2 of Exh 4IESO savings significantly exceed actual reduction in load - see 4.12.2 of Exh 4IESO ratios signficantly different from API actual ratios - see 4.12.2 of Exh 4
Description Rationale
Ontario Energy Board

7 of 25
Legend User Inputs (Green)
Drop Down List (Blue)
Auto Populated Cells (White)
Instructions (Grey)
Table 2-a. LRAMVA Threshold 2015
Total R1 (kWh) Seasonal (kWh) R2 (kW) Street Lights (kWh)
kWh kWh kw kWh 0.0 0.0 0.0 0.0 0.0 0.0 0.0 0.0 0.0 0.0 kWh 750,001 401,505 29,343 316,099 3,054kW 764 755 9
Summary 401505 29343 755 3054 0 0 0 0 0 0 0 0 0 0
Years Included in Threshold
Source of Threshold Application page 754/1796
Table 2-b. LRAMVA Threshold
Total R1 (kWh) Seasonal (kWh) R2 (kW) Street Lights (kWh)
kWh kWh kw kWh 0.0 0.0 0.0 0.0 0.0 0.0 0.0 0.0 0.0 0.0 kWh 0kW 0
Summary 0 0 0 0 0 0 0 0 0 0 0 0 0 0
Years Included in Threshold
Source of Threshold 20XX Settlement Agreement, p. X
Table 2-c. Inputs for LRAMVA Thresholds
Year LRAMVA Threshold R1 (kWh) Seasonal (kWh) R2 (kW) Street Lights (kWh)
kWh kWh kw kWh 0.0 0.0 0.0 0.0 0.0 0.0 0.0 0.0 0.0 0.0 2011 0 0 0 0 0 0 0 0 0 0 0 0 0 0 02012 0 0 0 0 0 0 0 0 0 0 0 0 0 0 02013 0 0 0 0 0 0 0 0 0 0 0 0 0 0 02014 0 0 0 0 0 0 0 0 0 0 0 0 0 0 02015 2015 401,505 29,343 755 3,054 0 0 0 0 0 0 0 0 0 02016 2015 401,505 29,343 755 3,054 0 0 0 0 0 0 0 0 0 02017 2015 401,505 29,343 755 3,054 0 0 0 0 0 0 0 0 0 0
Note: LDC to make note of assumptions included above, if any
Please provide the LRAMVA threshold approved in the cost of service (COS) application, which is used as the comparator against actual savings in the period of the LRAMVA claim. The LRAMVA threshold should generally be consistent with the annualized savings targets developed from Appendix 2-I. If a manual update is required to reflect a different allocation of forecast savings that was approved by the OEB, please note the changes and provide rationale for the change in Tab 1-a.
Please provide the LRAMVA threshold approved in the last COS application, which is used as the comparator against actual savings in the period of the LRAMVA claim. The LRAMVA threshold should generally be consistent with the annualized savings targets developed from Appendix 2-I. If a manual update is required to reflect a different allocation of forecast savings that was approved by the OEB, please note the changes and provide rationale for the change in Tab 1-a.
Please complete Table 2-c below by selecting the appropriate LRAMVA threshold year in column C. The LRAMVA threshold values in Table 2-c will auto-populate from Tables 2-a and 2-b depending on the year selected. If there was no LRAMVA threshold established for a particular year, please select the "blank" option. The LRAMVA threshold values in Table 2-c will be auto-populated in Tabs 4 and 5 of this work form.
Ontario Energy Board
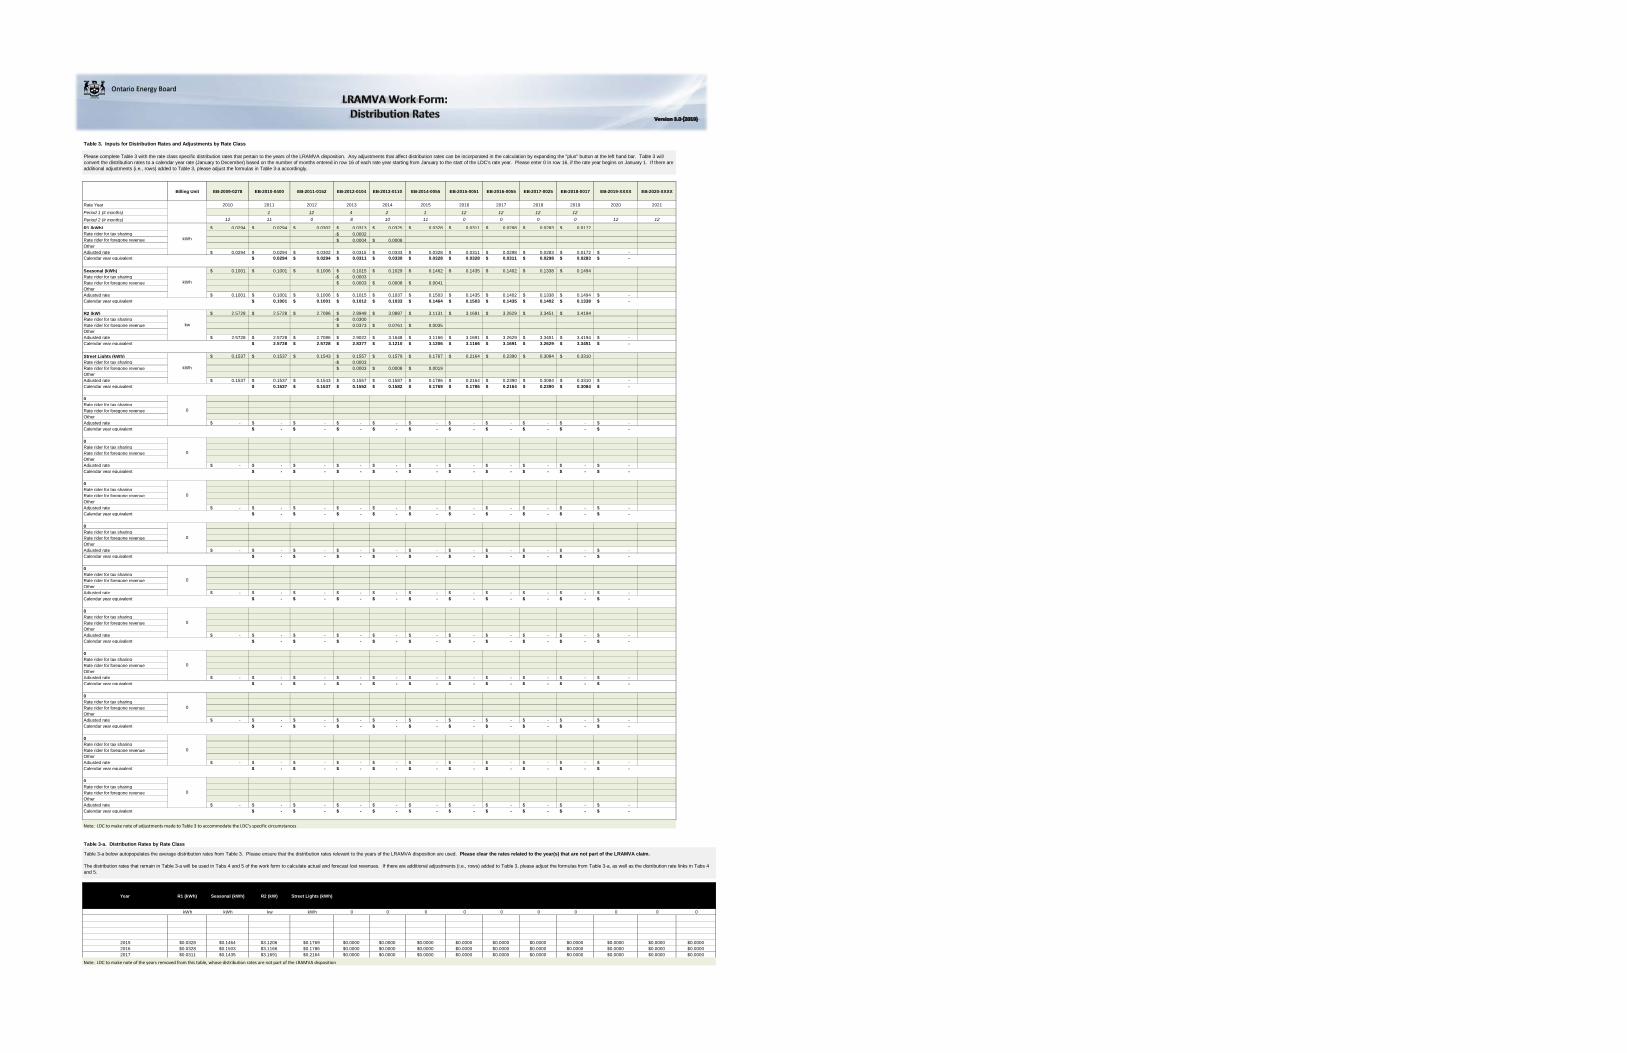
Table 3. Inputs for Distribution Rates and Adjustments by Rate Class
Billing Unit EB-2009-0278 EB-2010-0400 EB-2011-0152 EB-2012-0104 EB-2013-0110 EB-2014-0055 EB-2015-0051 EB-2016-0055 EB-2017-0025 EB-2018-0017 EB-2019-XXXX EB-2020-XXXX
Rate Year 2010 2011 2012 2013 2014 2015 2016 2017 2018 2019 2020 2021
Period 1 (# months) 1 12 4 2 1 12 12 12 12Period 2 (# months) 12 11 0 8 10 11 0 0 0 0 12 12
R1 (kWh) 0.0294$ 0.0294$ 0.0302$ 0.0313$ 0.0325$ 0.0328$ 0.0311$ 0.0298$ 0.0283$ 0.0172$ Rate rider for tax sharing 0.0002-$ Rate rider for foregone revenue 0.0004$ 0.0008$ OtherAdjusted rate 0.0294$ 0.0294$ 0.0302$ 0.0315$ 0.0333$ 0.0328$ 0.0311$ 0.0298$ 0.0283$ 0.0172$ -$ Calendar year equivalent 0.0294$ 0.0294$ 0.0311$ 0.0330$ 0.0328$ 0.0328$ 0.0311$ 0.0298$ 0.0283$ -$
Seasonal (kWh) 0.1001$ 0.1001$ 0.1006$ 0.1015$ 0.1029$ 0.1462$ 0.1435$ 0.1402$ 0.1338$ 0.1494$ Rate rider for tax sharing 0.0003-$ Rate rider for foregone revenue 0.0003$ 0.0008$ 0.0041$ OtherAdjusted rate 0.1001$ 0.1001$ 0.1006$ 0.1015$ 0.1037$ 0.1503$ 0.1435$ 0.1402$ 0.1338$ 0.1494$ -$ Calendar year equivalent 0.1001$ 0.1001$ 0.1012$ 0.1033$ 0.1464$ 0.1503$ 0.1435$ 0.1402$ 0.1338$ -$
R2 (kW) 2.5728$ 2.5728$ 2.7086$ 2.8949$ 3.0887$ 3.1131$ 3.1691$ 3.2629$ 3.3451$ 3.4194$ Rate rider for tax sharing 0.0300-$ Rate rider for foregone revenue 0.0373$ 0.0761$ 0.0035$ OtherAdjusted rate 2.5728$ 2.5728$ 2.7086$ 2.9022$ 3.1648$ 3.1166$ 3.1691$ 3.2629$ 3.3451$ 3.4194$ -$ Calendar year equivalent 2.5728$ 2.5728$ 2.8377$ 3.1210$ 3.1206$ 3.1166$ 3.1691$ 3.2629$ 3.3451$ -$
Street Lights (kWh) 0.1537$ 0.1537$ 0.1543$ 0.1557$ 0.1579$ 0.1767$ 0.2164$ 0.2390$ 0.3084$ 0.3310$ Rate rider for tax sharing 0.0003-$ Rate rider for foregone revenue 0.0003$ 0.0008$ 0.0019$ OtherAdjusted rate 0.1537$ 0.1537$ 0.1543$ 0.1557$ 0.1587$ 0.1786$ 0.2164$ 0.2390$ 0.3084$ 0.3310$ -$ Calendar year equivalent 0.1537$ 0.1537$ 0.1552$ 0.1582$ 0.1769$ 0.1786$ 0.2164$ 0.2390$ 0.3084$ -$
0Rate rider for tax sharingRate rider for foregone revenueOtherAdjusted rate -$ -$ -$ -$ -$ -$ -$ -$ -$ -$ -$ Calendar year equivalent -$ -$ -$ -$ -$ -$ -$ -$ -$ -$
0Rate rider for tax sharingRate rider for foregone revenueOtherAdjusted rate -$ -$ -$ -$ -$ -$ -$ -$ -$ -$ -$ Calendar year equivalent -$ -$ -$ -$ -$ -$ -$ -$ -$ -$
0Rate rider for tax sharingRate rider for foregone revenueOtherAdjusted rate -$ -$ -$ -$ -$ -$ -$ -$ -$ -$ -$ Calendar year equivalent -$ -$ -$ -$ -$ -$ -$ -$ -$ -$
0Rate rider for tax sharingRate rider for foregone revenueOtherAdjusted rate -$ -$ -$ -$ -$ -$ -$ -$ -$ -$ -$ Calendar year equivalent -$ -$ -$ -$ -$ -$ -$ -$ -$ -$
0Rate rider for tax sharingRate rider for foregone revenueOtherAdjusted rate -$ -$ -$ -$ -$ -$ -$ -$ -$ -$ -$ Calendar year equivalent -$ -$ -$ -$ -$ -$ -$ -$ -$ -$
0Rate rider for tax sharingRate rider for foregone revenueOtherAdjusted rate -$ -$ -$ -$ -$ -$ -$ -$ -$ -$ -$ Calendar year equivalent -$ -$ -$ -$ -$ -$ -$ -$ -$ -$
0Rate rider for tax sharingRate rider for foregone revenueOtherAdjusted rate -$ -$ -$ -$ -$ -$ -$ -$ -$ -$ -$ Calendar year equivalent -$ -$ -$ -$ -$ -$ -$ -$ -$ -$
0Rate rider for tax sharingRate rider for foregone revenueOtherAdjusted rate -$ -$ -$ -$ -$ -$ -$ -$ -$ -$ -$ Calendar year equivalent -$ -$ -$ -$ -$ -$ -$ -$ -$ -$
0Rate rider for tax sharingRate rider for foregone revenueOtherAdjusted rate -$ -$ -$ -$ -$ -$ -$ -$ -$ -$ -$ Calendar year equivalent -$ -$ -$ -$ -$ -$ -$ -$ -$ -$
0Rate rider for tax sharingRate rider for foregone revenueOtherAdjusted rate -$ -$ -$ -$ -$ -$ -$ -$ -$ -$ -$ Calendar year equivalent -$ -$ -$ -$ -$ -$ -$ -$ -$ -$
Note: LDC to make note of adjustments made to Table 3 to accommodate the LDC's specific circumstances
Table 3-a. Distribution Rates by Rate Class
Year R1 (kWh) Seasonal (kWh) R2 (kW) Street Lights (kWh)
kWh kWh kw kWh 0 0 0 0 0 0 0 0 0 0
2015 $0.0328 $0.1464 $3.1206 $0.1769 $0.0000 $0.0000 $0.0000 $0.0000 $0.0000 $0.0000 $0.0000 $0.0000 $0.0000 $0.00002016 $0.0328 $0.1503 $3.1166 $0.1786 $0.0000 $0.0000 $0.0000 $0.0000 $0.0000 $0.0000 $0.0000 $0.0000 $0.0000 $0.00002017 $0.0311 $0.1435 $3.1691 $0.2164 $0.0000 $0.0000 $0.0000 $0.0000 $0.0000 $0.0000 $0.0000 $0.0000 $0.0000 $0.0000
Note: LDC to make note of the years removed from this table, whose distribution rates are not part of the LRAMVA disposition
0
0
0
kWh
kWh
kw
kWh
0
Please complete Table 3 with the rate class specific distribution rates that pertain to the years of the LRAMVA disposition. Any adjustments that affect distribution rates can be incorporated in the calculation by expanding the "plus" button at the left hand bar. Table 3 will convert the distribution rates to a calendar year rate (January to December) based on the number of months entered in row 16 of each rate year starting from January to the start of the LDC's rate year. Please enter 0 in row 16, if the rate year begins on January 1. If there are additional adjustments (i.e., rows) added to Table 3, please adjust the formulas in Table 3-a accordingly.
Table 3-a below autopopulates the average distribution rates from Table 3. Please ensure that the distribution rates relevant to the years of the LRAMVA disposition are used. Please clear the rates related to the year(s) that are not part of the LRAMVA claim.
The distribution rates that remain in Table 3-a will be used in Tabs 4 and 5 of the work form to calculate actual and forecast lost revenues. If there are additional adjustments (i.e., rows) added to Table 3, please adjust the formulas from Table 3-a, as well as the distribution rate links in Tabs 4 and 5.
0
0
0
0
0
0
Ontario Energy Board
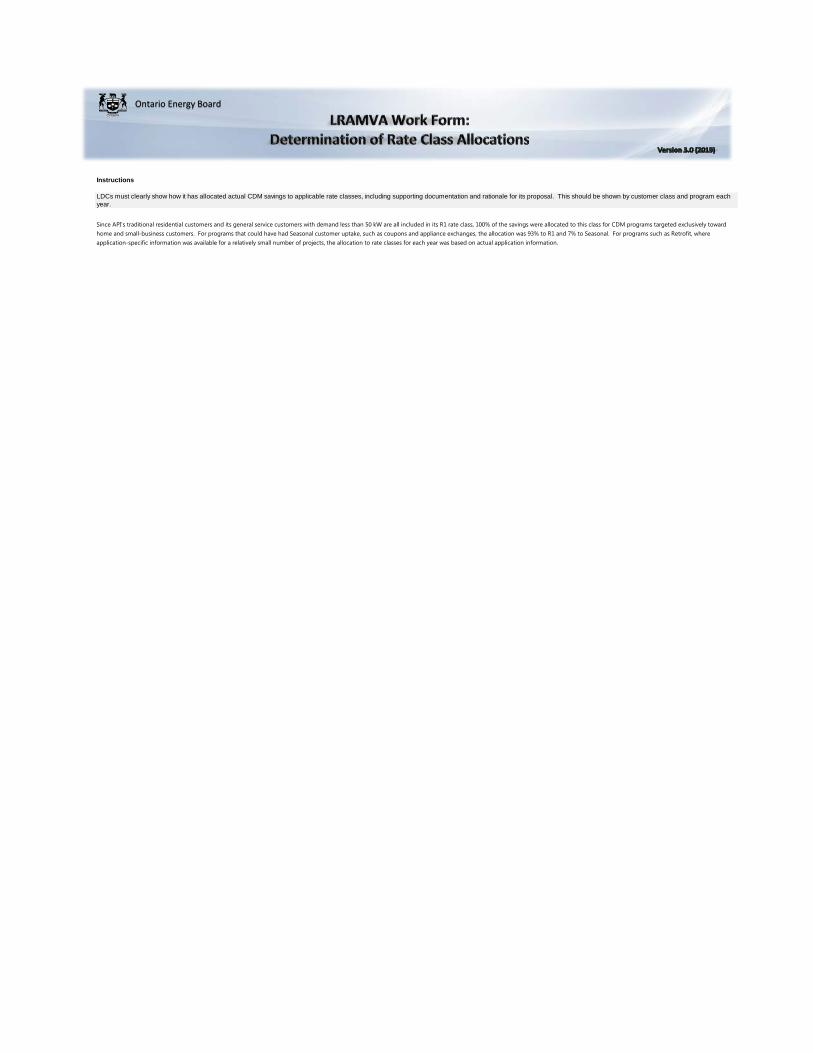
Instructions
LDCs must clearly show how it has allocated actual CDM savings to applicable rate classes, including supporting documentation and rationale for its proposal. This should be shown by customer class and program each year.
Since API’s traditional residential customers and its general service customers with demand less than 50 kW are all included in its R1 rate class, 100% of the savings were allocated to this class for CDM programs targeted exclusively toward home and small-business customers. For programs that could have had Seasonal customer uptake, such as coupons and appliance exchanges, the allocation was 93% to R1 and 7% to Seasonal. For programs such as Retrofit, where application-specific information was available for a relatively small number of projects, the allocation to rate classes for each year was based on actual application information.
Ontario Energy Board
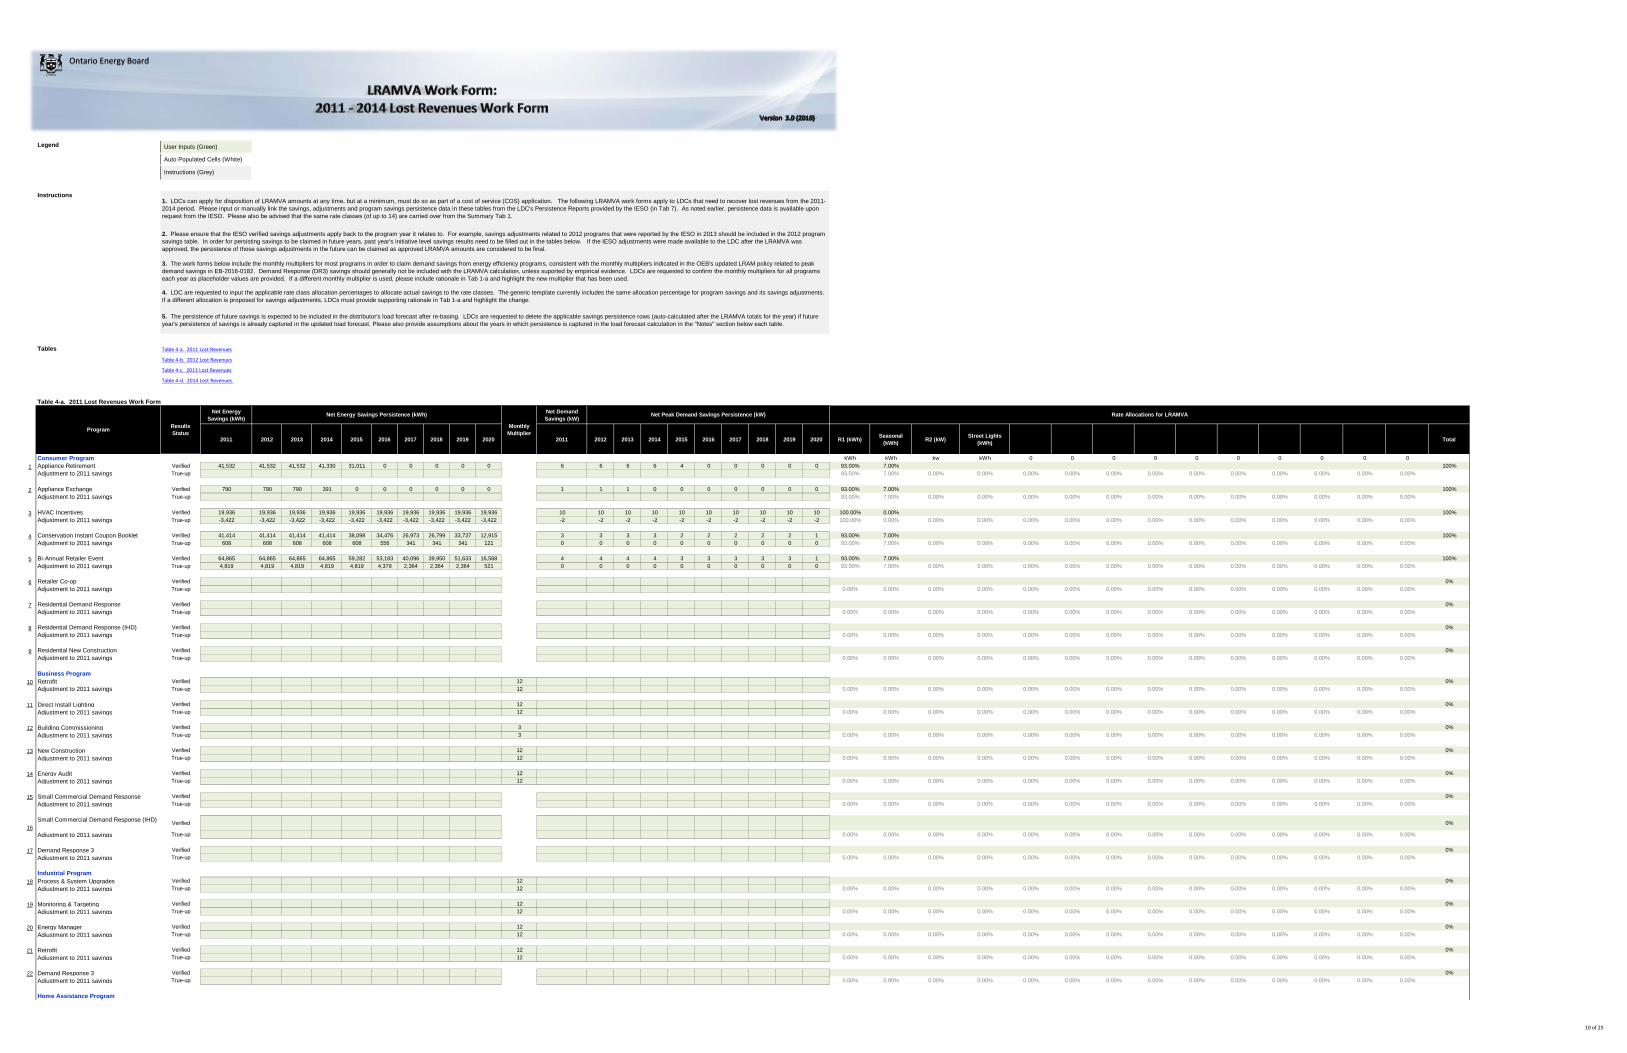
10 of 25
User Inputs (Green)
Auto Populated Cells (White)
Table 4-a. 2011 Lost Revenues
Table 4-b. 2012 Lost Revenues
Table 4-c. 2013 Lost Revenues
Table 4-d. 2014 Lost Revenues
Table 4-a. 2011 Lost Revenues Work FormNet Energy
Savings (kWh)Net Demand Savings (kW)
2011 2012 2013 2014 2015 2016 2017 2018 2019 2020 2011 2012 2013 2014 2015 2016 2017 2018 2019 2020 R1 (kWh) Seasonal (kWh) R2 (kW) Street Lights
(kWh) Total
Consumer Program kWh kWh kw kWh 0 0 0 0 0 0 0 0 0 01 Appliance Retirement Verified 41,532 41,532 41,532 41,330 31,011 0 0 0 0 0 6 6 6 6 4 0 0 0 0 0 93.00% 7.00% 100%
Adjustment to 2011 savings True-up 93.00% 7.00% 0.00% 0.00% 0.00% 0.00% 0.00% 0.00% 0.00% 0.00% 0.00% 0.00% 0.00% 0.00%
2 Appliance Exchange Verified 790 790 790 391 0 0 0 0 0 0 1 1 1 0 0 0 0 0 0 0 93.00% 7.00% 100%Adjustment to 2011 savings True-up 93.00% 7.00% 0.00% 0.00% 0.00% 0.00% 0.00% 0.00% 0.00% 0.00% 0.00% 0.00% 0.00% 0.00%
3 HVAC Incentives Verified 19,936 19,936 19,936 19,936 19,936 19,936 19,936 19,936 19,936 19,936 10 10 10 10 10 10 10 10 10 10 100.00% 0.00% 100%Adjustment to 2011 savings True-up -3,422 -3,422 -3,422 -3,422 -3,422 -3,422 -3,422 -3,422 -3,422 -3,422 -2 -2 -2 -2 -2 -2 -2 -2 -2 -2 100.00% 0.00% 0.00% 0.00% 0.00% 0.00% 0.00% 0.00% 0.00% 0.00% 0.00% 0.00% 0.00% 0.00%
4 Conservation Instant Coupon Booklet Verified 41,414 41,414 41,414 41,414 38,098 34,476 26,973 26,799 33,737 12,915 3 3 3 3 2 2 2 2 2 1 93.00% 7.00% 100%Adjustment to 2011 savings True-up 608 608 608 608 608 556 341 341 341 121 0 0 0 0 0 0 0 0 0 0 93.00% 7.00% 0.00% 0.00% 0.00% 0.00% 0.00% 0.00% 0.00% 0.00% 0.00% 0.00% 0.00% 0.00%
5 Bi-Annual Retailer Event Verified 64,865 64,865 64,865 64,865 59,282 53,183 40,096 39,950 51,633 16,568 4 4 4 4 3 3 3 3 3 1 93.00% 7.00% 100%Adjustment to 2011 savings True-up 4,819 4,819 4,819 4,819 4,819 4,379 2,364 2,364 2,364 521 0 0 0 0 0 0 0 0 0 0 93.00% 7.00% 0.00% 0.00% 0.00% 0.00% 0.00% 0.00% 0.00% 0.00% 0.00% 0.00% 0.00% 0.00%
6 Retailer Co-op Verified 0%Adjustment to 2011 savings True-up 0.00% 0.00% 0.00% 0.00% 0.00% 0.00% 0.00% 0.00% 0.00% 0.00% 0.00% 0.00% 0.00% 0.00%
7 Residential Demand Response Verified 0%Adjustment to 2011 savings True-up 0.00% 0.00% 0.00% 0.00% 0.00% 0.00% 0.00% 0.00% 0.00% 0.00% 0.00% 0.00% 0.00% 0.00%
8 Residential Demand Response (IHD) Verified 0%Adjustment to 2011 savings True-up 0.00% 0.00% 0.00% 0.00% 0.00% 0.00% 0.00% 0.00% 0.00% 0.00% 0.00% 0.00% 0.00% 0.00%
9 Residential New Construction Verified 0%Adjustment to 2011 savings True-up 0.00% 0.00% 0.00% 0.00% 0.00% 0.00% 0.00% 0.00% 0.00% 0.00% 0.00% 0.00% 0.00% 0.00%
Business Program10 Retrofit Verified 12 0%
Adjustment to 2011 savings True-up 12 0.00% 0.00% 0.00% 0.00% 0.00% 0.00% 0.00% 0.00% 0.00% 0.00% 0.00% 0.00% 0.00% 0.00%
11 Direct Install Lighting Verified 12 0%Adjustment to 2011 savings True-up 12 0.00% 0.00% 0.00% 0.00% 0.00% 0.00% 0.00% 0.00% 0.00% 0.00% 0.00% 0.00% 0.00% 0.00%
12 Building Commissioning Verified 3 0%Adjustment to 2011 savings True-up 3 0.00% 0.00% 0.00% 0.00% 0.00% 0.00% 0.00% 0.00% 0.00% 0.00% 0.00% 0.00% 0.00% 0.00%
13 New Construction Verified 12 0%Adjustment to 2011 savings True-up 12 0.00% 0.00% 0.00% 0.00% 0.00% 0.00% 0.00% 0.00% 0.00% 0.00% 0.00% 0.00% 0.00% 0.00%
14 Energy Audit Verified 12 0%Adjustment to 2011 savings True-up 12 0.00% 0.00% 0.00% 0.00% 0.00% 0.00% 0.00% 0.00% 0.00% 0.00% 0.00% 0.00% 0.00% 0.00%
15 Small Commercial Demand Response Verified 0%Adjustment to 2011 savings True-up 0.00% 0.00% 0.00% 0.00% 0.00% 0.00% 0.00% 0.00% 0.00% 0.00% 0.00% 0.00% 0.00% 0.00%
16Small Commercial Demand Response (IHD) Verified 0%
Adjustment to 2011 savings True-up 0.00% 0.00% 0.00% 0.00% 0.00% 0.00% 0.00% 0.00% 0.00% 0.00% 0.00% 0.00% 0.00% 0.00%
17 Demand Response 3 Verified 0%Adjustment to 2011 savings True-up 0.00% 0.00% 0.00% 0.00% 0.00% 0.00% 0.00% 0.00% 0.00% 0.00% 0.00% 0.00% 0.00% 0.00%
Industrial Program18 Process & System Upgrades Verified 12 0%
Adjustment to 2011 savings True-up 12 0.00% 0.00% 0.00% 0.00% 0.00% 0.00% 0.00% 0.00% 0.00% 0.00% 0.00% 0.00% 0.00% 0.00%
19 Monitoring & Targeting Verified 12 0%Adjustment to 2011 savings True-up 12 0.00% 0.00% 0.00% 0.00% 0.00% 0.00% 0.00% 0.00% 0.00% 0.00% 0.00% 0.00% 0.00% 0.00%
20 Energy Manager Verified 12 0%Adjustment to 2011 savings True-up 12 0.00% 0.00% 0.00% 0.00% 0.00% 0.00% 0.00% 0.00% 0.00% 0.00% 0.00% 0.00% 0.00% 0.00%
21 Retrofit Verified 12 0%Adjustment to 2011 savings True-up 12 0.00% 0.00% 0.00% 0.00% 0.00% 0.00% 0.00% 0.00% 0.00% 0.00% 0.00% 0.00% 0.00% 0.00%
22 Demand Response 3 Verified 0%Adjustment to 2011 savings True-up 0.00% 0.00% 0.00% 0.00% 0.00% 0.00% 0.00% 0.00% 0.00% 0.00% 0.00% 0.00% 0.00% 0.00%
Home Assistance Program
Instructions (Grey)
1. LDCs can apply for disposition of LRAMVA amounts at any time, but at a minimum, must do so as part of a cost of service (COS) application. The following LRAMVA work forms apply to LDCs that need to recover lost revenues from the 2011-2014 period. Please input or manually link the savings, adjustments and program savings persistence data in these tables from the LDC's Persistence Reports provided by the IESO (in Tab 7). As noted earlier, persistence data is available upon request from the IESO. Please also be advised that the same rate classes (of up to 14) are carried over from the Summary Tab 1.
Rate Allocations for LRAMVANet Peak Demand Savings Persistence (kW)Net Energy Savings Persistence (kWh)
Monthly MultiplierProgram Results
Status
Legend
Instructions
Tables
2. Please ensure that the IESO verified savings adjustments apply back to the program year it relates to. For example, savings adjustments related to 2012 programs that were reported by the IESO in 2013 should be included in the 2012 program savings table. In order for persisting savings to be claimed in future years, past year's initiative level savings results need to be filled out in the tables below. If the IESO adjustments were made available to the LDC after the LRAMVA was approved, the persistence of those savings adjustments in the future can be claimed as approved LRAMVA amounts are considered to be final.
3. The work forms below include the monthly multipliers for most programs in order to claim demand savings from energy efficiency programs, consistent with the monthly multipliers indicated in the OEB's updated LRAM policy related to peak demand savings in EB-2016-0182. Demand Response (DR3) savings should generally not be included with the LRAMVA calculation, unless suported by empirical evidence. LDCs are requested to confirm the monthly multipliers for all programs each year as placeholder values are provided. If a different monthly multiplier is used, please include rationale in Tab 1-a and highlight the new multiplier that has been used.
4. LDC are requested to input the applicable rate class allocation percentages to allocate actual savings to the rate classes. The generic template currently includes the same allocation percentage for program savings and its savings adjustments. If a different allocation is proposed for savings adjustments, LDCs must provide supporting rationale in Tab 1-a and highlight the change.
5. The persistence of future savings is expected to be included in the distributor's load forecast after re-basing. LDCs are requested to delete the applicable savings persistence rows (auto-calculated after the LRAMVA totals for the year) if future year's persistence of savings is already captured in the updated load forecast. Please also provide assumptions about the years in which persistence is captured in the load forecast calculation in the "Notes" section below each table.
Ontario Energy Board

11 of 25
23 Home Assistance Program Verified 0%Adjustment to 2011 savings True-up 0.00% 0.00% 0.00% 0.00% 0.00% 0.00% 0.00% 0.00% 0.00% 0.00% 0.00% 0.00% 0.00% 0.00%
Aboriginal Program24 Home Assistance Program Verified 0%
Adjustment to 2011 savings True-up 0.00% 0.00% 0.00% 0.00% 0.00% 0.00% 0.00% 0.00% 0.00% 0.00% 0.00% 0.00% 0.00% 0.00%
25 Direct Install Lighting Verified 0 0%Adjustment to 2011 savings True-up 0 0.00% 0.00% 0.00% 0.00% 0.00% 0.00% 0.00% 0.00% 0.00% 0.00% 0.00% 0.00% 0.00% 0.00%
Pre-2011 Programs completed in 201126 Electricity Retrofit Incentive Program Verified 12 0%
Adjustment to 2011 savings True-up 12 0.00% 0.00% 0.00% 0.00% 0.00% 0.00% 0.00% 0.00% 0.00% 0.00% 0.00% 0.00% 0.00% 0.00%
27 High Performance New Construction Verified 12 0%Adjustment to 2011 savings True-up 12 0.00% 0.00% 0.00% 0.00% 0.00% 0.00% 0.00% 0.00% 0.00% 0.00% 0.00% 0.00% 0.00% 0.00%
28 Toronto Comprehensive Verified 0 0%Adjustment to 2011 savings True-up 0 0.00% 0.00% 0.00% 0.00% 0.00% 0.00% 0.00% 0.00% 0.00% 0.00% 0.00% 0.00% 0.00% 0.00%
29 Multifamily Energy Efficiency Rebates Verified 0 0%Adjustment to 2011 savings True-up 0 0.00% 0.00% 0.00% 0.00% 0.00% 0.00% 0.00% 0.00% 0.00% 0.00% 0.00% 0.00% 0.00% 0.00%
30 LDC Custom Programs Verified 0 0%Adjustment to 2011 savings True-up 0 0.00% 0.00% 0.00% 0.00% 0.00% 0.00% 0.00% 0.00% 0.00% 0.00% 0.00% 0.00% 0.00% 0.00%
Other31 Program Enabled Savings Verified 0 0%
Adjustment to 2011 savings True-up 0 0.00% 0.00% 0.00% 0.00% 0.00% 0.00% 0.00% 0.00% 0.00% 0.00% 0.00% 0.00% 0.00% 0.00%
32 Time of Use Savings Verified 0 0%Adjustment to 2011 savings True-up 0 0.00% 0.00% 0.00% 0.00% 0.00% 0.00% 0.00% 0.00% 0.00% 0.00% 0.00% 0.00% 0.00% 0.00%
33 LDC Pilots Verified 12 0%Adjustment to 2011 savings True-up 12 0.00% 0.00% 0.00% 0.00% 0.00% 0.00% 0.00% 0.00% 0.00% 0.00% 0.00% 0.00% 0.00% 0.00%
Actual CDM Savings in 2011 170,543 170,543 170,543 169,941 150,333 109,108 86,288 85,968 104,588 46,639 21 21 21 21 18 14 13 13 14 11 159,761 10,782 0 0 0 0 0 0 0 0 0 0 0 0Forecast CDM Savings in 2011 0 0 0 0 0 0 0 0 0 0 0 0 0 0
Distribution Rate in 2011 $0.00000 $0.00000 $0.00000 $0.00000 $0.00000 $0.00000 $0.00000 $0.00000 $0.00000 $0.00000 $0.00000 $0.00000 $0.00000 $0.00000Lost Revenue in 2011 from 2011 programs $0.00 $0.00 $0.00 $0.00 $0.00 $0.00 $0.00 $0.00 $0.00 $0.00 $0.00 $0.00 $0.00 $0.00 $0.00Forecast Lost Revenues in 2011 $0.00 $0.00 $0.00 $0.00 $0.00 $0.00 $0.00 $0.00 $0.00 $0.00 $0.00 $0.00 $0.00 $0.00 $0.00LRAMVA in 2011 $0.00
2011 Savings Persisting in 2012 159,761 10,782 0 0 0 0 0 0 0 0 0 0 0 02011 Savings Persisting in 2013 159,761 10,782 0 0 0 0 0 0 0 0 0 0 0 02011 Savings Persisting in 2014 159,202 10,740 0 0 0 0 0 0 0 0 0 0 0 02011 Savings Persisting in 2015 140,966 9,367 0 0 0 0 0 0 0 0 0 0 0 02011 Savings Persisting in 2016 102,627 6,482 0 0 0 0 0 0 0 0 0 0 0 02011 Savings Persisting in 2017 81,404 4,884 0 0 0 0 0 0 0 0 0 0 0 02011 Savings Persisting in 2018 81,106 4,862 0 0 0 0 0 0 0 0 0 0 0 02011 Savings Persisting in 2019 98,423 6,165 0 0 0 0 0 0 0 0 0 0 0 02011 Savings Persisting in 2020 44,531 2,109 0 0 0 0 0 0 0 0 0 0 0 0
Note: LDC to make note of key assumptions included above
Table 4-b. 2012 Lost Revenues Work Form Return to top
Net Energy Savings (kWh)
Net Demand Savings (kW)
2012 2013 2014 2015 2016 2017 2018 2019 2020 2021 2012 2013 2014 2015 2016 2017 2018 2019 2020 2021 R1 (kWh) Seasonal (kWh) R2 (kW) Street Lights
(kWh) Total
Consumer Program kWh kWh kw kWh 0 0 0 0 0 0 0 0 0 01 Appliance Retirement Verified 25,447 25,447 25,447 25,345 16,788 0 0 0 0 0 0 3 3 3 3 2 0 0 0 0 0 93.00% 7.00% 100%
Adjustment to 2012 savings True-up 93.00% 7.00% 0.00% 0.00% 0.00% 0.00% 0.00% 0.00% 0.00% 0.00% 0.00% 0.00% 0.00% 0.00%
2 Appliance Exchange Verified 1,009 1,009 1,009 1,004 0 0 0 0 0 0 0 1 1 1 1 0 0 0 0 0 0 93.00% 7.00% 100%Adjustment to 2012 savings True-up 93.00% 7.00% 0.00% 0.00% 0.00% 0.00% 0.00% 0.00% 0.00% 0.00% 0.00% 0.00% 0.00% 0.00%
3 HVAC Incentives Verified 11,371 11,371 11,371 11,371 11,371 11,371 11,371 11,371 11,371 11,371 6 6 6 6 6 6 6 6 6 6 100.00% 0.00% 100%Adjustment to 2012 savings True-up 552 552 552 552 552 552 552 552 552 552 0 0 0 0 0 0 0 0 0 0 100.00% 0.00% 0.00% 0.00% 0.00% 0.00% 0.00% 0.00% 0.00% 0.00% 0.00% 0.00% 0.00% 0.00%
4 Conservation Instant Coupon Booklet Verified 3,086 3,086 3,086 3,086 3,040 3,040 1,431 1,424 1,424 1,424 1 1 1 1 1 1 0 0 0 0 93.00% 7.00% 100%Adjustment to 2012 savings True-up 93.00% 7.00% 0.00% 0.00% 0.00% 0.00% 0.00% 0.00% 0.00% 0.00% 0.00% 0.00% 0.00% 0.00%
5 Bi-Annual Retailer Event Verified 59,114 59,114 59,114 59,114 53,139 43,210 29,474 29,412 29,412 14,939 3 3 3 3 3 3 2 2 2 1 93.00% 7.00% 100%Adjustment to 2012 savings True-up 93.00% 7.00% 0.00% 0.00% 0.00% 0.00% 0.00% 0.00% 0.00% 0.00% 0.00% 0.00% 0.00% 0.00%
6 Retailer Co-op Verified 0%Adjustment to 2012 savings True-up 0.00% 0.00% 0.00% 0.00% 0.00% 0.00% 0.00% 0.00% 0.00% 0.00% 0.00% 0.00% 0.00% 0.00%
7 Residential Demand Response Verified 0%Adjustment to 2012 savings True-up 0.00% 0.00% 0.00% 0.00% 0.00% 0.00% 0.00% 0.00% 0.00% 0.00% 0.00% 0.00% 0.00% 0.00%
8 Residential Demand Response (IHD) Verified 0%Adjustment to 2012 savings True-up 0.00% 0.00% 0.00% 0.00% 0.00% 0.00% 0.00% 0.00% 0.00% 0.00% 0.00% 0.00% 0.00% 0.00%
9 Residential New Construction Verified 0%Adjustment to 2012 savings True-up 0.00% 0.00% 0.00% 0.00% 0.00% 0.00% 0.00% 0.00% 0.00% 0.00% 0.00% 0.00% 0.00% 0.00%
Business Program10 Retrofit Verified 141,850 141,850 141,850 141,850 141,850 141,850 141,850 141,850 141,850 141,850 12 18 18 18 18 18 18 18 18 18 18 100% 100%
Adjustment to 2012 savings True-up 74,689 74,689 74,689 74,689 74,689 74,689 74,689 74,689 74,689 74,689 12 10 10 10 10 10 10 10 10 10 10 0.00% 0.00% 100.00% 0.00% 0.00% 0.00% 0.00% 0.00% 0.00% 0.00% 0.00% 0.00% 0.00% 0.00%
11 Direct Install Lighting Verified 170,666 170,520 169,475 101,342 101,342 17,186 17,186 17,186 17,186 17,186 12 42 42 42 26 26 4 4 4 4 4 100.00% 100%Adjustment to 2012 savings True-up 12 100.00% 0.00% 0.00% 0.00% 0.00% 0.00% 0.00% 0.00% 0.00% 0.00% 0.00% 0.00% 0.00% 0.00%
12 Building Commissioning Verified 3 0%Adjustment to 2012 savings True-up 3 0.00% 0.00% 0.00% 0.00% 0.00% 0.00% 0.00% 0.00% 0.00% 0.00% 0.00% 0.00% 0.00% 0.00%
13 New Construction Verified 12 0%Adjustment to 2012 savings True-up 12 0.00% 0.00% 0.00% 0.00% 0.00% 0.00% 0.00% 0.00% 0.00% 0.00% 0.00% 0.00% 0.00% 0.00%
14 Energy Audit Verified 12 0%Adjustment to 2012 savings True-up 12 0.00% 0.00% 0.00% 0.00% 0.00% 0.00% 0.00% 0.00% 0.00% 0.00% 0.00% 0.00% 0.00% 0.00%
15 Small Commercial Demand Response Verified 0%Adjustment to 2012 savings True-up 0.00% 0.00% 0.00% 0.00% 0.00% 0.00% 0.00% 0.00% 0.00% 0.00% 0.00% 0.00% 0.00% 0.00%
16Small Commercial Demand Response (IHD) Verified 0%
Adjustment to 2012 savings True-up 0.00% 0.00% 0.00% 0.00% 0.00% 0.00% 0.00% 0.00% 0.00% 0.00% 0.00% 0.00% 0.00% 0.00%
17 Demand Response 3 Verified 0%Adjustment to 2012 savings True-up 0.00% 0.00% 0.00% 0.00% 0.00% 0.00% 0.00% 0.00% 0.00% 0.00% 0.00% 0.00% 0.00% 0.00%
Industrial Program18 Process & System Upgrades Verified 12 0%
Adjustment to 2012 savings True-up 12 0.00% 0.00% 0.00% 0.00% 0.00% 0.00% 0.00% 0.00% 0.00% 0.00% 0.00% 0.00% 0.00% 0.00%
19 Monitoring & Targeting Verified 12 0%Adjustment to 2012 savings True-up 12 0.00% 0.00% 0.00% 0.00% 0.00% 0.00% 0.00% 0.00% 0.00% 0.00% 0.00% 0.00% 0.00% 0.00%
Net Peak Demand Savings Persistence (kW) Rate Allocations for LRAMVA
Monthly MultiplierProgram Results
Status
Net Energy Savings Persistence (kWh)

12 of 25
20 Energy Manager Verified 12 0%Adjustment to 2012 savings True-up 12 0.00% 0.00% 0.00% 0.00% 0.00% 0.00% 0.00% 0.00% 0.00% 0.00% 0.00% 0.00% 0.00% 0.00%
21 Retrofit Verified 12 0%Adjustment to 2012 savings True-up 12 0.00% 0.00% 0.00% 0.00% 0.00% 0.00% 0.00% 0.00% 0.00% 0.00% 0.00% 0.00% 0.00% 0.00%
22 Demand Response 3 Verified 0%Adjustment to 2012 savings True-up 0.00% 0.00% 0.00% 0.00% 0.00% 0.00% 0.00% 0.00% 0.00% 0.00% 0.00% 0.00% 0.00% 0.00%
Home Assistance Program23 Home Assistance Program Verified 0%
Adjustment to 2012 savings True-up 0.00% 0.00% 0.00% 0.00% 0.00% 0.00% 0.00% 0.00% 0.00% 0.00% 0.00% 0.00% 0.00% 0.00%
Aboriginal Program24 Home Assistance Program Verified 0%
Adjustment to 2012 savings True-up 0.00% 0.00% 0.00% 0.00% 0.00% 0.00% 0.00% 0.00% 0.00% 0.00% 0.00% 0.00% 0.00% 0.00%
25 Direct Install Lighting Verified 0 0%Adjustment to 2012 savings True-up 0 0.00% 0.00% 0.00% 0.00% 0.00% 0.00% 0.00% 0.00% 0.00% 0.00% 0.00% 0.00% 0.00% 0.00%
Pre-2011 Programs completed in 201126 Electricity Retrofit Incentive Program Verified 242 242 242 242 242 242 242 242 242 242 12 0 0 0 0 0 0 0 0 0 0 100.00% 100%
Adjustment to 2012 savings True-up 12 100.00% 0.00% 0.00% 0.00% 0.00% 0.00% 0.00% 0.00% 0.00% 0.00% 0.00% 0.00% 0.00% 0.00%
27 High Performance New Construction Verified 12 0%Adjustment to 2012 savings True-up 12 0.00% 0.00% 0.00% 0.00% 0.00% 0.00% 0.00% 0.00% 0.00% 0.00% 0.00% 0.00% 0.00% 0.00%
28 Toronto Comprehensive Verified 0 0%Adjustment to 2012 savings True-up 0 0.00% 0.00% 0.00% 0.00% 0.00% 0.00% 0.00% 0.00% 0.00% 0.00% 0.00% 0.00% 0.00% 0.00%
29 Multifamily Energy Efficiency Rebates Verified 0 0%Adjustment to 2012 savings True-up 0 0.00% 0.00% 0.00% 0.00% 0.00% 0.00% 0.00% 0.00% 0.00% 0.00% 0.00% 0.00% 0.00% 0.00%
30 LDC Custom Programs Verified 0 0%Adjustment to 2012 savings True-up 0 0.00% 0.00% 0.00% 0.00% 0.00% 0.00% 0.00% 0.00% 0.00% 0.00% 0.00% 0.00% 0.00% 0.00%
Other31 Program Enabled Savings Verified 0 0%
Adjustment to 2012 savings True-up 0 0.00% 0.00% 0.00% 0.00% 0.00% 0.00% 0.00% 0.00% 0.00% 0.00% 0.00% 0.00% 0.00% 0.00%
32 Time of Use Savings Verified 0 0%Adjustment to 2012 savings True-up 0 0.00% 0.00% 0.00% 0.00% 0.00% 0.00% 0.00% 0.00% 0.00% 0.00% 0.00% 0.00% 0.00% 0.00%
33 LDC Pilots Verified 12 0%Adjustment to 2012 savings True-up 12 0.00% 0.00% 0.00% 0.00% 0.00% 0.00% 0.00% 0.00% 0.00% 0.00% 0.00% 0.00% 0.00% 0.00%
Actual CDM Savings in 2012 488,024 487,878 486,833 418,593 403,012 292,138 276,794 276,725 276,725 262,251 85 85 85 69 67 42 41 41 41 40 265,280 6,206 340 0 0 0 0 0 0 0 0 0 0 0Forecast CDM Savings in 2012 0 0 0 0 0 0 0 0 0 0 0 0 0 0
Distribution Rate in 2012 $0.00000 $0.00000 $0.00000 $0.00000 $0.00000 $0.00000 $0.00000 $0.00000 $0.00000 $0.00000 $0.00000 $0.00000 $0.00000 $0.00000Lost Revenue in 2012 from 2011 programs $0.00 $0.00 $0.00 $0.00 $0.00 $0.00 $0.00 $0.00 $0.00 $0.00 $0.00 $0.00 $0.00 $0.00 $0.00Lost Revenue in 2012 from 2012 programs $0.00 $0.00 $0.00 $0.00 $0.00 $0.00 $0.00 $0.00 $0.00 $0.00 $0.00 $0.00 $0.00 $0.00 $0.00Total Lost Revenues in 2012 $0.00 $0.00 $0.00 $0.00 $0.00 $0.00 $0.00 $0.00 $0.00 $0.00 $0.00 $0.00 $0.00 $0.00 $0.00Forecast Lost Revenues in 2012 $0.00 $0.00 $0.00 $0.00 $0.00 $0.00 $0.00 $0.00 $0.00 $0.00 $0.00 $0.00 $0.00 $0.00 $0.00LRAMVA in 2012 $0.00
2012 Savings Persisting in 2013 265,134 6,206 340 0 0 0 0 0 0 0 0 0 0 02012 Savings Persisting in 2014 264,089 6,206 340 0 0 0 0 0 0 0 0 0 0 02012 Savings Persisting in 2015 195,857 6,198 340 0 0 0 0 0 0 0 0 0 0 02012 Savings Persisting in 2016 181,366 5,108 340 0 0 0 0 0 0 0 0 0 0 02012 Savings Persisting in 2017 72,363 3,237 340 0 0 0 0 0 0 0 0 0 0 02012 Savings Persisting in 2018 58,092 2,163 340 0 0 0 0 0 0 0 0 0 0 02012 Savings Persisting in 2019 58,028 2,159 340 0 0 0 0 0 0 0 0 0 0 02012 Savings Persisting in 2020 58,028 2,159 340 0 0 0 0 0 0 0 0 0 0 0
Note: LDC to make note of key assumptions included above
Table 4-c. 2013 Lost Revenues Work Form Return to topNet Energy
Savings (kWh)Net Demand Savings (kW)
2013 2014 2015 2016 2017 2018 2019 2020 2021 2022 2013 2014 2015 2016 2017 2018 2019 2020 2021 2022 R1 (kWh) Seasonal (kWh) R2 (kW) Street Lights
(kWh) Total
Consumer Program kWh kWh kw kWh 0 0 0 0 0 0 0 0 0 01 Appliance Retirement Verified 18,290 18,290 18,290 18,188 12,395 0 0 0 0 0 3 3 3 3 2 0 0 0 0 0 93.00% 7.00% 100%
Adjustment to 2013 savings True-up 93.00% 7.00% 0.00% 0.00% 0.00% 0.00% 0.00% 0.00% 0.00% 0.00% 0.00% 0.00% 0.00% 0.00%
2 Appliance Exchange Verified 3,694 3,694 3,694 3,694 0 0 0 0 0 0 2 2 2 2 0 0 0 0 0 0 93.00% 7.00% 100%Adjustment to 2013 savings True-up 93.00% 7.00% 0.00% 0.00% 0.00% 0.00% 0.00% 0.00% 0.00% 0.00% 0.00% 0.00% 0.00% 0.00%
3 HVAC Incentives Verified 41,430 41,430 41,430 41,430 41,430 41,430 41,430 41,430 41,430 41,430 21 21 21 21 21 21 21 21 21 21 100.00% 0.00% 100%Adjustment to 2013 savings True-up 1,021 1,021 1,021 1,021 1,021 1,021 1,021 1,021 1,021 1,021 1 1 1 1 1 1 1 1 1 1 100.00% 0.00% 0.00% 0.00% 0.00% 0.00% 0.00% 0.00% 0.00% 0.00% 0.00% 0.00% 0.00% 0.00%
4 Conservation Instant Coupon Booklet Verified 17,012 17,012 16,357 13,858 13,858 13,858 13,858 13,846 10,068 10,068 1 1 1 1 1 1 1 1 1 1 93.00% 7.00% 100%Adjustment to 2013 savings True-up 52 52 49 43 43 43 43 43 36 36 0 0 0 0 0 0 0 0 0 0 93.00% 7.00% 0.00% 0.00% 0.00% 0.00% 0.00% 0.00% 0.00% 0.00% 0.00% 0.00% 0.00% 0.00%
5 Bi-Annual Retailer Event Verified 37,920 37,920 35,635 27,838 27,838 27,838 27,838 27,805 23,382 23,382 3 3 2 2 2 2 2 2 2 2 93.00% 7.00% 100%Adjustment to 2013 savings True-up 93.00% 7.00% 0.00% 0.00% 0.00% 0.00% 0.00% 0.00% 0.00% 0.00% 0.00% 0.00% 0.00% 0.00%
6 Retailer Co-op Verified 0%Adjustment to 2013 savings True-up 0.00% 0.00% 0.00% 0.00% 0.00% 0.00% 0.00% 0.00% 0.00% 0.00% 0.00% 0.00% 0.00% 0.00%
7 Residential Demand Response Verified 0%Adjustment to 2013 savings True-up 0.00% 0.00% 0.00% 0.00% 0.00% 0.00% 0.00% 0.00% 0.00% 0.00% 0.00% 0.00% 0.00% 0.00%
8 Residential Demand Response (IHD) Verified 0%Adjustment to 2013 savings True-up 0.00% 0.00% 0.00% 0.00% 0.00% 0.00% 0.00% 0.00% 0.00% 0.00% 0.00% 0.00% 0.00% 0.00%
9 Residential New Construction Verified 0%Adjustment to 2013 savings True-up 0.00% 0.00% 0.00% 0.00% 0.00% 0.00% 0.00% 0.00% 0.00% 0.00% 0.00% 0.00% 0.00% 0.00%
Business Program10 Retrofit Verified 76,699 76,699 76,699 76,699 76,699 76,699 76,699 76,699 76,699 76,699 12 20 20 20 20 20 20 20 20 20 20 5.60% 94% 100%
Adjustment to 2013 savings True-up 35,608 35,608 35,608 35,608 35,608 34,881 34,881 33,662 32,988 27,693 12 1 1 1 1 1 1 1 1 1 1 5.60% 0.00% 94.30% 0.00% 0.00% 0.00% 0.00% 0.00% 0.00% 0.00% 0.00% 0.00% 0.00% 0.00%
11 Direct Install Lighting Verified 265,180 265,180 258,051 218,328 58,491 58,491 58,491 58,064 58,064 58,064 12 82 82 80 69 19 19 19 19 19 19 100.00% 100%Adjustment to 2013 savings True-up 12 100.00% 0.00% 0.00% 0.00% 0.00% 0.00% 0.00% 0.00% 0.00% 0.00% 0.00% 0.00% 0.00% 0.00%
12 Building Commissioning Verified 3 0%Adjustment to 2013 savings True-up 3 0.00% 0.00% 0.00% 0.00% 0.00% 0.00% 0.00% 0.00% 0.00% 0.00% 0.00% 0.00% 0.00% 0.00%
13 New Construction Verified 12 0%Adjustment to 2013 savings True-up 12 0.00% 0.00% 0.00% 0.00% 0.00% 0.00% 0.00% 0.00% 0.00% 0.00% 0.00% 0.00% 0.00% 0.00%
14 Energy Audit Verified 12 0%Adjustment to 2013 savings True-up 12 0.00% 0.00% 0.00% 0.00% 0.00% 0.00% 0.00% 0.00% 0.00% 0.00% 0.00% 0.00% 0.00% 0.00%
15 Small Commercial Demand Response Verified 0%Adjustment to 2013 savings True-up 0.00% 0.00% 0.00% 0.00% 0.00% 0.00% 0.00% 0.00% 0.00% 0.00% 0.00% 0.00% 0.00% 0.00%
16Small Commercial Demand Response (IHD) Verified 0%
Adjustment to 2013 savings True-up 0.00% 0.00% 0.00% 0.00% 0.00% 0.00% 0.00% 0.00% 0.00% 0.00% 0.00% 0.00% 0.00% 0.00%
Rate Allocations for LRAMVA
Program Results Status
Net Energy Savings Persistence (kWh)
Monthly Multiplier
Net Peak Demand Savings Persistence (kW)

13 of 25
17 Demand Response 3 Verified 0%Adjustment to 2013 savings True-up 0.00% 0.00% 0.00% 0.00% 0.00% 0.00% 0.00% 0.00% 0.00% 0.00% 0.00% 0.00% 0.00% 0.00%
Industrial Program18 Process & System Upgrades Verified 12 0%
Adjustment to 2013 savings True-up 12 0.00% 0.00% 0.00% 0.00% 0.00% 0.00% 0.00% 0.00% 0.00% 0.00% 0.00% 0.00% 0.00% 0.00%
19 Monitoring & Targeting Verified 12 0%Adjustment to 2013 savings True-up 12 0.00% 0.00% 0.00% 0.00% 0.00% 0.00% 0.00% 0.00% 0.00% 0.00% 0.00% 0.00% 0.00% 0.00%
20 Energy Manager Verified 12 0%Adjustment to 2013 savings True-up 12 0.00% 0.00% 0.00% 0.00% 0.00% 0.00% 0.00% 0.00% 0.00% 0.00% 0.00% 0.00% 0.00% 0.00%
21 Retrofit Verified 12 0%Adjustment to 2013 savings True-up 12 0.00% 0.00% 0.00% 0.00% 0.00% 0.00% 0.00% 0.00% 0.00% 0.00% 0.00% 0.00% 0.00% 0.00%
22 Demand Response 3 Verified 0%Adjustment to 2013 savings True-up 0.00% 0.00% 0.00% 0.00% 0.00% 0.00% 0.00% 0.00% 0.00% 0.00% 0.00% 0.00% 0.00% 0.00%
Home Assistance Program23 Home Assistance Program Verified 73,624 71,924 71,637 64,520 61,541 58,617 57,173 57,173 30,565 30,565 6 6 6 6 5 5 5 5 4 4 100.00% 0.00% 100%
Adjustment to 2013 savings True-up 19,075 18,830 18,808 17,459 16,874 16,289 15,895 15,895 10,958 10,958 2 2 2 2 2 2 2 2 1 1 100.00% 0.00% 0.00% 0.00% 0.00% 0.00% 0.00% 0.00% 0.00% 0.00% 0.00% 0.00% 0.00% 0.00%
Aboriginal Program24 Home Assistance Program Verified 35,771 35,771 35,771 35,771 35,771 35,771 35,771 35,771 32,259 32,259 8 8 8 8 8 8 8 8 8 8 100.00% 100%
Adjustment to 2013 savings True-up 100.00% 0.00% 0.00% 0.00% 0.00% 0.00% 0.00% 0.00% 0.00% 0.00% 0.00% 0.00% 0.00% 0.00%
25 Direct Install Lighting Verified 0 0%Adjustment to 2013 savings True-up 0 0.00% 0.00% 0.00% 0.00% 0.00% 0.00% 0.00% 0.00% 0.00% 0.00% 0.00% 0.00% 0.00% 0.00%
Pre-2011 Programs completed in 201126 Electricity Retrofit Incentive Program Verified 12 0%
Adjustment to 2013 savings True-up 12 0.00% 0.00% 0.00% 0.00% 0.00% 0.00% 0.00% 0.00% 0.00% 0.00% 0.00% 0.00% 0.00% 0.00%
27 High Performance New Construction Verified 12 0%Adjustment to 2013 savings True-up 12 0.00% 0.00% 0.00% 0.00% 0.00% 0.00% 0.00% 0.00% 0.00% 0.00% 0.00% 0.00% 0.00% 0.00%
28 Toronto Comprehensive Verified 0 0%Adjustment to 2013 savings True-up 0 0.00% 0.00% 0.00% 0.00% 0.00% 0.00% 0.00% 0.00% 0.00% 0.00% 0.00% 0.00% 0.00% 0.00%
29 Multifamily Energy Efficiency Rebates Verified 0 0%Adjustment to 2013 savings True-up 0 0.00% 0.00% 0.00% 0.00% 0.00% 0.00% 0.00% 0.00% 0.00% 0.00% 0.00% 0.00% 0.00% 0.00%
30 LDC Custom Programs Verified 0 0%Adjustment to 2013 savings True-up 0 0.00% 0.00% 0.00% 0.00% 0.00% 0.00% 0.00% 0.00% 0.00% 0.00% 0.00% 0.00% 0.00% 0.00%
Other31 Program Enabled Savings Verified 0 0%
Adjustment to 2013 savings True-up 0 0.00% 0.00% 0.00% 0.00% 0.00% 0.00% 0.00% 0.00% 0.00% 0.00% 0.00% 0.00% 0.00% 0.00%
32 Time of Use Savings Verified 0 0%Adjustment to 2013 savings True-up 0 0.00% 0.00% 0.00% 0.00% 0.00% 0.00% 0.00% 0.00% 0.00% 0.00% 0.00% 0.00% 0.00% 0.00%
33 LDC Pilots Verified 12 0%Adjustment to 2013 savings True-up 12 0.00% 0.00% 0.00% 0.00% 0.00% 0.00% 0.00% 0.00% 0.00% 0.00% 0.00% 0.00% 0.00% 0.00%
Actual CDM Savings in 2013 625,378 623,433 613,052 554,457 381,569 364,938 363,101 361,410 317,472 312,176 149 149 147 135 82 80 80 80 77 77 513,972 5,388 237 0 0 0 0 0 0 0 0 0 0 0Forecast CDM Savings in 2013 0 0 0 0 0 0 0 0 0 0 0 0 0 0
Distribution Rate in 2013 $0.00000 $0.00000 $0.00000 $0.00000 $0.00000 $0.00000 $0.00000 $0.00000 $0.00000 $0.00000 $0.00000 $0.00000 $0.00000 $0.00000Lost Revenue in 2013 from 2011 programs $0.00 $0.00 $0.00 $0.00 $0.00 $0.00 $0.00 $0.00 $0.00 $0.00 $0.00 $0.00 $0.00 $0.00 $0.00Lost Revenue in 2013 from 2012 programs $0.00 $0.00 $0.00 $0.00 $0.00 $0.00 $0.00 $0.00 $0.00 $0.00 $0.00 $0.00 $0.00 $0.00 $0.00Lost Revenue in 2013 from 2013 programs $0.00 $0.00 $0.00 $0.00 $0.00 $0.00 $0.00 $0.00 $0.00 $0.00 $0.00 $0.00 $0.00 $0.00 $0.00Total Lost Revenues in 2013 $0.00 $0.00 $0.00 $0.00 $0.00 $0.00 $0.00 $0.00 $0.00 $0.00 $0.00 $0.00 $0.00 $0.00 $0.00Forecast Lost Revenues in 2013 $0.00 $0.00 $0.00 $0.00 $0.00 $0.00 $0.00 $0.00 $0.00 $0.00 $0.00 $0.00 $0.00 $0.00 $0.00LRAMVA in 2013 $0.00
2013 Savings Persisting in 2014 512,028 5,388 237 0 0 0 0 0 0 0 0 0 0 02013 Savings Persisting in 2015 501,853 5,182 237 0 0 0 0 0 0 0 0 0 0 02013 Savings Persisting in 2016 443,987 4,453 237 0 0 0 0 0 0 0 0 0 0 02013 Savings Persisting in 2017 271,762 3,789 237 0 0 0 0 0 0 0 0 0 0 02013 Savings Persisting in 2018 256,685 2,922 236 0 0 0 0 0 0 0 0 0 0 02013 Savings Persisting in 2019 254,848 2,922 236 0 0 0 0 0 0 0 0 0 0 02013 Savings Persisting in 2020 254,311 2,919 236 0 0 0 0 0 0 0 0 0 0 0
Note: LDC to make note of key assumptions included above
Table 4-d. 2014 Lost Revenues Work Form Return to Top
Net Energy Savings (kWh)
Net Demand Savings (kW)
2014 2015 2016 2017 2018 2019 2020 2021 2022 2023 2014 2015 2016 2017 2018 2019 2020 2021 2022 2023 R1 (kWh) Seasonal (kWh) R2 (kW) Street Lights
(kWh) Total
Consumer Program kWh kWh kw kWh 0 0 0 0 0 0 0 0 0 01 Appliance Retirement Verified 28,878 28,878 28,878 28,669 15,113 0 0 0 0 0 5 5 5 4 2 0 0 0 0 0 93.00% 7.00% 100%
Adjustment to 2014 savings True-up 93.00% 7.00% 0.00% 0.00% 0.00% 0.00% 0.00% 0.00% 0.00% 0.00% 0.00% 0.00% 0.00% 0.00%
2 Appliance Exchange Verified 5,911 5,911 5,911 5,911 0 0 0 0 0 0 3 3 3 3 0 0 0 0 0 0 93.00% 7.00% 100%Adjustment to 2014 savings True-up 93.00% 7.00% 0.00% 0.00% 0.00% 0.00% 0.00% 0.00% 0.00% 0.00% 0.00% 0.00% 0.00% 0.00%
3 HVAC Incentives Verified 49,165 49,165 49,165 49,165 49,165 49,165 49,165 49,165 49,165 49,165 25 25 25 25 25 25 25 25 25 25 100.00% 100%Adjustment to 2014 savings True-up 100.00% 0.00% 0.00% 0.00% 0.00% 0.00% 0.00% 0.00% 0.00% 0.00% 0.00% 0.00% 0.00% 0.00%
4 Conservation Instant Coupon Booklet Verified 65,790 61,438 59,307 59,307 59,307 59,307 59,307 59,078 59,078 50,377 5 5 5 5 5 5 5 5 5 4 93.00% 7.00% 100%Adjustment to 2014 savings True-up 93.00% 7.00% 0.00% 0.00% 0.00% 0.00% 0.00% 0.00% 0.00% 0.00% 0.00% 0.00% 0.00% 0.00%
5 Bi-Annual Retailer Event Verified 271,276 235,329 216,595 216,595 216,595 216,595 216,595 216,502 216,502 201,359 18 15 14 14 14 14 14 14 14 13 93.00% 7.00% 100%Adjustment to 2014 savings True-up 93.00% 7.00% 0.00% 0.00% 0.00% 0.00% 0.00% 0.00% 0.00% 0.00% 0.00% 0.00% 0.00% 0.00%
6 Retailer Co-op Verified 0%Adjustment to 2014 savings True-up 0.00% 0.00% 0.00% 0.00% 0.00% 0.00% 0.00% 0.00% 0.00% 0.00% 0.00% 0.00% 0.00% 0.00%
7 Residential Demand Response Verified 0%Adjustment to 2014 savings True-up 0.00% 0.00% 0.00% 0.00% 0.00% 0.00% 0.00% 0.00% 0.00% 0.00% 0.00% 0.00% 0.00% 0.00%
8 Residential Demand Response (IHD) Verified 0%Adjustment to 2014 savings True-up 0.00% 0.00% 0.00% 0.00% 0.00% 0.00% 0.00% 0.00% 0.00% 0.00% 0.00% 0.00% 0.00% 0.00%
9 Residential New Construction Verified 0%Adjustment to 2014 savings True-up 0.00% 0.00% 0.00% 0.00% 0.00% 0.00% 0.00% 0.00% 0.00% 0.00% 0.00% 0.00% 0.00% 0.00%
Business Program10 Retrofit Verified 236,863 236,863 236,863 236,863 236,863 236,863 236,656 236,656 211,679 210,802 12 38 38 38 38 38 38 38 38 30 30 24.30% 71% 4% 100%
Adjustment to 2014 savings True-up 12 24.30% 0.00% 71.30% 4.40% 0.00% 0.00% 0.00% 0.00% 0.00% 0.00% 0.00% 0.00% 0.00% 0.00%
11 Direct Install Lighting Verified 249,247 244,707 230,892 125,836 125,836 125,836 125,836 125,836 125,836 125,836 12 71 70 66 36 36 36 36 36 36 36 100.00% 100%Adjustment to 2014 savings True-up 12 100.00% 0.00% 0.00% 0.00% 0.00% 0.00% 0.00% 0.00% 0.00% 0.00% 0.00% 0.00% 0.00% 0.00%
12 Building Commissioning Verified 3 0%Adjustment to 2014 savings True-up 3 0.00% 0.00% 0.00% 0.00% 0.00% 0.00% 0.00% 0.00% 0.00% 0.00% 0.00% 0.00% 0.00% 0.00%
13 New Construction Verified 12 0%Adjustment to 2014 savings True-up 12 0.00% 0.00% 0.00% 0.00% 0.00% 0.00% 0.00% 0.00% 0.00% 0.00% 0.00% 0.00% 0.00% 0.00%
14 Energy Audit Verified 65,274 65,274 65,274 65,274 0 0 0 0 0 0 12 13 13 13 13 0 0 0 0 0 0 100.00% 100%
Rate Allocations for LRAMVA
Program Results Status
Net Energy Savings Persistence (kWh)Monthly
Multiplier
Net Peak Demand Savings Persistence (kW)
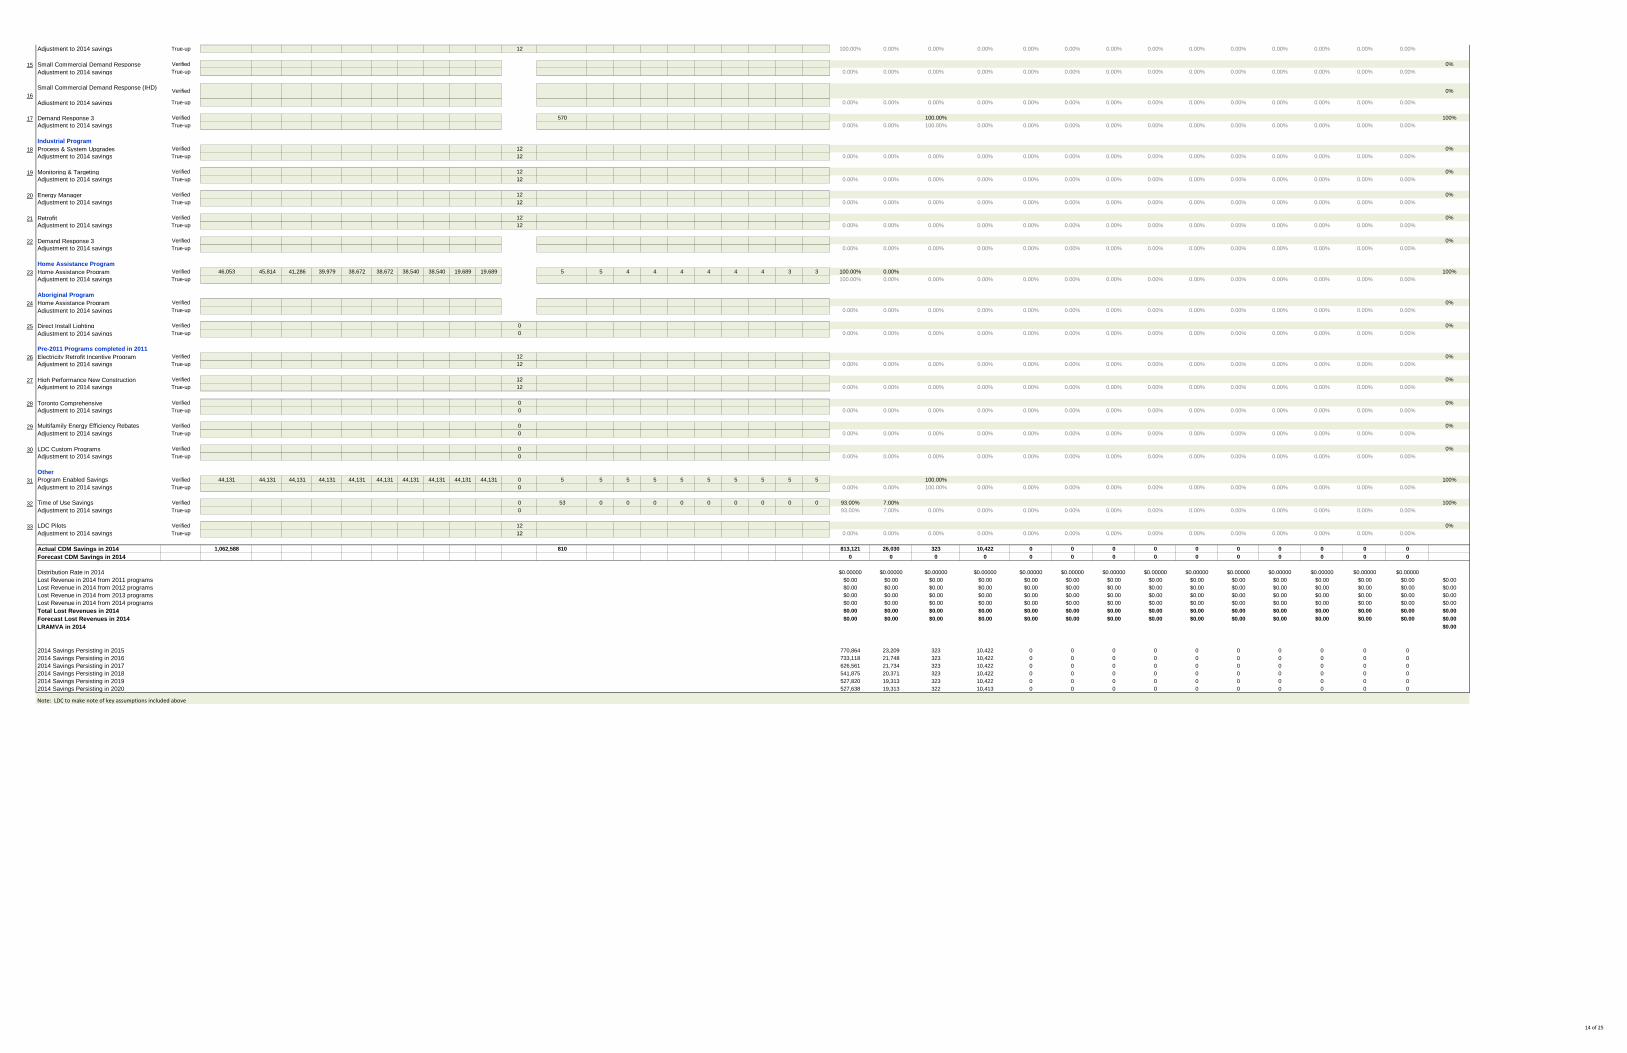
14 of 25
Adjustment to 2014 savings True-up 12 100.00% 0.00% 0.00% 0.00% 0.00% 0.00% 0.00% 0.00% 0.00% 0.00% 0.00% 0.00% 0.00% 0.00%
15 Small Commercial Demand Response Verified 0%Adjustment to 2014 savings True-up 0.00% 0.00% 0.00% 0.00% 0.00% 0.00% 0.00% 0.00% 0.00% 0.00% 0.00% 0.00% 0.00% 0.00%
16Small Commercial Demand Response (IHD) Verified 0%
Adjustment to 2014 savings True-up 0.00% 0.00% 0.00% 0.00% 0.00% 0.00% 0.00% 0.00% 0.00% 0.00% 0.00% 0.00% 0.00% 0.00%
17 Demand Response 3 Verified 570 100.00% 100%Adjustment to 2014 savings True-up 0.00% 0.00% 100.00% 0.00% 0.00% 0.00% 0.00% 0.00% 0.00% 0.00% 0.00% 0.00% 0.00% 0.00%
Industrial Program18 Process & System Upgrades Verified 12 0%
Adjustment to 2014 savings True-up 12 0.00% 0.00% 0.00% 0.00% 0.00% 0.00% 0.00% 0.00% 0.00% 0.00% 0.00% 0.00% 0.00% 0.00%
19 Monitoring & Targeting Verified 12 0%Adjustment to 2014 savings True-up 12 0.00% 0.00% 0.00% 0.00% 0.00% 0.00% 0.00% 0.00% 0.00% 0.00% 0.00% 0.00% 0.00% 0.00%
20 Energy Manager Verified 12 0%Adjustment to 2014 savings True-up 12 0.00% 0.00% 0.00% 0.00% 0.00% 0.00% 0.00% 0.00% 0.00% 0.00% 0.00% 0.00% 0.00% 0.00%
21 Retrofit Verified 12 0%Adjustment to 2014 savings True-up 12 0.00% 0.00% 0.00% 0.00% 0.00% 0.00% 0.00% 0.00% 0.00% 0.00% 0.00% 0.00% 0.00% 0.00%
22 Demand Response 3 Verified 0%Adjustment to 2014 savings True-up 0.00% 0.00% 0.00% 0.00% 0.00% 0.00% 0.00% 0.00% 0.00% 0.00% 0.00% 0.00% 0.00% 0.00%
Home Assistance Program23 Home Assistance Program Verified 46,053 45,814 41,286 39,979 38,672 38,672 38,540 38,540 19,689 19,689 5 5 4 4 4 4 4 4 3 3 100.00% 0.00% 100%
Adjustment to 2014 savings True-up 100.00% 0.00% 0.00% 0.00% 0.00% 0.00% 0.00% 0.00% 0.00% 0.00% 0.00% 0.00% 0.00% 0.00%
Aboriginal Program24 Home Assistance Program Verified 0%
Adjustment to 2014 savings True-up 0.00% 0.00% 0.00% 0.00% 0.00% 0.00% 0.00% 0.00% 0.00% 0.00% 0.00% 0.00% 0.00% 0.00%
25 Direct Install Lighting Verified 0 0%Adjustment to 2014 savings True-up 0 0.00% 0.00% 0.00% 0.00% 0.00% 0.00% 0.00% 0.00% 0.00% 0.00% 0.00% 0.00% 0.00% 0.00%
Pre-2011 Programs completed in 201126 Electricity Retrofit Incentive Program Verified 12 0%
Adjustment to 2014 savings True-up 12 0.00% 0.00% 0.00% 0.00% 0.00% 0.00% 0.00% 0.00% 0.00% 0.00% 0.00% 0.00% 0.00% 0.00%
27 High Performance New Construction Verified 12 0%Adjustment to 2014 savings True-up 12 0.00% 0.00% 0.00% 0.00% 0.00% 0.00% 0.00% 0.00% 0.00% 0.00% 0.00% 0.00% 0.00% 0.00%
28 Toronto Comprehensive Verified 0 0%Adjustment to 2014 savings True-up 0 0.00% 0.00% 0.00% 0.00% 0.00% 0.00% 0.00% 0.00% 0.00% 0.00% 0.00% 0.00% 0.00% 0.00%
29 Multifamily Energy Efficiency Rebates Verified 0 0%Adjustment to 2014 savings True-up 0 0.00% 0.00% 0.00% 0.00% 0.00% 0.00% 0.00% 0.00% 0.00% 0.00% 0.00% 0.00% 0.00% 0.00%
30 LDC Custom Programs Verified 0 0%Adjustment to 2014 savings True-up 0 0.00% 0.00% 0.00% 0.00% 0.00% 0.00% 0.00% 0.00% 0.00% 0.00% 0.00% 0.00% 0.00% 0.00%
Other31 Program Enabled Savings Verified 44,131 44,131 44,131 44,131 44,131 44,131 44,131 44,131 44,131 44,131 0 5 5 5 5 5 5 5 5 5 5 100.00% 100%
Adjustment to 2014 savings True-up 0 0.00% 0.00% 100.00% 0.00% 0.00% 0.00% 0.00% 0.00% 0.00% 0.00% 0.00% 0.00% 0.00% 0.00%
32 Time of Use Savings Verified 0 53 0 0 0 0 0 0 0 0 0 93.00% 7.00% 100%Adjustment to 2014 savings True-up 0 93.00% 7.00% 0.00% 0.00% 0.00% 0.00% 0.00% 0.00% 0.00% 0.00% 0.00% 0.00% 0.00% 0.00%
33 LDC Pilots Verified 12 0%Adjustment to 2014 savings True-up 12 0.00% 0.00% 0.00% 0.00% 0.00% 0.00% 0.00% 0.00% 0.00% 0.00% 0.00% 0.00% 0.00% 0.00%
Actual CDM Savings in 2014 1,062,588 810 813,121 26,030 323 10,422 0 0 0 0 0 0 0 0 0 0Forecast CDM Savings in 2014 0 0 0 0 0 0 0 0 0 0 0 0 0 0
Distribution Rate in 2014 $0.00000 $0.00000 $0.00000 $0.00000 $0.00000 $0.00000 $0.00000 $0.00000 $0.00000 $0.00000 $0.00000 $0.00000 $0.00000 $0.00000Lost Revenue in 2014 from 2011 programs $0.00 $0.00 $0.00 $0.00 $0.00 $0.00 $0.00 $0.00 $0.00 $0.00 $0.00 $0.00 $0.00 $0.00 $0.00Lost Revenue in 2014 from 2012 programs $0.00 $0.00 $0.00 $0.00 $0.00 $0.00 $0.00 $0.00 $0.00 $0.00 $0.00 $0.00 $0.00 $0.00 $0.00Lost Revenue in 2014 from 2013 programs $0.00 $0.00 $0.00 $0.00 $0.00 $0.00 $0.00 $0.00 $0.00 $0.00 $0.00 $0.00 $0.00 $0.00 $0.00Lost Revenue in 2014 from 2014 programs $0.00 $0.00 $0.00 $0.00 $0.00 $0.00 $0.00 $0.00 $0.00 $0.00 $0.00 $0.00 $0.00 $0.00 $0.00Total Lost Revenues in 2014 $0.00 $0.00 $0.00 $0.00 $0.00 $0.00 $0.00 $0.00 $0.00 $0.00 $0.00 $0.00 $0.00 $0.00 $0.00Forecast Lost Revenues in 2014 $0.00 $0.00 $0.00 $0.00 $0.00 $0.00 $0.00 $0.00 $0.00 $0.00 $0.00 $0.00 $0.00 $0.00 $0.00LRAMVA in 2014 $0.00
2014 Savings Persisting in 2015 770,864 23,209 323 10,422 0 0 0 0 0 0 0 0 0 02014 Savings Persisting in 2016 733,118 21,748 323 10,422 0 0 0 0 0 0 0 0 0 02014 Savings Persisting in 2017 626,561 21,734 323 10,422 0 0 0 0 0 0 0 0 0 02014 Savings Persisting in 2018 541,875 20,371 323 10,422 0 0 0 0 0 0 0 0 0 02014 Savings Persisting in 2019 527,820 19,313 323 10,422 0 0 0 0 0 0 0 0 0 02014 Savings Persisting in 2020 527,638 19,313 322 10,413 0 0 0 0 0 0 0 0 0 0
Note: LDC to make note of key assumptions included above

15 of 25
User Inputs (Green)
Auto Populated Cells (White)
Table 5-a. 2015 Lost RevenuesTable 5-b. 2016 Lost Revenues Table 5-c. 2017 Lost Revenues Table 5-d. 2018 Lost Revenues Table 5-e. 2019 Lost RevenuesTable 5-f. 2020 Lost Revenues
Table 5-a. 2015 Lost Revenues Work FormNet Energy
Savings (kWh)Net Demand
Savings (kW)
2015 2016 2017 2018 2019 2020 2021 2022 2023 2024 2015 2016 2017 2018 2019 2020 2021 2022 2023 2024 R1 (kWh) Seasonal (kWh) R2 (kW) Street Lights
(kWh) Total
Legacy Framework kWh kWh kw kWh 0 0 0 0 0 0 0 0 0 0Residential Program
1 Coupon Initiative Verified 56,071 55,570 55,570 55,570 55,570 55,570 55,570 55,558 55,558 55,558 11 11 11 11 11 11 11 11 11 11 93.00% 7.00% 100%Adjustment to 2015 savings True-up 497 464 464 464 464 464 464 442 442 442 0 0 0 0 0 0 0 0 0 0 93.00% 7.00% 0.00% 0.00% 0.00% 0.00% 0.00% 0.00% 0.00% 0.00% 0.00% 0.00% 0.00% 0.00%
2 Bi-Annual Retailer Event Initiative Verified 80,801 78,121 78,121 78,121 78,121 78,121 78,121 78,119 78,119 78,119 16 15 15 15 15 15 15 15 15 15 93.00% 7.00% 100%Adjustment to 2015 savings True-up 93.00% 7.00% 0.00% 0.00% 0.00% 0.00% 0.00% 0.00% 0.00% 0.00% 0.00% 0.00% 0.00% 0.00%
3 Appliance Retirement Initiative Verified 15,888 15,888 15,888 15,888 8,953 0 0 0 0 0 3 3 3 3 2 0 0 0 0 0 93.00% 7.00% 100%Adjustment to 2015 savings True-up 93.00% 7.00% 0.00% 0.00% 0.00% 0.00% 0.00% 0.00% 0.00% 0.00% 0.00% 0.00% 0.00% 0.00%
4 HVAC Incentives Initiative Verified 52,693 52,693 52,693 52,693 52,693 52,693 52,693 52,693 52,693 52,693 10 10 10 10 10 10 10 10 10 10 100.00% 100%Adjustment to 2015 savings True-up 2,058 2,058 2,058 2,058 2,058 2,058 2,058 2,058 2,058 2,058 0 0 0 0 0 0 0 0 0 0 100.00% 0.00% 0.00% 0.00% 0.00% 0.00% 0.00% 0.00% 0.00% 0.00% 0.00% 0.00% 0.00% 0.00%
5 Residential New Construction and Major
Verified 0%Adjustment to 2015 savings True-up 0.00% 0.00% 0.00% 0.00% 0.00% 0.00% 0.00% 0.00% 0.00% 0.00% 0.00% 0.00% 0.00% 0.00%
Commercial & Institutional Program6 Energy Audit Initiative Verified 12 0%
Adjustment to 2015 savings True-up 12 0.00% 0.00% 0.00% 0.00% 0.00% 0.00% 0.00% 0.00% 0.00% 0.00% 0.00% 0.00% 0.00% 0.00%
7 Efficiency: Equipment Replacement Incentive Initiative
Verified 407,941 407,941 406,839 406,839 406,839 406,839 405,263 405,263 405,263 400,127 12 80 80 80 80 80 80 79 79 79 78 2% 0% 1.01% 96.69% 100%
Adjustment to 2015 savings True-up 3,087 3,087 4,189 4,189 4,189 4,189 5,765 5,765 5,765 5,299 12 1 1 1 1 1 1 1 1 1 1 1.87% 0.00% 1.01% 96.69% 0.00% 0.00% 0.00% 0.00% 0.00% 0.00% 0.00% 0.00% 0.00% 0.00%
8 Direct Install Lighting and Water Heating Initiative
Verified 368,957 254,297 213,243 212,109 212,109 212,109 212,109 212,109 212,109 212,109 12 72 50 42 42 42 42 42 42 42 42 100.00% 0% 0.00% 100%
Adjustment to 2015 savings True-up -164,022 -49,362 -8,308 18,113 18,113 18,113 18,113 18,113 18,113 18,113 12 -32 -10 -2 4 4 4 4 4 4 4 100.00% 0.00% 0.00% 0.00% 0.00% 0.00% 0.00% 0.00% 0.00% 0.00% 0.00% 0.00% 0.00% 0.00%
9 New Construction and Major Renovation Initiative
Verified 12 0%
Adjustment to 2015 savings True-up 12 0.00% 0.00% 0.00% 0.00% 0.00% 0.00% 0.00% 0.00% 0.00% 0.00% 0.00% 0.00% 0.00% 0.00%
10 Existing Building Commissioning Incentive Initiative
Verified 3 0%
Adjustment to 2015 savings True-up 3 0.00% 0.00% 0.00% 0.00% 0.00% 0.00% 0.00% 0.00% 0.00% 0.00% 0.00% 0.00% 0.00% 0.00%
Industrial Program
11 Process and Systems Upgrades Initiatives - Project Incentive Initiative
Verified 12 0%
Adjustment to 2015 savings True-up 12 0.00% 0.00% 0.00% 0.00% 0.00% 0.00% 0.00% 0.00% 0.00% 0.00% 0.00% 0.00% 0.00% 0.00%
12 Process and Systems Upgrades Initiatives - Monitoring and Targeting Initiative
Verified 12 0%
Adjustment to 2015 savings True-up 12 0.00% 0.00% 0.00% 0.00% 0.00% 0.00% 0.00% 0.00% 0.00% 0.00% 0.00% 0.00% 0.00% 0.00%
13 Process and Systems Upgrades Initiatives - Energy Manager Initiative
Verified 12 0%
Adjustment to 2015 savings True-up 12 0.00% 0.00% 0.00% 0.00% 0.00% 0.00% 0.00% 0.00% 0.00% 0.00% 0.00% 0.00% 0.00% 0.00%
Low Income Program14 Low Income Initiative Verified 13,607 10,374 9,867 9,360 9,360 9,360 9,360 9,360 4,365 4,365 12 3 2 2 2 2 2 2 2 1 1 100.00% 0.00% 100%
Adjustment to 2015 savings True-up 12 100.00% 0.00% 0.00% 0.00% 0.00% 0.00% 0.00% 0.00% 0.00% 0.00% 0.00% 0.00% 0.00% 0.00%
Other15 Aboriginal Conservation Program Verified 0 0%
Adjustment to 2015 savings True-up 0 0.00% 0.00% 0.00% 0.00% 0.00% 0.00% 0.00% 0.00% 0.00% 0.00% 0.00% 0.00% 0.00% 0.00%
16 Program Enabled Savings Verified 0 0%Adjustment to 2015 savings True-up 0 0.00% 0.00% 0.00% 0.00% 0.00% 0.00% 0.00% 0.00% 0.00% 0.00% 0.00% 0.00% 0.00% 0.00%
Conservation Fund Pilots17 Conservation Fund Pilot - EnerNOC Verified 12 0%
Adjustment to 2015 savings True-up 12 0.00% 0.00% 0.00% 0.00% 0.00% 0.00% 0.00% 0.00% 0.00% 0.00% 0.00% 0.00% 0.00% 0.00%
18 Loblaws Pilot Verified 12 0%Adjustment to 2015 savings True-up 12 0.00% 0.00% 0.00% 0.00% 0.00% 0.00% 0.00% 0.00% 0.00% 0.00% 0.00% 0.00% 0.00% 0.00%
19 Conservation Fund Pilot - SEG Verified 12 0%Adjustment to 2015 savings True-up 12 0.00% 0.00% 0.00% 0.00% 0.00% 0.00% 0.00% 0.00% 0.00% 0.00% 0.00% 0.00% 0.00% 0.00%
20 Social Benchmarking Pliot Verified 12 0%Adjustment to 2015 savings True-up 12 0.00% 0.00% 0.00% 0.00% 0.00% 0.00% 0.00% 0.00% 0.00% 0.00% 0.00% 0.00% 0.00% 0.00%
Legend
Program Results Status
Net Energy Savings Persistence (kWh)
Instructions
Tables
1. LDCs can apply for disposition of LRAMVA amounts at any time, but at a minimum, must do so as part of a cost of service (COS) application. The following LRAMVA work forms apply to LDCs that need to recover lost revenues from the 2015-2020 period. Please input or manually link the savings, adjustments and program savings persistence data in these tables from the LDC's Persistence Reports provided by the IESO (in Tab 7). As noted earlier, persistence data is available upon request from the IESO. Please also be advised that the same rate classes (of up to 14) are carried over from the Summary Tab 1.
2. Please ensure that the IESO verified savings adjustments apply back to the program year it relates to. For example, savings adjustments related to 2016 programs that were reported by the IESO in 2017 should be included in the 2016 program savings table. In order for persisting savings to be claimed in future years, past year's initiative level savings results need to be filled out in the tables below. If the IESO adjustments were made available to the LDC after the LRAMVA was approved, the persistence of those savings adjustments in the future can be claimed as approved LRAMVA amounts are considered to be final.
3. The work forms below include the monthly multipliers for most programs in order to claim demand savings from energy efficiency programs, consistent with the monthly multipliers indicated in the OEB's updated LRAM policy related to peak demand savings in EB-2016-0182. Demand Response (DR3) savings should generally not be included with the LRAMVA calculation, unless suported by empirical evidence. LDCs are requested to confirm the monthly multipliers for all programs each year as placeholder values are provided. If a different monthly multiplier is used, please include rationale in Tab 1-a and highlight the new multiplier that has been used.
4. LDC are requested to input the applicable rate class allocation percentages to allocate actual savings to the rate classes. The generic template currently includes the same allocation percentage for program savings and its savings adjustments. If a different allocation is proposed for savings adjustments, LDCs must provide supporting rationale in Tab 1-a and highlight the change.
5. The persistence of future savings is expected to be included in the distributor's load forecast after re-basing. LDCs are requested to delete the applicable savings persistence rows (auto-calculated after the LRAMVA totals for the year) if future year's persistence of savings is already captured in the updated load forecast. Please also provide assumptions about the years in which persistence is captured in the load forecast calculation in the "Notes" section below each table.
Instructions (Grey)
Monthly Multiplier
Net Peak Demand Savings Persistence (kW) Rate Allocations for LRAMVA
Ontario Energy Board

16 of 25
Conservation First FrameworkResidential Province-Wide Programs
21 Save on Energy Coupon Program Verified 182,791 181,325 181,325 181,325 181,325 181,325 181,325 181,210 181,210 181,210 36 36 36 36 36 36 36 36 36 36 93.00% 7.00% 100%Adjustment to 2015 savings True-up 20,794 20,432 20,432 20,432 20,432 20,432 20,432 20,318 20,318 20,318 4 4 4 4 4 4 4 4 4 4 93.00% 7.00% 0.00% 0.00% 0.00% 0.00% 0.00% 0.00% 0.00% 0.00% 0.00% 0.00% 0.00% 0.00%
22 Save on Energy Heating and Cooling Program Verified 34,993 34,993 34,993 34,993 34,993 34,993 34,993 34,993 34,993 34,993 7 7 7 7 7 7 7 7 7 7 100.00% 100%
Adjustment to 2015 savings True-up 100.00% 0.00% 0.00% 0.00% 0.00% 0.00% 0.00% 0.00% 0.00% 0.00% 0.00% 0.00% 0.00% 0.00%
23 Save on Energy New Construction Program Verified 0%
Adjustment to 2015 savings True-up 0.00% 0.00% 0.00% 0.00% 0.00% 0.00% 0.00% 0.00% 0.00% 0.00% 0.00% 0.00% 0.00% 0.00%
24 Save on Energy Home Assistance Program Verified 0%Adjustment to 2015 savings True-up 0.00% 0.00% 0.00% 0.00% 0.00% 0.00% 0.00% 0.00% 0.00% 0.00% 0.00% 0.00% 0.00% 0.00%
Non-Residential Province-Wide Programs25 Save on Energy Audit Funding Program Verified 12 0%
Adjustment to 2015 savings True-up 12 0.00% 0.00% 0.00% 0.00% 0.00% 0.00% 0.00% 0.00% 0.00% 0.00% 0.00% 0.00% 0.00% 0.00%
26 Save on Energy Retrofit Program Verified 12 100.00% 100%Adjustment to 2015 savings True-up 1,013 1,013 1,013 1,013 1,013 1,013 1,013 1,013 1,013 1,013 12 0 0 0 0 0 0 0 0 0 0 0.00% 0.00% 0.00% 0.00% 0.00% 0.00% 0.00% 0.00% 0.00% 0.00% 0.00% 0.00% 0.00% 0.00%
27 Save on Energy Small Business Lighting Program
Verified 12 0%
Adjustment to 2015 savings True-up 12 0.00% 0.00% 0.00% 0.00% 0.00% 0.00% 0.00% 0.00% 0.00% 0.00% 0.00% 0.00% 0.00% 0.00%
28 Save on Energy High Performance New Construction Program
Verified 12 0%
Adjustment to 2015 savings True-up 12 0.00% 0.00% 0.00% 0.00% 0.00% 0.00% 0.00% 0.00% 0.00% 0.00% 0.00% 0.00% 0.00% 0.00%
29 Save on Energy Existing Building Commissioning Program
Verified 3 0%
Adjustment to 2015 savings True-up 3 0.00% 0.00% 0.00% 0.00% 0.00% 0.00% 0.00% 0.00% 0.00% 0.00% 0.00% 0.00% 0.00% 0.00%
30 Save on Energy Process & Systems Upgrades Program
Verified 12 0%
Adjustment to 2015 savings True-up 12 0.00% 0.00% 0.00% 0.00% 0.00% 0.00% 0.00% 0.00% 0.00% 0.00% 0.00% 0.00% 0.00% 0.00%
31 Save on Energy Monitoring & Targeting Program
Verified 12 0%
Adjustment to 2015 savings True-up 12 0.00% 0.00% 0.00% 0.00% 0.00% 0.00% 0.00% 0.00% 0.00% 0.00% 0.00% 0.00% 0.00% 0.00%
32 Save on Energy Energy Manager Program Verified 12 0%Adjustment to 2015 savings True-up 12 0.00% 0.00% 0.00% 0.00% 0.00% 0.00% 0.00% 0.00% 0.00% 0.00% 0.00% 0.00% 0.00% 0.00%
Local & Regional Programs33 Business Refrigeration Local Program Verified 0 0%
Adjustment to 2015 savings True-up 0 0.00% 0.00% 0.00% 0.00% 0.00% 0.00% 0.00% 0.00% 0.00% 0.00% 0.00% 0.00% 0.00% 0.00%
34 First Nation Conservation Local Program Verified 0 0%Adjustment to 2015 savings True-up 0 0.00% 0.00% 0.00% 0.00% 0.00% 0.00% 0.00% 0.00% 0.00% 0.00% 0.00% 0.00% 0.00% 0.00%
35 Social Benchmarking Local Program Verified 0 0%Adjustment to 2015 savings True-up 0 0.00% 0.00% 0.00% 0.00% 0.00% 0.00% 0.00% 0.00% 0.00% 0.00% 0.00% 0.00% 0.00% 0.00%
Pilot Programs
36Enersource Hydro Mississauga Inc. - Performance-Based Conservation Pilot Program - Conservation Fund
Verified 12 0%
Adjustment to 2015 savings True-up 12 0.00% 0.00% 0.00% 0.00% 0.00% 0.00% 0.00% 0.00% 0.00% 0.00% 0.00% 0.00% 0.00% 0.00%
37 EnWin Utilities Ltd. - Building Optimization Pilot
Verified 12 0%
Adjustment to 2015 savings True-up 12 0.00% 0.00% 0.00% 0.00% 0.00% 0.00% 0.00% 0.00% 0.00% 0.00% 0.00% 0.00% 0.00% 0.00%
38 EnWin Utilities Ltd. - Re-Invest Pilot Verified 12 0%Adjustment to 2015 savings True-up 12 0.00% 0.00% 0.00% 0.00% 0.00% 0.00% 0.00% 0.00% 0.00% 0.00% 0.00% 0.00% 0.00% 0.00%
39 Horizon Utilities Corporation - ECM Furnace Motor Pilot
Verified 12 0%
Adjustment to 2015 savings True-up 12 0.00% 0.00% 0.00% 0.00% 0.00% 0.00% 0.00% 0.00% 0.00% 0.00% 0.00% 0.00% 0.00% 0.00%
40 Horizon Utilities Corporation - Social Benchmarking Pilot
Verified 12 0%
Adjustment to 2015 savings True-up 12 0.00% 0.00% 0.00% 0.00% 0.00% 0.00% 0.00% 0.00% 0.00% 0.00% 0.00% 0.00% 0.00% 0.00%
41Hydro Ottawa Limited - Conservation Voltage Regulation (CVR) Leveraging AMI Data Pilot Verified 12 0%
Adjustment to 2015 savings True-up 12 0.00% 0.00% 0.00% 0.00% 0.00% 0.00% 0.00% 0.00% 0.00% 0.00% 0.00% 0.00% 0.00% 0.00%
42 Hydro Ottawa Limited - Residential Demand Response Wi-Fi Thermostat Pilot
Verified 0%
Adjustment to 2015 savings True-up 0.00% 0.00% 0.00% 0.00% 0.00% 0.00% 0.00% 0.00% 0.00% 0.00% 0.00% 0.00% 0.00% 0.00%
43 Kitchener-Wilmot Hydro Inc. - Pilot - DCKV Verified 12 0%Adjustment to 2015 savings True-up 12 0.00% 0.00% 0.00% 0.00% 0.00% 0.00% 0.00% 0.00% 0.00% 0.00% 0.00% 0.00% 0.00% 0.00%
44Niagara-on-the-Lake Hydro Inc. - Direct Install Energy Efficiency Measures for the Agricultural Sector
Verified 12 0%
Adjustment to 2015 savings True-up 12 0.00% 0.00% 0.00% 0.00% 0.00% 0.00% 0.00% 0.00% 0.00% 0.00% 0.00% 0.00% 0.00% 0.00%
45 Oakville Hydro Electricity Distribution Inc. - Direct Install - Hydronic
Verified 12 0%
Adjustment to 2015 savings True-up 12 0.00% 0.00% 0.00% 0.00% 0.00% 0.00% 0.00% 0.00% 0.00% 0.00% 0.00% 0.00% 0.00% 0.00%
46 Oakville Hydro Electricity Distribution Inc. - Direct Install - RTU Controls
Verified 12 0%
Adjustment to 2015 savings True-up 12 0.00% 0.00% 0.00% 0.00% 0.00% 0.00% 0.00% 0.00% 0.00% 0.00% 0.00% 0.00% 0.00% 0.00%
47 Toronto Hydro-Electric System Limited - Direct Install - Hydronic (Pilot Savings)
Verified 12 0%
Adjustment to 2015 savings True-up 12 0.00% 0.00% 0.00% 0.00% 0.00% 0.00% 0.00% 0.00% 0.00% 0.00% 0.00% 0.00% 0.00% 0.00%
48 Toronto Hydro-Electric System Limited - Direct Install - RTU Controls (Pilot Savings)
Verified 12 0%
Adjustment to 2015 savings True-up 12 0.00% 0.00% 0.00% 0.00% 0.00% 0.00% 0.00% 0.00% 0.00% 0.00% 0.00% 0.00% 0.00% 0.00%
49 Toronto Hydro-Electric System Limited - PFP - Large (Pilot Savings)
Verified 12 0%
Adjustment to 2015 savings True-up 12 0.00% 0.00% 0.00% 0.00% 0.00% 0.00% 0.00% 0.00% 0.00% 0.00% 0.00% 0.00% 0.00% 0.00%
Actual CDM Savings in 2015 1,077,169 1,068,894 1,068,387 1,093,167 1,086,232 1,077,279 1,077,279 1,077,014 1,072,019 1,066,417 211 210 209 214 213 211 211 211 210 209 647,835 24,979 10 62,009 0 0 0 0 0 0 0 0 0 0Forecast CDM Savings in 2015 401,505 29,343 755 3,054 0 0 0 0 0 0 0 0 0 0
Distribution Rate in 2015 $0.03280 $0.14640 $3.12060 $0.17690 $0.00000 $0.00000 $0.00000 $0.00000 $0.00000 $0.00000 $0.00000 $0.00000 $0.00000 $0.00000Lost Revenue in 2015 from 2011 programs $4,623.67 $1,371.37 $0.00 $0.00 $0.00 $0.00 $0.00 $0.00 $0.00 $0.00 $0.00 $0.00 $0.00 $0.00 $5,995.05Lost Revenue in 2015 from 2012 programs $6,424.11 $907.45 $1,062.46 $0.00 $0.00 $0.00 $0.00 $0.00 $0.00 $0.00 $0.00 $0.00 $0.00 $0.00 $8,394.02Lost Revenue in 2015 from 2013 programs $16,460.77 $758.62 $738.23 $0.00 $0.00 $0.00 $0.00 $0.00 $0.00 $0.00 $0.00 $0.00 $0.00 $0.00 $17,957.62Lost Revenue in 2015 from 2014 programs $25,284.32 $3,397.78 $1,008.53 $1,843.65 $0.00 $0.00 $0.00 $0.00 $0.00 $0.00 $0.00 $0.00 $0.00 $0.00 $31,534.28Lost Revenue in 2015 from 2015 programs $21,249.00 $3,656.92 $30.47 $10,969.39 $0.00 $0.00 $0.00 $0.00 $0.00 $0.00 $0.00 $0.00 $0.00 $0.00 $35,905.77Total Lost Revenues in 2015 $74,041.87 $10,092.14 $2,839.69 $12,813.04 $0.00 $0.00 $0.00 $0.00 $0.00 $0.00 $0.00 $0.00 $0.00 $0.00 $99,786.74Forecast Lost Revenues in 2015 $13,169.36 $4,295.82 $2,356.05 $540.25 $0.00 $0.00 $0.00 $0.00 $0.00 $0.00 $0.00 $0.00 $0.00 $0.00 $20,361.48LRAMVA in 2015 $79,425.26

17 of 25
2015 Savings Persisting in 2016 639,913 24,626 10 220,130 0 0 0 0 0 0 0 0 0 02015 Savings Persisting in 2017 639,406 24,626 10 220,130 0 0 0 0 0 0 0 0 0 02015 Savings Persisting in 2018 664,186 24,626 10 220,130 0 0 0 0 0 0 0 0 0 02015 Savings Persisting in 2019 657,737 24,141 10 220,130 0 0 0 0 0 0 0 0 0 02015 Savings Persisting in 2020 649,410 23,514 10 220,130 0 0 0 0 0 0 0 0 0 0
Note: LDC to make note of key assumptions included above - Included reduction in Street Lighting savings; Used API kW/kWh ratio for demand. See Tab 1a for rationale
Table 5-b. 2016 Lost Revenues Work Form Return to top
Net Energy Savings (kWh)
Net Demand Savings (kW)
2016 2017 2018 2019 2020 2021 2022 2023 2024 2025 2016 2017 2018 2019 2020 2021 2022 2023 2024 2025 R1 (kWh) Seasonal (kWh) R2 (kW) Street Lights
(kWh) Total
Legacy Framework kWh kWh kw kWh 0 0 0 0 0 0 0 0 0 0Residential Program
1 Coupon Initiative Verified 0%Adjustment to 2016 savings True-up 0.00% 0.00% 0.00% 0.00% 0.00% 0.00% 0.00% 0.00% 0.00% 0.00% 0.00% 0.00% 0.00% 0.00%
2 Bi-Annual Retailer Event Initiative Verified 0%Adjustment to 2016 savings True-up 0.00% 0.00% 0.00% 0.00% 0.00% 0.00% 0.00% 0.00% 0.00% 0.00% 0.00% 0.00% 0.00% 0.00%
3 Appliance Retirement Initiative Verified 0%Adjustment to 2016 savings True-up 0.00% 0.00% 0.00% 0.00% 0.00% 0.00% 0.00% 0.00% 0.00% 0.00% 0.00% 0.00% 0.00% 0.00%
4 HVAC Incentives Initiative Verified 0%Adjustment to 2016 savings True-up 0.00% 0.00% 0.00% 0.00% 0.00% 0.00% 0.00% 0.00% 0.00% 0.00% 0.00% 0.00% 0.00% 0.00%
5 Residential New Construction and Major Renovation Initiative
Verified 0%
Adjustment to 2016 savings True-up 0.00% 0.00% 0.00% 0.00% 0.00% 0.00% 0.00% 0.00% 0.00% 0.00% 0.00% 0.00% 0.00% 0.00%
Commercial & Institutional Program6 Energy Audit Initiative Verified 12 0%
Adjustment to 2016 savings True-up 12 0.00% 0.00% 0.00% 0.00% 0.00% 0.00% 0.00% 0.00% 0.00% 0.00% 0.00% 0.00% 0.00% 0.00%
7 Efficiency: Equipment Replacement Incentive Initiative
Verified 12 0%
Adjustment to 2016 savings True-up 12 0.00% 0.00% 0.00% 0.00% 0.00% 0.00% 0.00% 0.00% 0.00% 0.00% 0.00% 0.00% 0.00% 0.00%
8 Direct Install Lighting and Water Heating Initiative
Verified 12 0%
Adjustment to 2016 savings True-up 12 0.00% 0.00% 0.00% 0.00% 0.00% 0.00% 0.00% 0.00% 0.00% 0.00% 0.00% 0.00% 0.00% 0.00%
9 New Construction and Major Renovation Initiative
Verified 12 0%
Adjustment to 2016 savings True-up 12 0.00% 0.00% 0.00% 0.00% 0.00% 0.00% 0.00% 0.00% 0.00% 0.00% 0.00% 0.00% 0.00% 0.00%
10 Existing Building Commissioning Incentive Initiative
Verified 3 0%
Adjustment to 2016 savings True-up 3 0.00% 0.00% 0.00% 0.00% 0.00% 0.00% 0.00% 0.00% 0.00% 0.00% 0.00% 0.00% 0.00% 0.00%
Industrial Program
11 Process and Systems Upgrades Initiatives - Project Incentive Initiative
Verified 12 0%
Adjustment to 2016 savings True-up 12 0.00% 0.00% 0.00% 0.00% 0.00% 0.00% 0.00% 0.00% 0.00% 0.00% 0.00% 0.00% 0.00% 0.00%
12 Process and Systems Upgrades Initiatives - Monitoring and Targeting Initiative
Verified 12 0%
Adjustment to 2016 savings True-up 12 0.00% 0.00% 0.00% 0.00% 0.00% 0.00% 0.00% 0.00% 0.00% 0.00% 0.00% 0.00% 0.00% 0.00%
13 Process and Systems Upgrades Initiatives - Energy Manager Initiative
Verified 12 0%
Adjustment to 2016 savings True-up 12 0.00% 0.00% 0.00% 0.00% 0.00% 0.00% 0.00% 0.00% 0.00% 0.00% 0.00% 0.00% 0.00% 0.00%
Low Income Program14 Low Income Initiative Verified 12 0%
Adjustment to 2016 savings True-up 12 0.00% 0.00% 0.00% 0.00% 0.00% 0.00% 0.00% 0.00% 0.00% 0.00% 0.00% 0.00% 0.00% 0.00%
Other15 Aboriginal Conservation Program Verified 0 0%
Adjustment to 2016 savings True-up 0 0.00% 0.00% 0.00% 0.00% 0.00% 0.00% 0.00% 0.00% 0.00% 0.00% 0.00% 0.00% 0.00% 0.00%
16 Program Enabled Savings Verified 0 0%Adjustment to 2016 savings True-up 0 0.00% 0.00% 0.00% 0.00% 0.00% 0.00% 0.00% 0.00% 0.00% 0.00% 0.00% 0.00% 0.00% 0.00%
Conservation Fund Pilots17 Conservation Fund Pilot - EnerNOC Verified 12 0%
Adjustment to 2016 savings True-up 12 0.00% 0.00% 0.00% 0.00% 0.00% 0.00% 0.00% 0.00% 0.00% 0.00% 0.00% 0.00% 0.00% 0.00%
18 Loblaws Pilot Verified 12 0%Adjustment to 2016 savings True-up 12 0.00% 0.00% 0.00% 0.00% 0.00% 0.00% 0.00% 0.00% 0.00% 0.00% 0.00% 0.00% 0.00% 0.00%
19 Conservation Fund Pilot - SEG Verified 12 0%Adjustment to 2016 savings True-up 12 0.00% 0.00% 0.00% 0.00% 0.00% 0.00% 0.00% 0.00% 0.00% 0.00% 0.00% 0.00% 0.00% 0.00%
20 Social Benchmarking Pliot Verified 12 0%Adjustment to 2016 savings True-up 12 0.00% 0.00% 0.00% 0.00% 0.00% 0.00% 0.00% 0.00% 0.00% 0.00% 0.00% 0.00% 0.00% 0.00%
Conservation First FrameworkResidential Province-Wide Programs
21 Save on Energy Coupon Program Verified 864,090 864,090 864,090 864,090 864,090 864,090 864,090 863,963 863,963 859,983 169 169 169 169 169 169 169 169 169 169 93.00% 7.00% 100%Adjustment to 2016 savings True-up 97,452 97,452 97,452 97,452 97,452 97,452 97,452 97,444 97,444 97,547 19 19 19 19 19 19 19 19 19 19 93.00% 7.00% 0.00% 0.00% 0.00% 0.00% 0.00% 0.00% 0.00% 0.00% 0.00% 0.00% 0.00% 0.00%
22 Save on Energy Heating and Cooling Program Verified 69,942 69,942 69,942 69,942 69,942 69,942 69,942 69,942 69,942 69,942 14 14 14 14 14 14 14 14 14 14 100.00% 100%
Adjustment to 2016 savings True-up 100.00% 0.00% 0.00% 0.00% 0.00% 0.00% 0.00% 0.00% 0.00% 0.00% 0.00% 0.00% 0.00% 0.00%
23 Save on Energy New Construction Program Verified 0%
Adjustment to 2016 savings True-up 0.00% 0.00% 0.00% 0.00% 0.00% 0.00% 0.00% 0.00% 0.00% 0.00% 0.00% 0.00% 0.00% 0.00%
24 Save on Energy Home Assistance Program Verified 6,792 6,792 6,792 6,792 6,792 6,792 6,792 6,792 6,792 6,792 100.00% 0.00% 100%Adjustment to 2016 savings True-up 100.00% 0.00% 0.00% 0.00% 0.00% 0.00% 0.00% 0.00% 0.00% 0.00% 0.00% 0.00% 0.00% 0.00%
Non-Residential Province-Wide Programs25 Save on Energy Audit Funding Program Verified 12 0%
Adjustment to 2016 savings True-up 12 0.00% 0.00% 0.00% 0.00% 0.00% 0.00% 0.00% 0.00% 0.00% 0.00% 0.00% 0.00% 0.00% 0.00%
26 Save on Energy Retrofit Program Verified 111,513 109,850 109,850 109,850 109,850 109,850 109,850 109,850 109,850 109,850 12 22 22 22 22 22 22 22 22 22 22 89.70% 0.00% 10.30% 0.00% 100%Adjustment to 2016 savings True-up 1,032 2,696 2,696 2,696 2,696 2,696 2,696 2,696 2,696 2,696 12 0 1 1 1 1 1 1 1 1 1 89.70% 0.00% 10.30% 0.00% 0.00% 0.00% 0.00% 0.00% 0.00% 0.00% 0.00% 0.00% 0.00% 0.00%
27 Save on Energy Small Business Lighting Program
Verified 133,383 133,383 133,383 133,383 126,216 105,649 86,825 69,505 50,416 37,739 12 26 26 26 26 25 21 17 14 10 7 100.00% 100%
Adjustment to 2016 savings True-up 44,976 44,976 44,976 44,976 42,410 36,279 30,818 26,822 21,962 16,468 12 9 9 9 9 8 7 6 5 4 3 100.00% 0.00% 0.00% 0.00% 0.00% 0.00% 0.00% 0.00% 0.00% 0.00% 0.00% 0.00% 0.00% 0.00%
28 Save on Energy High Performance New Construction Program
Verified 12 0%
Adjustment to 2016 savings True-up 12 0.00% 0.00% 0.00% 0.00% 0.00% 0.00% 0.00% 0.00% 0.00% 0.00% 0.00% 0.00% 0.00% 0.00%
29 Save on Energy Existing Building Commissioning Program
Verified 3 0%
Adjustment to 2016 savings True-up 3 0.00% 0.00% 0.00% 0.00% 0.00% 0.00% 0.00% 0.00% 0.00% 0.00% 0.00% 0.00% 0.00% 0.00%
30 Save on Energy Process & Systems Upgrades Program
Verified 12 0%
Rate Allocations for LRAMVA
Program Results Status
Net Energy Savings Persistence (kWh)
Monthly Multiplier
Net Peak Demand Savings Persistence (kW)

18 of 25
Adjustment to 2016 savings True-up 12 0.00% 0.00% 0.00% 0.00% 0.00% 0.00% 0.00% 0.00% 0.00% 0.00% 0.00% 0.00% 0.00% 0.00%
31 Save on Energy Monitoring & Targeting Program
Verified 12 0%
Adjustment to 2016 savings True-up 12 0.00% 0.00% 0.00% 0.00% 0.00% 0.00% 0.00% 0.00% 0.00% 0.00% 0.00% 0.00% 0.00% 0.00%
32 Save on Energy Energy Manager Program Verified 12 0%Adjustment to 2016 savings True-up 12 0.00% 0.00% 0.00% 0.00% 0.00% 0.00% 0.00% 0.00% 0.00% 0.00% 0.00% 0.00% 0.00% 0.00%
Local & Regional Programs33 Business Refrigeration Local Program Verified 0 0%
Adjustment to 2016 savings True-up 0 0.00% 0.00% 0.00% 0.00% 0.00% 0.00% 0.00% 0.00% 0.00% 0.00% 0.00% 0.00% 0.00% 0.00%
34 First Nation Conservation Local Program Verified 0 0%Adjustment to 2016 savings True-up 0 0.00% 0.00% 0.00% 0.00% 0.00% 0.00% 0.00% 0.00% 0.00% 0.00% 0.00% 0.00% 0.00% 0.00%
35 Social Benchmarking Local Program Verified 0 0%Adjustment to 2016 savings True-up 0 0.00% 0.00% 0.00% 0.00% 0.00% 0.00% 0.00% 0.00% 0.00% 0.00% 0.00% 0.00% 0.00% 0.00%
Pilot Programs
36 Residential Direct Mail LDC Innovation Fund Pilot Program
Verified 108,513 108,513 108,513 108,513 108,513 108,513 108,513 101,200 69,840 69,840 12 21 21 21 21 21 21 21 20 14 14 100.00% 100%
Adjustment to 2016 savings True-up 12 100.00% 0.00% 0.00% 0.00% 0.00% 0.00% 0.00% 0.00% 0.00% 0.00% 0.00% 0.00% 0.00% 0.00%
37 EnWin Utilities Ltd. - Building Optimization Pilot
Verified 12 0%
Adjustment to 2016 savings True-up 12 0.00% 0.00% 0.00% 0.00% 0.00% 0.00% 0.00% 0.00% 0.00% 0.00% 0.00% 0.00% 0.00% 0.00%
38 EnWin Utilities Ltd. - Re-Invest Pilot Verified 12 0%Adjustment to 2016 savings True-up 12 0.00% 0.00% 0.00% 0.00% 0.00% 0.00% 0.00% 0.00% 0.00% 0.00% 0.00% 0.00% 0.00% 0.00%
39 Horizon Utilities Corporation - ECM Furnace Motor Pilot
Verified 12 0%
Adjustment to 2016 savings True-up 12 0.00% 0.00% 0.00% 0.00% 0.00% 0.00% 0.00% 0.00% 0.00% 0.00% 0.00% 0.00% 0.00% 0.00%
40 Horizon Utilities Corporation - Social Benchmarking Pilot
Verified 12 0%
Adjustment to 2016 savings True-up 12 0.00% 0.00% 0.00% 0.00% 0.00% 0.00% 0.00% 0.00% 0.00% 0.00% 0.00% 0.00% 0.00% 0.00%
41Hydro Ottawa Limited - Conservation Voltage Regulation (CVR) Leveraging AMI Data Pilot Verified 12 0%
Adjustment to 2016 savings True-up 12 0.00% 0.00% 0.00% 0.00% 0.00% 0.00% 0.00% 0.00% 0.00% 0.00% 0.00% 0.00% 0.00% 0.00%
42 Hydro Ottawa Limited - Residential Demand Response Wi-Fi Thermostat Pilot
Verified 0%
Adjustment to 2016 savings True-up 0.00% 0.00% 0.00% 0.00% 0.00% 0.00% 0.00% 0.00% 0.00% 0.00% 0.00% 0.00% 0.00% 0.00%
43 Kitchener-Wilmot Hydro Inc. - Pilot - DCKV Verified 12 0%Adjustment to 2016 savings True-up 12 0.00% 0.00% 0.00% 0.00% 0.00% 0.00% 0.00% 0.00% 0.00% 0.00% 0.00% 0.00% 0.00% 0.00%
44Niagara-on-the-Lake Hydro Inc. - Direct Install Energy Efficiency Measures for the Agricultural Sector
Verified 12 0%
Adjustment to 2016 savings True-up 12 0.00% 0.00% 0.00% 0.00% 0.00% 0.00% 0.00% 0.00% 0.00% 0.00% 0.00% 0.00% 0.00% 0.00%
45 Oakville Hydro Electricity Distribution Inc. - Direct Install - Hydronic
Verified 12 0%
Adjustment to 2016 savings True-up 12 0.00% 0.00% 0.00% 0.00% 0.00% 0.00% 0.00% 0.00% 0.00% 0.00% 0.00% 0.00% 0.00% 0.00%
46 Oakville Hydro Electricity Distribution Inc. - Direct Install - RTU Controls
Verified 12 0%
Adjustment to 2016 savings True-up 12 0.00% 0.00% 0.00% 0.00% 0.00% 0.00% 0.00% 0.00% 0.00% 0.00% 0.00% 0.00% 0.00% 0.00%
47 Toronto Hydro-Electric System Limited - Direct Install - Hydronic (Pilot Savings)
Verified 12 0%
Adjustment to 2016 savings True-up 12 0.00% 0.00% 0.00% 0.00% 0.00% 0.00% 0.00% 0.00% 0.00% 0.00% 0.00% 0.00% 0.00% 0.00%
48 Toronto Hydro-Electric System Limited - Direct Install - RTU Controls (Pilot Savings)
Verified 12 0%
Adjustment to 2016 savings True-up 12 0.00% 0.00% 0.00% 0.00% 0.00% 0.00% 0.00% 0.00% 0.00% 0.00% 0.00% 0.00% 0.00% 0.00%
49 Toronto Hydro-Electric System Limited - PFP - Large (Pilot Savings)
Verified 12 0%
Adjustment to 2016 savings True-up 12 0.00% 0.00% 0.00% 0.00% 0.00% 0.00% 0.00% 0.00% 0.00% 0.00% 0.00% 0.00% 0.00% 0.00%
Actual CDM Savings in 2016 1,437,693 1,437,694 1,437,694 1,437,694 1,427,961 1,401,263 1,376,978 1,348,214 1,292,905 1,270,857 280 280 280 280 279 273 269 263 252 248 1,358,793 67,308 27 0 0 0 0 0 0 0 0 0 0 0Forecast CDM Savings in 2016 401,505 29,343 755 3,054 0 0 0 0 0 0 0 0 0 0
Distribution Rate in 2016 $0.03280 $0.15030 $3.11660 $0.17860 $0.00000 $0.00000 $0.00000 $0.00000 $0.00000 $0.00000 $0.00000 $0.00000 $0.00000 $0.00000Lost Revenue in 2016 from 2011 programs $3,366.16 $974.18 $0.00 $0.00 $0.00 $0.00 $0.00 $0.00 $0.00 $0.00 $0.00 $0.00 $0.00 $0.00 $4,340.34Lost Revenue in 2016 from 2012 programs $5,948.81 $767.69 $1,061.10 $0.00 $0.00 $0.00 $0.00 $0.00 $0.00 $0.00 $0.00 $0.00 $0.00 $0.00 $7,777.60Lost Revenue in 2016 from 2013 programs $14,562.76 $669.35 $737.29 $0.00 $0.00 $0.00 $0.00 $0.00 $0.00 $0.00 $0.00 $0.00 $0.00 $0.00 $15,969.40Lost Revenue in 2016 from 2014 programs $24,046.27 $3,268.79 $1,007.23 $1,861.37 $0.00 $0.00 $0.00 $0.00 $0.00 $0.00 $0.00 $0.00 $0.00 $0.00 $30,183.66Lost Revenue in 2016 from 2015 programs $20,989.15 $3,701.29 $30.43 $39,315.21 $0.00 $0.00 $0.00 $0.00 $0.00 $0.00 $0.00 $0.00 $0.00 $0.00 $64,036.09Lost Revenue in 2016 from 2016 programs $44,568.41 $10,116.38 $84.97 $0.00 $0.00 $0.00 $0.00 $0.00 $0.00 $0.00 $0.00 $0.00 $0.00 $0.00 $54,769.76Total Lost Revenues in 2016 $113,481.56 $19,497.69 $2,921.02 $41,176.58 $0.00 $0.00 $0.00 $0.00 $0.00 $0.00 $0.00 $0.00 $0.00 $0.00 $177,076.85Forecast Lost Revenues in 2016 $13,169.36 $4,410.25 $2,353.03 $545.44 $0.00 $0.00 $0.00 $0.00 $0.00 $0.00 $0.00 $0.00 $0.00 $0.00 $20,478.09LRAMVA in 2016 $156,598.75
2016 Savings Persisting in 2017 1,358,794 67,308 27 0 0 0 0 0 0 0 0 0 0 02016 Savings Persisting in 2018 1,358,794 67,308 27 0 0 0 0 0 0 0 0 0 0 02016 Savings Persisting in 2019 1,358,794 67,308 27 0 0 0 0 0 0 0 0 0 0 02016 Savings Persisting in 2020 1,349,061 67,308 27 0 0 0 0 0 0 0 0 0 0 0
Note: LDC to make note of key assumptions included above
Table 5-c. 2017 Lost Revenues Work Form Return to top
Net Energy Savings (kWh)
Net Demand Savings (kW)
2017 2018 2019 2020 2021 2022 2023 2024 2025 2026 2017 2018 2019 2020 2021 2022 2023 2024 2025 2026 R1 (kWh) Seasonal (kWh) R2 (kW) Street Lights
(kWh) Total
Legacy Framework kWh kWh kw kWh 0 0 0 0 0 0 0 0 0 0Residential Program
1 Coupon Initiative Verified 0%Adjustment to 2017 savings True-up 0.00% 0.00% 0.00% 0.00% 0.00% 0.00% 0.00% 0.00% 0.00% 0.00% 0.00% 0.00% 0.00% 0.00%
2 Bi-Annual Retailer Event Initiative Verified 0%Adjustment to 2017 savings True-up 0.00% 0.00% 0.00% 0.00% 0.00% 0.00% 0.00% 0.00% 0.00% 0.00% 0.00% 0.00% 0.00% 0.00%
3 Appliance Retirement Initiative Verified 0%Adjustment to 2017 savings True-up 0.00% 0.00% 0.00% 0.00% 0.00% 0.00% 0.00% 0.00% 0.00% 0.00% 0.00% 0.00% 0.00% 0.00%
4 HVAC Incentives Initiative Verified 0%Adjustment to 2017 savings True-up 0.00% 0.00% 0.00% 0.00% 0.00% 0.00% 0.00% 0.00% 0.00% 0.00% 0.00% 0.00% 0.00% 0.00%
5 Residential New Construction and Major Renovation Initiative
Verified 0%
Adjustment to 2017 savings True-up 0.00% 0.00% 0.00% 0.00% 0.00% 0.00% 0.00% 0.00% 0.00% 0.00% 0.00% 0.00% 0.00% 0.00%
Commercial & Institutional Program6 Energy Audit Initiative Verified 12 0%
Adjustment to 2017 savings True-up 12 0.00% 0.00% 0.00% 0.00% 0.00% 0.00% 0.00% 0.00% 0.00% 0.00% 0.00% 0.00% 0.00% 0.00%
7 Efficiency: Equipment Replacement Incentive Initiative
Verified 12 0%
Rate Allocations for LRAMVANet Peak Demand Savings Persistence (kW)
Results Status
Net Energy Savings Persistence (kWh)
Monthly MultiplierProgram

19 of 25
Adjustment to 2017 savings True-up 12 0.00% 0.00% 0.00% 0.00% 0.00% 0.00% 0.00% 0.00% 0.00% 0.00% 0.00% 0.00% 0.00% 0.00%
8 Direct Install Lighting and Water Heating Initiative
Verified 12 0%
Adjustment to 2017 savings True-up 12 0.00% 0.00% 0.00% 0.00% 0.00% 0.00% 0.00% 0.00% 0.00% 0.00% 0.00% 0.00% 0.00% 0.00%
9 New Construction and Major Renovation Initiative
Verified 12 0%
Adjustment to 2017 savings True-up 12 0.00% 0.00% 0.00% 0.00% 0.00% 0.00% 0.00% 0.00% 0.00% 0.00% 0.00% 0.00% 0.00% 0.00%
10 Existing Building Commissioning Incentive Initiative
Verified 3 0%
Adjustment to 2017 savings True-up 3 0.00% 0.00% 0.00% 0.00% 0.00% 0.00% 0.00% 0.00% 0.00% 0.00% 0.00% 0.00% 0.00% 0.00%
Industrial Program
11 Process and Systems Upgrades Initiatives - Project Incentive Initiative
Verified 12 0%
Adjustment to 2017 savings True-up 12 0.00% 0.00% 0.00% 0.00% 0.00% 0.00% 0.00% 0.00% 0.00% 0.00% 0.00% 0.00% 0.00% 0.00%
12 Process and Systems Upgrades Initiatives - Monitoring and Targeting Initiative
Verified 12 0%
Adjustment to 2017 savings True-up 12 0.00% 0.00% 0.00% 0.00% 0.00% 0.00% 0.00% 0.00% 0.00% 0.00% 0.00% 0.00% 0.00% 0.00%
13 Process and Systems Upgrades Initiatives - Energy Manager Initiative
Verified 12 0%
Adjustment to 2017 savings True-up 12 0.00% 0.00% 0.00% 0.00% 0.00% 0.00% 0.00% 0.00% 0.00% 0.00% 0.00% 0.00% 0.00% 0.00%
Low Income Program14 Low Income Initiative Verified 12 0%
Adjustment to 2017 savings True-up 12 0.00% 0.00% 0.00% 0.00% 0.00% 0.00% 0.00% 0.00% 0.00% 0.00% 0.00% 0.00% 0.00% 0.00%
Other15 Aboriginal Conservation Program Verified 0 0%
Adjustment to 2017 savings True-up 0 0.00% 0.00% 0.00% 0.00% 0.00% 0.00% 0.00% 0.00% 0.00% 0.00% 0.00% 0.00% 0.00% 0.00%
16 Program Enabled Savings Verified 0 0%Adjustment to 2017 savings True-up 0 0.00% 0.00% 0.00% 0.00% 0.00% 0.00% 0.00% 0.00% 0.00% 0.00% 0.00% 0.00% 0.00% 0.00%
Conservation Fund Pilots17 Conservation Fund Pilot - EnerNOC Verified 12 0%
Adjustment to 2017 savings True-up 12 0.00% 0.00% 0.00% 0.00% 0.00% 0.00% 0.00% 0.00% 0.00% 0.00% 0.00% 0.00% 0.00% 0.00%
18 Loblaws Pilot Verified 12 0%Adjustment to 2017 savings True-up 12 0.00% 0.00% 0.00% 0.00% 0.00% 0.00% 0.00% 0.00% 0.00% 0.00% 0.00% 0.00% 0.00% 0.00%
19 Conservation Fund Pilot - SEG Verified 12 0%Adjustment to 2017 savings True-up 12 0.00% 0.00% 0.00% 0.00% 0.00% 0.00% 0.00% 0.00% 0.00% 0.00% 0.00% 0.00% 0.00% 0.00%
20 Social Benchmarking Pliot Verified 12 0%Adjustment to 2017 savings True-up 12 0.00% 0.00% 0.00% 0.00% 0.00% 0.00% 0.00% 0.00% 0.00% 0.00% 0.00% 0.00% 0.00% 0.00%
Conservation First FrameworkResidential Province-Wide Programs
21 Save on Energy Coupon Program Verified 857,052 689,875 689,875 689,875 689,875 689,875 689,875 689,868 689,868 688,163 168 135 135 135 135 135 135 135 135 135 93.00% 7.00% 100%Adjustment to 2017 savings True-up 93.00% 7.00% 0.00% 0.00% 0.00% 0.00% 0.00% 0.00% 0.00% 0.00% 0.00% 0.00% 0.00% 0.00%
22 Save on Energy Heating and Cooling Program Verified 101,120 101,120 101,120 101,120 101,120 101,120 101,120 101,120 101,120 101,120 20 20 20 20 20 20 20 20 20 20 100.00% 0.00% 100%
Adjustment to 2017 savings True-up 100.00% 0.00% 0.00% 0.00% 0.00% 0.00% 0.00% 0.00% 0.00% 0.00% 0.00% 0.00% 0.00% 0.00%
23 Save on Energy New Construction Program Verified 0%
Adjustment to 2017 savings True-up 0.00% 0.00% 0.00% 0.00% 0.00% 0.00% 0.00% 0.00% 0.00% 0.00% 0.00% 0.00% 0.00% 0.00%
24 Save on Energy Home Assistance Program Verified 51,754 51,754 51,754 51,754 51,754 51,754 51,754 51,754 51,754 51,754 10 10 10 10 10 10 10 10 10 10 100.00% 0.00% 100%Adjustment to 2017 savings True-up 100.00% 0.00% 0.00% 0.00% 0.00% 0.00% 0.00% 0.00% 0.00% 0.00% 0.00% 0.00% 0.00% 0.00%
Non-Residential Province-Wide Programs25 Save on Energy Audit Funding Program Verified 12 0%
Adjustment to 2017 savings True-up 12 0.00% 0.00% 0.00% 0.00% 0.00% 0.00% 0.00% 0.00% 0.00% 0.00% 0.00% 0.00% 0.00% 0.00%
26 Save on Energy Retrofit Program Verified 223,856 223,856 223,856 223,856 223,856 220,692 220,692 220,692 220,692 220,692 12 44 44 44 44 44 43 43 43 43 43 40.32% 25.73% 33.95% 100%Adjustment to 2017 savings True-up 12 40.32% 0.00% 25.73% 33.95% 0.00% 0.00% 0.00% 0.00% 0.00% 0.00% 0.00% 0.00% 0.00% 0.00%
27 Save on Energy Small Business Lighting Program
Verified 195,332 195,332 192,702 176,701 158,062 121,958 80,079 75,837 64,230 58,121 12 38 38 38 35 31 24 16 15 13 11 98.45% 1.55% 100%
Adjustment to 2017 savings True-up 12 98.45% 0.00% 1.55% 0.00% 0.00% 0.00% 0.00% 0.00% 0.00% 0.00% 0.00% 0.00% 0.00% 0.00%
28 Save on Energy High Performance New Construction Program
Verified 12 0%
Adjustment to 2017 savings True-up 12 0.00% 0.00% 0.00% 0.00% 0.00% 0.00% 0.00% 0.00% 0.00% 0.00% 0.00% 0.00% 0.00% 0.00%
29 Save on Energy Existing Building Commissioning Program
Verified 3 0%
Adjustment to 2017 savings True-up 3 0.00% 0.00% 0.00% 0.00% 0.00% 0.00% 0.00% 0.00% 0.00% 0.00% 0.00% 0.00% 0.00% 0.00%
30 Save on Energy Instant Discount Program Verified 806,051 583,733 583,733 583,733 583,733 583,733 583,733 583,721 583,721 583,721 12 158 114 114 114 114 114 114 114 114 114 93.00% 7.00% 100%Adjustment to 2017 savings True-up 12 93.00% 7.00% 0.00% 0.00% 0.00% 0.00% 0.00% 0.00% 0.00% 0.00% 0.00% 0.00% 0.00% 0.00%
31 Instant Savings Local Program Verified 384,362 384,362 384,362 384,362 384,362 384,362 384,362 384,362 384,362 384,362 12 75 75 75 75 75 75 75 75 75 75 100.00% 100%Adjustment to 2017 savings True-up 12 100.00% 0.00% 0.00% 0.00% 0.00% 0.00% 0.00% 0.00% 0.00% 0.00% 0.00% 0.00% 0.00% 0.00%
32 Save on Energy Energy Manager Program Verified 12 0%Adjustment to 2017 savings True-up 12 0.00% 0.00% 0.00% 0.00% 0.00% 0.00% 0.00% 0.00% 0.00% 0.00% 0.00% 0.00% 0.00% 0.00%
Local & Regional Programs33 Business Refrigeration Local Program Verified 0 0%
Adjustment to 2017 savings True-up 0 0.00% 0.00% 0.00% 0.00% 0.00% 0.00% 0.00% 0.00% 0.00% 0.00% 0.00% 0.00% 0.00% 0.00%
34 First Nation Conservation Local Program Verified 0 0%Adjustment to 2017 savings True-up 0 0.00% 0.00% 0.00% 0.00% 0.00% 0.00% 0.00% 0.00% 0.00% 0.00% 0.00% 0.00% 0.00% 0.00%
35 Social Benchmarking Local Program Verified 0 0%Adjustment to 2017 savings True-up 0 0.00% 0.00% 0.00% 0.00% 0.00% 0.00% 0.00% 0.00% 0.00% 0.00% 0.00% 0.00% 0.00% 0.00%
Pilot Programs36 Whole Home Pilot Program Verified 20,741 20,741 20,741 20,741 20,741 20,741 20,741 20,741 20,741 20,741 12 4 4 4 4 4 4 4 4 4 4 100.00% 0.00% 100%
Adjustment to 2017 savings True-up 12 100.00% 0.00% 0.00% 0.00% 0.00% 0.00% 0.00% 0.00% 0.00% 0.00% 0.00% 0.00% 0.00% 0.00%
37 EnWin Utilities Ltd. - Building Optimization Pilot
Verified 12 0%
Adjustment to 2017 savings True-up 12 0.00% 0.00% 0.00% 0.00% 0.00% 0.00% 0.00% 0.00% 0.00% 0.00% 0.00% 0.00% 0.00% 0.00%
38 EnWin Utilities Ltd. - Re-Invest Pilot Verified 12 0%Adjustment to 2017 savings True-up 12 0.00% 0.00% 0.00% 0.00% 0.00% 0.00% 0.00% 0.00% 0.00% 0.00% 0.00% 0.00% 0.00% 0.00%
39 Horizon Utilities Corporation - ECM Furnace Motor Pilot
Verified 12 0%
Adjustment to 2017 savings True-up 12 0.00% 0.00% 0.00% 0.00% 0.00% 0.00% 0.00% 0.00% 0.00% 0.00% 0.00% 0.00% 0.00% 0.00%
40 Horizon Utilities Corporation - Social Benchmarking Pilot
Verified 12 0%
Adjustment to 2017 savings True-up 12 0.00% 0.00% 0.00% 0.00% 0.00% 0.00% 0.00% 0.00% 0.00% 0.00% 0.00% 0.00% 0.00% 0.00%
41Hydro Ottawa Limited - Conservation Voltage Regulation (CVR) Leveraging AMI Data Pilot Verified 12 0%
Adjustment to 2017 savings True-up 12 0.00% 0.00% 0.00% 0.00% 0.00% 0.00% 0.00% 0.00% 0.00% 0.00% 0.00% 0.00% 0.00% 0.00%

20 of 25
42 Hydro Ottawa Limited - Residential Demand Response Wi-Fi Thermostat Pilot
Verified 0%
Adjustment to 2017 savings True-up 0.00% 0.00% 0.00% 0.00% 0.00% 0.00% 0.00% 0.00% 0.00% 0.00% 0.00% 0.00% 0.00% 0.00%
43 Kitchener-Wilmot Hydro Inc. - Pilot - DCKV Verified 12 0%Adjustment to 2017 savings True-up 12 0.00% 0.00% 0.00% 0.00% 0.00% 0.00% 0.00% 0.00% 0.00% 0.00% 0.00% 0.00% 0.00% 0.00%
44Niagara-on-the-Lake Hydro Inc. - Direct Install Energy Efficiency Measures for the Agricultural Sector
Verified 12 0%
Adjustment to 2017 savings True-up 12 0.00% 0.00% 0.00% 0.00% 0.00% 0.00% 0.00% 0.00% 0.00% 0.00% 0.00% 0.00% 0.00% 0.00%
45 Oakville Hydro Electricity Distribution Inc. - Direct Install - Hydronic
Verified 12 0%
Adjustment to 2017 savings True-up 12 0.00% 0.00% 0.00% 0.00% 0.00% 0.00% 0.00% 0.00% 0.00% 0.00% 0.00% 0.00% 0.00% 0.00%
46 Oakville Hydro Electricity Distribution Inc. - Direct Install - RTU Controls
Verified 12 0%
Adjustment to 2017 savings True-up 12 0.00% 0.00% 0.00% 0.00% 0.00% 0.00% 0.00% 0.00% 0.00% 0.00% 0.00% 0.00% 0.00% 0.00%
47 Toronto Hydro-Electric System Limited - Direct Install - Hydronic (Pilot Savings)
Verified 12 0%
Adjustment to 2017 savings True-up 12 0.00% 0.00% 0.00% 0.00% 0.00% 0.00% 0.00% 0.00% 0.00% 0.00% 0.00% 0.00% 0.00% 0.00%
48 Toronto Hydro-Electric System Limited - Direct Install - RTU Controls (Pilot Savings)
Verified 12 0%
Adjustment to 2017 savings True-up 12 0.00% 0.00% 0.00% 0.00% 0.00% 0.00% 0.00% 0.00% 0.00% 0.00% 0.00% 0.00% 0.00% 0.00%
49 Toronto Hydro-Electric System Limited - PFP - Large (Pilot Savings)
Verified 12 0%
Adjustment to 2017 savings True-up 12 0.00% 0.00% 0.00% 0.00% 0.00% 0.00% 0.00% 0.00% 0.00% 0.00% 0.00% 0.00% 0.00% 0.00%
Actual CDM Savings in 2017 2,640,268 2,250,773 2,248,143 2,232,142 2,213,503 2,174,235 2,132,356 2,128,095 2,116,488 2,108,674 517 441 441 437 434 426 418 417 415 413 2,387,226 116,417 143 2,039 0 0 0 0 0 0 0 0 0 0Forecast CDM Savings in 2017 401,505 29,343 755 3,054 0 0 0 0 0 0 0 0 0 0
Distribution Rate in 2017 $0.03110 $0.14350 $3.16910 $0.21640 $0.00000 $0.00000 $0.00000 $0.00000 $0.00000 $0.00000 $0.00000 $0.00000 $0.00000 $0.00000Lost Revenue in 2017 from 2011 programs $2,531.67 $700.88 $0.00 $0.00 $0.00 $0.00 $0.00 $0.00 $0.00 $0.00 $0.00 $0.00 $0.00 $0.00 $3,232.56Lost Revenue in 2017 from 2012 programs $2,250.48 $464.58 $1,078.97 $0.00 $0.00 $0.00 $0.00 $0.00 $0.00 $0.00 $0.00 $0.00 $0.00 $0.00 $3,794.03Lost Revenue in 2017 from 2013 programs $8,451.80 $543.77 $749.71 $0.00 $0.00 $0.00 $0.00 $0.00 $0.00 $0.00 $0.00 $0.00 $0.00 $0.00 $9,745.28Lost Revenue in 2017 from 2014 programs $19,486.03 $3,118.80 $1,024.20 $2,255.32 $0.00 $0.00 $0.00 $0.00 $0.00 $0.00 $0.00 $0.00 $0.00 $0.00 $25,884.36Lost Revenue in 2017 from 2015 programs $19,885.53 $3,533.83 $30.94 $47,636.13 $0.00 $0.00 $0.00 $0.00 $0.00 $0.00 $0.00 $0.00 $0.00 $0.00 $71,086.43Lost Revenue in 2017 from 2016 programs $42,258.49 $9,658.69 $86.41 $0.00 $0.00 $0.00 $0.00 $0.00 $0.00 $0.00 $0.00 $0.00 $0.00 $0.00 $52,003.58Lost Revenue in 2017 from 2017 programs $74,242.72 $16,705.87 $451.89 $441.26 $0.00 $0.00 $0.00 $0.00 $0.00 $0.00 $0.00 $0.00 $0.00 $0.00 $91,841.75Total Lost Revenues in 2017 $169,106.74 $34,726.42 $3,422.12 $50,332.71 $0.00 $0.00 $0.00 $0.00 $0.00 $0.00 $0.00 $0.00 $0.00 $0.00 $257,587.99Forecast Lost Revenues in 2017 $12,486.81 $4,210.72 $2,392.67 $660.89 $0.00 $0.00 $0.00 $0.00 $0.00 $0.00 $0.00 $0.00 $0.00 $0.00 $19,751.08LRAMVA in 2017 $237,836.91
2017 Savings Persisting in 2018 2,024,996 89,153 143 75,999 0 0 0 0 0 0 0 0 0 02017 Savings Persisting in 2019 2,022,406 89,153 142 75,999 0 0 0 0 0 0 0 0 0 02017 Savings Persisting in 2020 2,006,653 89,153 142 75,999 0 0 0 0 0 0 0 0 0 0
Note: LDC to make note of key assumptions included above - Included reduction in Street Lighting savings; Used API kW/kWh ratio for demand. See Tab 1a for rationale
Table 5-d. 2018 Lost Revenues Work Form Return to top
Net Energy Savings (kWh)
Net Demand Savings (kW)
2018 2019 2020 2021 2022 2023 2024 2025 2026 2027 2018 2019 2020 2021 2022 2023 2024 2025 2026 2027 R1 (kWh) Seasonal (kWh) R2 (kW) Street Lights
(kWh) Total
Legacy Framework kWh kWh kw kWh 0 0 0 0 0 0 0 0 0 0Actual CDM Savings in 2018 0 0 0 0 0 0 0 0 0 0 0 0 0 0 0 0Forecast CDM Savings in 2018 0 0 0 0 0 0 0 0 0 0 0 0 0 0
Distribution Rate in 2018 $0.02980 $0.14020 $3.26290 $0.23900 $0.00000 $0.00000 $0.00000 $0.00000 $0.00000 $0.00000 $0.00000 $0.00000 $0.00000 $0.00000Lost Revenue in 2018 from 2011 programs $2,416.97 $681.62 $0.00 $0.00 $0.00 $0.00 $0.00 $0.00 $0.00 $0.00 $0.00 $0.00 $0.00 $0.00 $3,098.59Lost Revenue in 2018 from 2012 programs $1,731.15 $303.30 $1,110.91 $0.00 $0.00 $0.00 $0.00 $0.00 $0.00 $0.00 $0.00 $0.00 $0.00 $0.00 $3,145.36Lost Revenue in 2018 from 2013 programs $7,649.21 $409.62 $769.63 $0.00 $0.00 $0.00 $0.00 $0.00 $0.00 $0.00 $0.00 $0.00 $0.00 $0.00 $8,828.46Lost Revenue in 2018 from 2014 programs $16,147.88 $2,856.03 $1,054.52 $2,490.86 $0.00 $0.00 $0.00 $0.00 $0.00 $0.00 $0.00 $0.00 $0.00 $0.00 $22,549.28Lost Revenue in 2018 from 2015 programs $19,792.75 $3,452.57 $31.86 $52,611.06 $0.00 $0.00 $0.00 $0.00 $0.00 $0.00 $0.00 $0.00 $0.00 $0.00 $75,888.24Lost Revenue in 2018 from 2016 programs $40,492.06 $9,436.57 $88.96 $0.00 $0.00 $0.00 $0.00 $0.00 $0.00 $0.00 $0.00 $0.00 $0.00 $0.00 $50,017.59Lost Revenue in 2018 from 2017 programs $60,344.87 $12,499.19 $465.26 $18,163.79 $0.00 $0.00 $0.00 $0.00 $0.00 $0.00 $0.00 $0.00 $0.00 $0.00 $91,473.11Lost Revenue in 2018 from 2018 programs $0.00 $0.00 $0.00 $0.00 $0.00 $0.00 $0.00 $0.00 $0.00 $0.00 $0.00 $0.00 $0.00 $0.00 $0.00Total Lost Revenues in 2018 $148,574.88 $29,638.90 $3,521.14 $73,265.71 $0.00 $0.00 $0.00 $0.00 $0.00 $0.00 $0.00 $0.00 $0.00 $0.00 $255,000.62Forecast Lost Revenues in 2018 $0.00 $0.00 $0.00 $0.00 $0.00 $0.00 $0.00 $0.00 $0.00 $0.00 $0.00 $0.00 $0.00 $0.00 $0.00LRAMVA in 2018 $255,000.62
2018 Savings Persisting in 2019 0 0 0 0 0 0 0 0 0 0 0 0 0 02018 Savings Persisting in 2020 0 0 0 0 0 0 0 0 0 0 0 0 0 0
Note: LDC to make note of key assumptions included above
Table 5-e. 2019 Lost Revenues Work Form Return to top
Net Energy Savings (kWh)
Net Demand Savings (kW)
2019 2020 2021 2022 2023 2024 2025 2026 2027 2028 2019 2020 2021 2022 2023 2024 2025 2026 2027 2028 R1 (kWh) Seasonal (kWh) R2 (kW) Street Lights
(kWh) Total
Legacy Framework kWh kWh kw kWh 0 0 0 0 0 0 0 0 0 0Actual CDM Savings in 2019 0 0 0 0 0 0 0 0 0 0 0 0 0 0 0 0Forecast CDM Savings in 2019 0 0 0 0 0 0 0 0 0 0 0 0 0 0
Distribution Rate in 2019 $0.02830 $0.13380 $3.34510 $0.30840 $0.00000 $0.00000 $0.00000 $0.00000 $0.00000 $0.00000 $0.00000 $0.00000 $0.00000 $0.00000Lost Revenue in 2019 from 2011 programs $2,785.37 $824.90 $0.00 $0.00 $0.00 $0.00 $0.00 $0.00 $0.00 $0.00 $0.00 $0.00 $0.00 $0.00 $3,610.27Lost Revenue in 2019 from 2012 programs $1,642.19 $288.81 $1,138.90 $0.00 $0.00 $0.00 $0.00 $0.00 $0.00 $0.00 $0.00 $0.00 $0.00 $0.00 $3,069.89Lost Revenue in 2019 from 2013 programs $7,212.20 $390.92 $789.02 $0.00 $0.00 $0.00 $0.00 $0.00 $0.00 $0.00 $0.00 $0.00 $0.00 $0.00 $8,392.14Lost Revenue in 2019 from 2014 programs $14,937.32 $2,584.11 $1,081.08 $3,214.14 $0.00 $0.00 $0.00 $0.00 $0.00 $0.00 $0.00 $0.00 $0.00 $0.00 $21,816.65Lost Revenue in 2019 from 2015 programs $18,613.95 $3,230.01 $32.66 $67,888.08 $0.00 $0.00 $0.00 $0.00 $0.00 $0.00 $0.00 $0.00 $0.00 $0.00 $89,764.70Lost Revenue in 2019 from 2016 programs $38,453.87 $9,005.80 $91.20 $0.00 $0.00 $0.00 $0.00 $0.00 $0.00 $0.00 $0.00 $0.00 $0.00 $0.00 $47,550.87Lost Revenue in 2019 from 2017 programs $57,234.10 $11,928.61 $476.66 $23,438.13 $0.00 $0.00 $0.00 $0.00 $0.00 $0.00 $0.00 $0.00 $0.00 $0.00 $93,077.50Lost Revenue in 2019 from 2018 programs $0.00 $0.00 $0.00 $0.00 $0.00 $0.00 $0.00 $0.00 $0.00 $0.00 $0.00 $0.00 $0.00 $0.00 $0.00Lost Revenue in 2019 from 2019 programs $0.00 $0.00 $0.00 $0.00 $0.00 $0.00 $0.00 $0.00 $0.00 $0.00 $0.00 $0.00 $0.00 $0.00 $0.00Total Lost Revenues in 2019 $140,878.99 $28,253.16 $3,609.52 $94,540.35 $0.00 $0.00 $0.00 $0.00 $0.00 $0.00 $0.00 $0.00 $0.00 $0.00 $267,282.02Forecast Lost Revenues in 2019 $0.00 $0.00 $0.00 $0.00 $0.00 $0.00 $0.00 $0.00 $0.00 $0.00 $0.00 $0.00 $0.00 $0.00 $0.00LRAMVA in 2019 $267,282.02
2019 Savings Persisting in 2020 0 0 0 0 0 0 0 0 0 0 0 0 0 0
Note: LDC to make note of key assumptions included above
Table 5-f. 2020 Lost Revenues Work Form Return to top
Net Energy Savings (kWh)
Net Demand Savings (kW)
2020 2021 2022 2023 2024 2025 2026 2027 2028 2029 2020 2021 2022 2023 2024 2025 2026 2027 2028 2029 R1 (kWh) Seasonal (kWh) R2 (kW) Street Lights
(kWh) Total
Legacy Framework kWh kWh kw kWh 0 0 0 0 0 0 0 0 0 0Actual CDM Savings in 2020 0 0 0 0 0 0 0 0 0 0 0 0 0 0 0 0Forecast CDM Savings in 2020 0 0 0 0 0 0 0 0 0 0 0 0 0 0
Program Results Status
Net Energy Savings Persistence (kWh)
Monthly Multiplier
Rate Allocations for LRAMVA
Net Peak Demand Savings Persistence (kW)
Program Results Status
Net Energy Savings Persistence (kWh)
Monthly Multiplier
Net Peak Demand Savings Persistence (kW) Rate Allocations for LRAMVA
Rate Allocations for LRAMVA
Net Peak Demand Savings Persistence (kW)
Monthly MultiplierProgram Results
Status
Net Energy Savings Persistence (kWh)

21 of 25
Distribution Rate in 2020 $0.00000 $0.00000 $0.00000 $0.00000 $0.00000 $0.00000 $0.00000 $0.00000 $0.00000 $0.00000 $0.00000 $0.00000 $0.00000 $0.00000Lost Revenue in 2020 from 2011 programs $0.00 $0.00 $0.00 $0.00 $0.00 $0.00 $0.00 $0.00 $0.00 $0.00 $0.00 $0.00 $0.00 $0.00 $0.00Lost Revenue in 2020 from 2012 programs $0.00 $0.00 $0.00 $0.00 $0.00 $0.00 $0.00 $0.00 $0.00 $0.00 $0.00 $0.00 $0.00 $0.00 $0.00Lost Revenue in 2020 from 2013 programs $0.00 $0.00 $0.00 $0.00 $0.00 $0.00 $0.00 $0.00 $0.00 $0.00 $0.00 $0.00 $0.00 $0.00 $0.00Lost Revenue in 2020 from 2014 programs $0.00 $0.00 $0.00 $0.00 $0.00 $0.00 $0.00 $0.00 $0.00 $0.00 $0.00 $0.00 $0.00 $0.00 $0.00Lost Revenue in 2020 from 2015 programs $0.00 $0.00 $0.00 $0.00 $0.00 $0.00 $0.00 $0.00 $0.00 $0.00 $0.00 $0.00 $0.00 $0.00 $0.00Lost Revenue in 2020 from 2016 programs $0.00 $0.00 $0.00 $0.00 $0.00 $0.00 $0.00 $0.00 $0.00 $0.00 $0.00 $0.00 $0.00 $0.00 $0.00Lost Revenue in 2020 from 2017 programs $0.00 $0.00 $0.00 $0.00 $0.00 $0.00 $0.00 $0.00 $0.00 $0.00 $0.00 $0.00 $0.00 $0.00 $0.00Lost Revenue in 2020 from 2018 programs $0.00 $0.00 $0.00 $0.00 $0.00 $0.00 $0.00 $0.00 $0.00 $0.00 $0.00 $0.00 $0.00 $0.00 $0.00Lost Revenue in 2020 from 2019 programs $0.00 $0.00 $0.00 $0.00 $0.00 $0.00 $0.00 $0.00 $0.00 $0.00 $0.00 $0.00 $0.00 $0.00 $0.00Lost Revenue in 2020 from 2020 programs $0.00 $0.00 $0.00 $0.00 $0.00 $0.00 $0.00 $0.00 $0.00 $0.00 $0.00 $0.00 $0.00 $0.00 $0.00Total Lost Revenues in 2020 $0.00 $0.00 $0.00 $0.00 $0.00 $0.00 $0.00 $0.00 $0.00 $0.00 $0.00 $0.00 $0.00 $0.00 $0.00Forecast Lost Revenues in 2020 $0.00 $0.00 $0.00 $0.00 $0.00 $0.00 $0.00 $0.00 $0.00 $0.00 $0.00 $0.00 $0.00 $0.00 $0.00LRAMVA in 2020 $0.00
Note: LDC to make note of key assumptions included above
Return to top
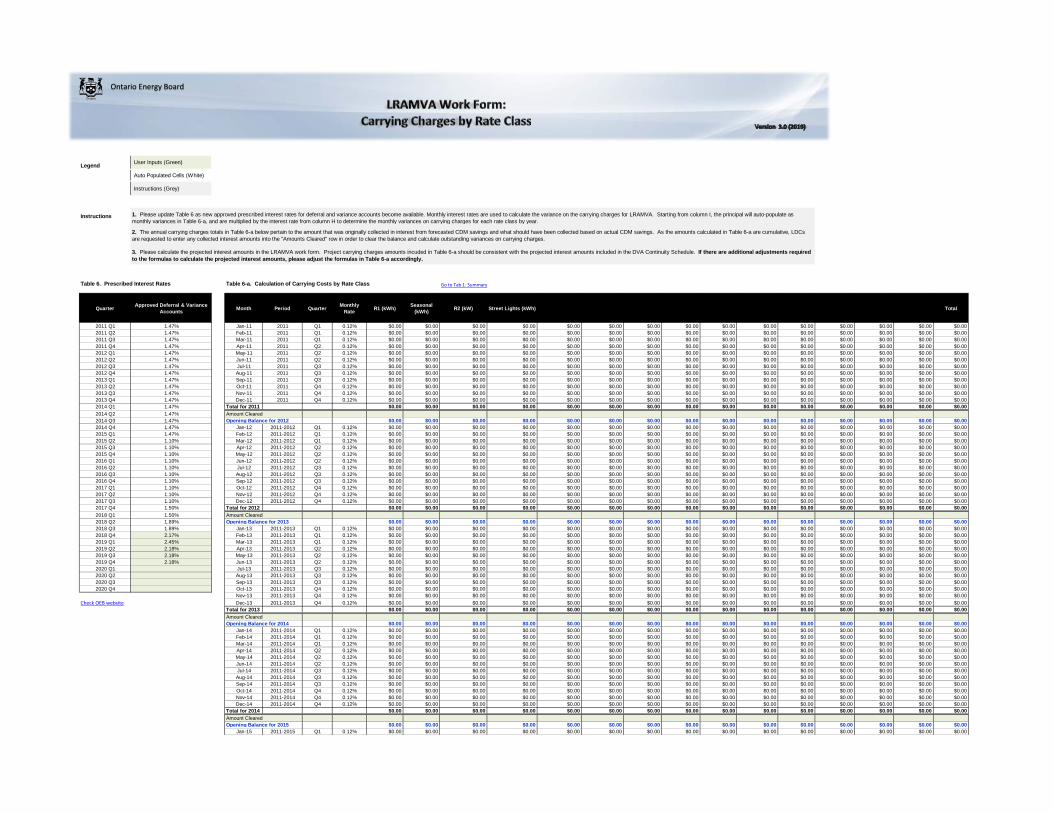
Legend User Inputs (Green)
Auto Populated Cells (White)
Instructions (Grey)
Instructions
Table 6-a. Calculation of Carrying Costs by Rate Class Go to Tab 1: Summary
Quarter Approved Deferral & Variance Accounts Month Period Quarter Monthly
Rate R1 (kWh) Seasonal (kWh) R2 (kW) Street Lights (kWh) Total
2011 Q1 1.47% Jan-11 2011 Q1 0.12% $0.00 $0.00 $0.00 $0.00 $0.00 $0.00 $0.00 $0.00 $0.00 $0.00 $0.00 $0.00 $0.00 $0.00 $0.002011 Q2 1.47% Feb-11 2011 Q1 0.12% $0.00 $0.00 $0.00 $0.00 $0.00 $0.00 $0.00 $0.00 $0.00 $0.00 $0.00 $0.00 $0.00 $0.00 $0.002011 Q3 1.47% Mar-11 2011 Q1 0.12% $0.00 $0.00 $0.00 $0.00 $0.00 $0.00 $0.00 $0.00 $0.00 $0.00 $0.00 $0.00 $0.00 $0.00 $0.002011 Q4 1.47% Apr-11 2011 Q2 0.12% $0.00 $0.00 $0.00 $0.00 $0.00 $0.00 $0.00 $0.00 $0.00 $0.00 $0.00 $0.00 $0.00 $0.00 $0.002012 Q1 1.47% May-11 2011 Q2 0.12% $0.00 $0.00 $0.00 $0.00 $0.00 $0.00 $0.00 $0.00 $0.00 $0.00 $0.00 $0.00 $0.00 $0.00 $0.002012 Q2 1.47% Jun-11 2011 Q2 0.12% $0.00 $0.00 $0.00 $0.00 $0.00 $0.00 $0.00 $0.00 $0.00 $0.00 $0.00 $0.00 $0.00 $0.00 $0.002012 Q3 1.47% Jul-11 2011 Q3 0.12% $0.00 $0.00 $0.00 $0.00 $0.00 $0.00 $0.00 $0.00 $0.00 $0.00 $0.00 $0.00 $0.00 $0.00 $0.002012 Q4 1.47% Aug-11 2011 Q3 0.12% $0.00 $0.00 $0.00 $0.00 $0.00 $0.00 $0.00 $0.00 $0.00 $0.00 $0.00 $0.00 $0.00 $0.00 $0.002013 Q1 1.47% Sep-11 2011 Q3 0.12% $0.00 $0.00 $0.00 $0.00 $0.00 $0.00 $0.00 $0.00 $0.00 $0.00 $0.00 $0.00 $0.00 $0.00 $0.002013 Q2 1.47% Oct-11 2011 Q4 0.12% $0.00 $0.00 $0.00 $0.00 $0.00 $0.00 $0.00 $0.00 $0.00 $0.00 $0.00 $0.00 $0.00 $0.00 $0.002013 Q3 1.47% Nov-11 2011 Q4 0.12% $0.00 $0.00 $0.00 $0.00 $0.00 $0.00 $0.00 $0.00 $0.00 $0.00 $0.00 $0.00 $0.00 $0.00 $0.002013 Q4 1.47% Dec-11 2011 Q4 0.12% $0.00 $0.00 $0.00 $0.00 $0.00 $0.00 $0.00 $0.00 $0.00 $0.00 $0.00 $0.00 $0.00 $0.00 $0.002014 Q1 1.47% Total for 2011 $0.00 $0.00 $0.00 $0.00 $0.00 $0.00 $0.00 $0.00 $0.00 $0.00 $0.00 $0.00 $0.00 $0.00 $0.002014 Q2 1.47% Amount Cleared2014 Q3 1.47% Opening Balance for 2012 $0.00 $0.00 $0.00 $0.00 $0.00 $0.00 $0.00 $0.00 $0.00 $0.00 $0.00 $0.00 $0.00 $0.00 $0.002014 Q4 1.47% Jan-12 2011-2012 Q1 0.12% $0.00 $0.00 $0.00 $0.00 $0.00 $0.00 $0.00 $0.00 $0.00 $0.00 $0.00 $0.00 $0.00 $0.00 $0.002015 Q1 1.47% Feb-12 2011-2012 Q1 0.12% $0.00 $0.00 $0.00 $0.00 $0.00 $0.00 $0.00 $0.00 $0.00 $0.00 $0.00 $0.00 $0.00 $0.00 $0.002015 Q2 1.10% Mar-12 2011-2012 Q1 0.12% $0.00 $0.00 $0.00 $0.00 $0.00 $0.00 $0.00 $0.00 $0.00 $0.00 $0.00 $0.00 $0.00 $0.00 $0.002015 Q3 1.10% Apr-12 2011-2012 Q2 0.12% $0.00 $0.00 $0.00 $0.00 $0.00 $0.00 $0.00 $0.00 $0.00 $0.00 $0.00 $0.00 $0.00 $0.00 $0.002015 Q4 1.10% May-12 2011-2012 Q2 0.12% $0.00 $0.00 $0.00 $0.00 $0.00 $0.00 $0.00 $0.00 $0.00 $0.00 $0.00 $0.00 $0.00 $0.00 $0.002016 Q1 1.10% Jun-12 2011-2012 Q2 0.12% $0.00 $0.00 $0.00 $0.00 $0.00 $0.00 $0.00 $0.00 $0.00 $0.00 $0.00 $0.00 $0.00 $0.00 $0.002016 Q2 1.10% Jul-12 2011-2012 Q3 0.12% $0.00 $0.00 $0.00 $0.00 $0.00 $0.00 $0.00 $0.00 $0.00 $0.00 $0.00 $0.00 $0.00 $0.00 $0.002016 Q3 1.10% Aug-12 2011-2012 Q3 0.12% $0.00 $0.00 $0.00 $0.00 $0.00 $0.00 $0.00 $0.00 $0.00 $0.00 $0.00 $0.00 $0.00 $0.00 $0.002016 Q4 1.10% Sep-12 2011-2012 Q3 0.12% $0.00 $0.00 $0.00 $0.00 $0.00 $0.00 $0.00 $0.00 $0.00 $0.00 $0.00 $0.00 $0.00 $0.00 $0.002017 Q1 1.10% Oct-12 2011-2012 Q4 0.12% $0.00 $0.00 $0.00 $0.00 $0.00 $0.00 $0.00 $0.00 $0.00 $0.00 $0.00 $0.00 $0.00 $0.00 $0.002017 Q2 1.10% Nov-12 2011-2012 Q4 0.12% $0.00 $0.00 $0.00 $0.00 $0.00 $0.00 $0.00 $0.00 $0.00 $0.00 $0.00 $0.00 $0.00 $0.00 $0.002017 Q3 1.10% Dec-12 2011-2012 Q4 0.12% $0.00 $0.00 $0.00 $0.00 $0.00 $0.00 $0.00 $0.00 $0.00 $0.00 $0.00 $0.00 $0.00 $0.00 $0.002017 Q4 1.50% Total for 2012 $0.00 $0.00 $0.00 $0.00 $0.00 $0.00 $0.00 $0.00 $0.00 $0.00 $0.00 $0.00 $0.00 $0.00 $0.002018 Q1 1.50% Amount Cleared2018 Q2 1.89% Opening Balance for 2013 $0.00 $0.00 $0.00 $0.00 $0.00 $0.00 $0.00 $0.00 $0.00 $0.00 $0.00 $0.00 $0.00 $0.00 $0.002018 Q3 1.89% Jan-13 2011-2013 Q1 0.12% $0.00 $0.00 $0.00 $0.00 $0.00 $0.00 $0.00 $0.00 $0.00 $0.00 $0.00 $0.00 $0.00 $0.00 $0.002018 Q4 2.17% Feb-13 2011-2013 Q1 0.12% $0.00 $0.00 $0.00 $0.00 $0.00 $0.00 $0.00 $0.00 $0.00 $0.00 $0.00 $0.00 $0.00 $0.00 $0.002019 Q1 2.45% Mar-13 2011-2013 Q1 0.12% $0.00 $0.00 $0.00 $0.00 $0.00 $0.00 $0.00 $0.00 $0.00 $0.00 $0.00 $0.00 $0.00 $0.00 $0.002019 Q2 2.18% Apr-13 2011-2013 Q2 0.12% $0.00 $0.00 $0.00 $0.00 $0.00 $0.00 $0.00 $0.00 $0.00 $0.00 $0.00 $0.00 $0.00 $0.00 $0.002019 Q3 2.18% May-13 2011-2013 Q2 0.12% $0.00 $0.00 $0.00 $0.00 $0.00 $0.00 $0.00 $0.00 $0.00 $0.00 $0.00 $0.00 $0.00 $0.00 $0.002019 Q4 2.18% Jun-13 2011-2013 Q2 0.12% $0.00 $0.00 $0.00 $0.00 $0.00 $0.00 $0.00 $0.00 $0.00 $0.00 $0.00 $0.00 $0.00 $0.00 $0.002020 Q1 Jul-13 2011-2013 Q3 0.12% $0.00 $0.00 $0.00 $0.00 $0.00 $0.00 $0.00 $0.00 $0.00 $0.00 $0.00 $0.00 $0.00 $0.00 $0.002020 Q2 Aug-13 2011-2013 Q3 0.12% $0.00 $0.00 $0.00 $0.00 $0.00 $0.00 $0.00 $0.00 $0.00 $0.00 $0.00 $0.00 $0.00 $0.00 $0.002020 Q3 Sep-13 2011-2013 Q3 0.12% $0.00 $0.00 $0.00 $0.00 $0.00 $0.00 $0.00 $0.00 $0.00 $0.00 $0.00 $0.00 $0.00 $0.00 $0.002020 Q4 Oct-13 2011-2013 Q4 0.12% $0.00 $0.00 $0.00 $0.00 $0.00 $0.00 $0.00 $0.00 $0.00 $0.00 $0.00 $0.00 $0.00 $0.00 $0.00
Nov-13 2011-2013 Q4 0.12% $0.00 $0.00 $0.00 $0.00 $0.00 $0.00 $0.00 $0.00 $0.00 $0.00 $0.00 $0.00 $0.00 $0.00 $0.00Check OEB website Dec-13 2011-2013 Q4 0.12% $0.00 $0.00 $0.00 $0.00 $0.00 $0.00 $0.00 $0.00 $0.00 $0.00 $0.00 $0.00 $0.00 $0.00 $0.00
Total for 2013 $0.00 $0.00 $0.00 $0.00 $0.00 $0.00 $0.00 $0.00 $0.00 $0.00 $0.00 $0.00 $0.00 $0.00 $0.00Amount ClearedOpening Balance for 2014 $0.00 $0.00 $0.00 $0.00 $0.00 $0.00 $0.00 $0.00 $0.00 $0.00 $0.00 $0.00 $0.00 $0.00 $0.00
Jan-14 2011-2014 Q1 0.12% $0.00 $0.00 $0.00 $0.00 $0.00 $0.00 $0.00 $0.00 $0.00 $0.00 $0.00 $0.00 $0.00 $0.00 $0.00Feb-14 2011-2014 Q1 0.12% $0.00 $0.00 $0.00 $0.00 $0.00 $0.00 $0.00 $0.00 $0.00 $0.00 $0.00 $0.00 $0.00 $0.00 $0.00Mar-14 2011-2014 Q1 0.12% $0.00 $0.00 $0.00 $0.00 $0.00 $0.00 $0.00 $0.00 $0.00 $0.00 $0.00 $0.00 $0.00 $0.00 $0.00Apr-14 2011-2014 Q2 0.12% $0.00 $0.00 $0.00 $0.00 $0.00 $0.00 $0.00 $0.00 $0.00 $0.00 $0.00 $0.00 $0.00 $0.00 $0.00May-14 2011-2014 Q2 0.12% $0.00 $0.00 $0.00 $0.00 $0.00 $0.00 $0.00 $0.00 $0.00 $0.00 $0.00 $0.00 $0.00 $0.00 $0.00Jun-14 2011-2014 Q2 0.12% $0.00 $0.00 $0.00 $0.00 $0.00 $0.00 $0.00 $0.00 $0.00 $0.00 $0.00 $0.00 $0.00 $0.00 $0.00Jul-14 2011-2014 Q3 0.12% $0.00 $0.00 $0.00 $0.00 $0.00 $0.00 $0.00 $0.00 $0.00 $0.00 $0.00 $0.00 $0.00 $0.00 $0.00Aug-14 2011-2014 Q3 0.12% $0.00 $0.00 $0.00 $0.00 $0.00 $0.00 $0.00 $0.00 $0.00 $0.00 $0.00 $0.00 $0.00 $0.00 $0.00Sep-14 2011-2014 Q3 0.12% $0.00 $0.00 $0.00 $0.00 $0.00 $0.00 $0.00 $0.00 $0.00 $0.00 $0.00 $0.00 $0.00 $0.00 $0.00Oct-14 2011-2014 Q4 0.12% $0.00 $0.00 $0.00 $0.00 $0.00 $0.00 $0.00 $0.00 $0.00 $0.00 $0.00 $0.00 $0.00 $0.00 $0.00Nov-14 2011-2014 Q4 0.12% $0.00 $0.00 $0.00 $0.00 $0.00 $0.00 $0.00 $0.00 $0.00 $0.00 $0.00 $0.00 $0.00 $0.00 $0.00Dec-14 2011-2014 Q4 0.12% $0.00 $0.00 $0.00 $0.00 $0.00 $0.00 $0.00 $0.00 $0.00 $0.00 $0.00 $0.00 $0.00 $0.00 $0.00
Total for 2014 $0.00 $0.00 $0.00 $0.00 $0.00 $0.00 $0.00 $0.00 $0.00 $0.00 $0.00 $0.00 $0.00 $0.00 $0.00Amount ClearedOpening Balance for 2015 $0.00 $0.00 $0.00 $0.00 $0.00 $0.00 $0.00 $0.00 $0.00 $0.00 $0.00 $0.00 $0.00 $0.00 $0.00
Jan-15 2011-2015 Q1 0.12% $0.00 $0.00 $0.00 $0.00 $0.00 $0.00 $0.00 $0.00 $0.00 $0.00 $0.00 $0.00 $0.00 $0.00 $0.00
Table 6. Prescribed Interest Rates
1. Please update Table 6 as new approved prescribed interest rates for deferral and variance accounts become available. Monthly interest rates are used to calculate the variance on the carrying charges for LRAMVA. Starting from column I, the principal will auto-populate as monthly variances in Table 6-a, and are multiplied by the interest rate from column H to determine the monthly variances on carrying charges for each rate class by year.
2. The annual carrying charges totals in Table 6-a below pertain to the amount that was originally collected in interest from forecasted CDM savings and what should have been collected based on actual CDM savings. As the amounts calculated in Table 6-a are cumulative, LDCs are requested to enter any collected interest amounts into the "Amounts Cleared" row in order to clear the balance and calculate outstanding variances on carrying charges.
3. Please calculate the projected interest amounts in the LRAMVA work form. Project carrying charges amounts incuded in Table 6-a should be consistent with the projected interest amounts included in the DVA Continuity Schedule. If there are additional adjustments required to the formulas to calculate the projected interest amounts, please adjust the formulas in Table 6-a accordingly.
Ontario Energy Board

Feb-15 2011-2015 Q1 0.12% $6.21 $0.59 $0.05 $1.25 $0.00 $0.00 $0.00 $0.00 $0.00 $0.00 $0.00 $0.00 $0.00 $0.00 $8.11Mar-15 2011-2015 Q1 0.12% $12.43 $1.18 $0.10 $2.51 $0.00 $0.00 $0.00 $0.00 $0.00 $0.00 $0.00 $0.00 $0.00 $0.00 $16.22Apr-15 2011-2015 Q2 0.09% $13.95 $1.33 $0.11 $2.81 $0.00 $0.00 $0.00 $0.00 $0.00 $0.00 $0.00 $0.00 $0.00 $0.00 $18.20May-15 2011-2015 Q2 0.09% $18.60 $1.77 $0.15 $3.75 $0.00 $0.00 $0.00 $0.00 $0.00 $0.00 $0.00 $0.00 $0.00 $0.00 $24.27Jun-15 2011-2015 Q2 0.09% $23.25 $2.21 $0.18 $4.69 $0.00 $0.00 $0.00 $0.00 $0.00 $0.00 $0.00 $0.00 $0.00 $0.00 $30.34Jul-15 2011-2015 Q3 0.09% $27.90 $2.66 $0.22 $5.63 $0.00 $0.00 $0.00 $0.00 $0.00 $0.00 $0.00 $0.00 $0.00 $0.00 $36.40Aug-15 2011-2015 Q3 0.09% $32.55 $3.10 $0.26 $6.56 $0.00 $0.00 $0.00 $0.00 $0.00 $0.00 $0.00 $0.00 $0.00 $0.00 $42.47Sep-15 2011-2015 Q3 0.09% $37.20 $3.54 $0.30 $7.50 $0.00 $0.00 $0.00 $0.00 $0.00 $0.00 $0.00 $0.00 $0.00 $0.00 $48.54Oct-15 2011-2015 Q4 0.09% $41.85 $3.98 $0.33 $8.44 $0.00 $0.00 $0.00 $0.00 $0.00 $0.00 $0.00 $0.00 $0.00 $0.00 $54.60Nov-15 2011-2015 Q4 0.09% $46.50 $4.43 $0.37 $9.38 $0.00 $0.00 $0.00 $0.00 $0.00 $0.00 $0.00 $0.00 $0.00 $0.00 $60.67Dec-15 2011-2015 Q4 0.09% $51.15 $4.87 $0.41 $10.31 $0.00 $0.00 $0.00 $0.00 $0.00 $0.00 $0.00 $0.00 $0.00 $0.00 $66.74
Total for 2015 $311.59 $29.67 $2.48 $62.82 $0.00 $0.00 $0.00 $0.00 $0.00 $0.00 $0.00 $0.00 $0.00 $0.00 $406.56Amount ClearedOpening Balance for 2016 $311.59 $29.67 $2.48 $62.82 $0.00 $0.00 $0.00 $0.00 $0.00 $0.00 $0.00 $0.00 $0.00 $0.00 $406.56
Jan-16 2011-2016 Q1 0.09% $55.80 $5.31 $0.44 $11.25 $0.00 $0.00 $0.00 $0.00 $0.00 $0.00 $0.00 $0.00 $0.00 $0.00 $72.81Feb-16 2011-2016 Q1 0.09% $63.46 $6.47 $0.49 $14.35 $0.00 $0.00 $0.00 $0.00 $0.00 $0.00 $0.00 $0.00 $0.00 $0.00 $84.77Mar-16 2011-2016 Q1 0.09% $71.13 $7.62 $0.53 $17.46 $0.00 $0.00 $0.00 $0.00 $0.00 $0.00 $0.00 $0.00 $0.00 $0.00 $96.73Apr-16 2011-2016 Q2 0.09% $78.79 $8.77 $0.57 $20.56 $0.00 $0.00 $0.00 $0.00 $0.00 $0.00 $0.00 $0.00 $0.00 $0.00 $108.69May-16 2011-2016 Q2 0.09% $86.45 $9.92 $0.62 $23.67 $0.00 $0.00 $0.00 $0.00 $0.00 $0.00 $0.00 $0.00 $0.00 $0.00 $120.66Jun-16 2011-2016 Q2 0.09% $94.11 $11.08 $0.66 $26.77 $0.00 $0.00 $0.00 $0.00 $0.00 $0.00 $0.00 $0.00 $0.00 $0.00 $132.62Jul-16 2011-2016 Q3 0.09% $101.78 $12.23 $0.70 $29.87 $0.00 $0.00 $0.00 $0.00 $0.00 $0.00 $0.00 $0.00 $0.00 $0.00 $144.58Aug-16 2011-2016 Q3 0.09% $109.44 $13.38 $0.75 $32.98 $0.00 $0.00 $0.00 $0.00 $0.00 $0.00 $0.00 $0.00 $0.00 $0.00 $156.54Sep-16 2011-2016 Q3 0.09% $117.10 $14.53 $0.79 $36.08 $0.00 $0.00 $0.00 $0.00 $0.00 $0.00 $0.00 $0.00 $0.00 $0.00 $168.51Oct-16 2011-2016 Q4 0.09% $124.76 $15.69 $0.83 $39.18 $0.00 $0.00 $0.00 $0.00 $0.00 $0.00 $0.00 $0.00 $0.00 $0.00 $180.47Nov-16 2011-2016 Q4 0.09% $132.43 $16.84 $0.88 $42.29 $0.00 $0.00 $0.00 $0.00 $0.00 $0.00 $0.00 $0.00 $0.00 $0.00 $192.43Dec-16 2011-2016 Q4 0.09% $140.09 $17.99 $0.92 $45.39 $0.00 $0.00 $0.00 $0.00 $0.00 $0.00 $0.00 $0.00 $0.00 $0.00 $204.39
Total for 2016 $1,486.93 $169.50 $10.66 $402.67 $0.00 $0.00 $0.00 $0.00 $0.00 $0.00 $0.00 $0.00 $0.00 $0.00 $2,069.75Amount ClearedOpening Balance for 2017 $1,486.93 $169.50 $10.66 $402.67 $0.00 $0.00 $0.00 $0.00 $0.00 $0.00 $0.00 $0.00 $0.00 $0.00 $2,069.75
Jan-17 2011-2017 Q1 0.09% $147.75 $19.14 $0.96 $48.50 $0.00 $0.00 $0.00 $0.00 $0.00 $0.00 $0.00 $0.00 $0.00 $0.00 $216.36Feb-17 2011-2017 Q1 0.09% $159.72 $21.47 $1.04 $52.29 $0.00 $0.00 $0.00 $0.00 $0.00 $0.00 $0.00 $0.00 $0.00 $0.00 $234.52Mar-17 2011-2017 Q1 0.09% $171.68 $23.81 $1.12 $56.08 $0.00 $0.00 $0.00 $0.00 $0.00 $0.00 $0.00 $0.00 $0.00 $0.00 $252.69Apr-17 2011-2017 Q2 0.09% $183.64 $26.14 $1.20 $59.88 $0.00 $0.00 $0.00 $0.00 $0.00 $0.00 $0.00 $0.00 $0.00 $0.00 $270.86May-17 2011-2017 Q2 0.09% $195.61 $28.47 $1.28 $63.67 $0.00 $0.00 $0.00 $0.00 $0.00 $0.00 $0.00 $0.00 $0.00 $0.00 $289.03Jun-17 2011-2017 Q2 0.09% $207.57 $30.80 $1.36 $67.47 $0.00 $0.00 $0.00 $0.00 $0.00 $0.00 $0.00 $0.00 $0.00 $0.00 $307.20Jul-17 2011-2017 Q3 0.09% $219.54 $33.13 $1.44 $71.26 $0.00 $0.00 $0.00 $0.00 $0.00 $0.00 $0.00 $0.00 $0.00 $0.00 $325.36Aug-17 2011-2017 Q3 0.09% $231.50 $35.46 $1.51 $75.06 $0.00 $0.00 $0.00 $0.00 $0.00 $0.00 $0.00 $0.00 $0.00 $0.00 $343.53Sep-17 2011-2017 Q3 0.09% $243.46 $37.79 $1.59 $78.85 $0.00 $0.00 $0.00 $0.00 $0.00 $0.00 $0.00 $0.00 $0.00 $0.00 $361.70Oct-17 2011-2017 Q4 0.13% $348.31 $54.71 $2.28 $112.70 $0.00 $0.00 $0.00 $0.00 $0.00 $0.00 $0.00 $0.00 $0.00 $0.00 $518.00Nov-17 2011-2017 Q4 0.13% $364.63 $57.89 $2.39 $117.87 $0.00 $0.00 $0.00 $0.00 $0.00 $0.00 $0.00 $0.00 $0.00 $0.00 $542.78Dec-17 2011-2017 Q4 0.13% $380.94 $61.07 $2.49 $123.05 $0.00 $0.00 $0.00 $0.00 $0.00 $0.00 $0.00 $0.00 $0.00 $0.00 $567.55
Total for 2017 $4,341.29 $599.38 $29.33 $1,329.34 $0.00 $0.00 $0.00 $0.00 $0.00 $0.00 $0.00 $0.00 $0.00 $0.00 $6,299.33Amount ClearedOpening Balance for 2018 $4,341.29 $599.38 $29.33 $1,329.34 $0.00 $0.00 $0.00 $0.00 $0.00 $0.00 $0.00 $0.00 $0.00 $0.00 $6,299.33
Jan-18 2011-2018 Q1 0.13% $397.26 $64.25 $2.60 $128.22 $0.00 $0.00 $0.00 $0.00 $0.00 $0.00 $0.00 $0.00 $0.00 $0.00 $592.33Feb-18 2011-2018 Q1 0.13% $412.73 $67.34 $2.97 $135.85 $0.00 $0.00 $0.00 $0.00 $0.00 $0.00 $0.00 $0.00 $0.00 $0.00 $618.89Mar-18 2011-2018 Q1 0.13% $428.21 $70.42 $3.33 $143.48 $0.00 $0.00 $0.00 $0.00 $0.00 $0.00 $0.00 $0.00 $0.00 $0.00 $645.45Apr-18 2011-2018 Q2 0.16% $559.04 $92.62 $4.66 $190.41 $0.00 $0.00 $0.00 $0.00 $0.00 $0.00 $0.00 $0.00 $0.00 $0.00 $846.74May-18 2011-2018 Q2 0.16% $578.54 $96.51 $5.13 $200.02 $0.00 $0.00 $0.00 $0.00 $0.00 $0.00 $0.00 $0.00 $0.00 $0.00 $880.21Jun-18 2011-2018 Q2 0.16% $598.04 $100.40 $5.59 $209.64 $0.00 $0.00 $0.00 $0.00 $0.00 $0.00 $0.00 $0.00 $0.00 $0.00 $913.68Jul-18 2011-2018 Q3 0.16% $617.55 $104.29 $6.05 $219.25 $0.00 $0.00 $0.00 $0.00 $0.00 $0.00 $0.00 $0.00 $0.00 $0.00 $947.14Aug-18 2011-2018 Q3 0.16% $637.05 $108.18 $6.51 $228.87 $0.00 $0.00 $0.00 $0.00 $0.00 $0.00 $0.00 $0.00 $0.00 $0.00 $980.61Sep-18 2011-2018 Q3 0.16% $656.55 $112.07 $6.97 $238.49 $0.00 $0.00 $0.00 $0.00 $0.00 $0.00 $0.00 $0.00 $0.00 $0.00 $1,014.08Oct-18 2011-2018 Q4 0.18% $776.20 $133.15 $8.54 $284.86 $0.00 $0.00 $0.00 $0.00 $0.00 $0.00 $0.00 $0.00 $0.00 $0.00 $1,202.74Nov-18 2011-2018 Q4 0.18% $798.59 $137.61 $9.07 $295.90 $0.00 $0.00 $0.00 $0.00 $0.00 $0.00 $0.00 $0.00 $0.00 $0.00 $1,241.17Dec-18 2011-2018 Q4 0.18% $820.98 $142.08 $9.60 $306.94 $0.00 $0.00 $0.00 $0.00 $0.00 $0.00 $0.00 $0.00 $0.00 $0.00 $1,279.60
Total for 2018 $11,622.03 $1,828.32 $100.36 $3,911.26 $0.00 $0.00 $0.00 $0.00 $0.00 $0.00 $0.00 $0.00 $0.00 $0.00 $17,461.97Amount ClearedOpening Balance for 2019 $11,622.03 $1,828.32 $100.36 $3,911.26 $0.00 $0.00 $0.00 $0.00 $0.00 $0.00 $0.00 $0.00 $0.00 $0.00 $17,461.97
Jan-19 2011-2019 Q1 0.20% $952.19 $165.45 $11.44 $359.01 $0.00 $0.00 $0.00 $0.00 $0.00 $0.00 $0.00 $0.00 $0.00 $0.00 $1,488.09Feb-19 2011-2019 Q1 0.20% $976.16 $170.26 $12.05 $375.09 $0.00 $0.00 $0.00 $0.00 $0.00 $0.00 $0.00 $0.00 $0.00 $0.00 $1,533.57Mar-19 2011-2019 Q1 0.20% $1,000.13 $175.07 $12.67 $391.18 $0.00 $0.00 $0.00 $0.00 $0.00 $0.00 $0.00 $0.00 $0.00 $0.00 $1,579.04Apr-19 2011-2019 Q2 0.18% $911.24 $160.05 $11.82 $362.38 $0.00 $0.00 $0.00 $0.00 $0.00 $0.00 $0.00 $0.00 $0.00 $0.00 $1,445.49May-19 2011-2019 Q2 0.18% $932.57 $164.33 $12.36 $376.69 $0.00 $0.00 $0.00 $0.00 $0.00 $0.00 $0.00 $0.00 $0.00 $0.00 $1,485.95Jun-19 2011-2019 Q2 0.18% $953.89 $168.61 $12.91 $391.01 $0.00 $0.00 $0.00 $0.00 $0.00 $0.00 $0.00 $0.00 $0.00 $0.00 $1,526.42Jul-19 2011-2019 Q3 0.18% $975.22 $172.88 $13.46 $405.32 $0.00 $0.00 $0.00 $0.00 $0.00 $0.00 $0.00 $0.00 $0.00 $0.00 $1,566.88Aug-19 2011-2019 Q3 0.18% $996.55 $177.16 $14.00 $419.63 $0.00 $0.00 $0.00 $0.00 $0.00 $0.00 $0.00 $0.00 $0.00 $0.00 $1,607.34Sep-19 2011-2019 Q3 0.18% $1,017.88 $181.44 $14.55 $433.94 $0.00 $0.00 $0.00 $0.00 $0.00 $0.00 $0.00 $0.00 $0.00 $0.00 $1,647.81Oct-19 2011-2019 Q4 0.18% $1,039.20 $185.71 $15.10 $448.26 $0.00 $0.00 $0.00 $0.00 $0.00 $0.00 $0.00 $0.00 $0.00 $0.00 $1,688.27Nov-19 2011-2019 Q4 0.18% $1,060.53 $189.99 $15.64 $462.57 $0.00 $0.00 $0.00 $0.00 $0.00 $0.00 $0.00 $0.00 $0.00 $0.00 $1,728.73Dec-19 2011-2019 Q4 0.18% $1,081.86 $194.27 $16.19 $476.88 $0.00 $0.00 $0.00 $0.00 $0.00 $0.00 $0.00 $0.00 $0.00 $0.00 $1,769.20
Total for 2019 $23,519.45 $3,933.55 $262.53 $8,813.23 $0.00 $0.00 $0.00 $0.00 $0.00 $0.00 $0.00 $0.00 $0.00 $0.00 $36,528.76Amount ClearedOpening Balance for 2020 $23,519.45 $3,933.55 $262.53 $8,813.23 $0.00 $0.00 $0.00 $0.00 $0.00 $0.00 $0.00 $0.00 $0.00 $0.00 $36,528.76
Jan-20 2011-2020 Q1 0.00% $0.00 $0.00 $0.00 $0.00 $0.00 $0.00 $0.00 $0.00 $0.00 $0.00 $0.00 $0.00 $0.00 $0.00 $0.00Feb-20 2011-2020 Q1 0.00% $0.00 $0.00 $0.00 $0.00 $0.00 $0.00 $0.00 $0.00 $0.00 $0.00 $0.00 $0.00 $0.00 $0.00 $0.00Mar-20 2011-2020 Q1 0.00% $0.00 $0.00 $0.00 $0.00 $0.00 $0.00 $0.00 $0.00 $0.00 $0.00 $0.00 $0.00 $0.00 $0.00 $0.00Apr-20 2011-2020 Q2 0.00% $0.00 $0.00 $0.00 $0.00 $0.00 $0.00 $0.00 $0.00 $0.00 $0.00 $0.00 $0.00 $0.00 $0.00 $0.00May-20 2011-2020 Q2 0.00% $0.00 $0.00 $0.00 $0.00 $0.00 $0.00 $0.00 $0.00 $0.00 $0.00 $0.00 $0.00 $0.00 $0.00 $0.00Jun-20 2011-2020 Q2 0.00% $0.00 $0.00 $0.00 $0.00 $0.00 $0.00 $0.00 $0.00 $0.00 $0.00 $0.00 $0.00 $0.00 $0.00 $0.00Jul-20 2011-2020 Q3 0.00% $0.00 $0.00 $0.00 $0.00 $0.00 $0.00 $0.00 $0.00 $0.00 $0.00 $0.00 $0.00 $0.00 $0.00 $0.00Aug-20 2011-2020 Q3 0.00% $0.00 $0.00 $0.00 $0.00 $0.00 $0.00 $0.00 $0.00 $0.00 $0.00 $0.00 $0.00 $0.00 $0.00 $0.00Sep-20 2011-2020 Q3 0.00% $0.00 $0.00 $0.00 $0.00 $0.00 $0.00 $0.00 $0.00 $0.00 $0.00 $0.00 $0.00 $0.00 $0.00 $0.00Oct-20 2011-2020 Q4 0.00% $0.00 $0.00 $0.00 $0.00 $0.00 $0.00 $0.00 $0.00 $0.00 $0.00 $0.00 $0.00 $0.00 $0.00 $0.00Nov-20 2011-2020 Q4 0.00% $0.00 $0.00 $0.00 $0.00 $0.00 $0.00 $0.00 $0.00 $0.00 $0.00 $0.00 $0.00 $0.00 $0.00 $0.00Dec-20 2011-2020 Q4 0.00% $0.00 $0.00 $0.00 $0.00 $0.00 $0.00 $0.00 $0.00 $0.00 $0.00 $0.00 $0.00 $0.00 $0.00 $0.00
Total for 2020 $23,519.45 $3,933.55 $262.53 $8,813.23 $0.00 $0.00 $0.00 $0.00 $0.00 $0.00 $0.00 $0.00 $0.00 $0.00 $36,528.76Amount Cleared

Legend User Inputs (Green)
Drop Down List (Blue)
Instructions (Grey)
** IESO Persistence Report filed as stand-alone workbook**Instructions 1. Columns B to H of this tab have been structured in a way to match the formatting of the persistence report provided by the IESO. Please copy and paste the program information by initiative in Columns B to H and the corresponding demand and energy savings data by initiative in Columns L to BT of this work form.(Steps) 2. Please identify the source of the report via the dropdown list in Column I.
3. To faciliate the identification of adjustments that may be available in a prospective year's results report, it will be easier to sort all the savings by implementation year (Column H). This can be done by clicking on the filter button at cell H25 (highlighted in orange). Before you sort values, please ensure that all table columns have filters.
4. Please identify what the savings value represents (i.e., current year savings for the year or an adjustment to a prior year) via the dropdown list in Column J. Current year savings would be identified with an implementation year that matches the year of the persistence report. A savings adjustment would be identified with a prior year implementation in the future year's results report.
5. Please manually input or link the applicable savings and adjustments (Columns L to BT) for all applicable initiatives in Tabs 4 and 5 of this work form.
NOTE: The Net Verified Peak Demand Savings table and Net Verified Energy Savings table below are in the reverse order to the accompanying tables in Tab 4 and Tab 5. The tables below match those provided by the IESO.
Table 7. 2011-2020 Verified Program Results and Persistence into Future YearsStep: #3 #2 #4 #1 #1Portfolio Program Initiative LDC Sector Conservation
Resource Type (Implementation) Year
Identify Source of Report
Identify Status of Savings
Net Verified Annual Peak Demand Savings at the End-User Level (kW) Net Verified Annual Energy Savings at the End-User Level (kWh)
###
###
###
###
###
###
###
###
###
###
###
###
###
###
###
###
###
###
###
###
###
###
###
###
###
###
###
###
###
###
###
###
###
###
###
###
###
###
###
###
###
###
###
###
###
###
###
###
###
###
###
###
###
###
###
###
###
###
###
###
#1
Ontario Energy Board

Instructions
Please provide documentation and/or data to substantiate program savings that were not provided in the IESO's verified results reports (i.e., streetlighting projects).
Not Applicable - API Street Lighting conversions completed under Retrofit applications and included in verified results.
Ontario Energy Board