
Inducing Multilingual Text Analysis Tools Using Bidirectional ...
WP/ Draft
Indian Rupee Market Intervention: Managing FX Volatility or Inducing
Additional Capital Inflows?
Hiroko Oura
© 2008 International Monetary Fund WP/ IMF Working Paper Asia and Pacific Department
Indian Rupee Market Intervention: Managing Volatility or Inducing Additional Capital Inflows?
Prepared by Hiroko Oura1
(To be) Authorized for distribution by Charles Kramer
(Tentative) September 2008
Abstract
This Working Paper should not be reported as representing the views of the IMF. The views expressed in this Working Paper are those of the author(s) and do not necessarily represent those of the IMF or IMF policy. Working Papers describe research in progress by the author(s) and are published to elicit comments and to further debate.
This paper sheds some lights on some side effects of FX market intervention even if it only aims at reducing currency volatility. The FX volatility management is often believed to be much more innocuous than interventions aiming at maintaining a certain level of an exchange rate. However, when carry-type trades become a significant factor driving large capital inflows, managing FX volatility could potentially increase capital inflows by artificially reducing the risks to carry trades. Recent Indian data indeed seem to indicate that a lower FX volatility increases capital inflows in the subsequent period. JEL Classification Numbers: F31, G11, G15, G18. Keywords: India, Intervention, Carry trade, Capital Inflows, Option Author’s E-Mail Address: [email protected]
1 Author thanks to Jorge Chan-lau, Joshua Felman, Andreas Jobst, Kalpana Kochhar, and Charles Kramer (in alphabetical order) for their helpful comments, Souvik Gupta for data input, and Lesa Yee for editorial help.

3
Contents Page
I. Introduction..........................................................................................................................4 II. Related Literature.................................................................................................................7 III. The Risk-Return Structure of Unhedged Carry Trades .......................................................8 IV. The Risk-Return Structure of Hedged Carry Trades .........................................................10 V. Capital Inflows, the Exchange Rate, and Risk-Adjusted Returns from Carry Trade .............................................................................................................13 VI. Conclusion .........................................................................................................................15 References................................................................................................................................17 Figures 1. India: capital inflows, Intervention, Interest Differential, and the Rupee Appreciation .........................................................................................................5 2. Exchange Rate Volatitlity and Capital Inflows ...................................................................5 3. Cumulative Excess Returns of Selected Trades...................................................................9 4. Rupee-Dollar Rate and Its Volatilities...............................................................................12 5. Carry Trade Returns: Hedged and Unhedged....................................................................12 6. INR_USD Carry Trade and Capital Inflows......................................................................14 Tables 1. Carry Trade Return Decomposition and Sharpe Ratio ........................................................9 2. Risk Adjusted Returns from Major Trades ........................................................................10 3. Risk and Returns from Rupee-USD Carry Trade ..............................................................13 4. Statistical Relationship: Capital Inflows, Rupee Appreciation, and Risk-Adjusted Carry Returns ..................................................................................15 Appendix Model Analysis: The Effect of Currency Volatility on the Optimal Investor Portfolio ...........................................................................................................19

4
I. INTRODUCTION
Capital inflows into emerging markets have picked up sharply in recent years (IMF (2007c, 2007d, and 2007e). Net private capital inflows to emerging markets have accelerated since 2000 from $75 billion or about 1 percent of emerging market GDP to over $600 billion or 3½ percent of emerging market GDP in 2007. In 2007, they exceeded the peak recorded during the large capital inflow episodes in 1990’s, both in U.S. dollar terms and in percent of GDP. Net private capital inflows to India, in particular, have increased from 1½ percent of GDP in fiscal year 2001/02 to over 9 percent of GDP in 2007/08. In particular, carry trade is considered to have played a significant role in the recent episode of large capital inflows into emerging markets. Carry trade is a currency strategy involving buying higher yielding currencies, earning the high yields, and selling (borrowing) lower yielding currencies. The gain is the interest rate differential assuming the exchange rate remains stable (Box 1.4 in IMF (2007a)). The carry return from various currency portfolio has been very attractive in recent years (as documented in Burnside et al (2007) and Gyntelberg and Remolona (2007)), suggesting that a potentially large portion of capital flows may be driven by carry trade strategy.2 Indeed, IMF (2007e) indicates that the interest differential is one of the driving factors for capital flows. Moreover, Bloomberg has created a dedicated section for carry trades3 responding to strong investors’ interest, and this indicates carry trade have become a standard strategy in the international capital market. In the case of India, debt-creating private capital inflows—a broad category of interest sensitive capital inflows—have increased from 0.2 percent of GDP in 2001/02 to over 5 percent of GDP in 2007/08. However, capital inflows motivated by carry returns could complicate monetary and exchange rate policy management in the recipient countries.4 India, for instance, has been tightening its monetary policy in order to contain overheating pressures as its economy has been growing at one of the fastest rates in the world. The tighter monetary policy increases the returns from carry trades involving buying the Indian rupee, adding appreciation
2 As pointed out in IMF (2007a), the actual magnitude of carry trade and related capital inflows are hard to measure even for developed markets, since there are varieties of instruments, including that of off balance sheet, to take practically the same positions as carry trades. For some currencies, net short positions in currency futures of non commercial traders on the Chicago Mercantile Exchange are often quoted as one measure about the carry trade size (IMF (2007a) and Brunnermeier et al (2008) for instance). However, they are available only for a limited number of currencies from developed economies, and considered to cover only a subset of carry trades. Therefore, Brunnermeier et al (2008), for instance, also use the size of carry return (interest rate differential) as a proxy for the magnitude of the trades and related flows.
3 FXCT <go>.
4 Other types of capital inflows could also raise policy dilemma by giving appreciation pressures. However, carry motivated debt-creating flows highlight the impossible trinity dilemma by increasing and softening domestic liquidity conditions precisely when the economy needs some cooling with tighter monetary policy. Equity inflows, on the other hand, could decline when interest rate goes up by lowering the discounted present value of future earnings.

5
pressures to the rupee. Such consequences complicate the monetary and exchange rate management: if the government is concerned about maintaining the stability of its exchange rate and intervenes by buying foreign exchange, domestic liquidity increases unless the domestic liquidity consequences are offset through sterilization. In turn, this sterilization tends to put upward pressure on interest rates, potentially drawing in further carry trade inflows. This is exactly the dilemma facing the Reserve Bank of India (RBI) faced in 2007. The RBI has been actively intervening in the foreign exchange markets with a view to managing the volatility of the rupee. Intervention in India appears to be positively correlated with capital inflows (with a correlation coefficient of 0.6 during 2001-2007, Figure 1). Furthermore, past IMF (2007b) and RBI (Pattanaik and Sahoo (2003)) research find that intervention could be effective in reducing exchange rate volatility in India, but its effectiveness in influencing the level of exchange rate is limited. This is in line with the findings for emerging markets as a whole. For example, Disyatat and Galati (2005) extensively reviewed the literature, and found that intervention could be effective in reducing volatility in foreign exchange market in emerging economies. Moreover, the rupee-U.S. dollar exchange rate volatility, while edging up recently reflecting large capital flows, seems to be starkly lower than the volatility in the rupee’s other bilateral exchange rates (Figure 2). This raises the question of whether in the past couple of years, exchange rate volatility vis-à-vis the U.S. dollar could have been much larger without intervention.5
Past research provides some empirical evidence that managing exchange rate volatility could potentially benefit the real economy. Policies to limit exchange rate volatility are often predicated on the belief that exchange rate uncertainty reduces international trade,
5 The correlation between exchange rate volatility and intervention per se is positive (about 0.2). This could reflect the reacting nature of the intervention policy (intervention is actively used when capital inflows and resulting exchange rate volatility are large), rather than the potential role of intervention to reduce volatility compared to the otherwise.
-4
-2
0
2
4
6
8
10
2001Q1
2001Q3
2002Q1
2002Q3
2003Q1
2003Q3
2004Q1
2004Q3
2005Q1
2005Q3
2006Q1
2006Q3
2007Q1
2007Q3
2008Q1
-4
-2
0
2
4
6
8
10
Debt creating private capital inflows % GDP
(Spot) Intervention % GDP
Interest differential (vis-a-vis USD)
Appreciation (q/q, %)
Figure 1. India: Capital Inflows, Intervention, Interest Differential, and the Rupee Appreciation
-4
-2
0
2
4
6
8
10
2000Q1
2000Q3
2001Q1
2001Q3
2002Q1
2002Q3
2003Q1
2003Q3
2004Q1
2004Q3
2005Q1
2005Q3
2006Q1
2006Q3
2007Q1
2007Q3
2008Q1
0
5
10
15
20
25Capital inflows (%GDP, left scale)USD (annual in percent, right, scale)JPY (annual in percent, right scale)CHF (annual in percent, right scale)
1/ Exchange rate volatility vis-à-vis the Indian rupee: Standard deviation of daily change, annualized, in percent, quarterly average; Capital inflows: quarterly debt-creating private inflows in percent of GDP.
Figure 2. Exchange Rate Volatility and Capital Inflows 1/

6
discourages investment and compounds the problems people face in insuring their employment and wage risks in incomplete asset markets. The theoretical literature on the issue is inconclusive, and results depend on assumptions on market competitiveness, symmetry/asymmetry of investment adjustment costs and entrepreneurial attitudes toward risk (Bagella et al (2006)). Benchmark models—with constant returns, and perfectly competitive firm with capital as the fixed factor— as in Caballerro and Corbo (1989) and Abel (1983) predict positive effect of volatility on investment and growth, as firm profit function becomes convex function of output prices (Jensen’s inequality). Bacchetta and van Wincoop (2000) developed a general-equilibrium model that shows that there is no one-to-one relationship between the levels of trade and welfare across different exchange rate volatility levels. Some empirical studies find that exchange rate volatility reduces investment and growth (Bagella et al. (2006) and Serven (2003), for instance), but there seems to be some threshold effects as well as differential impacts depending on the economic structure (trade openness and financial development, Serven (2003)). This paper focuses on some side-effects of the policies aimed at managing exchange rate volatility. Reducing volatility does not come without costs. Managing exchange rate volatility can potentially exacerbate capital inflows. Carry trade investors buying Indian assets care about two things—the interest differential and exchange rate volatility. The interest differential matters because investors typically borrow in a low-yielding foreign currency to invest in India, and the rate differential is the major source of returns from carry trades as shown in detail in the next section. Exchange rate volatility also matters, as it affects the risk of carry trades: an unexpected appreciation would boost carry returns but depreciation could eliminate the profits. The ratio of reward (interest rate differential) to risk (standard deviation of the exchange rate) is known as the Sharp ratio, a measure of investment returns adjusted for its risk. Potential investors focus on this risk-adjusted return. Intervention in the foreign exchange market to limit the volatility could increase the risk-adjusted return from carry trade by reducing the associated risks. In doing so, intervention could induce further capital inflows. In this paper, we show that indeed Indian data support the finding that lower foreign exchange volatility could increase subsequent capital inflows. The risk-return analysis of carry trades buying the rupee indicates that, despite lower interest differential between the Indian rupee and the U.S. dollar compared to the differential with other currencies, the Sharpe ratio using the two currencies is considerably higher than the other pairs, reflecting the much lower rupee-dollar volatility. Moreover, simple regression analyses seem to indicate a negative relationship between Sharpe ratio and capital inflows or exchange rate appreciation in India. While full welfare analysis of intervention weighing all the costs and benefits is beyond the scope of the work reported here, this paper’s contribution is to show some potential negative effects of managing exchange rate volatility. The bottom line is that intervention aimed at managing FX volatility may not be as innocuous as some would believe. The remainder of the paper is structured as follows. Section 2 reviews related literature on forward premium puzzle and carry trade, and discuss the angle this paper provides on the long-standing puzzle. Then, section 3 analyzes the risk return structures of unhedged carry

7
trade, section 4 discusses the returns from hedged carry trades with options, and section 5 attempts to draw the link between the risk adjusted returns to carry trade and relevant macroeconomic variables such as capital inflows
II. RELATED LITERATURE
This paper adds the exchange rate management policy angle to recent research on carry trades and underlining forward premium puzzle. Carry trades exploit an anomaly in the FX market, namely, the forward premium puzzle or the empirical failure of uncovered interest parity (UIP). Under rational expectations and risk neutrality, the UIP implies that returns from the interest rate differential should be completely offset by the depreciation of higher yielding currency to equate the total returns from fixed income investment denominated in different currencies. However, a mounting number of empirical studies (starting with Fama (1984), and other numerous papers surveyed in Chapter 24-27 of Cuthbertson and Nitzsche (2004), and Froot and Thaler (1990), Lewis (1995), and Engel (1996)) have shown that the higher yielding currency tend to appreciate—a puzzle. Despite extensive research, the source of carry trade returns and the forward premium puzzle are still being debated. This paper highlights the role of exchange rate management policy as an additional factor that limits the efficient functioning of the market and sustaining anomalies.
Standard portfolio models—which try to identify and model the risk associated with carry trades—fail to explain all the excess returns as rewards for risks. The UIP does not hold if investors are risk-averse and carry trades involve non-diversifiable risks in a portfolio context, even if the rational expectations and market efficiency assumptions were maintained. Standard portfolio models (including CAPM, consumption CAPM, and Fama-French factor model, and other factor models with additional risk factors) do not explain all the excess returns with carry trade (Cuthberston and Nitzche (2004) and Burnside et al (2008)). In case of consumption CAPM, one needs to assume unrealistically large risk aversion in representative agent’s utility the risk-aversion coefficient in order to explain excess returns from a carry trade—a result very similar to equity premium puzzle (unreasonably high excess returns to equity compared to safe bond returns).
More recent research looks for the role of risks from extreme events as an additional risk factor, but opinions are so far divided. Fahri and Gabaix (2008) incorporate extreme negative shocks to productivity (rare disaster) in a general equilibrium framework, and indicate that such risks can generate premiums justifying excess returns to carry trades. Brunnermeier et al (2008) focus on the risks from large and sudden exchange rate fluctuation (crash risks), that could endogenously arise after a long period of stability as a result of strategic interaction among investors as explored by Plantin and Shin (2006) and Abreu and Brunnermeier (2002). Assuming away the possibilities of Peso problem (underestimating risk by using historical sample that does not include any extreme event), Brunnermeier et al (2008) show that excess returns from carry corresponds to crash risks (measured as the skewness of return distribution). On the other hand, Burnside et al (2008) and Jurek (2007) use currency options to show that carry trades which hedge against the crash-risk and are free from Peso problem continue to show much higher risk-adjusted returns compared to other assets. Thus, the puzzle remains.

8
This paper sheds some light on the role of exchange rate and intervention policy in explaining a part of excess (risk-adjusted) returns to carry trade. Other things being equal, volatility-reducing intervention increases the excess risk-adjusted returns to carry trade at the margin and contributes to increasing the part of excess returns that are not well explained by existing risk factors, exaggerating the extent of the anomaly. Having said that, this paper does not intend to claim that intervention and exchange rate management can solve the forward premium puzzle. The forward premium puzzle prevails not only in India or other emerging markets, but also in major developed economies (Australia and New Zealand for instance) where intervention is less likely and less effective (Disyatat and Galati (2005)). And therefore, even if it were the case that exchange rate intervention explained all the excess returns to carry trade in India, the result may not automatically convey to the other countries.
III. THE RISK-RETURN STRUCTURE OF UNHEDGED CARRY TRADES
The sources of risk and return from carry trades are foreign exchange movement and interest rate differential. 6 Consider a simple carry trade funding in the U.S. dollar and investing in the rupee with 3-month investment horizon without any hedging. The case with a hedge will be discussed in the next section. The carry returns (expressed in terms of the U.S. dollar) are the sum of returns from the rupee appreciation and Indian interest rate net of the U.S. interest rate.
Carry returns = FX returns + Interest rate differential
The risk of the position is measured as the standard deviation of daily carry returns (the square root of the variance).7 The variance (expressed as Var( )) can be decomposed into the variance of exchange rate movement, the variance of interest rate differential, and the covariance (expressed as Cov( )) of exchange rate movement and interest rate differential.
Var(carry returns) = Var(FX returns) + Var(interest differential)
+ 2Cov(FX returns, interest differential)
6 Bloomberg, for instance, provides other decompositions, such as total returns from long currency and total returns from short currency. However, decomposition into currency and interest factors is more suited for our purpose to investigate the impact of intervention policy in the FX markets on risk-adjusted returns from carry trades.
7 As explored in Gyntelberg and Remolona (2007), this measure of risk is only one of many alternatives, including Value at Risk and skewness, which could provide richer risk profile from different angles. Yet, standard deviation is the most basic measure of risk and plays a crucial role in providing a standard risk-adjusted return measure (Sharpe ratio).

9
With Indian data, returns from carry trades mostly reflect the interest rate differential, while risks reflect almost entirely the volatility of exchange rates. The return decomposition in Table 1 shows that over 70 percent of the returns from carry trades reflect interest rate differential, except for the trades shorting the U.S. dollar in the past few years, where the majority of the returns came from the rupee’s appreciation vis-à-vis the U.S. dollar. However, the volatility decomposition (not shown) indicates that practically all the risk comes from exchange rate volatility vis-à-vis all the three funding currencies. The risks from changes in the interest differential and its covariance with the exchange rate are very small.
Despite lower total returns, the risk-adjusted returns (Sharpe ratio) from carry trades vis-à-vis the U.S. dollar are much higher than those vis-à-vis with the Japanese yen, owing to smaller exchange rate volatility between the rupee and the dollar. As a rule of thumb, a Sharpe ratio above one is considered as a good investment. The Sharpe ratio from carry trades vis-à-vis the U.S. dollar is substantially above one, indicating it has been indeed an attractive investment. Therefore, even if the funding cost using the U.S. dollar has been higher than that of yen, once adjusted for risks, it has made more sense to take a position between the rupee and the dollar owing to lower exchange rate volatility. Therefore, intervention could artificially raise risk-adjusted returns from carry trades to the extent it reduces exchange rate volatility at the margin.
Total Return FX Return Int. Diff. Return FX Return Int. Diff. Return St.dev. Sharpe Ratio 1/(Annu. %) ratio
Short USD 5.1 1.1 4.0 21.2 78.8 3.4 1.5
Short JPY 8.2 1.0 7.3 11.7 88.3 10.0 0.9
Short CHF 2.0 -4.0 5.9 -199.9 299.9 10.6 0.2
Short USD 5.7 3.2 2.5 55.7 44.3 4.3 1.3
Short JPY 8.4 2.4 6.1 28.2 71.7 10.2 0.8
Short CHF 3.6 -1.3 5.0 -37.1 137.1 9.8 0.4
1/ Sharpe ratio = total return/ standard deviation
Jan. 00–Apr. 08
Jan. 04–Apr. 08
Source: Bloomberg L.P. Using daily (bilateral) carry trade return on FXCT page. Returns from interest spread reflects difference in 3-month deposit rates. Returns are calculated in terms of funding currencies.
Table 1. Carry Trade Return Decomposition and Sharpe Ratio
(Annualized in percent) (In percent of total ret.)
050
100150
200250300
350400
450500
Dec
-99
Jun-
00
Dec
-00
Jun-
01
Dec
-01
Jun-
02
Dec
-02
Jun-
03
Dec
-03
Jun-
04
Dec
-04
Jun-
05
Dec
-05
Jun-
06
Dec
-06
Jun-
07
Dec
-07
Jun-
08
MSCI World
MSCI India
Long INR- short USD carry
Long AUD-shortl JPY carry
Long BRL-short JPY carry
Source: Bloomberg L.P.
Note: All returns are measured in terms of USD. Equity indices are total return indices and their returns are calculated as excess returns over 3-month US T-bills.
Figure 3. Cumulative Excess Returns of Selected Trades(End-December 1999=100)

10
The low volatility of the rupee-dollar rates is the key factor making the rupee-dollar carry trade extremely attractive even compared to other major trading strategies in the world. As shown in Figure 3, some major carry trades (Australian dollar-yen and Brazilian real-yen) have been extremely profitable, easily surpassing the world equity market performance, though the sample period might not be a fair representation of long-term world equity returns. The returns from rupee-dollar carry trades, on the other hand, are not particularly strong compared to other carry trades and Indian equities, but still higher than that of world equity market. However, the risk-adjusted returns give a very different picture. The data presented in Table 2 suggest that the rupee-dollar carry trade is a lot less risky than equities or other carry trades, raising its sharp ratio to the highest, only surpassed by real-yen carry trade in recent years. These comparisons reinforce the importance of volatilities and the potential impact of FX volatility management in international investment.
IV. THE RISK-RETURN STRUCTURE OF HEDGED CARRY TRADES
Could the high Sharpe ratio of rupee-dollar carry trades simply reflect a premium for risks that are not well captured by standard deviation? This is the question that recent papers on forward premium puzzle attempt to address, using long time series data from advanced economies (Farhi and Gabix (2008), Brunnermeier et al (2008), Burnside et al (2008), and Jurek (2007)). As discussed in Section II, their results provide mixed views and more work appears necessary before reaching strong conclusions. In this section, the question is addressed using Indian data, following the strategy adopted by Burnside et al (2008) and Jurek (2007). We compute the Sharpe ratio of carry trade returns hedged with options.8 By
8 Hedging with forward does not reap much benefit for speculators who do not have any existing rupee related positions. As long as the covered interest parity holds (CIP), hedging with forward would help reducing overall size of the position but would not affect the Sharpe ratio of the overall position. Using forward, henceforth,
(continued…)
MSCI World MSCI IndiaIndian rupee-
USDAustralian dollar-JPY
Brazilian real-JPY
Average daily returns 1/ 0.64 19.66 5.10 11.31 18.99Standard deviation 2/ 14.31 27.67 3.40 13.21 18.02Sharpe ratio 0.04 0.71 1.50 0.86 1.05
Average daily returns 1/ 8.63 33.76 5.70 11.61 30.39Standard deviation 2/ 11.24 27.18 4.30 13.05 16.24Sharpe ratio 0.77 1.24 1.33 0.89 1.87
Source: Bloomberg L.P.
Table 2. Risk Adjusted Returns from Major Trades
(Jan. 2004–Apr. 2008)
1/ Equity returns are daily excess returns of MSCI total return index over 3-month US T-bill. All returns are annualized daily data.
Equities
2/ Annualized in percent
Carry Trades
(Jan. 2000–Apr. 2008)
11
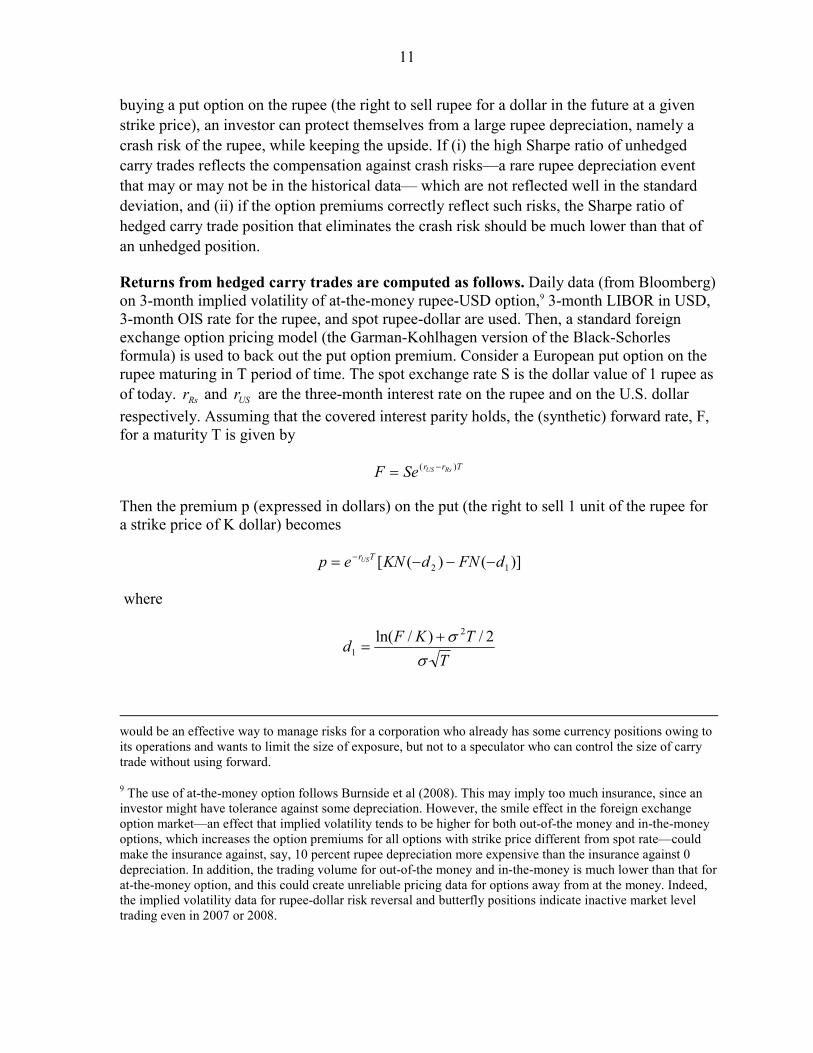
buying a put option on the rupee (the right to sell rupee for a dollar in the future at a given strike price), an investor can protect themselves from a large rupee depreciation, namely a crash risk of the rupee, while keeping the upside. If (i) the high Sharpe ratio of unhedged carry trades reflects the compensation against crash risks—a rare rupee depreciation event that may or may not be in the historical data— which are not reflected well in the standard deviation, and (ii) if the option premiums correctly reflect such risks, the Sharpe ratio of hedged carry trade position that eliminates the crash risk should be much lower than that of an unhedged position.
Returns from hedged carry trades are computed as follows. Daily data (from Bloomberg) on 3-month implied volatility of at-the-money rupee-USD option,9 3-month LIBOR in USD, 3-month OIS rate for the rupee, and spot rupee-dollar are used. Then, a standard foreign exchange option pricing model (the Garman-Kohlhagen version of the Black-Schorles formula) is used to back out the put option premium. Consider a European put option on the rupee maturing in T period of time. The spot exchange rate S is the dollar value of 1 rupee as of today. Rsr and USr are the three-month interest rate on the rupee and on the U.S. dollar respectively. Assuming that the covered interest parity holds, the (synthetic) forward rate, F, for a maturity T is given by
Trr RsUSSeF )( −=
Then the premium p (expressed in dollars) on the put (the right to sell 1 unit of the rupee for a strike price of K dollar) becomes
)]()([ 12 dFNdKNep TrUS −−−= −
where
TTKFd
σσ 2/)/ln( 2
1+
=
would be an effective way to manage risks for a corporation who already has some currency positions owing to its operations and wants to limit the size of exposure, but not to a speculator who can control the size of carry trade without using forward.
9 The use of at-the-money option follows Burnside et al (2008). This may imply too much insurance, since an investor might have tolerance against some depreciation. However, the smile effect in the foreign exchange option market—an effect that implied volatility tends to be higher for both out-of-the money and in-the-money options, which increases the option premiums for all options with strike price different from spot rate—could make the insurance against, say, 10 percent rupee depreciation more expensive than the insurance against 0 depreciation. In addition, the trading volume for out-of-the money and in-the-money is much lower than that for at-the-money option, and this could create unreliable pricing data for options away from at the money. Indeed, the implied volatility data for rupee-dollar risk reversal and butterfly positions indicate inactive market level trading even in 2007 or 2008.

12
TTKFd
σσ 2/)/ln( 2
2−
=
N( ) is a cumulative density function for a standard normal distribution, and σ is the implied volatility of the at-the-money option. The returns from hedged carry trade ( HCRR ) for a $1 investment becomes
KSwhenS
rprr
KSwhenS
rpr
SS
rR
TUS
USRS
TUS
UST
RSHCR
<+
−+−+=
≥+
−+−+=
)1()1()1(
)1()1()1(
where TS is the realized spot rate when the option matures.
The implied volatility data itself seem to reveal some interesting findings in the rupee-dollar market (Figure 4). First, sensible rupee-dollar option implied volatility data become available only from 2004, possibly reflecting the increase in such trading. The implied volatility has been increasing in tandem with actual volatility recently, and most recently (August 2008), it has reached the level (10 percent) observed among developed economy currencies.
Consistent with earlier findings with advanced economy currencies, the hedged rupee carry trade continues to show high Sharpe ratios. As in Burnside et al (2008) and Jurek (2007) covering major currencies from developed economies, the hedged rupee carry trade now offers lower standard deviation, which is also free from crash risk, and lower returns owing to the insurance premium. Still, the insurance premium is not very expensive and the strategy continues to provide an attractive Sharpe ratio (Figure 5 and Table 3).10 Indeed, for 10 Unlike the risk-return calculation in the previous section, which is based on daily returns, the calculation in this table is with respect to 3-month buy-and-hold carry trade strategies. Standard deviation with the 3-month
(continued…)
0
2
4
6
8
10
12
14
Jan-
00
Jul-0
0
Jan-
01
Jul-0
1
Jan-
02
Jul-0
2
Jan-
03
Jul-0
3
Jan-
04
Jul-0
4
Jan-
05
Jul-0
5
Jan-
06
Jul-0
6
Jan-
07
Jul-0
7
Jan-
08
Jul-0
8
35
37
39
41
43
45
47
49
51Implied vol. 2/USD-INR historical vol. 1/INR-USD spot, right scale
Source: Bloomber L.P. and author's calculation.
1/ Historical standard deviation of daily USD per INR rate changes, 3-month rolling, annualized in percent. 2/ Implied volatility of at-the-money option, three months to maturity.
Figure 4. Rupee-Dollar Rate and Its Volatilities
-40
-30
-20
-10
0
10
20
30
40
50
Apr
-00
Oct
-00
Apr
-01
Oct
-01
Apr
-02
Oct
-02
Apr
-03
Oct
-03
Apr
-04
Oct
-04
Apr
-05
Oct
-05
Apr
-06
Oct
-06
Apr
-07
Oct
-07
Apr
-08
0.020
0.021
0.022
0.023
0.024
0.025
0.026
Hedged return (left scale)
Unhedged return (left scale)
USD per rupee (right scale)
Source: Bloomberg L.P. and author's calculation.
1/ Returns from buy-and-hold carry trades (buying the rupee) for 3 month period, expressed in terms of USD. Using 3-month LIBOR for USD, and 3-month OIS for the rupee. Hedged returns use 3-month at-the-money put options on the rupee (right to sell the rupee at a strike price). Annualized in percent.
Figure 5. Carry Trade Returns: Hedged and Unhedgded 1/
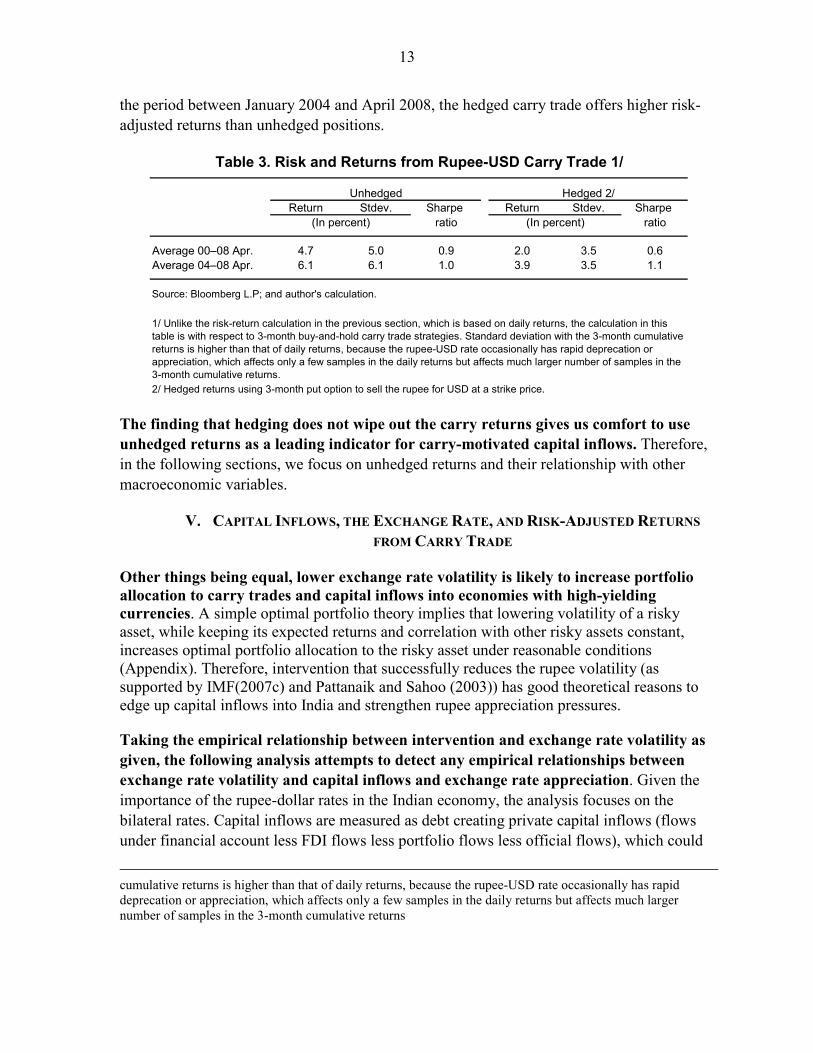
13
the period between January 2004 and April 2008, the hedged carry trade offers higher risk-adjusted returns than unhedged positions.
Return Stdev. Sharpe Return Stdev. Sharpe ratio ratio
Average 00–08 Apr. 4.7 5.0 0.9 2.0 3.5 0.6Average 04–08 Apr. 6.1 6.1 1.0 3.9 3.5 1.1
Source: Bloomberg L.P; and author's calculation.
2/ Hedged returns using 3-month put option to sell the rupee for USD at a strike price.
Table 3. Risk and Returns from Rupee-USD Carry Trade 1/
1/ Unlike the risk-return calculation in the previous section, which is based on daily returns, the calculation in this table is with respect to 3-month buy-and-hold carry trade strategies. Standard deviation with the 3-month cumulative returns is higher than that of daily returns, because the rupee-USD rate occasionally has rapid deprecation or appreciation, which affects only a few samples in the daily returns but affects much larger number of samples in the 3-month cumulative returns.
Unhedged Hedged 2/
(In percent) (In percent)
The finding that hedging does not wipe out the carry returns gives us comfort to use unhedged returns as a leading indicator for carry-motivated capital inflows. Therefore, in the following sections, we focus on unhedged returns and their relationship with other macroeconomic variables.
V. CAPITAL INFLOWS, THE EXCHANGE RATE, AND RISK-ADJUSTED RETURNS FROM CARRY TRADE
Other things being equal, lower exchange rate volatility is likely to increase portfolio allocation to carry trades and capital inflows into economies with high-yielding currencies. A simple optimal portfolio theory implies that lowering volatility of a risky asset, while keeping its expected returns and correlation with other risky assets constant, increases optimal portfolio allocation to the risky asset under reasonable conditions (Appendix). Therefore, intervention that successfully reduces the rupee volatility (as supported by IMF(2007c) and Pattanaik and Sahoo (2003)) has good theoretical reasons to edge up capital inflows into India and strengthen rupee appreciation pressures.
Taking the empirical relationship between intervention and exchange rate volatility as given, the following analysis attempts to detect any empirical relationships between exchange rate volatility and capital inflows and exchange rate appreciation. Given the importance of the rupee-dollar rates in the Indian economy, the analysis focuses on the bilateral rates. Capital inflows are measured as debt creating private capital inflows (flows under financial account less FDI flows less portfolio flows less official flows), which could
cumulative returns is higher than that of daily returns, because the rupee-USD rate occasionally has rapid deprecation or appreciation, which affects only a few samples in the daily returns but affects much larger number of samples in the 3-month cumulative returns

14
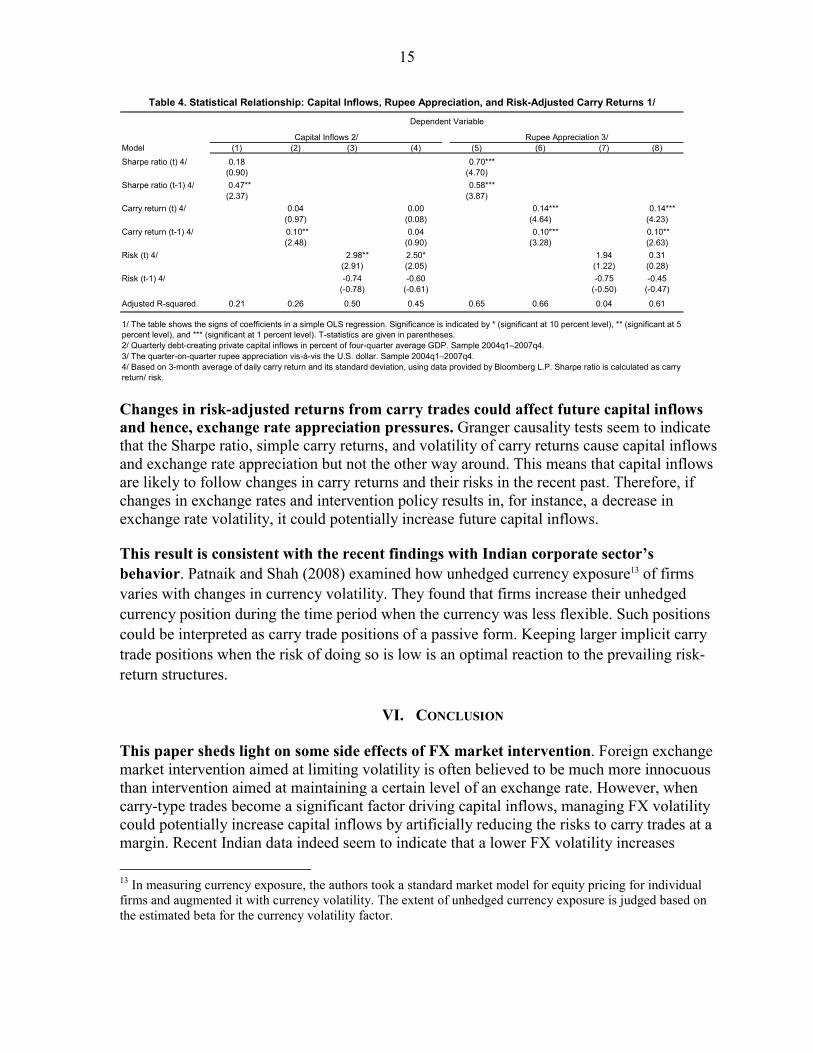
proxy for carry-trade related flows.11 Figure 6 provides a quick glance at the developments of relevant variables over time. Table 4 shows a summary of simple OLS regressions intended to check the statistical relationship among key variables more formally than simple bivariate correlation analyses.12 In the regressions, data from January 2004 are used because, as noted earlier, the influence from carry trades seems to be more pronounced during this period (as indicated in Table 1 and Figure 6).
Risk-adjusted returns do positively correlate with capital inflows and exchange rate appreciation (Table 4). Contemporaneous as well as one period lagged Sharpe ratios are positively correlated with both capital inflows and rupee appreciation. Simple carry returns also have significant positive correlations with capital inflows and rupee appreciation. Interest rate differentials (not shown) are positively—albeit not significantly—correlated with capital inflows and rupee appreciation.
There is weak evidence that higher risk in the near past could reduce capital inflows and appreciation. While not statistically significant, the lagged standard deviation of carry returns is negatively related to current capital inflows and rupee appreciation, consistent with the idea that increased volatility in the exchange rate could reduce future capital inflows and appreciation. The significant positive contemporaneous relationship between volatility and capital inflows/ appreciation could reflect causality from inflows/appreciation to volatility, rather than vice versa.
11 As discussed in IMF (2007a) and Brunnermeier et al (2008), the actual extent of carry trades is hard to measure. The debt-creating private flows, which are presumably interest rate differential sensitive, could serve as the second best solution. Portfolio flows in India, while being very important and volatile, are mostly equities whose risk mostly reflects the volatility of its (rupee-denominated) prices, rather than exchange rate. During January 2000-April 2008 period, over 90 percent of the daily returns from Indian equities (MSCI India index denominated in the U.S. dollar) and over 95 percent of their standard deviation were coming from the equity prices in the rupee. Therefore, the impact of the rupee volatility reduction on risk-adjusted returns should be visibly limited with equities, unlike carry trades. Hence, portfolio flows should be excluded from the capital flow measure in this paper.
12 They are not intended to test any hypothesis in a strict manner.
-2.0
-1.0
0.0
1.0
2.0
3.0
4.0
5.0
6.0
7.0
8.0
9.0
2001Q1
2001Q3
2002Q1
2002Q3
2003Q1
2003Q3
2004Q1
2004Q3
2005Q1
2005Q3
2006Q1
2006Q3
2007Q1
2007Q3
2008Q1
-5
0
5
10
15
20Debt creating private inflows (% GDP)Sharpe RatioVolatility (%, annualized)Carry return (%, annualized, right scale)
Figure 6. INR_USD Carry Trade and Capital Inflows(Four quarter moving average, long the Indian rupee and short the U.S. dollar)
15
Model (1) (2) (3) (4) (5) (6) (7) (8)Sharpe ratio (t) 4/ 0.18
(0.90) (4.70)Sharpe ratio (t-1) 4/
(2.37) (3.87)Carry return (t) 4/ 0.04 0.00
(0.97) (0.08) (4.64) (4.23)Carry return (t-1) 4/ 0.04
(2.48) (0.90) (3.28) (2.63)Risk (t) 4/ 2.50* 1.94 0.31
(2.91) (2.05) (1.22) (0.28)Risk (t-1) 4/ -0.74 -0.60 -0.75 -0.45
(-0.78) (-0.61) (-0.50) (-0.47)
Adjusted R-squared 0.21 0.26 0.50 0.45 0.65 0.66 0.04 0.61
3/ The quarter-on-quarter rupee appreciation vis-à-vis the U.S. dollar. Sample 2004q1–2007q4.
0.70***
0.58***
2.98**
0.10**
1/ The table shows the signs of coefficients in a simple OLS regression. Significance is indicated by * (significant at 10 percent level), ** (significant at 5 percent level), and *** (significant at 1 percent level). T-statistics are given in parentheses.2/ Quarterly debt-creating private capital inflows in percent of four-quarter average GDP. Sample 2004q1–2007q4.
Table 4. Statistical Relationship: Capital Inflows, Rupee Appreciation, and Risk-Adjusted Carry Returns 1/
0.47**
4/ Based on 3-month average of daily carry return and its standard deviation, using data provided by Bloomberg L.P. Sharpe ratio is calculated as carry return/ risk.
Dependent Variable
Capital Inflows 2/ Rupee Appreciation 3/
0.14***
0.10***
0.14***
0.10**
Changes in risk-adjusted returns from carry trades could affect future capital inflows and hence, exchange rate appreciation pressures. Granger causality tests seem to indicate that the Sharpe ratio, simple carry returns, and volatility of carry returns cause capital inflows and exchange rate appreciation but not the other way around. This means that capital inflows are likely to follow changes in carry returns and their risks in the recent past. Therefore, if changes in exchange rates and intervention policy results in, for instance, a decrease in exchange rate volatility, it could potentially increase future capital inflows.
This result is consistent with the recent findings with Indian corporate sector’s behavior. Patnaik and Shah (2008) examined how unhedged currency exposure13 of firms varies with changes in currency volatility. They found that firms increase their unhedged currency position during the time period when the currency was less flexible. Such positions could be interpreted as carry trade positions of a passive form. Keeping larger implicit carry trade positions when the risk of doing so is low is an optimal reaction to the prevailing risk-return structures.
VI. CONCLUSION
This paper sheds light on some side effects of FX market intervention. Foreign exchange market intervention aimed at limiting volatility is often believed to be much more innocuous than intervention aimed at maintaining a certain level of an exchange rate. However, when carry-type trades become a significant factor driving capital inflows, managing FX volatility could potentially increase capital inflows by artificially reducing the risks to carry trades at a margin. Recent Indian data indeed seem to indicate that a lower FX volatility increases 13 In measuring currency exposure, the authors took a standard market model for equity pricing for individual firms and augmented it with currency volatility. The extent of unhedged currency exposure is judged based on the estimated beta for the currency volatility factor.

16
capital inflows in the subsequent period. This implies interventions could induce capital inflows to the extent that interventions successfully reduce currency volatility, as indicated by past IMF and RBI research.
The potential side effects of intervention explored in this paper are different from those based on one-way bet hypothesis. The one-way bet hypothesis argues that intervention aimed at supporting a certain exchange rate level can induce additional capital inflows by creating expectations of an appreciation among investors who believe such intervention could not be continued forever. Under the one-way bet, intervention increases risk-adjusted returns of carry trades by raising their expected returns (the numerator of the Sharpe ratio). On the other hand, this paper emphasizes that intervention could increase risk-adjusted returns of carry trades by reducing volatility (the denominator of the Sharpe ratio). Having said that, the two hypotheses are not mutually exclusive, and one-way bet type incentives could also be well at play in Indian markets.

17
References Abel, A., 1983, “Optimal Investment under Uncertainty,” American Economic Review,
Vol. 73.
Abreu, D. and M. Brunnermeier, 2002, “Synchronization risk and Delayed Arbitrage,” Journal of Financial Economics, Vol. 66.
Bacchetta, P. and E. van Wincoop, 2000, “Does Exchange-Rate Stability Increase Trade and Welfare?” The American Economic Review, Vol. 90, No. 5.
Bagella, M., L. Becchetti, and I. Hasan, 2006, “Real Effective Exchange Rate Volatility and Growth: A Framework to Measure Advantages of Flexibility vs. Costs of Volatility,” Journal of Banking and Finance, Vol. 30.
Burnside, C., M. Eichenbaum, I. Kleschelski, and S. Rebelo, 2008, “Do Peso Problems Explain the Returns to Carry Trade?” NBER Working Paper No. 14054 (Cambridge, Massachusetts: National Bureau of Economic Research).
Burnside, C., M. Eichenbaum, and S. Rebelo, 2007, “The Returns to Currency Speculation in Emerging Markets,” American Economic Review, Papers and Proceedings, Vol. 97, No. 2.
Brunnermeier, M., S. Nagel, and L. Pedersen, 2008, “Carry Trades and Currency Crashes,” NBER Macroeconomics Annual 2008 (forthcoming).
Caballero, R. and V. Corbo, 1989, “The Effect of Real Exchange Rate Uncertainty on Exports: Empirical Evidence,” The World Bank Economic Review Vol. 3, No. 2.
Cuthbertson, K. and D. Nitzsche, 2004, Quantitative Financial Economics: Stocks Bonds and Foreign Exchange, (John Wiley and Sons Ltd, England, 2nd ed.).
Disyatat, P. and G. Galati, 2005, “The Effectiveness of Foreign Exchange Intervention in Emerging Market Countries,” BIS Papers No. 24, Part 7 (May).
Engel, C., 1996, “ The Forward Discount Anomaly and the Risk Premium: A Survey of Recent Evidence,” Journal of Empirical Finance, Vol. 3.
Fama, E., 1984, “Forward and Spot Exchange Rates,” Journal of Monetary Economics, Vol. 14.
Farhi, E. and X. Gabix, 2008, “Rare Disasters and Exchange Rates,” NBER Working Paper No. 13805 (Cambridge, Massachusetts: National Bureau of Economic Research).

18
Froot, K. and R. Thaler, 1990, “Anomalies Foreign Exchange,” Journal of Economic Perspectives, Vol. 4, No. 3.
Gyntelberg, J. and E. Remolona, 2007, “Risk in Carry Trades: A Look at Target Currencies in Asian and the Pacific,” BIS Quarterly Review (December), pp. 47–61.
International Monetary Fund, 2007a, “Box 1.4. Carry Trades: Getting Carried Away?” Asia and Pacific Department Regional Economic Outlook, April (Washington).
––––––, 2007b, The Evolving Nature of Capital Flows in Emerging Asia, Asia and Pacific Department, Regional Economic Outlook, April (Washington).
––––––, 2007c, Sterilized Intervention in Emerging Asia: Is it Effective? Asia and Pacific Department, Regional Economic Outlook, October (Washington).
––––––, 2007d, “Managing Large Capital Inflows,” World Economic Outlook, October, World Economic and Financial Surveys (Washington).
––––––, 2007e, “The Quality of Domestic Financial Markets and Capital Inflows,” Global Financial Stability Report, October (Washington).
Jurek, Jakub, 2007, “Crash-Neutral Currency Carry Trades” Unpublished Manuscript, Harvard Business School.
Lewis, K., 1995, “Puzzles in International Financial Markets,” in Handbook of International Economics, Vol. 3, ed. by G. Grossman and K. Rogoff (Amsterdam; New York and Oxford: Elsevier, North Holland)
Pattanaik, S. and S. Sahoo, 2003, “The Effectiveness of Intervention in India: an Empirical Assessment,” Reserve Bank of India Occasional Papers, Vol. 22. (New Delhi, India).
Patnaik, I. and A. Shah, 2008, “Does the Currency Regime Shape Unhedged Currency Exposure?” NIPFP-DEA Research Program on Capital Flows and their Consequences, NIPFP (New Delhi).
Plantin, G. and Shin, H., 2006, “Carry Trades and Speculative Dynamics,” Available via Internet: http://ssrn.com/abstract=898412
Serven, L., 2003, “Real Exchange-Rate Uncertainty and Private Investment in LDCs,” The Review of Economics and Statistics, Vol. 85(1)

19
APPENDIX
Model Analysis: The Effect of Currency Volatility on the Optimal Investor Portfolio
Although this paper focused on the standard deviation as a measure of risk and used it as guidance for investment strategy and capital flows, certain conditions need to be met in order to support clear negative relationship between standard deviation and capital flows. Standard deviation is a good measure of risk when an investor invests in only one risky asset, it is the only source of risk for the portfolio. However, if an existing portfolio includes other risky assets, the risks of a new risky asset should be considered in the portfolio context, namely, in terms of its covariance with other risky assets. Even if the new risky asset has very volatile returns, if their covariance with returns from other risky assets is very low, adding the new asset does not necessarily increase the total risk of the portfolio. In other words, the volatility of the new risky asset is diversifiable. Therefore, the full impact of currency volatility reduction needs to be examined by looking at how it affects the covariance of the portfolio.
In the followings, we characterize conditions under which standard deviation could be a good measure of the risk and become a good predictor of capital inflows (larger portfolio allocation to an economy) using a simple mean-variance optimal portfolio model.
If an investor can borrow or lend at the risk-free rate and invest in two risky assets, the weights maximize the portfolio Sharpe ratio (see, for instance Cuthbertson and Nitzche, 2004). Namely, the objective is to maximize the following function with respect to iw , the share of allocation to asset i .
p
p
w
ERi σ
max
Subject to
iip ERwER ∑=
1=∑ iw
212122
22
21
21
2 2 σρσσσσ wwwwp ++=
Where iER is the expected excess return of asset i over risk-free rate, ρ is the correlation coefficient for the two asset returns, and iσ is the standard deviation of asset i . Sequences of algebra show that the optimal weight for asset 1 is
20
22
21
22211
22*
1 )1( σσρσρσσ
η−−
=ERER
w
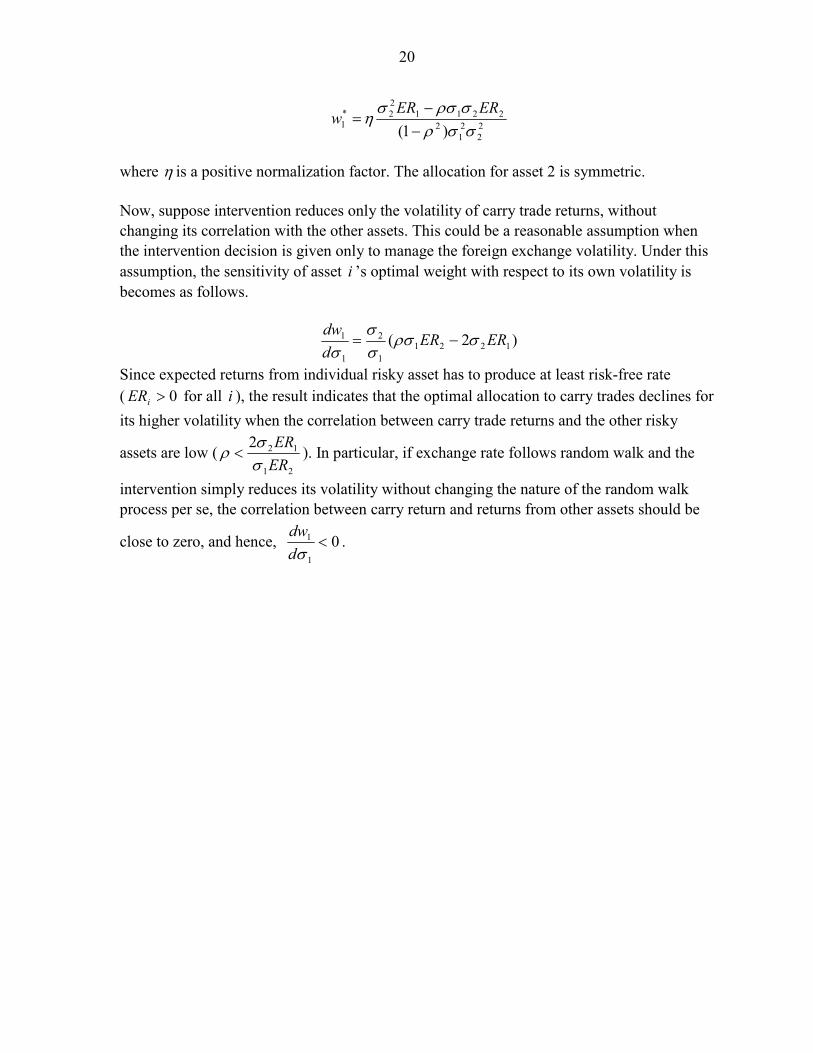
where η is a positive normalization factor. The allocation for asset 2 is symmetric.
Now, suppose intervention reduces only the volatility of carry trade returns, without changing its correlation with the other assets. This could be a reasonable assumption when the intervention decision is given only to manage the foreign exchange volatility. Under this assumption, the sensitivity of asset i ’s optimal weight with respect to its own volatility is becomes as follows.
)2( 12211
2
1
1 ERERddw
σρσσσ
σ−=
Since expected returns from individual risky asset has to produce at least risk-free rate ( 0>iER for all i ), the result indicates that the optimal allocation to carry trades declines for its higher volatility when the correlation between carry trade returns and the other risky
assets are low (21
122ERER
σσ
ρ < ). In particular, if exchange rate follows random walk and the
intervention simply reduces its volatility without changing the nature of the random walk process per se, the correlation between carry return and returns from other assets should be
close to zero, and hence, 01
1 <σd
dw.
Copyright © 2022 FDOKUMEN