A Classification-Based Machine Learning Approach for the Analysis of Genome-Wide Expression Data
10
A Classification-Based Machine Learning Approach for the Analysis of Genome-Wide Expression Data James Lyons-Weiler, 1,2 Satish Patel, and Soumyaroop Bhattacharya Department of Biological Sciences/Graduate Program in Biochemistry/Center for Bioinformatics and Computational Biology, University of Massachusetts, Lowell, Lowell, Massachusetts 01854, USA Three important areas of data analysis for global gene expression analysis are class discovery, class prediction, and finding dysregulated genes (biomarkers). The clinical application of microarray data will require marker genes whose expression patterns are sufficiently well understood to allow accurate predictions on disease subclass membership. Commonly used methods of analysis include hierarchical clustering algorithms, t-, F-, and Z-tests, and machine learning approaches. We describe an approach called the maximum difference subset (MDSS) algorithm that combines classification algorithms, classical statistics, and elements of machine learning and provides a coherent framework. By integrating prediction accuracy, the MDSS algorithm learns the critical threshold of statistical significance (the or P-value), eliminating the arbitrariness of setting a threshold of statistical significance and minimizing the effect of the normality assumptions. To reduce the false positive rate and to increase external validity of the predictive gene set, a jackknife step is used. This step identifies and removes genes in the initial MDSS with low combined predictive utility. The overall MDSS provides a prediction that is less dependent on an arbitrary study design (sample inclusion or exclusion) and should thus have high external validity. We demonstrate that this approach, unlike other published methods, identifies biomarkers capable of predicting the outcome of anthracycline-cytarabine chemotherapy in cases of acute myeloid leukemia. By incorporating two criteria—statistical significance and predictive utility—the approach learns the significance level relevant for a given data set. The MDSS approach can be used with any test and classifier operator pair. Microarray technology permits the monitoring of relative gene expression values for thousands of genes in one experi- ment. This extremely powerful technology has revolutionized functional genomics by allowing the simultaneous cross- tissue comparisons of expression levels in thousands of genes (Schena et al. 1995; DeRisi et al. 1997). This has set the stage for an era of rapid developments in molecular medicine and pharmacogenomics. Transcription profiles from microarray experiments can provide molecular fingerprints of normal and aberrant (diseased) tissues. Gene expression patterns are thought to be different for all tissue types, at different stages of development, and unique in particular diseased tissues such as tumors. Subclasses or subtypes of diseases are begin- ning to emerge on the basis of the comparative analysis of gene expression profiles from diseased tissues of the same class, and highly resolved, highly accurate classification of known subtypes are expected to result from the comparative analysis of expression profiles among different subtypes. Mi- croarray hybridization experiments are unveiling detail in the classification of cancers, including acute myeloid leukemia (AML) and acute lymphoid leukemia (ALL; Golub et al. 1999), breast cancer (Perou et al. 2000), melanomas (Bittner et al. 2000), colon cancer (Alon et al. 2000), ovarian cancer (Welsh et al. 2001), diffuse B-cell-type lymphomas (Alizadeh et al. 2000), lung cancers (Garber et al. 2001), and gastric cancers (Hippo et al. 2002). The lymphoma (Alizadeh et al. 2000) and lung cancer studies (Garber et al. 2001) provide especially clear examples of the discovery of new subtypes of cancers. Every newly discovered high-resolution classification us- ing molecular differences among previously unrecognized disease subtypes paves the way for refined clinical trials and the development of highly targeted therapies. Such classifica- tions will allow fine-tuning of diagnosis and prognosis. An equally exciting application of transcription profiles will be fine-scale predictions of drug responses. Given an expression profile from a patient, available drugs will be prescribed with greater precision and with higher effectiveness through highly individualized treatments, removing much of the guesswork as to whether an individual will or will not respond to a particular treatment. Analyses of functional genomic data also promise to increase the rate at which new routes to treat- ments can be developed. Genes that show differential expres- sion between diseased tissue and normal tissue and among disease subtypes or stages can be expected to suggest experi- mental therapies including gene therapy (e.g., replacing de- fective promoter sequences), genome therapy (drugs that en- hance or suppress the transcription of particular sets of genes), and even oral replacement therapy, as in the case of the effects of oral replacement of guanylin on colon cancer rates in mice (Shailubhai et al. 2000). The route to discovery includes gene expression profiling of known types → identi- fication of biomarkers (dysregulated genes) → identification 1 Present address: Department of Pathology/Center for Pathol- ogy Informatics/Benedum Center for Oncology Informatics, Uni- versity of Pittsburgh, Pittsburgh, Pennsylvania 15232, USA. 2 Corresponding author. E-MAIL [email protected]; FAX (412) 647-5380. Article and publication are at http://www.genome.org/cgi/doi/10.1101/ gr.104003. Methods 13:503–512 ©2003 by Cold Spring Harbor Laboratory Press ISSN 1088-9051/03 $5.00; www.genome.org Genome Research 503 www.genome.org
-
Upload
ipaknowledge -
Category
Documents
-
view
4 -
download
0
Transcript of A Classification-Based Machine Learning Approach for the Analysis of Genome-Wide Expression Data

A Classification-Based Machine Learning Approachfor the Analysis of Genome-Wide Expression DataJames Lyons-Weiler,1,2 Satish Patel, and Soumyaroop BhattacharyaDepartment of Biological Sciences/Graduate Program in Biochemistry/Center for Bioinformatics and Computational Biology,University of Massachusetts, Lowell, Lowell, Massachusetts 01854, USA
Three important areas of data analysis for global gene expression analysis are class discovery, class prediction,and finding dysregulated genes (biomarkers). The clinical application of microarray data will require markergenes whose expression patterns are sufficiently well understood to allow accurate predictions on diseasesubclass membership. Commonly used methods of analysis include hierarchical clustering algorithms, t-, F-, andZ-tests, and machine learning approaches. We describe an approach called the maximum difference subset(MDSS) algorithm that combines classification algorithms, classical statistics, and elements of machine learningand provides a coherent framework. By integrating prediction accuracy, the MDSS algorithm learns the criticalthreshold of statistical significance (the � or P-value), eliminating the arbitrariness of setting a threshold ofstatistical significance and minimizing the effect of the normality assumptions. To reduce the false positive rateand to increase external validity of the predictive gene set, a jackknife step is used. This step identifies andremoves genes in the initial MDSS with low combined predictive utility. The overall MDSS provides a predictionthat is less dependent on an arbitrary study design (sample inclusion or exclusion) and should thus have highexternal validity. We demonstrate that this approach, unlike other published methods, identifies biomarkerscapable of predicting the outcome of anthracycline-cytarabine chemotherapy in cases of acute myeloidleukemia. By incorporating two criteria—statistical significance and predictive utility—the approach learns thesignificance level relevant for a given data set. The MDSS approach can be used with any test and classifieroperator pair.
Microarray technology permits the monitoring of relativegene expression values for thousands of genes in one experi-ment. This extremely powerful technology has revolutionizedfunctional genomics by allowing the simultaneous cross-tissue comparisons of expression levels in thousands of genes(Schena et al. 1995; DeRisi et al. 1997). This has set the stagefor an era of rapid developments in molecular medicine andpharmacogenomics. Transcription profiles from microarrayexperiments can provide molecular fingerprints of normaland aberrant (diseased) tissues. Gene expression patterns arethought to be different for all tissue types, at different stagesof development, and unique in particular diseased tissuessuch as tumors. Subclasses or subtypes of diseases are begin-ning to emerge on the basis of the comparative analysis ofgene expression profiles from diseased tissues of the sameclass, and highly resolved, highly accurate classification ofknown subtypes are expected to result from the comparativeanalysis of expression profiles among different subtypes. Mi-croarray hybridization experiments are unveiling detail in theclassification of cancers, including acute myeloid leukemia(AML) and acute lymphoid leukemia (ALL; Golub et al. 1999),breast cancer (Perou et al. 2000), melanomas (Bittner et al.
2000), colon cancer (Alon et al. 2000), ovarian cancer (Welshet al. 2001), diffuse B-cell-type lymphomas (Alizadeh et al.2000), lung cancers (Garber et al. 2001), and gastric cancers(Hippo et al. 2002). The lymphoma (Alizadeh et al. 2000) andlung cancer studies (Garber et al. 2001) provide especiallyclear examples of the discovery of new subtypes of cancers.
Every newly discovered high-resolution classification us-ing molecular differences among previously unrecognizeddisease subtypes paves the way for refined clinical trials andthe development of highly targeted therapies. Such classifica-tions will allow fine-tuning of diagnosis and prognosis. Anequally exciting application of transcription profiles will befine-scale predictions of drug responses. Given an expressionprofile from a patient, available drugs will be prescribed withgreater precision and with higher effectiveness throughhighly individualized treatments, removing much of theguesswork as to whether an individual will or will not respondto a particular treatment. Analyses of functional genomic dataalso promise to increase the rate at which new routes to treat-ments can be developed. Genes that show differential expres-sion between diseased tissue and normal tissue and amongdisease subtypes or stages can be expected to suggest experi-mental therapies including gene therapy (e.g., replacing de-fective promoter sequences), genome therapy (drugs that en-hance or suppress the transcription of particular sets ofgenes), and even oral replacement therapy, as in the case ofthe effects of oral replacement of guanylin on colon cancerrates in mice (Shailubhai et al. 2000). The route to discoveryincludes gene expression profiling of known types → identi-fication of biomarkers (dysregulated genes) → identification
1Present address: Department of Pathology/Center for Pathol-ogy Informatics/Benedum Center for Oncology Informatics, Uni-versity of Pittsburgh, Pittsburgh, Pennsylvania 15232, USA.2Corresponding author.E-MAIL [email protected]; FAX (412) 647-5380.Article and publication are at http://www.genome.org/cgi/doi/10.1101/gr.104003.
Methods
13:503–512 ©2003 by Cold Spring Harbor Laboratory Press ISSN 1088-9051/03 $5.00; www.genome.org Genome Research 503www.genome.org

of routes to treatment suggested by the biomarkers. The goalof finding dysregulated genes is thus motivated by two dis-tinct applications: finding biomarkers for class prediction(Golub et al. 1999), and the biomarkers themselves tend tosuggest further experimental routes to prevention or treat-ment.
Lasting discoveries require appropriate and useful meth-ods of analysis. These are key to the success of individualstudies in functional genomics and pharmacogenomics, andare thus essential for rapid discovery. Analyses and data-handling steps to insure data quality have been described andare fairly well characterized for each type of microarray tech-nology (Brown et al. 2001; Wang et al. 2001). The goals ofdata analysis steps (after data collection and quality checking)fall into three broad categories: (1) class discovery (identifica-tion of subtypes from gene expression profiles), (2) class pre-diction (placing unknown samples into a preexisting classifi-cation), and (3) detecting differentially expressed genes (find-ing dysregulated genes that clearly delineate betweensubtypes within a classification). Important statistical consid-erations for each of these steps include the use of appropriatestudy design, which includes (a) not confounding tissue-of-origin differences or dye channel with pathological differencebetween normal and diseased tissues, (b) the use of an appro-priate training set for machine-learning based approaches,and (c) the sampling of a sufficient number of each type oftissue, or measuring each with sufficient accuracy and preci-sion to avoid outlier effects. Also important are the use ofappropriate algorithms and statistics for each step in dataanalysis, including (a) the selection of reliable and justifiedclassification methods, (b) the use of a valid and robust testfor differential expression designed to allow differences forthe variances in the two (or more) groups under study, and (c)avoiding over-training the test. Finally, in the class predictionstep, consideration is needed to ensure that (d) the predic-tions made are accurate, which includes (e) ensuring that thesample for which a prediction is sought belongs within one ofthe subtypes in the existing classification and does not repre-sent a unique subtype. Some classifiers will lead to a ‘call’ onany sample, so this is an important feature of a useful predic-tive classifier.
Approaches to data analysis are not uniform; indeed, al-most every major paper reporting results from microarray ex-periments describes or applies a different set of methods ordescribes a novel approach to analysis. The lack of standard-ization is expected, but can be problematic; different researchgroups might come to very different conclusions about a dis-ease given that different methods of analysis invoke differentsets of assumptions. Hierarchical clustering algorithms havebeen widely applied to class discovery (classical ‘clustering’)and class prediction (‘classification’ proper; Eisen et al. 1998;Golub et al. 1999). Previously applied approaches for detect-ing differentially expressed genes include k-fold differencemeasures (DeRisi et al. 1997); a regression model (Thomas etal. 2001), simple t-tests for each gene and related approaches(Baggerly et al. 2001; Baldi and Long 2001; Thomas et al.2001); projection methods such as principle componentanalysis (PCA), also known as singular value decomposition(Alter et al. 2000) and correspondence analysis (Fellenberg etal. 2001); machine learning approaches (e.g., support vectormachine classification, Furey et al. 2000), binary classifierssuch as weighted voting (Golub et al. 1999; Yeang et al. 2001),and mixed model approaches (Kerr et al. 2000; Wolfinger etal. 2001).
Important limitations exist even for simple methods.The use of fold-change difference ratios can be criticized onthe grounds that because they do not take into account mea-surement error (variance), they will fail to find genes thatshow a highly reproducible but small difference in relativeexpression values. Basic t-tests and related approaches (F tests,z-tests; Thomas et al. 2001; Welsh et al. 2001) can be criticizedon the grounds that they require distributional assumptions.Moreover, if the statistical tests are interpreted strictly, thenstraightforward interpretation can be muddled by the needfor correction for multiple tests. Most importantly, the im-portance of accounting for variability within and across geneshas been recognized by others concerned with developingmethods for finding differentially expressed genes (Kerr et al.2000; Wolfinger et al. 2001). As employed to date, the simpletests do not account for differences in the amount of variancebetween sample groups. Specifically, given two means m1,m2, from sample groups of size n1 and n2, and within-groupvariances s1
2 and s22, the error term in the simple Student
t-test statistic
t =�m1 − m2�
�s12
n1+
s22
n2
( 1)
is inappropriate in this application when the sample groupsare of different size, leading to differences in variance in ex-pression values among samples of genes from different tissuetypes. Moreover, the two sample sets may be measured withdifferent precision (due to dye-specific read efficiencies).Hedenfalk et al. (2001) attempted to circumvent the distribu-tional assumption by using F- and t- permutation tests. Kerr etal. (2000) implemented a mixed model (ANOVA) in whichthese (and experimental) factors can be examined as indepen-dent factors.
Notably, intuitive dimension-reduction and projectionmethods such as (PCA) and correspondence analysis can becriticized on the grounds that their eigenvalues must be itera-tively estimated and that they require that the number ofeigenvalues to be used be selected. Because of this, the overall“broad pattern” results can be entry order-sensitive (Tausch etal. 1996). This is especially so if only a few major componentsare sought.
Eventually, the discoveries made using different meth-ods should be formally compared. These very different ap-proaches seldom identify the same subset of genes, resultingin a major potential bottleneck to discovery. When differentmethods report different gene sets as biomarkers (and there-fore candidates for experiments leading to treatment or pre-vention), it would help to test the gene set to determinewhether it can, in fact, accurately differentiate between thetwo groups in a predictive application of the method used forclassification. Given the large number of options available forthe analysis of microarray data, it may be tempting for re-searchers to use all available methods and look for consensusamong them. An interesting but theoretically unjustified ap-plication of this type was conducted by Welsh et al. (2001),who created a composite score for each gene by summing thescores for three separate measures. One problem with such anapproach is that some of the methods used may provide re-dundant results, and no objective criterion exists for weight-ing (or not weighting) the results of different methods. Sec-ond, different researchers may come to different conclusionsdepending on which methods they decide to include in their
Lyons-Weiler et al.
504 Genome Researchwww.genome.org

composite score. Third, the choice of tests to include in suchapproaches is somewhat arbitrary. Indeed, Yeang et al. (2001)used a combination of three different binary discriminantfunctions (k-nearest neighbors, weighted voting, and supportvector machines) but in the end, selecting these three meth-ods instead of the three methods selected by Welsh et al.(2001) is a subjective call.
Because the rate of discovery can be hampered by built-in artifacts and flaws in experimental design intrinsic to thecurrent application of microarray technologies, mixed modelsto account for the limitations of microarray technologies andtheir applications have been described (Kerr et al. 2000;Wolfinger et al. 2001). These methods are currently useful dueto channel-specific variabilities and the complete confound-ing of treatment effect with dyes. Moreover, their generalform allows the testing for effects of any identifiable source ofvariability. This is at once a strength and a potential weakness;mixed-model approaches can be criticized on the groundsthat they attempt to estimate too many parameters withsparse data (few studies replicate enough), and in the extremecan become curve-fitting exercises (such as fitting polynomialequations to explain cross-sample variability). Indeed, onefactor that appears on the surface to present real problems isthe specter of sequence-specific fluorescence intensity. Be-cause reverse transcription and label incorporation may differwith the linear nucleotide sequence, a mixed model might beconstructed to account for this effect, requiring as many pa-rameters as sequences. This would be overkill, because thefluorescence intensities are compared across groups for eachgene, which is based on the same sequence. Therefore, as longas one scales the measured between-group difference by thedegree of variability, as in an appropriate test statistic, thesequence effect problem is not relevant for the problem offinding differentially expressed genes, as long as single probesare used and expression values are normalized within genes.
Eventually, advances in technology may permit simulta-neous high-throughput monitoring of thousands of genes us-ing laboratory techniques that either are or are not based onmicroarray technology but that do not result in the particularartifacts and confounding that these mixed models have beenaptly adapted to study. Because of their ability to test for andreport on problems with technology and experimental designwhen studied as factors, mixed models should remain an im-portant tool for functional genomics and will serve to setstandards for improvements. Technological fixes and appro-priate experimental design can minimize the effects of suchartifacts. In fact, labs, facilities, and bioinformatics researchcenters conducting microarray experiments are making goodprogress in developing both technological fixes and bioinfor-matics approaches for quality control, including spot locationeffects and dye effects (e.g., Brown et al. 2001; Wang et al.2001; P. Tonellato, pers. comm.). Therefore, our statisticalconsiderations are developed for application where experi-mental design has been appropriate (e.g., dye is not con-founded with sample group), for example, with study designor with technology in which measurements are made withoutthe complete confounding of treatment effect with other un-wanted sources of variability.
Idiosyncratic differences among methods of analysismake comparisons difficult. A potential second bottleneck todiscovery is the failure to understand and to capitalize on therelationships among the methods. For example, some of theapproaches for finding differentially expressed genes havebeen described as ‘alternatives to’ or have been ‘compared to’
cluster analysis. Moreover, the performance efficiencies of thevariety of approaches applied to date have not been objec-tively compared. Obviously, therefore, no objective criterionfor selecting among the available methods has been widelyadopted. Simple statistical approaches applied to date fail toincorporate classification accuracy as a criterion for findingbiomarkers (Xiong et al. 2001). In this paper, we explore thepossibility that cluster analysis in any form (e.g., hierarchicalclustering or support vector machines) can be used in con-junction with any test (e.g., familiar classical statistical analy-ses) in a way that incorporates classification accuracy into thecriterion for finding differentially expressed genes. We de-scribe an approach to analysis that combines classificationalgorithms, classical (Neyman-Pearson) statistics (usually usedfor classical hypothesis testing), and elements of machinelearning to provide a coherent framework for the analysis ofgenome-scale gene expression data sets. Our approach usesthe combined criteria of (1) the ranking of gene by degree ofsignificance of an appropriate (pooled variance) test statistic,and (2) classification accuracy for selecting biomarkers. Onlygenes with expression profiles that together provide 100%accurate prediction of group membership despite perturba-tion by sample jackknifing are included. The algorithm learnsfirst at which statistical threshold such a gene set might exist,eliminating the arbitrariness associated with setting a thresh-old of statistical significance. This feature of the approach alsominimizes the effect of the normality assumption of our t-test. This feature seems essential, given that the genome bi-ology behind the data set should determine the number ofgenes that are in fact biologically important, instead of anarbitrary but usually accepted � level of, say, � = 0.05. Al-though the human genome is large (estimated to have∼40,000 genes), the proportion of genes that will actually dif-fer between any two tissue sample sets (true positives) willvary with the biological differences between the two samplesets. It seems unreasonable, therefore, to expect that research-ers comparing very different tissue types will adopt a signifi-cance threshold that is the same as that adopted by research-ers comparing very similar tissue types, for example, tissue-of-origin sample and precancerous neoplasm samples.
RESULTS
Predicting Chemotherapy Response in AcuteMyeloid LeukemiaAcute myeloid leukemia (AML) can be readily distinguishedfrom acute lymphoid leukemia (ALL) using gene expressionpatterns of 6817 genes (Golub et al. 1999). The Golub et al.(1999) classification of AML and ALL is easily reproduciblewith almost any method. Although the differentiation ofAML and ALL is straightforward, cluster analysis of all thegenes does not predict therapy outcome within AML samplesonly (success or failure) with the anthracycline-cytarabinechemotherapy regimen (Fig. 1). Golub et al. (1999) attemptedan approach called “neighborhood analysis” in which geneswith expression distributions between groups most closelymatched (correlated) with the ideal cases, that is,(1,1,1,1,0,0,0,0) and (0,0,0,0,1,1,1,1). However, they reporteda negative result in deriving a predictive classification oftherapy outcome. They attributed this outcome in part tosmall sample size. More recently, Thomas et al. (2001) devel-oped a Z-test approach that finds genes that are differentiallyexpressed between two groups and applied it to both the
MDSS Algorithm
Genome Research 505www.genome.org
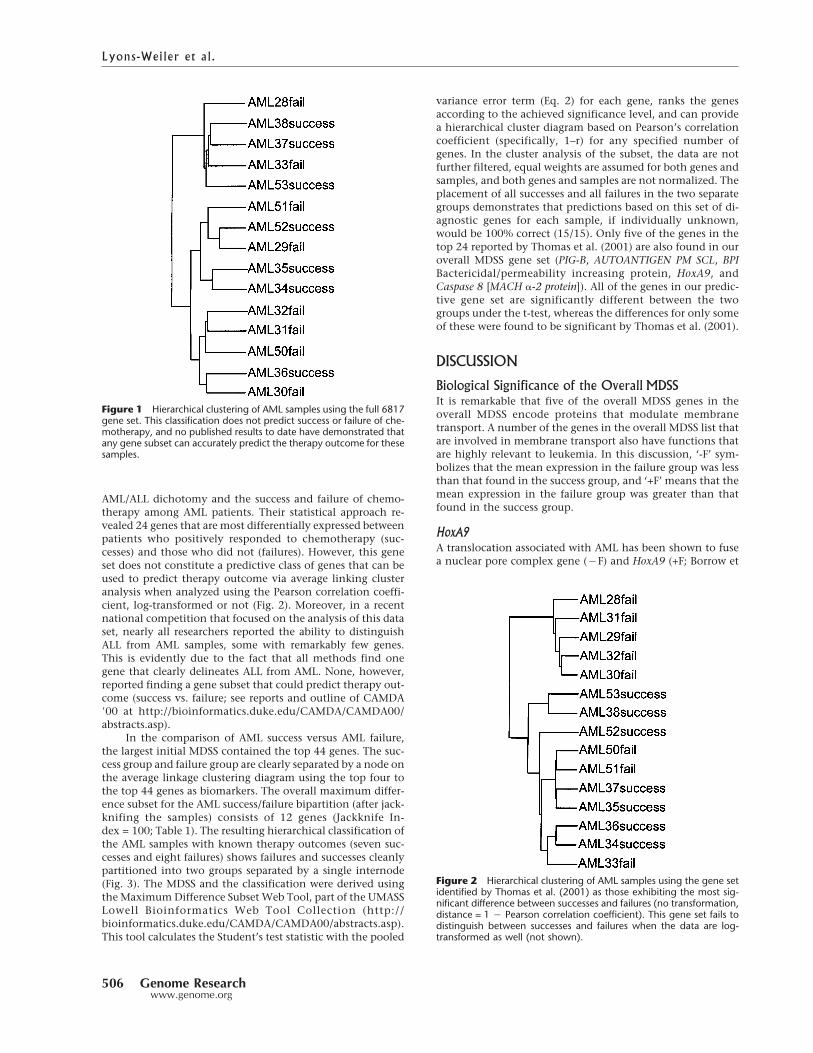
AML/ALL dichotomy and the success and failure of chemo-therapy among AML patients. Their statistical approach re-vealed 24 genes that are most differentially expressed betweenpatients who positively responded to chemotherapy (suc-cesses) and those who did not (failures). However, this geneset does not constitute a predictive class of genes that can beused to predict therapy outcome via average linking clusteranalysis when analyzed using the Pearson correlation coeffi-cient, log-transformed or not (Fig. 2). Moreover, in a recentnational competition that focused on the analysis of this dataset, nearly all researchers reported the ability to distinguishALL from AML samples, some with remarkably few genes.This is evidently due to the fact that all methods find onegene that clearly delineates ALL from AML. None, however,reported finding a gene subset that could predict therapy out-come (success vs. failure; see reports and outline of CAMDA�00 at http://bioinformatics.duke.edu/CAMDA/CAMDA00/abstracts.asp).
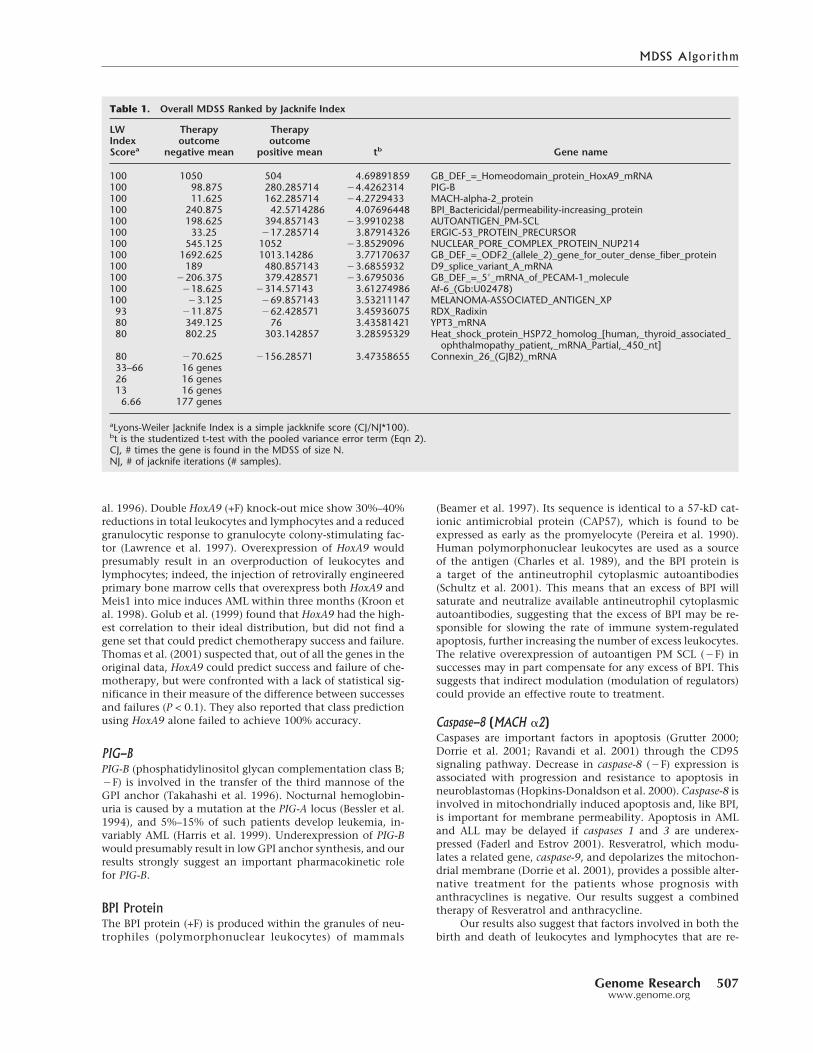
In the comparison of AML success versus AML failure,the largest initial MDSS contained the top 44 genes. The suc-cess group and failure group are clearly separated by a node onthe average linkage clustering diagram using the top four tothe top 44 genes as biomarkers. The overall maximum differ-ence subset for the AML success/failure bipartition (after jack-knifing the samples) consists of 12 genes (Jackknife In-dex = 100; Table 1). The resulting hierarchical classification ofthe AML samples with known therapy outcomes (seven suc-cesses and eight failures) shows failures and successes cleanlypartitioned into two groups separated by a single internode(Fig. 3). The MDSS and the classification were derived usingthe MaximumDifference Subset Web Tool, part of the UMASSLowell Bioinformatics Web Tool Collection (http://bioinformatics.duke.edu/CAMDA/CAMDA00/abstracts.asp).This tool calculates the Student’s test statistic with the pooled
variance error term (Eq. 2) for each gene, ranks the genesaccording to the achieved significance level, and can providea hierarchical cluster diagram based on Pearson’s correlationcoefficient (specifically, 1–r) for any specified number ofgenes. In the cluster analysis of the subset, the data are notfurther filtered, equal weights are assumed for both genes andsamples, and both genes and samples are not normalized. Theplacement of all successes and all failures in the two separategroups demonstrates that predictions based on this set of di-agnostic genes for each sample, if individually unknown,would be 100% correct (15/15). Only five of the genes in thetop 24 reported by Thomas et al. (2001) are also found in ouroverall MDSS gene set (PIG-B, AUTOANTIGEN PM SCL, BPIBactericidal/permeability increasing protein, HoxA9, andCaspase 8 [MACH �-2 protein]). All of the genes in our predic-tive gene set are significantly different between the twogroups under the t-test, whereas the differences for only someof these were found to be significant by Thomas et al. (2001).
DISCUSSION
Biological Significance of the Overall MDSSIt is remarkable that five of the overall MDSS genes in theoverall MDSS encode proteins that modulate membranetransport. A number of the genes in the overall MDSS list thatare involved in membrane transport also have functions thatare highly relevant to leukemia. In this discussion, ‘-F’ sym-bolizes that the mean expression in the failure group was lessthan that found in the success group, and ‘+F’ means that themean expression in the failure group was greater than thatfound in the success group.
HoxA9A translocation associated with AML has been shown to fusea nuclear pore complex gene (�F) and HoxA9 (+F; Borrow et
Figure 2 Hierarchical clustering of AML samples using the gene setidentified by Thomas et al. (2001) as those exhibiting the most sig-nificant difference between successes and failures (no transformation,distance = 1 � Pearson correlation coefficient). This gene set fails todistinguish between successes and failures when the data are log-transformed as well (not shown).
Figure 1 Hierarchical clustering of AML samples using the full 6817gene set. This classification does not predict success or failure of che-motherapy, and no published results to date have demonstrated thatany gene subset can accurately predict the therapy outcome for thesesamples.
Lyons-Weiler et al.
506 Genome Researchwww.genome.org
al. 1996). Double HoxA9 (+F) knock-out mice show 30%–40%reductions in total leukocytes and lymphocytes and a reducedgranulocytic response to granulocyte colony-stimulating fac-tor (Lawrence et al. 1997). Overexpression of HoxA9 wouldpresumably result in an overproduction of leukocytes andlymphocytes; indeed, the injection of retrovirally engineeredprimary bone marrow cells that overexpress both HoxA9 andMeis1 into mice induces AML within three months (Kroon etal. 1998). Golub et al. (1999) found that HoxA9 had the high-est correlation to their ideal distribution, but did not find agene set that could predict chemotherapy success and failure.Thomas et al. (2001) suspected that, out of all the genes in theoriginal data, HoxA9 could predict success and failure of che-motherapy, but were confronted with a lack of statistical sig-nificance in their measure of the difference between successesand failures (P < 0.1). They also reported that class predictionusing HoxA9 alone failed to achieve 100% accuracy.
PIG-BPIG-B (phosphatidylinositol glycan complementation class B;�F) is involved in the transfer of the third mannose of theGPI anchor (Takahashi et al. 1996). Nocturnal hemoglobin-uria is caused by a mutation at the PIG-A locus (Bessler et al.1994), and 5%–15% of such patients develop leukemia, in-variably AML (Harris et al. 1999). Underexpression of PIG-Bwould presumably result in low GPI anchor synthesis, and ourresults strongly suggest an important pharmacokinetic rolefor PIG-B.
BPI ProteinThe BPI protein (+F) is produced within the granules of neu-trophiles (polymorphonuclear leukocytes) of mammals
(Beamer et al. 1997). Its sequence is identical to a 57-kD cat-ionic antimicrobial protein (CAP57), which is found to beexpressed as early as the promyelocyte (Pereira et al. 1990).Human polymorphonuclear leukocytes are used as a sourceof the antigen (Charles et al. 1989), and the BPI protein isa target of the antineutrophil cytoplasmic autoantibodies(Schultz et al. 2001). This means that an excess of BPI willsaturate and neutralize available antineutrophil cytoplasmicautoantibodies, suggesting that the excess of BPI may be re-sponsible for slowing the rate of immune system-regulatedapoptosis, further increasing the number of excess leukocytes.The relative overexpression of autoantigen PM SCL (�F) insuccesses may in part compensate for any excess of BPI. Thissuggests that indirect modulation (modulation of regulators)could provide an effective route to treatment.
Caspase-8 (MACH �2)Caspases are important factors in apoptosis (Grutter 2000;Dorrie et al. 2001; Ravandi et al. 2001) through the CD95signaling pathway. Decrease in caspase-8 (�F) expression isassociated with progression and resistance to apoptosis inneuroblastomas (Hopkins-Donaldson et al. 2000). Caspase-8 isinvolved in mitochondrially induced apoptosis and, like BPI,is important for membrane permeability. Apoptosis in AMLand ALL may be delayed if caspases 1 and 3 are underex-pressed (Faderl and Estrov 2001). Resveratrol, which modu-lates a related gene, caspase-9, and depolarizes the mitochon-drial membrane (Dorrie et al. 2001), provides a possible alter-native treatment for the patients whose prognosis withanthracyclines is negative. Our results suggest a combinedtherapy of Resveratrol and anthracycline.
Our results also suggest that factors involved in both thebirth and death of leukocytes and lymphocytes that are re-
Table 1. Overall MDSS Ranked by Jacknife Index
LWIndexScorea
Therapyoutcome
negative mean
Therapyoutcome
positive mean tb Gene name
100 1050 504 4.69891859 GB_DEF_=_Homeodomain_protein_HoxA9_mRNA100 98.875 280.285714 �4.4262314 PIG-B100 11.625 162.285714 �4.2729433 MACH-alpha-2_protein100 240.875 42.5714286 4.07696448 BPI_Bactericidal/permeability-increasing_protein100 198.625 394.857143 �3.9910238 AUTOANTIGEN_PM-SCL100 33.25 �17.285714 3.87914326 ERGIC-53_PROTEIN_PRECURSOR100 545.125 1052 �3.8529096 NUCLEAR_PORE_COMPLEX_PROTEIN_NUP214100 1692.625 1013.14286 3.77170637 GB_DEF_=_ODF2_(allele_2)_gene_for_outer_dense_fiber_protein100 189 480.857143 �3.6855932 D9_splice_variant_A_mRNA100 �206.375 379.428571 �3.6795036 GB_DEF_=_5�_mRNA_of_PECAM-1_molecule100 �18.625 �314.57143 3.61274986 Af-6_(Gb:U02478)100 �3.125 �69.857143 3.53211147 MELANOMA-ASSOCIATED_ANTIGEN_XP93 �11.875 �62.428571 3.45936075 RDX_Radixin80 349.125 76 3.43581421 YPT3_mRNA80 802.25 303.142857 3.28595329 Heat_shock_protein_HSP72_homolog_[human,_thyroid_associated_
ophthalmopathy_patient,_mRNA_Partial,_450_nt]80 �70.625 �156.28571 3.47358655 Connexin_26_(GJB2)_mRNA33–66 16 genes26 16 genes13 16 genes6.66 177 genes
aLyons-Weiler Jacknife Index is a simple jackknife score (CJ/NJ*100).bt is the studentized t-test with the pooled variance error term (Eqn 2).CJ, # times the gene is found in the MDSS of size N.NJ, # of jacknife iterations (# samples).
MDSS Algorithm
Genome Research 507www.genome.org

sponsible for the unbalanced budget of these cells, the verydefinition of leukemia, are important determinants not onlyfor the diagnosis of the disease, but also for predictive prog-nosis. These results confirm the importance of these 12 genesfor potential treatments via gene expression modulation. Af-ter further laboratory validation of these transcript biomark-ers, randomized clinical studies of modulators of these genesare needed, especially given the high degree of correspon-dence of genes known to be significant to the developmentand treatment of AML through experimental results we havecited and those found in our predictive gene set.
Predictions Based on Samples of Unknown OutcomeAlthough a number of criteria for making predictions usingpotentially diagnostic gene sets have been proposed, no stan-dard criterion for making predictions has emerged. We pro-pose that predictions based on class label be used in the un-ambiguous case. An unambiguous prediction is made when asample clusters within a particular class (i.e., where both in-ternodes lead to nodes to which other members of that classare found). This simple, clearly defined prediction methodallows one to use the very same test in the class predictionapplication that was used to discover the set of genes forthe prediction. It also allows for cases to be identifiedwhere no prediction is to be made; for example, when anunknown clusters between and not within two distinctgroups (e.g., drug responders vs. no effects or ill effects), theapproach is said to decline on making a class prediction forthat sample.
In the original study, the therapy outcomes of 10 addi-tional samples in the original data set were unknown. Weincluded all of the 10 remaining AML samples in a hierarchi-cal clustering analysis to predict their response to the anthra-
cycline-cytarabine chemotherapy regime.Class prediction using hierarchical cluster-ing using only the 12 biomarkers we iden-tified places all but two samples of un-known clinical outcome in a partitioncontaining the successes (Fig. 4). The re-maining two samples (AML60 andAML66) cluster between the success andfailures (i.e., are not nested within eithercluster). Thus, using this gene set, MDSSopts to not make a prediction for two ofthe 10 samples with unknown outcome.This type of outcome should be expectedbecause some unknowns may not fall intoone of two predefined classes. Somesamples may be in transition between twopredefined sample groups in the progres-sion of a disease, whereas others may rep-resent a third (undiscovered) class. In ap-plication, such samples would require fur-ther study for prognosis. It is notable thatall unknowns cluster clearly within thesuccesses when theMACH �2 protein geneis excluded.
Extending MDSS to the MultipleClassification ProblemAny method for detecting differentiallyexpressed genes between two groups canbe extended to the problem of finding
genes with unique expression patterns given multiple typesand subtypes. In fact, if a strictly binary classification is ac-cepted, the two problems are equivalent; each group in abinary tree represents a bipartition. We note, however,that many studies make a comparison between all normalsamples and all tumor samples. Tumor subtypes are notstrictly hierarchically related; that is, in most cases, eachtumor subtype derives directly and uniquely from normaltissue. In these instances, the most appropriate comparison isall normal samples versus all samples of one tumor sub-type. This not only dramatically simplifies analysis andinterpretation, it prevents an unnecessarily confoundedanalysis.
On the Utility of the Jackknife: Reducing OverfittingMost methods approach the problem of finding importantgenes by looking for some attribute(s) in the distribution ofrelative expression values that seem to indicate that the genecould, in principle, be diagnostic (predictive). Methods thatevidently succeed at making predictions with one data setmay be susceptible to overfitting, that is, finding genes thatpredict well for the training data set—but which lack externalvalidity (false positives). Overfitting is only really an absoluteproblem if the data, or much of the data, are random, that is,if there is no biological signal in the change in gene expres-sion patterns. In the analysis of gene expression data, most ofthe thousands of genes may not be expressed differentially—but with low replication and with few samples, the possibilityof overfitting seems high for all methods.
Overfitting is at one level a problem associated with falsepositives. One problem with the claim that a given method issubject to ‘overfitting’ stems from the fact that the measure of‘overfitting’ itself relies on a negative (failed) outcome on in-
Figure 3 Average-linkage hierarchical cluster diagram of the tumors associated with successand failure of chemotherapy using the 12 genes in the overall MDSS (no transformation,distance = 1 � Pearson correlation coefficient). This gene set fails to distinguish between suc-cesses and failures when the data are log-transformed (data not shown). The hierarchicalclassification shows a clear distinction between successes and failures.
Lyons-Weiler et al.
508 Genome Researchwww.genome.org

dependent prediction(s) made using the features identified aspredictive. This is an impossible measure to make with em-pirical data when the true class membership is somewhat un-known (especially due to tissue heterogeneity).
The general idea of ‘overfitting’ is also made complexby the fact that it presumes that the classifier operator usedis capable of making the right prediction given a set ofinformative features. It must be remembered that the methodfor finding informative features is often independent or insome way different from the method used as a classifier,and in reality all such methods have limitations in predictiveutility.
In the usual application of ‘leave-one-out’ jackknife vali-dation, samples are removed, one at a time, and the predictivefeatures are found using a test applied to only the remaining
n�1 samples. These features arethen applied to make a predictionon the placement of the sample leftout. The procedure is repeated forall samples, and a score (usually theproportion of correct predictions) istallied. Leave-one-out validationuses n�1 samples as a training set,predicts on the sample left out, andthe score of 1�P (correct inference)leads to a classification error rate. Inour application of the jackknife, itsuse is turned around to identifythose features (genes) whose inclu-sion in the ‘overall MDSS’ is depen-dent on which samples are in-cluded in the analysis. As in leave-one-out validation, samples areremoved, one at a time, and the testis applied to the remaining n�1samples. Instead of using the resultto tally an error rate on the basis ofcorrect predictions, this applicationof the jackknife compares thefeature sets determined for eachjackknife iteration. The features(genes) common to all n feature setsare taken as a group as the overallMDSS. The motivation for thisapplication of the jackknife is toidentify and remove as many falsepositives as possible, and to identifyfeatures that will provide the mostaccurate predictions for all samplesfor which predictions are sought.Procedures that divide a dataset into a training set and a testset reduce the power of the testfor differentially expressed genes,such as cross-fold validation, can beused to create conservative classifi-cation error estimates. Such ap-proaches can nevertheless be ap-plied to any test + classifier operatorcombination, used with or withoutMDSS.
MDSS helps reduce the prob-ability of overfitting by the use ofthe jackknife—not for leave-one-
out-validation, but to reduce, as much as possible, thefalse positive rate. The jackknife is used by MDSS to capitalizeon information about the feature set (significant gene list)instead. By identifying genes whose predictive utility issensitive to study design, our approach should find outliersand generally reduce the false positive rate. MDSS leads toa small but biologically important list of genes, that is, apartial but highly accurate glimpse of changes in gene expres-sion.
In the analysis of the AML data, the initial MDSS (44genes) was determined using all 15 of the AML samples withknown therapy outcome. This initial gene set is the largestranked gene set found with the highest correct placement ofsamples. When 44 is adopted as the cut-off number duringthe jackknife, this total number of genes found to be signifi-
Figure 4 Predicted clinical outcome of the AML cases cited by Golub et al. (1999) as ‘unknowns’.Most cases cluster (average linkage) within the ‘therapy outcome = success’ sample group. Themethod opts to not make a prediction for two samples because they fall between the two classes andare not nested within either cluster. This important feature of the method will allow the identificationsof cases that are outside of the classification problem, such as those that belong to a third, unidentifiedclass.
MDSS Algorithm
Genome Research 509www.genome.org

cant when each sample is left out, one at a time, is 240. Thebulk of these genes (177) are included in the MDSS as a resultof leaving one of the samples out, and are thus represented inthe MDSS only once out of the 15 perturbations. The Jack-knife Index aids immensely in identifying which potentialbiomarkers are immune to study design (which samples areincluded or excluded). Misleading but apparently useful bio-markers that rank high in one simple analysis (say, with allsamples included) can be identified and excluded due to lowgeneral utility, revealed by the Jackknife Index. This stepseems essential given that decreases in the number of falsepositive candidates going into the drug discovery pipelinewould increase the rate at which useful treatments are discov-ered. We therefore recommend that the Jackknife Index beadopted as a standard step in determining differentially ex-pressed genes, whichever of the myriad of measures isadopted.
Supervised versus Unsupervised MDSSThe MDSS approach can in principle be conducted either as apartially supervised or completely automated (unsupervised)approach. Specifically, researchers can search for the largestthreshold value of the test measure for which a classificationanalysis returns a classification in which the sample groupsare clearly delineated (TB) ‘manually’ (i.e., trial-and-error), ora program could search all classifications derived using M ofM genes, M�1 genes, M�2 genes. . . until all levels werecharacterized. This should minimize the loss of true positives(increase sensitivity), and the jackknife should work to reducefalse positives. This aspect of the problem is solved in lineartime, and thus its computational cost is not unreasonable.
Simultaneous Use of Multiple BiomarkersInformation useful to prognosis and diagnosis on individualbiomarkers is used by combining these markers in a singlepredictive set. There is an immense number of ways to com-bine the mutual information and covariation among sets ofvalidated biomarkers, and an immense number of ways tomake predictions using this information. The algorithms usedin this report (t-test, pairwise distance calculation, and hier-archical clustering) only represent the simplest and mostpopular approaches. Much research is needed to find optimalalgorithms for these inferences before any such approachescan be adopted for clinical use.
On Correcting for Multiple ComparisonsUnder classical statistical inference, the acceptable false posi-tive rate is equal to �. Our outcome-driven approach invertsthe problem by incorporating classification accuracy into thedetermination of the MDSS. The approach thereby (inciden-tally) learns the significance level that returns the user-specified bipartition. Therefore, the problem of multiple com-parisons is an undefined problem in our application. In fact,even if a researcher wished to perform a Bonferroni-type cor-rection, this would in no way influence the outcome of theanalysis. We therefore recommend that users of this approachreport the number of genes in the gene set that exhibits ac-curate classification power instead of the associated t, �, or p.
METHODS
The MDSS AlgorithmDifferences in expression measured by a test can be checkedwith a second criterion: the predictive utility of gene setsfound to be different. The goal of the maximum differencesubset (MDSS) algorithm is to find genes expression differ-ences that are not only significant, but that also carry infor-mation useful to the classification applications. The MDSSalgorithm employs the following steps, described in the gen-eral form (for any test and any classifier):
1. Calculate a test (e.g., test statistic or S:N ratio) for each gene(spot) in a comparison of sample groups A and B (e.g.,normal vs. tumor).
2. Rank the genes in descending order according to the mag-nitude of that measure.
3. Find the largest threshold value of that measure for whicha classification analysis returns a classification in whichthe sample groups are clearly delineated (TB). For example,if the test employed in Step 1 is a t-test, find the largestsignificance level (�) where the classifier succeeds in dis-criminating between the two sample groups. This gene setis called the ‘initial MDSS.’
4. Jackknife out individual samples and store the list of genesthat are significant beyond threshold TB. Adjust the de-grees of freedom due to the exclusion of one sample asneeded. Each time a sample is removed, an individualMDSS list is created.
5. Identify the subset of genes common to all individualMDSSs. This gene set is comprised of genes that are notonly significantly different between the two; they alsopass, as a set, the criterion of predictive utility. This geneset is called the ‘overall MDSS’.
6. Verify that the overall MDSS returns the expected classifi-cation (e.g., a hierarchical cluster diagram with a biparti-tion between sample groups A and B). If this does not oc-cur, adjust (increase or decrease) the threshold value set atStep 3 and begin again.
Each and any outcome is possible here; that is, the over-all MDSS may contain all the genes in a data set, or, if nogenes are both statistically different and predictive as a set,the MDSS set may be empty. If the MDSS fails to find a geneset that predicts perfectly on the samples, the conclusion isthat the data are insufficient for the classification problemposed using the selected test and the selected classifier opera-tor.
Fortunately, these steps are not terribly computationallycomplex. These steps, including the generation of a hierarchi-cal classification, are automated in a simple Gene ExpressionData Analysis web tool (http://bioinformatics.upmc.edu/GEDA.html). A number of options are available for clustering(pairwise distance, clustering algorithm) and for the test(nfold thresholding vs. t-test vs. Mann-Whitney U-test).Given means from two groups (m1, m2) of sample sizes n1 andn2 and variance s1
2, s22, the pooled variance test statistic
t =�m1 − m2�
���n1 − 1�s12 + �n2 − 1�s2
2
n1 + n2 − 2 �� 1n1 +1n2�
( 2)
is appropriate when the sample sizes differ between groups.Nonparametric statistical analyses such as Spearman’s rankcorrelation or the Mann-Whitney U-test could be used insteadof the t-test; we prefer to use the parametric test given itssimplicity and relative ease of implementation. A simulationstudy comparing these and other tests is underway.
Lyons-Weiler et al.
510 Genome Researchwww.genome.org

ACKNOWLEDGMENTSWe thank Susan Braunhut, Kenneth Marx, Thomas Shea, LeeJones, and Chris Hassett for useful discussions on the topics inthis report, and two anonymous reviewers for their helpfulcomments. This research was supported by research fundsfrom the University of Massachusetts, Lowell and from theHassett Family. The support from Chris Hassett, Drs. RobertTamarin, Robert Wagner, and William Hogan for the UMASSLowell Bioinformatics Initiative and the UMASS Lowell Cen-ter for Bioinformatics and Computational Biology during theyears 2000–2002 is deeply appreciated.
The publication costs of this article were defrayed in partby payment of page charges. This article must therefore behereby marked “advertisement” in accordance with 18 USCsection 1734 solely to indicate this fact.
REFERENCESAlizadeh, A., Eisen, M., Davis, R.E., Ma, C., Sabet, H., Tran, T.,
Powell, J.I., Yang, L., Marti, G.E., Moore, D.T., et al. 2000.Distinct types of diffuse large B-cell lymphoma identified bygene expression profiling. Nature 403: 503–511.
Alon, U., Barkai, N., Notterman, D.A., Gish, K., Ybarra, S., Mack, D.,and Levine, A.J. 2000. Broad patterns of gene expression revealedby clustering analysis of tumor and normal colon tissues probedby oligonucleotide arrays. Proc. Natl. Acad. Sci. 96: 6745– 6750.
Alter, O., Brown, P.O., and Botstein, D. 2000. Singular valuedecomposition for genome-wide expression data processing andmodeling. Proc. Natl. Acad. Sci. 97: 10101–10106.
Baggerly, K.A., Coombes, K.R., Hess, K.R., Stivers, D.S., Abruzzo, L.V.,and Zhang, W. 2001. Identifying differentially expressed genes incDNA microarray experiments. J. Comp. Biol. 8: 639–659.
Baldi, P. and Long, A.D. 2001. A Bayesian framework for the analysisof microarray expression data: Regularized t-test and statisticalinferences of gene changes. Bioinformatics 17: 509–519.
Beamer, L.J., Carroll, S.F., and Eisenberg, D. 1997. Crystal structureof human BPI and two bound phospholipids at 2.4Å resolution.Science 276: 1861–1864.
Bessler, M., Mason, P.J., Hillmen, P., Miyata, T., Yamada, N., Takeda,J., Luzzatto, L., and Kinoshita, T. 1994. Paroxysmal nocturnalhaemoglobinuria (PNH) is caused by somatic mutations in thePIG-A gene. EMBO J. 1: 110–117.
Bittner, M., Meltzer, P., Chen, Y., Jiang, Y., Seftor, E., Hendrix, M.,Radmacher, M., Simon, R., Yakhini, Z., Ben-Dor, A., et al. 2000.Molecular classification of cutaneous malignant melanoma bygene expression profiling. Nature 406: 536–540.
Borrow, J., Shearman, A.M., Stanton Jr., V.P., Becher, R., Collins, T.,Williams, A.J., Dube, I., Katz, F., Kwong, Y.L., Morris, C., et al.1996. The t(7;11)(p15;p15) translocation in acute myeloidleukaemia fuses the genes for nucleoporin NUP98 and class Ihomeoprotein HoxA9. Nat. Genet. 12: 159–167.
Brown, C.S., Goodwin, P.C., and Sorger, P.K. 2001. Image metrics inthe statistical analysis of DNA microarray data. Proc. Natl. Acad.Sci. 98: 8944–8949.
Charles, L.A., Falk, R.J., and Jennette, J.C. 1989. Reactivity ofantineutrophil cytoplasmic autoantibodies with HL-60 cells. Clin.Immunol. Immunopathol. 53: 243–253.
DeRisi, J.L., Iyer, V.R., and Brown, P.O. 1997. Exploring themetabolic and genetic control of gene expression on a genomicscale. Science 278: 680–686.
Dorrie, J., Gerauer, H., Wachter, Y., and Zunino, S.J. 2001.Resveratrol induces extensive apoptosis by depolarizingmitochondrial membranes and activating caspase-9 in acutelymphoblastic leukemia cells. Cancer Res. 61: 4731–4739.
Eisen, M.B., Spellman, P.T., Brown, P.O., and Botstein, D. 1998.Cluster analysis and display of genome-wide expression patterns.Proc. Natl. Acad. Sci. 95: 14863–14868.
Faderl, S. and Estrov, Z. 2001. The clinical significance of caspaseregulation in acute leukemia. Leuk. Lymphoma 40: 471–481.
Fellenberg, K., Hauser, N.C., Brors, B., Neutzner, A., Hohheisel, J.D.,and Vingron, M. 2001. Correspondence analysis applied tomicroarray data. Proc. Natl. Acad. Sci. 98: 10781–10786.
Furey, T.S., Cristianini, N., Duffy, N., Bednarski, D.W., Schummer,M., and Haussler, D. 2000. Support vector machine classificationand validation of cancer tissue samples using microarrayexpression data. Bioinformatics 16: 906–914.
Garber, M.E., Troyanskaya, O.G., Schluens, K., Petersen, S., Thaesler,
Z., Pacyna-Gengelbach, M., van de Rijn, M., Rosen, G.D., Perou,C.M., Whyte, R.I., et al. 2001. Diversity of gene expression inadenocarcinoma of the lung. Proc. Natl. Acad. Sci.98: 13784–13789.
Golub, T.R., Slonim, D.K., Tamayo, P., Huard, C., Gaasenbeek, M.,Mesirov, J.P., Coller, H., Loh, M.L., Downing, J.R., Caligiuri,M.A., et al. 1999. Molecular classification of cancer: Classdiscovery and class prediction by gene expression monitoring.Science 286: 531–537.
Grutter, M.G. 2000. Caspases: Key players in programmed cell death.Curr. Opin. Struct. Biol. 10: 649–655.
Harris, J.W., Koscick, R., Lazarus, H.M., Eshleman, J.R., and Medof,M.E. 1999. Leukemia arising out of paroxysmal nocturnalhemoglobinuria. Leuk. Lymphoma 32: 401–426.
Hedenfalk, I., Duggan, D., Chen, Y., Radmacher, M., Bittner, M.,Simon, R., Meltzer, P., Gusterson, B., Esteller, M., Kallioniemi,O.P., et al. 2001. Gene-expression profiles in hereditary breastcancer. N. Engl. J. Med. 344: 601–602.
Hippo, Y., Taniguchi, H., Tsutsumi, S., Machida, N., Chong, J.M.,Fukayama, M., Kodama, T., and Aburatani, H. 2002. Global geneexpression analysis of gastric cancer by oligonucleotidemicroarrays. Cancer Res. 62: 233–240.
Hopkins-Donaldson, S., Bodmer, J.L., Bourloud, K.B., Brognara, C.B.,Tschopp, J., and Gross, N. 2000. Loss of caspase-8 expression inneuroblastoma is related to malignancy and resistance toTRAIL-induced apoptosis. Med. Pediatr. Oncol. 35: 608–611.
Kerr, M.K., Martin, M., and Churchill, G.A. 2000. Analysis ofvariance for gene expression microarray data. J. Comp. Biol.7: 819–37.
Kroon, E., Krosl, J., Thorsteinsdottir, U., Baban, S., Buchberg, A.M.,and Sauvageau, G. 1998. Hoxa9 transforms primary bonemarrow cells through specific collaboration with Meis1� but notPbx1�. EMBO J. 17: 3714–3725.
Lawrence, H.J., Helgason, C.D., Sauvageau, G., Fong, S., Izon, D.J.,Humphries, R.K., and Largman, C. 1997. Mice bearing a targetedinterruption of the homeobox gene HoxA9 have defects inmyeloid, erythroid, and lymphoid hematopoiesis. Blood89: 1922–1930.
Pereira, H.A., Spitznagel, J.K., Winton, E.F., Shafer, W.M., Martin,L.E., Guzman, G.S., Pohl, J., Scott, R.W., Marra, M.N., andKinkade Jr., J.M. 1990. The ontogeny of a 57-Kd cationicantimicrobial protein of human polymorphonuclear leukocytes:Localization to a novel granule population. Blood 76: 825–834.
Perou, C.M., Sorlie, T., Eisen, M.B., van de Rijn, M., Jeffrey, S.S.,Rees, C.A., Pollack, J.R., Ross, D.T., Johnsen, H., Akslen, L.A., etal. 2000. Molecular portraits of human breast tumours. Nature406: 747–752.
Ravandi, F., Kantarjian, H.M., Talpaz, M., O’Brien, S., Faderl, S.,Giles, F.J., Thomas, D., Cortes, J., Andreeff, M., Estrov, Z., et al.2001. Expression of apoptosis proteins in chronic myelogenousleukemia: Associations and significance. Cancer 91: 1964–1972.
Schena, M., Shalon, D., Davis, R.W., Brown, P.O. 1995. Quantitativemonitoring of gene expression patterns with a complimentaryDNA microarray. Science 270: 467–470.
Schultz, H., Weiss, J., Carroll, S.F., and Gross, W.L. 2001. Theendotoxin-binding bactericidal/permeability-increasing protein(BPI): A target antigen of autoantibodies. J. Leukoc. Biol.69: 505–512.
Shailubhai, K., Yu, H.H., Karunanandaa, K., Wang, J.Y., Eber, S.L.,Wang, Y., Joo, N.S., Kim, H.D., Miedema, B.W., Abbas, S.Z., et al.2000. Uroguanylin treatment suppresses polyp formation in theApc Min/1 mouse and induces apoptosis in human colonadenocarcinoma cells via cyclic GMP. Cancer Res. 60: 5151–5157.
Takahashi, M., Inoue, N., Ohishi, K., Maeda, Y., Nakamura, N.,Endo, Y., Fujita, T., Takeda, J., and Kinoshita, T. 1996. PIG-B, amembrane protein of the endoplasmic reticulum with a largelumenal domain, is involved in transferring the third mannoseof the GPI anchor. EMBO J. 15: 4254–4261.
Tausch, R.J., Charlet, D.A., Weixelman, D.A., and Zamudio, D.C.1996. Patterns of ordination and classification instability fromchanges in data input order. J. Veg. Sci. 6: 897–902.
Thomas, J.G., Olson, J.M., Tapscott, S.J., and Zhao, L-P. 2001. Anefficient and robust statistical modeling approach to discoverdifferentially expressed genes using genomic expression profiles.Genome Res. 11: 1227–1236.
Wang, X., Ghosh, S., and Guo, S-W. 2001. Quantitative qualitycontrol in microarray image processing and data acquisition.Nucleic Acids Res. 29: E75
Welsh, J.B., Zarrinker, P.P., Sapinoso, L.M., Kern, S.G., Behling, C.A.,Monk, B.J., Lockhart, D.J., and Hampton, G.M. 2001. Analysis of
MDSS Algorithm
Genome Research 511www.genome.org

gene expression profiles in normal and neoplastic ovarian tissuesamples candidate molecular markers of epithelial ovariancancer. Proc. Natl. Acad. Sci. 98: 1176–1181.
Wolfinger, R.D., Gibson, G., Wolfinger, E.D., Bennett, L., Hamadeh,H., Bushel, P., Afshari, C., and Paules, R.S. 2001. Assessing genesignificance from cDNA microarray expression data via mixedmodels. J. Comput. Biol. 8: 625–637.
Xiong, M., Fang, X., and Zhao, J. 2001. Biomarker identification byfeature wrappers. Genome Res. 11: 1878–1887.
Yeang, C-H., Ramaswamy, S., Tamayo, P., Mukherjee, S., Rifkin,R.M., Angelo, M., Reich, M., Lander, E., Mesirov, J., and Golub,T. 2001. Molecular classification of multiple tumor types.Bioinformatics 17: 316–322.
WEB SITE REFERENCEShttp://bioinformatics.upmc.edu/GEDA.html; A browser interface for
the analysis of expression of global gene expression patterns.http://www.camda.duke.edu/CAMDA00/abstracts.asp; A listing of
abstracts for the papers presented at the CAMDA 2000 meeting(Critical Assessment of Microarray Data Analysis 2000, December18–19, 2000 at Duke University in Durham, N.C.).
Received January 17, 2002; accepted in revised form December 30, 2002.
Lyons-Weiler et al.
512 Genome Researchwww.genome.org