991022287149503411.pdf - PolyU Electronic Theses
326
Copyright Undertaking This thesis is protected by copyright, with all rights reserved. By reading and using the thesis, the reader understands and agrees to the following terms: 1. The reader will abide by the rules and legal ordinances governing copyright regarding the use of the thesis. 2. The reader will use the thesis for the purpose of research or private study only and not for distribution or further reproduction or any other purpose. 3. The reader agrees to indemnify and hold the University harmless from and against any loss, damage, cost, liability or expenses arising from copyright infringement or unauthorized usage. IMPORTANT If you have reasons to believe that any materials in this thesis are deemed not suitable to be distributed in this form, or a copyright owner having difficulty with the material being included in our database, please contact [email protected] providing details. The Library will look into your claim and consider taking remedial action upon receipt of the written requests. Pao Yue-kong Library, The Hong Kong Polytechnic University, Hung Hom, Kowloon, Hong Kong http://www.lib.polyu.edu.hk
-
Upload
khangminh22 -
Category
Documents
-
view
0 -
download
0
Transcript of 991022287149503411.pdf - PolyU Electronic Theses

Copyright Undertaking
This thesis is protected by copyright, with all rights reserved.
By reading and using the thesis, the reader understands and agrees to the following terms:
1. The reader will abide by the rules and legal ordinances governing copyright regarding the use of the thesis.
2. The reader will use the thesis for the purpose of research or private study only and not for distribution or further reproduction or any other purpose.
3. The reader agrees to indemnify and hold the University harmless from and against any loss, damage, cost, liability or expenses arising from copyright infringement or unauthorized usage.
IMPORTANT
If you have reasons to believe that any materials in this thesis are deemed not suitable to be distributed in this form, or a copyright owner having difficulty with the material being included in our database, please contact [email protected] providing details. The Library will look into your claim and consider taking remedial action upon receipt of the written requests.
Pao Yue-kong Library, The Hong Kong Polytechnic University, Hung Hom, Kowloon, Hong Kong
http://www.lib.polyu.edu.hk

DECIPHERING AND OPTIMIZING THE
PROCESS OF REMOVAL AND
RECOVERY OF Pb(II) AND CD(II) FROM
WASTEWATER BY BIOSORBENT
DERIVED FROM FRUIT WASTE
WANG QIAN
PhD
The Hong Kong Polytechnic University
2019

The Hong Kong Polytechnic University
Department of Applied Biology and Chemical Technology
Deciphering and Optimizing the Process of
Removal and Recovery of Pb(II) and Cd(II)
from Wastewater by Biosorbent Derived from
Fruit Waste
WANG Qian
A thesis submitted in partial fulfillment of the
requirements for the degree of
DOCTOR OF PHILOSOPHY
February, 2019

Certificate of Originality
i
Certificate of Originality
I hereby declare that this thesis is my own work and that, to the best of my
knowledge and belief, it reproduces no material previously published or written,
nor material that has been accepted for the award of any other degree or diploma,
except where due acknowledgement has been made in the text.
WANG Qian

Abstract
ii
Abstract
Lead (Pb) and cadmium (Cd) are the two most hazardous heavy metals in
consideration of their prevalence in industries and high toxicity to living organisms.
Biosorption by using abundant fruit waste is an environmentally benign and cost-
effective approach for heavy metal removal from wastewater. In this study, the rind
of Citrullus lanatus (watermelon rind, shorten as WR) and the seed of Mangifera
indica (mango seed, shorten as MS) were employed for Pb(II) and Cd(II)
biosorption in aqueous solutions. For comprehensive mechanistic elucidation,
which is crucial for process control and commercial (bio)sorbent development, a
hybrid methodology of surface and structure analysis, spectroscopic techniques,
chemical methods and quantum chemistry simulation (QCS) was established in
combination with macroscopic biosorption studies.
In batch studies, the maximum biosorption capacities of 231.57 1.09 mg-
Pb/g-WR at pH 5.0 and 98.51 1.15 mg-Cd/g-WR at pH 7.0 were achieved by WR.
The Redlich-Peterson (R-P) and Dubinin-Radushkevich (D-R) isotherms provided
the best description to the equilibrium data of Pb(II) and Cd(II), respectively,
suggesting the heterogeneous surface of WR. Besides, Pb(II) and Cd(II) were
rapidly sequestered by WR, with the kinetic processes well described by the
pseudo-first-order and pseudo-second-order equations, respectively. For MS, the
maximum biosorption capacities were determined to be 263.63 0.06 mg-Pb/g-MS
at pH 5.0 and 93.53 1.43 mg-Cd/g-MS at pH 7.5. The R-P isotherm provided the
best description to Pb(II) and Cd(II) biosorption by MS, implying multilayer

Abstract
iii
loadings of Pb(II) and Cd(II) on the heterogeneous surface of MS. Rapid
biosorption of Pb(II) and Cd(II) was observed in the kinetic studies with the pseudo-
first-order and pseudo-second-order equations as the best fitting models,
respectively. The sequestered Pb(II) and Cd(II) were easily eluted from MS by
dilute acids including HNO3 and citric acid with a good biosorption capacity
remained in the regenerated MS. Unlike WR, the biosorption capacity of MS
dramatically decreased as its particle size increased. In the continuous mode, the
WR-packed bed column reactor maintained superior performance of Pb(II)
biosorption over 10 cycles with a breakthrough time ranging from 8.3 h to13.0 h,
and 95% of the sequestered Pb(II) was desorbed in 1.3-2.3 h by 0.05 M HCl. To the
best of my knowledge, advanced solid-state nuclear magnetic resonance (NMR)
spectroscopy was employed for the first time to investigate the interactions between
heavy metals and biosorbents in this study. Coupling with conventional
spectroscopic techniques such as Fourier-transform infrared (FTIR) spectroscopy
and X-ray photoelectron spectroscopy (XPS), carboxyl, hydroxyl, amine and ether
groups from cellulose, pectin and hemicellulose in WR, and cellulose,
hemicellulose and tannins in MS, were distinguished as the binding sites for Pb(II)
and Cd(II) sequestration. Together with analytical methods such as zeta potential
measurement, scanning electron microscopy equipped with energy dispersive X-
ray spectroscopy (SEM-EDX), powder X-ray diffraction (PXRD) and ion exchange
experiments, the underlying mechanisms were identified as complexation,
electrostatic attraction, ion exchange (with Ca2+ and Mg2+) and microprecipitation.
The QCS at a molecular level verified the feasibility of heavy metal complexation
with the identified binding sites and indicated the preference of heavy metal binding

Abstract
iv
to carboxyl groups. The mechanistic studies reveal that pectin, hemicellulose and
amorphous cellulose are promising matrices for developing commercial
(bio)sorbents for heavy metal sequestration.
Compared with other fruit-waste-derived biosorbents in the literature, WR
and MS in this study exhibited much higher Pb(II) biosorption capacities and
comparable Cd(II) biosorption capacities. In particular, the high selectivity of WR
towards Pb(II), the stability of the biosorption process, and the excellent column
performance reveal the great practicability of WR in scale-up treatment of Pb(II)-
bearing wastewater. Moreover, the hybrid mechanistic methodology established in
this study can comprehensively decipher biosorption processes at both macroscopic
and microscopic scales. It also provides important insights into other environmental
studies, as most environmental processes are related to interactions between
adsorbates and biological surfaces with varying degrees.

Acknowledgements
v
Acknowledgements
This thesis presents the research work of my PhD study in the past four years
at the Department of Applied Biology and Chemical Technology, The Hong Kong
Polytechnic University. The work could not have been finished without the valuable
assistance of several people and research funding provided by the Research Grants
Council (RGC) of Hong Kong SAR (China).
I would like to express my great gratitude to my chief supervisor, Dr. LO
Wai-hung, Thomas, for his patient guidance and constructive advice throughout the
entire period of my PhD study.
I am very grateful for Dr. LAM Yan Yan, who carefully instructed me in
the biosorption studies. Academic discussion with her gave me a lot inspiration in
the experimental design and result analysis. I also appreciate the continuous help
from my research colleagues Mr. HO Kwok Pan, Mr. CHAN Kwan Shing, Mr. KIM
Chi-fai and Mr. CHUNG Sai Fung. I want to thank Ms. CHENG Siu Yim and Ms.
WONG Ka Ki, who performed their final year projects in our lab, for their
contribution to parts of experiments in Pb(II) and Cd(II) biosorption by mango seed.
Mr. HO Chi-man, Jimmy, is acknowledged for his assistance with recording
elemental information of serval biosorbent samples and the use of the ICP-OES
instrument.
The research studies relevant to solid-state NMR spectroscopy, PXRD and
SEM-EDX were performed in a collaboration program with Prof. Ulla Gro
Nielsen’s research group at the Department of Physics, Chemistry, and Pharmacy,
University of Southern Denmark. I would like to thank Prof. Nielsen and Mr.

Acknowledgements
vi
Anders Bruhn Arndal Andersen, who helped me record the solid-state NMR spectra
of my samples and patiently instructed me to access the solid-state NMR
instruments. Besides, the PXRD and SEM-EDX information of my samples was
collected with the kind help from Dr. KIM Tae-Hyun; he also assisted with the
analysis of the SEM-EDX results of mango seed. The quantum chemistry
simulation via Gaussian modelling was performed with the assistance of Dr.
WANG Jian, who is an expert in structural chemistry. The discussion with her gave
me a better understanding on the heavy metal interaction with functional groups in
a molecular level.
I want to give my sincere thanks to Dr. LEE Po-Heng, Henry. As my
previous supervisor and also collaborator in some parts of my PhD study, he
continuously provided me with constructive advice on both academic and non-
academic aspects. Dr. HUANG Xiao Wu and Dr. TAN Giin-Yu, Amy also shared
a lot of their research experience with me and gave me extensive encouragement
during my PhD study. Their passion and persistency on research inspire me a lot.
Besides, I would like to thank Ms. LEUNG Hong-man, Josephine, who carefully
proofread this thesis and gave corrections on the writing of some parts.
Finally, I want to thank my dear family and friends, especially my best
friend, WANG Yun Long, for their continuous support and encouragement to me
to pursue my dreams. I am always on my way with their solid support.
Table of Contents
vii
Table of Contents
Certificate of Originality ....................................................................................... i
Abstract .................................................................................................................. ii
Acknowledgements ................................................................................................ v
Table of Contents ................................................................................................ vii
List of Abbreviations ......................................................................................... xiv
List of Figures ...................................................................................................... xx
List of Tables ..................................................................................................... xxv
1. Introduction ................................................................................................... 1
Motivations ................................................................................................. 2
Objectives .................................................................................................... 6
Organization of this dissertation ................................................................. 7
2. Literature Review.......................................................................................... 8
Heavy metal pollution and hazards ............................................................. 9
2.1.1. Lead ..................................................................................................... 9

Table of Contents
viii
2.1.2. Cadmium ........................................................................................... 10
Conventional treatment ............................................................................. 14
2.2.1. Chemical precipitation ...................................................................... 14
2.2.2. Ion exchange ..................................................................................... 16
2.2.3. Adsorption ......................................................................................... 17
2.2.4. Membrane filtration .......................................................................... 18
2.2.5. Coagulation-flocculation ................................................................... 20
2.2.6. Flotation ............................................................................................ 21
2.2.7. Electrochemical methods .................................................................. 22
Fruit waste ................................................................................................. 23
2.3.1. Fruit waste disposal ........................................................................... 23
2.3.2. Components of fruit waste materials................................................. 23
Biosorption ................................................................................................ 27
2.4.1. Conception of biosorption ................................................................. 27
2.4.2. Biosorption of heavy metal by using fruit waste .............................. 28
Important operational parameters in biosorption ...................................... 31
2.5.1. pH ...................................................................................................... 31
2.5.2. Particle size of biosorbent ................................................................. 31
2.5.3. Ionic strength ..................................................................................... 32
2.5.4. Presence of co-metal ions.................................................................. 33
2.5.5. Temperature ...................................................................................... 34
Important properties of biosorption .......................................................... 35

Table of Contents
ix
2.6.1. Biosorption isotherms ....................................................................... 35
2.6.2. Biosorption kinetics .......................................................................... 39
2.6.3. Biosorption thermodynamics ............................................................ 41
Biosorption mechanism ............................................................................. 43
2.7.1. Potential underlying mechanism ....................................................... 43
2.7.2. Techniques for mechanistic studies .................................................. 49
Desorption of heavy metal ........................................................................ 56
Biosorption in a continuous mode............................................................. 60
3. Materials and Methods ............................................................................... 64
Chemicals .................................................................................................. 65
Preparation of biosorbents......................................................................... 66
Instrumentations ........................................................................................ 68
Biosorption of Pb(II) and Cd(II) by WR ................................................... 70
3.4.1. Effect of pH ....................................................................................... 70
3.4.2. Effect of WR dosage ......................................................................... 70
3.4.3. Effect of initial metal concentration .................................................. 70
3.4.4. Effect of ionic strength ...................................................................... 70
3.4.5. Effect of co-metal ions ...................................................................... 71
3.4.6. Biosorption isotherms ....................................................................... 71
3.4.7. Biosorption kinetics .......................................................................... 72

Table of Contents
x
3.4.8. Desorption of Pb(II) and Cd(II) from WR ........................................ 73
3.4.9. Potential of WR for Pb(II) removal from drinking water ................. 76
3.4.10. Biosorption-desorption in a continuous mode .................................. 76
Biosorption of Pb(II) and Cd(II) by MS ................................................... 80
3.5.1. Effect of particle size ........................................................................ 80
3.5.2. Effect of pH ....................................................................................... 80
3.5.3. Effect of MS dosage .......................................................................... 80
3.5.4. Effect of initial metal concentration .................................................. 80
3.5.5. Effect of ionic strength ...................................................................... 81
3.5.6. Effect of co-metal ions ...................................................................... 81
3.5.7. Biosorption isotherms ....................................................................... 81
3.5.8. Biosorption kinetics .......................................................................... 82
3.5.9. Biosorption thermodynamics ............................................................ 82
3.5.10. Desorption of Pb(II) and Cd(II) from MS ......................................... 83
Mechanistic studies ................................................................................... 84
3.6.1. Basic characterization of WR and MS .............................................. 84
3.6.2. Spectroscopic techniques .................................................................. 85
3.6.3. Ion exchange experiment .................................................................. 86
3.6.4. Quantum chemistry simulation ......................................................... 87
Data processing and analysis .................................................................... 88
4. Biosorption of Pb(II) and Cd(II) by Watermelon Rind ........................... 89

Table of Contents
xi
Effect of pH ............................................................................................... 90
Effect of WR dosage ................................................................................. 92
Effect of initial metal concentration .......................................................... 94
Effect of ionic strength .............................................................................. 96
Effect of co-metal ions .............................................................................. 98
Biosorption isotherms of Pb(II) and Cd(II) biosorption by WR ............. 101
Kinetics of Pb(II) and Cd(II) biosorption by WR ................................... 105
4.7.1. Kinetic studies at different temperatures......................................... 105
4.7.2. Kinetic studies with WR in different particle sizes ......................... 110
4.7.3. Pb(II) biosorption without continuous pH adjustment .................... 115
Desorption of Pb(II) and Cd(II) from WR .............................................. 118
4.8.1. Optimal desorbing agents for desorption of Pb(II) and Cd(II) ....... 118
4.8.2. Response surface methodology analysis ......................................... 121
Pb(II) removal from drinking water by using WR .................................. 128
Biosorption-desorption in WR-packed bed column reactors .................. 129
4.10.1. Pb(II) biosorption-desorption cycles ............................................... 129
4.10.2. Cd(II) biosorption-desorption cycles .............................................. 136
Summary ................................................................................................. 140
5. Biosorption of Pb(II) and Cd(II) by Mango Seed .................................. 142

Table of Contents
xii
Effect of particle size .............................................................................. 143
Effect of pH ............................................................................................. 145
Effect of MS dosage ................................................................................ 147
Effect of initial metal concentration ........................................................ 149
Effect of ionic strength ............................................................................ 151
Effect of co-metal ions ............................................................................ 153
Biosorption isotherms of Pb(II) and Cd(II) biosorption by MS .............. 155
Kinetics of Pb(II) and Cd(II) biosorption by MS .................................... 159
Thermodynamics of Pb(II) and Cd(II) biosorption by MS ..................... 162
Desorption of Pb(II) and Cd(II) from MS ............................................... 164
Comparison with other fruit-waste-derived biosorbents ......................... 167
Summary ................................................................................................. 170
6. Comprehensive Elucidation of Biosorption Mechanisms ...................... 172
Characterization of WR and mechanistic studies.................................... 173
6.1.1. Elemental analysis ........................................................................... 173
6.1.2. Zeta potential measurement ............................................................ 174
6.1.3. PXRD .............................................................................................. 176
6.1.4. SEM-EDX ....................................................................................... 179

Table of Contents
xiii
6.1.5. FTIR spectroscopy .......................................................................... 184
6.1.6. XPS ................................................................................................. 188
6.1.7. Solid-state NMR spectroscopy ........................................................ 198
6.1.8. Ion exchange experiment ................................................................ 204
Characterization of MS and mechanistic studies .................................... 207
6.2.1. Elemental analysis ........................................................................... 207
6.2.2. Zeta potential measurement ............................................................ 207
6.2.3. PXRD .............................................................................................. 209
6.2.4. SEM-EDX ....................................................................................... 211
6.2.5. FTIR spectroscopy .......................................................................... 215
6.2.6. XPS ................................................................................................. 218
6.2.7. Solid-state NMR spectroscopy ........................................................ 228
6.2.8. Ion exchange experiment ................................................................ 233
6.2.9. Further mechanistic studies based on the effect of particle size ..... 235
Quantum chemistry simulation ............................................................... 242
Summary ................................................................................................. 247
7. Conclusions and Future Perspectives ...................................................... 252
Appendices ......................................................................................................... 256
References .......................................................................................................... 276

List of Abbreviations
xiv
List of Abbreviations
1/n: Heterogeneity factor in the Sips isotherm (0-1)
AC: Activated carbon
ANOVA: Analysis of variance
aR: R-P isotherm constant (L/mmol)
AT: Temkin isotherm equilibrium binding constant (L/g)
b: Sips equilibrium constant (L/mg)
BET: Brunauer-Emmett-Teller
bR: R-P isotherm constant (0<bR≦1)
BT: Temkin isotherm constant related to heat of adsorption (J/mol)
BV: Bed volume
C: Intercept related to thickness of boundary layer in intraparticle diffusion equation
C0: Adsorbate concentration in column influent (mg/L)
Cad,e: Concentration of adsorbate on adsorbent in equilibrium (mg/L)
CCD: Central composite design
Ce: Concentration of adsorbate remaining in solution in equilibrium (mg/L)
Cel: Cellulose
Cit: Citrulline
CP: Cross polarization

List of Abbreviations
xv
CPCM: Conductor-like polarizable continuum model
CSA: Chemical shift anisotropy
Ct: Adsorbate concentration in column effluent (mg/L)
DAF: Dissolved air flotation
DD: Dipolar dephasing
DDI: Distilled deionized water
DE: Desorption efficiency
D-R: Dubinin-Radushkevich
E. coli: Escherichia coli
EDTA: Ethylenediaminetetraacetic acid
EDX: Energy dispersive X-ray spectroscopy
EPS: Extracellular polymeric substance
EXAFS: Extended X-ray absorption fine structure
FTIR: Fourier-transform infrared spectroscopy
HRT: Hydraulic retention time
HSAB: Hard and soft acids and bases
IARC: International Agency for Research on Cancer
ICP-MS: Inductively coupled plasma mass spectrometer
ICP-OES: Inductively coupled plasma optical emission spectrometer
k: Fractional power kinetics constant

List of Abbreviations
xvi
k: Thomas rate constant (mL/min·mg)
k0: Temperature independent factor (g/mg·min)
k1: Lagergren equilibrium rate constant (min-1)
k2: Equilibrium rate constant of the pseudo-second-order equation (g/mg·min)
kBA: Bohart-Adams rate constant (L/h/mg)
KD: Equilibrium constant
KF: Freundlich isotherm constant related to adsorption capacity (L/g)
kint: Intraparticle diffusion rate constant
KL: Langmuir isotherm constant related to affinity of binding sites (L/mg)
KR: R-P isotherm constant (L/g)
kYN: Yoon and Nelson’s proportionality constant (min-1)
M: Mass of adsorbent in column (g)
M2+: Divalent heavy metal ions
MAS: Magic angle spinning
MF: Microfiltration
MS: Mango seed
N0: Equilibrium volumetric sorption capacity in the Bohart-Adams model (mg/L),
NA: Not applicable
NF: Freundlich isotherm constant related to adsorption intensity
NF: Nanofiltration

List of Abbreviations
xvii
NMR: Nuclear magnetic resonance
Pec: Pectin
pKa: Acid dissociation constant
ppb: Unit of concentration, µg/L
ppm: Unit of concentration, mg/L
PXRD: Powder X-ray diffraction
Q: Volumetric flow rate in column (mL/min)
q0: Maximum loading capacity of adsorbate on adsorbent in column (mg/g)
QCS: Quantum chemistry simulation
Qe: Amount of adsorbate bound to adsorbent in equilibrium, namely equilibrium
biosorption capacity (mg/g)
Qexp: Experimental biosorption capacity (mg/g)
Qm: Maximum biosorption capacity (mg/g)
Qpre: Predicted biosorption capacity by modeling (mg/g)
Qt: Amount of adsorbate adsorbed at time t (mg/g)
R: Universal gas constant, 8.314 J/mol·K
R2: Coefficient of determination
RMSD: Root-mean-square deviation
RO: Reverse osmosis
R-P: Redlich-Peterson

List of Abbreviations
xviii
RSM: Response surface methodology
S/L: Solid/liquid ratio
SDS: Sodium dodecyl sulfate
SEM: Scanning electron microscopy
SPIDER: Saturation-pulse induced dipolar exchange with recoupling
T: Absolute temperature (K)
t: time (min)
t1/2: Square root of time (min1/2)
tb: Breakthrough time
TMS: Tetramethylsilane
TOC: Total organic carbon
u: Linear flow velocity in column (cm/h)
UF: Ultrafiltration
v: Fractional power kinetic constants
V: Throughput volume in column (mL)
WHO: World Health Organization
WR: Watermelon rind
X0: Value of Xi at the center point
XANES: X-ray absorption near edge structure
xi: Dimensionless coded value of the variable Xi

List of Abbreviations
xix
Xi: Experimental variable
XPS: X-ray photoelectron spectroscopy
Z: Bed height of column (cm)
α: Dose-Response constant
β: D-R isotherm constant related to adsorption energy (mol2/ kJ2)
γ: Dose-Response constant representing the time when effluent concentration
reached 50% of influent concentration
ΔG0: Gibbs free energy change at standard condition (kJ/mol)
ΔH0: Enthalpy change at standard condition (kJ/mol)
ΔS0: Entropy change at standard condition (kJ/mol·K)
ΔX: Step change
τ: Time required for retaining 50% of the initial adsorbates in the Yoon and Nelson
model (min)

List of Figures
xx
List of Figures
Figure 2.1 Speciation of (a) Pb and (b) Cd at different pH. ................................. 12
Figure 3.1 Preparation of WR and MS biosorbents from raw fruit waste materials.
............................................................................................................................... 67
Figure 3.2 Schematic diagram of Pb(II)/Cd(II) biosorption operations in a batch
mode. ..................................................................................................................... 69
Figure 3.3 Schematic diagram of the WR-packed bed column reactor. .............. 79
Figure 4.1 Effect of pH on (a) Pb(II) and (b) Cd(II) biosorption by WR. ........... 91
Figure 4.2 Effect of WR dosage on (a) Pb(II) and (b) Cd(II) biosorption. .......... 93
Figure 4.3 Effect of initial metal concentration on (a) Pb(II) and (b) Cd(II)
biosorption by WR. ............................................................................................... 95
Figure 4.4 Effect of ionic strength on Pb(II) and Cd(II) biosorption by WR. ..... 97
Figure 4.5 Effect of co-metal ions on (a) Pb(II) and (b) Cd(II) biosorption by WR
in binary systems. ................................................................................................ 100
Figure 4.6 Non-linear regression of the equilibrium data of (a) Pb(II) and (b) Cd(II)
biosorption by WR. ............................................................................................. 103
Figure 4.7 (a) Pb(II) and (b) Cd(II) uptakes by WR versus time at different
temperatures. ....................................................................................................... 107
Figure 4.8 Non-linear regression of the kinetics of Pb(II) and Cd(II) biosorption by
WR at 298 K. ...................................................................................................... 108
Figure 4.9 (a) Pb(II) and (b) Cd(II) uptakes versus time by using WR in different
particle sizes. ....................................................................................................... 113

List of Figures
xxi
Figure 4.10 Intraparticle diffusion curves of the (a) Pb(II) and (b) Cd(II)
biosorption processes. ......................................................................................... 114
Figure 4.11 Pb(II) uptake by WR versus time at different temperatures without
continuous pH adjustment. .................................................................................. 117
Figure 4.12 Desorption efficiencies of Pb(II) and Cd(II) from WR by various
desorbing agents. ................................................................................................. 120
Figure 4.13 Three-dimensional plot showing the effect of S/L ratio and acid
concentration on desorption efficiency. .............................................................. 124
Figure 4.14 Three-dimensional plot showing the effect of S/L ratio and time on
desorption efficiency. .......................................................................................... 125
Figure 4.15 Three-dimensional plot showing the effect of acid concentration and
time on desorption efficiency. ............................................................................. 126
Figure 4.16 Breakthrough curves of Pb(II) biosorption in the WR-packed bed
column reactor. .................................................................................................... 132
Figure 4.17 Pb(II) desorption in the WR-packed bed column reactor. .............. 133
Figure 4.18 Change in pH of the effluent from the WR-packed bed column reactor
in 10 cycles of Pb(II) biosorption-desorption. .................................................... 134
Figure 4.19 Breakthrough curves of Cd(II) biosorption in the column reactor
packed with NaOH-treated WR. ......................................................................... 138
Figure 4.20 Cd(II) desorption in the column reactor packed with NaOH-treated
WR. ..................................................................................................................... 139
Figure 5.1 Effect of particle size on Pb(II) and Cd(II) biosorption by MS. ....... 144
Figure 5.2 Effect of pH on (a) Pb(II) and (b) Cd(II) biosorption by MS. .......... 146
Figure 5.3 Effect of MS dosage on (a) Pb(II) and (b) Cd(II) biosorption. ......... 148

List of Figures
xxii
Figure 5.4 Effect of initial metal concentration on (a) Pb(II) and (b) Cd(II)
biosorption by MS. .............................................................................................. 150
Figure 5.5 Effect of ionic strength on Pb(II) and Cd(II) biosorption by MS. .... 152
Figure 5.6 Effect of co-metal ions on (a) Pb(II) and (b) Cd(II) biosorption by MS
in binary systems. ................................................................................................ 154
Figure 5.7 Non-linear regression of the equilibrium data of Pb(II) and Cd(II)
biosorption by MS. .............................................................................................. 157
Figure 5.8 Non-linear regression of the kinetic processes of Pb(II) and Cd(II)
biosorption by MS. .............................................................................................. 160
Figure 5.9 Plot of lnKD versus 1/T for thermodynamic computation of (a) Pb(II)
and (b) Cd(II) biosorption by MS in duplicate. .................................................. 163
Figure 5.10 Desorption of Pb(II) and Cd(II) from MS by different desorbing agents.
............................................................................................................................. 165
Figure 6.1 Zeta potentials of WR at varying pH. ............................................... 175
Figure 6.2 PXRD patterns of pristine, Pb-, and Cd-loaded WR. ....................... 177
Figure 6.3 PXRD patterns of WR in different particle sizes. ............................. 178
Figure 6.4 SEM micrographs of (a) pristine WR, (b) Pb-, and (c) Cd-loaded WR at
two spots on the surface. ..................................................................................... 181
Figure 6.5 X-ray elemental mappings of Pb and Cd on the WR surface and the
corresponding SEM micrographs. ....................................................................... 182
Figure 6.6 EDX spectra of (a) pristine, (b) Pb-, and (c) Cd-loaded MS. ........... 183
Figure 6.7 FTIR spectra of pristine, Pb-, and Cd-loaded WR. ........................... 186
Figure 6.8 XPS survey spectra of pristine, Pb-, and Cd-loaded WR. ................ 192
Figure 6.9 XPS spectra of C 1s of (a) pristine, (b) Pb-, and (c) Cd-loaded WR. 193

List of Figures
xxiii
Figure 6.10 XPS spectra of O 1s of (a) pristine, (b) Pb-, and (c) Cd-loaded WR.
............................................................................................................................. 194
Figure 6.11 XPS spectra of N 1s of (a) pristine, (b) Pb-, and (c) Cd-loaded WR.
............................................................................................................................. 195
Figure 6.12 13C CP-MAS NMR spectra of pristine, Pb-, and Cd-loaded WR. .. 201
Figure 6.13 Zeta potentials of MS at varying pH. .............................................. 208
Figure 6.14 PXRD patterns of pristine, Pb-, and Cd-loaded MS. ...................... 210
Figure 6.15 SEM micrographs of (a) pristine, (b) Pb-, and (c) Cd-loaded MS. 212
Figure 6.16 X-ray elemental mappings of Pb and Cd on the MS surface and the
corresponding SEM micrographs. ....................................................................... 213
Figure 6.17 EDX spectra of (a) pristine, (b) Pb-, and (c) Cd-loaded MS. ......... 214
Figure 6.18 FTIR spectra of pristine, Pb-, and Cd-loaded MS. ......................... 216
Figure 6.19 XPS survey spectra of pristine, Pb-, and Cd-loaded MS. ............... 222
Figure 6.20 XPS spectra of C 1s of (a) pristine, (b) Pb-, and (c) Cd-loaded MS.
............................................................................................................................. 223
Figure 6.21 XPS spectra of O 1s of (a) pristine, (b) Pb-, and (c) Cd-loaded MS.
............................................................................................................................. 224
Figure 6.22 XPS spectra of N 1s of (a) pristine, (b) Pb-, and (c) Cd-loaded MS.
............................................................................................................................. 225
Figure 6.23 13C solid-state NMR spectra of pristine, Pb-, and Cd-loaded MS. . 230
Figure 6.24 PXRD patterns of MS in different particle sizes. ........................... 239
Figure 6.25 13C solid-state NMR spectra of MS in different particle sizes. ...... 240
Figure 6.26 Pb(II) and Cd(II) biosorption capacities and light metal ions contents
of MS in different particle sizes. ......................................................................... 241

List of Figures
xxiv
Figure 6.27 Comprehensive mechanistic elucidation of Pb(II) and Cd(II)
biosorption by fruit-waste-derived biosorbents via the established methodology.
............................................................................................................................. 251

List of Tables
xxv
List of Tables
Table 2.1 Important properties of Pb and Cd. ...................................................... 13
Table 2.2 Highest reported heavy metal uptakes by fruit waste materials. .......... 30
Table 2.3 Proposed mechanisms of heavy metal biosorption by fruit waste
materials. ............................................................................................................... 47
Table 2.4 Desorbing agents used for heavy metals desorption from fruit waste
materials. ............................................................................................................... 59
Table 3.1 Levels of factors used in CCD for optimization of desorption efficiency.
............................................................................................................................... 75
Table 4.1 Adsorption isotherm constants of Pb(II) and Cd(II) biosorption by WR.
............................................................................................................................. 104
Table 4.2 Kinetic constants of Pb(II) and Cd(II) biosorption by WR at 298 K. 109
Table 4.3 Confirmation of the predicted model by desorption experiments. ..... 127
Table 4.4 Column performance and parameters of the Thomas model in Pb(II)
biosorption. ......................................................................................................... 135
Table 5.1 Adsorption isotherm constants of Pb(II) and Cd(II) biosorption by MS.
............................................................................................................................. 158
Table 5.2 Kinetic constants of Pb(II) and Cd(II) biosorption by MS. ................ 161
Table 5.3 Pb(II) and Cd(II) biosorption capacities of native MS and MS regenerated
by different desorbing agents. ............................................................................. 166
Table 5.4 Pb(II) and Cd(II) biosorption by various fruit waste materials. ......... 169
Table 6.1 Assignments of the functional groups on WR in FTIR analysis. ....... 187

List of Tables
xxvi
Table 6.2 Binding energies and atomic concentrations of different elements on the
WR surface. ......................................................................................................... 196
Table 6.3 Bonds in pristine, Pb-, and Cd-loaded WR as identified by XPS. ..... 197
Table 6.4 Assignments of 13C CP-MAS NMR bands in WR. ............................ 202
Table 6.5 Release of light metal ions during Pb(II) and Cd(II) biosorption by WR.
............................................................................................................................. 206
Table 6.6 Assignments of the functional groups on MS in FTIR analysis......... 217
Table 6.7 Binding energies and atomic concentrations of different elements on the
MS surface. ......................................................................................................... 226
Table 6.8 Bonds in pristine, Pb-, and Cd-loaded MS as identified by XPS. ...... 227
Table 6.9 Assignments of 13C CP-MAS NMR bands in MS. ............................ 231
Table 6.10 Release of light metal ions during Pb(II) and Cd(II) biosorption by MS.
............................................................................................................................. 234
Table 6.11 Optimized structures and thermodynamic properties of Pb(II)
complexes. ........................................................................................................... 245

1. Introduction
1
1. Introduction

1. Introduction
2
Motivations
Water is the most essential substance for life on Earth and also an
indispensable resource for human civilization. Population growth, urbanization and
industrialization have resulted in water scarcity and contamination, rendering the
reliable access to clear water a major global challenge (Qu et al., 2013). The
prevalent use of heavy metals in industries (e.g., electroplating, mining, battery and
plastic factories) produces increasing amounts of heavy-metal-bearing wastewater.
Inappropriate treatment of this type of wastewater before discharge results in heavy
metal contamination in the receiving water bodies, which poses hazards to
ecosystems and humans due to the highly toxic and bioaccumulative properties of
heavy metals (Kurniawan et al., 2006b, Wei et al., 2018). In recent years, rice
containing high amounts of cadmium (Cd) caused by Cd(II)-polluted irrigation (Ok
et al., 2011), drinking water contaminated by lead (Pb) leaked from pipe systems
(Khan et al., 2013), and other heavy metal related accidents have been reported (Li
et al., 2014). The ever-growing demand for clean water resource and the
increasingly strict legislation make it imperative to apply efficient approaches for
the treatment of heavy-metal-bearing wastewater. Meanwhile, solid waste has
become another global challenge as a result of population growth and urbanization
(Greene and Tonjes, 2014). Fruit waste, which includes peels, rinds, shells and
seeds of fruits, comprises a large part of solid waste. It always makes solid waste
management intractable due to its highly hydrous and perishable nature.
Biosorption, a technology using inexpensive non-living biomaterials to sequester
heavy metals or other contaminants in aqueous solutions (Volesky, 1990), has
attracted considerable attention due to its low cost, high efficiency, easy operation

1. Introduction
3
and lack of toxic sludge compared with conventional physicochemical methods,
e.g., precipitation, ionic exchange and membrane processes (Fu and Wang, 2011,
Kurniawan et al., 2006a, b). It is strategically promising to utilize fruit waste
materials for the treatment of heavy-metal-bearing wastewater, so as to
simultaneously relieve the two environmental issues, i.e., heavy metal
contamination and fruit waste disposal.
The rind of Citrullus lanatus (watermelon rind, shorten as WR) and the seed
of Mangifera indica (mango seed, shorten as MS) are both abundant fruit waste
materials given the huge consumption of the two fruits in the world, with 117
million tons of watermelon and 40 million tons of mango produced per year
(FAOSTAT, 2016). Being natural sources of cellulose, hemicellulose, pectin,
protein and other biopolymers, WR and MS are found capable of effective
entrapment of heavy metals and organic pollutants (Alencar et al., 2012, Bhatnagar
et al., 2009, Lakshmipathy and Sarada, 2013, Liu et al., 2012b). However, their
biosorption performance on Pb(II) and Cd(II), two of the most toxic heavy metals,
has not been well-addressed, especially the biosorption-desorption operation in a
continuous mode and the underlying mechanisms governing the biosorption
processes (Lakshmipathy and Sarada, 2016, Liu et al., 2012a, Nadeem et al., 2016).
The former is crucial for evaluating the practicability of the biosorbents, and the
latter is highly important for better control of the biosorption processes and
development of commercial (bio)sorbents.
In the early literature, most biosorption studies focused on the fundamental
adsorption studies at the macroscopic scale, such as optimization of operational

1. Introduction
4
conditions, biosorption isotherms, kinetics and thermodynamics (Banerjee et al.,
2012, Choinska-Pulit et al., 2018, Liu et al., 2012a, Reddy et al., 2014). For
mechanistic elucidation, the research efforts are limited and usually restricted to
several conventional analytical methods (Lakshmipathy et al., 2013, Lalhmunsiama
et al., 2017, Li et al., 2018, Oliveira et al., 2014, Schiewer and Balaria, 2009),
resulting in vague and incomplete elucidation of the underlying biosorption
mechanisms (Ramrakhiani et al., 2017). It is noteworthy that a variety of
complicated interactions could be concurrently involved in a biosorption process,
given that a biomaterial often has a complex composition with barely defined
constituents. A hybrid mechanistic methodology that combines diverse
complementary analytical methods is indispensable to comprehensively decipher a
biosorption process, so as to facilitate the better control of biosorption and the
development of commercial (bio)sorbents. To this end, this study established a
methodology for mechanistic elucidation at both macroscopic and microscopic
scales. Solid-state nuclear magnetic resonance (NMR) spectroscopy, to the best of
my knowledge, was employed for the first time to investigate the interactions
between heavy metal ions and the surface of biosorbents. A variety of conventional
analytical tools, including scanning electron microscopy equipped with energy
dispersive X-ray spectroscopy (SEM-EDX), powder X-ray diffraction (PXRD),
Fourier-transform infrared (FTIR) spectroscopy and X-ray photoelectron
spectroscopy (XPS), were combined to disclose the underlying biosorption
mechanisms from different perspectives. In addition, chemical methods and
quantum chemistry simulation (QCS) were applied to complement the mechanistic
elucidation. Beyond biosorption studies, the methodology established in this study

1. Introduction
5
will also be helpful to other environmental studies as biosorption is a prevalent and
important process that occurs in nature and in environmental studies (e.g., biofilm,
sorption in soil, and adsorption onto the host cell as the first step for uptake or
invasion), which are related to interactions between biological surfaces and
adsorbates as involved in a biosorption process (Fomina and Gadd, 2014).

1. Introduction
6
Objectives
In order to fill the research gaps in the literature as aforementioned, the
present study aimed to:
(1) Investigate the biosorption performance of WR and MS on Pb(II) and Cd(II)
at varying operational parameters, including pH, biosorbent particle size,
biosorbent dosage, initial metal concentration, ionic strength, and presence
of co-metal ions.
(2) Examine the biosorption isotherms, kinetics and thermodynamics to unveil
the intrinsic nature of the biosorption processes.
(3) Screen superior desorbing agents for Pb(II) and Cd(II) desorption and
biosorbents regeneration.
(4) Develop a packed bed column reactor for continuous biosorption-desorption
of Pb(II) and Cd(II).
(5) Employ and integrate a variety of complementary analytical methods for
comprehensive mechanistic elucidation of Pb(II) and Cd(II) biosorption by
WR and MS so as to establish a hybrid methodology that can thoroughly
decipher a biosorption process.

1. Introduction
7
Organization of this dissertation
There are seven chapters in this dissertation. The chapters are listed as
follows:
Chapter 1 Introduction
Chapter 2 Literature Review
Chapter 3 Materials and Methods
Chapter 4 Biosorption of Pb(II) and Cd(II) by Watermelon Rind
Chapter 5 Biosorption of Pb(II) and Cd(II) by Mango Seed
Chapter 6 Comprehensive Elucidation of Biosorption Mechanisms
Chapter 7 Conclusions and Future Perspectives

2. Literature Review
8
2. Literature Review

2. Literature Review
9
Heavy metal pollution and hazards
Although there is not yet an unambiguous definition of a “heavy metal” in
consensus, density is most frequently used as the defining criterion. It is commonly
thought that a heavy metal is a naturally occurring element with a specific density
greater than 5 g/cm3. Given the general toxic properties of heavy metals, a number
of metalloids (e.g., arsenic) are also categorized as heavy metals (Järup, 2003). Pb
and Cd, being the “big two” when considering the environmental impact of heavy
metals, pose serious health and environmental concerns due to their widespread
uses in industries, bioaccumulative properties, and high toxicity to living organisms
(see Table 2.1) (Volesky, 1994). They are categorized as the first-level pollutants
in “Discharge standard of pollutants for municipal wastewater treatment plant” of
China (GB 18918-2002), and also specifically listed among the top three of
European Restriction of Hazardous Substances (RoHS3, 2015). Pb(II) and Cd(II)
may occur in substantial concentrations in the hydrosphere due to the improper
discharge of heavy-metal-bearing wastewater. The characteristics of Pb and Cd are
summarized in Table 2.1.
2.1.1. Lead
Lead is a natural constitute of Earth’s crust with a crustal abundance of 13
mg/kg (WHO, 2011c). The occurrence of Pb contamination in the environment,
however, mainly results from anthropogenic activities such as mining, smelting,
refining, soldering, manufacturing of batteries and paints, and use of leaded
gasoline (WHO, 2010). Despite the banning of Pb additives in gasoline since the
mid-1970s and their reduced use in paints and solders (Cheng and Hu, 2010),

2. Literature Review
10
significant sources of Pb exposure still remain due to the technological importance
of Pb in industries. Once Pb is released into the environment, it can be
bioaccumulated and biomagnified along with the food chain/net, resulting in high
health risks to living organisms in high trophic levels, e.g., humans. Pb can affect
body functions in neurological, haematological, gastrointestinal, cardiovascular and
renal systems. In particular, children are much more susceptible to the neurotoxic
effect of Pb than adults; a low level of exposure can cause irreversible neurological
damage (WHO, 2010). Besides, Pb has been categorized as a possible human
carcinogen in Group 2B of the International Agency for Research on Cancer (IARC)
classification, and its inorganic compounds have been placed in Group 2A, i.e.,
probable human carcinogens. The discharge limit of Pb in municipal wastewater is
0.1 ppm (i.e., mg/L) in China (GB 18918-2002), and its guideline value in drinking
water is 0.01 ppm according to the World Health Organization (WHO) (WHO,
2011b). The speciation of Pb in 0.48 mM Pb(NO3)2 solution at varying pH indicates
that Pb exists in the form of free cation (i.e., Pb2+) when the pH is lower than 6.0
(Figure 2.1a). Hydroxides will be generated as the pH gradually increases. Hence,
the Pb(II) biosorption in this study was investigated at pH lower than 6.0 to avoid
precipitation.
2.1.2. Cadmium
Cadmium is chemically similar to zinc (Zn), and naturally occurs with Zn
and Pb in sulfide ores. Similar to Pb, it is also widely employed in industrial
activities such as coal combustion, electroplating, manufacturing of glass, plastics,
and batteries (WHO, 2011a). Cadmium is a cumulative element along with the food

2. Literature Review
11
chain/net and poses serious health risks to humans. Once it enters the human body,
it will adversely affect the functions of the kidneys, lung and bones. Particularly, it
can form a strong bond with sulfur and displace essential metals, e.g., Zn2+ and Ca2+,
from the binding sites of certain enzymes. There are evidences that Cd is
carcinogenic by inhalation (Group 2A in the IARC classification) (WHO, 2011b).
The discharge limit of Cd in municipal wastewater is 0.01 ppm in China (GB
18918-2002), and its guideline value in drinking water is 0.003 ppm (WHO,
2011b). In solution, Cd hydroxides will not form until the pH increases over 8.0
(Figure 2.1b); this provides a wider pH range in investigating Cd(II) biosorption in
this study (pH < 8.0) as compared with that of Pb(II) biosorption (pH < 6.0).

2. Literature Review
12
Figure 2.1 Speciation of (a) Pb and (b) Cd at different pH.
[Simulated by Visual MINTEQ 3.1 with 0.48 mM Pb(NO3)2 solution and 0.89 mM
Cd(NO3)2 solution, namely 100 ppm Pb/Cd.]
0
20
40
60
80
100
1.0 2.0 3.0 4.0 5.0 6.0 7.0 8.0 9.0 10.0 11.0 12.0 13.0 14.0
Pb
rati
o (
%)
pH
Pb(NO3)2 (aq)(PbNO3)+Pb(OH)2 (aq)[Pb(OH)3]-(Pb2OH)+3[Pb3(OH)4]+2[Pb4(OH)4]+4(PbOH)+Pb+2
a
0
20
40
60
80
100
1.0 2.0 3.0 4.0 5.0 6.0 7.0 8.0 9.0 10.0 11.0 12.0 13.0 14.0
Cd
rati
o (
%)
pH
Cd(NO3)2 (aq)Cd(OH)2 (aq)[Cd(OH)3]-[Cd(OH)4]-2Cd+2[Cd2OH]+3(CdNO3)+(CdOH)+
b

2. Literature Review
13
Table 2.1 Important properties of Pb and Cd.
Pb Cd
Atomic number 82 48
Atomic weight 207.2 112.4
Density (g/cm3) 11.34 8.65
Electronegativitya 1.854 1.521
Ionic radius (pm) 133 109
Ionic potentialb 0.0150 0.0183
Hydration energy
(kJ/mol)
-1480 -1806
HSAB behaviorc Borderline acid Soft acid
Discharge limit (mg/L)d 0.1 0.01
Guideline value
(mg/L)e
0.01 0.003
Carcinogenesis Group 2B;
Inorganic compounds in
Group 2A
Group 2A
Toxicity to human Cardiovascular effects,
kidney damage,
premature birth,
damage on nervous system,
especially for children
Kidney disease,
lung damage, and
fragile bones
(Notes: a - Allen electronegativity of the element in the oxidation state (Allen, 1989); b -
The ratio of electric charge to ionic radius; c - Pearson’s HSAB principle (Pearson, 1963);
d - Discharge limit in municipal wastewater in China, GB 18918-2002; e - Guideline value
in drinking water (WHO, 2011b); Data of ionic radius and hydration energy from
(Wulfsberg, 2000).)

2. Literature Review
14
Conventional treatment
The traditional methods to remove heavy metal contaminants from
(waste)water systems mainly include chemical precipitation, ion exchange,
adsorption, membrane filtration, coagulation-flocculation, flotation, and
electrochemical methods (Fu and Wang, 2011, Kurniawan et al., 2006b). The
details of these physico-chemical methods, their advantages and limitations are
discussed below.
2.2.1. Chemical precipitation
Chemical precipitation is the most widely applied method in industries
given its simplicity and low cost. It is a process in which precipitant reagents react
with heavy metal ions to form insoluble precipitates at basic conditions (usually pH
8.0-11.0), and the precipitates are separated from aqueous solutions by
sedimentation or filtration. Lime, i.e., CaO or Ca(OH)2, is the most frequently used
precipitant because it is easily available in most countries (Charerntanyarak, 1999,
Kurniawan et al., 2006b). During chemical precipitation, heavy metal ions are
precipitated in the form of hydroxides through the reaction shown in Eq. 2.1:
M2++ 2OH- → M(OH)
2↓ (2.1)
where M2+ denotes divalent heavy metal ions, and OH- is the hydroxyl ions from
the precipitant, e.g., Ca(OH)2. To facilitate heavy metal precipitation, fly ash has
been used as a seed material. Chen et al. (2009) reported that the fly ash-lime-
carbonation treatment, in which fly ash was added as a seed material to enhance
lime precipitation, and the suspension was exposed to CO2, significantly increasing

2. Literature Review
15
the particle size of the precipitate and improving the heavy metal removal efficiency
and sludge sedimentation. The concentrations of Cr(III), Cu(II), Pb(II) and Zn(II)
were found to be reduced to 0.08, 0.14, 0.03, and 0.45 ppm, respectively, from the
initial concentrations of 100 ppm. Moreover, addition of coagulants such as alum
and iron salts can enhance heavy metal removal via chemical precipitation
(Charerntanyarak, 1999). Sulfide precipitation is also an effective alternative, as the
solubility of metal sulfide precipitates is significantly lower than that of hydroxide
precipitates, making heavy metal removal possible over a broader pH range
compared with hydroxide precipitation. Pyrite and synthetic iron sulfide (Özverdi
and Erdem, 2006), and even the hydrogen sulfide produced by sulfate-reducing
bacteria (Kousi et al., 2007), have been used for the precipitation of heavy metals.
The underlying principle is illustrated in Eq. 2.2:
M2++ H2S → MS ↓ + 2H+ (2.2)
where M2+ denotes divalent heavy metal ions. Yet, sulfide precipitation can result
in emission of toxic H2S gas as heavy metal ions usually exist in acidic conditions.
Besides, the colloidal precipitates generated can cause difficulties in separation.
These drawbacks somehow restrict the application of sulfide precipitation in
practice (Fu and Wang, 2011). Overall, chemical precipitation is effective for
wastewater bearing high concentrations of heavy metal ions, e.g., industrial
effluents. Still, the processed wastewater usually requires further treatment such as
adsorption, filtration, and ion exchange to fulfill the increasingly stringent
environmental regulations (Gonzalez-Munoz et al., 2006, Papadopoulos et al.,
2004). Besides, chemical precipitation is chemical-intensive, and the produced

2. Literature Review
16
toxic sludge is a big concern due to the high cost of sludge disposal and the potential
second pollution in the environment.
2.2.2. Ion exchange
Ion exchange is widely used for the removal and recovery of heavy metal
ions from aqueous solutions due to its high efficiency, selectivity on specific metal
ions, and lack of sludge generation. An ion-exchange resin removes metal ions from
the liquid phase and releases a chemically equivalent amount of ions from itself
(Vigneswaran et al., 2005). This exchange process is reversible without any
structural change of the resin: the entrapped metal ions can be recovered in a
concentrated form by appropriate eluants, and the ion-exchange resin will be
simultaneously regenerated. The most prevalent cation exchangers are strongly
acidic resins with sulfonic acid groups (-SO3H) and weakly acidic resins with
carboxylic acid groups (-COOH). Protons (H+) in these two types of groups
exchange with metal cations and finally separate the metal ions from the liquid
phase, as shown in Eqs. 2.3 and 2.4:
n+ - n+ +
3 3 nnR-SO H + M (R-SO ) M + nH→ (2.3)
n+ - n+ +
nnR-COOH + M (R-COO ) M + nH→ (2.4)
where Mn+ represents metal cations. In addition to the operational parameters (e.g.,
pH, initial metal concentration and temperature), the charge of the metal ion also
influences its removal efficiency via ion exchange. Abo-Farha et al. (2009)
observed that more positively charged metals achieved higher removal efficiencies
in ion exchange processes. In the market, there are a variety of synthetic ion-

2. Literature Review
17
exchange resins, including Amberlite IR-120, Dowex 2-X4, IRN77, SKN1,
Amberjet series and other types. Natural zeolites (especially clinoptilolite) have
also been frequently used as ion-exchangers for heavy metal removal because of
their high abundance and low cost. The nature and capabilities of these synthetic
and natural ion-exchange resins have been reviewed and discussed by Kurniawan
et al. (2006b). It was observed that ion-exchange resins were effective for the
removal of heavy metal ions in concentrations lower than 10 ppm, within the range
of 10-100 ppm, and even higher than 100 ppm (Kurniawan et al., 2006b).
Furthermore, synthetic ion-exchange resins usually exhibited high removal
efficiencies close to 100%, whereas lower effiencies (60%-90%) were generally
achieved by natural ones (Kurniawan et al., 2006b). This should be attributed to the
complicated and non-well defined components of natural ion-exchangers compared
with synthetic resins. In spite of the aforementioned advantages of ion exchange
processes, the drawbacks such as the high capital and operational cost and the
requirement of pretreatment of wastewater have restricted the application of ion-
exchangers in a large scale.
2.2.3. Adsorption
Adsorption has been widely used as a cost-effective technology for the
treatment of heavy-metal-bearing wastewater (Jusoh et al., 2007, Kang et al., 2008).
Conventional adsorption processes mostly employ granular activated carbon (AC)
as the adsorbent given its large surface area provided by micropore and mesopore.
The reversibility of adsorption processes makes heavy metal recovery and
adsorbent regeneration achievable; successive adsorption-desorption cycles can be

2. Literature Review
18
implemented in practice for sustainable wastewater treatment. Hence, adsorption
was thought better than other technologies for heavy metal removal from
wastewater in consideration of the low capital and operational cost, simple design,
easy operation, and insensibility to toxic or suspended substances (Jusoh et al.,
2007). Nowadays, however, the limited remaining source of coal results in an
increasing price of the coal-based AC. Converting carbonaceous materials, e.g.,
coconut shells, palm shells and other agro-waste materials, into AC has become a
sustainable measure to produce AC, especially in Southeast Asian countries (e.g.,
Malaysia and Thailand) (Dias et al., 2007, Yang et al., 2010). Yet, the high energy
required for the carbonization of raw materials at high temperatures (700-1100 ºC),
and the use of the gases (e.g., steam and CO2) or chemical agents (e.g., ZnCl2,
H3PO4 and KOH) for activation substantially increases the cost of adsorption
processes using AC converted from carbonaceous materials.
2.2.4. Membrane filtration
Membrane filtration is a promising technique for treatment of heavy-metal-
bearing wastewater due to its high efficiency and low space requirement. Apart
from heavy metal contaminants, it can remove suspended substances and organic
pollutants from wastewater at the same time. Membrane filtration is mainly
categorized into microfiltration (MF), ultrafiltration (UF), nanofiltration (NF) and
reverse osmosis (RO) depending on the characteristics of the membrane applied for
filtration. UF utilizes a permeable membrane at a low transmembrane pressure to
separate dissolved, colloidal and suspended pollutants larger than the pore size of
the membrane (5-20 nm). For dissolved heavy metal ions, either in the form of

2. Literature Review
19
hydrated ions or complexes, the pore size of UF membrane is usually too large to
separate them from the liquid phase. Micellar enhanced and polymer enhanced UF
techniques have been proposed for the efficient removal of heavy metal ions
(Camarillo et al., 2010, Landaburu-Aguirre et al., 2010). Landaburu-Aguirre et al.
(2010) reported that retention of 98% of Zn(II) and 99% of Cd(II) (initial metal
concentrations of 0.5 mM) were achieved by the micellar enhanced UF with sodium
dodecyl sulfate (SDS) as the surfactant. NF is an intermediate process between UF
and RO. It has the unique property of separating contaminants based on steric
(sieving) and electrical (Donnan) effects. That is to say, the NF membrane has small
pores and surface charge, through which the charged ions/molecules smaller than
the membrane pore can be retained together with the larger neutral ions/molecules
(Kurniawan et al., 2006b). RO is a pressure-driven membrane process in which the
water molecules can pass through the membrane. Under a hydrostatic pressure
higher than the osmotic pressure of the feeding solution, cationic ions/molecules
(e.g., heavy metal ions) can be removed from the aqueous solution. To fulfill the
increasingly stringent environmental standards, the RO membrane has been
developed with a particle size as small as 10 nm (Xie et al., 2015). As reviewed by
Kurniawan et al. (2006b), RO exhibited a higher capacity of heavy metal removal
with rejection efficiencies over 97% (initial metal concentrations of 21-200 ppm)
in comparison with UF and NF.
Taken together, the heavy metal removal capabilities of the aforementioned
membrane techniques are in an ascending order of UF < NF < RO, in which the
requirement for the membrane material and consumption of energy are increasing.
How to select a suitable membrane technique for the treatment of heavy-metal-

2. Literature Review
20
bearing wastewater? This question is answered by taking into account the
discharging standards and the characteristics of the target wastewater (e.g.,
properties of the co-pollutants and metal concentrations). In a nutshell, there is a
trade-off between efficiency and cost. Notably, membrane fouling is a common
problem in membrane filtration processes. It will cause a high transmembrane
pressure and even biodegradation of the membrane material, resulting in
impairment of the membrane performance and a high cost for operation and
maintenance of the membrane system.
2.2.5. Coagulation-flocculation
Coagulation is a process of adding coagulants, e.g., ferric or alum salts, to
destabilize colloidal particles in wastewater via neutralizing the repulsive force
between particles. It is followed by flocculation, which employs polymers (e.g.,
polyanionic cellulose, polyferric sulfate and polyacrylamide) to form bridges
between the generated flocs and aggregate them into large clumps, for easy
sedimentation or filtration (Kurniawan et al., 2006b). Given that the main targets of
coagulation-flocculation are hydrophobic colloids and suspended particles, there
are intensive efforts to invent new coagulants and flocculants and to modify the
conventional ones to remove soluble heavy metal ions together with turbidity
(Chang and Wang, 2007, Chang et al., 2009b, Duan et al., 2010). In general,
application of coagulation-flocculation alone on heavy-metal-bearing wastewater
cannot meet the stringent environmental legislations. Other techniques such as
adsorption and filtration are usually necessary (Fu and Wang, 2011). It is
noteworthy that pH plays a very important role in the efficiency of coagulation-

2. Literature Review
21
flocculation. Chang and Wang (2007) found that the colloidal substances with
negative charges were coagulated at lower pH with a poor removal of Ni(II),
whereas the removal of Ni(II) was improved with impaired turbidity treatment at
higher pH. However, intensive chemical consumption and sludge generation render
coagulation-flocculation far from an environmentally benign measure for the
treatment of heavy-metal-bearing wastewater.
2.2.6. Flotation
Flotation is a process to separate solids or dispersed liquids from a liquid
phase through bubble attachment. It has been employed to separate heavy metals
that originate from mineral processing in aqueous solutions (Fu and Wang, 2011).
Among the various types of flotation, dissolved air flotation (DAF), ion flotation,
and precipitation flotation are mainly used in the treatment of heavy-metal-bearing
wastewater. DAF utilizes micro air bubbles to attach to impurities and separated the
floated substances from the bulk solution in a foaming phase. Ion flotation removes
heavy metal ions in wastewater by using surfactants (e.g., SDS and biosurfactants)
and subsequent separation of the generated hydrophobic species by air bubbles. It
was reported that 90%, 81% and 71% of Pb(II), Cu(II) and Cd(II), respectively,
were removed by ion flotation with a tea-derived biosurfactant (Yuan et al., 2008).
Precipitation flotation is more like a combination of metal precipitation and
flotation, which generates metal precipitates and then separates them by the
attachment to air bubbles. Although flotation has the potential for industrial
application due to the low cost and short hydraulic retention time (HRT), it is

2. Literature Review
22
usually not as efficient as other physio-chemical techniques for heavy metal
removal from aqueous solutions (Kurniawan et al., 2006b).
2.2.7. Electrochemical methods
Electrochemical methods refer to concentrating metal ions on a cathode
surface with the possibility to recover metals in the elemental state. There are a
variety of electrochemical techniques that have been investigated for heavy metal
removal from aqueous solutions, such as electrodialysis, electrocoagulation and
electrodeposition. Electrodialysis denotes a membrane separation process in which
ionized species pass through an ion exchange membrane (usually plastic materials
with either anionic or cationic properties) by the driving force of the applied electric
potential. It is generally effective for metal ions at concentrations less than 20 ppm
(Kurniawan et al., 2006b). Electrocoagulation is a process in which coagulants are
generated in situ by electrically dissolving aluminum or ferric ions from aluminum
or iron electrodes. The coagulants can coagulate heavy metal species in the liquid
phase and the H2 gas produced in the cathode can help float the flocs out of water
(Heidmann and Calmano, 2008). Electrodeposition, also known as electroplating,
is a process of depositing heavy metal ions from the liquid phase onto a conducting
surface. It was reported as a potential method for recovery of metals under certain
operational conditions (Chang et al., 2009a, Oztekin and Yazicigil, 2006). Yet, the
requirements of qualified feed solutions, high capital investment and high
operational cost (e.g., electricity consumption and system maintenance) have
restricted a wider application of electrochemical methods.

2. Literature Review
23
Fruit waste
2.3.1. Fruit waste disposal
Fruit waste refers to discarded or leftover parts of fruits such as peel, rind,
seed and shell. A huge amount of fruit waste is produced from the food processing
industries. Citrullus lanatus (i.e., watermelon), which has the highest yield (117
million tons/year) among fruits in the world (FAOSTAT, 2016), leaves almost 50%
of its weight as waste in the form of rind. Mangifera indica (i.e., mango), which is
one of the most prized tropical fruits marketed in the world with a global production
around 40 million tons/year (FAOSTAT, 2016), generates plenty of fruit waste as
seed and peel from industrial processing. The mango seed alone corresponds to 30-
45% of the fruit weight (Meireles et al., 2010). For the treatment of fruit waste like
watermelon rind (WR) and mango seed (MS), composting has been frequently
employed in some developed countries. For instance, the city of Toronto offers
curbside collection of organic materials (e.g., fruit and vegetables scraps) to divert
waste from landfill to more environmentally benign compost (Assamoi and
Lawryshyn, 2012). Yet, in most countries, fruit waste produced from food
processing industries is directly disposed of with municipal solid waste in landfill
and/or incinerator, posing a heavy burden on waste management with nuisance due
to the high water content and perishable nature of fruit waste (USDA, 2004).
2.3.2. Components of fruit waste materials
Fruit waste materials have been widely studied as the precursors of
biosorbents for the removal of heavy metals. Their capability of sequestering heavy
metal ions is mainly due to their high contents of polysaccharides such as cellulose,

2. Literature Review
24
hemicellulose, pectin and lignin, which contain abundant organic functional groups
capable of binding heavy metal ions. It was determined that WR comprised 20% of
cellulose, 23% of hemicellulose, 13% of pectin and 10% of lignin (Singh et al.,
1975), while MS consisted of 55% of cellulose, 24% of lignin and 21% of
hemicellulose (based on dry weight) (Henrique et al., 2013). The major components
of fruit waste materials are introduced as follows.
Cellulose
Being the most abundant organic polymer on Earth, cellulose is a very
important skeletal component in plants. It is a straight chain polymer that consists
of hundreds to thousands of (1→4) linked D-glucose units without branching or
coiling. However, the hydroxyl groups in glucose units from one chain can form
hydrogen bonds with oxygen atoms in the same or an adjacent chain, holding the
chains firmly with high tensile strength. This ordered structure leads to much higher
crystallinity of cellulose than other polysaccharides (e.g., hemicellulose, pectin and
lignin) (Habets et al., 2013). A variety of crystalline structures have been found in
cellulose as a result of different locations of hydrogen bonds. It is noteworthy that
most natural cellulose is cellulose I, which is metastable.
Hemicellulose
Hemicellulose is also an important natural polymer which contributes to
about 20% of most plant biomass. In addition to glucose, xylose, mannose,
galactose, rhamnose and arabinose are usually included in hemicellulose. Unlike
cellulose which has a linear and crystalline structure, hemicellulose has a random,
branched and amorphous structure with weak strength. Hence it can be easily

2. Literature Review
25
hydrolyzed by dilute acids or bases. Given the variety of monomers and the random
organization, hemicelluloses have different chemical structures including xylan,
glucuronoxylan, arabinoxylan, glucomannan and xyloglucan. Furthermore, sugars
in the acidified forms such as glucuronic acid and galacturonic acid can be found
in hemicellulose, providing a variety of potential functional groups for the binding
of heavy metals.
Pectin
Pectin is a structural material of heteropolysaccharide in the primary cell
walls of terrestrial plants, especially abundant in the non-woody parts. It is mainly
composed of (1→4) linked D-galacturonic acid, in which the uronic acid carboxyl
groups are either fully or partially methyl esterified. Apart from galacturonic acid,
pectin comprises a complex set of polysaccharides such as galacturonans and
rhamnogalacturonan. In nature, about 80% of the carboxyl groups in galacturonic
acid are esterified with methanol (methyl esters), while the non-esterified ones can
be either free acids or salts with Na+, K+, Mg2+ or Ca2+ (known as “pectinate”).
Lignin
Lignin, as a cross-linked phenolic polymer, is a crucial structural material
in the supporting tissues of vascular plants. It fills up the empty space between
cellulose and hemicellulose polymers, leading to more rigid cell wall structures
(Habets et al., 2013). The structure of lignin presents significant quantities of
methoxy and free hydroxyl groups, which can interact with various metal ions
(Farinella et al., 2007). There are mainly three types of lignols, i.e., 4-hydroxy-3-

2. Literature Review
26
methoxyphenylpropane, 3,5-dimethoxy-4-hydroxyphenylpropane and 4-
hydroxyphenylpropane.
Beyond the four commonly found polysaccharides, a number of
characteristic macromolecules may exist in certain types of fruit waste materials.
For example, cutin, which is a waxy polyester functionalized as a cuticular
component covering all aerial surfaces of plants, was extracted from WR
(Chaudhari and Singhal, 2015). In MS, which denotes a mix of mango seed shell
and kernel in this study, there is an unneglectable content of tannins, starch and
lipids from the kernel (Widsten et al., 2014). The functional groups such as
hydroxyl, carboxyl, carbonyl and ether groups in these macromolecules can
contribute to the sequestration of heavy metal ions from aqueous solutions.

2. Literature Review
27
Biosorption
2.4.1. Conception of biosorption
“Biosorption” has become a more and more common concept in
environmental science since the 1980s (Friis and Myerskeith, 1986, Kuyucak and
Volesky, 1989, Tsezos and Volesky, 1981, Tsezos and Volesky, 1982). However,
the development of its relevant studies over the past few decades results in
difficulties in giving “biosorption” a sound definition, mainly due to the
complicated mechanisms involved and the types of biosorbents used. In the
literature, this term has been used for a diverse range of processes including
bioadsorption, bioabsorption, bioaccumulation and biosorption by living and dead
biomass (Fomina and Gadd, 2014). The prefix “bio” indicates the utilization of
biological matrices such as fungal biomass, agro-waste and fruit waste materials.
However, “sorption” is a polysemous term that refers to both adsorption and
absorption. The former denotes physical adherence or bonding of ions/molecules
onto the surface of another substance, e.g., entrapment of precious metal ions by
ion-exchange resin. The latter, absorption, is a process of incorporation of a
substance in one phase into another substance in a different phase (e.g., gases being
absorbed by liquids) (Fomina and Gadd, 2014). In the research area of biosorption,
most researchers consider biosorption as a subcategory of adsorption with
biomaterials as adsorbents (Michalak et al., 2013), since adsorption is the most
common form involved in a biosorption process for environmental remediation.
Another ambiguous aspect of the conception of biosorption is whether this process
is passive or not. Such ambiguity is the result of the utilization of different types of

2. Literature Review
28
biosorbents. For example, the removal of heavy metal ions from wastewater by a
microbial consortium can be attributed to active intake into the cell, and/or passive
adsorption onto the cell wall and extracellular polymeric substance (EPS) secreted
by microorganisms (Li et al., 2018). To circumvent the complex metabolically
dependent process of active intake, biosorption has been defined by most
researchers as a passive and metabolically independent process by non-living
biomass. Accordingly, biosorption in the present study is based on the conception
of passive adsorption of adsorbates by non-living biomass.
Notably, biosorption is not only a promising technology applied for
removing pollutants in environmental remediation, but also a prevalent and
important process occurring in nature, e.g., adsorption in soil and adsorption onto
the host cell as the first step for uptake or invasion. Similar to biosorption processes,
almost all life phenomena and natural processes are related to the interactions
between biological surfaces and adsorbates with different degrees (Fomina and
Gadd, 2014).
2.4.2. Biosorption of heavy metal by using fruit waste
In addition to fungal biomass and agro-waste, fruit waste is also an abundant,
reproducible and low-cost resource for biosorbents used in biosorption processes.
Among all the contaminants which have been investigated in biosorption studies,
heavy metals are the most widely targeted ones (He and Chen, 2014, Nguyen et al.,
2013). Park et al. (2008) investigated the Cr(VI) biosorption capacities of abundant
biowastes including banana skin and several agricultural wastes (e.g., oak leaf and
rice husk), and it was observed that the highest Cr(VI) biosorption capacity, 249.6

2. Literature Review
29
mg/g, was achieved by banana skin. The highest reported biosorption capacities on
various heavy metals are summarized in Table 2.2 based on the plentiful studies of
heavy metal biosorption by using fruit waste materials in the literature. In the
present study, only native fruit waste materials without any pretreatment were
considered, given that any physical or chemical pretreatment may contradict the
low cost of using fruit waste materials as biosorbents. Table 2.2 indicates that
almost all heavy metal ions have been studied in biosorption for their removals from
aqueous solutions by fruit-waste-derived biosorbents. A variety of fruit waste
materials, including different types of citrus peels, mango seed, yellow passion fruit
shell, banana peel and durian husk, have been explored as potential biosorbents.

2. Literature Review
30
Table 2.2 Highest reported heavy metal uptakes by fruit waste materials.
Adsorbent Heavy metal Qmax (mg/g) Reference
Citrus maxima peel Cd(II) 135.2a (Chao and Chang, 2012)
Mango seed (shell) Pb(II) 183 (Nadeem et al., 2016)
Ponkan mandarin peels Ni(II) 75 (Pavan et al., 2006)
Citrus maxima peel Cu(II) 84 (Chao and Chang, 2012)
Grapefruit peel Zn(II) 49.4 (Iqbal et al., 2009b)
Yellow passion fruit shell Cr(III) 80 (Jacques et al., 2007)
Banana skin Cr(VI) 249.6b (Park et al., 2008)
Fresh Garcinia cambogia As(III) 116 (Kamala et al., 2005)
Orange waste peel As(V) 36.81a (Khaskheli et al., 2011)
Citrus grandis waste U(VI) 38.97 (Saleem and Bhatti, 2011)
Citrus reticulate (tangerine) peel La(III) 88 (Torab-Mostaedi, 2013)
Citrus reticulate (tangerine) peel Ce(III) 95 (Torab-Mostaedi, 2013)
Durio zibethinus (durian) husk Au(III) 339.6a (Abidin et al., 2011)
(Notes: a - Simulated from the Langmuir isotherm model; b - Reduction capacity.)

2. Literature Review
31
Important operational parameters in biosorption
Investigation of the effects of different operational parameters is
indispensable in fundamental biosorption studies, as the information is crucial for
the process optimization and control. The important operational parameters,
including pH, particle size of biosorbent, ionic strength, presence of co-metal ions,
and temperature, are discussed as follows.
2.5.1. pH
pH plays a crucial role in a biosorption process, as it can influence the
protonation/deprotonation of functional groups on biosorbents, the release of
naturally occurring ions/molecules from biosorbents, and the speciation of
adsorbates (e.g., heavy metals in this study) in the liquid phase. For biosorption of
a cationic heavy metal, it was usually found that the biosorption capacity was
augmented with increasing pH due to less competition from H+ at higher pH
(Ahmad et al., 2018, Deniz and Karabulut, 2017). In addition, some functional
groups such as carboxyl and hydroxyl groups become deprotonated as pH increases,
providing more negative binding sites on the biosorbent surface for cationic heavy
metal ions. It is worth noting that precipitation of heavy metal ions may occur when
pH increases to a certain value (Vafajoo et al., 2018).
2.5.2. Particle size of biosorbent
Particle size of biosorbent may affect the biosorption performance of a
biosorbent in consideration of the surface area, the exposure of binding sites, and
the intraparticle diffusion (pore diffusion). It is frequently observed that biosorbents

2. Literature Review
32
in smaller particle sizes exhibit higher biosorption capacities due to the larger
surface area, which increases the availability of binding sites to adsorbates (Ali et
al., 2016, Krika et al., 2016, Liu et al., 2012b, Tarley and Arruda, 2004). Moreover,
smaller biosorbents may benefit the biosorption kinetics given the rapid transport
of adsorbates from the bulk solution to the surface of biosorbents, whereas larger
particle size may impede the biosorption rate because pore diffusion within the solid
particle is relatively slow (Leusch and Volesky, 1995). However, the preparation of
biosorbents in smaller particle sizes may increase the energy and time input since
more intense grinding work is required. Besides, biosorbents that are too small can
cause difficulties in the biosorption operation, e.g., poor separation of solids from
solutions and blocking of packed bed column reactors. The aforementioned factors
should be comprehensively considered when selecting a suitable particle size for a
biosorbent.
2.5.3. Ionic strength
Heavy-metal-bearing wastewater generally contains a mass of salt ions,
which may impact the biosorption capacity of the employed biosorbent by
weakening its electrostatic interaction with the targeted heavy metal ions. For
example, Na+ can occupy the negatively charged binding sites on the surface of
biosorbents and thus reduce the heavy metal uptake. In this sense, investigating the
effect of ionic strength on a biosorption process is necessary to evaluate the
practicality of the biosorbent. On the other hand, the effect of ionic strength is
capable of clarifying the roles of physical sorption and chemisorption in a
biosorption process. An insignificant effect of ionic strength may imply that the

2. Literature Review
33
binding of heavy metal ions to the biosorbent surface is mainly via chemisorption
rather than non-specific physical sorption (Albadarin et al., 2011).
2.5.4. Presence of co-metal ions
In general, there are various types of heavy metal ions that exist in industrial
wastewater. From the effect of co-existing heavy metal ions (shorten as co-metal
ions), it is possible to evaluate the selectivity of a biosorbent on the target heavy
metal ion. This is especially important when heavy metal recovery is expected.
The affinities of heavy metal ions to the binding sites mainly depend on four
respects: (1) Electronegativity. A metal ion with a higher electronegativity would
pose stronger attraction for the shared pair of electrons and forms stronger
coordination bonds with ligands (Chong and Volesky, 1996, Mahamadi and
Nharingo, 2010). (2) Ionic potential (i.e., charge/radius ratio). A metal ion with a
higher ionic potential can be electrostatically attracted by oppositely charged ions
more easily and strongly (Kalmykova et al., 2008). (3) Hydration energy. Metal
ions are generally hydrated in aqueous solutions. With lower hydration energies,
they would more readily dehydrate and bind to ligands, whereas those with higher
hydration energies prefer to remain in ionic forms (Hui et al., 2005). (4) Hard and
soft acids and bases (HSAB) characteristic. HSAB denotes a concept that rapid
reactions and strong bonds occur between hard acids and hard bases or between soft
acids and soft bases (Pearson, 1963). Accordingly, the discriminating factors of
heavy metal affinities to biosorbents can vary with the underlying biosorption
mechanisms. For example, the electronegativity of a heavy metal would be
important for a complexation-based biosorption process.

2. Literature Review
34
2.5.5. Temperature
Generally, a biosorption process is more rapid at a higher temperature given
that the faster movement of the adsorbate facilitates its entrapment by the
biosorbent. Yet, the effect of temperature on the equilibrium biosorption capacity
is more closely related to the thermodynamic nature of the adsorption process. For
an exothermic biosorption, there should be a negative correlation between the
biosorption capacity and temperature (Sari and Tuzen, 2008), whereas the
biosorption capacity of an endothermic biosorption process is usually positively
correlated to temperature (Ali et al., 2016, Khambhaty et al., 2009). Furthermore, a
higher temperature may enlarge the pore size of biosorbents and increase the
availability of binding sites by breaking some internal bonds on biosorbents,
leading to a higher biosorption capacity (Saeed et al., 2010).

2. Literature Review
35
Important properties of biosorption
2.6.1. Biosorption isotherms
Biosorption isotherm studies (also known as equilibrium studies) explore
the relationship between the concentration of adsorbate remaining in the solution
(Ce, ppm) and the amount of adsorbate bound to the biosorbent (Qe, mg/g) in
equilibrium. The maximum biosorption capacity (Qm, mg/g), which is an important
parameter to evaluate the performance of a biosorbent, can be obtained through
biosorption isotherm studies. Besides, different adsorption isotherm models,
including the Langmuir, Freundlich, Temkin, Dubinin-Radushkevich (D-R),
Redlich-Peterson (R-P) and Sips models, are frequently used to simulate
equilibrium data linearly or non-linearly. The most applicable model and the values
of the model constants can provide insights into the biosorption mechanism, surface
properties, adsorbate-biosorbent affinity and thermodynamics.
Langmuir isotherm
The Langmuir isotherm model was first presented to correlate the amount
of a gas adsorbed on a solid surface to the gas pressure by Langmuir (Langmuir,
1918). As a widely used adsorption isotherm having good agreement with a wide
variety of experimental data, the Langmuir model is based on the following
principles: (1) adsorbates are chemically adsorbed at a fixed amount of well-defined
surface sites; (2) each site binds with one adsorbate molecule; (3) all sites are
structurally homogenous and energetically equivalent; (4) adsorption is limited to
a monolayer; and (5) no interaction exists between adsorbates adsorbed on
neighboring sites (Ruthven, 1984). Accordingly, this model describes

2. Literature Review
36
quantitatively about monolayer adsorption of an adsorbate on the outer surface of
an adsorbent, and it can be represented as
e1
m L e
L e
Q K CQ
K C=
+,
where Qm (mg/g) is the amount of adsorbate at complete monolayer coverage; KL
(L/mg), which is derived from the rate constant of adsorption to desorption, is
related to the affinity of binding sites (molar heat of adsorption); Qe (mg/g) denotes
the amount of adsorbate adsorbed by per unit weight of adsorbent, and Ce (mg/L)
is the concentration of adsorbate remaining in the solution in equilibrium. The
Langmuir model effectively reduces to Henry’s law at low concentrations.
Freundlich isotherm
Freundlich (1906) developed the earliest known empirical adsorption
isotherm to illustrate the non-ideal adsorption on a heterogeneous surface as well
as multilayer adsorption with non-uniform distribution energy. The Freundlich
model is expressed as
1/ FN
e F eQ K C= ,
where KF (L/g) and NF are Freundlich constants respectively representing
adsorption capacity and intensity; Qe (mg/g) denotes the amount of adsorbate
adsorbed by per unit weight of adsorbent, and Ce (mg/L) is the concentration of
adsorbate remaining in the solution in equilibrium. As the original equation is
exponential, it can only be adequately applied in low and intermediate
concentrations (Liu and Liu, 2008).

2. Literature Review
37
Temkin isotherm
The Temkin isotherm, which was proposed to depict adsorption of
hydrogen on platinum electrodes in acidic solutions, considers the effect of indirect
adsorbate-adsorbate interactions on adsorption isotherms. Due to these interactions,
the heat of adsorption of all molecules in the layer decreases with coverage linearly
rather than logarithmically as in the Freundlich model (Aharoni and Sparks, 1991,
Aharoni and Ungarish, 1977). In a word, the heat of adsorption of all molecules in
the layer decreases linearly with coverage due to adsorbate-adsorbent interactions.
The Temkin model is given as
( )e T e
T
RTQ Ln A C
B= ,
where AT (L/g) is the Temkin isotherm equilibrium binding constant; Qe (mg/g) is
the amount of adsorbate adsorbed by per unit weight of adsorbent; Ce (mg/L) refers
to the concentration of adsorbate remaining in the solution in equilibrium; R (8.314
J/mol·K) is the universal gas constant, and T (K) is the absolute temperature. RT/BT
is also expressed as B (J/mol), which is a constant related to the heat of adsorption.
D-R isotherm
Assuming that binding sites on the surface of a biosorbent are non-identical
instead of being homogenous as in the Langmuir isotherm, Dubinin and
Radushkevich (1947) presented the D-R equation as
2
e
1exp( [ (1+ )] )e mQ Q RTLn
C= −
,

2. Literature Review
38
where Qm (mg/g) represents the theoretical monolayer saturation capacity; Qe (mg/g)
is the amount of adsorbate adsorbed by per unit weight of adsorbent; Ce (mg/L) is
the concentration of adsorbate remaining in the solution in equilibrium; R (8.314
J/mol·K) is the universal gas constant, and β (mol2/kJ2) is the D-R isotherm constant
related to adsorption energy.
R-P isotherm
The three-parameter R-P model first developed by Redlich and Peterson
(1959) was modified to incorporate characteristics of the Langmuir and Freundlich
isotherms (Jossens et al., 1978). It can be depicted as
1 R
R ee b
R e
K CQ
a C=
+,
where KR (L/g), aR (L/mmol), and bR (0 < bR ≦ 1) are R-P isotherm constants; Qe
(mg/g) is the amount of adsorbate adsorbed by per unit weight of adsorbent, and Ce
(mg/L) is the concentration of adsorbate remaining in the solution in equilibrium.
This equation reduces to Henry’s law at low concentrations (bR = 0), and to the
Langmuir model when bR equals to 1. In the case where the value of aRCebR is much
bigger than 1, the R-P isotherm approaches the Freundlich isotherm.
Sips isotherm
The Sips isotherm (as known as the Langmuir-Freundlich isotherm) is a
combination of the Langmuir and Freundlich isotherms (Sips, 1948). It describes
heterogeneous adsorption surface and circumvents the limitation of the Freundlich
equation for increasing adsorbate concentrations (Gunay et al., 2007). It is
expressed as

2. Literature Review
39
1/
1/1
n
m ee n
e
Q bCQ
bC=
+,
where b (L/mg) is the Sips equilibrium constant; 1/n (0-1) is the heterogeneity factor;
Qe (mg/g) refers to the amount of adsorbate adsorbed by per unit weight of
adsorbent, and Ce (mg/L) is the concentration of adsorbate remaining in the solution
in equilibrium. Values of 1/n close to 0 reveal heterogeneous adsorbents, whereas
values close to 1 indicate homogenous surfaces of adsorbents. The Sips isotherm
effectively reduces to the Freundlich isotherm at low adsorbate concentrations and
thus does not obey Henry’s law. At high concentrations, it predicts a monolayer
adsorption capacity characteristic of the Langmuir isotherm (Ho et al., 2002).
2.6.2. Biosorption kinetics
The kinetic aspect of a biosorption process plays an important role in its
scaling-up and the design of biosorption systems. In general, a biosorption process
consists of four stages: (1) adsorbate transfers from the bulk solution to the
boundary film bordering the biosorbent surface; (2) adsorbate transports from the
boundary film to the biosorbent surface; (3) adsorbate transfers from the biosorbent
surface to the intraparticle binding sites; and (4) interactions of the adsorbate with
the available binding sites (McKay, 1984). Determination of the time course of
heavy metal biosorption in kinetic studies can provide a window to the steps of
heavy metal sequestration. Besides, biosorption kinetic studies are always carried
out at different temperatures for thermodynamic insights (Ben-Ali et al., 2017). A
number of kinetic equations, including the pseudo-first-order, pseudo-second-order,

2. Literature Review
40
intraparticle diffusion and fractional power equations, are usually used to simulate
kinetic data for a better understanding of biosorption behaviors.
Pseudo-first-order kinetics
The pseudo-first-order kinetic equation, also known as the Lagergren’s rate
equation, illustrates that the rate of adsorption is proportional to the quantity of
unoccupied sites on an adsorbent (Lagergren, 1898). It can be written as
1-(1- )
k t
t eQ Q e= ,
where Qe and Qt (mg/g) are respectively the amounts of adsorbate adsorbed in
equilibrium and at time t (min), and k1 (min-1) is the Lagergren equilibrium rate
constant.
Pseudo-second-order kinetics
The pseudo-second-order kinetic equation is based on the assumption that
adsorption rate is positively correlated to the square of the number of unoccupied
sites upon an adsorbent (Schiewer and Patil, 2008). It is expressed as
2
2
21
et
e
Q k tQ
Q k t=
+,
where Qe and Qt (mg/g) are respectively the amounts of adsorbate adsorbed in
equilibrium and at time t (min), and k2 (g/mg·min) is the equilibrium rate constant
of the pseudo-second-order equation (Ho and McKay, 1999).
Intraparticle diffusion kinetics

2. Literature Review
41
The intraparticle diffusion model proposed by Weber and Morris (Weber
and Morris, 1963) was applied for the modeling of kinetic data to predict steps of
diffusion in an adsorption process. It is given as
1/2
t int +Q k t C= ,
where Qt (mg/g) is the amount of adsorbate adsorbed at time t (min); kint is the
intraparticle diffusion rate constant, and C is the intercept related to the thickness
of the boundary layer. If an adsorption process only follows intraparticle diffusion,
the plot of Qt versus t1/2 will be a straight line. In an adsorption process comprising
two or more steps, however, multi-linear plots will be obtained.
Fractional power kinetics
The fractional power model, which is modified from the Freundlich
equation (Dalal, 1974), is expressed as
v
tQ kt= ,
where Qt (mg/g) is the amount of adsorbate adsorbed at time t (min); k and v (< 1)
are fractional power kinetic constants, and kv is a constant representing the specific
adsorption rate at unit time (Ho and McKay, 2002).
2.6.3. Biosorption thermodynamics
An adsorption process, taking biosorption of heavy metal ions as an
example, can be regarded as a reversible reaction as
Heavy metal ions in solution ⇌ Heavy metal ions bound on biosorbent

2. Literature Review
42
The thermodynamic study of a biosorption process is to estimate the values of the
Gibbs free energy change (ΔG0), enthalpy change (ΔH0) and entropy change (ΔS0),
and such that to disclose the thermodynamic nature of biosorption. The
thermodynamic analysis of a biosorption process is usually based on the values of
the equilibrium constant, KD (also known as the distribution coefficient), which is
a constant describing the adsorption/desorption equilibrium for each reactant in
contact with a surface, at different temperatures (Khani et al., 2008, Sari and Tuzen,
2008). On the basis of the equilibrium biosorption capacities at 293, 303, 313 and
323 K, Sari and Tuzen (2008) computed that Pb(II) and Cd(II) biosorption on Ulva
lactuca biomass was spontaneous and exothermic (enthalpy-driven) under the
examined conditions, with a more negative value of ΔG0 at a lower temperature.
Given that the Langmuir isotherm describes the fraction of surface that is covered
by adsorbate molecules at a particular temperature and pressure, the Langmuir
isotherm constant (KL) is considered analogous to KD and used for thermodynamic
calculations in some biosorption studies (Gupta and Rastogi, 2008, Padmavathy,
2008). The negative ΔG0, positive ΔH0 and positive ΔS0 estimated in the Pb(II)
biosorption by green algae Spirogyra biomass revealed that the biosorption process
was spontaneous and endothermic, and the randomness at the solid-liquid interface
increased after Pb(II) fixation on the biosorbent surface (Gupta and Rastogi, 2008).

2. Literature Review
43
Biosorption mechanism
2.7.1. Potential underlying mechanism
In a biosorption process, an adsorbate is usually sequestered by a biosorbent
via a variety of forces, making complete elucidation of the biosorption mechanism
challengeable. To date, electrostatic attraction, ion exchange, complexation and
microprecipitation have been identified as the common underlying mechanisms that
govern the processes of heavy metal biosorption.
Electrostatic attraction
Electrostatic attraction is a non-specific force that weakly attracts the target
ions/molecules. A biosorbent with a negatively charged surface is capable of
binding heavy metal cations and other positively charged contaminants. The surface
charge of a biosorbent is associated to the organic functional groups it possesses.
For instance, deprotonation of functional groups such as carboxyl and hydroxyl
groups will lead to a negative surface charge, whereas the protonation of amine
groups may result in a positive surface charge. Therefore, the characteristics and
strength of the surface charge of a biosorbent are dependent on the biosorbent
composition and the pH of the biosorption system. Ogi et al. (2016) reported that
the positively charged Escherichia coli (E. coli) biomass efficiently removed
tungsten anions, and the biosorption performance was improved when the zeta
potential of E. coli was increased by heat treatment. Moubarik et al. (2015) observed
that the zeta potential of olive stone and bagasse changed from positive to negative
and became more negative when the pH increased from 2.0 to 12.0. Along with this
change, the biomass exhibited higher and higher affinity to Cd(II) ions.

2. Literature Review
44
Ion exchange
Ion exchange is a process in which the binding of one or several ionic
species onto a material is accompanied by the simultaneous
desorption/displacement of an equivalent amount of one or more ionic species. It is
the fundamental principle on which the commercial ion-exchange resins are based.
The ion-exchange characteristics of most biological materials, including microbial
biomass, agro-waste and fruit waste materials, have been intensively investigated
and confirmed (Hackbarth et al., 2015, Liu et al., 2012a, Pozdniakova et al., 2016,
Reddy et al., 2014). It has been well established that divalent metal ions (shown as
M2+) exchange with counter-ions, e.g., naturally occurring alkali and alkali earth
metal ions like Na+, K+, Ca2+ and Mg2+ (termed as “light metal ions” in this study),
from functional groups of polysaccharides. The reaction is shown in Eq. 2.5 with
alginic acid (ALG) as an example (Volesky, 2003).
2NaALG + M2+ → M(ALG)
2+ 2Na
+ (2.5)
To investigate whether ion exchange is involved in a biosorption process,
the release of light metal ions such as Na+, K+, Ca2+ and Mg2+ during the biosorption
process is required to be monitored. Some studies reported the participation of a
light metal ion in the ion exchange based on its loss from the biosorbent surface by
spectroscopic measurements (Maresova et al., 2011, Panda et al., 2006), or its
release into the liquid phase during the biosorption process (Girardi et al., 2014).
However, the spontaneous dissolution of light metal ions from biosorbents into
aqueous solutions might be overlooked; their natural release other than the
repulsion from adsorbates must be considered.

2. Literature Review
45
Complexation
Complexation and coordination, which refer to the formation of a covalent
bond in which the two shared electrons are from only one of the two atoms linked
by it, are frequently used as synonyms. Strictly speaking, however, they are not
identical since the latter also involves metal-free compounds (e.g., the combination
of trimethylamine with phosphorous fluoride) (Volesky, 2003). In this sense,
complexation is used instead of coordination to describe the interactions between
heavy metals and biosorbents in the present study. It is an important underlying
mechanism in heavy metal biosorption, as heavy metal ions can contribute
unoccupied orbitals to the lone pairs of electrons of O, N or S in the functional
groups on the biosorbent surface. Liang et al. (2010) found that the removal of
Cu(II), Cd(II), Pb(II), Zn(II) and Ni(II) by orange peel xanthate was attributed to
the formation of complexes between the empty orbitals of the heavy metals and the
lone pairs of electrons of S or N in the orange peel xanthate.
Microprecipitation
Microprecipitation of heavy metal ions can occur due to the deviation of the
local conditions (e.g., changes in pH or presence of certain substances) on the
biosorbent surface. Microprecipitation can significantly contribute to heavy metal
removal, as metal microprecipitates are collected by biosorbents and thus
immobilized and separated from aqueous solutions (Volesky, 2003). In a Cr K-edge
X-ray absorption near edge structure (XANES) spectroscopic study on Cr(VI)
biosorption by coconut coir, a portion of Cr(III) reduced by the biomass was found
to be precipitated as Cr(III) hydroxides on the biomass surface (Shen et al., 2010).

2. Literature Review
46
Table 2.3 lists a number of mechanistic studies of heavy metal biosorption
in the literature. Accordingly, biosorption of heavy metal ions by fruit waste
materials is usually governed by ion exchange, electrostatic attraction, and/or
complexation. This should be ascribed to the presence of charge and unoccupied
orbitals in heavy metal ions. Reduction is also likely to be involved in Cr(VI)
biosorption, in which a part of Cr(VI) is first reduced to Cr(III) and then sequestered
by biosorbents through the aforementioned biosorption mechanisms (Chand et al.,
2009, Park et al., 2008, Pehlivan and Kahraman, 2012). Notably, carboxyl and
hydroxyl groups were frequently identified as the active functional groups
providing binding sites to heavy metal ions.

2. Literature Review
47
Table 2.3 Proposed mechanisms of heavy metal biosorption by fruit waste
materials.
Biosorbent Heavy
metal
Proposed
mechanism
Active functional
group Reference
Grapefruit peel Cd(II) Ion exchange Carboxyl, amine,
hydroxyl
(Schiewer and
Iqbal, 2014)
Banana peel Cd(II) Ion exchange Carboxyl (Memon et al.,
2008)
Citrus maxima
peel
Passion fruit
shell
Cu(II),
Cd(II),
Ni(II),
Pb(II)
Complexation, ion
exchange
Carboxyl,
hydroxyl
(Chao et al.,
2014)
Garcinia
mangostana L.
shell
Pb(II),
Cd(II),
Co(II)
Ion exchange Carboxyl, amino,
hydroxyl, ester
(Zein et al.,
2010)
Mango peel Cd(II),
Pb(II)
Ion exchange Carboxyl,
hydroxyl
(Iqbal et al.,
2009a)
Cucumis melo
seed
Pb(II) Electrostatic
attraction, ion
exchange
Carboxyl (Akar et al.,
2012)
Ponkan peel Pb(II) Electrostatic
attraction,
coordination
Carboxyl (Pavan et al.,
2008)
Sour orange
residue
Cu(II) Complexation, ion
exchange,
electrostatic
attraction
Carboxyl,
hydroxyl
(Khormaei et
al., 2007)
Grapefruit peel Ni(II),
Zn(II)
Ion exchange Carboxyl,
hydroxyl
(Iqbal et al.,
2009b)
Orange waste Zn(II) Ion exchange Carboxyl,
hydroxyl
(Perez Marin et
al., 2010a)

2. Literature Review
48
Banana peel Cr(VI) Reduction,
complexation
Amino, carboxyl,
sulfonate, thiol,
phenolic
(Park et al.,
2008)
Osage orange
peel
Cr(VI) Electrostatic
attraction, ion
exchange,
complexation,
reduction
Polyphenyl,
carboxyl,
alcoholic,
carbonyl
(Pehlivan and
Kahraman,
2012)
Garcinia
cambogia rind
As(III) Complexation Carboxyl (Kamala et al.,
2005)
2. Literature Review
49
2.7.2. Techniques for mechanistic studies
To elucidate the underlying mechanism of a biosorption process,
characterization of the biosorbent is indispensable. Generally, the characterization
includes structural analysis, elemental analysis and phase analysis (a phase is a
specific chemistry and atomic arrangement). A variety of analytical tools, including
SEM-EDX for structural and elemental analysis, PXRD for structural analysis,
FTIR and solid-state NMR spectroscopy for phase analysis, and XPS for elemental
and phase analysis, have been used in the characterization of biomaterials. In
general, the characterization of a biosorbent before and after heavy metal
biosorption can examine the changes in structure, elemental composition, and phase
of the biosorbent caused by the interaction with heavy metal ions. This will provide
important insights into the binding sites and mechanisms involved in the
biosorption process.
SEM-EDX
SEM-EDX has been widely used in the surface analysis of biosorbents since
it can visualize morphological structure, determine elemental composition and trace
elemental distribution through a rapid, inexpensive and non-destructive approach
(Fontana et al., 2018, Mende et al., 2016, Oliveira et al., 2014, Pugazhendhi et al.,
2018, Remenarova et al., 2012). High resolution images of surface morphology are
produced by scanning the sample surface with a highly focused electron beam,
which enters the surface and interacts with the atoms in the sample. The excited
atoms emit low-energy secondary electrons, whose intensity is correlated to the
surface morphology (Stokes, 2008). In this way, images displaying the sample

2. Literature Review
50
surface can be created by scanning the sample and collecting the emitted secondary
electrons. Backscattered electrons, namely beam electrons back-scattered out of the
sample by elastic scattering interactions with atoms in the sample, are also used to
reflect the contrast between areas with distinct chemical compositions since heavy
elements can backscatter electrons more strongly than light elements. Its intensity,
which is dependent on the atomic number of the element from which the beam
electrons are back-scattered, can provide qualitative elemental information of the
sample. Quantitative elemental information can be obtained via EDX analysis of
characteristic X-rays, which are emitted from the sample surface as the electron
beam removes an inner shell electron in the sample, and a higher-energy electron
subsequently fills the shell and releases energy (Goldstein et al., 2017). Fontana et
al. (2018) observed a rigid structure of brewing waste with an irregular surface by
using SEM, and they found regular pores in the cross-section of the biomass. The
EDX spectra showed reduced amounts of light metals (i.e., Na, Ca and Mg) in the
biomass after Fe and Mn biosorption. Mende et al. (2016) reported the formation
of crystal-like structures in needle shape on the chitosan surface after exposing
chitosan to CuSO4 and FeSO4 solutions. The uneven distribution of Fe on the
chitosan surface detected by X-ray mapping implied partially adsorbed iron oxide
due to the rapid oxidation of Fe(II) in the air. SEM-EDX analysis revealed the
simultaneous entrapment of metal cations and sulfate anions by chitosan (Mende et
al., 2016).
PXRD

2. Literature Review
51
PXRD is a non-destructive and rapid analytical technique used for phase
identification and crystallinity measurement of materials. When an X-ray is targeted
on a crystalline material, it diffracts in a pattern characteristic of the structure of the
material. By scanning the material through a range of 2θ (the angle of the detector),
all possible diffraction directions can be attained given the random orientation of
powdered materials (Jenkins and Snyder, 1996). Unlike single-crystal XRD that
focuses on an individual crystal, PXRD looks at a powder material as a bulk
characterization method. The PXRD pattern, which plots the intensity of the
diffracted X-ray against 2θ, is a sum of the diffraction patterns produced by each
individual phase in a mixture. Given that most materials have unique diffraction
patterns, compounds can be identified by referring to the database of diffraction
patterns. Hence, the PXRD pattern is considered a fingerprint that helps figure out
what is in a given sample, and also the phase and crystallinity. Le Troedec et al.
(2008) employed PXRD to assess the effect of various chemical treatments on the
crystallinity of hemp fibers. The wide applications of PXRD in the characterization
of biomaterials, e.g., eggplant leaves (Yuvaraja et al., 2014), wheat straw (Tian et
al., 2011), grape bagasse (Farinella et al., 2007), and tree bark (Reddy et al., 2011),
indicated the amorphous nature of most biomaterials with broad reflections in their
diffraction patterns.
FTIR spectroscopy
FTIR spectroscopy, which collects the infrared spectrum of absorption of a
material over a wide spectral range, is widely employed for qualitative
characterization of functional groups in biosorbents (Fontana et al., 2018, Oliveira

2. Literature Review
52
et al., 2014). The term Fourier-transform refers to the mathematical process of
Fourier transform used in this analytical technique to convert raw data into a final
spectrum. The spectrum is formed based on how much of the light is absorbed at
each wavelength. Given that the wavelength at which absorption occurs is
characteristic to a functional group, the functional groups contained in a sample can
be recognized accordingly. Furthermore, the active ones involved in the biosorption
process can be inferred by collecting the FTIR spectra of the biosorbent before and
after exposure to the adsorbate. For instance, FTIR analysis of an apple pomace-
derived biosorbent with and without Cd(II) loading suggested the involvement of
ester, carboxyl, and amine groups in Cd(II) biosorption (Chand et al., 2014). The
participation of carboxyl and hydroxyl groups in the entrapment of crystal violet by
grapefruit peels (Saeed et al., 2010), and that of C=O groups in azo dye biosorption
by Citrus sinensis were also reported based on FTIR analysis (Asgher and Bhatti,
2010). Due to its easy operation and low cost, FTIR spectroscopy is the most widely
used spectroscopic method in biosorbent characterization in the literature. However,
it is very difficult to determine a detailed biosorption mechanism by using FTIR
analysis alone (Lalhmunsiama et al., 2017).
XPS
XPS is a versatile and sensitive surface analysis technique for compositional
and chemical states analysis (Oliveira et al., 2014). A sample is irradiated by a beam
of X-rays, and the quantity and kinetic energy of electrons ejected from the sample
surface (0-10 nm) are analyzed to determine the binding energy, which is element-
specific and allows chemical characterization of the sample. After spectral

2. Literature Review
53
collection, deconvolution of an XPS spectrum is performed to categorize the
diverse functional groups of a specific element, e.g., ligands of C 1s, O1s, or N 1s.
Not only being capable of examining the elemental composition and functional
groups of a biosorbent qualitatively and quantitatively, XPS can also provide useful
insights into the biosorption mechanism (Chen and Yang, 2006, Lim et al., 2008,
Oliveira et al., 2014). Oliveira et al. (2014) employed XPS to characterize the
Sargassum sp. biomass before and after La(III) biosorption, and a variety of C
groups (e.g., C-C, C-O, C=O/O-C-O, and COO-), O groups (e.g., La-O and C=O),
and N groups (e.g., NH2 and NH3+) were identified. The significant reduction of the
amount of Ca after La(III) biosorption suggested the occurrence of ion exchange
between Ca(II) and La(III) for the binding sites during the biosorption process
(Oliveira et al., 2014).
Solid-state NMR spectroscopy
Despite the well-established technology of liquid-state NMR spectroscopy,
the most appropriate samples for the analysis of molecular structure are solid in
many situations, especially in environmental studies. Solid-state NMR
spectroscopy provides a means to analyze a sample in its natural state via a
noninvasive manner. In liquid-state NMR spectroscopy, the spectral lines are sharp
given that the anisotropic NMR interactions are averaged by rapid random tumbling.
In contrast, solid-state NMR spectra are very broad due to the effect of anisotropic
(orientation-dependent) interactions in solid samples (Pavia et al., 2008). Despite
the challenges in spectral analysis, the broad lines produced in solid-state NMR
spectroscopy conceal crucial information on the chemistry, structure, and dynamics

2. Literature Review
54
of the targeted sample. A variety of techniques, e.g., cross polarization (CP) and
magic angle spinning (MAS), are frequently employed in solid-state NMR
spectroscopy for better resolution and higher signal/noise ratio. Superior to the
common spectroscopic techniques (e.g., FTIR spectroscopy and XPS), solid-state
NMR spectroscopy can provide information on the magnetically distinct atoms of
the functional group being studied. In the literature, it has been used for profiling
pollens and planktonic biomass (Komatsu et al., 2015, Zhang et al., 2016).
Furthermore, Habets et al. (2013) investigated the effects of thermochemical
treatments on the composition of wheat straw using 13C and 1H solid-state NMR
spectroscopy, and they found that hemicellulose, acetyl groups, and ash minerals
were removed via aquathermolysis. It is noteworthy that the limitations of solid-
state NMR spectroscopy (e.g., chemical shift anisotropy and dipole-dipole coupling)
often lead to the overlap of isotropic chemical shifts, making it difficult to
distinguish the magnetically distinct atoms (e.g., C atoms in pectin and cellulose)
(Ren et al., 2016). Also, the high cost and complexity of operation and spectral
analysis restrict the wide application of solid-state NMR spectroscopy in
biosorption studies.
The aforementioned techniques are always complementary in biosorbent
characterization and mechanistic elucidation. Although solid-state NMR
spectroscopy has emerged as a robust tool to provide unprecedented information
regarding molecular structures and interactions, it is not yet powerful enough to
take the place of FTIR spectroscopy and XPS. For instance, most of the solid-state
NMR studies on biomaterials only collect the 13C spectra because of the stringent
requirements on the element being studied. In this case, FTIR spectroscopy and

2. Literature Review
55
XPS can supplement information about the functional groups based on O and N
atoms. Beyond the aforementioned techniques, there are also some other methods
that can be helpful in disclosing biosorption mechanisms. For example, zeta
potential measurement can examine the surface electric properties of biosorbents
and provide insights into the contribution of electrostatic interaction in biosorption
processes. Besides, chemical methods, e.g., ion exchange experiment, are crucial to
investigate the role of the ion exchange with naturally occurring light metal ions
(e.g., Na+, K+, Mg2+ and Ca2+) in heavy metal biosorption. The utilization of diverse
techniques and methods makes the complete elucidation of a biosorption process
possible.

2. Literature Review
56
Desorption of heavy metal
Efficient desorption of the sequestered adsorbate is essential to improve the
cost-effectiveness of a biosorption process via adsorbate recovery and biosorbent
regeneration. A desirable desorption process should be able to recover the
adsorbates and regenerate the adsorbents to conditions similar to the original forms
(Volesky, 2001). This is highly dependent on the selection of desorbing agents,
which are expected to be non-destructive, mild and efficient. As summarized in
Table 2.4, dilute acids and alkalis, mineral salt solutions, and complexing agents
are the most frequently employed desorbing agents in the desorption of heavy
metals from fruit-waste-derived biosorbents.
As the most common desorbing agents with easy access and low cost,
mineral acids, e.g., HCl, HNO3 and H2SO4, desorb sequestered adsorbates via
proton exchange (Abdolali et al., 2015). Yet, mineral acids may destroy the
biosorbent surface to some extent, resulting in the often-observed impaired
biosorption capacities of regenerated biosorbents. Organic acids such as acetic acid
and citric acid are usually biocompatible and environmentally friendly alternatives
without deteriorating the surface structure of biosorbents to allow subsequent reuse.
This merit makes organic acids irreplaceable in some desorption situations in spite
of the relatively high cost (Jing et al., 2007). Mineral salt solutions, including CaCl2,
Ca(NO3)2, NaCl, NaHCO3 and other salt solutions, are also used as desorbing
agents through supplying competing cations for ion exchange with the bound
adsorbates. Meanwhile, anions present in salt solutions, e.g., HCO3-, CO3
2-, Cl- and
SO42-, can form metal complexes with heavy metal ions, and such that they can
destabilize the biosorbent-metal complex and entrap the bound heavy metal ions

2. Literature Review
57
(Stirk and van Staden, 2002). Still, this type of desorbing agents seems not suitable
when recovery of adsorbates (e.g., precious metals and radioactive elements) is
expected. A number of strong metal complexing agents, e.g.,
ethylenediaminetetraacetic acid (EDTA), are also employed to capture the
sequestered heavy metals from biosorbents through complexation (Koduru et al.,
2013, Njikam and Schiewer, 2012). However, the higher cost of complexing agents
than mineral acids and salts limits their applications in desorption studies.
Taken together, mineral acids are the most popular desorbing agents for
desorption of heavy metals (Table 2.4). One hundred percent of Cd(II) was
recovered by using 0.1 M HCl, 0.1 M H2SO4 or 0.05 M HNO3 from Cd(II)-loaded
banana peels (Memon et al., 2008). Besides, two adsorption-desorption cycles were
achieved by using 0.1 M HCl as the desorbing agent to recover Pb(II) from Pb(II)-
loaded passion fruit peels (Gerola et al., 2013). There was even an increase in the
Cu(II) uptake by a regenerated gooseberry fruit with 0.1 M HCl as the desorbing
agent; the increase could be due to the activation of more surface sites after contact
with 0.1 M HCl (Rao and Ikram, 2011). Njikam and Schiewer (2012) observed
more efficient Cd(II) desorption from citrus peels by using Ca(NO3)2 than HNO3,
but the Cd(II) biosorption capacity of the regenerated biosorbent treated by HNO3
was similar to that of the original biosorbent and considerably higher than that of
the Ca(NO3)2-treated one. This implies that both the desorption efficiency and the
regeneration ability of the biosorbent should be considered when selecting a
suitable desorbing agent. Occasionally, desorption of adsorbates and regeneration
of biosorbents require different agents. Abdolali et al. (2015) used CaCl2 after the
desorption process (HCl as the desorbing agent) to improve the stability and

2. Literature Review
58
reusability of a multi-metal binding biosorbent, which was a mixture of mandarin
peels, tea waste and maple leaves. The use of CaCl2 could repair the damage caused
by HCl and exchange the protons to provide accessible binding sites to heavy metal
cations in the subsequent biosorption cycles (Abdolali et al., 2015).

2. Literature Review
59
Table 2.4 Desorbing agents used for heavy metals desorption from fruit waste
materials.
Heavy
metal
Biosorbent Desorbing agent S/L
(g/L)
Time
(h)
DE
(%)
Reference
Cd(II) Banana peel 0.005 M HNO3 20 0.5 100 (Memon et
al., 2008) 0.01 M HCl 100
0.01 M H2SO4 100
Cd(II) Grapefruit
peel
0.01 M HNO3 1 1.67 100 (Njikam
and
Schiewer,
2012)
0.1 M Ca(NO3)2 1 24 90
Orange peel 0.001 M
Na2EDTA
1 24 100
0.001 M S,S-
EDDS
1 1.67 100
Cd(II) Mango peel 0.1 M HCl 20 1 98.2 (Iqbal et al.,
2009a) Pb(II) 99.1
Ni(II) 95.8
Cu(II) Gooseberry
fruit residue
0.1 M HCl 10 24 >80 (Rao and
Ikram,
2011)
Cu(II) Prunus
persica L.
stone
0.1 M HCl 10 2 98.64 (Lopicic et
al., 2017) 0.1 M HNO3 10 2 96.96
0.1 M
CH3COOH
10 2 77.70
Cu(II) Sour orange
residue
0.1 M HCl 2 1 99 (Khormaei
et al., 2007)
Pb(II) Passion
fruit peel
0.1 M HCl NA NA 91.1 (Gerola et
al., 2013)
Ni(II) Citrus
limetta peel
0.05 M HCl 8 1 96.56 (Singh and
Shukla,
2017)
(Notes: DE - Desorption efficiency; NA - Not available.)

2. Literature Review
60
Biosorption in a continuous mode
In the literature, a sizable portion of biosorption studies was based on the
batch mode for optimization of operational conditions and desorption. Yet, a packed
bed column reactor is more practically and commercially viable as this type of
reactor has been widely used in industries which employ ion exchange resins or
other commercial adsorbents (Chatterjee and Schiewer, 2011). The setting up of a
laboratory-scale packed bed column reactor is an indispensable procedure to
evaluate the practicability of the biosorbent being studied. Glass (Castro et al.,
2011, Long et al., 2014, Lopez-Garcia et al., 2013, Martin-Lara et al., 2012,
Sivasankara et al., 2010) and clear acrylic columns (Chatterjee and Schiewer, 2011,
Perez Marin et al., 2010a) are usually used for establishing continuous biosorption
systems. To avoid column blocking caused by the swelling of biosorbents, “wet
packing” is usually employed to pack already wet biosorbents inside the column
reactor. Both upward flow (Chatterjee and Schiewer, 2011, Martin-Lara et al.,
2012) and downward flow (Jin et al., 2018, Long et al., 2014) are adopted in
continuous biosorption experiments in column reactors. A number of studies on the
effects of operational parameters on the performance of column reactors have found
that higher bed height, lower flow rate and influent concentration can lead to longer
breakthrough and exhaustion time in packed bed column reactors (Chatterjee and
Schiewer, 2011, Jin et al., 2018, Long et al., 2014). To achieve a high biosorption
efficiency and ensure the effluent can meet the discharge limit, several identical
packed bed column reactors can be connected for a high enough bed height
(Chatterjee and Schiewer, 2011).

2. Literature Review
61
In column studies, a breakthrough curve, which corresponds to the plot of
the adsorbate concentration in effluent against time, is examined to evaluate the
adsorption performance of a packed bed column reactor. Sometimes it is also
expressed as a plot of the relative concentration (the ratio of the adsorbate
concentration in effluent to that in influent) against bed volume (BV). To predict
the dynamic behavior occurring in a column and allow some kinetic coefficients to
be estimated, the Thomas, Bohart-Adams, Dose-Response and Yoon and Nelson
models are frequently used to simulate breakthrough curves (Calero et al., 2009).
Thomas model
The Thomas model is the most widely applied model in column studies
(Thomas, 1948). It has the following form of
00 0
1
1 exp[ ( - )]
tC
kCq M C V
Q
=
+ ,
where Ct and C0 (mg/L) refer to the adsorbate concentrations in effluent and influent,
respectively; k (mL/min·mg) is the Thomas rate constant; q0 (mg/g) is the maximum
loading capacity of adsorbate on adsorbent; M (g) is the mass of adsorbent in the
column reactor; V (mL) is the throughput volume, and Q (mL/min) is the volumetric
flow rate. The Thomas model assumes that the adsorption process follows the
pseudo-second-order rate law, fits to the Langmuir isotherm in equilibrium, and
holds a plug flow without dispersion in the column reactor being studied (Thomas,
1948).
Bohart-Adams model

2. Literature Review
62
The Bohart-Adams model was developed based on the surface reaction
theory to describe the relationship between Ct/C0 and t in a continuous system for
gas adsorption onto solids (Bohart and Adams, 1920). However, it has been
extensively used in other types of adsorption systems. This model assumes that
equilibrium is not instantaneous, and thus the rate of an adsorption process is
proportional to the adsorption capacity that still remains on the adsorbent (Goel et
al., 2005). The Bohart-Adams model is expressed as
00
0
1
1 e xp( )
t
BABA
C
k N ZCk C t
=
+ ,
where Ct and C0 (mg/L) refer to the adsorbate concentrations in effluent and influent,
respectively; N0 (mg/L) is the equilibrium volumetric sorption capacity; kBA
(L/h/mg) is the Bohart-Adams rate constant; Z (cm) refers to the bed height, and u
(cm/h) is the linear flow velocity. It assumes an irreversible adsorption process and
an ideal plug flow in the column reactor being studied.
Dose-Response model
The Dose-Response model, which is commonly used in pharmacology, has
been frequently applied to illustrate adsorption in column reactors (Calero et al.,
2009). This model is presented as follows,
0
11-
1 ( )
tC
tC
=
+
,
where Ct and C0 (mg/L) refer to the adsorbate concentrations in effluent and influent,
respectively; α is the constant of the Dose-Response model, and γ is the constant

2. Literature Review
63
representing the time when the adsorbate concentration in effluent reached 50% of
that in influent (Ct/C0 = 50%). The Dose-Response model is an empirical model
with a zero value of Ct/C0 at time zero (Yan et al., 2001).
Yoon and Nelson model
The Yoon and Nelson model was initially developed for adsorption of gases
or vapors into activated coal (Calero et al., 2009). It is in the form of
0
1
1 exp( ( - )
t
YN
C
C k t=
+ ,
where Ct and C0 (mg/L) are the adsorbate concentrations in effluent and influent,
respectively; kYN (min-1) is the Yoon and Nelson’s proportionality constant, and τ
(min) is the time required for retaining 50% of the initial adsorbates.

3. Materials and Methods
64
3. Materials and Methods

3. Materials and Methods
65
Chemicals
The Pb(II) and Cd(II) solutions were respectively prepared by dissolving
metal salts, i.e., Pb(NO3)2 and Cd(NO3)2‧4H2O, in distilled deionized (DDI) water
in the desirable concentrations. Other solutions of cationic heavy metal ions (e.g.,
Cu(II), Zn(II), Ni(II) and Cr(III)) used in this study were also prepared in DDI water
using the corresponding metal nitrate salts. Solutions of HCl and NaOH at 0.5 M
and 1.0 M were used for pH adjustment. Sodium nitrate was employed to adjust the
ionic strength of the biosorption systems to investigate the effect of ionic strength.
In determination of metal concentrations, the standard solutions and samples were
diluted to the desirable concentrations by using 1% HNO3 (trace metal grade)
prepared in Milli Q water. All chemicals and reagents used in this study were of
analytical grade.

3. Materials and Methods
66
Preparation of biosorbents
A number of abundant fruit waste materials, including green pomelo peel,
yellow pomelo peel, dragon fruit peel, watermelon rind (WR), and mango seed
(MS), were tested for Pb(II) and Cd(II) removal in the preliminary studies (results
not shown). WR and MS were screened out for subsequent biosorption studies
because of their superior Pb(II) and Cd(II) biosorption capacities as compared with
other fruit waste materials.
Native WR and MS without any pretreatment were prepared as biosorbents
in this study for easy operation and low cost. As shown in Figure 3.1, WR and MS
(including the mango seed shell and kernel) collected from a local market were first
washed by tap water to remove the flesh residues and dusts. Then they were cut into
small pieces and washed by DDI water before drying in a laboratory-scale oven at
333 K for 24 h. Subsequently, the dried biomaterials were ground using an
electronic blender. Particles in the size distributions of < 180 µm, 180-500 µm and
500-1000 µm were collected by using sieves with the corresponding particle sizes
and stocked in sealed polypropylene containers at 277 K. WR and MS smaller than
180 µm were used in the biosorption studies in the batch mode and mechanistic
studies unless otherwise stated.

3. Materials and Methods
67
Figure 3.1 Preparation of WR and MS biosorbents from raw fruit waste materials.

3. Materials and Methods
68
Instrumentations
The biosorption operations in a batch mode are schematically described in
Figure 3.2. Biosorbents were dispersed in Pb(II)/Cd(II) solutions in biosorption
reactors made of polypropylene, and the reactors were placed in a thermostat orbital
shaker at 250 rpm (at room temperature for 24 h unless otherwise stated). The pH
of the biosorption systems was periodically measured and adjusted using a HCl or
NaOH solution to maintain constant pH. When the biosorption equilibrium was
reached, the suspensions were centrifuged at 4000 rpm for 10 min. The supernatants
were acidified and subjected to determination of the concentrations of the residual
Pb(II)/Cd(II) ions by inductively coupled plasma optical emission spectrometer
(ICP-OES, Agilent 700 Series, USA). Inductively coupled plasma mass
spectrometer (ICP-MS, Agilent 7500ce, USA) was used for the measurement of
metal ions at lower concentrations (0-100 ppb). The quantity of Pb(II)/Cd(II)
adsorbed was computed based on the mass balance between the initial and
equilibrium concentrations of the heavy metal ions.

3. Materials and Methods
69
Figure 3.2 Schematic diagram of Pb(II)/Cd(II) biosorption operations in a batch
mode.

3. Materials and Methods
70
Biosorption of Pb(II) and Cd(II) by WR
3.4.1. Effect of pH
A 0.015 g portion of WR was added into 50-mL polypropylene tubes
containing 15 mL of Pb(II)/Cd(II) solutions at varying pH, i.e., 2.0-5.5 in Pb(II)
biosorption and 3.0-7.5 in Cd(II) biosorption, to investigate the effect of pH. Two
initial metal concentrations, 100 ppm and 500 ppm, were used in this study.
3.4.2. Effect of WR dosage
The effect of WR dosage was examined by applying 0.5, 1, 2, 3 and 5 g/L
of WR into 15 mL of 500 ppm Pb(II)/Cd(II) solutions in 50-mL polypropylene
tubes. The pH was maintained at 5.0 in the Pb(II) biosorption systems and 7.0 in
the Cd(II) ones.
3.4.3. Effect of initial metal concentration
To unravel the effect of initial metal concentration, 0.015 g of WR was
respectively dispersed into 50-mL polypropylene tubes containing 15 mL of Pb(II)
solutions at 50, 100, 150, 250, 500, 750, 1000, 1250 and 1500 ppm, and 15 mL of
Cd(II) solutions at 25, 100, 200, 300, 500, 750 and 1000 ppm. The pH was
maintained at 5.0 in the Pb(II) biosorption systems and 7.0 in the Cd(II) ones.
3.4.4. Effect of ionic strength
By applying 0-0.2 M NaNO3 into 15 mL of 500 ppm Pb(II)/Cd(II) solutions
with 1.0 g/L WR in 50-mL polypropylene tubes, the Pb(II)/Cd(II) biosorption
capacities of WR at different ionic strength were examined. The pH was maintained
at 5.0 in the Pb(II) biosorption systems and 7.0 in the Cd(II) ones.

3. Materials and Methods
71
3.4.5. Effect of co-metal ions
Given that heavy-metal-bearing wastewater usually contains various types
of heavy metal ions, the effect of co-metal ions, including Cu(II), Zn(II), Ni(II) and
Cr(III) on Pb(II) and Cd(II) biosorption, was investigated in binary systems. A
0.015 g portion of WR was dispersed into 15 mL of metal solution containing Pb(II)
and a co-metal ion, i.e., Cd(II), Cu(II), Zn(II), Ni(II) or Cr(III), at pH 5.0 (initial
concentration of each heavy metal at 1 mM). In consideration of the optimal pH of
7.0 for Cd(II) biosorption by WR (see Section 4.1), at which Pb(II), Cu(II) and
Cr(III) would be remarkably precipitated, only the effect of Zn(II) and Ni(II) on
Cd(II) biosorption by WR at pH 7.0 was examined. The speciation of these types
of heavy metals at a pH range of 5.0-7.5 was simulated by Visual MINTEQ 3.1 and
shown in Figure A1 in Appendices.
3.4.6. Biosorption isotherms
The biosorption isotherm studies were carried out by respectively adding
0.015 g of WR into 50-mL polypropylene tubes containing 15 mL of Pb(II)
solutions at 100-1500 ppm, and Cd(II) solutions at 25-1000 ppm. The pH was
maintained at 5.0 in the Pb(II) biosorption systems and at 7.0 in the Cd(II) ones.
Given the frequently reported bias in linear regression (Ho, 2006, Ho et al., 2005,
Kumar, 2007, Vasanth Kumar, 2006), the six frequently used adsorption isotherm
models, namely the Langmuir, Freundlich, Temkin, D-R, R-P and Sips equations,
were non-linearly fitted to the equilibrium data to identify the best-fitting isotherm.

3. Materials and Methods
72
3.4.7. Biosorption kinetics
The kinetic information of a biosorption process is crucial for the design of
the biosorption system. Pilot studies showed that Pb(II) and Cd(II) were entrapped
by WR at a substantially high speed, with 94.4% of Pb(II) and 92.1% of Cd(II)
biosorption finished in the first 5 min at an initial metal concentration of 500 ppm
and a WR dosage of 1.0 g/L (Figure A2). Although the high biosorption speed is
beneficial for practical applications, it makes the monitoring and analysis of the
biosorption process as a function of time very difficult. Hence, a lower initial metal
concentration (50 ppm) and WR dosage (0.5 g/L) were applied in the kinetic
studies. Namely, 70 mL of WR solution at 1.5 g/L was mixed with 140 mL of 75
ppm Pb(II)/Cd(II) solution in a 500-mL polypropylene bottle, obtaining a
biosorption system with an initial Pb(II)/Cd(II) concentration of 50 ppm and a WR
dosage of 0.5 g/L. NaOH was constantly added to maintain the pH at around 5.0 in
Pb(II) biosorption and 7.0 in Cd(II) biosorption. Besides, a magnetic stirrer, instead
of an orbital shaker (as used in other biosorption studies), was applied for
convenient sampling in short time intervals. In order to investigate the effects of
temperature and biosorbent particle size on kinetics, Pb(II) and Cd(II) uptakes by
WR were determined as a function of time at different temperatures (i.e., 278 K,
298 K and 310 K) and different particle sizes of WR (i.e., < 180 µm, 180-500 µm
and 500-1000 µm). To examine the significance of constant pH to the biosorption
processes, Pb(II) biosorption by WR at different temperatures were also carried out
at initial pH of 5.0 without further pH adjustment as a comparison. The kinetic data
were non-linearly simulated by the pseudo-first-order, pseudo-second-order, and
fractional power equations. In addition, the intraparticle diffusion curves of the

3. Materials and Methods
73
Pb(II) and Cd(II) biosorption processes were also analyzed to disclose the different
steps involved in the biosorption.
3.4.8. Desorption of Pb(II) and Cd(II) from WR
Desorption of the sequestered adsorbate is of crucial importance for
concentrating the adsorbate as well as regenerating the biosorbent. To this end, HCl,
HNO3 and citric acid at 0.05 M and 0.1 M were tested as potential desorbing agents
for Pb(II) and Cd(II) desorption from WR. Pb- and Cd-loaded WR were added to
15 mL acid solutions with a solid/liquid (S/L) ratio of 1.0 g/L. The flasks containing
the suspensions were shaken at 250 rpm and 298 K for 3 h, and then centrifuged at
4000 rpm for 10 min to obtain the supernatants, which were subjected to the
determination of the quantity of Pb(II)/Cd(II) desorbed by ICP-OES. The
suspensions of Pb- and Cd-loaded WR in DDI water were used as the control groups.
Additionally, the separated WR after centrifugation was washed by DDI water 3
times and used for resorption of Pb(II)/Cd(II) after drying in a laboratory oven at
333 K for 12 h.
In order to evaluate the relative significance of the different experimental
factors and their possible interactions, and to optimize the desorption process,
response surface methodology (RSM) with central composite design (CCD), was
used for modeling and analyzing Pb(II) desorption by HCl from WR. Design-
Expert (Version 10) was utilized in the experimental design and data analysis. In
this study, desorption efficiency was the response variable, and S/L ratio, acid
concentration, and time were the independent variables. The levels of factors are
shown in Table 3.1. In the CCD, the total number of experiments is 2k+2k+n0, where

3. Materials and Methods
74
k is the number of independent variables, and n0 is the number of repetitions of
experiments at the center point. For statistical calculations, the experimental
variables Xi have been coded as xi according to the following transformation
equation:
0ii
X Xx
X
−=
where xi is the dimensionless coded value of the variable Xi; X0 is the value of Xi at
the center point, and ΔX is the step change (Muralidhar et al., 2001).

3. Materials and Methods
75
Table 3.1 Levels of factors used in CCD for optimization of desorption efficiency.
Variable Label Level
Δx -1.682 (-α) -1 0 1 1.682 (+α)
x1 S/L ratio (g/L)
2.64 4 6 8 9.36 2
x2 Acid
concentration (M)
0.064 0.2 0.4 0.6 0.74 0.2
x3 Time (h)
0.32 1 2 3 3.68 1

3. Materials and Methods
76
3.4.9. Potential of WR for Pb(II) removal from drinking water
Given the disturbing Pb contamination in drinking water that occurred at
Hong Kong in 2015 (HK, 2015), the potential of WR for Pb(II) removal to fulfill
the stringent standard of drinking water was investigated. Different dosages of WR,
i.e., 0.01, 0.02, 0.05 and 0.1 g/L, were dispersed in 15 mL of 400 ppb Pb(II)
solutions in 50-mL polypropylene tubes. After agitation at 250 rpm and 298 K for
24 h, the Pb-WR suspensions were centrifuged at 4000 rpm for 10 min and the
supernatants were subjected to the determination of the residual Pb(II)
concentrations by ICP-MS.
3.4.10. Biosorption-desorption in a continuous mode
Biosorption in a continuous mode is essential in practical applications for
an easy and efficient operation. In the preliminary studies, it was found that WR
smaller than 180 µm, which were used in the batch studies, exerted high pressure
drops in the column reactors due to the blocking of fine particles. Given that the
effect of particle size on the biosorption capacity of WR was slight (as observed in
the batch studies), WR in 500-1000 µm was used in the packed bed column reactors
to reduce the pressure drop. The packed bed column reactors were established by
filling WR in polystyrene columns with internal diameters of 6 mm. As shown in
Figure 3.3., glass wool was placed in the two terminals of the column reactor to
confine the biosorbent particles inside, and glass beads were used for an even
distribution of flows. The flows were injected in an upward mode at 1 mL/min using
a peristaltic pump (Masterflex, Cole-Parmer, USA). A fraction collector (Model
2110, Bio-Rad, USA) was used to automatically collect the effluent samples, which

3. Materials and Methods
77
were subjected to the determination of the Pb(II)/Cd(II) concentrations by ICP-OES.
Before biosorption, DDI water was injected for 20 h to wet the column reactor and
establish an equilibrium between the biosorbent and water.
For Pb(II) biosorption, a bed column reactor packed with 0.68 g of WR to
a bed height of 19 cm (the ratio of bed height to internal diameter was 32:1) was
employed. A Pb(II) solution at 50 ppm and pH 5.0 was used as the influent. For
Cd(II) biosorption, however, the WR-packed bed column reactor showed
undesirable biosorption performance in the preliminary study with breakthrough
time (at which Ct/C0 = 5%) of 30.3 BV and 15.9 BV in the first and second cycles,
respectively. This was probably due to the low pH condition inside the column
during biosorption (below 6.0 as measured in the effluent); it was observed that the
Cd(II) biosorption capacity of WR at pH 6.0 was only 34% of that at pH 7.0 in the
batch study (Section 4.1). The dissolution of CO2 from the air into the column
system and the existence of acidic substances in WR could be the causes for the
dropped pH, even though a Cd(II) solution at pH 7.5-8.0 was used as the influent
and the column was washed by DDI water to a pH of 7.0 before Cd(II) biosorption
started. Therefore, WR was pretreated by soaking in 0.05 M NaOH for 3 h to
remove the acidic substances, and also help break down the inter- and intra-
molecular hydrogen bonds to increase the number of free hydroxyl groups (Sostaric
et al., 2018). The pretreated WR was then washed by DDI water to a pH of 7.5-8.0
before column packing. The column reactor packed with NaOH-treated WR was
fed with a 50 ppm Cd(II) solution at pH 7.5-8.0. This pH was higher than the
optimal pH for Cd(II) biosorption (pH 7.0 as observed in the batch study, Section

3. Materials and Methods
78
4.1) considering that pH would decrease when the Cd(II) solution came in contact
with the WR particles packed in the column reactor.
A biosorption-desorption cycle in the column reactor comprised successive
injections of: (1) Pb(II)/Cd(II) solution for a sufficient time to saturate the WR
packed in the column reactor; (2) DDI water to remove the residue metal ions that
had not bound to WR; (3) 0.05 M HCl (selected based on the desorption studies in
batch systems) to desorb the metal ions sequestered by WR and to regenerate the
column reactor; (4) DDI water for a sufficient time to wash off any excess acid and
clean the column reactor for the subsequent cycles. The changes in pH and total
organic carbon (TOC) release (Shimadzu TOC-LCSN, Japan) during the
biosorption-desorption cycles were monitored. To understand the biosorption
behaviors in the column reactor, the Thomas, Bohart-Adams, Dose-Response and
Yoon and Nelson models were applied to simulate the breakthrough curves.

3. Materials and Methods
79
Figure 3.3 Schematic diagram of the WR-packed bed column reactor.

3. Materials and Methods
80
Biosorption of Pb(II) and Cd(II) by MS
3.5.1. Effect of particle size
The effect of MS particle size on Pb(II) and Cd(II) biosorption was
investigated. A 0.015 g portion of MS in the particle size distributions of < 180 μm,
180-500 μm, and 500-1000 μm were respectively dispersed into 15 mL of 500 ppm
Pb(II)/Cd(II) solutions. The pH was maintained at 5.0 in the Pb(II) biosorption
systems and 7.5 in the Cd(II) ones.
3.5.2. Effect of pH
To examine the pH effect and identify the optimal pH condition, 0.015 g of
MS was added into 50-mL polypropylene tubes containing 15 mL of 100 ppm
Pb(II) solutions at pH of 2.0-7.0, and Cd(II) solutions at pH of 4.0-8.5. The pH of
the biosorption systems was consistently adjusted and maintained at the desirable
values.
3.5.3. Effect of MS dosage
The effect of MS dosage was investigated by respectively adding 0.5, 1, 2,
3 and 5 g/L of MS into 15 mL of 500 ppm Pb(II)/Cd(II) solutions in 50-mL
polypropylene tubes. The pH was maintained at 5.0 in the Pb(II) biosorption
systems and 7.5 in the Cd(II) ones.
3.5.4. Effect of initial metal concentration
To examine the effect of the initial concentration of Pb(II)/Cd(II) on the
biosorption performance, 0.015 g of MS was dispersed into 50-mL polypropylene
tubes containing 15 mL of Pb(II) solutions at 50, 100, 150, 200, 300, 400, 500, 600,

3. Materials and Methods
81
800, 1000 and 1500 ppm, and Cd(II) solutions at 50, 100, 150, 200, 300, 400, 500,
800 and 1000 ppm. The pH was maintained at 5.0 in the Pb(II) biosorption systems
and 7.5 in the Cd(II) ones.
3.5.5. Effect of ionic strength
The effect of ionic strength on Pb(II)/Cd(II) biosorption by MS was studied
by adding 0-0.2 M NaNO3 into 50-mL polypropylene tubes containing 15 mL of
500 ppm Pb(II)/Cd(II) solutions with 1.0 g/L MS. The pH was maintained at 5.0 in
the Pb(II) biosorption systems and 7.5 in the Cd(II) ones.
3.5.6. Effect of co-metal ions
To explore the selectivity of MS on Pb(II) and Cd(II), the effect of co-metal
ions, including Cu(II), Zn(II), Ni(II) and Cr(III), on Pb(II) and Cd(II) biosorption
by MS was investigated. In binary systems, 0.015 g of MS was added into 15 mL
of metal solutions comprising Pb(II) and a co-metal ion, i.e., Cd(II), Cu(II), Zn(II),
Ni(II) or Cr(III), at pH 5.0 (initial concentration of each heavy metal at 1 mM). Due
to the optimal operational pH of 7.5 for Cd(II) biosorption by MS, at which Pb(II),
Cu(II) and Cr(III) would be significantly precipitated, only the effect of the
presence of Zn(II) and Ni(II) on Cd(II) biosorption was examined at pH 7.5.
3.5.7. Biosorption isotherms
In the biosorption isotherm studies of Pb(II) and Cd(II) biosorption by MS,
0.015 g of MS was added into 15 mL of Pb(II) solutions at 50-1500 ppm, and Cd(II)
solutions at 50-1000 ppm. The pH was adjusted to 5.0 in the Pb(II) biosorption
systems and 7.5 in the Cd(II) ones. Six adsorption isotherm models, namely the

3. Materials and Methods
82
Langmuir, Freundlich, Temkin, D-R, R-P and Sips equations, were used to non-
linearly simulate the equilibrium data.
3.5.8. Biosorption kinetics
The Pb(II) and Cd(II) uptakes by MS were determined as a function of time
in kinetic studies. In the 250-mL biosorption flasks, 0.15 g of MS was dispersed
into 150 mL of 100 ppm Pb(II) solution and also 150 mL of 100 ppm Cd(II)
solution. The pH was kept constant at 5.0 in the Pb(II) biosorption systems and 7.5
in the Cd(II) ones. The flasks were placed on magnetic stirrers at 250 rpm and 298
K. At predetermined time intervals, 2 mL of sample suspensions were collected and
centrifuged for ICP-OES analysis. The kinetic data were non-linearly simulated by
the pseudo-first-order, pseudo-second-order and fractional power equations.
3.5.9. Biosorption thermodynamics
The equilibrium constant (KD) of the biosorption process is defined as Eq.
3.1. ΔG0 can be calculated through Eq. 3.2, and the values of ΔH0 and ΔS0 can be
estimated from the slope and intercept of the plot of ln KD versus 1/T, respectively,
via Eq. 3.3.
ad,e
e
D
CK
C= (3.1)
0 ln DG RT K = − (3.2)
0 0
ln D
S HK
R RT
= − (3.3)
where Cad,e (mg/L) is the concentration of metal ions on the biosorbent in
equilibrium; Ce (mg/L) refers to the concentration of metal ions remaining in

3. Materials and Methods
83
solution in equilibrium; R (8.314 J/mol·K) is the universe gas constant, and T (K)
is the absolute temperature. To obtain the values of KD at different temperatures,
Pb(II) biosorption was performed by applying 15 mL of 50 ppm Pb(II) solutions
with 0.5 g/L of MS at 288, 298 and 308 K, respectively. Cd(II) biosorption was
carried out at the same conditions as Pb(II) biosorption but with 1.0 g/L of MS to
assure a high enough distribution of Cd(II) on the solid phase (i.e., MS) in
equilibrium. The pH was adjusted to 5.0 in the Pb(II) biosorption systems and 7.5
in the Cd(II) ones.
3.5.10. Desorption of Pb(II) and Cd(II) from MS
Different desorbing agents, including 0.2 M HCl, 0.2 M HNO3, 0.2 M citric
acid and 0.1 M sodium EDTA, were used to elute the bound Pb(II) and Cd(II) from
MS. Desorption was performed at a S/L ratio of 2 g/L for 3 h. The suspensions were
centrifuged at 4000 rpm for 10 min, and the concentrations of the desorbed
Pb(II)/Cd(II) ions in the supernatants were determined by ICP-OES. The
suspensions of Pb- and Cd-loaded MS in DDI water were used as the control groups.
Besides, the separated MS after centrifugation was washed by DDI water 3 times
and used for resorption of Pb(II)/Cd(II) after drying in a laboratory oven at 333 K
for 12 h.

3. Materials and Methods
84
Mechanistic studies
3.6.1. Basic characterization of WR and MS
Elemental analysis
The elemental compositions of WR and MS were examined by an elemental
analyzer (Elementar vario MICRO, Germany). The atomic concentrations of C, H,
N and S were determined, while the concentration of O was estimated based on
mass difference by neglecting the presence of other elements (Li et al., 2010).
Zeta potential measurement
In order to examine the surface charging characteristics of WR and MS, a
WR solution and a MS solution at 0.15 g/L were prepared in 1 mM KCl, and the
zeta potential was measured at pH ranging from 2.0 to 8.0 by a Malvern Zetasizer
(Nano Series, UK). The measurement was performed in triplicate with the averaged
value reported.
PXRD
PXRD can provide important information of the crystalline structure and
even the composition of the solid sample being studied. The wide-angle PXRD
patterns of pristine WR and MS in different particle sizes (i.e., < 180 μm, 180-500
μm and 500-1000 μm), as well as the metal-loaded biosorbents (i.e., Pb- and Cd-
loaded WR, Pb- and Cd-loaded MS) were recorded by a Rigaku MiniFlex 600
diffractometer (Rigaku, Japan) with CuK radiation (λ = 1.54060 Å) at 40 kV and
15 mA in the range of 2 from 3° to 90°. The biomass samples were first ground

3. Materials and Methods
85
into even powders and then pressed into thin tablets onto the sample holders for
PXRD measurement.
SEM-EDX
A SEM (Hitachi S-4800, Japan) coupled with an EDX tool (XFlash® 6,
Bruker, Germany) was employed to investigate the morphological properties of WR
and MS before and after Pb(II)/Cd(II) biosorption. In addition to SEM micrographs,
X-ray elemental mappings were performed to examine the element distribution,
especially that of Pb and Cd after biosorption, on the surface of WR and MS. The
EDX spectra were also collected for investigating the elemental characteristics of
the biosorbents.
3.6.2. Spectroscopic techniques
FTIR spectroscopy
The functional groups on WR and MS were examined by FTIR
spectroscopy before and after Pb(II)/Cd(II) biosorption (AVATAR 330, Thermo
Nicolet, USA). To prepare sample tablets for FTIR analysis, the biomass samples
were ground and evenly mixed with dry KBr salts.
XPS
An XPS (Axis Ultra DLD, Kratos, Japan) was used to examine the
elemental and structural characteristics of the surface of WR and MS before and
after Pb(II)/Cd(II) biosorption. The different forms of the same element and their
interactions with the adsorbed heavy metals were identified based on the obtained
high-resolution XPS spectra. The binding energy for C 1s at 285 eV was applied as

3. Materials and Methods
86
the internal reference for all binding energies. The XPS spectra were deconvoluted
and analyzed by the software Vision Processing.
Solid-state NMR spectroscopy
The CP-MAS (CP contact time of 1 ms) 13C solid-state NMR spectra of WR
and MS before and after Pb(II)/Cd(II) biosorption were recorded using a 3.2-mm
ZrO2 rotor at a spinning speed of 15 kHz with 4900 scans (JEOL 500 MHz, Japan).
The 13C chemical shifts were referenced to tetramethylsilane (TMS) with
adamantane as the secondary reference. The radiation frequency was 125 MHz for
13C and 500 MHz for 1H. Spectral editing and analysis were performed in
MestReNova 12. In consideration of the sensitivity of solid-state NMR
spectroscopy, the 13C solid-state NMR spectra of cellulose, pectin, and lignin
(model biopolymers) were collected at the same operation conditions to set
references for line assignment (Figures A3-5). Hemicellulose was not used as a
model biopolymer due to its random chemical structure which is difficult to be
standardized. The characteristic resonances of the 13C NMR spectra of the three
model biopolymers are summarized in Table A1 in Appendices.
3.6.3. Ion exchange experiment
In order to verify the involvement of ion exchange and to identify the
responsible light metal ions (e.g., Na+, Mg2+, K+ and Ca2+) in biosorption, the
release of light metal ions during the Pb(II) and Cd(II) biosorption processes was
determined by respectively adding 0.125 g of WR into 250 mL of 50 ppm Pb(II)
solution and 250 mL of 50 ppm Cd(II) solution. WR suspensions with the same
dosage of WR in DDI water were set as the blank groups. The release of light metal

3. Materials and Methods
87
ions from MS during Pb(II) and Cd(II) biosorption was measured through the same
procedures.
3.6.4. Quantum chemistry simulation
To further disclose the biosorption mechanisms and verify the proposed
ones from the aforementioned spectroscopic methods, the microscopic interactions
between Pb(II)/Cd(II) and the identified binding sites (e.g., hydroxyl and carboxyl)
were simulated by quantum chemistry simulation (QCS). The structures and
thermodynamic properties of the potential heavy metal complexes formed in
biosorption were analyzed through M06 method with the 6-311+G (d,p) basis set
in water solvent at 298 K. Chemical modelling was conducted by performing ab
initio electronic structure calculations using Gaussian 09 program package (Frisch,
2009). The calculations were carried out in an implicit water solvent (ε=78.3553)
using the conductor-like polarizable continuum model (CPCM) combined with
Bondi radii. The structural optimizations were obtained using the B3LYP hybrid
density functional with D3 dispersion correction. The def2tzvp was for Pb as basis
set and effective core potential, and 6-311++G (d,p) was for the other atoms, i.e.,
N, C, H and O. Frequency calculations at the same level were performed to check
whether the obtained stationary point is an isomer. All reported energy values are
free energies (in kcal/mol) at 298 K.

3. Materials and Methods
88
Data processing and analysis
All the batch biosorption experiments were performed in duplicate and the
averaged results were reported in this study. The Microsoft Excel 2007 program
was applied for data processing, and the software Prism 5.0 was used for non-linear
simulation of adsorption isotherms, kinetics, and breakthrough curves. In addition
to the frequently used coefficient of determination (R2), the fitting of the applied
models was also evaluated by the root-mean-square deviation (RMSD), which is a
widely used statistical parameter for evaluating the predictive power of a model.
RMSD is expressed as
n2
exp pre
1
( )
1
i
Q Q
RMSDn
=
−
=−
,
where Qexp (mg/g) is the experimental biosorption capacity, and Qpre (mg/g) is the
predicted biosorption capacity from modeling (Jalil et al., 2012).

4. Biosorption of Pb(II) and Cd(II) by Watermelon Rind
89
4. Biosorption of Pb(II) and Cd(II) by
Watermelon Rind

4. Biosorption of Pb(II) and Cd(II) by Watermelon Rind
90
Effect of pH
The Pb(II) and Cd(II) biosorption capacities of WR at varying pH are shown
in Figure 4.1. It can be concluded that the biosorption capacities of WR (Q, mg/g)
were augmented with increasing pH to the maximum values, namely 203.82 2.85
mg/g for Pb(II) at pH 5.0 and 87.03 0.47 mg/g for Cd(II) at pH 7.5. This positive
correlation was attributed to the presence of less H+ competition for the binding
sites and the deprotonation of the weakly acidic functional groups (e.g., carboxyl
groups) as pH increased (Ahmad et al., 2018, Jin et al., 2018). At the initial Pb(II)
concentration of 100 ppm, Pb(II) uptake was scarcely influenced at pH 4.0-5.5
(Figure 4.1a). This could be due to the presence of sufficient binding sites on WR
for entrapping the low amount of Pb(II) ions at this pH condition, implying that WR
has a wide applicable pH range for Pb(II) removal as the Pb(II) concentration in
industrial wastewater is usually below 100 ppm (Wang and Ren, 2014). Notably,
Cd(II) precipitation was observed at pH 7.5 in the control group (i.e., Cd(II) solution
without WR). Hence, pH 5.0 and 7.0 were respectively chosen as the optimal pH
for Pb(II) and Cd(II) biosorption by WR in the subsequent studies.

4. Biosorption of Pb(II) and Cd(II) by Watermelon Rind
91
Figure 4.1 Effect of pH on (a) Pb(II) and (b) Cd(II) biosorption by WR.
[Initial metal concentrations of 100 and 500 ppm, 1.0 g/L WR, 250 rpm, 298 K, 24
h.]
0
30
60
90
120
150
180
210
240
2.0 3.0 4.0 4.5 5.0 5.5
Q (
mg
/g)
pH
100 ppm 500 ppma
0
20
40
60
80
100
3.0 4.0 5.0 6.0 7.0 7.5
Q (
mg/g
)
pH
100 ppm 500 ppmb

4. Biosorption of Pb(II) and Cd(II) by Watermelon Rind
92
Effect of WR dosage
As Figure 4.2a illustrates, the highest Pb(II) biosorption capacity was
achieved at the WR dosage of 1.0 g/L. The Pb(II) biosorption capacity of WR
gradually reduced as its dosage increased in the biosorption system. This was a
consequence of the redundant binding sites supplied by a high dosage of WR. The
number of binding sites was beyond the demand of Pb(II) ions in the system,
resulting in a lower biosorption capacity per gram of WR. A similar result was
observed in the Cd(II) biosorption system (Figure 4.2b). Although the removal
efficiencies of Pb(II) and Cd(II) increased along with increasing WR dosage, 1.0
g/L was used in the subsequent biosorption studies to make the best use of the WR
biosorbent.

4. Biosorption of Pb(II) and Cd(II) by Watermelon Rind
93
Figure 4.2 Effect of WR dosage on (a) Pb(II) and (b) Cd(II) biosorption.
[Initial metal concentration of 500 ppm, pH 5.0 for Pb(II) and 7.0 for Cd(II)
biosorption, 250 rpm, 298 K, 24 h.]
0
20
40
60
80
100
0
40
80
120
160
200
240
0.5 1 2 3 5
Rem
ov
al
effi
cien
cy (
%)
Q (
mg
/g)
WR dosage (g/L)
Q Removal efficiencya
0
20
40
60
80
100
0
20
40
60
80
100
120
0.5 1 2 3 5
Rem
oval
effi
cien
cy (
%)
Q (
mg/g
)
WR dosage (g/L)
Q Removal efficiencyb

4. Biosorption of Pb(II) and Cd(II) by Watermelon Rind
94
Effect of initial metal concentration
Figure 4.3 indicates that the Pb(II) and Cd(II) biosorption capacities of WR
were positively correlated to the initial concentrations of Pb(II) and Cd(II) in the
biosorption systems. This was because heavy metal ions at a high concentration
would exert a high driving force to overcome the mass transfer resistance between
liquid and solid phases, leading to enhanced loadings of Pb(II) and Cd(II) on WR.
Due to the limited binding sites provided by the fixed dosage of WR in the
biosorption systems, the Pb(II) and Cd(II) uptakes gradually became steady as the
initial metal concentrations increased (Duan et al., 2010). Besides, descending
removal efficiencies were observed along with increasing initial metal
concentrations. This was due to the lack of sufficient number of binding sites on
WR for binding the increasing amounts of Pb(II)/Cd(II) ions. Accordingly, a higher
initial metal concentration can lead to a higher biosorption capacity of the
biosorbent. However, the removal efficiency of the heavy metal from the system
would be impaired.

4. Biosorption of Pb(II) and Cd(II) by Watermelon Rind
95
Figure 4.3 Effect of initial metal concentration on (a) Pb(II) and (b) Cd(II)
biosorption by WR.
[pH 5.0 for Pb(II) and 7.0 for Cd(II) biosorption, 1.0 g/L WR, 250 rpm, 298 K, 24
h.]
0
20
40
60
80
100
0
50
100
150
200
250
300
0 200 400 600 800 1000 1200 1400 1600
Rem
oval
effi
cien
cy (
%)
Q (
mg
/g)
Initial Pb(II) concentration (ppm)
Q Removal efficiencya
0
20
40
60
80
100
0
20
40
60
80
100
120
0 200 400 600 800 1000
Rem
oval
effi
cien
cy (
%)
Q (
mg/g
)
Initial Cd(II) concentration (ppm)
Q Removal efficiencyb

4. Biosorption of Pb(II) and Cd(II) by Watermelon Rind
96
Effect of ionic strength
The effect of ionic strength on Pb(II) and Cd(II) biosorption by WR is
illustrated in Figure 4.4. It shows that the Pb(II) uptake was slightly impaired by
the increasing ionic strength, with a decrease of 13.8% in Q at the ionic strength as
high as 0.2 M NaNO3 compared with the control group without NaNO3.
Comparatively, the Cd(II) biosorption by WR was influenced by the ionic strength
to a greater extent, with 42% of Q reduced at 0.2 M NaNO3. At higher ionic strength,
the surface sites on WR were surrounded by more counter ions, i.e., Na+, which
weakened the binding force of Pb(II)/Cd(II) to WR by electrostatic attraction (Lv
et al., 2012, Wang et al., 2013). Therefore, electrostatic attraction was one of the
underlying mechanisms responsible for Pb(II) and Cd(II) biosorption by WR, and
it was inferred that electrostatic attraction played a more important role in Cd(II)
biosorption than in Pb(II) biosorption by WR.

4. Biosorption of Pb(II) and Cd(II) by Watermelon Rind
97
Figure 4.4 Effect of ionic strength on Pb(II) and Cd(II) biosorption by WR.
[Initial metal concentration of 100 ppm, pH 5.0 for Pb(II) and 7.0 for Cd(II)
biosorption, 1.0 g/L WR, 250 rpm, 298 K, 24 h.]
0
20
40
60
80
100
120
0 0.02 0.05 0.1 0.15 0.2
Q (
mg
/g)
Ionic strength (M, NaNO3)
Pb Cd

4. Biosorption of Pb(II) and Cd(II) by Watermelon Rind
98
Effect of co-metal ions
As Figure 4.5a indicates, the Pb(II) biosorption capacity of WR was not
remarkably impeded by the presence of Cd(II), Ni(II) or Zn(II) at the same
concentration (i.e., 1.0 mM), whereas relatively intensive impact was exerted by
Cu(II) and Cr(III), which respectively reduced the Pb(II) uptake by 13.1% and 17.3%
(compared with the single system). For Cd(II) biosorption, only the effect of Zn(II)
and Ni(II) was examined given the dramatic precipitation of other heavy metal ions
at pH 7.0. It was observed that the presence of Zn(II) and Ni(II) reduced the Cd(II)
biosorption capacity of WR to 63.3% and 85.8% of that in the single system,
respectively (Figure 4.5b). The results revealed that WR had a much higher
selectivity on Pb(II) than Cd(II) under the studied conditions, and it also exhibited
great potential in the removal of Zn(II) and Cr(III) from heavy-metal-bearing
wastewater. As aforementioned in Section 2.5.4, the affinity of a cationic heavy
metal ion to the binding site is theoretically dependent on four major factors, namely,
electronegativity, ionic potential, hydration energy, and HSAB property. Referring
to the characteristics of Pb(II) and Cd(II) as shown in Table 2.1, the higher
selectivity of WR on Pb(II) over Cd(II) could be attributed to the higher
electronegativity and lower hydration energy of Pb(II). Also, Pb(II) is categorized
as a borderline acid, and such that it can react more rapidly and form stronger bonds
with the functional groups (e.g., hydroxyl and carboxyl groups, categorized as hard
bases) on the WR surface than Cd(II) (categorized as a soft acid) can (Unuabonah
et al., 2008). The lower ionic potential of Pb(II) than that of Cd(II) suggested that
electrostatic attraction played a less important role in Pb(II) biosorption than in

4. Biosorption of Pb(II) and Cd(II) by Watermelon Rind
99
Cd(II) biosorption by WR. This was consistent with the effect of ionic strength on
Pb(II) and Cd(II) biosorption by WR as observed in Section 4.4.

4. Biosorption of Pb(II) and Cd(II) by Watermelon Rind
100
Figure 4.5 Effect of co-metal ions on (a) Pb(II) and (b) Cd(II) biosorption by WR
in binary systems.
[Initial metal concentrations of 1.0 mM, pH 5.0 for Pb(II) and 7.0 for Cd(II)
biosorption, 1.0 g/L WR, 250 rpm, 298 K, 24 h.]
0
0.2
0.4
0.6
0.8
1
1.2
Q (
mm
ol/
g)
Pb(II)
Co-metal iona
0
0.2
0.4
0.6
0.8
1
Single Cd(II) Cd(II)&Zn(II) Cd(II)&Ni(II)
Q (
mm
ol/
g)
Cd(II)
Co-metal ionb

4. Biosorption of Pb(II) and Cd(II) by Watermelon Rind
101
Biosorption isotherms of Pb(II) and Cd(II) biosorption by WR
The equilibrium data of Pb(II) and Cd(II) biosorption by WR are described
in Figure 4.6 with non-linear regression to the Langmuir, Freundlich, Temkin, D-
R, R-P and Sips models. The constants of the adsorption isotherm models are
summarized in Table 4.1. Figure 4.6a indicates that the maximum Pb(II)
biosorption capacity, 231.57 1.09 mg/g (1.12 0.005 mmol/g), was achieved by
WR with the R-P isotherm as the best fitting model (the highest R2 of 0.995 and the
lowest RMSE of 2.219, Table 4.1). The R-P isotherm is similar to the Freundlich
isotherm when the term of aRCebR is much larger than 1.0. In this study, the value of
aRCebR ranged from 6.61 to 3187.56, implying that the Pb(II) biosorption by WR
could be interpreted by the Freundlich isotherm as well. This observation was
consistent with the high R2 (0.993) and low RMSE (2.586) of the Freundlich
isotherm, suggesting multilayer biosorption of Pb(II) on the heterogeneous surface
of WR with non-uniform distribution energy. The surface heterogeneity of WR was
also supported by the low value of 1/n (0.149) in the Sips equation, which suggests
a heterogeneous surface when approaching 0 (Papageorgiou et al., 2006).
According to Figure 4.6b, the maximum Cd(II) biosorption capacity, 98.51 1.15
mg/g (0.88 0.01 mmol/g), was achieved by WR. The values of R2 and RMSE
revealed the fitness of the adsorption isotherm models in a descending order of Sips
> R-P > D-R > Langmuir > Temkin > Freundlich (Table 4.1). However, the value
of 1/n (the heterogeneity factor) in the Sips model was 1.669, which was beyond
the defined range of 0-1. Moreover, the constant, bR, in the R-P model was 1.105,
which exceeded its range defined as 0-1. The disagreements observed in these

4. Biosorption of Pb(II) and Cd(II) by Watermelon Rind
102
isotherm constants revealed the inapplicability of the Sips and R-P isotherms for
simulating the Cd(II) biosorption by WR regardless of the values of R2 and RMSE.
Consequently, the D-R model was the most appropriate isotherm for modeling the
Cd(II) biosorption by WR, suggesting heterogeneous binding sites on the WR
surface as inferred in the equilibrium study of Pb(II) biosorption (Dubinin and
Radushkevich, 1947).

4. Biosorption of Pb(II) and Cd(II) by Watermelon Rind
103
Figure 4.6 Non-linear regression of the equilibrium data of (a) Pb(II) and (b) Cd(II)
biosorption by WR.
[pH 5.0 for Pb(II) and 7.0 for Cd(II) biosorption, 1.0 g/L WR, 250 rpm, 298 K, 24
h.]
0
50
100
150
200
250
0 200 400 600 800 1000 1200
Q(m
g/g
)
Ce (ppm)
Experimental_PbLangmuirFreundlichTemkinR-PSipsD-R
R-P:
a
Y =570.85X
1+ 5.19X0.9
0
20
40
60
80
100
120
0 200 400 600 800 1000
Q (
mg/g
)
Ce (ppm)
Experimental_CdLangmuirFreundlichTemkinR-PSipsD-R
D-R:
b
Y = 96.03exp(-113.55[2.48Ln(1+1
X)]2 )

4. Biosorption of Pb(II) and Cd(II) by Watermelon Rind
104
Table 4.1 Adsorption isotherm constants of Pb(II) and Cd(II) biosorption by WR.
Parameter Pb(II) Cd(II)
Langmuir
Qm (mg/g) 204.900 ± 1.838 104.650 ± 1.485
KL (L/mg) 0.458 ± 0.052 0.029 ± 0.001
R2 0.922 ± 0.008 0.965 ± 0.001
RMSE 8.449 ± 0.376 2.917 ± 0.007
Freundlich
KF 101.250 ± 0.212 23.355 ± 0.049
NF 8.791 ± 0.030 4.426 ± 0.033
R2 0.993 ± 0.002 0.861 ± 0.001
RMSE 2.586 ± 0.332 5.830 ± 0.062
Temkin
AT (L/mg) 157.200 ± 16.829 0.505 ± 0.014
BT (J/mol) 18.360 ± 0.269 17.675 ± 0.304
R2 0.992 ± 0.001 0.917 ± 0.002
RMSE 2.656 ± 0.161 4.510 ± 0.023
D-R
Qm (mg/g) 197.150 ± 1.202 96.025 ± 1.209
β (mol2/kJ2) 0.384 ± 0.072 113.550 ± 2.192
R2 0.868 ± 0.004 0.967 ± 0.001
RMSE 11.025 ± 0.100 2.841 ± 0.000
R-P
Kr (L/g) 570.850 ± 2.539 2.368 ± 0.023
aR (L/mg) 5.191 ± 1.732 0.012 ± 0.001
bR 0.900 ± 0.003 1.105 ± 0.003
R2 0.995 ± 0.001 0.974 ± 0.001
RMSE 2.219 ± 0.212 2.533 ± 0.033
Sips
Qm (mg/g) 744.400 ± 1.986 97.480 ± 1.414
b (L/mg) 0.160 ± 0.0450 0.003 ± 0.000
1/n 0.149 ± 0.012 1.669 ± 0.025
R2 0.993 ± 0.002 0.979 ± 0.001
RMSE 2.564 ± 0.307 2.270 ± 0.001

4. Biosorption of Pb(II) and Cd(II) by Watermelon Rind
105
Kinetics of Pb(II) and Cd(II) biosorption by WR
4.7.1. Kinetic studies at different temperatures
The Pb(II) and Cd(II) biosorption capacities of WR are plotted against time
at different temperatures in Figure 4.7. It shows that the Pb(II) and Cd(II)
biosorption processes were faster at higher temperature in the initial periods (0-7
min in Pb(II) biosorption and 0-10 min in Cd(II) biosorption). This should result
from the higher kinetic energies and thus faster diffusions of Pb(II) and Cd(II) to
the binding sites on WR at higher temperature. In the following stages, the
biosorption processes of Pb(II) and Cd(II) gradually reached equilibrium, with an
insignificant effect of temperature on the biosorption kinetics. Intriguingly, the
Pb(II) biosorption capacity of WR in equilibrium was slightly lower at higher
temperature (Figure 4.7a), whereas the Cd(II) biosorption capacity of WR in
equilibrium augmented from 15.53 ± 0.31 mg/g to 29.47 ± 0.67 mg/g when the
temperature increased from 278 K to 310 K. This observation could be ascribed to
the different thermodynamic properties of Pb(II) and Cd(II) biosorption by WR.
Beneficial to the practical removal/recovery of Pb(II) and Cd(II) in aqueous
solutions by WR, the biosorption processes were very rapid. Take the biosorption
at 298 K as an example, 94.3% of Pb(II) biosorption and 88.4% of Cd(II)
biosorption were completed in the first 10 min.
Figure 4.8 illustrates the non-linear simulation of the kinetics of Pb(II) and
Cd(II) biosorption by WR at 298 K using the pseudo-first-order, pseudo-second-
order and fractional power kinetic equations. The modeling results revealed that the
pseudo-first-order kinetics provided the best description to the Pb(II) biosorption

4. Biosorption of Pb(II) and Cd(II) by Watermelon Rind
106
process, whereas the pseudo-second-order kinetics fitted best to the Cd(II)
biosorption process with the highest R2 and lowest RMSE (details in Table 4.2).

4. Biosorption of Pb(II) and Cd(II) by Watermelon Rind
107
Figure 4.7 (a) Pb(II) and (b) Cd(II) uptakes by WR versus time at different
temperatures.
[Initial metal concentrations of 50 ppm, pH 5.0 for Pb(II) and 7.0 for Cd(II)
biosorption, 0.5 g/L WR, WR < 180 µm, 250 rpm.]
0
20
40
60
80
100
120
0 5 10 15 20 25 30
Qt(m
g/g
)
Time (min)
278 K
298 K
310 K
a
0
5
10
15
20
25
30
35
0 5 10 15 20 25 30 35 40
Qt(m
g/g
)
Time (min)
278 K
298 K
310 K
b

4. Biosorption of Pb(II) and Cd(II) by Watermelon Rind
108
Figure 4.8 Non-linear regression of the kinetics of Pb(II) and Cd(II) biosorption by
WR at 298 K.
[Initial metal concentrations of 50 ppm, pH 5.0 for Pb(II) and 7.0 for Cd(II)
biosorption, 0.5 g/L WR, WR < 180 µm, 250 rpm.]
0
20
40
60
80
100
120
140
0 5 10 15 20 25 30 35 40
Qt(m
g/g
)
Time (min)
Experimental_PbExperimental_CdPseudo-first-orderPseudo-second-orderFractional power
Y =18.17X
1+ 0.89X
Y = 94.69(1- e-0.36X)Pb:
Cd:

4. Biosorption of Pb(II) and Cd(II) by Watermelon Rind
109
Table 4.2 Kinetic constants of Pb(II) and Cd(II) biosorption by WR at 298 K.
Parameter Pb(II) Cd(II)
Pseudo-first-order
Qe (mg/g) 94.695 ± 0.007 18.840 ± 0.467
k1 (min-1) 0.359 ± 0.001 0.608 ± 0.032
R2 0.985 ± 0.002 0.968 ± 0.016
RMSD 1.382 ± 0.069 0.416 ± 0.097
Pseudo-second-order
Qe (mg/g) 107.600 ± 0.000 20.375 ± 0.530
k2 (g/mg/min) 0.004 ± 0.000 0.044 ± 0.004
R2 0.963 ± 0.002 0.990 ± 0.007
RMSD 2.917 ± 0.060 0.229 ± 0.080
Fractional power
k 49.005 ± 0.078 11.830 ± 0.141
v 0.229 ± 0.000 0.161 ± 0.003
R2 0.915 ± 0.001 0.968 ± 0.008
RMSD 3.918 ± 0.036 0.425 ± 0.062
(Notes: WR < 180 m was used.)

4. Biosorption of Pb(II) and Cd(II) by Watermelon Rind
110
4.7.2. Kinetic studies with WR in different particle sizes
Kinetics of the biosorption processes
The profiles of Pb(II) and Cd(II) biosorption capacities versus time by using
WR in different particle sizes are illustrated in Figure 4.9. Figure 4.9a indicates that
the Pb(II) biosorption process became faster, especially in the first 20 min, when
the particle size of WR decreased. Similarly, the biosorption rate of Cd(II) also
increased with decreasing particle size of WR in the initial periods (0-7 min, Figure
4.9b). Over time, WR in different particle sizes obtained similar Pb(II) biosorption
capacities in equilibrium (89.6-92.0 mg/g, Figure 4.9a). The Cd(II) biosorption
process by WR < 180 µm gradually reached equilibrium after 10 min with the
Cd(II) biosorption capacity of 20.96 ± 0.40 mg/g in equilibrium, whereas those of
WR in 180-500 µm and in 500-1000 µm approached equilibrium after 40 min and
60 min, respectively, achieving higher Cd(II) equilibrium biosorption capacities of
25.11 ± 0.62 and 26.45 ± 0.08, respectively (Figure 4.9b). The observation of the
faster biosorption with smaller WR is explained by the shorter distance that the lead
and cadmium ions need to diffuse from the external surface to the interior of the
smaller particles compared with larger particles. Additionally, the larger external
surface area provided by the smaller particles allow a faster access of lead and
cadmium ions to the surface and pores of WR particles. To evaluate the effect of
pore size distribution on the biosorption rate of Pb(II) and Cd(II), the N2 adsorption-
desorption isotherms of WR at 77 K were determined by an ASAP 2020
Physisorption Analyzer (Micromeritics, USA). The Barrett-Joyner-Halenda
method and the Horvath-Kawazoe method were used to determine the size

4. Biosorption of Pb(II) and Cd(II) by Watermelon Rind
111
distributions of macropores and mesopores, and micropores, respectively. It was
found that the different sized WR particles were dominated with mesopores with a
total pore volume of 0.02 cm3/g (80%-85% in mesopores), and the mesopore
surface areas were calculated to be 10.58-11.63 m2/g by the Barrett-Joyner-Halenda
method (BET surface area of 20.07-39.25 m2/g). It was observed that the total pore
volumes of different sized WR were statistically similar with slightly different
mesopore volumes and areas, showing that the pore volume and size distribution
did not significantly influence the Pb(II) and Cd(II) biosorption rate. Furthermore,
to evaluate the contribution of ion exchange to biosorption, the amount of naturally
occurring light metal ions on WR was examined by soaking WR in different particle
sizes into 0.05 M HNO3 for 3 h. It was determined that the content of Ca2+ and Mg2+
in WR < 180 μm (0.307 ± 0.00368 mmol/g) was lower as compared with those of
larger WR in 180-500 μm (0.332 ± 0.00917 mmol/g) and 500-1000 μm (0.377 ±
0.00870 mmol/g) (details in Figure A6). This observation could explain why the
larger WR particles exhibited a higher Cd(II) equilibrium biosorption capacities,
given that ion exchange with light metal ions (i.e., Ca2+ and Mg2+) played a
dominant role in Cd(II) biosorption by WR (see Section 6.1.8). It was estimated
that Ca2+ and Mg2+ on WR could exchange with Cd(II) in solution and provide
binding sites to 81.5% of the sequestered Cd(II); in contrast, this value was only
18.5% in Pb(II) biosorption by WR.
Intraparticle diffusion curves
The intraparticle diffusion model developed by Weber and Morris (1962)
was employed to further analyze the kinetics of Pb(II) and Cd(II) biosorption by

4. Biosorption of Pb(II) and Cd(II) by Watermelon Rind
112
WR in different particle sizes. Figure 4.10 shows the plots of the Pb(II) and Cd(II)
biosorption capacities against the square root of time (t1/2, min1/2). No curves shown
in Figures 4.10a and 4.10b have a prominent initial straight-line section passing
through the origin, showing that the rate of external mass transfer (film diffusion)
was not significantly faster compared with the rate of intraparticle diffusion. This
observation was consistent with the pore size distribution of the WR material, which
suggested that diffusion through the fluid-filled mesopores was expected to be quite
efficient during the biosorption of lead and cadmium ions, with a rate not much
different from the rate of film diffusion. On the other hand, the multi-linearity
observed in each biosorption process indicated that different steps were involved in
Pb(II) and Cd(II) biosorption by WR in three different ranges of particle size. The
first steep linear section of the curves should be attributed to the external mass
transfer of Pb(II) and Cd(II) from the bulk solution across the boundary layer to the
external surface of WR. The second linear section was the gradual biosorption
stage, in which the biosorption was limited by intraparticle diffusion of Pb(II) and
Cd(II) through the mesoporous WR solid matrix. The third linear section was the
final equilibrium stage with slow biosorption due to the decreased concentrations
of Pb(II) and Cd(II) in solution and the oncoming saturation of the binding sites on
the WR surface (Ofomaja, 2010, Wu et al., 2009). Comparison of the linearity of
the three steps shows that the WR in a larger particle size exhibited a longer stage
of rate-limiting intraparticle diffusion (i.e., the second step) in both Pb(II) and
Cd(II) biosorption processes. The lead and cadmium ions took longer time to
diffuse from the external surface to the interior of the larger particles compared with
smaller particles.

4. Biosorption of Pb(II) and Cd(II) by Watermelon Rind
113
Figure 4.9 (a) Pb(II) and (b) Cd(II) uptakes versus time by using WR in different
particle sizes.
[Initial metal concentrations of 50 ppm, pH 5.0 for Pb(II) and 7.0 for Cd(II)
biosorption, 0.5 g/L WR, 250 rpm, 298 K.]
0
20
40
60
80
100
0 20 40 60 80 100 120
Qt(m
g/g
)
Time (min)
180 um
180-500 um
500-1000 um
a
0
5
10
15
20
25
30
0 10 20 30 40 50 60 70 80 90 100 110 120
Qt(m
g/g
)
Time (min)
180 um
180-500 um
500-1000 um
b

4. Biosorption of Pb(II) and Cd(II) by Watermelon Rind
114
Figure 4.10 Intraparticle diffusion curves of the (a) Pb(II) and (b) Cd(II)
biosorption processes.
[Initial metal concentrations of 50 ppm, pH 5.0 for Pb(II) and 7.0 for Cd(II)
biosorption, 0.5 g/L WR, 250 rpm, 298 K.]
0
20
40
60
80
100
0 1 2 3 4 5 6 7 8 9 10 11
Q (
mg
/g)
t1/2 (min1/2)
180 um
180-500 um
500-1000 um
a
0
5
10
15
20
25
30
0 1 2 3 4 5 6 7 8 9 10 11
Qt (m
g/g
)
t1/2 (min1/2)
180 um
180-500 um
500-1000 um
b

4. Biosorption of Pb(II) and Cd(II) by Watermelon Rind
115
4.7.3. Pb(II) biosorption without continuous pH adjustment
Figure 4.11 depicts the kinetics of Pb(II) biosorption by WR at 298, 310 and
319 K without continuous pH adjustment (the initial pH of the biosorption systems
was adjusted to 5.0). Similar to Pb(II) biosorption by WR with constant pH (Figure
4.7a), faster biosorption was observed at higher temperature in the initial periods
(0-15 min), and similar Pb(II) biosorption capacities in equilibrium (92.16-96.97
mg/g) were obtained. It is interesting to note that Pb(II) biosorption without
continuous pH adjustment dramatically slowed down as compared with Pb(II)
biosorption with constant pH (equilibrium time 9-14 h versus 15-30 min). Why did
Pb(II) biosorption by WR was much slower without continuous pH adjustment, but
achieve similar equilibrium biosorption capacities in comparison with Pb(II)
biosorption by WR with constant pH?
The decrease of pH in the Pb(II) biosorption systems indicated the release
of H+ from the binding sites (e.g., -COOH and -NH3+, see Section 6.1) when Pb(II)
bound to them (Eqs. 4.1-4.4, M2+ refers to Pb(II) in this study). To maintain constant
pH during Pb(II) biosorption, NaOH was continuously added into the biosorption
systems. The introduction of OH- instantly consumed the released H+ according to
Eqs. 4.1 & 4.3 and facilitated the deprotonation of the active functional groups (Eqs.
4.1 & 4.3). This rendered the binding sites on WR more accessible for Pb(II) in
solution (Eqs. 4.2 & 4.4), leading to a faster Pb(II) biosorption process in the
biosorption system with constant pH. Without continuous pH adjustment (namely,
without NaOH addition), H+ produced according to Eqs. 4.1 & 4.3 would not be
instantly consumed by OH-, resulting in slower deprotonation of the active

4. Biosorption of Pb(II) and Cd(II) by Watermelon Rind
116
functional groups and thus slower binding of Pb(II) to the WR surface. However,
similar reaction equilibrium could be eventually reached because Pb(II) in solution
continuously reacted with the deprotonated functional groups (e.g., R-COO- in Eq.
4.1 and R-NH2 in Eq. 4.3) according to Eqs. 4.2 & 4.4. Besides, the final pH in the
Pb(II) biosorption systems without continuous pH adjustment was about 4.10, at
which the equilibrium Pb(II) biosorption capacity of WR was observed to be similar
to that at pH 5.0 (see Figure 4.1a with initial Pb(II) concentration of 100 ppm).
R-COOH ↔ R-COO−
+ H+ (4.1)
2R-COO-+ M2+ → (R-COO
-)2M (4.2)
R-NH3+ ↔ R-NH2 + H+ (4.3)
R-NH2 + M2+ ↔ R-NH2M2+ (4.4)

4. Biosorption of Pb(II) and Cd(II) by Watermelon Rind
117
Figure 4.11 Pb(II) uptake by WR versus time at different temperatures without
continuous pH adjustment.
[50 ppm Pb(II), initial pH 5.0, 0.5 g/L WR, WR < 180 µm, 250 rpm; Pb(II)
biosorption was also studied at 278 K, but the result was not shown given the
extremely long equilibrium time of 54 h.]
0
20
40
60
80
100
0 150 300 450 600 750
Qt(m
g/g
)
Time (min)
298 K
310 K
319 K

4. Biosorption of Pb(II) and Cd(II) by Watermelon Rind
118
Desorption of Pb(II) and Cd(II) from WR
4.8.1. Optimal desorbing agents for desorption of Pb(II) and Cd(II)
The desorption efficiencies of Pb(II) and Cd(II) from WR by different
desorbing agents, i.e., HCl, HNO3 and citric acid, are described in Figure 4.12. Pb(II)
was readily eluted with high desorption efficiencies (91%-99%) achieved by all
types of desorbing agents; the highest desorption efficiency of Pb(II), i.e., 99%, was
obtained by 0.1 M HCl. In the case of Cd(II) desorption, 78%-93% was recovered
with the highest desorption efficiency of 93% attained by 0.1 M HNO3. The
underlying mechanism of Pb(II)/Cd(II) desorption by acids should be the
competition from H+ with the loaded metal ions for the binding sites; H+ either
neutralized the negatively charged sites to release the electrostatically bound
Pb(II)/Cd(II) or occupied around the lone pairs of electrons of N and O atoms to
break the metal complexes. It is noteworthy that as high as 12% of Cd(II) loaded
on WR was desorbed by DDI water (only 1% of Pb(II)), suggesting that a part of
Cd(II) was weakly bound to WR. This could explain why Cd(II) desorption
efficiencies obtained were lower than the Pb(II) desorption efficiencies; a part of
adsorbed Cd(II) ions was removed from WR by DDI water during the washing
operation before desorption (the metal-loaded WR was washed by DDI water
before suspending in the desorbing agents to remove the metal residues that were
not attached to the binding sites). The resorption performance of the regenerated
WR after desorption was investigated, and it was observed that more than 90% of
the Pb(II) and Cd(II) biosorption capacities of WR (compared with pristine WR)

4. Biosorption of Pb(II) and Cd(II) by Watermelon Rind
119
were maintained after desorption using 0.1 M HCl, HNO3 or citric acid, indicating
the sustainability of WR in biosorption.

4. Biosorption of Pb(II) and Cd(II) by Watermelon Rind
120
Figure 4.12 Desorption efficiencies of Pb(II) and Cd(II) from WR by various
desorbing agents.
[S/L ratio 1.0 g/L, desorption time 3 h, 250 rpm, 298 K.]
0
20
40
60
80
100
0.05 M
HCl
0.1 M
HCl
0.05 M
HNO3
0.1 M
HNO3
0.05 M
Citric
acid
0.1 M
Citric
acid
DDI
Des
orp
tion
eff
icie
ncy
(%
)Pb Cd

4. Biosorption of Pb(II) and Cd(II) by Watermelon Rind
121
4.8.2. Response surface methodology analysis
Taking Pb(II) desorption from WR as an example, RSM was used to
evaluate the impact of three important desorption parameters, namely, S/L ratio,
acid concentration, and desorption time, on the desorption of Pb(II). HCl, which
had been proven as an efficient desorbing agent for Pb(II) elution, was used in the
RSM analysis. The experiments designed by CCD of RSM are listed in Table A2.
Based on the desorption efficiencies determined from the designed experiments, a
quadratic equation in coded factors (Eq. 4.5) and actual factors (Eq. 4.6) were
obtained to express the relationship between the response and independent variables.
In the equations, Y refers to desorption efficiency (%), and A, B, C are S/L ratio
(g/L), acid concentration (M), and desorption time (h), respectively. The coded
equation is useful for identifying the relative impact of the factors by comparing
their coefficients. Thus, the impact of the three factors on the desorption efficiency
was in a descending order of acid concentration > S/L ratio > desorption time
according to Eq. 4.5. Also, the interaction between acid concentration and
desorption time was relatively significant. Specifically, the impact of the acid
concentration on desorption efficiency became more significant at higher S/L ratios,
as shown in Figure 4.13. Likewise, desorption time played a more and more
important role as the S/L ratio increased (Figure 4.14). Figure 4.15 indicates that
time only exerted obvious influence on desorption efficiency at low acid
concentrations (e.g., 0.2-0.4 M HCl).
Y=95.20-2.63*A+3.65*B+2.28*C+2.00*AB+2.02*AC-2.69*BC-0.18*A2-1.38*B2-
1.49*C2 (4.5)

4. Biosorption of Pb(II) and Cd(II) by Watermelon Rind
122
Y=91.55-4.80*A+42.69*B+7.54*C+4.99*AB+1.01*AC-13.45*BC-0.044*A2-
34.39*B2-1.49*C2 (4.6)
Furthermore, the reliability of Eq. 4.6 for describing the relationship among
desorption efficiency, S/L ratio, acid concentration, and desorption time in Pb(II)
desorption from WR by HCl was evaluated by comparing the predicted and
experimental desorption efficiencies (Table 4.3). It was predicted that the
desorption efficiency would be the highest (98.92%) with S/L of 4 g/L, 0.6 M HCl,
and desorption time of 1.182 h. The experimental result was 97.14% at the
recommended conditions, indicating a good predictability of Eq. 4.6. The Analysis
of Variance (ANOVA) revealed that Eq. 4.6 derived from RSM analysis was
significant and its lack of fit for the experimental data was not significant. In
addition, the high value of R2 (0.89) supported the applicability of Eq. 4.6 for
describing the desorption data. However, the low value of the Prediction R2
suggested its weak predictability (details in Table A3). Despite the extensive
applications of RSM, especially on optimization of fermentation media (Desai et
al., 2008), some biases were observed when applying this method to desorb heavy
metal ions in this study. For example, with the same S/L ratio (6 g/L) and acid
concentration (0.2 M), the desorption efficiency of Pb(II) was supposed to increase
as the desorption time increased from 2 to 5 h. However, the highest desorption
efficiency was predicted at 3.42 h rather than 5 h by RSM (runs 11-13 in Table 4.3).
This was probably caused by the intrinsic limitation of RSM. RSM was mostly used
in the optimization of growth conditions and compositions of media/feed for
organisms, in which the response (e.g., growth rate of bacteria) would augment
along with the increase of an important factor (e.g., concentration of mineral ions

4. Biosorption of Pb(II) and Cd(II) by Watermelon Rind
123
in the medium) and start to decline due to inhabitation/toxicity when the factor was
larger than a certain value. However, this was not the case in heavy metal desorption
from biosorbents. Despite this limitation, this study suggests that RSM is still a
great tool for investigating the significance of various factors (e.g., S/L ratio,
concentration of the desorbing agent, and desorption time) on desorption
performance, as well as the interactive effect of any two factors in a system.

4. Biosorption of Pb(II) and Cd(II) by Watermelon Rind
124
Figure 4.13 Three-dimensional plot showing the effect of S/L ratio and acid
concentration on desorption efficiency.
[Desorption time 2 h.]

4. Biosorption of Pb(II) and Cd(II) by Watermelon Rind
125
Figure 4.14 Three-dimensional plot showing the effect of S/L ratio and time on
desorption efficiency.
[Acid concentration 0.4 M.]

4. Biosorption of Pb(II) and Cd(II) by Watermelon Rind
126
Figure 4.15 Three-dimensional plot showing the effect of acid concentration and
time on desorption efficiency.
[S/L ratio 6 g/L.]

4. Biosorption of Pb(II) and Cd(II) by Watermelon Rind
127
Table 4.3 Confirmation of the predicted model by desorption experiments.
Run S/L (g/L) Acid (M) Time (h) DEp (%) DEe (%) Residual
1a 4 0.6 1.182 98.92 97.14 -1.78
2 4.098 0.575 0.191 96.77 95.57 -1.20
3 5.323 0.6 0.05 94.15 92.27 -1.88
4 5.323 0.6 0.1 94.38 92.94 -1.44
5 4 0.359 0.191 90.93 93.68 2.75
6 4 0.359 1 94.96 94.24 -0.72
7 4 0.359 3 96.57 93.99 -2.58
8 2 0.2 0.5 93.99 95.05 1.06
9 2 0.2 1 96.31 94.56 -1.75
10 2 0.2 3 98.15 94.47 -3.68
11 6 0.2 2 90.17 89.75 -0.42
12 6 0.2 3.41 94.21 89.52 -4.69
13 6 0.2 5 91.68 94.54 2.86
14 6 0.4 0.083 85.37 89.36 3.99
15 6 0.4 0.1667 86.02 89.25 3.23
16 6 0.4 0.5 88.43 91.24 2.81
17 6 0.4 1 91.43 91.61 0.18
18 6 0.4 2 95.19 92.31 -2.88
19 6 0.4 3.41 95.44 92.7 -2.74
20 6 0.6 0.083 92.80 91 -1.80
21 6 0.6 0.1667 93.23 91.72 -1.51
22 6 0.6 0.5 94.74 91.83 -2.91
23 6 0.6 1 96.40 92 -4.40
24 6 0.6 2 97.47 92.75 -4.72
25 6 0.6 3.41 93.93 92.38 -1.55
(Notes: a - The predicted optimal group of experiment; DEp - Predicted desorption
efficiency; DEe - Experimental desorption efficiency.)

4. Biosorption of Pb(II) and Cd(II) by Watermelon Rind
128
Pb(II) removal from drinking water by using WR
In consideration of the frequent outbreaks of Pb contamination in drinking
water all over the world, the potential of WR for Pb(II) removal from drinking water
was investigated to examine if the stringent standard of drinking water can be met.
Different dosages of WR were employed to treat a Pb(II) solution at 400 ppb. The
results showed that the Pb(II) concentrations of the WR-treated solutions were as
low as 5.21 0.55 ppb and 1.97 0.09 ppb with WR dosages of 0.05 g/L and 0.1
g/L, respectively. These values were lower than the WHO guideline value of Pb in
drinking water, namely, 10 ppb (WHO, 2011b), revealing the great potential of WR
in treating Pb(II) contaminated drinking water to safeguard the health of humans.

4. Biosorption of Pb(II) and Cd(II) by Watermelon Rind
129
Biosorption-desorption in WR-packed bed column reactors
4.10.1. Pb(II) biosorption-desorption cycles
Biosorption
The breakthrough curves of Pb(II) biosorption in a WR-packed bed column
reactor are illustrated in Figure 4.16. It was observed that the column reactor
achieved excellent performance over 10 biosorption-desorption cycles (0.05 M HCl
as the desorbing agent) with a long breakthrough time (tb, time at which Ct/C0=5%)
of 8.3-13.0 h (i.e., 93-144 BV), revealing its high durability and repeatability for
Pb(II) sequestration. As shown in Table 4.4, there were even increasing trends in tb
and the equilibrium biosorption capacity (q0). Non-linear simulation of the
breakthrough curves by a variety of models, including the Thomas, Bohart-Adams,
Dose-Response, and Yoon and Nelson models, indicated that the Thomas model
was the best fitting one to Pb(II) biosorption in the WR-packed bed column reactor
(see details in Figure A7) with extremely high values of R2 (0.992-0.999, Table 4.4),
implying that Pb(II) biosorption in the column reactor had a plug flow and followed
the Langmuir isotherm and the pseudo-second-order kinetics.
Desorption
Figure 4.17 describes the desorption curves at the 1st, 3rd, 5th and 10th cycles
(for unambiguous plotting, other cycles were not shown due to the high similarity).
It can be seen that most of the bound Pb(II) in the column reactor was rapidly eluted
by the desorbing agent (i.e., 0.05 M HCl). As high as 95% of the sequestered Pb(II)
was rapidly desorbed within 1.3-2.3 h, achieving high concentration factors (i.e.,
ratio of Pb(II) concentration in desorption effluent to that in influent) of 5.8-11.6.

4. Biosorption of Pb(II) and Cd(II) by Watermelon Rind
130
In addition to the profoundly efficient desorption, the biosorption performance of
the packed bed column reactor remained very well after the acidic treatment in
desorption and became even better in the subsequent cycles. The improvement
could be ascribed to the release of organic substances (i.e., colored materials and
reducing sugars) from WR, which led to a more porous WR structure with larger
exposure of active sites for Pb(II) sequestration (Gupta and Rastogi, 2009). In
addition, the methylester group (-COOCH3) of galacturonic acid in pectin could be
hydrolyzed to carboxylic groups, which would favor Pb(II) biosorption as carboxyl
groups were identified as preferred active functional groups for heavy metal binding
(see Section 6.3).
Monitoring of the column effluent
The change in pH and total organic carbon (TOC) release were monitored
in the effluent of the WR-packed bed column reactor during the 10 Pb(II)
biosorption-desorption cycles. As shown in Figure 4.18, the pH of the effluent at
the beginning (0-230 min) of the biosorption process in the first cycle was higher
than 5.0 (i.e., the pH of the Pb(II) influent). This could be due to the release of
organic components from WR in the first cycle (evidenced by the high TOC release
in the first cycle, data not shown), which dissolved in the Pb(II) solution that passed
through the column reactor and resulted in the effluent with pH values higher than
5.0. In addition, light metal ions (i.e., Mg2+ and Ca2+) bound to the binding sites on
WR exchanged with Pb(II) in solution during the biosorption process of the first
cycle (see Section 6.1.8). The release of Mg2+ and Ca2+ from WR could barely cause
acidification of the Pb(II) solution that passed through the column reactor in

4. Biosorption of Pb(II) and Cd(II) by Watermelon Rind
131
comparison with the release of H+, which was responsible for the ion exchange with
Pb(II) in solution in the subsequent cycles due to the consumption of naturally
occurring light metal ions on WR in the first biosorption-desorption cycle. The WR
packed in the bed column reactor was regenerated by using 0.05 M HCl after Pb(II)
biosorption in the first cycle, and the binding sites on its surface would be
protonated. In the biosorption of the subsequent cycles (2nd-10th cycles), however,
the pH values of the column effluent were lower than 5.0 (i.e., the pH of Pb(II)
influent) at the beginning of the biosorption processes; it slowly approached 5.0 as
the column reactor gradually became saturated. The dropped pH of the effluent
(compared with that of the Pb(II) influent) should be caused by the release of H+
from the binding sites (e.g., carboxyl and hydroxyl groups) when Pb(II) loaded
upon them, and this interaction gradually weakened as the WR packed in the
column reactor became more and more saturated, resulting in less pH drops in the
Pb(II) effluent in the late phase of the biosorption processes. Determination of TOC
in the effluent of the WR-packed bed column reactor showed that there was
leaching of organic components from the WR in the column reactor during the 10
Pb(II) biosorption-desorption cycles (ca. 10% of the original WR biomass was
released in total); the TOC release from WR mainly occurred in the first
biosorption-desorption cycle.
The high durability, excellent repeatability, and efficient desorption
observed in the WR-packed bed column reactor indicate that WR was competitive
to those commercial adsorbents or ion-exchangers used in Pb(II) removal/recovery,
not to mention its low cost as a fruit waste material.

4. Biosorption of Pb(II) and Cd(II) by Watermelon Rind
132
Figure 4.16 Breakthrough curves of Pb(II) biosorption in the WR-packed bed
column reactor.
0
0.2
0.4
0.6
0.8
1
0 300 600 900 1200 1500 1800
Ct/
C0
Time (min)
1st cycle
2nd cycle
3rd cycle
4th cycle
5th cycle
6th cycle
7th cycle
8th cycle
9th cycle
10th cycle

4. Biosorption of Pb(II) and Cd(II) by Watermelon Rind
133
Figure 4.17 Pb(II) desorption in the WR-packed bed column reactor.
[Desorbing agent 0.05 M HCl was used; Four cycles shown as the representatives.]
0
500
1000
1500
2000
2500
3000
3500
0 200 400 600 800 1000 1200 1400
Ct (p
pm
)
Time (min)
1st cycle
3rd cycle
5th cycle
10th cycle

4. Biosorption of Pb(II) and Cd(II) by Watermelon Rind
134
Figure 4.18 Change in pH of the effluent from the WR-packed bed column reactor
in 10 cycles of Pb(II) biosorption-desorption.
[A: Adsorption; D: Desorption.]
0.0
1.0
2.0
3.0
4.0
5.0
6.0
7.0
0 300 600 900 1200 1500 1800
pH
Time (min)
1A 1D 2A 2D 3A 3D 4A 4D 5A 5D
6A 6D 7A 7D 8A 8D 9A 9D 10A 10D

4. Biosorption of Pb(II) and Cd(II) by Watermelon Rind
135
Table 4.4 Column performance and parameters of the Thomas model in Pb(II)
biosorption.
Cycle 1 2 3 4 5 6 7 8 9 10
tb (h) 8.3 10.3 10.8 12.0 12.6 12.0 11.7 12.1 12.4 13.0
qe (mg/g) 73.37 77.76 75.54 78.86 77.88 80.17 79.97 79.36 75.89 76.31
q0 (mg/g)a 71.96 74.68 74.30 76.25 75.48 79.65 79.80 78.77 79.86 81.19
kb 0.142 0.173 0.171 0.221 0.282 0.232 0.196 0.256 0.213 0.277
R2 0.999 0.993 0.992 0.995 0.995 0.999 0.999 0.999 0.998 0.998
(Notes: a - Maximum Pb(II) biosorption capacity predicted by the Thomas model;
b -Thomas rate constant with unit of mL/min/mg; Modeling results of the Bohart-
Adams, Dose-Response, and Yoon and Nelson models were not shown due to the
poor fitness.)

4. Biosorption of Pb(II) and Cd(II) by Watermelon Rind
136
4.10.2. Cd(II) biosorption-desorption cycles
As mentioned in Section 3.4.10, the column reactor packed with native WR
exhibited a poor performance on Cd(II) biosorption in the preliminary study (Figure
A8). It was observed that the Cd(II) biosorption capacity of WR at pH 6.0 was only
34% of that at pH 7.0 in the batch study (see Section 4.1). The poor Cd(II)
biosorption performance of the column reactor packed with native WR should be
caused by the low pH condition inside the column during biosorption, i.e., below
pH 6.0 as measured in the effluent. The dissolution of CO2 from the air into the
column reactor and the release of acidic substances from WR could be the causes
for the dropped pH, even though a Cd(II) solution at pH 7.5-8.0 was used as the
influent. To solve the pH problem, WR was pretreated by 0.05 M NaOH for 3 h to
remove the acidic substances and break down the inter- and intra-molecular
hydrogen bonds to increase the number of free hydroxyl groups. The NaOH-treated
WR was washed by DDI water to remove the residual Na+ and OH- before packing
inside the column reactor for Cd(II) biosorption. HCl at 0.05 M were used as the
desorbing agent to elute the sequestered Cd(II) and regenerate the column reactor.
After one biosorption-desorption cycle, the column reactor was thoroughly washed
by DDI water to remove the residual acid before the next biosorption-desorption
started. As shown in Figure 4.19, the breakthrough time (tb, time at which Ct/C0=5%)
of the column reactor packed with NaOH-treated WR was 4.8 h and 2.6 h (i.e., 42.3
BV and 27.3 BV) in the first and second cycles, respectively, increasing by 40%
and 72% in comparison with those of the native WR column reactor without any
NaOH treatment (details in Figure A8). Besides, the biosorption capacities
significantly increased to 93.9 mg/g in the first cycle and 76.3 mg/g in the second

4. Biosorption of Pb(II) and Cd(II) by Watermelon Rind
137
cycle, which were much higher than those of the native WR column reactor (22.9
mg/g and 24.7 mg/g, respectively). The great improvement should be attributed to:
(1) the removal of acidic substances from WR by NaOH, creating a neutral or even
slightly alkaline condition which was preferable for Cd(II) biosorption, and (2) the
more porous structure of WR with increased swelling resulted after pretreatment,
leading to exposure of more binding sites and better contact with Cd(II). In the
literature, NaOH was also used for pretreatment of Agaricus bisporus biomass for
better Pb(II) biosorption in a packed bed column reactor (Long et al., 2014). The
reduction of biosorption capacity observed in the second cycle could be caused by
the acidic treatment in desorption, which totally protonated the functional groups
(e.g., -COOH, -OH, and -NH3+) on the surface of WR, making Cd(II) binding to
WR difficult. Besides, the pH was still be slightly acidic inside the column reactor
even after a long time of washing by DDI water; the acidic condition impaired the
Cd(II) biosorption performance of the column reactor in the second cycle. In
addition, the successive treatment of WR by alkali in pretreatment and acid in
desorption could impair the structure of WR, resulting in a weakened biosorption
performance of WR. Pretreatment and regeneration of WR by proper reagents for
the biosorption of Cd(II) should be considered in future studies. As shown in Figure
4.20, most Cd(II) was rapidly eluted in 60 min, at which 95% and 97% of the
entrapped Cd(II) were eluted (concentration factors of 8.4 and 7.0) in the first and
second cycles, respectively.

4. Biosorption of Pb(II) and Cd(II) by Watermelon Rind
138
Figure 4.19 Breakthrough curves of Cd(II) biosorption in the column reactor
packed with NaOH-treated WR.
0
0.2
0.4
0.6
0.8
1
0 200 400 600 800 1000 1200
Ct/C
0
Time (min)
1st cycle
2nd cycle

4. Biosorption of Pb(II) and Cd(II) by Watermelon Rind
139
Figure 4.20 Cd(II) desorption in the column reactor packed with NaOH-treated
WR.
[Desorbing agent 0.05 M HCl was used.]
0
500
1000
1500
2000
2500
0 100 200 300 400 500 600
Ct(p
pm
)
Time (min)
1st cycle
2nd cycle

4. Biosorption of Pb(II) and Cd(II) by Watermelon Rind
140
Summary
This chapter presents the results obtained in the macroscopic biosorption
studies of Pb(II) and Cd(II) using WR as the biosorbent, both in batch and
continuous modes. The main findings are summarized as follows.
(1) The biosorption capacities of WR augmented with increasing pH, with
optimal pH 5.0 for Pb(II) biosorption and 7.0 for Cd(II) biosorption.
(2) Both Pb(II) and Cd(II) biosorption by WR were partially influenced by ionic
strength, implying electrostatic attraction as one of the underlying binding
mechanisms.
(3) WR had a high selectivity on Pb(II) in the presence of co-metal ions. Using
WR for biosorption of multiple heavy metal ions can make better use of the
biosorbents, as it was observed that a higher amount of heavy metal ions (in
mmol) was sequestered by a unit mass of biosorbent (in gram) in binary
systems than that of the single system.
(4) The maximum biosorption capacities, 231.57 1.09 mg-Pb/g (1.12 0.005
mmol/g) and 98.51 1.15 mg-Cd/g (0.88 0.01 mmol/g), were achieved
by WR at pH 5.0 and 7.0, respectively.
(5) The equilibrium data of Pb(II) biosorption were best described by the R-P
isotherm, suggesting multilayer loading of Pb(II) on the heterogeneous
surface of WR. The equilibrium data of Cd(II) biosorption were best fitted
by the D-R isotherm, which implied Cd(II) binding to non-identical sites on
the WR surface.

4. Biosorption of Pb(II) and Cd(II) by Watermelon Rind
141
(6) Pb(II) and Cd(II) biosorption became faster as the particle size of WR
decreased. The equilibrium Pb(II) biosorption capacities of WR in different
particle sizes remained similar, whereas the equilibrium Cd(II) biosorption
capacity augmented as the particle size increased. This should be caused by
the higher content of light metal ions in larger WR as ion exchange played
a more important role in Cd(II) biosorption than in Pb(II) biosorption by
WR (see Section 6.1.8).
(7) The sequestered Cd(II) on WR was more easily eluted by DDI water than
the sequestered Pb(II), suggesting that ion exchange and/or electrostatic
attraction (weaker force than complexation) played a more important role in
Cd(II) biosorption than in Pb(II) biosorption by WR.
(8) The WR-packed bed column reactor showed high durability, excellent
repeatability, and efficient desorption in Pb(II) biosorption-desorption
operations. However, the column performance for Cd(II) biosorption-
desorption operations was not as good as that for Pb(II) biosorption-
desorption operations, even after pretreatment of WR by using NaOH.
Taken together, WR is a promising biosorbent for Pb(II) and Cd(II) removal
from wastewater. In particular, the wide range of appropriate operational pH, the
slight effects of particle size, ionic strength, and co-metal ions, and the excellent
performance of the packed bed column reactor reflect that WR is competitive to
those commercial adsorbents and ion-exchangers for Pb(II) removal/recovery from
wastewater (and even drinking water), not to mention its low cost as a fruit waste
material.

5. Biosorption of Pb(II) and Cd(II) by Mango Seed
142
5. Biosorption of Pb(II) and Cd(II) by
Mango Seed

5. Biosorption of Pb(II) and Cd(II) by Mango Seed
143
Effect of particle size
The Pb(II) and Cd(II) biosorption capacities of MS in different particle sizes
are shown in Figure 5.1. MS smaller than 180 µm exhibited much higher Pb(II) and
Cd(II) uptakes than MS at 180-500 µm and at 500-1000 µm. The remarkably
different biosorption capacities could be caused by the different compositions of
MS in different particle sizes. Various characterization methods were employed to
further investigate the cause of the significant effect of particle size on the
biosorption capacity of MS as reported in Section 6.2.9. MS smaller than 180 µm
was used in the subsequent biosorption studies.

5. Biosorption of Pb(II) and Cd(II) by Mango Seed
144
Figure 5.1 Effect of particle size on Pb(II) and Cd(II) biosorption by MS.
[Initial metal concentrations of 500 ppm, pH 5.0 for Pb(II) and 7.5 for Cd(II)
biosorption, 1.0 g/L MS, 250 rpm, 298 K, 24 h.]
0
50
100
150
200
<180 180-500 500-1000
Q (
mg
/g)
Particle size (µm)
Pb Cd

5. Biosorption of Pb(II) and Cd(II) by Mango Seed
145
Effect of pH
Figure 5.2 indicates that the Pb(II) and Cd(II) biosorption capacities of MS
elevated along with increasing pH and reached the maximum at pH 6.0 and 8.0,
respectively. The positive correlation should be attributed to the less competition
from H+ for binding sites on the MS surface at higher pH. Moreover, the
deprotonation of carboxyl groups (dissociation constant pKa around 3.5) at high pH
would provide more binding sites to Pb(II) and Cd(II). The abrupt decreases of Q
at high pH, namely pH > 6.0 in Pb(II) biosorption and pH > 8.0 in Cd(II)
biosorption, were due to precipitation of Pb(II) and Cd(II) at the alkaline
environment. Given that precipitation of Pb(II) and Cd(II) was respectively
observed at pH 6.0 and 8.0 in the control groups, pH 5.0 was chosen in Pb(II)
biosorption and pH 7.5 in Cd(II) biosorption by MS in the following studies.

5. Biosorption of Pb(II) and Cd(II) by Mango Seed
146
Figure 5.2 Effect of pH on (a) Pb(II) and (b) Cd(II) biosorption by MS.
[Initial metal concentrations of 100 ppm, 1.0 g/L MS, 250 rpm, 298 K, 24 h.]
0
10
20
30
40
50
60
70
80
90
2.0 3.0 4.0 5.0 6.0 7.0
Q (
mg
/g)
pH
a
0
10
20
30
40
50
60
70
4.0 5.0 6.0 7.0 7.5 8.0 8.5
Q (
mg/g
)
pH
b

5. Biosorption of Pb(II) and Cd(II) by Mango Seed
147
Effect of MS dosage
As Figure 5.3 illustrates, higher Pb(II) and Cd(II) biosorption capacities
were obtained at the MS dosage of 0.5 and 1.0 g/L. This was because the binding
sites available on MS at a low dosage could be easily saturated by the metal ions in
the biosorption system. The Pb(II) and Cd(II) biosorption capacities gradually
reduced as the MS dosage augmented due to the excessive binding sites provided
by a high dosage of MS, resulting in a low metal uptake by a unit mass of MS (i.e.,
one gram). Although the removal efficiencies of Pb(II) and Cd(II) would increase
along with increasing MS dosage, 1.0 g/L was used in the subsequent biosorption
studies to achieve a better utilization of MS.

5. Biosorption of Pb(II) and Cd(II) by Mango Seed
148
Figure 5.3 Effect of MS dosage on (a) Pb(II) and (b) Cd(II) biosorption.
[Initial metal concentrations of 500 ppm, pH 5.0 for Pb(II) and 7.5 for Cd(II)
biosorption, 250 rpm, 298 K, 24 h.]
0
20
40
60
80
100
0
30
60
90
120
150
180
210
0.5 1 2 3 5
Rem
ov
al
effi
cien
cy (
%)
Q (
mg
/g)
MS dosage (g/L)
Q Removal efficiencya
0
20
40
60
80
100
0
20
40
60
80
100
0.5 1 2 3 5
Rem
oval
effi
cien
cy (
%)
Q (
mg/g
)
MS dosage (g/L)
Q Removal efficiencyb

5. Biosorption of Pb(II) and Cd(II) by Mango Seed
149
Effect of initial metal concentration
As indicated in Figure 5.4, the Pb(II) and Cd(II) biosorption capacities of
MS were augmented as the initial metal concentrations increased, and gradually
reached a plateau value. This was because a higher concentration of metal ions
would exert a more intensive driving force for their mass transport to the binding
sites on MS, enhancing the biosorption of Pb(II) and Cd(II) by MS (Aksu and Tezer,
2005). As the amount of metal ions increased to a certain level, binding sites on the
MS surface would become saturated, and the biosorption capacity of MS would not
increase any more. Decreasing removal efficiencies were observed along with
increasing initial metal concentrations given the limited number of binding sites
provided by the fixed dosage of MS (i.e., 1.0 g/L) in the biosorption systems (Duan
et al., 2010).

5. Biosorption of Pb(II) and Cd(II) by Mango Seed
150
Figure 5.4 Effect of initial metal concentration on (a) Pb(II) and (b) Cd(II)
biosorption by MS.
[pH 5.0 for Pb(II) and 7.5 for Cd(II) biosorption, 1.0 g/L MS, 250 rpm, 298 K, 24
h.]
0
20
40
60
80
100
0
50
100
150
200
250
300
0 200 400 600 800 1000 1200 1400 1600
Rem
ov
al
effi
cien
cy (
%)
Q (
mg
/g)
C0 (ppm)
Q
Removal efficiency
a
0
20
40
60
80
100
0
20
40
60
80
100
0 200 400 600 800 1000
Rem
oval
effi
cien
cy (
%)
Q (
mg/g
)
C0 (ppm)
Q
Removal efficiency
b

5. Biosorption of Pb(II) and Cd(II) by Mango Seed
151
Effect of ionic strength
As the ionic strength increased from 0 to 0.2 M NaNO3, the Pb(II)
biosorption capacity of MS decreased by 22%, and that of Cd(II) decreased by 13%
as compared with that of the biosorption systems without NaNO3 (Figure 5.5). This
should be caused by the competition from Na+ for the non-specific binding sites
based on electrostatic attraction on the surface of MS (Lv et al., 2012, Wang et al.,
2013). The partially impaired biosorption capacities suggested that electrostatic
attraction was one of the underlying mechanisms, but not the dominant one, in
Pb(II) and Cd(II) biosorption by MS. Other interaction(s) which was(were) not
easily influenced by the presence of other ions (especially cationic ones) could
contribute to sequestration of Pb(II) and Cd(II) by MS at the same time.
Additionally, the small reduction of Pb(II) and Cd(II) biosorption capacities by MS
at ionic strength as high as 0.2 M of NaNO3 indicates the application potential of
MS in real heavy-metal-bearing wastewater, which usually contains a variety of
ions.

5. Biosorption of Pb(II) and Cd(II) by Mango Seed
152
Figure 5.5 Effect of ionic strength on Pb(II) and Cd(II) biosorption by MS.
[Initial metal concentrations of 100 ppm, pH 5.0 for Pb(II) and 7.5 for Cd(II), 1.0
g/L MS, 250 rpm, 298 K, 24 h.]
0
20
40
60
80
0 0.02 0.05 0.1 0.15 0.2
Q (
mg
/g)
Ionic strength (M, NaNO3)
Pb Cd

5. Biosorption of Pb(II) and Cd(II) by Mango Seed
153
Effect of co-metal ions
Figure 5.6 illustrates the effect of different equal molar co-metal ions on
Pb(II) and Cd(II) biosorption by MS in binary metal systems. It was indicated that
the Pb(II) biosorption capacity of MS was not notably impaired by the presence of
co-metal ions (Figure 5.6a). The greatest impact was exerted by Cu(II) and Ni(II),
which respectively reduced the Pb(II) biosorption capacity only to 69.6% and 73.1%
(the single system without co-metal ions as the control). The influence of co-metal
ions on Cd(II) biosorption was more significant (Figure 5.6b). The presence of
Zn(II) and Ni(II) respectively decreased the Cd(II) biosorption capacity of MS to
53.1% and 59.6% of that determined in the single Cd(II) system. The high
selectivity of MS towards Pb(II) suggests the great potential of MS in Pb(II)
removal/recovery from heavy-metal-bearing wastewater. Moreover, biosorption of
multiple heavy metals could make a better use of the biosorbent than biosorption of
a single heavy metal under certain conditions. For instance, a much higher amount
of heavy metal ions was sequestered by MS in the binary system of Pb(II)&Cr(III)
as compared with that of the single Pb(II) biosorption system (Figure 5.6a).

5. Biosorption of Pb(II) and Cd(II) by Mango Seed
154
Figure 5.6 Effect of co-metal ions on (a) Pb(II) and (b) Cd(II) biosorption by MS
in binary systems.
[Initial metal concentrations of 1.0 mM, pH 5.0 for Pb(II) and 7.5 for Cd(II)
biosorption, 1.0 g/L MS, 250 rpm, 298 K, 24 h.]
0
0.2
0.4
0.6
0.8
1
1.2
Q (
mm
ol/
g)
Pb(II)
Co-metal iona
0
0.2
0.4
0.6
0.8
1
1.2
Single Cd(II) Cd(II)&Zn(II) Cd(II)&Ni(II)
Q (
mm
ol/
g)
Cd(II)
Co-metal ionb

5. Biosorption of Pb(II) and Cd(II) by Mango Seed
155
Biosorption isotherms of Pb(II) and Cd(II) biosorption by MS
The equilibrium data of Pb(II) and Cd(II) biosorption by MS are plotted in
Figure 5.7 with non-linear fitting to a variety of adsorption isotherm models. Table
5.1 summarizes the biosorption isotherm constants derived from the non-linear
modeling. The maximum Pb(II) biosorption capacity of MS was experimentally
determined as 263.63 0.06 mg/g (1.27 0.0003 mmol/g), and the R-P model
provided the best description to the equilibrium data with R2 of 0.985 and RMSE
of 3.564. Both the R2 and RMSE and the parameters of the different biosorption
isotherm models were considered and compared when evaluating the fitting of the
models to the biosorption by MS. It is worth mentioning that the Sips model with
R2 of 0.987 and RMSE of 3.353 was not considered due to the much higher
predicted Qm of 541.15 mg/g than the experimental value. The R-P model combines
the characteristics of the Langmuir and Freundlich isotherms. It reduces to the
Langmuir model when bR equals 1, and approaches the Freundlich model if the
value of aRCebR is much higher than 1 (Jossens et al., 1978, Redlich and Peterson,
1959). In this study, the value of aRCebR ranged from 1.42 to 63.44, suggesting the
good fitting of the Freundlich isotherm to Pb(II) biosorption by MS. This was
consistent with the higher R2 (0.981) and lower RMSE (3.986) of the Freundlich
model than those of the Langmuir model (R2 = 0.950; RMSE = 6.493), as shown in
Table 5.1. For Cd(II), the Qm of 93.53 1.43 mg/g (0.83 0.01 mmol/g) was
experimentally achieved, and similar non-linear fitting results to those of Pb(II)
biosorption by MS were observed. It was concluded that the Cd(II) biosorption by

5. Biosorption of Pb(II) and Cd(II) by Mango Seed
156
MS was best described by the R-P isotherm, which also exhibited the properties of
the Freundlich isotherm due to its large value of aRCebR (i.e., 2.91-70.93).

5. Biosorption of Pb(II) and Cd(II) by Mango Seed
157
Figure 5.7 Non-linear regression of the equilibrium data of Pb(II) and Cd(II)
biosorption by MS.
[pH 5.0 for Pb(II) and 7.5 for Cd(II) biosorption, 1.0 g/L MS, 250 rpm, 298 K, 24
h.]
0
50
100
150
200
250
300
0 200 400 600 800 1000 1200
Q (
mg
/g)
Ce (ppm)
Experimental
Langmuir
Freundlich
Temkin
D-R
R-P
Sips
a
R-P: Y =14.56X
1+ 0.36X0.73
0
20
40
60
80
100
120
0 200 400 600 800 1000
Q (
mg/g
)
Ce (ppm)
Experimental
Langmuir
Freundlich
Temkin
D-R
R-P
Sips
b
R-P: Y =7.73X
1+ 0.37X0.77

5. Biosorption of Pb(II) and Cd(II) by Mango Seed
158
Table 5.1 Adsorption isotherm constants of Pb(II) and Cd(II) biosorption by MS.
Parameter Pb(II) Cd(II)
Langmuir
Qm (mg/g) 281.050 4.313 100.900 0.424
KL (L/mg) 0.009 0.001 0.014 0.000
R2 0.950 0.007 0.959 0.007
RMSE 6.493 0.399 2.476 0.219
Freundlich
KF 28.440 1.131 15.565 0.827
NF 3.068 0.062 3.554 0.098
R2 0.981 0.001 0.980 0.011
RMSE 3.986 0.177 1.728 0.483
Temkin
AT (L/mg) 0.224 0.037 0.306 0.033
BT (J/mol) 46.465 1.888 17.495 0.276
R2 0.965 0.005 0.977 0.009
RMSE 5.441 0.321 1.852 0.383
D-R
Qm (mg/g) 215.950 0.778 73.525 0.403
β (mol2/kJ2) 357.450 24.678 38.390 6.152
R2 0.761 0.001 0.755 0.007
RMSE 14.254 0.060 6.081 0.139
R-P
Kr (L/g) 14.555 5.310 7.734 0.298
aR (L/mg) 0.359 0.158 0.367 0.042
bR 0.727 0.010 0.765 0.011
R2 0.985 0.000 0.982 0.010
RMSE 3.564 0.006 1.628 0.490
Sips
Qm (mg/g) 541.150 10.185 164.550 15.627
b (L/mg) 0.033 0.002 0.056 0.003
1/n 0.491 0.039 0.495 0.027
R2 0.987 0.001 0.986 0.009
RMSE 3.353 0.021 1.444 0.462

5. Biosorption of Pb(II) and Cd(II) by Mango Seed
159
Kinetics of Pb(II) and Cd(II) biosorption by MS
Figure 5.8 reveals that the biosorption of Pb(II) and Cd(II) by MS was very
rapid with 93.4% of Pb(II) and 80.6% of Cd(II) biosorption achieved in the first 10
min, and the equilibrium was attained around 180 min. Both the Pb(II) and Cd(II)
biosorption processes consisted of three phases: (1) in the first 5 min, Pb(II) and
Cd(II) rapidly loaded onto the MS surface because of the wide availability of active
binding sites; (2) from 5 to 45 min, the biosorption processes of Pb(II) and Cd(II)
became slower; (3) after 45 min, it was the final equilibrium stage with very slow
binding of Pb(II) and Cd(II) to MS, due to the decreased concentration of
Pb(II)/Cd(II) in the bulk liquid phase as well as the oncoming saturation of binding
sites on the MS surface. As shown in Figure 5.8 and Table 5.2, the kinetics of Pb(II)
biosorption could be better fitted by the non-linear pseudo-first-order kinetic model,
while that of Cd(II) biosorption was better described by the non-linear pseudo-
second-order kinetic model.

5. Biosorption of Pb(II) and Cd(II) by Mango Seed
160
Figure 5.8 Non-linear regression of the kinetic processes of Pb(II) and Cd(II)
biosorption by MS.
[Initial metal concentrations of 100 ppm, pH 5.0 for Pb(II) and pH 7.5 for Cd(II)
biosorption, 1.0 g/L MS, 250 rpm, 298 K, 24 h.]
0
20
40
60
80
100
0 30 60 90 120 150 180
Qt(m
g/g
)
Time (min)
Experimental_PbExperimental_CdPseudo-first-orderPseudo-second-orderFractional power
Pb:
Cd:
Y = 83.73(1- e-0.46X)
Y =30.08X
1+ 0.49X

5. Biosorption of Pb(II) and Cd(II) by Mango Seed
161
Table 5.2 Kinetic constants of Pb(II) and Cd(II) biosorption by MS.
Parameter Pb(II) Cd(II)
Pseudo-first-order
Qe (mg/g) 83.730 0.014 57.820 0.424
k1 (min-1) 0.461 0.005 0.324 0.041
R2 0.980 0.000 0.943 0.004
RMSD 0.805 0.014 1.088 0.046
Pseudo-second-order
Qe (mg/g) 87.585 0.021 61.320 0.651
k2 (g/mg/min) 0.008 0.000 0.008 0.001
R2 0.922 0.003 0.955 0.006
RMSD 1.629 0.038 0.971 0.142
Fractional power
k 54.810 0.156 32.695 1.294
v 0.103 0.001 0.139 0.010
R2 0.554 0.003 0.703 0.007
RMSD 3.874 0.051 2.497 0.220

5. Biosorption of Pb(II) and Cd(II) by Mango Seed
162
Thermodynamics of Pb(II) and Cd(II) biosorption by MS
The KD values of Pb(II) biosorption by MS in equilibrium were calculated
at different temperatures via Eq. 3.1. By inputting KD into Eq. 3.2, ΔG0 of Pb(II)
biosorption by MS was calculated to be -5.23 0.013, -6.86 0.205 and -8.43
0.186 kJ/mol at 288, 298 and 308 K, respectively, indicating that Pb(II) biosorption
by MS became more spontaneous with increasing temperature. From the slope and
intercept of the plot of lnKD versus 1/T in Eq. 3.3 (Figure 5.9a), ΔH0 and ΔS0 were
respectively estimated to be 40.94 2.911 kJ/mol and 0.16 0.010 kJ/mol·K,
revealing that the biosorption process was endothermic and entropy-driven.
Through the same thermodynamic computation procedures applied in Pb(II)
biosorption, the values of ΔG0 of Cd(II) biosorption by MS were calculated to be -
4.06 0.335, -2.59 1.039 and -1.05 0.711 kJ/mol at 288, 298 and 308 K,
respectively; ΔH0 and ΔS0 were respectively computed to be -47.39 5.243 kJ/mol
and -0.15 0.020 kJ/mol·K (Figure 5.9b). The data indicate that the Cd(II)
biosorption by MS was more spontaneous at a lower temperature, and it was
exothermic and enthalpy-driven. The negative ΔS0 reveals that the randomness of
the solid-liquid interface reduced after Cd(II) loading on the MS surface.

5. Biosorption of Pb(II) and Cd(II) by Mango Seed
163
Figure 5.9 Plot of lnKD versus 1/T for thermodynamic computation of (a) Pb(II)
and (b) Cd(II) biosorption by MS in duplicate.
[pH 5.0 for Pb(II) and 7.5 for Cd(II) biosorption.]
y = -5172x + 20.153
R² = 0.9978
y = -4676.9x + 18.419
R² = 0.9995
0.0
0.5
1.0
1.5
2.0
2.5
3.0
3.5
4.0
0.0032 0.00325 0.0033 0.00335 0.0034 0.00345 0.0035
lnK
D
1/T
Set 1Set 2
a
y = 6146.2x - 19.788
R² = 0.9878
y = 5254.4x - 16.399
R² = 0.976
0.0
0.2
0.4
0.6
0.8
1.0
1.2
1.4
1.6
1.8
2.0
0.0032 0.00325 0.0033 0.00335 0.0034 0.00345 0.0035
lnK
D
1/T
Set 1
Set 2
b

5. Biosorption of Pb(II) and Cd(II) by Mango Seed
164
Desorption of Pb(II) and Cd(II) from MS
As Figure 5.10 shows, higher than 98% of Pb(II) sequestered by MS was
desorbed by 0.2 M HNO3, 0.2 M citric acid and 0.1 M EDTA. As for the desorption
of Cd(II), desorption efficiencies of 79%-88% were obtained by 0.2 M HNO3, 0.2
M HCl, 0.2 M citric acid and 0.1 M EDTA. The lower recovery of Cd(II) than Pb(II)
was probably caused by Cd(II) loss during the washing of Cd-loaded MS after
centrifugation. The binding of Cd(II) to the MS surface might not be as strong as
that of Pb(II), given that 10.1% of Cd(II) was desorbed using DDI water as the
eluant, whereas only 1.7% of Pb(II) was desorbed in the same condition (Figure
5.10). The resorption experiments (i.e., the second cycle) indicated that 93%, 96%,
99% and 99% of Pb(II) biosorption capacities, and 92%, 97%, 93% and 97% of
Cd(II) biosorption capacities remained in the regenerated MS after desorption by
0.2 M HCl, 0.2 M HNO3, 0.2 M citric acid and 0.1 M EDTA, respectively (details
in Table 5.3). Although citric acid and EDTA exhibited comparable desorption
capabilities on Pb(II) and Cd(II) and regeneration of MS as compared with HNO3,
they have a higher cost than the mineral acid HNO3 as aforementioned in Section
2.8. Hence, HNO3 was selected as a promising desorbing agent for the desorption
of Pb(II) and Cd(II) from MS in consideration of the heavy metal desorption
efficiency, resorption capability of the treated MS, and the cost of the desorbing
agent. It is worth noting that the concentration of a desorbing agent applied in a
desorption system should be closely related to the S/L ratio used in the system.

5. Biosorption of Pb(II) and Cd(II) by Mango Seed
165
Figure 5.10 Desorption of Pb(II) and Cd(II) from MS by different desorbing agents.
[S/L ratio 2.0 g/L, 3 h, 250 rpm, 298 K.]
0
20
40
60
80
100
0.2M HCl 0.2M HNO3 0.2M Citric
acid
0.1M EDTA DDI
Des
orp
tio
n e
ffic
ien
cy (
%)
Pb Cd

5. Biosorption of Pb(II) and Cd(II) by Mango Seed
166
Table 5.3 Pb(II) and Cd(II) biosorption capacities of native MS and MS regenerated
by different desorbing agents.
Desorbing agent Q_Pb (mg/g) Q_Cd (mg/g)
1st cycle 142.66 1.32 111.30 1.73
2nd cycle
0.2 M HCl 133.29 7.08 102.53 2.98
0.2 M HNO3 136.93 6.21 107.90 1.24
0.2 M Citric acid 140.66 7.48 103.14 2.02
0.1 M EDTA 141.87 3.59 107.67 6.88
(Notes: NA - Not applicable; Initial metal concentrations of 250 ppm, pH 5.0 for Pb(II)
and 7.5 for Cd(II), 1.0 g/L MS and 298 K in the biosorption study.)

5. Biosorption of Pb(II) and Cd(II) by Mango Seed
167
Comparison with other fruit-waste-derived biosorbents
A variety of fruit waste materials have been investigated for Pb(II) and
Cd(II) biosorption in aqueous solutions in the literature. Table 5.4 lists a number of
fruit-waste-derived biosorbents (pristine biomass without modification) that have
been investigated for the removal of Pb(II)/Cd(II) in aqueous solutions. Apparently,
WR and MS in this study exhibited much higher Pb(II) biosorption capacities than
other fruit waste materials reported in the literature. For Cd(II), the biosorption
capacities of WR and MS were relatively high, and next came only to the pectin-
abundant peels of Citrus fruits such as Citrus maxima and orange (Chao and Chang,
2012, Schiewer and Iqbal, 2010). Notably, the MS in this study exhibited a much
higher Pb(II) biosorption capacity than the MS reported by Nadeem et al. (2016)
(263.6 versus 183.0 mg/g), even when the pH conditions were the same and the
particle sizes were similar. This was probably due to the fact that only the shell of
the mango seed was used in the biosorption study of Nadeem et al. (2016), whereas
both the shell and kernel of the mange seed were ground into the MS biosorbent in
this study for better utilization of the fruit waste source. Besides, variations in other
operational conditions (e.g., adsorbate concentration range and presence of
competing ions) and biosorbents’ chemical and physical characteristics (e.g.,
mineralogy and porosity) could also influence the observed biosorption capacity
(Loganathan et al., 2014).
Given the great potential of WR and MS as biosorbents for Pb(II) and Cd(II),
further studies are warranted on biosorption of other heavy metals, precious metals,
and even radioactive metals. Besides, the high yields of watermelon and mango

5. Biosorption of Pb(II) and Cd(II) by Mango Seed
168
among the total fruit production in the world can facilitate the application of WR
and MS as promising biosorbents due to their easy availability and low cost.

5. Biosorption of Pb(II) and Cd(II) by Mango Seed
169
Table 5.4 Pb(II) and Cd(II) biosorption by various fruit waste materials.
Biosorbent
Particle
size (μm)
Qm
(mg/g) pH Reference
Pb(II)
Grape bagasse < 355 79 3.0 (Farinella et al., 2008)
Ponkan peel < 600 112 5.0 (Pavan et al., 2008)
Mango peel 850-1000 99.1 5.0 (Iqbal et al., 2009a)
Orange peel NA 111 5.5 (Feng et al., 2011)
Pomegranate peel < 150 166.6 5.5 (Ay et al., 2012)
Muskmelon waste < 300 75.4 5.5 (Akar et al., 2012)
Citrus maxima peel < 149 145 5.0 (Chao and Chang, 2012)
Passion fruit peel < 149 110 5.0
Custard apple shell < 149 90.9 5.0 (Isaac and Sivakumar, 2013)
Avocado peel
NA
4.9
NA (Mallampati et al., 2015) Dragon fruit peel 4.6
Hamimelon peel 7.9
Mango seed < 250 183.0 5.0 (Nadeem et al., 2016)
WR < 180 231.6 5.0 This study
MS < 180 263.6 5.0
Cd(II)
Banana peel < 125 35.5 8.0 (Memon et al., 2008)
Orange peel 500-1000 107.3 5.0 (Schiewer and Iqbal, 2010)
Citrus maxima peel < 149 135.2 5.0 (Chao and Chang, 2012)
Passion fruit peel < 149 86.8 5.0
Grape bagasse < 355 87.0 7.0 (Farinella et al., 2008)
Custard apple shell < 149 73.3 5.0 (Isaac and Sivakumar, 2013)
Lemon peel 177-240 52.3 5.0 (Schiewer and Patil, 2008)
Mango peel 850-1000 67.1 5.0 (Iqbal et al., 2009a)
WR < 180 98.5 7.0 This study
MS < 180 93.5 7.5
(Notes: NA - Not available.)

5. Biosorption of Pb(II) and Cd(II) by Mango Seed
170
Summary
This chapter presents the results obtained in the macroscopic biosorption
studies of Pb(II) and Cd(II) using MS as the biosorbent. The significant findings
are summarized as below.
(1) MS in a smaller particle size (< 180 µm) exhibited a much higher
biosorption capacity than larger ones (180-500 µm and 500-1000 µm). This
could be ascribed to the biosorbent structure and binding mechanism, which
will be discussed in the following chapter (see Section 6.2.9).
(2) The biosorption capacities of MS augmented with increasing pH, with
optimal pH 5.0 for Pb(II) biosorption and 7.5 for Cd(II) biosorption.
(3) The partially impaired Pb(II) and Cd(II) biosorption capacities of MS at a
high ionic strength (i.e., 0.2 M NaNO3) suggested that electrostatic
attraction was one of the underlying binding mechanisms governing Pb(II)
and Cd(II) biosorption by MS.
(4) The maximum biosorption capacities, 263.63 0.06 mg-Pb/g (1.27 0.0003
mmol/g) and 93.53 1.43 mg-Cd/g (0.83 0.01 mmol/g), of MS were
observed at pH 5.0 and 7.5, respectively.
(5) The R-P isotherm provided the best description to Pb(II) and Cd(II)
biosorption by MS, implying multilayer loadings of Pb(II) and Cd(II) on the
heterogeneous surface of MS.
(6) Pb(II) and Cd(II) were rapidly sequestered by MS, with 93.4% of Pb(II)
biosorption and 80.6% of Cd(II) biosorption completed in the first 10 min.

5. Biosorption of Pb(II) and Cd(II) by Mango Seed
171
(7) The Pb(II) biosorption by MS was endothermic and entropy-driven, whereas
Cd(II) biosorption by MS was exothermic and enthalpy-driven.
(8) Comparable Pb(II) desorption efficiencies (higher than 98%) were achieved
with 0.2 M HNO3, 0.2 M citric acid and 0.1 M EDTA, and higher than 96%
of the Pb(II) biosorption capacities remained in the MS after regenerated
with 0.2 M HNO3, 0.2 M citric acid and 0.1 M EDTA. For Cd(II), desorption
efficiencies of 79%-88% were obtained by 0.2 M HNO3, 0.2 M HCl, 0.2 M
citric acid and 0.1 M EDTA, and 92%-97% of Cd(II) biosorption capacities
remained in the regenerated MS. It seemed that Cd(II) binding to the MS
surface was weaker than that of Pb(II).
(9) The biosorption capacity of MS (and also WR as shown in Table 5.4)
observed in this study was much higher on Pb(II) and relatively high on
Cd(II) as compared with other fruit waste materials reported in the literature.

6. Comprehensive Elucidation of Biosorption Mechanisms
172
6. Comprehensive Elucidation of
Biosorption Mechanisms

6. Comprehensive Elucidation of Biosorption Mechanisms
173
Characterization of WR and mechanistic studies
A good understanding of the underlying mechanism of a biosorption
process will facilitate better process control and provide important insights into the
development of commercial (bio)sorbents. In the literature, a series of analytical
methods such as SEM-EDX, FTIR and XPS were usually employed for biosorbent
characterization and mechanistic elucidation. However, it is not easy to thoroughly
decipher the complicated interactions occurring in a biosorption process through
these conventional techniques, given the complex composition of a biosorbent. In
this study, to the best of my knowledge, it was the first time to employ solid-state
NMR spectroscopy to investigate the interactions between biosorbents and heavy
metal ions, and QCS to decipher the interactions at a molecular level. The
combination of diverse advanced techniques and conventional analytical methods
can provide complementary mechanistic information to disclose a biosorption
process in a comprehensive way.
6.1.1. Elemental analysis
Elemental analysis indicated that WR comprised 36.89% of C, 6.51% of H,
52.92% of O, 3.30% of N, and 0.38% of S (in dry weight). The atomic ratio of the
sum of N and O to C (i.e., (O+N)/C), which is an indicator of polarity with higher
ratio suggesting higher polarity (Li et al., 2010), was 1.15 to WR. Besides, the ratio
of H to C (i.e., H/C), which indicates higher aromaticity with a lower ratio (Li et al.,
2010), was 2.12 to WR.

6. Comprehensive Elucidation of Biosorption Mechanisms
174
6.1.2. Zeta potential measurement
Figure 6.1 shows that WR became more negatively charged as pH
increased, with the isoelectric point (i.e., pH at which the net charge is zero) at
around pH 2.0. This should be caused by the deprotonation of certain organic
groups such as carboxyl (from -COOH to -COO-) and protonated amine (from -
NH3+ to -NH2) groups. As pH used in this study was higher than 2.0, electrostatic
attraction could be a driving force for Pb(II) and Cd(II) binding to the negatively
charged WR. The highly negative zeta potentials of WR at pH 5.0 and 7.0 supported
the observations of the highest Pb(II) uptake at pH 5.0 (Pb(II) would precipitate at
higher pH) and the highest Cd(II) uptake at pH 7.0 (see Section 4.1). Although the
zeta potential could not be measured at pH lower than 2.0 due to the extremely high
ionic strength and acidic condition, it was considered to be slightly positive (Ucun
et al., 2002).

6. Comprehensive Elucidation of Biosorption Mechanisms
175
Figure 6.1 Zeta potentials of WR at varying pH.
[0.15 g/L WR in 1 mM KCl.]
-30
-25
-20
-15
-10
-5
0
1.0 2.0 3.0 4.0 5.0 6.0 7.0 8.0
Zet
a p
ote
nti
al (m
V)
pH

6. Comprehensive Elucidation of Biosorption Mechanisms
176
6.1.3. PXRD
As illustrated in Figure 6.2, pristine WR exhibited reflections when 2 was
16.1 and 21.6, which were typical for the crystalline form of natural cellulose (i.e.,
cellulose I) (Singha and Guleria, 2014, Tian et al., 2011). The broadness of the
peaks indicated the amorphous nature of WR, through which Pb(II) and Cd(II)
could easily penetrate and be entrapped since adsorption mainly occurs in
amorphous regions (Zhou et al., 2005). The PXRD pattern of Pb-loaded WR (Pb-
WR) displayed distinct peaks at 2 of 27.0 and 30.3, which could be attributed to
the deposition of Pb precipitates in the crystalline state (Lee et al., 1997, Zhou et
al., 2005). The PXRD patterns of WR in different particle sizes are shown in Figure
6.3. All of the three WR samples presented reflections at 2 of 16 and 22,
suggesting similar crystalline structures of WR in different particle sizes.

6. Comprehensive Elucidation of Biosorption Mechanisms
177
Figure 6.2 PXRD patterns of pristine, Pb-, and Cd-loaded WR.
[: Cellulose I; : Pb precipitate.]
0
200
400
600
800
1000
3 6 9 12 15 18 21 24 27 30 33 36
Inte
nsi
ty (
CP
S)
2 (o)
Pristine WR
Pb-WR
Cd-WR

6. Comprehensive Elucidation of Biosorption Mechanisms
178
Figure 6.3 PXRD patterns of WR in different particle sizes.
[: Cellulose I; WR1: < 180 m; WR2: 180-500 m; WR3: 500-1000 m.]
0
200
400
600
800
1000
1200
3 6 9 12 15 18 21 24 27 30 33 36
Inte
nsi
ty(C
PS
)
2 (o)
WR1
WR2
WR3

6. Comprehensive Elucidation of Biosorption Mechanisms
179
6.1.4. SEM-EDX
Figure 6.4 shows the SEM micrographs of the WR surface before and after
Pb(II) and Cd(II) biosorption. The morphological structure of pristine WR was
uneven and irregular (Figure 6.4a), leading to a large surface area for Pb(II) and
Cd(II) sequestration. After loadings of Pb(II) and Cd(II), the WR surface became
more porous and rougher with some tiny holes (Figures 6.4b & 6.4c), which could
be caused by leaching of organic substances (e.g., natural pigments and other
impurities) from WR into the liquid phase during biosorption. Distinct precipitates
were observed on the surface of Pb- and Cd-loaded WR, indicating that
microprecipitation, which refers to the precipitation of metal species due to
deviation of the local condition on the biosorbent surface, was involved in Pb(II)
and Cd(II) biosorption by WR. Hydrolysis of metal complexes, which were
generated from the coordination of Pb(II)/Cd(II) to N and O atoms in the functional
groups on WR, could also result in microprecipitation of hydrolysis products on the
biosorbent surface (Zhou et al., 2005). Microprecipitation can significantly
contribute to metal removal as the metal precipitates are collected by the biosorbent
and thus immobilized and separated from the solution (Volesky, 2003). The greater
amount of precipitates bound on the surface of Pb-loaded WR than that of Cd-
loaded WR revealed greater microprecipitation of Pb(II) than Cd(II) in the
biosorption processes.
X-ray elemental mappings indicated that both Pb and Cd were distributed
almost everywhere on the WR surface with prominent loadings (Figure 6.5). The
intense signals of Pb and Cd detected in the X-ray elemental mappings (highlighted

6. Comprehensive Elucidation of Biosorption Mechanisms
180
in circles) were ascribed to Pb(II) and Cd(II) precipitation (Remenarova et al., 2012),
given that distinct precipitates were observed at the same sites in the corresponding
SEM micrographs. It is noteworthy that Pb/Cd was also mapped in the area where
no precipitate was observed in the SEM micrographs, implying the involvement of
mechanism(s) other than microprecipitation (e.g., electrostatic attraction and/or
complexation) in the biosorption process (Maresova et al., 2011).
The EDX spectra of WR before and after Pb(II) and Cd(II) biosorption are
shown in Figure 6.6. It can be observed that light metals, Mg, K and Ca, were
present in pristine WR, and they disappeared after the loadings of Pb(II) and Cd(II)
onto the WR surface. This was possibly caused by ion exchange between the light
metal ions and Pb(II)/Cd(II) for the binding sites on the WR surface.

6. Comprehensive Elucidation of Biosorption Mechanisms
181
Figure 6.4 SEM micrographs of (a) pristine WR, (b) Pb-, and (c) Cd-loaded WR at
two spots on the surface.
[Magnification 2000.]

6. Comprehensive Elucidation of Biosorption Mechanisms
182
Figure 6.5 X-ray elemental mappings of Pb and Cd on the WR surface and the
corresponding SEM micrographs.
[Magnification 5000.]

6. Comprehensive Elucidation of Biosorption Mechanisms
183
Figure 6.6 EDX spectra of (a) pristine, (b) Pb-, and (c) Cd-loaded MS.
0 1 2 3 4 5 6 7 8 9 10 11 12
a
MgP
Ca
K
C
K
Ca
O
Cl
0 1 2 3 4 5 6 7 8 9 10 11 12
b
Pb
Pb
P
O
C
Pb
0 1 2 3 4 5 6 7 8 9 10 11 12
Energy (keV)
c
Cd
P
O
C
Cd

6. Comprehensive Elucidation of Biosorption Mechanisms
184
6.1.5. FTIR spectroscopy
The FTIR spectra of WR before and after Pb(II) and Cd(II) biosorption are
shown in Figure 6.7. The various absorption bands observed in the FTIR spectra
indicated the complicated composition of WR. Bands at 2920 cm-1, 1740 cm-1, and
1632 cm-1 respectively represented C-H stretch in alkanes, C=O stretch in esters,
and N-H bend in primary amines (R-NH2). A distinct spectral difference was
observed at 1450-1000 cm-1 between pristine and heavy metal-loaded WR. The
peaks at 1406 cm-1 (indicative of symmetric stretch of C=O in carboxylic salts),
1363 cm-1 (indicative of C-N stretch in amines), 1259 cm-1 (indicative of bending
vibration of C-O-H in alcohol), 1149 cm-1 (indicative of asymmetric stretch of C-
O-C), and 1059 cm-1 (indicative of stretching vibration of C-O in primary alcohol)
respectively shifted to 1419 cm-1, 1373 cm-1, 1241 cm-1, 1159 cm-1, and 1055 cm-1
after Pb(II) biosorption, and to 1437 cm-1, 1369 cm-1, 1248 cm-1, 1159 cm-1, and
1053 cm-1 after Cd(II) biosorption (details in Table 6.1). All of the assignments
were referred to the absorption information of functional groups reported by Pavia
et al. (2008) and Griffiths et al. (2006). Accordingly, Pb(II) and Cd(II) were
sequestered by WR via interacting with the surface sites, and hydroxyl (C-O-H),
amine (-NH2), carboxyl (-COOH) and ether (C-O-C) groups were probably
involved. Notably, the absorption frequency of a functional group usually locates
in a wide range in the infrared region, possibly resulting in its overlap with those of
other functional groups (e.g., H-bonded O-H at 3400-3200 cm-1 versus N-H stretch
at 3500-3100 cm-1, C-O stretch at 1300-1000 cm-1 versus C-N stretch at 1350-1000
cm-1). The possible overlap makes the assignment of some bands ambiguous. Other
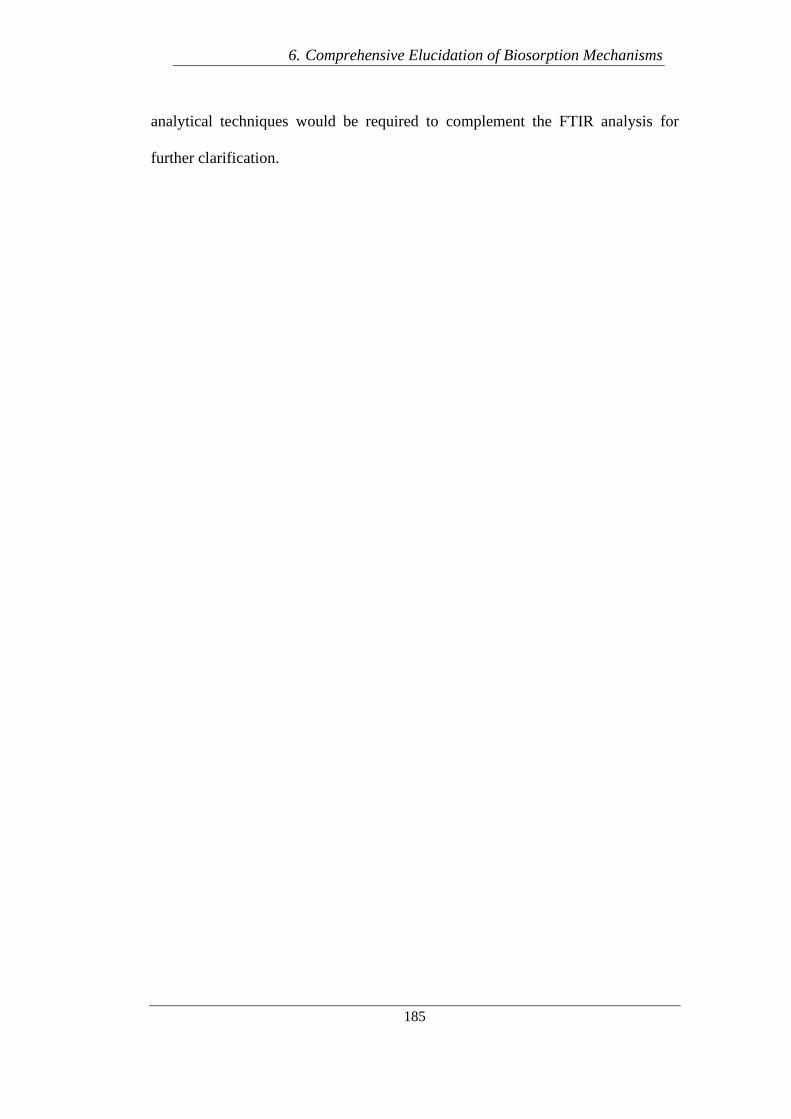
6. Comprehensive Elucidation of Biosorption Mechanisms
185
analytical techniques would be required to complement the FTIR analysis for
further clarification.

6. Comprehensive Elucidation of Biosorption Mechanisms
186
Figure 6.7 FTIR spectra of pristine, Pb-, and Cd-loaded WR.
40080012001600200024002800320036004000
Wavenumber (cm-1)
Pristine WR Pb-WR Cd-WR
C-H stretch
C=O
stretch
N-H bendsC=O stretch
in carboxylic salts
C-Nstretch
C-O-H
bends
C-O-C
stretch
C-O stretch

6. Comprehensive Elucidation of Biosorption Mechanisms
187
Table 6.1 Assignments of the functional groups on WR in FTIR analysis.
Wavenumber (cm-1) Shift (cm-1) Assignment
WR Pb-WR Cd-WR Pb-WR Cd-WR
2920 2919 2920 -1 0 C-H stretch in alkanes
2850 2850 2850 0 0 Asymmetric stretch of C-H in alkanes
1740 1739 1740 -1 0 C=O stretch in esters
1632 1632 1632 0 0 N-H bend in primary amines
1406 1419 1437 13 31 C=O stretch in carboxylic salts
1363 1373 1369 10 6 C-N stretch in amines
1259 1241 1248 -18 -11 C-O-H bend
1149 1159 1159 10 10 C-O-C stretch
1059 1055 1053 -4 -6 C-O stretch in primary alcohol

6. Comprehensive Elucidation of Biosorption Mechanisms
188
6.1.6. XPS
The survey XPS spectra in Figure 6.8 indicate that C and O were the two
most predominant elements on the WR surface. Significant signals of Pb and Cd,
especially Pb 4f at 138.9 eV (assigned to PbO) and Cd 3d at 405.6 eV (assigned to
CdO) (Moulder et al., 1992), were observed in Pb- and Cd-loaded WR, indicating
that prominent loadings of Pb(II) and Cd(II) on the WR surface were mainly in the
forms of metal oxides. The same phenomena were also observed in Pb(II) and Cd(II)
biosorption by biosorbents derived from Chlorella vulgaris microalgae
(Lalhmunsiama et al., 2017) and Pinus svlvestris sawdust (Taty-Costodes et al.,
2003). The formation of PbO and CdO should originate from Pb(II) and Cd(II)
precipitation and/or heavy metal complexion with O atoms in functional groups on
WR. Besides, it was observed that K and Ca almost disappeared from WR after
Pb(II)/Cd(II) biosorption (Table 6.2), suggesting the possible occurrence of ion
exchange with K+ and Ca2+ for binding sites during Pb(II)/Cd(II) biosorption by
WR. The surface sites involved in Pb(II)/Cd(II) biosorption can be further
deciphered based on the shifts of binding energies of C 1s, O 1s and N 1s in XPS
spectra before and after Pb(II)/Cd(II) biosorption (details in Table 6.3).
C 1s
As illustrated in Figure 6.9a, the C 1s spectrum of pristine WR consisted of
four peaks with binding energies of 284.967, 286.404, 287.829 and 288.937 eV,
corresponding to the C atoms in C-C, C-O (alcohol and/or ether), C=O and O=C-
O, respectively (Lim et al., 2008, Moulder et al., 1992, Ramrakhiani et al., 2017).
The peak area distribution indicated that the contents of the four bonds in WR were

6. Comprehensive Elucidation of Biosorption Mechanisms
189
in a descending order of C-C > C-O > C=O > O=C-O. This was consistent with the
components of WR in which cellulose, hemicellulose, and pectin were the main
compositions (see Section 6.1.7; the structures of the three biopolymers are shown
in Figure A9). The latter three peaks significantly shifted to 286.583, 288.175 and
289.096 eV after Pb(II) biosorption (Figure 6.9b), and to 286.518, 287.989 and
289.068 eV after Cd(II) biosorption (Figure 6.9c), indicating the participation of
hydroxyl (in alcohol), ether and carboxyl groups in Pb(II) and Cd(II) biosorption
by WR. The increased binding energies of the C atoms were indicative of the
formation of Pb and Cd complexes with the adjacent O atoms in these functional
groups (Cid et al., 2018, Ramrakhiani et al., 2017, Sheng et al., 2004). For instance,
the O atom in an ether group (C-O-C) donated lone pairs of electrons to the
unoccupied orbitals of Pb(II)/Cd(II) to form coordination bonds, resulting in a
lower electron density around the two adjacent C atoms and thus a higher binding
energy. Besides, the variation of the geometric shape, namely, the change in the C-
O-C angle upon its coordination to Pb(II)/Cd(II), could cause a binding energy shift
of the C atoms (Chen and Yang, 2006). This angle change was evidenced by the
QCS, which indicated that the angle of C-O-C in cellulose enlarged from 112.96
to 115.21 after Pb(II) biosorption (Structure 1 to 1a, Table 6.11). Similarly, the
increased binding energies of the C atoms in alcohol and carboxyl groups after
Pb(II)/Cd(II) biosorption were also indicative of Pb(II)/Cd(II) complexation with
the adjacent O atoms. The increased binding energy of the C atom in the carboxyl
group could also be caused by electrostatic binding of Pb(II)/Cd(II) to the
deprotonated carboxyl group, i.e., -COO- (pKa 3.5, lower than the pH used in

6. Comprehensive Elucidation of Biosorption Mechanisms
190
biosorption); positively charged Pb(II)/Cd(II) would grab electrons and lead to a
lower electron density around the C atom.
O 1s
Figure 6.10a indicates that the O 1s spectrum of pristine WR comprised two
peaks at 531.077 and 532.700 eV, which were respectively assigned to O atoms in
O=C and C-O (hydroxyl and/or ether) groups (Moulder et al., 1992). They shifted
to 531.385 eV (+0.308 eV) and 532.961 eV (+0.261 eV) after Pb(II) biosorption
(Figure 6.10b), indicating the occurrence of Pb(II) complexation with the O atoms
in carboxyl, hydroxyl and ether groups. The donation of lone pairs of electrons to
Pb(II) resulted in lower electron densities around the O atoms and thus higher
binding energies of themselves (Cid et al., 2018). This was coherent with the
increased binding energies of the C atoms in C-O, C=O and O=C-O as
aforementioned. Similarly, the two O 1s peaks were also significantly shifted after
Cd(II) biosorption (Figure 6.10c), indicating the similar binding mechanisms of
Cd(II) to those of Pb(II). Intriguingly, peaks at 530.789 eV and 531.147 eV
(assigned to metal oxides) appeared in the O 1s spectra of Pb- and Cd-loaded WR,
respectively. The existence of metal oxides on the WR surface after Pb(II) and Cd(II)
biosorption was consistent with the intensive Pb signal observed at 138.9 eV
(assigned to PbO) on Pb-loaded WR and the Cd one at 405.6 eV (assigned to CdO)
on Cd-loaded WR (Figure 6.8). The formation of metal oxides explains why the
atomic concentration of O on WR increased from 20.20% to 28.15% and 24.65%
after Pb(II) and Cd(II) biosorption, respectively (Table 6.2). In comparison, the
more intensive peak of metal oxides observed in Pb-loaded WR than in Cd-loaded

6. Comprehensive Elucidation of Biosorption Mechanisms
191
WR was consistent with the observation of more Pb precipitates on the WR surface
after Pb(II) biosorption than that of Cd(II) via SEM (Figure 6.4).
N 1s
In Figure 6.11a, two peaks at 399.968 and 401.854 eV, which corresponded
to the N atoms in -NH2 and -NH3+ groups (Gao et al., 2017), were observed in the
N 1s spectrum of pristine WR. The peak area indicated a much larger amount of
neutral N than the positively charged N on the WR surface (Ren et al., 2016). With
Pb(II) and Cd(II) loadings, the former peak shifted to 400.153 and 400.096 eV,
respectively. This was probably attributed to complexation in which the N atom in
-NH2 donated a lone pair of electrons to the empty orbital of Pb(II)/Cd(II), leading
to a lower electron density of itself and thus a higher binding energy (Zhou et al.,
2005). Notably, the peak assigned to -NH3+, which can be formed by protonation
of -NH2 at a certain range of pH (Eq. 6.1), vanished in Pb- and Cd-loaded WR. This
could be caused by the conversion of R-NH3+ groups to R-NH2Pb2+ (or R-NH2Cd2+)
complexes as indicated in Eq. 6.2 (Jin and Bai, 2002). Compared with C 1s and O
1s (Figures 6.9 and 6.10), the intensity of N 1s was significantly weaker, indicating
the much lower content of N-based functional groups and thus their smaller
contribution to Pb(II)/Cd(II) biosorption than C- and O-based functional groups.
R-NH2 + H+ ↔ R-NH3+ (6.1)
R-NH3+ + Pb
2+ → R-NH2Pb2+ + H+ (6.2)

6. Comprehensive Elucidation of Biosorption Mechanisms
192
Figure 6.8 XPS survey spectra of pristine, Pb-, and Cd-loaded WR.
0200400600800100012001400
Binding Energy (eV)
Pb 4p
O 1s
Pb 4d
C 1s
Pb 4f
O 1sC 1s
Pb 5d
O 1s
C 1s
Cd 3p Cd 3d
WR
Pb-WR
Cd-WR

6. Comprehensive Elucidation of Biosorption Mechanisms
193
Figure 6.9 XPS spectra of C 1s of (a) pristine, (b) Pb-, and (c) Cd-loaded WR.
0
10000
20000
30000
40000
282283284285286287288289290291
Inte
nsi
ty (
cps)
a
0
10000
20000
30000
40000
282283284285286287288289290291
Inte
nsi
ty (
cps)
b
0
10000
20000
30000
40000
282283284285286287288289290291
Inte
nsi
ty (
cps)
Binding energy (eV)
c

6. Comprehensive Elucidation of Biosorption Mechanisms
194
Figure 6.10 XPS spectra of O 1s of (a) pristine, (b) Pb-, and (c) Cd-loaded WR.
0
5000
10000
15000
20000
25000
30000
528529530531532533534535536
Inte
nsi
ty (
cps)
a
0
5000
10000
15000
20000
25000
30000
528529530531532533534535536
Inte
nsi
ty (
cps)
b
0
5000
10000
15000
20000
25000
30000
528529530531532533534535536
Inte
nsi
ty (
cps)
Binding energy (eV)
c

6. Comprehensive Elucidation of Biosorption Mechanisms
195
Figure 6.11 XPS spectra of N 1s of (a) pristine, (b) Pb-, and (c) Cd-loaded WR.
0
500
1000
1500
2000
2500
3000
397398399400401402403
Inte
nsi
ty (
cps)
a
0
500
1000
1500
2000
2500
397398399400401402403
Inte
nsi
ty (
cps)
b
0
500
1000
1500
2000
2500
397398399400401402403
Inte
nsi
ty (
cps)
Binding energy (eV)
c

6. Comprehensive Elucidation of Biosorption Mechanisms
196
Table 6.2 Binding energies and atomic concentrations of different elements on the
WR surface.
Binding energy (eV) Atomic concentration (%)
WR Pb-WR Cd-WR WR Pb-WR Cd-WR
C 1s 285.00 285.00 285.00 74.77 63 69.20
O 1s 532.70 532.90 532.80 20.20 28.15 24.65
N 1s 399.90 400.00 400.00 3.02 2.14 1.59
K 2p 293.00 297.40 290.80 1.32 0 0
Ca 2p 346.90 349.10 347.80 0.15 0 0.02
Pb 4f NA 138.90 NA NA 4.65 NA
Cd 3d NA NA 405.60 NA NA 2.96
(Notes: NA - Not applicable.)

6. Comprehensive Elucidation of Biosorption Mechanisms
197
Table 6.3 Bonds in pristine, Pb-, and Cd-loaded WR as identified by XPS.
Group
Binding energy (eV) Atomic concentration (%)
WR Pb-WR Cd-WR WR Pb-WR Cd-WR
BE Shift BE Shift
C 1s
C-C 284.967 284.996 0.029 284.975 0.008 63.04 54.25 57.83
C-O 286.404 286.583 0.179 286.518 0.114 25.44 33.98 29.91
C=O 287.829 288.175 0.346 287.989 0.16 8.00 8.37 9.19
O=C-O 288.937 289.096 0.159 289.068 0.131 3.53 3.41 3.06
O 1s
Metal oxide NA 530.789 NA 531.147 NA NA 16.42 13.35
O=C 531.077 531.385 0.308 531.765 0.688 12.63 23.32 26.84
O-C 532.700 532.961 0.261 532.934 0.234 87.37 60.25 59.81
N 1s -NH2 399.968 400.153 0.185 400.096 0.128 83.85 100 100
-NH3+ 401.854 NA NA NA NA 16.15 NA NA
(Notes: BE - Binding energy; NA - Not applicable.)

6. Comprehensive Elucidation of Biosorption Mechanisms
198
6.1.7. Solid-state NMR spectroscopy
Solid-state NMR spectroscopy is arguably a powerful approach to provide
compositional information with minimal pretreatment. Superior to spectroscopic
techniques like FTIR spectroscopy and XPS, it can distinguish magnetically distinct
atoms of the functional group being studied. In this sense, it is capable of clarifying
the biopolymer source of the binding site, so as to figure out the roles of different
biopolymers (e.g., cellulose, hemicellulose and pectin) in Pb(II) and Cd(II)
biosorption. This can provide crucial information for developing commercial
(bio)sorbents. In this study, the 13C CP-MAS NMR spectra of pristine, Pb-, and Cd-
loaded WR were collected to characterize the molecular structure of WR and its
change due to Pb(II) and Cd(II) biosorption (Figure 6.12). Spectral deconvolution
(not shown in the NMR spectra, details in Figures A10-12) was conducted for better
assignment of the broad lines which are characteristic of solid-state NMR spectra,
especially for biomaterials with complex compositions (Habets et al., 2013, Ren et
al., 2016).
In Figure 6.12, resonances at 179.5 (assigned to ionized carboxyl groups),
174.4 (assigned to carboxyl-C of the acetyl group in hemicellulose), and 171.2 ppm
(assigned to carboxyl-C of the ester group in pectin) were observed in pristine WR
(Table 6.4). They moved upfield to 177.6, 173.6 and 170.9 ppm after Pb(II)
biosorption, and to 175.6, 172.3 and 170.3 ppm after Cd(II) biosorption,
respectively. This indicated that carboxyl groups from hemicellulose and pectin
were involved in Pb(II) and Cd(II) biosorption by WR. Intriguingly, a resonance at
160.7 ppm (assigned to bicarbonates like KHCO3) was only observed in pristine
WR. The bicarbonates were probably produced from the interaction between light

6. Comprehensive Elucidation of Biosorption Mechanisms
199
metal ions on WR and CO2 in the air, and they disappeared from the WR surface
due to dissolution into the liquid phase during Pb(II) and Cd(II) biosorption.
Moreover, resonances at 105-102 ppm became stronger, while the one at 98.6 ppm
(assigned to hemicellulose C-1) significantly weakened after Pb(II)/Cd(II) loading.
This could be caused by the downfield shift of the resonance at 98.6 ppm to 105-
102 ppm when Pb(II)/Cd(II) bound to the O atom connecting to C-1 in
hemicellulose (C-O-C groups). The resonance at 104.8 ppm was assigned to C-1 in
(para)crystalline cellulose, and the one at 102.4 ppm could be C-1 of pectin and/or
amorphous cellulose (cellulose exposed on the surface). The upfield shift of the
latter resonance to 101.6 ppm after Pb(II) biosorption and to 101.2 ppm after Cd(II)
biosorption suggested that the ether groups adjacent to C-1 of pectin and/or
amorphous cellulose were binding sites. It is worth noting that the two shoulders at
81.8 ppm and 63.9 ppm, which were respectively assigned to C-4 and C-6 in
amorphous cellulose, became sharper after Pb(II) and Cd(II) biosorption, indicating
a more amorphous structure of the metal-loaded WR. The presence of C-2, 3, 5 in
cellulose, C-2, 3, 4, 5 in pectin, and C-2, 3, 4 in hemicellulose resulted in a dominant
and broad peak at 80-65 ppm; its precise resonance assignment was difficult due to
peak overlap. Still, overall downfield shifts were observed in the NMR spectra of
Pd- and Cd-loaded WR compared with that of pristine WR (see Figure 6.12). The
downfield shifts could be caused by interactions between Pb(II)/Cd(II) and the
hydroxyl and/or ether groups in cellulose, pectin and hemicellulose. Resonances at
54.0 ppm and 20.4 ppm were respectively characteristic of methyl-C of the ester
group in pectin and methyl-C of the acetyl group in hemicellulose. No significant
changes in the chemical shifts were observed in these groups. Notably, there was

6. Comprehensive Elucidation of Biosorption Mechanisms
200
no distinct resonance at 160-100 ppm (characteristic of aromatic C in lignin),
indicating that lignin was a negligible constitute in WR used in this study.
Despite the powerfulness of solid-state NMR spectroscopy, the rigidity of
solid samples and the intense dipole interactions between proximal nuclei cannot
be averaged to zero, resulting in line broadening as observed in this study (Simpson
et al., 2011). The considerable overlap rendered identification of components
masked by the main resonances difficult, making applications of solid-state NMR
spectroscopy limited in environmental studies. For instance, its utilization in
biosorption studies has been restricted to the rough compositional characterization
of biomaterials (Farinella et al., 2007, Krishnapriya and Kandaswamy, 2010, Perez
Marin et al., 2010b, Ren et al., 2016). To this regard, advanced technologies such
as chemical shift anisotropy (CSA) filters, dipolar dephasing (DD) filters, and
saturation-pulse induced dipolar exchange with recoupling (SPIDER) have been
used to obtain more qualified NMR spectra. Yet, these ingenious and “tailored”
techniques further restrict the access to solid-state NMR spectroscopy. With aids of
spectral deconvolution and references from model components (e.g., cellulose,
pectin and lignin), this study indicates that 13C NMR spectra of biomaterials can
still provide useful compositional information and help identify the interactions
between the contaminant and the sample.

6. Comprehensive Elucidation of Biosorption Mechanisms
201
Figure 6.12 13C CP-MAS NMR spectra of pristine, Pb-, and Cd-loaded WR.
[The typical units of cellulose, hemicellulose and pectin are shown as insets.]
020406080100120140160180200Chemical shift (ppm)
WR
Cd-WR
Car
bo
xyl-
Co
fac
etyl
gro
up
Car
bo
xyl-
Co
fes
ter
gro
up
C-1
C-1
C-1
C-4
C-2
C-6
Met
hyl-
Co
fes
ter
gro
up
Met
hyl-
Co
fac
etyl
gro
up
Alk
yl-
C
C-2
,3
,5
C-3
,4
,5
Pb-WR

6. Comprehensive Elucidation of Biosorption Mechanisms
202
Table 6.4 Assignments of 13C CP-MAS NMR bands in WR.
Chemical
shift (ppm)
Functional group Reference
179.5 Ionized carboxyl groups (Perez Marin et al., 2010b)
174.4 Carboxyl-C of the acetyl group in
hemicellulose
(Freitas et al., 2001, Wawer et al., 2006)
171.2 Carboxyl-C of the ester group in
pectin
(Keenan et al., 1985); Table A1
160.7 Bicarbonates (Perez Marin et al., 2010b)
100-160 Aromatic carbons in lignin (Farinella et al., 2007); Table A1
104.8 C-1 in (para)crystalline cellulose (Focher et al., 2001); Table A1
102.4 C-1 in pectin and/or amorphous
cellulose on the surface
(Dick-Perez et al., 2011, Focher et al.,
2001, Perez Marin et al., 2010b);
Table A1
98.6 C-1 in hemicellulose (Le Brech et al., 2016)
81.8 C-4 in amorphous cellulose (Jarvis and Apperley, 1990); Table A1
79.7 C-2 in pectin (Dick-Perez et al., 2011); Table A1
78.5 C-4 in hemicellulose (Dick-Perez et al., 2011)
75.5 C-3 in hemicellulose (Dick-Perez et al., 2011)
70-75 C-2, -3, -5 in cellulose (Focher et al., 2001, Habets et al.,
2013); Table A1
72.9 C-4 in pectin (Dick-Perez et al., 2011); Table A1
72.6 C-2 in hemicellulose (Dick-Perez et al., 2011)
71.1 C-3 in pectin (Dick-Perez et al., 2011); Table A1

6. Comprehensive Elucidation of Biosorption Mechanisms
203
68.1 C-5 in pectin (Dick-Perez et al., 2011); Table A1
63.9 C-6 in cellulose (Jarvis and Apperley, 1990); Table A1
54.0 Methyl-C of the ester group in
pectin
(Wang et al., 2015); Table A1
20.4 Methyl-C of the acetyl group in
hemicellulose
(Le Brech et al., 2016)

6. Comprehensive Elucidation of Biosorption Mechanisms
204
6.1.8. Ion exchange experiment
In the ion exchange experiment, the release of light metal ions (i.e., Mg2+,
K+ and Ca2+) from WR was determined, with K+ at a much higher content than Mg2+
and Ca2+ (15-20 times higher). However, it was intriguing to note that only Mg2+
and Ca2+ exhibited more intensive release in the Pb(II)/Cd(II) solution than in DDI
water, whereas K+ exhibited similar amounts of release no matter with or without
the presence of Pb(II)/Cd(II). This revealed that a part of the two naturally occurring
divalent light metal ions were squeezed from the binding sites by Pb(II)/Cd(II) ions
via ion exchange. Hence, mainly Mg2+ and Ca2+ participated in the ion exchange
with Pb(II)/Cd(II), even though disappearance of K on the WR surface was
observed after Pb(II)/Cd(II) biosorption in EDX and XPS measurements. Zheng et
al. (2016) also reported the mere release of Mg2+ and Ca2+ along with Cu(II) and
Cd(II) biosorption by water hyacinth roots. Occasionally, participation of a light
metal ion in ion exchange was concluded based on spectroscopic observation of its
loss from biosorbents (Maresova et al., 2011, Panda et al., 2006), or its release into
the liquid phase during biosorption (Girardi et al., 2014). However, the spontaneous
dissolution of the light metal ions from the biosorbent into the aqueous solution
(e.g., the disappearance of K+ from WR in this study) might be overlooked.
In the Pb(II) biosorption system, the Pb(II) biosorption capacity of WR in
equilibrium was calculated as 0.492 mmol/g. Compared with the control system
(WR in DDI water), 0.0364 mmol of Mg2+ and 0.0544 mmol of Ca2+ were released
in extra from one gram of WR in the Pb(II) system (Table 6.5); it was estimated
that ion exchange with divalent light metal ions participated in 18.5% of Pb(II)

6. Comprehensive Elucidation of Biosorption Mechanisms
205
biosorption. On the other hand, 0.0847 mmol/g of Mg2+ and 0.0783 mmol/g of Ca2+
were released in extra from WR in the Cd(II) system, and it was estimated that ion
exchange with the two divalent light metal ions was involved in 81.5% of Cd(II)
biosorption (Cd uptake of 0.200 mmol/g). Accordingly, it could be inferred that ion
exchange played a more important role in Cd(II) biosorption than in Pb(II)
biosorption by WR. This should be ascribed to the smaller ionic radius and larger
ionic potential of Cd(II) than Pb(II) (see Table 2.1), as ion-exchange materials tend
to prefer counter ions of higher valency (ionic potential) and smaller hydrated
equivalent volume (Loganathan et al., 2014). Following the step of ion exchange,
Pb(II)/Cd(II) ions might interact with the binding sites on WR through electrostatic
attraction, as shown in Eqs. 6.3 and 6.4 (M2+ represents Pb(II)/Cd(II) ions) (Ahmad
et al., 2015). The decrease of pH commonly observed in the Pb(II) and Cd(II)
biosorption processes in this study also suggested the occurrence of ion exchange
between H+ and Pb(II)/Cd(II) for the binding sites (taking carboxyl groups as an
example in Eq. 6.5).
2+ 2+
2 2(R-COO) Mg + M (R-COO) M + Mg (6.3)
2+ 2+R-O-Ca-O-R + M R-O-M-O-R + Ca (6.4)
2(R-COOH) + M2+ ↔ (R-COO)
2M + 2H+ (6.5)

6. Comprehensive Elucidation of Biosorption Mechanisms
206
Table 6.5 Release of light metal ions during Pb(II) and Cd(II) biosorption by WR.
Pb(II) biosorption Cd(II) biosorption
Pb solution Control Cd solution Control
Mg2+ 0.1313 0.0040 0.0949 0.0005 0.1340 0.0008 0.0493 0.0001
Ca2+ 0.0945 0.0001 0.0401 0.0004 0.0871 0.0007 0.0087 0.0002
(Notes: Control - WR suspension in DDI water; Unit in mmol/g.)

6. Comprehensive Elucidation of Biosorption Mechanisms
207
Characterization of MS and mechanistic studies
6.2.1. Elemental analysis
Elemental analysis revealed that MS was composed of 43.73% of C, 6.67%
of H, 48.81% of O, 0.75% of N and 0.04% of S (in dry weight). The atomic ratios
of (O+N)/C and H/C were 0.85 and 1.83, respectively. It was suggested that MS
had lower polarity and higher aromaticity than WR (Li et al., 2010). Besides, the
amounts of N and S in MS were much lower than those in WR (3.3% of N and
0.38% of S).
6.2.2. Zeta potential measurement
Figure 6.13 reveals that the MS surface was negatively charged, and the zeta
potential became more negative with increasing pH, with the isoelectric point at
about pH 2.0. As pH increased from 2.0 to 8.0, more and more functional groups
such as carboxyl (-COOH) and protonated amine (-NH3+) groups on the MS surface
would deprotonate, resulting in a more negatively charged MS surface. Electrostatic
attraction could be a binding force for Pb(II) and Cd(II) ions to MS, since MS would
be highly negatively charged in the biosorption systems with pH 5.0 for Pb(II) and
7.5 for Cd(II) biosorption in this study. The most negative zeta potential of MS at
pH 7.5 was in consistence with the highest Cd(II) uptake determined at pH 7.5 as
reported in Section 5.2.

6. Comprehensive Elucidation of Biosorption Mechanisms
208
Figure 6.13 Zeta potentials of MS at varying pH.
[0.15 g/L MS in 1 mM KCl.]
-35
-30
-25
-20
-15
-10
-5
0
1.0 2.0 3.0 4.0 5.0 6.0 7.0 8.0
Zet
a p
ote
nti
al (m
V)
pH

6. Comprehensive Elucidation of Biosorption Mechanisms
209
6.2.3. PXRD
Distinct reflections at 2θ of 15.3, 17.0, 18.0, 19.5 and 23.0 were
detected in the PXRD diffractogram of pristine MS (Figure 6.14). The reflections
at 2θ of 15.3, 23.0, and the unresolved doublet at 17.0 and 18.0 corresponded
to the mango kernel starch (Millan-Testa et al., 2005, Sandhu and Lim, 2008). This
indicated the existence of kernel starch in MS. The weaker and broader reflections
in the PXRD patterns of Pb- and Cd-loaded MS suggested reduced crystallinity of
MS after Pb(II) and Cd(II) biosorption. This should be attributed to the conversion
of (para)crystalline regions to disoriented amorphous regions in MS after
biosorption. The conversion could be caused by the breakage of hydrogen bonds
responsible for maintaining the ordered crystalline regions in MS (Krishnapriya and
Kandaswamy, 2010, Moyo et al., 2017).

6. Comprehensive Elucidation of Biosorption Mechanisms
210
Figure 6.14 PXRD patterns of pristine, Pb-, and Cd-loaded MS.
[: Mango kernel starch.]
0
200
400
600
800
1000
1200
1400
1600
3 6 9 12 15 18 21 24 27 30 33 36
Inte
nsi
ty(C
PS
)
2 (o)
Pristine MS
Pb-MS
Cd-MS

6. Comprehensive Elucidation of Biosorption Mechanisms
211
6.2.4. SEM-EDX
In Figure 6.15a, the SEM micrograph of pristine MS indicates that MS had
an irregular and uneven surface, which provided a large surface area for Pb(II) and
Cd(II) sequestration. After Pb(II) and Cd(II) biosorption, the MS surface was spread
with a number of particles (Figures 6.15b & 6.15c), which should be Pb(II) and
Cd(II) precipitates generated during biosorption. This was confirmed by X-ray
elemental mappings (Figure 6.16), in which intense Pb and Cd signals were
detected at the spots on the MS surface where solid precipitates were exactly
observed in the corresponding SEM micrographs (highlighted in circles). The Pb(II)
and Cd(II) precipitates on the MS surface could be produced from the
microprecipitation of Pb(II) and Cd(II) (Volesky, 2003), and/or conversion of metal
complexes which were generated from the coordination of Pb(II)/Cd(II) to N and
O atoms in the functional groups on MS (Zhou et al., 2005). Notably, Pb and Cd
were mapped over the MS surface even though there was no observation of any
solid precipitates in the corresponding SEM micrographs (Figure 6.16), indicating
that microprecipitation was not the only mechanism responsible for Pb(II) and
Cd(II) biosorption by MS. In Figure 6.17, the EDX spectra reveal the presence of
light metals, including Mg, K and Ca, on the surface of the pristine MS, and they
vanished after Pb(II) and Cd(II) biosorption. Instead, Pb and Cd were detected on
the surface of the Pb- and Cd-loaded MS, respectively. This suggested the
occurrence of ion exchange between Pb(II)/Cd(II) and light metal ions at the
binding sites on the surface of MS.

6. Comprehensive Elucidation of Biosorption Mechanisms
212
Figure 6.15 SEM micrographs of (a) pristine, (b) Pb-, and (c) Cd-loaded MS.
[Magnification 2000; Collected by Dr. KIM Tae-Hyun of University of Southern
Denmark.]

6. Comprehensive Elucidation of Biosorption Mechanisms
213
Figure 6.16 X-ray elemental mappings of Pb and Cd on the MS surface and the
corresponding SEM micrographs.
[Magnification 5000; Collected by Dr. KIM Tae-Hyun of University of Southern
Denmark.]

6. Comprehensive Elucidation of Biosorption Mechanisms
214
Figure 6.17 EDX spectra of (a) pristine, (b) Pb-, and (c) Cd-loaded MS.
[Collected by Dr. KIM Tae-Hyun of University of Southern Denmark.]
0 1 2 3 4 5 6 7 8 9 10 11 12
KCaPMg
O
C
CaK a
0 1 2 3 4 5 6 7 8 9 10 11 12
CPb
OP
PbPb
b
0 1 2 3 4 5 6 7 8 9 10 11 12Energy (keV)
CCd
OP Cd
c

6. Comprehensive Elucidation of Biosorption Mechanisms
215
6.2.5. FTIR spectroscopy
In Figure 6.18, a variety of absorption bands were observed in the FTIR
spectra of MS, indicating the complicated composition of MS. Specifically, the
FTIR spectrum of pristine MS exhibited absorption bands for stretching vibrations
of C-H in alkanes (2926 cm-1), C=O in esters (1736 cm-1), C=O in carboxylic salts
(1452 cm-1), C-N in amines (1340 cm-1), C-O-C in ethers (1161 cm-1), C-O in
primary alcohol (1022 cm-1), and bending vibrations of N-H in primary amines
(1618 cm-1) (Griffiths et al. 2006, Pavia et al., 2008). Significant shifts at 1618 cm-
1 after Pb(II) biosorption, and at 1618 cm-1, 1452 cm-1 and 1340 cm-1 after Cd(II)
biosorption were recorded (details in Table 6.6). This implied the involvement of
the corresponding functional groups (e.g., amine and carboxyl groups) in Pb(II) and
Cd(II) biosorption by MS. As mentioned before, more analytical techniques were
required to support and complement the findings from FTIR analysis in
consideration of the wide absorption range of a certain functional group in the
infrared region.

6. Comprehensive Elucidation of Biosorption Mechanisms
216
Figure 6.18 FTIR spectra of pristine, Pb-, and Cd-loaded MS.
40080012001600200024002800320036004000Wavenumber (cm-1)
Pristine MS Pb-MS Cd-MS
N-H bendsC=O stretch C-O stretch

6. Comprehensive Elucidation of Biosorption Mechanisms
217
Table 6.6 Assignments of the functional groups on MS in FTIR analysis.
Wavenumber (cm-1) Shift (cm-1) Assignment
MS Pb-MS Cd-MS Pb-MS Cd-MS
2926 2920 2922 -6 -4 C-H stretch in alkanes
2850 2850 2850 0 0 Asymmetric stretch of C-H in alkanes
1736 1736 1736 0 0 C=O stretch in esters
1618 1655 1655 37 37 N-H bend in primary amines
1452 1456 1421 4 -31 C=O stretch in carboxylic salts
1340 1340 1365 0 25 C-N stretch in amines
1161 1161 1159 0 -2 C-O-C stretch
1022 1020 1016 -2 -6 C-O stretch in primary alcohol

6. Comprehensive Elucidation of Biosorption Mechanisms
218
6.2.6. XPS
Figure 6.19 shows the XPS survey spectra of pristine, Pb-, and Cd-loaded
MS. The strongest signals of C 1s and O 1s revealed that C and O were the two
most predominant elements on the MS surface. Distinct signals of Pb and Cd,
especially those of Pb 4f and Cd 3d, were observed on the MS surface after exposure
of MS to Pb(II) and Cd(II), indicating substantial loadings of Pb(II) and Cd(II) on
MS. These findings were consistent with the elemental information summarized in
Table 6.7, which indicated that C and O were the two most important elements on
the MS surface with atomic concentrations of 76.1-79.6% and 18.6-21.5%,
respectively, and distinct amounts of Pb and Cd were detected on MS after Pb(II)
and Cd(II) biosorption. It is noteworthy that Ca, which accounted for 0.11% (atomic
concentration) on the MS surface, almost vanished after Pb(II) and Cd(II)
biosorption. This could be ascribed to the ion exchange between Ca2+ and the
counter ions Pb(II)/Cd(II) during biosorption. As shown in Table 6.7, Pb and Cd
sequestered by MS were mainly detected at 139.0 eV and 405.7 eV, which
respectively corresponded to Pb in PbO and Cd in CdO (Moulder et al., 1992). The
similar observations were also reported in Pb(II) and Cd(II) biosorption by using
biosorbents derived from Chlorella vulgaris microalgae (Lalhmunsiama et al., 2017)
and Pinus svlvestris sawdust (Taty-Costodes et al., 2003). The metal oxides were
probably derived from the metal complexes which were formed by Pb(II)/Cd(II)
complexation with O atoms in functional groups (e.g., hydroxyl, carboxyl and ether
groups) on the MS surface. Besides, the precipitation of metal hydroxides during
biosorption could also result in the deposition of metal oxides on the MS surface
(Zhou et al., 2005). The binding sites involved in Pb(II) and Cd(II) biosorption

6. Comprehensive Elucidation of Biosorption Mechanisms
219
would be disclosed based on the shifts of binding energies of C 1s, O 1s and N 1s
in XPS spectra after Pb(II) and Cd(II) biosorption (Table 6.8).
C 1s
Figure 6.20a shows that the C 1s spectrum of pristine MS consisted of four
peaks at 284.980, 286.511, 287.941 and 289.160 eV, which agreed with the binding
energies of the C atoms in C-C, C-O (alcohol and/or ether), C=O and O=C-O,
respectively (Lim et al., 2008, Moulder et al., 1992, Ramrakhiani et al., 2017). The
latter three peaks respectively shifted to 286.602, 288.214 and 289.279 eV in the C
1s spectrum of Pb-loaded MS (Figure 6.20b), and to 286.643, 288.419 and 289.396
eV in that of Cd-loaded MS (Figure 6.20c). The relatively significant increases of
the binding energies of the C atoms indicated the involvement of hydroxyl (in
alcohol), ether, and carboxyl groups in Pb(II) and Cd(II) biosorption by MS. Take
an ether group (C-O-C) as an example, the O atom donated lone pairs of electrons
to the unoccupied orbitals of Pb(II)/Cd(II) to form metal complexes, resulting in a
lower electron density around the two adjacent C atoms and thus a higher binding
energy. Similarly, the O atoms in hydroxyl and carboxyl groups could also
coordinate to Pb(II)/Cd(II), resulting in lower electron densities of the adjacent C
atoms and thus higher binding energies (Cid et al., 2018, Ramrakhiani et al., 2017,
Sheng et al., 2004). It is noteworthy that the electrostatic attraction of Pb(II)/Cd(II)
to the deprotonated carboxyl groups, i.e., -COO-, might also cause an increase in
the binding energy of the C atom as cationic Pb(II)/Cd(II) ions would grab electrons.
O 1s

6. Comprehensive Elucidation of Biosorption Mechanisms
220
As Figure 6.21a reveals, the O 1s spectrum of pristine MS comprised two
peaks at 531.315 and 532.881 eV, which corresponded to the O atoms in O=C and
C-O (hydroxyl and/or ether) groups (Moulder et al., 1992). The two peaks
respectively shifted to 531.574 eV and 532.997 eV after Pb(II) biosorption (Figure
6.21b), and to 531.706 eV and 533.001 eV after Cd(II) biosorption (Figure 6.21c).
The increased binding energies of the O atoms indicated the occurrence of Pb(II)
and Cd(II) complexation with the O atoms in O=C and C-O (e.g., carboxyl,
hydroxyl and ether groups). The donation of lone pairs of electrons to the empty
orbitals of Pb(II) and Cd(II) to form coordination bonds resulted in lower electron
densities around the O atoms and thus higher binding energies (Cid et al., 2018).
This observation was consistent with the aforementioned increased binding
energies of the C atoms in alcohol, ether and carboxyl groups. Notably, a peak
which was assigned to metal oxides emerged in the O 1s spectrum of Pb- (531.097
eV) and Cd-loaded MS (531.143 eV). The formation of PbO and CdO on the MS
surface after Pb(II) and Cd(II) biosorption could originate from the metal
precipitates as observed in the aforementioned SEM-EDX analysis.
N 1s
In Figure 6.22a, two peaks located at 400.175 eV (assigned to -NH2) and
401.643 eV (assigned to -NH3+) (Gao et al., 2017), were observed in the N 1s
spectrum of pristine MS. The area of the two peaks revealed a much higher content
of neutral N than the positively charged N on the MS surface (Ren et al., 2016). The
former peak significantly shifted to 400.300 eV and 400.289 eV after the
biosorption of Pb(II) and Cd(II), respectively. This was indicative of Pb(II)/Cd(II)

6. Comprehensive Elucidation of Biosorption Mechanisms
221
complexation with the N atom in the amine group; the N atom contributed a lone
pair of electrons to the empty orbital of Pb(II)/Cd(II), resulting in a lower electron
density and thus a higher binding energy of itself (Zhou et al., 2005). Intriguingly,
protonated amine groups, -NH3+, disappeared from the Pb- and Cd-loaded MS
(Figures 6.22b & 6.22c). This should be caused by the conversion of R-NH3+ to R-
NH2Pb2+ and R-NH2Cd2+ complexes after Pb(II) and Cd(II) binding to MS, as
shown in Eqs. 6.1 & 6.2.

6. Comprehensive Elucidation of Biosorption Mechanisms
222
Figure 6.19 XPS survey spectra of pristine, Pb-, and Cd-loaded MS.
0200400600800100012001400Binding energy (eV)
O 1s
C 1s
O
1s
O 1sC 1s
C 1s
Cd 3p Cd 3d
Pristine MS
Pb-MS
Cd-MS
Pb 4p Pb 4dPb 4f
Pb 5d

6. Comprehensive Elucidation of Biosorption Mechanisms
223
Figure 6.20 XPS spectra of C 1s of (a) pristine, (b) Pb-, and (c) Cd-loaded MS.
0
10000
20000
30000
40000
50000
60000
282283284285286287288289290291
Inte
nsi
ty (
cps)
a
0
10000
20000
30000
40000
50000
282283284285286287288289290291
Inte
nsi
ty (
cps)
b
0
10000
20000
30000
40000
50000
60000
282283284285286287288289290291
Inte
nsi
ty (
cps)
Binding energy (eV)
c

6. Comprehensive Elucidation of Biosorption Mechanisms
224
Figure 6.21 XPS spectra of O 1s of (a) pristine, (b) Pb-, and (c) Cd-loaded MS.
0
5000
10000
15000
20000
25000
30000
35000
528529530531532533534535536
Inte
nsi
ty (
cps)
a
0
5000
10000
15000
20000
25000
30000
528529530531532533534535536
Inte
nsi
ty (
cps)
b
0
5000
10000
15000
20000
25000
30000
528529530531532533534535536
Inte
nsi
ty (
cps)
Binding energy (eV)
c

6. Comprehensive Elucidation of Biosorption Mechanisms
225
Figure 6.22 XPS spectra of N 1s of (a) pristine, (b) Pb-, and (c) Cd-loaded MS.
0
500
1000
1500
2000
2500
397398399400401402403404
Inte
nsi
ty (
cps)
a
0
200
400
600
800
1000
1200
397398399400401402403
Inte
nsi
ty (
cps)
b
0
200
400
600
800
1000
1200
397398399400401402403
Inte
nsi
ty (
cps)
Binding energy (eV)
c

6. Comprehensive Elucidation of Biosorption Mechanisms
226
Table 6.7 Binding energies and atomic concentrations of different elements on the
MS surface.
Binding energy (eV) Atomic concentration (%)
MS Pb-MS Cd-MS MS Pb-MS Cd-MS
C 1s 285.000 285.000 285.000 79.62 76.06 79.1
O 1s 533.000 532.900 533.000 18.64 21.46 18.74
N 1s 400.400 400.200 400.300 1.48 0.48 0.4
Ca 2p 347.400 350.9 347.500 0.11 0.03 0
Pb 4f NA 139.000 NA NA 1.96 NA
Cd 3d NA NA 405.700 NA NA 1.59
(Notes: NA - Not applicable.)

6. Comprehensive Elucidation of Biosorption Mechanisms
227
Table 6.8 Bonds in pristine, Pb-, and Cd-loaded MS as identified by XPS.
Group
Binding energy (eV) Atomic concentration (%)
MS Pb-MS Cd-MS MS Pb-MS Cd-MS
BE Shift BE Shift
C 1s
C-C 284.980 285.059 0.079 285.034 0.054 64.16 66.15 70.03
C-O 286.511 286.602 0.091 286.643 0.134 26.50 22.19 21.50
C=O 287.941 288.214 0.273 288.419 0.478 5.11 6.50 5.16
O=C-O 289.160 289.279 0.119 289.396 0.236 4.23 5.16 3.31
O 1s
Metal
oxide NA 531.097 NA 531.143 NA NA 8.91 5.35
O=C 531.315 531.574 0.259 531.706 0.391 4.95 9.47 11.02
O-C 532.881 532.997 0.116 533.001 0.120 95.05 81.62 83.63
N 1s NH2 400.175 400.300 0.125 400.289 0.114 84.85 100 100
NH3+ 401.643 NA NA NA NA 15.15 NA NA
(Notes: BE - Binding energy; NA - Not applicable.)

6. Comprehensive Elucidation of Biosorption Mechanisms
228
6.2.7. Solid-state NMR spectroscopy
To characterize the molecular structure of MS and its change due to Pb(II)
and Cd(II) biosorption, the 13C CP-MAS NMR spectra of pristine, Pb-, and Cd-
loaded MS were collected (Figure 6.23). Spectral deconvolution was performed for
better assignment of the broad lines detected in the spectra (Figures A13-15). In
Figure 6.23, a weak resonance at 170.9 ppm (assigned to carboxyl-C of the acetyl
group in hemicellulose) was observed in the 13C NMR spectrum of pristine MS, and
it moved downfield to 171.6 ppm after Pb(II) and Cd(II) biosorption. The downfield
shifts should be attributed to the interaction between Pb(II)/Cd(II) and the O atoms
in carboxyl groups, possibly via complexation, which changed the magnetic
environment around the C atoms in carboxyl groups. In addition, significant
resonances at 143.5 and 137.5 ppm, which corresponded to the C atoms in tannins,
were detected in the 13C NMR spectrum of pristine MS; they almost disappeared
after Pb(II) and Cd(II) biosorption probably due to the dissolution of tannins in the
liquid phase. It has been reported that the mango seed kernel contains a high content
of tannins (Maisuthisakul and Gordon, 2009). Besides, the resonances at 102.6 and
99.1 ppm corresponded to C-1 in amorphous cellulose and C in tannins,
respectively. The downfield shift of the former to 104.2 ppm after Pb(II)
biosorption and to 104.1 ppm after Cd(II) biosorption should be attributed to the
binding of Pb(II) and Cd(II) to the O atoms in the ether groups connected to C-1 in
cellulose, leading to a change in the magnetic environment around C-1. The latter
also moved downfield to 100.1 and 100.0 ppm after Pb(II) and Cd(II) biosorption,
respectively, suggesting the involvement of tannins (e.g., hydroxyl and/or carboxyl
groups) in biosorption. The dominant resonance was located at about 71.9 ppm,

6. Comprehensive Elucidation of Biosorption Mechanisms
229
which might contain C-2, -3, -5 in cellulose and C-2, -3, -4 in hemicellulose.
Although precise assignment of the broad lines was difficult due to the overlap,
downfield shifts of the peak were observed after Pb(II) and Cd(II) biosorption. This
could be caused by the interactions between Pb(II)/Cd(II) and certain functional
groups in cellulose and hemicellulose (e.g., hydroxyl, ether and carboxyl groups).
Two shoulders at 81.8 and 61.6 ppm, which were respectively assigned to C-4 and
C-6 in amorphous cellulose, were located aside the dominant resonance. The
resonance at 30.1 ppm might correspond to the lipids in mango kernel, and the one
at 21.6 ppm was a characteristic of the methyl carbon of the acetyl group in
hemicellulose. As no distinct resonance was observed at around 54.7 ppm, which
is a characteristic of the methoxyl-C in lignin (Table A1), it was concluded that
lignin was a negligible component in MS used in this test (particle size < 180 µm).
All of the 13C spectral assignments of MS are summarized in Table 6.9. Taken
together, MS dominantly comprised cellulose, with low contents of hemicellulose,
tannins and lipids. In addition to carboxyl groups in hemicellulose, hydroxyl and
ether groups in cellulose and hemicellulose were also potential binding sites for
Pb(II) and Cd(II). Tannins in MS might also contribute to the sequestration of Pb(II)
and Cd(II).

6. Comprehensive Elucidation of Biosorption Mechanisms
230
Figure 6.23 13C solid-state NMR spectra of pristine, Pb-, and Cd-loaded MS.
0306090120150180210240
Chemical shift (ppm)
Pristine MS
Pb-MS
Cd-MS Car
bo
xyl-
C o
fac
etyl
gro
up
Tan
nic
aci
d
C-1
Tan
nic
aci
d
C-4 C
-6
Lip
ids
Met
hyl-
C o
f ac
etyl
gro
up
C-2
,3,5
C-2
,3,4

6. Comprehensive Elucidation of Biosorption Mechanisms
231
Table 6.9 Assignments of 13C CP-MAS NMR bands in MS.
Chemical
shift (ppm) Functional group Reference
170.9 Carboxyl-C of acetyl group in
hemicellulose
(Freitas et al., 2001, Wawer et al.,
2006)
152.0 Aromatic C-O in lignin (Habets et al., 2013, Le Brech et al.,
2016); Table A1
143.5 Aromatic C-O in lignin (Le Brech et al., 2016); Table A1
137.5 C in tannic acid (Gamble et al., 1996)
118.5 Aromatic C in lignin (Love et al., 1994); Table A1
110 Aromatic C in lignin (Le Brech et al., 2016); Table A1
104.5 C-1 in (para)crystalline cellulose (Focher et al., 2001); Table A1
102.6 C-1 in amorphous cellulose (Focher et al., 2001)
99.11 C in tannic acid (Gamble et al., 1996)
88.1 C-4 in (para)crystalline cellulose (Focher et al., 2001); Table A1
81.8 C-4 in amorphous cellulose (Jarvis and Apperley, 1990); Table A1
79.0-67.0 C-2, -3, -5 in cellulose, C-2, -3, -4 in
hemicellulose
(Dick-Perez et al., 2011, Komatsu and
Kikuchi, 2013); Table A1
64.0 C-6 in (para)crystalline cellulose (Wang et al., 2012); Table A1
61.6 C-6 in amorphous cellulose (Jarvis and Apperley, 1990, Wang et
al., 2012); Table A1
56.0 Methoxyl-C in lignin (Le Brech et al., 2016, Wang et al.,
2012); Table A1
30.1 Lipids (Jarvis and Apperley, 1990)

6. Comprehensive Elucidation of Biosorption Mechanisms
232
21.6 Methyl-C of acetyl group in
hemicellulose
(Freitas et al., 2001)

6. Comprehensive Elucidation of Biosorption Mechanisms
233
6.2.8. Ion exchange experiment
In the ion exchange experiment, it was observed that Mg2+, K+ and Ca2+
were released from MS during Pb(II) and Cd(II) biosorption, and the amount of K+
was 5-20 times higher than those of Mg2+ and Ca2+. Only the two divalent light
metal ions, Mg2+ and Ca2+, were released at distinctly higher amounts in the Pb(II)
and Cd(II) biosorption systems as compared with the control groups (MS in DDI
water). Therefore, only Mg2+ and Ca2+ bound to the binding sites significantly
exchanged with Pb(II) and Cd(II) in solution. This was probably ascribed to the
ease of replacing metal ions with the same valence for the binding sites. The
observation in the ion exchange experiment was consistent with the disappearance
of Ca in the XPS survey spectra of MS after Pb(II) and Cd(II) biosorption (Table
6.7), as well as the vanishing of Mg and Ca from the EDX spectra of Pb- and Cd-
loaded MS (Figure 6.17). Notably, the disappearance of K from MS as observed by
EDX spectroscopy should be attributed to the natural dissolution of K+ from MS in
the solution.
In comparison with the control groups, 0.0107 mmol/g of Mg2+ and 0.0069
mmol/g of Ca2+ were released in extra in the Pb(II) biosorption system, while
0.0124 mmol/g of Mg2+ and 0.0093 mmol/g of Ca2+ were released in extra in the
Cd(II) system (Table 6.10). As Pb(II) and Cd(II) uptakes were respectively
calculated as 0.151 mmol/g and 0.0915 mmol/g, it was estimated that ion exchange
with Mg2+ and Ca2+ was involved in 11.7% of Pb(II) biosorption and 27.1% of
Cd(II) biosorption by MS.

6. Comprehensive Elucidation of Biosorption Mechanisms
234
Table 6.10 Release of light metal ions during Pb(II) and Cd(II) biosorption by MS.
Pb(II) biosorption Cd(II) biosorption
Pb solution Control Cd solution Control
Mg2+ 0.0565 0.0000 0.0457 0.0005 0.0506 0.0019 0.0382 0.0013
Ca2+ 0.0313 0.0003 0.0243 0.0015 0.0168 0.0009 0.0075 0.0002
(Notes: Control - MS suspension in DDI water; Unit in mmol/g.)

6. Comprehensive Elucidation of Biosorption Mechanisms
235
6.2.9. Further mechanistic studies based on the effect of particle size
As intriguingly observed in Section 5.1, MS in different particle sizes
exhibited hugely distinct Pb(II) and Cd(II) biosorption capacities. Deciphering the
reason behind would provide important insights into the underlying mechanisms of
Pb(II) and Cd(II) biosorption by MS. To this end, the PXRD patterns, 13C solid-
state NMR spectra and contents of light metal ions of MS in the three different
particle sizes (i.e., MS1: < 180 m, MS2: 180-500 m, and MS3: 500-1000 m)
were investigated.
PXRD
As shown in Figure 6.24, the PXRD patterns of MS in larger particle sizes
(i.e., MS2 and MS3) presented reflections at 2θ of 16 and 22 (typical for
crystalline cellulose I), which were distinctly different from those of MS1 (see
Figure 6.14). This indicated that mango kernel starch was negligible in MS2 and
MS3, in which cellulose was a crucial constitute. The poor biosorption performance
of MS in 180-500 and 500-1000 µm was probably caused by the crystalline
structure of MS. The diverse PXRD patterns of MS in different particle sizes lead
to a puzzle as to why there was a huge difference in composition between MS <
180 µm and larger MS in 180-500 µm and 500-1000 µm. This should result from
the preparation of the MS biosorbent; when grinding MS in an electrical blender,
the mango kernel could be ground into fine powders more easily than the mango
seed shell. Consequently, the starch-containing mango kernel became the dominant
constitute in MS < 180 µm, and the mango seed shell with a high content of
cellulose mostly remained in larger MS.

6. Comprehensive Elucidation of Biosorption Mechanisms
236
13C solid-state NMR spectra
As the dependence of the biosorption capacity of MS on particle size should
be caused by compositional and structural differences of MS in different particle
sizes, the 13C CP-MAS NMR spectra of MS1 (< 180 µm), MS2 (180-500 µm) and
MS3 (500-1000 µm) were collected (Figure 6.25, deconvolution shown in Figures
A13, A16 & A17). It was observed that resonances at 171-172 ppm (assigned to
carboxyl-C in hemicellulose) in MS2 and MS3 were stronger than those in MS1.
Also, the resonance corresponding to methyl-C of the acetyl group in hemicellulose
at 21 ppm exhibited peaks much more intense in MS2 and MS3 than those in MS1,
indicating higher contents of hemicellulose in lager MS than smaller MS. Besides,
resonances at 152 ppm, which were assigned to carbon atoms in lignin (lignin
structure in Figure A9), were observed in MS2 and MS3. Together with the
resonances observed at 56 ppm (assigned to methoxyl-C in lignin) in MS2 and
MS3, it was concluded that there was lignin in MS2 and MS3, while its content in
MS1 was negligible. The resonances corresponding to C atoms in tannins at 143.5
and 137.5 ppm in MS1 almost vanished in MS2 and MS3. This should be ascribed
to the much lower amount of mango kernel, which contains tannins, in larger MS.
In addition to C-1 (102-103 ppm), C-4 (82-83 ppm) and C-6 (61-62 ppm) in
amorphous cellulose (as observed in MS1), C-1 (105 ppm), C-4 (88 ppm) and C-6
(64 ppm) in (para)crystalline cellulose were also observed in MS2 and MS3. This
revealed a higher content of cellulose and a more crystalline structure of cellulose
in larger MS, which was consistent with the PXRD patterns of MS in different
particle sizes (Figure 6.24). It is worth noting that the resonance corresponding to

6. Comprehensive Elucidation of Biosorption Mechanisms
237
lipids in mango seed kernel at 30 ppm almost vanished in MS2 and MS3, indicating
the insignificant content of mango kernel in MS2 and MS3.
Content of light metal ions
To determine the contents of light metal ion, 0.02 g of MS in different
particle sizes was respectively dispersed in 20 mL of 0.05 M HNO3 and agitated at
250 rpm for 24 h. The light metal ions soaked in the liquid phase were measured.
According to Figure 6.26, smaller MS particles had a higher content of Ca2+ and
Mg2+ than the larger ones. As mentioned in Section 6.2.8, Ca2+ and Mg2+ bound to
the binding sites on MS could exchange with Pb(II) and Cd(II) in solution. This was
consistent with the negative correlation between the biosorption capacities of MS
and its particle size. However, the total molar content of Ca2+ and Mg2+ in MS was
much lower compared with the Pb(II) and Cd(II) biosorption capacities of MS. For
example, the Pb(II) biosorption capacity of MS1 was 0.95 ± 0.008 mmol/g, whereas
the total content of Ca2+ and Mg2+ in MS1 was only 0.11 ± 0.001 mmol/g (Figure
6.26). Hence, the total content of Ca2+ and Mg2+ in MS could not account for the
significant effect of MS particle size on Pb(II) and Cd(II) biosorption capacities.
To summarize, there were higher contents of hemicellulose, cellulose and
lignin with a more crystalline structure of cellulose in larger MS (i.e., MS2 and
MS3). For MS1, the component of mango seed kernel led to a more amorphous
structure with the presence of tannins and some lipids. In this sense, the much higher
Pb(II) and Cd(II) biosorption capacities of MS1 should be due to its more
amorphous structure and the presence of more active binding sites, as tannins
contain massive hydroxyl and carboxyl groups (see Figure A9). On the other hand,

6. Comprehensive Elucidation of Biosorption Mechanisms
238
the more crystalline structure and higher content of lignin led to lower Pb(II) and
Cd(II) biosorption capacities of larger MS. Lignin was assumed to be the main
storage medium of organic pollutants, but not to mineral pollutants due to its
aromatic structure (high aromaticity) (Tran et al., 2015, Zhang et al., 2016).

6. Comprehensive Elucidation of Biosorption Mechanisms
239
Figure 6.24 PXRD patterns of MS in different particle sizes.
[: Cellulose I; MS1: < 180 m; MS2: 180-500 m; MS3: 500-1000 m.]
0
500
1000
1500
2000
2500
3000
3500
3 6 9 12 15 18 21 24 27 30 33 36
Inte
nsi
ty (
CP
S)
2 (o)
MS1
MS2
MS3

6. Comprehensive Elucidation of Biosorption Mechanisms
240
Figure 6.25 13C solid-state NMR spectra of MS in different particle sizes.
[MS1: < 180 m; MS2: 180-500 m; MS3: 500-1000 m.]
020406080100120140160180200
Chemical shift (ppm)
MS1
MS2
MS3
Car
bo
xyl-
C i
n h
emic
ellu
lose
C-1
in (
par
a)cr
yst
alli
ne
cell
ulo
seC
-1 i
n a
mo
rpho
us
cell
ulo
se
C-1
in(p
ara)
cryst
alli
ne
cell
ulo
seC
-1in
amo
rpho
us
cell
ulo
se
C-6
in
(par
a)cr
yst
alli
ne
cell
ulo
seC
-6 i
nam
orp
ho
us
cell
ulo
seM
etho
xyl-
C i
n l
ignin
Met
hyl-
C o
f ac
etyl
gro
up
in h
emic
ellu
lose
Aro
mat
icC
in l
ignin
C i
n t
annin C
in t
annin

6. Comprehensive Elucidation of Biosorption Mechanisms
241
Figure 6.26 Pb(II) and Cd(II) biosorption capacities and light metal ions contents
of MS in different particle sizes.
[Initial metal concentrations of 500 ppm, pH 5.0 for Pb and pH 7.5 for Cd, 1.0 g/L
MS.]
0
30
60
90
120
150
180
210
0.00
0.02
0.04
0.06
0.08
0.10
0.12
0.14
<180 180-500 500-1000
Q (
mg
/g)
Lig
ht
met
al
con
ten
t (m
mo
l/g
)
Particle size (µm)
Ca
Mg
Q_Pb
Q_Cd

6. Comprehensive Elucidation of Biosorption Mechanisms
242
Quantum chemistry simulation
As aforementioned, hydroxyl, carboxyl, amine and ether groups in WR and
MS were identified as the active functional groups for Pb(II) and Cd(II) biosorption,
with the formation of coordination bonds (i.e., complexation) as an important
underlying mechanism. But a puzzle remained: how would the heavy metal ions
interact with these functional groups in situ (i.e., in biopolymers which contain
these functional groups)? Also, if the heavy metal ions had any preference to bind
to any particular binding sites? To answer these questions, QCS was applied to
simulate the microscopic interactions between the heavy metal ions (Pb(II) as the
representative, Cd(II) not shown due to similar simulation results) and some typical
components of fruit waste materials, such as cellulose, pectin and citrulline (a
model of amino acid providing amine groups). This would provide information of
the structural and thermodynamic properties of the heavy metal complexes formed
in biosorption (Leng et al., 2016).
Table 6.11 lists the optimized structures and thermodynamic properties of a
number of Pb-cellulose, Pb-pectin and Pb-citrulline complexes. As hydroxyl groups
usually adjoin with ether groups in cellulose (Structure 1 in Table 6.11), three
possible reactions, namely Pb(II) complexation with ether and hydroxyl groups (1a),
and that with two adjoining hydroxyl groups in different spatial locations (1b and
1c) were simulated. The negative values of ∆G indicated that the reactions were
favorable. Given that Pb(II) biosorption was performed at pH 5.0, at which the
hydroxyl groups (pKa at about pH 10.0) would exist as R-OH without
deprotonation, it was still unknown that whether Pb(II) would exchange with H+ in
R-OH and bind to R-O-. QCS indicated that this process was unfavorable with a

6. Comprehensive Elucidation of Biosorption Mechanisms
243
positive ∆G of 21.53 kcal/mol (Structure 1d), implying that the pH decrease during
Pb(II) biosorption was mainly due to the deprotonation of carboxyl groups and
protonated amine groups (i.e., -NH3+) rather than hydroxyl groups. Similar to
cellulose, carboxyl, hydroxyl and ether groups adjoin with each other in pectin
(Structure 2), and the carboxyl groups adjoin amine groups in citrulline (Structure
3). These permutations provide possibilities of forming various Pb complexes. As
Table 6.11 shows, the values of ∆G were more negative when carboxyl groups were
involved in the reactions (e.g., by comparing 2a, 2b and 2c, to 2d and 2e), revealing
that carboxyl groups were more favorable binding sites for Pb(II). This could be
attributed to the electrostatic attraction exerted by carboxyl groups as they would
stay deprotonated at pH 5.0 (pKa around 3.5). Lam (2015) also found that the
carboxyl group was the main active site for heavy metal biosorption based on
surface complexation modeling, even both hydroxyl and carboxyl groups were
abundant on the biosorbent. It is worth noting that the bond length of the
coordination bonds in this study was 2.216-2.565 Å, which was comparable to the
values reported in Pb-EDTA complexes (Kovács et al., 2010), and Pb complexes
formed with aliphatic carboxylates, aliphatic oxoligands and aromatic carboxylates
(Davidovich et al., 2009).
Most of the Pb complexes were simulated with two coordination bonds in
this study to simplify the simulation. However, real interactions can be more
complicated given the composition complexity of fruit waste materials. The
favorable formation of Structure 3c and 3d indicated the feasibility of Pb(II)
complexation with four or more N/O atoms. The actual coordination number

6. Comprehensive Elucidation of Biosorption Mechanisms
244
achieved would be the result of the optimization of the electronic and geometric
factors.

6. Comprehensive Elucidation of Biosorption Mechanisms
245
Table 6.11 Optimized structures and thermodynamic properties of Pb(II)
complexes.
Reaction Cel + Pb2+ → (1a, 1b, or 1c)2+; Cel + Pb2+ + 2H2O → 1d + 2H3O+
No. Cellulose (Cel): 1 1a 1b 1c 1d
Optimized
structure
Bond length (Å)a - 2.426; 2.479 2.404; 2.441 2.408; 2.405 2.189; 2.191
Active groups - Ether; Hydroxyl Hydroxyl Hydroxyl Hydroxyl
∆G (kcal/mol) - -20.05 -22.56 -25.31 21.53
Reaction Pec- + Pb2+ → (2a, 2b, or 2c)+ or (2d or 2e)2+
No. Pectin (Pec): 2 2a 2b 2c 2d 2e
Optimized
structure
Bond length (Å) - 2.388; 2.219 2.393; 2.216 2.370; 2.386 2.395; 2.377 2.388; 2.395
Active groups - Ether; Carboxyl Hydroxyl;
Carboxyl
Carboxyl Hydroxyl Hydroxyl
∆G (kcal/mol) - -46.55 -41.23 -39.86 -29.11 -28.78
Reaction Cit- + Pb2+ → (3a or 3b)+; 2Cit- + Pb2+ → (3c or 3d)
No. Citrullineb (Cit): 3 3a 3b 3c 3d
Optimized
structure
Bond length (Å) - 2.416; 2.217 2.362; 2.364 2.455; 2.322;
2.565; 2.469
2.548; 2.386;
2.410; 2.505
1 2 2
1 2
1
2
1
2
1
2
1
2
2
1 2
1
2
4
2 3
1 1
2
3 4
1
2

6. Comprehensive Elucidation of Biosorption Mechanisms
246
Active groups - Carboxyl; Amine Carboxyl Carboxyl; Amine Carboxyl
∆G (kcal/mol) - -56.07 -43.03 -76.91 -64.67
(Notes: a - Bond length was shown in an order of (1; 2) or (1; 2; 3; 4); b - Citrulline was
selected as an amino acid for simulation of Pb-protein complexes given its high
concentration in WR (Rimando and Perkins-Veazie, 2005); Monomers of cellulose and
pectin were used to simplify the simulation; Pectin monomer and citrulline are charged due
to the dissociation of carboxyl at pH 5.0 applied in this study; Numbers in blue show
different bonds formed in complexes; Large grey sphere - C atom; Small grey sphere - H
atom; Red sphere - O atom; Blue sphere: N atom; Black sphere: Pb atom.)

6. Comprehensive Elucidation of Biosorption Mechanisms
247
Summary
In combination with macroscopic biosorption studies, a variety of
spectroscopic techniques (e.g., FTIR, XPS and solid-state NMR), chemical
methods (e.g., ion exchange experiment), and some other surface and structure
analytical methods (e.g., zeta potential measurement, SEM-EDX and PXRD) were
employed to comprehensively elucidate the mechanisms of Pb(II) and Cd(II)
biosorption by WR and MS. At last, modeling via QCS at a molecular scale was
applied to further disclose the interactions between the heavy metal ions and the
surface sites on the biosorbents. The comprehensive mechanistic elucidation via the
hybrid methodology established in this study is described in Figure 6.27. The main
findings in this chapter are summarized as follows.
(1) Spectroscopic techniques indicated that WR and MS had very complicated
compositions, making the biosorbent characterization and mechanistic
elucidation challenging.
(2) On both WR and MS, carboxyl, hydroxyl, amine and ether groups were
involved in Pb(II) and Cd(II) sequestration via the binding force of
complexation, ion exchange (with Ca2+ and Mg2+), and electrostatic
attraction. Microprecipitation on the surface of WR and MS also contributed
to Pb(II) and Cd(II) removal from aqueous solutions. Among the four types
of active functional groups, carboxyl groups were more preferable for Pb(II)
and Cd(II) binding.
(3) Specifically, Pb(II) and Cd(II) could be bound to the negatively charged
surface of WR and MS via electrostatic attraction according to the zeta

6. Comprehensive Elucidation of Biosorption Mechanisms
248
potential measurements. Pb(II) and Cd(II) also acquired binding sites
through the ion exchange with naturally occurring Ca2+ and Mg2+ in the
biosorbents. Besides, complexation with O and N atoms from carboxyl,
hydroxyl, amine and ether groups provided a stronger force for Pb(II) and
Cd(II) sequestration. In addition, a part of Pb(II) and Cd(II) ions deposited
on the biosorbent surface due to microprecipitation.
(4) Solid-state NMR analysis indicated that the three main constitutes of WR,
i.e., cellulose, pectin and hemicellulose, were all capable of providing
binding sites to Pb(II) and Cd(II). For MS, it was found that cellulose,
hemicellulose and tannins were responsible for supplying binding sites to
Pb(II) and Cd(II). Additionally, significant differences were found in the
compositions of MS in different particle sizes; the drastically reduced
biosorption capacity of larger MS should be mainly caused by its more
crystalline structure and higher content of lignin.
(5) Despite the same underlying mechanisms in Pb(II) and Cd(II) biosorption
processes, the contributions of different mechanisms to Pb(II) and Cd(II)
biosorption were different. For instance, microprecipitation of Pb(II) was
more intense than that of Cd(II) as observed by SEM-EDX and XPS (O 1s
spectra), whereas ion exchange played a more important role in Cd(II)
biosorption than in Pb(II) biosorption.
(6) For developing commercial (bio)sorbents, amorphous cellulose, pectin and
hemicellulose which contain carboxyl groups and other active functional
groups (e.g., hydroxyl, ether and amine groups) could be promising

6. Comprehensive Elucidation of Biosorption Mechanisms
249
matrices, whereas lignin and (para)crystalline cellulose seemed not
preferable.
(7) Neither spectroscopic techniques nor other analytical methods can stand
alone for complete mechanistic elucidation. For example, it is not easy to
identify microprecipitation through FTIR, XPS or solid-state NMR analysis,
whereas SEM-EDX can give a distinct micrograph of the surface
precipitates. Superior to FTIR and XPS, solid-state NMR spectroscopy can
identify atoms or organic groups in different chemical environments, e.g.,
distinguishing carboxyl groups from pectin or hemicellulose. Yet, 13C
spectra give no information about O and N based functional groups. FTIR
and XPS can complement information in this respect, and the latter can also
examine the binding force of complexation. On the other hand, chemical
methods can further disclose a biosorption process. For example, EDX
spectra and XPS elemental analysis suggested the occurrence of ion
exchange given the disappearance of light metal ions (e.g., K, Ca and Mg)
after Pb(II) and Cd(II) biosorption in this study. The ion exchange
experiment further indicated that only Mg2+ and Ca2+ bound to the binding
sites on WR and MS significantly exchanged with Pb(II)/Cd(II) in solution,
and the disappearance of K from the surfaces of WR and MS was due to
natural dissolution. Also, the ion exchange experiment was capable of
quantifying the significance of ion exchange in the Pb(II) and Cd(II)
biosorption processes. Integrated investigations using different methods can
achieve a more reliable conclusion. For example, the peak at 287.829 ppm
in the XPS C 1s spectrum of WR and the peak at 287.941 ppm in the XPS

6. Comprehensive Elucidation of Biosorption Mechanisms
250
C 1s spectrum of MS were assigned to C=O, which could be the carbonyl
group in aldehydes and ketones, or the carboxyl group in carboxylic acids
and carboxylates (Moulder et al., 1992). However, the 13C solid-state NMR
spectra indicated the presence of cellulose, hemicellulose and pectin in WR,
and cellulose, tannins and hemicellulose in MS, in which the carbonyl
groups were negligible. Therefore, the C=O bonds in WR and MS were
assigned to carboxyl groups.
Accordingly, the complementary techniques and methods employed in this
mechanistic study presented a comprehensive and reliable elucidation of Pb(II) and
Cd(II) biosorption by fruit-waste-derived biosorbents. The findings will facilitate
the better process control and development of commercial (bio)sorbents.

6. Comprehensive Elucidation of Biosorption Mechanisms
251
Figure 6.27 Comprehensive mechanistic elucidation of Pb(II) and Cd(II)
biosorption by fruit-waste-derived biosorbents via the established methodology.
[M2+: Pb2+/Cd2+.]

7. Conclusions and Future Perspectives
252
7. Conclusions and Future Perspectives

7. Conclusions and Future Perspectives
253
Low-cost fruit waste materials are promising biosorbents for heavy metal
removal from wastewater. In this study, WR and MS exhibited highly efficient
biosorption of Pb(II) and Cd(II), with much higher Pb(II) biosorption capacities and
comparable Cd(II) biosorption capacities as compared with other fruit waste
materials reported in the literature. Column studies indicated that the WR-packed
bed column reactor maintained excellent biosorption performance on Pb(II) over
10 biosorption-desorption cycles, and the sequestered Pb(II) was rapidly eluted by
0.05 M HCl with the achievement of excellent Pb(II) recovery in concentrated
solutions. Mechanistic studies revealed the involvement of carboxyl, hydroxyl,
amine and ether groups from cellulose, pectin and hemicellulose in WR, and
cellulose, hemicellulose and tannins in MS in Pb(II) and Cd(II) biosorption, with
electrostatic attraction, complexation, ion exchange (with Ca2+ and Mg2+), and
microprecipitation as the underlying mechanisms. The modeling method, QCS,
further interpreted the biosorption nature at a molecular level, verifying the
feasibility of heavy metal complexation with the active functional groups and
indicating the preference of heavy metal binding to carboxyl groups. It is inferred
that pectin, hemicellulose and amorphous cellulose are promising matrices for
developing commercial (bio)sorbents for heavy metal removal.
Findings in this study provided important insights into the potential of WR
and MS for scale-up Pb(II) and Cd(II) biosorption from (waste)water, especially
the practicability of Pb(II) removal/recovery by WR. Furthermore, the hybrid
mechanistic methodology developed in this study not only shed light on the
mechanisms of Pb(II) and Cd(II) biosorption by fruit waste materials, it should also
be helpful to other relevant environmental studies as interactions between an

7. Conclusions and Future Perspectives
254
adsorbate and a biological surface is involved in most natural and environmental
processes.
Last but not least, there are a number of blind spots in this study and further
research efforts are required.
(1) This study exhaustively deciphered the active binding sites for Pb(II) and
Cd(II) biosorption, as well as the biosorption mechanisms involved.
However, some specifics of the interactions between Pb(II)/Cd(II) and the
biosorbent surface are still ambiguous. For example, the XPS O 1s spectra
identified the solid precipitates on the biosorbent surface, which were also
observed by SEM, as metal oxides (PbO/CdO). It remains ambiguous what
the precursors (e.g., metal hydroxides and/or metal carbonates) of the metal
oxides are. Furthermore, how did the precursors convert to metal oxides?
(2) Extended X-ray absorption fine structure (EXAFS) measurement could be
a useful analytical technique to further disclose the details of the
complexation mechanisms in this study. It may provide crucial information
about the structures of the Pb and Cd complexes (e.g., coordination number
and bond length) generated in biosorption (Dithmer et al., 2016).
(3) As an advanced spectroscopic technique, solid-state NMR spectroscopy has
the potential to provide more useful information about the structures of the
biosorbents, their interactions with heavy metal ions, and even the dynamics
of the interaction. More specialized knowledge and analytical technologies
in solid-state NMR spectroscopy are required to be developed for better
biomass characterization and mechanistic elucidation.

7. Conclusions and Future Perspectives
255
(4) To further evaluate the biosorption performance of WR and MS, real heavy-
metal-bearing wastewater, e.g., electroplating effluents and landfill leachate,
needs to be used.
(5) Life cycle assessment can be used to assess the environmental impact
associated with all the stages of the life of WR and MS, so as to evaluate the
competitiveness of fruit-waste-derived biosorbents in comparison with
commercial ion-exchangers and adsorbents for pollutants removal.

Appendices
256
Appendices
Table A1 Assignments of 13C CP-MAS NMR bands of model biopolymers.
Chemical shift (ppm) Assignment
181.58 Carboxyl-C in lignin
146.82 (154-140) Aromatic C-O in lignin
140-100 Aromatic C in lignin
54.74 Methoxyl-C in lignin
104.57 (Para)crystalline cellulose C-1
88.23 (Para)crystalline cellulose C-4
83.39 Amorphous cellulose C-4
76-70 Cellulose C-2, 3, 5
64.72 (Para)crystalline cellulose C-6
62.04 Amorphous cellulose C-6
170.54 Carboxyl-C of acetyl group in pectin
100.01 Pectin C-1
79.35 Pectin C-2
73-68 Pectin C-3, 4, 5
52.96 Methyl ester-C in pectin

Appendices
257
Table A2 Experimental design derived from CCD of RSM.
Run Code values Real values DEe
(%)
DEp
(%)
Resid
ual
Categorical
factor level x1 x2 x3 X1 X2 X3
1 -1 -1 -1 4 0.2 1 89.45 90.19 -0.74
Factorial
points
(2k=8)
2 1 -1 -1 8 0.2 1 73.01 76.89 -3.88
3 -1 1 -1 4 0.6 1 97.22 98.87 -1.65
4 1 1 -1 8 0.6 1 93.64 93.56 0.08
5 -1 -1 1 4 0.2 3 95.18 96.07 -0.89
6 1 -1 1 8 0.2 3 91.70 90.86 0.84
7 -1 1 1 4 0.6 3 97.06 94.00 3.06
8 1 1 1 8 0.6 3 96.70 96.78 -0.08
9 -1.682 0 0 2.64 0.4 2 98.86 99.12 -0.26
Star points
(6)
10 1.682 0 0 9.36 0.4 2 91.70 90.27 1.43
11 0 -1.682 0 6 0.064 2 87.56 85.16 2.40
12 0 1.682 0 6 0.74 2 96.22 97.44 -1.22
13 0 0 -1.682 6 0.4 0.32 90.45 87.16 3.29
14 0 0 1.682 6 0.4 3.68 92.70 94.81 -2.11
15 0 0 0 6 0.4 2 92.31 95.19 -2.88
Central
points
(6)
16 0 0 0 6 0.4 2 96.62 95.19 1.43
17 0 0 0 6 0.4 2 95.21 95.19 0.02
18 0 0 0 6 0.4 2 95.38 95.19 0.19
19 0 0 0 6 0.4 2 95.77 95.19 0.58
20 0 0 0 6 0.4 2 95.69 95.19 0.50
(Notes: DEe - Experimental desorption efficiency; DEP - Predicted desorption efficiency.)

Appendices
258
Table A3 ANOVA for RSM analysis.
Source Sum of
squares df.
Mean
Square F-value
p-value
Prob>F
Model 523.57 9 58.17 8.98 0.0010 Significant
A-S/L 94.38 1 94.38 14.57 0.0034
B-Acid conc. 181.92 1 181.92 28.08 0.0003
C-Time 70.84 1 70.84 10.93 0.0079
AB 31.92 1 31.92 4.93 0.0507
AC 32.72 1 32.72 5.05 0.0484
BC 57.89 1 57.89 8.93 0.0136
A2 0.45 1 0.45 0.070 0.7973
B2 27.26 1 27.26 4.21 0.0674
C2 31.86 1 31.86 4.92 0.0509
Lack of Fit 53.84 5 10.77 4.91 0.0527 Not significant
Std. Dev. 2.55
Mean 93.12
C.V.% 2.73
R2 0.89
Adj. R2 0.79
Pred. R2 0.25

Appendices
259
Figure A1 Speciation of heavy metal ions at different pH.
[Initial metal concentrations of 1 mM, simulated by Visual MINTEQ 3.1.]
0
20
40
60
80
100
5.0 6.0 7.0 7.5
Per
cen
tag
e o
f fr
ee i
on
s (%
)
pH
Cd(II) Pb(II) Cu(II) Zn(II) Ni(II) Cr(III)

Appendices
260
Figure A2 Kinetics of Pb(II) and Cd(II) biosorption by WR.
[Initial metal concentration of 500 ppm, pH 5.0 for Pb(II) and 7.0 for Cd(II)
biosorption, 1.0 g/L WR, 250 rpm, 298 K.]
0
50
100
150
200
0 100 200 300 400 500 600
Q (
mg
/g)
Time (min)
Pb(II)
Cd(II)

Appendices
261
Figure A3 13C CP-MAS NMR spectrum of cellulose.
[Collected by Prof. Nielsen and Mr. Anders Bruhn Arndal Andersen of University
of Southern Denmark.]
020406080100120140160180200Chemical shift (ppm)
Cellulose
(Par
a)cr
yst
alli
ne
C-1
(Par
a)cr
yst
alli
ne
C-4
Am
orp
ho
us
C-4
C-2, 3, 5
(Par
a)cr
yst
alli
ne
C-6
Am
orp
ho
us
C-6

Appendices
262
Figure A4 13C CP-MAS NMR spectrum of pectin.
020406080100120140160180200Chemical shift (ppm)
Car
bo
xyl-
Co
fes
ter
gro
up
C-1
C-2
Met
hyl-
Co
fes
ter
gro
up
C-3
,4
,5Pectin

Appendices
263
Figure A5 13C CP-MAS NMR spectrum of lignin.
[Collected by Prof. Nielsen and Mr. Anders Bruhn Arndal Andersen of University
of Southern Denmark.]
020406080100120140160180200Chemical shift (ppm)
Lignin
Car
bo
xyl-
C
Aro
mat
icC
-O
Aromatic C
Met
ho
xyl-
C

Appendices
264
Figure A6 Cd(II) biosorption capacities and light metal ion contents of WR in
different particle sizes.
[Initial Cd(II) concentration of 50 ppm, 0.5 g/L WR, pH 7.0, 1.0 g/L WR in 0.05 M
HNO3 for 24 h for the light metal ion release.]
0
5
10
15
20
25
30
35
0
0.1
0.2
0.3
0.4
0.5
<180 180-500 500-1000
Q (
mg
/g)
Met
al
con
ten
t (m
mo
l/g
)
Particle size (µm)
Ca(II) Mg(II) Q_Cd(II)

Appendices
265
Figure A7 Simulation of the breakthrough curves of Pb(II) biosorption in the WR-
packed bed column reactor by the Thomas model.
[The first and fourth cycle were selected as the representatives to avoid overlap.]
0
0.2
0.4
0.6
0.8
1
0 0.2 0.4 0.6 0.8 1 1.2 1.4 1.6 1.8
Ct/C
0
V(L)
Experiment (1st)
Model (1st)
Experiment (4th)
Model (4th)

Appendices
266
Figure A8 Breakthrough curves of Cd(II) biosorption in the WR-packed bed
column reactor.
0
0.2
0.4
0.6
0.8
1
0 200 400 600 800 1000
Ct/C
0
Time (min)
1st cycle
2nd cycle

Appendices
267
Figure A9 Structures of the main biopolymers contained in WR and MS.
[Lignin structure from (Fu et al., 2016) and tannin structure from (Sionkowska et
al., 2014).]

Appendices
268
Figure A10 13C CP-MAS NMR spectrum of pristine WR with spectral
deconvolution.

Appendices
269
Figure A11 13C CP-MAS NMR spectrum of Pb-loaded WR with spectral
deconvolution.

Appendices
270
Figure A12 13C CP-MAS NMR spectrum of Cd-loaded WR with spectral
deconvolution.
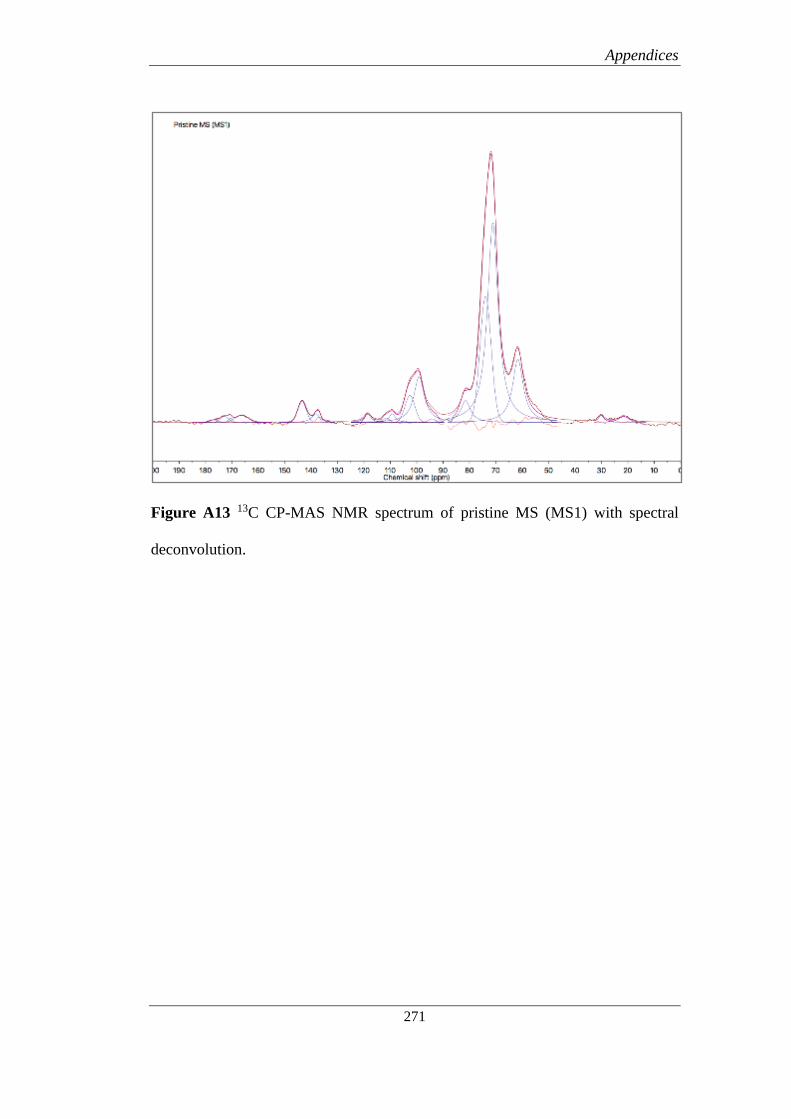
Appendices
271
Figure A13 13C CP-MAS NMR spectrum of pristine MS (MS1) with spectral
deconvolution.

Appendices
272
Figure A14 13C CP-MAS NMR spectrum of Pb-loaded MS with spectral
deconvolution.

Appendices
273
Figure A15 13C CP-MAS NMR spectrum of Cd-loaded MS with spectral
deconvolution.

Appendices
274
Figure A16 13C CP-MAS NMR spectrum of MS2 (180-500 µm) with spectral
deconvolution.

Appendices
275
Figure A17 13C CP-MAS NMR spectrum of MS3 (500-1000 µm) with spectral
deconvolution.

References
276
References
Abdolali, A., Ngo, H.H., Guo, W.S., Zhou, J.L., Du, B., Wei, Q., Wang, X.C.C. and
Nguyen, P.D. (2015) Characterization of a multi-metal binding biosorbent:
Chemical modification and desorption studies. Bioresource Technology 193,
477-487.
Abidin, M.A.Z., Jalil, A.A., Triwahyono, S., Adam, S.H. and Kamarudin, N.H.N.
(2011) Recovery of gold(III) from an aqueous solution onto a durio zibethinus
husk. Biochemical Engineering Journal 54(2), 124-131.
Abo-Farha, S.A., Abdel-Aal, A.Y., Ashour, I.A. and Garamon, S.E. (2009)
Removal of some heavy metal cations by synthetic resin purolite C100.
Journal of Hazardous Materials 169(1-3), 190-194.
Aharoni, C. and Sparks, D.L. (1991) Kinetics of soil chemical reactions-A
theoretical treatment. Research, 1-18.
Aharoni, C. and Ungarish, M. (1977) Kinetics of activated chemisorption. Part 2-
Theoretical models. Journal of the Chemical Society, Faraday Transactions 1:
Physical Chemistry in Condensed Phases 73, 456-464.
Ahmad, A., Bhat, A.H. and Buang, A. (2018) Biosorption of transition metals by
freely suspended and Ca-alginate immobilised with Chlorella vulgaris:
Kinetic and equilibrium modeling. Journal of Cleaner Production 171, 1361-
1375.
Ahmad, A., Khatoon, A., Mohd-Setapar, S.-H., Kumar, R. and Rafatullah, M. (2015)
Chemically oxidized pineapple fruit peel for the biosorption of heavy metals
from aqueous solutions. Desalination and Water Treatment 57(14), 1-11.
Akar, S.T., Arslan, S., Alp, T., Arslan, D. and Akar, T. (2012) Biosorption potential
of the waste biomaterial obtained from Cucumis melo for the removal of Pb2+
ions from aqueous media: Equilibrium, kinetic, thermodynamic and
mechanism analysis. Chemical Engineering Journal 185, 82-90.
Aksu, Z. and Tezer, S. (2005) Biosorption of reactive dyes on the green alga
Chlorella vulgaris. Process Biochemistry 40(3-4), 1347-1361.
Albadarin, A.B., Al-Muhtaseb, A.a.H., Al-laqtah, N.A., Walker, G.M., Allen, S.J.
and Ahmad, M.N.M. (2011) Biosorption of toxic chromium from aqueous
phase by lignin: mechanism, effect of other metal ions and salts. Chemical
Engineering Journal 169(1-3), 20-30.
Alencar, W.S., Acayanka, E., Lima, E.C., Royer, B., de Souza, F.E., Lameira, J.
and Alves, C.N. (2012) Application of Mangifera indica (mango) seeds as a

References
277
biosorbent for removal of Victazol Orange 3R dye from aqueous solution and
study of the biosorption mechanism. Chemical Engineering Journal 209, 577-
588.
Ali, R.M., Hamad, H.A., Hussein, M.M. and Malash, G.F. (2016) Potential of using
green adsorbent of heavy metal removal from aqueous solutions: Adsorption
kinetics, isotherm, thermodynamic, mechanism and economic analysis.
Ecological Engineering 91, 317-332.
Allen, L.C. (1989) Electronegativity is the average one-electron energy of the
valence-shell electrons in ground-state free atoms. Journal of the American
Chemical Society 111(25), 9003-9014.
Asgher, M. and Bhatti, H.N. (2010) Mechanistic and kinetic evaluation of
biosorption of reactive azo dyes by free, immobilized and chemically treated
Citrus sinensis waste biomass. Ecological Engineering 36(12), 1660-1665.
Assamoi, B. and Lawryshyn, Y. (2012) The environmental comparison of
landfilling vs. incineration of MSW accounting for waste diversion. Waste
Management 32(5), 1019-1030.
Ay, C.O., Ozcan, A.S., Erdogan, Y. and Ozcan, A. (2012) Characterization of
Punica granatum L. peels and quantitatively determination of its biosorption
behavior towards lead(II) ions and Acid Blue 40. Colloids and Surfaces B-
Biointerfaces 100, 197-204.
Banerjee, K., Ramesh, S., Gandhimathi, R., Nidheesh, P. and Bharathi, K. (2012)
A novel agricultural waste adsorbent, watermelon shell for the removal of
copper from aqueous solutions. Iranica Journal of Energy and Environment
3(2), 143-156.
Ben-Ali, S., Jaouali, I., Souissi-Najar, S. and Ouederni, A. (2017) Characterization
and adsorption capacity of raw pomegranate peel biosorbent for copper
removal. Journal of Cleaner Production 142, 3809-3821.
Bhatnagar, A., Minocha, A.K., Kumar, E., Sillanpaa, M. and Jeon, B.H. (2009)
Removal of phenolic pollutants from water utilizing Mangifera indica
(Mango) seed waste and cement fixation. Separation Science and Technology
44(13), 3150-3169.
Bohart, G. and Adams, E. (1920) Some aspects of the behavior of charcoal with
respect to chlorine. Journal of the Franklin Institute 189(5), 669.
Calero, M., Hernáinz, F., Blázquez, G., Tenorio, G. and Martín-Lara, M. (2009)
Study of Cr (III) biosorption in a fixed-bed column. Journal of Hazardous
Materials 171(1-3), 886-893.
Camarillo, R., Llanos, J., Garcia-Fernandez, L., Perez, A. and Canizares, P. (2010)
Treatment of copper (II)-loaded aqueous nitrate solutions by polymer

References
278
enhanced ultrafiltration and electrodeposition. Separation and Purification
Technology 70(3), 320-328.
Castro, R.S.D., Caetano, L., Ferreira, G., Padilha, P.M., Saeki, M.J., Zara, L.F.,
Martines, M.A.U. and Castro, G.R. (2011) Banana peel applied to the solid
phase extraction of copper and lead from river water: Preconcentration of
metal ions with a fruit waste. Industrial & Engineering Chemistry Research
50(6), 3446-3451.
Chand, P., Shil, A.K., Sharma, M. and Pakade, Y.B. (2014) Improved adsorption
of cadmium ions from aqueous solution using chemically modified apple
pomace: Mechanism, kinetics, and thermodynamics. International
Biodeterioration & Biodegradation. 90, 8-16.
Chand, R., Narimura, K., Kawakita, H., Ohto, K., Watari, T. and Inoue, K. (2009)
Grape waste as a biosorbent for removing Cr(VI) from aqueous solution.
Journal of Hazardous Materials 163(1), 245-250.
Chang, J.H., Ellis, A.V., Yan, C.T. and Tung, C.H. (2009a) The electrochemical
phenomena and kinetics of EDTA-copper wastewater reclamation by
electrodeposition and ultrasound. Separation and Purification Technology
68(2), 216-221.
Chang, Q. and Wang, G. (2007) Study on the macromolecular coagulant PEX
which traps heavy metals. Chemical Engineering Science 62(17), 4636-4643.
Chang, Q., Zhang, M. and Wang, J.X. (2009b) Removal of Cu2+ and turbidity from
wastewater by mercaptoacetyl chitosan. Journal of Hazardous Materials
169(1-3), 621-625.
Chao, H.P. and Chang, C.C. (2012) Adsorption of copper(II), cadmium(II),
nickel(II) and lead(II) from aqueous solution using biosorbents. Adsorption-
Journal of the International Adsorption Society 18(5-6), 395-401.
Chao, H.P., Chang, C.C. and Nieva, A. (2014) Biosorption of heavy metals on
Citrus maxima peel, passion fruit shell, and sugarcane bagasse in a fixed-bed
column. Journal of Industrial and Engineering Chemistry 20(5), 3408-3414.
Charerntanyarak, L. (1999) Heavy metals removal by chemical coagulation and
precipitation. Water Science and Technology 39(10-11), 135-138.
Chatterjee, A. and Schiewer, S. (2011) Biosorption of cadmium(II) ions by citrus
peels in a packed bed column: Effect of process parameters and comparison
of different breakthrough curve models. Clean-Soil Air Water 39(9), 874-881.
Chaudhari, S.A. and Singhal, R.S. (2015) Cutin from watermelon peels: A novel
inducer for cutinase production and its physicochemical characterization.
International Journal of Biological Macromolecules 79, 398-404.

References
279
Chen, J.P. and Yang, L. (2006) Study of a heavy metal biosorption onto raw and
chemically modified Sargassum sp via spectroscopic and modeling analysis.
Langmuir 22(21), 8906-8914.
Chen, Q.Y., Luo, Z., Hills, C., Xue, G. and Tyrer, M. (2009) Precipitation of heavy
metals from wastewater using simulated flue gas: Sequent additions of fly ash,
lime and carbon dioxide. Water Research 43(10), 2605-2614.
Cheng, H.F. and Hu, Y.A. (2010) Lead (Pb) isotopic fingerprinting and its
applications in lead pollution studies in China: A review. Environmental
Pollution 158(5), 1134-1146.
Choinska-Pulit, A., Sobolczyk-Bednarek, J. and Laba, W. (2018) Optimization of
copper, lead and cadmium biosorption onto newly isolated bacterium using a
Box-Behnken design. Ecotoxicology and Environmental Safety 149, 275-283.
Chong, K. and Volesky, B. (1996) Metal biosorption equilibria in a ternary system.
Biotechnology and Bioengineering 49(6), 629-638.
Cid, H.A., Flores, M.I., Pizarro, J.F., Castillo, X.A., Barros, D.E., Moreno-Pirajan,
J.C. and Ortiz, C.A. (2018) Mechanisms of Cu2+ biosorption on Lessonia
nigrescens dead biomass: Functional groups interactions and morphological
characterization. Journal of Environmental Chemical Engineering 6(2), 2696-
2704.
Dalal, R. (1974) Desorption of soil phosphate by anion ‐ exchange resin.
Communications in Soil Science & Plant Analysis 5(6), 531-538.
Davidovich, R.L., Stavila, V., Marinin, D.V., Voit, E.I. and Whitmire, K.H. (2009)
Stereochemistry of lead(II) complexes with oxygen donor ligands.
Coordination Chemistry Reviews 253(9-10), 1316-1352.
Deniz, F. and Karabulut, A. (2017) Biosorption of heavy metal ions by chemically
modified biomass of coastal seaweed community: Studies on
phycoremediation system modeling and design. Ecological Engineering 106,
101-108.
Desai, K.M., Survase, S.A., Saudagar, P.S., Lele, S.S. and Singhal, R.S. (2008)
Comparison of artificial neural network (ANN) and response surface
methodology (RSM) in fermentation media optimization: Case study of
fermentative production of scleroglucan. Biochemical Engineering Journal
41(3), 266-273.
Dias, J.M., Alvim-Ferraz, M.C.M., Almeida, M.F., Rivera-Utrilla, J. and Sanchez-
Polo, M. (2007) Waste materials for activated carbon preparation and its use
in aqueous-phase treatment: A review. Journal of Environmental
Management 85(4), 833-846.

References
280
Dick-Perez, M., Zhang, Y.A., Hayes, J., Salazar, A., Zabotina, O.A. and Hong, M.
(2011) Structure and interactions of plant cell-wall polysaccharides by two-
and three-dimensional magic-angle-spinning solid-state NMR. Biochemistry
50(6), 989-1000.
Dithmer, L., Lipton, A. S., Reitzel, K., Warner, T. E., Lundberg, D. and Nielsen, U.
G. (2015) Characterization of phosphate sequestration by a lanthanum
modified bentonite clay: a solid-state NMR, EXAFS, and PXRD
study. Environmental Science and Technology 49(7), 4559-4566.
Duan, J.C., Lu, Q., Chen, R.W., Duan, Y.Q., Wang, L.F., Gao, L. and Pan, S.Y.
(2010) Synthesis of a novel flocculant on the basis of crosslinked Konjac
glucomannan-graft-polyacrylamide-co-sodium xanthate and its application in
removal of Cu2+ ion. Carbohydrate Polymers 80(2), 436-441.
Dubinin, M.M. and Radushkevich, L.V. (1947) Equation of the characteristic curve
of activated charcoal. Proceedings of the Academy of Sciences of the USSR,
Physical Chemistry Section 55, 331-333.
FAOSTAT (2016) Food and agricultural commodities production, Food and
Agricultural Organization of United Nations: Economic and Social
Department: The Statistical Division.
Farinella, N.V., Matos, G.D. and Arruda, M.A.Z. (2007) Grape bagasse as a
potential biosorbent of metals in effluent treatments. Bioresource Technology
98(10), 1940-1946.
Farinella, N.V., Matos, G.D., Lehmann, E.L. and Arruda, M.A.Z. (2008) Grape
bagasse as an alternative natural adsorbent of cadmium and lead for effluent
treatment. Journal of Hazardous Materials 154(1-3), 1007-1012.
Feng, N., Guo, X., Liang, S., Zhu, Y. and Liu, J. (2011) Biosorption of heavy metals
from aqueous solutions by chemically modified orange peel. Journal of
Hazardous Materials 185(1), 49-54.
Focher, B., Palma, M.T., Canetti, M., Torri, G., Cosentino, C. and Gastaldi, G.
(2001) Structural differences between non-wood plant celluloses: evidence
from solid state NMR, vibrational spectroscopy and X-ray diffractometry.
Industrial Crops & Products 13(3), 193-208.
Fomina, M. and Gadd, G.M. (2014) Biosorption: Current perspectives on concept,
definition and application. Bioresource Technology 160, 3-14.
Fontana, I.B., Peterson, M. and Cechinel, M.A.P. (2018) Application of brewing
waste as biosorbent for the removal of metallic ions present in groundwater
and surface waters from coal regions. Journal of Environmental Chemical
Engineering.

References
281
Franca, A.S., Oliveira, L.S., Saldanha, S.A., Santos, P.I.A. and Salum, S.S. (2010)
Malachite green adsorption by mango (Mangifera indica L.) seed husks:
Kinetic, equilibrium and thermodynamic studies. Desalination and Water
Treatment 19(1-3), 241-248.
Freitas, J.C.C., Bonagamba, T.J. and Emmerich, F.G. (2001) Investigation of
biomass- and polymer-based carbon materials using 13C high-resolution
solid-state NMR. Carbon 39(4), 535-545.
Freundlich, H. (1906) Over the adsorption in solution. The Journal of Physical
Chemistry 57(385), e470.
Friis, N. and Myerskeith, P. (1986) Biosorption of uranium and lead by
streptomyces longwoodensis. Biotechnology and Bioengineering 28(1), 21-
28.
Frisch, M.J., Trucks, G. W., Schlegel, H. B., Scuseria, G. E., Robb, M. A.,
Cheeseman, J. R., Scalmani, G., Barone,V., Mennucci, B., Petersson, G. A.,
Nakatsuji, H., Caricato, M., Li, X., Hratchian, H. P., Izmaylov, A. F., Bloino,
J., Zheng, G., Sonnenberg, J. L., Hada, M., Ehara, M., Toyota, K., Fukuda,
R., Hasegawa, J., Ishida, M., Nakajima, T., Honda, Y., Kitao, O., Nakai, H.,
Vreven, T., Montgomery Jr, J. A., Peralta, J. E., Ogliaro, F., Bearpark, M.,
Heyd, J. J., Brothers, E., Kudin, K. N., Staroverov, V. N., Keith, T.,
Kobayashi, R., Normand, J., Raghavachari, K., Rendell, A., Burant, J.
C.,Iyengar, S. S., Tomasi, J., Cossi, M., Rega, N., Millam, J. M., Klene, M.,
Knox, J. E., Cross, J. B., Bakken, V., Adamo, C., Jaramillo, J., Gomperts, R.,
Stratmann, R. E., Yazyev, O., Austin, A. J., Cammi, R., Pomelli, C.,
Ochterski, J. W., Martin, R. L., Morokuma, K., Zakrzewski, V. G., Voth, G.
A., Salvador, P., Dannenberg, J. J., Dapprich, S., Daniels, A. D., Farkas,O.,
Foresman, J. B., Ortiz, J. V., Cioslowski, J. and Fox, D. J. (2009) Gaussian
09, Revision D.01.
Fu, F. and Wang, Q. (2011) Removal of heavy metal ions from wastewaters: A
review. Journal of Environmental Management 92(3), 407-418.
Fu, L., McCallum, S., Miao, J.J., Hart, C., Tudryn, G., Zhang, F.M. and Linhardt,
R. (2016) Rapid and accurate determination of the lignin content of
lignocellulosic biomass by solid-state NMR. Fuel 141, 39-45.
Gamble, G.R., Akin, D.E., Makkar, H.P.S. and Becker, K. (1996) Biological
degradation of tannins in sericea lespedeza (Lespedeza cuneta) by the white
rot fungi Ceriporiopsis subvermispora and Cyathus stercoreus analyzed by
solid-state C-13 nuclear magnetic resonance spectroscopy. Applied and
Environmental Microbiology 62(10), 3600-3604.

References
282
Gao, X.P., Zhang, Y. and Zhao, Y.M. (2017) Biosorption and reduction of Au (III)
to gold nanoparticles by thiourea modified alginate. Carbohydrate Polymers
159, 108-115.
Gerola, G.P., Boas, N.V., Caetano, J., Tarley, C.R.T., Goncalves, A.C. and
Dragunski, D.C. (2013) Utilization of passion fruit skin by-product as lead(II)
ion biosorbent. Water Air and Soil Pollution 224(2).
Girardi, F., Hackbarth, F.V., de Souza, S., de Souza, A.A.U., Boaventura, R.A.R.
and Vilar, V.J.P. (2014) Marine macroalgae Pelvetia canaliculata (Linnaeus)
as natural cation exchanger for metal ions separation: A case study on copper
and zinc ions removal. Chemical Engineering Journal 247, 320-329.
Goel, J., Kadirvelu, K., Rajagopal, C. and Garg, V.K. (2005) Removal of lead(II)
by adsorption using treated granular activated carbon: Batch and column
studies. Journal of Hazardous Materials 125(1-3), 211-220.
Goldstein, J.I., Newbury, D.E., Michael, J.R., Ritchie, N.W., Scott, J.H.J. and Joy,
D.C. (2017) Scanning Electron Microscopy and X-ray Microanalysis. New
York: Springer New York.
Gonzalez-Munoz, M.J., Rodriguez, M.A., Luque, S. and Alvarez, J.R. (2006)
Recovery of heavy metals from metal industry waste waters by chemical
precipitation and nanofiltration. Desalination 200(1-3), 742-744.
Greene, K.L. and Tonjes, D.J. (2014) Quantitative assessments of municipal waste
management systems: Using different indicators to compare and rank
programs in New York State. Waste Management 34(4), 825-836.
Griffiths, P.R. and De Haseth, J.A. (2006) Fourier Transform Infrared Spectrometry.
Second Edition. New York: John Wiley & Sons.
Gunay, A., Arslankaya, E. and Tosun, I. (2007) Lead removal from aqueous
solution by natural and pretreated clinoptilolite: Adsorption equilibrium and
kinetics. Journal of Hazardous Materials 146(1-2), 362-371.
Gupta, V.K. and Rastogi, A. (2008) Biosorption of lead from aqueous solutions by
green algae Spirogyra species: Kinetics and equilibrium studies. Journal of
Hazardous Materials 152(1), 407-414.
Gupta, V.K. and Rastogi, A. (2009) Biosorption of hexavalent chromium by raw
and acid-treated green alga Oedogonium hatei from aqueous solutions.
Journal of Hazardous Materials 163(1), 396-402.
Habets, S., de Wild, P.J., Huijgen, W.J.J. and van Eck, E.R.H. (2013) The influence
of thermochemical treatments on the lignocellulosic structure of wheat straw
as studied by natural abundance 13C NMR. Bioresource Technology 146, 585-
590.

References
283
Hackbarth, F.V., Girardi, F., Santos, J.C., de Souza, A.A.U., Boaventura, R.A.R.,
de Souza, S. and Vilar, V.J.P. (2015) Ion-exchange breakthrough curves for
single and multi-metal systems using marine macroalgae Pelvetia
canaliculata as a natural cation exchanger. Chemical Engineering Journal 269,
359-370.
He, J. and Chen, J.P. (2014) A comprehensive review on biosorption of heavy
metals by algal biomass: Materials, performances, chemistry, and modeling
simulation tools. Bioresource Technology 160, 67-78.
Heidmann, I. and Calmano, W. (2008) Removal of Zn(II), Cu(II), Ni(II), Ag(I) and
Cr(VI) present in aqueous solutions by aluminium electrocoagulation. Journal
of Hazardous Materials 152(3), 934-941.
Henrique, M.A., Silverio, H.A., Neto, W.P.F. and Pasquini, D. (2013) Valorization
of an agro-industrial waste, mango characterization of its cellulose
nanocrystals. Journal of Environmental Management 121, 202-209.
HK, G. (2015) Report of the task force on investigation of excessive lead content
in drinking water, Hong Kong SAR Government.
Ho, Y., Porter, J. and McKay, G. (2002) Equilibrium isotherm studies for the
sorption of divalent metal ions onto peat: copper, nickel and lead single
component systems. Water, Air, and Soil Pollution 141(1-4), 1-33.
Ho, Y.S. (2006) Isotherms for the sorption of lead onto peat: Comparison of linear
and non-linear methods. Polish Journal of Environmental Studies 15(1), 81-
86.
Ho, Y.S., Chiu, W.T. and Wang, C.C. (2005) Regression analysis for the sorption
isotherms of basic dyes on sugarcane dust. Bioresource Technology 96(11),
1285-1291.
Ho, Y.S. and McKay, G. (1999) Pseudo-second order model for sorption processes.
Process biochemistry 34(5), 451-465.
Ho, Y.S. and McKay, G. (2002) Application of kinetic models to the sorption of
copper(II) on to peat. Adsorption Science & Technology 20(8), 797-815.
Hui, K.S., Chao, C.Y.H. and Kot, S.C. (2005) Removal of mixed heavy metal ions
in wastewater by zeolite 4A and residual products from recycled coal fly ash.
Journal of Hazardous Materials 127(1-3), 89-101.
Iqbal, M., Saeed, A. and Zafar, S.I. (2009a) FTIR spectrophotometry, kinetics and
adsorption isotherms modeling, ion exchange, and EDX analysis for
understanding the mechanism of Cd2+ and Pb2+ removal by mango peel waste.
Journal of Hazardous Materials 164(1), 161-171.

References
284
Iqbal, M., Schiewer, S. and Cameron, R. (2009b) Mechanistic elucidation and
evaluation of biosorption of metal ions by grapefruit peel using FTIR
spectroscopy, kinetics and isotherms modeling, cations displacement and
EDX analysis. Journal of Chemical Technology and Biotechnology 84(10),
1516-1526.
Isaac, C.P.J. and Sivakumar, A. (2013) Removal of lead and cadmium ions from
water using Annona squamosa shell: Kinetic and equilibrium studies.
Desalination and Water Treatment 51(40-42), 7700-7709.
Jacques, R.A., Lima, E.C., Dias, S.L.R., Mazzocato, A.C. and Pavan, F.A. (2007)
Yellow passion-fruit shell as biosorbent to remove Cr(III) and Pb(II) from
aqueous solution. Separation and Purification Technology 57(1), 193-198.
Jalil, A.A., Triwahyono, S., Yaakob, M.R., Azmi, Z.Z.A., Sapawe, N., Kamarudin,
N.H.N., Setiabudi, H.D., Jaafar, N.F., Sidik, S.M., Adam, S.H. and Hameed,
B.H. (2012) Utilization of bivalve shell-treated Zea mays L. (maize) husk leaf
as a low-cost biosorbent for enhanced adsorption of malachite green.
Bioresource Technology 120, 218-224.
Järup, L. (2003) Hazards of heavy metal contamination. British medical bulletin
68(1), 167-182.
Jarvis, M.C. and Apperley, D.C. (1990) Direct observation of cell-wall structure in
living plant-tissues by solid-state C-13 NMR spectroscopy. Plant Physiology
92(1), 61-65.
Jenkins, R. and Snyder, R.L. (1996) Introduction to X-ray Powder Diffractometry
(Volume 138), Wiley Online Library.
Jin, L. and Bai, R.B. (2002) Mechanisms of lead adsorption on chitosan/PVA
hydrogel beads. Langmuir 18(25), 9765-9770.
Jin, Y., Teng, C.Y., Yu, S.M., Song, T., Dong, L.Y., Liang, J.S., Bai, X., Liu, X.S.,
Hu, X.J. and Qu, J.J. (2018) Batch and fixed-bed biosorption of Cd(II) from
aqueous solution using immobilized Pleurotus ostreatus spent substrate.
Chemosphere 191, 799-808.
Jing, Y.D., He, Z.L. and Yang, X.E. (2007) Effects of pH, organic acids, and
competitive cations on mercury desorption in soils. Chemosphere 69(10),
1662-1669.
Jossens, L., Prausnitz, J.M., Fritz, W., Schlunder, E.U. and Myers, A.L. (1978)
Thermodynamics of multi-solute adsorption from dilute aqueous-solutions.
Chemical Engineering Science 33(8), 1097-1106.
Jusoh, A., Shiung, L.S., Ali, N. and Noor, M. (2007) A simulation study of the
removal efficiency of granular activated carbon on cadmium and lead.
Desalination 206(1-3), 9-16.

References
285
Kalmykova, Y., Stromvall, A.M. and Steenari, B.M. (2008) Adsorption of Cd, Cu,
Ni, Pb and Zn on Sphagnum peat from solutions with low metal
concentrations. Journal of Hazardous Materials 152(2), 885-891.
Kamala, C.T., Chu, K.H., Chary, N.S., Pandey, P.K., Ramesh, S.L., Sastry, A.R.K.
and Sekhar, K.C. (2005) Removal of arsenic(III) from aqueous solutions
using fresh and immobilized plant biomass. Water Research 39(13), 2815-
2826.
Kang, K.C., Kim, S.S., Choi, J.W. and Kwon, S.H. (2008) Sorption of Cu2+ and
Cd2+ onto acid- and base-pretreated granular activated carbon and activated
carbon fiber samples. Journal of Industrial and Engineering Chemistry 14(1),
131-135.
Keenan, M.H., Belton, P.S., Matthew, J.A. and Howson, S.J. (1985) A 13C-nmr
study of sugar-beet pectin. Carbohydrate Research 138(1), 168-170.
Khambhaty, Y., Mody, K., Basha, S. and Jha, B. (2009) Kinetics, equilibrium and
thermodynamic studies on biosorption of hexavalent chromium by dead
fungal biomass of marine Aspergillus niger. Chemical Engineering Journal
145(3), 489-495.
Khan, S., Shahnaz, M., Jehan, N., Rehman, S., Shah, M.T. and Din, I. (2013)
Drinking water quality and human health risk in Charsadda district, Pakistan.
Journal of Cleaner Production 60, 93-101.
Khani, M.H., Keshtkar, A.R., Ghannadi, M. and Pahlavanzadeh, H. (2008)
Equilibrium, kinetic and thermodynamic study of the biosorption of uranium
onto Cystoseria indica algae. Journal of Hazardous Materials 150(3), 612-618.
Khaskheli, M.I., Memon, S.Q., Siyal, A.N. and Khuhawar, M.Y. (2011) Use of
orange peel waste for arsenic remediation of drinking water. Waste and
Biomass Valorization 2(4), 423-433.
Khormaei, M., Nasernejad, B., Edrisi, M. and Eslamzadeh, T. (2007) Copper
biosorption from aqueous solutions by sour orange residue. Journal of
Hazardous Materials 149(2), 269-274.
Koduru, J.R., Chang, Y.Y., Yang, J.K. and Kim, I.S. (2013) Iron oxide impregnated
Morus alba L. fruit peel for biosorption of Co(II): Biosorption properties and
mechanism. The Scientific World Journal 2013, 1-14.
Komatsu, T. and Kikuchi, J. (2013) Comprehensive signal assignment of 13C-
labeled lignocellulose using multidimensional solution NMR and 13C
chemical shift comparison with solid-state NMR. Analytical chemistry
85(18), 8857-8865.
Komatsu, T., Kobayashi, T., Hatanaka, M. and Kikuchi, J. (2015) Profiling
planktonic biomass using element-specific, multicomponent nuclear

References
286
magnetic resonance spectroscopy. Environmental Science & Technology
49(11), 7056-7062.
Kousi, P., Rernoudaki, E., Hatzkoseyian, A. and Tsezos, M. (2007) A study of the
operating parameters of a sulphate-reducing fixed-bed reactor for the
treatment of metal-bearing wastewater. Advanced Materials Research 20-21,
230-234.
Kovács, A., Nemcsok, D.S. and Kocsis, T. (2010) Bonding interactions in EDTA
complexes. Journal of Molecular Structure: THEOCHEM 950(1), 93-97.
Krika, F., Azzouz, N. and Ncibi, M.C. (2016) Adsorptive removal of cadmium from
aqueous solution by cork biomass: Equilibrium, dynamic and thermodynamic
studies. Arabian Journal of Chemistry 9, S1077-S1083.
Krishnapriya, K.R. and Kandaswamy, M. (2010) A new chitosan biopolymer
derivative as metal-complexing agent: synthesis, characterization, and
metal(II) ion adsorption studies. Carbohydrate Research 345(14), 2013-2022.
Kumar, K.V. (2007) Optimum sorption isotherm by linear and non-linear methods
for malachite green onto lemon peel. Dyes and Pigments 74(3), 595-597.
Kurniawan, T.A., Chan, G.Y.S., Lo, W.H. and Babel, S. (2006a) Comparisons of
low-cost adsorbents for treating wastewaters laden with heavy metals.
Science of the Total Environment 366(2-3), 409-426.
Kurniawan, T.A., Chan, G.Y.S., Lo, W.H. and Babel, S. (2006b) Physico-chemical
treatment techniques for wastewater laden with heavy metals. Chemical
Engineering Journal 118(1-2), 83-98.
Kuyucak, N. and Volesky, B. (1989) The mechanism of cobalt biosorption.
Biotechnology and bioengineering 33(7), 823-831.
Lagergren, S. (1898) About the theory of so-called adsorption of soluble substances.
Kungliga Svenska Vetenskapsakademiens Handlingar 24(4), 1-39.
Lakshmipathy, R. and Sarada, N.C. (2013) Application of watermelon rind as
sorbent for removal of nickel and cobalt from aqueous solution. International
Journal of Mineral Processing 122, 63-65.
Lakshmipathy, R. and Sarada, N.C. (2016) Metal ion free watermelon (Citrullus
lanatus) rind as adsorbent for the removal of lead and copper ions from
aqueous solution. Desalination and Water Treatment 57(33), 15362-15372.
Lakshmipathy, R., Vinod, A. and Sarada, N. (2013) Watermelon rind as biosorbent
for removal of Cd2+ from aqueous solution: FTIR, EDX and kinetic studies.
Journal of the Indian Chemical Society 90 (8), 1147-1154.
Lalhmunsiama, Gupta, P.L., Jung, H., Tiwari, D., Kong, S.H. and Lee, S.M. (2017)
Insight into the mechanism of Cd(II) and Pb(II) removal by sustainable

References
287
magnetic biosorbent precursor to Chlorella vulgaris. Journal of the Taiwan
Institute of Chemical Engineers 71, 206-213.
Lam, Y.Y. (2015) Utilization of fruit waste materials for Cr(III) biosorption and
fungal biomass for As(V) biosorption, The Hong Kong Polytechnic
University.
Landaburu-Aguirre, J., Pongracz, E., Peramaki, P. and Keiski, R.L. (2010)
Micellar-enhanced ultrafiltration for the removal of cadmium and zinc: Use
of response surface methodology to improve understanding of process
performance and optimisation. Journal of Hazardous Materials 180(1-3), 524-
534.
Langmuir, I. (1918) The adsorption of gases on plane surfaces of glass, mica and
platinum. Journal of the American Chemical society 40(9), 1361-1403.
Le Brech, Y., Raya, J., Delmotte, L., Brosse, N., Gadiou, R. and Dufour, A. (2016)
Characterization of biomass char formation investigated by advanced solid
state NMR. Carbon 108, 165-177.
Le Troedec, M., Sedan, D., Peyratout, C., Bonnet, J.P., Smith, A., Guinebretiere,
R., Gloaguen, V. and Krausz, P. (2008) Influence of various chemical
treatments on the composition and structure of hemp fibres. Composites Part
a-Applied Science and Manufacturing 39(3), 514-522.
Lee, M.Y., Park, J.M. and Yang, J.W. (1997) Micro precipitation of lead on the
surface of crab shell particles. Process Biochemistry 32(8), 671-677.
Leng, L., Wang, J., Qiu, X.X., Zhao, Y.X., Yip, Y.W., Law, G.L., Shih, K., Zhou,
Z.Y. and Lee, P.H. (2016) Thermodynamic selectivity of functional agents on
zeolite for sodium dodecyl sulfate sequestration. Journal of Hazardous
Materials 318, 41-47.
Leusch, A. and Volesky, B. (1995) The influence of film diffusion on cadmium
biosorption by marine biomass. Journal of Biotechnology 43(1), 1-10.
Li, X.H., Xu, H.X., Gao, B., Shi, X.Q., Sun, Y.Y. and Wu, J.C. (2018) Efficient
biosorption of Pb(II) from aqueous solutions by a PAH-degrading strain
Herbaspirillum chlorophenolicum FA1. Journal of Industrial and Engineering
Chemistry 57, 64-71.
Li, Y.G., Chen, B.L. and Zhu, L.Z. (2010) Enhanced sorption of polycyclic
aromatic hydrocarbons from aqueous solution by modified pine bark.
Bioresource Technology 101(19), 7307-7313.
Li, Z.Y., Ma, Z.W., van der Kuijp, T.J., Yuan, Z.W. and Huang, L. (2014) A review
of soil heavy metal pollution from mines in China: Pollution and health risk
assessment. Science of the Total Environment 468, 843-853.

References
288
Liang, S., Guo, X.Y., Feng, N.C. and Tian, Q.H. (2010) Effective removal of heavy
metals from aqueous solutions by orange peel xanthate. Transactions of
Nonferrous Metals Society of China 20, S187-S191.
Lim, S.F., Zheng, Y.M., Zou, S.W. and Chen, J.P. (2008) Characterization of
copper adsorption onto an alginate encapsulated magnetic sorbent by a
combined FT-IR, XPS and mathematical modeling study. Environmental
Science & Technology 42(7), 2551-2556.
Liu, C., Ngo, H.H. and Guo, W. (2012a) Watermelon rind: Agro-waste or superior
biosorbent? Applied biochemistry and biotechnology 167(6), 1699-1715.
Liu, C., Ngo, H.H., Guo, W.S. and Tung, K.L. (2012b) Optimal conditions for
preparation of banana peels, sugarcane bagasse and watermelon rind in
removing copper from water. Bioresource Technology 119, 349-354.
Liu, Y. and Liu, Y.J. (2008) Biosorption isotherms, kinetics and thermodynamics.
Separation and Purification Technology 61(3), 229-242.
Loganathan, P., Vigneswaran, S., Kandasamy, J. and Bolan, N.S. (2014) Removal
and recovery of phosphate from water using sorption. Critical Reviews in
Environmental Science and Technology 44(8), 847-907.
Long, Y., Lei, D., Ni, J., Ren, Z., Chen, C. and Xu, H. (2014) Packed bed column
studies on lead(II) removal from industrial wastewater by modified Agaricus
bisporus. Bioresource Technology 152, 457-463.
Lopez-Garcia, M., Lodeiro, P., Herrero, R., Barriada, J.L., Rey-Castro, C., David,
C. and de Vicente, M.E.S. (2013) Experimental evidences for a new model in
the description of the adsorption-coupled reduction of Cr(VI) by protonated
banana skin. Bioresource Technology 139, 181-189.
Lopicic, Z.R., Stojanovic, M.D., Radoicic, T.S.K., Milojkovic, J.V., Petrovic, M.S.,
Mihajlovic, M.L. and Kijevcanin, M.L.J. (2017) Optimization of the process
of Cu(II) sorption by mechanically treated Prunus persica L. - Contribution
to sustainability in food processing industry. Journal of Cleaner Production
156, 95-105.
Love, G.D., Snape, C.E., Jarvis, M.C. and Morrison, I.M. (1994) Determination of
phenolics structures in flax fiber by solid-state 13C NMR. Phytochemistry
35(2), 489-491.
Lv, J., Luo, L., Zhang, J., Christie, P. and Zhang, S. (2012) Adsorption of mercury
on lignin: Combined surface complexation modeling and X-ray absorption
spectroscopy studies. Environmental Pollution 162, 255-261.
Mahamadi, C. and Nharingo, T. (2010) Competitive adsorption of Pb2+, Cd2+ and
Zn2+ ions onto Eichhornia crassipes in binary and ternary systems.
Bioresource Technology 101(3), 859-864.

References
289
Maisuthisakul, P. and Gordon, M.H. (2009) Antioxidant and tyrosinase inhibitory
activity of mango seed kernel by product. Food Chemistry 117(2), 332-341.
Mallampati, R., Li, X., Adin, A. and Vaiyaveettil, S. (2015) Fruit peels as efficient
renewable adsorbents for removal of dissolved heavy metals and dyes from
water. ACS Sustainable Chemistry & Engineering 3(6), 1117-1124.
Maresova, J., Pipiska, M., Rozloznik, M., Hornik, M., Remenarova, L. and
Augustin, J. (2011) Cobalt and strontium sorption by moss biosorbent:
Modeling of single and binary metal systems. Desalination 266(1-3), 134-141.
Martin-Lara, M.A., Blazquez, G., Ronda, A., Rodriguez, I.L. and Calero, M. (2012)
Multiple biosorption-desorption cycles in a fixed-bed column for Pb(II)
removal by acid-treated olive stone. Journal of Industrial and Engineering
Chemistry 18(3), 1006-1012.
McKay, G. (1984) The adsorption of basic dye onto silica from aqueous solution-
solid diffusion model. Chemical Engineering Science 39(1), 129-138.
Meireles, C.D., Rodrigues, G., Ferreira, M.F., Cerqueira, D.A., Assuncao, R.M.N.,
Ribeiro, E.A.M., Poletto, P. and Zeni, M. (2010) Characterization of
asymmetric membranes of cellulose acetate from biomass: Newspaper and
mango seed. Carbohydrate Polymers 80(3), 954-961.
Memon, J.R., Memon, S.Q., Bhanger, M.I., Memon, G.Z., El-Turki, A. and Allen,
G.C. (2008) Characterization of banana peel by scanning electron microscopy
and FT-IR spectroscopy and its use for cadmium removal. Colloids and
Surfaces B-Biointerfaces 66(2), 260-265.
Mende, M., Schwarz, D., Steinbach, C., Boldt, R. and Schwarz, S. (2016)
Simultaneous adsorption of heavy metal ions and anions from aqueous
solutions on chitosan Investigated by spectrophotometry and SEM-EDX
analysis. Colloids and Surfaces A: Physicochemical and Engineering Aspects
510, 275-282.
Michalak, I., Chojnacka, K. and Witek-Krowiak, A. (2013) State of the art for the
biosorption process-a review. Applied Biochemistry and Biotechnology
170(6), 1389-1416.
Millan-Testa, C.E., Mendez-Montealvo, M.G., Ottenhof, M.A., Farhat, I.A. and
Bello-Perez, L.A. (2005) Determination of the molecular and structural
characteristics of Okenia, Mango, and banana starches. Journal of
Agricultural and Food Chemistry 53(3), 495-501.
Moubarik, A. and Grimi, N. (2015) Valorization of olive stone and sugar cane
bagasse by-products as biosorbents for the removal of cadmium from aqueous
solution. Food Research International 73, 169-175.

References
290
Moulder, J.F., Stickle, W.F., Sobol, P.E. and Bombe, K., D. (1992) Handbook of
X-ray Photoelectron Spectroscopy: A Reference Book of Standard Spectra
for Identification and Interpretation of XPS Data. Physical Electronics
Division, Perkin-Elmer Corporation, Eden Prairie, MN.
Moyo, M., Pakade, V.E. and Modise, S.J. (2017) Biosorption of lead(II) by
chemically modified Mangifera indica seed shells: Adsorbent preparation,
characterization and performance assessment. Process Safety and
Environmental Protection 111, 40-51.
Muralidhar, R.V., Chirumamila, R.R., Marchant, R. and Nigam, P. (2001) A
response surface approach for the comparison of lipase production by
Candida cylindracea using two different carbon sources. Biochemical
Engineering Journal 9(1), 17-23.
Nadeem, R., Manzoor, Q., Iqbal, M. and Nisar, J. (2016) Biosorption of Pb(II) onto
immobilized and native Mangifera indica waste biomass. Journal of Industrial
and Engineering Chemistry 35, 185-194.
Nguyen, T.A.H., Ngo, H.H., Guo, W.S., Zhang, J., Liang, S., Yue, Q.Y., Li, Q. and
Nguyen, T.V. (2013) Applicability of agricultural waste and by-products for
adsorptive removal of heavy metals from wastewater. Bioresource
Technology 148, 574-585.
Njikam, E. and Schiewer, S. (2012) Optimization and kinetic modeling of cadmium
desorption from citrus peels: A process for biosorbent regeneration. Journal
of Hazardous Materials 213, 242-248.
Ofomaja, A.E. (2010) Intraparticle diffusion process for lead(II) biosorption onto
mansonia wood sawdust. Bioresource Technology 101(15), 5868-5876.
Ogi, T., Makino, T., Iskandar, F., Tanabe, E. and Okuyama, K. (2016) Heat-treated
Escherichia coli as a high-capacity biosorbent for tungsten anions.
Bioresource Technology 218, 140-145.
Ok, Y.S., Kim, S.C., Kim, D.K., Skousen, J.G., Lee, J.S., Cheong, Y.W., Kim, S.J.
and Yang, J.E. (2011) Ameliorants to immobilize Cd in rice paddy soils
contaminated by abandoned metal mines in Korea. Environmental
Geochemistry and Health 33, 23-30.
Oliveira, R.C., Hammer, P., Guibal, E., Taulemesse, J.-M. and Garcia, O., Jr. (2014)
Characterization of metal-biomass interactions in the lanthanum(III)
biosorption on Sargassum sp using SEM/EDX, FTIR, and XPS: Preliminary
studies. Chemical Engineering Journal 239, 381-391.
Oztekin, Y. and Yazicigil, Z. (2006) Recovery of metals from complexed solutions
by electrodeposition. Desalination 190(1-3), 79-88.

References
291
Özverdi, A. and Erdem, M. (2006) Cu2+, Cd2+ and Pb2+ adsorption from aqueous
solutions by pyrite and synthetic iron sulphide. Journal of Hazardous
Materials 137(1), 626-632.
Padmavathy, V. (2008) Biosorption of nickel(II) ions by baker's yeast: Kinetic,
thermodynamic and desorption studies. Bioresource Technology 99(8), 3100-
3109.
Panda, G.C., Das, S.K., Chatterjee, S., Maity, P.B., Bandopadhyay, T.S. and Guha,
A.K. (2006) Adsorption of cadmium on husk of Lathyrus sativus: Physico-
chemical study. Colloids and Surfaces B-Biointerfaces 50(1), 49-54.
Papadopoulos, A., Fatta, D., Parperis, K., Mentzis, A., Haralambous, K.J. and
Loizidou, M. (2004) Nickel uptake from a wastewater stream produced in a
metal finishing industry by combination of ion-exchange and precipitation
methods. Separation and Purification Technology 39(3), 181-188.
Papageorgiou, S.K., Katsaros, F.K., Kouvelos, E.P., Nolan, J.W., Le Deit, H. and
Kanellopoulos, N.K. (2006) Heavy metal sorption by calcium alginate beads
from Laminaria digitata. Journal of Hazardous Materials 137(3), 1765-1772.
Park, D., Lim, S.R., Yun, Y.S. and Park, J.M. (2008) Development of a new Cr(VI)-
biosorbent from agricultural biowaste. Bioresource Technology 99(18),
8810-8818.
Pavan, F.A., Lima, I.S., Lima, E.C., Airoldi, C. and Gushikem, Y. (2006) Use of
Ponkan mandarin peels as biosorbent for toxic metals uptake from aqueous
solutions. Journal of Hazardous Materials 137(1), 527-533.
Pavan, F.A., Mazzocato, A.C., Jacques, R.A. and Dias, S.L.P. (2008) Ponkan peel:
A potential biosorbent for removal of Pb(II) ions from aqueous solution.
Biochemical Engineering Journal 40(2), 357-362.
Pavia, D.L., Lampman, G.M., Kriz, G.S. and Vyvyan, J.A. (2008) Introduction to
spectroscopy, Cengage Learning.
Pearson, R.G. (1963) Hard and soft acids and bases. Journal of the American
Chemical Society 85(22), 3533-3539.
Pehlivan, E. and Kahraman, H.T. (2012) Hexavalent chromium removal by Osage
Orange. Food Chemistry 133(4), 1478-1484.
Perez Marin, A.B., Isabel Aguilar, M., Francisco Ortuno, J., Francisco Meseguer,
V., Saez, J. and Llorens, A. (2010a) Biosorption of Zn(II) by orange waste in
batch and packed-bed systems. Journal of Chemical Technology and
Biotechnology 85(10), 1310-1318.
Perez Marin, A.B., Ortuno, J.F., Aguilar, M.I., Meseguer, V.F., Saez, J. and Llorens,
M. (2010b) Use of chemical modification to determine the binding of Cd(II),

References
292
Zn(II) and Cr(III) ions by orange waste. Biochemical Engineering Journal
53(1), 2-6.
Pozdniakova, T.A., Mazur, L.P., Boaventura, R.A.R. and Vilar, V.J.P. (2016)
Brown macro-algae as natural cation exchangers for the treatment of zinc
containing wastewaters generated in the galvanizing process. Journal of
Cleaner Production 119, 38-49.
Pugazhendhi, A., Boovaragamoorthy, G.M., Ranganathan, K., Naushad, M. and
Kaliannan, T. (2018) New insight into effective biosorption of lead from
aqueous solution using Ralstonia solanacearum: Characterization and
mechanism studies. Journal of Cleaner Production 174, 1234-1239.
Qu, X., Alvarez, P.J. and Li, Q. (2013) Applications of nanotechnology in water
and wastewater treatment. Water Research 47(12), 3931-3946.
Ramrakhiani, L., Halder, A., Majumder, A., Mandal, A.K., Majumdar, S. and
Ghosh, S. (2017) Industrial waste derived biosorbent for toxic metal
remediation: Mechanism studies and spent biosorbent management.
Chemical Engineering Journal 308, 1048-1064.
Rao, R.A.K. and Ikram, S. (2011) Sorption studies of Cu(II) on gooseberry fruit
(emblica officinalis) and its removal from electroplating wastewater.
Desalination 277(1-3), 390-398.
Reddy, D.H.K., Ramana, D., Seshaiah, K. and Reddy, A. (2011) Biosorption of
Ni(II) from aqueous phase by Moringa oleifera bark, a low cost biosorbent.
Desalination 268(1-3), 150-157.
Reddy, N.A., Lakshmipathy, R. and Sarada, N. (2014) Application of Citrullus
lanatus rind as biosorbent for removal of trivalent chromium from aqueous
solution. Alexandria Engineering Journal 53(4), 969-975.
Redlich, O. and Peterson, D.L. (1959) A useful adsorption isotherm. Journal of
Physical Chemistry 63(6), 1024-1024.
Remenarova, L., Pipiska, M., Hornik, M., Rozloznik, M., Augustin, J. and Lesny,
J. (2012) Biosorption of cadmium and zinc by activated sludge from single
and binary solutions: Mechanism, equilibrium and experimental design study.
Journal of the Taiwan Institute of Chemical Engineers 43(3), 433-443.
Ren, Z.F., Xu, X., Wang, X., Gao, B.Y., Yue, Q.Y., Song, W., Zhang, L. and Wang,
H.T. (2016) FTIR, Raman, and XPS analysis during phosphate, nitrate and
Cr(VI) removal by amine cross-linking biosorbent. Journal of Colloid and
Interface Science 468, 313-323.
Rimando, A.M. and Perkins-Veazie, P.M. (2005) Determination of citrulline in
watermelon rind. Journal of Chromatography A 1078(1-2), 196-200.

References
293
RoHS3 (2015) Restriction of Hazardous Substances, Directive 2015/863. Union, E.
(ed).
Ruthven, D.M. (1984) Principles of Adsorption and Adsorption Processes. New
York: John Wiley & Sons.
Saeed, A., Sharif, M. and Iqbal, M. (2010) Application potential of grapefruit peel
as dye sorbent: Kinetics, equilibrium and mechanism of crystal violet
adsorption. Journal of Hazardous Materials 179(1-3), 564-572.
Saleem, N. and Bhatti, H.N. (2011) Adsorptive removal and recovery of U(VI) by
citrus waste biomass. Bioresources 6(3), 2522-2538.
Sandhu, K.S. and Lim, S.T. (2008) Structural characteristics and in vitro
digestibility of mango kernel starches (Mangifera indica L.). Food Chemistry
107(1), 92-97.
Sari, A. and Tuzen, M. (2008) Biosorption of Pb(II) and Cd(II) from aqueous
solution using green alga (Ulva lactuca) biomass. Journal of Hazardous
Materials 152(1), 302-308.
Schiewer, S. and Balaria, A. (2009) Biosorption of Pb2+ by original and protonated
citrus peels: Equilibrium, kinetics, and mechanism. Chemical Engineering
Journal 146(2), 211-219.
Schiewer, S. and Iqbal, M. (2010) The role of pectin in Cd binding by orange peel
biosorbents: A comparison of peels, depectinated peels and pectic acid.
Journal of Hazardous Materials 177(1-3), 899-907.
Schiewer, S. and Iqbal, M. (2014) Physicochemical characterization and
mechanism analysis of native and protonated grapefruit peels adsorbing
cadmium. Desalination and Water Treatment 52(31-33), 5900-5911.
Schiewer, S. and Patil, S.B. (2008) Pectin-rich fruit wastes as biosorbents for heavy
metal removal: Equilibrium and kinetics. Bioresource Technology 99(6),
1896-1903.
Shen, Y.S., Wang, S.L., Huang, S.T., Tzou, Y.M. and Huang, J.H. (2010)
Biosorption of Cr(VI) by coconut coir: Spectroscopic investigation on the
reaction mechanism of Cr(VI) with lignocellulosic material. Journal of
Hazardous Materials 179(1-3), 160-165.
Sheng, P.X., Ting, Y.P., Chen, J.P. and Hong, L. (2004) Sorption of lead, copper,
cadmium, zinc, and nickel by marine algal biomass: characterization of
biosorptive capacity and investigation of mechanisms. Journal of Colloid and
Interface Science 275(1), 131-141.

References
294
Simpson, A.J., McNally, D.J. and Simpson, M.J. (2011) NMR spectroscopy in
environmental research: From molecular interactions to global processes.
Progress in Nuclear Magnetic Resonance Spectroscopy 58(3-4), 97-175.
Singh, R., Kumar, J. and Nandpuri, K. (1975) A Study on the influence of the
structural chemical constituents of the skin of water melon (Citrullus Lanatus
Sch.) fruit on the incidence of its blossom-end-rot and cracking. Indian
Journal of Horticulture 32, 98-101.
Singh, S. and Shukla, S.R. (2017) Theoretical studies on adsorption of Ni(II) from
aqueous solution using Citrus limetta peels. Environmental Progress &
Sustainable Energy 36(3), 864-872.
Singha, A.S. and Guleria, A. (2014) Chemical modification of cellulosic
biopolymer and its use in removal of heavy metal ions from wastewater.
International Journal of Biological Macromolecules 67, 409-417.
Sionkowska, A., Kaczmarek, B. and Lewandowska, K. (2014) Modification of
collagen and chitosan mixtures by the addition of tannic acid. Journal of
Molecular Liquids 199, 318-323.
Sips, R. (1948) On the structure of a catalyst surface. The Journal of Chemical
Physics 16(5), 490-495.
Sivasankara, V., Ramachandramoorthy, T. and Chandramohan, A. (2010) Fluoride
removal from water using activated and MnO2-coated Tamarind Fruit
(Tamarindus indica) shell: Batch and column studies. Journal of Hazardous
Materials 177(1-3), 719-729.
Sostaric, T.D., Petrovic, M.S., Pastor, F.T., Loncarevic, D.R., Petrovic, J.T.,
Milojkovic, J.V. and Stojanovic, M.D. (2018) Study of heavy metals
biosorption on native and alkali-treated apricot shells and its application in
wastewater treatment. Journal of Molecular Liquids 259, 340-349.
Stirk, W.A. and van Staden, J. (2002) Desorption of cadmium and the reuse of
brown seaweed derived products as biosorbents. Botanica Marina 45(1), 9-
16.
Stokes, D. (2008) Principles and Practice of Variable Pressure: Environmental
Scanning Electron Microscopy (VP-ESEM). Chichester, UK: John Wiley &
Sons.
Tarley, C.R.T. and Arruda, M.A.Z. (2004) Biosorption of heavy metals using rice
milling by-products. Characterisation and application for removal of metals
from aqueous effluents. Chemosphere 54(7), 987-995.
Taty-Costodes, V.C., Fauduet, H., Porte, C. and Delacroix, A. (2003) Removal of
Cd(II) and Pb(II) ions, from aqueous solutions, by adsorption onto sawdust
of Pinus sylvestris. Journal of Hazardous Materials 105(1-3), 121-142.

References
295
Thomas, H.C. (1948) Chromatography: a problem in kinetics. Annals of the New
York Academy of Sciences 49(2), 161-182.
Tian, Y., Wu, M., Lin, X.B., Huang, P. and Huang, Y. (2011) Synthesis of magnetic
wheat straw for arsenic adsorption. Journal of Hazardous Materials 193, 10-
16.
Torab-Mostaedi, M. (2013) Biosorption of lanthanum and cerium from aqueous
solutions using tangerine (Citrus reticulata) peel: Equilibrium, kinetic and
thermodynamic studies. Chemical Industry and Chemical Engineering
Quarterly 19(1), 79-88.
Tran, V.S., Ngo, H.H., Guo, W.S., Zhang, J., Liang, S., Ton-That, C. and Zhang,
X.B. (2015) Typical low cost biosorbents for adsorptive removal of specific
organic pollutants from water. Bioresource Technology 182, 353-363.
Tsezos, M. and Volesky, B. (1981) Biosorption of uranium and thorium.
Biotechnology and Bioengineering 23(3), 583-604.
Tsezos, M. and Volesky, B. (1982) The mechanism of uranium biosorption by
rhizopus-arrhizus. Biotechnology and Bioengineering 24(2), 385-401.
Ucun, H., Bayhan, Y.K., Kaya, Y., Cakici, A. and Algur, O.F. (2002) Biosorption
of chromium(VI) from aqueous solution by cone biomass of Pinus sylvestris.
Bioresource Technology 85(2), 155-158.
Unuabonah, E.I., Adebowale, K.O., Olu-Owolabi, B.I., Yang, L.Z. and Kong, L.X.
(2008) Adsorption of Pb(II) and Cd(II) from aqueous solutions onto sodium
tetraborate-modified Kaolinite clay: Equilibrium and thermodynamic studies.
Hydrometallurgy 93(1-2), 1-9.
USDA (2004) National Nutrient Database for Standard Reference.
Vafajoo, L., Cheraghi, R., Dabbagh, R. and McKay, G. (2018) Removal of cobalt
(II) ions from aqueous solutions utilizing the pre-treated 2-Hypnea Valentiae
algae: Equilibrium, thermodynamic, and dynamic studies. Chemical
Engineering Journal 331, 39-47.
Vasanth Kumar, K. (2006) Comparative analysis of linear and non-linear method
of estimating the sorption isotherm parameters for malachite green onto
activated carbon. Journal of Hazardous Materials 136(2), 197-202.
Vigneswaran, S., Ngo, H.H., Chaudhary, D.S. and Hung, Y.T. (2005)
Physicochemical treatment processes for water reuse. In Physicochemical
Treatment Processes (pp. 635-676). Totowa, NJ: Humana Press.
Volesky, B. (1990) Biosorption of Heavy Metals. Boca Raton, Fla.: CRC Press.
Volesky, B. (1994) Advances in biosorption of metals: Selection of biomass types.
FEMS Microbiology Reviews 14(4), 291-302.

References
296
Volesky, B. (2001) Detoxification of metal-bearing effluents: biosorption for the
next century. Hydrometallurgy 59(2-3), 203-216.
Volesky, B. (2003) Sorption and Biosorption. BV Sorbex, Inc.
Wang, T., Liu, W., Xiong, L., Xu, N. and Ni, J.R. (2013) Influence of pH, ionic
strength and humic acid on competitive adsorption of Pb(II), Cd(II) and Cr(III)
onto titanate nanotubes. Chemical Engineering Journal 215, 366-374.
Wang, T., Park, Y.B., Cosgrove, D.J. and Hong, M. (2015) Cellulose-pectin spatial
contacts are inherent to never-dried arabidopsis primary cell walls: Evidence
from solid-state nuclear magnetic resonance. Plant Physiology 168(3), 871-
884.
Wang, T., Zabotina, O. and Hong, M. (2012) Pectin-cellulose interactions in the
arabidopsis primary cell wall from two-dimensional magic-angle-spinning
solid-state nuclear magnetic resonance. Biochemistry 51(49), 9846-9856.
Wawer, I., Wolniak, M. and Paradowska, K. (2006) Solid state NMR study of
dietary fiber powders from aronia, bilberry, black currant and apple. Solid
State Nuclear Magnetic Resonance 30(2), 106-113.
Weber, W.J. and Morris, J.C. (1963) Kinetics of adsorption on carbon from solution.
Journal of the Sanitary Engineering Division 89(2), 31-60.
Wei, D., Ngo, H.H., Guo, W.S., Xu, W.Y., Du, B., Khan, M.S. and Wei, Q. (2018)
Biosorption performance evaluation of heavy metal onto aerobic granular
sludge-derived biochar in the presence of effluent organic matter via batch
and fluorescence approaches. Bioresource Technology 249, 410-416.
WHO (2010) Exposure to lead: A major public health concern, World Health
Organization, Geneva.
WHO (2011a) Cadmium in drinking-water. Background document for preparation
of WHO Guidelines for drinking-water quality, World Health Organization,
Geneva.
WHO (2011b) Guidelines for drinking water quality, World Health Organization,
Geneva.
WHO (2011c) Lead in drinking water. World Health Organization, Geneva.
Widsten, P., Cruz, C.D., Fletcher, G.C., Pajak, M.A. and McGhie, T.K. (2014)
Tannins and extracts of fruit byproducts: antibacterial activity against
foodborne bacteria and antioxidant capacity. Journal of Agricultural and Food
Chemistry 62(46), 11146-11156.
Wu, F.C., Tseng, R.L. and Juang, R.S. (2009) Initial behavior of intraparticle
diffusion model used in the description of adsorption kinetics. Chemical
Engineering Journal 153(1-3), 1-8.

References
297
Wulfsberg, G. (2000) Inorganic Chemistry. Sausalito, Calif.: University Science
Books, USA.
Xie, M., Lee, J., Nghiem, L.D. and Elimelech, M. (2015) Role of pressure in organic
fouling in forward osmosis and reverse osmosis. Journal of Membrane
Science 493, 748-754.
Yan, G., Viraraghavan, T. and Chen, M. (2001) A new model for heavy metal
removal in a biosorption column. Adsorption Science & Technology 19(1),
25-43.
Yang, K.B., Peng, J.H., Srinivasakannan, C., Zhang, L.B., Xia, H.Y. and Duan, X.H.
(2010) Preparation of high surface area activated carbon from coconut shells
using microwave heating. Bioresource Technology 101(15), 6163-6169.
Yuan, X.Z., Meng, Y.T., Zeng, G.M., Fang, Y.Y. and Shi, J.G. (2008) Evaluation
of tea-derived biosurfactant on removing heavy metal ions from dilute
wastewater by ion flotation. Colloids and Surfaces A-Physicochemical and
Engineering Aspects 317(1-3), 256-261.
Yuvaraja, G., Krishnaiah, N., Subbaiah, M.V. and Krishnaiah, A. (2014)
Biosorption of Pb(II) from aqueous solution by Solanum melongena leaf
powder as a low-cost biosorbent prepared from agricultural waste. Colloids
and Surfaces B-Biointerfaces 114, 75-81.
Zein, R., Suhaili, R., Earnestly, F., Indrawati and Munaf, E. (2010) Removal of
Pb(II), Cd(II) and Co(II) from aqueous solution using Garcinia mangostana
L. fruit shell. Journal of Hazardous Materials 181(1-3), 52-56.
Zhang, D.N., Duan, D.D., Huang, Y.D., Yang, Y. and Ran, Y. (2016) Novel
phenanthrene sorption mechanism by two pollens and their fractions.
Environmental Science & Technology 50(14), 7305-7314.
Zheng, J.C., Liu, H.Q., Feng, H.M., Li, W.W., Lam, M.H.W., Lam, P.K.S. and Yu,
H.Q. (2016) Competitive sorption of heavy metals by water hyacinth roots.
Environmental Pollution 219, 837-845.
Zhou, D., Zhang, L. and Guo, S.L. (2005) Mechanisms of lead biosorption on
cellulose/chitin beads. Water Research 39(16), 3755-3762.