b20592917.pdf - PolyU Electronic Theses
265
-
Upload
khangminh22 -
Category
Documents
-
view
0 -
download
0
Transcript of b20592917.pdf - PolyU Electronic Theses


Abstract of thesis entitled
LABORATORY PULL-OUT TESTING STUDY ON SOIL
NAILS IN COMPACTED COMPLETELY DECOMPOSED GRANITE FILL
Submitted by
Su Li-Jun
for the degree of Doctor of Philosophy
at The Hong Kong Polytechnic University
in March 2006
Soil nailing is a technique for stabilizing soil slopes and excavations by installing a
large number of closely spaced passive inclusions into the in-situ soil mass. The soil
nailing technique has been increasingly used worldwide since its origination in the early
1970’s because of its technical and economical advantages. In Hong Kong, soil nailing
has been commonly used to stabilize new cut and sub-standard existing slopes since the
late 1980’s. The interface shear strength between a soil nail and the surrounding soil is a
key parameter for design and stability assessment of the soil nailing system. However,
in current practice in Hong Kong, this parameter is generally assumed to be the same as
the shear strength of the soil and verified by field pull-out tests in the construction stage.
Field verification tests are normally subjected to variations of the site conditions and the
results are therefore scattered. Laboratory pull-out tests have been carried out to help
overcome these problems and precisely investigate the factors influencing the nail-soil
interface shear strength. However, there were still some deficiencies in these tests and
can be improved.
A laboratory study of the pull-out shear resistance of cement grouted soil nails was
therefore conducted in compacted completely decomposed granite (CDG) fill. A
pull-out box with the internal dimensions of 1.0m in length, 0.6m in width and 0.83m in

height was designed and constructed to carry out the pull-out tests. An extension
cylindrical chamber was provided to house an extension part of the nail and ensure that
a constant 1.0m length of the test soil nail was maintained within the test box during
pull-out and no cavity would be left behind the end of the test nail. A waterproof front
cap was used to cover the soil nail head and prevent water leakage which made it
possible to apply back pressure to saturate the testing soil in submerged tests.
Comprehensive instrumentation was used and the earth pressure, suction, and pore
water pressure in the soil, the deformation of the testing soil, and the pull-out force and
displacement were measured. During the pull-out tests, the overburden pressure was
applied before drilling to simulate the actual construction procedure of the soil nailing
system.
A series of pull-out tests have been conducted using two copies of the above introduced
pull-out box. The test results showed that soil stresses around the hole were largely
released after drilling and recovery of the stresses due to grouting of the soil nail was
minimal. The development of pull-out shear resistance was mainly derived from the
constrained dilatancy of the soil. Tests in soil at different degrees of saturation showed
that the peak pull-out shear resistance varies with different degrees of saturation of the
soil, with higher resistances at the degrees of saturation of 50% and 75%. Pressure
grouting tests were carried out and showed that the average peak pull-out shear
resistance of the soil nail increased almost linearly with the increase in grouting
pressure. Numerical modeling was performed and agreements between the measured
and simulated results were good.

Acknowledgements
I wish to express my deepest gratitude to my chief supervisor, Professor J-H. Yin, for
his encouragement, support and guidance during this period of study. It was his endless
efforts and experienced guidance that made this work possible. The privilege of working
with Professor Yin has appreciably influenced my professional development and
perspectives.
Some of the tests in the study received financial support from Civil Engineering and
Development Department of The Hong Kong Special Administrative Region
Government and is gratefully acknowledged. The author would like to express thanks to
the Director of Civil Engineering and Development and the Head of the Geotechnical
Engineering Office for the permission of the use of data from those tests which received
financial support.
The improvement, setup and usage of the equipment and apparatus for the soil nail
pull-out resistance studies have received valuable comments from Mr. C. F. Chan, Mr. Y.
K. Shiu, Dr. S. L. Chiu, Dr. W. M. Cheung, Mr. W.K. Pun, Mr. Tony Cheung, Miss
Carrie Leung, Mr. K. L. Tang, and Mr. Danny Fu. All these comments are gratefully
acknowledged. I also wish to thank Mr. L. M. Chu, Miss W. H. Zhou and all the
technicians in the Soil Mechanics Laboratory of Department of Civil and Structural
Engineering in The Hong Kong Polytechnic University for their assistance in the setup
of the test apparatus and participation in some of the soil nail pull-out tests.
The author wishes to express his sincere gratitude to the two examiners, Professor R. J.
Jardine and Dr. L. M. Zhang for their invaluable comments in their thesis examination
reports and insightful questions and valuable suggestions during the oral examination.
I would like to express my special thanks and admirations to my wife, Xiao Jia, for her
understanding and support. I sincerely appreciate my parents and my sister for their
endless encouragement and constant support.

TABLE OF CONTENTS
CERTIFICATE OF ORIGINALITY
ABSTRACT
ACKNOWLEDGEMENTS
TABLE OF CONTENTS
LIST OF TABLES
LIST OF FIGURES
Chapter 1: INTRODUCTION
1.1 Background 1
1.2 Objectives 5
1.3 Organization of the thesis 5
Chapter 2: LITERATURE REVIEW
2.1 The soil nailing technique 10
2.1.1 Characteristics of soil nailing 12
2.1.2 Advantages and limitations of soil nailing 14
2.1.3 Fields of application 15
2.1.4 Soils suitable for soil nailing 17
2.2 Behaviour of soil nailing 17
2.2.1 Soil nailing mechanism 17
2.2.2 Nail-soil interface shear resistance 19
2.2.3 Influence of bending stiffness of the nail 22
2.2.4 Failure modes of soil nailed structures 23
2.3 Design methods for soil nailing structures 24
2.3.1 The Davis method 25

2.3.2 The French method 26
2.3.3 The German method 27
2.3.4 The Juran method 28
2.3.5 Discussion on current design guides and codes 30
2.4 Factors influencing the pull-out resistance 33
2.4.1 Soil conditions 33
2.4.2 Stress conditions 34
2.4.3 Methods of installation 34
2.4.4 The nail surface conditions 35
2.5 Research and development 35
2.5.1 Large scale model tests and field monitoring 35
2.5.2 Laboratory testing studies 38
2.5.2.1 Laboratory pull-out tests 38
2.5.2.2 Direct shear and interface shear testing studies 41
2.5.2.3 Centrifuge Modeling 42
2.5.2.4 Small scale tests 43
2.5.3 Numerical modeling 44
Chapter 3: EQUIPMENT AND APPARATUS FOR PULL-OUT TESTS
3.1 Problems studied by laboratory pull-out tests 60
3.2 Numerical study on boundary effect for design of the box 62
3.3 Design and construction of two pull-out boxes 64
3.3.1 Investigations to be conducted using the boxes 64
3.3.2 Description of the pull-out box 65
3.3.2.1 Extension cylindrical chamber covering the
soil nail end 67

3.3.2.2 A waterproof front cap to covering the soil nail head 68
3.3.2.3 Application of back pressure for saturation of the soil 69
3.4 Measures for reducing side friction of the box 70
3.5 Instrumentation and measurements 72
3.6 Drilling machine and cement grouting tools 75
3.6.1 Drilling machine 75
3.6.2 Equipment for cement grouting without and with pressure 76
3.7 Setup of the box for soil nail pull-out testing 79
3.8 Summary and conclusions 79
Chapter 4: MATERIAL PROPERTIES AND TEST PROCEDURES
4.1 Introduction 98
4.2 Material properties 98
4.2.1 Basic properties of the CDG soil 98
4.2.2 Determination of the shear strength of the soil 99
4.2.2.1 Conventional triaxial tests on saturated
soil specimens 99
4.2.2.2 Double cell triaxial tests on unsaturated
soil specimens 101
4.2.3 Properties of the cement grout 102
4.3 Calibration of transducers 103
4.4 Soil preparation and test procedures 105
4.4.1 Soil preparation 105
4.4.2 Preparation of soil specimens for triaxial tests 106
4.4.3 Application of vertical overburden pressure 106
4.4.4 Hole drilling and cement grouting 107

4.4.5 Installation of tensiometers and/or porewater
pressure transducers 107
4.4.6 Saturation of the test CDG soil 108
4.4.7 Pull-out of the nail 108
Chapter 5: INFLUENCE OF OVERBURDEN PRESSURE ON SOIL NAIL
PULL-OUT BEHAVIOUR AND RESISTANCE
5.1 Introduction 127
5.2 Stress variations during drilling and grouting 128
5.2.1 Stress release during drilling 128
5.2.2 Variation of earth pressure during and after grouting 130
5.3 Development of earth pressure during pull-out 131
5.4 Pull-out shear stress-displacement behaviour 133
5.5 Influence of overburden pressure on pull-out shear resistance 134
5.5.1 Peak pull-out shear resistance 134
5.5.2 Apparent coefficient of friction 135
5.6 Shear stress distribution on the nail-soil interface 136
5.7 Summary 139
Chapter 6: INFLUENCE OF DEGREE OF SATURATION ON SOIL NAIL
PULL-OUT BEHAVIOUR AND RESISTANCE
6.1 Introduction 152
6.2 Earth pressure and pore pressure responses
during saturating the soil 153
6.3 Variations of earth pressure 155
6.3.1 Decreased earth pressure immediately after grouting 155

6.3.2 Variations of earth pressure 156
6.4 Failure patterns of the soil nail 157
6.4.1 Surface of the drillhole before and after pull-out 157
6.4.2 Failure surfaces of soil nails in the soil
at different degrees of saturation 157
6.5 Effect of degree of saturation of the soil on pull-out
behaviour and resistance 158
6.6 Summary and major findings 160
Chapter 7: EFFECT OF GROUTING PRESSURE ON SOIL NAIL PULL-OUT
BEHAVIOUR AND RESISTANCE
7.1 Introduction 176
7.2 Variations of earth pressures 177
7.2.1 Variations of earth pressures during drilling
and pressure grouting 177
7.2.2 Variations of earth pressures during the whole
period of testing 179
7.3 Failure patterns of the soil nail 179
7.4 Influence of grouting pressure 180
7.5 Summary and conclusions 183
Chapter 8: NUMERICAL SIMULATION OF PULL-OUT TESTS
8.1 Introduction 191
8.2 Simulation of the shearing plane 192
8.3 Description of the finite element model 193
8.3.1 Mesh and boundary conditions 193

8.3.2 Procedure of the simulation 194
8.3.3 Material properties 196
8.4 Simulation of the pull-out tests 198
8.4.1 Stress and strain rate contours 198
8.4.2 Variations of the vertical stress during the simulation 199
8.4.3 Influence of the overburden pressure 200
8.5 Parametric studies 201
8.5.1 Influence of dilation angle 201
8.5.2 Influence of grouting pressure 202
8.6 Summary 204
Chapter 9: SUMMARY, CONCLUSIONS AND SUGGESTIONS
9.1 Summary 219
9.2 Conclusions 221
9.3 Recommendations and suggestions 224
REFERENCES 226

LIST OF TABLES
Table 2.1 – Basic assumptions of different soil nailing design approaches 46
Table 4.1 – Properties of the CDG soil and cement grout 110
Table 4.2 – Shear strength parameters of the CDG soil 110
Table 8.1 – Material properties used in the finite element model 205

LIST OF FIGURES
Figure 1.1 – 1972 Sau Mau Ping Landslide 8
Figure 1.2 – 1972 Po Shan Road Landslide 9
Figure 2.1 – Equipment for launched soil nails (After Myles and Bridle1992)
47
Figure 2.2 – Comparison of soil nailing, micro piles and soil dowelling(After Bruce and Jewell 1986)
47
Figure 2.3 – Contrast of the construction sequence of reinforced earth and soil nailing (After Bruce and Jewell 1986)
48
Figure 2.4 – Soil nailing mechanism (After Byrne et al. 1998) 48
Figure 2.5 – Skin friction mobilization in pullout test (After Cartier andGigan 1983)
49
Figure 2.6 – Nails subject to shear and bending (After Mitchell 1987) 49
Figure 2.7 – Davis design method (After Shen et al. 1981b) 50
Figure 2.8 – Failure surfaces obtained by Davis design method and FiniteElement analysis (After Shen et al. 1981b)
50
Figure 2.9 – French design method (After Schlosser 1982) 51
Figure 2.10 – Final yielding curve for inclusion in French method (AfterSchlosser 1982)
51
Figure 2.11 – German design method: (a) Bilinear failure surface; (b)Acting forces and displacements; (c) Hodograph; and (d)Force polygon (After Gassler 1988)
52
Figure 2.12 – Juran’s kinematical limit analysis design method: (a)Mechanism of failure; (b) State of stress in inclusion; and (c)Theoretical solution for infinitely long bar adopted fordesign purpose (After Juran et al. 1990)
52
Figure 2.13 – Large model tests in the “Bodenvernagelung” project (AfterGassler 1992)
53

Figure 2.14 – Full scale test failure by breakage of inclusions in the“Clouterre” project (After Clouterre 1993)
53
Figure 2.15 – Full scale test failure by reducing adherence length of inclusions in the “Clouterre” project (After Clouterre 1993)
54
Figure 2.16 – Full scale test failure by excessive excavation in the“Clouterre” project (After Clouterre 1993)
54
Figure 2.17 – Pullout box used by Tei (After Tei 1993) 55
Figure 2.18 – Axial stress distributions along the nail obtained by Tei(After Tei 1993)
55
Figure 2.19 – Pullout box used by Pradhan (After Junaideen et al. 2004) 56
Figure 2.20 – Pullout box used by Chu (After Chu 2003) 56
Figure 2.21 – Relationship between effect of reinforcement and inclination of inclusion (After Jewell 1987)
57
Figure 2.22 – Failure surface of centrifuge model (After Tufenkjian and Vucetic 2003)
57
Figure 2.23 – Reduced scale model test of a nailed soil slope (AfterKitamura et al. 1988)
58
Figure 2.24 – Reduced scale model test of a nailed wall (After Kim et al. 1996)
58
Figure 2.25 – Mesh for (a) unreinforced slope and (b) soil nail slopedeveloped by Yang and Drumm (2000)
59
Figure 3.1 – A soil-nailed slope and pull-out box simulation 81
Figure 3.2 – Mesh for boundary effect study 81
Figure 3.3 – Vertical stresses induced by the hole drilling procedure 82
Figure 3.4 – Horizontal stresses induced by the hole drilling procedure 82
Figure 3.5 – Relationship between the vertical stress and the distance from the top surface of the drillhole in vertical direction for (a) elastic material and (b) Mohr-Coulomb material
83

Figure 3.6 – Relationship between the vertical stress and the distancefrom the top surface of the drillhole in vertical direction for (a) box size model (b) large size model
84
Figure 3.7 – Layout of transducers and pull-out equipment 85
Figure 3.8 – Design of the pull-out box – 3-D view 86
Figure 3.9 – Back and front views of the pull-out box 86
Figure 3.10 – Side view of the pull-out box 87
Figure 3.11 – Cross-section of the top cover and the pull-out box 87
Figure 3.12 – Watertight bolt 88
Figure 3.13 – Waterproof front cap 88
Figure 3.14 – Setup for saturating the soil 89
Figure 3.15 – Results of direct shear tests on the interface between the stainless steel sheet and the flexible plastic film withlubricating oil in between
89
Figure 3.16 – Method for reducing side friction 90
Figure 3.17 – Mesh and boundary conditions for investigating side friction of the box
90
Figure 3.18 – Vertical stress contour for small side friction 91
Figure 3.19 – Vertical stress variations with distance from the bottom of the model along the path in Figure 3.17
91
Figure 3.20 – Transducers and datalogger used in the tests 92
Figure 3.21 – Locations of the earth pressure cells 93
Figure 3.22 – Locations of the soil moisture probes (or pore pressuretransducers)
93
Figure 3.23 – Setup of the drilling machine 94
Figure 3.24 – Adjustment of drilling bit and drilling bars to ensure that they pass the centers of the two holes
94

Figure 3.25 – Drilling the hole 95
Figure 3.26 – Grouting without pressure (gravity head only) 95
Figure 3.27 – Grouting with pressure 96
Figure 3.28 – Setup of the box with full instrumentation and loading devices for soil nail pull-out under submerged condition
97
Figure 4.1 – Particle size distribution of the CDG soil 111
Figure 4.2 – Relationship between dry density and moisture content 111
Figure 4.3 – (a) Deviator stress vs. axial strain (b) pore water pressure vs. axial strain and (c) effective stress paths for conventionalCU triaxial tests with saturated soil specimens
112
Figure 4.4 – Relationship between s' and t for conventional CU triaxial tests with saturated soil specimens at axial strain of (a) 15% and (b) 20%
113
Figure 4.5 – (a) Deviator stress vs. axial strain (b) pore water pressure vs. axial strain and (c) effective stress paths for conventionalCD triaxial tests with saturated soil specimens
114
Figure 4.6 – Relationship between s' and t for conventional CD triaxial tests with saturated soil specimens at axial strain of (a) 15%and (b) 20%
115
Figure 4.7 – Schematic diagram of the double cell triaxial system 116
Figure 4.8 – The double cell triaxial system (After Yin 2003) 116
Figure 4.9 – (a) Deviator stress vs. axial strain (b) volume strain vs. axial strain and (c) s' vs. t for double cell triaxial tests on soil specimens at 38% degree of saturation
117
Figure 4.10 – (a) Deviator stress vs. axial strain (b) volume strain vs. axial strain and (c) s' vs. t for double cell triaxial tests on soil specimens at 50% degree of saturation
118
Figure 4.11 – (a) Deviator stress vs. axial strain (b) volume strain vs. axial strain and (c) s' vs. t for double cell triaxial tests on soil specimens at 75% degree of saturation
119

Figure 4.12 – Failed cement grout specimens of Uniaxial CompressiveStrength (UCS) tests
120
Figure 4.13 – Results of Uniaxial Compressive Strength (UCS) tests forthe cement grout (cylindrical specimen)
121
Figure 4.14 – Apparatus for calibrating earth pressure cells, pore water pressure transducers and transducers for the soil moisture probes
122
Figure 4.15 – Calibration results for the transducers 122
Figure 4.16 – Full bridge connection for strain gauge 123
Figure 4.17 – Soil compaction and pressure cell installation 123
Figure 4.18 – Taking soil samples for triaxial tests 124
Figure 4.19 – Tensiometer (Soil Moisture Probe) used in the test 125
Figure 4.20 – De-airing for a tensiometer 125
Figure 4.21 – A soil nail being pulled out under a dry soil condition 126
Figure 5.1 – (a) Total earth pressure and (b) vertical displacement vs. time during applying overburden pressure (OP) – for overburden pressure of 200kPa and initial degree of saturation (Sr) of 38%
140
Figure 5.2 – Total earth pressure vs. time during drilling and grouting –for overburden pressure of 200kPa and initial degrees of saturation (Sr) of (a) 38% and (b) 75%
141
Figure 5.3 – Average earth pressure and pull-out shear stress vs. (a) time and (b) pull-out displacement during pull-out – for overburden pressure of 300kPa and initial degree of saturation (Sr) of 75%
142
Figure 5.4 – Changes of average total earth pressure of P-Cells 1 to 4 at different stages of testing for tests with soil at 38% degree of saturation
143
Figure 5.5 – Relationship between average pull-out shear stress and pull-out displacement for tests in soil at degree of saturation (Sr) of 38%
143

Figure 5.6 – Relationship between average pull-out shear stress and pull-out displacement for tests in soil at degree of saturation (Sr) of 50%
144
Figure 5.7 – Relationship between average pull-out shear stress and pull-out displacement for tests in soil at degree of saturation (Sr) of 75%
144
Figure 5.8 – Relationship between average pull-out shear stress and pull-out displacement for tests under submerged condition (Sr≈98%)
145
Figure 5.9 – Relationship between peak pull-out shear resistance and applied overburden pressure for tests in soil at degree of saturation of 38%
145
Figure 5.10 – Relationship between peak pull-out shear resistance and applied overburden pressure for tests in soil at degree of saturation of 50%
146
Figure 5.11 – Relationship between peak pull-out shear resistance and applied overburden pressure for tests in soil at degree of saturation of 75%
146
Figure 5.12 – Relationship between peak pull-out shear resistance and applied overburden pressure for submerged tests
147
Figure 5.13 – Relationship between the peak apparent coefficient of friction and applied overburden pressure for tests in soil atdegree of saturation of 38%
147
Figure 5.14 – Peak apparent coefficient of friction vs. applied overburden pressure for tests in soil at degrees of saturation of (a) 50%, (b) 75% and (c) 98%
148
Figure 5.15 – Relationship between measured strain and pull-out displacement during pull-out for test with overburdenpressure of 40 kPa and degree of saturation of 75%
149
Figure 5.16 – Strain distribution along the nail at peak pull-out stress for test with overburden pressure of 40 kPa and degree of saturation of 75%
149

Figure 5.17 – Relationship between pull-out force and strain measured by Strain gauge 1 for test with overburden pressure of 40 kPa and degree of saturation of 75%
150
Figure 5.18 – Illustration of pull-out procedure 150
Figure 5.19 – Calculated theoretical axial tensile force vs. pull-outdisplacement
151
Figure 6.1 – (a) Effective earth pressure and (b) pore water pressure vs. time during saturating the soil – for a submerged test with overburden pressure of 200kPa
162
Figure 6.2 – Relationship between the decrease in average earth pressure immediately after grouting and applied overburden pressurefor tests at different degrees of saturation
163
Figure 6.3 – Changes of average earth pressure at different stages of testing for tests with soil at (a) 38% and (b) 50% degrees ofsaturation
164
Figure 6.4 – Changes of average earth pressure at different stages of testing for tests with soil at (a) 75% and (b) 98% degrees ofsaturation
165
Figure 6.5 – Surfaces of the drilllhole before and after pull-out in a test with soil at 38% degree of saturation
166
Figure 6.6 – Surfaces of the drillhole before and after pull-out in a test with soil at 50% degree of saturation
167
Figure 6.7 – Surfaces of the drillhole before and after pull-out in a test with soil at 75% degree of saturation
168
Figure 6.8 – Surfaces of the drillhole before and after pull-out in a test with soil at 98% degree of saturation
169
Figure 6.9 – Nail surfaces after pull-out in tests with soil at degrees of saturation of (a) 38% (b) 50% (c) 75% and (d) 98%
170
Figure 6.10 – Relationship between average pull-out shear stress andpull-out displacement for tests at different degrees of saturation under overburden pressure of 40kPa
171

Figure 6.11 – Relationship between average pull-out shear stress andpull-out displacement for tests at different degrees of saturation under overburden pressure of 80kPa
171
Figure 6.12 – Relationship between average pull-out shear stress andpull-out displacement for tests at different degrees of saturation and overburden pressure of 120kPa
172
Figure 6.13 – Relationship between average pull-out shear stress andpull-out displacement for tests at different degrees of saturation and overburden pressure of 200kPa
172
Figure 6.14 – Relationship between average pull-out shear stress andpull-out displacement for tests at different degrees of saturation under overburden pressure of 300kPa
173
Figure 6.15 – Relationship between peak pull-out shear resistance anddegree of saturation with overburden pressure of 40kPa
173
Figure 6.16 – Relationship between peak pull-out shear resistance anddegree of saturation with overburden pressures of (a) 80kPa and (b) 120kPa
174
Figure 6.17 – Relationship between peak pull-out shear resistance anddegree of saturation with overburden pressure of (a) 200kPa and (b) 300kPa
175
Figure 7.1 – Earth pressure vs. time during (a) drilling and grouting and (b) pressure grouting only – for a test in soil at 50% degree of saturation under overburden pressure of 200kPa and withgrouting pressure of 130kPa
185
Figure 7.2 – Variation of average total earth pressure for tests in soil at50% degree of saturation with grouting pressure of (a) 80kPaand (b) 130 kPa
186
Figure 7.3 – Failure surfaces of the soil nails for tests in soil at 50%degree of saturation with grouting pressure of (a) 0kPa (gravity head only) (b) 80kPa and (c) 130kPa
187

Figure 7.4 – Average pull-out shear stress vs. pull-out displacement for tests in soil at 50% degree of saturation with groutingpressures (GP) of 0, 80, 130kPa and under overburden pressures of (a) 80kPa and (b) 200kPa
188
Figure 7.5 – Average pull-out shear stress vs. pull-out displacement for tests in soil at 50% degree of saturation under overburdenpressures of 80kPa and 200kPa with grouting pressures of (a) 80kPa and (b) 130kPa
189
Figure 7.6 – (a) Peak shear resistance, (b) shear stress at displacement of 100mm and (c) shear stress at displacement of 200mm versus grouting pressure for tests in soil at 50% degree of saturation under overburden pressure OP=80kPa and 200kPa
190
Figure 8.1 – 3-D mesh of the finite element model 205
Figure 8.2 – Load and boundary conditions of the FE model beforepull-out – (a) front view (cross-section) and (b) side view (longitudinal section)
206
Figure 8.3 – Load and boundary conditions of the model during pull-out (side view)
207
Figure 8.4 – Vertical stress contour after drilling for a simulation with anapplied overburden pressure (OP) of 120kPa (compressivestress is negative)
207
Figure 8.5 – Vertical stress contour after pull-out for a simulation with OP=120kPa (compressive stress is negative)
208
Figure 8.6 – Maximum strain rate contour after pull-out for a simulation with OP=120kPa
208
Figure 8.7 – Vertical stress distribution before and after drilling along thepath shown in Figure 8.4
209
Figure 8.8 – Distribution of the vertical stress and increased verticalstress at peak pull-out resistance along the path shown in Figure 8.4
209

Figure 8.9 – Changes of average vertical stress at the locations of P-cells 1 to 4 at different stages of modeling under different applied overburden pressures
210
Figure 8.10 – Simulated average pull-out shear stress vs. pull-out displacement under different applied overburden pressures
210
Figure 8.11 – Comparison between the measured and simulated average pull-out shear stress- displacement curves with OP=40kPa
211
Figure 8.12 – Comparison between the measured and simulated averagepull-out shear stress- displacement curves with OP=80kPa
211
Figure 8.13 – Comparison between the measured and simulated average pull-out shear stress- displacement curves with OP=120kPa
212
Figure 8.14 – Comparison between the measured and simulated averagepull-out shear stress- displacement curves with OP=200kPa
212
Figure 8.15 – Comparison the between measured and simulated average pull-out shear stress- displacement curves with OP=300kPa
213
Figure 8.16 – Simulated average pull-out shear stress vs. pull-out displacement with different dilation angles underOP=120kPa
213
Figure 8.17 – Simulated peak pull-out shear stress vs. dilation angle with OP=120kPa
214
Figure 8.18 – Simulated vertical displacement on the top surface of themodel vs. pull-out displacement with different dilation angles under OP=120kPa
214
Figure 8.19 – Procedure for simulating the pressure grouting 215
Figure 8.20 – Minimum principal stress contour after application ofgrouting pressure for a simulation with OP=80kPa andgrouting pressure (GP) of 200kPa (compressive stress isnegative)
215
Figure 8.21 – Variation of the minimum principal stress in the elements next to the hole surface throughout the simulation withOP=80kPa and GP=200kPa (compressive stress is negative)
216

Figure 8.22 – Simulated average pull-out shear stress vs. pull-out displacement under different grouting pressures with OP=80kPa
216
Figure 8.23 – Simulated average pull-out shear stress vs. pull-out displacement under different grouting pressures withOP=120kPa
217
Figure 8.24 – Simulated average pull-out shear stress vs. pull-out displacement under different grouting pressures withOP=200kPa
217
Figure 8.25 – Simulated peak pull-out shear stress vs. grouting pressure under different applied overburden pressures
218

Laboratory Pull-out Testing Study on Soil Nails in Compacted Completely Decomposed Granite Fill Su Lijun
CHAPTER 1: INTRODUCTION
1.1 BACKGROUND
Soil nailing is a technique for stabilizing soil slopes and excavations by installing a
large number of closely spaced passive inclusions (steel bar, fibre glass bar/pipe, or
other slender structures with high-tensile strength) into the in-situ soil mass. Soil nails
can be divided into several types according to the installation method, such as driven
soil nails, jacked soil nails, fired soil nails and cement (or concrete) grouted soil nails.
Cement (or concrete) grouted soil nails are the most widely used. The soil nailing
technique has been increasingly used in many countries since it originated in the early
1970’s because of its technical and economic advantages. In Hong Kong, soil nailing
has been commonly used to stabilize newly cut and sub-standard existing slopes for
decades. Every year, tens of thousands of soil nails are installed into these slopes to
increase stability.
The Hong Kong territory is mostly hilly, for 70% of the land area. Flat land is very
limited. During the rapid economic growth of the 1950’s and 1960’s, large amounts of
flat lands were required for residential, commercial, industrial and infrastructural
developments. Prior to 1977, more than 6000 cut and fill slopes were constructed at
angles of 60º or steeper, with slope heights ranging from 15 to 30m (Brand 1985). Most
of the cut slopes formed before 1977 were designed empirically to an angle of 10
vertical to 6 horizontal without much consideration of the geological or hydrological
characteristics of the slope. Slopes in Hong Kong generally consist of completely
decomposed granite (CDG) or volcanic (CDV) soil with CDG being more common.
- 1 -

Chapter 1: Introduction
Both of these two types of soils have a high strength when unsaturated during the dry
season but a low strength when fully saturated (Lumb 1975). According to the current
standard, many of those pre-1977 slopes in Hong Kong are considered to be substandard
and liable to failure in periods of intense tropical rainfall. Some publications have
reported the relationship between rainfall and landslides in Hong Kong (Brand et al.
1984, Kay and Chen 1995). A number of disasters occurred in the early and mid 1970’s
(Lumb 1975 and 1979). The two major disastrous landslides in Hong Kong’s history
occurred on 18 June 1972 at Po Shan Road and Sau Mau Ping. At the Sau Mau Ping
housing estate, a 35m high fill slope liquefied and a single-story building at the foot of
the slope was embedded (Figure 1.1), 6000 m3 of soil cascaded down and 71 were killed
and 60 injured. On the steep hillside above Po Shan Road, a slope failure with an area of
120m long and 67m wide occurred with a failure depth of 10m (about 20000 m3). This
slope failure demolished a 4-story building and a 13-story apartment block (Figure 1.2),
67 were killed and 20 injured (Government of Hong Kong 1972). There have also been
some other landslides which have caused more than 30 fatalities and more than 20
injuries. Horelli (2005) studied landslides in Hong Kong, including the major causes of
landslides, and a case study of a land slide etc. Sun (1998) carried out a review of fill
slope failures in Hong Kong.
After the disastrous landslides occurred in the early and mid 1970’s, The Hong Kong
Government started the Landslip Preventative Measures (LPM) programme. In this
programme preventative and remedial works were carried out on those prior to 1977
steeper cut and fill slopes to bring them up to current standards. The most direct method
of improving the factor of safety was to cut back the slope to a flatter angle. But in
Hong Kong’s crowded conditions, this was often not possible because of space
restrictions. In these cases, structural strengthening elements such as retaining walls,
- 2 -

Laboratory Pull-out Testing Study on Soil Nails in Compacted Completely Decomposed Granite Fill Su Lijun
cantilever caisson walls or large diameter dowels were used. From the late 1980’s, soil
nailing was found to be cheaper and more flexible in relation to the demand for space.
In some cases, this method was found to be even cheaper than the cut back method. The
use of soil nailing to stabilize existing and newly formed slopes blossomed from then on
(Powell and Watkins, 1990; Watkins and Powell 1992; Yim et al. 1988 and Forth 1997).
There are approximately 25,000 cut and fill slopes formed in hilly terrain in Hong Kong,
as identified so far by the Geotechnical Engineering Office of the Hong Kong
Government. More than HK$0.8 billion (US$103 million) is spent on slope upgrading
each year. About 80% of slopes are stabilized using soil nails. In the design of a soil
nailing system, the shear strength of the interface between a soil nail and the
surrounding soil is a key parameter for the design and stability assessment of a soil nail
stabilized slope. In current practice in Hong Kong, the interface shear strength (adhesion
ca and friction angle δ) is generally assumed to be the same as the shear strength
(cohesion c and internal friction angleφ ) of the soil itself. The interface shear strength is
then normally verified in the construction stage by field pull-out tests on soil nails
(Powell and Watkins 1990). There are considerable uncertainties about the evaluation of
interface shear strength parameter with field verification tests. For example, the shear
strength at the interface between the cement grout surface and the surrounding soil is
different from that of the soil itself. In addition, the field soil nail pull-out tests are
subjected to actual site conditions that have high local variations and the results
therefore in many cases are scattered even for two adjacent test nails within the same
site. Another problem is that the field pull-out tests are usually conducted under
conditions that are less severe than design conditions (e.g. the soil is not saturated) and
as a result the in-situ pull-out resistance may not be representative of the worst site
conditions. To enable a reliable and economic design of a soil nailing system,
- 3 -

Chapter 1: Introduction
understanding of the fundamental interaction mechanism and shear strength between a
cement grouted soil nail and the surrounding soil is of great significance.
Laboratory pull-out tests can be used to study the interaction mechanism and shear
strength between a soil nail and the surrounding soil under controllable conditions.
Many laboratory pull-out tests have been carried out by other researchers in other
countries, such as the tests conducted by Chang et al. (1996), Hong et al. (2003) and
Franzén (1998). In Hong Kong, most soil nail pull-out tests are performed on
completely decomposed granite (CDG). Laboratory pull-out tests on both steel bars and
grouted nails were carried out by Lee et al. (2001), Junaideen et al. (2004), Pradhan et
al. (2003) in the Hong Kong University using a large pull-out box in loose CDG fill.
The vertical pressure was applied by a hydraulic jack acting on a rigid plate on the top
soil surface. The stresses on the soil nail were not uniform and the water saturation
control was difficult (Pradhan et al. 2003). Chu (2003), Chu and Yin (2005, 2005a)
carried out a series of laboratory pull-out tests using a 700mm×570mm×610mm
pull-out box on grouted nails in compacted CDG fill. As a general observation from
these studies, the pull-out resistance was found to increase with the applied overburden
pressure and decrease with increasing degree of saturation of the soil. However, the
influences of the drilling process, stress release, pressure grouting etc. were not studied
at all. In addition, the box used by Chu and Yin (2005a) was a simple one without good
instrumentation. In order to overcome these disadvantages and to meet the demands for
more comprehensive studies on the soil nail pull-out resistance, an innovative pull-out
box was designed. In order to accelerate the testing programme, two boxes were
constructed and setup in the Soil Mechanics Laboratory of The Hong Kong Polytechnic
University. Each pull-out box is fully instrumented with earth pressure cells,
tensiometers, etc. inside the box. A number of pull-out tests have been carried out using
- 4 -

Laboratory Pull-out Testing Study on Soil Nails in Compacted Completely Decomposed Granite Fill Su Lijun
the two boxes to study the relationship between the pull-out resistance and certain
influencing factors, such as the overburden pressure after hole drilling and stress release,
the degree of saturation and dilatancy of the soil, and cement pressure grouting.
1.2 OBJECTIVES
The objectives of this research project are to study the influences of a few factors on the
nail-soil interface shear resistance based on laboratory pull-out tests which simulate the
procedure of soil nailing construction in the field. The following specific issues have
been studied:
(a) The pull-out resistance of soil nails in a CDG soil at the same degree of
saturation under different overburden pressures.
(b) The effect of the degree of saturation of the soil on the pull-out resistance soil
nails.
(c) The stress release effect during the drill hole procedure by monitoring the earth
pressures at locations close to the hole surface with earth pressure cells.
(d) The influence of soil dilatancy on the pull-out resistance soil nails.
(e) The influence of pressure grouting on the pull-out resistance of soil nails.
1.3 ORGANIZATION OF THE THESIS
This thesis consists of nine chapters. Chapter 1 briefly introduces the background to the
soil nailing technique and its use in Hong Kong. The objectives and methodology of this
- 5 -

Chapter 1: Introduction
research project are presented.
Chapter 2 reviews the origins and history of soil nailing. The definition of soil nailing,
the mechanism and failure modes of soil nailing systems and the fields of soil nailing
applications are presented and discussed. Different design methods are reviewed.
Current design codes and guides for soil nailing practice are examined. Research work
for developing the soil nailing technique and its analysis in the literature are reviewed
and summarized.
The design and construction of the laboratory pull-out box and relevant apparatus are
described in Chapter 3. A detailed description of the determination of the dimensions of
the box is presented. The design and details of the apparatus for saturating the soil,
drilling the hole, grouting and pull-out of the nail are described.
Chapter 4 presents the basic properties of the soil and cement grout, the calibration of
the sensors and transducers used in the pull-out tests and the test procedures. The results
of the tests for determining the properties of the soil and the cement grout are presented
and discussed. Methods and procedures for calibrating each type of sensor and
transducer are described.
Chapter 5 presents the results of tests on soil nails in a compacted CDG fill at degrees of
saturation of 38%, 75% and 98% under applied overburden pressures of 40kPa, 80kPa,
120kPa, 200kPa and 300kPa respectively. The stress release effects, the distribution of
shear stress on the nail-soil interface along the length of a nail and the influence of
overburden pressure on the soil nail pull-out behaviour and resistance are discussed.
- 6 -

Laboratory Pull-out Testing Study on Soil Nails in Compacted Completely Decomposed Granite Fill Su Lijun
Chapter 6 discusses the influence of the degree of saturation of the soil on the soil nail
pull-out behaviour and resistance. Variations of earth pressure, failure patterns and
pull-out resistance of the soil nail in tests with CDG soil at different degrees of
saturation are compared and discussed.
In Chapter 7, the results of the tests with nails grouted under grouting pressures of
80kPa and 130kPa under overburden pressures of 80kPa and 200kPa respectively in the
soil at the same degree of saturation of 50% are presented. The variations of earth
pressure and failure pattern of the soil nail in these tests are discussed. Investigation into
the influence of grouting pressure on the soil nail pull-out behaviour and resistance is
also discussed.
In Chapter 8, the establishment of a three dimensional finite element model is described.
Simulation results are presented and discussed.
Chapter 9 presents a summary of major conclusions drawn from this research project
and suggests recommendations for further research in this subject.
- 7 -

Chapter 1: Introduction
Figure 1.1 – 1972 Sau Mau Ping Landslide
- 8 -

Laboratory Pull-out Testing Study on Soil Nails in Compacted Completely Decomposed Granite Fill Su Lijun
Figure 2.2 – 1972 Po Shan Road Landslide
- 9 -

Chapter 2: Literature review
CHAPTER 2: LITERATURE REVIEW
2.1 THE SOIL NAILING TECHNIQUE
Soil nailing is a technique for stabilizing in-situ soil mass by installing a large number
of closely spaced passive slender inclusions into the soil mass. The inclusions are called
soil nails. Soil nails can be steel bars, steel strips and steel bars surrounded by cement
grout or concrete. In recent years, Fiber glass Reinforced Plastic (FRP), a material with
high tensile strength, is increasingly being used to replace steel bars in cement grouted
soil nails because of its high corrosion resistance and advantages in environmental
protection (Ortigao and Palmeira 1997). Soil nails can resist tensile stress, shear stress
and bending moments. The soil nailing technique originated as the New Austrian
Tunneling method evolved in the early 1960’s by combining shotcrete and fully bonded
steel inclusions to support a rock tunneling system. It became popular in Europe and
North America in the 1970’s. In Hong Kong, soil nailing has been widely used for
stabilizing slopes since the late 1980’s.
Soil nails are divided according to installation methods, into driven, fired (or launched),
jet-grouted, corrosion-protected and cement (or concrete) grouted soil nails. The most
widely used nail is the cement (or concrete) grouted type.
Driven soil nails, commonly used in France and Germany, are small-diameter rods or
bars, or metallic strips, made of mild steel with yield strength of 350MPa. They are
closely spaced (2 to 4 bars per square meter) and create a rather homogeneous
composite reinforced soil mass. The nails are driven into the ground at the designed
- 10 -

Laboratory Pull-out Testing Study on Soil Nails in Compacted Completely Decomposed Granite Fill Su Lijun
inclination using a vibropercussion pneumatic or hydraulic hammer with no preliminary
drilling. Special nails with an axial channel can be used to allow for grout sealing of the
nail to the surrounding soil after its complete penetration. This installation technique is
rapid and economical (4 to 6 nails per hour). However, it is limited by the length of the
bars and by the inhomogeneous of the soil (e.g., the presence of boulders).
Fired (launched) soil nails are directly fired into the soil mass using a compressed air
launcher (Bridle and Myles 1991; Myles and Bridle 1992) as shown in Figure 2.1. The
nails are installed at speeds of 200mph (89.39m/s) with an energy transfer of up to
100kJ. This installation technique enables optimization of nail installation with a
minimum of site disruption. During penetration the ground around the nail is displaced
and compressed. The technology is currently used primarily for slope stabilization.
Jet-grouted nails are composite inclusions made of a grouted soil with a central steel rod.
This technique combines vibropercussion driving and high-pressure jet grouting. The
nails are installed using a high frequency vibropercussion hammer, and cement grouting
is performed during installation. The grout is injected through a small-diameter channel
in the reinforcing rod under a pressure that is sufficiently high to cause hydraulic
fracturing of the surrounding soil. However, in granular soils, nailing with a lower
grouting pressure has also succeeded. The jet-grouting installation technique provides
hydraulic fracturing and re-compaction of the surrounding soil and significantly
increases the pull-out resistance of the soil nail.
Corrosion-protected nails generally use double protection schemes similar to those
commonly used in ground anchor practice. They are usually used in permanent
structures. For permanent applications of soil nailing, based on current experience, it is
- 11 -

Chapter 2: Literature review
recommended (Elias and Juran, 1991) that a minimum grout cover of 1.5 inches
(38.1mm) is achieved along the total length of the nail for corrosion protection purpose.
Secondary protection should be provided by electro statically applied resin-bonded
epoxy on the bars with a minimum thickness of 0.35mm.
Cement grouted nails can be used in both temporary and permanent construction. They
are generally steel bars (15 to 46mm in diameter) which are placed into boreholes (100
to 150mm in diameter) and grouted with cement (or concrete) grout. The vertical and
horizontal spaces between nails vary typically from 1 to 3m depending on the type of
the in-situ soil. The nails are grouted by gravity or under low pressure. Ribbed bars can
be used to improve the nail-grout adherence. This method can provide relatively high
pull-out resistance and is widely used in Hong Kong.
2.1.1 Characteristics of soil nailing
Compared with some traditional soil reinforcement methods, soil nailing has the
following characteristic features (Bruce and Jewell 1986 and 1987a):
a) Compared with the reticulated micro piles
The reticulated micro piles are steeply inclined in the soil at various angles both
parallel and perpendicular to the wall face. The overall aim of this method, similar
to soil nailing, is to provide a stable block to support the soil mass behind. But soil
nails are generally installed into the soil mass horizontally or at small and usually
similar angles (Figure 2.2).
b) Compared with soil dowelling
Soil dowelling is applied to reduce downslope movements for relatively flat slopes
- 12 -

Laboratory Pull-out Testing Study on Soil Nails in Compacted Completely Decomposed Granite Fill Su Lijun
with a small number of large diameter dowels. Soil nailing, by contrast, uses a large
number of small diameter inclusions (Figure 2.2).
c) Compared with prestressed ground anchorages
Ground anchorages are stressed after installation and their effectiveness does not
depend on ground deformation in service. But soil nails are not prestressed and
require a finite soil deformation to mobilize their strengthening forces.
Soil nails are in contact with the soil along their whole length but ground anchorages
transfer loads only along the fixed anchorage length.
Soil nails are installed at a much higher density than ground anchorages. Thus the
failure of a single nail is not very important for the whole system.
Strong bearing facilities must be provided at the head of a ground anchorage to
resist the high prestress. But for soil nails, small steel bearing plates or simple
welding of the nail head to the rebar mesh are enough.
d) Compared with reinforced earth walls
The reinforced earth method has many similar features to the soil nailing method.
They are both horizontally installed (or nearly horizontally) into the soil mass with
high density. The reinforcement is placed in the soil unstressed and the
reinforcement forces are mobilized by subsequent deformation of the soil. The
reinforcement forces are resisted by frictional bond between the soil and the
reinforcement. But the construction sequences of these two methods are totally
different. For strengthening excavations, the soil nailing is constructed by staged
- 13 -

Chapter 2: Literature review
excavations and installation of nails from “top-down”. For reinforcing existing
slopes, the construction is completed by direct drilling and installation of nails. But
reinforced earth structures are constructed “bottom-up” (Figure 2.3).
2.1.2 Advantages and limitations of soil nailing
The most important advantage which has contributed to the growing popularity of soil
nailing is its economic advantage. Soil nailing can save 10% to 30% of the cost
comparing with the ground anchorage method (Bruce and Jewell 1986). In Hong Kong,
the direct cost of soil nailing is generally similar to that for cutting back solutions, but
since no additional land is required the overall cost is significantly lower (Powell and
Watkins 1990).
The construction equipment of soil nailing is relatively small scale, mobile and quiet.
This is an important advantage in urban environments where the construction space is
congested and noise and vibration may cause problems. The low vibration will cause
fewer disturbances to the surrounding existing buildings.
The construction of soil nailing system is flexible. For drilling, coring, rotary drilling
and even hand drilling can be used according to the site conditions. The facings of the
soil nailing system are also diversified, such as shotcrete facing, precast concrete facing
etc. For slope stabilization sometimes there is even no facing and only steel plates are
used to fix the nail heads.
Even though soil nailing has the above advantages, it still has some limitations. For
stabilizing excavations, soil nailing construction requires the formation of cuts generally
1-2m high in the soil. These cuts must stand up unsupported for at least a few hours
- 14 -

Laboratory Pull-out Testing Study on Soil Nails in Compacted Completely Decomposed Granite Fill Su Lijun
prior to shotcreting and nailing. If the soil is not strong enough, a pretreatment may be
necessary to stabilize the face.
Extra care should be taken when using soil nailing in soft clay. The low frictional
resistance of soft clay would require a very high density of reinforcements of
considerable length to ensure adequate levels of stability (Bruce and Jewell 1986).
In urban areas, a closely spaced array of reinforcements may interfere with nearby
utilities. Soils close to utility trenches may contain poorly compacted or unsuitable fill
for soil nailing.
The horizontal displacements for structures supported with soil nails may be greater
than for those supported by prestressed tiebacks. This may cause distortions to
immediately adjacent structures (Byrne et al. 1998).
2.1.3 Fields of application
Soil nailing has been successfully used in both temporary and permanent constructions
for stabilizing existing natural and fill slopes or new cut slopes and excavations (Bruce
and Jewell 1986). The fields of application for soil nailing are summarized as follows:
(a) New construction
1) Support of deep excavations for high rise buildings or underground constructions
for car parks and so on (Shen et al. 1981 and 1981a; Cheang et al. 1999).
2) Retaining walls for protecting highways or railways from being affected by
landslips (Bruce and Jewell 1987; Wehr 2003).
- 15 -

Chapter 2: Literature review
3) Stabilizing tunnel portals and tunnel facings (Ortigao et al. 1995; Barley and
Graham 1997; Ng and Lee 2002).
4) Reinforcement of bridge abutments (Hanna et al. 1998; Briaud and Lim 1997).
5) Stabilizing cut slopes (Pedley and Pugh 1995).
(b) Remedial works
Remedial works include the strengthening of existing marginally stable natural or fill
slopes and existing old retaining structures (Bruce and Jewell 1986; Schwing and
Gudehus 1988). The types of projects in this category include:
1) Repair of masonry gravity retaining walls after or before failure to prevent
possible movements behind the wall.
2) Repair of reinforced earth walls to replace the effect of the reinforcing strips or
fasteners damaged by overloading or corrosion.
3) Reinforcement of failed slopes due to failure or inadequate strength of preexisting
supports. Stabilization of marginally stable slopes to eliminate any threat to other
nearby constructions (Guilloux and Schlosser 1982; Cali 1996).
4) Stabilization of anchored walls after failure of the prestressed rock anchorages
caused by structure overloading or by corrosion of tendons.
- 16 -

Laboratory Pull-out Testing Study on Soil Nails in Compacted Completely Decomposed Granite Fill Su Lijun
2.1.4 Soils suitable for soil nailing
For stabilizing excavations, the ideal soil for soil nailing should be able to stand vertical
for a height of 1-2 meters for 1-2 days. In addition, the soil nails should be able to be
easily installed, that is, there should not be large amount of cobbles and boulders in the
soil. At the same time, the soil must provide enough bond or frictional resistance on the
interface between soil nails and the surrounding soil. Soil types that are ideal for soil
nailing include glacial till with a limited number of boulders and cobbles, weathered
rock (such as CDG), cemented sands, stiff silts and dense sands and silts. Applications
of soil nailing in residual soil (weathered rock) have been reported by Khalil et al. (1998)
and Sigourney (1996). Successful applications of soil nailing in loess and moraine soils
have been presented by Guilloux et al. (1983) and Ho et al. (1989) respectively.
Soil nailing is normally not recommended for use in plastic clays, clean granular soils
and varved and organic silts, especially for permanent constructions. For these types of
soils, the nail-soil interface shear resistances are very small and the nail needs to be
excessively long to reduce the deformation of the structure. In addition, clean granular
soils, varved and organic silts generally can not remain vertical for the time required to
install the nails and shotcrete. In order to provide more data on soil nailing in these
types of soils, Oral and Sheahan (1998) and Sheahan (2000) studied an experimental
soil nailing wall in soft clay. Based on the observation of the deformation and failure
mode of the experimental wall, they concluded that soil nailing can be effectively used
for temporary excavation support in clayey soils.
2.2 BEHAVIOUR OF SOIL NAILING
2.2.1 Soil nailing mechanism
The fundamental mechanism of soil nailing is the development of tensile forces in the
- 17 -

Chapter 2: Literature review
passive reinforcements as they react against the lateral deformations of the structure. In
the case of a top-down constructed soil nail wall, the lateral expansion of the reinforced
zone is associated with further excavations. In the case of repair of existing retaining
structures or the stabilization of marginally stable slopes, the lateral deformations are
due to the movements of the wall or slope as a result of inadequate support. In both
cases, the reinforcements interact with the ground to support the stresses and strains that
would otherwise cause the unreinforced ground to fail. These reinforcements are
oriented to correspond in general with the direction of maximum tensile straining within
the soil so that the generation of tensile forces is dominant (Byrne et al. 1998).
The tensile forces are developed within the soil nails primarily as a result of the friction
interaction between the nail and the surrounding soils, and secondarily by the
soil-structure interaction between the nail head and the soils. The tensile force at the nail
head is much smaller than the maximum tensile force in the nail. The maximum tensile
forces are located at the intersections of the nails and the potential failure surface. This
surface divides the reinforced soil mass into two zones as shown in Figure 2.4:
An “active zone” located immediately behind the facing, where the frictional shear
stresses exerted on the surface of the nail are oriented towards the facing and tends to
pull out the nails.
A “passive zone” located behind the potential failure surface, where the frictional shear
stresses are directed towards the inside of the soil nail structure and tends to restrain the
reinforcements from pull-out (Schlosser 1982; Guilloux and Schlosser 1982).
- 18 -

Laboratory Pull-out Testing Study on Soil Nails in Compacted Completely Decomposed Granite Fill Su Lijun
2.2.2 Nail-soil interface shear resistance
As discussed above, the development of shear stresses on the interface between soil
nails and the surrounding soil is the fundamental interaction mechanism between the
nail and the ground. Thus the nail-soil interface resistance becomes a key parameter
which controls the design, deformation and stability assessment of soil nailed structures.
In order to fully utilize the tensile strength of the steel bar, the pull-out failure should be
avoided in soil nailing design and therefore the pull-out resistance provided by that part
of the nail inside the passive zone should be sufficiently large.
The nail-soil interface shear resistance is related to many factors, such as the normal
stress exerted on the nail surface, the shear strength of the soil, the roughness of the nail
surface, the nail perimeter, soil dilatancy and etc. Since the 1980’s, many authors have
studied the soil nail pull-out resistance by analytical and empirical methods including
Schlosser and Guilloux (1981), Cartier and Gigan (1983), Jewell (1990), HA 68/94
(1994) and Luo (2002). In these studies the parameters involved were normal stress
acting on the nail surface, shear strength of the soil, nail perimeter and soil dilatancy.
These methods are classified into two categories according to whether the soil nail
pull-out resistance is dependent on the depth or not.
Schlosser and Guilloux (1981) developed an equation for calculation of the ultimate
pull-out resistance:
*2 μσ vef DcPT ′+′= (2-1)
where Tf is the pull-out force per linear meter; P is the perimeter of the nail; c′ is the
effective cohesion of the soil; De is the width of an equivalent flat reinforcement strip;
vσ ′ is the theoretical vertical stress calculated at the mid-depth of the reinforcement;
- 19 -

Chapter 2: Literature review
*μ is the coefficient of apparent friction of the soil.
The apparent friction coefficient is defined by dividing the maximum shear stress *μ
maxτ by the theoretical effective vertical stress (Schlosser 1982):
vστ
μ′
= max* (2-2)
Schlosser and Guilloux (1981) observed that the apparent friction coefficient
decreased with depth and the reason might be the decrease of dilatancy. The
decreased with depth and became equal to
*μ
*μ
φ′tan (φ′ is the effective internal friction
angle of the soil) below a certain depth. The pull-out resistance was considered to be
independent of the depth because the decrease of the apparent friction coefficient
was compensated by the increase of the theoretical effective vertical stress. This was
confirmed by Cartier and Gigan (1983) by pull-out tests on driven metal profiles used as
reinforcements in a nailed soil retaining wall built in silty fine sand (Figure 2.5).
*μ
This equation was adopted by many other authors directly (such as Juran 1985) or after
some modification (such as Milligan and Tei (1998) who replaced vσ ′ by mσ which is
the normal stress acting on the nail surface by considering the K0).
Jewell (1990) proposed an equation in which the pull-out capacity was related to the
average normal effective stress exerted on the soil nail surface:
φσπ tanbrapull fDLP ′= (2-3)
where Ppull is the pull-out force; La is the anchorage length of the nail; fb is the bond
coefficient; φ is the internal friction angle of the soil; rσ ′ is the average normal
effective stress acting on the circumference of the reinforcement.
- 20 -

Laboratory Pull-out Testing Study on Soil Nails in Compacted Completely Decomposed Granite Fill Su Lijun
Considering the at rest lateral earth pressure coefficient K0, the average normal effective
stress acting on the soil nail surface can be derived as:
vrK
σσ ′+=′
2)1( 0 (2-4)
Jewell (1990) pointed out that the average normal effective stress is often in the range of
7.0/1 ≥′′≥ vr σσ in steep slopes with lightly over consolidated soils. The range of fb is
from fb=1 for a fully rough surface which might be achieved at a grout to soil surface to
fb=0.2 to 0.4 for a smooth surface as might be apply between soil and a smooth metal
surface.
In HA 68/94 (1994) a similar equation which considered the cohesion of the soil was
suggested:
)tan( φσλ ′′+′= neppull cLP
(2-5)
where Le is the anchorage length of the nail; c′ and φ′ are the effective cohesion and
internal friction angle of the soil; nσ ′ is the average normal effective stress acting on
the nail surface and pλ is the pull-out factor:
hholep Sd /απλ = (2-6)
where dhole is the diameter of the borehole; Sh is the horizontal spacing of the nails and
α is the interface sliding factor which is similar to the bond coefficient fb and is
defined as:
)tan()tan( intint
desdesv
v
cc′+′′′+′′
=φσφσ
α (2-7)
where the subscripts int and des relate to interface and design values respectively.
- 21 -

Chapter 2: Literature review
Luo et al. (2000 and 2002) developed a theoretical model, in which the soil dilatancy is
considered, to calculate the pull-out resistance. In this model the apparent friction
coefficient for the peak state and critical state are given by:
)tan( maxψφσ
η +′′
′= cv
v
pp
q (2-8)
cvv
cvcv
qφ
ση ′
′′
= tan (2-9)
where and are the average normal stresses on the soil nail for the peak and
critical states respectively;
pq′ cvq′
cvφ′ and maxψ are the effective internal friction angle at the
critical state and the maximum dilation angle of the soil.
This model was verified by simulating the pull-out tests presented by Schlosser et al.
(1992) and Luo (2001) and good agreement between the test results and predicted
results was achieved.
2.2.3 Influence of bending stiffness of the nail
The soil nails may be subjected to shear forces and bending moments along the potential
failure surface in the soil nail structures (Figure 2.6). Many authors have investigated
the contribution of the bending stiffness of the nails to the stability of a soil nail
structure, such as Schlosser (1982), Jewell (1990), Jewell and Pedley (1990 and 1992)
and Juran et al. (1990). But different authors have different points of view on the
influence of the bending stiffness of the nail. Schlosser (1991) claimed the effect of the
bending stiffness can be either beneficial or not beneficial depending on the behaviour
of the soil nail system. Juran et al. (1991) concluded that increasing the nail bending
stiffness could result in a decrease of structure stability. But Jewell and Pedley (1990
and 1992) thought otherwise and considered that the bending stiffness of the nail is only
- 22 -

Laboratory Pull-out Testing Study on Soil Nails in Compacted Completely Decomposed Granite Fill Su Lijun
of secondary importance compared with the tensile resistance and can be ignored in soil
nailing design.
2.2.4 Failure modes of soil nailed structures
Soil nailed structures include the soil nails, the facing and soils between them and they
work together to support the soil mass behind them. Soil nailed structures may fail due
to internal or external failure.
Internal failure is failure which occurs inside the reinforced zone and can be considered
as one or a combination of the following:
(a) Tension failure of the nail: The rupture of the steel bar may occur if the steel bar is
not strong enough but the bond strength between the nails and the surrounding soils
in the passive zone is large enough to ensure the nails can not be pulled out.
(b) Pull-out failure: In contrast, when the steel bar is strong enough but the bond
strength between the nails and the surrounding soils in the passive zone is not large
enough, pull-out failure may occur.
(c) Facing failure: When the bond strength in the passive zone and the tensile strength
of the steel bar are both large enough but the bond strength in the active zone and
strength of the facing are not large enough, head or facing failure may occur.
External failure is defined as failure which occurs behind the reinforced zone. In this
type of failure, the soil nailed structure may fail like any retaining structure would, such
as by overturning, sliding, insufficient bearing capacity and overall slope failure. The
main reason for this type of failure is insufficient length of the nails together with poor
- 23 -

Chapter 2: Literature review
quality foundation etc. In this type of failure, the soil nailed structure fails as a
monolithic block and the reinforcements have not been brought into play. Thus in the
design of soil nailing, external failure should be avoided. Combination of soil nailing
and other stabilizing methods such as prestressed tiebacks is a good way of avoiding
this problem. Kim et al. (1995) studied the failure mechanism of soil nailed structures
under surcharge loading using reduced model tests. Cardoso and Fernandes (1991)
investigated the failure mechanism of soil nailed walls using the Finite Element
Method.
2.3 DESIGN METHODS FOR SOIL NAILING STRUCTURES
There are several different methods currently used for the design of soil nailed
structures. All these methods are based on limit equilibrium analysis in which the
potential failure surfaces throughout the soil mass are examined. Both internal and
external failures are examined in these methods. Most of these methods are based on the
slope stability concept and are the same as the limit equilibrium analysis methods for
slope stability except that the resistance of the soil nails at the failure surface are also
included. Famous methods of this type are the Schlosser method (1982) in France and
Davis (Shen et al. 1981) method in the USA. The former method considers the tensile
resistance as well as the shear resistance of the reinforcement in the analysis, while the
later method uses only the tensile resistance. There are also some methods that consider
the soil nailing support system as a composite retaining wall when conducting a stability
analysis and design, such as the Stoker and Gasler (1979) method in Germany. All the
above are overall stability analysis methods and can not assess the internal force in each
soil nail. Juran et al. (1988) developed a limit equilibrium method using logarithmic
spirals failure surface. In this method, an empirical earth pressure distribution is given
and soil nail forces can be estimated based on this distribution. These methods are
- 24 -

Laboratory Pull-out Testing Study on Soil Nails in Compacted Completely Decomposed Granite Fill Su Lijun
briefly presented in the following paragraphs.
2.3.1 The Davis method
The Davis method was developed at the University of California at Davis, by Shen et al.
(1981b). A parabolic curve passing through the toe of the wall is assumed to represent
the failure surface for an in-situ reinforced soil mass. A classical method-of-slices slope
stability analysis is used to evaluate the contribution of the nails to overall stability.
Only tensile forces are considered to be mobilized in the reinforcements. The tensile
forces are divided into components parallel and perpendicular to the failure surface. The
normal and tangential components of the tensile forces in all of the reinforcements
crossing the failure surface are added to the resisting forces mobilized in the soil when
determining the factor of safety of the entire mass. To carry out the stability analysis,
two conditions must be considered separately. One condition is that the failure surface
must be entirely within the reinforced soil mass and the other condition allows the
failure surface to extend beyond the reinforced zone (Figure 2.7). As with conventional
slope stability analysis, a factor of safety for the soil nail reinforced soil mass can be
obtained by iteration.
Limit analyses performed in accordance with the above method have been compared
with the finite element analysis results carried out by Bang (1979) on an in-situ
reinforced soil excavation. Figure 2.8 shows the predicted potential failure surfaces
using the two methods and the results are in good agreement. Bang (1992) further
introduced this method and carried out some parametric studies. Bang (1996) developed
an approximate solution to evaluate the factor of safety for soil nailed walls against deep
seated failure based on this method.
- 25 -

Chapter 2: Literature review
2.3.2 The French method
The French method developed by Schlosser (1982) considers the tensile resistance,
shearing strength and bending stiffness of the nails, which contribute to the overall
stability of the in-situ reinforced soil mass. This method is also derived from the slices
methods (Fellinius, Bishop, etc.) used in slope stability analysis. The global equilibrium
of a partly or completely reinforced soil mass between the external surface and the
potential failure surface is considered. In this method, the reinforced soil is considered
as a composite material and the failure for each inclusion and the interaction between
the soil and the inclusions are taken into account (Figure 2.9). The analysis procedure is
similar to the Davis method, however, four failure criteria are considered: shear strength
of the soil, soil-inclusion friction, soil-inclusion normal pressure and strength of the
inclusion.
The strength of the inclusions combined with the tension and shear stresses (the bending
moment is related to the shear stress) is given by means of maximum plastic work under
Tresca’s yield criterion:
122
≤⎟⎟⎠
⎞⎜⎜⎝
⎛+⎟⎟
⎠
⎞⎜⎜⎝
⎛
c
c
n
n
RT
RT (2-10)
where Tn and Tc are the tension and shear force respectively and Rn and Rc are their
maximum allowable values. The corresponding yield curve is an ellipse in the (Tc, Tn )
plane. The shear strength of the soil is determined by Mohr Coulomb’s failure criterion
and the soil-inclusion friction is governed by the Schlosser and Guilloux (1981)
criterion which is discussed above. For the soil-inclusion normal pressure, considering
the combination of failure within the soil and the inclusions, the final yielding curve is
shown in Figure 2.10.
- 26 -

Laboratory Pull-out Testing Study on Soil Nails in Compacted Completely Decomposed Granite Fill Su Lijun
A particular factor of safety is used for each failure criterion. For the strength of the
inclusion, a factor of safety of 1 is used. A factor of safety of 2 is applied for the
soil-inclusion normal pressure. For the shear strength of soil, a minimum factor of
safety of 1.5 is generally required relative to overall slope stability. For the
soil-inclusion friction, the factor of safety is taken as equal to that of the soil shear
strength and has to be equal to or greater than 1.5.
2.3.3 The German method
Stocker et al. (1979) proposed a limit equilibrium approach (German method) for
designing soil nailed structures using a bilinear failure surface and assuming that nails
can withstand only tensile force. The inclinations of the two-part wedge passing through
the toe are determined iteratively to obtain a minimum factor of safety (Figure 2.11). A
force polygon is constructed by considering the forces acting on a rigid soil wedge
limited by the potential failure surface. The soil is assumed to be homogeneous and
without water. For the design of permanent structures a minimum global factor of safety
of 1.5 is recommended, the suggested partial factor of safety for soil strength parameters
is 1.2 to 1.25 and a factor of safety for friction of the inclusions is in the range of 1.5 to
2.0.
Further investigations of this method were reported by Gassler and Gudehus (1981),
Gassler and Gudehus (1983) and Gassler (1988). These studies indicated that the
bilinear failure surface is only suitable for nearly vertical nailed walls in cohesionless
soils with nails of constant length or shorter nails in the upper rows subjected to high
surcharge loads. For less steep walls or longer nails in the upper rows the circular failure
surface is more suitable. Later observations on the behaviour of soil nailing structures
which subject to self-weight of the soils and the nails themselves also shows that the
- 27 -

Chapter 2: Literature review
bilinear failure surface is not applicable for this circumstance.
2.3.4 The Juran method
Juran et al. (1988 and 1990) proposed a limit equilibrium analysis method — the
kinematical limit analysis design approach which can estimate the maximum tension
and shear forces mobilized in each inclusion. The main design assumptions (Figure 2.12)
are:
(a) The potential failure surface is a log-spiral intersecting the bottom of the wall.
(b) At failure, the locus of maximum tension and shear forces coincides with the failure
surface.
(c) The quasi-rigid active and resistant zones are separated by a thin layer of soil at a
limit state of rigid plastic flow.
(d) The shear strength of the soil is entirely mobilized all along the failure surface.
(e) The horizontal components of the interslice forces acting on both sides of a slice
containing a nail are equal.
The reinforced soil mass is divided into slices parallel to the nails with a single nail row
in one slice. The tensile and shear forces developed in each nail row at their point of
intersection with the failure surface are determined by considering the local equilibrium
in each slice. The soil nailing structure can be designed to prevent failure by pull-out
and breakage of reinforcements. This approach can evaluate the effect of the main
- 28 -

Laboratory Pull-out Testing Study on Soil Nails in Compacted Completely Decomposed Granite Fill Su Lijun
design parameters (inclination, bending stiffness and spacing of the nails) and the
structure geometry on the stability of the structure. The method was verified by
comparing the predicted results with measured results in laboratory models and
full-scale structures and the agreement between them is fairly good.
Besides proposing the kinematical analysis design method, Juran also conducted much
other work related to soil nails. Juran et al. (1982) studied the soil-bar interaction
mechanism in soil nailing by experimental and numerical methods. Juran (1985)
compared soil nailing and reinforced earth retaining structures, summarized the main
results of both laboratory model studies and full scale experiments and illustrated the
mechanism and proposed design methods for soil nail structures. Juran and Elias (1990)
presented some field observations during and after construction on instrumented full
scale structures and compared the measured results with results predicted by Juran
method. Juran et al. (1990a) compared the foregoing design methods (Table 2.1),
recommended a design procedure and provided useful charts for preliminary design.
There remains other work done by Juran which is not practical to be listed here one by
one.
Many other design methods existed. Briddle (1989) and Briddle and Barr (1990)
developed a limit equilibrium design method using a log-spiral failure surface and
dividing the active zone into vertical slices. Sabhahit et al. (1995) proposed a design
method by calculating the total reinforcement force required to raise the factor of safety
to a desired value for an unreinforced slope using Janbu’s rigorous method. Patra and
Basudhar (1997 and 2005) improved this method by further considering the location,
length, diameter and orientations of nails and considering not only overall equilibrium
but also internal equilibrium. Yuan et al. (2003) introduced a design method based on
- 29 -

Chapter 2: Literature review
the method of slices and reliability analysis. Sheahan and Ho (2003) proposed a
simplified trial wedge method which is preferable when commercial software for
traditional methods is not available.
2.3.5 Discussion on current design guides and codes
There is no universally accepted document which provides definitive guidance on soil
nail design. But there are a number of published documents which provide direction and
advice, including the UK Highways Agency’s advice note HA 68/94, the British
Standard BS 8006: 1995 and the US Department of Transportation’s design manual
named “Manual for Design & Construction Monitoring of Soil Nail Walls”. These
documents are intended to ensure good design practices and are based on the knowledge
of experts in this field and previous research and projects undertaken.
The HA 68/94 named “Design methods for the reinforcement of highway slopes by
reinforced soil and soil nailing techniques” was originally prepared to give guidance on
the design requirements for the strengthening of highway earthworks using reinforced
soil and soil nailing techniques. A single design method based on limit equilibrium of a
two-part wedge failure mechanism is offered that applies equally to both reinforced soil
and soil nailing (Love and Milligan 1995). The constraints on the mechanism are that
the inter-wedge boundary should be vertical, and that the base of the lower wedge
should intersect the toe of the slope. The two part wedge is a slightly conservative
approach for the analysis of slopes steeper than 60°. However, for shallow slopes which
are less than 27° it can be overly conservative and a circular failure surface might be
more applicable.
For the limit equilibrium calculation, a set of driving forces are assumed to be in
- 30 -

Laboratory Pull-out Testing Study on Soil Nails in Compacted Completely Decomposed Granite Fill Su Lijun
equilibrium with a set of resisting forces. The driving forces include the self weight of
the soil plus any surcharge load and unfactored values are used. The resisting forces are
represented by the shear strength of the soil and reinforcement force for which factored
design values are used. For the shear strength of the soil, the critical state parameters
cvφ′ and obtained from large displacement shear box tests or drained triaxial tests
can be directly used for granular soils or cohesive soils with PI<25%. For these types of
soils, a factor of safety ranged between 1.3 and 1.5 is recommended to be used if the
peak strength parameters
cvc′
pkφ′ and pkc′ are used. At the same time, the design value
is assumed not to be greater than 5kN/mdesc′ 2. For cohesive soils with PI>25%, cvφ′
and or the residual strength cvc′ rφ′ are recommended to be used and the design value
would normally be zero. A series of partial factors of safety is applied to the yield
strength of a nail taking account of mechanical damage, environmental effects and other
uncertainties in material strength. The nail-soil interface shear strength recommended
by HA 68/94 is discussed in the above paragraphs. HA 68/94 does not provide guidance
on serviceability limit states (Johnson et al. 2002).
desc′
The British Standard BS 8006 “Code of practice for Strengthened/reinforced soils and
other fills”, provides detailed design methods and procedures for reinforced earth fill
structures with limited advices on the design of soil nail structures. Limit equilibrium
analysis based on the two-part wedge and log-spiral failure surfaces is recommended for
the internal stability analysis of soil nail slopes. Force equilibrium is used for the
two-part wedge failure surface and moment equilibrium is used for the log-spiral failure
surface. The two-part wedge analysis is recommended because of its relative simplicity
although it may be over conservative for shallow slopes. Axial tensile forces are
considered to be the predominant stabilizing effect of the reinforcements. External
- 31 -

Chapter 2: Literature review
stability and serviceability limits governing the internal stability of soil nailed slopes are
considered to be similar to those for reinforced fill slopes.
The American Department of Transportation’s design manual provides a guideline
procedure to ensure that agencies adopting soil nail wall design and construction follow
a safe, rational procedure from site investigation through construction. Detailed design
guidance including considerations of nail and nail head strength, corrosion protection
and drainage is provided. The recommended design method has the following
characteristics:
(a) Based on slip surface limit equilibrium concepts.
(b) Considers the strength of the nail head connection to the facing, the tensile strength
of the nail and the pull-out resistance of the nail-ground interface.
(c) Provides an approach for determining the strength of the facing and the nail-facing
connection system.
(d) Recommends design earth pressures for the facing and nail head system based on
soil-structure interaction considerations and monitoring of in-service structures
(e) Introduces both Service Load Design (SLD) and Load and Resistance Factor
Design (LRFD) approaches. The allowable loads and load factors and design
strengths for the soil and reinforcements are provided respectively for SLD and
LRFD method.
(f) Recommends procedures for ensuring a proper distribution of reinforcements
within the reinforced block to enhance stability and limit wall deformation.
(g) Checks both the ultimate limit and serviceability limit.
In Hong Kong, the design of soil nailing is based on some published papers, including
- 32 -

Laboratory Pull-out Testing Study on Soil Nails in Compacted Completely Decomposed Granite Fill Su Lijun
Schlosser and Guilloux (1981), Powell and Watkins (1990) and Jewell (1990). Janbu’s
Simplified and Rigorous method are normally used to calculate the total horizontal force
required to maintain the required factor of safety. The soil nails are then designed to
provide this force (Shiu et al. 1997). The factor of safety for global failure is
recommended to be 1.4. For checking against the pull-out failure of soil nails from the
resistant zone, a minimum factor of safety of 2.0 should be applied to the ultimate
grout-steel bond strength and soil-grout bond strength to obtain the allowable design
strength. For checking against tensile failure of reinforcement, allowable tensile stresses
in the steel bars should be restricted to 55% of the characteristic strength of the steel or
230 Mpa (use the smaller one) (GEO 2005; Burland 2002).
In Hong Kong, a commercial program "Slope/W" has been widely used to aid the
design of soil nail structures. Slope/W uses the equilibrium of forces and moments to
compute the factor of safety.
2.4 FACTORS INFLUENCING THE PULL-OUT RESISTANCE
There are a number of factors influencing the pull-out resistance of a soil nail, such as
the stress conditions, methods of installation, soil conditions and soil nail surface
condition.
2.4.1 Soil conditions
The soil conditions that will influence the pull-out resistance of a soil nail include the
strength, particle size, dilatancy and degree of saturation of the soil.
One of the most important factors that influence the pull-out resistance of a soil nail is
the type of soil surrounding the nail. For example, the same type of soil nail, installed in
- 33 -

Chapter 2: Literature review
the same way into silty clay, sand and sandy gravel may give pull-out resistance values
of about 40-80kPa, 100kPa and 200kPa respectively (Bruce and Jewell 1987). The
particle size and shape of particles which are related to the soil dilatancy will
significantly influence the pull-out behaviour and pull-out resistance of a soil nail. For
soils that are composed of larger and more uniform particles with irregular shapes, the
particles will rotate and rearrange during pull-out which will result in dilation of the soil.
If the soil dilation is constrained, an increase of normal stress will result and the pull-out
resistance will increase. Luo et al. (2000) studied the influence of soil dilatancy on the
pull-out resistance. A moderate degree of water saturation of the soil is beneficial for
soil nail pull-out resistance. Soil which is either too dry or too wet is not good. Chu and
Yin (2005a) and Pradhan (2003) studied the influence of the degree of soil water
saturation on soil nail pull-out resistance and low resistance was observed for nails in
approximately saturated soils.
2.4.2 Stress conditions
The stress conditions that will influence the pull-out resistance of a nail normally refer
to the normal stress acting on the nail surface. Some authors consider that the normal
stress is related to the soil overburden pressure corresponding to depth, such as Jewell
(1990). Some other authors considered that the normal stress is independent of soil
depth, such as Schlosser and Guilloux (1981) and Cartier and Gigan (1983).
2.4.3 Methods of installation
Nails installed by different methods will have different pull-out resistances. Normally
the pull-out resistances of cement (concrete) grouted nails and jet-grouted nails are
larger than those for driven, jacked and launched nails. For driven and jacked nails, the
pull-out resistance of the former is found to be 50% greater than the latter (Franzen
- 34 -

Laboratory Pull-out Testing Study on Soil Nails in Compacted Completely Decomposed Granite Fill Su Lijun
1998). For a grouted nail, the grouting pressure will also influence the pull-out
resistance (Milligan et al. 1997).
2.4.4 The nail surface conditions
The roughness of the nail surface is an important parameter that influences the soil nail
pull-out resistance. Tei (1993) and Milligan and Tei (1998) carried out a series of
pull-out tests on both smooth and rough nails in sands. The typical displacements
needed to mobilize the peak pull-out resistance for smooth nails were found to be half
of those for rough nails. For smooth nails the pull-out resistance was observed to be
much smaller than that of rough nails under the same test conditions. The diameter of
the nail compared with the particle size of the soil was also found to have some
influence on the pull-out resistance.
2.5 RESEARCH AND DEVELOPMENT
2.5.1 Large scale model tests and field monitoring
The most direct and reliable method of studying the mechanism and failure modes of
soil nail structures is to use full scale model tests. But these tests are very expensive,
time consuming and need much space to carry out. Thus only a few large scale model
tests have been carried out in the two large soil nail projects of “Bodenvernagelung” in
Germany (1975-1980) and “Clouterre” in France (1986-1991).
Totally seven soil nail walls were constructed from top-down with vertical or nearly
vertical facings in the “Bodenvernagelung” project. Three of the seven walls were built
in sand, three in layered sand and clay or silt clay, and one in a stiff heavily over
consolidated clay as shown in Figure 2.13 (Gassler 1992). The German design method
of soil nail structures is based on these tests and the later reduced scale tests in the
- 35 -

Chapter 2: Literature review
University of Karlsruhe.
Gassler (1992) presented the results of test G in Figure 2.13. The surcharge of this test
was applied by dead loads of six reinforced concrete plates which were placed on the
top surface of the nailed wall. The measured horizontal displacements were found to be
larger than the vertical displacements and the ratio between horizontal and vertical
displacements was about 5:3 at the top of the wall. Creep displacements and change of
force distribution in the nails caused by creep effects were observed. A conclusion was
drawn that the creep property of cohesive soils can play a major role in the behaviour of
a soil nail structure.
In the French national project “Clouterre” three full scale experimental soil nail walls
were constructed to study three types of failures: breakage and pull-out of the nail bar,
and failure by excessive excavation. The first nailed wall was 7m high and built of
Fontainebleau sand and loaded from the top until failure by saturation of the soil. This
wall failed by breakage of the inclusions. The second nailed wall was the same as the
first but failed by decreasing the adherence length of the inclusions. The third wall was
failed by progressively increasing the height of the unsupported excavation (Plumelle
and Schlosser 1990; Plumelle et al. 1990; Schlosser et al. 1992; Clouterre 1993).
After failure of the first test, the nails were found to have suffered large bending
deformations and some of the top nails were broken. The tensile force was found to be
the major resisting force and bending was mobilized only when large deformation had
already occurred. At failure, a crack was observed at the top of the wall and 2.5m
behind the wall facing and this was approximately equal to the theoretical value of 0.3H
used in reinforced earth structures. A failure zone was formed at failure and the
- 36 -

Laboratory Pull-out Testing Study on Soil Nails in Compacted Completely Decomposed Granite Fill Su Lijun
maximum tensile force line and bending line were found to lie within the failure zone.
The location of the observed crack was found to coincide with the point where the
maximum tensile force line intersected the top surface of the wall (Figure 2.14).
The second experimental wall was brought to failure by gradually reducing the length of
the telescopic nails (comprising nails slid into tubes). After reducing the length of the
nails to a minimum, the whole of the soil nailed mass sank 0.27m and slid along a
well-defined failure surface, which was demarcated by the nails (figure 2.15).
The third experimental wall was a 6m high wall with the top 3m nailed and the facing of
the wall supported by one 3m and three 1m high metallic panels. The wall was brought
to failure by removing the panels one by one. Firstly the 3m high panel was removed
and the nailed wall was exposed unsupported. When the first one meter panel was
removed, a one meter excessive excavation was formed and one crack was observed but
the wall remained intact. Then the second one meter panel was removed and some sand
fell down which resulted in the formation of a soil arch. This arch remained stable
during the 24 hours before removal of the last panel. After a 45mm removal of the last
panel, the failure occurred and the nailed panel subsided 1.4m but remained attached to
the nails (Figure 2.16).
In Hong Kong, a large scale field test was carried out in the Kadoorie Agricultural
Research Center of the University of Hong Kong. The slope angle was 33°. The height
and width were 43.75m and 9m respectively. Two rows of grouted nails with diameter
of 100mm were installed at a grid of 1.5m×1.5m at an inclination of 20° from the
horizontal. The slope was brought to failure by a surcharge loading of 72kPa which was
generated by placing concrete blocks on the slope crest. Monitored data showed that the
- 37 -

Chapter 2: Literature review
nail forces had greatly improved the stability of the slope (Tang and Lee 2003).
Field monitoring has been carried out to study the deformation and serviceability
behaviour of soil nail structures especially for permanent structures. Stocker and
Riedinger (1990) presented the long term monitoring results for a 15m high soil nail
wall which had been carried out over a period of 10 years. The observed horizontal
displacements were well within the limits of suitability and serviceability. Barley et al.
(1998) conducted an eighteen-month monitoring of a soil nail slope by installing strain
gauged soil nails. During the monitoring period, loads of only 3-6kN were found to
have developed in the nails. No visually detectable movement of the slope occurred
which indicated that the soil nails fulfilled their intended purpose of stabilizing the slope.
Barley et al. (1997 and 1997a) discussed the field testing of soil nailing. Wong et al.
(1997) monitored the performance of a 9m deep permanent cut in residual soil and the
results showed that the soil nail wall performed well. Landau Associates Inc. (1999)
monitored the nail force mobilization and wall deflection of nailed highway walls.
2.5.2 Laboratory testing studies
Laboratory tests, including pull-out tests, direct shear tests, centrifuge tests and small
scale tests, have been carried out to study the failure mode and mechanism of soil nail
structures. The advantages of laboratory tests are the relatively low cost and small space
requirement. The test conditions can be well controlled and large amounts of data can be
obtained by instrumentation.
2.5.2.1 Laboratory pull-out tests
The pull-out tests carried out by other authors have been mentioned in Chapter 1 and the
above paragraphs of this chapter. Some of the tests are briefly introduced in the
- 38 -

Laboratory Pull-out Testing Study on Soil Nails in Compacted Completely Decomposed Granite Fill Su Lijun
following paragraphs.
Tei (1993) carried out a series of pull-out tests on soil nails in three types of sands using
a 254mm long, 153mm wide and 202mm high pull-out box (Figure 2.17). Two types of
nails, stiff and flexible, with different lengths and diameters were tested using the
pull-out box. Stiff nails were made of mild steel with diameter from 1.0mm to 5.2mm
and flexible nails were made of a rubber tube with external diameter of 3.0mm and
internal diameter of 2.0mm. For stiff rough nails, the pull-out displacement required to
mobilize the peak pull-out force was observed to be independent of diameter, length of
the nails and the applied vertical pressure. The peak pull-out force was found to increase
with the shear strength of the soil. Based on the data measured by strain gauges, the
axial stress in the stiff nail was observed to be approximately linearly distributed along
the nail (Figure 2.18). Analytical analysis also showed that the axial stress distribution
became more linear and the shear stress distribution became more uniform as the
relative stiffness between a nail and the soil increased. For stiff smooth surface nails, the
peak pull-out forces were found to be, as expected, much smaller than those for the stiff
rough surface nails. For the flexible nails, the peak pull-out forces were found to be
smaller than those for the stiff nails and seemed to be not proportional to the length of
the nails.
At the Chalmers University of Technology, Franzén (1998) created a 2m×4m×1.5m
pull-out box for four types (angle bar, ribbed bar, expansion bolt and round steel bar)
jacked or driven nails pulled out under four different stress levels of 25, 37.5, 75 and
125kPa. The jacked nails were installed into the soil by two hydraulic jacks and the
driven nails were installed using a percussion hammer. The objective of these laboratory
tests was to study the influence of overburden pressure, relative density, surface
- 39 -

Chapter 2: Literature review
roughness and method of installation on soil nail pull-out resistance. The results showed
that the pull-out capacity in a cohesionless soil mainly depended on the roughness of the
nail surface, relative density of the soil, nail surface area and normal pressure acting on
the nail surface. The peak pull-out resistance for driven nails was found to be 50%
higher than that for jacked nails and showed more of a strain-softening behaviour. The
residual pull-out resistance, however, seemed to be independent of the method of
installation.
In Hong Kong, the first laboratory pull-out tests were performed in completely
decomposed granite (CDG) by Lee et al. (2001) in The University of Hong Kong. Since
then, the Government, researchers and contractors showed their interest in pull-out tests
of this type of soil and more tests have been conducted. Some representative examples
are the tests conducted by Pradhan (2003) in Loosely Compacted Silty and Gravelly
Sand Fills and interface strength study tests in CDG soil by Chu (2003). The box used
by Pradhan (2003) was the 2m×1.6m×1.4m box introduced by Lee et al. (2001) and
Junaideen et al. (2004) (Figure 2.19). The interface friction angle was found to be very
close to the soil friction angle. Pull-out tests in both natural moisture content and nearly
saturated soil were carried out and it was found that the interface friction angle obtained
was similar but the cohesion reduced with a high degree of saturation. Chu (2003)
carried out a series of pull-out tests using a 0.6m×0.6m×0.7m steel box in CDG soil
which was compacted to 95% of the maximum dry density (Figure 2.20). The drilling of
the hole and installation of the nail occurred just after compaction and the vertical
pressure was applied after the cement grout had hardened. Pull-out tests in soil with
different applied vertical pressures and degrees of saturation were carried out. The
results showed that the pull-out resistance increases with the applied vertical pressure
and decreases with the degree of saturation from the natural wet to nearly saturated
- 40 -

Laboratory Pull-out Testing Study on Soil Nails in Compacted Completely Decomposed Granite Fill Su Lijun
conditions.
Smith (1992) discussed the effects of variable geology on soil nail pull-out resistance in
Hong Kong.
2.5.2.2 Direct shear and interface shear testing studies
Direct shear tests have been carried out to study the influence of the inclination, shear
and bending resistance of the inclusions on the overall strength of the reinforced soil.
Many authors have carried out this type of tests, such as Jewell and Wroth (1987),
Marchal (1990), Pedley (1990), Barr et al. (1990), Davies and Masurier (1997) and
Briddle and Davies (1997).
Jewell and Wroth (1987) carried out some direct shear tests on unreinforced soils and
soils with extensible and inextensible reinforcements. It was found that the
reinforcement has no influence on shearing resistance until the mobilized shearing
resistance in the sand exceeds the critical state value for the first time. The radiographic
observations show that the reinforcement caused more sand to deform and helped to
resist localized shear deformation. The effects of the reinforcement increase with the
stiffness of the inclusions. The maximum improvement in shear strength was achieved
when the inclination angle was about 30° from vertical (Figure 2.21). Similar tests were
carried out by Pedley (1990) using a large shear box with the internal dimension of
1m×1m×1m. It was found that surface roughness and reinforcement orientation
significantly influences the axial stress on the reinforcement but has a limited effect on
the shear stress. The shear strength improvement of the soil increases with the increase
in the stiffness and strength of the reinforcement.
Interface shear tests can be used to investigate the behaviour of soil-structure interfaces,
- 41 -

Chapter 2: Literature review
including the pile-soil interface, nail-soil interface etc. Ramsey et al. (1998) performed a
review of soil-steel interface testing with the ring shear apparatus. Chu (2003) carried out a
series of direct shear tests on the interface between a CDG soil and cement grout to
investigate soil-grout interface shearing behaviour.
2.5.2.3 Centrifuge Modeling
Centrifuge modeling is a method for studying soil structures, such as foundations,
tunnels and reinforced slopes, using greatly reduced scale models under high gravity
accelerations to represent the prototype structures under normal gravity. In the Hong
Kong University of Science and Technology, McVay et al. (1998), Zhang and McVay
(1998) and Zhang et al. (1999) carried out a series of centrifuge modeling tests to study
laterally loaded piles and pile foundations. Kamata and Mashimo (2003) carried out
centrifuge model tests of tunnel face reinforcement by bolting. This technique has been
introduced to study soil nail slopes since the early 1990’s. There are normally two types
of centrifuge modeling for soil nailing, one type is to reproduce the construction
procedure and study the behaviour and the failure of a soil nail structure under
surcharge loading (Davies et al. 1997; Aminfar 1998); another type is applying a cyclic
shaking load to the centrifuge model to simulate the behaviour of a soil nail structure
during earthquakes (Choukeir 1996; Choukeir et al. 1997; Tufenkjian and Vucetic 1992
and 2000; Vucetic et al. 1993).
Davies et al. (1997) and Aminfar (1998) carried out series of centrifuge tests on soil nail
slopes. The nailed model slope was first constructed by reproducing the construction
procedure in a number of sequential centrifuge runs. Then a surcharge load was applied
to bring the model slope to failure. The measured development of lateral displacements
of the model slope with the excavation stages was similar to that measured from the
- 42 -

Laboratory Pull-out Testing Study on Soil Nails in Compacted Completely Decomposed Granite Fill Su Lijun
actual structures. Nail axial forces and bending moments were also measured during the
tests.
Choukeir (1996) carried out series of centrifuge model tests on soil nail walls under
cyclic shaking loads and developed a seismic design method for soil nail structures on
the basis of the test results. The proposed design method was a quasi-static method
which could evaluate the seismic loading effects on the magnitude and location of the
maximum force in each inclusion. Tufenkjian and Vucetic (1992 and 2000) conducted a
number of dynamic centrifuge tests on soil nail excavation models to investigate the
stability and failure mechanisms under earthquake loading. A nearly bilinear failure
surface was observed (Figure 2.22). The nail length was observed to have a strong
influence on the stability but do not affect the failure mechanism. All these tests showed
that soil nail structures provide excellent stability under seismic loading.
2.5.2.4 Small scale tests
The first small scale model tests were conducted at University of Karlsruhe, Germany as
a part of the “Bodenvernagelung” Project. The model was 1.1m in length, 0.56m in
width and 0.72m in height and the sides of the container were constructed of Perspex to
observe the failure mode of the model. A bilinear failure surface was observed in the
nailed wall by applying surcharge to the reinforced zone.
Kitamura et al. (1988) carried out a series of reduced scale model tests for both
reinforced and unreinforced slopes. The model was 0.9m in width, 0.75m in height and
2.1m in length and the load was applied by a hydraulic jack against a loading frame
(Figure 2.23). An approximately linear and shallow failure surface was observed for
unreinforced slope. The failure surface became circular and moved backwards when the
- 43 -

Chapter 2: Literature review
inclination of the reinforcement varies in the order of upward, downward and horizontal.
The settlements of the upward and downward reinforcement at yield stress were nearly
twice as large as that of the horizontal reinforcement. This meant the horizontal
reinforcement provided the best reinforcement effects. It was observed that bending and
shear resistance of reinforcements contributed little to the reinforcement effects.
A relative large model test with a 2.0m high excavation in a 2.0m wide, 3.0m high and
6.0m long model box was carried out by Kim et al. (1996) (Figure 2.24). The loads
were also applied by hydraulic jack. The excavation was constructed by top-down
sequence to simulate the actual construction procedure. The maximum strain line
showed that the failure surface of this experimental soil nailed wall could be represented
by bilinear or log-spiral lines.
Larger model tests were carried out by Raju et al. (1997) in the Nanyang Technological
University in Singapore. Six 3.0m long, 3.0m wide and 2.4m high nailed wall were
constructed in sand with different nail lengths, nail inclinations and methods of nail
installation. The nailed wall was constructed by the top-down method and the nails were
jacked into the wall by hydraulic jack at a horizontal spacing of 1.0m and vertical
spacing of 0.5m. A uniform flexible load provided by building up a sand fill on the top
surface of the wall was applied to bring the test wall to failure. The experimental nailed
wall was observed to rotate around the toe at failure. The maximum settlements were
situated immediately behind the facing and decreased with distance from the facing.
2.5.3 Numerical modeling
Numerical modeling can be used to study nail-soil interaction, stress distribution in both
soil and nails, deformation and serviceability of soil nail structures and for conducting
- 44 -

Laboratory Pull-out Testing Study on Soil Nails in Compacted Completely Decomposed Granite Fill Su Lijun
parametric studies. Most numerical modeling has been carried out to study the overall
and localized behaviour of soil nail structures, such as the investigations conducted by
Benhamida et al. (1997 and 1997a), Kim et al. (1997), Smith and Su (1997) and Cheuk
et al. (2005). Some numerical modeling has been carried out to study nail-soil
interaction behaviour, such as the works performed by Ochiai et al. (1997) and Tsai et al.
(2005). Numerical modeling can provide the stress and strain distribution throughout the
whole model which is not possible with limit equilibrium methods. But when carrying
out numerical modeling of soil nailing, one must face up to the challenge of how to
simulate the nail-soil interface behaviour.
There are normally three methods to simulate nail-soil interface behaviour. The first
method is to simulate the nail-soil interface using zero thickness interface elements
(Kim 1998; Zhang et al. 1999; Yang and Drumm 2000). Zhang et al. (1999) used two
fictitious springs perpendicular to each other to simulate the normal and tangential
behaviour of the nail-soil interface. Yang and Drumm (2000) adopted a type of surface
based frictional interaction to simulate the interaction between the nail and the
surrounding soil. The advantage of this method is that a large relative displacement
between soil and inclusion is allowed. But the actual behaviour of the nail-soil interface
is neither purely elastic nor frictional so that interface elements with more complex
behaviour need to be developed. The second method is using one dimensional structural
elements, such as beam and cable elements, directly imbedded in the soil mass to
simulate the inclusions (Lim 1996; Briaud and Lim 1997). The third method is to use a
thin layer of continuum elements to simulate the interface as reported by Tabrizi et al.
(1995). The advantage of this method is that many material properties can be selected
and there are fewer convergence problems than with the contact (interaction) method.
But only a finite relative displacement between the nail and the surrounding soil is
- 45 -

Chapter 2: Literature review
allowed with the material properties remaining constant both before and after sliding of
the nail. In fact, the nature of the interaction between the nail and the surrounding soil is
a combination of cohesion and friction and the properties may not be the same before
and after sliding.
Table 2.1 – Basic assumptions of different soil nailing design approaches
Davis Method (Shen et al. 1981)
French Method (Schlosser 1983)
German Method (Stocker et al. 1979)
Kinematical Method (Juran et al. 1988)
Analysis Limit force equilibrium
Limit moment equilibrium
Limit force equilibrium
Limit force equilibrium
Global stability Global stability Global stability Local stability Input material properties
Soil parameters (c', φ'), limit nail forces, lateral friction
Soil parameters (c', φ'), limit nail forces, bending stiffness
Soil parameters (c', φ'), lateral friction
Soil parameters (c', φ'), limit nail forces, lateral friction
Nail forces Tension Tension, shear, bending
Tension Tension
Failure surface
Parabolic Circular, any input shape
Bilinear Log-spiral
Safety factors soil strength Fc, Fφ
1.5 1.5 1 (residual shear strength) 1
Pullout resistance Fp
1.5 1.5 1.5-2.0 2
Tension Yield stress Yield stress Yield stress Yield stress Bending Plastic moment Plastic moment Ground water No Yes No Yes Soil stratification No Yes No Yes
Loading Uniform surcharge Slope, any surcharge
Slope surcharge Slope surcharge
Structure geometry
Vertical facing Any input geometry Inclined facing, vertical facing
Inclined facing, vertical facing
- 46 -

Laboratory Pull-out Testing Study on Soil Nails in Compacted Completely Decomposed Granite Fill Su Lijun
Figure 2.1 – Equipment for launched soil nails (After Myles and Bridle 1992) Figure 2.2 – Comparison of soil nailing, micro piles and soil dowelling (After Bruce and Jewell 1986)
- 47 -

Chapter 2: Literature review
Figure 2.3 – Contrast of the construction sequence of reinforced earth and soil nailing (After Bruce and Jewell 1986) Figure 2.4 – Soil nailing mechanism (After Byrne et al. 1998)
- 48 -

Laboratory Pull-out Testing Study on Soil Nails in Compacted Completely Decomposed Granite Fill Su Lijun
Figure 2.5 – Skin friction mobilization in pullout test (After Cartier and Gigan 1983) Figure 2.6 – Nails subject to shear and bending (After Mitchell 1987)
- 49 -

Chapter 2: Literature review
Figure 2.7 – Davis design method (After Shen et al. 1981b) Figure 2.8 – Failure surfaces obtained by Davis design method and Finite Element analysis (After Shen et al. 1981b)
- 50 -

Laboratory Pull-out Testing Study on Soil Nails in Compacted Completely Decomposed Granite Fill Su Lijun
Figure 2.9 – French design method (After Schlosser 1982) Figure 2.10 – Final yielding curve for inclusion in French method (After Schlosser 1982)
- 51 -

Chapter 2: Literature review
Figure 2.11 – German design method: (a) Bilinear failure surface; (b) Acting forces and displacements; (c) Hodograph; and (d) Force polygon (After Gassler 1988) Figure 2.12 – Juran’s kinematical limit analysis design method: (a) Mechanism of failure; (b) State of stress in inclusion; and (c) Theoretical solution for infinitely long bar adopted for design purpose (After Juran et al. 1990)
- 52 -

Laboratory Pull-out Testing Study on Soil Nails in Compacted Completely Decomposed Granite Fill Su Lijun
Figure 2.13 – Large model tests in the “Bodenvernagelung” project (After Gassler 1992) Figure 2.14 – Full scale test failure by breakage of inclusions in the “Clouterre” project (After Clouterre 1993)
- 53 -

Chapter 2: Literature review
Figure 2.15 – Full scale test failure by reducing adherence length of inclusions in the “Clouterre” project (After Clouterre 1993) Figure 2.16 – Full scale test failure by excessive excavation in the “Clouterre” project (After Clouterre 1993)
- 54 -

Laboratory Pull-out Testing Study on Soil Nails in Compacted Completely Decomposed Granite Fill Su Lijun
Figure 2.17 – Pullout box used by Tei (After Tei 1993) Figure 2.18 – Axial stress distributions along the nail obtained by Tei (After Tei 1993)
- 55 -

Chapter 2: Literature review
Figure 2.19 – Pullout box used by Pradhan (After Junaideen et al. 2004) Figure 2.20 – Pullout box used by Chu (After Chu 2003)
- 56 -

Laboratory Pull-out Testing Study on Soil Nails in Compacted Completely Decomposed Granite Fill Su Lijun
Figure 2.21 – Relationship between effect of reinforcement and inclination of inclusion (After Jewell 1987) Figure 2.22 – Failure surface of centrifuge model (After Tufenkjian and Vucetic 2000)
- 57 -

Chapter 2: Literature review
Figure 2.23 – Reduced scale model test of a nailed soil slope (After Kitamura et al. 1988) Figure 2.24 – Reduced scale model test of a nailed wall (After Kim et al. 1996)
- 58 -

Laboratory Pull-out Testing Study on Soil Nails in Compacted Completely Decomposed Granite Fill Su Lijun
Figure 2.25 – Mesh for (a) unreinforced slope and (b) soil nail slope developed by Yang and Drumm (2000)
- 59 -

Chapter 3: Equipments and apparatus for laboratory pull-out tests
CHAPTER 3: EQUIPMENT AND APPARATUS FOR
PULL-OUT TESTS
3.1 PROBLEMS STUDIED BY LABORATORY PULL-OUT TESTS
As discussed in Chapter 2, the reinforced zone of a soil nail structure is separated into
an active zone and a passive zone during internal failure. In order to fully utilize the
strength of the steel bars, enough nail bond strength in the passive zone should be
ensured to avoid the nail being pulled out prematurely. Laboratory pull-out tests can be
used to study the pull-out resistance of a soil nail in the passive zone (or in the active
zone with the nail in an opposite pull-out direction).
Figure 3.1 shows a soil nailed slope. The deformation of the soil nailed slope (or the nail
itself) is a boundary value problem if no time effects (creep, consolidation, etc.) are
involved. To solve a boundary value problem, for example, the deformation and
stability analysis of a three-dimensional soil nailed slope, we need 3 types of equations:
(a) 3 stress equilibrium equations,
(b) 6 strain displacement compatibility equations, and
(c) 6 constitutive equations.
There are totally 15 equations for solving 15 unknowns (6 stresses, 6 strains and 3
displacements) by considering proper boundary conditions. The 6 constitutive equations
in fact describe the elementary stress-strain-strength behaviour of the soil (or interface).
As shown in Figure 3.1, to study the performance of a full length soil nail in a slope, we
- 60 -

Laboratory Pull-out Testing Study on Soil Nails in Compacted Completely Decomposed Granite Fill Su Lijun
need a full-scale physical model (or a small-scale centrifuge model), since this is a
boundary value problem for this nail. On the other hand, if our purpose is to study the
influences of, for example, the installation procedures (hole drilling with stress release,
cement grouting) and overburden pressures on soil nail pull-out resistance, we need
only a representative short length of the nail as shown in Figure 3.1 (top left). This is
because that the full length of a nail in a slope at failure (the ultimate case for stability
analysis) is actually subjected to a tensile force. The interface shear stresses are in
opposite directions toward the slip surface as shown in Figure 3.1. The soil and stress
conditions along this full length nail are not uniform. Thus, if a full length nail with
nonuniform conditions is used for pull-out testing, the influences of parameters such as
overburden pressure and installation procedures cannot be clearly identified or separated
and therefore cannot be well studied.
However, if we consider a short length of the nail, the soil and stress conditions should
be approximately uniform along the longitudinal direction. We can then study the
influences of factors on the pull-out resistance of this short length of the nail in the soil.
The results obtained can be used as reference for a full length nail.
In the pull-out box study, a short length of the nail in a soil block is used (see the top
left in Figure 3.1). In such a test, the initial conditions of soil properties, stresses and
loading conditions in this short length in the longitudinal direction are all close to
uniform. This longitudinal section is considered to be an element, similar to the soil
specimen (element) used in a direct shear box or triaxial test. However, the stress and
loading conditions in the cross-section are not uniform, for example, due to hole drilling
and stress release, the radial stresses at the boundary of the hole are approximately zero.
The stresses and deformation in this cross-section are not uniform and are affected by
- 61 -

Chapter 3: Equipments and apparatus for laboratory pull-out tests
the boundaries and loading. This is, in fact, what has been investigated in this study.
The nail with soil in the box is considered to be a boundary value problem with uniform
conditions in the axial direction (an element). The results obtained from the pull-out box
simulation can be applied to the full length of a soil nail in a slope subjected to the same
conditions.
3.2 NUMERICAL STUDY ON BOUNDARY EFFECT FOR DESIGN
OF THE BOX
With the discussion on the pull-out box simulation above, the design of the pull-out box
needs careful consideration of the boundary effects and an optimum selection of the size
(or dimension) of the box. The box should be large enough to ensure that the boundary
will not affect the pull-out test results. On the other hand, the box should not be too
large considering the weight of the box, the space required for the test and difficulties in
preparing a huge volume of soil sample.
In order to determine the distance between the nail centre and the boundary of the box, a
two-dimensional (2-D) plane strain finite element model was established using
ABAQUS code to obtain the stress redistributions in areas around the hole after drilling.
The dimensions of the model were 24m in height and 10m in width for simulating the
excavation of a hole with the diameter of 100mm (typical size in Hong Kong) at a level
of 20m beneath the ground surface as shown in Figure 3.2. A type of 4-node bilinear
quad reduced integration plane strain element was used in the model. The mesh was
very fine near the hole and relatively coarse when distant from the hole. The right and
left boundaries were located 5m away from the centre of the hole which was believed to
be sufficiently far that the influence caused by excavating the hole could be neglected.
The horizontal displacement of these two boundaries was restrained. The bottom of this
- 62 -

Laboratory Pull-out Testing Study on Soil Nails in Compacted Completely Decomposed Granite Fill Su Lijun
model was located 4m from the centre of the hole and the vertical displacement was
restrained.
The simulation was accomplished in two analysis steps. Firstly, the initial stress
condition in the model was established by assigning an initial stress field and applying
gravity to the model to obtain an equilibrium state between them. The excavation of the
hole was simulated by removing the elements (here was the soil) at the location of the
hole using the “model change” command. Two constitutive models were used in the
simulation – an isotropic linear elastic model (as an elastic material) and an
elastic-perfectly plastic model using the Mohr-Coulomb failure criterion (as a
Mohr-Coulomb material).
Results from the ABAQUS finite element simulation are shown in Figures 3.3, 3.4 and
3.5. Figure 3.3 and Figure 3.4 show the vertical and horizontal stress contours induced
by the hole drilling procedure which were obtained by subtracting the stresses before
drilling from those after drilling. The stresses obtained were positive because the
compressive stresses were negative and decrease of compressive stresses (compressive
stresses are released during drilling) leads to increase of positive stresses. From the
contours in Figure 3.3 and Figure 3.4, it can be seen that the stresses induced by the
procedure of drilling the hole are negligible in areas which are over 300mm away from
the centre of the hole. Figure 3.5 shows the relationship between the vertical stress and
distance from the top circumference of the hole in the vertical direction before and after
drilling. For the Mohr-Coulomb material, the relative differences of the vertical stresses
before and after excavating the hole are 5.35% and 3.26 % at points with distances of
300mm and 400mm respectively from the top circumference of the hole in the vertical
direction. For the elastic material, the corresponding relative differences are 3.09% and
- 63 -

Chapter 3: Equipments and apparatus for laboratory pull-out tests
1.87% as shown in Figure 3.5. In order to study the influence of the boundary effect,
another model with the same dimensions of the pull-out box was established and
simulated results are shown in Figure 3.6. The results showed that agreement between
the results from the two models are good.
From the above results, we can determine that the influence of drilling the hole is small
enough and can be neglected in areas which are over 300mm away from the center of
the hole. According to this conclusion and considering that there is a little larger
influence in the vertical direction due to the overburden pressure, the effective internal
dimensions of the box were determined as 0.6m wide, 0.83m high and 1.0m long. A
pull-out box with these dimensions was designed and two were manufactured to
accelerate the testing program. Considering the shortage of space in the laboratory, the
time and costs together with the accuracy of the test, the dimensions selected are
believed to be the optimum ones for our study purposes. But it should be pointed out
that the width of the box is only 6 times of the nail diameter so that the increase in
constrained dilatancy of the soil by boundaries of the box during pull-out may not be
neglectable. It should be careful to directly use the results from this project to field
conditions.
3.3 DESIGN AND CONSTRUCTION OF THE PULL-OUT BOX
3.3.1 Investigations to be conducted using the boxes
The pull-out boxes used for the study propose had to meet certain requirements. Before
testing, CDG soil is compacted into a box, normally to 95% of the maximum dry
density. A hole is then drilled after application of the vertical load. After drilling, a steel
bar is installed into the hole and kept centered. The hole is then grouted with cement
grout. After about 5 curing days until the strength of the cement grout has developed a
- 64 -

Laboratory Pull-out Testing Study on Soil Nails in Compacted Completely Decomposed Granite Fill Su Lijun
value of at least 21MPa, the soil nail is ready to be pulled out with a hydraulic jack.
Following studies were carried out to investigate the influence of the following four
factors on the interface shear strength between the grouted nail and the surrounding soil:
(a) Overburden pressure (vertical stresses) of the soil
(b) Degree of saturation of the soil (dry or wet) and suction effects
(c) Influence of installation procedures (hole drilling, stress release, pressure grouting)
(d) Interface shear dilation
A box which can be used for investigating all of the above aspects has to fulfill some
fundamental requirements. Firstly the box should be strong enough to sustain the weight
of the soil and a higher applied overburden pressure with relative small deformation.
Secondly the box should be able to be sealed so that back water pressure can be applied
to the test soil to obtain a higher degree of saturation of the soil. A third requirement is
that enough access holes should be available for transducers cables and these holes must
be capable of being sealed when saturating the soil. All the above requirements were
allowed for during the design of the pull-out box.
3.3.2 Description of the pull-out box
The pull-out box was designed as shown in Figure 3.7 to Figure 3.10. The internal
dimensions of the box are 1.0m in length, 0.6m in width and 0.83m in height. A rubber
diaphragm is fixed under the bottom surface of the top cover of the box to form a fluid
chamber for application of overburden pressure to the top soil surface. A wooden board
is placed between the rubber diaphragm and the top soil surface in order to make the
soil deformation more uniform. The dimensions of the test soil are 1.0m in length, 0.6m
in width and 0.8m in height. The top 30mm thickness of space remaining above the soil
- 65 -

Chapter 3: Equipments and apparatus for laboratory pull-out tests
surface in the box is used to house the rubber diaphragm and wooden board.
The box was constructed with five 8mm thick steel plates welded together. Square
section steel pipe was welded to the outside of the box to increase strength and reduce
bending deformation of the box. The top cover of the box was similarly constructed
with the 8mm thick steel plate and strengthened with steel pipes. A sheet of rubber
which was cut from a truck tyre inner tube was fixed under the top cover of the box by a
rigid steel frame using a quantity of short screws to form the fluid chamber for the
application of normal pressure. Two valves were connected to two holes on the top
cover of the box (see Figure 3.8 to Figure 3.10). One valve was for applying the
overburden pressure and included a pressure dial gauge for measuring the overburden
pressure; the other was for releasing air from the fluid chamber which may otherwise
lead to inaccurately measured volume changes in the test soil. This volume change
during the test was measured by an automatic volume change apparatus connected to
the pressure-supply line. The water pressure in the fluid chamber and the water pressure
source should be in equilibrium. Expansion of the soil sample would lead to an increase
in the water pressure in the fluid chamber and water would flow out of the fluid
chamber because of the nonzero hydraulic gradient. In contrast, water would flow into
the fluid chamber when the soil sample contracted. The volume of the water flowing
into and out of the fluid chamber was measured by the automatic volume change
apparatus and thus the volume change of the test soil was obtained. Four thicker (about
18mm) steel plates were welded to the outer surface of the box as a brim stiffener to
allow fixing of the top cover (Figure 3.8, 3.10 and 3.11). There were about 20 holes on
the brim stiffener and the cover of the box at the same locations. The top cover was
connected to the brim stiffener using M16 steel bolts during the tests. The brim stiffener
is a little bit lower than the top edge of the side plates of the pull-out box, to allow the
- 66 -

Laboratory Pull-out Testing Study on Soil Nails in Compacted Completely Decomposed Granite Fill Su Lijun
rubber sheet to be squeezed tightly between the top cover and edges of the side plates as
tightening the bolts. This was able to prevent leakage of water from the pull-out box in
tests under submerged conditions (Figure 3.11). Four small 12mm thick steel plates
were welded to the strengthening beams of the front plate for connecting the drilling
machine during drilling the hole and the load reaction frame during the pull-out process
(Figure 3.8). Four thick rubber blocks were located under each foot of the box in order
to reduce vibration of the box during compaction and drilling. The rubber blocks could
also reduce disturbance (vibration and noises) caused by the test to the offices under or
surrounding the laboratory.
There are six 8mm diameter holes in the front and two in each side plate of the box as
accesses for wires of the pressure cells and tensiometers (or porewater pressure
transducers). The holes were sealed with watertight bolts (Figure 3.12) under
submerged conditions. The watertight bolt can be divided into two components and a
small rubber O-ring can be put between them. The two parts of the bolt are both hollow
and the transducer wire can pass through the hole along the bolt and be sealed by
tightening the two parts and squeezing the O-ring between them. On each side plate,
there are five holes for use in applying back pressure and for releasing air in the soil.
3.3.2.1 Extension cylindrical chamber covering the soil nail end
An extension cylindrical chamber of 250mm in length and 180mm in diameter (internal
space) was attached to the end of the box to cover the end of a soil nail as shown in
Figure 3.7, 3.8 and 3.10. This chamber was constructed using an 8mm thick steel
cylinder together with a flange welded on one end and an 8mm thick circular steel plate
fixed by bolts on the other end. This chamber was filled with the same type of soil
during the test. A hole was drilled through the box leading into this chamber. A soil nail
- 67 -

Chapter 3: Equipments and apparatus for laboratory pull-out tests
was grouted in the drillhole and inside the chamber. The soil inside the extension
chamber was removed after the nail had hardened. Therefore the part of the nail within
the test box was maintained a constant length of 1.0m at all time during the pull-out
tests and no cavity would be left behind the end of the test nail. Thus the deformations
of the soil surrounding the hole would be more uniform and no stress concentration
would occur because no cavity was left behind the end of the nail. Therefore, the
stresses on the soil nail surface and in the surrounding soil would be more uniform than
has been the case in the boxes used by others (Chang et al. 1996, Franzén 1998, Lee et
al. 2001, Junaideen et al. 2004, Pradhan et al. 2003, Chu 2003). The extension chamber
was connected on the back plate of the box using the flanges on them with a deformable
rubber O-ring in between to prevent leakage.
A 140mm diameter hole was cut through the front plate with its centre 315mm from the
bottom of the box for drilling the hole and grouting the nail. On the back plate of the
box, there was an opening at the same level with a diameter of 180mm (the same as the
internal diameter of the extension chamber), which was used to make it possible to
extend the nail into the extension chamber.
3.3.2.2 A waterproof front cap to covering the soil nail head
A waterproof front cap was designed and constructed to be attached to the front plate of
the box to cover the soil nail head as shown in Figure 3.13 (the length unit in this figure
is cm). This waterproof front cap was used to prevent water leakage and enable back
pressure to be applied to the soil in the box in a water submerged condition. The
waterproof front cap is similar to a traditional triaxial cell. It is formed by a Perspex
cylinder which is restrained by a steel plate and a steel ring using tie rods. A steel rod is
used to connect the nail head and the bolt for pulling out. Two copper rings and
- 68 -

Laboratory Pull-out Testing Study on Soil Nails in Compacted Completely Decomposed Granite Fill Su Lijun
deformable rubber O-rings are used at the location where the rod passes through the
steel plate to prevent leakage. The internal surfaces of the two copper rings are inclined
in order to make it possible to adjust the direction of the rod during pull-out. There are
several holes in the steel plate for water filling purpose and as accesses for strain gauge
wires. An extension square plate was designed to connect the waterproof front cap to
the box. To make connection, a 198×188×12mm steel plate was welded to the front
plate together with four M12 bolts on it. A rubber O-ring was used between the
waterproof front cap, square plate and the box to prevent leakage. There are four
elongated holes in the square plate which allow adjustment of the triaxial cell in the
vertical direction (Figure 3.13).
3.3.2.3 Application of back pressure for saturation of the soil
A permanent soil nail structure will serve in various weather conditions including
intense rainfalls. Even for temporary soil nail structures, it is also possible to meet
heavy rain during construction. Considering the possible variations of underground
water levels and weather conditions, the behaviour of a soil nail structure when the
degree of water saturation changes should be investigated even if drainage is provided
during construction of the structure. Thus pull-out tests should be carried out in soils
with higher degrees of saturation and nearly saturated soils. For a submerged test in
which the soil is close to saturation, the soil needs to be saturated before the nail is
pulled out. In order to obtain a higher degree of saturation, back water pressure needs to
be applied to the soil sample because of the large volume of the sample.
Preventing leakage of water is difficult during the application of back water pressure to
a soil nail pull-out box especially at the location of the nail head because the nail needs
to be pulled out through the nail head. Some authors have adopted steel wire reinforced
- 69 -

Chapter 3: Equipments and apparatus for laboratory pull-out tests
flexible plastic tubes to cover the nail head in submerged soil nail laboratory pull-out
tests (Pradhan 2003; Chu 2003). In their method, however, back water pressure can not
be applied to the soil sample because the sealing could be damaged very easily so that it
is difficult to obtain a relatively high degree of saturation. In Chu’s tests, the obtained
highest degree of saturation was 86%. Pradhan stated that a nearly saturated condition
was obtained but the sealing was easily damaged. Enlightened by the mechanism of a
traditional triaxial apparatus, the specially designed waterproof front cap described in
the above paragraphs was used to cover the nail head in submerged pull-out tests. The
waterproof front cap could prevent leakage of water under a relative high (more than
100kPa) pressure and allowed the nail to be pulled out with very low friction between
the rubber O-ring and the steel rod for pull-out. The arrangement for applying back
pressure and saturating the soil is shown in Figure 3.14.
In the design of this pull-out box, the use of an extension chamber at back and a
waterproof cap in front of the box is most important. It becomes possible to keep the
stress and deformation of the soil more uniform during the course of pulling out and to
achieve a higher degree of saturation (even fully saturated) in the soil sample.
3.4 MEASURES FOR REDUCING SIDE FRICTION OF THE BOX
The internal surface of the box is not very smooth and the friction cannot be neglected.
Many options were tried to reduce the side friction of the box. We first planned to use a
type of PVC sheet attached to the internal surface of the box to reduce the friction. In
order to verify the effect of this method, a serious of direct shear tests on the interface of
this type of PVC sheet and the CDG soil were carried out. But the measured friction
angle of the interface was very large and even larger than the internal friction angle of
the pure soil. After the tests, many scratches were found on the PVC sheets, because the
- 70 -

Laboratory Pull-out Testing Study on Soil Nails in Compacted Completely Decomposed Granite Fill Su Lijun
PVC sheet was so soft that the soil particles had penetrated resulting in a large friction
angle. Based on this experience, a stainless steel sheet with smooth surface was adopted
and direct shear tests were carried out on the interface of the stainless steel sheet and the
soil. The obtained friction angle was still a little larger.
Lubricating oil was then considered for spreading onto the stainless plate, but the oil
would pollute the soil which could not be reused. On the basis of this idea, a type of
flexible plastic sheet (film) was used to separate the soil from the oil. This approach
included a combination of the following three measures:
(a) A smooth stainless steel sheet was attached to the internal surface of the box.
(b) The stainless steel sheet was covered with a layer of lubricating oil.
(c) After this, a flexible plastic sheet (film) was placed on the stainless steel sheet with
the lubricating oil in between.
Direct shear tests were conducted to measure the friction angle of the interface between
the flexible plastic sheet (film) and the stainless steel sheet with the lubricating oil in
between. It was found that the friction angle was only 6.9o as shown in Figure 3.15. The
flexible plastic sheets (film) and the stainless steel sheets with the lubricating oil
between them placed on the surface inside the box are shown in Figure 3.16. The soil
was compacted in the box and in full contact with the flexible plastic film. The plastic
sheets can move more freely together with the soil in the vertical direction during
compaction of the soil and application of the overburden pressure to the test soil sample.
In order to study the influence of side friction on pressure transfer from the top soil
surface to the soil inside the box, a three-dimensional (3-D) finite element model was
established. Only one quarter of the test soil needed to be simulated because of the
- 71 -

Chapter 3: Equipments and apparatus for laboratory pull-out tests
symmetry of the geometry and loading. The model was 0.32m in width, 0.52m in length
and 0.8m in height. The interface of the flexible plastic sheet (film) and the stainless
steel sheet with the lubricating oil between them was simulated by thin continuous
elements 0.02m thick and considered as a frictional material (φ=6.9°) to the front and
to the right side of the test soil. At the bottom of the model, the vertical displacement
was restrained to simulate the bottom support of the pull-out box. At the left and back
sides, the displacements normal to the surfaces were restrained to simulate the
symmetry of the model. At the front and right hand boundaries, the vertical
displacements and displacements normal to the surfaces were restrained. The applied
overburden pressure to the top surface of the test soil was 100kPa. The mesh and model
boundary conditions is shown in Figure 3.17.
The results are shown in Figures 3.18 and 3.19. Figure 3.18 gives the contours of
vertical stress, from which, we can see that the vertical stress drops slightly from top to
bottom. Figure 3.19 shows the relationship between vertical stress and distance from the
bottom of the model along the path shown in Figure 3.18. The vertical stress is 100kPa
at the top of the model and about 93kPa at the bottom of the model. These results
indicate that the influence of side friction was small after taking the above measures for
reducing side friction.
3.5 INSTRUMENTATION AND MEASUREMENTS
Comprehensive instrumentation was used for the laboratory pull-out tests. A description
of the transducers used and their measurements is as follows.
(a) Measurement of overburden pressure and vertical settlement of the top soil surface
In these laboratory pull-out tests, the overburden pressure was applied by a rubber
- 72 -

Laboratory Pull-out Testing Study on Soil Nails in Compacted Completely Decomposed Granite Fill Su Lijun
diaphragm attached under the bottom surface of the top cover of the box through an
air-water interface from an air pressure source. A pressure dial gauge with a maximum
capacity of 350kPa was fixed to the top cover of the box to measure the applied
overburden pressure (Figure 3.14 and Figure 3.20). An automatic volume change
apparatus (Figure 3.14 and Figure 3.20), which is normally used in traditional triaxial
tests, was used to measure the volume change of the soil. The apparatus was attached to
the plastic tube which connected the top cover of the box and the air-water interface as
shown in Figure 3.14. The water in-flow (compression) or out-flow (expansion)
quantity was measured by the automatic volume change apparatus, which represents the
volume change of the soil mass in the box. The average settlement of the top soil
surface was calculated by dividing the measured water volume change by the area of the
top soil surface.
(b) Measurement of local soil pressures
Six strain gauge based earth pressure cells (TML Model KDA-PA/KD-A) with a
maximum capacity of 1MPa were embedded in the soil in each pull-out box to measure
and monitor earth pressures (Figure 3.20). Two earth pressure cells were placed 40mm
below the bottom of the soil nail and two cells 45mm above the top of the nail. The
remaining two pressure cells were in the middle between the soil nail and the top soil
surface. The locations of the earth pressure cells are shown in Figure 3.21. The
overburden pressure distributions in vertical direction and along the axis of the soil nail
could be obtained from the pressure cells at different time and stages during testing.
Variations in earth pressure in the course of testing were closely monitored particularly
before and after the drilling of soil nail installation holes.
(c) Measurement of soil suction and porewater pressure
- 73 -

Chapter 3: Equipments and apparatus for laboratory pull-out tests
The research required tests to be carried out in CDG soil with different degrees of
saturation, from unsaturated to saturated conditions. Miniature tensiometers (soil
moisture probe 2100F with an operational range of pressures from -100kPa to 100kPa)
and porewater pressure transducers (Druck PDCR-81 miniature pore pressure
transducers with a maximum capacity of 1.5MPa) were employed in the tests to
measure the suction and porewater pressure of the soil (Figure 3.20). As shown in
Figure 3.22, a total of four soil moisture probes (or porewater pressure transducers)
were installed in positions close to the nail surface (about 25mm away from the nail
surface). Soil moisture probes with vacuum dial gauges were used to measure the
suction of the soil compacted in the box for tests in partially saturated soil. For tests
under saturated conditions, both the soil moisture probes and miniature porewater
pressure transducers were used for measuring pore pressure in the soil. When using the
soil moisture probes to measure porewater pressure, the vacuum dial gauge of the probe
was replaced by a type of transducer which can measure both suction and positive pore
pressure (up to 100kPa).
(d) Measurement of axial strain in the soil nail
Four strain gauges were glued to the steel bar, at spacing of about 300mm with the first
strain gauge located 50mm away from the nail head to measure the axial strain of the
soil nail. The locations where the strain gauges were to be glued were polished to be
smooth and planar so that the strain gauges could fully contact the steel bar and work
properly. A water proof strain gauge was used to ensure that the cement grout would not
affect the accuracy of the measurement. Extra care was taken during installation of the
strain gauges to make sure that the strain gauges were parallel to the axis of the steel bar
so that accurate axial strain of the steel bar could be obtained. The measured axial strain
of the steel bar would be used to deduce the frictional shear force distribution on the
- 74 -

Laboratory Pull-out Testing Study on Soil Nails in Compacted Completely Decomposed Granite Fill Su Lijun
surface of the soil nail.
(e) Measurement of the pull-out displacement of the soil nail
Two LVDTs as shown in Figure 3.7 and Figure 3.20 were installed at the nail head to
measure the pull-out displacement. The average of the two values was used.
(f) Measurement of the pull-out force
The pull-out force was measured using a load cell located between the hydraulic jack
and the pull-out reaction frame as shown in Figure 3.7 and Figure 3.20.
Readings of all transducers were taken automatically by a datalogger connected to a
computer (Figure 3.20). The datalogger used in the tests is a CR10X datalogger with a
Multiplexer which can connect up to 32 transducers at the same time. There are two
terminals (High and Low) with each channel and the voltage difference between the two
terminals is used as output of the transducer response. This method can eliminate the
influence of the variation of the voltage supported by the datalogger. A computer
program needs to be developed to input transducer coefficients and determine which
channel is to be used by each transducer. The data were temporarily stored in the
datalogger and then automatically collected by the computer at a certain time interval
such as 30 minutes.
3.6 DRILLING MACHINE AND CEMENT GROUTING TOOLS
3.6.1 Drilling machine
The test soil was firstly compacted into the box under certain controlled conditions such
as initial dry density, initial water content, etc. The top soil surface was then loaded to a
constant vertical pressure. After about twenty four hours the deformation of the soil
- 75 -

Chapter 3: Equipments and apparatus for laboratory pull-out tests
sample had become negligible and a hole was then drilled by an electrical drilling
machine as shown in Figure 3.23.
In previous pull-out tests by Chu (2003) and the author’s own trial test made previous to
the carrying out of the main tests in this project, the drilling machine was just fixed to
the box with G clamps. Some dead loads were placed on the base of the drilling
machine to stabilize it, but violent vibration was observed and accurate drilling was
impossible. To solve this problem, the base of the drilling machine was firmly fixed to
the floor using expansive bolts. At the same time, the drilling arm was secured to a steel
plate fixed on the box with four long bolts (Figure 3.23). This significantly reduced the
vibration of the drilling machine during drilling and guaranteed the quality of the
drillhole.
The hole was drilled through the two access holes on the box into the extension
cylindrical chamber. In order to ensure that the hole would be successfully drilled into
the extension chamber and would not touch the back plate of the box, the hole had to be
coaxial with the two access holes. If the soil was compacted before setting up the
drilling machine, this would be very difficult to ensure. Thus the drilling bit and drilling
bars were connected to the drilling machine and the height and inclination of the drilling
arm were adjusted before compaction of the soil (Figure 3.24) to be coaxial with the two
access holes. The drilling machine was then fixed in position. Figure 3.25 shows a hole
under drilling.
3.6.2 Equipment for cement grouting without and with pressure
The grouting procedure was accomplished using a plastic pipe which was attached to
the steel bar. During grouting, a square steel plate supported the steel bar and blocked
- 76 -

Laboratory Pull-out Testing Study on Soil Nails in Compacted Completely Decomposed Granite Fill Su Lijun
the drillhole to prevent leakage of cement grout. There is one larger hole in the center
and two smaller holes above and below it on the square plate. The larger hole is to
accommodate the steel bar and the smaller holes are for the plastic pipes. Before
grouting, a longer plastic grouting pipe was attached to the steel bar and fixed on the
square plate together with the steel bar. The steel bar passed through the center larger
hole and the plastic pipe passed through the lower smaller hole. A shorter plastic pipe
was then inserted into the upper smaller hole as a grout-return pipe for air release and
for checking whether the drillhole was full or not. The gaps between the steel bar and
plastic pipes and the holes were sealed with plasticene. After this, the steel bar was
installed together with the grouting pipe to the end of the drillhole. The square plate was
then fixed on the pull-out box using steel bolts. The steel bar was supported by a steel
pipe and the load reaction frame to keep it centered in the hole.
At the beginning, gravity grouting were tried by simply raising the grouting pipe to a
level of about two meters above the drillhole for the cement grout to flow into the hole
under the gravity head. But this method was so slow that the cement grout solidified and
blocked the pipe before grouting was completed. A Perspex cylindrical container with a
piston was therefore designed to push the cement grout into the drillhole. A hole at the
bottom of the container enabled the grouting pipe to be connected to the cylinder. A
modified soil sample extruder was employed for grouting the drillhole. Grout was
pumped in by a piston fixed on the extruder when the grout container was driven up by
an electric motor of the extruder. Using this method, we can successfully complete the
grouting procedure. It was not possible however to apply any pressure to the cement
grout (Figure 3.26).
In order to accomplish the study of pressure grouting, there were several problems
- 77 -

Chapter 3: Equipments and apparatus for laboratory pull-out tests
needed to be solved. The first was the design of a grouting apparatus which could
sustain a high pressure and keep the pressure constant for a relatively long period. This
problem was solved by using a steel cylinder and air pressure to inject the cement grout.
The bottom and cover of the cylinder were fixed with steel bolts and were sealed with
rubber membranes to prevent leakage. There are two holes of the cylinder, one in the
top cover for connecting the pipe from the air pressure source and the other at the
bottom for connecting the grouting pipe. Another problem was the preventing of
leakage between the steel bar and grouting pipes and the square plate used for blocking
the drillhole. To solve this problem, a new square plate was machined and a kind of
hard plastic pipe was used which made it possible to use screw and O-ring to seal the
gaps. A third problem was how to measure the grouting pressure. The pressure of the air
source could be measured, but the pressure in the hole was smaller than that of the air
source because of the viscosity of the cement grout. Therefore the magnitude of the
grouting pressure in the drillhole was unknown. Another difficulty in measuring the
grouting pressure was that we could not measure the pressure of the cement grout
directly using a pressure dial gauge because the grout would block the gauge. This
problem was solved by using a type of oil to separate the cement grout from the
pressure dial gauge and the grouting pressure was transferred to the gauge by the oil.
Two pressure dial gauges were used — one lay in front of the hole and the other at
back of the hole — to take an average of the pressure (Figure 3.27).
Cement grout was poured into the cylinder first and then the top cover of the cylinder
was fixed. A constant air pressure was applied on the top surface of the cement grout.
The air pressure was kept constant for a relatively long period. Using the specially
designed cylinder, the cement gout was easily grouted under controlled pressures.
- 78 -

Laboratory Pull-out Testing Study on Soil Nails in Compacted Completely Decomposed Granite Fill Su Lijun
3.7 SETUP OF THE BOX FOR SOIL NAIL PULL-OUT TESTING
The experimental arrangement of the box with full instrumentation and loading devices
is shown in Figure 3.28. The pull-out was accomplished by a hydraulic jack and a load
reaction frame which was connected on the front plate of the box as shown in Figure
3.28. Two LVDTs and a load cell were used to measure the pull-out displacement and
pull-out force respectively. The LVDTs had to be carefully adjusted to be parallel to the
steel bolt for pulling out.
3.8 SUMMARY AND CONCLUSIONS
A new soil nail pull-out box has been designed and two were manufactured to study the
mechanisms of soil nail pull-out resistance and influencing factors. A series of tests
have been carried out using the boxes. The results obtained are reliable, accurate and
meaningful. Based on the presentation above, the innovative features and capabilities of
the boxes are summarized as follows:
(a) There was comprehensive instrumentation in the soil and the nail for measuring the
necessary parameters and meeting study requirements.
(b) An extension chamber was used to keep the test length and stress condition of the
soil nail constant during pull-out.
(c) A waterproof front cap was placed to cover the soil nail head and to seal the nail so
that back water pressure could be applied to accelerate the saturation of the soil in
submerged tests. Using this method, the influence of the degree of saturation on soil
nail pull-out resistance could be easily examined.
(d) The vertical stress was applied by a flexible rubber diaphragm fixed under the top
cover of the pull-out box. A fluid chamber formed by the rubber diaphragm and the
top cover was filled with de-aired water. The water in/out-flow was automatically
- 79 -

Chapter 3: Equipments and apparatus for laboratory pull-out tests
measured by an automatic volume change apparatus. In this way, the vertical stress
acting on the soil surface was more uniform and the volume change of the soil in
the box (or settlement) could be measured. This design made the box compact and
simple to operate.
(e) Specially designed apparatus was used to carry out pressure cement grouting so that
the influence of the applied grouting pressure could be studied.
(f) The overburden pressure was applied before installation of the soil nail in the test.
In this way, the stress release influence of the drilling of the hole on the soil nail
pull-out resistance could be investigated.
Based on the experience of using the two boxes and the results obtained, the following
conclusions may be drawn:
(a) The two pull-out boxes are simple, compact and capable of carrying out soil nail
pull-out tests under controlled conditions and meeting the study requirements.
(b) The instrumentation is reliable and meets the measurement requirements.
(c) The waterproof front cap was effective in sealing the nail head and could be
subjected to a high back water pressure. The whole design is effective for
increasing the degree of saturation of the soil to about 98%.
(d) The usage of the specially designed apparatus for cement pressure grouting is a
simple and effective way for conducting pressure grouting in the laboratory.
(e) The results from soil nail pull-out tests using the two new boxes were reliable,
accurate and meaningful. The results are presented and interpreted in the following
chapters.
- 80 -

Laboratory Pull-out Testing Study on Soil Nails in Compacted Completely Decomposed Granite Fill Su Lijun
Figure 3.1 – A soil-nailed slope and pull-out box simulation Figure 3.2 – Mesh for boundary effect study
10m
4m
20m
Soil nails
Uniform conditions in longitudinal direction
Slip surface
A soil-nailed slope Pull-out box simulation
Nonuniform conditions in cross-section
- 81 -

Chapter 3: Equipments and apparatus for laboratory pull-out tests
0.22
02m
Figure 3.3 – Vertical stresses induced by the hole drilling procedure
0.2796m
Figure 3.4 – Horizontal stresses induced by the hole drilling procedure
- 82 -

Laboratory Pull-out Testing Study on Soil Nails in Compacted Completely Decomposed Granite Fill Su Lijun
Elastic material
0.00.20.40.60.81.01.21.41.61.82.02.22.42.62.83.03.23.43.63.84.04.2
0 100 200 300 400Vertical stress (kPa)
Dist
ance
from
the
hole
surfa
ce (m
) __
After excavation
Before excavation
Mohr-Coulomb material
0.00.20.40.60.81.01.21.41.61.82.02.22.42.62.83.03.23.43.63.84.04.2
0 100 200 300 400Vertical stress (kPa)
Dist
ance
from
the
hole
surfa
ce (m
) _
After excavation
Before excavation
(a) (b) Figure 3.5 – Relationship between the vertical stress and the distance from the top surface of the drillhole in vertical direction for (a) elastic material and (b) Mohr-Coulomb material
- 83 -

Chapter 3: Equipments and apparatus for laboratory pull-out tests
Figure 3.6 – Relationship between the vertical stress and the distance from the top surface of the drillhole in vertical direction for (a) box size model (b) large size model
0.00
0.05
0.10
0.15
0.20
0.25
0.30
0.35
0.40
0.45
0.50
0 100 200 300 400Vertical stress (kPa)
Dist
ance
from
the
hole
surfa
ce (m
) __
After excavation
Before excavation
0.00
0.05
0.10
0.15
0.20
0.25
0.30
0.35
0.40
0.45
0.50
0 100 200 300 400Vertical stress (kPa)
Dist
ance
from
the
hole
surfa
ce (m
) __
After excavation
Before excavation
(a) (b)
- 84 -

Laboratory Pull-out Testing Study on Soil Nails in Compacted Completely Decomposed Granite Fill Su Lijun
1 m
0.8
m
Wooden Plate
Rubber Diaphragm
Strengthening Beam
Pressure Gauge
CDG Soil Sample
Cement Grout
Rebar
Extension Chamber
Waterproof Front Cap
Guided Bar
Coupler
LVDT
Load Reaction Frame
Load Cell
Hydraulic Jack
Tensiometers
Earth Pressure Cells
Pressure Cells
Cement Grout
Rebar
0.6 m
0.8
m
Tensiometers
Figure 3.7 – Layout of transducers and pull-out equipment
- 85 -

Chapter 3: Equipments and apparatus for laboratory pull-out tests
Figure 3.8 – Design of the pull-out box – 3-D view Figure 3.9 – Back and front views of the pull-out box
Flange for Connecting the Extension Chamber
Rubber Diaphragm
Plate for Connecting the
g Machine and Reaction Frame
Pressure Gauge
Accesses for Transducer
wires Air Release
DrillinOpenings for Applying
Back Pressure Plate for Connecting the Triaxial Cell
Extension ChambeBrim
Stiffener r
- 86 -

Laboratory Pull-out Testing Study on Soil Nails in Compacted Completely Decomposed Granite Fill Su Lijun
Figure 3.10 – Side view of the pull-out box
Access holes for tensiometers and pore water pressure transducers
Strengthening beams
Brim Stiffener
Rubber diaphragm Brim stiffener
Edge of the side plate
Rubber gasket
Figure 3.11 – Cross-section of the top cover and the pull-out box
- 87 -

Chapter 3: Equipments and apparatus for laboratory pull-out tests
Figure 3.12 – Watertight bolt
40
40
17
1.6
5
Screw thread(M16×2)
Screw thread(M16×2)
Opening for applying water pressure
Access for transducer wires
Steel guide bar for pull-out
1.6
O-ring
Figure 3.13 – Waterproof front cap
- 88 -

Laboratory Pull-out Testing Study on Soil Nails in Compacted Completely Decomposed Granite Fill Su Lijun
Waterproof front cap
Water pressure dial gauge
Automatic volume change Apparatus
Box B
Figure 3.14 – Setup for saturating the soil
Failure envelop of the direct shear tests
y = 0.121x
0
5
10
15
20
25
30
35
40
0 50 100 150 200 250 300 350Normal stress (kPa)
Shea
r stre
ss (k
Pa) _
φ=6.9°
Figure 3.15 – Results of direct shear tests on the interface between the stainless steel sheet and the flexible plastic film with lubricating oil in between
- 89 -

Chapter 3: Equipments and apparatus for laboratory pull-out tests
Plastic and stainless steel sheets with oil in between
Figure 3.16 – Method for reducing side friction Figure 3.17 – Mesh and boundary conditions for investigating side friction of the box
- 90 -

Laboratory Pull-out Testing Study on Soil Nails in Compacted Completely Decomposed Granite Fill Su Lijun
Path for Figure 3.18
Figure 3.18 – Vertical stress contour for small side friction
Vertical stress vs. distance from the bottom of the model
0.0
0.1
0.2
0.3
0.4
0.5
0.6
0.7
0.8
0.9
0 20 40 60 80 100 120Vertical stress (kPa)
Dist
ance
from
the
botto
m (m
) __
Figure 3.19 – Vertical stress variations with distance from the bottom of the model along the path in Figure 3.17
- 91 -

Chapter 3: Equipments and apparatus for laboratory pull-out tests
LVDT
Soil moisture probe
Pressure dial gauges
Pressure cell
Load cell hydraulic jack
Data logger
Volume Change apparatus
Computer
Figure 3.20 – Transducers and datalogger used in the tests
- 92 -

Laboratory Pull-out Testing Study on Soil Nails in Compacted Completely Decomposed Granite Fill Su Lijun
2 1
34
6 5
400 300300 200
190
100
225
485
315
435
265
100
4540
Figure 3.21 – Locations of the earth pressure cells
400300 300
225
100
225
2525
Figure 3.22 – Locations of the soil moisture probes (or pore pressure transducers)
- 93 -

Chapter 3: Equipments and apparatus for laboratory pull-out tests
Drilling machine
Drilling arm
Figure 3.23 – Setup of the drilling machine
Drilling bit
Drilling bars
Figure 3.24 – Adjustment of drilling bit and drilling bars to ensure that they pass the centers of the two holes
- 94 -

Laboratory Pull-out Testing Study on Soil Nails in Compacted Completely Decomposed Granite Fill Su Lijun
Drilling bit
Figure 3.25 – Drilling the hole
Setup of the rebar
Pipe for grouting
Grout-return pipe
Grout container
Soil sample extruder
Figure 3.26 – Grouting without pressure (gravity head only)
- 95 -

Chapter 3: Equipments and apparatus for laboratory pull-out tests
Grout into drillhole
Pressure into cylinder
Pressure Supply
Grout-return pipe
Pressure Gauge
Box B Box A
Grouting cylinder
Figure 3.27 – Grouting with pressure
- 96 -

Laboratory Pull-out Testing Study on Soil Nails in Compacted Completely Decomposed Granite Fill Su Lijun
Box B
Waterproof Front Cap
Datalogger
Two LVDTs Figure 3.28 – Setup of the box with full instrumentation and loading devices for soil
nail pull-out under submerged condition
Load Cell
Hydraulic Jack
- 97 -

Chapter 4: Material properties and test procedures
CHAPTER 4: MATERIAL PROPERTIES AND TEST
PROCEDURES
4.1 INTRODUCTION
In Hong Kong, the completely decomposed granite (CDG) soil is one of the most
common soils (another is CDV – completely decomposed volcanic soil) forming fill and
cut slopes. Soil nailing has been the most popular method for stabilizing slopes in Hong
Kong since the late 1980’s. It is therefore important to study the behaviour of soil nail
structures and nail-soil interaction in a CDG soil. The soil used in this study was taken
from a site in Tai Wai, Hong Kong.
The properties of the CDG soil and cement grout, calibration of transducers and the test
procedures are described in this chapter.
4.2 MATERIAL PROPERTIES
4.2.1 Basic properties of the CDG soil
A series of basic property tests were carried out following the procedures as described in
BS 1377: 1990 to determine the basic properties of the CDG soil. The basic property
tests include particle size distribution, compaction tests, specific gravity, and liquid and
plastic limit tests.
The particle size distribution of the soil was determined by wet sieving and hydrometer
tests following the procedures in BS 1377-2 (1990) and GEO REPORT No.36 (Chen
1992). The result of the particle size distribution is shown in Figure 4.1. According to
- 98 -

Laboratory Pull-out Testing Study on Soil Nails in Compacted Completely Decomposed Granite Fill Su Lijun
British Standards (BS 5930, 1981), this CDG soil is composed of 9.33% gravel, 62.51%
sand, 24.97% silt and 3.19% clay. The mean grain size d50 was 0.25mm. The coefficient
of uniformity Cu and coefficient of curvature Cz of the soil are 38.3 and 1.6 respectively.
The plastic limit wp and liquid limit wl of the soil are 27.3% and 35.5% respectively.
According to the soil classification system in BS 5930 (1981), the soil can be classified
as a yellowish brown, very silty sand.
A standard compaction test using a 2.5kg rammer and a container of 1000cm3 was
carried out. The relationship between the dry density and moisture content of the soil is
shown in Figure 4.2. The maximum dry density ρdmax of the soil obtained is 1.668
Mg/m3 with an optimum moisture content mopt of 19%. The specific gravity Gs of the
soil is 2.645. The basic parameters of the soil are summarized in Table 4.1.
4.2.2 Determination of the shear strength of the soil
Conventional consolidated drained triaxial tests on recompacted saturated soil
specimens and double cell triaxial tests on recompacted unsaturated soil specimens had
been carried out. The double cell triaxial test was carried out using an inner cell and an
outer cell with the soil specimen within the inner cell. This apparatus makes it possible
to measure the volume change of partially saturated soil specimens by measuring the
volume change of water inside the inner cell. The recompacted soil specimens were
taken from the test soil sample which was compacted in the box to 95% of the
maximum dry density.
4.2.2.1 Conventional triaxial tests on saturated soil specimens
Both consolidated undrained (CU) and drained (CD) triaxial tests were carried out on
saturated recompacted soil specimens. The size of the specimen was 100mm in height
- 99 -

Chapter 4: Material properties and test procedures
and 50mm in diameter. The initial degree of saturation of the soil specimens was 80%
and then they were saturated to the degree of saturation of 98% under a back pressure of
200kPa. This saturation condition was achieved by checking that the value of coefficient
B was larger than 0.95 (BS 1377, 1990). The consolidation process followed
immediately after the saturation stage to bring the specimen to the required effective
stress state. The consolidation was allowed to continue until there was no further
significant volume change, and until at least 95% of the excess pore pressure had been
dissipated. Five different consolidation pressures were used in the tests, which were
40kPa, 80kPa, 120kPa, 200kPa, and 300kPa. Finally axial compression was performed
under either undrained or drained conditions at axial displacement rates of 0.3mm/min
for the undrained tests and 0.1mm/min for drained tests until an axial strain of 20% was
achieved.
Figure 4.3 (a) shows the relationship between the deviator stress q and axial strain aε
under five different confining (consolidation) pressures for CU tests. No distinct peak
stress is observed in the curves and the maximum shear stresses are observed at the end
of the tests, that is, the stress-strain behaviour is strain hardening. Figure 4.3 (b) and (c)
show the relationship of porewater pressure u with axial strain aε and the effective
stress paths respectively. Figure 4.4 shows the relationship between s' (( 31 σσ ′−′ )/2) and
t (( 31 σσ ′+′ )/2) at axial strains of 15% and 20%. The calculated shear strengths (c' andφ′ )
are close to each other and the values at the axial strain of 20% were adopted.
In the CD tests, the sample was drained at bottom and porewater pressure was measured
on the top. Excess porewater pressures were observed at small strains and dissipate to
almost zero at the end of the tests. This indicated that the adopted strain rate was not
- 100 -

Laboratory Pull-out Testing Study on Soil Nails in Compacted Completely Decomposed Granite Fill Su Lijun
small enough and the tests were not real drained tests. During calculation of the shear
strength, effective stresses were used by subtracting a corrected porewater pressure from
the measured total stress. Figure 4.5 and 4.6 show the results of the ‘CD’ tests. There are
still no apparent peaks on the deviator stress-axial strain curves, but the deviator stresses
tend to be constant when the strain is larger than 15%. Shear strengths at axial strains of
15% and 20% were calculated and similar magnitudes were obtained.
4.2.2.2 Double cell triaxial tests on unsaturated soil specimens
The double cell triaxial system is shown in Figure 4.7 and 4.8. The apparatus is similar
to a conventional triaxial system except that two water pressure cells are used. The outer
water pressure cell has an internal diameter of 230mm, height of 425mm and wall
thickness of 8mm. The inner water pressure cell has an internal diameter of 90mm,
height of 235mm and wall thickness of 6mm.
For conventional triaxial tests, the volume change of unsaturated soil specimen cannot
be measured because of the presence of air in the voids. The volume change of the
water inside the water pressure cell cannot represent the volume change of the soil
specimen because the cell is deformable. In the double cell system, the water pressure in
the inner water pressure cell is equal to that in the outer water pressure cell so that the
deformation of the inner cell is negligible. Thus the volume change of water inside the
inner cell can be used as the volume change of the soil specimen (Yin 2003).
Figure 4.9 to figure 4.11 show the (a) Deviator stress vs. axial strain, (b) volume strain
vs. axial strain and (c) s vs. t for double cell triaxial tests on soil specimens with 38%,
50% and 75% degrees of saturation respectively. The stress-strain behaviour is normally
straining hardening under lower confining pressures. Under a higher confining pressure
- 101 -

Chapter 4: Material properties and test procedures
(300kPa), slightly strain softening behaviour is observed for the stress-strain curves.
Compressive volume strain is considered to be positive. The volume strains are
observed to be compressive at the beginning of the tests and become dilative after
certain values of the axial strain, the larger the confining pressure, the longer the
compressive part of the volume strain-axial strain curves. Because the soil specimens
are unsaturated, the measured cohesions are larger than those in conventional triaxial
tests because of the suction effect. The measured shear strength parameters from both
conventional and double cell triaxial tests are summarized in Table 4.2.
4.2.3 Properties of the cement grout
The cement grout used for the tests had a water cement ratio of 0.42. Uniaxial
Compressive Strength (UCS) tests were carried out on both cylindrical and cubic
specimens to obtain the properties of the cement grout. The specimens were cured for 5
days which was the same as the curing time for the cement grout of the soil nail in the
pull-out tests. Totally four strain gauges were attached to the surface of the cylindrical
specimen with two of them parallel and the other two perpendicular to the axis of the
specimens. Photographs of failed specimens are shown in Figure 4.12. Results of the
tests on cylindrical specimens are shown in Figure 4.13. The average uniaxial
compressive strength cσ of the cement grout for cylindrical specimens is 32.09MPa.
The secant Young’s modulus and the corresponding Poisson’s ratio are
12.59GPa and 0.21 respectively. A total of four cubic specimens were also tested and
the measured average compressive strength is 32.2MPa. The density of the cement grout
was found to be 1.886Mg/m
50E nv
3. The properties of the cement grout are summarized in
Table 4.1.
- 102 -

Laboratory Pull-out Testing Study on Soil Nails in Compacted Completely Decomposed Granite Fill Su Lijun
4.3 CALIBRATION OF TRANSDUCERS
A CR10X data logger was used to collect data from the test. Before conducting the test,
all the transducers were calibrated over the entire operational ranges.
The pressure cells were calibrated using a GDS (Geotechnical digital system) pressure
controller and a sealed Perspex cylinder (Figure 4.14). Pressure cells were put into the
water in the cylinder and sealed with a watertight bolt. Then water pressures from
50KPa to 500kPa with an increment of 50KPa were applied to the water in the cylinder.
The responses (differential voltages) of the pressure cells under each pressure were
recorded and the relationship between the applied pressures and the responses of the
pressure cells was established. Therefore calibration factors for converting the responses
from the datalogger into pressures were obtained. The porewater pressure transducers
and transducers of the tensiometers were calibrated in the same way except that
negative pressure was applied for calibrating the transducers of the tensiometers. The
load cell was calibrated by a standard proving ring using the loading system of a triaxial
apparatus. The load cell was put between the loading plate of the triaxial apparatus and
the proving ring. Raise the loading plate, and then load was mobilized gradually on the
proving ring. The responses corresponding to each load were recorded and factors for
converting the responses into loads was obtained by plotting the load-response curve.
The LVDTs were calibrated using a micrometer to obtain the calibration factors
converting the datalogger responses into displacements. Figure 4.15 shows the
calibration results for one of the pressure cells, the tensiometers and the LVDTs, and the
load cell.
The strain gauges had no need of calibration but a bridge had to be developed for
connecting them to the CR10X datalogger. A full bridge was developed as shown in
- 103 -

Chapter 4: Material properties and test procedures
Figure 4.16. R1, R2 and R3 are three 120Ω resistances and Rg is the strain gauge with
the same resistance. The H, L and AG are connected to the High, Low and Ground
terminals of the data logger’s differential channel separately. The Vx is connected to an
excitation voltage which provides the voltage for the strain gauge. It is important that
the gauge be wired as shown with the wire from H connected at the gauge, and that the
leads to the L and AG terminals be the same length, diameter and wire type. With this
configuration, changes in wire resistance due to temperature occur equally in both arms
of the bridge with negligible effect on the output from the bridge.
The result of the full bridge measurement is the measured bridge output in millivolts
divided by the excitation in volts, which means the result obtained directly from the data
logger is:
⎟⎟⎠
⎞⎜⎜⎝
⎛
+−
+⋅=⋅
21
2
3
10001000RR
RRR
RVV
g
g
in
out (4.1)
When strain is calculated the direct ratio of the voltages (volts per volts not
millivolts per volts) will be used:
21
2
3 RRR
RRR
VV
g
g
in
out
+−
+= (4.2)
When the gauge is strained it will change the resistance by , the equation for
the bridge output is:
gRΔ
21
2
3 RRR
RRRRR
VV
gg
gg
strainedin
out
+−
Δ++
Δ+=⎟⎟
⎠
⎞⎜⎜⎝
⎛ (4.3)
Subtracting the unstrained result from the strained result gives : rV
g
g
gg
gg
unstrainedin
out
strainedin
outr RR
RRRR
RRVV
VV
V+
−Δ++
Δ+=⎟⎟
⎠
⎞⎜⎜⎝
⎛−⎟⎟
⎠
⎞⎜⎜⎝
⎛=
33
(4.4)
- 104 -

Laboratory Pull-out Testing Study on Soil Nails in Compacted Completely Decomposed Granite Fill Su Lijun
Because the resistance of the strain gauge is also 120Ω, which is equal to the
resistance of R3, substituting Rg for R3:
gg
gr RR
RV
Δ+
Δ=
24 (4.5)
Solving for strain:
r
r
g
g
VV
RR
214−
=Δ
(4.6)
Strain is calculated by dividing the gauge factor from the above equation and the
units are converted to micro strain by multiplying by 106.
)21(10410 66
r
r
g
g
VGFV
RGFR
−⋅
=⋅
Δ=με (4.7)
4.4 SOIL PREPARATION AND TEST PROCEDURES
4.4.1 Soil preparation
Firstly, the CDG soil, with 95% of the maximum dry density, was compacted in the box
and the extension chamber in 9 layers (each with a maximum thickness of 100mm)
(1.668Mg/m3). Before compaction the soil was mixed to the moisture content
corresponding to a given degree of saturation. It was then manually compacted in the
box using a rammer whose weight was about 12kg. To achieve a relative compaction Cr
of 95%, the weight of each layer was calculated based on the moisture content w and
maximum dry density maxdρ of the soil. The required mass M of the soil sample for a
given volume V is determined by the following equation
[ VwCM rd )1(max += ]ρ (4.8)
A total of 6 earth pressure cells were embedded in the soil at three different levels
- 105 -

Chapter 4: Material properties and test procedures
during the soil compaction. The installation of the pressure cells was divided into three
steps. The first step was to excavate a small pit in the compacted soil and put a small
amount of fine sand into the pit. The second step was to put a pressure cell (50mm in
diameter and 10mm in thickness) into the pit and check its level and whether it was in
full contact with the fine sand. The final step was to cover the pressure cell with the
same fine sand. Figure 4.17 shows the compaction of soil and installation of pressure
cells.
4.4.2 Preparation of soil specimens for triaxial tests
The recompacted soil specimens for triaxial tests were cut from soil samples taken from
the compacted test soil in the box using core cutters as shown in Figure 4.18. The core
cutter is 180mm long with an internal diameter of 50mm and produces a specimen
100mm in length and 50mm in diameter. After all the required soil had been compacted
into the box to 95% of the maximum dry density, four M16 bolts and two hollow square
steel sections were installed to form a reaction frame. The core cutter was then jacked
into the soil using a hydraulic jack against the reaction frame. The use of a hydraulic
jack instead of a hammer to push the core cutter into the soil was to reduce disturbance
to the soil sample. Finally the core cutter together with the soil sample was removed
from the soil and kept in a sealed plastic bag for further use in the triaxial test.
4.4.3 Application of vertical overburden pressure
After all the required soil had been compacted in the box, the top cover was connected
onto the box. Overburden pressure was then applied to the test soil by water pressure
through the rubber diaphragm under the top cover. De-aired water was continuously
filled in the fluid chamber formed by the rubber diaphragm and the top cover to
compensate for the deformation of the soil. The change in volume of the water was
- 106 -

Laboratory Pull-out Testing Study on Soil Nails in Compacted Completely Decomposed Granite Fill Su Lijun
measured using the automatic volume change apparatus. The volume change and the
variation of pressure cell readings were recorded using the CR10X data logger.
4.4.4 Hole drilling and cement grouting
About 24 hours after the application of overburden pressure, any further volume change
had become negligible, which indicated the soil was close to an equilibrium state under
the applied overburden pressure. A 100mm diameter hole was then drilled from the
front of the box, through the soil horizontally all the way into the extension chamber.
After this, a 40mm ribbed steel rebar with 4 strain gauges was placed in the center of the
hole. The hole was then grouted with cement grout with a water-cement ratio of 0.42.
Detailed description of arrangement of the drilling and grouting apparatus can be found
in Chapter 3.
4.4.5 Installation of tensiometers and/or porewater pressure transducers
In partially saturated soil, the tensiometers were installed after about 4 curing days (one
day before pull-out). A 2100F soil moisture probe shown in Figure 4.19 was used to
measure the soil suction in the case of partially saturated soil. Before being installed in
the soil, the probe was saturated with de-aerated water and the air which remained in the
vacuum dial gauge was sucked out under a negative pressure created by a GDS pressure
controller (Figure 4.20). Four 6mm holes, the same diameter (6mm) as the porous
ceramic tip, were drilled through the existing 8mm holes in both the side plates of the
pull-out box, extending to a location about 25mm away from the soil nail surface. The
plastic body tube of the probe was then fixed on the side of the box together with the
porous ceramic tip installed into the hole (Figure 4.19). The hole was finally filled up
with soil and sealed by watertight bolt (Figure 4.19). After about 24 hours, the soil
moisture probe and the surrounding soil reached equilibrium and the soil suction value
- 107 -

Chapter 4: Material properties and test procedures
was read from the vacuum dial gauge. For tests in saturated soil, two tensiometers with
transducers and a porewater pressure transducer were installed before submerging the
soil to measure the porewater pressure. The same procedure was followed during
installation.
4.4.6 Saturation of the test CDG soil
For tests under submerged conditions, the soil was saturated before pull-out. About two
days after grouting, the cement grout had hardened and the steel plate for blocking the
hole during grouting was removed. Then the waterproof front cap (Figure 3.12) was
carefully fixed to the front plate of the box to cover the nail head. During installation,
the location of the waterproof front cap was carefully adjusted to ensure that the steel
guide bar could move smoothly during pull-out without any leakage. The soil in the
back extension chamber was then removed. Plastic pipes were connected to the holes on
the waterproof front cap, back extension chamber and left and right sides of the box.
After that a vacuum pump was used to suck out the air inside the soil from the upper
holes of the box and water was filled into the box from the lower holes at the same time.
After the waterproof front cap and the back chamber were full of water and not much air
was being sucked out, back pressure was incrementally applied to the soil to obtain a
higher degree of saturation. About two days later, no more water could be filled into the
soil under a given amount of back pressure and then the nail was ready to be pulled out.
The setup for saturating the CDG sample is shown in Figure 3.13.
4.4.7 Pull-out of the nail
After five curing days when the strength of the cement grout developed was about
32MPa, the nail was pulled out using a hydraulic jack against a steel reaction frame.
The reaction frame was secured on the box and its height could be adjusted to fit the
- 108 -

Laboratory Pull-out Testing Study on Soil Nails in Compacted Completely Decomposed Granite Fill Su Lijun
location of the nail head. A 1.2m long M16 bolt was connected to the nail head for
pull-out. Before pull-out the peak pull-out load was estimated based on previous
experience and evenly divided into five loading increments. The load was applied step
by step and was held for about one hour at each loading step. After the peak pull-out
resistance was achieved, the nail was continuously pulled out under displacement
control using rates of 1mm/min or about 0.3mm/min for tests in partially saturated and
saturated soil respectively. For tests in partially saturated soil, the displacement at the
end of pull-out was 200mm. However, for tests in saturated soil, a displacement of only
100mm was achieved because of the difficulties in maintaining alignment of the
pull-out force with the nail and preventing leakage of water from the waterproof cap.
Time constraint was another reason because the displacement rate for pull-out in the
submerged tests was very slow and the time needed would be too long if proposed to
pull out of 200mm. The setup of the box with full instrumentation and loading devices
for soil nail pull-out under submerged condition is given in Figure 3.23. Figure 4.21
shows a soil nail being pulled out under a dry soil condition.
The pull-out of the nail was conducted by load control before peak pull-out resistance
and by displacement control after peak. The loading speed was slow and a relatively
long time interval of one hour was maintained between two loading steps. The
displacement rate after peak pull-out resistance was small, especially for saturated tests.
Therefore the pull-out tests could be considered to have been carried out under
approximately drained conditions.
- 109 -

Chapter 4: Material properties and test procedures
Table 4.1 – Properties of the CDG soil and cement grout
Properties of the completely decomposed granite soil Specific Gravity (Gs) 2.645 Maximum dry density (ρdmax) Mg/m3 1.668 Optimum moisture content % 19 Plastic limit (wp) % 27.3 Liquid limit (wl) % 35.5 Gravel % 9.33 Sand % 62.51 Silt % 24.97 Clay % 3.19 Coefficient of uniformity Cu 38.3 Coefficient of curvature Cz 1.6 Properties of the cement grout Density (ρd) Mg/m3 1.886 Uniaxial compressive strength (σc) MPa 32.09 Secant Young's modulus (E50) GPa 12.59 Poisson's ratio (υ) 0.21
Table 4.2 – Shear strength parameters of the CDG soil
Degree of Saturation Shear strength
Type of Test (Sr)
Cohesion (c or c')
Friction Angle (φ or φ')
Sample Condition
38% c=36.6kPa φ =35.9° Recompacted
50% c=59.5kPa φ =30.4° Recompacted Unsaturated Consolidated
Drained (CD) 75% c=26.8kPa φ =33.8° Recompacted
Consolidated Drained
(CD) 98% c’=9.4kPa φ'=33.9° Recompacted
Saturated Consolidated Undrained
(CU) 98% c’=11.4kPa φ'=32.6° Recompacted
- 110 -

Laboratory Pull-out Testing Study on Soil Nails in Compacted Completely Decomposed Granite Fill Su Lijun
Particle Size Distribution
0
10
20
30
40
50
60
70
80
90
100
0.001 0.01 0.1 1 10 100
Particle Size (mm)
Perc
enta
ge F
iner
0.002 0.06 2 60
Fine Medium Coarse Fine Medium Coarse Fine Medium CoarseClay
Silt Sand Gravel Cob
ble
Figure 4.1 – Particle size distribution of the CDG soil
Relationship between dry density and moisture content
1.50
1.521.54
1.561.58
1.60
1.621.64
1.661.68
1.70
5 6 7 8 9 10 11 12 13 14 15 16 17 18 19 20 21 22 23 24 25 26 27 28 29 30Moisture content (%)
Dry
den
sity
(Mg/
m3 )
2.5 kg rammer
ρ d max=1.668Mg/m3
w opt =19%
Figure 4.2 – Relationship between dry density and moisture content
- 111 -

Chapter 4: Material properties and test procedures
0
100
200
300
400
500
600
0 0.05 0.1 0.15 0.2Axial strain, εa
Dev
iato
r Stre
ss (k
Pa) 40kPa
80kPa
120kPa
200kPa
300kPa
(a)
-50
0
50
100
150
200
0 0.05 0.1 0.15 0.2Axial strain, εa
Pore
wat
er P
ress
ure,
u (k
Pa) _ 40kPa
80kPa
120kPa
200kPa
300kPa
(b)
0
200
400
600
800
0 100 200 300 400 500 600 700 800 900 1000Mean stress p' (kPa)
Dev
iato
r stre
ss q
' (kP
a) 40kPa
80kPa
120kPa
200kPa
300kPa
(c) Figure 4.3 – (a) Deviator stress vs. axial strain (b) pore water pressure vs. axial strain and (c) effective stress paths for conventional saturated CU triaxial tests
- 112 -

Laboratory Pull-out Testing Study on Soil Nails in Compacted Completely Decomposed Granite Fill Su Lijun
y = 0.5429x + 12.16
0
100
200
300
400
0 100 200 300 400 500 600 700 800 900 1000
t' (kPa)
s' (k
Pa)
t'=(σ'1+σ'3)/2
s'=(σ1-σ3)/2
c'=14.5kPa
φ '=32.9°
(a)
y = 0.5388x + 9.6163
0
100
200
300
400
0 100 200 300 400 500 600 700 800 900 1000t' (kPa)
s' (k
Pa) t'=(σ'1+σ'3)/2
s'=(σ1-σ3)/2
c'=11.4kPa
φ '=32.6°
(b) Figure 4.4 – Relationship between s' and t' for conventional saturated CU triaxial tests at axial strain of (a) 15% and (b) 20%
- 113 -

Chapter 4: Material properties and test procedures
0100200300400500600700800900
0 0.05 0.1 0.15 0.2Axial strain, εa
Dev
iato
r Stre
ss (k
Pa) 40kPa
80kPa
120kPa
200kPa
300kPa
(a)
-50
0
50
100
150
200
0 0.05 0.1 0.15 0.2Axial strain, εa
Pore
wat
er P
ress
ure,
u (k
Pa) _
40kPa
80kPa
120kPa
200kPa
300kPa
(b)
0
200
400
600
800
1000
0 100 200 300 400 500 600 700 800 900 1000Mean stress p' (kPa)
Dev
iato
r Stre
ss q
' (kP
a) 40kPa
80kPa
120kPa
200kPa
300kPa
(c) Figure 4.5 – (a) Deviator stress vs. axial strain (b) pore water pressure vs. axial strain and (c) effective stress paths for conventional saturated ‘CD’ triaxial tests (partially drained and correction made on the excess pore water pressure)
- 114 -

Laboratory Pull-out Testing Study on Soil Nails in Compacted Completely Decomposed Granite Fill Su Lijun
y = 0.5829x
0
100
200
300
400
500
0 100 200 300 400 500 600 700 800 900 1000t' (kPa)
s' (k
Pa)
t'=(σ'1+σ'3)/2
s'=(σ1-σ3)/2
c'=0
φ '=35.7°
(a)
y = 0.5575x + 7.8021
0
100
200
300
400
500
0 100 200 300 400 500 600 700 800 900 1000t' (kPa)
s
Figure 4.6 – Relationship between s' and t' for conventional saturated ‘CD’ triaxial tests at axial strain of (a) 15% and (b) 20% (partially drained and correction made on the excess pore water pressure)
' (kP
a)
t'=(σ'1+σ'3)/2
s'=(σ1-σ3)/2
c'=9.4kPa
φ '=33.9°
(b)
- 115 -

Chapter 4: Material properties and test procedures
Figure 4.7 – Schematic diagram of the double cell triaxial system Figure 4.8 – The double cell triaxial system (After Yin 2003)
- 116 -

Laboratory Pull-out Testing Study on Soil Nails in Compacted Completely Decomposed Granite Fill Su Lijun
0
200
400
600
800
1000
1200
0 5 10 15 20 25Axial Strain, εa (%)
Dev
iato
r Stre
ss (k
Pa)
80kPa
120kPa
200kPa
300kPa
(a)
-5
-4
-3
-2
-1
0
1
2
0 5 10 15 20 25
Axial Strain, εa (%)Vol
ume
Stra
in, ε
v (%
) _ 80kPa
120kPa
200kPa
300kPa
(b)
y = 0.5863x + 29.658
0
100
200
300
400
500
600
0 200 400 600 800 1000t (kPa)
s (kP
a)
t=(σ1+σ3)/2s=(σ1-σ3)/2
c=36.6kPaφ=35.9°
(c) Figure 4.9 – (a) Deviator stress vs. axial strain (b) volume strain vs. axial strain and (c) s vs. t for double cell triaxial tests on soil specimens at 38% degree of saturation
- 117 -

Chapter 4: Material properties and test procedures
0100200300400500600700800900
0 5 10 15 20 25Axial Strain, εa (%)
Dev
iato
r Stre
ss (k
Pa)
80kPa120kPa200kPa300kPa
(a) -6
-5
-4
-3
-2
-1
0
1
2
3
0 5 10 15 20 25
Axial Strain, εa (%)
Vol
ume
Stra
in, ε
v (%
)
80kPa120kPa200kPa300kPa
(b)
y = 0.5061x + 51.298
0
100
200
300
400
500
0 200 400 600 800t (kPa)
s (kP
a) t=(σ1+σ3)/2s=(σ1-σ3)/2
c=59.5kPaφ=30.4°
(c) Figure 4.10 – (a) Deviator stress vs. axial strain (b) volume strain vs. axial strain and (c) s vs. t for double cell triaxial tests on soil specimens at 50% degree of saturation
- 118 -

Laboratory Pull-out Testing Study on Soil Nails in Compacted Completely Decomposed Granite Fill Su Lijun
0100200300400500600700800900
0 5 10 15 20 25Axial Strain,εa (%)
Dev
iato
r Stre
ss (k
Pa)
80kPa120kPa200kPa300lPa
(a)
-6
-5
-4
-3
-2
-1
0
1
0 5 10 15 20 25
Axial Strain, εa (%)
Vol
ume
Stra
in, ε
v (%
)
80kPa120kPa200kPa300kPa
(b)
y = 0.5563x + 22.271
0
100
200
300
400
500
0 200 400 600 800t (kPa)
s (kP
a) t=(σ1+σ3)/2s=(σ1-σ3)/2
c=26.8kPaφ=33.8°
(c) Figure 4.11 – (a) Deviator stress vs. axial strain (b) volume strain vs. axial strain and (c) s' vs. t for double cell triaxial tests on soil specimens at 75% degree of saturation
- 119 -

Chapter 4: Material properties and test procedures
Figure 4.12 – Failed cement grout specimens of Uniaxial Compressive Strength (UCS) tests
- 120 -

Laboratory Pull-out Testing Study on Soil Nails in Compacted Completely Decomposed Granite Fill Su Lijun
Uniaxial Compressive Strength for Sample A
0
5
10
15
20
25
30
35
-1.E-03 0.E+00 1.E-03 2.E-03 3.E-03 4.E-03 5.E-03
)
Axi
al S
tress
(MPa
Uniaxial Compressive Strength for Sample B
0
5
10
15
20
25
30
35
-2.E-03 -1.E-03 0.E+00 1.E-03 2.E-03 3.E-03 4.E-03 5.E-03 6.E-03
Axi
al S
tress
(MPa
)
σa=33.0MPa
σa/2=16.5MPa
Δεa=1.30e-03
α
Δεl=-2.80e-04
Axial StrainLateral Strain
Figure 4.13 – Results of Uniaxial Compressive Strength (UCS) tests for the cement grout (cylindrical specimen)
σa=31.2MPa
σa/2=15.6MPa
Δεa=1.25e-03Δεl=-2.50e-04
α
Axial StrainLateral Strain
- 121 -

Chapter 4: Material properties and test procedures
Watertight bolt
GDS pressure controller
Figure 4.14 – Apparatus for calibrating earth pressure cells, pore water pressure transducers and transducers for the soil moisture probes
Pressure cell1(EBJ04026)
y = 441.45x - 1197.5
0100200300400500600
0 2 4 6Dataloger reading (mv)
Pres
sure
(kPa
)
Tensiometer
y = -2.1037x + 2.8473
-120-100-80-60-40-20
00 20 40
Dataloger reading (mv)
Pres
sure
(kPa
)
60
LVDT1(m352407)
y = 13.51x + 1.2052
020406080
100120
0 2 4 6 8Dataloger Reading (mv)
Dis
plac
emen
t (m
m)_
Load cell
y = -12324x - 2327.5
0
1
2
3
4
5
-0.6 -0.5 -0.4 -0.3 -0.2 -0.1 0Dataloger reading (mv)
Load
(kN
)
Figure 4.15 – Calibration results for the transducers
- 122 -

Laboratory Pull-out Testing Study on Soil Nails in Compacted Completely Decomposed Granite Fill Su Lijun
Figure 4.16 – Full bridge connection for strain gauge
H
L
AG
Vx
R1
R2
R3
Rg
Pressure cells
Access holes
Rammer
Leveler
Fine sands
Figure 4.17 – Soil compaction and pressure cell installation
- 123 -

Chapter 4: Material properties and test procedures
Reaction frame
Hydraulic jack
Core cutters
Remove the core cutter out of the soil
A core cutter with a sample
Figure 4.18 – Taking soil samples for triaxial tests
- 124 -

Laboratory Pull-out Testing Study on Soil Nails in Compacted Completely Decomposed Granite Fill Su Lijun
Vacuum Dial Gauge
Porous Ceramic tip
Plastic Body Tube
Watertight bolt
Plastic pipe
Body tube fixed on the box
Figure 4.19 – Tensiometer (Soil Moisture Probe) used in the test Figure 4.20 –De-airing for a tensiometer
- 125 -

Chapter 4: Material properties and test procedures
Figure 4.21 –A soil nail being pulled out under a dry soil condition
- 126 -

Laboratory Pull-out Testing Study on Soil Nails in Compacted Completely Decomposed Granite Fill Su Lijun
CHAPTER 5: INFLUENCE OF OVERBURDEN PRESSURE ON
SOIL NAIL PULL-OUT BEHAVIOUR AND RESISTANCE
5.1 INTRODUCTION
There are a number of factors that govern the shear strength between a soil nail and the
surrounding soil, such as the stress condition, soil properties, groundwater condition,
soil nail surface condition and etc. As mentioned in Chapter 2, the stress conditions that
will influence the pull-out resistance of a soil nail are normally referred to the normal
stresses acting on the nail surface. Current views on how the overburden pressure
influences the normal stress acting on the nail surface are diversified. Some researchers
believe that the normal stress is related to the soil overburden pressure corresponding to
the depth of soil, such as Jewell (1990). Some other researchers hold the view that the
normal stress is independent of soil depth, such as Schlosser and Guilloux (1981) and
Cartier and Gigan (1983).
In the design approach commonly adopted in Hong Kong, the pull-out shear resistance
of a soil nail is assumed to be directly proportional to the vertical stress. The vertical
stress that acts on the soil nail is calculated as the overburden stress at the mid depth of
the nail in the resistant zone (GEO 2005). However, for cement grouted nails that are
commonly used in Hong Kong, when a drillhole is formed for the soil nail installation,
the soil stresses on the surface of the hole are released and the soil above the hole is
supported by soil arching developed across the hole. As just a certain amount (not all) of
the stresses may be restored after hardening of the grout, the current design method may
not be able to reflect the actual site condition. Quality field test and laboratory test
- 127 -

Chapter 5: Influence of overburden pressure on pull-out resistance
results in this area are limited, especially for soil nails in the completely decomposed
granite (CDG) soils in Hong Kong. The CDG soils are one of the most common types
of soils in Hong Kong, covering more than 70% of the territories of Hong Kong.
In order to study the influence of overburden pressure on the soil nail pull-out shear
resistance, a number of pull-out tests in the CDG soil with various degrees of saturation
under different overburden pressures have been carried out using the two boxes
introduced in Chapter 3. The results of the tests in the soil at 38%, 50%, 75% and 98%
(submerged) degrees of saturation and under applied overburden pressures of 40kPa,
80kPa, 120kPa, 200kPa and 300kPa are presented in this chapter. The stress release,
development of normal stress, pull-out stress-displacement behaviour and influence of
applied overburden pressure on the pull-out resistance of soil nails will be presented and
discussed in the following sections.
5.2 STRESS VARIATIONS DURING DRILLING AND GROUTING
5.2.1 Stress release during drilling
The responses of earth pressure cells and the automatic volume change apparatus during
application of overburden pressure for all the tests are of similar pattern. Figure 5.1
shows the (a) total earth pressure and (b) vertical displacement versus time during
application of overburden pressure for the test under overburden pressure of 200kPa and
at initial degree of saturation (Sr) of 38%. The overburden pressure reached the target in
a short time and kept constant before drilling the hole. The change in volume of the soil
started to be measured as soon as the overburden pressure had reached its target. The
vertical displacement was calculated from the measured volume change of the soil.
From Figure 5.1, it can be observed that the vertical displacement increased fast firstly
and then slowed down with time elapsed. The increasing rate of the vertical
- 128 -

Laboratory Pull-out Testing Study on Soil Nails in Compacted Completely Decomposed Granite Fill Su Lijun
displacement became substantially small about ten hours (600min) after application of
the overburden pressure, indicating that the soil was close to an equilibrium state under
the applied overburden pressure. This state was held up to 24 hours to further improve
the equilibrium of the soil.
The results of the tests with applied overburden pressure of 200kPa and at degrees of
saturation of 38% and 75% are used to illustrate the variations of earth pressure during
drilling and grouting (Figure 5.2). The variations of earth pressure for tests in dryer and
wetter soil are both included. The locations of the earth pressure cells are shown in
Figure 3.20. From Figure 5.2 it can be seen that, before drilling, the earth pressures in
the soil as measured by the pressure cells generally agreed with the applied overburden
pressure of 200kPa (the slight difference was due to the self-weight of soil above the
earth pressure cells). The changes in earth pressures measured by earth pressure cells 5
and 6 were not significant comparing with the other four pressure cells. The earth
pressures measured by earth pressure cells 1 to 4 substantially decreased soon after the
drilling bit had passed them. Stress redistribution in the soil surrounding the hole was
apparent. In Figure 5.2 (a), the earth pressures measured by pressure cell 2 and pressure
cell 4 dropped to about 70kPa and those measured by pressure cell 1 and pressure cell 3
dropped to about 50kPa and 60kPa respectively. In Figure 5.2 (b), the earth pressures
measured by pressure cell 1 and pressure cell 2 dropped to about 70kPa and those
measured by pressure cell 3 and pressure cell 4 dropped to about 20kPa. Residual
pressures were recorded because the pressure cells were about 40mm away from the
surface of the hole where stresses remained locked in the soil due to the arching effect.
It can be observed that, for the test in soil at 75% degree of saturation, the residual earth
pressures measured by pressure cells 3 and 4 were smaller than those of pressure cells 1
and 2. This phenomenon was observed in most of the tests and was probably because
- 129 -

Chapter 5: Influence of overburden pressure on pull-out resistance
that pressure cells 3 and 4 were, located above the hole, affected by gravity. For the test
in soil at 38% degree of saturation, the residual earth pressure measured by earth
pressure cell 1 was smaller probably due to slight misalignment of drilling.
5.2.2 Variation of earth pressure during and after grouting
Upon injection of grout, the earth pressures were observed to increase slightly in some
of the tests but keep unchanged in the others. In the tests presented here, changes in the
earth pressures were not notable (Figure 5.2). Immediately after grouting, the earth
pressures started to decrease in almost all the tests probably due to the softening of the
soil by water of the cement grout. In Figure 5.2 (a), a remarkable decrease of more than
20kPa was observed immediately after grouting. A small decrease of about 5kPa was
observed in Figure 5.2 (b) after grouting. The decrease of earth pressures was normally
more significant in tests under higher overburden pressure. In the tests under higher
overburden pressure, the residual earth pressures after drilling were also higher so that
the decrease in earth pressures was more significant. The variation of earth pressures
before and after grouting was also different in tests with soil at different degrees of
saturation, which will be discussed in next chapter. One or two days after grouting, the
cement grout hardened and the earth pressures recovered a little bit perhaps owing to
stress redistribution. The recovered earth pressure was negligible in Figure 5.2 (a). In
Figure 5.2 (b), the earth pressures measured by pressure cells 1 and 2 recovered to the
values which were about 10kPa higher than those before grouting, and earth pressures
measured by pressure cells 3 and 4 recovered to the same value as those before grouting.
For all the tests, the recovered stresses are neglectable compared with the applied
overburden pressure.
The pull-out resistance of a soil nail is dependent on the local stress state of soil around
- 130 -

Laboratory Pull-out Testing Study on Soil Nails in Compacted Completely Decomposed Granite Fill Su Lijun
the drillhole at the time of pull-out. From the results, it is observed that the stresses in
the soil around the drillhole were largely released after drilling and the recovered
stresses after the grout had hardened was very small in comparison with the applied
overburden pressure. Thus in design of soil nailing system, the normal stress exerted on
the soil nail surface may not be taken as the weight of the soil above the soil nail as a
matter of course.
5.3 DEVELOPMENT OF EARTH PRESSURE DURING PULL-OUT
The average pull-out shear stress was calculated by dividing the pull-out force by the
surface area of the nail. The average earth pressure was calculated by averaging the
earth pressures measured by earth pressure cells 1 to 4. Figure 5.3 shows the typical
variations of average pull-out shear stress and average earth pressure against (a) time
and (b) displacement during a pull-out test in the soil at degree of saturation of 75% and
under an applied overburden pressure of 300kPa. The soil nail was pulled out by a
hydraulic jack using load control method. The loading increment was calculated by
dividing the peak load estimated from current design practice by a factor of 5. Because
the estimated peak load could not be perfectly equal to the actual peak pull-out load, the
amount of loading steps varied from test to test. There are four loading steps in Figure
5.3 (a). At each load increment the nail was held for about one hour. After the peak
stress was mobilized, the nail was pulled out continuously at a rate of 1.0mm per
minute.
From Figure 5.3, it can be seen that the average earth pressure increased simultaneously
with increase in the pull-out shear stress. No change in the earth pressure was observed
during the time interval when the applied load was held constant between two loading
increments. After the pull-out shear stress reached the peak, it started to decrease and
- 131 -

Chapter 5: Influence of overburden pressure on pull-out resistance
the same phenomenon happened to the earth pressure. The increase in earth pressure
was due to constrained dilatancy of the soil. The completely decomposed granite (CDG)
soil used in these tests is basically granular and was compacted to a very dense state. It
is therefore expected to dilate under shearing. The soil around the nail was under the
constraint imposed by the nail and the surrounding soil. This caused an increase in earth
pressure as measured by pressure cells during pull-out. It is apparent that this increased
normal stress due to the effect of confined dilatancy contributes significantly to the
pull-out shear resistance for drill-and-grout nails in dense granular soils.
Figure 5.4 shows the changes of average earth pressure measured by earth pressure cells
1 to 4 at different stages of testing for all the tests with soil at 38% degree of saturation.
The variations of average earth pressure during the course of testing, which are similar
to what has been discussed in the above paragraphs, are clearly shown in this figure.
After application of overburden pressures, the average earth pressures measured by
pressure cells 1 to 4 were approximate to the applied overburden pressures. The average
earth pressures substantially decreased to residual values after drilling and did not
recover much after installation of the soil nail. At the peak pull-out resistance, the
average earth pressures increased to certain values due to the constrained dilation of the
soil. The increased average earth pressures were scattered and not directly related to the
overburden pressure.
It needs to point out that the pressure cells above and below the nail did not respond
consistently. The drillhole might not be strictly in the same alignment with the steel bar
of the soil nail. The pull-out load was therefore not perfectly parallel to the soil nail
surface so that the pressure cells did not respond consistently. For example, if the
pull-out load slightly inclined upward, the earth pressures measured by earth pressure
- 132 -

Laboratory Pull-out Testing Study on Soil Nails in Compacted Completely Decomposed Granite Fill Su Lijun
cells 2 and 3 should be larger than those measured by earth pressure cells 1 and 4.
Therefore the average value of readings for the four earth pressure cells (P-cells 1 to 4)
was used in the analysis.
5.4 PULL-OUT SHEAR STRESS-DISPLACEMENT BEHAVIOUR
Figure 5.5 to Figure 5.8 show the relationship between average pull-out shear stress and
pull-out displacement for tests with soil at degrees of saturation of 38%, 50%, 75% and
98% (submerged tests) respectively. Results of the tests under overburden pressures of
40kPa and 80kPa, in soil at 50% degree of saturation and under overburden pressure of
80kPa, in soil at 38% degree of saturation were not included because those tests were
believed to have failed due to grouting problem. In general, the pull-out shear stress
firstly develops rapidly at small initial pull-out displacements, and then it continues to
develop as the displacement increases but at a decreasing rate as it approaches the peak
shear stress. After the peak shear strength, the pull-out shear stress is observed to
decrease gradually towards its residual value at the displacement of 200mm. The
displacement and pull-out resistance of the tests do not agree with the results presented
by Pradhan et al. (2003) and Chu (2003). The discrepancy may be due to the difference
in stress states of soil around the test nail between theirs and the present study. In the
tests reported by Pradhan et al. (2003) and Chu (2003), the pressure was applied after
soil nail installation but in the tests in this project, the pressure was applied before soil
nail installation and the stress in soil on the surface of the drillhole was released during
drilling. As a result, the normal stress on the soil nail was less at the beginning of
pull-out. The pull-out stress was generally mobilized by constrained dilatancy of the soil
and thus the displacement required to mobilize the peak shear strength was larger
compared to their results. The cement grout would contract during hardening and thus
the applied overburden pressure after installation of the soil nail would improve the
- 133 -

Chapter 5: Influence of overburden pressure on pull-out resistance
bond between the nail surface and the surrounding soil. This should be another reason
for the smaller displacements at the peak shear strengths occurred in their tests.
The pattern of the pull-out shear stress-displacement curves is different for tests in soil
at different degrees of saturation. The displacements required to mobilize the peak
pull-out shear strengths decrease with the increase in degree of saturation of the soil.
The post-peak decrease of pull-out shear stress becomes more apparent with the
increase in degree of saturation of the soil. The reason for these phenomena will be
discussed in next chapter concerning the influence of degree of saturation of the soil on
the soil nail pull-out resistance and behaviour.
5.5 INFLUENCE OF OVERBURDEN PRESSURE ON PULL-OUT
SHEAR RESISTANCE
5.5.1 Peak pull-out shear resistance
As shown in Figure 5.5 to Figure 5.8, four series of tests in soil at different degrees of
saturation had been carried out to study the influence of overburden pressure on the
pull-out shear resistance. For soil used in the first series of tests, the degree of saturation
was 38% and the measured average soil suction was -87kPa. For soil used in the second
series of tests, the degree of saturation was 50% and the measured soil suction was
-68kPa. For soil used in the third series of tests, the degree of saturation was 75% and
measured average soil suction was -6kPa. The suction of the soil generally kept constant
during testing. It was measured for reference only and was not used for analysis. In the
analysis of pull-out tests results, total stress was used. For soil used in the fourth series
of tests, the soil was submerged by water under back pressure and an average degree of
saturation of 98% was achieved. Each series of tests was subjected to applied
overburden pressures of 40kPa, 80kPa, 120kPa, 200kPa and 300kPa respectively. The
- 134 -

Laboratory Pull-out Testing Study on Soil Nails in Compacted Completely Decomposed Granite Fill Su Lijun
peak shear resistances under different applied overburden pressures in these four series
of tests are shown in Figure 5.9 to Figure 5.12. It can be seen that, for tests in soil at
degree of saturation of 38%, the peak pull-out shear resistances were quite constant
under different overburden pressures. For tests under submerged condition, the peak
pull-out resistances were also generally constant. However, for tests in soil at degrees of
saturation of 50% and 75%, the peak pull-out shear resistances varied more under
different overburden pressures. The scattered peak pull-out shear resistances in these
two series of tests might be resulted from greater disturbance during drilling in wetter
soil. This was evidenced by the difficulty experienced in drilling the holes and the
stronger vibration during drilling in the wetter soil. For tests under submerged
conditions, the submerge procedure reduced the influence of drilling disturbance so that
the results were generally constant.
The test results above suggest that there was no apparent relationship between the
pull-out shear resistance and the applied overburden pressure, which was consistent
with the observations from Cartier and Gigan (1983) and Clouterre (1991) by field
pull-out tests. The pull-out resistances under lower overburden pressure could be larger
than those under higher overburden pressure. The variation of the peak pull-out shear
resistance under different overburden pressures might have been caused by some
disturbance factors, such as misalignment of the pull-out force, variations in stress
condition of the soil and roughness of the nail surface along the nail, disturbance to the
hole surface due to drilling, etc.
5.5.2 Apparent coefficient of friction
Figure 5.13 and 5.14 show the relationship between the peak apparent coefficient of
friction μ* and applied overburden pressure for the tests in soil at degrees of saturation
- 135 -

Chapter 5: Influence of overburden pressure on pull-out resistance
of 38%, 50%, 75% and 98% respectively. The μ* is defined by dividing the peak
pull-out shear stress by the applied overburden pressure. The results show that the μ*
generally decreased with increase in the applied overburden pressure. The decreasing
rate of μ* decreased with the increase in overburden pressure. The μ* at higher
overburden pressure was smaller than φtan (φ is the internal friction angle of the soil)
and kept decreasing with overburden pressure, which was different from the
observations reported by Schlosser and Guilloux (1981) and Cartier and Gigan (1983).
In their observations, the μ* decreased with depth and became equal to φtan below a
certain depth. This is probably due to that different types of soil nail were used in the
tests. In the investigation performed by Cartier and Gigan (1983), driven metal nails
were used. The stresses in the soil were not substantially released during driven the
metal nails into the soil. But drill-and-grout nails were used in this project and the
stresses on the surface of the drillhole were released after drilling and did not recover
much after installing the nail. The initial normal stress acting on the nail-soil interface
was therefore much smaller in comparison with the applied overburden pressure. The
normal stress exerted on the surface of the soil nail was generally mobilized by
constrained dilatancy of the soil and was smaller than higher applied overburden
pressure. But the apparent coefficient of friction μ* was calculated by dividing the peak
pull-out shear stress by the applied overburden pressure so that it was smaller than
φtan at higher overburden pressure.
5.6 SHEAR STRESS DISTRIBUTION ON THE NAIL-SOIL
INTERFACE
The strain of the soil nail was measured by strain gauges fixed on the steel bar during
the course of pull-out. Totally four strain gauges were adhered to the steel bar at spacing
- 136 -

Laboratory Pull-out Testing Study on Soil Nails in Compacted Completely Decomposed Granite Fill Su Lijun
of about 300mm to measure the changes in strains in the steel bar and in turn the shear
stress distribution along the soil nail interface. The locations of the strain gauges are
shown in Figures 5.15 and 5.16. In the tests, the total grouted length of the steel bar was
1.2m with the length inside the box of 1.0m (0.2m of its length was within the extension
chamber). The first strain gauge was located 50mm behind the front wall of the box and
others 300mm apart.
For all the tests, the measured strains were observed to increase with the increase in
pull-out force before the peak pull-out resistance was reached. The measured strains at
the four strain gauges generally decreased in order from Strain gauge 1 to Strain gauge
4. After the peak pull-out resistance had been fully mobilized, the variation of the
strains became erratic probably due to the nonlinear response of the strain gauges at
very small strains of the large diameter steel bar subjected to residual pull-out resistance
at large displacements. Figure 5.15 shows the strain gauge responses with the pull-out
displacement for a test under overburden pressure of 40kPa and in soil at 75% degree of
saturation. Comparing with the pull-out shear stress-displacement curve shown in
Figure 5.7, it can be found that the strains measured by Strain gauges 1, 2 and 3 reached
their peak at displacements close to the displacement at which the peak shear strength
was mobilized. After the peak, they started to decrease and the strain measured by
Strain gauge 1 kept decreasing till the pull-out was finished but the strains measured by
Strain gauges 2 and 3 increased again at displacement of about 50mm. The strain
measured by Strain gauge 4 kept increasing slowly from the very start to the end of the
pull-out. The relationship between the measured strain at the peak shear strength and the
distance from the nail head is shown in Figure 5.16. The strains are observed to
decrease approximately linearly from the nail head to the nail end, which indicates a
generally uniform shear resistance along the nail length.
- 137 -

Chapter 5: Influence of overburden pressure on pull-out resistance
The behaviour for the curve of Strain gauge 1 is easy to understand. This strain gauge
was located close to the nail head and the pull-out force applied by the hydraulic jack
was transferred to it with little frictional loss along the nail. The strain gauge basically
measured the variation of the total pull-out force and the curve thus resembles that
pull-out shear stress-displacement curve in Figure 5.7. Figure 5.17 shows the
relationship between the pull-out force and strain measured by Strain gauge 1 and a
generally linear behaviour of the curve is observed.
The behaviour of Strain gauges 2, 3 and 4 after the peak shear stress was more complex.
Figure 5.18 illustrates the pull-out procedure. It should be noted that there was no soil
inside the extension chamber in order to maintain a constant test nail length of 1.0m
throughout the pull-out procedure. After the peak pull-out shear strength, the shear
stress on the nail-soil interface decreased, on the other hand the length of the nail inside
the soil behind Strain gauges 2, 3 and 4 increased. A theoretical analysis was conducted
to study the behaviour of these strain gauges. In the analysis, the distribution of shear
stress along the nail-soil interface was assumed to be uniform. The calculated
theoretical axial tensile forces at different pull-out displacements are shown in Figure
5.19. Compared with the corresponding strain-displacement curve in Figure 5.15, it can
be seen that the variation of the calculated axial tensile force at the location of Strain
gauge 1 and 4 is in good agreement with that of the measured strain. However, such
agreement cannot be found in the behaviour of Strain gauge 2 and 3. It is difficult to tell
the actual reason behind this phenomenon. One probable reason might be that bending
deformation was mobilized in the steel bar. If the deformation of the steel bar was
purely tensile, the strain measured by Strain gauge 3 would not exceed the strain
measured by Strain gauge 1.
- 138 -

Laboratory Pull-out Testing Study on Soil Nails in Compacted Completely Decomposed Granite Fill Su Lijun
5.7 SUMMARY
The results of the tests in soil at degrees of saturation of 38%, 50%, 75% and 98% and
under applied overburden pressures of 40kPa, 80kPa, 120kPa, 200kPa and 300kPa are
presented and discussed in this chapter. The following are the key observations from the
test results:
(a) After drilling a horizontal hole in the soil, most of the soil stresses around the hole
were released and recovery of the stresses was minimal due to grouting of the soil
nail.
(b) During pull-out, the normal stress in the soil surrounding the soil nail was increased.
The increased stress is believed to be generated by constrained dilatancy of the soil.
(c) Most of the pull-out shear stress-displacement curves exhibit a peak and post-peak
displacement softening behavior in particular for tests in soil at higher degrees of
saturation.
(d) The development of pull-out shear resistance was mainly derived from the
constrained dilatancy of the soil.
- 139 -

Chapter 5: Influence of overburden pressure on pull-out resistance
Earth pressure vs. time during applying overburden pressure
0
50
100
150
200
250
300
0 500 1000 1500 2000Time (min)
Earth
pre
ssur
e (k
Pa)
P-Cell 1 P-Cell 2 P-Cell 3P-Cell 4 P-Cell 5 P-Cell 6
(a)
OP=200kPaSr=38%
Vertical displacement vs. time during applying overburden pressure
0
5
10
15
20
25
30
35
40
45
50
0 500 1000 1500 2000Time (min)
Ver
tical
disp
lace
men
t (m
m) _
(b)
OP=200kPaSr=38%
Figure 5.1 – (a) Total earth pressure and (b) vertical displacement vs. time during applying overburden pressure (OP) – for overburden pressure of 200kPa and initial degree of saturation (Sr) of 38%
- 140 -

Laboratory Pull-out Testing Study on Soil Nails in Compacted Completely Decomposed Granite Fill Su Lijun
Earth pressure vs. time during drilling and grouting
0
50
100
150
200
250
300
1 10 100 1000 10000Time (min)
Earth
pre
ssur
e (k
Pa)
P-Cell 1 P-Cell 2P-Cell 3 P-Cell 4P-Cell 5 P-Cell 6
(a)
OP=200kPaSr=38%
Drill bit reached thepressure cells
Figure 5.2 – Total earth pressure vs. time during drilling and grouting – for overburden pressure of 200kPa and initial degrees of saturation (Sr) of (a) 38% and (b) 75%
Earth pressure vs. time during drilling and grouting
0
50
100
150
200
250
300
1 10 100 1000 10000
Time (min)
Earth
pre
ssur
e (k
Pa)
P-Cell 1 P-Cell 2P-Cell 3 P-Cell 4P-Cell 5 P-Cell 6
OP=200kPaSr=75%
Drill bit reached thepressure cells
P-Cell1P-Cell3P-Cell2
P-Cell4
Groutingcompleted
P-Cell6
P-Cell5
(b)
P-Cell1
P-Cell3
P-Cell2
P-Cell4
Groutingcompleted
P-Cell6
P-Cell5
- 141 -

Chapter 5: Influence of overburden pressure on pull-out resistance
Average earth pressure and shear stress vs. time during pull-out
020406080
100120140160180200
0 50 100 150 200 250 300 350 400Time (min)
Pres
sure
/stre
ss (k
Pa)
Earth pressureShear stress
Loading stepsPeak stress
Peak earth pressure
End of test
(a)
OP=300kPa
Sr=75%
Average earth pressure and shear stress vs. pull-out displacement
020406080
100120140160180200
0 50 100 150 200 250Pull-out displacement (mm)
Pres
sure
/stre
ss (k
Pa)
Earth pressureShear stress
Peak stress
Peak earth pressure
OP=300kPaSr=75%
End of test
(b)
Figure 5.3 – Average earth pressure and pull-out shear stress vs. (a) time and (b) pull-out displacement during pull-out – for overburden pressure of 300kPa and initial degree of saturation (Sr) of 75%
- 142 -

Laboratory Pull-out Testing Study on Soil Nails in Compacted Completely Decomposed Granite Fill Su Lijun
Changes of average earth pressure at different stages of testing
0
50
100
150
200
250
300
350
0 50 100 150 200 250 300 350Overburden pressure (kPa)
Ave
rage
ear
th p
ress
ure
(kPa
)Before drillingAfter drillingBefore pull-outAt peak resistance
Before drilling
At peak resistance
After drilling
Before pull-out
2 1
34
Figure 5.4 – Changes of average total earth pressure of P-Cells 1 to 4 at different stages of testing for tests with soil at 38% degree of saturation
Average pull-out shear stress vs. pull-out displacement
0
20
40
60
80
100
120
0 20 40 60 80 100 120 140 160 180 200 220Pull-out displacement (mm)
Ave
rage
pul
l-out
shea
r stre
ss (k
Pa)_ 40 kPa 120 kPa
200 kPa 300 kPaPeak stress
End of test
Figure 5.5 – Relationship between average pull-out shear stress and pull-out displacement for tests in soil at degree of saturation (Sr) of 38%
- 143 -

Chapter 5: Influence of overburden pressure on pull-out resistance
Average pull-out shear stress vs. pull-out displacement
0
20
40
60
80
100
120
140
0 20 40 60 80 100 120 140 160 180 200 220Pull-out displacement (mm)
Ave
rage
pul
l-out
shea
r stre
ss (k
Pa) _
__120 kPa 200 kPa 300 kPa
Peak stress
End of test
Figure 5.6 – Relationship between average pull-out shear stress and pull-out displacement for tests in soil at degree of saturation (Sr) of 50%
Average pull-out shear stress vs. pull-out displacement
0
20
40
60
80
100
120
0 20 40 60 80 100 120 140 160 180 200 220Pull-out displacement (mm)
Ave
rage
pul
l-out
shea
r stre
ss (k
Pa) _ 40 kPa 80 kPa
120 kPa 200 kPa300 kPa
Peak stress
End of test
Figure 5.7 – Relationship between average pull-out shear stress and pull-out displacement for tests in soil at degree of saturation (Sr) of 75%
- 144 -

Laboratory Pull-out Testing Study on Soil Nails in Compacted Completely Decomposed Granite Fill Su Lijun
Average pull-out shear stress vs. pull-out displacement
0
10
20
30
40
50
60
70
0 20 40 60 80 100 120Pull-out displacement (mm)
Ave
rage
pul
l-out
shea
r stre
ss (k
Pa) _ 40 kPa 80 kPa
120kPa 200 kPa300 kPa
Peak stress
End of test
Figure 5.8 – Relationship between average pull-out shear stress and pull-out displacement for tests under submerged condition (Sr≈98%)
Peak pull-out shear resistance vs. overburden pressure
0
20
40
60
80
100
0 50 100 150 200 250 300 350Overburden pressure (kPa)
Peak
pul
l-out
shea
r res
istan
ce (k
Pa)
_
Figure 5.9 – Relationship between peak pull-out shear resistance and applied overburden pressure for tests in soil at degree of saturation of 38%
- 145 -

Chapter 5: Influence of overburden pressure on pull-out resistance
Peak pull-out shear resistance vs. overburden pressure
0
20
40
60
80
100
120
0 20 40 60 80 100 120 140 160 180 200 220 240 260 280 300 320Overburden pressure (kPa)
Peak
pul
l-out
shea
r res
istan
ce (k
Pa)
__
Figure 5.10 – Relationship between peak pull-out shear resistance and applied overburden pressure for tests in soil at degree of saturation of 50%
Peak pull-out shear resistance vs. overburden pressure
0
20
40
60
80
100
120
0 50 100 150 200 250 300 350Overburden pressure (kPa)
Peak
pul
l-out
shea
r res
istan
ce (k
Pa) _
Figure 5.11 – Relationship between peak pull-out shear resistance and applied overburden pressure for tests in soil at degree of saturation of 75%
- 146 -

Laboratory Pull-out Testing Study on Soil Nails in Compacted Completely Decomposed Granite Fill Su Lijun
Peak pull-out shear resistance vs. overburden pressure
0
20
40
60
80
0 50 100 150 200 250 300 350Overburden pressure (kPa)
Peak
pul
l-out
shea
r res
istan
ce (k
Pa)
_
Figure 5.12 – Relationship between peak pull-out shear resistance and applied overburden pressure for submerged tests
0.00.20.40.60.81.01.21.41.6
0 50 100 150 200 250 300 350Overburden pressure (kPa)
Coe
ffici
ent o
f fric
tion,
μ*
Tanφ
Figure 5.13 – Relationship between the peak apparent coefficient of friction and applied overburden pressure for tests in soil at degree of saturation of 38%
- 147 -

Chapter 5: Influence of overburden pressure on pull-out resistance
Figure 5.14 – Peak apparent coefficient of friction vs. applied overburden pressure for tests in soil at degrees of saturation of (a) 50%, (b) 75% and (c) 98%
Tanφ'
0.00.10.20.30.40.50.60.70.8
0 50 100 150 200 250 300 350Overburden pressure (kPa)
Coe
ffici
ent o
f fric
tion,
μ*
(a)
Tanφ
0.0
0.5
1.0
1.5
2.0
0 50 100 150 200 250 300 350Overburden pressure (kPa)
Coe
ffici
ent o
f fric
tion,
μ*
(b)
Tanφ
0.00.10.20.30.40.50.60.70.80.91.0
0 50 100 150 200 250 300 350Overburden pressure (kPa)
Coe
ffici
ent o
f fric
tion,
μ*
(c)
Tanφ
- 148 -

Laboratory Pull-out Testing Study on Soil Nails in Compacted Completely Decomposed Granite Fill Su Lijun
0102030405060708090
0 50 100 150 200 250Pull-out displacement (mm)
Mic
ro-s
train
( με)
Strain 2
Strain 4
Strain 3Strain 1
50mm300mm
50mm300mm 300mm
Strain gauge 1 Strain gauge 2 Strain gauge 3 Strain gauge 4
200mmNail head
Figure 5.15 – Relationship between measured strain and pull-out displacement during pull-out for test with overburden pressure of 40 kPa and degree of saturation of 75%
0
20
40
60
80
100
0 200 400 600 800 1000 1200Distance from nail head (mm)
Mic
ro-s
train
( με)
50mm300mm
50mm300mm 300mm
Strain gauge 1 Strain gauge 2 Strain gauge 3 Strain gauge 4
200mmNail head Figure 5.16 – Strain distribution along the nail at peak pull-out stress for test with overburden pressure of 40 kPa and degree of saturation of 75%
- 149 -

Chapter 5: Influence of overburden pressure on pull-out resistance
Pull-out force vs. strain measured by Strain gauge 1
0
5
10
15
20
25
30
0 20 40 60 80Micro-strain (με)
Pull-
out f
orce
(kN
100
) OP=40kPa
Sr=75% Figure 5.17 – Relationship between pull-out force and strain measured by Strain gauge 1 for test with overburden pressure of 40 kPa and degree of saturation of 75%
Pullout No soil here
Strain gauges (changed locations during pull-out)
Strain gauge 1Strain gauge 4
Figure 5.18 – Illustration of pull-out procedure
- 150 -

Laboratory Pull-out Testing Study on Soil Nails in Compacted Completely Decomposed Granite Fill Su Lijun
Theoretical tensile force vs. displacement during pull-out
0
5
10
15
20
25
30
0 50 100 150 200 250Pull-out displacement (mm)
Axi
al te
nsile
forc
e (k
N) _
Strain gauge 1Strain gauge 2Strain gauge 3Strain gauge 4
OP=40kPaSr=75%
Figure 5.19 – Calculated theoretical axial tensile force vs. pull-out displacement
- 151 -

Chapter 6: Influence of degree of saturation on pull-out behaviour and resistance
CHAPTER 6: INFLUENCE OF DEGREE OF SATURATION ON
SOIL NAIL PULL-OUT BEHAVIOUR AND RESISTANCE
6.1 INTRODUCTION
In Chapter 5, the influence of overburden pressure on the pull-out resistance of the soil
nail had been discussed based on the four series of tests on soil nails in the CDG soil
under different overburden pressures and at different degrees of saturation. In this
chapter the influence of degree of saturation of soil on the pull-out behaviour and
resistance of the soil nail will be analyzed and discussed.
Among a number of factors influencing the soil nail pull-out resistance, the degree of
saturation of soil is an important influencing factor, especially for permanent soil nailed
structures. This is because the degree of saturation of the soil mass changes frequently
due to the variation of ground water table and weather conditions. The degree of
saturation of the soil can alter the suction of the soil. The pull-out resistance of a soil
nail may drop to an unsafe level in the intense rainfalls due to the increase of the degree
of saturation, that is, reduction in soil suction. However, in the previous reported
investigations, the effect of degree of saturation of soil on the nail-soil interface shear
resistance was scarcely studied.
In the literatures reviewed in Chapter 2, only a few researchers had investigated the
influence of degree of saturation of soil on the pull-out resistance of the soil nail. In the
French National Project CLOUTERRE (1991), the maximum pull-out force was found
to be reduced by more than a half when the moisture content was increased from the
- 152 -

Laboratory Pull-out Testing Study on Soil Nails in Compacted Completely Decomposed Granite Fill Su Lijun
optimum water content to the saturation moisture content. Pradhan (2003) noted from
laboratory pull-out tests with cement grouted nails in loose CDG fill at both natural
moisture content and nearly saturated conditions that only the nail-soil interface
adhesion was reduced due to high degree of saturation but the interface friction angle
kept unchanged. Chu and Yin (2005a) carried out a series of tests in CDG fill prepared
to different degrees of saturation and found that the nail-soil interface shear resistance
decreased as degree of saturation of the soil increased.
The reported investigations on the influence of degree of saturation of soil on the
pull-out resistance of a soil nail are limited. Further more, tests were only carried out in
soil from natural wet or at optimum moisture content to saturated condition but tests in
dry soil were never reported. Thirdly, in tests carried out by Chu and Yin (2005a), it was
difficult to achieve a higher degree of saturation due to leakage problem.
In this project, tests were carried out in soil at degrees of saturation from 38% to about
98%. The apparatus is waterproof and allows application of back pressure to speed up
the saturation process of the test soil. Soil samples taken after test revealed that a high
degree of saturation (about 98%) was achieved. In this chapter, the earth pressure and
pore pressure during application of back pressure, the failure patterns of soil nails at
different degrees of saturation of the soil and effect of degree of saturation of the soil on
the soil nail pull-out behaviour and resistance will be presented and discussed.
6.2 EARTH PRESSURE AND PORE PRESSURE RESPONSES
DURING SATURATING THE SOIL
Figure 6.1 shows (a) the effective earth pressure and (b) the porewater pressure
- 153 -

Chapter 6: Influence of degree of saturation on pull-out behaviour and resistance
responses with time during de-aerating process, water infiltration and application of
back pressure for a submerged test with overburden pressure of 200kPa. A back pressure
up to 55kPa (average) was applied to accelerate the saturation of the test soil.
Measurement after completion of the pull-out test revealed that the degree of saturation
of the soil was increased to 95% from the initial value of about 84% before saturating
the soil. Suction in soil and positive porewater pressure were measured by two soil
moisture probes and one miniature porewater pressure transducer (PPT) respectively at
locations approximately 25mm to either side of the testing nail as shown in Figure 6.1 (a)
and Figure 3.21. In the longitudinal direction the two tensiometers and the PPT were
300mm and 700mm away from the nail head respectively.
In Figure 6.1 (a), the effective earth pressure is defined as the total earth pressure
measured by earth pressure cells minus the average porewater pressure measured by the
porewater pressure transducer and soil moisture probes (from negative values of about
-26kPa to a positive value of approximately 55kPa). The box was first sealed for
de-aerating with four plastic pipes connecting the four accesses on the upper side of the
side plates of the box with a vacuum pump. The vacuum pump was on for about one
hour and then the valve on the pipe connected to the vacuum pump was closed. Vacuum
was developed in the box and negative pore pressure was measured as shown in Figure
6.1 (b). Under the vacuum, water flowed into the box automatically rising upwards
inside the box from the bottom. This water inflow process lasted for about ten hours.
During this period, the pore pressure increased slowly with time. When there was no
further change in the pore pressure for about one hour, the valve connected to the
vacuum pump was reopened and the de-aerating process started again. This procedure
was repeated for several times until water was seen continuously flowing out without air
bubbles therein. The whole procedure of de-aerating and soaking the sample with water
- 154 -

Laboratory Pull-out Testing Study on Soil Nails in Compacted Completely Decomposed Granite Fill Su Lijun
lasted for more than 24 hours (about 1500 minutes).
Even with the repeated process of de-aerating and soaking, there might still be some air
inside the soil. Back water pressure was applied to dissolve the air so that a higher
degree of saturation could be achieved. Back pressure was applied in steps and the same
amount of vertical overburden pressure was applied at the same time to ensure the
effective earth pressure was constant. From Figure 6.1, it can be observed that the pore
pressure increased stepwise to an average value of about 55kPa and the effective earth
pressure only increased slightly at the end of this procedure.
6.3 VARIATIONS OF EARTH PRESSURE
The typical variations of earth pressure during the whole procedure of the pull-out test
had been presented and discussed in Chapter 5. However, the variations of earth
pressure for different series of tests in soil at different degrees of saturation were
different, which will be discussed in this chapter.
6.3.1 Decreased earth pressure immediately after grouting
As mentioned in Chapter 5, the earth pressure was observed to decrease immediately
after grouting probably due to the softening of the soil by water of the cement grout.
Figure 6.2 shows the relationship between the decrease in average earth pressure
immediately after grouting and applied overburden pressure for tests at different degrees
of saturation. The decrease in average earth pressure increased with applied overburden
pressure as had been discussed in Chapter 5. For different series of tests, the decrease in
average earth pressure was larger for tests in soil at lower degrees of saturation. For
tests in soil at lower degrees of saturation, the suction power of the soil was higher and
more water would be absorbed from the cement grout. The softening of the soil and
- 155 -

Chapter 6: Influence of degree of saturation on pull-out behaviour and resistance
decrease in earth pressure were therefore more significant.
6.3.2 Variations of earth pressure
Figure 6.3 and Figure 6.4 show the variations of average earth pressure at different
stages of testing for all the tests with the nail grouted without pressure (gravity head
only). For all of the four series of tests, the variations of average earth pressure were
similar. The average earth pressure firstly increased to the objective value of the applied
overburden pressure during application of the overburden pressure. After drilling, the
stresses on the surface of the hole were released and the average earth pressure
substantially decreased to a residual value. A further decrease of the average earth
pressure was observed immediately after grouting probably due to softening of the soil
by water of the cement grout. After the cement grout had hardened, the average earth
pressure recovered a little bit in most of the tests due to stress redistribution. During
pull-out, the average earth pressure was observed to increase with the increase of
pull-out load. However, differences still existed for different series of tests in soil at
different degrees of saturation. For the tests in soil at 38% degree of saturation, the
average earth pressure before pull-out was smaller than that after drilling due to the
relative higher decrease in average earth pressure immediately after grouting (Figure 6.3
(a)). For other series of tests, the average earth pressure before pull-out was close to or a
little larger than that after drilling. For all the tests carried out in partially saturated soil,
the average earth pressure significantly increased at peak pull-out resistance due to
constrained dilation of the soil. However, the increased average earth pressure was
smaller for submerged tests probably due to that the dilatancy of the soil was reduced by
saturation of the soil.
- 156 -

Laboratory Pull-out Testing Study on Soil Nails in Compacted Completely Decomposed Granite Fill Su Lijun
6.4 FAILURE PATTERNS OF THE SOIL NAIL
6.4.1 Surface of the drillhole before and after pull-out
Figure 6.5 to Figure 6.8 show the surfaces of the drillholes before and after pull-out in
tests with soil at different degrees of saturation. For tests in soil at 38% and 98%
(submerged) degrees of saturation, the surfaces of the drillholes were fairly smooth
before pull-out because that less disturbance was observed during drilling. For soil at
38% degree of saturation, the hole was easy to be drilled because the soil was dry. For
submerged tests, during drilling, the soil was so wet (over 80% degree of saturation)
that could stick on the outer surface of the drill bit to prevent the drill bit from vibrating.
For soil at 50% and 75% degrees of saturation, vibration of the drill bit was observed
and small annular grooves were scratched on the surfaces of the drillholes before
pull-out. The surfaces of the drillholes after pull-out in tests with soil at 38% and 50%
degrees of saturation were generally smooth except some axial scratches along the hole.
For tests in soil at 75% degree of saturation, the surface of the drillhole after pull-out
was very rough because the failure plane was within the soil. For submerged tests,
slurry of the soil was observed on the surface of the drillhole after pull-out.
6.4.2 Failure surfaces of soil nails in the soil at different degrees of saturation
Figure 6.9 shows the nail surfaces after pull-out in tests with soil at different degrees of
saturation. The migration of shearing plane from the interface between the soil nail
surface and the surrounding soil to the interior of the soil was obvious when the soil was
getting wetter. It can be clearly seen that failure occurred mainly on the interface
between soil nail surface and the surrounding soil in tests with soil at 38% degree of
saturation. This indicates that the nail-soil interface shear strength is smaller than that of
the soil surrounding the soil nail, probably because of the strong soil suction within the
soil around the nail. For the nail in soil at 50% degree of saturation, more soil was
- 157 -

Chapter 6: Influence of degree of saturation on pull-out behaviour and resistance
observed on the surface of the nail, which indicated that the shearing plane was
migrating into the soil. For tests in soil at 75% and 98% degrees of saturation, failure
occurred within the soil, which suggested that the nail-soil interface shear strength was
higher than that of the soil.
6.5 EFFECT OF DEGREE OF SATURATION OF THE SOIL ON
PULL-OUT BEHAVIOUR AND RESISTANCE
Figure 6.10 to Figure 6.14 show the relationship between average pull-out shear stress
and pull-out displacement for tests in soil at different degrees of saturation and under
overburden pressures of 40kPa, 80kPa, 120kPa, 200kPa and 300kPa respectively. It is
observed that the post-peak pull-out shear stresses generally decrease faster at higher
degree of saturation of the soil. This is probably related to the migration of shearing
plane from the interface between the soil nail surface and the surrounding soil to the
interior of the soil when the soil is getting wetter. For the failures within the soil, the
pull-out stress-displacement behaviour showed obvious displacement softening as
generally shown in the behaviour of dense dilative soil. For the failures on the nail-soil
interface, there was small and slow reductions of the post-peak pull-out shear resistance,
i.e., the displacement softening was not the dominating behaviour of the dilative soil
subjected to shearing against a hard surface.
From Figure 6.10 to Figure 6.14, it can be observed that, for all the applied overburden
pressures, the peak pull-out shear strengths in tests with soil prepared to 50% and 75%
degrees of saturation were greater than those for saturated tests and tests with soil
prepared to 38% degree of saturation. For soil at degree of saturation of 75%, the
moisture content is close to the optimum moisture content. The peak pull-out shear
strength in tests at degree of saturation of 75% was about 2 times that in the saturated
- 158 -

Laboratory Pull-out Testing Study on Soil Nails in Compacted Completely Decomposed Granite Fill Su Lijun
tests. The pull-out displacement at peak pull-out shear strength increased with decrease
in degree of saturation of the soil. The displacement at peak pull-out shear strength in
tests at degree of saturation of 75% was about 2 times as much as that in the saturated
tests. These results are similar to the results presented in CLOUTERRE (1991) which
showed that the maximum pull-out force was increased by 2 times when the moisture
content was decreased from saturation to the optimum water content and the
displacement corresponding to this maximum force was increased by 3 times. The
decrease in pull-out resistance with degree of saturation from the optimum moisture
content to the saturated condition was also observed by Chu and Yin (2005a) and
Pradhan (2003). Pradhan (2003) considered that this was because of the decrease in soil
cohesion.
Figure 6.15 to 6.17 show the relationship between the peak pull-out shear resistance and
degree of saturation with soil under different vertical pressures. From the plotted trend
lines in the figures, it can be observed that the peak pull-out shear strength firstly
increased and then decreased with increase in degree of saturation of the soil. In the
tests under the overburden pressure of 80kPa, only the decrease in pull-out resistance
when the degree of saturation of the soil increased from 75% to 98% was observed
because that the tests in soil at 38% and 50% degrees of saturation had failed. It is
believed that if the soil is dry, water is more readily to be absorbed by the soil due to a
higher suction power. This may cause more contraction of the cement grout thus
reducing the bond strength between the nail surface and the surrounding soil. In the tests
with soil at 38% degree of saturation, as mentioned in the above paragraphs, further
decrease of earth pressure was observed immediately after grouting and the earth
pressure did not recover after the cement grout had hardened. This is a possible
indication of the contraction of the cement grout. The actual reason is unknown and
- 159 -

Chapter 6: Influence of degree of saturation on pull-out behaviour and resistance
needs to be found out by further tests and analyses. In this respect, tests conducted using
pressure grouting method to improve the contact between the nail surface and the
surrounding soil may throw some light into it. As in the submerged tests, the decrease in
soil cohesion could be one of the reasons for the decrease in pull-out resistance. The
decrease in dilatancy of the soil could be another reason. In Figures 6.3 and 6.4, it is
observed that the increases in earth pressures at peak pull-out resistance for submerged
tests were much smaller than those in tests with soil at other degrees of saturation.
The peak pull-out shear strength for tests at degree of saturation of 75% was about 2
times that for saturated tests. Some of the tests in soil at 50% degree of saturation were
even higher (Figures 6.15 to 6.17). This indicates that the effect of degree of saturation
on soil nail pull-out resistance is significant and should be carefully addressed in design
of the soil nailing system.
6.6 SUMMARY AND MAJOR FINDINGS
The effect of degree of saturation of the soil on the soil nail pull-out behaviour and
resistance is discussed in this chapter. The following are the key observations from the
test results:
(a) The migration of shearing plane from the interface between the nail surface and the
surrounding soil to the interior of the soil was observed with the increase in degree
of saturation of the soil.
(b) The displacement at peak pull-out shear resistance for saturated tests was smaller
than those for partially saturated tests. The decreasing rates of the post-peak pull-out
shear stress increased with the increase in degree of saturation of the soil.
(c) The peak pull-out shear resistance varies with different degrees of saturation of the
soil, with higher resistances at the degrees of saturation of 50% and 75%.
- 160 -
cesulijun
Note
MigrationConfirmed set by cesulijun
cesulijun
Note
MigrationConfirmed set by cesulijun

Laboratory Pull-out Testing Study on Soil Nails in Compacted Completely Decomposed Granite Fill Su Lijun
(d) The increases in earth pressures at peak pull-out resistance for submerged tests were
much smaller than those in tests at other degrees of saturation. This indicates that
the soil dilatancy was reduced when the soil was saturated and as a result the
pull-out resistance decreased.
It should be emphasized that the number of tests carried out was limited and only four
different degrees of saturation were tested. It is premature to draw any conclusion on the
precise correlation between the degree of saturation of the soil and the pull-out
resistance of soil nail. Further research in this area is needed.
- 161 -

Chapter 6: Influence of degree of saturation on pull-out behaviour and resistance
Effective earth pressure vs. time during applying back pressure
-50
0
50
100
150
200
250
0 500 1000 1500 2000 2500 3000 3500 4000Time (min)
Effe
ctiv
e ea
rth p
ress
ure
(kPa
) _
P-Cell 1 P-Cell 2 P-Cell 3P-Cell 4 P-Cell 5 P-Cell 6
2 1
346 5
PPT T1,T2
(a)
OP=200kPaSubmerged
Pore pressure vs. time during applying back pressure
-60
-40
-20
0
20
40
60
80
0 500 1000 1500 2000 2500 3000 3500 4000Time (min)
Pore
pre
ssur
e (k
Pa)
PPT Tensiometer 1 Tensiometer 2
“-” for suction and “+” forpositive pore water pressure
Applying back water pressure
Air release andWater infiltration
(b) Figure 6.1 – (a) Effective earth pressure and (b) porewater pressure vs. time during saturating the soil – for a submerged test with overburden pressure of 200kPa
- 162 -

Laboratory Pull-out Testing Study on Soil Nails in Compacted Completely Decomposed Granite Fill Su Lijun
Decreased average earth pressure immediately after grouting
0
5
10
15
20
25
30
0 50 100 150 200 250 300 350Overburden pressure (kPa)
Dec
reas
ed a
vera
ge e
arth
pre
ssur
e (k
Pa) _ 38% 50% 75%
Figure 6.2 – Relationship between the decrease in average earth pressure immediately after grouting and applied overburden pressure for tests at different degrees of saturation
- 163 -

Chapter 6: Influence of degree of saturation on pull-out behaviour and resistance
Changes of average earth pressure at different stages of testing
0
50
100
150
200
250
300
350
0 50 100 150 200 250 300 350Overburden pressure (kPa)
Ave
rage
ear
th p
ress
ure
(kPa
)Before drillingAfter drillingBefore pull-outAt peak resistance
Before drilling
At peak resistance
After drilling
Before pull-out
2 1
34
(a)
Changes of average earth pressure at different stages of testing
0
50
100
150
200
250
300
350
0 50 100 150 200 250 300 350Overburden pressure (kPa)
Figure 6.3 – Changes of average earth pressure at different stages of testing for tests with soil at (a) 38% and (b) 50% degrees of saturation
Ave
rage
ear
th p
ress
ure
(kPa
) _
Before drillingAfter drillingBefore pull-outAt peak resistance
Before drilling
At peak resistance
After drilling
Before pull-out
2 1
34
(b)
- 164 -

Laboratory Pull-out Testing Study on Soil Nails in Compacted Completely Decomposed Granite Fill Su Lijun
Changes of average earth pressure at different stages of testing
0
50
100
150
200
250
300
350
0 50 100 150 200 250 300 350Overburden pressure (kPa)
Figure 6.4 – Changes of average earth pressure at different stages of testing for tests with soil at (a) 75% and (b) 98% degrees of saturation
Ave
rage
ear
th p
ress
ure
(kPa
) _Before drillingAfter drillingBefore pull-outAt peak resistance
Before drilling
At peak resistance
After drilling
Before pull-out
2 1
34
(a)
Changes of average earth pressure at different stages of testing
0
50
100
150
200
250
300
350
0 50 100 150 200 250 300 350Overburden pressure (kPa)
Ave
rage
ear
th p
ress
ure
(kPa
) _
Before drillingAfter drillingBefore pull-outAt peak resistance
Before drilling
At peak resistance
After drilling
Before pull-out
2 1
34
(b)
- 165 -

Chapter 6: Influence of degree of saturation on pull-out behaviour and resistance
(a) (b) Figure 6.5 – Surfaces of the drilllhole before and after pull-out in a test with soil at 38% degree of saturation
- 166 -

Laboratory Pull-out Testing Study on Soil Nails in Compacted Completely Decomposed Granite Fill Su Lijun
(a)
(b) Figure 6.6 – Surfaces of the drillhole before and after pull-out in a test with soil at 50% degree of saturation
- 167 -

Chapter 6: Influence of degree of saturation on pull-out behaviour and resistance
(a)
(b) Figure 6.7 – Surfaces of the drillhole before and after pull-out in a test with soil at 75% degree of saturation
- 168 -

Laboratory Pull-out Testing Study on Soil Nails in Compacted Completely Decomposed Granite Fill Su Lijun
(a) (b) Figure 6.8 – Surfaces of the drillhole before and after pull-out in a test with soil at 98% degree of saturation
- 169 -

Chapter 6: Influence of degree of saturation on pull-out behaviour and resistance
(a)
(b)
(c) (d) Figure 6.9 – Nail surfaces after pull-out in tests with soil at degrees of saturation of (a) 38% (b) 50% (c) 75% and (d) 98%
- 170 -

Laboratory Pull-out Testing Study on Soil Nails in Compacted Completely Decomposed Granite Fill Su Lijun
Average pull-out shear stress vs. pull-out displacement
0
20
40
60
80
100
120
0 20 40 60 80 100 120 140 160 180 200 220Pull-out displacement (mm)
Ave
rage
pul
l-out
shea
r stre
ss (k
Pa) _
38 % 75 %98 %Peak Stress
Overburden Pressure=40kPa
Figure 6.10 – Relationship between average pull-out shear stress and pull-out displacement for tests at different degrees of saturation under overburden pressure of 40kPa
Average pull-out shear stress vs. pull-out displacement
0
20
40
60
80
100
120
0 20 40 60 80 100 120 140 160 180 200 220Pull-out displacement (mm)
Ave
rage
pul
l-out
shea
r stre
ss (k
Pa) _
__
75 % 98 %Peak Stress
Overburden Pressure=80kPa
Figure 6.11 – Relationship between average pull-out shear stress and pull-out displacement for tests at different degrees of saturation under overburden pressure of 80kPa
- 171 -

Chapter 6: Influence of degree of saturation on pull-out behaviour and resistance
Average pull-out shear stress vs. pull-out displacement
0
20
40
60
80
100
120
0 20 40 60 80 100 120 140 160 180 200 220 240Pull-out displacement (mm)
Ave
rage
pul
l-out
shea
r stre
ss (k
Pa)__ 38 % 50%
75 % 98 %Peak Stress
Overburden Pressure=120kPa
Figure 6.12 – Relationship between average pull-out shear stress and pull-out displacement for tests at different degrees of saturation and overburden pressure of 120kPa
Average pull-out shear stress vs. pull-out displacement
0
20
40
60
80
100
120
0 20 40 60 80 100 120 140 160 180 200 220Pull-out displacement (mm)
Ave
rage
pul
l-out
shea
r stre
ss (k
Pa) _ 38 % 75 %
98 % 50%Peak Stress
Overburden Pressure=200kPa
Figure 6.13 – Relationship between average pull-out shear stress and pull-out displacement for tests at different degrees of saturation and overburden pressure of 200kPa
- 172 -

Laboratory Pull-out Testing Study on Soil Nails in Compacted Completely Decomposed Granite Fill Su Lijun
Average pull-out shear stress vs. pull-out displacement
0
20
40
60
80
100
120
140
0 20 40 60 80 100 120 140 160 180 200 220Pull-out displacement (mm)
Ave
rage
pul
l-out
shea
r stre
ss (k
Pa) _ 38 % 50%
75 % 98 %Peak Stress
Overburden Pressure=300kPa
Figure 6.14 – Relationship between average pull-out shear stress and pull-out displacement for tests at different degrees of saturation under overburden pressure of 300kPa
Peak pull-out shear resistance and degree of saturation
0
20
40
60
80
100
0 20 40 60 80 100 120Degree of saturation (%)
Peak
resis
tanc
e (k
Pa)
__
Figure 6.15 – Relationship between peak pull-out shear resistance and degree of saturation with overburden pressure of 40kPa
- 173 -

Chapter 6: Influence of degree of saturation on pull-out behaviour and resistance
Peak pull-out shear resistance and degree of saturation
0
20
40
60
80
0 20 40 60 80 100 1Degree of saturation (%)
Peak
resis
tanc
e (k
Pa)
__
20
(a)
Peak pull-out shear resistance and degree of saturation
0
20
40
60
80
100
0 20 40 60 80 100 120Degree of saturation (%)
Peak
resis
tanc
e (k
Pa)
__
(b) Figure 6.16 – Relationship between peak pull-out shear resistance and degree of saturation with overburden pressures of (a) 80kPa and (b) 120kPa
- 174 -

Laboratory Pull-out Testing Study on Soil Nails in Compacted Completely Decomposed Granite Fill Su Lijun
Peak pull-out shear resistance and degree of saturation
0
20
40
60
80
100
0 20 40 60 80 100Degree of saturation (%)
Peak
resis
tanc
e (k
Pa)
__
120
(a) Peak pull-out shear resistance and degree of saturation
0
20
40
60
80
100
120
0 20 40 60 80 100 120Degree of saturation (%)
Peak
resis
tanc
e (k
Pa)
(b) Figure 6.17 – Relationship between peak pull-out shear resistance and degree of saturation with overburden pressure of (a) 200kPa and (b) 300kPa
- 175 -

Chapter 7: Effect of grouting pressure on pull-out behaviour and resistance
CHAPTER 7: EFFECT OF GROUTING PRESSURE ON SOIL
NAIL PULL-OUT BEHAVIOUR AND RESISTANCE
7.1 INTRODUCTION
In common practice of the soil nail construction, gravity or low pressure grouting is
normally adopted. Some initial results from field pull-out tests on soil nails grouted
under high pressure have indicated that the grouting pressure contributed a lot to the
pull-out resistance. The pressure grouting is a cost effective method for increasing the
soil nail pull-out resistance and in turn improving the performance of the nailed
structure. Studies on the significance of the pressure grouting are common for anchors,
piles and ground improvement, but limited for soil nails. Haberfield (2000) presented a
study on the prediction of the initial normal stress in piles and anchors constructed using
expansive cements. Moosavi et al. (2005) reported a study on the bond of cement
grouted bars under pressure. Soga et al. (2005) presented results of a laboratory
investigation of multiple grout injection into clay. Yeung et al. (2005) carried out field
pull-out tests on Glass Fiber Reinforced Polymer (GFRP) pipes with cement pressure
grouting in a CDG soil slope in Hong Kong and observed a significant increase in the
pull-out resistance due to the pressure grouting. Study on the influence of grouting
pressure on soil nail pull-out resistance together with the other factors, such as the
overburden pressures and soil conditions, etc., is limited, especially for soils in Hong
Kong.
In this project, a total of four pull-out tests have been carried out on soil nails grouted
with grouting pressures of 80kPa and 130kPa respectively. The degree of saturation of
- 176 -

Laboratory Pull-out Testing Study on Soil Nails in Compacted Completely Decomposed Granite Fill Su Lijun
the soil was 50% and applied overburden pressures were 80kPa and 200kPa respectively.
In this chapter, the results of these tests will be presented and the influence of grouting
pressure on the soil nail pull-out behaviour and resistance will be discussed.
7.2 VARIATIONS OF EARTH PRESSURES
7.2.1 Variations of earth pressures during drilling and pressure grouting
As discussed in Chapter 5, in current practice of soil nail installation, the hole-drilling
may cause stress release in soil around the drillhole and this would affect the earth
pressure acting on the soil nails. Reasonable simulation of the stress release and
examination of the earth pressure changes are therefore important. Figure 7.1 (a) shows
the measured earth pressures at the six earth pressure cells versus time during drilling
and pressure grouting for a test in soil at 50% degree of saturation under overburden
pressure of 200kPa and with grouting pressure of 130kPa. Because the grouting time
was short comparing with the time for the whole procedure, the variations of earth
pressures during pressure grouting were not clear in Figure 7.1 (a). Therefore the
variations of earth pressures measured by earth pressure cells 1 to 4 during pressure
grouting are shown in Figure 7.1 (b). The variations of earth pressures during drilling
were similar to those in tests with nails grouted without pressure (gravity head only) as
discussed in Chapter 5 and it is not necessary to repeat the discussion here.
After the drillhole was formed, a high yield steel bar with 40mm in diameter was
installed in the centre of the hole and pressure grouting was conducted. Figure 7.1 (b)
shows rapid increases in the earth pressures at the four earth pressure cells due to the
action of the pressure grouting. The earth pressures increased quickly from initial values
of about 50kPa to 70kPa to peak values of about 140kPa to 160kPa in less than ten
minutes. Immediately after the peak values were achieved, the earth pressures started to
- 177 -

Chapter 7: Effect of grouting pressure on pull-out behaviour and resistance
decrease and finally reached values approximating to their original values before
pressure grouting. The reasons for this are explained as follows.
(a) First, the cement grout inside the plastic grouting tube set with time quickly,
leading to a significant increase in friction between the cement grout and the tube.
As a result, the applied grouting pressure in the pressure grouting cylinder could not
be totally transmitted to the cement grout inside the drillhole due to friction loss.
(b) Second, as hardening developed with time, the cement grout in the plastic grouting
tube could not move much or would not move at all.
(c) On the other hand, the viscosity of the grout inside the drillhole increased with time,
preventing further grout from entering the drillhole through the plastic tube.
(d) In fact, the factors (a), (b) and (c) above caused the grouting pressure inside the
drillhole to decrease with time elapsing.
(e) At the same time, the water inside the cement grout was absorbed by the soil and as
such the water pressure in the cement grout was dissipated into the soil. This was
similar to the dissipation of excess pore water pressure in a saturated soil.
(f) It is considered that the factor in (e) together with the decrease in the grouting
pressure in (d) caused the cement grouting pressure inside the drillhole to drop
rapidly shortly after grouting. After the cement grout had solidified in the last
period of the soil nail installation, the earth pressures at earth pressure cells 1 to 4
increased slightly, probably due to re-arrangement of the soil particles.
It will be seen that, even with this short duration of the pressure increase, the soil nail
pull-out resistance has been significantly increased. The reasons for this are given in the
remaining sections of this chapter.
- 178 -

Laboratory Pull-out Testing Study on Soil Nails in Compacted Completely Decomposed Granite Fill Su Lijun
7.2.2 Variations of earth pressures during the whole period of testing
Figure 7.2 shows the changes of average earth pressures measured by earth pressure
cells 1 to 4 at different stages of testing for the tests in soil at 50% degree of saturation
with grouting pressure of (a) 80kPa and (b) 130kPa respectively. The variations of the
average earth pressures are similar to those in tests with nail grouted by gravity head
only as discussed in Chapter 5 and 6. Compared with Figure 6.3 (b), it can be seen that
the average earth pressures before pull-out (after the cement grout had hardened) for
tests with nail grouted at pressure of 80kPa, 130kPa and 0kPa (gravity head only) were
all close to each other. This is because that the pressure grouting did not permanently
increase the earth pressure as has been discussed in the above paragraphs. However, at
peak pull-out resistance, the average earth pressures in pressure grouting tests were
much higher than those in gravity grouting tests. For most of the pressure grouting tests
(3 out of 4), the average earth pressures at peak pull-out resistance were even higher
than the applied overburden pressure.
7.3 FAILURE PATTERNS OF THE SOIL NAIL
Figure 7.3 shows the soil nail surfaces after pull-out in tests with different grouting
pressures. It can be observed that the soil adhered to the soil nail surface increased with
the increase in grouting pressure. For the nail grouted without pressure, there were some
soil loosely adhered to the nail surface after pull-out and no scratch of the soil was
observed. This indicates that the contact between the surface of the soil nail and the
surrounding soil was not very tight, probably because of the loss of water of the cement
grout due to soil suction within the soil around the nail. For the nail grouted at grouting
pressure of 80kPa, more soil was observed to tightly adhere to the nail surface after
pull-out and some slight scratches parallel to the axis of the soil nail were observed.
This indicates that the grouting pressure improved the contact between the nail surface
- 179 -

Chapter 7: Effect of grouting pressure on pull-out behaviour and resistance
and the surrounding soil. For the nail grouted at grouting pressure of 130kPa, the
amount of the soil adhered to the nail surface was observed to have further increased
compared with the nail grouted at grouting pressure of 80kPa. The soil was observed to
tightly adhere to the nail surface and slight scratches parallel to the axis of the soil nail
were also observed. This indicates that the increase in grouting pressure further
improved the contact between the nail surface and the surrounding soil. From the failure
patterns of the soil nail, it can be concluded that the increase in grouting pressure
improved the contact between the nail surface and the surrounding soil even though the
grouting pressure just temporarily increased the earth pressure in soil surrounding the
soil nail.
7.4 INFLUENCE OF GROUTING PRESSURE
The results from the four soil-nail pull-out tests with grouting pressures of 80kPa and
130kPa under overburden pressures of 80kPa and 200kPa together with a gravity
grouting test under overburden pressure of 200kPa are interpreted together here. These
results are used to examine the influences of grouting pressures on the soil nail pull-out
behaviour and resistance. The gravity grouting test under the overburden pressure of
80kPa had failed and is not included here.
Figure 7.4 (a) shows the measured average pull-out shear stress versus pull-out
displacement for tests with grouting pressures (GP) of 80kPa and 130kPa under the
same overburden pressure (OP) of 80kPa and in soil at degree of saturation (Sr) of 50%.
It is clear that the average pull-out shear stress increased with the applied grouting
pressure. Figure 7.4 (b) shows the results of those tests in soil at the same Sr with GP of
0kpa (gravity grouting), 80kPa and 130kPa under a different OP of 200kPa. It can be
noted that the average pull-out shear stress increased with the grouting pressure.
- 180 -

Laboratory Pull-out Testing Study on Soil Nails in Compacted Completely Decomposed Granite Fill Su Lijun
Furthermore, for the test with a grouting pressure of 130kPa, the curve shows clearly a
peak and post-peak displacement-softening behaviour. In contrast, for the test with a
grouting pressure of 80kPa, the curve indicates a relatively ductile behaviour without a
distinct peak in shear stress. The test with zero grouting pressure also exhibits a ductile
behaviour but with much lower pull-out shear stress. The differences in the
load-displacement responses of different tests reflect the differences of the grouting
pressure influences on the surrounding soil and the soil-nail interface among the three
tests. Under higher grouting pressure, the amount of soil adhered to the nail surface
increased which indicates that the failure surface was migrating from the nail-soil
surface to the interior of the soil as the grouting pressure increased. For nail grouted
with grouting pressure of 130kPa, the failure could be considered to occur within the
soil. Further more, the soil surrounding the nail was further compressed under the high
grouting pressure of 130kPa and became denser. The stress-displacement behaviour of
dense sandy soil is generally displacement-softening during shearing.
From Figure 7.4, the influences of the grouting pressures on the pull-out resistance of
soil nails are clearly observed. The increase in the soil nail peak pull-out resistance due
to the increase in grouting pressure may be explained as follows:
(a) First, after drilling, the soil at and close to the internal surface of the hole had been
disturbed and thus was loosened, and in the meantime soil arching was developed
to support the soil above the hole. Under the effect of grouting pressure, the cement
grout inside the hole compacted and densified the soil within the disturbed zone
around the hole. Depending on the magnitude of grouting pressure, the compacted
soil could be stronger than that before grouting.
(b) Second, some of the cement grout might have infiltrated into the soil around the
drillhole and increased the bond strength of the nail-soil interface and the cohesion
- 181 -

Chapter 7: Effect of grouting pressure on pull-out behaviour and resistance
of the soil. The higher the grouting pressure, the more infiltration of the cement
grout into the soil would be.
(c) Third, the drillhole formation could have been rough because of the unevenness of
the drill bit teeth, resulting in a rough surface of the grouted nail. The higher the
grouting pressure, the greater the roughness of the surface of the grouted nail would
be. This resulted in a greater contact area with soil and soil dilation during shear
movement between the nail and the surrounding soil.
(d) Though the grouting pressure had dropped after grouting, the processes in (a), (b)
and (c) were irreversible. One or a combination of the factors explained in (a), (b)
and (c) then caused the pull-out resistance to increase.
Figure 7.5 shows plots of the average pull-out shear stress versus pull-out displacement
of the test nails in soil at Sr=50% under OP= 80kPa and 200kPa with grouting pressures
of (a) 80kPa and (b) 130kPa respectively. It can be observed that, for pressure grouting
tests, the average pull-out shear stress-displacement behaviour and peak pull-out shear
resistance were related to the overburden pressure to a certain extent. However, the
residual pull-out resistance at large pull-out displacement was not directly related to the
overburden pressure. How the overburden pressure affects the curves and the pull-out
resistance with the presence of grouting pressure needs more test results and further
study.
Figure 7.6 shows plots of (a) peak shear strength, (b) shear stress at displacement of
100mm, and (c) shear stress at displacement of 200mm versus grouting pressure under
the overburden pressure OP=80kPa and 200kPa. For the test nail prepared under a
grouting pressure of 80kPa, the peak pull-out shear strengths for the two overburden
pressures were nearly the same. However, for the one prepared under a higher grouting
- 182 -

Laboratory Pull-out Testing Study on Soil Nails in Compacted Completely Decomposed Granite Fill Su Lijun
pressure of 130kPa, the pull-out shear strengths for OP=200kPa was substantially
higher than that for OP=80kPa. This illustrates that the peak pull-out shear strength of
the nail was less dependent on the overburden pressure when the grouting pressure was
low, but the peak shear strength increased with increasing overburden pressure when the
grouting pressure was high. The probable explanation is that when the grouting pressure
was low, the disturbed soil around the drill hole was still loose and the soil arching
effect existed to a certain extent. When the grouting pressure was high, the loosened soil
was well compacted by the grout; and as a result, the strength of the soil increased back
to or even higher than that before the drilling. This led to a change in the stress
condition in the soil around the hole and the soil arching effect no longer existed. As
such, most of the vertical stress above the nail was transferred to the nail surface. At the
displacement of 100mm, the pull-out stress for the two tests under overburden pressure
of 80kPa and 200kPa with grouting pressure of 80kPa were equal to each other and the
difference between the pull-out stresses for the two tests with grouting pressure of
130kPa was reduced. At the displacement of 200mm, the pull-out resistances for tests
under 80kPa and 200kPa were close to each other with both of the two grouting
pressures. This indicates that the influence of grouting pressure was reduced at large
pull-out displacement.
7.5 SUMMARY AND CONCLUSIONS
The results for the pressure grouting tests are presented and the influence of the grouting
pressure on the pull-out behaviour and resistance of the soil nail is discussed in this
chapter. Based on the discussion, the following observations and conclusions may be
presented here:
(a) The pressure grouting device, grouting pressure measurement and procedures are
simple, practical, and reliable for studying pressure grouted soil nails using a
- 183 -

Chapter 7: Effect of grouting pressure on pull-out behaviour and resistance
laboratory pull-out box.
(b) The grouting pressure inside the hole increased quickly, but then dropped rapidly due
to hardening of the cement grout and shrinkage of grout volume because of water
seepage from the cement grout to the surrounding soil (accompanied by dissipation
of the excess water pressure inside the grout and absorbing of water in the grout by
the dryer surrounding soil).
(c) At peak pull-out resistance, the earth pressures measured by earth pressure cells
close to the nail for pressure grouting tests increased to much higher values than
those for gravity grouting tests. For most of the tests, the earth pressure at peak
pull-out resistance was even higher than the applied overburden pressure. This is
probably because that the contact between the soil nail surface and the surrounding
soil was improved by the grouting pressure so that the effect of the constrained
dilation of soil was strengthened.
(d) The amount of soil adhered to the nail surface after pull-out increased with the
increase in grouting pressure.
(e) The average peak pull-out shear resistance of the soil nail increased almost linearly
with the increase in grouting pressure in the present study.
It shall be noted that the amount of the pressure grouting tests was limited and only one
type of CDG soil at the degree of saturation of 50% was tested in this study. More soil
nail pull-out tests on more types of soil at different degrees of saturation shall be carried
out to examine the influences of the grouting pressure. The present study may serve as a
good basis for further investigations in this area.
- 184 -

Laboratory Pull-out Testing Study on Soil Nails in Compacted Completely Decomposed Granite Fill Su Lijun
Earth pressure vs. time during drilling and pressure grouting
0
50
100
150
200
250
300
350
1 10 100 1000 10000Time (min)
Earth
pre
ssur
e (k
Pa)
P-Cell 1 P-Cell 2 P-Cell 3P-Cell 4 P-Cell 5 P-Cell 6
Drilling
Before grouting After groutingDuring grouting
2 1
346 5
(a)
Earth pressure vs. time during pressure grouting
0
20
40
60
80
100
120
140
160
180
920 925 930 935 940 945 950 955 960Time (min)
Earth
pre
ssur
e (k
Pa)
(b) Figure 7.1 – Earth pressure vs. time during (a) drilling and grouting and (b) pressure grouting only – for a test in soil at 50% degree of saturation under overburden pressure of 200kPa and with grouting pressure of 130kPa
- 185 -
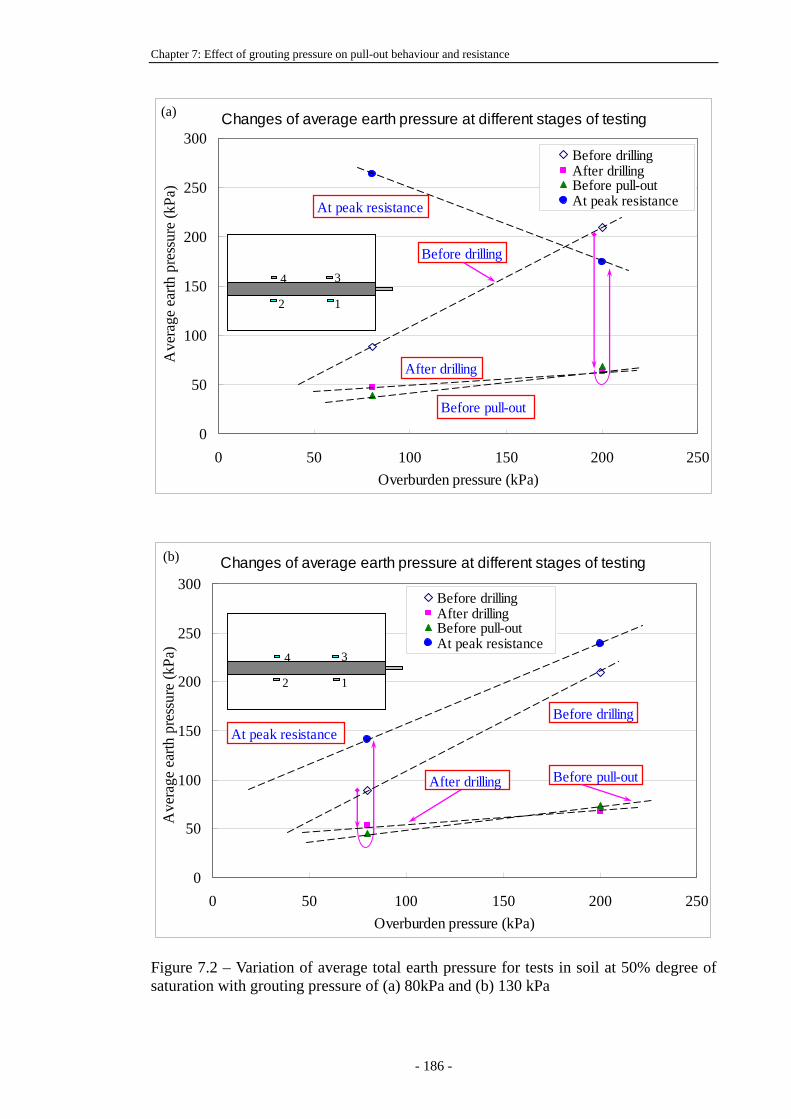
Chapter 7: Effect of grouting pressure on pull-out behaviour and resistance
Changes of average earth pressure at different stages of testing
0
50
100
150
200
250
300
0 50 100 150 200 250Overburden pressure (kPa)
Ave
rage
ear
th p
ress
ure
(kPa
) _Before drillingAfter drillingBefore pull-outAt peak resistance
Before drilling
At peak resistance
After drilling
Before pull-out
2 1
34
(a)
Changes of average earth pressure at different stages of testing
0
50
100
150
200
250
300
0 50 100 150 200 250Overburden pressure (kPa)
Ave
rage
ear
th p
ress
ure
(kPa
) _
Before drillingAfter drillingBefore pull-outAt peak resistance
Before drillingAt peak resistance
After drilling Before pull-out
2 1
34
(b) Figure 7.2 – Variation of average total earth pressure for tests in soil at 50% degree of saturation with grouting pressure of (a) 80kPa and (b) 130 kPa
- 186 -

Laboratory Pull-out Testing Study on Soil Nails in Compacted Completely Decomposed Granite Fill Su Lijun
(a)
(b)
(b) (c) Figure 7.3 – Failure surfaces of the soil nails for tests in soil at 50% degree of saturation with grouting pressures of (a) 0kPa (gravity head only) (b) 80kPa and (c) 130kPa
- 187 -

Chapter 7: Effect of grouting pressure on pull-out behaviour and resistance
Average pull-out shear stress vs. pull-out displacement
0
20
40
60
80
100
120
140
160
180
0 20 40 60 80 100 120 140 160 180 200 220Pull-out displacement (mm)
Ave
rage
pul
l-out
shea
r stre
ss (k
Pa) _
__80 kPa 130 kPa
Peak Stress
(a) Average pull-out shear stress vs. pull-out displacement
020406080
100120140160180200220
0 20 40 60 80 100 120 140 160 180 200 220Pull-out displacement (mm)
Ave
rage
pul
l-out
shea
r stre
ss (k
Pa) _ 0 kPa 80 kPa 130 kPaPeak Stress
(b) Figure 7.4 – Average pull-out shear stress vs. pull-out displacement for tests in soil at 50% degree of saturation with grouting pressures (GP) of 0, 80, 130kPa and under overburden pressures of (a) 80kPa and (b) 200kPa
- 188 -

Laboratory Pull-out Testing Study on Soil Nails in Compacted Completely Decomposed Granite Fill Su Lijun
Average pull-out shear stress vs. pull-out displacement
020406080
100120140160180200220
0 20 40 60 80 100 120 140 160 180 200 220Pull-out displacement (mm)
Ave
rage
pul
l-out
shea
r stre
ss (k
Pa) _ 80 kPa 200 kPaPeak Stress
(a)
Average pull-out shear stress vs. pull-out displacement
020406080
100120140160180200220240
0 20 40 60 80 100 120 140 160 180 200 220Pull-out displacement (mm)
Ave
rage
pul
l-out
shea
r stre
ss (k
Pa) _ 80 kPa 200 kPa
Peak Stress
(b) Figure 7.5 – Average pull-out shear stress vs. pull-out displacement for tests in soil at 50% degree of saturation under overburden pressures of 80kPa and 200kPa with grouting pressures of (a) 80kPa and (b) 130kPa
- 189 -

Chapter 7: Effect of grouting pressure on pull-out behaviour and resistance
Peak pull-out shear resistance vs. grouting pressure
020406080
100120140160180
0 20 40 60 80 100 120 140Grouting pressure (kPa)
Peak
resis
tanc
e (k
Pa) OP=80kPa OP=200kPa
(a)
Pull-out shear stress at 100mm vs. grouting pressure
020406080
100120140160180
0 20 40 60 80 100 120 140Grouting pressure (kPa)
Pull-
out s
hear
stre
ss (k
Pa)
OP=80kPa OP=200kPa
(b)
Pull-out shear stress at 200mm vs. grouting pressure
020406080
100120140160180
0 20 40 60 80 100 120 140Grouting pressure (kPa)
Pull-
out s
hear
stre
ss (k
Pa)
OP=80kPa OP=200kPa
(c) Figure 7.6 – (a) Peak shear resistance, (b) shear stress at displacement of 100mm and (c) shear stress at displacement of 200mm versus grouting pressure for tests in soil at 50% degree of saturation under overburden pressure OP=80kPa and 200kPa
- 190 -

Laboratory Pull-out Testing Study on Soil Nails in Compacted Completely Decomposed Granite Fill Su Lijun
CHAPTER 8: NUMERICAL SIMULATION OF PULL-OUT
TESTS
8.1 INTRODUCTION
Physical modeling can obtain direct measured, accurate and reliable results on the
influences of certain parameters under strictly controlled test conditions. However, a
parametric study using a physical model is expensive, time consuming, and, sometimes,
impossible such as requirements of space and special instrumentation. Numerical
modeling can overcome these difficulties. In numerical simulation, a parametric study
can be easily conducted by simply changing one parameter at one time with other
parameters unchanged. Numerical modeling methods, especially the finite element
method, have been successfully used in simulation of the soil nailing system as in the
literature reviewed in Chapter 2. The finite element method is a numerical procedure,
which can be used to obtain solutions to a large class of engineering systems, including
analysis of stress, heat transfer, fluid flow and electromagnetism problems. In
geotechnical engineering, conventional methods for design and stability analysis are the
limit equilibrium analysis methods. These methods are generally based on a series of
assumptions and can only examine the overall resistance and stability of geotechnical
structures. Limit equilibrium analysis methods cannot predict the deformation and stress
(strain) distribution in the structures. The finite element method has the advantages of
simulating the deformation, stress (strain) distribution, and failure of geotechnical
structures.
In this project, ABAQUS, a powerful finite element (FE) program, is used to simulate
- 191 -

Chapter 8: Numerical simulation of the pull-out tests
the pull-out tests carried out in this project and to conduct further parametric studies. A
three dimensional (3-D) finite element model is established for pull-out tests and is
verified by comparing simulated results with measured data. If the agreements between
the simulated results and the test results are good, this indicates that this 3-D FE model
is applicable to other simulations. Using this model, the influences of the grouting
pressure and the dilation angle of the shearing zone on the soil nail pull-out resistance
are studied. The method for simulating the shearing plane, description of the model and
simulated results are presented and discussed in this chapter.
8.2 SIMULATION OF THE SHEARING PLANE
There are normally three types of methods for simulating the interface problem in
ABAQUS (ABAQUS6.3-1 Online Doc., 2002). The first method is to simulate an
interface using zero thickness interface elements, such as the Gap elements and
Tube-to-tube contact elements. The Gap elements can be used to simulate the contact
and separation between two nodes and a frictional coefficient can be defined to simulate
the tangential interaction behaviour. The Tube-to-tube contact elements can be used to
model the finite-sliding interaction along a slide line between two pipelines or tubes
where one tube lies inside the other or between two tubes or rods that lie next to each
other. This type of elements can be used only with first-order pipe, beam, or truss
elements and does not consider deformations of the tube or pipe cross-section. The
second method is using surface based contact to simulate the interaction between two
contact surfaces. Both normal and tangential properties can be defined for the contact
pair. The tangential properties of the contact pair can be smooth (no friction), rough (no
slide), frictional, etc. However, cohesion cannot be defined for the tangential properties
of a contact pair. The third method is to use a thin layer of continuum elements to
simulate the interface. The normal and tangential behaviour of the interface are both
- 192 -

Laboratory Pull-out Testing Study on Soil Nails in Compacted Completely Decomposed Granite Fill Su Lijun
simulated by the material properties of the continuum elements of the thin layer.
The Gap elements are similar to the surface based contact method which cannot
simulate the cohesion effect between the two surfaces. Further more, convergence
problems are often encountered when using these two methods. Tube-to-tube contact
elements are restricted to some particular problems and cannot simulate general contact
between two surfaces. As a result, the method of using a thin layer of continuum
elements is used to simulate the shearing plane in the soil nail pull-out test. A linear
elastic-perfectly plastic model using the Mohr-Coulomb failure criterion is adopted to
define the material properties of continuum elements in the shearing zone.
8.3 DESCRIPTION OF THE FINITE ELEMENT MODEL
8.3.1 Mesh and boundary conditions
A 3-D FE model is developed to simulate the pull-out tests. The dimensions of the
model are 1.0m in length, 0.3m in width and 0.81m in height. The dimensions of the test
soil sample in the pull-out tests are 1.0m in length, 0.6m in width and 0.8m in height.
The 10mm thickness on the top of the FE model is used to simulate the wooden board
placed on the test soil during the tests. Only a half of the physical model is simulated
because of the symmetry of the geometry, load and boundary conditions of the tests.
The nail is 0.1m in diameter and 1.2m in length and is formed with its center at the level
of 0.315m in height. A thin layer of material with the thickness of 4.0mm surrounding
the nail is used to simulate the shearing zone. The mesh of the model is shown in Figure
8.1. The mesh is fine around the nail and becomes coarser as the distance from the nail
surface increases. The soil, the nail and the shearing zone are all made up of C3D8R
elements, a type of 8-node linear brick elements with reduced integration. There is no
interface between the nail and the surrounding soil. As the soil nail is being pulled out,
- 193 -

Chapter 8: Numerical simulation of the pull-out tests
the relative sliding of the nail and the surrounding soil is simulated by the plastic flow
of the shearing zone. During calculation unsymmetric matrix is used because of the high
nonlinearity of the problem.
The displacements on both left and right surfaces of the model in direction-1 (direction
perpendicular to these surfaces) are fixed at zero to simulate the symmetrical plane and
the side boundary of the box. The displacements at the bottom of the model in
direction-3 (vertical direction) are fixed at zero to simulate the bottom support of the
box. During simulating the application of the overburden pressure and formation of the
drillhole, the displacements on the front and back surfaces of the model in direction-2
are fixed at zero to simulate the front and back boundaries of the box. During simulation
of the pull-out process, the direction-2 displacements constraints at locations of the two
drilling accesses in the front and back plates of the pull-out box are released. A nonzero
displacement boundary condition is applied on the nail head to simulate the pull-out
displacement. The load and boundary conditions of the model before and during
pull-out are shown in Figures 8.2 and 8.3 respectively.
8.3.2 Procedure of the simulation
In order to simulate the actual procedure of the pull-out tests, the formation of the
drillhole and installation of the nail need to be simulated. The excavation of the drillhole
can be accomplished by simply removing the elements at the location of the drillhole.
However, upon installation of the nail, we will face two difficulties. One is that the
material properties are global model variables which cannot be changed during
calculation. Another is that deformations have been generated in elements surrounding
the drillhole due to removal of elements so that activation of the nail elements will
result in superposition of elements. These can be overcome by simulating the drilling
and grouting separately but step-by-step in two models. The stresses obtained from the
- 194 -

Laboratory Pull-out Testing Study on Soil Nails in Compacted Completely Decomposed Granite Fill Su Lijun
first model are input into the second model as initial stresses and the deformations
induced by the drilling procedure are then eliminated by equilibrium between the initial
stresses and the applied loads. The elements forming the soil nail can be activated and
assigned with nail properties in the second model to simulate the installation of the nail.
Therefore the application of the overburden pressure, formation of the drillhole and
pull-out of the soil nail were simulated in three separate models. The detailed procedure
of the simulation is as follows:
(a) In the first model, all the elements are assigned with the soil properties to simulate
the test soil compacted in the pull-out box. The elements forming the extension part
of the nail behind the box is removed because only the soil in the pull-out box is
simulated. On all the vertical surfaces and the bottom surface, the corresponding
displacements are constrained as has discussed in the forgoing paragraphs. The
gravity load is applied to the entire model and pressure load is applied on the top
surface of the model. After the calculation of this model has completed, the stresses
in all the elements are exported.
(b) In the second model, the same loading and boundary conditions as in the first model
are used and the calculation is accomplished in two steps. In the first step, the
stresses exported from the first model are imported as initial stresses of the elements.
At the end of this step, equilibrium between the initial stresses and the applied loads
is established. In the second step, the elements forming the nail are removed to
simulate the drilling process. At the end of this step, the stresses in all the elements
are exported again to be used as initial stresses for the third model.
- 195 -

Chapter 8: Numerical simulation of the pull-out tests
(c) In the third model, the elements forming the nail and the shearing zone are assigned
with their own properties respectively. This model includes four steps. In the first
step, the elements forming the nail are removed and equilibrium between the applied
loads and the initial stresses imported from the second model is established. In the
second step, the elements forming the nail are activated without stress. In the third
step, gravity load is applied to the nail elements to simulate the grouting procedure.
In the final step, displacements constraints at locations of the two drilling accesses
are released and a pull-out displacement is applied on the nail head to simulate the
pull-out of the nail.
8.3.3 Material properties
The constitutive model used for the nail is an isotropic linear elastic model. The
material properties of the nail are calculated considering a combination of the known
stiffness of the steel bar and the cement grout. The density, Young’s Modulus and
Poisson’s ratio for the nail are calculated as 2.0Mg/m3, 16.37GPa and 0.28 respectively.
For the soil and the material in the shearing zone, an isotropic linear elastic-perfectly
plastic model using the Mohr-Coulomb failure criterion is adopted. Non-associate flow
rule is used. The model is expressed in terms of stress invariants in ABAQUS
(ABAQUS/Standard online Doc., 2002) as follows:
Mean total stress,
3321 σσσ ++
=p (8.1)
Mises equivalent stress,
)(23 S:S=q (8.2)
The third invariant of deviatoric stress
- 196 -

Laboratory Pull-out Testing Study on Soil Nails in Compacted Completely Decomposed Granite Fill Su Lijun
31
)( 29 S:SS ⋅=r (8.3)
where S is the deviatoric stress tensor and defined as IσS p−= ; is stress tensor; pI
is hydrostatic stress tensor; and I is unit tensor.
σ
Therefore, the Mohr-Coulomb model is defined by:
0tanRF =−+= cpqmc φ (8.4)
where
φπθπθφ
φθ tan3
cos31
3sin
cos31),(R ⎟
⎠⎞
⎜⎝⎛ ++⎟
⎠⎞
⎜⎝⎛ +=mc (8.5)
φ is the slope of the Mohr-Coulomb yield surface in the p-Rmcq stress plane, which is
commonly referred to as the friction angle of the material; c is the cohesion of the
material; and θ is the deviatoric polar angle defined as . 3)/()3cos( qr=θ
The flow potential G is chosen as:
( ) ( ) ψψ tanRtanG 220 pqac mw ++= (8.6)
where
( φθθ
θθ π ,R45cos)1(4)12(cos)1(2
)12(cos)1(4),(R 32222
222
mcmweeeee
eee−+−−+−
−+−= ) (8.7)
ψ is the dilation angle; 0c is the initial cohesion yield stress; a is the meridional
eccentricity with a default value of 0.1; and e is the deviatoric eccentricity which is
calculated as )sin3()sin3( φφ +−=e by default.
In this constitutive model, the Young’s Modulus, Poisson’s ratio, friction angle and
dilation angle need to be provided. The material properties for the shearing zone were
assumed based on the soil properties and verified by test results. The properties for all
of the materials in this finite element model are summarized in Table 8.1.
- 197 -

Chapter 8: Numerical simulation of the pull-out tests
Actually in the pull-out test, the constrained dilatancy of the material in the shearing
zone was not constant throughout the test. After the peak pull-out resistance, the earth
pressures measured by earth pressure cells 1 to 4 were observed to have decreased
which indicated that the constrained dilatancy had decreased. In ABAQUS, the material
properties can be defined to depend on field variables and as a result, can be changed
during the analysis. In this model, the dilation angle of the material in the shearing zone
is defined to depend on the equivalent plastic strain using the subroutine of user defined
field. After the peak pull-out resistance, the dilation angle is gradually reduced to zero.
8.4 SIMULATION OF THE PULL-OUT TESTS
Using the model described above, simulations with applied overburden pressures of
40kPa, 80kPa, 120kPa, 200kPa and 300kPa were carried out to verify the model by
simulating the influence of the overburden pressure on the soil nail pull-out resistance.
The simulated results will be presented and discussed in the following paragraphs and
compared with the measured results in the laboratory pull-out tests.
8.4.1 Stress and strain rate contours
Figure 8.4 and Figure 8.5 show the vertical stress contours after drilling and after
pull-out, respectively, for a simulation with an applied overburden pressure of 120kPa.
In the stress contours, compressive stress is negative. From Figure 8.4, it can be
observed that the stresses are released after the elements at the location of the hole are
removed so that the vertical stresses in the elements above the hole decrease to zero. As
the distance from the surface of the hole increases, the vertical stress increases until it
reaches the applied overburden pressure of 120kPa. During pull-out of the nail, the
vertical stresses in the elements above the hole increase due to the constrained dilatancy
- 198 -

Laboratory Pull-out Testing Study on Soil Nails in Compacted Completely Decomposed Granite Fill Su Lijun
of the material. As a result, it can be observed that vertical stresses in the elements
above the nail become more even in vertical direction at the end of the pull-out (Figure
8.5). Figure 8.6 shows the maximum strain rate contour of the model after pull-out. The
maximum strain rates of the elements in the shearing zone are much larger than those in
other elements, which indicate that plastic flow had occurred in the shearing zone.
8.4.2 Variations of the vertical stress during the simulation
Figure 8.7 shows the vertical stress distribution before and after drilling along the path
shown in Figure 8.4. In Figures 8.7, 8.8 and 8.9, compressive stress is positive. Before
drilling, the vertical stress at the top surface of the model is equal to the applied
overburden pressure of 120kPa and it increases linearly as the depth increases due to
gravity effect. After drilling, the vertical stress in the elements just above the hole
decreases to zero. As the distance from the hole surface increases, the vertical stress first
increases quickly to about 90% of that before drilling at the distance of 0.15m and then
slowly increases to the applied overburden pressure at the top surface of the model. This
is similar to the measured earth pressures in the pull-out tests where the earth pressures
measured by earth pressure cells 5 and 6 just decreased in a small amount after drilling.
Figure 8.8 shows the distribution of the vertical stress and increased vertical stress at
peak pull-out resistance along the path shown in Figure 8.4. The distribution of the
vertical stress at peak pull-out resistance is more uniform compared with that after
drilling. The increased vertical stress is the maximum in the elements just above the nail
and decreases quickly to about 10kPa as the distance increases to 0.1m. As the distance
continues to increase, the increased vertical stress decreases slowly and become zero
when the distance is greater than 0.3m. In the pull-out tests, almost no change was
observed in the earth pressures measured by earth pressure cells 5 and 6 during pull-out.
In the finite element model, the increased vertical stress at peak pull-out resistance at
- 199 -

Chapter 8: Numerical simulation of the pull-out tests
the level of earth pressure cells 5 and 6 (0.2m below the top surface) is just about 3kPa.
The agreement between the measured and simulated results is good.
Figure 8.9 shows the changes of average vertical stress at the locations of earth pressure
cells 1 to 4 at different stages of modeling under different applied overburden pressures.
Comparing with the results shown in Figure 6.4 (a), it can be seen that the typical
variations of the measured average earth pressure and the simulated average vertical
stress are similar. The values of the measured and simulated average earth pressure
(vertical stress) at each stage of testing (modeling) are also close to each other.
8.4.3 Influence of the overburden pressure
Figure 8.10 shows the simulated average pull-out shear stress-displacement curves
under different applied overburden pressures. The average pull-out shear stress was
calculated using the same method as in the laboratory pull-out tests. Only slight increase
in the peak average pull-out shear stress is observed as the applied overburden pressure
increases from 40kPa to 200kPa. The peak pull-out shear stress under the overburden
pressure of 300kPa is smaller than that under the overburden pressure of 200kPa. This is
consistent with the observation in the laboratory pull-out tests that the applied
overburden pressure did not significantly influence the pull-out resistance of the soil
nail for drill-and-grout nails. Figures 8.11 to 8.15 show the comparison between the
measured and simulated average pull-out shear stress-displacement curves under
different applied overburden pressures. The agreements between the measured and
simulated results are generally good. Before the peak pull-out resistance, the measured
average pull-out shear stress-displacement curves have a short linear part and then
become nonlinear. However, the simulated average pull-out shear stress linearly
increases to the peak pull-out resistance because the constitutive model used in the
- 200 -

Laboratory Pull-out Testing Study on Soil Nails in Compacted Completely Decomposed Granite Fill Su Lijun
simulation is a linear elastic-perfectly plastic model. In addition, the simulated peak
pull-out resistances are not perfectly the same as the measured ones for all the
overburden pressures. This is probably because that the test conditions cannot be
perfectly controlled due to some inevitable disturbance factors.
8.5 PARAMETRIC STUDIES
Parametric studies are performed on the influences of the dilation angle of the shearing
zone and the grouting pressure on the soil nail pull-out resistance. The results are
presented and discussed in the following paragraphs.
8.5.1 Influence of dilation angle
The curves shown in Figure 8.16 are the relationship between the simulated average
pull-out shear stress and pull-out displacement with different dilation angles under the
same applied overburden pressure of 120kPa. From the results, it can be observed that
the average pull-out shear stress increases linearly at the beginning of the pull-out
process, the larger the dilation angle, the larger the increasing rate. After a peak is
reached, the pull-out shear stress tends to keep constant till the end of the pull-out. The
peak pull-out shear stress with zero dilation angle is quite small which indicates that the
dilatancy of the soil plays an important role in development of the pull-out resistance.
Figure 8.17 shows the simulated peak pull-out shear stress vs. dilation angle under the
same applied overburden pressure of 120kPa. The peak pull-out shear stress is observed
to increase with the increase in dilation angle. The increasing rate decreases as the
dilation angle increases. Figure 8.18 shows the relationship between the simulated
vertical displacement on the top surface of the model and pull-out displacement with
different dilation angles under the applied overburden pressure of 120kPa. The curves
are similar to those in Figure 8.16. The vertical displacement first increases linearly
- 201 -

Chapter 8: Numerical simulation of the pull-out tests
with the increase in pull-out displacement and then tends to keep constant at larger
pull-out displacement, the larger the dilation angle, the larger the maximum vertical
displacement.
This parametric study shows the theoretical influence of the dilation angle of the
shearing zone on the pull-out resistance of a drill-and-grout soil nail. Laboratory
pull-out tests are suggested to be carried out in soil with different dilation angles to find
out the actual influence of this parameter.
8.5.2 Influence of grouting pressure
The influence of grouting pressure is also investigated using the finite element method.
The simulation procedure is similar to that described in section 8.3.2. In the second
model, the calculation is accomplished in three steps. The first and second steps are the
same as those in the foregoing simulations. In the third step, a pressure load
representing the grouting pressure is applied to the surface of the hole which is formed
in the second step. After the calculation is completed, the stresses in all of the elements
are exported to be used as initial stresses for the third model. The third model includes
five steps. In the first step, the stresses obtained from the second model are imported
and overburden pressure and gravity loads are applied. The grouting pressure load
acting on the hole surface is removed and replaced by fixed boundary conditions. The
stresses generated by the grouting pressure are therefore locked in the elements
surrounding the hole. In the second step, the nail is activated without stress. The fixed
boundary conditions are removed in the third step and the locked-in stresses are released
and transmitted to the nail surface. The gravity of the nail is applied in the fourth step
and the nail is pulled out in the fifth step (Figure 8.19).
- 202 -

Laboratory Pull-out Testing Study on Soil Nails in Compacted Completely Decomposed Granite Fill Su Lijun
Figure 8.20 shows the minimum principal stress contour after application of grouting
pressure for a simulation with the applied overburden pressure of 80kPa and grouting
pressure of 200kPa (compressive stress is negative). The applied grouting pressure is
normal to the hole surface so that the minimum principal stress in areas surrounding the
hole should be normal to the hole surface. Therefore, in areas surrounding the hole, the
minimum principal stress represents the stress normal to the surface of the hole. From
Figure 8.20, it can be observed that the stress normal to the hole surface is approximate
to 200kPa in the elements next to the hole surface and decreases as distance increases.
Figure 8.21 shows the variation of the minimum principal stress in the elements next to
the hole surface throughout the simulation (compressive stress is negative). The
compressive stress decreases during excavation of the hole and then increases to a value
close to the grouting pressure after application of the grouting pressure. In the following
four steps, the compressive stress keeps constant. During pull-out, the compressive
stress increases due to constrained dilation of the material surrounding the nail.
Figures 8.22 to 8.24 show the simulated average pull-out shear stress – displacement
curves with different grouting pressures under the applied overburden pressures of
80kPa, 120kPa and 200kPa. For the overburden pressure of 80kPa, the simulation with
the grouting pressure of 400kPa cannot converge because that the grouting pressure is
too large compared with the overburden pressure. The increasing rates and peak pull-out
stresses of the curves are found to increase as the grouting pressure increases. Figure
8.25 shows the simulated peak pull-out shear stress vs. grouting pressure under different
applied overburden pressures. The peak pull-out shear stress is observed to significantly
increase with the increase in grouting pressure. The increase in peak pull-out shear
stress with the overburden pressure is insignificant.
- 203 -

Chapter 8: Numerical simulation of the pull-out tests
The numerical simulation of pressure grouting only simulates the influence of the
locked-in grouting pressure acting on the nail surface. The simulation does not
reproduce the pressure grouting tests because that the grouting pressure dropped to zero
after grouting and the increase in pull-out resistance was due to change of properties for
soil and nail-soil interface. No directly measured data for the change of soil and nail soil
properties is available for numerical simulation. Therefore it is impossible to reproduce
the tests in the simulation. The FE modeling is probably over-simplified due to time
limit of the PhD study. More work is required to be carried out in the future to further
study the influence of grouting pressure on the soil nail pull-out resistance.
8.6 SUMMARY
A 3-D finite element model has been developed and verified by using pull-out test
results. Results of parametric studies on the influence of the grouting pressure and the
dilation angle of the shearing zone on the soil nail pull-out resistance are presented and
discussed. Based on the simulation and discussion, the following conclusions can be
drawn:
(a) The simulated results are in good agreements with the measured results from
the laboratory pull-out tests. This indicates that the use of continuum elements
for simulation of the nail-soil interface is applicable by using appropriate
material properties.
(b) The simulated peak pull-out resistance is significantly increased with the
increase in grouting pressure and dilation angle of the shearing zone. This
indicates the constrained dilatancy of the soil surrounding the nail and the
grouting pressure contribute a lot to the peak pull-out resistance.
- 204 -

Laboratory Pull-out Testing Study on Soil Nails in Compacted Completely Decomposed Granite Fill Su Lijun
Table 8.1 Material properties used in the finite element model
Density Young’s Modulus
Poisson’s ratio
Friction angle
Dilation angle Cohesion
Nail 2.0Mg/m3 16.37GPa 0.28 Plate 1.6GPa 0.25 Soil 1.668Mg/m3 14MPa 0.35 34° 11° 26kPa Shearing zone 1.668Mg/m3 14MPa 0.35 29° 10° 5kPa
1.0m
0.3m
0.81
m
21
3 Figure 8.1 –3-D mesh of the finite element model
- 205 -

Chapter 8: Numerical simulation of the pull-out tests
Pressure
(a)
1
2 Pressure
(b) 3
2
Figure 8.2 – Load and boundary conditions of the FE model before pull-out – (a) front view (cross-section) and (b) side view (longitudinal section)
- 206 -

Laboratory Pull-out Testing Study on Soil Nails in Compacted Completely Decomposed Granite Fill Su Lijun
Pressure
Pull
3
2
Figure 8.3 – Load and boundary conditions of the model during pull-out (side view)
Path
Figure 8.4 – Vertical stress contour after drilling for a simulation with an applied overburden pressure (OP) of 120kPa (compressive stress is negative)
- 207 -

Chapter 8: Numerical simulation of the pull-out tests
Figure 8.5 – Vertical stress contour after pull-out for a simulation with OP=120kPa (compressive stress is negative) Figure 8.6 – Maximum strain rate contour after pull-out for a simulation with OP=120kPa
- 208 -

Laboratory Pull-out Testing Study on Soil Nails in Compacted Completely Decomposed Granite Fill Su Lijun
0
0.05
0.1
0.15
0.2
0.25
0.3
0.35
0.4
0.45
0 50 100 150 200 250Vertical stress (kPa)
Dist
ance
from
nai
l sur
face
(m)_
Before drillingAfter drilling
Figure 8.7 – Vertical stress distribution before and after drilling along the path shown in Figure 8.4
0
0.05
0.1
0.15
0.2
0.25
0.3
0.35
0.4
0.45
0 50 100 150 200 250Vertical stress (kPa)
Dist
ance
from
nai
l sur
face
(m)_
Vertical stress
Increased vertical stress
Figure 8.8 – Distribution of the vertical stress and increased vertical stress at peak pull-out resistance along the path shown in Figure 8.4
- 209 -

Chapter 8: Numerical simulation of the pull-out tests
Changes of average vertical stress at different stages of modeling
0
50
100
150
200
250
300
350
0 50 100 150 200 250 300 350Overburden pressure (kPa)
Ave
rage
ver
tical
stre
ss (k
Pa)_
Before drillingAfter drillingBefore pull-outAt peak resistance Before drilling
At peak resistance
After drillingBefore pull-out
Figure 8.9 – Changes of average vertical stress at the locations of P-cells 1 to 4 at different stages of modeling under different applied overburden pressures
Average pull-out shear stress vs. pull-out displacement
0
20
40
60
80
100
120
0 10 20 30 40 50 6Pull-out displacement (mm)
Ave
rage
pul
l-out
shea
r stre
ss (k
Pa) _
0
40 kPa 80 kPa120 kPa 200 kPa300 kPa
Figure 8.10 – Simulated average pull-out shear stress vs. pull-out displacement under different applied overburden pressures
- 210 -

Laboratory Pull-out Testing Study on Soil Nails in Compacted Completely Decomposed Granite Fill Su Lijun
Average pull-out shear stress vs. pull-out displacement
0
20
40
60
80
100
120
0 10 20 30 40 50 6Pull-out displacement (mm)
Ave
rage
pul
l-out
shea
r stre
ss (k
Pa) _
0
Test ABAQUS
OP=40kPa
Figure 8.11 – Comparison between the measured and simulated average pull-out shear stress- displacement curves with OP=40kPa
Average pull-out shear stress vs. pull-out displacement
0
20
40
60
80
100
120
0 10 20 30 40 50 6Pull-out displacement (mm)
Ave
rage
pul
l-out
shea
r stre
ss (k
Pa) _
0
Test ABAQUS
OP=80kPa
Figure 8.12 – Comparison between the measured and simulated average pull-out shear stress- displacement curves with OP=80kPa
- 211 -

Chapter 8: Numerical simulation of the pull-out tests
Average pull-out shear stress vs. pull-out displacement
0
20
40
60
80
100
120
0 10 20 30 40 50Pull-out displacement (mm)
Ave
rage
pul
l-out
shea
r stre
ss (k
Pa) _
60
Test ABAQUS
OP=120kPa
Figure 8.13 – Comparison between the measured and simulated average pull-out shear stress- displacement curves with OP=120kPa
Average pull-out shear stress vs. pull-out displacement
0
20
40
60
80
100
120
0 10 20 30 40 50 6Pull-out displacement (mm)
Ave
rage
pul
l-out
shea
r stre
ss (k
Pa) _
0
Test ABAQUS
OP=200kPa
Figure 8.14 – Comparison between the measured and simulated average pull-out shear stress- displacement curves with OP=200kPa
- 212 -

Laboratory Pull-out Testing Study on Soil Nails in Compacted Completely Decomposed Granite Fill Su Lijun
Average pull-out shear stress vs. pull-out displacement
0
20
40
60
80
100
120
0 10 20 30 40 50 6Pull-out displacement (mm)
Ave
rage
pul
l-out
shea
r stre
ss (k
Pa) _
0
Test ABAQUS
OP=300kPa
Figure 8.15 – Comparison between the measured and simulated average pull-out shear stress- displacement curves with OP=300kPa
Average pull-out shear stress vs. pull-out displacement
0
40
80
120
160
200
0 10 20 30 40 50 6Pull-out displacement (mm)
Ave
rage
pul
l-out
shea
r stre
ss (k
Pa) _
0
ψ=0 ψ=4 ψ=8ψ=10 ψ=14 ψ=18ψ=26 ψ=29
Figure 8.16 – Simulated average pull-out shear stress vs. pull-out displacement with different dilation angles under OP=120kPa
- 213 -

Chapter 8: Numerical simulation of the pull-out tests
0
20
40
60
80
100
120
140
160
180
0 5 10 15 20 25 30 35Dilation angle (Degree)
Peak
pul
l-out
shea
r stre
ss (k
Pa)_
Figure 8.17 – Simulated peak pull-out shear stress vs. dilation angle with OP=120kPa
Vertical displacement vs. pull-out displacement
0.00
0.40
0.80
1.20
1.60
2.00
0 10 20 30 40 50Pull-out displacement (mm)
Ver
tical
disp
lace
men
t (m
m) _
60
ψ=0 ψ=4 ψ=8ψ=10 ψ=14 ψ=18ψ=26 ψ=29
Figure 8.18 – Simulated vertical displacement on the top surface of the model vs. pull-out displacement with different dilation angles under OP=120kPa
- 214 -

Laboratory Pull-out Testing Study on Soil Nails in Compacted Completely Decomposed Granite Fill Su Lijun
Model 1
Initial stress
Model 2Step 1
Import Initial stress
Model 2Step 2
Drill hole
Model 2Step 3
Pressure grouting
Pressure
Model 3Step 1
Import stress
Fixed boundary
Model 3 Step 2
Add nail
Fixed boundary
Model 3Step 3Release
boundary
Model 3Step 4
Add nail gravity
Model 3 Step 5 Pull-out
Figure 8.19 – Procedure for simulating the pressure grouting Figure 8.20 – Minimum principal stress contour after application of grouting pressure for a simulation with OP=80kPa and grouting pressure (GP) of 200kPa (compressive stress is negative)
- 215 -

Chapter 8: Numerical simulation of the pull-out tests
-400
-350
-300
-250
-200
-150
-100
-50
00 1 2 3 4 5 6 7 8 9
Step time
Min
imum
prin
cipa
l stre
ss (k
Pa) _
Figure 8.21 – Variation of the minimum principal stress in the elements next to the hole surface throughout the simulation with OP=80kPa and GP=200kPa (compressive stress is negative)
Average pull-out shear stress vs. pull-out displacement
0
40
80
120
160
200
0 10 20 30 40 50 6Pull-out displacement (mm)
Ave
rage
pul
l-out
shea
r stre
ss (k
Pa) _
0
GP=0 GP=80 GP=130GP=200 GP=300 GP=400OP=80kPa
Figure 8.22 – Simulated average pull-out shear stress vs. pull-out displacement under different grouting pressures with OP=80kPa
- 216 -

Laboratory Pull-out Testing Study on Soil Nails in Compacted Completely Decomposed Granite Fill Su Lijun
Average pull-out shear stress vs. pull-out displacement
0
50
100
150
200
250
0 10 20 30 40 50Pull-out displacement (mm)
Ave
rage
pul
l-out
shea
r stre
ss (k
Pa) _
60
GP=0 GP=80 GP=130GP=180 GP=300 GP=400
OP=120kPa
Figure 8.23 – Simulated average pull-out shear stress vs. pull-out displacement under different grouting pressures with OP=120kPa
Average pull-out shear stress vs. pull-out displacement
0
40
80
120
160
200
240
280
0 10 20 30 40 50 6Pull-out displacement (mm)
Ave
rage
pul
l-out
shea
r stre
ss (k
Pa) _
0
GP=0 GP=80 GP=130GP=180 GP=300 GP=400
OP=200kPa
Figure 8.24 – Simulated average pull-out shear stress vs. pull-out displacement under different grouting pressures with OP=200kPa
- 217 -

Chapter 8: Numerical simulation of the pull-out tests
70
90
110
130
150
170
190
210
0 50 100 150 200 250 300 350 400 450Grouting pressure (kPa)
Peak
pul
l-out
shea
r stre
ss (k
Pa)_ OP=80 OP=120 OP=200
Figure 8.25 – Simulated peak pull-out shear stress vs. grouting pressure under different applied overburden pressures
- 218 -

Laboratory Pull-out Testing Study on Soil Nails in Compacted Completely Decomposed Granite Fill Su Lijun
CHAPTER 9: SUMMARY, CONCLUSIONS AND
SUGGESTIONS
9.1 SUMMARY
In this thesis, a literature review is made first on the soil nailing technique and its
applications. Types and characteristics of soil nails and application fields of the soil
nailing technique are summarized. The soil nailing mechanism and failure modes of soil
nail structures are presented. Current design methods and design guides are introduced.
Previous testing and numerical studies on the soil nailing technique and soil nail
structures are reviewed. Approaches available for estimating the soil nail pull-out
resistance and studies on factors influencing the pull-out behaviour and resistance are
reviewed in detail.
In the present study, elementary tests were conducted to simulate the pull-out behaviour
of a soil nail in soil slope. The tests were carried out using two copies of a newly
designed pull-out box in compacted completely decomposed granite (CDG) fill. The
internal dimensions of the pull-out box are 1.0m in length, 0.6m in width and 0.83m in
height. Totally 24 soil nail pull-out tests were carried out using the two pull-out boxes.
Among them, 20 tests were performed with the nails grouted under gravity head only
and 4 tests were carried out with the nails grouted with different applied grouting
pressures. The gravity grouting tests were conducted in soil at degrees of saturation of
38%, 50%, 75% and 98% (submerged) under overburden pressures of 40kPa, 80kPa,
120kPa, 200kPa and 300kPa respectively. The pressure grouting tests were carried out
in soil at 50% degree of saturation only, with grouting pressures of 80kPa and 130kPa
- 219 -

Chapter 9: Summary, conclusions and suggestions
under overburden pressure of 80kPa and 200kPa respectively. The test results were
presented and discussed.
For submerged tests, the test soil needed to be saturated before pull-out of the soil nail.
In order to obtain a higher degree of saturation, back water pressure needs to be applied
to the soil sample because of the large volume of the sample. Preventing leakage of
water is difficult during applying back water pressure to a soil nail pull-out box
especially at the location of the nail head because that the nail needs to be pulled out
through the nail head. Enlightened by the mechanism of a traditional triaxial apparatus,
a specially designed waterproof front cap was used to cover the nail head in submerged
pull-out tests. The waterproof front cap could prevent leakage of water under a relative
high (more than 100kPa) pressure and allowed the nail to be pulled out with very low
friction between the rubber O-ring and the steel rod for pull-out. During saturating the
soil and pull-out of the nail, no water leakage was observed and an average degree of
saturation of 98% was found to be achieved by checking the soil after pull-out.
The CDG soil was thoroughly remixed and compacted in the box and the extension
chamber in 9 layers (with the maximum thickness of 100mm) with 95% of the
maximum dry density (1.668Mg/m3). For each degree of saturation, the soil was mixed
with water to the target moisture content before compaction. The stress release due to
installation of the soil nail was simulated by drilling the hole after application of the
overburden pressure. The estimated peak pull-out load was divided into 5 loading
increments and applied stepwise. After the peak pull-out resistance was achieved, the
nail was continuously pulled out by displacement control using displacement rates of
1mm/min or about 0.3mm/min for tests in partially saturated and saturated soil
respectively.
- 220 -

Laboratory Pull-out Testing Study on Soil Nails in Compacted Completely Decomposed Granite Fill Su Lijun
The overburden pressure was applied by water pressure through a rubber diaphragm
fixed on the bottom surface of the top cover of the box and measured by pressure dial
gauge. An automatic volume change apparatus, which is normally used in the traditional
triaxial tests, was used to measure the volume change of the soil. Earth pressure cells
were imbedded in the test soil at different levels to estimate the distributions and
variations of stresses in the soil during testing. Soil moisture probes and miniature
porewater pressure transducers were installed to locations 25mm away from the nail
surface to measure the suction or porewater pressure in the soil surrounding the nail.
The axial strains at different locations of the soil nail were measured by means of strain
gauges adhered to the steel bar.
Numerical modeling was carried out using a three dimensional (3-D) finite element
model. The agreements between the measured and simulated results were good.
9.2 CONCLUSIONS
Based on the results of the pull-out tests and numerical simulation, the following
observations and conclusions can be obtained for soil nails installed in a compacted
completely decomposed granite (CDG) fill:
(a) Variation of the earth pressure throughout the test: After application of the
overburden pressure, the average earth pressure measured by pressure cells 1 to 4
was approximately equal to the applied overburden pressure. The average earth
pressure of pressure cells 1 to 4 substantially decreased to residual values after
drilling and did not recover much after installation of the soil nail. At the peak
pull-out resistance, the average earth pressures increased to certain values due to
- 221 -

Chapter 9: Summary, conclusions and suggestions
the constrained dilatancy of the soil. This indicated that the normal stress acting
on the surface of the soil nail during pull-out, which contributed to the pull-out
resistance, was largely generated by constrained dilatancy of the soil.
(b) Average pull-out shear stress-displacement behaviour: The average pull-out
shear stress-displacement curves generally showed a peak and post-peak
displacement softening behaviour. The post-peak displacement softening was
more obvious in tests with soil at higher degrees of saturation. This is probably
related to the migration of shearing plane from the interface between the soil nail
surface and the surrounding soil to the interior of the soil when the soil is getting
wetter. For the tests performed in dryer soil, the failures occurred on the nail-soil
interface. The displacement softening was not the dominating behaviour of the
dilative soil subjected to shearing against a hard surface. For the tests performed
in wetter soil, the failures occurred within the soil. The pull-out
stress-displacement behaviour showed obvious displacement softening as
generally shown in the behaviour of dense dilative soil.
(c) Influence of overburden pressure on pull-out resistance: The peak pull-out
shear resistances for tests under different overburden pressures were a little
scattered and did not directly related to the applied overburden pressures. This
was consistent with the observations from Cartier and Gigan (1983) and
Clouterre (1991) by field pull-out tests. The pull-out resistances under lower
overburden pressure could be larger than those under higher overburden pressure.
The variation of the peak pull-out shear resistance under different overburden
pressures might have been caused by some inevitable disturbance factors, such as
- 222 -

Laboratory Pull-out Testing Study on Soil Nails in Compacted Completely Decomposed Granite Fill Su Lijun
misalignment of the pull-out force, disturbance to the hole surface due to drilling,
and etc.
(d) Influence of degree of saturation on pull-out resistance: The peak pull-out
shear resistance varied with different degrees of saturation of the soil, with higher
resistances at the degrees of saturation of 50% and 75%. In both dryer (38%) and
wetter (submerged) soil, the pull-out shear resistance was lower. It is believed
that if the soil is dry, water is more readily to be absorbed by the soil due to a
higher suction power. This may cause more contraction of the cement grout thus
reducing the bond strength between the nail surface and the surrounding soil. As
in the submerged tests, the decrease of the apparent cohesion of the fill could be
one of the reasons for the decrease of pull-out resistance. The decrease of
dilatancy of the soil could be another reason.
(e) Effect of pressure grouting: The grouting pressure inside the hole increased
quickly, but then dropped rapidly due to hardening of the cement grout and
shrinkage of grout volume because of water seepage from the cement grout to the
surrounding soil (accompanied by dissipation of the excess water pressure inside
the grout and absorbing of water in the grout by the dryer surrounding soil). This
indicated that the grouting pressure did not permanently increase the normal
stress acting on the nail-soil interface.
(f) Influence of grouting pressure on pull-out resistance: Even though the
grouting pressure just temporarily increased the normal stress acting on the
nail-soil interface, the pull-out resistance increased with the increase in grouting
pressure. The increase in pull-out resistance was probably due to the
- 223 -

Chapter 9: Summary, conclusions and suggestions
recompaction of the soil around the hole, the infiltration of the cement grout into
the soil, the increase in nail surface roughness and etc.
(g) Numerical modeling: Numerical modeling results using a 3-D finite element
model are in good agreement with measured results. This indicates that using a
thin layer of continuum elements with Mohr-Coulomb material to simulate the
nail-soil failure surface is applicable. Parametric study shows that the pull-out
resistance generally increases with the increase in grouting pressure and dilation
angle of the material in the shearing zone.
9.3 RECOMMENDATIONS AND SUGGESTIONS
(a) The pull-out tests in this project were carried out in CDG soil at only four
different degrees of saturation and could not show a clear relationship between
the soil nail pull-out resistance and degree of saturation of the soil. More tests
are recommended to be carried out in soil at more different degrees of saturation
in order to find out the relationship.
(b) The earth pressure cells close to the nail were imbedded at locations about
40mm away from the nail surface to avoid damage of the pressure cells. The
measured earth pressures cannot represent the normal stress acting on the
nail-soil interface. Direct measurement of the normal stress on the nail-soil
interface may be to be developed to study the influence of the normal stress on
the pull-out resistance.
(c) The bond strength between the cement grout of the soil nail and the surrounding
soil may depend on the curing time of the cement grout. Tests with soil nails of
- 224 -

Laboratory Pull-out Testing Study on Soil Nails in Compacted Completely Decomposed Granite Fill Su Lijun
different curing time are suggested to be carried out to study the influence of
curing time on the pull-out resistance.
(d) Only four pressure grouting pull-out tests were carried out in the present work.
More pressure grouting tests are recommended to be conducted with different
grouting and overburden pressures in soil at different degrees of saturation.
Especially, pressure grouting tests should be carried out in submerged
conditions to see whether or not the grouting pressure can still increase the
pull-out resistance when the soil is saturated.
(e) In a soil nailed slope, the nail in the passive zone is normally subjected to a
combination of shear force, tensile force and bending moment when a failure
surface is formed. Pull-out tests is recommended to be carried out considering
the influence of shear force and bending moment.
(f) Pull-out tests are recommended to be carried out on nails with different
diameters and surface roughness to study the influences of these factors on the
pull-out resistance.
(g) The pull-out test results showed that the constrained dilatancy of the soil
contributed a lot to the pull-out resistance. Analytical solution of the pull-out
resistance considering the influence of dilation angle of the soil is recommended
to be developed and used for design and numerical modeling.
- 225 -

References
REFERENCES
ABAQUS6.3-1 Online Doc. “ABAQUS/Standard User's Manual”. ABAQUS Inc.
(2002)
Aminfar, M. H. “Centrifuge modeling of stabilization of slopes using the technique of
soil nailing”. Ph.D. Thesis, University of Wales, Cardiff (1998)
Bang, S., Kroetch, P. P. and Shen, C. K. “Analysis of soil nailing system”. Proc. Int.
Symp. on Earth Reinforcement Practice, Fukuoka, Kyushu, Japan, Vol.1,
pp457-462 (1992)
Bang, S., Wilkins, B. and Shen, C. K. “Deep seated stability of soil nailing walls”. Proc.
3 Int. Symp. on Earth Reinforcement, Fukuoka, Kyushu, Japan, pprd 729-734 (1996)
Barley, A. D., Davies, M. C. R. and Jones, A. M. “Proposed methods for field testing of
soil nails”. Proc. 3rd Int. Conf. On Ground Improvement Geosystems, London,
England, pp424-431 (1997)
Barley, A. D., Davies, M. C. R. and Jones, A. M. “Review of current field testing
methods for soil nailing”. Proc. 3rd Int. Conf. On Ground Improvement Geosystems,
London, England, pp477-483 (1997a)
Barley, A. D. and Graham, M. “Trial Soil Nails for Tunnel Face Support in London
Clay and the Detected Influence of Tendon Stiffness and Bond Length on Load
Transfer”. Proc. 3rd Int. Conf. on Ground Improvement Geosystems, London,
pp432-444 (1997).
Barley, A. D., Davies, M. C. R. and Jones, A. M. “Instrumentation and Long Term
Monitoring of a Soil Nailed Slope at Madeira Walk, Exmouth, UK”. Symposium of
Field Instrumentation for Soil and Rock, Atlanta, USA, pp51-65 (1998)
Barr, B. I. G., Davies, M. C. R. and Jacobs, C. D. “A large direct shear box – some
initial results of tests on nails”. Ground Engineering, 24(3), pp44-50 (1991)
Benhamida, B., Schlosser, F. and Unterreiner, P. “Finite element modeling of a soil
- 226 -

Laboratory Pull-out Testing Study on Soil Nails in Compacted Completely Decomposed Granite Fill Su Lijun
nailed wall: Earth pressures and arching effects”. Numerical models in
Geomechanics, Pietruszczak & Pande (eds), Balkema, Rotterdam, pp245-250
(1997)
Benhamida, B., Unterreiner, P. and Schlosser, F. “Numerical analysis of a full scale
experimental soil nailed wall”. Proc. 3rd Int. Conf. On Ground Improvement
Geosystems, London, pp452-458 (1997a)
Brand, E. W., Premchitt, A. and Phillipson, H. B. “Relationship between rainfall and
landslide in Hong Kong”. Proc. 4th Int. Symp. on landslides, Toronto, pp377-384
(1984)
Brand, E. W. “Predicting the performance of residual soil slopes”. Proc. 11th Int. Conf.
on Soil Mechanics and Foundation Engineering, San Francisco, Vol.5,
pp2541-2578 (1985)
Briaud, J. L. and Lim Y. J. “Soil-nailed wall under piled bridge abutment: simulation
and guidelines”. Journal of Geotechnical and Geoenvironmental engineering,
123(11), pp1043-1050 (1997)
Bridle R. J. “Soil nailing-analysis and design”. Ground Engineering, Sept. 1989,
pp52-56 (1989)
Bridle, R. J. and Barr, B. I. G. “The analysis and design of soil nails”. Proc. Int.
Reinforced Soil Conf., Glasgow, Scotland, pp249-254 (1990)
Bridle, R. J. and Davies, M. C. R. “Analysis of soil nailing using tension and shear:
experimental observations and assessment”. Proc. Instn. Of Civil Engineering,
Geotechnical Engineering, Vol.125, pp155-167 (1997)
Bridle, R. J. and Myles, B. “A Machine for Soil Nailing: Process and Design”. ECOLE
Nationale des Ponts et Chaussees, Civil Engineering European Courses in Soil
Reinforcement, Paris. (1991)
Bruce, D. A. and Jewell, R. A. “Soil nailing: Application and Practice-Part 1”. Ground
- 227 -

References
Engineering, 19(8), pp10-15 (1986)
Bruce, D. A. and Jewell, R. A. “Soil nailing: Application and Practice - Part 2”. Ground
Engineering, 20(1), pp21-23 (1987)
Bruce, D. A. and Jewell, R. A. “Soil nailing: The second decade”. Proc. Int. Conf. On
Foundations and Tunnels, pp68-83 (1987a)
BS 1377-2. “Methods of test for soils for civil engineering purpose-Part 2: classification
tests”. British Standards Institution (1990)
BS 5930. “Code of practice for site investigations”. British Standards Institution (1981)
BS 8006. “Code of Practice for Strengthened/reinforced soil and other fills”. British
Standards Institution, London, (1995)
Burland, J. B. “Reliability of soil nailed slopes in Hong Kong”. Geotechnical
Engineering Office (Internal Report), Hong Kong, pp4-12 (2002)
Byrne, R. J., Cotton, D., Porterfield, J., Wolschlag, C. and Ueblacker, G. “Manual for
design and construction monitoring of soil mail walls”. Federal Highway
Administration, Publication No. FHW A-SA-96-069R (1998)
Cali, P. R. “Stabilization of a creeping slope using soil nails”. Measuring and Modeling
Time Dependent Soil Behavior, proceedings of sessions, ASCE, pp109-121 (1996)
Cardoso, A. S., Fernandes, M. M. “Some considerations about the failure mechanism of
nailed walls during construction”. Applications of computational mechanics in
geotechnical engineering: proc. 1 Int. Workshop on Applications of Computational
Mechanics in Geotechnical Engineering, Rio De Janeiro, Brazil, 29-31 July,
st
pp275–286 (1991)
Cartier, G. and Gigan, J. P. “Experiments and observations on soil nailing structures”.
Proc. Enropean Conf. Soil Mechanics and Foundation Engineering, Helsinki,
pp473-476 (1983)
Chang, K. T. and Milligan, G. W. E. “Effects of the transition zone in a nailed wall
- 228 -

Laboratory Pull-out Testing Study on Soil Nails in Compacted Completely Decomposed Granite Fill Su Lijun
model test”. Proc. 3 In. Symp. on Earth Reinforcement, Fukuoka, Kyushu, Japan,
pp
rd
333-338 (1996)
Chen, P. Y. M. “Methods of test for soils in Hong Kong for Civil Engineering Purposes
(Phase 1 Tests)”. Geotechnical Engineering office, Civil Engineering Department,
The Government of HKSAR, GEO Report No.36 (1992)
Cheang, W. L., Tan, S. A., Yong, K. Y., Gue, S. S., Aw, H. T., Yu, H. T. and Liew, Y.
L. “Jacked-in pipe reinforcement of a deep excavation in soft soil”. 5th Int. Symp. on
Field Measurements in Geomechanics, Singapore. pp1-8 (1999)
Cheuk,C. Y., Ng, C. W. W. and Sun, H. W. “Numerical experiments of soil nails in
loose fill slopes subjected to rainfall infiltration effects” Computers and
Geotechnics, 32(4), pp290-303 (2005)
Choukeir, Mohamed H. “Seismic analysis of reinforced earth and soil-nailed structures”.
Ph.D Thesis, New York Polytechnic University (1996)
Choukeir, M., Juran, I. And Hanna, S. “Seismic design of reinforced-earth and
soil-nailed structures”. Ground Improvement, Vol.1, pp223-238 (1997)
Chu, L. M. “Study on the Interface Shear Strength of Soil Nailing in Completely
Decomposed Granite (CDG) Soil”. M.Phil thesis, Sept. 2003, The Hong Kong
Polytechnic University (2003)
Chu L. M. and Yin J. H. “Comparison of Interface Shear Strength of Soil Nails
Measured by Both Direct Shear Box Tests and Pullout Tests”. Journal of Geotechnical
& Geoenvironmental Engineering, 131(9), pp1097-1107 (2005)
Chu, L. M. and Yin, J. H. “A Laboratory Device to Test the Pull-Out Behavior of Soil
Nails”. Geotechnical Testing Journal, ASTM, 28(5), September, pp1-15 (2005a)
Clouterre. “Recommendations Clouterre 1991”. US Department of Transportation,
Federal Highway Administration (English translation) (1993)
Davies, M. C. R., Aminfar, M. H. and Gammage, P. J. “Centrifuge modeling of slope
- 229 -

References
stabilization using soil nailing”. Proc. 3rd Int. Conf. On Ground Improvement
Geosystems, London, England, pp485-491 (1997)
Davies, M. C. R. and Masurier, J. W. LE. “Soil/nail interaction mechanisms from large
direct shear tests”. Proc. 3rd Int. Conf. On Ground Improvement Geosystems,
London, England, pp492-499 (1997)
Elias V. and Juran, I. “Soil Nailing for Stabilization of Highway Slopes and
Excavations”. United States Federal Highway Administration, Publication No.
FHWA-RD-89-193, June (1991)
Forth, R. A. “Soil nailing-a cost-effective way of improving the factor of safety of
marginally stable slopes in Hong Kong”. Proc. 3rd Int. Conf. On Ground
Improvement Geosystems, London, England, pp383-388 (1997)
Franzen, G. “Soil Nailing – A laboratory and field study of pullout capacity”. Doctoral
thesis, Department of Geotechnical Engineering, Chalmers University of
Technology, Sweden (1998)
Frydman, S., Baker, R. and Levy, A. “Modeling the soil nailing excavation process”.
Proc. of the Int. Centrifuge Conference 94, Singapore, pp669-674 (1994)
Gassler, G. “Soil-nailing - theoretical basis and practical design”. Pro. Int. Geotechnical
Symp. on Theory and Practice of Earth Reinforcement, Fukuoka Kyushu,
pp283–288 (1988)
Gassler, G. and Gudehus, G. “soil nailing—statistical design”. Proc. 8th European Conf.
on Soil Mechanics and Foundation Engineering, Helsinki, Vol.2, pp491-494
(1983)
Gassler, G. and Gudehus, G. “Soil nailing – Some aspects of a new technique”. Proc.
10th Int. Conf. on Soil Mechanics and Foundation Engineering, Sweden, Vol.3,
15-19 June, pp665-670 (1981)
Gassler, G. “Full scale test on a nailed wall in consolidated clay”. Proc. Int. Symp. on
- 230 -

Laboratory Pull-out Testing Study on Soil Nails in Compacted Completely Decomposed Granite Fill Su Lijun
Earth Reinforcement Practice, Fukuoka, Kyushu, Japan, Vol.1, pp475-480 (1992)
Government of Hong Kong. “Final report of the commission of inquiry into the
rainstorm disasters”. Hong Kong Government Printer, pp13-26(1972)
GEO. “Good Practice in Design of Steel Soil Nails for Soil Cut Slopes”. GEO
Technical Guidance Note No. 23, Geotechnical Engineering Office, Civil
Engineering and Development Department, The Government of the Hong Kong
Special Administrative Region (2005)
Guilloux, A. and Schlosser, F. “Soil nailing: practical applications” Proc. Symp. on
Recent Developments in Ground Improvement Techniques, Bangkok, pp389–397
(1982)
Guilloux, A., Notte, G. and Gonin, H. “Experiences on a retaining structure by nailing
in moraine soils”. Proc. 8th European Conf. on Soil Mechanics and Foundation
Engineering, Helsinki, Vol. 2, pp499-502 (1983)
HA 68/94. “Design methods for the reinforcement of highway slopes by reinforced soil
and soil nailing techniques”. Geotechniques and Drainage, Section 1 Earthworks,
Vol.4, Part 4 (1994)
HA 68/94. “Front-face pull-out in the absence of facing elements or wrap-round
reinforcement”. Geotechniques and Drainage, Section 1 Earthworks, Vol.4, Part 4
(1994)
Haberfield, C. M. “Prediction of the initial normal stress in piles and anchors
constructed using expansive cements”. International Journal for Numerical and
Analytical Methods in Geomechanics, Vol.24, pp305-325 (2000)
Hanna, S., Juran, I., Levy, O. and Benslimane, A. “Recent Developments in
Soil-Nailing: Design and Practice”. Soil improvement for big digs: proc. of sessions
of Geo-Congress 98: October 18-21, Boston, Massachusetts, pp259-284 (1998)
Ho, C. L., Ludwig, H. P., Fragaszy, R. J. and Chapman, K. R. “Field Performance of a
- 231 -

References
Soil Nail System in Loess”. Foundation engineering: current principles and
practices: proc. of the congress, Evanston, Illinois, pp1281-1292 (1989)
Hong, Y. S., Wu, C. S., and Yang, S. H. “Pullout resistance of single and double nails in
a model sandbox”. Canadian Geotechnical Journal, 40(5), pp1039-1047 (2003)
Horelli, J. A. “Landslides in Hong Kong”. Master’s thesis, University of Helsinki
Finland. (2005)
Jewell, R. A. “Review of theoretical models of soil nailing”. Proc. Int. Reinforced Soil
Conf., Glasgow, Scotland, pp265-275 (1990)
Jewell, R. A. and Pedley, M. J. “Sold nailing design: the role of bending stiffness”.
Ground Engineering, 23(2), March, pp30-36 (1990)
Jewell, R. A. and Pedley, M. J. “Analysis for soil reinforcement with bending stiffness”.
ASCE Journal of Geotechnical Engineering Division, 118(10), pp1505-1528 (1992)
Jewell, R. A. and Wroth, C. P. “Direct shear tests on reinforced sand”. Geotechnique,
37(1), pp53-68 (1987)
Johnson, P. E., Card, G. B. and Darley, P. “Soil nailing for slopes”. Transport Research
Laboratory, TRL Report TRL537 (2002)
Junaideen, S. M., Tham, L. G., Law, K. T., Lee, C. F., and Yue, Z. Q. “Laboratory study
of soil-nail interaction in loose, completely decomposed granite”. Canadian
Geotechnical Journal, 41(2), pp. 274-286 (2004)
Juran, I. and Elias, V. “Behaviour and working stress design of soil nailed retaining
structures”. Proc. Int. Reinforced Soil Conf., Glasgow, Scotland, pp207-212 (1990)
Juran, I., Baudrand, G., Khalid, F. and Elias, V. “Kinematical limit analysis approach
for the design of nailed soil retaining structures”. Int. Geotechnical Symp. on
Theory and Practice of Earth Reinforcement, Fukuoka, Japan, pp301-306 (1988)
Juran, I., Baudrand, G., Farrag, K. and Elias, V. “Kinematical Limit Analysis for Design
of Soil-Nailed Structures”. ASCE Journal of Geotechnical Engineering, 116(1), pp
- 232 -

Laboratory Pull-out Testing Study on Soil Nails in Compacted Completely Decomposed Granite Fill Su Lijun
54-72 (1990)
Juran, I., Baudrand, G., Farrag, K. and Elias, V. “Kinematical Limit Analysis for Design
of Soil-Nailed Structures (Discussion)”. ASCE Journal of Geotechnical Engineering,
117(11), pp1640-1647 (1991)
Juran, I., Baudrand, G., Farrag, K. and Elias, V. “Design of soil nailed retaining
structures”. Proc. Conf. on Design and Performance of Earth Retaining Structures,
Geotechnical Special Publication No.25, Ithaca, USA, pp644-659 (1990a)
Juran, I. “Reinforced soil systems – Application in retaining structures”. Proc. Int. of
Civil Engineer, Geotechnical Engineering, Vol.16, pp39-82 (1985)
Juran, I., Shaffiee, S., Schlosser, F., Humbert, P. and Guenot, A. “Study of soil-bar
interaction in the technique of soil nailing”. Proc. 8th European Conf. on Soil
Mechanics and Foundation Engineering, pp513-516 (1982)
Kamata, H. and Mashimo, H. “Centrifuge model test of tunnel face reinforcement by
bolting”. Tunnelling and Underground Space Technology, 18(2-3), pp205-212
(2003)
Kay, J. N. and Chen, T. “Rainfall-landslide relationship for Hong Kong”. Proc. Int. of
Civil Engineer, Geotechnical Engineering, Vol.113, pp117-118 (1995)
Khalil, M., Rhodes, M., Daly, J. and Ferris, Jeanine. “Soil Nail Walls in Residual Soils”.
Soil improvement for big digs: proc. of sessions of Geo-Congress 98: October 18-21,
Boston, Massachusetts, pp214-225 (1998)
Kim, D. S., Juran, I., Nasimov, R. and Drabkin, S. “Model study on the failure
mechanism of soil-nailed structure under surcharge loading”. Geotechnical Testing
Journal, 18(4), December, pp421-430 (1995)
Kim, J. S., Kim, J. Y. and Lee S. R. “analysis of soil nailed earth slope by discrete
element method”. Computer and Geotechnics, 20(1), pp1-14 (1997)
Kim, J. S., Park, C. L., Lee, S. D. and Lee, S. R. “A large-scale experimental study of
- 233 -

References
soil-nailed structures”. Proc. of the 3 Int. Symp. on Earth Reinforcement, Fukuoka,
Kyushu, Japan, pp
rd
775-780 (1996)
Kim, W. C. “The effect of nail stiffness and inclination in soil nailing by finite element
method”. Ph.D thesis, Utah State University, United States. (1998)
Kitamura, T., Nagao, A. and Uehara, S. “Model loading tests of reinforced slopes with
steel bars”. Proc. Int. Geotechnical Symp. on Theory and Practice of Earth
Reinforcement, Fukuoka, Japan, 5-7 October, pp311-316 (1988)
Landau Associates Inc. “Monitoring of soil nailed walls at the highway 217 and
highway 26 interchange-final report”. Federal Highway Administration,
Washington D.C. (1999)
Lee, C. F., Law, K. T., Tham, L. G., Yue, Z. Q. and Junaideen, S. M. “Design of a large
soil box for studying soil-nail interaction in loose fill”. Soft Soil Engineering, Lee et
al (eds.), pp413-418 (2001)
Lim, Y. J. “Three-dimensional nonlinear finite element analysis of tieback walls and of
soil nailed walls under piled bridge abutments”. Ph.D thesis, Texas A&M
University, United States. (1996)
Love, J. and Milligan, G. “Reinforced soil and soil nailing for slopes - advice note
HA68/94”. Ground Engineering, 28(4), pp32-36 (1995)
Luo, S. Q. “Soil nail behaviour in cohesionless soil”. Ph.D thesis, National University
of Singapore. (2001)
Luo, S. Q., Tan S. A. and Yong K. Y. “Pull-out resistance mechanism of a soil nail
reinforcement in dilative soils”. Soils and foundations, 40(1), pp47-56 (2000)
Luo, S. Q., Tan S. A., Cheang, W. and Yong K. Y. “Elastoplastic analysis of pull-out
resistance of soil nails in dilatant soils”. Ground Improvement, 6(4), pp153-161
(2002)
Lumb, P. “Slope failures in Homg Kong”. Quarterly Journal of Engineering Geology,
- 234 -

Laboratory Pull-out Testing Study on Soil Nails in Compacted Completely Decomposed Granite Fill Su Lijun
Vol.8, pp31-65 (1975)
Lumb, P. “Statistics of natural disasters in Hong Kong”. Proc. 3rd Int. Conf. Applic
Statistics and Prob. To Soil and Structure Engineering, Sydney, Vol.1, pp9-22
(1979)
Marchal, J. “Soil nail-experimental laboratory study of soil nail interaction”. Transport
and road research laboratory, Department of Transport, UK, Contractor report 239
(1990)
McVay, M. C., Zhang, L. M., Molnit, T. and Lai, P. “Centrifuge testing of large plumb
pile groups in sands”. Journal of Geotechnical & Geoenvironmental Engineering,
ASCE, 124(10), pp1016-1026 (1998)
Milligan, G. W. E., Chang, K. T. and Morris, J. D. “Pull-out resistance of soil nails in
sand and clay”. Proc. 3rd Int. Conf. On Ground Improvement Geosystems, London,
United Kingdom, pp414-422 (1997)
Milligan, G. W. E. and Tei, K. “The pull-out resistance of model soil nails”. Journal of
Soils and Foundations, 38(2), pp179-190 (1998)
Mitchell, J. K. and Villet, W. C. B. “Reinforcement of earth slopes and embankments”.
NCHRP report 290, USA Transportation Research Board, National Research
Council, Washington D.C., USA (1987)
Moosavi, M., Jafari, A., and Khosravi, A. “Bond of cement grouted reinforcing bars
under constant radial pressure” Cement and Concrete Composites, 27(1), pp103-109
(2005)
Myles, B. and Bridle, R.J. “Fired soil nails”. Proc. Int. Symp. on Earth Reinforcement
Practice, Fukuoka, Kyushu, Japan, Vol.1, pp509-514 (1992)
Ng, C. W. W. and Lee, G. T. K. “A three-dimensional parametric study of the use of
soil nails for stabilizing tunnel faces”. Computers and Geotechnics, 29(8),
pp673-697 (2002)
- 235 -

References
Ochiai, T., Hattori, K. and Pokharel, G. “Numerical modeling of an in-situ pull-out test
on soil reinforcing bars”. Numerical models in Geomechanics, Pietruszczak &
Pande (eds), Balkema, Rotterdam, pp263-268 (1997)
Oral, Tolga and Sheahan, Thomas C. “The Use of Soil Nails in Soft Clays”. Design and
Construction of Earth Retaining Systems: proc. of sessions of Geo-Congress 98,
pp26-40 (1998)
Ortigao, J. A. R., Palmeira, E. M. and Zirlis, A. C. “Experience with soil nailing in
Brazil: 1970-1994”. Proc. Int. Civil Engineer, Geotechnical Engineering, Vol.113,
pp93-106 (1995)
Ortigao, J. A. R. and Palmeira, E. M. “Optimized design for soil nailed walls”. Proc. 3rd
Int. Conf. On Ground Improvement Geosystems, London, England, pp368-374
(1997)
Patra, C. R. and Basudhar, P. K. “Optimum design of nailed soil slopes”. Geotechnical
and Geological Engineering, 23(3), pp273-296 (2005)
Patra, C. R. and Basudhar, P. K. “Stability computations in nailed slopes”. Proc. 3rd Int.
Conf. On Ground Improvement Geosystems, London, England, pp376-381 (1997)
Pedley, M. J. and Pugh, R. S. “Soil nailing in the Hastings Beds”. Engineering geology
of construction, Geological Society of London, Engineering Geology Special
Publication, pp361–368 (1995)
Pedley, M. J. “The performance of soil reinforcement in bending and shear”. Ph.D.
Thesis, University of Oxford (1990)
Plumelle, C. and Schlosser, F. “A French national research project on soil nailing:
Clouterre”. Proc. Int. Reinforced Soil Conf., Glasgow, Scotland, pp219-223 (1990)
Plumelle, B. C., Schlosser, F., Delage, P. and Knochenmus, G. “French national
research project on soil nailing Clouterre”. Proc. of a Conf. on Design and
Performance of Earth Retaining Structures, Geotechnical Special Publication No.25,
- 236 -

Laboratory Pull-out Testing Study on Soil Nails in Compacted Completely Decomposed Granite Fill Su Lijun
Ithaca, USA, pp660-675 (1990)
Powell, G. E. and Watkins, A. T. “Improvement of marginally stable existing slopes by
soil nailing in Hong Kong”. Proc. Int. Reinforced Soil Conf., Glasgow, Scotland,
pp241-247 (1990)
Pradhan, B. “Study of pullout behaviour of soil nails in completely decomposed granite
fill”. M.Phil thesis, The University of Hong Kong (2003)
Pradhan, B., Yue, Z. Q., Tham, L. G. and Lee, C. F. “Laboratory study of soil nail
pullout strength in loosely compacted silty and gravelly sand fills”. 12th
Panamerican Conf. on Soil Mechanics and Geotechnical Engineering, 39th U.S.
Rock Mechanics Symp., Germany, Verlag Gluckauf Essen, pp2139-2146 (2003)
Ramsey, N., Jardine, R. J., Lehane, B. M. and Ridley, A. “A Review of soil-steel interface
testing with the ring shear apparatus”. Int. Conf. on Offshore Site Investigations and
Foundation Behaviour, SUT, London, pp237-258 (1998)
Raju, G. V. R., Wong, I. H. and Low, B. K. “Experimental nailed soil
walls”. Geotechnical testing journal, 20(1), pp90-102 (1997)
Sabhahit, N., Basudhar, P. K. and Madhav, Madhira R. “A generalized procedure for
the optimum design of nailed soil slopes”. International journal for numerical and
analytical methods in geomechanics, Vol.19, pp437-452 (1995)
Schlosser, F. and Guilloux, A. “Le frottement dens les sols”. Revue Francaise de
Geotechnique, No.16, pp65-77 (1981)
Schlosser, F. “Behaviour and design of soil nailing”. Proc. Symp. on Recent
Developments in Ground Improvement Techniques, Bangkok, Thailand, pp399-413
(1982)
Schlosser F. S., “The multicriteria theory in soil nailing”. Ground engineering,
November 1991.
Schlosser, F., Unterreiner, P., Plumelle, C. and Benoit, J. “Failure of a full scale
- 237 -

References
experimental soil nailed wall by reducing the nails lengths (French research project
Clouterre)”. Proc. Int. Symp. on Earth Reinforcement Practice, Fukuoka, Kyushu,
Japan, Vol.1, pp531-535 (1992)
Schwing, E. and Gudehus, G. “Soil nailing - design and application to modern and
ancient retaining walls”. Proc. Int. Geotechnical Symp. on Theory and Practice of
Earth Reinforcement, Fukuoka Kyushu, pp605–610 (1988)
Sheahan, Thomas C. “A Field Study of Soil Nails in Clay at the UMASS NGES”.
National Geotechnical Experimentation Sites, pp250-263 (2000)
Sheahan, Thomas C. and Ho, Carlton L. “Simplified Trial Wedge Method for Soil
Nailed Wall Analysis”. Journal of Geotechnical & Geoenvironmental Engineering,
129(2), pp117-124 (2003)
Shen, C. K., Bang, S. and Herrmann, L. R. “Field measurements of an earth support
system”. ASCE Journal of the Geotechnical Engineering Division, Vol.107,
pp1625-1642 (1981)
Shen, C. K., Bang, S., Romstad, K. M., Kulchin, L. and DeNatale, J. S. “Ground
movement analysis of an earth support system”. ASCE Journal of the Geotechnical
Engineering Division, Vol. 107, pp1609-1624 (1981a)
Shen, C. K., Herrmann, L.R., Romstad, K. M., Bang, S., Kim, Y. S. and DeNatale, J. S.
“In situ earth reinforcement lateral support system”. Department of Civil
Engineering, University of California, Davis, Report No. 81-03 (1981b)
Shiu, Y. K., Yung, P. C. Y. and Wong, C. K. “Design, construction and performance of
a soil nailed excavation in Hong Kong”. Proc. 14th Int. Conf. on Soil Mechanics and
Foundation Engineering, Hamburg, Germany, pp1339-1342 (1997)
Sigourney, J. W. “Applications of Soil Nailing in Residual Soil”. Design with residual
materials: geotechnical and construction considerations: proc. of sessions
sponsored by the Geo-Institute of the American Society of Civil Engineers in
- 238 -

Laboratory Pull-out Testing Study on Soil Nails in Compacted Completely Decomposed Granite Fill Su Lijun
conjunction with the ASCE National Convention, pp57-65 (1996)
Smith, I. M. and Su, N. “Three-dimensional FE analysis of a nailed soil wall curved in
plan”. International Journal for Numerical and Analytical Method in Geomechanics,
Vol.21, pp583-597 (1997)
Smith, M. J. “The effects of variable geology on soil nail pull-out test results in Hong
Kong”. Proc. Int. Symp. on Earth Reinforcement Practice, Fukuoka, Kyushu, Japan,
Vol.1, pp543-548 (1992)
Soga, K., Au, S. K. A., Jafari, M. R. and Bolton, M.D. “Laboratory investigation of
multiple grout injection into clay”. Geotechnique, 54(2), pp81-90 (2005).
Stocker, M. F., Korber, G. W., Gassler, G. and Gudehus, G. “Soil Nailing”. Int. Conf.
on Soil, Reinforcement, Paris, pp469-474 (1979)
Stocker, M. F. and Riedinger, G. “The bearing behaviour of nailed retaining structures”.
Proc. Conf. on Design and Performance of Earth Retaining Structures,
Geotechnical Special Publication No.25, Ithaca, USA, pp612-628 (1990)
Sun, H. W. “Review of fill slope failures in Hong Kong”. GEO report No. 96,
Geotechnical Engineering Office, Civil Engineering Department, the Government
of the Hong Kong special administrative region. (1998)
Tabrizi, K. S., Gucunski, N. and Maher, M. H. “3-D FEM Analysis of Excavation of a
Soil-Nail Wall”. Computing in civil engineering: proc. 2 Congress held in
conjunction with A/E/C Systems '95,
nd
Atlanta, Georgia, pp812-819 (1995)
Tang, W. H. and Lee C. F. “Potential use of soil nails in loose fill slopes: an overview”.
Proc. Int. Conf. on Slope Engineering, Hong Kong, China, Vol.2, pp974-997 (2003)
Tei, K. “A study of soil nailing in sand”. Ph.D thesis, University of Oxford (1993)
Tsai, J. H., Patra, A. and Wetherhold, R. “Finite element simulation of shaped ductile
fiber pullout using a mixed cohesive zone-friction interface model”. Composites:
Part A, 36, pp827–838 (2005)
- 239 -

References
Tufenkjian, M. R. and Vucetic, M. “Seismic stability of soil nailed excavations”. Proc.
Int. Symp. on Earth Reinforcement Practice, Fukuoka, Kyushu, Japan, Vol. 1,
pp573-578 (1992)
Tufenkjian, M. R. and Vucetic, M. “Dynamic failure mechanism of soil-nailed
excavation models in centrifuge”. Journal of Geotechnical and Geoenvironmental
Engineering, 126(3), pp227-235 (2000)
Vucetic, M., Tufenkjian, M. R. and Doroudian, M. “Dynamic centrifuge testing of
soil-nailed excavations”. Geotechnical Testing Journal, 16(2), pp172-187 (1993)
Watkins, A. T. and Powell, G. E. “Soil nailing to existing slopes as landslip preventive
works”. Hong Kong Engineer, March, pp20-27 (1992)
Wehr, W. “Stabilization of retaining walls with non-grouted soil nails”. Ground
improvement, 7(4), pp173-176 (2003)
Wong, I. H., Low B. K., Pang P. Y. and Raju, G. V. R. “Field performance of nailed
soil wall in residual soil”. Journal of performance of constructed facilities, 11(3),
pp105-112 (1997)
Yang, M. Z. and Drumm, E. C. “Numerical analysis of the load transfer and
deformation in a soil nailed slope”. Numerical methods in geotechnical engineering:
recent developments: proc. of sessions of Geo-Denver 2000, pp102-116 (2000)
Yeung, A. T., Cheng, Y.M., Lau, C. K., Mak, L. M., Yu, R. S. M., Choi, Y. K. and Kim
J. H. “An innovative Korean system of pressure-grouted soil nailing as a slope
stabilization measure”. The HKIE Geotechnical Division 25th Annual Seminar, 4
May 2005, Hong Kong, published by HKIE-GDC and HKGES, pp.43-49 (2005).
Yim, K. P., Watkins, A. T. and Powell, G. E. “Insitu ground reinforcement for slope
improvement in Hong Kong”. Proc. Int. Geotechnical Symp. on Theory and
Practice of Earth Reinforcement, Fukuoka, Japan, 363-368 (1988)
Yin, J. H. “A double Cell Triaxial System for Continuous Measurement of Volume
- 240 -

Laboratory Pull-out Testing Study on Soil Nails in Compacted Completely Decomposed Granite Fill Su Lijun
Changes of an Unsaturated or Saturated Soil Specimen in Triaxial Testing”.
Geotechnical Testing Journal, ASTM, 26(3), pp353-358 (2003)
Yuan, J. X., Yang, Y. W., Tham, L. G., Lee, P. K. K. and Tsui, Y. “New Approach to
Limit Equilibrium and Reliability Analysis of Soil Nailed Walls”. International
Journal of Geomechanics, 3(2), pp145-151 (2003)
Zhang, M.J., Song, E.X. and Chen, Z.Y. “Ground movement analysis of soil nailing
construction by three-dimensional (3-D) finite element modeling (FEM)”.
Computers and Geotechnics, 25(4), pp191-204(1999)
Zhang, L. M. and McVay, M.C. “Centrifuge testing of vertically loaded battered pile
groups in sand”. Geotechnical Testing Journal, ASTM, 21(4), pp281-288 (1998)
Zhang, L. M., McVay, M. C. and Lai, P. W. “Centrifuge modeling of laterally loaded
single battered piles in sands”. Canadian Geotechnical Journal, 36(6), pp1074 -1084
(1999)
- 241 -