991021965755503411.pdf - PolyU Electronic Theses
323
Copyright Undertaking This thesis is protected by copyright, with all rights reserved. By reading and using the thesis, the reader understands and agrees to the following terms: 1. The reader will abide by the rules and legal ordinances governing copyright regarding the use of the thesis. 2. The reader will use the thesis for the purpose of research or private study only and not for distribution or further reproduction or any other purpose. 3. The reader agrees to indemnify and hold the University harmless from and against any loss, damage, cost, liability or expenses arising from copyright infringement or unauthorized usage. IMPORTANT If you have reasons to believe that any materials in this thesis are deemed not suitable to be distributed in this form, or a copyright owner having difficulty with the material being included in our database, please contact [email protected] providing details. The Library will look into your claim and consider taking remedial action upon receipt of the written requests. Pao Yue-kong Library, The Hong Kong Polytechnic University, Hung Hom, Kowloon, Hong Kong http://www.lib.polyu.edu.hk
-
Upload
khangminh22 -
Category
Documents
-
view
0 -
download
0
Transcript of 991021965755503411.pdf - PolyU Electronic Theses

Copyright Undertaking
This thesis is protected by copyright, with all rights reserved.
By reading and using the thesis, the reader understands and agrees to the following terms:
1. The reader will abide by the rules and legal ordinances governing copyright regarding the use of the thesis.
2. The reader will use the thesis for the purpose of research or private study only and not for distribution or further reproduction or any other purpose.
3. The reader agrees to indemnify and hold the University harmless from and against any loss, damage, cost, liability or expenses arising from copyright infringement or unauthorized usage.
IMPORTANT
If you have reasons to believe that any materials in this thesis are deemed not suitable to be distributed in this form, or a copyright owner having difficulty with the material being included in our database, please contact [email protected] providing details. The Library will look into your claim and consider taking remedial action upon receipt of the written requests.
Pao Yue-kong Library, The Hong Kong Polytechnic University, Hung Hom, Kowloon, Hong Kong
http://www.lib.polyu.edu.hk

TOWARDS PROPERTY VALUATION
ACCURACY: A COMPARISON OF
HEDONIC PRICING MODEL AND
ARTIFICIAL NEURAL NETWORK
ABIDOYE ROTIMI BOLUWATIFE
Ph.D
The Hong Kong Polytechnic University
2017

The Hong Kong Polytechnic University
Department of Building and Real Estate
Towards Property Valuation Accuracy:
A Comparison of Hedonic Pricing Model and
Artificial Neural Network
ABIDOYE Rotimi Boluwatife
A thesis submitted in partial fulfilment of the requirements for
the degree of Doctor of Philosophy
April 2017

i
CERTIFICATE OF ORIGINALITY
I hereby declare that this thesis is my own work and that, to the best of my knowledge
and belief, it reproduces no material previously published or written, nor material that
has been accepted for the award of any other degree or diploma, except where due
acknowledgement has been made in the text.
Signed
ABIDOYE Rotimi Boluwatife

ii
DEDICATION
This thesis is dedicated to God Almighty, Jesus Christ and the Holy Spirit for granting
me life and the grace to complete this study. Secondly, to my parents Late Prince
M. A. Abidoye and Mrs. J. F. Abidoye for their prayers and support towards my
education from the cradle. To my lovely wife, Mrs. Funmilayo Adenike Abidoye and
my lovely son, Master Oluwaloni Abidoye for their support and sacrifice throughout
my PhD study.

iii
ABSTRACT
The need for accurate property valuation in any country cannot be underestimated due
to the significant relationship between the real estate industry and the national
economy. Investment decisions relating to the acquisition or disposal of real estate
assets are largely dependent on valuation estimates. Inaccuracies in property valuation
is a global problem which have been of interest to all stakeholders, and Nigeria is no
exception. A possible explanation for this might be the valuation techniques currently
adopted, with the hedonic pricing model (HPM) being an example. As evidenced in
previous literature, the HPM approach has gained wide acceptance among real estate
researchers, despite its shortcomings.
There is an obvious need to seek innovative approaches to improve the quality of
property valuation estimates. To address the shortcomings of the HPM approach in
property valuation, the current study sets out to develop prediction models for property
valuation in Nigeria. Two modeling techniques, i.e. HPM and artificial neural network
(ANN), were applied in this study. The predictive accuracy of the developed models
served as a basis for comparison. The research objectives are to; assess the current
property valuation practice in the Lagos metropolis; identify and generate a list of
attributes that influence residential property values in the Lagos metropolis property
market; develop a hedonic pricing model for the Lagos metropolis residential property
market; develop an artificial neural network model for the Lagos metropolis residential
property market; evaluate the predictive accuracy of HPM and the ANN model
developed for the Lagos metropolis residential property market; and assess the
Nigerian valuers’ receptiveness to the application of artificial intelligence (AI)
techniques in property valuation.

iv
The data used for this study were sourced from registered real estate firms operating
in the Lagos metropolis, Nigeria. The information collected includes the awareness
and adoption of various valuation methods, residential property value determinants
and the receptiveness of valuers to AI techniques in property valuation, and they were
gathered via the administration of online-based questionnaires to the valuers. The data
were analyzed using the mean score (MS) ranking technique and the chi-square test.
In addition, the sale transactions information of residential properties situated in the
Lagos Island property market were collected. These were fitted into HPM and the ANN
model developed for the Lagos metropolis property market.
The present research found that the valuers are aware of and adopt the traditional
valuation methods, especially the comparable, investment and cost methods in practice.
Whereas there is a little awareness and non-adoption of the advanced valuation
methods. This suggests that there is a need for a paradigm shift towards more accurate
and reliable property valuation approaches. The analysis of the property value
determinants reveals that the structural attributes are the most significant to property
value formation in the Lagos metropolis. This set of attributes were used for the
modeling of the property values in the study area.
In order to facilitate a justifiable comparison, the HPM and the ANN models were
developed with the same data set. This data set was divided into two parts; for the
training and the testing of the developed models. The HPM approach generated a
coefficient of determination (r2) value of 0.77, but this did not translate into the
prediction of accurate property values because of the high mean absolute percentage
error (MAPE) value of 38.23% recorded. This is coupled with high mean absolute
error (MAE) and root mean squared error (RMSE) values recorded as well. The ANN
model produced an r2 value of 0.81 and a MAPE value of 15.94%. These values

v
together with lower MAE and RMSE values are more encouraging when compared
with these of the HPM approach. This indicates that the ANN model is a better
substitute to the HPM approach in property valuation. Also, a large percentage of the
ANN predicted property values generated prediction errors which are within
acceptable international standards, when compared with the HPM outputs. The
investigation into the receptiveness of Nigerian valuers to AI valuation techniques
shows that the majority of the valuers are willing to acquire the competence in the
application of the AI techniques in property valuation. When other requirements of
developing a robust property valuation model are met, coupled with this high level of
willingness of the valuers, the prevalence of property valuation inaccuracy in the
Nigerian context could be reduced remarkably.
Overall, the Nigerian property valuation practice is still at a traditional level. Also,
structural attributes of properties were found to be the most important attributes
affecting its value. The developed ANN model provides a tool which can be used for
property valuation. In addition, the findings provide evidence which justifies the need
to adopt advanced modeling techniques (such as AI technique) in the property
valuation research and practice.

vi
LIST OF PUBLICATIONS
Chapters of this thesis have been fully, or partially, published in the following
publications:
Journal Papers (Published and accepted for publication)
Abidoye R. B. & Chan, A. P. C. (forthcoming). Improving property valuation
accuracy: A comparison of hedonic pricing model and artificial neural network.
Pacific Rim Property Research Journal (Accepted, Manuscript ID – RPRJ-
2017-0010).
Abidoye R. B. & Chan, A. P. C. (2017). Artificial neural network in property valuation:
Application framework and research trend. Property Management, 35 (5), (In
Press, DOI: https://doi.org/10.1108/PM-06-2016-0027).
Abidoye R. B. & Chan, A. P. C. (2017). Valuers' receptiveness to the application of
artificial intelligence to property valuation. Pacific Rim Property Research
Journal, 23 (2), pp. 175 - 193.
Abidoye R. B. & Chan, A. P. C. (2017). Critical review of hedonic pricing model
application in property price appraisal: A case of Nigeria. International Journal
of Sustainable Built Environment, 6 (1), pp. 250 - 259.
Abidoye R. B. & Chan, A. P. C. (2017). Modeling property value in Nigeria using
artificial neural network. Journal of Property Research, 34 (1), pp. 36 – 53.
Abidoye, R. B. & Chan, A. P. C. (2016). Critical determinants of residential property
value: Professionals’ perspective. Journal of Facilities Management, 14 (3), pp.
283 - 300.
Abidoye R. B. & Chan, A. P. C. (2016). A survey of property valuation approaches in
Nigeria. Property Management, 34 (5), pp. 364 – 380.
Journal Papers (Under Review)
Abidoye R. B. & Chan, A. P. C. (forthcoming). Hedonic valuation of properties in
Nigeria. Journal of Real Estate Literature (Under Review, Manuscript ID –
JREL-D-17-00013).

vii
Conference Papers (Presented)
Abidoye R. B. & Chan, A. P. C. (2017). The efficacy of using machine learning
models for property value prediction in Nigeria. Proceedings of the
Environmental Design and Management International Conference, Ile-Ife,
Nigeria, 22th – 24th May, pp. 57 - 65.
Abidoye R. B. & Chan, A. P. C. (2016). Review of the application of hedonic pricing
model in the Nigerian real estate market. Proceedings of the 21st CRIOCM
International Conference on Advancements of Construction Management and
Real Estate, Hong Kong, 14th - 17th December.
Abidoye R. B. & Chan, A. P. C. (2016). Research trend of the application of artificial
neural network in property valuation. Proceedings of the 33rd CIB W78
Conference, Brisbane, Australia, 31st October - 2nd November.
Abidoye, R. B., Chan, A. P. C. & Oshodi, O. S. (2016). Factors that influence real
estate project investment: Professionals’ standpoint. Proceedings of the 9th CIDB
Postgraduate Conference, Cape Town, South Africa, 2nd - 4th February, pp. 229-
239.
Abidoye, R. B. & Chan, A. P. C. (2015). Professionals’ awareness of real estate
valuation methods in Nigeria: A case of Lagos metropolis. Proceedings of the
2nd International Conference on Research Methodology for Built Environment
and Engineering, Kuala Lumpur, Malaysia, 7th October, pp. 1- 6.
Honours and Awards
Best Paper Award (May 2017), Environmental Design and Management
International Conference, Obafemi Awolowo University, Ile-Ife, Nigeria, 22th –
24th May. Paper entitled - The efficacy of using machine learning models for
property value prediction in Nigeria.

viii
ACKNOWLEDGEMENTS
I will like to appreciate the Research Grants Council of Hong Kong (SAR) for granting
me the opportunity to acquire this Doctoral degree through the prestigious Hong Kong
PhD Fellowship Scheme (HKPFS), and also The Hong Kong Polytechnic University,
Hong Kong (PolyU) for awarding me a tuition waiver throughout my PhD study. I
sincerely appreciate the Department of Building and Real Estate (BRE), PolyU, for
providing the financial and material support towards my study.
My sincere gratitude goes to my Chief Supervisor, Ir. Professor Albert P. C. Chan, for
his support, guidance and encouragement towards my PhD study. The seeds of
greatness he has sown in me will last throughout my lifetime, asides being a source of
inspiration to me. I am so grateful to him for accepting to supervise my PhD research,
which gave me an opportunity to tap into his wealth of experience. I also appreciate
all the academic staff of BRE, I am glad to have had the opportunity to learn from
everyone at different fora. I can never forget all the BRE administrative and technical
staff, especially Ms Chloe. I also appreciate all my research group members for
inspiring me during my PhD study. I appreciate the constructive comments of Prof.
Winnie Cheng on the draft of this thesis. I will like to appreciate the time, effort and
constructive comments of the BoE Chair of my PhD Thesis examination, Prof. Eddie
C. M. Hui and the external examiners, Prof. K. W. Chau and Dr. J. X. Ge, before and
during my Viva. And also, all the anonymous scholars that provided constructive
comments on the publications that emanated from this PhD research.
I am grateful to Mr. Abiodun Oyetunji, for sharing the information about HKPFS with
me, I sincerely appreciate this kind gesture. I acknowledge Dr. Olalekan Oshodi, Dr.
Ernest Ameyaw and Dr. Olugbenga Oladinrin for their support, encouragement,

ix
scholarly comments and technical assistance during my study. I thank all the estate
surveyors and valuers practicing in the Lagos metropolis, Nigeria, where the data used
for this research were collected. The efforts of Gbemi and Esther that helped in the
collection of data in Lagos, Nigeria, is appreciated.
My in-laws, Hon. and Mrs. T. A .T. Samaiye, I appreciate your prayers and
encouragement to support my family and I during this period. My mother, Mrs. J. F.
Abidoye, I cannot thank you enough for your support, prayers and understanding
during my PhD study. I also want to appreciate all my siblings (The ‘Doye Empire),
for their phone calls, support and prayers toward my family and I while in Hong Kong.
Mr. Adebisi Sotola, Mr. Samson Olatunbosun, Mr. Yesufa Olawunmi, and other friends
and loved ones in Nigeria, thank you all for always checking on my family and I.
My stay in Hong Kong would not have been interesting without being part of the CIB,
PolyU Student Chapter, which gave me the platform to serve as her Vice-President.
And also, the Association of Nigerian Scholars in Hong Kong (ANSHK) for allowing
me to serve in the capacity of the Treasurer for two academic sessions. I appreciate
you all. I appreciate the Nigerian community living in Hung Hom, Hong Kong, for
been a supportive and wonderful family.
Without my beautiful, supportive, smart, understanding and Godly wife, this journey
would have been impossible. I appreciate all the sacrifices you have made since I met
you and during my PhD study, and also for finding time to read and correct all my
manuscripts. I will be forever grateful to you. Lastly, to my lovely son, Oluwaloni
Boluwatiwi Abidoye, I appreciate your selflessness to release me to come to Hong
Kong to pursue my dream when you were barely two months old, this is coupled with
your understanding during my PhD study. Son, I owe you so much.

x
TABLE OF CONTENTS
CERTIFICATE OF ORIGINALITY i
DEDICATION ii
ABSTRACT iii
LIST OF PUBLICATIONS vi
ACKNOWLEDGEMENTS viii
TABLE OF CONTENTS x
LIST OF TABLES xvi
LIST OF FIGURES xviii
LIST OF ABBREVIATIONS xix
Chapter 1 INTRODUCTION 1
1.1 INTRODUCTION 1
1.2 BACKGROUND OF THE RESEARCH 1
1.3 RESEARCH PROBLEM 3
1.4 AIM AND OBJECTIVES 8
1.5 RESEARCH APPROACH 10
1.6 SIGNIFICANCE OF THE STUDY 12
1.7 SCOPE OF THE STUDY 15
1.8 STRUCTURE OF THE THESIS 16
1.9 CHAPTER SUMMARY 18
Chapter 2 PROPERTY VALUATION, methods AND MODELING
TECHNIQUES 20
2.1 INTRODUCTION 20
2.2 PROPERTY VALUATION 20
2.2.1 The Concept of Property Value 22
2.2.2 Property Valuation Process 24
2.3 PROPERTY VALUE DETERMINANTS 26
2.3.1 Property Value Determinants: Theoretical Framework 27
2.3.2 Property Value Determinants: Review of the Literature 31
2.4 VALUATION METHODS AND MODELING TECHNIQUES 40
2.4.1 Valuation Methods 40

xi
2.4.2 Modeling Techniques 44
2.5 PROPERTY VALUATION ACCURACY 53
2.5.1 The International Property Valuation Accuracy Studies 55
2.5.2 The Nigerian Property Valuation Accuracy Studies 57
2.5.3 The Nigerian Property Market 60
2.6 CHAPTER SUMMARY 62
Chapter 3 ARTIFICIAL NEURAL NETWORK AND HEDONIC PRICING
MODEL 65
3.1 INTRODUCTION 65
3.2 THE ARTIFICIAL NEURAL NETWORK MODEL 66
3.2.1 Background and Theory of Artificial Neural Network 68
3.2.2 Construction of Artificial Neural Network Model 71
3.2.3 Network Architecture and ANN Model Development 73
3.2.4 Strengths and Weaknesses of Artificial Neural Network 77
3.2.5 Applications of Artificial Neural Network in Property Valuation 79
3.3 THE HEDONIC PRICING MODEL 83
3.3.1 Background of the Hedonic Pricing Model 84
3.3.2 Principles of the Hedonic Pricing Model 85
3.3.3 Hedonic Pricing Model Issues 88
3.3.4 Strengths and Weaknesses of Hedonic Pricing Model 90
3.3.5 Applications of Hedonic Pricing Model in Property Valuation 91
3.4 COMPARISON OF THE PREDICTIVE ACCURACY OF HPM AND ANN 97
3.4.1 Comparative Performance of HPM and ANN in Property Valuation 99
3.5 MODELING THE NIGERIAN REAL ESTATE PROPERTY MARKET 105
3.6 CHAPTER SUMMARY 107
Chapter 4 RESEARCH METHODOLOGY 110
4.1 INTRODUCTION 110
4.2 RESEARCH DESIGN 110
4.3 RESEARCH FRAMEWORK OF THE STUDY 113
4.4 DATA COLLECTION 115
4.4.1 Data Collection for the Questionnaire Surveys 115

xii
4.4.2 Data Collection for Property Value Modeling 117
4.5 RESEARCH METHODS 121
4.5.1 Literature Review 124
4.6 ADDRESSING THE RESEARCH OBJECTIVES 124
4.6.1 Addressing Research Objective 1: Questionnaire Survey 124
4.6.2 Addressing Research Objective 2: Questionnaire Survey 125
4.6.3 Addressing Research Objective 3: Hedonic Pricing Modeling 127
4.6.4 Addressing Research Objective 4: Artificial Neural Network Modeling 127
4.6.5 Addressing Research Objective 5: Validation of the Developed Models 128
4.6.6 Addressing Research Objective 6: Questionnaire Survey 129
4.7 MODEL ACCURACY PERFORMANCE MEASUREMENT 129
4.8 DESCRIPTIVE STATISTICS AND OTHER ANALYSIS TOOLS
ADOPTED 131
4.8.1 Cronbach’s Alpha 132
4.8.2 Mean Score Ranking 133
4.8.3 Coefficient of Variation 134
4.8.4 Chi-Square 134
4.8.5 Variance Inflation Factor 135
4.9 CHAPTER SUMMARY 136
Chapter 5 DECIPHERING THE LAGOS METROPOLIS PROPERTY
VALUATION PRACTICE AND PROPERTY VALUE DETERMINANTS 137
5.1 INTRODUCTION 137
5.2 DATA COLLECTION AND ANALYSIS METHODS 137
5.2.1 Data Collection 137
5.2.2 Reliability Test 141
5.2.3 The Study Area 142
5.2.4 The Valuers’ Profile 143
5.3 THE LAGOS METROPOLIS PROPERTY VALUATION PRACTICE 146
5.3.1 Level of Awareness of the Valuation Methods 146
5.3.2 Level of Usage of the Valuation Methods 151
5.4 PROPERTY VALUE DETERMINANTS 155

xiii
5.5 THE LAGOS METROPOLIS PROPERTY VALUE DETERMINANTS 155
5.5.1 Analysis of Attributes’ Significance 155
5.5.2 Ranking of the Locational Attributes 157
5.5.3 Ranking of the Neighbourhood Attributes 158
5.5.4 Ranking of the Structural Attributes 160
5.6 SUMMARY OF RESEARCH FINDINGS 162
5.7 CHAPTER SUMMARY 164
Chapter 6 MODELING THE LAGOS METROPOLIS PROPERTY VALUES:
THE HPM APPROACH 165
6.1 INTRODUCTION 165
6.2 HEDONIC PRICING MODEL IN NIGERIA 165
6.3 DATA COLLECTION AND METHODS 166
6.3.1 The Data 166
6.4 MODEL SPECIFICATIONS 173
6.5 RESULTS AND DISCUSSION 176
6.5.1 Empirical Results 176
6.5.2 Model Performance 179
6.6 CHAPTER SUMMARY 181
Chapter 7 MODELING THE LAGOS METROPOLIS PROPERTY VALUES:
THE ANN MODEL APPROACH 183
7.1 INTRODUCTION 183
7.2 DATA COLLECTION AND METHODS 183
7.3 MODEL SPECIFICATIONS 184
7.4 RESULTS AND DISCUSSION 187
7.4.1 Model Performance 187
7.4.2 Relative Importance of the Property Attributes 191
7.5 CHAPTER SUMMARY 193
Chapter 8 A COMPARISON OF THE PREDICTIVE ACCURACY OF HPM
AND ANN TECHNIQUES 194
8.1 INTRODUCTION 194
8.2 HPM AND ANN MODEL COMPARISON IN PROPERTY VALUATION 194

xiv
8.3 DATA COLLECTION AND METHODS 196
8.4 RESULTS AND DISCUSSION 197
8.5 CHAPTER SUMMARY 203
Chapter 9 VALUERS’ RECEPTIVENESS TO AI TECHNIQUES IN
PROPERTY VALUATION 204
9.1 INTRODUCTION 204
9.2 DATA COLLECTION AND METHODS 204
9.2.1 Questionnaire Administration 205
9.2.2 Data Analysis Method 207
9.2.3 The Respondents 207
9.3 RESULTS AND DISCUSSION 208
9.3.1 Reliability Test 208
9.3.2 The Valuers’ Profile 208
9.3.3 Knowledge of the AI Valuation Techniques 211
9.3.4 Reasons for the Low Awareness and Application of the AI Techniques 214
9.3.5 Valuers’ Profile and Willingness to Acquire and Adopt AI Techniques 216
9.3.6 Enablers of the AI Valuation Techniques Adoption 217
9.3.7 Prospects of Adopting AI Valuation Techniques 220
9.4 CHAPTER SUMMARY 222
Chapter 10 CONCLUSIONS AND RECOMMENDATIONS 223
10.1 INTRODUCTION 223
10.2 REINTRODUCTION OF THE RESEARCH OBJECTIVES 223
10.3 SUMMARY OF MAJOR FINDINGS 224
10.3.1 Research Trend of the Application of ANN in Property Valuation 224
10.3.2 The Research Trend of the Application of HPM in Nigerian 225
10.3.3 The Current Property Valuation Practice in the Lagos Metropolis 226
10.3.4 Property Value Determinants in the Lagos Metropolis Property Market
228
10.3.5 Modeling the Lagos Metropolis Residential Property Values: The HPM
Approach 229
10.3.6 Modeling the Lagos Metropolis Residential Property Values: The ANN

xv
Approach 230
10.3.7 Evaluation of the Predictive Accuracy of the HPM and ANN Models 230
10.3.8 Valuers’ Receptiveness to the AI Techniques in Property Valuation 231
10.4 SIGNIFICANCE AND CONTRIBUTIONS TO KNOWLEDGE 232
10.4.1 Contributions to Theory 233
10.4.2 Contributions to Practice 234
10.5 RECOMMENDATIONS OF THE STUDY 236
10.5.1 Maintenance of a Robust Property Transactions Databank 237
10.5.2 Training of Real Estate Valuers 238
10.5.3 Collaboration between the Real Estate Scholars and the Practitioners 238
10.5.4 Overhauling of Real Estate Curriculum in Higher Institutions of Learning
239
10.5.5 Collaboration with International Real Estate Professional Bodies 239
10.6 STUDY LIMITATIONS 240
10.7 FUTURE RESEARCH 241
10.8 CHAPTER SUMMARY 242
APPENDICES 243
APPENDIX 1 244
APPENDIX 2 249
APPENDIX 3 252
APPENDIX 4 258
APPENDIX 5 262
APPENDIX 6 266
APPENDIX 7 268
References 271

xvi
LIST OF TABLES
Table 1.1: Applications of ANN in property valuation in different countries ............. 7
Table 2.1: Property attributes from the Lagos literature and the international
literature ..................................................................................................................... 38
Table 2.2: Applications of advanced valuation techniques ....................................... 52
Table 3.1: The applications of ANN techniques in different domains ...................... 67
Table 3.2: Studies of ANN applications in property valuation ................................. 82
Table 3.3: Hedonic pricing model and property attributes studies ............................ 93
Table 3.4: Details of HPM studies in real estate ....................................................... 95
Table 3.5: Accuracy measure techniques adopted in ANN and HPM studies ........... 98
Table 3.6: Summary of ANN and HPM comparative studies ................................. 104
Table 4.1: Research methods adopted for the research ........................................... 123
Table 5.1: Reliability analysis of the variables ........................................................ 142
Table 5.2: Estate surveyors and valuers’ profile ...................................................... 145
Table 5.3: Awareness of traditional valuation methods .......................................... 147
Table 5.4: Chi-square test for awareness of traditional methods and valuers’
education and experience ......................................................................................... 149
Table 5.5: Awareness of advanced valuation methods ............................................ 150
Table 5.6: Chi-square test for awareness of advanced methods and valuers’ education
and experience .......................................................................................................... 151
Table 5.7: Adoption of traditional valuation methods ............................................. 153
Table 5.8: Adoption of advanced valuation methods .............................................. 154
Table 5.9: Ranking of property value determinants ................................................ 157
Table 6.1: Descriptive statistics of the variables ..................................................... 168
Table 6.2: Definition, measurement and frequencies of the variables .................... 170
Table 6.3: Variance inflation factor test ................................................................... 174
Table 6.4: Glejser test for heteroscedasticity........................................................... 175
Table 6.5: Results of the regression analysis ........................................................... 178
Table 6.6: Predictive accuracy of the HPM approach ............................................. 180
Table 6.7: Valuation accuracy of the HPM prediction ............................................ 181
Table 7.1: Details of the ANN model ...................................................................... 187
Table 7.2: Predictive accuracy of the ANN model .................................................. 188
Table 7.3: Valuation accuracy of the ANN model predictions ................................ 190
Table 8.1: Predictive accuracy of HPM and ANN models ....... Error! Bookmark not
defined.
Table 8.2: Property valuation accuracy of the HPM and the ANN models prediction
.................................................................................................................................. 200

xvii
Table 9.1: The valuers’ profile ................................................................................. 209
Table 9.2: Knowledge of AI appraisal techniques ................................................... 213
Table 9.3: Reasons for the level of awareness and applications of the AI valuation
techniques ................................................................................................................. 215
Table 9.4: Chi-square test for valuers’ willingness to acquire and adopt AI
knowledge and their profile ..................................................................................... 217
Table 9.5: Measures to enhance the adoption of AI valuation techniques .............. 219
Table 9.6: Benefits of adopting the AI valuation techniques .................................. 221

xviii
LIST OF FIGURES
Figure 1.1: Flowchart of overall objectives of the research ........................................ 9
Figure 1.2: Decision-making flowchart .................................................................... 12
Figure 2.1: Property valuation process ..................................................................... 25
Figure 2.2: Framework of property value determinants in the Lagos metropolis ..... 30
Figure 2.3: An overview of spatial analysis operation .............................................. 47
Figure 2.4: A fuzzy logic system ............................................................................... 48
Figure 2.5: Uncertainty valuation report ................................................................... 57
Figure 3.1: The structure of a neuron ........................................................................ 69
Figure 3.2: The components of a typical processing unit ......................................... 70
Figure 3.3: Sigmoid function .................................................................................... 71
Figure 4.1: Framework of the research ................................................................... 115
Figure 4.2: Map of Lagos showing the study area for data collection .................... 119
Figure 7.1: The ANN architecture ........................................................................... 185
Figure 7.2: Expected property values against predicted property values ............... 189
Figure 7.3: The relative importance of the property attributes ............................... 192
Figure 8.1: Actual property values and the predicted values of HPM and the ANN
model ........................................................................................................................ 201
Figure 9.1: Valuers’ highest educational qualifications .......................................... 210
Figure 9.2: Location of an academic institution(s) attended ................................... 211

xix
LIST OF ABBREVIATIONS
AI Artificial intelligence
ANN Artificial neural network
ANR Additive nonparametric regression
AR Additive regression
ARIMA Autoregressive integrated moving average
ARMA Autoregressive moving average
BP Backpropagation
BQ Boys’ quarters
CBD Central business district
CBN Central Bank of Nigeria
CBR Case-based reasoning
CPI Consumer price index
COV Coefficient of variation
CSA Comparable sales analysis
EFInA Enhancing Financial Innovation and Access
ES Expert system
ESVARBON Estate Surveyors and Valuers Registration Board of Nigeria
FLS Fuzzy logic system
GDP Gross domestic product
GIS Geographic information system
GWR Geographical weight regression
HPM Hedonic pricing model
IVSC International Valuation Standards Council
JLL Jones Lang LaSalle
MAE Mean absolute error
MAPE Mean absolute percentage error
MBR Memory-based reasoning
MCPD Mandatory continuing professional development
ME Mean error
MLP Multilayer perceptron
MRA Multiple regression analysis
MS Mean score
MSE Mean squared error
MTR Mass transit railway (MTR)
NBS National Bureau of Statistics
NIESV Nigerian Institution of Estate Surveyors and Valuers

xx
OECD Organisation for Economic Co-operation and Development
OMV Open market value
RA Research Assistants
RBFNN Radial basis function neural network
RI Relative importance
RICS Royal Institution of Chartered Surveyors
RMSE Root mean square error
SAPOA South African Property Owners Association
SPSS Statistical Package for Social Sciences
SVM Support vector machine
VGC Victoria Garden City
VIF Variance inflation factor
WEKA Waikato Environment for Knowledge Analysis
YP Years’ purchase

1
CHAPTER 1 INTRODUCTION
1.1 INTRODUCTION
This chapter describes the purpose of this research by presenting the background of
the research, the research problem, the research aim and objectives and the research
approach adopted. It also presents the significance and the scope of this study. The
chapter also outlined the structure of the thesis so as to enable easier navigation
through the remaining chapters of the thesis.
1.2 BACKGROUND OF THE RESEARCH
Real estate property is an investment opportunity which has an edge against inflation.
Also, most of the human activities take place in real estate properties such as for living,
working, leisure, and so on (Smith and Zaibert, 2001). Due to the importance and the
advantages of real estate properties, a significant number of investors are attracted to
it for long-term gains. This has resulted in the total value of the world’s wealth been
estimated at US$250.1 trillion in 2015 (Credit Suisse, 2015), in which more than half
of this value is embedded in real estate assets (Giacomini et al., 2015). According to
Organisation for Economic Co-operation and Development (OECD) (2016), the real
estate industry contributed 11.55%, 11.97%, 12.13% and 6.03% to the gross domestic
product (GDP) of the UK (2015), the US (2014), Australia (2015) and China (2015),

2
respectively, during these periods1. Nigeria is a developing nation which the researcher
has a high affinity for, and it is the focus of this research. However, the real estate
sector contributed 8.64% to the Nigerian GDP in 2016Q2 (National Bureau of
Statistics, 2016b).
A principal factor considered during the process of investment decisions on real estate
property is property valuation estimates (Newell and Seabrook, 2006). Empirical
evidence from previous research has shown that property prices are positively related
to the volume of investments in construction works (Zheng et al., 2012). Furthermore,
the volume of the activities in the real estate industry and the construction sector
influences the pace of economic development (Pietroforte et al., 2000; Akinbogun et
al., 2014; Chiang et al., 2015). Thus, it can be inferred that the accuracy of property
valuation estimates has a significant impact on the economy of a nation.
Real estate investors (such as private individuals, mortgagors, mortgagees, financial
institutions, corporate investors and government authorities, among others) rely
heavily on real estate professionals’ opinions of value to make economic, investment
and financial decisions (Taffese, 2007; Adegoke et al., 2013). Thus, a misleading figure
can bring about a negative profit margin or even bankruptcy. For instance, if there is a
1 Author’s calculations.

3
large negative disparity in the valuation figure and the value the subject property
eventually commands when sold, when there is a mortgage foreclosure or when there
is a takeover. Therefore, estimating the value of real estate properties in an objective
and accurate manner is important to real estate stakeholders and the economy of a
nation at large (Yalpir, 2014).
1.3 RESEARCH PROBLEM
In estimating the value of a property, valuers usually adopt some valuation methods
which include comparable, investment, profit, contractor’s and residual methods,
which are termed as “traditional methods” (Pagourtzi et al., 2003). Previous studies
(Adair et al., 1996b; Crosby, 2000; Babawale and Ajayi, 2011; Owusu-Ansah, 2012)
have pointed out the inadequacies of the traditional valuation methods in producing
objective, reliable and accurate property values (Zurada et al., 2006).
Property valuation inaccuracy is a global problem which has attracted the attention of
scholars all over the world (Parker, 1998; Crosby, 2000; Babawale, 2013b). Webb
(1994) and Mallinson and French (2000) posited that property valuation inaccuracy
could be inevitable due to the peculiar characteristics of real estate assets. However, a
margin of error of between ± 0 and 10% is generally acceptable (Hutchinson et al.,
1996; Brown et al., 1998). Studies have shown that the inaccuracies observed within

4
the Nigerian context are beyond the acceptable global standard (Ajibola, 2010;
Babawale and Ajayi, 2011; Adegoke et al., 2013). For instance, Ogunba (2004) found
that property valuation inaccuracy errors generated in Nigeria are between 22 and 67%.
The primary reason for this level of inaccuracies has been linked to the application of
inappropriate valuation approaches (Aluko, 2007; Babawale and Ajayi, 2011).
Adegoke et al. (2013) found that the inability of the Nigerian valuers to provide
accurate valuation estimates has led to the loss of confidence among valuation report
end-users in the professionals and the profession. Also, Babawale and Alabi (2013)
reported that there is a high level of inaccuracies in the mortgage valuations carried
out by the Nigerian valuers. This has resulted in various stakeholders’ doubt of the
credibility and reliability of valuation estimates reported by the Nigerian valuers. The
study of Adegoke (2016) also confirmed this; that the inaccuracies in the property
valuations reported by the Nigerian valuers have reduced their integrity, eroded their
credibility and exposed them to professional negligence liabilities.
Recently, there has been renewed interest targeted at improving the reliability and
accuracy of property valuation estimates. Previous researches have established that
real estate professionals practicing in Nigeria are conversant with the traditional
methods of valuation (Bello and Bello, 2009; Babawale, 2012; Abidoye and Chan,

5
2016c). However, the use of the advanced valuation methods has been limited.
Considering the globalization being experienced in different property markets around
the world, there is a need to shift from the traditional methods towards advanced
approaches so as to achieve a sustainable property valuation practice (Wiltshaw, 1995;
Gilbertson and Preston, 2005).
The quest for robust and reliable property valuation methods by researchers has led to
the development of a number of valuation approaches. The Hedonic Pricing Model
(HPM) is one of such methods, which has been widely adopted in the real estate
research domain (Bender et al., 2000; Babawale et al., 2012) across the world (Adair
et al., 1996b; Tse and Love, 2000; Ge, 2009). HPM is an analytic technique which is
designed for valuing utility bearing capacity goods (Selim, 2008), based on the
regression of the independent variables of the subject under consideration against its
dependent variable (Limsombunchai et al., 2004). In Nigeria, especially in the Lagos
metropolis property market, scholars have used HPM to model property values in
different submarkets in the state (Olayiwola et al., 2005; Aluko, 2011; Babawale et al.,
2012; Oloke et al., 2013; Famuyiwa and Babawale, 2014, amongst others). There are
several drawbacks of the HPM approach which include, but are not limited to: (1)
selecting the best functional form (Lin and Mohan, 2011), (2) inability to handle
outliers (Selim, 2008), and (3) the issue of multicollinearity of variables and

6
heteroscedasticity (Limsombunchai et al., 2004), amongst others. These shortcomings
affect the quality of property valuation estimates computed with the HPM approach.
In order to address the shortcomings of the HPM approach, new modeling techniques
(such as artificial neural network {ANN}) have been applied in property valuation
research (Do and Grudnitski, 1992; Evans et al., 1992; Tay and Ho, 1992; Bagnoli and
Smith, 1998; Amri and Tularam, 2012). ANN is a type of artificial intelligence (AI)
modeling techniques designed to function like the biological neural network to handle
the complex relationship which exists between the input and output of the subject
under consideration (Mora-Esperanza, 2004). It has a learning ability and process
commands by the interplay of the network neurons which mimics the human brain
neurons (Taffese, 2006).
The ANN technique has been applied successfully and produced excellent results in
diverse disciplines, including health and medicine (Zhang and Berardi, 1998),
accounting and finance (Tam and Kiang, 1992), engineering and manufacturing (Dvir
et al., 2006), marketing (Thieme et al., 2000) and general application (Chang, 2005),
for prediction, pattern recognition, classification, nonlinear mapping, and so on
(Paliwal and Kumar, 2009).
In the real estate industry, researchers have applied ANN in property valuation and it

7
has produced excellent results. Some instances of the application of ANN in property
valuation are presented in Table 1.1.
Table 1.1: Applications of ANN in property valuation in different countries
Author(s) Countries
Borst (1991) United States
Do and Grudnitski (1992) United States
Evans et al. (1992) United Kingdom
Tay and Ho (1992) Singapore
Rossini (1997) Australia
Cechin et al. (2000) Brazil
Limsombunchai et al. (2004) New Zealand
Lam et al. (2008) Hong Kong
Selim (2009) Turkey
McCluskey et al. (2013) United Kingdom
Abidoye and Chan (2016b) found that in almost all the ANN studies (property
valuation related), the outstanding performance of ANN in terms of predictive
accuracy in property valuation is affirmed when compared with the HPM approach.
The excellent performance of the ANN technique over other advanced models:
additive nonparametric regression (ANR), expert system (ES) and fuzzy logic system
(FLS) approach, has also been established (see, for example, Pagourtzi et al., 2007;
Lin and Mohan, 2011; Amri and Tularam, 2012).
The property valuation practice in Nigeria, especially in the Lagos metropolis, being
the most active property market in Nigeria (Oni, 2010), has been dominated by the
adoption of traditional methods of valuation and the HPM approach. Such practice has

8
made valuation inaccuracy unavoidable in property valuation reports which real estate
valuers produce to meet the demand of their clients for state-of-the-art services in the
twenty-first century (Gilbertson and Preston, 2005). The situation in Nigeria of date is
that there has not been any concerted effort to examine the efficacy of applying
advanced valuation approaches in the property market, which could produce reliable
and accurate property valuation estimates.
Against this background, this research aims to apply the ANN technique to the Lagos
metropolis property market in Nigeria, and to investigate if the ANN technique can
actually outperform the widely adopted HPM in terms of their ability to accurately
predict property values. The results of this research will be useful to real estate scholars
and valuers in Nigeria, and beneficial to both the local and foreign real estate
stakeholders interacting in the Nigerian property market.
1.4 AIM AND OBJECTIVES
The aim of this study is to investigate the predictive accuracy of HPM and ANN in
property valuation, in a bid to improve the accuracy of property valuation estimates in
the Lagos metropolis property market in Nigeria.
In order to achieve this aim, the following objectives are pursued:
(i) to assess the current property valuation practice in the Lagos metropolis;
(ii) to identify and generate a list of attributes that influence residential property
9
values in the Lagos metropolis property market;
(iii) to develop a hedonic pricing model for the Lagos metropolis residential
property market;
(iv) to develop an artificial neural network model for the Lagos metropolis
residential property market;
(v) to evaluate the predictive accuracy of HPM and the ANN model developed for
the Lagos metropolis residential property market; and
(vi) to assess the Nigerian valuers’ receptiveness to the application of the AI
techniques in property valuation.
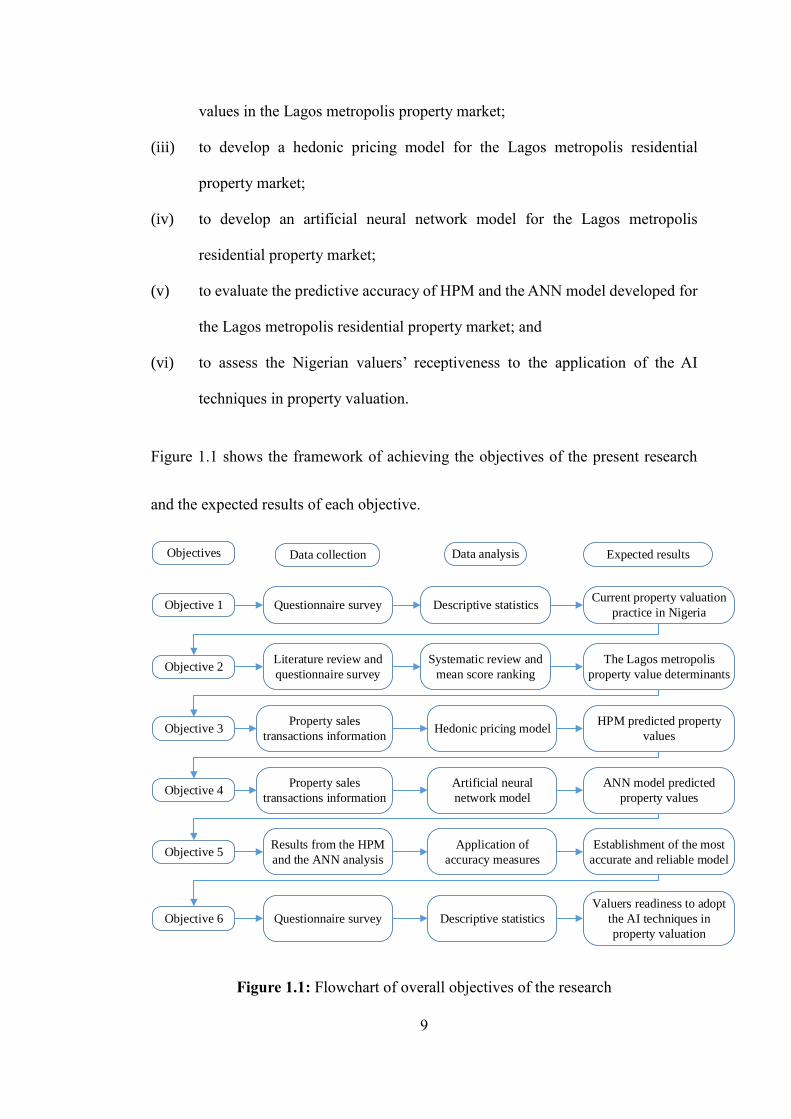
Figure 1.1 shows the framework of achieving the objectives of the present research
and the expected results of each objective.
Objectives Data collection Data analysis Expected results
Objective 1 Questionnaire survey Descriptive statisticsCurrent property valuation
practice in Nigeria
Objective 2Literature review and
questionnaire survey
Systematic review and
mean score ranking
The Lagos metropolis
property value determinants
Objective 3Property sales
transactions informationHedonic pricing model
HPM predicted property
values
Objective 4Property sales
transactions information
Artificial neural
network model
ANN model predicted
property values
Objective 5Results from the HPM
and the ANN analysis
Application of
accuracy measures
Establishment of the most
accurate and reliable model
Objective 6 Questionnaire survey Descriptive statistics
Valuers readiness to adopt
the AI techniques in
property valuation
Figure 1.1: Flowchart of overall objectives of the research

10
1.5 RESEARCH APPROACH
The data used in this study were collected from both primary and secondary sources.
A literature review was conducted to extract information related to the research topic
from journals articles, conference proceedings, PhD theses, books and reports of
organizations sourced from various search engines and databases. Also, questionnaire
surveys were conducted to collect information from real estate professionals practicing
in the study area on the valuation approaches adopted in practice, variables which
influence property values and the willingness to adopt the AI techniques in property
valuation.
Historical sales transactions data were retrieved from registered real estate firms
operating within the Lagos metropolis. The firms were contacted for historical
information/data from their databanks. The collated data were used for the
development of both the ANN model and HPM. The Statistical Package for Social
Sciences (SPSS) version 20.0 was used for the HPM analysis and for the descriptive
statistical analysis of the questionnaires. On the other hand, the R programming
software and the Rminer package were employed for the construction of the ANN
model.
A key objective of this research is to establish the predictive accuracy of HPM and the

11
ANN model for the Lagos metropolis property market. Therefore, the mean absolute
percentage error (MAPE), the mean absolute error (MAE), the root mean square error
(RMSE) and the coefficient of determination (r2) accuracy measure techniques were
used to evaluate the predictive accuracy performance of both models. In addition, the
percentage of property values that were predicted by the developed models and that
had percentage errors within the acceptable global margin of error was also established
for the evaluation of the models. Figure 1.2 shows the research approach flowchart for
this study, while the detailed research methodology is provided in Chapter 4.

12
A
N
A
L
Y
S
I
S
S
Y
N
T
H
E
S
I
S
Formulation of the problem
Specification of property
attributes
Modeling of the property
values
Current property valuation practice
Analysis of residential property value
determinants
Hedonic pricing model
Artificial neural network
Outputs of the HPM Outputs of the ANN model
Comparison of the HPM and the ANN models
Prospects of the AI valuation techniques in practice
Conclusions and recommendations
E
V
A
L
U
A
T
I
O
N
Figure 1.2: Decision-making flowchart
Adapted from: Aragonés-Beltrán et al. (2010)
1.6 SIGNIFICANCE OF THE STUDY
This research focuses on the development of an accurate and reliable model for
property valuation. Studies have shown that there is a strong relationship between the
property market and economic growth, especially in developing countries (Giang and
Pheng, 2011). As discussed in Section 1.2, it is evident that property valuation estimate

13
is a major factor that influences investment decisions of relevant real estate
stakeholders. Thus, it is important to have a model that can be used as a decision
support tool to facilitate accurate estimation of property values. The present research
makes the following contributions to knowledge and the real estate practice in Nigeria
and beyond.
First, evidence abounds in the literature that shows that inaccurate property valuation
is a problem in the Nigerian property market (Babawale and Alabi, 2013). This
inaccuracy could be explained in part by the subjectivity associated with traditional
approaches and the lack of property transactions databank. To address this problem,
the current research explores the efficacy of using ANN as a model for predicting
property values. This study provides a comprehensive review of the literature on
property valuation. In addition, it offers deep insight into the factors that influence
property values in the context of Nigeria. The findings present a case why the
application of ANN in property value prediction can be instrumental in leading to a
shift in the property valuation practice, especially in Nigeria. This provides the
justification for the adoption of advanced modeling techniques (such as ANN) in
property valuation both in practice and research. This would increase the relevance
and competitiveness of Nigerian valuers, both locally and in the international property
market.

14
Second, the literature shows that the determinants of property value vary across
different countries and locations. Theoretically, the present study attempts to develop
models that can adequately capture the interaction between property value and its
determinants. This information provided by the models developed in this research are
useful to researchers and practitioners. This will help identify attributes that should be
incorporated in new property development to maximize return on investments. Also,
the determinants can be used for the development of property valuation models in other
developing countries.
Finally, the origin of the global financial crisis which occurred between 2007 and 2009,
has been traced to the real estate industry (Jiang et al., 2013). The economic crisis may
be due to the inefficient and the inaccurate property valuation approaches adopted.
Thus, it is necessary to develop a reliable model for property value estimation to
support decision-making relating to the mortgage sector. The ANN model developed
in this research provides reliable and accurate predictions of property values. It can
serve as a learning tool for stakeholders involved in mortgage financing, property
development financing, real estate portfolio management and to financial service
providers. This would facilitate sustainable growth of the property market and the
economy of Nigeria.

15
1.7 SCOPE OF THE STUDY
The property market is a localized market (Glindro et al., 2008), and as such, a study
of this nature must be adaptable and significant to a particular geographical location
(Famuyiwa and Babawale, 2014). Bearing this in mind, this research focuses on the
Lagos metropolis property market, which is the most vibrant property market in
Nigeria (Dugeri, 2011). The sophistication of the stakeholders in this property market
has made the Lagos metropolis to be a peculiar city in Nigeria (Oni, 2010). The
metropolis houses the head offices of about 95% of Nigeria’s commercial banks, and
most multinational companies operating in the country (Babawale and Oyalowo, 2011;
Central Bank of Nigeria, 2015). Also, more than half of the registered real estate firms
in Nigeria have their head offices in the Lagos metropolis (Ibiyemi and Tella, 2013).
The rich financial and commercial activities that take place in the Lagos metropolis
have led to high demand for the valuation of real estate properties for different
purposes by diverse real estate investors. However, this research is restricted to the
estimation of capital values of residential properties in the metropolis and focuses on
measuring and comparing the predictive accuracy of the ANN model and HPM
valuation techniques in the Lagos metropolis property market.

16
1.8 STRUCTURE OF THE THESIS
This research is organized and presented in ten chapters described as follows:
Chapter 1 introduces this research by stating the research problem and the aim and
objectives of this study. It briefly describes the research approach adopted for the
present research, the significance, as well as the scope of this study. And, finally, it
presents the outline structure of this thesis. Chapter 2 reviews the literature and
explains the concept of property value, property valuation and property value
determinants. It further reviews various valuation methods, modeling techniques and
property valuation accuracy. Finally, it presents a brief detail of the Nigerian property
market.
Chapter 3 reviews the two modeling techniques under consideration in this research,
namely HPM and ANN. The chapter reviews the literature on ANN, as well as HPM
in terms of their nature, structure, operations, pros and cons and their applications in
the property valuation domain. The remaining part of the chapter presents literature on
studies which compared the predictive accuracy performance of both models in
different property markets around the world. Chapter 4 presents the research
methodology adopted for this research. The research design, the research methods, the
data collection process and the data analysis tools adopted are explained in detail in

17
this chapter.
Chapter 5 presents the empirical evidence of the current property valuation practice in
the Lagos metropolis, which reveals the property valuation methods prevalent in the
Lagos metropolis. The empirical evaluation of the residential property value
determinants in the Lagos metropolis is also reported in Chapter 5.
Chapter 6 presents the results of HPM developed for the Lagos metropolis property
market from the collected data in the study area. Chapter 7 is structured similarly to
Chapter 6, by presenting the outputs of the ANN model developed for the Lagos
metropolis property market using the same data set.
Chapter 8 discusses the evaluation of the outputs of both the ANN model and HPM.
The predictive accuracy of both models is compared and evaluated. Chapter 9 presents
the response of the Nigerian valuers as regards their willingness to embrace the AI
valuation techniques in practice.
Chapter 10 concludes the thesis by firstly restating the research objectives and
summarizing the research findings. It also provides the research’s contributions to
knowledge and proffers some recommendations. The limitations of this study and
finally, the direction of future research are presented in this chapter.
The overall structure of this thesis is presented in Figure 1.

18
Chapter One
Introduction
Chapter Two
Property valuation and modeling techniques
Chapter Three
Artificial neural network and hedonic pricing
model
Chapter Four
Research methodology
Chapter FiveDeciphering the Lagos metropolis property
valuation practice and property value determinants
Chapter SevenModeling the Lagos metropolis property values:
The artificial neural network approach
Chapter Six
Modeling the Lagos metropolis property values:
The hedonic pricing model approach
Chapter Eight
Accuracy of property valuation models:
A comparison of HPM and ANN techniques
Chapter Nine
Valuers' receptiveness to the AI techniques in
property valuation
Chapter Ten
Conclusion and recommendations
Figure 1.3: Overall flowchart of this thesis
1.9 CHAPTER SUMMARY
This chapter presents the background of the PhD study, the research problem, the aim
and objectives of this research and the research approach adopted. It also highlights
the significance and the scope of this study. The next chapter presents a review of
property valuation, property value determinants, property valuation methods,

19
modeling techniques, and property valuation accuracy. The review will present an
insight into the body of knowledge on these issues related to this research.

20
CHAPTER 2 PROPERTY VALUATION, METHODS AND
MODELING TECHNIQUES
2.1 INTRODUCTION
The previous chapter presents the introduction to this study by describing the research
problem, the research aim and objectives, the scope of this study, a brief research
approach and the significance of this study. This chapter, provides a review of
important areas of this research retrieved from articles sourced from online databases
and search engines which include Springer, Science Direct, ProQuest, Taylor &
Francis and Google Scholar. It explains the property valuation process by presenting
different views about the process. The various factors that determine the value of a real
estate property are evaluated and a theoretical framework was developed. Property
valuation methods and modeling techniques found in the literature (namely traditional
methods and advanced methods) are discussed and evaluated. The issue of property
valuation inaccuracy, which is an international issue, as well as the Nigerian property
market, are discussed.
2.2 PROPERTY VALUATION
Real estate property is a form of long-term investment in which stakeholders invest in
so as to recoup capital or regular flow of income at a future date (Shapiro et al., 2012).
Generally, a rational investor would occasionally or regularly request to know the

21
value of his/her investment at every point in time, for the purpose ranging from sales
and purchase of interest, letting or leasing of property, development feasibility and
viability appraisal, alternative use, financial reporting and secured lending, amongst
other purposes (Scarrett and Osborn, 2014). The characteristics of the property market
which include imperfection, heterogeneous, complex legal interest, complicated land-
related laws and regulations have made the services of a real estate professional
unavoidable by a rational real estate investor (Shapiro et al., 2012). The services of
real estate professionals are essentially needed amongst others to estimate the
monetary value of an interest in land and landed properties (Pagourtzi et al., 2003).
Authors have ascribed different meanings to the word ‘property valuation’.
Czernkowski (1990) defines property valuation as the process of transforming some
given set of data which include age, size, location and proximity to services into a
single output (value). That is, property valuation is patterned to an extent to follow a
set of rules (heuristics) with a combination of facts to infer new facts (conclusions) to
achieve the desired output (valuation figure). In another context, French and Byrne
(1996) posit that property valuation is the estimation of the worth of an interest in a
property, through the application of valuation approaches which is a reflection of the
subject property characteristics and the circumstances surrounding the exchange of the
interest in the open market. Millington (2000, p. 4) describes valuation as:

22
The art, or science, of estimating the value for a specific purpose of a
particular interest in property at a particular moment in time, taking into
account all the features of the property and also considering all the underlying
economic factors of the market, including the range of alternative investments.
Thus, property valuation is the processing of the property related characteristics, as
well as the subject property market information in estimating the value which the
interest in a real estate property could be exchanged in an open market. In the following
subsections, property value and property valuation process are discussed.
2.2.1 The Concept of Property Value
According to Webster Online Dictionary (2015), value is “the property or aggregate
properties of a thing which it is rendered useful or desirable, or the degree of such
property or sum of properties; worth; excellence; utility; importance”. The word ‘value’
has been commonly used interchangeably with other related concepts - ‘price’ and
‘worth’. However, the distinction amongst them, according to French (2004), is that:
a. value can be referred to as market value, an estimation of the probable price
that a property can be exchanged for when sold in the open market;
b. price is the actual amount a property is sold in the open market; and
c. worth is a subjective perception of an individual as to the capital sum or stream
of income s/he is prepared to accept (seller/landlord) or pay (buyer/tenant), for
the exchange of an interest in a land or a landed property.

23
In a perfect property market, the price of a property is a function of the value the buyer
and the seller place on it at any given time, and sometimes, the price may also reflect
the interest of a third party, for instance, tax authority, other stakeholders in the
property market, the agents and the general submarket condition (Daly et al., 2003).
In an effort to present a generally acceptable meaning of the open market value (OMV),
Royal Institution of Chartered Surveyors (RICS) (1991, p. SAVP 2:1) 2 practice
statement describes OMV as “an opinion of the best price at which the sale of an
interest in property would have been completed unconditionally for cash consideration
on the date of valuation”, assuming some stated conditions are met. Furthermore, the
International Valuation Standards Council (IVSC) revised the definition of market
value and it was adopted and presented in the Red Book of Royal Institution of
Chartered Surveyors (RICS) (2012, p. 12) as:
the estimated amount for which an asset or liability should exchange on the
valuation date between a willing buyer and a willing seller in an arm’s length
transaction after proper marketing and where the parties had each acted
knowledgeably, prudently and without compulsion.
This suggests that market value is the value achieved by both buyers and sellers when
2 SAVP means Statements of Asset Valuation Practice and Guidance Notes

24
the interest in a land or landed property is exchanged in a transparent process.
2.2.2 Property Valuation Process
The main purpose of embarking on a valuation exercise is to estimate an accurate
property value, buttressed with movements in the property market by analysing the
implicit market behaviour to arrive at the probable property value (Lawson, 2008).
Property valuation process involves systematic procedures which the valuer observes
in estimating the property value. The process involves the application of both
mathematical calculation and the valuers’ market opinion formed by market
experience, and this has made property valuation to be referred to both as an ‘art’ and
a ‘science’ (Kummerow, 2003; Azmi et al., 2013).
Appraisal Institute (2013) describes the property valuation process as involving
problem identification, the collection of relevant market and subject property data,
verification and analysis and the communication of the value opinion to the client.
Appraisal Institute (2013) developed a framework for property valuation process
which involves eight steps to be followed in a valuation exercise. The process starts
with the identification of the problem and ends with the reporting of defined value to
the client as shown in Figure 2.1.

25
Site value opinion
Application of the approaches to value
Reconciliation of value indications and final opinion of value
Report of defined value
CostSales comparison Income capitalization
Scope of work determination
Identification of the problem
Intended use Purpose of the
assignment Effective date
of the opinion
Relevant characteristics
of the property
Client and
intended user
Data analysis
Market analysis
Demand studies
Supply studies
Marketability studies
Highest and best use analysis
Site as though vacant
Ideal improvement
Property as improved
Data collection and property description
Market area data
General characteristics
of region, city and
neighbourhood
Subject property data
Specific characteristics of
land and improvements,
personal property, asset etc.
Comparable property data
Sales, listings, offerings,
vacancies, cost and depreciation,
capitalization rate etc.
Figure 2.1: Property valuation process
Adopted from: Appraisal Institute (2013, p. 8)
The steps in the valuation process presented in Figure 2.1 can be summarized into three
distinct phases: i) data, ii) analysis, and iii) valuation, and every stage’s accuracy and
reliability are determined by the quality of the previous stage (Tretton, 2007). This
suggests that in executing a valuation instruction, the first step is to gather information

26
about the subject property and from the local property market under consideration.
This information is analyzed, and this stage is where the real estate professional’s
experience and skills are applied to deduce facts from the gathered data, as well as
apply the most appropriate valuation approach. In the final stage, the valuer
pronounces the opinion of the value of the property to the client in the form of a formal
written report.
2.3 PROPERTY VALUE DETERMINANTS
Globally, the values of real estate properties are determined by different attributes due
to economic, cultural, legal and financial structural peculiarities of each country
(Jenkins, 2000; Olayiwola et al., 2005). Scholars (Jenkins, 2000; Li et al., 2011) have
emphasized that location is a critical factor that influences property value. This is quite
obvious in the real estate practice when property buyers or tenants inform the real
estate professionals the areas/locations in which they prefer to live or invest in when
engaging their services.
Undoubtedly, a property market is a localized market (Ajide and Alabi, 2010; Galbraith,
2013). An earlier study of Dale-Johnson (1982) also posits that in conducting property
price analysis, market segmentation should be considered. This has necessitated the
wide use of the case study research approach in property valuation studies in different

27
countries around the world. This could be attributed to the peculiarity of each economy,
as well as the delineation of property markets into submarkets in a particular location.
The theoretical framework and literature review of property value determinants are
presented in the following subsections.
2.3.1 Property Value Determinants: Theoretical Framework
Studies conducted in different property markets around the world have shown that the
value of a property is determined by some sets of variables which have been
categorized into groups (Tse and Love, 2000; Kauko, 2003; Oloke et al., 2013;
Famuyiwa and Babawale, 2014). The classification of these variables as theorized by
Chin and Chau (2002) are the locational, the structural and the neighbourhood factors.
A further analysis of Chin and Chau (2002) showed that most of the structural
attributes contribute positively to property value with the only exception of the age of
the property. Whereas some of the locational attributes and neighbourhood attributes
impact property value positively, others negatively affect property values.
Wong et al. (2002) classified property attributes into three classes: location attributes
(access to social and economic facilities); structural traits (floor area, floor height etc.),
and neighbourhood characteristics (neighbourhood quality). Also, property value
determinants were grouped into three categories in the study of Wen et al. (2005). The

28
categorization corroborates with those in the literature which are the structural, the
neighbourhood and the locational attributes. Property value has been established to be
a function of some set of attributes in the real estate domain and those attributes are
inherent attributes, neighbourhood characteristics, accessibility and environmental
quality (Choy et al., 2007).
Pozo (2009), however, noted that the independent variables that influence property
values are explained by the structural, the neighbourhood and the locational factors.
Ajide and Alabi (2010) argued that property value determinants are classified into three
groups, namely the structural traits, the neighbourhood characteristics and the
locational traits. Likewise, Babawale et al. (2012) asserted that property values are
determined by attributes which are categorized into three classifications which include
the location attributes, the structural and the neighbourhood attributes.
The residential location theory centers on the principle that utility is a function of
accessibility to the central business district (CBD) (Wilkinson and Archer, 1973).
However, in analyzing residential property location, accessibility is considered not
only to the CBD but in relation to other social activities like schools, public transport
and recreational center, among others (Jenkins, 2000). Residential locational attributes
are variables which relate to access to both social and economic facilities (Mok et al.,

29
1995). The social and economic facilities that surround a property influence its value,
probably because accessibility to these facilities would determine the travel time and
the cost to access them, which home seekers would likely consider when making sound
real estate decisions.
Property structural attributes are property specific and have been established to be
highly significant in property value formation and are hence, widely adopted in
property value analysis studies (Wilhelmsson, 2000). Palmquist (1984) found that
structural attributes have the high contributory power to property values in the US.
Wen et al. (2005) also reported that structural characteristics contribute 60% to
property values formation.
Neighbourhood classification consists of attributes which are regarded as public
services provided within a neighbourhood which residents make use of. The
significance of neighbourhood attributes in property value formation cannot be
underestimated, as Linneman (1980) reported that neighbourhood characteristics
explains between 15 and 50% of property value and explains as much as 100%, where
the properties in the neighbourhood are similar in terms of structural characteristics.
Based on the broad classified of property value determinants in the literature, a
framework of the property value determinants in the Lagos metropolis property market

30
was constructed. To this end, a systematic review of studies focused on the Lagos
metropolis was conducted. This was conducted in three phases: i) the search of online
databases and search engines, ii) the use of selection criteria to filter search results,
and iii) the review of selected published studies. Based on the results of the systematic
review, a framework of the property market was developed as presented in Figure 2.2.
This framework depicts what is obtainable in the Lagos metropolis property market.
Figure 2.2: Framework of property value determinants in the Lagos metropolis
Source: Abidoye and Chan (2016a, p. 286)
Location
Accessibility to school
Accessibility to shopping mall
Accessibility to place of work
Accessibility to CBD
Accessibility to public transport facility
Proximity to highway
Availability of electricity
Neighbourhood characteristics
Availability of pipe borne water supply
Availability of waste disposal system
Availability of neighborhood security
Age of the property
Numbers of bedrooms
Size of bedrooms
Number of bathrooms/toilets
Building characteristics
State of repair of the property
Size of property
Availability of security fence
Locational
Neighbourhood
Structural
Property
value

31
2.3.2 Property Value Determinants: Review of the Literature
The significance attached to real estate properties by different stakeholders has
warranted a number of studies conducted in different economies of the world, to
investigate the variables that influence property values and the dynamics of property
values in these property markets.
The early study of Ball (1973) reviewed studies conducted between 1965 and 1973 in
the US and the UK which examined the determinants of property values in these
property markets. Locational attributes in terms of distance to social facilities/activities
such as CBD and place of work appeared to be more significant in determining
property value in these studies. Ball (1973) further added that property values in cities
are influenced by the geographical setting and historical evolution of the submarket,
the income level of the residents, the level of transportation technological advancement
available, the extent of the concentration of activities at CBD, and the willingness of
the residents to travel to CBD and also to take up houses in the submarket.
Sirmans et al. (2005) reviewed 125 studies that adopted the HPM approach in
measuring the influence of property characteristics on property values in the US. The
authors extracted the variables which appeared often in literature in terms of their
number of appearances, the number of positive impacts, the negative impact and the

32
number of times not significant to property value determination. The analysis shows
that the age of a property is the most frequently used variable and expectedly, its
negative impact on property values was recorded in 63 instances out of the 78
appearances. The property square feet, the garage space, the number of bathrooms and
the number bedrooms were positive in almost all of their appearances.
Using Hong Kong as a study area, Tse (2002) examined the influence of property
characteristics on property value. The study used data collected from six housing
estates which witness a high number of transactions. Accessibility to mass transit
railway (MTR) station was found to be highly significant to property value formation
in Hong Kong, probably because most of the low and middle-income earners depend
on it for transportation in the city. In addition, the presence of a sea view, the
availability of clubhouse and the high floor level were found to positively influence
property values. Expectedly, the age of a property contributes negatively to property
values. Conclusively, the study discovered that the availability of more than two
bathrooms in a property negatively influences property values, as an increase in the
number of bathrooms results in smaller bedroom size, due to the high price/sqft of
properties in Hong Kong. This suggests that home buyers prefer to have more space
than more bathrooms in Hong Kong.

33
Mbachu and Lenono (2005) examined the factors that influence residential property
values in South Africa. The authors surveyed the opinion of professional members of
the South African Property Owners Association (SAPOA) in Johannesburg, as regards
the significant attributes which determine property values. It was reported that the
property location, the market conditions, the microeconomic and macroeconomic
dynamics and the building features are the most significant variables that affect
residential property market values.
Wen et al. (2005) constructed HPM equation for the Hangzhou’s property market in
China. The authors employed 18 independent variables but found that 14 of those 18
variables significantly influence property values. These variables include the floor area,
the distance to West Lake, the distance to CBD, the inner environment, the traffic
condition, the decoration degree, the garage, the environment, the housing story, the
entertainment facility, the community management, the transaction time, the attic and
the proximity to the university. Others which include the age of property were found
to adversely influence property values.
The prices of residential properties in Hong Kong was modelled by Choy et al. (2007)
adopting the HPM approach. The authors collected 749 sales and purchase transactions
data from residential apartments in Taikoo Shing housing estate in Hong Kong. It was

34
found that almost all the variables considered are statistically significant and produced
all expected signs. However, the author concluded that when an apartment is located
on an ‘unlucky number’ floor, it negatively affect its values, whereas an apartment
situated on a ‘lucky number’ floor enjoys a premium in terms of higher value. The
explanation for this is that in the Chinese culture, “luck” is attributed to some numbers
such an 8 (Bourassa and Peng, 1999; Chau et al., 2001), so a premium is added to the
value of apartments situated on floor 8, 18, 28, and so on.
The property market and structure of Malaga, one of the most active cities in Spain
was explored by Pozo (2009). The author selected structural and location variables for
the study and retrieved data from the database of real estate companies, Municipal
Census Office and the IT Department in Malaga. The study reported that the floor area
of the property, the private parking space, the natural light, the number of bathrooms,
the proximity to the coast and the location of the property significantly influence
property values in Spain.
Anim-Odame et al. (2009) measured the determinants of property value. The authors
collated 2,950 property transactions data from five different districts in Ghana which
were consummated between 1992 and 2005. The number of bedrooms, the number of
stories, the quality of landscaping, the property size and type, the security of tenure,

35
the plot size and the location were established to be significant determinants of
property values.
Messah and Kigige (2011) examined the determinants of property value in Meru,
Kenya. The study found that the income of real estate investor is the most highly
significant property value determinant which contributes 70% to property value
formation, while demand for properties contributes 20%. Surprisingly, the location of
a property is not significant to property value formation in Kenya, as it contributed
about 3% to property values.
The relationship between property value and some major property components was
studied by Boye (2012). The author used a few variables (the gross area of the property,
the plot size, the number of apartment units and the number of parking space) for the
study. All these variables fit well into the model by producing a high r2 in all the models
developed and further analysis revealed that they are all significant determinants of
property value in Ghana.
The study of Sanjari (2012) in Iran, reported that only eight out of the 16 variables
used to construct the hedonic model were found to be significant in property value
formation. These variables include the gross floor area, the distance from CBD, the
stone façade, the floor level, the land area, the distance to the park and the parking

36
facilities.
Adegoke (2014) researched into the critical factors which determine the values of
residential properties in Ibadan metropolis, Nigeria. The study examined the factors
which affect different classes of property (tenement, bungalow and detached house),
but generally, the number of living rooms, the number of bedrooms, the existence of
burglary alarm in a property and the number of toilets are the most important
determinants of property values.
The determinants of the prices of flats in the city of Paris, France, was examined by
Baltagi et al. (2015). A rich data of 156,896 sales transactions of flats sold between
1990 and 2003 was used for the study. The authors reported that the number of
bathrooms, the maid’s room, the availability of garage and the balcony are the most
significant property attributes. One extra unit of these variables contributes €293/m2,
€254/m2, €326/m2 and €385/m2, respectively, to the price of a flat.
Studies carried out in the Lagos metropolis property market were reviewed alongside
these conducted in other property markets of the world. A total of 20 attributes were
found to be significant in those studies as shown in Table 2.1. From the Lagos
metropolis studies, it is clear that the availability of neighbourhood security
significantly influences property value in the metropolis, at the same time, the

37
accessibility to the place of work, the number of bedrooms and the number of
toilets/bathrooms appeared more often too. In contrast, in the international property
markets, the emphasis is placed on the size of a property in property value formation.
On a category basis, structural variables appeared often as property value determinants
in other international real estate markets, except for property location under the
locational category. This cross-national analysis reveals that different set of variables
influence property values in Lagos, Nigeria, compared with other parts of the world.
These disparities could be explained by the peculiarities of different property markets
which is shaped by the characteristics of the stakeholders in terms of their preferences,
purchasing power and culture, amongst other factors.

38
Table 2.1: Property attributes from the Lagos literature and the international literature
Property attributes
The Lagos metropolis studies Selected international literature
Ola
yiw
ola
et
al.
(20
05
)
Bel
lo a
nd
Bel
lo (
20
07
)
Aji
de
and
Kar
eem
(2
01
0)
Bab
awal
e an
d J
oh
nso
n (
201
2)
Bab
awal
e et
al.
(2
01
2)
Olo
ke
et a
l. (
20
13)
Fam
uy
iwa
and
Bab
awal
e (2
014
)
No
. o
f v
aria
ble
occ
urr
ence
Mb
ach
u a
nd
Len
on
o (
200
5)
Ch
oy
et
al.
(20
07)
Ge
and
Du
(2
007
)
Sel
im (
20
08)
Zie
tz e
t al
. (2
008
)
Po
zo (
200
9)
An
im-O
dam
e et
al.
(2
009
)
San
jari
(2
012
)
Bal
tag
i et
al.
(2
01
5)
No
. o
f v
aria
ble
occ
urr
ence
Locational attributes
Location ✓ 1 ✓ ✓ ✓ ✓ 4
Accessibility to place of work ✓ ✓ ✓ 3 0
Accessibility to CBD ✓ 1 ✓ 1
Accessibility to public transport facility ✓ ✓ 2 ✓ ✓ 2
Proximity to highway ✓ 1 0
Accessibility to school ✓ 1 0
Accessibility to shopping mall ✓ 1 0

39
Source: Abidoye and Chan (2016a, pp. 287-288)
Table 2.1: Continuation
Neighbourhood attributes
Neighbourhood characteristics ✓ ✓ 2 0
Availability of neighbourhood security ✓ ✓ ✓ ✓ ✓ ✓ 6 ✓ 1
Availability of electricity ✓ ✓ 2 0
Availability of pipe borne water supply ✓ ✓ 2 ✓ 1
Availability of waste disposal system ✓ ✓ 2 ✓ 1
Structural attributes
State of repair of the property ✓ 1 0
Size of property ✓ 1 ✓ ✓ ✓ ✓ ✓ ✓ ✓ 7
Age of the property ✓ 1 0
Numbers of bedrooms ✓ ✓ ✓ 3 ✓ ✓ ✓ ✓ 4
Number of bathrooms/toilets ✓ ✓ ✓ 3 ✓ ✓ ✓ 3
Building characteristics ✓ 1 ✓ ✓ ✓ ✓ 4
Availability of security fence ✓ 1 ✓ 1
Size of bedrooms ✓ ✓ 2 ✓ 1

40
2.4 VALUATION METHODS AND MODELING TECHNIQUES
Several methods and modeling techniques have been used in property valuation
research and practice. These methods and techniques can be found in the literature
(Özkan et al., 2007). The appropriate valuation approach to be adopted in property
valuation depends on the amount of information available, the use and type of the
subject property and the purpose of the valuation exercise (Vos and Have, 1996).
Although there is no best method or modeling approach applicable to all property
valuation problems (Tse, 1997; Pagourtzi et al., 2007), the differences in stakeholder’s
perception on the acceptability of a particular approach and real estate properties
(goods) suggest the application of different methods of valuation to meet the present
need (French and Byrne, 1996; Yacim and Boshoff, 2014). The cultural experience,
the socio-economic and also the profile and exposure of the real estate professionals
practicing in a country would determine the methods of valuation which would be
adopted for property valuation in the nation (Pagourtzi et al., 2003; Tao, 2010).
2.4.1 Valuation Methods
Pagourtzi et al. (2003) present a classification of property valuation methods adopted
in practice and theory. This classification includes traditional valuation methods which
basically rely on the direct comparison from which the valuer draws a conclusion on
the value of the subject property (Yacim and Boshoff, 2014). According to Pagourtzi

41
et al. (2003, p. 386), the traditional property valuation methods include;
i. Comparable method
ii. Investment/income method
iii. Profit/accounts method
iv. Residual/development method
v. Cost/contractor’s method
Others are the advanced valuation methods. The details of the advanced methods
which are occasionally referred to as modeling techniques are presented in Section
2.4.2. This classification has been established and accepted in the real estate research
domain (see, for instance, Özkan et al., 2007; Tao, 2010; Babawale and Oyalowo,
2011).
Among the traditional methods, the comparable (market sales), the investment
(income) and the cost (contractor’s) methods are the principal and most popular
approaches in the property valuation domain (Jenkins, 2000). This is due to their
simplicity in the application in the valuation of residential properties (French, 2004).
Residential properties, amongst other types of properties, are the main consumer of
land in urban areas (Olayiwola et al., 2005), and attracts the highest demand by
urban dwellers. Thus, these three methods have been widely explored in the literature,
unlike the profit and the residual methods.

42
The comparable method is the most widely adopted valuation method amongst valuers
in different property markets around the world (Bonissone and Cheetham, 1998;
Jenkins, 2000; Kauko, 2002). In applying this method, the valuer identifies comparable
properties exchanged in the open market and then makes some adjustments to reflect
the difference(s) in the attributes of the properties in arriving at a value opinion.
The process of employing the comparable method of valuation is presented by
Mackmin (2008, p. 44) as:
1. Select comparable properties in the same property market;
2. Retrieve, confirm and analyze comparable sale prices extracted;
3. Adjust the sale prices based on the established differences in the comparable and
subject property; and
4. Pronouncement of the opinion of OMV of the appraised property.
Appraisal Institute (1994) argued that the comparable valuation method is an
appropriate and sufficient approach, but due diligence must be observed when
adopting it. The performance of this method is also subject to the availability of
historical sales databank (American Institute of Real Estate Appraisers, 1987).
However, Jenkins (2000) argued that the comparable (grid) approach is subjective and
the apportionment of the points seem arbitrary which gives room for the inaccuracy of
opinions of values.

43
On the investment method of valuation, which is usually adopted for the valuation of
income generating properties such as residential and commercial properties, Baum and
Crosby (1995) provided an approach to the adoption of the method in estimating the
capital value of a property as shown below:
In the same vein, Millington (2000) presented an outline for the mathematics of the
cost method of valuation as presented below:
Cost of site
Plus Cost of the building
Less Depreciated allowance
And Obsolescence allowance
Value of the existing property
Dotzour (1990) tested the reliability and precision ability of the cost method and the
comparable method using 320 samples of appraisals collected from 33 states in the US.
The author found that the comparable method is more reliable than the cost approach
because on the average, an absolute error of 5.98% and 9.78%, respectively, were
recorded. The study concludes that the cost method can be used as a check for the
comparable method because it estimates the ‘top end’ ranges of valuation figure. The
Rent
Less Outgoings
Net income
Multiply by Capitalization factor
Capital value

44
findings of Dotzour (1990) is consistent with the argument of Ratcliff (1972) that the
cost method is unproductive, unrealistic and subjective.
Despite the simplicity attributed to the application of these traditional methods, they
are marred with imprecision and inaccuracy (Zurada et al., 2006). This is because these
methods are subjective in nature and their output is dependent on the skills and
experience of the valuer (Paris, 2008). The application of all the traditional valuation
approaches, particularly the comparable method, requires the valuers’ adoption of
heuristics and industry experience in arriving at property values (Kauko, 2002). This
subjective nature of these methods has rendered them inappropriate in this information
technology age (McGreal et al., 1998; Gilbertson and Preston, 2005; Grover, 2016).
2.4.2 Modeling Techniques
Modeling techniques (advanced property valuation methods) are models that mimic
the thought process of the stakeholders in the property market, as well as the subject
property market in arriving/producing valuation figures (Pagourtzi et al., 2003). Some
alternative approaches have been developed by scholars to replace the traditional
valuation approaches that are entrenched with limitations such as imprecision and high
subjectivity as mentioned earlier. These advanced approaches are mostly mathematical
models and they include ANN, HPM, spatial analysis, FLS and Autoregressive

45
Integrated Moving Average (ARIMA) (Pagourtzi et al., 2003).
To date, computer-aided advanced valuation methods are often used instead of the
traditional methods in the property valuation practice (Özkan et al., 2007). Rossini
(1999) indicated that in some cases, the advanced approaches may produce on average
more accurate property valuation estimates than the traditional valuation methods. In
addition, the traditional methods do not emulate the thought process of the real estate
market players like the advanced methods (Bagnoli and Smith, 1998). Although these
advanced methods of valuation usually require the use of a large number of historical
property transaction data in their application (Pacharavanich et al., 2000), they have
proven to produce, with speed, reliable and accurate valuation figures (Waziri, 2010).
These approaches are discussed below:
The application of geographic information system (GIS) has been widely discussed in
the property valuation literature (Wyatt, 1996; McCluskey et al., 1997; Wyatt, 1997).
The valuation technique which is incorporated with GIS in modeling property prices
is the spatial analysis technique. Spatial analysis helps in detecting the omitted
property neighbourhood factors that are important for the analysis. This approach has
been used to examine and measure the effect of location on property values (Pagourtzi
et al., 2003). The inefficiency and misrepresentation of property variables common to

46
HPM are been addressed by the application of the spatial analysis technique (Yacim
and Boshoff, 2014).
According to Anselin (1998), the process of adopting the spatial analysis in property
valuation involves four steps, and they are model specification, model estimation,
diagnosis and model prediction. Anselin (1998) further claimed that the spatial
analysis technique can be useful in property value modeling to forecast accurate
property values in locations where there is no information on property attributes.
Can and Megbolugbe (1997) applied the spatial analysis technique in Miami, Florida.
It was demonstrated in the study with the use of a few property variables which
surround a property. The study concludes that the spatial analysis approach would
produce accurate valuation outputs even when variables are not available or omitted.
Cellmer (2011) integrated spatial analysis with geographical weight regression (GWR)
to evaluate the impact of noise on property values. The author found that traffic noise
significantly influences property values and established the usability of spatial analysis
to measure the effect of environmental externalities in a particular location. An
overview of the spatial analysis process is presented by Wyatt (1996) as shown in
Figure 2.3.

47
Physical analysis Interface dialogue
General profile Collect comparables
Specific profile
Adjust comparable values
Value map display
Geographical
information system
Write selected and
adjust comparables to a
new data file
Spatial analysis Accessibility index
Measure effect of
accessibility on value
Spatial analysis
Join to geographical data
Stage one:
selection and
physical
reconciliation of
comparable
properties
Stage two:
spatial analysis
of the selected
comparable
properties
Figure 2.3: An overview of spatial analysis operation
Adopted from: Wyatt (1996, p. 75)
Despite the applicability of this technique (i.e. spatial analysis) in property value
modeling, the limitations of this approach include non-continuity, the number and
distribution of observations, non-homogeneity and the influence of non-spatial factors,
relatively high price spread and changes in prices over time (Cellmer, 2014, p. 58).
The vagueness and ambiguity that is associated with property price analysis may
render property price modeling estimates unreliable (González and Formoso, 2006).
The FLS technique is a property valuation approach that has been designed to handle

48
this vagueness - ambiguous, inaccurate market data in property price modeling. Zadeh
(1965) introduced FLS technique and argued that the fuzzy set of an element in a group
is characterized by a membership function.
The principle of FLS is based on the translation of vague property information into
meaningful numeric value, by following some defined set of rules in the application.
These rules are expressed as “if”, “or” and “then” to produce the output. A typical
example is “if a property is big and has high floors, then the value is high”. The FLS
technique has been widely employed in the different fields of studies for decision-
making. See McNeill and Freiberger (1994) and Mardani et al. (2015) for the review
of the application of FLS. According to Pagourtzi et al. (2003), the process of operating
a knowledge-based FLS consists of four elements, namely fuzzification, knowledge
base, processing and defuzzification as shown in Figure 2.4.
Rules
Fuzzifier
Inference
Defuzzifier Crisp
Outputs
(property value)
Crisp
Inputs
(Property Data)
fuzzy input set fuzzy output set
Figure 2.4: A fuzzy logic system
Adopted from: Mendel (1995, p. 347)

49
The first demonstration of the application of FLS in property valuation was the study
of Dilmore (1993), and it was adopted to assess the impact of distance on property
values. Bagnoli and Smith (1998) applied FLS on income-generating properties in
order to measure the contributory power of property attributes on property values. The
price of properties in Turkey was also forecasted using the FLS technique by Kuşan et
al. (2010). The superiority of FLS over HPM has been established in the literature. For
example, González and Formoso (2006) and Yalpir and Özkan (2011) documented the
predictive accuracy of FLS over HPM.
Property transactions data that are used for market analysis are sometimes in a time
series form. When this is the case and the observations have a statistical dependent
relationship, Box-Jenkins also known as ARIMA technique is usually applied (Tse,
1997). The autoregressive moving average (ARMA) models which are applicable to
stationary data, is being transformed to handle non-stationary data set by differencing
the data, and this modification is the ARIMA model (Pagourtzi et al., 2003). This
technique was developed by Box and Jenkins (1976). Since then, the model has been
applied in property value forecasting. Tse (1997) applied the ARIMA technique in
property value forecasting in Hong Kong. In the US, Crawford and Fratantoni (2003)
also applied the ARIMA model in property value forecasting and found that the model
is good for out-of-sample property value forecasting.

50
The HPM approach is suitable for property market research (Kauko, 2003; Selim, 2008;
Babawale et al., 2012), and has been widely adopted in real estate research (Bender et
al., 2000; Jenkins, 2000). The HPM principle is premised on multiple regression
analysis (MRA) (Jenkins, 2000; Kauko, 2002). The origin of this technique could be
traced to the novel study of Haas (1922a) that employed the regression analysis to
predict farmland prices in Minnesota, United States. Since then, the model has been
adopted in different property markets around the world, both in theory and in practice
(Schwartz, 1995; McCluskey et al., 1997). This technique is explained in detail in the
next chapter.
The ANN technique is a contemporary property value modeling technique which was
developed to handle the limitations of HPM (Tay and Ho, 1992; Bagnoli and Smith,
1998; Amri and Tularam, 2012). ANN is a type of AI which is designed to function
like the human brain (Mora-Esperanza, 2004). It has a learning ability and process
commands by the interplay of the network neurons that mimics the human brain
neurons (Taffese, 2006). In the real estate industry, researchers have applied ANN in
property valuation, for instance, Borst (1991), Evans et al. (1992), Wilson et al. (2002),
Lam et al. (2008) and Kauko et al. (2002), amongst others. In all these cases, their
results affirm the outstanding performance of ANN in terms of its predictive accuracy
in property valuation. A detailed review of the ANN technique is presented in the next

51
chapter.
When the impressive performance of the advanced techniques are compared with the
traditional methods, all of the advanced valuation techniques are not without their own
pros and cons (Lam et al., 2008). This is because none of the various advanced models
fits into all modeling and real-life property valuation situations (Tse, 1997). Table 2.2
shows the applications of the advanced techniques in different real estate markets
around the world, as well as their strengths and weaknesses (Abidoye and Chan, 2016c,
p. 367).

52
Source: Abidoye and Chan (2016c, p. 367)
Table 2.2: Applications of advanced valuation techniques
Valuation techniques Authors Country Strengths Weaknesses
Autoregressive
integrated moving
average (ARIMA)
McGough and Tsolacos (1995) United Kingdom Helps in tracking real estate price cycle
directions, its reliance on autocorrelation
gives accurate results
Can only handle time-series data, short-term
forecasting model Tse (1997) Hong Kong
Crawford and Fratantoni (2003) United States
Artificial neural
network (ANN)
Borst (1991) United States User friendly and easy to use, deals with
nonlinear relationship in data, adaptability
and generalization ability, higher precision
‘Black box’ nature, hidden internal structure,
data hungry Tay and Ho (1992) Singapore
Lam et al. (2008) Hong Kong
Hedonic pricing model
(HPM)
Adair et al. (1996b) Northern Ireland Versatile approach, can handle many
variables, objective, gives contributory
power of each variable, good indicator of
value
Multicollinearity, heteroscedasticity, functional
form misspecification, cannot handle nonlinear
variable relationship and outlier data
Tse and Love (2000) Hong Kong
Babawale et al. (2012) Nigeria
Fuzzy logic system d'Amato and Siniak (2009) Belarus Ability to cope with vagueness nature of
property variables, more realistic approach
Difficulty in determining fuzzy set and fuzzy
rules Hui et al. (2009) Hong Kong
Kuşan et al. (2010) Turkey
Spatial analysis Basu and Thibodeau (1998) United States Applicable where there is inadequate
information on property variable, produces
fair value estimates of local variables
Non-continuity, the influence of non-spatial
factors, non-homogeneity and changes in
prices over time can affect estimates
Cho et al. (2008) United States
Li et al. (2011) Hong Kong

53
2.5 PROPERTY VALUATION ACCURACY
Property valuation accuracy has received widespread attention by real estate
researchers in different property markets around the world - the US, UK, Australia,
and so on. Waldy (1997) defines valuation accuracy as the measure of the closeness or
divergence of valuation estimates to the market value of a subject property. Waldy
(1997) argued that valuation variation/variance is the difference in the values arrived
at by different valuers when a subject property is being appraised and should not be
mistaken for valuation accuracy. The position of Crosby (2000) substantiates the
argument of Waldy (1997), but adding that valuation bias occurs when there is a
consistent overvaluation or undervaluation of a subject property, in relation to the sales
price (target).
The issue of valuation inaccuracy could lead to the bankruptcy of real estate investors
and stakeholders rely largely on the opinion of value communicated by real estate
professionals to make real estate investment decisions (Taffese, 2007). When this
happens, it could lead to the questioning of the relevance, as well as the credibility of
valuers. At the same time, it could reduce the confidence stakeholders have in the
profession (Adegoke et al., 2013), and this will, in turn, affect the performance of the
property market and impliedly the economy of the nation at large, due to the relevance
of real estate to the economic development of a nation (Chiang et al., 2015).

54
In a more stable property market, those variations in property valuation estimates may
be within a lesser range, but in an unstable market, the reverse may be true (Shapiro et
al., 2012). Valuation inaccuracy may be unavoidable in property valuation because
different valuers interpret the property market and property value determinants
differently, but there is an acceptable range of variations in estimates (Shapiro et al.,
2012).
Hager and Lord (1985) posited that the range of acceptance for property valuation
inaccuracy should be about 5% more or less of the average value of the subject
property. Similarly, Mackmin (1985) suggested that valuation estimates produced by
valuers would be acceptable if it is within ± 5% range of the property value.
Furthermore, Hutchinson et al. (1996) argued that a valuation estimate within 5 to 10%
range is acceptable, only when it is above 10% that the estimate can be subjected to
contention. This argument is supported by Brown et al. (1998) that mentioned that a
valuation figure beyond 10% could be attributed to a valuer’s negligence in property
value estimation. The following subsections discuss property valuation accuracy
studies, both within the international context and the Nigerian context, and also present
a brief description of the Nigerian property market.

55
2.5.1 The International Property Valuation Accuracy Studies
In the UK, Hager and Lord (1985) were the first to investigate valuation accuracy in
property valuation. The study involved ten valuers who were asked to appraise two
properties. The ten valuers were not certainly familiar with the subject property market
but possess property valuation experience. The average variation in the value estimates
for property A was ±10.34%, while that of property B was ±16.94%, both which are
wider than the ±5% range which was expected by the authors. Hager and Lord (1985)
argued that valuers’ in-depth knowledge of the submarket of the property to be
appraised would reduce valuation inaccuracy in property valuation.
The reliability of commercial property valuation was assessed by Cole et al. (1986),
using the sales conducted between 1978 and 1984 as data for the study. The authors
mentioned the causes of property valuation inaccuracy to include the terms of sale, the
buyer and the sellers’ motivations, the capital improvement carried out since the last
valuation, the sales date, the change in discount or capitalization rate, the date of the
last valuation and the closing cost. The study found the margin of error to be between
5.9 and 9.5%, without outliers and with outliers, respectively. The authors concluded
that 9.5% margin is acceptable in property valuation considering the exigencies of time.
Webb (1994) also admitted that valuation inaccuracy is unavoidable in the US property

56
market, but argues that the faulty valuation processes may not be responsible for that,
rather it could be attributed to limited information available to the valuers at the time
of valuation. Webb (1994) further posit that since valuation inaccuracy is unavoidable
during the real estate life cycle, investors and stakeholders should make provision for
it when making real estate investment decisions.
Newell and Kishore (1998) examined the accuracy of commercial valuations in
Australia using data of valuation conducted between 1987 and 1996. Comparing the
results of the study to what was obtained in the US and the UK, the authors found that
the range of valuation inaccuracy experienced in Australia is lesser. This is in tangent
with the findings of Parker (1998, p. 16) that mentioned that “Australian valuation
estimates are a good proxy for market prices”, but further advocate for efforts to ensure
that valuation estimates fall within the 5% range of the market value.
The uncertainty being experienced in property valuation was discussed by Mallinson
and French (2000) who posited that uncertainty in property valuation is unavoidable,
and hence proposed a method of measuring and recording valuation uncertainty.
According to Mallinson and French (2000, p. 28), a valuer must report some variables
after a valuation exercise in order to convey the uncertainties associated with the
estimates. These items are listed below and depicted in Figure 2.5.

57
1. the single valuation estimate [V];
2. the range of most likely observations [V1 - V2];
3. the probability of the most likely observation [P3];
4. the range of higher probability [Za - Zz];
5. the range of 100% probability [Va - Vz];
6. the skewness of probabilities [Va-V1, V2-Vz].
V VzVa
Pa
P3
Za Zz
V1 V2
Figure 2.5: Uncertainty valuation report
Adopted from: Mallinson and French (2000, p. 28)
2.5.2 The Nigerian Property Valuation Accuracy Studies
Despite Nigeria being the biggest economy in Africa (The World Bank, 2017), its
property market and valuation practice are still at a developing stage (Babawale and
Ajayi, 2011; Abidoye and Chan, 2016c), that is, the property market has not yet
matured (Dugeri, 2011). Therefore, research in this area has been of interest to
Nigerian real estate scholars.
The study of Ogunba and Ajayi (1998) carried out in the Lagos metropolis revealed

58
that the valuation estimates produce by valuers in the metropolis are not a good
representation of actual property values. This was established by the findings of the
study which discovered a prevalent margin of error ranging between 33.43 and 36.47%
in the study area.
The valuation variations in five south-western states in Nigeria was investigated by
Ogunba (2004). The valuers’ estimates of 11 residential properties were compared with
the actual selling price of these properties in order to establish what variations in value
that occurred. The author found that there was a wide variation between the valuers’
figures and the actual selling price of these properties in all the states, which range
between 22.73 and 67.91%.
Ogunba (2004) attributed valuation inaccuracy to the non-uniformity in the mode of
making provision for outgoings by valuers in property valuation exercise,
inconsistency in the yield used by valuers in property valuation and the defective mode
of estimating rental value. The study concluded that valuers’ higher educational and
professional qualification, vast years of valuation practice experience and being
specialized in valuation practice are the factors that could improve valuation accuracy.
This conclusion is similar to the position of Shapiro et al. (2012) that argued that the
accuracy of a valuation estimate is largely dependent on the understanding and

59
knowledge of the valuer of the price movement in the subject property market, as well
as the expertise of the valuer to measure the impact on property values.
Ajibola (2010) also examined the Lagos metropolis and found a similar result to the
existing Nigerian literature. However, the lack of market data, the influence of clients
on valuers and the adoption of traditional methods of valuation were attributed to the
prevalence of valuation inaccuracy in the Lagos metropolis property market.
Babawale and Ajayi (2011) also examined the variance in residential property
valuation in the Lagos metropolis. Although most of the sampled valuers are in support
of the industry standard of ± 10% deviation, only 55% of the valuations examined in
the study fall within this range. The authors conclude that “residential property
valuation in Lagos metropolis exhibits inaccuracy below industry’s acceptable
minimum standards” (Babawale and Ajayi, 2011, p. 222).
Other contributions to this debate in Nigeria include causes of valuation inaccuracy in
the Lagos metropolis (Otegbulu and Babawale, 2011; Ayedun et al., 2012; Babawale
and Omirin, 2012), the perception and expectations of valuation report end-users on
valuation accuracy (Adegoke et al., 2013; Babawale, 2013b), and the role of estate
surveyors and valuers’ training and exposure on property valuation accuracy (Ayedun
et al., 2014). Other areas include point estimate and acceptable margin of error in

60
valuation reporting (Aluko et al., 2004) and the effect of valuation inaccuracy on
mortgage financing in Nigeria (Babawale and Alabi, 2013).
2.5.3 The Nigerian Property Market
The evolution and growth of the Nigerian property market are not well documented in
the literature. Dugeri (2011) attributed this to the lack of interest by international
property investors when compared with the European and Asian property markets.
Another plausible reason could be linked to the lack of a centralized databank for the
storage of property transactions information (Aluko, 2007). The emergence of big data
analysis has led to improvements in practice related to property valuation, investment
analysis and portfolio management, among other aspects, of the real estate practice
(Du et al., 2014). However, Ogunba and Ajayi (2007) acknowledged that the reverse
is the case in property markets of developing countries, with Nigeria as an example.
Nigeria is made up 36 states and a Federal Capital Territory - Abuja (The World Bank,
2014). The Nigerian property market can be categorized into primary (characterized
with high rental and capital values) and secondary markets (characterized by low rental
and capital values), with the primary markets being the most active (Olaleye, 2008).
The primary markets are the Lagos, the Abuja and the Port Harcourt property markets
and these three markets account for about 60% of the real estate transactions completed

61
in Nigeria (Olaleye, 2008). The Lagos metropolis is the most active property market
in Nigeria due to the high number of sophisticated real estate stakeholders that interact
in the metropolis (Oni, 2010). Also, a large percentage of the multinational companies
operating in Nigeria are domiciled in Lagos and over 90% of the commercial banks
and financial companies operating in Nigeria have their head offices in Lagos (Central
Bank of Nigeria, 2015). This is because the Lagos metropolis is the commercial nerve
center of Nigeria (Aluko, 2007). This corroborates why more than 50% of the Nigerian
registered real estate professionals practice in the Lagos metropolis property market
(Ibiyemi and Tella, 2013).
Dugeri (2011) evaluated the maturity of the Nigerian property market based on five
parameters which include the openness of the market, the property profession, capital
liquidity, the state of information and the market transparency. The study discovered
that the Nigerian property market is characterized by immature real estate professional
practice which is evident with a scanty number of registered professionals practicing
in different submarkets in Nigeria (with the exception of the primary markets), and
with an increasing number of charlatans intruding on the professional practice
(Akinbogun et al., 2014). Also, its mortgage system is not robust enough to cater for
the demand of every eligible Nigerian (Enhancing Financial Innovation and Access
(EFInA), 2014). The Nigerian property market is not transparent because real estate

62
professionals do not provide the correct property transactions information in a bid to
protect their clients and real estate market research is limited in Nigeria because there
is a paucity of data which are needed for research endeavour (Dugeri, 2011).
Dugeri (2011) concluded that the property market is still in its infancy stage. This
conforms to the findings of Akinbogun et al. (2014) that the lack of proper land
registration system, inefficient planning system and constraints in access to housing
finance are the plausible reasons for the immature state of the Nigerian property market.
These findings could be substantiated with the position of Jones Lang LaSalle (JLL)
(2016) that reported that the Nigerian property market can be categorized as a “low
transparent” real estate market. This is in comparison with South Africa which is
“highly transparent”, and Botswana, Zambia and Kenya that are classified as
“transparent” property markets in the Sub-Saharan African region. However, it should
be noted that the Nigerian property market has the potential to grow and mature into
the one of the most advanced within the African continent, but there is a need to
address several pertinent issues (see Dugeri, 2011; Akinbogun et al., 2014), so that the
property market can grow in a sustainable manner.
2.6 CHAPTER SUMMARY
Property value and property valuation are reviewed in this chapter. Property value is

63
differentiated from ‘price’ and ‘worth’ which are widely used interchangeably. The
process of conducting a valuation exercise is elaborated and the stages involved are
summarized into data collection, data analysis and pronouncement of the opinion of
value.
The framework of property value determinants for the Lagos metropolis is developed
based on the existing literature – neighbourhood, structural and locational factors. It is
established that different sets of attributes affect property value in different property
markets around the world due to the difference in the socio-economic, financial and
legal peculiarities of the economies.
The traditional and advanced valuation methods employed in property valuation are
evaluated. It was established that the traditional methods have some drawbacks in
terms of inaccuracy and inefficiency and thus, the development of the advanced
methods to address the shortcomings of the traditional methods. Despite the
shortcomings of the advanced methods, they have been established in different
property markets of the world to have produced reliable and accurate valuation
estimates. Therefore, their applicability in other developing economies should be
explored, which is what the present study is set out to achieve.
Valuation inaccuracy has been in the international debate for a while and the Nigerian

64
property market is not an exception. Generally, a valuation inaccuracy error of ± 5 to
10% closeness to the property value has been established to be of minimum industry
standards. The studies conducted in the Lagos metropolis, Nigeria, have shown that
valuation inaccuracy is predominant in the property market, with ranges obtained in
studies beyond industry standards and makes the valuations conducted in the
metropolis not to be a good proxy for property values.
The application of inappropriate (traditional) valuation methods has been attributed to
valuation inaccuracy. Therefore, the following chapter discusses in detail the
applications of HPM and ANN in property valuation. These two approaches were
selected amongst other modeling techniques due to their peculiarities as elaborated in
Chapter 1, and their review is aimed at establishing the trend in the literature and
establish the need to compare the predictive accuracy of both models in property
valuation in the Nigerian property market.

65
CHAPTER 3 ARTIFICIAL NEURAL NETWORK AND HEDONIC
PRICING MODEL
3.1 INTRODUCTION
The preceding chapter presents a review of property valuation, its process, various
valuation methods and modeling techniques adopted in the property valuation domain.
It also discusses property valuation inaccuracy which has remained an issue of debate
amongst professionals and academics on the global scene. All of these provides a
background for the main issues which this research centers on. Previous studies which
aimed at applying modeling techniques in property valuation have shown that
nonlinear modeling approaches are more accurate and reliable when compared with
linear approaches. Therefore, the HPM approach which has been widely adopted in
the real estate research and the novel ANN technique are reviewed in this chapter. This
is to offer insights into both techniques and a foundation for this study.
In this chapter, the background of both techniques is presented, contemporary issues
which arise in their applications in property valuation, as well as their pros and cons
in property valuation are also discussed. In addition, the application of both techniques
in the real estate research domain is examined so as to draw inferences and establish
trends from previous studies. Due to the fact that no model fits all (Pagourtzi et al.,
2007), a review of studies that have compared the predictive accuracy of ANN and

66
HPM is conducted to establish the extent to which ANN is superior to the HPM
approach in property valuation application.
The application of both ANN and HPM techniques in the Nigerian real estate research
domain is also reviewed. This is done so as to gain further insights into the current
state of knowledge and identify the gaps which exist in the literature.
3.2 THE ARTIFICIAL NEURAL NETWORK MODEL3
In the literature, several modeling techniques have been applied to solve problems in
different academic disciplines. Frew and Jud (2003) asserted that the emergence of
nonlinear modeling techniques addresses the shortcomings of traditional models in the
area of efficiency. Also, the value estimates arrived at by the application of the
traditional valuation approaches are not generally acceptable and lack a ‘certification
process’ (Taffese, 2006, p. 710). This could be attributed to the fact that ‘real world’
problems have nonlinear behaviours.
Mora-Esperanza (2004, p. 257) describes ANN as a “computer system whose
microprocessors, rather than laid out in series as in traditional computers, are
connected in parallel, forming layers and making multiple connections, imitating the
3 This section has been published in Abidoye R. B. and Chan, A. P. C. (2017). Artificial neural network
in property valuation: Application framework and research trend. Property Management, 35(5), (In
Press, DOI: https://doi.org/10.1108/PM-06-2016-0027).

67
way the neuronal network is organized in the brain”. Taffese (2006), in another context,
describes ANN as an interaction between processing elements in a network which
ultimately presents the global behaviour of the network by interpreting the relationship
between the elements’ parameters and processing elements.
The ANN technique has been applied in the different subject areas for prediction,
pattern recognition, classification, process control, nonlinear mapping and data
analysis (Paliwal and Kumar, 2009). Its outstanding predictive accuracy has been
established in wide range fields as presented in Table 3.1.
Table 3.1: The applications of ANN techniques in different domains
Domains Studies
Health and
medicine
Razi and Athappilly (2005); Subasi and Erçelebi (2005); Behrman et
al. (2007); Chien et al. (2007); Wesolowski and Suchacz (2012)
Engineering Yesilnacar and Topal (2005); Dvir et al. (2006); Pendharkar (2006);
Maliki et al. (2011); Yuan and Guangchen (2011)
Marketing Thieme et al. (2000); Gan et al. (2005); Chiang et al. (2006)
Stock market Fernandez-Rodrıguez et al. (2000); Enke and Thawornwong (2005);
Eriki and Udegbunam (2013)
Tourism demand Law and Au (1999); Uysal and El Roubi (1999); Burger et al. (2001)
Environment
management
Al-Alawi and Al-Hinai (1998); Mohandes et al. (1998); Chukwu and
Nwachukwu (2012)
General application Curry et al. (2002); Sharda and Delen (2006); Xuefeng et al. (2006);
Nikolopoulos et al. (2007); Nasr et al. (2012)
ANN has proven to be an appropriate technique for prediction. This is corroborated by
the comprehensive review of its applications in different disciplines conducted by

68
Paliwal and Kumar (2009). The review shows that ANN outperformed other advanced
techniques in 56 out of the 96 articles reviewed. It ranked equally with others in 23 out
of 96 articles, and it is only in 17 instances out of 96 that other techniques outperformed
ANN. All these suggest that ANN is an advanced technique that has been tested in
many instances to be a good predictive analytical tool.
The ANN technique is suitable for property price modeling because the model mimics
humans, and hence the output produced by it could be a proxy for the estimation of a
real estate valuer (Borst, 1991). The ‘pattern recognition’ feature of the ANN model
makes it suitable for property valuation because real estate properties possess attributes
which define the nature of a property. ANN ‘learns’ from the information of the
properties to identify the pattern to produce the outputs (property values) (Tay and Ho,
1992).
3.2.1 Background and Theory of Artificial Neural Network
The origin of the neural network technique could be traced to McCulloch and Pitts
(1943) who attempted to model the human brain neuron by demonstrating that the
neural network can work out arithmetic logical functions. According to Zhang et al.
(1998), the first application of ANN to forecasting was conducted by Hu (1964) that
explored the technique for weather forecasting by using Widrow’s adaptive linear

69
network. But as at that time, there were no multi-layer network training algorithms,
the technique did not receive enough attention. A follow-up study of Rumelhart et al.
(1986) introduced the backpropagation (BP) algorithms and since then, the ANN
technique has been applied in the various fields of studies.
The operation of ANN is based on the interaction of neurons. Neurons are
interconnected and function by receiving commands from the ‘Dendrites’ (connectors),
and after the information has been processed, it is passed to the other neuron by the
‘Axons’ (connectors) (Mora-Esperanza, 2004). The structure of a neuron is presented
in Figure 3.1.
NEURON
Dendrites Axons
Figure 3.1: The structure of a neuron
Adopted from: Mora-Esperanza (2004, p. 256)
According to Wong et al. (2002), the operation of the neural network, as presented in
Figure 3.2, starts with an activation function which integrates the input values. This
information is transferred to the hidden layer. The operation in the hidden layer
happens in two stages: “1) the weighted summation functions and 2) the transformation

70
functions” (Pagourtzi et al., 2007, p. 53). The weights are transferred through an
activation process to the sigmoid transformation function, from where the output is
produced. The integration which takes place in the network is more advanced than the
polynomial equation which HPM is based on (Mora-Esperanza, 2004).
ARTIFICIAL NEURONX1
X2
X3
W3
W2
W1
Inputs from other
Neurons
Weights
Summation:
Threshold
Function: f
Activation: u
Output signal
to other Neurons
O1
Figure 3.2: The components of a typical processing unit
Adopted from: Wong et al. (2002, p. 190)
Where X1-3 are the input values, W1-3 are the assigned weights of the input values, U is
the summation function, while f is the threshold value from which output is determined.
The transfer function “determines the relationship between input and output of a
neuron and its network” (Lin and Mohan, 2011, p. 234), by summing the weights of
the input signals in generating the network output (Fausett, 1994). There are three basic
forms of action or transfer functions, namely threshold functions, piecewise-linear

71
function and sigmoid function (Haykin, 1999). The most widely used is the sigmoid
function (Mora-Esperanza, 2004), typically due to being ‘advantageous within the
context of many paradigms’ (Ge, 2004, p. 139) and easy to apply in computer
programming (Mora-Esperanza, 2004). The sigmoid function takes continuous values
which range from 0 to 1 (Haykin, 1999), using the expression in Equation 3.1 (Morano
et al., 2015, p. 26). Figure 3.3 shows a typical sigmoid function graph.
𝑓(𝑥) =1
1+𝑒−𝑘𝑥 (3.1)
Where 𝑥 is the input and 𝑘 is the slope of the tangent of the curve at the inflection
point.
Figure 3.3: Sigmoid function
Adapted from: (Haykin, 1999, p. 13)
3.2.2 Construction of Artificial Neural Network Model
The process of applying the ANN technique to a problem involves some steps. These
steps are not a one-off procedure because the steps are iterative until an optimal ANN
network is identified. Kaastra and Boyd (1996) documented a detailed process of

72
developing an ANN model which involves eight main steps presented below:
Step 1: The selection of the variables to be included in the model
Step 2: The collection of data from the study area
Step 3: Pre-processing of the collected data
Step 4: Division of the data set for training and testing of the model
Step 5: Neural network paradigm
• Determination of the number of hidden layers
• Determination of the number of hidden neurons
• Determination of the number of output neurons
• Selection of the transfer function
Step 6: Model evaluation criteria and accuracy measure
Step 7: Training of the ANN model
Step 8: Implementation
In applying ANN in property valuation, historical sales transaction data of the property
market under consideration are required. The ANN model can then be processed to
‘learn’ from the input data. This sales transaction data comprises the property attributes
(ANN inputs) and property prices (ANN outputs). These parameters can be likened to
the independent variables and the dependent variable, respectively, similarly used in
the development of HPM. This is probably one of the reasons it is easy to compare the
predictive accuracy of both techniques based on the same parameters.
The data set available for the construction of the model is to be divided into two parts.
The first is used for ‘training’; while the other is used for ‘verification and testing’ of
the model (Wilson et al., 2002). The training data set is utilized for the construction of

73
the model, whereas the testing data set is used for the evaluation of the predictive
accuracy of the developed model (Lam et al., 2008). There is no consensus as to the
sharing ratio of the data set (Cechin et al., 2000). However, a ratio of 80:20, i.e. for
training and testing/validation, respectively, is common in the literature (see Table 3.2).
3.2.3 Network Architecture and ANN Model Development
The construction of artificial neural network is referred to as the ‘network architecture’
(Zhang et al., 1998). There are generally three types of network architecture which
include feedback (recurrent) network, single-layer feedforward network and multi-
layer feedforward network (De Castro and Timmis, 2002). Figure 3.4 shows the
graphical representation of feedforward or feedback network architecture. In the
feedforward architecture, the activation travels in a forward manner i.e. from the input
layer to the output layer and the neurons in each layer are connected in a forward
direction, but the reverse is the case for feedback architecture (Callan, 1999). BP is a
network training method which is adopted to minimize the squared error of the outputs
generated by the network (Fausett, 1994). It is simple, stable and can handle complex
data set (Elhag, 2002). This could be attributed to why the feedforward-
backpropagation ANN paradigm is commonly applied in property valuation (Selim,
2009; McCluskey et al., 2013).

74
Feedforward sweep
Feedback sweep
Figure 3.4: Artificial neural network paradigm
Source: Callan (1999, p. 33)
The ANN model consists of three layers, namely the input, the hidden and the output
layers (Zhang et al., 1998). At the input layer, input variables which represent property
attributes (when the model is used for property price prediction) are fed into the
network. The hidden layer is the layer in-between the input and the output layers. The
result of the transformation which takes place in the hidden layer is produced at the
output layer, which is where the predicted property value is obtained.
Mora-Esperanza (2004) posited that an input variable size of between 10 and 50 is
common for the construction of ANN models for property valuation and that the
number of the hidden layers can range between half and double the number of input
variables. However, Hornik (1991) and Masters (1993) argued that one hidden layer is

75
sufficient for ANN to perform excellently. The output layer usually has just one neuron,
which is the predicted property price.
The number of neurons used in the hidden layer of a model could aid the retrieval of
an improved result (Borst, 1995), but unfortunately, there is no consensus as to the
number of hidden neurons to be included in a model (Cechin et al., 2000). Nevertheless,
Ward (1996) presented an expression which can be used in determining the number of
neurons in the hidden layer which is presented in Equation 3.2.
soutin
h NNN
N
2
(3.2)
Where Nh is the number of neurons of the hidden layer, Nin is input layer, Nout is output
layer and Ns is the number of training samples.
A typical ANN model architecture is presented in Figure 3.5. The architecture depicts
a scenario of a model which has six input variables, one hidden layer (with three
neurons) and one output layer which represents the market value.

76
Floor area
Location
State of repair
Age of building
N
Number of
bedrooms
Quality of
finishing
Market
value
N
N
Input layer Hidden layer Output layer
Figure 3.5: A simple ANN model for property valuation
Adapted from: Mora-Esperanza (2004, p. 257) and Taffese (2006, p. 711)
The number of samples needed to construct an ANN model is not established in the
literature. However, Rossini (1997, p. 9) mentioned that a ‘small data set’ is sufficient
for the construction of an ANN model. From another view, Mora-Esperanza (2004)
posited that the number of samples should be proportional to the number of variable
entries. The ANN model does not need more data than usually required by linear
models for it to function excellently (Zhang et al., 1998).
The need for the ANN model to ‘learn’ like the human brain makes its operation to be
based on a ‘trial and error’ process to determine the best optimal ANN model
(Limsombunchai et al., 2004; Lin and Mohan, 2011). The reason is that it learns like a

77
new baby from experience when mastering the act of talking or walking.
3.2.4 Strengths and Weaknesses of Artificial Neural Network
The emergence of the ANN technique in the property valuation domain has addressed
the technical limitations of the HPM technique (Do and Grudnitski, 1992; Tay and Ho,
1992; Worzala et al., 1995). The ANN modeling technique has proven to be a better
alternative to the commonly adopted HPM in property valuation due to its adaptability
and generalization capabilities (Taffese, 2006). The model can handle the nonlinear
relationship (the complex interaction between demand and supply factors that affects
property prices (Ge, 2004)) which exists between property values and property
variables (Cechin et al., 2000). It has generalization ability (Xie and Hu, 2007) and is
easy to operate when compared with the HPM approach (Borst, 1991). It can also
address the ‘time variant problem, even under uncertain or erroneous attributes of real
estate valuation’ (Taffese, 2006, p. 712).
Some other valuation approaches e.g. comparable method and HPM are characterized
by subjectivity (Kauko, 2004; Yacim and Boshoff, 2014), whereas the processing of
the ANN model does not require human input in its analysis (Tay and Ho, 1992). The
ANN technique has been widely accepted in the property valuation domain for its
ability to outperform the HPM approach (Borst, 1991; Taffese, 2006) because the

78
technique produces model output with speed and is also simple to operate (Ge, 2004).
The ANN model produces estimates (outputs) which are highly precise, handles data
set which contains outliers and is also user-friendly (Mora-Esperanza, 2004).
ANN, being an advanced property modeling technique, comes with some drawbacks.
Jenkins (2000) presented the limitations of ANN in relation to the traditional
approaches and HPM to include the fact that ANN is data hungry because more data
are needed for its development, compared to the comparable method which could be
applied with as few as two comparable properties.
Other shortcomings of the ANN technique are the inability to understand what happens
in the internal structure of the network (Jenkins, 2000), and the problem of determining
the actual size and structure to produce the output (Taffese, 2006). McGreal et al.
(1998), Limsombunchai et al. (2004) and Lam et al. (2008) opined that the ‘black-box’
nature of the ANN model and the lack of the interpretation of the produced output are
some of the limitations of the modeling technique. However, the operation of HPM is
also complex and cannot be easily explained (Mora-Esperanza, 2004).
In essence, the ANN technique is to be used as a tool which the valuer adopts in
property valuation exercise and not to be seen as an expert in itself. This has translated
into “various countries having included the ANN in their real estate valuation

79
computer system, as a help tool for their valuators” (Mora-Esperanza, 2004, p. 260).
In sum, the continuous development of different neural network software has been
handling these shortcomings (McCluskey, 1996). Moreover, ANN’s user-friendliness
makes it easy to be used by non-computer experts, for instance, other real estate
stakeholders (Rossini, 1997; Wong et al., 2002). Also, since the aim of a valuer is to
arrive at a reliable and precise estimate which will be a good proxy for property value,
the need to fully understand how the output is generated may not be significant,
because the main reason for embarking on a valuation exercise is to estimate reliable
and acceptable valuation figures (McCluskey, 1996).
Further comments by Jenkins (2000) revealed that towards the end of the 1990s, efforts
to reduce the arbitrariness associated with the ANN technique were published. This
was confirmed by Borst (1995) that proved that the explainability of the ANN model
is possible. This is substantiated in the literature, where studies have applied the ANN
technique in the sensitivity analysis of variables included in the model (see Lai, 2011;
Tabales et al., 2013; Abidoye and Chan, 2017a, amongst others).
3.2.5 Applications of Artificial Neural Network in Property Valuation
The application of ANN in property valuation can be traced to the early 1990s. Borst
(1991) is the first to apply ANN in property valuation. The study presented a

80
description of ANN and examined the predictive accuracy of the ANN technique under
four cases using different network architecture. Borst (1991) concluded that the
prediction accuracy produced by ANN is reliable and that with more research efforts
towards the application of ANN in property valuation, the model will produce
outstanding estimates.
After Borst (1991) seminal study, other scholars have applied ANN in property
valuation problems. Kathmann (1993) presented an overview of the application of
ANN in property valuation and also evaluated the significance of the technique. The
author found ANN to be superior to other valuation techniques. In a similar vein,
McGreal et al. (1998) applied ANN in predicting property value using 1,026 Belfast
property sales data. In an attempt to avoid bias in the data utilized, the authors restricted
the data to transactions completed between 1992 and 1993. In order to extend the scope
of the study from the mere application, the 1992 and 1993 data were analyzed
separately so as to establish if ANN can produce a consistent result over time. The
predictive accuracy of ANN was confirmed in the study. The model produced accurate
and consistent outputs in both the 1992 and 1993 models. The authors documented the
excellent predictive accuracy of the ANN technique but suggested that more effort
should be invested in researching into how to make the ANN model perfect.

81
More property markets around the world have been modeled using ANN. A summary
of such studies is presented in Table 3.2, while some others are presented in Section
3.4.2. The information in Table 3.2 depicts that the technique truly possess an
outstanding accurate predictive ability as it was established in all the studies

82
Table 3.2: Studies of ANN applications in property valuation
Authors Countries Sample size/ no.
of variables
Training: Testing ratio Summary of findings
Borst (1995) United States 217/11 90:10 ANN predicted more accurately than HPM
McCluskey (1996) Ireland 416/9 90:10 ANN produced excellent realistic output
Wilson et al. (2002) United Kingdom ? 80:20 ANN is a promising forecasting technique
Ge and Runeson (2004) Hong Kong ?/18 ? ANN is an effective forecasting technique
Mora-Esperanza (2004) Spain 100/12 85:15 ANN is appropriate for property value forecasting
Lam et al. (2008) Hong Kong 4143/29 80:20 ANN is a viable property forecasting tool
Tabales et al. (2013) Spain 10124/6 80:20 ANN is an effective forecasting technique
Ahmed et al. (2014) Bangladesh 100/40 70:30 ANN is an alternative to HPM
Morano et al. (2015) Italy 90/7 80:20 ANN predicted excellently
Kutasi and Badics (2016) Hungary 1,806/52 80:20 ANN produced better results than HPM
Note: ? means value or figure not provided.

83
3.3 THE HEDONIC PRICING MODEL4
Real estate property is a composite good which is made up of a number of unique
bundles of attributes that affect its value wherever it is located (Rosen, 1974; Sirmans
et al., 2005). The uniqueness of the stakeholders that interact in the property market,
as well as the heterogeneous characteristics of real estate properties, could be attributed
to the differences in the value ascribed to them by different stakeholders (Chin and
Chau, 2002; Sirmans et al., 2005). The inability to separately value those property
attributes has led to the development of a model which presents the contributory power
of each of those attributes to property value formation, and hence the emergence of the
HPM technique.
The HPM approach has been applied in price indexes analysis in different fields,
including, but are not limited to, computers (Dulburger, 1989; Nelson et al., 1994;
Berndt et al., 1995; Holdway, 2011), healthcare (Berndt et al., 2000; Cutler and Berndt,
2007), home appliances (Silver and Heravi, 2001), automobiles (Triplett, 1969; Ohta
and Griliches, 1976; Triplett, 2004), and so on. The background of HPM, its principles,
pros and cons and applications in the real estate domain are presented in subsequent
4 Part of this section has been published in Abidoye, R. B. and Chan, A. P. C. (2017). Critical review
of hedonic pricing model application in property price appraisal: A case of Nigeria . International
Journal of Sustainable Built Environment, 6(1), pp. 250 - 259.

84
subsections.
3.3.1 Background of the Hedonic Pricing Model
HPM is a popular quantitative analysis technique which has been widely adopted in
property appraisal and used at the same time to complement the traditional methods
especially the comparable method (Limsombunchai et al., 2004; Taffese, 2006).
The origin of the application of HPM in real estate research dates back to the early
1920s. Although it may be hard to trace the actual origin of HPM, Colwell and Dilmore
(1999) argued that the first study that adopted the HPM approach in real estate research
is Haas (1922b) who applied HPM to estimate the value of a farmland in Minnesota,
United States. Likewise, Bruce and Sundell (1977) mentioned that MRA was applied
to farmland appraisal in 1924. These arguments were substantiated by Lentz and Wang
(1998) but claimed that there was no proper justification for the model until later years.
Wallace (1926) adopted the regression analysis to predict the farmland in different
counties in Iowa, United States. Chin and Chau (2002) argued that Ridker and Henning
(1967) are the first authors to apply HPM in residential property appraisal to examine
the impact of air quality on property values. Chin and Chau (2002) further asserted
that Freeman (1979) gave the much needed theoretical justification for HPM in the
real estate research domain.

85
Authors generally relate the origin of HPM to the study of Court (1939) who developed
a hedonic pricing index for the price of automobiles. Court (1939) asserted that the
demand for automobiles cannot be explained by a single variable, but the implicit
market price of the subject’s characteristics, derived by equating the demand and
supply for each characteristic in a model are needed for value formation. Court (1939)
explained in a semi-log form that these three variables, wheelbase, dry weight and
horsepower, would contribute to the price being paid for cars. Thereafter, still in the
early days, scholars (see, Muth, 1966; Oates, 1969) adopted HPM to real estate
research. However, Lancaster (1966), through “consumer theory” and especially the
study of Rosen (1974), presented the theoretical underpinning for the application of
HPM in property valuation. Based on the assertions found in Rosen (1974), researchers
have been adopting this method in different property markets around the world.
3.3.2 Principles of the Hedonic Pricing Model
The principles of HPM are based on the regression analysis (Lentz and Wang, 1998;
Selim, 2009). Regression analysis could be in the form of simple regression or multiple
regression. In the case of simple regression, the analysis is geared toward evaluating
the relationship between a dependent variable and one independent variable. When the
relationship under consideration is between a dependent variable and more than one
independent variable, then it is referred to as MRA. MRA is largely employed for

86
property price analysis because the value of a real estate property is dependent on more
than one attribute (Chin and Chau, 2002).
One of the essences of MRA is to develop the best-fit representation for the
relationship which exists between the dependent variable and the independent
variables of the sample data being analyzed (Elhag, 2002). According to Kmenta
(1997), simple and multiple regression can be expressed mathematically as shown in
Equations 3.3 and 3.4, respectively.
iii XY 110ˆ (3.3)
ikikiii XXXY ............ˆ22110 (3.4)
Where valuepredictedY i 0 regression constant
1β slope of Y with variable X1 when variables X2, X3, ….., Xk are held constant
2β slope of Y with variable X2 when variables X1, X3, ….., Xk are held constant
k slope of iY with variable Xk when variables X1, X2, …., Xk-1 are held constant
i random error in Y for observation i
1 , 2 ,3 , ……….,
k are referred to as the regression coefficients.
In order to establish if the regression analysis yields a goodness of fit, the r2 is usually
computed. This indicates the proportion of the variability in Y which is explained by
variation in X. The r2 measures how well the regression line fits the sample data and

87
this value ranges between 0 and 1 (0 ≤ r2 ≤ 1) (Kmenta, 1997). An r2 value of 1 depicts
a perfect goodness of fit that is the better X is able to explain Y, while a value close to
0 signifies otherwise.
Adjusted r2 (r2adj) is computed in order to reflect the number of independent variables
(k) and the sample size (n) used for the development of the regression model (Elhag,
2002). The r2 and r2adj can be computed using Equations 3.5 and 3.6, respectively.
SST
SSRr 2
(3.5)
1
111 22
kn
nrr adj (3.6)
Where SSR is the sum of squares regression and SST is the total sum of squares.
The construction of HPM involves a prescribed procedure. However, Verma (2013,
p. 146) presented the procedure for developing HPM as follows:
i. compute descriptive statistics of the sample data in terms of mean, standard
deviation, skewness, kurtosis and frequency distribution to check the distribution
of each variable;
ii. plot the scatter diagram in order to evaluate the linearity of all the independent
variables with the dependent variable;
iii. compute the correlation matrix among the independent variables to assess if
multicollinearity exists among them. If it exists, then one of the two correlated
variables can be deleted or other appropriate multicollinearity treatments can be
applied;

88
iv. develop the regression equation by using the unstandardized regression
coefficients;
v. conduct a significance test of the regression coefficients by using the t-test;
vi. test the significance of the regression model by using the F-test; and
vii. compute the r2 and adjusted r2 to establish the percentage variance of the
dependent variable explained by all the independent variables in the regression
model.
3.3.3 Hedonic Pricing Model Issues
Despite the fact that HPM has been generally accepted in the property valuation
domain, some issues are still embedded in its application which includes model
specification procedures, independent variable interactions, heteroscedasticity,
multicollinearity, outlier data points and nonlinearity (Do and Grudnitski, 1992;
Limsombunchai et al., 2004).
Functional form specification is the process of choosing the functional form of the
regression equation which best explains the relationship between the dependent
variable and the independent variables. There are three general functional forms of an
HPM analysis, which includes the linear, log-linear/semi-log and log-log functional
forms (Freeman, 1993). There is no consensus in the literature as to the functional form
to be chosen in the HPM analysis (Kryvobokov and Wilhelmsson, 2007). Thus, there
is little guidance as to choosing the right functional form (Selim, 2008).

89
Heteroscedasticity, which is the opposite of homoscedasticity, is a well-established
issue in terms of the application of HPM (Selim, 2009). Homoscedasticity describes
an assumption that for all values of X, the variation around the regression line is
constant. When otherwise, heteroscedasticity occurs, that is the variation of errors are
different for different values of the independent variables. This can be checked by a
visual inspection (the plot of the standardized residuals against the standardized
predicted value to identify the changing scatters), White’s test, Breusch-Pagan test and
Glejser test, among others.
Multicollinearity occurs when two or more explanatory variables are highly correlated
in the sample and this violates the classical linear regression model. Sheppard (1997)
argued that multicollinearity may be inevitable in hedonic pricing analysis due to the
similarity of some property variables. This is also the position of Newel (1982) who
argued that multicollinearity is not uncommon in property data. This can be handled
with the computation of correlation matrix which displays the correlation coefficient
between the explanatory variables. A common method of measuring multicollinearity
among independent variables is the variance inflation factor (VIF) approach (details
of VIF is presented in Section 4.8.5).
Nonlinearity depicts the situation where the dependent variable does not have a linear

90
relationship with the independent variables. This can be examined through the
scattered plots or by conducting Kolmogorov–Smirnov test and Shapiro–Wilk
test, amongst other approaches.
3.3.4 Strengths and Weaknesses of Hedonic Pricing Model
Do and Grudnitski (1992) asserted that the HPM technique addresses the deficiencies
of the traditional property valuation methods. Also, the HPM approach has the ability
to estimate the contributory impact of an independent variable (property attribute) on
a dependent variable (property value). “The superiority of the HPM technique is its
simplicity and computational advantage” (Lin and Mohan, 2011, p. 226). The
regression coefficient is the only variable needed to interpret the structure of HPM,
and this makes it a straightforward technique (Chin and Chau, 2002).
Comments on the drawbacks of the HPM technique, according to Taffese (2006),
include the issue of multicollinearity and the inclusion of outliers into the model.
According to McGreal et al. (1998), HPM is limited in its application in property
valuation due to its inability to adequately capture the nonlinearity of real estate data
and the subjectivity in identifying the appropriate functional form, whereas the ANN
technique maps the best functional form by learning from data provided to the model
during training (Do and Grudnitski, 1992; Limsombunchai et al., 2004).

91
The workability of the HPM technique could be affected by small sample data set
(Rossini, 1997). The nonlinearity relationship which exists between property values
and property attributes which HPM cannot handle limits its application in property
valuation (Taffese, 2006). Worzala et al. (1995) augured that the shortcomings of the
HPM approach include subjectivity, inaccuracy, multicollinearity and the lack of
ability to handle outliers. All these could result in imprecise valuation estimates.
3.3.5 Applications of Hedonic Pricing Model in Property Valuation
The HPM approach has been widely adopted in the real estate research domain and
has been widely adopted to estimate the price effect of various property attributes on
property values.
Bruce and Sundell (1977) conducted a review of studies that adopted MRA in real
estate appraisal before 1954, during 1954 and 1964 and between 1964 and 1977. The
authors asserted that during the study period, the approach has been applied in the
appraisal of four classes of real estate properties, namely rural bare land, urban bare
land, single-family residences and multiple-family residences. The authors attributed
the unpopularity of the approach in these early days to unavailability of computers to
handle the mathematical calculations involved.
The study conducted by King (1976) adopted the HPM approach in the estimation of

92
property price utilising data of 683 properties sold or purchased in New Haven, the
United States, between 1967 and 1970. The study adopted property characteristics
categorised into four groups to validate the Lancaster’s demand theory in property
pricing. The findings of the study conform to the Lancastrian ‘new demand theory’
which reveals that households price those property attributes in making sound real
estate decisions. Table 3.3 shows a summary of some studies that have adopted HPM
in examining the effect of property attributes on property values.

93
Table 3.3: Hedonic pricing model and property attributes studies
Attributes Studies
Property size Wolverton (1997), Tse (2002), Wen et al. (2005), Choy et al. (2007),
Pozo (2009), Selim (2008)
Better view Rodriguez and Sirmans (1994), Benson et al. (1998), Wolverton
(1997), Choy et al. (2007)
Balcony Chau et al. (2004)
Lucky number Bourassa and Peng (1999), Chau and Ma (1998), Chau et al. (2001),
Age of property Tse (2002), Choy et al. (2007)
Location Joslin (2005), Mbachu and Lenono (2005), Pozo (2009), Anim-
Odame et al. (2009),
Nearness to transport facilities Mbachu and Lenono (2005), Choy et al. (2007)
Nearness to shopping centers Sirpal (1994), Des Rosiers et al. (1996),
Number of bedrooms Morancho (2003), Ottensmann et al. (2008), Pozo (2009), Canavarro
et al. (2010), Selim (2008)
Number of bathrooms Morancho (2003), Maurer et al. (2004), Ottensmann et al. (2008)
Parking space Goodman and Thibodeau (1997) Maurer et al. (2004), Wen et al.
(2005), Canavarro et al. (2010)
Open space/parks Bolitzer and Netusil (2000), Irwin (2002), Nicholls and Crompton
(2005), Crompton (2005), Voicu and Been (2008)
Place of worship Do et al. (1994), Carroll et al. (1996), Babawale and Adewunmi
(2011)
Airport noise Levesque (1994), Tomkins et al. (1998), Espey and Lopez (2000)
Landfills/waste site Bouvier et al. (2000), Seok Lim and Missios (2007), Ready (2010),
Owusu et al. (2014)
Power lines Wolverton and Bottemiller (2003), Sims et al. (2009), Elliott and
Han (2013)
An applied review and detailed theoretical development of the HPM approach is
presented by Chin and Chau (2002) and Malpezzi (2003), but a meta-analysis of
articles that have adopted HPM to measure the marginal contribution of attributes that
determine property values was conducted by Sirmans et al. (2005). Table 3.4 shows
the summary of HPM studies carried out in some property markets around the world.

94
The findings of those studies reiterate the fact that different property attributes drive
property values in different property markets around the world.
In developing HPM, the aim is usually to model the property market under
consideration. However, the essence, at the same time, is to establish the significance
and contribution of each independent variable to property values in terms of the effect
of the marginal changes in property values. HPM housing studies (Adair et al., 1996b;
Tse and Love, 2000; Selim, 2008) have found property attributes to be either positively
or negatively significant to property value formation. Chin and Chau (2002) presented
a checklist of commonly used property attributes and their expected effect on property
values.

95
Table 3.4: Details of HPM studies in real estate
Authors Countries Sample size Variables used Summary of findings
Pasha and Butt
(1996)
Pakistan 650 A total of 26 variables which consist of property specific
attributes and household demographics
Income elasticity of demand for property attributes in
Pakistan is relatively low. However, plot size, living
space and number of bedroom influence property values
in Pakistan
Maurer et al.
(2004)
Paris 84,686 (1990:1-
1999:12)
Property area, the number of toilets, the number of floors,
number of garages, terrace, the number of service rooms,
elevator, construction period, garden and occupancy
status.
An overview into the real estate cycles of Parisian
property market was presented by the identification of
specific patterns in historical index sequences, which
provides valuable information about property value
formation in the property market.
Jim and Chen
(2006)
China 652
(2003-2004)
Window orientation, the number of bedrooms, floor area,
the number of floors, the number of bathrooms, green
space view, distance to new town center, proximity to the
woods, traffic noise and water bodies.
Proximity to green space and water bodies were found
to influence property values. Whereas, traffic noise and
proximity to the woods did not have any impact on
property values.
Choy et al. (2007) Hong Kong 749
(1999:07 – 2000:06)
Ground floor area, age, floor level, garden, sea view,
unclear view, nearness to railway station, lucky number
floor, unlucky number floor
Almost all the variables significantly influence property.
However, lucky floor number is statistically
insignificant to property prices in Hong Kong.
Hui et al. (2007) Hong Kong 3000
(Q3:2000-Q2:2001)
Age, the number of floors, the number of bedrooms and
bathrooms, clubhouse, time to CBD, secondary school,
sea view, noise level, air quality and greenbelt area.
Apart from distance to CBD and greenbelt area and all
other variables are significant to property values.

96
Langrin (2008) Jamaica 2,271
(2003:2-2008:3)
Date of sale, postcode, lot size, floor area, year of
construction, property type, the number of floors, the
number of bedrooms and bathrooms, garage and water
tank.
The number of floors, lot size, the number of bathroom,
garage and water tank influence property prices.
Whereas, the number of the bedroom more than three
reduces property values.
Selim (2008) Turkey 5741
(2004:01 –2004:12)
Forty-six variables which include but not limited to age of
the property, the number of rooms, property size, property
type and heating system.
The water system, swimming pool, type of property, the
number of rooms and property size significantly
influence property prices in Turkey.
Cebula (2009) United States 2,888
(2000-2005)
Twenty-four variables which include a number of
bathrooms, fireplaces, number bedrooms, garage, floor
area and a pool, amongst others.
Most of the variables are significant including the
number of bedrooms and bathrooms, fireplaces, the
number of floors, garage car spaces, living space floor
area, the presence of a deck, private courtyard, a pool,
brick construction, new house, located close to a park
and situated on a cul-de-sac.
Canavarro et al.
(2010)
Portugal 16,700
(2005-2009)
Eighteen variables which include property type, the
number of bedroom and bathroom, air condition, garage,
elevator and security, among others.
A different set of variables affects the value of both new
and second-hand properties. However, location, area,
the number of bathroom and garage are significant to the
values of both sets of properties.
Owusu-Ansah
(2012)
Ghana 18,652
(2005-2010)
Bedroom, property area, the number of floors, the number
of bathrooms, the number of public rooms, garage, fence
wall, swimming pool, land registration, year of valuation.
All the variables are significant to property value in
Ghana with the exception of property area.

97
3.4 COMPARISON OF THE PREDICTIVE ACCURACY OF HPM AND ANN
In order to improve the predictions generated from a modeling process, researchers
seek to identify and develop techniques with improved predictive accuracy. This has
led to some studies comparing the application of HPM and the ANN model in property
valuation (McGreal et al., 1998). This has probably been driven by the quest to
establish a more reliable and accurate model which is able to produce valuation
estimates which are a good proxy for property values. Most of such studies have
investigated the predictive accuracy of the widely adopted HPM over the more recent
valuation models especially the AI-based techniques. The output produced/yielded by
the models under consideration are usually subjected to accuracy measure in order to
establish the most accurate model.
There exists a number of model accuracy measures in the literature and they include
MAE, RMSE, mean error (ME), mean squared error (MSE), Theil’s U, MAPE, r2 and
the adjusted r2, amongst others. More details about these measures are presented in
Chapter 4. The information in Table 3.5 shows the model performance measures
adopted in the real estate literature. The analysis reveals that RMSE and MAE are
commonly used in comparative studies with a frequency of eight, respectively, out of
18 studies. In addition, r2 and MAPE were adopted six times, respectively, while others
were used either once or twice in the studies reviewed.

98
Table 3.5: Accuracy measure techniques adopted in ANN and HPM studies
Authors Forecasting Models Accuracy measures
MSE ME RMSE MAE MPE MAPE Theil’s U R² Adj. R²
Do and Grudnitski (1992) ANN, MRA and Comparable X X
Tay and Ho (1992) MRA and ANN X X
Worzala et al. (1995) MRA, ANN X
McCluskey and Borst (1997) MRA, CSA and ANN
Rossini (1997) MRA and ANN X
Nguyen and Cripps (2001) MRA and ANN X
Wilson et al. (2002) ANN X
Limsombunchai et al. (2004) MRA and ANN X X
Pagourtzi et al. (2007) MRA, ANN, ES and BN X
Xie and Hu (2007) ARIMA, ANN and SVM X X
Guan et al. (2008) ANN X X X
Lam et al. (2008) ANN X X
Peterson and Flanagan (2009) MRA and ANN X X X
Selim (2009) MRA and ANN X X X
Lin and Mohan (2011) MRA, ANR and ANN X X X
Zurada et al. (2011) MRA, ANN, AR, RBFNN, MBR,
SVO-SMO Regr.
X X X
Amri and Tularam (2012) ANN, HPM and ANFIS X
McCluskey et al. (2013) ANN, HPM and GWR X X X X X
Total 2 1 8 8 2 6 1 6 2
Note: CSA - Comparable sales analysis, SVM - Support vector machine, MBR – memory-based reasoning, RBFNN - Radial basis function neural network, AR - additive regression

99
3.4.1 Comparative Performance of HPM and ANN in Property Valuation
A number of scholars have performed studies in different property markets around the
world to establish the superiority of both models in property valuation. The likeness
between the ANN technique and other statistical analysis techniques has allowed its
comparison with HPM (Brunson et al., 1994). A comprehensive review of comparative
studies of the performance of ANN and HPM in property valuation conducted by
Mora-Esperanza (2004) shows that on average, ANN produces an error rate of between
5 and10%, while the rate is between 10 and 15% for HPM. It is reasonable to suggest
that the ANN technique has proven to be more accurate than the HPM approach in
property valuation research.
One of the early efforts to compare the predictive accuracy of ANN and HPM is the
study of Do and Grudnitski (1992) who utilized property sales data of California,
United States. The study showed that the ANN model produced forecast which was
twice better than HPM, in terms of the predictive accuracy of the property values. A
further comparison of the novel ANN model with the traditional comparable valuation
method produced exceptional accurate results. Do and Grudnitski (1992) posited that
the ANN technique has great potential in producing accurate property valuation
estimates.
Utilizing 1055 property sales data from the Singapore’s property market, Tay and Ho

100
(1992) examined the predictive performance of ANN and HPM. The same data set was
used to develop both models and their outputs were compared to establish the most
reliable model. The study found that with the presence or the removal of the outliers,
the ANN technique produced more accurate and reliable estimates when compared
with HPM.
Thereafter, researchers continued to evaluate the performance of both models. As a
result, Worzala et al. (1995) investigated the predictive accuracy of the ANN model
and HPM in property valuation by attempting to confirm the veracity of earlier studies,
i.e., Borst (1991) and Do and Grudnitski (1992). Three models were constructed in the
study; the first utilized the whole 288 sample data, the remaining two were developed
using data set similar to the two previous research. This was done in order to allow for
justifiable comparison. It was found that ANN produced a slightly different output
compared with HPM. However, the authors suggested a note of warning when
employing ANN in property valuation, due to much effort not being put into the ANN
principles at that time.
Further comments by McGreal et al. (1998) support the position of Worzala et al. (1995)
that a cautionary measure should be taken when adopting ANN in property valuation.
The position of those authors does not limit the predictive accuracy of the ANN

101
technique because virtually all property valuation techniques require a measure of
caution in their application. So advocating for carefulness in ANN technique
application is expected.
Recently, studies have been assessing the predictive accuracy of some other modeling
techniques in relation to ANN and HPM. Lin and Mohan (2011) assessed the predictive
accuracy of ANN, HPM and ANR using 33,342 transaction data of residential
properties in Amherst, US. The data was divided into two sets in the ratio of 80:20,
which is for the training and testing of the models, respectively. The study found that
ANN outperformed HPM and ANR, and concluded that ANN is a good property price
prediction tool.
Using a large sample size of about 16,000, Zurada et al. (2011) examined the predictive
performance of a total of seven traditional regression and AI-based modeling
techniques. These techniques include M5P trees, additive regression, support vector
machines using sequential minimal optimization regression (SVM-SMO regression),
radial basis function neural network (RBFNN), memory-based reasoning (MBR),
HPM and ANN. The AI-based techniques did not produce exceptional forecasts when
compared with the nontraditional regression models.
In Australia, Amri and Tularam (2012) conducted a similar assessment by examining

102
ANN, HPM and FLS predictive ability in property value prediction. The three models
were developed using a data set of 7,849 sales data and ten independent variables. The
comparative performance shows that the ANN model outperformed the other two
techniques. A further analysis which involved the inclusion of social indicators into
HPM produced an adjusted r2 value of 0.42, a value which is still lower than that of
the ANN model. In sum, the outstanding predictive accuracy of the ANN technique
was proven in relation to HPM and FLS.
Recently, McCluskey et al. (2013) conducted a comparison of the performance of ANN,
HPM and GWR, utilizing 2,694 sales data of properties in Northern Ireland. The GWR
approach was adopted in the study in order to explore other modeling techniques. The
analysis shows that the GWR approach is superior to ANN and HPM in terms of model
explanation, but ANN was found to be a reliable technique in terms of predictive
accuracy in property valuation.
The results of the comparative studies on both models conducted in different property
markets may be mixed, but there is a confirmation of the predictive accuracy of ANN
over HPM and some other modeling techniques which have been adopted in the real
estate industry. This was confirmed by the review conducted by Abidoye and Chan
(2016b) on studies that adopted ANN and HPM in property valuation which reveals

103
that in about 82% of the articles reviewed, the ANN technique outperformed other
techniques. In 11% of the cases, the performance of ANN, compared with other
valuation approaches, was equal, while only 7% of the reviewed studies reported that
the ANN technique did not outperform other valuation techniques. See Table 3.6 for
the details of some comparative studies.

104
Table 3.6: Summary of ANN and HPM comparative studies
Authors Countries Sample size/ no. of variables Summary of findings
Do and Grudnitski (1992) United States 163/8 ANN better than HPM
Tay and Ho (1992) Singapore 1055/10 ANN better than HPM
Worzala et al. (1995) United States 288/8 ANN not totally better than HPM
Lenk et al. (1997) United States 288/7 ANN did not outperform HPM
Rossini (1997) Australia 334/12 Superiority of ANN over HPM is inconclusive
Cechin et al. (2000) Brazil 1600/6 ANN better than HPM
Din et al. (2001) Switzerland 285/15 ANN is more promising than HPM
Nguyen and Cripps (2001) United States 3906/6 ANN outperformed HPM
Wong et al. (2002) Hong Kong 251/12 ANN is an alternative to HPM
Limsombunchai et al. (2004) New Zealand 200/13 ANN outperformed HPM
Özkan et al. (2007) Turkey 170/7 ANN outperformed HPM
Pagourtzi et al. (2007) Greece 141/13 ANN is a better alternative to HPM
Selim (2009) Turkey 5741/46 ANN is a better alternative to HPM
Peterson and Flanagan (2009) United States 46467/7 ANN better than HPM
Lai (2011) Taiwan 2471/9 ANN is a better alternative to HPM
McCluskey et al. (2012) Northern Ireland 2,694/6 HPM better than ANN
Morano and Tajani (2013) Italy 85/6 ANN forecast well than HPM
Sampathkumar et al. (2015) India 204/13 ANN more accurate than HPM

105
3.5 MODELING THE NIGERIAN REAL ESTATE PROPERTY MARKET
The Nigerian property market has been of interest to domestic real estate scholars and
their efforts have been invested in modeling different real estate submarkets in the
country (Abidoye and Chan, 2017b). However, more attention has been placed on
major urban centers, probably due to the vibrancy of their property markets, especially
the Lagos metropolis property market (Oni, 2010).
Of all the advanced valuation modeling techniques, HPM has received more attention
by the Nigerian real estate scholars. The first application of the HPM technique in the
Nigerian real estate research can be linked to the study of Megbolugbe (1986).
Megbolugbe (1986) applied the model to property price analysis in the city of Jos,
Nigeria. After this initial application, the next two applications were reported in
Megbolugbe (1989) and Megbolugbe (1991). Other early real estate HPM studies in
Nigeria include Arimah (1992), Arimah and Adinnu (1995), Arimah (1997) and
Akpom (1996).
The HPM approach had not received much attention by Nigerian real estate scholars
until 2000 and subsequently, HPM has been adopted in the modeling of different
submarkets in Nigeria. For instance, Akure (Bello and Bello, 2008; Olujimi and Bello,
2009), Onitsha (Emo et al., 2013), Ibadan (Adegoke, 2014), Abuja (Oduwole and Eze,

106
2013), Bauchi (Aliyu et al., 2011; Gambo, 2012) and Lagos (Olorunfemi, 2009;
Babawale et al., 2012; Famuyiwa and Babawale, 2014), amongst other submarkets.
The impact of property attributes and externalities on property values has been
measured in Nigeria using the HPM approach. Some of those studies examined the
impact of closeness to place of worship (Babawale and Adewunmi, 2011; Iroham et
al., 2011; Babawale, 2013a), proximity to high voltage power line (Akinjare et al.,
2012; Oluwunmi et al., 2012; Abidoye and Oyedeji, 2014), proximity to landfill and
waste dump site (Bello and Bello, 2009; Akinjare et al., 2011) and impact of the
availability of Jacuzzi bathtub on property value (Otegbulu and Johnson, 2011),
amongst others. Abidoye and Chan (2017b) presented a review of the application of
the HPM approach in the Nigerian property market.
The AI techniques that have been adopted in the international real estate research
domain have not been embraced in Nigeria. Therefore, its origin and application in the
Nigerian real estate domain may not be easily articulated, probably due to the scanty
literature. Igbinosa (2011) applied the ANN technique to the Nigerian property market
domain in prioritizing the property value determinants. The data used for the analysis
were collated from the Lagos metropolis and Benin city property markets. Those are
two different real estate submarkets which possess totally different market

107
characteristics. Therefore, the results of the study may not be generalized for either of
the markets.
Musa et al. (2013) developed an ANN hybrid model which combines the ANN and the
case-based reasoning (CBR) technique in property valuation. The study found the
ANN-CBR system to be a good valuation technique which produces a more accurate
result than the individual ANN or CBR techniques. However, the data used for the
study was collected in Benin city and from just one real estate firm. Hence, the model
may not be generalized to the whole city and let alone the Lagos metropolis property
market, which is the focus of this research.
All these points to the fact that there has not been any deliberate effort to effectively
model the Lagos metropolis property market exclusively using ANN or to efficiently
assess its predictive accuracy in property valuation in Nigeria’s most active and vibrant
property market. This gap is to be filled by this study focusing mainly on modeling the
Lagos metropolis property market using the ANN technique and comparing its output
with that of the HPM approach, so as to establish a model that can be adopted for
accurate and reliable property value estimation.
3.6 CHAPTER SUMMARY
This chapter presents the background and the application of both ANN and HPM in

108
property valuation. The HPM approach has been in the real estate research domain
since the early 1970s and subsequently, the technique has caught the attention of
scholars in virtually every property market around the world. Conversely, the ANN
technique came to light in the early 1990s, to address most of the shortcomings of
HPM due to its ability to adequately capture nonlinear characteristics in real estate data
and its predictive accuracy strength.
The issues that are common in their application were examined and possible ways of
overcoming them were reviewed. It was discovered that the shortcomings attributed to
the ANN technique in real estate application has been continually addressed by
researchers through the development of software programs and this has aided its rapid
popularity amongst real estate researchers.
The ANN technique was found to have outperformed the HPM approach in property
valuation by producing accurate and reliable estimates in different property markets,
though a few studies have reported otherwise. This predictive accuracy has been
established in other domains where both approaches have been applied. This finding
indicates that the choice of the ANN technique for the case study area is an appropriate
attempt.
The Nigerian property market was modeled with HPM first in 1986 and since then it

109
has been widely employed in modeling different submarkets within the country.
Whereas, ANN which has received so much attention in the international real estate
research has not been embraced in the Nigerian real estate research domain.
Due to the need for real estate professionals to report reliable and accurate valuation
estimates, this study will experiment the application of ANN in the Lagos metropolis
property market. The next chapter presents the research methodology adopted for this
research. A detailed discussion of the various research methods, research approach and
data collection methods is presented in the next chapter.

110
CHAPTER 4 RESEARCH METHODOLOGY
4.1 INTRODUCTION
The previous two chapters have discussed the background of this research and also
provided a comprehensive literature review of the issues related to this research topic.
Chapter 2 and 3 present the current state of knowledge in the area of property valuation
and various valuation methods. Despite the importance of ANN, there remains a
paucity of evidence of its application in property values estimation in Nigeria. To
address this gap, a comparative analysis of the predictive accuracy of HPM and ANN
model was carried out in this research.
To achieve the aim of the present research, six objectives were delineated at the outset.
This chapter provides an explanation of the research methods adopted in addressing
each of the objectives of this research, as well as the different statistical analyses
conducted in the course of the current research. It also describes the research
framework for the study, the different types of data and the process of data collection.
4.2 RESEARCH DESIGN
The research design describes a plan which integrates the different parts of a study (e.g.
data collection, variables measurement and data analysis) so as to address the research
objectives (Sekaran and Bougie, 2013). The essence of developing a research design

111
for a study is to provide a systematic approach to answering the research questions of
the study and this could be achieved by adopting quantitative, qualitative or multi-
method designs (Saunders et al., 2012). The present research has two main objectives:
1) to identify the current property valuation practice prevalent in the Lagos metropolis,
Nigeria, and 2) to develop and compare the predictive accuracy of HPM and ANN
model in property valuation in the Lagos metropolis property market.
The nature of this research warrants the collection of data from a group of people and
data from a large area, and therefore the quantitative research approach was adopted
(Easterbrook et al., 2008). Quantitative data that relates to the property market,
property valuation practice and the value of properties within the Lagos metropolis
property market were collected from registered real estate firms operating in the Lagos
metropolis. A registered real estate firm is a firm that is accredited by both The
Nigerian Institution of Estate Surveyors and Valuers (NIESV) and the Estate Surveyors
and Valuers Registration Board of Nigeria (ESVARBON). These professional bodies
are backed up by the Laws of the Federal Republic of Nigeria (Decree No. 24 of 1975,
now CAP III of 1990) to regulate the real estate professionals and real estate practice,
respectively, in Nigeria (Abidoye and Chan, 2016c).
In the literature, there are a number of research methods which have been adopted by

112
scholars, i.e. “the general plan of how the researcher will go about answering the
research question(s)” (Saunders et al., 2012, p. 680). Alavi and Carlson (1992)
identified 18 research strategies and found that experiment, survey research, literature
survey, case study, modeling, archival research, grounded theory, action research and
ethnography are more popular in built environment related studies (Laryea and
Leiringer, 2012). Hence, in order to achieve the aim and objectives of this research as
detailed in Chapter 1, survey research and modeling approach were adopted. This is in
addition to the literature (review) survey conducted to complement the survey research
and the modeling approach.
The survey research approach is suitable for addressing the research objectives of this
research because it is appropriate to answer the “what; where; how much and how
many questions” (Saunders et al., 2012, p. 176), that pertain to this research topic. The
modeling approach was adopted because it can handle the complexity of real-world
problems (Bertrand and Fransoo, 2002), with property valuation as an example.
However, the literature review was conducted so as to assess the current state of
knowledge of the topics under investigation in the present research, and to also
evaluate the existing range of literature (Mulrow, 1994).

113
4.3 RESEARCH FRAMEWORK OF THE STUDY
The first step of this research entailed an assessment of the current property valuation
practice in the study area. This was conducted so as to ascertain the extent to which
real estate valuers practicing in the study area are aware of and utilize various valuation
methods identified in the literature, particularly the advanced approaches that have
proven to be reliable and accurate in property valuation. The essence of this
investigation was to identify any gap(s), which this research intends to fill.
In the next stage, the property attributes that influence property values in the study area
were identified through a literature review and an empirical study. The literature
review was conducted in parallel with other property markets around the world, so as
to establish any correlation or difference in the set of attributes that homebuyers
consider when making real estate decisions in different property markets around the
world. The significance of each property attribute was established under each category
factors: locational, neighbourhood and structural. The property attributes that are
peculiar to the study area were fitted in the ANN model and HPM.
Residential property sales transactions data were retrieved from registered real estate
firms operating in the Lagos metropolis property market. The collected data were used
to develop HPM and the ANN model reported in the current research. Previous studies

114
have suggested that property valuation models should be market specific (Goodman
and Thibodeau, 1998; Famuyiwa and Babawale, 2014). Therefore, HPM and the ANN
model were constructed for the Lagos metropolis property market. The models
represent constructs which could be adopted for the valuation of residential properties
in the study area.
The predictive accuracy of both models was evaluated using measures of accuracy
which have been successfully used in previous studies. The accuracy measures were
used to compare the predictive value (i.e. outputs from the developed models) and the
actual property values in the test data set. This was used to establish the model which
can accurately and reliably predict property values in the Lagos metropolis property
market. Lastly, the receptiveness of valuers practicing in Nigeria, as regards the
adoption of advanced valuation techniques in property valuation was investigated.
This was done to establish the willingness to embrace these approaches in property
valuation in Nigeria. Figure 4.1 shows the framework of the process followed in
conducting this research.

115
Literature review
Data collection:
Questionnaire survey
Property valuation practice in
the Lagos metropolis
Property value determinants
in the Lagos metropolis Objectives 1
and 2
Current property valuation practice and residential property
attributes in the Lagos metropolis
Data collection:
Sales transaction dataModel development
Hedonic pricing model Artificial neural network model
Objectives 3
and 4
Model validation:
Establishment of the most accurate and reliable modelObjective 5
Valuers receptiveness to advanced
property valuation techniques
Data analysis
Research problem
Conclusions and Recommendations
Objective 6Data collection:
Questionnaire survey
Figure 4.1: Framework of this research
4.4 DATA COLLECTION
4.4.1 Data Collection for the Questionnaire Surveys
The adoption of a questionnaire in survey research is usually utilized to examine the
perception or opinion of people about the subject under study and it can be
administered face-to-face, by post, over the telephone, by email or over the internet,

116
the latter which is the trending approach (Hoxley, 2008). This approach was adopted
in the present research to capture the opinion of real estate valuers on the research
questions under investigation.
Before the questionnaire surveys of this research were conducted, the questionnaires
were subjected to a thorough review and refining by a group of real estate experts as
opined by Gillham (2000). As a result, pilot questionnaires which contained variables
and attributes retrieved from the literature were administered to five registered real
estate professionals that are experienced in property valuation and have a solid
knowledge of the Lagos metropolis property market, as suggested by scholars (Hager
and Lord, 1985; Shapiro et al., 2012; Mooya, 2015). The valuers were asked to assess
the appropriateness and suitability of the developed questionnaires. The feedback
received from those experienced professionals showed that the instrument adequately
captured information relevant to the Nigerian context. Hence, the questionnaires were
suitable for administration to the target respondents (see Appendix 1 and 3).
The targeted respondents for the questionnaire surveys were professional members of
NIESV. The sampled valuers were contacted via their email addresses, which were
retrieved from the 2014 edition of the membership directory of NIESV (see Nigerian
Institution of Estate Surveyors and Valuers, 2014). Conversely, the survey instruments

117
were administered to the respondents via an online platform - SurveyMonkey
(www.SurveyMonkey.com). The collection of data through the use of an online-based
platform ensures reliability because it affords a wider coverage of the respondents and,
at the same time, gather data which are less susceptible to error (Dix and Anderson,
2000).
In addition to the online questionnaires, Microsoft Word version of the structured
questionnaires was designed and attached to the email message which also contained
the online link to the SurveyMonkey questionnaires. This Microsoft Word version was
purposely designed in order to cater for respondents that may not have access to a
stable internet service, and thus allowing them to partake in the online survey. The
respondents were invited to fill in the Word version offline and return it to the
researcher’s email address. This approach is similar to those used in previous studies,
for instance, Mooya (2015) and Ameyaw and Chan (2015), amongst others.
4.4.2 Data Collection for Property Value Modeling
The data used for the construction of HPM and the ANN model were residential
property sales and purchase transactions concluded in the Lagos metropolis property
market. The collected data for this study covered a long time between 2010 and 2016.
This is due to the fact that property transactions are not well documented in Nigeria

118
(Babawale and Ajayi, 2011; Dugeri, 2011). As various property submarkets in a nation
are not the same (Fletcher et al., 2000), this necessitates market segmentation in
property market analysis research (Dale-Johnson, 1982). Hence, the data of residential
properties in affluent areas of the Lagos metropolis (Lagos Island) which include the
Lekki Peninsula Scheme 1, Ikoyi, Victoria Island, Victoria Garden City (VGC) and
gated estates along the Lekki - Epe Expressway corridor were collected (see Figure
4.2 for the map showing the area under consideration).
Using data retrieved from the whole city of Lagos may produce misleading and
unreliable models (see Jenkins, 2000). Moreover, the data was restricted to this
particular geographical area, in order to control the variations in household income,
resident characteristics and other exogenous factors that could influence property
values (Wolverton, 1997). The study area where the data was collected is a
neighbourhood that has common characteristics in terms of income, population density,
property finishes, access to infrastructure, and so on. The choice of this submarket was
due to two reasons: (1) a high number of completed transactions, and (2) the number
of registered real estate professionals involved in the market. Hence, there is a high
likelihood that sales data would be recorded (Iroham et al., 2014).

119
Figure 4.2: Map of Lagos showing the study area for data collection
Source: http://www.lgtnigeria.com/topic_page.php?id=87&page=1
Due to the lack of a property sales databank in the Lagos metropolis, Nigeria (Ajibola,
2010; Adegoke et al., 2013; Oduwole and Eze, 2013), unlike in developed nations such
as Singapore, Japan, Hong Kong, and so on (Hofmann, 2003), the researcher and two
trained Research Assistants (RA) retrieved the transaction data from registered estate
surveying and valuation firms operating in the Lagos metropolis property market.
According to the 2014 edition of the membership directory of NIESV, there are 313
registered real estate firms in the Lagos metropolis. Out of the 313, about 145 are
situated in the Lagos Island (the area where the properties sales data collected are
situated), while the rest are located in other parts of the metropolis. The 145 Lagos
Island firms are initially contacted to check on their willingness to participate in the
study. Thereafter, some other firms located outside Lagos Island were contacted as
The areas where the
transactions data
were collected.

120
well in order to retrieve as large a number of samples as possible.
Landis (1998) contended that property transactions data collection involves the
process of collecting the details of exchanged properties which include the selling price,
the selling date, the number of bedrooms, the property size and the number of toilets,
amongst other property attributes. Landis (1998) further elaborated that property
transactions data may not be readily available because of the confidential nature of
property market transactions. This approach to data collection is not uncommon in
previous studies. Castle and Joseph (1998), McGreal et al. (1998), Bourassa et al.
(2006), Choy et al. (2007) and Owusu-Ansah (2012), amongst others, adopted a similar
approach.
The RAs were trained on the data collection process. This was done to ensure that the
required data were collected in an appropriate manner from the real estate firms (see
Appendix 2 for a sample of the letter of introduction to the firms and the data collection
sheet). The first part of the data collection sheet includes information about the name,
the address and the contact phone number of the firms under consideration. The main
part consists of the list of attributes which influence property values as identified from
the literature, with the researchers’ judgement and the valuers’ opinions on the property
attributes which are peculiar to the Lagos metropolis property market.

121
It should be noted that due to the limitation of a complete property attributes databank
in Nigeria, and the importance of the structural property attributes to property value
formation (Palmquist, 1984; Wen et al., 2005), the property attributes retrieved from
real estate firms are structural attributes. At the end of the data collection period, which
lasted for four months, all the collected data were collated and pre-processed. The
processing entails the removal of entries with incomplete details. The valid data were
eventually used for the development of the HPM and ANN models.
As mentioned earlier, the transaction data which the author collected were those
completed between 2010 and 2016. However, the effect of inflation on the prices
recorded during the transaction periods may have rendered the data inconsistent. To
this end, a price deflator was applied to the retrieved property prices in order to factor
in the effect of inflation on the property prices. The Consumer Price Index (CPI) for
Nigeria, for the period under consideration, was collected from the Central Bank of
Nigeria (CBN) and the National Bureau of Statistics (NBS). More details on the
collected data are presented in Chapter 6 and 7.
4.5 RESEARCH METHODS
In order to achieve the objectives of this research as presented in Chapter 1, certain
research methods were adopted in accomplishing each of them. Table 4.1 shows the

122
corresponding research method(s) and data analysis techniques used to achieve each
objective. It is worth mentioning that this chapter only provides an outline of the
methodologies adopted in this research and more details of the research method used
in achieving each objective is presented alongside the analysis of each objective in
subsequent chapters.

123
Table 4.1: Research methods adopted for this research
Research Objectives
Research methods Data analysis
Literature
review
Questionnaire
Survey
Transaction
data
MS ranking
technique
Hedonic
pricing model
Artificial
neural network
Model
validation
1 To assess the current property valuation practice
in the Lagos metropolis ✓ ✓ ✓
2 To identify and generate a list of attributes which
influence residential property values in the Lagos
metropolis property market
✓ ✓ ✓
3 To develop a Hedonic pricing model for the
Lagos metropolis residential property market ✓ ✓
✓
4 To develop an artificial neural network model for
the Lagos metropolis residential property market ✓ ✓
✓
5 To evaluate the predictive accuracy of HPM and
ANN models developed for the Lagos metropolis
residential properties
✓ ✓
✓
6 To assess Nigerian valuers’ receptiveness to the
application of the AI techniques in property
valuation
✓ ✓ ✓

124
4.5.1 Literature Review
This research started with a systematic literature review. This review ensured that the
current state of knowledge is established and the gap(s) in the literature are identified
(Mayer, 2009). This research method can be said to be the backbone of this research
because, in order to accomplish the objectives of this research, references are made to
the literature that focuses on the major issues that are related to the research topic.
Thus, references are made to previous studies in every part of this thesis in cases where
there is a need to justify assertions, actions and to make comparisons (Denscombe,
2014). The comprehensive literature reviewed in this study was presented in Chapters
2 and 3. The adoption of other research methods used in this research to achieve the
research objectives is presented in the next section.
Articles reviewed in this study were sourced from online databases and search engines
such as Scopus, EBSCOhost, Springer, Science Direct, ProQuest, Taylor & Francis
and Google Scholar. These articles include journal papers, books, PhD theses,
conference proceedings and online reports published by organizations.
4.6 ADDRESSING THE RESEARCH OBJECTIVES
4.6.1 Addressing Research Objective 1: Questionnaire Survey
The questionnaire used to address objective 1 was designed to have four sections (see

125
Appendix 1). In the first part, the valuers were asked to provide information about their
demographic characteristics in terms of educational qualifications, professional status,
years of industry cognitive experience and area of specialization, amongst other
information. The second section contained details about the real estate firm, where the
respondent is working. In the third section, the various valuation approaches identified
from the literature as being applicable in property valuation were presented to the
valuers. The professionals were requested to indicate if they are aware or not of both
the traditional and the advanced valuation methods. In addition to the response to the
awareness of the valuation methods, the valuers were also asked to signify how often
they used those sets of valuation approaches in practice.
Descriptive statistics in terms of the frequency distribution and chi-square test were
used for the analysis of the collected data for this purpose. The appropriate reliability
and statistical significance tests were conducted and their details are presented in
Section 4.7. The findings of objective 1 are reported in Chapter 5.
4.6.2 Addressing Research Objective 2: Questionnaire Survey
For objective 2, the questionnaire instrument was structured to collect information
from real estate professionals practicing in the study area on their opinions on the
determinants of residential property values in the Lagos metropolis property market.

126
A single questionnaire was designed to collect data used for the achievement of
objectives 1 and 2, indicating that the respondents’ information and details of the
valuers’ firm provided in section one and two, respectively, in the questionnaire,
represent the characteristics of the valuers and firms that provided information for
objective 2. However, the various attributes that influence residential property values
in the case study area that were identified from the literature, were presented to the
valuers in the fourth section of the questionnaire (see Appendix 1).
Adopting a five-point Likert scale, the respondents were asked to rank the importance
of each property attribute in property value formation. The scale of 1 to 5, representing
highly insignificant to highly significant, was adopted. That is, a valuer is expected to
tick 1 if the subject property attribute’s contribution is highly insignificant to property
values, tick 3 if the effect of the attribute on property value is neutral, and select 5 if
the impact of the attribute is highly significant to property value formation. The
reliability of the collected data was estimated using the Cronbach’s alpha, and the
mean score (MS) ranking technique was adopted for the analysis of the collected data.
Further details on these analysis techniques are presented in Section 4.7, while the
results of this survey are documented in Chapter 5.

127
4.6.3 Addressing Research Objective 3: Hedonic Pricing Modeling
The HPM analysis reveals the association between independent variables and the
dependent variable in terms of the contributory power of each independent variable to
the formation of the dependent variable (Wen et al., 2005). The HPM approach was
used to achieve objective 3. The necessary tests were conducted on the collected data
before been feed into the regression model. The variables’ coefficients generated from
the analysis were used to estimate the property values of the holdout samples. The
accuracy of the predicted property values was evaluated by comparing it with the
actual property values of the holdout samples. This was done to establish the predictive
accuracy of the HPM approach in property valuation. A detailed explanation of the
application of HPM is described in Chapter 3, while the detailed reporting of its actual
adoption in this research is presented in Chapter 6.
4.6.4 Addressing Research Objective 4: Artificial Neural Network Modeling
The ANN model is a novel analysis technique which is gaining rapid popularity among
researchers (Adhikari and Agrawal, 2013), including real estate researchers and
professionals. An ANN model was developed in order to achieve research objective 4.
Data of sales and purchases transactions completed in the Lagos metropolis property
market were fitted into the ANN model. The validity of the trained model was tested
with the holdout sample so as to establish the predictive accuracy of the ANN

128
technique in property valuation. The detailed process of the application of the ANN
model is presented in Chapter 3, while the actual application of ANN in this research
is presented in Chapter 7.
4.6.5 Addressing Research Objective 5: Validation of the Developed Models
In order to establish the predictive accuracy of HPM and the ANN model developed
in this research, the predictive accuracy of both models was measured using r2, MAPE,
MAE and RMSE. Model validation is an essential part of model development because
the generalization of an inaccurate and non-validated model could lead to inaccurate
estimates (Nordstrom, 2012). Each of the models was validated with the holdout
sample data and the predicted values were compared with the actual property values
so as to establish the model which predicts property values accurately (Wen, 2014). In
addition to the accuracy measures adopted for model validation, the percentage of
predicted property values that had prediction error rates that fell within the acceptable
industry standards was established. This was done to establish the predictive accuracy
of the ANN technique in comparison with the HPM approach in predicting property
values in the Lagos metropolis property market. A more detailed description of
predictive accuracy measures adopted is presented in Section 4.7, while the model
validation analysis is presented in Chapter 8.

129
4.6.6 Addressing Research Objective 6: Questionnaire Survey
There is a relationship between research and the practice of any profession (Hemsley-
Brown and Sharp, 2003). Therefore, the readiness of the Nigerian valuers to adopt the
AI valuation techniques in property valuation was assessed. A questionnaire survey
was conducted on the Nigerian valuers through an online platform (see Appendix 3 for
a sample of the questionnaire). The questionnaire was divided into five parts. The first
section of the questionnaire is about the valuers’ demographic information. Section
two included questions which center on their knowledge of AI techniques, while the
third part contained questions on the reason for the low awareness and application of
the techniques. The fourth section contained factors that could enhance the adoption
of the AI techniques, and the last section center on the benefits and prospects of
adopting the AI valuation techniques. The response of the respondents was received
on a five-point Likert scale with options that range from 1 to 5, representing from
‘strongly dissatisfied’ to ‘strongly satisfied’, respectively. The reliability of the
collected data was estimated and the MS ranking technique and chi-square were
adopted for the analysis of the collected data. The results of this survey are presented
in Chapter 9.
4.7 MODEL ACCURACY PERFORMANCE MEASUREMENT
Model performance measures are approaches used to evaluate the predictive accuracy

130
of a model. The metrics found in the literature include MAE, RMSE, ME, MAPE, r2,
adjusted r2, and so on (Hyndman and Koehler, 2006; McCluskey et al., 2013). However,
there is no generally acceptable indicator, but the RMSE has been widely adopted in
the literature (Wilson et al., 2002; Zurada et al., 2011; McCluskey et al., 2013), and
the closer a RMSE and MAE values to 0, the better the model (Lin and Mohan, 2011).
Contrarily, Makridakis et al. (1998) argued that MAPE is widely used in the literature.
The MAPE measure quantifies the error of prediction in terms of percentage (Zurada
et al., 2011).
The r2 is usually adopted to interpret the relationship between the independent
variable(s) and the dependent variable (Sincich, 1996b). Therefore, the adoption of
other measures of accuracy which can establish estimation errors is necessary. In this
study r2, MAPE, MAE and RMSE accuracy measures were adopted, based on their
suitability for the topic under investigation based on the existing literature (see Table
3.5 for the commonly used accuracy measures in the literature). The expressions for
the calculation of the accuracy measures found in the literature (Limsombunchai et al.,
2004; Lin and Mohan, 2011; Zurada et al., 2011) are presented in Equations 4.1 to 4.7.
n
in 1
2
ii PP1
RMSE
(4.1)

131
n
1i
2
i
n
1i
2
i i
2
PP
PP
1r
(4.2)
1i
ii PPn
1MAE
(4.3)
2n
1i
i i PPn
1MSE
(4.4)
i i
ni
PPME max (4.5)
n
P
PP
MAPE
n
1 i
ii
i
(4.6)
i
2
i
t
2
i i
P
PP UsTheil'
(4.7)
Where iP is the actual property value, iP is estimated/predicted property value from the
model, P is the sample mean of the property values, and n is the number of
observations.
4.8 DESCRIPTIVE STATISTICS AND OTHER ANALYSIS TOOLS
ADOPTED
Some descriptive statistics and analysis tools were employed in addressing the
research objectives of this study. In analyzing the collected data and making inferential
conclusions from the questionnaire surveys, the statistical analysis tools employed are
namely, Cronbach’s alpha, MS, the coefficient of variation (COV) and chi-square. The
SPSS software version 20.0 (SPSS Inc., Chicago, USA) was used in performing these

132
statistical analyses. The SPSS software was also used for the development of HPM
using MRA. Microsoft Excel (Microsoft, USA) was utilized for data coding before
being entered into the SPSS software for analysis and for some calculations.
For the development of the ANN model, R programming software (R CoreTeam, 2016)
and the Rminer package (Cortez, 2010) were adopted in this research. R programming
software is freely available for download from http://www.r-project.org/. “R is more
flexible and extensible by design, thus integration of statistics, programming and
graphics are more natural” when compared with other software, for instance, Waikato
Environment for Knowledge Analysis (WEKA) (Cortez, 2010, p. 572). This software
has been adopted in previous ANN studies and has produced excellent results; see, for
instance, Cortez et al. (2009) (food processing), Lisboa and Taktak (2006) (medicine)
and Hu et al. (2005) (civil engineering), among other studies.
4.8.1 Cronbach’s Alpha
In establishing the reliability of the questionnaire surveys conducted in this research,
Cronbach’s alpha was estimated. This test measures the extent of the internal
consistency amongst all the respondents of a survey (Tavakol and Dennick, 2011).
Cronbach’s alpha value ranges between 0 and 1; however, Nunnally and Bernstein
(1978) posited that a value between 0.50 and 0.60 signifies a reliable consistency

133
amongst the subjects, while Hair et al. (2010) put the value at 0.70 and above.
According to Reinhardt (1996), the Cronbach’s alpha value can be computed using the
mathematical expression presented in Equation 4.8.
2
T
k
2
11-k
kα
(4.8)
Where K is the number of items in the test, 2σ
k is the sum of the k item score
variances and 𝜎𝑇2 is the variance of the total test scores.
4.8.2 Mean Score Ranking
The MS ranking technique is usually used to evaluate the importance and significance
of variables under consideration in a survey research and it is widely employed in the
literature (Adair et al., 1996a). In this research, MS was adopted in objectives 1, 2 and
6 to evaluate the valuers’ responses to the knowledge and application of valuation
methods, evaluate the significance of each property attribute which contributes to
property value formation and to evaluate the respondents’ receptiveness to the AI
valuation techniques. The MS ranking is estimated using the formula in Equation 4.9
as obtainable in Ameyaw and Chan (2015).
N
nnnnn 12345 12345MS
(4.9)
Where n is the score given by valuers based on a five-point scale of 1 to 5 and N is the
number of valuers that rated a variable.

134
As such, a variable with MS of 4.00 and above is adjudged as highly significant, those
with MS of values ranging between 3.50 and 3.99 as significant, variables with MS of
3.00 to 3.49 as slightly significant, while variables with less than 3.00 were regarded
as insignificant.
4.8.3 Coefficient of Variation
In addition to the MS ranking, another analysis conducted is COV. The COV analysis
is the measure of the standard deviation as a percentage of the mean (Sørensen, 2002).
The COV of each property attribute was estimated in this research to express the
relative variability of valuers’ responses of each property attribute on property value
(Elhag and Boussabaine, 1998). According to Elhag et al. (2005), a low COV value
signifies a relatively high agreement amongst the respondents and vice-versa. The
COV can be computed using the formula in Equation 4.10.
%100COV X
S
(4.10)
Where S is the standard deviation and X represents the sample mean.
4.8.4 Chi-Square
In analyzing the property valuation practice in the study area (objective 1), and the
willingness of the Nigerian valuers to adopt the AI techniques, the chi-square (χ2) test
was conducted. This was performed in order to establish the statistical relationship and

135
independence amongst the research variables (Verma, 2013). That is, the significant
statistical relationship between valuers’ demographic characteristics and their
awareness and the questions under investigation. According to Verma (2013), χ2 can
be computed using the mathematical expression presented in Equation 4.11.
n
i f
ff
1 e
2
eo2
(4.11)
Where of and ef are the observed and expected frequencies for each of the possible
outcome.
4.8.5 Variance Inflation Factor
The VIF test was conducted to identify correlated property attributes used in
developing a robust HPM in achieving objective 3. A VIF value is usually greater or
equal to 1, and this connotes little or no presence of multicollinearity among the
variables, whereas a VIF value of above 10 indicates a high level of multicollinearity
(Berenson et al., 2012). According to Elhag (2002), VIF can be estimated using the
expression in Equation 4.12.
21
1
iRVIF
(4.12)
Where 2
iR is the coefficient of determination of the regression of ith independent
variable and all other independent variables.

136
4.9 CHAPTER SUMMARY
This chapter provides a discussion of the philosophical assumptions that underlie the
current research. Based on the description of various research approaches, this chapter
shows the reasons for the suitability of literature review, survey and modeling for this
research. The literature review (which is presented in Chapters 2 and 3) provides
information on the current state of knowledge related to the research topic. While the
other research methods were employed in achieving objectives 1 to 6. The research
methods and data analysis tools are explained and discussed. Predictive accuracy
evaluation of HPM and the ANN model was carried out so as to address objective 5.
Due to the lack of a real estate transactions databank in Nigeria, a detailed description
of the data collection process is provided. The various statistical analyses conducted
in this research are also discussed and are used mainly in this research in analyzing the
data collected for the questionnaire surveys. This chapter shows that this research is
built on robust research methods and methodology. Based on these, the evidence
provided and discussed in the subsequent chapters of the thesis are valid.

137
CHAPTER 5 DECIPHERING THE LAGOS METROPOLIS
PROPERTY VALUATION PRACTICE5 AND PROPERTY VALUE
DETERMINANTS6
5.1 INTRODUCTION
The previous chapter has presented the research methodology adopted in this research.
It describes the various research methods adopted for the present research, the
analytical framework of this research, the research design and the descriptive statistical
analysis performed. It also describes the process of data collection and how each of
the research objectives was achieved. This chapter presents the findings of research
objectives 1 and 2 and those of research objectives 3 -6 will be discussed in Chapters
6 to 9. These two objectives provide an overview of the Lagos metropolis property
market in terms of the prevalent property valuation practice and the determinants of
residential property values.
5.2 DATA COLLECTION AND ANALYSIS METHODS
5.2.1 Data Collection
In the literature, it has been pointed out that quantitative research methods are adequate
for addressing problems which involve a large population and a widespread of
5 This chapter has been published in Abidoye, R. B. and Chan, A. P. C. (2016). A survey of property
valuation approaches in Nigeria. Property Management, 34 (5,) 364-382.
6 This chapter has been published in Abidoye, R. B. and Chan, A. P. C. (2016). Critical determinants
of residential property value: Professionals’ perspective. Journal of Facilities Management, 14 (3), 283-
300.

138
participants over a geographical area (Easterbrook et al., 2008). In addition, those
methods ensure that comparative data analysis and generalization of results could be
inferred from research findings (Phua, 2013). Therefore, this study adopted
quantitative research methods to collect and analyse data from valuers practicing in
the Lagos metropolis.
The data was collected with the use of an online-based questionnaire. Mooya (2015)
adopted the same research method to investigate the real estate education and
professional practice in South Africa. The questions in the questionnaire were
structured into four parts. The first part was designed to obtain demographic
information about the professionals, while the second part was about the information
of valuers’ firm. The third part presented various property valuation methods that have
been established in the literature (see, for instance, Pagourtzi et al., 2003; Lorenz and
Lützkendorf, 2008; Yacim and Boshoff, 2014), and the respondents were instructed to
indicate their level of awareness of those methods. This third section also contained
questions designed to capture how often the professionals employ those methods in
practice, that is, they were asked to indicate if they use them always, regularly,
occasionally, or not at all. This was aimed at achieving research objective 1 of this
research. The content of the fourth section aimed at achieving research objective 2.

139
The questions in the fourth section were designed based on a comprehensive list of
residential property value determinants in Lagos generated from previous studies
conducted in the study area. Those research articles were sourced from various online
databases and search engines. In the light of the findings of the reviewed studies, a
total of 20 attributes were identified as attributes that influence residential property
values in the Lagos metropolis property market. The respondents were asked to rate
the level of significance of the identified attributes based on a five-point Likert scale,
with options ranging from 1 to 5, where 1 signifies highly insignificant, 2 -
insignificant, 3 - indifferent, 4 - significant and 5 - highly significant. The respondents
of this study were professional members of NIESV.
The 2014 membership directory of NIESV (Nigerian Institution of Estate Surveyors
and Valuers, 2014) shows that 548 valuers are domiciled in the Lagos metropolis.
However, a total 350 of those valuers have their email addresses documented in the
directory. Eventually, the questionnaire was sent to the email addresses of 150
stratified randomly sampled valuers practicing in the Lagos metropolis property
market. A professional valuer is an individual that has attained the prescribed minimum
educational qualification, cognitive professional experience and expertise as set by
NIESV and ESVARBON.

140
The sample size was carefully selected by considering the sample size obtainable in
previous studies. For example, 50 professionals were sampled by Finlay and Tyler
(1991), Kennedy (1998) surveyed 100 professionals, Bello and Bello (2009) elicited
information from 107 experts, while Ibiyemi and Tella (2013) examined 110 valuers.
The respondents were expected to respond to the survey within three months, with a
reminder sent to them at the end of the second month.
At the end of the cut-off date, a total of 60 responses were received, representing 40%
response rate, out of which five of the responses were incomplete. In sum, a total of
55 responses were valid for analysis. This response rate exceeds the acceptable margin
of 30% as posited by Akintoye and Fitzgerald (2000). It is assumed that the busy nature
of the study area may have been responsible for the average response rate. The
situation in the Lagos metropolis is that most valuers spend much of their time on the
road due to the jostle and bustle in the megacity.
The SPSS software version 20.0 was employed in the data analysis and the data were
presented using descriptive statistics in terms of percentiles. This approach was also
adopted in Boyd (1995), Waziri (2013) and Mooya (2015). In addition, the chi-square
test was conducted in order to prove the statistical relationship between the research
variables, namely the relationship between valuers’ level of education, years of

141
experience and their awareness of these valuation methods.
5.2.2 Reliability Test
When measuring the internal consistency of the data used for this study, the
Cronbach’s alpha test was performed to establish the reliability and internal
consistency of the collected data. The purview of the Cronbach’s alpha value lies
between 0 and 1. Conversely, a Cronbach’s alpha value of above 0.70 depicts a valid
reliability (Hair et al., 2010). For research objective 1, the Cronbach’s alpha value of
0.74 was achieved. For research objective 2, a Cronbach’s alpha value of 0.843 was
recorded. These values are above the acceptable threshold of 0.70, which shows that
there is internal consistency amongst the respondents. This means that from the
collected data, valid conclusions can be made.
Regarding the Cronbach’s alpha of the collected data for objective 2, the information
in Table 5.1 shows the Cronbach’s alpha when each variable is deleted. According to
Oyedele (2013), the Cronbach’s alpha if an item is deleted measures the significance
of each variable to the overall Cronbach’s alpha. This indicates that the value of a
variable which is equal to or less than the overall Cronbach’s alpha value (0.843)
suggests a significant contribution, whereas a value higher than the overall Cronbach’s
alpha value signifies insignificant contribution. Following this rule, it was revealed

142
that all the attributes have values less than 0.843, and hence they were all retained in
the analysis.
5.2.3 The Study Area
The Lagos metropolis property market was chosen as the study area for this research.
This choice stems from the fact that the Lagos metropolis property market is the most
Table 5.1: Reliability analysis of the variables
Overall Cronbach’s alpha reliability = 0.843
Property attributes Cronbach’s alpha if item deleted
Locational attributes
Location 0.838
Accessibility to place of work 0.822
Accessibility to CBD 0.828
Accessibility to public transport facility 0.838
Proximity to highway 0.835
Accessibility to School 0.840
Accessibility to shopping mall 0.832
Neighbourhood attributes
Neighbourhood characteristics 0.836
Availability of neighbourhood security 0.831
Availability of electricity 0.829
Availability of pipe borne water supply 0.827
Availability of waste disposal system 0.833
Structural attributes
State of repair of the property 0.841
Size of property 0.839
Age of the property 0.837
Numbers of bedrooms 0.838
Number of bathrooms/toilets 0.839
Building characteristics 0.824
Availability of security fence 0.835
Size of bedrooms 0.822

143
vibrant and has highest average property value in Nigeria (Dugeri, 2011). This
translates into the high sophistication of the players and stakeholders in the property
market (Oni, 2010). The United Nations has adjudged Lagos as a megacity, the most
populous city in West Africa, and projected that the city could be the third largest in
the world after Tokyo and Bombay (Lagos State Government, 2015).
About 95% of commercial banks and 90% of insurance companies operating in Nigeria
have their head offices situated in the Lagos metropolis and also, most multinational
companies in the Nigeria operate in the Lagos metropolis (Babawale and Oyalowo,
2011; Central Bank of Nigeria, 2015). This class of real estate stakeholders constitutes
the biggest proportion of valuation report end-users (Gilbertson and Preston, 2005).
This implies that the findings of this research would be beneficial to all the real estate
stakeholders in Nigeria and beyond.
5.2.4 The Valuers’ Profile
The profile of the respondents in a survey research determines the reliability of the
information elicited from the survey. The profile of the respondents for this study is
presented in Table 5.2. The lowest academic qualification required to become a
member of NIESV is a high school degree, although this membership route is very
unpopular, because of the lengthy membership route. Since anyone who aspires to

144
become a professional in a field would acquire a higher education, it is expected that
none of the professionals possesses a high school degree as the highest educational
qualification. About 32.73% of the respondents possess Higher National Diploma
which is the minimum higher educational qualification required to become a
professional member of NIESV. A total of 21.82% of the professionals have acquired
a Bachelor of Science degree, while about half (45.45%) of the respondents have
acquired a Postgraduate degree and Masters of Science degree, which implies that the
professionals are developing themselves academically. None of the valuers possesses
a PhD degree, probably because of the general notion that a PhD degree is only
necessary for individuals that want to build an academic or research career.
In terms of years of professional experience which suggests good knowledge and
understanding of the property market, a total of 61.81% of the professionals have been
practicing in the industry for between 6 and15 years. Also, 32.73% of the respondents
can be said to be new in the real estate practice, because they possess less than five
years of real estate industry experience. The remaining 5.46% possess over 15 years
of experience. Since the majority of the professionals have between 6 and 15 years of
working experience, it may be reasonable to assume that most of them are of the
middle-aged class, and thus are expected to be well informed of the current
developments in the real estate profession globally, because of the likelihood of an

145
affinity for the trending information technology.
The area of specialization of the valuers indicates their specialization at the time of
this survey. It is worth to note that it is common for real estate professionals to switch
from one area of the profession to another, or even be involved in general practice,
making them experienced in all the areas. As such, Mooya (2015) posited that the
experience real estate professionals gather from general practice, property
Table 5.2: Estate surveyors and valuers’ profile
Variables Frequency (n) Percentage (%)
Educational qualifications
High school 0 0.00
Associate degree/Higher National Diploma 18 32.73
Bachelor of Science 12 21.82
Postgraduate/Masters of Science 25 45.45
PhD 0 0.00
Total 55 100.00
Years of industry experience
0-5 years 18 32.73
6-10 years 24 43.63
11-15 years 10 18.18
16-20 years 2 3.64
Above 20 years 1 1.82
Total 55 100.00
Area of specialization
Valuation 14 25.45
Property management 15 27.27
Agency 3 5.46
Property investment consulting 2 3.64
General practice 21 38.18
Total 55 100.00

146
management, agency, investment analysis, valuation, and so on, is essential and helpful
to the valuation practice. About 38.18% of the respondents that specialize in the
general practice area of the profession indicate that those proportions are conversant
with property valuation practice. Their knowledge of the Lagos metropolis property
market is noteworthy for this study, coupled with 25.45% of the professionals that
major in property valuation. However, 27.27% of the valuers are into property
management, while the remaining three and two valuers specialize in real estate
agency and property investment consulting, respectively.
5.3 THE LAGOS METROPOLIS PROPERTY VALUATION PRACTICE
The research findings and the discussions of the outcomes of addressing research
objective 1, which aimed at assessing the property valuation practice in the Lagos
metropolis in terms of the level of awareness and usage of valuation methods by
valuers, are presented in subsequent subsections.
5.3.1 Level of Awareness of the Valuation Methods
The valuers’ level of awareness of the various valuation methods which forms part of
the fulcrum of this study was examined and presented in Table 5.3. The response shows
that the professionals are very much aware of the traditional valuation methods. This
is deduced from the information that reveals that all the respondents (100%) are aware
of investment, comparable and cost valuation methods, while 98.18% and 94.54% of

147
the valuers are aware of the profit and the residual methods, respectively. This
conforms to the findings of Bello and Bello (2009) and also corroborates the position
of some researchers (Bagnoli and Smith, 1998; McGreal et al., 1998; Yacim and
Boshoff, 2014) that the traditional methods of valuation are simple in approach,
because they are dependent on the availability of market information and the valuers’
subjective judgement, and thus are generally common amongst real estate
professionals.
The information in Table 5.4 shows the relationship between the valuers’ educational
level, their level of experience and their awareness of the valuation methods. For the
traditional methods, the valuers’ level of educational qualifications has a significant
statistical relationship with the investment, the comparable and the cost methods of
valuation with a ρ-value of 0.000 in the three instances. This indicates that the
awareness of these three property valuation methods could be attributed to valuers’
educational qualifications. For the profit and residual methods, their ρ-values of 0.161
Table 5.3: Awareness of traditional valuation methods
Valuation methods Aware Not aware
Frequency (n) Percentage (%) Frequency (n) Percentage (%)
Investment method 55 100.00 0 0.00
Comparable method 55 100.00 0 0.00
Cost method 55 100.00 0 0.00
Profit method 54 98.18 1 1.82
Residual method 52 94.54 3 5.46

148
and 0.867, respectively, which are greater than 0.05 depicts a non-statistical significant
relationship between valuers’ level of education and awareness of both valuation
methods.
In the same vein, the valuers’ awareness of the investment, the comparable and the
cost approaches could be attributed to their years of professional experience. This is
because, for the three methods, a ρ-value of 0.000 was recorded for each. However,
valuers’ level of professional experience does not have a statistically significant
relationship with their level of awareness of profit and residual methods, as in the case
of educational qualifications. This suggests that the more a graduate valuer continues
to acquire cognitive professional experience, the more s/he acquires more skills in the
application of the three most widely adopted traditional methods of valuation.

149
Table 5.4: Chi-square test for awareness of traditional methods and valuers’ education and experience
Valuation methods 2 value
Degree of freedom
(df) -value
Educational level
Investment method 0.000a 4 0.000a
Comparable method 0.000a 4 0.000a
Cost method 0.000a 4 0.000a
Profit method 3.650 4 0.161
Residual method 0.296 4 0.867
Level of professional experience
Investment method 0.000a 4 0.000a
Comparable method 0.000a 4 0.000a
Cost method 0.000a 4 0.000a
Profit method 1.316 4 0.859
Residual method 5.391 4 0.249
Note: a – No statistics are computed because the method is a constant.
On the other hand, the professionals are not generally aware of any of the advanced
valuation methods as shown in Table 5.5. There is some level of awareness of the HPM
method (32.73%) in this category, and this may be attributed to the fact that HPM is
popular and widely used in the housing market research as posited by researchers
(Adair et al., 1996b; Bender et al., 2000; Tse and Love, 2000; Kauko, 2003).
Comparatively, the moderate level of awareness indicted for HPM by the valuers could
be substantiated by the adoption of the HPM approach in the property market research
in Nigeria by researchers (see Aluko, 2011; Babawale et al., 2012; Famuyiwa and
Babawale, 2014, amongst others).

150
For the other advanced methods, the level of awareness has not improved considerably
after the study of Bello and Bello (2009), despite the findings of Babawale and
Oyalowo (2011) where 100%, 90.70% and 80.40% of the valuers sampled indicated a
willingness to acquire more training on ANN, ARIMA and FLS, respectively. This
enthusiasm has not materialized to date, as 92.73%, 90.91% and 96.36% of the
professionals surveyed in the present study are not aware of these aforementioned
methods, respectively. In addition, 89.09% are not aware of the spatial analysis method.
These results suggest that the property valuation practice in the metropolis has not
transformed over time. It seems the professionals have not developed themselves by
acquiring the know-how to apply the advanced property valuation techniques.
The information in Table 5.6 shows that the valuers’ educational achievements do not
have a statistically significant relationship with their awareness of all the advanced
valuation approaches. This is because the ρ-values for each of the methods are greater
Table 5.5: Awareness of advanced valuation methods
Valuation methods Aware Not aware
Frequency (n) Percentage (%) Frequency (n) Percentage (%)
Hedonic pricing method 18 32.73 37 67.27
Spatial analysis method 6 10.91 49 89.09
Autoregressive integrated
moving average
5 9.09 50 90.91
Artificial neural networks 4 7.27 51 92.73
Fuzzy logic system 2 3.64 53 96.36

151
than 0.05. Also, their levels of professional experience do not translate into the
awareness of the advanced valuation approaches, with all the methods having a ρ-value
of greater than 0.05. This depicts that with most of the valuers possessing years of
experience of between six and 15 years, they have not become familiar with the
advanced valuation methods. It is, therefore, reasonable to suggest that the
professionals are not updated in terms of the paradigm shift going on in the property
valuation domain around the world.
5.3.2 Level of Usage of the Valuation Methods
It may be misleading to conclude that the level of awareness of these valuation
methods would automatically translate into their level of usage. Moreover, the level of
Table 5.6: Chi-square test for awareness of advanced methods and valuers’ education and experience
Valuation methods 2 value Degree of freedom (df) -value
Educational Level
Hedonic pricing method 1.505 4 0.471
Spatial analysis method 3.680 4 0.159
Autoregressive integrated moving average 1.444 4 0.486
Artificial neural network 3.694 4 0.158
Fuzzy logic system 0.651 4 0.722
Level of professional experience
Hedonic pricing method 4.419 4 0.352
Spatial analysis method 1.811 4 0.770
Autoregressive integrated moving average 1.198 4 0.878
Artificial neural networks 2.071 4 0.723
Fuzzy logic system 1.967 4 0.742
Note: a – No statistics are computed because the method is a constant.

152
usage would reveal the most adopted approach in practice. Thus, the frequency of use
of the valuation methods is presented in this section.
The response of the professionals shown in Table 5.7 depicts that many (63.64%) of
the valuers always employ the comparable method in property valuation practice. This
conforms to the case in other property markets around the world, where the comparable
method is the most widely applied method amongst the traditional approaches
(Pagourtzi et al., 2003; Yacim and Boshoff, 2014). The investment and the cost
methods are used regularly as 54.55% of the valuers indicated this for both methods.
This agrees with the findings of Babawale (2012) that valuers widely adopt these three
methods in practice. The profit and residual methods are the least adopted, because
60% and 70.90%, respectively, employ these approaches occasionally. This finding is
similar to that of Bello and Bello (2009). This is probably because the purpose for
which most valuation reports are requested and the types of properties being valued in
the metropolis cannot be appraised with these valuation methods.
The property valuation method to be adopted for a valuation exercise is largely
dependent on the property type (Yacim and Boshoff, 2014), consequently, the less
adoption of these two methods is in line with what is obtainable in South Africa
according to Mooya (2015). This similarity may be attributed to the fact that both

153
countries are on the same continent - Africa.
On the use of the advanced methods, it is obvious that the professionals do not always
adopt any of the advanced methods in practice, as shown in Table 5.8. A minuscule
proportion of the professionals do use these approaches regularly and occasionally,
while a larger percentage (more than 90% in almost all the cases) do not use these
approaches at all. In this category, it is only the HPM approach that is used occasionally
and regularly by 18.20 and 7.30% valuers, respectively. The low adoption of these
advanced methods may be ascribed to the fact that most of the professionals are not
aware of these advanced methods and even the few who are aware lack the proficiency
to apply them in practice.
This seems to be the true picture of the professionals, as the findings of Waziri (2013)
in a related profession, the construction industry in Nigeria, indicated that construction
industry experts do not employ the AI techniques in cost estimation. Mooya (2015)
Table 5.7: Adoption of traditional valuation methods
Valuation methods Always Regularly Occasionally Not at all
n % n % n % n %
Investment method 17 30.90 30 54.55 8 14.55 0 0.00
Comparable method 35 63.64 19 34.54 1 1.82 0 0.00
Cost method 14 25.45 30 54.55 11 20.00 0 0.00
Profit method 6 10.91 11 20.00 33 60.00 5 9.09
Residual method 3 5.46 10 18.18 39 70.90 3 5.46

154
reported the same for real estate valuers in South Africa. It appears that built
environment professionals in this continental region are not embracing the advanced
approaches in practice.
It can be summarised that after the studies of Bello and Bello (2009) and Babawale
and Oyalowo (2011), there has not been a substantial transformation in the property
valuation practice in Nigeria when compared with what is obtainable in other parts of
the world. The valuers still adopt traditional valuation methods in practice. It seems
the professionals are not being educated about these methods because with about
67.27% possessing at least a Bachelor of Science degree, it means they had not been
introduced to these methods in the classroom and neither has the regulatory
professional bodies organized professional development workshops or conferences
centered on these advanced trends in property valuation.
Table 5.8: Adoption of advanced valuation methods
Valuation methods Always Regularly Occasionally Not at all
n % n % n % n %
Hedonic pricing method 0 0.00 4 7.27 10 18.18 41 74.55
Spatial analysis method 0 0.00 2 3.64 1 1.82 52 94.54
Autoregressive integrated
moving average
0 0.00 1 1.82 2 3.64 52 94.54
Artificial neural networks 0 0.00 2 3.64 0 0.00 53 96.36
Fuzzy logic system 0 0.00 2 3.64 0 0.00 53 96.36

155
5.4 PROPERTY VALUE DETERMINANTS
Real estate property serves as consumption (owner-occupier) and investment
(investors) goods to its holder (Chin and Chau, 2002). Real estate property is complex
in nature, that is, it is made up of many unique sets of characteristics that influence its
value (Rosen, 1974; Sirmans et al., 2005). The impacts of property attributes on
property values are perceived differently by the different stakeholders due to the
heterogeneous nature of real estate properties (Shapiro et al., 2012). A real estate
professional is often sought to appraise the value of an interest in a property and in so
doing, what the valuer analyses during this exercise are the bundles of characteristics
of the subject property (Appraisal Institute, 1994). The present investigation, therefore,
aims to evaluate the valuers’ judgement on the level of significance of property value
determinants in the Lagos metropolis property market in Nigeria.
5.5 THE LAGOS METROPOLIS PROPERTY VALUE DETERMINANTS
The outcomes of addressing research objective 2 which is aimed at identifying the
property value determinants are presented in the following subsections.
5.5.1 Analysis of Attributes’ Significance
The level of significance (i.e. MS), COV, the category ranking, the overall ranking and
the criticality of each property attribute are presented in the second to the sixth columns
in Table 5.9. The COV of each attribute was calculated. The COV of the attributes

156
ranges between 8.85% (location) and 31.63% (accessibility to school). These
variations are low, which suggests a high agreement among the valuers as regards the
significance of those property attributes.
As evident in Table 5.9, the MS values of the attributes ranges between 4.92 and 3.13.
The MS values of six out of the 20 attributes are considered to be highly significant,
11 are significant, while the remaining three are slightly significant to property value
formation, whereas none of the attributes is insignificant. Property size and
neighbourhood security had the same MS value of 4.06. Also, accessibility to CBD
and building characteristics recorded MS values of 3.75, respectively. This suggests
that when appraising a property, the same value is placed on those pairs of attributes.

157
5.5.2 Ranking of the Locational Attributes
The highest and lowest ranked attributes in the overall variable list (location and
accessibility to a shopping mall) are in the locational category. Property location has
been investigated widely in the literature. This attribute was ranked as the most highly
significant attribute by the valuers, both in the locational category, as well as in the
Table 5.9: Ranking of property value determinants
Property attributes Mean score COV Category
ranking
Overall
ranking
Criticality
Locational attributes
Location 4.92 8.85 1 1 H. significant
Accessibility to place of work 3.79 25.78 2 9 Significant
Accessibility to CBD 3.75 21.04 3 10 Significant
Accessibility to public transport facility 3.62 19.86 4 13 Significant
Proximity to highway 3.56 25.14 5 15 Significant
Accessibility to school 3.15 31.63 6 17 S. significant
Accessibility to shopping mall 3.13 27.55 7 18 S. significant
Neighbourhood attributes
Neighbourhood characteristics 4.31 15.61 1 2 H. significant
Availability of neighbourhood security 4.06 20.36 2 4 H. significant
Availability of electricity 3.81 22.69 3 8 Significant
Availability of pipe borne water supply 3.65 24.76 4 12 Significant
Availability of waste disposal system 3.38 27.53 5 16 S. significant
Structural attributes
State of repair of the property 4.23 16.62 1 3 H. significant
Size of property 4.06 22.87 2 4 H. significant
Age of the property 4.00 15.65 3 5 H. significant
Numbers of bedrooms 3.98 13.61 4 6 Significant
Number of bathrooms/toilets 3.90 18.47 5 7 Significant
Building characteristics 3.75 21.04 6 10 Significant
Availability of security fence 3.73 27.12 7 11 Significant
Size of bedrooms 3.60 22.87 8 14 Significant
Note: H. significance is highly significant and S. significance is slightly significant.

158
overall category with an MS of 4.92. The early study of Wilkinson and Archer (1973)
posit that location is an important variable that influences property values. Authors
have reported that location is highly significant in property value formation (for
example, Cheshire and Sheppard, 1998; McCluskey et al., 2000; Han et al., 2002;
Kauko, 2003; Joslin, 2005; Ge and Du, 2007). In the Lagos metropolis, a property
located in the high-income neighbourhood, such as Ikeja GRA, Banana Island, Ikoyi
and Lekki Peninsular, among others, would command a high value than those located
in the low-income areas of Mushin, Oshodi, Iyana-Ipaja, and so on.
The next two significant attributes in this category are accessibility to the place of work
and accessibility to CBD, with MS values of 3.79 and 3.75, respectively. They are
ranked as the ninth and tenth attributes, respectively, in the overall variable list. Their
position in the locational category could be justified, probably due to the fact that the
Lagos metropolis is the commercial nerve center of Nigeria, where a high number of
commercial and industrial activities takes place. Hence, when making residential
decisions, a home buyer or tenant would consider the distance from their place to work
and CBD to their house.
5.5.3 Ranking of the Neighbourhood Attributes
This classification consists of attributes that are regarded as public services provided
within a residential neighbourhood. The significance of neighbourhood attributes in

159
property value formation cannot be underestimated, as Linneman (1980) reported that
neighbourhood characteristics account for between 15 and 50% of property values,
and explains as much as 100%, where the properties in the neighbourhood are similar
in terms of structural characteristics.
In this investigation, neighbourhood characteristics attribute was ranked as the highest
in this category, and, at the same time, second in the overall list of the attributes. This
shows its significance to property value determination because it recorded an MS value
of 4.31. The study of Cheshire and Sheppard (1998) found that the characteristics of a
neighbourhood where a property is located influence its value. Home seekers would
be willing to pay for a property located in a neighbourhood characterized by good
features. Han et al. (2002) reported that a property in a neighbourhood with good
characteristics commands a high value. Also, Kauko (2003) established that this
attribute is a significant property value determinant. This is what is obtainable in Lagos
because a neighbourhood with good characteristics, such as Ikeja GRA, Banana Island,
Lekki Peninsular Phase 1 and VGC are provided with good facilities (good roads,
properties with modern designs, properties finished with modern materials, properties
with an ocean view, a neighbourhood with a large composition of high-income earners)
and attract a higher property value. This corroborates the study of Iroham et al. (2014)
conducted in the Lagos metropolis, Nigeria.

160
Gallimore et al. (1996) remarked that home seekers would be willing to pay for an
apartment in a neighbourhood which is free of crime, kidnapping and other forms of
social vices. Also, Clark and Herrin (2000) reported that murder rate in a
neighbourhood has an adverse effect on property values. This was also noted by
Amenyah and Fletcher (2013) who reported that residents prefer to live in a
neighbourhood that has no history of theft, kidnapping and robbery cases. Hence, it is
understandable that the attribute was ranked as highly significant by the valuers with
an MS value of 4.06. This suggests that home seekers place more value on the security
of their lives and properties, in other words, a property in a safe neighbourhood would
command a high property value. In the Lagos metropolis, properties located in areas
that are perceived to be free of crime, either because it is a gated neighbourhood with
a corporate-regulated security or close to a police station, would be highly sought after.
This is also the case in the Ibadan metropolis, Nigeria, where Adegoke (2014) found
that the availability of burglar alarm is significant to property values.
5.5.4 Ranking of the Structural Attributes
Property structural attributes (Table 5.9) have been established to be highly significant
in property value formation and are, thus, widely adopted in property value analysis
studies (Wilhelmsson, 2000). Palmquist (1984) found that structural attributes have
the highest contributory power to property values in the US. Wen et al. (2005) also

161
reported that structural characteristics contribute 60% to property values. From the
valuers’ point of view in the Lagos metropolis, in the overall attributes category,
structural attributes occupy the third to the seventh positions, confirming the literature.
In this category, the state of repair of a property is the most important structural
variable and indeed highly significant with an MS value of 4.23. This attribute,
describing the aesthetics and the finishes of a property, influences the value place on a
property, suggesting that a property that is well maintained would command a high
value. A property in a poor state would thus require a degree of money to repair or
replace some of its components. This would be factored into the overall value which
would result in a lower value. This is also the case in South Africa, as reported by
Mbachu and Lenono (2005), where aesthetic design in terms of design and finishes
was ranked as significant by real estate valuers.
The taste, needs and the preference of different home seekers would influence the size
of property they may be willing to pay for. Also, the size of a property would determine
the value they would place on such a property (Owusu-Ansah, 2012), with the
implication that big households would, all things being equal, create a demand for a
large property and would be willing to pay for such. Out of the 20 most frequent
property attributes used in related studies reviewed by Sirmans et al. (2005), property

162
size positively influenced property values 42 times out of the 52 instances. This
indicates that the bigger a property, the higher the price the property would command.
The case is not different in the Lagos metropolis and the influence of the size of a
property is confirmed with an MS value of 4.06 recorded by the variable.
According to Chin and Chau (2002), the expected sign of the age of a property on
property value is negative. This means that the value of a property decreases as the age
increases (in a case where the property is not being maintained). This attribute, being
ranked as highly significant to property value in the Lagos metropolis, is justifiable
because a home seeker would make provisions in terms of a premium on the amount
to offer, considering the age of the property. It is expected that as a property gets older,
wear and tear of its components begins to set in, which would warrant some level of
repair, replacement or refurbishment as the case may be. This suggests that a new
property would command a higher value when compared with an older property.
5.6 SUMMARY OF RESEARCH FINDINGS
The questionnaire findings of the current property valuation practice in the Lagos
metropolis reveal that the majority of the professionals are aware of and familiar with
the traditional valuation methods, especially comparable, cost and investment methods.
In contrast, the valuers are not much aware of the advanced methods of valuation,
although with an exception of the HPM method, which is being adopted in real estate

163
research in the study area. It was also found that valuers’ level of education, as well as
years of professional experience, do not have a statistically significant relationship
with their awareness of the advanced valuation methods. And for the traditional
methods, a statistically significant relationship only exists for the investment, the
comparable and the cost methods.
In terms of the frequency of use of all the valuation approaches, the valuers always
and regularly make use of the traditional valuation methods (comparable, cost and
investment methods). Their little awareness of the advanced approaches results in their
low adoption in practice. All these indicate that the property valuation practice in
Nigeria is still in its infancy, and so there is the need to introduce the AI valuation
techniques in property valuation in the Lagos metropolis, which could generate more
accurate and reliable property valuation estimates as obtainable in other property
markets around the world.
As regards the property value determinants in the Lagos metropolis, the most highly
significant attributes are in this order: the location of a property, the neighbourhood
characteristics, the state of repair of a property, the size of a property, the availability
of neighbourhood security and the age of a property. The location of a property was
the highest ranked significant variable, which conforms to the existing literature. The

164
Lagos metropolis property market has been proven to be the most vibrant property
market in Nigeria, and hence when making financial and economic investment
decisions in the metropolis, real estate stakeholders ought to consider those sets of
highly significant attributes. In addition, the list of property value determinants
peculiar to the property market is one of the main requirements for the modeling of
property values in Lagos, which is demonstrated in this research.
5.7 CHAPTER SUMMARY
The studies reported in this chapter are questionnaire surveys pertained to the Lagos
metropolis property market. The current property valuation practice prevalent in the
Lagos metropolis was investigated, and the findings reveal that the adoption of the
traditional valuation methods is predominant among the valuers. At the same time, it
was found that property structural attributes significantly influence residential property
values in the metropolis, when compared with locational and neighbourhood attributes.
Property location, neighbourhood characteristics, property state of repair, property size,
availability of neighbourhood security and age of property were eventually found to
be the most highly significant attributes that influence residential property values in
the Lagos metropolis. A list of property attributes generated is used for the empirical
modeling of the Lagos metropolis property values adopting the HPM approach and
evaluating the predictive accuracy of the approach. This is presented in the next chapter.

165
CHAPTER 6 MODELING THE LAGOS METROPOLIS
PROPERTY VALUES: THE HPM APPROACH
6.1 INTRODUCTION
In Chapter 5, the current property valuation practice in the Lagos metropolis, as well
as the evaluation of the residential property values determinants in the Lagos
metropolis are reported. It was found that the valuation practice is still at the traditional
level. With the advocacy that advanced property valuation methods could provide
more reliable and accurate estimates, this may warrant a shift towards advanced
property valuation methods. Property structural attributes were established to be highly
significant to property values in the Lagos metropolis. However, those attributes are
needed for the development of property value models. The HPM approach was used
in modeling residential property values of the Lagos metropolis. The study
documented in this chapter evaluates the predictive accuracy of the HPM approach to
generate accurate and reliable property valuation estimates, which would be a good
representation of the market value.
6.2 HEDONIC PRICING MODEL IN NIGERIA
In measuring the impact of various property attributes on property values in Nigeria,
scholars have adopted the HPM approach to examine the effect of the nearness to a
university (Babalola et al., 2013), the neighbourhood security (Olujimi and Bello, 2009;

166
Adegoke, 2014), the electricity supply (Bello and Bello, 2008; Famuyiwa and
Babawale, 2014), the number of bedrooms (Oduwole and Eze, 2013), the number of
bathrooms and toilets (Babawale et al., 2012), the pipe-borne water (Babawale et al.,
2012) and the property size (Oduwole and Eze, 2013), among other attributes, on
property values.
Previous studies that have adopted HPM in real estate in Nigeria have only established
the explanatory relationship of property attributes and property values. To date, no
effort has been invested to substantiate the suitability of the HPM approach to produce
accurate and reliable property valuation estimates which can be a good proxy for
property values. There is a need to bridge the gap between ‘explaining’ and ‘predicting’
modeling, as this would provide the “reality check to the relevance” (Shmueli, 2010,
p. 292) of HPM in property valuation. This study, therefore, aims to establish the
predictive accuracy of the HPM approach for property valuation to produce accurate
and reliable property valuation figures.
6.3 DATA COLLECTION AND METHODS
6.3.1 The Data7
Transactions (i.e. sales and purchases) data were collected from registered real estate
7 The same data set used for this study was used for the development of the ANN model. Thus, the
details of data collection process are not presented in Chapter 7.

167
firms domiciled in the Lagos metropolis property market. Due to the unavailability of
a centralized sales transactions databank in Nigeria (Adegoke et al., 2013), the data
collection process was limited to those firms which provided access to the information
on completed transactions relating to residential properties. Therefore, structural
attributes of residential properties were the major independent variables selected for
this study. This is not uncommon in similar studies such as Do and Grudnitski (1992),
Owusu-Ansah (2012) and Thanasi (2016), amongst others, where data sets of
structural attributes were used to model property prices.
The only neighbourhood variable added is the sea view, as the study area is surrounded
by water bodies (see Figure 4.2), and it was easy for the real estate professionals to
provide such information regarding the properties included in this study. In the same
vein, the location of a property was included in order to distinguish the location of
each data entry. The list of the 11 independent variables and one dependent variable
considered in this study are presented in Table 6.1, alongside their mean, standard
deviation, minimum and maximum values.

168
Table 6.1: Descriptive statistics of the variables
Variables Mean Standard deviation Minimum Maximum
Dependent
Price 149,769,541.60 199,367,090.90 14,500,000.00 1,182,844,000.00
Independent
Bedrooms 3.49 1.26 1 10
Toilets 4.28 1.37 1 7
Bathrooms 3.38 1.25 1 7
Property type 3.87 1.45 1 6
Boys’ quarters 1.08 1.36 0 8
Parking 3.27 2.45 0 20
Age 3.30 4.97 0 42
Floors 2.83 2.19 1 16
Security fence 0.98 0.14 0 1
Sea view 0.05 0.22 0 1
Location 3.36 1.70 1 5
Sample size = 321. US$1 = N282.5 (Source: Central Bank of Nigeria, as at 30/06/2016)
The information was collected from high-income neighbourhoods in the Lagos Island
property market (i.e. Ikoyi, Victoria Island, VGC, Lekki Peninsula Phase 1 and other
high-income neighbourhoods on the Lekki – Epe corridor (between Lekki Peninsula
Phase 1 and Abraham Adesanya Estate)) and properties in the study area command
higher values, when compared with other locations in the Lagos metropolis (Famuyiwa
and Babawale, 2014).
It was intended to retrieve information of completed sale transactions as far back as
possible, in order to retrieve a sizable sample data. Unfortunately, the firms do not
maintain a property sales databank. However, the author managed to collect
transactions completed between 2010 and 2016. At the end of the data collection

169
exercise which lasted for four months (March 2016 - June 2016), data on 370
completed transactions were retrieved. The data were pre-processed. After the cleaning
process which aimed at excluding entries with missing/incomplete records, 321
observations remained and were subjected to analysis. The definition and
measurement of the property variables included in this study are shown in Table 6.2.

170
Table 6.2: Definition, measurement and frequencies of the variables
Variables Definition Measurement Frequencies of the variables
Price Sale price of property Naira (N), Nigerian currency Most of the properties were sold for between N14,500,000.00 - N200,000,000.00
Bedrooms Number of bedrooms Numeric (0,1,2,3…) Most of the properties have between 3-5
Toilets Number of toilets Numeric (0,1,2,3…) Most of the properties have between 4-6
Bathrooms Number of bathrooms Numeric (0,1,2,3…) Most of the properties have between 3-5
Property type* Construction style of the property Numeric (1,2…6) Study area is characterized by flats and detached houses
Boys’ quarters Number of BQ rooms Numeric (0,1,2,3…) Most of the properties have at least 1
Parking Number of parking lots Numeric (0,1,2,3…) Most of the properties have at least 2 lots
Age Property age Numeric (0,1,2,3…) Most of the properties were relatively new. 37.1% are 1year old
Floors Number of floors Numeric (0,1,2,3…...) 52.6% of the properties are on 2 floors
Security fence Availability of security fence 1 if available, and 0 otherwise 98.1% have security fencing
Sea view Presence of sea view 1 if available, and 0 otherwise 94.7% do not face the sea or lagoon
Location Location of the property The neighbourhood situated This is spread over the areas
Note: * Property type includes: duplex, detached house, semi-detached house, terrace, flat and others.
BQ means Boy’s quarters which is called servants’ quarters in some environment.
Location describes the geographical position of each property included in this study.

171
The frequency distributions of the collected data show that about 57% of the properties
were sold for less than N100,000,000, while only 15 properties were sold for above
N500,000,000 (see Appendix 4). It can be said that most of the properties were either
three-, four- or five-bedroom properties, with the properties having a corresponding
number of bathrooms. Most of the properties had about four, five and above five toilets,
suggesting that most properties had extra toilets when compared with the number of
bathrooms in a property. The extra toilet facility could be for guest use. It is worth
noting that this feature is highly priced in the Lagos metropolis property market.
Flat, detached and terrace buildings are common in the study area (see Appendix 4).
One servants’ quarters (usually referred to as boys’ quarters [BQ] in the Nigerian
environment) is attached to about half (44.2%) of the properties. Although some
properties do not have BQ, those are probably one bedroom properties. In those cases,
the occupants may not need their domestic staff to live with them in the property. The
properties used for this study have at least one parking lot for the use of the occupants.
Twenty-one of the properties were recently constructed and sold at the time of data
collection. Also, most of the properties were either constructed between one to three
years ago, suggesting that properties in the study area are relatively new.
More than half (52.6%) of the properties are on 2 floors, 13.7% have 3 floors, while

172
some (10.6%) are on one floor. Almost all (98.1%) the properties included in this study
have security fences erected around their perimeter boundaries. On the other hand,
most of the properties do not have sea view (94.7%). In terms of the location of the
properties, about a quarter are located in Ikoyi, 16.5% are located in Lekki Peninsula
Phase 1, while about half (46.7%) are located in other areas such as Northern Foreshore,
Nicon Town, Oniru Estate and Chevy View Estate, amongst other high-income
neighbourhoods, in the study area.
It should be noted that the ‘location of property’ variable was included to describe the
geographical position of the property. The actual address of each property used in this
study could not be retrieved from the real estate firms. This is not uncommon in the
literature (for instance Selim, 2009; Kontrimas and Verikas, 2011; Tabales et al., 2013).
The composite CPI that is available from the National Bureau of Statistics (see
National Bureau of Statistics, 2016a) was used to deflate the current property prices to
constant prices. This adjustment ensured that the effect of inflation on property values
was removed. The process for adjusting the values can be mathematically expressed
as presented in Equation 6.1. This formula was adopted from McCluskey et al. (2012).
CPIyear Base
CPICurrent priceyear Base priceproperty Current (6.1)

173
6.4 MODEL SPECIFICATIONS
The selection of the variables to be included in the model started with the testing for
multicollinearity between the independent variables by estimating their partial
correlation coefficients. In addition, the VIF test was conducted.
The multicollinearity test reveals a high correlation between the number of toilets and
the number of bathrooms in a property. The correlation coefficient of the number of
bathrooms and the number of toilets was 0.965 which was the highest amongst the
variables. This corroborates the statistics in Table 6.3 which shows that their VIF
values are higher than the acceptable value of 10, as well as their tolerance values
which are also higher than 0.10 (Berenson et al., 2012). Consequently, the number of
toilets variable was removed from the list of independent variables and a reanalysis of
the data produced an acceptable VIF value of 8.400 and tolerance value of 0.119 for
the number of bathrooms’ variable, which was subsequently retained.
The plausible explanation for the multicollinearity that existed between those two
variables could be due to the fact that most of the bathrooms in the properties used for
this study have in-built toilets (en-suite). This may be responsible for the number of
bathrooms in a property to be almost the same as the number of toilets, and in most
cases, the number of toilets is the number of bathrooms plus one toilet (usually guests’

174
toilet). The need for guest toilets could be attributed to the fact that the residents in the
study area value privacy and convenience (Otegbulu and Johnson, 2011). Although the
correlated variable (the number of toilets) was removed, it should be noted that the
presence of multicollinearity is irrelevant when adopting HPM for prediction, thus it
will not affect the predictive performance of the developed model (Nguyen and Cripps,
2001).
Table 6.3: Variance inflation factor test
Variables
Collinearity Statisticsa
All the variables Retained variables
Tolerance VIF Tolerance VIF
Bedrooms 0.158 6.334 0.161 6.210
Property type 0.367 2.728 0.367 2.727
Boy’s quarters 0.439 2.279 0.446 2.243
Parking 0.449 2.228 0.457 2.190
Age 0.684 1.463 0.686 1.458
Floors 0.724 1.381 0.730 1.370
Security fence 0.839 1.192 0.844 1.185
Sea view 0.931 1.075 0.930 1.075
Location 0.608 1.644 0.642 1.559
Bathrooms 0.049 20.405 0.119 8.400
Toilets 0.062 16.009 Removed Removed
Note: a. is Dependent variable: Price of property
A linear relationship between property price (dependent variable) and the independent
variables was established. The scatter plot approach was adopted so as to visualize the
association between the variables. The scatter plots (see Appendix 5) show that there
is a linear relationship between property price and the independent variables. The

175
relationship recorder here does not violate model assumptions (Janssen et al., 2001),
and is common in real estate related studies (McGreal et al., 1998; Din et al., 2001;
Limsombunchai et al., 2004).
The Glejser test was performed to check for heteroscedasticity (see Table 6.4). This
was performed following three basic steps. (1) conducting a regression analysis and
saving the residuals; (2) the absolute value of the residuals were then regressed on the
possible sources of heteroscedasticity, which in this case were the independent
variables; and (3) a significant coefficient of each variable indicates heteroscedasticity.
This analysis shows that there is no presence of heteroscedasticity among the variables
because the significant coefficients of all independent variables are greater than 0.05
(Gujarati and Porter, 2009).
Table 6.4: Glejser test for heteroscedasticity
Variables t Sig. Explanation
(Constant) 1.652 .100 No heteroscedasticity
Number of bedrooms -.869 .385 No heteroscedasticity
Number of bathrooms 1.066 .288 No heteroscedasticity
Type of property 1.074 .284 No heteroscedasticity
Number of BQ rooms -1.033 .303 No heteroscedasticity
Number of parking space 5.355 .420 No heteroscedasticity
Age of property -.483 .630 No heteroscedasticity
Number of floors -1.687 .093 No heteroscedasticity
Presence of security fence -.838 .403 No heteroscedasticity
Presence of sea view .658 .511 No heteroscedasticity
Location of property -4.903 .372 No heteroscedasticity

176
In order to establish the predictive accuracy of the HPM approach, the data set was
divided into two parts, for training and testing of the model. The training set was 80%
(256) of the data set and was used to generate the HPM coefficients, while the
remaining 20% (65) holdout samples were used for the testing of the model. The
accuracy of the model was tested based on its r2, MAPE, MAE, RMSE and ultimately,
the percentage of the predicted values that are close to the actual property values. In
this study, the linear functional form was adopted. This is because it can be easily
computed and also relatively easy to interpret (Lin and Mohan, 2011). The linear
functional form has also been frequently adopted in previous studies and this could be
attributed to the ease of the interpretation of the parameters (Morancho, 2003), which
is noteworthy for a study of this nature. The data were analyzed using the SPSS
software, version 20.0.
6.5 RESULTS AND DISCUSSION
6.5.1 Empirical Results
The result of the HPM analysis is presented in Table 6.5. The model produced an
adjusted r2 value of 0.76 and an r2 value of 0.77, which indicates that the variables
included in the model explain 77% variations in the prices of properties in the study
area. Most of the variables produced expected contributive signs to property values,
while the rest produced unexpected signs. For instance, expectedly, the age of a

177
property had a negative sign which is consistent with the literature (see for instance
Hui et al., 2007), suggesting that an old property will usually command a lower value
when compared with new ones.
The effect of the number of bathrooms and the presence of a security fence in a
property were negative. In terms of the number of bathrooms in a property, some
previous studies such as Ottensmann et al. (2008) and Pozo (2009), among others,
reported that this variable would positively influence property values. Whereas, Tse
(2002) and Kutasi and Badics (2016) found that the number of bathrooms in an
apartment could negatively affect the price of properties in Hong Kong and Hungary,
respectively. Those diverse findings could be attributed to the localized nature of the
property market. Therefore, it could be safe to conclude that in the study area, home
buyers do not place more importance on the number of bathrooms in a property, but
they value privacy in some other forms in terms of the master’s bedroom being en-
suite and there being a visitors’ toilet in a property.

178
Table 6.5: Results of the regression analysis
Independent variables Coefficient t-ratio p-value
Bedrooms 8664822.596 .738 .461
Bathrooms -20051336.870 -1.448 .149
Property type 8076944.769 1.144 .254
Boys’ quarters 102816020.589 15.151 .000
Parking 9526774.351 2.615 .009
Age -1635743.326 -1.068 .286
Floors 4539570.089 1.455 .147
Security fence -10789691.840 -0.229 .819
Sea view 154767562.522 4.832 .000
Location -26885403.503 -6.176 .000
Constant 98778305.063 1.396 .164
R2= 0.766, Adj R2= 0.757, F-ratio= 80.381, n=256
In the same vein, Lynch and Rasmussen (2001), Owusu-Ansah (2012) and Adegoke
(2014), among other studies, found that higher security measures (low crime rate) in a
neighbourhood would significantly increase the value of a property, whereas this study
found that the presence of a security fence (high-security measure) in a property would
negatively influence its price. This finding may be attributed to the fact that most of
the residential neighbourhoods sampled usually have a general neighbourhood
organized security personnel, in addition to each house’s security guards. So the
presence of a security fence in those neighbourhoods may not be regarded as a security
measure for real estate investors in the study area.
Of all the ten explanatory variables, the presence of a sea view and the number of BQ

179
rooms in a property are the most highly significant variables which influence property
value. Both variables had the highest coefficients which contribute to the value
formation of properties in the study area. In a similar previous study of Mok et al.
(1995), it was found that a property that has a sea view will command a higher value.
The positive influence of the BQ room on the price of properties was also reported in
the study of Basu and Thibodeau (1998).
6.5.2 Model Performance
As stated earlier, in an attempt to achieve the objectives of this study, the performance
of the model developed was tested using the MAPE, the MAE and the RMSE accuracy
measures. These approaches are commonly adopted in the literature (McCluskey et al.,
2013). The results shown in Table 6.6 reveals an MAE value of N61,408,856 and an
RMSE value of N103,370.573. In addition, an MAPE value of 38.23% was recorded
which depicts that the prediction produced an average error of 38%, which may not be
acceptable by a rational real estate stakeholder. This suggests that there is some level
of inaccuracies in the HPM predictions, despite the satisfactory r2 value of 0.77.
This confirms that the performance of a model could not be evaluated entirely by
adopting the r2 value (Willmott, 1981). These findings of the present study corroborate
the position of Ogunba and Ajayi (1998) and Babawale and Ajayi (2011) that reported

180
that the level of property valuation inaccuracy prevalent in the Nigerian valuation
practice is unacceptable based on international standards.
Table 6.6: Predictive accuracy of the HPM approach
Measure of accuracy Hedonic pricing model
r2 .77
MAPE (%) 38.23
MAE 61,408,856.10
RMSE 103,370.573.40
Hager and Lord (1985) and Hutchinson et al. (1996), among others scholars, posited
that a property valuation margin of error of between ± 5 and 10% of the actual property
value is acceptable and that any error beyond this could be attributed to the valuers’
negligence. The HPM coefficients generated from the analysis was used to predict the
holdout samples in order to establish the predictive accuracy of the HPM approach.
The result of the predictions was categorized so as to establish the percentage of the
samples that fell within the acceptable margin and those which were otherwise.
The information in Table 6.7 shows that only 26.67% of the predicted property prices
had an error margin of between ± 0 and 10%, while 13.33% of the predicted prices had
an error margin of between ± 11 and 19%. In addition, a whopping 60% predictions
produced an error of above ± 20%. This indicates that in two out of three HPM
predictions, an error rate of above ± 20% could be generated and the chance of
producing accurate estimates with lesser errors is slim.

181
Table 6.7: Valuation accuracy of the HPM prediction
Accuracy range Frequency (n) Percentage (%)
± 0-10% 8 26.67
± 11-19% 4 13.33
Above ± 20% 18 60.00
These findings seem unsatisfactory, suggesting that the adoption of the HPM approach
for property valuation would not produce accurate and reliable valuation figures which
can be a good proxy for market value. One of the implications of this is that it would
continually deepen the loss of the confidence which property valuation end-users have
in the real estate profession and professionals. Property valuation inaccuracy could be
minimal in stable (developed) property markets (Shapiro et al., 2012). This has been
substantiated in the study of Cole et al. (1986), Newell and Kishore (1998) and Parker
(1998), among others. Therefore, it is highly imperative that research endeavour is
directed at investigating and addressing the factors mitigating against the estimation
of accurate valuation figures, especially in developing economies, with Nigeria as an
example. If property valuation inaccuracy is reduced to an acceptable standard, this
would result in achieving a sustainable property valuation practice.
6.6 CHAPTER SUMMARY
This chapter reports the establishment of the predictive accuracy of the HPM approach
in property valuation which addressed research objective 3. Residential properties

182
sales transactions data fitted into the model were collected in the Lagos metropolis.
The data included 11 independent variables (property attributes) and one dependent
variable (property values). The HPM model was solely developed to evaluate the
accuracy performance of the HPM approach, and thus the developed HPM coefficients
were used to predict the property values of the holdout data sample. This accuracy was
assessed based on the accuracy measures generally adopted in the literature. The
evaluation shows that the HPM approach is not a good valuation method that could
produce accurate and reliable property values. This could be attributed to its inability
to handle the nonlinearity relationship that exists between property values and property
attributes (Lin and Mohan, 2011), its inability to handle outliers (Selim, 2008) and
inaccuracy (Lam et al., 2008), among other shortcomings. This necessitated the
adoption of other nonlinear valuation techniques such as ANN which could produce
better accurate valuation estimates than HPM. The application of the ANN technique
in property valuation using the Lagos metropolis as a representative case is presented
in the next chapter.

183
CHAPTER 7 MODELING THE LAGOS METROPOLIS
PROPERTY VALUES: THE ANN MODEL APPROACH8
7.1 INTRODUCTION
The application of the HPM approach in property valuation was reported in Chapter 6.
The predictive accuracy of the HPM approach was established and found to be
undesirable for predicting accurate and reliable property valuation estimates. Given
the prevalence of valuation inaccuracy in the Lagos metropolis, it is not desirable to
continually rely on the HPM approach to produce accurate property values, and thus
the need to adopt a more robust advanced valuation method. The ANN technique
which has been proven to be a reliable technique was applied in the property valuation
of the Lagos metropolis residential properties. This exploration is reported in this
chapter.
7.2 DATA COLLECTION AND METHODS
The data used for the development of the ANN model reported in this study was
collected from the Lagos metropolis property markets. This data set was the same used
for the construction of the HPM (see Section 6.3.1 in Chapter 6). This was done so as
to facilitate a justifiable comparison of the performance of both models. So the data
8 This chapter has been published in Abidoye R. B. and Chan, A. P. C. (2017). Modeling property
values in Nigeria using artificial neural network. Journal of Property Research, 34(1), pp. 36 - 53.

184
collection details and process presented in Section 6.3.1 for the HPM study will not be
repeated here. The process followed in developing the ANN model is presented in the
next section.
7.3 MODEL SPECIFICATIONS
The ANN model was developed using a three-layer feedforward network. Mora-
Esperanza (2004) suggest that the number of hidden layers in an ANN model can range
between half and double the number of the input variables. However, the use of one
hidden layer is considered adequate for handling complex real-life prediction for ANN
models (Masters, 1993; McCluskey et al., 2012). There is no agreement in the literature
as regards the number of hidden neurons an ANN model should have (Cechin et al.,
2000). However, in the present study, the number of neurons in the hidden layer was
automatically determined by the R programming software, by optimizing the network
architecture that best fit the data during the grid search, using the default parameters
in terms of learning rate, stopping criteria and weight decay.
The development of an ANN model is based on a trial and error experimentation to
attain the best model (Limsombunchai et al., 2004). The iteration process is usually
performed in order to construct the best ANN model that fits the data. After the
iteration, an ANN architecture of 11-5-1 (11 input variables, 1 hidden layer (with 5

185
neurons) and 1 output) generated by the software was found to be the best network in
this study. Figure 7.1 shows the topology of the ANN architecture generated in this
study.
Bedrooms
Toilets
Bathrooms
Property type
BQ
Parking lots
Age
Floors
Security fence
Sea view
Location
Input
Layer
Hidden
Layer
Output
Layer
Property
Price
Figure 7.1: The ANN architecture
Source: Abidoye and Chan (2017a)
As mentioned, the ANN model presented in the present study was developed using the
R programming software (R CoreTeam, 2016) and the Rminer package (Cortez, 2010).
The R custom codes (see Appendix 7) were used in implementing the development of

186
the ANN model in this study, by using the multilayer perceptron (MLP) package in R.
The BP learning algorithm which is widely adopted in the literature (Mimis et al., 2013)
was adopted in this study. BP is based on MLP which ensures that the neurons in the
models are arranged in interconnected layers (input, hidden and output).
In developing the ANN model, the available data set was divided into two sets, i.e. for
training and testing of the model (Wilson et al., 2002). The training data set was used
to develop the model by determining the arc weights, while testing entails the
evaluating of the predictive and generalization ability of the developed model (Lam et
al., 2008). There is little or no guidance in the literature on the division ratio for the
data for the training and testing of the model (Cechin et al., 2000). Ratio 90:10, 80:20
and 70:30 for training and testing, respectively, have been widely adopted in the
literature because the model testing can be performed with a small data set (Zhang et
al., 1998). This suggests that the analyst’s discretion is required in determining the
ratio based on what is obtainable in the literature.
For this study, the collected data were randomly divided into two parts using a ratio of
80% and 20%, respectively, for the model training and testing. This amounted to 256
samples for training and 65 holdout samples for the testing of the predictive accuracy
of the ANN model. In estimating the error rate of this model, a cross-validation was

187
used and the standard approach is a 10-fold cross-validation (Witten and Frank, 2005).
Through this, the model average all the ten error estimates generated, in order to arrive
at an unbiased and minimum error measure (Murat and Ceylan, 2006). In this study, a
10-fold cross-validation was used as obtainable in previous studies (see for instance
Zurada et al., 2011; McCluskey et al., 2012). Table 7.1 shows the details of the ANN
model developed.
Table 7.1: Details of the ANN model
Parameters Details
Network architecture Three-layer (11-5-1)
Algorithm Backpropagation
Training and testing ratio 80:20
Dataset 321
Validation 10-fold cross-validation
7.4 RESULTS AND DISCUSSION
7.4.1 Model Performance
The developed ANN model generated an r2 value of 0.81. This connotes that the model
explains 81% of the variance in the property values. The r2 value ranges between 0
and 1, and a value close to 1 shows perfect performance (Limsombunchai et al., 2004).
Hence, the ANN model can be said to have performed satisfactorily in this regard. The
MAPE value of the model is 15.94%, the MAE value is N28,492,514, while the RMSE
is N41,814,564 (see Table 7.2). According to Lin and Mohan (2011), an MAE value
of a model that tends towards 0 depicts a goodness of fit; a low RMSE value connotes

188
a superlative model (Limsombunchai et al., 2004); and the MAPE measures the error
of prediction in terms of percentage (Zurada et al., 2011). The MAE and RMSE figures
recorded here suggest that the outputs of the ANN model are encouraging, considering
the mean property price of the properties used for this study is N149,796,541. Also,
the MAPE value (15.94%) recorded in this study seems promising when compared
with the high property valuation inaccuracy of as high as about 67.91% being
experienced in the Nigerian property market as reported by Ogunba (2004).
Table 7.2: Predictive accuracy of the ANN model
Accuracy measures ANN model
r2 0.81
MAPE (%) 15.94
MAE 28,492,514
RMSE 41,814,564
The validation of the developed model was performed on the holdout sample data.
Through this, the holdout sample data were predicted using the ANN model developed
with the training samples. Those predicted estimates were compared with the expected
property values so as to establish if there is any difference between the actual property
values and predicted values. Figure 7.2 shows the plot of the relationship between the
expected property values and the ones predicted by the ANN model. The scatterplot
shows that the ANN model produced a good prediction for almost all the holdout
samples, with just few which were far from the line of fit. The ANN model can handle

189
data sets that contain outliers and still produce precise outputs (Mora-Esperanza, 2004).
This has been proven in previous studies where the ANN model produced a good fit
with and without the inclusion of outliers in the data set (see for instance Cole et al.,
1986; Tay and Ho, 1992).
Figure 7.2: Expected property values against predicted property values
Source: Abidoye and Chan (2017a)
Concerning the number of the ANN model predicted property values, 33.33% of the
predicted values has a margin of error of between ± 0 and 10%, while 43.33% has an
error margin of between ± 11 and 19%. Only 23.33% has an error greater than ± 20%
(see Table 7.3). This implies that the tendency of generating a more accurate and
reliable property valuation estimate is higher when the ANN technique is adopted.

190
Table 7.3: Valuation accuracy of the ANN model predictions
Accuracy range Frequency Percentage (%)
± 0 - 10% 10 33.33
± 11 - 19% 13 43.33
˃ ± 20% 7 23.33
The results of this study are similar to the findings of Ge and Runeson (2004), Mimis
et al. (2013) and Cechin et al. (2000), among other studies, all of which reported that
the ANN technique possesses a reliable predictive accuracy that can address the
nonlinearity of property values and property attributes. Whereas, a few studies (for
instance, Kontrimas and Verikas, 2011; McCluskey et al., 2012) conclude that the
ANN may not be a reliable predictive technique for property valuation.
The inconclusiveness of the findings of previous studies could be attributed to the
quality of the data sample used for those studies, as this may have an effect on the
ANN output (Lenk et al., 1997). The ANN model should not be seen as a replacement
of the valuer in a valuation exercise; it is a tool to achieve the end result (property
valuation figure). This is evident in most developed property markets around the world
where AI property valuation techniques have been adopted in practice (Mora-
Esperanza, 2004; Grover, 2016). Hence, valuers’ sound knowledge of the property
market under investigation is necessary for property valuation because this may also
affect the quality of the ANN predicted estimates (Gilbertson and Preston, 2005).

191
7.4.2 Relative Importance of the Property Attributes
The output of the ANN model does not contain the coefficients or t-values of the
property attributes like in the HPM approach; however, its output can establish the
relative importance (RI) of the attributes included in the model (McCluskey et al.,
2012). Figure 7.3 shows the RI of the 11 attributes used in developing the ANN model.
The RI value ranges between 0.0 and 0.5, where a 0.0 value indicates that the attribute
has no effect on property value formation, while 0.5 connotes a highly significant
contribution to property value estimation.
The most important attribute is the number of BQ in a property, which recorded an RI
value of 0.49 out of the 0.50 benchmark (see Figure 7.3), implying a highly significant
contribution to the value of properties in the study area. A BQ is an adjoining room
normally constructed outside of the main building for the accommodation of domestic
and other personal staff. Given that the study area is a high-income residential
neighbourhood, it is safe to suggest that home buyers or tenants would first consider
the number of BQ rooms available in a property before negotiating further. This
property attribute may be uncommon in the real estate literature, probably because in
other real estate markets, servants’ quarters are within the main building. However,
Basu and Thibodeau (1998) found that the presence of servants’ quarters has a
significant influence on property prices in Dallas, United States.

192
Figure 7.3: The relative importance of the property attributes
Source: Abidoye and Chan (2017a)
The second most important attribute is the number of bedrooms in a property, which
translates that the higher the number of bedrooms in a property, the higher the property
value. This corroborates the findings in other property markets around the world (Ge
and Du, 2007; Selim, 2008). The presence of a sea view in a property was found to be
the third most important attribute in the present study. The study area where data were
collected for this research is surrounded by the sea and lagoon, which may explain
why it is considered a high-income neighbourhood dominated mostly by expatriates
and high-income earners. These findings corroborate the studies of Tse (2002); Choy
et al. (2007) Hui et al. (2007) and Michael et al. (2002) who reported that the presence
of a sea view significantly influences the value of a property. The least important

193
attribute is property type. Generally, the study area is characterized by property types
associated with high-income earners such as duplexes, detached houses, terraces, and
others. So, it is understandable that property values in this property market are not
highly determined by this variable.
7.5 CHAPTER SUMMARY
The findings presented in this chapter emanated from the modeling of property values
in the Lagos metropolis using the ANN technique. The model produces encouraging
results by predicting property values with a MAPE value which is in the range of what
is obtainable in the literature. These results show that the techniques could be applied
in property valuation both in developed and developing property markets and still
produce excellent results. The technique was also used to conduct a sensitivity analysis
of the RI of the variables included in the model. This analysis revealed that the number
of BQ rooms in property has the highest significance to property values in the study
area. Therefore, real estate developers should accord this variable more importance
when developing real estate properties in the study area. The result of the ANN study
is compared with that of the HPM approach and is presented in the next chapter. This
evaluation will provide an insight into the most accurate and reliable property
valuation technique between both models.

194
CHAPTER 8 A COMPARISON OF THE PREDICTIVE
ACCURACY OF HPM AND ANN TECHNIQUES
8.1 INTRODUCTION
The previous chapter reported the predictive performance of the ANN technique in
property valuation using the Lagos metropolis as the study area. The predictive
accuracy of the ANN technique was found to be encouraging, which corroborates the
existing literature. The predictive accuracy of HPM and the ANN model is compared
and reported in this chapter. The evaluation is conducted based on the accuracy
measures and establishing the number of predicted property values produced by both
models which have an error margin that is within the acceptable industry standards.
This will indicate the best model which is robust and reliable to produce more accurate
property valuation estimates.
8.2 HPM AND ANN MODEL COMPARISON IN PROPERTY VALUATION
In the real estate research domain, several methods have been used to estimate property
values (Kummerow, 2003). Those approaches range from traditional to advanced
valuation techniques (Pagourtzi et al., 2003). Studies have shown that traditional
valuation approaches are unreliable and inaccurate (Crosby, 2000; Zurada et al., 2006).
This has led to a shift towards advanced valuation techniques, which tend to be more
accurate and reliable when compared with traditional methods (Gilbertson and Preston,

195
2005). HPM is an advanced valuation method which has been used widely both in
theory and in practice (Selim, 2008). However, despite its simplicity and
straightforwardness in approach (Chin and Chau, 2002), it cannot effectively capture
the nonlinear relationship which exists between property values and property attributes;
it is subjective in nature, inaccurate, and so on (Worzala et al., 1995; Limsombunchai
et al., 2004; Lin and Mohan, 2011).
In addressing the shortcomings of the HPM approach, the ANN technique, which has
produced more accurate, reliable and comfortable predictions estimates, has been
adopted in property valuation (Borst, 1995; Mora-Esperanza, 2004). A plausible reason
for this is that the ANN technique possesses high precision quality, it can handle the
nonlinear relationship between property attributes and property values (Cechin et al.,
2000), it can handle data outliers (Mora-Esperanza, 2004), it is not subjective (Tay and
Ho, 1992) and user-friendly (Borst, 1991; Ge and Runeson, 2004), amongst others.
Studies (Babawale and Ajayi, 2011; Adegoke et al., 2013) focused on the Nigerian real
estate industry have reported that the property valuation inaccuracy predominant in the
domain is highly unacceptable based on international standards (Hutchinson et al.,
1996; Brown et al., 1998). This could be attributed to the adoption of inappropriate
and unreliable property valuation approaches (Aluko, 2007). The HPM approach has

196
been widely applied in the Nigerian property valuation research (Abidoye and Chan,
2017b), and in the property valuation practice (Abidoye and Chan, 2016c). However,
the application of the ANN model in property valuation by researchers in such
developing countries as Nigeria has been limited (Abidoye and Chan, 2016c). This
may be accountable for the prevalence of property valuation inaccuracy observed in
both practice and research in Nigeria (Ogunba and Ajayi, 1998). Considering the
aforementioned, the present study seeks to evaluate the predictive accuracy of the
ANN technique in comparison with the HPM approach in Nigeria.
8.3 DATA COLLECTION AND METHODS
The same data set were used to develop both the ANN model and HPM. This was done
so as to enable a common ground for comparison. The results from the ANN model
and the HPM predictions serve as the data for this study. Therefore, Section 6.3.1 could
be referred to for the details of the data used in developing both models.
A large portion (80%) of the data set was used for the development of both models,
while the rest (20%) was used for the testing of the models, as commonly done in
previous studies (see Wilson et al., 2002; Lam et al., 2008; Morano et al., 2015,
amongst others). The testing of the models was performed so as to establish the
predictive accuracy of the models. In doing this, the holdout samples were used to

197
predict the actual property values and any difference between the predicted property
values and the actual property values (if any) amounts to an error in estimation. The
accuracy measures adopted are RMSE, MAE, MAPE and r2 as obtainable in previous
related studies. (McCluskey et al., 2013).
In addition to the accuracy measures adopted for the evaluation of the accuracy of the
developed models, the percentage of the predicted property values that have an error
margin which falls within the international acceptable margin of between ± 0 and 10%
(see Hutchinson et al., 1996; Brown et al., 1998), and those that fell beyond this margin
were established. This is to ascertain how suitable either of the models can satisfy
international standards in the property valuation domain.
A visual examination of the predicted property values shows that some were beyond
reasonable range, and hence the removal of such properties sales. Consequently, a
holdout sample of 30 observations were used for the testing of the models. This is not
uncommon in previous studies, see, for instance, Worzala et al. (1995) and McCluskey
(1996).
8.4 RESULTS AND DISCUSSION
The evaluation of the developed HPM and ANN model are presented in Table 8.1. On
the basis of the r2 values of the models, ANN produced an r2 of 0.81. This is higher

198
than that of HPM which is 0.77. Since the r2 only explains the relationship between
the dependent variable and the independent variables and not the quality of the
predictions generated by the models (Willmott, 1981), the evaluation of the models
based on MAE, RMSE and MAPE is necessary. In the same vein, the ANN model
produced MAE and RMSE values lower than that of HPM, because those of the ANN
model are closer to 0 when compared with the values of HPM. This depicts that the
ANN could predict property values more accurately than HPM.
Table 8.1: Predictive accuracy of HPM and ANN models
Models r2 MAE RMSE MAPE (%)
HPM 0.77 61,408,856 103,370.573 38.23
ANN 0.81 28,492,514 41,814,564 15.94
On the MAPE values of the models, the ANN model produced a MAPE value of
15.94%. This suggests that the average absolute error which could be recorded in
predicting property values using the ANN technique is about 15%. This figure seems
above the ± 10% industry standard, a plausible reason could be because the Nigerian
property market is not transparent (Akinbogun et al., 2014), which could have some
implications on the property valuation estimates (Grover, 2016). However, this figure
is in the range of what is obtainable in the literature (see for instance Lewis et al., 1997
(18%); Jenkins et al., 1999 (18%); Pagourtzi et al., 2007 (31.6%); Guan et al., 2008

199
(17.6%); Kutasi and Badics, 2016 (15.93%), amongst others).
The MAPE value generated from the HPM approach is 38.23%, indicating that the
absolute error using HPM could be higher than 30%. And in a few instances, the
percentage difference between actual property values and predicted property values
was as high as 100% (see Appendix 6). These results show that the ANN model could
predict accurately two times better than the HPM approach. This corroborates the
findings of Do and Grudnitski (1992, p. 44) that reported that “the ANN’s estimates of
residential property values are nearly twice as accurate as those of a multiple
regression model”, based on the MAPE values of both models. This also substantiates
the findings of Ogunba (2004) that the valuation inaccuracy that is common in Nigeria
could be as high as between 22 and 67%, probably due to the adoption of unreliable
valuation approaches, yielding valuation inaccuracies that are not within acceptable
industry standards (Babawale and Ajayi, 2011).
These results indicate that other nonlinear valuation approaches, specifically ANN,
could produce better results than HPM. This is because the prediction error generated
with the use of the HPM approach would be unacceptable by any rational real estate
investor. This supports the findings of previous studies that reported the better
predictive accuracy of the ANN technique compared to the HPM approach (for

200
instance, Do and Grudnitski, 1992; Wong et al., 2002; Peterson and Flanagan, 2009;
Lin and Mohan, 2011, amongst others).
The predictive accuracy of both models was also evaluated based on the number of
predicted property values which had an absolute error range within the acceptable
industry standards. The information in Table 8.2 shows that 26.67% of the predicted
values of HPM has an error of between ± 0 and 10%, whereas the ANN model had
33.33% of its predictions within the same range. This same trend was evident for the
rest of the accuracy range, with the ANN model having a lower number of predicted
values with an error rate of greater than ± 20%, when compared with HPM.
About two-thirds (60%) of the HPM predictions had an error margin of over ± 20%.
This could be responsible for the loss of confidence the valuation clients have in the
profession and the professionals in Nigeria (Adegoke et al., 2013), because such a high
error margin may render a real estate investor/stakeholder to go bankrupt.
Table 8.2: Property valuation accuracy of the HPM and the ANN models prediction
Accuracy range
Hedonic pricing model Artificial neural network
Frequency Percentage (%) Frequency Percentage (%)
± 0 - 10% 8 26.67 10 33.33
± 11 - 19% 4 13.33 13 43.33
˃ ± 20% 18 60.00 7 23.33

201
The predicted property values produced by both HPM and the ANN model were
plotted against the actual property values as shown in Figure 8.1. This visual evaluation
shows that the ANN model predicted property values are much closer to the actual
property values when compared with the HPM predicted values. Greater disparities
exist between the HPM predictions and the actual property values which suggest that
the HPM could not produce reliable and accurate property valuation estimates.
Figure 8.1: Actual property values and the predicted values of HPM and the ANN model
Overall, the results of this study clearly indicate that the ANN model could predict
more accurate and reliable property valuation estimates when compared with the HPM
approach. These results support the findings established in different property markets
around the world that have reported the greater predictive accuracy of the ANN model
0
50000000
100000000
150000000
200000000
250000000
300000000
350000000
400000000
450000000
1 2 3 4 5 6 7 8 9 10 11 12 13 14 15 16 17 18 19 20 21 22 23 24 25 26 27 28 29 30
Actual property value ANN predicted value HPM predicted value

202
over the HPM approach in property valuation; for instance, the studies of Nguyen and
Cripps (2001) and Lin and Mohan (2011) in the United States, Selim (2009) in Turkey,
Morano and Tajani (2013) in Turkey, Wong et al. (2002) in Hong Kong,
Limsombunchai et al. (2004) in New Zealand and Amri and Tularam (2012) in
Australia, amongst other property markets, around the world.
The present study is an exploration of the ANN technique in a developing nation,
Nigeria, whose property market is opaque and immature (Dugeri, 2011; Walters et al.,
2011). However, the credibility of the models could be improved by the use of more
robust and quality data (Grover, 2016). When such data are in place together with other
preconditions for developing a robust property valuation models (see Grover, 2016),
as obtainable in most developed nations (Hofmann, 2003), accurate property valuation
estimates could be recorded. This would, in turn, reduce the property valuation
inaccuracies prevalent in such emerging markets. Subsequently, AI property value
modeling techniques could be introduced in the property valuation practice in
developing countries as evident in some developed property markets (see Wilkinson
and Archer, 1973; Schwartz, 1995; McCluskey et al., 1997; Mora-Esperanza, 2004;
Grover, 2016).

203
8.5 CHAPTER SUMMARY
The predictive accuracy of HPM and the ANN model was evaluated and reported in
this chapter to demonstrate the efficacy of both models in property valuation. The
predictions of both models were compared using measures of accuracy and the
percentage of predicted values with estimation errors that fell within the acceptable
industry standards. It is concluded that the ANN model outperformed the HPM
approach in terms of predictive accuracy. The ANN model predictions were about two
times more accurate than those of the HPM approach, and a higher number of ANN
predicted property values had error margins within the admissible industry standards.
The accurate predictive performance of ANN over the HPM approach reported in this
study corroborates the existing literature. The findings of this study suggest that the
ANN technique could produce accurate and reliable valuation figures. Therefore, the
receptiveness of the Nigerian valuers to adopt the AI techniques in property valuation
was investigated and reported in the next chapter.

204
CHAPTER 9 VALUERS’ RECEPTIVENESS TO AI TECHNIQUES
IN PROPERTY VALUATION9
9.1 INTRODUCTION
The previous chapter reported that the ANN technique outperformed the HPM
approach in property valuation. Since the ANN technique has proven to be a good
property valuation method, there is a need to establish the receptiveness of the Nigerian
valuers who are the providers of property valuation services, to acquire the know-how
of the AI valuation techniques and to eventually adopt them in practice. This
exploration which would determine the future direction of the Nigerian property
valuation practice, is presented in this chapter.
9.2 DATA COLLECTION AND METHODS
The main focus of this study is to evaluate valuers’ willingness to embrace the AI
techniques in property valuation in Nigeria. Quantitative research approach which
allows the coverage of a wider spectrum of respondents being studied (Dix and
Anderson, 2000) is adopted in this study. A questionnaire survey is a form of
quantitative research approach that is usually adopted to measure the perception of
9 This chapter has been published in Abidoye R. B. and Chan, A. P. C. (2017). Valuers’ receptiveness
to the application of artificial intelligence in property valuation. Pacific Rim Property Research Journal,
23(2), pp. 175 - 193.

205
respondents in respect of the subject matter under study. It can be administered to the
respondents by face-to-face, by post, over the telephone, by email or over the internet
(Hoxley, 2008). Online questionnaire approach was used in this study to capture the
opinion of real estate valuers on the research topic under investigation. As opined by
Gillham (2000) and Mooya (2015), the survey instrument was validated by a group of
real estate experts that have good knowledge of the Nigerian property market before
the administration of the questionnaire to the respondents. After this exercise, the
valuers commented that the instrument was adequately designed to capture the
objectives of the study, hence the questionnaire was administered to the respondents.
9.2.1 Questionnaire Administration
The SurveyMonkey platform was utilized to design the online questionnaire. This
approach is not uncommon in similar studies (see, for instance, Poon et al., 2011;
Worzala et al., 2013; Mooya, 2015). The questionnaire was segmented into five parts.
The first section centered on the characteristics of the respondents. Section Two to Five
focused on questions on; the knowledge of the AI valuation techniques, the reasons for
low awareness and applications of the AI valuation techniques, the measures which
would enhance the adoption of the AI valuation techniques and the benefits, and the
prospects of adopting the AI valuation techniques, respectively.

206
It is worth noting that the AI techniques referred to in this study are HPM, ANN and
FLS. These AI techniques have been applied in property valuation both in theory and
in practice in some developed countries (see, Schwartz, 1995; McCluskey et al., 1997;
Grover, 2016). Responses were ranked on a five-point Likert scale (where 1 = strongly
disagree, 2 = disagree, 3 = neutral, 4 = agree and 5 = strongly agree). This scale is
common and appropriate for the study of this nature (Allen and Seaman, 2007; Dawes,
2008).
According to the 2014 membership directory of NIESV, there are 1794 registered
estate surveyor and valuers in Nigeria. Out of this number, only 1229 have their email
recorded in the directory. Consequently, the link to the online questionnaire was sent
to 300 randomly selected valuers. The respondents were expected to respond to the
survey within a period of two months. Furthermore, a reminder was sent to the
respondents within the survey period so as to increase the response rate. At the end of
the survey period, 138 responses were received, which represents a response rate of
46%, which is higher than what is obtainable in similar studies that have utilized
survey research method (Akintoye and Fitzgerald, 2000). It was worth mentioning that
92 out of the138 responses were properly completed and valid for further analysis.

207
9.2.2 Data Analysis Method
The collected data were analyzed using the SPSS version 20.0 software. This tool was
used to conduct descriptive analyses in terms of percentile distribution and MS. Also,
the chi-square test was performed to examine the statistical relationship (if any) which
exist between the valuers’ profile and the factors which affect the issues under
investigation. The MS ranking technique was adopted in ranking the factors included
in the survey instrument. This approach has been adopted in previous built
environment studies. See, for instance, Frank et al. (2007), Babarinde (2015), Mooya
(2015) and Abidoye and Chan (2016c), among others.
9.2.3 The Respondents
Professional members of NIESV practicing in different property markets in Nigeria
are the participants of this survey. Those valuers have obtained either a Probationer,
Associate or Fellow membership status of NIESV and have acquired some
considerable years of professional real estate practice experience. Estate Surveyors and
Valuers are real estate professionals that have been empowered by the Laws of the
Federal Republic of Nigeria (Decree No. 24 of 1975, now Cap III of 1990) to carry out
real estate related services to the public. Therefore, the responses from NIESV
members are considered as the most appropriate for the present study.

208
9.3 RESULTS AND DISCUSSION
9.3.1 Reliability Test
The reliability of the collected data was evaluated in order to ascertain the suitability
of the data for the present study. The Cronbach’s alpha test was conducted so as to
establish the internal consistency amongst the valuers. A Cronbach’s alpha value of
0.72 was recorded in this study which signifies a satisfactory reliability and internal
consistency because a Cronbach’s alpha value that is above 0.70 is satisfactory (Hair
et al., 2010).
9.3.2 The Valuers’ Profile
It is expected that the characteristics of the valuers in terms of educational
qualifications, professional experience, sector of practice and the position held in their
firms, among other factors, would have an influence on the subject under consideration.
Some of the demographic profiles of the respondents are presented in Table 9.1.
These characteristics include their membership status with NIESV, the number of years
of industry experience, the gender and the sector of practice. The statistics presented
in Table 9.1 shows that about 76% of the valuers are either Fellow or Associate
members of NIESV. This implies that majority of the respondents are committed
members of the professional body. Also, Table 9.1 shows that about 63% of the valuers

209
have acquired an industry professional experience ranging between 6 and 20 years,
and 17% possess over 20 years of experience. This indicates that the valuers are
sufficiently experienced in the real estate practice.
The gender distribution of the participants indicates that 85% are men, whereas, 15%
are female. It fair to interpret that the real estate profession is male-dominated in
Table 9.1: The valuers’ profile
Variables Frequency (n) Percentage (%)
Membership status with NIESV
Fellow 14 15.20
Associate 56 60.90
Probationer 22 23.90
Total 92 100.00
Years of industry experience
1-5 years 18 19.60
6-10 years 28 30.40
11-15 years 22 23.90
16-20 years 8 8.70
20 years and above 16 17.40
Total 92 100.00
Gender
Male 78 84.80
Female 14 15.20
Total 92 100.00
Sector of practice
Private real estate firm 66 71.70
Government parastatal 4 4.30
Financial institution 2 2.20
Education (lecturer) 16 17.40
Oil and gas sector 0 0.00
Built environment consortium 4 4.30
Total 92 100.00

210
Nigeria. In addition, about 72% of the respondents work in a private real estate firm
and 17% are lecturers. This high percentage of valuers that are working in
organizations where property valuation is either carried out or researched in is
noteworthy for the present study.
The information presented in Figure 9.1 shows the highest educational qualification of
the valuers. About 22% of the valuers have acquired Bachelor of Science degree, 61%
possess a Postgraduate Diploma/Master’s degree and 4% of the respondents are Doctor
of Philosophy degree holder. This suggests that the valuers are much educated and are
expected to be conversant with the global updates in the property valuation practice.
Figure 9.1: Valuers’ highest educational qualifications
On the positions held by the valuers in their firms, 44% are principal partners, 15% are
managing partners and senior estate surveyors, respectively. This amounts to over 70%

211
of the valuers occupying top positions in their firms, which assures the validity of the
feedback of this survey. Figure 9.2 presents the distribution of the location of higher
institutions the valuers attended. It is evident that about 87% of the valuers attended
higher institutions located in Nigeria, while meagre 2% have experienced foreign
education. Eleven percent of the valuers have a combination of foreign and local
educational experience.
Figure 9.2: Location of an academic institution(s) attended
9.3.3 Knowledge of the AI Valuation Techniques
The questions contained in Table 9.2 was posed to the valuers in order to ascertain
their level of awareness of the AI techniques and some other issues relating to the
knowledge of the AI techniques. Almost 60% of the valuers either strongly agree or
agree to be aware of these techniques, while the rest are either indifferent or disagree

212
on the issue. On the use of the AI techniques in practice, only 13% of the valuers adopt
the approaches in practice. The technique referred to here by those valuers could
probably be HPM, as Abidoye and Chan (2016c) reported that this is one of the
advanced approaches which the valuers operating in the Lagos metropolis (Nigeria)
widely adopt. The low usage of these techniques may be connected to the lack of
introduction to these techniques during academic training at tertiary educational (i.e.
university and polytechnic), as more than half (52%) of the valuers indicated this.
It is expected that the basic rudiments of these techniques are to be taught to students
during academic training. However, in a situation where that did not happen, the
valuers have to learn on the job by attending workshops, seminars, training and
conferences. Unfortunately, about 74% of the valuers have never received any in-
house training organized by NIESV or ESVARBON, suggesting that the valuers have
not been provided with the opportunity to learn on the job through this avenue. These
professional bodies that have been empowered by the Laws of the Federal Republic of
Nigeria seem to have failed to sufficiently promote the awareness and adoption of
those AI techniques in practice.

213
Table 9.2: Knowledge of the AI valuation techniques
Questions
Level of agreement (%) Mean
score
Standard
deviation
SA A N D SD
Valuers are aware of the AI valuation techniques 13.0 45.7 15.2 10.9 15.2 3.3043 1.2730
Valuers do use the AI valuation techniques in practice 2.2 10.9 28.3 32.6 26.1 2.3043 1.0455
Valuers were introduced to AI valuation techniques while in school (university
or polytechnic)
4.2 34.8 8.7 21.7 30.4 2.6087 1.3502
NIESV or ESVARBON do organize conference, MCPD, seminar or workshop
where this issue is discussed
6.5 13.0 6.5 41.3 32.6 2.1957 1.2156
The basics of AI valuation techniques are well documented in valuation
textbooks and journal articles
10.9 37.0 13.0 17.4 21.7 2.9783 1.3666
Valuers are willing to acquire the know-how of the application of AI
techniques in property valuation
56.5 37.0 2.2 2.2 2.2 4.4348 0.8294
Valuers will adopt the AI techniques in practice after acquiring the know-how 41.3 41.3 10.9 2.2 4.3 4.1304 0.9968
Note: SA – Strongly agree, A – Agree, N – Neutral, D – Disagree and SD – Strongly disagree

214
Putting all the aforementioned together, 93% of the valuers indicated their willingness
to acquire the know-how of the application of the AI techniques, while about 82%
indicated their readiness to adopt those techniques in practice. This high receptiveness
of the valuers should be harnessed by the relevant professional bodies and other real
estate stakeholders, as this would expose the valuers to international best property
valuation practice.
9.3.4 Reasons for the Low Awareness and Application of the AI Techniques
In order to further investigate the cause(s) of low awareness and application of the AI
techniques amongst valuers, responses were sought on questions addressing the issue
(see Table 9.3). The factors were ranked in order of their importance to the awareness
and application of the AI techniques that are under investigation.
As shown in Table 9.3, the professional bodies (NIESV and ESVARBON) and the
educational institutions were ranked as the first and second factors, respectively, with
an MS of 3.5870 and 3.5435, respectively. This corroborates the findings reported
earlier (see Table 9.2) and implies that it is imperative that these two factors are
accorded utmost attention by the concerned real estate stakeholders. The third factor
is the individual valuers that have not been proactive enough to be updated about the
developments in other property markets around the world.

215
Table 9.3: Reasons for the level of awareness and applications of the AI valuation techniques
Factors
Level of agreement (%) Mean
score
Standard
deviation
Rank
SA A N D SD
NIESV and ESVARBON are responsible for the lack of awareness
and adoption of the AI valuation techniques among valuers
26.1 34.8 21.7 6.5 10.9 3.5870 1.2505 1st
The educational institutions (academics) are responsible for the lack
of awareness of the AI valuation techniques among valuers
26.1 28.3 26.1 13.0 6.5 3.5435 1.1990 2nd
Real estate professionals are responsible for their own lack of
awareness of the AI valuation techniques
13.0 21.7 39.1 21.7 4.3 3.1739 1.0546 3rd
My level of education is responsible for the lack of awareness of
the AI valuation techniques
10.9 6.5 26.1 21.7 34.8 2.3696 1.3153 4th
My years of professional experience is responsible for my lack of
awareness of the AI valuation techniques
4.3 6.5 23.9 28.3 37.0 2.1304 1.2139 5th
Note: SA – Strongly agree, A – Agree, N – Neutral, D – Disagree and SD – Strongly disagree

216
9.3.5 Valuers’ Profile and Willingness to Acquire and Adopt AI Techniques
It will be interesting to know if the valuers’ level of education, the year of experience,
the sector of practice, or the location of the institution(s) attended have any significant
relationship with their willingness to acquire the know-how and adopt the AI valuation
techniques. As this would indicate what to focus on in order to achieve the goal of
transforming the valuation practice in Nigeria. The results of the chi-square test
performed to establish the relationship are presented in Table 9.4.
On the willingness to acquire the know-how of the AI techniques, the year of
experience has a strong statistical significance with the acquisition of AI know-how at
5% level of significance. It is safe to suggest that the longer a valuer practice the real
estate profession, the greater the desire to be proficient in AI valuation. This
substantiates the findings of Mooya (2015) in South Africa who reported that the
length of professional experience of a valuer determines their professional competence.
On the other side, the years of experience and the sector where a valuer practices
significantly influence their readiness to adopt the AI techniques in practice. This
implies that the more a valuer practice this profession, the more the eagerness to adopt
the techniques in practice. This is coupled with the sector of practice which is probably
in a real estate firm, owing to the fact that most (70%) of the valuers work in private

217
real estate firms.
Table 9.4: Chi-square test for valuers’ willingness to acquire and adopt AI knowledge and their profile
Characteristics 2
value
Degree of
freedom (df)
-value
Willingness to acquire AI techniques know-how
Acquire higher educational qualification 5.281a 16 0.994a
The years of experience 32.229a 16 0.009a
The sector of practice 11.778a 16 0.759a
The location of institution(s) attended 10.282 8 0.246
Willingness to adopt AI techniques in practice
Acquire higher educational qualification 24.539a 16 0.078a
The years of experience 41.857a 16 0.000a
The sector of practice 64.305a 16 0.000a
The location of institution(s) attended 9.926 8 0.270
9.3.6 Enablers of the AI Valuation Techniques Adoption
From the perspective of introducing the AI techniques in practice in Nigeria, all real
estate stakeholders have a role to play. Table 9.5 reflect the opinion of valuers on the
measure that could enhance the adoption of the AI techniques. Of the five measures
presented, a partnership between the Nigerian real estate professional bodies (NIESV
and ESVARBON) and international professional bodies such as RICS was ranked first
with an MS value of 3.8913. This implies the need for an active and sustainable
collaboration between the Nigerian real estate professional bodies and their
international counterparts. This partnership has been achieved in some African
countries (Ghana, Kenya and South Africa) and has gone beyond mere affiliations,

218
rather the operation of international real estate bodies such as RICS has been extended
to those property markets (Royal Institution of Chartered Surveyors (RICS), 2015).
The second factor is the overhauling of the property valuation curriculum of higher
institutions of learning where real estate related courses are offered. This still amounts
to the need for basic educational training for real estate undergraduates in order to keep
them updated with the current trends in the international property valuation practice
(Mooya, 2015). The compulsory attendance of training, workshops and conferences
organized by NIESV and ESVARBON was ranked as the third factor which could
enhance AI valuation adoption in Nigeria. While, the acquisition of higher education
was ranked as the least factor in this category, probably because it was established that
professional practice would influence the adoption of AI valuation techniques (see
Table 9.5).

219
Table 9.5: Measures to enhance the adoption of AI valuation techniques
Enablers
Level of agreement (%) Mean
score
Standard
deviation
Rank
SA A N D SD
NIESV and ESVARBON partnership with other international
real estate professional bodies
30.4 45.7 10.9 8.7 4.3 3.8913 1.0737 1st
The overhauling of valuation curriculum by ESVARBON 23.9 50.0 15.2 8.7 2.2 3.8478 0.9600 2nd
Valuers compulsory attendance of seminar, training, workshop
and conference organized by ESVARBON and NIESV
21.7 50.0 19.6 2.2 6.5 3.7826 1.0252 3rd
The amendment of the membership code of conduct of NIESV
and ESVARBON
19.6 21.7 28.3 19.6 10.9 3.1957 1.2687 4th
Valuers mandatory acquisition of higher academic education 15.2 26.1 10.9 32.6 15.2 2.9348 1.3490 5th
Note: SA – Strongly agree, A – Agree, N – Neutral, D – Disagree and SD – Strongly disagree

220
9.3.7 Prospects of Adopting AI Valuation Techniques
Scholars have applied successfully and reported outstanding results in the application
of the AI techniques under investigation in the present study (see for instance Tay and
Ho, 1992; Adair et al., 1996b; Tse and Love, 2000; Hui et al., 2009; Kuşan et al., 2010;
McCluskey et al., 2013). Therefore, it is believed that if the AI techniques are
employed in the Nigerian property market, it could bring about a paradigm shift from
the present state to an international level (Babawale and Oyalowo, 2011). However, in
order of importance from the view of the valuers, the adoption of the AI techniques in
the Nigerian property market would transform the real estate practice, it would be
sustained when implemented and the techniques would produce reliable and accurate
valuation estimates that would reduce valuation inaccuracy in the property market (see
Table 9.6).
The views of the Nigerian valuers are not estranged with that of Malaysian valuers that
are optimistic that computer-aided valuation would transform the Malaysian property
valuation practice (Azmi et al., 2013). These benefits should not be underemphasized
because the Nigerian property market is still at the developing stage (Dugeri, 2011)
and at the same time, it is highly imperative to regain end-users’ confidence of
valuation reports in Nigeria (Adegoke et al., 2013), in order for Nigerian real estate
professionals to remain competitive and respected (Babawale and Ajayi, 2011).

221
Table 9.6: Benefits of adopting the AI valuation techniques
Factors Level of agreement (%) Mean
score
Standard
deviation Rank
SA A N D SD
This will add value and transform the Nigerian property valuation practice 23.9 47.8 19.6 4.3 4.3 3.8261 0.9901 1st
The adoption of the AI techniques in the Nigerian property valuation practice will be sustained
when implemented
8.7 50.0 39.1 2.2 0.0 3.6522 0.6701 2nd
It will produce reliable estimates that will be acceptable by valuation report end-users and all
stakeholders
15.2 41.3 39.1 2.2 2.2 3.6522 0.8446 2nd
The AI valuation techniques can reduce subjective interference in property valuation practice 17.4 34.8 39.1 6.5 2.2 3.5870 0.9276 4th
It will reduce the time involved in carrying out valuation exercise 13.0 41.3 34.8 10.1 0.0 3.5652 0.8555 5th
The AI valuation techniques can replicate human skills 10.9 37.0 32.6 15.2 4.3 3.3478 1.0102 6th
It will reduce the cost involved in carrying out valuation exercise 4.3 39.1 39.1 15.2 2.2 3.2826 0.8558 7th
The AI valuation techniques are more superior to the traditional valuation methods 10.9 17.4 39.1 26.1 6.5 3.0000 1.0690 8th
Note: SA – Strongly agree, A – Agree, N – Neutral, D – Disagree and SD – Strongly disagree

222
9.4 CHAPTER SUMMARY
The current immature state of the Nigerian real estate practice, in terms of its property
valuation practice, motivated the present study. Howbeit, the receptiveness of Nigerian
valuers to adopt the AI valuation techniques was investigated. It was revealed that a
little bit above half of the valuers are aware of the AI appraisal techniques, but do not
adopt them in practice. This is largely due to the little or no continuous professional
training and non-inclusion of the AI techniques in the current curriculum of real estate
programs at universities and polytechnics. Valuers’ length of professional experience
and the sector where they work was found to influence their willingness to adopt these
AI techniques.
Meaningful collaboration and affiliation with international real estate professional
bodies and the overhauling of valuation curriculum at universities and polytechnics
would aid the adoption of the techniques across the nation. This will add value to the
property valuation practice, in terms of estimating and reporting reliable and accurate
valuation estimates that would be a good representation of market value. The
subjective interference of valuers in property valuation exercise can be reduced and
then lessen the level of valuation inaccuracy prevalent in the property market to the
lowest minimum. The next chapter of this thesis concludes the research.

223
CHAPTER 10 CONCLUSIONS AND RECOMMENDATIONS
10.1 INTRODUCTION
The previous nine chapters of this thesis have presented the different components of
the current research. The introduction to the research was presented in Chapter 1. The
review of the literature conducted was documented in Chapters 2 and 3, while Chapter
4 contains the information about the research methodology adopted for this research.
Chapters 5, 6, 7, 8 and 9 presented the findings from achieving the six objectives of
this research. The present chapter is the last chapter of this thesis which concludes this
research. This chapter firstly restates the aim and objectives of the research and also
presents the summary of the research findings. The significance of the study, as well
as the contributions to knowledge, are documented in this chapter. The
recommendations, limitations of the study and the future research directions are also
presented in this chapter.
10.2 REINTRODUCTION OF THE RESEARCH OBJECTIVES
The aim of the present research is to examine the accuracy and reliability of property
value prediction models in the Lagos metropolis property market, by comparatively
evaluating the application of HPM and the ANN model in property valuation. In order
to achieve this aim, the following objectives were pursued:
i. to assess the current property valuation practice in the Lagos metropolis;

224
ii. to identify and generate a list of attributes that influence residential property
values in the Lagos metropolis property market;
iii. to develop a Hedonic Pricing Model for the Lagos metropolis residential
property market;
iv. to develop an Artificial Neural Network model for the Lagos metropolis
residential property market;
v. to evaluate the predictive accuracy of the HPM and ANN models developed
for the Lagos metropolis residential property; and
vi. to assess Nigerian valuers’ receptiveness to the application of the AI
techniques in property valuation.
10.3 SUMMARY OF MAJOR FINDINGS
The aim and objectives of this research have been achieved at various stages of the
research. A summary of the findings which address each objective are presented in the
subsections below:
10.3.1 Research Trend of the Application of ANN in Property Valuation
The ANN technique has been applied in the different disciplines, without the exception
of the real estate domain for property price prediction and forecasting. The technique
has gained much popularity amongst real estate researchers and professionals and has
produced encouraging results in different property markets around the world. However,
the trend of its application in this research domain has not been documented in the
literature. An effort was made in this research to document the research trend of the

225
application of ANN in the real estate domain.
The analysis of the retrieved articles shows that the first study that applied ANN in
property valuation was published in 1991 (see Borst, 1991). Thereafter, the technique
received more attention from 2000. A quarter of the articles selected for review
emanated from the United States, while the rest were conducted mostly in developed
countries. It was also found in most of the instances, the ANN model outperformed
other modeling techniques. This established predictive accuracy of the ANN technique
makes it a valuable tool for property valuation. These research findings are
documented in Abidoye and Chan (2016b).
The application of the ANN technique in property valuation in developing property
markets has been limited. This is a major gap in the current knowledge relating to this
field. Due to the importance of property valuation, there is a need to consistently seek
for ways to improve its accuracy. This information would facilitate improvement in
the property valuation practice.
10.3.2 The Research Trend of the Application of HPM in Nigeria
The origin of the HPM approach could be traced to the early 1920s. This early usage
and ease of application may be the principal reason for the popularity of the HPM
approach in the property price modeling domain. The literature on the application of

226
HPM is disjointed. Hence, it is difficult to know what has been done and the gaps that
need to be addressed. Therefore, a need to highlight the trend and gap(s) of its
application in property price appraisal in the Nigerian property market in this research.
It was found that the HPM approach was first introduced into the Nigerian real estate
research domain in 1986. Since then, there was a scanty turnout of publications, until
2010 when a considerable number of articles were published annually, suggesting that
the approach gained prominence amongst Nigerian real estate researchers in 2010. The
highest number of articles were published in 2011. The Lagos metropolis property
market and indeed south-western states have been widely used as study areas by the
researchers. In addition, real estate practitioners have not been involved in real estate
research, whereas academics affiliated to universities have been the highest
contributors to real estate research literature in Nigeria. This review shows the gap
between theory and practice in the Nigerian real estate domain, and this could be one
of the factors responsible for the immature state of the Nigerian property market. This
gap must be filled in order to achieve a sustainable real estate practice (Hemsley-
Brown and Sharp, 2003). These research findings are documented in Abidoye and
Chan (2017b).
10.3.3 The Current Property Valuation Practice in the Lagos Metropolis
A number of methods exist for property valuation. Those methods are used in

227
estimating property values in several countries around the world. Studies conducted in
Nigeria have reported that the level valuation inaccuracy being experienced in the
property market could be linked to the adoption of inappropriate valuation approaches.
The current property valuation practice in Nigeria, in terms of the valuation approaches
adopted by valuers, was investigated in this study. It was found that majority of the
valuers are aware of and familiar with the traditional valuation methods, especially the
comparable, the cost and the investment methods. In contrast, the valuers are not much
aware of the advanced valuation approaches, although with an exemption of the HPM
approach, which is being adopted by the Nigeria real estate scholars.
On the frequency of use of all the valuation approaches, the valuers always and
regularly make use of the traditional valuation methods (comparable, cost and
investment methods). The little awareness of the advanced approaches results in their
low adoption in practice. Due to the prevalence of traditional valuation approaches in
Nigeria, there is the need to improve the accuracy of property valuation estimates
which necessitates a paradigm shift towards the application of AI modeling. With the
successes recorded in the application of the AI techniques in developed property
markets and even in other domains, there is a need for its exploration in Nigeria. Hence,
the justification to conduct this research.

228
10.3.4 Property Value Determinants in the Lagos Metropolis Property Market
Studies have shown that the value attached to a property is dependent on certain factors,
which can be categorized into; locational, neighbourhood and structural. The impact
of those factors on property values vary from one location to another. A possible
explanation for the inconsistency could be attributed to differences in the socio-
economic, legal, environmental, cultural peculiarity across countries. Therefore, an
attempt was made to gain deep insight into the determinants of property value in the
Lagos metropolis property market. A literature review of relevant studies was carried
out. This led to the identification of the 20 factors (i.e. determinants) that influence
property values in the property market within the study area (i.e. the Lagos metropolis).
In this order, the location of a property, the neighbourhood characteristics, the state of
repair of a property, the size of the property, the availability of neighbourhood security
and the age of a property are the most significant attributes that determine residential
property values in the Lagos metropolis, based on their RI. This process provides the
justification for the variables included in the final property values prediction models
developed. Therefore, those set of variables was used to develop HPM and ANN model
for the Lagos metropolis property market.

229
10.3.5 Modeling the Lagos Metropolis Residential Property Values: The HPM
Approach
A number of HPM previous research have applied the HPM approach in property
appraisal in Nigeria. Those studies have largely focused on ‘explanatory’ rather than
‘prediction’. Therefore, the predictive accuracy of the approach was investigated using
the Lagos metropolis as the study area. The analysis shows that the HPM approach
produced inaccurate property values when the predicted values of the holdout samples
were compared with the actual property values. The approach generated high MAPE
(38.23%), MAE (N61,408,856) and RMSE (N103,370.573) values. These values may
partly explain the prevalent level of inaccuracy in property values reported in previous
studies.
About 60% of the predicted property values produced an inaccuracy error which is
above ± 20% of the actual property values. This demonstrates that the HPM approach
may not be able to accurately capture the nonlinear relationship between property
value and its determinants. It is also imperative to note that the errors are larger than
acceptable industry standards. Therefore, there is a need to explore the use of nonlinear
modeling techniques in the property market which could generate more accurate and
reliable property valuation estimates.

230
10.3.6 Modeling the Lagos Metropolis Residential Property Values: The ANN
Approach
Studies have shown that the ANN technique has the capability of capturing and
producing accurate predictions in real-world problems. The efficacy of using ANN
model in property valuation was investigated in the present study. This is largely
because a reliable model for predicting property values in Nigeria is lacking. The
findings of the present study show that the ANN technique possesses a good accurate
predictive ability based on MAPE value of 15.94%, MAE value of N28,492,514 and
RMSE value of N41,814,564 that the model generated. These figures are encouraging
as the MAPE value is within the range obtainable in the literature. This implies that
the ANN technique is suitable for generating accurate and reliable property valuation
estimates.
The RI analysis conducted on the property attributes revealed that the number of BQ
rooms in a property is the most important attribute affecting property values. This
implies that home buyers would consider this attribute when making real estate
decisions. The findings suggest that the ANN technique could be used as a tool by real
estate stakeholders, especially, valuers and researchers in property valuation both in
the developing and developed countries.
10.3.7 Evaluation of the Predictive Accuracy of the HPM and ANN Models
The predictive accuracy performance of a model could not be conclusive until it is

231
benchmarked against another. This necessitated the comparison of the predictive
accuracy of HPM and the ANN model, so as to establish the most accurate and reliable
property valuation technique between the two models. The same data set was fitted
into both models and this was done in order to enable a fair comparison. It was found
that the ANN technique outperformed the HPM approach, in terms of accuracy in
predicting property values, by producing a higher r2 value, lower MAPE, MAE and
RMSE values when compared with the HPM approach.
The MAPE values generated by HPM and ANN model are 38.23% and 15.94%,
respectively. This shows that the ANN techniques could predict figures which are two
times more accurate than the HPM approach. This confirms the predictive accuracy of
the ANN model which has also been established in previous studies. In addition, a
higher number of the ANN predictions generated prediction errors that are within the
acceptable industry standards. The findings demonstrate the efficacy of the ANN
technique in property valuation, and if all the preconditions of property value modeling
are met, the ANN technique could produce property valuation estimates which would
be generally acceptable by all property valuation stakeholders.
10.3.8 Valuers’ Receptiveness to the AI Techniques in Property Valuation
In a bid to bridge the gap between theory and practice, the receptiveness of the
Nigerian valuers to the application of the AI techniques in property valuation was

232
investigated. This was done so as to ascertain if the valuers, who are the main player
in the valuation process (Ogunba, 2004; Shapiro et al., 2012), are actually prepared for
the transformation that is much needed in the Nigerian property valuation landscape.
The results of the study show that more than half of the valuers are aware of the AI
valuation techniques. However, the techniques are not used in practice. Whereas,
almost all the valuers are willing to acquire the know-how of and are prepared to adopt
these techniques in property valuation.
The low adoption of the AI techniques was attributed to professional bodies
responsible for the regulation of real estate practice and tertiary educational institutions
in Nigeria, who were not proactive enough to promote their know-how and application.
It was found that active collaboration between local professional bodies and similar
international organizations on the training and development of members may improve
the usage of the AI techniques. The study highlights the need for a paradigm shift in
property valuation practice within the Nigerian context.
10.4 SIGNIFICANCE AND CONTRIBUTIONS TO KNOWLEDGE
An effort was made in this research to evaluate the predictive accuracy of HPM and
the ANN model in property valuation in Nigeria, towards achieving property valuation
accuracy. This investigation is crucial to both the real estate research and practice,

233
considering the significant relationship between the theory and practice of a profession
in achieving a sustainable growth (Van de Ven and Johnson, 2006). Therefore, the
contributions of this research could be categorized into two folds i.e. theory and
practice.
10.4.1 Contributions to Theory
In the research parlance, an effort was made to review and document the trends in the
application of the ANN technique in property valuation (see Abidoye and Chan,
2016b). This provides an in-depth insight into the past, present and the future of this
research area, which could stimulate more research effort directed towards this topic.
In the same vein, a review of the application of the widely adopted HPM approach in
the Nigeria property market was also documented. This was done in order to trace the
origin of the technique in Nigeria and also to identify research gap(s) (Abidoye and
Chan, 2017b). The study reveals that a wide gap exists between the Nigerian real estate
scholars and practitioners. When this gap is bridged, it could lead to the transformation
of the Nigerian real estate industry.
Previous HPM real estate studies conducted in Nigeria have focused solely on the
‘explanatory’ ability rather than the ‘predictive’ ability of the HPM approach in
property value analysis. However, the predictive ability of the HPM approach in
property valuation in the Nigerian property market was explored in this study. The

234
study found the HPM approach to be inaccurate and unreliable for property valuation,
hence the need for the adoption of a more robust property valuation model.
The ANN valuation technique has gained widespread popularity among real estate
scholars and professionals in different property markets around the world. However,
the technique has not been embraced by the Nigerian real estate scholars and
practitioners. An effort was directed towards investigating its predictive accuracy in
property valuation in Nigeria. This study confirms that the ANN technique is an
effective property valuation tool that could reduce property valuation inaccuracy. This
phase of the present research is reported in Abidoye and Chan (2017a). The
comparison of the predictive accuracy of HPM and the ANN technique show that ANN
outperformed HPM in terms of accuracy and reliability. This indicated that the ANN
is a better alternative to the HPM approach in property valuation.
10.4.2 Contributions to Practice
The estimation of accurate property valuation figures is dependent on the methods
adopted by the valuers. In a situation where the valuers cannot provide state-of-the-art
services to meet the demand of both the local and the international valuation clients,
the growth of the real estate profession in such economy could be endangered. This
prompted an investigation into the current property valuation methods adopted in

235
practice in Nigeria (Abidoye and Chan, 2016c). It was found that despite the
transformation being experienced in different sectors of the Nigerian economy, the
Nigerian property valuation practice is still at the traditional level because the majority
of the valuers are not aware of and do not adopt the advanced valuation approaches in
practice. This reveals a big challenge, which needs an urgent attention by all the
stakeholders in order to ensure a sustainable property valuation practice in Nigeria.
Currently, the Nigerian mortgage system is not robust and not well established
(Udechukwu, 2008; Ibem, 2011). Knowing that the financial institutions are the
biggest property valuation report end-users (Gilbertson and Preston, 2005), the
readiness of the Nigerian valuers to provide impeccable property valuation services to
complement the Nigerian mortgage sector in the nearest future cannot be
overemphasized. The adoption of the AI techniques would ensure that accurate and
reliable estimates are generated so as to reduce the risk that all the stakeholders are
exposed to in this system.
The Nigerian economy is an oil-dependent economy. Fluctuations in the prices of
crude oil usually create a lot of societal problems and a significant reduction in
government’s revenues. Thus, it is important for the government to restructure its
alternative sources for revenue generation. The AI modeling techniques can be used to

236
facilitate the process of estimating property valuation figures for the purpose of
collecting property-related taxes such as the ground rent, the tenement rate, and so on.
This has proven to be cost-effective and required less number of valuers to appraise a
large number of properties as obtainable in other property markets around the world
(see Grover, 2016).
Property attributes that determine property values were evaluated and ranked based on
their RI. This information would be of great importance to real estate portfolio
managers, as well as real estate developers. This provides them with a list to consider
when investing in real estate in the study area. This would ensure profit maximization.
The survey of the willingness of the Nigerian valuers to embrace the adoption of AI
techniques in property valuation is significant because this reveals that the valuers are
prepared to be agents of transformation as soon as other necessary conditions of
property value modeling are in place in Nigeria. This could be capitalized upon by the
real estate regulatory bodies to begin the campaign toward the transformation of the
property valuation practice in Nigeria.
10.5 RECOMMENDATIONS OF THE STUDY
Continuous improvement is a process which facilitates competitiveness and continued
relevance of a person, process, profession, and so on. This research has reported that

237
the valuation practice in Nigeria is still in its infancy. However, in order to meet
international standards in terms of property valuation services, a whole lot has to be
done to achieve this. Therefore, in the light of the findings from this research, the
following recommendations are proposed:
10.5.1 Maintenance of a Robust Property Transactions Databank
Authors (Gilbertson and Preston, 2005; Grover, 2016) have claimed that a robust and
quality property transactions databank is a precondition for developing a reliable and
accurate property valuation models. However, the opposite is what is obtainable in
Nigeria. Therefore, NIESV and ESVARBON should put a plan of action in place to
ensure that a robust databank is maintained. This could be achieved by directing real
estate firms to henceforth document the records of property transactions they
consummate electronically. This can then be collated by a team that would be trained
in this regard. Incentives and penalties could be put in place so as to ensure compliance.
NIESV and ESVARBON could evaluate the international best practices of how
databanks are maintained in developed property markets and then adopt such to the
Nigerian situation. Although a databank maintenance effort was made previously by
NIESV, this only generated yields and years’ purchase (YP) in the Lagos, the Abuja
and the Port-Harcourt property markets (see Nigerian Institution of Estate Surveyors
and Valuers, 2013). Hence, the data was not used in this study because it is not useful

238
for developing property valuation models.
10.5.2 Training of Real Estate Valuers
The training of practicing estate surveyors and valuers in the proficiency of the
advanced valuation approaches should be accorded an urgent attention by NIESV and
ESVARBON. This could be achieved by formulating and implementing massive
nationwide campaign strategies to promote the enlightenment, the training and
eventual enforcement of the adoption of the advanced valuation methods by
professional members. This can be achieved by organizing seminars, mandatory
continuing professional development (MCPD), workshops and conferences that will
address this issue. Those training should be aimed at exposing valuers to global best
practices and should be hands-on, as this would enhance the ability of the valuers to
incorporate market research into property valuation practice.
10.5.3 Collaboration between the Real Estate Scholars and Practitioners
It has been established that research is vital for a sustainable professional practice in
any discipline (Hemsley-Brown and Sharp, 2003). Therefore, there is a need to close
the gap between the real estate academics and professionals in Nigeria. The need to
improve the accuracy of property valuation estimates necessitates a paradigm shift
towards the application of AI modeling. This collaboration would facilitate

239
improvements in the real estate practice.
10.5.4 Overhauling of Real Estate Curriculum in Higher Institutions of
Learning
There is a need to improve the current curriculum used for real estate courses,
especially property valuation, at different levels of higher institutions of education in
Nigeria. This was vividly established in this research where it was found that most of
the valuers were not introduced to advanced property valuation methods while in
school. The overhauling should be benchmarked against international standards in
order to keep the students updated with the trending international valuation theories
and methodologies before they graduate and mature into a professional. This would
ensure that real estate graduates can fit in properly into both the local and the
international job markets.
10.5.5 Collaboration with International Real Estate Professional Bodies
NIESV should also speedily facilitate the affiliation with RICS, this revolutionary
achievement has been achieved in Ghana, Kenya and South Africa (Royal Institution
of Chartered Surveyors (RICS), 2015). When this is affiliation replicated in Nigeria, it
would: 1) facilitate information transfer, 2) provide a platform for the exposure to
global best practices, and 3) facilitate the process of diffusion of innovation in the real
estate practice.

240
10.6 STUDY LIMITATIONS
The questionnaire surveys conducted in this research were limited to the sampling of
valuers whose email addresses are documented in the 2014 edition of NIESV’s
directory. Therefore, valuers whose details are not in the directory or have their
incomplete information (no e-mail address) captured in the directory might have been
excluded from this research. However, the high profile of the sampled surveyors
ensures that meaningful inferences were made from the questionnaire surveys.
To date, in Nigeria, there is no centrally managed property sales and purchases
information databank. This current situation warranted the door-to-door collection of
property sales and purchases information from real estate firms operating in the Lagos
metropolis. This resulted in retrieving 370 sales observations and eventually using 321
complete sales observations to build the property valuation models reported in this
research. The relevance of the findings of this research is not undermined by this
sample size because the sample size used in this research is within the range used in
previous studies. However, if more data becomes available in the future the study could
be replicated.
Data used in developing HPM and the ANN model were collected from high-end
property market in Lagos, Nigeria. The exploration of the ANN technique in other

241
property markets in Nigeria could generate different results. Also, the use of the ANN
technique can be replicated in other developing countries too. Other macroeconomic
variables (such as interest rates, GDP and exchange rate, amongst others), locational
and neighbourhood attributes that could affect property values, were not included in
the models developed in this research.
10.7 FUTURE RESEARCH
With the results of this research, continuing research is necessary so as to improve the
desirable performance of the ANN model. This is because of the importance of
accurate and reliable property valuation estimates to all real estate stakeholders and
the nation at large. Studies in certain fields have shown that the inclusion of
macroeconomic variables could improve the quality of predictions. Hence, future
research could consider including those in the models. Also, property size variable was
not considered in this study, due to the lack of adequate information from the real estate
firms. However, should this be available in future, it may and should be included in
property price modeling. Future research should consider developing the ANN model
with a bigger sample size. This was not possible in this research due to the time and
logistics constraints. The applicability of the ANN technique in property valuation in
other property markets within Nigeria and also in other developing countries should
be explored, as this will ensure a sustainable property valuation practice.

242
10.8 CHAPTER SUMMARY
This chapter summarizes this research by providing the major research findings, the
significance of the research, recommendations of the study, study limitations and the
area of future research direction.

243
APPENDICES

244
APPENDIX 1
Questionnaire administered to valuers on property valuation
methods and property value determinants

245
QUESTIONNAIRE ON
ESTATE SURVEYORS & VALUERS PERSPECTIVE ON THE FACTORS
THAT DETERMINES RESIDENTIAL PROPERTY VALUES IN LAGOS
METROPOLIS
Dear Sir/Ma,
I am currently undergoing my PhD programme at The Hong Kong Polytechnic
University, Hong Kong in the Department of Building and Real Estate and I am
conducting a research on the above-mentioned topic.
The aim of the research is to identify the critical factors that determine the value of
properties in Lagos metropolis and also the effect of externalities on property values.
The result of this study will inform estate surveyors and valuers on the major factors
to consider when appraising a property and when giving sound investment advice to
their clients in the study area.
I will appreciate it if you will provide answers to the questions below diligently and I
assure you that all information provided by you, will be treated with extreme
confidentiality.
Thank you
Rotimi. B. Abidoye M.Sc., ANIVS, RSV
rotimi.abidoye@
+8523400
Section I: Estate Surveyor’s Personal data
(i) Name (optional): …………………………………………….
(ii) Highest educational qualifications
High School { } Asso. Degree/Higher Diploma { } B.Sc. { }
Postgraduate/M.Sc. { } PhD { } Others (Please
specify): …………………………………..
(iii) Membership status with NIESV (Nigerian Institution of Estate Surveyors and
Valuers)
Student Member { } Probationer { } Associate { } Fellow { }

246
(iv) Membership of other professional body (you can tick more than one)
ESVARBON { } NIM { } RICS { } AFRES { }
FIABCI { }
Others (Please specify): ………………………, ……………………………
(v) Position in your firm
Principal Partner { } Branch Manager { } Senior Estate Surveyor
{ } Estate Surveyor { } Pupil Surveyor { } Others (Please
specify): ……………………
(vi) How long have you been in real estate practice?
0-5years { } 6-10years { } 11-15 years { } 16-20years { }
Above 20 years { }
(vii) Area of practice/specialization?
Valuation { } Property Management { } Agency { } General
practice { }
Section II: Firm’s data
(i) Name of firm
(Optional): …………………………………………………………
(ii) Age of firm
0-5years { } 6-10years { } 11-15 years { } 16-20 years { }
Above 20 years { }
(iii) Firm’s staff strength
0-5 { } 6-10 { } 11 and above { }
(iv) Location of firm within Lagos
Victoria Island / Lagos Island { } Lagos Mainland { }
(v) Number of branches in Nigeria
0-5 { } 6-10{ } Above 11 { }
(vi) Number of oversea branches
0-5 { } 6-10{ } Above 11 { }
S

247
Section III: Valuation methods
(i) How many valuation exercise(s) do you carryout averagely per month?
0-5 { } 6-10 { } 11-15 { } 16-20 { } Above 20 { }
Kindly indicate your level of familiarity with each method of valuation for appraisal
of residential properties and how often you adopt them in residential property valuation
exercise.
S/N Valuation Methods
Familiarity Frequency of usage
Aware Not
Aware
Always Regularly Occasionally Not
at all
1 Investment method
2 Comparison method
3 Cost method
4 Profit method
5 Residual method
6 Hedonic pricing method
7 Spatial analysis method
8 Autoregressive integrated
moving average
9 Artificial neural network
10 Fuzzy logic method
11 Others (Please specify)

248
Section IV: Factors that determine residential property values in the Lagos
metropolis
Kindly indicate your level of agreement with the factors listed below by ranking them
based on the scale; 1- Highly insignificant, 2- Insignificant, 3- Indifferent, 4-
Significant, 5- Highly Significant.
End of the questionnaire.
Thank you.
S/N Property characteristics Scale
1 2 3 4 5
1 Location of the property
2 Accessibility to school
3 Accessibility to shopping mall
4 Accessibility to place of work
5 Accessibility to CBD
6 Accessibility to public transport facility
7 Proximity to highway
8 Neighbourhood characteristics
9 Availability of electricity
10 Availability of pipe borne water supply
11 Availability of waste disposal system
12 Availability of neighbourhood security
13 Age of the property
14 Numbers of bedrooms
15 Size of bedrooms
16 Number of bathrooms/toilets
17 Building characteristics
18 Size of property
19 State of repair of the property
20 Availability of security fence
21 Others (Please specify)

249
APPENDIX 2
Letter of introduction to registered real estate firms and a
sample of the data collection sheet

Date,
Receiver’s Address
Dear Sir/Madam,
Towards Property Valuation Accuracy in Nigeria – Residential
Properties Sales and Purchases Data Collection
I am a PhD student at Department of Building and Real Estate of the Hong Kong
Polytechnic University, Hong Kong. Currently, I am undertaking a research on
Property Valuation Accuracy in Nigeria – Developing an Efficient Valuation
Model. I hereby solicit for your support towards this research by kindly providing
me/my research assistant with residential properties sales and purchase information
that has been completed in your firm since 2000 to 2015. The data collection form
consists of residential property attributes that have been established to influence
property value in the Lagos metropolis property market. Hence, I request that you
provide the features of each property that has been sold or purchased on behalf of your
clients.
The data so collected will be used solely for the development of a hedonic pricing
model and an artificial neural network valuation model. These models will be
eventually compared in order to establish the most reliable and accurate model. Kindly
note that the details of your firm remain anonymous and the information received will
be treated with strict confidentiality and used solely for academic research purposes.
Your cooperation is highly sorted in order for this research aim to be achieved.
Thank you.
Rotimi Boluwatife ABIDOYE, M.Sc., ANISV, RSV.
Mobile Number: +234802951
Ir. Professor Albert P. C. Chan (Chief supervisor).
250

251
THE LAGOS METROPOLIS RESIDENTIAL PROPERTIES SALES AND PURCHASES DATA COLLECTION FORM
Name of firm: Firm’s contact number
Address of firm:
S/N Location No. of
bedrooms
No. of
toilets
No. of
bathrooms
Property
size
Property
type
No. of
BQ
No. of
parking space
Age of
property
No. of
floors
Availability of
security fence
Year of
sale
Sea
view
Price

252
APPENDIX 3
Questionnaire on AI property valuation techniques: Valuers’
receptiveness and prospects in the Nigerian valuation practice

253
QUESTIONNAIRE ON
ARTIFICIAL INTELLIGENCE PROPERTY VALUATION: VALUERS’
RECEPTIVENESS AND PROSPECTS IN THE NIGERIAN APPRAISAL
PRACTICE
Dear Sir/Ma,
I am currently undertaking my PhD programme at The Hong Kong Polytechnic
University, Hong Kong, in the Department of Building and Real Estate, and I am
conducting a research on the above-mentioned topic.
The aim of this research is to establish valuers’ receptive level and the prospects of
adopting the Artificial Intelligence (hedonic pricing model, artificial neural
network and fuzzy logic system) valuation approaches in the Nigerian real estate
valuation practice. The result of this study will inform estate surveyors and valuers,
real estate professional bodies and other property valuation stakeholders on the
possibility of automating the Nigerian property valuation practice.
I will appreciate it if you will provide answers to the questions below diligently and I
assure you that all information provided by you, will be treated with extreme
confidentiality.
Thank you.
Rotimi. Boluwatife ABIDOYE M.Sc., ANIVS, RSV
rotimi.abidoye@
+8523400
Section I: Estate Surveyor’s Personal data
(viii)Highest educational qualification
High School { } Associate Degree/Higher Diploma { } B.Sc. { }
Postgraduate/M.Sc. { } PhD { } Others (Please
specify): ………………………
(ix) Sex Male { } Female { }
(x) What is your professional membership status with NIESV?
Fellow { } Associate { } Probationer { } Student { } None { }

254
(xi) Position in your firm
Principal Partner { } Managing Partner { } Branch Manager { }
Senior Estate Surveyor { } Estate Surveyor { } Pupil Surveyor { }
Others (Please specify): ……………………………………………
(xii) How long have you been in real estate practice? 0-5years { } 6-10years
{ } 11-15 years { } 16-20years { } 20years and above { }
(xiii) Location of academic institution(s) attended
Local Institution { } Foreign { } Both { }
(xiv) Sector of practice
Private real estate firm { } Government parastatal { } Financial institution
{ } Education (Lecturer) { } Oil and gas sector { } Built environment
consortium { } (Please specify): ……………………………………………
Section II: Knowledge of AI appraisal techniques
Kindly indicate your level of agreement with the following statements.
Note: Artificial Intelligence (AI) valuation approaches for the purpose of this study are
hedonic pricing model, artificial neural network and fuzzy logic system.
Note: SD - strongly disagree, D - disagree, N- neutral, A- agree and SA - strongly agree
Questions Response
SA D N A SA
Are you aware of the AI valuation techniques?
Do you use the AI valuation techniques in practice?
Were you introduced to AI valuation techniques while
in school (university or polytechnic)?
Have you ever attended a conference, MCPD, seminar
or workshop organized by NIESV or ESVARBON
where this issue was discussed?
Have you read about AI techniques in valuation
textbook(s) or journal article(s)?
Are you willing to acquire the know-how of the
application of AI techniques in property valuation?
Will you be willing to adopt the AI techniques in
practice after acquiring the know-how?

255
Section III: Reasons for the low awareness and applications of the AI valuation
techniques
Kindly indicate your level of agreement with the following statements.
Note: SD means strongly disagree, D – disagree, N- neutral, A- agree and SA – strongly
agree
Statements Response
SD D N A SA
NIESV and ESVARBON are responsible for the lack of
awareness and adoption of the AI appraisal approaches
amongst valuers
Educational institutions (academics) are responsible for the
lack of awareness of the AI appraisal approaches amongst
valuers
Real estate professionals are responsible for their lack of
awareness of the AI appraisal techniques
My level of education is responsible for the lack of
awareness of the AI valuation techniques
My years of professional experience is responsible for my
lack of awareness of the AI valuation techniques

256
Section IV: Measures that will enhance the adoption of AI appraisal techniques
Kindly indicate your level of agreement with the following statements on the measures
that will enhance the adoption of AI appraisal techniques in the Nigerian appraisal
practice.
Note: SD-strongly disagree, D - disagree, N- neutral, A- agree and SA - strongly agree
Statements Response
SD D N A SA
The adoption of the AI techniques in Nigeria can be achieved by
mandating valuers to acquire higher academic education
The adoption of the AI techniques in Nigeria can be achieved when valuers
are mandated to attend seminars, training, workshops and conferences
centered on this topic organized by ESVARBON and NIESV
The adoption of the AI techniques in Nigeria can be achieved when
ESVARBON overhauls the valuation curriculum of universities and
polytechnics offering real estate courses
The adoption of the AI techniques in Nigeria can be achieved when
NIESV and ESVARBON amend their membership code of conduct
The adoption of the AI techniques in Nigeria can be achieved when
NIESV and ESVARBON partner with other International real estate
professional bodies such as RICS

257
Section V: Benefits of adopting AI appraisal techniques
Kindly indicate your level of agreement with the following statements on the benefits
of adopting AI appraisal techniques in the Nigerian appraisal practice.
Note: SD-strongly disagree, D - disagree, N- neutral, A- agree and SA - strongly agree
Statements Response
SD D N A SA
The adoption of the AI technique in Nigerian valuation
practice will be sustained when implemented
The adoption of AI appraisal techniques will add value and
transform the appraisal practice in Nigeria
The AI appraisal techniques can replicate human skills
AI appraisal approaches are more superior to the traditional
valuation methods
The AI appraisal techniques can reduce subjective
interference in property valuation practice
The adoption of AI techniques will reduce time involved in
carrying out valuation exercise
The adoption of AI techniques will reduce cost involved in
carrying out valuation exercise
AI techniques will produce reliable estimates that will be
acceptable by valuation report end-users and all stakeholders
End of the questionnaire.
Thank you.

258
APPENDIX 4
Frequency distributions of the collected data

259
Frequency distribution of the variables
Variables Frequency Percentage (%)
Price
0-50,000,000 111 34.6
50,000,001 – 100,000,000 73 22.7
100,000,001 – 200,000,000 66 20.6
200,000,001 – 500,000,000 56 17.4
Above 500,000,000 15 4.7
Number of bedrooms
1 29 9.0
2 31 9.7
3 95 29.6
4 94 29.3
5 69 21.5
Above 5 3 0.9
Number of bathrooms
1 29 9.0
2 50 15.6
3 83 25.9
4 92 28.7
5 64 19.9
Above 5 3 0.9
Number of toilets
1 19 5.9
2 11 3.4
3 52 16.2
4 84 26.2
5 92 28.7
Above 5 63 19.6
Property type
Duplex 12 3.7
Detached house 71 22.1
Semi-detached house 36 11.2
Terrace 67 20.9
Flat 98 30.5
Others 37 11.5

260
Number of BQ
0 105 32.7
1 142 44.2
2 61 19.0
3 3 0.9
4 1 0.3
5 1 0.3
Above 5 8 2.5
Number of parking lots
0 3 .9
1 46 14.3
2 121 37.7
3 45 14.0
4 34 10.6
5 28 8.7
Above 5 44 13.7
Age of building
0 21 6.5
1 119 37.1
2 54 16.8
3 53 16.5
4 14 4.4
5 19 5.9
Above 5 41 12.8
Number of floors
1 34 10.6
2 169 52.6
3 44 13.7
4 57 17.8
5 1 0.3
Above 5 16 5.0
Availability of security fence
Yes 315 98.1
No 6 1.9
Availability of sea view
Yes 17 5.3
No 304 94.7

261
Location of property
Ikoyi 82 25.5
Victoria Island 28 8.7
Lekki 1 53 16.5
VGC 8 2.5
Others 150 46.7

262
APPENDIX 5
Scatter plots of linearity test of the HPM

263

264

265

266
APPENDIX 6
Actual property values, ANN predicted property values and
HPM predicted property values

267
HPM and ANN property values predictions
Actual
Property
Values
ANN
predicted
values
HPM
predicted
values
ANN
prediction
error (%)
HPM
prediction
error (%)
111090000 97872115 187515677.2 11.90 -68.80
189303750 153268249 74929931.62 19.04 60.42
265025250 264723657.8 244410951.7 0.11 7.78
192556000 142297011 178031793.8 26.10 7.54
75647000 54106903 46897170.54 28.47 38.01
165048000 126230126 232250234.9 23.52 -40.72
89401000 81172837 145774376.6 9.20 -63.06
261326000 170040410 264980670.6 34.93 -1.40
68770000 81958549 157160890.9 -19.18 -128.53
82712500 51038195 74437574.35 38.29 10.00
95437500 111057526 114701420.1 -16.37 -20.18
419925000 347516329 250301576.3 17.24 40.39
127250000 150635901 127798471 -18.38 -0.43
184512500 125580216 236789805 31.94 -28.33
212020200 211778926.2 195528761.4 0.11 7.78
203600000 178111842 256067350.3 12.52 -25.77
42000000 53853180 90139662.12 -28.22 -114.62
30000000 31030426 14826321.51 -3.43 50.58
40000000 40057821 23491144.1 -0.14 41.27
190000000 167423921 227263030.7 11.88 -19.61
42000000 44607030 70904367.27 -6.21 -68.82
72500000 58956057 30117844.6 18.68 58.46
100000000 90933980 109827092 9.07 -9.83
210000000 171751581 175520356.9 18.21 16.42
110000000 98987646 165622515 10.01 -50.57
190000000 202613838 156957692.4 -6.64 17.39
145000000 159363934 161864922.4 -9.91 -11.63
218000000 175146167 198277100.2 19.66 9.05
145000000 161555621 292154224.3 -11.42 -101.49
272000000 319791715 195005613.6 -17.57 28.31
111090000 97872115 187515677.2 11.90 -68.80

268
APPENDIX 7
R Codes

269
# Load package
library(rminer)
# load data
data2 = read.csv(file.choose(), header=T)
# select inputs:
inputs=1:11 # select from 1 ("location") to 11 ("sea view")
# select outputs: regression task
price = which(names(data2)=="Price")
cat("output class:",class(data2[,price]),"\n")
# fit holdout example:
set.seed(12345)
H=holdout(data2$Price,ratio=0.8,seed=12345)
print("holdout:")
print(summary(H))
# Fit model
R1=fit(Price~.,data2[H$tr,c(inputs,price)], model="mlpe",size = 2, decay = 0, rang =
0.7, maxit = 100)
# get predictions on test set (new data)
P1=predict(R1,data2[H$ts,c(inputs,price)])
# show scatter plot with quality of the predictions:
T1=data2[H$ts,]$Price
e1=mmetric(target1,P1,metric=c("RMSE","R2"))

270
error=paste("ANN, holdout: RMSE=",round(e1[1],2),", R2=",round(e1[2],2), sep=" ")
pdf("rf-1.pdf")
mgraph(target1,P1,graph="RSC",Grid=10,main=error)
dev.off()
cat(error,"\n")
### regression examples: y - desired values; x - predictions
y = target1
x = P1
print(mmetric(y,x,"ALL"))
print(mmetric(y,x,"MAE"))
m=mmetric(y,x,c("MAE","RMSE","RAE","RSE","R2"))
print(m)
# Run sensitivity analysis
I=Importance(R1,data2[H$tr,c(inputs,price)])
print(round(I$imp,digits=2))
imax=which.max(I$imp)
L=list(runs=1,sen=t(I$imp),sresponses=I$sresponses) # create a simple mining list
par(mar=c(2.0,2.0,2.0,2.0)) # enlarge PDF margin
mgraph(L,graph="IMP",leg=names(cmath),col="gray",Grid=10,PDF="imp-8")

271
REFERENCES
Abidoye, R. and Chan, A. (2017a). Modeling Property Values in Nigeria using
Artificial Neural Network. Journal of Property Research, 34(1), 36-53.
Abidoye, R. B. and Chan, A. P. C. (2016a). Critical determinants of residential property
value: Professionals’ perspective. Journal of Facilities Management, 14(3),
283-300.
Abidoye, R. B. and Chan, A. P. C. (2016b). Research trend of the application of
artificial neural network in property valuation. Paper presented at the 33rd CIB
W78 International Conference, Brisbane, Australia. October 31st – November
2nd.
Abidoye, R. B. and Chan, A. P. C. (2016c). A survey of property valuation approaches
in Nigeria. Property Management, 34(5), 364-382.
Abidoye, R. B. and Chan, A. P. C. (2017b). Critical review of hedonic pricing model
application in property price appraisal: A case of Nigeria. International Journal
of Sustainable Built Environment, 6(1), 250 -259.
Abidoye, R. B. and Oyedeji, J. O. (2014). The impact of high voltage power lines on
residential property values in selected parts of Lagos state. Journal of
International Academic Research for Multidisciplinary, 2(8), 443-453.
Adair, A., Berry, J. and McGreal, S. (1996a). Valuation of residential property:
Analysis of participant behaviour. Journal of Property Valuation and
Investment, 14(1), 20-35.
Adair, A. S., Berry, J. N. and McGreal, W. S. (1996b). Hedonic modelling, housing
submarkets and residential valuation. Journal of Property Research, 13(1), 67-
83.
Adegoke, J. O. (2014). Critical factors determining rental value of residential property
in Ibadan metropolis, Nigeria. Property Management, 32(3), 224-240.
Adegoke, O., Olaleye, A. and Oloyede, S. (2013). A study of valuation clients
perception on mortgage valuation reliability. African Journal of Environmental
Science and Technology, 7(7), 585-590.
Adegoke, O. J. (2016). Effects of valuation variance and inaccuracy on Nigerian
commercial property market: An empirical study. Journal of Property
Investment & Finance, 34(3), 276-292.
Adhikari, R. and Agrawal, R. (2013). An introductory study on time series modeling
and forecasting. Retrieved 12 July 2016, from arXiv, Cornell University
http://arxiv.org/ftp/arxiv/papers/1302/1302.6613.pdf
Ahmed, S., Rahman, M. and Islam, S. (2014). House rent estimation in Dhaka city by
multilayer perceptions neural network. International Journal of u-and e-

272
Service, Science and Technology, 7(4), 287-300.
Ajibola, M. O. (2010). Valuation inaccuracy: An examination of causes in Lagos
metropolis. Journal of Sustainable Development, 3(4), 187-193.
Ajide, B. K. and Alabi, M. (2010). Does the functional form matter in the estimation
of hedonic price model for housing market? The Social Sciences, 5(6), 559-
564.
Ajide, B. K. and Kareem, I. (2010). Hedonic analysis of residential housing market in
a third world city: A preliminary investigation. The Social Sciences, 5(6), 520-
524.
Akinbogun, S., Jones, C. and Dunse, N. (2014). The property market maturity
framework and its application to a developing country: The case of Nigeria.
Journal of Real Estate Literature, 22(2), 217-232.
Akinjare, O., Oloyede, S., Ayedun, C. and Oloke, C. O. (2011). Price effects of landfills
on residential housing in Lagos, Nigeria. International Journal of Marketing
Studies, 3(2), 64-72.
Akinjare, O. A., Akinjare, V. A. and Oluwatobi, A. O. (2012). Proximity of HVOTLS
and residential rental values in the metropolitan Lagos. Transnational Journal
of Science and Technology, 2(8), 18-29.
Akintoye, A. and Fitzgerald, E. (2000). A survey of current cost estimating practices
in the UK. Construction Management & Economics, 18(2), 161-172.
Akpom, U. N. (1996). Housing attributes and the cost of private rental buildings in
Lagos Nigeria: A hedonic price analysis. The Review of Regional Studies, 26(3),
351-365.
Al-Alawi, S. and Al-Hinai, H. (1998). An ANN-based approach for predicting global
radiation in locations with no direct measurement instrumentation. Renewable
Energy, 14(1), 199-204.
Alavi, M. and Carlson, P. (1992). A review of MIS research and disciplinary
development. Journal of Management Information Systems, 8(4), 45-62.
Aliyu, A. A., Kasim, R. and Martin, D. (2011). Effect of Kasuwan Laushi supermarket
on surrounding residential accommodations in Bauchi metropolis, Nigeria.
Paper presented at the International Conference on Environment and Industrial
Innovation (ICEII 2011), Singapore
Allen, I. E. and Seaman, C. A. (2007). Likert scales and data analyses. Quality
Progress, 40(7), 64-65.
Aluko, B. T. (2007). Examining valuer's judgement in residential property valuations
in metropolitan Lagos, Nigeria. Property Management, 25(1), 98-107.
Aluko, B. T., Ajayi, C. and Amidu, A. R. (2004). The estate surveyors and valuers and
the magic number: A point estimate or a range of value? International Journal

273
of Strategic Property Management, 8(3), 149-162.
Aluko, O. (2011). The effects of location and neighbourhood attributes on housing
values in metropolitan Lagos. Ethiopian Journal of Environmental Studies and
Management, 4(2), 69-82.
Amenyah, I. D. and Fletcher, E. A. (2013). Factors determining residential rental prices.
Asian Economic and Financial Review, 3(1), 39-50.
American Institute of Real Estate Appraisers. (1987). The Appraisal of Real Estate
(9th ed.). Chicago: American Institute of Real Estate Appraisers.
Ameyaw, E. E. and Chan, A. P. C. (2015). Risk ranking and analysis in PPP water
supply infrastructure projects. Facilities, 33(7/8), 428-453.
Amri, S. and Tularam, G. A. (2012). Performance of multiple linear regression and
nonlinear neural networks and fuzzy logic techniques in modelling house
prices. Journal of Mathematics and Statistics, 8(4), 419-434.
Anim-Odame, W., Key, T. and Stevenson, S. (2009). Measures of real estate values
from land registration and valuation systems in emerging economies: The case
of Ghana. Journal of Real Estate Literature, 17(1), 63-84.
Anselin, L. (1998). GIS research infrastructure for spatial analysis of real estate
markets. Journal of Housing Research, 9(1), 113-133.
Appraisal Institute. (1994). Appraising residential properties (2nd Ed.). Chicago:
Appraisal Institute.
Appraisal Institute. (2013). Understanding the appraisal (pp. 18). Chicago, US:
Appraisal Institute.
Aragonés-Beltrán, P., Pastor-Ferrando, J. P., García-García, F. and Pascual-Agulló, A.
(2010). An analytic network process approach for siting a municipal solid
waste plant in the metropolitan area of Valencia (Spain). Journal of
Environmental Management, 91(5), 1071-1086.
Arimah, B. C. (1992). Hedonic prices and the demand for housing attributes in a third
world city: The case of Ibadan, Nigeria. Urban Studies, 29(5), 639-651.
Arimah, B. C. (1997). The determinants of housing tenure choice in Ibadan, Nigeria.
Urban Studies, 34(1), 105-124.
Arimah, B. C. and Adinnu, F. I. (1995). Market segmentation and the impact of
landfills on residential property values: Empirical evidence from an African
city. Netherlands Journal of Housing and the Built Environment, 10(2), 157-
171.
Ayedun, C., Oloyede, S. and Durodola, O. (2012). Empirical study of the causes of
valuation variance and inaccuracy in Nigeria. International Business Research,
5(3), p71.
Ayedun, C. A., Durodola, O. D., Ajibola, M. O. and Oloke, O. C. (2014). Defective

274
selection and application of valuation data as the cause of valuation
inconsistency in metropolitan Lagos, Nigeria. Developing Country Studies,
4(15), 62-75.
Azmi, A. S. M., Nawawi, A. H., Ab Latif, S. N. F. and Ling, N. L. F. J. (2013). Property
valuers’ receptive level on knowledge of computer aided valuation (CAV)
system. Procedia-Social and Behavioral Sciences, 105, 734-744.
Babalola, S. J., Umar, A. I. and Sulaiman, L. A. (2013). An economic analysis of
determinants of house rents in the university environment. European Scientific
Journal, 9(19), 99-111.
Babarinde, J. A. (2015). Asset valuation and the role of news in sub-Saharan Africa:
Valuers’ rationality and the hype dilemma. Pacific Rim Property Research
Journal, 21(2), 139-159.
Babawale, G. K. (2012). Paradigm shift in investment property valuation theory and
practice: Nigerian practitioners’ response. Mediterranean Journal of Social
Sciences, 3(3), 217-228.
Babawale, G. K. (2013a). Measuring the impact of church externalities on house prices.
Khazar Journal of Humanities & Social Sciences, 16(4), 53-68.
Babawale, G. K. (2013b). Valuation accuracy–the myth, expectation and reality!
African Journal of Economic and Management Studies, 4(3), 387-406.
Babawale, G. K. and Adewunmi, Y. (2011). The impact of neighbourhood churches on
house prices. Journal of Sustainable Development, 4(1), 246-253.
Babawale, G. K. and Ajayi, C. A. (2011). Variance in residential property valuation in
Lagos, Nigeria. Property Management, 29(3), 222-237.
Babawale, G. K. and Alabi, A. A. (2013). The nexus between valuation accuracy and
mortgage finance: A Nigerian perspective. Journal of Transformative
Entrepreneurship, 1(1), 1-13.
Babawale, G. K. and Johnson, O. (2012). The specification of hedonic indexes for
duplexes in Lekki peninsular area of Lagos metropolis. Elixir Social Science,
45(1), 7689-7698.
Babawale, G. K., Koleoso, H. A. and Otegbulu, A. C. (2012). A hedonic model for
apartment rentals in Ikeja area of Lagos metropolis. Mediterranean Journal of
Social Sciences, 3(3), 109-120.
Babawale, G. K. and Omirin, M. (2012). An assessment of the relative impact of
factors influencing inaccuracy in valuation. International Journal of Housing
Markets and Analysis, 5(2), 145-160.
Babawale, G. K. and Oyalowo, B. A. (2011). Incorporating sustainability into real
estate valuation: The perception of Nigerian valuers. Journal of Sustainable
Development, 4(4), 236-248.

275
Bagnoli, C. and Smith, H. C. (1998). The theory of fuzz logic and its application to
real estate valuation. Journal of Real Estate Research, 16(2), 169-200.
Ball, M. J. (1973). Recent empirical work on the determinants of relative house prices.
Urban Studies, 10(2), 213-233.
Baltagi, B. H., Bresson, G. and Etienne, J. M. (2015). Hedonic housing prices in Paris:
An unbalanced spatial lag pseudo‐panel model with nested random effects.
Journal of Applied Econometrics, 30(3), 509-528.
Basu, S. and Thibodeau, T. G. (1998). Analysis of spatial autocorrelation in house
prices. The Journal of Real Estate Finance and Economics, 17(1), 61-85.
Baum, A. E. and Crosby, N. (1995). Property investment appraisal (2nd ed.). London:
Routledge.
Behrman, M., Linder, R., Assadi, A. H., Stacey, B. R. and Backonja, M.-M. (2007).
Classification of patients with pain based on neuropathic pain symptoms:
Comparison of an artificial neural network against an established scoring
system. European Journal of Pain, 11(4), 370-376.
Bello, M. O. and Bello, V. A. (2007). The influence of consumers behavior on the
variables determining residential property values in Lagos, Nigeria. American
Journal of Applied Sciences, 4(10), 774-778.
Bello, M. O. and Bello, V. A. (2008). Willingness to pay for better environmental
services: Evidence from the Nigerian real estate market. Journal of African
Real Estate Research, 1(1), 19-27.
Bello, V. A. and Bello, M. O. (2009). Valuation of properties in close proximity to
waste dumps sites: The Nigeria experience. International Journal of Strategic
Property Management, 13(4), 309-317.
Bender, A., Din, A., Hoesli, M. and Brocher, S. (2000). Environmental preferences of
homeowners: Further evidence using the AHP method. Journal of Property
Investment & Finance, 18(4), 445-455.
Benson, E. D., Hansen, J. L., Schwartz Jr, A. L. and Smersh, G. T. (1998). Pricing
residential amenities: The value of a view. The Journal of Real Estate Finance
and Economics, 16(1), 55-73.
Berenson, M., Levine, D., Szabat, K. A. and Krehbiel, T. C. (2012). Basic business
statistics: Concepts and applications. Australia: Pearson Higher Education AU.
Berndt, E. R., Cutler, D. M., Frank, R. G., Griliches, Z., Newhouse, J. P. and Triplett,
J. E. (2000). Medical care prices and output. Handbook of Health Economics,
1, 119-180.
Berndt, E. R., Griliches, Z. and Rappaport, N. J. (1995). Econometric estimates of
price indexes for personal computers in the 1990's. Journal of Econometrics,
68(1), 243-268.

276
Bertrand, J. W. M. and Fransoo, J. C. (2002). Operations management research
methodologies using quantitative modeling. International Journal of
Operations & Production Management, 22(2), 241-264.
Bolitzer, B. and Netusil, N. R. (2000). The impact of open spaces on property values
in Portland, Oregon. Journal of Environmental Management, 59(3), 185-193.
Bonissone, P. and Cheetham, W. (1998). Fuzzy Case-Based Reasoning for residential
property valuation. In P. P. Bonissone, E. H. Ruspini and W. Pedrycz (Eds.),
Handbook on Fuzzy Computing. London: Oxford University Press.
Borst, R. A. (1991). Artificial neural networks: The next modelling/calibration
technology for the assessment community. Property Tax Journal, 10(1), 69-94.
Borst, R. A. (1995). Artificial neural networks in mass appraisal. Journal of Property
Tax Assessment & Administration, 1(2), 5-15.
Bourassa, S. C., Hoesli, M. and Sun, J. (2006). A simple alternative house price index
method. Journal of Housing Economics, 15(1), 80-97.
Bourassa, S. C. and Peng, V. S. (1999). Hedonic prices and house numbers: The
influence of feng shui. International Real Estate Review, 2(1), 79-93.
Bouvier, R., Halstead, J. M., Conway, K. and Manalo, A. (2000). The effect of landfills
on rural residential property values: Some empirical evidence. Journal of
Regional Analysis and Policy, 30(2), 23-38.
Box, G. E. and Jenkins, G. M. (1976). Time series analysis: Forecasting and control.
Oakland, CA: Holden-Day.
Boyd, T. (1995). Current valuation practice in Australia: A survey of valuers. Journal
of Property Valuation and Investment, 13(3), 59-69.
Boye, P. (2012). The use of multiple linear regressions in determining the relationship
between housing unit price and some major components in a real estate
building. Scottish Journal of Arts, Social Sciences and Scientific Studies, 7(1),
3-17.
Brown, G. R., Matysiak, G. A. and Shepherd, M. (1998). Valuation uncertainty and the
Mallinson Report. Journal of Property Research, 15(1), 1-13.
Bruce, R. W. and Sundell, D. J. (1977). Multiple regression analysis: History and
applications in the appraisal profession. The Real Estate Appraiser, 43(1), 37-
44.
Brunson, A., Buttimer Jr, R. and Rutherford, R. (1994). Neural networks, nonlinear
specifications, and industrial property values Working Paper Series. Texas,
USA: University of Texas at Arlington.
Burger, C., Dohnal, M., Kathrada, M. and Law, R. (2001). A practitioners guide to
time-series methods for tourism demand forecasting: A case study of Durban,
South Africa. Tourism Management, 22(4), 403-409.

277
Callan, R. (1999). The essence of neural networks. England Prentice Hall.
Can, A. and Megbolugbe, I. (1997). Spatial dependence and house price index
construction. The Journal of Real Estate Finance and Economics, 14(1-2),
203-222.
Canavarro, C., Caridad, J. M. and Ceular, N. (2010). Hedonic methodologies in the
real estate valuation. Paper presented at the Mathematical Methods in
Engineering International Symposium, Coimbra, Portugal, 21 - 24 October.
Carroll, T. M., Clauretie, T. M. and Jensen, J. (1996). Living next to godliness:
Residential property values and churches. The Journal of Real Estate Finance
and Economics, 12(3), 319-330.
Castle, G. H. and Joseph, R. (1998). GIS in real estate: Integrating, analyzing, and
presenting locational information. Chicago, IL: Appraisal Institute.
Cebula, R. J. (2009). The hedonic pricing model applied to the housing market of the
city of Savannah and its Savannah historic landmark district. The Review of
Regional Studies, 39(1), 9-22.
Cechin, A., Souto, A. and Gonzalez, A. M. (2000). Real estate value at Porto Alegre
city using artificial neural networks. Paper presented at the 6th Brazilian
Symposium on Neural Networks, Rio de Janeiro, Brazil. 22-25 November.
Cellmer, R. (2011). Spatial analysis of the effect of noise on the prices and value of
residential real estates. Geomatics and Environmental Engineering, 5(4), 13-
28.
Cellmer, R. (2014). The possibilities and limitations of geostatistical methods in real
estate market analyses. Real Estate Management and Valuation, 22(3), 54-62.
Central Bank of Nigeria. (2015). List of financial institutions-Commercial Banks.
Retrieved 5 May 2015, from Central Bank of Nigeria
http://www.cenbank.org/Supervision/Inst-DM.asp
Chang, L. Y. (2005). Analysis of freeway accident frequencies: Negative binomial
regression versus artificial neural network. Safety Science, 43(8), 541-557.
Chau, K. and Ma, S. (1998). How do superstition and taboo affect the pricing of
apartment units? Paper presented at the 14th American Real Estate Society
Meeting, Monterery, California. 15-18, April.
Chau, K. W., Ma, V. S. and Ho, D. C. (2001). The pricing of ‘luckiness’ in the
apartment market. Journal of Real Estate Literature, 9(1), 29-40.
Chau, K. W., Wong, S. K. and Yiu, C. Y. (2004). The value of the provision of a balcony
in apartments in Hong Kong. Property Management, 22(3), 250-264.
Cheshire, P. and Sheppard, S. (1998). Estimating the demand for housing, land and
neighbourhood characteristics. Oxford Bulletin of Economics and Statistics,
60(3), 357-382.

278
Chiang, W. K., Zhang, D. and Zhou, L. (2006). Predicting and explaining patronage
behavior toward web and traditional stores using neural networks: A
comparative analysis with logistic regression. Decision Support Systems, 41(2),
514-531.
Chiang, Y., Tao, L. and Wong, F. K. (2015). Causal relationship between construction
activities, employment and GDP: The case of Hong Kong. Habitat
International, 46(1), 1-12.
Chien, C. W., Lee, Y. C., Ma, T., Lee, T. S., Lin, Y. C., Wang, W. and Lee, W. J. (2007).
The application of artificial neural networks and decision tree model in
predicting post-operative complication for gastric cancer patients.
Hepatogastroenterology, 55(84), 1140-1145.
Chin, T. L. and Chau, K. W. (2002). A critical review of literature on the hedonic price
model. International Journal for Housing Science and Its Applications, 27(2),
145-165.
Cho, S.-H., Poudyal, N. C. and Roberts, R. K. (2008). Spatial analysis of the amenity
value of green open space. Ecological Economics, 66(2), 403-416.
Choy, L. H., Mak, S. W. and Ho, W. K. (2007). Modeling Hong Kong real estate prices.
Journal of Housing and the Built Environment, 22(4), 359-368.
Chukwu, S. C. and Nwachukwu, A. N. (2012). Analysis of some meteorological
parameters using artificial neural network method for Makurdi, Nigeria.
African Journal of Environmental Science and Technology, 6(3), 182-188.
Clark, D. E. and Herrin, W. E. (2000). The impact of public school attributes on home
sale prices in California. Growth and Change, 31(3), 385-407.
Cole, R., Guilkey, D. and Miles, M. (1986). Toward an assessment of the reliability of
commercial appraisals. The Appraisal Journal, 54(3), 422-432.
Colwell, P. F. and Dilmore, G. (1999). Who was first? An examination of an early
hedonic study. Land Economics, 75(4), 620-626.
Cortez, P. (2010). Data mining with neural networks and support vector machines
using the R/rminer tool. Paper presented at the 10th Industrial Conference on
Data Mining, Berlin, Germany. 12 - 14 July.
Cortez, P., Cerdeira, A., Almeida, F., Matos, T. and Reis, J. (2009). Modeling wine
preferences by data mining from physicochemical properties. Decision Support
Systems, 47(4), 547-553.
Court, A. T. (1939). Hedonic price indexes with automobile examples The dynamics
of the automobile demand. New York: General Motors.
Crawford, G. W. and Fratantoni, M. C. (2003). Assessing the forecasting performance
of Regime‐Switching, ARIMA and GARCH models of house prices. Real
Estate Economics, 31(2), 223-243.

279
Credit Suisse. (2015). Global wealth Report 2015. In T. Thiam (Ed.), (pp. 64).
Switzerland.
Crompton, J. L. (2005). The impact of parks on property values: Empirical evidence
from the past two decades in the United States. Managing Leisure, 10(4), 203-
218.
Crosby, N. (2000). Valuation accuracy, variation and bias in the context of standards
and expectations. Journal of Property Investment & Finance, 18(2), 130-161.
Curry, B., Morgan, P. and Silver, M. (2002). Neural networks and non-linear statistical
methods: An application to the modelling of price-quality relationships.
Computers & Operations Research, 29(1), 951-969.
Cutler, D. M. and Berndt, E. R. (2007). Medical care output and productivity (Vol. 62).
Chicago and London: University of Chicago Press.
Czernkowski, R. M. (1990). Expert systems in real estate valuation. Journal of
Valuation, 8(4), 376-393.
d'Amato, M. and Siniak, N. (2009). Using fuzzy numbers in mass appraisal: The case
of the Belarusian property market. In T. Kauko and M. d'Amato (Eds.), Mass
appraisal methods: An international perspective for property valuers (pp. 91-
107). Oxford, UK: Blackwell.
Dale-Johnson, D. (1982). An alternative approach to housing market segmentation
using hedonic price data. Journal of Urban Economics, 11(3), 311-332.
Daly, J., Gronow, S., Jenkins, D. and Plimmer, F. (2003). Consumer behaviour in the
valuation of residential property: A comparative study in the UK, Ireland and
Australia. Property Management, 21(5), 295-314.
Dawes, J. G. (2008). Do data characteristics change according to the number of scale
points used? An experiment using 5 point, 7 point and 10 point scales.
International Journal of Market Research, 51(1), 61-77.
De Castro, L. N. and Timmis, J. (2002). Artificial immune systems: A new
computational intelligence approach. Great Britain: Springer Science &
Business Media.
Denscombe, M. (2014). The good research guide: For small-scale social research
projects (5th ed.). England: Open University Press.
Des Rosiers, F., Lagana, A., Thériault, M. and Beaudoin, M. (1996). Shopping centres
and house values: An empirical investigation. Journal of Property Valuation
and Investment, 14(4), 41-62.
Dilmore, G. (1993). Fuzzy set theory: An introduction to its application for real estate
analysts. Paper presented at the Annual Conference of the American Real
Estate Society, Key West, Florida.
Din, A., Hoesli, M. and Bender, A. (2001). Environmental variables and real estate

280
prices. Urban Studies, 38(11), 1989-2000.
Dix, K. and Anderson, J. (2000). Distance no longer a barrier: Using the internet as a
survey tool in educational research. International Education Journal, 1(2), 83-
93.
Do, A. Q. and Grudnitski, G. (1992). A neural network approach to residential property
appraisal. The Real Estate Appraiser, 58(3), 38-45.
Do, A. Q., Wilbur, R. W. and Short, J. L. (1994). An empirical examination of the
externalities of neighborhood churches on housing values. The Journal of Real
Estate Finance and Economics, 9(2), 127-136.
Dotzour, M. G. (1990). An empirical analysis of the reliability and precision of the cost
approach in residential appraisal. Journal of Real Estate Research, 5(1), 67-74.
Du, D., Li, A. and Zhang, L. (2014). Survey on the applications of big data in Chinese
real estate enterprise. Procedia Computer Science, 30(1), 24-33.
Dugeri, T. T. (2011). An evaluation of the maturity of the Nigerian property market.
(Doctoral dissertation), University of Lagos, Lagos, Nigeria. Retrieved from
http://www.afrer.org/docs/pdf/dugeri.pdf
Dulburger, E. R. (1989). The application of a hedonic model to a quality-adjusted price
index for computer processors. In D. Jorgenson and R. Landau (Eds.),
Technology and Capital formation (pp. 37-75). Cambridge, MA: MIT Press.
Dvir, D., Ben-David, A., Sadeh, A. and Shenhar, A. J. (2006). Critical managerial
factors affecting defense projects success: A comparison between neural
network and regression analysis. Engineering Applications of Artificial
Intelligence, 19(5), 535-543.
Easterbrook, S., Singer, J., Storey, M.-A. and Damian, D. (2008). Selecting empirical
methods for software engineering research. In F. Shull, J. Singer and D. I. K.
Sjøberg (Eds.), Guide to advanced empirical software engineering (pp. 285-
311). London: Springer.
Elhag, T. (2002). Tender price modeling: Artificial neural network and regression
techniques. (Doctoral dissertation), University of Liverpool, United Kingdom.
Elhag, T. and Boussabaine, A. (1998). An artificial neural system for cost estimation
of construction projects. Paper presented at the 14th ARCOM annual
conference, University of Reading. 9-11, September.
Elhag, T., Boussabaine, A. and Ballal, T. (2005). Critical determinants of construction
tendering costs: Quantity surveyors’ standpoint. International Journal of
Project Management, 23(1), 538-545.
Elliott, P. and Han, H. (2013). Impact of high voltage overhead transmission lines on
property value: An Australian residential case study: European Real Estate
Society (ERES).

281
Emo, F. I., Oni, A. O. and Egolum, C. C. (2013). Prioritizing residential land value
determinants in Onitsha, Nigeria. International Journal of Academic Research
in Business and Social Sciences, 3(3), 201-213.
Enhancing Financial Innovation and Access (EFInA). (2014). EFInA Access to
Financial Services in Nigeria 2014 Survey (pp. 78). Lagos, Nigeria: EFInA.
Enke, D. and Thawornwong, S. (2005). The use of data mining and neural networks
for forecasting stock market returns. Expert Systems with Applications, 29(4),
927-940.
Eriki, P. O. and Udegbunam, R. (2013). Predicting corporate distress in the Nigerian
stock market: Neural network versus multiple discriminant analysis. African
Journal of Business Management, 7(38), 3856-3863.
Espey, M. and Lopez, H. (2000). The impact of airport noise and proximity on
residential property values. Growth and Change, 31(3), 408-419.
Evans, A., James, H. and Collins, A. (1992). Artificial neural networks: An application
to residential valuation in the UK (pp. 1-18): Department of Economics,
University of Portsmouth.
Famuyiwa, F. and Babawale, G. K. (2014). Hedonic values of physical infrastructure
in house rentals. Journal of Facilities Management, 12(3), 211-230.
Fausett, L. V. (1994). Fundamentals of neural networks: Architecture, algorithms, and
applications. United States of America: Prentice-Hall International.
Fernandez-Rodrıguez, F., Gonzalez-Martel, C. and Sosvilla-Rivero, S. (2000). On the
profitability of technical trading rules based on artificial neural networks::
Evidence from the Madrid stock market. Economics Letters, 69(1), 89-94.
Finlay, P. N. and Tyler, S. B. (1991). The performance measurement of property
investments. Journal of Property Valuation and Investment, 9(4), 295-312.
Fletcher, M., Gallimore, P. and Mangan, J. (2000). Heteroscedasticity in hedonic house
price models. Journal of Property Research, 17(2), 93-108.
Frank, L. D., Saelens, B. E., Powell, K. E. and Chapman, J. E. (2007). Stepping
towards causation: Do built environments or neighborhood and travel
preferences explain physical activity, driving, and obesity? Social Science &
Medicine, 65(9), 1898-1914.
Freeman, A. M. (1979). Hedonic prices, property values and measuring environmental
benefits: A survey of the issues. The Scandinavian Journal of Economics, 81(2),
154-173.
Freeman, A. M. (1993). The measurement of environmental and resource values
resources for the future: Theory and methods. Washington, DC: Resources for
the Future.
French, N. (2004). The valuation of specialised property: A review of valuation

282
methods. Journal of Property Investment and Finance, 22(6), 533-541.
French, N. and Byrne, P. (1996). Concepts and models of value. In A. Adair, M. L.
Downie, S. McGreal and G. Vos (Eds.), European valuation practice: Theory
and techniques (1st ed., pp. 15-29). London: E & FN SPON.
Frew, J. and Jud, G. (2003). Estimating the value of apartment buildings. Journal of
Real Estate Research, 25(1), 77-86.
Galbraith, J. K. (2013). The nature of real estate and real estate markets. In D. Ling
and W. Archer (Eds.), Real Estate Principles: A value approach (4th ed.).
Columbus, United States: McGraw-Hill Higher Education.
Gallimore, P., Fletcher, M. and Carter, M. (1996). Modelling the influence of location
on value. Journal of Property Valuation and Investment, 14(1), 6-19.
Gambo, Y. L. (2012). Hedonic price modelling of the influence of violent ethno-
religious conflict on residential property values in Bauchi metropolis, Nigeria.
Journal of Sustainable Development, 5(9), 85-97.
Gan, C., Limsombunchai, V., Clemes, M. and Weng, A. (2005). Consumer choice
prediction: Artificial neural networks versus logistic models. Journal of Social
Sciences, 1(4), 211-219.
Ge, J. X. (2004). Housing price models for Hong Kong. (Doctoral dissertation),
University of Newcastle, Australia.
Ge, X. J. (2009). Determinants of house prices in New Zealand. Pacific Rim Property
Research Journal, 15(1), 90-112.
Ge, X. J. and Du, Y. (2007). Main variables influencing residential property values
using the entropy method–the case of Auckland. Paper presented at the 5th
International Structural Engineering and Construction Conference, Shunan,
Japan. 20-23 September.
Ge, X. J. and Runeson, G. (2004). Modeling property prices using neural network
model for Hong Kong. International Real Estate Review, 7(1), 121-138.
Giacomini, E., Ling, D. C. and Naranjo, A. (2015). Leverage and returns: A cross-
country analysis of public real estate markets. The Journal of Real Estate
Finance and Economics, 51(2), 125-159.
Giang, D. T. and Pheng, L. S. (2011). Role of construction in economic development:
Review of key concepts in the past 40 years. Habitat International, 35(1), 118-
125.
Gilbertson, B. and Preston, D. (2005). A vision for valuation. Journal of Property
Investment & Finance, 23(2), 123-140.
Gillham, B. (2000). Developing a questionnaire. London: Continuum.
Glindro, E. T., Subhanij, T., Szeto, J. and Zhu, H. (2008). Determinants of house prices
in nine Asia-Pacific economies. BIS working paper, No 263.

283
González, M. A. S. and Formoso, C. T. (2006). Mass appraisal with genetic fuzzy rule-
based systems. Property Management, 24(1), 20-30.
Goodman, A. C. and Thibodeau, T. G. (1997). Dwelling-age-related heteroskedasticity
in hedonic house price equations: An extension. Journal of Housing Research,
8(2), 299-317.
Goodman, A. C. and Thibodeau, T. G. (1998). Housing market segmentation. Journal
of Housing Economics, 7(2), 121-143.
Grover, R. (2016). Mass valuations. Journal of Property Investment & Finance, 34(2),
191-204.
Guan, J., Zurada, J. and Levitan, A. S. (2008). An adaptive neuro-fuzzy inference
system based approach to real estate property assessment. Journal of Real
Estate Research, 30(4), 395-421.
Gujarati, D. N. and Porter, D. C. (2009). Basic econometrics (5th ed.). Boston:
McGraw-Hill Education.
Haas, G. C. (1922a). Sale prices as a basis for farmland appraisal (Technical Bulletin
9, Agricultural Experimental Station) (Vol. 9). St. Paul, Minnesota: The
University of Minnesota.
Haas, G. C. (1922b). A statistical analysis of farm sales in blue earth county,
Minnesota, as a basis for farm land appraisal. (Masters Thesis), University of
Minnesota, United States of America. Retrieved from
http://ageconsearch.umn.edu/handle/184329
Hager, D. P. and Lord, D. J. (1985). The property market, property valuations and
property performance measurement. Journal of the Institute of Actuaries,
112(1), 19-60.
Hair, J., Black, W., Babin, B., Anderson, R. and Tatham, R. (2010). Multivariate data
analysis (7th ed.). New Jersey: Prentice-Hall.
Han, S., Yu, M. S., Malone-Lee, C. L. and Basuki, A. (2002). Dynamics of property
value distribution in an Asian metropolis: The case of landed housing in
Singapore, 1991-2000. Journal of Property Investment & Finance, 20(3), 254-
276.
Haykin, S. (1999). Neural networks: A comprehensive foundation (2nd` ed.). New
Jersey: Prentice-Hall.
Hemsley-Brown, J. and Sharp, C. (2003). The use of research to improve professional
practice: A systematic review of the literature. Oxford Review of Education,
29(4), 449-471.
Hofmann, B. (2003). Bank lending and property prices: Some international evidence
Working Paper No. 22 (pp. 1-20). Hong Kong: Hong Kong Institute for
Monetary Research.

284
Holdway, M. (2011). Quality-adjusting computer prices in the producer price index:
an overview. Retrieved 23rd October, 2015, from U.S. Bureau of Labor
Statistics http://www.bls.gov/ppi/ppicomqa.htm
Hornik, K. (1991). Approximation capabilities of multilayer feedforward networks.
Neural Networks, 4(2), 251-257.
Hoxley, M. (2008). Questionnaire design and factor analysis. In A. Knight and L.
Ruddock (Eds.), Advanced research methods in the built environment (pp. 122-
134). Chichester, UK: Wiley-Blackwell.
Hu, M. J.-C. (1964). Application of the adaline system to weather forecasting. Stanford,
CA: Stanford Electronic Laboratories.
Hu, T., Lam, K. and Ng, S. T. (2005). A modified neural network for improving river
flow prediction. Hydrological Sciences Journal, 50(2), 299-318.
Hui, C. M. E., Lau, M. F. O. and Lo, K. K. T. (2009). Deciphering real estate
investment decisions through fuzzy logic systems. Property Management,
27(3), 163-177.
Hui, E. C., Chau, C., Pun, L. and Law, M. (2007). Measuring the neighboring and
environmental effects on residential property value: Using spatial weighting
matrix. Building and Environment, 42(6), 2333-2343.
Hutchinson, N., MacGregor, B., Nanthakumaran, N., Adair, A. and McGreal, S. (1996).
Variations in the capital valuations of UK commercial property. London: Royal
Institute of Chartered Surveyors.
Hyndman, R. J. and Koehler, A. B. (2006). Another look at measures of forecast
accuracy. International Journal of Forecasting, 22(4), 679-688.
Ibem, E. O. (2011). The contribution of Public-Private Partnerships (PPPs) to
improving accessibility of low-income earners to housing in southern Nigeria.
Journal of Housing and the Built Environment, 26(2), 201-217.
Ibiyemi, A. and Tella, E. (2013). Critical issues in economic risks consideration by
commercial property investors and valuers in Nigeria: The case of Lagos.
International Journal of Emerging Science and Engineering, 1(12), 35-43.
Igbinosa, S. O. (2011). Determinants of residential property value in Nigeria –a neural
network approach. African Research Review, 5(5), 152-168.
Iroham, C., Durodola, O., Ayedun, C. and Ogunbola, M. (2014). Comparative study of
rental values of two gated estates in Lekki peninsula Lagos. Journal of
Sustainable Development Studies, 5(2), 218-235.
Iroham, C. O., Oloyede, S. A. and Oluwunmi, A. O. (2011). An analysis of the location
of worship centers on residential property values in Ota, Nigeria. Journal of
Sustainable Development in Africa, 13(1), 13-22.
Irwin, E. G. (2002). The effects of open space on residential property values. Land

285
Economics, 78(4), 465-480.
Janssen, C., Söderberg, B. and Zhou, J. (2001). Robust estimation of hedonic models
of price and income for investment property. Journal of Property Investment &
Finance, 19(4), 342-360.
Jenkins, D. (2000). Residential valuation theory and practice. Oxford: Chandos
Publishing.
Jenkins, D., Lewis, O., Almond, N., Gronow, S. and Ware, J. (1999). Towards an
intelligent residential appraisal model. Journal of Property Research, 16(1),
67-90.
Jiang, H., Jin, X.-H. and Liu, C. (2013). The effects of the late 2000s global financial
crisis on Australia’s construction demand. Australasian Journal of
Construction Economics and Building, 13(3), 65-79.
Jim, C. and Chen, W. Y. (2006). Impacts of urban environmental elements on
residential housing prices in Guangzhou (China). Landscape and Urban
Planning, 78(4), 422-434.
Jones Lang LaSalle (JLL). (2016). Sub-Saharan Africa real estate transparency index,
2016 World real estate transparency report. Chicago.
Joslin, A. (2005). An investigation into the expression of uncertainty in property
valuations. Journal of Property Investment & Finance, 23(3), 269-285.
Kaastra, I. and Boyd, M. (1996). Designing a neural network for forecasting financial
and economic time series. Neurocomputing, 10(3), 215-236.
Kathmann, R. M. (1993). Neural networks for the mass appraisal of real estate.
Computers, Environment and Urban Systems, 17(4), 373-384.
Kauko, T. (2004). Towards the 4th generation-an essay on innovations in residential
property value modelling expertise. Journal of Property Research, 21(1), 75-
97.
Kauko, T., Hooimeijer, P. and Hakfoort, J. (2002). Capturing housing market
segmentation: An alternative approach based on neural network modelling.
Housing Studies, 17(6), 875-894.
Kauko, T. J. (2002). Modelling the locational determinants of house prices: Neural
network and value tree approaches. (Doctoral dissertation), Utrecht University,
Finland.
Kauko, T. J. (2003). Residential property value and locational externalities: On the
complementarity and substitutability of approaches. Journal of Property
Investment & Finance, 21(3), 250-270.
Kennedy, P. J. (1998). Investment valuation of contaminated land and UK practice: A
study with special reference to former gasworks. (Doctoral dissertation),
Nottingham Trent University, England.

286
King, A. T. (1976). The demand for housing: A Lancastrian approach. Southern
Economic Journal, 1077-1087.
Kmenta, J. (1997). Elements of econometrics (2nd ed.). New York: Macmillan.
Kontrimas, V. and Verikas, A. (2011). The mass appraisal of the real estate by
computational intelligence. Applied Soft Computing, 11(1), 443-448.
Kryvobokov, M. and Wilhelmsson, M. (2007). Analysing location attributes with a
hedonic model for apartment prices in Donetsk, Ukraine. International Journal
of Strategic Property Management, 11(3), 157-178.
Kummerow, M. (2003). Theory for real estate valuation: An alternative way to teach
real estate price estimation methods. Perth: Department of Land Economy and
Valuation, Curtin University.
Kuşan, H., Aytekin, O. and Özdemir, I. (2010). The use of fuzzy logic in predicting
house selling price. Expert Systems with Applications, 37(3), 1808-1813.
Kutasi, D. and Badics, M. C. (2016). Valuation methods for the housing market:
Evidence from Budapest. Acta Oeconomica, 66(3), 527-546.
Lagos State Government. (2015). Population. Retrieved 3 March 2015, from Lagos
State Government http://www.lagosstate.gov.ng/pagelinks.php?p=6
Lai, P. Y. (2011). Analysis of the mass appraisal model by using artificial neural
network in Kaohsiung city. Journal of Modern Accounting and Auditing, 7(10),
1080-1089.
Lam, K. C., Yu, C. Y. and Lam, K. Y. (2008). An artificial neural network and entropy
model for residential property price forecasting in Hong Kong. Journal of
Property Research, 25(4), 321-342.
Lancaster, K. J. (1966). A new approach to consumer theory. Journal of Political
Economy, 74(2), 132-157.
Landis, J. (1998). An overview of GIS technology in real estate. In G. H. Castle (Ed.),
GIS in real estate: Integrating, analyzing, and presenting locational
information (pp. 5-23). Chicago: The Appraisal Institute.
Langrin, R. B. (2008). A hedonic residential real estate index for Jamaica: A pilot study
of the Kingston & St. Andrew region. Jamaica: Bank of Jamaica.
Laryea, S. and Leiringer, R. T. F. (2012). Built environment research in West Africa:
Current trends and future directions. Paper presented at the West Africa Built
Environment Research (WABER) Conference, Abuja, Nigeria. 24 - 26 July.
Law, R. and Au, N. (1999). A neural network model to forecast Japanese demand for
travel to Hong Kong. Tourism Management, 20(1), 89-97.
Lawson, J. W. W. (2008). Theory of real estate valuation. (Masters Thesis), Royal
Melbourne Institute of Technology, Australia.
Lenk, M. M., Worzala, E. M. and Silva, A. (1997). High-tech valuation: Should

287
artificial neural networks bypass the human valuer? Journal of Property
Valuation and Investment, 15(1), 8-26.
Lentz, G. and Wang, K. (1998). Residential appraisal and the lending process: A survey
of issues. Journal of Real Estate Research, 15(1), 11-39.
Levesque, T. J. (1994). Modelling the effects of airport noise on residential housing
markets: A case study of Winnipeg International Airport. Journal of Transport
Economics and Policy, 199-210.
Lewis, O. M., Ware, J. A. and Jenkins, D. (1997). A novel neural network technique
for the valuation of residential property. Neural Computing & Applications,
5(4), 224-229.
Li, C. W., Wong, S. K. and Chau, K. W. (2011). An analysis of spatial autocorrelation
in Hong Kong's housing market. Pacific Rim Property Research Journal, 17(3),
443-462.
Limsombunchai, V., Gan, C. and Lee, M. (2004). House price prediction: Hedonic
price model vs. artificial neural network. American Journal of Applied Sciences,
1(3), 193-201.
Lin, C. C. and Mohan, S. B. (2011). Effectiveness comparison of the residential
property mass appraisal methodologies in the USA. International Journal of
Housing Markets and Analysis, 4(3), 224-243.
Linneman, P. (1980). Some empirical results on the nature of the hedonic price
function for the urban housing market. Journal of Urban Economics, 8(1), 47-
68.
Lisboa, P. J. and Taktak, A. F. (2006). The use of artificial neural networks in decision
support in cancer: A systematic review. Neural Networks, 19(4), 408-415.
Lorenz, D. and Lützkendorf, T. (2008). Sustainability in property valuation: Theory
and practice. Journal of Property Investment and Finance, 26(6), 482-521.
Lynch, A. K. and Rasmussen, D. W. (2001). Measuring the impact of crime on house
prices. Applied Economics, 33(15), 1981-1989.
Mackmin, D. (1985). Is there a residential valuer in the house? Journal of Valuation,
3(4), 384-390.
Mackmin, D. (2008). Valuation and sale of residential property (3rd ed.). London: EG
Books.
Makridakis, S., Wheelwright, S. C. and Hyndman, R. J. (1998). Forecasting methods
and applications (3rd ed.). New York: Wiley.
Maliki, O. S., Agbo, A. O., Maliki, A. O., Ibeh, L. M. and Agwu, C. O. (2011).
Comparison of regression model and artificial neural network model for the
prediction of electrical power generated in Nigeria. Advances in Applied
Science Research, 2(5), 329-339.

288
Mallinson, M. and French, N. (2000). Uncertainty in property valuation-the nature and
relevance of uncertainty and how it might be measured and reported. Journal
of Property Investment & Finance, 18(1), 13-32.
Malpezzi, S. (2003). Hedonic pricing models: A selective and applied review. In T.
O'Sullivan and K. Gibb (Eds.), Housing Economics and Public Policy (pp. 67-
89). Oxford, UK: Blackwell Science Ltd.
Mardani, A., Jusoh, A. and Zavadskas, E. K. (2015). Fuzzy multiple criteria decision-
making techniques and applications–Two decades review from 1994 to 2014.
Expert Systems with Applications, 42(1), 4126-4148.
Masters, T. (1993). Practical neural network recipes in C++. Boston: Academic Press.
Maurer, R., Pitzer, M. and Sebastian, S. (2004). Hedonic price indices for the Paris
housing market. Allgemeines Statistisches Archiv, 88(3), 303-326.
Mayer, P. (2009). Guidelines for writing a review article. Retrieved 12 July 2016,
from Zurich-Basel: Plant Science Center http://ueberfachliche-
kompetenzen.ethz.ch/dopraedi/pdfs/Mayer/guidelines_review_article.pdf
Mbachu, J. I. and Lenono, N. (2005). Factors influencing market values of residential
properties. Paper presented at the Queensland University of Technology
Research Week International Conference, Brisbane, Australia. 4-8 July.
McCluskey, W. (1996). Predictive accuracy of machine learning models for the mass
appraisal of residential property. New Zealand Valuers Journal, 16(1), 41-47.
McCluskey, W., Davis, P., Haran, M., McCord, M. and McIlhatton, D. (2012). The
potential of artificial neural networks in mass appraisal: The case revisited.
Journal of Financial Management of Property and Construction, 17(3), 274-
292.
McCluskey, W., Deddis, W., Mannis, A., McBurney, D. and Borst, R. (1997).
Interactive application of computer assisted mass appraisal and geographic
information systems. Journal of Property Valuation and Investment, 15(5),
448-465.
McCluskey, W. J. and Borst, R. A. (1997). An evaluation of MRA, comparable sales
analysis, and ANNs for the mass appraisal of residential properties in Northern
Ireland. Assessment Journal, 4, 47-55.
McCluskey, W. J., Deddis, W. G., Lamont, I. G. and Borst, R. A. (2000). The
application of surface generated interpolation models for the prediction of
residential property values. Journal of Property Investment & Finance, 18(2),
162-176.
McCluskey, W. J., McCord, M., Davis, P., Haran, M. and McIlhatton, D. (2013).
Prediction accuracy in mass appraisal: A comparison of modern approaches.
Journal of Property Research, 30(4), 239-265.

289
McCulloch, W. S. and Pitts, W. (1943). A logical calculus of the ideas immanent in
nervous activity. The Bulletin of Mathematical Biophysics, 5(4), 115-133.
McGough, T. and Tsolacos, S. (1995). Forecasting commercial rental values using
ARIMA models. Journal of Property Valuation and Investment, 13(5), 6-22.
McGreal, S., Adair, A., McBurney, D. and Patterson, D. (1998). Neural networks: The
prediction of residential values. Journal of Property Valuation and Investment,
16(1), 57-70.
McNeill, D. and Freiberger, P. (1994). Fuzzy logic: The revolutionary computer
technology that is changing our world. New York: Simon and Schuster.
Megbolugbe, I. F. (1986). Econometric analysis of housing trait prices in a third world
city. Journal of Regional Science, 26(3), 533-547.
Megbolugbe, I. F. (1989). A hedonic index model: The housing market of Jos, Nigeria.
Urban Studies, 26(5), 486-494.
Megbolugbe, I. F. (1991). Hedonic indices and housing programme benefits. Urban
Studies, 28(5), 773-781.
Mendel, J. M. (1995). Fuzzy logic systems for engineering: A tutorial. Proceedings of
the IEEE, 83(3), 345-377.
Messah, O. B. and Kigige, A. M. (2011). Factors influencing real estate property prices
a survey of real estates in Meru municipality, Kenya. Journal of Economics
and Sustainable Development, 2(4), 34-53.
Michael, B., Vicky, S. and Michael, S. (2002). Residential real estate prices: A room
with a view. Journal of Real Estate Research, 23(2), 129-138.
Millington, A. F. (2000). An introduction to property valuation (5th ed.). London:
Estate Gazette.
Mimis, A., Rovolis, A. and Stamou, M. (2013). Property valuation with artificial neural
network: The case of Athens. Journal of Property Research, 30(2), 128-143.
Mohandes, M., Rehman, S. and Halawani, T. (1998). Estimation of global solar
radiation using artificial neural networks. Renewable Energy, 14(1), 179-184.
Mok, H. M., Chan, P. P. and Cho, Y.-S. (1995). A hedonic price model for private
properties in Hong Kong. The Journal of Real Estate Finance and Economics,
10(1), 37-48.
Mooya, M. M. (2015). The education and professional practice of valuers in South
Africa: A critical review. Property Management, 33(3), 245 - 274.
Mora-Esperanza, J. G. (2004). Artificial intelligence applied to real estate valuation:
An example for the appraisal of Madrid. CATASTRO, April(1), 255-265.
Morancho, A. B. (2003). A hedonic valuation of urban green areas. Landscape and
Urban Planning, 66(1), 35-41.
Morano, P. and Tajani, F. (2013). Bare ownership evaluation: Hedonic price model vs.

290
artificial neural network. International Journal of Business Intelligence and
Data Mining, 8(4), 340-362.
Morano, P., Tajani, F. and Torre, C. M. (2015). Artificial intelligence in property
valuations An application of artificial neural networks to housing appraisal.
Retrieved September 9th 2015, from Advances in Environmental Science and
Energy Planning http://www.wseas.us/e-
library/conferences/2015/Tenerife/ENVIR/ENVIR-02.pdf
Mulrow, C. D. (1994). Rationale for systematic reviews. British Medical Journal,
309(6954), 597.
Murat, Y. S. and Ceylan, H. (2006). Use of artificial neural networks for transport
energy demand modeling. Energy Policy, 34(17), 3165-3172.
Musa, A. G., Daramola, O., Owoloko, E. and Olugbara, O. (2013). A Neural-CBR
system for real property valuation. Journal of Emerging Trends in Computing
and Information Sciences, 4(8), 611-622.
Muth, R. F. (1966). Household production and consumer demand functions.
Econometrica, 34(3), 699-708.
Nasr, M. S., Moustafa, M. A., Seif, H. A. and El Kobrosy, G. (2012). Application of
artificial neural network (ANN) for the prediction of EL-AGAMY wastewater
treatment plant performance-EGYPT. Alexandria Engineering Journal, 51(1),
37-43.
National Bureau of Statistics. (2016a). Consumer Price Index (CPI) June 2016
(Publication no. http://www.nigerianstat.gov.ng/report/413). (No. 555).
Retrieved 18th July 2016, from NBS
National Bureau of Statistics. (2016b). Nigerian gross domestic product report (pp. 27).
Abuja, Nigeria.
Nelson, R. A., Tanguay, T. L. and Patterson, C. D. (1994). A quality-adjusted price
index for personal computers. Journal of Business & Economic Statistics,
12(1), 23-31.
Newel, G. (1982). The application of ridge regression to real estate appraisal. The
Appraisal Journal, January 1992, 116-119.
Newell, G. and Kishore, R. (1998). The accuracy of commercial property valuations.
Paper presented at the 4th Pacific Rim Real Estate Society Conference, Perth.
19 - 21 January.
Newell, G. and Seabrook, R. (2006). Factors influencing hotel investment decision
making. Journal of Property Investment & Finance, 24(4), 279-294.
Nguyen, N. and Cripps, A. (2001). Predicting housing value: A comparison of multiple
regression analysis and artificial neural networks. Journal of Real Estate
Research, 22(3), 313-336.

291
Nicholls, S. and Crompton, J. L. (2005). The impact of greenways on property values:
Evidence from Austin, Texas. Journal of Leisure Research, 37(3), 321-341.
Nigerian Institution of Estate Surveyors and Valuers. (2013). Investment Property
Databank 2013 (1st ed., pp. 71). Lagos, Nigeria: NIESV.
Nigerian Institution of Estate Surveyors and Valuers. (2014). The Nigerian Institution
of Estate Surveyors and Valuers membership directory (8th ed.). Lagos, Nigeria:
WhitefieldHouse.
Nikolopoulos, K., Goodwin, P., Patelis, A. and Assimakopoulos, V. (2007).
Forecasting with cue information: A comparison of multiple regression with
alternative forecasting approaches. European Journal of operational research,
180(1), 354-368.
Nordstrom, D. K. (2012). Models, validation, and applied geochemistry: Issues in
science, communication, and philosophy. Applied Geochemistry, 27(10), 1899-
1919.
Nunnally, J. C. and Bernstein, I. H. (1978). Psychometric theory (3rd Ed.). New York:
McGraw-Hill.
Oates, W. E. (1969). The effects of property taxes and local public spending on
property values: An empirical study of tax capitalization and the Tiebout
hypothesis. The Journal of Political Economy, 77(6), 957-971.
Oduwole, H. and Eze, H. (2013). A hedonic pricing model on factors that influence
residential apartment rent in Abuja satellite towns. Mathematical Theory and
Modeling, 3(12), 65-73.
Ogunba, O. (2004). The demand for accuracy in valuations: The case of Nigeria. Paper
presented at the CIB International Symposium on Globalization and
Construction, Bangkok, Thailand. 17 - 19 November.
Ogunba, O. and Ajayi, C. (1998). An assessment of the accuracy of valuations in the
residential property market of Lagos. The Estate Surveyor and Valuer, 21(2),
19-23.
Ogunba, O. and Ajayi, C. (2007). The response of Nigerian valuers to increasing
sophistication in investors' requirements. Journal of Property Investment and
Finance, 25(1), 43-61.
Ohta, M. and Griliches, Z. (1976). Automobile prices revisited: Extensions of the
hedonic hypothesis. In N. E. Terleckyj (Ed.), Household production and
consumption (pp. 325-398). New York: NBER.
Olaleye, A. (2008). Property market nature and the choice of property portfolio
diversification strategies: The Nigeria experience. International Journal of
Strategic Property Management, 12(1), 35-51.
Olayiwola, L. M., Adeleye, O. A. and Oduwaye, A. O. (2005). Correlates of land value

292
determinants in Lagos metropolis, Nigeria. Journal of Human Ecology, 17(3),
183-189.
Oloke, C. O., Simon, F. R. and Adesulu, A. F. (2013). An examination of the factors
affecting residential property values in Magodo neighborhood, Lagos state.
International Journal of Economy, Management and Social Sciences, 2(8),
639-643.
Olorunfemi, F. B. (2009). Willingness to pay for improved environmental quality
among residents living in close proximity to landfills in Lagos metropolis,
Nigeria. Ethiopian Journal of Environmental Studies and Management, 2(3),
27-33.
Olujimi, J. A. and Bello, M. O. (2009). Effects of infrastructural facilities on the rental
values of residential property. Journal of Social Sciences, 5(4), 332-341.
Oluwunmi, A. O., Adedoyin, A. O. and Ayedun, A. C. (2012). Rental value around
HVOTL facilities in residential neighborhoods of metropolitan Lagos, Nigeria.
European Scientific Journal, 8(11), 75-86.
Oni, A. O. (2010). Harnessing real estate investment through decision process for
selecting tenants in Nigeria. Paper presented at the 10th African Real Estate
Society Conference, Naivasha, Kenya. 26th-29th, October.
Organisation for Economic Co-operation and Development (OECD). (2016). Gross
Domestic Product. from OECD
https://stats.oecd.org/index.aspx?queryid=60702
Otegbulu, A. and Babawale, G. K. (2011). Valuers' perception of potential sources of
inaccuracy in plant and machinery valuation in Nigeria. Property Management,
29(3), 238-261.
Otegbulu, A. and Johnson, O. (2011). The impact of Jacuzzi bathtubs on house prices.
Journal of Sustainable Development, 4(3), 199-209.
Ottensmann, J. R., Payton, S. and Man, J. (2008). Urban location and housing prices
within a hedonic model. Journal of Regional Analysis and Policy, 38(1), 19-
35.
Owusu-Ansah, A. (2012). Examination of the determinants of housing values in urban
Ghana and implications for policy makers. Journal of African Real Estate
Research, 2(1), 58-85.
Owusu, G., Nketiah-Amponsah, E., Codjoe, S. N. A. and Afutu-Kotey, R. L. (2014).
How do Ghana’s landfills affect residential property values? A case study of
two sites in Accra. Urban Geography, 35(8), 1140-1155.
Oyedele, L. O. (2013). Avoiding performance failure payment deductions in PFI/PPP
projects: Model of critical success factors. Journal of Performance of
Constructed Facilities, 27(3), 283-294.

293
Özkan, G., Yalpır, Ş. and Uygunol, O. (2007). An investigation on the price estimation
of residable real-estates by using artificial neural network and regression
methods. Paper presented at the 12th Applied Stochastic Models and Data
Analysis International conference (ASMDA), Crete, Greece. May 29 - June 1.
Pacharavanich, P., Wongpinunwatana, N. and Rossini, P. (2000). The development of
a case-based reasoning system as a tool for residential valuation in Bangkok.
Paper presented at the Pacific-Rim Real Estate Society (PRRES) Conference,
Sydney.
Pagourtzi, E., Assimakopoulos, V., Hatzichristos, T. and French, N. (2003). Real estate
appraisal: A review of valuation methods. Journal of Property Investment &
Finance, 21(4), 383-401.
Pagourtzi, E., Metaxiotis, K., Nikolopoulos, K., Giannelos, K. and Assimakopoulos,
V. (2007). Real estate valuation with artificial intelligence approaches.
International Journal of Intelligent Systems Technologies and Applications,
2(1), 50-57.
Paliwal, M. and Kumar, U. A. (2009). Neural networks and statistical techniques: A
review of applications. Expert Systems with Applications, 36(1), 2-17.
Palmquist, R. B. (1984). Estimating the demand for the characteristics of housing. The
Review of Economics and Statistics, 66(3), 394-404.
Paris, S. D. (2008). Using artificial neural networks to forecast changes in national
and regional price indices for the UK residential property market. (Doctoral
dissertation), University of Glamorgan, Wales, UK.
Parker, D. (1998). Valuation accuracy - An Australian perspective. Paper presented at
the 4th Pacific Rim Real Estate Society Conference, Perth. 19-21 January.
Pasha, H. A. and Butt, M. S. (1996). Demand for housing attributes in developing
countries: A study of Pakistan. Urban Studies, 33(7), 1141-1154.
Pendharkar, P. C. (2006). Scale economies and production function estimation for
object-oriented software component and source code documentation size.
European Journal of Operational Research, 172(3), 1040-1050.
Peterson, S. and Flanagan, A. B. (2009). Neural network hedonic pricing models in
mass real estate appraisal. Journal of Real Estate Research, 31(2), 147-164.
Phua, F. T. (2013). Construction management research at the individual level of
analysis: Current status, gaps and future directions. Construction Management
and Economics, 31(2), 167-179.
Pietroforte, R., Bon, R. and Gregori, T. (2000). Regional development and construction
in Italy: An input-output analysis, 1959-1992. Construction Management and
Economics, 18(2), 151-159.
Poon, J., Hoxley, M. and Fuchs, W. (2011). Real estate education: An investigation of

294
multiple stakeholders. Property Management, 29(5), 468-487.
Pozo, A. G. (2009). A nested housing market structure: Additional evidence. Housing
Studies, 24(3), 373-395.
R CoreTeam. (2016). R: A language and environment for statistical computing.
Retrieved 19th July 2016, from R Foundation for Statistical Computing
https://www.R-project.org/
Ratcliff, R. U. (1972). Valuation for real estate decisions. Santa Cruz, Calif: Democrat
Press.
Razi, M. A. and Athappilly, K. (2005). A comparative predictive analysis of neural
networks (NNs), nonlinear regression and classification and regression tree
(CART) models. Expert Systems with Applications, 29(1), 65-74.
Ready, R. (2010). Do landfills always depress nearby property values? Journal of Real
Estate Research, 32(3), 321-339.
Reinhardt, B. M. (1996). Factors affecting coefficient alpha: A mini Monte Carlo study.
In B. Thompson (Ed.), Advances in social science methodology (Vol. 4, pp. 3-
20). United Kingdom: Emerald Group Publishing.
Ridker, R. G. and Henning, J. A. (1967). The determinants of residential property
values with special reference to air pollution. The Review of Economics and
Statistics, 49(2), 246-257.
Rodriguez, M. and Sirmans, C. (1994). Quantifying the value of a view in single-
family housing markets. Appraisal Journal, 62, 600-600.
Rosen, S. (1974). Hedonic prices and implicit markets: Product differentiation in pure
competition. The Journal of Political Economy, 82(1), 34-55.
Rossini, P. (1997). Artificial neural networks versus multiple regression in the
valuation of residential property. Australian Land Economics Review, 3(1), 1-
12.
Rossini, P. (1999). Accuracy issues for automated and artificial intelligent residential
valuation systems. Paper presented at the International Real Estate Society
Conference, Kuala Lumpur. 26-30 January, 1999.
Royal Institution of Chartered Surveyors (RICS). (1991). Statements of Asset
Valuation Practice and Guidance Notes (Red Book). London: RICS Books.
Royal Institution of Chartered Surveyors (RICS). (2012). RICS Valuation Professional
Standards: Incorporating the International Valuation Standards. United
Kingdom: RICS Books.
Royal Institution of Chartered Surveyors (RICS). (2015). Unleashing sub-Saharan
African property markets. Retrieved 1st May 2015, from Royal Institution of
Chartered Surveyors http://www.rics.org/hk/knowledge/research/research-
reports/unleashing-sub-saharan-african-property-markets/

295
Rumelhart, D. E., Hinton, G. E. and Williams, R. J. (1986). Learning internal
representations by back-propagating errors. In D. E. Rumelhart and J. L.
McCleland (Eds.), Parallel distributed processing: Explorations in the
microstructure of cognition. MA, United States: MIT Press.
Sampathkumar, V., Santhi, M. H. and Vanjinathan, J. (2015). Evaluation of the trend
of land price using regression and neural network models. Asian Journal of
Scientific Research, 8(2), 182-194.
Sanjari, H. (2012). Estimation of the hedonic pricing function for housing units (A case
study of Hashtgerd New Town, Iran). International Business Management,
6(6), 676-679.
Saunders, M., Lewis, P. and Thornhill, A. (2012). Research methods for business
students (6th ed.). Essex, England: Pearson Education Limited.
Scarrett, D. and Osborn, S. (2014). Property valuation: The five methods (3rd ed.).
New York: Routledge.
Schwartz, T. J. (1995). Automating appraisal. Wall Street & Technology, 12(13), 64-
66.
Sekaran, U. and Bougie, R. (2013). Research methods for business: A skill building
approach (6th ed.). Italy: John Wiley & Sons.
Selim, H. (2009). Determinants of house prices in Turkey: Hedonic regression versus
artificial neural network. Expert Systems with Applications, 36(2), 2843-2852.
Selim, S. (2008). Determinants of house prices in Turkey: A hedonic regression model.
Doğuş Üniversitesi Dergisi, 9(1), 65-76.
Seok Lim, J. and Missios, P. (2007). Does size really matter? Landfill scale impacts on
property values. Applied Economics Letters, 14(10), 719-723.
Shapiro, E., Mackmin, D. and Sams, G. (2012). Modern methods of valuation (11th
ed.). London: Estates Gazette.
Sharda, R. and Delen, D. (2006). Predicting box-office success of motion pictures with
neural networks. Expert Systems with Applications, 30(2), 243-254.
Sheppard, S. (1997). Hedonic analysis of housing markets. Handbook of Regional and
Urban Economics (pp. 1595-1635).
Shmueli, G. (2010). To explain or to predict? Statistical Science, 25(3), 289-310.
Silver, M. and Heravi, S. (2001). Scanner data and the measurement of inflation. The
Economic Journal, 111(472), 383-404.
Sims, S., Dent, P. and Ennis-Reynolds, G. (2009). Calculating the cost of overheads:
the real impact of HVOTLs on house price. Property Management, 27(5), 319-
347.
Sincich, T. (1996a). Business statistics by example (5th ed.). New Jersey: Prentice Hall
Englewood Cliffs.

296
Sincich, T. (1996b). Business statistics by example (5th ed.). New Jersey: Prentice Hall
Englewood.
Sirmans, S. G., Macpherson, D. A. and Zietz, E. N. (2005). The composition of
hedonic pricing models. Journal of Real Estate Literature, 13(1), 1-44.
Sirpal, R. (1994). Empirical modeling of the relative impacts of various sizes of
shopping centers on the values of surrounding residential properties. Journal
of Real Estate Research, 9(4), 487-505.
Smith, B. and Zaibert, L. (2001). The metaphysics of real estate. Topoi-An
International Review of Philosophy, 20(2), 161-172.
Sørensen, J. B. (2002). The use and misuse of the coefficient of variation in
organizational demography research. Sociological Methods & Research, 30(4),
475-491.
Subasi, A. and Erçelebi, E. (2005). Classification of EEG signals using neural network
and logistic regression. Computer Methods and Programs in Biomedicine,
78(2), 87-99.
Tabales, J. N. M., Ocerin, C. J. M. and Carmona, F. J. R. (2013). Artificial neural
networks for predicting real estate prices. Revista de Metodos Cuantitativos
para la Economia y la Empresa, 15, 29-44.
Taffese, W. Z. (2006). A survey on application of artificial intelligence in real estate
industry. Paper presented at the 3rd International Conference on Artificial
Intelligence in Engineering and Technology, Kota Kinabalu, Malaysia.
Taffese, W. Z. (2007). Case-based reasoning and neural networks for real estate
valuation. Paper presented at the 25th IASTED International Multi-Conference,
Artificial Intelligence and Applications, Innsbruck, Austria. 12 - 14 February.
Tam, K. Y. and Kiang, M. Y. (1992). Managerial applications of neural networks: The
case of bank failure predictions. Management Science, 38(7), 926-947.
Tao, C. (2010). On the use of analytic network process for modeling housing prices: A
Chongqing perspective. (Doctoral dissertation), City University of Hong Kong,
Hong Kong.
Tavakol, M. and Dennick, R. (2011). Making sense of Cronbach's alpha. International
Journal of Medical Education, 2(1), 53-55.
Tay, D. P. and Ho, D. K. (1992). Artificial intelligence and the mass appraisal of
residential apartments. Journal of Property Valuation and Investment, 10(2),
525-540.
Thanasi, M. (2016). Hedonic appraisal of apartments in Tirana. International Journal
of Housing Markets and Analysis, 9(2), 239-255.
The World Bank. (2014). Project performance assessment report federal republic of
Nigeria state education sector project (pp. 69). Washington DC: The World

297
Bank IEG Public Sector Evaluation.
The World Bank. (2017). Gross domestic product 2015. Retrieved 28th February
2017, from World Bank
http://databank.worldbank.org/data/download/GDP.pdf
Thieme, R. J., Song, M. and Calantone, R. J. (2000). Artificial neural network decision
support systems for new product development project selection. Journal of
Marketing Research, 37(4), 499-507.
Tomkins, J., Topham, N., Twomey, J. and Ward, R. (1998). Noise versus access: The
impact of an airport in an urban property market. Urban Studies, 35(2), 243-
258.
Tretton, D. (2007). Where is the world of property valuation for taxation purposes
going? Journal of Property Investment & Finance, 25(5), 482-514.
Triplett, J. (2004). Handbook on hedonic indexes and quality adjustments in price
indexes: Special application to information technology products (pp. 255).
Paris: OECD Science, Technology and Industry Working Papers, 2004/09.
Triplett, J. E. (1969). Automobiles and hedonic quality measurement. Journal of
Political Economy, 77(3), 408-417.
Tse, R. Y. (1997). An application of the ARIMA model to real-estate prices in Hong
Kong. Journal of Property Finance, 8(2), 152-163.
Tse, R. Y. (2002). Estimating neighbourhood effects in house prices: Towards a new
hedonic model approach. Urban Studies, 39(7), 1165-1180.
Tse, R. Y. and Love, P. E. (2000). Measuring residential property values in Hong Kong.
Property Management, 18(5), 366-374.
Udechukwu, C. E. (2008). Obstacles to individual home ownership in Nigeria.
International Journal of Housing Markets and Analysis, 1(2), 182-194.
Uysal, M. and El Roubi, M. S. (1999). Artificial neural networks versus multiple
regression in tourism demand analysis. Journal of Travel Research, 38(2), 111-
118.
Van de Ven, A. H. and Johnson, P. E. (2006). Knowledge for theory and practice.
Academy of Management Review, 31(4), 802-821.
Verma, J. P. (2013). Data analysis in management with SPSS software. India: Springer
Science & Business Media.
Voicu, I. and Been, V. (2008). The effect of community gardens on neighboring
property values. Real Estate Economics, 36(2), 241-283.
Vos, G. and Have, G. T. (1996). Valuation practice in Europe: The Netherlands. In A.
Adair, M. L. Downie, S. McGreal and G. Vos (Eds.), European valuation
practice: Theory and technique (1st ed., pp. 165-186). London: E & FN SPON.
Waldy, B. (1997). Valuation accuracy. Paper presented at the 64th FIG Permanent

298
Committee Meeting and International Symposium, Singapore. 11-16, May.
Wallace, H. A. (1926). Comparative farm-land values in Iowa. The Journal of Land &
Public Utility Economics, 2(4), 385-392.
Walters, L., Sietchiping, R. and Haile, S. (2011). Land and property tax: A policy guide.
Nairobi: United Nations Human Settlements Programme.
Ward. (1996). Neuroshell 2 Manual. United States: Ward Systems Group Inc.
Waziri, B. S. (2010). An artificial neural network model for predicting construction
costs of institutional building projects in Nigeria. Paper presented at the West
Africa Built Environment Research (WABER) Conference, Accra, Ghana. 27-
28, July.
Waziri, B. S. (2013). Awareness of artificial intelligence (AI) methods for cost
estimating in the Nigerian construction industry. Paper presented at the West
Africa Built Environment Research Conference, Accra, Ghana. 12-14 August.
Webb, R. B. (1994). On the reliability of commercial appraisals: An analysis of
properties sold from the Russell-NCREIF Index (1978–1992). Real Estate
Finance, 11(1), 62-65.
Webster Online Dictionary. (2015). Value. Retrieved July 2, 2015
http://www.webster-dictionary.org/definition/value
Wen, H.-Z., Jia, S.-H. and Guo, X.-Y. (2005). Hedonic price analysis of urban housing:
An empirical research on Hangzhou, China. Journal of Zhejiang University
Science, 6A(8), 907-914.
Wen, Y. (2014). Modeling rebar labor productivity in hot weather. (Doctoral
dissertation), The Hong Kong Polytechnic University.
Wesolowski, M. and Suchacz, B. (2012). Artificial neural networks: Theoretical
background and pharmaceutical applications: A review. Journal of AOAC
International, 95(3), 652-668.
Wilhelmsson, M. (2000). The impact of traffic noise on the values of single-family
houses. Journal of Environmental Planning and Management, 43(6), 799-815.
Wilkinson, R. and Archer, C. A. (1973). Measuring the determinants of relative house
prices. Environment and Planning, 5(3), 357-367.
Willmott, C. J. (1981). On the validation of models. Physical Geography, 2(2), 184-
194.
Wilson, I. D., Paris, S. D., Ware, J. A. and Jenkins, D. H. (2002). Residential property
price time series forecasting with neural networks. Knowledge-Based Systems,
15(5), 335-341.
Wiltshaw, D. G. (1995). Comments on methodology and valuation. Journal of
Property Research, 12(2), 157-161.
Witten, I. H. and Frank, E. (2005). Data Mining: Practical machine learning tools and

299
techniques (Second ed.). San Francisco: Morgan Kaufmann.
Wolverton, M. L. (1997). Empirical study of the relationship between residential lot
price, size and view. Journal of Property Valuation and Investment, 15(1), 48-
57.
Wolverton, M. L. and Bottemiller, S. C. (2003). Further analysis of transmission line
impact on residential property values. The Appraisal Journal, 71(3), 244-252.
Wong, K., So, A. T. and Hung, Y. (2002). Neural network vs. hedonic price model:
Appraisal of high-density condominiums. In K. Wang and M. L. Wolverton
(Eds.), Real Estate Valuation Theory (pp. 181-198). New York: Springer.
Worzala, E., Lenk, M. and Silva, A. (1995). An exploration of neural networks and its
application to real estate valuation. Journal of Real Estate Research, 10(2),
185-201.
Worzala, E., Tu, C., Benedict, R. and Matthews, A. (2013). A graduate real estate
program survey: Careers and compensation. Journal of Real Estate Practice
and Education, 16(1), 29-40.
Wyatt, P. (1996). Using a geographical information system for property valuation.
Journal of Property Valuation and Investment, 14(1), 67-79.
Wyatt, P. J. (1997). The development of a GIS-based property information system for
real estate valuation. International Journal of Geographical Information
Science, 11(5), 435-450.
Xie, X. and Hu, G. (2007). A comparison of Shanghai housing price index forecasting.
Paper presented at the 3rd International Conference on Natural Computation,
Haikou, China. 24-27 August.
Xuefeng, L., Lu, L., Lihua, W. and Zhao, Z. (2006). Predicting the final prices of online
auction items. Expert Systems with Applications, 31(3), 542-550.
Yacim, J. A. and Boshoff, D. G. (2014). Mass appraisal of properties. Paper presented
at the 2nd Virtual Multidisciplinary Conference, Zilina, Slovakia. 15-19
December.
Yalpir, S. (2014). Forecasting residential real estate values with AHP method and
integrated GIS. Paper presented at the People, Buildings and Environment
Conference, an International Scientific Conference, Kroměříž, Czech Republic.
15-17 October.
Yalpir, S. and Özkan, G. (2011). Fuzzy logic methodology and multiple regressions
for residential real-estates valuation in urban areas. Scientific Research and
Essays, 6(12), 2431-2436.
Yesilnacar, E. and Topal, T. (2005). Landslide susceptibility mapping: A comparison
of logistic regression and neural networks methods in a medium scale study,
Hendek region (Turkey). Engineering Geology, 79(3), 251-266.

300
Yuan, R. and Guangchen, B. (2011). New neural network response surface methods
for reliability analysis. Chinese Journal of Aeronautics, 24(1), 25-31.
Zadeh, L. A. (1965). Fuzzy sets. Information and Control, 8(3), 338-353.
Zhang, G., Patuwo, B. E. and Hu, M. Y. (1998). Forecasting with artificial neural
networks: The state of the art. International Journal of Forecasting, 14(1), 35-
62.
Zhang, G. P. and Berardi, V. L. (1998). An investigation of neural networks in thyroid
function diagnosis. Health Care Management Science, 1(1), 29-37.
Zheng, X., Chau, K. W. and Hui, E. C.-M. (2012). The impact of property price on
construction output. Construction Management and Economics, 30(12), 1025-
1037.
Zietz, J., Zietz, E. N. and Sirmans, G. S. (2008). Determinants of house prices: A
quantile regression approach. The Journal of Real Estate Finance and
Economics, 37(4), 317-333.
Zurada, J., Levitan, A. and Guan, J. (2011). A comparison of regression and artificial
intelligence methods in a mass appraisal context. Journal of Real Estate
Research, 33(3), 349-387.
Zurada, J. M., Levitan, A. S. and Guan, J. (2006). Non-conventional approaches to
property value assessment. Journal of Applied Business Research, 22(3), 1-14.