b27629028.pdf - PolyU Electronic Theses
192
Copyright Undertaking This thesis is protected by copyright, with all rights reserved. By reading and using the thesis, the reader understands and agrees to the following terms: 1. The reader will abide by the rules and legal ordinances governing copyright regarding the use of the thesis. 2. The reader will use the thesis for the purpose of research or private study only and not for distribution or further reproduction or any other purpose. 3. The reader agrees to indemnify and hold the University harmless from and against any loss, damage, cost, liability or expenses arising from copyright infringement or unauthorized usage. IMPORTANT If you have reasons to believe that any materials in this thesis are deemed not suitable to be distributed in this form, or a copyright owner having difficulty with the material being included in our database, please contact [email protected] providing details. The Library will look into your claim and consider taking remedial action upon receipt of the written requests. Pao Yue-kong Library, The Hong Kong Polytechnic University, Hung Hom, Kowloon, Hong Kong http://www.lib.polyu.edu.hk
-
Upload
khangminh22 -
Category
Documents
-
view
1 -
download
0
Transcript of b27629028.pdf - PolyU Electronic Theses

Copyright Undertaking
This thesis is protected by copyright, with all rights reserved.
By reading and using the thesis, the reader understands and agrees to the following terms:
1. The reader will abide by the rules and legal ordinances governing copyright regarding the use of the thesis.
2. The reader will use the thesis for the purpose of research or private study only and not for distribution or further reproduction or any other purpose.
3. The reader agrees to indemnify and hold the University harmless from and against any loss, damage, cost, liability or expenses arising from copyright infringement or unauthorized usage.
IMPORTANT
If you have reasons to believe that any materials in this thesis are deemed not suitable to be distributed in this form, or a copyright owner having difficulty with the material being included in our database, please contact [email protected] providing details. The Library will look into your claim and consider taking remedial action upon receipt of the written requests.
Pao Yue-kong Library, The Hong Kong Polytechnic University, Hung Hom, Kowloon, Hong Kong
http://www.lib.polyu.edu.hk
I
The Hong Kong Polytechnic University
School of Optometry
Early Functional Changes in Human
Diabetic Retina
–
A Multifocal Electroretinogram Study
Jenny Chun-Yee Lung
A thesis submitted in partial fulfillment of the
requirements for the Degree of Doctor of
Philosophy
September 2013
lbsys
Text Box
This thesis in electronic version is provided to the Library by the author. In the case where its contents is different from the printed version, the printed version shall prevail.


III
Abstract
Diabetes mellitus (DM) is a set of metabolic disorders leading to chronic
hyperglycemia. It has become one of the most concerning health problems
around the world. DM can damage the ocular capillary circulation which
develops into diabetic retinopathy (DR).
DR is the most common cause of new incidence of blindness among the working
population due to its sight-threatening complications. The current clinical
screening tests involve the fundus camera and ophthalmoscopy. These two tests
form an effective and accurate means of detecting DR; however, DR can only be
confirmed when obvious retinal vascular defects or damage exist. Studying early
retinal changes before there are visible signs of retinopathy can help to prevent
the visual functional loss resulting from DR. This helps in relieving the heavy
economic burden to society produced by DR.
Multifocal electroretinogram (mfERG) is a functional test which can reflect
subtle retinal changes before any visible retinopathy. By modifying the mfERG
paradigm, retinal activity from different origins can be measured. The modified
mfERG is likely to be a more suitable technique to investigate the underlying
mechanism of DR at an early stage. In this study, modified mfERG paradigms
(Global flash multifocal electroretinogram [MOFO mfERG] and
“Long-duration” multifocal electroretinogram) were applied in human eyes with
type II DM to study any early retinal changes. Comparisons were made with two
other common clinical morphological and functional assessments (Humphrey
perimetry and Stratus circumpapillary retinal nerve fiber layer (RNFL) thickness
measurement) so as to study their correlations and their diagnostic sensitivity.

IV
Objectives
1) To ascertain the characteristics of the response triggered by the global flash
multifocal electroretinogram (MOFO mfERG) under various combinations of
global and focal flash luminance, and to determine the optimal conditions for
this measurement in healthy subjects
2) To investigate early functional changes of local retinal defects in type II
diabetic patients using the global flash multifocal electroretinogram (MOFO
mfERG)
3) To investigate the correlations of the global flash multifocal
electroretinogram (MOFO mfERG) with two common clinical visual
assessments – Humphrey perimetry and Stratus circumpapillary retinal nerve
fiber layer (RNFL) thickness measurement in type II diabetic patients
4) To investigate the characteristics of the multifocal on- and off-responses in
the human diabetic retina by a “long-duration” multifocal electroretinogram
paradigm. This was to evaluate any changes in the antagonistic interaction in
the middle and inner retina in the early stage of Type II DM
Methods
Experiment 1: The global flash electroretinogram (MOFO mfERG) measurement
was applied in this experiment with a visual stimulation consisting of a
103-hexagon pattern. The stimulation was displayed with four video frames
(multifocal flashes, followed by a dark frame, a global flash and then another
dark frame). The focal and global flash intensities were varied independently at

V
four levels (50, 100, 200 and 400 cd/m2). Ten healthy young adult subjects were
recruited and underwent MOFO mfERG measurements with sixteen
combinations of focal and global flash luminance. The mfERG responses were
grouped into central and peripheral regions for analysis.
Experiment 2: The MOFO mfERG measurement was carried at high (98%) and
low (46%) contrast conditions. A 103-hexagon pattern was used as the stimulus.
The focal and global luminance at the high contrast condition was kept at the
optimal ratio found in Experiment 1. Thirty-eight type II diabetic patients and
fourteen age-matched controls were recruited. Nine of the diabetics were free
from retinopathy, while the remainder had mild to moderate non-proliferative
diabetic retinopathy (NPDR). The mfERG responses were grouped into 35
regions for comparison according to the DR classification at those locations. The
diagnostic values of the MOFO mfERG parameters on DR were also evaluated
by constructing the receiver-operating-characteristic (ROC) curve.
Experiment 3: Three visual assessments were carried out: the MOFO mfERG
measurement with 103-hexagon stimulus pattern at high (98%) and low (46%)
contrast conditions, Humphrey perimetry and Stratus circumpapillary retinal
nerve fiber layer (RNFL) thickness. Forty-two type II diabetic patients and
fourteen age-matched controls were recruited for comparison. Ten of the
diabetics were free from diabetic retinopathy, while the remainder had mild to
moderate NPDR. Correlations between local values of mfERG responses,
perimetric sensitivity and RNFL thickness were evaluated by mapping the
localized responses for the three subject groups. This helped in evaluating the
early functional and morphological changes at the early stage of DR.

VI
Experiment 4: A “long-duration” mfERG paradigm was used to evaluate the
multifocal on- and off-responses in the human diabetic retina. In this paradigm,
the stimulus pattern contained eight successive multifocal flashes, and followed
by eight successive dark frames. The mfERG stimulus was a 61-hexagon pattern
with measurement carried out under two chromatic conditions --- white and blue
conditions. Twenty type II diabetic patients with no or mild NPDR and
twenty-one age-matched healthy controls were recruited. The mfERG responses
were grouped into rings for analysis. Changes of the mfERG responses under the
two chromatic conditions were used to investigate any changes in antagonistic
interaction within the retina at the early stage of DR.
Results
Experiment 1: The MOFO mfERG paradigm gave rise to two main components
in the resultant waveform: the direct component (DC) and induced component
(IC). The DC amplitude increased with the focal flash intensity with global flash
held constant. The global flash and focal flash luminance (g/f ratio) was an
important parameter in determining the optimal DC and IC responses; the IC
amplitude reached the peak value when the g/f ratio was at about 2:1. Further
increasing the global flash luminance did not enhance the IC amplitude. Keeping
this ratio at 1:1 with the focal flash luminance set between 100 cd/m2 and 200
cd/m2 was recommended for subsequent experiments.
Experiment 2: The MOFO mfERG paradigm helped in investigating the middle
and inner retinal responses in terms of DC and IC respectively. Local reduction
of the DC and IC amplitudes were found in diabetic patients with and without
DR. With increasing severity of retinopathy, a further reduction of the mfERG
VII
amplitudes was found. The reductions in the DC and IC responses provided
crucial evidence that the middle and inner retina are impaired at an early stage in
diabetic patients. Under the MOFO mfERG paradigm, the amplitude of the high
contrast DC was useful in screening for localized functional deterioration, even
before the appearance of visible DR signs.
Experiment 3: The MOFO mfERG was superior to the automated Humphrey
perimetry and the Stratus circumpapillary RNFL thickness measurement in type
II diabetic patients, in showing differences between the diabetic group and the
controls. The MOFO mfERG parameters demonstrated a better correlation with
the functional perimetric assessment than the RNFL thickness measurement. All
the MOFO mfERG amplitudes (except IC amplitude at high contrast) correlated
significantly with the perimetric sensitivity (Pearson’s r ranged from 0.23 to 0.36,
p<0.01) than did the mfERG implicit time at both high and low contrast
conditions across all subject groups. No consistent correlation was found
between the mfERG parameters and the RNFL thickness for any subject group.
Experiment 4: The “long-duration” mfERG paradigm helped in minimizing the
overlap between the on- and off-pathway activities of the retinal responses. The
resultant mfERG waveform includes two main parts. The first part is
predominantly from the on-pathway activity containing a negative trough (N1), a
positive peak (P1) and then a trough (N2). Beyond N2, there is a plateau
followed by a second peak (P2). The diabetic group showed significantly greater
N2 amplitude than the controls under white stimulation in retinal regions Rings 2
and 4 (p<0.05). The blue stimulation generally triggered greater mfERG
amplitudes in P1, N2 and P2 (p<0.05) than did the white stimulation for both

VIII
diabetic and control groups. When the stimulus changed from white to blue, the
diabetic group showed a smaller percentage change than the controls in the
peripheral retinal region (Ring 5) (p<0.02).
Conclusion
The MOFO mfERG indicated that the middle and inner retinal function has
deteriorated before the existence of clinically visible DR lesions. Such functional
impairment would be expected to continue with the existence of observable
vascular lesions. The MOFO mfERG measurement correlated better with the
functional perimetric sensitivity than the morphological RNFL changes. However,
the deterioration of local luminance sensitivity (as measured using perimetry)
could not fully explain the functional loss found by mfERG. The “long-duration”
mfERG paradigm, under two different chromatic stimulation conditions,
demonstrated an imbalance of lateral antagonism which is proposed to be at or
near the middle retinal layer.

IX
Publications arising from the thesis
Lung JC, Chan HH. (2010). Effects of luminance combinations on the
characteristics of the global flash multifocal electroretinogram (mfERG). Graefes
Archive for Clinical and Experimental Ophthalmology, 248:1117-25.
Lung JC, Swann PG, Chan HH. (2012). Early local functional changes in the
human diabetic retina: a global flash multifocal electroretinogram study. Graefes
Archive for Clinical and Experimental Ophthalmology, 250: 1745-54.
Lung JC, Swann PG, Wong DS, Chan HH. (2012). Global flash multifocal
electroretinogram: early detection of local functional changes and its correlations
with optical coherence tomography and visual field tests in diabetic eyes.
Documenta Ophthalmologica, 125: 123-35.
Lung JC, Swann PG, Wong DS, Chan HH. The multifocal on- and off-responses
in the human diabetic retina. (Manuscript prepared for submission).
Conference presentations
Oral presentations
Lung JC, Tang GY, Chu PH, Ng YF, Chan HH. (July 6-10, 2009). Global flash
mfERG in the early detection of the local functional changes of diabetic
retinopathy lesions. 47th International Society for Clinical Electrophysiology of
Vision (ISCEV) Symposium, Padova, Abano Terme, Italy
(Published in Doc Ophthalmol 2009: 119; 17-92)

X
Lung JC, Swann PG, Chan HH. (Sept 18-23, 2011). The on- and off-responses in
human diabetic eye – a multifocal electroretinogram study. 49th International
Society for Clinical Electrophysiology of Vision (ISCEV) Symposium,
Lac-Beauport, Quebec, Canada.
(Published in Doc Ophthalmol 2011: 123; 3-50)
Poster presentations
Lung JC, Chu PH, Ng YF, Chan HH. (July 10-15, 2008). Characteristics of
global flash multifocal electroretinogram (mfERG) under different combinations
of global and focal flash luminance. 46th International Society for Clinical
Electrophysiology of Vision (ISCEV) Symposium, Morgantown, WV, USA.
(Published in Doc Ophthalmol 2008: 117; 3-10)
Lung JC, Swann PG, Chan HH. (May 2-6, 2010). Global flash multifocal
electroretinogram (MOFO mfERG): Early detection of local functional changes
and its correlations with optical coherence tomography and visual field test in
diabetic patients. The Association for Research in Vision and Ophthalmology
(ARVO) Annual meeting 2010, Fort Lauderdale, FL, USA.
Lung JC, Lam AK, Chan HH. (March 5-6, 2011). The early inner retinal changes
(GCC) in type II diabetic patients with and without non-proliferative diabetic
retinopathy (NPDR). 6th International Symposium on Healthy Aging “A New
Golden Age” by The University of Hong Kong Li Ka Shing Faculty of Medicine
Research Centre of Heart, Brain, Hormone and Healthy Aging, Sheraton Hong
Kong Hotel and Towers, Tsim Sha Tsui, Hong Kong.
XI
Lung JC, Chan HH. (July 15-18, 2011). The antagonistic interaction of cones in
the human eye - a pilot study. Asia-Pacific Conference on Vision (APCV), The
University of Hong Kong, Hong Kong.
(Published in i-Perception 2011: 2: 302)
Lung JC, Wong DS, Chan HH. (Sept 18-23, 2011). The age-related changes of
the on- and off-responses in human eye - a multifocal electroretinogram study.
49th International Society for Clinical Electrophysiology of Vision (ISCEV)
Symposium, Lac-Beauport, Quebec, Canada.
(Published in Doc Ophthalmol 2011: 123; 3-50)

XII
Acknowledgements
Throughout the PhD study in The Hong Kong Polytechnic University, I would
like to express my gratitude to the School of Optometry for providing supports to
carry out the research experiments. I would like to express my sincere thanks to
Dr. Henry Chan, my chief supervisor, who provided patient guidance and useful
suggestions during the study period. With his generous support, I was able to
attend several international overseas conferences which broadened my horizons
of research and provided me the opportunities to receive opinions from various
researchers.
Moreover, I am in great debt to Prof. Brian Brown, who spent long hours for
reviewing my manuscripts and thesis writing. I was deeply impressed by his
outstanding insight and analytical skills. Prof. Brown always provided useful
ideas and valued advice for my research experiments. It was a great and
memorable time for the in-person discussion with him in the year of 2011.
I would also like to express my great thanks to the co-authors of my manuscript
especially to Prof. Peter Swann, for helping me in proofreading my manuscripts
and grading of the numerous clinical fundus photos of my experimental subjects.
In terms of my statistical knowledge, I am grateful to receive teaching from
lecturers of different departments. In memory and special thanks to Dr. Ka-fai
Choi from ITC, who passed away in 2011. He always shared his knowledge and
experience with students generously and unconditionally.
My thanks also go to the research colleagues from different fields, those I met in

XIII
NEOC, the ISCEV and ARVO international meetings, with their peer-support
and sharing, my study life has been fruitful and memorable.
Last but not least, I would be grateful to the endless love from my family over
the years. With their continuous caring and support, I can maintain a healthy
condition, devote myself to the study and finish it finally.

XIV
Table of Contents
Contents Pages
Declaration of originality II
Abstract III
Publications from the thesis IX
Acknowledgements XII
Table of contents XIV
Lists of figures, tables and abbreviations XXIII
Part I Literature review 1
Chapter 1 Diabetes mellitus (DM) and diabetic retinopathy (DR) 2
1.1 Background information of diabetes mellitus 2
1.1.1 Metabolism and endocrine problems 2
1.1.2 Clinical diagnostic tests 3
1.1.3 Definition of DM 3
1.2 Classification of DM 4
1.2.1 Type I DM 4
1.2.2 Type II DM 5
1.2.3 Others types of DM 5
1.2.4 Gestational diabetes 5
1.3 Pathogenesis of diabetic vascular abnormalities 6
1.4 Vascular abnormalities in retina – Diabetic retinopathy (DR) 7
1.5 Prevalence of DM and DR 8
1.5.1 DM population worldwide 8
1.5.2 DM population in Hong Kong and its expected statistics 8
1.5.3 DR population worldwide and in HK 9

XV
Chapter 2 Current management and care for DM patients 11
2.1 Current clinical assessments for DR screening 11
2.2 Clinical grading system of DR 13
2.3 Current clinical management of DR patients 14
2.4 Quality of life and socio-economic burden of DR patients 15
Chapter 3 Pathogenesis of DR 16
3.1 Vascular pathway 16
3.2 Neuronal pathway 17
Chapter 4 The influence of DM on the visual system 20
4.1 Morphological aspects 20
4.1.1 Cornea 20
4.1.2 Crystalline lens 20
4.1.3 Retinal nerve fiber layer (RNFL) thickness 21
4.1.4 Macular thickness 22
4.1.5 Retinal pigment epithelium (RPE) 23
4.2 Functional aspects 23
4.2.1 Visual acuity (VA) 23
4.2.2 Contrast sensitivity (CS) 24
4.2.3 Colour vision 24
4.2.4 Automated perimetry 24
4.2.5 Dark adaptation 26
4.3 Electrophysiological objective ocular assessments 26
4.3.1 Electro-oculogram (EOG) 26
4.3.2 Full-field electroretinogram (ERG) 27
4.3.3 Pattern electroretinogram (PERG) 29

XVI
Chapter 5 Multifocal electroretinogram (mfERG) 30
5.1 Background information of mfERG 30
5.2 mfERG assessment results on DM patients 31
5.2.1 Standard mfERG paradigm 31
5.2.2 Modified mfERG paradigms 31
5.2.2.1 Second order mfERG study 32
5.2.2.2 Slow flash mfERG (sfmfERG) study 32
5.2.2.3 Periodic global flash mfERG (MOFO mfERG)
study
33
5.2.2.4 “Long-duration” stimulus mfERG 35
5.2.3 Summary and aims of this study 36
Part II Experiments 37
Chapter 6 Middle and inner retinal responses measured by MOFO
mfERG
38
6.1 Experiment A1 – Effects of luminance combinations on the
characteristics of MOFO mfERG
38
6.1.1 Abstract 38
6.1.2 Introduction 40
6.1.3 Methods 42
6.1.3.1 Subjects and inclusion criteria 42
6.1.3.2 Experimental set-up and procedures 42
6.1.3.2.1 Stimulus conditions 42
6.1.3.2.2 Recording conditions 43
6.1.3.3 Statistical analysis and g/f ratio calculation 44
6.1.4 Results 45

XVII
6.1.4.1 Direct components (DC) 45
6.1.4.1.1 DC amplitude 45
6.1.4.1.2 DC implicit time 48
6.1.4.2 Induced components (IC) 50
6.1.4.2.1 IC amplitude 50
6.1.4.2.2 IC implicit time 52
6.1.5 Discussion 54
6.1.5.1 Changes of MOFO mfERG responses with g/f
ratio
54
6.1.5.2 Optimal conditions of MOFO mfERG 56
6.2 Experiment A2 – Early local functional changes in human
diabetic retina: a MOFO mfERG study
58
6.2.1 Abstract 58
6.2.2 Introduction 59
6.2.3 Methods 61
6.2.3.1 Subject recruitment and inclusion criteria 61
6.2.3.2 Experimental set-up and procedures 61
6.2.3.2.1 Stimulus conditions 61
6.2.3.2.2 Recording conditions 62
6.2.3.3 Data analysis 63
6.2.3.3.1 Analysis of the MOFO mfERG
responses
63
6.2.3.3.2 Relating the plasma glucose level, DM
duration and averaged mfERG
responses in the control and diabetic
65

XVIII
subjects
6.2.3.3.3 Mapping between fundus photographs
and MOFO mfERG topography
65
6.2.3.3.4 Grouping of data 68
6.2.3.3.5 Statistical analysis 69
6.2.3.3.6 Evaluation of the diagnostic values of
the MOFO mfERG parameters
69
6.2.4 Results 69
6.2.4.1 Correlation of the plasma glucose level and DM
duration with the averaged MOFO mfERG
parameters
69
6.2.4.2 Local MOFO mfERG responses in different types
of retinopathy defects
71
6.2.4.2.1 Amplitude of DC (DCA_z) between
groups
72
6.2.4.2.2 Amplitude of IC (ICA_z) between
groups
73
6.2.4.2.3 Implicit time of DC (DCIT_z) between
groups
74
6.2.4.2.4 Implicit time of IC (ICIT_z) between
groups
75
6.2.4.2.5 Diagnostic value of the MOFO
mfERG parameters
76
6.2.5 Discussion 78
6.2.5.1 MOFO mfERG amplitude 79

XIX
6.2.5.2 MOFO mfERG implicit time 80
6.2.5.3 Difference between current and previous studies 81
Chapter 7 The correlations of the MOFO mfERG with traditional
functional and morphological clinical assessments
84
7.1 Experiment B- MOFO mfERG: Early detection of local
functional changes and its correlations with optical
coherence tomography (OCT) and visual field (VF) tests in
diabetic patients
84
7.1.1 Abstract 84
7.1.2 Introduction 86
7.1.3 Methods 87
7.1.3.1 Subject inclusion and recruitment 87
7.1.3.2 Experimental set-up and procedures 88
7.1.3.2.1 mfERG stimulation and recording 88
7.1.3.2.2 Optical coherence tomography (OCT) 89
7.1.3.2.3 Visual field (VF) 90
7.1.3.2.4 Fundus photodocumentation 90
7.1.3.3 Data analysis 90
7.1.3.3.1 MOFO mfERG parameters 90
7.1.3.3.2 Visual field (VF) sensitivity 91
7.1.3.3.3 RNFL thickness 92
7.1.3.3.4 Duration of DM, plasma glucose level
and averaged findings of the three
ocular assessments (mfERG, RNFL
thickness and VF sensitivity)
93

XX
7.1.3.4 Correlations of the local retinal responses among
three ocular assessments by mapping
93
7.1.3.4.1 Overlay of fundus photographs with
MOFO mfERG topography
93
7.1.3.4.2 Overlay of VF and MOFO mfERG
topography
94
7.1.3.4.3 Overlay of OCT RNFL and MOFO
mfERG topography
96
7.1.4 Results 97
7.1.4.1 Correlation between local mfERG responses with
the local sensitivity deviation (TD) of VF
97
7.1.4.1.1 MOFO mfERG amplitude z-scores 99
7.1.4.1.2 MOFO mfERG implicit time z-scores 102
7.1.4.2 Correlation between the local MOFO mfERG
responses with the sectoral RNFL thickness
z-scores
102
7.1.4.3 Regional data of groups I, II and III from each
measurement (MOFO mfERG, VF and RNFL)
after mapping based on mfERG topography
103
7.1.4.4 Relationship of the plasma glucose levels with the
averaged mfERG responses, VF sensitivity
deviation and RNFL thickness
104
7.1.5 Discussion 106
7.1.5.1 Correlation between MOFO mfERG and VF
assessments
106

XXI
7.1.5.2 Correlation between MOFO mfERG and RNFL
assessments
108
7.1.5.3 Limitations of this experiment 109
Chapter 8 The on- and off-responses in diabetic patients by the
application of the long-duration stimulus mfERG with white
(Broad-spectrum) and blue (Narrow-spectrum) stimuli
110
8.1 Experiment C – Characteristics of the on- and off-responses
in diabetic retina with white and blue stimuli- a mfERG
study
110
8.1.1 Abstract 110
8.1.2 Introduction 112
8.1.3 Methods 114
8.1.3.1 Subject recruitment and inclusion criteria 114
8.1.3.2 Experimental set-up and procedures 115
8.1.3.2.1 mfERG recording 115
8.1.3.3 Data analysis 118
8.1.3.3.1 Grouping of mfERG responses 118
8.1.3.3.2 Calculation of percentage changes of
mfERG responses under achromatic
and chromatic conditions
119
8.1.3.3.3 Statistical analysis 120
8.1.4 Results 121
8.1.4.1 Effect of retinal eccentricity 121
8.1.4.2 Effect of chromatic (white and blue) mfERG
stimulation
123

XXII
8.1.4.3 Comparison between the control and diabetic
groups
125
8.1.5 Discussion 128
8.1.5.1 Spectral difference between the white and blue
stimuli
129
8.1.5.2 The waveform and its representative components
under long-duration stimulus mfERG
129
8.1.5.3 mfERG response in diabetic retina 130
8.1.5.4 Role of lateral antagonism 130
8.1.5.5 Proposed explanations of the long-duration
stimulus mfERG changes in DM patients
131
Chapter 9 Summary of experimental results, conclusions and
suggestions for future research
133
9.1 Summary of experimental results 133
9.2 Limitations of this study 139
9.3 Suggestions for future research 141
References 143

XXIII
Lists of figures, tables and abbreviations
List of figures
Figure 5.1 Basic resultant waveform of the standard mfERG paradigm (Adopted
from Hood et al. 2012)
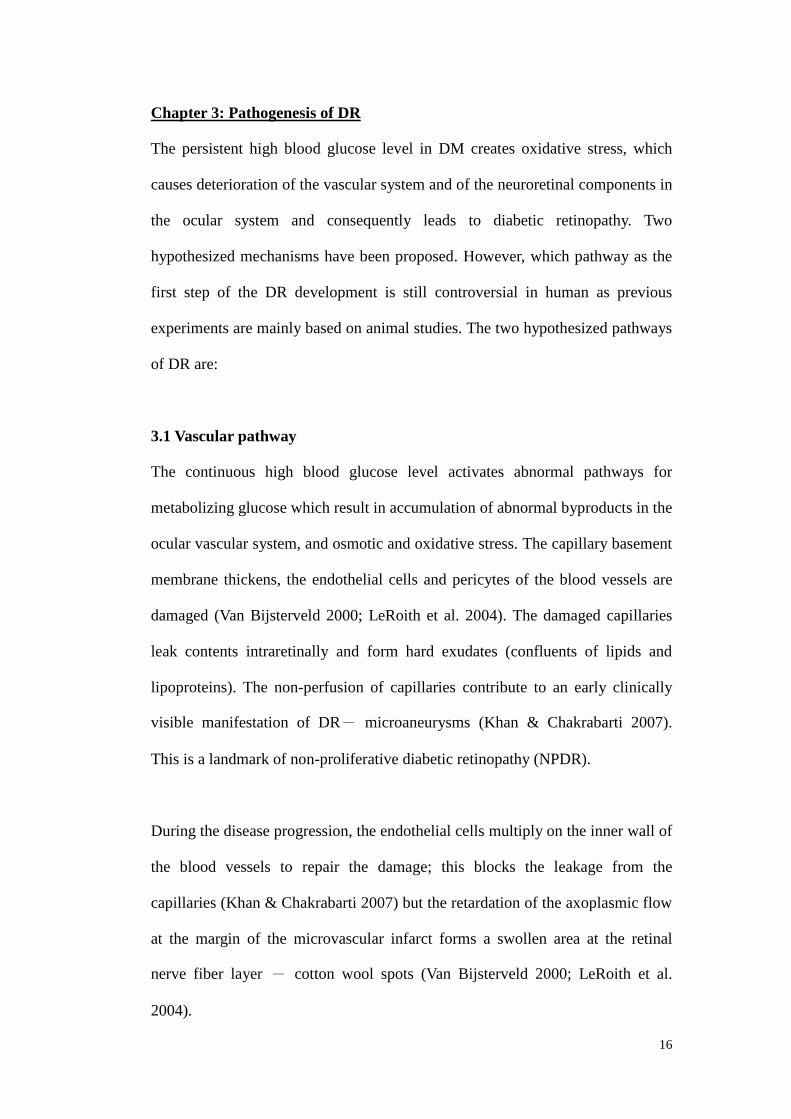
Figure 5.2a Basic resultant waveform of the slow flash mfERG paradigm
Figure 5.2b Basic resultant waveform of the global flash mfERG paradigm
Figure 5.2c Basic resultant waveform of the “long-duration” mfERG paradigm
Figure 6.1a Central MOFO mfERG waveform
Figure 6.1b Peripheral MOFO mfERG waveform
Figure 6.2a The central DC amplitude at various g/f ratios. Each coloured line
represents the DC amplitude under different focal flash intensities. The error bar
shows ± 1 standard deviation
Figure 6.2b The peripheral DC amplitude at various g/f ratios. Each coloured
line represents the DC amplitude under different focal flash intensities. The error
bar shows ± 1 standard deviation
Figure 6.3a The central DC implicit time at various g/f ratios. Each coloured line
represents the DC amplitude under different focal flash intensities. The error bar
shows ± 1 standard deviation
Figure 6.3b The peripheral DC implicit time at various g/f ratios. Each coloured
line represents the DC amplitude under different focal flash intensities. The error
bar shows ± 1 standard deviation
Figure 6.4a The central IC amplitude at various g/f ratios. Each coloured line
represents the DC amplitude under different focal flash intensities. The error bar
shows ± 1 standard deviation
Figure 6.4b The peripheral IC amplitude at various g/f ratios. Each coloured line
represents the DC amplitude under different focal flash intensities. The error bar

XXIV
shows ± 1 standard deviation
Figure 6.5a The central IC implicit time at various g/f ratios. Each coloured line
represents the DC amplitude under different focal flash intensities. The error bar
shows ± 1 standard deviation
Figure 6.5b The peripheral IC implicit time at various g/f ratios. Each coloured
line represents the DC amplitude under different focal flash intensities. The error
bar shows ± 1 standard deviation
Figure 6.6 Waveform of the MOFO responses contain two main components: the
direct component (DC) and the induced component (IC). Note that the implicit
time of the DC is measured from the onset of the multifocal stimulus to the
response peak of the DC, while the implicit time of the IC is measured from the
onset of the global flash (26.6 ms) to the response peak of the IC
Figure 6.7 The multifocal stimuli pattern was mapped with the automated
mosaic fundus photo (each circle indicates the fundus photo taken at a particular
gaze position. There are in total nine gaze positions, one central gaze position
and eight peripheral gaze positions, to form a mosaic fundus photo). Both were
divided into 35 regions as in previous studies (about two to three hexagons were
grouped as one region in the mfERG topography as indicated by the dark
polygons). This figure illustrates the regional mfERG waveform of a diabetic
patient with DR lesions at different locations. Those regional mfERG samples
with DR (in red lines) are compared with the averaged regional samples from the
control group (in blue lines)
Figure 6.8 Comparison of the DC amplitude z-scores (DCA_z) for groups 0 to 4
at high (98%) and low (46%) contrast levels. *: p<0.05 when compared with
group 0; †: p<0.05 when compared with group 1. Boxplot: centre line- the mean;
the edges of the box - ± 1 standard deviation; the edges of the vertical bars -

XXV
range
Figure 6.9 Comparison of IC amplitude z-scores (ICA_z) for groups 0 to 4 at
high (98%) and low (46%) contrast levels. *: p<0.05 when compared with group
0; †: p<0.05 when compared with group 1. Boxplot: centre line- the mean; the
edges of the box - ± 1 standard deviation; the edges of the vertical bars - range
Figure 6.10 Comparison of DC implicit time z-score (DCIT_z) for groups 0 to 4
at high (98%) and low (46%) contrast levels. *: p<0.05 when compared with
group 0; †: p<0.05 when compared with group 1. Boxplot: centre line- the mean;
the edges of the box - ± 1 standard deviation; the edges of the vertical bars -
range
Figure 6.11 Comparison of IC implicit time z-score (ICIT_z) for groups 0 to 4 at
high (98%) and low (46%) contrast levels. *: p<0.05 when compared with group
0; †: p<0.05 when compared with group 1. Boxplot: centre line- the mean; the
edges of the box - ± 1 standard deviation; the edges of the vertical bars - range
Figure 7.1 MOFO mfERG resultant waveform. The measurement of amplitudes
and implicit times of DC and IC are also shown
Figure 7.2 Mapping between the data of the mfERG, VF test and OCT RNFL
profile. Left side: Mapping of the overlays between the mfERG topography (35
polygonal patches) and the VF test spots (coloured spots). Right side: The
sectoral RNFL profile measured by the OCT. Colour indication: Through
mapping the VF test spots with the corresponding sectoral RNFL thickness
(Garway-Heath et al. 2000; Garway-Heath et al. 2002), the regional mfERG data
could be matched with the corresponding RNFL thickness (the central red cross
represents the fixation point of the mfERG and VF assessments)
Figure 7.3 Correlation between the local responses of the VF (TD) and DCA_z
of the MOFO mfERG at 98% and 46% contrast conditions from groups I, II and
XXVI
III
Figure 7.4 Correlation between the local responses of the VF (TD) and ICA_z of
the MOFO mfERG at 98% and 46% contrast conditions from groups I, II and III
Figure 8.1a The 61-hexagonal mfERG stimulus pattern for the white condition
Figure 8.1b The 61-hexagonal mfERG stimulus pattern for the blue condition
Figure 8.2 The waveform under the "long-duration" mfERG paradigm showing
the parameters measured
Figure 8.3 a) The N1 amplitude in the DM and control groups under both the
white and blue stimulus conditions; b) The P1 amplitude in the DM and control
groups under both the white and blue stimulus conditions; c) The N2 amplitude
in the DM and control groups under both the white and blue stimulus conditions;
d) The P2 amplitude in the DM and control groups under both the white and blue
stimulus conditions (*: indicates parameters that achieved statistically
significance level with p<0.05) (Error bar: indicates ± 1 standard deviation)
Figure 8.4 The P1 implicit time in the diabetic group under both the white and
blue stimulus conditions (*: indicates parameters that achieved statistically
significance level with p<0.05) (Error bar: indicates ± 1 standard deviation)
Figure 8.5 The N2 amplitude in the control and diabetic groups under the white
stimulus condition (*: indicates parameters that achieved statistically significance
level with p<0.05) (Error bar: indicates ± 1 standard deviation)
Figure 8.6 a) The amplitude changes (in percentage) of the P1 amplitude due to
the change from white to blue stimulus between the control and the diabetic
groups; b) The amplitude changes (in percentage) of the N2 amplitude due to the
change from white to blue stimulus between the control and the diabetic groups;
c) The amplitude changes (in percentage) of the P2 amplitude due to the change
from white to blue stimulus between the control and the diabetic groups (*:

XXVII
indicates parameters that achieved statistically significance level with p<0.05)
(Error bar: indicates ± 1 standard deviation)

XXVIII
List of tables
Table 1.1 Conversion table between the capillary plasma glucose values and the
venous plasma glucose concentration provided by WHO (Adopted from Alberti
& Zimmet 1998)
Table 6.1 Correlation of the plasma glucose level and DM duration with the
averaged MOFO mfERG parameters in diabetic subjects
(*: p<0.05)
Table 6.2 Summary of the area-under-the-curve (AUC) for each MOFO
parameter used in screening the regional samples with visible DR signs and
screening the regional samples from DM groups (those with and without DR
signs)
(Light-grey shaded cell: MOFO parameter with the highest screening power of
the retinal samples with DR signs)
(Dark-grey shaded cells: MOFO parameters with the relatively high screening
power of the retinal samples from the DM patients with and without DR signs)
Table 7.1 Regional data from each measurement (VF TD, OCT sectoral RNFL
thickness and MOFO mfERG parameters) according to its mapping with the
MOFO mfERG topography
(*: Significantly different from the control group (Group I) with p< 0.05)
(†: Significantly different from the DM patients without DR (Group II) with p<0.05)
Table 7.2 Summary of Pearson's correlation (r) between local responses of VF
(TD) and MOFO mfERG parameters
(*: Statistically significance level achieved with p< 0.05)
Table 7.3 Summary of Pearson's correlation (r) between local responses of RNFL
sectoral z-score and MOFO mfERG parameters
(*: Statistically significance level achieved with p< 0.05)

XXIX
Table 7.4 Summary of Pearson’s correlation (r) between plasma glucose level
(mmol/L) with each mean visual assessment parameters (VF mean deviation
[dB], RNFL mean thickness [um] and the averaged MOFO mfERG parameters
[z-scores])
(*: Significance level with p< 0.05)

XXX
List of abbreviations
Abbreviations
AAO American Academy of Ophthalmology
AGEs Advance glycosylation end products
ANOVA Analysis of variance
AR Aldose-reductase
AUC Area-under-the-curve
CRT monitor Cathode-ray tube monitor
CS Contrast sensitivity
DC Direct component
DM Diabetes mellitus
DR Diabetic retinopathy
DTL electrode Dawson-Trick-Litzkow electrode
EOG Electro-oculogram
ERG Full-field elelctroretinogram
ETDRS Early Treatment Diabetic Retinopathy Study
FFA Fundus fluorescein angiogram
GEE Generalized estimating equation
HbA1c Glycated haemoglobin
HK Hong Kong
IC Induced component
IDDM Insulin-dependent diabetes mellitus
IFG Impaired fasting glycaemia
IGT Impaired glucose tolerance
IRMA Intraretinal microvascular abnormalities
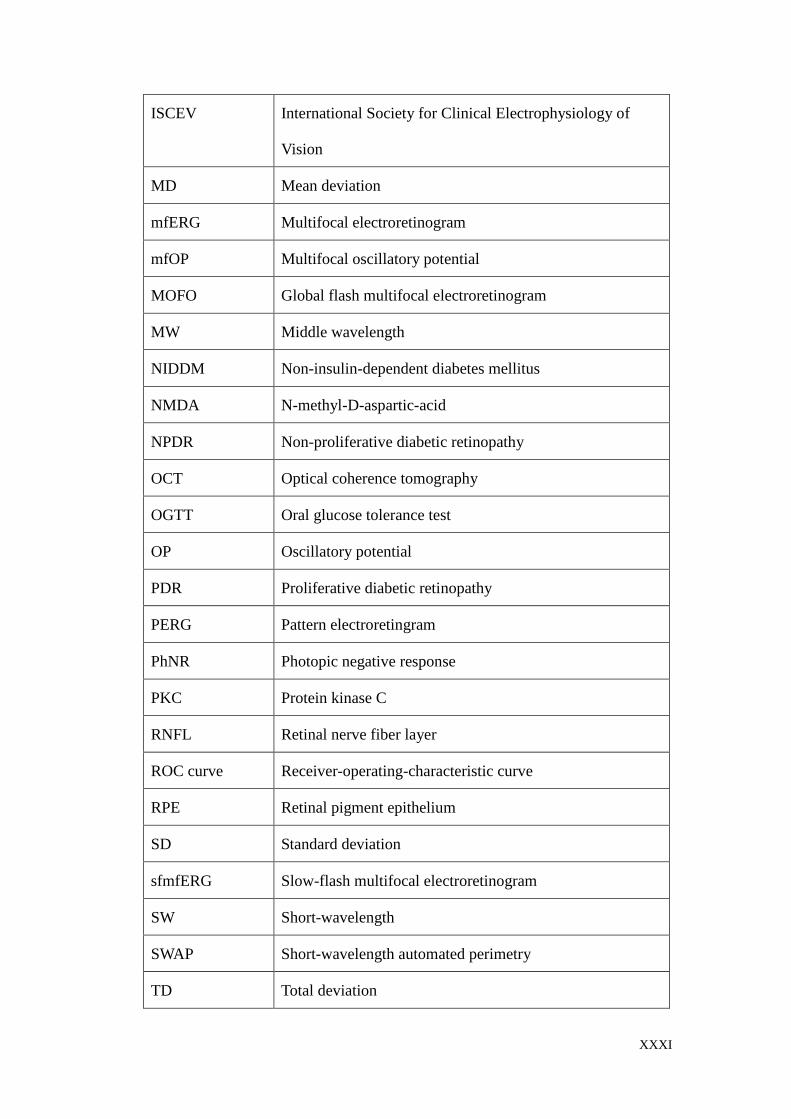
XXXI
ISCEV International Society for Clinical Electrophysiology of
Vision
MD Mean deviation
mfERG Multifocal electroretinogram
mfOP Multifocal oscillatory potential
MOFO Global flash multifocal electroretinogram
MW Middle wavelength
NIDDM Non-insulin-dependent diabetes mellitus
NMDA N-methyl-D-aspartic-acid
NPDR Non-proliferative diabetic retinopathy
OCT Optical coherence tomography
OGTT Oral glucose tolerance test
OP Oscillatory potential
PDR Proliferative diabetic retinopathy
PERG Pattern electroretingram
PhNR Photopic negative response
PKC Protein kinase C
RNFL Retinal nerve fiber layer
ROC curve Receiver-operating-characteristic curve
RPE Retinal pigment epithelium
SD Standard deviation
sfmfERG Slow-flash multifocal electroretinogram
SW Short-wavelength
SWAP Short-wavelength automated perimetry
TD Total deviation

XXXII
VA Visual acuity
VEGF Vascular endothelial growth factor
VF Visual field
WHO World Health Organization
WWP White-on-white perimetry

1
Part I
Introduction & Literature Review

2
Chapter 1: Diabetes mellitus (DM) and diabetic retinopathy (DR)
1.1 Background information of diabetes mellitus
Diabetic mellitus (DM) is a clinically and genetically heterogeneous group of
systemic disorders. This systemic disease is caused by a deficiency of insulin
secretion, and a cellular resistance to the action of insulin, these result in chronic
high level of blood glucose - hyperglycemia (LeRoith et al. 2004). DM may
present with characteristic symptoms such as thirst, polyuria, blurred vision and
weight loss (Alberti & Zimmet 1998).
DM increases the risk of stroke, renal failure and lower limb amputations. It can
cause severe visual impairment and blindness (Alberti & Zimmet 1998).
According to World Health Organization (WHO) statistics in 2008, about 1.3
million persons died from DM worldwide which is noted to be one of the leading
fatal causes among the non-communicable disease categories (WHO 2010).
1.1.1 Metabolism and endocrine problems
Deficiency of a hormone called insulin is the main cause of diabetes. This
hormone is a chemical messenger produced by the pancreas. It has effects on
many distant parts of the body through its release into the bloodstream. However,
if there is a complete failure of insulin production or a combination of partial
failure of insulin production with a reduced body response to the insulin (insulin
resistance), a problem of blood glucose regulation will result and give rise to
different types of DM (which will be discussed below) (Alberti & Zimmet 1998;
Clark 2004).

3
1.1.2 Clinical diagnostic tests
Measurement of the venous plasma glucose level (fasting plasma glucose level or
a 2-hour postprandial plasma glucose level) is the common clinical test for
diagnosis of DM (Alberti & Zimmet 1998; Holt 2004). In 2009, an expert group
from WHO concluded that glycated haemoglobin (HbA1c), which reflects the
average plasma glucose over the previous 8-12 weeks, should be accepted as the
official means to represent the plasma glucose level (WHO 2011). A patient who
fails in one of the above plasma glucose assessments and who reports the classic
diabetic symptoms meets the clinical diagnosis of DM. For an asymptomatic
patient, a supplementary oral glucose tolerance test (OGTT) is required. The
WHO recommends that a 75g OGTT should be performed under this situation
(Alberti & Zimmet 1998; Holt 2004).
1.1.3 Definition of DM
The current WHO diagnostic criteria for diabetes is a patient with fasting plasma
glucose equal to or above 7.0 mmol/L (126 mg/dl) or a 2-hour postprandial
plasma glucose equal to or above 11.1 mmol/L (200 mg/dl) (Alberti & Zimmet
1998). In 2009, the WHO recommended that a cut-off point for the diagnosis of
DM, an HbA1c value equal to or above 6.5% indicates a possibility of DM
(WHO 2011). The WHO also provides a conversion table between the values of
the capillary plasma and the venous plasma glucose concentration for easier
comparison (Table 1.1).

4
Table 1.1. Conversion table between the capillary plasma values and the venous
plasma glucose concentration provided by WHO (Adopted from Alberti &
Zimmet 1998)
1.2 Classification of DM
According to the WHO Expert Committee on Diabetes in early 80s, two forms of
DM, insulin-dependent DM (IDDM) and non-insulin-dependent DM (NIDDM),
were classified. Considering the modifications recommended by the American
Diabetes Association, a new classification with four main categories was
launched by the WHO in 1999 as follows (Alberti & Zimmet 1998):
1.2.1 Type I DM
Type I DM, previously known as IDDM or juvenile-onset DM, is caused by
pancreatic beta-cell destruction. It is usually immune mediated, and represents
about 10% of all of diabetic cases (Holt 2004). It results in loss of insulin
secretion and absolute insulin deficiency (LeRoith et al. 2004).These patients are

5
prone to ketoacidosis (Alberti & Zimmet 1998) and the majority of these patients
are diagnosed as children or as adolescents (LeRoith et al. 2004).
1.2.2 Type II DM
Type II DM, previously known as NIDDM, is caused by a combination of
genetic and non-genetic factors. It is more common and makes up to about 90%
of the global diabetic population (LeRoith et al. 2004). The incidence of this
form of DM increases with age, with most cases diagnosed after the age of 40
years (Holt 2004). The common non-genetic factors are ageing, obesity and
lifestyle including diet. Both genetic and non-genetic factors will result in
impaired insulin action due to insulin resistance and insulin deficiency caused by
partial dysfunction of pancreatic beta-cells (Holt 2004; LeRoith et al. 2004).
However, this type of DM is frequently not diagnosed for many years because
the hyperglycemia is often not severe enough to cause obvious symptoms in the
early stages (Alberti & Zimmet 1998).
1.2.3 Other types of DM
Causes of these types of DM include known genetic defects affecting beta-cell
function or insulin action, diseases of the exocrine pancreas, drug-induced
pancreatic changes etc. They account for about 1-2% of the diabetic cases
(LeRoith et al. 2004).
1.2.4 Gestational diabetes
Gestational diabetes is carbohydrate intolerance resulting in hyperglycemia with
variable severity (Alberti & Zimmet 1998; LeRoith et al. 2004) caused by insulin
resistance and/or insulin deficiency associated with the onset or recognition of
6
DM occurring during pregnancy. It is found in about 3% to 5% of all pregnancies.
Women with gestational diabetes are at high risk for development of type II DM
after pregnancy (LeRoith et al. 2004).
The WHO diagnostic criteria also recognize two further categories: impaired
fasting glycaemia (IFG) and impaired glucose tolerance (IGT); while the latter
can only be diagnosed following a 75g OGTT (Holt 2004). IFG and IGT, which
are not interchangeable, represent the abnormal glucose regulation in the fasting
state and in the post-prandial state respectively (Alberti & Zimmet 1998). IFG
and IGT are not distinct clinical entities, but rather risk factors for future
development of DM and cardiovascular disease (pre-diabetes) (Holt 2004).
1.3 Pathogenesis of diabetic vascular abnormalities
Hyperglycemia results from reduced insulin secretion or insulin resistance. Both
small blood vessels (microvascular) and large blood vessels (macrovascular) can
be affected. Macrovascular complications are caused by deposits of lipids and
other substances on the wall of large arteries leading to the narrowing of vessel
lumen. The reduction of blood flow results from the atherosclerosis (Tuch et al.
2000).
Hyperglycemia also causes an abnormal increase in blood flow and vascular
permeability in smaller vessels. As a consequence, capillary leakage which is a
microvascular complication exists in the retina and renal systems. This process is
reversible in the early stage but the abnormalities of the extracellular matrix
contribute to an irreversible increase in vascular permeability. Together with the
decrease in production of trophic factors for endothelial and neuronal cells,

7
microvascular cell loss, apoptosis and progressive capillary occlusion occurs
over time (LeRoith et al. 2004).
There are four major hypotheses for the pathogenesis seen in microvascular
systems: 1) The activation of the polyol pathway - The aldose-reductase (AR) of
the glucose metabolism in polyol pathway of all cells is activated and is
overstimulated by lack of insulin (Camera et al. 2007); 2) The activation of the
protein kinase C isoform - Long-standing high blood glucose level increases the
diacylglycerol production. This activates the production of protein kinase C
(PKC) isoform which can lead to endothelial dysfunction (LeRoith et al. 2004;
Camera et al. 2007); 3) The activation of non-enzymatic glycosylation -
Non-enzymatic glycosylation protein occurs during hyperglycemia and results in
advance glycosylation end products (AGEs) (LeRoith et al. 2004). This will
create an oxidative stress and lead to vascular disorders in diabetic patients (Van
Bijsterveld 2000; Yokoi et al. 2005); 4) The activation of hexosamine pathway –
this will elevate N-acetyl-glucosamine levels (Hanover 2001) which will induce
insulin-resistance and hinders insulin-induced vasodilation (Hanover 2001;
Veldman & Vervoort 2002; Wallis et al. 2005).
1.4 Vascular abnormalities in retina – Diabetic retinopathy (DR)
There are five basic pathologic processes at the retinal capillary level in
development of DR. Due to the loss of capillary pericytes, microaneurysms are
formed. With the increased formation of microaneurysms and the breakdown of
endothelial tight junctions in retinal capillaries, there is excessive vascular
permeability leading to formation of hard exudates. This is followed by capillary
closure and formation of acellular capillaries, intraretinal haemorrahge and

8
dilated retinal veins/ venous beading are formed. Increasing vascular
non-perfusion will also further trigger the formation of intraretinal microvascular
abnormalities (IRMA). When the abnormal new blood vessels grow from the
retinal layers towards the vitreous, DR is in the proliferative stage. These
abnormal fibrovascular projections can contract, leading to a larger scale of
haemorrhage and to retinal detachment with severe visual loss (LeRoith et al.
2004).
1.5 Prevalence of DM and DR
DM has become one of the most concerning health problems, and it has come to
create a heavy economic burden in both developing and developed countries, due
to a dramatic increase in patient numbers.
1.5.1 DM population worldwide
According to the statistical data from the World Health Organization (WHO), the
prevalence of DM in 2004 was 220.5 million worldwide; and 44.7 million of
these were from the South-East Asia (WHO 2008). The global prevalence of
diabetes in 2008 was estimated to be 10% in adults aged 25 years or above
(WHO 2010). The total number of people with diabetes was projected to rise
from 171 millions in 2000 to 366 millions in 2030 (Wild et al. 2004).
1.5.2 DM population in Hong Kong and its expected statistics
In Hong Kong (HK), according to the report from the Hong Kong Society for
Endocrinology, nearly 10% of the population suffers from DM (Diabetes
Division, Hong Kong Society for Endocrinology, Metabolism and Reproduction
2000). The prevalence of diabetes in the working population has doubled over

9
the past 10 years (Tam et al. 2005). The prevalence of young-onset type II DM
(<40 years old) is increasing with a different causes and natures. The occurrence
of DM ranged from 2% in people with age less than 35 years to more than 20%
in those older than 65 years. The increasing number of diabetic patients with
increasing age was suggested to be caused by diet, obesity and physical inactivity
(Diabetes Division, Hong Kong Society for Endocrinology, Metabolism and
Reproduction 2000).
1.5.3 DR population worldwide and in HK
DR is an important cause of blindness due to long-term accumulated damage to
the retinal microvascular circulation. This ocular complication exists in both
types I and II diabetic patients. For the two types of patients who survive over 20
years with DM, nearly all type I patients and more than 77% of those with type II
DM develop DR at different stages (Klein et al. 1984; Klein et al. 1984).
WHO reported that DR is the 5th leading cause of blindness and had estimated
that DR is responsible for 48% of the 37 million cases of blindness throughout
the world (Resnikoff et al. 2004). By the meta-analysis of 25 studies (from
1980-2008) with 22,896 diabetic individuals, it was estimated that there would
be 92.6 million (35.4%) diabetic adults with any type of DR, 17.2 million (7.2%)
with proliferative DR, 28.6 million (11.7%) with vision-threatening DR and 20.6
million (7.4%) with diabetic macular oedema (Yau et al. 2012).
Among patients with type II diabetes, 40% have evidence of DR with 8% in a
vision-threatening state (pre-proliferative or proliferative DR or macular oedema)
at any time (Kempen et al. 2004). Of those without retinopathy, it has been

10
suggested that the risk of incidence of new retinopathy is between 5% and 10%
per year (Wong & Hyman 2008). Local HK studies reported a prevalence of DR
of 15-23% among DM patients (Siu et al. 1998; Wang et al. 1998).
Concerning the type of DM, type I patients are more likely to have proliferative
DR whereas those with type II DM patients are prone to have macular oedema
(Van Bijsterveld 2000). The diagnosis of DR is often delayed, and hyperglycemia
has been reported to be present for more than 20 years before the diagnosis is
confirmed (Liu et al. 2002).
Among diabetic patients, the majority will have type II DM, and these patients
will form the basis of this study.

11
Chapter 2: Current management and care for DM patients
2.1 Current clinical assessments for DR screening
Retinal photography or dilated pupil fundus examination using ophthalmoscopy
are the methods currently used to screen out the retinal anomalies in diabetes
(Garg & Davis 2009). Dilated pupil fundus examination by direct
ophthalmoscope, slit-lamp biomicroscopy and binocular indirect
ophthalmoscopy are three common ways to detect vascular anomalies.
Biomicroscopic examination of the fundus is highly sensitive for DR screening
(Khalaf et al. 2007). However, these tests must be performed by skillful and
experienced professionals.
Mydriatic fundus photodocumentation is recommended as an effective and
accurate method for DR screening (Carmichael et al. 2005). It provides an easy
way of recording and comparison of the disease progression. Its sensitivity and
specificity in screening the presence of DR has been reported to be comparable
to the ophthalmological examination with direct and indirect ophthalmoscopy
(Carmichael et al. 2005; Garg & Davis 2009). The ‘gold standard’ was taking
seven 30 degree stereoscopic colour photos as suggested by the Early Treatment
Diabetic Retinopathy Study (ETDRS) (Early Treatment Diabetic Retinopathy
Study Research Group 1991). Different modified methods of fundus photography
with comparable accuracy to the gold standard have been suggested (Scanlon et
al. 2003; Williams et al. 2004; Garg & Davis 2009; Vujosevic et al. 2009).
Fundus photodocumentation has been used to detect the capillary occlusion as an
early clinical feature of DR that leads to retinal non-perfusion and subsequent
damage; this early form of non-perfusion is potentially reversible (Bloomgarden
2008).

12
Fundus fluorescein angiogram (FFA) is naturally the most effective means of
detecting microaneurysms. A significant correlation has been found between the
microaneurysm counted by FFA and colour fundus photographs of individual
patients (Hellstedt et al. 1996). Although in the past it has been reported that
about twice as many microaneurysms detected on the FFA as on the colour
photographs (Friberg et al. 1987; Hellstedt et al. 1996) both the microaneurysm
counts obtained from FFA and colour fundus photographs were also
demonstrated to predict and correlate well with the progression of early DR
(Hellstedt et al. 1996). With the improvement in the resolving power of modern
fundus cameras, the accuracy of retinopathy detection by fundus photography
can reach a very high level. In the absence of DR detected by colour photography,
the result of FFA is usually found to be negative. Even if it is positive, the
angiograms will usually show only one or two microaneurysms (The Diabetes
Control and Complications Trial Research Group 1987). The microaneurysms in
FFA and red dots in colour photographs reflect the level of DR. About half of the
red dots in photographs do not represent open aneurysms in FFA. It has been
proposed that in fact the “missing” microaneurysms are small intraretinal
haemorrhage, or that the aneurysms are occluded by material containing
erythrocytes and are thus visible in photography but not in FFA (Hellstedt et al.
1996). Due to the invasiveness and cost of angiogram, colour fundus
photography has been preferred in the study of early DR (Hellstedt et al. 1996).
In 2002, Shiba and co-authors suggested a simpler photographic method. A
nine-field of retinal view was taken, which displayed more than 90 degrees
vertically and horizontally. This field covers more than 95% of the fundus area
photographed by the standard ETDRS method (Shiba et al. 2002) and has
13
comparable accuracy to ophthalmoscopy performed by experienced professionals.
This photographic method will be applied in this study.
2.2 Clinical grading system of DR
The ETDRS Research Group launched a severity grading scale of DR in the
1990s. This scale provides a standard set of definitions and photographs of
various types of retinal lesions describing the severity of diabetic retinopathy
(Wilkinson et al. 2003). It consists of different levels of severity including mild
and moderate NPDR, moderately severe and severe NPDR, non-high-risk and
high-risk and advanced proliferative DR (PDR) (Early Treatment Diabetic
Retinopathy Study Research Group 1991). Although it is recognized as the gold
standard, its complexity makes it difficult to apply in clinical practice.
In 2001, the AAO launched a project to develop a new clinical severity scale of
DR (Wilkinson et al. 2003). The AAO scale simplified the sub-levels of the
ETDRS classification and grouped them into a five-stage classification for DR
severity, including three low-risk stages (No DR, mild NPDR and moderate
NPDR), a severe NPDR stage, followed by a proliferative stage. The existence of
microaneurysms is the sign of mild NPDR in the AAO scale, while
microaneurysms must be individually graded in the ETDRS scale before
proceeding to the NPDR levels.
In 2012, the United Kingdom National Screening Committee further simplified
the grading system, based on the essence of ophthalmological referral and the
follow-up intervals, in order to ease the screening program. DM patients without
retinopathy are graded as R0 and those with non-referrable retinopathy are R1.
14
Those with potentially sight-threatening non-proliferative and proliferative DR,
are graded as R2 and R3 respectively with referral required. Apart from this
simplification, the system is more or less similar to the AAO grading (Taylor
2012; Heng et al. 2013).
2.3 Current clinical management of DR patients
There is no active ophthalmological treatment for DM patients at the early stage
of non-proliferative DR except for regular dilated fundus examination and
glycemic control. Ophthalmic treatment is only applied for late-stage DR with
sight-threatening retinopathy signs. For many years, the most common
ophthalmic treatment has been destructive laser photocoagulation. By ablating
the ischemic retinal area or the retinal region with vascular leakage, angiogenic
growth factor(s) and vascular leakage are reduced. However, peripheral visual
field constrictions with poor dark adaptation, and occasional subretinal fibrosis
and vitreous haemorrhage sometimes occur as side-effects after this treatment
(Yam & Kwok 2007; Bandello et al. 2013; Heng et al. 2013).
Other surgical interventions include vitrectomy and intravitreal injections of
anti-VEGF substances. The aims are to remove the VEGF and to reduce the
abnormal neovascularization formation at the late stage of DR (Yam & Kwok
2007; Bandello et al. 2013; Heng et al. 2013). Currently, there is no active
medical treatment for the earlier stage of the disease in order to postpone the
occurrence of the irreversible retinopathy or to reduce any progression of DR.

15
2.4 Quality of life and socio-economic burden of DR patients
DR and its treatment affect many aspects of the quality of life of patients who
suffer from the condition. DR leads to reduction of both central visual acuity and
contrast sensitivity which directly affect the patient’s daily life in terms of
reading, facial recognition, reading street signs, dialing a telephone and locating
objects in a room (Warrian et al. 2010). For DR patients with retinal laser
photocoagulation, peripheral vision will also be reduced (Warrian et al. 2010).
DR may produce negative emotional reactions due to anxiety about the future,
and restriction of physical activities which are not proportional to the actual loss
of visual capacity (Woodcock et al. 2004).
Among 136 categories of diseases and injury cases as classified by the WHO,
DM ranked the 12th in the leading causes of death among all ages in 2004 (WHO
2008). DM accounts for 3.5% of cases of death among non-communicable
diseases (WHO 2012). It was also estimated that the ranking of DM will rise
from 19th in 2004 to 10th by 2030, in terms of the leading causes of social burden
of diseases over the world (WHO 2008). As DM patients require at least two to
three times more health-care resources than people without DM (WHO 2009),
diabetes care may account for up to 15% of national healthcare budgets (Zhang
et al. 2010). Among diabetic patients, there is a higher rate of visual impairment
than in the general population (Schmier et al. 2009). The average health care
costs increase with the severity of DR (Schmier et al. 2009; Heintz et al. 2010).
Total health care payments were 35% higher in patients with proliferative DR
than in those with non-proliferative DR (Schmier et al. 2009; Heintz et al. 2010).
These findings suggest that delaying DR progression markedly assists in
lowering of health care expenditures (Schmier et al. 2009; Heintz et al. 2010).
16
Chapter 3: Pathogenesis of DR
The persistent high blood glucose level in DM creates oxidative stress, which
causes deterioration of the vascular system and of the neuroretinal components in
the ocular system and consequently leads to diabetic retinopathy. Two
hypothesized mechanisms have been proposed. However, which pathway as the
first step of the DR development is still controversial in human as previous
experiments are mainly based on animal studies. The two hypothesized pathways
of DR are:
3.1 Vascular pathway
The continuous high blood glucose level activates abnormal pathways for
metabolizing glucose which result in accumulation of abnormal byproducts in the
ocular vascular system, and osmotic and oxidative stress. The capillary basement
membrane thickens, the endothelial cells and pericytes of the blood vessels are
damaged (Van Bijsterveld 2000; LeRoith et al. 2004). The damaged capillaries
leak contents intraretinally and form hard exudates (confluents of lipids and
lipoproteins). The non-perfusion of capillaries contribute to an early clinically
visible manifestation of DR- microaneurysms (Khan & Chakrabarti 2007).
This is a landmark of non-proliferative diabetic retinopathy (NPDR).
During the disease progression, the endothelial cells multiply on the inner wall of
the blood vessels to repair the damage; this blocks the leakage from the
capillaries (Khan & Chakrabarti 2007) but the retardation of the axoplasmic flow
at the margin of the microvascular infarct forms a swollen area at the retinal
nerve fiber layer - cotton wool spots (Van Bijsterveld 2000; LeRoith et al.
2004).

17
With further blockage of large blood vessels, and as more non-perfused
capillaries are formed, the endothelial cells of blood vessels will have
proliferative response changes to form branches of intraretinal microvascular
abnormalities (IRMA). Non-perfusing capillaries may extend up to the major
veins causing irregularities of the vein wall and venous beading or segmentation
will occur (Van Bijsterveld 2000; LeRoith et al. 2004).
The increase of the non-perfused capillary and higher vitreous concentrations of
the vasoproliferative growth factors will cause IRMA to break through the
internal limiting membrane on to the retinal surface. These new vessels may
grow rapidly. This is the mark of proliferative diabetic retinopathy (PDR) which
results in new vessels elsewhere, even on the optic disc (Van Bijsterveld 2000;
LeRoith et al. 2004).
Due to the effect of the proliferating endothelial cells on the posterior hyaloid
surface, the configuration of the vitreous collagen may be changed and lead to
localized vitreous contraction. This may give rise to pre-retinal haemorrhage,
vitreous traction and tractional retinal detachment (Van Bijsterveld 2000;
LeRoith et al. 2004).
3.2 Neuronal pathway
Glial reactivity and altered glial glutamate metabolism have been shown to be
early pathological changes in the rat model of diabetic retinopathy developed by
Lieth and co-workers (Lieth et al. 1998). These elevated levels of retinal
glutamate are toxic to the retina.

18
In human retina, glial cells include the Müller cells, astrocytes and microglial
cells. They play an important role in the homeostatic regulation of the retina, and
control critical processes such as uptake of glucose from the circulation and
transfer of energy to neural cells in the retina (Lopes de Faria et al. 2002). The
glial cells also induce the formation of the tight endothelial junctions and thus
confer barrier properties to the retinal blood vessels (Mizutani et al. 1998). They
help to maintain the endothelial lining of retinal microvessels in the blood-retinal
barrier so as to maintain normal neuronal and vascular functions in the retina.
The glia aid in maintaining low synaptic levels of neurotransmitters. The major
excitatory neurotransmitter in the retina is glutamate, which is an amino acid
toxic to retinal neurons at high levels (Lieth et al. 1998). Glial cells are activated
during certain injury states.
In the diabetic condition, there are several aspects that lead to the neural
degeneration in the retina. First, there are changes in the glutamate metabolism of
diabetic rats (Barber et al. 1998). Glutamate accumulation in the retina may
cause glutamate toxicity which will in turn lead to neuronal apoptosis.
Secondly, the rate of apoptosis increases in DM. The retinal cells involved in the
apoptosis are ganglion cells, glial cells (Müller cells and retinal astrocytes) and
other neurons (Barber et al. 1998). With the loss of Müller cells, the
compromised blood-retinal barrier triggers the activation of Müller cells to
increase immunoreactivity to the intermediary filament glial fibrillary acid
protein. This process may be involved in retinal capillary occlusion in diabetic
patients (Van Bijsterveld 2000).

19
Finally, the progressive dysfunction of capillaries leads to ischemia which causes
neuronal death from the inner retinal layers down to the outer plexiform layer.
Diabetic retinopathy is the final result of these vascular and neuroretinal
degenerations, it is an irreversible outcome even after good glycemic control is
re-instituted. It is probably caused by the oxidative stress built up in the diabetic
condition which creates a phenomenon called metabolic memory (Kowluru &
Chan 2007).

20
Chapter 4: The influence of DM on the visual system
4.1 Morphological aspects
4.1.1 Cornea
Decreased corneal sensitivity is a common finding in patients with DM (Aiello et
al. 1998; Yam & Kwok 2007; Scott et al. 2010). Moreover, due to the thickening
of the corneal basement membrane, decreased hemidesmosome frequency and
decreased penetration of anchoring fibrils (Scott et al. 2010), there is poor
adhesion of the corneal basement membrane which leads to impaired epithelial
barrier function and recurrent corneal erosion after trauma.
4.1.2 Crystalline lens
Accumulation of the sugar alcohol sorbitol leads to the influx of water molecules
to the fibers of the lens. Swelling of the crystalline lens, which is reversible,
leads to fluctuation of refractive error in diabetic patients (Scott et al. 2010).
Diabetic patients are also at risk of early cataract formation compared to those in
non-diabetic groups. The accumulation of crystalline, a long-lived protein, in the
lens has been suggested to have a role in lens protein insolubilization. The
formation of crystalline fragments scatters lights and is the starting point for
cataractogenesis (Sharma & Santhoshkumar 2009). The ultrasonic and
biochemical evaluation of the human diabetic lens has revealed that the diabetic
changes mainly influence the lens of early-onset (type I) rather than late-onset
(type II) diabetic patients. No significant differences have been found in terms of
lens thickness, ultrasound attenuation coefficient and lens protein amount
between the type II diabetic patients to age-matched controls (Raitelaitiene et al.
2005). The biometric findings in late-onset diabetes are in marked contrast to the
21
large overall effect of diabetes reported in early-onset diabetes (Sparrow et al.
1992). By means of Scheimpflug photography and densitograms, very little
effect was found in type II DM on different zones of the lens. These findings
suggest that type I and II DM have different underlying pathophysiologic
mechanisms (Wiemer et al. 2008).
4.1.3 Retinal nerve fiber layer (RNFL) thickness
Oshitari and co-workers (Oshitari et al. 2009) found that type II DM patients
with DR had significantly thinner retinal nerve fiber layer than did the eyes of
control patients. However, no significant thinning was found between DM
patients without DR and the controls. Lopes de Faria and co-workers (Lopes de
Faria et al. 2002) also stated that significant nerve fiber loss in the superior retina
occurred before the existence of DR in type I DM. Similar findings by optical
coherence tomography (OCT) had been reported by Sugimoto and co-workers
(Sugimoto et al. 2005). It has been proposed that the loss of the neuroglial cells
in hyperglycemia increases neural apoptosis. However, the discrepancy of the
findings between studies would be probably due to the limitation of the OCT
operation principles. The OCT measures the retinal nerve fiber layer, and not
only the ganglion cell axons, which also includes the Müller cell processes,
astrocytes and the intraretinal fluid accumulation. This may cause inconsistent
RNFL findings in studies of DM and result in over-estimation of the RNFL
(Sugimoto et al. 2005; Takahashi & Chihara 2008) .

22
4.1.4 Macular thickness
Optical coherence tomography (OCT) has been applied to investigate structural
changes at the macula in diabetic patients without clinically significant macular
oedema. Thickening of the macular region in diabetic patients without
retinopathy was reported by Sugimoto et al. (Sugimoto et al. 2005) and Cho et al.
(Cho et al. 2010). Macular thickening laws found to increase with the severity of
DR (Cho et al. 2010). The thickening was proposed to be caused by the low
resistance to oedema of the macular region (Sugimoto et al. 2005). On the other
hand, Bressler et al. (Bressler et al. 2008) and Browning et al. (Browning et al.
2008) reported no significant difference in macular thickness of diabetic patients
with no or minimal retinopathy and their control subjects.
There are other studies reporting pericentral macular thinning at the early stage
of disease (Biallosterski et al. 2007; Nilsson et al. 2007; Van Dijk et al. 2009;
DeBuc & Somfai 2010; Van Dijk et al. 2010). These investigators reported
retinal thinning which was attributed to selective loss of the inner retinal layers,
including the ganglion cell layer, followed by the axonal loss, which then led to
the reduction of the retinal nerve fiber layer thickness. Thus, early DR was
proposed to include a neurodegenerative component even before the onset of
vascular lesions (Van Dijk et al. 2009; DeBuc & Somfai 2010; Van Dijk et al.
2010). Oshitari et al. and Browning et al. suggested that neuronal abnormalities
gave rise to retinal thinning in diabetic eyes without retinopathy. With the
increase of retinopathy severity, the nerve fiber layer thinning was overwhelmed
by the intraretinal fluid accumulation of the other retinal layers (Browning et al.
2008; Oshitari et al. 2009). Further, Verma et al. reported that thinning also
existed in the photoreceptor level of diabetic patients without retinopathy (Verma

23
et al. 2009). Hence, there are great variations among the structural measurement
in the diabetic retina in the early stages of the disease.
4.1.5 Retinal Pigment Epithelium (RPE)
Incomplete removal of photoreceptor outer segment disks with subsequent
incomplete release of degraded material initially leads to the increased
accumulation of outer segment-derived material in the outer retina and subretinal
space. Over time, the accumulated material will thicken the outer retina and
result in autofluorescence (Schmitz-Valckenberg et al. 2008; Spaide 2008).
Hyperglycemia has been shown to lead to oxidative damage of the retinal
mitochondria. It causes apoptosis of the retinal pericytes and endothelial cells. In
the diabetic retina, an increased level of fundus autofluorescence has been
demonstrated (Kowluru & Abbas 2003; Elner et al. 2008). It is believed that the
fundus autofluorescence signal is not due to the accumulation of lipofuscin, a
fluorophore that has not been found to be increased in diabetes (Elner et al. 2008).
Moreover, increased autofluorescence of mitochondrial flavoproteins, an
indicator of mitochondrial oxidative stress, probably correlates with retinal cell
dysfunction (Elner et al. 2008) and the apoptosis of retinal cells is a key
pathophysiologic mechanism in diabetic retinopathy.
4.2 Functional aspects
4.2.1 Visual acuity (VA)
Visual acuity is not a good test for monitoring the development of the
sight-threatening DR. VA in diabetic patients can be within the normal range
even in patients with severe proliferative diabetic retinopathy (Rudnicka & Birch

24
2000) because VA decreases only when maculopathy or vitreous haemorrhage
occurs. VA is a test which assesses foveal function only (Bengtsson et al. 2008).
4.2.2 Contrast sensitivity (CS)
Contrast sensitivity decreases at all spatial frequencies in diabetic maculopathy
(Rudnicka & Birch 2000). Ismail and Whitaker (Ismail & Whitaker 1998) found
that contrast sensitivity declined in their diabetic subjects compared to
age-matched controls. However, as with VA, CS is a relatively weak test for
identifying the onset or development of DR because it produces an unacceptably
high false positive rate. Although a CS reduction has been reported in some
studies of diabetic patients (Ismail & Whitaker 1998), it is hard to confirm
whether the decrease of CS in diabetic patients is caused by retinopathy or other
aspects of aging (Rudnicka & Birch 2000).
4.2.3 Colour vision
Ismail and Whitaker (Ismail & Whitaker 1998) assessed colour vision for the
diabetics using the Farnsworth-Munsell 100-Hue test. All diabetic subjects were
found to have higher error scores than the control subjects. Error scores increase
steadily with the severity of the DR. The acquired colour defect is predominantly
along the blue-yellow colour axis. However, screening for tritan deficits usually
has low sensitivity and specificity due to individual variations in pre-retinal
absorption of wavelength by macular pigment and lens (Rudnicka & Birch
2000).
4.2.4 Automated perimetry
Bengtsson and co-workers (Bengtsson et al. 2005) demonstrated that visual field

25
(VF) measures correlated better than VA with the severity of DR (Bengtsson et al.
2005). Transient relative scotomas occur over the areas of poorly perfused retina
(Rudnicka & Birch 2000) but some VF scotomas cannot be related to any visible
lesions in the fundus (Ghirlanda et al. 1997). The conventional white-on-white
perimetry (WWP) and short-wavelength automated perimetry (SWAP) show
similar validity for the functional changes in DR. Test-retest variability is
unaffected by blood glucose fluctuation either for WWP or for SWAP (Bengtsson
et al. 2008). Both WWP and SWAP show the same decrease in sensitivity (mean
defect) of about 0.40 dB per ETDRS step (Bengtsson et al. 2005). WWP may be
better than SWAP in separating groups with different levels of retinopathy, while
SWAP for the central field appears superior to WWP in identifying more
localized field losses caused by ischemic damage (rather than macular oedema)
(Remky et al. 2003; Bengtsson et al. 2005). However the sensitivity and
specificity of SWAP are rather low because of the poor differentiation between
eyes with and without oedema (Agardh et al. 2006).
It has been suggested that the functional loss in VF sensitivity is relatively
unrelated to localized blood-retinal barrier defects (Bek & Lund-Andersen 1990).
In a study using microperimetry, retinal regions with macular hard exudates and
cystoid oedema were associated with local reduction of sensitivity; regions with
focal and diffuse non-cystoid macular oedema (for example, intra-retinal
haemorrhage, non-perfusion and serous retinal detachment) were shown to have
sensitivity comparable to normal retina. Since hard exudates and cystoid oedema
block or scatter the light before it reaches the photoreceptors, these optical effects
have been proposed to be major causes of sensitivity loss (Soliman et al. 2010).

26
4.2.5 Dark adaptation
Elevated rod threshold have been found in diabetic patients. Poor night vision is
a symptom of pre-proliferative and proliferative DR. Poor night vision may be
due to poor pupil dilation under mesopic and scotopic condition. Extensive
scotomas in the peripheral visual field may also contribute (Rudnicka & Birch
2000). Henson and North reported that a large number of diabetics had an
elevated final threshold above the age-norm in dark adaptation but there was
considerable scatter in their data (Henson & North 1979). They proposed that
ischemia in the retina could be the reason for this fairly large amount of data
variability. The abnormalities in dark adaptation might imply the inability of the
rods to increase their dark current, or a postsynaptic failure to detect minimal rod
signals (Arden et al. 1998).
4.3 Electrophysiological objective ocular assessments
4.3.1 Electro-oculogram (EOG)
The EOG is an electrical signal detected by electrodes placed at inner and outer
canthus (for the monocular case), and is produced as the ocular dipole rotates in
the orbit. It may be measured binocularly by placing electrodes at right and left
outer canthus. The EOG is a measure of the functional status of the retinal
pigment epithelium (RPE) and the photoreceptors, and is assessed by calculating
the ratio of the eye movement signal amplitudes (for a standard eye movement)
in light phase and dark phase (Arden ratio) (Van Bijsterveld 2000; Arden &
Constable 2006).
Shirao and Kawasaki (Shirao & Kawasaki 1998) suggested that the mean
waveforms of the conventional EOG dark trough and light peak in diabetic

27
patients at various stages of DR were not essentially different. Schneck et al.
(Schneck et al. 2008) reported that the Arden ratio was insensitive to alterations
in DM, while the reduction of the fast oscillation amplitudes in EOG might
reflect the alterations of the RPE and/or photoreceptors. There are conflicting
results in this aspect of diabetes, with some reports that the Arden ratio
deteriorates with the duration of diabetes and the severity of the retinopathy
while others deny this finding (Van Bijsterveld 2000).
4.3.2 Full-field electroretinogram (ERG)
The ERG is a measure of the summated electrical response of the retina to a light
stimulus. The rod and cone retinal systems can be isolated by manipulating
different stimulus and adaptation conditions. There are several components
obtained from ERG. The negative a-wave reflects the proximal photoreceptor
response together with some postsynaptic activities (Sieving et al. 1994; Tzekov
& Arden 1999; Van Bijsterveld 2000); the positive b-wave reflects the bipolar
cell responses (Sieving et al. 1994; Tzekov & Arden 1999; Van Bijsterveld 2000);
oscillatory potentials (OPs) are supposed to reflect the inner plexiform layer
response and are probably generated by neural interactions (Tzekov & Arden
1999); the photopic negative response (PhNR) originates more distally and
overlaps in time with the inner retinal contributions (Rangaswamy et al. 2007).
The b-wave, OPs and PhNR have been reported to have reduced amplitudes and
delayed responses in the early stages of DR. The b-wave implicit time has been
reported to be delayed in non-proliferative and proliferative DR (Kim et al. 1997).
Its amplitude reduction is mostly observed to be reduced in eyes with
proliferative DR (Kim et al. 1997). The b-wave implicit time has been shown to

28
be more sensitive in showing the difference between the diabetic group (without
DR) and the control group than is b-wave amplitude (Holopigian et al. 1992).
Reduction of OP amplitudes has been found in diabetic patients (Holopigian et al.
1992; Kim et al. 1997; Shirao & Kawasaki 1998; Tzekov & Arden 1999;
Vadala et al. 2002; Kizawa et al. 2006; Chen et al. 2008) and OP amplitudes has
been shown to reduce with increased DR severity (Kizawa et al. 2006) and
selectively in certain OP wavelets (Ghirlanda et al. 1997). OP wavelets have also
been found to be delayed (Ghirlanda et al. 1997; Kim et al. 1997; Shirao &
Kawasaki 1998; Tzekov & Arden 1999; Kizawa et al. 2006). The OP amplitudes
change prior to the period when retinal disruption is extensive enough to alter the
b-wave amplitude (Speros & Price 1981). The OP generator is presumed to be in
the intra-retinal feedback neuronal circuitry, mostly probably in the amacrine
cells (Shirao & Kawasaki 1998). However, the findings in different studies vary
considerably. Some studies have reported that the deterioration of OPs is present
even without ophthalmoscopically visible DR (Kim et al. 1997; Shirao &
Kawasaki 1998; Tzekov & Arden 1999) while other studies have reported that
deterioration of OPs was only found in those with mild NPDR (Kizawa et al.
2006; Chen et al. 2008). Reduced neurosensory retinal function as indicated by
reduced OPs before the presence of vascular defects may indicate the risk of
developing typical defects of DR (Vadala et al. 2002). Moreover, there is no
standard method of analyzing OP data, with some studies summing OP
amplitudes (Shirao & Kawasaki 1998; Kizawa et al. 2006; Chen et al. 2008)
while others have analyzed individual OP wavelets (Kim et al. 1997; Shirao &
Kawasaki 1998). The instrumentation and software for analyzing OPs power and
amplitude are less widespread than are those for other ERG components (Kim et

29
al. 1997). The fluctuation of OP responses from normal to subnormal amplitudes
might occur in relation to unsteady metabolic retinal changes even with minimal
vascular injury (Vadala et al. 2002). This might lead to the variation of study
findings and the sensitivity of OPs.
The PhNR has been proposed to indicate inner retinal activities (Rangaswamy et
al. 2007). Chen and co-workers demonstrated that diabetic patients have a
delayed PhNR with reduced amplitude (Chen et al. 2008). In their study, the
PhNR also had a better sensitivity than OPs in screening diabetic patients without
retinopathy (Chen et al. 2008).
However, Kizawa and co-workers stated a contradictory finding. They reported
that the PhNR amplitudes were only significantly reduced at the mild NPDR
stage (Kizawa et al. 2006) and that its sensitivity was less than that of OPs.
However these investigators used different chromatic stimuli in ERG
measurement, and this may account for the difference in their findings.
4.3.3 Pattern electroretinogram (PERG)
The PERG is a measure of ganglion cell activity and is thus abnormal in diseases
of the optic nerve and ganglion cells (Van Bijsterveld 2000). PERG amplitude is
reduced with increasing severity of diabetic retinopathy (Van Bijsterveld 2000).
However, different PERG paradigms (for example stimulus size, luminance,
frequency etc) in each clinic may produce different or even contradictory
experimental results (Kim et al. 1997; Tzekov & Arden 1999; Parisi & Uccioli
2001). There is currently no agreement on the standard stimulus used to generate
a PERG (Ghirlanda et al. 1997; Kim et al. 1997; Tzekov & Arden 1999).

30
Chapter 5: Multifocal electroretinogram (mfERG)
5.1 Background information of mfERG
The mfERG is a photopic, topographic measure of retinal function (Sutter &
Tran 1992). The stimulus consists of a pattern of hexagons that are usually scaled
to produce approximately equal ERG responses from each stimulus element on
the normal retina. The series of stimuli are controlled by a pseudorandom binary
m-sequence (Sutter & Tran 1992; Sutter 2000) and displayed as alternating white
and black hexagons. These small retinal areas are independently stimulated and
the local ERG contributions to the recorded mass potential are extracted using a
cross-correlation technique (Hood et al. 1997).
According to the ISCEV guidelines, the basic clinical setting of the mfERG is
103 scaled hexagons extending to a diameter of 50. The filtering bandpass is
3-300 Hz or 10-300 Hz. The mfERG waveforms are largely shaped by bipolar
cell activity, together with small contributions from the photoreceptor cells and
inner retinal (amacrine and ganglion) cells (Hood 2003; Ng et al. 2008). The
mean flash response is called the first-order component. There are three main
components: N1, P1 and N2 (Figure 5.1). They are influenced in different ways
by the onset and offset of the bipolar cells responses and, to a much lesser extent,
by responses of the photoreceptors. The inner retina exerts a subtle influence on
the waveform (Ng et al. 2008).

31
Figure 5.1. Basic resultant waveform of the standard mfERG paradigm
(Adopted from Hood et al. 2012)
5.2 mfERG assessment of DM patients
5.2.1 Standard mfERG paradigm
Palmowski and co-workers (Palmowski et al. 1997) investigated the first-order
response component in DM with and without retinopathy. They observed overall
reduced amplitudes and delayed implicit times in the diabetic patients with
NPDR. For those without retinopathy, they found no such trend; however, Klemp
and co-workers (Klemp et al. 2004) found that both the implicit times and
amplitudes could be affected by the hyperglycemic condition. The implicit time
of P1 and N2 were shortened significantly and the amplitude increased slightly in
the hyperglycemic condition. This might indicate some impairment of outer
retinal function in diabetes with NPDR (Palmowski et al. 1997) and
hyperglycemia might suggest accelerated retinal metabolism in the early stages
of DM (Klemp et al. 2004).
5.2.2 Modified mfERG paradigms
The response of the conventional mfERG paradigm (the first-order component)
is mainly derived from the outer retina, with much lesser contribution from the
inner retina. To investigate the role of the inner retina in the mfERG, several

32
modified mfERG paradigms have been suggested. As neurodegeneration exists in
diabetic retinopathy, the following modified mfERG paradigms have been
applied in investigation of DR.
5.2.2.1 Second order mfERG study
Second-order responses reflect the short-term adaptation from a preceding flash.
The second-order response is smaller than the first-order response. It is related to
the activity of the inner retina and ganglion cells (Lam 2005; Ng et al. 2008).
Palmowski and co-workers (Palmowski et al. 1997) found that diabetics had
reduced amplitude and delayed implicit time of the second-order response,
whether retinopathy had developed or not. Short-term hyperglycemia could also
affect the implicit time of the second-order response (Klemp et al. 2004). This
indicated that diabetes might have impaired adaptive mechanisms, and the inner
retina might be impaired earlier than the outer retina (Palmowski et al. 1997).
5.2.2.2 Slow flash mfERG (sfmfERG) study
In the commonly used version of the sfmfERG, there are 4 video frames in each
interval of the sfmfERG stimulus. The first frame is the multifocal stimulus,
which is followed by 3 dark frames to increase the time interval between
multifocal flash frames (by 13.33 x 3 = 39.99ms). The basic waveform of the
slow flash mfERG is shown in figure 5.2a. his enables the retinal responses to
develop and decay more completely and allows a clearer assessment of the
first-order component including the oscillatory potentials (OPs) (Lai et al. 2007).
OPs are believed to originate from the inner plexiform layer and be generated by
neural interaction (Lam 2005).
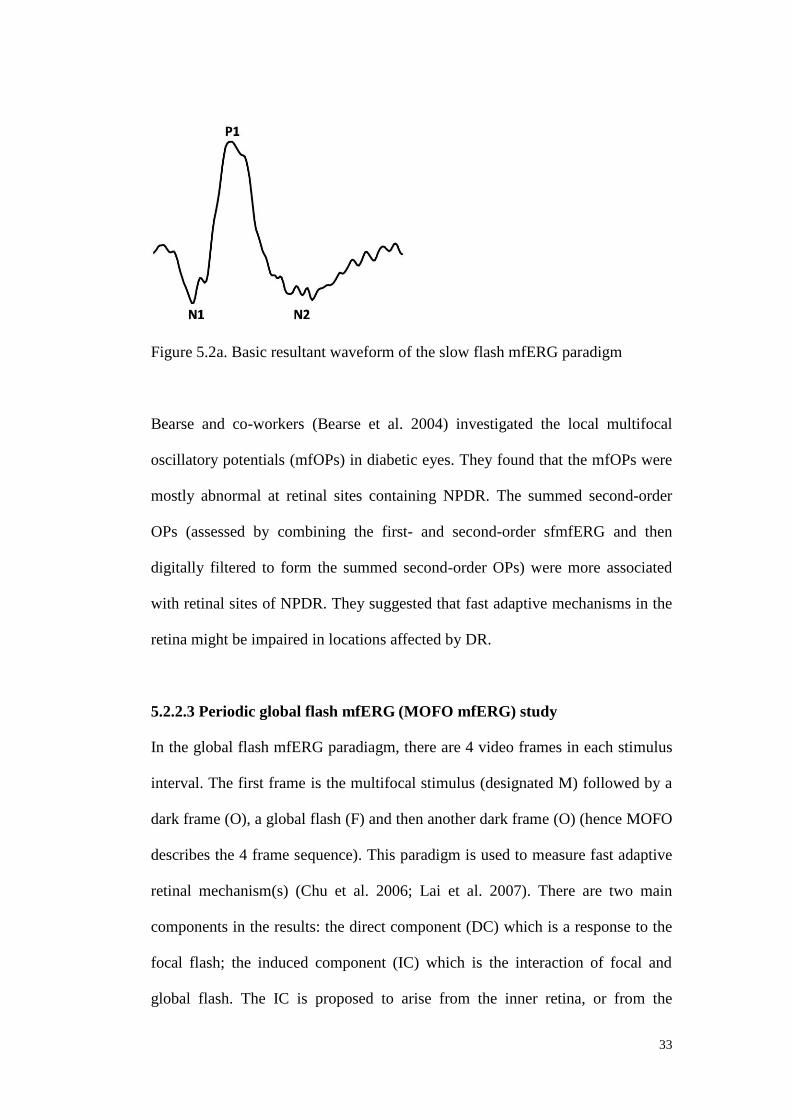
33
Figure 5.2a. Basic resultant waveform of the slow flash mfERG paradigm
Bearse and co-workers (Bearse et al. 2004) investigated the local multifocal
oscillatory potentials (mfOPs) in diabetic eyes. They found that the mfOPs were
mostly abnormal at retinal sites containing NPDR. The summed second-order
OPs (assessed by combining the first- and second-order sfmfERG and then
digitally filtered to form the summed second-order OPs) were more associated
with retinal sites of NPDR. They suggested that fast adaptive mechanisms in the
retina might be impaired in locations affected by DR.
5.2.2.3 Periodic global flash mfERG (MOFO mfERG) study
In the global flash mfERG paradiagm, there are 4 video frames in each stimulus
interval. The first frame is the multifocal stimulus (designated M) followed by a
dark frame (O), a global flash (F) and then another dark frame (O) (hence MOFO
describes the 4 frame sequence). This paradigm is used to measure fast adaptive
retinal mechanism(s) (Chu et al. 2006; Lai et al. 2007). There are two main
components in the results: the direct component (DC) which is a response to the
focal flash; the induced component (IC) which is the interaction of focal and
global flash. The IC is proposed to arise from the inner retina, or from the
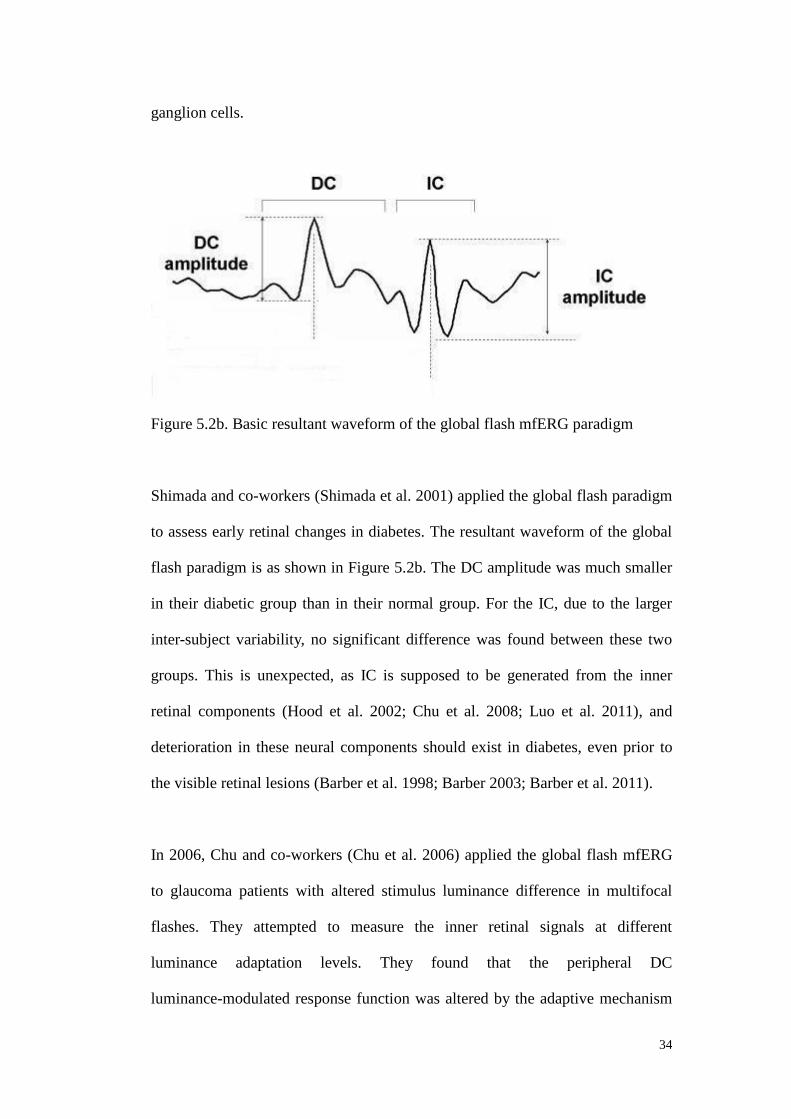
34
ganglion cells.
Figure 5.2b. Basic resultant waveform of the global flash mfERG paradigm
Shimada and co-workers (Shimada et al. 2001) applied the global flash paradigm
to assess early retinal changes in diabetes. The resultant waveform of the global
flash paradigm is as shown in Figure 5.2b. The DC amplitude was much smaller
in their diabetic group than in their normal group. For the IC, due to the larger
inter-subject variability, no significant difference was found between these two
groups. This is unexpected, as IC is supposed to be generated from the inner
retinal components (Hood et al. 2002; Chu et al. 2008; Luo et al. 2011), and
deterioration in these neural components should exist in diabetes, even prior to
the visible retinal lesions (Barber et al. 1998; Barber 2003; Barber et al. 2011).
In 2006, Chu and co-workers (Chu et al. 2006) applied the global flash mfERG
to glaucoma patients with altered stimulus luminance difference in multifocal
flashes. They attempted to measure the inner retinal signals at different
luminance adaptation levels. They found that the peripheral DC
luminance-modulated response function was altered by the adaptive mechanism

35
that was induced by the global flash. This luminance-modulated global flash
paradigm might help in reflecting an abnormal adaptive mechanism in ocular
diseases.
5.2.2.4 “Long-duration” stimulus mfERG
In the output waveform of the standard mfERG paradigm, there is a large overlap
of the on- and off-pathway responses. This may mask the different performance
along different pathways in the investigation of normal and abnormal retina. To
separate the on- and off-pathways, Kondo and Miyake (Kondo & Miyake 2000)
introduced a mfERG paradigm to simulate the “long-duration” flash in the
Ganzfeld full-field electroretinogram (Sieving 1993). By increasing the number
of multifocal flashes and dark frames, the overlap between the on-response (the
retinal signal measured when the light stimulus turns on) and off-response (the
retinal signal measured when the light stimulus turns off) in the mfERG can be
minimized. The basic resultant waveform is shown in figure 5.2c. This protocol
has been applied in some retinal diseases to study the responses of the on- and
off-pathways (Kondo et al. 1998; Marmor et al. 1999; Luu et al. 2005).
Figure 5.2c. Basic resultant waveform of the “long-duration” mfERG paradigm

36
5.2.3 Summary of the aims of this study
DR is one of the most common causes of blindness in the world. Two basic
hypotheses have been suggested as its cause; however, the exact mechanism of
DR development is still unclear. When cellular apoptosis begins and what types
of cells involved in the neurodegeneration process are still unknown (Barber et al.
1998). Early detection of neural changes in diabetes helps in understanding what
may delay the irreversible stage of DR. Also, neuroprotection might be the
direction to consider in the future medical treatment of DR (Westall 2005). The
mfERG, in standard form or in a modified paradigm provide a powerful and
objective tool which clinicians can assess the early neural changes in DR. This
may help in deciding the proper time to start the neuroprotective therapies, and to
assess the safety and effectiveness issues involved with various therapies.
In this study, its aims are to:
1) find out the optimal luminance combination for the MOFO mfERG paradigm
2) investigate the localized DR lesions by means of the MOFO mfERG paradigm
3) find out if the MOFO mfERG is sensitive enough to screen out the early DR
functional deterioration
4) compare the sensitivity among the three ocular assessments – MOFO mfERG
measurement, automated perimetry and the RNFL assessment
5) correlate the objective MOFO mfERG measurement with two common
morphological and functional clinical assessments - automated perimetry and
optical coherence tomography RNFL assessment in diabetic eyes
6) apply the "Long-duration" mfERG paradigm to investigate the on- and
off-pathway responses of the diabetic retina in order to study their lateral
antagonistic properties

37
Part II
Experiments

38
Chapter 6: Middle and inner retinal responses measured by MOFO mfERG
6.1 Experiment A1 – Effects of luminance combinations on the
characteristics of MOFO mfERG
Modified from the manuscript published in: Graefes Arch Clin Exp
Ophthalmol 2010; 248: 1117-25
6.1.1 Abstract
Purpose: This study aims to ascertain the characteristics of the response
triggered by the global flash multifocal electroretinogram (MOFO mfERG)
under various combinations of global and focal flash luminance, and to
determine the optimal conditions for this measurement.
Methods: Ten normal subjects with mean age 23.2 years (± 1.14 years) were
recruited for the MOFO mfERG measurement. The visual stimulation consisted
of four video frames (stimulus frame with 103 scaled hexagonal focal flashes,
followed by a dark frame, a global flash and then another dark frame). The focal
and global flash intensities were varied independently for four levels (50, 100,
200 and 400 cd/m2). The subjects then underwent measurements with sixteen
combinations of focal and global flash luminance. The direct component (DC)
and induced component (IC) of the MOFO mfERG were grouped into central
and peripheral regions for analysis.
Results: The central and peripheral DC amplitude increased with the focal flash
luminance under constant global flash luminance. Moreover, the proportion of
the global flash and focal flash intensity was shown to be important to achieve an
optimal IC response. When the ratio of global flash luminance to focal flash
luminance (g/f ratio) was kept at about 2:1, the central and peripheral IC
39
amplitude reached the peak value, and further increasing the global flash
luminance did not enhance the IC response magnitude. The implicit time of both
central and peripheral DC generally decreased with the increase of g/f ratio.
However, the implicit time of central and peripheral IC increased with increasing
g/f ratio.
Conclusion: The g/f ratio is important in the MOFO mfERG paradigm since the
DC and IC responses change with this ratio. In order to obtain both optimal DC
and IC responses, a g/f ratio of 1:1 with focal flash luminance between 100cd/m2
and 200cd/m2 is recommended. As the global flash mfERG paradigm is used to
study the interaction triggered by both flashes, the g/f ratio is a vital parameter
for measurement in future studies.
40
6.1.2 Introduction
The multifocal electroretinogram (mfERG) provides information regarding
topographic retinal responses. It helps in examining local functional changes or
losses in various retinal diseases such as glaucoma, diabetic retinopathy,
age-related macular degeneration and retinitis pigmentosa (Chan & Brown 1998;
Chan & Brown 1999; Chan & Brown 2000; Kretschmann et al. 2000;
Palmowski-Wolfe et al. 2006; Asano et al. 2007; Palmowski-Wolfe et al. 2007;
Nagy et al. 2008; Tyrberg et al. 2008; Gerth 2009; Wolsley et al. 2009). The
conventional mfERG signals have been reported to originate mainly from bipolar
cells (Hood et al. 2002; Ng et al. 2008). With a modified mfERG protocol
suggested by Sutter and his co-workers, the retinal responses from the inner
retinal layer, especially ganglion cell activity, can also be studied (Sutter et al.
1999).
This modified multifocal stimulation was used to study the retinal adaptive
mechanism by inserting interleaved global flashes between the successive frames
of the multifocal stimulus (Sutter et al. 1999). A large non-linear inner retinal
response could be triggered. This “global flash” protocol has been further applied
to study ocular diseases that involve the inner retina. Shimada et al. (Shimada et
al. 2001) used the global flash paradigm for the early detection of functional
changes in DR. Chu et al. (Chu et al. 2006; Chu et al. 2007) further modified the
global flash protocol to facilitate the early detection of glaucoma.
In the global flash mfERG response, there are two main components: the direct
component (DC) and the induced component (IC). The DC is the mean response
to the focal flash and the IC is an adaptive response due to the interaction of the

41
focal and the global flash (Shimada et al. 2005). The DC has been proposed to be
composed of outer retinal responses and inner retinal oscillation-like wavelets;
the origin of the IC has been proposed to be predominantly from the inner retinal
layers (Sutter & Bearse 1999; Chu et al. 2008). This modified protocol
demonstrates its capability in diagnosing inner retinal dysfunction. Since the
luminance intensities of the focal and global flashes can influence the retinal
physiology that alters the characteristics (i.e. amplitude, implicit time) of the DC
and IC, apart from applying it as a clinical tool, it is important to understand the
effects of luminance on this protocol.
Shimada and colleagues have studied the effect of different combinations of focal
and global flash luminance in the MOFO paradigm (Shimada et al. 2005) but
used only three subjects with a wide age range (23-63 years) for all experimental
conditions. This did not provide an adequate description of MOFO mfERG
response characteristics. Moreover, a thorough understanding of the relationship
between the global and focal flash luminance and the DC and IC characteristics
should help to increase the value of the MOFO global flash mfERG for different
purposes. Hence, the optimal setting of the focal and global flash luminance
would help in maximizing the measurement of outer and inner retinal responses.
This is necessary to achieve the most effective paradigm, especially in the
clinical assessment of retinal diseases. In this study, we investigated the
characteristics of the DC and IC at different retinal regions under various
luminance combinations (both global and focal flashes) in the global flash
(MOFO) mfERG paradigm. We attempted to suggest the optimal luminance
setting for this particular mfERG paradigm.
42
6.1.3 Methods
6.1.3.1 Subjects and inclusion criteria
Ten normal subjects (age range 21-24 years, mean age 23.2 ± 1.14 years) were
recruited for this study. The subjects had visual acuity of 6/6 without any ocular
or systemic disorders. Their refractive errors were within +3.00 to -6.00 D with
less than -1.25 D of astigmatism. One eye was randomly selected for
measurement. Pupil dilatation was carried out on the tested eye of the subjects
with room illumination (about 100 lux) throughout the whole experiment. All
procedures of the study followed the tenets of the Declaration of Hesinki. The
study was approved by the Ethics Committee of The Hong Kong Polytechnic
University. Informed consent was obtained from each subject after the
experimental procedures were described.
6.1.3.2 Experimental set-up and procedures
6.1.3.2.1 Stimulus conditions
The VERIS Science 5.1 system (Electro-Diagnostic-Imaging; San Mateo, CA,
USA) was used for the mfERG measurement. The visual stimulus consisted of
103 scaled hexagons subtending a visual angle of about 45. The stimulus was
displayed on a high luminance CRT monitor (FIMI, Medical Electronic
Equipment, Italy). The hexagonal stimulation followed a pseudo-random binary
m-sequence (213-1) with a video frame rate of 75 Hz. There were four video
frames in the stimulation sequence: a frame with pseudo-random focal flash
followed by a full screen dark frame, a full screen global flash and another full
screen dark frame. The total duration of these four video frames was 53.2 ms,
with 13.3 ms between frames. The luminances of the focal flash and the global
flash were varied independently, with four different luminance levels used (50,

43
100, 200 and 400 cd/m2); the dark frame was set to a luminance of 2 cd/m2. This
gave sixteen combinations of global (g) and focal (f) flash luminance for this
study. The background luminance was set at 100 cd/m2. A central cross on the
stimulus pattern was used for fixation.
6.1.3.2.2 Recording conditions
Before testing, the pupil of the tested eye was fully dilated with 1% tropicamide
(Alcon, Fort Worth, TX). The untested eye was occluded by an eye patch. A
Dawson-Trick-Litzkow (DTL) electrode was used as the active electrode.
Gold-cup electrodes were placed at the ipsilateral temporal side and forehead
respectively as reference and ground electrodes. The refractive error of the tested
eye was corrected by the spherical equivalent power for a viewing distance of 33
cm. The signals were amplified by 100,000 with a band-pass filter from 3 to 300
Hz (Grass Instrument Co., Quincy, MA, U.S.A.). The recording time for each
luminance combination was about eight minutes. There were a total of sixteen
recordings for each subject. The sequence of the sixteen recordings was
randomized. The sixteen recordings took place over two days over to minimize
subjects’ fatigue. Each recording was divided into thirty-two segments of
approximately 14 seconds and a break was allowed between each segment. The
recording quality, including the fixation quality, was monitored using the real
time display from VERIS. Any segment contaminated by poor fixation, eye
movements, or blinks was rejected and re-recorded immediately.

44
6.1.3.3 Statistical analysis and g/f ratio calculation
The mfERG responses were grouped into two regions: central (Ring 1-2, about
7 of the central visual field) and peripheral (Ring 4-6, about 17.2 to 44.5
visual field). Ring 3 was a transitional region between the central and peripheral
regions (Chu et al. 2006), and it was excluded from the analysis. The first-order
kernel of the mfERG response was extracted and analysed. The DC and IC
peak-to-peak amplitudes of the mfERG were measured and compared among
different combinations of the global and focal flash luminance as shown in
Figure 6.1a and 6.1b. The implicit times of the DC and IC were also measured
for analysis. All the comparisons were performed by repeated measures ANOVA
with Bonferroni post-hoc test. The ratio of global flash luminance to focal flash
luminance (g/f ratio) was also applied to correlate with changes in the DC and IC
responses.
Figure 6.1a. Central MOFO mfERG waveform
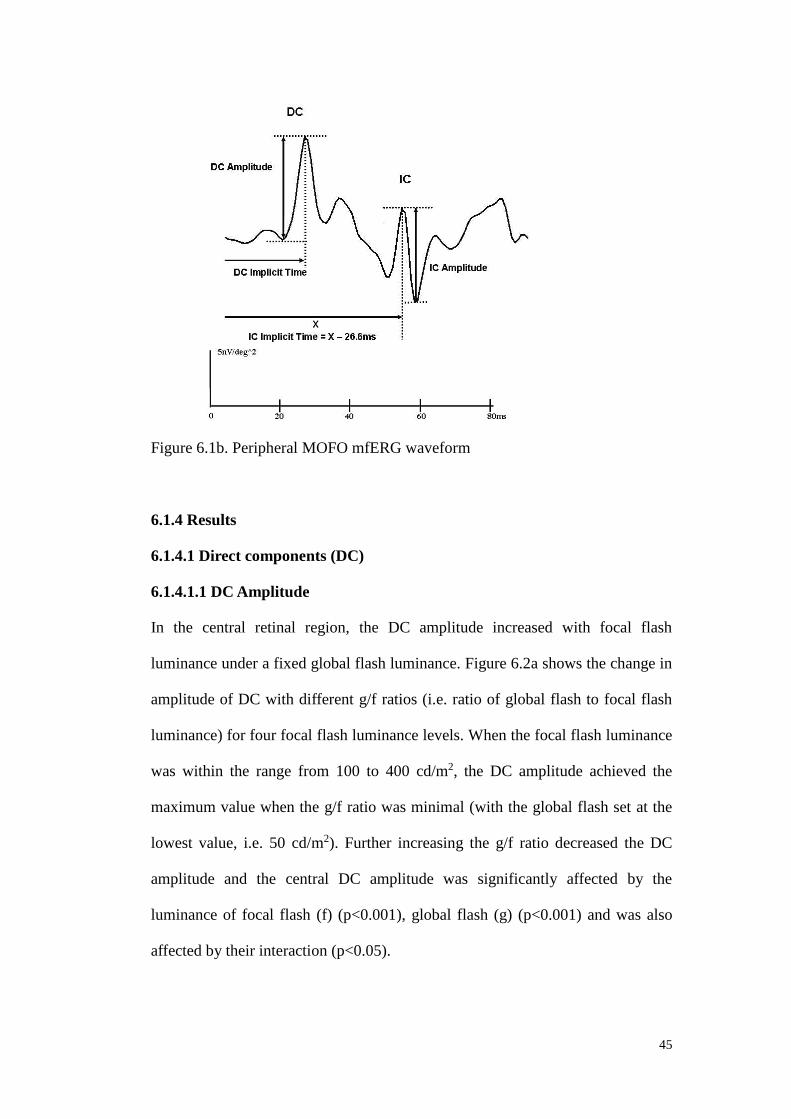
45
Figure 6.1b. Peripheral MOFO mfERG waveform
6.1.4 Results
6.1.4.1 Direct components (DC)
6.1.4.1.1 DC Amplitude
In the central retinal region, the DC amplitude increased with focal flash
luminance under a fixed global flash luminance. Figure 6.2a shows the change in
amplitude of DC with different g/f ratios (i.e. ratio of global flash to focal flash
luminance) for four focal flash luminance levels. When the focal flash luminance
was within the range from 100 to 400 cd/m2, the DC amplitude achieved the
maximum value when the g/f ratio was minimal (with the global flash set at the
lowest value, i.e. 50 cd/m2). Further increasing the g/f ratio decreased the DC
amplitude and the central DC amplitude was significantly affected by the
luminance of focal flash (f) (p<0.001), global flash (g) (p<0.001) and was also
affected by their interaction (p<0.05).

46
In the peripheral retinal region, the DC amplitude increased with the focal flash
luminance but decreased with the global flash luminance. When the focal flash
luminance was within the range of 100 to 400 cd/m2, the DC response reached
the maximum value while the g/f ratio was the smallest (Figure 6.2b). It was
significantly affected by the luminance of focal flash (p<0.001), global flash
(p<0.005) and their interaction (p<0.025).
When the global flash intensity was less than the focal flash intensity (i.e. g/f
ratio < 1), the DC responses for the focal flash intensity from 100 to 400 cd/m2
showed a similar trend. Post-hoc testing revealed that with the combination of g/f
at 50/400, the DC amplitude achieved the maximum value in both the central and
peripheral regions; when the combination of g/f was at 400/50, amplitude was at
its minimum value. These findings show that a focal flash luminance greater than
or equal to 100 cd/m2, together with a global flash of not more than 400 cd/m2
gives rise to a better DC signal. Under constant focal flash luminance, if the
global flash is less than or equal to the focal flash luminance (i.e. g/f ratio ≤ 1), a
reasonable DC signal is obtained.

47
Figure 6.2a. The central DC amplitude at various g/f ratios. Each coloured line
represents the DC amplitude under different focal flash intensities. The error bar
shows ± 1 standard deviation.
Figure 6.2b. The peripheral DC amplitude at various g/f ratios. Each coloured
line represents the DC amplitude under different focal flash intensities. The error
bar shows ± 1 standard deviation.

48
6.1.4.1.2 DC Implicit time
The change in the central DC implicit time as a function of the g/f ratio is shown
in Figure 6.3a. When the global flash was dimmer than the focal flash (g/f ratio <
1), the higher the focal flash intensity, the longer was the delay in the DC implicit
time, at the same g/f ratio. Initially, the implicit time increased with the g/f ratio.
After increasing to a certain level, it would then decrease. It was significantly
affected by changes in the focal flash luminance (p<0.001). The scattered points
of the DC implicit time in the central region converged with the increase in g/f
ratio (Figure 6.3a).
The peripheral DC implicit time decreased with an increasing g/f ratio. In other
words, a brighter global flash would trigger the DC to occur earlier (Figure 6.3b).
It was affected by the intensity of the focal flash (p<0.001), global flash (p<0.001)
and their interaction (p<0.001). The peripheral DC implicit time seemed to reach
the maximum as the g/f ratio was less than 1. Thereafter, the implicit time
decreased.

49
Figure 6.3a. The central DC implicit time at various g/f ratios. Each coloured line
represents the DC amplitude under different focal flash intensities. The error bar
shows ± 1 standard deviation.
Figure 6.3b. The peripheral DC implicit time at various g/f ratios. Each coloured
line represents the DC amplitude under different focal flash intensities. The error
bar shows ± 1 standard deviation.

50
6.1.4.2 Induced components (IC)
6.1.4.2.1 IC Amplitude
In the central retinal region, when the focal flash luminance ranged from 50 to
200 cd/m2, the IC amplitude increased with the global flash luminance until the
g/f ratio reached 2 (i.e. the global flash luminance was twice the focal flash
luminance). Thereafter, the IC amplitude began to decrease even with further
increase in the global flash intensity (Figure 6.4a). The central IC signal was
significantly affected by the luminance of the focal flash (p<0.005) and its
interaction with the global flash luminance (p<0.025) as described below.
The IC amplitude in the peripheral region showed the same characteristic as in
the central region. When the focal flash luminance was within the range of 50 to
200 cd/m2, the IC response increased with the global flash luminance until the g/f
ratio was about 2 (Figure 6.4b). Beyond this point, the IC amplitude decreased.
The peripheral IC response was significantly affected by the focal flash
(p<0.025), global flash (p<0.001) and their interaction (p<0.005).
Post-hoc testing showed that the g/f combinations of 100/50 and 200/100 led to
the maximum IC amplitude in the central and peripheral regions respectively,
while the combinations of 50/200 and 50/100 led to the minimum IC amplitude
in the central and peripheral regions respectively. A focal flash luminance less
than or equal to 400 cd/m2 and a global flash greater than or equal to 100 cd/m2
gave rise to a better IC response. For a focal flash between 50 and 200 cd/m2, the
global flash luminance should be greater than or equal to the focal flash in order
to achieve a reasonable IC signal (i.e. g/f ratio1), except for the combination
with focal flash of 200 cd/m2 and global flash of 100 cd/m2. The IC signal

51
generated by this combination did not show a significant difference compared
with other combinations.
Figure 6.4a. The central IC amplitude at various g/f ratios. Each coloured line
represents the DC amplitude under different focal flash intensities. The error bar
shows ± 1 standard deviation.
Figure 6.4b. The peripheral IC amplitude at various g/f ratios. Each coloured line
represents the DC amplitude under different focal flash intensities. The error bar
shows ± 1 standard deviation.

52
6.1.4.2.2 IC Implicit time
The IC implicit time in the central retina was significantly affected by the global
flash luminance (p<0.01) and it was generally delayed with increased g/f ratio
(Figure 6.5a). The changes were variable at different focal flash luminance levels.
IC implicit time increased within each set of focal luminance measures, peaking
at the third and fourth g/f measure.
However in the peripheral retinal region, the IC implicit time was delayed with
an increase in the g/f ratio, that is, the IC implicit time was lengthened with
brighter global flash than with the focal flash. IC implicit time increased for g/f
rations up to 1 in the periphery. The delay of response then seemed not to
increase when the g/f ratio exceeded 1 (Figure 6.5b). It was significantly affected
by both the intensities of the focal (p<0.001) and global flashes (p<0.01).
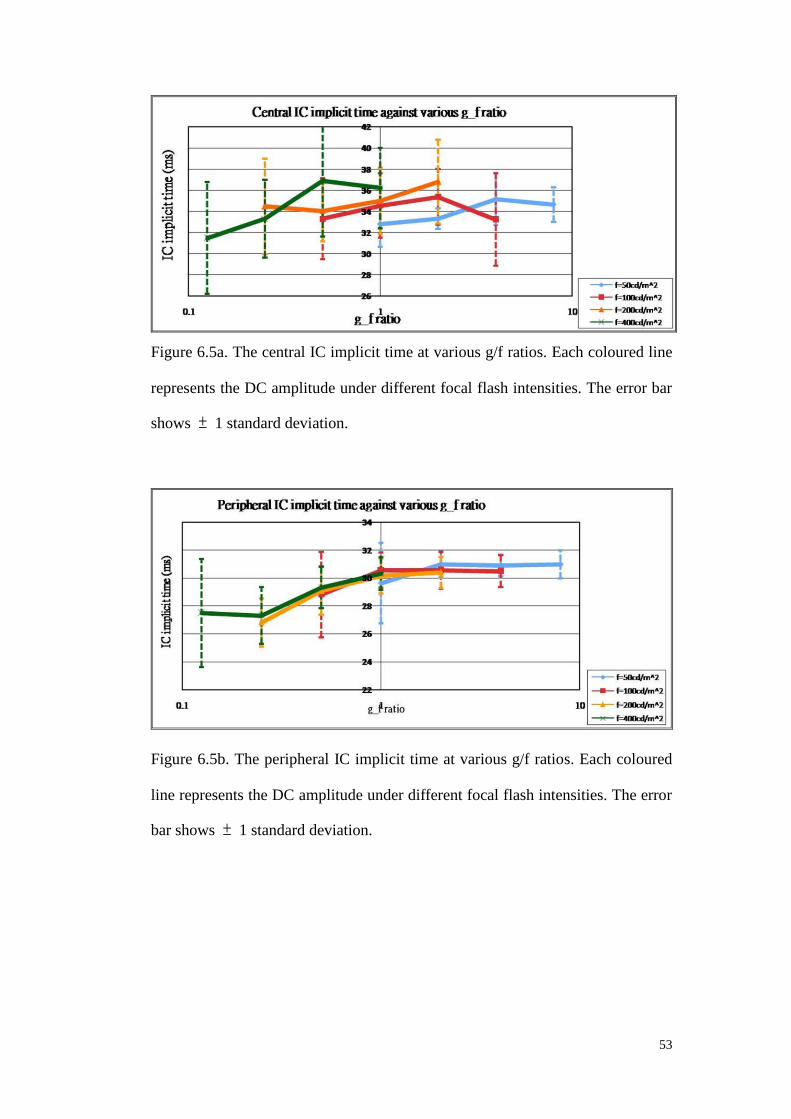
53
Figure 6.5a. The central IC implicit time at various g/f ratios. Each coloured line
represents the DC amplitude under different focal flash intensities. The error bar
shows ± 1 standard deviation.
Figure 6.5b. The peripheral IC implicit time at various g/f ratios. Each coloured
line represents the DC amplitude under different focal flash intensities. The error
bar shows ± 1 standard deviation.

54
6.1.5 Discussion
6.1.5.1 Changes of MOFO mfERG responses with g/f ratio
In the periodic global flash mfERG measurement, the resultant waveform
contains two sharp peaks: the direct component (DC) and the induced component
(IC). These findings clearly show that the amplitudes and implicit times of both
responses are influenced by the intensity of global and focal flashes as well as by
the combination of these two flashes (i.e. g/f ratio). The DC contains the
response predominantly from the ON- and OFF-bipolar cells with oscillatory
wavelets from the inner retina forming a small component; this is generated from
the inner retina, mainly from ganglion cells and amacrine cells (Chu et al. 2008).
The mfERG waveforms and amplitudes change with retinal eccentricity (Sutter
& Tran 1992; Sutter & Bearse 1999; Sutter et al. 1999; Chu et al. 2006);
therefore, in this study, we divided retinal responses into central (about central 7)
and peripheral regions (about 17.2 to 44.5) examine the variations of DC and
IC responses under conditions with different luminance. A new parameter, the g/f
ratio for this MOFO measurement, is introduced to assist in understanding how
the interaction of the global and focal flashes influences both DC and IC in terms
of amplitude and implicit time.
In a previous study (Shimada et al. 2005), the DC amplitude was found to
increase approximately linearly with increasing log units of focal flash intensity.
These findings were consistent with those of Shimada and both the central and
peripheral DC amplitudes increased with the focal flash intensity. The DC
amplitude seemed to achieve its largest value when the g/f ratio was kept at the
minimum. Different proportions of global flash intensity and focal flash intensity

55
produced a larger DC response instead of increasing the focal flash intensity
alone. A greater flash intensity could improve the signal-to-noise ratio, but the
greater luminance would cause irritation to the subjects during measurements. By
applying the g/f ratio, an optimal DC response can be obtained even under a
focal flash with dimmer and more comfortable intensity.
The IC is the response change to the global flash from the preceding focal flash
and it has been reported to be related to the inner retina (Chu et al. 2008). After
the IC amplitude peaked at a g/f ratio of 2:1, the retinal response did not increase
further with the increased global flash intensity. This demonstrated the non-linear
characteristics of the inner retinal adaptive mechanisms. Shimada et al (Shimada
et al. 2005) found a point of inflexion for the individual data when both
intensities of focal flash and global flash were equal to 200 cd/m2. This point was
absent in the present study. There are two possible explanations. Firstly, ring 3,
regarded as a transition zone, was discarded in the retinal area grouping for
analysis in the current study. Secondly, the adaptive mechanisms of the central
and peripheral IC may not be similar. Figure 6.1a and 6.1b illustrate the
waveforms from the central and peripheral regions. Due to the shift of implicit
time, the waveform at the central and peripheral regions showed different
patterns. This may be why the waveforms from the present findings differed from
the grouped responses shown in their study. The separated analysis of the central
and peripheral responses may make the point of inflexion less obvious. This may
also explain why the IC property at g/f ratio equal to 2:1 was not obvious in
Shimada’s study.
Under constant focal flash intensity, a shortened DC implicit time was reported

56
with increasing global flash intensity (Shimada et al. 2005). Their findings were
only similar to the present results when g/f ratio was less than or equal to 1. The
performance of the central DC implicit time was opposite to that reported when
g/f ratio was greater than 1. The peripheral DC implicit time was initially stable
as g/f ratio increased and it decreased when the ratio was greater than 1. This
showed that the implicit time of the DC in different retinal regions behaved
differently according to the ratio. The IC implicit time in the central region was
initially delayed with an increase in the g/f ratio until it reached a saturated level
with the ratio more than 1. Its variation was more obvious in the peripheral
region. It was also very similar to the findings reported in Shimada’s study
(Shimada et al. 2005) which showed a shorter IC implicit time when the focal
flash intensity was greater than the global flash intensity. When comparing their
reported implicit times in both central and peripheral regions, different behaviors
under different g/f ratios suggested that the adaptive mechanism had different
characteristics across the retina. In terms of the implicit times between DC and
IC, the trends of the variations in both DC and IC implicit times were totally
different. The DC became less delayed but the IC became more delayed as the g/f
ratio increased in value. This clearly demonstrated different physiological
characteristics of the DC and IC in response to the combinations of the global
and focal flash intensities.
6.1.5.2 Optimal conditions of MOFO mfERG
Considering the stray light problem suggested by the ISCEV guideline (2007)
(Hood et al. 2008) and the patients’ discomfort, the focal flash luminance,
according to the current findings, should be between 100 and 200 cd/m2.
Together with a global flash dimmer than the focal flash, a considerable DC

57
amplitude with good signal-to-noise ratio can be obtained (i.e. 100 cd/m2 < f ≤
200 cd/m2, f g). My recommended focal flash luminance is higher than the
range suggested by Shimada et al. (i.e. 50 cd/m2 < f < 100 cd/m2) (Shimada et al.
2005).
For a reasonable IC amplitude, it is recommended, that the focal flash should be
less than or equal to 200 cd/m2 and the global flash higher than or equal to 100
cd/m2. The g/f ratio should be kept at greater than or equal to 1 (i.e. f ≤ 200 cd/m2;
g 100 cd/m2; f ≤ g). The focal flash luminance suggested in this study is higher
than that of Shimada et al. (Shimada et al. 2005) .
Thus, in order to obtain both optimal DC and IC responses, a g/f ratio of 1:1 and
with focal flash luminance greater than 100 cd/m2 and smaller than 200 cd/m2
would be recommended.

58
6.2 Experiment A2- Early local functional changes in human diabetic retina:
a global flash mfERG study
Modified from the manuscript published in: Graefes Arch Clin Exp
Ophthalmol 2012; 250: 1745-54
6.2.1 Abstract
Purpose: To investigate early functional changes of local retinal defects in type
II diabetic patients using the global flash multifocal electroretinogram (MOFO
mfERG).
Methods: Thirty-eight diabetic patients and fourteen age-matched controls were
recruited. Nine of the diabetics were free from diabetic retinopathy (DR) while
the remainder had mild to moderate non-proliferative diabetic retinopathy
(NPDR). The MOFO mfERG was performed at high (98%) and low (46%)
contrast levels. MfERG responses were grouped into 35 regions for comparison
with DR classification at those locations. Z-scores of the regional mfERG
responses were compared across different types of DR defects.
Results: The MOFO mfERG waveform indicated a local reduction in DC and IC
amplitudes in diabetic patients with and without DR. With increasing severity of
retinopathy, there was a further deterioration in amplitude of both components.
Under the MOFO mfERG paradigm, DC and IC amplitudes were useful
screening parameter as compared to their implicit times.
Conclusion: The MOFO mfERG can help in detecting early functional
anomalies before the appearance of visible signs of DR, and may assist in
monitoring further functional deterioration in diabetic patients.

59
6.2.2 Introduction
Diabetic Retinopathy (DR) is the most frequent cause of new cases of blindness
in the working population (Porta & Bandello 2002; Fong et al. 2003; Carmichael
et al. 2005). In the first two decades after diagnosis of the disease, over half of
the patients with Type II DM have retinopathy (Fong et al. 2003; Carmichael et
al. 2005). Diabetic patients are usually assessed using ophthalmoscopy and
fundus photography (Aldington et al. 1995; Fong et al. 2003). The main focus is
to detect visible sign of vascular retinopathy in order to monitor progress of DR
and to avoid its sight-threatening complications (Harding et al. 1995; Carmichael
et al. 2005), however the basis of functional changes in the retina, especially in
the early stages, has not been determined.
The Ganzfeld full-field electroretinogram has been used to study the changes of
retinal function in diabetic patients (Yamamoto et al. 1996; Holopigian et al.
1997; Kizawa et al. 2006; Luu et al. 2010). The defects of DR are not distributed
uniformly across the retina and show a range of stages of development (Kern &
Engerman 1995). The fullfield electroretinogram, which is a summated retinal
response measurement, is not likely to reflect local or eccentric functional
changes in diabetes. The multifocal electroretinogram (mfERG) provides
objective topographical measurements of retinal responses across the visual field
(Sutter & Tran 1992). Palmowski et al. (Palmowski et al. 1997) and Shimada et
al. (Shimada et al. 2001) examined retinal function in diabetes using the mfERG;
however, the mfERG responses were either grouped into rings, quadrants or
summed across the retina. Such groupings lose the fine topographic details in
studying various types of vascular defect (Fortune et al. 1999; Bearse et al. 2004).
Bearse et al. applied the slow flash mfERG in a study of local oscillatory

60
potentials in the diabetic retina and suggested that retinal adaptation was more
likely to be abnormal at sites with early retinopathy (Bearse et al. 2004).
Bronson-Castain et al. and Fortune et al. applied the conventional mfERG to the
diabetic retina and observed an implicit time delay increasing with the severity of
retinopathy. However, local response amplitudes failed to show a consistent
relationship with retinal abnormalities in diabetic eyes (Fortune et al. 1999;
Bronson-Castain et al. 2009).
Sutter and Bearse used the MOFO mfERG to study retinal adaptive effects. In
the global flash mfERG, waveform (Figure 6.6), the direct component (DC)
arises predominantly from bipolar and N-methyl-D-aspartic-acid
(NMDA)-sensitive cells; the induced component (IC) is predominantly from
NMDA-sensitive cells and ganglion cells from the inner retina (Chu et al. 2008).
This global flash mfERG allows separate examination of the response from the
outer and inner retina. In addition, Hood and co-workers found that nonlinear
retinal responses saturate at high contrast levels and they suggested that low
contrast stimuli would enhance the inner retinal response (Hood et al. 1999).
The aim of this study was to investigate the early local functional changes in
diabetic retina at both high (98%) and low (46%) contrast levels. The use of the
periodic global flash multifocal electroretinogram (MOFO mfERG) in diabetic
patients assisted in correlating the local functional changes with retinopathy, and
in investigating the depth of retinal dysfunction in diabetic patients.
61
6.2.3 Methods
6.2.3.1 Subject recruitment and inclusion criteria
Thirty-eight type II diabetic patients were examined: nine (aged 49.7 6.4 years)
did not have DR while twenty-nine (aged 49.8 6.4 years) had mild to moderate
NPDR. Fourteen control subjects (aged 49.4 7.0 years) were also examined. All
subjects had visual acuity better than 6/9. Their refractive errors were between
+3.00 and -6.00 D, and astigmatism was less than -1.25 D. None had any
clinically significant ocular or systemic disorders other than DM or DR. The
plasma glucose level of the subjects was measured during the visit using a blood
glucose meter (Accu-Chek Compact Plus, F. Hoffmann-La Roche Ltd, Basel,
Switzerland), at least two hours after any food intake. Ten healthy controls and
thirty-six diabetic patients consented to plasma glucose measurements. The
duration of DM was based on patient’s own report, and was represented by an
ordinal parameter (DM diagnosed less than 5 years, DM diagnosed for 5 to 10
years, DM diagnosed for more than 10 years).
All procedures of the study followed the tenets of the Declaration of Hesinki.
This study was approved by the Ethics Committee of The Hong Kong
Polytechnic University. Informed consent was obtained from each subject
following full explanation of the experimental procedures.
6.2.3.2 Experimental set-up and procedures
6.2.3.2.1 Stimulus conditions
The VERIS Science 5.1 system (Electro-Diagnostic-Imaging, San Mateo, CA,
USA) was used for mfERG measurement. The stimulus was shown on a high
luminance CRT monitor (FIMI Medical Electrical Equipment, Saronno, Italy).
62
The stimulus pattern contained 103 scaled hexagons with an angular subtense of
44 vertically and 47 horizontally. The sequence of hexagonal pattern
stimulation followed a pseudo-random binary m-sequence (213-1) with a video
frame rate of 75 Hz. In each MOFO stimulation, there were four video frames: a
frame with pseudo-random m-sequence focal flash, followed by a full-screen
dark frame, a full-screen global flash, and another full-screen dark frame. The
duration of one MOFO stimulation sequence was 53.3 ms. The background
luminance of the mfERG display was 100 cd/m2. At the high contrast level (98%),
both the luminance of the bright phase of the multifocal stimulus and the global
flashes were set at 200 cd/m2 as suggested in Experiment A1 (Ch. 6.1) (Lung &
Chan 2010), in order to obtain optimal DC and IC responses. The dark phase was
set at a luminance of 2 cd/m2. At the low contrast level (46%), the bright phase of
the multifocal stimulus was set at 166 cd/m2, while the dark phase was set at 61
cd/m2. A central cross on the stimulus pattern was used as a fixation target. One
eye was randomly selected for mfERG measurement. The recording was carried
out with room illuminance of about 100lux.
6.2.3.2.2 Recording conditions
Detailed eye examination (including subjective refraction, biomicroscopy and
indirect ophthalmoscopy) with fundus photodocumentation was carried out for
each subject. Slit-lamp biomicroscopic assessment was performed and the
crystalline lens was graded according to the Lens Opacities Classification System
III (Chylack et al. 1993). Best-corrected VA was measured in order to exclude
subjects with clinically significant cataract condition which led to
non-age-related visual impairment. Stratus optical coherence tomography (Carl
Zeiss Meditec, Inc., Dublin, CA, USA) was used to measure macular thickness in

63
a fast scanning mode in order to rule out any subjects with macular oedema. In
the MOFO mfERG measurement, the pupil of the tested eye was dilated with 1%
tropicamide (Alcon, Fort Worth, TX, USA) to at least 7 mm diameter. The
untested eye was occluded. A Dawson-Trick-Litzkow (DTL) electrode was
placed on the lower bulbar conjunctiva as the active electrode. Gold-cup
electrodes were used as reference and ground electrodes, on the temporal side of
the tested eye and forehead respectively. The ERG signal was amplified
(x100,000) and band-pass filtered (3-300 Hz) (Grass Instrument Co., Quincy,
MA, USA). The MOFO mfERG protocol was randomly carried out at high (98%)
and low (46%) contrast levels. The mfERG recording time for each contrast level
was about 8 minutes and was divided into 32 segments. Each segment lasted
approximately 14 seconds, and a short break was provided between segments.
The refractive error of the tested eye was corrected for the viewing distance of 33
cm. The recording quality as well as the fixation quality was monitored using the
real time display of the VERIS program. Segments contaminated by poor
fixation, eye movement or blinks were rejected and re-recorded immediately.
6.2.3.3 Data Analysis
6.2.3.3.1 Analysis of the MOFO mfERG responses
The 103 MOFO mfERG trace arrays were grouped into 35 regions as suggested
by Bearse and colleagues. This grouping combines similar waveforms while
maintaining their nasal, temporal and eccentricity locations (Figure 6.7) (Bearse
et al. 2003; Bearse et al. 2004). For each region, signal amplitudes of the DC and
IC were measured. The DC implicit time was measured from the onset of the
multifocal stimulus to the peak of DC; the IC implicit time was measured from
the onset of the global flash to the peak of IC (Figure 6.6). Left eye MOFO
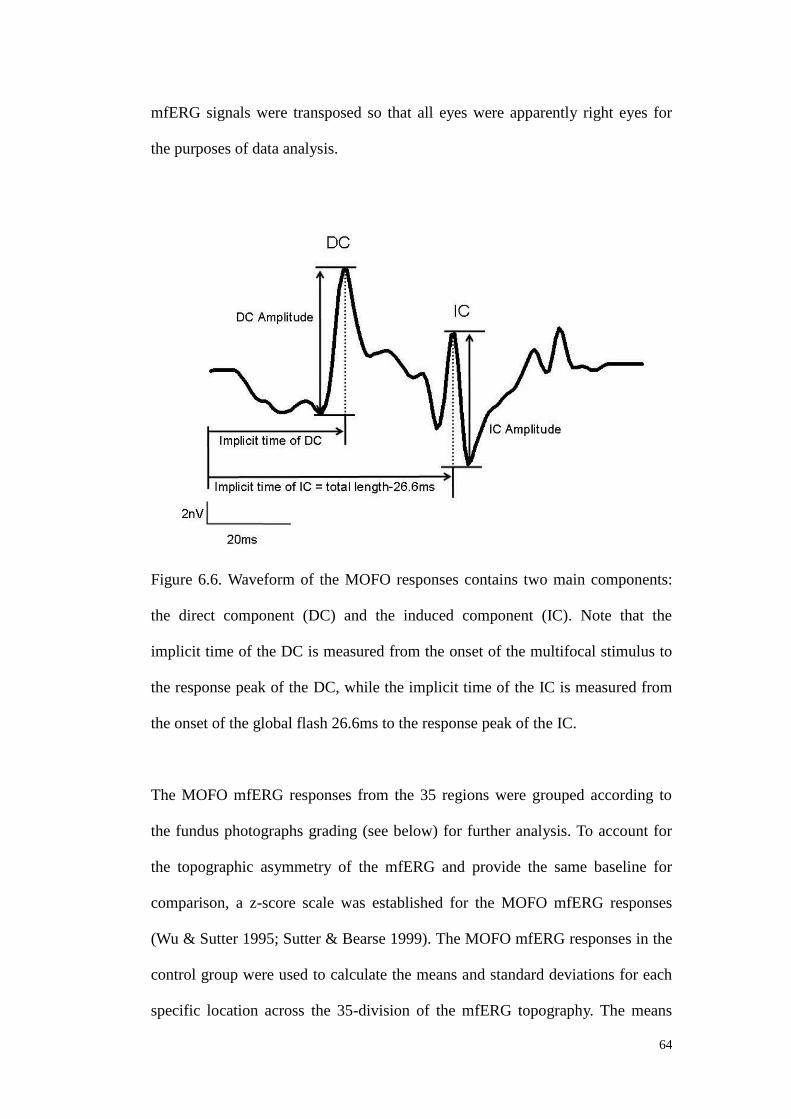
64
mfERG signals were transposed so that all eyes were apparently right eyes for
the purposes of data analysis.
Figure 6.6. Waveform of the MOFO responses contains two main components:
the direct component (DC) and the induced component (IC). Note that the
implicit time of the DC is measured from the onset of the multifocal stimulus to
the response peak of the DC, while the implicit time of the IC is measured from
the onset of the global flash 26.6ms to the response peak of the IC.
The MOFO mfERG responses from the 35 regions were grouped according to
the fundus photographs grading (see below) for further analysis. To account for
the topographic asymmetry of the mfERG and provide the same baseline for
comparison, a z-score scale was established for the MOFO mfERG responses
(Wu & Sutter 1995; Sutter & Bearse 1999). The MOFO mfERG responses in the
control group were used to calculate the means and standard deviations for each
specific location across the 35-division of the mfERG topography. The means

65
and standard deviations obtained above were then used to calculate the z-score of
the MOFO mfERG responses for each subject at that specific region (by
subtracting the mean from the individual mfERG response and then dividing it
by the standard deviation obtained from the control group.
Equation:
Z-score of the MOFO mfERG response =
(Individual response - Mean response of the control group)
Standard deviation
6.2.3.3.2 Relating the plasma glucose level, DM duration and averaged
mfERG responses in the control and diabetic subjects
The plasma glucose level was compared between the control and diabetic
subjects by independent t-test. The MOFO mfERG responses from the
35-division array were averaged so that each subject gave a mean z-score of the
mfERG responses. The correlation between the individual plasma glucose level
and DM duration with the averaged mfERG responses of the diabetic subjects
was then obtained.
6.2.3.3.3 Mapping between fundus photographs and MOFO mfERG
topography
A Topcon IMAGEnet Fundus camera was used to take colour fundus
photographs with one central 45° field and eight peripheral surrounding fields.
The fundus photographs from various fields were grouped into a single
photograph in mosaic format. The 103 hexagonal pattern of the mfERG
topography was aligned with the mosaic of fundus photos for each subject. The

66
blind spot depression and the central peak were aligned with the optic disc and
fovea respectively. The 103 hexagons were then grouped into the 35-division
pattern as shown in Figure 6.2 (Calculations including the range of corrections
used in these experiments and the range of axial lengths expected suggest that the
variation in magnification of the retinal image of the stimulus pattern would be
small, in the range of 3%).
Figure 6.7. The multifocal stimuli pattern was mapped with the automated
mosaic fundus photo (each circle indicates the fundus photo taken at a particular
gaze position. There are in total nine gaze positions, one central gaze position
and eight peripheral gaze positions, to form a mosaic fundus photo). Both were
divided into 35 regions as in previous studies (about two to three hexagons were
grouped as one region in the mfERG topography as indicated by the dark
polygons). This figure illustrates the regional mfERG waveform of a diabetic

67
patient with DR lesions at different locations. Those regional mfERG samples
with DR (in red lines) are compared with the averaged regional samples from the
control group (in blue lines).

68
6.2.3.3.4 Grouping of data
The regional retinal defects were then graded by a masked retinal specialist
according to the following scales based on the severity of retinopathy:
Group 0 Regional samples from control subjects
Group 1 Regional samples from DM patients without retinopathy (“No
NPDR” group) (equivalent up to the ETDRS level 10) (Early
Treatment Diabetic Retinopathy Study Research Group 1991; Early
Treatment Diabetic Retinopathy Study Research Group 1991)
Group 2 Regional samples containing hard exudates (“HE” group)
(equivalent up to the ETDRS level 14) (Early Treatment Diabetic
Retinopathy Study Research Group 1991; Early Treatment Diabetic
Retinopathy Study Research Group 1991)
For the regional samples with definite haemorrhage (equivalent up
to the ETDRS level 35 and 43) (Early Treatment Diabetic
Retinopathy Study Research Group 1991; Early Treatment Diabetic
Retinopathy Study Research Group 1991), they were further divided
into two types (outer and inner retinal haemorrhage) based on the
retinal depth of the haemorrhage
Group 3 Regional samples containing outer retinal haemorrhage – Dot/ Blot
haemorrhage, together with or without hard exudates (“Outer retinal
haemorrhage +/- HE” group)
Group 4 Regional samples containing inner retinal defect – Flame
haemorrhage, together with or without cotton-wool-spots (“Inner +/-
Outer retinal haemorrhage +/- CWS +/- HE” group)
(Note that retinal regions with small drusen and the retinal regions lacking

69
retinopathy signs from the NPDR groups were excluded).
6.2.3.3.5 Statistical analysis
Based on the above grading in the 35 retinal regions, the corresponding regional
MOFO mfERG responses were then associated with these grades of different
retinal defect for multiple comparisons. It was assumed that the mfERG from
those 35 divisions were independent of each other (Fortune et al. 1999). The
statistical analysis was performed using SPSS 16.0 (SPSS, Chicago IL).
Repeated measures Analysis of Variance with Bonferroni's adjustment was
applied to study the group differences (Group 0 to 4). Bonferroni’s adjustment
was based on the contrast levels (a within-subject factor with 2 levels) and retinal
defect groups (a between-subject factor with 5 levels). In case of the existence of
interaction between factors, simple effect of the group factor was then reported.
6.2.3.3.6 Evaluation of the diagnostic values of the MOFO mfERG
parameters
For each MOFO mfERG parameter (amplitude and implicit time of the DC and
IC) at each contrast level, a receiver-operating-characteristic curve was
constructed and the area-under-the-curve was calculated (GraphPad Prism 5, CA)
to estimate the predictive ability of each parameter in the detection of DR.
6.2.4 Results
6.2.4.1 Correlation of the plasma glucose level and DM duration with the
averaged MOFO mfERG parameters
The plasma glucose levels of the diabetic subjects were significantly higher than
those of the control subjects (independent t-test, p<0.0001). Among the
70
thirty-eight diabetic subjects, no significant correlation was found between the
averaged MOFO mfERG responses and the DM duration (Spearman’s r ranged
from -0.09 to 0.1, p-value ranged from 0.57 to 0.94). For the plasma glucose
level measured from the thirty-six diabetic subjects, significant correlation was
only found with the mean z-score of IC implicit time at low contrast level. The
higher the plasma glucose level was, the greater was the delay of the mean IC
implicit time at low contrast level (Pearson’s r=0.412; p=0.012) (Table 6.1).

71
Averaged
MOFO
parameters
Contrast
levels
Plasma glucose level
(mmol/L)
n = 36 persons
DM duration (ordinal
parameters)
n = 38 persons
Pearson’s r p-value Spearman’s r p-value
DCA_z 46% -0.136 0.427 0.012 0.943
98% -0.054 0.752 -0.081 0.631
ICA_z 46% 0.027 0.876 -0.022 0.897
98% 0.082 0.636 -0.084 0.617
DCIT_z 46% 0.162 0.345 -0.048 0.776
98% 0.134 0.435 -0.028 0.868
ICIT_z 46% 0.412 0.012 * 0.058 0.730
98% 0.293 0.083 0.095 0.569
Table 6.1. Correlation of the plasma glucose level and DM duration with the
averaged MOFO mfERG parameters in diabetic subjects (*: p<0.05)
6.2.4.2 Local MOFO mfERG responses in different types of retinopathy
defects
A total of 1019 MOFO regional samples was collected. The number of regional
samples from each group were: Group 0 – 486 regional samples (47.7%), Group
1 – 302 regional samples (29.6%), Group 2 – 28 regional samples (2.8%), Group
3 – 168 regional samples (16.5%), Group 4 – 35 regional samples (3.4%).
DC and IC amplitude measures, and DC and IC implicit time measures, showed
statistically significant effects of contrast levels (Repeated measures ANOVA,
p<0.001), groups (p<0.001) and their interaction (p<0.001). The differences

72
between the subgroups of subjects were further studied by applying One-way
ANOVA and Bonferroni’s post-hoc test.
6.2.4.2.1 Amplitude of DC (DCA_z) between groups
There were significantly smaller DC amplitudes at high and low contrast levels
for all diabetic groups than for the control subjects (p<0.02) (Figure 6.8). At the
low contrast level, the DC amplitude showed a greater decrease in the presence
of retinopathy signs. The DCA_z from the regions in Group 4 deteriorated even
more compared to the regional samples from Group 1 (p=0.011) (Figure 6.8). It
should be noted that the diabetic subjects showed considerable variation in
response.
Figure 6.8. Comparison of the DC amplitude z-scores (DCA_z) for groups 0 to 4
at high (98%) and low (46%) contrast levels. *: p<0.05 when compared with
group 0; †: p<0.05 when compared with group 1. Boxplot: central line - the
mean; the edges of the box - ±1 standard deviation; the edges of the vertical bars
- range.
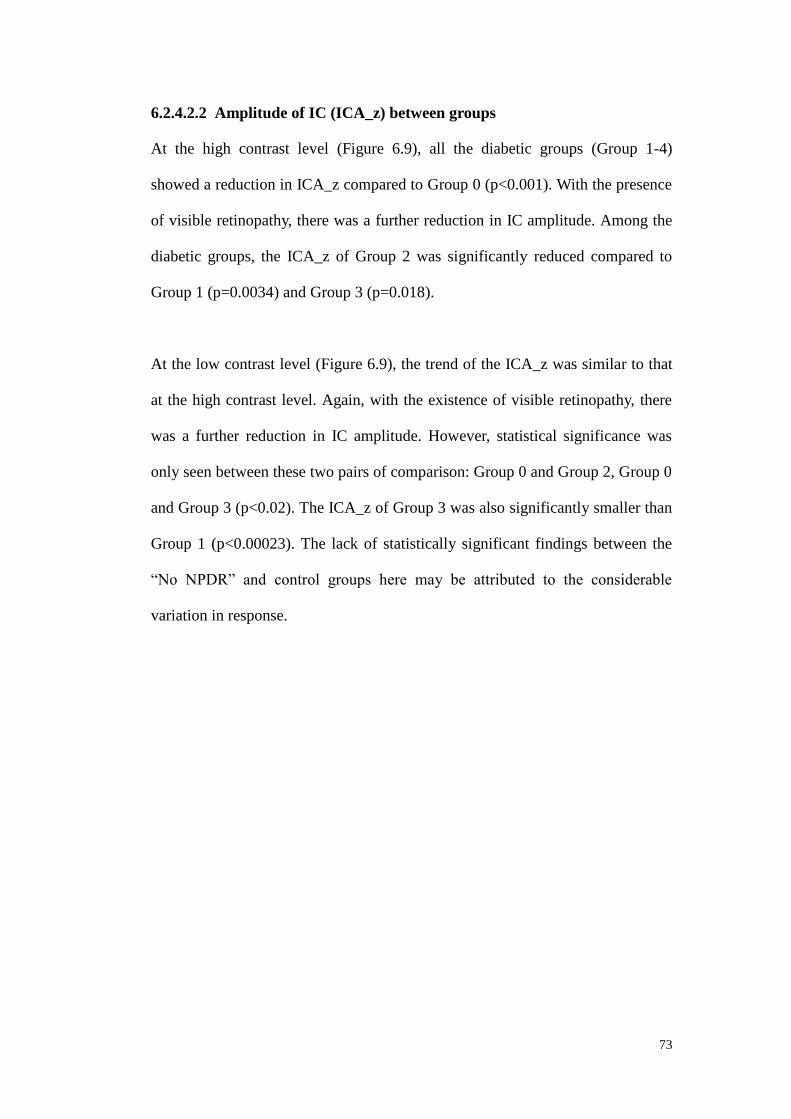
73
6.2.4.2.2 Amplitude of IC (ICA_z) between groups
At the high contrast level (Figure 6.9), all the diabetic groups (Group 1-4)
showed a reduction in ICA_z compared to Group 0 (p<0.001). With the presence
of visible retinopathy, there was a further reduction in IC amplitude. Among the
diabetic groups, the ICA_z of Group 2 was significantly reduced compared to
Group 1 (p=0.0034) and Group 3 (p=0.018).
At the low contrast level (Figure 6.9), the trend of the ICA_z was similar to that
at the high contrast level. Again, with the existence of visible retinopathy, there
was a further reduction in IC amplitude. However, statistical significance was
only seen between these two pairs of comparison: Group 0 and Group 2, Group 0
and Group 3 (p<0.02). The ICA_z of Group 3 was also significantly smaller than
Group 1 (p<0.00023). The lack of statistically significant findings between the
“No NPDR” and control groups here may be attributed to the considerable
variation in response.
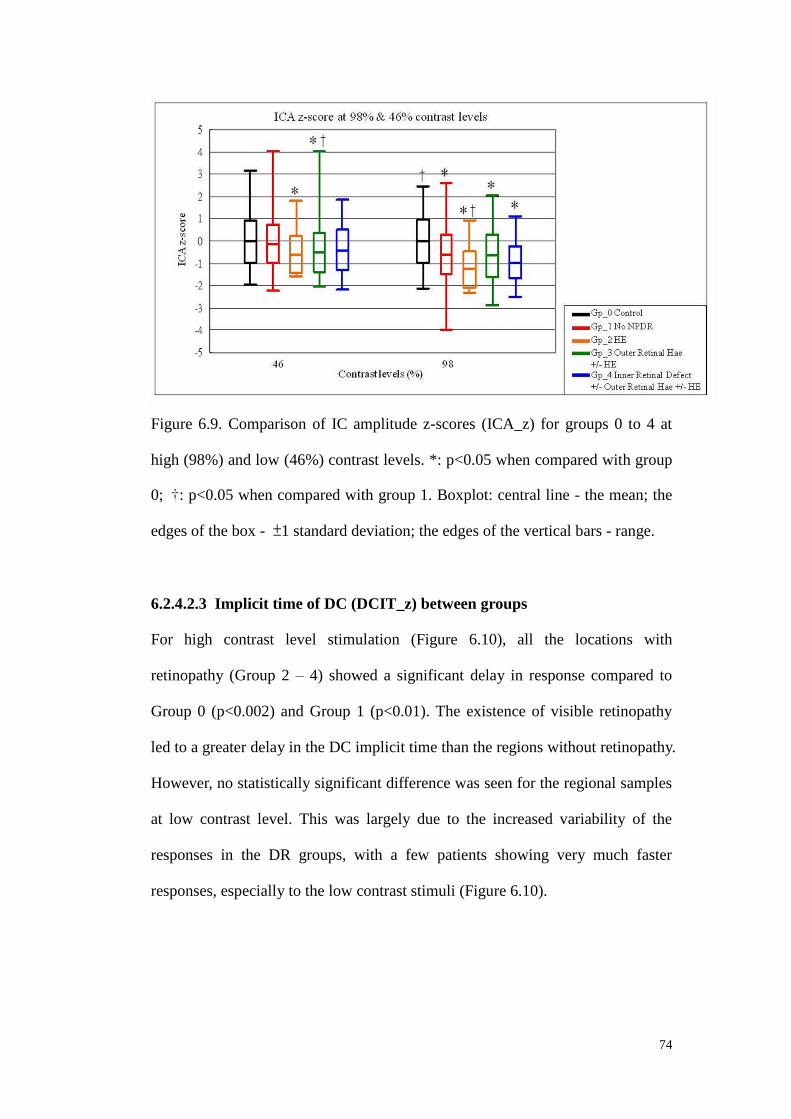
74
Figure 6.9. Comparison of IC amplitude z-scores (ICA_z) for groups 0 to 4 at
high (98%) and low (46%) contrast levels. *: p<0.05 when compared with group
0; †: p<0.05 when compared with group 1. Boxplot: central line - the mean; the
edges of the box - ±1 standard deviation; the edges of the vertical bars - range.
6.2.4.2.3 Implicit time of DC (DCIT_z) between groups
For high contrast level stimulation (Figure 6.10), all the locations with
retinopathy (Group 2 – 4) showed a significant delay in response compared to
Group 0 (p<0.002) and Group 1 (p<0.01). The existence of visible retinopathy
led to a greater delay in the DC implicit time than the regions without retinopathy.
However, no statistically significant difference was seen for the regional samples
at low contrast level. This was largely due to the increased variability of the
responses in the DR groups, with a few patients showing very much faster
responses, especially to the low contrast stimuli (Figure 6.10).

75
Figure 6.10. Comparison of DC implicit time z-scores (DCIT_z) for groups 0 to
4 at high (98%) and low (46%) contrast levels. *: p<0.05 when compared with
group 0; †: p<0.05 when compared with group 1. Boxplot: central line - the
mean; the edges of the box - ±1 standard deviation; the edges of the vertical bars
- range.
6.2.4.2.4 Implicit time of IC (ICIT_z) between groups
At the high contrast level (Figure 6.11), the mfERG responses from the diabetic
groups were, on average, slower than those from Group 0. With visible
retinopathy (Group 2-4), the delay was larger than those without DR (Group 1).
Group 2 and Group 3 showed a significant delay compared to Group 0 in the IC
implicit time (p<0.02). The IC implicit time of Group 3 also had a significant
delay in response compared to Group 1 (p=0.0022).
At the low contrast level (Figure 6.11), only Group 1 showed a significant delay
in IC implicit time compared to Group 0 (p=0.0013).
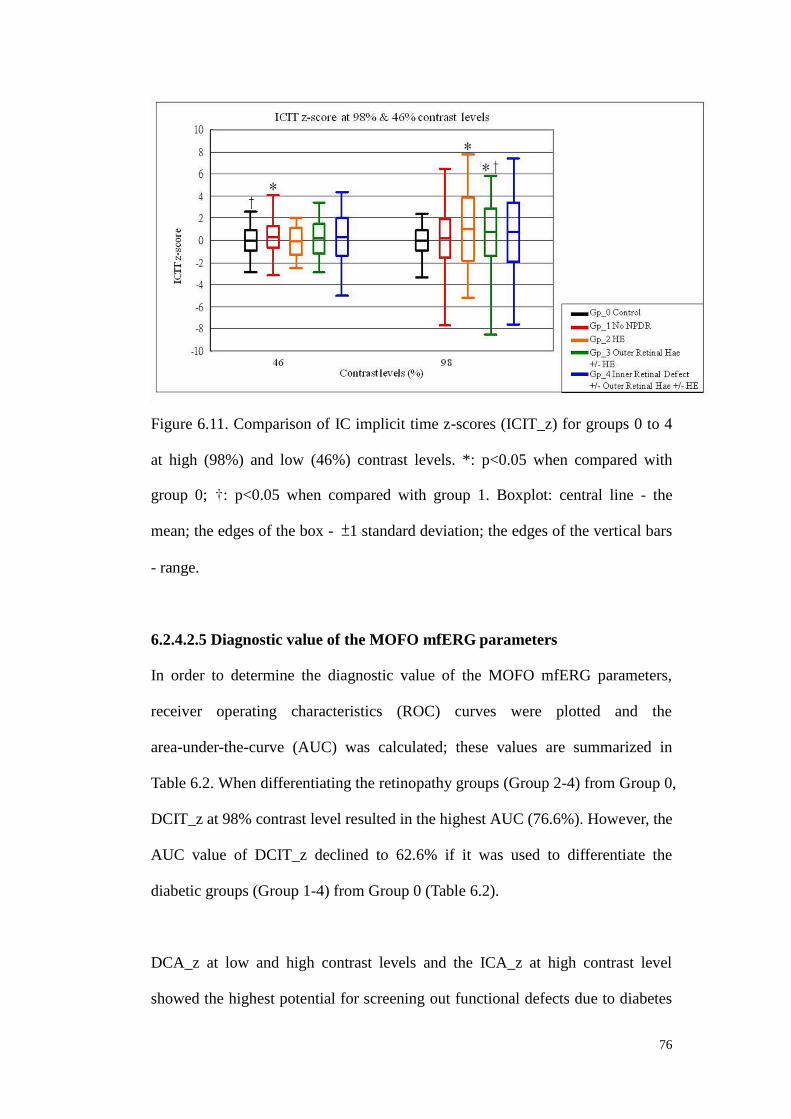
76
Figure 6.11. Comparison of IC implicit time z-scores (ICIT_z) for groups 0 to 4
at high (98%) and low (46%) contrast levels. *: p<0.05 when compared with
group 0; †: p<0.05 when compared with group 1. Boxplot: central line - the
mean; the edges of the box - ±1 standard deviation; the edges of the vertical bars
- range.
6.2.4.2.5 Diagnostic value of the MOFO mfERG parameters
In order to determine the diagnostic value of the MOFO mfERG parameters,
receiver operating characteristics (ROC) curves were plotted and the
area-under-the-curve (AUC) was calculated; these values are summarized in
Table 6.2. When differentiating the retinopathy groups (Group 2-4) from Group 0,
DCIT_z at 98% contrast level resulted in the highest AUC (76.6%). However, the
AUC value of DCIT_z declined to 62.6% if it was used to differentiate the
diabetic groups (Group 1-4) from Group 0 (Table 6.2).
DCA_z at low and high contrast levels and the ICA_z at high contrast level
showed the highest potential for screening out functional defects due to diabetes

77
(including those without visible vascular defects) having AUC values ranging
from 69.1 to 70.9% (Table 6.2).
MOFO
parameters
Contrast
levels
AUC for screening out the
regional sample with visible
DR signs (Group 2 - 4)
AUC for screening out the
regional sample from DM
group (Group 1 - 4)
DCA_z 46% 74.47% 70.89%
98% 67.14% 69.28%
ICA_z 46% 65.90% 58.20%
98% 71.73% 69.10%
DCIT_z 46% 56.45% 53.63%
98% 76.59% 62.58%
ICIT_z 46% 53.30% 56.67%
98% 68.39% 61.31%
Table 6.2. Summary of the area-under-the-curve (AUC) for each MOFO
parameter used in screening the regional samples with visible DR signs and
screening the regional samples from DM groups (those with and without DR
signs)
(Light-grey shaded cell: MOFO parameter with the highest screening power of
the retinal samples with DR signs)
(Dark-grey shaded cells: MOFO parameters with the relatively high screening
power of the retinal samples from the DM patients with and without DR signs)
78
6.2.5 Discussion
This study illustrated the variations of MOFO mfERG responses under high
(98%) and low (46%) contrast levels in the diabetic retina. By inserting a
periodic global flash between two successive multifocal stimuli, retinal
adaptation activity should be enhanced (Sutter et al. 1999). In MOFO mfERG
assessment, there are two main components: the direct component (DC) and the
induced component (IC). The DC response is the average response to the focal
stimulation, while the IC response shows the effect of the preceding focal
stimulation on the response to the global flash (Shimada et al. 2001).
In this study, using the high contrast MOFO paradigm, the delay and reduction of
the mfERG responses suggests that both middle and inner retinal layers (i.e. DC
and IC responses respectively) were impaired even in diabetic patients without
signs of retinopathy. Greater delay of response (on average) and reduction of
response amplitude in the mfERG were seen when retinopathy signs were
present. This implies that certain local functional deterioration started before the
visible signs of vascular retinopathy could be detected in the clinical screening
assessment.
Previous studies have reported reduced responses in DR in the pattern ERG
(Parisi & Uccioli 2001), the second order kernel responses of mfERG
(Palmowski et al. 1997), the oscillatory potentials (OPs) and photopic negative
responses (PhNR) of the standard full-field ERG (Simonsen 1980;
Brinchmann-Hansen et al. 1992; Vadala et al. 2002; Chen et al. 2008) and
mfERG (Kurtenbach et al. 2000; Onozu & Yamamoto 2003; Bearse et al. 2004;
Shinoda et al. 2007). All these previous studies proposed that inner retinal
79
function(s) were affected in the diabetic retina. In experiments on pigs in which
pharmacological dissection techniques have been used, the IC has been found to
arise from third order neurons and ganglion cells (Chu et al. 2008). The reduction
of IC response here further supports the localized nature of functional changes in
the inner retina of the diabetic patients. However, Shimada et al. (Shimada et al.
2001) did not report similar findings, perhaps because of differences in the
subject selection. In their study, data from both type I and II diabetic patients
were merged for analysis, while only type II diabetic patients were recruited in
the current study.
The DC in MOFO mfERG has been found to be predominantly from the bipolar
cells with partial contribution from third order neurons (Chu et al. 2008). Its
amplitude reduction among diabetic patients before observable vascular lesions
in this study suggests that the middle retinal layers may deteriorate early in DR.
Shimada et al. (Shimada et al. 2001) reported similar findings for the high
contrast mfERG. Considering that the minimum oxygen supply occurs in the
region of the inner nuclear layer (INL) (Alder et al. 1983), the present results
support the hypothesis that the middle retina is at risk of hypoxic damage in
diabetic patients.
6.2.5.1 MOFO mfERG amplitude
The reductions in the DC and IC responses provide crucial evidence that the
middle and inner retina are actually impaired at an early stage in diabetic patients.
Recent studies have reported that hypoxia can affect the photoreceptors and the
INL (Alder et al. 1983; Linsenmeier 1986; Linsenmeier et al. 1998;
Wangsa-Wirawan & Linsenmeier 2003; Arden et al. 2010) while excito-toxicity

80
also plays a role in affecting the neurotransmission among amacrine and glial
cells in the diabetic retina (Barber et al. 1998; Kaneko et al. 2000; Barber 2003).
It seems that multiple retinal layers are affected in diabetes at the early stage
(Greenstein et al. 1989). In the present study, low contrast MOFO mfERG
stimulation was applied to avoid saturation of the non-linear retinal response.
Hood and co-workers (Hood et al. 1999) reported that mfERG stimulation at a
contrast level of 50% evokes a waveform with more involvement of the inner
human retina (Bearse & Sutter 1999; Sutter et al. 1999). The low contrast
mfERG stimulus has been used to investigate inner retinal activity in glaucoma
(Chu et al. 2006; Chan et al. 2011). In this study, diabetic patients demonstrated
reduced DC and IC amplitudes in both high and low contrast conditions.
However, reducing contrast of the stimulus does not appear to improve
discrimination between the control and diabetic patients and additional delay of
implicit time for low contrast stimuli was not obvious; this might be due to a
large inter-subject variability or, more likely, the problems in the inner retina
induced by DR are different from those induced by glaucoma. Since amplitude
and implicit time responses at different contrast levels appear to be different in
diabetes and glaucoma (Chu et al. 2006; Chan et al. 2011), the basis of these two
diseases is believed to be different (e.g. cell loss or cellular dysfunction). This
finding further supports the hypothesis by Greenstein and co-workers
(Greenstein et al. 1989) that the mechanism of the retinal dysfunction at the early
stage of DM is unlike that of glaucoma.
6.2.5.2 MOFO mfERG implicit time
Previous mfERG studies reported that the implicit time was a more “sensitive”
parameter in detecting functional anomalies than response amplitude in DM

81
patients (Fortune et al. 1999; Kurtenbach et al. 2000; Bearse et al. 2004; Schneck
et al. 2004; Harrison et al. 2011). In the current study, the implicit time of DC
was only maximally sensitive on screening retinal locations with retinopathy
signs with delayed response in average. However, some very fast responses were
obtained from the diabetic patients especially for the low contrast condition. This
could not be fully explained by the range of plasma glucose levels among
subjects as there was no significant correlation with the DCIT. Moreover, Klemp
and co-workers (Klemp et al. 2004) found the short-term hyperglycemia leads to
a shorter implicit time in the first and second order mfERG responses,
presumably because of increased retinal metabolism. This seems to contradict to
the positive correlation here between of the plasma glucose level and the ICIT_z
at low contrast level. The discrepancy may be due to the effect of chronic instead
of short-term hyperglycemia in these diabetic subjects. Studies on the effect of
the stability of the plasma glucose level (e.g. glycated hemoglobin) in type II
diabetic patients should also be considered.
6.2.5.3 Difference between current and previous studies
Based on the current findings, to screen out functional abnormalities at a very
early stage in the diabetic patients without retinopathy, the amplitudes of IC from
high contrast stimuli, and DC at both high and low contrast levels were preferred.
Compared with the longitudinal study by Harrison and co-authors (Harrison et al.
2011) which showed the implicit time as a more sensitive parameter than
amplitude, a number of possibilities may account for any differences: 1) The
MOFO paradigm dissociates the original mfERG retinal responses into two
different components. The MOFO mfERG with the insertion of a global flash is
used to enhance the retinal adaptation mechanism. By splitting the retinal

82
components, subtle changes in the waveform amplitude may thus become more
obvious; 2) Modifying the electrophysiological protocols may favor the activities
of different types of retinal cells (Kaneko et al. 2000; Masland 2001; Lung &
Chan 2010). The mfERG protocol used in Harrison et al.’s study (Harrison et al.
2011) was the standard mfERG. Without the dissociation of the inner retinal
responses by the global flash, the standard mfERG responses would not separate
the middle and inner retinal responses, and thus subtle changes of the resultant
waveform may be masked. And additionally the bandpass filter applied in
Harrison et al’s study was 10-100 Hz which screened out some high-frequency
oscillatory potentials contributed from the retinal ganglion cells and third order
neurons (Zhou et al. 2007); in this study, filtering from 3-300 Hz was applied to
cover the range of both high- and low-frequency retinal responses to study the
middle and inner retinal layer performance. The involvement of the
high-frequency component may thus lead to the difference; 3) In the present
study, only type II diabetic patients were recruited while both type I and II
diabetic patients were recruited by Harrison et al. Differences in the subject pools
may contribute to this discrepancy because the underlying mechanism, medical
treatment and prevalence of DR progression of type I and type II DM show
different patterns (Barber et al. 1998; Fong et al. 2003; LeRoith et al. 2004).
The MOFO mfERG paradigm provides more detailed information in terms of the
retinal adaptive changes or the retinal recovery rate than does the conventional
paradigm. However, as this study was limited by its cross-sectional nature, a
longitudinal follow-up study should be performed to determine the prediction
ability of the MOFO mfERG for DR onset. It is surprising that the duration of
DM does not correlate with the individual mean MOFO responses, but this may

83
be due to the variability of the latent period before DM can be diagnosed.
The multifocal electroretinogram, together with the MOFO paradigm, provides a
means of detecting early functional anomalies in the diabetic retina before visible
vascular defects appear. Comparing with the other standard electrophysiological
assessments (full-field ERG, pattern ERG and Visual Evoked Potential), the
MOFO mfERG not only provides assessment of retinal adaptation but also
provides topographic details. It aids in differentiating the early functional
deterioration(s) of the middle and inner retina in the diabetic retina. This result
suggests potential retinal sites (middle and inner retina) for future pharmaceutical
therapies. The MOFO mfERG is helpful in monitoring disease progression
before sight-threatening retinopathy supervenes. Moreover it may be useful in
evaluating the effectiveness of the potential therapies, so as to restore retinal
function or delay the deterioration of the retina (Simo & Hernandez 2009).

84
Chapter 7: The correlations of the MOFO mfERG with traditional
functional and morphological clinical assessments
7.1 Experiment B- MOFO mfERG: Early detection of local functional
changes and its correlations with optical coherence tomography (OCT) and
visual field (VF) tests in diabetic patients
Modified from the manuscript published in: Documenta Ophthalmologica
2012; 125: 123-35
7.1.1 Abstract
Purpose: To investigate the correlations of the global flash multifocal
electroretinogram (MOFO mfERG) with common clinical visual assessments –
Humphrey perimetry and Stratus circumpapillary retinal nerve fiber layer (RNFL)
thickness measurement in type II diabetic patients.
Methods: Forty-two diabetic patients participated in the study: ten were free
from diabetic retinopathy (DR) while the remainder suffered from mild to
moderate non-proliferative diabetic retinopathy (NPDR). Fourteen age-matched
controls were recruited for comparison. MOFO mfERG measurements were
made under high and low contrast conditions. Humphrey central 30-2 perimetry
and Stratus OCT circumpapillary RNFL thickness measurements were also
performed. Correlations between local values of implicit time and amplitude of
the mfERG components (direct component (DC) and induced component (IC)),
and perimetric sensitivity and RNFL thickness were evaluated by mapping the
localized responses for the three subject groups.
Results: MOFO mfERG was superior to perimetry and RNFL assessments in
showing differences between the diabetic groups (with and without DR) and the

85
controls. All the MOFO mfERG amplitudes (except IC amplitude at high contrast)
correlated better with perimetry findings (Pearson’s r ranged from 0.23 to 0.36,
p<0.01) than did the mfERG implicit time at both high and low contrasts across
all subject groups. No consistent correlation was found between the mfERG and
RNFL assessments for any group or contrast conditions.
Conclusion: The responses of the local MOFO mfERG correlated with local
perimetric sensitivity but not with RNFL thickness. Early functional changes in
the diabetic retina seem to occur before morphological changes in the RNFL.

86
7.1.2 Introduction
Diabetes mellitus (DM) is a group of systemic disorders resulting in
hyperglycemia. Vascular anomalies are common complications of DM. The
earliest visible sign of vascular anomalies in the eyes are microaneurysms, which
lead to the diagnosis of diabetic retinopathy (DR) (Van Bijsterveld 2000).
In a rat model, Barber and co-workers demonstrated that neural apoptosis occurs
shortly after DM is induced (Barber et al. 1998; Barber 2003; Kern & Barber
2008; Barber et al. 2011). Neural apoptosis was proposed to cause functional and
anatomical changes of the inner retina even before the existence of visible
vascular lesions. With the development of new diagnostic instruments, changes
in the retinal nerve fiber layer (RNFL) thickness have been evaluated in diabetic
patients. Optical coherence tomography (OCT) is an optical diagnostic
instrument which provides an objective and non-invasive measurement of
cross-sectional retinal thickness. Thinning of the neuronal layer has been
reported in the human diabetic retina (Lopes de Faria et al. 2002; Ozdek et al.
2002; Parravano et al. 2008; Takahashi & Chihara 2008; Oshitari et al. 2009).
Visual function, assessed by automated perimetry, which provides a subjective
measurement of luminance increment sensitivity at different visual field locations,
has also been shown to be disturbed before visible DR lesions occur (Bresnick et
al. 1985; Ismail & Whitaker 1998; Kurtenbach et al. 2002; Bengtsson et al. 2005;
Parravano et al. 2008). These two common clinical assessments have been
reported to be useful in detecting early changes in diabetic retina (Lopes de Faria
et al. 2002; Ozdek et al. 2002; Bengtsson et al. 2005; Bengtsson et al. 2008;
Parravano et al. 2008; Takahashi & Chihara 2008; Oshitari et al. 2009).

87
In Experiment A2 (Ch. 6.2) above, the MOFO mfERG was shown to be helpful
in separating the “middle” and “inner” retinal responses. It has been found that
both the middle and inner retinal functions deteriorate before vascular lesions are
visible in DM patients.
In the present study, the aim was to compare electrophysiological assessment
with automated perimetry and with OCT RNFL thickness measurements in the
diabetic retina; this would enrich our knowledge of their relationships at the early
stages of DM and further our understanding of the relationships between tests at
various levels of DR severity.
7.1.3 Methods
7.1.3.1 Subjects inclusion and recruitment
Forty-two patients with type II DM were recruited for the study: ten (aged 51.0 ±
6.9 years) were free from DR while thirty-two (aged 49.5 ± 5.8 years) had
non-proliferative diabetic retinopathy (NPDR). Fourteen healthy controls (aged
49.4 ± 7.0 years) were recruited for comparison. All subjects had visual acuity
better than 6/9. Their refractive errors were between +3.00 D and -6.00 D and
astigmatism was less than -1.25 D. Subjects with systemic or ocular diseases
other than DM or DR were excluded. Detailed eye examination (including
subjective refraction, biomicroscopy and indirect ophthalmoscopy) with fundus
photodocumentation was carried out for each subject. Slit-lamp biomicroscopic
assessment was performed and the crystalline lens was graded according to the
Lens Opacities Classification System III (Chylack et al. 1993). Best-corrected
VA was measured in order to exclude subjects with clinically significant cataract
condition which led to non-age-related visual impairment. One eye was

88
randomly selected for this study.
Instantaneous plasma glucose data were obtained from ten controls and forty
diabetic patients using a plasma-glucose meter before the mfERG measurement
(Accu-Chek Compact Plus, F. Hoffmann-La Roche Ltd, Basel, Switzerland);
testing was conducted more than 2 hours after any food intake.
All procedures of the study followed the tenets of the Declaration of Hesinki.
This study was approved by the Ethics Committee of The Hong Kong
Polytechnic University. Informed consent was obtained from each subject
following full explanation of the experimental procedures.
7.1.3.2 Experimental set-up and procedures
7.1.3.2.1 mfERG stimulation and recording
A VERIS Science 5.1 system (Electro-Diagnostic-Imaging, Redwood City, CA,
USA) was used for the MOFO mfERG measurement. The instrumental set-up
was similar to that described in our previous studies (Experiments A1 and A2 in
Ch. 6) (Lung & Chan 2010; Lung et al. 2012). Briefly, the mfERG stimulation
was a 103 scaled hexagonal pattern (stretch factor: 10.46) which subtended 47°
horizontally and 44° vertically. It was displayed on a high luminance CRT
monitor (FIMI Medical Electrical Equipment, MD0709BRM, Saronno, Italy)
with a frame rate of 75 Hz. A cycle of the MOFO mfERG stimulation included
four video frames: a multifocal flash frame, a dark frame, a global flash frame
and a further dark frame. The multifocal frame was modulated between bright
and dark phases according to a binary pseudo-random m-sequence (213-1). Each
subject had the mfERG measurement made at both high contrast (98% contrast;
89
bright phase: 200 cd/m2; dark phase: 2 cd/m2) and low contrast (46% contrast;
bright phase: 166 cd/m2; dark phase: 61 cd/m2) in a random order with the
background luminance set at 100 cd/m2. The measurement for each contrast level
was divided into 32 segments and lasted for about 8 minutes. Short breaks were
provided between segments. Any segment with blinks or eye movements was
discarded and re-recorded immediately.
One eye of each subject, with the pupil dilated using 1% tropicamide (Alcon,
Fort Worth, TX, USA), was randomly selected for mfERG measurement. A
Dawson-Trick-Litzkow (DTL) electrode was used as the active electrode. A
gold-cup reference electrode was placed 10 mm lateral to the outer canthus of the
tested eye, and a similar ground electrode was placed on the central forehead.
The signal was amplified 100,000 times with bandpass from 3 to 300 Hz (Grass
Instrument Co., Quincy, MA, USA). The amplitudes and implicit times of the DC
and IC for both contrast conditions (Figure 7.1) were measured as previously
described in Experiments A1 and A2 in Ch. 6.
7.1.3.2.2 Optical coherence tomography (OCT)
The circumpapillary retinal nerve fiber layer (RNFL) thickness was measured
using the Stratus OCT (Carl Zeiss Meditec, Inc., Dublin, CA, USA) set to the fast
scanning mode. The scanning area was circular with a 3.4 mm diameter. The
circle centre was aligned with the centre of the optic nerve head. The RNFL
thickness within the circular region was further divided into 12 sectors and the
sectoral RNFL thickness values were then used for analysis (see below).

90
7.1.3.2.3 Visual field (VF)
The Humphrey Field Analyzer (Carl Zeiss Meditec, Inc., Dublin, CA, USA) was
used to measure monocular visual field in this study. The white-on-white static
protocol “Central 30-2 (SITA-fast)” was chosen to assess the central 60 degree
field; full-aperture lenses were placed in front of the patient’s tested eye to
correct refractive errors for the viewing distance of the VF analyzer. The
locations of the VF test spots were plotted on a grid; the grid was then overlaid
with the mfERG topography which was divided into 35 regions for further
analysis as in Experiment A2 in Ch. 6.2 (Lung et al. 2012) and previous studies
(Bearse et al. 2003; Bearse et al. 2004; Han et al. 2004). The overlay is shown as
in Figure 7.2. Details of the grid scaling and alignment are discussed below.
7.1.3.2.4 Fundus photodocumentation
A Topcon IMAGEnet fundus camera was used to take fundus photographs of the
tested eye centrally and at eight peripheral locations for each subject. The
photographs were then combined to form a mosaic for each subject.
7.1.3.3 Data analysis
7.1.3.3.1 MOFO mfERG parameters
The 103 mfERG trace arrays were divided into 35 regions as suggested by
Bearse and co-workers (Bearse et al. 2003; Bearse et al. 2004). The mfERG from
left eyes was reflected so that all data resembled those from right eyes. The
amplitudes and implicit times of the local MOFO mfERG responses (i.e. DC and
IC) were collected for analysis (Figure 7.1). For each region, data of mfERG
parameters from the control group were used to calculate the means and standard
deviations (SD) which were then used to calculate z-scores of the mfERG
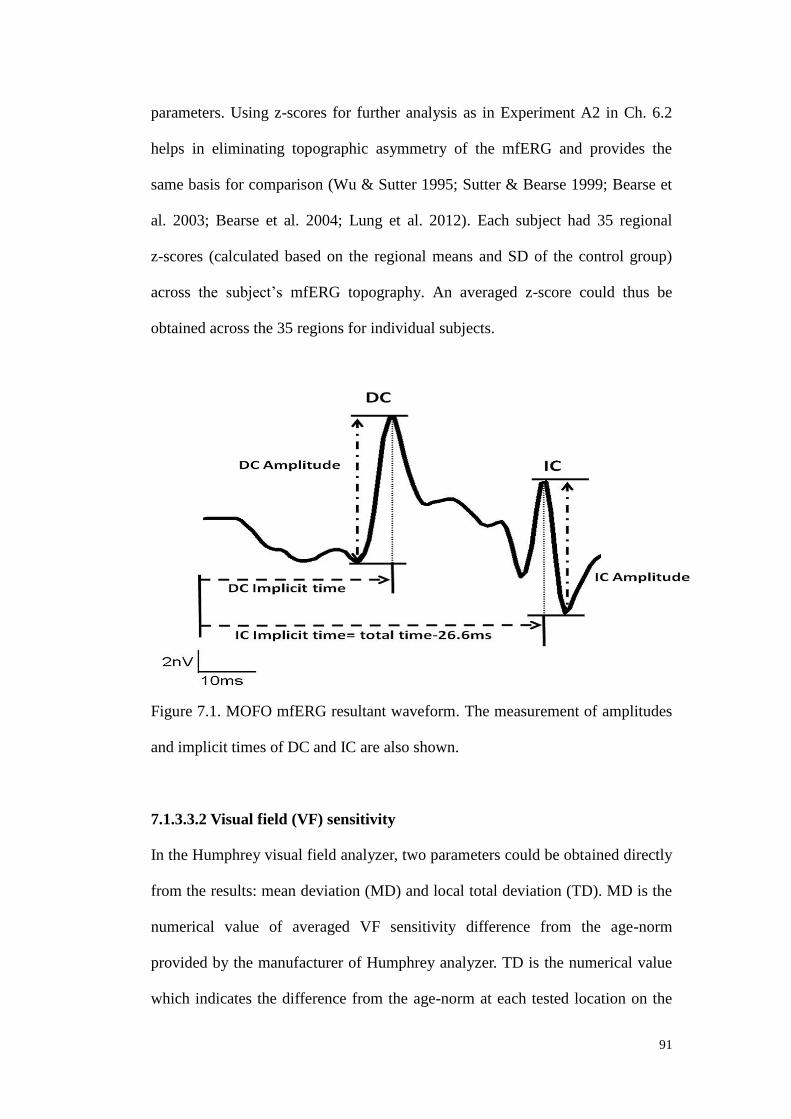
91
parameters. Using z-scores for further analysis as in Experiment A2 in Ch. 6.2
helps in eliminating topographic asymmetry of the mfERG and provides the
same basis for comparison (Wu & Sutter 1995; Sutter & Bearse 1999; Bearse et
al. 2003; Bearse et al. 2004; Lung et al. 2012). Each subject had 35 regional
z-scores (calculated based on the regional means and SD of the control group)
across the subject’s mfERG topography. An averaged z-score could thus be
obtained across the 35 regions for individual subjects.
Figure 7.1. MOFO mfERG resultant waveform. The measurement of amplitudes
and implicit times of DC and IC are also shown.
7.1.3.3.2 Visual field (VF) sensitivity
In the Humphrey visual field analyzer, two parameters could be obtained directly
from the results: mean deviation (MD) and local total deviation (TD). MD is the
numerical value of averaged VF sensitivity difference from the age-norm
provided by the manufacturer of Humphrey analyzer. TD is the numerical value
which indicates the difference from the age-norm at each tested location on the

92
field. In this experiment, the VF from left eyes was reflected and all data
resembled those from right eyes. The MD and local TD were used for analysis in
order to provide the same basis for comparison among different subject groups
(Heijl & Patella 2002; Dersu & Wiggins 2006). The MD was also correlated with
the plasma glucose level to evaluate the relationship between and among the
three subject groups. The TD of each VF test spot which fell in the mfERG
topography was associated with the mfERG responses in order to evaluate its
correlation with the electrophysiological assessment.
7.1.3.3.3 RNFL thickness
The mean RNFL thickness and the RNFL thickness values obtained in each of
the 12 sectors measured by the OCT within the circular scanning region were
used for analysis. The averaged RNFL thickness of each subject was correlated
with the plasma glucose level and compared among the three subject groups. To
eliminate topographic asymmetry, the sectoral RNFL thicknesses of the control
group were used to calculate the sectoral z-scores for individual subject as
suggested by Bronson-Castain and co-workers (Bronson-Castain et al. 2009).
The RNFL data from left eyes was reflected and resembled those from right eyes.
For each sector of RNFL thickness, the values from the control group were
initially averaged and this value was used to calculate the sectoral z-score of each
subject using the equation:
Sectoral z-score of RNFL thickness =
(Individual sectoral thickness – Averaged sectoral thickness from controls)
Averaged sectoral thickness from controls
This provides the same basis for comparison among the three groups of regional
data after mapping between mfERG topography and RNFL profile.
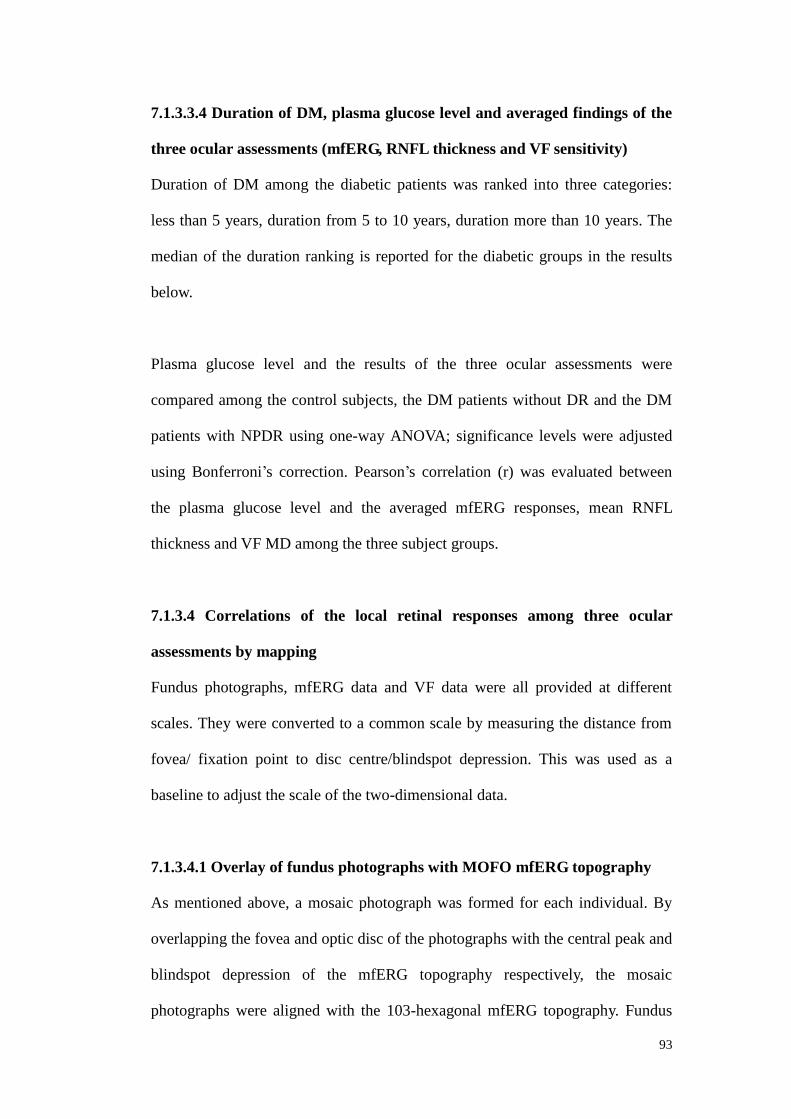
93
7.1.3.3.4 Duration of DM, plasma glucose level and averaged findings of the
three ocular assessments (mfERG, RNFL thickness and VF sensitivity)
Duration of DM among the diabetic patients was ranked into three categories:
less than 5 years, duration from 5 to 10 years, duration more than 10 years. The
median of the duration ranking is reported for the diabetic groups in the results
below.
Plasma glucose level and the results of the three ocular assessments were
compared among the control subjects, the DM patients without DR and the DM
patients with NPDR using one-way ANOVA; significance levels were adjusted
using Bonferroni’s correction. Pearson’s correlation (r) was evaluated between
the plasma glucose level and the averaged mfERG responses, mean RNFL
thickness and VF MD among the three subject groups.
7.1.3.4 Correlations of the local retinal responses among three ocular
assessments by mapping
Fundus photographs, mfERG data and VF data were all provided at different
scales. They were converted to a common scale by measuring the distance from
fovea/ fixation point to disc centre/blindspot depression. This was used as a
baseline to adjust the scale of the two-dimensional data.
7.1.3.4.1 Overlay of fundus photographs with MOFO mfERG topography
As mentioned above, a mosaic photograph was formed for each individual. By
overlapping the fovea and optic disc of the photographs with the central peak and
blindspot depression of the mfERG topography respectively, the mosaic
photographs were aligned with the 103-hexagonal mfERG topography. Fundus

94
photographs were then divided into 35 regions following the mfERG topography
in Figure 7.2 (Bearse et al. 2003; Bearse et al. 2004). A retinal specialist who was
masked to each patient’s diagnosis then rated each region for presence or absence
of a DR lesion.
This was done for the three groups of subjects, thus allowing creation of three
groups of regional data:
Group I – Regional data from the control group only
Group II – Regional data from the DM patients (without any DR signs) only
Group III – Regional data from the DM patients with NPDR only, but only those
with DR lesions were included. Those regions without DR lesions were
discarded to avoid confusion with group II
7.1.3.4.2 Overlay of VF and MOFO mfERG topography
The 103 hexagonal stimulus pattern of mfERG was aligned with the VF test grid.
The locations of the blindspot and the fixation point (i.e. foveal peak) in mfERG
topography were overlaid with the blindspot and fixation point of the VF test grid,
respectively. By overlaying the VF test grid with the 35-division mfERG
topography as shown in Figure 7.2, the mfERG parameters measured at each
division could be grouped with the TD of the VF test spot that fell within the
division. If more than one VF test spot fell within the same mfERG division, the
TD of those VF test spots were averaged before matching with the mfERG
parameters. As the Humphrey central 30-2 program (central 60°) provides a
larger field of view than that of mfERG (about central 47°), those VF test spots
which fell outside the mfERG topography were excluded from the study. Once
groupings of mfERG parameters and VF TD values were accomplished,
95
correlation values were calculated.
Figure 7.2. Mapping between the data of the mfERG, VF test and OCT RNFL
profile. Left side: mapping of the overlays between the mfERG topography (35
polygonal patches) and the VF test spots (coloured spots). Right side: The
sectoral RNFL profile measured by the OCT. Colour indication: Through
mapping the VF test spots with the corresponding sectoral RNFL thickness
(Garway-Heath et al. 2000; Garway-Heath et al. 2002), the regional mfERG data
could be matched with the corresponding RNFL thickness (the central red cross
represents the fixation point of the mfERG and VF assessments).
96
7.1.3.4.3 Overlay of OCT RNFL and MOFO mfERG topography
The OCT RNFL profile at the optic disc was mapped with the VF test grid
(Figure 7.2) according to the overlay generated by Garway-Heath and
co-workers (Garway-Heath et al. 2000; Garway-Heath et al. 2002). The fundus
locations mapped by Garway-Heath et al. are on a 3° grid, simplifying alignment
of the two data sets. Together with the mapping applied in the above section
between the mfERG topography and the VF test grid, it was possible to link the
MOFO mfERG topography to its corresponding sectoral RNFL profile obtained
from the OCT measurement (Figure 7.2). If more than one mfERG division fell
along a sector of the RNFL profile, the z-scores of the mfERG parameters at that
sector were averaged before mapping with the RNFL thickness. The correlation
between the regional MOFO mfERG responses and the sectoral RNFL thickness
could then be calculated.
The correlations (Pearson’s r) between the local z-scores of the MOFO mfERG
responses and the results of two clinical assessments (VF and OCT) were
calculated for groups I (regional data from the control group), II (regional data
from the DM patients without any DR signs) and III (regional data from the DM
patients with NPDR).
The regional responses of the three ocular assessments (mfERG, RNFL thickness
and VF sensitivity) were also compared among groups I, II and III. Due to the
repeated contribution from individual subject, generalized estimating equation
(GEE) with Bonferroni’s post-hoc adjustment was used for statistical analysis
with the assumption of an unstructured working matrix.

97
7.1.4 Results
7.1.4.1 Correlation between local mfERG responses with the local sensitivity
deviation (TD) of VF
After overlaying the MOFO mfERG topography with VF test spots, there were
76 VF test spots which fell into the mfERG topography. This gave a total of 854
VF regional data points: 392 in group I, 280 in group II and 182 in group III
(Table 7.1). The correlations of the local mfERG responses with the local VF TD
are shown in Table 7.2 for different groups of data (Groups I, II and III). The
mfERG amplitude provides a more consistent relationship with the VF findings
across various groups than implicit time does.

98
Group I Group II Group III
Visual field (VF) (n= 392) (n= 280) (n= 182)
Total deviation (TD) -1.51 ± 1.55 -1.84 ± 2.06 -3.30 ± 2.39 (* p=0.005)
OCT (n= 168) (n= 120) (n= 110)
Sectoral RNFL thickness
(z-score)
0.00 ± 0.97 0.02 ± 1.25 0.029 ± 1.21
MOFO mfERG (n= 490) (n= 350) (n= 234)
98% contrast level
(z-scores)
DCIT _z 0.00 ± 0.96 0.02 ± 1.50
1.23 ± 1.66 (* p<0.001)
(† p=0.013)
DCA_z 0.00 ± 0.96 -0.67 ± 1.01 -0.62 ± 1.09
ICIT_z 0.00 ± 0.96 0.06 ± 1.68 0.75 ± 2.31 (* p=0.013)
ICA_z 0.00 ± 0.96 († p=0.045) -0.64 ± 0.85 (* p=0.045) -0.80 ± 0.92 (* p=0.007)
46% contrast level
(z-scores)
DCIT_z 0.00 ± 0.96 -0.15 ± 1.85 -0.02 ± 2.22
DCA_z 0.00 ± 0.96 († p=0.014) -0.66 ± 0.90 (* p=0.014) -0.93 ± 1.20 (* p=0.003)
ICIT_z 0.00 ± 0.96 0.20 ± 1.08 0.12 ± 1.39
ICA_z 0.00 ± 0.96 -0.12 ± 0.85 -0.47 ± 0.89
Table 7.1. Regional data from each measurement (VF TD, OCT sectoral RNFL
thickness and MOFO mfERG parameters) according to its mapping with the
MOFO mfERG topography
(*: Significantly different from the control group (Group I) with p< 0.05)
(†: Significantly different from the DM patients without DR (Group II) with p<0.05)

99
Contrast
conditions
MOFO mfERG
parameters
Control Samples
(Group I)
No DR Samples
(Group II)
DR Samples
(Group III)
Pearson
r
p-value
Pearson
r
p-value
Pearson
r
p-value
98% DCIT_z 0.26 <0.001* -0.10 0.109 -0.05 0.532
DCA_z 0.36 <0.001* 0.28 <0.001* 0.32 <0.001*
ICIT_z 0.22 <0.001* -0.20 0.001* 0.03 0.719
ICA_z 0.24 <0.001* 0.01 0.909 0.42 <0.001*
46% DCIT_z 0.18 <0.001* 0.09 0.142 0.02 0.794
DCA_z 0.25 <0.001* 0.24 <0.001* 0.23 <0.001*
ICIT_z 0.16 0.002* -0.22 <0.001* 0.06 0.427
ICA_z 0.30 <0.001* 0.23 <0.001* 0.27 <0.001*
Table 7.2. Summary of Pearson’s correlation (r) between local responses of VF
(TD) and MOFO mfERG parameters (*: Statistically significance level achieved
with p< 0.05).
7.1.4.1.1 MOFO mfERG amplitude z-scores
At both high and low contrast levels, the DC and IC amplitudes showed a
positive correlation with VF local sensitivity deviation in all three groups of data
(except the IC amplitude of group II at high contrast level). Retinal regions with
higher luminance sensitivity also showed greater mfERG amplitudes. The
Pearson’s correlation value ranged from 0.24 to 0.42 (p<0.05) (Table 7.2) (Figure
7.3 and 7.4). However, the variations of the correlation did not show any trend in
terms of the DR lesions or contrast levels.

100
Figure 7.3. Correlation between the local responses of the VF (TD) and DCA_z
of the MOFO mfERG at 98% and 46% contrast condition from groups I, II and
III.

101
Figure 7.4. Correlation between the local responses of the VF (TD) and ICA_z of
the MOFO mfERG at 98% and 46% contrast conditions from groups I, II and III.

102
7.1.4.1.2 MOFO mfERG implicit time z-scores
No significant correlations with visual field results were found in the diabetic
groups (groups II and III) in terms of the DC implicit time at either contrast level.
For the IC implicit time, significant correlations were found in group II but not in
group III at high and low contrast levels. However, the relationship between the
IC implicit time and luminance sensitivity was inconsistent across the diabetic
groups.
7.1.4.2 Correlations between the local MOFO mfERG responses with the
sectoral RNFL thickness z-scores
There were 398 sectoral RNFL thickness z-scores after mapping with the mfERG
topography: 168 in group I, 120 in group II and 110 in group III (Table 7.1).
However, no significant differences were found among these three groups of data
(p>0.05). The correlations between the mfERG responses with the sectoral RNFL
thickness are listed in Table 7.3. No significant trends were found in correlations
between MOFO mfERG parameters and sectoral RNFL thickness; few statistical
significant correlations were found between in terms of IC amplitude z-score.
However, these correlations were not consistent with the changes of contrast
levels or among the various subject groups.

103
Contrast
conditions
MOFO mfERG
parameters
Control Samples
(Group I)
No DR Samples
(Group II)
DR Samples
(Group III)
Pearson
r
p-value
Pearson
r
p-value
Pearson
r
p-value
98% DCIT_z -0.08 0.309 -0.09 0.330 0.18 0.067
DCA_z 0.02 0.799 0.13 0.159 0.03 0.770
ICIT_z -0.05 0.520 -0.06 0.492 0.04 0.718
ICA_z -0.06 0.437 0.00 0.995 0.27 0.005*
46% DCIT_z -0.08 0.331 0.07 0.432 0.14 0.139
DCA_z -0.14 0.081 -0.00 0.968 -0.08 0.392
ICIT_z 0.09 0.233 -0.05 0.596 -0.00 0.966
ICA_z -0.20 0.008* -0.06 0.491 -0.15 0.128
Table 7.3. Summary of Pearson’s correlation (r) between local responses of
RNFL sectoral z-score and MOFO mfERG parameters
(*: Statistically significance level achieved with p< 0.05).
7.1.4.3 Regional data of groups I, II and III from each measurement (MOFO
mfERG, VF and RNFL) after mapping based on mfERG topography
For the MOFO mfERG, there were a total of 1074 regional data values: 490 in
group I, 350 in group II and 234 in group III (Table 7.1). Only the amplitudes of
the DC at low-contrast level and IC at the high contrast level were able to
differentiate the diabetic data (groups II and III) from the control data (group I)
(p<0.05). The amplitudes from the diabetic groups were significantly smaller
than those of the control group. There was a significant delay in high contrast DC

104
and IC for group III (p<0.05), compared to group I data (p<0.05). There was a
further delay of DC response in group III in high contrast condition than group II
(p<0.05). DC and IC implicit time findings did not differentiate between diabetic
data (groups II and III) and the control data.
Compared with the corresponding VF regional data points after overlaying the
MOFO mfERG topography with VF test spots as shown in Table 7.1, it was
found that only the regions with DR lesions demonstrated a marked reduction in
VF sensitivity (p<0.01) compared to the regional data from the controls (group I).
However, for the sectoral RNFL thickness z-scores collected after mapping with
the MOFO mfERG topography (Table 7.1), no significant differences were found
among these three groups of data (p>0.05).
7.1.4.4 Relationship of the plasma glucose levels with the averaged mfERG
responses, VF sensitivity deviation and RNFL thickness
The control subjects had significantly lower plasma glucose levels than did the
diabetic patients, either with or without DR (p<0.02 and p<0.01 respectively)
(Table 7.4). The MOFO mfERG IC amplitude z-score for the low contrast
condition in the control group increased with the plasma glucose level (r=0.731,
p<0.02). There were no significant correlations between DC or IC amplitude
z-scores at either contrast level and glucose level for either group of diabetic
patients. No significant correlations were found between plasma glucose levels
and RNFL thickness or VF assessments in all groups of subjects (controls, DM
patients with or without DR).

105
Visual assessment
parameters
Controls DM patients without DR DM patients with NPDR
(n= 10persons) (n= 10persons) (n= 30persons)
Pearson’s r p-value Pearson’s r p-value Pearson’s r p-value
VF mean deviation (dB) -0.011 0.976 -0.044 0.904 -0.034 0.857
Mean RNFL thickness (um) -0.367 0.297 -0.245 0.494 0.017 0.928
MOFO mfERG
98% contrast level (z-scores)
DCIT_z -0.049 0.892 0.520 0.124 -0.110 0.565
DCA_z -0.386 0.270 -0.091 0.803 -0.225 0.233
ICIT_z 0.224 0.534 0.510 0.132 0.133 0.485
ICA_z 0.371 0.291 -0.028 0.938 0.020 0.917
46% contrast level (z-scores)
DCIT_z -0.215 0.552 0.585 0.076 -0.071 0.710
DCA_z 0.454 0.187 -0.287 0.421 -0.183 0.333
ICIT_z 0.543 0.104 0.580 0.079 0.206 0.276
ICA_z 0.731 0.016* 0.010 0.979 -0.146 0.440
Table 7.4. Summary of Pearson’s correlation (r) between plasma glucose level
(mmol/L) with each mean visual assessment parameters (VF mean deviation
[dB], RNFL mean thickness [um] and the averaged MOFO mfERG parameters
[z-scores]) (*: Significance level with p< 0.05).
106
7.1.5 Discussion
The current findings demonstrated that the MOFO mfERG responses generally
correlated better with the results of perimetric testing than those of the RNFL
thickness measurement in diabetes. Among these three assessments, only the
MOFO mfERG differentiates the “No DR” regional data (group II) from the
control group (group I). The MOFO mfERG amplitude provides a more
consistent relationship with the perimetric test across retinal regions than does
implicit time. RNFL thickness has no relationship with the functional testing
performed in this study.
These results showed that the local VF sensitivity deviation (i.e. TD), rather than
the RNFL thickness, was moderately correlated with most of the MOFO mfERG
parameters in the control data. It is not surprising that an electrophysiological
assessment correlates better with a clinical functional test than with a
morphological test in these subjects. Visual field assessment has been applied in
studies of DM patients, but whether VF measures can differentiate diabetic
patients without DR from healthy controls is still controversial. It is generally
accepted that the VF mean deviation should decrease with increasing DR severity
(Remky et al. 2003; Bengtsson et al. 2005; Nitta et al. 2006; Bengtsson et al.
2008; Parravano et al. 2008).
7.1.5.1 Correlation between MOFO mfERG and VF assessments
Correlations between mfERG amplitudes and VF parameters were more
consistent than correlations between implicit time and VF parameters in the
diabetic samples (groups II and III). Only group II showed a significant negative
association between the VF sensitivity and the IC implicit time. There was an

107
opposite change in the correlation direction from group I to group II (as shown in
Table 7.2) for the high and low contrast conditions. Although the mechanisms for
the mfERG amplitude and implicit time changes in DM patients are not
understood, neither reduced contrast levels nor the increased DR severity led to a
great change in the values of Pearson’s r value between MOFO mfERG
parameters and VF sensitivity deviations. This result should be repeated to
determine whether the relationship between VF and IC implicit time can be
substantiated or whether it is anomalous. In both previous studies (Shimada et al.
2001; Lung et al. 2012) and current experiment, the amplitudes of the MOFO
mfERG paradigm demonstrated a greater ability in showing the group difference
between the healthy and diabetic groups (with or without DR). Moreover, it also
showed a better and more consistent correlation with the perimetric functional
test than the implicit time. These findings are different from those reported in
other mfERG paradigm studies (Fortune et al. 1999; Han et al. 2004; Han et al.
2004; Bearse et al. 2006; Ng et al. 2008; Harrison et al. 2011) that delay of
implicit time existed earlier before the amplitude changes in DM patients. This
discrepancy between the amplitude and implicit time findings would be probably
due to the different mfERG paradigms involved in the studies which may in turn
trigger a different cellular performance.
Similar to a previous study (Han et al. 2004), Pearson’s correlation r between the
mfERG and VF was maintained at about 0.2 to 0.4. The relatively weak to
moderate correlations between these two functional tests may be due to different
underlying mechanisms. MOFO mfERG provides an objective measurement of
the retinal adaptation activity predominantly from retinal components beyond the
secondary neural level, while VF provides a subjective measurement of the

108
retinal threshold detection from the whole visual system. Although the MOFO
mfERG was shown to be better than VF in differentiating DM patients without
DR from the control group, it cannot be concluded that mfERG is superior to VF.
One of the major differences between VF and mfERG is that VF provides a static
stimulus for assessing luminance sensitivity while mfERG measures activities to
luminance changes and temporal interactions. The information from these two
tests is supplementary and gives rise to a clearer picture of the underlying
changes in DM.
7.1.5.2 Correlation between MOFO mfERG and RNFL assessments
However, the functional deterioration in the diabetic retina found in this study
cannot be purely explained by the luminance detection/sensitivity or the
morphological changes of the RNFL. The changes observed in MOFO mfERG
and its weak to moderate correlations with RNFL thickness and luminance
sensitivity indicated the alteration of adaptive function in the middle and/or inner
retinal layers (with the RNFL excluded).
While there are some conservative opinions on the ability of OCT to detect
RNFL thinning for the DM patients without visible DR lesions (Ozdek et al.
2002; Takahashi & Chihara 2008), many studies have proposed that there is
RNFL thinning, at least in a specific quadrant of the optic disc, in the early stages
of NPDR (Lopes de Faria et al. 2002; Ozdek et al. 2002; Sugimoto et al. 2005;
Takahashi & Chihara 2008; Oshitari et al. 2009). In the present study, functional
deterioration was found, but no structural anomalies were detected in early DM.
Only the IC amplitude findings provided a weak correlation with RNFL
morphological changes. Zhang et al. (Zhang et al. 2000) suggested that

109
retrograde axonal transport was impaired in the early stage of DM. The ganglion
cells would be adversely affected before morphological impairment of the optic
nerve fibers. This may indicate why the retinal functional deterioration found by
the MOFO mfERG paradigm in DM patients does not match with RNFL changes,
and the optic neuropathy found in DM patients is very different from the
glaucomatous optic neuropathy (Ozdek et al. 2002; Oshitari et al. 2009). This
weak electrophysiological-morphological association further supports the
hypothesis raised by Greenstein et al. (Greenstein et al. 1989) that the
problematic site of DM is at/near the middle retinal layers which is different from
glaucoma or retinitis pigmentosa (RP). Further investigation of the
electrophysiological-morphological association in the more severe DR group will
help to understand the nature of the disease progression.
7.1.5.3 Limitations of this experiment
Hyperglycemia is an underlying problem in DM. Unexpectedly, the high
correlation of the plasma glucose level to the IC amplitude in the low contrast
condition was shown only in the healthy controls but not in the diabetic patients.
This might be due to the large variations of plasma glucose level as well as
different effects caused by glycemic control and chronic hyperglycemia (Klemp
et al. 2004; Jeppesen et al. 2007; Parravano et al. 2008). Further studies on how
glycemic control and chronic hyperglycemia affect middle/inner retinal
responses (as reflected in mfERG responses) in both normal and diabetic patients
would be useful. Another limitation of this study is the mapping between the
RNFL bundles with the OCT which was based on a Caucasian population.
Whether there is any ethnic difference in the mapping of the RNFL to each OCT
sector needs to be investigated.

110
Chapter 8: The on- and off-responses in diabetic patients assessed using the
long-duration stimulus mfERG with white (Broad-spectrum) and blue
(Narrow-spectrum) stimuli
8.1 Experiment C – Characteristics of the on- and off-responses in diabetic
retina with white and blue stimuli – a mfERG study
8.1.1 Abstract
Purpose: To investigate the characteristics of the on- and off-responses in the
human diabetic retina using a “long-duration” multifocal electroretinogram
(mfERG) paradigm. Changes in retinal antagonistic interaction were also
evaluated in the early stage of diabetes mellitus (DM).
Methods: Twenty type II diabetic patients with no or mild non-proliferative
diabetic retinopathy (NPDR) and twenty-one age-matched healthy controls were
recruited for “long-duration” mfERG measurements. A 61-hexagon mfERG
stimulus was displayed under acromatic (white/black) and chromatic (blue/black)
conditions with matched luminance. The amplitudes and implicit times of the
on-response components (N1, P1 and N2) and off-response (P2) components of
the mfERG were analysed using conventional ring analysis.
Results: The blue stimulation generally triggered greater mfERG amplitudes in
on-response (P1, N2) and off-response (P2) (p<0.05) than those from white
stimulation in both control and diabetic groups. The diabetic group showed
significantly greater N2 amplitude than the controls under white stimulation in
Rings 2 and 4 (p<0.05). When the stimulus was changed from white to blue, the
diabetic group showed a smaller percentage of enhancement in N2 amplitude
than the controls in the periphery (Ring 5) (p<0.02).

111
Conclusion: When the stimulus changes from white (broad-band spectral
stimulation) to blue (narrow-band spectral stimulation), a decrease in
involvement of lateral antagonism would be expected. The larger amplitude of
the on-response component (N2) in the diabetic patients suggested an imbalance
of lateral antagonism, and the lesser percentage change of N2 amplitude in the
diabetic group may indicate an impairment of interaction at the middle retinal
level in the early stages of DM.

112
8.1.2 Introduction
Diabetic retinopathy (DR) is an ocular vascular complication associated with
diabetes mellitus (DM) which has shown a rapid increase of incidence in Asia
(Wild et al. 2004). DR is one of the leading causes of blindness among the
working population (Porta & Bandello 2002). It has been proposed that due to
the damage of the endothelium and pericytes, together with the acceleration of
apoptosis, vascular leakage results and leads to the clinically visible signs of DR
(Cunha-Vaz 2007). Both reduction of sensitivity in automated perimetry
(Bengtsson et al. 2005; Bengtsson et al. 2008) and thinning of the retinal nerve
fiber layer (RNFL) (Lopes de Faria et al. 2002; Sugimoto et al. 2005; Takahashi
& Chihara 2008; Oshitari et al. 2009; Cho et al. 2010) have been reported in
diabetic patients. In previous Experiments A2 and B in this thesis (Ch. 6.2 and 7)
(Lung et al. 2012; Lung et al. 2012), the mfERG has been shown to be superior
to two common clinical assessments (automated white-on-white perimetry and
RNFL thickness measurement by optical coherence tomography) in
demonstrating early physiological changes before the existence of visible
vascular lesions.
The multifocal electroretinogram (mfERG) provides an objective assessment of
retinal function and provides topographic details of retinal function (Sutter &
Tran 1992). The mfERG reflects neural activities mainly in the middle and inner
retinal layers (Hood et al. 1999). Functional deterioration detected by the mfERG
indicates disturbance of retinal adaptation at or beyond the level of secondary
neurons. Several studies have applied the mfERG with different protocols to
provide objective evaluation of functional changes in diabetic patients, and to
assess topographic details of these changes (Palmowski et al. 1997; Fortune et al.

113
1999; Shimada et al. 2001; Onozu & Yamamoto 2003; Bearse et al. 2004; Bearse
et al. 2004; Han et al. 2004; Han et al. 2004; Tyrberg et al. 2005; Bearse et al.
2006; Ng et al. 2008; Tyrberg et al. 2008; Bronson-Castain et al. 2009; Harrison
et al. 2011; Lung et al. 2012). The retinal dysfunction detected in diabetic
patients cannot be fully explained by either reduced luminance sensitivity or by
morphological changes of the RNFL (Lung et al. 2012). It is believed that the
possible site for the functional changes is within the middle to inner layers of the
retina.
However, there is a large overlap of the on- and off-pathway responses in the
responses of the conventional mfERG paradigm, and these responses are
important in the investigation of normal and abnormal retinal physiology. In
order to dissociate the on- and off-pathways, Kondo and Miyake (Kondo &
Miyake 2000) modified the mfERG paradigm to mimic the “long-duration” flash
which is applied in the Ganzfeld full-field electroretinogram (Sieving 1993). By
increasing the number of multifocal flashes and dark frames, the overlap between
the on-response and off-response in the mfERG can be minimized. In using this
protocol, the mfERG can be used to separately assess the on- and off-pathways
(Kondo & Miyake 2000). Such a protocol has been applied in some retinal
disorders to study the activities of the on- and off-pathways (Kondo et al. 1998;
Marmor et al. 1999; Luu et al. 2005).
Previous studies have demonstrated that narrow-band spectral stimulation can
trigger a larger retinal signal than broad-band stimulation in electroretinogram
measurements. This is probably due to antagonistic interactions initiated by
networks of long-, middle- and short-wavelength cones and their secondary
114
neurons (Rangaswamy et al. 2007). Colour discrimination ability has been shown
to deteriorate early in diabetic retinopathy (Bresnick et al. 1985; Kurtenbach et al.
2002; Ong et al. 2004). A generalized loss of chromatic discrimination has been
suggested by Feitosa-Santana et al. (Feitosa-Santana et al. 2006), while various
authors have proposed a reduction of short-wavelength sensitivity in diabetic
patients (Bresnick et al. 1985; Greenstein et al. 1989; Yamamoto et al. 1996).
Selective loss of short-wavelength cone sensitivity in diabetic patients has also
been illustrated by electrophysiological assessment (Yamamoto et al. 1996;
Yamamoto et al. 1997).
In this experiment, the modified long-duration mfERG paradigm described above
was used to study the on- and off-responses of the middle and inner retinal layers
at different retinal regions in diabetic patients. Furthermore, the mfERG stimulus
pattern was used under achromatic (white/black) and chromatic (blue/black)
conditions to manipulate the antagonistic interactions, in order to evaluate the
changes of the interaction at or beyond the middle retinal level in the early stages
of DM.
8.1.3 Methods
8.1.3.1 Subject recruitment and inclusion criteria
Twenty type II diabetic patients (aged 46.6±7.4 years) with no or mild
non-proliferative diabetic retinopathy (NPDR) and twenty-one age-matched
healthy controls (aged 46.6±7.4 years) were recruited for this study. All of the
participants had best corrected visual acuity equal to or better than 6/9 and their
refractive errors were between +3.00D and -6.00D with astigmatism less than
-1.25D. Detailed eye examination (including subjective refraction,
115
biomicroscopy and indirect ophthalmoscopy) with fundus photodocumentation
was carried out for each subject. Slit-lamp biomicroscopic assessment was
performed and the crystalline lens was graded according to the Lens Opacities
Classification System III (Chylack et al. 1993). Best-corrected VA was measured
in order to exclude subjects with clinically significant cataract condition which
led to non-age-related visual impairment. Fundus photodocumentation was
performed in the central retina and in the eight cardinal gaze directions using a
fundus camera (Topcon IMAGEnet, Japan). Participants with ocular diseases
other than DR or systemic diseases other than DM were excluded
All of the study procedures fulfilled the tenets of the Declaration of Hesinki. This
study was approved by the Ethics Committee of The Hong Kong Polytechnic
University. Written consent was obtained from each individual subject after full
explanation of the experimental procedures.
8.1.3.2 Experimental set-up and procedures
8.1.3.2.1 mfERG recording
The VERIS Science 5.1 system (Electro- Diagnostic- Imaging, Redwood City,
CA, USA) was used for the mfERG measurement with the “long-duration”
protocol. A scaled 61-hexagon pattern (Figure 7.1) (stretch factor: 10.46) which
subtended 49° horizontally and 47° vertically was displayed on a high luminance
CRT monitor with P45 phosphor (FIMI Medical Electrical Equipment, Saronno,
Italy). Each base period of the mfERG stimulation contained 16 video frames: 8
successive multifocal flash frames and 8 successive dark frames, as suggested by
Kondo and Miyake (Kondo et al. 1998; Kondo & Miyake 2000). Each base
period lasted about 213.3 ms (bright phase duration: 106.6 ms, dark phase
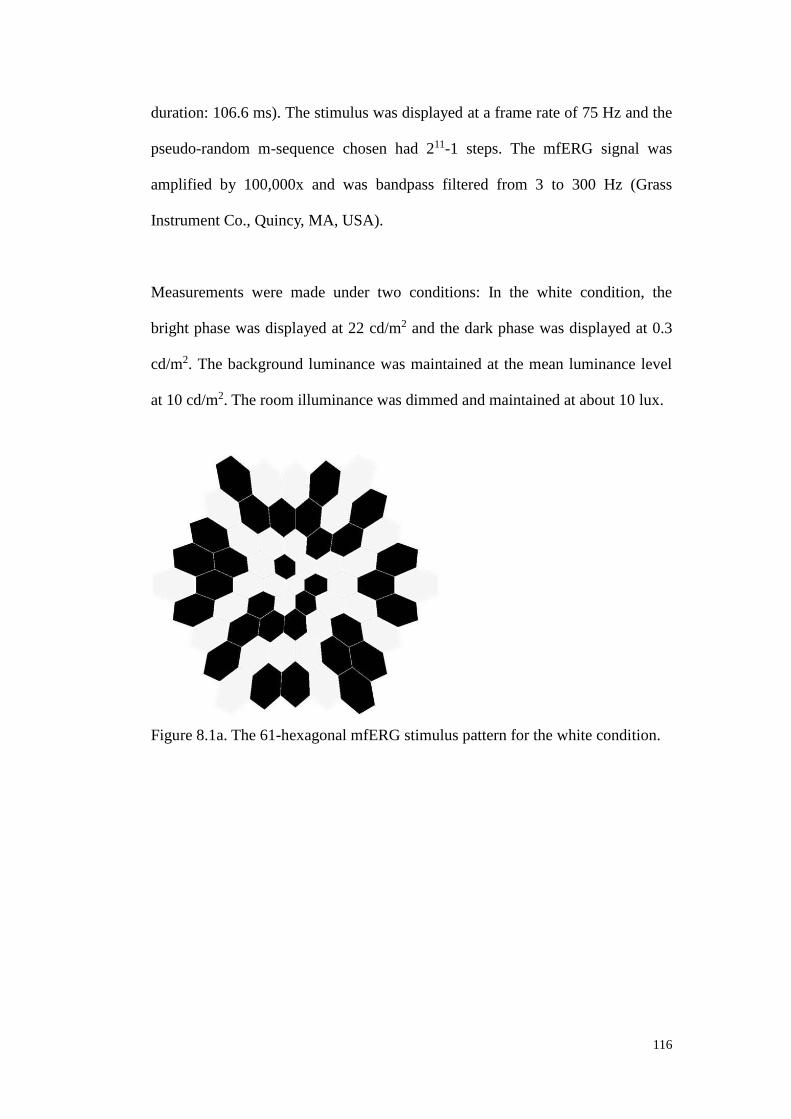
116
duration: 106.6 ms). The stimulus was displayed at a frame rate of 75 Hz and the
pseudo-random m-sequence chosen had 211-1 steps. The mfERG signal was
amplified by 100,000x and was bandpass filtered from 3 to 300 Hz (Grass
Instrument Co., Quincy, MA, USA).
Measurements were made under two conditions: In the white condition, the
bright phase was displayed at 22 cd/m2 and the dark phase was displayed at 0.3
cd/m2. The background luminance was maintained at the mean luminance level
at 10 cd/m2. The room illuminance was dimmed and maintained at about 10 lux.
Figure 8.1a. The 61-hexagonal mfERG stimulus pattern for the white condition.

117
Figure 8.1b. The 61-hexagonal mfERG stimulus pattern for the blue condition.
A Wratten 47A filter was inserted between the display and the eye to achieve the
blue stimulation condition. The Wratten 47A filter has peak transmission at 450
nm, with cutoff at half-height at about 500 nm. The spectrum of visible
wavelengths emitted from P45 phosphor is broader than the cutoff of the Wratten
47A filter, and the combination of P45 and Wratten 47A produces a deep blue
stimulus which stimulates mainly the short-wavelength (SW) and partly
middle-wavelength (MW) cone systems (Poloschek & Sutter 2002; Ozawa &
Itoh 2003). The luminance of the white and black hexagons on the FIMI monitor
under the 47A filter was adjusted so that the same luminance was achieved as for
the white stimulation condition. The luminance measurements were made using a
Konica Minolta LS-110 photometer (Konica Minolta Optics, Inc., Tokyo, Japan).
Both the white and blue mfERG stimulations with the same luminance were
displayed randomly to the subjects.
One eye of each subject was randomly selected for mfERG measurement and
dilated using 1% Tropicamide (Alcon, Fort Worth, TX, U.S.A.) until the pupil
118
reached at least 7 mm diameter. A Dawson-Trick-Litzkow (DTL) electrode was
used as the active electrode. A gold-cup electrode was placed at the outer canthus
as the reference electrode, and another at the central forehead as the ground.
Subjects were corrected for the viewing distance of 33 cm using ophthalmic trial
lenses. Each subject was instructed to fixate the central cross of the mfERG
stimulus pattern throughout the measurement. The measurement for each
condition was divided into 32 segments. Any recorded segment contaminated by
blinks or other artifacts was rejected and re-measured immediately.
8.1.3.3 Data analysis
8.1.3.3.1 Grouping of mfERG responses
The mfERG responses from the 61-hexagon pattern were grouped into 5 rings for
analysis. There are two sections of the resultant waveform: the on-response
triggered by the mfERG bright phase (stimulus-on) and the off-response
triggered by the mfERG dark phase (stimulus-off) (Figure 8.2). The on-response
is the initial part of the waveform, which is similar to the conventional mfERG
waveform, including a negative trough (N1) followed by a positive peak (P1) and
then another trough (N2). After a plateau following N2, there is a second peak
(P2) which is the off-response. The relevant amplitude and time parameters are
shown in Figure 8.2.

119
Figure 8.2. The waveform under the "long-duration" mfERG paradigm showing
the parameters measured.
8.1.3.3.2 Calculation of percentage changes of mfERG responses under
achromatic and chromatic conditions
When the mfERG stimulus changed from white to blue stimulation, the
percentage change for the mfERG responses was calculated using:
(mfERG response under blue stimulus – mfERG response under white stimulus) x 100%
(mfERG response under white stimulus)
This value was used to investigate the changes of the antagonistic interaction
within the retina.
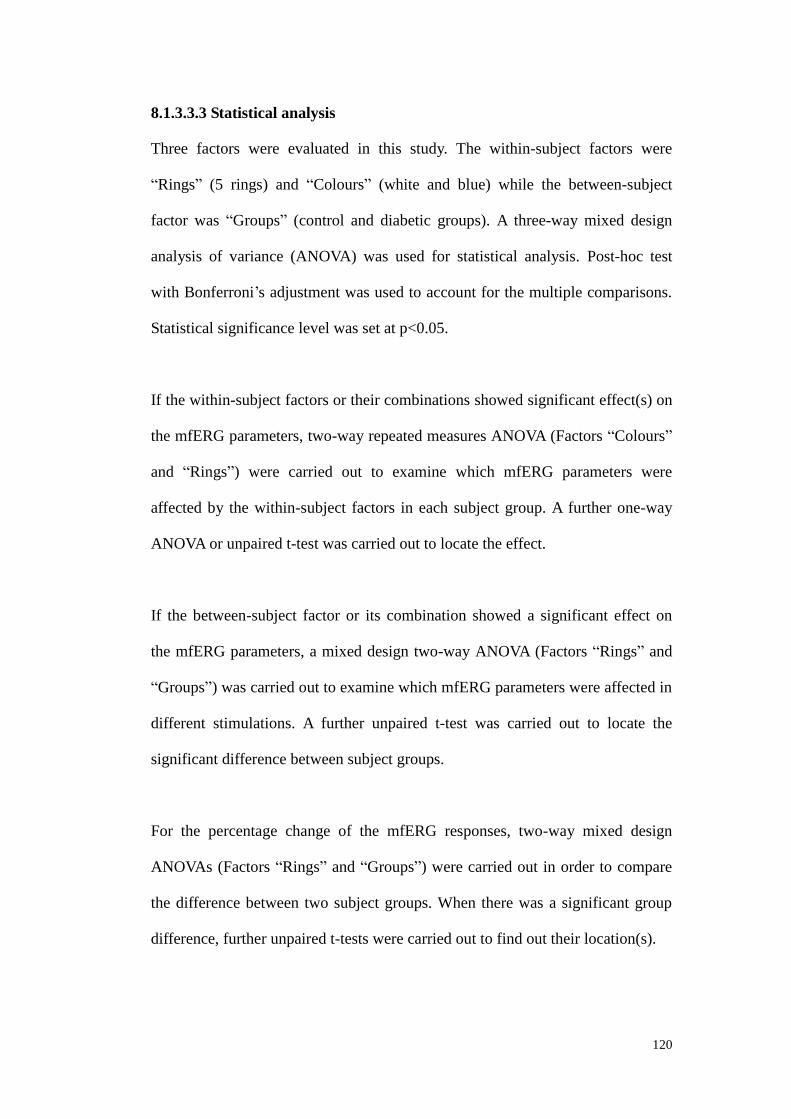
120
8.1.3.3.3 Statistical analysis
Three factors were evaluated in this study. The within-subject factors were
“Rings” (5 rings) and “Colours” (white and blue) while the between-subject
factor was “Groups” (control and diabetic groups). A three-way mixed design
analysis of variance (ANOVA) was used for statistical analysis. Post-hoc test
with Bonferroni’s adjustment was used to account for the multiple comparisons.
Statistical significance level was set at p<0.05.
If the within-subject factors or their combinations showed significant effect(s) on
the mfERG parameters, two-way repeated measures ANOVA (Factors “Colours”
and “Rings”) were carried out to examine which mfERG parameters were
affected by the within-subject factors in each subject group. A further one-way
ANOVA or unpaired t-test was carried out to locate the effect.
If the between-subject factor or its combination showed a significant effect on
the mfERG parameters, a mixed design two-way ANOVA (Factors “Rings” and
“Groups”) was carried out to examine which mfERG parameters were affected in
different stimulations. A further unpaired t-test was carried out to locate the
significant difference between subject groups.
For the percentage change of the mfERG responses, two-way mixed design
ANOVAs (Factors “Rings” and “Groups”) were carried out in order to compare
the difference between two subject groups. When there was a significant group
difference, further unpaired t-tests were carried out to find out their location(s).
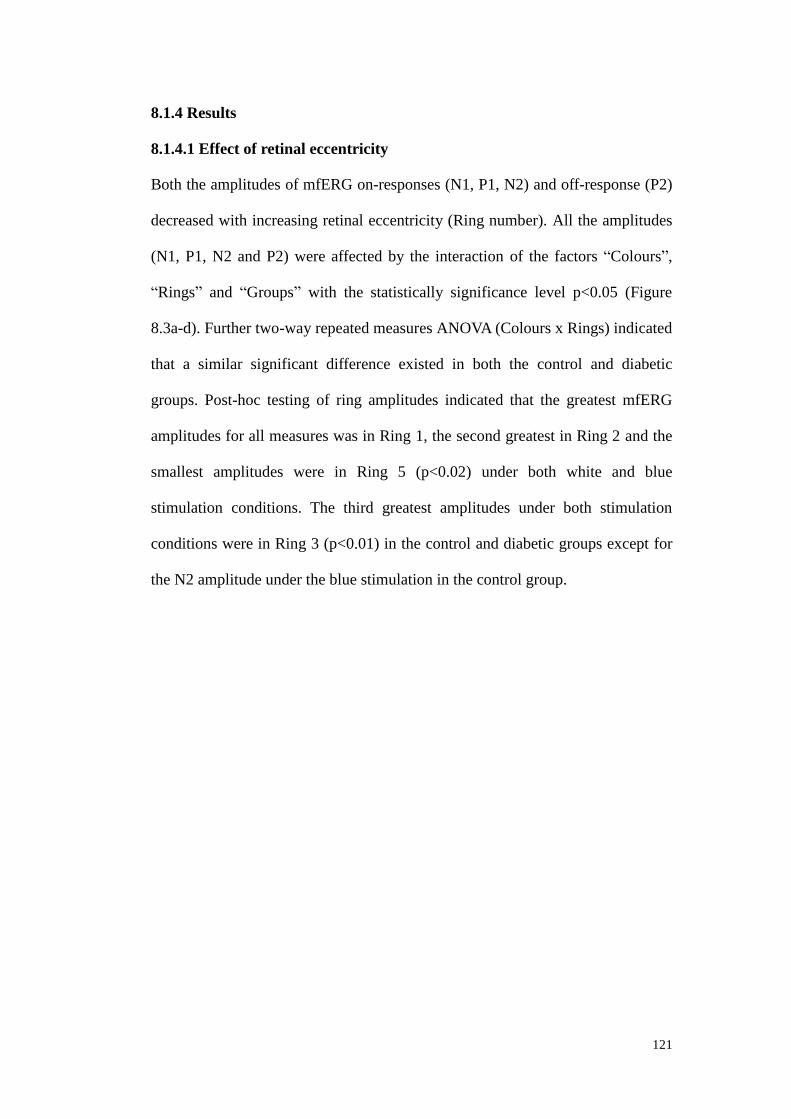
121
8.1.4 Results
8.1.4.1 Effect of retinal eccentricity
Both the amplitudes of mfERG on-responses (N1, P1, N2) and off-response (P2)
decreased with increasing retinal eccentricity (Ring number). All the amplitudes
(N1, P1, N2 and P2) were affected by the interaction of the factors “Colours”,
“Rings” and “Groups” with the statistically significance level p<0.05 (Figure
8.3a-d). Further two-way repeated measures ANOVA (Colours x Rings) indicated
that a similar significant difference existed in both the control and diabetic
groups. Post-hoc testing of ring amplitudes indicated that the greatest mfERG
amplitudes for all measures was in Ring 1, the second greatest in Ring 2 and the
smallest amplitudes were in Ring 5 (p<0.02) under both white and blue
stimulation conditions. The third greatest amplitudes under both stimulation
conditions were in Ring 3 (p<0.01) in the control and diabetic groups except for
the N2 amplitude under the blue stimulation in the control group.

122
Figure 8.3. a) The N1 amplitude in the DM and control groups under both the
white and blue stimulus conditions; b) The P1 amplitude in the DM and control
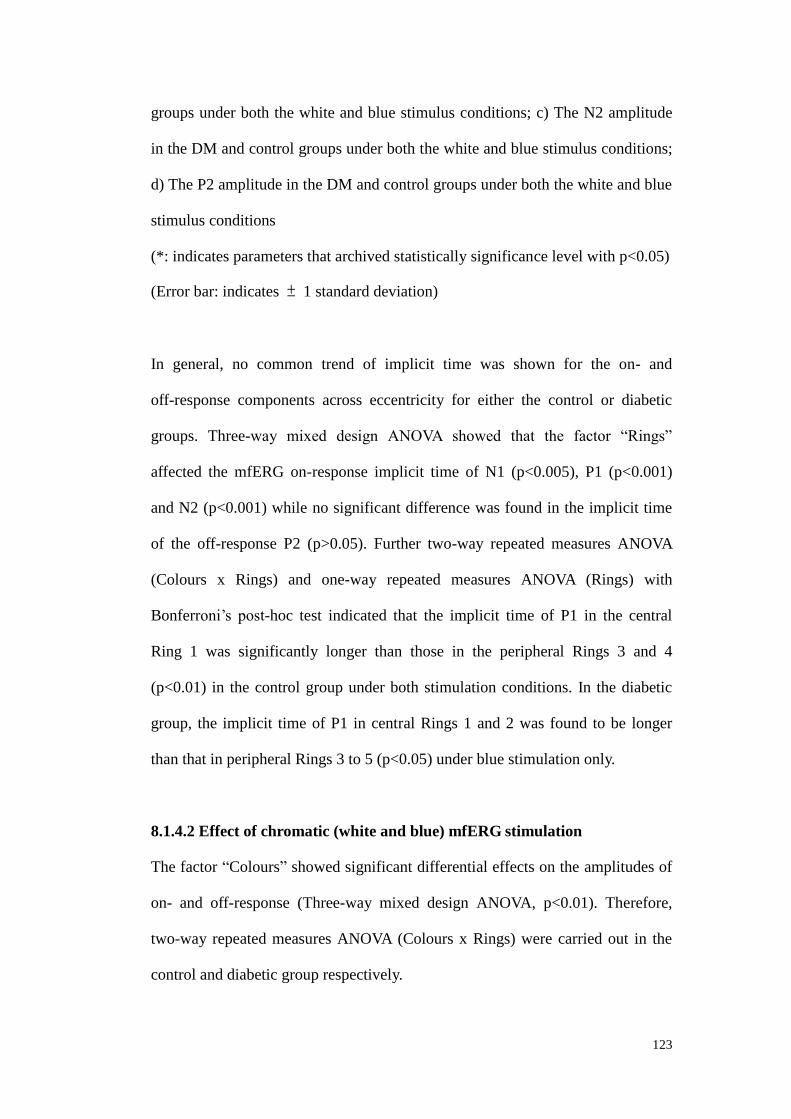
123
groups under both the white and blue stimulus conditions; c) The N2 amplitude
in the DM and control groups under both the white and blue stimulus conditions;
d) The P2 amplitude in the DM and control groups under both the white and blue
stimulus conditions
(*: indicates parameters that archived statistically significance level with p<0.05)
(Error bar: indicates ± 1 standard deviation)
In general, no common trend of implicit time was shown for the on- and
off-response components across eccentricity for either the control or diabetic
groups. Three-way mixed design ANOVA showed that the factor “Rings”
affected the mfERG on-response implicit time of N1 (p<0.005), P1 (p<0.001)
and N2 (p<0.001) while no significant difference was found in the implicit time
of the off-response P2 (p>0.05). Further two-way repeated measures ANOVA
(Colours x Rings) and one-way repeated measures ANOVA (Rings) with
Bonferroni’s post-hoc test indicated that the implicit time of P1 in the central
Ring 1 was significantly longer than those in the peripheral Rings 3 and 4
(p<0.01) in the control group under both stimulation conditions. In the diabetic
group, the implicit time of P1 in central Rings 1 and 2 was found to be longer
than that in peripheral Rings 3 to 5 (p<0.05) under blue stimulation only.
8.1.4.2 Effect of chromatic (white and blue) mfERG stimulation
The factor “Colours” showed significant differential effects on the amplitudes of
on- and off-response (Three-way mixed design ANOVA, p<0.01). Therefore,
two-way repeated measures ANOVA (Colours x Rings) were carried out in the
control and diabetic group respectively.

124
In the control group, two-way repeated measures ANOVA (Colours x Rings)
indicated that the blue stimulation triggered greater P1 (p=0.006), N2 (p=0.03)
and P2 (p=0.034) amplitudes than the white stimulation. Further paired t-tests on
the ring amplitudes were performed. For the P1 amplitude, a significant
chromatic effect was found at Rings 2 to 4 (p<0.05) (Figure 8.3b, left panel); for
the N2 amplitude, the significant chromatic effect was found at Rings 2, 4 and 5
(p<0.02) (Figure 8.3c, left panel); for the P2 amplitude, a significant chromatic
effect was found at Rings 2 to 5 (p<0.05) (Figure 8.3d, left panel).
In the diabetic group, two-way repeated measures ANOVA (Colours x Rings)
indicated that the blue stimulation triggered greater amplitudes for all mfERG
responses than the white stimulation (p<0.04). Further paired t-tests on the ring
amplitudes showed where the significant effect existed. For the N1 amplitude, a
significant chromatic effect existed in Rings 4 to 5 (p<0.01) (Figure 8.3a, right
panel); for the P1 amplitude, this effect was found in all five rings (p<0.02)
(Figure 8.3b, right panel); for the N2 and P2 amplitudes, a chromatic effect was
mainly found in Rings 3 to 5 (p<0.01) (Figure 8.3c and 8.3d, right panels).
Under different chromatic stimuli, it was observed that the implicit times of the
on-responses (P1 and N2) of the blue stimulation were shorter than those of the
white stimulation in the diabetic group only. The chromatic factor had a
statistically significant effect on the implicit time of P1 at Rings 3 and 4 only in
the diabetic group. The P1 implicit time in response to the white stimulation was
longer than to blue stimulation (p<0.01) (Figure 8.4). No other consistent trend in
implicit time was observed for the remaining mfERG components.

125
Figure 8.4. The P1 implicit time in the diabetic groups under both the white and
blue stimulus conditions
(*: indicates parameters that achieved statistically significance level with p<0.05)
(Error bar: indicates ± 1 standard deviation)
8.1.4.3 Comparison between the control and diabetic groups
The diabetic subjects showed significantly greater N2 amplitudes than did the
healthy controls (Three-way mixed design ANOVA, p<0.05). Two-way mixed
design ANOVA indicated that a significant “Groups” difference occurred only for
white stimulation (p<0.03). Unpaired t-tests showed that this effect achieved a
statistical significance level at Ring 2 (p<0.05) and Ring 4 (p<0.001) (Figure
8.5).

126
Figure 8.5. The N2 amplitude in the control and diabetic groups under the white
stimulus condition.
(*: indicates parameters that achieved statistically significance level with p<0.05)
(Error bar: indicates ± 1 standard deviation)
Considering the amplitude changes of major components (as a percentage) when
the stimulus was changed from white to blue, although there was a great
variation of the percentage value, the P1 amplitude consistently showed a greater
increase across retinal eccentricity in the diabetic than in the control group
(Figure 8.6a), while the on-response component N2 showed an opposite trend.
Two-way mixed design ANOVA (Rings x Groups) showed that the N2 amplitude
of the diabetic group had a significantly smaller increase than the control group
(p<0.02) especially for Ring 5 as found by the unpaired t-tests (Figure 8.6b).
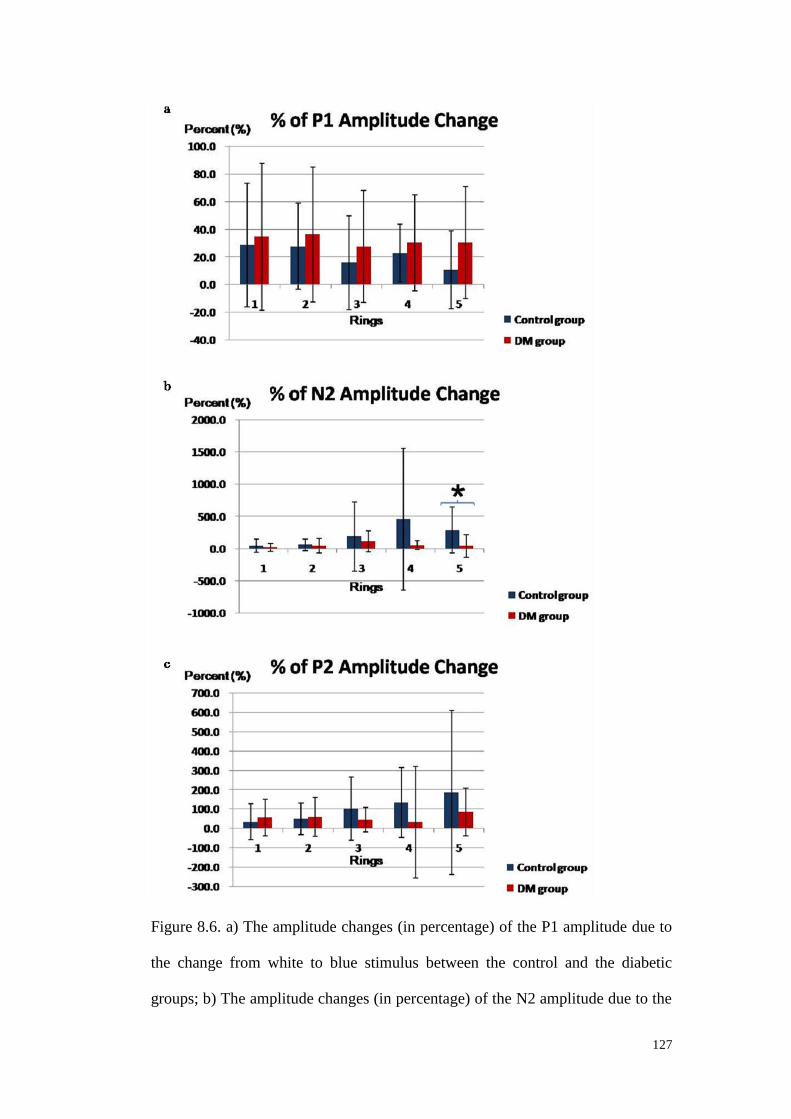
127
Figure 8.6. a) The amplitude changes (in percentage) of the P1 amplitude due to
the change from white to blue stimulus between the control and the diabetic
groups; b) The amplitude changes (in percentage) of the N2 amplitude due to the

128
change from white to blue stimulus between the control and the diabetic groups;
c) The amplitude changes (in percentage) of the P2 amplitude due to the change
from white to blue stimulus between the control and the diabetic groups.
(*: indicates parameters that achieved statistically significance level with p<0.05)
(Error bar: indicates ± 1 standard deviation)
For the P2 amplitude, when the stimulation changed from white to blue, the
diabetic group also had a greater increase than the control at Rings 1 and 2 but a
lesser increase for Rings 3 to 5 as shown in Figure 8.6c; however, no statistical
significance was shown in the two-way mixed design ANOVA (p>0.05). No
consistent trend was observed in the N1 amplitude change. Both the diabetic and
control groups showed an increase in the P2 implicit time but no consistent
change was observed in the implicit time of the other mfERG components.
8.1.5 Discussion
By using white and blue stimuli in the “long-duration” mfERG paradigm,
waveforms contain two positive peaks which are similar to the resultant
waveform in the long-duration full-field electroretinogram. This “long-duration”
mfERG paradigm is based on the Ganzfeld full-field electroretinogram with a
long-duration stimulus. The mfERG stimulus applied here was not a true
continuous flash, but a series of flash impulses at high frequency up to 75 Hz.
Saeki and Gouras (Saeki & Gouras 1996) demonstrated that a high frequency
flash series produces an effect similar to that produced by a light pulse of
long-duration which can generate a positive off-response.
129
8.1.5.1 Spectral difference between the white and blue stimuli
In this study, the blue stimulus generally triggered stronger mfERG signal than
the white stimulus in both diabetic and control groups. The mfERG paradigm
was conducted at the same luminance level under white and blue conditions. The
white stimulus has a broad-band spectrum which stimulates the long (L)-, middle
(M)- and short (S)-wavelength sensitive cones; while the blue stimulus has a
narrow-band spectrum and it mainly stimulates the S-wavelength sensitive cones.
The Wratten 47A filter used (λmax = 450um) minimizes but does not totally
eliminate the involvement of the L- and M-cone pathways. This would reduce the
lateral antagonism between different cone pathways (Rangaswamy et al. 2007),
an effect which is expected to enhance the mfERG responses.
8.1.5.2 The waveform and its representative components under
long-duration stimulus mfERG
Because of the similarity of the “long-duration” protocols in the full-field
electroretinogram and mfERG (Saeki & Gouras 1996; Kondo & Miyake 2000;
Rangaswamy et al. 2007), it is proposed that the N2 trough found beyond the
first P1 peak originates from the inner retinal layer, probably a site near the
ganglion cell layer (Saeki & Gouras 1996; Kondo & Miyake 2000; Rangaswamy
et al. 2007). Although, under the “long-duration” mfERG paradigm, the overlap
between the on- and off-pathway responses was minimized, the on- and
off-responses were not completely dissociated. The on-response is predominantly
from the depolarizing bipolar cells shaped by the hyperpolarizing bipolar cells,
while the off-response is predominantly from the hyperpolarizing bipolar cells
shaped by the depolarizing bipolar cells (Miyake et al. 1987; Sieving 1993;
Kondo & Miyake 2000; Ueno et al. 2006; Rangaswamy et al. 2007).

130
8.1.5.3 mfERG response in diabetic retina
Under both the white and blue stimulation conditions, the N2 amplitude in the
diabetic group was larger than that in the control group. The on-response
component under blue stimulus conditions increased in the diabetic group. Four
possibilities may lead to an increase of the N2 amplitude in the DM patients: 1)
Stronger activity of the inner retina (near the ganglion cell layer); 2) Reduced
on-pathway activity; 3) Enhanced off-pathway activity; 4) Weakening of the
lateral antagonistic interaction. However, the first three possibilities appear
unable to explain the changes in the DM patients. Firstly, previous morphological
studies (Barber et al. 1998; Lopes de Faria et al. 2002; Ozdek et al. 2002; Barber
2003; Sugimoto et al. 2005; Kern & Barber 2008; Sato et al. 2008; Takahashi &
Chihara 2008; Oshitari et al. 2009; Barber et al. 2011) have indicated that the
inner retinal structure is altered, with increased neural apoptosis, reduced rather
than increased inner retinal responses have been reported (Palmowski et al. 1997;
Fortune et al. 1999; Kurtenbach et al. 2000; Onozu & Yamamoto 2003; Bearse et
al. 2004; Bearse et al. 2004; Han et al. 2004; Han et al. 2004; Han et al. 2004;
Bearse et al. 2006; Ng et al. 2008; Bronson-Castain et al. 2009; Harrison et al.
2011). Secondly, the P1 and N2 amplitudes in the diabetic group were generally
greater than in the control group. This seems to oppose the possibility stated
above as point 2). Thus, the increased N2 amplitude cannot be simply explained
by changes in the activities of the ganglion cells, the on- or off-pathways alone.
Probably the antagonistic interactions within retinal cellular components play a
role on the enhancement of the N2 amplitude.
8.1.5.4 Role of lateral antagonism
Considering the hypothesized changes in lateral antagonism, when the stimulus

131
was changed from white (broad-band) to blue (narrow-band), it was proposed
that there was a reduction in antagonistic interaction (Rangaswamy et al. 2007)
and this resulted in an increase of the mfERG amplitude. This was reflected by
the positive percentage amplitude change found in our results as seen in Figures
8.6a-c.
The higher the percentage value of the mfERG amplitude change calculated in
the results (Figure 8.6), the greater would be the hypothesized reduction in lateral
antagonistic interaction due to the change of stimulus colours from white to blue.
Comparing the percentage change of the mfERG amplitude in both subject
groups, the control group initially showed a greater percentage change than the
diabetic group in terms of the on-response P1, but a reverse trend was apparent in
the later on-response component N2 and the off-response component P2,
although these data do show marked variability. It is suggested that both the N2
and P2 components share a common origin, most likely the off-pathway, which,
we suggest, exerts less antagonistic interaction to the on-pathway in the early
stage of DM. These effects were consistent across the retina, but only reached
statistical significance for ring 5 (see Figure 8.6b). Whether the peripheral retina
is more prone to this functional loss still needs further investigation.
8.1.5.5 Proposed explanations of the long-duration stimulus mfERG changes
in DM patients
Previous electroretinogram studies (Brinchmann-Hansen et al. 1992; Palmowski
et al. 1997; Fortune et al. 1999; Kaneko et al. 2000; Kurtenbach et al. 2000;
Shimada et al. 2001; Bearse et al. 2003; Onozu & Yamamoto 2003; Bearse et al.
2004; Han et al. 2004; Han et al. 2004; Tyrberg et al. 2005; Bearse et al. 2006;

132
Kizawa et al. 2006; Chen et al. 2008; Ng et al. 2008; Bronson-Castain et al. 2009;
Harrison et al. 2011; Laron et al. 2011; Lung et al. 2012; Lung et al. 2012)
reported a decrease in the inner retinal responses rather than an enhanced
response. However, in this experiment, greater amplitude was recorded from the
diabetic subjects when the blue stimulus was used. The dissociation of the on-
and off-retinal pathway activities by the long-duration paradigm can allow subtle
changes in responses of the diabetic retina to be more readily observed. It is
possible that the changes or weakening of the inhibitory interaction between
different retinal pathways will cause this enhancement of mfERG response. In
the full-field electroretinogram, a decrease of photopic negative response has
been reported for a brief blue flash stimulus. (McFarlane et al. 2012) The dark
frames in this mfERG paradigm help to eliminate the temporal adaptive effect of
the successive flash stimuli, but there may be a certain spatial lateral effect from
the neighboring hexagons which may affect the high-order retinal response. Thus
the N2 component may not be directly comparable to the photopic negative
response in the conventional full-field electroretinogram. Further studies on the
long-duration full-field electroretinogram on diabetic patients and on animal
models using pharmacological dissection of the response (Sieving 1993; Hood et
al. 1999; Ueno et al. 2006; Rangaswamy et al. 2007) should be conducted in
order to increase our understanding of the cellular origin of the N2 component.

133
Chapter 9: Summary of experimental results, conclusions and suggestions
for future research
9.1 Summary of experimental results
DM has become one of the health problems of greatest concern in Hong Kong.
According to a recent report from the Hong Kong Society for Endocrinology,
nearly 10% of the Hong Kong population was suffering from DM (Diabetes
Division, Hong Kong Society for Endocrinology, Metabolism and Reproduction
2000). DM can lead to DR, which is one of the most common causes of
blindness. About 28.4% of DM patients in Hong Kong have developed DR with
levels ranging from the minimal non-proliferative type to the sight-threatening
proliferative type (Tam et al., 2005).
Since the prevalence of early-onset type II diabetes is continuously increasing
globally (Rosenbloom et al. 1999; WHO 2012) and it is estimated that nearly all
type I DM patients and more than 60% of the type II DM patients will progress
to have DR during the first two decades after diagnosis of DM (Fong et al. 2003).
This public health issue will create a heavy financial burden on society. With
appropriate assessment and treatment, more than 90% of visual loss resulting
from DR can be prevented (Li et al. 2004). Better knowledge of the
abnormalities in diabetic retinopathy will help to delay as well as to prevent
visual loss in DM patients.
By using current clinical tests, only obvious retinal defects or damage can be
ruled out (Carmichael et al. 2005). DM affects the capillary circulation and thus
leads to ocular disorders. This has a large impact on the inner retinal segment and
is believed to affect retinal signal transmission and efficiency. The mfERG offers
134
a technique that can reflect the abnormalities of retinal functions before the
presence of significant observable signs (Shimada et al. 2001). Here, a modified
mfERG paradigm (MOFO mfERG) was applied in order to screen out the
potential retinal sites with the functional changes in the early stage of DR. Before
the paradigm can be used, it is necessary to determine the optimal luminance
combination for the MOFO mfERG measurement.
In Experiment A1, sixteen luminance combinations of the global (g) and focal (f)
flashes in the MOFO mfERG paradigm were investigated. The experiment
demonstrated the variations of the amplitudes and implicit time of the two main
parameters, DC and IC under different g/f ratios. The DC amplitude increases
approximately with the focal flash intensity and achieves the maximum value
when the g/f ratio is kept at the minimal value among the sixteen luminance
combinations. The IC amplitude achieves the peak value when the g/f ratio is
kept at 2:1. DC and IC implicit times change in opposite directions. With the
increasing g/f ratio, DC is less delayed while the IC is more postponed.
Considering together with the ISCEV guideline (2007) (Hood et al. 2008) and
patient’s discomfort, a focal flash intensity between 100 and 200 cd/m2 with g/f
≤1 (i.e. 100 cd/m2 < f ≤ 200 cd/m2, f ≥ g) is recommended to obtain an optimal
DC response. To obtain an optimal IC response, with a g/f ratio 2:1 is
recommended.
Therefore, in order to obtain a considerable DC and IC amplitudes together, a g/f
ratio equals to 1, and a focal flash intensity above 100 cd/m2 and equal to or
below 200 cd/m2 is recommended.

135
In Experiment A2, the MOFO mfERG was applied to investigate the early
functional changes in different types of localized diabetic retinal lesions under
high and low contrast conditions. With the increase of DR severity, greater delay
and amplitude reduction were found, which indicates a further deterioration of
retinal function. The amplitudes of IC from the high contrast condition and DC at
both high and low contrast conditions are sensitive indicators which can be used
to screen out early functional anomalies before DR is seen in the diabetic retina.
Both the reduction and delay of the DC and IC parameters suggest that the
middle and inner retinal layers are impaired in diabetic patients even before
visible DR can be detected by the usual clinical assessments.
In Experiment B, three ocular measurements were carried out in the diabetic
retina. The measurements were the MOFO mfERG, visual field and retinal nerve
fiber thickness assessment by OCT. A combination of the topographic mapping
among the localized data from these three ocular assessments was performed. It
was used to compare the sensitivity of these three assessments in diabetic
patients and to investigate the localized morphological and functional changes in
diabetic lesions. The MOFO mfERG responses generally correlate better with
automated perimetry data than do the morphological RNFL thickness measures.
The amplitude of mfERG parameters has a more consistent correlation with the
perimetric sensitivity than does the implicit time. The MOFO mfERG is superior
to the other two assessments in differentiating the diabetic retinal area without
DR from other retinal areas. However, only a moderate correlation exists
between the MOFO mfERG and localized luminance sensitivity as found in the
visual field tests. The changes observed in the MOFO mfERG and its weak to
moderate correlations with the RNFL thickness and luminance sensitivity

136
indicate that the alteration of the adaptive function in the diabetic retina is in the
middle and/or inner retinal layers, but appears not to show any effects on the
RNFL. The correlation between the MOFO mfERG and luminance sensitivity
exists across all diabetic samples, including those without any visible DR signs.
This implies that the functional deterioration should exist much earlier than the
vascular changes in the human diabetic retina.
From the above experiments, it has demonstrated that the functional deterioration
exists at the middle and /or inner retina even before the visible DR lesions. The
functional deterioration can only be partially explained by the luminance
sensitivity reduction while the structural changes of the RNFL do not have any
significant association with it. The cellular structures, which are responsible for
the lateral antagonism, are probably vulnerable in the disease of DM. It would be
probably one of the new areas to study for the early changes in diabetic human
retina.
In order to further investigate the function of the middle to inner retinal layers,
Experiment C was carried out. This experiment examined antagonistic processes
by means of a “long-duration” mfERG paradigm. The “long-duration” mfERG
measurement was carried out using blue and white stimuli. The “long-duration”
mfERG minimizes the overlap of the on- and off-pathway responses as compared
to the conventional mfERG paradigm. With the insertion of a blue colour filter,
the stimulus changes from a white (broad-band spectral stimulation) to blue
(narrow-band spectral stimulation), and there is a decreased involvement of
lateral antagonism. The larger amplitude of the on-response component (N2) in
the diabetic patients suggested an imbalance of lateral antagonism in the diabetic
137
retina at the early stage (with no or mild NPDR) of the disease. This situation
seems unlikely be solely explained by the changes of ganglion cells, the on- or
off-pathways. It is hypothesized that the decreased percentage change of the N2
amplitude in the diabetic group may further indicate an impairment of the
interaction at the middle retinal level.
Novel findings from the above experiments were, firstly, it demonstrated the
linear and non-linear properties of the DC and IC responses through repeated
measures experimental design of the MOFO mfERG paradigm. The optimal
luminance combination of MOFO mfERG measurement was also obtained.
Secondly, by means of MOFO mfERG, it showed that the functional deterioration
exists at the middle and /or inner retina even before the visible DR lesions.
Thirdly, the amplitudes of the DC and IC responses have better diagnostic power
in screening out the diabetic retina than the implicit time. Fourthly, MOFO
mfERG paradigm is superior to two other common clinical devices (automated
perimetry and OCT) in differentiating the “No DR” retina from the “DR” retina.
Furthermore the functional deterioration in the diabetic retina can only be
partially explained by the luminance sensitivity reduction, while the structural
changes of RNFL do not have any significant association with it. Fifthly, the
cellular structures, which are responsible for the lateral antagonism, are
vulnerable in the disease of DM. It would be probably one of the new areas to
study for the early changes in diabetic human retina.
The objective mfERG findings of the above experiments agree with previous
studies (as mentioned in Ch. 4.3), that functional deterioration exists early,
becoming apparent before the clinically visible vascular changes. The MOFO

138
mfERG indicates that the functional deterioration exists before the visible
vascular lesions in the human diabetic retina. With the comparison among
mfERG, automated perimetry and OCT RNFL thickness measurement, it further
provides evidence that the functional deterioration comes earlier than the
structural damage in humans. Together with the imbalance of the lateral
antagonism for those with no or only mild NPDR lesions from the above
experiments, it proposes that the functional damage may exist earlier than the
structural damage in the diabetic retina. Applying similar experimental setup to
study the retinal functional changes in the type I diabetic patients who are newly
diagnosed would have been useful for providing further support on this
hypothesis. As the functional deterioration of the type I diabetic patients can be
investigated before the development of any vascular damage which was proposed
not to exist in the first month of the onset of DM.
The mfERG paradigm shows a greater power to differentiate the “No DR” retina
from the “DR” retina than two other common clinical devices. The results from
this study can help to develop a method for early detection in preventing or
delaying the progression of the sight-threatening visual loss in the diabetic
patients, for use in daily clinical operation. We hope this would relieve the social
economic burden on this public health issue by reducing the number of DR cases
at advance stage in terms of early detection and prompt treatment at the early
stage. Moreover, with the application of the modified mfERG paradigms and
with different stimulus colours, it is proposed that the middle retinal components
may indicate the potential retinal sites vulnerable at the early stages of DM.
These techniques will help to provide target retinal components to assess
experimental therapeutic treatment(s) in DR, to assist in retaining the retinal

139
function before irreversible retinopathy occurs.
9.2 Limitations of in this study
Due to the upper luminance limitation of the mfERG display unit, the luminance
combination in Experiment A1 reached only a maximum value of 400 cd/m2. The
optimal luminance for MOFO mfERG may be beyond this limited range, but the
value reached is within the range suggested by the international guideline (Hood
et al. 2012).
In the diabetic experiments, the recruited subjects in this study were from the
optometric clinic in The Hong Kong Polytechnic University. The medical history
of the diabetic patients heavily depended on the hospital medical summary kept
by the patients. However, there was a lack of detail about the glycemic control
status and the exact onset time of the DM condition. This is a common problem
faced in the study of type II DM, as there is always a variable latent period
before the condition is diagnosed. Applying similar experimental set-up in type I
diabetic patients who are newly diagnosed would have been helpful to study the
early functional changes in the human diabetic retina. Moreover, HbA1c of the
blood sample would have provided a more reliable plasma glucose level than the
on-site fasting spot test. As the HbA1c can reflect the estimation of the averaged
plasma glucose level for the past 120 days while the spot test can only reflect the
instant plasma glucose level in the capillary which can be fluctuated.
In Experiments A2 to C, the crystalline lenses of the diabetic subjects and their
age-matched controls were assessed by the slit-lamp biomicroscopy. Although
previous studies (as mentioned in Ch. 4.1.2) found that the crystalline lenses of

140
the type II diabetic patients were not significantly different from the age-matched
healthy controls, performing objective clinical assessments of the crystalline lens
by means of ultrasonic or optical methods would have been helpful in a
quantitative analysis for showing the non-significant difference in each
experiment.
In Experiment C, although the blue stimulation was used, there were still mild
middle-wavelength (MW) cone pathway being triggered; if possible, a
suppressive amber background would have been helpful in isolating different
cone pathway responses in order to further explore the retinal antagonistic
interactions at the middle retina.
In terms of the clinical assessments, the major limitations of my study were the
absence of fundus fluorescein angiogram (FFA), contrast sensitivity (CS) and
colour vision assessments. Performing the FFA would have allowed me to
understand the retinal blood circulation and vascular perfusion in a deeper extent.
Combining the fundus photodocumentation, biomicroscopy and FFA, the
sensitivity and accuracy for classifying DR lesions would have been markedly
increased. This would have been useful to improve the grading system of the DR
severity in Experiments A2 and B. With the improved grading system, the
variation of the experimental data in Experiments A2 and B would be minimized
and the “true” diagnostic values of MOFO mfERG would be reflected.
CS and colour vision assessments, as subjective functional tests, were reported to
have deterioration in diabetic patients at early stage. Although the accuracy of CS
was reported to be low (Ismail & Whitaker 1998) as mentioned in Ch. 4.2.2,

141
collecting the CS data would have provided a more comprehensive picture of the
functional deterioration in the diabetic retina. This would have been helpful to
link the objective mfERG functional findings to the subjective visual symptoms
of the diabetic patients in their daily life.
Blue-yellow acquired colour deficiency was reported in the diabetic patients
(Ismail & Whitaker 1998) as mentioned in Ch. 4.2.3. Collecting the data of the
subjective colour vision test would have provided more information for the
comparison of the objective mfERG findings from the blue-pathway in
Experiment C.
Combining my mfERG findings with the additional clinical data from the FFA,
CS and colour vision assessments, it would have provided a more detailed
picture of the subjective and objective functional deterioration of the diabetic
patients. Variations among the test results might have been useful in further
sub-categorizing the diabetic patients into different stages.
9.3 Suggestions for future research
The findings from the human diabetic retina proposed that the impairment of the
inhibitory interaction between different retinal pathways may play a key role at
the early stage of the disease. In order to further investigate the antagonistic
interaction properties, pharmacological dissection studies as suggested by Hood
et al. and Chu et al. (Hood et al. 2002; Chu et al. 2008) of the “long-duration”
mfERG in an animal model (such as pig or primate) will help to isolate the
cellular component contributing to N2. Studying the "long-duration" mfERG
component N2, which was found to be affected in the diabetic retina, in both
142
control and diabetic models will be useful in order to explore further aspects of
the cellular or physiological changes in the diabetic retina.
Moreover, applying different chromatic stimuli with suppressive background
may help to further understand this property. As in the current study, it was
hypothesized that the middle retina might be a potential site early affected in the
diabetic patients, although the blue stimuli was used, there were still mild MW
cone pathway being triggered; if possible, a suppressive amber background will
be helpful in isolating different cone pathway responses in order to further
explore the retinal antagonistic interactions at the middle retina.
A more systematic recruitment of the subjects with clear onset time and known
glycemic control condition on both types I and II diabetic patients will give a
better understanding of the difference of these two types of DM. Measurement of
HbA1c rather than the instant capillary plasma glucose level is suggested in order
to obtain a more reliable plasma glucose level reading. Further subcategories of
diabetic patients in term of medical intervention and glycemic control will give
more details of the nature of the disease. Those with glucose intolerance will also
be an interesting group for investigation, in the period before they deteriorate to
become diabetic.

143
References
Agardh E, Stjernquist H, Heijl A & Bengtsson B (2006): Visual acuity and
perimetry as measures of visual function in diabetic macular oedema.
Diabetologia 49: 200-6.
Aiello LP, Gardner TW, King GL, Blankenship G, Cavallerano JD, Ferris III FL
& Klein R (1998): Diabetic retinopathy. Diabetes Care 21: 143-56.
Alberti KG & Zimmet PZ (1998): Definition, diagnosis and classification of
diabetes mellitus and its complications. Part 1: diagnosis and
classification of diabetes mellitus provisional report of a WHO
consultation. Diabet Med 15: 539-53.
Alder VA, Cringle SJ & Constable IJ (1983): The retinal oxygen profile in cats.
Invest Ophthalmol Vis Sci 24: 30-6.
Aldington SJ, Kohner EM, Meuer S, Klein R & Sjolie AK (1995): Methodology
for Retinal Photography and Assessment of Diabetic-Retinopathy - the
Eurodiab IDDM Complications Study. Diabetologia 38: 437-444.
Arden GB & Constable PA (2006): The electro-oculogram. Prog Retin Eye Res
25: 207-48.
Arden GB, Gunduz MK, Kurtenbach A, Volker M, Zrenner E, Gunduz SB,
Kamis U, Ozturk BT & Okudan S (2010): A preliminary trial to
determine whether prevention of dark adaptation affects the course of
early diabetic retinopathy. Eye 24: 1149-55.
Arden GB, Wolf JE & Tsang Y (1998): Does dark adaptation exacerbate diabetic
retinopathy? Evidence and a linking hypothesis. Vision Res 38: 1723-9.
Asano E, Mochizuki K, Sawada A, Nagasaka E, Kondo Y & Yamamoto T (2007):
Decreased nasal-temporal asymmetry of the second-order kernel response
of multifocal electroretinograms in eyes with normal-tension glaucoma.
Jpn J Ophthalmol 51: 379-89.
Bandello F, Lattanzio R, Zucchiatti I & Del Turco C (2013): Pathophysiology
and treatment of diabetic retinopathy. Acta Diabetol 50: 1-20.
Barber AJ (2003): A new view of diabetic retinopathy: a neurodegenerative
disease of the eye. Prog Neuropsychopharmacol Biol Psychiatry 27:
283-90.
Barber AJ, Gardner TW & Abcouwer SF (2011): The significance of vascular
and neural apoptosis to the pathology of diabetic retinopathy. Invest
Ophthalmol Vis Sci 52: 1156-63.
Barber AJ, Lieth E, Khin SA, Antonetti DA, Buchanan AG & Gardner TW
(1998): Neural apoptosis in the retina during experimental and human
diabetes. Early onset and effect of insulin. J Clin Invest 102: 783-91.

144
Bearse MA Jr, Adams AJ, Han Y, Schneck ME, Ng J, Bronson-Castain K &
Barez S (2006): A multifocal electroretinogram model predicting the
development of diabetic retinopathy. Prog Retin Eye Res 25: 425-48.
Bearse MA Jr, Han Y, Schneck ME & Adams A (2003): Enhancement and
mapping of inner retinal contributions to the human multifocal
electroretinogram (mfERG). Invest Ophthalmol Vis Sci 44: ARVO
E-abstract 2696.
Bearse MA Jr, Han Y, Schneck ME & Adams AJ (2004): Retinal function in
normal and diabetic eyes mapped with the slow flash multifocal
electroretinogram. Invest Ophthalmol Vis Sci 45: 296-304.
Bearse MA Jr, Han Y, Schneck ME, Barez S, Jacobsen C & Adams AJ (2004):
Local multifocal oscillatory potential abnormalities in diabetes and early
diabetic retinopathy. Invest Ophthalmol Vis Sci 45: 3259-65.
Bearse MA Jr & Sutter EE (1999): Contrast dependence of multifocal ERG
components. Vision Science and Its Applications, OSA Technical Digest
Series 1: 24-27.
Bek T & Lund-Andersen H (1990): Localised blood-retinal barrier leakage and
retinal light sensitivity in diabetic retinopathy. Br J Ophthalmol 74:
388-92.
Bengtsson B, Heijl A & Agardh E (2005): Visual fields correlate better than
visual acuity to severity of diabetic retinopathy. Diabetologia 48:
2494-500.
Bengtsson B, Hellgren KJ & Agardh E (2008): Test-retest variability for standard
automated perimetry and short-wavelength automated perimetry in
diabetic patients. Acta Ophthalmol 86: 170-6.
Biallosterski C, Van Velthoven ME, Michels RP, Schlingemann RO, DeVries JH
& Verbraak FD (2007): Decreased optical coherence
tomography-measured pericentral retinal thickness in patients with
diabetes mellitus type 1 with minimal diabetic retinopathy. Br J
Ophthalmol 91: 1135-8.
Bloomgarden ZT (2008): Diabetic retinopathy. Diabetes Care 31: 1080-3.
Bresnick GH, Condit RS, Palta M, Korth K, Groo A & Syrjala S (1985):
Association of hue discrimination loss and diabetic retinopathy. Arch
Ophthalmol 103: 1317-24.
Bressler NM, Edwards AR, Antoszyk AN, Beck RW, Browning DJ, Ciardella AP,
Danis RP, Elman MJ, Friedman SM, Glassman AR, Gross JG, Li HK,
Murtha TJ, Stone TW & Sun JK (2008): Retinal thickness on Stratus
optical coherence tomography in people with diabetes and minimal or no

145
diabetic retinopathy. Am J Ophthalmol 145: 894-901.
Brinchmann-Hansen O, Dahl-Jorgensen K, Hanssen KF & Sandvik L (1992):
Oscillatory potentials, retinopathy, and long-term glucose control in
insulin-dependent diabetes. Acta Ophthalmol (Copenh) 70: 705-12.
Bronson-Castain KW, Bearse MA Jr, Neuville J, Jonasdottir S, King-Hooper B,
Barez S, Schneck ME & Adams AJ (2009): Adolescents with type 2
diabetes early indications of focal retinal neuropathy, retinal thinning, and
venular dilation. Retina 29: 618-26.
Browning DJ, Fraser CM & Clark S (2008): The relationship of macular
thickness to clinically graded diabetic retinopathy severity in eyes
without clinically detected diabetic macular edema. Ophthalmology 115:
533-9.
Camera A, Hopps E & Caimi G (2007): Diabetic microangiopathy:
physiopathological, clinical and therapeutic aspects. Minerva Endocrinol
32: 209-29.
Carmichael TR, Carp GI, Welsh ND & Kalk WJ (2005): Effective and accurate
screening for diabetic retinopathy using a 60 degree mydriatic fundus
camera. S Afr Med J 95: 57-61.
Chan HH & Brown B (2000): Pilot study of the multifocal electroretinogram in
ocular hypertension. Br J Ophthalmol 84: 1147-53.
Chan HH, Ng YF & Chu PH (2011): Applications of the multifocal
electroretinogram in the detection of glaucoma. Clin Exp Optom 94:
247-58.
Chan HL & Brown B (1998): Investigation of retinitis pigmentosa using the
multifocal electroretinogram. Ophthalmic Physiol Opt 18: 335-50.
Chan HL & Brown B (1999): Multifocal ERG changes in glaucoma. Ophthalmic
Physiol Opt 19: 306-16.
Chen H, Zhang M, Huang S & Wu D (2008): The photopic negative response of
flash ERG in nonproliferative diabetic retinopathy. Doc Ophthalmol 117:
129-35.
Chylack LT Jr, Wolfe JK, Singer DM, Leske MC, Bullimore MA, Bailey IL,
Friend J, McCarthy D & Wu SY (1993): The Lens Opacities
Classification System III. The longitudinal study of cataract study group.
Arch Ophthalmol 111: 831-36.
Cho HY, Lee DH, Chung SE & Kang SW (2010): Diabetic retinopathy and
peripapillary retinal thickness. Korean J Ophthalmol 24: 16-22.
Chu PH, Chan HH & Brown B (2006): Glaucoma detection is facilitated by
luminance modulation of the global flash multifocal electroretinogram.

146
Invest Ophthalmol Vis Sci 47: 929-37.
Chu PH, Chan HH & Brown B (2007): Luminance-modulated adaptation of
global flash mfERG: fellow eye losses in asymmetric glaucoma. Invest
Ophthalmol Vis Sci 48: 2626-33.
Chu PH, Chan HH, Ng YF, Brown B, Siu AW, Beale BA, Gilger BC & Wong F
(2008): Porcine global flash multifocal electroretinogram: possible
mechanisms for the glaucomatous changes in contrast response function.
Vision Res 48: 1726-34.
Clark M (2004): Understanding diabetes. Chichester ; John Wiley and Sons Ltd:
pp.1-3.
Cunha-Vaz J (2007): Characterization and relevance of different diabetic
retinopathy phenotypes. Dev Ophthalmol 39: 13-30.
DeBuc DC & Somfai GM (2010): Early detection of retinal thickness changes in
diabetes using OCT. Med Sci Monit 16: 15-21.
Dersu I & Wiggins MN (2006): Understanding visual fields, Part II: Humphrey
visual fields. Journal of Ophthalmic Medical Technology 2.
Diabetes Division, Hong Kong Society for Endocrinology, Metabolism and
Reproduction (2000): A statement for health care professionals on type 2
diabetes mellitus in Hong Kong. Hong Kong Med J 6: 105-7.
Early Treatment Diabetic Retinopathy Study Research Group (1991): Fundus
photographic risk factors for progression of diabetic retinopathy. ETDRS
report number 12. Ophthalmology 98: 823-33.
Early Treatment Diabetic Retinopathy Study Research Group (1991): Grading
diabetic retinopathy from stereoscopic color fundus photographs--an
extension of the modified Airlie House classification. ETDRS report
number 10. Ophthalmology 98: 786-806.
Elner SG, Elner VM, Field MG, Park S, Heckenlively JR & Petty HR (2008):
Retinal flavoprotein autofluorescence as a measure of retinal health.
Trans Am Ophthalmol Soc 106: 215-24.
Feitosa-Santana C, Oiwa NN, Paramei GV, Bimler D, Costa MF, Lago M, Nishi
M & Ventura DF (2006): Color space distortions in patients with type 2
diabetes mellitus. Vis Neurosci 23: 663-8.
Fong DS, Aiello L, Gardner TW, King GL, Blankenship G, Cavallerano JD,
Ferris III FL & Klein R (2003): Diabetic retinopathy. Diabetes Care 26:
226-9.
Fortune B, Schneck ME & Adams AJ (1999): Multifocal electroretinogram
delays reveal local retinal dysfunction in early diabetic retinopathy. Invest
Ophthalmol Vis Sci 40: 2638-51.

147
Friberg TR, Lace J, Rosenstock J & Raskin P (1987): Retinal microaneurysm
counts in diabetic retinopathy: colour photography versus fluorescein
angiography. Can J Ophthalmol 22: 226-9.
Garg S & Davis RM (2009): Diabetic retinopathy screening update. Clinical
diabetes 27: 140-5.
Garway-Heath DF, Holder GE, Fitzke FW & Hitchings RA (2002): Relationship
between electrophysiological, psychophysical, and anatomical
measurements in glaucoma. Invest Ophthalmol Vis Sci 43: 2213-20.
Garway-Heath DF, Poinoosawmy D, Fitzke FW & Hitchings RA (2000):
Mapping the visual field to the optic disc in normal tension glaucoma
eyes. Ophthalmology 107: 1809-15.
Gerth C (2009): The role of the ERG in the diagnosis and treatment of
Age-Related Macular Degeneration. Doc Ophthalmol 118: 63-8.
Ghirlanda G, Di Leo MA, Caputo S, Cercone S & Greco AV (1997): From
functional to microvascular abnormalities in early diabetic retinopathy.
Diabetes Metab Rev 13: 15-35.
Greenstein VC, Hood DC, Ritch R, Steinberger D & Carr RE (1989): S (blue)
cone pathway vulnerability in retinitis pigmentosa, diabetes and
glaucoma. Invest Ophthalmol Vis Sci 30: 1732-7.
Han Y, Adams AJ, Bearse MA Jr & Schneck ME (2004): Multifocal
electroretinogram and short-wavelength automated perimetry measures in
diabetic eyes with little or no retinopathy. Arch Ophthalmol 122:
1809-15.
Han Y, Bearse MA Jr, Schneck ME, Barez S, Jacobsen C & Adams AJ (2004):
Towards optimal filtering of "standard" multifocal electroretinogram
(mfERG) recordings: findings in normal and diabetic subjects. Br J
Ophthalmol 88: 543-50.
Han Y, Bearse MA Jr, Schneck ME, Barez S, Jacobsen CH & Adams AJ (2004):
Multifocal electroretinogram delays predict sites of subsequent diabetic
retinopathy. Invest Ophthalmol Vis Sci 45: 948-54.
Hanover JA (2001): Glycan-dependent signaling: O-linked N-acetylglucosamine.
FASEB J 15: 1865-76.
Harding SP, Broadbent DM, Neoh C, White MC & Vora J (1995): Sensitivity and
specificity of photography and direct ophthalmoscopy in screening for
sight threatening eye disease: the Liverpool Diabetic Eye Study. BMJ 311:
1131-5.
Harrison WW, Bearse MA Jr, Ng JS, Jewell NP, Barez S, Burger D, Schneck ME
& Adams AJ (2011): Multifocal electroretinograms predict onset of

148
diabetic retinopathy in adult patients with diabetes. Invest Ophthalmol
Vis Sci 52: 772-7.
Heijl A & Patella VM (2002): Essential perimetry: The field analyzer primer.
Germany; Carl Zeiss Meditec Inc.: pp. 44-70.
Heintz E, Wirehn AB, Peebo BB, Rosenqvist U & Levin LA (2010): Prevalence
and healthcare costs of diabetic retinopathy: a population-based register
study in Sweden. Diabetologia 53: 2147-54.
Hellstedt T, Vesti E & Immonen I (1996): Identification of individual
microaneurysms: a comparison between fluorescein angiograms and
red-free and colour photographs. Graefes Arch Clin Exp Ophthalmol 234
Suppl 1: S13-7.
Heng LZ, Comyn O, Peto T, Tadros C, Ng E, Sivaprasad S & Hykin PG (2013):
Diabetic retinopathy: pathogenesis, clinical grading, management and
future developments. Diabet Med 30: 640-50.
Henson DB & North RV (1979): Dark adaptation in diabetes mellitus. Br J
Ophthalmol 63: 539-41.
Holopigian K, Greenstein VC, Seiple W, Hood DC & Carr RE (1997): Evidence
for photoreceptor changes in patients with diabetic retinopathy. Invest
Ophthalmol Vis Sci 38: 2355-65.
Holopigian K, Seiple W, Lorenzo M & Carr R (1992): A comparison of photopic
and scotopic electroretinographic changes in early diabetic retinopathy.
Invest Ophthalmol Vis Sci 33: 2773-80.
Holt RI (2004): Diagnosis, epidemiology and pathogenesis of diabetes mellitus:
an update for psychiatrists. Br J Psychiatry Suppl 47: S55-63.
Hood DC (2003): Objective measurement of visual function in glaucoma. Curr
Opin Ophthalmol 14: 78-82.
Hood DC, Bach M, Brigell M, Keating D, Kondo M, Lyons JS, Marmor MF,
McCulloch DL & Palmowski-Wolfe AM (2012): ISCEV standard for
clinical multifocal electroretinography (mfERG) (2011 edition). Doc
Ophthalmol 124: 1-13.
Hood DC, Bach M, Brigell M, Keating D, Kondo M, Lyons JS &
Palmowski-Wolfe AM (2008): ISCEV guidelines for clinical multifocal
electroretinography (2007 edition). Doc Ophthalmol 116: 1-11.
Hood DC, Frishman LJ, Saszik S & Viswanathan S (2002): Retinal origins of the
primate multifocal ERG: implications for the human response. Invest
Ophthalmol Vis Sci 43: 1673-85.
Hood DC, Greenstein V, Frishman L, Holopigian K, Viswanathan S, Seiple W,
Ahmed J & Robson JG (1999): Identifying inner retinal contributions to

149
the human multifocal ERG. Vision Res 39: 2285-91.
Hood DC, Seiple W, Holopigian K & Greenstein V (1997): A comparison of the
components of the multifocal and full-field ERGs. Vis Neurosci 14:
533-44.
Ismail GM & Whitaker D (1998): Early detection of changes in visual function in
diabetes mellitus. Ophthalmic Physiol Opt 18: 3-12.
Jeppesen P, Knudsen ST, Poulsen PL, Mogensen CE, Schmitz O & Bek T (2007):
Response of retinal arteriole diameter to increased blood pressure during
acute hyperglycaemia. Acta Ophthalmol Scand 85: 280-6.
Kaneko M, Sugawara T & Tazawa Y (2000): Electrical responses from the inner
retina of rats with streptozotocin-induced early diabetes mellitus. J Jpn
Ophthalmol Soc 101: 775-8.
Kempen JH, O'Colmain BJ, Leske MC, Haffner SM, Klein R, Moss SE, Taylor
HR & Hamman RF (2004): The prevalence of diabetic retinopathy among
adults in the United States. Arch Ophthalmol 122: 552-63.
Kern TS & Barber AJ (2008): Retinal ganglion cells in diabetes. J Physiol 586:
4401-8.
Kern TS & Engerman RL (1995): Vascular lesions in diabetes are distributed
non-uniformly within the retina. Exp Eye Res 60: 545-9.
Khalaf SS, Al-Bdour MD & Al-Till MI (2007): Clinical biomicroscopy versus
fluorescein angiography: effectiveness and sensitivity in detecting
diabetic retinopathy. Eur J Ophthalmol 17: 84-8.
Khan ZA & Chakrabarti S (2007): Cellular signaling and potential new treatment
targets in diabetic retinopathy. Exp Diabetes Res 2007: 31867.
Kim SH, Lee SH, Bae JY, Cho JH & Kang YS (1997): Electroretinographic
evaluation in adult diabetics. Doc Ophthalmol 94: 201-13.
Kizawa J, Machida S, Kobayashi T, Gotoh Y & Kurosaka D (2006): Changes of
oscillatory potentials and photopic negative response in patients with
early diabetic retinopathy. Jpn J Ophthalmol 50: 367-73.
Klein R, Klein BE, Moss SE, Davis MD & DeMets DL (1984): The Wisconsin
epidemiologic study of diabetic retinopathy. II. Prevalence and risk of
diabetic retinopathy when age at diagnosis is less than 30 years. Arch
Ophthalmol 102: 520-6.
Klein R, Klein BE, Moss SE, Davis MD & DeMets DL (1984): The Wisconsin
epidemiologic study of diabetic retinopathy. III. Prevalence and risk of
diabetic retinopathy when age at diagnosis is 30 or more years. Arch
Ophthalmol 102: 527-32.
Klemp K, Larsen M, Sander B, Vaag A, Brockhoff PB & Lund-Andersen H

150
(2004): Effect of short-term hyperglycemia on multifocal
electroretinogram in diabetic patients without retinopathy. Invest
Ophthalmol Vis Sci 45: 3812-9.
Kondo M & Miyake Y (2000): Assessment of local cone on- and off-pathway
function using multifocal ERG technique. Doc Ophthalmol 100: 139-54.
Kondo M, Miyake Y, Horiguchi M, Suzuki S & Tanikawa A (1998): Recording
multifocal electroretinogram on and off responses in humans. Invest
Ophthalmol Vis Sci 39: 574-80.
Kowluru RA & Abbas SN (2003): Diabetes-induced mitochondrial dysfunction
in the retina. Invest Ophthalmol Vis Sci 44: 5327-34.
Kowluru RA & Chan PS (2007): Oxidative stress and diabetic retinopathy. Exp
Diabetes Res 2007: 43603-14.
Kretschmann U, Bock M, Gockeln R & Zrenner E (2000): Clinical applications
of multifocal electroretinography. Doc Ophthalmol 100: 99-113.
Kurtenbach A, Flogel W & Erb C (2002): Anomaloscope matches in patients
with diabetes mellitus. Graefes Arch Clin Exp Ophthalmol 240: 79-84.
Kurtenbach A, Langrova H & Zrenner E (2000): Multifocal oscillatory potentials
in type 1 diabetes without retinopathy. Invest Ophthalmol Vis Sci 41:
3234-41.
Lai TY, Chan WM, Lai RY, Ngai JW, Li H & Lam DS (2007): The clinical
applications of multifocal electroretinography: a systematic review. Surv
Ophthalmol 52: 61-96.
Lam BL (2005): Electrophysiology of vision: clinical testing and applications.
London; Taylor & Francis: pp. 1-83; 105-18.
Laron M, Bearse MA Jr, Bronson-Castain K, Jonasdottir S, King-Hooper B,
Barez S, Schneck ME & Adams AJ (2011): Interocular symmetry of
abnormal multifocal electroretinograms in adolescents with diabetes and
no retinopathy. Invest Ophthalmol Vis Sci 53: 316-21.
LeRoith D, Taylor SI & Olefsky JM (2004): Diabetes mellitus - a fundamental
and clinical text. Philadelphia; Lippincott Williams and Wilkins: pp.
458-9; 1441-54.
Li PS, Wong TH, Tang WW & Lai JS (2004): Diabetic retinopathy. Hong Kong
Pract 26: 346-53.
Lieth E, Barber AJ, Xu B, Dice C, Ratz MJ, Tanase D & Strother JM (1998):
Glial reactivity and impaired glutamate metabolism in short-term
experimental diabetic retinopathy. Penn State Retina Research Group.
Diabetes 47: 815-20.
Linsenmeier RA (1986): Effects of light and darkness on oxygen distribution and

151
consumption in the cat retina. J Gen Physiol 88: 521-42.
Linsenmeier RA, Braun RD, McRipley MA, Padnick LB, Ahmed J, Hatchell DL,
McLeod DS & Lutty GA (1998): Retinal hypoxia in long-term diabetic
cats. Invest Ophthalmol Vis Sci 39: 1647-57.
Liu DP, Molyneaux L, Chua E, Wang YZ, Wu CR, Jing H, Hu LN, Liu YJ, Xu
ZR & Yue DK (2002): Retinopathy in a Chinese population with type 2
diabetes: factors affecting the presence of this complication at diagnosis
of diabetes. Diabetes Res Clin Pract 56: 125-31.
Lopes de Faria JM, Russ H & Costa VP (2002): Retinal nerve fibre layer loss in
patients with type 1 diabetes mellitus without retinopathy. Br J
Ophthalmol 86: 725-8.
Lung JC & Chan HH (2010): Effects of luminance combinations on the
characteristics of the global flash multifocal electroretinogram (mfERG).
Graefes Arch Clin Exp Ophthalmol 248: 1117-25.
Lung JC, Swann PG & Chan HH (2012): Early local functional changes in the
human diabetic retina: a global flash multifocal electroretinogram study.
Graefes Arch Clin Exp Ophthalmol 250: 1745-54.
Lung JC, Swann PG, Wong DS & Chan HH (2012): Global flash multifocal
electroretinogram: early detection of local functional changes and its
correlations with optical coherence tomography and visual field tests in
diabetic eyes. Doc Ophthalmol 125: 123-35.
Luo X, Patel NB, Harwerth RS & Frishman LJ (2011): Loss of the
low-frequency component of the global-flash multifocal
electroretinogram in primate eyes with experimental glaucoma. Invest
Ophthalmol Vis Sci 52: 3792-804.
Luu CD, Koh AH & Ling Y (2005): The ON/OFF-response in retinopathy of
prematurity subjects with myopia. Doc Ophthalmol 110: 155-61.
Luu CD, Szental JA, Lee SY, Lavanya R & Wong TY (2010): Correlation
between retinal oscillatory potentials and retinal vascular caliber in type 2
diabetes. Invest Ophthalmol Vis Sci 51: 482-6.
Marmor MF, Tan F, Sutter EE & Bearse MA Jr (1999): Topography of cone
electrophysiology in the enhanced S cone syndrome. Invest Ophthalmol
Vis Sci 40: 1866-73.
Masland RH (2001): Neuronal diversity in the retina. Curr Opin Neurobiol 11:
431-6.
McFarlane M, Wright T, Stephens D, Nilsson J & Westall CA (2012): Blue Flash
ERG PhNR Changes Associated with Poor Long-Term Glycemic Control
in Adolescents with Type 1 Diabetes. Invest Ophthalmol Vis Sci 53:

152
741-8.
Miyake Y, Yagasaki K, Horiguchi M & Kawase Y (1987): On- and off-responses
in photopic electroretinogram in complete and incomplete types of
congenital stationary night blindness. Jpn J Ophthalmol 31: 81-7.
Mizutani M, Gerhardinger C & Lorenzi M (1998): Muller cell changes in human
diabetic retinopathy. Diabetes 47: 445-9.
Nagy D, Schonfisch B, Zrenner E & Jagle H (2008): Long-term follow-up of
retinitis pigmentosa patients with multifocal electroretinography. Invest
Ophthalmol Vis Sci 49: 4664-71.
Ng JS, Bearse MA Jr, Schneck ME, Barez S & Adams AJ (2008): Local diabetic
retinopathy prediction by multifocal ERG delays over 3 years. Invest
Ophthalmol Vis Sci 49: 1622-8.
Ng YF, Chan HH, Chu PH, Siu AW, To CH, Beale BA, Gilger BC & Wong F
(2008): Pharmacologically defined components of the normal porcine
multifocal ERG. Doc Ophthalmol 116: 165-76.
Nilsson M, Von Wendt G, Wanger P & Martin L (2007): Early detection of
macular changes in patients with diabetes using Rarebit Fovea Test and
optical coherence tomography. Br J Ophthalmol 91: 1596-8.
Nitta K, Saito Y, Kobayashi A & Sugiyama K (2006): Influence of clinical
factors on blue-on-yellow perimetry for diabetic patients without
retinopathy: comparison with white-on-white perimetry. Retina 26:
797-802.
Ong GL, Ripley LG, Newsom RS, Cooper M & Casswell AG (2004): Screening
for sight-threatening diabetic retinopathy: comparison of fundus
photography with automated color contrast threshold test. Am J
Ophthalmol 137: 445-52.
Onozu H & Yamamoto S (2003): Oscillatory potentials of multifocal
electroretinogram in diabetic retinopathy. Doc Ophthalmol 106: 327-32.
Oshitari T, Hanawa K & Adachi-Usami E (2009): Changes of macular and RNFL
thicknesses measured by Stratus OCT in patients with early stage diabetes.
Eye 23: 884-9.
Ozawa L & Itoh M (2003): Cathode ray tube phosphors. Chem Rev 103:
3835-56.
Ozdek S, Lonneville YH, Onol M, Yetkin I & Hasanreisoglu BB (2002):
Assessment of nerve fiber layer in diabetic patients with scanning laser
polarimetry. Eye 16: 761-5.
Palmowski-Wolfe AM, Allgayer RJ, Vernaleken B, Schotzau A & Ruprecht KW
(2006): Slow-stimulated multifocal ERG in high- and normal-tension

153
glaucoma. Doc Ophthalmol 112: 157-68.
Palmowski-Wolfe AM, Todorova MG, Orguel S, Flammer J & Brigell M (2007):
The 'two global flash' mfERG in high and normal tension primary
open-angle glaucoma. Doc Ophthalmol 114: 9-19.
Palmowski AM, Sutter EE, Bearse MA Jr & Fung W (1997): Mapping of retinal
function in diabetic retinopathy using the multifocal electroretinogram.
Invest Ophthalmol Vis Sci 38: 2586-96.
Parisi V & Uccioli L (2001): Visual electrophysiological responses in persons
with type 1 diabetes. Diabetes Metab Res Rev 17: 12-8.
Parravano M, Oddone F, Mineo D, Centofanti M, Borboni P, Lauro R, Tanga L &
Manni G (2008): The role of Humphrey Matrix testing in the early
diagnosis of retinopathy in type 1 diabetes. Br J Ophthalmol 92: 1656-60.
Poloschek CM & Sutter EE (2002): The fine structure of multifocal ERG
topographies. J Vis 2: 577-87.
Porta M & Bandello F (2002): Diabetic retinopathy - A clinical update.
Diabetologia 45: 1617-34.
Raitelaitiene R, Paunksnis A, Ivanov L & Kurapkiene S (2005): Ultrasonic and
biochemical evaluation of human diabetic lens. Medicina (Kaunas) 41:
641-8.
Rangaswamy NV, Shirato S, Kaneko M, Digby BI, Robson JG & Frishman LJ
(2007): Effects of Spectral Characteristics of Ganzfeld Stimuli on the
Photopic Negative Response (PhNR) of the ERG. Invest Ophthalmol Vis
Sci 48: 4818-28.
Remky A, Weber A, Hendricks S, Lichtenberg K & Arend O (2003):
Short-wavelength automated perimetry in patients with diabetes mellitus
without macular edema. Graefes Arch Clin Exp Ophthalmol 241: 468-71.
Resnikoff S, Pascolini D, Etya'ale D, Kocur I, Pararajasegaram R, Pokharel GP
& Mariotti SP (2004): Global data on visual impairment in the year 2002.
Bull World Health Organ 82: 844-51.
Rosenbloom AL, Joe JR, Young RS & Winter WE (1999): Emerging epidemic of
type 2 diabetes in youth. Diabetes Care 22: 345-54.
Rudnicka AR & Birch J (2000): Diabetic eye disease - identification and
co-management. Oxford; Butterworth-Heinemann: pp. 85-89.
Saeki M & Gouras P (1996): Cone ERGs to flash trains: the antagonism of a later
flash. Vision Res 36: 3229-35.
Sato S, Hirooka K, Baba T, Yano I & Shiraga F (2008): Correlation between
retinal nerve fibre layer thickness and retinal sensitivity. Acta Ophthalmol
86: 609-13.

154
Scanlon PH, Malhotra R, Greenwood RH, Aldington SJ, Foy C, Flatman M &
Downes S (2003): Comparison of two reference standards in validating
two field mydriatic digital photography as a method of screening for
diabetic retinopathy. Br J Ophthalmol 87: 1258-63.
Schmier JK, Covert DW, Lau EC & Matthews GP (2009): Medicare expenditures
associated with diabetes and diabetic retinopathy. Retina 29: 199-206.
Schmitz-Valckenberg S, Holz FG, Bird AC & Spaide RF (2008): Fundus
autofluorescence imaging: review and perspectives. Retina 28: 385-409.
Schneck ME, Bearse MA Jr, Han Y, Barez S, Jacobsen C & Adams AJ (2004):
Comparison of mfERG waveform components and implicit time
measurement techniques for detecting functional change in early diabetic
eye disease. Doc Ophthalmol 108: 223-30.
Schneck ME, Shupenko L & Adams AJ (2008): The fast oscillation of the EOG
in diabetes with and without mild retinopathy. Doc Ophthalmol 116:
231-6.
Scott IU, Flynn HW & Smiddy WE (2010): Diabetes and ocular disease: past,
present, and future therapies. Oxford; Oxford University Press: 13-24;
321-338.
Sharma KK & Santhoshkumar P (2009): Lens aging: effects of crystallins.
Biochim Biophys Acta 1790: 1095-108.
Shiba T, Yamamoto T, Seki U, Utsugi N, Fujita K, Sato Y, Terada H, Sekihara H
& Hagura R (2002): Screening and follow-up of diabetic retinopathy
using a new mosaic 9-field fundus photography system. Diabetes Res
Clin Pract 55: 49-59.
Shimada Y, Bearse MA Jr & Sutter EE (2005): Multifocal electroretinograms
combined with periodic flashes: direct responses and induced components.
Graefes Arch Clin Exp Ophthalmol 243: 132-41.
Shimada Y, Li Y, Bearse MA Jr, Sutter EE & Fung W (2001): Assessment of
early retinal changes in diabetes using a new multifocal ERG protocol. Br
J Ophthalmol 85: 414-9.
Shinoda K, Rejdak R, Schuettauf F, Blatsios G, Volker M, Tanimoto N, Olcay T,
Gekeler F, Lehaci C, Naskar R, Zagorski Z & Zrenner E (2007): Early
electroretinographic features of streptozotocin-induced diabetic
retinopathy. Clin Experiment Ophthalmol 35: 847-54.
Shirao Y & Kawasaki K (1998): Electrical responses from diabetic retina. Prog
Retin Eye Res 17: 59-76.
Sieving PA (1993): Photopic ON- and OFF-pathway abnormalities in retinal
dystrophies. Trans Am Ophthalmol Soc 91: 701-73.

155
Sieving PA, Murayama K & Naarendorp F (1994): Push-pull model of the
primate photopic electroretinogram: a role for hyperpolarizing neurons in
shaping the b-wave. Vis Neurosci 11: 519-32.
Simo R & Hernandez C (2009): Advances in the medical treatment of diabetic
retinopathy. Diabetes Care 32: 1556-62.
Simonsen SE (1980): The value of the oscillatory potential in selecting juvenile
diabetics at risk of developing proliferative retinopathy. Acta Ophthalmol
58: 865-78.
Siu SC, Ko TC, Wong KW & Chan WN (1998): Effectiveness of non-mydriatic
retinal photography and direct ophthalmoscopy in detecting diabetic
retinopathy. Hong Kong Med J 4: 367-70.
Soliman W, Hasler P, Sander B & Larsen M (2010): Local retinal sensitivity in
relation to specific retinopathy lesions in diabetic macular oedema. Acta
Ophthalmol 90: 248-53.
Spaide R (2008): Autofluorescence from the outer retina and subretinal space:
hypothesis and review. Retina 28: 5-35.
Sparrow JM, Bron AJ, Phelps Brown NA & Neil HA (1992): Biometry of the
crystalline lens in late onset diabetes: the importance of diabetic type. Br
J Ophthalmol 76: 428-33.
Speros P & Price J (1981): Oscillatory potentials. History, techniques and
potential use in the evaluation of disturbances of retinal circulation. Surv
Ophthalmol 25: 237-52.
Sugimoto M, Sasoh M, Ido M, Wakitani Y, Takahashi C & Uji Y (2005):
Detection of early diabetic change with optical coherence tomography in
type 2 diabetes mellitus patients without retinopathy. Ophthalmologica
219: 379-85.
Sutter EE (2000): The interpretation of multifocal binary kernels. Doc
Ophthalmol 100: 49-75.
Sutter EE & Bearse MA Jr (1999): The optic nerve head component of the
human ERG. Vision Res 39: 419-36.
Sutter EE, Shimada Y, Li Y & Bearse MA Jr (1999): Mapping inner retinal
function through enhancement of adaptation components in the M-ERG.
Vision Science and Its Applications, OSA Technical Digest Series 1:
52-5.
Sutter EE & Tran D (1992): The field topography of ERG components in man--I.
The photopic luminance response. Vision Res 32: 433-46.
Takahashi H & Chihara E (2008): Impact of diabetic retinopathy on quantitative
retinal nerve fiber layer measurement and glaucoma screening. Invest

156
Ophthalmol Vis Sci 49: 687-92.
Tam TK, Lau CM, Tsang LC, Ng KK, Ho KS & Lai TC (2005): Epidemiological
study of diabetic retinopathy in a primary care setting in Hong Kong.
Hong Kong Med J 11: 438-44.
Taylor D (2012): Diabetic eye screening revised grading definitions 2012.
Gloucester, England; NHS Screening Programmes.
The Diabetes Control and Complications Trial Research Group (1987): Color
photography vs fluorescein angiography in the detection of diabetic
retinopathy in the diabetes control and complications trial. The Diabetes
Control and Complications Trial Research Group. Arch Ophthalmol 105:
1344-51.
Tuch B, Dunlop M & Proietto J (2000): Diabetes research: a guide for
postgraduates. Amsterdam; Harwood Academic: pp. 1-3.
Tyrberg M, Ponjavic V & Lovestam-Adrian M (2005): Multifocal
electroretinography (mfERG) in insulin dependent diabetics with and
without clinically apparent retinopathy. Doc Ophthalmol 110: 137-43.
Tyrberg M, Ponjavic V & Lovestam-Adrian M (2008): Multifocal
electroretinogram (mfERG) in patients with diabetes mellitus and an
enlarged foveal avascular zone (FAZ). Doc Ophthalmol 117: 185-9.
Tzekov R & Arden GB (1999): The electroretinogram in diabetic retinopathy.
Surv Ophthalmol 44: 53-60.
Ueno S, Kondo M, Ueno M, Miyata K, Terasaki H & Miyake Y (2006):
Contribution of retinal neurons to d-wave of primate photopic
electroretinograms. Vision Res 46: 658-64.
Vadala M, Anastasi M, Lodato G & Cillino S (2002): Electroretinographic
oscillatory potentials in insulin-dependent diabetes patients: A long-term
follow-up. Acta Ophthalmol Scand 80: 305-9.
Van Bijsterveld OP (2000): Diabetic retinopathy. London; Martin Dunitz Ltd: pp.
2-14, 169-88.
Van Dijk HW, Kok PH, Garvin M, Sonka M, Devries JH, Michels RP, Van
Velthoven ME, Schlingemann RO, Verbraak FD & Abramoff MD (2009):
Selective loss of inner retinal layer thickness in type 1 diabetic patients
with minimal diabetic retinopathy. Invest Ophthalmol Vis Sci 50: 3404-9.
Van Dijk HW, Verbraak FD, Kok PH, Garvin MK, Sonka M, Lee K, Devries JH,
Michels RP, Van Velthoven ME, Schlingemann RO & Abramoff MD
(2010): Decreased retinal ganglion cell layer thickness in patients with
type 1 diabetes. Invest Ophthalmol Vis Sci 51: 3660-5.
Veldman BA & Vervoort G (2002): Pathogenesis of renal microvascular

157
complications in diabetes mellitus. Neth J Med 60: 390-6.
Verma A, Rani PK, Raman R, Pal SS, Laxmi G, Gupta M, Sahu C, Vaitheeswaran
K & Sharma T (2009): Is neuronal dysfunction an early sign of diabetic
retinopathy? Microperimetry and spectral domain optical coherence
tomography (SD-OCT) study in individuals with diabetes, but no diabetic
retinopathy. Eye 23: 1824-30.
Vujosevic S, Benetti E, Massignan F, Pilotto E, Varano M, Cavarzeran F,
Avogaro A & Midena E (2009): Screening for diabetic retinopathy: 1 and
3 nonmydriatic 45-degree digital fundus photographs vs 7 standard early
treatment diabetic retinopathy study fields. Am J Ophthalmol 148: 111-8.
Wallis MG, Smith ME, Kolka CM, Zhang L, Richards SM, Rattigan S & Clark
MG (2005): Acute glucosamine-induced insulin resistance in muscle in
vivo is associated with impaired capillary recruitment. Diabetologia 48:
2131-9.
Wang WQ, Ip TP & Lam KS (1998): Changing prevalence of retinopathy in
newly diagnosed non-insulin dependent diabetes mellitus patients in
Hong Kong. Diabetes Res Clin Pract 39: 185-91.
Wangsa-Wirawan ND & Linsenmeier RA (2003): Retinal oxygen: fundamental
and clinical aspects. Arch Ophthalmol 121: 547-57.
Warrian KJ, Lorenzana LL, Lankaranian D, Dugar J, Wizov SS & Spaeth GL
(2010): The assessment of disability related to vision performance-based
measure in diabetic retinopathy. Am J Ophthalmol 149: 852-60.
Westall CA (2005): Detecting ocular-visual function changes in diabetes. Br J
Ophthalmol 89: 1392-3.
WHO (2008): The global burden of disease 2004 update. Geneva, Switzerland;
World Health Organization.
WHO (2009): Global health risks: mortality and burden of disease attributable to
selected major risk. Geneva, Switzerland; World Health Organization.
WHO (2010): WHO non-communicable disease 2010. Geneva, Switzerland;
World Health Organization. pp. 9-31.
WHO (2011): Use of glycated haemoglobin (HbA1c) in the diagnosis of diabetes
mellitus: abbreviated report of a WHO consultation 2011. Geneva,
Switzerland; World Health Organization.
WHO (2012): World health statistics 2012. Geneva, Switzerland; World Health
Organization.
Wiemer NG, Dubbelman M, Hermans EA, Ringens PJ & Polak BC (2008):
Changes in the internal structure of the human crystalline lens with
diabetes mellitus type 1 and type 2. Ophthalmology 115: 2017-23.

158
Wild S, Roglic G, Green A, Sicree R & King H (2004): Global prevalence of
diabetes: estimates for the year 2000 and projections for 2030. Diabetes
Care 27: 1047-53.
Wilkinson CP, Ferris III FL, Klein RE, Lee PP, Agardh CD, Davis M, Dills D,
Kampik A, Pararajasegaram R & Verdaguer JT (2003): Proposed
international clinical diabetic retinopathy and diabetic macular edema
disease severity scales. Ophthalmology 110: 1677-82.
Williams GA, Scott IU, Haller JA, Maguire AM, Marcus D & McDonald HR
(2004): Single-field fundus photography for diabetic retinopathy
screening: a report by the American Academy of Ophthalmology.
Ophthalmology 111: 1055-62.
Wolsley CJ, Silvestri G, O'Neill J, Saunders KJ & Anderson RS (2009): The
association between multifocal electroretinograms and OCT retinal
thickness in retinitis pigmentosa patients with good visual acuity. Eye 23:
1524-31.
Wong TY & Hyman L (2008): Population-based studies in ophthalmology. Am J
Ophthalmol 146: 656-63.
Woodcock A, Bradley C, Plowright R, Ffytche T, Kennedy-Martin T & Hirsch A
(2004): The influence of diabetic retinopathy on quality of life: interviews
to guide the design of a condition-specific, individualised questionnaire:
the RetDQoL. Patient Educ Couns 53: 365-83.
Wu S & Sutter EE (1995): A topographic study of oscillatory potentials in man.
Vis Neurosci 12: 1013-25.
Yam JC & Kwok AK (2007): Update on the treatment of diabetic retinopathy.
Hong Kong Med J 13: 46-60.
Yamamoto S, Kamiyama M, Nitta K, Yamada T & Hayasaka S (1996): Selective
reduction of the S cone electroretinogram in diabetes. Br J Ophthalmol 80:
973-5.
Yamamoto S, Takeuchi S & Kamiyama M (1997): The short
wavelength-sensitive cone electroretinogram in diabetes: relationship to
systemic factors. Doc Ophthalmol 94: 193-200.
Yau JW, Rogers SL, Kawasaki R, Lamoureux EL, Kowalski JW, Bek T, Chen SJ,
Dekker JM, Fletcher A, Grauslund J, Haffner S, Hamman RF, Ikram MK,
Kayama T, Klein BE, Klein R, Krishnaiah S, Mayurasakorn K, O'Hare JP,
Orchard TJ, Porta M, Rema M, Roy MS, Sharma T, Shaw J, Taylor H,
Tielsch JM, Varma R, Wang JJ, Wang N, West S, Xu L, Yasuda M, Zhang
X, Mitchell P & Wong TY (2012): Global prevalence and major risk
factors of diabetic retinopathy. Diabetes Care 35: 556-64.

159
Yokoi M, Yamagishi SI, Takeuchi M, Ohgami K, Okamoto T, Saito W,
Muramatsu M, Imaizumi T & Ohno S (2005): Elevations of AGE and
vascular endothelial growth factor with decreased total antioxidant status
in the vitreous fluid of diabetic patients with retinopathy. Br J Ophthalmol
89: 673-5.
Zhang L, Ino-ue M, Dong K & Yamamoto M (2000): Retrograde axonal
transport impairment of large- and medium-sized retinal ganglion cells in
diabetic rat. Curr Eye Res 20: 131-6.
Zhang P, Zhang X, Brown J, Vistisen D, Sicree R, Shaw J & Nichols G (2010):
Global healthcare expenditure on diabetes for 2010 and 2030. Diabetes
Res Clin Pract 87: 293-301.
Zhou W, Rangaswamy N, Ktonas P & Frishman LJ (2007): Oscillatory potentials
of the slow-sequence multifocal ERG in primates extracted using the
Matching Pursuit method. Vision Res 47: 2021-36.