5602.pdf - PolyU Electronic Theses
278
Copyright Undertaking This thesis is protected by copyright, with all rights reserved. By reading and using the thesis, the reader understands and agrees to the following terms: 1. The reader will abide by the rules and legal ordinances governing copyright regarding the use of the thesis. 2. The reader will use the thesis for the purpose of research or private study only and not for distribution or further reproduction or any other purpose. 3. The reader agrees to indemnify and hold the University harmless from and against any loss, damage, cost, liability or expenses arising from copyright infringement or unauthorized usage. IMPORTANT If you have reasons to believe that any materials in this thesis are deemed not suitable to be distributed in this form, or a copyright owner having difficulty with the material being included in our database, please contact [email protected] providing details. The Library will look into your claim and consider taking remedial action upon receipt of the written requests. Pao Yue-kong Library, The Hong Kong Polytechnic University, Hung Hom, Kowloon, Hong Kong http://www.lib.polyu.edu.hk
-
Upload
khangminh22 -
Category
Documents
-
view
3 -
download
0
Transcript of 5602.pdf - PolyU Electronic Theses
Copyright Undertaking
This thesis is protected by copyright, with all rights reserved.
By reading and using the thesis, the reader understands and agrees to the following terms:
1. The reader will abide by the rules and legal ordinances governing copyright regarding the use of the thesis.
2. The reader will use the thesis for the purpose of research or private study only and not for distribution or further reproduction or any other purpose.
3. The reader agrees to indemnify and hold the University harmless from and against any loss, damage, cost, liability or expenses arising from copyright infringement or unauthorized usage.
IMPORTANT
If you have reasons to believe that any materials in this thesis are deemed not suitable to be distributed in this form, or a copyright owner having difficulty with the material being included in our database, please contact [email protected] providing details. The Library will look into your claim and consider taking remedial action upon receipt of the written requests.
Pao Yue-kong Library, The Hong Kong Polytechnic University, Hung Hom, Kowloon, Hong Kong
http://www.lib.polyu.edu.hk

DESTINATION BRAND EXPERIENCES OF LAKE
MALAWI: SCALE DEVELOPMENT AND VALIDATION
NGWIRA, CECILIA NDAMIWE
PhD
The Hong Kong Polytechnic University
2021

ii
THE HONG KONG POLYTECHNIC UNIVERSITY
SCHOOL OF HOTEL & TOURISM MANAGEMENT
DESTINATION BRAND EXPERIENCES OF LAKE MALAWI:
SCALE DEVELOPMENT AND VALIDATION.
CECILIA NDAMIWE NGWIRA
A thesis submitted in partial fulfilment of the requirements for the degree of
Doctor of Philosophy
March 2020

iii
CERTIFICATE OF ORIGINALITY
I hereby declare that this thesis is my work and that, to the best of my knowledge and belief, it
reproduces no material previously published or written, nor material that has been accepted for the
award of any other degree or diploma, except where due acknowledgement has been made in the
text.
CECILIA NDAMIWE NGWIRA

iv
ABSTRACT
Tourism destinations compete for the attention of the same tourist pool using similar
tourism products such as beautiful scenery, friendly people, and quality accommodation, among
others. Unfortunately, due to the absence of branded destination experiences, distinguishing
destination experiences becomes a difficult task for tourists to settle down on a destination in their
decision making. Destination brand experiences (DBE) are thus vital to the uniqueness of a
destination as they provide stronger stimuli and reduce substitutability in the minds of tourists or
the target market by creating superior experiences. Branded destination experiences refer to a way
destinations communicate their unique identity that aims at differentiating the destination from
that of competitors. Destination brand experiences serve to identify and differentiate a destination
from other destinations by evoking certain subjective internal responses of tourists to brand-related
stimuli such as experience design, packaging, and the environment and communication messages.
Destination branding use marketing activities such as the creation of logos, names, signs and
symbols aimed at differentiating a destination while at the same time conveying an expectation of
memorable travel experience.
For lake destinations, having branded experiences can attract tourists who pursue water
and beach-based experiences such as scuba diving, beach parties, yoga, and snorkelling, among
others. At the same time, cognizant that tourist behaviours are influenced and dependent on the
experiences they have as they interact with brands, lake destinations need to control tourists’
adverse effects to the lacustrine environment by promoting positive environmental behaviours.
Thus, the implementation of pro-environmental behaviours (PEB) among tourists is paramount to
curbing negative environmental effects while at the same time safeguarding the destinations brand
experiences. Yet, there are no destination-specific scales to measure destination brand experiences

v
(DBEs) as well as test the relationship between DBEs and pro-environmental behaviours. This gap
limits our understanding and application of branding in a tourism destination context.
To fill this gap, the present study developed and validated a destination brand experiences
scale, with Lake Malawi as a caste study, to measure the role of DBES in promoting destination
sustainability through pro-environmental behaviours among tourists. The study was guided by five
objectives: a) to conceptualise and validate a destination brand experience scale, b) to evaluate the
association between DBE and tourist satisfaction, c) to investigate the relationship between DBE
and tourist PEB, d) to examine the mediating power of tourist satisfaction on the association
between DBE and tourist PEB, and e) to explore the moderating role of domestic or international
tourists’ status on their evaluation of DBE, tourist satisfaction and PEB.
Following a rigorous scale development process by Churchill (1979), a questionnaire that
mirrored the objectives of the study was developed. The questionnaire consisted of items covering
the proposed six DBE domains namely sensory, cognitive, affective, behavioural, relational and
spiritual, from both literature and in-depth interviews. The sensory DBE is about tourists’ use of
their multi-senses when interacting with the destination experiences whereas the cognitive DBE
represents tourists’ use of their productive reasoning power and curiosity as they engage with the
destination brand. The emotional DBE dimension entails tourist emotions, feelings and sentiments
which are induced as they consume the destination brand experiences. The behavioural DBE is
concerned with tourists’ physical actions and behaviours upon interacting with the destination
brand whereas social DBE deals with tourists’ experiences as they interact with other tourists,
service providers as well as the local communities in the destination during consumption of
products and services. The spiritual/psychic DBE domain relates to tourist desire to escape to quiet
places to recollect and unwind as they connect with nature or the destination in general.

vi
Furthermore, items on satisfaction and PEB were included in the questionnaire alongside
a question on tourist’s nationality, under the bio-data section. Data for the study was collected in
a field survey over four months in 2019 and a total of 670 usable questionnaires comprising both
domestic and international tourists samples to Lake Malawi in the South-East African country of
Malawi, were collected. Data were split into two and one half was used for exploratory factor
analysis using principal components with varimax rotation to scrutinise the principal DBE scale
dimensions. Consequently, six dimensions were extracted: relational/social DBE, spiritual/psychic
DBE, expressive/emotional DBE, bodily/sensory DBE, action/behavioural DBE and
perceptive/cognitive DBE. A confirmatory factor analysis was then performed on the other half,
and the six extracted factors were confirmed and had reliable goodness of fit indices. Modelling
was conducted to test the stated hypotheses of the study.
Results show that relational/social DBE is the most sought after DBE at Lake Malawi,
followed by spiritual/psychic DBE. Regarding DBEs and satisfaction relationship, only three
DBEs were positively related to satisfaction (relational/social, expressive/emotional and
bodily/sensory) whereas on the relationship between DBEs and PEB, only relational/social and
bodily/sensory were significant. Overall, satisfaction fully mediated the relationships between
expressive/emotional DBE and PEB and between relational/social DBE and PEB. For
bodily/sensory DBE and PEB, partial mediation was observed whereas, for the relationships
between perceptive/cognitive DBE and PEB, action/behavioural DBE and PEB and
spiritual/psychic DBE and PEB, no mediation effect was found.
Using domestic or international tourist status in a measurement invariance test, important
differences were observed in the association between DBEs and PEB such that relational/social
and bodily/sensory DBEs were found to be important factors for pro-environmental behaviours
vii
among domestic tourists while for the international tourists, no DBE led to pro-environmental
behavioural intentions. Some similarities were observed in the relationships between DBEs and
satisfaction such that for the domestic market, relational/social, expressive/emotional,
bodily/sensory, and perceptive/cognitive (negative relationship) DBEs were found to be important
and led to satisfaction. For the international market, relational/social, bodily/sensory,
perceptive/cognitive were important factors that led to satisfaction.
Furthermore, using independent samples t-tests, significant differences were observed
between domestic and international tourists across four of the six DBE dimensions;
relational/social, bodily/sensory, expressive/emotional and perceptive/cognitive DBE. Negative
but insignificant t-values were observed under action/behavioural evidenced by international
tourists having higher scores than their domestic counterparts.
This study contributes to both knowledge and practice. Firstly, the thesis pioneers the
generation of a DBE scale with six dimensions that test its predictive power on tourist satisfaction
and PEB. Secondly, the thesis introduces a new factor (spiritual/psychic DBE) and demonstrates
how it relates to other DBE factors and with other dependent variables such as satisfaction and
pro-environmental behaviours. Noting its importance in tourists’ DBE at Lake Malawi, the study
illustrates the need to investigate more ways of nurturing this brand experience dimension for
meaningful and memorable experiences. Thirdly, the study underscores the importance of the
relational/social DBE component, a component whose importance has not been established in
previous studies. These results show differences between destination and product brand
experiences.
Practically, the study highlights important elements that would help destinations to develop
and market their DBEs to give them a competitive advantage. Given the importance of

viii
relational/social DBE to both domestic and international tourists, destination managers need to
design activities and experiences that promote friendships among tourists to maximise this
experience. Furthermore, for the Malawian destination, Lake Malawi could be strategically
marketed as a place where people meet and make lasting friendships. Finally, to promote
sustainable tourism destinations, the study submits that destinations should actively engage tourists
in transformative learning or on-site knowledge about sustainability for long- term impacts as
research suggests that most nature-based tourism experiences fall short in delivering convincing
conservation messages. To achieve this, there is a need for Destination Management Organisations
(DMOs) to use technology for lasting mental imagery and cognitive experiences.

ix
ACKNOWLEDGEMENTS
First, I am highly indebted to my supervisor, Dr Vincent Tung, for taking the risk of
supervising me. Dr Tung, you are a force to reckon with and your supervisory excellence is
comparable to none. You are my heritage and I will strive to mirror you on the academic ladder
although your shoes are too big for me. To Professor Bob McKercher, my co-supervisor, thank
you for being there for me and your constructive comments and motivation whenever I thought I
was losing it. I am also grateful to members of my supervisory committee members: Dr Mimi Li,
Dr Wantanee Suntikul and Dr Karen Weber, for the insightful ideas they shared with me that
helped shape my idea.
If I don’t acknowledge the School of Hotel and Tourism Management (SHTM) at PolyU
for the chance to study at this prestigious school, then I am devoid of truth. I am thankful to the
Dean of SHTM, Professor Kaye Chon, an ever-present mentor and loving father to the SHTM
family. Thank you all professors for the lessons and interactions throughout the years and for
providing me with a conducive academic environment. Thank you, PolyU for the scholarship that
enabled me to study at this world’s leading tourism and hospitality school.
To my mother Maria Lonely Msiska and my husband Emmanuel Molande, thanks for being
there for me and for your understanding throughout these three years. My gratitude also extends
to all friends and family for helping me along this PhD path. For all colleagues at SHTM, thanks
for the competition, advice and assistance that contributed to the completion of this wonderful
thesis project.

x
DEDICATION
I dedicate this work to myself for the taking this PhD challenge head-on. It was not a mean
feat to work on this thesis at SHTM given the academic pressure of excellence and quality: but I
survived. Kudos to me.
Being a believer, I also thank God for the strength.

xi
TABLE OF CONTENTS
ABSTRACT .................................................................................................................................. iv
TABLE OF CONTENTS ............................................................................................................ xi
LIST OF TABLES ..................................................................................................................... xvi
LIST OF FIGURES ................................................................................................................. xviii
CHAPTER 1: INTRODUCTION TO THE STUDY ................................................................. 1
1.1 Introduction ............................................................................................................................. 1
1.2. Study background .................................................................................................................. 4
1.3 Lake Malawi as a destination brand ..................................................................................... 5
1.4 Problem statement .................................................................................................................. 7
1.5.1 Research questions ......................................................................................................... 11
1.5.2 Thesis objectives ............................................................................................................. 11
1.6 Significance of the thesis ....................................................................................................... 12
1.6.1 Contribution to knowledge and scholarship................................................................ 12
1.6.2 Contribution to practice and management.................................................................. 14
1.7 Definition of thesis’ key terms ............................................................................................. 15
1.7.1 Tourism destination ....................................................................................................... 15
1.7.2 Tourism Experience ....................................................................................................... 15
1.7.3 Destination branding ..................................................................................................... 16
1.7.4 Satisfaction...................................................................................................................... 16
1.7.5 Pro-environmental behaviours ..................................................................................... 16
1.8 Summary ................................................................................................................................ 16
1.9 Outline of the thesis .............................................................................................................. 17
CHAPTER 2: LITERATURE REVIEW ................................................................................. 19
2.1 Introduction ........................................................................................................................... 19
2.2 Destination branding ............................................................................................................ 20
2.3 Brand experiences ................................................................................................................. 23
2.3.1 Sensory brand experience ............................................................................................. 24
2.3.2 Affective brand experience............................................................................................ 27
2.3.3 Behavioural brand experience ...................................................................................... 28
2.3.4 Intellectual brand experience........................................................................................ 29

xii
2.3.5 Relational brand experience ......................................................................................... 29
2.3.6 Summary of the brand experiences .............................................................................. 30
2.4 Tourism experiences ............................................................................................................. 32
2.4.1 Defining tourism experiences ........................................................................................ 33
2.4.2 Types and elements of tourism experiences................................................................. 36
2.4.3 The experience economy................................................................................................ 38
2.4.4 Memorable tourism experiences ................................................................................... 41
2.4.5 DBEs and stakeholders .................................................................................................. 42
2.4.6 Tourist nationality and tourism experiences ............................................................... 46
2.5 Tourist satisfaction................................................................................................................ 47
2.6 Pro-environmental behaviours ............................................................................................ 50
2.7 Lakes and tourism................................................................................................................. 53
2.7.1 Lake Malawi ................................................................................................................... 56
2.7.2 Challenges facing lakes .................................................................................................. 58
2.7.3 Lake Malawi National Park .......................................................................................... 60
2.7.4 Malawi and Lake Malawi’s International recognitions between 2012 and 2018 ..... 62
2.7.5 Connecting DBE to Lake Malawi ................................................................................. 63
2.8 Conclusion ............................................................................................................................. 64
CHAPTER THREE: CONCEPTUAL FRAMEWORK AND HYPOTHESES ................... 67
3.1 Introduction ........................................................................................................................... 67
3.2 Conceptual framework ......................................................................................................... 67
3.3 Research hypotheses ............................................................................................................. 68
3.3.1 Consequences of tourist DBEs ...................................................................................... 68
3.3.1.1 The relationship between DBE and satisfaction .................................................. 69
3.3.1.2. DBE and tourist pro-environmental behaviours ................................................ 71
3.3.1.3. Satisfaction and pro-environmental behaviours ................................................. 73
3.3.2 The mediation role of satisfaction on DBE and pro-environmental behaviour
intentions .................................................................................................................................. 75
3.3.3 The moderating effect of tourists’ domestic or international status ......................... 76
3.4 Summary ................................................................................................................................ 78
CHAPTER FOUR: RESEARCH METHODOLOGY ............................................................ 79
4.1 Introduction ........................................................................................................................... 79
4.2 Measurement scale development process ........................................................................... 79

xiii
4.3 Specification of items and domains of constructs .............................................................. 83
4.3.1 Destination brand experiences ...................................................................................... 83
4.4 Generation of items ............................................................................................................... 83
4.5 Generation of items through in-depth interviews .............................................................. 90
4.6 Experts review on the initial pool of items for destination experiences ........................... 92
4.7 Amendment of items for destination brand experiences ................................................... 93
4.8 Purification of items .............................................................................................................. 94
4.8.1 Summary of items after purification for destination brand experiences.................. 94
4.9 Pilot study .............................................................................................................................. 96
4.9.1 Data screening, descriptive analysis and normality test ............................................. 96
4.9.2 Demographic characteristics of the pilot study respondents ..................................... 97
4.9.3 Exploratory factor analysis (EFA) of the pilot study ................................................. 98
4.10 Main survey ....................................................................................................................... 101
4.10.1 Study population ........................................................................................................ 101
4.10.2 Sample structure ........................................................................................................ 102
4.10.3 Sample size .................................................................................................................. 102
4.10.4 Data collection ............................................................................................................ 103
4.10.5 Data analysis ............................................................................................................... 104
4.10.5.1 Exploratory data analysis................................................................................... 104
4.10.5.2 Confirmatory Factor Analysis ........................................................................... 105
4.10.5.3 Validity and reliability check ............................................................................. 105
4.10.5.4 Modelling ............................................................................................................. 106
4.10.5.5 Independent Samples T-test ............................................................................... 107
4.11 Summary research design ................................................................................................ 107
4.12 Research ethics .................................................................................................................. 108
4.13 Summary ............................................................................................................................ 109
CHAPTER FIVE: RESEARCH FINDINGS ......................................................................... 110
5.1 Introduction ......................................................................................................................... 110
5.2 Data screening ..................................................................................................................... 110
5.2.1 Missing data and outliers ............................................................................................ 110
5.2.2 Normality test ............................................................................................................... 110
5.3 Descriptive results of the study respondents .................................................................... 111

xiv
5.3.1 Demographics of the study respondents .................................................................... 111
5.4 Cross-validation of data ..................................................................................................... 114
5.4.1 EFA of the destination brand experience model (N=335) ........................................ 114
5.5 CFA of the destination brand experience model (N=335) ............................................... 117
5.6 CFA of the measurement model including dependent variables (N = 335) ................... 120
5.7 Modelling (n=670) ............................................................................................................... 123
5.8 Hypotheses testing ............................................................................................................... 124
5.8.1 Direct effects between DBE, satisfaction and pro-environmental behaviours ....... 126
5.8.2 Direct effects between DBE and pro-environmental behaviours ............................ 130
5.8.3 Indirect effect: satisfaction mediating the association between DBE and pro-
environmental behaviours .................................................................................................... 135
5.8.4 Invariance tests............................................................................................................. 136
5.8.4.1 Measurement invariance ...................................................................................... 136
5.8.4.2 Model invariance test ............................................................................................ 138
5.8.4.2.1 Modelling results of the Malawian and international tourists’ comparison 140
5.8.5 Comparison of means between Malawian and international tourists across the DBE
dimensions ............................................................................................................................. 150
5.9 Summary of the chapter ..................................................................................................... 153
CHAPTER 6: DISCUSSION ................................................................................................... 155
6.1 Introduction ......................................................................................................................... 155
6.2 The destination brand experiences of Lake Malawi ........................................................ 155
6.3 DBEs and tourist satisfaction ............................................................................................. 160
6.4. DBEs and pro-environmental behavioural intentions .................................................... 165
6.5 DBE, satisfaction and PEB intentions ............................................................................... 170
6.6 Comparison of means between domestic and international tourists across DBE
dimensions ................................................................................................................................. 172
6.5 Chapter summary ............................................................................................................... 174
CHAPTER 7: CONCLUSION AND IMPLICATIONS ........................................................ 175
7.1 Introduction ......................................................................................................................... 175
7.2 Study overview .................................................................................................................... 175
7.3 Contribution to knowledge................................................................................................. 178
7.4 Implications to practice and management ........................................................................ 182
7.5 Study limitations and future research suggestions .......................................................... 187

xv
7.6 Areas for further studies .................................................................................................... 189
7.7 Personal reflections ............................................................................................................. 190
7.8 Concluding remarks ........................................................................................................... 192
REFERENCES .......................................................................................................................... 193
APPENDICES ........................................................................................................................... 236
Appendix 1: Survey questionnaire ...................................................................................... 236
Appendix 2: Human Subjects Ethics Sub-Committee approval Hong Kong Polytechnic
University ............................................................................................................................... 240
Appendix 3: Letter of introduction from The Hong Kong PolyU .................................... 241
Appendix 4: Request for permission letter to conduct research in Malawi .................... 242
Appendix 5: Ethical approval to conduct survey in Malawi............................................. 243
Appendix 6: Amendment of items on behavioural brand experiences ............................ 245
Appendix 7: Amendments of items on sensory brand experiences .................................. 247
Appendix 8: Amendments of items on emotional brand experiences .............................. 249
Appendix 9: Amendments of items on cognitive brand experiences ................................ 251
Appendix 10: Amendments of items on social brand experiences ................................... 252
Appendix11: Amendments of items on spiritual brand experiences ............................... 254
Appendix 12: Normality test results of the items used in the pilot study ........................ 255
Appendix 13: Normality test results of the items used in the main study ....................... 257

xvi
LIST OF TABLES
Table 2. 1 Stakeholders’ roles in Destination Brand Experience ................................................. 45
Table 2. 2 Malawi international accolades ................................................................................... 62
Table 2. 3 Assumed Lake Malawi DBE ....................................................................................... 63
Table 3. 1 Summary of research hypotheses ................................................................................ 78
Table 4. 1 Initial items for destination brand experiences and their domains based on literature
review ............................................................................................................................................ 85
Table 4. 2 Profile of in-depth interviews for Lake Malawi DBE ................................................. 90
Table 4. 3 New items generated from interviews on Lake Malawi DBE ..................................... 91
Table 4. 4 Experts’ profile for destination brand experience interviews ...................................... 93
Table 4. 5 Revision of measurement items used to measure destination brand experiences ........ 95
Table 4. 6 Demographic features of the respondents .................................................................... 98
Table 4. 7 Results of pilot study EFA with descriptive statistics of components’ items ............ 100
Table 5. 1Respondents’ demographics in the main survey (N=670) .......................................... 112
Table 5. 2 Respondents’ travel information (N=670) ................................................................. 114
Table 5. 3 EFA results on the destination brand experiences of Lake Malawi (N=335) ............ 115
Table 5. 4 EFA results on satisfaction and pro-environmental behaviours (N=335) ................. 117
Table 5. 5 CFA results of the measurement model (N=335) ...................................................... 119
Table 5. 6 AVE, CR, MSV and correlations on the destination brand experience scale ............ 120
Table 5. 7 CFA of the measurement model with dependent variables (N=335) ........................ 122
Table 5. 8 Correlation results, mean and standard deviations of the measurement model (N=335)
..................................................................................................................................................... 123
Table 5. 9 Results of the direct path modelling .......................................................................... 125
Table 5. 10 Model fit results ....................................................................................................... 126
Table 5. 11 Results of the structural modelling .......................................................................... 129
Table 5. 12 Results of mediating model fit analysis ................................................................... 131
Table 5. 13 Results of the direct path between DBE and pro-environmental behaviours .......... 133
Table 5. 14 Mediation results using bootstrapping method ........................................................ 136
Table 5. 15 Measurement invariances for Malawian tourists (N=483) and International tourists
(N=172) ....................................................................................................................................... 138
Table 5. 16 Model invariances for Malawian tourists (N=483) and International tourists (N=172)
..................................................................................................................................................... 138
Table 5. 17 DBE, satisfaction and PEB invariance test results .................................................. 139
Table 5. 18 DBE and pro-environmental behaviours model invariance test results
..................................................................................................................................................... 140
Table 5. 19 Malawian tourists structural model results (N=483) ............................................... 141
Table 5. 20 Results of the direct path analysis between DBE and pro-environmental behaviours
for Malawian tourist (N=483) ..................................................................................................... 143

xvii
Table 5. 21 Results of the direct paths between DBE and satisfaction, DBE and pro-
environmental behaviours for International tourists (N=172) .............................. 145
Table 5. 22 Results of the direct path between DBE and pro-environmental behaviours for
international tourists (N=172) ..................................................................................................... 147
Table 5. 23 Results of the comparison of item means between Malawian and International
tourists across DBE dimensions.................................................................................................. 152
Table 5. 24 Findings summary.................................................................................................... 153

xviii
LIST OF FIGURES
Figure 3. 1 Research conceptual framework ................................................................................. 68
Figure 4. 1 Scale development process adapted from Churchill (1979) ....................................... 81
Figure 4. 2 Research design ........................................................................................................ 107
Figure 5. 1 Conceptual model ..................................................................................................... 124
Figure 5. 2 Results of the model (N=670) .................................................................................. 126
Figure 5. 3 Results of the DBE, satisfaction and pro-environmental behaviours modelling
(N=670) ....................................................................................................................................... 130
Figure 5. 4 Results of the DBE and pro-environmental behaviours model test (N=670) ........... 134
Figure 5. 5 Malawian tourists’ path analysis results (N=483) .................................................... 142
Figure 5. 6 DBE and Pro-environmental behaviours of Malawian tourists path analysis results
..................................................................................................................................................... 144
Figure 5. 7 International tourists path analysis results ................................................................ 146
Figure 5. 8 International tourists DBE and pro-environmental behavioural intentions analysis
results .......................................................................................................................................... 148
Figure 5. 9 Malawian and international tourist groups path analysis results .............................. 149

1
CHAPTER 1: INTRODUCTION TO THE STUDY
“As goods and services become commoditized, the customer experiences that companies create
will matter most” (Pine & Gilmore, 1998, p.97)
1.1 Introduction
Experiences are at the centre of tourism production (Sternberg, 1997) and they provide
tourists with various benefits as they seek entertainment, socialisation, fantasies, feelings, fun and
learning at a destination (Holbrook & Hirschman, 1982; Nicholson & Pearce, 2001) to transform
their lives as they construct reality (Carù & Cova, 2003) and create memorable experiences.
Spanning customer experience, product experience, service experience, brand equity, experiential
consumption, experiential marketing and experience economy (Aaker, 1991; Holbrook &
Hirschman, 1982; Pine & Gilmore, 1998; Schmitt, 1999a, 1999b) among others, tourism
experiences help distinguish destinations as they promote distinctiveness. As opined by Schmitt
(1999a), tourists desire extraordinary experiences and memorable experiences that “dazzle their
senses, touch their hearts, and stimulate their minds” (p.57). Therefore, following the introduction
of the notion of experience economy by Pine and Gilmore in 1998, most tourism destinations have
positioned themselves as experience-based attractions (Oh, Fiore, & Jeoung, 2007) intending to
enable tourists to experience new things first hand.
Experiences are regarded as individual and experiential phenomena and are directly related
to the attributes and appeal of a destination. Most authors contend that tourism is about
experiences (Gill, Packer & Ballantyne, 2019; Barnes, Mattsson, & Sørensen, 2014; Ritchie &
Ritchie, 1998) - and these experiences are continuously changing with the times, societies and
space (Packer & Ballantyne, 2016). Tourism experiences engage tourists’ senses as they partake
2
in the activities at the destination. Hence, sensory tourist experiences are memorable (Pine &
Gilmore, 1999). Customer brand experience is an extension of customer value manifesting beyond
measuring product attributes and benefits, as customers no longer buy the physical product or
service but the experience it offers (Pine & Gilmore, 1999; Zarantonello & Schmitt, 2010).
Experiences create value for the destination more than logos, names and symbols (Ritchie &
Ritchie, 1998), hence the need for destinations to move from the product and service environment
to the experience-led industry (Pine & Gilmore, 1999) which emphasizes personal engagement.
Against this backdrop, destinations strive to brand their experiences to outdo competition
on the market and to create a unique destination appeal. Tourism experience branding (hereafter
brand experience (BE)), continues to engage the attention of both academics and practitioners. BE
is the engagement that consumers have with the brand and the resultant perception and evaluation
of the brand experience. Brand experience is an amalgam of consumer interactions with the
product or service personality and helps to develop a relationship with the brand. Thus, as a
marketing tool, tourism destinations use branding to create meanings and experiences that appeal
to tourists as one way of differentiating themselves from the competition while at the same time
communication the destination experience value (Morgan, Pritchard, & Piggott, 2003).
Brakus, Schmitt, and Zarantonello (2009, p.52) define BE as “…sensations, feeling,
cognition and behavioural responses evoked by brand-related stimuli that are part of a brand’s
design and identity, packaging, communications and environments.” Brand experiences are
consumer reactions to brand stimuli and they are very subjective. They connect the brand and the
company to the customers’ lifestyle and include sensations such as cognitions, feelings, and
behavioural reactions to brand experience stimuli. Hence some brand experiences offer stronger
stimuli than others and reduce substitutability by focusing on unique tourist experiences (Brakus

3
et al., 2009; Hudson & Ritchie, 2009). A destination brand symbolizes unique experiences in
consumers’ mindset and constitutes logos, symbols, trademark and identity (Prasad & Dev, 2000).
Place or destination branding, although done on a smaller scale like a city, could also be done on
a bigger scale such as a country or regional brand (Hall, 2008).
Schmitt (2009) posits that brand experience is much more important than other brand
concepts as customers are more concerned with brands that provide them with desired and
pleasurable experiences (Chattopadhyay & Laborie, 2005; Schmitt, 1999a, 199b). Brand
experiences offer customers a chance to relate either positively or negatively to the branded
product or service for better relationships. Brand experiences can be sensory, affective, intellectual
and behavioural according to Brakus et al.’s (2009). They are also a function of a destination’s
tangible attributes like infrastructure and landscape (Cai, 2002). Destination brand experience adds
value to the tourism products at a destination and it is an important precursor to tourist experience
consequences, such as satisfaction, recommendation and destination revisit intentions (Barnes et
al., 2014).
For destinations with experiences that meet tourists’ needs and motivations, the prone to
damaging environmental consequences from tourists is undebatable (Luo, Tang, Jiang & Su, 2020;
Su, Huang, & Pearce, 2018). Tourists act a seed of prosperity to destinations through their spending
while at the same time sow seeds of destruction (Jimura, 2019). Thus, as destinations plan and
deliver DBEs, there is need to put in place measures that control or reduce negative environmental
impacts from tourists (Su, Huang, & Huang, 2018). This can be achieved by engaging and
sensitising tourists on pro- environmental behaviours (Luo et al., 2020).

4
1.2. Study background
Malawi is predominantly an agro-based economy that has tobacco as the country’s main
export (over 50% export earnings and contributing 25% of the total African tobacco production).
This is followed by sugar (9% export earnings) and tea (8% export earnings) which comes only
second after Kenya in Africa (FAOSTAT, 2014). The above notwithstanding, tourism in Malawi
has undergone various stages of development, although still in its infancy. Currently, tourism is
considered as an alternative foreign currency earner due to the low prices of tobacco on the market
(Armstrong, 2012). To this effect, the government isolated tourism as one of the potential
alternative solutions in some of its policy documents (World Bank, 2006; World Bank, 2012).
Malawi is made up of various destination products such as Lake Malawi, Mulanje
Mountain and the 11 wildlife reserves, offering an integrated experience (Buhalis, 2000). Also,
Malawi and indeed Lake Malawi have won many international recognitions for its well-preserved
beauty and is considered a must-visit bucket list destination (see Table 2.2 below). Lake Malawi,
similar to Lake Tanganyika, has abundant tourism potential due to the availability of beautiful
beaches, scenery, clear blue waters, and colourful and diverse range of both flora and fauna (Weyl,
Ribbink & Tweddle, 2010). Furthermore, the availability of diverse and local culture, fishing
villages and abundant wildlife is of interest to foreign tourists (Weyl et al., 2010). Tourism in
Malawi is centred on Lake Malawi - also called the Calendar Lake owing to its dimensions (365
miles long and 52 miles wide). Its clear blue waters make water sporting such as skiing, snorkelling
and angling a fantasy (Weyl et al., 2010). The World Travel and Tourism Council (WTTC, 2018),
states that tourism numbers have been growing steadily in the country, with tourism contributing
about 3.5% (i.e. US$ 221.5 million) to Malawi’s Gross Domestic Product (GDP) whereas the total
contributions were at US$481.5 million representing 7.7% of the GDP. Currently, Malawi is

5
projected to be 66th of the 185 countries as far as long-term growth in tourism between 2018 and
2028 is concerned (WTTC, 2018).
Although Malawi has several tourist attractions, tourists’ selection of a destination is not
random. Tourists select destinations with attributes that are important to them. Tourist destination
selection depends on various factors such as type of activities available at the destination (Huybers,
2003), image (Pike, 2009) and other destination attractions and attributes that let them improve
their competencies and fulfil their dreams (Kim, 2014; Mehmetoglu & Engen, 2011). Hence,
Malawi has to compete with other destinations within the Sub-Saharan and indeed the Southern
Africa Development Community (SADC) region for the 30% of tourists projected to travel to
developing countries worldwide (Morgan & Pritchard, 2002). To achieve this, various measures
have been put in place such as the introduction of tourism and hospitality studies at tertiary level,
destination branding as well as the marketing of the country at international tourism markets such
as ITB Berlin (Internationale Tourismus-Börse Berlin) and the World Travel Market (WTM) in
London and South Africa. To complement these actions and to attract more visitors and to retain
them, Malawi needs to clearly define her destination brand experiences. As argued by Iversen and
Hem (2008), destination brands have a strong impact in attracting visitors to the destination as they
form strong images in their mind-set. MGDS
1.3 Lake Malawi as a destination brand
Pike (2005) defines destination branding as measures put in place by a destination in a bid
to be competitive and distinctive. A destination brand can be perceived as the aura of a region,
place, an activity or a country as a whole that draws tourists to the place (Beckman, Kumar, &
Kim, 2013; Hankinson, 2005). Some authors contend that destination branding not only draws

6
leisure tourists and inward investments to an area but also new residents, business tourists and
employees (Hankinson, 2005) or simply for the place’s growth (Zenker & Martin, 2011).
Due to the different conceptualizations of a destination brand (Aaker, 1991; Anholt, 2004;
Blain, Levy, & Ritchie, 2005; Pike, 2005, Pike, 2009), a destination brand could be a logo, a
slogan, a name, a wordmark, trademark, etc. that is used to differentiate one destination from the
rest. A destination brand, according to Blain et al. (2005), communicates memorable experience
expectation messages, reduces tourists search costs and risks and connects the visitor and the
destination. A destination brand is, thus, a distinguishing characteristic that promises visitors some
experiences and after interacting with it, visitors get an impression of the place and decide whether
to return or not depending on their experiences (Beckman et al., 2013; Hanna & Rowley, 2011;
Lindstedt, 2011).
Destination Malawi is marketed as “The Warm Heart of Africa.” This slogan is often
accompanied by Lake Malawi, the sun and heart graphic images. The destination is associated with
the lake and its friendly people. To this effect, the lake has also been branded as Lake of Stars and
Calendar Lake (see www.visitmalawi.mw/index.php/en/). Lake Malawi is ranked the 5th largest
freshwater body in the world by water volume at 6140km3 (Beeton, 2002) and provides a valuable
resource for tourism, agriculture and fisheries. Despite a part of the lake gaining a World Heritage
Site status in 1984, the lake has not been damaged by tourism activities (Sinclair, 2000), making
it a good destination for relaxation (Ekinci, 2003).
Currently, tourism operators (both public and private) market the lake individually with
uncoordinated messages due to the absence of agreed brand identity and experiences (Armstrong,
2002; Buhalis, 2000). However, in the face of rising global competition with substitutable products
and services (including destinations), destination branding plays a huge role in making a

7
destination stand out (Hankinson, 2012; Morgan et al., 2003). Currently, about 70% of the global
tourist traffic only visits the top ten destinations, most of which are in Europe, and the remaining
30% tourists’ traffic is shared among the rest of the world (Morgan & Pritchard, 2002). This makes
it necessary for rising destinations such as Malawi to compete effectively for the remaining 30%
‘tourist cake’ by assessing and communicating their unique destination experiences (Hankinson,
2012). For example, Malawi needs to move beyond the slogan “The Warm Heart of Africa” or
“The Lake of Stars” and offer experiences that tourists can identify with and which satisfy their
emotional and basic needs (Ekinci, 2003), as a place name is not enough differentiation (Pike,
2005).
1.4 Problem statement
11 years ago, Brakus et al. developed and tested a four-dimensional scale to measure brand
experiences for product and service brands. Brakus et al. (2009) indicated that BE can be measured
using sensory, cognitive, behavioural and affective dimensions. They could not establish support
for the fifth dimension: relational. Given a tourism destination where tourists are always in contact
with other tourists, local communities and service providers (Iglesias, Markovic, & Rialp, 2019;
Zhang, Meng & So, 2020), this study perceived BE as a phenomenon that is socially constructed
by tourists, local communities and service providers (Andreini, Pedeliento, Zarantonello, &
Solerio, 2018). Thus a gap arises to explore DBEs and the importance of the relational BE construct
in a destination setup, which varies greatly from products and services. From an academic
perspective, opportunities to develop scales for tourism destination brand experiences have been
lost as most scholars have adopted the scale wholesomely without destination considerations
despite experiences evolving overtime. Such a wholesale application of marketing and branding
strategies to tourism destinations pose a great challenge given the complexity of different

8
destinations (Cai, 2002). What is more, researchers agree that adopting conceptualisation and
measurement approaches developed and tested for product brands without theoretical
consideration of the construct dimensionality does not always work in a destination context due to
the characteristics of tourism as a service industry (Aaker, 1991; Christodoulides & de Chernatony,
2010).
Second, applying Brakus et al. (2009) BE scale, Barnes et al. (2014), found that sensory
experiences were of superior importance than affective BE and the other two domains in predicting
customer loyalty and satisfaction whereas literature stresses the importance of cognitive and
emotional aspects of the brand (Bigné Andreu & Gnoth, 2005). Furthermore, Barnes et al. (2014)
results suggest that behavioural and intellectual BE were not significant domains. Additionally,
results do not account for affective experiences which are equally important in tourism as they
determine future relationships with the destination (Larsen & Jenssen, 2004; Pike & Ryan, 2004).
Thus, a gap exists to further explore the BE constructs to enhance their validity and application in
a tourism destination setup which differs significantly from consumer products (Christodoulides
& de Chernatony, 2010; Zhang et al., 2020).
The third gap is in the relationship between BE and other marketing constructs. Although
other studies have worked on BEs, they maintained the marketing line of thought by applying the
BE to concepts such as trust, loyalty, and brand personality (Nysveen et al., 2013), intention to
revisit and to recommend (Beckman et al., 2013). From these studies, differences have been found
in the association between BE and satisfaction (Brakus et al., 2009; Nysveen et al., 2013). Whereas
literature indicates that experience leads to satisfaction, these studies found varying results. Brakus
et al (2009) found that there was a positive association between BE and tourist satisfaction, a
negative link was established by Nysveen et al. (2013) whereas Barnes et al, (2013) found partial

9
support for the relationship in all their three studies. The apparent differences in these results
highlight the importance for researchers to revisit this relationship to provide destinations with
clear findings on this important relationship. This is because the provision of satisfying DBEs has
been linked to tourist loyalty (Cutler & Carmichael, 2010; Zhang et al., 2020). Furthermore, all
of the research on BEs, none of these studies considered destination-specific attributes such as pro-
environmental behaviours which can also be affected by the outcome of the tourist destination
experience. Of more importance, pro-environmental behavioural intentions among tourists need
to be promoted for sustainable use of the environment which can be damaged by the same tourists
in the course of consuming destination experiences. Stamboulis and Skayannis (2003) and Cutler
& Carmichael (2010) observe that on-site tourist experiences are an interface between destination
attractions and tourists where the destinations are the site of the experience and tourists are the
actors of the experience. As such, this interaction could result in undesired effects on the
destination environment. For the lake destination under study, there is a need to manage, monitor
and control tourists’ adverse effects on the lacustrine environment by promoting positive
environmental behaviours. Currently, no literature has empirically assessed the relationship
between tourist DBE and PEB. Therefore, the thesis fills the gap in understanding the possible
relationship to advance our understanding and application of branding in a tourism destination
context and demonstrate how DBEs could be used to foster pro-environmental behaviours.
Fourth, although some studies have applied the BE scale in various contexts, only a few
studies have used it in tourism – for example, Barnes et al. (2014), Beckman et al. (2013) and Lin
(2015) – albeit these studies neither focused on lake destinations nor settings in the developing
world. Consequently, Khan and Rahman (2015) decry the unavailability of research in developing
countries. Their systematic analysis established that although there has been an influx of studies

10
on brand experience, the majority of them have been conducted in the US, Australia and China.
They also noted that there is a lack of research in service industries such as tourism, hospitality
and banks, among others. Noting that consumer tastes and preferences vary among nationalities
and culture (Khan & Rahman, 2015), a call for more brand experience research in developing
countries to facilitate comparative studies are made. Carpenter (2008, p.27) also writes that
“scholars should never assume the rigour of published scales.” Therefore, there are calls for the
development of destination-specific BE dimensions as different destination attributes attract
different tourists (Kim, 2014; Nysveen et al., 2013).
Thus, appreciating the different nature of tourism experiences that vary according to place
and the types of tourists involved (Barnes et al., 2014; O’Dell, 2007), there are currently no scales
to measure destination brand experiences let alone lake destination brand experiences. As stated
above, the current scales are either useful for generic experiences (Pine & Gilmore, 1998, 1999),
physical products (Brakus et al., 2009) or MTEs which are a fusion of generic experiences and
physical products (Kim, Ritchie, & Tung, 2010; Tung & Ritchie, 2011). Furthermore, noting that
the outcomes of these studies might have been influenced by student respondents, it can be argued
that the characteristics of tourists (such as age, budget, prior experience, nationality, travel party
and gender) influence the outcome of the DBE as they act as moderators in the evaluation of the
experience encountered (Kim & Crompton, 2002). Therefore, if destinations such as Malawi aim
to attract more tourists by being distinctive, it is imperative to examine tourists’ DBE evaluation
of Lake Malawi, the country’s main tourist attraction site (Baloglu & Mangaloglu, 2001).
1.5 Study aims
The thesis intends to assess the destination brand experiences with Lake Malawi as a case
study. The study develops and empirically validates a destination brand experience measurement

11
scale. Furthermore, the study investigates the predictive power of the DBE scale on variables such
as satisfaction and pro-environmental behaviours. The study assumes that knowledge on the
destination experiences and their impact on satisfaction and pro-environmental behaviours would
help in the design of promotional materials that would project Malawi as an experiential, satisfying
as well as an environmentally friendly tourism destination (Crompton, 1979; Tasci & Kozak,
2006).
1.5.1 Research questions
The core question of thesis is:
1. What are the destination brand experiences of Lake Malawi?’
As the study also examines the consequences of DBE by measuring its impact on satisfaction and
pro-environmental behaviours, the second research question is:
2. What is the association among DBE, tourist satisfaction and PEB?
1.5.2 Thesis objectives
Mirroring the aim of the study, the objectives are as follows:
a) To conceptualise and validate a destination brand experience scale,
b) To evaluate the association between DBE and tourist satisfaction,
c) To investigate the relationship between DBE and tourist PEB,
d) To examine the mediating power of tourist satisfaction on the association between DBE
and tourist PEB, and

12
e) To explore the moderating role of domestic or international tourists’ status on their
evaluation of DBE, tourist satisfaction and PEB.
1.6 Significance of the thesis
The thesis’ contribution is two-fold: academic and practical.
1.6.1 Contribution to knowledge and scholarship
The understanding of the destination brand experience and its measurement is crucial in
the creation of memorable experiences for the tourists, which is one of the greatest benefits derived
from a tourist visit. Currently, little research has addressed this area on lake destinations (Hall &
Härkönen, 2006). Indeed, as far as tourists’ view of destination branding excellence is concerned,
the provision of a brand name, logo or symbol is not important if it does not offer promised
experiences. Hence, to create a distinctive destination, destinations should strive to provide travel
experiences that are exciting and memorable, and this should be at the heart of all stakeholders’
tourism product offerings (Frost, 2004). This study makes at least three academic contributions.
1. DBE measurement scale development
The study contributes to the knowledge bank on DBEs by developing and validating a scale
that measures destination brand experiences using Lake Malawi as a case study. The study
provides six constructs that measure the DBEs of a lake destination, and this is envisaged to enrich
the understanding of tourists’ brand experiences at destinations. It is projected that the scale is
holistic enough and applicable to destinations with similar attributes like that of Lake Malawi and,
thus, contributes to the overall understanding of DBEs in conjunction with studies done in other
tourism sectors.

13
Different from previous studies where utilitarian products were used and scales were
conceptualised in the western society (Pearce, 2004), this study uses actual tourists and measures
their evaluation of DBE in a real destination context. This addresses Barnes et al. (2014)
acknowledgement that DBEs vary from one destination to another and their conceptualisation
would affect tourists’ review of DBEs. Indeed, as indicated by Lehmann, Keller, & Farley (2008)
and Saari and Mäkinen (2017), brand experiences vary from one country to another.
2. DBE scale validation and linkage to pro-environmental behaviours
The study furthers the understanding of destination brand experiences concerning pro-
environmental behaviours unlike previous studies that only focused satisfaction (Brakus et al.,
2009) or recommendation intentions (Barnes et al., 2014). This thesis also furthers our
understanding of the measurement of brand experiences by applying it to a lake destination
especially by linking DBEs to pro-environmental behaviours which have yet to be tested in any
destination. In doing this, the study fills in the gap by providing answers on the role of DBEs in
promoting sustainable environmental behaviours among tourists.
3. Enrich literature on lake destinations
Despite a growing number of studies in tourism, few have focussed attention on lake
tourism (see Gössling & Hall, 2006; Hall & Härkönen, 2006; Jennings, 2001; Rodrigues, Correia,
Kozak & Tuohino 2015a; Rodrigues, Rodrigues & Peroff, 2015b) and lake activities in particular
(Furgała-Selezniow et al., 2016). Notably, Hall and Härkönen’s (2006) edited volume, Jennings’
(2001) book and studies by Rodrigues, Correia, and Kozak (2013) are the notable few studies that
have attempted to address the lack of studies on lakes and tourism. Other studies that have been
conducted have focused on general lake limnology, the impact of lakes on tourism and restoration

14
and management of lakes and reservoirs (see Cooke, Welch, Peterson, & Nichols, 2005).
Furthermore, despite the growing number of research on tourism experiences, only a few have
focused on water experiences (see Jennings, 2007) while none has examined DBEs at lake
destinations, let alone in developing countries (Gössling & Hall, 2006). In fact, in their book,
Gössling and Hall (2006, p. 4), noted that the focus of the book was “primarily on the developed
world, given that that is where the majority of the world’s tourism occurs, although that is not to
ignore the role that lakes play in the tourism industries of many developing countries including the
Alpine lakes …the Great Rift Valley Lakes of Africa…”
Given the limited amount of empirical research on brand experiences at lake destinations,
results from this thesis add to the body of knowledge on tourism brand experiences, particularly at
lake destinations, which are under-researched. By clearly articulating the destination attributes that
are vital in the creation of experiences, the study helps the DMOs and researchers alike to have a
renewed view of tourism experiences.
1.6.2 Contribution to practice and management
The study offers DMOs, the Department of Tourism in Malawi in particular, a broader
understanding of tourists’ DBEs of Lake Malawi. The findings will, thus, help tourism
practitioners to identify the kind of attractions, activities and indeed DBEs that tourists are looking
for and associate with Lake Malawi. This has a bearing on the evaluation of the brand offering,
satisfaction and pro-environmental behaviours, among others.
Secondly, the results provide insights that could help DMOs to allocate their resources
properly as they understand their target market, the needs of this market and how to satisfy them.
By applying this scale to lake destinations, it is hoped that the needs of tourists to lake attractions

15
could be met if destinations knew the DBEs different tourist segments are looking for and
communicate this in their marketing campaigns (Kim, 2014; Morgan et al., 2003). What is more,
the understanding of the brand experiences of Lake Malawi (and similar destinations), as well as
the evaluations from tourists, would enable the DMOs to develop tourist experiences that are
pleasurable, authentic and appealing to the tourists (Tung & Ritchie, 2011) and at the same time
enforce pro-environmental behaviours.
As an exploratory study in Malawi, the research contributes to an understanding of how
the private sector and local communities could be integrated into the development and promotion
of lake experiences alongside the government. As stated by Morgan et al. (2003) it is imperative
for stakeholders in any destination to work together for the destination to realize tourism growth.
1.7 Definition of thesis’ key terms
1.7.1 Tourism destination
Tourism destinations are spatial brands with political and legislative boundaries, which
combine goods, services and experiences, offered at a local scale, for the enjoyment of vacation
travellers (Barnes et al., 2014; Buhalis, 2000; McKercher & Guillet, 2011).
1.7.2 Tourism Experience
For this thesis, tourism experience is conceptualised as ‘the emotional state, feeling of fun’
(Holbrook & Hirschman, 1982) which are subjective (Pine & Gilmore, 1998, 1999; O’Dell, 2007),
bound by time (Packer & Ballantyne, 2016), affects all the senses (Sundbo & Sørensen, 2013),
after undergoing a situation (Schmitt, 1999a) or an external stimulus (Sundbo & Sørensen, 2013)
and interrupts them from their lives… and are incredibly involving (Ray, 2008).

16
1.7.3 Destination branding
Destination branding refers to a set of marketing activities including the creation of logos,
names, signs and symbols aimed at differentiating a destination an expectation of memorable
experience (Kotler, 2000).
1.7.4 Satisfaction
Satisfaction connotes the cognitive appraisal or evaluation a consumer makes about how
good an experience was based on the perceived difference between what was expected and the
perceived performance after consumption (Hunt, 1977; Oliver, 1980; Williams, 1989).
1.7.5 Pro-environmental behaviours
Pro-environmental behaviours also known as environmentally responsible behaviours
(ERB) are concerned with tourists’ environmental concern, knowledge, responsible consumption
and commitment in an attempt to preserve and protect the sanctity of the destination (Cottrell &
Graefe, 1997; Gupta & Agrawal, 2018). ERB are tourists’ behaviours aimed at reducing negative
impacts on both the natural or cultural environment in a destination (Miller, Merrilees, & Coghlan,
2015).
1.8 Summary
Tourism experiences, like all other experiences, are psychological phenomena whose
interpretation differs from one person to another, rendering them a complicated psychological
issue (Cutler & Carmichael, 2010; Kanagasapapathy, 2017). Tourism is a complex industry and
system where various facets of the destination play vital roles in supplying the traveller with what
is missing in their life through destination experiences. Destination experiences spice up tourists’
consumption of the place. To survive market competition (Morgan et al., 2003), destinations need

17
to continuously assess their brand experiences and communicate the brand promise to tourists. For
lake destinations such as Lake Malawi, the need for a brand experience assessment is long overdue
given its importance in projecting Malawi as an international brand. As observed by Ashworth and
Tunbridge (2000), tourists are growing in their experiences and venturesomeness, and the ability
for destinations to conform to tourists’ expectations leads to the attainment of their trip goals.
Therefore, this study explores develops validates a Lake Malawi destination brand experience
measurement scale.
1.9 Outline of the thesis
Guided by the research aim, objectives and research questions, this study comprises seven
chapters. This segment gives a synopsis of the thesis chapters.
The introduction chapter introduced the overall research study. It has presented the study’s
background, problem statement and the study’s justification. The chapter also illustrates how the
thesis questions, aims and objectives, and the academic and practical contributions of the study.
Chapter 2 explores the relevant literature that constitutes a theoretical thrust for the study.
The chapter explores tourism experiences, an overview of tourism brand experience, place
branding, lake destinations and the Lake Malawi destination. The definitions and explanations of
the core research constructs such as satisfaction, pro-environmental behaviours, and brand
experience are also discussed.
Chapter 3 presents the conceptual framework and the various hypothesised relationships
that governed the study. The chapter presents the literature discussion in support of the proposed
hypotheses. The conceptual framework and hypotheses centre on DBEs, tourist satisfaction and
PEB.

18
Chapter 4 discusses the methodological procedures of the study. It outlines the research
design, sampling, variables measurement, questionnaire design and data collection procedures and
data analyses and justification for using the survey method. It also explains how survey items were
collected using a literature review and qualitative interviews.
Chapter 5 presents the research findings. It employs statistical analyses such as exploratory
factor analysis (EFA), confirmatory factor analysis (CFA) and modelling to understand the data.
Furthermore, the chapter presents results of moderation and mediation analyses.
Chapter 6 provides a discussion on the research findings. It relates the findings to the extant
literature.
Finally, chapter 7 is the conclusion of the study. It wraps up the study by giving out a
review of the seven chapters of the study. The academic and practical contributions of the results
are also proffered. The thesis limitations are proffered followed by suggestions for further research.

19
CHAPTER 2: LITERATURE REVIEW
“It is useful to remember occasionally that life unfolds as a chain of subjective experiences…the
quality of these experiences determines whether and to what extent life was worth living”
(Csikszentmihalyi, 2014)
2.1 Introduction
Deriving largely from hedonic consumptions, tourism experience is diverse (Kim, 2014;
Uriely, 2005) and it takes people away from their daily lives in search of interesting activities
(Zátori, Michalkó, Nagy, Kulcsár, & Balizs, 2017). Tourism experiences at a destination have
engaged the attention of academics in various disciplines, including marketing, sociology, tourism
and hospitality (Brakus et al., 2009, Cohen, 1979; Jorgenson et al., 2018; Tung & Ritchie, 2011).
Given the nature of tourism services and products, it is unsurprising that the focus has moved from
retail shopping and experiential consumption to the creation and provision of activity-based
experiences. These studies have helped to shape and define the understanding of tourism
experiences, their paradigms as well as their importance in destination management and marketing.
This chapter situates the present study within the literature on destination branding, destination
brand experiences, tourism experiences, lake tourism, Lake Malawi, satisfaction, pro-
environmental behaviours and tourism stakeholders.

20
2.2 Destination branding
For a long time, scholars have discussed and researched on place branding, also referred to
as destination branding (Pike, 2009). As a concept borrowed from marketing, its applicability has
dwelt on the need for destinations to develop unique propositions, identities and personalities that
differentiate them from the competition (Cai, 2002). Destination branding, according to Cai
(2002), is a deliberate selection of a consistent brand element mix (price, place, product,
promotion), which helps to differentiate a destination from others. According to Cai (2002), a
destination brand name is fixed to an actual geographical name of a place.
Drawing on insights from urban planning, Hankinson (2004) argues that a destination
brand can focus on three issues: 1) a place’s products nature, 2) its historical development and 3)
its distinctive features ‘marketing implications (also see Van den Berg, & Braun, 1999). From the
tourism and vacation marketing perspective, he argues that a destination brand is mostly seen as a
perceptual entity. Hankinson (2004) posits that four functions of destination brands: brand as a
communication, perceptual or image entity building, value enhancement and relationship building.
In tourism, destination branding has become extremely important given the ever-increasing
competitive nature of the tourism market as many destinations offer almost similar and
substitutable experiences (Pike, 2005). In this regard, Morgan and Pritchard (2002, p. 11) observe
that “branding is perhaps the most powerful marketing weapon available to contemporary
destination marketers.” To this end, certain places and destinations have applied this concept to
make them stand out among their competitors (Ashworth & Kavaratzis, 2009; Iversen & Hem,
2008). Place branding is thus seen as “the practice of applying brand strategy and other marketing
techniques and disciplines to the economic, political and cultural development of cities, regions
and countries” (Govers & Cull, n.d.). Since place branding and brand experiences have a

21
significant effect on the destination, it is critical for destinations to engage, stimulate and entertain
visitors beyond just ‘being there’. Tsiotsou and Goldsmith (2012) state that interactions between
tourists and various elements of the ‘servicescape’ coupled with cognitive and emotional reactions
of the tourists are vital in the creation of destination experience.
Tourism destinations are considered brands to be consumed (Boo, Busser, & Baloglu,
2009) and brands are understood from both the company’s and consumers’ perspective (Stern,
2006). Defining place branding, Zenker and Baun (2010, p. 5) state that it is “a network of
associations in the consumers’ mind based on the visual, verbal, and behavioural expression of a
place, which is embodied through the aims, communication, values, and the general culture of the
place's stakeholders and the overall place design.” As a proxy for positioning (Gilmore & Pine,
2002) as well as destination competitiveness (Kumar & Nayak, 2018), destination branding can be
used to increase their competitive advantage. Furthermore, some destinations have applied
destination saliency, which refers to the building of an emotional relationship with the tourist.
Destination saliency focuses on providing destination attractions and services that appeal to the
tourists’ emotional needs (Ekinci, 2003).
In addition to conveying brand expectations or promises to travellers, branding should
strive to provide memorable experiences (Ritchie & Crouch, 2003) by making the brand promises
a reality (Hankinson, 2009). As noted by Hanna and Rowley (2011), a destination brand experience
results from tourist experience of a branded place where they attain an enjoyable experience after
which they attach emotional meaning to it (Lindstedt, 2011). Discussions on the meanings of a
place, for example, Relph (1976) identify three aspects of a place from a geographical perspective:
the physical setting, activities therein and meanings. Canter (1977a), a psychologist, also puts

22
forward a three-part model of a place, which derives from the relationship between actions,
physical attributes and conceptions.
Pike (2009) notes that the benefits of destination branding accrue to both the destination
and the consumer. Branded places convey promises of memorable and enjoyable destination
experiences to the tourists and reduce searching costs (Aaker, 1991; Beckman et al., 2013; Blain
et al., 2005; Cai, 2002;) and perceived risks (Berthon, Hulbert, & Pitt, 1999) while at the same
time creating impressions or beliefs about the destination (Erdem, 1998; Kotler & Gertner, 2002)
and consolidating and reinforcing the emotional bonds between the tourist and the destination.
This may lead to a positive destination image (Blain et al., 2005) and loyalty (Pike, 2009). Place
branding, like product branding, facilitates tourist’s positive attitudes towards the destination brand
when their needs are met; hence, successful destination brands need to merge promised brand
values that are both symbolic and functional (Hankinson & Cowking, 1993) with actual lived
tourist experiences (Copeland, 2001; Kavaratzis, 2005) or what Hankinson (2004) calls ‘potential
experiential attributes’.
For most developing destinations, for example, Africa, destinations are associated with
negative or stereotype brand identities such as diseases, poverty and sometimes war (see
Rittichainuwat & Chakraborty, 2009; Tasci & Kozak, 2006). Given that tourists’ perceptions are
an important element of destination choice (Hosany & Prayag, 2013; Iversen & Hem, 2008) as
well as tourists’ experiences at a destination (Tsiotsou & Goldsmith, 2012), destination branding
is critical in the creation and communication of destination identity (Anholt, 2007; Cai, 2002).
Destination branding has also been linked to new and enjoyable experiences owing to the image it
creates (Beckman et al., 2013) – this can attract premium prices (Buncle, 2009). What is more,
Blain et al. (2005) posit the need for visitor experiences to be considered in destination branding

23
as the DBE has a positive effect on their experiences. For destination Malawi and indeed Lake
Malawi, the unique characteristics are its natural assets such as clear and fresh blue waters,
landscape, heritage, history of the Rift Valley Lake, fish species and cultural attractions.
2.3 Brand experiences
With its origin in marketing where it is linked to shopping and service experience, product
experience and consumption experience among others (Hoch, 2002; Holbrook & Hirschman,
1982; Hui & Bateson, 1991), brand experience refers to the ‘sensory, affective and cognitive’
(Schmitt, 1999b, p.57) associations or stimuli that a product or service conveys to the consumer.
These associations could be derived from innumerable settings such as service, product, place and
corporate brands (Skinner, 2008). BE is also derived from customer experience concept (Meyer &
Schwager, 2007), which hinges on a consumer’s encounter with brand marketing communication,
product packaging or product design and it is at the core of company strategies as one way of
delivering memorable and unique consumer experience (Schmitt, 1999a). Brand experience is
further conceptualised as the degree to which an individual is familiar with a brand as a result of
brand exposure (Ha & Perks, 2005).
Brand experience is also defined as a set of internal subjective experiences that affect
consumers’ behavioural outcomes (Khan & Rahman, 2015). The customer-brand relationship has
an important effect on consumers’ attitude and evaluation of the brand and this informs repurchase
intention and brand loyalty among others (Aggarwal, 2004; Brakus et al., 2009). BE entail the
cognitive, goal-oriented and rational responses of consumers to a brand (Morgan-Thomas &
Veloutsou, 2013), they are often private, unique, seductive and intriguing (Hoch, 2002) and have
been linked to business success. Brand experiences can differ in strength and intensity (Skard,
Nysveen, & Pedersen, 2011). In tourism studies, brand experiences have been linked to ‘scapes’

24
or experience-scapes, referring to physical environments that tourists experience (Hall, 2008) and
which are strategically planned and designed.
In a study that can be termed as a pioneer of applied BE research, Brakus et al. (2009)
analysed various categories of experiences such as, products, shopping, service and consumer
experiences, and later developed a scale of brand experience. In this paper, Brakus et al. (2009)
carried out six studies to ascertain what brand experiences are, how they are measured and how
they affect consumer satisfaction and loyalty. The study delimited aspects that constitute brand
experiences. The authors state that brand experiences are internal subjective experiences to
consumer brand consumption. They also argue that BE is different from evaluative, affective and
associative constructs such as brand involvement, brand attachment, customer delights, and brand
personality even though the concepts are related. They further state that BE is different from
motivational and affective brand constructs like involvement, attachment and delight. Brakus et
al. (2009) put forward five dimensions of brand experiences: (affective, intellectual, sensory,
behavioural and social) which were later reduced to four (sensory, affective, intellectual and
behavioural) as they could not find evidence for the relational dimension. The subsequent sections
discuss Brakus et al.’s (2009) BE scale.
2.3.1 Sensory brand experience
Sensory experiences are peoples’ perception of goods and services in a service setup in the
form of an image that challenges their mind (Hultén, 2011) through their sense of sight, hearing,
feeling, smell and taste (Barnes et al., 2014). These human senses are also referred to as
‘sensescapes’ (Agapito, Valle, & Mendes, 2013). According to Agapito et al. (2013), sensescapes
constitute the five human senses of smell, sight, hearing, taste and feel. They proposed the need to
not only focus on the western view of experiences that highlight ocular sense but rather take a

25
holistic approach to sensescapes (Agapito et al., 2013; Dann & Jacobsen, 2003). Brakus et al.
(2009) postulate that people engage in sensory experiences to evade pain. Indeed, Rodaway (1994)
stated that human senses are mediators in geographical experiences. In other words, humans
depend on their senses to experience a destination. Thus, in a destination or geographical setting,
the five senses are also termed soundscapes, smellscapes, tastescapes and geographies of touch
(Agapito et al., 2013; Porteous, 1985; Urry, 2002). Agapito et al. (2013) further argue that human
sense-the sensescapes- are an important element to an individual’s perception of the world where
sensory stimuli affect their behaviours in a destination which is multisensory.
Several studies have demonstrated the role of various senses in consumers’ perception of
brands. For example, the sense of sight enables tourists to experience places in what Urry (1990,
2002) terms the tourist gaze. The visual sense is crucial in observing commercial environmental
changes and differences, and it aids in the creation of a perception of goods and services (Agapito
et al., 2013) whose evaluations can be affected by colour, design and light (Crowley, 1993;
Summers & Herbert, 2001; Orth & Malkewitz, 2008).
Other studies have focused on the sense of taste, indicating how the consumption of
foreign, strange or ‘scary’ foods are seen as one way of experiencing and connecting with the
places visited. To some travellers, this is part of their travel motivations whereas to others this
forms part of their travel experience (Mkono, 2011). Studies have found that tourists experience
the places or ‘taste the area’ they visit by consuming local food and drinks such as wines and milk
(Everett, 2008). For food lovers and those willing to try new things- i.e. neophilia- and this
becomes the ‘wow’ experience whereas, for other travellers, this may be scary, risky or bizarre
(Mkono, 2011; Molz, 2007). Krishna (2012) writes that the sense of taste is manipulated by

26
external factors such as brand name, advertisement, product information and physical attributes
such as food colour.
Research has shown that the sense of touch has a positive impact on consumers’ attitudes
and behaviour when they are allowed to touch a product before buying it (Peck & Wiggins, 2006)
as this reduces their frustration and increases their confidence in the product. That is, consumers
can evaluate products and create information about the product through touching (McCabe &
Nowlis, 2003) to establish their texture, hardness and weight (Hultén, 2012). Krishna and Morrin
(2007) found a correlation between the sense of touch and taste that suggests that consumers prefer
shops that allow them to touch a product before purchasing.
Concerning the sense of hearing/sound, music, for instance, has been found to affect
shopping experience (Yalch & Spangenberg, 2000) and infomercials have been found to have a
direct impact on consumer experience (Singh, Balasubramanian, & Chakrabotry, 2000). Studies
have also been done on the sense of smell (Dann & Jacobsen, 2003; Lwin, Morrin, & Krishna,
2010; Spangenberg, Crowley, & Henderson, 1996) and scent has a positive impact on consumers’
intention to visit a store again and to buy (Spangenberg et al., 1996).
Since brand experience involves the interplay of several senses, some studies have analysed
the impact of multi-senses on brand experience, for example for high-tech products (Agapito et
al., 2013) and the influence on buying behaviour (Hultén, 2011, 2015). These studies recommend
that destinations ought to consider multisensory stimuli (Dann & Jacobsen, 2002; Krishna, 2012)
when designing tourism experiences in the countryside (Agapito et al., 2013) to create memorable
experiences (Pine & Gilmore, 1998) as one sense can affect other senses when consumers evaluate
a brand (Agapito et al., 2013).

27
For water-based destinations such as Lake Malawi, the interplay of tourist senses as they
consume the destination need not be accentuated (Agapito et al., 2013; Rodaway, 1994). As
tourists experience the destination, experiences that captivate the sense of sight can be stimulated
as in the tourist gaze (Urry, 1990, 2002), the smell from the lake and nearby fishing villages, sense
of hearing from fellow tourists’ noise, noise from the villages as well as wildlife. For tourists who
like to shake their neophilia, tasting local foods could lead to further sensory experiences among
others (Porteous, 1985). Thus, this study stresses the importance of these sensescapes in a
destination context.
2.3.2 Affective brand experience
Affective brand experiences have been acknowledged to be important in understanding
consumer emotional attachments with the brand as well as their evaluation of product quality. For
example, various studies have examined affective brand experiences such as emotion (Brakus et
al., 2009; Khan & Rahman, 2017; Schmitt, 1999a), attachment (Thomson, MacInnis, & Park,
2005, mood and emotions (Schmitt, 1999a) and brand love (Pawle & Cooper, 2006) and they have
been found to affect consumers’ behavioural intention such as loyalty (Iglesias, Singh, & Batista-
Foguet., 2011). Thomson et al. (2005) summarise brand emotions into affection, connection and
passion. They report that consumers can develop strong emotions ties with brands and the ties can
foretell the nature of consumers’ interface with the brand or object. Consumers’ emotional
attachment to a brand might also lead to their commitment to the brand through loyalty or their
willingness to pay premium prices (Thomson et al., 2005).
Brakus et al. (2009) define affective brand experience as sentiments, feeling or emotions
that people develop when consuming a product or service whereas Holbrook and Hirschman
(1982) state that affective brand dimension encompasses psychologically defined emotions of awe,

28
anxiety, elation, love, pride, ecstasy, hate, shame, joy, fear, disgust, sympathy, boredom, greed,
sadness, and guilt evoked by a brand. Furthermore, affective brand experiences could be positive
or negative moods or a combination of the two (Andrade & Cohen, 2007). Affective brand
experience denotes the strength of the connection between the brand and the consumer and can
have an impact on a company’s profitability (Park, MacInnis, Priester, Eisingerich, & Iacobucci,
2010). In general, studies have shown that emotions developed with humans are more intense than
those developed with an object (So, Parsons, & Yap, 2013). It has also been established that
consumers’ brand relationship is influenced by emotional factors (Pawle & Cooper, 2006; Thonson
et al., 2005).
2.3.3 Behavioural brand experience
Behavioural experiences refer to those experiences or choice processes that involve the
body as a whole such as physical actions (e.g. dancing, or purchase action). Behavioural
experience, through stimulation of the consumer’s behaviours or intentions, appeals to the
consumer’s physical experiences, lifestyles as well as interactions with the brand or other people.
Evidence in the literature shows that customers’ encounter with brand experience affects their
commitment and relationship with the brand in future (Ding & Tseng, 2015; Gentile et al., 2007)
and this can result in satisfaction.
Behavioural experiences, in integrated resorts, for example, should encourage customers
to learn or practise new skills so that users can exercise and release stress (Ahn & Back, 2018). In
a visitor behaviour study at Taipei zoo, Tsaur, Chiu, and Wang (2007) found that emotion had a
positive effect on visitors’ behavioural intention as a result of their satisfaction with the zoo. When
presented with a brand experience, consumers exhibit changes in their lifestyles and behaviours
(Schmitt, 1999b). Also, brand consumption in groups or with other customers has been found to

29
have a positive impact on behavioural BE (Nysveen et al., 2013). Hence, Brakus et al. (2009)
report that satisfaction and brand loyalty are the bye-products of brand experience, which Klaus
and Maklan (2012) later described as a service experience.
2.3.4 Intellectual brand experience
According to Barnes et al. (2014, p.124), intellectual actions entail “the thought,
stimulation of curiosity and problem solving” activities resulting from neural events pairing in the
brand experience (Howard & Sheth, as cited in Holbrook & Hirschman, 1982). Holbrook and
Hirschman (1982) submit that cognitive experiential consumption is a subconscious and private
process that enables a customer to moderate their fatigue or boredom (Cacioppo & Petty, 1982).
Some studies (e.g. Ahn & Back, 2018) argue that intellectual or cognitive perception of a brand
leads to a customer-brand relationship as an end product of the memory, attention and information
processing stages and is critical in consumers’ BE assessment. On the other hand, Nysveen et al.
(2013) illustrate that a brand experience that requires customers to do a lot of thinking and problem
solving affects their cognitive or intellectual experience of consumers negatively because this
makes the problem-solving process less exciting. Although most studies on brand experiences
acknowledge the importance of sensory brand experiences, some propose that cognitive
experiences are vital in the conceptualisation and interpretation of other experiences (Lazarus,
1991). For example, Bustamante & Rubio (2017) and Han, Lee, Song, Lee, and Chua (2019) posit
that cognitive experiences affect customer evaluation of a service or product. That is, consumers
first perceive the product’s benefits before they can deem it to be good or bad.
2.3.5 Relational brand experience

30
Relational brand experience, also known as social brand experience, refers to customer
experiences that involve the person, their social context, the ideal self as well as other people
(Gentile et al., 2007). This experience is derived from connecting with other consumers such that
common passion leads to the creation of a community, social identity and a sense of belonging
(Gentile et al., 2007; Schmitt, 1999b). The relational brand experience is concerned with the social
experiences of people with their reference group (Schmitt, 1999a). In festival events, relational
experiences are reported through attendees’ shared experiences, social interactions and parties,
among others (Geus, Richards, & Toepoel, 2016; Nordvall, Petterson, Svensson, & Brown, 2014).
Writing on the multi-perspective view of brand experience, Andreini et al. (2018) contend
that relational brand experiences are a critical component of brand experience as consumers,
through experiences, partake in brand meaning creation. They assert that brands are socially
constructed phenomena and they “connect individuals, activating subject-to-subject(s), subject(s)-
to brand and subject(s)-to-stakeholder(s) relationships.” In sum, Andreini et al. (2018) assert that
through interactions, relational brand experiences enable consumers and other actors (service
providers, community, and other customers) to experience psychological cultural, social, and
market swings. These sentiments are also shared by Iglesias et al. (2019) who argued that
employees are an important aspect of customer brand experience creation through service delivery
interactions.
2.3.6 Summary of the brand experiences
Generally, several studies have examined brand experiences in various sectors, including
corporate brand experience (Hamza, Alwai, & Othman, 2014), online brand experience (Hamza et
al., 2014; Lee & Jeong, 2014), brand experiences of global high-tech products (Saari & Mäkinen,
2017) and brand experiences in service organisations (Nysveen et al., 2013). Some research has

31
also concentrated on BE in multi-sensory marketing (Hultén, 2011), brand experience in airlines
(Lin, 2015), brand experience for downtown success (Beckman et al., 2013), brand experience in
hotels (Khan & Rahman, 2015) and retail brand experience (Khan & Rahman, 2015). However, to
date, only a few studies have investigated destination brand experiences (Barnes et al., 2014;
Brakus et al., 2009).
Despite their effect on customer evaluation of a service or product (Bustamante & Rubio,
2017; Han et al., 2019) research by Barnes et al. (2014) and Brakus et al. (2009) found that
intellectual experiences were difficult to achieve in a destination. This is because cognitive
experiences demand consumers to make mental calculations as they interact with a product.
Indeed, Schmitt (2013, p. 251) refers to cognitive BE as having “both convergent/ analytical and
divergent/ imaginative’ thinking about the brand. That’s in marketing literature, cognitive
experiences have been found to precede consumers’ satisfaction with a service or product through
mental processes, positive thoughts and memory which result from product or service encounter
(Bustamante & Rubio, 2017; Gentile et al., 2007; Schmitt, 1999a).
Regarding affective BE, studies attribute the affective component of DBE to the important
element of memorable experiences (Kim, 2014; Larsen & Jenssen, 2004). Since tourism largely
concerns hedonic experiences (Kim, 2014; Uriely, 2005), behavioural and affective experiences
need to be measured as they determine a trip’s evaluation based on how sociable, happy, pleasant
or irritating the trip elements were (Larsen & Jenssen, 2004; Tung & Ritchie, 2011; Schmitt,
1999a). Additionally, Andreini et al. (2018) highlight the importance of social brand experiences,
a variable many studies have either overlooked or have failed to “provide any criticism or further
elaboration [on]” (p. 123). Therefore, there is a need to develop a scale that can account for all
possible aspects of a brand experience as far as a destination is concerned. Indeed writing from a

32
psychological perspective Schmitt (2013) submits that all the BEs: affective, cognitive,
behavioural and sensory BE are responsible for consumers long term customer-brand relationship
equity. He argued that the four BEs either entice/annoy, enable/disable or enrich/impoverish the
self, resulting in brand self-distance or brand prominence (Schmitt, 2013).
In the context of this study, all five brand experiences i.e. social, behavioural, affective,
cognitive and sensory, as espoused by Brakus et al. (2009) and Nysveen et al. (2013) are used to
measure the holistic experiences a destination could offer to tourists. Realising the interactions
between service providers and tourists, tourists and fellow tourists as well as between tourists and
the host community (Lin, Zhang, Gursoy, & Fu, 2019; Pine & Gilmore, 2009; Sharpley, 2014),
the study most importantly explores the social dimension to ascertain the extent to which it applies
to a tourist destination. As alluded to by Lin et al. (2019) and Sharpley (2014), social interactions
are an important element in tourist experiences and are created through tourists’ interaction with
people and places they visit during their vacation. Social dimension has an impact on tourist
destination experience and can also induce their future behaviours as tourists spend more time
interacting with other tourists, the local community and service providers (Crompton, 1979; Lin
et al., 2019; Torres, 2016). An introspective examination of the proposed DBEs at Lake Malawi is
provided for in section 2.7.5.
2.4 Tourism experiences
Tourism is concerned with the creation and selling of experiences; it also focuses on
helping tourists to construct stories and collect memories (Oh et al., 2007; Ooi, 2005). Tourists
seek experiences that create unforgettable images and stimulate their minds (Sternberg, 1997).
These experiences emanate from activities and their social meanings and from the physical

33
environment (O’Dell 2007; Packer & Ballantyne, 2016), and they are key to an innovative,
successful and competitive destination (Cai, 2002; Kotler, 2000).
Seminal studies by Cohen (1979), Holbrook and Hirschman (1982), Urry (1990, 2002),
Csikszentmihalyi (1996) set the pace for research into tourism experiences. Indeed, from
rethinking the sociology of tourism (Cohen, 1979) to the psychological nature of leisure and
tourism (Mannell & Iso-Ahola, 1987) and then to the tourist gaze (Urry, 1990, 2002), studies on
tourism experience have moved to the experience economy (Pine & Gilmore, 1998, 1999), and
memorable tourism experiences (Kim, 2010). Some of these studies have discussed festival event
experiences and others have explored outdoor sports experiences. A common theme in these
studies is that travellers engage their sensory interactions with the tourism purchase (Schmitt,
1999a) or people (environment) (Adhikari & Bhattacharya, 2016
In the early tourism literature, authors focused on the hard elements of the destination such
as the sea, sun and sand (triple S) – these were the typical characteristics of a beautiful destination.
Later, the focus shifted to service and service quality as determinants of a competitive destination.
For example, Cohen’s (1979) study holds that people travel to different destinations in search of
experiences, which are a multifaceted phenomenon undertaken during leisure time and involves
entertainment or learning or both (Ryan, 1997) as they interact with the tourism system and people
in that system (Larsen, 2007). Thus, tourists’ consumption of goods and services in a destination
to satisfy their needs has overtime changed focus from physical goods to experiences (Pine &
Gilmore, 1999).
2.4.1 Defining tourism experiences

34
Although different authors have different viewpoints on what experiences and services are
and how they differ from each other (Jorgenson et al., 2018), one thing is certain: experiences are
part and parcel of services and vice versa. Schmitt (1999, p.25) defines experiences as:
“...the result of encountering, undergoing, or living through situations. They are triggered
stimulations to the senses, the heart, and the mind. Experiences also connect the company
and the brand to the customer’s lifestyle and place individual customer actions and the
purchase occasion in a broader social context. In sum, experiences provide sensory,
emotional, cognitive, behavioural and relational values that replace functional values”.
On their part, Holbrook and Hirschman (1982) conceptualise customer experience as the
sensory, fantasy and emotional consumer expressions of product use. It is the enjoyment, the
immersion and the reactions consumers express when they interact with a product or a brand.
(Gentile et al., 2007; Pine & Gilmore, 1998). Experiences can be real or virtual and are purely
individual or shared (Schmitt, 1999a, 1999b) in response to a stimulus. Lorentzen (2009) observes
that experiences can be place-based (festivals), services (galleries) and activities (handicraft). This
view is also held by Cai (2002) and Baker (2007) who state that experiences are a function of the
place’s tangible attributes such as infrastructure and landscape. Experiences are built into services
to be able to satisfy the consumer’s need whereas services have an embedded experience in them
as the consumer enjoys their consumption of the same (Agapito et al., 2013; Pine & Gilmore,
1998).
Tourism experiences are manifested through the creation, production and customization of
tourist’s product and services in a meaningful way, aimed at giving tourism firms and destinations
competitive advantage by reducing substitutability (Chang & Horng, 2010) while focusing on

35
pleasurable brand experiences. They offer tourists alternative experiences during their free time or
when they are free from the constraints of daily life (Wang, 2000). Consequently, destination
marketers appreciate the need to offer unique characteristics of tourism experiences while
recognising that such experiences are subjective (Aho, 2001; Otto & Ritchie, 1996), highly
personal, intangible and always changing (O’Dell, 2007) as they are products of psychological
processes (Brakus et al., 2009). Currently, tourism scholars have combined products and services
to capture the concept of tourists’ experience.
Chang and Horng (2010) state that an experience is an impression that consumers create
and take away with them after interacting with a brand. Larsen (2007, p. 9) makes a distinction
between two German words Erlebnis and Erfahrung which are directly related to experience.
Erlebnis means ‘the immediate participate or consciousness related to specific situations’ whereas
as Erfahrung ‘connotes the accumulated experiences in the course of a period or even the entity’s
life span.’ He concludes that tourism experiences are a combination of both Erlebnis and
Erfahrung as travellers participate in activities at a destination and at the same time accumulate
memories of the place.
Due to the different nature of tourism experiences, scholars contend that experiences
should be studied from different perspectives such as psychology and feminism (Wearing & Foley,
2017), among others. For example, social psychology holds that there are three scopes of
experience namely conative, cognitive and affective (Mannel & Kleiber, 1997). Conative
experiences describe the things that people do or their actual behaviour, cognitive experiences deal
with mental perceptions, memory, understanding experiences as well as how the tourist evaluates
the experience encountered and affective experiences refer to feelings, emotions and preferences

36
that travellers develop after encountering a tourism experience (Kanagasapapathy, 2017; Mannel
& Kleiber, 1997).
2.4.2 Types and elements of tourism experiences
The tourism industry largely focuses on the creation of experiences that help guests to
participate, relate to and enjoy a destination. Several scholars have studied this experience
phenomenon (Cohen, 1979; MacCannell, 1973) and different conclusions have been made (see
Ritchie, Tung & Ritchie, 2011). In their attempt to understand factors that affect customers’
experiences, Gentile et al. (2007) worked on a six experience dimensions that influence customers’
perception of an experience: pragmatic, cognitive, emotional, lifestyle, sensorial, and relational
dimensions. From the literature reviewed above, sensorial, emotional and cognitive experiences
are related to what was proposed by Pine and Gilmore (1998, 1999) and Schmitt (1999a). They
explained the sensorial experience as an experience that involves the stimulation of the senses of
taste, hearing, sight, tactile, and olfactory which eventually lead to aesthetic pleasure with the
product. Emotional experiences border on one’s feelings and perception and they are linked to the
affective system. Cognitive experiences are linked to the brain and mental processes of an
individual and they help an individual to be creative and solve problems. Pragmatic experiences
refer to the tourists’ actions taken as they enjoy the product that is the involvement of the customer
in doing the task. Lifestyle experience denotes the adoption of a certain lifestyle, values and beliefs
by the tourists and relational experiences reflect the way a tourist relates with others and with their
ideal selves. O’Dell (2005) corroborating Pine and Gilmore (1998), posit that experiences are
random phenomena in people’s minds, hence their evaluation is subjective.
Cohen (1979) describes the nature of tourist experience as a derivative of a tourist’s total
worldview, dependent on the ‘centre’ and the location of the ‘centre’. He puts forward five modes

37
of touristic experiences – diversionary, existential, recreational, experimental, and experiential –
that satisfy the tourist. A recreational mode is a form of entertainment intended to restore the
physical or mental well-being of tourists by releasing everyday pressure; the diversionary mode
emphasises getting rid of boredom in one’s daily routine; the experiential mode highlights travel
in search of an authentic experience in other societies; the experimental mode underscores
travelling to engage in alternative ways of life to satisfy one’s desires and needs and the existential
mode, characterises travelling to switch worlds and embrace a new life and culture.
Hall and McArthur (1996) provide five stages of tourist experience based on forest tourists
in Tasmania, Australia. These stages describe the process that a traveller goes through from an
initial idea to travel, to the travel phase through to the journey back home. These stages have
different accompanying experiences. The stages include decision-making and anticipation, travel
to the destination, on-site behaviour, and return travel and recollection. Similar to Hall and
McArthur’s (1996) experience stages, Weaver (2007) proposes an eight-stage tourist experience
model, depicting tourists’ processes before and during the destination visit: Invitation, Welcome,
Orientation, Comfort, Communication, Sensation, Common sense and Finale. On the other hand,
Packer and Ballantyne (2016) have developed a ten-stage process of the visitor experience, which
they claim can be applied to different tourism and leisure activities. Akin to Kim, Ritchie, and
McCormick, (2012), Packer and Ballantyne (2016) synthesize evidence in the literature and submit
that experiences consist of physical, hedonic, emotional, relational, spiritual, cognitive,
transformative, restorative, introspective and sensory experiences. Their work is closely related to
Pine and Gilmore’s (1998, 1999) model of tourism experiences but for the integration of certain
aspects. For instance, they consider introspective experiences as the imagination or reflection of
tourists, relational experiences as social interactions or friendliness and the transformative

38
experiences as the inspiration that tourists get after encountering an experience. In their work, Kim
et al. (2012) summarise various attributes of tourism experience from the literature and identify 19
attributes namely social interaction, involvement, challenge, personal relevance, meaningfulness,
timelessness, refreshment, hedonism, stimulation, relaxation, sense of separation, spontaneity,
knowledge, adventure, novelty, escaping pressure, and intellectual cultivation.
In general, the value a destination offers in terms of experiences has a direct impact on
tourists’ perceptions and can affect their revisit and recommendation. Hence, Chon (1990) asserts
than negative destination image can be corrected by offering visitors a positive experience
confirming that destination brand experience goes beyond having a good image. Therefore,
destinations need to create a series of leisure activities that would engage tourists physically,
emotionally and cognitively, which would subsequently make them enjoy their tourism experience
(Holbrook & Hirschman, 1982; Pine & Gilmore, 1999).
2.4.3 The experience economy
Pine and Gilmore (2011) argue that goods and services are not enough to keep tourists
motivated, hence the shift to experiences as an exceptional economic offer. They also postulate
that in the modern era, it is very difficult to encounter a product that is truly new given that
modifications and product enhancement are the core differentiating features. Hence time is the
currency for experiences where consumers are admitted at a fee (Pine & Gilmore, 2011).
According to the experience economy concept, travel experiences are ‘staged in a theatre’ to satisfy
tourists’ desire to participate in experiences during their vacation, making destination image,
destination ambience and narratives extremely important in this process. Experiences in any given
scenario can be categorized into four aspects: entertainment, education, escapist and aesthetic
divisions. This means that each time DMOs present and engage tourists in activities, they should

39
be able to offer them these mental journeys to ensure unique and memorable tourism experiences
(Kim, 2010; Pine & Gilmore, 1998, 1999).
Williams (2006) offers a different approach to the understanding of the experience
economy and the level of immersion and activity. He observes that in essence, education
experience involves learning, the entertainment aspect involves sensing, aesthetic experiences
involve being there and escapist experiences involve active participation. Pine and Gilmore’s
(1998, 1999) work mirrors Cohen’s (1979) five modes of tourist experiences mentioned above:
experiential mode, experimental mode, recreation mode, diversionary and existential mode.
Furthermore, the work of Hirschman (1984) can be seen in the experience economy. Hirschman
(1984) asserts that there are three stages of experience seeking: novelty, cognitive and sensation.
Nilsen and Dale (2013) differentiate the nomenclature of experience economy from
experience industries. They argue that the experience economy is a bigger set in the economy
where the integration of various experiences create value for different kinds of goods and services
therein and it represents a secondary experience sector whereas experience industries refer to
economic activities where experiences are the main product. Nilsen and Dale (2013) disagree with
Pine and Gilmore’s (1998) assertion that economists view experiences just as they do with services
despite ‘experiences’ being different from services. They propose that services, goods and
experiences share some similarities, making it difficult to define experience industries. They add
that there is no consensus on the scope of experience industries.
Of importance to the definition of service is the proposal that service consists of a
relationship between providers and consumers where there are simultaneous production and
consumption with both the producer and the consumer being present (Nilsen & Dale, 2013). This
concept further stipulates that the consumer needs to actively participate in the consumption of the

40
service experience but distinctions are now made on the human element of the producer, which is
now often replaced by technology and robots. Summing up, they state that experience
consumption, as with services, requires participation or attendance by the consumer and the
consumer can be a co-producer of the experience. This is what Toffler (as cited in Nilsen & Dale,
2013) terms as ‘prosumer’ in leisure consumption. According to Sundbo (2009), experiences as
products, are innovative despite not being unique. However, they should be able to surprise the
consumer. This view suggests that depending on people’s feelings and reactions when presented
with a product (Mannell & Iso-Ahola, 1987) – for example, food in a restaurant – that could
constitute an experience if the consumer sees a ‘wow effect’ in the food presentation or taste.
Hence, DMOs influence on the brand experience is limited as they do not have direct control over
the contact points of many tourist brand experiences (Baker, 2007).
Testing Pine and Gilmore’s Experience economy concept, Kao, Huang, and Wu (2008)
defined immersion as consumers’ involvement in the creation of the experience they are
consuming which consequently leads to them forgetting about time spent in the process. Surprise
refers to the awesomeness of the experience being encountered, participation refers to tourists’
interaction with the tourist product or service and fun is defined as the joy that emanates from the
consumption of the experience.
It can be deduced from the above that the tourism experience economy is concerned with
making experiences or memorable events out of the trivial (mundane) things to extract market
value (Lorentzen, 2009). Hence Lorentzen (2009) concludes that experiences are ‘individual’ as
they stem from the interaction and relationship of one person and the staged event at hand. In light
of the above, tourism destinations have positioned themselves as ‘experiences’ to leverage the

41
situation (Oh et al., 2007) as they provide platforms for tourists to engage with the sensory,
cognitive, affective and behavioural brand experiences (Pine & Gilmore, 1998, 1999).
2.4.4 Memorable tourism experiences
Tourists typically seek appealing, unique and memorable experiences. They purchase
holidays or visit destinations for various reasons, including the search for an escape, authenticity
and identity (Cohen, 1979). Several factors have been considered as drivers of MTEs such as past
experiences, motivation, perceptions and behaviours among others (Loureiro, 2014; Mossberg,
2007). In tourism, various studies have examined tourists’ memory to understand their future
behavioural intentions (Kozak, 2001; Kim et al., 2012). Memory, according to Hoch and Deighton
(as cited in Kim et al., 2012), aids tourists to be highly motivated and involved. Owing to
information drawn from their past experiences, tourists deem past experiences as highly credible
and these experiences influence their future behaviour. This notwithstanding, Kim (2014) observes
that tourists can make biased destination choices based on past experiences.
In his 2010 editorial note, Pizam noted that tourists would remember the experience quality
and not the quantity. In other words, memorable tourism experiences are a result of the quality of
the experience regardless of the situation or location of the tourist (Loureiro, 2014). Tung and
Ritchie (2011) established that four factors are vital for tourists to remember their trips:
expectations, affect, recollection and consequentiality. For Kim et al. (2012), tourists engage in
tourism for hedonics, involvement, local culture, refreshment, to do something meaningful with
their life, knowledge and in search of novelty. These constitute the seven constructs of their
memorable tourism experiences scale. In a later study, however, Kim (2014) criticised Kim et al.’s
(2012) memorable tourism experiences scale, stating that it failed to account for the negative
aspects of emotional experience. They proposed a 10-construct MTE scale.

42
A study by Oh et al. (2007), found that tourists’ quest for a unique and memorable
experience was mainly found in the escapist and aesthetic components of the experience economy.
They note that these are the underlying reasons why people travel in search of staged concrete
experiences to satisfy their abstract intrinsic needs. Oh et al. (2007) observe that escapist
experience demands more immersion and active participation in the activity as compared to
education and entertainment experiences. Furthermore, they argue that the escapist experience has
not been extensively studied concerning its role in attracting tourists. They posit that escapist
experiences are responsible for tourists’ motivation to leave their daily activities and to escape to
the destination region (pull). The next section considers tourism stakeholders who are part and
parcel of the production and provision of DBEs at a destination.
2.4.5 DBEs and stakeholders
With its origin in the business field, stakeholders have been found to have a keen interest
in the operations of an organisation. For example, Clarkson (1995, p. 2) defines stakeholders as
“people or interests that have a stake, something to gain or lose as a result of [a corporation’s]
activities.” Similarly, Carroll (1996, p.74) defines stakeholders as “any individual or groups of
people who can or affected by the actions, decisions, policies, practices or goal of the
organisation.” Concerning tourism festivals and events, stakeholders are people or groups of
people who have a legitimate interest (Bowdin, Allen, O’Toole, Harris, & McDonnell, 2006) or
those that have a stake in an activity or event and its outcome (Getz, 1991). It is deducible from
the definitions that a stakeholder could be virtually anybody and anything and these stakeholders
could be in the present or the future.
Acknowledging that a destination brand exists in the eyes of the beholder, Buncle (2009)
postulates that it is imperative that the brand is credible and goes beyond the logo, symbols and

43
slogans. In this wake, the involvement of different stakeholders is vital for the production of
varying and pleasant destination experiences (Fyall, 2011; Fyall, Garrod, & Y. Wang, 2012).
Furthermore, creating a country or a place brand is not simple and the central government seldom
has total control (Buhalis, 2000); on the contrary, there are multiple stakeholders, with some
having competing interests (Frost, 2004; Iversen & Hem, 2008) as well as defining their roles
differently within a community (von Friedrichs Grangsjo, 2001). Indeed, Hankinson (2004)
acknowledges the collective nature of destination branding which according to Morgan et al.,
2003), is a complex politicized activity. Thus, the involvement of stakeholders in branding is vital
for successful outcomes.
Apart from financial shareholders, there is a broad scope for the people or things that
constitute stakeholders (Gibson, 2000). Hence, the stakeholder theory (Freeman, 1984) helps to
delimit these broad stakeholder inclusions so that the organisation efficiently carries out its moral
and corporate responsibility while pursuing its core business. Freeman (1984) posits that different
groups of people come into play and they can either affect or be affected by an organisation’s
activities, depending on their legitimacy (Suchman, 1995), power and urgency (Mitchell, Agle, &
Wood, 1997). Drawing on the work of Gibson (2000) and Mitchell et al. (1997) who posit that
stakeholders should be viewed from a power standpoint which – this being beneficial or
detrimental to an organisation – Saito and Ruhanen (2017) discovered that there are four types of
stakeholder power at a destination: coercive, induced, competent and legitimate. This differs from
the earlier work of Mitchell et al. (1997) who wrote about coercive, utilitarian and normative
stakeholder powers. It is believed that stakeholders’ power can influence their voice, actions, as
well as their position and this, can have a direct impact on various relationships (Beritelli &
Laesser, 2011).

44
Furthermore, Freeman (2004) agrees with Gibson (2000) on the need to delimit who an
organisations’ stakeholders are either implicitly or explicitly. Consequently, Kaler (2002, 2004)
proposed ‘contributing principle’ as one guiding principle an organisation can use to determine
who its stakeholders are. It is, therefore, important that any destination singles out who its key
stakeholders are in the provision of tourism experience because without doing so, there will be no
limit to who and the number of stakeholders an organisation has. Stakeholders’ involvement has
been linked to responsive and sustainable tourism development. Byrd (2007) propose that
stakeholders’ involvement must begin with the DMO identifying and recognising them and then
giving them a chance to make informed decisions and recommendations about the destination.
Several stakeholders have been identified in different sectors of tourism: events (Getz,
Andersson, & Larson, 2007; Presenza & Iocca, 2012; Bowdin et al., 2006), destination marketing
(Bornhosrt, Ritchie, & Sheehan, 2010; Line & Wang, 2017), tourism planning (Ladkin &
Bertramini, 2002; Ross, 1993), sustainable tourism development (Byrd, 2007), destination
branding (Morgan et al., 2003), destination competitiveness (Dwyer, Mellor, & Livaic 2004),
tourism services (Chen & Chen, 2016) and heritage management (Aas, Ladkin, & Fletcher, 2005),
among others. From these studies, stakeholders can be summarised into five categories as
expressed by Hall and Page (1999) and Hardy (2005); government departments, the local
community, visitor, the private sector and the public sector. In the current study, stakeholders
include educators, the public sector, hoteliers, tour operators, travel agents, tour guides, local
community, domestic and international tourists.

45
Table 2. 1 Stakeholders’ roles in Destination Brand Experience
Stakeholder Relevance to DBE Source
Government departments/
public sector
Policymaking
Coordination of public and private sector interests
Facilitation of an environment for tourism development
Provision of experiences to tourists while benefiting the
locals.
Investments and subsidies
Bornhorst et al., (2010); Ritchie &
Crouch (2003); Sharpley (2002);
Tung & Ritchie (2011)
Educators Research that feeds into the national tourism policy
Training workforce for the tourism industry
Deliver tourism education in line with national tourism
policy
Amoah & Baum (1997)
Hoteliers/ entrepreneurs As entrepreneurial service providers, they help in
destination development by investing in tourism
experiences and providing innovation, attractions and
marketing them among others.
Koh & Hatten (2002): Ritchie &
Crouch (2003)
Tour operators/Travel
agents/tour guides
Information providers/gatekeepers who help the tourist
to develop a destination image as well as enjoy their
experience through interpretation.
Reisinger & Steiner (2006);Tung &
Ritchie (2011)
Local community Resource providers and support tourism (experiences)
if they benefit from it. They can also affect tourism
growth if negative impacts occur.
Bornhorst et al. (2010)
Tourists They engage with various tourism products and
evaluate the experience quality based on their
expectation and perceptions.
Bornhorst et al. (2010); Walls,
Okumus, Wang, & Kwun (2011)

46
2.4.6 Tourist nationality and tourism experiences
Tourists are an important aspect of tourism as the destination’s products and services are
produced for their consumption. In tourism literature, tourists are classed as either domestic or
international (Ponsignon, Lunardo, & Michrafy, 2020). Domestic tourism refers to tourists’ travel
within their national borders whereas international tourism refers to travel to and staying in places
away from the usual environment of the tourists’’ country of residence (Ponsignon et al., 2020).
For many countries, attracting foreign tourists signify the epitome of their marketing campaigns.
In the Sub-Saharan African region, the number of international tourists attracted to its protected
wildlife parks significantly surpasses that of domestic tourists (Melubo, 2020) this is despite
domestic tourism is a leading form of tourism in most countries of the region such as in Kenya and
Tanzania (Melubo, 2020). For other countries like Fiji, tourism is predominantly international
(Folkersen, Fleming, & Hasan, 2018). Among the South Pacific islands, tourism plays an
important role in its economy as evidenced by its contribution to the GDP which stands at 14%
(Folkersen et al., (2018).
Through tourist categorization as either domestic or international, researchers have noted
numerous differences between the two tourist markets in their selection, consumption, and
evaluation of destination experiences. For example, Mechinda, Seriat, and Gulid (2009),
Ponsignon et al. (2020), Simpson, Siguaw, and Sheng (2016) established that international tourists
were easily satisfied with a destination than domestic tourists. Ponsignon et al. (2020 attributed
several factors such as hedonic value, psychic distance, and escapism to this incidence.
Consumption and experience evaluation differences have also been noted between international
and domestic tourists elsewhere (Beckman et al., 2013; Huang, Huang, & Wu, 1996; Kozak, 2001)
and between people of different nationalities (Ballantyne et al., 2011b; Pizam & Sussmann, 1995).
47
Working on pro-environmental behaviours, Li and Wu (2019) argued that the behaviours
of local and international tourists differ in a destination due to differences in the reason for
destination choice. They explain that domestic tourists choose natural environments “habitually,
and their experience is often more strongly related to hedonic goals such as relaxation, pleasure,
and enjoyment” (p. 133). On the other hand, they opined that international tourists choose a
destination purposefully and as such, their observance of PEBs relates to their intrinsic
motivations.
Studying tourists’ behaviours in a destination, Carr (2002) discovered that young and single
British domestic visitors displayed different behaviours compared to international tourists, the
latter being more hedonistic and passive. In Thailand, Mechinda et al. (2009) demonstrated that
domestic and international tourists varied significantly in their contentment with the place and
emotional attachment. The study revealed that domestic visitors were more emotionally attached
and contented with the destination. Similarly, a study in the US by Bonn, Joseph-Mathews, and
Dai (2005) discovered that international tourists had a lower evaluation of the service image
experience than domestic tourists. This is, however, in sharp contrast to McDowall and Ma (2010)
and Ponsignon et al. (2020) studies that established that international tourists’ evaluation of the
destination experiences was more favourable than locals. Based on the foregoing studies, this study
expects that international and domestic tourists would evaluate DBE, satisfaction, and PEB
differently.
2.5 Tourist satisfaction
Satisfaction is considered as an antecedent of consumer behavioural intentions (Chiu, Lee,
& Chen, 2014; Cronin, Brady, & Hult, 2000; Petrick & Backman, 2002) having both direct and

48
indirect effects on brand experience behavioural intention while others consider it as a dependent
variable (Hosany & Prayag, 2013; Yeh, 2013). Its definition and conceptualisation vary widely
among scholars. To some, satisfaction is the perceived variation between actual performance and
expectation; a performance that beats expectation leading to satisfaction whereas below
expectation performance leading to dissatisfaction (Oliver, 1980; Rust & Oliver, 1994). This
concept emanated from Oliver (1980) who proposed that consumers are satisfied with an
experience when they compare it to their expectations; that is if the service/product performance
is higher than expectations, it results into satisfaction (positive confirmation) and vice versa.
Hunt (1977) describes satisfaction as the evaluation a consumer makes about how good an
experience was, and not how pleasurable the experience was, rending it to be evaluated
subjectively (Petrick & Backman, 2002). Similarly, Williams (1989) perceive consumer
satisfaction as the cognitive appraisal humans make about a product or service’s performance
relative to its subjective standard. Other scholars contend that satisfaction is an overall feeling that
customers have about a product and can be satisfied with it despite its poor performance (Fornell,
1992). This line of thought concurs with Barsky (1992) who criticises the disconfirmation of
expectation paradigm by stating that there is no conclusive evidence that expectations are
correlated to either satisfaction or dissatisfaction. The disconfirmation paradigm holds that
consumers have prior standards about how a product or service should perform and this acts as a
reference point to gauge their satisfaction with the product or service (Williams, 1989). This is
also known as contrast theory (Oliver, 1980).
Other scholars have proposed the use of both affective and cognitive elements to
understand consumers experience and satisfaction with a service or product. For example,
Westbrook (1987) posits that emotional elements of satisfaction help service providers to meet the

49
consumers’ demands. These sentiments are also shared by Hunt (1977) who stated that satisfaction
comprises elements of affect or feeling- and this can be a subjective evaluation of a product’s
outcome and experiences, but not necessarily the pressure derived from using the product.
Service quality (SERVIQUAL) is the most applied scale in measuring satisfaction in the
tourism and hospitality industry. It measures the perceived service quality at a given point without
taking into consideration the process (Parasuraman, Zeithaml, & Berry, 1994). However, there are
still arguments on whether researchers should measure customer experience or service quality to
determine satisfaction. Anderson, Fornell, and Lehmann (1994) argue that customers will rate their
satisfaction after experiencing a product unlike quality, which can be perceived even before
customers consume the product (Oliver, 1993). Given these debates, the current study measures
tourist satisfaction after they consume destination brand experiences.
Having satisfied customers has several advantages for organisations. For instance, it can
lead to reduced expenses on drawing new customers (Fornell, 1992) and reduced transaction
expenses in future (Anderson et al., 1994), positive word of mouth (Anderson, 1998), increased
profit due to reduced failure costs (Anderson et al., 1994), and good firm reputation (Anderson et
al., 1994), loyalty (Cronin & Taylor, 1992), among others. Although more studies have focussed
on the positive consequences of satisfaction, other studies have established that unsatisfied
customers may express negative comments about the destination to friends. Chen & Chen (2010)
found that experience quality did not affect behavioural intentions. In Mittal and Lassar’s (1998)
study titled “why do customers switch”, satisfaction with a product or service did not translate into
loyalty as a behavioural intention. They discovered that despite being satisfied, customers would
still switch products in search of better performance.

50
2.6 Pro-environmental behaviours
Despite tourism experience being an intangible element, it relies upon space and
destination materials for tourists to engage in self-development activities, build their identity,
improve their competencies and connect with other tourists and locals (Campos, Mendes, Valle &
Scott, 2018; Mehmetoglu & Engen, 2011; O’Dell, 2005; Rodaway, 1994). Also, most destinations
depend on their physical attractiveness to attract tourists (Ramkissoon, Smith & Weiler, 2013a,
2013c; Ramkissoon, Weiler & Smith, 2013b). Consequently, the need to encourage tourists to act
responsibly in a destination is essential to the development of sustainable tourism (Buonincontri,
Marasco, & Ramkissoon, 2017). This is especially important given the increased number of people
making tourism trips every year, worldwide. Tourists can engage in detrimental behaviours such
as waste generation, overcrowding, collection of flora and fauna, damage of facilities, pollution,
and depletion of wildlife (Chiu et al., 2014; Zhao et al., 2018). Moreover, in most destinations, it
is often assumed that it is the responsibility of the destination or the supply side to ensure the
sustainability of the attractions (López-Sánchez & Pulido-Fernandez, 2016). Therefore, it is
necessary to involve tourists in positive environmental behaviours, especially in natural attraction
sites such as Lake Malawi.
Pro-environmental behaviours, also known as environmental responsible behaviours
(ERB), are concerned with tourists’ environmental concern, knowledge and commitment to the
protection of the environment (Cottrell & Graefe, 1997). Miller et al. (2015) define ERB as tourist
behaviour aimed at reducing negative impacts on both the natural or cultural environment of a
destination. Additionally, Gupta and Agrawal (2018) define ERB as responsible consumption that
is rational and efficient in the use of resources mindful of both global and the human population.
ERB aims at contributing to the conservation of nature and the promotion of a sustainable natural

51
environment as a response to climate change (Han, Lee, & Hwang, 2016). The proposition is that
when tourists are exposed to information about an environmental issue or when they appreciate
the effect of their actions on the environment they are visiting, they can engage in sustainable
behaviours such as education, community activism, energy management, green consumption, and
waste recycling, among others (Hines, Hungerford, & Tomera, 1987; Iwata, 2001; Puhakka, 2011;
Thapa, 2010). To scholars like Stern (2000), PEB can manifest through various practices such as
private-sphere, non-activist behaviours in the public sphere and environmentalism environmental
activism. These actions stem from environmental knowledge of issues, locus of control for the
individual, knowledge of action strategies, sense of responsibility and verbal commitment (Hines
et al., 1987). Hence, PEBs by tourists’ is considered as advocacy for environmental protection
besides being an effective way for addressing the balance between sustainability and profitability
in the tourism industry (Li & Wu, 2019; Moeller, Dolnicar, & Leisch, 2011). For nature-based
destinations such as Lake Malawi, they are marked with undeveloped and/or undisturbed natural
areas which raise the need for conservation of such pristine areas (Lee, Jan, & Yang, 2013).
In light of the negative environmental concerns such as global warming, climate change
and some consequences emanating from tourist activities, calls have been made for environmental
protection as well as ecology maintenance to prevent or reduce the adverse effects of these
changes. As observed by Grosjean (as cited in Butler, 1990), every tourist can be damaging to the
environment. Tourists’ actions at attractions such as lakes can result in waste generation,
overcrowding, pollution, and damage of facilities, collection of flora and fauna, and depletion of
wildlife (Chang, 2010; Chen, 2011; Zhao et al., 2018). Thus, cognizant that the natural
environment, landscapes, flora and fauna are a core component of tourists’ experiences in such
destinations, the adoption of sustainable behaviours also known as pro-environmental behaviours

52
by the tourists themselves is relevant for the preservation of such places, which are generally prone
to negative environmental impacts. The involvement of tourists has been lacking due to the
common belief that it is the responsibility of supply-side stakeholders to ensure the sustainability
of tourist attractions. However, tourists are also important stakeholders; hence, the promotion of
environmentally responsible behaviours among tourists is vital. Furthermore, DMOs can lobby the
participation of the general public and /or tourists in environmental conservation. For lake tourism,
which is regarded as rural tourism and often happens in natural areas, the emphasis on
environmental conservation is even more crucial (Bjork, 2000).
Other studies state that tourists’ pro-environmental behaviours are different at home and
during vacations when they seem not to care much about the environment (Dolnicar & Leisch,
2008). This has been attributed to tourist’s fear that engaging in PEB could affect their enjoyment
while on vacation or lead to a sacrifice their lifestyles (Fairweather, Maslin, & Simmons, 2005).
Thus, tourist values and attitudes of the environment (Andereck, 2009; Wu, Font & Liu, 2020)
have a significant effect on their pro-environmental behaviours at a destination.
Kang and Moscardo (2006) assert that pro-environmental behaviours can be seen in
tourists’ attitudes towards the environment. Furthermore, levels of environmental responsibility
vary according to travel motivation, personal experience and participation in the environment
(Kerstetter, Hou, & Lin, 2004; Hungerford & Volk, 1990). Research suggests that tourist
motivation, destination image, tourist satisfaction and their attitude towards the destination are
predictors of behavioural intentions such as environmental attitudes (Lee, 2009; Luo & Deng,
2008; Orams 1995). Thus, several factors have been attributed to drivers of tourists’ PEB.
Precisely, these drivers have been grouped into two: external in-situ factors and internal
psychological factors (Juvan & Dolnicar, 2017; Luo et al., 2020). Regarding internal psychological

53
factors, several factors have been identified such as social responsibility awareness (Luo et al.,
2020), local destination attachment (Cheng & Wu, 2015; Ramkissoon, Weiler, & Smith, 2012),
tourists’ knowledge on the environment (Ballantyne & Packer, 2011), perceived benefits (Chiu et
al., 2014; Luo et al., 2020; Wan, Shen, & Yu, 2015), satisfaction (Chiu et al., 2014) and
environmental attitude (Kil et al., 2014; Thapa, 2010; Wan et al. 2015), among others. For some
like Wan et al. (2015), these psychological factors are grouped into five namely: social/external
influences, past behaviour, perceived benefits, perceived policy effectiveness and attitudes. For
external in-situ factors, the destinations regulations and policies (Luo et al., 2020; Wan et al.,
2015), quality of the environment (Chiu et al., 2014), environmental education as well as
interpretation (Ballantyne, Packer, & Hughes, 2009; Ballantyne & Packer, 2011), are some of the
convincing reasons for tourist to engage in PEB.
In the case of Lake Malawi, the ambition the by Malawi government to drill oil in the lake
has been a cause of concern to environmentalists, tourism business and local communities. Calls
have been made for the government to halt its intended action to preserve the lake, especially the
UNESCO protected cichlid fishes (see section 2.7.3 below). Furthermore, wanton cutting down of
trees to support the ever-increasing human population and the fishing and tourism industries pose
a threat of siltation to the lake, which could impact on tourism experiences. This study, therefore,
explores tourists’ commitment to and support for environmental conservation by identifying tourist
actions that can help reduce negative impacts. The next section discusses tourism experiences at
lake destinations, which is the focus of this thesis.
2.7 Lakes and tourism
From the perspective of both local and international tourists, lakes and seaside resorts are
some of the most preferred tourist attractions and destinations in the world, (Łukasik & Perzyński,

54
2013). Lakes can be a core recreation and tourism development resource for leisure purposes and
they offer lake destinations economic benefits apart from the traditional fishing industry. Hall and
Härkönen (2006, p. 3) observe that lakes are a “vital part of recreation and tourism as both location
and for leisure activities, as well as an attraction in their own right.” For some countries such as
Finland and Malawi, lakes provide the most unique tourism resource with an emphasis placed on
the sense of the lake, sense of place and the spirit of the lake (Tuohino, 2006). Lake environments,
like other water bodies such as rivers and seas, contribute to tourists’ experience than their
characteristics (Guyer & Pollard, 1997; Mosley, 1989) as the water environment exerts positive
vibes on tourists’ well-being (Ulrich, 1981). For example, the Great Lakes in North America are a
popular destination for both tourism and recreation and have over 6 million registered boats as
well as 1, 413 marinas (Thorp & Stone, 2000). Lake landscapes provide bodily or sensory
experiences through boating, swimming, among others (Tuohino, 2006).
The lake experience space entails shores, trees and forests and it is expressed through
memories, feelings and activities (Tuohino, 2006, p.103). Lake landscapes, according to Tuohino
(2006), consists of personal experience as well as the social and cultural interpretation of these
experiences. Lake tourism is credited with the development of national identity and cultural
independent senses during the Romanticism period through the indigenous expressions of nature
by artists (Hall & Härkönen, 2006), which consequently led to the development and growth of
tourism in the lake environments. Lake tourism, despite being viewed as a rural activity, helps
destinations to depend on the quality of their pristine waters as a valuable asset for their tourism
activities (Cooper, 2006).
As described by Hall and Härkönen (2006), lakes are important assets for recreation
purposes and this is truer for natural lakes than artificial lakes as the later oftentimes has use

55
conflicts (Cooper, 2006). Lakes, like national parks and other tourism attractions, are used to create
visitor experiences through tourists’ interaction with the environment (Vaske, Donnelly, &
Whittaker, 2000). Water bodies have created a demand for tourist services along with them hence
the proliferation of lake destinations with all the supporting services to ensure travellers have
maximum water-based experiences.
Lakes are resource-based tourism attractions that generate visits to the area but demand
sound management and coordination between the users (Cooper, 2006). Indeed, lakes are a
significant tourism component offering tourists with transient experiences during their free time.
There are several types of lakes throughout the world, the common division being permanent
freshwater lakes like Lake Malawi and Lake Baikal in Russia or permanent saline lakes like Lake
Turkana, Lake Nakuru and Lake Bogoria in Kenya. Furthermore, lakes can be man-made like Lake
Kariba (Zambia and Zimbabwe) or natural like Lake Victoria.
Lakes and their catchment areas such as wetlands are also important recreational
destinations for tourists interested in angling, hunting and bird watching (Jones, Scott, & Gössling,
2006). For countries like Canada, bird watching in freshwater lakes such as in Point Pelee National
Park generates 60, 000 tourists annually and contributes US$4 million to the local economy
(American Birding Association as cited in Jones et al., 2006). Likewise, Lake Malawi and its
catchment area pride in over 678 bird species some of which are endemic to Malawi and is the
largest bird concentration in the world concerning the country size (see
https://www.lonelyplanet.com/malawi/wildlife/birds).
Other lakes are glacial lakes and they mainly attract tourists interested in skiing, ice fishing
and winter vacations in general. Scott et al. (2002) report that Lake Simcoe in Southern Ontario
receives more visitors in winter who are attracted by the ice fishing season than in summer. The

56
importance of ice cover on lake reservoirs is also appreciated in Northern America where ice
skating brings in US$82 million to the local economy along the Rideau Canal Skateway in Ottawa,
Canada (Ekos Research Associates as cited in Jones et al., 2006).
Although freshwater lakes have gained attention due to tourism recreation, some countries
have benefited from saline lake tourism. For example, Lake Nakuru and Lake Bogoria in Kenya
have flourished as tourist spots owing to a large number of flamingos (Ndetei & Muhandiki, 2005).
According to the International Lake Environment Committee Foundation (ILEC, 2005), the lake’s
extreme salinity makes it unique and contributes to its most important values. Lake Nakuru is a
highly prized national park in Kenya. Importantly, the proceeds from lake tourism and tourism, in
general, are an important revenue for both government and local economies (ILEC, 2005).
2.7.1 Lake Malawi
Lake Malawi is the largest freshwater body in Southern Africa. Lake Malawi is the third-
largest lake in Africa and the fourth largest lake in the world (by volume). Hence, its importance
in tourism experiences and environmental significance cannot be overlooked (Hall & Härkönen,
2006). The lake, together with Lake Tanganyika and Lake Baikal, is one of the few deep-water
lakes still existing today (Delvaux, 1995). Lake Malawi is the main tourism product for destination
Malawi, and it represents Malawi in all her marketing communications. Lake Malawi lies in the
Great African Rift valley and has sister lakes such as Albert, Victoria, Edward, Tanganyika and
Turkana. Together with Lake Victoria and Tanganyika, Lake Malawi makes the three largest rift
valley lakes in Africa (Beeton, 2002). The lake’s deepest point is around 702 metres and it
measures 365 miles long and 52 miles wide earning itself, ‘The Calendar Lake’ nickname (see
www.visitmalawi.mw). The lake, being home to the largest fish species found in any lake in the
world, necessitated the formation of its southern part into a protected area, Lake Malawi National

57
Park (LMNP). The cichlid fish, locally known as ‘Mbuna’, is endemic to Lake Malawi and
displays ‘a significant biological evolution,’ (cf. www.whc.unesco.org/en/list/289). Lake Malawi
is comparable to Lake Baikal in Russia which is also a freshwater lake and a world heritage site
(WHS) and like Lake Malawi, it has several inlets but only one outlet. Lake Malawi’s sole outlet
is Shire River, which extends from Malawi to Mozambique and on which Malawi’s Hydroelectric
Power stations are located.
Hall and Härkönen (2006) maintain that lake tourism should not only be delimited to the
water body alone but its surrounding areas as well. In this regard, Lake Malawi’s aquatic zone also
includes islands, villages and hills such as Mwenya, Nkhudzi and Chombe hills. Lake Malawi has
two large inhabited islands (Likoma and Chizumulu), which are geographically in Mozambican
waters. The islands are home to the historic St. Peters Cathedral of the Anglican Church (see
www.visitmalawi.com) and attract heritage as well as cruise tourists.
Although lake tourism is considered a form of rural tourism that offers a rural tourism
experience (Gartner, 2006), Lake Malawi provides travellers with water-based experiences that
can also be found in urban water bodies such as sightseeing and kayaking. As described by
Furgała-Selezniow, Turkowski, Nowak, Skrzypczak, and Mamcarz (2006), natural, climatic and
landscape conditions are vital for tourist recreation in lake area destinations. For tourists’
experiences and discovery, Lake Malawi provides the following activities: walking and hiking,
cycling, water-based sports such as kayaking, canoeing, and surfing. The lake is also known for
its perfect diving spots, fishing, fish watching, boating and shopping from local people.
It is important to mention that fishing is a predominant activity among locals around Lake
Malawi with Chambo (Tilapia lidole) and Usipa (Engraulicypris sardella) being the most common
fish species harvested in the lake all year round constituting the main protein source for the

58
Malawian population. The lake is also a source of water to the villages as well as their recreation
in the form of swimming and diving. Lake Malawi has contributed to the development of water-
based activities such as scuba diving as travellers seek to have an up-close view of the cichlid
fishes. Furthermore, some aquariums have emerged that harvest and export the cichlid fishes for
ornamental purposes.
For Hall and Stoffels (2006), notable freshwater activities in New Zealand include fishing,
swimming, hot pools, sports, and beach walking. Similarly, in Malawi despite the unavailability
of official data, most domestic visitors associate the lake with their recreation and leisure times
and beach soccer, volleyball, swimming, boating, kayaking and BBQ are the frequently preferred
activities. Other activities the lake is used for include canoeing, sailing, diving, snorkelling and
fishing (Hall & Härkönen, 2006).
Lake tourism in Malawi has seen rapid tourism development. The topography of the areas
adds beauty to the landscapes and various lodges and hotels made from local materials provide
accommodation and restaurant services to tourists at Lake Malawi. Currently, the lakeside is a
preferred conference and holiday destination and many hotels have been established to support the
business. Furthermore, Lake Malawi is home to the only lakeshore international music festival in
the world: Lake of Stars Music Festival, which is hosted over the last weekend of September and
attracts artists and attendees from across the globe (cf. http://lakeofstars.org/).
2.7.2 Challenges facing lakes
Currently, lakes face various problems worldwide due to man-made and natural challenges.
Cooper (2006) submits that as a tourism destination, lakes are not only susceptible to change

59
brought by tourism and recreation use but also to external threats that endanger the lakes’ integrity.
Jorgensen & Matsui (1997) summarised the following environmental issues concerning lakes:
1. Decreasing water volume due to water over usage
2. Water acidification due to acid precipitation
3. Collapse of aquatic ecosystems
4. Eutrophication for nutrients inflow
5. Rapid siltation due to increased run-off
6. Water contamination with pollutants
For example, Lake Malawi is currently threatened by deforestation, excessive fishing, the
introduction of alien fishes and plants such as Hyacinth (locally known as ‘Namasupuni’),
industrial pollution and the prospect of oil exploration (Weyl et al., 2010). There is fear that
deforestation coupled with little rainfall would affect the lake’s water levels and subsequently
tourism activities and experiences and other industries such as hydro-electrical generation and
farming. For example, in the United States, the US National Park Service closed six ramps between
2002 and 2003 due to low water levels (below fill level) in various lakes (Hollenhorst, as cited in
Jones et al., 2006).
According to ILEC (2005) and Turner (1994), Lake Malawi’s major challenges are
overfishing, climate change and the shrinking lake size. Most communities in the lakes’ catchment
area rely on fishing for their livelihood, resulting in their engagement in unsustainable fishing
practices that have led to the harvesting of small fishes as well as fishing during the breeding
season (Bulirani, 2003). Furthermore, due to the fish diversity in Lake Malawi and Lake
Tanganyika, ornamental fishing poses a risk of Mbuna fish deprivation as the species are endemic
and, therefore, their export needs to be regulated (ILEC, 2005). In recent years, Lake Malawi has

60
been threatened by possible oil exploration by the government across the lake (Beeton, 2002).
There is fear that if the government goes ahead with the programme, there could be loss of fishes.
There is also the risk of removing Lake Malawi from the World Heritage list (Etter-Phoya, 2014;
Mweninguwe, 2012) should there be the ‘Gulf oil disaster’. Furthermore, increased climate change
is harming water levels and this can lead to reduced water activities (which can result in limited
lake experiences) as has been the case with North American lakes as well as Aral Sea in
Kazakhstan and Uzbekistan (Cooper, 2006; Jones et al., 2006).
2.7.3 Lake Malawi National Park
Lake Malawi National Park (LMNP) is located in Cape Maclear at the southern end of a
rift valley lake. It covers an area of 94, 000 ha and is the first freshwater national park to be
designated as a WHS in the world. It is one of the two tourism attractions in Malawi found on the
WHS list; the other is Chongoni Rock Art Paintings. Lake Malawi National Park is a natural
heritage attraction and was declared as a WHS in 1984 to preserve the cichlid ‘mbuna’ fishes, other
aquatic life and land wildlife. The park is home to over 700 cichlid fishes most of which are
endemic to Malawi (Turner, Seehausen, Knight, Allender, & Robinson, 2001), with only five
similar to those in other waters of the world (see https://whc.unesco.org/en/list/289). The park
consists of the lake itself, the shoreline, its various islands, mountains, and five enclave villages.
The park is also home to the graveyards of the early British missionaries to Malawi and a historical
baobab tree, under which Dr David Livingstone conducted his classes.
Lake Malawi National Park located on 14° 02’S by 34° 53’E, was established by the
Malawian government in 1980 to conserve the freshwater fishes. Situated at Nankumba Peninsula
at the southern end of the lake in Cape Maclear, Mangochi, the hub of tourism activities in Malawi,
Lake Malawi National Park is another reason to visit the area. The park is 94.1km2 long covering

61
two districts of Mangochi and Salima of which 7km2 is the aquatic zone. The park goes 100m
offshore into the waters of Lake Malawi. Lake Malawi is comparable to the finches of Galapagos
Island in the study of evolution. The lake is home to over 1,300 fish species, more than any other
freshwater lake in the world. The Mbuna fish is a prized ornamental fish (Weyl et al., 2010). The
lake is an important tourism resource in Malawi due to its scenic significance such that Lake
Malawi National Park waters and islands are often used on destination Malawi’s promotional
materials and its website (cf. www.visitmalawi.mw).
Being a World Heritage Site, Lake Malawi National Park is a unique tourism attraction due
to its location and attributes such as sandy beaches and pristine clear blue waters that offer tourists
memorable experiences as they provide values that are longed for by wanderlust tourists. The
notion of World Heritage is built on the principles of Outstanding Value that needs to be preserved
for the benefit of mankind (UNESCO, 1972a, Preamble). As a result, heritage tourism at many
WHS is a valued development opportunity (Su & Wall, 2014). Evidence in the literature suggests
that WHS designation of attractions often results in an increased number of tourists to the site
(Tucker & Emge, 2010) as well as the creation of a branded cultural image for the site (Ung &
Vong, 2010). Consequently, tourists visiting WHS have higher expectations and perceptions of
the services and experiences the site offers and satisfaction with the visit experiences may translate
into increased numbers to the heritage sites (Poria, Reichel, & Cohen, 2013). Heritage has recently
gained favourable attention among tourists and destinations alike, leading to the proliferation of
heritage tourism with more and more destinations fronting their tourism products as heritage
attractions to offer heritage experiences.
Lake Malawi National park was inscribed onto the World Heritage list having satisfied
criteria seven, nine and ten, according to UNESCO.

62
LMNP also has an aquamarine biological sciences museum. Visitors can celebrate parties
and have a barbeque (famously known as braai) with friends and relatives on the beaches, relax by
the shores, read as well as having educational and fieldwork contacts with the local people. The
five enclave villages in LMNP namely, Chembe, Msaka, Mvunguti, Zambo and Chidzale
(Nyanyale, 2005), offer visitors the contact point to the southern Malawi Yao culture which has
some Arab traits due to Islamic religion, which accentuates the tourists’ experience of the area.
2.7.4 Malawi and Lake Malawi’s International recognitions between 2012 and 2018
The table below lists some notable world recognitions that Lake Malawi has received between
2012 and 2018.
Table 2. 2 Malawi international accolades
Destination Area for recognition Source of
recognition Year
Lake Malawi
National Park Places Prince Harry will likely go for
his honeymoon with Meghan The Telegraph
2018
Lake Malawi 25 of Africa’s most amazing places to
visit CNN
2018;
2017;
2012
Malawi
One of top 10 must-visit countries in
2014 Lonely Planet 2014
Lake Malawi Five great places to visit in May 2018 CNN 2018
Vwaza Marsh and
Liwonde Game
Parks
The World's 50 best wildlife holidays The Telegraph
2018
Malawi The 15 coolest places to go in 2018 Forbes 2017
Lake Malawi
National Park
Boat cruises on the pristine Mumbo
Island Lodge on Lake Malawi.
Sawubona (South
African Inflight)
Magazine 2016
Lake Malawi The family holiday in Lake Malawi The Telegraph 2015
Source: Abel (2017), Cha (2014), Bruce (2015), Bruce (2018), CNN (2018), Jacobs (2018),
Madden (2018), Sawubona (2016)
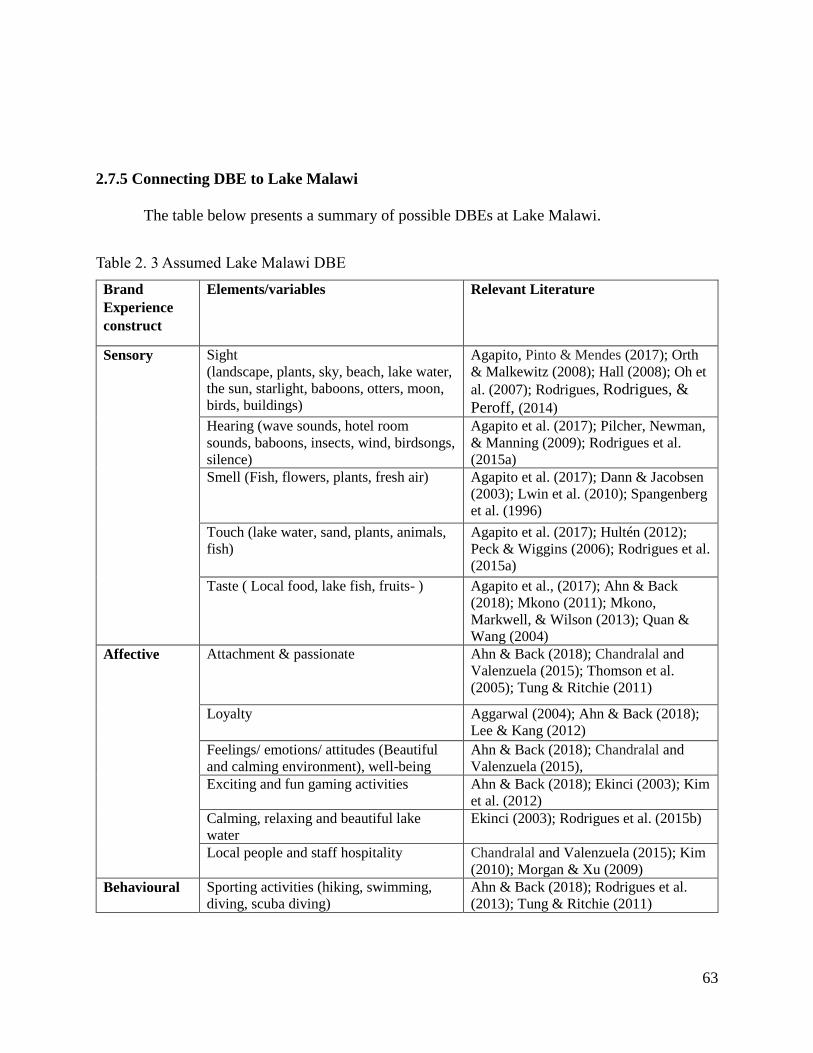
63
2.7.5 Connecting DBE to Lake Malawi
The table below presents a summary of possible DBEs at Lake Malawi.
Table 2. 3 Assumed Lake Malawi DBE
Brand
Experience
construct
Elements/variables Relevant Literature
Sensory Sight
(landscape, plants, sky, beach, lake water,
the sun, starlight, baboons, otters, moon,
birds, buildings)
Agapito, Pinto & Mendes (2017); Orth
& Malkewitz (2008); Hall (2008); Oh et
al. (2007); Rodrigues, Rodrigues, &
Peroff, (2014)
Hearing (wave sounds, hotel room
sounds, baboons, insects, wind, birdsongs,
silence)
Agapito et al. (2017); Pilcher, Newman,
& Manning (2009); Rodrigues et al.
(2015a)
Smell (Fish, flowers, plants, fresh air) Agapito et al. (2017); Dann & Jacobsen
(2003); Lwin et al. (2010); Spangenberg
et al. (1996)
Touch (lake water, sand, plants, animals,
fish)
Agapito et al. (2017); Hultén (2012);
Peck & Wiggins (2006); Rodrigues et al.
(2015a)
Taste ( Local food, lake fish, fruits- ) Agapito et al., (2017); Ahn & Back
(2018); Mkono (2011); Mkono,
Markwell, & Wilson (2013); Quan &
Wang (2004)
Affective Attachment & passionate
Ahn & Back (2018); Chandralal and
Valenzuela (2015); Thomson et al.
(2005); Tung & Ritchie (2011)
Loyalty Aggarwal (2004); Ahn & Back (2018);
Lee & Kang (2012)
Feelings/ emotions/ attitudes (Beautiful
and calming environment), well-being
Ahn & Back (2018); Chandralal and
Valenzuela (2015),
Exciting and fun gaming activities Ahn & Back (2018); Ekinci (2003); Kim
et al. (2012)
Calming, relaxing and beautiful lake
water
Ekinci (2003); Rodrigues et al. (2015b)
Local people and staff hospitality Chandralal and Valenzuela (2015); Kim
(2010); Morgan & Xu (2009)
Behavioural Sporting activities (hiking, swimming,
diving, scuba diving)
Ahn & Back (2018); Rodrigues et al.
(2013); Tung & Ritchie (2011)

64
Leisure activities (e.g. Biking, walking in
a park or racing, local clubs, games,
entertainment )
Adhikari & Bhattacharya, 2016);
Beckman et al. (2013); Brakus et al.
(2009); Kim (2010); Chandralal et al.
(2015)
Eating local foods Mkono (2011); Mkono et al. (2013);
Quan & Wang (2004)
Gazing Urry (1990, 2002)
Cognitive/
Intellectual
Thinking-
Ahn & Back (2018); Brakus et al.
(2009); Cacioppo & Petty (1982); Kim
et al. (2012); Nysveen et al. (2013);
Tung & Ritchie (2011)
Interaction with other tourists/locals Ahn & Back (2018); Kim et al. (2009).
Doing strange and dangerous things i.e.
eating strange local food
Mkono (2011); Molz (2007)
Enthusiasm Harrigan, Evers, Miles & Daly (2017)
Absorption Harrigan et al. (2017)
Relational Interpersonal interactions, shared mood
and emotional intensity, mutual focus of
attention, feelings of communion, contact
with people, enhancing social
relationships
Collin (2004); Geus et al. (2016)
Nordvall et al. (2014); Tung & Ritchie
(2011)
2.8 Conclusion
Experiences are a core ingredient of tourists’ consumption of a destination and it has been
argued that their realisation depends on the destination. As Crouch and Ritchie (2000) note,
experiences can be met wherever people are irrespective of the place, brand or what they are doing.
With tourists migrating from the passive gaze to more experience-based attractions, it has become
more important for destinations to incorporate experiences in their attraction offerings to appeal to
this market segment that wants be actively involved in the production and consumption of the
experience. Therefore, Barnes et al. (2014) urge destination marketers to highlight sensory brand
experiences that are consistent with the destination in their marketing messages. They maintain
that brand experiences are ‘complex’ but are very useful in determining visitor outcomes,
satisfaction, revisit and recommendation intentions. An experience with a brand has an important
effect on a person’s interpretation of the brand than the product’s features and benefits (Ha &

65
Perks, 2005) such that consumers would categorise brands according to their attributes. Visitors to
Lake Destination attractions fall within the category of a brand experience as patrons that visit
these destinations engage with and consume the product/service/experience offered to them.
Following Brakus et al’s. (2009) study, few studies have been conducted to fully
conceptualise their model. As Barnes et al. (2014) write, destination brand experience is complex
and varies from one destination to another and among different visitor types who have different
interests. Hence, different individuals can have different interpretations of the same experience
(Ooi, 2005). Tourists’ values are a necessary ingredient in the outcome of the tourism destination
experience evaluation. As seen from the reviewed literature, scales developed by Brakus et al.
(2009) have yielded different conclusions in different setups. As conceded by Barnes et al. (2014),
different destinations produce different experiences which have effects on tourists’ evaluation of
the experiences. Andreini et al. (2018), observed that for all the research work done on BE, they
sorely depended on Brakus et al. (2019) theoretical perspective “without any criticism and further
theoretical elaboration of the concept ”(p. 123). This is against the fact that experience is not static
and revolutionary changes continue to take place on the tourism market (Andreini et al. 2018; Pine
& Gilmore, 1999). Thus, observing that the scale by Brakus et al. (2009) was meant for consumer
products that vary distinctively from destination experiences and that tourist experiences are ever-
changing, the current study finds it imperative to develop a scale that measures the core destination
brand experiences, using tourists as respondents as no study has yet to measure this. Thus, by
developing and empirically testing a tourism purpose-made DBE scale, the present study fills a
void in the literature where only one operationalization and single theoretical perspective of BE is
being used (Andreini et al., 2018).

66
This chapter has reviewed the literature on the constructs that build a theoretical framework
for this study. These important constructs include destination brand experience, satisfaction and
pro-environmental behaviours. The next chapter presents the conceptual framework of the thesis
as well as the hypothetical relationships between the various dimensions used in the thesis.

67
CHAPTER THREE: CONCEPTUAL FRAMEWORK AND
HYPOTHESES
“There’s no discovery without a search and there’s no rediscovery without research. Every
discovery man ever made has always been concealed. It takes searchers and researchers to unveil
them, that’s what makes an insightful leader.” Benjamin Suulola
3.1 Introduction
This chapter discusses the conceptual framework of the study, the constructs used in the
study and the relationships among them as well as the basis of the research hypotheses.
3.2 Conceptual framework
The main goal of this thesis is to conceptualise and validate a Destination Brand Experience
(DBE) Scale. The study also aims to examine the relationship between DBE and satisfaction, DBE
and PEB and DBE, tourist satisfaction and PEB. Based on the work in Chapter 2, a conceptual
framework is proposed using satisfaction as the mediating factor. Based on the conceptual
framework, three main hypotheses are tested in this study.

68
Figure 3. 1 Research conceptual framework
3.3 Research hypotheses
The evaluation of a destination and the experiences it offers have been linked to various
factors that are either external or internal to the tourists. Bearing in mind that no two tourists are
the same and that experiences are multifaceted and existential (Ooi, 2005), the following constitute
some of the factors that can affect tourists’ evaluation of DBE at Lake Malawi and their inherent
hypotheses.
3.3.1 Consequences of tourist DBEs
Behavioural intentions refer to the likelihood that a tourist, having visited a destination,
will select the destination again in a given time (Bigné et al., 2005; Ekinci, Sirakaya-Turk, &
H7
H4
H5
H6
DBE
Satisfaction
Pro
environmental
behaviours
H1 H
3
H2
Nationality
69
Preciado, 2013; Pike & Ryan, 2004) or recommend it to others (Chen & Tsai, 2007; Hosany &
Prayag, 2013). A plethora of studies has linked brand experience outcomes to brand loyalty
(Barnes et al., 2014; Brakus et al., 2009; Carù & Cova, 2003; Iglesias et al., 2011), satisfaction
(Agyeiwaah, Otoo, Suntikul, & Huang, 2019; Bigné et al., 2005; Bolton, 1998; Bustamante &
Rubio, 2017), attachment (Park et al., 2010), commitment (Fullerton, 2003) and brand trust (Ha &
Perks, 2005; Morgan & Hunt, 1994). Although these studies highlight behavioural outcomes of
either present or future brand purchases, not many studies have shown the relationship among
DBE, tourist satisfaction, and PEB.
3.3.1.1 The relationship between DBE and satisfaction
Evidence from the literature shows that customers’ encounter with brand experiences
affects their commitment to and involvement with a brand in future (Barnes et al., 2014; Brakus et
al., 2009; Ding & Tseng, 2015; Gentile et al., 2007). Indeed, studies have found relationships
between brand experience and satisfaction (Barnes et al., 2014; Khan & Rahman, 2015; Lin, 2015),
and between service quality and satisfaction (Cronin & Taylor, 1992; Žabkar, Brenčič, &
Dmitrović, 2010).
Working on brand experience, Brakus et al. (2009) proposed that BE influences customers’
satisfaction. They demonstrate that there is a direct and indirect relationship between brand
experience and satisfaction. The indirect relationship between brand experience and satisfaction
was mediated by brand personality. Similarly, using the same scale as Brakus et al. (2009), Barnes
et al. (2014), found a relationship between brand experience and satisfaction. Similar results have
been reported by Ooi (2005) and Zhang, Agarwal, & Lucas (2011). Working on customer website
brand experience, Ha and Perks (2005) found that brand experience was positively related to

70
satisfaction. They report that this was due to the price offered, although not all customers were
satisfied with low pricing.
Studying tourist emotional experiences using the pleasure and arousal theory, Bigné et al.
(2005) established that positive arousal affects visitor pleasure and this is strongly related to visitor
satisfaction. Likewise, describing satisfaction as stemming from positive emotional and cognitive
states of online brand experience, Morgan-Thomas and Veloutsou (2013) established a
relationship between online consumer brand experiences and satisfaction. Further, Klaus and
Maklan (2013), measuring customer experience using four dimensions abbreviated as POMP
(product experience, outcome focus, moments of truth and peace of mind), found evidence for the
relationship between experience and satisfaction. Additionally, it has been observed that tourists’
satisfaction in natural environments derives from their engagement with the natural environment
and with quality service providers (Ballantyne & Packer, 2011; Coghlan, 2012). Ramkissoon et al.
(2013a) investigated the relationship between place attachment, satisfaction and pro-
environmental behaviours. Their study conducted at Dandenong Ranges National Park in Australia
found that visitors’ experience had a strong influence on their pro-environmental behavioural
intentions. Therefore, this study postulates that:
H1: Lake Malawi DBE has a positive effect on tourist satisfaction
In this thesis, we use satisfaction as a one-dimensional construct having items that reflect
tourist satisfaction with the destination (Fornell, 1992), the destination brand performance with the
tourists’ expectations (Fornell, 1992) and the extent to which the destination is a good choice
(Oliver, 1980). Items to measure satisfaction were adapted from Oliver (1980) and Veasna, Wu,
and Huang (2013). The following are some of the items used to measure satisfaction:

71
i. I am pleased to have visited this destination,
ii. I am delighted with this destination experiences,
iii. Coming to this destination was a good choice and
iv. It gives me joy that I have decided to come to this tourist destination.
3.3.1.2. DBE and tourist pro-environmental behaviours
Behavioural intentions are defined as tourists’ judgement of a destination as well as their
determination to revisit and/or recommend the destination (Chen & Tsai, 2007). Studies have
found that behavioural intentions are a consequence of brand quality, perceived value and
satisfaction (Chen & Tsai, 2007; Petrick, 2004). Studies have identified various behavioural
intentions, with loyalty, word of mouth and willingness to recommend being the most frequently
used behavioural intentions (Chen & Chen, 2010; Chen & Tsai, 2007). In recent years, pro-
environmental behaviours have also been considered as meaningful behavioural intentions,
especially in natural areas owing to environmental phenomena such as climate change
(Buonincontri et al., 2017; Han et al., 2016; Hines et al., 1987; Lee, 2009; Ramkissoon et al.,
2013a).
Lake tourism, as a subset of nature-based tourism, depends on the use of natural resources
such as water, mountains and another biodiversity that adds to the place’s scenery like vegetation,
cultural heritage, wildlife and topography in general. Due to tourists’ activities in such areas,
environmental degradation has always been a concern and tourism experience has been used to
raise awareness of environmental management and conservation (pro-environmental behaviours)
in national parks, forests, lakes and mountains that can be affected by tourists’ activities (Chiu et
al., 2014). Scholars contend that people’s reaction to environmental degradation can be used to
predict their pro-environmental behavioural intention (Kollmuss & Agyeman, 2002).

72
Tourism experience, with place attachment as a mediating factor, has been linked with pro-
environmental actions aimed at promoting sustainable use of natural resources (Cheng & Wu,
2015; Cheng, Wu, & Huang, 2013). This notwithstanding, Chiu et al. (2014) found that overall
tourists’ travel experience not only affects their intention to engage in environmental behaviours
but also their involvement and satisfaction partially mediates environmental responsible
behaviour. Based on the premise that the choice of travel type influences tourists’ willingness to
adopt environmentally responsible behaviours in nature-based destinations (Cheng & Wu, 2015;
Cheng et al., 2013; Dolnicar & Leisch, 2008), scholars have investigated tourists’ commitment to
environmental conservation after their tourism trips.
Investigating recreational experience, Hosany and Witham (2010) postulate that
recreational experiences lead to recommendation intentions among cruise tourists whereas
Buonincontri et al. (2017) state that visitor heritage experiences lead to either general or site-
specific sustainable behaviours. Furthermore, Ballantyne, Packer, and Sutherland (2011a) and
Ballantyne, Packer, and Falk (2011b) illustrate the relationship between visitor experiences and
environmental learning and between visitor experiences and pro-environmental behaviours.
In their study at Repos Conservation Park in Queensland, Ballantyne, Packer, and Hughes
(2009) found that tourist experiences with wildlife affected their support for conservation of the
environment for their comfort and experience. They also found that conservation-themed
interpretation and clear park guidelines on wildlife-tourist interactions affected tourists’ learning
and their long term behaviour. Lee, Jan, and Huang (2015) found that recreational experiences had
a positive effect on tourists’ environmental responsible behaviour on Liuqiu Island. In another
study by Powell and Ham (2008), guidance in ecological areas was correlated with tourist

73
satisfaction to Galapagos National Park and this led to environmentally responsible behaviour.
Therefore, the following hypothesis is proposed:
H2: Lake Malawi DBE has a positive effect on tourists’ pro-environmental behaviour
3.3.1.3. Satisfaction and pro-environmental behaviours
In tourism terms, Bigovic and Prašnikar (2015), Chen and Chen (2020) and Wang and Hsu
(2010) conceptualise satisfaction as tourists’ post-purchase evaluation of their destination
experiences. It represents their pleasure and contentment with the destination facilities, services,
experiences and the people concerning their motivation to travel to that destination (Chen & Tsai,
2007). As such, various studies propose that high consumer satisfaction leads to positive post-
experience behavioural intentions (Bigovic & Prašnikar, 2015; Brakus et al., 2009; Chen & Chen,
2010; Yoon & Uysal, 2005; Žabkar et al., 2010). Research has linked satisfaction to behavioural
intentions such as loyalty (Oliver, 1999; Žabkar et al., 2010) ahnd paying a high price (Cronin &
Taylor, 1992; Tsaur et al., 2007), satisfaction and brand quality (Fornell, 1992), satisfaction and
brand reputation (Cronin & Taylor, 1992), satisfaction and pro-environmental behaviours
(Ramkissoon et al., 2013a).
Regarding satisfaction and pro-environmental behaviours, some studies propose that
recreation experiences have a positive effect on satisfaction and loyalty among tourists and on
environmental behaviours (Hosany & Witham, 2010). Orams (1995) posits that tourists’
satisfaction with their ecotourism experiences results in behavioural changes towards the
environment. Concerning national parks or green spaces, various studies have found that tourists
who are satisfied with their park experience are more likely to engage in positive behavioural
intentions such as pro-environmental behaviour (Cheng & Wu, 2015; Ramkissoon et al., 2013a,
2013b) and are likely to have a heightened sense of support for ecological conservation (Powell &

74
Ham, 2008). Other studies have demonstrated that satisfaction is a strong predictor of positive
behavioural intentions such as willingness to pay high park fees (Ramkissoon et al., 2013a) and
committing to the environment and park (Ramkissoon et al., 2013a).
Ramkissoon et al. (2013a) established that tourists with highly park experience satisfaction
had a higher intention to participate in low-effort PEB. Results suggest that the more satisfied
visitors were, the less likely they were to engage in high-effort pro-environmental behaviours. The
results somewhat differ from Stedman’s (2002) findings, which revealed that visitors’ low
satisfaction levels lead to environmental protection behaviours. Whereas others like Ramkissoon
et al. (2013a, 2013b) categorised PEB as either low effort or high effort, some researchers
categorise them as either direct or indirect PEB. For example, Kollmuss and Agyeman (2002)
indicate that examples of direct behaviours include performance or adoption of PEB while indirect
PEB includes signing petitions, supporting government policies, voting for favourable politicians
who drive sustainability or green agenda, among other.
In Ramkissoon et al. (2013a) study, low-effort pro-environmental behaviour was measured
with items such as:
i. volunteer to reduce my favourite spot in the park if it needs to recover from
environmental damage,
ii. tell my friends not to feed animals,
iii. sign petitions in support of this national park,
iv. pay increased park fees if introduced,
v. volunteer to stop visiting a favourite spot in this park if it needs to recover from
environmental damage
whereas high-effort pro-environmental behaviours were measured using these three items;

75
i. volunteer my time to projects that help this national park,
ii. participate in public meetings about managing this national park and
iii. write letters in support of this national park.
Further, some studies have categorized pro-environmental behaviours depending on
resources, effort and physical actions (Ramkissoon et al., 2013a, 2013b) and based on satisfaction
levels (Cheng & Wu, 2015; Cheng et al., 2013; Stedman, 2002). The present study measured pro-
environmental behavioural intentions following (Ramkissoon et al., 2013a, 2013b) – that is, as
either low-effort or high-effort. Therefore, this study formulates the following hypothesis:
H3: Satisfaction with Lake Malawi DBE has a positive effect on tourists’ pro-
environmental behavioural intentions
3.3.2 The mediation role of satisfaction on DBE and pro-environmental behaviour intentions
The mediating power of satisfaction has been acknowledged in many studies. For example,
Spreng, MacKenzie, and Olshavsky (1996) found that satisfaction is a good predictor of
behavioural intentions and so did Petrick (2004) who established that satisfaction is an antecedent
of repurchase intention. Brakus et al. (2009) established that there is a direct and indirect
relationship between brand experience and behavioural intention (loyalty). The indirect
relationship was mediated by satisfaction. Similarly, Barnes et al. (2014) reported that none of the
BE constructs has a strong prediction for satisfaction, intention to recommend and intention to
revisit except the sensory dimension. Satisfaction was found to be a mediator for behaviour
intentions when they used the brand experience scale developed by Brakus et al. (2009). Chiu et
al. (2014) found that overall tourist travel experience affects their intentions to engage in
environmental behaviours and satisfaction partially mediates environmental responsible

76
behaviour. Hosany and Witham (2010) reported the same results – that is, satisfaction with cruise
experiences partially mediates the association between cruisers’ experiences and intention to
recommend.
Therefore, this study proposes that:
H4: Satisfaction mediates the relationship between Lake Malawi DBE and pro-
environmental behavioural intentions
3.3.3 The moderating effect of tourists’ domestic or international status
Consumption and experience evaluation differences have been noted between international
and domestic tourists (Beckman et al., 2013; Huang et al., 1996; Kozak, 2001) and between people
of different nationalities (Ballantyne et al., 2011b; Pizam & Sussmann, 1995). In a study of young
tourists, Carr (2002) discovered that young and single British domestic visitors displayed different
behaviours compared to international tourists, the latter being more hedonistic and passive.
Mechinda et al. (2009) demonstrated that domestic and international tourists varied significantly
in their contentment with the place and emotional attachment. The study revealed that domestic
visitors were more emotionally attached and contented with the destination. Similarly, a study in
the US by Bonn et al. (2005) discovered that international tourists had a lower evaluation of the
service image experience than domestic tourists. This is, however, in sharp contrast with a study
done in Bangkok by McDowall and Ma (2010) who found that international tourists’ evaluation
of Bangkok was more favourable than locals on all the 24 items that were assessed.
Although some studies acknowledge that certain groups of people, labelled as foodies,
travel to eat (Molz, 2007; Smith & Xiao, 2008), Mkono (2011) discovered that international
visitors to Zimbabwe were more willing to try local foods but expressed caution and reservations

77
for foods like Mopane worms which they considered as ‘scary’ and for the ‘brave.’ These foods
made international visitors curious but they were hesitant to try them. Mkono (2011) notes that
tourists avoided the risk of consuming ‘wild’, ‘unusual’ ‘not for the squeamish’ and ‘exotic’ foods
by seeking familiar western foods in the Zimbabwean restaurants. Bonn et al. (2005) affirm that
visitors’ perception, evaluation and experience of the destination is dependent on their
geographical origin. Furthermore, affective emotions are stronger when there is a connection, love
and passion between the items being studied (Thomson et al., 2005). Hence, the study formulates
the following hypotheses:
H5 Domestic/international tourists’ status moderates the relationship between DBE and
satisfaction
H6: Domestic/international tourists’ status moderates the association between DBE and
PEB
H7: Domestic/international tourists’ status moderates the association between tourist
satisfaction and PEB.
3.3.4 Summary of research hypotheses
The research has formulated seven hypotheses surrounding the three main study constructs
of destination brand experience, tourist satisfaction and PEB. The study also tests the mediating
role of satisfaction between DBE and pro-environmental behaviours and the moderating role of
domestic/international tourists’ status of these relationships. Table 3.1 presents a summary of the
hypotheses.

78
Table 3. 1 Summary of research hypotheses
Hypotheses
H1: Lake Malawi DBEs have a positive effect on tourists’ satisfaction.
H2: Lake Malawi DBEs have a positive effect on tourists’ pro-environmental behaviours.
H3: Satisfaction with Lake Malawi DBEs has a positive effect on tourist PEB intentions.
H4 Tourists satisfaction mediates the association between DBEs and tourist PEB intentions.
H5: Domestic/international tourists’ status moderates the relationship between DBE and
satisfaction.
H6: Domestic/international tourists’ status moderates the association between DBE and PEB
intentions.
H7: Domestic/international tourists’ status moderates the association between satisfaction and
PEB intentions.
3.4 Summary
This chapter has proffered the conceptual framework of the thesis as well as the
relationships among the main research constructs. The conceptual framework consists of three
main constructs: DBE, satisfaction, and pro-environmental behavioural intentions. Seven research
hypotheses were proposed and they would be tested using modelling (see chapter 4). The study,
however, has three main hypotheses that focus on the relationships between DBE and satisfaction,
DBE and pro-environmental behaviours and satisfaction and pro-environmental behaviours.
Satisfaction and domestic/international tourist’s status have also been used and as a mediator and
a moderator respectively.

79
CHAPTER FOUR: RESEARCH METHODOLOGY
“If we knew what it was we were doing, it would not be called research, would it?”
Albert Einstein.
4.1 Introduction
The preceding chapter presented the theoretical background of the study. This chapter
explains the study’s methodology. It explores the scale development process for destination brand
experiences. It also outlines the study’s methodological procedures such as research design, the
study area, population and sampling. Further, it gives insight into the data collection techniques
and the data analysis methods used for the proposed model and the hypotheses. The proposed
approaches and techniques were selected based on the research objectives, the literature review
and the conceptual framework.
4.2 Measurement scale development process
Developing a sound measurement scale is a tedious and time-consuming process (Schmitt
& Klimoski, 1991). To develop meaningful and user-friendly scales, scholars have put forward
various scales for the measurement of tourism experiences. For example, to understand wilderness
experiences, travellers were asked to describe their wilderness experiences (Borrie & Birzell,
2001; Hull, Stewart, & Young, 1992) whereas recreation experience preferences (REP) scales were
used to measure leisure motivation (Manfredo, Driver, & Tarrant, 1996). For Oh et al.’s (2007)
study on tourism experiences, Pine and Gilmore’s (1999) experience framework was used – this
scale has been used in several studies on cultural attractions (Hayes & MacLeod, 2007; Quadri-
Felitti & Fiore, 2012).

80
In recent years, memorable tourism experiences (MTE) have become popular. Hence,
following the work of Kim (2010), Morgan and Xu (2009) and Tung and Ritchie (2011) among
others, scholars have employed MTEs and Tourism Autobiographical Memory Scale (TAMS) to
understand tourists’ experiences of a destination (Jorgenson et al., 2018). For Kim, Ritchie and
McCormick (2012), they employed Churchill’s (1979) scale development process and developed
24 items for the memorable tourism experience scale, which were categorized into seven main
themes: hedonism, local culture, meaningfulness, involvement, novelty and refreshment.
Furthermore, Chandralal and Valenzuela (2015) developed a scale to measure MTE arguing that
earlier scales by Kim et al. (2012) and Tung and Ritchie (2011) were less representative as they
used student samples instead of real travellers.
Thus, the most comprehensive work on destination brand experiences is that of Barnes et
al. (2014) which used Brakus et al.’s (2009) four DBE facets to measure tourism experiences in
Sweden. Even though the study emphasised the importance of sensory brand experiences,
intellectual and behavioural experiences were not significant in their study partly because of the
nature of the destination. Also, their use of Brakus et al.’s (2009) BE scale without adapting it to
the tourism destination context is a major drawback. Furthermore, as pointed out by Barnes et al.
(2014), their scale needs refinement to be used to test destination brand experience in different
destinations while taking into account the different profiles of destination brand experiences.
Given the limitations of the scales of Brakus et al. (2009) and the MTEs, especially in terms of
their lack of applicability to lake destinations, it became necessary for the current study to develop
its scales.
The study followed best practices of scale development as suggested by Churchill (1979),
De Vellis (2003), Walsh & Beatty (2007) and Worthington and Whittaker (2006). The scale was

81
developed in multiple stages as shown in Figure 4.1. The study adopted items after a rigorous
review of the literature on tourism experiences, lake tourism, nature-based tourism and rural
tourism among others. Interviews with tourists and other stakeholders, as explained in section 4.5,
were used to substantiate the adopted items.
Figure 4. 1 Scale development process adapted from Churchill (1979)

82
Step 7
Main survey hypothesis testing
Step 2
Item generation
Step 3
Experts’ review of items
Step 4
Purification of the survey items
Step 5
Pilot testing
Step 6
Main survey
Step 1
Construct domain and item specification
Literature review of studies on tourism experiences
Literature review of tourism experience studies and qualitative
study (interviews)
In-depth interview with experts; analyses, content validity and
construct validity check
Pretesting using graduate students; content validity and construct
validity checking
Pilot test with 80 tourists. Reliability and validity test; Cronbach’s
alpha, Factor analysis and communalities
Main survey with a sample of 670 tourists
Factor and structure analyses, EFA, CFA. Check for convergent
and discriminant validity
CFA and modelling

83
4.3 Specification of items and domains of constructs
As alluded to by Churchill (1979) and De Vellis (2003) among others, item generation and
domain specification are the most important considerations when developing a scale. This stage
allows the researcher(s) to define what they want to measure by extracting items that represent the
constructs under examination (Ghiselli, Campbell, & Zedeck, 1981 as cited in Hinkin, 1998). To
achieve this, this study used both interviews and literature review to generate the items.
4.3.1 Destination brand experiences
The tourism literature is awash with many experience scales that largely focus on product
brand experiences (see Brakus et al., 2009), but which have been applied in the tourism industry
without amendments (Barnes et al., 2014; Saari & Mäkinen, 2017). Consequently, no study to date
has developed a measurement scale for destination brand experiences. Yet, destinations are unique
and different from generic products. Following from Brakus et al.’s (2009) study, four brand
experience constructs were extracted, namely behavioural, cognitive, affective and sensory
(Chapter 2 provides an in-depth discussion on these constructs). However, cognizant that
destinations extend beyond these constructs, the literature review identified other constructs such
as relational/social and spiritual experiences among others.
The relational/social, as discussed in Chapter 2, is the communal feeling that tourists have
when experiencing a product or a destination. Spiritual experiences emanate from the tranquillity
of the place and the connection that tourists have with nature.
4.4 Generation of items
The second phase of the measurement scale development was item generation for the
specified constructs. Firstly, the literature was reviewed to identify the underlying tourism

84
experiences at a lake destination. Web search engines such as Google Scholar, Scopus and JSTOR
were used to identify papers on tourism experiences. Through content analysis, only those items
that suit lake tourism experiences and rural tourism were selected regardless of the sectors they
belonged to. Previous studies on tourism experiences, destination experiences and brand
experiences were considered, and a deductive approach was employed to draw items for the current
study (Hinkin, 1995). A deductive approach was adopted to have a clear understanding of the
literature given its applicability where underlying principles already exists (Hinkin, 1995).
Furthermore, a deductive approach was used in item generation to ensure content validity and to
retain a connection with in-depth interviews in the final scales.
Secondly, following Tung and Ritchie (2011) and Otto and Ritchie (1996), this study ran
a qualitative study to generate destination brand experience items. The qualitative study combined
face-to-face interviews and/or open-ended questionnaire. Using convenience sampling, a total of
13 respondents were drawn to ascertain their views on what they think tourism brand experiences
of Lake Malawi are. A general question asking respondents ‘when you think of Lake Malawi,
what experiences come to your mind’ was posed. Respondents were then asked to describe their
experiences of Lake Malawi. The respondents were given guidance to differentiate their travel
motivations from their experiences at a destination.
Thirdly, thematic analysis was employed to extract emerging themes from the interviews.
The study employed a realistic and semantic thematic analysis approach to code and develop
themes that reflect the data as captured during the interviews (Weiss, 1994). Before analysing the
data, the researcher familiarised herself with the data by going through the interview notes. This
was followed by data coding where labels that best described the data features were generated.
Furthermore, codes were reviewed to generate emerging themes, followed by defining and naming

85
the generated themes (Braun & Clarke, 2006). A total of 142 items were derived from both the
literature review and the interviews. Table 4.1 presents the results of the literature review DBE
exercise, followed by Table 4.3 which presents results of the in-depth interviews.
Table 4. 1 Initial items for destination brand experiences and their domains based on literature rev
iew

86
Possible DBE domains from literature Authors (sources) cited
Action/Behavioural experiences 1 2 3 4 5 6 7 8 9 1
0
1
1
1
2
1
3
1
4
1
5
1
6
1
7
1
8
1
9
2
0
2
1
2
2
2
3
2
4
2
5
2
6
2
7
2
8
2
9
3
0
3
1
3
2
3
3
1. I engage in a lot of physical actions and
behaviours when I use this brand
x x x x x x x x x
2. Activities x
3. Lake sunset x
4. Bathing and swimming x
5. Walking trail on the lakeshore x
6. This brand results in a lot of bodily
experiences
x x x x x x x x x
7. Natural beaches x
8. Cultural and heritage monuments visits x
9. Lifestyle x x
10. This brand is not action oriented x x x x x x x x x
11. m Man working on the lake x
12. Sailing on the lake x
13. As a customer of this brand I am rarely
passive
x
14. Fishing x
15. Express who I am x
16. This brand engages me physically x
17. Boating x
Bodily/sensory brand experiences 1 2 3 4 5 6 7 8 9 1
0
1
1
1
2
1
3
1
4
1
5
1
6
1
7
1
8
1
9
2
0
2
1
2
2
2
3
2
4
2
5
2
6
2
7
2
8
2
9
3
0
3
1
3
2
3
3
18. This brand makes a strong impression on my
visual sense or other senses
x x x x x x x x x x
19. Richness of fauna x
20. I find this brand interesting in a sensory way x x x x x x x x x
21. Villages on the shoreline x
22. Lake’s shoreline x
23. Perceptual interesting x

87
24. This brand does not appeal to my senses x x x x x x x x x
25. The brand gives sensory experiences x
26. Shape and design x
27. Idyllic countryside, picturesque x
28. Transparent water x
29. Blue waters x
30. Animals x
31. Local people visual impression x
32. Maritime impression x
33. Sense of beauty x x
Affective/emotional brand experiences 1 2 3 4 5 6 7 8 9 1
0
1
1
1
2
1
3
1
4
1
5
1
6
1
7
1
8
1
9
2
0
2
1
2
2
2
3
2
4
2
5
2
6
2
7
2
8
2
9
3
0
3
1
3
2
3
3
34. I do not have strong emotions for this brand x x x x x x x x x
35. This brand is an emotional brand x x x x x x x x x x
36. Relieved x
37. This brand induces feelings and sentiments x x x x x x x x x
38. This brand gives me pleasure x x
39. This brand makes me happy x x
40. I feel good when I use this brand x
41. Brand often engage me emotionally x
42. Positive moods x x
43. Joyful x
44. Positive feelings x
45. Cheerful x
Intellectual/cognitive brand experiences 1 2 3 4 5 6 7 8 9 1
0
1
1
1
2
1
3
1
4
1
5
1
6
1
7
1
8
1
9
2
0
2
1
2
2
2
3
2
4
2
5
2
6
2
7
2
8
2
9
3
0
3
1
3
2
3
3
46. I engage in a lot of thinking when I
encounter this brand
x x x x x x x
47. This brand does not make me think x x x x x x x
48. This brand stimulates my curiosity and
problem solving
x x x x x x x
49. This brand challenges my way of thinking x

88
50. Nostalgic x x
51. The brand engages my creative thinking x
52. Learnt something new x
53. Intrigues me x
Relational/social brand experiences 1 2 3 4 5 6 7 8 9 1
0
1
1
1
2
1
3
1
4
1
5
1
6
1
7
1
8
1
9
2
0
2
1
2
2
2
3
2
4
2
5
2
6
2
7
2
8
2
9
3
0
3
1
3
2
3
3
54. As a customer of a brand, I feel like a part of
a community
x x x
55. Activate meaningful relationships with
brand, peers and organization
x
56. I feel like I am part of the brand family x
57. Tourists admiring the view x
58. When I use brand I do not feel left alone x
59. The brand gives me an identity x
60. Help me build relationships x
61. Relates me to others/ communitas x x x x
62. Collectivism by involving people, groups
and society
x
63. Connects me to nature (subject to brand) x
64. Connects me to stakeholders (i.e.
communities)
x
65. Social rules and arrangements x
66. Connects me with people with similar or
different views/ lifestyle
x x
67. Consumption with other people x
68. Connects me with societal context x
69. Sense of belonging x
Spiritual experiences 1 2 3 4 5 6 7 8 9 1
0
1
1
1
2
1
3
1
4
1
5
1
6
1
7
1
8
1
9
2
0
2
1
2
2
2
3
2
4
2
5
2
6
2
7
2
8
2
9
3
0
3
1
3
2
3
3
70. Spiritual awareness x x
71. Connects me with nature/ this world x x
72. Restorative/ revitalizing effects x x x

89
73. Connection to nature x x x
74. Solitude and quietness x x x
75. Being with others/communitas x x x
76. Nostalgia x x
77. Connection with inner self x
78. Away from civilization/remoteness x
79. Inner well-being x x
80. Appreciates creation x x
81. Sense of renewal x
82. Space (to oneself) x x x
83. Spiritual uplifting x x
84. Feeling of being blessed x
85. Feeling of being part of something bigger
and infinite
x
1. Brakus et al. (2009); 2. Barnes et al. (2014; 3. Beckman et al. (2013); 4. Lee & Kang (2012); 5. Saari & Makinen (2017); 6. Iglesias
et al. (2011); 7. Zarantonello & Schmitt (2010); 8. Lin (2015); 9. Schmitt (2009); 10. Chaudhuri & Morris (2001); 11. Das, Agarwal,
Malhotra, & Varshneya, (2019); 12. Iglesias et al. (2019); 13. Andreini et al. (2018); 14. Nysveen et al. (2013); 15. Schmitt (1999a,
1999b); 16. del Bosque & Martín (2008); 17. Bigné et al. (2005); 18. Choi, Ok, & Hyun (2011); 19. Shamim & Mohsin Butt (2013); 20.
Schmitt et al. (2015); 21. Swaminathan et al. (2007); 22. Hamzah, Alwi, & Othman, (2014); 23. Gentile et al. (2007); 24. Agapito et
al. (2017); 25. de Geus et al. (2016); 26. Hay & Socha (2005); 27. Sharpley & Jepson (2011); 28. Kaplan (1995); 29. de Botton (2003);
30. Heintzman (1999); 31. Heintzman (2007); 32. Smith (2003); 33. Rodrigues et al. (2014).

90
4.5 Generation of items through in-depth interviews
Interviews were conducted with tourism professionals, tourists, lodge owners, tour
operators and government tourism officers on what they think are the destination brand experiences
of Lake Malawi. This was done to consolidate the items generated from the literature through first-
hand experiences. As Carpenter (2018) asserts, conducting qualitative research to generate items
and dimensions is one critical step in scale development. Thirteen people were interviewed and
their demographics have been presented in Table 4.2 below.
Table 4. 2 Profile of in-depth interviews for Lake Malawi DBE
No. Gender Occupation Recent travel
destination
1 Male International tourist Malawi
2 Female International tourist Malawi
3 Male Tourism Professor South Africa
4 Male International tourist Malawi
5 Male Teacher/domestic visitor China
6 Male Tourism officer Zimbabwe
7 Male Tourism officer Zambia
8 Male Domestic visitor Britain
9 Male Tour operator Zambia
10 Male Tourism Professor Britain
11 Male Lodge owner Britain
12 Male Lodge owner Malawi
13 Female Tour consultant Malawi
From these interviews, 57 items were generated. Table 4.3 below presents the overall results
and their presumed DBE domains.

91
Table 4. 3 New items generated from interviews on Lake Malawi DBE
No Item Presumed domain/construct
1. Amazement at nature Sensory
2. Sunsets over the lake Sensory
3. Eating local food like Chambo (Tilapia) Sensory
4. Walking on the beach is soothing Sensory
5. Beautiful scenery Sensory
6. To absorb into nature Sensory
7. Fish smells in the villages Sensory
8. The waters stimulate me Sensory
9. Bird watching opportunities Sensory
10. Fear of drowning and crocodile Cognitive
11. I forget trouble Cognitive
12. Tranquillity Cognitive
13. Lake Malawi experiences make me more
knowledgeable
Cognitive
14. Learn local cultures Cognitive
15. The lake waters help me to focus Cognitive
16. I start my day with the lake Cognitive
17. Learn more about the lake Cognitive
18. I forget trouble Cognitive
19. The lake rejuvenates me Cognitive
20. Offers me quite time Cognitive
21. Lake Malawi is therapeutic Cognitive
22. Rock jumping at Lake Malawi makes my adrenaline rise Behavioural
23. Beach sports like soccer/volleyball Behavioural
24. Water-based sports Behavioural
25. Basking in the sun on the sandy beaches makes me get a
natural skin tan
Behavioural
26. Photo taking opportunities Behavioural
27. Walking on the sand is good Behavioural
28. Walking on the beach keeps me in shape Behavioural
29. Reunites me with mother nature Spiritual
30. The lake uplifts me spiritually Spiritual
31. Lake Malawi connects me to nature powers Spiritual
32. Relaxed feeling Spiritual
33. Peace of mind Spiritual
34. The lake gives me spiritual nourishment Spiritual
35. Meditation time Spiritual
36. Reflection about oneself Spiritual
37. Lake offers me solitude Spiritual
38. It draws me away from civilization Spiritual
39. The lake has spiritual revitalizing powers Spiritual
40. Refreshing experience Spiritual
41. I have spiritual awareness at the lake Spiritual
42. The lake offers restorative powers Spiritual

92
43. Traditional way of life Social
44. Meeting groups of diverse people Social
45. Lake Malawi allows me to watch other people enjoy
themselves
Social
46. Family bonding opportunities Social
47. Walking in the villages gives me an African experience Social
48. Lake Malawi offers me shared experiences with other
people
Social
49. I make friends/ socialize Social
50. Local hospitality Social
51. Interaction with local communities Social
52. Fulfilling experiences Emotional
53. Full of fun Emotional
54. Lake Malawi snorkelling gives me fun Emotional
55. The lake is a fulfilling place Emotional
56. The lake surprises me Emotional
57. Lake Malawi is charming Emotional
4.6 Experts review on the initial pool of items for destination experiences
After the initial survey items were generated, six tourism experts were contacted to review
the consolidated items from both the literature and the interviews. This was done to identify the
most relevant items that define destination brand experience. The process generated new items that
were not initially included in the preceding step as well as it reduced the number of items through
the face and construct validity (Hardesty & Bearden, 2004; Nunnally & Bernstein, 1994). The
experts critically analysed the pool of items for face and content validity before developing and
testing a quantitative tourism brand experience scale for Lake Malawi (Hardesty & Bearden, 2004;
Hinkin, 1995; Nunnally & Bernstein, 1994; Worthington & Whittaker, 2006). A purposive
sampling technique was used to identify the experts and their selection was guided by Churchill’s
(1979) assertion that the sample should comprise people who are conversant with the phenomenon
under investigation. Table 4.4 provides the profile of the experts used in the study.

93
Table 4. 4 Experts’ profile for destination brand experience interviews
No. Gender Occupation Tourism
experience
Recent
destination
Location
1 Male Tourism Professor 10 Brazil Asia
2 Female Tourism Professor 6 Thailand Asia
3 Female Tourism Professor 11 Macao Asia
4 Male Tourism Officer 8 Zambia Africa
5 Male Tourism Professor 17 Uganda Africa
6 Male Tourism professional 9 United Kingdom Europe
As proposed by Chandralal and Valenzuela (2015) and DeVellis (2003), the experts were
asked to appraise the degree to which the items were representative and valid on each DBE
construct. They were asked to assess construct deficiency, terminology, readability and phrasing
based on a three-point scale of (1), not representative, (2) somewhat representative and (3)
representative. A clear definition of DBE was given to the experts to avoid misunderstandings and
delimit the scope of the study. Content validity was, thus, evaluated in terms of item meaning and
definition (Hardesty & Bearden, 2004).
After this exercise, all items that lacked clarity were excluded from the study and repetitive
items were either merged or modified. Out of 143 items, 89 items were deleted, resulting in 54
items eligible for further exploration.
4.7 Amendment of items for destination brand experiences Feedback from the experts revealed that some items under the proposed six domains should
be merged or modified for concise meaning while others were recommended for deletion. For
details refer to appendices 6 to 11. Table 4.5 below presents the final items retained for piloting.

94
4.8 Purification of items
Following the procedure laid down by Churchill (1979), the next step after experts review
was the purification of the generated items to streamline the number of measurement items and to
check their validity and applicability. Scale item purification, according to Churchill (1979), entails
pretesting, running analyses and conducting validity tests. Thirty doctoral students from the Hong
Kong Polytechnic University were asked to evaluate the research instrument and the items used.
Ten of the students were pursuing their studies in tourism and were, therefore, knowledgeable about
the phenomenon under investigation. A five-point Likert scale was used to determine respondents’
level of agreement with the scale item statements. This scale was used instead of a 7- point Likert
scale to increase respondents’ response rate and the quality of their responses (Babakus & Mangold,
1992). Also, a 5-point Likert scale does not overwhelm respondents with options hence reducing
respondents’ frustrations (Brooke, 1996). Further, a 5-point Likert scale had been used in previous
experience studies (Lin, 2015). After the pretesting exercise, the respondents made certain
recommendations that led to the correction of certain items and the revision of irregular household
income scale, among others.
4.8.1 Summary of items after purification for destination brand experiences
After the expert review, all the items were proofread to ensure that they were face valid and
comprehensible to the survey participants before pretesting them. As shown in Table 4.5 below, the
six domains had a total of 54 items. The “action/ behavioural” domain had 14 items, the
“bodily/sensory” domain had 8 items and the domain “expressive/emotional” had 10 items.
Furthermore, the “spiritual/psychic” domain had 6 items, the ‘relational/social” domain had 9 items
and the “perceptive/cognitive” domain had 7 items.

95
Table 4. 5 Revision of measurement items used to measure destination brand experiences
Action/behavioural destination brand experiences
DBE1 LM makes me express who I am through water-based activities
DBE2 LM gives me an enjoyable experience
DBE3 LM makes me engage in physical actions and behaviours
DBE4 Lying on LM beach relaxes me
DBE5 LM activities allows me to self-actualise
DBE6 LM gives me a laid-back feeling
DBE7 LM transforms my mind
DBE8 Physical experiences at LM keep me fit
DBE9 LM is action (water-based sports) oriented
DBE10 LM is a cultural experience
DBE11 Walking along LM sandy beaches is a worthwhile experience
DBE12 LM activities makes my adrenaline rise
DBE13 Sun tanning at LM is important for me
DBE14 LM puts me in a meditation mood
Expressive/emotional destination brand experiences
DBE15 LM has a positive effect on how I feel about myself
DBE16 LM induces feelings and sentiments
DBE17 LM atmosphere is relaxing
DBE18 LM gives me a sense of belonging
DBE19 LM makes me happy
DBE20 LM gives positive feelings
DBE21 LM surprises me
DBE22 I have strong emotions for LM
DBE23 LM is a friendly destination
DBE24 LM gives me nostalgic feelings
Perceptive/cognitive destination brand experiences
DBE25 LM captivates me
DBE26 I have feelings of amazement at nature
DBE27 LM helps me forget about my problems
DBE28 I gain new knowledge at LM
DBE29 LM stimulates curiosity and problem solving
DBE30 I engage in a lot of thinking when I am at LM
DBE31 Learning about animals of LM is rewarding
Bodily/sensory destination brand experiences
DBE32 LM environment is delightful
DBE33 LM provides me with a good culinary experience
DBE34 LM animals are appealing to watch
DBE35 LM allows me to take in the beauty of the place
DBE36 LM waters stimulates my senses
DBE37 LM appeals to my senses
DBE38 Sunrise and sunsets over the LM are exciting to watch
DBE39 LM provides me with a serene experience
Relational/social destination brand experiences DBE40 LM offers me an opportunity of being a member of a community
DBE41 Being at LM helps me interact with others
DBE42 LM allows me to interact with local people

96
DBE43 LM represents local hospitality
DBE44 LM allows me to learn about the locals’ way of life
DBE45 LM allows me to participate in activities with other people
DBE46 LM allows me to experience the friendliness of local people
DBE47 LM experience helps me to make friends
DBE48 Being at LM is a good opportunity to spend time with my family
Spiritual/psychic destination brand experiences DBE49 LM connects me with higher powers of nature
DBE50 LM draws me away from the secular
DBE51 LM reunites me with mother nature
DBE52 LM has spiritual revitalising powers
DBE53 LM offers me solitude
DBE54 LM gives me spiritual awareness
The abbreviation “DBE” denotes destination brand experience while ‘LM’ denotes Lake Malawi
4.9 Pilot study
After all the generated items had been revised, a pilot test study was conducted to predict
the scale’s generalizability. The pilot test was conducted to confirm and validate the research
instrument and to identify challenges that may arise from its administration at the main survey
stage. The pilot study was also done to identify whether the measurement items and the
questionnaire design were appropriate (Oppenheim, 1992). Errors and weaknesses of the
questionnaire were addressed before the main study was rolled out. Using a paper-based survey, a
sample of 80 respondents were approached in-situ (Lake Malawi). For pilot testing, Johanson and
Brooks (2009) recommend a sample size of 30 as a reasonable minimum. As the aim of the pilot
study was not to generalise results (Worthington & Whittaker, 2006), a sample size of 80 was
deemed appropriate and representative after Otoo, Kim, & Choi (2020). The measurement was done
in English as it is the official language of Malawi.
4.9.1 Data screening, descriptive analysis and normality test
Data screening was done to determine the quality of the data before further analysis was
done. Following Kline (2011, 2016), data were checked for outliers, missing data and normality.

97
Descriptive analysis and boxplots were used to detect data analysis issues such as outliers (Hair,
Black, Babin, Anderson, & Tatham, 2010) with the help of Statistical Package for Social Scientists
(IBM SPSS version 25). During this exercise, two major issues were identified: 1). some
respondents did not fill out some sections of the survey questionnaire such as demographics, 2).
some respondents filled the survey on the same level of responses across all items and domains.
Furthermore, normality tests were conducted to examine the data for skewness and kurtosis.
The results indicated that data were within the acceptable skewness range from -0.43 to 2.04
(Brown, 2006; Field, 2009; Hair et al., 2010). The kurtosis result also revealed that data were
normally distributed except for six items DBE2 “Lake Malawi gives me an enjoyable experience’,
DBE4 “Lying on Lake Malawi beaches relaxes me”, DBE17 “Lake Malawi atmosphere is
relaxing,” DBE32 “Lake Malawi environment is delightful”, DBE35 “Lake Malawi allows me to
take in the beauty of the place” and DBE38 “Sunrise and sunsets over Lake Malawi are exciting to
watch” which were between 5.25 and 7.19. Following Brown’s (2006) assertion that skewness
indices falling between ±3 and kurtosis indices falling between ±10 are acceptable, the items were
retained for further analysis. Refer to Appendix 12 for details.
4.9.2 Demographic characteristics of the pilot study respondents
The pilot study involved 80 participants who were randomly drawn at the study site in
Mangochi, Malawi. Their demographics include age, sex, level of education, nationality, marital
status and occupation. The pilot study engaged more males (57.5%) than females (42.5%). For
marital status, 52.5% was married whereas 46.3% was single and 1.3% was engaged. In terms of
education, university first-degree holders were in majority (43.9%) followed by master’s degree
holders at (30%) and middle/high school graduates (23.8%). Additionally, the majority of
respondents were Malawians (73.8%) whereas more respondents were employed by companies

98
(31.3%) followed by those who owned businesses (27.5%). Table 4.6 presents the demographics of
pilot study respondents.
Table 4. 6 Demographic features of the respondents
Variable Category Frequency Per cent (%)
Gender Female 34 42.5
Male 46 57.5
Marital status Single 37 46.3
Married 42 52.5
Others 1 1.3
Age Under 20
20s
3
31
3.8
38.9
30s 26 32.7
40s 12 15.2
50s or older 8 10.2
Nationality/origin Malawian 59 73.8
International 21 26.2
Educational level Primary school 1 1.3
Middle/High School 19 23.8
Undergraduate degree 35 43.9
Masters’ degree 24 30.0
Doctorate degree 1 1.0
Occupation Company employee 25 31.3
Own business 22 27.5
Civil servant 7 8.8
Parastatal 2 2.5
Housewife 4 5.0
Tourism industry 3 3.8
Student 6 7.5
Retired 5 6.3
Others 6 7.6
4.9.3 Exploratory factor analysis (EFA) of the pilot study
Exploratory Factor Analysis (EFA) was conducted to identify the underlying destination
brand experiences at lake destinations. EFA was also used to reduce the number of items for a scale
as well to determine the composition of factors for further data analysis. Principal components was
used as an extraction method with varimax rotation. In the sample of 80 respondents, items with
communalities below 0.5 were excluded from the analysis (Stevens, 2002). Similarly, items with
eigenvalues below 1 and factor loadings below 0.4 were excluded from the analysis. In general, the
communalities ranged from .51 to .79, indicating that the items explained 51% to 79% of the
99
variance. A preferred Kaiser-Meyer-Olkin (KMO) measure of sampling adequacy was 0.845
greater than the 0.60 threshold (Worthington & Whittaker, 2006). The data were suitable for factor
analysis following a Bartlett’s Test of Sphericity (χ2 (406) =1906.50, p =.000), in line with
Tabachnik’s rule of thumb (Tabachnick & Fidell, 2013). All reliability coefficients were above the
threshold of 0.6 (Nunnally, 1978).
From the factor analysis as presented in Table 4.7 below, six components were extracted
with a total variance of 66.69%. Factor 1 was labelled “relational/social experiences” and it had
eight items and explained 34.91% of the variance. Factor 2 was named “spiritual/psychic
experiences” and it explained 10.90% of the variance with six items. Factor 3 was termed
“expressive/emotional experiences” and had four items explaining 6.52% of the variance. Factor 4,
“action/behavioural experiences”, had five items and explained 5.29% of the variance. Factor 5,
“bodily/sensory experiences”, accounted for 4.96% of the variance and had three items and factor
6, “perceptive/cognitive experiences”, had 3 items and explained 4.12% of the variance.

100
Table 4. 7 Results of pilot study EFA with descriptive statistics of components’ items
Factors and items
Communality
Factor
loading Mean
Factor 1: Relational/social experiences (α = .92, eigenvalue= 10.12,
variance explained = 34.91, Grand mean = 4.16)
LM allows me to experience the friendliness of local people .82 .85 4.21
LM allows me to learn about the local ways of life .77 .82 4.14
LM allows me to participate in activities with other people .72 .77 4.07
LM helps me to make friends .67 .76 4.17
LM represents local hospitality .63 .72 4.21
LM allows me to interact with local people .63 .70 4.23
Being at LM helps me to interact with others .71 .68 4.35
LM offers me an opportunity of being a member of the community .50 .56 3.88
Factor 2: Spiritual/psychic experiences (α = .88, eigenvalue= 3.16,
explained variance = 10.90, Grand mean = 3.53)
LM has spiritual revitalising powers .76 .82 3.30
LM offers me solitude .70 .76 3.53
LM draws me away from the secular .67 .75 3.29
LM gives me a spiritual awareness .63 .69 3.39
LM reunites me with mother nature .59 .69 4.00
LM connects me with high powers of nature .59 .67 3.68
Factor 3: Expressive/emotional experiences (α = .86, eigenvalue=
1.89, variance explained = 6.52, Grand mean = 4.03)
LM makes me happy .79 .73 4.31
LM gives me positive feelings .79 .72 4.30
LM has a positive effect on how I feel about myself .67 .71 3.75
LM induces feelings and sentiments .65 .70 3.77
Factor 4: Action/behavioural experiences (α = .71, eigenvalue= 1.53,
variance explained = 5.29, Grand mean = 3.75)
LM makes me engage in physical actions and behaviours .66 .77 3.66
LM makes me express who I am through water-based activities .59 .72 3.59
Physical experiences at LM keeps me fit .58 .63 3.80
LM gives me enjoyable experiences .55 .58 4.17
Sun tanning at LM is important to me .52 .52 3.54
Factor 5: Bodily/sensory experiences (α = .78, eigenvalue= 1.43,
variance explained = 4.96, Grand mean = 4.22)
LM waters stimulate my senses .77 .76 4.01
LM appeals to my senses .71 .73 4.06
Sunrise and sunsets over LM are exciting to watch .59 .72 4.60
Factor 6: Perceptive/cognitive experiences (α =.74, eigenvalue= 1.19,
variance explained =4.12, Grand mean = 3.89)
Learning about animals at Lm is rewarding .70 .75 3.96
I engage in a lot of thinking at LM .73 .67 3.75
I gain new knowledge at LM .61 .53 3.90

101
Cognizant that the main aim of this EFA was to determine the underlying dimensions, no
item was dropped from the exercise to avoid unnecessary elimination of items, which could affect
the measurement properties of the scale (Suddaby, 2010). Furthermore, the application of
judgmental item reduction technique showed that the item correlation would improve with a bigger
sample size (Cambra-Fierro & Polo-Redondo, 2008; Wieland, Durach, Kembro, & Treiblmaier,
2017; Puri, 1996). After this exercise, some items were revised. For example, under the cognitive
domain, “Lake Malawi captivates me” was revised as “Lake Malawi makes me think” while under
the sensory domain, “Lake Malawi’s colourful fishes are appealing to watch” was revised as “Lake
Malawi’s animals are appealing to watch”. Furthermore, the pilot study furnished the researcher
with information on respondents’ incentive as most respondents complained that the questionnaire
was long. The pilot study also made it possible to forecast the study area’s conditions such as few
international tourists in April and May.
4.10 Main survey
The main survey was conducted in Malawi at three places along the lakeshore: Nkhata-Bay,
Salima and Mangochi. Paper-based questionnaires, QR code and survey links were used to
distribute the survey, depending on respondents’ preferences.
4.10.1 Study population
A study population, also called a universe, is a group of elements from which a researcher
draws a sample for a study and to which the results of a study are. As Cooper and Schindler (2003,
p.179) define it, a population refers to “the total collection of elements about which a researcher
wishes to make inferences.” Malawi has a population of about 18 million people and there are about
1 million international tourists yearly, a majority of which are from the neighbouring country of

102
Mozambique (Department of Tourism, 2017). The study’s target population, therefore, was Lake
Malawi tourists/visitors, both domestic and international.
4.10.2 Sample structure
The study recruited persons who were 18 years old and above and were willing to
voluntarily take part in the study.
4.10.3 Sample size
The size of a sample in any study is crucial as it determines the statistical analyses that can
be used and has implications for the reliability and generalisation of the findings. Worthington and
Whittaker (2006) observe that there are two risks associated with having a small sample: 1) unstable
patterns of covariation due to correlations of items and 2) difficulties to generalise results on the
population as it is not representative. Since this study was set to use Factor Analysis, a large sample
was desired (Hair, Anderson, Tatham, & Black, 1998). Although Oppenheim (1992) states that
sample accuracy is better than its size, scholars like Tabachnick and Fidell (2013) propose the use
of large sample size in scale development research to cancel any scale variances that arise from
drawing a small and specific sample of participants. A large sample also ensures population
representativeness (De Vellis, 2003) and helps to stabilise covariation patterns.
Although there is no clear agreement among scholars on what a large or desirable sample
is, Worthington and Whittaker (2006) recommend a sample of at least 300 participants to be suitable
for factor analysis. That said, Tabachnick and Fidell (2013) state that such guidelines are misleading
while Ferguson and Cox (1993) posit that 100 respondents are a good number for quantitative
analysis such as EFA.
Worthington and Whittaker (2006, p. 817) gave four guidelines to sample size
determination:

103
i. Sample size of at least 300 is sufficient in most cases
ii. Sample sizes of 150 is adequate if data sets have communalities higher than 0.50
iii. Smaller samples would be adequate is all communalities are .60 or greater and
iv. Samples sizes less than 100 are generally inadequate
Going by Worthington and Whittaker (2006) suggestion and taking into account the tourism
traffic in the chosen study area, the study targeted 600 respondents to produce reliable results (Hair
et al., 2010). However, 823 questionnaires were received at the end of the study in August. Initially,
the survey sought to split the respondents into a quota of 400 locals and 200 international visitors.
Of the 670 usable questionnaires, 478 responses were recorded from domestic visitors and 192 from
international tourists. Having different data sizes for different groups of tourists can be found in the
tourism literature, Truong, Lenglet, and Mothe’s study (2018) being an example.
4.10.4 Data collection
The sample for the on-the-site survey was drawn using quota sampling (Bryman, 2016)
based on a quota attached to each respondent group (see section 4.10.3 above). As this study aims
to develop a scale for a lake destination brand experience, issues of generalizability and randomness
should not hamper the study (Otto & Ritchie, 1996). Quota sampling, a non-probability sampling
technique, ensures that the researcher subdivides the population into different strata in advance
based on issues such as age, employment, marital status and gender, based on the proportion of the
population being targeted (Segwick, 2012).
Questionnaires are the frequently used tools for data collection in field surveys and were,
thus, employed in this study (Stone, 1978). Questionnaires were used for operational and pragmatic
reasons to capture a large number of respondents than would be possible if using in-depth

104
interviews. According to Babbie (2016) and Creswell & Creswell (2018), the administration of
questionnaires is preferred because of the following reasons:
i. They are cheaper to administer
ii. They are faster to collect data from a large number of respondents
iii. They ensure respondents anonymity
iv. Since questions are structured, it is because easier to code and analyse the answers
v. They reduce interviewer bias
vi. They reduce data collection time
Structured questions were used for easy data analysis with Statistical Package for Social
Sciences (SPSS) (Bryman, 2016). The questionnaires also carried items on satisfaction and future
intention (pro-environmental behaviours) to ascertain whether DBE leads to these post-
consumption behaviours. Additionally, the questionnaire included questions on tourist
demographics such as household income, marital status, age, gender, occupation, tourism trips in
the last 12 months, and trips made to Lake Malawi. These questions were included to help in
ascertaining whether the tourists’ characteristics have any impact on their evaluation of the DBE at
Lake Malawi.
4.10.5 Data analysis
As with the pilot survey data, the main survey followed the same procedure as explained in
section 4.9 above. Various data analysis tools, techniques and procedures were utilised to
extrapolate meanings and patterns from the data.
4.10.5.1 Exploratory data analysis
EFA is employed to explore the underlying structures of observed variables. It is used as
part of a scale development process to ensure that optimum fit of the items to their underlying

105
dimensions is achieved (Hair et al., 2010). Since this study aimed at developing a DBE
measurement scale, EFA was found suitable. Principal components method with varimax rotation
was employed to explore the factors underlying DBE dimensions (Worthington & Whittaker,
2006).
Hair et al. (2010) states that a sample size of 50 is the minimum requirement to run factor
analysis as long as the sample has enough observations and variables. This study employed 670
respondents of which 335 were used in EFA. For factor extraction, the study considered items with
Eigenvalues of 1.0 or higher and factor loadings of 0.4 or higher (Hair, Black, Babin, Anderson, &
Tatham, 2006) for further analysis (Tabachnick & Fidell, 2013). Bartlett test of Sphericity which
tests the factorability of the data and Kaiser-Mayer-Olkin (KMO) measure of sampling adequacy
was also assessed as presented in section 4.9 above.
4.10.5.2 Confirmatory Factor Analysis
For construct validation and to measure the latent structure of the scale produced after
running an EFA test, Confirmatory Factor Analysis (CFA) was conducted. CFA is advantageous in
that it deals with multiple relationships simultaneously (Kline, 2016). Estimates of the parameters
of the hypothesised model and the residual error variance of the observed variables were assessed.
CFA assesses the model fit and obtains measurement model estimates. Thus, the model fit was
examined by assessing the fit indices such as Root Mean Error Approximation (RMSEA),
Goodness-of-Fit Index (GFI), Chi-Square statistic, Comparative Fit Index (CFI) and Tucker-Lewis
Index (TLI) as proposed by Hair et al. (2010) and Kline (2016).
4.10.5.3 Validity and reliability check
Validity assessment was done to identify whether the developed scale was valid. Several
validity tests have been outlined in the literature, including construct validity, content validity,

106
discriminant and convergent validity. The study employed both convergent and discriminant
validity analyses using CFA. Hair et al. (1998) states that construct validity is the degree to which
two measures of the same concept are correlated whereas convergent validity estimates t-tests
significance of the factor loadings. Convergent validity is supported when the average variance
extracted (AVE) exceed the 0.5 threshold whereas discriminant validity is supported when the
factor loadings for the indicators are significant (Bagozzi & Yi, 2012; Hair et al., 2010). When AVE
for the constructs is greater than the squared correlation coefficients, discriminant validity is upheld.
Cronbach alpha test was conducted to evaluate the composite reliability for the DBE scale domains
which is supposed to be above 0.6 or above (Nunnally, 1978; Tabachnick & Fidell, 2013).
4.10.5.4 Modelling
Modelling was conducted using version 25 of A Moment Structures (AMOS) software. It
is a statistical analysis that combines multivariate procedures such as factor analysis, regression,
discriminant analysis etc. through path diagram and matrix equations. Modelling was useful in
testing measurement, functional and predictive research hypotheses (Bagozzi & Yi, 2012).
Modelling enables researchers to assess latent variables and the interrelationship among variables
in a model (Hair, Sarstedt, Ringle, & Mena, 2012).
The study employed path analysis, using modelling, to examine the conceptual model and
to test the theoretical and measurement assumptions (Hair et al., 2010). As the study employs both
exogenous (independent) and endogenous (dependent) variables as well as latent and observed
variables, modelling was deemed appropriate as it facilitates the analysis of multiple layer
relationships between the variables. Modelling was also used to analyse and compare alternative
models, enabling a study to assess the relative model fit (Bollen, 1989; D. Kaplan, 2000). Maximum
likelihood parameter estimates (MLE) and correlation matrix were used to derive parameter
estimates in modelling. MLE is a commonly used estimate technique as it minimizes fit functions

107
and validates the composition of observed variables drawn from one population. MLE analyses all
estimates of model parameters at once and its fit function is related to the differences between the
sample covariance and the study’s proposed model (Hair et al., 2010; Kline, 2001).
4.10.5.5 Independent Samples T-test
To understand the differences between the two tourists groups (domestic and
international), an independent samples t-test was done to compare means across the DBE
dimensions. An item mean comparison was undertaken to evaluate how the two groups rated
various DBE items and dimensions.
4.11 Summary research design
Figure 4. 2 Research design
Source: Authors illustration
•Conceptualising brand and tourism experiences
•Setting research problem
•Developing research hypotheses/problem
Phase 1
•Interviews with Tourism experts, tourists, locals for tourism experience scale item generation
•Literature review
Phase 2: Qualitative method
•Questionnaire design
•Data collection
•Exploratory Factor Analysis
Phase 3: Quantitative method
•Confirmatory factor Analysis
•Modelling
•Independent samples t-test
Research results

108
4.12 Research ethics
Since this study involved human subjects, research ethics were strictly adhered to. There are
four ethical areas of concern in any research (Diener & Crandall, 1978):
i. Seeking respondents’ consent before commencing the study
ii. Causing no harm to respondents. This could be physical or psychological by for example
asking respondents a sensitive question that reminds them a painful event
iii. Not invading their privacy i.e. by asking questions on respondents’ attitudes or behaviours
that could be embarrassing
iv. Not deceiving respondents. Researchers need to pursue methods of inquiry that do not
deceive or infringe on human values (Bryman, 2016).
To overcome these ethical concerns, the study ensured confidentiality through respondents’
anonymity. Furthermore, the Hong Kong Polytechnic University’s research office checklist was
completed before the data collection exercise. The researcher obtained ethics approval from the
Human Subjects Ethics Sub-Committee (HSESC) of the Hong Kong Polytechnic University
Research Office, application number HSEARS20181219002 (see Appendix 2). Respondents were
briefed on the nature of the study, its purpose and the types of questions to be asked. No respondent
was forced to take part in the study if s/he declined.
Since the study was done in Malawi, the researcher also sought ethics approval from the
National Committee on Research in the Social Sciences and Humanities (NCRSSH). This body
issued the researcher an introductory letter to present to tourists and authorities when asked for it
as it is illegal to collect data in Malawi without the authorisation of NCRSSH (see Appendices 3
and 4).

109
4.13 Summary
The chapter has submitted the methodological procedures of the study. It explained the
study’s setting, design and the development of the survey instrument. It also explained how the
measurement scale was developed based on an extensive literature review and a qualitative study.
Further, the chapter explicated the sampling design and techniques employed in data collection and
discussed the pilot study and data analysis methods.

110
CHAPTER FIVE: RESEARCH FINDINGS
“If you torture the data long enough, it will confess”
(Coase 1994, p.27)
5.1 Introduction
The following sections document the major findings of the thesis. It covers issues of data
processing, descriptive analysis of the survey respondents, measurement scale reliability and
construct and model validity. The chapter also presents the results of both the EFA and CFA,
followed by a hypothesised model testing.
5.2 Data screening
5.2.1 Missing data and outliers
To avoid multivariate data analysis problems that can arise from missing data (Kline, 2016),
surveys with missing data that accounted for more than 20% per indicator were removed from
further analysis. Of the 823 collected surveys, 153 were deleted for missing significant data. Box
plots in SPSS and descriptive analysis were used to detect such anomalies. The final completed
surveys available for further analysis were 670.
5.2.2 Normality test
Before data were analysed, a normality test was conducted to ascertain the normality of the
dataset, a prerequisite step before model analysis (Hair et al., 2010). Using kurtosis and skewness
analyses, data were tested for normality, noting that skewness at around +1 indicates normal
distribution (Doane & Seward, 2011; Kline, 2016). However, Field (2009) and Trochim and
Donnelly (2006) posit that skewness and kurtosis values of between ±2 are acceptable. Agreeing
with these scholars, Brown (2006) states that for modelling, skewness indices falling between ±3

111
and kurtosis indices falling between ±10 are acceptable. Given that the dataset used in the current
study is larger than 500 samples, obtaining a statistically significant non-normality data was highly
impossible; yet, histograms showed that data were normal.
For this study, data were slightly negatively skewed as most scores were higher than the
mean score. Furthermore, positive kurtosis scores indicate that the data has heavy tails and a high
peak, as opposed to a normally distributed data and the opposite, is true with negative kurtosis
scores. In this regard, Brown (2006) and Kline (2011, 2016) argue that skewness scores of less than
three are acceptable. In this study, skewness indices were within acceptable levels of 0.28 and 1.93
whereas kurtosis scores are of an acceptable range from 0.01 to 5.90 (Brown, 2006). However, five
items were removed from further analysis based on their kurtosis values. They include: “LM gives
me an enjoyable experience”, which had kurtosis value of 5.09; “Lying on LM beaches relaxes
me”, with a kurtosis of 4.09; “LM atmosphere is relaxing”, which had a kurtosis value of 3.95;
“Sunrise and sunsets over LM are exciting”, with a kurtosis value of 4.32, and “I will tell others on
the need care for LM”, with a kurtosis of 5.38. Refer to Appendix 13 for detailed descriptive
statistics results.
5.3 Descriptive results of the study respondents
5.3.1 Demographics of the study respondents
The study employed seven respondent socio-demographic variables namely: age, marital
status, highest education qualification, gender, nationality, occupation and annual household
income (see Table 5.1). There were more females than males (51.8%), 54.8% were married and the
age range was between 26 to 35 years old (47%), followed by 36 to 45 years (22.1%). Regarding
the level of education, 32.8% had college degrees, followed by undergraduate degrees (31.3%).
Regarding occupation, company employees constituted 26.8% of the sample, followed by civil
servants (20.8%) and the self-employed (17.3%). Regarding nationality, 72.7% were Malawians

112
and of the 172 international tourists, British citizens constituted the majority (4.5%) followed by
Italians (2.4%). Eleven respondents did not specify their nationalities. The income category of
US$100, 000 or above was common (20.8%), followed by the income bracket of less than US$10,
000 (14.5%) among international tourists. For the domestic respondents, the income bracket of
MK701, 000 or above was the most prevalent (53.7%), followed by MK401, 000 – MK500, 000
(6.2%).
Table 5. 1Respondents’ demographics in the main survey (N=670)
Variable Category Frequency Percentage
Gender Female 339 51.8
Male 315 48
Other 1 0.2
Marital status Single 268 41
Married 367 56.1
Others 19 2.9
Age 18-25 122 18.9
26-35 304 47
36-45 143 22.1
46-55 44 6.8
56-65 21 3.2
66 or above 13 2
Education Primary 2 0.3
Secondary/ High School 108 16.5
College degree 215 32.8
Undergraduate degree 205 31.3
Master degree 106 16.2
Doctorate degree 18 2.8
Occupation Company employee 175 26.8
Self-employed 113 17.3
Civil servant 136 20.8
Retired 24 3.7
Student 90 13.8
Housewife 20 3.1
Parastatal employees 45 6.9
Other 50 7.7
Nationality Malawian 483 72.7
British 30 4.5
Italian 16 2.4

113
American 13 1.9
Zambian 11 1.6
German 10 1.5
Other (Africa) 36 4.5
Other (Non- African) 55 7.5
Household income
Less than US$10, 000 25 3.7
(International tourists) US$ 10, 000-19, 999 10 1.5
US$ 20, 000-29, 999 10 1.5
US$ 30, 000-39, 999 6 0.9
US$ 40, 000-49, 999 11 1.6
US$ 50, 000-59, 999 10 1.5
US$ 60, 000-69, 999 14 2.1
US$ 70, 000-79, 999 14 2.1
US$ 80, 000-89, 000 16 2.4
US$ 90, 000-99, 000 21 3.1
US$100, 000 or above 36 5.4
(Domestic visitors) Less than MK50,000 26 3.9
MK51, 000-99, 999 22 3.3
MK100, 000- 149, 999 26 3.9
MK150, 000-199, 999 28 4.2
MK200, 000- 249, 999 22 3.3
MK250, 000-299, 999 18 2.7
MK300,000 – MK400, 000 25 3.7
MK401, 000-MK500, 000 32 4.8
MK501, 000 – MK600,000 22 3.3
MK 601, 000 –MK700,000 20 3
MK701, 000 or above 279 41.6 N.B: 1US$ = 720 Malawi Kwacha at the time of data collection in 2019
5.3.2 Travel related information of the survey respondents
Respondents were asked two travel-related questions: number of tourism trips (both
domestic and international) made in the past 12 months and number of tourism trips made to Lake
Malawi, including the current trip. Results are presented in Table 5.2.

114
Table 5. 2 Respondents’ travel information (N=670)
Travel information Count Frequency Percentage
Tourism trips in the past 12
months including this one 1-2 307 50.8
3-5 201 33.3
6-10 69 11.4
11-20 26 4.3
21-40 1 0.2
Lake Malawi visits including
this one 1-2 131 23.1
3-5 112 19.8
6-10 107 18.9
11-20 117 20.7
21-40 71 12.5
41 and above 28 4.9
5.4 Cross-validation of data
Cross-validation of data is used to evaluate whether the results of statistical analysis can be
generalised to an independent dataset to estimate the predictive model’s performance. In cross-
validation, in most cases, the dataset is split into two equal parts as the use of large samples in
structural model analyses makes it challenging for researchers to replicate such studies (DeVellis,
2016; Hair et al., 2010; Kline, 2016). Thus, the sample dataset was randomly split into two halves
of 335 cases each using SPSS. EFA was performed on the first 335 sample-units dataset to explore
the fundamental DBE dimensions and to reduce the number of measurement items for destination
brand experiences. CFA was conducted on the remaining dataset (N=335).
5.4.1 EFA of the destination brand experience model (N=335)
Principal components with varimax rotation was used to explore the principal factors for
the destination brand experience scale of Lake Malawi. The study considered factor loadings of
more than 0.40 as suitable (Stevens, 2002) whereas eigenvalues were pegged at 1.0 or higher. A
scree plot was inspected to determine factors and only those above the elbow were considered.

115
After running and re-running the EFA tests, 31 items failed to qualify for inclusion on the
DBE scale. Table 5.3 presents the results of the factor analysis. In all, six domains with a total of
23 items, as presented in Table 5.3, were as follows: (1) interpersonal/social, (2) spiritual/psychic,
(3) bodily/sensory, (4) expressive/emotional, (5) action/behavioural and (6) perceptive/cognitive.
Each factor had at least three or more items which is a recommended threshold for further
exploration (Gorsuch, 1997; Tabachnick & Fidell, 2013). The six-factor model explained 64.44%
of the variance. The result of Bartlett’s Test of Sphericity was 6119.264 (df = 253, p=0.000) whereas
Kaiser-Meyer-Olkin Measure of sampling adequacy was 0.89. Furthermore, the communalities
were between 0.48 to 0.78, indicating that the domains accounted for 48% to 78% of the variance.
The reliability Cronbach’s alpha for the six domains were above the minimum recommended
threshold of 0.70 except for Action/Behavioural DBE factor which had an acceptable Cronbach’s
alpha of 0.68 (Tabachnick & Fidell, 2007).
Table 5. 3 EFA results on the destination brand experiences of Lake Malawi (N=335)
Domains Communality
Factor
loading
Item
Mean
Domain 1: Relational/social DBE (Eigenvalue=6.86, Variance
explained= 29.81, Cronbach’s α= .85, Grand mean= 4.19)
(Social 3) LM allows me to interact with local people 0.65 0.80 4.22
(Social 7) LM allows me to experience the friendliness of local
people 0.69 0.80 4.19
(Social 5) LM allows me to learn about the local ‘ way of life 0.65 0.76 4.06
(Social 2) Being at LM helps me interact with others 0.61 0.75 4.31
(Social 6) LM allows me to participate in activities with other
people 0.59 0.71 4.17
Domain 2: Spiritual/Psychic DBE (Eigenvalue= 2.72, Variance
explained= 11.83, Cronbach’s α= .83, Grand mean= 3.50)
(Spiritual 4) LM has spiritual revitalising powers 0.75 0.84 3.31
(Spiritual 2) LM draws me away from the secular 0.60 0.76 3.26
(Spiritual 5) LM offers me solitude 0.63 0.74 3.59
(Spiritual 6) LM gives me spiritual awareness 0.57 0.70 3.36
(Spiritual 3) LM reunites me with mother nature 0.56 0.61 3.98
Domain 3: Expressive/emotional DBE (Eigenvalue= 1.61, Variance
explained= 6.99, Cronbach’s α= .80, Grand mean= 4.02)
(Expressive 6) LM gives positive feelings 0.68 0.75 4.26
(Expressive 5) LM makes me happy 0.64 0.74 4.26

116
(Expressive 1) LM has a positive effect on how I feel about
myself 0.64 0.73 3.80
(Expressive 2) LM induces feelings and sentiments 0.63 0.72 3.77
Domain 4: Bodily/Sensory DBE (Eigenvalue= 1.39, Variance
explained= 6.05, Cronbach’s α= .76, Grand mean= 4.20)
(Bodily 5) LM waters stimulates my senses 0.78 0.79 4.09
(Bodily 6) LM appeals to my senses 0.77 0.78 4.08
(Bodily 4) LM allows me to take in the beauty of the place 0.61 0.63 4.42
Domain 5: Action/behavioural DBE (Eigenvalue= 1.15, Variance
explained= 5.00, Cronbach’s α= .68, Grand mean= 3.70)
(Action 9) LM is action (water-based sports) oriented 0.68 0.81 3.60
(Action 8) Physical experiences at LM keep me fit 0.68 0.79 3.74
(Action 3) LM makes me engage in physical actions and
behaviours 0.48 0.66 3.74
Domain 6: Perceptive/cognitive DBE (Eigenvalue= 1.10, Variance
explained= 4.76, Cronbach’s α= .70, Grand mean= 3.78)
(Cognitive 5) LM stimulates curiosity and problem solving 0.75 0.76 3.65
(Cognitive 6) I engage in a lot of thinking when I am at LM 0.62 0.70 3.75
(Cognitive 4) I gain new knowledge at LM 0.58 0.63 3.94
LM = Lake Malawi
Following this exercise, an EFA was done on the two dependent variables of satisfaction
and future intention (pro-environmental behaviours). One item on pro-environmental behaviours
(“I will tell others on the need to care for Lake Malawi”) was deleted and two factors were extracted,
depicting low and high-effort intentions consistent with the literature (Ramkissoon et al., 2013a,
2013b). KMO was 0.89 and Bartlett’s test of Sphericity was 0.84 (df =28, p=0.000). The first
domain was termed “high-effort intentions” and it had four items. The factor explains 42.64% of
the total variance. The second domain termed “Low-effort intentions” had four items explaining
15.48 % of the variance.
Satisfaction generated a single- factor solution with seven items and an eigenvalue of 4.06.
The KMO value of 0.78 and Bartlett’s Test of Sphericity value of 2190.86 (df =21, p=0.000) were
attained. The factor had an alpha value of 0.87 and a mean value of 4.54, which indicates that the
data were internally consistent. The dimension explained 58.02% of the variance. EFA results are
presented in Table 5.4.

117
Table 5. 4 EFA results on satisfaction and pro-environmental behaviours (N=335)
Domains and items Communality
Factor
loading
Item
Mean
Satisfaction (Eigenvalue= 4.06, Variance explained= 58.02,
Cronbach’s α= .87, Grand mean= 4.54)
(Satis 2) I am delighted with LM experiences 0.67 0.82 4.61
(Satis 3) Coming to LM was a good choice 0.65 0.81 4.62
(Satis 6) I enjoyed myself at LM 0.63 0.80 4.58
(Satis 4) My experience at LM was what I needed 0.59 0.77 4.46
(Satis 7) Overall, I am satisfied with my decision to visit LM 0.56 0.75 4.60
(Satis 1) I am pleased to have visited LM 0.52 0.72 4.64
(Satis 5) The visit to LM exceeded my expectations 0.45 0.67 4.27
Pro-environmental behavioural intentions High-effort intentions (Eigenvalue= 3.34, Variance explained=
41.76, Cronbach’s α= .84 Grand mean= 4.10)
(Intent 5) I will volunteer my time to projects that help this lake 0.64 0.78 4.16
(Intent 6) I will write letters in support of this lake 0.74 0.84 4.16
(Intent 7) I will participate in public meetings about managing
this lake 0.75 0.86 4.18
(Intent 8) I will make a financial donation to an environmental
organization in support of this lake 0.57 0.74 3.88
Low-effort intentions (Eigenvalue= 1.28, Variance explained=
16.02, Cronbach’s α= .60, Grand mean= 3.82)
(Intent 1) I volunteer to avoid visiting some areas along the lake
if they need to recover from environmental damage 0.48 0.68 4.05
(Intent 2) I will sign petitions against oil drilling in support of
this lake 0.43 0.62 4.13
(Intent 3) I will tell my friends not to feed fish in LM 0.57 0.75 3.40
(Intent 4) I will pay increased fees if introduced at Lake Malawi
National Park 0.45 0.54 3.70
LM= Lake Malawi
5.5 CFA of the destination brand experience model (N=335)
The study employed CFA to analyse the measurement model using the second sample
(n=335). CFA was used to confirm the underlying dimensions in the first sample. Generally, CFA
is used to ascertain model. Various model fit indices were applied to determine model fitness which
included root mean square error approximation (RMSEA), which indicates the deviation between
the observed correlation and the reproduced correlation. According to Kline (2011), the RMSEA
indices – also known as “badness of fit” – has to be lower than 0.05 for a good fit to be obtained.

118
However, for RMSEA, values of between 0.05 and 0.08 are also “acceptable”. The closeness of fit
index (P-close), whose threshold should be greater than 0.05, was also explored.
Other fit indices are the normed chi-square (X2 /df statistic) which assesses the statistical
significance of the model by comparing how the measurement and the structural model predicts the
observed variance matrix. X2/df values of between 1 and 5 are recommended although those
between 1 and 3 are ideal (Hu & Bentler, 1999). However, it should be noted that this statistic might
be significant when dealing with larger samples. Tucker-Lewis Index (TLI) and comparative fit
index (CFI) were also explored. The rule of thumb is that values greater than or equal to 0.90
indicate a good model fit for both CFI and TLI (Hair et al., 2010; Kline, 2011). Finally, the goodness
of fit index (GFI) was explored. GFI compares the squared residuals of the prediction model and
the actual data model. Indices greater than 0.90 represent a good model fit. All AVE values for the
constructs were above 0.50, thereby indicating convergent validity. Using the Heterotrait-monotrait
ratio of correlations (HTMT), discriminant validity was passed as no correlation between
exogenous constructs exceeded 0.85 (Kline, 2011). Furthermore, all-composite reliability values
were higher than 0.70. Table 5.5 presents the findings of the CFA analysis.

119
Table 5. 5 CFA results of the measurement model (N=335)
Construct Item Estimate S.E t-
value
p-
value
Standardised
factor
loading
AV
E
C.R
Social/
Interpersonal
DBE
Social5 1.00 0.83
Social7 0.97 0.06 15.50 *** 0.80
Social6 0.86 0.06 13.71 *** 0.72 0.54 0.86
Social3 0.83 0.06 13.11 *** 0.70
Social2 0.73 0.06 11.40 *** 0.62
Spiritual/
Psychic DBE
Spiritual5 1.00 0.75
Spiritual4 1.14 0.08 13.56 *** 0.79
Spiritual3 0.86 0.07 12.07 *** 0.70 0.50 0.83
Spiritual2 0.93 0.08 11.02 *** 0.64
Spiritual6 0.95 0.09 11.19 *** 0.65
Emotional/
Expressive
DBE
Emot6 1.00 0.77
Emot5 1.05 0.09 11.77 *** 0.71
Emot2 1.21 0.10 11.66 *** 0.71 0.51 0.81
Emot1 1.13 0.10 10.98 *** 0.67
Action/
Behavioural
DBE
Action9 1.00 0.60
Action3 1.03 0.20 5.14 *** 0.91 0.56 0.78
Action8 1.46 0.26 5.64 *** 0.68
Perceptive/
Cognitive
DBE
Cogn4 1.00 0.66
Cogn6 1.22 0.14 8.79 *** 0.70 0.51 0.76
Cogn5 1.28 0.13 9.70 *** 0.78
Bodily/
Sensory
DBE
Sensory4 1.00 0.47
Sensory5 2.05 0.26 7.98 *** 0.81 0.51 0.75
Sensory6 2.01 0.25 7.98 *** 0.81
Note: AVE = (∑standardized factor loading2)/ [(∑standardized factor loading2) + ∑measurement
error].
S.E = Standard error
AVE = Average variance extracted
C.R. =Composite reliability
***p<0.001
One item from the EFA stage, sensory 3 “Lake Malawi animals are appealing to watch”,
was deleted to improve the model fit. As shown in Table 5.6, the results of the CFA using the
second half of the data (N=335) gives a statistical level of fit support for the overall sample indices
except for chi-square (χ2 =428.65, df=211, p=0.000). For instance, all factor loadings were above
the 0.40 threshold (Stevens, 2002) and they ranged from 0.47 to 0.91. The RMSEA indicated a

120
good fit with a value of less than 0.08 at 0.056. The normed chi-square was within the acceptable
threshold (x2 /df = 2.03). Given that chi-square is sensitive to sample size, the following fit indices
confirmed the suitability of the measurement model- CFI (0.93), TLI (0.92) and GFI (0.90). All
AVEs were above the 0.50 threshold and were higher than the squared multiple correlations. The
composite reliability of all factors exceeded the cut-off point of 0.7 and they ranged from 0.75 to
0.86. Using the Heterotrait-monotrait ratio of correlations (HTMT), discriminant validity was
passed as no correlation between exogenous constructs exceeded 0.85 (Kline, 2011). Thus, both
discriminant and convergent reliability tests were passed. Table 5.6 presents the results of the
reliability tests.
Table 5. 6 AVE, CR, MSV and correlations on the destination brand experience scale
CR AVE MSV Relational Psychic Emotional Bodily Action Perceptive
Relational 0.86 0.54 0.22 0.74
Psychic 0.83 0.50 0.30 0.24*** 0.71
Emotional 0.81 0.51 0.36 0.43*** 0.55*** 0.72
Bodily 0.75 0.51 0.34 0.38*** 0.50*** 0.58*** 0.72
Action 0.78 0.56 0.14 0.37*** 0.22** 0.36*** 0.19** 0.75
Perceptive 0.76 0.51 0.36 0.47*** 0.52*** 0.60*** 0.53*** 0.33*** 0.72
Mean 4.19 3.50 4.02 4.20 3.70 3.78
Std. dev 0.67 0.90 0.76 0.71 0.78 0.81
** Correlation is significant at p < 0.01
*** Correlation is significant at p < 0.001
5.6 CFA of the measurement model including dependent variables (N = 335)
Using the second half of the dataset (N=335), the measurement model was tested following
the cross-validation process. CFA was performed to confirm the underlying DBE dimensions and
the items were extracted during the EFA stage. All six independent variables (relational/social,
spiritual/psychic, action/behavioural, bodily/sensory, perceptive/cognitive and
expressive/emotional) and the two dependent variables (satisfaction and pro-environmental

121
behaviours) were measured as first-order factors. The CFA fit indices results support the
measurement model statistical level of fit except for chi-square (χ2 =712.29, df = 424, p=0.000).
For instance, all factor loadings were above the 0.40 threshold (Stevens, 2002) and they ranged
from 0.63 to 0.85. The RMSEA indicated a good fit with a value of less than 0.08 at 0.045 and a P-
close value of 0.92. The normed chi-square was within the acceptable threshold (x2 /df = 1.68).
Given that chi-square is sensitive to sample size, the following fit indices confirmed the suitability
of the measurement model – GFI (0.88), TLI (0.93), and CFI (0.94) – and indicated an acceptable
model fit. All AVEs were above the 0.50 threshold and were higher than the squared multiple
correlations. The square root of the AVE on the diagonal lane was higher than the corresponding
latent construct correlations (Hair et al., 2010), supporting discriminant validity. The composite
reliability of all factors exceeded the cut-off point of 0.70 and they ranged from 0.76 to 0.86. Thus,
both discriminant and convergent reliability tests were passed. Table 5.7 presents reliability test
results.

122
Table 5. 7 CFA of the measurement model with dependent variables (N=335)
Construct Item Estimate S.E. t-value p-
value
Std. factor
Loadings AVE CR
Relational/social
DBE
Social5 1.00 0.82
Social7 0.97 0.06 15.11 *** 0.80
Social6 0.87 0.06 13.71 *** 0.72 0.54 0.85
Social3 0.83 0.07 12.37 *** 0.69
Social2 0.74 0.06 11.57 *** 0.63
Spiritual/psychic
DBE
Spiritual5 1.00 0.75
Spiritual4 1.15 0.09 13.55 *** 0.79
Spiritual3 0.87 0.07 12.08 *** 0.70 0.50 0.83
Spiritual2 0.93 0.09 10.96 *** 0.64
Spiritual6 0.95 0.09 11.57 *** 0.65
Expressive/emoti
onal DBE
Emot6 1.00 0.79
Emot5 1.03 0.08 12.27 *** 0.71 0.51 0.80
Emot2 1.14 0.10 11.69 *** 0.69
Emot1 1.07 0.10 11.05 *** 0.65
Bodily/sensory
DBE
Sensory4 1.00 0.83
Sensory5 1.20 0.14 8.87 *** 0.82 0.67 0.86
Sensory6 1.15 0.14 8.35 *** 0.81
Action/behaviou
ral DBE
Behav9 1.00 0.61
Behav8 1.43 0.24 5.88 *** 0.91 0.55 0.78
Behav3 1.01 0.19 5.31 *** 0.67
Perceptive/cogni
tive DBE
Cogn4 1.00 0.67
Cogn6 1.21 0.14 8.84 *** 0.71 0.52 0.76
Cogn5 1.23 0.13 9.62 *** 0.77
Satisfaction
Satis1 1.00 0.71
Satis2 1.02 0.08 12.21 *** 0.78
Satis3 0.98 0.09 10.74 *** 0.73 0.55 0.86
Satis4 1.22 0.12 10.50 *** 0.80
Satis6 0.83 0.08 9.91 *** 0.68
Pro-
environmental
behavioural
intentions
Intent5 1.00 0.63
Intent6 1.27 0.11 11.48 *** 0.85
Intent7 1.34 0.12 11.11 *** 0.79 0.55 0.83
Intent8 1.44 0.14 10.06 *** 0.68
*** Correlation is significant at p < 0.001

123
Table 5. 8 Correlation results, mean and standard deviations of the measurement model (N=335)
Note: (1) Relational/social, (2) Spiritual/psychic, (3) Expressive/emotional, (4) Bodily/sensory, (5)
Action/behavioural, (6) Perceptive/cognitive, (7) Satisfaction, (8) Pro-environmental intention
** Correlation is significant at p < 0.01
*** Correlation is significant at p < 0.001
5.7 Modelling (n=670)
Modelling was conducted to test the conceptual model. The study used a maximum
likelihood estimation method to test the parameters in the conceptual model as stated in Chapter 3
(see Figure 5.1) Goodness-of-fit was conducted before proceeding with hypothesis testing. The
Chi-square statistic ((χ2 =45, df = 28, p=0.000) showed a poor fit due to its susceptibility to large
samples. However, the Normed Chi-square value was within the recommended range of 1 to 3 at
2.36. Other fit indices also supported the conceptual model as follows: GFI = 0.99, TLI= 0.99,
CFI=0.99, RMSEA =0.031 and p-close =0.98 (Hair et al., 2010).
Furthermore, data were checked for multicollinearity between the independent variables
(DBEs) and the dependent variable (satisfaction). According to Hair et al. (2010), if the VIF score
Construct CR AVE (1) (2) (3) (4) (5) (6) (7) (8)
(1) 0.85 0.54 0.74
(2) 0.83 0.50 0.25*** 0.71
(3) 0.80 0.51 0.44*** 0.53*** 0.71
(4) 0.86 0.67 0.43*** 0.41*** 0.54*** 0.82
(5) 0.78 0.55 0.38*** 0.22** 0.37*** 0.19** 0.74
(6) 0.76 0.52 0.48*** 0.52*** 0.60*** 0.41*** 0.33*** 0.72
(7) 0.86 0.55 0.50*** 0.35*** 0.56*** 0.59*** 0.17* 0.36*** 0.74
(8) 0.83 0.55 0.34*** 0.35*** 0.30*** 0.39*** 0.21** 0.35*** 0.38*** 0.74
Mean 4.19 3.50 4.02 4.20 3.70 3.78 4.58 4.10
Std. dev. 0.67 0.90 0.76 0.71 0.78 0.81 0.47 0.77

124
exceeds four and tolerance value is less than 0.2, there could be possible problems with
multicollinearity. Multicollinearity diagnosis was not prevalent in the data as the lowest tolerance
value was 0.43 and the highest VIF score was 2.33, both on Spiritual/Psychic DBE.
Figure 5. 1 Conceptual model
5.8 Hypotheses testing
Three hypotheses were tested. Hypothesis 1 was divided into six sub- hypotheses based on
the six DBE dimensions extracted at the EFA stage. These hypotheses examined the direct influence
of DBE on satisfaction and future intentions (pro-environmental behaviours). In total, thirteen direct
relationships were investigated between paths as presented in Table 5.9 and Table 5.11.
Furthermore, six mediated hypotheses were explored as presented in Table 5.14.
Hypothesis 1 proposes that DBE positively affect tourists’ satisfaction. The result revealed
that there is a statistically significant relationship between the two constructs (β=0.51, t=11.59, p<
H7
H4
H5
H6
DBE
Satisfaction
Pro
environmental
behaviours
H1 H
3
H2
Nationality

125
0.001). This means that tourists who enjoy DBEs are likely to be satisfied with the destination.
Therefore, the null hypothesis is rejected.
Hypothesis 2 proposes that DBE is likely to positively affect pro-environmental behaviours.
The result of the path coefficient was statistically significant (β=0.31, t=6.74, p< 0.001). This means
that tourists who encounter the lake destination brand experiences will have a favourable attitude
towards pro-environmental behaviours. Thus, the null hypothesis is rejected.
Hypothesis 3 postulates that satisfaction with Lake Malawi DBE would result in positive
pro-environmental behaviours. The result of the test revealed that the path coefficient was
statistically significant (β=0.26, t=5.18, p< 0.001). Consequently, tourists who are satisfied with
Lake Malawi are more likely to engage in PEB. Thus, the null hypothesis is rejected.
Table 5. 9 Results of the direct path modelling
Hypot
hesis Path
Standard
coefficient (β) t-value
p-
value
Null
hypothesis
H1 DBE → Satisfaction 0.51 11.59*** 0.001 Rejected
H2 DBE →
Pro-
environmental
behaviours
0.31 6.74*** 0.001 Rejected
H3 Satisfaction →
Pro-
environmental
behaviours 0.26 5.18*** 0.001 Rejected
*** significant at p<0.001(two-tailed)

126
Figure 5. 2 Results of the model (N=670)
5.8.1 Direct effects between DBE, satisfaction and pro-environmental behaviours
To determine which DBE items were important for tourists’ satisfaction and pro-
environmental behaviour, a first-order path model analysis was conducted. First, a model fit
analysis was conducted (see Table 5.10 for the results). Thereafter, the direct regression paths were
analysed among the eight constructs to test the three hypotheses listed in Chapter 3.
Table 5. 10 Model fit results
GFI CFI TLI CMIN DF CMIN/DF RMSEA PCLOSE
0.91 0.94 0.93 977.18 430 2.27 0.044 0.998
Hypothesis 1 was divided into six sub- hypotheses based on the six DBE dimensions
extracted at the EFA stage. These hypotheses examined the direct influence of DBE on satisfaction
and the effect of satisfaction on future intentions (pro-environmental behaviours). In total, seven
direct relationships were investigated between paths as presented in Table 5.12 and Figure 5.3.
H3 0.26***
H1 0.51***
DBE
Satisfaction
Pro-
environmental
behaviours
H2 0.31***

127
Hypothesis 1a proposes that relational/social DBE has a positive effect on tourists’
satisfaction with the destination. To test this hypothesis, the path coefficient between
relational/social DBE and satisfaction were examined. The result reveals that there is a statistically
significant relationship between the two constructs (β=0.33, t=6.35, p< 0.001). This means that
tourists who enjoy relational/social DBE are likely to be satisfied with the destination. Therefore,
the null hypothesis is rejected.
Hypothesis 1b postulates that spiritual/psychic DBE is positively related to tourists’
satisfaction with the destination. To test this hypothesis, the path coefficient between
spiritual/psychic DBE and satisfaction were examined. The result of the path coefficient was
insignificant (β=-0.04, t=-0.80, p> 0.05). This means that tourists who highly perceive
spiritual/psychic DBE do not necessarily get satisfied with the Lake Malawi destination brand.
Thus, the null hypothesis is not rejected.
Hypothesis 1c states that expressive/emotional DBE positively affects tourists’ satisfaction
with the Lake Malawi destination brand. To test this hypothesis, the path coefficient between
expressive/emotional DBE and satisfaction were examined. The path coefficient between
expressive/emotional DBE and satisfaction was tested and the results were significant (β=0.27,
t=4.43, p<0.001). Therefore, tourists who highly perceive expressive/emotional DBEs are likely to
be satisfied with the Lake Malawi destination brand. Therefore, the null hypothesis is rejected.
Hypothesis 1d postulates that bodily/sensory DBE is likely to positively affect tourists’
satisfaction with the destination. To test this hypothesis, the path coefficient between bodily/sensory
and satisfaction were examined and the results were statistically significant (β=0.37, t=5.89,
p<0.001). Thus, tourists who highly perceive bodily/sensory DBE are highly satisfied with Lake
Malawi destination brand. Thus, we reject the null hypothesis.

128
Hypothesis 1e states that action/behavioural DBEs are likely to positively affect tourists’
satisfaction with the Lake Malawi destination brand. To test this hypothesis, the path coefficient
between action/behavioural DBE and satisfaction were examined. The result showed that the path
coefficient for this hypothesis was statistically insignificant (β=-0.06, t=-1.29, p> 0.05). Thus,
tourists who highly seek action/behavioural destination brand experiences are not satisfied with the
destination brand experience. Thus, the null hypothesis is not rejected.
Hypothesis 1f proposes that perceptive/cognitive DBE is positively related to satisfaction
with the destination. To test this hypothesis, the path coefficient between perceptive/cognitive DBE
and satisfaction were examined. The results indicated that there is no statistically significant
relationship between the two (β=-0.10, t=-1.55, p> 0.05). Thus, tourists who highly seek
perceptive/cognitive DBE do not necessarily get satisfied with Lake Malawi. Thus, the null
hypothesis is not rejected.
Hypothesis 3 postulates that satisfaction with Lake Malawi DBE would result in positive
pro-environmental behaviours. To test this hypothesis, the path coefficient between satisfaction
DBE and PEB were examined. Results reveal a statistically significant path coefficient (β=0.45,
t=9.12, p< 0.001). Consequently, tourists who are satisfied with Lake Malawi are more likely to
participate in PEB. Thus, null hypothesis 2 is rejected.

129
Table 5. 11 Results of the structural modelling
Hypoth
esis Path
Standard
coefficient
(β)
t-value p-
value
Null
hypothesis
H1a Relational/social DBE → Satisfaction 0.33 6.35*** 0.001 Rejected
H1b Spiritual/psychic DBE → Satisfaction
-0.04 -0.80 0.422 Not
rejected
H1c Expressive/emotional
DBE
→ Satisfaction 0.27 4.43*** 0.001 Rejected
H1d Bodily/sensory DBE → Satisfaction 0.37 5.89*** 0.001 Rejected
H1e
Action/behavioural
DBE
→ Satisfaction -0.06 -1.29 0.198 Not
rejected
H1f
Perceptive/cognitive
DBE
→ Satisfaction -0.10 -1.55 0.122 Not
rejected
H3
Satisfaction
→
Pro-environmental
behavioural
intention
0.45 9.12*** 0.001 Rejected
Note: *** significant at 0.001(two tailed)

130
Figure 5. 3 Results of the DBE, satisfaction and pro-environmental behaviours modelling (N=670)
5.8.2 Direct effects between DBE and pro-environmental behaviours
Some research has measured the effect of DBE on loyalty as a future intention (Barnes et
al., 2014; Brakus et al., 2009; Nysveen et al., 2013) or intention to recommend (Barnes et al., 2014).
In the current study, the pro-environmental future intention was necessary given that lake
destinations can be fragile and can be adversely affected by tourists’ activities as it happened to
Maya Bay in Thailand. Furthermore, tourism activities are unsustainable in some cases as they harm
eco-systems, bring in litter, cause crowding, etc. Therefore, direct path effects were tested between
H3 0.45***
H1d 0.37***
H1e -0.06
H1c 0.27**
*
H1b -0.04
H1a 0.33***
H1f -0.10
Relational/
social DBE
Spiritual/
psychic DBE
Expressive/
emotional
DBE
Bodily/
sensory DBE
Behavioural
/action DBE
Perceptive/
cognitive
DBE
Satisfaction
Pro-
environmenta
l behaviours

131
the six DBE constructs and pro-environmental behaviours. The model fit results are presented in
Table 5.12.
Table 5. 12 Results of mediating model fit analysis
GFI CFI TLI CMIN DF CMIN/DF RMSEA PCLOSE
0.93 0.95 0.94 675.88 296 2.28 0.044 0.991
Hypothesis 2a proposes that relational/social DBE has a positive effect on tourists’ attitude
towards pro-environmental behaviours at the destination. To test this hypothesis, the path
coefficient between relational/social DBE and pro-environmental behaviours were examined. The
result revealed that there is a statistically significant relationship between the two constructs
(β=0.14, t=2.57, p< 0.01). This means that tourists who enjoy relational/social DBE are likely to
display pro-environmental behaviours at the destination. Therefore, the null hypothesis is rejected.
Hypothesis 2b postulates that spiritual/psychic DBE positively affects tourists’ pro-
environmental behaviours at the destination. To test this hypothesis, the path coefficient between
spiritual/psychic DBE and pro-environmental behaviours were examined. The result of the path
coefficient was insignificant (β=0.10, t=1.75, p> 0.05). This means that tourists who highly
perceive spiritual/psychic DBE are not likely to participate in PEB at Lake Malawi. Hence, the null
hypothesis is not rejected.
Hypothesis 2c states that expressive/emotional DBE positively affects tourists’ attitude
towards pro-environmental behaviours at Lake Malawi. The path coefficient between
expressive/emotional DBE and pro-environmental behaviours was tested and the results showed a
statistically insignificant relationship (β=0.05, t=0.68, p>0.05). Therefore, tourists who highly
perceive expressive/emotional DBEs will not necessarily engage in pro-environmental behaviours
at Lake Malawi. Hence, the null hypothesis is not rejected.

132
Hypothesis 2d postulates that bodily/sensory DBE is likely to positively affect tourists’ pro-
environmental behaviours at the destination. To test this hypothesis, the path coefficient between
bodily/sensory DBE and pro-environmental behaviours was examined. The path was found to be
statistically significant (β=0.26, t=4.12, p<0.001). Thus, tourists who highly perceive
bodily/sensory DBE are more likely to participate in PEB at Lake Malawi. Hence, the null
hypothesis is rejected.
Hypothesis 2e states that action/behavioural DBEs are likely to positively affect tourists’
pro-environmental behaviours at Lake Malawi. To test this hypothesis, the path coefficient between
action/behavioural DBE and pro-environmental behaviours were examined. The result was not
statistically insignificant (β=0.04, t=0.70, p> 0.05). Thus, tourists who highly seek
action/behavioural destination brand experiences will not necessarily engage in pro-environmental
behaviours. Therefore, the null hypothesis is not rejected.
Hypothesis 2f proposes that perceptive/cognitive DBE is positively related to tourists’ pro-
environmental behaviours at the destination. To test this hypothesis, the path coefficient between
perceptive/cognitive DBE and satisfaction was examined. The result indicated that there is no
statistically significant relationship between the two (β=0.51, t=0.73, p> 0.05). Thus, tourists who
highly seek perceptive/cognitive DBE do not necessarily display pro-environmental behaviours at
Lake Malawi. Therefore, the null hypothesis is not rejected. Results of these path analyses are
presented in Table 5.13 and Figure 5.4.

133
Table 5. 13 Results of the direct path between DBE and pro-environmental behaviours
Note: ** significant at 0.01
*** significant at 0.001
Hypoth
esis Path
Standard
coefficient
(β)
t-value p-
value
Null
hypothes
is
H2a Relational/social DBE →
Pro-environmental
behavioural
intention 0.14 2.57** 0.01 Rejected
H2b Spiritual/psychic DBE →
Pro-environmental
behavioural
intention 0.10 1.75 0.08
Not
rejected
H2c Expressive/emotional
DBE
→
Pro-environmental
behavioural
intention 0.05 0.68 0.49
Not
rejected
H2d Bodily/sensory DBE →
Pro-environmental
behavioural
intention 0.26 4.12*** 0.001 Rejected
H2e
Action/behavioural
DBE
→
Pro-environmental
behavioural
intention 0.04 0.70 0.49
Not
rejected
H2f
Perceptive/cognitive
DBE
→
Pro-environmental
behavioural
intention 0.05 0.73 0.46
Not
rejected

134
Figure 5. 4 Results of the DBE and pro-environmental behaviours model test (N=670)
H2d 0.26***
H2e 0.04
H2c 0.05
H2b 0.10
H2a 0.14**
H2f 0.05
Relational/
social DBE
Spiritual/
psychic DBE
Expressive/
emotional
DBE
Bodily/
sensory DBE
Behavioural
/action DBE
Perceptive/
cognitive
DBE
Pro-
environmenta
l behaviours
135
5.8.3 Indirect effect: satisfaction mediating the association between DBE and pro-
environmental behaviours
Following Iacobucci (2008) and Zhao, Lynch and Chen (2010) suggestion that SEM-based
mediation was superior to the Baron and Kenny method, the study used bootstrapping method in
Amos to test the mediating effect of satisfaction on the relationship between DBEs (predictor) and
PEB (dependent). By investigating the indirect and direct effects of satisfaction on the relationship
between DBEs and PEB, we analysed standard errors and 95% confidence intervals for statistical
significance. Researchers opine that bias-corrected bootstrapping is a powerful technique to identify
mediation in a model (Memon, Cheah, Ramayah, Ting, & Chuah, 2018). Thus, t-values greater than
1.96, p<0.05 is evidence for the presence mediation (Zhao et al., 2010). We thus ran a bootstrapping
procedure using 200 iterations to test the significance of the indicators and the coefficient paths of
the model. From the mediation analysis, results indicate that satisfaction fully mediates the
relationships between expressive/emotional DBE and PEB and between relational/social DBE and
PEB. For bodily/sensory DBE and PEB, partial mediation was observed whereas, for the
relationships between perceptive/cognitive DBE and PEB, action/behavioural DBE and PEB and
spiritual/psychic DBE and PEB, no mediation effect was found. Refer to Table 5.14 for details.
Results are interpreted following Zhao et al. (2010).
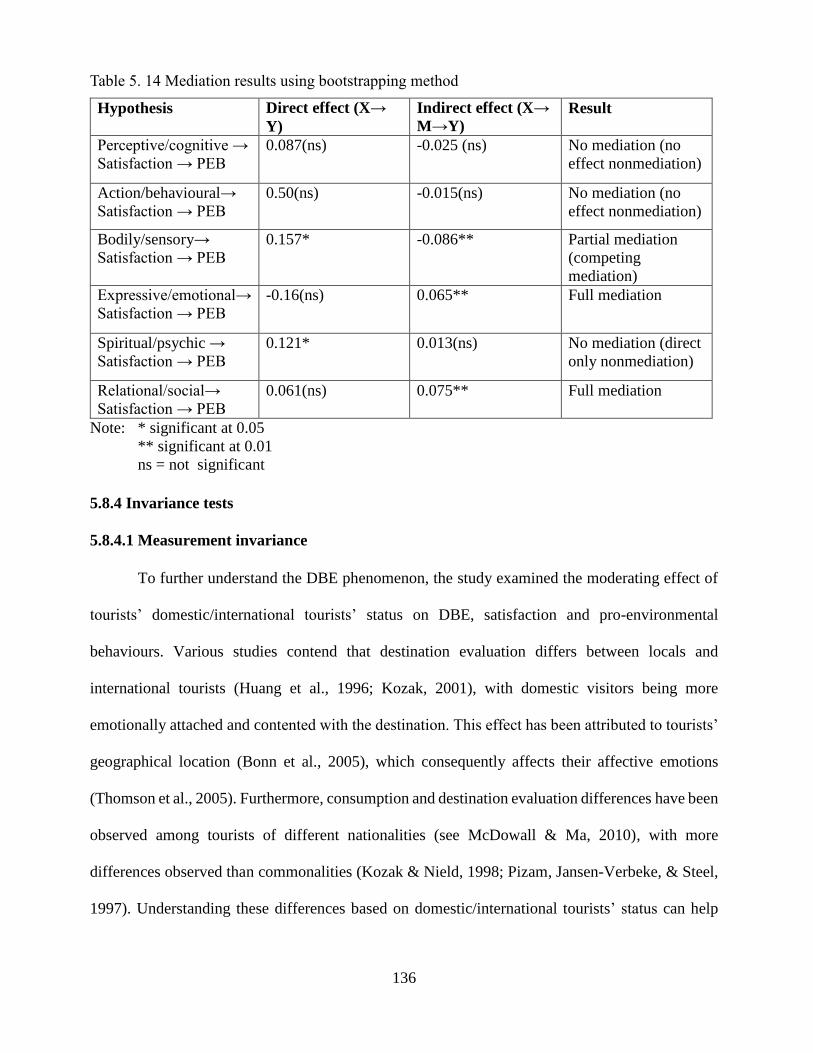
136
Table 5. 14 Mediation results using bootstrapping method
Hypothesis Direct effect (X→
Y)
Indirect effect (X→
M→Y)
Result
Perceptive/cognitive →
Satisfaction → PEB
0.087(ns) -0.025 (ns) No mediation (no
effect nonmediation)
Action/behavioural→
Satisfaction → PEB
0.50(ns) -0.015(ns) No mediation (no
effect nonmediation)
Bodily/sensory→
Satisfaction → PEB
0.157* -0.086** Partial mediation
(competing
mediation)
Expressive/emotional→
Satisfaction → PEB
-0.16(ns) 0.065** Full mediation
Spiritual/psychic →
Satisfaction → PEB
0.121* 0.013(ns) No mediation (direct
only nonmediation)
Relational/social→
Satisfaction → PEB
0.061(ns) 0.075** Full mediation
Note: * significant at 0.05
** significant at 0.01
ns = not significant
5.8.4 Invariance tests
5.8.4.1 Measurement invariance
To further understand the DBE phenomenon, the study examined the moderating effect of
tourists’ domestic/international tourists’ status on DBE, satisfaction and pro-environmental
behaviours. Various studies contend that destination evaluation differs between locals and
international tourists (Huang et al., 1996; Kozak, 2001), with domestic visitors being more
emotionally attached and contented with the destination. This effect has been attributed to tourists’
geographical location (Bonn et al., 2005), which consequently affects their affective emotions
(Thomson et al., 2005). Furthermore, consumption and destination evaluation differences have been
observed among tourists of different nationalities (see McDowall & Ma, 2010), with more
differences observed than commonalities (Kozak & Nield, 1998; Pizam, Jansen-Verbeke, & Steel,
1997). Understanding these differences based on domestic/international tourists’ status can help

137
DMOs to tailor experiences for each market segment, as satisfaction with a destination’s experience
can be affected by nationality (Yu & Goulden, 2006).
Consequently, respondents from Malawi were compared to respondents from other
countries. Before doing this, a measurement invariance test was done to ascertain whether the two
groups were indeed invariant. Specifically, a chi-square difference test was run to assess the
measurement invariance. The two models are said to be invariant if the chi-square does not show a
significant difference (Yoo, 2002). First, the study runs a non-restricted model invariance test using
CFA (measurement model invariance), the results of which are presented in Table 5.15.
The model fit test of the two groups indicates that the proposed model fits the data well.
Nonetheless, full metric invariance was not established as a significant chi-square different was
established between both the unconstrained (full metric) and the constrained model χ2 0.05 (848)
=1505.1 and χ2 0.05 (872) =1569.2, p=0.000, respectively. Although a full metric invariance was not
established, a partial invariance test can be acceptable in the event where a subset of parameters is
constrained to be equal (Yoo, 2002). Based on parameter changes and modification indices, the
constrained paths were released step-by-step. The study released seven paths that were found to be
significant while all other paths were constrained for the invariance test. The released items include:
relational/social 2, relational/social 3, expressive/emotional 1, expressive/emotional 2,
expressive/emotional 3, pro-environmental behaviour intention 7 and pro-environmental behaviour
intention 8. Finally, the invariance between the two groups was supported thus warranting structural
invariance analyses. Table 5.16 presents the test results

138
Table 5. 15 Measurement invariances for Malawian tourists (N=483) and International tourists
(N=172)
a. Chi-square test Δχ2 (df) > χ2 0.05 = 36.42; thus the full invariance model is not supported.
b. Chi-square test Δχ2 (df) > χ2 0.05 = 27.59; thus partial invariance model is supported.
5.8.4.2 Model invariance test
Following the direct path analysis, path invariance analysis was tested on the two groups by
running the two models (DBE, satisfaction and pro-environmental behaviours and DBE and pro-
environmental behaviours). Chi-square test with a constrained and unconstrained model was
performed. The difference was significant albeit indicating a partial metric invariance model
(restricted model χ2 0.05(891) = 1665.7 > unrestricted model χ2 0.05 (860) = 1569.7). These results
indicated that the paths between the Malawian tourists and the international group of tourists are
different, making it necessary for further investigations. Results are presented in Table 5.16.
Table 5. 16 Model invariances for Malawian tourists (N=483) and International tourists (N=172)
Groups Models χ2 df Δχ2/df GFI CFI TLI RMSEA
Malawian
tourists and
International
tourists
Partial metric
invariance 1594.6 877 0.87 0.92 0.91 0.035
Full metric
invariance of the
modelling model
(L(X)Y=IN) a 1628.79 884
34.19/
7 0.87 0.92 0.91 0.036
Note: a. Chi-square difference test Δχ2 (df) > χ2 0.05 (7) = 12.02: thus, the full path invariance
model is not supported and the paths between the two groups are different.
Groups Models χ2 df Δχ2/df GFI CFI TLI RMSEA
Malawian
tourists and
International
tourists
Non-restricted
model 1505.119 848 0.877 0.928 0.916 0.034
Full metric
invariance of the
measurement
model
(L(X)Y=IN)a 1569.24 872
64.12 /
24 0.872 0.924 0.913 0.035
Partial metric
invariance of the
CFA model b 1528.2 865
23.15 /
17 0.874 0.927 0.917 0.034

139
Following the partial invariance test, individual coefficient paths were analysed on the DBE,
satisfaction and pro-environmental model. Four of the seven coefficient paths indicated significant
chi-square differences namely relational/social to satisfaction, expressive/emotional to satisfaction,
perceptive/cognitive to satisfaction and from satisfaction to pro-environmental behaviours.
Therefore, the moderating role of domestic/international tourists’ status has partially been verified.
Hypothesis 5 and 7 are partially supported.
On the DBE and pro-environmental model, however, no structural path had a significant
chi-square difference for the two groups. Results of these path analyses are presented in Table 5.17
and Table 5.18.
Table 5. 17 DBE, satisfaction and PEB invariance test results
Hypothesis Path Malawian and International tourist group
ΔX2/df ΔX2/df
Free model 1594.6/877 1628.79/884
H1-1a Relation/social to satisfaction 1600.4/878 5.8/1**
H1-2a Spiritual/psychic to satisfaction 1595.8/878 1.2/1
H1-3a
Expressive/emotional to
satisfaction 1605.4/878 10.5/1****
H1-4a Bodily/sensory to satisfaction 1594.7/878 0.1/1
H1-5a
Action/behavioural to
satisfaction 1594.9/878 0.1/1
H1-6a
Perceptive/cognitive to
satisfaction 1604.3/878 9.7/1***
H3
Satisfaction to pro-
environmental behaviours 1597.6/878 3/1*
Note: * Δ X2/df> ΔX20.1(1) =2.701
** Δ X2/df> ΔX20.05(1) =3.841
*** Δ X2/df> ΔX20.01(1) =6.635
**** Δ X2/df> ΔX20.001(1) =10.83

140
Table 5. 18 DBE and pro-environmental behaviours model invariance test results
Hypothesis Path Malawian and international tourist group
ΔX2/df ΔX2/df
Free model 1100.81/605 1110.07/611
H2a
Relation/social to pro-
environmental behaviours 1103.37/606 2.56/1
H2b
Spiritual/psychic to pro-
environmental behaviours 1102.25/606 1.44/1
H2c
Expressive/emotional to pro-
environmental behaviours 1100.93/606 0.12/1
H2d
Bodily/sensory to pro-
environmental behaviours 1101.12/606 0.31/1
H2e
Action/behavioural to
satisfaction 1102.45/606 1.64/1
H2f
Perceptive/cognitive to pro-
environmental behaviours 1101.79/606 0.98/1
5.8.4.2.1 Modelling results of the Malawian and international tourists’ comparison
Modelling test was done on the two groups before conducting structural invariance tests,
the results of which are presented in the three tables below.
The model fit results for the Malawian dataset were good except for the Chi-square value
which was significant χ2 (430) = 910.36, p=0.000. Other model fit indices were as follows: CFI =
0.93, GFI = 0.89, TLI= 0.92, RMSEA = 0.048 and P-close = 0.755. Five coefficient paths were
significant out of the seven paths. The insignificant ones were spiritual/psychic to satisfaction and
action/behavioural to satisfaction. Of the five significant coefficient paths, perceptive/cognitive
coefficient path showed a negative coefficient value. Table 5.19 and Figure 5.5 depict the results.

141
Table 5. 19 Malawian tourists structural model results (N=483)
Hypothesis Path
Standard
coefficient
(β)
t-value p-value
Null
hypothesis
H1a Relational/social
DBE → Satisfaction 0.20 3.39*** 0.001
Rejected
H1b Spiritual/psychic
DBE →
Satisfaction 0.02 0.38 0.703
Not rejected
H1c
Expressive/emotiona
l DBE
→ Satisfaction 0.43 5.89*** 0.001
Rejected
H1d Bodily/sensory DBE → Satisfaction 0.41 5.84*** 0.001 Rejected
H1e
Action/behavioural
DBE
→ Satisfaction -0.02 -0.46 0.643
Not rejected
H1f
Perceptive/cognitive
DBE
→ Satisfaction -0.23 -3.06** 0.002 Rejected
H3
Satisfaction
→
Pro-
environmental
behaviours
0.48 8.33*** 0.001 Rejected
Note: ** significant at 0.01
*** significant at 0.001

142
Figure 5. 5 Malawian tourists’ path analysis results (N=483)
The direct path coefficient from DBE to pro-environmental behaviours for Malawian
tourists was also analysed in a separate model. The model fit analysis values were as follows: χ2
(296) = 650.27, p=0.000. Other model fit indices included the following: TLI = 0.92, CFI = 0.93,
GFI= 0.91, RMSEA = 0.050 and P-close = 0.513. Two coefficient paths were significant out of the
six paths namely relational/social to pro-environmental behaviours (β = .19, t = 2.84, p< 0.01) and
bodily/sensory to pro-environmental behaviours (β = 0.33, t = 4.11, p< 0.001). Both coefficients
were positive. Table 5.20 and Figure 5.6 show the results of this path analysis.
H1f -0.23***
H3 0.48***
H1d 0.41***
H1e -0.02
H1c 0.43***
H1b 0.02
H1a 0.20***
Relational/
social DBE
Spiritual/
psychic DBE
Expressive/
emotional
DBE
Bodily/
sensory DBE
Behavioural/
action DBE
Perceptive/
cognitive
DBE
Satisfaction
Pro-
environmenta
l behaviours

143
Table 5. 20 Results of the direct path analysis between DBE and pro-environmental behaviours for
Malawian tourist (N=483)
Hypothesis Path Standard
coefficient (β) t-value p-value
Null hypothesis
H2a Relational/social
DBE →
Pro-environment
behaviour 0.19 2.84** 0.004 Rejected
H2b Spiritual/psychic
DBE →
Pro-environment
behaviour 0.03 0.44 0.657 Not rejected
H2c Expressive/emoti
onal DBE
→
Pro-environment
behaviour 0.00 0.01 0.991 Not rejected
H2d Bodily/sensory
DBE →
Pro-environment
behaviour 0.33 4.11**
* 0.001
Rejected
H2e
Action/behaviour
al DBE
→
Pro-environment
behaviour 0.07 1.22 0.220
Not rejected
H2f
Perceptive/cognit
ive DBE
→
Pro-environment
behaviour 0.03 0.386 0.700 Not rejected
Note: ** significant at 0.01
*** significant at 0.001

144
Figure 5. 6 DBE and Pro-environmental behaviours of Malawian tourists path analysis results
H2d 0.33***
H2e 0.07
H2c 0.00
H2b 0.03
H2a 0.19**
H2f 0.03
Relational/
social DBE
Spiritual/
psychic DBE
Expressive/
emotional
DBE
Bodily/
sensory DBE
Behavioural
/action DBE
Perceptive/
cognitive
DBE
Pro-
environmenta
l behaviours

145
Further, path analyses were conducted on the international tourist group. The results
indicated that the model fit was good with Chi-square χ2 (430) = 658.43, p=0.000. GFI and TLI
indices were acceptable at 0.81 and 0.87 respectively. CFI was 0.90, RMSEA =0.056 and P-close=
0.133. Of the seven coefficient paths, four paths were significant and had positive coefficients.
These include relational/social to satisfaction (β=.46, t=4.06, p< 0.001), bodily/sensory to
satisfaction (β=0.31, t=2.38, p< 0.05), perceptive/cognitive to satisfaction (β=0.23, t=1.97, p< 0.05)
and satisfaction to pro-environmental behaviours (β=0.34, t=3.39, p< 0.001). Table 5.21 and Figure
5.7 show the results of this path analysis.
Table 5. 21 Results of the direct paths between DBE and satisfaction, DBE and pro-environmental
behaviours for International tourists (N=172)
Hypothesis Path
Standard
coefficient
(β)
t -value p-value
Null
hypothesis
H1a Relational/social
DBE → Satisfaction 0.46 4.06*** 0.001
Rejected
H1b Spiritual/psychic
DBE →
Satisfaction -0.10 -0.80 0.424
Not
rejected
H1c Expressive/emot
ional DBE
→ Satisfaction -0.15 -1.10 0.272 Not
rejected
H1d Bodily/sensory
DBE →
Satisfaction 0.31 2.38* 0.018
Rejected
H1e Action/behaviou
ral DBE
→ Satisfaction -0.07 -0.79 0.428 Not
rejected
H1f
Perceptive/cogni
tive DBE
→ Satisfaction 0.26 2.00* 0.049 Rejected
H3
Satisfaction
→
Pro-
environment
behaviour
0.34 3.39*** 0.001 Rejected
Note: * significant at 0.05
*** significant at 0.001

146
Figure 5. 7 International tourists’ path analysis results
Additionally, a coefficient path analysis was conducted on the DBE and pro-environmental
behaviour using the international tourists’ dataset. The results of the model fit analyses were as
follows: χ2 (296) = 433.88, p=0.000. TLI = 0.91, CFI =0.91, GFI was acceptable at 0.81, RMSEA
=0.052 and P-close= 0.358. None of the coefficient paths was significant at the 0.05 level. Table
5.22 and Figure 5.8 show the results of this analysis.
H2f 0.26*
H3 0.34***
H2d 0.31*
H2e -0.07
H2c -0.15
H2b -0.10
H2a 0.46***
Relational/
social DBE
Spiritual/
psychic DBE
Expressive/
emotional
DBE
Bodily/
sensory DBE
Behavioural/
action DBE
Perceptive/
cognitive
DBE
Satisfaction
Pro-
environmenta
l behaviours

147
Table 5. 22 Results of the direct path between DBE and pro-environmental behaviours for
international tourists (N=172)
Hypothesis Path Standard
coefficient (β) t-value p-value
Null
hypothesis
H2a Relational/social
DBE →
Pro-environment
behaviour -0.02 -0.15 0.880 Not rejected
H2b Spiritual/psychic
DBE →
Pro-environment
behaviour 0.21 1.56 0.120 Not rejected
H2c Expressive/emoti
onal DBE
→
Pro-environment
behaviour -0.05 -0.33 0.745 Not rejected
H2d Bodily/sensory
DBE →
Pro-environment
behaviour 0.22 1.66 0.098 Not rejected
H2e
Action/behaviour
al DBE
→
Pro-environment
behaviour 0.03 0.29 0.776
Not rejected
H2f
Perceptive/cognit
ive DBE
→
Pro-environment
behaviour 0.18 1.24 0.214 Not rejected

148
Figure 5. 8 International tourists DBE and pro-environmental behavioural intentions analysis resul
ts
H2d 0.22
H2e 0.03
H2c -0.05
H2b 0.21
H2a -0.02
H2f 0.18
Relational/
social DBE
Spiritual/
psychic DBE
Expressive/
emotional
DBE
Bodily/
sensory DBE
Behavioural/
action DBE
Perceptive/
cognitive
DBE
Pro-
environmenta
l behaviours

149
Figure 5.9 and Figure 5.10, summarises the path analysis invariance model tests of the two tourist
groups.
Figure 5. 9 Malawian and international tourist groups path analysis results
H1f MW: -0.23***, INT: 0.26*
H3 MW: 0.48***, INT: 0.34***
H1d MW:0.41***, INT:0.31*
H1e MW: -0.02, INT: -0.07
H1c MW:0.43***, INT: -0.15
H1b MW:0.02, INT: -0.10
H1a MW:0.20***, INT: 0.46***
Relational/
social DBE
Spiritual/
psychic DBE
Expressive/
emotional
DBE
Bodily/
sensory DBE
Behavioural/
action DBE
Perceptive/
cognitive
DBE
Satisfaction
Pro-
environmenta
l behaviours

150
Figure 5.10 Malawian and international tourist groups DBE to pro-environmental behaviours path
analysis results
5.8.5 Comparison of means between Malawian and international tourists across the DBE
dimensions
Following the invariance test, a comparison of means between domestic and international
tourists was run to test the differences in their evaluation of the destination brand experiences.
Independent sample t-tests on tourists’ DBE mean scores between the two groups showed
significant differences in four of the six DBE dimensions, namely relational/social,
expressive/emotional, bodily /sensory and perceptive/cognitive. There were significant differences
H2d MW: 0.33***, INT:
0.22
H2e MW: 0.07, INT:0.03
H2c MW: 0.00, INT: -0.05
H2b MW: 0.03, INT: 0.21
H2a MW: 0.19**, INT: -0.02
H2f MW: 0.03, INT: 0.18
Relational/
social DBE
Spiritual/
psychic DBE
Expressive/
emotional
DBE
Bodily/
sensory DBE
Behavioural/
action DBE
Perceptive/
cognitive
DBE
Pro-
environmenta
l behaviours

151
in relational/social mean scores for Malawian tourists (M=4.23, SD=0.67) and international tourists
(M=4.05, SD=0.67), conditions; t(657)=3.17, p=0.002, expressive/emotional for Malawian tourists
(M=4.42, SD=0.47) and international tourists (M=4.29, SD=0.40), conditions; t(657)=3.46,
p=0.001, bodily /sensory for Malawian tourists (M=4.46, SD=0.53) and international tourists
(M=4.27, SD=0.57), conditions; t(657)=3.90, p=0.000, and perceptive/cognitive for Malawian
tourists (M=4.28, SD=0.63) and international tourists (M=4.10, SD=0.57), conditions; t(657)=3.39,
p=0.001.
Furthermore, to determine the differences between the two tourists groups, an item mean
analysis was run. Significant differences were observed for relational/social, bodily/sensory and
perceptive/cognitive DBE. Negative but insignificant t-values were observed for action/behavioural
DBE whereby international tourists had higher scores than their domestic counterparts. Table 5.23
presents the details of these results.

152
Table 5. 23 Results of the comparison of item means between Malawian and International tourists
across DBE dimensions
DBE dimension Malawian International t-value p-value
Null
Hypothesis
Factor 1:
Relational/social 4.23 4.05 3.17 0.002 Rejected
2 4.37 4.11 3.79 0.000
3 4.28 4.03 3.28 0.001
5 4.08 3.96 1.55 0.123
6 4.22 4.02 2.55 0.011
7 4.22 4.10 1.65 0.100
Factor 2:
Spiritual/psychic 3.90 3.81 1.37 0.171
Not
rejected
2 3.80 4.06 -2.86 0.005
3 4.21 3.95 3.46 0.001
4 4.01 3.77 2.46 0.014
5 3.86 3.73 1.42 0.156
6 3.60 3.54 0.59 0.555
Factor 3:
Expressive/emotional 4.42 4.29 3.46 0.000 Rejected 1 4.51 4.58 -1.21 0.226
2 4.36 4.38 -0.39 0.698
5 4.45 4.19 4.10 0.000
6 4.36 4.01 5.07 0.000
Factor 4: Bodily/sensory 4.46 4.27 3.90 0.000 Rejected 4 4.52 4.18 5.41 0.000
5 4.45 4.28 2.65 0.008
6 4.40 4.34 0.94 0.349
Factor 5:
Action/behavioural 4.43 4.50 -1.89 0.059
Not
rejected
3 4.43 4.52 -1.83 0.068
8 4.32 4.37 -0.78 0.438
9 4.54 4.61 -1.25 0.210
Factor 6:
Perceptive/cognitive 4.28 4.10 3.39 0.001 Rejected
4 4.36 4.10 4.06 0.000
5 4.26 4.04 3.13 0.002
6 4.24 4.16 1.15 0.250
Note: Hypothesis were significant at 0.01 level
The negative t-values indicate that international tourists had higher mean scores than Malawian
tourists for the related DBE items based on the five-point Likert scale which ranged from 1 =
strongly disagree to 5= strongly agree.

153
5.9 Summary of the chapter
This chapter presented the research findings, beginning with survey demographics,
measurement scale development as well as validation and its predictive validity on satisfaction and
pro-environmental behavioural intentions. The results of the study are summarised in Table 5.24.
Table 5. 24 Findings summary
DBE scale development
DBE was evaluated using six factors: relational/social, spiritual/psychic, expressive/emotional,
bodily/sensory, action/behavioural and perceptive/cognitive.
Direct effects between DBE, satisfaction and pro-environmental behaviours
Four positive relationships were discovered between relational/social DBE and satisfaction,
expressive/emotional DBE and satisfaction, bodily/sensory DBE and satisfaction and between
satisfaction and pro-environmental behavioural intentions.
Direct effects between DBE and pro-environmental behaviours
Two positive and statistically significant relationships were found between relational/social
DBE, bodily/sensory DBE and pro-environmental behavioural intentions.
Satisfaction as a mediator between DBE and pro-environmental behaviours
Satisfaction was found to be a full/perfect mediator in the relationships between relational/social
DBE and expressive/emotional DBE and pro-environmental behavioural intentions. A partial
mediation was found between bodily/sensory DBE and pro-environmental behaviours whereas,
for the relationships between perceptive/cognitive DBE and PEB, action/behavioural DBE and
PEB and spiritual/psychic DBE and PEB, no mediation effect was found.
Measurement and structural invariance

154
Domestic/international tourists’ status affected tourists’ evaluation of the DBE, satisfaction and
pro-environmental behaviours. For the domestic tourists, relational/social,
expressive/emotional, bodily/sensory, perceptive/cognitive (negative) factors were important
and led to their satisfaction and subsequently to pro-environmental behavioural intentions. For
the direct effects between DBE and pro-environmental behaviours, relational/social and
action/behavioural DBE were important factors for pro-environmental behaviours.
For international tourists, relational/social, bodily/sensory, perceptive/cognitive were important
factors that led to satisfaction. Subsequently, their satisfaction led to pro-environmental
behavioural intentions. However, international tourists’ status did not moderate the relationship
between DBE and pro-environmental behaviours intentions.
A comparison of means between domestic and international tourists
Significant differences were observed for four dimensions: relational/social, bodily/sensory,
expressive/emotional and perceptive/cognitive DBE. Negative but insignificant t-values were
observed for action/behavioural DBE whereby international tourists had higher scores than
domestic tourists.

155
CHAPTER 6: DISCUSSION
“The key to motivating others with your ideas is to use the core message to help them make
decisions as they apply your idea. The essential part is to make the message compact and to have
it imply a sense of worth or priorities about how to implement it”
(Heath & Heath, 2008)
6.1 Introduction
This chapter presents a discussion of the findings of the study as presented in Chapter 5.
The section focuses on two main areas: a discussion of the measurement scale for destination brand
experience, and the relationship between DBE, satisfaction, and pro-environmental behavioural
intentions. The chapter also situates the results of the study within the extant literature. Finally, a
conclusion of the chapter is presented.
6.2 The destination brand experiences of Lake Malawi
The derived DBE factors were “relational/social”, “spiritual/psychic”, “expressive/
emotional”, “bodily/sensory”, action/behavioural’, and “perceptive/cognitive”, which altogether
represent tourists’ encountered and lived experiences (Schmitt, 1999b) of Lake Malawi. This scale
is different from the one proposed by Brakus et al. (2009) which had four dimensions, namely
sensory, affective, cognitive and behavioural.
The relational/social DBE and connotes tourists’ desire to be part of a group or have an
identity (Andreini et al., 2018; Nysveen et al., 2013; Schmitt et al., 2015). Relational/social DBE
entails tourists’ desire for interpersonal relationships with other tourists, locals as well as service
providers in a destination. This experience is derived from communing with other consumers such
that common passion leads to the creation of a community, social identity and a sense of belonging

156
(Gentile et al., 2007; Nysveen et al., 2013; Schmitt, 1999b). Although the relational/social
experiences have been addressed in previous conceptual brand studies (see Gentile et. al, 2007;
Schmitt, 1999b), the present study underscores its importance in destination brand experiences.
This attests to Arnould and Price (1993) as well as Aron and Aron’s (1996) proposition that people
seek to expand themselves through situations and experiences and by including others in their lives
through close relationships. Given that tourism experience results from multiple interactions with
fellow tourists, local communities, service providers as well as built and natural attractions,
relational/social DBE is an important element of a destination experience.
The spiritual/psychic DBE indicates tourists’ desire to be close to nature and secluded from
all disturbances of everyday life. This DBE resonates with escape as well as the relaxation motive
in that tourists’ desire to move away from daily life activities (Iso-Ahola, 1982; Oh et al., 2007;
Smith & Kelly, 2006). The escape motive informs tourists’ decision to travel to quiet environments
for renewal, rejuvenation and health-related motivations. In this study, tourists indicated their desire
to move away from civilization or secular activities and draw closer to nature for spiritual
nourishment and revitalisation (Gill et al., 2019; Hay & Socha, 2005; Rodrigues, Rodrigues, &
Peroff, 2014; Sharpley & Jepson, 2011). With lake tourism described as rural (Cooper, 2006),
tourists escape modernity to lakeshore areas for deeper spiritual experiences (Kastenholz, 2000;
Sharpley & Jepson, 2011). Spirituality is conceptualised as a human experience that deals with
connectedness or relatedness (Gomez & Fisher, 2003) and is responsible for peace and harmony
between people and nature, God and with themselves (Esfahani, Musa, & Khoo, 2017; Fisher, 2011;
Gill, Packer, & Ballantyne, 2019) and promotes happiness, good health and well-being (Smith &
Kelly, 2006). Agapito, Valle, and Mendes (2014) posit that apart from all the motivations for
tourists to travel to rural places such as lakesides, the rural areas provide a romantic idea of being
connected with nature. Furthermore, this factor aligns with what Cohen (1979) describes as ‘the

157
diversionary tourist experience’ that allows tourists to temporarily reverse their everyday life to
soothe the spirit and heal the body. Given the intensity of everyday work and life in general, it
becomes imperative that people seek mental and body renewal by escaping to natural environments
such as lake destinations (Kaplan, 1995; Kastenholz, 2000; Sharpley & Jepson, 2011). Indeed,
Kaplan (1995) states that when people visit natural environments such as lakes, seaside, parks and
forests, they get fascinated with nature and objects such as clouds, sunsets, and snow patterns.
Kaplan (1995) adds that the movement of leaves in the breeze helps the people to think about other
things and in so doing they gain restorative opportunities. This dimension thus provides a yawning
understanding of spiritual and wellness tourism where people visit quite places for their recollection
and rejuvenation. Furthermore, visits to lake destinations, mountainside and other resort areas
provide tourists connectedness to nature, socialisation and spiritual experience that are an important
aspect of their well-being (Bond, Packer, & Ballantyne, 2015).
Expressive/ emotional DBE was the third factor to be extracted. It describes tourists’
emotional connection with the DBEs, and it affirms tourists’ desire to travel to destinations that
they feel emotionally attached to (Nysveen et al., 2013) as well as to fulfil the nature of humans to
attach to various objects or humans they find dear (Bowlby, 1980; Thomson et al., 2005). Brakus
et al.’s (2009) study found that this factor was second in importance. However, there is a distinction
between this study’s finding and their study. Compared to the items in Brakus et al.’s (2009) study,
the present study found Lake Malawi to be the only item that induces emotional sentiments. This
distinction can be attributed to the different nature of products (for whose purpose the scale was
developed), the fact that a destination is an amalgam of different products and services in discrete
geographic spaces (Barnes et al., 2014; Buhalis, 2000; McKercher & Guillet, 2011), and to the
subjective nature of experiences (Brakus et al., 2009; Chhetri, Arrowsmith, & Jackson, 2004;
O’Dell, 2007). Various studies have found that emotions developed with fellow humans are more

158
intense than those developed with an object (So et al., 2013) and consequently, this influences
consumers’ brand relationship (Pawle & Cooper, 2006). This finding also affirms Lin et al. (2019),
Torress (2016) and Tsiotsou and Goldsmith’s (2012) assertions that interactions between tourists
and various elements of the ‘servicescape’ together with cognitive and emotional reactions of the
tourists are vital in the creation of destination experience.
The fourth DBE dimension extracted was named bodily/sensory and is consistent with the
literature (Barnes et al., 2014; Brakus et., 2009; Holbrook & Hirschman, 1982; Schmitt, 1999b).
This dimension covers multisensory experiences such as sound, motion, smell etc., natural
landscapes such as rivers and lakes (Agapito eta l., 2013; Chhetri et al., 2004). Schmitt (1999b)
states that sensory experiences relate to the destination/brand appeals through smell, sight, taste,
sound and touch and tourists can use this to differentiate [destination] brands. This study revealed
that bodily/sensory destination brand experiences are an important aspect of tourists’ experiences
at a destination. Unlike Brakus et al.’s (2009) study where sensory dimension was found to be the
most important, followed by affective dimension, the current study found that relational/social DBE
was the most important. Through tourist engagement with the destination, sensory experiences help
them to evade pain (Brakus et al., 2009) as they form images that challenge their minds (Hultén,
2011). This study finds that sensescapes through Lake Malawi were an important element of tourist
destination experiences. In agreeing with previous studies (Agapito et al., 2013; Barnes et al., 2013;
Brakus et al., 2009; Krishna, 2012; Mkono, 2011), sensory experiences offer tourists a window or
taste of the area to the destination experiences through sight, tasting, touch, smelling and hearing
and these have positive effects on consumer consumers’ attitudes and behaviour (Agapito et al.,
2013; Hultén, 2012; McCabe & Nowlis, 2003; Peck & Wiggins, 2006; Singh et al., 2000). The
study results highlight the need for destinations to intensify multi-sensory stimuli brand encounters
for the tourists beyond the tourist gaze, which only focuses on the visual component of the tourist

159
experience (Agapito et al., 2013; Dann & Jacobsen, 2002; Krishna, 2012). This is important because
one sense can affect other senses when consumers evaluate a brand (Agapito et al., 2013).
Action/behavioural DBE was the fifth factor derived in the scale and is consistent with
earlier studies (Brakus et al., 2009; Gentile et al., 2007; Schmitt, 1999b). This factor supports
Holbrook and Hirschman’s (1982) assertion on the importance of playful leisure activities. This
experience dimension relates to tourists desire to engage in hedonic activities. The present study
found that tourists express themselves by engaging in physical actions and behaviours, engaging in
physical experiences to keep fit and visiting action-oriented attractions at a destination. In their
study on pilgrimage and restoration, Wang, Luo, Huang, and Yang (2020) discovered that among
pilgrims to the Tibetan Plateau in China, tourists regarded the ‘do-it-yourself activities’ and
behaviours as an important element of the pilgrim. This resonates with previous assertions that
tourism is an experiential product where some tourists engage in physical activities to experience
the destination (Gilmore & Pine, 2002; Wang et al., 2020). Cognizant that tourists choose a
destination to satisfy various motives, action/behavioural DBE play a vital role in meeting tourists’
desire to escape, recovery and self-determination (Wang et al., 2020). Thus, action/behavioural
DBE helps understand tourist’s activities in the destination and its relation to sought destination
experiences (Bond et al., 2015; Wang et al., 2020). Furthermore, Ahn and Back (2018) stress that
destination experiences should encourage customers to learn or practise new skills so that users can
exercise and release stress. This finding concurs with previous studies that point to the role of the
physical environment, in this study, Lake Malawi, in provoking tourist’s action/behavioural
responses to the destination experiences (Bustamante & Rubio, 2017).
The sixth factor of the DBE scale was termed perceptive/cognitive. According to Holt
(1995), tourists attach understanding, interpretations and meaning to a product. This factor,
according to Holt (1995), is responsible for consumers’ evaluation and appreciation of an encounter.

160
This result concurs with Brakus et al. (2009) and Holt’s (1995) assertion that individuals learn or
think when they encounter a brand such as a branded place (Beckham et al., 2013) and this can
moderate their tiredness or boredom (Cacioppo & Petty, 1982) through pleasurable experiences that
translate into the emotional meaning that tourists associate with a place (Lindstedt, 2011).
Concerning sporting event experiences, cognitive experiences drive participants desire to win by
perfecting their skills and dexterity (Weed & Bull, 2012). Although experiences are conceptualised
as internal subjective experiences (Brakus et al., 2009; Khan & Rahman, 2015) the environment
(destination activities, events, the social fabric) in which tourists find themselves are also
responsible for their evaluation of destination experiences as well as that affect consumers’
behavioural outcomes (Ahn & Back, 2018; Cacioppo & Petty, 1982; Packer & Ballantyne, 2016;
Walls et al., 2011). Accordingly, intellectual BE that entail stimulation of curiosity and problem
solving (Barnes et al., 2014), affects consumers negatively because since the problem-solving
process is less exciting (Nysveen et al., 2013).
6.3 DBEs and tourist satisfaction
The tested relationship between relational/social DBE and satisfaction was significant and
it was the second strongest of all the DBEs. The results are comparable to Nysveen et al. (2013)
who concluded that relational/social BEs are an important predictor of customer satisfaction. This
affirms the assertion that people’s desire to belong and love (Fournier, 1998; Schmitt, 1999b) and
to expand themselves (Aron & Aron, 1996; Gentile et al., 2007) can lead to satisfaction. Agreeing
with theories from psychology on peoples’ need to belong (see Aron & Aron, 1996; Sağkal &
Özdemir, 2020), this study finds that experiences enjoyed in a group lead to satisfaction. Given the
importance of the relational/social DBE dimension in the current study, results echo So et al.’s
(2013) proposition that emotions developed with humans are more intense than those developed
with an object. So et al (2013) in agreement with Pawle and Cooper (2006), further state that

161
consumers’ brand relationship is influenced by emotional factors. In a study by Lemon, Bengtson,
and Peterson (1972), it was found that informal social activities done together with others lead to
satisfaction. Additionally, these results resonate with Arnould and Price (1993) proposition that
tourists seeking various experiences in natural environments such as white water rafting, three
elements namely: communion with nature, personal growth and renewal of self as well as
communitas with friends, family or strangers is a recipe for positive satisfaction with the
destination. Since the lake destination allows people to interact through water-based sports, dining,
shopping spaces and the local community, the shared experiences are likely to lead to satisfaction
when tourists join parties and find a social identity and a sense of belonging through socialisation
with people from their reference group (Andreini et al., 2018; Geus et al., 2016; Nordvall et al.,
2014; Schmitt, 1999b).
The insignificant hypothesis 1b is akin Heintzman’s (1999, 2002) studies where 44.5% of
the campers indicated that spirituality neither added to nor reduced their satisfaction with the park
experience whereas 2.7% said that spirituality reduced from their satisfaction with the camping
experience in the park. The present results indicate that although tourists prefer a quiet place to
unwind, this does not necessarily lead to satisfaction. However, this result is contrary to Esfahani
et al. (2017) who found that spirituality among mountaineers led to satisfaction. Care, however,
must be taken in interpreting this relationship as spirituality was not a DBE dimension in Esfahani
et al.’s (2017) study. With some people deeming satisfaction to be more of affective than based on
the quality of the experience (Chen & Tsai, 2007; Wu & Li, 2017), such results are expected. Lack
of facilities as well as tourism programs that reflect spirituality along Lake Malawi to help tourists
feel spiritually stronger and gain more spiritual benefits, is another explanation for this finding as
materialists tend to be less satisfied (Roberts, Tsang, & Manolis, 2015; Solberg, Diener &
Robinson, 2004). Results point towards insufficient development of beach tourism that takes into

162
account spiritual tourists’ needs by offering them advanced tourism activities such as yoga and
meditation places where tourists can be alone, find inner peace and beauty as they rekindle their
spirituality (Stringer & McAvoy, 1992). Indeed, as found by Stringer and McAvoy (1992), tourists
who were involved in canoeing exercises reported spiritual exercises that dwelt on social
interactions and teamwork with other tourists whereas their counterparts who went hiking reported
spiritual experiences emanating from appreciating the beauty of the local environment. Given that
Lake Malawi combines both water and land activities, there is need to provide more spiritual-
friendly zones where tourists can switch off from their everyday activities and the interpersonal
world (Ross & Iso-Ahola, 1991) and participate in hedonistic experiences.
The tested relationship between expressive/emotional DBE and satisfaction was significant.
The results support Barnes et al. (2014) and Bigné et al. (2005) who found that emotional
experiences influence visitors’ satisfaction. Indeed, Thomson et al. (2005) affirm that individuals
that are emotionally attached to a brand are more likely to be satisfied with it. Results stress the
importance of emotional attachment to a destination brand. Consistent with previous studies,
emotional brand experiences is the desired component of a destination experience and they can
determine post-consumption evaluations of the destination (Pike & Ryan, 2004). Thus, agreeing
with Morrison and Crane (2007), the present study asserts that destination brands must differentiate
themselves from others and create customer satisfaction through consumers’ emotional experience
with the service brands such as the destination of reference in this study. Similarly, the satisfaction
with the brand could be a determinant for emotional attachment with the brand. The result of the
present study can be attributed to the nature of a lake destination, which is different from a physical
product or a service and generates more emotions in the diverse tourism destination environment.
Whereas as Barnes et al. (2014) found partial support for this relationship in all their three
studies, the present study found that bodily/sensory DBE have a positive effect on tourists’

163
satisfaction. The relationship between bodily/sensory DBE and satisfaction also produced the
strongest relationship. This relationship has also been established in previous studies (Iglesias et
al., 2019; Nysveen et al., 2013), demonstrating that the sense element of the brand triggers peoples’
reaction and satisfaction with the brand. As alluded to by Barnes et al. (2014) and Nysveen et al.
(2013), visitors’ destination evaluation and their satisfaction is mostly triggered by the sensory
aspect such as the taste of food, the feel of sand beneath their feet, the beauty of architectural designs
and the smell of the destination, among others. This result could be attributed to the nature of the
destination under this study. For destination Lake Malawi, tourists are faced with golden sandy
beaches, fish smells and fish is the main dish served in the restaurants. Furthermore, the lake views,
which is the main attraction, coupled with water-based sports, sightings of the rare Fish Eagle, could
be some of the reasons behind this result. Other studies have also argued that tourism experiences
that stimulate the senses reach the heart and mind of tourists (Agapito et al., 2013; Pine & Gilmore,
1998; Schmitt, 1999b). Results of this study indicate the importance of providing multi-sensory
experiences that are innovative, exciting and unique (Kao et al., 2008; Oh et al., 2007; Pine &
Gilmore, 1998, 1999).
The insignificant effect of action/behavioural DBE on satisfaction validates Barnes et al
(2014), Chiu et al.’s (2014) and Nysveen et al. (2013) studies. However, Esfahani et al. (2017)
found that mountaineers were highly satisfied with the activities in Sabah. Esfahani et al. (2017)
attributed satisfaction to the high-quality tourism products provided in the region. Similar results
were recorded by Musa (2002) among divers in Sipadan. The results of the current study suggest
that although tourists engage in various activities at the lake destination, they do not derive
satisfaction from these activities. This either implies that the activities are not engaging enough or
there is lack of stimulating activities (Kao et al., 2008; Pine & Gilmore, 2011), novelty (Hirschman,
1984) and quality (Loureiro, 2014; Parasuraman et al., 1994; Pizam, 2010) as found elsewhere

164
(Heide & Grønhaug, 2009; Skogland & Siguaw, 2004), facility attributes (in this case lake
destination facilities) are highly correlated to satisfaction.
Although Bigné et al. (2005) indicated that perceptive/cognitive BE leads to satisfaction and
Nysveen et al. (2013) found a negative relationship between the two, the present study found that
there is no significant relationship between perceptive/cognitive DBE and satisfaction. Like Barnes
et al. (2014), the cognitive element of brand experience did not lead to satisfaction in the current
study and reveals that tourists did not want to exert a lot of mental effort when encountering a brand.
Although some studies propose that cognitive experiences are vital in the conceptualisation and
interpretation of all other experiences (Lazarus, 1991), the findings in the literature are varied.
Going with Lazarus (1991) proposition, Ahn and Back (2018) argue that intellectual or cognitive
perception of a brand is crucial in consumers’ evaluation of the brand experiences. To the contrary,
Barnes et al. (2014) and the present study did not establish that. In the present study, results point
that engaging tourists in mental calculations while consuming the DBE would not lead to
satisfaction. Being a developing nation, tourist facilities and infrastructure provision on both land
and in the water is limited. This would be expected to pose some challenges to tourists interested
in for example, engaging in water based activities and sports, which would eventually affect their
consumption of the destination experience. For example, use of unlicensed boats, beaches without
plastic mesh enclosures among others, would engage tourists in some critical decision making as
they would be exposing themselves to some danger if they chose to ride the boats or swim in the
water where there are likelihoods of encountering crocodiles or hippos (Wang, Liu-Lastres, Ritchie,
& Pan, 2019). Thus, offering experiences that engage tourists’ mental imagery and those that elicit
memorable experiences need to be balanced as tasks that demand too much mental work is
undesirable (Nysveen et al., 2013). Concurring with Nysveen et al.’s (2013) recommendation, a
brand experience that requires customers to do a lot of thinking and problem solving negatively

165
affects their cognitive or intellectual experience as it creates challenges for consumers to solve
problems.
Overall as proposed by MacCannell (1973), where destination experiences are shallow or
rather offer unauthentic experiences, tourists would not be satisfied with that destination. As echoed
by Tung and Ritchie (2011), destinations must strive to balance tourists’ needs and their
(destination) performance. Indeed, for lake destinations that are adventuresome and activity-based
such as swimming and sightseeing (Uysal, 2003), instrumental actions such as accessibility,
accommodation, dining, fishing, boating, driving and communication services among others are
core to tourists’ satisfaction in outdoor recreation destinations such as Lake Malawi. Uysal (2003)
states that instrumental actions should also be accompanied by expressive goals that bring out
tourists’ goals and subjective emotional rewards such as the pursuit of happiness or self-
actualisation.
6.4. DBEs and pro-environmental behavioural intentions
Pro-environmental behavioural intention element incorporated in the study to find out
tourists’ possible support against various environmental threats that Lake Malawi is currently
facing, including deforestation, excessive fishing, the introduction of alien fishes and plants such
as Hyacinth (locally known as ‘Namasipuni,’) industrial pollution and the prospect of oil
exploration in the lake which would cause the risk of oil spills (Beeton, 2002; Weyl et al., 2010).
More importantly, there is fear that if the government goes ahead with the oil exploration
programme, there could be loss of fishes as well as the risk of having Lake Malawi removed from
the World Heritage list (Etter-Phoya, 2014; Mweninguwe, 2012) should there be the ‘Gulf oil
disaster’. Additionally, reports indicate that deforestation together with little rainfall in the country
would affect lake water levels and consequently tourism activities and experiences. Again,

166
commercial ornamental fishing poses a risk of Mbuna cichlid fish degradation as the species are
endemic to Lake Malawi; hence, its export needs to be regulated (ILEC, 2005).
The results of direct effect test indicated that only two DBE factors: (relational/social DBE
and bodily/sensory DBE) have positive effects on tourist’ pro-environmental intentions. The
influence of relational/social DBE on PEB was positive and resonates with previous studies on
DBEs although they did not use PEB as a DBE illustrative factor, they found that relational DBE
had a direct effect on post-consumption intention of loyalty (Nysveen et al., 2013). This study’s
result point to the importance of the relational/social DBE factor in relation to pro-environmental
behavioural intentions. For some tourists, social interactions and shared experiences during a
tourism trip are responsible for the formation of their pro-environmental behaviours, confirming
Graumann and Kruse’ (1990) position that social contexts influence how people view the
environment partly due to family influence on recreational activities and environmental attitudes.
The positive relationship results on the hypothesis that tested the effect of bodily/sensory
DBE pro-environmental behavioural intentions corroborate with Clark, Mulgrew, Kannis-Dymand,
Schaffer, and Hoberg’s (2019) study which also found a positive connection between whale
watching and PEB. On their part, Kastenholz, Carneiro, Marques, and Lima (2012) posit that multi-
sensory elements of the rural and natural environment are an important aspect of tourist experiences
in natural areas and need to be carefully included in the design of such experiences. Since this study
did not individually specify which sensory DBEs had an effect of tourists’ PEBs, a multi-sense
bundling approach is useful (Agapito et al., 2013) in nature-based destinations such as Lake Malawi
cognizant that no sense is dominant in determining tourists’ destination brand experiences.
The insignificant effect of spiritual/psychic DBE on pro-environmental behavioural
intentions is surprising because if individuals desire a quiet place to find personal meaning through
travel, they would be expected to engage in activities that would keep the sanctity of those places.

167
Akin to the relational/social dimension discussed above, it would be expected that if tourists desire
a quiet place where they could recollect, they would be willing to invest in or pay a premium price
to maintain the maintain or upgrade their experiences at the destination (Thomson et al., 2005). In
a study in Taiwan, Lee at al. (2015) found that escapism (recreation experience) was directly related
to onsite as well as general pro-environmental behavioural intentions. Lee et al. (2015) argue that
tourists who escape to natural places have a higher immersion with the environment and, thus, have
greater environmental knowledge. The same could be expected of spiritual/psychic DBE seeking
tourists. Thus, it would follow that spiritual/psychic DBE seeking tourists would be interested in
PEB based on their environmental knowledge (Ballantyne & Packer, 2011) which would lead them
to seek destinations with quality environments (Chiu et al., 2014) to meet their needs (Wan et al.,
2015). From these results, tourists’ lack of interest in pro-environmental behaviours despite going
to the lake for spiritual experiences could be attributed to their lack of attachment to the place
(Cheng & Wu, 2015; Cheng et al., 2013; Ramkissoon et al., 2012). According to Ramkissoon et al.
(2013), where tourists are attached to the destination, they display pro-environmental behavioural
intentions to preserve the place or destination. Ramkissoon et al.’s (2013), study revealed that
tourists to national parks displayed positive pro-environmental behaviours because of how attached
to the place they felt. Bowlby (1980) state that people develop attachment according to the beliefs
about themselves and their world. Ramkissoon et al. (2013) found that place attachment predicted
both low effort and high effort PEBs. Thus, the more people feel connected to the place, the more
likely their intention to protect it (Ramkissoon et al., 2013). In this case, it was expected that tourists
would show a positive emotional relationship to pro-environmental behaviours if they perceived or
believed the environment to be beneficial to them. As attachment is known to last a lifetime, it
could be inferred that tourists’ would commit to a destination’s environmental sustainability for a
long-lasting relationship with it (Bowlby, 1980; Thomson et al., 2005). In the case of Lake Malawi

168
which is a natural area destination and a part of it is a national park designated as a WHS, similar
results to Ramkissoon et al. (2013) would be expected.
Expressive/emotional DBE did not have a positive effect on pro-environmental behavioural
intention in this study. In their study regarding emotional experiences among wildlife watchers,
Ballantyne et al. (2011a) found that emotional experiences led to deeper thoughts that translated
into concern and respect for the environment and wildlife protection. Similarly, Lee et al. (2015)
state that experiential engagement leads to pro-environmental behavioural intentions because of
nature-based activities that arouse emotional experiences (whether positive or negative) that
influence people’s experiences with the environment as well as their pro-environmental behaviours.
For Tsaur et al. (2007), emotion had a positive effect on visitors’ behavioural intention. Studies
indicate that people’s emotional bond with the environment is a motivating factor to participate in
PEB and could be out of guilt for their environmental mischiefs (Kaiser & Shimoda, 1999). For
Bowlby (1980) and Schmitt (2013), it is a human desire to be emotionally attached to others or
objects. For the results derived in this study, it could be hypothesized that the tourists felt indifferent
because they could not bear the environmental problems at a personal level or because they had not
encountered the problems themselves (Ballantyne et al., 2009; Loewenstein & Frederick, 1997).
Research holds that if tourists do not see the destination putting in measures to reduce negative
environmental impacts (Luo et al., 2020; Wan et al., 2015), nor see any threat to the environment
because of lack of an inclination to do that (Cheng & Wu, 2015; Kil et al., 2014; Thapa, 2010; Wan
et al. 2015), they would more likely not engage in positive environmental behaviours (Dolinar,
2010). According to Thomson et al. (2005) findings, consumers who are attached to a brand would
be committed to the brand and be willing to invest in it by among other things engaging in PEB
directly or indirectly (Kollmuss & Agyeman, 2002). Analogously, it could be deduced that tourists
who are emotionally attached to a destination would be willing to invest or pay a premium price to

169
access its experiences (Thomson et al., 2005). As Thomson et al. (2005) postulate, humans commit
to an object if they perceive it to be irreplaceable. This is also echoed by Chiu et al. (2014), Luo et
al. (2020) and Wan et al. (2015) who indicate that perceived value or benefit is a precursor to
tourists’ PEB in a destination. Nonetheless, this study found no relationship between DBEs and
PEB.
Action/behavioural DBE did not have a positive effect on PEB intention in this study. This
result is contrary to Chiu et al. (2014) who found support for activity engagement and pro-
environmental intentions. They argue that activity engagement coupled with satisfaction promote
tourists’ concern for the environment and consequently, strengthens tourists’ desire to act
responsibly. In her study on identifying tourists with smaller environmental footprints, Dolnicar
(2010) found that membership to an environmental friendly segment was a predictor of tourist pro-
environmental behaviours during a vacation. Although this variable (membership to an
environmental friendly segment) and moral obligation were not tested in this thesis, being a member
of an environmentally friendly organisation keeps subscribers in motion and would be expected to
conform to the group's norms whether in a usual environmental or on a vacation. Of recent, an
illustration could be drawn from Greta Thunberg, a young Swedish environmentalist who has taken
it upon herself and her family to reduce carbon footprints by among others, not using air travel,
being vegans and up-cycling (Jung, Petkanic, Nan, & Kim, 2020).
Lastly, perceptive/cognitive DBE did not yield a positive impact on PEB intentions in this
study. This is in line with Lee et al.’s (2015) finding that educational experiences do not lead to
general pro-environmental behavioural intentions but leads to on-site pro-environmental
behavioural intentions. As proposed by Ballantyne et al. (2011a) and Lee et al. (2015), educating
tourists about ecosystems is a vital step towards sustainable destinations as some of them may not
aware of the adverse effects of their behaviours on the environment (Ballantyne & Packer 2011;

170
Luo et al., 2020). Since cognitive experiences require tourists’ use of their brainpower, it is
unsurprising that it does not lead to pro-environmental behaviours as this could affect their
enjoyment while on vacation (Fairweather et al., 2005). Han (2015) and Li and Wu (2019) indicate
that tourists involvement in PEB is a reasoned choice and it involves weighing the pros and cons of
such an involvement in terms of social status, effort, and money, among others. Other studies also
state that tourists’ pro-environmental behaviours are different at home and during vacations when
they seem not to care much about the environment (Dolnicar & Leisch, 2008) and hence tourists’
moral obligation has an impact on their pro-environmental behaviours in a destination (Kil et al.,
2014; Wu et al., 2020). Thus, it would be assumed that tourists do not want to think more about
what they are doing in the destination (whether detrimental to the environment or not) as this could
spoil their holidays. Furthermore, if the destination does not regulate pro-environmental behaviours
(Juvan & Dolnicar, 2016; Luo et al., 2020; Wan et al., 2015), tourists are less likely to mind the
environment reflecting their norms on PEB (Dolnicar & Leisch, 2008; Dolnicar, 2010; Kil et al.,
2014; Mehmetoglu, 2010). In the case of a destination where tourists do not perceive that their
actions are detrimental to the environment, they may present no intent to work on their behaviours
while on a vacation (Dolnicar & Leisch, 2008; Stern, 2000; Mehmetoglu, 2010).
6.5 DBE, satisfaction and PEB intentions
Validating previous studies (Ballantyne et al., 2011a, 2011b; Ballantyne & Packer, 2011;
Bigné et al., 2005; Chiu et al., 2014; Ramkissoon et al., 2013a), the results of the current study
showed that satisfaction with Lake Malawi DBEs leads to a strong desire among tourists to
participate in high-effort PEB. In the same vein, Stedman (2002) discovered that visitors’ low
satisfaction levels led to environmental protection behaviours. To the contrary, the current findings
are different from Ramkissoon et al.‘s (2013b, 2013c) studies that found no relationship between
satisfaction and high-effort PEB but there was a link between satisfaction and low-effort PEB.

171
Although some research document different results on the connection between satisfaction and PEB
(Ramkissoon et al., 2012; Ramkissoon et al., 2013b, 2013c; Stedman, 2002), this study reiterates
the view that satisfaction leads to high-effort pro-environmental behaviours (Ballantyne & Packer,
2011; Ramkissoon et al., 2013a,). High-effort pro-environmental behaviours constitute collective
actions like attending public meetings to protect the destination’s resources unlike low-effort PEB,
which are more individualistic (e.g. reduce the use of a spot in a park if it needs to recover from
environmental damage) according to Ramkissoon et al. (2012).
Regarding the mediation role of satisfaction, Barnes et al. (2014) found relationships
between all the four DDE variables (sensory, affective, cognitive and behavioural) and intentions
to revisit and to recommend, but sensory BE had the strongest effect size. In this study, however,
we identified no salient role of satisfaction in mediating the relationships between
perceptive/cognitive DBE and PEB, action/behavioural DBE and PEB and spiritual/psychic DBE
and PEB. Satisfaction fully mediates the relationships between expressive/emotional DBE and PEB
and between relational/social DBE and PEB. For bodily/sensory DBE and PEB, partial mediation
was observed. For water or beach-based destinations such as Lake Malawi, tourist groups are a
common sight where they share the same resources such as the beach, swimming pools, bars and
restaurants. It is envisaged that these communities could lead to greater achievement of DBEs and
satisfaction (Aaron & Aaron, 1996; Arnould & Price, 1993; Lemon et al., 1972; Pawle & Cooper,
2006) through group cohesion or which would potentially lead to PEB (Dolnicar, 2010). The
overarching influence of bodily/sensory DBE over the other DBE components provides an
important discussion point in the DBE literature concerning satisfaction and pro-environmental
behavioural intentions. In this study, bodily/sensory DBE was found to be a significant DBE factor
unlike in some studies where emotional and cognitive experiences were found to be significant
influencers of satisfaction and future intention (Bigné et al., 2005). Furthermore, where sensory

172
DBE is induced through various water-based activities, sensory DBE is to be achieved as also found
by Barnes et al. (2014). Thus, satisfaction is an important element for promoting pro-environmental
behaviours among visitors at a destination as action/behavioural and perceptive/cognitive DBE do
not directly lead to PEB intentions on their own. Regarding the partial mediation role of satisfaction
in the relationship between bodily/sensory and PEB intention, the reasoning posited by Agapito et
al. (2013), Brakus et al. (2009) that sensory experiences are very important BE than the other three
(based on Brakus et al., 2009 scale) holds. Just as Agapito et al. (2013) stressed the need for multi-
sensory experiences to achieve tourist satisfaction, loyalty and other post-consumption
consequences, Kastenholz et al. (2012) also posit that multi-sensory tourist elements, in this study
bodily/sensory DBEs, are more related to rurality as was the case in this study. Indeed, Pan & Ryan
(2009) singled out multi-sensory elements of hearing, touch and smell as being important to
tourists’ enjoyment of rural areas than urban environments. Therefore, it is unsurprising that
bodily/sensory DBE was partially mediated by satisfaction at Lake Malawi destination where
multiple senses play a role in tourist appreciation of the destinations BE. As indicated in the
literature, satisfied tourists are more likely to engage in positive behavioural intentions (Bigné et
al., 2005; Chen & Tsai, 2007; Ramkissoon et al., 2013a) such as pro-environmental behaviours.
6.6 Comparison of means between domestic and international tourists across
DBE dimensions
The findings revealed that domestic and international tourists varied significantly in their
evaluation of the DBEs mainly across relational/social, expressive/emotional, bodily /sensory and
perceptive/cognitive DBE where significant results were obtained. Although statistical mean
differences were observed in four of the six DBE domains, results indicate that for domestic tourists,
bodily/sensory DBEs was a highly ranked DBE as evidenced by its high mean score, unlike the

173
other three domains which were also significant. On the other hand, international tourists highly
rated expressive/emotional DBE over the other three significant means differences.
Concurring with previous research (Huang et al., 1996; Kozak, 2002), the present study
demonstrates that tourists’ evaluation of destination attributes as well as tourist activities can vary
based on tourist state as either domestic or international. The results showed that both international
and domestic tourists highly scored expressive/emotional and bodily/sensory DBE respectively
whereas the insignificant spiritual/psychic DBE had a low score for both groups. However,
international tourists evaluated expressive/emotional DBE more positively while domestic tourists
evaluated bodily/sensory DBE more positively. Consistent with the work of Yuksel, Yuksel, and
Bilim (2010), the current study found that tourists’ attachment to a destination could affect how
tourists feel, think or evaluate a destination’s attributes. International tourists showed a sense of
place or emotional DBE attachment that could lead to positive future behavioural intentions such
as loyalty towards Lake Malawi (Prayag & Ryan, 2012). These results are in line with Tung and
Ritchie’s (2011) assertion that emotions are vital for memorable destination experiences. Thus,
Lake Malawi destination attributes and experiences connect international tourists to their self-
concept (Prayag & Ryan, 2012; Yuksel et al., 2010) as they visit the lake and surrounding places
for relaxation and to identify with the lake’s attributes. For the local tourists, it can be hypothesized
that their familiarity with Lake Malawi is responsible for their place attachment (Goodrich, 1978).
As seen from the descriptive statistics, some locals and international tourists had been to the lake
for more than 40 times making experiential familiarity a reason for the emotional attachment to the
lake destination (Tan & Wu, 2016) which positively influences visit intentions (Tan & Wu, 2016;
Tsai, 2012). Although not much is known about the relationship between local tourists and place
attachment, repeat visits to a destination lead to a sense of home and this is true for both local and
international tourists (Chubchuwong & Speece, 2016; Tsai, 2012).
174
Furthermore, although action/behavioural DBE had no significant mean difference between
the two groups, international tourists had a higher mean score than domestic tourists. This
demonstrates that international tourists engage in more action water-based activities than their
domestic counterparts. Given than most water-based sporting activities such as scuba diving,
kayaking, snorkelling and boating are more targeted at the international clientele, it is unsurprising
that international tourists highly scored these items which characterise an outdoor recreation
destination (Uysal, 2003). For the perceptive/cognitive destination brand experience which had no
significant mean difference, locals ranked the domain higher as compared to their international
counterparts. For most international tourists, they may probably have been to other destinations
more demanding than Lake Malawi and, hence, did not find Lake Malawi challenging as it lacked
novelty (Goodrich, 1978).
6.5 Chapter summary
This chapter has presented a discussion of the findings of the study outlined in Chapter 5. It
also situated the findings within the extant literature to demonstrate the relationship between this
study and existing studies as well as provide a clear understanding of the results. The next chapter
is the conclusion of the thesis and presents both the academic and practical implications of the
study, recommendations for further studies as well as limitations of this thesis.

175
CHAPTER 7: CONCLUSION AND IMPLICATIONS
“Once we know something, we find it hard to imagine what it was like not to know it” (Heath &
Heath, 2008)
7.1 Introduction
This chapter summarises the study that was set out to answer two main research questions:
1) what are the destination brand experiences of Lake Malawi? 2) What are the relationships among
DBE, satisfaction and pro-environmental behaviours? To respond to these questions, five objectives
were outlined: a) to develop and validate a destination brand experience scale, b) to evaluate the
relationships between DBEs and satisfaction, c) to examine the association between DBE and PEB,
d) to examine the mediating influence of satisfaction on the relationship between DBE and pro-
environmental behavioural intentions, and e) to explore the moderating role of domestic or
international tourists’ status on their evaluation of DBE, satisfaction and pro-environmental
behavioural intentions. This chapter outlines how the research objectives were achieved, the
limitations of the study and makes suggestions for future research.
7.2 Study overview
Destination band experiences are an important element for destination management
organisation as they strive to make their destination different from the competition. Given that
almost all tourist products can be imitated, destination branding becomes an important tool that sets
destinations apart. Although Brakus et al. (2009) proposed a brand experience scale, its usability
has been limited to in-store products with mixed findings when applied to destination areas. The
inconsistent findings were mainly between the relationship between BE and satisfaction (Brakus et
al., 2009; Nysveen et al., 2013). Mindful that destinations are an amalgam of both products and
services and that makes the destination complex and different from consumer products (destinations
176
pose a challenge given the complexity of different destinations (Cai, 2002), the primary aim of this
study was to develop and validate a destination brand experience scale with Lake Malawi being a
case study destination. In the wake of environmental concerns due to tourists’ activities as well as
global warming and climate change, the study analysed the relationships among DBE, satisfaction
and pro-environmental behaviours, a gap that was yet to be filled. To address this aim, the study
had five objectives: a) to conceptualise and validate a destination brand experience scale, b) to
evaluate the association between DBE and tourist satisfaction, c) to investigate the relationship
between DBE and tourist PEB, d) to examine the mediating power of tourist satisfaction on the
association between DBE and tourist PEB, and e) to explore the moderating role of domestic or
international tourists’ status on their evaluation of DBE, tourist satisfaction and PEB. A multi-stage
procedure which involved a mixed-method approach was taken to implement this project. First, a
literature review was done to identify items that could be used to measure a DBE. From this
exercise, a total of 96 items bordering on DBEs were identified. Second, in-depth interviews were
carried out with international tourists, tourism operators, tourism officials and local tourists. From
this exercise, 58 items were generated. Third, experts in the field of tourism were invited to judge
the generated items as well as the suggested domains. On a scale of 1 (not representative) to 3 (very
representative), they were asked to rate the items based on clarity and relevance. At the end of this
exercise, some items were either merged or deleted and a total of 54 remained. A questionnaire
with items on DBE, satisfaction and pro-environmental behaviours was piloted at Lake Malawi.
Results of the study indicated that DBE could be measured using six dimensions namely:
Relational/social, spiritual/psychic, expressive/emotional, action/behavioural, perceptive/cognitive
and bodily/sensory. After this analysis, the main survey was conducted at Lake Malawi from May
to August 2019. A total of 670 useable questionnaires were collected. An EFA with varimax
rotation was performed on the first half of the data (N=335) to extract the underlying dimension of

177
the DBE, which answers the first objective of the study. Results of this analysis were consistent
with the pilot study results. Six domains were extracted namely: Relational/social, spiritual/psychic,
expressive/emotional, action/behavioural, perceptive/cognitive and bodily/sensory. Altogether, the
six constructs accounted for 64.44% of the variance explained and comprised 23 items. Cronbach’s
alpha reliability of each extracted dimension as greater than 0.70 thus indicating internal
consistency. The relational/social DBE had five items and entails tourist’s desire to experience the
destination together with other tourists and local people. The spiritual/psychic DBE domain relates
to tourist desire to escape to quiet places to recollect and unwind as they connect with nature. The
relational/social DBE deals with tourists’ experiences as they interact with other tourists, service
providers as well as the local communities in the destination during consumption of the
destinations’ products and services. The action/behavioural DBE is concerned with tourists’
behaviours and actions upon interacting with the destination brand. The expressive/emotional DBE
dimension entails tourist emotions, feelings and sentiments as they consume the destination brand.
The bodily/sensory DBE is about tourists’ use of their multi-senses when interacting with the
destination whereas the perceptive/cognitive DBE represents tourists’ use of their reasoning power,
problem-solving and curiosity as they engage with the destination brand.
Following this stage, a confirmatory factor analysis (CFA) was conducted on the other half
of the data (N=335), and the six extracted factors were confirmed and had reliable goodness of fit
indices such as Normed chi-square, CFI, TLI, GFI, RMSEA, P-close. The factors also had good
CR and AVE for discriminant and convergent validity respectively. To test the hypotheses of the
study and answering objectives two, three, four and five, modelling using AMOS was done. Of the
six DBE factors, relational/social DBE, expressive/emotional DBE and bodily/sensory DBE had a
direct effect on satisfaction whereas the other three (spiritual/psychic DBE, action/behavioural DBE
and perceptive/cognitive DBE) were not significant. Satisfaction was also found to be positively
178
related to pro-environmental behaviours. For the direct relationship between DBEs and pro-
environmental behaviours, only relational/social DBE and bodily/sensory DBE were significant.
Using bootstrapping mediation method, we found that satisfaction partially mediated the
relationship between bodily/sensory DBE and PEB and satisfaction fully mediated the relationships
between expressive/emotional DBE and PEB and between relational/social DBE and PEB. Finally,
for the relationships between perceptive/cognitive DBE and PEB, action/behavioural DBE and PEB
and spiritual/psychic DBE and PEB, no mediation effect was found. Differences were also observed
between Malawian and international tourists. Domestic/international tourists’ status moderated two
DBEs (relational/social and bodily/sensory DBE and pro-environmental behaviours) for the
Malawian group and none for the international group
7.3 Contribution to knowledge
Despite the conceptualization of BE by Brakus et al. (2009) which has been widely used in
different sectors including marketing, technology, banking, e-commerce and tourism, a gap still
existed in the conceptualisation of destination brand experience from a destination perspective
(Christodoulides & de Chernatony, 2010; Khan & Rahman, 2015; Zhang et al., 2020). Furthermore,
need arose to link the DBE scale to destination-specific experience outcomes such as pro-
environmental behaviours cognisant that tourists are capable of destroying the very assets that
attract them (Wu et al., 2020). Such being the case, this study provides several implications for
knowledge and academia.
This study contributes to the body of knowledge of brand experiences. Building on previous
brand experience studies and integrating concepts of general tourism experiences, this study
developed a first-order, six-factor DBE measurement scale. Hence, the study deepens our
understanding of brand experiences by extending and refining the existing variables in the literature
from four to six: relational/social, spiritual/psychic, expressive/emotional, bodily/sensory

179
action/behavioural and perceptive/cognitive DBE. Essentially, the study highlights the DBE-related
items that can be accurately used to measure tourists’ DBEs, thereby offering valuable insights to
researchers and academics on destination brand experiences. By introducing a new factor
(spiritual/psychic DBE) the study had extended the conceptualisation of brand experiences from
the product orientation to a destination orientation. Resonating with previous scholars on rural
tourism (S. Kaplan, 1995; Kastenholz, 2000; Sharpley & Jepson, 2011), the spiritual/psychic DBE
dimension underscores the importance of mental and body renewal needs of tourist who escape to
natural environments such as lakes, forests and mountain destinations. This is different from a
product-oriented BE scale which did not factor in the need for spiritual connectedness with the
product, which is mostly utilitarian. Wehrli et al. (2017) state that utilitarian products mostly
emphasise product attributes factual information and describe product benefits.
The study has demonstrated the importance of relational/social DBE, a component whose
importance Brakus et al.’s (2009) study did not establish. Although Nysveen et al. (2013) validated
the importance of relational brand experience dimension in service brands such as mobile,
television and broadband services, the construct was not ranked first. Also, their study used three
items, including how consumers feel about belonging to a community, how they feel about being
part of a family and how they feel about being alone. The current study, however, used five
significant items that succinctly described the relational/social attributes people expect at a
destination. This makes the current study one of the first studies to demonstrate the importance of
the relational/social construct in a tourism destination; even the more as this construct was found
in the current study to be the most important brand experience. This study found that
relational/social and spiritual/psychic experiences are very important at a lake destination, unlike
previous studies that identified sensory DBEs as the most important. Given the differences between
products and destinations, this study advances the understanding that destination brand experiences

180
vary from tourist to tourist depending on their preferred destinations and engagement in various
activities. For example, tourists engaged in spiritual or retreat tourism activities might either need
social isolation to concentrate on meditation or they might need the presence of other people for
group retreat activities (Gill et al., 2019).
Unlike other studies that only focussed on loyalty/revisit intentions, recommendations and
word of mouth as future intentions, this study has shown the importance of considering the
destination environment as a future behavioural intention in the wake of vast environmental
concerns (Wu et al., 2020). Thus, this study contributes to an understanding of the relationship
between DBEs and sustainability through pro-environmental behaviours. By investigating the
relationship between DBE and pro-environmental behaviours, this study extends the
conceptualisation of DBE and its predictive ability on dependent variables beyond satisfaction,
brand equity and loyalty. Importantly, this study has highlighted the importance of relational/social
DBE in tourists’ pro-environmental behavioural intentions at a lake destination, followed by
bodily/sensory DBE. And it has responded to Agapito et al.’s (2013) call for studies to address the
underexplored tourist sensory experiences in the rural environment, which Kastenholz et al. (2012)
agree plays a crucial role in stimulating various tourists’ senses. Additionally, this study has shown
the uniqueness of applying DBE to a lake destination and linking the experiences to pro-
environmental behaviours, a practice that is missing in literature. Thus, the results of this study
contribute to an understanding of tourism experiences in marine environments, especially
freshwater environments such as Lake Malawi which are currently facing environmental threats.
The study’s results also beam light on how freshwater lake destinations can provide DBEs as many
lakes are saline in the world (Cooper, 2006), and how these destinations can sustain the experiences
by engaging tourists in pro-environmental behaviours. Moreover, for the few studies that have
investigated pro-environmental behaviours in relation to tourism experiences, none used DBE as

181
an antecedent variable. For example, Ballantyne et al. (2011a) used recreation experience and
Ballantyne et al. (2011b) used visitor learning.
The study has shed more light on the relationship between DBE domains and satisfaction.
In agreement with Nysveen et al. (2013) and Barnes et al. (2014), this study affirms the importance
of sensory brand experiences to visitors’ satisfaction with a destination. Indeed, the sense element
of the destination brand triggers peoples’ reactions and satisfaction with the destination brand.
Although satisfaction is a prerequisite for behavioural intentions, this study has shown that not all
DBE lead to satisfaction. Indeed, the study contributes to DBE scholarship by demonstrating that
relational/social DBE relates to tourist satisfaction with the destination, agreeing with theories from
psychology on peoples’ need to belong (see Aron & Aron, 1996). This study is a step towards the
conceptualisation of DBEs and satisfaction. Consistent with previous studies, the study
demonstrates that emotional brand experiences are the desired component of a destination
experience and they can determine post-consumption evaluations of the destination (Pike & Ryan,
2004). Again, this study gives us an understanding of the importance of the relationship between
cognitive/perceptual DBE and satisfaction which is less studied in the literature. Concurring with
Nysveen et al.’s (2013) conclusion, a brand experience that requires customers to do a lot of
thinking and problem solving negatively affects their cognitive or intellectual experience as it
creates challenges for consumers to solve problems. Although some studies propose that cognitive
experiences are vital in the conceptualisation and interpretation of all other experiences (Lazarus,
1991), the findings in the literature are varied. For instance, Ahn and Back (2018) argue that
intellectual or cognitive perception of a brand is crucial in consumers’ evaluation of the brand
experiences; however, Barnes et al. (2014) and the present study found quite the opposite.
Furthermore, the study contributes to our understanding of tourist evaluation of the
destination brand experience based on their nationality. While it would be expected that locals

182
would be more emotionally attached to their destination, the results surprisingly indicate that
international tourists were more interested in expressive/emotional DBE than the other five DBEs.
As Kozak (2002) posits, international tourists are likely to be interested in culture and nature-based
tourism activities that make them feel at home and attached to a destination. Moreover, when
destinations provide outstanding outdoor recreation experiences, tourists derive emotional
experiences which are an indication of their internal emotional state (Uysal, 2003).
7.4 Implications to practice and management
This study offers valuable insights into destination marketing organisations on how to
develop and market their destination brand experiences. Given that nearly every product can be
imitated, it is vital for each destination to explicitly market its core DBEs to tourists who are always
looking for new experiences. Hence, the present study’s identification of DBEs drawn from and
validated in a destination context can help DMOs to identify products and services that can support
these new experiences. By promoting a destination’s BE, DMOs could work towards delivering the
brand promise to the tourists for enhanced tourist-brand relationships such as repeat visits (Brakus
et al., 2009; Iglesias et al, 2011). For example, the study has revealed the importance of
relational/social DBE among both international and domestic tourists. Accordingly, DMOs in
collaboration with the private sector need to design activities and experiences that promote
friendships among tourists to maximise this desired experience. Given the assumption that people
tend to be individualistic, destinations can ‘exploit’ this by creating opportunities for people to meet
and interact. Thus, the DMO can strategically market Lake Malawi, for example, as a place where
people could meet and make long-lasting friendships. Furthermore, destinations need to develop
experiences that stimulate tourists’ affection, their senses as well as their social relationships since
these were found to lead to satisfaction and give an indication of tourists’ future intentions. Such
experiences are likely to lead to satisfaction and long-term impressions on the visitor’s memory, as

183
the relationships and experiences would be meaningful to the tourists and could shape their normal
lifestyles or ‘vacation lifestyle’. DMOs, through collaboration with various destination service
providers, are encouraged to provide facilities and services that promote this DBE through various
touchpoints (Baker, 2007), which is the most sought-after experience at the lake. Tour operators in
Malawi can also arrange village tours for tourists- this can foster closer relationships between
tourists and the local people and promote healthy social exchanges. Furthermore, the Tourism
Department in Malawi should consider designating and developing public beaches where people
can access quality services at an affordable rate without necessarily being in-house guests.
Regarding expressive/emotional DBE, a lesson goes to DMOs to strive to make tourists
identify with the places or attractions they visit as this can have a direct link to their emotions. As
the study has demonstrated, emotional DBEs led to satisfaction; hence, DMOs should strive to
create and maintain emotional DBEs for an intimate relationship between the customers and the
destination. With specific reference to Lake Malawi, the DMO could consider engaging operators
to design holiday packages commensurate with locals’ earning power, cognizant that most
respondents were locals who cannot afford the exorbitant prices currently being charged by
operators. Another way of fostering emotional destination experience is to offer boat rides to
significant islands in Lake Malawi, bird watching spots as well as cichlid fish spots at an affordable
price. A new version of “Tidziyamba ndife a Malawi”, a media program that highlighted touristic
areas in Malawi and encouraged Malawians to travel locally, would also be useful. Furthermore,
destination planners need to understand their destination attributes and regulate the enhancement
of quality tourist experiences that can influence tourists’ emotional attachment to and evaluation of
a destination. Considering that a destination experience is part and parcel of a destination image
(Pike & Ryan, 2004), tourists’ desire for an emotionally positive destination experience which
affects their choice of a destination besides the cognitive benefit of a destination image formulation,

184
must be well managed. In this regard, to build a long-lasting emotional tie with tourists, destination
Malawi can capitalise on its internationally recognised activities such as Lake of Stars Music
Festival, Lake Malawi Yachting Marathon, Sand Music Festival, Cape Maclear Triathlon and
Likoma Island Festival among others, which are exclusive to Lake Malawi destination. Given that
these events involve active tourist engagement; they can contribute to tourists’ emotional
identification with the experiences (Andreini et al., 2018; Pine & Gilmore, 2009).
Concerning action/behavioural DBE, results indicate that tourists desire to engage in
physical activities at Lake Malawi but lack of quality water-based tourism products, services and
facilities can prevent this from happening (MacCannell, 1973). Thus, there is need for the DMO in
Malawi to collaborate with the private sector to provide water-based activities that can engage the
attention of tourists as ‘prosumers’ in leisurely brand experience consumption and give them a
‘wow effect’ (Kao et al., 2008; Nilsen & Dale, 2013; Sundbo, 2009) and an engaging experience
(Pine & Gilmore, 1999).
Regarding perceptive/cognitive DBE, tourists are likely to ponder their decision before
participating in water activities at Lake Malawi – this is common with lake destinations given the
risk associated with such destinations (Ahn & Back, 2018; Brakus et al., 2009; Nysveen et al.,
2013). Therefore, the DMO should ensure the safety of tourists at the beach by providing divers
and lifeguards, a practice that is currently non-existent. Furthermore, the DMOs need to actively
promote Lake Malawi as a safe destination to counter the negative publicity (e.g. the presence of
crocodiles and contracting bilharzia) given to the lake since the negative publicity is likely to make
tourists think hard before engaging in any water activities at the lake. In this vein, the DMO needs
to have an active social media presence that they can use to address rumours and/or reports that can
adversely affect the image of the destination. By using social media, the DMO can also engage and
influence younger and prospective tourists’ perception and evaluation of Lake Malawi, a segment

185
that represents most visitors to the lake, thereby enhancing customer-brand relationship (Ahn &
Back, 2018). Thus, the DMO should recognise the importance of the perceptive/cognitive DBE
dimension as this could have an impact on the conceptualisation and interpretation of all other
destination brand experiences (Ahn & Back, 2018; Lazarus, 1991). In sum, DMOs should provide
brand experiences that engage tourists and gives them satisfaction as it indirectly influences
responsible behaviours. For DMOSs like Malawi, there is a need to capitalise on the DBEs that
lead to satisfaction in its positioning strategy. If the destination promotes DBEs that lead to
satisfaction in its marketing campaigns, Lake Malawi is likely to gain a competitive advantage over
other competing destinations.
Since not all people who visit ecological places such as lakes have positive environmental
behaviours or norms (Dolnicar & Leisch, 2008; Dolnicar, 2010; Kil et al., 2014; Mehmetoglu,
2010), DMOs need to consider environmental education for such tourists as studies indicate that
knowledge about environmental problems leads to environmental concern (Chiu et al., 2014). In a
bid to reduce negative environmental impacts, the study has revealed the need to increase nature-
based information to visitors of Lake Malawi on the importance of pro-environmental behaviours.
In agreement with Ballantyne and Packer (2011) and Chiu et al. (2014), the current study submits
that destinations should strongly engage tourists in transformative learning or on-site knowledge
about sustainability for long-term impacts as research suggests that most nature-based tourism
experiences fall short in delivering convincing conservation messages (Ballantyne & Packer, 2011).
To achieve this, there is a need for DMOs to use technology (see Boomsma, Pahl, & Andrade,
2016) for lasting mental imagery and cognitive experiences. Given that Lake Malawi is also being
threatened by debris from surrounding communities as well as lake users, it is high time lodge
owners increased awareness about caring for the environment. As research also indicates that some
tourists will conform to destinations PEB policies (Luo et al., 2020; Wan et al., 2015), destinations

186
need to adopt strict policies and regulations on the environment. Given that in this study only
relational/social and bodily/sensory DBEs had a positive relationship with pro-environmental
behavioural intentions, DMOs need to ensure that other dimensions of the destination brand
experience also contribute to pro-environmental behavioural intentions. For example, Tsaur et al.
(2007) found that emotions had a positive effect on visitors’ behavioural intentions, hence the need
to explore how best DMOs can provide experiences that lead to the preferred pro-environmental
behavioural intentions. Additionally, the DMO should create positive
expressive/emotional/experiences of the lake destination for the target markets to realise or
reinforce the attractiveness of Lake Malawi (San Martin & del Bosque, 2008). The DMO can also
look into the possibility of engaging tourists and potential tourists on the need to engage in pro-
environmental behavioural intentions through social media. Noting that the problems facing Lake
Malawi could be curtailed if different stakeholders were involved, the DMO should be proactive in
promoting the destination while at the same time communicating a message of intent to save the
lake through various desirable tourists’ pro-environmental behavioural intentions.
Last, there is a need for the Malawi DMO to strengthen expressive/emotional destination
experiences to attract more international tourists. By providing services and activities that evoke
positive feelings, Lake Malawi is likely to become a ‘must-go-to destination’ for international
tourists who, according to this thesis, highly scored expressive/emotional attributes. Also, more
village tours and social activities for tourists must be introduced at Lake Malawi to consolidate the
emotional and social experiences the lake provides. Such activities can be used to demonstrate the
uniqueness of Lake Malawi and its people, which could build up more expressive/emotional and
action/behavioural destination brand experiences for international tourists. Furthermore, the local
DMO should collaborate with the national DMO to project Malawi as an emotional and action-
based destination in their international marketing campaigns. For local tourists, the DMO should

187
emphasise on bodily/sensory destination experiences that stimulate their five senses as they engage
in activities at the lake. The DMO should also ensure that the lake and its surrounding environment
is clean and beautiful as this dimension was highly scored by domestic tourists. Moreover, the DMO
at Lake Malawi should focus on developing and managing shared tourists’ spaces that can promote
relational/social experience for locals in line with their Ubuntu philosophy, which underscores the
importance of bonding with other people (Hidago & Hernandez, 2001).
7.5 Study limitations and future research suggestions
The first limitation of the study is that the collection of data was limited to three data
collection points along Lake Malawi even though the lake stretches across seven districts.
Furthermore, although the main data collection involved a large sample (N=670), data were
collected in three lakeshore districts only and we could have missed tourists who had already been
to the lake but were in other cities. Therefore, further research needs to be conducted on a bigger
scale capturing several Lake Malawi destinations. To corroborate or repudiate the findings and
relationships established in this study, similar studies should also be done in other tourism
destinations.
Sampling is a very critical element in any research where the chosen sample units should
be representative of the general population. Although United Nations World Tourism Organisation
(UNWTO) (2018) indicate that tourism is predominantly domestic in many countries with domestic
tourism trips (9 billion) outdoing international arrivals by six times, there is need to balance
domestic and international tourist sample of respondents. Since this study recruited more domestic
tourist respondents as compared to international tourists, this could lead to bias in terms of the
interpretation of destination brand experience results. Thus, this presents a second limitation of the
study.

188
The third limitation relates to the sampling approach used in the research. Convenience
sampling was considered more appropriate owing to the unknown population of Lake Malawi
tourists. Despite the bias of convenience sampling and its lack of representativeness, which can
reduce the generalisation power of the findings, it was the best way to collect data in the context of
the present study where there is an unknown number of tourists. To mitigate this challenge, a large
amount of data were collected. Future studies could consider using probability sampling methods.
The measurement of pro-environmental behavioural intentions is yet another limitation.
Although this variable was divided into low-effort and high-effort, low-effort item component was
not used for further analysis due to its low reliability. Therefore, it is suggested that better and multi-
dimensional measures of pro-environmental behavioural intentions be developed in future studies.
Future research can also transcend pro-environmental behavioural intentions to consider other
environmentally responsible behaviours such as civil action, education, activist behaviour or
persuasive action. Furthermore, future studies could consider testing other antecedents of pro-
environmental behaviours such as place attachment (Ballantyne et al., 2011a, 2011b; Buonincontri
et al., 2017; Ramkissoon et al., 2013b), environmental concern (Chiu et al., 2014; Cottrell & Graefe,
1997), recreation experience (Lee et al., 2015), perceived value (Chiu et al., 2014), and service
quality (Ballantyne & Packer, 2011; Coghlan, 2012) in terms of how they relate to the DBE scale.
Furthermore, this study used pro-environmental behavioural intentions and not actual behaviours.
Although behavioural intentions are used to predict actual behaviour, future research should
consider measuring actual behaviours of tourists at a destination. Deliberate efforts should also be
made to compare tourist pro-environmental behaviours at home and in a destination and how that
affects their experience of the destination.
This study used modelling to test the relationships among the constructs. Future studies
could consider using other data analysis methods such as regressions, ANOVA, and t-tests. For

189
example, Ramkissoon et al. (2013a) used both multiple regression and SEM and found different
results on the relationships between place identity and satisfaction, place social bonding and low-
effort PEB. Similar analyses on the relationships between DBE dimensions and satisfaction as well
as DBE and PEB are recommended. Multiple regressions could be conducted to test relationships
between DBEs and satisfaction, DBES and pro-environmental behaviours and t-test could be done
to test differences in satisfaction or pro-environmental behavioural intentions between domestic
and international tourist groups.
7.6 Areas for further studies
Although spirituality is an “essential nature of human being, their strength of purpose,
perception, mental powers and frame of the mind” (Fisher, 2011, p.18), having this attribute at a
destination does not necessarily satisfy tourists. Theoretically, researchers need to further examine
this relationship and the antecedent motivational factors, which could perhaps impact on this
relationship. Furthermore, research into the requirements of spiritual/psychic driven tourists who
desire a stable mindset through perception in a serene environment (Esfahani et al., 2017) is
required, as this has a direct impact on their revisit intention (Yoon & Uysal, 2000).
Relational/ social DBE was found to be the strongest factor of the DBE scale. The dimension
has shown positive relationships with satisfaction as well as pro-environmental behaviours.
Nonetheless, for tourism research which has barely investigated this DBE dimension, more research
needs to be done to understand the relational/social DBE domain. Since some studies have only
focussed on some DBE dimensions such as emotional DBE (Morrison & Crane, 2007), sensory
(Hultén, 2011), other studies need to be conducted for the relational/social DBE other than testing
social or tour groups as moderating factors to understand its interplay with other variables such as
brand love, brand trust and word of mouth as consequences of the brand experience.

190
Lastly, results of this study show that satisfaction with DBE leads to high-effort pro-
environmental behaviours which constitute collective actions like attending public meetings to
protect the destination’s resources unlike the individualistic low-effort PEB (e.g. reduce the use of
a spot in a park if it needs to recover from environmental damage). These results are different from
those arrived at by Ramkissoon et al. (2013b, 2013c). The disparity in the findings of the current
study and the findings of previous studies is fertile ground for further research.
7.7 Personal reflections
Looking back to the three years I spent at SHTM, I can only gaze in wonder as to how I
survived the scorching academic heat of the place. Those three years are the most critical and most
memorable years of my life in many ways. First, SHTM made me realise how small I am in
academic circles. I will always cherish those peer meetings, seminars and silent competitions that
helped me to be who I am now.
This place enabled me to come out of my shell and meet the giants of the industry both in
class and in research. These three years opened my deep understanding of what research is all about.
SHTM groomed me from a scratch to conceptualise research methodology. As someone who
thought and believed that I was cut for qualitative research, SHTM unearthed the potential of my
quantitative skills. Research idea and gap conceptualisation was another thing I will always
remember when I reflect upon my PhD journey. As my supervisor will allude to, it was not easy to
shape and define the research gap owing to my poor research background. As I had to juggle classes,
teaching workload, research proposal writing and socialising, research gap conceptualisation was
the most tormenting part of the journey. This could also be true to most students at SHTM.
Furthermore, being in an Asian setting where students always want to attain good grades
and do not show if they are equally struggling, having problems in statistics and quantitative classes

191
were the most painful experiences ever. But here I am, I have learnt and unlearnt several times for
the perfection of my research concept. I have also mastered the basics of both qualitative and
quantitative research methods. SHTM exposed me to conference paper writing, journal article
writing a well as paper reviewing and critiquing thereby building up research skills I never had
before joining the school. I am proud to have passed through this fire for my purification like gold.
During data collection, facing respondents was another concern. Coming from a background
where locals always look for an incentive to do anything even if it’s for their good, convincing
domestic respondents to respond to my questionnaire was exhausting. Similarly, international
tourists were not keen to hear you out when approached to fill out a questionnaire. This was due to
their preconceived beliefs that black people always beg for money from white people. As a result,
to manage to collect 670 duly completed questionnaires was not an easy task.
The experience gained while writing this thesis is yet the most exciting part of this PhD
reflection as I came to realise and exploit my potential in both data analysis and interpretation. As
someone who likes telling stories, I found data result reporting the most fantastic part of this whole
journey. It is at this point that I realised that the three years spent at SHTM were worth it. I realised
that everything is attainable if you strive to get it. I also realised that goal setting is an important
aspect of academic life.
Despite all the challenges faced on this journey, it is only worth having memorable
experiences of the positive aspects that will make me soldier on as a young academic. I am grateful
to my supervisor who always pushed me to think critically and to be specific with my ideas. I
appreciate this mentor/mentee relationship established.

192
7.8 Concluding remarks
It has come to the attention of both destination managers and researchers that tourists are
rational beings and that they involve reason in their holiday decision making. Tourists seek
experiences that offer value for their money. Tourists choose a destination that promises and
delivers their preferred experiences commensurate with their motivations and basic needs (Ekinci,
2003; Uysal, 2003). As such, in developing destination strategies, destination branding is a dynamic
effort where destinations seriously package and market their experiences as a brand (Ha & Perks,
2005). Destination or place branding signifies an intangible competitive trophy that destinations
long to attain as it aids their understanding of their brand performance against the competition. By
providing branded and unique experiences, destinations make tourists hold memorable experiences
of the experiences encountered in the destination (Aaker, 1991; Beckman et al., 2013; Blain et al.,
2005; Cai, 2002; Tung & Ritchie, 2011). Since tourism services are highly intangible, building
strong brands could help tourists to differentiate one destination from another (Ha & Perks, 2005;
Lee & Jeong, 2014).
Building on the brand experience scale developed by Brakus et al. (2009), this study has
provided an enhanced tourism-centred way of measuring destination brand experiences. Testing 13
research hypotheses with other variables such as satisfaction and pro-environmental behaviour, the
study has shown the predictive power of the newly constructed multi-dimensional DBE scale. The
thesis has provided its academic and practical contributions concerning the conceptualisation and
operationalization of DBEs using Lake Malawi as a point of reference. The significance of the study
notwithstanding, it has certain limitations especially since it is one of the first studies of its kind. It
is, therefore, hoped that this thesis would engender further research to respond to the limitations of
the study and provide a better understanding of the DBE phenomenon.

193
REFERENCES
Aaker, D. A. (1991). Managing Brand Equity. New York: Free Press.
Aas, C., Ladkin, A., & Fletcher, J. (2005). Stakeholder collaboration and heritage
management. Annals of Tourism Research, 32(1), 28-48.
Abel, A. (2017, December 11). The 15 coolest places to go in 2018. Forbes. Retrieved from
https://www.forbes.com/sites/annabel/2017/12/11/the-15-coolest-places-to-go-in-
2018/#6134379c78cf
Adhikari, A., & Bhattacharya, S. (2016). Appraisal of literature on customer experience in tourism
sector: review and framework. Current Issues in Tourism, 19(4), 296-321.
Agapito, D., Mendes, J., & Valle, P. (2013). Exploring the conceptualization of the sensory
dimension of tourist experiences. Journal of Destination Marketing & Management, 2(2),
62-73.
Agapito, D., Valle, P., & Mendes, J. (2014). The sensory dimension of tourist experiences:
Capturing meaningful sensory-informed themes in Southwest Portugal. Tourism
Management, 42, 224-237.
Agapito, D., Pinto, P., & Mendes, J. (2017). Tourists' memories, sensory impressions and loyalty:
In loco and post-visit study in Southwest Portugal. Tourism Management, 58, 108-118.
Aggarwal, P. (2004). The effects of brand relationship norms on consumer attitudes and
behaviour. Journal of Consumer Research, 31(1), 87-101.
Agyeiwaah, E., Otoo, F. E., Suntikul, W., & Huang, W. J. (2019). Understanding culinary tourist
motivation, experience, satisfaction, and loyalty using a structural approach. Journal of
Travel & Tourism Marketing, 36(3), 295-313.
Ahn, J., & Back, K. J. (2018). Influence of brand relationship on customer attitude toward integrated
resort brands: a cognitive, affective, and conative perspective. Journal of Travel & Tourism
Marketing, 35(4), 449-460.
Aho, S. K. (2001). Towards a general theory of touristic experiences: Modelling experience process
in tourism. Tourism Review, 56(3/4), 33-37.

194
Amoah, V. A., & Baum, T. (1997). Tourism education: policy versus practice. International
Journal of Contemporary Hospitality Management, 9(1), 5-12.
Andereck, K. L. (2009). Tourists' perceptions of environmentally responsible innovations at
tourism businesses. Journal of Sustainable Tourism, 17(4), 489-499.
Anderson, E. W. (1998). Customer satisfaction and word of mouth. Journal of Service
Research, 1(1), 5-17.
Anderson, E. W., Fornell, C., & Lehmann, D. R. (1994). Customer satisfaction, market share, and
profitability: Findings from Sweden. Journal of Marketing, 58(3), 53-66.
Andrade, E. B., & Cohen, J. B. (2007). On the consumption of negative feelings. Journal of
Consumer Research, 34(3), 283-300.
Andreini, D., Pedeliento, G., Zarantonello, L., & Solerio, C. (2018). A renaissance of brand
experience: Advancing the concept through a multi-perspective analysis. Journal of
Business Research, 91,123-133.
Anholt, S. (2004). Editor’s foreword to the first issue. Place Branding and Public Policy, 1 (1), pp.
4-11.
Anholt, S. (2007). Competitive identity: A new model for brand management of nations, cities and
regions (1st Ed.). New York: Palgrave Macmillan.
Armstrong, K. (2012). Eco-tourism in Malawi market assessment full report. The Ministry of
Tourism, Culture and Wildlife and Volunteers Overcoming Poverty (VSO): Lilongwe.
Arnould, E. J., & Price, L. L. (1993). River magic: Extraordinary experience and the extended
service encounter. Journal of Consumer Research, 20(1), 24-45.
Aron, E. N., & Aron, A. (1996). Love and expansion of the self: The state of the model. Personal
Relationships, 3(1), 45-58.
Ashworth, G., & Kavaratzis, M. (2009). Beyond the logo: Brand management for cities. Journal of
Brand Management, 16(8), 520-531.
Ashworth, G. J., & Tunbridge, J. E. (2000). The tourist-historic city. London: Routledge.

195
Babakus, E., & Mangold, W. G. (1992). Adapting the SERVQUAL scale to hospital services: an
empirical investigation. Health Services Research, 26(6), 767.
Babbie, E. R. (2016). The basics of social research (7th ed.). Boston: Cengage Learning.
Bagozzi, R. P., & Yi, Y. (2012). Specification, evaluation, and interpretation of structural equation
models. Journal of the Academy of Marketing Science, 40(1), 8-34.
Baker, B. (2007). Destination branding for small cities: The essentials for successful place
branding. Destination Branding Book.
Ballantyne, R., & Packer, J. (2011). Using tourism free‐choice learning experiences to promote
environmentally sustainable behaviour: the role of post‐visit ‘action
resources’. Environmental Education Research, 17(2), 201-215.
Ballantyne, R., Packer, J., & Hughes, K. (2009). Tourists' support for conservation messages and
sustainable management practices in wildlife tourism experiences. Tourism
Management, 30(5), 658-664.
Ballantyne, R., Packer, J., & Sutherland, L. A. (2011a). Visitors’ memories of wildlife tourism:
Implications for the design of powerful interpretive experiences. Tourism
Management, 32(4), 770-779.
Ballantyne, R., Packer, J., & Falk, J. (2011b). Visitors’ learning for environmental sustainability:
Testing short-and long-term impacts of wildlife tourism experiences using structural
equation modelling. Tourism Management, 32(6), 1243-1252.
Baloglu, S., & Mangaloglu, M. (2001). Tourism destination images of Turkey, Egypt, Greece, and
Italy as perceived by US-based tour operators and travel agents. Tourism
Management, 22(1), 1-9.
Barnes, S. J., Mattsson, J., & Sørensen, F. (2014). Destination brand experience and visitor
behaviour: Testing a scale in the tourism context. Annals of Tourism Research, 48, 121-139.
Barsky, J. D. (1992). Customer satisfaction in the hotel industry: Meaning and
measurement. Hospitality Research Journal, 16(1), 51-73.
Beckman, E., Kumar, A., & Kim, Y. K. (2013). The impact of brand experience on downtown
success. Journal of Travel Research, 52(5), 646-658.

196
Beeton, A. M. (2002). Large freshwater lakes: present state, trends, and future. Environmental
Conservation, 29(1), 21-38.
Beritelli, P. & Laesser, C. (2011) ‘Power dimensions and influence reputation in tourist
destinations: Empirical evidence from a network of actors and stakeholders’, Tourism
Management 32(6): 1299-1309.
Berthon, P., Hulbert, J. M., & Pitt, L. F. (1999). Brand management prognostications. Sloan
Management Review, 40(2), 53-54.
Bigné, J. E., Andreu, L., & Gnoth, J. (2005). The theme park experience: An analysis of pleasure,
arousal and satisfaction. Tourism Management, 26(6), 833-844.
Bjork, P. (2000). Ecotourism from a conceptual perspective, an extended definition of a unique
tourism form. International Journal of Tourism Research, 2(3), 189- 202.
Blain, C., Levy, S. E., & Ritchie, J. B. (2005). Destination branding: Insights and practices from
destination management organizations. Journal of Travel Research, 43(4), 328-338.
Bollen, K. A. (1989). Structural equations with latent variables. New York: Wiley.
Bolton, R. N. (1998). A dynamic model of the duration of the customer's relationship with a
continuous service provider: The role of satisfaction. Marketing Science, 17(1), 45-65.
Bond, N., Packer, J., & Ballantyne, R. (2015). Exploring visitor experiences, activities and benefits
at three religious tourism sites. International Journal of Tourism Research, 17(5), 471-481.
Bonn, M. A., Joseph-Mathews, S. M., & Dai, M. (2005). International versus domestic visitors: An
examination of destination image perceptions. Journal of Travel Research, 43(3), 294-301.
Boo, S., J. Busser, and S. Baloglu (2009). A Model of Customer Based Brand Equity and Its
Application to Multiple Destinations. Tourism Management, 30 (2), 219-31.
Boomsma, C., Pahl, S., & Andrade, J. (2016). Imagining change: An integrative approach toward
explaining the motivational role of mental imagery in pro-environmental
behavior. Frontiers in Psychology, 7, 1780.

197
Bornhorst, T., Ritchie, J. B., & Sheehan, L. (2010). Determinants of tourism success for DMOs &
destinations: An empirical examination of stakeholders' perspectives. Tourism
Management, 31(5), 572-589.
Borrie, W. T., & Birzell, R. M. (2001). Approaches to measuring quality of the wilderness
Experience. A paper presented at the visitor use density and wilderness experience
conference, Missoula, MT, June 13, 2000.
Bowdin, G. A. J., Allen, J., O'Toole, Harris, W. R., & McDonnell, I., (2006). Events management
(2nd ed.). New York: Butterworth-Heinemann.
Bowlby, J. (1980). Attachment and loss Vol. 3. Loss: Sadness and depression. New York, NY:
Basic Books.
Brakus, J. J., Schmitt, B. H., & Zarantonello, L. (2009). Brand experience: what is it? How is it
measured? Does it affect loyalty? Journal of Marketing, 73(3), 52-68.
Braun, V., & Clarke, V. (2006). Using thematic analysis in psychology. Qualitative Research in
Psychology, 3(2), 77-101.
Brooke, J. (1996). SUS-A quick and dirty usability scale. Usability evaluation in
industry, 189(194), 4-7.
Brown, F. (2018, May 10). Five great places to visit in May. Cable News Network. Retrieved from
https://edition.cnn.com/travel/article/places-to-visit-may/index.html
Brown, T. (2006). Confirmatory factor analysis for applied research. New York, NY: Guilford
Press.
Bruce, F. (2015). Family holidays in Malawi. The Telegraph. Retrieved from
https://www.telegraph.co.uk/travel/destinations/africa/malawi/articles/A-family-holiday-
in-Lake-Malawi-zen-and-the-art-of-paddleboarding/
Bryman, A. (2016). Social research methods. England: Oxford University Press.
Buhalis, D. (2000). Marketing the competitive destination of the future. Tourism
Management, 21(1), 97-116.

198
Bulirani, A. E. (2003). The challenges of developing an integrated approach to the management of
Lake Malawi/Niassa and its catchment resources. LMNN Ecoregion Report on the Donors
and Partners Meeting. World Wide Fund: Mangochi, Malawi.
Buncle, T. (2009). Handbook on tourism destinations branding. Madrid, Spain: The World Tourism
Organization and the European Travel Commission.
Buonincontri, P., Marasco, A., & Ramkissoon, H. (2017). Visitors’ experience, place attachment
and sustainable behaviours at cultural heritage sites: A conceptual
framework. Sustainability, 9(7), 1112.
Bustamante, J. C., & Rubio, N. (2017). Measuring customer experience in physical retail
environments. Journal of Service Management, 28(5), 884–913.
Butler, R. W. (1990). Alternative tourism: pious hope or Trojan horse? Journal of Travel
Research, 28(3), 40-45.
Byrd, E. T. (2007). Stakeholders in sustainable tourism development and their roles: applying
stakeholder theory to sustainable tourism development. Tourism Review, 62(2), 6-13.
Cable News Network. (2018, May 11). 25 of Africa’s most amazing places to visit. Cable News
Network. Retrieved from https://edition.cnn.com/travel/article/africa-amazing-
places/index.html
Cacioppo, J. T., & Petty, R. E. (1982). The need for cognition. Journal of Personality and Social
Psychology, 42(1), 116.
Cai, L. A. (2002). Cooperative branding for rural destinations. Annals of Tourism Research, 29(3),
720-742.
Cambra-Fierro, J. J., & Polo-Redondo, Y. (2008). Creating satisfaction in the demand-supply chain:
the buyers' perspective. Supply Chain Management: An International Journal, 13(3), 211-
224.
Campos, A. C., Mendes, J., Valle, P. O. D., & Scott, N. (2018). Co-creation of tourist experiences:
A literature review. Current Issues in Tourism, 21(4), 369-400.
Canter, D. (1977a). The Psychology of Place. London: Architectural Press.

199
Carpenter, S. (2018). Ten Steps in Scale Development and Reporting: A Guide for
Researchers. Communication Methods and Measures, 12(1), 25-44.
Carr, N. (2002). A comparative analysis of the behaviour of domestic and international young
tourists. Tourism Management, 23(3), 321-325.
Carroll, A. B. (1996). Business and society: ethics and stakeholder management (3rd Ed.).
Cincinnati: South-western.
Carù, A., & Cova, B. (2003). Revisiting consumption experience: A more humble but complete
view of the concept. Marketing Theory, 3(2), 267-286.
Cha, F. (2013, October 23). Lonely Planet’s top destinations for 2014. Cable News Network.
Retrieved from https://edition.cnn.com/travel/article/lonely-planet-best-
destinations/index.html
Chandralal, L., & Valenzuela, F. R. (2015). Memorable tourism experiences: Scale
development. Contemporary Management Research, 11(3), 291-310.
Chang, L. C. (2010). The effects of moral emotions and justifications on visitors’ intention to pick
flowers in a forest recreation area in Taiwan. Journal of Sustainable Tourism, 18, 137–150
Chang, T. Y., & Horng, S. C. (2010). Conceptualizing and measuring experience quality: the
customer's perspective. The Service Industries Journal, 30(14), 2401-2419.
Chattopadhyay, A., & Laborie, J. L. (2005). Managing brand experience: The market contact
audit. Journal of Advertising Research, 45(1), 9-16.
Chen, C. L. (2011). From catching to watching: Moving towards quality assurance of whale/dolphin
watching tourism in Taiwan. Marine Policy, 35(1), 10–17.
Chen, C. F., & Chen, F. S. (2010). Experience quality, perceived value, satisfaction and behavioural
intentions for heritage tourists. Tourism Management, 31(1), 29-35.
Chen, J. S., & Chen, Y. L. (2016). Tourism stakeholders’ perceptions of service gaps in Arctic
destinations: Lessons from Norway's Finnmark region. Journal of Outdoor Recreation and
Tourism, 16, 1-6.
Chen, C. F., & Tsai, D. (2007). How destination image and evaluative factors affect behavioural
intentions? Tourism Management, 28(4), 1115-1122.

200
Cheng, T. M., & Wu, H. C. (2015). How do environmental knowledge, environmental sensitivity,
and place attachment affect environmentally responsible behaviour? An integrated approach
for sustainable island tourism. Journal of Sustainable Tourism, 23(4), 557-576.
Cheng, T. M., Wu, H. C., & Huang, L. M. (2013). The influence of place attachment on the
relationship between destination attractiveness and environmentally responsible behaviour
for island tourism in Penghu, Taiwan. Journal of Sustainable Tourism, 21(8), 1166-1187.
Chhetri, P., Arrowsmith, C., & Jackson, M. (2004). Determining hiking experiences in nature-based
tourist destinations. Tourism Management, 25(1), 31-43.
Chiu, Y. T. H., Lee, W. I., & Chen, T. H. (2014). Environmentally responsible behaviour in
ecotourism: Antecedents and implications. Tourism Management, 40, 321-329.
Choi, Y. G., Ok, C., & Hyun, S. S. (2011). Evaluating relationships among brand experience, brand
personality, brand prestige, brand relationship quality, and brand loyalty: an empirical study
of coffeehouse brands. Retrieved from
https://pdfs.semanticscholar.org/db3c/3648ffdde1b38ce1bb2117081374c5715bfe.pdf
Chon, K. S. (1990), ‘The Role of Destination in Tourism: a review and discussion’, The Tourist
Review, 45(2), 2–9.
Christodoulides, G., & De Chernatony, L. (2010). Consumer-based brand equity conceptualization
and measurement: A literature review. International Journal of Research in
Marketing, 52(1), 43-66.
Chubchuwong, M., & Speece, M. W. (2016). The “people” aspect of destination attachment in
international tourism. Journal of Travel & Tourism Marketing, 33(3), 348-361.
Churchill, G.A. Jr. (1979). A paradigm for developing better measures of marketing constructs.
Journal of Marketing Research, 16, 64-73.
Clark, E., Mulgrew, K., Kannis-Dymand, L., Schaffer, V., & Hoberg, R. (2019). Theory of planned
behaviour: predicting tourists’ pro-environmental intentions after a humpback whale
encounter. Journal of Sustainable Tourism, 27(5), 649-667.
Clarkson, M. (1995). The Toronto conference: reflections on the stakeholder theory. Business &
Society 33(1), 83- 131.

201
Coghlan, A. (2012). Linking natural resource management to tourist satisfaction: a study of
Australia's Great Barrier Reef. Journal of Sustainable Tourism, 20(1), 41-58.
Cohen, E. (1979). A phenomenology of tourist experiences. Sociology, 13(2), 179-201.
Cooke, G. D., Welch, E. B., Peterson, S. A. & Nichols, S. A. (2005). Restoration and Management
of lakes and reservoirs (3rd ed.). London: CRS Press.
Cooper, C. (2006). Lakes as tourism destination resources. In M. C. Hall & T. Härkönen (Eds.),
Lake tourism: an integrated approach to lacustrine tourism systems (pp. 27-42). Toronto:
Channel View.
Cooper, W., & Schindler, D. (2003). Approaches to Social Research. New York. McGraw-Hill.
Copeland, J. T. (2001). Successful brand repositioning. Aspirational vs. achievable. Strategies.
Retrieved from http://marketing.mckinsey.com
Cottrell, S. P., & Graefe, A. R. (1997). Testing a conceptual framework of responsible
environmental behavior. The Journal of Environmental Education, 29(1), 17-27.
Creswell, J. W. & Creswell, D. J. (2018). Research design: qualitative, quantitative and mixed
research methods approaches (5th ed.). Los Angeles: Sage.
Crompton, J. L. (1979). An assessment of the image of Mexico as a vacation destination and the
influence of geographical location upon that image. Journal of Travel Research, 17, 18–23.
Cronin Jr, J. J., & Taylor, S. A. (1992). Measuring service quality: a re-examination and
extension. The Journal of Marketing, 55-68.
Cronin Jr, J. J., Brady, M. K., & Hult, G. T. M. (2000). Assessing the effects of quality, value, and
customer satisfaction on consumer behavioural intentions in service environments. Journal
of Retailing, 76(2), 193-218.
Crouch, G. I., & Ritchie, J. B. (2000). The competitive destination: A sustainability
perspective. Tourism Management, 21(1), 1-7.
Crowley, A. E. (1993). The two-dimensional impact of colour on shopping. Marketing Letters, 4(1),
59-69.
Csikszentmihalyi, M. (1996). The creative personality. Psychology today, 29(4), 36-40.

202
Csikszentmihalyi, M. (2014). Toward a Psychology of Optimal Experience. In Flow and the
Foundations of Positive Psychology (pp.209-226). Dordrecht: Springer.
Cutler, S. Q., & Carmichael, B. A. (2010). The dimensions of the tourist experience. The tourism
and leisure experience: Consumer and Managerial Perspectives, 3-26.
Dann, G. M. S., & Jacobsen, J. K. S. (2002). Leading the tourist by the nose. In G. M. S. Dann
(Ed.), The tourist as a metaphor of the social world (pp. 209–235). Wallingford: CABI.
Dann, G. M. S., & Jacobsen, J. K. S. (2003). Tourism smellscape. Tourism Geographies, 5(1), 3-
25.
Das, G., Agarwal, J., Malhotra, N. K., & Varshneya, G. (2019). Does brand experience translate
into brand commitment? A mediated-moderation model of brand passion and perceived
brand ethicality. Journal of Business Research, 95, 479-490.
Delvaux, D. (1995). Age of Lake Malawi (Nyasa) and water level fluctuations. Mus R Afr Centr
Tervuren (Belg) Dept Geol Min Rapp Ann, 1996(99), 108.
de Botton, A. (2003). The art of travel. London: Penguin Books.
del Bosque, I. R., & San Martín, H. (2008). Tourist satisfaction a cognitive-affective model. Annals
of Tourism Research, 35(2), 551-573.
Department of Tourism (2017). Tourism statistics. Lilongwe
DeVellis, R. F. (2003). Scale development: Theory and applications. Applied social research
methods series (2nd ed.). Thousand Oaks, CA: Sage.
DeVellis, R. F. (2016). Scale development: Theory and applications (Vol. 26). Thousand Oaks,
CA: Sage.
Diener, E. & Crandall, R. (1978). Ethics in Social and Behavioural Research. Chicago: Chicago
University Press.
Ding, C. G., & Tseng, T. H. (2015). On the relationships among brand experience, hedonic
emotions, and brand equity. European Journal of Marketing, 49(7/8), 994-1015.

203
Doane, D. P., & Seward, L. E. (2011). Measuring skewness: a forgotten statistic? Journal of
Statistics Education, 19(2).
Dolnicar, S. (2010). Identifying tourists with smaller environmental footprints. Journal of
Sustainable Tourism, 18(6), 717-734.
Dolnicar, S., & Leisch, F. (2008). An investigation of tourists' patterns of obligation to protect the
environment. Journal of Travel Research, 46(4), 381-391.
Dwyer, L., Mellor, R., Livaic, Z., Edwards, D., & Kim, C. (2004). Attributes of destination
competitiveness: A factor analysis. Tourism Analysis, 9(1-1), 91-101.
Ekinci, Y. (2003). From destination image to destination branding: An emerging area of
research. E-review of Tourism Research, 1(2), 21-24.
Ekinci, Y., Sirakaya-Turk, E., & Preciado, S. (2013). Symbolic consumption of tourism destination
brands. Journal of Business Research, 66(6), 711-718.
Erdem, T. (1998). An empirical analysis of umbrella branding. Journal of Marketing Research,
339-351.
Esfahani, M., Musa, G., & Khoo, S. (2017). The influence of spirituality and physical activity level
on responsible behaviours and mountaineering satisfaction on Mount Kinabalu,
Borneo. Current Issues in Tourism, 20(11), 1162-1185.
Etter-Phoya, R. (2014). UNESCO examines potential impact of oil exploration in Lake Malawi
National Park amid unresolved border dispute. Mining in Malawi. Accessed from
https://mininginmalawi.com/2014/08/19/unesco-examines-potential-impact-of-oil-
exploration-in-lake-malawi-national-park-amid-unresolved-border-dispute/
Everett, S. (2008). Beyond the visual gaze? The pursuit of an embodied experience through food
tourism. Tourist Studies, 8(3), 337-358.
Fairweather, J. R., Maslin, C., & Simmons, D. G. (2005). Environmental values and response to
ecolabels among international visitors to New Zealand. Journal of Sustainable
Tourism, 13(1), 82-98.

204
Ferguson, E., & Cox, T. (1993). Exploratory factor analysis: A users’ guide. International Journal
of Selection and Assessment, 1(2), 84-94.
Field, A. (2009). Discovering Statistics using SPSS (and Sex and Drugs and Rock “n” Roll, (3rd
ed.). London: Sage Publications.
Fisher, J. (2011). The four domains model: Connecting spirituality, health and well-
being. Religions, 2(1), 17-28.
Folkersen, M. V., Fleming, C. M., & Hasan, S. (2018). Deep sea mining's future effects on Fiji's
tourism industry: A contingent behaviour study. Marine Policy, 96, 81-89.
Food and Agriculture Organisation Statistics. (2014). Retrieved from
http://www.fao.org/news/archive/news-by-date/2014/en/
Fornell, C. (1992). A national customer satisfaction barometer: The Swedish experience. Journal
of Marketing ,56, 6-21.
Fournier, S. (1998). Consumers and their brands: Developing relationship theory in consumer
research. Journal of Consumer Research, 24(4), 343-373.
Freeman, R. E. (1984). Strategic management: A stakeholder approach. Boston: Pitman.
Freeman, R. E. (2004). A stakeholder theory of modern corporations. In T. L. Beauchamp & N. E.
Bowie (Eds.), Ethical theory and business (pp.145 -176). Upper Saddle River, NJ: Prentice
Hall.
Frost, R. (2004). Mapping a country’s future. Brandchannel. com, 19.
Fullerton, G. (2003). When does commitment lead to loyalty? Journal of Service Research, 5(4),
333-344.
Furgała-Selezniow, G., Turkowski,K., Nowak, A., Skrzypczak, A., & Mamcarz, A. (2006). The
Ostroda-Elblag canal in Poland: the past and future for water tourism. In M. C. Hall & T.
Härkönen (Eds.), Lake tourism: an integrated approach to lacustrine tourism systems (pp.
131-148). Toronto: Channel View.
Furgała-Selezniow, Małgorzata Jankun, M., Woźnicki, P., Skrzypczak, A., Bronakowska, A.,
Borkowska, I., Wiszniewska, K., & Kujawa, R. (2016). An assessment of recreational

205
potential of chosen lakes of Olsztyńskie Lake District (Warmia and Mazury, Poland) for
angling purposes. Polish Journal of Natural Sciences, 31(3): 445–458.
Fyall, A. (2011). Destination Management: Challenges and Opportunities. In Y. Wang and A.
Pizam (Eds.). Destination Marketing and Management: Theories and Applications.
Wallingford: CABI, pp. 340-357.
Fyall, A., Garrod, B., & Wang, Y. (2012). Destination collaboration: A critical review of theoretical
approaches to a multi-dimensional phenomenon. Journal of Destination Marketing &
Management, 1(1-2), 10-26.
Gartner, W. C. (2006). Planning and management of lake destination development: lake gateways
in Minesota. In M. C. Hall & T. Härkönen (Eds.), Lake tourism: an integrated approach
to lacustrine tourism systems (pp. 167-181). Toronto: Channel View.
Gentile, C., Spiller, N., & Noci, G. (2007). How to sustain the customer experience: An overview
of experience components that co-create value with the customer. European Management
Journal, 25(5), 395-410.
Getz, D. (1991). Festivals, special events, and tourism, New York: Van Nostrand Reinhold.
Getz, D., Andersson, T. and Larson, M. (2007). Managing festival stakeholders: Concepts and case
studies. Event Management 10, 103-122.
Geus, S. D., Richards, G., & Toepoel, V. (2016). Conceptualisation and operationalisation of event
and festival experiences: Creation of an event experience scale. Scandinavian Journal of
Hospitality and Tourism, 16(3), 274-296.
Gibson, K. (2000). The moral basis of stakeholder theory. Journal of Business Ethics, 26(3), 245-
257.
Gill, C., Packer, J., & Ballantyne, R. (2019). Spiritual retreats as a restorative destination: Design
factors facilitating restorative outcomes. Annals of Tourism Research, 79, 102761, 1-13.
Gilmore, J. H., & Pine, B. J. (2002). Differentiating hospitality operations via experiences: Why
selling services is not enough. Cornell Hotel and Restaurant Administration
Quarterly, 43(3), 87-96.

206
Gomez, R., & Fisher, J. W. (2003). Domains of spiritual well-being and development and validation
of the Spiritual Well-Being Questionnaire. Personality and individual differences, 35(8),
1975-1991.
Goodrich, J. N. (1978). The relationship between preferences for and perceptions of vacation
destinations: Application of a choice model. Journal of Travel Research, 17(2), 8-13.
Gorsuch, R. L. (1997). Exploratory factor analysis: Its role in item analysis. Journal of
Personality Assessment, 68(3), 532-560.
Govers, R. & Cull, N. (Eds) (n.d). Place branding and public diplomacy. Accessed on 8th
November, 2018 from https://www.palgrave.com/gp/journal/41254
Gössling, S. & Hall, M. C. (2006). An introduction to tourism and global environmental change. In
S. Gössling & M. C. Hall (Eds.), Tourism and the global environmental change: ecological,
social, economic and political interrelationships (pp.1 – 33). London: Routledge.
Graumann, C. F., & Kruse, L. (1990). The environment: Social construction and psychological
problems. In H. T. Himmelweit & G. Gaskell (Eds.), Societal Psychology (pp. 212–229).
London: Sage Publications.
Gupta, S., & Agrawal, R. (2018). Environmentally responsible consumption: Construct definition,
scale development, and validation. Corporate Social Responsibility and Environmental
Management, 25(4), 523-536.
Guyer, C., & Pollard, J. (1997). Cruise visitor impressions of the environment of the Shannon–Erne
waterways system. Journal of Environmental Management, 51(2), 199-215.
Ha, H. Y., & Perks, H. (2005). Effects of consumer perceptions of brand experience on the web:
Brand familiarity, satisfaction and brand trust. Journal of Consumer Behaviour, 4(6), 438-
452.
Hair, J. F., Anderson, R. E., Tatham, R. L., & Black, W. C. (1998). Multivariate Data Analysis (5th
ed.). New Jersey: Prentice Hall.
Hair, J. F., Black, W. C., Babin, B. J., Anderson, R. E., & Tatham, R. L. (2006). Multivariate data
Analysis (6th ed.). Upper Saddle River, NJ: Prentice Hall.

207
Hair, J. F., Black, W. C., Babin, B. J., Anderson, R. E., & Tatham, R. L. (2010). Multivariate data
analysis. Upper Saddle River, NJ: Prentice Hall.
Hair, J. F., Sarstedt, M., Ringle, C. M., & Mena, J. A. (2012). An assessment of the use of partial
least squares structural equation modelling in marketing research. Journal of the Academy
of Marketing Science, 40(3), 414-433.
Hall, C. M. (2008). Tourism planning: Policies, processes and relationships. London: Pearson
Education.
Hall, C. M., & Härkönen, T. (Eds.). (2006). Lake tourism: An integrated approach to lacustrine
tourism systems. Toronto: Channel View.
Hall, C. M., & McArthur, S. (1996). Heritage management in Australia and New Zealand: The
human dimension. Melbourne: Oxford University Press.
Hall, C. M., & Page, S. J. (1999). The geography of tourism and recreation: environment, space
and place. Routledge: London.
Hall, C. M., & Stoffels, M. (2006). Lake tourism in New Zealand: sustainable management issues.
In M. C. Hall & T. Härkönen (Eds.), Lake tourism: an integrated approach to lacustrine
tourism systems (pp. 182- 206). Toronto: Channel View.
Hamzah, Z. L., Alwi, S. F. S., & Othman, M. N. (2014). Designing corporate brand experience in
an online context: A qualitative insight. Journal of Business Research, 67(11), 2299-2310.
Han, H. (2015). Travellers’ pro-environmental behaviour in a green lodging context: Converging
value-belief-norm theory and the theory of planned behaviour. Tourism Management, 47,
164-177.
Han, J., Lee, M., & Hwang, Y. (2016). Tourists’ environmentally responsible behaviour in response
to climate change and tourist experiences in nature-based tourism. Sustainability, 8, 644.
Han, H., Lee, K. S., Song, H., Lee, S., & Chua, B. L. (2019). Role of coffeehouse brand experiences
(sensory/affective/intellectual/behavioral) in forming patrons’ repurchase intention. Journal
of Hospitality and Tourism Insights, 3(1), 17-35.
Hankinson, G. (2004). Relational network brands: Towards a conceptual model of place
brands. Journal of Vacation Marketing, 10(2), 109-121.

208
Hankinson, G. (2005). Destination brand images: a business tourism perspective. Journal of
Services Marketing, 19 (1), 24-32.
Hankinson, G. (2009). Managing destination brands: establishing a theoretical foundation. Journal
of Marketing Management, 25(1-2), 97-115.
Hankinson, G. (2012). The measurement of brand orientation, its performance impact, and the role
of leadership in the context of destination branding: An exploratory study. Journal of
Marketing Management, 28(7-8), 974-999.
Hankinson, G. A. & Cowking, P. (1993). Branding in Action. Maidenhead: McGraw-Hill.
Hanna, S., & Rowley, J. (2011). Towards a strategic place brand-management model. Journal of
Marketing Management, 27(5-6), 458-476.
Hardesty, D. M., & Bearden, W. O. (2004). The use of expert judges in scale development:
Implications for improving face validity of measures of unobservable constructs. Journal of
Business Research, 57(2), 98-107.
Hardy, A. (2005). Using grounded theory to explore stakeholder perceptions of tourism. Journal of
Tourism and Cultural Change, 3(2), 108-133.
Harrigan, P., Evers, U., Miles, M., & Daly, T. (2017). Customer engagement with tourism social
media brands. Tourism Management, 59, 597-609.
Hay, D., & Socha, P. M. (2005). Spirituality as a natural phenomenon: Bringing biological and
psychological perspectives together. Zygon, 40(3), 589-612.
Hayes, D., & MacLeod, N. (2007). Packaging places: Designing heritage trails using an experience
economy perspective to maximize visitor engagement. Journal of Vacation
Marketing, 13(1), 45-58.
Heide, M., & Grønhaug, K. (2009). Key factors in guests' perception of hotel atmosphere. Cornell
Hospitality Quarterly, 50(1), 29-43.
Heintzman, P. (1999). Spiritual Wellness: Theoretical Links and Leisure. Journal of
Leisurability, 26, 21-32.

209
Heintzman, P. (2002). The role of introspection and spirituality in the park experience of day
visitors to Ontario Provincial Parks. Managing protected areas in a changing world, 992-
1004.
Heintzman, P. (2007). Men's wilderness experience and spirituality: A qualitative study. In In:
Burns, R.; Robinson, K., comps. Proceedings of the 2006 North-eastern Recreation
Research Symposium; 2006 April 9-11; Bolton Landing, NY. Gen. Tech. Rep. NRS-P-14.
Newtown Square, PA: US Department of Agriculture, Forest Service, Northern Research
Station: 216-225. (Vol. 14).
Hidalgo, M. C., & Hernandez, B. (2001). Place attachment: Conceptual and empirical
questions. Journal of Environmental Psychology, 21(3), 273-281.
Hines, J. M., Hungerford, H. R., & Tomera, A. N. (1987). Analysis and synthesis of research on
responsible environmental behaviour: a meta-analysis. The Journal of Environmental
Education, 18(2), 1-8.
Hinkin, T. R. (1995). A review of scale development practices in the study of organizations. Journal
of Management, 21(5), 967-988.
Hinkin, T. R. (1998). A brief tutorial on the development of measures for use in survey
questionnaires. Organizational Research Methods, 1(1), 104-121.
Hirschman, E. C. (1984). Experience seeking: a subjectivist perspective of consumption. Journal
of Business research, 12(1), 115-136.
Hoch, S. J. (2002). Product experience is seductive. Journal of Consumer Research, 29(3), 448-
454.
Holbrook, M. B., & Hirschman, E. C. (1982). The experiential aspects of consumption: Consumer
fantasies, feelings, and fun. Journal of Consumer Research, 9(2), 132-140.
Holt, D. B. (1995). How consumers consume: A typology of consumption practices. Journal of
Consumer Research, 22 (1), 1 -16.
Hosany, S., & Prayag, G. (2013). Patterns of tourists' emotional responses, satisfaction, and
intention to recommend. Journal of Business Research, 66(6), 730-737.

210
Hosany, S., & Witham, M. (2010). Dimensions of cruisers’ experiences, satisfaction, and intention
to recommend. Journal of Travel Research, 49(3), 351-364.
Hu, L. T., & Bentler, P. M. (1999). Cut-off criteria for fit indexes in covariance structure analysis:
Conventional criteria versus new alternatives. Structural equation modelling: a
multidisciplinary journal, 6(1), 1-55.
Huang, J. H., Huang, C. T., & Wu, S. (1996). National character and response to unsatisfactory
hotel service. International Journal of Hospitality Management, 15(3), 229-243.
Hudson, S., & Ritchie, J. R. (2009). Branding a memorable destination experience. The case of
‘Brand Canada’. International Journal of Tourism Research, 11(2), 217-228.
Hui, M. K., & Bateson, J. E. (1991). Perceived control and the effects of crowding and consumer
choice on the service experience. Journal of Consumer Research, 18(2), 174-184.
Hull, R. B., Stewart, W. P., & Young, K. Y. (1992). Experience patterns: capturing the dynamic
nature of a recreation experience. Journal of Leisure Research 24 (3): 240-252, 24(3).
Hungerford, H. R., & Volk, T. L. (1990). Changing learner behaviour through environmental
education. The Journal of Environmental Education, 21(3), 8-21.
Hultén, B. (2011). Sensory marketing: the multi-sensory brand-experience concept. European
Business Review, 23(3), 256-273.
Hultén, B. (2012). Sensory cues and shoppers' touching behaviour: the case of IKEA. International
Journal of Retail & Distribution Management, 40(4), 273-289.
Hunt, H. K. (1977). Consumer Satisfaction/Dissatisfaction: Overview and Research Directions. In
H. K. Hunt (Ed.), Conceptualization and Measurement of Consumer Satisfaction and
Dissatisfaction (pp. 455-88). Cambridge: Marketing Science Institute.
Huybers, T. (2003). Domestic tourism destination choice – a choice modelling analysis.
International Journal of Tourism Research, 5 (6), 445-459.
Iacobucci, D. (2008). Mediation analysis. Thousand Oaks, CA: Sage.
Iglesias, O., Singh, J. J., & Batista-Foguet, J. M. (2011). The role of brand experience and affective
commitment in determining brand loyalty. Journal of Brand Management, 18(8), 570-582.

211
Iglesias, O., Markovic, S., & Rialp, J. (2019). How does sensory brand experience influence brand
equity? Considering the roles of customer satisfaction, customer affective commitment, and
employee empathy. Journal of Business Research, 96, 343-354.
International Lake Environment Committee Foundation. (2005). Managing lakes and their basins
for sustainable use: a report for lake basin managers and stakeholders. International Lake
Environment Committee Foundation. Kusatsu: Japan.
Iso-Ahola, S. E. (1982). Toward a social psychological theory of tourism motivation: A
rejoinder. Annals of Tourism Research, 9(2), 256-262.
Iversen, N. M., & Hem, L. E. (2008). Provenance associations as core values of place umbrella
brands: A framework of characteristics. European Journal of Marketing, 42(5/6), 603-626.
Iwata, O. (2001). Attitudinal determinants of environmentally responsible behaviour. Social
Behaviour and Personality, 29(2), 183-190.
Jacobs, S. (2018, May 21). Royal honeymoon: Where will the duke and Duchess of Sussex go? The
Telegraph. https://www.telegraph.co.uk/travel/hotels/articles/where-will-the-Duke-and-
Duchess-of-Sussex-honeymoon/
Jennings, G. (2001). Tourism research. Queensland: John Wiley and sons.
Jennings, G. (2007). Water-based tourism, sport, leisure, and recreation experiences. In Water-
based tourism, sport, leisure, and recreation experiences (pp. 19-38). Oxford: Routledge.
Jimura, T. (2019). World Heritage Sites: tourism, local communities and conservation activities.
Boston: CABI
Jones, B. E., Scott, D., & Gössling, S. (2006). Lakes and Streams. In S. Gössling & M. C. Hall
(Eds.), Tourism and the global environmental change: ecological, social, economic and
political interrelationships (pp.76 – 94). London: Routledge.
Jorgensen, S. E., & Matsui, S. (1997). Guidelines of lake management (Vol. 8). The world’s lakes
in crisis. Washington DC: United Nations Environmental Program.
Jorgenson, J., Nickerson, N., Dalenberg, D., Angle, J., Metcalf, E., & Freimund, W. (2018).
Measuring Visitor Experiences: Creating and Testing the Tourism Autobiographical
Memory Scale. Journal of Travel Research, 1-13.

212
Juvan, E., & Dolnicar, S. (2016). Measuring environmentally sustainable tourist behaviour. Annals
of Tourism Research, 59, 30-44.
Juvan, E., & Dolnicar, S. (2017). Drivers of pro-environmental tourist behaviours are not
universal. Journal of Cleaner Production, 166, 879-890.
Jung, J., Petkanic, P., Nan, D., & Kim, J. H. (2020). When a girl awakened the world: A user and
social message analysis of Greta Thunberg. Sustainability, 12(7), 2707.
Kaiser, F. G., & Shimoda, T. A. (1999). Responsibility as a predictor of ecological
behaviour. Journal of Environmental Psychology, 19(3), 243-253.
Kaler, J. (2002). Morality and strategy in stakeholder identification. Journal of Business
Ethics, 39(1-2), 91-99.
Kaler, J. (2004). Arriving at an acceptable formulation of stakeholder theory. Business Ethics: A
European Review, 13(1), 73-79.
Kanagasapapathy, G. D. (2017). Understanding the flow experiences of heritage tourists (Doctoral
Dissertation, Bournemouth University). Retrieved from
http://eprints.bournemouth.ac.uk/29882/1/KANAGASAPAPATHY%2C%20Gayathri%20
Daisy_Ph.D._2017.pdf
Kang, M., & Moscardo, G. (2006). Exploring cross-cultural differences in attitudes towards
responsible tourist behaviour: a comparison of Korean, British and Australian tourists. Asia
Pacific Journal of Tourism Research, 11(4), 303-320.
Kao, Y. F., Huang, L. S., & Wu, C. H. (2008). Effects of theatrical elements on experiential quality
and loyalty intentions for theme parks. Asia Pacific Journal of Tourism Research, 13(2),
163-174.
Kaplan, S. (1995). The restorative benefits of nature: Toward an integrative framework. Journal of
Environmental Psychology, 15(3), 169-182.
Kaplan, D. (2000). Structural equation modelling: Foundation and extensions. Thousand Oaks,
CA: Sage.
Kaplan, R., & Kaplan, S. (1989). The experience of nature: A psychological perspective.
Cambridge: Cambridge University Press

213
Kaplan, R., Kaplan, S., & Ryan, R. (1998). With people in mind: Design and management of
everyday nature. United States of America: Island Press
Kastenholz, E. (2000). The market for rural tourism in north and central Portugal. A benefit
segmentation approach. In D. Richards & G. Hall (Eds.), Tourism and sustainable
community development (pp. 268–284). London: Routledge.
Kastenholz, E., Carneiro, M. J., Marques, C. P., & Lima, J. (2012). Understanding and managing
the rural tourism experience—The case of a historical village in Portugal. Tourism
Management Perspectives, 4, 207-214.
Kavaratzis, M. (2005). Place branding: A review of trends and conceptual models. The Marketing
Review, 5(4), 329-342.
Kavaratzis, M. (2009). Cities and their brands: Lessons from corporate branding. Place branding
and public diplomacy, 5(1), 26-37.
Kerstetter, D. L., Hou, J.-S., & Lin, C.-H. (2004). Profiling Taiwanese eco-tourists using a
behavioural approach. Tourism Management, 25(4), 491- 498.
Khan, I., & Rahman, Z. (2015). Brand experience anatomy in retailing: An interpretive structural
modelling approach. Journal of Retailing and Consumer Services, 24, 60-69.
Khan, I., & Rahman, Z. (2017). Brand experience and emotional attachment in services: The
moderating role of gender. Service Science, 9(1), 50-61.
Kil, N., Holland, S. M., & Stein, T. V. (2014). Structural relationships between environmental
attitudes, recreation motivations, and environmentally responsible behaviors. Journal of
Outdoor Recreation and Tourism, 7, 16-25.
Kim, J. H. (2010). Determining the factors affecting the memorable nature of travel
experiences. Journal of Travel & Tourism Marketing, 27(8), 780-796.
Kim, J. H. (2014). The antecedents of memorable tourism experiences: The development of a scale
to measure the destination attributes associated with memorable experiences. Tourism
Management, 44, 34-45.
Kim, A. K., & Brown, G. (2012). Understanding the relationships between perceived travel
experiences, overall satisfaction, and destination loyalty. Anatolia, 23(3), 328-347.

214
Kim, J. H., Ritchie, J. R., & Tung, V. W. S. (2010). The effect of memorable experience on
behavioural intentions in tourism: A structural equation modelling approach. Tourism
Analysis, 15(6), 637-648.
Kim, J. H., Ritchie, J. B., & McCormick, B. (2012). Development of a scale to measure memorable
tourism experiences. Journal of Travel Research, 51(1), 12-25.
Kim, S., & Crompton, J. L. (2002). The influence of selected behavioural and economic variables
on perceptions of admission price levels. Journal of Travel Research, 41(2), 144-152
Klaus, P., & Maklan, S. (2007). The role of brands in a service-dominated world. Journal of Brand
Management, 15(2), 115-122.
Klaus, P., & Maklan, S. (2012). EXQ: a multiple-item scale for assessing service
experience. Journal of Service Management, 23(1), 5-33.
Klaus, P. P., & Maklan, S. (2013). Towards a better measure of customer experience. International
Journal of Market Research, 55(2), 227-246.
Kline, R. B. (2011). Principles and practices of structural equation modelling. Guilford: Guildford
Press.
Kline, R. B. (2016). Principles and practice of structural equation modelling (4th ed.). New York,
NY, US: Guilford Press.
Koh, K. Y., & Hatten, T. S. (2002). The tourism entrepreneur: The overlooked player in tourism
development studies. International Journal of Hospitality & Tourism Administration, 3(1),
21-48.
Kollmuss, A., & Agyeman, J. (2002). Mind the gap: why do people act environmentally and what
are the barriers to pro-environmental behavior? Environmental Education Research, 8(3),
239-260.
Kotler, P. (2000). Marketing management: The millennium edition. Marketing Management, 23(6),
188-193.
Kotler, P., & Gertner, D. (2002). Country as brand, product, and beyond: A place marketing and
brand management perspective. Journal of Brand Management, 9(4), 249-261.

215
Kozak, M. (2001). Comparative assessment of tourist satisfaction with destinations across two
nationalities. Tourism Management, 22(4), 391-401.
Kozak, M. (2002). Comparative analysis of tourist motivations by nationality and
destinations. Tourism Management, 23(3), 221-232.
Kozak, M., & Nield, K. (1998). Importance-performance analysis and cultural perspectives in
Romanian Black Sea resorts. Anatolia, 9(2), 99-116.
Krishna, A. (2012). An integrative review of sensory marketing: Engaging the senses to affect
perception, judgment and behaviour. Journal of Consumer Psychology, 22(3), 332-351.
Krishna, A., & Morrin, M. (2007). Does touch affect taste? The perceptual transfer of product
container haptic cues. Journal of Consumer Research, 34(6), 807-818.
Kumar, V., & Nayak, J. K. (2018). Destination personality: Scale development and
validation. Journal of Hospitality & Tourism Research, 42(1), 3-25.
Ladkin, A., & Bertramini, A. M. (2002). Collaborative tourism planning: A case study of Cusco,
Peru. Current Issues in Tourism, 5(2), 71-93.
Larsen, S. (2007). Aspects of a psychology of the tourist experience. Scandinavian Journal of
Hospitality and Tourism, 7(1), 7-18.
Larsen, S., & Jenssen, D. (2004). The school trip: Travelling with, not to or from. Scandinavian
Journal of Hospitality and Tourism, 4(1), 43-57.
Lazarus, R. S. (1991). Emotion and adaptation. New York: Oxford University Press.
Lee, T. H. (2009). A structural model to examine how destination image, attitude, and motivation
affect the future behaviour of tourists. Leisure Sciences, 31(3), 215-236.
Lee, T. H., Jan, F. H., & Huang, G. W. (2015). The influence of recreation experiences on
environmentally responsible behaviour: The case of Liuqiu Island, Taiwan. Journal of
Sustainable Tourism, 23(6), 947-967.

216
Lee, T. H., Jan, F. H., & Yang, C. C. (2013). Conceptualizing and measuring environmentally
responsible behaviors from the perspective of community-based tourists. Tourism
Management, 36, 454-468.
Lee, S. A., & Jeong, M. (2014). Enhancing online brand experiences: An application of congruity
theory. International Journal of Hospitality Management, 40, 49-58.
Lee, H. J., & Kang, M. S. (2012). The effect of brand experience on brand relationship
quality. Academy of Marketing Studies Journal, 16(1), 87.
Lehmann, D. R., Keller, K. L., & Farley, J. U. (2008). The structure of survey-based brand
metrics. Journal of International Marketing, 16(4), 29-56.
Lemon, B. W., Bengtson, V. L., & Peterson, J. A. (1972). An exploration of the activity theory of
aging: Activity types and life satisfaction among in-movers to a retirement
community. Journal of gerontology, 27(4), 511-523.
Li, Q. C., & Wu, M. Y. (2019). Rationality or morality? A comparative study of pro-environmental
intentions of local and nonlocal visitors in nature-based destinations. Journal of Destination
Marketing & Management, 11, 130-139.
Lin, H., Zhang, M., Gursoy, D., & Fu, X. (2019). Impact of tourist-to-tourist interaction on tourism
experience: The mediating role of cohesion and intimacy. Annals of Tourism Research, 76,
153-167.
Lin, Y. H. (2015). Innovative brand experience's influence on brand equity and brand
satisfaction. Journal of Business Research, 68(11), 2254-2259.
Lindstedt, J. (2011). Place, identity and the socially responsible construction of place brands. Place
Branding and Public Diplomacy, 7(1), 42-49.
Line, N. D., & Wang, Y. (2017). A multi-stakeholder market oriented approach to destination
marketing. Journal of Destination Marketing & Management, 6(1), 84-93.
Loewenstein, G., & Frederick, S. (1997). Predicting reactions to environmental
change. Environment, Ethics, and Behavior, 52-72.

217
López-Sánchez, Y., & Pulido-Fernández, J. I. (2016). In search of the pro-sustainable tourist: A
segmentation based on the tourist “sustainable intelligence”. Tourism Management Perspectives, 17,
59-71.
Lorentzen, A. (2009). Cities in the experience economy. European Planning Studies, 17(6), 829-
845.
Loureiro, S. M. C. (2014). The role of the rural tourism experience economy in place attachment
and behavioural intentions. International Journal of Hospitality Management, 40, 1-9.
Luo, Y., & Deng, J. (2008). The New Environmental Paradigm and nature-based tourism
motivation. Journal of Travel Research, 46(4), 392-402.
Luo, W., Tang, P., Jiang, L., & Su, M. M. (2020). Influencing mechanism of tourist social
responsibility awareness on environmentally responsible behavior. Journal of Cleaner
Production, 271, 122565.
Łukasik, Z., & Perzyński, T. (2013, October). Telematic systems to aid in safety in Inland water
tourism. In International Conference on Transport Systems Telematics (pp. 89-96).
Springer, Berlin, Heidelberg.
Lwin, M. O., Morrin, M., & Krishna, A. (2010). Exploring the super additive effects of scent and
pictures on verbal recall: An extension of dual coding theory. Journal of Consumer
Psychology, 20(3), 317-326.
Madden, R. (2018, February 5). The world’s 50 best wildlife holidays. The Telegraph. Retrieved
from https://www.telegraph.co.uk/travel/safaris-and-wildlife/best-wildlife-holidays/
MacCannell, D. (1973). Staged authenticity: Arrangements of social space in tourist
settings. American Journal of Sociology, 79(3), 589-603.
Manfredo, M. J., Driver, B. L., & Tarrant, M. A. (1996). Measuring leisure motivation: A meta-
analysis of the recreation experience preference scales. Journal of Leisure Research, 28(3),
188-213.
Mannell, R. C., & Iso-Ahola, S. E. (1987). Psychological nature of leisure and tourism
experience. Annals of Tourism Research, 14(3), 314-331.

218
McCabe, D. B., & Nowlis, S. M. (2003). The effect of examining actual products or product
descriptions on consumer preference. Journal of Consumer Psychology, 13(4), 431-439.
McDowall, S., & Ma, E. (2010). An analysis of tourists' evaluation of Bangkok's performance, their
satisfaction, and destination loyalty: Comparing international versus domestic Thai
tourists. Journal of Quality Assurance in Hospitality & Tourism, 11(4), 260-282.
McKercher, B., & Guillet, B. (2011). Are tourists or markets destination loyal? Journal of Travel
Research, 50(2), 121-132.
Mechinda, P., Serirat, S., & Gulid, N. (2009). An examination of tourists' attitudinal and
behavioural loyalty: Comparison between domestic and international tourists. Journal of
Vacation Marketing, 15(2), 129-148.
Mehmetoglu, M. (2010). Factors influencing the willingness to behave environmentally friendly at
home and holiday settings. Scandinavian Journal of Hospitality and Tourism, 10(4), 430-
447.
Mehmetoglu, M., & Engen, M. (2011). Pine and Gilmore’s concept of experience economy and its
dimensions: An empirical examination in tourism. Journal of Quality Assurance in
Hospitality & Tourism, 12(4), 237–255. d
Melubo, K. (2020). Is there room for domestic tourism in Africa? The case of Tanzania. Journal of
Ecotourism, 19(3), 248-265.
Memon, M. A., Cheah, J., Ramayah, T., Ting, H., & Chuah, F. (2018). Mediation analysis issues
and recommendations. Journal of Applied Structural Equation Modelling, 2(1), 1-9.
Meyer, C., & Schwager, A. (2007). Customer experience. Harvard Business Review, 85(2), 116-
126.
Miller, D., Merrilees, B., & Coghlan, A. (2015). Sustainable urban tourism: Understanding and
developing visitor pro-environmental behaviours. Journal of Sustainable Tourism, 23(1),
26-46.
Mittal, B., & Lassar, W. M. (1998). Why do customers switch? The dynamics of satisfaction versus
loyalty. Journal of Services Marketing, 12(3), 177-194.

219
Mitchell, R. K., Agle, B. R., & Wood, D. J. (1997). Toward a theory of stakeholder identification
and salience: Defining the principle of who and what really counts. Academy of
Management Review, 22(4), 853-886.
Mkono, M. (2011). The othering of food in touristic eatertainment: A netnography. Tourist
Studies, 11(3), 253-270.
Mkono, M., Markwell, K., & Wilson, E. (2013). Applying Quan and Wang's structural model of
the tourist experience: A Zimbabwean netnography of food tourism. Tourism Management
Perspectives, 5, 68-74.
Moeller, T., Dolnicar, S., & Leisch, F. (2011). The sustainability–profitability trade-off in tourism:
Can it be overcome? Journal of Sustainable Tourism, 19(2), 155-169.
Molz, J. G. (2007). Eating Difference. Space and Culture 10(1): 77–93.
Morgan, R. M., & Hunt, S. D. (1994). The commitment-trust theory of relationship
marketing. Journal of Marketing, 20-38.
Morgan, N., & Pritchard, A. (2002). Contextualizing destination branding. Destination branding:
Creating the unique destination proposition, 11-41.
Morgan, N. J., Pritchard, A., & Piggott, R. (2003). Destination branding and the role of the
stakeholders: The case of New Zealand. Journal of Vacation Marketing, 9(3), 285-299.
Morgan, M., & Xu, F. (2009). Student travel experiences: Memories and dreams. Journal of
Hospitality Marketing & Management, 18(2-3), 216-236.
Morgan-Thomas, A., & Veloutsou, C. (2013). Beyond technology acceptance: Brand relationships
and online brand experience. Journal of Business Research, 66(1), 21-27.
Morrison, S., & Crane, F. G. (2007). Building the service brand by creating and managing an
emotional brand experience. Journal of Brand Management, 14(5), 410-421.
Moscardo, G., Morrison, A. M., Pearce, P. L., Lang, C. T., & O'Leary, J. T. (1996). Understanding
vacation destination choice through travel motivation and activities. Journal of Vacation
Marketing, 2(2), 109-122.
Mosley, M. P. (1989). Perceptions of New Zealand river scenery. New Zealand Geographer, 45(1),
2-13.

220
Mossberg, L. (2007). A marketing approach to the tourist experience. Scandinavian Journal of
Hospitality and Tourism 7 (1), 59–74.
Musa, G. (2002). Sipadan: a SCUBA-diving paradise: an analysis of tourism impact, diver
satisfaction and tourism management. Tourism Geographies, 4(2), 195-209.
Mweninguwe, R. (2012). Oil exploration, mining threaten Lake Malawi. Earth and Island Journal.
(accessed from http://www.earthisland.org/journal/index.php/articles/entry/
oil_exploration_mining_threaten_lake_malawi/)
Ndetei, R., & Muhandiki, V. S. (2005). Mortalities of lesser flamingos in Kenyan Rift Valley saline
lakes and the implications for sustainable management of the lakes. Lakes & Reservoirs:
Research & Management, 10(1), 51-58.
Nicholson, R. E., & Pearce, D. G. (2001). Why do people attend events: A comparative analysis of
visitor motivations at four South Island events. Journal of Travel Research, 39(4), 449-460.
Nilsen, B. T., & Dale, B. E. (2013). Defining and categorizing experience industries. Handbook on
the experience economy, 65-83.
Nordvall, A., Pettersson, R., Svensson, B., & Brown, S. (2014). Designing events for social
interaction. Event Management, 18(2), 127-140.
Nunnally, J. C. (1978). Psychometric theory. New York: McGraw-Hill.
Nunnally, J. C., & Bernstein, I. H. (1994). The theory of measurement error. Psychometric
theory, 3, 209-247.
Nyanyale, S. (2005). Lake Malawi National Park National Park WHS summary report. Retrieved
from http://www.cons-dev.org/africanature/mtkenya/MAL/Lake-Malawi.html.
Nysveen, H., Pedersen, P. E., & Skard, S. (2013). Brand experiences in service organizations:
Exploring the individual effects of brand experience dimensions. Journal of Brand
Management, 20(5), 404-423.
O’Dell, T. (2005). Experiencescapes. In P. O’Dell & T. Billing (Eds.), Experiencescapes: Tourism,
culture, and economy (pp. 11–33). Koge: Copenhagen Business School Press.
O'Dell, T. (2007). Tourist experiences and academic junctures. Scandinavian Journal of Hospitality
and Tourism, 7(1), 34-45.

221
Oh, H., Fiore, A. M. and Jeoung, M., (2007). Measuring experience economy concepts: tourism
applications. Journal of Travel Research 46, 119 -132.
Oliver, R. L. (1980). A cognitive model of the antecedents and consequences of satisfaction
decisions. Journal of Marketing Research, 460-469.
Oliver, R. L. (1993). A Conceptual Model of Service Quality and Service Satisfaction. In T. A.
Swartz, D. E. Bowen, and S. W. Brown (Eds.), Advances in Services Marketing and
Management, (pp. 65). Greenwich, CT: JAI Press.
Oliver, R. L. (1999). Whence consumer loyalty? Journal of Marketing, 33-44.
Ooi, C. S. (2005). A theory of tourism experiences: The management of attention. In T. O’Dell &
P. Billing (Eds.), Experiencescapes (pp. 51-68). Copenhagen: Copenhagen Business School
Press.
Oppenheim, A. N. (1992). Questionnaire design, interviewing and attitude measurement. London:
Continuum.
Orams, M. B. (1995). Towards a more desirable form of ecotourism. Tourism Management, 16(1),
3-8.
Orth, U. R., & Malkewitz, K. (2008). Holistic package design and consumer brand
impressions. Journal of Marketing, 72(3), 64-81.
Otoo, F. E., Kim, S., & Choi, Y. (2020). Developing a multidimensional measurement scale for
diaspora tourists’ motivation. Journal of Travel Research, 1-7.
doi.org/10.1177/0047287519899990
Otto, J. E., & Ritchie, J. B. (1996). The service experience in tourism. Tourism Management, 17(3),
165-174.
Packer, J., & Ballantyne, R. (2016). Conceptualizing the visitor experience: A review of literature
and development of a multifaceted model. Visitor Studies, 19(2), 128-143.
Parasuraman, A., Zeithaml, V. A., & Berry, L. L. (1994). Reassessment of expectations as a
comparison standard in measuring service quality: implications for further research. Journal
of Marketing, 58(1), 111-124.

222
Park, C. W., MacInnis, D. J., Priester, J., Eisingerich, A. B., & Iacobucci, D. (2010). Brand
attachment and brand attitude strength: Conceptual and empirical differentiation of two
critical brand equity drivers. Journal of Marketing, 74(6), 1-17.
Patton, M. Q. (1990). Qualitative evaluation and research methods. Newbury Park: Sage.
Pawle, J., & Cooper, P. (2006). Measuring emotion—Lovemarks, the future beyond
brands. Journal of Advertising Research, 46(1), 38-48.
Pearce, P. L. (2004). Theoretical innovation in Asia Pacific tourism research. Asia Pacific Journal
of Tourism research, 9(1), 57 – 70.
Peck, J., & Wiggins, J. (2006). It just feels good: Customers' affective response to touch and its
influence on persuasion. Journal of Marketing, 70(4), 56-69.
Petrick, J. F. (2004). The roles of quality, value, and satisfaction in predicting cruise passengers’
behavioural intentions. Journal of Travel Research, 42(4), 397-407.
Petrick, J. F., & Backman, S. J. (2002). An examination of the determinants of golf travelers’
satisfaction. Journal of Travel Research, 40(3), 252-258.
Pike, S. (2005). Tourism destination branding complexity. Journal of Product & Brand
Management, 14(4), 258-259.
Pike, S. (2009). Destination brand positions of a competitive set of near-home destinations. Tourism
Management, 30(6), 857-866.
Pike, S., & Ryan, C. (2004). Destination positioning analysis through a comparison of cognitive,
affective, and conative perceptions. Journal of Travel Research, 42(4), 333-342.
Pilcher, E. J., Newman, P., & Manning, R. E. (2009). Understanding and managing experiential
aspects of soundscapes at Muir Woods National Monument. Environmental
Management, 43(3), 425.
Pine, B. J., & Gilmore, J. H. (1998). Welcome to the experience economy. Harvard Business
Review, 76, 97-105.
Pine, B. J., & Gilmore, J. H. (1999). The experience economy: work is theatre & every business a
stage. Massachusetts: Harvard.

223
Pine, B. J, & Gilmore, J. H. (2011). The experience economy: work is theatre and every business a
stage. (Rev. ed.). Boston: Harvard.
Pizam, A. (2010). Creating memorable experiences. International Journal of Hospitality
Management, 29 (3), 343.
Pizam, A., & Sussmann, S. (1995). Does nationality affect tourism behaviour? Annals of Tourism
Research, 22(4), 901–917.
Pizam, A., Jansen-Verbeke, M., & Steel, L. (1997). Are all tourists alike, regardless of nationality?
The perceptions of Dutch tour-guides. Journal of International Hospitality, Leisure &
Tourism Management, 1(1), 19-38.
Ponsignon, F., Lunardo, R., & Michrafy, M. (2020). Why Are International Visitors More Satisfied
with the Tourism Experience? The Role of Hedonic Value, Escapism, and Psychic
Distance. Journal of Travel Research, doi.org/10.1177/0047287520961175
Poria, Y., Reichel, A., & Cohen, R. (2013). Tourists’ perceptions of World Heritage Site and its
designation. Tourism Management, 35, 272-274.
Porteous, J. D. (1985). Smellscape. Progress in Physical Geography, 9, 356–378.
Powell, R. B., & Ham, S. H. (2008). Can ecotourism interpretation really lead to pro-conservation
knowledge, attitudes and behaviour? Evidence from the Galapagos Islands. Journal of
Sustainable Tourism, 16(4), 467-489.
Prasad, K., & Dev, C. S. (2000). Managing hotel brand equity: A customer-centric framework for
assessing performance. The Cornell Hotel and Restaurant Administration Quarterly, 41(3),
22-4.
Prayag, G., & Ryan, C. (2012). Antecedents of tourists’ loyalty to Mauritius: The role and influence
of destination image, place attachment, personal involvement, and satisfaction. Journal of
Travel Research, 51(3), 342-356.

224
Presenza, A., & Iocca, S. (2012). The weight of stakeholders on festival management. The case of
music festivals in Italy. PASOS. Revista de Turismo y Patrimonio Cultural, 10(2).
Puhakka, R. (2011). Environmental concern and responsibility among nature tourists in Oulanka
Pan park, Finland. Scandinavian Journal of Hospitality and Tourism, 11(1), 76-96.
Puri, R. (1996). Measuring and modifying consumer impulsiveness: A cost‐benefit accessibility
framework. Journal of Consumer Psychology, 5(2), 87-113.
Quadri-Felitti, D., & Fiore, A. M. (2012). Experience economy constructs as a framework for
understanding wine tourism. Journal of Vacation Marketing, 18(1), 3-15.
Quan, S., & Wang, N. (2004). Towards a structural model of the tourist experience: An illustration
from food experiences in tourism. Tourism Management, 25(3), 297-305.
Ramkissoon, H., Weiler, B., & Smith, L. D. G. (2012). Place attachment and pro-environmental
behaviour in national parks: The development of a conceptual framework. Journal of
Sustainable Tourism, 20(2), 257-276.
Ramkissoon, H., Weiler, B., & Smith, L. D. G. (2013a). Place attachment, place satisfaction and
pro-environmental behaviours: a comparative assessment of multiple regression and
structural equation modelling. Journal of Policy Research in Tourism, Leisure and
Events, 5(3), 215-232.
Ramkissoon, H., Smith, L. D. G., & Weiler, B. (2013b). Testing the dimensionality of place
attachment and its relationships with place satisfaction and pro-environmental behaviours:
A structural equation modelling approach. Tourism Management, 36, 552-566.
Ramkissoon, H., Smith, L. D. G., & Weiler, B. (2013c). Relationships between place attachment,
place satisfaction and pro-environmental behaviour in an Australian national park. Journal
of Sustainable Tourism, 21(3), 434-457.
Ray, A. (2008). Experiential Art: Marketing Imitating Art Imitating Life. Retrieved from
https://www.experiencetheblog.com/2008/05/experiential-art-marketing-imitating.html
Reisinger, Y., & Steiner, C. (2006). Reconceptualising interpretation: The role of tour guides in
authentic tourism. Current Issues in Tourism, 9(6), 481-498.
Relph, E. (1976). Place and placeness. London: Pion.

225
Ritchie, J. B., & Crouch, G. I. (2003). The competitive destination: A sustainable tourism
perspective. Wallingford: CABI.
Ritchie, J. R. B., & Ritchie, J. R. R. (1998, September). The branding of tourism destinations.
In Annual Congress of International Association of Scientific Experts in Tourism (pp. 1-31).
Ritchie, J. R. B, Tung, V. W. S, & Ritchie, R. J. B. (2011). Tourism experience management
research: Emergence, evolution and future directions. International Journal of
Contemporary Hospitality Management, 23(4), 419-438.
Rittichainuwat, B. N., & Chakraborty G. (2009). Perceived Travel Risks Regarding Terrorism and
Disease: The Case of Thailand. Tourism Management 30 (3), 410–18.
Roberts, J. A., Tsang, J. A., & Manolis, C. (2015). Looking for happiness in all the wrong places:
The moderating role of gratitude and affect in the materialism–life satisfaction
relationship. The Journal of Positive Psychology, 10(6), 489-498.
Rodaway, P. (1994). Sensuous geographies: body, sense and place. London: Routledge.
Rodrigues, A. I., Correia, A., & Kozak, M. (2013). The Alqueva reservoir in Portugal: towards the
development of a new lake destination. Polish Journal of Natural Sciences, Olsztyn, 28(1),
131-143.
Rodrigues, A. L., Rodrigues, A., & Peroff, D. M. (2014). The sky and sustainable tourism
development: A case study of a dark sky reserve implementation in Alqueva. International
Journal of Tourism Research, 17(3), 292-302.
Rodrigues, A. I., Correia, A., Kozak, M., & Tuohino, A. (2015a). Lake-destination image attributes:
content analysis of text and pictures. In A. Correia, J. Gnoth, M. Kozak, & A. Fyall, (Eds.),
Advances in Marketing Places and Spaces (pp. 293-314). Book series: Advances in Culture,
Tourism and Hospitality Research (Vol. 10). England: Emerald.
Rodrigues, A. L., Rodrigues, A., & Peroff, D. M. (2015b). The sky and sustainable tourism
development: A case study of a dark sky reserve implementation in Alqueva. International
Journal of Tourism Research, 17(3), 292-302.
Ross, G. F. (1993). Ideal and actual images of backpacker visitors to Northern Australia. Journal
of Travel Research, 32(2), 54-57.

226
Ross, E. L. D., & Iso-Ahola, S. E. (1991). Sightseeing tourists' motivation and satisfaction. Annals
of Tourism Research, 18(2), 226-237.
Rust, R. T. & Oliver, R. L. (1994). Service quality: insights and managerial implication from the
frontier. In R.T. Rust & R. L. Oliver (Eds.), Service quality: New directions in the theory
and practice (pp. 1-19). Thousand Oaks, CA: Sage
Ryan, C. (Ed.). (1997). The Tourist Experience: An Introduction. London: Cassell.
Saari, U. A., & Mäkinen, S. J. (2017). Measuring brand experiences cross-nationally. Journal of
Brand Management, 24(1), 86-104.
Sağkal, A. S., & Özdemir, Y. (2020). I am satisfied with my sweetheart, therefore I am satisfied
with my life (and vice versa): A cross-lagged autoregressive panel model. The Journal of
General Psychology, 147(4), 381-397.
Saito, H., & Ruhanen, H. (2017). Power in tourism stakeholder collaborations: Power types and
power holders. Journal of Hospitality and Tourism Management, 31, 189-196.
San Martín, H., & Del Bosque, I. A. R. (2008). Exploring the cognitive–affective nature of
destination image and the role of psychological factors in its formation. Tourism
Management, 29(2), 263-277.
Sawubona (2017, November). Boat cruises on the pristine Mumbo Island on Lake Malawi.
Sawubona (South African Airways Inflight magazine). Retrieved from
www.visitmalawi.com.
Schmitt, B. H. (1999a). Experiential marketing. Journal of Marketing Management, 15(1-3), 53-
67.
Schmitt, B. H. (1999b). Experiential marketing: How to get customer to sense, feel, think, act, and
relate to your company and brands. New York: Free Press.
Schmitt, B.H. (2009). The concept of brand experience. Journal of Brand Management, Vol. 16
No. 7, pp. 417-19.
Schmitt, B. (2013). The consumer psychology of customer–brand relationships: Extending the AA
Relationship model. Journal of Consumer Psychology, 23(2), 249-252.

227
Schmitt, N. W., & Klimoski, R. J. (1991). Research methods in human resources Management.
Cincinnati: South-Western.
Schmitt, B., Brakus, J. J., & Zarantonello, L. (2015). From experiential psychology to consumer
experience. Journal of Consumer Psychology, 25 (1), 166-171.
Scott, D., Jones, B., Mills, B., McBoyle, G., Lemieux, C., Svenson, S., & Wall, G. (2002). The
vulnerability of winter recreation to climate change in Ontario's Lakelands Tourism Region.
Department of Geography Publication Series 18. Waterloo, Ontario: University of
Waterloo.
Segwick, P. (2012). Proportional quota sampling. BMJ: British Medical Journal, 345: 6336
Shamim, A., & Mohsin Butt, M. (2013). A critical model of brand experience consequences. Asia
Pacific Journal of Marketing and Logistics, 25(1), 102-117.
Sharpley, R. (2002). Rural tourism and the challenge of tourism diversification: the case of
Cyprus. Tourism Management, 23(3), 233-244.
Sharpley, R. (2014). Host perceptions of tourism: A review of the research. Tourism Management,
42, 37–49.
Sharpley, R., & Jepson, D. (2011). Rural tourism: A spiritual experience? Annals of Tourism
Research, 38(1), 52-71.
Simpson, P. M., Siguaw, J. A. & Sheng, X. (2016). Tourists’ Life Satisfaction at Home and Away:
A Tale of Two Cities. Journal of Travel Research, 55 (2): 161–75.
Sinclair, J. (2000). The Fatal Shore. Habitat Australia, 28 (2), 6–8.
Singh, M., Balasubramanian, S. K., & Chakraborty, G. (2000). A comparative analysis of three
communication formats: advertising, infomercial, and direct experience. Journal of
Advertising, 29(4), 59-75.
Skard, S., Nysveen, H., & Pedersen, P. E. (2011). Brand and customer experience in service
organizations: Literature review and brand experience construct validation. SNF Working
Paper No. 09/11 available at: http://brage.bibsys.no/xmlui/bitstream/ha

228
Skinner, H. (2008). The emergence and development of place marketing's confused
identity. Journal of Marketing Management, 24(9-10), 915-928.
Skogland, I., & Siguaw, J. A. (2004). Are your satisfied customers loyal? Cornell Hotel and
Restaurant Administration Quarterly, 45(3), 221-234.
Smith, M. (2003). Holistic holidays: Tourism and the reconciliation of body, mind and
spirit. Tourism Recreation Research, 28(1), 103-108.
Smith, M., & Kelly, C. (2006). Wellness tourism. Tourism Recreation Research, 31 (1), 1-14.
Smith, S. L., & Xiao, H. (2008). Culinary tourism supply chains: A preliminary
examination. Journal of Travel Research, 46(3), 289-299.
So, J. T., Parsons, A. G, & Yap, S. F. (2013). Corporate branding, emotional attachment and brand
loyalty: the case of luxury fashion branding. Journal of Fashion Marketing and
Management: An International Journal, 17(4), 403-423.
Solberg, E. G., Diener, E., & Robinson, M. D. (2004). Why are materialists less
satisfied? In T. Kasser & A. D. Kanner (Eds.), Psychology and consumer culture: The
struggle for a good life in a materialistic world (pp. 29–48). Washington, DC: American
Psychological Association.
Spangenberg, E. R., Crowley, A. E., & Henderson, P. W. (1996). Improving the store environment:
do olfactory cues affect evaluations and behaviours? The Journal of Marketing, 67-80.
Spreng, R. A., MacKenzie, S. B., & Olshavsky, R. W. (1996). A re-examination of the determinants
of consumer satisfaction. The Journal of Marketing, 15-32.
Stamboulis, Y., & Skayannis, P. (2003). Innovation strategies and technology for experience-based
tourism. Tourism Management, 24(1), 35-43.
Stedman, R. C. (2002). Toward a social psychology of place: Predicting behaviour from place-
based cognitions, attitude, and identity. Environment and Behaviour, 34(5), 561-581.
Stern, P. C. (2000). New environmental theories: toward a coherent theory of environmentally
significant behaviour. Journal of Social Issues, 56(3), 407-424.
Stern, B. B. (2006). What does brand mean? Historical – analysis method and construct definition.
Journal of the Academy of Marketing Science, 31(36 – 46).

229
Sternberg, E. (1997). The iconography of the tourism experience. Annals of Tourism
Research, 24(4), 951-969.
Stevens, J. P. (2002). Applied multivariate statistics for the social sciences (4th ed.). Mahwah, NJ:
Lawrence Erlbaum.
Stringer, L. A., & McAvoy, L. H. (1992). The need for something different: Spirituality and
wilderness adventure. Journal of Experiential Education, 15(1), 13-20.
Stone, E. F. (1978). Research methods in organizational behaviour. Illinois: Scott Foresman.
Su, L., Huang, S., & Huang, J. (2018). Effects of destination social responsibility and tourism
impacts on residents’ support for tourism and perceived quality of life. Journal of
Hospitality & Tourism Research, 42(7), 1039-1057.
Su, L., Huang, S. S., & Pearce, J. (2018). How does destination social responsibility contribute to
environmentally responsible behaviour? A destination resident perspective. Journal of
Business Research, 86, 179-189.
Su, M. M., & Wall, G. (2014). Community participation in tourism at a world heritage site:
Mutianyu Great Wall, Beijing, China. International Journal of Tourism Research, 16(2),
146-156.
Suchman, M. C. (1995). Managing legitimacy: Strategic and institutional approaches. Academy of
Management Review, 20(3), 571-610.
Suddaby, R. (2010). Editor’s comments: construct clarity in theories of management and
organization. Academy of Management Review, 35(3), 346-357.
Summers, T. A., & Hebert, P. R. (2001). Shedding some light on store atmospherics: influence of
illumination on consumer behaviour. Journal of Business Research, 54(2), 145-150.
Sundbo, J. (2009). ’Innovation in the Experience Economy: A Taxonomy of Innovation
Organizations. The Services Industries Journal, 29(4), 431-455.
Sundbo, J., & Sørensen, F. (2013). (Eds.), Handbook on the experience economy. Cheltenham:
Edward Elgar.
Suulola, B. (n.d.). Retrieved from https://www.goodreads.com/quotes/6763716-there-s-no-
discovery-without-a-search-and-there-s-no-rediscovery

230
Swaminathan, V., Page, K. L., & Gürhan-Canli, Z. (2007). “My” brand or “our” brand: The effects
of brand relationship dimensions and self-construal on brand evaluations. Journal of
Consumer Research, 34(2), 248-259.
Tabachnick, B. G., & Fidell, L. S. (2013). Using multivariate statistics (6th Edn.). Boston: Pearson
Education.
Tan, W. K., & Wu, C. E. (2016). An investigation of the relationships among destination familiarity,
destination image and future visit intention. Journal of Destination Marketing &
Management, 5(3), 214-226.
Tasci, A. D., & Kozak, M. (2006). Destination brands vs destination images: Do we know what we
mean? Journal of Vacation Marketing, 12(4), 299-317.
Thapa, B. (2010). The mediation effect of outdoor recreation participation on environmental
attitude-behaviour correspondence. The Journal of Environmental Education, 41(3), 133-
150.
Thomson, M., MacInnis, D. J., & Park, C. W. (2005). The ties that bind: Measuring the strength of
consumers’ emotional attachments to brands. Journal of Consumer Psychology, 15(1), 77-
91.
Thorp, S., & Stone, J. (2000). Recreational boating and the Great Lakes–St. Lawrence Region.
Feature Report. Ann Arbor, MI: Great Lakes Commission.
Torres, E. N. (2016). Guest interactions and the formation of memorable experiences: An
ethnography. International Journal of Contemporary Hospitality Management, 28(10),
2132-2155.
Trochim, W., & Donnelly, J. (2006). The Research Methods Knowledge Base, 3rd. Mason, Ohio:
Atomic Dog Publishing.
Truong, T. L. H., Lenglet, F., & Mothe, C. (2018). Destination distinctiveness: Concept,
measurement, and impact on tourist satisfaction. Journal of Destination Marketing &
Management, 8, 214-231.
Tsai, S. P. (2012). Place attachment and tourism marketing: Investigating international tourists in
Singapore. International Journal of Tourism Research, 14(2), 139-152.

231
Tsaur, S. H., Chiu, Y. T., & Wang, C. H. (2007). The visitors’ behavioural consequences of
experiential marketing: an empirical study on Taipei Zoo. Journal of Travel & Tourism
Marketing, 21(1), 47-64.
Tsiotsou, R., & Goldsmith, R. E. (2012). Strategic marketing in tourism services. Bingley: Emerald.
Tucker, H., & Emge, A. (2010). Managing a world heritage site: The case of
Cappadocia. Anatolia, 21(1), 41-54.
Tung, V. W. S., & Ritchie, J. B. (2011). Exploring the essence of memorable tourism
experiences. Annals of Tourism Research, 38(4), 1367-1386.
Tuohino, A. (2006). Lakes as an opportunity for tourism marketing: In search for the spirit of the
lake. In M. C. Hall & T. Härkönen (Eds.), Lake tourism: an integrated approach to
lacustrine tourism systems (pp. 101- 118). Toronto: Channel View.
Turner, G.F., Seehausen, O., Knight, M.E., Allender, C.J., and Robinson, R.L. (2001). How many
species of cichlid fishes are there in African lakes? Molecular Ecology, 10: 793–806.
Ulrich, R. S. (1981). Natural versus urban scenes: Some psychophysiological effects. Environment
and behaviour, 13(5), 523-556.
United Nations Educational, Scientific and Cultural Organisation. (1972a). Convention concerning
the protection of world cultural and natural heritage. Retrieved from
http://whc.unesco.org/archive/convention-en.pdf, Preamble.
Ung, A., & Vong, T. N. (2010). Tourist experience of heritage tourism in Macau SAR,
China. Journal of Heritage Tourism, 5(2), 157-168.
Uriely, N. (2005). The tourist experience: Conceptual developments. Annals of Tourism
Research, 32(1), 199-216.
Urry, J., 1990. The Tourist Gaze: Leisure and Travel in Contemporary Society. London: Sage
Urry, J. (2002). The tourist gaze (2nd Ed.). London: Sage Publications.
Uysal, M. (2003). Satisfaction components in outdoor recreation and tourism settings. e-Review of
Tourism Research, 1(3), 2-29.

232
Van den Berg, L., & Braun, E. (1999). Urban competitiveness, marketing and the need for
organising capacity. Urban Studies, 36(5-6), 987-999.
Vaske, J. J., Donnelly, M. P., & Whittaker, D. (2000). Tourism, national parks and impact
management. In R. W. Butler and S. W. Boyd (Eds.), Tourism and National parks: Issues
and implications, 203 -222. New York: John Wiley & Sons.
Veasna, S., Wu, W. Y., & Huang, C. H. (2013). The impact of destination source credibility on
destination satisfaction: The mediating effects of destination attachment and destination
image. Tourism Management, 36, 511-526.
von Friedrichs Grangsjo, Y. (2001). Destination networking: Co-opetition in a ski resort. Nordiska
Företagsekonomiska Ämneskonferensen, Uppsala, August, 16-18.
Walls, A. R., Okumus, F., Wang, Y. R., & Kwun, D. J. W. (2011). An epistemological view of
consumer experiences. International Journal of Hospitality Management, 30(1), 10-21.
Walsh, G., & Beatty, S. E. (2007). Customer-based corporate reputation of a service firm: scale
development and validation. Journal of the Academy of Marketing Science, 35(1), 127-143.
Wan, C., Shen, G. Q., & Yu, A. (2015). Key determinants of willingness to support policy measures
on recycling: A case study in Hong Kong. Environmental Science & Policy, 54, 409-418.
Wang, C. Y., & Hsu, M. K. (2010). The relationships of destination image, satisfaction, and
behavioral intentions: An integrated model. Journal of Travel & Tourism Marketing, 27(8),
829-843.
Wang, J., Liu-Lastres, B., Ritchie, B. W., & Pan, D. Z. (2019). Risk reduction and adventure
tourism safety: An extension of the risk perception attitude framework (RPAF). Tourism
Management, 74, 247-257.
Wang, J., Luo, Q., Huang, S. S., & Yang, R. (2020). Restoration in the exhausted body? Tourists
on the rugged path of pilgrimage: Motives, experiences, and benefits. Journal of Destination
Marketing & Management, 15. Retrieved from
https://www.sciencedirect.com/science/article/pii/S2212571X19303877
Wang, N. (2000). Tourism and modernity: A sociological analysis. Oxford: Pergamon.

233
Wearing, S. L., & Foley, C. (2017). Understanding the tourist experience of cities. Annals of
Tourism Research, 65, 97-107.
Weaver, S. (2007). Creating Great Visitor Experiences: A Guide for Museums, Parks, Zoos,
Gardens and Libraries. California: Left Coast Press.
Weed, M., & Bull, C. (2012). Sports tourism: Participants, policy and providers. Oxfordshire:
Routledge.
Wehrli, R., Priskin, J., Demarmels, S., Schaffner, D., Schwarz, J., Truniger, F., & Stettler, J. (2017).
How to communicate sustainable tourism products to customers: Results from a choice
experiment. Current Issues in Tourism, 20(13), 1375-1394.
Weiss, R. S. (1994). Learning from Strangers: The Art and Method of Qualitative Interview Studies.
New York: The Free Press.
Westbrook, R. A. (1987). Product/consumption-based affective responses and post-purchase
processes. Journal of Marketing Research, 24, 258-270.
Weyl, O. L., Ribbink, A. J., & Tweddle, D. (2010). Lake Malawi: fishes, fisheries, biodiversity,
health and habitat. Aquatic Ecosystem Health & Management, 13(3), 241-254.
Wieland, A., Durach, C. F., Kembro, J., & Treiblmaier, H. (2017). Statistical and judgmental
criteria for scale purification. Supply Chain Management: An International Journal, 22(4),
321-328.
Williams, D. R. (1989). Great expectations and the limits to satisfaction: A review of recreation and
consumer satisfaction research. In Outdoor recreation benchmark 1988: Proceedings of the
National Outdoor Recreation Forum. USDA Forest Service general technical report SE-52.
USDA Forest Service, Ogden (pp. 422-438).
Williams, A. (2006). Tourism and hospitality marketing: fantasy, feeling and fun. International
Journal of Contemporary Hospitality Management, 18(6), 482-495.
World Bank (2006). Malawi - Poverty Reduction Strategy Paper (Malawi Growth and
Development Strategy) and Joint IDA-IMF Staff Advisory Note (English). Washington, DC:
World Bank. http://documents.worldbank.org/curated/en/130231468056034747/Malawi-
Poverty-Reduction-Strategy-Paper-Malawi-Growth-and-Development-Strategy-and-Joint-
IDA-IMF-Staff-Advisory-Note

234
World Bank (2012). Malawi - Second growth and development strategy for 2011-2016: joint staff
advisory note (English). Washington, DC: World Bank.
http://documents.worldbank.org/curated/en/399931468089371016/Malawi-Second-
growth-and-development-strategy-for-2011-2016-joint-staff-advisory-note
World Travel & Tourism Council. (2018). Travel & Economic Impact 2018 Malawi. Retrieved
from https://www.wttc.org/-/media/files/reports/economic-impact-research/countries-
2018/malawi2018.pdf
Worthington, R. L., & Whittaker, T. A. (2006). Scale development research: A content analysis and
recommendations for best practices. The Counselling Psychologist, 34(6), 806-838.
Wu, J., Font, X., & Liu, J. (2020). Tourists’ Pro-environmental Behaviors: Moral Obligation or
Disengagement? Journal of Travel Research. https://doi.org/10.1177/0047287520910787.
Wu, H. C., & Li, T. (2017). A study of experiential quality, perceived value, heritage image,
experiential satisfaction, and behavioural intentions for heritage tourists. Journal of
Hospitality & Tourism Research, 41(8), 904-944.
Yalch, R. F., & Spangenberg, E. R. (2000). The effects of music in a retail setting on real and
perceived shopping times. Journal of Business Research, 49(2), 139-147.
Yeh, C. M. (2013). Tourism involvement, work engagement and job satisfaction among frontline
hotel employees. Annals of Tourism Research, 42, 214-239.
Yoo, B. (2002). Multi-group comparisons: A cautionary note. Psychology & Marketing, 19(4), 357-
368.
Yoon, Y., & Uysal, M. (2005). An examination of the effects of motivation and satisfaction on
destination loyalty: a structural model. Tourism Management, 26(1), 45-56.
Yu, L., & Goulden, M. (2006). A comparative analysis of international tourists’ satisfaction in
Mongolia. Tourism Management, 27(6), 1331-1342.
Yuksel, A., Yuksel, F., & Bilim, Y. (2010). Destination attachment: Effects on customer
satisfaction and cognitive, affective and conative loyalty. Tourism Management, 31(2), 274-
284.

235
Žabkar, V., Brenčič, M. M., & Dmitrović, T. (2010). Modelling perceived quality, visitor
satisfaction and behavioural intentions at the destination level. Tourism Management, 31(4),
537-546.
Zarantonello, L., & Schmitt, B. H. (2010). Using the brand experience scale to profile consumers
and predict consumer behaviour. Journal of Brand Management, 17(7), 532-540.
Zátori, A., Michalkó, G., Nagy, J. T., Kulcsár, N., & Balizs, D. (2017). The tourist experience of
domestic VFR travellers: the case of Hungary. Current Issues in Tourism, 1-23.
Zenker, S, & Braun, E. (2010). Branding a city: A conceptual approach for place branding and
place brand management. In Proceedings of the 39th European Marketing Academy
Conference, Copenhagen: Denmark. Accessed from
https://www.scribd.com/document/46876952/A-Conceptual-Approach-for-Place-
Branding-and-Place-Brand-Management.
Zenker, S., & Martin, N. (2011). Measuring success in place marketing and branding. Place
Branding and Public Diplomacy, 7(1), 32-41.
Zhang, P., Meng, F., & So, K. K. F. (2020). Cocreation Experience in Peer-to-Peer
Accommodations: Conceptualization and Scale Development. Journal of Travel Research,
1-19. Doi: 0047287520938873.
Zhang, T., Agarwal, R., & Lucas, Jr, H. C. (2011). The value of IT-enabled retailer learning:
personalized product recommendations and customer store loyalty in electronic markets.
MIS Quarterly Management Information Systems, 35(4), 859–882.
Zhao, M., Dong, S., Wu, H. C., Li, Y., Su, T., Xia, B., ... & Guo, X. (2018). Key impact factors of
visitors’ environmentally responsible behaviour: personality traits or interpretive services?
A case study of Beijing’s Yuyuantan Urban Park, China. Asia Pacific Journal of Tourism
Research, 23(8), 792-805.
Zhao, X., Lynch, J. G., & Chen, Q. (2010). Reconsidering Baron and Kenny: Myths and Truths
about Mediation Analysis. Journal of Consumer Research, 37(3), 197-206.

236
APPENDICES
Appendix 1: Survey questionnaire
Dear Respondent,
I am working on Destination Brand experiences of Lake Malawi (LM) with an aim of developing
a measurement scale. I, therefore, would like to invite you to participate in this study. Please
indicate on a scale of 1 to 5 (1= Strongly Disagree 2 = Disagree 3= Neutral, 4 = Agree and 5 =
Strongly Agree), your agreement with the items below that measure your experiences at Lake
Malawi.
Furthermore, note that your participation is voluntary and that the data you provide will only be
used for the purposes of this study.
I appreciate your time and willingness to participate in this study.
Cecilia Ndamiwe Ngwira, PhD Candidate
School of Hotel and Tourism Management
The Hong Kong Polytechnic University.
Email: cecilia.ngwira@______________
N.B: Brand experiences are the reactions people give when they interact with a brand. Experiences could come from activities of by just being at the lake.
Part 1: This section will ask you questions pertaining to your evaluation of experiences at
Lake Malawi
Action/Behavioural experiences at Lake Malawi Strongly
Disagree
Disagree Neutral Agree Strongly
Agree
1. LM makes me express who I am through water-based activities 1 2 3 4 5
2. LM gives me an enjoyable experience 1 2 3 4 5
3. LM makes me engage in physical actions and behaviours 1 2 3 4 5
4. Lying on LM beach relaxes me 1 2 3 4 5
5. LM activities allows me to self-actualise in water-based
activities
1 2 3 4 5
6. LM gives me a laid-back feeling 1 2 3 4 5
7. LM transforms my mind 1 2 3 4 5
8. Physical experiences at LM keep me fit 1 2 3 4 5
9. LM is action (water-based sports) oriented 1 2 3 4 5
10. LM is adventuresome 1 2 3 4 5
11. Walking along LM sandy beaches is a worthwhile experience 1 2 3 4 5
12. LM activities makes my adrenaline rise 1 2 3 4 5
13. Sun tanning at LM is important for me 1 2 3 4 5
14. LM puts me in a meditation mood 1 2 3 4 5

237
Expressive/emotional experiences at Lake Malawi Strongly
Disagree
Disagree
Neutral Agree Strongly
Agree
1. LM has a positive effect on how I feel about myself 1 2 3 4 5
2. LM induces feelings and sentiments 1 2 3 4 5
3. LM atmosphere is relaxing 1 2 3 4 5
4. LM gives me a sense of belonging 1 2 3 4 5
5. LM makes me happy 1 2 3 4 5
6. LM gives positive feelings 1 2 3 4 5
7. LM surprises me 1 2 3 4 5
8. I have strong emotions for LM 1 2 3 4 5
9. LM is a friendly destination 1 2 3 4 5
10. LM gives me nostalgic feelings 1 2 3 4 5
Perceptive/cognitive experiences at Lake Malawi Strongly
Disagree
Disagree
Neutral Agree Strongly
Agree
1. LM makes me think 1 2 3 4 5
2. I have feelings of amazement at nature 1 2 3 4 5
3. LM helps me forget about my problems 1 2 3 4 5
4. I gain new knowledge at LM 1 2 3 4 5
5. LM stimulates curiosity and problem solving 1 2 3 4 5
6. I engage in a lot of thinking when I am at LM 1 2 3 4 5
7. Learning about animals of LM is rewarding 1 2 3 4 5
Bodily/sensory experiences at Lake Malawi Strongly
Disagree
Disagree
Neutral Agree Strongly
Agree
1. LM environment is delightful 1 2 3 4 5
2. LM provides me with a good culinary experience 1 2 3 4 5
3. LM animals are appealing to watch 1 2 3 4 5
4. LM allows me to take in the beauty of the place 1 2 3 4 5
5. LM waters stimulates my senses 1 2 3 4 5
6. LM appeals to my senses 1 2 3 4 5
7. Sunrise and sunsets over the LM are exciting 1 2 3 4 5
8. LM provides me with a serene experience 1 2 3 4 5
Relational/social experiences at Lake Malawi Strongly
Disagree
Disagree
Neutral Agree Strongly
Agree
1. LM offers me an opportunity of being a member of a community 1 2 3 4 5
2. Being at LM helps me interact with others 1 2 3 4 5
3. LM allows me to interact with local people 1 2 3 4 5
4. LM represents local hospitality 1 2 3 4 5
5. LM allows me to learn about the locals’ way of life 1 2 3 4 5
6. LM allows me to participate in activities with other people 1 2 3 4 5
7. LM allows me to experience the friendliness of local people 1 2 3 4 5
8. LM experience helps me make friends 1 2 3 4 5
9. Being at LM is a good opportunity to spend time with my family 1 2 3 4 5
Spiritual/psychic experiences at Lake Malawi Strongly
Disagree
Disagree
Neutral Agree Strongly
Agree
1. LM connects me with higher powers of nature 1 2 3 4 5
2. LM draws me away from the secular/ civilisation 1 2 3 4 5
3. LM reunites me with mother nature 1 2 3 4 5
4. LM has spiritual revitalising powers 1 2 3 4 5
5. LM offers me solitude 1 2 3 4 5

238
6. LM gives me spiritual awareness 1 2 3 4 5
Part 2: This section will ask you questions pertaining to your evaluation of the destination
satisfaction and future intention after experiencing Lake Malawi.
Satisfaction Strongly
Disagree
Disagree
Neutral Agree Strongly
Agree
1. I am pleased to have visited LM 1 2 3 4 5
2. I am delighted with LM experiences 1 2 3 4 5
3. Coming to LM was a good choice 1 2 3 4 5
4. My experience at LM was what I needed 1 2 3 4 5
5. Overall, I am satisfied with my decision to visit LM 1 2 3 4 5
Future intention (Pro-environmental behaviour) Strongly
Disagree
Disagree
Neutral Agree Strongly
Agree
1. I volunteer to avoid visiting some areas along the lake if they need
to recover from environmental damage
1 2 3 4 5
2. I will sign petitions against oil drilling in support of this lake 1 2 3 4 5
3. I will tell my friend not to feed fish in LM 1 2 3 4 5
4. I will pay increased fees if introduced at Lake Malawi National
Park
1 2 3 4 5
5. I will volunteer my time to projects that help this lake 1 2 3 4 5
6. I will write letters in support of this lake 1 2 3 4 5
7. I will participate in public meetings about managing this lake 1 2 3 4 5
8. I will make a financial donation to an environmental organization
in support of Lake Malawi
1 2 3 4 5
9. I will tell others on the need to care for our Lake Malawi 1 2 3 4 5
Part 3: Socio-demographics
1. Gender: ① Female ② Male ③ Others______________
2. Marital status: ① Single ② Married ③ Other___________________
3. Age _________
4. Highest educational status: ①Primary ②Secondary school /High School ③ Undergraduate degree ④
Master’s degree⑤ Doctorate degree ⑥ Other ______________________________
5. Your current occupation: ① Company employee ② Self-employed ③ Civil servant ④ Retired⑤
Student ⑥ Housewife ⑦ Parastatal employee ⑧ Other_____________________________
6. Your nationality: ___________________________________
7. How many times have you made a tourism trip in the past 12 months including this one? _______________
8. How many times have you been to Lake Malawi including this one? _________________________
9. Which of the following best describes your annual household income?
For international tourists
① Less than US$10,000
② US$ 10,000-19,999
③ US$ 20,000-29,999
④ US$ 30,000-39,999
⑤ US$ 40,000-49,999
⑥ US$ 50,000-59,999
⑦US$ 60,000-69,999
⑧US$ 70,000-79,999
⑨ US$ 80,000-89, 000
⑩ US$ 90,000-99,000
⑪US$100,000 or above
For domestic visitors

239
① Less than MK50,000
② MK51,000-99,999
③ MK100,000- 149,999
④ MK 150,000-199,999
⑤ MK200,000- 249,999
⑥ MK250,000-299,999
⑦ MK300,000 – MK400, 000
⑧ MK401, 000-MK500, 000
⑨ MK501, 000 – MK600,000
⑩ MK 601,000 –MK700,000
⑪ MK701,000 or above
THANK YOU VERY MUCH

Appendix 2: Human Subjects Ethics Sub-Committee approval Hong Kong
Polytechnic University

Appendix 3: Letter of introduction from The Hong Kong PolyU

Appendix 4: Request for permission letter to conduct research in Malawi
C/O Mzuzu University
Department of Tourism
Private Bag 201
Luwinga
Mzuzu 2.
Cell: 099 701
27th April, 2019.
The Executive committee
NCSRH
Private Bag B303
Lilongwe.
Dear Sir/Madam,
Application for a PhD Research proposal approval
I am sending my research proposal for consideration and approval. The study is on Destination
Brand Experiences of Lake Malawi. The goal of this study is to develop and validate a scale
which would be used to measure visitor experiences of a lake destination.
With this letter, I am enclosing the following:
a) Research proposal (two copies)
b) Budget
c) Curriculum vitae of the principal investigator and supervisors
d) Bank deposit slip for the application fee
e) Informed consent form
f) Data collection instruments and
g) A letter of research approval/introduction from The Hong Kong Polytechnic University
Sincerely yours,
Cecilia Ndamiwe Ngwira
PhD Candidate
The Hong Kong Polytechnic University
cecilia.ngwira@

Appendix 5: Ethical approval to conduct survey in Malawi
NATIONAL COMMITTEE ON RESEARCH IN THE SOCIAL SCIENCES AND
HUMANITIES
3rd. June, 2019 Ref No: NCST/RTT/2/6
Ms Cecilia Ndamiwe Ngwira,
C/O Mzuzu University,
Department of Tourism,
Private Bag 201,
Luwinga, Mzuzu.
Email:cecilia.ngwira@_____________
Dear Ms Ngwira,
RESEARCH ETHICS AND REGULATORY APPROVAL AND PERMIT FOR PROTOCOL NO. P.04/19/373: DESTINATION BRAND EXPERIENCES OF LAKE MALAWI: SCALE DEVELOPMENT AND VALIDATION
Having satisfied all the relevant ethical and regulatory requirements, I am pleased to inform you
that the above referred research protocol has officially been approved. You are now permitted to
proceed with its implementation. Should there be any amendments to the approved protocol in the
course of implementing it, you shall be required to seek approval of such amendments before
implementation of the same.
This approval is valid for one year from the date of issuance of this approval. If the study goes beyond
one year, an annual approval for continuation shall be required to be sought from the National
Committee on Research in the Social Sciences and Humanities (NCRSH) in a format that is available
at the Secretariat. Once the study is finalized, you are required to furnish the Committee and the

Commission with a final report of the study. The committee reserves the right to carry out compliance
inspection of this approved protocol at any time as may be deemed by it. As such, you are expected
to properly maintain all study documents including consent forms.
Wishing you a successful implementation of your study.
Yours Sincerely,
Yalonda .I. Mwanza
NCRSH ADMINISTRATOR
HEALTH, SOCIAL SCIENCES AND HUMANITIES DIVISION
For: CHAIRMAN OF NCRSH

Appendix 6: Amendment of items on behavioural brand experiences
1. Lake Malawi makes me express who I am
Modified “Lake Malawi makes me express who I am through water-based activities”
2. Lake Malawi gives me enjoyable experience
Merged to “Lake Malawi gives me enjoyable experience”
3. I engage in a lot of physical actions when I encounter this brand
Modified to “Lake Malawi makes me engage in physical actions and behaviours”
4. Lying on Lake Malawi beach makes me feel romantic
Modified to “Lying on lake Malawi beaches relaxes me”
5. I engage in physical actions and behaviours when I use this brand
Modified to “Lake Malawi makes me engage in physical actions and behaviours”
6. Bathing and swimming
Merged to “Lake Malawi makes me express who I am through water-based activities”
7. Walking trails on the lakeshores
Modified to “Walking along Lake Malawi sandy beaches is a worthwhile experience”
8. This brand engages me physically
Merged to “Lake Malawi makes me engage in physical actions and behaviours”
9. I like to see people working on the lake
Deleted
10. This brand results on bodily experiences
Merged to “Lake Malawi makes me engage in physical actions and behaviours”
11. Natural beaches
Deleted
12. Retained “Lake Malawi gives me a laid-back feeling”
13. Basking in the sun on the sandy beaches makes me get a natural skin tan
Modified to “Sun tanning at lake Malawi is important to me”
14. As a customer of this brand I am rarely passive
Merged to “Lake Malawi makes me engage in physical actions and behaviours”
15. Sailing on the lake
Merged to “Lake Malawi makes me engage in physical actions and behaviours”
16. Rock jumping at Lake Malawi makes my adrenaline rise
Deleted
17. Boating
Merged to “Lake Malawi makes me engage in physical actions and behaviours”
18. Fishing
Merged to “Lake Malawi makes me engage in physical actions and behaviours”
19. Cultural and heritage monument visits
Modified to “Lake Malawi is a cultural experience”

20. Walking in the villages at Malawi gives me an African experience
Merged to “Lake Malawi is a cultural experience”
21. This brand is not action oriented
Modified to “Lake Malawi is action oriented”
22. Lake Malawi engages me physically
Merged to “Lake Malawi makes me engage in physical actions and behaviours”
23. Lake Malawi snorkelling gives me fun
Lake Malawi gives me enjoyable experience
24. Walking on the beach keeps me fit
Merged to “Lake Malawi makes me engage in physical actions and behaviours”
25. Beach sports like soccer and volleyball
Merged to “Lake Malawi makes me engage in physical actions and behaviours”
26. Water based sports
Merged to “Lake Malawi makes me engage in physical actions and behaviours”
27. Lifestyle
Deleted
28. Photo taking opportunities
Deleted

Appendix 7: Amendments of items on sensory brand experiences
1. This brand makes a strong impression on my visual senses or other senses
Modified to “Lake Malawi appeals to my senses”
2. Richness of fauna
Modified to “Lake Malawi animals are appealing to watch”
3. I find this brand interesting in a sensory way
Merged to “Lake Malawi appeals to my senses”
4. This brand does not appeal to my senses
Modified to “Lake Malawi appeals to my senses”
5. Beautiful villages on the shoreline
Deleted
6. Lakes shoreline are appealing
Modified to “Lake Malawi environment is delightful”
7. To absorb into nature
Merged to “Lake Malawi environment is delightful”
8. Amazement at nature
Merged to “Lake Malawi environment is delightful”
9. Fish smells in the villages
Merged to “Lake Malawi appeals to my senses”
10. Lake Malawi allows me to take in the beauty of the place
Retained
11. Lake Malawi waters stimulates me
Modified to “Lake Malawi waters stimulates my senses”
12. Perceptual interesting
Merged to “Lake Malawi appeals to my senses”
13. The brand gives me sensory experiences
Merged to “Lake Malawi appeals to my senses”
14. Sunsets and sunrises over Lake Malawi are exciting to watch
Retained
15. Maritime impression
Merged to “Lake Malawi environment is delightful”
16. Shape and design of the lake
Merged to “Lake Malawi appeals to my senses”
17. Idyllic countryside, picturesque
Merged to “Lake Malawi allows me to take in the beauty of the place”
18. Transparent waters
Merged to “Lake Malawi environment is delightful”
19. Blue waters
Merged to “Lake Malawi environment is delightful”
20. To absorb in nature
Merged to “Lake Malawi environment is delightful”
21. LM colourful fishes are appealing to watch
Modified to “Lake Malawi animals are appealing to watch”
22. Animals

Merged to “Lake Malawi animals are appealing to watch”
23. Lake Malawi provides me with a serene experience
Retained
24. Local people visual impression
Merged to “Lake Malawi allows me to take in the beauty of the place”
25. Sense of beauty
Merged to “Lake Malawi allows me to take in the beauty of the place”
26. Eating local food like Chambo
Modified to “Lake Malawi gives me a culinary experience”
27. Lake waters stimulates my senses
Retained
28. Beautiful scenery
Merged to “Lake Malawi allows me to take in the beauty of the place”
29. Walking on the beach is soothing
Merged to “Lake Malawi appeals to my senses”
30. Bird watching opportunities
" Merged to “Lake Malawi animals are appealing to watch”

Appendix 8: Amendments of items on emotional brand experiences
1. This brand induces feelings and sentiments
Modified to “Lake Malawi induces feelings and sentiments”
2. Walking on the sand is romantic
Merged to “Lake Malawi induces feelings and sentiments”
3. Lake Malawi is charming
Retained
4. Lake Malawi atmosphere is relaxing
Retained
5. Full of fun
Modified to “Lake Malawi induces feelings and sentiments”
6. Refreshing experience
Modified to “Lake Malawi atmosphere is relaxing”
7. Sense of belonging
Modified to “Lake Malawi gives me a sense of belonging”
8. Fulfilling experiences
Merged to “Lake Malawi induces feelings and sentiments”
9. Amazement at nature
Merged to “Lake Malawi surprises me”
10. Positive mood
Modified to “Lake Malawi has a positive effect on how I feel about myself”
11. Good mood
Merged to “Lake Malawi has a positive effect on how I feel about myself”
12. Lake Malawi is a friendly destination
Retained
13. Positive feeling
Retained
14. Cheerful
Merged to “Lake Malawi induces feelings and sentiments”
15. This brand makes me happy
Retained
16. I have strong emotions for Lake Malawi”
Retained
17. This brand is an emotional brand
Merged to “I have strong emotions for Lake Malawi”
18. Brand often engages me emotionally
Merged to “Lake Malawi induces feelings and sentiments”
19. Nostalgic feelings
Retained
20. Feel relieved
Merged to “Lake Malawi atmosphere is relaxing”
21. I feel good when I use this brand
Merged to “Lake Malawi has a positive effect on how I feel about myself”
22. This brand gives me pleasure

Merged to “Lake Malawi has a positive effect on how I feel about myself”
23. I do not have strong emotions for this brand
Modified to “I have strong emotions for Lake Malawi”

Appendix 9: Amendments of items on cognitive brand experiences
1. I engage in a lot of thinking when I encounter this brand
Modified to “I engage in a lot of thinking when I am at lake Malawi”
2. This brand does not make me think
Deleted
3. The lake amazes me
Modified to “I have feelings of amazement at nature”
4. This brand stimulates my curiosity and problem solving
Modified to “Lake Malawi stimulates curiosity and problem solving”
5. This brand challenges my way of thinking
Merged to “Lake Malawi stimulates curiosity and problem solving”
6. I forget my problem when at the lake
Modified to “Lake Malawi helps me forget about my problems”
7. I learn new things at Lake Malawi
Modified to “ I gain new knowledge at Lake Malawi”
8. The lake captivates me
Modified to “Lake Malawi captivates me”
9. Learn more about the lake
Merged to “I gain new knowledge at Lake Malawi”
10. LM makes me think
Merged to “Lake Malawi captivates me”
11. Learn local cultures
Merged to “I gain new knowledge at Lake Malawi”
12. Lake Malawi is therapeutic
Merged to “Lake Malawi helps me forget about my problems”
13. I forget trouble
Merged to “Lake Malawi helps me forget about my problems”
14. Learn about animals
Modified to “Learning about animals of lake Malawi is rewarding”
15. The brand engages my creative thinking
Merged to “Lake Malawi stimulates curiosity and problem solving”
16. Learnt something new
Merged to “I gain new knowledge at Lake Malawi”
17. The lake intrigues me
Merged to “Lake Malawi captivates me”

Appendix 10: Amendments of items on social brand experiences
1. As a customer of the brand, I feel like a part of a community
Modified to “Lake Malawi offers me an opportunity of being a member of a
community”
2. Active and meaningful relationship with the brand, peers and organization
Merged to “Lake Malawi offers me an opportunity of being a member of a community”
3. I feel like I am part of the brand family
Merged to “Lake Malawi offers me an opportunity of being a member of a community”
4. Tourists admiring the views
Deleted”
5. When I use the brand, I do not feel left alone
Merged to “Lake Malawi offers me an opportunity of being a member of a community”
6. The brand gives me an identity
Merged to “Lake Malawi offers me an opportunity of being a member of a community”
7. Help me build relationships
Modified to “Lake Malawi helps me make friends”
8. Relates me to others/communitas
Modified to “Being at Lake Malawi helps me interact with others”
9. Collectivism by involving people, groups and society
Merged to “Lake Malawi offers me an opportunity of being a member of a community”
10. Connects me to stakeholders
Merged to “Lake Malawi offers me an opportunity of being a member of a community”
11. Connects me to nature
Deleted
12. Social rules and arrangements
Modified to “Lake Malawi allows me to learn about the local’s way of life”
13. Shared experiences with others
Modifies to “Lake Malawi allows me to participate in activities with other people”
14. Watch others enjoy themselves
Deleted
15. Experience the friendliness of local people
Modified to “Lake Malawi allows me to experience the friendliness of local people”
16. Connects me to the societal context
Merged to “Lake Malawi allows me to learn about the local’s way of life”
17. Consumption with other people
Merged to “Lake Malawi allows me to participate in activities with other people”
18. Sense of belonging
Merged to “Lake Malawi offers me an opportunity of being a member of a community”
19. Interaction with local communities
Modified to “Lake Malawi allows me to interact with local people”
20. Traditional way of life
Merged to “Lake Malawi allows me to learn about the local’s way of life”

21. Meeting groups of diverse people
Merged to “Being at Lake Malawi helps me interact with others”
22. Family bonding opportunity
Modified to “Being at Lake Malawi is a good opportunity to spend time with my family”
23. Local hospitality
Modified to “Lake Malawi represents local hospitality”
24. I make friends and socialize
Merged to “Lake Malawi helps me make friends”
25. Friendliness of local people
Merged to “Lake Malawi allows me to interact with local people”
26. Learn local cultures
Merged to Lake Malawi allows me to learn about the local’s way of life”

Appendix11: Amendments of items on spiritual brand experiences
1. Lake Malawi connects me with higher powers of nature
Retained
2. Away from civilization
Modified to “Lake Malawi draws me away from the secular”
3. Restorative/ revitalizing powers
Modified to “Lake Malawi has spiritual revitalizing powers”
4. Connection to nature
Merged to “Lake Malawi connects me with higher powers of nature”
5. Solitude and quietness
Modified to “Lake Malawi offers me solitude”
6. Connection with inner self
Merged to “Lake Malawi connects me with higher powers of nature”
7. Spiritual uplifting
Deleted
8. Inner well-being
Deleted
9. Appreciate creation
Merged to “Lake Malawi connects me with higher powers of nature”
10. Feeling of being blessed
Deleted
11. I have spiritual awareness at the lake
Modified to “To feel privileged and/or important”
12. Space to oneself
Deleted
13. Reunite me with mother nature
Retained
14. The lake uplifts me spiritually
Deleted
15. The lake offers me restorative powers
Merged to ““Lake Malawi has spiritual revitalizing powers””
16. Reflection about my self
Deleted
17. Lake Malawi connects me to nature powers
Merged to “Lake Malawi connects me with higher powers of nature”
18. I start my day at the lake
Merged to “Lake Malawi gives me spiritual awareness”
19. The lake gives me spiritual nourishment
Merged to “Lake Malawi gives me spiritual awareness”
20. The lake gives me spiritual nourishment
Merged to “Lake Malawi gives me spiritual awareness”
21. Feeling of being part of something bigger and infinite
Modified to “Lake Malawi gives me spiritual awareness”

Appendix 12: Normality test results of the items used in the pilot study
Items
Mean Skewness Kurtosis
Statistic Statistic SE Statistic SE
LM makes me express who I am through water-based
activities
3.59 -0.79 0.22 0.42 0.44
LM gives me an enjoyable experience 4.17 -1.83 0.22 5.25 0.44
LM makes me engage in physical actions and behaviours 3.66 -0.88 0.22 0.17 0.44
Lying on LM beach relaxes me 4.17 -1.83 0.22 5.25 0.44
LM activities allows me to self-actualise 3.54 -0.81 0.22 0.30 0.44
LM gives me a laid-back feeling 3.58 -0.95 0.22 0.26 0.44
LM transforms my mind 3.68 -1.01 0.22 0.56 0.44
Physical experiences at LM keep me fit 3.80 -1.03 0.22 0.88 0.44
LM is action (water-based sports) oriented 3.58 -0.94 0.22 0.39 0.44
LM is a cultural experience 3.78 -1.22 0.22 1.47 0.44
Walking along LM sandy beaches is a worthwhile
experience
4.15 -1.78 0.22 4.13 0.44
LM activities makes my adrenaline rise 3.34 -0.54 0.22 -0.61 0.44
Sun tanning at LM is important for me 3.54 -0.86 0.22 -0.41 0.44
LM puts me in a meditation mood 3.53 -0.83 0.22 -0.17 0.44
LM has a positive effect on how I feel about myself 3.77 -0.65 0.22 -0.46 0.44
LM induces feelings and sentiments 3.78 -0.83 0.22 -0.10 0.44
LM atmosphere is relaxing 4.45 -2.04 0.22 7.11 0.44
LM gives me a sense of belonging 4.06 -1.14 0.22 1.34 0.44
LM makes me happy 4.31 -1.76 0.22 3.67 0.45
LM gives positive feelings 4.31 -1.61 0.22 2.85 0.44
LM surprises me 3.46 -0.44 0.22 -0.72 0.44
I have strong emotions for LM 4.00 -0.81 0.22 0.43 0.44
LM is a friendly destination 4.34 -1.74 0.22 3.17 0.44
LM gives me nostalgic feelings 3.80 -0.71 0.22 -0.32 0.44
LM captivates me 3.99 -1.17 0.22 0.68 0.44
I have feelings of amazement at nature 4.24 -1.30 0.22 1.53 0.44
LM helps me forget about my problems 3.88 -0.86 0.22 0.09 0.44

I gain new knowledge at LM 3.89 -0.68 0.22 -0.04 0.44
LM stimulates curiosity and problem solving 3.64 -0.43 0.22 -0.62 0.44
I engage in a lot of thinking when I am at LM 3.76 -0.84 0.22 0.19 0.44
Learning about animals of LM is rewarding 3.97 -0.71 0.22 -0.13 0.44
LM environment is delightful 4.50 -1.90 0.22 5.19 0.44
LM provides me with a good culinary experience 3.98 -1.10 0.22 0.74 0.44
LM animals are appealing to watch 4.38 -1.70 0.22 2.99 0.44
LM allows me to take in the beauty of the place 4.39 -1.92 0.22 5.11 0.44
LM waters stimulates my senses 4.02 -0.93 0.22 0.58 0.44
LM appeals to my senses 4.08 -0.98 0.22 0.67 0.44
Sunrise and sunsets over the LM are exciting to watch 4.61 -2.16 0.22 7.10 0.44
LM provides me with a serene experience 4.38 -0.82 0.22 0.14 0.44
LM offers me an opportunity of being a member of a
community
3.88 -0.89 0.22 0.10 0.44
Being at LM helps me interact with others 4.35 -1.64 0.22 4.05 0.44
LM allows me to interact with local people 4.21 -1.47 0.22 2.42 0.44
LM represents local hospitality 4.22 -1.46 0.22 2.76 0.44
LM allows me to learn about the locals’ way of life 4.14 -1.51 0.22 3.02 0.44
LM allows me to participate in activities with other people 4.08 -1.29 0.22 1.62 0.44
LM allows me to experience the friendliness of local
people
4.23 -1.52 0.22 2.60 0.44
LM experience helps me to make friends 4.17 -1.16 0.22 1.59 0.44
Being at LM is a good opportunity to spend time with
my family
4.55 -2.01 0.22 4.78 0.44
LM connects me with higher powers of nature 3.69 -0.69 0.22 0.03 0.44
LM draws me away from the secular 3.32 -0.33 0.22 -0.81 0.44
LM reunites me with mother nature 4.00 -1.14 0.22 0.80 0.44
LM has spiritual revitalising powers 3.30 -0.29 0.22 -0.79 0.44
LM offers me solitude 3.53 -0.51 0.22 -0.70 0.44
LM gives me spiritual awareness 3.40 -0.37 0.22 -0.90 0.44
SE= Standard Error
LM – Lake Malawi

Appendix 13: Normality test results of the items used in the main study
Item
Mean Std. Dev Skewness Kurtosis
Statistic Statistic Statistic SE Statistic SE
LM makes me express who I am through water-
based activities
3.66 0.97 -0.94 0.09 0.79 0.19
LM gives me an enjoyable experience 4.25 0.73 -1.72 0.09 5.90 0.19
LM makes me engage in physical actions and
behaviours
3.74 0.94 -0.93 0.09 0.80 0.19
Lying on LM beach relaxes me 4.20 0.80 -1.55 0.09 4.09 0.19
LM activities allows me to self-actualise 3.71 0.98 -0.88 0.09 0.61 0.19
LM gives me a laid-back feeling 3.77 1.00 -0.98 0.09 0.79 0.19
LM transforms my mind 3.73 1.03 -0.93 0.09 0.53 0.19
Physical experiences at LM keep me fit 3.74 0.99 -0.82 0.09 0.40 0.19
LM is action (water-based sports) oriented 3.60 1.06 -0.83 0.09 0.15 0.19
LM is a cultural experience 3.72 0.98 -0.97 0.09 0.75 0.19
Walking along LM sandy beaches is a worthwhile
experience
4.15 0.86 -1.48 0.09 3.02 0.19
LM activities makes my adrenaline rise 3.46 1.11 -0.64 0.09 -0.28 0.19
Sun tanning at LM is important for me 3.61 1.13 -0.96 0.09 0.32 0.19
LM puts me in a meditation mood 3.71 1.05 -1.00 0.09 0.62 0.19
LM has a positive effect on how I feel about myself 3.80 1.07 -0.77 0.09 0.03 0.19
LM induces feelings and sentiments 3.77 1.06 -0.81 0.09 0.13 0.19
LM atmosphere is relaxing 4.41 0.77 -1.68 0.09 3.95 0.19
LM gives me a sense of belonging 4.03 0.93 -0.92 0.09 0.66 0.19
LM makes me happy 4.26 0.88 -1.45 0.09 2.32 0.19
LM gives positive feelings 4.26 0.83 -1.23 0.09 1.72 0.19
LM surprises me 3.69 1.10 -0.70 0.09 -0.14 0.19
I have strong emotions for LM 3.96 0.99 -0.87 0.09 0.35 0.19
LM is a friendly destination 4.37 0.83 -1.67 0.09 3.47 0.19
LM gives me nostalgic feelings 3.70 1.15 -0.77 0.09 -0.06 0.19
LM captivates me 4.00 0.97 -0.89 0.09 0.40 0.19
I have feelings of amazement at nature 4.33 0.79 -1.26 0.09 1.64 0.19

LM helps me forget about my problems 3.83 1.06 -0.78 0.09 0.08 0.19
I gain new knowledge at LM 3.94 0.94 -0.81 0.09 0.39 0.19
LM stimulates curiosity and problem solving 3.65 1.04 -0.50 0.09 -0.35 0.19
I engage in a lot of thinking when I am at LM 3.75 1.09 -0.80 0.09 -0.01 0.19
Learning about animals of LM is rewarding 3.89 1.00 -0.71 0.09 -0.05 0.19
LM environment is delightful 4.45 0.76 -1.59 0.09 2.88 0.19
LM provides me with a good culinary experience 4.01 0.96 -1.03 0.09 0.90 0.19
LM animals are appealing to watch 4.32 0.84 -1.33 0.09 1.69 0.19
LM allows me to take in the beauty of the place 4.42 0.74 -1.37 0.09 2.66 0.19
LM waters stimulates my senses 4.09 0.92 -0.87 0.09 0.35 0.19
LM appeals to my senses 4.08 0.90 -0.78 0.09 0.13 0.19
Sunrise and sunsets over the LM are exciting to
watch
4.55 0.68 -1.82 0.09 4.32 0.19
LM provides me with a serene experience 4.35 0.73 -1.07 0.09 1.32 0.19
LM offers me an opportunity of being a member of
a community
3.87 1.08 -0.82 0.09 -0.01 0.19
Being at LM helps me interact with others 4.31 0.78 -1.27 0.09 2.12 0.19
LM allows me to interact with local people 4.22 0.85 -1.15 0.09 1.28 0.19
LM represents local hospitality 4.21 0.85 -1.11 0.09 1.32 0.19
LM allows me to learn about the locals’ way of life 4.06 0.89 -1.05 0.09 1.23 0.19
LM allows me to participate in activities with other
people
4.17 0.85 -1.18 0.09 1.70 0.19
LM allows me to experience the friendliness of
local people
4.19 0.84 -1.17 0.09 1.62 0.19
LM experience helps me to make friends 4.18 0.87 -1.09 0.09 1.15 0.19
Being at LM is a good opportunity to spend time
with my family
4.45 0.79 -1.59 0.09 2.60 0.19
LM connects me with higher powers of nature 3.66 1.14 -0.67 0.09 -0.17 0.19
LM draws me away from the secular 3.26 1.23 -0.29 0.09 -0.88 0.19
LM reunites me with mother nature 3.98 1.03 -1.08 0.09 0.81 0.19
LM has spiritual revitalising powers 3.31 1.21 -0.28 0.09 -0.82 0.19
LM offers me solitude 3.59 1.12 -0.57 0.09 -0.37 0.19
LM gives me spiritual awareness 3.36 1.23 -0.48 0.09 -0.71 0.19

I am pleased to have visited LM 4.64 0.59 -1.90 0.09 5.03 0.19
I am delighted with LM experiences 4.60 0.57 -1.39 0.09 2.58 0.19
Coming to LM was a good choice 4.62 0.57 -1.51 0.09 3.15 0.19
My experiences at LM was what I needed 4.46 0.67 -1.33 0.09 2.66 0.19
The visit to Lm exceeded my expectations 4.27 0.83 -1.30 0.09 2.06 0.19
I really enjoyed myself at LM 4.58 0.57 -1.34 0.09 2.97 0.19
Overall, I am satisfied with my decision to visit
LM
4.60 0.58 -1.36 0.09 1.84 0.19
I volunteer to avoid visiting some areas along the
lake if they need to recover from environmental
damage
4.05 1.06 -1.13 0.09 0.79 0.19
I will sign petitions against oil drilling in support of
this lake
4.13 1.10 -1.22 0.09 0.77 0.19
I will tell my friends not to feed fish in LM 3.40 1.38 -0.38 0.09 -1.07 0.19
I will pay increased fees if introduced at Lake
Malawi National Park
3.70 1.15 -0.70 0.09 -0.28 0.19
I will volunteer my time to projects that help this
lake
4.16 0.87 -1.09 0.09 1.26 0.19
I will write letters in support of this lake 4.16 0.86 -1.00 0.09 0.93 0.19
I will participate in public meetings about
managing this lake
4.18 0.93 -1.20 0.09 1.36 0.19
I will make a financial donation to an
environmental organization in support of this lake
3.88 1.11 -0.95 0.09 0.44 0.19
I will tell others on the need to care for Lake
Malawi
4.52 0.71 -1.93 0.09 5.38 0.19
SE = Standard Error
LM = Lake Malawi